cod , haddockandnephrops - Seafish
160
Prepared by KPMG AS, Centre for Aquaculture and Fisheries and Sea Fish Industry Authority SEAFOOD INDUSTRY VALUE CHAIN ANALYSIS COD, HADDOCK AND NEPHROPS
-
Upload
khangminh22 -
Category
Documents
-
view
2 -
download
0
Transcript of cod , haddockandnephrops - Seafish

Prepared by KPMG AS, Centre for Aquaculture and Fisheries
and Sea Fish Industry Authority
S E A F O O D I N D U S T R Y V A L U E C H A I N A N A L Y S I S
C O D , H A D D O C K A N D N E P H R O P S
Foreword Representatives of the UK fish industry asked the Sea Fish Industry Authority (Seafish) to carry out an analysis of the seafood value chain, focusing on routes to market of the key species landed at UK ports. Seafish initiated this study in the summer of 2003 to obtain a clear picture of the value chains for the study species, and has conducted the study in co-operation with KPMG, Centre for Aquaculture and Fisheries in Trondheim, Norway. The authors of this report are Merete Gisvold Sandberg, Andreas Gjermundsen, Erik Hempel and Trude Olafsen of KPMG, and Hazel Curtis and Aoife Martin of Seafish. The authors would like to thank all who generously contributed their time to participate in interviews and complete questionnaires. The authors would particularly like to thank the following,
• Members of the Project Advisory Group • Petur Bjarnson, Fisheries Association of Iceland • John Rajani, Faeroe Islands Councillor in London
Assistance was received from Seafish colleagues and the authors would like to thank in particular Ceara Nevin, Julie Graham, Maria Calvo and Sean Botha from the Market Insight team, and Jim Watson and Rebecca Seidel from the Economics team. This project was part-financed by the European Union through the Financial Instrument for Fisheries Guidance (FIFG), the structural fund for fisheries. FIFG is administered in the UK by DEFRA and the devolved administrations. 30.03.04 Sea Fish Industry Authority KPMG AS, Centre for Aquaculture and Fisheries
MARCH 2004 Page 2

Table of contents 1. Executive summary ................................................................................................ 5 2. Background, objectives and method .................................................................... 12
2.1 Background................................................................................................... 12 2.2 Objectives ..................................................................................................... 12 2.3 Scope............................................................................................................ 13 2.4 Approach ...................................................................................................... 13 2.5 Method.......................................................................................................... 13 2.6 Definitions ..................................................................................................... 18
3. Global industry analysis........................................................................................ 20 3.1 The global supply situation ........................................................................... 20 3.2 Global consumer trends................................................................................ 22 3.3 Study species ............................................................................................... 22 3.4 Waste problems and waste utilisation .......................................................... 29
4. UK market situation .............................................................................................. 31 4.1 Supplies ........................................................................................................ 31 4.2 Consumption and exports............................................................................. 34
5. Description of the UK value chain ........................................................................ 39 5.1 UK fleet ......................................................................................................... 39 5.2 Import and export agents.............................................................................. 39 5.3 Fish auction markets and inland markets ..................................................... 40 5.4 Merchants ..................................................................................................... 41 5.5 Processing .................................................................................................... 41 5.6 Wholesalers .................................................................................................. 42 5.7 Retail sector.................................................................................................. 43 5.8 Foodservices ................................................................................................ 43
6. Value chain analysis Cod ..................................................................................... 46 6.1 Supply situation (I) ........................................................................................ 46 6.2 Auction markets ............................................................................................ 55 6.3 Merchants ..................................................................................................... 56 6.4 Processing (II and III).................................................................................... 56 6.5 Wholesalers .................................................................................................. 65 6.6 Consumption and exports (IV) ...................................................................... 66 6.7 Total picture cod ........................................................................................... 73 6.8 Price analysis – the cod value chain............................................................. 74 6.9 Main findings cod value chain....................................................................... 78
7. Value chain analysis Haddock.............................................................................. 80 7.1 Supply picture (I)........................................................................................... 81 7.2 Fish markets and auctions............................................................................ 87 7.3 Merchants ..................................................................................................... 89 7.4 Processing .................................................................................................... 89 7.5 Wholesalers .................................................................................................. 98 7.6 Consumption and exports (IV) ...................................................................... 98 7.7 Total picture haddock ................................................................................. 105 7.8 Price analysis – the haddock value chain................................................... 106 7.9 Main findings haddock value chain............................................................. 110
8. Value chain analysis Nephrops .......................................................................... 112 8.1 Supply picture (I)......................................................................................... 113 8.2 Auction markets .......................................................................................... 117 8.3 Merchants and agents ................................................................................ 118 8.4 Processing (II and III).................................................................................. 118 8.5 Wholesalers ................................................................................................ 124
MARCH 2004 Page 3

8.6 Consumption and exports (IV) .................................................................... 125 8.7 Total picture – nephrops ............................................................................. 132 8.8 Price analysis – the nephrops value chain ................................................. 133 8.9 Main findings nephrops value chain ........................................................... 136
9. Issues of special interest .................................................................................... 138 9.1 UK landing prices compared to first hand landing prices in Norway........... 138 9.2 Habits and reasons for raw material purchases of cod and haddock – with special focus on what happens to the fish landed by UK fishing vessels............... 140 9.3 Waste handling and by-product utilisation .................................................. 144
10. Findings and implications ............................................................................... 147 10.1 Interactions and framework in the value chain ........................................... 147 10.2 Implications for stakeholders ...................................................................... 148
11. References ..................................................................................................... 156 12. Appendix......................................................................................................... 157
12.1 Information wanted from processors .......................................................... 157 12.2 Information wanted from auction markets................................................... 158 12.3 Information wanted from supermarkets ...................................................... 159
MARCH 2004 Page 4

EXECUTIVE SUMMARY
1 . E X E C U T I V E S U M M A R Y
This study provides a close look at the UK seafood value chain for the species cod (Gadus morhua), haddock (Gadus aeglefinus) and nephrops (Nephrops norvegicus). This report treats each value chain separately, and the main findings from each analysis can be found below. In addition, the key points extracted from the interviews held with industry players and the implications of the main findings for the major stakeholders in this study are presented here. When seen as a whole, these observations provide a background for understanding some of the developments that are observed in the seafood industry today for the selected species. All figures presented are for year 2002. Main findings from the cod value chain Supply
Total supply of cod into UK was 148,000 tonnes of product weight or 283,000 tonnes of live weight.
Imports represented 85% of product weight volume (of this landings by foreign fleet represented 4%) and landings by UK vessels represented 15%.
Average price achieved for cod landings by UK fleet was £1.36 per kg live weight. This is considerably higher than the average price achieved for landings by foreign vessels (£1.23 per kg).
Main sources of import for cod are Russia, Norway, Iceland and the Faeroe Islands.
Frozen fillets and frozen whole or headless fish are the main cod products imported. Imported frozen fillets represented 50% of the total cod product supply and the average price paid for frozen imported fillets was £3.13 per kg.
Processing (based on information from interviewed companies)
Total supply to cod processors was 136,000 tonnes of products at a purchase price of £372 million. Total sale from cod processors was 115,500 tonnes at a sales value of £443 million. Based on this, the raw material cost was 84% of the sales value.
The main product from primary processors is natural fillets, while from secondary/mixed processors frozen coated products is the main category.
The product weight loss in cod processing was 15% which is the difference between loss of weight to by-products/waste and addition of weight in form of added ingredients (e.g breading).
Consumption and exports
Total sales volume of cod was 123,000 tonnes in product weight with a final sales value of £1,146 million in the UK.
88% of the volume was sold and consumed in the UK; 52% through the retail sector and 36% through the foodservice sector. 12% of cod volume was exported.
The foodservice sector was the most important in terms of value, representing 66% of the total sales value or £762 million.
The average price (paid by the consumer) of cod products in the retail sector was £5.57 per kg, giving a total value of £354 million for expenditure on cod in the retail sector.
Fish and chip shops ordered 22,000 tonnes of cod. This represents about one fifth of total sales volume in product weight.
MARCH 2004 Page 5
EXECUTIVE SUMMARY
The main products for domestic consumption and exports are coated frozen products, natural frozen products, natural chilled products and frozen added value products.
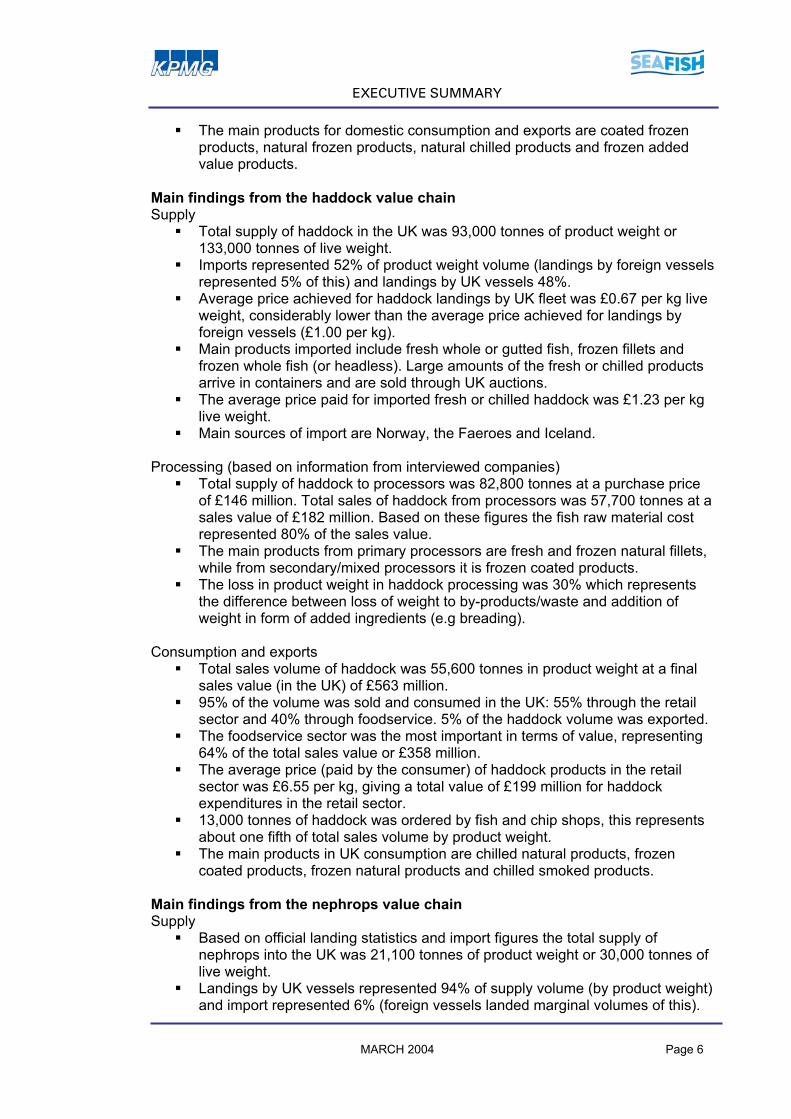
Main findings from the haddock value chain Supply
Total supply of haddock in the UK was 93,000 tonnes of product weight or 133,000 tonnes of live weight.
Imports represented 52% of product weight volume (landings by foreign vessels represented 5% of this) and landings by UK vessels 48%.
Average price achieved for haddock landings by UK fleet was £0.67 per kg live weight, considerably lower than the average price achieved for landings by foreign vessels (£1.00 per kg).
Main products imported include fresh whole or gutted fish, frozen fillets and frozen whole fish (or headless). Large amounts of the fresh or chilled products arrive in containers and are sold through UK auctions.
The average price paid for imported fresh or chilled haddock was £1.23 per kg live weight.
Main sources of import are Norway, the Faeroes and Iceland. Processing (based on information from interviewed companies)
Total supply of haddock to processors was 82,800 tonnes at a purchase price of £146 million. Total sales of haddock from processors was 57,700 tonnes at a sales value of £182 million. Based on these figures the fish raw material cost represented 80% of the sales value.
The main products from primary processors are fresh and frozen natural fillets, while from secondary/mixed processors it is frozen coated products.
The loss in product weight in haddock processing was 30% which represents the difference between loss of weight to by-products/waste and addition of weight in form of added ingredients (e.g breading).
Consumption and exports
Total sales volume of haddock was 55,600 tonnes in product weight at a final sales value (in the UK) of £563 million.
95% of the volume was sold and consumed in the UK: 55% through the retail sector and 40% through foodservice. 5% of the haddock volume was exported.
The foodservice sector was the most important in terms of value, representing 64% of the total sales value or £358 million.
The average price (paid by the consumer) of haddock products in the retail sector was £6.55 per kg, giving a total value of £199 million for haddock expenditures in the retail sector.
13,000 tonnes of haddock was ordered by fish and chip shops, this represents about one fifth of total sales volume by product weight.
The main products in UK consumption are chilled natural products, frozen coated products, frozen natural products and chilled smoked products.
Main findings from the nephrops value chain Supply
Based on official landing statistics and import figures the total supply of nephrops into the UK was 21,100 tonnes of product weight or 30,000 tonnes of live weight.
MARCH 2004 Page 6
Landings by UK vessels represented 94% of supply volume (by product weight) and import represented 6% (foreign vessels landed marginal volumes of this).

EXECUTIVE SUMMARY
Average price achieved for nephrops landings by the UK fleet was £2.42 per kg live weight or £3.42 per kg product weight. The highest price was achieved in Scotland.
Approximately 40% of animals caught are tailed at sea, while 60% of the animals reach the shore as whole animals. Whole animals from UK vessels therefore represent 75% of total nephrops supply (volume by product weight) and tails from UK vessels 19%.
80% of the UK nephrops landings are landed in Scotland. Processing (based on information from interviewed companies)
The total supply of nephrops to processors was 18,000 tonnes at a value of £60 million. Total sales from nephrops processors were 20,500 tonnes at a sales value of £111 million. Based on these figures the shellfish raw material cost represented 54% of the sales value.
The main raw materials taken in by processors are fresh tails and whole fresh animals.
The main nephrops product from processors was coated tails, representing more than 54% of the volume.
There is a weight gain in nephrops processing of 15%, this represents the difference between loss of weight due to by-products/waste and addition of weight in form of added ingredients (e.g breading). The gain is mainly due to the large proportion of coated products.
Consumption and exports
Nephrops are sold under a number of product names. Whole nephrops are often called Norway lobster, Langoustines or Dublin Bay Prawns, while processed nephrops can be sold as Norway lobster tails, or as scampi (coated tails, fresh or frozen).
Total sales volume of nephrops was 27,700 tonnes at a final sales value in the UK value chain of £276 million.
By volume 46% is sold and consumed in the UK and 54% is exported. About 40% of UK consumption was sold through the retail sector and 60% through the foodservice sector.
The bulk of exported products was frozen and had an average sales price of £4.82 per kg product (FOB prices).
Main markets for exported nephrops are Spain, France and Italy. Together these countries buy 94% of UK nephrops export.
The foodservice sector is the most important in terms of value, representing 56% of the total sales value or £154 million. Pubs and restaurants are the outlet types in the foodservice sector ordering the most nephrops (approximately 5,000 tonnes). This represents 18% of total sales volume.
The average price (paid by the consumer) of nephrops products in the retail sector was £8.35 per kg, giving a total value of £42.6 million for nephrops expenditures in the retail sector. The main product in retail is frozen coated whole tail (sold as Scampi).
MARCH 2004 Page 7

EXECUTIVE SUMMARY
Summary of interviews with processors This section presents some of the statements made during interviews with processors which throw some light on current practices. The project team has not further verified these statements, but they illustrate some of the views observed in industry.
Some processors stress the importance of proper cooling in the whole distribution/logistic chain. They claim that foreign companies tend to be better at this than UK companies.
For many of the larger processors supplying the retail sector, the ability to trace raw material through the supply routes is essential.
It was stated that other countries fleets are more used to being more exposed to the market. Other countries seem to have more vertical integration between the catching sector and primary processing; this enables the vessels to have a stronger focus on the market and the consumer. It was claimed that the UK fleet does not co-operate in groups of vessels to give a consistent supply in compliance with product specifications.
Generally, many state that the UK landed fish is smaller than the imported (especially for haddock, but also for cod). Since the size of raw material is often an important factor in production, flexibility and ability to meet volumes within specified size ranges are important factors in choosing supplier. These processors say that this favours foreign suppliers.
Several of the processors say they prefer the line caught fish to trawled fish because of quality. Others say that on-board handling is more important than the fishing method.
Several mention the issue of sustainability of stocks and some say they use no UK raw materials due to the question of sustainability.
Summary of findings and implications for stakeholders The increased market share of multiples in overall seafood turnover has had a significant impact on the UK seafood value chain. The fact that products are being channelled through fewer and larger multiples has lead to a shift of influence in the value chain towards the market. Among the most important trends is the increased customer/market focus throughout the UK seafood industry. Increasingly, the consumer preference has an impact in business areas upstream in the value chain. Customer perceptions are not always based on facts, and it is clear that the industry has an increased need to develop communication channels into the consumer segments and remain market focused. There is an overall perception in the industry that the market for seafood has substantial growth potential in the UK. The market can be expanded in terms of value through increased market share of seafood compared to other nutrients, or higher prices achieved on existing product volumes. Increased competition from twice-frozen products (mostly primary processed) from low-cost countries is also becoming an important factor in the UK seafood industry. The foreign products are hand-processed in such countries as China, giving a higher yield in filleting at an overall lower processing cost per kg of fillet. As a result, the domestic primary processors meet an increasingly tough competitive environment on product quality and price in the frozen products sector. This has to some extent resulted in a shift of focus by primary processors toward the fresh/chilled sector to remain profitable and to take advantage of the short distance to market.
MARCH 2004 Page 8

EXECUTIVE SUMMARY
Furthermore, the discussion regarding the issue of waste handling and by-product utilisation has shown a significant potential for improvement in the UK industry. Currently, most of the by-products that are utilised go to fishmeal or fish oil production with low and unstable prices. To achieve an overall better utilisation of by-products and better profitability in doing so, it is essential to focus on product development and to have focus on by-product handling, storage and transportation throughout the value chain. The primary objective should be to reduce the overall percentage of by-products and to maximise the yield in terms of primary products from the raw material. Secondly, businesses should maximise the volume processed for human consumption to raise the value of the by-products that remain (heads, cheeks, tongue, liver, roe, stomachs). There is also a high value potential for by-product utilisation in marine ingredients for foods, cosmetics, medicine etc. This opportunity can in most cases only be exploited through intensive research and product development. Implications for private businesses The UK fishing fleet is faced with the increased influence and quality requirements of the multiple retail sector. This implies increased focus on the quality and handling of the raw material on board vessels, and after landing in the UK, is needed in order to remain competitive. It is becoming increasingly important for the UK fleet that UK landed fish is perceived in the market as environmentally sustainable and of high quality. The UK catching sector has an advantage in the closeness to the end market. In order to exploit this, it is necessary to offer a fresher, better quality product to compete with imported raw material. The price must also be competitive in relation to the quality of the raw material. There seems to be a significant potential for better co-ordination and co-operation in the UK catching sector to gain a stronger influence in the seafood industry and government. Main opportunities and areas for improvement in the UK fleet sector are:
Increased co-operation between catching businesses to have a stronger influence in the seafood industry and government.
Establish a clear strategy on improving environmental sustainability of operations.
Establish information channels into the end user market to improve perception of UK caught fish.
Effective chilled logistics chains, improved hygiene and catch handling methods may give the opportunity to offer a premium raw material for chilled products.
Establish strategic alliances with distributors to strengthen market position. Improve waste processing and utilisation to improve economic results and the
perception of the fleet as being environmentally sustainable. Encourage strict regulatory requirements from government to ensure
compliance with quota regulations. The primary processors are facing increased competition from the frozen product sector, mainly due to imported primary processed raw material. Increased focus on chilled products by primary processors and increased consumer popularity of chilled seafood will increase demands for quality in supply logistics and handling of raw material in order to maximise quality and shelf life of products. There is reason to believe that competition from foreign suppliers will increase also in the chilled product market as the quality of international chilled seafood logistics improves.
MARCH 2004 Page 9

EXECUTIVE SUMMARY
In primary processing of fish it can be difficult to differentiate the products from those of other suppliers. In several ways, the possibilities for differentiation relate to process rather than product. Hygiene standards, quality of filleting, specification of product, freshness (shelf life), reliability of supply, consistent on-time delivery are examples of important criteria to deliver a premium product. Main opportunities for primary processors include:
Increased consumption in the chilled seafood sector offers possibilities. Closeness to the market gives the opportunity to serve a premium chilled
product with long shelf-life. This involves securing high quality raw material and having a strong focus on hygiene and effective logistics; in house and during transportation to the market.
Secure strong market position through vertical strategic alliances in supply and with customers.
Focus on process to differentiate from other primary processors. The secondary/mixed processors have a large exposure to the market through the retail sector. The need to expand product ranges and adapt to shifts in the market puts emphasis on flexibility and product innovation for suppliers. To have maximum flexibility and maintain a broad product spectrum, there is an advantage in performing the final product preparation/assembly in geographic proximity to the market. To take advantage of this and to reduce risk of losing market share to international vertically integrated competitors, UK processors could seek strategic alliances in supply and product development. Main opportunities for secondary/mixed processor include:
Increased co-operation with multiples in product development and sales may secure stronger relations and solid market position.
Expansion of the overall seafood consumption market through product innovation and marketing.
Strategic alliances in supply with UK/foreign companies may increase security in supply.
Strategic alliances with integrated companies may reduce the risk of competition in the consumer market.
Increased competition in frozen primary processed raw materials gives lower raw material prices. This may give increased margins for secondary processors for a limited time.
Implications for government A reliable control method to prevent illegal landings and catching will help improve the competitive situation for the UK catching sector. The UK landings will then have a clear profile of being well-managed and environmentally sustainable. This may improve the preference for UK landed fish significantly with the major domestic customer groups.
MARCH 2004 Page 10
The government has the opportunity to stimulate performance in the companies and to provide the foundation for a prosperous seafood industry without distortion of competition. This type of function is generally more attributed to the Department of Trade and Industry, rather than DEFRA or SEERAD, but there is the opportunity for fisheries departments to be more involved in supporting and developing the fish industry in the way that the DTI supports industry in general. To do this, it is essential to focus on areas where growth is possible. This is also in the interest of the consumers, who will not tolerate distortion of competition with the effect of higher prices
EXECUTIVE SUMMARY
in the long run. It is also clear from other European seafood industries that the greatest potential for creating jobs and value added is in the land-based part of the seafood industry. Examples of important areas of improvement for government that do not cause distortion of competition are:
Establish a fisheries management regime (quotas etc) that allows for long term planning for companies and an environmentally sustainable industry.
Maintain control and perform inspections to ensure that commercial activity is in compliance with the current management regime.
Maintain and develop infrastructure and communications to support commercial activity (port facilities, logistics etc).
Stimulate innovation through research and increased co-operation between commercial and institutional sectors (universities, research facilities etc).
Establish and stimulate education in relevant areas to maintain and expand key competence to further develop the seafood industry.
Implications for Seafish Seafish will have the main responsibility of presenting the findings of this study to the industry. Seafish has an important task in offering precise insight on status and developments in the value chain. Such information must be regularly updated and available to ensure that it maintains its value for the industry. As the interactions in the value chain increase, it is also increasingly important for companies to meet new requirements and developments driven from other stages in the value chain. It should be a priority for Seafish to contribute to increased information exchange in the industry on a level that benefits individual companies. Seafish also has an important role as a main channel for information flow between government and industry. It is important that Seafish is able to provide a comprehensive information base that serves the purposes of both government and industry. This means presenting a clear and documented overview of the industry situation and its needs. In addition, Seafish should inform industry players of the implications and importance of the current regulatory regime. Examples of key areas for improvement for Seafish are:
Co-ordinate and present official data and statistics from various data sources to increase the value of the data in the industry.
Stimulate increased information exchange between industry players for mutual benefit.
Serve as a communications channel for the industry into the public. This report shows the importance of educating the consumer.
Sustain a dialogue between government and industry by communicating needs for improvement and the importance of compliance with the current management regime.
Increase awareness and knowledge of the potential for waste handling and commercial utilisation.
Stimulate innovation projects in the seafood industry
MARCH 2004 Page 11

BACKGROUND, OBJECTIVES AND METHOD
2 . B A C K G R O U N D , O B J E C T I V E S A N D
M E T H O D
2 .1 Backgro und
Representatives of the UK fish industry asked Seafish Economics to carry out an analysis of the seafood value chain, focusing on routes to market of the key species landed at UK ports. There was concern that the importance of the UK processing industry was sometimes underestimated in comparison to the catching sector. It was also felt that the UK catching industry could benefit from a better understanding of the current UK market and consumers. Opportunities to improve profitability might exist if the catching sector had a better understanding of the potential consumer markets it could target if it were to compete successfully with higher value imports, e.g. fresh cod flown in from Iceland. The Seafish whitefish advisory committee agreed that three species should be included in the first phase of this study, namely, cod (Gadus morhua), haddock (Gadus aeglefinus) and nephrops (Nephrops norvegicus). The Sea Fish Industry Authority (Seafish) initiated this study in the summer of 2003 to obtain a clear picture of the value chains for the selected study species. The study was conducted by Seafish in co-operation with KPMG, Centre for Aquaculture and Fisheries in Trondheim, Norway. Stakeholders The study aims to give information to help businesses, government departments, and Seafish a better foundation for decisions about future dispositions. Consequently, an initial discussion of the objectives and needs of each of these three parties was undertaken in order to clarify the different purposes of the study for each institution. 2 .2 Ob jec t i ves
The primary objective of this study is to provide the identified stakeholders with an overview of the value chains for the selected species and point out the strategic significance of some key elements. The project is to analyse the UK seafood value chain and the economic importance of the three key species; cod, haddock and nephrops. The project will cover the whole of the UK industry and the study is based on data collected for year 2002. Findings were to be presented in the context of the overall UK seafood market, which includes other high volume species such as salmon. The principal stages of the study were:
Estimate volumes and values of study species at each stage of the value chain from UK landings and from imports.
Estimate the final value of exports and consumption of the study species in the UK.
Identify principle routes from raw material to consumer for each of the study species.
Price analysis of selected products throughout the value chain. Investigate the routes to the market for domestically caught fish
MARCH 2004 Page 12
Present these findings, and the implications for businesses throughout the value chain, in a report to assist management decisions by companies in industry, by government and by Seafish.
BACKGROUND, OBJECTIVES AND METHOD
2 .3 Scope
At the beginning of this study a meeting was arranged with the project advisory group. The initial objectives set by Seafish were discussed and somewhat revised. It was agreed that it was important to focus on mapping the flows of fish by volume through the different stages of the value chain, identifying different routes to the market, although information on values and prices would still be collected. The main focus in this study therefore has therefore been to establish a map of what happens to volumes and values in the processing sector for the selected species. The most recent figures available on processing of the individual species were published in the 1995 Survey of the UK Fish Processing Industry and in addition to be being out of date, did not give the picture that was sought. It was decided that the original Seafish objective of detailed regional analysis should be a reduced priority and that the whole UK picture was the most important. Collection of volumes and values and other information from processors and other seafood industry was carried out principally by Seafish with several interviews being conducted jointly with members of the KPMG project team. Estimates of total value proved difficult and have been substituted with price and value adding information. 2 .4 Approac h
The project was carried out in the following stages: Project design
Identification of categories for industry players. In order to simplify the analysis, industry players with similar business concepts are grouped into categories.
Identification of processing categories for each of the study species. Here, the same categories have been used with cod and haddock, while nephrops categories have been modified to match the actual processing in each sector.
Project analysis and detail of deliverables have been adjusted to match available data.
Data collection
Questionnaires that match the deliverables in the project design were produced for data collection from processors and other industry players.
Data was collected, where possible, in meetings with industry players. Analysis
Analysis was carried out for each of the study species according to the project design. Prices and volumes throughout each of the identified categories were estimated for the UK.
Co-operation
All work was done with close co-operation between Seafish and KPMG.
2 .5 Me thod
This section describes the methodology used in the value chain analysis for the study species presented in chapters 6 – 8. MARCH 2004 Page 13

BACKGROUND, OBJECTIVES AND METHOD
2.5.1 Survey method
As mentioned above data was collected from throughout the value chain by interviews. Several groups of operators were interviewed and the most important ones are mentioned below. Import agents Several import agents were interviewed. Seafish staff visited a range of companies in Iceland and the Faeroes, while representatives from KPMG interviewed Norwegian companies. These visits provided some of the information needed about imports of raw materials. Fishing vessels / Auction markets Three vessels, a vessel owning company and five of the main auction markets were interviewed. Processors Seafish selected part of the processing industry in order to make sure the largest companies and also had a good distribution of smaller processors were included. The study covered 32 processing companies (4 companies did not provide data), representing over 70% of the full time equivalents employed in the demersal processing industry. For the nephrops value chain, 10 companies were interviewed. The main objective of the interviews was to get a good understanding of the raw material flow of the selected species in the study. Information on volumes and prices of purchases and sales was requested from individual processors, as well as information about, for example, preferred raw materials, habits and reasons for purchases. The collected data was consolidated by KPMG to present a total image of all the interviewed companies and the value chain in total. Supermarkets / foodservice sector Three large supermarket chains and three fish and chip owners were interviewed. Chapter 11, the appendix, shows the questionnaires used for interviews. 2.5.2 Terminology
To give an overview of the value chain analysis, the following terms will be used throughout this document: Live weight equivalent is obtained from landing, import and export statistics. It is obtained by using a factor to estimate the relation between the weight of a refined product to the weight of raw materials needed to make the product (whole live fish). Product weight is the actual weight of the processed fish, not corrected for any weight reductions due to processing. All measures are given in tonnes. Volume flow is in the following used for mapping the quantity of raw materials that flow between the entities in the value chain. All figures presented are yearly values and volumes measured in tonnes product weight (where live weight is used, it is specified).
MARCH 2004 Page 14

BACKGROUND, OBJECTIVES AND METHOD
Value flow is nearly the same as volume flow, but estimates the value of the materials through an average price of the raw-materials/products in question. Control sums refer to fixed parts of the value chain. For each control sum an estimated balance of raw materials/products was established. Four such sums (labelled I-IV, as shown below) are used in this analysis. Supply In this study defined as the sum of landings into UK by UK and foreign vessels plus imports, which together also corresponds to control sum I. Consumption and exports In this study defined as the sum of sales from the retail sector, the foodservice sector and exports, control sum IV. Overall value chain analysis refers to the presentation of the balances for the control volumes as well as graphical presentation of the volume/value flows between these. Detailed value chain analysis refers to an analysis of interactions and volume/value flows within the separate control volumes. 2.5.3 Description of the overall value chain analysis
The control sums used in the overall value chain analysis can be described as follows:
I. The combined imports and landings by UK and foreign vessels can be said to represent the supply of raw material in the value chain.
II. The second control sum represents the inflow of raw materials to the processing sector.
III. The third control sum represents the outgoing products from the processing sector.
IV. The fourth control sum is the amount of finished product that goes to domestic consumption in the foodservice sector and through the retail sector, in addition to the flow of raw materials and finished product that are exported from the UK. Control sum IV can be labelled the consumption and exports in the value chain.
MARCH 2004 Page 15

BACKGROUND, OBJECTIVES AND METHOD
UK vessellandings
ImportsExports
I II III IVRetail sector
Foodservicesector
Processing
Wholesaler,Trader
Overall value chain analysis
Figure 1 Overall value chain picture
Overall value chain analysis refers to the presentation of the balances for the control sums as well as graphical presentation of the volume/value flows between these. An example of the overall analysis is shown in the figure above. The flows in the overall volume/value picture have been scaled vertically to represent the magnitude of the individual flows. The data in I (landings and imports) is based on official statistics. The data in I are used to estimate the percentage of total UK volumes that have been covered by data collection through interviews with the processing industry. It is assumed that the data available to establish the volume in control sum I are fairly accurate, and this is therefore used as base assumption for the total volume of each study species in the UK value chain. From this source material assumptions were made to estimate total volume and value of raw material entering the processing sector (II) and going directly to control sum IV. This estimate of II is later used to scale the interview results up to give a total estimate of volumes of different products and corresponding values for the entire processing industry. Total export (IV) volumes and values were found using statistics, while data for the retail and foodservice sectors is based on external studies. Retail data is based on the Taylor Nelson Sofres database at Seafish and foodservice data is based on a study done by Friary Marketing & Consulting Group 2003. The project team has made estimates to establish an overall value chain analysis for the selected species. The routes of raw materials from I (landings and imports) to II (processors) are complex and a wide variety of combinations involving auction markets, direct sales import agents, merchants and markets exists. No attempt was made to quantify these stages of the value chain, but rather a general description of the companies involved and how they operate is given. This is important to remember when looking at the diagram above. 2.5.4 Description of the detailed value chain analysis
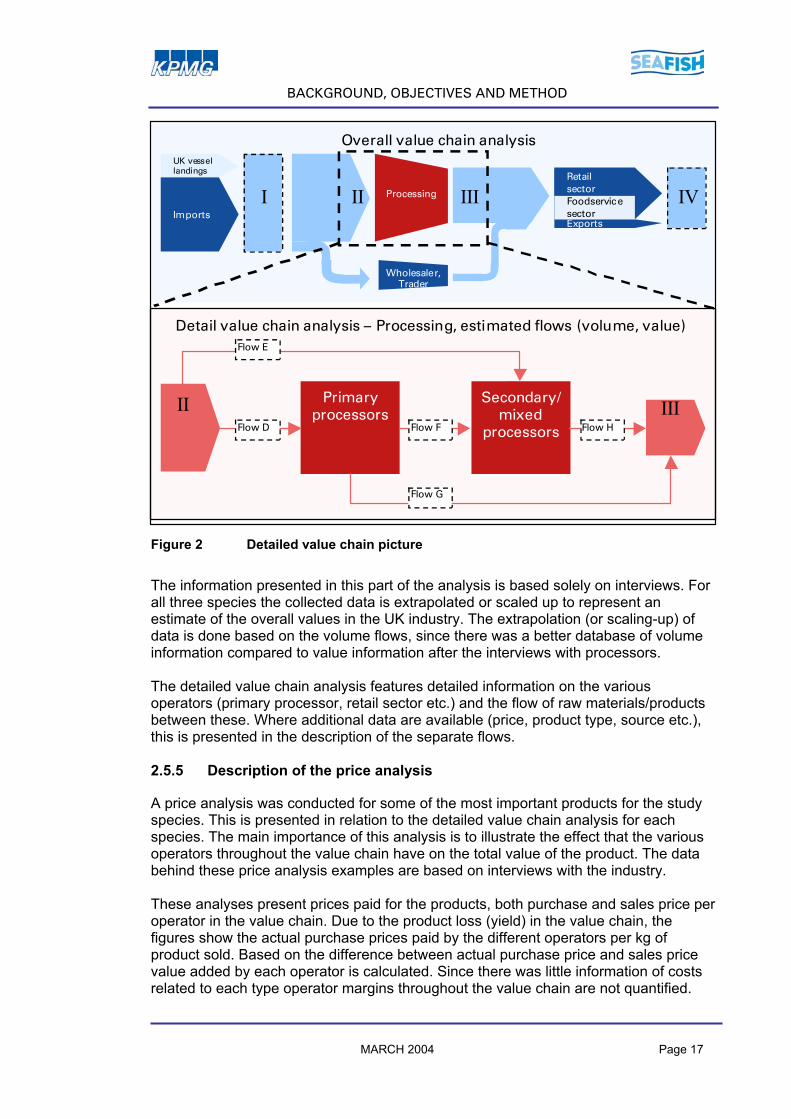
Detailed value chain analysis refers to an analysis of interactions and volume/value flows within the separate control sums. The diagram below illustrates the detailed analysis framework for the processing sector. The volume and value flows (D-H) will be described more closely for each of the study species.
MARCH 2004 Page 16
BACKGROUND, OBJECTIVES AND METHOD
UK vessel landings
ImportsExports
I II III IVRetail sectorFoodservicesector
Processing
II
Overall value chain analysis
IIISecondary/mixed
processors
Primaryprocessors
Flow G
Flow D
Flow E
Flow F Flow H
Detail value chain analysis – Processing, estimated flows (volume, value)
Wholesaler,Trader
Figure 2 Detailed value chain picture
The information presented in this part of the analysis is based solely on interviews. For all three species the collected data is extrapolated or scaled up to represent an estimate of the overall values in the UK industry. The extrapolation (or scaling-up) of data is done based on the volume flows, since there was a better database of volume information compared to value information after the interviews with processors. The detailed value chain analysis features detailed information on the various operators (primary processor, retail sector etc.) and the flow of raw materials/products between these. Where additional data are available (price, product type, source etc.), this is presented in the description of the separate flows. 2.5.5 Description of the price analysis
A price analysis was conducted for some of the most important products for the study species. This is presented in relation to the detailed value chain analysis for each species. The main importance of this analysis is to illustrate the effect that the various operators throughout the value chain have on the total value of the product. The data behind these price analysis examples are based on interviews with the industry. These analyses present prices paid for the products, both purchase and sales price per operator in the value chain. Due to the product loss (yield) in the value chain, the figures show the actual purchase prices paid by the different operators per kg of product sold. Based on the difference between actual purchase price and sales price value added by each operator is calculated. Since there was little information of costs related to each type operator margins throughout the value chain are not quantified.
MARCH 2004 Page 17
BACKGROUND, OBJECTIVES AND METHOD
2 .6 De f in i t ions
UK vessel landings Includes landings in UK ports by UK vessels. Freezing at sea / at sea processing is not done to any significant extent by UK vessels. Foreign vessel landings This includes landings in UK ports by foreign registered fishing vessels (e.g. Icelandic landing in Hull or Faroese landing in Scrabster). This category only refers to direct landings by the vessels, other indirect landings by seaway (i.e. in containers or frozen bulk transported by non-fishing vessels) is categorised as imports. Imports All volumes of the selected study species transported into the UK outside volumes landed by fishing vessels. Import volumes can enter at various levels in the value chain and in various product formats / presentations. Volumes are expressed as actual weight and live weight equivalent, and values are given in CIF (cost, insurance and freight). Fish auctions Fish auctions are markets that sell raw material supplied by combinations of local landings, landings brought over land from another port, imports via truck, ferry, or direct landing. Usually, this is the first sale of fish from vessels. The raw material is normally unprocessed beyond heading and gutting, and fish auctions normally do not take ownership of the fish in a trade. Auctions are distinguished from merchants primarily through the trading facilities, and the form of trade (auction). Fish merchants Fish merchants are companies who buy and sell fish, possibly including defrosting, repackaging, selling in smaller quantities, but not actually cutting or coating the fish in any way. They normally buy volumes from auction markets, direct purchase from vessels, other merchants and importers. Merchants sell to processors, retailers, caterers and smaller merchants. Some companies, however, engage in both merchant activity and processing, in some cases as separate divisions. Primary processors Producing semi-processed products, which usually undergo further processing before reaching the final consumer. Primary processors could also sell in example fillets directly to fish & chip shops, hotels and restaurants or fish mongers. Primary processing includes heading, gutting, washing, cutting, filleting and peeling, as well as freezing. Secondary processors Producing finished products, which need no further processing before reaching the final producer. Secondary processing includes packing, freezing, cooking, smoking, brining, de-boning, salting, marinating, breading/battering, canning, modified atmosphere packaging, preparation of ready meals, incorporation of fish into recipe dishes. Mixed processors The mixed processors category consists of integrated processors involved in both primary and secondary processing.
MARCH 2004 Page 18
BACKGROUND, OBJECTIVES AND METHOD
Wholesalers There are two main types of wholesaler determined by size. Smaller companies typically supply primary processed fish products into fish and chip shops, restaurants and small independent retailers, fishmongers. The larger wholesale companies include importers supplying primary processed fish into secondary processors in the UK and large catering companies delivering to pub and restaurant chains in the foodservice sector such as Brakes or 3663. Retail sector Retailers sell the final product to the end user. This category includes fishmongers, retail-chains (multiples) and individual grocery stores. In-home consumption is mainly based on purchases from this sector. Foodservice sector Includes restaurants, hotels, fish & chip shops, fast food outlets, and consumption in institutions (schools, hospitals, prisons etc.) Out of home consumption is mainly based on purchases from this sector. Exports All transport of the study species from the UK to other countries. Landings by UK vessels in other countries are not included in exports. Export volumes can exit at various levels in the value chain. Volumes are expressed as product weight and live weight equivalent, while values are given in FOB (free on board).
MARCH 2004 Page 19
GLOBAL INDUSTRY ANALYSIS
3 . G L O B A L I N D U S T R Y A N A L Y S I S
3 .1 The g loba l supp l y s i tua t ion
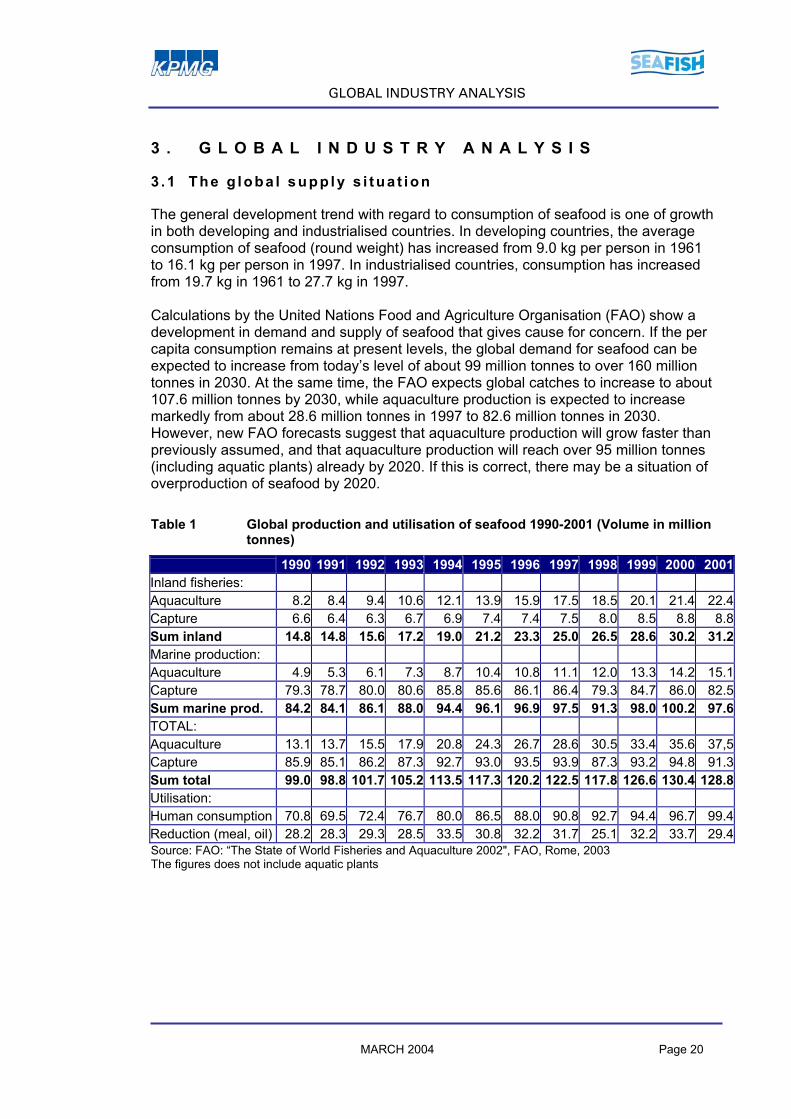
The general development trend with regard to consumption of seafood is one of growth in both developing and industrialised countries. In developing countries, the average consumption of seafood (round weight) has increased from 9.0 kg per person in 1961 to 16.1 kg per person in 1997. In industrialised countries, consumption has increased from 19.7 kg in 1961 to 27.7 kg in 1997. Calculations by the United Nations Food and Agriculture Organisation (FAO) show a development in demand and supply of seafood that gives cause for concern. If the per capita consumption remains at present levels, the global demand for seafood can be expected to increase from today’s level of about 99 million tonnes to over 160 million tonnes in 2030. At the same time, the FAO expects global catches to increase to about 107.6 million tonnes by 2030, while aquaculture production is expected to increase markedly from about 28.6 million tonnes in 1997 to 82.6 million tonnes in 2030. However, new FAO forecasts suggest that aquaculture production will grow faster than previously assumed, and that aquaculture production will reach over 95 million tonnes (including aquatic plants) already by 2020. If this is correct, there may be a situation of overproduction of seafood by 2020. Table 1 Global production and utilisation of seafood 1990-2001 (Volume in million
tonnes)
1990 1991 1992 1993 1994 1995 1996 1997 1998 1999 2000 2001Inland fisheries: Aquaculture 8.2 8.4 9.4 10.6 12.1 13.9 15.9 17.5 18.5 20.1 21.4 22.4Capture 6.6 6.4 6.3 6.7 6.9 7.4 7.4 7.5 8.0 8.5 8.8 8.8Sum inland 14.8 14.8 15.6 17.2 19.0 21.2 23.3 25.0 26.5 28.6 30.2 31.2Marine production: Aquaculture 4.9 5.3 6.1 7.3 8.7 10.4 10.8 11.1 12.0 13.3 14.2 15.1Capture 79.3 78.7 80.0 80.6 85.8 85.6 86.1 86.4 79.3 84.7 86.0 82.5Sum marine prod. 84.2 84.1 86.1 88.0 94.4 96.1 96.9 97.5 91.3 98.0 100.2 97.6TOTAL: Aquaculture 13.1 13.7 15.5 17.9 20.8 24.3 26.7 28.6 30.5 33.4 35.6 37,5Capture 85.9 85.1 86.2 87.3 92.7 93.0 93.5 93.9 87.3 93.2 94.8 91.3Sum total 99.0 98.8 101.7 105.2 113.5 117.3 120.2 122.5 117.8 126.6 130.4 128.8Utilisation: Human consumption 70.8 69.5 72.4 76.7 80.0 86.5 88.0 90.8 92.7 94.4 96.7 99.4Reduction (meal, oil) 28.2 28.3 29.3 28.5 33.5 30.8 32.2 31.7 25.1 32.2 33.7 29.4Source: FAO: “The State of World Fisheries and Aquaculture 2002", FAO, Rome, 2003 The figures does not include aquatic plants
MARCH 2004 Page 20

GLOBAL INDUSTRY ANALYSIS
Future supply and demand of seafood
0
20
40
60
80
100
120
140
160
180
200
2001
2003
2005
2007
2009
2011
2013
2015
2017
2019
2021
2023
2025
2027
2029
Mill
ion
tonn
es Supply
Demand
Figure 3 Future supply and demand of seafood Source: Forecasts by KPMG based on analysis of FAO statistics
Future production of seafood
0
20
40
60
80
100
120
140
160
180
200
1990
1992
1994
1996
1998
2000
2002
2004
2006
2008
2010
2012
2014
2016
2018
2020M
illion
tonn
es
Culture
Capture
Figure 4 Future production of seafood Source: 1990 – 2001: FAO FISHSTAT; projections 2002 – 2020: Hempel Consult As mentioned, most of the increase in fish production is expected to come from aquaculture, which is growing rapidly. The contribution from capture fisheries will depend on the effectiveness of fisheries management. Improved management of currently over fished stocks could provide an increase of between 5 and 13 million tonnes, whereas continued over fishing will lead to declining production. Global aquaculture production is expected to continue to grow over the next 20 years. As biological and technological problems related to marine aquaculture are solved, a dramatic increase in the production of farmed marine fish can be expected.
MARCH 2004 Page 21
GLOBAL INDUSTRY ANALYSIS
3 .2 G loba l consumer t rends
Eating habits of consumers change over time. New products, new habits, and new life styles influence eating habits and purchasing patterns. For the food industry, it is important to detect such trends, because they influence the relationship between the consumer and the industry’s products. A quick glance at retail trade data will reveal some of the trends presently active in the market. These can be summarised as follows: - An increasing supply of convenience products - An increase in the supply of fresh products - There is a trend towards more exotic products - The products have a longer shelf-life in general - There is an increasing occurrence of portion-packed, fresh products - There is increasing attention to quality and food safety - Consumers appear to be more concerned about health With regard to the organisation of the sales and distribution of food, the most potent trend today is the continued shift from small retail shops to larger and larger supermarkets (supermarkets might dominate the retail trade but they are also moving into smaller units in city centres and at petrol filling stations) and the growth of the large supermarket chains. In some countries, the supermarket chains (multiples) today account for over 60% of sales of food. The power of the multiples has been well documented over the past years. As more and more of the trade go through these multinational companies, it becomes even more important to adapt to the trends in these outlets. 3 .3 S tud y sp ec ies
Cod, haddock and nephrops represent two different sectors of the seafood industry, in which cod and haddock are part of the whitefish market, while nephrops is part of the shellfish market. Because of the variation within these markets they will be reported on individually. 3.3.1 Whitefish market trends
Cod and haddock are important species in the global whitefish market, which includes a number of species and product forms. It is a very complex market, with a complicated and varied value chain. During the last 50 years the total supply of whitefish has varied between 3 and 11 million tonnes. From 1950 until 1974 catches increased markedly, but then a sudden decline in landings occurred. After a while landings increased again, until a new peak was reached in 1987, when the landed volume was 11.5 million tonnes. The lowest level during the last 20 years was in 2000, with just 5.9 million tonnes. However, global whitefish supplies have been declining since 1985, and FAO expecting that a further decline in whitefish supplies will continue.
MARCH 2004 Page 22

GLOBAL INDUSTRY ANALYSIS
Development in landings of some of the most important whitefish species (1950 – 2000)
,
2,000
4,000
6,000
8,000
10,000
12,000
14,000
1950
1953
1956
1959
1962
1965
1968
1971
1974
1977
1980
1983
1986
1989
1992
1995
1998
1,00
0 to
nnes
Haddock
Saithe
Ling/blue ling
Hake
Cod
Alaska pollock
Figure 5 Development in landings of some of the most important whitefish species
(1950 – 2000). Source: FAO FISHSTAT The decline in the catches of Alaska pollock has contributed significantly to this overall decline. In 1986, almost 7 million tonnes of Alaska Pollock were landed. In 2001, however, Alaska Pollock landings had declined to just 3.1 million tonnes. Landings of Atlantic cod have declined significantly over the past 30 years. In 1968, landings peaked at over 4 million tonnes, while in 2000 total landings of Atlantic cod were less than 1 million tonnes. Catches in the Barents Sea have been relatively stable compared to other areas. There have been very serious problems off the east coast of North America, where a moratorium was imposed some years ago. Catches of whitefish in the North Atlantic have been significantly reduced in recent years. In 1986, the total whitefish landings in this area were some 3.4 million tonnes, while in 2001 they amounted to just 1.6 million tonnes. It is not expected that landings of Atlantic cod will increase significantly in the coming years. Consequently, Atlantic cod will probably lose market share to other species, as it has done over the past ten years.
MARCH 2004 Page 23

GLOBAL INDUSTRY ANALYSIS
Global landings of haddock and Atlantic cod
0
0,5
1
1,5
2
2,5
3
3,5
4
4,5
5
1950
1953
1956
1959
1962
1965
1968
1971
1974
1977
1980
1983
1986
1989
1992
1995
1998
2001
Milli
on to
nnes
Haddock
Atlantic cod
Figure 6 Global landings of Atlantic cod and haddock Source: FAO FISHSTAT Some ”new” whitefish species have entered the market in recent years to replace part of the volume of traditional whitefish species like cod, haddock, and saithe. Freshwater farmed species like channel catfish and tilapia today constitute a growing share of the total whitefish supplies. In 2000, tilapia production amounted to almost 1.9 million tonnes or approximately one third of the total supplies of whitefish. Most of this production came from aquaculture. However, only a small part of this has so far entered the global whitefish markets, as the major share of this production is consumed locally in the producing countries (mainly China). The present development is that a larger share of the production of particularly tilapia will be destined for the low-value whitefish market, particularly as frozen fillets. 3.3.2 Product forms and market trends
As mentioned, whitefish enters a value chain that is varied and diverse, with a number of different products at different price levels. In addition, the quality of these products can vary greatly. Only a minor share of supplies is sold as fresh fish. However, the trend is that an increasing share of cod is sold fresh, either for the catering/restaurant business, or as raw material for fresh, portion-packed products sold through supermarkets. This trend is expected to strengthen in the coming years. It is related to the trend of increasing sales of fresh, portion-packed products in general through supermarkets. The main cod suppliers, such as Norway, Iceland, and the Faeroes, will increasingly be supplying a “semi-processed” product (fresh fillets and loins) which will be processed into consumer products in the destination markets. Fresh headed and gutted cod will probably be destined mainly for the high-end restaurant market.
MARCH 2004 Page 24
GLOBAL INDUSTRY ANALYSIS
3.3.3 Cod
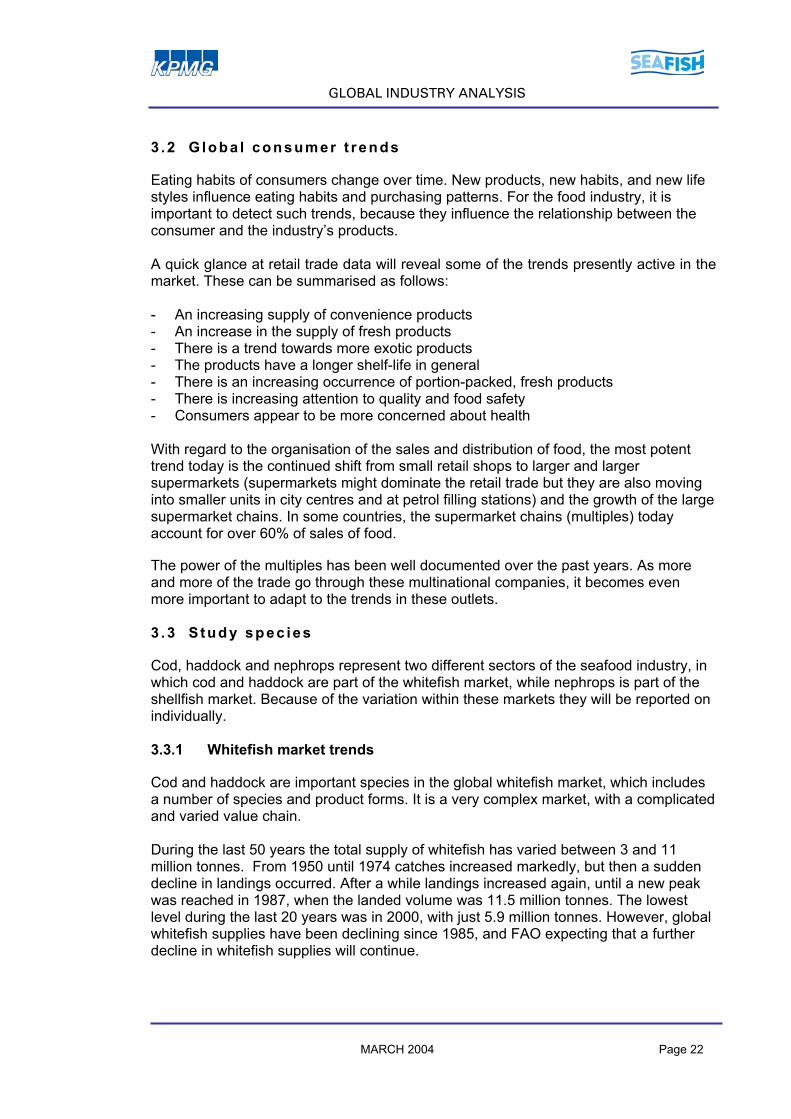
Atlantic cod is transformed into a number of products, which can be broadly categorised as fillets (fresh or frozen), salted (wet-salted or salted and dried), fresh (headed and gutted or head-on, gutted), and round (fresh or round frozen). The figure below gives the approximate global utilisation in these product forms by per cent.
Global utilisation of Atlantic cod
Salted26 %
Fillet37 %
Round15 %
Fresh 22 %
Figure 7 Global utilisation of Atlantic cod Source: Groundfish Forum 2001 3.3.4 Haddock
The haddock value chain features the product groups as were reported on in the cod value chain. However, the utilisation in percent differs significantly compared to cod. The figure below gives the global utilisation in percent of haddock.
MARCH 2004 Page 25

GLOBAL INDUSTRY ANALYSIS
Global utilisation of haddock
Fresh 47 %
Round11 %
Fillet41 %
Salted1 %
Figure 8 Global utilisation of haddock Source: Groundfish Forum 2001 3.3.5 Outlook
In general, global whitefish supplies are expected to continue to decline. This should indicate price increases, but there are other factors at play. First of all, large amounts of small cod and haddock from the Barents Sea are being shipped to China for processing into fillets there, and then shipped back to Europe and the USA as cheap products competing with the traditional suppliers. This operation will push prices down if the volumes processed in China remain high. Indications at present are that this activity is expanding. Secondly, farmed species such as tilapia, seabass and catfish are beginning to appear in larger quantities on the market in competition with cod, haddock and pollock. Again, China may play an important role in this development. Of the total farmed tilapia production of more than 1.2 million tonnes, over 600,000 tonnes come from China. However, China is now building up both a large farmed tilapia production as well as a modern processing industry that will produce mainly for export markets. Whitefish fillet and block prices stayed level through 2001 and 2002 and increased slightly in 2003. With the shortage of supplies of traditional whitefish species such as cod, one should expect prices to at least edge upwards, as they have for some products. But competition from other products - not only whitefish species, but also for example salmon, which is now a cheap product - has prevented a major price increase. Substantial price increases are not expected in the short term. One should also take into account that cheap whitefish products are meeting competition from other sources of cheap protein, such as chicken and white meat.
MARCH 2004 Page 26
GLOBAL INDUSTRY ANALYSIS
On the fresh fish market, one may expect higher quality products at higher prices as the industry adjusts to new handling and transportation technology. There is a growing trend for substantial quantities of fresh haddock to be air freighted to the UK and market acceptance appears to be good. Furthermore, developments within the supermarkets have had a significant impact on fresh fish sales. To an increasing extent, fresh fish is being pre-packaged and sold through supermarkets and hypermarkets. This trend is expected to strengthen in the years to come, and may lead to increasing consumer interest in fresh, pre-packaged whitefish products. 3.3.6 Shellfish market trends
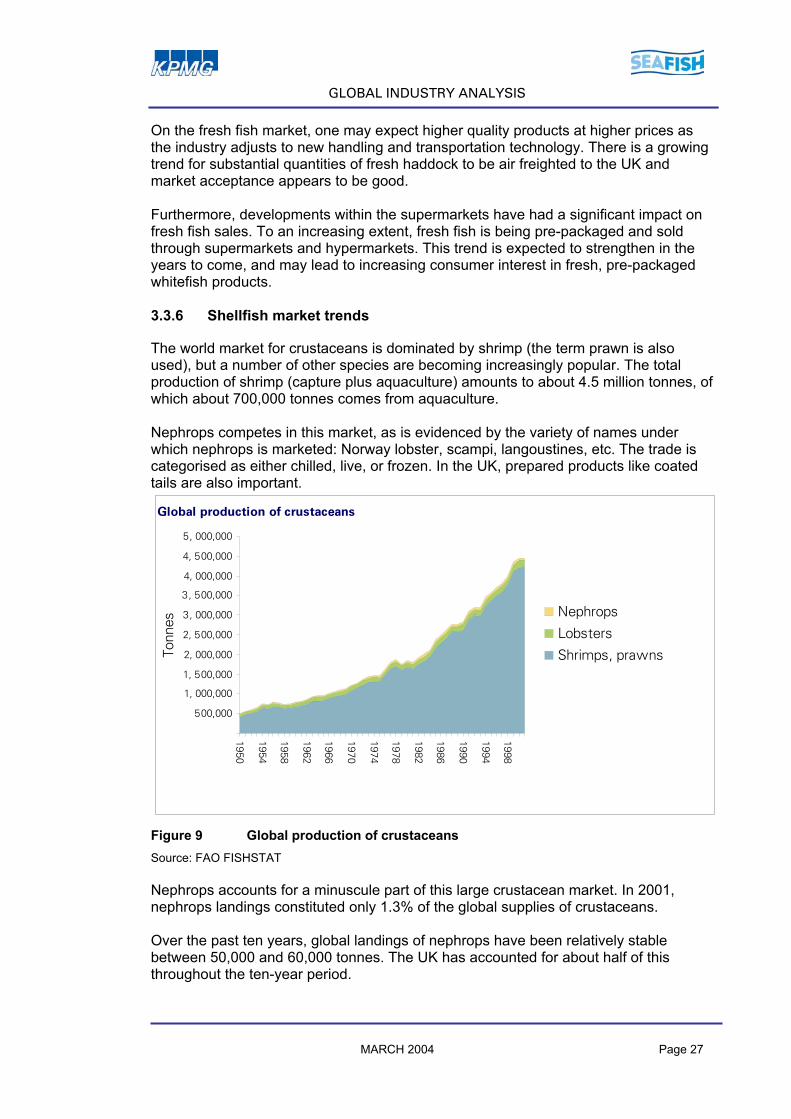
The world market for crustaceans is dominated by shrimp (the term prawn is also used), but a number of other species are becoming increasingly popular. The total production of shrimp (capture plus aquaculture) amounts to about 4.5 million tonnes, of which about 700,000 tonnes comes from aquaculture. Nephrops competes in this market, as is evidenced by the variety of names under which nephrops is marketed: Norway lobster, scampi, langoustines, etc. The trade is categorised as either chilled, live, or frozen. In the UK, prepared products like coated tails are also important.
Global production of crustaceans
, ,
, 500,000
1, 000,000
1, 500,000
2, 000,000
2, 500,000
3, 000,000
3, 500,000
4, 000,000
4, 500,000
5, 000,0001950
1954
1958
1962
1966
1970
1974
1978
1982
1986
1990
1994
1998
Tonn
es
Nephrops
Lobsters
Shrimps, prawns
Figure 9 Global production of crustaceans Source: FAO FISHSTAT Nephrops accounts for a minuscule part of this large crustacean market. In 2001, nephrops landings constituted only 1.3% of the global supplies of crustaceans. Over the past ten years, global landings of nephrops have been relatively stable between 50,000 and 60,000 tonnes. The UK has accounted for about half of this throughout the ten-year period.
MARCH 2004 Page 27

GLOBAL INDUSTRY ANALYSIS
,
Global landings of nephrops by country
10,000
20,000
30,000
40,000
50,000
60,000
70,000
1950
1953
1956
1959
1962
1965
1968
1971
1974
1977
1980
1983
1986
1989
1992
1995
1998
2001
Tonn
es
Others
Italy
Denmark
France
Ireland
United Kingdom
Figure 10 Global landings of nephrops by country Source: FAO FISHSTAT The main suppliers of nephrops are to be found in Northern Europe. The UK is by far the largest exporter, followed by Denmark and Ireland. According to the FAO, global trade in nephrops amounts to some 30,000 to 35,000 tonnes (2001). The main markets are all in Europe, with France and Spain being the major importing countries. The total import value of this species amounts to some USD 260 million (2001).
Global imports of nephrops
,
5,000
10,000
15,000
20,000
25,000
30,000
35,000
40,000
1991
1992
1993
1994
1995
1996
1997
1998
1999
2000
Tonn
es
Other
Germany
Belgium
Netherlands
UK
Denmark
Ireland
Spain
France
Italy
Figure 11 Global imports of nephrops Source: FAO FISHSTAT MARCH 2004 Page 28

GLOBAL INDUSTRY ANALYSIS
There are obviously large discrepancies in the statistical material. The figures quoted by the FAO for global exports and global imports of nephrops do not match, and are consequently not reliable. The reason for these discrepancies is probably the fact that nephrops is traded under a number of different commercial names, and therefore this trade may be reported as “shrimp” or “prawn” or “scampi” etc. In recent years, reporting appears to have improved, as the discrepancies have been reduced. 3 .4 Was te p rob lems and w as te u t i l i sa t ion
It is not the intention of this report to investigate the volume and value generated from waste from either the processing sector or from other steps in the value chain. However, as there is an increasing focus on better utilisation of seafood waste, it is important to outline the potential that this represents in the value chain. Estimates by the FAO tell us that as much as 25 to 30 million tonnes of the total catch is lost due to improper handling, inadequate practices, or other reasons. These losses represent a very large resource, which are not being utilising properly and responsibly. It is unreasonable to expect fishermen, processors and aquaculturists to achieve a better utilisation of the global marine resources purely on the basis of good will. Ultimately, more responsible use of the resources can only be achieved if the various actors in the industry find ways to make money on more responsible utilisation. 3.4.1 Processing
Over the last 50 years there has been a revolutionary development within processing and conservation of seafood. With the broad introduction of freezing and mass distribution of refrigeration equipment from the 1950s onwards, the shelf life of the products were considerably prolonged. At the same time, the quality of seafood was enhanced tremendously. While the development of so-called cold chains has come a long way, there are still areas in the world where this technology and equipment are not available to the masses. In these areas, one is therefore still dependent on traditional methods of preservation, such as drying, salting and fermenting. Freezing is also dependent on massive investments in equipment, and it is costly in terms of energy to operate. This has led to high prices for frozen fish in many parts of the world, while the quality of frozen fish is often regarded as inferior to that of fresh fish. The development of high value aquaculture, especially salmon farming, has led to the emergence of advances in fresh fish handling technology and distribution. This technology is not fully exploited today, and could be applied to a much larger part of the seafood industry. This would enhance the quality of fresh fish, and it would make a lot more fresh fish available to the market. A further development of this type of technology is seen in the development of technology and methods for transportation of live fish. Although these advances in processing have improved the quality and availability of seafood, they have demonstrated the magnitude of the waste problem. On average, only about 30 per cent of the raw material are utilised as food when the fish goes MARCH 2004 Page 29

GLOBAL INDUSTRY ANALYSIS
through the processing chain. Until today, the waste produced by processing plants has become an environmental problem, but it is also a resource utilisation problem. 3.4.2 Utilisation of waste
Waste products, which today have little use as food, represent a great potential as raw materials for non-food products in the feed industry, in the pharmaceutical industry, in the biochemical industries, in the cosmetics industry, and in other applications. Broadly categorised, these include: • Human consumption products • Marine ingredients • Functional foods • Nutritional supplements • Feed (fish feed/animal feed) • Pharmaceutical products • Cosmetics products • Industrial applications (enzymes etc) See chapter 9 for a further discussion of this issue.
MARCH 2004 Page 30
UK MARKET SITUATION
4 . U K M A R K E T S I T U A T I O N
The UK represents one of the most interesting seafood markets in Europe. Consumption of whitefish has been strong for a long period, be it in-home consumption or out-of-home consumption in restaurants, fish and chip shops, or institutions. The UK also has a significant fishing fleet. However, recent developments have included a reduction of the fleet, reduced landings, and greater dependence on imports. 4 .1 Supp l i es
4.1.1 Landings in the UK
Total UK landings year 1990-2002
0
100
200
300
400
500
600
700
800
900
1990
1991
1992
1993
1994
1995
1996
1997
1998
1999 20
0020
0120
02
1,00
0 to
nnes
0
100
200
300
400
500
600
£ million
Volume
Value
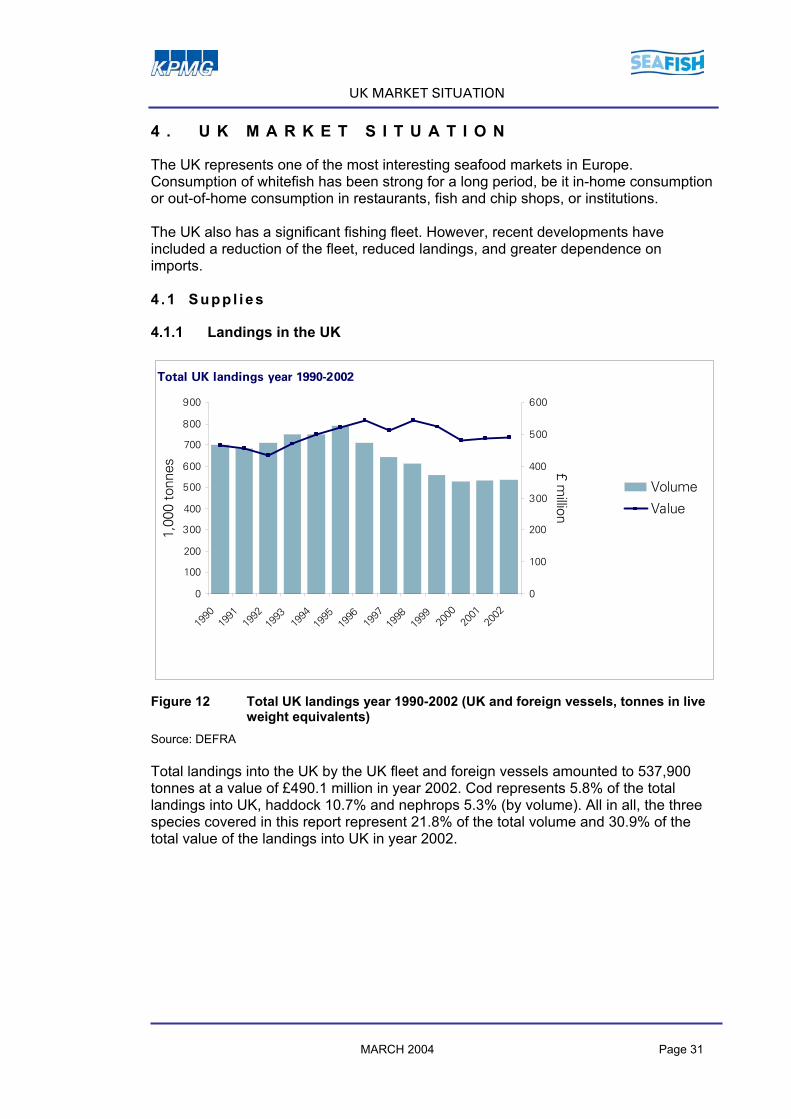
Figure 12 Total UK landings year 1990-2002 (UK and foreign vessels, tonnes in live
weight equivalents) Source: DEFRA Total landings into the UK by the UK fleet and foreign vessels amounted to 537,900 tonnes at a value of £490.1 million in year 2002. Cod represents 5.8% of the total landings into UK, haddock 10.7% and nephrops 5.3% (by volume). All in all, the three species covered in this report represent 21.8% of the total volume and 30.9% of the total value of the landings into UK in year 2002.
MARCH 2004 Page 31
UK MARKET SITUATION
Table 2 Total landings into UK by the UK fleet and foreign vessels in 2002 (tonnes in live weight equivalents)
UK fleet and foreign vessels Foreign vessels UK fleet*
tonnes £000 tonnes £000 tonnes £000 Cod 31,600 42,200 5,860 7,210 25,740 34,990 Haddock 57,500 40,300 5,637 5,642 51,863 34,658 Total demersal 235,800 265,900 57,734 67,530 178,066 198,370 Nephrops 28,500 69,000 143 267 28,357 68,733 Total all species 537,900 490,100 72,273 75,372 465,627 414,728
*Calculated based on other columns Source: UK Sea Fisheries Statistics 2002, DEFRA These landing figures can be compared to the UK aquaculture production of Atlantic salmon which in 2002 was estimated to be in excess of 130,000 tonnes. In addition, the UK fleet lands fish abroad. In 2002 this represented 5,800 tonnes of cod (value of £7.1 million), 1,000 tonnes of haddock (£0.9 million) and 100 tonnes of nephrops (£0.5 million). The fishing methods and equipment vary, as do on-board handling and location of landings. The importance of these (and other) factors in relation to imports of foreign raw materials will be discussed later in this report.
UK landings of cod and haddock year 1992-2002
0
10
20
30
40
50
60
70
80
90
100
1992
1993
1994
1995
1996
1997
1998
1999
2000
2001
2002
1,00
0 to
nnes Atlantic cod
Haddock
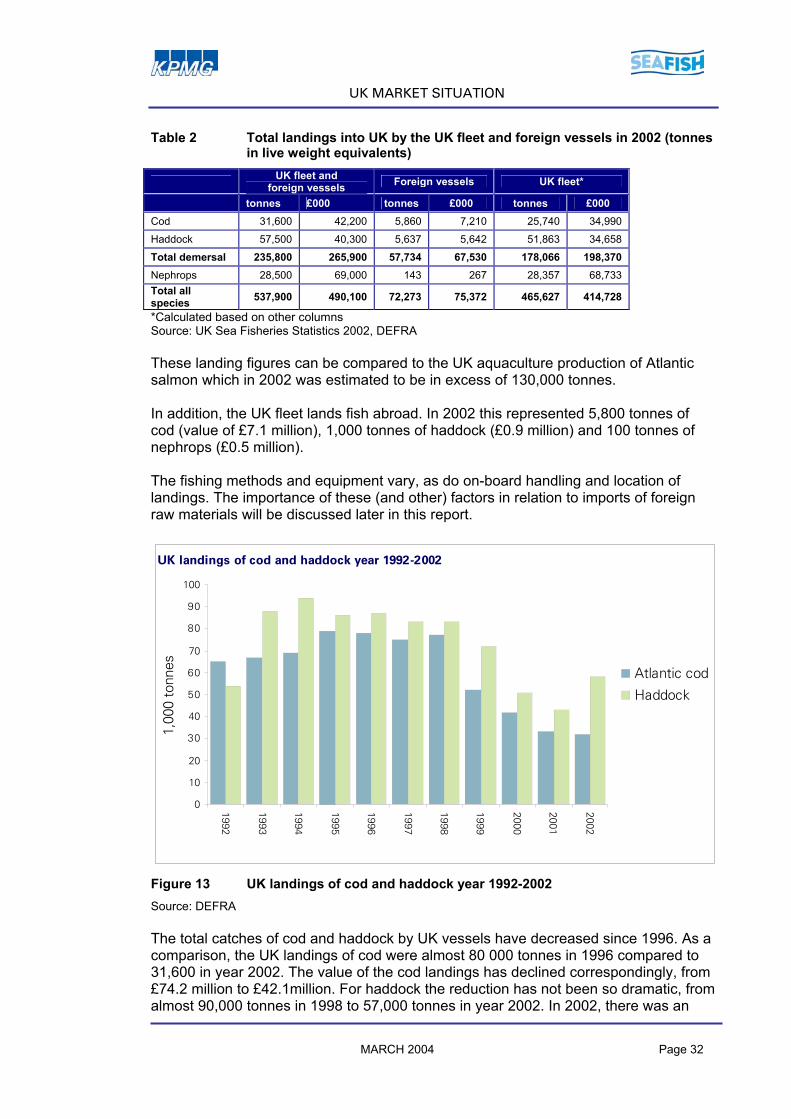
Figure 13 UK landings of cod and haddock year 1992-2002 Source: DEFRA
MARCH 2004 Page 32
The total catches of cod and haddock by UK vessels have decreased since 1996. As a comparison, the UK landings of cod were almost 80 000 tonnes in 1996 compared to 31,600 in year 2002. The value of the cod landings has declined correspondingly, from £74.2 million to £42.1million. For haddock the reduction has not been so dramatic, from almost 90,000 tonnes in 1998 to 57,000 tonnes in year 2002. In 2002, there was an

UK MARKET SITUATION
increase in UK fleet haddock landings, to 51,900 tonnes. The value of UK haddock landings in 1994 amounted to £55 million, while in 2002 the value was £35.5 million. 4.1.2 Imports to the UK
Over the past 10 years, UK seafood imports have grown steadily in volume and value.
UK seafood imports (all species)
0
100
200
300
400
500
600
700
1993
1994
1995
1996
1997
1998
1999
2000
2001
2002
1,00
0 to
nnes
,
,200
,400
,600
,800
1,000
1,200
1,400
1,600
£ million
Volume
Value
Figure 14 UK seafood imports (all species) Source: DEFRA In 2002, the UK imported some 620,000 tonnes of seafood worth £1.4 billion. Total import of demersal and pelagic species to the UK in 2002 was 515,000 tonnes at a value of £1,028 million. Of this, cod represented about 23.5% of the volume and haddock about 9.5%. In addition, 105,000 tonnes of shellfish was imported. When compared to other whitefish species in UK imports, cod and haddock are among the top three (by volume).
MARCH 2004 Page 33

UK MARKET SITUATION
,0
UK imports 2002 selected species
20,000
40,000
60,000
80,000
100,000
120,000
140,000
cod
tuna
haddock
salmon
mackerel
saithe
hake
Tonn
es
Figure 15 UK imports for selected species in 2002 Source: DEFRA Further information about the volume and value of each of the study species imported into the UK will be discussed later in the report. 4 .2 Consumpt ion and expor ts
4.2.1 UK consumer and market trends
It is estimated by Seafish that UK consumers spent around £4 billion on seafood in 2003. Of this, over £2 billion was sold through retail outlets (fishmongers and supermarkets), and the supermarkets are strengthening their position in the market with around 90% being sold through supermarkets. UK consumption of seafood is increasing, and most of this increase benefits the large multiples. The traditional fishmonger is losing market share, and seems to be in the process of disappearing. This is a general trend that is apparent across continental Europe. The expenditure on seafood products as part of expenditure on all food and non-alcoholic drink is 3.8% in year 20021. The average volume bought per household has stayed the same from 2001 to 2002, approximately 10.64 kg per household, but average expenditure per household has risen from £58.61 to £60.59 (3%) from 2001 to 2002 and the total expenditure thereby risen2. Key Note estimates in their market report for 2002 that the total market for all fish consumed in the home will be valued around £2.33 billion in 2002, rising to £2.57 billion
1 Source: Key Note Ltd 2002 2 Source; Vital Statistics Winter 2002 Seafish
MARCH 2004 Page 34

UK MARKET SITUATION
by 2006. In this estimate they forecast the fresh and chilled sector to have the largest growth. Retail sector Based on data from Taylor Nelson Sofres (TNS) the UK spent £1.65 billion on chilled and frozen seafood and a further £400 million on canned seafood bought in retail outlets in 2002.
Retail sales of seafood in the UK
, ,
, 200,000
, 400,000
, 600,000
, 800,000
1, 000,000
1, 200,000
1, 400,000
1, 600,000
1, 800,000
2000 2001 2002
£ 1,
000
Others
Independents
Freezing centres
Co-ops
Other non-grocery
Multiples
Figure 16 Retail sales of chilled and frozen seafood in Great Britain Source: TNS
MARCH 2004 Page 35
UK MARKET SITUATION
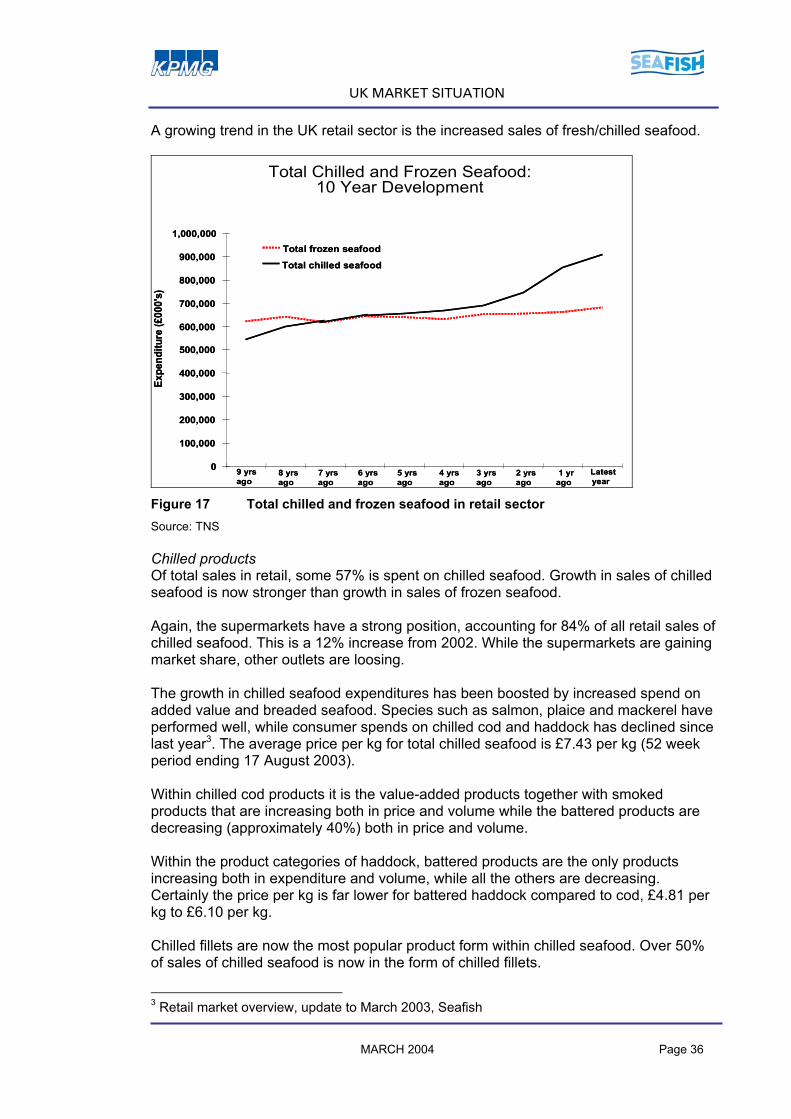
A growing trend in the UK retail sector is the increased sales of fresh/chilled seafood.
Total Chilled and Frozen Seafood:10 Year Development
0
100,000
200,000
300,000
400,000
500,000
600,000
700,000
800,000
900,000
1,000,000
9 yrs ago
Latest year
Expe
nditu
re (£
000'
s)
Total frozen seafoodTotal chilled seafood
8 yrs ago
7 yrs ago
6 yrs ago
5 yrs ago
4 yrs ago
3 yrs ago
2 yrs ago
1 yr ago
0
100,000
200,000
300,000
400,000
500,000
600,000
700,000
800,000
900,000
1,000,000
9 yrs ago
Latest year
Expe
nditu
re (£
000'
s)
Total frozen seafoodTotal chilled seafood
8 yrs ago
7 yrs ago
6 yrs ago
5 yrs ago
4 yrs ago
3 yrs ago
2 yrs ago
1 yr ago
Figure 17 Total chilled and frozen seafood in retail sector Source: TNS Chilled products Of total sales in retail, some 57% is spent on chilled seafood. Growth in sales of chilled seafood is now stronger than growth in sales of frozen seafood. Again, the supermarkets have a strong position, accounting for 84% of all retail sales of chilled seafood. This is a 12% increase from 2002. While the supermarkets are gaining market share, other outlets are loosing. The growth in chilled seafood expenditures has been boosted by increased spend on added value and breaded seafood. Species such as salmon, plaice and mackerel have performed well, while consumer spends on chilled cod and haddock has declined since last year3. The average price per kg for total chilled seafood is £7.43 per kg (52 week period ending 17 August 2003). Within chilled cod products it is the value-added products together with smoked products that are increasing both in price and volume while the battered products are decreasing (approximately 40%) both in price and volume. Within the product categories of haddock, battered products are the only products increasing both in expenditure and volume, while all the others are decreasing. Certainly the price per kg is far lower for battered haddock compared to cod, £4.81 per kg to £6.10 per kg. Chilled fillets are now the most popular product form within chilled seafood. Over 50% of sales of chilled seafood is now in the form of chilled fillets.
MARCH 2004 Page 36
3 Retail market overview, update to March 2003, Seafish

UK MARKET SITUATION
Frozen products Consumer spending on frozen seafood represents 43% of total retail spending on seafood. With regard to frozen seafood, the supermarkets hold an even stronger position. As much as 92% of retail sales of frozen seafood are sold through supermarkets. For frozen products sales also increased in 2002, expenditure by 4% and volume by 1%. Cod is the most popular frozen seafood sold. In 2002/03, sales of frozen cod in the retail sector amounted to £231 million. However, this is a reduction in relation to the previous year. Within the cod products a decrease is observed for all product categories except natural/smoked fillet, which has increased both in expenditure and volume (by 13% and 9%, respectively). Frozen haddock, on which consumers spend £74 million, is on the rise, however both in expenditure and volume; expenditure was up by 12% and volume by 14%. This is made up of an increase in the product categories ready meals, battered and breaded, and natural steaks and fish cakes. Consumer spending on shellfish, such as prawns, is also rising. Foodservice Of the estimated £4 billion the UK consumers spend on seafood each year, the foodservice sector represents about £1.4 billion. The annual seafood purchase volume by UK Foodservice sector is by TNS estimated at 115,000 tonnes and the top 3 species ordered by this sector are cod, haddock and salmon. Cod represents 30% of order volume, haddock 18% and salmon 10%. See section 5.8 for more details. 4.2.2 Exports
The UK exported some 388,283 tonnes of seafood worth £759 million in 2002. In other words, the UK has a “deficit” in its seafood trade balance. While the deficit in terms of volume has been relatively stable over the years, in terms of value it has grown.
MARCH 2004 Page 37
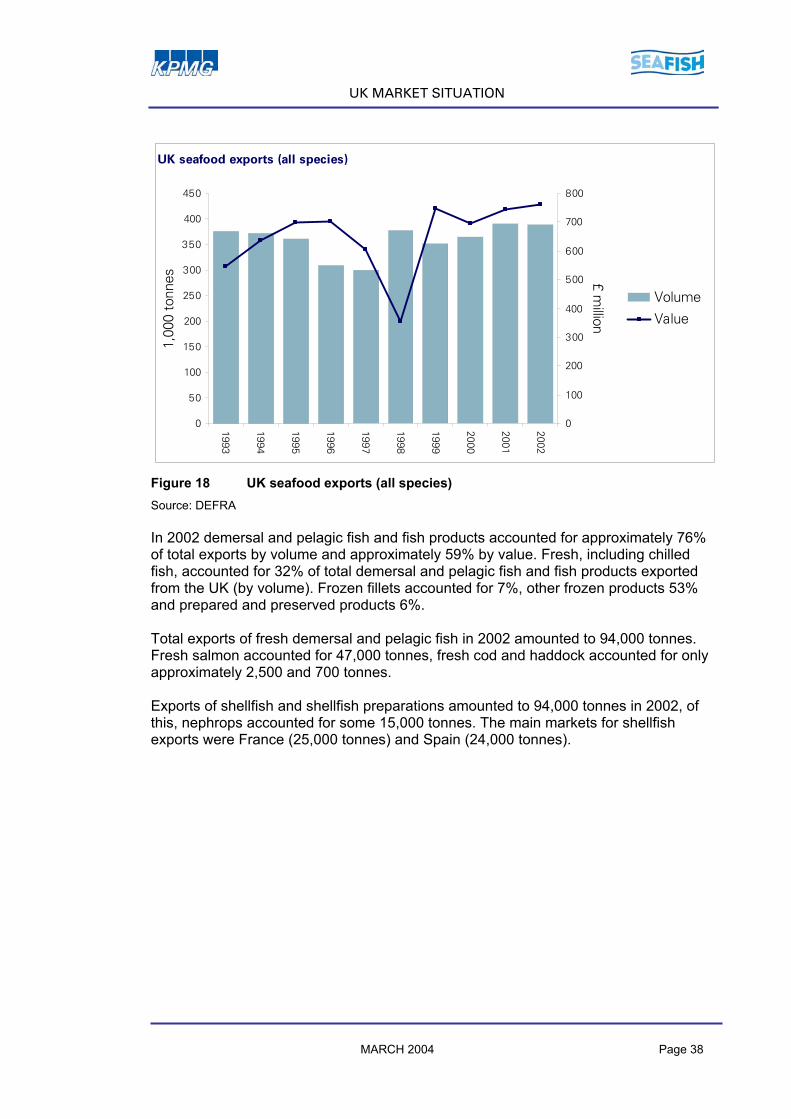
UK MARKET SITUATION
UK seafood exports (all species)
0
50
100
150
200
250
300
350
400
450
1993
1994
1995
1996
1997
1998
1999
2000
2001
2002
1,00
0 to
nnes
0
100
200
300
400
500
600
700
800£ m
illion
Volume
Value
Figure 18 UK seafood exports (all species) Source: DEFRA In 2002 demersal and pelagic fish and fish products accounted for approximately 76% of total exports by volume and approximately 59% by value. Fresh, including chilled fish, accounted for 32% of total demersal and pelagic fish and fish products exported from the UK (by volume). Frozen fillets accounted for 7%, other frozen products 53% and prepared and preserved products 6%. Total exports of fresh demersal and pelagic fish in 2002 amounted to 94,000 tonnes. Fresh salmon accounted for 47,000 tonnes, fresh cod and haddock accounted for only approximately 2,500 and 700 tonnes. Exports of shellfish and shellfish preparations amounted to 94,000 tonnes in 2002, of this, nephrops accounted for some 15,000 tonnes. The main markets for shellfish exports were France (25,000 tonnes) and Spain (24,000 tonnes).
MARCH 2004 Page 38
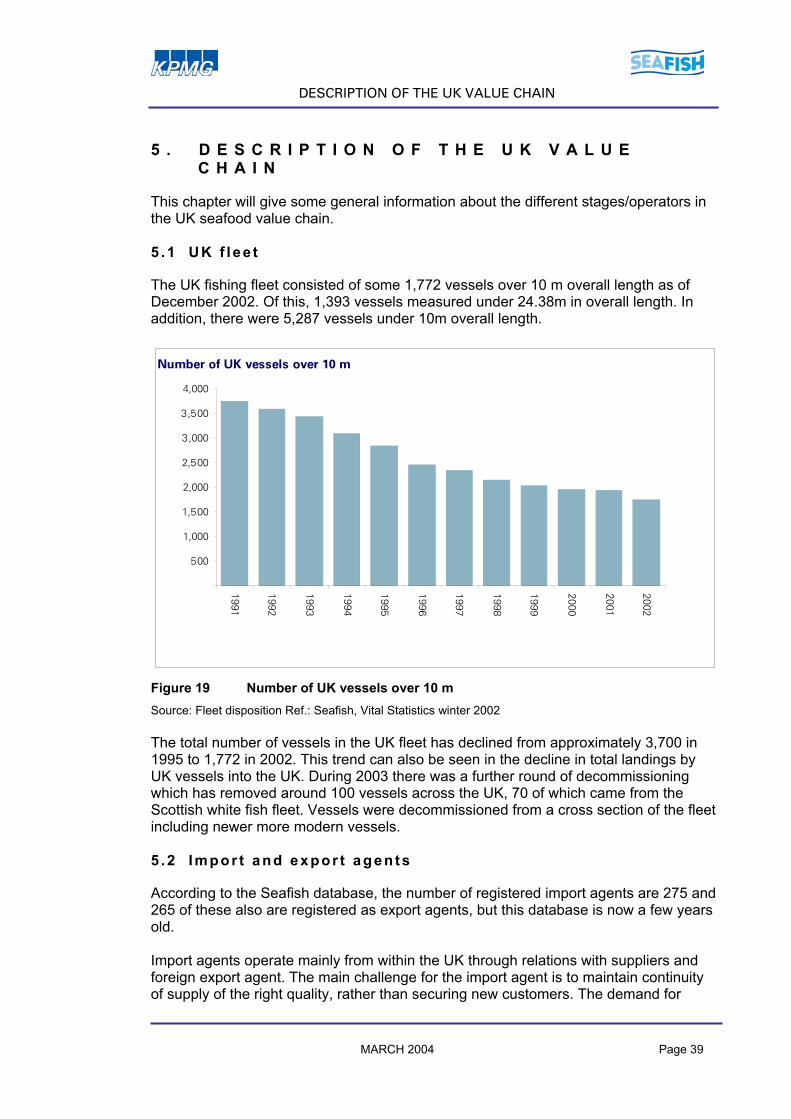
DESCRIPTION OF THE UK VALUE CHAIN
5 . D E S C R I P T I O N O F T H E U K V A L U E
C H A I N
This chapter will give some general information about the different stages/operators in the UK seafood value chain. 5 .1 UK f l ee t
The UK fishing fleet consisted of some 1,772 vessels over 10 m overall length as of December 2002. Of this, 1,393 vessels measured under 24.38m in overall length. In addition, there were 5,287 vessels under 10m overall length.
Number of UK vessels over 10 m
,
,500
1,000
1,500
2,000
2,500
3,000
3,500
4,000
1991
1992
1993
1994
1995
1996
1997
1998
1999
2000
2001
2002
Figure 19 Number of UK vessels over 10 m Source: Fleet disposition Ref.: Seafish, Vital Statistics winter 2002 The total number of vessels in the UK fleet has declined from approximately 3,700 in 1995 to 1,772 in 2002. This trend can also be seen in the decline in total landings by UK vessels into the UK. During 2003 there was a further round of decommissioning which has removed around 100 vessels across the UK, 70 of which came from the Scottish white fish fleet. Vessels were decommissioned from a cross section of the fleet including newer more modern vessels. 5 .2 Impor t and expor t agen ts
According to the Seafish database, the number of registered import agents are 275 and 265 of these also are registered as export agents, but this database is now a few years old. Import agents operate mainly from within the UK through relations with suppliers and foreign export agent. The main challenge for the import agent is to maintain continuity of supply of the right quality, rather than securing new customers. The demand for
MARCH 2004 Page 39
DESCRIPTION OF THE UK VALUE CHAIN
certain size and quality fillets, for instance, is quite marked. These “top quality” raw materials may be in short supply. The main supply for cod and haddock is based on harvesting natural populations and there is a risk related to availability as well as seasonal fluctuations in supplies. Suppliers to UK import agents can be overseas export agents, foreign vessels (with frozen on-board landings in UK, or other), primary/mixed processors, and volumes are mainly sold in bulk. Some repacking and re-grading is performed. Import agents often have some form of quality control system shared/integrated with their primary suppliers in order to secure correct quality and properly labelled raw material to customers. The supply in the processing sector is often secured through medium/long term contracts while a smaller portion of supplies are traded on a spot-market basis. This pattern is observed throughout the value chain as a way to secure a steady supply while maintaining an option to take advantage of opportunities in the market. Price fluctuations in the raw-material market and short shelf-life of purchased volumes put pressure on import agents dealing in fish compared to other trading environments. The need for know-how and network is a significant barrier for new entrants in the market. Purchases can be made on certain specifications for a particular order, or with no determined buyer or contract. The agents often operate with a mix between the two options; both methods represent a risk for the import agent. Customer relations are seldom based on long-term binding contracts. 5 .3 F ish auc t ion marke ts and in land marke ts
Auction market is a port-based market, supplied by a combination of local landings, landings brought over land from other ports, imports via truck, ferry, or direct landings. Usually the auction market is the first place of sale of fish from vessels. The market can be a traditional "shout" auction or electronic auction, with or without remote access for bidding. Sellers include vessel agents / sales agents, while the auction company itself is not usually active in the trade, just offering the facilities (there are exceptions). The buyers at these first-hand markets are generally processors, wholesalers and merchants. Many of the larger processing companies rely heavily on imports and are using auction markets only to top up supplies, while many of the smaller buyers rely more solely on the market. This type of market includes Scrabster, Fraserburgh, Peterhead, Aberdeen, Eyemouth, Grimsby, Hull, Brixham and Plymouth. Some markets, like Fishgate in Hull, offer both auction sales and direct sales of imported fish. Several markets across the UK offer cold storage facilities for imported fish. In these auctions most of the fish is graded mechanically to different sizes and fish is sold in boxes. The weight of the boxes varies from market to market but are usually around 40 - 50 kg. In some markets, like Hull, the standard is that the boxes sold are labelled with details of the vessel, catch area and fishing method. Most of the fish sold in the markets are head on gutted fish, but there is also some ungutted fish (rounders). None of the markets report that they are selling frozen fish in the normal auction. During the course of the survey work interviews were conducted with key personnel at Peterhead, Aberdeen, Grimsby and Hull markets. Information about other UK markets, Fraserburgh and Scrabster was sourced from SEERAD. Information on the volumes of raw material, and its origin, was gathered for each of the study species from the markets. There is no official information available on the volumes and value of species
MARCH 2004 Page 40

DESCRIPTION OF THE UK VALUE CHAIN
sold across the UK markets and all information reported has come from study interviews and ad-hoc government statistics. Inland markets usually consist of a building that houses a group of wholesale merchants who buy fish and seafood products from processors and importers and sell to the catering and independent retail trade and to the public. They include Billingsgate, Manchester, and Birmingham. Billingsgate market was surveyed during the course of the project. It is the UK’s largest inland fish market, with estimated annual sales of £150 million and on average 25,000 tonnes of fish and fish products through its merchants every year. The inland markets differ from the first hand markets by the type of products they sell, since they are selling both unprocessed and processed or value-added fish products. 5 .4 Merchants
Merchants are defined as companies that buy and sell fish, possibly thawing, repackaging, and selling in smaller quantities, but not actually cutting or coating the fish in any way. Merchants buy from auction markets, make direct purchases from vessels, and from other merchants and importers. They sell to processors, retailers, caterers, and smaller merchants. Some companies engage in both merchant activity and processing, possibly as separate divisions. Some of the practices merchants perform can be similar to the wholesalers, but they generally operate earlier in the value chain, closer to the fishing fleet. This is not a large sector within the value chain, and all fish handled by these businesses is counted in previous and subsequent stages of the value chain. 5 .5 P rocess ing
Primary processors have operations mainly in heading, gutting, washing, cutting, filleting de-boning, and peeling. Primary processed products are usually further processed (by secondary processors) before consumption. The main exception to this is chilled seafood, which is sold in its natural form. Secondary processors are involved in packing, freezing, cooking, smoking, brining, de-boning, salting, marinating, breading/battering, canning, modified atmosphere packaging, preparation of ready meals, and incorporation of fish into recipe dishes. Some companies have a vertical integration performing both primary and secondary processing (categorised as mixed processors). The number of UK processing units was counted by Seafish as 518 in 2002/2003. There has been a decline from 719 in 1995. The sizes of the processing units have risen, with an average of 40.8 full-time employees per firm in 2002/2003. All in all the UK processing industry employed approximately 21,000 full time equivalents in 2002/2003. Of the 518 processing units, 203 units (39%) are only carrying out primary processing, 244 units (47%) are engaged in both primary and secondary processing (mixed) and 71 units (14%) are engaged only in secondary processing. 406 (78%) units process demersal fish and 220 (42%) process shellfish. Many of the companies are processing several different species.
MARCH 2004 Page 41
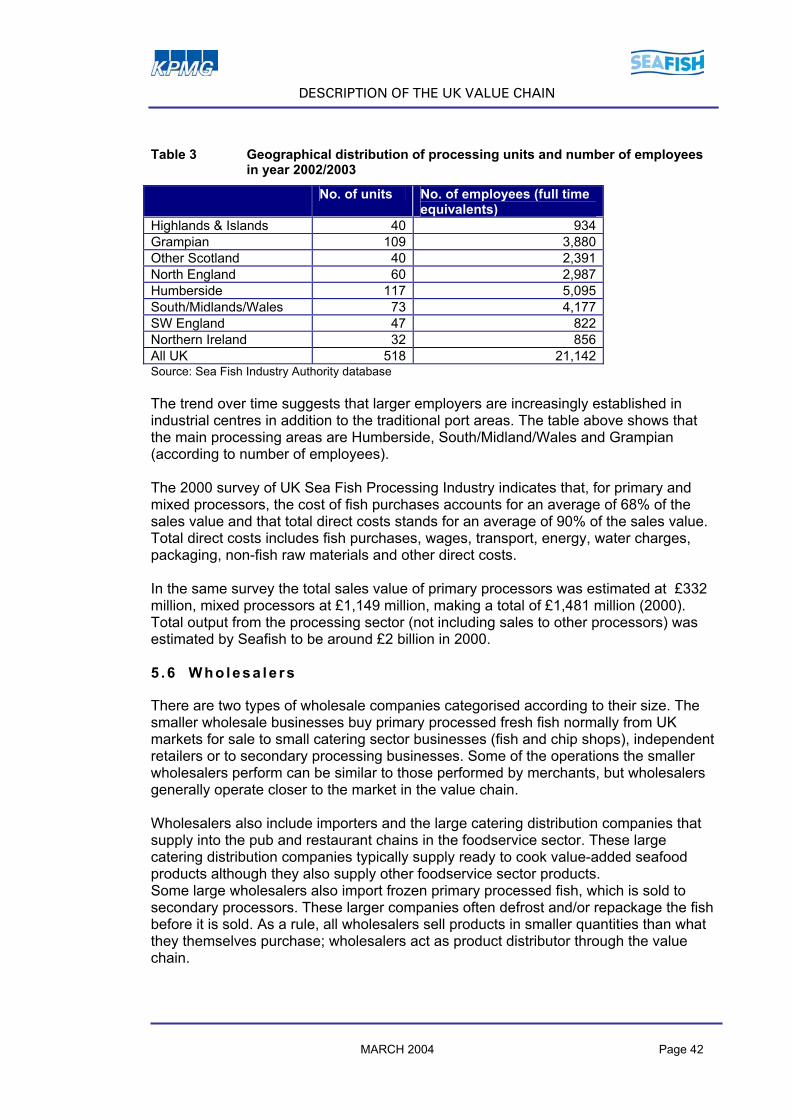
DESCRIPTION OF THE UK VALUE CHAIN
Table 3 Geographical distribution of processing units and number of employees
in year 2002/2003
No. of units No. of employees (full time equivalents)
Highlands & Islands 40 934 Grampian 109 3,880 Other Scotland 40 2,391 North England 60 2,987 Humberside 117 5,095 South/Midlands/Wales 73 4,177 SW England 47 822 Northern Ireland 32 856 All UK 518 21,142 Source: Sea Fish Industry Authority database The trend over time suggests that larger employers are increasingly established in industrial centres in addition to the traditional port areas. The table above shows that the main processing areas are Humberside, South/Midland/Wales and Grampian (according to number of employees). The 2000 survey of UK Sea Fish Processing Industry indicates that, for primary and mixed processors, the cost of fish purchases accounts for an average of 68% of the sales value and that total direct costs stands for an average of 90% of the sales value. Total direct costs includes fish purchases, wages, transport, energy, water charges, packaging, non-fish raw materials and other direct costs. In the same survey the total sales value of primary processors was estimated at £332 million, mixed processors at £1,149 million, making a total of £1,481 million (2000). Total output from the processing sector (not including sales to other processors) was estimated by Seafish to be around £2 billion in 2000. 5 .6 Who lesa le rs
There are two types of wholesale companies categorised according to their size. The smaller wholesale businesses buy primary processed fresh fish normally from UK markets for sale to small catering sector businesses (fish and chip shops), independent retailers or to secondary processing businesses. Some of the operations the smaller wholesalers perform can be similar to those performed by merchants, but wholesalers generally operate closer to the market in the value chain. Wholesalers also include importers and the large catering distribution companies that supply into the pub and restaurant chains in the foodservice sector. These large catering distribution companies typically supply ready to cook value-added seafood products although they also supply other foodservice sector products. Some large wholesalers also import frozen primary processed fish, which is sold to secondary processors. These larger companies often defrost and/or repackage the fish before it is sold. As a rule, all wholesalers sell products in smaller quantities than what they themselves purchase; wholesalers act as product distributor through the value chain.
MARCH 2004 Page 42

DESCRIPTION OF THE UK VALUE CHAIN
Information about wholesaling activities is limited because processing companies carries much of it out. The figure of 120 wholesaler businesses has been suggested, but this may be somewhat high since some of these are multiple sites for the same company. 5 .7 Re ta i l sec to r
The retail sector is increasingly dominated by the multiples (the supermarket chains). Independent fishmongers are losing market share every year. In 2002 there were some 1,600 fishmongers in the UK. Excluding canned products, some 71.8% of seafood (by volume) sold at the retail level was sold through supermarkets. Table 4 Number of UK VAT-based specialist fishmongers by turnover size (£000)
in 2002
Turnover (£000) Number of enterprises
1-49 415 50-99 480 100-249 435 250-499 165 500-999 65 1000-4999 40 5000+ 0 Total 1,600
Source: Business Monitor PA1003 – Size Analysis of UK Businesses While the independent fishmongers are considerably fewer in number, most of the larger supermarkets now have fish counters within their stores, and to a large extent these “fishmongers within the supermarkets” are taking over the role of the traditional fishmongers. Some supermarkets contain fish counters that are operated by former independent fishmongers as branded counters. 5 .8 Foodserv ices
The foodservice sector is generally defined in terms of the profit sector, including restaurants, hotels, fast food (fish and chips shops), coffee bars etc and the cost sector. The cost sector generally refers to those institutions or outlets where the food is subsidised to some extent, for example catering in various institutions, such as educational (private or public schools and universities), health care (private or public, hospitals, homes), services (incl. prisons, NAAFIs), and others. The BT Business Database provides an estimate for the total size of the foodservice sector to be 163,187 establishments (excluding the institutional sector). Of this, 75,470 establishments serve fish and are included in the population for this research. Figure 20 shows the proportion of the different types of outlets: restaurants and pubs being the major outlets followed by cafes, hotels and fish & chip shops.
MARCH 2004 Page 43
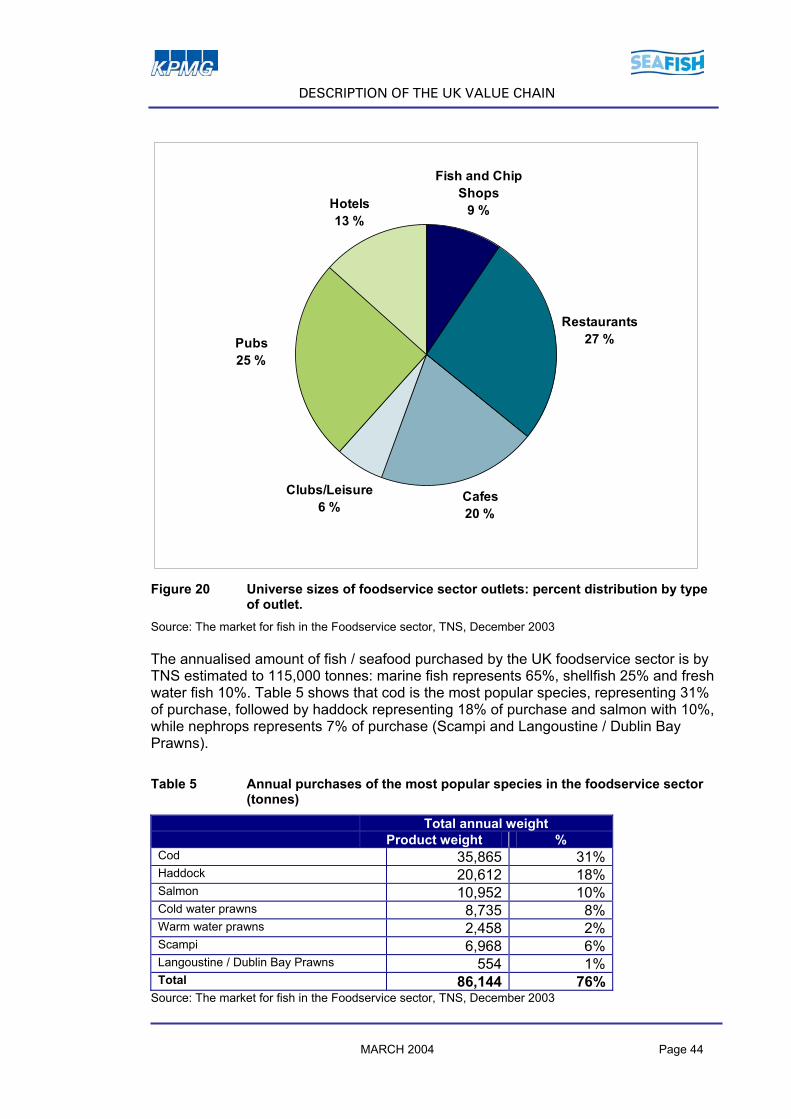
DESCRIPTION OF THE UK VALUE CHAIN
Restaurants27 %
Cafes20 %
Hotels13 %
Clubs/Leisure6 %
Fish and Chip Shops
9 %
Pubs 25 %
Figure 20 Universe sizes of foodservice sector outlets: percent distribution by type
of outlet. Source: The market for fish in the Foodservice sector, TNS, December 2003 The annualised amount of fish / seafood purchased by the UK foodservice sector is by TNS estimated to 115,000 tonnes: marine fish represents 65%, shellfish 25% and fresh water fish 10%. Table 5 shows that cod is the most popular species, representing 31% of purchase, followed by haddock representing 18% of purchase and salmon with 10%, while nephrops represents 7% of purchase (Scampi and Langoustine / Dublin Bay Prawns). Table 5 Annual purchases of the most popular species in the foodservice sector
(tonnes)
Total annual weight Product weight % Cod 35,865 31% Haddock 20,612 18% Salmon 10,952 10% Cold water prawns 8,735 8% Warm water prawns 2,458 2% Scampi 6,968 6% Langoustine / Dublin Bay Prawns 554 1% Total 86,144 76%
Source: The market for fish in the Foodservice sector, TNS, December 2003
MARCH 2004 Page 44

DESCRIPTION OF THE UK VALUE CHAIN
The fish and chip shops dominate the foodservice market, and account for a third (37,851 tonnes) of total fish / seafood purchases and 10% of all outlets within foodservice. These numbers do not include institutional outlets.
MARCH 2004 Page 45

VALUE CHAIN ANALYSIS COD
6 . V A L U E C H A I N A N A L Y S I S C O D
The diagram below shows the value chain and the control volumes (I-IV) to be discussed further in this chapter.
UK vessellandings
Imports
Exports
I II III IVRetail sector
Foodservicesector
Processing
Wholesaler,Trader
Overall value chain analysis
Figure 21 Overall value chain analysis
The control sums used in the overall value chain analysis can be described as follows:
I. The combined imports and landings by UK and foreign vessels can be said to represent the supply of raw material in the value chain.
II. The second control sum represents the inflow of raw materials to the processing sector.
III. The third control sum represents the outgoing products from the processing sector.
IV. The fourth control sum is the amount of finished product that goes to domestic consumption in the foodservice sector and through the retail sector, in addition to the flow of raw materials and finished product that are exported from the UK. Control sum IV can be labelled the consumption and exports in the value chain.
6 .1 Supp l y s i tua t ion ( I )
In the following, supplies of cod coming from three main sources are considered:
MARCH 2004 Page 46

VALUE CHAIN ANALYSIS COD
• Landings in UK by UK vessels • Landings in UK by foreign vessels • Imports into the UK
Import statistics from Customs and Excise includes landings in UK by foreign vessels, but these are illustrated separately under landings as well. It is assumed that all of the fish landed in UK ports is either round fish or gutted fish, and that no other handling or processing has taken place on board.
Overall value chain analysis
Detail value chain analysis – Imports and landings, estimated flows (volume, value)
Imports
IUK vessel landings Flow B
Flow A
UK vessel landings
ImportsExports
II III IVRetail sectorFoodservicesector
ProcessingI
Wholesaler,Trader
Figure 22 Total supply picture
Control volume I: The volume flows A and B will be discussed in the following sections (6.1.1 to 6.1.3.) 6.1.1 Landings (Flow B)
Total landings into UK of cod amounted to 31,600 tonnes in 2002. Of this, foreign vessels landed 5,860 tonnes. The average price of cod landed in UK was £1.34 per kg live weight in 2002 (foreign and UK fleet). The foreign vessels achieved an average price of £1.23 per kg live weight, while the UK vessels achieved an average price of £1.36 per kg live weight. To see prices achieved in the different size grades see section 6.2. For comparison: in year 2003 total landings of cod into UK was 23,563 tonnes at a value of £31.5 million and an average price of £1.34 per kg live weight. The pattern from 2002 showing that foreign vessels landings are paid less than landings by UK fleet continued. In year 2003 the average price paid for cod landed by foreign vessels
MARCH 2004 Page 47
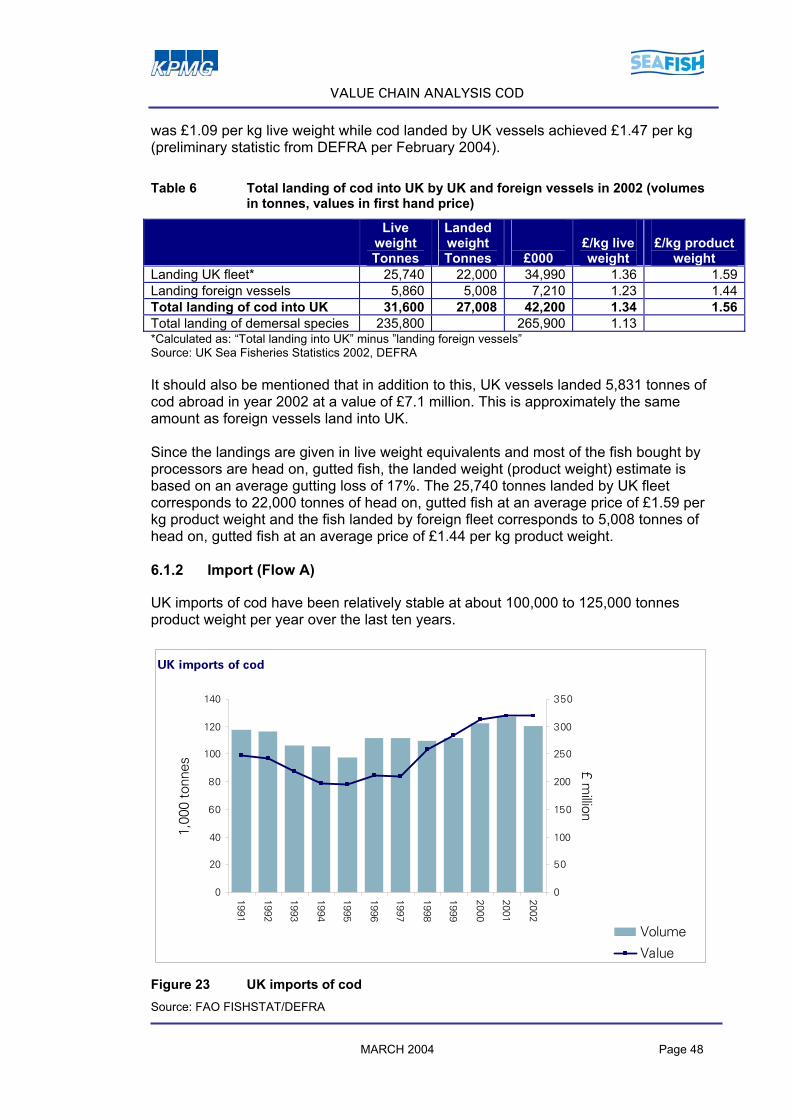
VALUE CHAIN ANALYSIS COD
was £1.09 per kg live weight while cod landed by UK vessels achieved £1.47 per kg (preliminary statistic from DEFRA per February 2004). Table 6 Total landing of cod into UK by UK and foreign vessels in 2002 (volumes
in tonnes, values in first hand price)
Live weight Tonnes
Landed weight Tonnes
£000
£/kg live weight
£/kg product
weight Landing UK fleet* 25,740 22,000 34,990 1.36 1.59Landing foreign vessels 5,860 5,008 7,210 1.23 1.44Total landing of cod into UK 31,600 27,008 42,200 1.34 1.56Total landing of demersal species 235,800 265,900 1.13 *Calculated as: “Total landing into UK” minus ”landing foreign vessels” Source: UK Sea Fisheries Statistics 2002, DEFRA It should also be mentioned that in addition to this, UK vessels landed 5,831 tonnes of cod abroad in year 2002 at a value of £7.1 million. This is approximately the same amount as foreign vessels land into UK. Since the landings are given in live weight equivalents and most of the fish bought by processors are head on, gutted fish, the landed weight (product weight) estimate is based on an average gutting loss of 17%. The 25,740 tonnes landed by UK fleet corresponds to 22,000 tonnes of head on, gutted fish at an average price of £1.59 per kg product weight and the fish landed by foreign fleet corresponds to 5,008 tonnes of head on, gutted fish at an average price of £1.44 per kg product weight. 6.1.2 Import (Flow A)
UK imports of cod have been relatively stable at about 100,000 to 125,000 tonnes product weight per year over the last ten years.
UK imports of cod
0
20
40
60
80
100
120
140
1991
1992
1993
1994
1995
1996
1997
1998
1999
2000
2001
2002
1,00
0 to
nnes
0
50
100
150
200
250
300
350
£ million
Volume
Value
Figure 23 UK imports of cod
MARCH 2004 Page 48
Source: FAO FISHSTAT/DEFRA

VALUE CHAIN ANALYSIS COD
Over 120,000 tonnes of cod were imported into the UK in 2002, mainly from Iceland, Norway, Russia, Denmark, and the Faeroe Islands. Most of this was imported frozen either round, semi-processed or processed. According to Icelandic exporters, most of their exports to the UK is shipped by sea, but a growing amount is also shipped fresh by air. Icelandic exporters find that it is impractical for their vessels to land directly in the UK, partly because an extra 10% of the volume landed is deducted from their quota, by the Icelandic government, if it is landed directly in the UK. By doing so the Icelandic government try to get as much processing done in Iceland as possible. Quality and regularity of supplies are quoted by companies interviewed for this study as the most important factors for UK processors preferring Icelandic products. Quality refers to whiteness, taste, yield, shelf life, size and freshness. Interviews revealed that most of the Icelandic exporters work with large processors on a regular basis, although very few have long-term contracts. This implies that larger processors tend to be always keeping an option open to transfer their business to a different (cheaper?) supplier and perhaps fear being tied into a long, fixed price contract. Opportunism in obtaining supplies at cheaper prices was in evidence among several of the processing and trading companies interviewed. Faeroese exporters tend to land their catch in the UK directly to some extent, as frozen at sea or semi-processed products. Fresh fish is shipped by sea directly to UK ports. Exporters in the Faeroes also quote quality and regularity of supplies as the main factors for UK processors preferring their products. In some cases, exporters have had guaranteed delivery agreements with UK processors, whereby the supplier would have to pay compensation to the processors if no fish were available. Faeroese exporters sell mainly to the large processors (semi-processed products) and to some extent directly to multiples (processed products). Interviews revealed that Norwegian and Icelandic exporters land some fish directly in UK ports, but mostly ship their products by sea in semi-processed form. Some large processors and exporters ship finished products, often under the client’s own label. The European suppliers to the UK whitefish industry have for a few years been feeling the competition from Russia and China, which supply lower priced products to the UK industry. They report a trend towards more semi-processed and finished products from Russia and China as time goes on, and this is perceived as a threat to European suppliers, UK catchers and primary processors. In contrast, larger processors viewed this as an opportunity and some companies interviewed commented that there are now well established trading relationships with Chinese suppliers who are increasingly supply exactly the high quality that is required in Europe and at cheaper prices than European primary processors are able to deliver. This competition has been causing some UK businesses to change their buying and trading patterns and in some cases to make strategic decision to focus on areas where they will not be subject to this competition, such as with fresh / chilled products. Some exporters to the UK view this as a new route to the UK market.
MARCH 2004 Page 49
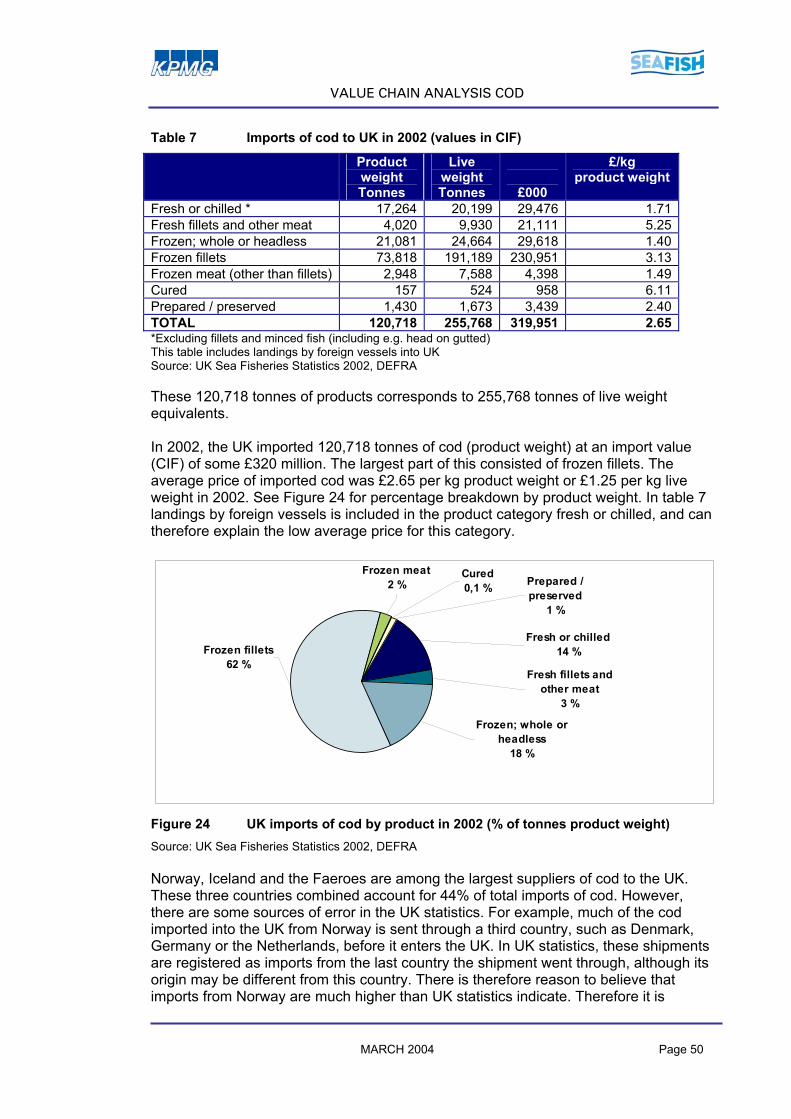
VALUE CHAIN ANALYSIS COD
Table 7 Imports of cod to UK in 2002 (values in CIF)
Product weight Tonnes
Live weight Tonnes
£000
£/kg product weight
Fresh or chilled * 17,264 20,199 29,476 1.71Fresh fillets and other meat 4,020 9,930 21,111 5.25Frozen; whole or headless 21,081 24,664 29,618 1.40Frozen fillets 73,818 191,189 230,951 3.13Frozen meat (other than fillets) 2,948 7,588 4,398 1.49Cured 157 524 958 6.11Prepared / preserved 1,430 1,673 3,439 2.40TOTAL 120,718 255,768 319,951 2.65*Excluding fillets and minced fish (including e.g. head on gutted) This table includes landings by foreign vessels into UK Source: UK Sea Fisheries Statistics 2002, DEFRA These 120,718 tonnes of products corresponds to 255,768 tonnes of live weight equivalents. In 2002, the UK imported 120,718 tonnes of cod (product weight) at an import value (CIF) of some £320 million. The largest part of this consisted of frozen fillets. The average price of imported cod was £2.65 per kg product weight or £1.25 per kg live weight in 2002. See Figure 24 for percentage breakdown by product weight. In table 7 landings by foreign vessels is included in the product category fresh or chilled, and can therefore explain the low average price for this category.
Frozen fillets62 %
Frozen; whole or headless
18 %
Prepared / preserved
1 %
Frozen meat2 %
Cured0,1 %
Fresh fillets and other meat
3 %
Fresh or chilled14 %
Figure 24 UK imports of cod by product in 2002 (% of tonnes product weight) Source: UK Sea Fisheries Statistics 2002, DEFRA Norway, Iceland and the Faeroes are among the largest suppliers of cod to the UK. These three countries combined account for 44% of total imports of cod. However, there are some sources of error in the UK statistics. For example, much of the cod imported into the UK from Norway is sent through a third country, such as Denmark, Germany or the Netherlands, before it enters the UK. In UK statistics, these shipments are registered as imports from the last country the shipment went through, although its origin may be different from this country. There is therefore reason to believe that imports from Norway are much higher than UK statistics indicate. Therefore it is MARCH 2004 Page 50
VALUE CHAIN ANALYSIS COD
estimated that Norwegian imports are twice as large as indicated by UK statistics. Official Norwegian export statistics, which are recorded according to final destination, support this. Table 8 UK cod imports by exporting country in 2002 (product weight, values in
CIF)
Origin Tonnes £000 £/kg Iceland 25,533 86,088 3.37 Russia 31,122 62,604 2.01 Denmark 13,903 40,897 2.94 Norway 12,737 39,943 3.14 Faroe Islands 14,575 31,909 2.19 Germany 6,132 18,684 3.05 China 7,121 15,194 2.13 Total 119,196 315,491 2.65
Source: DEFRA As is apparent from the average prices in table 8, the different countries are exporting different product types. There is a tendency for certain countries to focus on a limited number of product types. Russia is the main source of cod imports into the UK. In the case of China, most of the shipments are sourced from European-caught fish that is shipped to China for processing, and then re-exported to the UK. Russia, China and the Faeroes have supplied the UK market with cheap cod, as is evident from the price per kg in the above table. Imports from Iceland Export statistics from Iceland indicate that most of the shipments go directly from Iceland to the UK. This is deduced from the fact that the figures given in Icelandic statistics are very close to the figures given in UK statistics for imports from Iceland.
MARCH 2004 Page 51
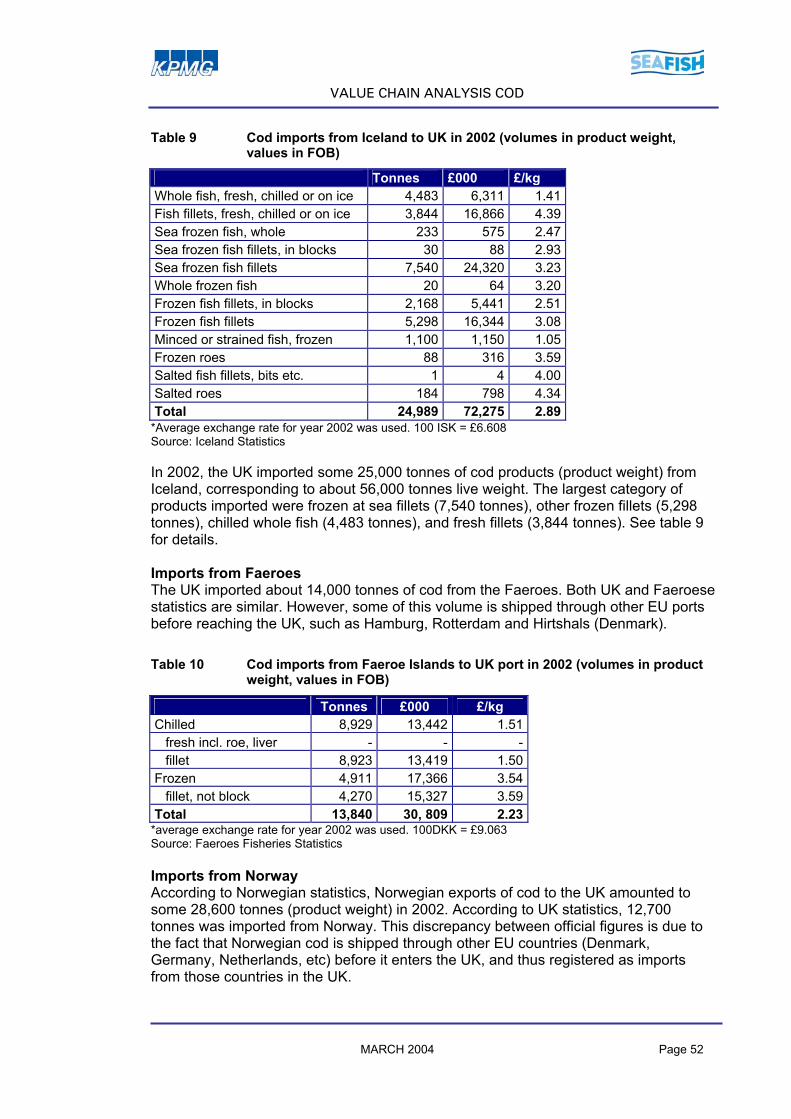
VALUE CHAIN ANALYSIS COD
Table 9 Cod imports from Iceland to UK in 2002 (volumes in product weight, values in FOB)
Tonnes £000 £/kg Whole fish, fresh, chilled or on ice 4,483 6,311 1.41 Fish fillets, fresh, chilled or on ice 3,844 16,866 4.39 Sea frozen fish, whole 233 575 2.47 Sea frozen fish fillets, in blocks 30 88 2.93 Sea frozen fish fillets 7,540 24,320 3.23 Whole frozen fish 20 64 3.20 Frozen fish fillets, in blocks 2,168 5,441 2.51 Frozen fish fillets 5,298 16,344 3.08 Minced or strained fish, frozen 1,100 1,150 1.05 Frozen roes 88 316 3.59 Salted fish fillets, bits etc. 1 4 4.00 Salted roes 184 798 4.34 Total 24,989 72,275 2.89
*Average exchange rate for year 2002 was used. 100 ISK = £6.608 Source: Iceland Statistics In 2002, the UK imported some 25,000 tonnes of cod products (product weight) from Iceland, corresponding to about 56,000 tonnes live weight. The largest category of products imported were frozen at sea fillets (7,540 tonnes), other frozen fillets (5,298 tonnes), chilled whole fish (4,483 tonnes), and fresh fillets (3,844 tonnes). See table 9 for details. Imports from Faeroes The UK imported about 14,000 tonnes of cod from the Faeroes. Both UK and Faeroese statistics are similar. However, some of this volume is shipped through other EU ports before reaching the UK, such as Hamburg, Rotterdam and Hirtshals (Denmark). Table 10 Cod imports from Faeroe Islands to UK port in 2002 (volumes in product
weight, values in FOB)
Tonnes £000 £/kg Chilled 8,929 13,442 1.51 fresh incl. roe, liver - - - fillet 8,923 13,419 1.50Frozen 4,911 17,366 3.54 fillet, not block 4,270 15,327 3.59Total 13,840 30, 809 2.23
*average exchange rate for year 2002 was used. 100DKK = £9.063 Source: Faeroes Fisheries Statistics Imports from Norway According to Norwegian statistics, Norwegian exports of cod to the UK amounted to some 28,600 tonnes (product weight) in 2002. According to UK statistics, 12,700 tonnes was imported from Norway. This discrepancy between official figures is due to the fact that Norwegian cod is shipped through other EU countries (Denmark, Germany, Netherlands, etc) before it enters the UK, and thus registered as imports from those countries in the UK.
MARCH 2004 Page 52
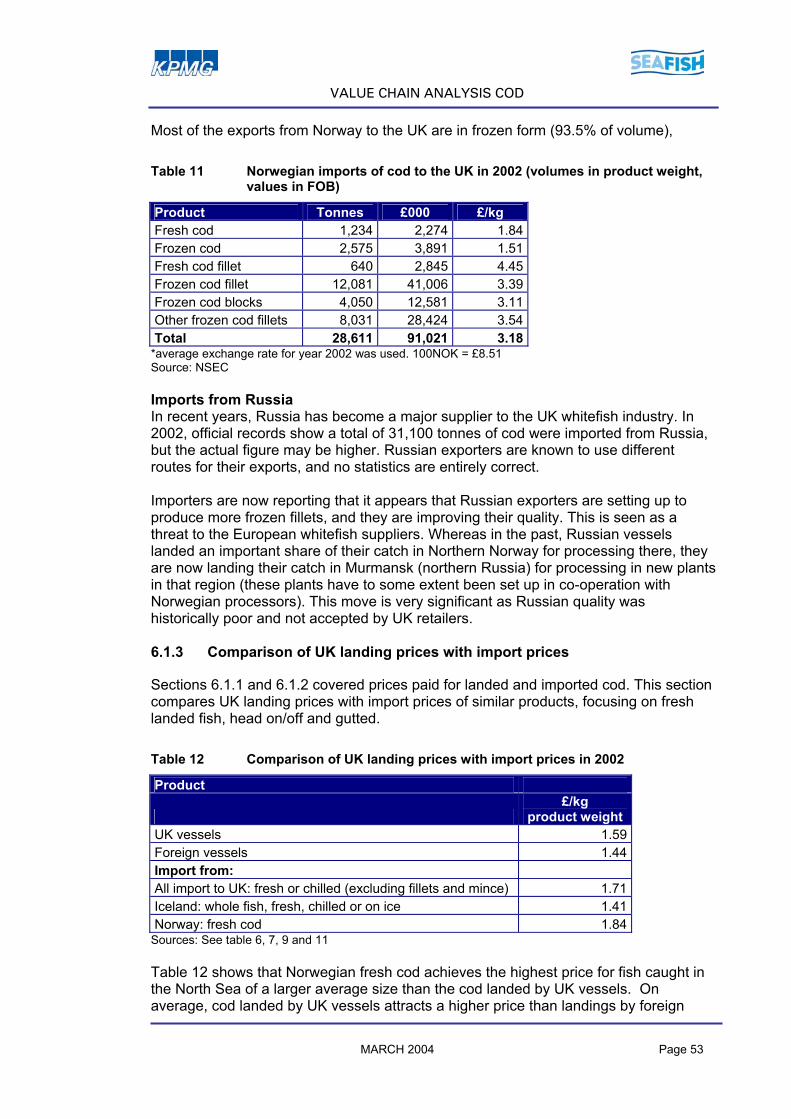
VALUE CHAIN ANALYSIS COD
Most of the exports from Norway to the UK are in frozen form (93.5% of volume), Table 11 Norwegian imports of cod to the UK in 2002 (volumes in product weight,
values in FOB)
Product Tonnes £000 £/kg Fresh cod 1,234 2,274 1.84Frozen cod 2,575 3,891 1.51Fresh cod fillet 640 2,845 4.45Frozen cod fillet 12,081 41,006 3.39Frozen cod blocks 4,050 12,581 3.11Other frozen cod fillets 8,031 28,424 3.54Total 28,611 91,021 3.18
*average exchange rate for year 2002 was used. 100NOK = £8.51 Source: NSEC Imports from Russia In recent years, Russia has become a major supplier to the UK whitefish industry. In 2002, official records show a total of 31,100 tonnes of cod were imported from Russia, but the actual figure may be higher. Russian exporters are known to use different routes for their exports, and no statistics are entirely correct. Importers are now reporting that it appears that Russian exporters are setting up to produce more frozen fillets, and they are improving their quality. This is seen as a threat to the European whitefish suppliers. Whereas in the past, Russian vessels landed an important share of their catch in Northern Norway for processing there, they are now landing their catch in Murmansk (northern Russia) for processing in new plants in that region (these plants have to some extent been set up in co-operation with Norwegian processors). This move is very significant as Russian quality was historically poor and not accepted by UK retailers. 6.1.3 Comparison of UK landing prices with import prices
Sections 6.1.1 and 6.1.2 covered prices paid for landed and imported cod. This section compares UK landing prices with import prices of similar products, focusing on fresh landed fish, head on/off and gutted. Table 12 Comparison of UK landing prices with import prices in 2002
Product
£/kg
product weight UK vessels 1.59 Foreign vessels 1.44 Import from: All import to UK: fresh or chilled (excluding fillets and mince) 1.71 Iceland: whole fish, fresh, chilled or on ice 1.41 Norway: fresh cod 1.84
Sources: See table 6, 7, 9 and 11
MARCH 2004 Page 53
Table 12 shows that Norwegian fresh cod achieves the highest price for fish caught in the North Sea of a larger average size than the cod landed by UK vessels. On average, cod landed by UK vessels attracts a higher price than landings by foreign
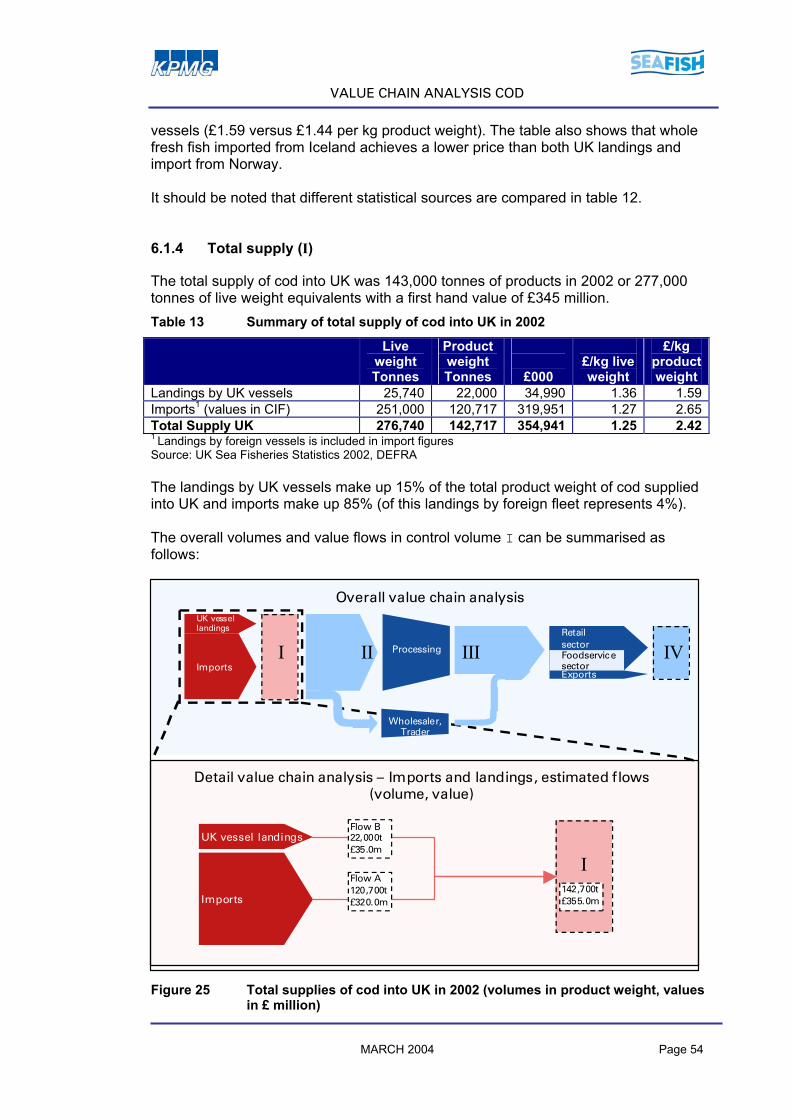
VALUE CHAIN ANALYSIS COD
vessels (£1.59 versus £1.44 per kg product weight). The table also shows that whole fresh fish imported from Iceland achieves a lower price than both UK landings and import from Norway. It should be noted that different statistical sources are compared in table 12. 6.1.4 Total supply (I)
The total supply of cod into UK was 143,000 tonnes of products in 2002 or 277,000 tonnes of live weight equivalents with a first hand value of £345 million. Table 13 Summary of total supply of cod into UK in 2002
Live weight Tonnes
Product weight Tonnes
£000
£/kg live weight
£/kg product weight
Landings by UK vessels 25,740 22,000 34,990 1.36 1.59Imports1 (values in CIF) 251,000 120,717 319,951 1.27 2.65Total Supply UK 276,740 142,717 354,941 1.25 2.421 Landings by foreign vessels is included in import figures Source: UK Sea Fisheries Statistics 2002, DEFRA The landings by UK vessels make up 15% of the total product weight of cod supplied into UK and imports make up 85% (of this landings by foreign fleet represents 4%). The overall volumes and value flows in control volume I can be summarised as follows:
Overall value chain analysis
Detail value chain analysis – Imports and landings, estimated flows (volume, value)
Imports
IUK vessel landings
Flow B22,000t£35.0m
Flow A120,700t£320.0m
142,700t£355.0m
UK vessel landings
ImportsExports
II III IVRetail sectorFoodservicesector
ProcessingI
Wholesaler,Trader
MARCH 2004 Page 54
Figure 25 Total supplies of cod into UK in 2002 (volumes in product weight, values in £ million)

VALUE CHAIN ANALYSIS COD
Imported cod is by far the most important source of raw material for the UK seafood value chain, representing 85% of total supply (by volume). The value per unit weight of the imported raw material is almost double that of the raw material landed by the UK fleet. However, this is explained by the fact that imported volumes are often a mix of different products, some of which have a higher value. 6 .2 Auc t ion marke ts
During the data collection stage, senior personnel from the key auction markets in the UK were interviewed. The information presented here is based on official information and data collected during interviews. Table 14 Information of sales of cod from markets/auctions for year 2002 (volumes
are estimates)
District Volume (live weight equiv.) tonnes
Average price £/kg live weight
Comments
Aberdeen 2,800 1.35 almost only domestic landings Fraserburgh 1,500 1.15 Grimsby 13,400 1.86 mostly Scottish and imported fish,
price from £1.80 - £2.00 per kg Hull 5,900 - mostly imported fish Peterhead 7,900 1.45 majority domestic landings Scrabster 4,854 1.23 includes Faeroes landings Wick other* 36 1.11 36,390 1.36 *Figures for Scrabster simply reflects the proportion of the fish sold in the district of Wick that were initially landed into the port of Scrabster. Therefore figures are only indicative of the volumes of fish actually sold in Scrabster. Source: SEERAD, interviews with markets/auctions All prices are average and combine all sizes (grades) of fish sold in the different markets. As detailed in table 14, the average price paid for cod at these markets in 2002 was £1.36 per kg, with a variation from £1.10 to £1.86 per kg. The average price paid for cod in these markets corresponds with the official landing statistics, where the average price paid by landings of UK vessels was £1.36 per kg live weight in 2002 (see section 6.1.1). Approximately 36,000 tonnes of cod were sold in 2002, first hand, through the above mentioned auction markets. Table 15 Average auction price for head on gutted cod per size categories. Average price £/kg live weight Average price £/kg landed weight Size 2002 2003 2002 20031 1.72 1.78 2.01 2.082 1.56 1.61 1.83 1.883 1.29 1.37 1.51 1.614 1.15 1.24 1.35 1.455 1.06 1.07 1.24 1.25
Source: SEERAD
MARCH 2004 Page 55

VALUE CHAIN ANALYSIS COD
Table 15 shows the price difference for the five size grades of head on gutted cod. The largest size, grade 1, achieved an average of £1.72 per kg live weight in 2002, while the smallest size, grade 5, achieved £1.06 per kg. Table 15 also show that the average prices for head on gutted cod has increased from year 2002 to 2003. 6 .3 Merchants
As mentioned in Chapter 5, merchants are a group of companies that buy and sell fish, sometimes including defrosting, repackaging, selling in smaller quantities, but not actually cutting or coating the fish in any way. This study has not focused on trying to quantify the volumes and values going through the merchants. 6 .4 P rocess ing ( I I an d I I I )
The following diagram illustrates the volume flows in the control volume for processors. II covers the inflow of raw material into the processing industry, and III covers the outflow of products from the processing industry.
UK vessel landings
ImportsExports
I II III IVRetail sectorFoodservicesector
Processing
II
Overall value chain analysis
IIISecondary/mixed
processors
Primaryprocessors
Flow G
Flow D
Flow E
Flow F Flow H
Detail value chain analysis – Processing, estimated flows (volume, value)
Wholesaler,Trader
Figure 26 Detailed value chain analyses for processing
During the research stage interviews were held with key companies in the processing sector. The processing capacity of these companies represents a substantial part of the total volume of cod processed, based on the supply situation described above (these companies account for 90,000 tonnes of processed cod from a total supply of 143,000 tonnes). The findings from the interview stage have been extrapolated to estimate the total volume flows for the UK industry in the processing sector. The total volume of cod flow is estimated by making an assumption based on the actual volume of cod that finds its way into the processing sector (Control II). The factor of scale MARCH 2004 Page 56

VALUE CHAIN ANALYSIS COD
between the data collected during interviews and the assumed total volume into processing (II) is then used to estimate the individual flows (D-H, see above) within the processing sector. The product mix and prices are assumed to remain constant. The research interviews focused on the larger processors and estimates may not be entirely representative of the industry. An example of this is that the smaller processing units may have a more specialised production and less integration. The prices used for the value estimates vary within the same product categories, especially for high quality products such as fillets and loins. This is because there are varying suppliers, and because the quality and size of the raw material influences price. In these cases estimates are based on an average price for a given product category. The diagram below illustrates the main forms of products that are produced from the most common forms of raw material. This picture is identical for cod and haddock and the most important products forms that will be discussed in the following detailed analysis. The main by-products of the processing activity are also shown.
SmokedSaltedMarinated
Coated
– Fillets– Loins– Other
Ready meals
– Pies– Variations
Coated
– Cakes– Fish fingers– Other
Whole fish
– Rounders– Head on gutted– Headed and
gutted– Frozen at sea,
gutted
IntestinesHeads
SkinSkeletonTailsHeadsTrimmings
TrimmingsSkinDust (from cutting)
Fillets
– Skin on/off– Pinbone in/out– Trimming
variations
Fillets
– Skin on/off– Pinbone in/out– Trimming
variations– IQF
Blocks
– Variations in grading
FRE
SH
FRO
ZE
N
By-products
Natural
– Loins– Portions
Figure 27 The main forms of products for cod based on common forms of raw
material Source: KPMG AS, Centre for Aquaculture and Fisheries
MARCH 2004 Page 57

VALUE CHAIN ANALYSIS COD
6.4.1 Detailed analysis of products and values
The following section describes the volume flows D-H (see figure 26, page 56) and any related information. Flow D and G relate to primary processing, while flow E, F and H relate to secondary/mixed processors. Flow D: supplies to primary processing The total volume going in to primary processing is estimated to 15,200 tonnes (product weight) with an estimated value of £26.6 million. As expected, the main stream of raw material to primary processors consists of unprocessed fish beyond gutting (see figure 28). The majority of the raw material is fresh, which may be a consequence of increased competition from foreign suppliers of frozen primary processed products, as well as an increased focus on chilled seafood products.
Products by type, volume and value
,
2,000
4,000
6,000
8,000
10,000
12,000
14,000Fresh headon, gutted
Undefined
Tonn
es
0
5
10
15
20
25
Val
ue £
mill
ion
Tonnes Value £ million
Figure 28 Flow D: Estimated flows of supply (volume and value) into primary processing
A comparison of the output of primary processors with the input indicates that filleting is the primary activity of the processors in interviewed companies. Since the other major product coming out is fresh fish, head on gutted, it is clear that many primary processors also act as wholesalers just selling the fish on.
MARCH 2004 Page 58
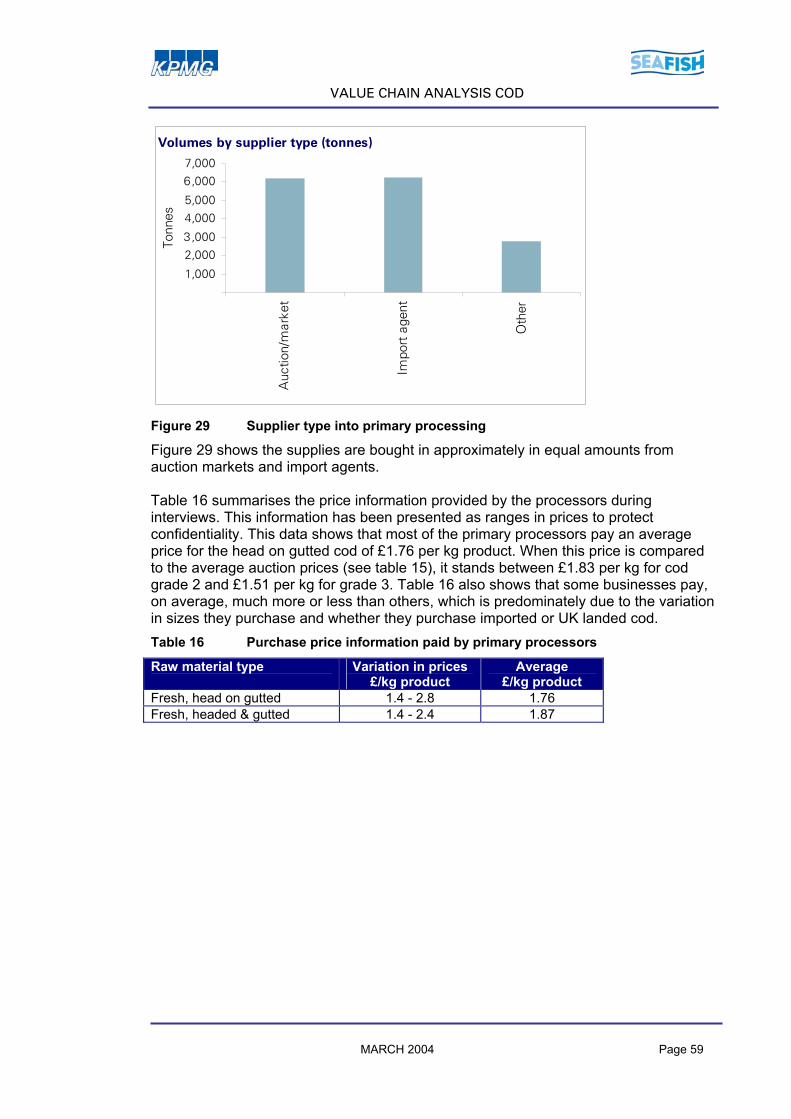
VALUE CHAIN ANALYSIS COD
Volumes by supplier type (tonnes)
1,000
2,0003,000
4,0005,000
6,0007,000
Auc
tion/
mar
ket
Impo
rt a
gent
Oth
er
Tonn
es
,
Figure 29 Supplier type into primary processing
Figure 29 shows the supplies are bought in approximately in equal amounts from auction markets and import agents. Table 16 summarises the price information provided by the processors during interviews. This information has been presented as ranges in prices to protect confidentiality. This data shows that most of the primary processors pay an average price for the head on gutted cod of £1.76 per kg product. When this price is compared to the average auction prices (see table 15), it stands between £1.83 per kg for cod grade 2 and £1.51 per kg for grade 3. Table 16 also shows that some businesses pay, on average, much more or less than others, which is predominately due to the variation in sizes they purchase and whether they purchase imported or UK landed cod. Table 16 Purchase price information paid by primary processors
Raw material type Variation in prices £/kg product
Average £/kg product
Fresh, head on gutted 1.4 - 2.8 1.76 Fresh, headed & gutted 1.4 - 2.4 1.87
MARCH 2004 Page 59

VALUE CHAIN ANALYSIS COD
Flow E: direct supplies to secondary/mixed processors The mixed processors category consists of integrated processors involved in both primary and secondary processing. The total supply volume in this flow is estimated to be 120,800 tonnes (product weight) with an estimated value of £345.4 million.
Products by type, volume and value
,
10,000
20,000
30,000
40,000
50,000
60,000
70,000
Freshhead on,gutted
Headedand
gutted
Freshfillets and
loins
Frozenfillets and
loins
Frozenblocks
Undefined
Tonn
es
020406080100120140160180200
Valu
e £
mill
ion
Tonnes Value £ million
Figure 30 Flow E: Estimated flows of supply (volume and value) directly into secondary/mixed processing (see figure 26)
The major products directly supplied to secondary/mixed processors are frozen fillets / loins and frozen blocks: together they constitute 82% of the total volume supply and 87% of the value. Fresh, head on gutted fish is also an important raw material. The share of fresh raw material is around 15 % while the rest is frozen.
Volumes by supplier type (tonnes)
,
20,000
40,000
60,000
80,000
100,000
120,000
Auc
tion/
mar
ket
Con
trac
t UK
vess
el
Impo
rt a
gent
Mer
chan
t
Oth
er
Tonn
es
Figure 31 Supplier type directly into secondary/mixed processing
MARCH 2004 Page 60
As figure 31 shows, according to collected data, import agents are the main supply source for raw materials going directly into secondary/mixed processing. This fits very

VALUE CHAIN ANALYSIS COD
well with the import figures which show that UK imports approximately 120,000 tonnes of cod products in year 2002. Table 17 shows that the prices paid for the raw materials vary quite significantly. This is due to the extensive range of different products and supply sources and their respective costs that are included in the prices (e.g. air freight). Average prices have not been provided when there are less than 5 observations. Table 17 Purchase price information paid by secondary/mixed processor
Raw material type Variation in prices £/kg product
Average £/kg product
Frozen fillets 2.5 - 4.8 3.4 Frozen block 2.7 - 3.5 - Chilled: fillets, loins and other 2.9 - 6.1 - Flow F: supplies from primary to secondary/mixed processors In addition to the flow coming directly from primary processors this flow also contains some of the raw material being sold within the category secondary/mixed processors. An example of this can be a product (produced by one secondary/mixed processor) being bought and used as an ingredient in another product by another secondary/mixed processor. The total volume of this flow is estimated to 8,700 tonnes (product weight) with an estimated value of £35.6 million.
Products by type, volume and value
,
,500
1,000
1,500
2,000
2,500
3,000
3,500
Freshhead on,gutted
Freshfillets and
loins
Freshother
Frozenfillets and
loins
Sm
oked
Frozenother
Tonn
es
0
2
4
6
8
10
12
14
16
Val
ue £
mill
ion
Tonnes Value £ million
Figure 32 Flow F: Estimated flows of supply (volume and value) directly from primary processors into secondary/mixed processors (see figure 26)
The main products coming from primary processors and going in to secondary/mixed processors are fresh fillets, loins and other fresh products (61%). In addition there is some frozen products as fillets, loins and other. It can seem somewhat strange that frozen fillets & loins is a large product, but this is due to the above-mentioned fact that MARCH 2004 Page 61

VALUE CHAIN ANALYSIS COD
there is trade within the category secondary/mixed processors. This internal trade is estimated to a volume of approximately 5,700 tonnes and also includes substantial parts of the fresh products and some smoked products. In values the fresh products are best paid per unit weight, with an average price of £4.7 per kg. Table 18 Purchase price information paid by secondary processors buying from
primary processors
Raw material type Variation in prices £/kg product
Chilled: fillets, loins and other 4.2 - 6.1 Flow G: supplies from primary processors to consumption and exports The total volume of this flow is estimated to 5,000 tonnes (product weight) with an estimated value of £26.7 million. The main product going directly from primary processors to consumption and exports is fresh fillet (83% by volume). In addition there’s some unprocessed fish (head on, gutted).
Products by type, volume and value
,,500
1,0001,5002,0002,5003,0003,5004,0004,500
Freshhead on,gutted
Natural
fillets
FrozenN
aturalfillets and
readym
eals
Tonn
es
0
5
10
15
20
25
30
Valu
e £
milli
on
Tonnes Value £ million
Figure 33 Flow G: Estimated sales flow (volume and value) from primary processing directly to the market (see figure 26)
As figure 34 shows most products are sold to wholesalers and the rest going directly to the foodservice or retail sector.
MARCH 2004 Page 62
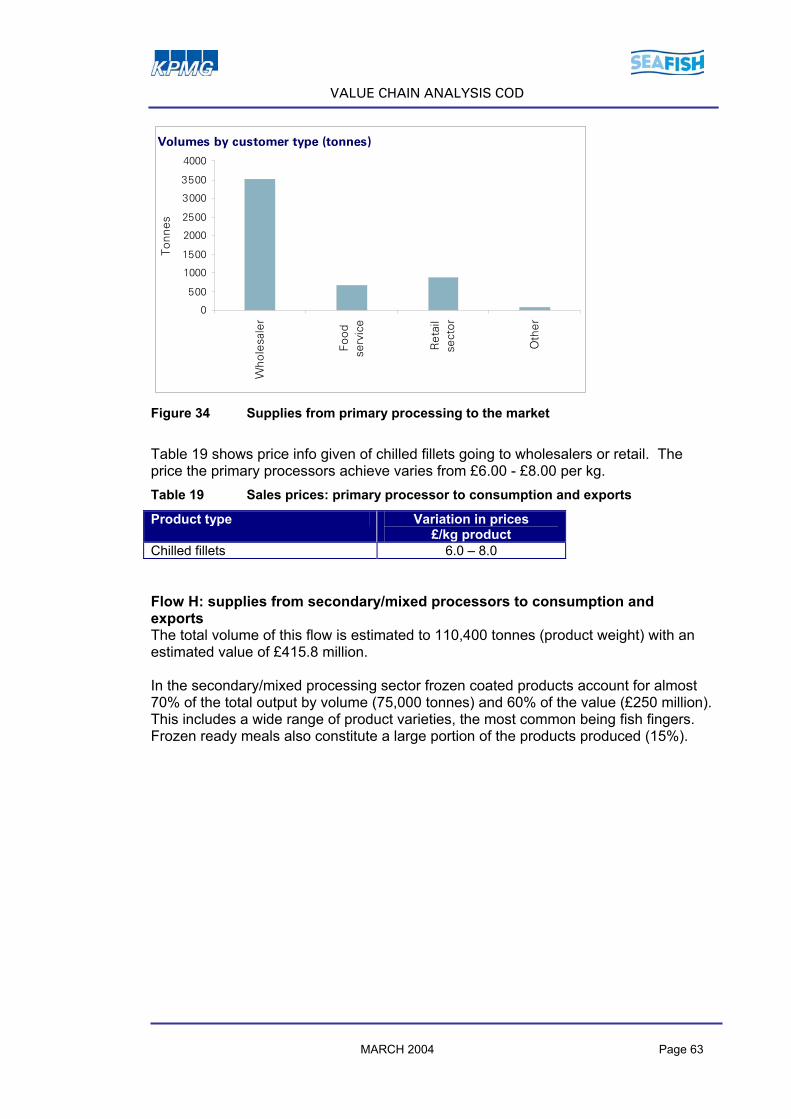
VALUE CHAIN ANALYSIS COD
Volumes by customer type (tonnes)
0
500
1000
1500
2000
2500
3000
3500
4000
Who
lesa
ler
Food
serv
ice
Ret
ail
sect
or
Oth
er
Tonn
es
Figure 34 Supplies from primary processing to the market
Table 19 shows price info given of chilled fillets going to wholesalers or retail. The price the primary processors achieve varies from £6.00 - £8.00 per kg. Table 19 Sales prices: primary processor to consumption and exports
Product type Variation in prices £/kg product
Chilled fillets 6.0 – 8.0 Flow H: supplies from secondary/mixed processors to consumption and exports The total volume of this flow is estimated to 110,400 tonnes (product weight) with an estimated value of £415.8 million. In the secondary/mixed processing sector frozen coated products account for almost 70% of the total output by volume (75,000 tonnes) and 60% of the value (£250 million). This includes a wide range of product varieties, the most common being fish fingers. Frozen ready meals also constitute a large portion of the products produced (15%).
MARCH 2004 Page 63

VALUE CHAIN ANALYSIS COD
,
Products by type, volume and value
10,00020,00030,00040,00050,00060,00070,00080,000
Fresh head on, gutted
Fresh natural fillets
Fresh coated fillets andother
Frozen natural fillets
Frozen coated filletsand other
Frozen ready meals
Sm
oked
Tonn
es
0
50
100
150
200
250
300
Val
ue £
mill
ion
Tonnes Value £ million
Figure 35 Flow H: Estimated sales flow (volume and value) from secondary/mixed processing directly to the market (see figure 26)
Table 20 Sales prices: secondary/mixed processors to consumption and exports
Product type Variation in prices, £/kg product
Chilled, fillets, loins and other 4.0 – 8.0 Fresh, coated fillets and other 2.7 – 3.9 Frozen fillets 3.0 –7.0 Frozen coated fillets and others 2.9 - 3.7 Smoked 5.5 – 6.5 Table 20 shows that the sales prices achieved by secondary/mixed processors varies a lot, especially for natural products (fillets and loins), which are sold in a large variety of sizes and qualities in different market sectors.
MARCH 2004 Page 64

VALUE CHAIN ANALYSIS COD
Control volume II and III can be summarised as follows (estimated for the entire UK cod industry):
UK vessel landings
ImportsExports
I II III IVRetail sectorFoodservicesector
Processing
II
Overall value chain analysis
IIISecondary/mixed
processors
Primaryprocessors136,000t
£372.0m 115,500t£442.5m
Flow G5,000t£26.7m
Flow D15,200t£26.6m
Flow E120,800t£345.4m
Flow F8,700t£35.6m
Flow H110,400t£415.8m
Detail value chain analysis – Processing, estimated flows (volume, value)
Wholesaler,Trader
Figure 36 Total flows of raw material/products and values in processing of cod.
(volume in tonnes product weight, values in £ million). Source: Section 6.4 Total supply to cod processors was estimated to 136,000 tonnes of products at a purchase price of £372 million. Total sale from cod processors was 115,500 tonnes at a sales value of £442,5 million. This gives an average raw material purchase price for cod processors of £2.74 per kg and an average sales price of £3.81 per kg cod product from processors. Figure 36 also shows that there is a 15% product weight loss in processing of cod. More fish by-products (waste) are lost than these 15%, since they represents the difference between by-products lost and addition of added ingredients (e.g. breading for coated products). The value or volume of by-products has not been estimated in this study. It must be considered that some of the loss in product weight has a commercial value and can be exploited by the processor. 6 .5 Who lesa le rs
There are two types of wholesale companies categorised according to their size. The smaller wholesale businesses buy primary processed fresh fish for sale to small catering sector businesses (fish and chip shops), independent retailers or to secondary processing businesses. Some of the operations the smaller wholesalers perform can be similar to those performed by merchants, but wholesalers generally operate closer to the market in the value chain.
MARCH 2004 Page 65
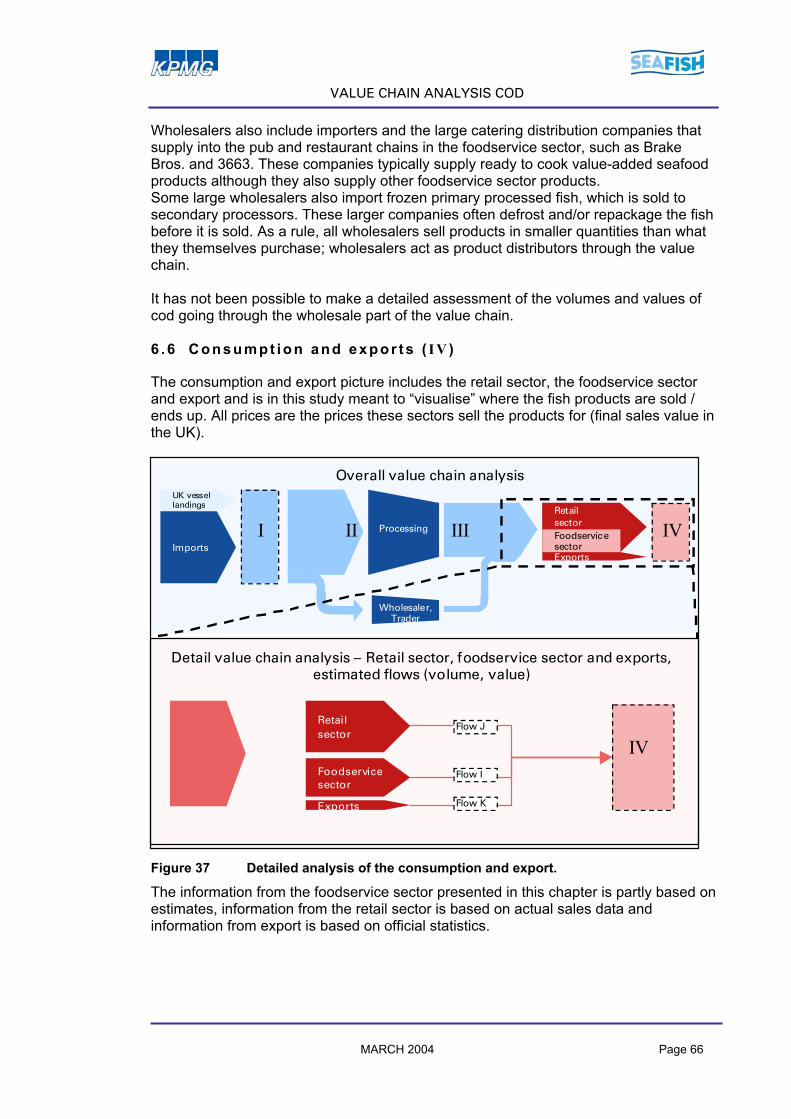
VALUE CHAIN ANALYSIS COD
Wholesalers also include importers and the large catering distribution companies that supply into the pub and restaurant chains in the foodservice sector, such as Brake Bros. and 3663. These companies typically supply ready to cook value-added seafood products although they also supply other foodservice sector products. Some large wholesalers also import frozen primary processed fish, which is sold to secondary processors. These larger companies often defrost and/or repackage the fish before it is sold. As a rule, all wholesalers sell products in smaller quantities than what they themselves purchase; wholesalers act as product distributors through the value chain. It has not been possible to make a detailed assessment of the volumes and values of cod going through the wholesale part of the value chain. 6 .6 Consumpt ion and expor ts ( I V )
The consumption and export picture includes the retail sector, the foodservice sector and export and is in this study meant to “visualise” where the fish products are sold / ends up. All prices are the prices these sectors sell the products for (final sales value in the UK).
UK vessel landings
Imports
I II III IVRetail sectorFoodservicesector
Processing
Overall value chain analysis
Exports
Detail value chain analysis – Retail sector, foodservice sector and exports, estimated flows (volume, value)
IVRetail sector
Exports
Foodservicesector
Flow I
Flow K
Flow J
Wholesaler,Trader
Figure 37 Detailed analysis of the consumption and export.
The information from the foodservice sector presented in this chapter is partly based on estimates, information from the retail sector is based on actual sales data and information from export is based on official statistics.
MARCH 2004 Page 66

VALUE CHAIN ANALYSIS COD
6.6.1 Retail sector (Flow J)
The retail sector includes multiples, co-ops, independents, other non-grocers, freezer centres, fishmongers and others. The data originates from the TNS database at Seafish. Some product categories in the frozen sector have been merged in order to make them fit this value chain analysis approach. Expenditure (value) refers to the price paid by the consumer to the retail sector. Table 21 Total retail volumes in UK, excluding Northern Ireland in 2002 (tonnes
product weight)
Total sector
Added value products1
Coated2 Natural Smoked3 Fish cakes
Other
Cod Chilled 17,919 3,259 5,046 7,738 1,877 - - Frozen 45,759 6,111 33,287 958 1,6133) 2,912 876Total cod 63,678 9,370 38,333 8,696 3,490 2,912 876Total cod and haddock 94,052 12,926 52,715 14,527 9,877 3,051 933Total cod share of all seafood (in %)
23 % 14% 47% 15% 12% 52% 38%
1) added value products include ready main meals and fish in sauce 2) coated includes battered, breaded, fish fingers 3) called natural/smoked in statistics Source: Taylor Nelson Sofres, Seafish Cod accounts for a total of 63,678 tonnes of products at a value of £354 million in the retail sector in 2002. The average price paid for cod in this sector was £5.57 per kg product in 2002. For comparison, haddock stands for a total of 30,400 tonnes of product at a value of £199 million and an average price of £6.55 per kg. Cod sells more than twice the volume of haddock, but at a lower average price per kg product. The main reason for this difference in average price is due to the price of added value products (cod: average £5.15 per kg, haddock: £6.16 per kg) and frozen coated products (cod: £5.06 per kg, haddock: 5.41 per kg). The main cod product category is frozen coated products, representing 52% of the sales volume (33,287 tonnes) and 48% of the value (£168 million). Chilled natural fillets follows with 12% of the sales volume (7,738 tonnes) and 16% of the value (£58 million).
MARCH 2004 Page 67
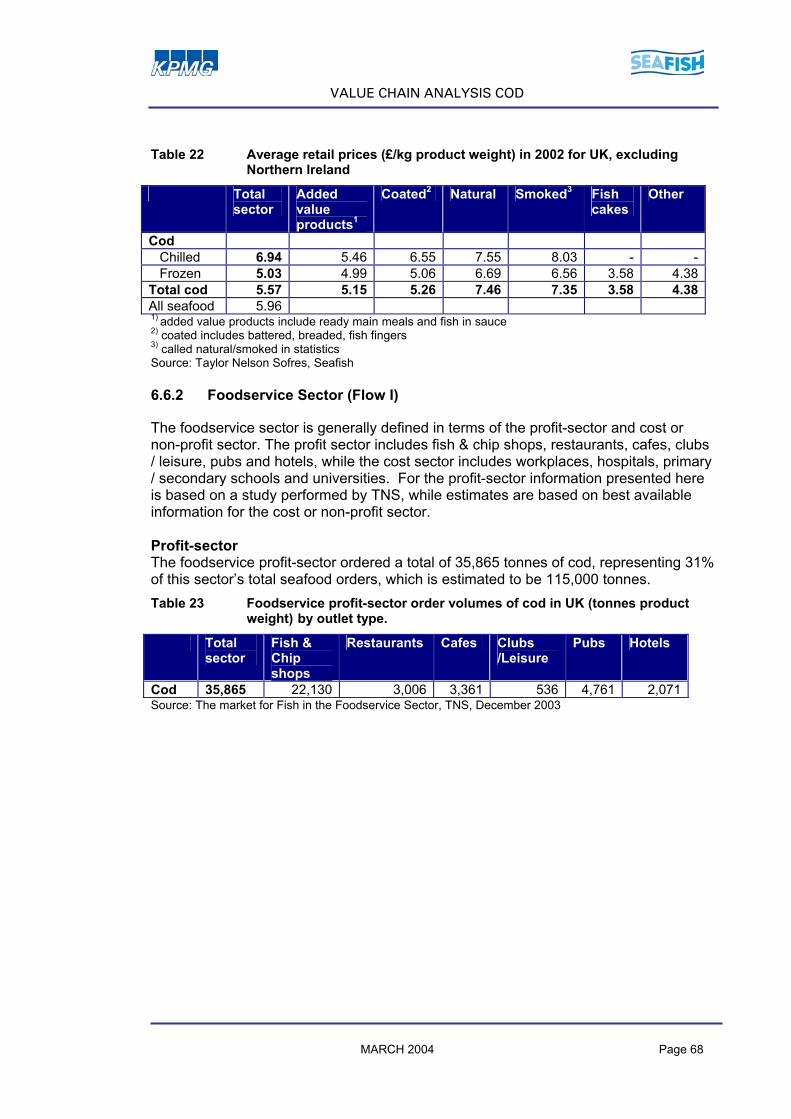
VALUE CHAIN ANALYSIS COD
Table 22 Average retail prices (£/kg product weight) in 2002 for UK, excluding
Northern Ireland Total
sector Added value products1
Coated2 Natural Smoked3 Fish cakes
Other
Cod Chilled 6.94 5.46 6.55 7.55 8.03 - - Frozen 5.03 4.99 5.06 6.69 6.56 3.58 4.38Total cod 5.57 5.15 5.26 7.46 7.35 3.58 4.38All seafood 5.96 1) added value products include ready main meals and fish in sauce 2) coated includes battered, breaded, fish fingers 3) called natural/smoked in statistics Source: Taylor Nelson Sofres, Seafish 6.6.2 Foodservice Sector (Flow I)
The foodservice sector is generally defined in terms of the profit-sector and cost or non-profit sector. The profit sector includes fish & chip shops, restaurants, cafes, clubs / leisure, pubs and hotels, while the cost sector includes workplaces, hospitals, primary / secondary schools and universities. For the profit-sector information presented here is based on a study performed by TNS, while estimates are based on best available information for the cost or non-profit sector. Profit-sector The foodservice profit-sector ordered a total of 35,865 tonnes of cod, representing 31% of this sector’s total seafood orders, which is estimated to be 115,000 tonnes. Table 23 Foodservice profit-sector order volumes of cod in UK (tonnes product
weight) by outlet type. Total
sector Fish & Chip shops
Restaurants Cafes Clubs /Leisure
Pubs Hotels
Cod 35,865 22,130 3,006 3,361 536 4,761 2,071Source: The market for Fish in the Foodservice Sector, TNS, December 2003
MARCH 2004 Page 68
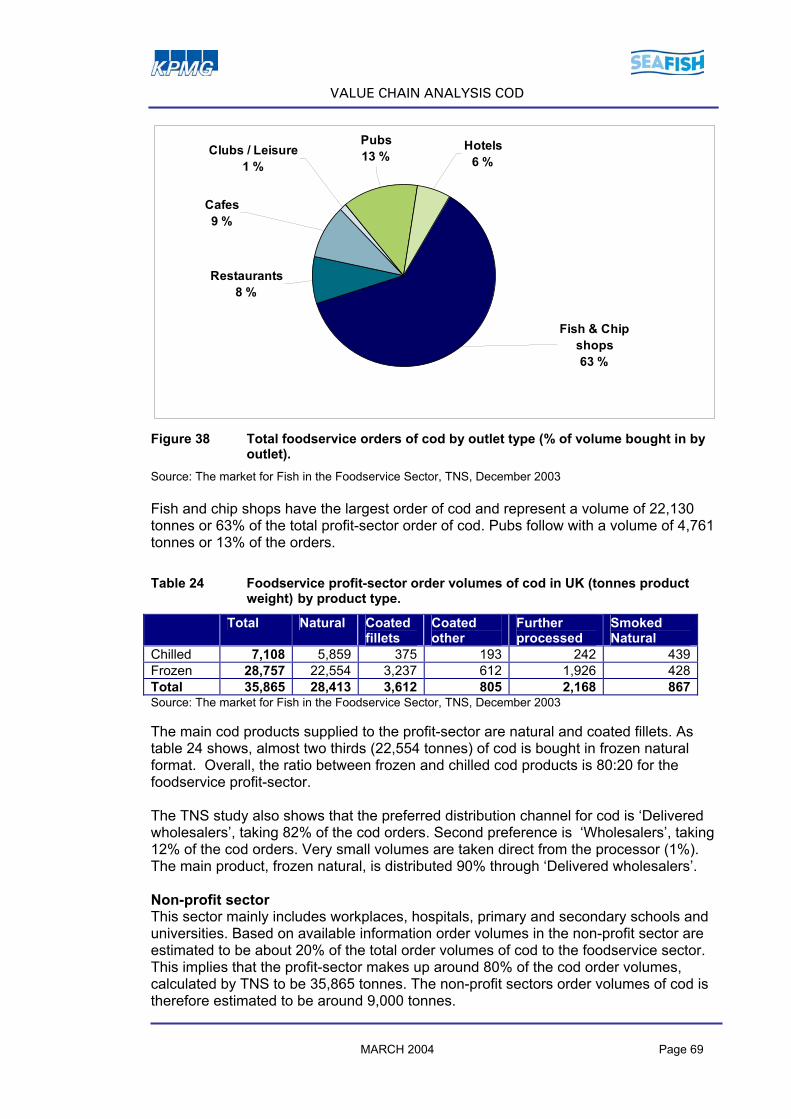
VALUE CHAIN ANALYSIS COD
Fish & Chip shops63 %
Restaurants8 %
Hotels6 %
Pubs13 %
Cafes9 %
Clubs / Leisure1 %
Figure 38 Total foodservice orders of cod by outlet type (% of volume bought in by
outlet). Source: The market for Fish in the Foodservice Sector, TNS, December 2003 Fish and chip shops have the largest order of cod and represent a volume of 22,130 tonnes or 63% of the total profit-sector order of cod. Pubs follow with a volume of 4,761 tonnes or 13% of the orders. Table 24 Foodservice profit-sector order volumes of cod in UK (tonnes product
weight) by product type. Total Natural Coated
fillets Coated other
Further processed
Smoked Natural
Chilled 7,108 5,859 375 193 242 439Frozen 28,757 22,554 3,237 612 1,926 428Total 35,865 28,413 3,612 805 2,168 867Source: The market for Fish in the Foodservice Sector, TNS, December 2003 The main cod products supplied to the profit-sector are natural and coated fillets. As table 24 shows, almost two thirds (22,554 tonnes) of cod is bought in frozen natural format. Overall, the ratio between frozen and chilled cod products is 80:20 for the foodservice profit-sector. The TNS study also shows that the preferred distribution channel for cod is ‘Delivered wholesalers’, taking 82% of the cod orders. Second preference is ‘Wholesalers’, taking 12% of the cod orders. Very small volumes are taken direct from the processor (1%). The main product, frozen natural, is distributed 90% through ‘Delivered wholesalers’. Non-profit sector This sector mainly includes workplaces, hospitals, primary and secondary schools and universities. Based on available information order volumes in the non-profit sector are estimated to be about 20% of the total order volumes of cod to the foodservice sector. This implies that the profit-sector makes up around 80% of the cod order volumes, calculated by TNS to be 35,865 tonnes. The non-profit sectors order volumes of cod is therefore estimated to be around 9,000 tonnes. MARCH 2004 Page 69
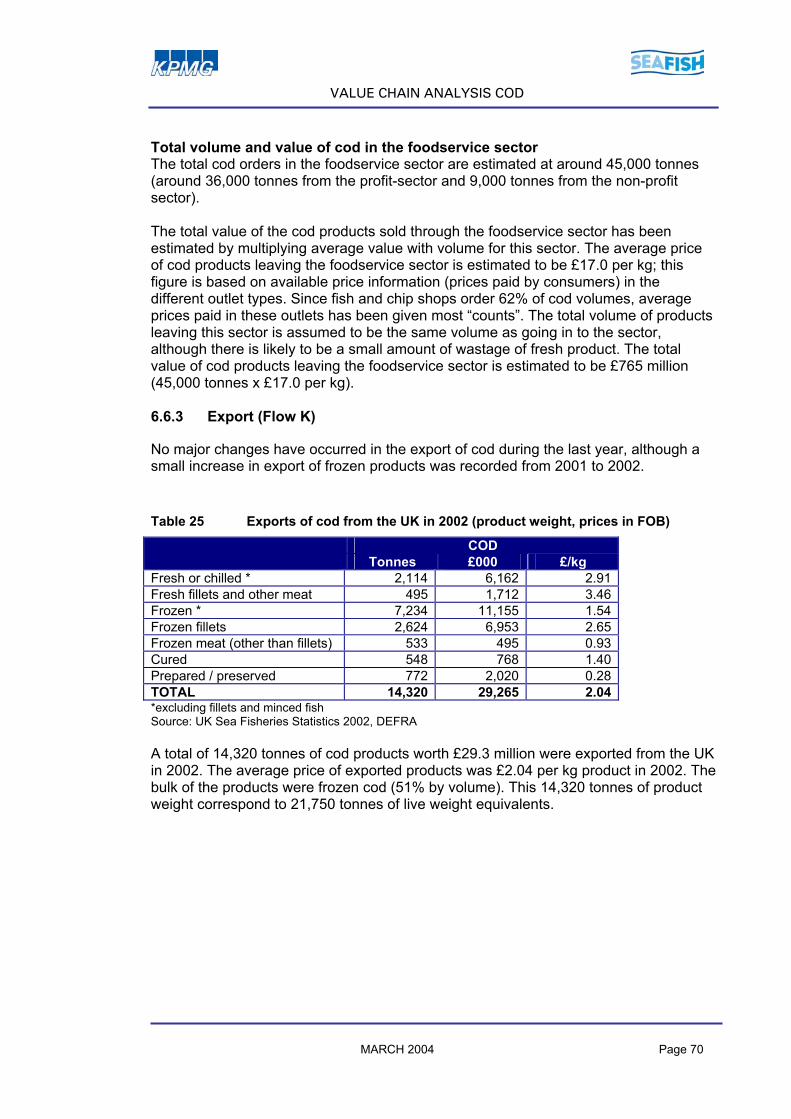
VALUE CHAIN ANALYSIS COD
Total volume and value of cod in the foodservice sector The total cod orders in the foodservice sector are estimated at around 45,000 tonnes (around 36,000 tonnes from the profit-sector and 9,000 tonnes from the non-profit sector). The total value of the cod products sold through the foodservice sector has been estimated by multiplying average value with volume for this sector. The average price of cod products leaving the foodservice sector is estimated to be £17.0 per kg; this figure is based on available price information (prices paid by consumers) in the different outlet types. Since fish and chip shops order 62% of cod volumes, average prices paid in these outlets has been given most “counts”. The total volume of products leaving this sector is assumed to be the same volume as going in to the sector, although there is likely to be a small amount of wastage of fresh product. The total value of cod products leaving the foodservice sector is estimated to be £765 million (45,000 tonnes x £17.0 per kg). 6.6.3 Export (Flow K)
No major changes have occurred in the export of cod during the last year, although a small increase in export of frozen products was recorded from 2001 to 2002.
Table 25 Exports of cod from the UK in 2002 (product weight, prices in FOB)
COD Tonnes £000 £/kg Fresh or chilled * 2,114 6,162 2.91 Fresh fillets and other meat 495 1,712 3.46 Frozen * 7,234 11,155 1.54 Frozen fillets 2,624 6,953 2.65 Frozen meat (other than fillets) 533 495 0.93 Cured 548 768 1.40 Prepared / preserved 772 2,020 0.28 TOTAL 14,320 29,265 2.04 *excluding fillets and minced fish Source: UK Sea Fisheries Statistics 2002, DEFRA A total of 14,320 tonnes of cod products worth £29.3 million were exported from the UK in 2002. The average price of exported products was £2.04 per kg product in 2002. The bulk of the products were frozen cod (51% by volume). This 14,320 tonnes of product weight correspond to 21,750 tonnes of live weight equivalents.
MARCH 2004 Page 70

VALUE CHAIN ANALYSIS COD
Fresh or chilled15 %
Fresh fillets and other meat
3 %
Cured4 %
Frozen meat4 %
Prepared / preserved
5 %Frozen:whole or
headless51 %
Frozen fillets18 %
Figure 39 UK exports of cod by product type 2002 (% of tonnes product weight) Source: UK Sea Fisheries Statistics 2002, DEFRA 6.6.4 Total consumption and exports for cod (IV)
Table 26 summarises the total consumption and export of cod products. Table 26 Summary of consumption and exports of cod in 2002 (volumes in
product weight, values are sales prices)
Product weight £000 £/kg Foodservice Sector 45,000 765,0001 17.00 Retail Sector 63,678 354,0001 5.56 Exports 14,320 29,2652 2.04 Total 122,990 1.148,265 9.32 1Sales price 2Price in export statistics (FOB) Sources: Section 6.6.1, 6.6.2. and 6.6.3.
MARCH 2004 Page 71
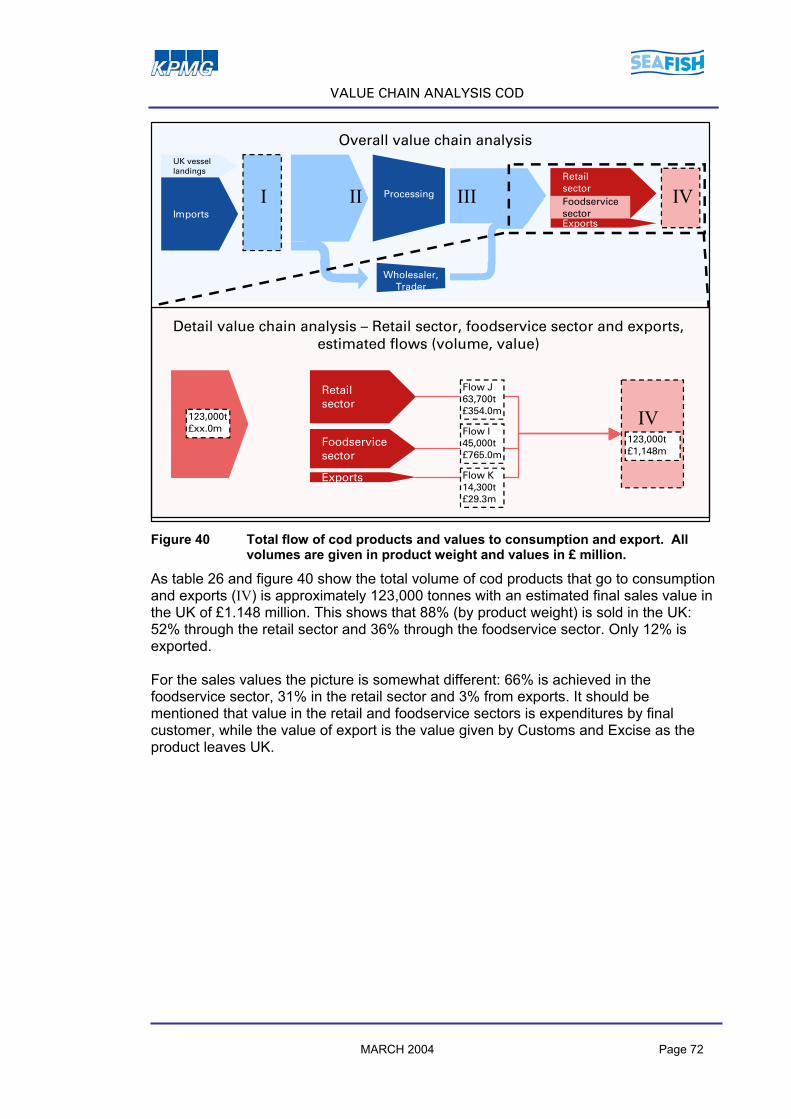
VALUE CHAIN ANALYSIS COD
UK vessel landings
Imports
I II III IVRetail sectorFoodservicesector
Processing
Overall value chain analysis
Exports
Detail value chain analysis – Retail sector, foodservice sector and exports, estimated flows (volume, value)
IVRetail sector
Exports
Foodservicesector
Flow I45,000t£765.0m
Flow K14,300t£29.3m
Flow J63,700t£354.0m
123,000t£1,148m
123,000t£xx.0m
Wholesaler,Trader
Figure 40 Total flow of cod products and values to consumption and export. All
volumes are given in product weight and values in £ million.
As table 26 and figure 40 show the total volume of cod products that go to consumption and exports (IV) is approximately 123,000 tonnes with an estimated final sales value in the UK of £1.148 million. This shows that 88% (by product weight) is sold in the UK: 52% through the retail sector and 36% through the foodservice sector. Only 12% is exported. For the sales values the picture is somewhat different: 66% is achieved in the foodservice sector, 31% in the retail sector and 3% from exports. It should be mentioned that value in the retail and foodservice sectors is expenditures by final customer, while the value of export is the value given by Customs and Excise as the product leaves UK.
MARCH 2004 Page 72

VALUE CHAIN ANALYSIS COD
6 .7 To ta l p ic tu re cod
IVUK vessellandings
Imports
Exports
143,000 t
I II IIIRetail sector
Foodservicesector
136,000 t
7,000 t 6,000 t
116,000 t
64,000 t
45,000 t
14,000 t121,000 t
22,000 t
122,000 tProcessing
The total live weight of imports and UK vessel landings is: 283,000 t
UK vessellandings
Imports£355.0m
I II IIIIV
£372.0m
£19.1m £22.2m
£442.5m
£320.0m
£35.0m
£464.7mProcessing
Retail sector
£354.0m
Foodservicesector
£765.0m
Value
Volume
15% loss/waste
15% loss/waste
Wholesaler,Trader
Exports
£29.3m
Wholesaler,Trader
123,000 t
£1,148 m
Figure 41 Total picture of the cod value chain for UK in 2002. Volumes are given in
product weight and values in £ million. The volume/value flows have been scaled vertically to indicate the magnitude of the flows in this diagram.
When looking at the total picture put together by the information from the different parts of the value chain it is worth commenting on some specific issues. There is a certain amount of the supply that is not going through the processing industry, but that is either going through wholesalers/merchants or imported directly by the retail or foodservice sector. This study estimates this total flow to be in the region of 7,000 tonnes at a value of £2.80 per kg (purchase price for buyer, estimated from likely import/wet fish prices), giving at a total value of £19.1 million. There will be some weight loss for these products during their route to market, and an estimate of 6,000 tonnes reaches the market. It is concluded that the total picture given of the cod processing sector in this study is very likely to be close to the real situation in the industry. The volume and value of by-products is substantial and are not included in the picture. In the processing sector there is a loss of weight due to by-products but also an addition in weight related to adding of other ingredients except fish in the products (as breading, batter). This study does not report on the volume or value of by-products produced throughout the value chain. Based on the interviews in the cod-processing sector, the total weight loss in processing is calculated as 15%. Looking at the value of the raw materials going into the processing in relation to the value of the products coming out, the cost of fish raw materials is 84% in the UK cod MARCH 2004 Page 73

VALUE CHAIN ANALYSIS COD
processing industry. Income from sale of by-products is not included in the total value of processing. As described in chapter 5, the cost of fish purchases was on average 68% of sales for the UK processors in 2000, and the total direct costs was on average 90% of sales. In this study, collected data shows fish purchases are on average 84% of sales, which seems logical, since the value of the purchases collected in interviews is expected to include a certain part of other direct costs, such as transport costs. 6 .8 P r ice ana l ys is – the cod va lue cha in
The intention of the study was to show the volume flows together with price information for each main product. It has not been possible to report on each main product in this level of detail. Instead the report presents some selected value chains which show the price development and value added for specific products. The price analysis is not trying to do an analysis of costs, but rather focusing on the value added. The information and prices featured in these selected value chains were collected during the interview phase and from follow up telephone interviews.
Example 1 Imported fresh cod sold as a chilled natural fillet in a supermarket
Table 27 Imported fresh cod fillet (skin- on, pin bone out), sold as a chilled natural fillet in a supermarket.
Operator (product sold)
Purchase price, £/kg product
Average yield1
Sales price, £/kg product
Raw material cost per kg sold, £/kg
Value added £*
% of value added
Importer (primary processed fillet) - 100 % 4.75 - - -Processor (chilled, natural fillet) 4.75 100% 6.15 4.75 1.40 33.0%
6.15 100% 9.00 6.15 2.85 67.0%Sum 4.25 100.0 %
Supermarket (chilled, natural fillet)
*Absolute value added, based on sales price minus raw material cost per kg product sold 1 Yield based on raw material taken in The processor purchases a primary processed cod fillet, skin on, pin bone out from Iceland. The fillet is air freighted in to UK and the cost of this transportation is included in purchase price of £4.75 per kg. The fillet is then repacked, transported and distributed to a supermarket where it is sold in a retail desk Processor costs include the Seafish levy, transportation and distribution costs, labour and repackaging. The sales price from processor includes delivery to Supermarket depot.
MARCH 2004 Page 74

VALUE CHAIN ANALYSIS COD
3 4 5 6 7 8 9Purchase and sales price, £/kg product
Import agent (chilledfillet, skin on, pinbone
out)
Processor (chillednatural fillet)
Supermarket (chillednatural fillet)
Figure 42 Price increments for the operators in this product chain (values in £/kg product)
Figure 42 portrays visually the first example, showing the product weight prices as the imported cod fillet is sold at a supermarket as a chilled, natural fillet. As table 27 shows, the supermarket takes 67% of the value added and the processor 33% in this example. It has not been possible to report on the proportion of value added achieved by the importer because no cost information was collected from this sector. This calculated value added is not a comment on the different operators margins, since the costs related to each operation are not considered. From the interviews with supermarkets it is estimated that the multiples aim for an average margin on all fish products of over 35%. This fish is sold on the wet fish counter and the supermarkets need to factor in to the price that some of the fish may not be sold and will need to be disposed of as wastage. Example 2 UK landed cod (head-on, gutted), sold as a chilled natural fillet in a
London upmarket restaurant The processor buys a large grade head-on gutted cod, from UK landed vessels, on a market. The processor makes a chilled natural fillet, which is sold fresh into the wholesale trade, for instance a trader at one of the inland markets such as Billingsgate. Costs of processor include auction and box charges, labour costs. The wholesaler sells the fillet on to a London upmarket restaurant.
MARCH 2004 Page 75

VALUE CHAIN ANALYSIS COD
Table 28 UK landed cod (head-on, gutted), sold as a chilled natural fillet in a restaurant
Operator (product sold)
Purchase price, £/kg product
Average yield1
Sales price, £/kg product
Raw material cost per kg sold, £/kg
Value added £*
% of value added
Auction (fresh, head on, gutted) - 2.50 - - -Processor (chilled, natural fillet) 2.50 45% 6.1 5.56 0.5 1.0%Wholesaler (chilled, natural fillet) 6.10 100% 7.70 6.10 1.6 2.0%London up market restaurant 7.70 50% 89.70 15.40 74.3 97.0%Sum 76.4 100.0 %
*Absolute value added, based on sales price minus raw material cost per kg product sold 1Yield based on raw material taken in Based on yield factors, calculations provide the processors’ actual raw material cost per kg product sold, corrected for weight loss in processing (see table 28). Adjustment is based on a fillet yield (skin on, boneless fillet) of 45% from a head-on gutted fish and the processor’s raw material price per kg fish sold on will be £5.56 per kg. When he sells the fillet on for £6.10 per kg, there is not much left for making margins on filleting. If using a yield of 50% the corrected purchase price would be £5.00 per kg. It is assumed that the restaurant has a 50% loss or wastes, meaning they only sell out 50% of what they buy in (in terms of weight). Their calculated raw material price per kg fish sold is then £15.40 per kg.
0 10 20 30 40 50 60 70 80 90
Purchase and sales price, £/kg product
Auction (fresh head on, gutted)
Processor (chilled nat. fillet, skin on ,boneless)
Wholesaler (chilled nat. fillet)
Restaurant (chilled 8 oz portions)
Figure 43 Price increments for the operators in this product chain (values in £ per
kg product)
Figure 43 shows that the restaurant charges a high price per kg product. While this price also includes other meal ingredients, it is expected that the fish is the substantial food ingredient cost. The value added in this example is almost all taken by the restaurant. It must be remembered that these restaurants have very high direct costs, for example cost of property in London. MARCH 2004 Page 76

VALUE CHAIN ANALYSIS COD
Example 3 Imported cod block directly from processor, sold as frozen fish fingers in a supermarket
0 1 2 3 4 5Purchase and sales price, £/kg product
Brooker (frozen block)
Processor (frozen fishfingers)
Supermarket (frozen fishfingers)
Figure 44 Price increments for the operators in this product chain (values in £ per
kg product)
The processor imports a frozen cod block directly from China and produces frozen fish fingers. The fish fingers are sold directly from the processor to a supermarket. Based on yield factors, the processors “actual” fish raw material cost price per kg product he can sell (meaning corrected for weight gain in processing) has been calculated. In this process a weight gain of 45% has been used, based on adding breading to the product, so the processor’s fish raw material price per kg of fish fingers sold will then be £1.93 per kg, compared to the actual price of the raw material, which is £2.8 per kg (see table 29). In this calculation the cost of the breading is not included. Table 29 Imported cod block directly from processor, sold as frozen fish fingers in
a supermarket
Operator (product sold)
Purchase price, £/kg product
Average yield1
Sales price, £/kg product
Raw material cost per kg sold, £/kg
Value added £*
% of value added
Import agent (frozen block) - 100 % 2.80 - - -Processor (frozen fish fingers) 2.80 145% 3.20 1.93 1.27 53.0%Supermarket (frozen fish fingers) 3.20 100% 4.33 3.20 1.13 47.0%Sum 2.40 100.0 %
*Absolute value added, based on sales price minus raw material cost per kg product sold 1Yield based on raw material taken in, using 45%gain from adding breading In this example the yield of the processor is more than 100% due to addition of coating ingredients.
MARCH 2004 Page 77

VALUE CHAIN ANALYSIS COD
The absolute value added in this example is almost equally shared between the processor and the supermarket. This calculated value added is not a comment on the different operators’ margins, since the costs related to each operation are not considered. 6 .9 Ma in f ind ings cod va lue cha in
These findings are based on the presented data in chapter 6: different data sources and interviews with processing sector put together to give the total picture for the cod value chain. This should be seen in perspective with interview findings presented in chapter 9 and implications presented in chapter 10. Supply
Total supply of cod into UK was 148,000 tonnes of product weight or 283,000 tonnes of live weight.
Imports represented 85% of product weight volume (of this landings by foreign fleet represented 4%) and landings by UK vessels represented 15%.
Average price achieved for cod landings by UK fleet was £1.36 per kg live weight. This is considerably higher than the average price achieved for landings by foreign vessels (£1.23 per kg).
Main sources of import for cod are Russia, Norway, Iceland and the Faeroe Islands.
Frozen fillets and frozen whole or headless fish are the main cod products imported. Imported frozen fillets represented 50% of the total cod product supply and the average price paid for frozen imported fillets was £3.13 per kg.
Processing (based on information from interviewed companies)
Total supply to cod processors was 136,000 tonnes of products at a purchase price of £372 million. Total sale from cod processors was 115,500 tonnes at a sales value of £443 million. Based on this, the raw material cost was 84% of the sales value.
The main product from primary processors is natural fillets, while from secondary/mixed processors frozen coated products is the main category.
The product weight loss in cod processing was 15% which is the difference between loss of weight to by-products/waste and addition of weight in form of added ingredients (e.g breading).
Consumption and exports
Total sales volume of cod was 123,000 tonnes in product weight with a final sales value of £1,146 million in the UK.
88% of the volume was sold and consumed in the UK; 52% through the retail sector and 36% through the foodservice sector. 12% of the cod volume was exported.
The foodservice sector was the most important in terms of value, representing 66% of the total sales value or £762 million.
The average price (paid by the consumer) of cod products in the retail sector was £5.57 per kg, giving a total value of £354 million for expenditure on cod in the retail sector.
Fish and chip shops ordered 22,000 tonnes of cod. This represents about one fifth of total sales volume in product weight.
MARCH 2004 Page 78
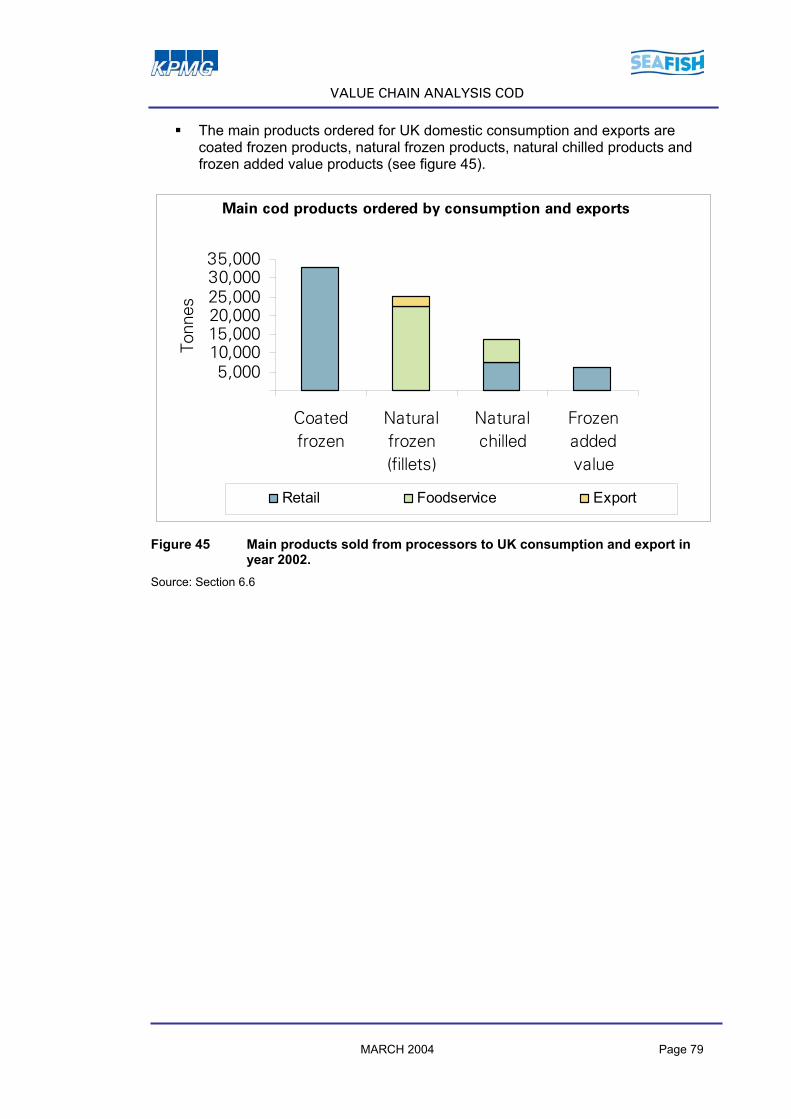
VALUE CHAIN ANALYSIS COD
The main products ordered for UK domestic consumption and exports are coated frozen products, natural frozen products, natural chilled products and frozen added value products (see figure 45).
Main cod products ordered by consumption and exports
5,00010,00015,00020,00025,00030,00035,000
Coatedfrozen
Naturalfrozen(fillets)
Naturalchilled
Frozenaddedvalue
Tonn
es
Retail Foodservice Export
,
Figure 45 Main products sold from processors to UK consumption and export in year 2002.
Source: Section 6.6
MARCH 2004 Page 79

VALUE CHAIN ANALYSIS HADDOCK
7 . V A L U E C H A I N A N A L Y S I S H A D D O C K
The analysis of the value chain for haddock will have the same structure as that used for cod. The overall breakdown is shown below:
UK vessellandings
ImportsExports
I II III IVRetail sector
Foodservicesector
Processing
Wholesaler,Trader
Overall value chain analysis
Figure 46 Overall value chain analyses
The control sums used in the overall value chain analysis can be described as follows:
I. The combined imports and landings by UK and foreign vessels can be said to represent the supply of raw material in the value chain.
II. The second control sum represents the inflow of raw materials to the processing sector.
III. The third control sum represents the outgoing products from the processing sector.
IV. The fourth control sum is the amount of finished product that goes to domestic consumption in the foodservice sector and through the retail sector, in addition to the flow of raw materials and finished product that are exported from the UK. Control sum IV can be labelled the consumption and exports in the value chain.
MARCH 2004 Page 80

VALUE CHAIN ANALYSIS HADDOCK
7 .1 Supp l y p ic tu re ( I )
In the following, supplies of cod coming from three main sources are considered: • Landings in UK by UK vessels • Landings in UK by foreign vessels • Imports into the UK
Import statistics from Customs and Excise include landings in UK by foreign vessels, but these are illustrated separately under landings as well. It is assumed that all of the fish landed in UK ports is either round fish or gutted fish, and that no other handling or processing has taken place on board.
Overall value chain analysis
Detail value chain analysis – Imports and landings, estimated flows (volume, value)
Imports
IUK vessel landings Flow B
Flow A
Exports
II III IVRetail sectorFoodservicesector
ProcessingIUK vessel landings
Imports
Wholesaler,Trader
Figure 47 Total supply picture
Control volume I: The volume flows A and B will be discussed in the following chapters 7.1.1 to 7.1.2. 7.1.1 Landings (Flow B)
Total landings into UK of haddock amounted to 57,500 tonnes in 2002. Of this, foreign vessels in UK ports landed 5,637 tonnes. The average price of haddock landed in UK was £0.70 per kg live weight in 2002. The landings by UK vessels achieved on average £0.67 per kg, while the foreign vessel landings achieved on average £1.00 per kg. This difference in price is mainly due to the fact that foreign vessels land larger fish sizes than UK vessels. Section 7.2 gives more information of prices paid per size category. For comparison: in year 2003 total landings of haddock into UK was 46,279 tonnes at a value of £32.3 million and an average price of £0.70 per kg live weight. The pattern
MARCH 2004 Page 81
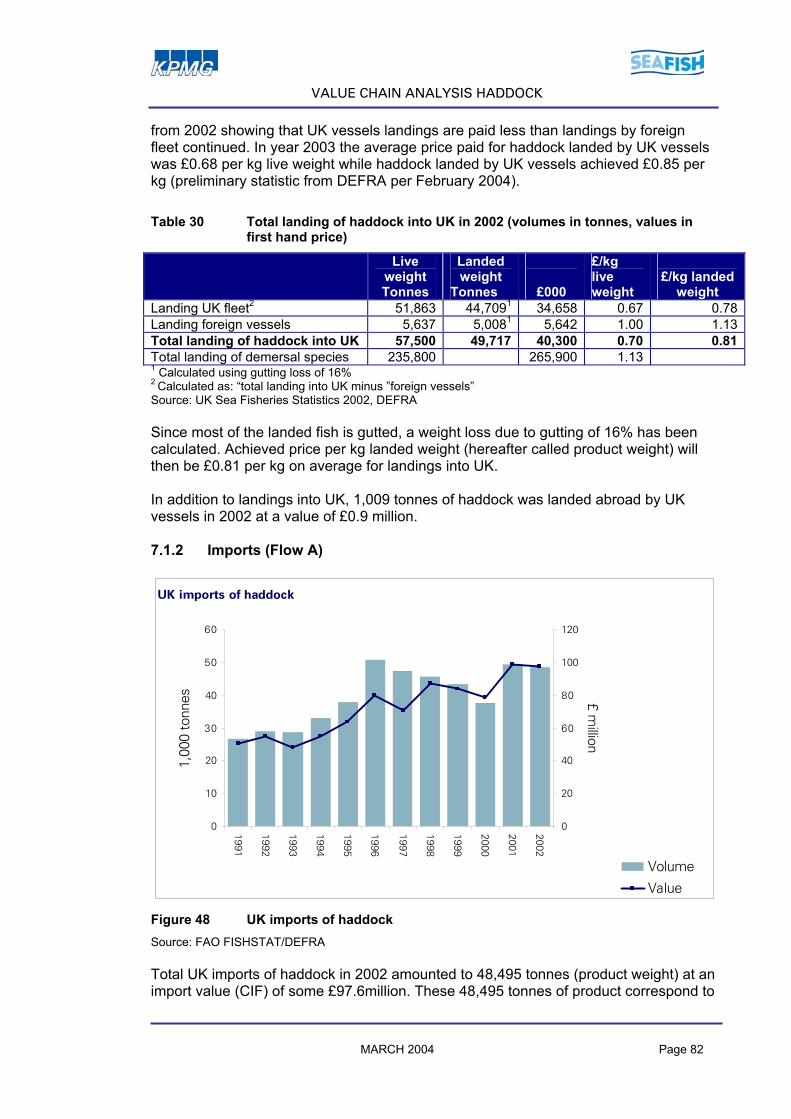
VALUE CHAIN ANALYSIS HADDOCK
from 2002 showing that UK vessels landings are paid less than landings by foreign fleet continued. In year 2003 the average price paid for haddock landed by UK vessels was £0.68 per kg live weight while haddock landed by UK vessels achieved £0.85 per kg (preliminary statistic from DEFRA per February 2004). Table 30 Total landing of haddock into UK in 2002 (volumes in tonnes, values in
first hand price)
Live weight Tonnes
Landed weight
Tonnes
£000
£/kg live weight
£/kg landed
weight Landing UK fleet2 51,863 44,7091 34,658 0.67 0.78Landing foreign vessels 5,637 5,0081 5,642 1.00 1.13Total landing of haddock into UK 57,500 49,717 40,300 0.70 0.81Total landing of demersal species 235,800 265,900 1.13 1 Calculated using gutting loss of 16% 2 Calculated as: “total landing into UK minus ”foreign vessels” Source: UK Sea Fisheries Statistics 2002, DEFRA Since most of the landed fish is gutted, a weight loss due to gutting of 16% has been calculated. Achieved price per kg landed weight (hereafter called product weight) will then be £0.81 per kg on average for landings into UK. In addition to landings into UK, 1,009 tonnes of haddock was landed abroad by UK vessels in 2002 at a value of £0.9 million. 7.1.2 Imports (Flow A)
UK imports of haddock
0
10
20
30
40
50
60
1991
1992
1993
1994
1995
1996
1997
1998
1999
2000
2001
2002
1,00
0 to
nnes
0
20
40
60
80
100
120
£ million
Volume
Value
Figure 48 UK imports of haddock Source: FAO FISHSTAT/DEFRA Total UK imports of haddock in 2002 amounted to 48,495 tonnes (product weight) at an import value (CIF) of some £97.6million. These 48,495 tonnes of product correspond to
MARCH 2004 Page 82
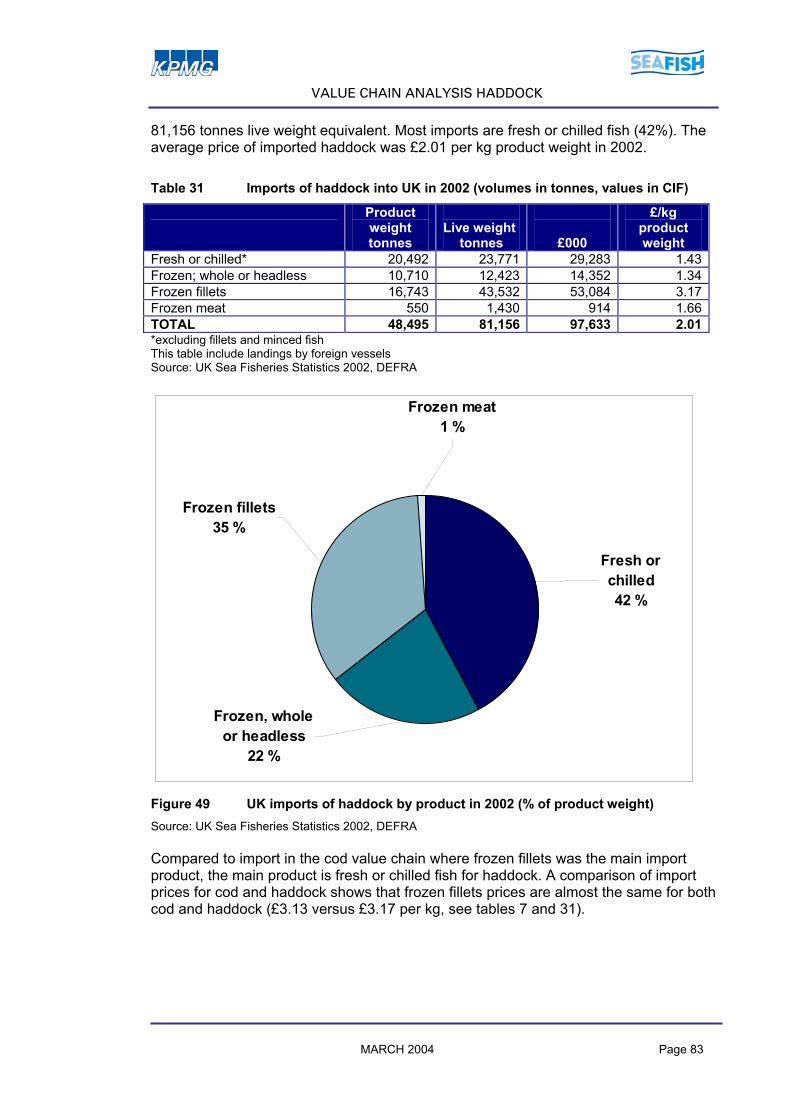
VALUE CHAIN ANALYSIS HADDOCK
81,156 tonnes live weight equivalent. Most imports are fresh or chilled fish (42%). The average price of imported haddock was £2.01 per kg product weight in 2002. Table 31 Imports of haddock into UK in 2002 (volumes in tonnes, values in CIF)
Product weight tonnes
Live weight
tonnes
£000
£/kg product weight
Fresh or chilled* 20,492 23,771 29,283 1.43Frozen; whole or headless 10,710 12,423 14,352 1.34Frozen fillets 16,743 43,532 53,084 3.17Frozen meat 550 1,430 914 1.66TOTAL 48,495 81,156 97,633 2.01*excluding fillets and minced fish This table include landings by foreign vessels Source: UK Sea Fisheries Statistics 2002, DEFRA
Fresh or chilled42 %
Frozen, whole or headless
22 %
Frozen fillets35 %
Frozen meat 1 %
Figure 49 UK imports of haddock by product in 2002 (% of product weight) Source: UK Sea Fisheries Statistics 2002, DEFRA Compared to import in the cod value chain where frozen fillets was the main import product, the main product is fresh or chilled fish for haddock. A comparison of import prices for cod and haddock shows that frozen fillets prices are almost the same for both cod and haddock (£3.13 versus £3.17 per kg, see tables 7 and 31).
MARCH 2004 Page 83

VALUE CHAIN ANALYSIS HADDOCK
Table 32 UK haddock imports by exporting country (product weight, values in CIF)
Origin Tonnes £000 £/kg Iceland 9,087 22,655 2.49 Russia 6,107 9,397 1.54 Denmark 5,026 10,244 2.04 Norway 9,114 19,984 2.19 Faroe Islands 14,736 26,852 1.82 Germany 325 917 2.82 China 1,183 2,825 2.39 Others 2,928 4,724 1.61 Total 48,506 97,597 2.01
Source: DEFRA Imports from the Faeroe Islands The UK imported about 15,000 tonnes of haddock (product weight in 2002). The most important product was fresh or chilled haddock (more than 12,000 tonnes), followed by frozen fillets (1,700 tonnes). Table 33 Haddock imports from Faroe Islands (volumes in product weight, values
in FOB)
Product Tonnes £000* £/kgChilled 12,434 16,629 1.33 fresh incl. Roe, liver 12,433 16,626 1.33 filet - - Frozen 2,619 9,723 3.71 filet, not block 1,743 6,871 3.94Total 15,053 26,352 1.75*average exchange rate for year 2002 was used. 100DKK = £9.063 Source: Export statistics from the Faeroe Islands Imports from Norway There is a small difference in the figures relating to Norway. According to UK figures, Norwegian exports to the UK are much less than shown by Norwegian figures (17,600 versus 9,100). This difference is explained by the fact that a lot of Norwegian seafood exports is transported by truck and ferry through other EU countries, while for example exports from Iceland are mainly shipped directly to the UK. UK imports are registered as originating in the last country the shipment went through, while the Norwegian export statistics are registered by final destination (based on customs declarations at the Norwegian border). Imports from Norway are considerably higher than shown in UK statistics, while imports from some other EU countries (e.g. Denmark, the Netherlands) are considerably less4.
MARCH 2004 Page 84
4 Personal communication from Mr. Edmund Mikkelsen jr, Market Analyst with the Norwegian Seafood Export Council, Tromsø.
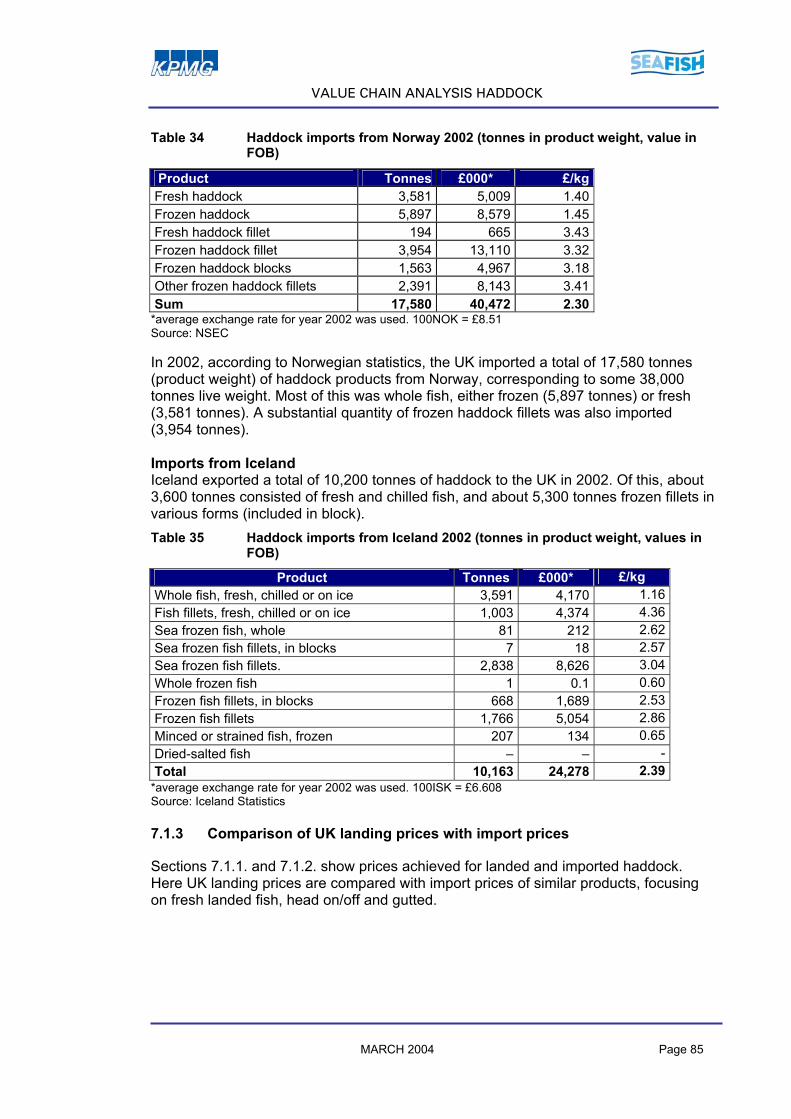
VALUE CHAIN ANALYSIS HADDOCK
Table 34 Haddock imports from Norway 2002 (tonnes in product weight, value in FOB)
Product Tonnes £000* £/kg Fresh haddock 3,581 5,009 1.40 Frozen haddock 5,897 8,579 1.45 Fresh haddock fillet 194 665 3.43 Frozen haddock fillet 3,954 13,110 3.32 Frozen haddock blocks 1,563 4,967 3.18 Other frozen haddock fillets 2,391 8,143 3.41 Sum 17,580 40,472 2.30
*average exchange rate for year 2002 was used. 100NOK = £8.51 Source: NSEC In 2002, according to Norwegian statistics, the UK imported a total of 17,580 tonnes (product weight) of haddock products from Norway, corresponding to some 38,000 tonnes live weight. Most of this was whole fish, either frozen (5,897 tonnes) or fresh (3,581 tonnes). A substantial quantity of frozen haddock fillets was also imported (3,954 tonnes). Imports from Iceland Iceland exported a total of 10,200 tonnes of haddock to the UK in 2002. Of this, about 3,600 tonnes consisted of fresh and chilled fish, and about 5,300 tonnes frozen fillets in various forms (included in block). Table 35 Haddock imports from Iceland 2002 (tonnes in product weight, values in
FOB)
Product Tonnes £000* £/kg Whole fish, fresh, chilled or on ice 3,591 4,170 1.16Fish fillets, fresh, chilled or on ice 1,003 4,374 4.36Sea frozen fish, whole 81 212 2.62Sea frozen fish fillets, in blocks 7 18 2.57Sea frozen fish fillets. 2,838 8,626 3.04Whole frozen fish 1 0.1 0.60Frozen fish fillets, in blocks 668 1,689 2.53Frozen fish fillets 1,766 5,054 2.86Minced or strained fish, frozen 207 134 0.65Dried-salted fish – – -Total 10,163 24,278 2.39
*average exchange rate for year 2002 was used. 100ISK = £6.608 Source: Iceland Statistics 7.1.3 Comparison of UK landing prices with import prices
Sections 7.1.1. and 7.1.2. show prices achieved for landed and imported haddock. Here UK landing prices are compared with import prices of similar products, focusing on fresh landed fish, head on/off and gutted.
MARCH 2004 Page 85
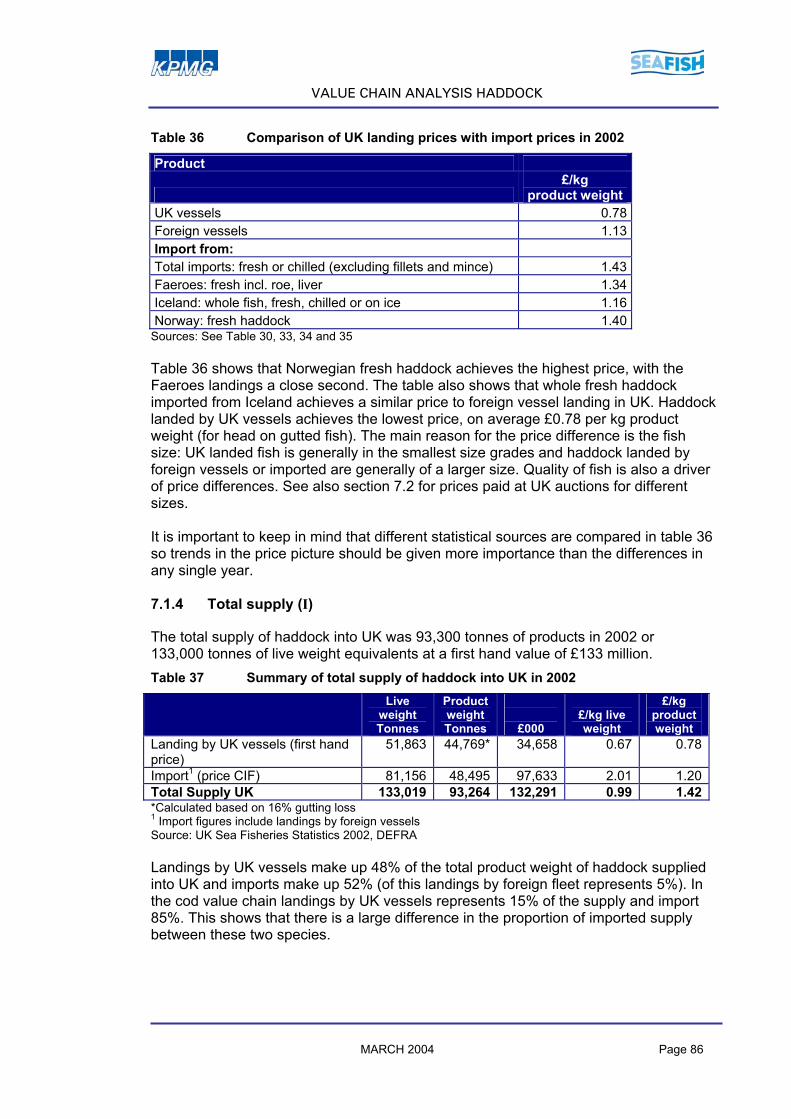
VALUE CHAIN ANALYSIS HADDOCK
Table 36 Comparison of UK landing prices with import prices in 2002
Product
£/kg
product weight UK vessels 0.78 Foreign vessels 1.13 Import from: Total imports: fresh or chilled (excluding fillets and mince) 1.43 Faeroes: fresh incl. roe, liver 1.34 Iceland: whole fish, fresh, chilled or on ice 1.16 Norway: fresh haddock 1.40
Sources: See Table 30, 33, 34 and 35 Table 36 shows that Norwegian fresh haddock achieves the highest price, with the Faeroes landings a close second. The table also shows that whole fresh haddock imported from Iceland achieves a similar price to foreign vessel landing in UK. Haddock landed by UK vessels achieves the lowest price, on average £0.78 per kg product weight (for head on gutted fish). The main reason for the price difference is the fish size: UK landed fish is generally in the smallest size grades and haddock landed by foreign vessels or imported are generally of a larger size. Quality of fish is also a driver of price differences. See also section 7.2 for prices paid at UK auctions for different sizes. It is important to keep in mind that different statistical sources are compared in table 36 so trends in the price picture should be given more importance than the differences in any single year. 7.1.4 Total supply (I)
The total supply of haddock into UK was 93,300 tonnes of products in 2002 or 133,000 tonnes of live weight equivalents at a first hand value of £133 million. Table 37 Summary of total supply of haddock into UK in 2002
Live weight Tonnes
Product weight Tonnes
£000
£/kg live weight
£/kg product weight
Landing by UK vessels (first hand price)
51,863 44,769* 34,658 0.67 0.78
Import1 (price CIF) 81,156 48,495 97,633 2.01 1.20Total Supply UK 133,019 93,264 132,291 0.99 1.42*Calculated based on 16% gutting loss 1 Import figures include landings by foreign vessels Source: UK Sea Fisheries Statistics 2002, DEFRA Landings by UK vessels make up 48% of the total product weight of haddock supplied into UK and imports make up 52% (of this landings by foreign fleet represents 5%). In the cod value chain landings by UK vessels represents 15% of the supply and import 85%. This shows that there is a large difference in the proportion of imported supply between these two species.
MARCH 2004 Page 86
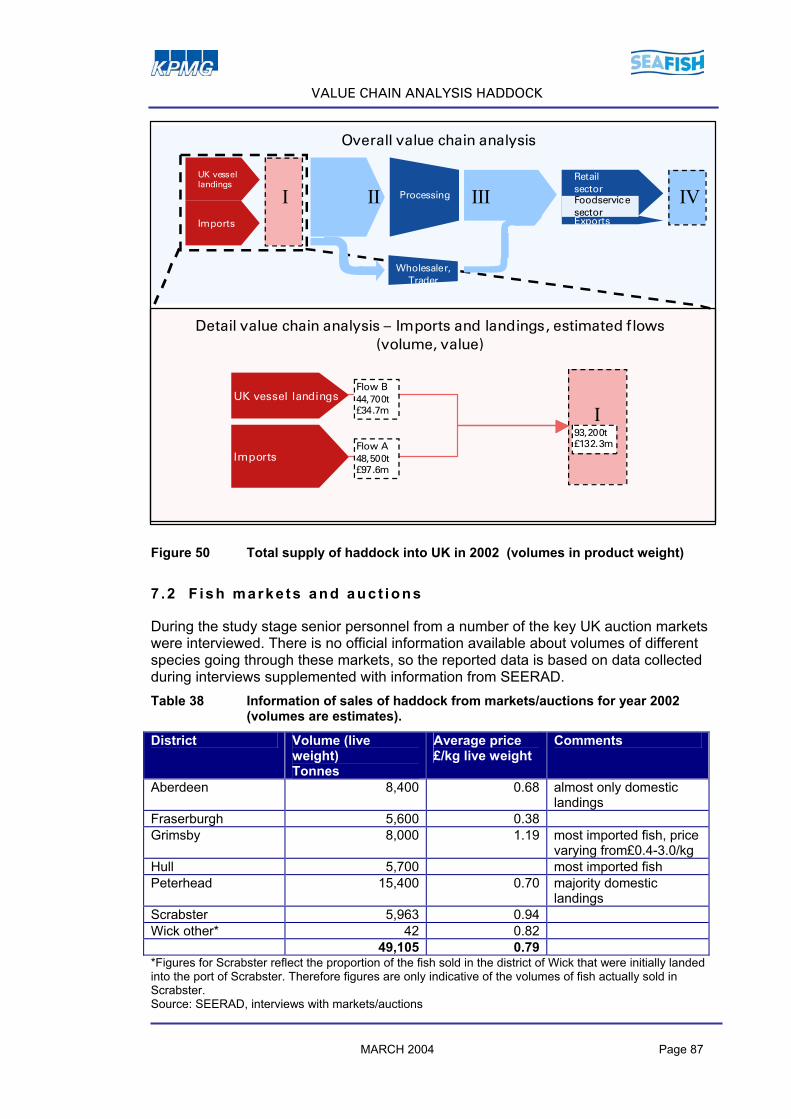
VALUE CHAIN ANALYSIS HADDOCK
Overall value chain analysis
Detail value chain analysis – Imports and landings, estimated flows (volume, value)
Imports
IUK vessel landings
Flow B44,700t£34.7m
Flow A48,500t£97.6m
93,200t£132.3m
Exports
II III IVRetail sectorFoodservicesector
ProcessingIUK vessel landings
Imports
Wholesaler,Trader
Figure 50 Total supply of haddock into UK in 2002 (volumes in product weight)
7 .2 F ish marke ts and auc t ions
During the study stage senior personnel from a number of the key UK auction markets were interviewed. There is no official information available about volumes of different species going through these markets, so the reported data is based on data collected during interviews supplemented with information from SEERAD. Table 38 Information of sales of haddock from markets/auctions for year 2002
(volumes are estimates).
District Volume (live weight) Tonnes
Average price £/kg live weight
Comments
Aberdeen 8,400 0.68 almost only domestic landings
Fraserburgh 5,600 0.38 Grimsby 8,000 1.19 most imported fish, price
varying from£0.4-3.0/kg Hull 5,700 most imported fish Peterhead 15,400 0.70 majority domestic
landings Scrabster 5,963 0.94 Wick other* 42 0.82 49,105 0.79 *Figures for Scrabster reflect the proportion of the fish sold in the district of Wick that were initially landed into the port of Scrabster. Therefore figures are only indicative of the volumes of fish actually sold in Scrabster. Source: SEERAD, interviews with markets/auctions MARCH 2004 Page 87

VALUE CHAIN ANALYSIS HADDOCK
All prices in table 38 are average and so take no account of sizes of fish (grades) sold in the different markets. Approximately 49,000 tonnes of haddock are sold, first hand, through the above-mentioned auctions at an average price of £0.79 per kg live weight. The total landing of haddock in UK, by vessels, was 57,000 tonnes in year 2002. In addition a substantial volume of haddock is imported in to the UK (head on gutted or rounders) by truck or ferry and sold through auctions, mainly in Hull and Grimsby. Table 39 Average auction prices for head on gutted haddock per size categories. Average price £/kg live weight Average price £/kg landed weight Size 2002 2003 2002 20031 1.38 1.20 1.59 1.392 1.18 1.04 1.37 1.213 0.98 0.87 1.14 1.014 0.63 0.60 0.73 0.69Source: SEERAD Table 39 shows that there is a very large difference in price achieved according to the size grades, with the largest fish achieving the highest price. In 2002 prices varied from £1.38 per kg live weight for size grade 1 to £0.63 per kg for the smallest size, grade 4. Comparing table 38 and 39 shows that Grimsby, which reports that they auction mostly imported fish, achieve a higher average price per kg than the other auctions. This because the imported fish, on average, is of a larger size than UK landed fish. Haddock is also landed as whole fish ungutted and the table underneath gives details of auction prices achieved for whole haddock. Table 40 Average auction prices for whole haddock per size categories. Average price £/kg live weight or
landed weight Size 2002 20031 - 1.032 1.17 0.993 1.13 0.944 0.60 0.59Source: SEERAD Table 40 shows that for whole haddock the situation is the same as for head on gutted haddock (table 39). The larger sizes achieve the highest price. It is not uncommon for small, often ungutted, haddock to be withdrawn from UK auction markets because they fail to achieve the minimum price. Withdrawn haddock is normally disposed of by the vessel’s Producer Organisation (PO) often for fish meal production, although some POs export it to Eastern Europe for further processing and consumption. The withdrawal price (normally paid to the vessel owner) varies depending on the size, presentation and freshness of the haddock.
MARCH 2004 Page 88
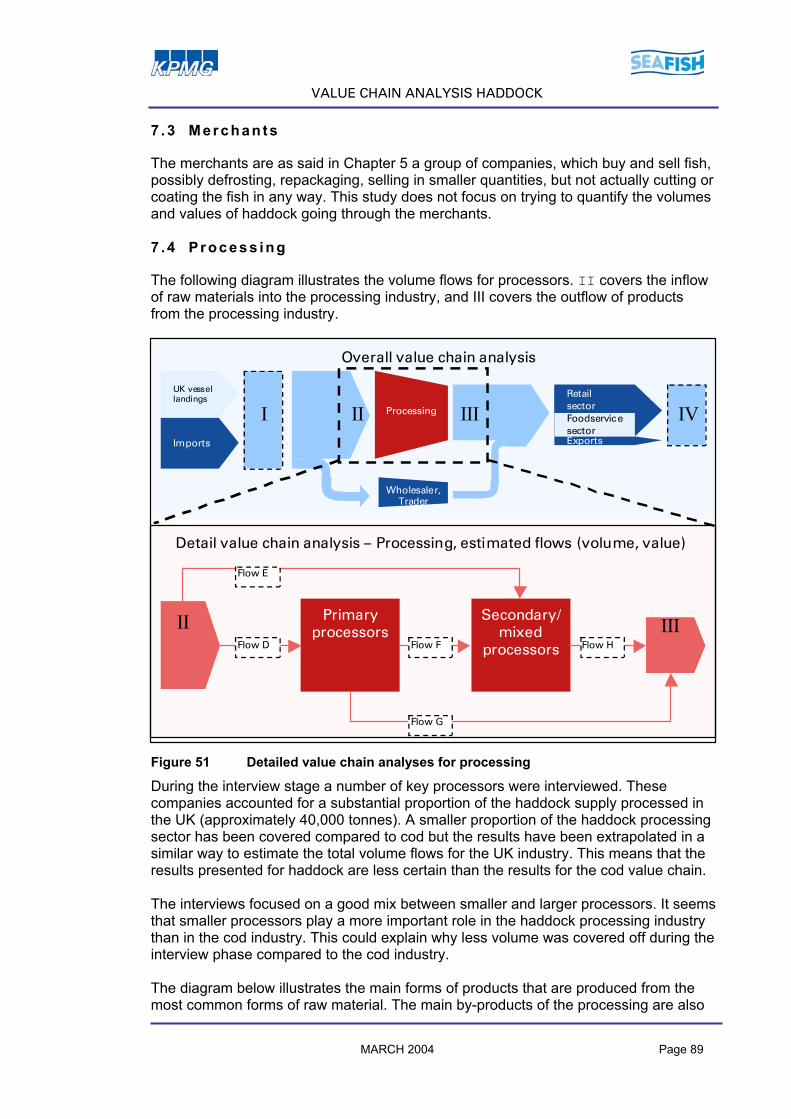
VALUE CHAIN ANALYSIS HADDOCK
7 .3 Merchants
The merchants are as said in Chapter 5 a group of companies, which buy and sell fish, possibly defrosting, repackaging, selling in smaller quantities, but not actually cutting or coating the fish in any way. This study does not focus on trying to quantify the volumes and values of haddock going through the merchants. 7 .4 P rocess ing
The following diagram illustrates the volume flows for processors. II covers the inflow of raw materials into the processing industry, and III covers the outflow of products from the processing industry.
Exports
I II III IVRetail sectorFoodservicesector
Processing
II
Overall value chain analysis
IIISecondary/mixed
processors
Primaryprocessors
Flow G
Flow D
Flow E
Flow F Flow H
Detail value chain analysis – Processing, estimated flows (volume, value)
UK vessellandings
Imports
Wholesaler,Trader
Figure 51 Detailed value chain analyses for processing
During the interview stage a number of key processors were interviewed. These companies accounted for a substantial proportion of the haddock supply processed in the UK (approximately 40,000 tonnes). A smaller proportion of the haddock processing sector has been covered compared to cod but the results have been extrapolated in a similar way to estimate the total volume flows for the UK industry. This means that the results presented for haddock are less certain than the results for the cod value chain. The interviews focused on a good mix between smaller and larger processors. It seems that smaller processors play a more important role in the haddock processing industry than in the cod industry. This could explain why less volume was covered off during the interview phase compared to the cod industry.
MARCH 2004 Page 89
The diagram below illustrates the main forms of products that are produced from the most common forms of raw material. The main by-products of the processing are also
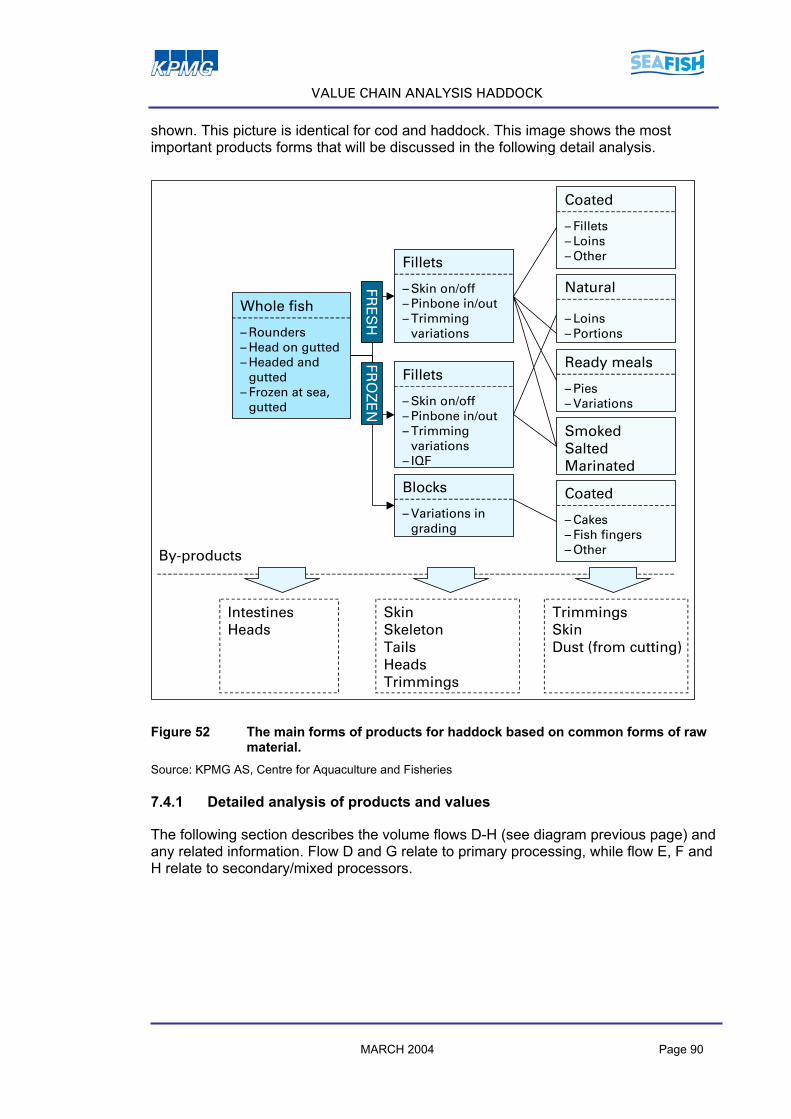
VALUE CHAIN ANALYSIS HADDOCK
shown. This picture is identical for cod and haddock. This image shows the most important products forms that will be discussed in the following detail analysis.
SmokedSaltedMarinated
Coated
– Fillets– Loins– Other
Ready meals
– Pies– Variations
Coated
– Cakes– Fish fingers– Other
Whole fish
– Rounders– Head on gutted– Headed and
gutted– Frozen at sea,
gutted
IntestinesHeads
SkinSkeletonTailsHeadsTrimmings
TrimmingsSkinDust (from cutting)
Fillets
– Skin on/off– Pinbone in/out– Trimming
variations
Fillets
– Skin on/off– Pinbone in/out– Trimming
variations– IQF
Blocks
– Variations in grading
FRE
SH
FRO
ZE
N
By-products
Natural
– Loins– Portions
Figure 52 The main forms of products for haddock based on common forms of raw material.
Source: KPMG AS, Centre for Aquaculture and Fisheries 7.4.1 Detailed analysis of products and values
The following section describes the volume flows D-H (see diagram previous page) and any related information. Flow D and G relate to primary processing, while flow E, F and H relate to secondary/mixed processors.
MARCH 2004 Page 90

VALUE CHAIN ANALYSIS HADDOCK
Flow D: supplies to primary processing The total volume going into primary processing is estimated to 30,900 tonnes (product weight) with an estimated value of £33.2 million.
Products by type, volume and value
,
5,000
10,000
15,000
20,000
25,000
30,000
35,000
Freshw
hole
Freshhead on,gutted
Frozenhead on,gutted
Tonn
es
0
5
10
15
20
25
30
35
Valu
e £
milli
on
Tonnes Value £ million
Figure 53 Flow D: Estimated flows of supply (volume and value) into primary processing (see figure 51)
As figure 53 shows the main raw material taken in by primary processors is fresh head on, gutted fish. Most of the raw materials are bought in through auction markets and only a small part comes from import.
Volumes by supplier type (tonnes)
,5,000
10,00015,00020,00025,00030,00035,000
Auc
tion/
mar
ket
Impo
rt a
gent
Tonn
es
Figure 54 Supply source into primary processing
MARCH 2004 Page 91

VALUE CHAIN ANALYSIS HADDOCK
Table 41 summarises the price information provided by the processors during interviews. This information has been presented as ranges in prices in order to protect confidentiality. The data show that many of the primary processors pay a higher price for the head on gutted haddock than the average UK landed haddock price achieved (£0.81 per kg landed weight). Table 41 Purchase price information paid by primary processor
Product type Variation in prices £/kg product
Fresh, head on gutted 0.6-1.8 Flow E: direct supplies to secondary/mixed processors The volume flow E going into secondary/mixed processing is estimated to be 51,900 tonnes (product weight) with an estimated value of £113.2 million.
Products by type, volume and value
,2,0004,0006,0008,000
10,00012,00014,00016,00018,00020,000
Fresh head on, gutted
Fresh headed and gutted
Fresh fillets
Frozen headed andgutted
Frozen fillets
Frozen blocks
Frozen loins
Tonn
es
051015202530354045
Valu
e £
milli
on
Tonnes Value £ million
Figure 55 Flow E: Estimated flows of supply (volume and value) directly into secondary/mixed processors (see figure 51)
Figure 55 shows that the main raw materials are frozen blocks, fresh head on gutted fish and frozen fillets. When the percentage distribution of raw materials is analysed it would appear that the results from the interviewed companies are somewhat different than would be expected. The proportion of frozen blocks of 35% seems a bit high, especially when compared to the import volumes, since processing companies reported that frozen blocks are imported. based on import volumes, it seems reasonable to suggest that the percentage of frozen blocks supplied to the secondary/mixed processing sector is lower and the proportion of fresh fish supplied is greater.
MARCH 2004 Page 92

VALUE CHAIN ANALYSIS HADDOCK
Volumes by supplier type (tonnes)
5,00010,00015,00020,00025,00030,00035,00040,000
Auc
tion/
mar
ket
Con
trac
t U
Kve
ssel
Impo
rt a
gent
Mer
chan
t
Oth
er
Tonn
es
,
Figure 56 Flow E: Direct supply source into secondary/mixed processing
The majority of the processors say they are importing their raw materials. Those which have a contract with UK vessels for supplies are getting the raw material fresh, head on gutted fish or frozen headed and gutted fish.
Flow F: supplies directly from primary to secondary/mixed processors In addition to the flow coming directly from primary processors this flow also contains some of the raw material being sold within the category secondary/mixed processors. Meaning that some of the companies sell to each other. The total volume going into secondary/mixed processing coming from these sources is estimated to 15,800 tonnes (product weight) with an estimated value of £43.5 million.
Products by type, volume and value
,1,0002,0003,0004,0005,0006,0007,0008,0009,000
10,000
Freshheadon,
gutted
Freshfillets
Frozenfillets
Frozencoatedfillets
Tonn
es
0
5
10
15
20
25
30
35
Valu
e £
milli
on
Tonnes Value £ million
Figure 57 Flow F: Estimated flows of supply (volume and value) directly from primary processors into secondary/mixed processors (see figure 51)
MARCH 2004 Page 93

VALUE CHAIN ANALYSIS HADDOCK
The main product going in is frozen fillets and fresh, head on gutted fish. It can seem somewhat strange that frozen fillets is a big product, but this is due to the above mentioned fact that there’s trade within the category secondary/mixed processors. This internal trade is estimated to a volume of approximately 1,900 tonnes. A mixed processor can i.e. sell frozen filets to a secondary or other mixed processor. When primary processors sell on head on gutted fish they either have gutting as a process or they act as wholesalers in addition to processors. Flow G: supplies from primary processors to consumption and exports The total volume coming out of primary processing going directly to consumption and exports is estimated to 2,400 tonnes (product weight) with an estimated value of £7.8 million. This is a very small flow compared to what is going through the category secondary/mixed processors (flow H).
Products by type, volume and value
,
,200
,400
,600
,800
1,000
1,200
Freshheadon,
gutted
Freshfillets
FrozenN
aturalfillets
Smoked
Tonn
es
0,00,51,01,52,02,53,03,54,04,55,0
Valu
e £
milli
on
Tonnes Value £ million
Figure 58 Flow G: Estimated flows of products (volume and value) from primary processors to consumption and export (see figure 51)
Flow G is mainly fresh, head on gutted fish or fresh fillets and most of these products are going through a wholesaler before they end in the final consumer chain. By value fresh fillets gives the main income source to primary processors. The reason some smoked products here are categorised under primary processing is because some companies view themselves as primary processors who also do some smoking.
MARCH 2004 Page 94
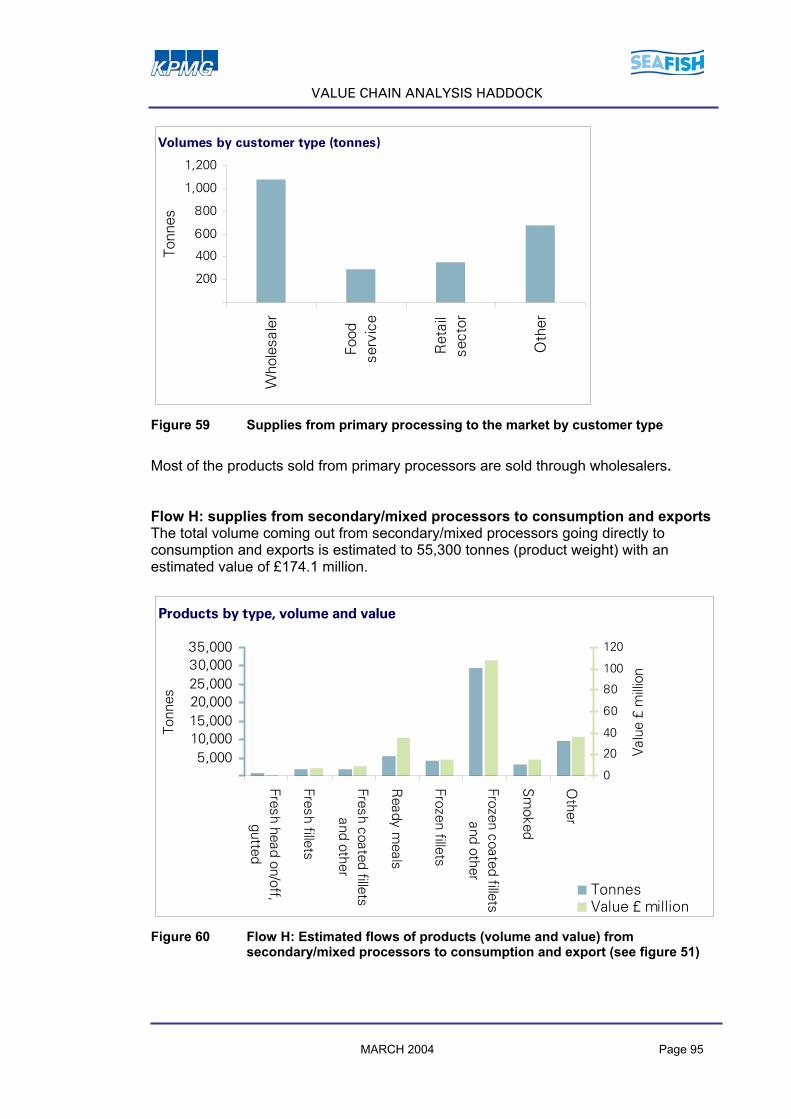
VALUE CHAIN ANALYSIS HADDOCK
Volumes by customer type (tonnes)
00
00
00
00
1,000
1,200
Who
lesa
ler
Food
serv
ice
Ret
ail
sect
or
Oth
er
Tonn
es
,2
,4
,6
,8
,
Figure 59 Supplies from primary processing to the market by customer type
Most of the products sold from primary processors are sold through wholesalers. Flow H: supplies from secondary/mixed processors to consumption and exports The total volume coming out from secondary/mixed processors going directly to consumption and exports is estimated to 55,300 tonnes (product weight) with an estimated value of £174.1 million.
Products by type, volume and value
,5,000
10,00015,00020,00025,00030,00035,000
Fresh head on/off,gutted
Fresh fillets
Fresh coated filletsand other
Ready m
eals
Frozen fillets
Frozen coated filletsand other
Smoked
Other
Tonn
es
0
20
40
60
80
100
120Va
lue
£ m
illion
TonnesValue £ million
Figure 60 Flow H: Estimated flows of products (volume and value) from secondary/mixed processors to consumption and export (see figure 51)
MARCH 2004 Page 95
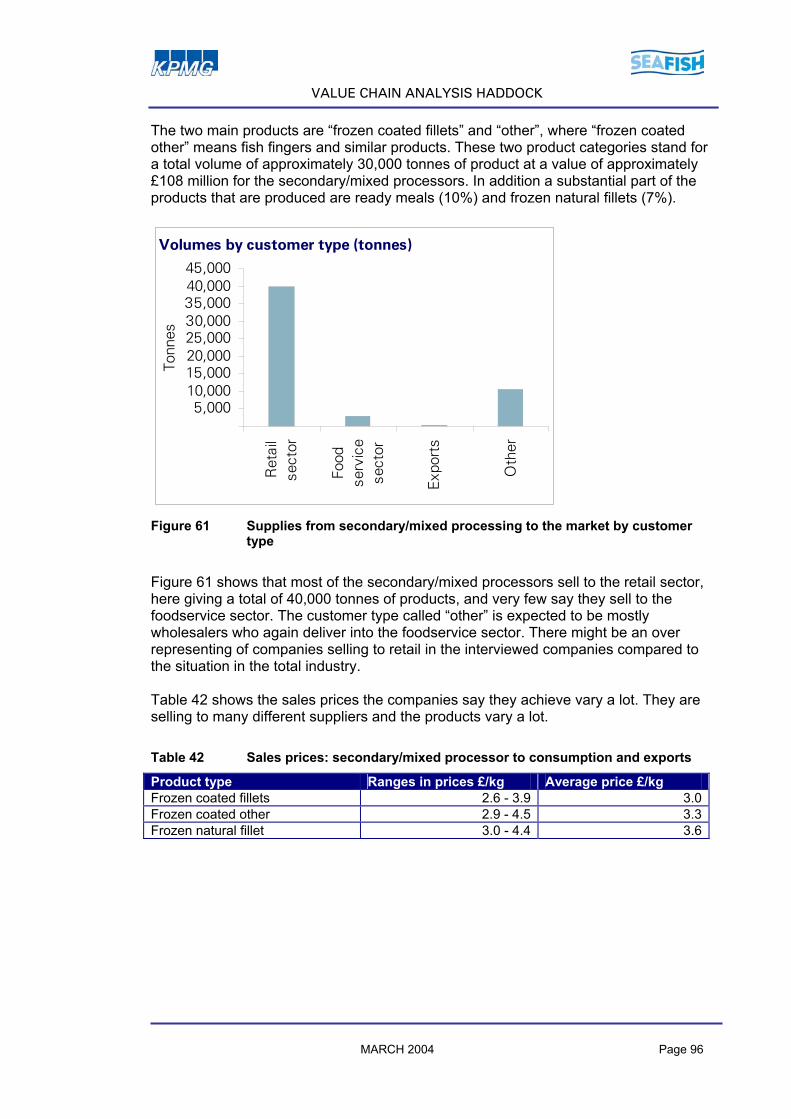
VALUE CHAIN ANALYSIS HADDOCK
The two main products are “frozen coated fillets” and “other”, where “frozen coated other” means fish fingers and similar products. These two product categories stand for a total volume of approximately 30,000 tonnes of product at a value of approximately £108 million for the secondary/mixed processors. In addition a substantial part of the products that are produced are ready meals (10%) and frozen natural fillets (7%).
Volumes by customer type (tonnes)
,5,000
10,00015,00020,00025,00030,00035,00040,00045,000
Ret
ail
sect
or
Food
serv
ice
sect
or
Expo
rts
Oth
er
Tonn
es
Figure 61 Supplies from secondary/mixed processing to the market by customer
type
Figure 61 shows that most of the secondary/mixed processors sell to the retail sector, here giving a total of 40,000 tonnes of products, and very few say they sell to the foodservice sector. The customer type called “other” is expected to be mostly wholesalers who again deliver into the foodservice sector. There might be an over representing of companies selling to retail in the interviewed companies compared to the situation in the total industry. Table 42 shows the sales prices the companies say they achieve vary a lot. They are selling to many different suppliers and the products vary a lot.
Table 42 Sales prices: secondary/mixed processor to consumption and exports
Product type Ranges in prices £/kg Average price £/kg Frozen coated fillets 2.6 - 3.9 3.0Frozen coated other 2.9 - 4.5 3.3Frozen natural fillet 3.0 - 4.4 3.6
MARCH 2004 Page 96

VALUE CHAIN ANALYSIS HADDOCK
Control volume II and III can be summarised as follows (estimated for the entire UK haddock industry):
Exports
I II III IVRetail sectorFoodservicesector
Processing
II
Overall value chain analysis
IIISecondary/
mixedprocessors
Primaryprocessors
Flow G2,400t£7.8m
Flow D30,900t£33.2m
Flow E51,900t£113.2m
Flow F15,800t£43.5m
Flow H55,300t£174.1m
Detail value chain analysis – Processing, estimated flows (volume, value)
UK vessellandings
Imports
Wholesaler,Trader
57,700t£181,9m
82,800t£146,4m
Figure 62 Total flows of raw material/products and values in processing of haddock
(volume in tonnes product weight, values in £ million). Source: Section 7.4 Total supply to haddock processors was 82,800 tonnes at a purchase price of £146 million. Total sales from haddock processors were 57,700 tonnes at a sales value of £182 million. This gives an average raw material purchase price for haddock processors of £1.76 per kg and an average sales price of £3.15 per kg haddock product from processors. Figure 62 also shows that there’s a 30% product weight loss in processing of haddock. More fish by-products (waste) are lost than these 30%, since they represents the difference between by-products lost and addition of added ingredients (e.g. breading for coated products). The value or volume of by-products has not been estimated in this study. It must be considered that some of the loss in product weight has a commercial value and can be exploited by the processor. A combined assessment of flows H and G with respect to customer type shows that the retail sector is the main market for processors. The wholesale/foodservice sector also has a significant turnover related to haddock products, so the assumption is that the companies interviewed are not fully representative in this respect. In addition, the data indicates that primary processors handle marginal volumes compared to secondary/mixed processors. This may not be representative, as the majority of the companies interviewed were larger companies with vertically integrated production. MARCH 2004 Page 97

VALUE CHAIN ANALYSIS HADDOCK
7 .5 Who lesa le rs
There are two types of wholesale companies categorised according to their size. The smaller wholesale businesses buy primary processed fresh fish for sale to small catering sector businesses (fish and chip shops), independent retailers or to secondary processing businesses. Some of the operations the smaller wholesalers perform can be similar to those performed by merchants, but wholesalers generally operate closer to the market in the value chain. Wholesalers also include importers and the large catering distribution companies that supply into the pub and restaurant chains in the foodservice sector, such as Brakes and 3663. These companies typically supply ready to cook value-added seafood products although they also supply other foodservice sector products. Some large wholesalers also import frozen primary processed fish, which is sold to secondary processors. These larger companies often defrost and/or repackage the fish before it is sold. As a rule, all wholesalers sell products in smaller quantities than what they themselves purchase; wholesalers act as product distributors through the value chain. It has not been possible to make a detailed assessment of the volumes and values of haddock going through the wholesale part of the value chain. 7 .6 Consumpt ion and expor ts ( I V )
The consumption and export picture includes the retail sector, the foodservice sector and export and is in this study meant to “visualise” where the fish products are sold / ends up. All prices are the prices these sectors sell the products for (final sales value in the UK).
I II III IVRetail sectorFoodservicesector
Processing
Overall value chain analysis
Exports
Detail value chain analysis – Retail sector, foodservice sector and exports, estimated flows (volume, value)
IVRetail sector
Exports
Foodservicesector
Flow I
Flow K
Flow J
UK vessellandings
Imports
Wholesaler,Trader
Figure 63 Detailed analysis of consumption and exports MARCH 2004 Page 98

VALUE CHAIN ANALYSIS HADDOCK
7.6.1 Retail sector (Flow J)
The retail sector includes multiples, co-ops, independents, other non-grocers, freezer centres, fishmongers and others. The data originates from the TNS database at Seafish. Some product categories in the frozen sector have been merged in order to make them fit this value chain analysis approach. Expenditure (value) refers to the price paid by the consumer to the retail sector. Table 43 Total retail volumes of haddock in UK, excluding Northern Ireland in 2002
(tonnes product weight)
Total sector
Added value products1
Coated2
Natural
Smoked3
Fish cakes
Other
Haddock Chilled 17,269 2,644 3,835 5,784 5,005 - - Frozen 13,105 932 10,547 47 1,382 139 57Total haddock 30,374 3,556 14 382 5,831 6,387 139 57Total cod and haddock 94,052 12,926 52 715 14,27 9,877 3,051 933Total haddock share of all seafood (in %)
11% 5% 18% 10% 23% 3% 2%
1) added value products include ready main meals and fish in sauce 2) coated includes battered, breaded, fish fingers 3) called natural/smoked in statistics Source: Taylor Nelson Sofres, Sea Fish Industry Authority The retail sector sold a total of 30,374 tonnes of haddock products at a total value of £199 million in 2002. The average price paid for haddock in this sector was £6.55 per kg. In comparison cod retail sales were a total of 63,678 tonnes of product at a value of £354 million and an average price of £5.57 per kg. The main haddock product sold through retail is coated products with a value of £81 million. It is interesting to observe that frozen coated haddock products achieve a better price than frozen coated cod products (£5.41 vs. £5.06 per kg) Table 44 Average retail prices (£/kg) in 2002 for UK, excluding Northern Ireland Total
sector Added value products1
Coated2 Natural Smoked3 Fish cakes
Other
Haddock Chilled 7.21 6.33 6.29 7.49 8.05 - - Frozen 5.67 5.54 5.41 7.21 7.61 6.54 6.42Total haddock
6.55
Total seafood
5.96
1) added value products include ready main meals and fish in sauce 2) coated includes battered, breaded, fish fingers 3) called natural/smoked in statistics Source: Taylor Nelson Sofres, Sea Fish Industry Authority
MARCH 2004 Page 99

VALUE CHAIN ANALYSIS HADDOCK
7.6.2 Foodservice Sector (Flow I)
The foodservice sector is generally defined in terms of the profit sector and cost or non-profit sector. The profit sector includes fish & chip shops, restaurants, cafes, clubs / leisure, pubs and hotels, while the non-profit sector includes workplaces, hospitals, primary / secondary schools and universities. For the profit sector information presented here is based on a study performed by TNS, while estimates are based on best available information for the non-profit sector. Profit sector The foodservice profit sector ordered an estimated total of 20,600 tonnes of haddock, representing 18% of the sector’s total seafood orders, which is estimated to 115,000 tonnes by TNS. Table 45 Foodservice profit sector order volumes of haddock in UK (tonnes
product weight) by outlet type. Total
sector Fish & Chip shops
Restaurants Cafes Clubs /Leisure
Pubs Hotels
Haddock 20,612 12,780 1,913 2,011 284 2,036 1,588Source: The market for Fish in the Foodservice Sector, TNS, December 2003
Clubs / Leisure1 %
Cafes10 %
Pubs10 %
Hotels8 %
Restaurants9 %
Fish & Chip shops62 %
Figure 64 Total foodservice orders by outlet type for haddock (% of volume bought
in by outlet). Source: The market for Fish in the Foodservice Sector, TNS, December 2003 Fish and chip shops have the largest order of haddock and represent a volume of an estimated 12,780 tonnes or 62% of the total profit sector’s haddock orders. This is exactly the same proportion as fish and chip shops represent in the cod value chain.
MARCH 2004 Page 100
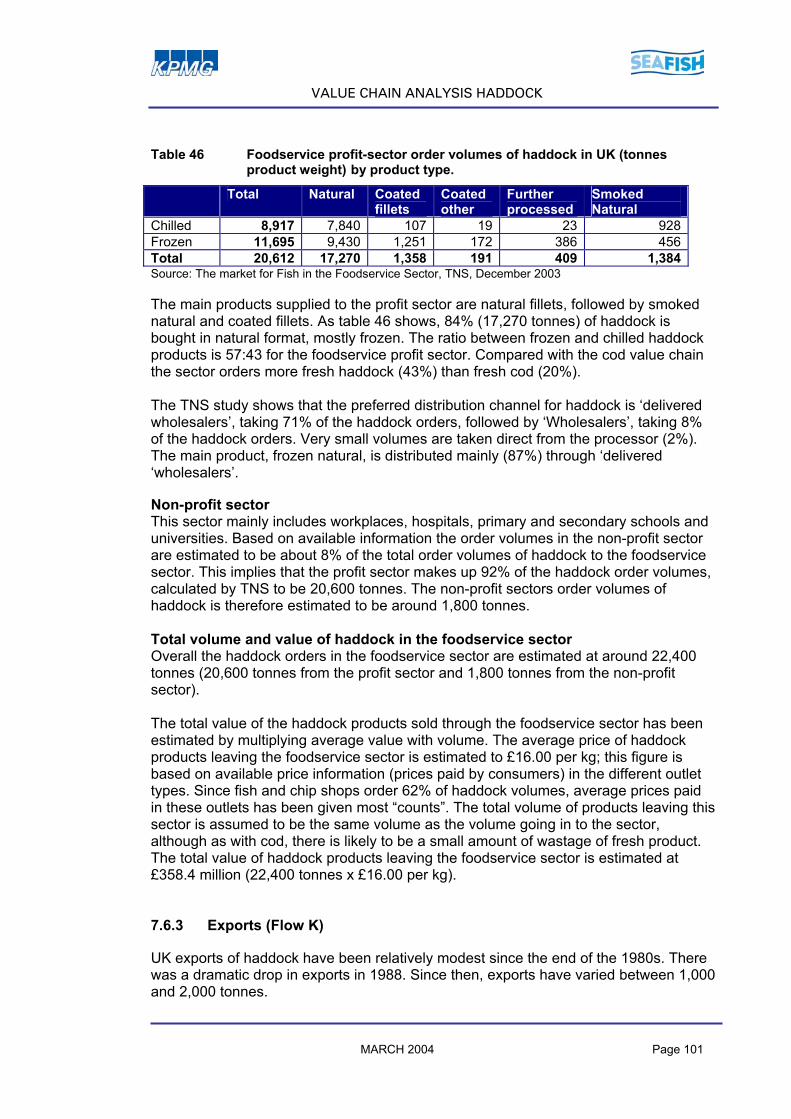
VALUE CHAIN ANALYSIS HADDOCK
Table 46 Foodservice profit-sector order volumes of haddock in UK (tonnes
product weight) by product type. Total Natural Coated
fillets Coated other
Further processed
Smoked Natural
Chilled 8,917 7,840 107 19 23 928Frozen 11,695 9,430 1,251 172 386 456Total 20,612 17,270 1,358 191 409 1,384Source: The market for Fish in the Foodservice Sector, TNS, December 2003 The main products supplied to the profit sector are natural fillets, followed by smoked natural and coated fillets. As table 46 shows, 84% (17,270 tonnes) of haddock is bought in natural format, mostly frozen. The ratio between frozen and chilled haddock products is 57:43 for the foodservice profit sector. Compared with the cod value chain the sector orders more fresh haddock (43%) than fresh cod (20%). The TNS study shows that the preferred distribution channel for haddock is ‘delivered wholesalers’, taking 71% of the haddock orders, followed by ‘Wholesalers’, taking 8% of the haddock orders. Very small volumes are taken direct from the processor (2%). The main product, frozen natural, is distributed mainly (87%) through ‘delivered ‘wholesalers’. Non-profit sector This sector mainly includes workplaces, hospitals, primary and secondary schools and universities. Based on available information the order volumes in the non-profit sector are estimated to be about 8% of the total order volumes of haddock to the foodservice sector. This implies that the profit sector makes up 92% of the haddock order volumes, calculated by TNS to be 20,600 tonnes. The non-profit sectors order volumes of haddock is therefore estimated to be around 1,800 tonnes. Total volume and value of haddock in the foodservice sector Overall the haddock orders in the foodservice sector are estimated at around 22,400 tonnes (20,600 tonnes from the profit sector and 1,800 tonnes from the non-profit sector). The total value of the haddock products sold through the foodservice sector has been estimated by multiplying average value with volume. The average price of haddock products leaving the foodservice sector is estimated to £16.00 per kg; this figure is based on available price information (prices paid by consumers) in the different outlet types. Since fish and chip shops order 62% of haddock volumes, average prices paid in these outlets has been given most “counts”. The total volume of products leaving this sector is assumed to be the same volume as the volume going in to the sector, although as with cod, there is likely to be a small amount of wastage of fresh product. The total value of haddock products leaving the foodservice sector is estimated at £358.4 million (22,400 tonnes x £16.00 per kg). 7.6.3 Exports (Flow K)
UK exports of haddock have been relatively modest since the end of the 1980s. There was a dramatic drop in exports in 1988. Since then, exports have varied between 1,000 and 2,000 tonnes.
MARCH 2004 Page 101

VALUE CHAIN ANALYSIS HADDOCK
UK export of haddock
0
1
2
3
4
5
6
7
1976
1978
1980
1982
1984
1986
1988
1990
1992
1994
1996
1998
2000
1,00
0 to
nnes
0
2
4
6
8
10
12
14
16£ m
illion
Volume
Value
Figure 65 UK export of haddock
Source: FAO FISHSTAT A total of 2,814 tonnes of haddock at a value of £5.7 million was exported from UK in 2002. This corresponds to 3,970 tonnes of live weight equivalents. The average price of exported products was £2.05 per kg in 2002, the same as the average price for exported cod products. Table 47 Exports of haddock from the UK in 2002 (product weight, prices in FOB)
HADDOCK Tonnes £000 £/kg Fresh or chilled * 609 2,090 1.64 Frozen * 1,739 2,200 1.26 Frozen fillets 466 1,475 3.16 TOTAL 2,814 5,765 2.05 *excluding fillets and minced fish Source: UK Sea Fisheries Statistics 2002, DEFRA
MARCH 2004 Page 102

VALUE CHAIN ANALYSIS HADDOCK
Frozen fillets17 %
Frozen, whole or headless
61 %
Fresh or chilled22 %
Figure 66 UK exports of haddock by product form 2002 (% of tonnes product
weight) Source: UK Sea Fisheries Statistics 2002, DEFRA 7.6.4 Total consumption and export of haddock (IV)
Table 48 summarises the total consumption and export of haddock products. Table 48 Summary of consumption and export of haddock in 2002 (product weight
and sales prices)
Tonnes £000 £/kg Foodservice Sector 22,400 358,400 16.00 Retail Sector 30,374 199,000 6.55 Exports* (values in FOB) 2,814 5,765 2.05 Total 55,588 563,165 10.07 *product weight analysis Sources: Sections 7.6.1, 7.6.2. and 7.6.3.
MARCH 2004 Page 103

VALUE CHAIN ANALYSIS HADDOCK
I II III IVRetail sectorFoodservicesector
Processing
Overall value chain analysis
Exports
Detail value chain analysis – Retail sector, foodservice sector and exports, estimated flows (volume, value)
IV
Retail sector
Exports
Foodservicesector
Flow I22,400t£358.4m
Flow K2,800t£5.8m
Flow J30,400t£199.0m
UK vessellandings
Imports
Wholesaler,Trader
55,600t£563.2m
Figure 67 Total flow of haddock products to consumption and export (volumes in tonnes product weight and values in £ million)
The total volume of haddock products that go to consumption and exports (IV) is approximately 55,600 tonnes (neglecting loss in the foodservice sector) with an estimated value of approximately £563 million. This shows that 90% of haddock products are sold in UK; 55% through the retail sector and 40% through the foodservice sector. Export customers take around 5% of haddock products. Compared to the cod value chain less haddock products is exported (5% versus 12%).
MARCH 2004 Page 104

VALUE CHAIN ANALYSIS HADDOCK
7 .7 To ta l p ic tu re haddock
Exports
UK vessellandings
ImportsExports
93,300 t
I II III IVRetail sector
Foodservicesector
82,800 t
7,800 t
57,700 t22,400t
48,500 t
44,800 t
65,500 tProcessing
The total live weight of imports and UK vessel landings is: 137,800 t
11,000 t
30,400t
2,800t
UK vessellandings
Imports£138.0m
I II IIIIV
£146.4m
£19.4m £24.6m
£181.9m£97.7m
£40.3m
£206.5mProcessing
Retail sector
£199.0m
Foodservicesector
£358.4m
Value
30% loss/waste
30% loss/waste
Wholesaler,Trader
Wholesaler,Trader
£5.8m
Volume
55,600t
£563.2m
Figure 68 Total picture of the haddock value chain for UK in 2002. All volumes in
product weight and values in £ million. The volume/value flows have been scaled vertically to indicate the magnitude of the flows in this diagram.
Source: KPMG AS, Centre for Aquaculture and Fisheries The total picture put together by the information from the different parts of the value chain throws up some specific issues. There is a certain amount of the supply that is not going through the processing industry, but that is either going through wholesalers/merchants or imported directly by the retail or foodservice sector. A small amount is withdrawn from sale at auction markets and goes into fish meal production. In this study flow is estimated to be about 11,000 tonnes at a value of £1.80 per kg (purchase price for buyer, estimated from likely import/wet fish prices), giving a total value of £19.4 million. There will be some weight loss and value increase for these products during their way to the market; it is estimated that 7,800 tonnes reach the market, at a value of £25 million. The sum of the volumes from processing (III) and the side stream do not add together to the sum of flow IV (total sale of products), 65,500 tonnes versus 55,600 tonnes (see figure 67). The most likely reasons for this discrepancy are uncertainty over total volumes extrapolated from those collected from the processing industry (in this study) and the estimation of the volumes going through the Foodservice Sector done in the TNS study. Based on the overall study however, there can be confidence that the actual figure lies between these two estimates. MARCH 2004 Page 105

VALUE CHAIN ANALYSIS HADDOCK
Looking at the value of the raw materials going into processing in relation to the value of the products coming out, the cost of fish raw materials is 80.5% of the sales value in the UK haddock processing industry. Income from sale of by-products (or costs) is not included in the total value of processing. As mentioned in chapter 5 the cost of fish purchases was on average 68% of sales for the UK primary and mixed processors in 2000, and the total direct costs was on average 90% of sales. This study’s figure of the cost of fish raw materials is 80.5% in haddock processing, which seems reasonable as the value of the purchases collected in interviews may also include other direct costs, for example transport costs. 7 .8 P r ice ana l ys is – the haddock va lue cha in
The intention of the study was to show the volume flows together with price information for each main product. It has not been possible to report on each main product in this level of detail. Instead the report presents some selected value chains which show the price development and value added for specific products. The price analysis is not trying to do an analysis of costs, but rather focusing on the value added. The information and prices featured in these selected value chains were collected during the interview phase and from follow up telephone interviews. Example 1 Scottish caught haddock into fish and chip trade Table 49 UK landed haddock (head-on, gutted), sold as fish & chips
Operator (product sold)
Purchase price, £/kg product
Average yield1
Sales price, £/kg product
Raw material cost per kg sold, £/kg
Value added £*
% of value added
UK vessel (fresh head on gutted) 0.00 1.25 0.00 1.25 9.5%Processor (frozen fillet, 8oz) 1.25 36% 6.60 3.47 3.13 23.7%Fish & chip shop (coated fillet) 6.60 100% 15.40 6.60 8.80 66.8%Sum 13.18 100.0 %
*Absolute value added, based on sales price minus raw material cost per kg product sold 1Yield based on raw material taken in Scottish caught fish is sold on contract to a primary processor for an average price of £1.25 per kg. Processing company makes fillets (normally 34-39 cm) and sells them into the fish and chip shop sector normally in 1 stone boxes at a price of £6.60 per kg. The fish and chip shop purchases by approximate size, sold as 28 fillets per stone (4.4 fillets per kg). The average sale price for a battered haddock fillet is £3.50 unit price. The sale price per kg of fillet is then £15.40 per kg. In this example it is assumed that the weight of the added batter and the weight loss of water when cooking balance each other and the product weight is therefore not changed. This might not hold true across all fish and chip shops.
MARCH 2004 Page 106
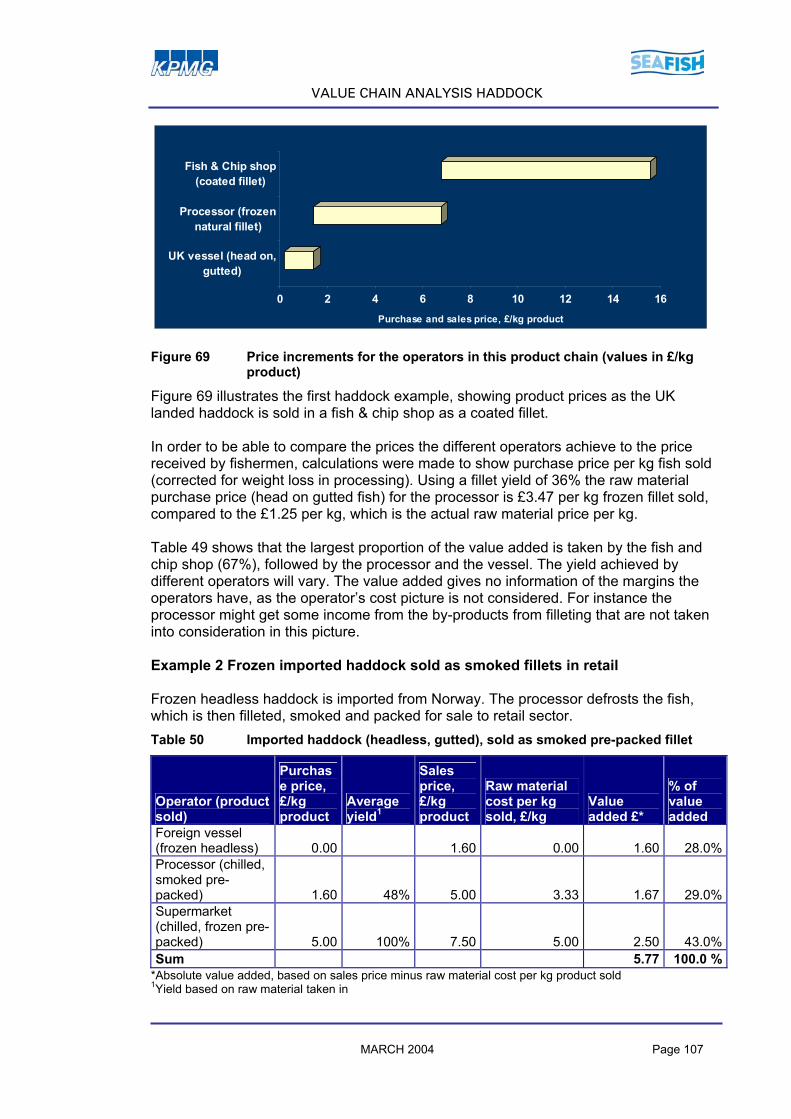
VALUE CHAIN ANALYSIS HADDOCK
0 2 4 6 8 10 12 14 16Purchase and sales price, £/kg product
UK vessel (head on,gutted)
Processor (frozennatural fillet)
Fish & Chip shop(coated fillet)
Figure 69 Price increments for the operators in this product chain (values in £/kg product)
Figure 69 illustrates the first haddock example, showing product prices as the UK landed haddock is sold in a fish & chip shop as a coated fillet. In order to be able to compare the prices the different operators achieve to the price received by fishermen, calculations were made to show purchase price per kg fish sold (corrected for weight loss in processing). Using a fillet yield of 36% the raw material purchase price (head on gutted fish) for the processor is £3.47 per kg frozen fillet sold, compared to the £1.25 per kg, which is the actual raw material price per kg. Table 49 shows that the largest proportion of the value added is taken by the fish and chip shop (67%), followed by the processor and the vessel. The yield achieved by different operators will vary. The value added gives no information of the margins the operators have, as the operator’s cost picture is not considered. For instance the processor might get some income from the by-products from filleting that are not taken into consideration in this picture. Example 2 Frozen imported haddock sold as smoked fillets in retail Frozen headless haddock is imported from Norway. The processor defrosts the fish, which is then filleted, smoked and packed for sale to retail sector. Table 50 Imported haddock (headless, gutted), sold as smoked pre-packed fillet
Operator (product sold)
Purchase price, £/kg product
Average yield1
Sales price, £/kg product
Raw material cost per kg sold, £/kg
Value added £*
% of value added
Foreign vessel (frozen headless) 0.00 1.60 0.00 1.60 28.0%Processor (chilled, smoked pre-packed) 1.60 48% 5.00 3.33 1.67 29.0%Supermarket (chilled, frozen pre-packed) 5.00 100% 7.50 5.00 2.50 43.0%Sum 5.77 100.0 %
*Absolute value added, based on sales price minus raw material cost per kg product sold 1Yield based on raw material taken in
MARCH 2004 Page 107

VALUE CHAIN ANALYSIS HADDOCK
0 1 2 3 4 5 6 7 8 9Purchase and sales price, £/kg product
Foreign vessel(frozen headless)
Processor (chilledsmoked pre-packed)
Supermarket (chilledsmoked pre-packed)
Figure 70 Price increments for the operators in this product chain (values in £/kg product)
Figure 70 shows that in actual prices it appears that the processor has the highest value added. But in table 50, which shows the different operators raw material purchase price per kg product sold (corrected for weight loss in processing) the picture changes. A fillet yield of 48% (for smoked packed fillets) gives a purchase price of £3.33 per kg fish raw material that can be sold as a smoked fillet. The largest proportion of the value added is in this example taken by the supermarket, followed by the processor and the vessel. It should be noted that this value added is not a comment about the different operators’ margins, as the costs related to the operations are complex. Example 3 Scottish caught haddock into retail fish pie Scottish caught fish (head on gutted) landed in UK and contracted to a processor at a sales price of £0.90 per kg. The processor fillets and freezes the haddock and it is then sold in to a secondary processor. The secondary processor then mixes the filleted fish with the added ingredients – sauce, mushrooms, potato & cheese - and gets a price of £4.40 per kg product from the retailer. The individual fish pie contains 27% fish (178g) and the total volume of haddock in 1kg of fish pie is then 270g. This pie is then sold in the retail sector for £7.15 per kg. Table 51 UK landed haddock (headless, gutted), sold as ingredient in a fish pie
Operator (product sold)
Purchase price, £/kg product
Average yield
Sales price, £/kg product
Sales price £/kg fish
UK vessel (fresh, head on gutted) 0.00 0.90 0.90Primary processor (chilled fillet) 0.90 36% 4.25 4.25Secondary processor (fish pie) 4.25 27%1) 4.40 16.3Retail (fish pie) 4.40 27%1) 7.15 26.5
1) fish content in pie
MARCH 2004 Page 108

VALUE CHAIN ANALYSIS HADDOCK
0 1 2 3 4 5 6 7 8
Purchase and sales price, £/kg product
UK vessel (head on, gutted)
Primary processor (frozen fillet)
Secondary processor (fish pie)
Retail (fish pie)
Figure 71 Price increments for the operators in this product chain (values in £/kg product)
Figure 71 show the actual prices the different operators pay for the raw material they take in and what they get for the product they sell. This figure does not take the yield of the fish into consideration. Because this is very important this example is treated in a different way than the previous examples. Since the fish pie contains several ingredients other than haddock the actual purchase and sales prices per kg fish has been analysed (see table 51 and figure 72). Using a fish content of 27% in the fish pie the sales price of the fish in the pie is £16.30 per kg out from secondary processor. The sales price in retail per kg fish will correspondingly be £26.50 per kg. Here the cost of other ingredients in the pie is not added.
0 3 6 9 12 15 18 21 24 27
Purchase and sales price, £/kg fish in product
UK vessel (head on, gutted)
Primary processor (frozen fillet)
Secondary processor (fish pie)
Retail (fish pie)
Figure 72 Purchase and sales price (£/kg fish )
This figure does not reveal information about the different operators margins. Other costs (except fish raw material) are not taken into consideration, but it shows the value of the fish raw material as it travels through the product chain from head on gutted fish to an ingredient in a fish pie. MARCH 2004 Page 109
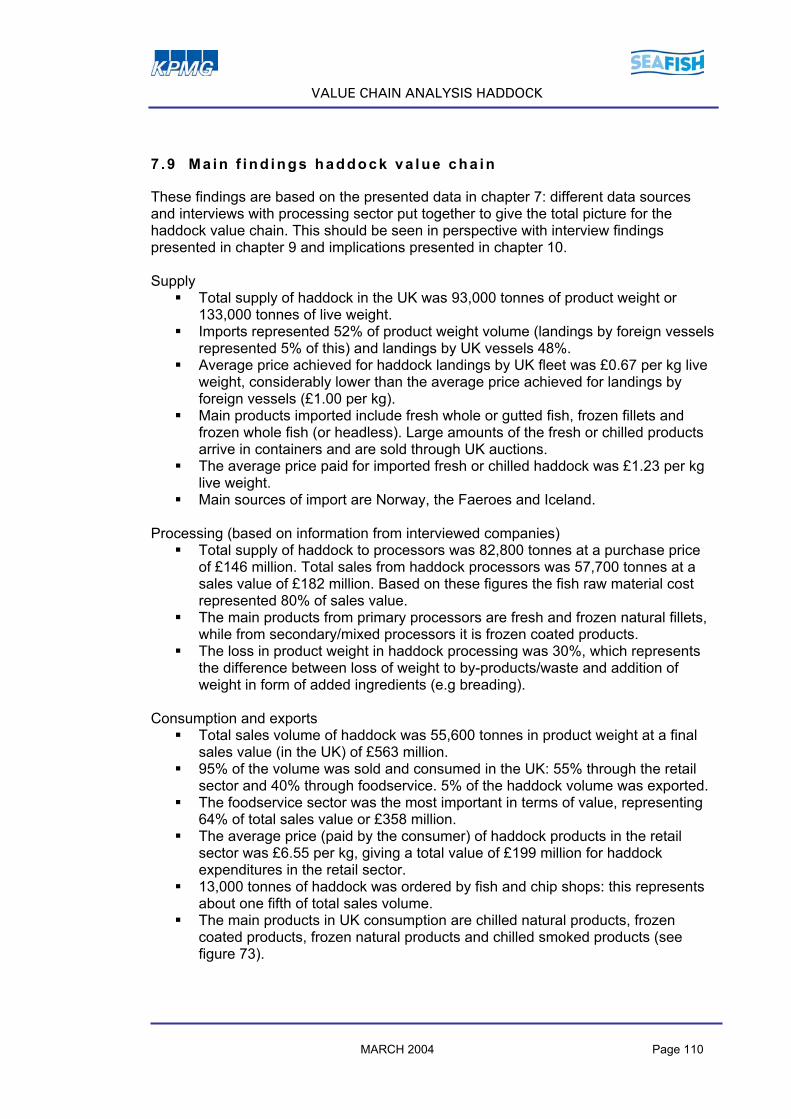
VALUE CHAIN ANALYSIS HADDOCK
7 .9 Ma in f ind ings haddock va lue cha in
These findings are based on the presented data in chapter 7: different data sources and interviews with processing sector put together to give the total picture for the haddock value chain. This should be seen in perspective with interview findings presented in chapter 9 and implications presented in chapter 10. Supply
Total supply of haddock in the UK was 93,000 tonnes of product weight or 133,000 tonnes of live weight.
Imports represented 52% of product weight volume (landings by foreign vessels represented 5% of this) and landings by UK vessels 48%.
Average price achieved for haddock landings by UK fleet was £0.67 per kg live weight, considerably lower than the average price achieved for landings by foreign vessels (£1.00 per kg).
Main products imported include fresh whole or gutted fish, frozen fillets and frozen whole fish (or headless). Large amounts of the fresh or chilled products arrive in containers and are sold through UK auctions.
The average price paid for imported fresh or chilled haddock was £1.23 per kg live weight.
Main sources of import are Norway, the Faeroes and Iceland. Processing (based on information from interviewed companies)
Total supply of haddock to processors was 82,800 tonnes at a purchase price of £146 million. Total sales from haddock processors was 57,700 tonnes at a sales value of £182 million. Based on these figures the fish raw material cost represented 80% of sales value.
The main products from primary processors are fresh and frozen natural fillets, while from secondary/mixed processors it is frozen coated products.
The loss in product weight in haddock processing was 30%, which represents the difference between loss of weight to by-products/waste and addition of weight in form of added ingredients (e.g breading).
Consumption and exports
Total sales volume of haddock was 55,600 tonnes in product weight at a final sales value (in the UK) of £563 million.
95% of the volume was sold and consumed in the UK: 55% through the retail sector and 40% through foodservice. 5% of the haddock volume was exported.
The foodservice sector was the most important in terms of value, representing 64% of total sales value or £358 million.
The average price (paid by the consumer) of haddock products in the retail sector was £6.55 per kg, giving a total value of £199 million for haddock expenditures in the retail sector.
13,000 tonnes of haddock was ordered by fish and chip shops: this represents about one fifth of total sales volume.
The main products in UK consumption are chilled natural products, frozen coated products, frozen natural products and chilled smoked products (see figure 73).
MARCH 2004 Page 110
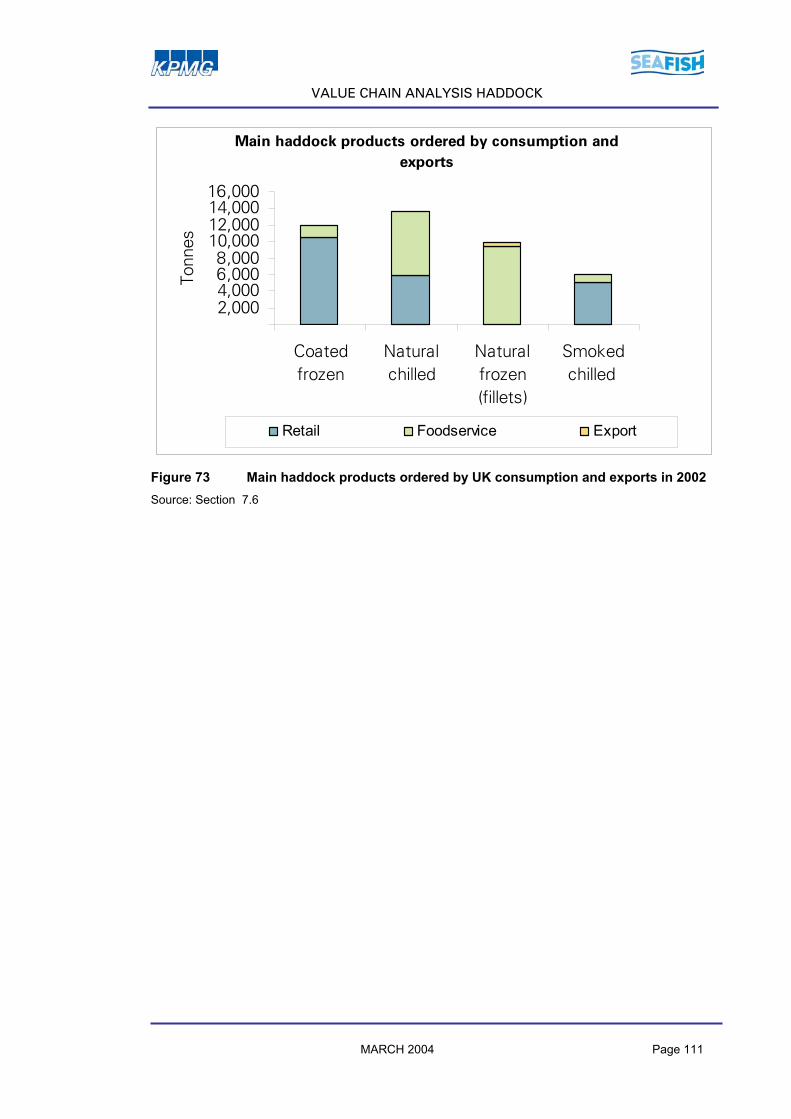
VALUE CHAIN ANALYSIS HADDOCK
,
Main haddock products ordered by consumption and exports
2,0004,0006,0008,000
10,00012,00014,00016,000
Coatedfrozen
Naturalchilled
Naturalfrozen(fillets)
Smokedchilled
Tonn
es
Retail Foodservice Export
Figure 73 Main haddock products ordered by UK consumption and exports in 2002 Source: Section 7.6
MARCH 2004 Page 111

VALUE CHAIN ANALYSIS NEPHROPS
8 . V A L U E C H A I N A N A L Y S I S N E P H R O P S
Nephrops norvegicus is the Latin name for a species which is also known colloquially as Dublin Bay Prawns, Norway Lobsters, Langoustines and, in Spanish, Cigalas. Scottish fishermen and processors refer to them as prawns. This report will use nephrops as a common name. The tail of a nephrops is approximately one third the weight of a whole animal. Smaller animals are tailed at sea, and some of the larger animals which are landed whole, may be tailed due to damage of the claws or other quality considerations. Somewhat confusingly, whole animals are referred to as “live” in the north east of Scotland, to differentiate them from tails, even though the animals are in fact dead. Before consumption, tails are normally shelled, coated in breadcrumbs, and then become known as scampi. These are eaten widely in the UK. The value chain for nephrops is somewhat different from those of cod and haddock, but for the sake of comparability, it has been described in the same way as for cod and haddock. The diagram below shows the value chain and the control volumes (I-IV) to be discussed further in this section.
MARCH 2004 Page 112

VALUE CHAIN ANALYSIS NEPHROPS
UK vessellandings
Imports
I II III IVProcessing
Exports
Retail sector
Foodservicesector
Wholesaler,Trader
Overall value chain analysis
Figure 74 Overall value chain analyses
The control sums used in the overall value chain analysis can be described as follows:
I. The combined imports and landings by UK and foreign vessels can be said to represent the supply of raw material in the value chain.
II. The second control sum represents the inflow of raw materials to the processing sector.
III. The third control sum represents the outgoing products from the processing sector.
IV. The fourth control sum is the amount of finished product that goes to domestic consumption in the foodservice sector and through the retail sector, in addition to the flow of raw materials and finished product that are exported from the UK. Control sum IV can be labelled the consumption and exports in the value chain.
8 .1 Supp l y p ic tu re ( I )
In the following, supplies of nephrops coming from three main sources are considered: • Landings in UK by UK vessels • Landings in UK by foreign vessels • Imports into the UK
Import statistics from Customs and Excise include landings into UK by foreign vessels.
MARCH 2004 Page 113

VALUE CHAIN ANALYSIS NEPHROPS
Overall value chain analysis
Detail value chain analysis – Imports and landings, estimated flows (volume, value)
Imports
IUK vessel landings Flow B
Flow A
ProcessingUK vessellandings
Imports
I II III IVProcessing
Exports
Retail sectorFoodservicesector
Wholesaler,Trader
Figure 75 Total supply picture
8.1.1 Landings (Flow B)
According to DEFRA statistics, the UK shellfish fleet in 2002 consisted of 532 vessels over 10m in length, of a combined 17,253 registered tonnes. UK landings of nephrops have been relatively stable over the past ten years, at some 25 – 30,000 tonnes. The UK fleet catches by far the largest part of this, as foreign vessels land only very small amounts in the UK.
MARCH 2004 Page 114

VALUE CHAIN ANALYSIS NEPHROPS
UK landings of nephrops (volume in live weight)
0
5
10
15
20
25
30
35
1994 1995 1996 1997 1998 1999 2000 2001 2002
1,00
0 to
nnes
Figure 76 UK landings of nephrops (volume in live weight) Source: DEFRA In 2002, DEFRA figures show that a total of 19,909 tonnes of nephrops where landed in UK, corresponding to 28,164 tonnes of live weight (see table 52). Of this, foreign vessels landed only 143 tonnes. The total value of landings was approximately £68.1 million and the average price achieved was £3.42 per kg product weight or £2.42 per kg live weight. For comparison landings in 2003 were 27,705 tonnes of live weight equivalents at an average price of £2.32 per kg live weight (provisional DEFRA statistics per February 2004). This figure suggests there was no major change in nephrops landings from 2002 to 2003. Table 52 Landings of nephrops by product type (year 2002)
Product weight Tonnes
Live weight Tonnes £000
£/kg product weight
£/kg live weight
Tail 4,127 12,383 12,650 3.06 1.02Whole 15,782 15,782 55,458 3.51 3.51Total UK 19,909 28,164 68,108 3.42 2.42
Source: Seafish Table 52 shows that approximately 40% of caught animals are tailed at sea, while 60% of the caught animals reach the shore as whole animals. Whole animals represented 79% of the landed volume and tails 21% (by product weight).
MARCH 2004 Page 115

VALUE CHAIN ANALYSIS NEPHROPS
Table 53 Landings of nephrops by regions 2002 (volume in product weight)
Tail Whole Total Tonnes £/kg Tonnes £/kg Tonnes £/kg Scotland 2,798 3.13 12,868 3.68 15,666 3.58Northern Ireland 1,051 3.01 1,394 2.99 2,445 3.00England and Wales 278 2.62 1,520 2.59 1,798 2.59Total UK 4,127 3.06 15,782 3.51 19,909 3.42
Source: Seafish Most of the catch is landed in Scotland (79%), with the remainder landed in Northern Ireland (12%) and England and Wales (9%). Table 53 also shows that nephrops achieve a higher price in Scotland compared to Northern Ireland and England and Wales. The difference in price is largest for whole animals, which are paid £3.68 per kg in Scotland versus respectively £2.99 and £2.59 per kg in Northern Ireland and England and Wales. 8.1.2 Imports (Flow A)
UK imports of nephrops have increased over the recent years. Until 1994, most imports were fresh or chilled, but since then a large part has been in frozen form. The UK is a net exporter of nephrops. Even so, the country imported almost 1,000 tonnes of frozen nephrops in 2002, in addition to 215 tonnes of not frozen nephrops. The average price of imported nephrops was £3.33 per kg product and the main suppliers were Ireland, Germany and Sweden. Table 54 UK imports of nephrops in 2002 (product weight, prices in CIF)
Tonnes £000 £/kg Not frozen Germany 27.8 85.7 3.09Ireland 155.8 502.2 3.22Sweden 31.1 91.6 2.95Others 0.53 3. 0 5.68Sum not frozen 215.2 682.5 3.17 Frozen Ireland 946.8 3,153.5 3.33Spain 15.8 66.9 4.23Iceland 15.2 30.9 2.03Others 15.0 82.8 5.52Sum frozen 992.8 3,334.1 3.36Total sum 1,208.5 4,016.5 3.33
Import figures includes landings by foreign vessels Source: Customs and Excise These 1,208 tonnes of imported nephrops products corresponds to approximately 1,800 tonnes of live weight equivalents.
MARCH 2004 Page 116

VALUE CHAIN ANALYSIS NEPHROPS
8.1.3 Total supply (I)
Official landings and import statistics show that the total supply of nephrops into UK was 21,117 tonnes of product weight or approximately 30,000 tonnes of live weight equivalents at a first hand value of £72.1 million in year 2002 (see table 55). Table 55 Summary of total supply of nephrops into UK in 2002
Live weight Tonnes
Product weight Tonnes
£000
£/kg live weight
£/kg product weight
Landing into UK (first hand price) 28,164 19,909 68,108 2.42 3.42Import (price CIF) 1,800 1,208 4,016 2.23 3.33Total Supply UK 29,964 21,117 72,124 2.41 3.42Source: UK Sea Fisheries Statistics 2002, DEFRA Table 55 shows that 94% of nephrops supply to the UK is directly landed by UK vessels (by product weight) and 6% is imported (of this foreign vessels landed only a tiny amount). This is very different from the cod and haddock value chain, where UK landings represented 15 and 48% respectively.
Overall value chain analysis
Detail value chain analysis – Imports and landings, estimated flows (volume, value)
Imports
IUK vessel landings
Flow B19,900t£68.1m
Flow A1,200t£4.0m
21,100t£72.1m
ProcessingUK vessellandings
Imports
I II III IVProcessing
Exports
Retail sectorFoodservicesector
Wholesaler,Trader
Figure 77 Supply picture of nephrops into UK in year 2002 (volumes in product weight)
UK landed nephrops is by far the most important raw material for the UK nephrops value chain. 8 .2 Auc t ion marke ts
Nephrops are generally not sold on many first hand markets, but rather by direct sales/contracts. The only mainland market with information on nephrops sales is
MARCH 2004 Page 117

VALUE CHAIN ANALYSIS NEPHROPS
Aberdeen, selling 769 tonnes at an average price per kg live weight of £2.22 in year 2002. Other sectors depend on the auctions for supplies. 8 .3 Merchants and agen ts
Merchants do not seem to be very active in the nephrops market, as most large processors are buying their raw material either directly from the vessels (with or without contracts), or in Northern Ireland from auction markets. But there are a number of agents in the market place who purchase the nephrops on contract from the vessels and then supply on to the processor or export. It should also be noted that vessel owners on the west coast of Scotland often sell their live nephrops landings direct to Spanish businesses, which transport the live animals in their own vivier trucks to Spain. This constitutes a direct export, bypassing the processing sector. 8 .4 P rocess ing ( I I an d I I I )
From interviews with the nephrops processing sector this study covered approximately 15,000 tonnes of raw materials going into processing. Based on the total supply picture and from knowledge of the major processors not interviewed in this study it is estimated that study interviews have covered about 85% of the whole UK nephrops processing sector. The interview results are therefore scaled up in order to present the whole UK nephrops industry. The nephrops processing industry is simplified a little compared to the cod and haddock industry. Processors are presented as one step in the value chain, partly due to lack of detailed information on the product flow between primary and secondary processors.
MARCH 2004 Page 118

VALUE CHAIN ANALYSIS NEPHROPS
II
Overall value chain analysis
ProcessingFlow D Flow E
Detail value chain analysis – Processing, estimated flows (volume, value)
ProcessingUK vessellandings
Imports
I II III IVProcessing
Exports
Retail sectorFoodservicesector
Wholesaler,Trader
III
Figure 78 Detailed analysis of the processing sector
The diagram below illustrates the main forms of products that are produced from the most common forms of raw material. The main by-products of the processing are also shown. This image shows the most important products forms that will be discussed in the following detail analysis.
MARCH 2004 Page 119

VALUE CHAIN ANALYSIS NEPHROPS
Whole animals
– Live– Chilled– Frozen
ShellHeadsLegs / claws
HeadShellLegs / claws
Tails
– Shell on– Shell off
Coated
– Coated tails
Tails
– Scampi– Tail meat
FRO
ZE
N
Tails
– IQF– IQF shell on– Block
Ready meals
– Salads– Variations
By-products
Whole animals
– Live– Chilled
FRE
SH
Whole animals
– Live– Chilled
Whole animals
– Frozen
Whole animals
– Frozen
Figure 79 The main forms of products for nephrops based on common forms of raw
material Source: KPMG AS, Centre for Aquaculture and Fisheries Processed products include tails, frozen whole, breaded (scampi) tails chilled or frozen. The main products are live whole nephrops and frozen coated tails (scampi). Flow D: supplies to processors The total volume going into processing is estimated at 17,900 tonnes of nephrops products at a value of £60.2 million. As figure 78 show most of the raw material is received either as fresh tails (56% by volume) or as whole, fresh animals (37%). Live animals are also exported by companies that do some processing. Some importers/processors are also involved in shrimp, so nephrops is often associated with the shrimp and prawn market.
MARCH 2004 Page 120
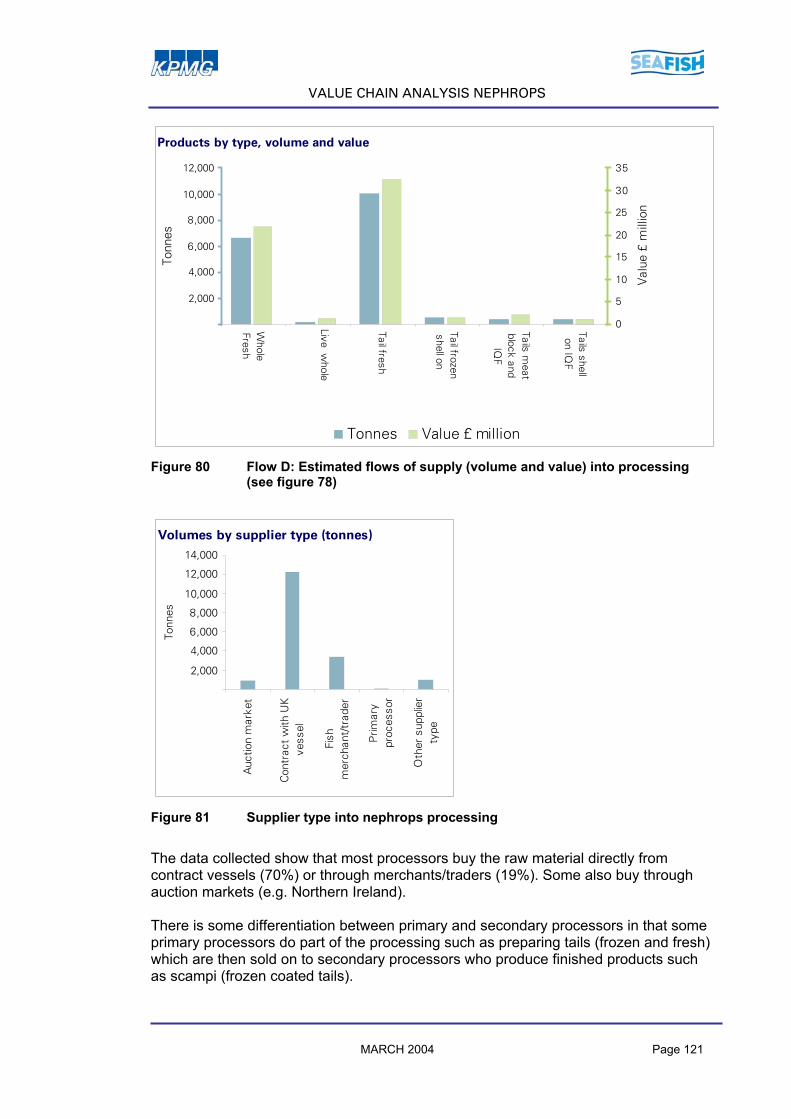
VALUE CHAIN ANALYSIS NEPHROPS
,
Products by type, volume and value
2,000
4,000
6,000
8,000
10,000
12,000
Whole
Fresh
Live whole
Tail fresh
Tail frozenshell on
Tails meat
block andIQ
F
Tails shellon IQ
F
Tonn
es
0
5
10
15
20
25
30
35
Val
ue £
mill
ion
Tonnes Value £ million
Figure 80 Flow D: Estimated flows of supply (volume and value) into processing (see figure 78)
Volumes by supplier type (tonnes)
,
2,000
4,000
6,000
8,000
10,000
12,000
14,000
Auc
tion
mar
ket
Con
trac
t w
ith U
Kve
ssel
Fish
mer
chan
t/tr
ader
Prim
ary
proc
esso
r
Oth
er s
uppl
ier
type
Tonn
es
Figure 81 Supplier type into nephrops processing
The data collected show that most processors buy the raw material directly from contract vessels (70%) or through merchants/traders (19%). Some also buy through auction markets (e.g. Northern Ireland). There is some differentiation between primary and secondary processors in that some primary processors do part of the processing such as preparing tails (frozen and fresh) which are then sold on to secondary processors who produce finished products such as scampi (frozen coated tails).
MARCH 2004 Page 121

VALUE CHAIN ANALYSIS NEPHROPS
Some processors buy prepared (shelled) tails only to undertake the secondary processing (breading, freezing) and packaging, while some of the larger producers buy raw material from vessels and do both primary and secondary processing. Table 56 summarises the price information provided by the processors during interviews. This information has been presented as ranges in prices to protect confidentiality. Average prices are presented where there are more than 5 observations. Table 56 Purchase price information given by processors
Raw material type Range in prices, £/kg Average Whole fresh 3.0 – 3.4 - Fresh tails 2.8 – 3.3 3.05 Frozen tails, shell on 2.9 – 3.1 - For fresh tails the price information given by the processors corresponds very well with the official landing prices. Official statistics state that tails on achieve on average £3.06 per kg product weight, and study interviews suggests a price of £3.05 per kg. For whole animals the official average landing price is £3.51 per kg, while the interviewed processing companies reported paying from £3.00 - £3.40 per kg. This difference might be due to coincidence, but is still surprising. Flow E: supplies from processors to consumption and export The total output from the processing sector is estimated at 20,500 tonnes of products at a value of £111 million. This is mainly in the form of coated tails (scampi), whole frozen or whole fresh nephrops. For the latter product, processing is limited mainly to packaging and sorting.
Products by type, volume and value
,
2,000
4,000
6,000
8,000
10,000
12,000
Whole
fresh
Whole
frozen
Tails(fresh,frozen,peeled)
Tail meat
frozen
Coatedtails
(scampi)
Other
Tonn
es
0
10
20
30
40
50
60
70
Val
ue £
mill
ion
Tonnes Value £ million
Figure 82 Flow E: Estimated sales flows (volume and value) from processing to the market (see figure 78)
MARCH 2004 Page 122

VALUE CHAIN ANALYSIS NEPHROPS
,
Volumes by customer type (tonnes)
1,000
2,000
3,000
4,000
5,000
6,000
Who
lesa
ler
Ret
ail s
ecto
r
Food
ser
vice
sec
tor
Exp
ort
cust
omer
Oth
er c
usto
mer
typ
e
Tonn
es
Figure 83 Supplies to the market, by type of customer
As figure 83 shows, processors sell their products mainly to the retail sector (27%), to export (25%) or to the foodservice sector (23%). The volumes given here correspond well with the picture given of nephrops sales in the retail and foodservice sector (see section 8.6.1 and 8.6.2). The table below summarises price information provided by processors during interviews. The price achieved for whole fresh nephrops varies a lot depending on the time of year, size and in which market it is sold. The price of coated tails (scampi) also varies quite significantly, the data collected show that companies selling to foodservice or wholesaler report a lower sales price than the companies selling to retail. Table 57 Sales price information given by processors
Raw material type Variation in prices, £/kg Average, £/kg Whole fresh 5.0 – 12.2 - Coated tails 3.1 – 6.9 4.9 Frozen tail meat 6.0 – 11.4 - The problem of waste is big in the nephrops processing industry, as discarding the shells and substandard animals is difficult, as waste now needs to be heat treated. Processors report that some UK vessels have problems meeting the quality standards, and that discards therefore can be a problem.
MARCH 2004 Page 123

VALUE CHAIN ANALYSIS NEPHROPS
II
Overall value chain analysis
ProcessingFlow D17,900t£60.2m
Flow E20,500t£110.9m
Detail value chain analysis – Processing, estimated flows (volume, value)
ProcessingUK vessellandings
Imports
I II III IVProcessing
Exports
Retail sectorFoodservicesector
Wholesaler,Trader
III
Figure 84 Summary of detailed analysis of the nephrops processing sector
(volumes in product weight)
It is estimated that some 17,900 tonnes of product weight enter the processing sector and some 20,500 tonnes leave the processing sector as finished products. This gives a weight gain in nephrops processing of 15%, representing the difference between loss of weight due to by-products/waste and addition of weight in form of added ingredients (e.g breading). The gain is due to the large proportion of coated products (scampi). 8 .5 Who lesa le rs
There are two types of wholesale companies categorised according to their size. The smaller wholesale businesses buy primary processed fresh fish for sale to small catering sector businesses (fish and chip shops), independent retailers or to secondary processing businesses. Some of the operations the smaller wholesalers perform can be similar to those performed by merchants, but wholesalers generally operate closer to the market in the value chain. Many wholesalers are congregated at the large wholesale fish markets, such as Billingsgate. Wholesalers also include importers although in the nephrops market the larger wholesalers are often the large catering distribution companies that supply into the pub and restaurant chains in the foodservice sector, such as Brakes and 3663. These companies typically supply ready to cook value-added seafood products although they also supply other foodservice sector products. As a rule, all wholesalers sell products in smaller quantities than when they purchased; wholesalers act as product distributors through the value chain. MARCH 2004 Page 124

VALUE CHAIN ANALYSIS NEPHROPS
8 .6 Consumpt ion and expor ts ( I V )
As mentioned before nephrops are sold under a number of different product names. Whole nephrops are often called Norway lobster, Langoustines or Dublin Bay Prawns, while processed nephrops can be marketed as Norway lobster tails, or as scampi (coated tails, fresh or frozen). The domestic distribution chain for nephrops is roughly divided into two: retail (supermarkets) and foodservice. In addition, a big proportion of the total supplies of nephrops are exported to other countries. 8.6.1 Foodservice sector (flow F)
The foodservice sector consists of two parts: a profit sector and a non-profit sector. The profit sector representing fish & chip shops, restaurants, cafes, clubs / leisure, pubs and hotels, while the non-profit sector includes workplaces, hospitals, primary / secondary schools and universities. For the profit sector information is based on a study performed by TNS, while estimates are based on best available information for the non-profit sector. The foodservice sector is important in the nephrops business. Most of the domestically distributed product seems to be sold to wholesalers/distributors who sell to pubs, restaurants and hotels. As mentioned before nephrops is sold under many product names- the foodservice sector refers to whole nephrops as Langoustine and Dublin Bay prawns, while coated nephrops tails is referred to as scampi. Profit sector The foodservice profit sector ordered a total of 7,522 tonnes of nephrops, this representing 6.5% of the total foodservice sectors orders, which is estimated at 115,000 tonnes of seafood. Table 58 Foodservice (profit sector) order volumes of scampi and Langoustines /
Dublin Bay prawns in UK (tonnes product weight) by outlet type. Total
sector Fish & Chip Shops
Pubs Restaurants Hotels Café
Club/ Leisure
Scampi (coated tails) 6,968 545 3,021 1,457 929 468 548Langoustine / Dublin Bay Prawns (whole animals) 554 <1 7 481 64 - 2Total 7,522 545 3,028 1,938 993 468 550Source: The market for Fish in the Foodservice Sector, TNS, December 2003
MARCH 2004 Page 125

VALUE CHAIN ANALYSIS NEPHROPS
Clubs / Leisure7 %
Cafes6 %
Pubs41 %
Hotels13 %
Restaurants26 %
Fish & Chip shops
7 %
Figure 85 Total foodservice orders by outlet type for nephrops (% of volume bought
in by outlet). Source: The market for Fish in the Foodservice Sector, TNS, December 2003 Pubs have the largest order of nephrops (made up of scampi) and represent a volume of 3,280 tonnes or 41% of the total profit-sectors nephrops orders. Restaurants place 26% of nephrops orders by volume, and here most of the whole animals (Langoustine / Dublin Bay Prawns) are sold. Table 59 Details of the foodservice (profit sector) order volumes of nephrops UK
(product weight)
Scampi
Tonnes
Langoustine/ Dublin Bay prawn
Tonnes
Total
Tonnes Frozen coated whole tail 5,661 - 5,661 Frozen coated formed 1,173 - 1,173 Frozen peeled tails 134 - 134 Chilled whole animal - 505 505 Frozen whole animal - 49 49 Total 6,968 657 7,522 Source: The market for Fish in the Foodservice Sector, TNS, December 2003 The main nephrops products supplied to the profit-sector are scampi sold as: frozen coated whole tails (75% or 5,661 tonnes), followed by frozen coated formed. Langoustine/Dublin Bay prawns are mainly ordered as whole chilled animals. The same study shows that the preferred distribution channel for nephrops is ‘delivered wholesalers’, taking 85% of the scampi orders and 59% of the Langoustine/ Dublin Bay prawn orders.
MARCH 2004 Page 126
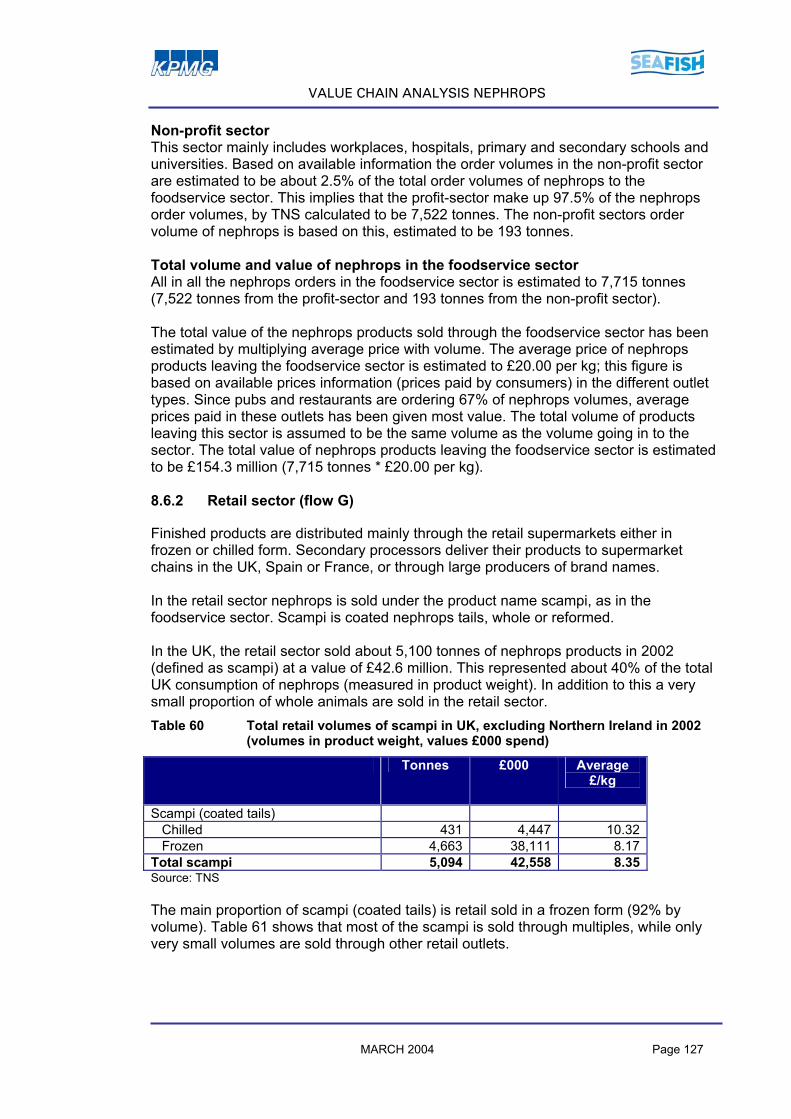
VALUE CHAIN ANALYSIS NEPHROPS
Non-profit sector This sector mainly includes workplaces, hospitals, primary and secondary schools and universities. Based on available information the order volumes in the non-profit sector are estimated to be about 2.5% of the total order volumes of nephrops to the foodservice sector. This implies that the profit-sector make up 97.5% of the nephrops order volumes, by TNS calculated to be 7,522 tonnes. The non-profit sectors order volume of nephrops is based on this, estimated to be 193 tonnes. Total volume and value of nephrops in the foodservice sector All in all the nephrops orders in the foodservice sector is estimated to 7,715 tonnes (7,522 tonnes from the profit-sector and 193 tonnes from the non-profit sector). The total value of the nephrops products sold through the foodservice sector has been estimated by multiplying average price with volume. The average price of nephrops products leaving the foodservice sector is estimated to £20.00 per kg; this figure is based on available prices information (prices paid by consumers) in the different outlet types. Since pubs and restaurants are ordering 67% of nephrops volumes, average prices paid in these outlets has been given most value. The total volume of products leaving this sector is assumed to be the same volume as the volume going in to the sector. The total value of nephrops products leaving the foodservice sector is estimated to be £154.3 million (7,715 tonnes * £20.00 per kg). 8.6.2 Retail sector (flow G)
Finished products are distributed mainly through the retail supermarkets either in frozen or chilled form. Secondary processors deliver their products to supermarket chains in the UK, Spain or France, or through large producers of brand names. In the retail sector nephrops is sold under the product name scampi, as in the foodservice sector. Scampi is coated nephrops tails, whole or reformed. In the UK, the retail sector sold about 5,100 tonnes of nephrops products in 2002 (defined as scampi) at a value of £42.6 million. This represented about 40% of the total UK consumption of nephrops (measured in product weight). In addition to this a very small proportion of whole animals are sold in the retail sector. Table 60 Total retail volumes of scampi in UK, excluding Northern Ireland in 2002
(volumes in product weight, values £000 spend)
Tonnes £000 Average £/kg
Scampi (coated tails) Chilled 431 4,447 10.32 Frozen 4,663 38,111 8.17 Total scampi 5,094 42,558 8.35 Source: TNS The main proportion of scampi (coated tails) is retail sold in a frozen form (92% by volume). Table 61 shows that most of the scampi is sold through multiples, while only very small volumes are sold through other retail outlets.
MARCH 2004 Page 127
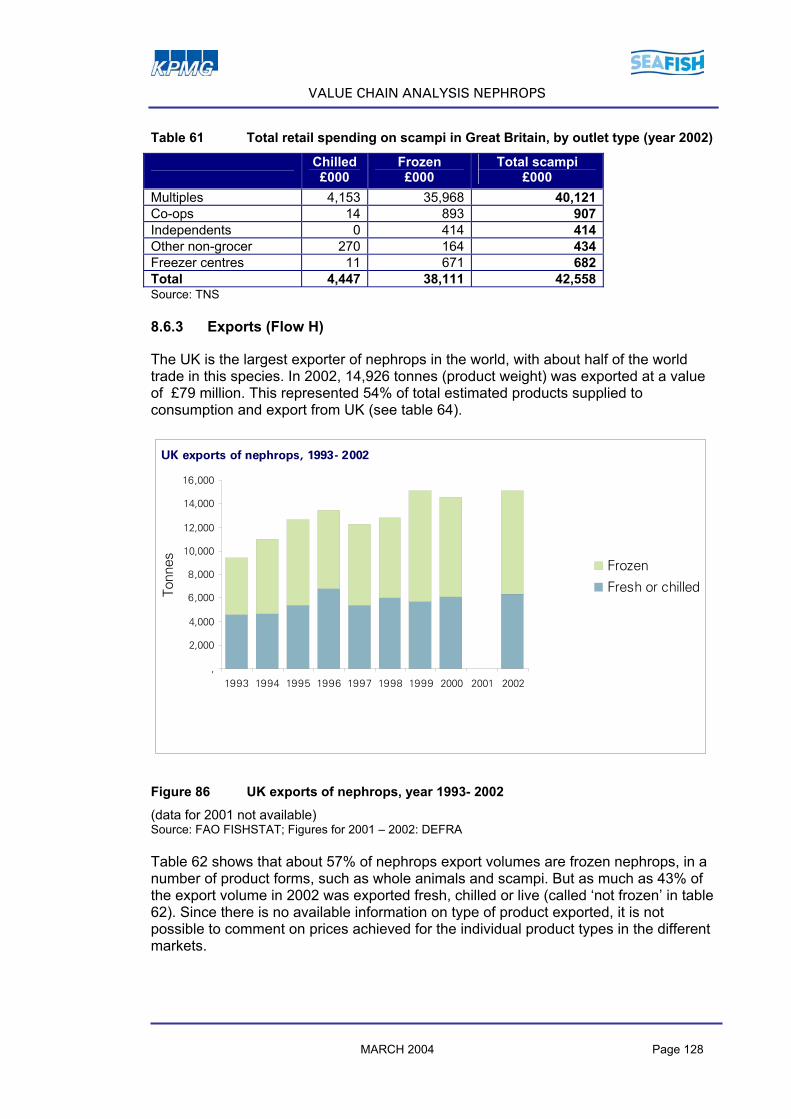
VALUE CHAIN ANALYSIS NEPHROPS
Table 61 Total retail spending on scampi in Great Britain, by outlet type (year 2002)
Chilled £000
Frozen £000
Total scampi £000
Multiples 4,153 35,968 40,121 Co-ops 14 893 907 Independents 0 414 414 Other non-grocer 270 164 434 Freezer centres 11 671 682 Total 4,447 38,111 42,558 Source: TNS 8.6.3 Exports (Flow H)
The UK is the largest exporter of nephrops in the world, with about half of the world trade in this species. In 2002, 14,926 tonnes (product weight) was exported at a value of £79 million. This represented 54% of total estimated products supplied to consumption and export from UK (see table 64).
UK exports of nephrops, 1993- 2002
,
2,000
4,000
6,000
8,000
10,000
12,000
14,000
16,000
1993 1994 1995 1996 1997 1998 1999 2000 2001 2002
Tonn
es Frozen
Fresh or chilled
Figure 86 UK exports of nephrops, year 1993- 2002 (data for 2001 not available) Source: FAO FISHSTAT; Figures for 2001 – 2002: DEFRA Table 62 shows that about 57% of nephrops export volumes are frozen nephrops, in a number of product forms, such as whole animals and scampi. But as much as 43% of the export volume in 2002 was exported fresh, chilled or live (called ‘not frozen’ in table 62). Since there is no available information on type of product exported, it is not possible to comment on prices achieved for the individual product types in the different markets.
MARCH 2004 Page 128

VALUE CHAIN ANALYSIS NEPHROPS
Table 62 UK exports of nephrops in 2002 (product weight, values in FOB)
Tonnes £000 £/kg Frozen: France 2,653 10,540 3.97Spain 4,135 21,926 5.30Italy 1,256 6,541 5.21Ireland 266 1,032 3.88Others 137 641 4.68Sum frozen 8,447 40,681 4.82 Not frozen: France 3,154 15 025 4.76Spain 1,648 12 041 7.30Italy 1,185 8 648 7.30Ireland 361 1 736 4.81Others 131 851 6.49Sum not frozen 6,479 38 302 5.91Total sum 14,925 78 984 5.29
Source: DEFRA The main markets for UK nephrops are France and Spain, both importing about 5,800 tonnes of nephrops from UK. France import most ‘not frozen’ products while Spain imports most frozen products. Italy follows with an import of 2,440 tonnes, evenly distributed between frozen and not frozen products. Together these three countries buy 94% of all UK nephrops exports (both by volume and value). Although not yet popular in the UK, there is a healthy demand for whole animals in France, Spain and Italy, with some live nephrops being air freighted and some exported in vivier lorries.
UK exports of nephrops by marked
Others2 %
Ireland4 %
Italy16 %
Spain39 %
France39 %
Figure 87 UK exports of nephrops by marked Source: DEFRA MARCH 2004 Page 129

VALUE CHAIN ANALYSIS NEPHROPS
According to Italian import statistics (see table 63), Italy imports 2,939 tonnes of nephrops from UK in year 2002 at a value of £15,9 million. There’s a small discrepancy between what UK export statistics say they export to Italy and what Italy say they import from UK (2,440 tonnes versus 2,939, and £14.9 million versus £15.9 million). There is no obvious explanation to this. In Italy there are only three nephrops supplying nations of any importance, these being Denmark, UK and Ireland. Of these the UK is the only one showing both growth in volume and value. Table 63 Main markets for nephrops supplied to Italy in year 2002
Tonnes £000* £/kg Denmark 4,080 28,552 7.00UK 2,939 15,919 5.42Ireland 2,917 13,067 4.48Holland 314 1,814 5.78France 184 1,155 6.28
*Average currency rates for 2002 used to change EURO into £ Source: Ismea 8.6.4 Total consumption and export situation for nephrops (IV)
Based on the information in the chapters above a summary of the UK consumption and export for the nephrops value chain is presented below. Table 64 Summary of consumption and export of nephrops (product weight,
values are sales prices)
Tonnes £000 £/kg Foodservice Sector (total) 7,715 154,300 20.00 Retail sector 5,094 42,558 8.36 Exports (values are FOB) 14,900 79,000 5.29 Total 27,709 275,858 9.96 Sources: Section 8.6.1, 8.6.2 and 8.6.3. Table 64 shows that the total volume of nephrops products that go to consumption and export (IV) is approximately 27,700 tonnes with an estimated sales value of £276 million. 54% of nephrops products (by product weight) go to export and 46% to UK consumption: 28% to the foodservice sector and 18% to the retail sector. This is a very different picture than the cod and haddock value chain, where exports represent 12% and 5% respectively. In terms of nephrops sales value (final sales price in UK), 56% is achieved in the foodservice sector, 29% from exports and 15% in the retail sector. It should be noted that value in the retail and foodservice sectors is spend by final customer, while the value of export is the value given by Customs and Excise as the product leaves UK.
MARCH 2004 Page 130

VALUE CHAIN ANALYSIS NEPHROPS
Overall value chain analysis
Detail value chain analysis – Retail sector, foodservice sector and exports, estimated flows (volume, value)
IV
Retail sector
Exports
Foodservicesector
Flow F7,700t£154.3m
Flow H14,900t£79.0m
Flow G5,100t£42.6m
ProcessingII III IVProcessing
Exports
Retail sectorFoodservicesector
Wholesaler,Trader
UK vessellandings
Imports
I
27,700t£278.9m
Figure 88 Consumption and demand picture for nephrops
MARCH 2004 Page 131

VALUE CHAIN ANALYSIS NEPHROPS
8 .7 To ta l p ic tu re – nephrops
UK vessellandings
Imports
I II III IV17,900 t 20,500 t
1,200 t
19,900 t23,700 tProcessing
The total live weight of imports and UK vessel landings is: 30,000 t
3,200 t
Exports
Retail sector
Foodservicesector
7,700t
5,100t
14,900tExports
Retail sector
Foodservicesector
7,700t
5,100t
14,900t
UK vessellandings
Imports
.I II III
IV
£60.2m
£10.8m £17.3m
£110.9m
£4.0m
£68.1m £128.2mProcessing
£42.6m
Foodservicesector
£154.3m
Value
0% loss/waste
15% weight increase
Wholesaler,Trader, Direct sales/
Export
Wholesaler,Trader, Direct sales/
Export
£79.0m
Volume
3,200 t
Retail sector
Exports
27,700 t
£275.9m
21,100 t
£72.1m
Figure 89 Total picture of the nephrops value chain for UK in 2002. Volumes are given in tonnes product weight, values in £ million. The volume/value flows have been scaled vertically to indicate the magnitude of the flows in this diagram.
Source: KPMG AS, Centre for Aquaculture and Fisheries There are a number of specific issues, which need further clarification when the total nephrops picture is presented. Based on official statistics and DEFRA figures the total supply of nephrops into UK is 21,100 tonnes (I). Based on interviews undertaken by this study, the nephrops-processing sector buy in 17,900 tonnes of raw material (II). This leaves us with a flow of 3,200 tonnes of supplied nephrops, which do not go through the processing industry. Available studies from the retail / foodservice sector (figures from TNS) and export figures by Customs and Excise show that a total of 27,700 tonnes of nephrops products are sold in UK or exported (IV). When the volumes of products leaving the processing sector (III) are added to the side stream there is a total volume of 23,700 tonnes, which can go to the UK market or export. The difference of 4,000 tonnes could arise from a number of factors, including use of different data sets (TNS, Customs and Excise), inaccuracy of yield factors and weight added in the processing sector and / or a higher supply of nephrops into the supply chain than is shown in landing statistics.
MARCH 2004 Page 132

VALUE CHAIN ANALYSIS NEPHROPS
Looking at the value of the raw materials going into the processing sector in relation to the value of the products coming out, the cost of shellfish raw materials is 54% of sales in the UK nephrops processing industry. 8 .8 P r ice ana l ys is – the nephrops va lue cha in
The intention of the study was to show the volume flows together with price information for each main product. It has not been possible to report on each main product in this level of detail. Instead the report presents some selected value chains which show the price development and value added for specific products. The price analysis is not trying to do an analysis of costs, but rather focusing on the value added. The information and prices featured in these selected value chains were collected during the interview phase and from follow up telephone interviews. Following nephrops through the value chain, from landing to retail reveals where the product assumes added value. Two main products were investigated in greater detail: frozen coated scampi and live nephrops. Example 1 UK landed tails sold as frozen coated scampi
0 1 2 3 4 5 6 7 8 9 10Purchase and sales price, £/kg product
UK vessel (tails)
Primary processor (frozen tails)
Secondary processor (frozen coated tails)
Retail (frozen coated scampi)
Figure 90 Price increments for the operators in this product chain (values in £/kg
product)
The simple price analysis undertaken here is based on information obtained through interviews with various operators in the value chain. It is important to point out that the prices referred to in figure 90 are product weight prices.
MARCH 2004 Page 133

VALUE CHAIN ANALYSIS NEPHROPS
Table 65 UK landed tails sold as frozen coated scampi in a supermarket
Operator (product sold)
Purchase price, £/kg product
Average yield1
Sales price, £/kg product
Raw material cost per kg sold, £/kg
Value added £*
% of value added
UK vessel (tails) 0.00 2.90 0.00 2.90 28.5%Primary processor (frozen tails) 2.90 96 % 3.20 3.02 0.18 1.8%
Secondary processor (frozen coated tails) 3.20 200% 5.85 1.60 4.25 41.8%
Retail (frozen coated scampi) 5.85 95% 9.00 6.16 2.84 27.9%
Sum 10.17 100.0 %*Absolute value added, based on sales price minus raw material cost per kg product sold 1Yield based on raw material taken in
The weight loss from one step in the value chain to the next is variable, and it has been possible to estimate only average yields (i.e. the percentage of product weight going out of the step in relation to the raw material entering the step in the chain). The secondary processor adds water and breading in the coating process and the yield is therefore estimated to 200% (add about 15% of water and 80% of breading). In order to arrive at an estimate of added value, the raw material price per kg sold for each operator has been calculated using the yield ratios estimated. In the case of frozen coated tails (scampi) it appears that much of the value added is created by the secondary processor and little value is created in the primary processing sector. In fact, most large processors omit this step in the value chain, and buy their raw material directly from contract vessels or auction markets and undertake the entire processing from raw material to consumer-ready product. In the retail sector, value creation is somewhat higher, but one has to consider that there may be some waste in this sector (unsold products, out-of-date products etc) for which figures were unavailable. In terms of value added, most is created by the secondary processor (here 42%) and an equal share between the vessel and the retail sector (around 28%). This study has not focused on costs in each step in the value chain, so value added is not necessarily a reflection of operators’ margins. The secondary processor will as an example have costs related to breading, which is not included in the example above. Example 2 UK landed live nephrops sold live to a restaurant in Spain For live nephrops sold to export markets, the value creation is notably different (figure 91 below). The exporter and the wholesale market (in this example in Spain) have similar mark-ups, while a much larger mark-up is used in the restaurant sector, which represents the last link in the value chain for this product. It could be the case that the amount of waste and unsold products, which have to be discarded, is much higher in the restaurant sector than in the preceding steps, and that this necessitates a high mark-up, but as mentioned before, there are high overheads involved in operating a restaurant which have to be covered by large mark-ups on the food and wine. The diner is purchasing the service of the chef and waiters, as well as the fish.
MARCH 2004 Page 134

VALUE CHAIN ANALYSIS NEPHROPS
0 2 4 6 8 10 12 14 16 18 20 22 24 26 28 30
Purchase and sales price, £/kg product
UK vessel (live nephrops)
Processor/exporter (live)
Spanish wholesale market (live)
Restaurant (live)
Figure 91 Price increments for the operators in this product chain (values in £/kg product)
An attempt was made to calculate the value added per kg nephrops in this chain, which revealed that the value added is highest closer to the customer and by the vessel. However, it should be pointed out that operating costs, investments or financial costs, for example also tend to increase in retail and catering businesses and therefore the value added does not relate to the operators’ margins.
Table 66 UK landed live nephrops sold live to a restaurant in Spain
Operator (product sold)
Purchase price, £/kg product
Average yield1
Sales price, £/kg product
Raw material cost per kg sold, £/kg
Value added £*
% of value added
UK vessel (live nephrops) 0.00 6.50 6.5 6.5 27.5 %Processor/exporter (live) 6.50 98 % 10.00 6.6 3.4 14.3 %Spanish wholesale market (live) 10.00 91 % 14.00 11.0 3.0 12.8 %
Restaurant (live) 14.00 81 % 28.00 17.3 10.7 45.4 %Sum 23.6 100.0 %
*Absolute value added, based on sales price minus raw material cost per kg product sold 1Yield based on raw material taken in
MARCH 2004 Page 135

VALUE CHAIN ANALYSIS NEPHROPS
8 .9 Ma in f ind ings nephrops va lue cha in
These findings are based on the presented data in chapter 8. This should be seen in perspective with interview findings presented in chapter 9 and the implications presented in chapter 10. Supply
Based on official landing statistics and import figures the total supply of nephrops into the UK was 21,100 tonnes of product weight or 30,000 tonnes of live weight.
Landings by UK vessels represented 94% of supply volume (by product weight) and import represented 6% (foreign vessels landed marginal volumes of this).
Average price achieved for nephrops landings by the UK fleet was £2.42 per kg live weight or £3.42 per kg product weight. The highest price was achieved in Scotland.
Approximately 40% of animals caught are tailed at sea, while 60% of the animals reach the shore as whole animals. Whole animals from UK vessels therefore represent 75% of total nephrops supply (volume by product weight) and tails from UK vessels 19%.
80% of the UK nephrops landings are landed in Scotland. Processing (based on information from interviewed companies)
The total supply of nephrops to processors was 18,000 tonnes at a purchase price of £60.2 million. Total sale from nephrops processors was 20,500 tonnes at a sales value of £111 million. Based on these figures the shellfish raw material cost represented 54% of the sales value.
The main raw materials taken in by processors are fresh tails and whole fresh animals.
The main nephrops product from processors was coated tails, representing more than 54% of the volume.
There is a weight gain in nephrops processing of 15%, this represents the difference between loss of weight due to by-products/waste and addition of weight in form of added ingredients (e.g breading). The gain is mainly due to the large proportion of coated products.
Consumption and exports
Nephrops are sold under a number of product names. Whole nephrops are often called Norway lobster, Langoustines or Dublin Bay Prawns, while processed nephrops can be sold as Norway lobster tails, or as scampi (coated tails, fresh or frozen).
Total sales volume of nephrops was 27,700 tonnes at a final sales value in the UK value chain of £276 million.
By volume 46% is sold and consumed in the UK and 54% is exported. About 40% of UK consumption was sold through the retail sector and 60% through the foodservice sector.
The bulk of exported products was frozen and had an average sales price of £4.82 per kg product (FOB prices).
Main markets for exported nephrops are Spain, France and Italy. Together these countries buy 94% of UK nephrops export.
The foodservice sector is the most important in terms of value, representing 56% of the total sales value or £154 million. Pubs and restaurants are the outlet
MARCH 2004 Page 136
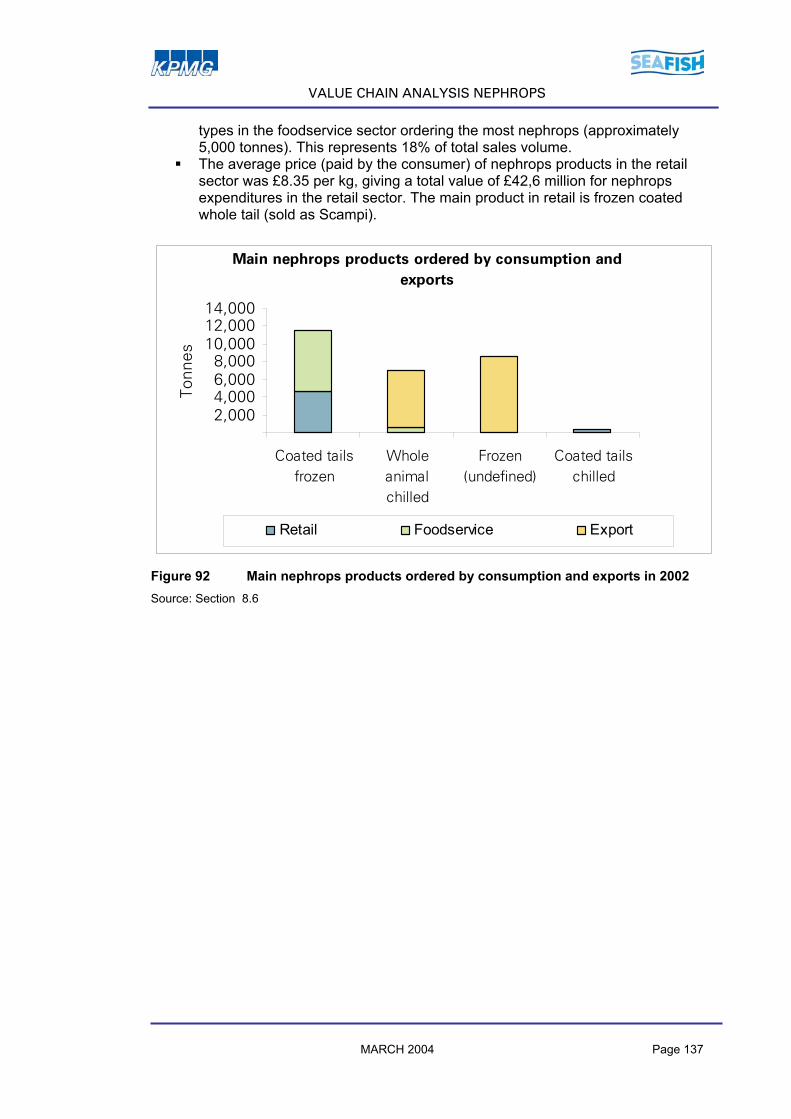
VALUE CHAIN ANALYSIS NEPHROPS
types in the foodservice sector ordering the most nephrops (approximately 5,000 tonnes). This represents 18% of total sales volume.
The average price (paid by the consumer) of nephrops products in the retail sector was £8.35 per kg, giving a total value of £42,6 million for nephrops expenditures in the retail sector. The main product in retail is frozen coated whole tail (sold as Scampi).
Main nephrops products ordered by consumption and exports
,2,0004,0006,0008,000
10,00012,00014,000
Coated tailsfrozen
Wholeanimalchilled
Frozen(undefined)
Coated tailschilled
Tonn
es
Retail Foodservice Export
Figure 92 Main nephrops products ordered by consumption and exports in 2002 Source: Section 8.6
MARCH 2004 Page 137

ISSUES OF SPECIAL INTEREST
9 . I S S U E S O F S P E C I A L I N T E R E S T
9 .1 UK land i ng p r ices compared to f i r s t hand l and ing p r ices in Norw ay
UK fishermen have claimed that the ready availability of imported fish has depressed the overall market price and reduced the value of UK landed fish. In order to throw some light on this issue, the situation in Norway has been analysed by KPMG as a comparison. In 1938, the fishermen in Norway established their own sales organisation in the northern part of Norway – The Norwegian Raw Fish Organisation - for the purpose of selling fish and seafood at optimal, but stable prices. Later on, other sales organisations for mackerel, herring and other species in the southern part of Norway were established, but the Norwegian Raw Fish Organisation is still the most important sales organisation for cod and other similar species. The Norwegian Raw Fish Organisation operates in accordance with the Norwegian Fisheries Act (The Raw Fish Law). In terms of species, the organisation sells mainly cod, coalfish, haddock and shrimps/prawns caught in the Barents Sea, around Svalbard (Spitzbergen) and along the Norwegian coast. It sells annual catches from approximately 6,100 fishing vessels of various sizes to around 270 buyers. In 2002, the Norwegian Raw Fish Organisation sold 585,000 tonnes (live weight) at a first hand value of £486 million. Sales are based on a minimum price system. Transactions may also occur through different types of contract sales and auctions. Based on a contract note between the fisherman and the first hand buyer, the Norwegian Raw Fish Organisation guarantees that settlement is paid no later than 30 days after the contract is signed. The contract note at first hand is also the basis for the detailed and useful statistics made by organisations and public authorities. These statistics are compiled weekly, monthly and yearly and show volumes and prices per species. Table 67 Total landings of cod and haddock into Norway in 2002
Species Tonnes live weight
First hand price £/kg
Cod 226,814 1.05 Landed by Norwegian vessels
Haddock 53,979 0.84 Landed by foreign vessels
Cod and comparable species1)
156,169 0.89
1) Mainly cod and haddock Source: The Norwegian Directorate of Fisheries In 2002 the Norwegian and foreign fishing fleet landed about 437,000 tonnes (live weight) cod and haddock at a total value of £423 million into Norway. The average price at first hand (per kg live weight) of cod landed by Norwegian fishing fleet was £1.05 per kg, and for haddock £0.84 per kg.
MARCH 2004 Page 138

ISSUES OF SPECIAL INTEREST
In the diagrams below landings (tonnes and prices at first hand) of cod and haddock from 1999 to 2002 are shown. The Norwegian landing prices (originally in NOK) are recalculated to £ sterling based on average exchange rates.
Landings of cod in Norway 1999-2002
0
50 000
100 000
150 000
200 000
250 000
300 000
1999 2000 2001 2002
Tonn
es li
ve w
eigh
t
0,960,9811,021,041,061,081,1
£
Landings (byNorwegian vessels)Prices per kg liveweight
Source: The Norwegian Directorate of Fisheries
Figure 93 Landings of cod from Norwegian vessels at first hand in Norway 1999-2002
Landings of haddock in Norway 1999-2002
40 00042 00044 00046 00048 00050 00052 00054 00056 000
1999 2000 2001 2002
Tonn
es li
ve w
eigh
t
0,80,820,840,860,880,90,920,94
£
Landings (byNorwegian vessels)Prices per kg liveweight
Source: The Norwegian Directorate of Fisheries
Figure 94 Landings of haddock from Norwegian vessels at first hand in Norway 1999-2002
As can be seen from the figures, the Norwegian landings of cod were 250,000 tonnes at an average price of £1.05 per kg live weight. In comparison, UK landings by UK fleet were 26,000 tonnes at an average price of £1.36 per kg live weight in 2002. Thus, the fish landed in UK obtained a higher price, but the difference in landing volumes could be a factor, Norway having ten times higher cod landings than the UK fleet. For haddock the situation between Norway and the UK is similar in year 2002. Norwegian landings of haddock were 55 000 tonnes at an average price of £0.84 per kg. The fish landed in the UK by UK vessels in the same period amounts to 52,000
MARCH 2004 Page 139

ISSUES OF SPECIAL INTEREST
tonnes at an average price of £0.79 per kg. There is no specific information about fish sizes, but the fish landed in Norway on average is of a larger size than the UK landed fish. This might be part of the reason for the better price achieved in Norway. 9 .2 Hab i ts and reasons fo r raw mate r ia l purchases o f cod and
haddock – w i th spec ia l focus on w ha t happens to the f i sh l anded by UK f i sh ing vesse ls
In interviews with the processing sector companies were asked about their raw material preferences, and why they preferred the raw materials from the sources they use. This section presents comments related to purchasing decisions and the reasons for these. Other than further questioning in interviews, no attempts were made to evaluate whether opinions are reasonable. Seafish also wanted to focus especially on what happens to the fish landed by the UK vessels. This section explains the main channels to the market for the UK landed cod and haddock. 9.2.1 General comments
Almost all processors give several reasons for their choice of raw materials supply. The recurring reasons stated as most important are; price, size, quality and the continuity of delivery/reliability of the supplier. Consistency in quality and continuity of supplies Several processors state that the consistency of supply is better from foreign sources and that this is the reason why they tend to rely on imported fish instead of domestically landed fish. This is especially the case for cod. Guaranteed sizes and availability is important. Fish size Generally, many state that the UK landed fish is smaller than the imported (especially for haddock, but also for cod). Since the size of raw material is often an important factor in production, flexibility and ability to meet volumes within specified size ranges are important factors in choosing supplier. Many say that this favours foreign suppliers. Fishing method Several of the processors say they prefer the line caught fish to trawled fish because of quality. Others say that on-board handling is more important than the fishing method. As one processor stated; line caught fish should be better, but trawling can also yield quality fish if handled correctly, just as line caught fish can be badly treated once on board and end up having poor quality. Handling of raw materials on board the fishing vessels. Some processors stated that vessels that store fish in bins rather than boxes give poorer quality fish, as a result of too much pressure on the fish at the bottom. The fact that many now are landing lighter boxes has helped a lot on the quality. Fish at the bottom is then still good quality. Another comment is that mechanical gutting at sea reduces the quality of fresh Scottish fish, reduces the yield and results in more “ripped” fish. Handling of raw materials at markets/ in the distribution chain
MARCH 2004 Page 140

ISSUES OF SPECIAL INTEREST
Several have mentioned the issue of chilling at markets/auctions. They say the raw material is not properly chilled, but are also saying that some auction markets have made vast improvements to this. Proper cooling in the whole distribution/logistics chain improves quality. Some state that the foreign (Norwegian) companies tend to be better at this than UK companies. Buying from auction or on contract Some processors report that they prefer to buy from auction market because it is a more transparent system. It also allows for exploiting short-term opportunities in the raw material market. Others again very much prefer contract based buying in order to ensure their supplies and get fixed raw material prices. Fluctuations in raw material price often have to be covered by the processing sector since their sales prices often are difficult to change. They say they are mainly importing raw materials since they need and want fixed prices on raw materials and cannot get this in the UK market. Sustainability of fishing stocks Several processors mention the issue of sustainability of stocks and some say they use no UK raw materials due to the question of sustainability. See chapter 10 for a further discussion of this. Traceability For many of the big processors (mainly secondary) supplying the retail sector, the issue of transparency of supply routes is essential. They need a certain degree of traceability (aiming for full traceability) and some form of quality management. The issue of sustainability of fish populations is also important together with size and price. They prefer the suppliers who have clear strategies and involvement with the catching sector and some of them like to be able to have a dialogue with the fishermen through the primary processors they buy from. Some processors say they would prefer to buy from vessels on a contract basis, rather than from the open market on an anonymous basis. Market focus in the UK fleet One statement was made by a processor saying that other countries’ fleets are more used to being more exposed to the market. Other countries seem to have more vertical integration between catching and primary processing and this enables the vessels to have a closer contact with the market and the consumer. Furthermore, it is said that the UK does not have strong businesses in the catching sector and that the POs do not market the fish properly; they do not co-operate in groups of vessels to give a consistent supply in order to meet specifications for products. It is claimed that this is done to a greater extent by some of the countries where the main import volumes come from. 9.2.2 Haddock
UK vessels declared landings of 51,863 tonnes of haddock into UK in year 2002. Most of this volume is sold through the markets/auctions. As chapter 7 states, UK landings make up 46% of haddock supply into UK (percent of product weight), and is therefore an important source of raw materials for UK processors. Preference for UK landed haddock
MARCH 2004 Page 141
Most of the companies interviewed for this project reported that they prefer UK landed haddock due to the fact that they prefer smaller fish sizes and that the UK landings provide this. Many of the processors interviewed find the imported fish too big (for

ISSUES OF SPECIAL INTEREST
example Norwegian haddock). Some also said they buy Scottish haddock due to tradition. It was also mentioned by one processor that some supermarkets preferred to avoid Faroese fish because of protests from environmental campaigners about the Faroese whale hunt. Market channels for haddock landed by the UK fleet The companies that prefer UK landed haddock produce mostly fillets; natural, smoked or frozen. It is mostly primary processors and not so many secondary/mixed processors who say they prefer UK landed fish. However, the data indicate that the larger processors very often have most of their supplies from imports, and that UK landed fish is used to fill the balance. Preference for imported haddock The processors who prefer imported haddock also do so because of the sizes available. They find the UK landed haddock too small and therefore they have to use imported raw materials. Other arguments include the detail in grading systems for the fish. One example is a preference for Danish haddock because of the size specifications; they use grades 1-5, compared to grade 1-4 used in the UK. Grade 5 is a smaller grade and as a result the Danish size ranges are more predictable and give a more uniform grading for the smaller fish sizes. Some also say they prefer on-board graded fish, a method the Norwegian vessels use and the UK vessels do not. Some of the processors who import raw materials say this is due to the quality. They generally find foreign haddock of better quality than the domestic supply. Others say they find the domestic fish better because it is fresher compared to for example the containers coming from Iceland. Statements have also been made about shelf life, and that it differs between UK and foreign raw materials. They find that the availability of volumes and consistency from UK suppliers is not adequate, and claim that imported fish meet their specifications more reliably. Two processors stated they use mostly imported raw material since their main product is smoked fillet. They find that haddock frozen at sea, headed & gutted, is the best raw material for this and that only foreign vessels have the ability to meet their needs. However, they would very much like this kind of agreements with UK vessels as well. Two processors also report that they do not find UK prices and quality as good as Norwegian, but better than Icelandic.
MARCH 2004 Page 142
9.2.3 Cod
UK vessels landed 25,740 tonnes of cod into the UK in year 2002. As presented in chapter 6, the UK landings make up 15% of cod supply into the UK (% of product weight), and are therefore not the most important source of raw materials for UK cod processors. This is an important difference compared to haddock, since most processors have to import in order to meet their volume needs. Most companies processing cod use both domestically landed and imported raw material. The larger processors often want significant quantities and state that they therefore use imports as a main source and rather top up with some domestic fish. This is primarily due to the need for reliability and consistency of supplies. Many of the same arguments for choice of supply source of haddock are also used for cod.
ISSUES OF SPECIAL INTEREST
Preference for UK landed cod The preference for UK landed cod is normally found in the smaller primary processors who do not process large volumes. One processor claims that UK landed fish is firmer, stronger, and fatter and is a better quality fish. The same source says that Faeroese fish is softer by comparison. Another processor supported this by saying the Faeroese fish has a different texture. Market channels for cod landed by the UK fleet Based on the data collected in this study, it is difficult to identify the destinations of all of the UK landed cod, though it appears that it is used mostly in fresh products. Primary processors and some mixed processors make fresh fillets, loins and cuts. These products mainly seem to go either to the foodservice sector (including fish and chip shops) and/or fishmongers, with smaller volumes to multiple retailers. Wholesalers often serve as the link between the primary processor and the foodservice sector, trading the fresh products further on in the value chain. Preference for imported cod As mentioned before, the available volume in the market is the most important reason why the companies select imported raw material. Companies cannot obtain their needed raw materials from domestic landings alone. Some processors who mainly buy blocks say they do not use any UK raw material. This because the availability of UK fish is inadequate and the fish is therefore used for fresh products instead. Use of the Internet and e-mail has made it far easier to trade with foreign sources. Specifications and even images of fish are used in trade, and with electronic communications this is not a problem even when dealing with i.e. a Chinese supplier. Many have started to import cod from China, most of them saying this is at the expense of other countries (mainly Norway). Chinese quality and hygiene is very good and reliable. Many who are buying blocks state this is the cheapest alternative, and this is what has stimulated the import of double-frozen products from China. Some processors say they can get guarantees on short supply chains on products from abroad, being supplied by vessels that land fish every or every other day. They then have a close relationship with importing companies in Iceland and get the raw material flown into the UK. This helps them to be able to ensure high quality on the fresh products and these products end up being sold as fresh products at a very high price in selected supermarkets Others again say there is no substantial difference between UK and imported raw material, or that local fish is fresher and is probably the best product available. 9.2.4 Marks and Spencer Conservation Haddock Scheme
This Marks and Spencer conservation haddock scheme is included as an example of changes currently taking place in the industry in response to some of the driving-forces outlined previously:
MARCH 2004 Page 143

ISSUES OF SPECIAL INTEREST
The purpose of the project initiated by Marks and Spencer, in association with Cavaghan and Gray (supplier to Marks and Spencer) and Seafood Scotland, has been to develop a conservation grade haddock for sale in Marks and Spencer stores. As part of their social responsibility commitment to their stakeholders, Marks and Spencer are making every effort to source raw material from a sustainable source. Marks and Spencer want to be sure that the haddock they are sourcing from Scottish fishing vessels is caught using methods which minimise the by-catch of cod. In the long term this would enable Marks and Spencer to ‘badge’ and market their haddock products as being sustainable. The project started in summer 2003 and is expected to continue for 18 months. The conservation haddock scheme is also promoting quality standards on board those fishing vessels that supply Cavaghan and Gray. With this in mind the project has involved the establishment of a quality benchmarking system by Cavaghan and Gray, whereby haddock coming into the factory is assessed for quality against the overall standards of supplies received by the factory. This ensures that Marks and Spencer are able to sell a sustainable quality product from Scotland. Information on the skippers supplying haddock into Marks and Spencer has also been collected which can be used to reference raw material sources but also for marketing purposes. Marks and Spencer have been pleased with the project results to date and wish to make Scottish haddock an “icon” product in their stores, and to substantially increase their uptake of Scottish haddock through Cavaghan and Gray. This requires a quality standard scheme being implemented on all vessels supplying haddock to Marks and Spencer via Cavaghan and Gray. To date around 10 vessels are committed to participating in the project. 9 .3 Was te hand l ing and b y-p roduc t u t i l i sa t ion
This study has focused on the primary products of fish. Prices and volumes of fish-waste (hereafter called by-products) have not been investigated in this report. Quantities of by-products produced in UK and opportunities for better utilisation of these are fully described in a report conducted by Sea Fish Industry Authority: “Fish Waste Production in the United Kingdom” (2001). This section therefore only outlines the most important conclusions from this report and in addition include some comments from the interviews conducted in relation to this study. Cod, haddock and nephrops are to some extent processed at sea before the catch is landed. The by-products from cod and haddock consist of guts, liver and other viscera, which are removed during the gutting operation. The by-products from nephrops consist of head, shell and claws in addition to whole animals (the latter applies to both nephrops and fish). Whole animals may be discarded at sea because of undesirable size, being wrong specie by-catch etc. Most of the by-products “produced” on board are discarded at sea. Seafish has estimated the by-product production from the fleet at sea at 45,800 tonnes (37,000 tonnes from demersal species and 8,800 tonnes from nephrops). There should be a potential for reducing the by-catch at sea and/or utilising those by-products that are produced but reduction in by-catch might require a change in fishery management rules. The great majority of fish and shellfish processing operations are carried out in shore-based processing facilities. The amount of by-products varies according to the species
MARCH 2004 Page 144

ISSUES OF SPECIAL INTEREST
being processed, type of raw material supplied and the type of product being produced. The most important by-products from processing of cod and haddock are head (cheeks, tongues), backbone, fins, fillet trimmings and skin. Some of these, like tongue and cheeks may be sold directly as products for human consumption. Fish-mince is also produced from trimmings etc. The majority of seafood by-products are utilised for fishmeal and fish oil production. Much smaller quantities are used in pet food production. The most important by-product from production of nephrops is shell. In 2001, Seafish estimated that the on-shore processing sector produced a total of 301,037 tonnes of seafood by-products. Of this, 250,768 tonnes was produced by the demersal and shellfish sectors. Some processors have stated in interviews that by-products represent an important area for improvement, with possibility of increased profitability for the industry. Increased profitability in the land-based industry is closely connected to the industry’s ability to optimise production processes. Optimising production processes is again closely linked to processing yield or the proportion of “primary products” the processor is able to produce. Minimising the amount of by-products is therefore another way of looking at increased profitability. The next step is to maximise the utilisation of the edible by-products of fish and shellfish. The edible by-products are roe, liver, fish mince, tongues, cheeks, fins, fish heads, fish stomachs, and so on. Some of these products are sold in the UK market or exported. Still, the indication is that most of the edible by-products are not directly utilised for food, but for fishmeal and fish oil production. To achieve better prices on by-products it is necessary to maximise the amount of by-products used for direct human consumption. The most important markets for such edible by-products are probably not in the UK but in other parts of the world, like Africa or South East Asia, were they have a tradition for utilising edible by-products directly. There are obvious implications regarding cost of transport for these markets however. Major products based on by-products from the processing industry are fishmeal and fish oil production, and only small amounts of by-products are utilised for other purposes such as pet food. The prices for the by-products going to fishmeal and fish oil are generally low. The prices for pet food may either be low or non-existent. Some processing plants have to pay to get rid of by-products. There are three fishmeal and fish oil plants in the UK and for those processors located some distance from these plants, the transport costs are higher than the price paid for the by-products. The main market for fishmeal and fish oil is feedstuff production – the feed is used mainly in agriculture or aquaculture. From by-products it is also possible to produce silage, fish protein hydrolysate and fish protein concentrate for the same market. There is currently an issue with generally low and fluctuating prices in the feedstuff market and legal issues preventing the use of some animal proteins, currently including fish, back into the food chain. This is still an important market because of the large volumes of by-products that can be utilised in this sector.
MARCH 2004 Page 145
By-products from nephrops contains chitin/chitosan and carotenoid pigments. Chitin/chitosan are industrially manufactured from shellfish by-products, the main producers being Japan and the USA. Chitosan has many commercial uses within water-treatment, cosmetics, food ingredients and pharmaceutical industries. Charotenoid pigments are a group of pigments, which give fish and shellfish their red and pink colouring. In feedstuff for aquaculture such production pigment is an important ingredient.

ISSUES OF SPECIAL INTEREST
It is possible to utilise a larger portion of the by-products as marine ingredients in foodstuff, healthy/functional foods, pharmacy, cosmetics etc. The products are often high technology products with high value, and development and production require close interaction with the market players – in most cases multinational enterprises. Important criteria for success in the marine ingredients industry are extensive research and development of commercial applications, long-term capital investment and market relations. The main impression of the UK seafood industry is that the industry has not been putting much effort in to developing alternatives to the fishmeal and fish oil market. In other countries, such as Norway, the seafood industry and the government have been subsidised work with alternative markets for by-products for 15 years. This work has been done through the RUBIN Foundation with the aim to increase the value of seafood by-products.
MARCH 2004 Page 146

FINDING AND IMPLICATIONS
1 0 . F I N D I N G S A N D I M P L I C A T I O N S
10 .1 In te rac t ions and f ramew ork in the va lue cha in
The increased market share of multiples in overall seafood turnover has had a significant impact on the UK seafood value chain. Among the most important trends is the increased customer/market focus throughout the value chain. The fact that products are being channelled through fewer and larger multiples has lead to a shift of influence in the value chain towards the market. This has lead to increased demands and awareness of matters such as quality, traceability, continuity of supply and the need for uniform raw materials for high volume processing. Multiples require that suppliers have a broad spectrum of products available for sale in order to do business with them. The concentration of bargaining-power with fewer and larger players has also led to increased pressure on margins throughout the value chain. The implications are felt in every step of the value chain from processors to fishing fleet. Increased quality requirements and the demand for suppliers to secure continuity in their supply have also raised the barriers for new entrants in the seafood value chain. This development is seen primarily with products sold into the retail sector. The foodservice sector also represents a significant share of the seafood market, and the foodservice industry is still fragmented with a large number of smaller outlets. This may imply that the demands of large buyers have not yet induced the same pressure on margins in the supply chain as is observed within the retail sector. However, there is reason to believe that a similar development towards consolidation and increased pressure on margins throughout the supply chain of the foodservice sector will take place. Consumer preference is becoming a key driving factor for development in the entire value chain. Increasingly, consumer preference has an impact in business areas upstream in the value chain. Customer perceptions are not always based on facts, and it is clear that the industry has an increased need to develop communication channels into the consumer segments and remain market focused. In addition, the larger companies in the retail and foodservice sector have their own interpretation of consumer preferences. Thus, these companies may have tight risk management policies imposing strict food safety and quality requirements on suppliers in order to minimise risk of negative publicity. Suppliers must meet these requirements regardless of their actual necessity. There is an overall perception in the industry that the market for seafood has substantial growth potential in the UK. The market (in terms of value) can be expanded through increased market share compared to other nutrients, or higher prices achieved on existing volumes:
MARCH 2004 Page 147
Increased consumption volume compared to other nutrients - The potential for growth can be realised through product diversification or increased consumption of existing products. Some players have stressed the importance and need to “educate” consumers to choose new products and expand into higher value quality/exotic products. Increased market share of seafood will necessarily come at the expense of other nutrients/protein sources, if population growth is neglected and total food consumption per capita is assumed constant. Seafood has several competitive advantages in a marketing perspective as a healthy and natural nutrient in a market with increasing awareness towards healthy products.
FINDING AND IMPLICATIONS
Higher prices on existing volumes – Another form of growth can occur if total
expenditure is increased on a fixed volume of sold products sold. The average price on sold volumes can increase as a consequence of a shift towards more high quality, convenient, expensive products. An increase in chilled/fresh fish market segment is an example that can be observed today.
Increased competition from twice-frozen products (mostly primary processed) from low-cost countries is also changing the face of the domestic industry. The competition is felt by primary processors and to some extent the UK fishing fleet. The foreign products are hand-processed in such countries as China, giving a higher yield in filleting at an overall lower processing cost per kg of fillet. New developments in hygiene standards and freezing technology makes the quality difference between foreign-processed and domestic-processed frozen raw material negligible. The Chinese processors have achieved superior hygiene and quality control standards to gain entry into foreign markets such as in the UK. As a result, the UK processors face an increasingly tough competitive environment on product quality and price in the frozen products sector. This has to some extent resulted in a shift of focus by primary processors toward the fresh/chilled sector to remain profitable and to take advantage of the short distance to market. The market for chilled products is on the rise, but is still a relatively moderate market. Because of this, competition in the chilled market has also increased. Other European whitefish exporters such as Norway and Iceland also expose the chilled seafood sector to competition. Furthermore, the discussion regarding the issue of waste handling and by-product utilisation has shown a significant potential for improvement in the UK industry. Currently, most of the by-products that are utilised go to fishmeal or fish oil production with low and unstable prices. Fishmeal and fish oil is primarily used in feed production for agriculture and aquaculture and this sector can utilise large volumes of marine by-products. However, there are few processing plants that accept by-products and this makes it costly to transport the by-products for processing. To achieve an overall better utilisation of by-products and better profitability in doing so, it is essential to focus on product development and to have focus on by-product handling, storage and transportation throughout the value chain. The primary objective should be to reduce the overall percentage of by-products and to maximise the yield in terms of primary products from the raw material. Secondly, processors should maximise the volume processed for human consumption to raise the value of some the by-products that remain (heads, cheeks, tongue, liver, roe, stomachs). There is also a high value potential for by-product utilisation in marine ingredients for foods, cosmetics, medicine etc. This opportunity can in most cases only be exploited through intensive research and product development. 10 .2 Imp l i ca t ions fo r s takeho lders
10.2.1 Implications for private businesses
The UK fishing fleet - The increased influence and quality requirements of the multiple retail sector implies increased focus on the quality and handling of the raw material on board vessels and after landing in the UK is needed in order to remain competitive. The larger multiples are also concerned that their supply is harvested in an environmentally sustainable way. This is closely related to public perception of the sustainability of UK quotas in relation to UK fish populations, as well as a clear understanding of catching MARCH 2004 Page 148

FINDING AND IMPLICATIONS
methods with respect to by-catch and size grading during harvest. It is becoming increasingly important for the UK fleet that the UK landed fish is perceived in the market as environmentally sustainable and being of high quality. This is not the case at present. One way to achieve this is a co-ordinated strategy to improve operations with respect to these issues- compliance with fishery rules must be seen to be good. This will raise the need for modernisation of the fleet and improvement of catch handling methods. There is also a need for a joint market effort, or introduction of certification standards that are marketed to consumers to make improvements visible in the market. There seems to be a significant potential for better c-ordination and co-operation in the UK catching sector to have a stronger influence in the seafood industry and with government on fishery management issues. The UK catching sector has an advantage in its proximity the end market. In order to exploit this, it is necessary to offer a fresher, better quality product to compete with imported raw material. The price must also be competitive in relation to the quality of the raw material. Premium quality raw material will likely be better paid. To achieve this implies that catching methods, catch handling, logistics and chilling during transport must be optimised and well co-ordinated. Additional comments relating to the UK nephrops fleet – The UK nephrops fleet does not face the same competition from extensive volumes of imported raw materials like the UK whitefish fleet. UK imports of nephrops are marginal and exports have been increasing over the last 10 years. The main form of competition may be related to substitute products for nephrops. Shrimp and prawns are traded in increasing volumes in the international seafood market, and aquaculture is perhaps the main driver behind this development. Prawns available around the year and at relatively low prices could be a threat to the market for nephrops.
MARCH 2004 Page 149
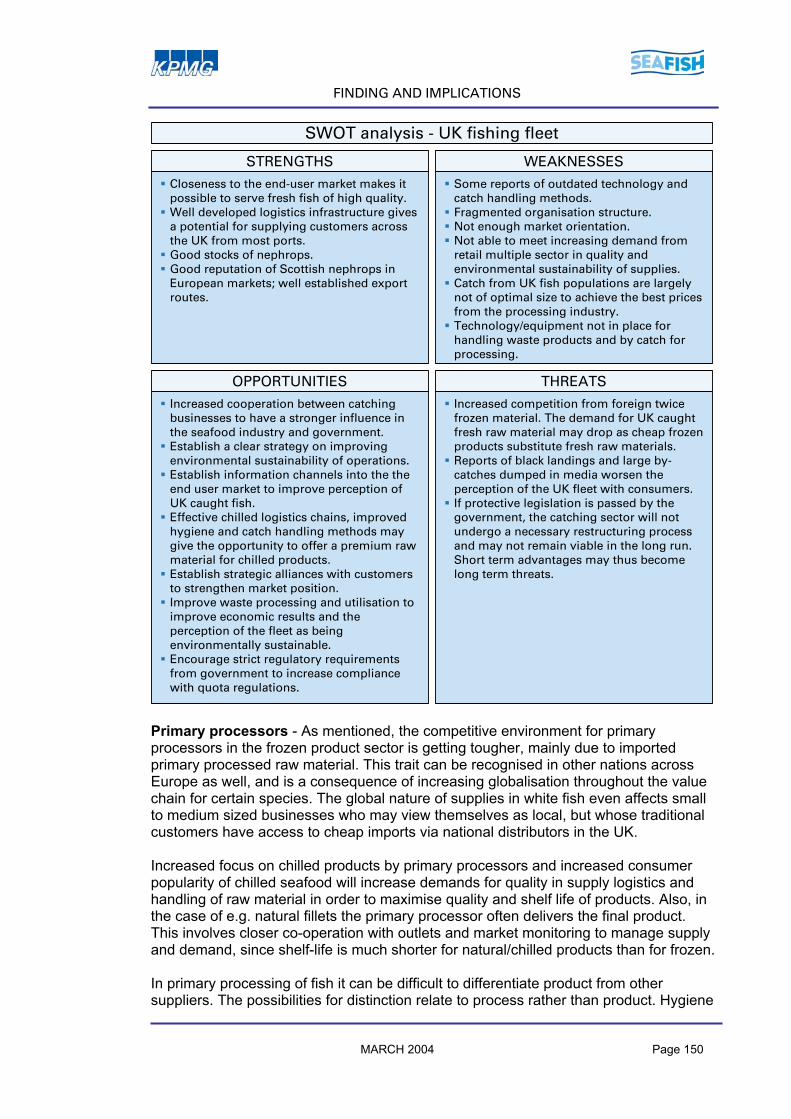
FINDING AND IMPLICATIONS
Closeness to the end-user market makes it possible to serve fresh fish of high quality.Well developed logistics infrastructure gives a potential for supplying customers across the UK from most ports.Good stocks of nephrops.Good reputation of Scottish nephrops in European markets; well established export routes.
STRENGTHS
Some reports of outdated technology and catch handling methods.Fragmented organisation structure.Not enough market orientation.Not able to meet increasing demand from retail multiple sector in quality and environmental sustainability of supplies.Catch from UK fish populations are largely not of optimal size to achieve the best prices from the processing industry.Technology/equipment not in place for handling waste products and by catch for processing.
WEAKNESSES
Increased cooperation between catching businesses to have a stronger influence in the seafood industry and government.Establish a clear strategy on improving environmental sustainability of operations.Establish information channels into the the end user market to improve perception of UK caught fish.Effective chilled logistics chains, improved hygiene and catch handling methods may give the opportunity to offer a premium raw material for chilled products.Establish strategic alliances with customers to strengthen market position.Improve waste processing and utilisation to improve economic results and the perception of the fleet as being environmentally sustainable.Encourage strict regulatory requirements from government to increase compliance with quota regulations.
OPPORTUNITIES
Increased competition from foreign twice frozen material. The demand for UK caught fresh raw material may drop as cheap frozen products substitute fresh raw materials. Reports of black landings and large by-catches dumped in media worsen the perception of the UK fleet with consumers.If protective legislation is passed by the government, the catching sector will not undergo a necessary restructuring process and may not remain viable in the long run. Short term advantages may thus become long term threats.
THREATS
SWOT analysis - UK fishing fleet
Primary processors - As mentioned, the competitive environment for primary processors in the frozen product sector is getting tougher, mainly due to imported primary processed raw material. This trait can be recognised in other nations across Europe as well, and is a consequence of increasing globalisation throughout the value chain for certain species. The global nature of supplies in white fish even affects small to medium sized businesses who may view themselves as local, but whose traditional customers have access to cheap imports via national distributors in the UK. Increased focus on chilled products by primary processors and increased consumer popularity of chilled seafood will increase demands for quality in supply logistics and handling of raw material in order to maximise quality and shelf life of products. Also, in the case of e.g. natural fillets the primary processor often delivers the final product. This involves closer co-operation with outlets and market monitoring to manage supply and demand, since shelf-life is much shorter for natural/chilled products than for frozen. In primary processing of fish it can be difficult to differentiate product from other suppliers. The possibilities for distinction relate to process rather than product. Hygiene MARCH 2004 Page 150
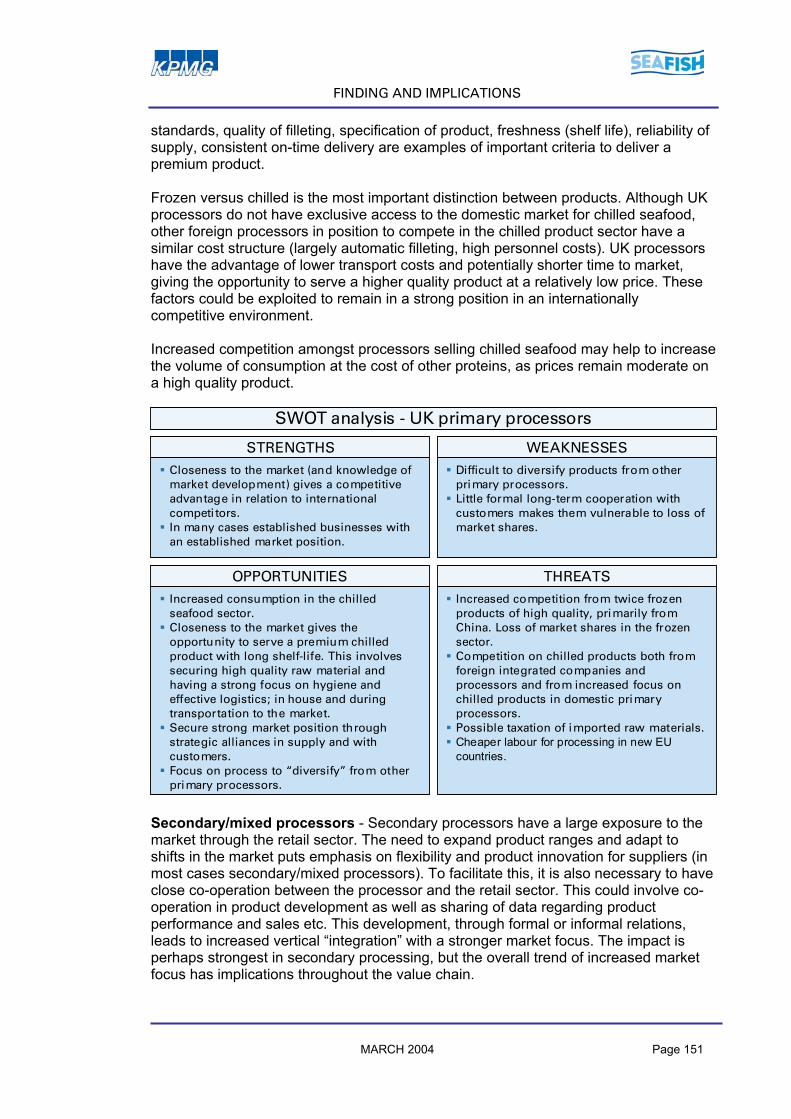
FINDING AND IMPLICATIONS
standards, quality of filleting, specification of product, freshness (shelf life), reliability of supply, consistent on-time delivery are examples of important criteria to deliver a premium product. Frozen versus chilled is the most important distinction between products. Although UK processors do not have exclusive access to the domestic market for chilled seafood, other foreign processors in position to compete in the chilled product sector have a similar cost structure (largely automatic filleting, high personnel costs). UK processors have the advantage of lower transport costs and potentially shorter time to market, giving the opportunity to serve a higher quality product at a relatively low price. These factors could be exploited to remain in a strong position in an internationally competitive environment. Increased competition amongst processors selling chilled seafood may help to increase the volume of consumption at the cost of other proteins, as prices remain moderate on a high quality product.
Closeness to the market (and knowledge of market development) gives a competitive advantage in relation to international competitors.In many cases established businesses with an established market position.
STRENGTHS
Difficult to diversify products from other primary processors.Little formal long-term cooperation with customers makes them vulnerable to loss of market shares.
WEAKNESSES
Increased consumption in the chilled seafood sector.Closeness to the market gives the opportunity to serve a premium chilled product with long shelf-life. This involves securing high quality raw material and having a strong focus on hygiene and effective logistics; in house and during transportation to the market.Secure strong market position through strategic alliances in supply and with customers.Focus on process to “diversify” from other primary processors.
OPPORTUNITIES
Increased competition from twice frozen products of high quality, primarily from China. Loss of market shares in the frozen sector.Competition on chilled products both from foreign integrated companies and processors and from increased focus on chilled products in domestic primary processors.Possible taxation of imported raw materials.Cheaper labour for processing in new EU countries.
THREATS
SWOT analysis - UK primary processors
Secondary/mixed processors - Secondary processors have a large exposure to the market through the retail sector. The need to expand product ranges and adapt to shifts in the market puts emphasis on flexibility and product innovation for suppliers (in most cases secondary/mixed processors). To facilitate this, it is also necessary to have close co-operation between the processor and the retail sector. This could involve co-operation in product development as well as sharing of data regarding product performance and sales etc. This development, through formal or informal relations, leads to increased vertical “integration” with a stronger market focus. The impact is perhaps strongest in secondary processing, but the overall trend of increased market focus has implications throughout the value chain.
MARCH 2004 Page 151
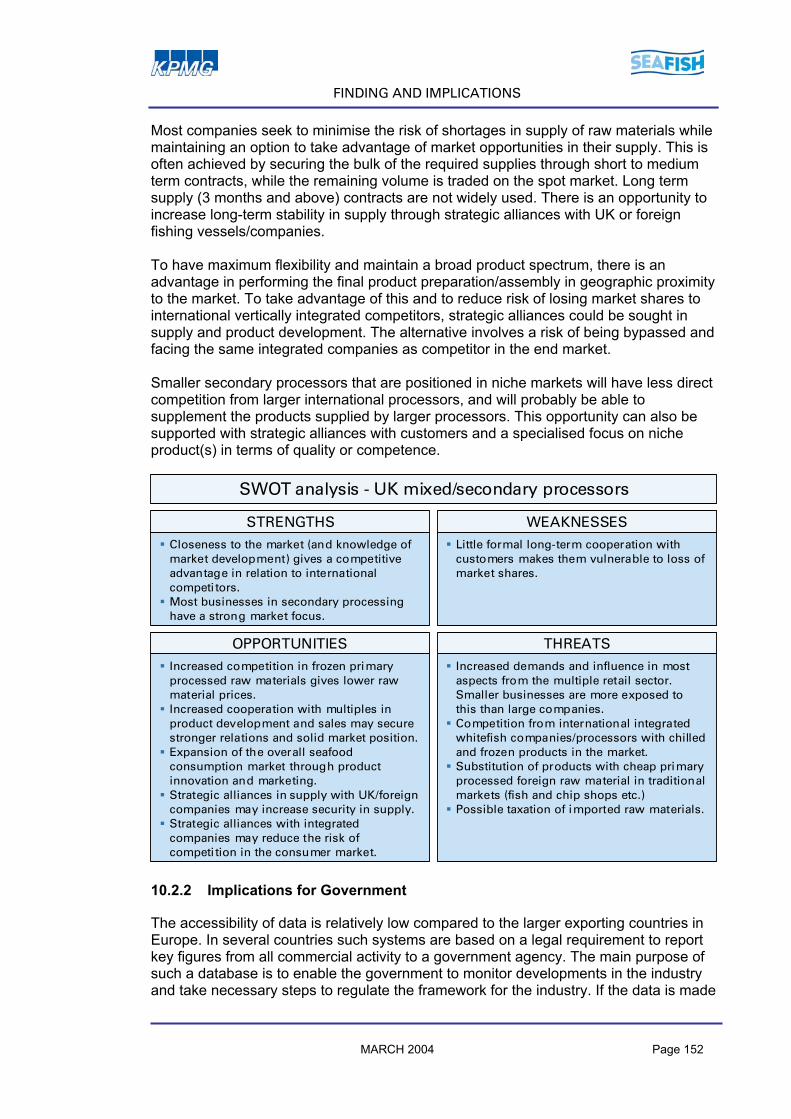
FINDING AND IMPLICATIONS
Most companies seek to minimise the risk of shortages in supply of raw materials while maintaining an option to take advantage of market opportunities in their supply. This is often achieved by securing the bulk of the required supplies through short to medium term contracts, while the remaining volume is traded on the spot market. Long term supply (3 months and above) contracts are not widely used. There is an opportunity to increase long-term stability in supply through strategic alliances with UK or foreign fishing vessels/companies. To have maximum flexibility and maintain a broad product spectrum, there is an advantage in performing the final product preparation/assembly in geographic proximity to the market. To take advantage of this and to reduce risk of losing market shares to international vertically integrated competitors, strategic alliances could be sought in supply and product development. The alternative involves a risk of being bypassed and facing the same integrated companies as competitor in the end market. Smaller secondary processors that are positioned in niche markets will have less direct competition from larger international processors, and will probably be able to supplement the products supplied by larger processors. This opportunity can also be supported with strategic alliances with customers and a specialised focus on niche product(s) in terms of quality or competence.
Closeness to the market (and knowledge of market development) gives a competitive advantage in relation to international competitors.Most businesses in secondary processing have a strong market focus.
STRENGTHS
Little formal long-term cooperation with customers makes them vulnerable to loss of market shares.
WEAKNESSES
Increased competition in frozen primary processed raw materials gives lower raw material prices.Increased cooperation with multiples in product development and sales may secure stronger relations and solid market position.Expansion of the overall seafood consumption market through product innovation and marketing. Strategic alliances in supply with UK/foreign companies may increase security in supply.Strategic alliances with integrated companies may reduce the risk of competition in the consumer market.
OPPORTUNITIES
Increased demands and influence in most aspects from the multiple retail sector. Smaller businesses are more exposed to this than large companies.Competition from international integrated whitefish companies/processors with chilled and frozen products in the market.Substitution of products with cheap primary processed foreign raw material in traditional markets (fish and chip shops etc.)Possible taxation of imported raw materials.
THREATS
SWOT analysis - UK mixed/secondary processors
10.2.2 Implications for Government
The accessibility of data is relatively low compared to the larger exporting countries in Europe. In several countries such systems are based on a legal requirement to report key figures from all commercial activity to a government agency. The main purpose of such a database is to enable the government to monitor developments in the industry and take necessary steps to regulate the framework for the industry. If the data is made
MARCH 2004 Page 152
FINDING AND IMPLICATIONS
accessible through official statistics (on a regular and frequent basis), the increased availability of data will make the industry more transparent. Transparency implies a better base for executive decisions in the industry. It may also serve as a catalyst for increased operational diversification into niche markets in contrast to most companies responding to the same overall trends in the competitive environment in a similar way. Monitoring the commercial activity at all stages of the value chain may also serve as a means to monitor compliance with fishing quotas and size restrictions in the catching sector. A reliable control method to prevent illegal landings and catching will help improve the competitive situation for the UK catching sector. The UK landings will then have a clear profile of being well-managed and environmentally sustainable. This may improve the preference for UK landed fish significantly with the major domestic customer groups. This study provides an overview of the supply situation into the UK for the selected species. The relation between import and UK landings is made clear, and the importance of imports in the value chain is illustrated. The balance illustrates the possible difficulties that could arise from taxation of imported raw material in order to protect the catching sector from competition: the heavy dependence on imports for cod and haddock will mean an extra cost for the UK industry to maintain current volumes. Increased raw material prices will put additional pressure on margins that are already low. This report has illustrated the importance to vessels of being able to adopt a long-term strategic partnership approach to marketing in order to remain successful and compete against foreign imports. This means that government has the chance to grant this competitive advantage by ensuring that fisheries management regimes are designed to permit that longer term planning. The UK fleet must be able to compete without protective legislation to remain viable in the long run. The reductions in the UK fleet are part of a general trend observed in most European fisheries toward greater efficiency and reductions in fleet over-capacity in relation to quotas. This restructuring is necessary to sustain a profitable and environmentally sustainable catching sector. The implication is that there is no room for growth in terms of number of fishermen in the catching sector. It is also clear from other European seafood industries that the greatest potential for creating jobs and value added is in the land-based part of the seafood industry. This is also the case in the UK. The government has the opportunity to stimulate performance in seafood companies at all stages of the value chain and to provide the foundation for a prosperous seafood industry without distortion of competition. This type of function is generally more attributed to the Department of Trade and Industry, rather than DEFRA or SEERAD, but there is the opportunity for fisheries departments to be more involved in supporting and developing the fish industry in the way that the DTI supports industry in general. To do this, it is essential to focus on areas where growth is possible. This is also in the interest of the consumers, who might not tolerate distortion of competition with the effect of higher prices in the long run. It is also clear from other European seafood industries that the greatest potential for creating jobs and value added is in the land-based part of the seafood industry.
MARCH 2004 Page 153

FINDING AND IMPLICATIONS
Examples of important areas of focus for government that do not cause distortion of competition are:
Establish a fisheries management regime (quotas etc) that allows for long term planning for catching, processing and retail companies and an environmentally sustainable industry.
Maintain control and perform inspections to ensure that commercial activity is in compliance with the current management regime.
Maintain and develop infrastructure and communications to support commercial activity (port facilities, logistics etc).
Stimulate innovation through research and increased co-operation between commercial and institutional sectors (universities, research facilities etc).
Establish and stimulate education in relevant areas to maintain and expand key competence to further develop the seafood industry.
10.2.3 Implications for Sea Fish Industry Authority
Seafish will have the main responsibility of presenting the findings of this study to the industry. The information presented in this report is aimed at giving an overview of the value chains for the three selected study species, and shows some key features in the interactions in the value chains. Seafish has an important task in offering precise insight on status and developments in the value chain. Such information must be regularly updated and available to ensure that it maintains its value for the industry. As the interactions in the value chain increase, it is also increasingly important for companies to meet new requirements and developments driven from other stages in the value chain. It should be a priority for Seafish to contribute to increased information exchange in the industry on a level that benefits individual companies. In order to provide a unified image of the situation to the industry, it is an important task for Seafish to gather available information from a large number of sources and present this in a uniform format. As a potential “co-ordinator” of these data sources it should be a priority for Seafish to make suggestions to the individual sources of information on adjustments in presentation in order to improve the compatibility of the data. This could help to create an overview image of the industry rather than being fragments of information from various sources. This implies that the data format, timing and presentation from each source should be converted to a common standard to the maximum possible extent. Seafish is faced with the challenge to provide the proper motivation and incentive to the data sources in order to achieve this. Seafish also has an important role as a main channel for information flow between government and industry. It is important that Seafish is able to transfer a representative information base for decisions by authorities that serve the purposes of both government and industry. This means presenting a clear and documented overview of the industry situation and needs. In addition, Seafish has an important task in informing industry players of implications and the importance of the current regulatory regime. One example of this could be for Seafish to argue to the catching sector that a stricter control of the landings may improve the competitive situations for UK vessels and an increased demand for UK caught fish, as mentioned earlier.
MARCH 2004 Page 154
Seafish can also play an important role in increasing awareness regarding the potential for increased profitability involved in commercial utilisation of waste products. Seafish may serve as a catalyst to initiate a joint project in the seafood industry to further

FINDING AND IMPLICATIONS
develop a commercial activity for better utilisation of raw material in a profitable way. This will also help to improve the seafood industry’s reputation as an efficient and environmentally sustainable business in the public opinion. Likewise, Seafish could initiate and stimulate innovation projects in the industry or as joint co-operative projects between research institutions/universities and companies to help build competence and further develop the UK seafood industry. Examples of key focus areas for Seafish are:
Co-ordinate and present official data and statistics from various data sources to increase the value of the data in the industry.
Stimulate increased information exchange between industry players for mutual benefit.
Serve as a communications channel for the industry into the public. This report shows the importance of educating the consumer.
Sustain a dialogue between government and industry by communicating needs for improvement and the importance of compliance with the current management regime.
Increase awareness and knowledge of the potential for waste handling and commercial utilisation.
More investment in or co-ordination of research into commercial uses as this could be an important way to improve efficiency and sustainability.
Stimulate innovation projects in the seafood industry.
MARCH 2004 Page 155
REFERENCES
1 1 . R E F E R E N C E S
Archer, Michaela: Fish Waste Production in the United Kingdom, Sea Fish Industry Authority, 2001. Cameron, Fiona: The UK Seafood Chain. IntraFish Industry Report, IntraFish Media AS, Bodø, Norway, 20 August 2003. Curtis, Hazel C.: 2000 Survey of the UK Sea Fish Processing Industry, Sea Fish Industry Authority, Edinburgh, 2000. Export Statistics of Norway, 2001-2002. Export Statistics of the Faeroes, 2001 – 2002. FAO: FISHSTAT: Global fisheries statistics: Catches and landings, aquaculture production and commodity production and trade. FAO, Rome, 2003. Iceland’s Export Statistics 2001 – 2002. Jones, Adam: British tastes in fish threaten cod revival. Article in Financial Times, London, 15 September 2003. Lee, David (ED.): UK Sea Fisheries Statistics 2002. Published by Defra (Department of Environment Food and Rural Affairs, London, 2003. Mikkelsen, Edmund jr.: Markedssituasjonen for hvitfisk i UK. (The Market Situation for whitefish in the UK). Paper presented at the Whitefish Conference, Tromsø, December 2002. Norwegian Seafood Export Council, Tromsø, 2003. Mikkelsen, Edmund jr: Personal communication. October 2003. Norwegian Seafood Export Council: Monthly seafood statistics. NSEC, Tromsø, 2003. Patullo, Emily (RED.): Fish & Fish Products. Market Report 2002. Published by Key Note Ltd, Middlesex, 2002. TNS Business Services: The Market for Fish in the Foodservice Sector, December 2003. Woodhatch, Libby: 1996/97 Study of the UK Fish Transport and Distribution System. Study done by CEMARE, University of Portsmouth, First Draft, November 1997.
MARCH 2004 Page 156

APPENDIX
1 2 . A P P E N D I X
12 .1 In fo rmat ion w anted f rom processors
Processors Questions regarding the sales matrix:
• What types of products do you produce?
• Your company’s share (in %) of total UK production
• What raw materials are used for which products?
Questions regarding the purchasing matrix:
• What types of raw materials are bought, and from whom?
• Why do you choose these raw materials, and why do you buy them from your present suppliers?
• What is the difference between UK domestic and foreign raw material?
• How does the size of the raw material (whole/fillets/portions) influence your purchasing decisions?
• What changes, if any, have occurred in your sourcing of raw material over the past two years?
Sales:
• How are your products sold? (Integrated sales department, large contracts, many small contracts, etc.)
• To which degree are your customer relations based on long-term contracts?
• Which products give the best margin for your company?
• How many segments do your products pass through before they reach the end consumer (give examples)?
• What types of by-products do you produce (if any) (approx. volumes, types, to whom are they sold, at what price, etc.)
• Who do you feel are controlling your decision with regard to which products and volumes you produce (supermarkets, other customers, yourself, etc.)?
MARCH 2004 Page 157

APPENDIX
12 .2 In fo rmat ion w anted f rom auc t ion marke ts
Market
• How is the fish sold?
• Is fresh and frozen fish sold?
• Are cod, haddock and nephrops sold on your market?
• What volumes of the three species were sold in 2002? Fresh Cod Haddock Nephrops
• What was the total value of the three species sold in 2002? Fresh Cod Haddock Nephrops
• In what format is the fish sold/auctioned? E.g. graded head on gutted.
• Source of fish by species e.g. domestic landings, consigned UK fish, imported fish, foreign landings?
Cod Haddock Nephrops
• Proportion of fish by source. E.g. 75% of cod auctioned was from domestic landings.
• Is frozen fish sold on market? - if yes split out by volume/value. Cod Haddock Nephrops
• Are buyers using the market as the main source of the supply?
• Have the volumes sold increased/ decreased between 2002 and to 2003 (year to date). If yes what is the cause of this change e.g. increase in imported fish being sold on the market.
Size of market
• Number of selling agents registered to use the market?
• Number of buyers registered to use the market?
• What type of customer purchases volumes of the study species from the auction:
• What changes do you for see for the market in the next 2-5 years MARCH 2004 Page 158

APPENDIX
MARCH 2004 Page 159
12 .3 In fo rmat ion w anted f rom supermarke ts
General information about the company:
• Where in the value chain is your company engaged (retail/in-store catering)
• How is the company organised?
• How many stores are there including number of stores with wet fish counters?
• What proportion of your sales are by frozen products (including ready meals) and by fresh/chilled products?
• What were your total fish sales in 2002, can you include estimates for 2003?
• What products do you sell that feature the three study species? E.g. cod fillets on the wet fish counter, cod fish fingers in the freezer cabinet.
• Where are the fish products you sell sourced from?
• Why do you choose your current suppliers?
• How closely do you co-operate with your suppliers? E.g. Do you work together on developing new products?
• What factors affect your purchasing decisions?
• How do issues such as sustainability and traceability influence your purchasing decisions?
• Do you purchase UK caught fish?
• If yes how does it differ to fish sourced via imports?
• If you do not source UK fish what factors have led to this decision?
• What volumes and value of fish are sold through your in-store cafes/restaurant?
• What factors influence the products and volumes you sell. (suppliers, customers etc.)
KPMG AS
Centre for Aquaculture and Fisheries
Fjordgaten 68
7010 Trondheim
Telephone +47 73 80 21 00
Telefax +47 73 80 21 30
www.kpmg.no
© 2004 KPMG AS, the Norwegian member firm of KPMG International, a Swiss cooperative. All rights reserved.
Sea Fish Industry Authority
18 Logie Mill, Logie Green Road
Edinburgh
EH7 4HG
Telephone +44 (0)131 558 3331
Telefax +44 (0)131 558 1442
www.seafish.org.uk