Three-dimensional topography corrections of magnetotelluric data
Coast e¡ects on magnetic and magnetotelluric transferfunctions and their correction: application to MT soundings
carried out in SW Iberia
Fernando A. Monteiro Santos a;*, Maria Nolasco a, Eugenio P. Almeida a;b,Jaume Pous c, Lu|s A. Mendes-Victor a
a Centro de Geof|sica da Universidade de Lisboa (CGUL), R. Escola Politecnica, 58, 1269-102 Lisboa, Portugalb Instituto Politecnico de Tomar, Tomar, Portugal
c Departament de Geodina©mica i Geof|sica, Universitat de Barcelona, Marti Franques s/n, 08028 Barcelona, Spain
Received 25 September 2000; accepted 11 January 2001
Abstract
The coast effect on magnetic and magnetotelluric data acquired near the SW coast in the Iberian Peninsula wasinvestigated using three-dimensional modelling. The ocean was modelled as a layer with constant conductivity (0.3 ohmm) and thickness of 3.5 km. The continental resistivity model was constructed taking into account its electrical structureobtained from previous magnetotelluric studies. The model shows that the ocean-coast effects are important for periodsgreater than 100^300 s (in this case), affecting both the induction vectors and the impedance tensors. A method for thecorrection of the coast effects on the impedance tensor is presented. Synthetic data generated from a model includingcoast effects were corrected using the method and compared successfully with data not showing those effects. As anexample the correction has been applied to some magnetotelluric soundings carried out in SW Iberia. ß 2001 ElsevierScience B.V. All rights reserved.
Keywords: magnetotellurics; 3D modelling; coastal e¡ects corrections; Iberia
1. Introduction
Magnetotelluric soundings have been carriedout across major geotectonic structures in SWIberia ^ the South Portuguese Zone (SPZ), theOssa Morena Zone (OMZ) and the Central Iber-ian Zone (CIZ) ^ during 1997, 1998 and 1999
(Fig. 1). The survey was carried out in the scopeof the EUROPROBE/IBERIA programme and ofbilateral cooperation between Universities of Lis-bon and Barcelona with the objective of charac-terising the electrical structure of the crust inthose regions [1]. Forty-one MT soundings havebeen carried out on a pro¢le striking roughly inthe NNE^SSW direction. The southernmostsounding site is located approximately at a dis-tance of 70^80 km from the south and westcoasts. The measurement directions of the hori-zontal ¢elds were N^S and E^W. The typical
0012-821X / 01 / $ ^ see front matter ß 2001 Elsevier Science B.V. All rights reserved.PII: S 0 0 1 2 - 8 2 1 X ( 0 1 ) 0 0 2 3 7 - 0
* Corresponding author. Fax: +351-1-395-3327;E-mail: [email protected]
EPSL 5754 14-3-01
Earth and Planetary Science Letters 186 (2001) 283^295
www.elsevier.com/locate/epsl

measuring time per site was between 2 and 3 days.In general very high quality data have been ob-tained, allowing reliable estimation of magneticand magnetotelluric transfer functions within the0.0039 to 4000 s period range.
The magnetic transfer function (MTF) can beused to identify zones of enhanced current in theearth. Following Schmucker [2], the MTF can beexpressed as a pair of in-phase and quadratureinduction vectors which, when plotted on amap, point away from regions of current concen-tration in the earth. The induction vectors ac-quired in SW Iberia at high frequencies are gen-erally of low amplitude and do not show apreferential orientation, re£ecting the in£uenceof the one-dimensional nature of the uppermostcrust and its local conductive structures. How-
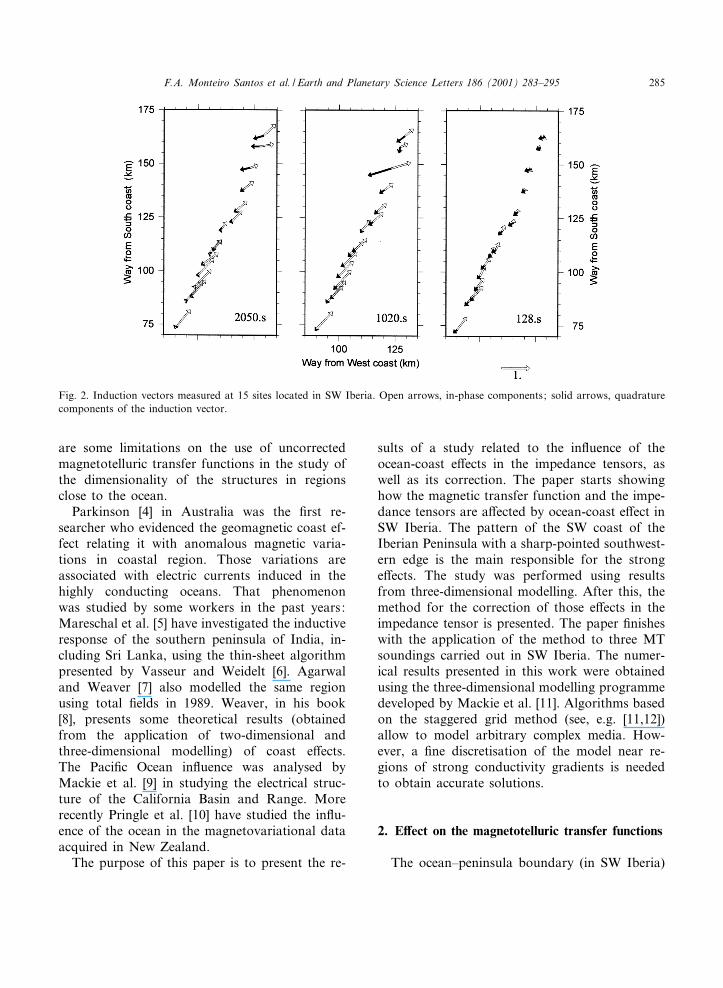
ever, an increase of the amplitude and a NE pref-erential orientation, at periods greater than 100 sare noted, at least at southern sites. The in-phase(open arrows) and quadrature induction vectors(solid arrows) at the 15 southmost sites and forthree periods (128, 1020 and 2050 s), are shown inFig. 2. The features of the vectors seem to indi-cate the presence of a deep conductive structurewith a strike ranging from N125³E to N135³E.However, the results obtained by Monteiro San-tos et al. [3] showed that the increasing of theinduction vectors, at the longest periods, is in£u-enced by three-dimensional coast e¡ects. Thoseauthors showed that ocean e¡ects could also af-fect the impedance tensors. These e¡ects lead to abreakdown of strike estimation based on the mag-netotelluric transfer functions. Therefore, there
Fig. 1. Location of the studied zone and MT sites. The bold lines show a planview of the central part (core) of the 3D model.Contours are isobaths in m.
EPSL 5754 14-3-01
F.A. Monteiro Santos et al. / Earth and Planetary Science Letters 186 (2001) 283^295284
are some limitations on the use of uncorrectedmagnetotelluric transfer functions in the study ofthe dimensionality of the structures in regionsclose to the ocean.
Parkinson [4] in Australia was the ¢rst re-searcher who evidenced the geomagnetic coast ef-fect relating it with anomalous magnetic varia-tions in coastal region. Those variations areassociated with electric currents induced in thehighly conducting oceans. That phenomenonwas studied by some workers in the past years:Mareschal et al. [5] have investigated the inductiveresponse of the southern peninsula of India, in-cluding Sri Lanka, using the thin-sheet algorithmpresented by Vasseur and Weidelt [6]. Agarwaland Weaver [7] also modelled the same regionusing total ¢elds in 1989. Weaver, in his book[8], presents some theoretical results (obtainedfrom the application of two-dimensional andthree-dimensional modelling) of coast e¡ects.The Paci¢c Ocean in£uence was analysed byMackie et al. [9] in studying the electrical struc-ture of the California Basin and Range. Morerecently Pringle et al. [10] have studied the in£u-ence of the ocean in the magnetovariational dataacquired in New Zealand.
The purpose of this paper is to present the re-
sults of a study related to the in£uence of theocean-coast e¡ects in the impedance tensors, aswell as its correction. The paper starts showinghow the magnetic transfer function and the impe-dance tensors are a¡ected by ocean-coast e¡ect inSW Iberia. The pattern of the SW coast of theIberian Peninsula with a sharp-pointed southwest-ern edge is the main responsible for the stronge¡ects. The study was performed using resultsfrom three-dimensional modelling. After this, themethod for the correction of those e¡ects in theimpedance tensor is presented. The paper ¢nisheswith the application of the method to three MTsoundings carried out in SW Iberia. The numer-ical results presented in this work were obtainedusing the three-dimensional modelling programmedeveloped by Mackie et al. [11]. Algorithms basedon the staggered grid method (see, e.g. [11,12])allow to model arbitrary complex media. How-ever, a ¢ne discretisation of the model near re-gions of strong conductivity gradients is neededto obtain accurate solutions.
2. E¡ect on the magnetotelluric transfer functions
The ocean^peninsula boundary (in SW Iberia)
Fig. 2. Induction vectors measured at 15 sites located in SW Iberia. Open arrows, in-phase components; solid arrows, quadraturecomponents of the induction vector.
EPSL 5754 14-3-01
F.A. Monteiro Santos et al. / Earth and Planetary Science Letters 186 (2001) 283^295 285

used in the modelling is shown in Fig. 1 (bottom).The shape of the coastlines was taken as a straightline in order to avoid numerical problems. In fact,the electric ¢eld obtained from models including amore detailed coastline showed not realistic fea-tures, unless that a very detailed mesh is used.
Adopting straight lines we balanced the e¤ciencywith reliability of the calculations. However, somenumerical problems are expected in the pointwhere the coastlines meet. Nevertheless, theseproblems are not propagated till the area of thepro¢le in study. The parameters of the models
Fig. 3. 3D models used in this work. In the inlet at the top MT sounding sites relative to the position of the conducting bodyare shown. Note the arbitrary vertical scale.
EPSL 5754 14-3-01
F.A. Monteiro Santos et al. / Earth and Planetary Science Letters 186 (2001) 283^295286
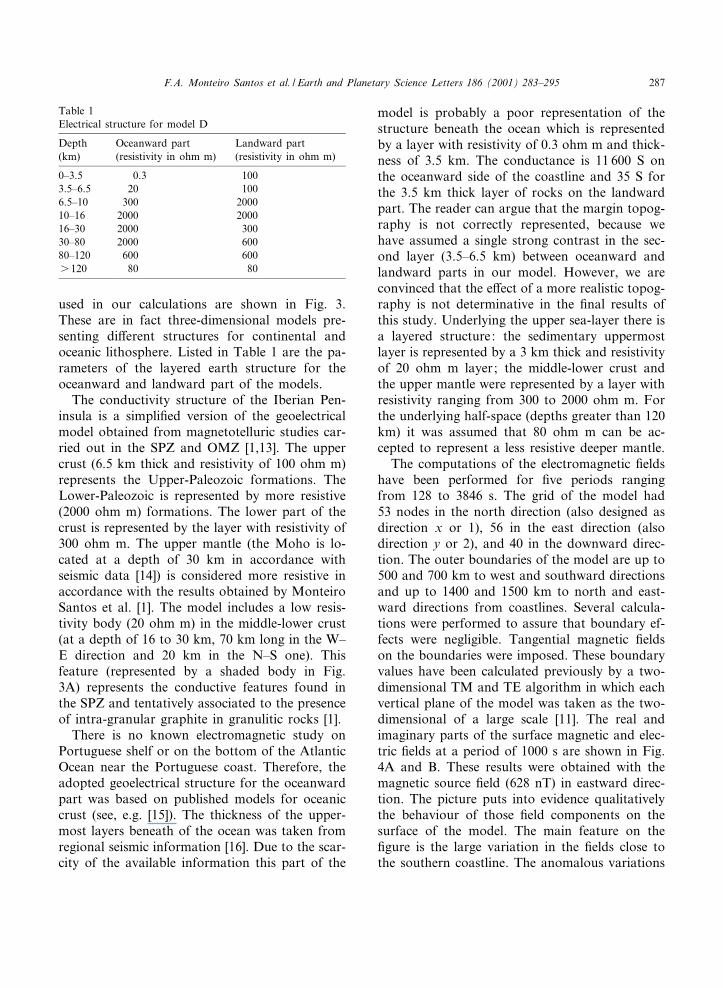
used in our calculations are shown in Fig. 3.These are in fact three-dimensional models pre-senting di¡erent structures for continental andoceanic lithosphere. Listed in Table 1 are the pa-rameters of the layered earth structure for theoceanward and landward part of the models.
The conductivity structure of the Iberian Pen-insula is a simpli¢ed version of the geoelectricalmodel obtained from magnetotelluric studies car-ried out in the SPZ and OMZ [1,13]. The uppercrust (6.5 km thick and resistivity of 100 ohm m)represents the Upper-Paleozoic formations. TheLower-Paleozoic is represented by more resistive(2000 ohm m) formations. The lower part of thecrust is represented by the layer with resistivity of300 ohm m. The upper mantle (the Moho is lo-cated at a depth of 30 km in accordance withseismic data [14]) is considered more resistive inaccordance with the results obtained by MonteiroSantos et al. [1]. The model includes a low resis-tivity body (20 ohm m) in the middle-lower crust(at a depth of 16 to 30 km, 70 km long in the W^E direction and 20 km in the N^S one). Thisfeature (represented by a shaded body in Fig.3A) represents the conductive features found inthe SPZ and tentatively associated to the presenceof intra-granular graphite in granulitic rocks [1].
There is no known electromagnetic study onPortuguese shelf or on the bottom of the AtlanticOcean near the Portuguese coast. Therefore, theadopted geoelectrical structure for the oceanwardpart was based on published models for oceaniccrust (see, e.g. [15]). The thickness of the upper-most layers beneath of the ocean was taken fromregional seismic information [16]. Due to the scar-city of the available information this part of the
model is probably a poor representation of thestructure beneath the ocean which is representedby a layer with resistivity of 0.3 ohm m and thick-ness of 3.5 km. The conductance is 11 600 S onthe oceanward side of the coastline and 35 S forthe 3.5 km thick layer of rocks on the landwardpart. The reader can argue that the margin topog-raphy is not correctly represented, because wehave assumed a single strong contrast in the sec-ond layer (3.5^6.5 km) between oceanward andlandward parts in our model. However, we areconvinced that the e¡ect of a more realistic topog-raphy is not determinative in the ¢nal results ofthis study. Underlying the upper sea-layer there isa layered structure: the sedimentary uppermostlayer is represented by a 3 km thick and resistivityof 20 ohm m layer; the middle-lower crust andthe upper mantle were represented by a layer withresistivity ranging from 300 to 2000 ohm m. Forthe underlying half-space (depths greater than 120km) it was assumed that 80 ohm m can be ac-cepted to represent a less resistive deeper mantle.
The computations of the electromagnetic ¢eldshave been performed for ¢ve periods rangingfrom 128 to 3846 s. The grid of the model had53 nodes in the north direction (also designed asdirection x or 1), 56 in the east direction (alsodirection y or 2), and 40 in the downward direc-tion. The outer boundaries of the model are up to500 and 700 km to west and southward directionsand up to 1400 and 1500 km to north and east-ward directions from coastlines. Several calcula-tions were performed to assure that boundary ef-fects were negligible. Tangential magnetic ¢eldson the boundaries were imposed. These boundaryvalues have been calculated previously by a two-dimensional TM and TE algorithm in which eachvertical plane of the model was taken as the two-dimensional of a large scale [11]. The real andimaginary parts of the surface magnetic and elec-tric ¢elds at a period of 1000 s are shown in Fig.4A and B. These results were obtained with themagnetic source ¢eld (628 nT) in eastward direc-tion. The picture puts into evidence qualitativelythe behaviour of those ¢eld components on thesurface of the model. The main feature on the¢gure is the large variation in the ¢elds close tothe southern coastline. The anomalous variations
Table 1Electrical structure for model D
Depth Oceanward part Landward part(km) (resistivity in ohm m) (resistivity in ohm m)
0^3.5 0.3 1003.5^6.5 20 1006.5^10 300 200010^16 2000 200016^30 2000 30030^80 2000 60080^120 600 600s 120 80 80
EPSL 5754 14-3-01
F.A. Monteiro Santos et al. / Earth and Planetary Science Letters 186 (2001) 283^295 287

in Ex component indicate a strong accumulationof electric charge associated with lateral changesof electrical conductivity and responsible for themodi¢cation of the regional ¢eld. Similar features(not shown) are obtained for Ey at the westerncoastline, when considering the magnetic sourcenorthwards. Following Dosso and Meng [17] thecoast e¡ect response range, de¢ned as the distanceover which the induction vector magnitude re-duces to a value of 0.2, is ranging from 60 to
120 km for the period of 128 s and from 210 to320 km for 3846 s (Fig. 5).
The in-phase and quadrature induction vectorscalculated from models A and B (the latter issimilar to model A but without ocean) at threesites located in the SPZ and OMZ are shown inFig. 6. For model A and at the periods used inour calculations the in-phase induction vectors(open arrows) are always pointing to northeast.The maximum magnitude is observed for the pe-
Fig. 4. (A) Plots of the real and imaginary parts of the horizontal (Bx and By) and vertical magnetic ¢eld Bz and (B) the hori-zontal electric components Ex and Ey for model D. The regional magnetic ¢eld has a period of 1000 s and is toward east.
EPSL 5754 14-3-01
F.A. Monteiro Santos et al. / Earth and Planetary Science Letters 186 (2001) 283^295288

riod of 2050 s, decreasing slowly for 1020 andstrongly at 128 s. The quadrature vectors, point-ing to southwest, have smaller magnitude. Themaximum value is obtained at 1020 s decreasingfor 2050 and 128 s. The induction vectors ob-tained from ¢eld MT data carried out at thesame three sites located in the SPZ and OMZare shown in Fig. 2 and their features are verysimilar to those presented in Fig. 6, at the studiedperiods. The results obtained from model B aredominated by the e¡ect of the conductive body inthe middle-lower crust mainly at periods shorterthan 1020 s.
The di¡erence between (local) components ofthe impedance tensors MZij(model A)3Zij(modelB)M at the three selected sites is plotted in Fig.7. These results, where the responses of the mod-els with and without the presence of the ocean arecompared, put into evidence the coast e¡ects onthe impedance tensors. As can be observed, allsites show evidences of distortion, being site 13the most a¡ected. The components Z12 and Z21
are the most distorted ones. The oceanic e¡ect in
Fig. 4 (continued).
Fig. 5. Plot of the coast e¡ect response range (de¢ned as thedistance over which the induction vector magnitude reducesto a value of 0.2) for four periods.
EPSL 5754 14-3-01
F.A. Monteiro Santos et al. / Earth and Planetary Science Letters 186 (2001) 283^295 289

the component Z12 increase with the period. Anopposite behaviour is observed in the Z21 compo-nent. It can be concluded that the electromagnetic¢eld is signi¢cantly modi¢ed over several tens ofkilometres. The o¡-diagonal components are themost a¡ected but the diagonal components of thetensor are also distorted.
3. Method to correct the coast e¡ects
In this section the method used in the correc-tion of the coast e¡ect on the magnetotelluric im-pedance data will be presented. Considering thatthe electrical conductivity can be decomposed intobackground (cn) and anomalous (ca) parts, i.e.
c=cn+ca, the total electric and magnetic ¢eldsin the frequency domain can be expressed by:
E � En � Ea
B � Bn � Ba
As in [18] we want to obtain the distortion ten-sors M and K related to the background and total¢elds by:
E � En �MEn
B � Bn � KEn�1�
where E and B are the total electric and magnetic¢elds, En and Bn are the background electromag-
Fig. 6. Induction vectors obtained from models A and B at three sites and for three periods. Open arrows, in-phase components;solid arrows, quadrature components of the induction vector. Note the di¡erent scale used in upper and lower graphs.
EPSL 5754 14-3-01
F.A. Monteiro Santos et al. / Earth and Planetary Science Letters 186 (2001) 283^295290

netic ¢elds in the absence of the ocean coast andany further inland anomalies and M (2U2) and K(3U2) are the distortion tensors due to the pres-ence of the ocean.
The background impedance tensor is solutionof
En � ZrBn �2�
while the total magnetotelluric response satis¢es
E � Z0B �3�
Here Z0 is the measured magnetotelluric tensor.Combining Eqs. 2, 3 with Eq. 1 and rearrangingthe terms yields
Zr � Z0�I �M3Z0K�31 �4�
where I is the identity tensor. Eq. 4 gives thebackground (also called regional) tensor in termsof the observations once the distortion matricesare known. In our case the elements of M andK were computed numerically using Eq. 1 and¢elds calculated from models C and D shown inFig. 3. The computation of the M and K tensorsis made assuming that it depends mainly on thecoast e¡ect features and weakly on the details ofthe crust electrical structure. The elements ofthose tensors at sites 1, 10 and 13 are shown inFig. 8. All the elements of the tensor K approachzero at short periods (6 100 s), indicating that thecoast e¡ect on B is not observed at short periods,as expected. The o¡-diagonal elements increasewith the periods and the di¡erences between sitesare slight. A similar behaviour can be observed inthe o¡-diagonal elements of the matrix M. Thereal parts, but not the imaginary ones, of the di-agonal components of this matrix, mainly at site1, approach zero at the period of 128 s, as ex-pected. In fact, the imaginary parts also approachzero but only at periods shorter than 128 s (notshown in ¢gure).
6Fig. 7. Plots of the absolute values of the di¡erence of theimpedance tensors calculated from models A and B, at threesites on SW Iberia.
EPSL 5754 14-3-01
F.A. Monteiro Santos et al. / Earth and Planetary Science Letters 186 (2001) 283^295 291

3.1. Application to synthetic data
The impedance tensors and induction vectorsobtained from model A (Fig. 9) at two siteswere compared with those calculated from modelB and Eq. 4 in order to test the validity of theproposed method. Model A is a complex three-dimensional model with di¡erent resistivity struc-tures beneath the ocean and in the Iberian Pen-insula. The model includes a low resistivity inclu-sion at middle-lower crust. The electric andmagnetic ¢elds calculated from model B were dis-torted using the matrices M and K previously cal-culated. Then, the magnetotelluric transfer func-tions were estimated using these distorted ¢elds.The distorted responses of model B and the im-pedance tensor calculated considering the coastand oceanic e¡ects from model A agree within
an error less than 5%, showing that the methodworks well.
4. Field example
The magnetotelluric impedance tensors ob-served at three sites in the SPZ and OMZ werecorrected for distortion due to coast e¡ects usingthe proposed method. Fig. 10 compares the cor-rected (solid symbols) with the observed (opensymbols) impedance tensor components. The cor-rection was carried out using Eq. 4 and the ma-trices M and K calculated before. The most sub-stantial changes are observed at site 13, while atsites 10 and 1 the tensor is only altered slightly.This behaviour was expected, because site 13 iscloser to the coastlines. In contrast, site 1 is far-
Fig. 8. Elements of the K and M distortion tensors. Real part, circles; imaginary part, stars. Site 13, open symbol; site 10, greysymbol; and site 1, black symbol.
EPSL 5754 14-3-01
F.A. Monteiro Santos et al. / Earth and Planetary Science Letters 186 (2001) 283^295292

ther from the coasts and the distortion might beexpected to be weaker. At site 13 all the compo-nents of the impedance tensor are corrected. Inthis site the behaviour of the corrections in Z12
and Z21 components follows that exposed in Sec-tion 2 (Fig. 7), i.e. an increase (with the period) inthe magnitude of the corrections associated to Z12
and an opposite behaviour for corrections in Z21.
Fig. 9. (A) Comparison of the impedance tensors obtained from model A (solid symbols) with the distorted impedance tensorcalculated from model B (open symbols) at two sites. Real part, circles; imaginary part, stars. (B) Comparison of the inductionvectors obtained from model A with the distorted ones calculated from model B at two sites.
EPSL 5754 14-3-01
F.A. Monteiro Santos et al. / Earth and Planetary Science Letters 186 (2001) 283^295 293

5. Conclusions
The results obtained in this investigation allowto conclude that the enhancement of Bz observedin the MT data collected in SW Iberia (typicallyfor periods greater than 100^300 s) seems to bemainly due to the three-dimensional geomagneticcoast e¡ects. The three-dimensional modellingshowed that coast e¡ects also a¡ect impedancetensors.
A method for removing the distortion from theimpedance tensor, due to ocean-coast e¡ects, waspresented and tested using synthetic data. Theresults showed that the method could be usedeven in a complex geological environment. Fi-nally, and as an example of application, the meth-od was used to correct some MT data acquired inSW Iberia.
Acknowledgements
Sincere thanks are due to Dr. Robert Tyler andProf. Ulrich Schumcker for their review and thehelpful suggestions, which improved the ¢nal ver-sion of this paper. This work was partially sup-ported by Fundac°a¬o para a Cieªncia e Tecnologia(Portugal) and by Acc°o¬es Integradas Luso-Espan-holas (E-11/97 and E-18/99) and was developed inthe scope of the Europrobe/Iberia project (Euro-pean Science Foundation).[AC]
References
[1] F.A. Monteiro Santos, J. Pous, E.P. Almeida, P. Queralt,A. Marcuello, H. Matias, L.A. Mendes-Victor, Electricalconductivity of the crust across the Ossa Morena andSouth Portuguese Zone suture, Tectonophysics 313(1999) 449^462.
[2] U. Schmucker, Anomalies of Geomagnetic Variations inthe Southwestern United States, University of CaliforniaPress, Berkeley, CA, 1970, 165 pp.
6Fig. 10. Comparison of the corrected (solid symbols) withthe observed (open symbols) impedance tensor components.The correction was carried out using Eq. 4 and the matricesM and K shown in Fig. 8. Real part, circles; imaginary part,stars.
EPSL 5754 14-3-01
F.A. Monteiro Santos et al. / Earth and Planetary Science Letters 186 (2001) 283^295294

[3] F.A. Monteiro Santos, E.P. Almeida, J. Pous, M. Nolas-co, P. Queralt, A. Marcuello, L.A. Mendes-Victor, Ocean-ic e¡ects on MT data acquired in Iberian Peninsula,MARELEC Conference, Brest, 1999.
[4] W.D. Parkinson, Directions of rapid geomagnetic £uctu-ations, Geophys. J.R. Astrol. Soc. 2 (1959) 1^13.
[5] M. Mareschal, G. Vasseur, B.J. Srivastava, R.N. Singh,Induction models of southern India and the e¡ect of o¡-shore geology, Phys. Earth Planet. Inter. 45 (1987) 137^148.
[6] G. Vasseur, P. Weidelt, Bimodal electromagnetic induc-tion in non-uniform thin sheets with an application tonorthern Pyrenean induction anomaly, Geophys. J.R. As-trol. Soc. 51 (1977) 669^690.
[7] K. Agarwal, J.T. Weaver, Regional electromagnetic in-duction around the Indian peninsula and Sri Lanka; athree-dimensional numerical model study using the thinsheet approximation, Phys. Earth Planet. Inter. 54(1989) 320^331.
[8] J.T. Weaver, Mathematical Methods for Geo-electromag-netic Induction, Research Studies Press and Wiley, NewYork, 1994, pp. 316.
[9] R.L. Mackie, B.R. Bennett, T.R. Madden, Long-periodmagnetotelluric measurements near the central Californiacoast: a land-locked view of the conductivity structureunder the Paci¢c Ocean, Geophys. J. 95 (1996) 181^194.
[10] D. Pringle, M. Ingham, D. McKnight, F. Chamalaun,Magnetovariational soundings across the South Islandof New Zealand: di¡erence induction arrows and theSouthern Alps conductor, Phys. Earth Planet. Inter. 119(2000) 285^298.
[11] R.L. Mackie, T.R. Madden, P. Wannamaker, Three-di-mensional magnetotelluric modeling using di¡erenceequations - Theory and comparisons to integral equationsolutions, Geophysics 58 (1993) 215^226.
[12] J.T. Smith, Conservative modeling of 3-D electromagnetic¢elds. Part I: Properties and error analysis, Geophysics 61(1996) 1308^1318.
[13] E.P. Almeida, F.A. Monteiro Santos, L.A. Mendes Vic-tor, The structure of the upper crust in the South Portu-guese Zone from magnetotelluric studies - preliminaryresults, Acta Geodyn. Geophys. Hung. 31 (1995) 217^229.
[14] L. Matias, A sismologia experimental na modelac°a¬o daestrutura da crusta em Portugal Continental, Ph.D. thesis,University of Lisbon, 1996.
[15] G. Heinson, Lithosphere-asthenosphere interactions: a re-view, in: Book of Abstracts of the 14th Workshop inElectromagnetic Induction in the Earth, Sinaia, 1998,pp. 229^246.
[16] A. A¢lhado, D. Vales, A. Hirn, A. Gonzalez, L. Matias,L.A. Mendes-Victor, Contribution for the monitoring ofthe SW Portuguese margin: crustal thinning along IAM5,in: IUGG 99, XXII General Assembly, Birmingham,1999, B.7.
[17] H.W. Dosso, Z.W. Meng, The coast e¡ect response ingeomagnetic ¢eld measurements, Phys. Earth Planet. In-ter. 70 (1992) 39^56.
[18] M. Nolasco, P. Tarits, J.H. Filloux, A.D. Chave, Magne-totelluric imaging of the Society Island hotspot, J. Geo-phys. Res. B 103 (1998) 30287^30309.
EPSL 5754 14-3-01
F.A. Monteiro Santos et al. / Earth and Planetary Science Letters 186 (2001) 283^295 295
Copyright © 2022 FDOKUMEN