Cluster Size Effects in the Surface-Enhanced Raman Scattering Response of Ag and Au Nanoparticle...
18
Cluster Size Effects in the Surface-Enhanced Raman Scattering Response of Ag and Au Nanoparticle Aggregates: Experimental and Theoretical Insight Juan C. Fraire, Luis A. Pe ́ rez, and Eduardo A. Coronado* INFIQC, Centro Laser de Ciencias Moleculares, Departamento de Fisicoquímica, Facultad de Ciencias Químicas, Universidad Nacional de Có rdoba, Có rdoba, 5000, Argentina * S Supporting Information ABSTRACT: In this work we report the spectral evolution of the surface- enhanced Raman scattering (SERS) response of biotin molecules that generate the assembly of Ag and Au nanospheres (NSs) into clusters with controlled interparticle gaps during the aggregation process. The experiments are analyzed using rigorous near-field electrodynamic calculations of the enhancement produced in a close-packed cluster with a different number of NSs. Two kinetic mechanisms during the NS aggregation were identified which give rise to a different cluster size distribution and as a consequence to a different SERS response. It is found that during NS aggregation there is an initial fast growth of the SERS signals followed by a decay that reaches an almost constant value at relatively long times. These results are qualitatively explained by the trends observed in the electrodynamics calculations of the near-field enhancement as a function of the cluster size, which highlights the critical role played by radiation damping as the size of the cluster increases for small clusters (dimers and trimers), in contrast with the behavior observed for clusters with a relative greater number of particles where the decrease of the near-field enhancement is less significant. In addition, a general procedure is presented that makes it possible to perform a suitable comparison of the SERS response for tight-compact clusters, in the limit of large clusters, as long as the wavelength range of the SERS response is almost size independent. This procedure is tested for Ag and Au nanoaggregates generated in solution formed by spheres of different size, at an almost constant interparticle separation. It was found that even there are differences between the analytic enhancement factor and the calculated enhancement predicted by the electrodynamic theory in the large cluster size limit, and the trends in the SERS response of the biotin molecules are qualitatively explained by the electromagnetic (EM) mechanism for both Ag and Au clusters. These discrepancies could be indicative of a chemical contribution to the global SERS response, but a rigorous assessment of this mechanism would require additional theoretical calculations supported by experiments. Notwithstanding, the SERS enhancement results obtained with noncovalent bonded dye molecules (Coumarin 440 and Rhodamine B) that are randomly distributed in the clusters as Raman reporters, using the same large clusters as substrates (linked by biotin molecules), are in fairly good quantitative agreement with the electrodynamics model of the average SERS enhancement. ■ INTRODUCTION Understanding the factors that control the degree of enhance- ment of confined fields around noble metal nanoparticles (NPs) and nanoaggregates is a topic of great current interest, as it is the main mechanism associated to many enhanced spectroscopies such as surface-enhanced Raman scattering (SERS), 1 tip-enhanced Raman spectroscopy (TERS), 2 surface- enhanced fluorescence (SEF), 3 etc. In particular, the huge enhancement factors enabled by SERS have led to the possibility of detecting very few molecules or even single molecules. 4 The substrates used for SERSinitially electro- chemically roughened silver electrodeshave evolved over time from deposited metal films, random nanoparticle aggregates, 5−10 to rationally designed nanostructures, 11−16 and most recently to single metal nanoparticles. 12,17−20 SERS is a plasmonic phenomenon based on the optical properties of noble metal NPs which supports localized surface plasmons, associated with the collective oscillation of the conduction electrons of the nanoparticle, the so-called localized surface plasmon resonance (LSPR). The collective excitation near the plasmon resonance induces an enhanced electro- magnetic field surrounding the metallic nanoparticle with a spatial distribution that depends for a given metallic nanostructure on its geometry, its orientation with respect to the incident polarization, illumination wavelength, and dielectric environment. In addition, the LSPR frequencies can Received: December 15, 2012 Revised: October 4, 2013 Published: October 4, 2013 Article pubs.acs.org/JPCC © 2013 American Chemical Society 23090 dx.doi.org/10.1021/jp3123709 | J. Phys. Chem. C 2013, 117, 23090−23107
Transcript of Cluster Size Effects in the Surface-Enhanced Raman Scattering Response of Ag and Au Nanoparticle...
Cluster Size Effects in the Surface-Enhanced Raman ScatteringResponse of Ag and Au Nanoparticle Aggregates: Experimental andTheoretical InsightJuan C. Fraire, Luis A. Perez, and Eduardo A. Coronado*
INFIQC, Centro Laser de Ciencias Moleculares, Departamento de Fisicoquímica, Facultad de Ciencias Químicas, UniversidadNacional de Cordoba, Cordoba, 5000, Argentina
*S Supporting Information
ABSTRACT: In this work we report the spectral evolution of the surface-enhanced Raman scattering (SERS) response of biotin molecules that generatethe assembly of Ag and Au nanospheres (NSs) into clusters with controlledinterparticle gaps during the aggregation process. The experiments are analyzedusing rigorous near-field electrodynamic calculations of the enhancementproduced in a close-packed cluster with a different number of NSs. Two kineticmechanisms during the NS aggregation were identified which give rise to adifferent cluster size distribution and as a consequence to a different SERSresponse. It is found that during NS aggregation there is an initial fast growth ofthe SERS signals followed by a decay that reaches an almost constant value atrelatively long times. These results are qualitatively explained by the trendsobserved in the electrodynamics calculations of the near-field enhancement as afunction of the cluster size, which highlights the critical role played by radiationdamping as the size of the cluster increases for small clusters (dimers and trimers),in contrast with the behavior observed for clusters with a relative greater numberof particles where the decrease of the near-field enhancement is less significant. Inaddition, a general procedure is presented that makes it possible to perform asuitable comparison of the SERS response for tight-compact clusters, in the limit of large clusters, as long as the wavelength rangeof the SERS response is almost size independent. This procedure is tested for Ag and Au nanoaggregates generated in solutionformed by spheres of different size, at an almost constant interparticle separation. It was found that even there are differencesbetween the analytic enhancement factor and the calculated enhancement predicted by the electrodynamic theory in the largecluster size limit, and the trends in the SERS response of the biotin molecules are qualitatively explained by the electromagnetic(EM) mechanism for both Ag and Au clusters. These discrepancies could be indicative of a chemical contribution to the globalSERS response, but a rigorous assessment of this mechanism would require additional theoretical calculations supported byexperiments. Notwithstanding, the SERS enhancement results obtained with noncovalent bonded dye molecules (Coumarin 440and Rhodamine B) that are randomly distributed in the clusters as Raman reporters, using the same large clusters as substrates(linked by biotin molecules), are in fairly good quantitative agreement with the electrodynamics model of the average SERSenhancement.
■ INTRODUCTIONUnderstanding the factors that control the degree of enhance-ment of confined fields around noble metal nanoparticles(NPs) and nanoaggregates is a topic of great current interest, asit is the main mechanism associated to many enhancedspectroscopies such as surface-enhanced Raman scattering(SERS),1 tip-enhanced Raman spectroscopy (TERS),2 surface-enhanced fluorescence (SEF),3 etc. In particular, the hugeenhancement factors enabled by SERS have led to thepossibility of detecting very few molecules or even singlemolecules.4 The substrates used for SERSinitially electro-chemically roughened silver electrodeshave evolved overtime from deposited metal films, random nanoparticleaggregates,5−10 to rationally designed nanostructures,11−16
and most recently to single metal nanoparticles.12,17−20
SERS is a plasmonic phenomenon based on the opticalproperties of noble metal NPs which supports localized surfaceplasmons, associated with the collective oscillation of theconduction electrons of the nanoparticle, the so-called localizedsurface plasmon resonance (LSPR). The collective excitationnear the plasmon resonance induces an enhanced electro-magnetic field surrounding the metallic nanoparticle with aspatial distribution that depends for a given metallicnanostructure on its geometry, its orientation with respect tothe incident polarization, illumination wavelength, anddielectric environment. In addition, the LSPR frequencies can
Received: December 15, 2012Revised: October 4, 2013Published: October 4, 2013
Article
pubs.acs.org/JPCC
© 2013 American Chemical Society 23090 dx.doi.org/10.1021/jp3123709 | J. Phys. Chem. C 2013, 117, 23090−23107
be tuned changing geometrical parameters, such as nanoparticlesize,21 shape,21,22 crystal face,23 surface roughness,24 andinterparticle spacing.25−30
As mentioned above, it is widely accepted that the majorcontribution to SERS signals comes from the electromagnetic(EM) enhancement, caused by LSPR excitations. Anothermechanism often argued to explain SERS is the chemical one,but this mechanism has proved to have by far a lowercontribution.31 Furthermore, it is well-known that the EM fieldaround metal nanoparticle aggregates is amplified in anonuniform way as a consequence of plasmon coupling. Thiscoupling gives rise to the so-called hot spots generated withinthe nanoparticle gaps.32−35 The strong interactions of plasmonsin NP assemblies can render possible many useful applications
including SERS bio(nano)sensors and also nanoparticlewaveguides.36
Although particles with sharp features can provide high near-field enhancement, most of the reports of the strongest SERSsignals achieved come from NP clusters.5,7,30 Calculations ofthe field strengths in the coupling region between adjacent NPstypically reveal that interparticle fields are many orders ofmagnitude greater than the fields at the surface of singlenanoparticles. Although gaps play a key role in the surface-enhancing properties of NP clusters, the electromagneticcontribution to SERS in this particular type of nanostructuresis a topic that still remains to be further investigated.The SERS activity observed in metal NP aggregates is often
rationalized by considering only the interaction of two neighbor
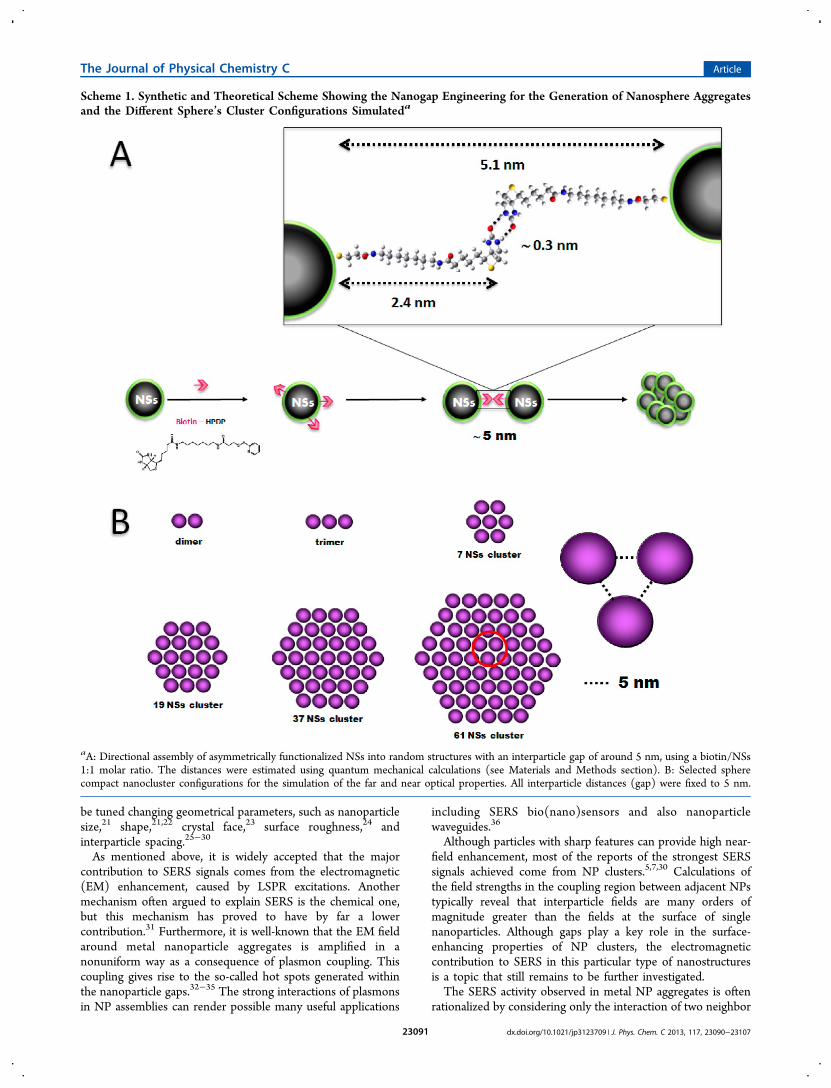
Scheme 1. Synthetic and Theoretical Scheme Showing the Nanogap Engineering for the Generation of Nanosphere Aggregatesand the Different Sphere’s Cluster Configurations Simulateda
aA: Directional assembly of asymmetrically functionalized NSs into random structures with an interparticle gap of around 5 nm, using a biotin/NSs1:1 molar ratio. The distances were estimated using quantum mechanical calculations (see Materials and Methods section). B: Selected spherecompact nanocluster configurations for the simulation of the far and near optical properties. All interparticle distances (gap) were fixed to 5 nm.
The Journal of Physical Chemistry C Article
dx.doi.org/10.1021/jp3123709 | J. Phys. Chem. C 2013, 117, 23090−2310723091
NPs, i.e., using dimer models. A more rigorous model should beto consider the interaction of the LSPR of all the particles ofthe aggregate, i.e., a many-particle model.37,38 This fact focusedour attention on the validity of the implementation of a dimermodel to correlate the experimental SERS behavior of NPaggregates.The expected theoretical electromagnetic SERS enhance-
ment, for small Raman shifts, scales with the fourth power ofthe field, while for Raman shifts that are significantly greaterthan the width of plasmon resonance local electromagneticSERS enhancement scales with the product of the fieldintensity enhancements at the incident and scatteredfrequencies.31 Considering that upon optical excitation of theLSPR of metallic nanoparticles and nanostructures themaximum near-field enhancements occur at lower energiesthan the maximum of the extinction in the corresponding far-field spectrum,39 evaluating the variation of the maximumenhancement at a particular excitation wavelength as thenumber of NPs in the aggregate increases is crucial for arational design of SERS substrates.Despite that there is a great number of studies dealing with
the SERS performance of NP dimers,11,17,28,29,40−43 there areonly a few theoretical studies devoted to investigating theoptical properties of NP aggregates as a function of theaggregate size, and to the best of our knowledge all thesestudies were performed with aggregates deposited or generatedon a substrate.20,44−48 In a previous work Taylor et al. studiedthe SERS response of growing Au nanosphere aggregates insolution.49 Nevertheless, more detailed studies focused oncorrelating the evolution of the experimental Raman signal asmetal clusters grow with theoretical simulations are still needed.The goal of the present work is to identify trends in the
magnitude of the SERS signal as a function of the aggregate sizefor silver and gold spherical NP aggregates. In particular, wehave investigated the evolution of the SERS signals duringaggregation induced by biotin molecules in colloidal solutionsof 56 nm silver and 90 nm gold NSs. In addition, we havecorrelated the analytical enhancement factors (AEFs)50 withthe theoretical enhancement factors as a function of cluster sizeat a constant excitation wavelength (488 nm for Ag and 633 nmfor Au experiments, respectively). These wavelengths werechosen because, as it will be shown later, in this wavelengthrange a regular behavior of the enhancement with cluster size isachieved; i.e., at these wavelengths the enhancement predictedby electrodynamics theory quickly decreases with cluster sizeuntil it reaches an almost constant asymptotic value. Thisfeature is important since as soon as a critical value of thecluster size is reached the electromagnetic contribution isalmost the same; therefore, detailed knowledge of the clustersize distribution is not needed to evaluate the electromagneticcontribution to the SERS enhancement.The generation of aggregates involves the biotinylation of Ag
and Au nanospheres (NSs) by the addition of “activated” Biotin(molar ratio 1:1 biotin/NSs), which gets chemisorbed onto thesurface of the NSs. The “activation” of biotin was performed bya thiol exchange reaction with mercaptoundecanoic acid(MUA), with a 1:10 biotin/MUA ratio. Using this procedure(see below) there is on average one biotin per nanoparticle inall the experiments, and the interaction of the biotinylated NSsleads to the formation of close-packed aggregates through Hbonds between biotins, with an interparticle gap of around 5nm (Scheme 1A).
The variation of the SERS signals during the aggregationprocess was rationalized theoretically using selected close-packed nanoclusters with 5 nm interparticle distance. Toestimate the role of the cluster configuration in the near-fieldenhancement factors, we have also calculated (using thegeneralized multiparticle Mie theory (GMM theory)) theangular average near-field enhancement achieved at differentwavelengths for nanoclusters with increasing number of NSs (2,3, 7, 19, 37, and 61 NSs) to rationalize the experimental SERSenhancement (Scheme 1B). The selected configurations werechosen by inspection of the TEM images, as will be shownbelow. The results show that the theoretical average enhance-ment decreases with cluster size until reaching an almostconstant asymptotic value for both Ag and Au clusters.Finally, the experimental AEF achieved for relatively large
aggregates is compared with the theoretical angular averageenhancement factor for a 61 NS cluster. The role played byslight variation of the cluster geometries (the interparticle gapand the presence of vacancies in the structure of the cluster) inthe calculated angular average enhancements as well as thevariation of the near-field distribution as a function of theenhancement factor have been also analyzed. It was found thatthe SERS enhancement given by the theoretical simulations is afactor of 10−100 smaller than that obtained experimentally forthe biotin molecules for the larger aggregates (formed once anasymptotic value of the experimental SERS has been achieved).This result could be indicative of chemical contribution to theSERS enhancement. In contrast, the average enhancementpredicted by theory is in very good agreement with the SERSenhancements experimentally obtained adding dye molecules(Cumarin 440 and Rhodamine 6G) to the same clustersolution, demonstrating that the EM mechanism is able toaccount for the experimental observations within experimentalerror.
■ MATERIALS AND METHODSMaterials. The following materials were used as obtained:
HAuCl4 (Carlo Erba); AgNO3 (Blaker); sodium citrate(Mallinckrodt); EZ-Link biotin-HPDP (Pierce); rhodamine B(Exciton); coumarin 440 (Exciton).
Nanosphere Synthesis. The synthesis of gold and silvernanoparticles was performed using the Turkevich method,which is based on the reduction properties of boiling citratesolutions. Au nanoparticles were produced by reducing a 50 mL0.2 mM chloroauric acid solution (HAuCl4) with the additionof 0.5 mL of a 0.01 M citrate solution (corresponding to a 1:0.5Au/Citrate molar ratio) under heat and rapid stirring for 30min. Ag NSs were obtained through a similar procedure asdescribed above but using a 1:1 Ag/citrate molar ratio. Themorphological characterization of the Au and Ag NSs wasperformed combining UV−vis spectroscopy, TEM, dynamiclight scattering (DLS), and electrodynamic modeling using Mietheory. The overall results after combining all of these differenttechniques and modeling indicate that the average diameter was90 nm with a picomolar concentration of 4.36 × 10⁹ NSs/cm3
(7.24 × 10⁻¹² M), for Au NSs, and was 56 nm with aconcentration of 4.57 × 10⁹ NSs/cm3 (7.59 × 10⁻¹² M) for AgNSs. The concentration of the Au and Ag nanoparticles wasestimated to be around 7 pM, using the experimental extinctionintensities at the maximum wavelength and Mie theorycalculations of the extinction cross section for sphericalparticles with the corresponding diameter (determined byTEM).
The Journal of Physical Chemistry C Article
dx.doi.org/10.1021/jp3123709 | J. Phys. Chem. C 2013, 117, 23090−2310723092
Nanoparticle Surface Funcionalization. EZ-Link Biotin-HPDP (N-[6-(biotinamido)hexyl]-3′-(2′-pyridyldithio)-propionamide) was used for surface functionalization of bothAu NSs and Ag NSs. The procedure for the generation of close-packed aggregates consists of the incubation at roomtemperature of 30 mL of NS colloidal dispersion in thepresence of EZ-Link Biotin-HPDP (molar ratio NS/biotin 1:1).In all cases biotin was previously “activated” by reaction with
mercaptoundecanoic acid (MUA), with a 1:10 biotin/MUAratio.Extinction Measurements. The characterization of the
extinction properties of the Ag NS and Au NS colloidaldispersions was carried out by UV−vis spectroscopy in the300−1100 nm wavelength range using a Shimazdu UV-1700PharmaSpec spectrophotometer with a 1 cm quartz cell atroom temperature.DLS Measurements. The dynamic light scattering (DLS)
characterization of Ag NS and Au NS colloidal dispersions wasperformed using a Delsa Nano 2.2 spectrometer with a 1 cmquartz cell at room temperature.Electron Microscopy. Transmission electron microscopy
(TEM) images were obtained using a JEM-JEOL 1120 EXIIunder an accelerating voltage of 80 kV. Samples were preparedby adding one drop (∼50 μL) of the sample colloidal solution
onto a holey carbon-Formvar coated copper TEM grid (300mesh).
SERS Measurements. SERS measurements were per-formed using a Horiba LabRaman confocal microscope witha 5× (NA = 0.12) length in the backscattering geometry. Thespectra acquisition time was 10 s for measuring the SERSevolution during NS aggregation and was 20 s for determiningthe analytic enhancement factor (AEF) at the end of NSaggregation. The spectra were acquired with a 600 lines mm−1
grating, giving a resolution of 4 cm−1. The excitationwavelengths used were the 488 nm line from an argon laserfor Ag experiments and the 633 nm line from a He−Ne laserfor Au experiments. All measurements were performed at roomtemperature and were calibrated to Si and to H2O bands in thecolloidal solutions.
Computational Methods. The optical response of Ag andAu NS clusters was computed using the generalized multi-particle Mie theory (GMM) as described elsewhere.51−53 In allnear-field calculations presented in this work the dielectricfunction tabulated by Palik for Au and Ag was employed.54 Foreach cluster analyzed, the separation parameter between thenanospheres is large enough so that nonlocal effects on thedielectric constant can be neglected. For the calculations of thecluster, near-field properties were used of a multipolar order of20. Three different average enhancement factors have been
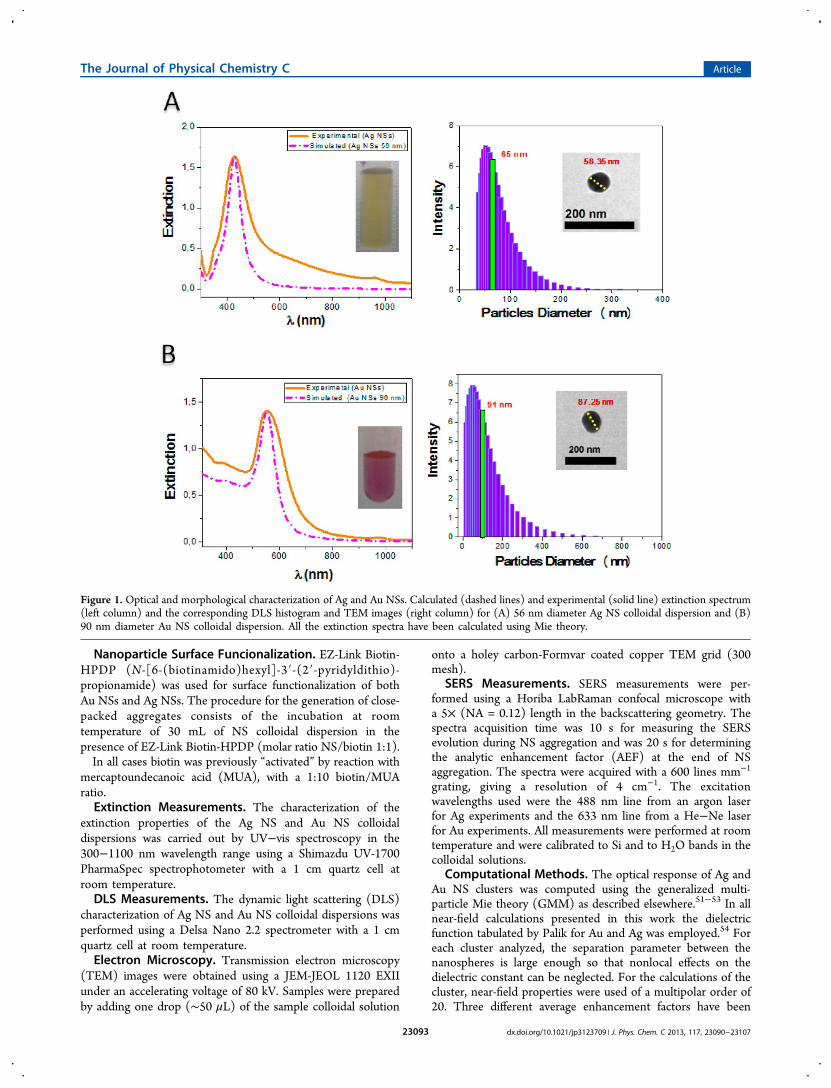
Figure 1. Optical and morphological characterization of Ag and Au NSs. Calculated (dashed lines) and experimental (solid line) extinction spectrum(left column) and the corresponding DLS histogram and TEM images (right column) for (A) 56 nm diameter Ag NS colloidal dispersion and (B)90 nm diameter Au NS colloidal dispersion. All the extinction spectra have been calculated using Mie theory.
The Journal of Physical Chemistry C Article
dx.doi.org/10.1021/jp3123709 | J. Phys. Chem. C 2013, 117, 23090−2310723093
computed: angular average denoted by ⟨Γ(ω)⟩θ averaged over18 different polarizations (from 0° to 170° at 10° steps),angular average considering vacancies in the nanostructuredenoted by ⟨Γ(ω)⟩θ,v which considers simultaneously theaverage over different polarizations and the variation of thecluster geometry by generating vacancies in the cluster in arandom way, and ⟨Γ(ω)⟩θ,v,d which takes into accountsimultaneously the average over different polarizations of thecluster geometry by generating vacancies and the variation ofthe gap distance between 4 ± 1 nm.Quantum Chemistry Calculations. Ab initio calculations
were performed with the Gaussian 98 program suite.55 In allcalculations, we use Becke’s three-parameter hybrid functionalmethod using Lee−Yang−Parr correlation functional (B3LYP)methods with 6-311++G(d,p) basis sets.
■ RESULTS AND DISCUSSIONFar-Field Optical and Morphological Characterization
of NSs and Aggregates. The left column of Figure 1 depictsthe experimental extinction spectra (solid line) of the Ag(Figure 1A) and Au (Figure 1B) NS colloidal dispersions andthe corresponding simulated spectrum using GMM theory(dashed lines). Details of how to calculate the far as well as the
near-field properties of NS aggregates can be found else-where.51−53 As it can be noticed, in both cases the correlationof experimental and theoretical extinction spectra is satisfactory,regarding the peak position of the LSPR wavelength. Thisfeature indicates that nearly spherical nanoparticles areobtained in the NP synthesis, with average diameters of 56and 90 nm for Ag and Au NSs, respectively, as can be seen inthe transmission electron microscopy (TEM) images (rightcolumn of Figure 1). The differences observed with respect tothe peak width are due to inhomogeneous size broadening as itcould be appreciated in the dynamic light scattering (DLS)histograms (right column of Figure 1). Note that DLS signalsshown in Figure 1 are in intensity units, and therefore, they areproportional to the scattering cross section of the clusters. Asthe scattering cross section scales, in the quasi-static limit, withthe sixth power of size, larger particles will have very highscattering intensities even if their concentration is very lowcompared with that of the smaller particles (i.e., a particle being10 times greater in size will have a million times greaterscattering cross section).56 Therefore, even if the DLS signalsare spread over a relatively large size distribution, the meandiameter agrees quite well with the mean diameter obtained byTEM and with the electrodynamics simulations.
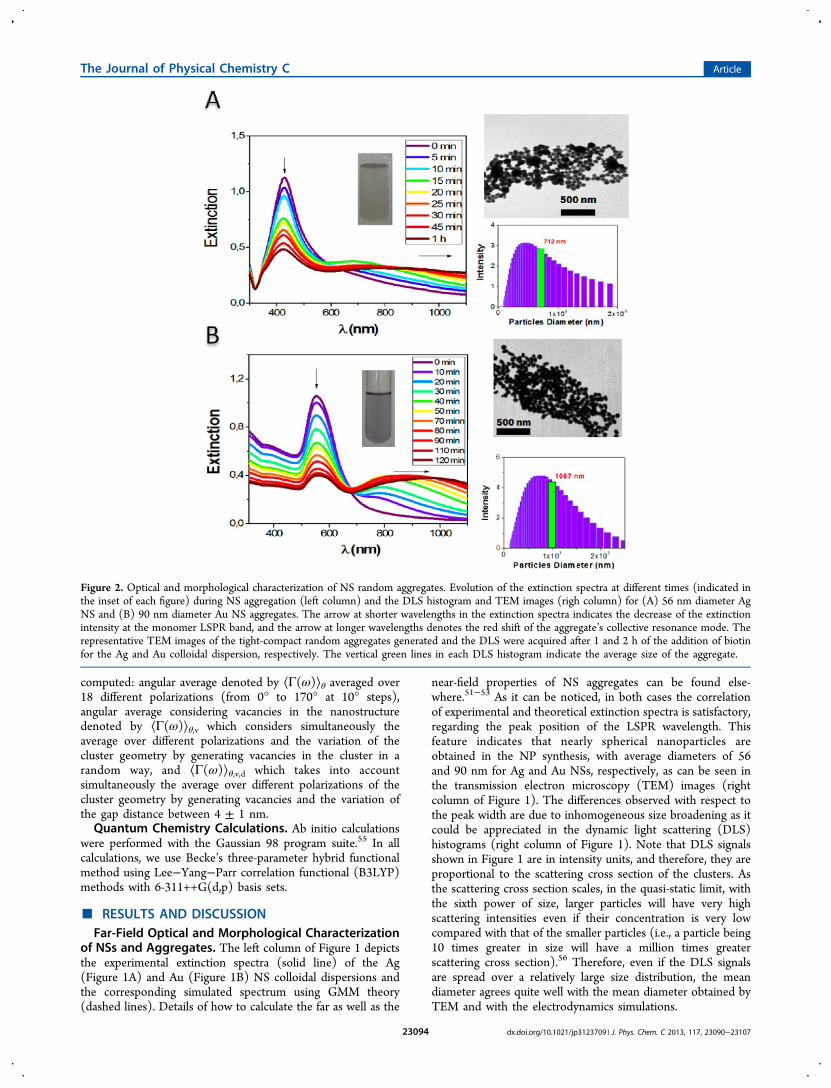
Figure 2. Optical and morphological characterization of NS random aggregates. Evolution of the extinction spectra at different times (indicated inthe inset of each figure) during NS aggregation (left column) and the DLS histogram and TEM images (righ column) for (A) 56 nm diameter AgNS and (B) 90 nm diameter Au NS aggregates. The arrow at shorter wavelengths in the extinction spectra indicates the decrease of the extinctionintensity at the monomer LSPR band, and the arrow at longer wavelengths denotes the red shift of the aggregate’s collective resonance mode. Therepresentative TEM images of the tight-compact random aggregates generated and the DLS were acquired after 1 and 2 h of the addition of biotinfor the Ag and Au colloidal dispersion, respectively. The vertical green lines in each DLS histogram indicate the average size of the aggregate.
The Journal of Physical Chemistry C Article
dx.doi.org/10.1021/jp3123709 | J. Phys. Chem. C 2013, 117, 23090−2310723094
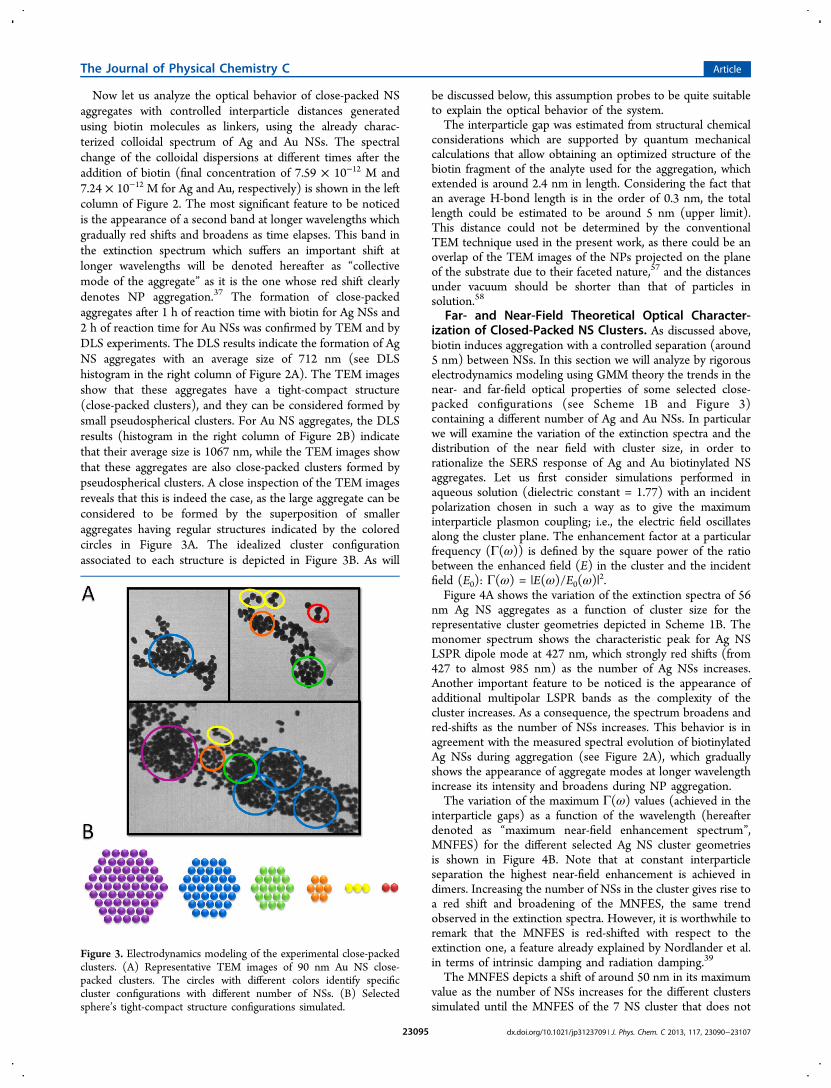
Now let us analyze the optical behavior of close-packed NSaggregates with controlled interparticle distances generatedusing biotin molecules as linkers, using the already charac-terized colloidal spectrum of Ag and Au NSs. The spectralchange of the colloidal dispersions at different times after theaddition of biotin (final concentration of 7.59 × 10⁻¹² M and7.24 × 10−12 M for Ag and Au, respectively) is shown in the leftcolumn of Figure 2. The most significant feature to be noticedis the appearance of a second band at longer wavelengths whichgradually red shifts and broadens as time elapses. This band inthe extinction spectrum which suffers an important shift atlonger wavelengths will be denoted hereafter as “collectivemode of the aggregate” as it is the one whose red shift clearlydenotes NP aggregation.37 The formation of close-packedaggregates after 1 h of reaction time with biotin for Ag NSs and2 h of reaction time for Au NSs was confirmed by TEM and byDLS experiments. The DLS results indicate the formation of AgNS aggregates with an average size of 712 nm (see DLShistogram in the right column of Figure 2A). The TEM imagesshow that these aggregates have a tight-compact structure(close-packed clusters), and they can be considered formed bysmall pseudospherical clusters. For Au NS aggregates, the DLSresults (histogram in the right column of Figure 2B) indicatethat their average size is 1067 nm, while the TEM images showthat these aggregates are also close-packed clusters formed bypseudospherical clusters. A close inspection of the TEM imagesreveals that this is indeed the case, as the large aggregate can beconsidered to be formed by the superposition of smalleraggregates having regular structures indicated by the coloredcircles in Figure 3A. The idealized cluster configurationassociated to each structure is depicted in Figure 3B. As will
be discussed below, this assumption probes to be quite suitableto explain the optical behavior of the system.The interparticle gap was estimated from structural chemical
considerations which are supported by quantum mechanicalcalculations that allow obtaining an optimized structure of thebiotin fragment of the analyte used for the aggregation, whichextended is around 2.4 nm in length. Considering the fact thatan average H-bond length is in the order of 0.3 nm, the totallength could be estimated to be around 5 nm (upper limit).This distance could not be determined by the conventionalTEM technique used in the present work, as there could be anoverlap of the TEM images of the NPs projected on the planeof the substrate due to their faceted nature,57 and the distancesunder vacuum should be shorter than that of particles insolution.58
Far- and Near-Field Theoretical Optical Character-ization of Closed-Packed NS Clusters. As discussed above,biotin induces aggregation with a controlled separation (around5 nm) between NSs. In this section we will analyze by rigorouselectrodynamics modeling using GMM theory the trends in thenear- and far-field optical properties of some selected close-packed configurations (see Scheme 1B and Figure 3)containing a different number of Ag and Au NSs. In particularwe will examine the variation of the extinction spectra and thedistribution of the near field with cluster size, in order torationalize the SERS response of Ag and Au biotinylated NSaggregates. Let us first consider simulations performed inaqueous solution (dielectric constant = 1.77) with an incidentpolarization chosen in such a way as to give the maximuminterparticle plasmon coupling; i.e., the electric field oscillatesalong the cluster plane. The enhancement factor at a particularfrequency (Γ(ω)) is defined by the square power of the ratiobetween the enhanced field (E) in the cluster and the incidentfield (E0): Γ(ω) = |E(ω)/E0(ω)|
2.Figure 4A shows the variation of the extinction spectra of 56
nm Ag NS aggregates as a function of cluster size for therepresentative cluster geometries depicted in Scheme 1B. Themonomer spectrum shows the characteristic peak for Ag NSLSPR dipole mode at 427 nm, which strongly red shifts (from427 to almost 985 nm) as the number of Ag NSs increases.Another important feature to be noticed is the appearance ofadditional multipolar LSPR bands as the complexity of thecluster increases. As a consequence, the spectrum broadens andred-shifts as the number of NSs increases. This behavior is inagreement with the measured spectral evolution of biotinylatedAg NSs during aggregation (see Figure 2A), which graduallyshows the appearance of aggregate modes at longer wavelengthincrease its intensity and broadens during NP aggregation.The variation of the maximum Γ(ω) values (achieved in the
interparticle gaps) as a function of the wavelength (hereafterdenoted as “maximum near-field enhancement spectrum”,MNFES) for the different selected Ag NS cluster geometriesis shown in Figure 4B. Note that at constant interparticleseparation the highest near-field enhancement is achieved indimers. Increasing the number of NSs in the cluster gives rise toa red shift and broadening of the MNFES, the same trendobserved in the extinction spectra. However, it is worthwhile toremark that the MNFES is red-shifted with respect to theextinction one, a feature already explained by Nordlander et al.in terms of intrinsic damping and radiation damping.39
The MNFES depicts a shift of around 50 nm in its maximumvalue as the number of NSs increases for the different clusterssimulated until the MNFES of the 7 NS cluster that does not
Figure 3. Electrodynamics modeling of the experimental close-packedclusters. (A) Representative TEM images of 90 nm Au NS close-packed clusters. The circles with different colors identify specificcluster configurations with different number of NSs. (B) Selectedsphere’s tight-compact structure configurations simulated.
The Journal of Physical Chemistry C Article
dx.doi.org/10.1021/jp3123709 | J. Phys. Chem. C 2013, 117, 23090−2310723095
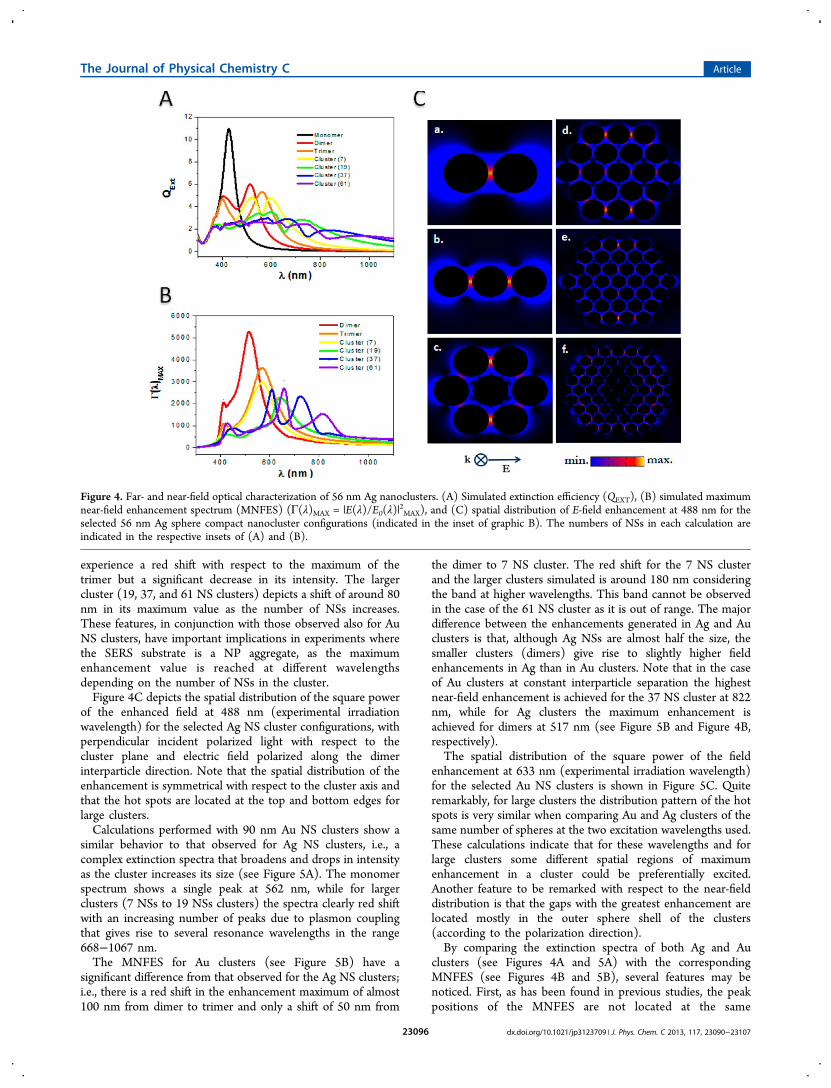
experience a red shift with respect to the maximum of thetrimer but a significant decrease in its intensity. The largercluster (19, 37, and 61 NS clusters) depicts a shift of around 80nm in its maximum value as the number of NSs increases.These features, in conjunction with those observed also for AuNS clusters, have important implications in experiments wherethe SERS substrate is a NP aggregate, as the maximumenhancement value is reached at different wavelengthsdepending on the number of NSs in the cluster.Figure 4C depicts the spatial distribution of the square power
of the enhanced field at 488 nm (experimental irradiationwavelength) for the selected Ag NS cluster configurations, withperpendicular incident polarized light with respect to thecluster plane and electric field polarized along the dimerinterparticle direction. Note that the spatial distribution of theenhancement is symmetrical with respect to the cluster axis andthat the hot spots are located at the top and bottom edges forlarge clusters.Calculations performed with 90 nm Au NS clusters show a
similar behavior to that observed for Ag NS clusters, i.e., acomplex extinction spectra that broadens and drops in intensityas the cluster increases its size (see Figure 5A). The monomerspectrum shows a single peak at 562 nm, while for largerclusters (7 NSs to 19 NSs clusters) the spectra clearly red shiftwith an increasing number of peaks due to plasmon couplingthat gives rise to several resonance wavelengths in the range668−1067 nm.The MNFES for Au clusters (see Figure 5B) have a
significant difference from that observed for the Ag NS clusters;i.e., there is a red shift in the enhancement maximum of almost100 nm from dimer to trimer and only a shift of 50 nm from
the dimer to 7 NS cluster. The red shift for the 7 NS clusterand the larger clusters simulated is around 180 nm consideringthe band at higher wavelengths. This band cannot be observedin the case of the 61 NS cluster as it is out of range. The majordifference between the enhancements generated in Ag and Auclusters is that, although Ag NSs are almost half the size, thesmaller clusters (dimers) give rise to slightly higher fieldenhancements in Ag than in Au clusters. Note that in the caseof Au clusters at constant interparticle separation the highestnear-field enhancement is achieved for the 37 NS cluster at 822nm, while for Ag clusters the maximum enhancement isachieved for dimers at 517 nm (see Figure 5B and Figure 4B,respectively).The spatial distribution of the square power of the field
enhancement at 633 nm (experimental irradiation wavelength)for the selected Au NS clusters is shown in Figure 5C. Quiteremarkably, for large clusters the distribution pattern of the hotspots is very similar when comparing Au and Ag clusters of thesame number of spheres at the two excitation wavelengths used.These calculations indicate that for these wavelengths and forlarge clusters some different spatial regions of maximumenhancement in a cluster could be preferentially excited.Another feature to be remarked with respect to the near-fielddistribution is that the gaps with the greatest enhancement arelocated mostly in the outer sphere shell of the clusters(according to the polarization direction).By comparing the extinction spectra of both Ag and Au
clusters (see Figures 4A and 5A) with the correspondingMNFES (see Figures 4B and 5B), several features may benoticed. First, as has been found in previous studies, the peakpositions of the MNFES are not located at the same
Figure 4. Far- and near-field optical characterization of 56 nm Ag nanoclusters. (A) Simulated extinction efficiency (QEXT), (B) simulated maximumnear-field enhancement spectrum (MNFES) (Γ(λ)MAX = |E(λ)/E0(λ)|
2MAX), and (C) spatial distribution of E-field enhancement at 488 nm for the
selected 56 nm Ag sphere compact nanocluster configurations (indicated in the inset of graphic B). The numbers of NSs in each calculation areindicated in the respective insets of (A) and (B).
The Journal of Physical Chemistry C Article
dx.doi.org/10.1021/jp3123709 | J. Phys. Chem. C 2013, 117, 23090−2310723096
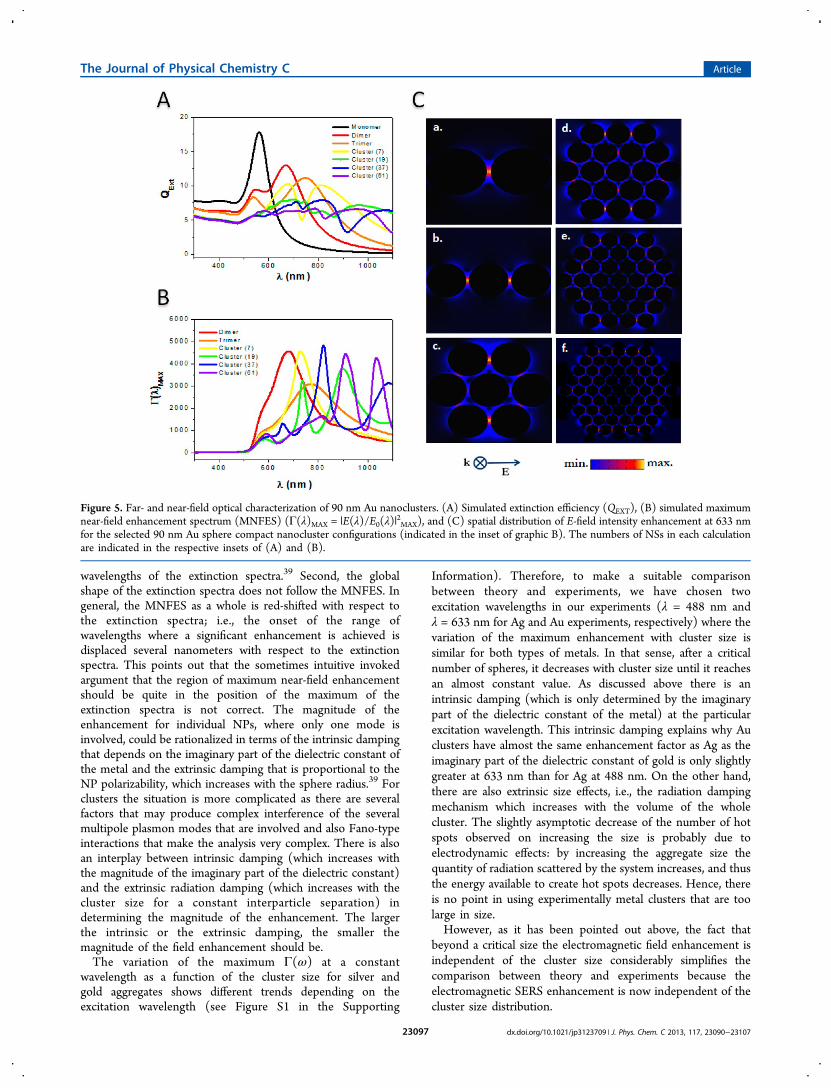
wavelengths of the extinction spectra.39 Second, the globalshape of the extinction spectra does not follow the MNFES. Ingeneral, the MNFES as a whole is red-shifted with respect tothe extinction spectra; i.e., the onset of the range ofwavelengths where a significant enhancement is achieved isdisplaced several nanometers with respect to the extinctionspectra. This points out that the sometimes intuitive invokedargument that the region of maximum near-field enhancementshould be quite in the position of the maximum of theextinction spectra is not correct. The magnitude of theenhancement for individual NPs, where only one mode isinvolved, could be rationalized in terms of the intrinsic dampingthat depends on the imaginary part of the dielectric constant ofthe metal and the extrinsic damping that is proportional to theNP polarizability, which increases with the sphere radius.39 Forclusters the situation is more complicated as there are severalfactors that may produce complex interference of the severalmultipole plasmon modes that are involved and also Fano-typeinteractions that make the analysis very complex. There is alsoan interplay between intrinsic damping (which increases withthe magnitude of the imaginary part of the dielectric constant)and the extrinsic radiation damping (which increases with thecluster size for a constant interparticle separation) indetermining the magnitude of the enhancement. The largerthe intrinsic or the extrinsic damping, the smaller themagnitude of the field enhancement should be.The variation of the maximum Γ(ω) at a constant
wavelength as a function of the cluster size for silver andgold aggregates shows different trends depending on theexcitation wavelength (see Figure S1 in the Supporting
Information). Therefore, to make a suitable comparisonbetween theory and experiments, we have chosen twoexcitation wavelengths in our experiments (λ = 488 nm andλ = 633 nm for Ag and Au experiments, respectively) where thevariation of the maximum enhancement with cluster size issimilar for both types of metals. In that sense, after a criticalnumber of spheres, it decreases with cluster size until it reachesan almost constant value. As discussed above there is anintrinsic damping (which is only determined by the imaginarypart of the dielectric constant of the metal) at the particularexcitation wavelength. This intrinsic damping explains why Auclusters have almost the same enhancement factor as Ag as theimaginary part of the dielectric constant of gold is only slightlygreater at 633 nm than for Ag at 488 nm. On the other hand,there are also extrinsic size effects, i.e., the radiation dampingmechanism which increases with the volume of the wholecluster. The slightly asymptotic decrease of the number of hotspots observed on increasing the size is probably due toelectrodynamic effects: by increasing the aggregate size thequantity of radiation scattered by the system increases, and thusthe energy available to create hot spots decreases. Hence, thereis no point in using experimentally metal clusters that are toolarge in size.However, as it has been pointed out above, the fact that
beyond a critical size the electromagnetic field enhancement isindependent of the cluster size considerably simplifies thecomparison between theory and experiments because theelectromagnetic SERS enhancement is now independent of thecluster size distribution.
Figure 5. Far- and near-field optical characterization of 90 nm Au nanoclusters. (A) Simulated extinction efficiency (QEXT), (B) simulated maximumnear-field enhancement spectrum (MNFES) (Γ(λ)MAX = |E(λ)/E0(λ)|
2MAX), and (C) spatial distribution of E-field intensity enhancement at 633 nm
for the selected 90 nm Au sphere compact nanocluster configurations (indicated in the inset of graphic B). The numbers of NSs in each calculationare indicated in the respective insets of (A) and (B).
The Journal of Physical Chemistry C Article
dx.doi.org/10.1021/jp3123709 | J. Phys. Chem. C 2013, 117, 23090−2310723097
Having analyzed the near-field optical behavior of Ag and Auclusters as a function of the cluster size for a single polarizationand the distribution of the near-field enhancement, it is nowconvenient to have a more realistic comparison with experi-ments to analyze the variation of the angular average of Γ(ω) asa function of the cluster size. In addition, different angularaverages (⟨Γ(ω)⟩θ) have been computed depending on thelower limit of the enhancement (Γmin) used to perform theintegration
∫ ∫ω ω⟨Γ ⟩ = ΓθΓ
Γ
Γ
Γ
Γi i( ) ( )d / di
min
min
max
min
max
(1)
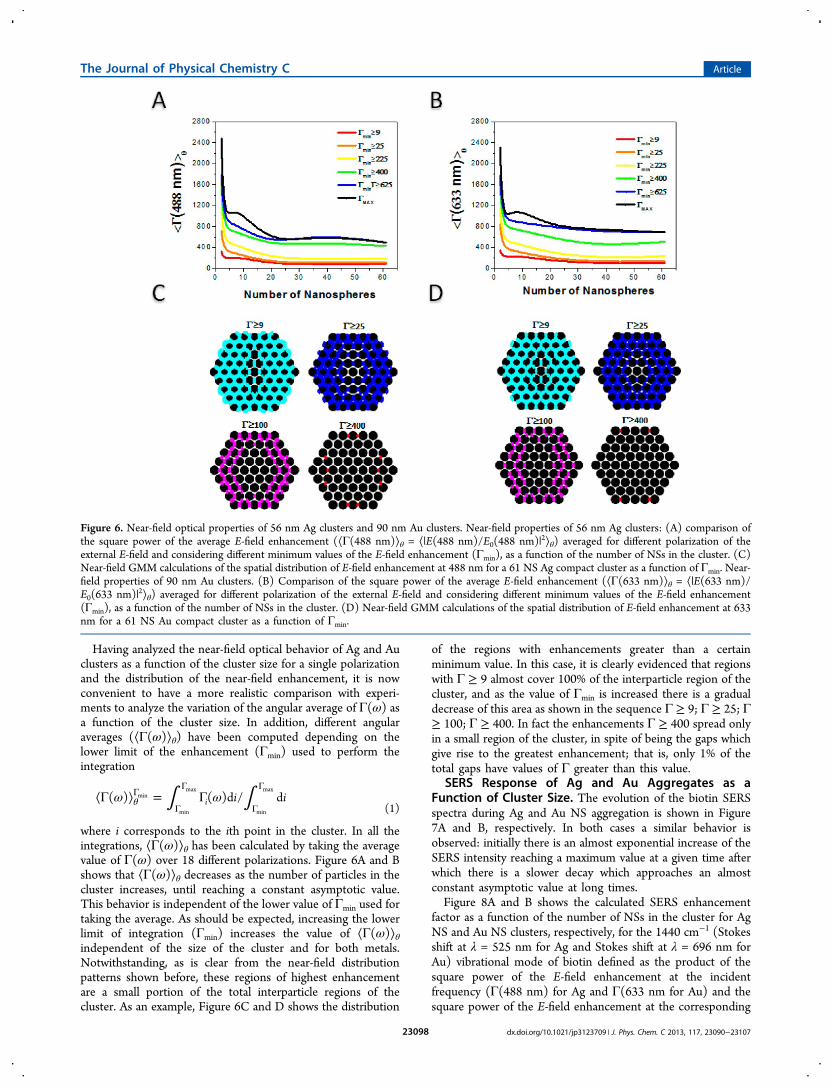
where i corresponds to the ith point in the cluster. In all theintegrations, ⟨Γ(ω)⟩θ has been calculated by taking the averagevalue of Γ(ω) over 18 different polarizations. Figure 6A and Bshows that ⟨Γ(ω)⟩θ decreases as the number of particles in thecluster increases, until reaching a constant asymptotic value.This behavior is independent of the lower value of Γmin used fortaking the average. As should be expected, increasing the lowerlimit of integration (Γmin) increases the value of ⟨Γ(ω)⟩θindependent of the size of the cluster and for both metals.Notwithstanding, as is clear from the near-field distributionpatterns shown before, these regions of highest enhancementare a small portion of the total interparticle regions of thecluster. As an example, Figure 6C and D shows the distribution
of the regions with enhancements greater than a certainminimum value. In this case, it is clearly evidenced that regionswith Γ ≥ 9 almost cover 100% of the interparticle region of thecluster, and as the value of Γmin is increased there is a gradualdecrease of this area as shown in the sequence Γ ≥ 9; Γ ≥ 25; Γ≥ 100; Γ ≥ 400. In fact the enhancements Γ ≥ 400 spread onlyin a small region of the cluster, in spite of being the gaps whichgive rise to the greatest enhancement; that is, only 1% of thetotal gaps have values of Γ greater than this value.
SERS Response of Ag and Au Aggregates as aFunction of Cluster Size. The evolution of the biotin SERSspectra during Ag and Au NS aggregation is shown in Figure7A and B, respectively. In both cases a similar behavior isobserved: initially there is an almost exponential increase of theSERS intensity reaching a maximum value at a given time afterwhich there is a slower decay which approaches an almostconstant asymptotic value at long times.Figure 8A and B shows the calculated SERS enhancement
factor as a function of the number of NSs in the cluster for AgNS and Au NS clusters, respectively, for the 1440 cm−1 (Stokesshift at λ = 525 nm for Ag and Stokes shift at λ = 696 nm forAu) vibrational mode of biotin defined as the product of thesquare power of the E-field enhancement at the incidentfrequency (Γ(488 nm) for Ag and Γ(633 nm for Au) and thesquare power of the E-field enhancement at the corresponding
Figure 6. Near-field optical properties of 56 nm Ag clusters and 90 nm Au clusters. Near-field properties of 56 nm Ag clusters: (A) comparison ofthe square power of the average E-field enhancement (⟨Γ(488 nm)⟩θ = ⟨|E(488 nm)/E0(488 nm)|2⟩θ) averaged for different polarization of theexternal E-field and considering different minimum values of the E-field enhancement (Γmin), as a function of the number of NSs in the cluster. (C)Near-field GMM calculations of the spatial distribution of E-field enhancement at 488 nm for a 61 NS Ag compact cluster as a function of Γmin. Near-field properties of 90 nm Au clusters. (B) Comparison of the square power of the average E-field enhancement (⟨Γ(633 nm)⟩θ = ⟨|E(633 nm)/E0(633 nm)|2⟩θ) averaged for different polarization of the external E-field and considering different minimum values of the E-field enhancement(Γmin), as a function of the number of NSs in the cluster. (D) Near-field GMM calculations of the spatial distribution of E-field enhancement at 633nm for a 61 NS Au compact cluster as a function of Γmin.
The Journal of Physical Chemistry C Article
dx.doi.org/10.1021/jp3123709 | J. Phys. Chem. C 2013, 117, 23090−2310723098
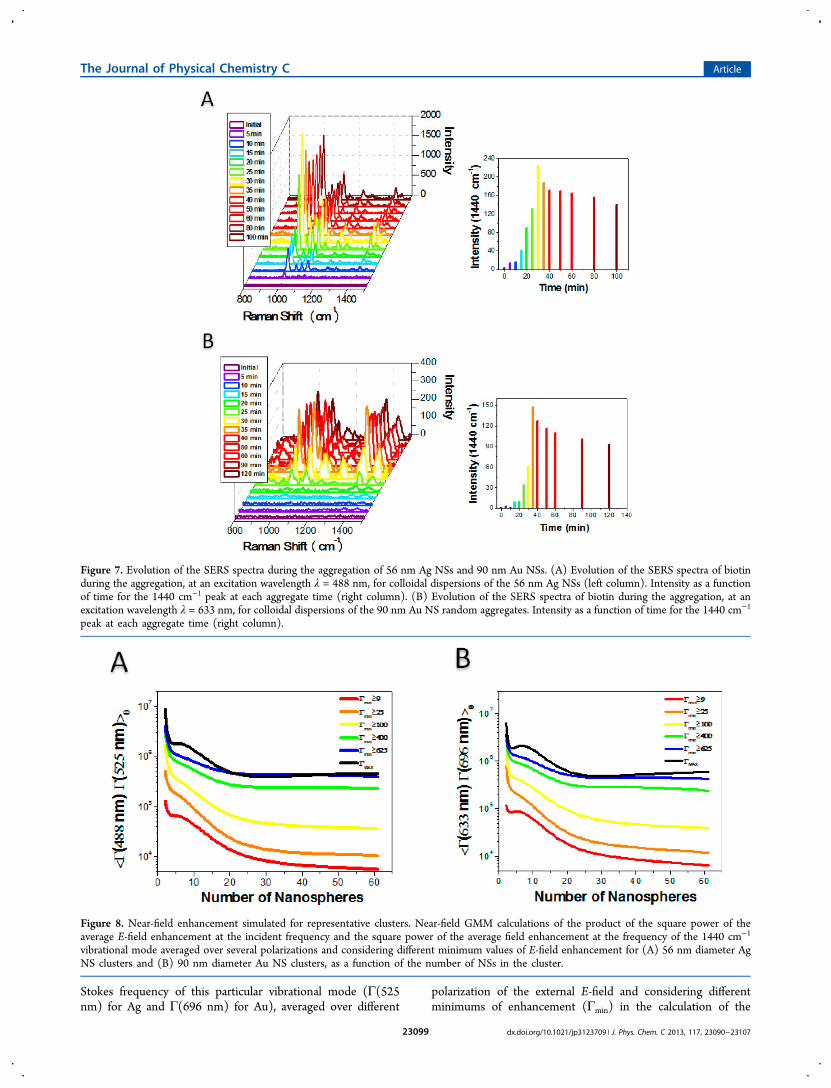
Stokes frequency of this particular vibrational mode (Γ(525nm) for Ag and Γ(696 nm) for Au), averaged over different
polarization of the external E-field and considering differentminimums of enhancement (Γmin) in the calculation of the
Figure 7. Evolution of the SERS spectra during the aggregation of 56 nm Ag NSs and 90 nm Au NSs. (A) Evolution of the SERS spectra of biotinduring the aggregation, at an excitation wavelength λ = 488 nm, for colloidal dispersions of the 56 nm Ag NSs (left column). Intensity as a functionof time for the 1440 cm−1 peak at each aggregate time (right column). (B) Evolution of the SERS spectra of biotin during the aggregation, at anexcitation wavelength λ = 633 nm, for colloidal dispersions of the 90 nm Au NS random aggregates. Intensity as a function of time for the 1440 cm−1
peak at each aggregate time (right column).
Figure 8. Near-field enhancement simulated for representative clusters. Near-field GMM calculations of the product of the square power of theaverage E-field enhancement at the incident frequency and the square power of the average field enhancement at the frequency of the 1440 cm−1
vibrational mode averaged over several polarizations and considering different minimum values of E-field enhancement for (A) 56 nm diameter AgNS clusters and (B) 90 nm diameter Au NS clusters, as a function of the number of NSs in the cluster.
The Journal of Physical Chemistry C Article
dx.doi.org/10.1021/jp3123709 | J. Phys. Chem. C 2013, 117, 23090−2310723099
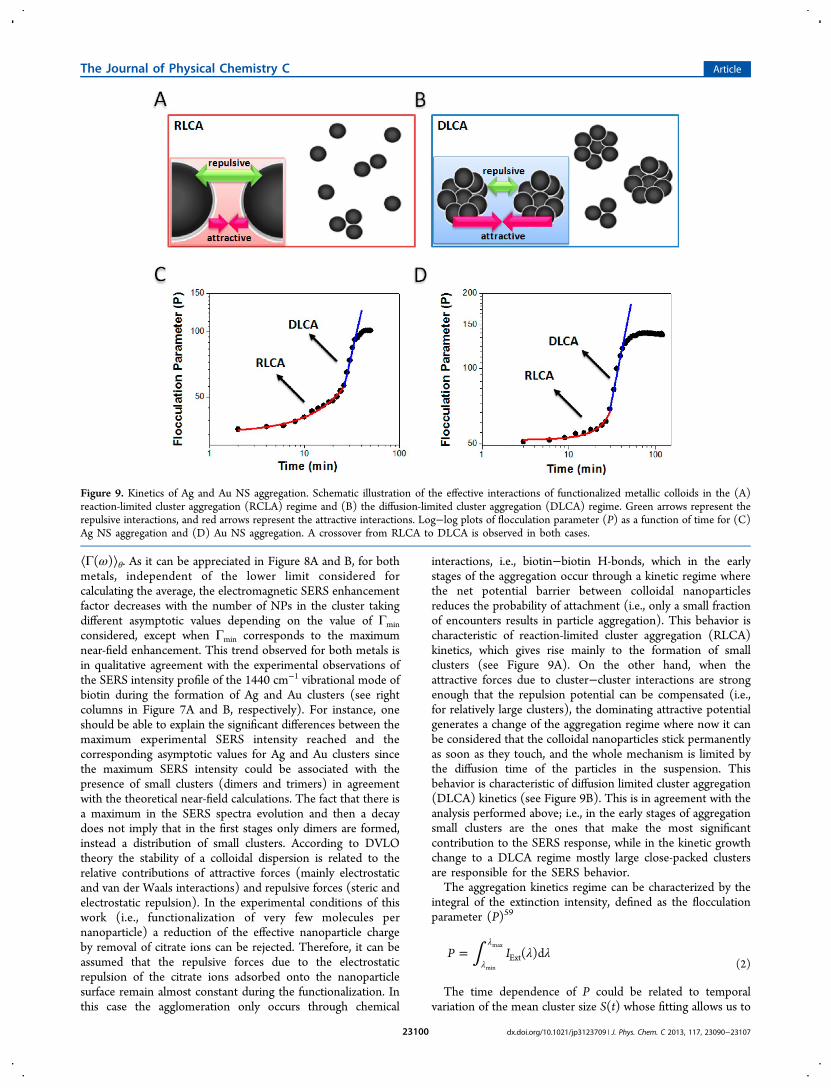
⟨Γ(ω)⟩θ. As it can be appreciated in Figure 8A and B, for bothmetals, independent of the lower limit considered forcalculating the average, the electromagnetic SERS enhancementfactor decreases with the number of NPs in the cluster takingdifferent asymptotic values depending on the value of Γminconsidered, except when Γmin corresponds to the maximumnear-field enhancement. This trend observed for both metals isin qualitative agreement with the experimental observations ofthe SERS intensity profile of the 1440 cm−1 vibrational mode ofbiotin during the formation of Ag and Au clusters (see rightcolumns in Figure 7A and B, respectively). For instance, oneshould be able to explain the significant differences between themaximum experimental SERS intensity reached and thecorresponding asymptotic values for Ag and Au clusters sincethe maximum SERS intensity could be associated with thepresence of small clusters (dimers and trimers) in agreementwith the theoretical near-field calculations. The fact that there isa maximum in the SERS spectra evolution and then a decaydoes not imply that in the first stages only dimers are formed,instead a distribution of small clusters. According to DVLOtheory the stability of a colloidal dispersion is related to therelative contributions of attractive forces (mainly electrostaticand van der Waals interactions) and repulsive forces (steric andelectrostatic repulsion). In the experimental conditions of thiswork (i.e., functionalization of very few molecules pernanoparticle) a reduction of the effective nanoparticle chargeby removal of citrate ions can be rejected. Therefore, it can beassumed that the repulsive forces due to the electrostaticrepulsion of the citrate ions adsorbed onto the nanoparticlesurface remain almost constant during the functionalization. Inthis case the agglomeration only occurs through chemical
interactions, i.e., biotin−biotin H-bonds, which in the earlystages of the aggregation occur through a kinetic regime wherethe net potential barrier between colloidal nanoparticlesreduces the probability of attachment (i.e., only a small fractionof encounters results in particle aggregation). This behavior ischaracteristic of reaction-limited cluster aggregation (RLCA)kinetics, which gives rise mainly to the formation of smallclusters (see Figure 9A). On the other hand, when theattractive forces due to cluster−cluster interactions are strongenough that the repulsion potential can be compensated (i.e.,for relatively large clusters), the dominating attractive potentialgenerates a change of the aggregation regime where now it canbe considered that the colloidal nanoparticles stick permanentlyas soon as they touch, and the whole mechanism is limited bythe diffusion time of the particles in the suspension. Thisbehavior is characteristic of diffusion limited cluster aggregation(DLCA) kinetics (see Figure 9B). This is in agreement with theanalysis performed above; i.e., in the early stages of aggregationsmall clusters are the ones that make the most significantcontribution to the SERS response, while in the kinetic growthchange to a DLCA regime mostly large close-packed clustersare responsible for the SERS behavior.The aggregation kinetics regime can be characterized by the
integral of the extinction intensity, defined as the flocculationparameter (P)59
∫ λ λ=λ
λP I ( )dExt
min
max
(2)
The time dependence of P could be related to temporalvariation of the mean cluster size S(t) whose fitting allows us to
Figure 9. Kinetics of Ag and Au NS aggregation. Schematic illustration of the effective interactions of functionalized metallic colloids in the (A)reaction-limited cluster aggregation (RCLA) regime and (B) the diffusion-limited cluster aggregation (DLCA) regime. Green arrows represent therepulsive interactions, and red arrows represent the attractive interactions. Log−log plots of flocculation parameter (P) as a function of time for (C)Ag NS aggregation and (D) Au NS aggregation. A crossover from RLCA to DLCA is observed in both cases.
The Journal of Physical Chemistry C Article
dx.doi.org/10.1021/jp3123709 | J. Phys. Chem. C 2013, 117, 23090−2310723100
differentiate the kinetic regime (RLCA or DLCA) as they obeydifferent growth laws
∝ ∝P t S t t kRCLA: ( ) ( ) exp( / ) (3)
∝ ∝ τP t S t tDCLA: ( ) ( ) (4)
where τ is considered a constant value and k is the timeconstant.59
To corroborate the kinetic regime crossover observed in themeasures of the SERS temporal variation, the temporalvariation of the flocculation parameter (P) as a function oftime for Ag NS and Au NS aggregation was determined. Thecorresponding time evolutions of each extinction spectra atdifferent times during NS aggregation are available in theSupporting Information (Figure S2). The wavelength rangeused to calculate P was from 530 to 1100 nm for Ag NSs andfrom 700 to 1100 nm for Au NSs, and they were chosen in sucha way to cover the whole collective mode of the aggregates. Thelog−log plots of the temporal variation of the flocculationparameter (P) for Ag NSs and Au NSs are shown in Figure 9Cand D, respectively. The analysis of Figure 9C reveals that inthe very early stages, within the first 25 min, there is a clearexponential growth in agreement with eq 3 which indicates aRCLA kinetics growth. Following this exponential growth thereis a change to a power law behavior kinetics observed as a linearrelation in the log−log plot. In the case of Au NSs (see Figure9D) the exponential growth occurs during the first 30 min, alsofollowed by a linear relation in the log−log plot. This evidencesuggests that there is indeed a change of regime from a RCLAto a DCLA kinetic growth, during the nanoparticlesaggregation.Note that there is an excellent correlation between the time
in which this change of regime (from RCLA to DCLA)determined from the flocculation parameter and the time whenan abrupt change in the graphic of the SERS intensity as afunction of time for the 1440 cm−1 peak occurs (see Figure 6Aand B), which is 25 and 35 min during Ag NS and Au NSaggregation, respectively.To give a quantitative assessment of the near-field properties,
we will now compare the experimental and the theoretical
enhancement values in the asymptotic region (large clusters).For that purpose we will first calculate the analytic enhance-ment factor (AEF) for Ag and Au clusters, defined as the ratioof the intensity of the SERS signal (ISERS) of a given mode andthe intensity of the Raman signal (IRS) of the same mode for agiven analyte, both normalized with the respective analyteconcentration (C)50
=AEF
IC
IC
SERS
SERS
RS
RS (5)
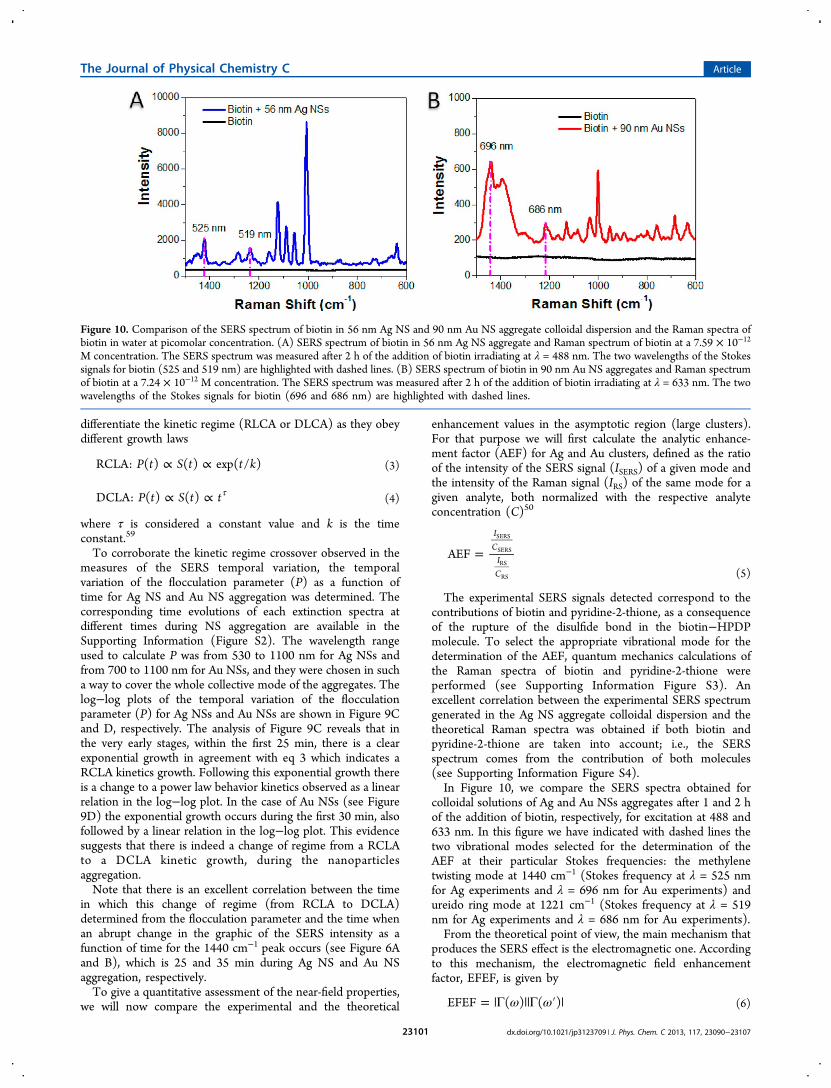
The experimental SERS signals detected correspond to thecontributions of biotin and pyridine-2-thione, as a consequenceof the rupture of the disulfide bond in the biotin−HPDPmolecule. To select the appropriate vibrational mode for thedetermination of the AEF, quantum mechanics calculations ofthe Raman spectra of biotin and pyridine-2-thione wereperformed (see Supporting Information Figure S3). Anexcellent correlation between the experimental SERS spectrumgenerated in the Ag NS aggregate colloidal dispersion and thetheoretical Raman spectra was obtained if both biotin andpyridine-2-thione are taken into account; i.e., the SERSspectrum comes from the contribution of both molecules(see Supporting Information Figure S4).In Figure 10, we compare the SERS spectra obtained for
colloidal solutions of Ag and Au NSs aggregates after 1 and 2 hof the addition of biotin, respectively, for excitation at 488 and633 nm. In this figure we have indicated with dashed lines thetwo vibrational modes selected for the determination of theAEF at their particular Stokes frequencies: the methylenetwisting mode at 1440 cm−1 (Stokes frequency at λ = 525 nmfor Ag experiments and λ = 696 nm for Au experiments) andureido ring mode at 1221 cm−1 (Stokes frequency at λ = 519nm for Ag experiments and λ = 686 nm for Au experiments).From the theoretical point of view, the main mechanism that
produces the SERS effect is the electromagnetic one. Accordingto this mechanism, the electromagnetic field enhancementfactor, EFEF, is given by
ω ω= |Γ ||Γ ′ |EFEF ( ) ( ) (6)
Figure 10. Comparison of the SERS spectrum of biotin in 56 nm Ag NS and 90 nm Au NS aggregate colloidal dispersion and the Raman spectra ofbiotin in water at picomolar concentration. (A) SERS spectrum of biotin in 56 nm Ag NS aggregate and Raman spectrum of biotin at a 7.59 × 10⁻¹²
M concentration. The SERS spectrum was measured after 2 h of the addition of biotin irradiating at λ = 488 nm. The two wavelengths of the Stokessignals for biotin (525 and 519 nm) are highlighted with dashed lines. (B) SERS spectrum of biotin in 90 nm Au NS aggregates and Raman spectrumof biotin at a 7.24 × 10⁻¹² M concentration. The SERS spectrum was measured after 2 h of the addition of biotin irradiating at λ = 633 nm. The twowavelengths of the Stokes signals for biotin (696 and 686 nm) are highlighted with dashed lines.
The Journal of Physical Chemistry C Article
dx.doi.org/10.1021/jp3123709 | J. Phys. Chem. C 2013, 117, 23090−2310723101
ω ωω
|Γ | =⎛⎝⎜⎜
⎞⎠⎟⎟E
E( )
( )( )0
2
(7)
ω ωω
|Γ ′ | = ′′
⎛⎝⎜⎜
⎞⎠⎟⎟E
E( )
( )( )0
2
(8)
where |Γ(ω)| is the square of the enhanced electric fieldgenerated at the frequency of the incident radiation (ω) and|Γ(ω′)| is the square of the enhanced electric field generated ata particular Stokes frequency (ω′).32The ordinary Raman intensity (IRS) can be written as
σ=I F CRS R R RS (9)
where FR is an instrumental factor; σR is the Raman crosssection of the free molecule; and CRS is the concentration. TheSERS intensity (ISERS) is given by a similar expression butslightly modified to separate out the physical enhancement, i.e.,EFEF, from the molecular cross section and other contributions
σ=I F C EFEFSERS S S SERS (10)
where FS is an instrumental factor; σS is the Raman crosssection of the molecule on the nanostructure; and CSERS is theconcentration on the nanostructure. If we assume that theinstrumental factors are the same in both experiments theglobal SERS enhancement factor (AEF) can be obtainedsubstituting eqs 9 and 10 into eq 5
σ σ=AEF ( / )EFEFS R (11)
The ratio σS/σR could be augmented as a result of theformation of metal−ligand coordination complexes with thesurface or by charge transfer transitions.60 However, thesemechanisms alone cannot account for the 106−108 AEFobserved in many experiments. In addition, these mechanisms
are still the subject of considerable research work, but it is nowaccepted that they can contribute with a factor of 10−100 tothe global AEF.60
The average EFEF (⟨Γ(ω)Γ(ω′)⟩θΓmin) for enhancementsgreater than Γmin was calculated taking the average of eq 6,considering all the points inside the cluster, according to thefollowing equation
∫ ∫ω ω ω ω⟨Γ Γ ′ ⟩ = Γ Γ ′θΓ
Γ
Γ
Γ
Γi i( ) ( ) ( ) ( )d / di i
min
min
max
min
max
(12)
Nevertheless, it is important to remark that there are twoopposite effects in the theoretical estimation of the EFEF withrespect to the selected Γmin value: On one hand, increasing theselected Γmin value will lead to a higher average EFEF, whichwill decrease the difference between the calculated EFEF andthe experimental AEF. On the other hand, as Γmin increases thespatial region of the cluster having these values is constrained,which implies a smaller fraction of molecules contributing tothe SERS signal. In that sense, for a given Γmin value, theeffective average EFEF should take into account this effectivenumber of active molecules. Therefore, the effective EFEF for agiven Γmin has to be calculated multiplying the average EFEF byan appropriate fraction. This quantity can be calculatedmultiplying eq 12 by the fraction ( f) of the electromagneticcontribution to the SERS signal coming from all the pointshaving enhancements greater than Γmin
∫ ∫ω ω ω ω= Γ Γ ′ Γ Γ ′Γ
Γ
Γ
Γ
=
f i i( ) ( )d / ( ) ( )di i i imin
max
min 9
max
(13)
The value Γmin = 9 in the denominator of eq 13 has beenchosen because this value encompasses all the points inside thecluster. Note that if we choose Γmin = 9 for all the integrals ineqs 12 and 13, the effective EFEF corresponds just to the
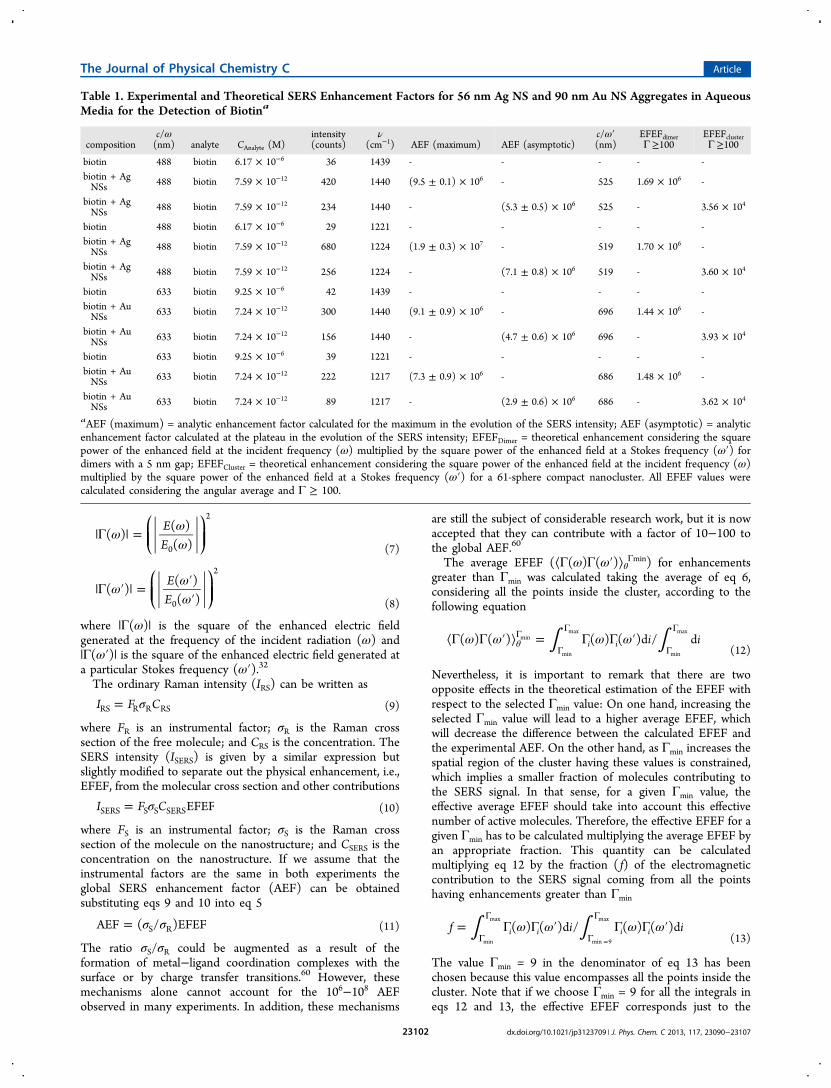
Table 1. Experimental and Theoretical SERS Enhancement Factors for 56 nm Ag NS and 90 nm Au NS Aggregates in AqueousMedia for the Detection of Biotina
compositionc/ω(nm) analyte CAnalyte (M)
intensity(counts)
ν(cm−1) AEF (maximum) AEF (asymptotic)
c/ω′(nm)
EFEFdimerΓ≥100
EFEFclusterΓ ≥100
biotin 488 biotin 6.17 × 10⁻⁶ 36 1439 - - - - -biotin + AgNSs 488 biotin 7.59 × 10⁻¹² 420 1440 (9.5 ± 0.1) × 106 - 525 1.69 × 10⁶ -
biotin + AgNSs 488 biotin 7.59 × 10⁻¹² 234 1440 - (5.3 ± 0.5) × 106 525 - 3.56 × 10⁴
biotin 488 biotin 6.17 × 10⁻⁶ 29 1221 - - - - -biotin + AgNSs 488 biotin 7.59 × 10⁻¹² 680 1224 (1.9 ± 0.3) × 107 - 519 1.70 × 10⁶ -
biotin + AgNSs 488 biotin 7.59 × 10⁻¹² 256 1224 - (7.1 ± 0.8) × 106 519 - 3.60 × 10⁴
biotin 633 biotin 9.25 × 10⁻⁶ 42 1439 - - - - -biotin + AuNSs 633 biotin 7.24 × 10⁻¹² 300 1440 (9.1 ± 0.9) × 106 - 696 1.44 × 10⁶ -
biotin + AuNSs 633 biotin 7.24 × 10⁻¹² 156 1440 - (4.7 ± 0.6) × 106 696 - 3.93 × 10⁴
biotin 633 biotin 9.25 × 10⁻⁶ 39 1221 - - - - -biotin + AuNSs 633 biotin 7.24 × 10⁻¹² 222 1217 (7.3 ± 0.9) × 106 - 686 1.48 × 10⁶ -
biotin + AuNSs 633 biotin 7.24 × 10⁻¹² 89 1217 - (2.9 ± 0.6) × 106 686 - 3.62 × 10⁴
aAEF (maximum) = analytic enhancement factor calculated for the maximum in the evolution of the SERS intensity; AEF (asymptotic) = analyticenhancement factor calculated at the plateau in the evolution of the SERS intensity; EFEFDimer = theoretical enhancement considering the squarepower of the enhanced field at the incident frequency (ω) multiplied by the square power of the enhanced field at a Stokes frequency (ω′) fordimers with a 5 nm gap; EFEFCluster = theoretical enhancement considering the square power of the enhanced field at the incident frequency (ω)multiplied by the square power of the enhanced field at a Stokes frequency (ω′) for a 61-sphere compact nanocluster. All EFEF values werecalculated considering the angular average and Γ ≥ 100.
The Journal of Physical Chemistry C Article
dx.doi.org/10.1021/jp3123709 | J. Phys. Chem. C 2013, 117, 23090−2310723102
average EFEF of the cluster. We have calculated the effectiveEFEF for different values of Γmin in the range 25 ≤ Γmin ≤ 400,and it was found that the value varies from 10 000 to 50 000within this range (see Figure S5 in the SupportingInformation). Considering this feature, at this point we willmake the comparison between experiments and theoryperforming the average with Γmin ≥ 100 and taking intoaccount the effective EFEF. The average EFEF was determinedfor two different cluster models, a dimer and considering a 61NS close-packed cluster, and the results were compared withthe AEF given by eq 5. The comparison was performed for theStokes signals of biotin at λ = 525 and λ = 519 nm for Agexperiments and at λ = 696 and λ = 686 nm for Au experiments(highlighted by the vertical lines in Figure 10). The calculatedvalues of the AEF and EFEFΓ≥100 for Ag and Au aggregates andclusters are shown in Table 1. The reference spectrum of biotinused to calculate the AEF according to eq 5 is available in theSupporting Information (Figure S6). There are two features tobe remarked: First, there are discrepancies between theexperimental AEF with the theoretical enhancement values ofbiotin in Ag and Au aggregates when both models areconsidered (the dimer model and the 61 NS cluster model).The ratio between the experimental enhancements (AEFmaximum) obtained at the time where the maximum SERSintensity is reached (30 and 35 min for Ag and Au aggregates,respectively) and the EFEF calculated for dimers is a factor of5−10. In this calculation it has been assumed that, at this stage,the experimental SERS signal is due to the presence of dimersinstead of a distribution of small clusters. To asses a moreaccurate correlation between the EFEF and the SERS response,the asymptotic value of the experimental SERS signals is thesuitable region to perform such analysis. In this regime, as hasbeen demonstrated by the theoretical calculations, the EFEF isalmost independent of the cluster size. The ratio between theasymptotic AEF and the EFEF for a 61 NS cluster is 149 and197 for the Stokes signals at λ = 525 and λ = 519 nm for Agclusters and 119 and 80 for the Stokes signals at λ = 696 nmand at λ = 686 nm for Au clusters (or 196, 259, 157, and 105 ifone considers the effective EFEF, respectively). Other sourcesthat could modify the calculated EFEF besides the angularaverage are the fluctuations in the interparticle distance and the
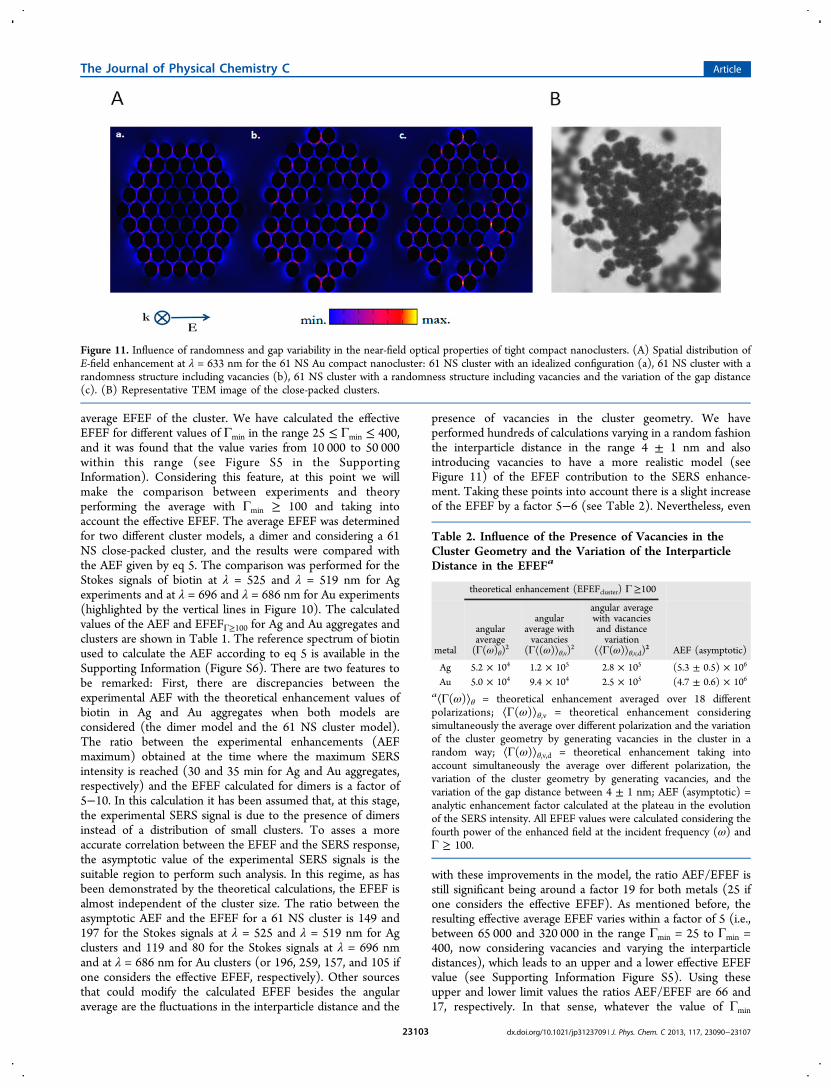
presence of vacancies in the cluster geometry. We haveperformed hundreds of calculations varying in a random fashionthe interparticle distance in the range 4 ± 1 nm and alsointroducing vacancies to have a more realistic model (seeFigure 11) of the EFEF contribution to the SERS enhance-ment. Taking these points into account there is a slight increaseof the EFEF by a factor 5−6 (see Table 2). Nevertheless, even
with these improvements in the model, the ratio AEF/EFEF isstill significant being around a factor 19 for both metals (25 ifone considers the effective EFEF). As mentioned before, theresulting effective average EFEF varies within a factor of 5 (i.e.,between 65 000 and 320 000 in the range Γmin = 25 to Γmin =400, now considering vacancies and varying the interparticledistances), which leads to an upper and a lower effective EFEFvalue (see Supporting Information Figure S5). Using theseupper and lower limit values the ratios AEF/EFEF are 66 and17, respectively. In that sense, whatever the value of Γmin
Figure 11. Influence of randomness and gap variability in the near-field optical properties of tight compact nanoclusters. (A) Spatial distribution ofE-field enhancement at λ = 633 nm for the 61 NS Au compact nanocluster: 61 NS cluster with an idealized configuration (a), 61 NS cluster with arandomness structure including vacancies (b), 61 NS cluster with a randomness structure including vacancies and the variation of the gap distance(c). (B) Representative TEM image of the close-packed clusters.
Table 2. Influence of the Presence of Vacancies in theCluster Geometry and the Variation of the InterparticleDistance in the EFEFa
theoretical enhancement (EFEFcluster) Γ≥100
metal
angularaverage(Γ(ω)θ)2
angularaverage withvacancies
(Γ⟨(ω)⟩θ,v)2
angular averagewith vacanciesand distancevariation
(⟨Γ(ω)⟩θ,v,d)2 AEF (asymptotic)
Ag 5.2 × 10⁴ 1.2 × 10⁵ 2.8 × 10⁵ (5.3 ± 0.5) × 106
Au 5.0 × 10⁴ 9.4 × 10⁴ 2.5 × 10⁵ (4.7 ± 0.6) × 106
a⟨Γ(ω)⟩θ = theoretical enhancement averaged over 18 differentpolarizations; ⟨Γ(ω)⟩θ,v = theoretical enhancement consideringsimultaneously the average over different polarization and the variationof the cluster geometry by generating vacancies in the cluster in arandom way; ⟨Γ(ω)⟩θ,v,d = theoretical enhancement taking intoaccount simultaneously the average over different polarization, thevariation of the cluster geometry by generating vacancies, and thevariation of the gap distance between 4 ± 1 nm; AEF (asymptotic) =analytic enhancement factor calculated at the plateau in the evolutionof the SERS intensity. All EFEF values were calculated considering thefourth power of the enhanced field at the incident frequency (ω) andΓ ≥ 100.
The Journal of Physical Chemistry C Article
dx.doi.org/10.1021/jp3123709 | J. Phys. Chem. C 2013, 117, 23090−2310723103
chosen the average effective EFEF is always smaller than theexperimentally determined AEF, and this difference could notbe explained solely by the EM mechanism. A possibleexplanation could be that some kind of chemical enhancementis operating. However, the confirmation that this chemicalcontribution is present would require additional quantummechanical calculations to have a more quantitative assessmentof the ratio σS/σR for biotin interacting with Ag or Au clustersand for the biotin free molecule, but this is beyond the scope ofthe present work. Despite this, the fact that the trends in thefield enhancement values are maintained for different Γminvalues indicates that there is a very good qualitative correlationbetween theory and experiment considering the complexity ofthe system under study.To evaluate if there is a better correlation between AEF and
EFEF without having the difficulties involved in the analysesperformed above for biotin molecules, additional experimentsusing two dye molecules (Coumarin 440 and Rhodamine B) asSERS reporters were conducted. These molecules are, inprinciple, not able to form any covalent interaction with thenanoparticles and therefore should be distributed randomly inthe cluster, making the comparison between theory andexperiments by far more simple. For such a purpose, oncethe clusters using biotin molecules as linkers were formed, thesedye molecules were added at long enough times (1 and 2 h forAg and Au experiments, respectively) to ensure that an
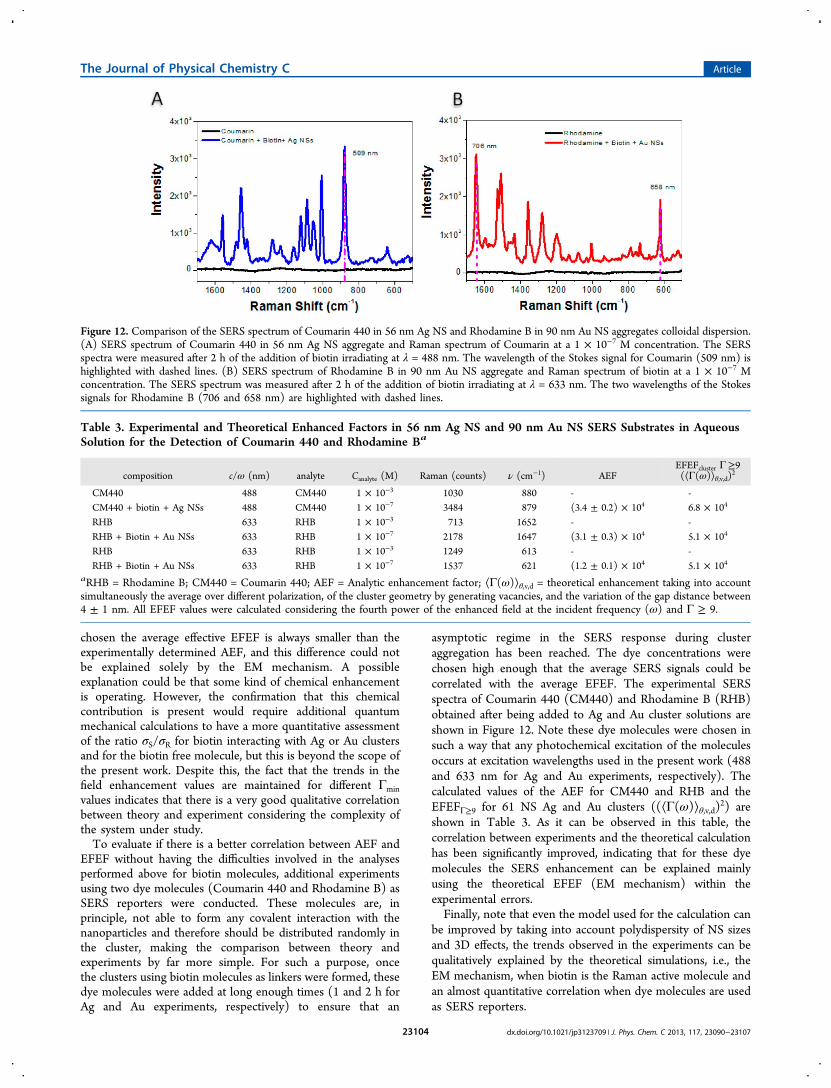
asymptotic regime in the SERS response during clusteraggregation has been reached. The dye concentrations werechosen high enough that the average SERS signals could becorrelated with the average EFEF. The experimental SERSspectra of Coumarin 440 (CM440) and Rhodamine B (RHB)obtained after being added to Ag and Au cluster solutions areshown in Figure 12. Note these dye molecules were chosen insuch a way that any photochemical excitation of the moleculesoccurs at excitation wavelengths used in the present work (488and 633 nm for Ag and Au experiments, respectively). Thecalculated values of the AEF for CM440 and RHB and theEFEFΓ≥9 for 61 NS Ag and Au clusters ((⟨Γ(ω)⟩θ,v,d)2) areshown in Table 3. As it can be observed in this table, thecorrelation between experiments and the theoretical calculationhas been significantly improved, indicating that for these dyemolecules the SERS enhancement can be explained mainlyusing the theoretical EFEF (EM mechanism) within theexperimental errors.Finally, note that even the model used for the calculation can
be improved by taking into account polydispersity of NS sizesand 3D effects, the trends observed in the experiments can bequalitatively explained by the theoretical simulations, i.e., theEM mechanism, when biotin is the Raman active molecule andan almost quantitative correlation when dye molecules are usedas SERS reporters.
Figure 12. Comparison of the SERS spectrum of Coumarin 440 in 56 nm Ag NS and Rhodamine B in 90 nm Au NS aggregates colloidal dispersion.(A) SERS spectrum of Coumarin 440 in 56 nm Ag NS aggregate and Raman spectrum of Coumarin at a 1 × 10⁻⁷ M concentration. The SERSspectra were measured after 2 h of the addition of biotin irradiating at λ = 488 nm. The wavelength of the Stokes signal for Coumarin (509 nm) ishighlighted with dashed lines. (B) SERS spectrum of Rhodamine B in 90 nm Au NS aggregate and Raman spectrum of biotin at a 1 × 10⁻⁷ Mconcentration. The SERS spectrum was measured after 2 h of the addition of biotin irradiating at λ = 633 nm. The two wavelengths of the Stokessignals for Rhodamine B (706 and 658 nm) are highlighted with dashed lines.
Table 3. Experimental and Theoretical Enhanced Factors in 56 nm Ag NS and 90 nm Au NS SERS Substrates in AqueousSolution for the Detection of Coumarin 440 and Rhodamine Ba
composition c/ω (nm) analyte Canalyte (M) Raman (counts) ν (cm−1) AEFEFEFcluster Γ≥9(⟨Γ(ω)⟩θ,v,d)2
CM440 488 CM440 1 × 10⁻³ 1030 880 - -CM440 + biotin + Ag NSs 488 CM440 1 × 10⁻⁷ 3484 879 (3.4 ± 0.2) × 104 6.8 × 10⁴
RHB 633 RHB 1 × 10⁻³ 713 1652 - -RHB + Biotin + Au NSs 633 RHB 1 × 10⁻⁷ 2178 1647 (3.1 ± 0.3) × 104 5.1 × 10⁴
RHB 633 RHB 1 × 10⁻³ 1249 613 - -RHB + Biotin + Au NSs 633 RHB 1 × 10⁻⁷ 1537 621 (1.2 ± 0.1) × 104 5.1 × 10⁴
aRHB = Rhodamine B; CM440 = Coumarin 440; AEF = Analytic enhancement factor; ⟨Γ(ω)⟩θ,v,d = theoretical enhancement taking into accountsimultaneously the average over different polarization, of the cluster geometry by generating vacancies, and the variation of the gap distance between4 ± 1 nm. All EFEF values were calculated considering the fourth power of the enhanced field at the incident frequency (ω) and Γ ≥ 9.
The Journal of Physical Chemistry C Article
dx.doi.org/10.1021/jp3123709 | J. Phys. Chem. C 2013, 117, 23090−2310723104
■ CONCLUSIONSIn the present work we have investigated the influence ofcluster size on the SERS response of 56 nm diameter silver and90 nm gold NS aggregates with controlled interparticle gapsgenerated by biotin−biotin H-bond interactions.By calculating the variation of the maximum ||Γ|(ω)| as a
function of wavelength for clusters having a different number ofnanospheres, it is possible to choose a wavelength range wherethis Γ value becomes independent of the number of spheres ofthe cluster after reaching a critical number. The variation of theangular average follows the same trend observed for themaximum Γ at a single polarization; therefore, this calculation isvery helpful to choose the excitation wavelength, even if thecorrelation is performed without the angular average enhance-ment of the cluster.For other wavelength ranges the variation of Γ with the
number of spheres could be more complex. Taking intoaccount that at sufficiently long time the populations of theselarge clusters which give rise to an almost equal enhancementare prevailing, the comparison of the asymptotic value of theSERS AEF with the EFEF is feasible. At any other wavelengthor at earlier times this comparison could not be directlyperformed as it would be necessary to know the cluster sizedistribution, as each cluster has a different (not constant)contribution to the SERS enhancement. Therefore we proposethe following procedure to make a more rigorous andreasonable comparison of the SERS response with electro-dynamics simulations:
1. Calculate the MNFES for tight compact clusters ofdifferent size (with a controlled and known interparticlegap).
2. Choose a wavelength range where Γ as a function ofcluster size reaches a constant value and uses theexcitation wavelength for the SERS experiments.
3. Follow the evolution of the SERS enhancement of aparticular vibrational mode and verify that it reaches aftera given time an almost constant value. This corroboratesthe theoretical hypothesis that for large enough clustersthe SERS signal is independent of the cluster sizedistribution.
The above methodology seems to be quite suitable as it hasbeen demonstrated for two different noble metal aggregates inthe present work by choosing the two excitation wavelengths(488 nm for Ag and 633 nm for Au experiments, respectively)according to the above prescription.The advantage of using this procedure is that a better
assessment of the contribution of the EM mechanism to theSERS response is feasible. In this respect, we found that eventhough there are differences between the experimental andtheoretical enhancement factors the trends in the SERSresponse of the biotin molecules are qualitatively explainedby the EM mechanism for both Ag and Au clusters. Moreover,the analytical SERS enhancements of nonbonded moleculesrandomly located in the clusters such as CM440 and RHB arein quantitative agreement with that predicted by the EMmechanism.In addition, experiments performed at low biotin concen-
trations (on the order of one biotin per NS) allow us toqualitatively explain the trend observed for the evolution of theintensity of the Raman signals, at 488 nm for Ag and 633 nmfor Au, in terms of the enhancements in clusters of different sizeduring the aggregation process. In this respect two different
kinetic regimes, RLCA and DLCA, determine the cluster sizedistribution at each stage of the aggregation. The initial growthof the SERS signals is consistent with the generation of smallclusters, while the decay is consequence to the formation oflarge clusters. These results correlate very well with GMM near-field calculations that give rise to a decay of the maximumenhancement as the number of NSs in the cluster increases, forboth Ag and Au aggregates, upon a critical size being reached.Beyond this critical size (around 20 nanoparticles) the EFEF isalmost constant independent of the number of nanoparticles.This decay of the EFEF with cluster size is consistent with theincreasing role played by retardation damping effects for largerclusters. This feature is evidenced in both the extinction spectraby a significant broadening of the LSPR with cluster size and inthe red shift of the MNFES with respect to the correspondingextinction spectra for the same cluster size. This effect,however, gives rise to very significant changes in the EFEFby increasing the number of NSs for small clusters, while theeffect is by far less significant for large clusters; i.e., the changein the EFEF is so small that it could be considered almostconstant after some critical number of spheres in the cluster.As a final remark, the present results demonstrate the
importance of generating small clusters (dimers and trimers)rather than large aggregates, if one wishes to optimize the SERSresponse for ultrasensitive detection, tuning at the appropriateexcitation wavelength according to the MNFES.
■ ASSOCIATED CONTENT*S Supporting InformationMaximum near-field enhancements of 56 nm Ag and 90 nm Auclusters at different wavelengths; Evolution of the extinctionspectra during Ag and Au aggregation for determining thekinetics of the agglomeration process and determining theFlocculation Parameter (P); Quantum chemistry calculations ofbiotin and pyridine-2-thione Raman spectra; Spectroscopicassignment of the contribution of each molecule to theexperimental SERS spectrum; Calculation of the effective EFEFas a function of the Γmin; Reference Raman spectrum of biotinat 6.17 × 10⁻⁶ M and 9.25 × 10⁻⁶ M. This material is availablefree of charge via the Internet at http://pubs.acs.org.
■ AUTHOR INFORMATIONCorresponding Author*E-mail: [email protected] ContributionsAll authors contributed equally to this work.NotesThe authors declare no competing financial interest.
■ ACKNOWLEDGMENTSAuthors acknowledge financial support of CONICET, SECYT-UNC, and PME 1544 − 2006. J.C.F. and L.A.P. are gratefulrecipients of fellowships from CONICET.
■ REFERENCES(1) Stiles, P. L; Dieringer, J. A.; Shah, N. C.; Van Dyune, R. P.Surface-Enhanced Raman Spectroscopy. Annu. Rev. Anal. Chem. 2008,1, 601−626.(2) Bruno Pettinger, B.; Schambach, P.; Villagomez, C. J.; Scott, N.Tip-Enhanced Raman Spectroscopy: Near-Fields Acting on a FewMolecules. Annu. Rev. Phys. Chem. 2012, 63, 379−399.(3) Gill, R.; Tian, L.; Somerville, W. R. C.; Le Ru, E. C.; Amerongen,H.; Subramaniam, V. Silver Nanoparticle Aggregates as Highly
The Journal of Physical Chemistry C Article
dx.doi.org/10.1021/jp3123709 | J. Phys. Chem. C 2013, 117, 23090−2310723105
Efficient Plasmonic Antennas for Fluorescence Enhancement. J. Phys.Chem. C 2012, 116, 16687−16693.(4) Le Ru, E. C.; Etchegoin, P. G. Single-molecule Surface-EnhancedRaman Spectroscopy. Annu. Rev. Phys. Chem. 2012, 63, 65−87.(5) Futamata, M.; Maruyama, Y.; Ishikawa, M. MicroscopicMorphology and SERS Activity of Ag Colloidal Particles; Elsevier: NewYork, 2002.(6) Schwartzberg, A. M.; Grant, C. D.; Wolcott, A.; Talley, C. E.;Huser, T. R.; Bogomolni, R.; Zhang, J. Z. Unique Gold NanoparticleAggregates as a Highly Active Surface-Enhanced Raman ScatteringSubstrate. J. Phys. Chem. B 2004, 108, 19191−19197.(7) Futamata, M.; Maruyama, Y.; Ishikawa, M. Critical Importance ofthe Junction in Touching Ag Particles for Single Molecule Sensitivityin SERS. J. Mol. Struct. 2005, 735, 75−84.(8) Kneipp, K.; Kneipp, H.; Kneipp, J. Surface-Enhanced RamanScattering in Local Optical Fields of Silver and Gold Nano-aggregatessfrom Single-molecule Raman Spectroscopy to Ultra-sensitive Probing in Live Cells. Acc. Chem. Res. 2006, 39, 443−450.(9) Zhao, L. L.; Jensen, L.; Schatz, G. C. Surface-Enhanced RamanScattering of Pyrazine at the Junction Between Two Ag-20Nanoclusters. Nano Lett. 2006, 6, 1229−1234.(10) Meyer, M.; Le Ru, E. C.; Etchegoin, P. G. Self-LimitingAggregation Leads to Long-Lived Metastable Clusters in ColloidalSolutions. J. Phys. Chem. B 2006, 110, 6040−6047.(11) Fraire, J. C.; Perez, L. A.; Coronado, E. A. Rational Design ofPlasmonic Nanostructures for Biomolecular Detection: Interplaybetween Theory and Experiments. ACS Nano 2012, 6, 3441−3452.(12) Lim, D.-K.; Jeon, K.-S.; Kim, H. M.; Nam, J.-M.; Suh, Y.-D.Nanogap-engineerable Raman-active Nanodumbbells for Single-molecule Detection. Nat. Mater. 2010, 9, 60−67.(13) Halas, N. J.; Lal, S.; Chang, W.-S.; Link, S.; Nordlander, P.Plasmons in Strongly Coupled Metallic Nanostructures. Chem. Rev.2011, 111, 3913−3961.(14) Braun, G. B.; Lee, S. J.; Laurence, T.; Fera, N.; Fabris, L.; Bazan,G. C.; Moskovits, M.; Reich, N. O. Generalized Approach to SERS-Active Nanomaterials via Controlled Nanoparticle Linking, PolymerEncapsulation, and Small-Molecule Infusion. J. Phys. Chem. C 2009,113, 13622−13629.(15) Kumar, J.; Thomas, K. G. Surface-Enhanced Raman Spectros-copy: Investigations at the Nanorod Edges and Dimer Junctions. J.Phys. Chem. Lett. 2011, 2, 610−615.(16) Hofmann, A.; Schmiel, P.; Stein, B.; Graf, C. ControlledFormation of Gold Nanoparticle Dimers Using Multivalent ThiolLigands. Langmuir 2011, 27, 15165−15175.(17) Talley, C. E.; Jackson, J. B.; Oubre, C.; Grady, N. K.; Hollars, C.W.; Lane, S. M.; Huser, T. R.; Nordlander, P.; Halas, N. J. Surface-Enhanced Raman Scattering from Individual Au Nanoparticles andNanoparticle Dimer Substrates. Nano Lett. 2005, 5, 1569−1574.(18) McLellan, J. M.; Li, Z.-Y.; Siekkinen, A. R.; Xia, Y. The SERSActivity of a Supported Ag Nanocube Strongly Depends on ItsOrientation Relative to Laser Polarization. Nano Lett. 2007, 7, 1013−1017.(19) Wiley, B. J.; Chen, Y.; McLellan, J. M.; Xiong, Y.; Li, Z.-Y.;Ginger, D.; Xia, Y. Synthesis and Optical Properties of Silver Nanobarsand Nanorice. Nano Lett. 2007, 7, 1032−1036.(20) Mock, J. J.; Norton, S. M.; Chen, S.-Y.; Lazarides, A. A.; Smith,D. R. Electromagnetic Enhancement Effect Caused by Aggregation onSERS-Active Gold Nanoparticles. Plasmonics 2011, 6, 113−124.(21) Kelly, K. L.; Coronado, E. A.; Zhao, L. L.; Schatz, G. C. TheOptical Properties of Metal Nanoparticles: The Influence of Size,Shape, and Dielectric Environment. J. Phys. Chem. B 2003, 107, 668−677.(22) Perassi, E. M.; Hernandez-Garriddo, J. C.; Moreno, M. S.;Encina, E. R.; Coronado, E. A.; Midgley, P. A. Using Highly Accurate3D Nanometrology to Model the Optical Properties of HighlyIrregular Nanoparticles: A Powerful Tool for Rational Design ofPlasmonic Devices. Nano Lett. 2010, 10, 2097−2104.
(23) Kambhampati, P.; Child, C. M.; Foster, M. C.; Campion, A. Onthe Chemical Mechanism of Surface Enhanced Raman Scattering:Experiment and Theory. J. Chem. Phys. 1998, 108, 5013−5026.(24) Li, S.; Pedano, M. L.; Chang, S.-H.; Mirkin, C. A.; Schatz, G. C.Gap Structure Effects on Surface-Enhanced Raman ScatteringIntensities for Gold Gapped Rods. Nano Lett. 2010, 10, 1722−1727.(25) Su, K. H.; Wei, Q. H.; Zhang, X.; Mock, J. J.; Smith, D. R.;Schultz, S. Interparticle Coupling Effects on Plasmon Resonances ofNanogold Particles. Nano Lett. 2003, 3, 1087−1090.(26) Jiang, J.; Bosnick, K.; Maillard, M.; Brus, L. Single MoleculeRaman Spectroscopy at the Junctions of Large Ag Nanocrystals. J.Phys. Chem. B 2003, 107, 9964−9972.(27) Gunnarsson, L.; Bjerneld, E. J.; Xu, H.; Petronis, S.; Kasemo, B.;Kall, M. Interparticle Coupling Effects in Nanofabricated Substratesfor Surface-Enhanced Raman Scattering. Appl. Phys. Lett. 2001, 78,802−804.(28) Jain, P. K.; El-Sayed, M. A. Surface Plasmon Coupling and ItsUniversal Size Scaling in Metal Nanostructures of Complex Geometry:Elongated Particle Pairs and Nanosphere Trimers. J. Phys. Chem. C2008, 112, 4954−4960.(29) Rechberger, W.; Hohenau, A.; Leitner, A.; Krenn, J. R.;Lamprecht, B.; Aussenegg, F. R. Optical Properties of Two InteractingGold Nanoparticles. Opt. Commun. 2003, 220, 137−141.(30) Xu, H. X.; Aizpurua, J.; Kall, M.; Apell, P. ElectromagneticContributions to Single-molecule Sensitivity in Surface-EnhancedRaman Scattering. Phys. Rev. E 2000, 62, 4318−4324.(31) Le Ru, E.; Etchegoin, P. G. Principles of Surface Enhanced RamanSpectroscopy; Elsevier: Amsterdam, 2009; Vol. 1.(32) Perassi, E. M.; Coronado, E. A. The Structure, Energy,Confinement, and Enhancement of Hot Spots between TwoNanoparticles. J. Phys. Chem. C 2013, 117, 7744−7750.(33) Henry, A.-I.; Bingham, J. M.; Ringe, E.; Marks, L. D.; Schatz, G.C.; Van Duyne, R. P. Correlated Structure and Optical PropertyStudies of Plasmonic Nanoparticles. J. Chem. Phys. 2011, 115, 9291−9305.(34) Romo-Herrera, J. M.; Alvarez-Puebla, R. A.; Marzan, L. M.Controlled Assembly of Plasmonic Colloidal Nanoparticle Clusters.Nanoscale 2011, 3, 1304−1315.(35) Haes, A. J.; Haynes, C. L.; MacFarland, A. D.; Schatz, G. C.; Vanduyne, R. P.; Zou, S. Plasmonic Materials for Surface-EnhancedSensing and Spectroscopy. MRS Bull. 2005, 30, 368−375.(36) Lal, S.; Link, S.; Halas, N. J. Nano-optics from Sensing toWaveguiding. Nat. Photonics 2007, 1, 641−648.(37) Lazarides, A. A.; Schatz, G. C. DNA-Linked Metal NanosphereMaterials: Structural Basis for the Optical Properties. J. Phys. Chem. B2000, 104, 460−467.(38) Stockman, M. I.; Shalaev, V. M.; Moskovits, M.; Botet, R.;George, T. F. Enhanced Raman Scattering by Fractal Clusters: Scale-invariant Theory. Phys. Rev. B 1992, 46, 2821−2830.(39) Zuloaga, J.; Nordlander, P. On the Energy Shift between Near-field and Far-field Peak Intensities in Localized Plasmon Systems.Nano Lett. 2011, 11, 1280−1283.(40) Brown, L. V.; Sobhani, H.; Lassiter, J. B.; Nordlander, P.; Halas,N. J. Heterodimers: Plasmonic Properties of Mismatched NanoparticlePairs. ACS Nano 2010, 4, 819−832.(41) Sonnichsen, C.; Reinhard, B. M.; Liphardt, J.; Alivisatos, A. P. AMolecular Ruler Based on Plasmon Coupling of Single Gold and SilverNanoparticles. Nat. Biotechnol. 2005, 23, 741−745.(42) Nordlander, P.; Oubre, C.; Prodan, E.; Li, K.; Stockman, M. I.Plasmon Hybridization in Nanoparticle Dimers. Nano Lett. 2004, 4,899−903.(43) Yang, S. C.; Kobori, H.; He, C. L.; Lin, M. H.; Chen, H. Y.; Li,C. C.; Kanehara, M.; Teranishi, T.; Gwo, S. Plasmon Hybridization inIndividual Gold Nanocrystal Dimers: Direct Observation of Bright andDark Modes. Nano Lett. 2010, 10, 632−637.(44) Wang, J.; Yang, L.; Boriskina, S.; Yan, B.; Reinhard, B. M.Spectroscopic Ultra-Trace Detection of Nitroaromatic Gas Vapor onRationally Designed Two-Dimensional Nanoparticle Cluster Arrays.Anal. Chem. 2011, 83, 2243−2249.
The Journal of Physical Chemistry C Article
dx.doi.org/10.1021/jp3123709 | J. Phys. Chem. C 2013, 117, 23090−2310723106
(45) Yan, B.; Boriskina, S. V.; Reinhard, B. M. Optimizing GoldNanoparticle Cluster Configurations (n ≥ 7) for Array Applications. J.Phys. Chem. C 2011, 115, 4578−4583.(46) Ye, J.; Wen, F.; Sobhani, J.; Lassiter, J. B.; Van Dorpe, P.;Nordlander, P.; Halas, N. J. Plasmonic Nanoclusters: Near FieldProperties of the Fano Resonance Interrogated with SERS. Nano Lett.2012, 12, 1660−1667.(47) Rahmani, M.; Lei, D. Y.; Giannini, V.; Lukiyanchuk, B.; Ranjbar,M.; Fook Liew, T. Y.; Hong, M.; Maier, S. A.; Subgroup.Decomposition of Plasmonic Resonances in Hybrid Oligomers:Modeling the Resonance Lineshape. Nano Lett. 2012, 12, 2101−2106.(48) Girard, C.; Dujardin, E.; Li, M.; Mann, S. Theoretical Near-fieldOptical Properties of Branched Plasmonic Nanoparticle Networks.Phys. Rev. Lett. 2006, 97, 100801−100804.(49) Taylor, R. W.; Lee, T.-C.; Sherman, O. A.; Esteban, R.;Aizpurua, J.; Huang, F. M.; Baumberg, J. J.; Mahajan, S. PreciseSubnanometer Plasmonic Junctions for SERS within Gold Nano-particle Assemblies Using Cucurbit[n]uril “Glue”. ACS Nano 2011, 5,3878−3887.(50) Le Ru, E. C.; Blackie, E.; Meyer, M.; Etchegoin, P. G. SurfaceEnhanced Raman Scattering Enhancement Factors: A ComprehensiveStudy. J. Phys. Chem. C 2007, 111, 13794−13803.(51) Encina, E. R.; Coronado, E. A. On the Far Field OpticalProperties of Ag−Au Nanosphere Pairs. J. Phys. Chem. C 2010, 114,16278−16284.(52) Encina, E. R.; Coronado, E. A. Plasmon Coupling in SilverNanosphere Pairs. J. Phys. Chem. C 2010, 114, 3918−3923.(53) Encina, E. R.; Coronado, E. A. Near Field Enhancement in AgAu Nanospheres Heterodimers. J. Phys. Chem. C 2011, 115, 15908−15914.(54) Palik, E. D. Handbook of Optical Constants of Solids; AcademicPress: New York, 1985.(55) Frisch, M. J.; Trucks, G. W.; Schlegel, H. B.; Scuseria, G. E.;Robb, M. A.; Cheeseman, J. R.; Zakrzewski, V. G.; Montgomery, J. A.,Jr.; Stratmann, R. E.; Burant, J. C.; et al. Gaussian 98, Revision A.7;Gaussian, Inc.: Pittsburgh, PA, 1998.(56) Coronado, E. A.; Encina, E. R.; Stefani, F. D. Optical Propertiesof Metallic Nanoparticles: Manipulating Light, Heat and Forces at theNanoscale. Nanoscale 2011, 3, 4042−4059.(57) Marhaba, S.; Bachelier, G.; Bonnet, C.; Broyer, M.; Cottancin,E.; Grillet, N.; Lerme, J.; Vialle, J.-L.; Pellarin, M. Surface PlasmonResonance of Single Gold Nanodimers Near the Conductive ContactLimit. J. Phys. Chem. C 2009, 113, 4349−4356.(58) Park, S.-J.; Lazarides, A. A.; Storhoff, J. J.; Pesce, L.; Mirkin, C.A. The Structural Characterization of Oligonucleotide-Modified GoldNanoparticle Networks Formed by DNA Hybridization. J. Phys. Chem.B 2004, 108, 12375−12380.(59) Zhang, F.; Dressen, D. G.; Skoda, M. W. A.; Jacobs, R. M. J.;Zorn, S.; Martin, R. A.; Martin, C. M.; Clark, G. F.; Schreiber, F. GoldNanoparticles Decorated with Oligo(ethylene glycol) Thiols: Kineticsof Colloid Aggregation Driven by Depletion Forces. Eur. Biophys. J.2008, 37, 551−561.(60) Moskovits, M. Persistent Misconceptions Regarding SERS. Phys.Chem. Chem. Phys. 2013, 15, 5301−5311.
The Journal of Physical Chemistry C Article
dx.doi.org/10.1021/jp3123709 | J. Phys. Chem. C 2013, 117, 23090−2310723107