Critical Evaluation of Nanoparticle Tracking Analysis (NTA) by NanoSight for the Measurement of...
15
Research Paper Critical Evaluation of Nanoparticle Tracking Analysis (NTA) by NanoSight for the Measurement of Nanoparticles and Protein Aggregates Vasco Filipe, 1,2 Andrea Hawe, 1 and Wim Jiskoot 1,3 Received December 9, 2009; accepted January 14, 2010; published online March 4, 2010 Purpose. To evaluate the nanoparticle tracking analysis (NTA) technique, compare it with dynamic light scattering (DLS) and test its performance in characterizing drug delivery nanoparticles and protein aggregates. Methods. Standard polystyrene beads of sizes ranging from 60 to 1,000 nm and physical mixtures thereof were analyzed with NTA and DLS. The influence of different ratios of particle populations was tested. Drug delivery nanoparticles and protein aggregates were analyzed by NTA and DLS. Live monitoring of heat-induced protein aggregation was performed with NTA. Results. NTA was shown to accurately analyze the size distribution of monodisperse and polydisperse samples. Sample visualization and individual particle tracking are features that enable a thorough size distribution analysis. The presence of small amounts of large (1,000 nm) particles generally does not compromise the accuracy of NTA measurements, and a broad range of population ratios can easily be detected and accurately sized. NTA proved to be suitable to characterize drug delivery nanoparticles and protein aggregates, complementing DLS. Live monitoring of heat-induced protein aggregation provides information about aggregation kinetics and size of submicron aggregates. Conclusion. NTA is a powerful characterization technique that complements DLS and is particularly valuable for analyzing polydisperse nanosized particles and protein aggregates. KEY WORDS: dynamic light scattering; liposomes; nanoparticles; nanoparticle tracking analysis; protein aggregates. INTRODUCTION Most macromolecular drugs, such as proteins, peptides, DNA and RNA, cannot be administrated via the traditional oral route of administration, due to their susceptibility to enzymatic degradation or low absorption efficiency (1,2). To be effective, these drugs have to be delivered in most cases via injection and/or through a drug delivery system (DDS). DDSs not only protect the therapeutic drug or antigen from degradation and/or increase their absorption, but may also allow controlled release or the precise delivery to a specific target (3). Common examples of DDS include polymer-based particles, lipid-based carriers and virus-like particles. Given that most of these DDSs are nanosized colloidal particles, it is essential to have reliable character- ization tools to ensure their quality and colloidal stability. Another pharmaceutically important field that requires adequate tools for the analysis of particles in the nano- meter size range is the characterization of protein aggre- gates. Therapeutic proteins are prone to several chemical and physical degradation pathways, which often lead to aggregation (4). The presence of aggregates in a protein formulation compromises product quality and may lead to unwanted immunogenicity (5). Thorough aggregate char- acterization is crucial to better understand the underlying mechanism of aggregate-related immunogenicity and ensure the quality of protein therapeutics. An accurate determination of the size and size distribution of aggre- gated protein formulations is not straightforward, as protein aggregates are typically very heterogeneous, with sizes ranging from a few nanometers to several micro- meters (6–8). Recently, the importance of analyzing sub- visible protein aggregates with sizes in the nanometer up to the low micrometer range has become recognized (9). The most commonly used techniques for the analysis of nanoparticles and protein aggregates include dynamic light scattering (DLS), scanning electron microscopy (SEM), size exclusion chromatography (SEC), gel electrophoresis, asym- metrical flow field-flow fractionation (AF4) and analytical ultracentrifugation (AUC) (10–12). From the mentioned techniques, DLS is the most user-friendly, and it yields relatively accurate and consistent results that can be obtained in a rather short period of time (10). Therefore, DLS has become the preferred technique to routinely determine the size of nanoparticles. 1 Division of Drug Delivery Technology, Leiden/Amsterdam Center for Drug Research, Leiden University, P.O. Box 9502, 2300 RA Leiden, The Netherlands. 2 Department of Pharmaceutics, Utrecht Institute for Pharmaceutical Sciences (UIPS), Utrecht University, P.O. Box 80082, 3508 TB Utrecht, The Netherlands. 3 To whom correspondence should be addressed. (e-mail: w.jiskoot@ lacdr.leidenuniv.nl) Pharmaceutical Research, Vol. 27, No. 5, May 2010 ( # 2010) DOI: 10.1007/s11095-010-0073-2 0724-8741/10/0500-0796/0 # 2010 The Author(s). This article is published with open access at Springerlink.com 796
-
Upload
independent -
Category
Documents
-
view
0 -
download
0
Transcript of Critical Evaluation of Nanoparticle Tracking Analysis (NTA) by NanoSight for the Measurement of...

Research Paper
Critical Evaluation of Nanoparticle Tracking Analysis (NTA) by NanoSightfor the Measurement of Nanoparticles and Protein Aggregates
Vasco Filipe,1,2 Andrea Hawe,1 and Wim Jiskoot1,3
Received December 9, 2009; accepted January 14, 2010; published online March 4, 2010
Purpose. To evaluate the nanoparticle tracking analysis (NTA) technique, compare it with dynamic lightscattering (DLS) and test its performance in characterizing drug delivery nanoparticles and proteinaggregates.Methods. Standard polystyrene beads of sizes ranging from 60 to 1,000 nm and physical mixtures thereofwere analyzed with NTA and DLS. The influence of different ratios of particle populations was tested.Drug delivery nanoparticles and protein aggregates were analyzed by NTA and DLS. Live monitoring ofheat-induced protein aggregation was performed with NTA.Results. NTA was shown to accurately analyze the size distribution of monodisperse and polydispersesamples. Sample visualization and individual particle tracking are features that enable a thorough sizedistribution analysis. The presence of small amounts of large (1,000 nm) particles generally does notcompromise the accuracy of NTA measurements, and a broad range of population ratios can easily bedetected and accurately sized. NTA proved to be suitable to characterize drug delivery nanoparticles andprotein aggregates, complementing DLS. Live monitoring of heat-induced protein aggregation providesinformation about aggregation kinetics and size of submicron aggregates.Conclusion. NTA is a powerful characterization technique that complements DLS and is particularlyvaluable for analyzing polydisperse nanosized particles and protein aggregates.
KEY WORDS: dynamic light scattering; liposomes; nanoparticles; nanoparticle tracking analysis; proteinaggregates.
INTRODUCTION
Most macromolecular drugs, such as proteins, peptides,DNA and RNA, cannot be administrated via the traditionaloral route of administration, due to their susceptibility toenzymatic degradation or low absorption efficiency (1,2). Tobe effective, these drugs have to be delivered in most casesvia injection and/or through a drug delivery system (DDS).
DDSs not only protect the therapeutic drug or antigenfrom degradation and/or increase their absorption, but mayalso allow controlled release or the precise delivery to aspecific target (3). Common examples of DDS includepolymer-based particles, lipid-based carriers and virus-likeparticles. Given that most of these DDSs are nanosizedcolloidal particles, it is essential to have reliable character-ization tools to ensure their quality and colloidal stability.
Another pharmaceutically important field that requiresadequate tools for the analysis of particles in the nano-
meter size range is the characterization of protein aggre-gates. Therapeutic proteins are prone to several chemicaland physical degradation pathways, which often lead toaggregation (4). The presence of aggregates in a proteinformulation compromises product quality and may lead tounwanted immunogenicity (5). Thorough aggregate char-acterization is crucial to better understand the underlyingmechanism of aggregate-related immunogenicity andensure the quality of protein therapeutics. An accuratedetermination of the size and size distribution of aggre-gated protein formulations is not straightforward, asprotein aggregates are typically very heterogeneous, withsizes ranging from a few nanometers to several micro-meters (6–8). Recently, the importance of analyzing sub-visible protein aggregates with sizes in the nanometer up tothe low micrometer range has become recognized (9).
The most commonly used techniques for the analysis ofnanoparticles and protein aggregates include dynamic lightscattering (DLS), scanning electron microscopy (SEM), sizeexclusion chromatography (SEC), gel electrophoresis, asym-metrical flow field-flow fractionation (AF4) and analyticalultracentrifugation (AUC) (10–12). From the mentionedtechniques, DLS is the most user-friendly, and it yieldsrelatively accurate and consistent results that can be obtainedin a rather short period of time (10). Therefore, DLS hasbecome the preferred technique to routinely determine thesize of nanoparticles.
1 Division of Drug Delivery Technology, Leiden/Amsterdam Centerfor Drug Research, Leiden University, P.O. Box 9502, 2300 RALeiden, The Netherlands.
2 Department of Pharmaceutics, Utrecht Institute for PharmaceuticalSciences (UIPS), Utrecht University, P.O. Box 80082, 3508 TBUtrecht, The Netherlands.
3 To whom correspondence should be addressed. (e-mail: [email protected])
Pharmaceutical Research, Vol. 27, No. 5, May 2010 (# 2010)DOI: 10.1007/s11095-010-0073-2
0724-8741/10/0500-0796/0 # 2010 The Author(s). This article is published with open access at Springerlink.com 796

Despite being a powerful and accessible tool, DLS is alsoknown to have several drawbacks, which are mainly inherentto the principles of the technique. Particle size is determinedfrom fluctuations in scattered light intensity due to theBrownian movement of the particles (13). The fact that theintensity of the scattered light is proportional to the sixthpower of the particle diameter makes this technique verysensitive to the presence of large particles (14). This can be anadvantage if the purpose is to detect small amounts of largeparticles, but it can be a major drawback for accurate sizedetermination. Dust particles or small amounts of largeaggregates can impede the size determination if the maincomponent exhibits a distinctly smaller size (15).
Nanoparticle tracking analysis (NTA), which was firstcommercialized in 2006, is an innovative system for sizingparticles from about 30 to 1,000 nm, with the lower detectionlimit being dependent on the refractive index of the nano-particles. This technique combines laser light scattering micro-scopy with a charge-coupled device (CCD) camera, whichenables the visualization and recording of nanoparticles insolution. The NTA software is then able to identify and trackindividual nanoparticles moving under Brownian motion andrelates the movement to a particle size according to thefollowing formula derived from the Stokes-Einstein Eq. I (16):
x; yð Þ2 ¼ 2kBT3rhp�
ðIÞ
where kB is the Boltzmann constant and x; yð Þ2 is the mean-squared speed of a particle at a temperature T, in a mediumof viscosity η, with a hydrodynamic radius of rh.
Our aim was to explore the potential of nanoparticletracking analysis (NTA) for the analysis of nanosized particlesand protein aggregates.A direct comparisonwithDLSwasmadein order to reveal the advantages and pitfalls of a technique thatis now making its first steps in the field of characterization ofnanoparticles and submicron protein aggregates.
MATERIALS AND METHODS
Chemicals
Poly (lactic-co-glycolic acid) 50:50 (PLGA) and 4-(2-hydroxyethyl)-1-piperazine-ethanesulfonic acid (HEPES) wereobtained from Sigma-Aldrich (Steinheim, Germany), chitosan(deacetylation degree 92%, MW 120 kDa) from Primex(Siglufjordur, Iceland) and egg L-α-phosphatidyl choline (EPC)from Lipoid GmbH (Ludwigshafen, Germany). 1,2-dioleoyl-sn-glycero-3-phospho ethanolamine (DOPE) and 1,2-dioleoyl-3-trimethyl ammonium-propane (DOTAP) were supplied byINstruchemie (Delfzijl, The Netherlands). Chloroform waspurchased from Biosolve (Valkenswaard, The Netherlands).All other chemicals used were from Sigma-Aldrich (Steinheim,Germany), unless mentioned otherwise.
Preparation of Polystyrene Bead Samples
Polystyrene nanometer standard beads with sizes of 60,100, 200, 400 and 1,000 nm were purchased from ThermoScientific (Fremont, USA). They were diluted from the
supplied package in deionized water until the concentrationwas acceptable for NTA measurements, i.e. between 107 and109 total particles/ml. Thus, from the supplier’s recipient, a1:30,000 volume based dilution was made for the 60-nm beads,1:100,000 dilution for the 100-nm beads, 1:25,000 dilution forthe 200-nm beads, 1:2,500 dilution for the 400-nm beads, and1:100 dilution for the 1,000-nm beads. All polystyrene beadmeasurements were performed with these samples, eitheralone or mixed at different volume ratios or number ratiosbased on NTA particle counts, as stated in the results section.
The 100-nm and 400-nm beads mixture used for thespiking experiments contained about 1.7*108 beads/ml. Forthese experiments, 2 or 40 μl of a suspension of 1,000-nmbeads (ca. 1.6*108 particles/ml) were added to 500 μl of the100-nm and 400-nm beads mixture, which resulted in a1,000-nm beads concentration of about 6.4*105 beads/ml and1.2*107 beads/ml, respectively. The resulting number ratiosof 1,000-nm beads to the beads in the initial mixture was1:267 for the 2 μl spike (small spike) and 1:13 for the 40 μlspike (big spike).
Preparation of Drug Delivery Nanoparticles
N-trimethyl chitosan (TMC) with a degree of quaterni-zation of 15% was prepared from chitosan and used to makeTMC nanoparticles, as described in the literature (17). Inshort, TMC was dissolved in a 5 mM HEPES buffer (pH 7.4),and pentasodium tripolyphosphate (TPP) was added undercontinuous stirring to a weight ratio TMC:TPP of 10:1.8.Nanoparticles were collected by centrifugation (30 min,15,000 g) on a glycerol bed, to avoid aggregation, andresuspended in 5 mM HEPES buffer (pH 7.4). The samplewas diluted 1,000-fold with deionized water before themeasurements.
PLGA nanoparticles were prepared by an “oil-in-water”solvent evaporation method, using polysorbate 20 as emulsi-fying agent. Briefly, 1 ml of dichloromethane containing50 mg of PLGA and 2 ml 1% (w/v) polysorbate 20 wereemulsified using an ultrasonic processor for 15 s at 70 W(Branson Instruments, Connecticut, USA). The emulsion wastransferred to 50 ml of 0.02% (w/v) polysorbate 20 in waterand stirred at 50°C for 1 hr. The resulting PLGA nano-particles were collected by centrifugation (8,000 g for 10 min)and washed twice in distilled water to remove excesspolysorbate 20. The sample was diluted 2000-fold withdeionized water before the measurements.
Cationic liposomes were prepared by the film-hydration-rehydration method and sized by sonication. In detail, alipid film was formed by solvent evaporation of a chloro-form solution of EPC, DOPE and DOTAP in a rotaryevaporator at 37°C. To prepare 1 ml of liposome disper-sion, a total amount of 28 μmol lipid was used at a EPC/DOPE/DOTAP molar ratio of 4/2/1. The film was hydratedin 1 ml of 20 mM HEPES, 5% glucose, pH 7.4, and thedispersion was equilibrated for 1 hr at room temperature.The dispersion was then sonicated twice for 30 s, with 30 sinterval, using a Branson Sonifier 250 (Branson Ultra-sonics, Danbury, UK), with 3 mm microtip at 20 mWenergy output. The sample was diluted 10,000-fold withdeionized water before the measurements.
797Critical Evaluation of Nanoparticle Tracking Analysis (NTA)

All the buffers used in this section were filtered using a0.22-μm PES low binding syringe-driven filter unit (Millex™GP, Millipore, Ireland), and the absence/very low content ofsubmicron particles was confirmed by their visualization inthe NanoSight sample chamber.
Preparation of Protein Aggregates
A recombinant human monoclonal antibody of the IgG1
subclass (IgG) was used for preparing IgG aggregates. TheIgG was formulated at a concentration of 1.0 mg/ml in 10 mMsodium citrate (Merck, Darmstadt, Germany), 5% (w/v)sucrose (Sigma-Aldrich, Buchs, Switzerland), pH 6.0. TheIgG formulation was filtered using a 0.22-μm PES low bindingsyringe-driven filter unit. One ml of the filtered IgGformulation was placed in 1.5-ml reaction tubes (Eppendorf,Hamburg, Germany) and incubated for 15 min at 74°C in aheating block (Eppendorf, Hamburg, Germany). The samplewas diluted 50-fold with the formulation buffer before eachmeasurement.
Recombinant human insulin (insulin) was formulated in10 mM sodium phosphate, pH 7.4, and the formulation wasfiltered using the same filter unit as for the IgG formulation.Insulin aggregation was induced via a metal-catalyzed oxida-tion reaction by the addition of copper chloride (0.04 mM),followed by ascorbic acid (4 mM). The formulation wasincubated at room temperature for three hours, and thereaction was stopped by the addition of 1 mM ethylenedia-minetetraacetic acid (EDTA).
All the buffers used in this section were filtered using a0.22-μm PES low binding syringe-driven filter unit, and theabsence/very low content of submicron particles was con-firmed by their visualization in the NanoSight samplechamber.
Dynamic Light Scattering (DLS)
DLS measurements were performed with a MalvernZetasizer Nano ZS (Malvern, Herrenberg, Germany) equip-ped with a 633-nm He-Ne laser and operating at an angle of173°. The software used to collect and analyze the data wasthe Dispersion Technology Software version 6.01 fromMalvern. Five-hundred μl of each sample was measured insingle-use polystyrene half-micro cuvettes (Fisher Emergo,Landsmeer, The Netherlands) with a pathlength of 10 mm.
The measurements were made at a position of 4.65 mmfrom the cuvette wall with an automatic attenuator and at acontrolled temperature of 25°C. For each sample, 15 runs of 10 swere performed, with three repetitions for all the polystyrenebeads and six repetitions for the polymer nanoparticles,liposomes and protein aggregates. The intensity size distribu-tion, the Z-average diameter (Z-ave) and the polydispersityindex (PdI) were obtained from the autocorrelation functionusing the “general purpose mode” for the monodispersepolystyrene beads, liposomes and polymer samples, the “multi-ple narrowmode” for themixtures of polystyrene beads and the“protein analysis mode” for the protein aggregates. The defaultfilter factor of 50% and the default lower threshold of 0.05 andupper threshold of 0.01 were used. The error bars displayed onthe DLS graphs were obtained by the standard deviation (SD)of three or six measurements of the same sample.
Nanoparticle Tracking Analysis (NTA)
NTA measurements were performed with a NanoSightLM20 (NanoSight, Amesbury, United Kingdom), equippedwith a sample chamber with a 640-nm laser and a Vitonfluoroelastomer O-ring. The samples were injected in thesample chamber with sterile syringes (BD Discardit II, NewJersey, USA) until the liquid reached the tip of the nozzle. Allmeasurements were performed at room temperature exceptthe live monitoring protein heat stress measurements (seesection below).
The software used for capturing and analyzing the datawas the NTA 2.0 Build 127. The samples were measured for40 s with manual shutter and gain adjustments. The “singleshutter and gain mode” was used to capture the monodis-perse polystyrene beads, the 60/100 nm beads mixture, theliposomes, the TMC particles and the protein aggregates. The“extended dynamic range mode,” which splits the capturevideo into two videos with independent shutter and gainsettings, was used for all the other mixtures of monodispersepolystyrene beads, the PLGA particles and the insulinaggregates. Three measurements of the same sample wereperformed for all the polystyrene beads and six measure-ments for the polymer nanoparticles and protein aggregates.The error bars displayed on the NTA graphs were obtainedby the standard deviation of the different measurements ofeach sample. The mean size and SD values obtained by theNTA software correspond to the arithmetic values calculatedwith the sizes of all the particles analyzed by the software.
Live Monitoring of Protein Heat Stress
For the live monitoring of protein aggregation, theabove-mentioned IgG was formulated at a concentration of1.0 mg/ml in 100 mM sodium citrate (Merck, Darmstadt,Germany), pH 7.6. Unstressed IgG was inserted in theNanoSight sample chamber at room temperature, and theheating block was then set to 50°C. Once the chamber hadreached the set temperature, which took about 10 min, avideo was recorded for 40 s (t0), followed by three time pointswith the same video length, at 15, 25 and 35 min. The videosof the first three time points were captured with the “singleshutter and gain mode” and of the last time point with the“extended dynamic range mode,” because of the high samplepolydispersity observed for this time point.
RESULTS AND DISCUSSION
Evaluation of NTA Performance and Comparison to DLS
Monodisperse Polystyrene Beads
In order to verify the accuracy of NTA to sizemonodisperse samples, standard polystyrene beads of60 nm, 100 nm, 200 nm, 400 nm and 1,000 nm were analyzedwith NTA, and the results were compared to DLS (Fig. 1).While NTA requires particle concentrations of 107–109/ml,the DLS concentration range is less critical and depends upona number of instrumental and sample properties (18). Formost of the samples used in this study, the DLS concentrationwas about 108–1012 particles/ml (data not shown). Given the
798 Filipe, Hawe and Jiskoot

difference in concentration range between the two techniques,a concentration suitable for both techniques was selected foreach bead size.
Contrary to DLS, NTA enables sample visualization andprovides approximate particle concentrations, which are veryuseful features. Both techniques showed good sizing accuracyand relatively narrow distributions for all monodispersesamples. Nevertheless, it is possible to observe a tailing ofall DLS size distributions towards larger sizes, mostly due tothe immense contribution of a few large particles to theoverall scattering (14).
The mean size values obtained by NTA are slightlysmaller and closer to the expected values than the Z-avegiven by DLS, but all values are close to the bead sizespecified by the manufacturer (Table I). However, the errorbars of the size distribution obtained for each sample aresmaller with DLS (Fig. 1), which is a consequence of the largeamount of statistical data collected by DLS when comparedto NTA. In fact, these high error bars in the NTA results are
mostly caused by different particle counts between eachmeasurement. The size distributions are practically the same,but the software sometimes detects slightly more or slightlyless particles between each measurement of the same sample.This variation in the number of particles detected by NTAbrings attention to the imprecision of the particle concentrationgiven by this technique. Still, though not the primary aim ofNTA, its capability to provide approximate submicron particlecounts is an obvious advantage of the method over DLS.
While DLS measurements are fast and rather straightfor-ward, NTA requires several optimization steps by a skilledoperator, e.g. with respect to indentifying suitable settings forthe video capture and analysis. Whereas DLS can automati-cally adjust the attenuator to adapt to a wide range of sampleconcentrations, the search for the right sample concentrationfor a successful NTA measurement can be time-consuming, asit may require various dilution steps. However, NTA provedto be slightly more accurate than DLS for sizing monodis-perse samples.
Fig. 1. Size distribution from NTA and DLS measurements of monodisperse polystyrene beads. Error bars represent standard deviationsobtained from three measurements of the same sample.
Table I. Mean Size and Size Distribution of Monodisperse Polystyrene Beads from NTA and DLS Measurements
Bead size (nm)
DLS NTA
Z-ave (nm) PdI Mean (nm) SD (nm) Particle conc. (E8/ml)
60 68±1 0.04±0.01 66±2 20±1 7.70100 112±4 0.13±0.07 105±6 30±10 1.87200 218±1 0.04±0.01 200±5 30±5 2.32400 443±5 0.13±0.03 394±7 62±6 1.08
1,000 1056±164 0.36±0.08 989±51 117±14 1.64
Z-ave Z-average; PdI polydispersity index; SD standard deviation calculated by the NTA software; Conc. concentration in particles E8/ml asmeasured by NTA. Numbers represent average values ± standard deviation (n=3 measurements). See Materials and Methods for details.
799Critical Evaluation of Nanoparticle Tracking Analysis (NTA)

Mixtures ofMonodisperse PolystyreneBeads: FixedNumber Ratio
One of the well-known pitfalls of DLS is its low peakresolution, i.e. it can only resolve particle populations thatdiffer in size at least by a factor of 3 (19). Thus, with the
purpose of testing the resolution of NTA, the monodispersepolystyrene standard beads analyzed in the previous sectionwere mixed at a fixed number ratio (60 nm and 100 nm; 100 nmand 200 nm; 200 nm and 400 nm; 400 nm and 1,000 nm) andanalyzed with both techniques. The two-dimensional (2D) size
Fig. 2. Size distribution from NTA and DLS measurements of mixtures of monodisperse polystyrene beads (middle panels) with the correspondingNTAvideo frame (left panels) and 3D graph (size vs. intensity vs. concentration; right panels). a) 60-nm/100-nm beads at a 4:1 number ratio; b) 100-nm/200-nm beads at a 1:1 number ratio; c) 200-nm/400-nm beads at a 2:1 number ratio; d) 400-nm/1,000-nm beads at a 1:1 number ratio.
800 Filipe, Hawe and Jiskoot
distributions of DLS and NTA, with the corresponding NTAvideo frames and three-dimensional (3D) graphs (size vs.intensity vs. concentration) are shown in Fig. 2.
From these results, the difficulty of DLS in resolvingpeaks of polydisperse samples becomes apparent, as it wasnot possible to separate the two bead sizes of any of themixtures. On the other hand, NTA was able to resolve anddistinguish the two size populations in all mixtures andyielded accurate size estimations of the beads in the mixtures(Table II). The 2D size distributions show that DLS onlygives a single peak for the mixtures shifted towards the largerparticle size present, which is again related to its bias to largerparticles. The error bars of the DLS results of the twomixtures with the larger bead size (Fig. 2c and d) are largerthan the ones of the NTA results. This is related to thedifficulty that the DLS software has to fit the data of anautocorrelation curve of a sample that has two populationswith size differences smaller than the peak resolution limit ofthis technique. As a result, the single peak as calculated bythe DLS software is prone to changes in shape and positionfrom measurement to measurement, giving rise to relativelylarge error bars in the average result.
The two different bead sizes with different scatteringintensities can be observed in the NTA video frames and 2Dsize distribution graphs and can be clearly distinguished in the3D graphs (Fig. 2). Despite having a 60-nm/100-nm beadnumber ratio of 4:1 (Fig 2a), NTA analysis of this mixtureshows more 100-nm beads than 60-nm beads. This is mainlycaused by a masking effect of the larger beads over thesmaller beads, explained in detail in the Influence of SmallNumbers of Large Particles section, combined with the factthat some of the 60-nm beads move so fast that they oftenmove out of focus in the detection area before they can betracked long enough to be considered for the final result.Nevertheless, the difference in scattering intensities displayedby the 3D graphs proves to be very useful to confirm thepresence of different populations of similar sizes, such as inthis 60-nm/100-nm bead mixture. While the 2D graph shows apeak at 100 nm and a shoulder at 60 nm, the 3D graph showstwo distinct size populations, clearly confirmed by the higherlight scattering intensity of the 100-nm particles compared tothe 60-nm ones. Thereby, the third dimension (scatteringintensity) in NTA contributes not only to the resolution ofparticle populations, but also provides information about thenature of the particles: for particles with equal refractive
index, the larger ones should scatter more light, proportionalto the diameter to the power six.
Measuring the mixture of monodisperse beads with DLSis as easy and fast as measuring the standard polystyrenebeads alone, but the results do not reflect the samples’ realcontent. On the other hand, NTA analysis of two differentparticle sizes implies in most cases the use of the “extendeddynamic range mode,” which adds a complex variable to theanalysis. This mode allows the recording of a set of twovideos at the same time with different shutter and gainsettings, enabling the simultaneous analysis of large and smallparticles in one measurement. A big advantage of NTA is theunbiased high peak resolution for polydisperse samples,which is not possible by DLS.
Mixtures of Monodisperse Polystyrene Beads: Effectof Number Ratio
In the field of nanoparticle characterization, it is impor-tant to have tools that are able to detect and characterize smallamounts of a certain particle size population, different fromthe main population. Thus, to elucidate the ratio detectionlimits of NTA, 100 and 400 nm polystyrene beads were mixedat 100-nm/400-nm bead number ratios of 3:1, 6:1, 15:1, 150:1and 300:1, and analyzed with NTA andDLS (Fig. 3). The ratioswere based on the particle concentration of the individual beadsamples obtained by NTA.
The selection of the distinct sizes of beads for thesemeasurements took into consideration the DLS theoreticalpeak resolution of 3:1 in size. Nonetheless, DLS was not ableto distinguish the two bead sizes for the lower 100-nm/400-nmbead number ratios of 3:1 and 6:1, for which mainly the largerbeads were detected. When the number ratio reached 300:1,the larger particles were no longer shown by DLS.
On the other hand, analysis with NTA enabled accuratesizing and a clear distinction of the two size populations for allthe ratios analyzed. The presence of the two distinct sizepopulations is very clear in the video frames of Fig. 3. In fact,being able to see the sample and search for the desiredlocation where the video is recorded enables the operator thechoice of including or excluding certain particles. Therefore,the appearance of the 400 nm peak for ratios bigger than300:1 depends on the operator. Being able to see and scan thesample is a useful feature of NTA, but it should be usedprudently to avoid false or biased results.
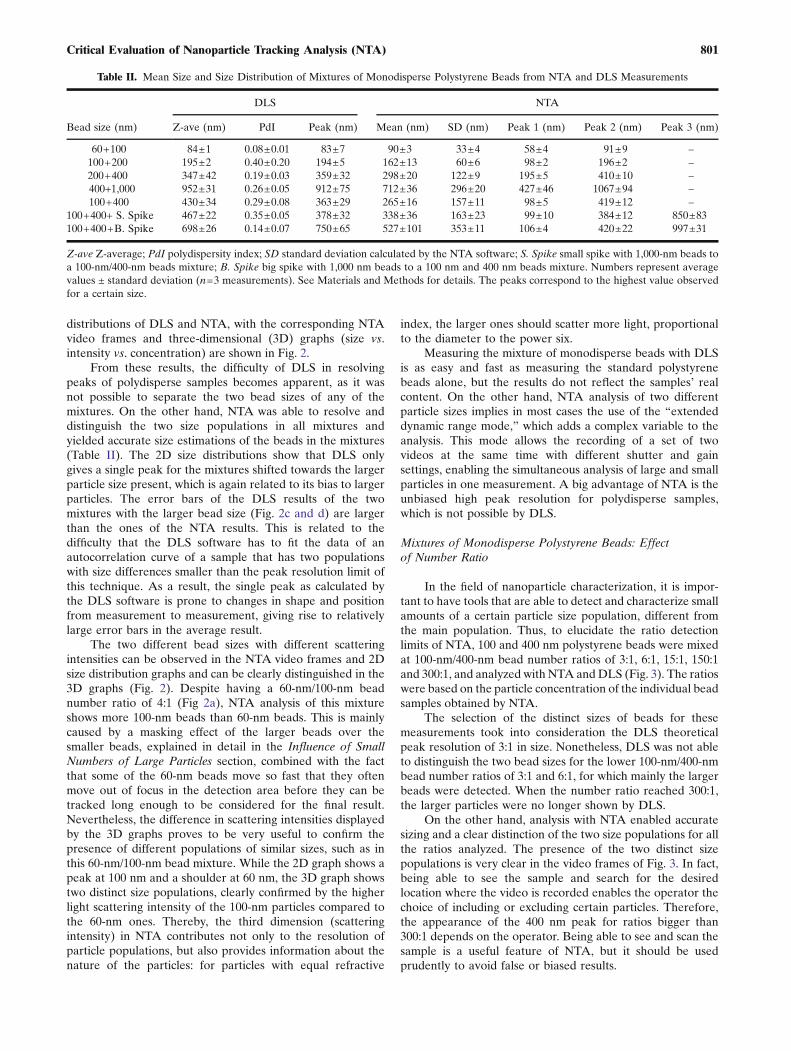
Table II. Mean Size and Size Distribution of Mixtures of Monodisperse Polystyrene Beads from NTA and DLS Measurements
Bead size (nm)
DLS NTA
Z-ave (nm) PdI Peak (nm) Mean (nm) SD (nm) Peak 1 (nm) Peak 2 (nm) Peak 3 (nm)
60+100 84±1 0.08±0.01 83±7 90±3 33±4 58±4 91±9 –100+200 195±2 0.40±0.20 194±5 162±13 60±6 98±2 196±2 –200+400 347±42 0.19±0.03 359±32 298±20 122±9 195±5 410±10 –400+1,000 952±31 0.26±0.05 912±75 712±36 296±20 427±46 1067±94 –100+400 430±34 0.29±0.08 363±29 265±16 157±11 98±5 419±12 –
100+400+ S. Spike 467±22 0.35±0.05 378±32 338±36 163±23 99±10 384±12 850±83100+400+B. Spike 698±26 0.14±0.07 750±65 527±101 353±11 106±4 420±22 997±31
Z-ave Z-average; PdI polydispersity index; SD standard deviation calculated by the NTA software; S. Spike small spike with 1,000-nm beads toa 100-nm/400-nm beads mixture; B. Spike big spike with 1,000 nm beads to a 100 nm and 400 nm beads mixture. Numbers represent averagevalues ± standard deviation (n=3 measurements). See Materials and Methods for details. The peaks correspond to the highest value observedfor a certain size.
801Critical Evaluation of Nanoparticle Tracking Analysis (NTA)

802 Filipe, Hawe and Jiskoot

Influence of Small Numbers of Large Particles
One of the main concerns of DLS is the influence that asmall amount of large particles, such as dust, may have on theoutcome. The NTA technique is based on the tracking ofsingle particles, whereas DLS measures a bulk of particleswith a strong bias to the largest particles present in thesample. Therefore, the performance of NTA is expected to beless sensitive than DLS to the presence of minute amounts oflarge particles. To compare the influence of large particles onNTA and DLS results, a mixture of 100-nm and 400-nmpolystyrene beads was spiked with two different amounts of
1,000-nm beads. The resulting number ratios of 1,000-nmbeads to the beads in the initial mixture was 1:267 for thesmall spike and 1:13 for the big spike (Fig. 4).
The small spike was sufficient to cause an increase ofabout 40 nm in the Z-ave and of about 0.05 in the PdIdetermined by DLS (Table II). The same spike made theNTA analysis slightly more complicated because the highlyscattering 1,000-nm beads made the 100-nm beads slightlymore difficult to detect. However, with optimized settings(Table III), all bead types present in the sample could bedetected and accurately sized by NTA (Fig. 4b). Nevertheless,after the spike, the number of 100-nm beads detected by NTAdecreased by about 70% and the number of 400-nm beads byabout 20%. The intense light scattering of large particlesmakes the small particles more difficult to detect and preventssome of them from being tracked by the NTA software.
The big spike increased the Z-ave of DLS from 430 to698 nm, but curiously decreased the PdI from 0.29 to 0.14.
Fig. 4. Influence of large particles (1,000-nm beads) in a mixture of 100-nm and 400-nm monodisperse beads on NTA and DLS measurements.The size distribution (middle panels) with the corresponding NTA video frame (left panels) and normalized 3D graph (size vs. intensity vs.concentration; right panels) are shown. a) no 1,000-nm beads; b) 1:267 number ratio of 1,000-nm beads to the other beads in the mixture; c) 1:13number ratio of 1,000-nm beads to the other beads in the mixture.
Fig. 3. Influence of different number ratios of 100-nm/400-nmmonodisperse beads in NTA and DLS measurements (middle panels)with the corresponding NTA video frame (left panels) and normalized3D graph (size vs. intensity vs. concentration; right panels).
R
803Critical Evaluation of Nanoparticle Tracking Analysis (NTA)

TableIII.
Effectof
theMostIm
portan
tNTA
SoftwareSe
ttings
onSize
Ana
lysis
Param
eter
Description
Impa
cton
themeasuremen
t
Incorrectsettings
Optim
alsettings
Shutter/Gaina
Shutterde
term
ines
leng
thof
timecamerashutterisop
en,
gain
regu
latessensitivityof
thecamera
-Und
erex
posedvide
osom
itsm
allerpa
rticles
Allpa
rticlesap
pear
asclea
rmov
ingdo
ts,
traceableby
thesoftware
-Overexp
osed
vide
osshow
particlesas
untraceablewob
blinglig
htflares
Cap
ture
Duration
Determines
theleng
thof
thecaptured
vide
o-Too
shortvide
osresultin
inaccurate
and
statistically
poor
size
distribu
tion
sStatistically
robu
stan
dreprod
ucible
size
distribu
tion
s
Blur
Smoo
thes
captured
vide
o,elim
inating
visual
noisefrom
arou
ndan
dwithin
thepa
rticle
-Excessive
blur
mak
essm
allpa
rticlesdisapp
ear
Rem
oves
falselig
htscattering
centers,he
lpssoftware
trackreal
particles
-Insufficien
tblur
leaves
falselig
htscattering
centers
Detection
Thresho
lda
Determines
minim
umgray
scale
valueof
ado
tne
cessaryforitto
qualify
asatraceablepa
rticle
-Too
high
thresholds
resultin
loss
ofsm
allpa
rticles
Allpa
rticlesin
thevide
oare
tracke
d,visual
noiseis
igno
red
-Too
low
thresholds
resultin
loss
oflargepa
rticles
ormistracking
ofvisual
noise
Minim
umExp
ected
ParticleSize
(MEPS)
Determines
area
arou
ndthepa
rticle
whe
rethesoftwaresearches
foritin
thefollo
wingfram
e(large
particles—
slow
mov
emen
ts—
smallareas;sm
allpa
rticles—
fast
mov
emen
ts—largeareas)
-Too
high
MEPSresultin
loss
ofsm
allpa
rticles
becausethey
mov
eou
tsideof
thesearch
area
Mostpa
rticlesin
thevide
oaretracke
dlong
enou
ghto
beinclud
edin
fina
lresult
-Too
low
MEPSresultin
loss
ofpa
rticlesin
gene
raldu
eto
search
area
overlap
aParam
etersthat
requ
irethorou
ghop
timizationan
dthat
have
amajor
impa
ctin
thefina
lou
tcom
e
804 Filipe, Hawe and Jiskoot
The lower PdI of this spiked sample is most likely aconsequence of the masking effect of the 1,000 nm beads overthe smaller beads in DLS measurements. These DLS valuescould have suggested that it was a fairly monodisperse 700 nmsample, when in fact it contained three distinct size populationsof 100, 400 and 1,000 nm. Such misinterpretation was not madewhen using NTA, since the presence of different populationswas clearly detected by sample visualization. Although the bigspike made the NTA measurements considerably morecomplex, all the beads in the sample could still be visualizedand accurately sized (Fig. 4c). However, also in this case, spikingwith large particles resulted in the underestimation of thenumber of smaller beads. After this spike, the number of 100-nm beads detected by NTA decreased by about 80% and that ofthe 400-nm beads by about 35%.
Effect of Settings in NTA Software on Particle Size Data
As already mentioned, NTA involves several adjustmentsteps during the video capture and analysis, which areessential to obtain accurate measurement results. The power
of choice given to the operator may be seen as a greatadvantage, but also raises concerns. The operator can easilychoose settings that ignore or emphasize the presence ofcertain particles, which makes the veracity of the resultsdependent on individual judgment and experience.
To obtain accurate results, one should (i) thoroughlysearch with the microscope for the presence of all particle sizeclasses in the sample, (ii) optimize the video settings in orderto capture all these identified particle sizes, and (iii) adjust theanalytical settings to unbiasedly track all moving particlescaptured by the video. With the purpose of clarifying theweight of the different software settings on the result, theinfluence of each parameter was carefully analyzed, assummarized in Table III.
Since the quality of NTA data will be dependent on thesoftware settings used, which in turn depend on sampleproperties, as well as on the experience and decisions of theoperator, NTA will be very difficult to qualify as a qualitycontrol method. Instead, NTA is—like DLS—very useful as acharacterization tool, as will be demonstrated in the applica-tions discussed below.
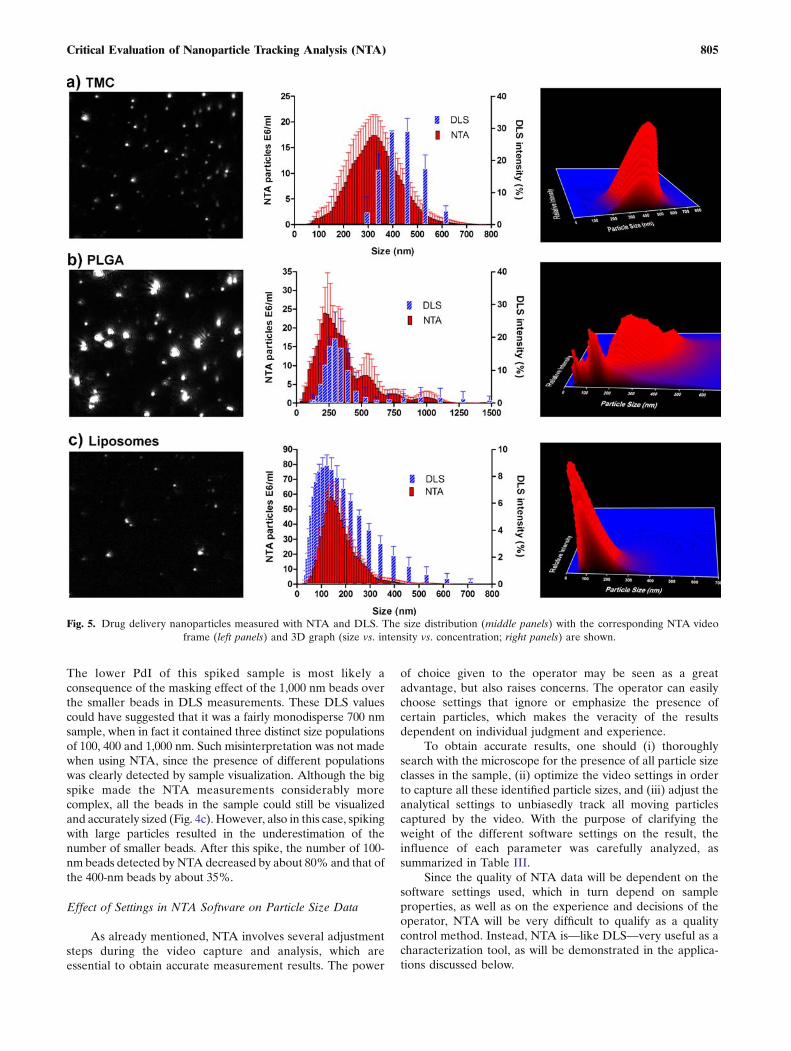
Fig. 5. Drug delivery nanoparticles measured with NTA and DLS. The size distribution (middle panels) with the corresponding NTA videoframe (left panels) and 3D graph (size vs. intensity vs. concentration; right panels) are shown.
805Critical Evaluation of Nanoparticle Tracking Analysis (NTA)

NTA Applications
Drug Delivery Nanoparticles
In order to evaluate the analytical performance of NTAfor nanoparticles commonly used in the pharmaceutical field,PLGA particles, TMC particles and liposomes were analyzedwith NTA and the results compared to DLS (Fig. 5).
DLS analysis resulted in a Z-ave of 411 nm and a PdI of0.09 for the TMC particles, indicating a relatively monodis-perse sample. This was confirmed by the visualization of theparticles in the NanoSight sample chamber (Fig. 5a) and by therelatively low standard deviation (91 nm) given by NTA.However, the mean size obtained by NTAwas 320 nm, which isabout 90 nm smaller than the Z-ave given by DLS, whichpoints to a certain degree of polydispersity. The systematicsize distribution shift towards larger sizes by DLS is moreaccentuated for the TMC particles than for the monodispersepolystyrene beads. This shift can be explained by the fact thatsize distributions obtained by DLS are intensity distributions,whereas NTA provides number distributions, which results in alarger shift in case of higher polydispersity.
The PLGA particles analyzed by DLS exhibited a Z-aveof 308 nm and a PdI of 0.22. This PdI value suggests that thePLGA particles were more polydisperse than the TMCparticles. The relatively high polydispersity of the PLGAparticles became very clear during the visualization of thesample by NTA (Fig. 5b) and was confirmed by the highstandard deviation (182 nm) obtained for the PLGA particles.The main population of these particles given by DLS wasshifted to larger sizes as compared to NTA. However, contrary
to most samples analyzed in this evaluation, the mean valueobserved with NTA (322 nm) was slightly higher than the Z-ave given by DLS (Fig. 5). This may be due to the inherentdifficulty for DLS to properly analyze polydisperse samples.
DLS analysis of the liposomes resulted in a Z-ave of117 nm and a PdI of 0.248, suggesting that this sample wasmore polydisperse than the PLGA sample. Surprisingly, thevisualization of the liposomes with NTA revealed a fairlymonodisperse sample, and the standard deviation obtainedwas 77 nm, which is even smaller than that of TMC particles.The mean size value obtained with NTAwas 154 nm, which isagain larger than the Z-ave given by DLS. This time the peakgiven by DLS is shifted to smaller sizes as compared to the oneobtained by NTA. Given that DLS has a lower detection limitthan NTA, it is possible that smaller particles (<30 nm) presentin the formulation decreased the Z-ave in DLS, which wouldalso explain the relatively high PdI. Other analytical tech-niques would have been necessary to clarify this observation.
Protein Aggregates
A heat-stressed IgG formulation and a metal-oxidizedinsulin formulation were used to evaluate the analyticalperformance of NTA with protein aggregates (Fig. 6). Thedifference in the lower detection limits of the two techniqueswas evident when it came to the characterization of proteinaggregates. DLS was able to detect not only the monomericIgG (∼11 nm) but also the sucrose molecules (∼1 nm) presentin the buffer, as was earlier described by others (20,21). Giventhat the lower detection limit of NTA for proteins is about30 nm, protein monomers and aggregates smaller than this
Fig. 6. IgG aggregates (obtained by heat stress) and insulin aggregates (obtained by metal catalyzed oxidation) measured with NTA and DLS.The size distribution (middle panels) with the corresponding NTA video frame (left panels) and 3D graph (size vs. intensity vs. concentration;right panels) are shown.
806 Filipe, Hawe and Jiskoot

are not detected by this technique. Nevertheless, in thestressed IgG formulation, the IgG aggregate size distributionobtained by DLS and NTA was similar, with a main peak ataround 200 nm. The Z-ave obtained by DLS was 47 nm andthe PdI 0.5, while the average size according to NTA was
175 nm and the standard deviation 76 nm. The difference inthe mean size values is most likely due to the fact that DLSconsiders aggregates, monomer and sucrose for the Z-ave(also explaining the high PdI), while NTA considers onlyaggregates for calculating the mean particle size (Fig. 6a).
Fig. 7. Live monitoring of IgG aggregation at 50°C in the NanoSight sample chamber. The size distribution (middle panels) with thecorresponding NTA video frame (left panels) and 3D graph (size vs. intensity vs. concentration; right panels) are shown.
807Critical Evaluation of Nanoparticle Tracking Analysis (NTA)

The visualization of the aggregated IgG sample withNTA allowed the distinction of two or more lightscattering centers in very large aggregates (>1 μm), whichsuggests that they were formed by the assembly ofsmaller aggregates. However, the brightness of such largeparticles interferes with the optimization of the instru-ment settings, because it makes smaller aggregates moredifficult to detect. The monomer present in the sampleincreases the background light and also makes smalleraggregates more difficult do detect.
In the aggregated insulin sample, the native insulinwas only detected by DLS and found to have an averagesize of about 6 nm, consistent with literature data for
insulin at neutral pH (22). Also for this sample, theaggregate size distribution was consistent between thetwo techniques, with a broad peak centered around160 nm (Fig. 6b). The Z-ave given by DLS was 70 nmand the PdI 1.0, while the mean given by NTA was199 nm and the standard deviation 103 nm. Such a highPdI given by DLS suggested that the aggregates in thesample were very polydisperse, which can be confirmedby sample visualization and high standard deviationprovided by NTA. Once again, the difference in meanvalue and Z-ave given by the two techniques is mostlikely due to the fact that DLS considers native insulinand aggregates, while NTA considers only aggregates.
Table IV. Comparison of NTA with DLS
DLS NTA
CharacteristicsSize accuracy Accurate for monodisperse samples, inaccurate
for polydisperse samplesAccurate for both monodisperse andpolydisperse samples
Peak resolution Low (>3 fold difference in diameter) High (<0.5 fold difference in diameter)
Size range Ca. 1–1,000 nm Ca. 30–1,000 nm
Concentration range (particles/ml) Broad (about 108–1012) Limited (107–109)
Population ratio Narrow range Very broad rangeLarge influence on size accuracy and distribution Very little influence on size accuracy and
little influence on size distribution
Reproducibility More reproducible Less reproducible
Contaminations Large particles can seriously compromise the results Dust, microorganisms or aggregateseasily detected, large particles havelittle influence
OperationalDevice handling Very user-friendly Requires several parameter adjustments
Little sample handling Sample handling may affect size distributionPossibility of using disposable cuvettes Sample chamber must be cleaned after each
sampleExperienced operator required
Time consumption Between 2 to 5 min per measurement Between 5 min to 1 hour per measurement
Particular output Approximate size distribution Individual particle sizingIntensity distribution Number distributionZ-ave Approximate concentrationsPdI Individual particle intensity
Sample visualization No Yes
ApplicationsDrug delivery nanoparticles Accurate sizing Accurate sizing
Approximate size distribution More reliable size distributionHard detection of contaminants Easy detection of contaminants
Protein aggregates Approximate size distribution Accurate size distributionIncludes protein monomers and someexcipients
Protein monomer and small aggregatesexcluded
Presence of very large aggregates has abig impact on the result
Aggregate architecture informationInterference of large aggregates maysometimes be overcome
808 Filipe, Hawe and Jiskoot

Several factors are known to induce protein aggregation,and some characterization techniques have been reported toinduce or disturb the aggregation state (8). During NTAmeasurements, the sample is in contact with glass, stainlesssteel, a Viton fluoroelastomer O-ring and nylon tubing.Moreover, the samples are submitted to a slight shear duringthe injection into the measurement cell. It has been reportedthat the synergistic effect of adsorption of a monoclonalantibody to stainless steel and shear can create small amountsof aggregates (23). In fact, we noticed that some stressed IgGformulations slightly increase the amount and size of aggre-gates if left in the sample chamber for more than 30 min (datanot shown). This phenomenon became more evident if thesample was moved back and forth in the measurement cellwith the syringe piston. While DLS size measurements areusually performed in disposable (polystyrene) cuvettes, theNanoSight sample chamber has to be manually cleaned andreused. Furthermore, as previously mentioned, NTA mea-surements often require sample dilution, which may destroyor create new aggregates and affect the size distribution(8). In general, the effect of sample content dilution on thesample content is related to the instability of the submicronparticles and is more likely to affect protein aggregatesthan drug delivery nanoparticles.
Overall, DLS sample treatment seems to be less aggres-sive than NTA, which is an advantage for unstable samples,such as protein aggregates. However, the high peak resolu-tion and suitability for polydisperse samples make NTA avery useful technique to analyze protein aggregates.
Live Monitoring of Heat-Induced Protein Aggregation
The heating block of NanoSight allows NTA measure-ments at temperatures ranging from room temperature to50°C, which enables the live monitoring of protein aggrega-tion at elevated temperatures. This feature is also possiblewith DLS, but the possibility of visualizing the aggregatesbeing formed with NTA gives a more complete overview ofthe aggregation process.
An IgG formulation was heated at 50°C for 45 min in theNanoSight heating block, while movies were being recorded(Fig. 7). Since NTA is not capable of detecting particlessmaller than about 30 nm, it was not possible to see theformation of dimers, trimers or any small oligomers. At t0, thesample had already been exposed to some heat stress forabout 10 min, the time required for the temperature to risefrom room temperature to 50°C, and some polydisperseaggregates of about 50–350 nm were detected. At t1, thenumber of aggregates had increased, and distinct subpopula-tions became apparent around 50 nm, 100 nm and 200 nm.After about 20 min, the number of aggregates rapidlyincreased. Even though the number of aggregates had slightlyincreased at t2, it does not reflect this sudden increase ofaggregates observed, because the background scattering(visible in the video frame of t2) made particle tracking moredifficult for the NTA software. After 35 min of heat-stressing,the number of aggregates reached the upper concentrationlimit of NTA, and especially the number of aggregates withsizes around 50 nm increased significantly. After 45 min, verylarge (>5 μm) aggregates were visible, and they madeaccurate NTA size measurements impossible, because the
light they scattered masked the smaller traceable aggregates(<1 μm). These large aggregates contained several intenselight scattering centers (results not shown), which wereprobably formed by the assembly of several smaller aggre-gates. Unfortunately, aggregate assembly process was notdetectable by this technique, since the aggregates wereconstantly entering and leaving the view area.
CONCLUSIONS
In this work, we evaluated NTA as a new character-ization method for nanoparticle analysis and compared it toDLS. The differences between the two techniques aresummed in Table IV. NTA can be time-consuming andrequires some operational skills for the adjustment allsoftware settings, but has some clear advantages over DLS.NTA enables the visualization of the sample, gives anapproximate particle concentration and obtains size informa-tion based on the Brownian motion of individual particles.NTA is very accurate for sizing both monodisperse andpolydisperse samples and has a substantially better peakresolution. The presence of few large particles in a sample hasa little impact on NTA sizing accuracy, but reduces thenumber of small particles detected by the software. Differentpopulation ratios in standard polystyrene bead mixtures areeasily detected and do not affect the sizing accuracy.
NTA proved to be very suitable for analyzing drugdelivery nanoparticles. This technique is also very suitable foranalyzing protein aggregates, but care should be taken thatsample preparation does not influence the aggregate distri-bution in the measurement cell. It also gives the possibility oflive monitoring heat-induced aggregation, providing informa-tion about the aggregation kinetics.
AKNOWLEDGEMENTS
This research is supported by the Dutch TechnologyFoundation STW, applied science division of NWO and theTechnology Program of the Ministry of Economic Affairs.The authors are grateful to Bram Slütter and Ana Silva forthe preparation of the TMC nanoparticles and PLGAparticles, to Myrra Carstens for the preparation of theliposomes and to Riccardo Torosantucci and OlubukayoOyetayo for preparing the aggregated protein samples.
Open Access This article is distributed under the terms of theCreative Commons Attribution Noncommercial License, whichpermits any noncommercial use, distribution, and reproduction inany medium, provided the original author(s) and source are credited.
REFERENCES
1. Mahato RI, Narang AS, Thoma L, Miller DD. Emerging trendsin oral delivery of peptide and protein drugs. Crit Rev TherDrug Carrier Syst. 2003;20:153–214.
2. Lipinski CA. Drug-like properties and the causes of poorsolubility and poor permeability. J Pharmacol Toxicol Meth.2000;44:235–49.
809Critical Evaluation of Nanoparticle Tracking Analysis (NTA)

3. Jiskoot W, van Schie RM, Carstens MG, Schellekens H.Immunological risk of injectable drug delivery systems. PharmRes. 2009;26:1303–14.
4. Cromwell ME, Hilario E, Jacobson F. Protein aggregation andbioprocessing. AAPS J. 2006;8:E572–9.
5. Schellekens H. Bioequivalence and the immunogenicity ofbiopharmaceuticals. Nat Rev Drug Discov. 2002;1:457–62.
6. Mahler HC, Friess W, Grauschopf U, Kiese S. Protein aggrega-tion: pathways, induction factors and analysis. J Pharm Sci.2009;98:2909–34.
7. Frokjaer S, Otzen DE. Protein drug stability: a formulationchallenge. Nat Rev Drug Discov. 2005;4:298–306.
8. Philo JS. A critical review of methods for size characterization ofnon-particulate protein aggregates. Curr Pharm Biotechnol.2009;10:359–72.
9. Carpenter JF, Randolph TW, JiskootW, Crommelin DJ, MiddaughCR,Winter G, et al.Overlooking subvisible particles in therapeuticprotein products: gaps that may compromise product quality. JPharm Sci. 2009;98:1201–5.
10. Bootz A, Vogel V, Schubert D, Kreuter J. Comparison ofscanning electron microscopy, dynamic light scattering andanalytical ultracentrifugation for the sizing of poly(butyl cyanoa-crylate) nanoparticles. Eur J Pharm Biopharm. 2004;57:369–75.
11. Brown PH, Schuck P. Macromolecular size-and-shape distribu-tions by sedimentation velocity analytical ultracentrifugation.Biophys J. 2006;90:4651–61.
12. FraunhoferW,Winter G, Coester C. Asymmetrical flow field-flowfractionation and multiangle light scattering for analysis of gelatinnanoparticle drug carrier systems. Anal Chem. 2004;76:1909–20.
13. Frisken BJ. Revisiting the method of cumulants for the analysisof dynamic light-scattering data. Appl Opt. 2001;40:4087–91.
14. Demeester J, Smedt S, Sanders N, Haustraete J. LightScattering. In: Jiskoot W, Crommelin DJ, editors. Methods for
structural analysis of protein pharmaceuticals. Arlington:AAPS; 2005.
15. Berne B, Pecora R. Dynamic light scattering with applications tochemistry, biology, and physics. Mineola: Dover; 2000.
16. Applications of Nanoparticle Tracking Analysis (NTA) in Nano-particle Research. http://www.schaefer-tec.com/fileadmin/user_upload/sortiment/nanopartikel/NanoSight/NANOSIGHT_Application_Review_NTA_April_2009_M201B.pdf (accessed 26/09/2009), part of NanoSight. http://www.nanosight.co.uk (accessed26/09/2009).
17. Slutter B, Plapied L, Fievez V, Sande MA, des Rieux A,Schneider YJ, et al. Mechanistic study of the adjuvant effect ofbiodegradable nanoparticles in mucosal vaccination. J ControlRelease. 2009;138:113–21.
18. Minimum DLS concentration? http://www.malvern.com/malvern/kbase.nsf/allfaqbyno/KB000795?opendocument (accessed 22/09/2009), part of Malvern support FAQ. http://www.malvern.com(accessed 22/09/2009).
19. Can DLS resolve oligomer mixtures? http://www.malvern.com/malvern/kbase.nsf/allfaqbyno/KB001102 (accessed 22/09/2009),part of Malvern support FAQ. http://www.malvern.com(accessed 22/09/2009).
20. Mahler HC, Muller R, Friess W, Delille A, Matheus S. Inductionand analysis of aggregates in a liquid IgG1-antibody formulation.Eur J Pharm Biopharm. 2005;59:407–17.
21. Kaszuba M, McKnight D, Connah MT, McNeil-Watson FK,Nobbmann U. Measuring sub nanometre sizes using dynamiclight scattering. J Nanopart Res. 2007;10:823–9.
22. Hvidt S. Insulin association in neutral solutions studied by lightscattering. Biophys Chemist. 1991;39:205–13.
23. Bee JS, Stevenson JL, Mehta B, Svitel J, Pollastrini J, Platz R, etal. Response of a concentrated monoclonal antibody formulationto high shear. Biotechnol Bioeng. 2009;103:936–43.
810 Filipe, Hawe and Jiskoot