
Rheological consequences of the lithospheric thermal structure in the Fennoscandian Shield

JOURNAL OF GEOPHYSICAL RESEARCH, VOL. , NO. , PAGES 1–22,
Clues to the lithospheric structure of Mars from wrinkle ridge setsand localization instability
Laurent G. J. Montesi1
Maria T. Zuber2
Massachusetts Institute of Technology, Cambridge, Massachusetts.
Abstract. Wrinkle ridges are a manifestation of horizontal shortening in planetary lithospheres,for which deformation is localized on faults that underlie individual ridges. In ridged plainsof Mars, such as Solis Planum or Lunae Planum, wrinkle ridges are spaced � ��� -km apart,whereas in the Martian northern lowlands, where ridges are identified only in MOLA altimet-ric data, the ridge spacing is at least ��� � km. We attribute ridge spacing to an instabilityof the lithosphere under horizontal compression. The localization instability, which results inperiodically-spaced faults [Montesi and Zuber, 2002b], links the difference of ridge spacingin the northern lowlands and in the highland ridged plains to the difference of crustal thick-ness, via the depth of the brittle-ductile transition (BDT). In Solis and Lunae Plana, wherethe crust is 50- to 60-km thick, the crust may be ductile at depth, limiting faulting to the BDTof crustal rocks. In the lowlands, the crust is only about 30-km thick and may be brittle through-out. Thus, the depth of faulting may be controlled by the BDT of mantle rocks, which is roughlya factor of two deeper than that of crustal rocks. The geotherm can be identical in both re-gions, at ����� ��� ��� � � , although differences of a few ��� ��� � � can be accommodated withinthis model. The heat flux implied by this geotherm is similar to the heat produced by radio-genic decay 3 Gyr ago. Our analysis provides a rheological explanation for the difference inspacing between ridges in the highlands and the lowlands, in contrast to the suggestion of Headet al. [2002], who proposed that alternating lowlands ridges are buried by sediments. In ad-dition, finite element models that use the lithospheric structure deduced from ridge spacingshow that modest gradients of crustal thickness or heat flux across a ridged plains favor theformation of faults dipping towards high-elevation areas, as may be the case in Solis Planum[Golombek et al., 2001].
1. IntroductionThe structure and evolution of planetary lithospheres helps to
constrain the thermal history of a planet. As no direct subsurfaceinformation is available for objects other than the Earth and Moon,the three-dimensional structure of the lithosphere of other planetsmust be inferred from modeling of remote sensing data such asmultispectral and panchromatic images, surface topography, andthe gravity and magnetic fields. In particular, the vertical strengthprofile of planetary lithospheres can be constrained from the hor-izontal length scale of tectonic features. The wavelength of theflexural response to surface or subsurface loads indicates the thick-ness of an equivalent elastic plate [Turcotte and Schubert, 1982;Comer et al., 1985; Banerdt et al., 1992; Wieczorek and Phillips,1998]; fold wavelengths are proportional to the thickness of a stronglayer sometimes associated with the brittle layers of the lithosphere[Fletcher and Hallet, 1983; Ricard and Froidevaux, 1986; Zuber,
�Now at Woods Hole Oceanographic Institution, Woods Hole,
Massachusetts.�Also at Laboratory for Terrestrial Physics, NASA/Goddard Space
Flight Center, Greenbelt, MD.
Copyright by the American Geophysical Union.
Paper number 2002JE001974.0148-0227/03/2002JE001974$9.00
1987; Zuber and Aist, 1990]. The spacing of wrinkle ridges hasbeen used to infer the thickness of a mechanically strong layer atthe top of the Martian lithosphere [Saunders et al., 1981; Zuber andAist, 1990; Watters, 1991], as will be done here. Depending on themodel used, however, wrinkle ridge spacing can imply deep pen-etration of ridge-related deformation (several to tens of km), mostconsistent with the influence of global stress patterns on ridge ori-entation [Zuber and Aist, 1990; Banerdt et al., 1992; Zuber, 1995],or the presence of a shallow weak layer (1- to 2-km deep) relatedto a possible megaregolith at the base of volcanic plains [Saunderset al., 1981; Watters, 1991].
As faulting is an important aspect of wrinkle ridge formation[Lucchita and Klockenbrink, 1981; Plescia and Golombek, 1986;Watters, 1988; Allemand and Thomas, 1992], faults have been de-fined a priori in previous theories of ridge formation [Zuber, 1995;Schultz, 2000]. However, fault formation, i.e., the localization offailure onto discrete shear zones, has not been included as a dy-namic process. In order to relate ridge spacing and the mechanicalstructure of the lithosphere, the faulted layer has sometimes beenregarded as pseudo-plastic [Zuber and Aist, 1990]. This rheologyincludes a yield strength at which faulting occurs, but also im-plies that deformation remains distributed instead of localizing ondiscrete shear zones. In this study, we show how the estimatedthickness of the layer involved in faulting at Martian wrinkle ridgesis modified by the consideration of localization, using the concept ofa localization instability introduced in Montesi and Zuber [2003b].That the localization instability is the most likely control on fault
1

2 MONTESI AND ZUBER: WRINKLE RIDGES ON MARS
-5000 -4000 -3000 -2000 -1000 0 1000 2000 3000 4000 5000
(m)
a)
0 10 20 30 40 50 60 70 80 90
(km)
b)
Figure 1. a) Topography from Mars Orbiter Laser Altimeter (MOLA, from Smith et al. [2001]) and b) crustal thicknessup to degree 40 derived from MGS data overlain on a shaded relief image of MOLA topography (from Zuber [2001]and Smith and Zuber [2002]). Contours in b) every 10 km, thicker contours every 30 km. The boxes mark the locationof the areas detailed in in Fig. 4 and 5. Hammer projection centered on ������� E longitude.
spacing is best seen when the ridge spacing of different regionsis compared. In areas where wrinkle ridges were recognized inViking images, ridge spacing is � ��� km [Saunders et al., 1981;Zuber and Aist, 1990; Watters, 1991], whereas in the northern low-lands (Fig. 1a), where ridges were only recently recognized fromMars Observed Laser Altimeter (MOLA) data [Withers and Neu-mann, 2001; Head et al., 2002], their spacing is �"!�� km [Headet al., 2002]. The localization instability can link the difference ofridge spacing to crustal thickness variations (Fig. 1b).
Variations of the thickness of the Martian crust have been inferredfrom the gravity field and topography of Mars, with the assump-
tions of an average crustal thickness of 50 km, density of the crustand the mantle of 2900 and 3500 #%$�& ')(+* , respectively [Zuberet al., 2000; Zuber, 2001, Fig. 1b]. The precision of the gravityfield implies that crustal thickness variations up to degree 40 canbe confidently used for geological interpretation [Smith and Zuber,2002], although additional uncertainties arise from model assump-tions such as a uniform crustal density. The crust is approximately30-km thick in the northern lowlands, and about 60-km thick inthe southern highlands, with locally much reduced thickness insideimpact basins (Fig. 1b). These numbers depend on the assumedaverage crustal thickness, but the 50-km value is well constrained:smaller values would result in negative crustal thickness, whereas

MONTESI AND ZUBER: WRINKLE RIDGES ON MARS 3
2km
MOC 02-03134
50 km
MOC 02-03135
with interbed slip
without interbed slip
Layered plain
Basement
Thrust
Backthrust Ridge
Wrinkle Topographicoffset
MDL
Figure 2. Mars Orbiter Camera (MOC) a) narrow angle and b) wide angle images of a wrinkle ridge in Solis Planum(NASA/JPL/Malin Space Science Systems). c) Possible subsurface structure of a wrinkle ridge, after Schultz [2000]and Nino et al. [1998]. A blind thrust fault offsets vertically the basement underneath a layered plain unit of volcanicor sedimentary origin. A backthrust may be generated if interbed slip occurs in the layered unit. The crenulation,or wrinkle, on top of the ridge represents the shallower geometry of faults within the layered plains. MDL: MainDecollement Level, possibly ice-rich [Mangold et al., 1998].
an overall thicker crust would relax too quickly to preserve theobserved long-wavelength variations such as the degree-1 pole-to-pole crustal thickness variation and the Hellas Basin [Zuber et al.,2000; Nimmo and Stevenson, 2001]. Although some chemical datapoint to either thinner (20-30 km, Norman [1999]) or thicker (75-95km, Norman [2002]; 100-200 km, Sohl and Spohn [1997]) crust,gravity-topography ratios constrain the average crustal thickness ofMars to be ���-,.�/� km [Wieczorek and Zuber, 2002] and localizedgravity/topography admittances in some regions [McGovern et al.,2002; Nimmo, 2002] are best explained by flexural models with areference crustal thickness �10�� km, in agreement with Zuber et al.[2000].
The difference of topography and gravity between the northernlowlands and the southern highlands might also be explained by a
crust of uniform thickness that would be �32����4#%$�& ')(+* denserin the North. However, at present, there is no geochemical jus-tification for that assumption (see section 4.2) and we follow theinterpretation that the Martian crust is thinner in the north than inthe south.
Although the Martian northern plains are technically ridgedplains since ridges have been identified in the lowlands with MOLAdata, we restrict herein the appellation “ridged plains” to thoseplains where ridges were recognized in Viking images. We presentin the next section topographic models of plains with wrinkle ridgesderived from MOLA data [Smith et al., 2001], showing in partic-ular the newly-identified wrinkle ridges in the northern lowlands[Withers and Neumann, 2001; Head et al., 2002] and evidence forconsistent fault vergence at regional scale [Golombek et al., 2001]

4 MONTESI AND ZUBER: WRINKLE RIDGES ON MARS
derived from the asymmetry of individual ridges. Then, the local-ization instability analysis developed in Montesi and Zuber [2003b]is applied to wrinkle ridge sets. In our preferred model, the faultsunderlying Martian ridges penetrate to the brittle-ductile transition(BDT), which is 30- or 60-km deep, depending on the crustal thick-ness and the geotherm. Finally, we present finite element modelsthat address the origin of the vergence selectivity observed in SolisPlanum [Golombek et al., 2001] by appealing to lateral variationsof geotherm or crustal thickness perpendicular to the ridge trend.Variations of crustal thickness within individual plains are beyondthe resolution of current crustal thickness models, but there is nodoubt that the crustal thickness and the heat flow under Tharsis werehigher than in neighboring regions, providing a justification for thegradients used in this study. The implications of our study for thesedimentation history in the lowlands and for the thermal evolutionof Mars are subsequently discussed.
2. Wrinkle ridge sets2.1. Morphology of wrinkle ridge
Wrinkle ridges are elongated and sinuous topographic highsidentified at the surface of all the terrestrial planets and satellites[Watters, 1988, 1992, Fig. 2]. They result from horizontal short-ening [Lucchita and Klockenbrink, 1981; Plescia and Golombek,1986; Golombek et al., 1991]. Individual wrinkle ridges on Marsare composed of a broad swell, or ridge (up to 10-km wide, 10-to 300-m high, and hundreds of km long) with a summit crenula-tion, or wrinkle ( �5� -km wide, 100-m high) [Watters, 1988, 1993;Schultz, 2000; Golombek et al., 2001].
The ridges have an asymmetric profile that indicates that faultingwas important in their formation [Golombek et al., 1991; Plescia,1991; Golombek et al., 2001], although the relative roles of foldingand faulting in forming the ridge have been much debated [Plesciaand Golombek, 1986; Golombek et al., 1991; Watters and Robinson,1997]. Recent numerical models showed that the ridge morphol-ogy is consistent with folding of a near-surface layered sequenceforced by a deeper blind thrust [Nino et al., 1998; Schultz, 2000,Fig. 2]. Layering in Martian examples may come from the volcanicsequence of the ridged plains. Alternatively, the backthrust may begenerated at an ice-rich decollement layer [Mangold et al., 1998].In the models of Nino et al. [1998] and Schultz [2000], the wrinklesappear as no more than a secondary structure related either to faultpropagation or to a back thrust generated by interbed slip. Theorigin of the wrinkle may vary along the strike of the ridge, whichis consistent with observations of wrinkle switching from one sideof a ridge to another or broken en echelon [Schultz, 2000, Fig. 2].
Ridges form sub-parallel sets [Maxwell, 1982; Watters andMaxwell, 1986, Fig. 2] with consistent inter-ridge spacing at re-gional scale [Saunders et al., 1981; Watters, 1991]. At largescale, their pattern is concentric to global centers of tectonic andvolcanic activity such as the Tharsis province on Mars [Banerdtet al., 1982, 1992; Maxwell, 1982; Chicarro et al., 1985; Wattersand Maxwell, 1986] and Aphrodite Terra or Lada Terra on Venus[Banerdt et al., 1997; Bilotti and Suppe, 1999]. Local centers arealso recognized on Venus [Tracadas and Zuber, 1998; Bilotti andSuppe, 1999]. A Tharsis-centric pattern on Mars has been recentlyestablished by the recognition of numerous ridges in the northernlowlands using MOLA data [Withers and Neumann, 2001; Thomsonand Head, 2001; Head et al., 2002].
2.2. Regional Topography
Two of the most intensely-studied ridged plain regions on Marsare Solis Planum and Lunae Planum (Fig. 4a, b). Both display sub-parallel ridge sets visible in Viking images [Watters and Maxwell,1986]. They trend respectively N ����� E and N-S. The ridge spacing
is 40 to 50 km on average [Saunders et al., 1981; Watters, 1991;Head et al., 2002].
At regional scale, both Solis Planum and Lunae Planum are tilteddown to the east. Using MOLA data, Golombek et al. [2001] showedthat the plains have a staircase-like profile, being vertically offsetacross individual ridges and sub-horizontal to back-tilted betweenridges (Fig. 3). This geometry indicates that the faults underlyingindividual ridges penetrate tens of km deep in the lithosphere anddip systematically to the same direction across the plains [Golombeket al., 2001]. A significant fraction of the current topography mayreflect reverse motion on the stacked faults. Golombek et al. [2001]interpreted that topography as indicative of faults dipping toward thehigh-standing topography. On the other hand, Okubo and Schultz[2001], favored faults dipping in the opposite direction, based on amodel that assumes internal deformation of fault-bounded blocks.
More recent analyses [Okubo and Schultz, 2002; Tate et al., 2002]have documented faults in Solis and Lunae Plana that do not fol-low the consistent vergence advocated by [Golombek et al., 2001].However, there are domains in which faults dip consistently to thewest, most notably in Solis Planum, near ��2�2 � E, ��0 � S (Fig. 3a).East-dipping faults occur more randomly. In some cases, ridgesoccur in pairs, with opposite vergence (e.g. Fig. 3b) and may reflecta near surface branching of the underlying thrust. Further studiesthat take into account fault length, inferred fault offset and prox-imity of other faults are needed to better understand the regional
0 100 200 300 400 500 600
3200
3000
2800
3100
2900
2700
a)
100
-100
-300
0
-200
b)1700
1500
1600
1400
c)-3100
-3300
-3500
-3200
-3400
d)
-3500
-3700
-3400
-3800
e)
f)
Topo
grap
hy (m
)
Ground distance (km)
-3900
-3300
-3500
-3700
-3400
-3600
-3800
Figure 3. Topographic profiles taken across wrinkle ridges in a)Solis Planum, b) Lunae Planum, c) Hesperia Planum, d) Alba Pa-tera, e) Arcadia Planitia, f) Chryse Planitia. The location of theprofiles is indicated in Figs. 4 and 5. Data from Smith et al. [2001].

MONTESI AND ZUBER: WRINKLE RIDGES ON MARS 5
270°
270°
275°
275°
280°
280°
285°28
5°
290°
290°
-35°
-35°
-30°
-30°
-25°
-25°
-20°
-20°
-15°
-15°
-10°
-10°
2200
2400
2600
2800
3000
3200
3400
3600
3800
4000
(m)
285°28
5°
290°29
0°
295°
295°
300°
300°
305°
305°
10°
10°
15°
15°
20°
20°
25°
25°
-100
0
-800
-600
-400
-2000
200
400
600
800
1000
(m)
105°
105°
110°
110°
115°
115°
120°
120°
125°12
5°
130°
130°
-35°
-35°
-30°
-30°
-25°
-25°
-20°
-20°
-15°
-15°
0
200
400
600
800
1000
1200
1400
1600
1800
2000
(m)
a)
b) c)
Figure 4. Digital Elevation Models of a) Solis Planum, b) northern Lunae Planum, and c) Hesperia Planum. Terrainmodels from Mars Orbiter Laser Altimeter (MOLA) data gridded in ��687:9;6 blocks [Smith et al., 2001].
arrangement of wrinkle ridges. We will present in < 5 finite elementmodels that show how faults dipping toward the high-standing areamay be favored in presence of lateral variations of geotherms and/orcrustal thickness.
In Lunae Planum, topographic data show a second set of ridgestrending east-west, nearly perpendicular to the trend detected in
Viking images [Montesi, 2002]. The most pronounced of theseridges are visible in Fig. 4b, near ��=%9 � E and 9�9 � N. These ridgesare nearly invisible in the Viking and Mars Orbiter Camera (MOC)images because of the illumination direction and of the apparentlack of a summit crenulation. As the tectonically-important fea-ture of wrinkle ridges is the master fault, which is expressed by

6 MONTESI AND ZUBER: WRINKLE RIDGES ON MARS
45°
210°
210°
215°
220°
220° 22
5°23
0°
230°
235°
240°
240°
245°
250°
250°
55°
55°
60°
60°
65°
65°
-500
0
-450
0
-400
0
-350
0
-300
0
-250
0(m
)
180°
180°
185°
190°
190° 19
5°20
0°
200°
205°
210°
210°
215°
220°
220°
40°
40°
45°
50°
50°
55°
55°
60°
60°
-450
0
-400
0
-350
0
-300
0(m
)
305°
305°
310°31
0°
315°
315°
320°
320°
325°
325°
330°
330°
10°
15°
10°
15°
20°
20°
25°
25°
30°
30°
35°
35°
40°
40°
-450
0-4
000
-350
0-3
000
-250
0-2
000
-150
0-1
000
-500
050
0
(m)
a) b)
c)
Figure 5. Digital Elevation Models of a) the northern flank of Alba Patera, b) south-east Arcadia Planitia, and c)Chryse Planitia. Terrain models from Mars Orbiter Laser Altimeter (MOLA) data gridded in ��6>7 9;6 blocks [Smithet al., 2001].
the ridge, and not the wrinkle [Schultz, 2000], these “wrinkle-less” ridges should be considered as bona fide examples of wrinkle ridges.The orientation of the second set of ridges in Lunae Planum is at

MONTESI AND ZUBER: WRINKLE RIDGES ON MARS 7
odds with the Tharsis-dominated stress field that controls the nearly-perpendicular N-S ridges [Watters and Maxwell, 1986]. They arealso unlikely to represent buried craters, as other ridges in the LunaePlanum [Plescia, 1991; Allemand and Thomas, 1995]. Instead, theE-W ridges are circumferential to a topographic high at the south-west corner of Lunae Planum, near 0 � N, ��=�� � E; their orientation iscontrolled by a local stress field. The E-W ridges often end againsta N-S ridge, indicating that they formed later. However, more de-tailed mapping of the “wrinkle-less” ridges should be conductedto address their relation to the classical wrinkle ridges. HesperiaPlanum displays two perpendicular sets of ridges as well (Fig. 4c),but the ridges are so intertwined that they probably formed contem-poraneously [Raitala, 1988; Mangold et al., 2000]. The spacing ofeach set of wrinkle ridges in Hesperia Planum is of order 40 km[Watters, 1991; Goudy and Gregg, 2002].
Although largely featureless in Viking images, the northernplains of Mars appear riddled with linear features in MOLA topog-raphy [Withers and Neumann, 2001]. Although the first of thesenew ridges, to the north of Alba Patera (Fig. 5a), were originallyinterpreted as ancient beach terraces [Head et al., 1999], a morecomplete data set shows that these lineations are more consistentwith degraded wrinkle ridges [Withers and Neumann, 2001; Thom-son and Head, 2001; Head et al., 2002]. Fig. 5b shows anotherexample of lowland ridges in Arcadia Planitia. Lowland ridges aresub-parallel and controlled both by global stresses such as the Thar-sis province and local stress sources such as the Utopia basin [Headet al., 2002]. The lowland ridges parallel and complete previously-recognized ridge trends, implying a common origin and time offormation [Head et al., 2002].
Northern lowlands ridges have a smaller height than the ridgesrecognized in Viking images, which, combined with the identifica-tion of buried impact structures and the unique roughness propertiesof the northern lowlands [Aharonson et al., 1998; Kreslavsky andHead, 2000; Aharonson et al., 2001], led Head et al. [2002] to inferthat �"9?��� m of sediments covers a Hesperian-age northern plainsimilar to Lunae Planum in age and morphology. More evidence forsignificant flux of material towards the lowlands include possibleburied channels in Chryse Planitia [Zuber et al., 2000] and massiveerosion in Arabia Terra [Hynek and Phillips, 2001]. Large partsof the northern plains have been imaged at high resolution. Theseimages also indicate that sediments cover the northern plains [Ma-lin and Edgett, 2001]. Although controversial, the northern oceanthat has been proposed to have been in the Hesperian [Head et al.,1999] could have facilitated the sediment deposition [Baker, 2001;Jakosky and Phillips, 2001]. These sediments are different fromthe older infilling of impact basins in the same region [Frey et al.,2002].
In addition to their degraded appearance, northern lowland ridgesdiffer from the ridges in other ridged plains by a larger spacing, �1!��km, which may also reflect sedimentation of a pre-existing ridgedplain [Head et al., 2002]. Interaction between sedimentation andridges is also evident in Chryse Planitia (Fig. 5c), where mass flowis guided by the ridges: the ridges are present in streamlined topo-graphic highs and pre-existing plains kipukas, especially near themouth of the channels. Debris flows were guided by pre-existingridges. However, we will argue in < 6.2 that the sediment infilling hasdifficulties in explaining the difference in ridge spacing. Instead,we show that fault spacing may be controlled by a localization in-stability in a brittle layer of different thickness. The thickness of thebrittle layer may reflect the different crustal thickness between thenorthern lowlands and the other ridged plains [Zuber et al., 2000,Fig. 1b].
3. Localization instability
The spacing or wrinkle ridges varies systematically between thenorthern and southern hemisphere. Using the theories of buck-
ling and localization instabilities, we can link ridge spacing to thestrength profile of the Martian lithosphere [Biot, 1961; Fletcher andHallet, 1983; Montesi and Zuber, 2003b]. These theories, beingsemi-analytical, permit the exploration of a wide range of param-eters describing the Martian lithosphere. However, they are validonly for the onset of the instability, not once ridges are well formed,and they neglect a host of complications realistically present in thelithosphere, such as preexisting structures and lateral variations inlithosphere properties. To handle these, numerical techniques arerequired. In this section, we use the instability analysis to providea simplified picture of the lithosphere in the Martian highlands andlowlands, and in the next section, we use a finite element model toshow what is the effect of a regional gradient in the structure of thelithosphere.
3.1. The buckling and localization instabilities
A model lithosphere with vertically-stratified mechanical prop-erties deforms by pure shear as long as the interfaces betweendifferent mechanical layers are perfectly flat and horizontal. How-ever, any topography at these interfaces generates a secondary flowthat in turn deforms the interfaces [Fletcher, 1974; Smith, 1977;Johnson and Fletcher, 1994]. The rate at which interface perturba-tions grow varies as a function of the perturbation wavelength. Thegrowth rate may be maximum, or diverge at particular wavelengths,which may be expressed in the tectonic record [Biot, 1961; Johnsonand Fletcher, 1994]. Lithospheric-scale instabilities are associatedwith these wavelengths.
Two simultaneous instabilities develop when the lithosphere issubjected to horizontal shortening. One of them, the buckling insta-bility, results in broad undulations of the lithosphere as a whole, withwavelength @+A [Fletcher, 1974; Ricard and Froidevaux, 1986; Zu-ber, 1987; Zuber and Aist, 1990]. The other, the localization insta-bility, results in periodically-spaced localized zones of high defor-mation rate, that we interpret as faults [Montesi and Zuber, 2003b].The wavelength of that instability, @CB , gives the fault spacing. Thebuckling instability might also produce regularly-spaced faults ifthe undulations reach sufficient amplitude to produce significantstress heterogeneities before the fault pattern develops [Martinodand Davy, 1994; Montesi and Zuber, 2003a].
These two instabilities do not require exactly the same type ofmechanical layering in the lithosphere. Buckling requires a stronglayer overlying a weaker substrate [Fletcher, 1974; Smith, 1977]and is favored if the strong layer is plastic. For tectonic appli-cations, that layer may be identified with the brittle upper crust orupper mantle [Fletcher and Hallet, 1983; Zuber, 1987]. In contrast,the localization instability requires a layer where faulting occurs,but it can be stronger or weaker than its substrate. In this study,the localizing layer is also identified with the brittle upper crust ormantle, but it is possible that it is only a part of it [Montesi andZuber, 2003a].
Beyond its strength D or its apparent viscosity E , the rheologyof a layer is characterized by the effective stress exponent FHG , ameasure of the response of the overall strength of a material to alocal perturbation of —for instance— the strain rate IJ [Smith, 1977;Montesi and Zuber, 2002]. The effective stress exponent is definedas: 9FKG L IJD M DM IJ & (1)
If FKGON59 (non-Newtonian behavior), increasing the strain rate de-creases the apparent viscosity but not the strength of the material;

8 MONTESI AND ZUBER: WRINKLE RIDGES ON MARS
the material is stable with respect to local perturbations. This is thecase for rocks deforming in the dislocation creep regime. A mate-rial is termed plastic in the limit FHGQPSR [Chapple, 1978; Smith,1979; Fletcher and Hallet, 1983; Zuber and Aist, 1990], or, moreconveniently, 9/T/FKGUPV� . When FKGUWX� , the material weakensdynamically: a local increase of strain rate decreases not only theapparent viscosity but also the strength of the material. Hence, thematerial is unstable with respect to local perturbations of strain rateand generates spontaneously localized shear zones that we identifywith faults [Montesi and Zuber, 2002].
While generated by local perturbations, these localized shearzones organize at the scale of the lithosphere into regularly-spacedfault sets as they interact with one another and with the non-localizing layers of the lithosphere [Montesi and Zuber, 2003b].The lithospheric-scale fault pattern is controlled by the localizationinstability. The morphology of the ridges cannot be addressed withthis analysis as the perturbations are infinitesimal, and near-surfaceinterbed slip is not modeled.
3.2. Instability scaling
Both buckling and localization instabilities may result inregularly-spaced ridges [Montesi and Zuber, 2003a], but they differin the relation between ridge spacing and brittle layer thickness thatthey predict [Montesi and Zuber, 2003b]. Physically, the wave-length of each instability is controlled by a resonance between cer-tain deformation modes within the strong and/or localizing layer.The resonances involved in the buckling and localization instabil-ities are different in detail, and have different associated wave-lengths, which can be determined analytically [Montesi and Zuber,2003b]. Resonances occur at any integer multiple of a fundamentalwavenumber. We define Y as that integer, and call it the order ofthe resonance and of the associated buckling or localization insta-bility. The resonant wavelengths are the basis for a scaling relationbetween the instability wavelength, @CB and @+A , the thickness of the
-0.1 -0.08 -0.06 -0.04 -0.02 0
1
10
Inst
abilt
y w
avel
engt
h λ/
H
Effective stress exponent ne
Inverse effective stress exponent 1/ne
-10 ±∞ -20 -50-30-15
Localization instability
Buckling instability
loca
lizin
g
non-
loca
lizin
g
0.1
Figure 6. Wavelength of the buckling and localization instabilitiesas a function of the effective stress exponent. The parameter Z isthe thickness of the material that develops the instability. Localiza-tion requires FKGQW[� and is more efficient for more negative 9/T/FHG .The range of wavelengths for each instability corresponds to therange of \�A and \�B in Eq. 2 and 3.
strong and/or localizing layer Z , and the effective stress exponentof that layer, FKG .
For the buckling instability, we obtain@+AZ^] �9/T��Q_:\�A 71`�9a_ 9FKG�b �dc �8e (2)
and for the localization instability, we have@+BZ ] �\�B 7 ` _ 9FKG�b �dc �8e (3)
where \�A and \�B are the spectral offsets, which depend on thetype of strength profile assumed in the lithosphere. In Montesi andZuber [2003b], we have calibrated \�A and \�B for the cases wherethe strength of the layer increases with depth and the strength ofthe substrate decreases quasi-exponentially, as may be expected ifthere is only one brittle and one ductile layer in the lithosphere. Wefound��Wf\�AfW19/T/� e (4)
Table 1. Inferred Depth of Brittle-Ductile Transition
Ridge spacing Ridged plains Northern lowlands40 km 80 km
Bucking instability 5 to 10 km 10 to 20 kmLocalization instability, g+G =-50 70 to 141 km 141 to 282 kmLocalization instability, g+G =-15 38 to 77 km 77 to 144 km
Brittle crust, n1, η1(z), ρc
λ
H1
Brittle mantle n3=n1,η3(z), ρm
Ductile mantle n4, η4(z), ρm
half-space
H4
H4
Substratumn4, η4(zmax), ρm
Ductile crust, n2, η2(z), ρc H2 εxx
Figure 7. Schematic representation of lithosphere models. A se-quence of layers undergoes horizontal shortening. The strengthprofile follows the weakest of frictional resistance or ductile flowlaw. Each layer h is characterized by a density i�j , a thickness Zkj , aneffective stress exponent FHj , and a viscosity profile E�jmlon�p that corre-spond to the dominant deformation mechanism in that depth range.A substratum with rheology corresponding to the lowest level ofthe model is included for convenience. The shading differentiatesbetween localizing layers (lighter shade, FHj>Wq� ) and ductile layers(darker shade, FKjars� ). The same shading is used in the strengthprofile in the next figures. The ductile crust and brittle mantle areincluded only if the crustal thickness and geotherm allows it.

MONTESI AND ZUBER: WRINKLE RIDGES ON MARS 99/T/�kWt\�BuW19/T���& (5)
The density of the lithosphere has little effect on the localizationinstability, but reduces the maximum growth rate and the preferredwavelength of the buckling instability. The order Y ] � gives thelongest preferred wavelength for each instability family, which weconsider the most likely to be visible in nature. Higher order insta-bilities Y:rv9 may also be present, but are harder to differentiatefrom noise in the Y ] � instability. Hence, we consider only Y ] �in the application to large-scale tectonics. For equal brittle layerthickness, the wavelength of the localization instability is generallysmaller than that of the buckling instability (Fig. 6).
The effective stress exponent that applies to the Martian litho-sphere cannot be specified a priori because the exact localizationmechanism is not known, and because extrapolating the valuesdetermined from laboratory studies requires reasonable caution.Based on rock mechanics experiments, the effective stress expo-nent may be between -10 to -50 for brittle failure mechanisms,and between -300 and -50 for localization over pre-existing faults[Montesi and Zuber, 2002]. The same localization process is prob-ably at work in the ridged plains and in the northern lowlands,as similar tectonic structures, the wrinkle ridges, are observed inthese areas. Hence, we may assume that FHG , although unknown, isidentical in both regions.
Table 1 shows what thickness of strong or localizing layer isneeded to explain the ridge spacing in the ridged plains or in thenorthern lowlands according to each instability. The values FHG =-50and FKG =-15 are chosen to illustrate the possible wavelengths of thelocalization instability. If the localization instability controls theridge spacing, FKG ] _O9/0 and \�A ] 9/T/� , the thickness of the layerundergoing localization may be between 40 and 80 km in the high-lands and twice that much in the lowlands. For tighter constraintson the depth of localization, we must compute the growth spectraof realistic strength models, which do not assume an a priori valuefor the spectral offsets \�A and \�B .
0 10 20 30
0
20
40
60
Surface Geotherm, K/km
Dep
th o
f brit
tle-d
uctil
e tra
nsiti
on (k
m)
40
Figure 8. Depth of brittle-ductile transition for different materialsas a function of the surface geotherm. Solid lines: diabase rheology[Caristan, 1982]; dashed lines: dry olivine [Karato et al., 1986].thick lines: strain rate 9?�%( �dwyx ( � ; thin lines: strain rate 9?�%( �{z|x ( � .The brittle-ductile transition is defined as the point where the resis-tance to frictional sliding [Byerlee, 1978] equals the ductile strength.Horizontal shortening and a temperature profile in }�~��?lon�p with sur-face temperature of _���� � C and asymptotic temperature of 9?��0�� � Care assumed.
3.3. Growth spectrum
Because the spectral offsets ( \�A and \�B ) in Eq. 2 and 3 weredetermined empirically for simplified models of the lithosphere[Montesi and Zuber, 2003b], we need to verify the prediction ofinstability wavelengths for more realistic models of the Martianlithosphere. This also results in a tighter range of Z compatiblewith a given effective stress exponent FHG . Hence, we computethe growth spectra using strength profiles derived from laboratoryexperiments on rock deformation.
Following the method described in Montesi [2002] and Montesiand Zuber [2003a], the lithosphere is idealized as a sequence ofhorizontal layers (Fig. 7). The density and dominant rheology arespecified for each layer. The dominant rheology is the weakest ofthe pressure-dependent brittle strength and temperature-dependentductile creep law. The brittle strength follows Byerlee’s law offrictional sliding [Byerlee, 1978], which does not depend on rocktype. By contrast, the ductile flow law does depend on the rocktype. Meteorites as well as in situ analyses of Martian rocks indi-cate that the crust is composed mostly of igneous rocks. Althoughandesite-like compositions have been recognized [McSween et al.,1999; Bandfield et al., 2000], most analyses indicate a basalticcomposition for the crust [McSween, 1994; Zuber, 2001; Wyatt andMcSween, 2002]. Hence, we use the dislocation creep laws of dia-base [Caristan, 1982] for the crust. The upper mantle is probablyolivine-rich [Longhi et al., 1992; Zuber, 2001] and may be dry if thecrust is extracted from it by partial melting [Hirth and Kohlstedt,1996]. Hauck and Phillips [2002] argue that water extraction onMars is not efficient, so that a wet olivine rheology is appropriatefor the Martian interior. While this may be true for the averagemantle composition, we are concerned here only with the shallow-est mantle, which is most likely to have undergone melting andwater extraction. We envision that the Martian lithospheric mantleis drier than the interior. Hence, we use the rheology of dry olivine[Karato et al., 1986] for the mantle. The depth at which these flowlaws are weaker than the brittle failure envelope is shown in Fig. 8.
The ductile strength is a non-linear function of the strain rate.Obviously, there is no direct constrain on the strain rate at the timeof ridge formation. Here we select a strain rate of 9?� ( �{� x ( � ,slightly smaller than in terrestrial diffuse plate boundaries [Gordon,2000]. The thickness of the layers in the model used to compute thegrowth spectra as well as the depth-dependent strength profile inthe ductile regime are computed for a prescribed temperature pro-file [Montesi and Zuber, 2003a]. We assume that the temperatureincreases linearly with depth to a saturation temperature of 9?��0�� � Csimilar to that of the Earth’s asthenosphere. At the surface, weassume a temperature of _���� � C, warmer than present-day Mars,but consistent with models of the Martian atmosphere at the time ofridge formation [Carr, 1999]. The surface temperature has only aweak influence on the preferred instability wavelengths. The effec-tive stress exponent of the ductile layers is given by the flow law. Inthe brittle regime, we only constrain FHG to be the same for the brittlecrust and the brittle mantle. Localization requires FHG4Ws� . Fromthe scaling analysis, FKG���_O9/0 should explain the ridge spacing.
Stokes’ equation is solved in each layer and stress and velocityboundary conditions are matched to determine the growth rate ofinterface perturbations as a function of their wavelength, or growthspectrum. The buckling instability appears as a finite maximum ofgrowth rate, and results in smooth undulations of the brittle layersas a whole. The growth rate diverges at the localization instability,reflecting the unstable character of localization [Montesi and Zuber,2003b].
The growth spectra of models with 30- and 60-km thick crustare presented in Fig. 9, along with the corresponding strength pro-files. We used FKG ] _O9?� and
M�� T M�� ] 9/�-�k& #%' ( � . Under these
10 MONTESI AND ZUBER: WRINKLE RIDGES ON MARS
10 1000.01
1
100
Wavelength (km)
Gro
wth
rate
0
20
40
60
80
100
Dep
th (k
m)
0
20
40
60
80
100
Dep
th (k
m)
crust
mantle
crustmantle
a) c)b)
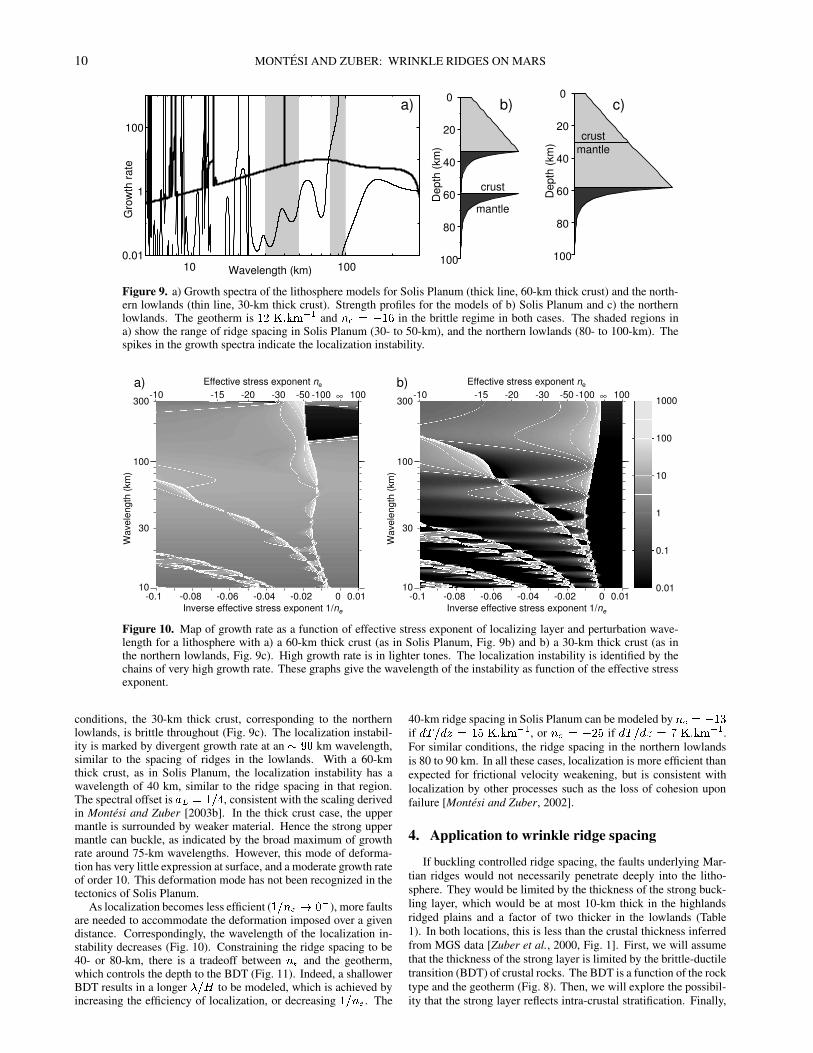
Figure 9. a) Growth spectra of the lithosphere models for Solis Planum (thick line, 60-km thick crust) and the north-ern lowlands (thin line, 30-km thick crust). Strength profiles for the models of b) Solis Planum and c) the northernlowlands. The geotherm is 9/���k& #%'�( � and FKG ] _O9?� in the brittle regime in both cases. The shaded regions ina) show the range of ridge spacing in Solis Planum (30- to 50-km), and the northern lowlands (80- to 100-km). Thespikes in the growth spectra indicate the localization instability.
10
100
Wav
elen
gth
(km
)
Effective stress exponent ne
Inverse effective stress exponent 1/ne
-30-10 ∞ -50 -100 100
-0.08 -0.06 -0.04 0.01-0.1 -0.02 0
300
30
-15 -20
10
100
Wav
elen
gth
(km
)Effective stress exponent ne
Inverse effective stress exponent 1/ne
-30-10 ∞ -50 -100 100
-0.08 -0.06 -0.04 0.01-0.1 -0.02 0
300
30
0.01
0.1
1
10
100
1000-15 -20
a) b)
Figure 10. Map of growth rate as a function of effective stress exponent of localizing layer and perturbation wave-length for a lithosphere with a) a 60-km thick crust (as in Solis Planum, Fig. 9b) and b) a 30-km thick crust (as inthe northern lowlands, Fig. 9c). High growth rate is in lighter tones. The localization instability is identified by thechains of very high growth rate. These graphs give the wavelength of the instability as function of the effective stressexponent.
conditions, the 30-km thick crust, corresponding to the northernlowlands, is brittle throughout (Fig. 9c). The localization instabil-ity is marked by divergent growth rate at an ��=�� km wavelength,similar to the spacing of ridges in the lowlands. With a 60-kmthick crust, as in Solis Planum, the localization instability has awavelength of 40 km, similar to the ridge spacing in that region.The spectral offset is \�B ] 9/T/� , consistent with the scaling derivedin Montesi and Zuber [2003b]. In the thick crust case, the uppermantle is surrounded by weaker material. Hence the strong uppermantle can buckle, as indicated by the broad maximum of growthrate around 75-km wavelengths. However, this mode of deforma-tion has very little expression at surface, and a moderate growth rateof order 10. This deformation mode has not been recognized in thetectonics of Solis Planum.
As localization becomes less efficient ( 9/T/FHG�P�� ( ), more faultsare needed to accommodate the deformation imposed over a givendistance. Correspondingly, the wavelength of the localization in-stability decreases (Fig. 10). Constraining the ridge spacing to be40- or 80-km, there is a tradeoff between FHG and the geotherm,which controls the depth to the BDT (Fig. 11). Indeed, a shallowerBDT results in a longer @+T�Z to be modeled, which is achieved byincreasing the efficiency of localization, or decreasing 9/T/FHG . The
40-km ridge spacing in Solis Planum can be modeled by FHG ] _O9?�if ����T/�%n ] 9/0O�k& #%' ( � , or FKG ] _���0 if ����T/�%n ] 2O�k& #%' ( � .For similar conditions, the ridge spacing in the northern lowlandsis 80 to 90 km. In all these cases, localization is more efficient thanexpected for frictional velocity weakening, but is consistent withlocalization by other processes such as the loss of cohesion uponfailure [Montesi and Zuber, 2002].
4. Application to wrinkle ridge spacing
If buckling controlled ridge spacing, the faults underlying Mar-tian ridges would not necessarily penetrate deeply into the litho-sphere. They would be limited by the thickness of the strong buck-ling layer, which would be at most 10-km thick in the highlandsridged plains and a factor of two thicker in the lowlands (Table1). In both locations, this is less than the crustal thickness inferredfrom MGS data [Zuber et al., 2000, Fig. 1]. First, we will assumethat the thickness of the strong layer is limited by the brittle-ductiletransition (BDT) of crustal rocks. The BDT is a function of the rocktype and the geotherm (Fig. 8). Then, we will explore the possibil-ity that the strong layer reflects intra-crustal stratification. Finally,

MONTESI AND ZUBER: WRINKLE RIDGES ON MARS 11
as neither of these possibilities is likely to explain the systematicridge spacing difference between ridged plains and northern low-lands, we explore the possibility that the ridge spacing is controlledby the localization instability. Then, the different crustal thicknessbetween the highlands and the lowlands provides an explanation forthe different ridge spacing.
4.1. Brittle-ductile transition controlled by different geotherms
If the ridge spacing is controlled by the buckling instability andthe crust has similar composition in the highlands and the lowlands,then the ridge spacing implies that the geotherm in the lowlandswas at least a factor of two lower than in the ridged plains at timeof ridge formation. However, this situation is unlikely. The ridgesformed roughly at the same time in both areas [Head et al., 2002],and the northern lowlands lithosphere is approximately as old asthe Martian highlands [Frey et al., 2002], precluding significantdifferences in the mantle heat flow or in the heat loss by coolingof a immobile lithospheric plate between the two regions. Thelowlands’ lithosphere might have lost heat more rapidly than thehighlands during an early episode of plate tectonics in the low-lands [Sleep, 1994]. However, it is not known how strong the heatflux reduction would be, and for how long it would be preservedwith a dynamic mantle. In addition, the recognition of buried im-pact basins [Smith et al., 1999; Frey et al., 2002; McGill, 2001;Thomson and Head, 2001] makes it unlikely for plate tectonics tohave occurred in the lowlands after the end of heavy bombardment.Degree-1 convection that caused excess heat loss and resurfacing inthe lowlands [Zhong and Zuber, 2001] would cause lowland ridgesto have smaller spacing than in the highlands, which is contrary tothe observations.
It is possible that the lithospheres of Solis and Lunae Plana werereheated by mantle plumes and associated volcanism, but the tem-perature anomaly associated with thermal plumes on Earth is at most200 K [Shen et al., 1998; Korenaga and Kelemen, 2000], or 20% ofthe temperature drop across the lithosphere. If a similar temperaturechange also happened on Mars, it would not be sufficient to explainthe difference of depth of BDT. Radiogenic heating in the thickerhighland crust, also cannot account for more than ��& 9��k& #%' ( � , as-suming a concentration of heat-producing elements in the Martianlower crust similar to that of tholeiitic basalts on Earth 3 Gyr ago[Turcotte and Schubert, 1982].
For simplicity, we assume the same surface temperature in thelowland and the highlands. In fact, the mean temperatures at presentvaries from _O9/����� C near the poles to _�0���� C near the equator. Thebest studied ridged plains are near the equator (Fig. 1) and on aver-age less cold than the lowland plains. This might have been the caseat the time of ridge formation as well. However, surface tempera-ture differences of even 9?����� C result in only a few km of differencein the BDT, and therefore in the wavelength of the buckling insta-bility. This is insufficient to account for the factor of two differencein ridge spacing between the highlands and lowlands.
In summary, there is little reason to expect a significant differ-ence between the thermal structure of the lowlands and the highlandsduring ridge formation, but future thermal models should explorethis question in more detail.
4.2. Brittle-ductile transition controlled by different crustalcomposition
The factor of two difference in BDT implied by the buckling anal-ysis may reflect different crustal compositions between the high-lands and the lowlands. Both data from Mars Pathfinder and MarsGlobal Surveyor Thermal Emission Spectrometer (MGS-TES) indi-cate the presence of silica-rich rocks such as icelandite or andesite[McSween et al., 1999; Bandfield et al., 2000]. Bandfield et al.
[2000] showed that the andesite-like component to be predominantin the northern lowlands. Although compositional inferences madefrom remote sensing data are non-unique and sediments make thelink between surface and crustal composition ambiguous, especiallyin the lowlands, MGS-TES data are consistent with the Martian crustbeing more silica-rich in the lowlands than the highlands. However,silica-rich rocks such as granite are generally weaker than basalticrocks such as gabbros [Tsenn and Carter, 1987; Evans and Kohlst-edt, 1995]. Hence, if that compositional difference is real, the BDTof the lowlands would be shallower than in the highlands, for iden-tical geotherm, which would result in more closely-spaced ridgesin the lowlands, contrary to the observations [Head et al., 2002]. Itmay be argued that the lowland crust is actually more mafic than thehighland crust but is covered by a veneer of silica-rich sedimentsderived from the highlands. In this case, the density differencebetween highlands and lowlands could explain their elevation dif-ference in the same manner as the different elevation of the oceanicand continental crusts on Earth and the BDT in the highland crustwould be shallower than that of the lowland crust. However, onewould expect the surface of the highlands to be silica-rich, con-trary to the remote sensing observations [Bandfield et al., 2000].The spectral signature of the lowlands sediments is also compatiblewith that of weathered basalt [Noble and Pieters, 2001; Wyatt andMcSween, 2002], which is easier to reconcile with their geographicdistribution. Unless the crust of either the lowlands or the highlandsis dominated by a different rock type than seen at the surface, or thegeotherm of the lowlands is much colder than that of the highland,for a unknown reason, the BDT of the lowlands is unlikely to be afactor of two deeper than in the highlands. Hence, the ridge spacing,if controlled by the buckling instability, does not reflect the BDT ofcrustal materials.
4.3. Buckling controlled by intra-crustal stratification
The buckling layer may be limited by a change of rock typewith depth within the crust rather than the BDT. Early models ofridge spacing assumed that the strong layer corresponds to basalticflood plain units that are underlain by a weaker substrate usuallyidentified with a lunar-type megaregolith [Saunders et al., 1981;Zuber and Aist, 1990; Watters, 1991]. Recent morphological stud-ies of canyon walls showed that the plain’s thickness is at least 8 km[McEwen et al., 1999; Caruso and Schultz, 2001; Peulvast et al.,2001], which is inconsistent with previous models using viscoelas-tic buckling requiring plain thicknesses of order 1 km [Saunderset al., 1981; Watters, 1991]. Models using a plastic layer [Zuberand Aist, 1990] are consistent with such a plain thickness. However,they also imply that the Hesperian plains unit would be between 20-and 40-km thick in the lowlands to explain the longer ridge spacing(Table 1). The plains would then constitute the major part of the20- to 30-km thick crust of the lowlands [Zuber et al., 2000, Fig.1], which is inconsistent both with the identification of basins un-derneath the volcanic plain unit in the lowlands [Frey et al., 2002]and with the presence of a significant megaregolith underneath thevolcanic plains, as needed for buckling. A weak substrate wouldalso decouple efficiently the surface from deeper stresses [Zuber,1995], which is hard to reconcile with observations of consistentridge orientation over thousands of km.
In summary, it is unlikely that the buckling instability controlsthe ridge spacing, regardless of whether the buckling layer is lim-ited by the brittle-ductile transition of the crust, or an intra-crustalweak layer. We are thus motivated to test the hypothesis that ridgespacing is controlled by the localization instability. In that scenario,the thickness of the faulting layer is at least 40 km, depending on thevalue of effective stress exponent (Table 1). This value is consistent
12 MONTESI AND ZUBER: WRINKLE RIDGES ON MARS
a) b)
e e
e e
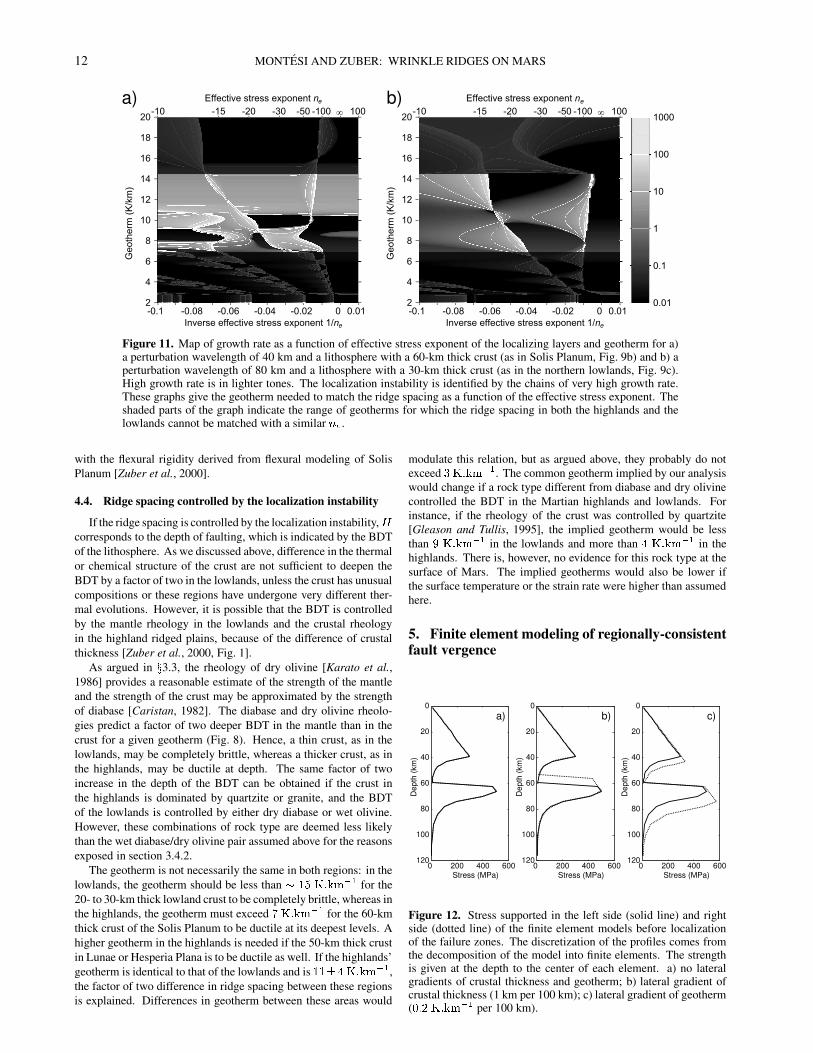
Figure 11. Map of growth rate as a function of effective stress exponent of the localizing layers and geotherm for a)a perturbation wavelength of 40 km and a lithosphere with a 60-km thick crust (as in Solis Planum, Fig. 9b) and b) aperturbation wavelength of 80 km and a lithosphere with a 30-km thick crust (as in the northern lowlands, Fig. 9c).High growth rate is in lighter tones. The localization instability is identified by the chains of very high growth rate.These graphs give the geotherm needed to match the ridge spacing as a function of the effective stress exponent. Theshaded parts of the graph indicate the range of geotherms for which the ridge spacing in both the highlands and thelowlands cannot be matched with a similar FHG .
with the flexural rigidity derived from flexural modeling of SolisPlanum [Zuber et al., 2000].
4.4. Ridge spacing controlled by the localization instability
If the ridge spacing is controlled by the localization instability, Zcorresponds to the depth of faulting, which is indicated by the BDTof the lithosphere. As we discussed above, difference in the thermalor chemical structure of the crust are not sufficient to deepen theBDT by a factor of two in the lowlands, unless the crust has unusualcompositions or these regions have undergone very different ther-mal evolutions. However, it is possible that the BDT is controlledby the mantle rheology in the lowlands and the crustal rheologyin the highland ridged plains, because of the difference of crustalthickness [Zuber et al., 2000, Fig. 1].
As argued in < 3.3, the rheology of dry olivine [Karato et al.,1986] provides a reasonable estimate of the strength of the mantleand the strength of the crust may be approximated by the strengthof diabase [Caristan, 1982]. The diabase and dry olivine rheolo-gies predict a factor of two deeper BDT in the mantle than in thecrust for a given geotherm (Fig. 8). Hence, a thin crust, as in thelowlands, may be completely brittle, whereas a thicker crust, as inthe highlands, may be ductile at depth. The same factor of twoincrease in the depth of the BDT can be obtained if the crust inthe highlands is dominated by quartzite or granite, and the BDTof the lowlands is controlled by either dry diabase or wet olivine.However, these combinations of rock type are deemed less likelythan the wet diabase/dry olivine pair assumed above for the reasonsexposed in section 3.4.2.
The geotherm is not necessarily the same in both regions: in thelowlands, the geotherm should be less than ��9/0Q�k& #%'�( � for the20- to 30-km thick lowland crust to be completely brittle, whereas inthe highlands, the geotherm must exceed 2-�k& #%' ( � for the 60-kmthick crust of the Solis Planum to be ductile at its deepest levels. Ahigher geotherm in the highlands is needed if the 50-km thick crustin Lunae or Hesperia Plana is to be ductile as well. If the highlands’geotherm is identical to that of the lowlands and is 9�9C,��-�k& #%'�( � ,the factor of two difference in ridge spacing between these regionsis explained. Differences in geotherm between these areas would
modulate this relation, but as argued above, they probably do notexceed ���k& #%'�( � . The common geotherm implied by our analysiswould change if a rock type different from diabase and dry olivinecontrolled the BDT in the Martian highlands and lowlands. Forinstance, if the rheology of the crust was controlled by quartzite[Gleason and Tullis, 1995], the implied geotherm would be lessthan =��k& #%'�( � in the lowlands and more than ���k& #%'�( � in thehighlands. There is, however, no evidence for this rock type at thesurface of Mars. The implied geotherms would also be lower ifthe surface temperature or the strain rate were higher than assumedhere.
5. Finite element modeling of regionally-consistentfault vergence
0 200 400 600
0
20
40
60
80
100
120
Stress (MPa)
Dep
th (k
m)
a)
0 200 400 600
0
20
40
60
80
100
120
Stress (MPa)
Dep
th (k
m)
b)
0 200 400 600
0
20
40
60
80
100
120
Stress (MPa)
Dep
th (k
m)
c)
Figure 12. Stress supported in the left side (solid line) and rightside (dotted line) of the finite element models before localizationof the failure zones. The discretization of the profiles comes fromthe decomposition of the model into finite elements. The strengthis given at the depth to the center of each element. a) no lateralgradients of crustal thickness and geotherm; b) lateral gradient ofcrustal thickness (1 km per 100 km); c) lateral gradient of geotherm( �%& �a�k& #%' ( � per 100 km).

MONTESI AND ZUBER: WRINKLE RIDGES ON MARS 13
crus
tm
antle
10 K/km10 K/km
60 km
120 km
0km
60 km
120 km
0km
0 km600 km
a)
crus
tm
antle
10 K/km10 K/km
60 km
120 km
0km
120 km
0km
0 km600 km
b)
54 km
crus
tm
antle
10 K/km8.8 K/km
60 km
120 km
0km
60 km
120 km
0km
0 km600 km
c)
Figure 13. Initial configuration of finite element models. The thick line shows the base of the crust, and the thin linesrepresent isotherms every 9?��� � C. The shaded region shows the elements undergoing failure if the model deformsunder uniform strain rate. However, the failure zone changes and forms discrete shear zones after convergence of themodel (Fig. 14 to 16). a) no lateral gradients of crustal thickness and geotherm; b) lateral gradient of crustal thickness(1 km per 100 km); c) lateral gradient of geotherm ( �%& �a�k& #%'�( � per 100 km).
Reliable topographic data from MOLA [Smith et al., 2001]demonstrated that plains are vertically offset across ridges, indi-cating that individual ridges are underlain by deeply rooted faults[Golombek et al., 2001, Fig. 4]. The sense of the topographic offsetindicates the dip direction, or vergence, of the fault. In some parts ofSolis Planum, the faults dip consistently toward the high–standingarea. The instability analysis presented above can match the pre-dicted fault spacing, but cannot explain regionally-consistent faultvergence. Indeed, if the region deforms by pure shear, conjugatefaults are expected, with an approximately equal number of faultsdipping toward and away from the high-standing areas. The sym-metry of faulting can be broken if deformation has a component ofsimple shear in addition to the pure shear that represents horizontalshortening. We investigate using finite element models how sucha component may arise from lateral variations in the mechanicalproperties of the lithosphere. Specifically, we model the effects oflaterally-varying crustal thickness and geotherm.
5.1. Numerical Technique
The lithosphere is modeled as a visco-plastic material using thefinite element method [Chen and Morgan, 1990; Neumann and Zu-ber, 1995; Zuber and Parmentier, 1996; Behn et al., 2002]. Thelithosphere is divided into contiguous elements that are initiallyrectangles. There are four nodes for each element. Velocity andforces are defined at each node of each element, and interpolated
within the element. The physical relation between forces and ve-locities (or strain rate) is integrated over individual elements, sothat each element is represented by an effective stiffness (or ratherviscosity) matrix linking the velocity and the forces at each of itsnodes. Then, displacement boundary conditions are imposed onselected nodes, so that, as the velocity in the model must be con-tinuous and the forces at each node must be in equilibrium, it ispossible to solve for the velocity and forces at every node [Bathe,1996]. Our formulation is Lagrangian: computational nodes areadvected with the velocity field. Concerns of finite distortion ofthe elements, time discretization, and regridding of the model areirrelevant for this work as we consider only the initial configurationof faulting.
In the results presented herein, the computational domain is�����Q#%'�7 9/���Q#%' , discretized in �����47���� rectangular elements.Each element is 2-km wide in the horizontal direction. From top tobottom, the mesh is composed of 30 rows of 2-km high elements,5 rows of 4-km high elements, and 5 rows of 8-km high elements.This stratification does not influence significantly the numerical re-sults for the wavelengths of interest, but improves significantly thecomputation time.
The top surface of the models is stress-free and the other bound-aries have free-slip conditions. The vertical velocity is 0 at thebottom of the model and the horizontal velocity is 0 on the left walland � ] _�����#%'�& ����( � on the right wall to provide the horizontalshortening rate of 9?� (C�>� ~ ( � ���%& 9?�47:9?� ( �dw x ( � .

14 MONTESI AND ZUBER: WRINKLE RIDGES ON MARS
0.01
0.1
1
10a) Strain rate εII/ε0
b) Stress σII (MPa)
100
km
100 km
c) Failure zone
0
100
200
300
400
500
10
20
30
40
50
0 100 200 300 400 500 600Horizontal distance (km)
Stra
in ra
te ε
II/ε 0
d)
1
10
100
1000
6 10 30 60 100 300 600Wavelength (km)
Spe
ctra
l pow
er
e)
Figure 14. a) strain rate field, b) stress field, c) failure zone (darker elements), d) surface strain rate, and e) powerspectrum of the surface strain rate of the model without crustal thickness or geotherm gradients (Fig. 13a) afterconvergence and localization of the solution. In a), b), and c), a horizontal shortening of 3% was imposed in onetime step after deformation field has converged to visualize the deformation field. The vertical arrows in d) indicateleft-dipping faults. Strain rate is scaled by IJ�� ] 9?��� � ~?( � .
The temperature, � , the pressure, � , and the strain rate, IJ , ofeach element are used to compute the stress required for ductilecreep, D�� , and its brittle strength, D+� . The weakest of D�� andD+� is retained to compute the apparent viscosity of the element,E ] '4 ¡+¢?D�� e D+��£�T��-IJ , which is used to compute the stress andvelocity fields in the model.
The strain rate is initially uniform throughout the model, but isthen recomputed from the velocity solution. The procedure is re-peated without deforming the model until self-consistent viscosityand strain rate fields are attained, producing the initial fault patternthat we discuss here. Convergence requires usually less than 200iterations. In order to visualize the deformation field, we deform
the grid producing the equivalent of 3% horizontal shortening inone time increment.
The ductile flow law isD�� ]�¤ IJ �dcm¥ }�¦�§��H¨yT?� e (6)
where ¤ , F , and �H¨ are constants determined from laboratory ex-periments and � the absolute temperature of an element. As before,we use the flow laws of dry olivine [Karato et al., 1986] in the mantleand diabase [Caristan, 1982] in the crust.
In the brittle regime, the rock strength follows Byerlee’s law offrictional sliding [Byerlee, 1978]. Following Neumann and Zuber[1995], the brittle rock strength decreases with the logarithm ofstrain rate to simulate the dynamic weakening required for local-

MONTESI AND ZUBER: WRINKLE RIDGES ON MARS 15
ization: D+� ] l{©�ª¬«���p4ld9a_.U® ¡ IJ T�IJ�� p e (7)
where © and « are experimentally-determined constants, IJ�� is areference strain rate and is a constant that controls the efficiencyof localization. The dependence on strain rate mimics the veloc-ity dependence of steady-state friction determined from laboratoryexperiments [Dieterich, 1979; Ruina, 1983]. The effective stressexponent in that regime is:9FKG¯] _ 9-_.U® ¡ IJ T�IJ�� ��_� (8)
For numerical reasons, localization requires �N1�%& 9 , whereas weexpect to match the ridge spacing for �Wq�%& ��� . Hence, we do notaddress the question of ridge spacing with the finite element modelbut only that of the selectivity of fault vergence. Fault spacing isbetter addressed by the instability analysis of the previous section.
5.2. ResultsIn the first model, there is no lateral variation of crustal thickness
or geotherm (Fig. 13a). The crustal thickness is 60 km, as in SolisPlanum (Fig. 1b). The temperature is 253 K at the surface, and in-creases with depth as }�~��?lon�p with a surface gradient of 9?�-�k& #%'�( �and an asymptotic temperature of 1600 K. The crust is brittle to 40km, and the mantle is brittle from 60 to 65 km (Fig. 13a and 12a).
Brittle failure, which is initially uniform (Fig. 13a), collapsesonto discrete bands of enhanced strain rate and reduced stress asthe model converges to a self-consistent solution (Fig. 14 a, b, c).The strain rate in the shear zones is about a factor of 10 higher thanthe strain rate of 9?�%(C� � ~;( � imposed on the model as a whole (Fig.14d). Between the bands, the strain rate is reduced to the point thatthe material is not undergoing failure (Fig. 14c). The BDT deepensby a few km beneath the shear zones due to the enhanced strain rate.Even deeper, in the ductile regime, the shear zones become diffuse.The power spectrum of the surface strain rate shows a pronouncedmaximum a wavelength of � ��� km (Fig. 14e), corresponding tothe spacing of localized shear zones, and a secondary maximumnear 200 km. That secondary maximum may correspond to thebuckling instability but is not well resolved in this model. As themodel is laterally invariant, the pattern of localized shear zonesis symmetric, with right-dipping and left-dipping faults of similarintensity (Fig. 14d).
In the second model, the crustal thickness varies from 60 to 54km over the 600 km of the model (Fig. 13b). As the weak lowercrust is replaced by strong upper mantle, the strength of the litho-sphere increases as the crustal thickness decreases (Fig. 12b). Theresulting fault pattern is asymmetric (Fig. 15), with the strain ratebeing higher on faults dipping toward the thick crust region (Fig.15d). The spectrum of the surface strain rate (Fig. 15e) shows a peakat the spacing of shear zones, around 70 km, and large amplitude atlong wavelength that reflects a developing regional slope (Fig. 15).The regional slope results from the lithosphere being weaker, andtherefore deforming faster, where the crust is thick. The preferredfaults dip toward the growing high-standing area.
In the third model, the crustal thickness is 60 km throughout themodel, but the surface geotherm decreases from 10 to !%& !-�k& #%'�( �over the 600 km-wide model (Fig. 13c). The deeper BDT where thegeotherm is low results in stronger lithosphere (Fig. 12c). As in thesecond model, the fault pattern is asymmetric, with the faults thatdip toward the weak area being favored (Fig. 16). The spectrum ofthe surface strain rate (Fig. 16e) peaks at �52�� km wavelength. Itshigh amplitude at long wavelengths reflects the developing slope
that, as in the second model, results from the lithosphere beingweaker on one side of the model. The preferred faults dip towardthe growing high-standing area.
5.3. Applications
Gradients in crustal thickness and surface geotherm are both suc-cessful at producing an asymmetric pattern of faulting. The favoredfaults dip toward the weaker part of the lithosphere, being eitherof thicker crust or of higher geotherm. Shortening and thickeningare concentrated in the weakest part of the model, resulting in pro-gressive tilting of the surface, which may be part of the regionalslope observed in Lunae and Solis Plana. This would be consis-tent with the observation that faults dip preferentially toward thehigh-standing areas [Golombek et al., 2001].
In Solis and Lunae Plana, lateral variations of geotherm similarto that considered in the third model may be linked to the Tharsisrise, if the volcano-tectonic province is due to mantle plumes. SolisPlanum is best described as a local minimum of crustal thickness.Around ��2�0 � E, �/� � N, where the systematic fault vergence is themost obvious, the crustal thickness increases towards the north-west, towards the high-elevation areas [Zuber, 2001, Fig. 1b]. Thegradient of crustal thickness is comparable to that used above.
Our models, which include only strain-rate weakening, do noteliminate completely the faults conjugate to the dominant vergence.Using either strain weakening, or isotropic weakening may forcethe least developed shear zones to be abandoned. Within our mod-els, the asymmetry of faulting is enhanced if the crustal thicknessor geotherm gradients are higher than shown here. However, thiscomes at the price of concentrating deformation to a region just afew tens of km wide where the lithosphere is weakest. Awaiting im-provements of the modeling technique, we conclude that vergenceselectivity is possible for realistic lateral gradients of the crustalthickness or of the geotherm, although it remains to be determinedwhether this consistent vergence selectivity can occur over an en-tire ridged plain. It should be noted that recent studies found thatboth ridges dipping towards high-elevation areas and ridges dippingaway from it are found in Solis and Lunae Plana, although the setdipping towards the high-elevation area is dominant in some areas[Okubo and Schultz, 2002; Tate et al., 2002]. Our model can ex-plain this observation even better than the original proposition thatall the faults dip towards the high-elevation areas [Golombek et al.,2001]. Time-dependent deformation in these models also reducesthe selectivity of a given fault vergence, as a conjugate fault tendsto form if displacement over an individual fault is too large.
6. Discussion
6.1. Fault geometry underneath wrinkle ridges
The depth to which the faults underlying wrinkle ridges penetratehas been a major issue in Martian tectonics [Plescia and Golombek,1986; Watters, 1991; Golombek et al., 1991; Watters and Robinson,1997]. Deep faulting models were recently promoted by the recog-nition of elevation offsets in MOLA data [Golombek et al., 2001]and models of ridge morphology as folding driven by a deeperblind fault [Schultz, 2000]. Our models of ridge spacing, whichmake no a priori assumption about the depth of faulting, favor deepfaulting as well. The comparison of ridge spacing in two differentprovinces leads us to conclude that faulting penetrates to the shal-lowest brittle-ductile transition (BDT) of the Martian lithosphere.In Solis and Lunae Plana, where the crust is 50- to 60-km thick,the BDT is determined from the crustal rheology and is 30- to 50-km deep. In the northern lowlands, where the crust is no morethan 30-km thick, the BDT is controlled by the mantle rheology

16 MONTESI AND ZUBER: WRINKLE RIDGES ON MARS
a) Strain rate εII/ε0
b) Stress σII (MPa)
100
km
100 km
c)Failure zone
0.01
0.1
1
10
0
100
200
300
400
500
10
20
30
40
50
0 100 200 300 400 500 600Horizontal distance (km)
Stra
in ra
te ε
II/ε 0
d)
1
10
100
1000
6 10 30 60 100 300 600Wavelength (km)
Spe
ctra
l pow
er
e)
Figure 15. a) strain rate field, b) stress field, c) failure zone (darker elements), d) surface strain rate, and e) powerspectrum of the surface strain rate of the model with a crustal thickness gradient of 1 km per 100 km (Fig. 13b) afterconvergence and localization of the solution. In a), b), and c), a horizontal shortening of 3% was imposed in onetime step after deformation field has converged to visualize the deformation field. The vertical arrows in d) indicateleft-dipping faults. Strain rate is scaled by IJ�� ] 9?��� � ~?( � .
and is 60- to 100-km deep. The penetration depth depends on thegeotherm, which should be less than 9/0��k& #%'�( � in the lowlandsand more than 2��k& #%'�( � in the uplands to explain the systematicdifference of spacing of ridges in the northern lowlands comparedto Solis and Lunae Plana if the effective stress exponent is identicalin both regions. A similar penetration depth has been determinedfrom kinematic analysis of individual ridges in Lunae Planum [Tateet al., 2002].
The effective stress exponents that can explain the ridge spacingare between -15 to -25. These values may indicate that localizationis dictated by processes active during initial failure of rocks, suchas cohesion loss upon failure or non–associated elastic–plastic flow[Montesi and Zuber, 2002]. It is therefore unlikely that the faultunderlying the ridges existed before the horizontal shortening of
the lithosphere that is expressed by the ridges. This is in contrastwith another area where a localization instability appears to con-trol fault spacing, the Central Indian Ocean [Montesi and Zuber,2003a], or with the terrestrial examples of basement uplift [Rodgers,1987], which have been proposed as terrestrial analogue of deeply-rooted wrinkle ridges [Plescia and Golombek, 1986; Golombeket al., 2001]. Reactivation explains why the planform and orien-tation of terrestrial basement uplifts is more irregular than that ofMartian wrinkle ridges.
Impact craters influence wrinkle ridges on Mars. Some ridgeshave a curvilinear planform that probably reflects impact cratersburied within or underneath the volcanic plain unit [Plescia, 1991;Raitala and Kauhanen, 1992; Head et al., 2002] and, statistically,wrinkle ridges are located at a shorter distance from impact craters

MONTESI AND ZUBER: WRINKLE RIDGES ON MARS 17
a) Strain rate εII/ε0
b) Stress σII (MPa)
100
km
100 km
c)Failure zone
0.01
0.1
1
10
0
100
200
300
400
500
10
20
30
40
50
0 100 200 300 400 500 600Horizontal distance (km)
Stra
in ra
te ε
II/ε 0
d)
1
10
100
1000
6 10 30 60 100 300 600Wavelength (km)
Spe
ctra
l pow
er
e)
Figure 16. a) strain rate field, b) stress field, c) failure zone (darker elements), d) surface strain rate, and e) powerspectrum of the surface strain rate of the model with a geotherm gradient of �%& �a�k& #%'�( � per 100 km (Fig. 13a) afterconvergence and localization of the solution. In a), b), and c), a horizontal shortening of 3% was imposed in onetime step after deformation field has converged to visualize the deformation field. The vertical arrows in d) indicateleft-dipping faults. Strain rate is scaled by IJ�� ] 9?��� � ~?( � .
than if random [Allemand and Thomas, 1995]. Although the in-fluence of craters has been used to argue that ridges are only shal-lowly rooted [Allemand and Thomas, 1992, 1995; Mangold et al.,1998], we note that a deeply-rooted fault would be likely to usethe pre-existing heterogeneity constituted by an impact structure asit propagates near the surface. The influence of craters on ridgetrajectory does not exclude the ridges being deeply rooted.
6.2. Sediment and ridge interaction in the northern plains
The morphology of the Martian northern plains and outflowchannels at their margin has been reported to support the ideathat an ocean may have been present in the lowlands during theHesperian [Lucchita et al., 1986; Jons, 1990; Baker et al., 1991;
Scott et al., 1992; Parker et al., 1989, 1993; Moore et al., 1995;Head et al., 1999; Parker and Currey, 2001], contemporaneousto ridge formation. However, these observations have alternativeinterpretations and the proposed ocean is still controversial [Ma-lin and Edgett, 1999, 2001; Edgett and Malin, 2000; Baker, 2001;Jakosky and Phillips, 2001; McGill, 2001; Withers and Neumann,2001]. The presence of a Hesperian ocean may be further testedby studying the effects of sedimentation on the northern plains to-pography. The characteristic roughness of the Vastitas Borealisformation [Kreslavsky and Head, 2000] is consistent with ��9?��� mof sediments covering a unit resembling ridged plains such as Lu-nae Planum [Head et al., 2002; Kreslavsky and Head, 2002]. Thepower spectrum of northern lowland topography for wavelengths inexcess of 10 km is consistent with the expected result of sediment

18 MONTESI AND ZUBER: WRINKLE RIDGES ON MARS
transport [Aharonson et al., 2001]. However, these sediments arenot necessarily marine; Edgett and Malin [2000] report on possiblesediments in the northern plains using MOC images, but found noobvious submarine landform. It is worth noting that the landformsinterpreted in MOC images as evidence for sediments are also vis-ible in the southern hemisphere, in locations where no ocean wereproposed [Malin and Edgett, 2001]. The topographic roughnessof Amazonis Planitia, also in the lowlands but at the limit of theproposed ocean, is compatible with either aeolian or submarinedeposition [Aharonson et al., 1998].
The numerous ridges now recognized in the northern lowlands[Withers and Neumann, 2001; Thomson and Head, 2001; Headet al., 2002] lead to new ways to evaluate sedimentation in thatregion. Head et al. [2002] proposed that the spacing of ridges in thelowlands is a factor of two larger than in the ridged plains because ofa sedimentary cover. If the sediments bury completely the smallestridges, the average spacing of the exposed ridges increases [Headet al., 2002]. However, the ��9?��� m of sediments required to simu-late the roughness characteristics of the Vastitas Borealis formationexceeds the average and median ridge height in non-sedimentedplains such as Lunae Planum (Resp. 65 and 47 m [Head et al.,2002]). Most ridges should vanish under such a sediment cover. Toincrease the ridge spacing by a factor of two, half the ridges mustbe entirely buried. The level of flooding would then correspond tothe median of the distribution of ridge height in ridged plains, 47 m.In that case, flooding would reduce the maximum-likelihood valueof the ridge height distribution by the thickness of the sediments,As the maximum-likelihood value for Lunae Planum ridge heightsis also �v0�� m [Head et al., 2002], the height distribution of theexposed ridges in the lowlands should decay monotonically or havea small maximum likelihood value, if a sediment flooding modelwas correct. However, the histograms of exposed ridge height inthe lowlands are peaked around 45 to 50 m [Head et al., 2002],similar to the value in the non-sedimented ridged plain. We do notknow of a physical mechanism to explain why every other ridgewould display a lower amplitude, and therefore be more likely tobe buried, than the intervening one, and the bimodal distribution ofridge height expected in that case is not observed in the highlandridges. Hence, we conclude that majority of the lowland ridgesare still visible: burial of ridges does not explain the factor of twodifference in ridge spacing between lowlands and highlands.
Our model shows that the deeper BDT in the lowland than thehighlands, due to the thinner crust, can explain the larger ridge spac-ing in this region. However, the uncertainty in the rheology, heatflux, and strain rate at the time of ridge formation make it impossibleto ascertain that the difference in BDT is solely responsible for thelarge ridge spacing in the lowlands. The morphology of these ridgesindicates that they have been degraded and sedimented [Thomsonand Head, 2001; Head et al., 2002]. Sedimentation effects cancertainly modulate the observed ridge spacing, although we doubtthat sedimentation alone can explain the difference. Thomson andHead [2001] also showed that lowland ridges are longer than high-land ridges, which indicates, if the scaling relations between faultlength, displacement, and depth are verified at the scale of inter-est [Bonnet et al., 2001], that the faults underlying lowland ridgespenetrate more deeply than those under highland ridges. This isconsistent with our explanation of the ridge spacing using a deeperBDT.
We noted that if the northern lowlands are covered by an approx-imately 100-m thick sediment layer, the majority of the pre-existingridges may be completely buried. Instead, a large fraction of thepopulation is visible. Hence, the sediments may be draped over thepre-existing ridge-scale topography rather than flooding it. Drapedsediments could preserve the ridge topography while smoothingthe smallest length scales. Summit crenulations may be erased in
that process, explaining the difficulty in identifying the ridges invisible images. Crater remnants in the northern plains identified intopographic data [stealth craters, Head et al., 2002] are also moreconsistent with draping rather than flooding of the topography asthey are filled to a level that is systematically below the surroundingplains. Head et al. [2002] argue that the entire population of stealthcraters is visible in the present topography, with a residual craterdepth �s9?��� m, independent of crater diameter. Therefore, the dis-tribution of stealth crater depths indicates that sediment transporthas not been able to remove topographic signatures with amplitude��9?��� m, the characteristic depth of stealth craters, which is similarto ridge heights. It is therefore possible that most ridges are visiblein the current topography.
Sedimentation in the Earth’s ocean can be modeled as simul-taneous emplacement and downslope-diffusion of sediments overa pre-existing topography [Webb and Jordan, 1993, 2001a]. In-version of seafloor bathymetry indicates that the diffusivity of thesediments is ���%& �>,U�%& �/'�( � & � ~?( � for a length scale similar to theridge spacing [Webb and Jordan, 2001b]. Values of diffusivity atleast one order of magnitude smaller are required if the sedimentsare to be draped over the preexisting topography [Webb and Jor-dan, 2001a], as we infer is the case in the Martian lowlands. Asscaling by gravity, which is a factor of three smaller on Mars thanon the Earth, may not be enough to account for this difference, thismight indicate either that the putative ocean was short-lived, whichreduces the time during which sediment transport occurs, or that thetransporting medium was more viscous than water, as mud is. Botha mud ocean [Jons, 1990; Tanaka et al., 2001] and an episodic short-lived ocean [Baker et al., 1991; Baker, 2001; Kreslavsky and Head,
Figure 17. Estimates of Martian surface heat flux. Darkest box:our analysis of ridge spacing; Semi-transparent boxes: admittanceanalyses from McGovern et al. [2002]. Dashed boxes indicateanalyses of Hesperian plains. Lines: heat flux needed to balanceradiogenic heat production using the chemical models of Treimanet al. [1986] (solid line) and Laul et al. [1986] (dashes); predictionfrom lithosphere cooling (dash-dots). The bars above the graph in-dicate the time span of Martian epochs from Hartmann and Neukum[2001].

MONTESI AND ZUBER: WRINKLE RIDGES ON MARS 19
2002] have been proposed on the basis of surface morphology, butthe evidence is ambiguous.
6.3. Surface geotherm and heat budget of Mars
The thermal evolution of Mars has important implications forthe history of volcanism, volatile abundance, and climate [Weizmanet al., 2001; Jakosky and Phillips, 2001]. The results of thermalmodels, however, are variable. Some predict intensive melting inpresent-day Mars [Schubert et al., 1992; Reese et al., 1998], whileothers, appealing to an early episode of intense cooling [Nimmoand Stevenson, 2000; Choblet and Sotin, 2001; Zhong and Zuber,2001] or differentiation of heat-producing elements [Kiefer, 2001;Weizman et al., 2001], allow the volcanic activity to diminish overtime. This is supported by geological observations [Greeley andSpudis, 1981].
Constraints on the thermal history of a planet come from es-timates of the heat flux. Our modeling of ridge spacing im-plies a geotherm
M�� T M�� ] 9/�Q,[���k& #%'�( � in the ridged plainsand in the northern lowlands. We cannot resolve differencesbetween the two regions. Hence, the corresponding heat flux,°?± � ��2Q,19?��'k²³& '�( � may be taken as representative of Marsduring the time of ridge formation, the Hesperian (3.7 to 3.0 Gyrago, [Hartmann and Neukum, 2001]). Smaller heat flux would beimplied if the surface temperature or the strain rate were higher thanassumed here.
Heat flux can also be determined from modeling of elastic flex-ure, constrained by the topography and the gravity field of the planet[Turcotte and Schubert, 1982; Comer et al., 1985; Wieczorek andPhillips, 1998]. Admittance analyses of Mars Global Surveyor data[Zuber et al., 2000; McGovern et al., 2002; McKenzie et al., 2002;Nimmo, 2002] constrain the effective elastic thickness, �HG , for sev-eral regions of Mars, which can be converted in a heat flow estimate.The most ancient terrains show very little elastic support ( �HG��5� ,°?± P´R ), whereas the most recent terrains appear almost rigid( �KG�PµR , °?± P¶� ). The thickening of �KG with time is interpretedto reflect cooling of the planet.
The heat flux in the Hesperian-age Solis Planum is constrainedfrom admittance studies to be between 18 and ��0�'k²³& '�( � [Mc-Govern et al., 2002], slightly lower than our estimates for the sameregion (27 to ��2a'k²³& ' ( � ). However, the admittance analysis in-dicates significant sub-surface loading [McGovern et al., 2002], thetiming of which is not constrained. As our estimate of the Hesperianheat flux fits well into the time evolution of heat flux determinedby elastic flexure analysis we consider that the flexural and ridgespacing analyses are broadly consistent (Fig. 17).
The gradual decrease of heat flux with time, apparent in Fig. 17,has been attributed to cooling of the lithosphere [Zuber et al., 2000],as for the heat flux of the Earth’s ocean floor [Sclater et al., 1980].If the lithosphere, initially at a temperature �H· , is cooled such thatits surface temperature is fixed at � ± , its heat flux is °?± after a time¸ ]º¹ � l»�K·q_:� ± p �¼H½ ° �± (9)
with ½ ] !:7�9?� (C� ' � & x ( � the thermal diffusivity, and ¹ ]�%& 9�²³& '�( � & �k( � the thermal conductivity [Turcotte and Schu-bert, 1982]. If we take �H·�_�� ± ] 9?�����¯,³����� K, the heatflux °?± ] ��2O,�9?�k'k²³& '�( � , compatible with our observationsof wrinkle ridges, is attained after only 90 to 300 Myr. Numerousimpact basins, even in the northern lowlands [Frey et al., 2002], aswell as Rb-Sr and Lu-Hf isotope systematics in Martian meteorites[Borg et al., 1997; Blichert-Toft et al., 1999] attest that the litho-sphere formed in the earliest Martian history. The wrinkle ridges ofSolis Planum and the northern lowlands, of middle to late Hesperianage, formed �"9 Gyr after formation of the lithosphere. The heat
flux that we infer from the spacing of the ridges is higher than thesimple cooling model predicts.
As the heat flux compatible with geological and geophysical ob-servations exceeds that predicted by plate cooling, a contributionof radiogenic heating or secular cooling is required. We comparein Fig. 17 the heat flux deduced from flexure and ridge spacingmodels with the surface heat flux needed to transport the heat pro-duced in the Martian interior according to the composition modelsof Treiman et al. [1986] and Laul et al. [1986]. The heat fluxinferred from our analysis follows closely the decay trend of theradiogenic heat production. This implies that the heat evacuatedat the surface was roughly balanced by the heat produced in theinterior. Hence, the mantle temperature may have stayed roughlyconstant with time. If the mantle was cooled early on either by anepisode of plate tectonics [Nimmo and Stevenson, 2000] or degree-1 convection [Zhong and Zuber, 2001], it could have remained atrelatively low temperature, and volcanism would be progressivelyless important, due to the progressive thickening of the lithosphere.
7. ConclusionsWith the recent discovery of wrinkle ridges in the Martian north-
ern lowlands [Withers and Neumann, 2001; Head et al., 2002], thepenetration depth of ridge-related faulting as well as the structure ofthe lithosphere in the Hesperian can be constrained. The spacing oflowland ridges is a factor of two greater than in other ridged plains,which may reflect a two-fold increase in the depth of the brittle-ductile transition arising from variations of the crustal thickness. Inthe ridged plains, where the crust is relatively thick, the lower crustmay be ductile, in which case faulting is limited by the brittle-ductiletransition of crustal rocks. In the lowlands, the thinner crust maybe brittle throughout, so that faulting is limited by the brittle-ductiletransition of mantle rocks. If we use a combination of diabase[Caristan, 1982] and dry olivine [Karato et al., 1986] as controllingthe ductile strength of the crust and the mantle, respectively, thefactor of two increase is explained. The implied geotherm, tied tothe crustal thickness derived from MGS data [Zuber et al., 2000],is 9/��,¬���k& #%'�( � , without any resolvable difference between thetwo regions. Such a heat flux is comparable with the heat producedby radiogenic decay during the Hesperian.
Penetration of ridge-related strains to the brittle-ductile transi-tion categorized the wrinkle ridges as thick-skinned tectonics, likebasement uplifts on Earth [Rodgers, 1987]. The recent analogy ofwrinkle ridges with folds forced by a blind thrust [Schultz, 2000] isalso consistent with deep penetration of the faults underlying wrin-kle ridges. The ratio of ridge spacing to depth of faulting is �s9 , toosmall to be explained by buckling of the lithosphere. However, thelocalization instability developed in Montesi and Zuber [2003b] canexplain this ratio. The efficiency of localization, determined fromthe ridge spacing, points towards failure of intact rock, as opposedto reactivation of a pre-existing structure. This inference is how-ever subject to caution, because of the wide ranges of localizationefficiency associated with localization mechanisms [Montesi andZuber, 2002]. With a lithospheric structure similar to that impliedby the ridge spacing analysis, faults dipping toward high-standingareas can be preferentially activated by even minor lateral varia-tions of crustal thickness or geotherm. Such a pattern of faulting isindeed observed in Solis Planum [Golombek et al., 2001].
Acknowledgments. We thank Oded Aharonson for assistance with theMOLA data, and Matt Golombek, Jim Head, Misha Kreslavsky, ChrisOkubo, Rich Schultz, and Paul Withers for their comments on ridge tec-tonics and morphology. We benefited from reviews by Roger Phillips andan anonymous reviewer. This work was supported by NASA grant NAG5-4555.

20 MONTESI AND ZUBER: WRINKLE RIDGES ON MARS
ReferencesAharonson, O., M. T. Zuber, G. A. Neumann, and J. W. Head, III, Mars:
Northern hemisphere slopes and slope distribution, Geophys. Res. Lett.,25, 4413–4416, 1998.
Aharonson, O., M. T. Zuber, and D. H. Rothman, Statistics of Mars’s to-pography from the Mars Orbiter Laser Altimeter: Slopes, correlations,and physical models, J. Geophys. Res., 106, 23,723–23,735, 2001.
Allemand, P., and P. Thomas, Modele fragile des rides martiennes con-traint par la geometrie de surface, C. R. Acad. Sci. Paris, Serie II, 315,1397–1402, 1992.
Allemand, P., and P. Thomas, Localization of Martian ridges by impactcraters: Mechanical and chronological implications, J. Geophys. Res.,100, 3251–3262, 1995.
Baker, V. R., Water and the Martian landscape, Nature, 412, 228–236, 2001.Baker, V. R., R. G. Strom, V. C. Gulick, J. S. Kargel, G. Komatsu, and V. S.
Kale, Ancient oceans, ice sheets, and the hydrological cycle on Mars,Nature, 352, 589–594, 1991.
Bandfield, J. L., V. E. Hamilton, and P. R. Christensen, A global viewof Martian surface compositions from MGS-TES, Science, 287, 1626–1630, 2000.
Banerdt, W. B., R. J. Phillips, N. H. Sleep, and R. S. Saunders, Thick shelltectonics on one-plate planets: Applications to Mars, J. Geophys. Res.,87, 9723–9733, 1982.
Banerdt, W. B., M. P. Golombek, and K. L. Tanaka, Stress and tectonics onMars, in Mars, edited by H. H. Kieffer, B. M. Jakosky, C. W. Snyder,and M. S. Matthews, pp. 249–297, Univ. Arizona Press, Tucson, 1992.
Banerdt, W. B., G. E. McGill, and M. T. Zuber, Plain tectonics on Venus, inVenus II, edited by S. W. Bougher, D. M. Hunten, and R. J. Phillips, pp.901–930, Univ. Arizona Press, 1997.
Bathe, K.-J., Finite Elements Procedures, Prentice Hall, Englewood Cliffs,1996.
Behn, M. D., J. Lin, and M. T. Zuber, A continuum mechanics modelfor normal faulting using a strain-rate softening rheology: Implicationsfor thermal and rheological controls on continental and oceanic rifting,Earth Planet. Sci. Lett., 202, 725–740, 2002.
Bilotti, F., and J. Suppe, The global distribution of wrinkle riges of Venus,Icarus, 139, 137–139, 1999.
Biot, M. A., Theory of folding of stratified viscoelastic media and its impli-cations in tectonics and orogenesis, Geol. Soc. Am. Bull., 72, 1595–1620,1961.
Blichert-Toft, J., J. D. Gleason, P. Telouk, and F. Albarede, The Lu-Hfisotope geochemistry of shergottites and the evolution of the Martianmantle-crust system, Earth Planet. Sci. Lett., 173, 25–39, 1999.
Bonnet, E., O. Bour, N. E. Odling, P. Davy, I. Main, P. Cowie, andB. Berlowitz, Scaling of fracture systems in geological media, Rev. Geo-phys., 39, 347–383, 2001.
Borg, L. E., L. E. Nyquist, L. A. Taylor, H. Weismann, and C.-Y. Shih,Constraints on Martian differentiation processes from Rb-Sr and Sm-Ndisotopic analyses of the basaltic shergottite QUE 94201, Geochim. Cos-mochim. Acta, 61, 4915–4931, 1997.
Byerlee, J. D., Friction of rocks, Pure Appl. Geophys., 116, 615–626, 1978.Caristan, Y., The transition from high temperature creep to fracture in Mary-
land diabase, J. Geophys. Res., 87, 6781–6790, 1982.Carr, M. H., Retention of an atmosphere on early Mars, J. Geophys. Res.,
105, 21,897–21,909, 1999.Caruso, P., and R. A. Schultz, Slope stability and lithology for interior
layered deposits and wallrock in Valles Marineris, Lunar Planet. Sci.,XXXII, 1745 [Abst.], 2001.
Chapple, W. M., Mechanics of thin-skinned fold-and-thrust belts,Geol. Soc. Am. Bull., 89, 1189–1198, 1978.
Chen, Y., and W. J. Morgan, A nonlinear rheology model for mid-oceanridge axis topography, J. Geophys. Res., 95, 17,583–17,604, 1990.
Chicarro, A. F., P. H. Schultz, and P. Masson, Global and regional ridgepatterns on Mars, Icarus, 63, 153–174, 1985.
Choblet, G., and C. Sotin, Early transient cooling of Mars, Geo-phys. Res. Lett., 28, 3035–3038, 2001.
Comer, R. P., S. C. Solomon, and J. W. Head, III, Mars: Thickness of thelithosphere from the tectonic response to volcanic loads, Rev. Geophys.,21, 61–92, 1985.
Dieterich, J. H., Modeling of rock friction 1: Experimental results andconstitutive equations, J. Geophys. Res., 84, 2161–2168, 1979.
Edgett, K. S., and M. C. Malin, MGS MOC view of the Martian NorthernPlains, Lunar Planet. Sci., XXXI, 1054 [Abst.], 2000.
Evans, B., and D. L. Kohlstedt, Rheology of rocks, in Rock Physics andPhase Relations: A Handbook of Physical Constants, edited by T. J.Ahrens, vol. 3 of AGU Ref. Shelf , pp. 148–165, Am. Geophys. Union,Washington, 1995.
Fletcher, R. C., Wavelength selection in the folding of a single layer withpower-law rheology, Am. J. Sci., 274, 1029–1043, 1974.
Fletcher, R. C., and B. Hallet, Unstable extension of the lithosphere: Amechanical model for Basin-and-Range structure, J. Geophys. Res., 88,7457–7466, 1983.
Frey, H. V., J. H. Roark, K. M. Shockey, E. L. Frey, and S. E. H.Sakimoto, Ancient lowlands on Mars, Geophys. Res. Lett., 29,10.1029/2001GL013,832, 2002.
Gleason, G. C., and J. Tullis, A flow law for dislocation creep of quartzaggregates determined with the molten salt cell, Tectonophysics, 247,1–23, 1995.
Golombek, M. P., J. B. Plescia, and B. J. Franklin, Faulting and folding inthe formation of planetary wrinkle ridges, Proc. Lunar Planet. Sci. Conf.,21, 679–693, 1991.
Golombek, M. P., F. S. Anderson, and M. T. Zuber, Martian wrinkle ridge to-pography: Evidence for subsurface faults from MOLA, J. Geophys. Res.,106, 23,811–23,922, 2001.
Gordon, R. G., Diffuse oceanic plate boundaries: Strain rates, verticallyaveraged rheology, and comparisons with narrow plate boundaries andstable interiors, in The History and Dynamics of Global Plate Motions,edited by M. A. Richards, R. G. Gordon, and R. D. van der Hilst, vol. 121of Geophys. Mono., pp. 143–159, Am. Geophys. Union, Washington,2000.
Goudy, C. L., and T. K. P. Gregg, Insight to the evolution of wrinkle ridges inHesperia Planum, Mars, Lunar Planet. Sci. Conf., XXXIII, 1135, [Abst.],2002.
Greeley, R., and P. D. Spudis, Volcanism on Mars, Rev. Geophys. SpacePhys., 19, 13–41, 1981.
Hartmann, W. K., and G. Neukum, Cratering chronology and the evolutionof Mars, Space Sci. Rev., 96, 165–194, 2001.
Hauck, S. A., II, and R. J. Phillips, Thermal and crustal evolution of Mars,J. Geophys. Res., 107, 10.1029/2001JE001,801, 2002.
Head, J. W., III, H. Hiesinger, M. A. Ivanov, M. A. Kreslavsky, S. Pratt,and B. Thomson, Possible ancient oceans on Mars: Evidence from MarsOrbiter Laser Altimeter Data, Science, 286, 2134–2137, 1999.
Head, J. W., III, M. A. Kreslavsky, and S. Pratt, Northern lowlands of Mars:Evidence for widespread volcanic flooding and tectonic deformation inthe Hesperian period, J. Geophys. Res., 107, 10.1029/2000JE001,445,2002.
Hirth, G., and D. L. Kohlstedt, Water in the oceanic upper mantle: Implica-tions for rheology, melt extraction and the evolution of the lithosphere,Earth Planet. Sci. Lett., 144, 93–108, 1996.
Hynek, B., and R. J. Phillips, Evidence for extensive denudation of theMartian highlands, Geology, 29, 407–410, 2001.
Jakosky, B. M., and R. J. Phillips, Mars’ volatile and climate history, Nature,412, 237–244, 2001.
Johnson, A. M., and R. C. Fletcher, Folding of Viscous Layers, CambridgeUniv. Press, New York, 1994.
Jons, H. P., Das Relief des Mars: Versuch einer zusammenfassendenubersicht, Teil III, Geol. Runds., 79, 131–164, 1990.
Karato, S.-I., M. Paterson, and J. Fitz Gerald, Rheology of synthetic olivineaggregates: Influence of grain size and water, J. Geophys. Res., 91,8151–8176, 1986.
Kiefer, W. S., Mantle convection on Mars with enhanced crustal radioac-tivity: Implications for geophysical and geological observables, LunarPlanet. Sci., XXXII, 1949, [Abst.], 2001.
Korenaga, J., and P. B. Kelemen, Major element heterogeneity in the mantlesource of the north atlantic igneous province, Earth Planet. Sci. Lett.,184, 251–268, 2000.
Kreslavsky, M. A., and J. W. Head, III, Kilometer-scale roughness of Mars:Results from MOLA data analysis, J. Geophys. Res., 105, 15,051–15,059, 2000.
Kreslavsky, M. A., and J. W. Head, III, Fate of outflow channel effluents inthe northern lowlands of Mars: The Vastitas Borealis formation as a sub-limation residue from frozen ponded bodies of water, J. Geophys. Res.,107, 10.1029/2001JE001,831, 2002.
Laul, J. C., et al., Chemical systematics of the shergotty meteorite and thecomposition of its parent body (Mars), Geochim. Cosmochim. Acta, 50,909–926, 1986.
Longhi, J., E. Knittle, J. R. Holloway, and H. Wanke, The bulk composi-tion, mineralogy and internal structure of Mars, in Mars, edited by H. H.Kieffer, B. M. Jakosky, C. W. Snyder, and M. S. Matthews, pp. 184–208,Univ. Arizona Press, Tucson, 1992.
Lucchita, B. K., and J. L. Klockenbrink, Ridges and scarps in equatorialbelts of Mars, Moon Planets, 24, 415–429, 1981.
Lucchita, B. K., H. M. Ferguson, and C. Summers, Sedimentary deposits inthe Northern lowland plains, Mars, Proc. 17th Lunar Planet. Sci. Conf.,J. Geophys. Res., 91, E166–E174, 1986.

MONTESI AND ZUBER: WRINKLE RIDGES ON MARS 21
Malin, M. C., and K. S. Edgett, Oceans or seas in the Martian northernlowlands: High resolution imaging tests of proposed coastlines, Geo-phys. Res. Lett., 26, 3049–3052, 1999.
Malin, M. C., and K. S. Edgett, Mars Global Surveyor Mars Orbiter Cam-era: Interplanetary cruise through primary mission, J. Geophys. Res.,106, 23,429–23,570, 2001.
Mangold, N., P. Allemand, and P. G. Thomas, Wrinkle ridges of Mars:Structural analysis and evidence for shallow deformation by ice-richdecollements, Planet. Space Sci., 46, 345–356, 1998.
Mangold, N., P. Allemand, P. G. Thomas, and G. Vidal, Chronology ofcompressional deformation on Mars: Evidence for a single and globalorigin, Planet. Space Sci., 48, 1201–1211, 2000.
Martinod, J., and P. Davy, Periodic instabilities during compression or ex-tension of the lithosphere 2. Analogue experiments, J. Geophys. Res.,99, 12,057–12,069, 1994.
Maxwell, T. A., Orientation and origin of ridges in the Lunae Palus-Copratesregion of Mars, Proc. 13th Lunar Planet. Sci. Conf., J. Geophys. Res.,87, A97–A108, 1982.
McEwen, A. S., M. C. Malin, M. H. Carr, and W. K. Hartmann, Volumi-nous volcanism on early Mars revealed in Valles Marineris, Nature, 397,584–586, 1999.
McGill, G. E., The Utopia basin revisited: Regional slope and shorelinesfrom MOLA profiles, Geophys. Res. Lett., 28, 411–414, 2001.
McGovern, P. J., et al., Localized gravity/topography admittance correla-tion spectra on Mars: Implications for regional and global evolution,J. Geophys. Res., 107, 10.1029/2002JE001,854, 2002.
McKenzie, D., D. N. Barnett, and D.-N. Yuan, The relationship betweenMartian gravity and topography, Earth Planet. Sci. Lett., 195, 1–16,2002.
McSween, H. Y., Jr., What have we learned about Mars from SNC mete-orites, Meteoritics, 29, 757–779, 1994.
McSween, H. Y., Jr., et al., Chemical, multispectral, and textural constraintson the composition and origin of rocks at the Mars Pathfinder site,J. Geophys. Res., 104, 8679–8715, 1999.
Montesi, L. G. J., Localization instability and the origin of regularly-spacedfaults in planetary lithospheres, Ph.D., Massachusetts Institute of Tech-nology, 2002.
Montesi, L. G. J., and M. T. Zuber, A unified description of localiza-tion for application to large-scale tectonics, J. Geophys. Res., 107,10.1029/2001JB000,465, 2002.
Montesi, L. G. J., and M. T. Zuber, Spacing of faults at the scale of the litho-sphere and localization instability 2: Application to the Central IndianBasin, J. Geophys. Res., In press, 10.1029/2002JB001,924, 2003a.
Montesi, L. G. J., and M. T. Zuber, Spacing of faults at the scale of thelithosphere and localization instability 1: Theory, J. Geophys. Res., Inpress, 10.1029/2002JB001,923, 2003b.
Moore, J. M., G. D. Clow, W. L. Davis, V. C. Gulick, D. R. Janke, C. P.McKay, C. R. Stoker, and A. P. Zent, The circum-Chryse region as apossible example of a hydrologic cycle on Mars: Geologic observationsand theoretical evaluation, J. Geophys. Res., 100, 5433–5447, 1995.
Neumann, G. A., and M. T. Zuber, A continuum approach to the develope-ment of normal faults, in Proc. 25 ¾À¿ US. Symp. Rock. Mech., edited byJ. J. K. Daemen and R. A. Schultz, pp. 191–198, Balkema, Rotterdam,1995.
Nimmo, F., Admittance estimates of mean crustal thickness and den-sity at the Martian hemispheric dichotomy, J. Geophys. Res., 107,10.1029/2002JE001,488, 2002.
Nimmo, F., and D. J. Stevenson, Influence of early plate tectonics on thethermal evolution and magnetic field of Mars, J. Geophys. Res., 105,11,969–11,980, 2000.
Nimmo, F., and D. J. Stevenson, Estimates of Martian crustal thicknessfrom viscous relaxation of topography, J. Geophys. Res., 106, 5085–5097, 2001.
Nino, F., H. Philip, and J. Chery, The role of bed-parallel slip in the formationof blind thrust faults, J. Struct. Geol., 20, 503–516, 1998.
Noble, S. K., and C. M. Pieters, Type 2 terrain: Compositional constraintson the Martian lowlands, Lunar Planet. Sci., XXXII, 1230, [Abst.], 2001.
Norman, M. D., The composition and thickness of the Martian crust esti-mated from rare Earth elements and Neodynium isotopic compositionsof Martian meteorites, Meteoritics Planet. Sci., 34, 439–449, 1999.
Norman, M. D., Thickness and composition of the Martian crust revisited:Implications of an ultradepleted mantle with a Nd isotopic compositionlike that of QUE94201, Lunar Planet. Sci. Conf., XXXIII, 1175, [Abst.],2002.
Okubo, C. H., and R. A. Schultz, Elevation offsets across wrinkle ridges:Key to structural width, Lunar Planet. Sci., XXXII, 2086, [Abst.], 2001.
Okubo, C. H., and R. A. Schultz, Fault geometry below wrinkle ridges basedon slope asymmetry and implications for mechanical stratigraphy, LunarPlanet. Sci., XXXIII, 1708, [Abst.], 2002.
Parker, T. J., and C. R. Currey, Extraterrestrial coastal geomorphology,Geomorphology, 37, 303–328, 2001.
Parker, T. J., R. S. Saunders, and D. M. Schneeberger, Transitional morphol-ogy in West Deuteronilus Mensae, Mars: Implications for modificationof the lowland/upland boundary, Icarus, 82, 111–145, 1989.
Parker, T. J., D. S. Gorsline, R. S. Saunders, D. C. Pieri, and D. M. Schnee-berger, Coastal morphology of the Martian northern plains, J. Geo-phys. Res., 98, 11,061–11,078, 1993.
Peulvast, J.-P., D. Mege, J. Chiciak, F. Costard, and P. L. Masson, Mor-phology, evolution, and tectonics of Valles Marineris wallslopes (Mars),Geomorphology, 37, 329–352, 2001.
Plescia, J. B., Wrinkle ridges in Lunae Planum Mars: Implications forshortening and strain, Geophys. Res. Lett., 18, 913–916, 1991.
Plescia, J. B., and M. P. Golombek, Origin of planetary wrinkle ridges basedon the study of terrestrial analogs, Geol. Soc. Am. Bull., 97, 1289–1299,1986.
Raitala, J., Superposed ridges of the Hesperia Planum area on Mars, Earth,Moon and Planets, 40, 71–99, 1988.
Raitala, J., and K. Kauhanen, Ridge systems related to martian impactcraters, Earth, Moon and Planets, 58, 65–78, 1992.
Reese, C. C., V. S. Solomatov, and L.-N. Moresi, Heat transport efficiencyfor stagnant lid convection with dislocation viscosity: Application toMars and Venus, J. Geophys. Res., 103, 13,643–16,457, 1998.
Ricard, Y., and C. Froidevaux, Stretching instabilities and lithospheric boud-inage, J. Geophys. Res., 91, 8314–8324, 1986.
Rodgers, J., Chains of basement uplifts within cratons marginal to orogenicbelts, Am. J. Sci., 287, 661–692, 1987.
Ruina, A. L., Slip instability and state-variable friction laws, J. Geo-phys. Res., 88, 10,359–10,370, 1983.
Saunders, R. S., T. G. Bills, and L. Johansen, The ridged plains on Mars,Lunar Planet. Sci., XII, 924–925, [Abst.], 1981.
Schubert, G., S. C. Solomon, D. L. Turcotte, M. J. Drake, and N. H. Sleep,Origin and thermal evolution of Mars, in Mars, edited by H. H. Kief-fer, B. M. Jakosky, C. W. Snyder, and M. S. Matthews, pp. 147–183,Univ. Arizona Press, Tucson, 1992.
Schultz, R. A., Localization of bedding-plane slip and backthrust faultsabove blind thrust faults: Keys to wrinkle ridge structure, J. Geo-phys. Res., 105, 12,035–12,052, 2000.
Sclater, J. G., C. Jaupart, and D. Galson, The heat flow through oceanicand continental crust and the heat loss of the Earth, Rev. Geophys. SpacePhys., 18, 269–312, 1980.
Scott, D. H., M. G. Chapman, J. W. Rice, and J. M. Dohm, New evidence oflacustrine basins on Mars: Amazonis and Utopia Planitiae, Proc. LunarPlanet. Sci. Conf., 22, 53–62, 1992.
Senshu, H., K. Kuramoto, and T. Matsui, Thermal evolution of a growingMars, J. Geophys. Res., 107, 10.1029/2001JE001,819, 2002.
Shen, Y., S. C. Solomon, I. T. Bjarnason, and C. J. Wolfe, Seismic evidencefor a lower mantle origin of the Iceland mantle plume, Nature, 395,62–65, 1998.
Sleep, N. H., Martian plate tectonics, J. Geophys. Res., 99, 5639–5655,1994.
Smith, D. E., and M. T. Zuber, The crustal thickness of Mars: Accuracy andresolution, Lunar Planet. Sci., XXXIII, 1893, [Abst.], 2002.
Smith, D. E., et al., The global topography of Mars and implications forsurface evolution, Science, 284, 1495–1503, 1999.
Smith, D. E., et al., Mars Orbiter Laser Altimeter (MOLA): Experimentsummary after the year of global mapping of Mars, J. Geophys. Res.,106, 23,689–23,723, 2001.
Smith, R. B., Formation of folds, boudinage, and mullions in non-Newtonianmaterials, Geol. Soc. Am. Bull., 88, 312–320, 1977.
Smith, R. B., The folding of a strongly non-Newtonian layer, Am. J. Sci.,279, 272–287, 1979.
Sohl, F., and T. Spohn, The interior structure of Mars: Implications fromSNC meteorites, J. Geophys. Res., 102, 1613–1635, 1997.
Tanaka, K. L., W. B. Banerdt, J. S. Kargel, and N. Hoffman, Huge CO�-
charged debris-flow deposits and tectonics sagging in the northern plainsof Mars, Geology, 29, 427–430, 2001.
Tate, A., K. J. Mueller, and M. P. Golombek, Geometry and kinematicsof wrinkle ridges on Lunae and Solis Plana, Mars: Implications forfault/fold growth history, Lunar Planet. Sci., XXXIII, 1836, [Abst.],2002.
Thomson, B. J., and J. W. Head, III, Utopia Basin, Mars: Characterization oftopography and morphology and assessment of the origin and evolutionof basin internal structure, J. Geophys. Res., 106, 23,209–23,230, 2001.
Tracadas, P. W., and M. T. Zuber, What a global stress map of Venus reveals,Lunar Planet. Sci., XXXI, 1895, [Abst.], 1998.

22 MONTESI AND ZUBER: WRINKLE RIDGES ON MARS
Treiman, A. H., M. J. Drake, N.-J. Janssens, R. Wolf, and M. Enihara,Core formation in the Earth and shergottite parent body, Geochim. Cos-mochim. Acta, 50, 1061–1070, 1986.
Tsenn, M. C., and N. L. Carter, Upper limits of power law creep of rocks,Tectonophysics, 136, 1–26, 1987.
Turcotte, D. L., and G. Schubert, Geodynamics: Applications of ContinuumPhysics to Geological Problems, John Wiley and Sons, New York, 1982.
Watters, T. R., Wrinkle ridge assemblages on the terrestrial planets, J. Geo-phys. Res., 93, 10,236–10,254, 1988.
Watters, T. R., Origin of periodically spaced wrinkle ridges on the Tharsisplateau of Mars, J. Geophys. Res., 96, 15,599–15,616, 1991.
Watters, T. R., System of tectonic features common to Earth, Mars, andVenus, Geology, 20, 609–612, 1992.
Watters, T. R., Compressional tectonism on Mars, J. Geophys. Res., 98,17,049–17,060, 1993.
Watters, T. R., and T. A. Maxwell, Orientation, relative age, and extent ofthe Tharsis plateau ridge system, J. Geophys. Res., 91, 8113–8125, 1986.
Watters, T. R., and M. S. Robinson, Radar and photoclinometric studies ofwrinkle ridges on Mars, J. Geophys. Res., 102, 10,889–10,903, 1997.
Webb, H. F., and T. H. Jordan, Quantifying the distribution and transportof pelagic sediments on young abyssal hills, Geophys. Res. Lett., 20,2203–2206, 1993.
Webb, H. F., and T. H. Jordan, Pelagic sedimentation on rough seafloortopography 1. forward model, J. Geophys. Res., 106, 30,433–30,449,2001a.
Webb, H. F., and T. H. Jordan, Pelagic sedimentation on rough seafloortopography 2. inversion results from the North Atlantic Acoustic Rever-beration Corridor, J. Geophys. Res., 106, 30,451–30,473, 2001b.
Weizman, A., D. J. Stevenson, D. Prialnik, and M. Podolak, Modeling thevolcanism on Mars, Icarus, 150, 195–205, 2001.
Wieczorek, M. A., and R. J. Phillips, Potential anomalies on a sphere: Ap-plications to the thickness of the lunar crust, J. Geophys. Res., 103,1715–1724, 1998.
Wieczorek, M. A., and M. T. Zuber, The thickness of the Mars crust asinferred from geoid-to-topography ratios, Lunar Planet. Sci., XXXIII,1390, [Abst.], 2002.
Withers, P., and G. A. Neumann, Enigmatic northern plains of Mars, Nature,410, 652, 2001.
Wyatt, M. B., and H. Y. McSween, Jr., Spectral evidence for weatheredbasalt as an alternative to andesite in the northern lowlands of Mars,Nature, 417, 263–266, 2002.
Zhong, S., and M. T. Zuber, Degree-1 mantle convection and the crustaldichotomy on Mars, Earth Planet. Sci. Lett., 189, 75–84, 2001.
Zuber, M. T., Compression of oceanic lithosphere: An analysis of intraplatedeformation in the Central Indian Basin, J. Geophys. Res., 92, 4817–4825, 1987.
Zuber, M. T., Wrinkle ridges, reverse faulting, and the depth of penetrationof lithospheric strain in Lunae Planum, Mars, Icarus, 114, 80–92, 1995.
Zuber, M. T., The crust and mantle of Mars, Nature, 412, 220–227, 2001.Zuber, M. T., and L. L. Aist, The shallow structure of the Martian lithosphere
in the vicinity of the ridged plains, J. Geophys. Res., 95, 14,125–14,230,1990.
Zuber, M. T., and E. M. Parmentier, Finite amplitude folding of a continu-ously viscosity-stratified lithosphere, J. Geophys. Res., 101, 5489–5498,1996.
Zuber, M. T., et al., Internal structure and early thermal evolution of Marsfrom Mars Global Surveyor topography and gravity, Science, 287, 1788–1793, 2000.
Laurent G. J. Montesi, Department of Geology and Geophysics, WoodsHole Oceanographic Institution, MS#22, Woods Hole, MA 02543, [email protected].
Maria T. Zuber, Department of Earth, Atmospheric, and Planetary Sci-ences, Massachusetts Institute of Technology, Cambridge, MA 02139, [email protected].
(Received .)
Copyright © 2022 FDOKUMEN