Rheological consequences of the lithospheric thermal structure in the Fennoscandian Shield
14
Global and Planetary Change, 8 (1993) 113-126 113 Elsevier Science Publishers B.V., Amsterdam Rheological consequences of the lithospheric thermal structure in the Fennoscandian Shield M. Dragoni a, V. Pasquale b, M. Verdoya b and P. Chiozzi b a Dipart. di Fisica, Settore di Geofisica, Univ. di Bologna, 1-40127 Bologna, Italy b Dipart. di Scienze della Terra, Settore di Geofisica, Univ. di Genova, 1-16132 Genova, Italy (Received July 1, 1992; revised and accepted November 5, 1992) ABSTRACT Dragoni, M., Pasquale, V., Verdoya, M. and Chiozzi, P., 1993. Rheologicai consequences of the lithospheric thermal structure in the Fennoscandian Shield. Global Planet. Change, 8: 113-126. The surface heat-flow density of the Fennoscandian Shield, after removing the disturbances due to palaeoclimatlc changes, shows a remarkable contrast from the Archaean terrains to the Late Proterozoic provinces which derive from tectonic reactivation and reheating of older materials. This involves lateral variations in the rheological behaviour of the lithosphere. On the basis of seismic structural data and assumptions about the petrological composition and flow parameters of steady-state dislocation creep, strength profiles and lateral viscosity variations have been deduced for several sites. In the northern and northeastern parts of the shield, where the Moho temperature and mantle heat-flow density are typically cratonic, the rheological thickness of the lithosphere, given by the depth at which the strength is reduced to 1 MPa, ranges from 120 to 140 km. In the southwestern shield, where enhanced Moho temperatures and mantle heat-flow density occur, the rheological thickness is reduced to 60-80 km. The depth of the brittle-ductile transition in the upper crust, above which most earthquakes occur, varies on average from 30 km in the northeast to 18 km in the southwest. The limiting temperature of the brittle uppermost layer on average is 365 :t: 700C. The essentially aseismic behaviour of the mantle agrees with the subcrustai predominating ductile deformations predicted by the models. The average lithospheric strength falls within the range 70-200 MPa, typical of the older stable areas. The viscosity of the upper mantle, at a reference depth level of 60 km, ranges from 1021 to 1024 Pa s and increases with the geological age, being maximum beneath the Archaean nucleus. Introduction Continental heat-flow density values vary by large amounts in young areas in relation to the thermal perturbations associated with tectono- genic events. In Precambrian regions, the range of variation is smaller and it can be solely ac- counted for by known differences in the radio- genic contents of surface rocks (Sclater et al., 1980; Vitorello and Pollack, 1980). In these re- gions and in particular in the Archaean proto- shields, we can assume with reasonable approxi- mation that the steady-state heat conduction is the only heat transport mechanism in the crust and upper mantle. The surface heat-flow density is the sum of the mantle heat-flow and the heat generation produced by radioactive decay of the crustal rocks (Pasquale et al., 1989). In the provinces older than 800 Ma, the mean surface heat-flow density has values not higher than 50 mW/m 2. This value tends to be even lower than 40 mW/m 2 in the oldest areas which apparently underwent little thermal disturbance. The mantle heat-flow density is quite constant around 27 + 6 mW/m 2 yielding a value of about 0.6 ~W/m 3 for the mean heat production rate of the crust (Sclater et al., 1981). Studies on the surface heat-flow density field (Bailing, 1990), crustal thermal structure (Cermfik, 1982; Pasquale et al., 1990; Baumann and Ry- bach, 1991) and thermal lithospheric thickness (Pasquale et al., 1991) show that the Fennoscan- 0921-8181/93/$06.00 © 1993 - Elsevier Science Publishers B.V. All rights reserved
Transcript of Rheological consequences of the lithospheric thermal structure in the Fennoscandian Shield
Global and Planetary Change, 8 (1993) 113-126 113 Elsevier Science Publishers B.V., Amsterdam
Rheological consequences of the lithospheric thermal structure in the Fennoscandian Shield
M. Dragoni a, V. Pasquale b, M. Verdoya b and P. Chiozzi b
a Dipart. di Fisica, Settore di Geofisica, Univ. di Bologna, 1-40127 Bologna, Italy b Dipart. di Scienze della Terra, Settore di Geofisica, Univ. di Genova, 1-16132 Genova, Italy
(Received July 1, 1992; revised and accepted November 5, 1992)
ABSTRACT
Dragoni, M., Pasquale, V., Verdoya, M. and Chiozzi, P., 1993. Rheologicai consequences of the lithospheric thermal structure in the Fennoscandian Shield. Global Planet. Change, 8: 113-126.
The surface heat-flow density of the Fennoscandian Shield, after removing the disturbances due to palaeoclimatlc changes, shows a remarkable contrast from the Archaean terrains to the Late Proterozoic provinces which derive from tectonic reactivation and reheating of older materials. This involves lateral variations in the rheological behaviour of the lithosphere. On the basis of seismic structural data and assumptions about the petrological composition and flow parameters of steady-state dislocation creep, strength profiles and lateral viscosity variations have been deduced for several sites. In the northern and northeastern parts of the shield, where the Moho temperature and mantle heat-flow density are typically cratonic, the rheological thickness of the lithosphere, given by the depth at which the strength is reduced to 1 MPa, ranges from 120 to 140 km. In the southwestern shield, where enhanced Moho temperatures and mantle heat-flow density occur, the rheological thickness is reduced to 60-80 km. The depth of the brittle-ductile transition in the upper crust, above which most earthquakes occur, varies on average from 30 km in the northeast to 18 km in the southwest. The limiting temperature of the brittle uppermost layer on average is 365 :t: 700C. The essentially aseismic behaviour of the mantle agrees with the subcrustai predominating ductile deformations predicted by the models. The average lithospheric strength falls within the range 70-200 MPa, typical of the older stable areas. The viscosity of the upper mantle, at a reference depth level of 60 km, ranges from 1021 to 1024 Pa s and increases with the geological age, being maximum beneath the Archaean nucleus.
Introduction
Continental heat-flow density values vary by large amounts in young areas in relation to the thermal perturbations associated with tectono- genic events. In Precambrian regions, the range of variation is smaller and it can be solely ac- counted for by known differences in the radio- genic contents of surface rocks (Sclater et al., 1980; Vitorello and Pollack, 1980). In these re- gions and in particular in the Archaean proto- shields, we can assume with reasonable approxi- mation that the steady-state heat conduction is the only heat transport mechanism in the crust and upper mantle. The surface heat-flow density is the sum of the mantle heat-flow and the heat
generation produced by radioactive decay of the crustal rocks (Pasquale et al., 1989). In the provinces older than 800 Ma, the mean surface heat-flow density has values not higher than 50 m W / m 2. This value tends to be even lower than 40 m W / m 2 in the oldest areas which apparently underwent little thermal disturbance. The mantle heat-flow density is quite constant around 27 + 6 m W / m 2 yielding a value of about 0.6 ~ W / m 3 for the mean heat production rate of the crust (Sclater et al., 1981).
Studies on the surface heat-flow density field (Bailing, 1990), crustal thermal structure (Cermfik, 1982; Pasquale et al., 1990; Baumann and Ry- bach, 1991) and thermal lithospheric thickness (Pasquale et al., 1991) show that the Fennoscan-
0921-8181/93/$06.00 © 1993 - Elsevier Science Publishers B.V. All rights reserved
114 M. DRAGONI ET AI..
d ian (or Balt ic) Shie ld is a reg ion of thick, cold,
c ra ton ic l i thosphere . Changes in a b u n d a n c e of
rad ioac t ive isotopes, p roduc ing most of the in ter -
nal hea t of the crust and consequen t h igher hea t
p roduc t ion ra te in the pas t imply tha t l i t hosphe re
has been coo led and th i ckened with t ime, unti l
r each ing its p r e sen t s t ructure . However , the ther-
mal reg ime of the P ro te rozo ic provinces of the
shield r a the r differs f rom the o l d e r n o r t h e r n part .
The surface hea t - f low densi ty, co r r ec t ed for the d i s tu rbances due to long t e rm cl imatic changes
and local g round wa te r migra t ions , is charac te r i s -
t ically low, a round 40 m W / m 2 only in the nor th-
ern areas , marked ly increas ing to the south and
southwest unti l it a t ta ins values g rea t e r than 65
m W / m 2. The re fo re , s t rong la te ra l var ia t ions are
expec ted for the t e m p e r a t u r e g r ad i en t in the crust
as well as for the man t l e heat- f low densi ty, which ranges f rom 20 m W / m 2 to the nor th to more
than 40 m W / m 2 to the south. R e m a r k a b l e var ia-
t ions have b e e n also found for the th ickness of
the t he rma l l i thosphere , de f ined by the homolo-
gous t e m p e r a t u r e for a pe r ido t i t i c u p p e r mant le .
L i thospher ic th ickness is found to exceed 200 km
in the Bothn ian G u l f - n o r t h e r n F in l a nd and par t
of the Kola pen insu la and dec reases unt i l it at-
ta ins a va lue lower than 100 km unde r sou thern Sweden (Pasquale et aL. 199t).
These f ea tu re s con t ras t with the gene ra l ther-
mal charac ter i s t ics of the P recambr i an regions.
The obse rved la te ra l var ia t ions of the the rmal
s t ruc ture involve re levant rheologica l conse-
quences , on which this p a p e r is focused. In o r d e r
to ca lcula te l i thospher ic s t reng th and viscosity of
65°N
55*
0 °
i
4 0 ° E
I I ~ I I
/
o;; ® ..... , , - j
0 8 - - ~ / , / ! : /
/
y ~
T EUROPEAN ~LATFORM
o
65
o
55
I
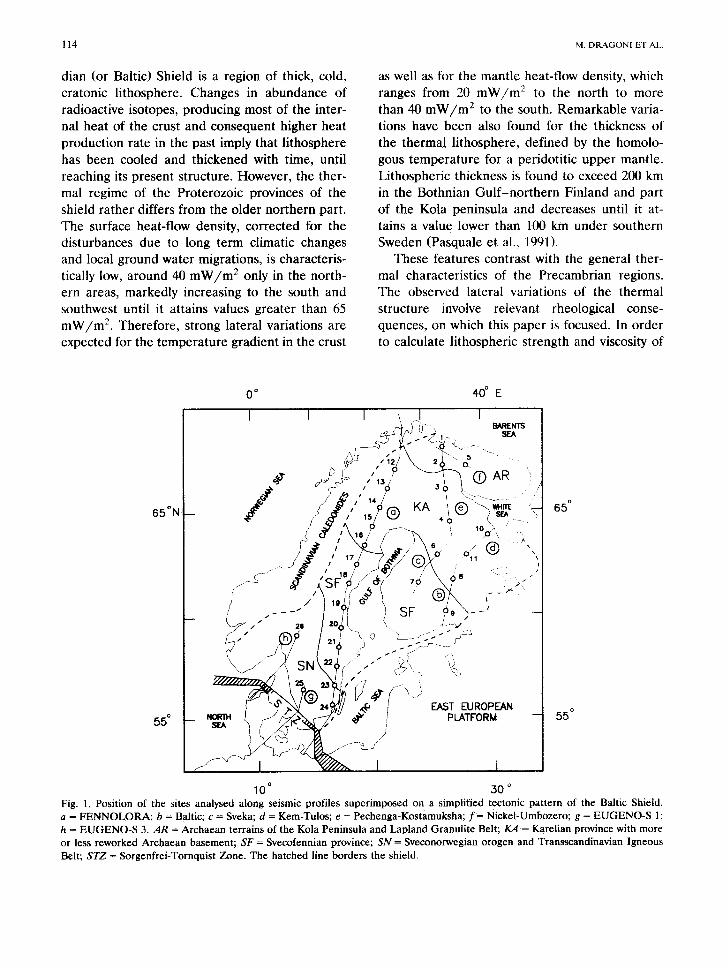
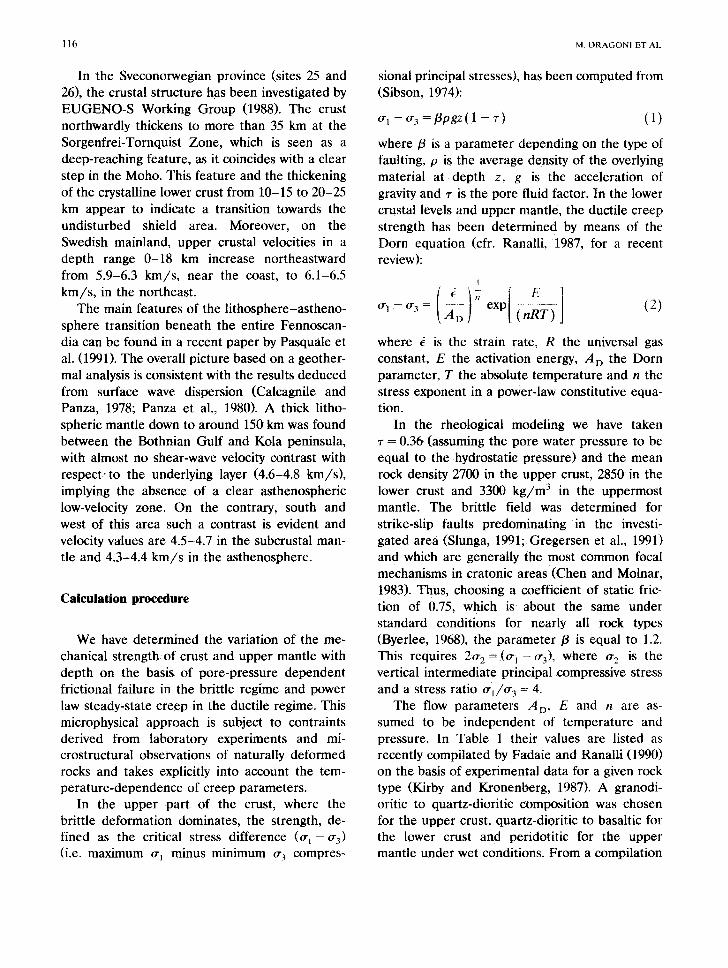
1 0 ° 3 0 ° Fig. 1. Position of the sites analysed along seismic profiles superimposed on a simplified tectonic pattern of the Baltic Shield. a = FENNOLORA; b = Baltic; c = Sveka; d = Kem-Tulos; e = Pechenga-Kostamuksha; f = Nickel-Umbozero; g = EUGENO-S 1; h = EUGENO-S 3. AR = Archaean terrains of the Kola Peninsula and Lapland Granulite Belt;/CA = Karelian province with more or less reworked Archaean basement; SF = Svecofennian province; S N = Sveconorwegian orogen and Transseandinavian Igneous Belt; S T Z = Sorgenfrei-Tornquist Zone. The hatched line borders the shield.
RHEOLOGICAL CONSEQUENCES OF L1THOSPHERIC THERMAL STRUCTURE IN FENNOSCANDIAN SHIELD 115
the mantle in numerous sites of the shield, as- sumptions on the deformation laws, values of parameters, crustal and mantle composition are necessary. The results are compared with other kinds of geophysical evidences, such as the distri- bution of focal depths of earthquakes and the observations of ground deformations due to post- glacial uplift. Although such an approach can give order-of-magnitude estimates, the results can supply a physical insight on the deformation mechanisms and geodynamic problems.
Structural constraints
The Fennoscandian Shield is part of the Fen- nosarmatian palaeocontinent. Consisting of par- tially reworked Archaean terrains in the north- east and progressively younger units to the west and southwest, the geological evidences suggest that the shield attained its present size and struc- ture over a period of about 2300 Ma, but there- after (about the least 800 Ma), was tectonically quiescent. Slightly upwarping, it rises from the Palaeozoic sediments of the East European Plat- form in the southeast and is flanked by the low- angle overthrust nappes of the Caledonian oro- gen to northwest. Its northern boundary is not well-defined laying somewhere in the Barents Sea, whereas to the south it is delimited by the Sor- genfrei-Tornquist Zone (the Scanian-Danish part of the Tomquist-Teisseyre Tectonic Zone), which is defined as a Mesozoic-Early Cenozoic feature (EUGENO-S Working Group, 1988; Gafil et al., 1989; Guggisberg et al., 1991).
Several seismic refraction profiles, analysed in order to have information on the crustal structure beneath 26 sites scattered on the entire investi- gated area, are shown in Fig. 1. The Nickel- Umbozero and Pechenga-Kostamuksha seismic profiles (sites 1-5), in the Kola peninsula and northern Finland, affect both the Karelian province, having Late Archaean-Early Protero- zoic age and the terrains forming the oldest core of the shield (Abzel et al., 1989). The upper c.rust beneath these areas has a well defined thickness of 15 km and its lower boundary is marked by a rapid increase of P-wave velocity from 6.3 to 6.6 km/s. Crustal thickness varies from about 35 to
45 km with a regional deepening of the Moho from northeast to southwest (Glaznev et al., 1989).
In central and southern Finland, along the Sveka and Baltic profiles (sites 6-9), which lay astride of the Svecofennian and Archaean provinces, the layering and the seismic crustal structure are fairly typical of the entire shield, but the thicknesses and depths of the layers vary (Grad and Luosto, 1987; Luosto, 1991). The structure of the upper crust is complicated by a great granite intrusion having high P-wave veloc- ity (6.5 km/s), within 10-15 km of depth. There- fore, it is not easy to define the thickness of the upper crust because of this intrusive body and of a second high-velocity interface at about 20 km. It has been found that the crustal thickness has a maximum of about 50-60 km in central Finland, then it southerly decreases to less than 45 km. The Moho discontinuity is clearly marked by a sudden change in P-wave velocity from 7.2 to 8.0-8.1 km/s. The crustal structure in the east- ern part of the Karelian province resulting from the Kem-Tulos profile (sites 10 and 11) remark- ably differs (Litvinenko et al., 1987). The average velocities in the crust are rather low because of the presence of thick low-velocity layers and the depth of the Moho is only 40 km (Luosto, 1991).
The structural features of the Scandinavian crust mainly derive from the interpretation of the results along the FENNOLORA seismic refrac- tion profile (sites 12-24), which crosses the Sve- cofennian and Karelian provinces (Clowes et al., 1987; Guggisberg and Berthelsen, 1987; Guggis- berg et al., 1991). The upper crust, generally quite homogeneous, contains several low-velocity zones with limited lateral extent. Its thickness averages 20 km and velocity increases with depth from about 6.0 to 6.4 km/s. However, in detail there are considerable lateral variations, in par- ticular in the uppermost 5-10 km. The lower crust is characterized by a gradual velocity in- crease with depth from 6.5-6.8 to 6.9-7.3 km/s next to the base of the crust. Discounting the anomalously thick crustal areas in southern and central Sweden, the crustal thickness increases from about 35-38 km in southern Sweden to more than 42 km in central Sweden and further to 44-47 km under northern Sweden.
1 1 6 M. D R A G O N I E T AI_
In the Sveconorwegian province (sites 25 and 26), the crustal structure has been investigated by EUGENO-S Working Group (1988). The crust northwardly thickens to more than 35 km at the Sorgenfrei-Tornquist Zone, which is seen as a deep-reaching feature, as it coincides with a clear step in the Moho. This feature and the thickening of the crystalline lower crust from 10-15 to 20-25 km appear to indicate a transition towards the undisturbed shield area. Moreover, on the Swedish mainland, upper crustal velocities in a depth range 0-18 km increase northeastward from 5.9-6.3 km/s , near the coast, to 6.1-6.5 km/s , in the northeast.
The main features of the l i thosphere-astheno- sphere transition beneath the entire Fennoscan- dia can be found in a recent paper by Pasquale et al. (1991). The overall picture based on a geother- mal analysis is consistent with the results deduced from surface wave dispersion (Calcagnile and Panza, 1978; Panza et al., 1980). A thick litho- spheric mantle down to around 150 km was found between the Bothnian Gulf and Kola peninsula, with almost no shear-wave velocity contrast with respect, to the underlying layer (4.6-4.8 km/s) , implying the absence of a clear asthenospheric low-velocity zone. On the contrary, south and west of this area such a contrast is evident and velocity values are 4.5-4.7 in the subcrustal man- tle and 4.3-4.4 k m / s in the asthenosphere.
Calculation procedure
We have determined the variation of the me- chanical strength of crust and upper mantle with depth on the basis of pore-pressure dependent frictional failure in the brittle regime and power law steady-state creep in the ductile regime. This microphysical approach is subject to contraints derived from laboratory experiments and mi- crostructural observations of naturally deformed rocks and takes explicitly into account the tem- perature-dependence of creep parameters.
In the upper part of the crust, where the brittle deformation dominates, the strength, de- fined as the critical stress difference (0-1- 0-3) (i.e. maximum 0-~ minus minimum 0-3 compres-
sional principal stresses), has been computed from (Sibson, 1974):
0-1 - 0-3 = f l p g z ( 1 - ~') (1)
where/3 is a parameter depending on the type of faulting, p is the average density of the overlying material at depth z, g is the acceleration of gravity and ~- is the pore fluid factor. In the lower crustal levels and upper mantle, the ductile creep strength has been determined by means of the Dorn equation (cfr. Ranalli, 1987, for a recent review):
1
where i is the strain rate, R the universal gas constant, E the activation energy, A D the Dorn parameter, T the absolute temperature and n the stress exponent in a power-law constitutive equa- tion.
In the rheological modeling we have taken r = 0,36 (assuming the pore water pressure to be equal to the hydrostatic pressure) and the mean rock density 2701) in the upper crust, 2850 in the lower crust and 3300 k g / m 3 in the uppermost mantle. The brittle field was determined for strike-slip faults predominating in the investi- gated area (Slunga, 1991; Gregersen et al., 1991) and which are generally the most common focal mechanisms in cratonic areas (Chen and Molnar, 1983). Thus, choosing a coefficient of static fric- tion of 0.75, which is about the same under standard conditions for nearly all rock types (Byerlee, 1968), the parameter /3 is equal to 1.2. This requires 20- 2 = ( 0 - i - 0-3)' where 0-2 is the vertical intermediate principal compressive stress and a stress ratio 0-1/0-3 = 4.
The flow parameters AD, E and n are as- sumed to be independent of temperature and pressure. In Table 1 their values are listed as recently compilated by Fadaie and Ranalli (1990) on the basis of experimental data for a given rock type (Kirby and Kronenberg, 1987). A granodi- oritic to quartz-dioritic composition was chosen for the upper crust, quartz-dioritic to basaltic for the lower crust and peridotitic for the upper mantle under wet conditions. From a compilation
RHEOLOGICAL CONSEQUENCES OF LITHOSPHERIC THERMAL STRUCTURE IN FENNOSCANDIAN SHIELD 117
TABLE 1
Values of the flow parameters used in the calculation of the strength profiles
Layer Stress Activation Dorn parameter exponent energy AD(MPa -n s -1)
n E (kJ/mol)
Upper crust 2.4 219 1.3 × 10 -3 Lower crust 3.3 268 3.2 X 10 -3
Upper mantle 4.0 471 2.0 × 10³
of strain rate values obtained by different meth- ods, Carter and Tsenn (1987) recognizing that wide variations occur suggested to adopt repre- sentative values of average strain rate which for a cratonic l i thosphere is of the order of 10-t5 s-1. All the strength profiles are built assuming this strain rate as uniform for the whole lithosphere.
We de te rmined the average l i thospheric strength defined as:
1 L z f 0 (0" 1 - - 0 " 3 ) d z (3) ITL=
where L is the rheological thickness of the litho- sphere given by the depth at which the strength is reduced to 1 MPa, a reasonable value for a convective process in the upper mantle and below which no further discontinuities in strength occur
(Ranalli, 1987; Sato, 1991). Assuming the upper mantle to have uniform composition, the viscosity at some depth z is given by:
1 1]) r / ( z ) = r / . exp T(z) T~ (4)
where ~/a and T a are viscosity and tempera ture at the base of the lithosphere, respectively.
The t empe ra tu r e -dep th distribution was esti- mated on the basis of a stationary thermal regime by using the one-dimensional heat conduction equation:
dk{dT) 2 dZT + = - A ( z ) (5)
dT ~ dz k dz 2
where k is the thermal conductivity and A is the heat generation. The boundary conditions are the mean annual temperature , equal to 5°C and the surface heat-flow density.
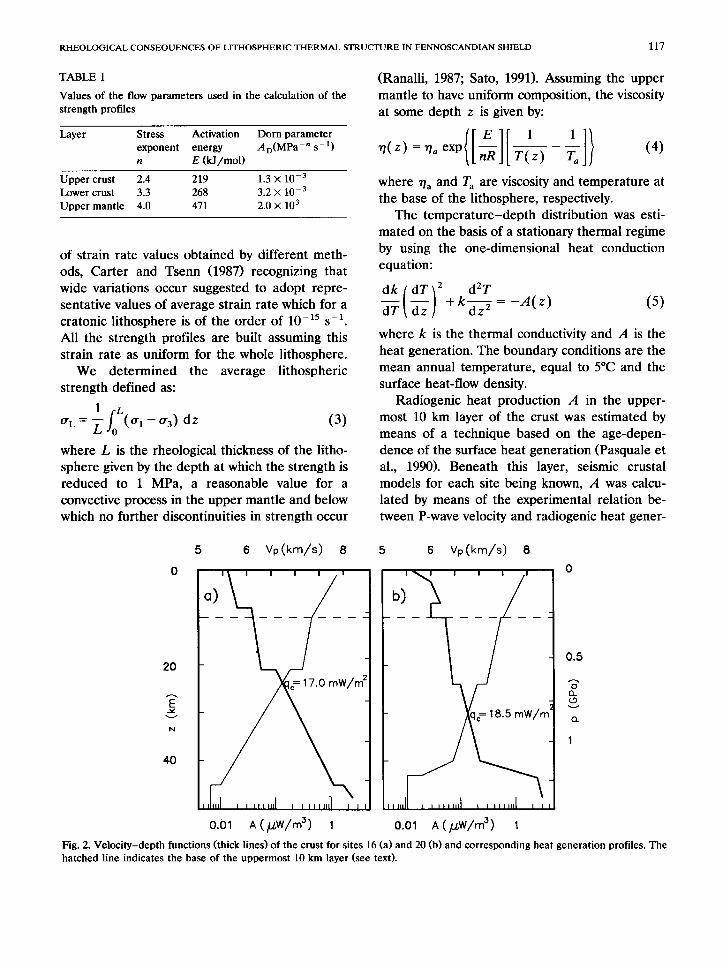
Radiogenic heat production A in the upper- most 10 km layer of the crust was estimated by means of a technique based on the age-depen- dence of the surface heat generation (Pasquale et al., 1990). Beneath this layer, seismic crustal models for each site being known, A was calcu- lated by means of the experimental relation be- tween P-wave velocity and radiogenic heat gener-
20
E v
40
5
0
6 Vp (km/s) 8
I I I I I I
o)
n~
I I I I I I I I I I I I l l l I I I I I I l l [ I I
0.01 A ( ~W/rn 3) I
5 6 Vp(km/s) 8
0.01 A (~W/m 3) I
0.5
(2. t..9 v O_
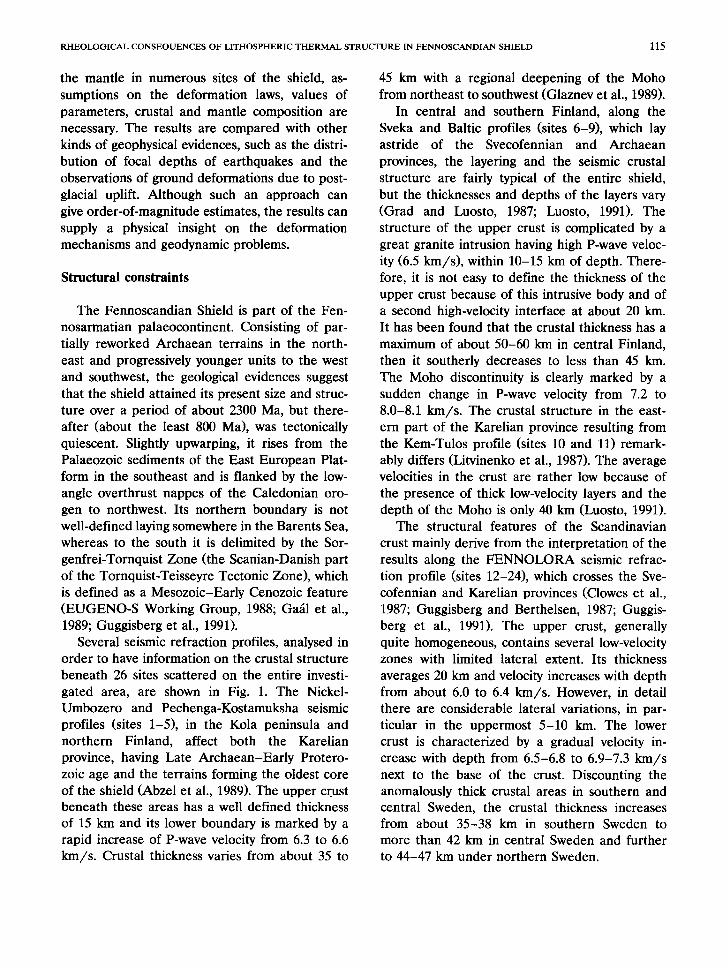
Fig. 2. Velocity-depth functions (thick lines) of the crust for sites 16 (a) and 20 (b) and corresponding heat generation profiles. The hatched line indicates the base of the uppermost 10 km layer (see text).
1 1 8 M. D R A G O N 1 ET At_.
ation rate (Rybach and Buntebarth, 1984). The temperature and pressure effect on seismic veloc- ity, corresponding to in situ conditions, composi- tion and geological age of the crust were taken into account. Within the uppermost layer and for each layer of specified seismic velocities, the heat production was assumed to decrease with depth according to an exponential model. Correspond- ingly, the heat generation function for the i-th layer takes the form (Lachenbruch, 1970):
A ( z ) = A i e x p i - z ) \ (', ,
( Z i + I --Zi) ci In[ Ai ] (6)
~Ai+l ] where z is the depth between the upper bound-
ary of the layer z i and the lower one zi+ ~ with heat generation A i and A~+ 1, respectively. In the uppermost mantle A was considered to be con- stant with depth and equal to 0.01 /xW/m 3 (Cermfik and Bodri, 1986). An example of seismic velocity profile converted into heat production is shown in Fig. 2.
The thermal conductivity variation with tem- perature and thus with depth was determined by using the following type of relation:
k0 k - (7)
(1 +br) where k 0 ( W / m K) is the thermal conductivity at surface conditions and b (1/°C) is an empirical constant. Values of k 0, corrected for pressure effect and b are 2.9 and 0.00060 for the upper crust, 2.1 and 0 for the lower crust, 2.6 and
® T (°C)
0 500 1000 0
\
150
.~ 50 E
2~
N
10o
LogO" (MPa) 0 2 4 i i ~ l i
, /
/ qo=40 mW/m 2
_-. 50 E
® T (°C)
0 500 10oo 0
I \ 150~
Log {7 (MPa) 0 2 4 i i - ~ . 4 , r i
/ / /
/ /
/' /
/ /
/ qo= 45 mW/m 2
0
20 v
40
Vp(km/s)
6 7 8 L L L ~ f f ,
L i i i i I ~
Vp(km/s )
6 7 8 0
~ 2o N
4o ~ \
i ~ i i i
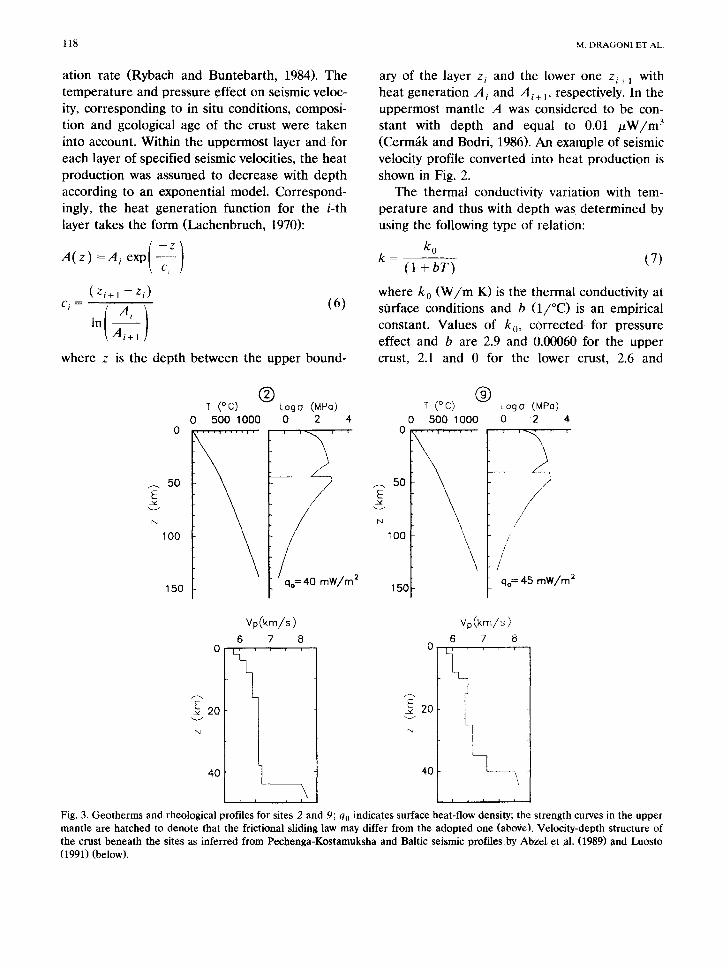
Fig. 3. Geotherms and rheological profiles for sites 2 and 9; q0 indicates surface heat-flow density; the strength curves in the upper mantle are hatched to denote that the frictional sliding law may differ from the adopted one (above). Velocity-depth structure of the crust beneath the sites as inferred from Pecbenga-Kostamuksha and Baltic seismic profiles by Abzel et al. (1989) and Luosto (1991) (below).
R H E O L O G I C A L CONSEQUENCES OF LITHOSPHERIC T H E R M A L S T R U C T U R E IN FENNOSCANDIAN SHIELD 119
@ @ @ T (oc) Log o(MPo) T (°C) Log o'(MPo) T (°C) Log ~(UPo)
0 500 1000 0 2 0 500 1000 0 2 0 500 1000 0 2
,00 / 1 0 0 ' qo = ,50 mW/m 2 qo65mW/rn 2
@ @ @ ® @ @ @ @ @ @ @ @ @ o I I , ,J I . . . J . . I I I I I I I I
. . . . : . , , , ; , > h 2 / / / z . . . . . , , , ' H , , . . . . . . . . , , / / ,
0 600 1200 km 1800
FENNOLORA- PROFILE
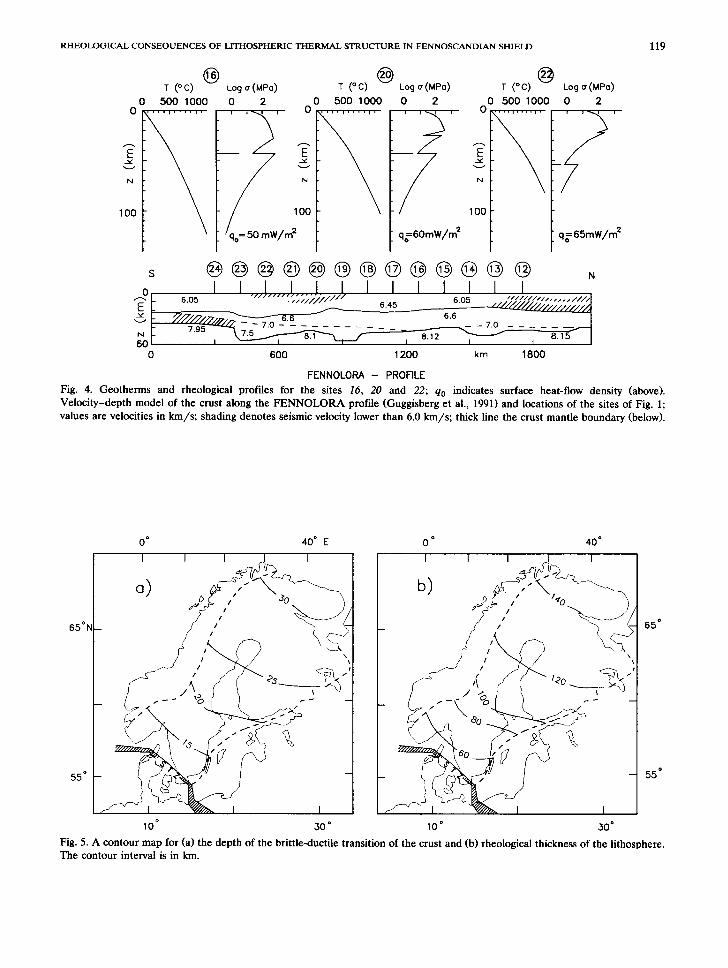
Fig. 4. Geotherms and rheological profiles for the sites 16, 20 and 22; qo indicates surface heat-flow density (above). Velocity-depth model of the crust along the FENNOLORA profile (Guggisberg et al., 1991) and locations of the sites of Fig. 1; values are velocities in km/s; shading denotes seismic velocity lower than 6.0 km/s; thick line the crust mantle boundary (below).
0 ° 40* E
a) '
55° ~ ~ I --
10 ° 30 °
0 * 40*
I I I I I
- -
10 ° 30 °
6 5 °
55 °
Fig. 5. A contour map for (a) the depth of the brittle-ductile transition of the crust and (b) rheoiogical thickness of the lithosphere. The contour interval is in km.
12(1 M. D R A G O N I E T AI .
-0.00025 for the uppermost mantle, respectively (Pasquale, 1987). More details on the computa- tion procedure and limitations of the techniques adopted are found in Pasquale et al. (1990).
Results and discussion
By using the seismic structural data and the deformation laws above described we have calcu- lated the lithospheric strength for the selected 26 sites located in Fig. 1. Some representative tem- pera tu re -dep th and theological profiles are shown in Fig. 3. Site 2, belonging to the Pechenga-Kostamuksha profile, is typical of the entire northeastern sector of the shield having a heat-flow density of 40 m W / m 2. The thermal and structural features of southern Finland are repre- sented by site 9, along the Baltic seismic profile, with a heat-flow density of 45 m W / m 2. The southwestern part of the shield, with heat-flow density ranging from 50 to 65 m W / m 2, is de- picted in Fig. 4 by the sites 16, 20 and 22, laying along the F E N N O L O R A profile.
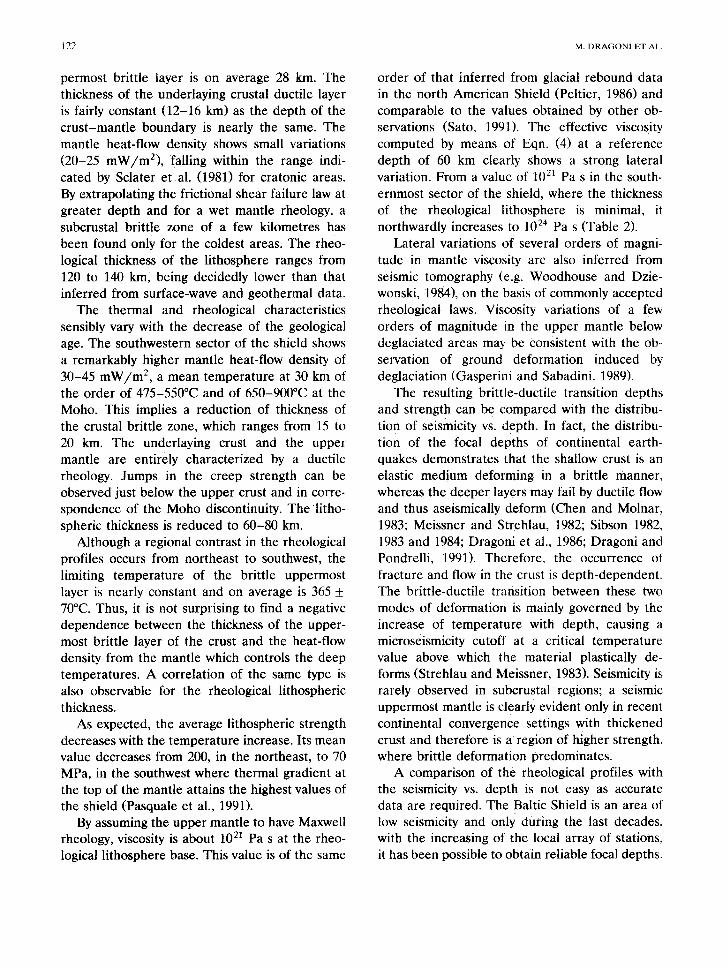
Figure 5 displays the contour maps of the thickness of the uppermost brittle layer and the theological thickness of the lithosphere. Table 2 shows the minima and maxima of the rheological lithospheric thickness, uppermost brittle layer thickness, average lithospheric strength and ef- fective viscosity at 60 km of depth for three sectors of the shield characterized by a well de- termined surface heat-flow~ density. The northern sector, which has a heat-flow density of 35-45 m W / m 2, corresponds to the Archaean-Early Proterozoic provinces mainly consisting of the
TABLE 2
Intervals of variation of surface heat-flow density (q0), rheo- logical lithospherie thickness (L), uppermost brittle layer thickness (D), average lithospheric strength (o- L) and mantle viscosity (',7) at 60 km of depth for three sectors of the Baltic Shield
Sector q0 L D o- L 7/ (mW/ (km) (km) (MPa) (Pa s) m 2 )
Northern 35-45 140-120 30-25 200-150 2.5-25.0 × 10 23
Central 45-55 120-100 25-20 150-110 1.0-25.0 × 10²² Southern 55-65 100- 60 20-15 110- 70 2.5-10.0 x 10²¹
Karelides and Kola protoshield. The main part of the Early Proterozoic Svecofennian province forms the central sector with 45-55 m W / m 2. The southern sector of Middle-Late Proterozoic age, affected by the Sveconorwegian orogen, Trans- scandinavian Igneous Belt and southernmost part of the Svecofennides, has the highest heat-flow density of 55-65 m W / m 2.
Since the structure and composition of the lithosphere have been of course schematized and assumptions about the parameters of Eqns. (1) and (2) have been made, it is important first to analyze the limits of the rheotogical models. The frictional sliding law is experimentally confirmed to the pressure corresponding to mid-crustal depths. Its extrapolation to greater depth and in particular to the mantle implies an uncertainty difficult to quantify (Ranalli and Murphy, 1987). In the ductile field, a remarkable change in com- position (from granodioritic to basaltic) involves a difference in the creep strength by less than one order of magnitude under crustal conditions. Al- though uncertainties on the creep parameters are typically around 10-20%, their combined effect depends on the sign of the individual variations. If an uncertainty of 10% in the activation energy and 20% in the stress exponent are assumed, it follows that the variation in the creep strength is not greater than one order of magnitude. An other effect is given by the strain rate; a deviation of one order of magnitude corresponds to a creep strength difference by a factor of two or three (Strehlau and Meissner, 1987; Fadaie and Ranalli, 1990).
Another critical parameter is the surface heat-flow density used to determine the tempera- tu re -dep th distribution. If an uncertainty of 10% in the surface heat-flow density is assumed, it follows that the error on the thickness of the uppermost brittle layer averages 15% and 25 km on the theological thickness of the lithosphere. Geotherms are less sensitive to variations in Moho depth and thermal conductivity values, as the heat production in the lower crust is very small and a thermal conductivity variation of 10% should give a negligible error.
The thermal properties measured along the world's deepest hole of the Kola peninsula allow
R H E O L O O I C A L C O N S E Q U E N C E S O F L I T H O S P H E R I C T H E R M A L S T R U C T U R E I N F E N N O S C A N D I A N S H I E L D 121
(~'W/r~ 3 ) o 1
0 I '
q ®
2 ~
I 4 ~
N
6 ~
• ~1
1 0 - -
( W/m K)
2 2 3
g , o I
u
Q_
c ~ o i
8 ,
T~C) 0 1 O0 200
50
1 5 0
cL
25O
i u i i i
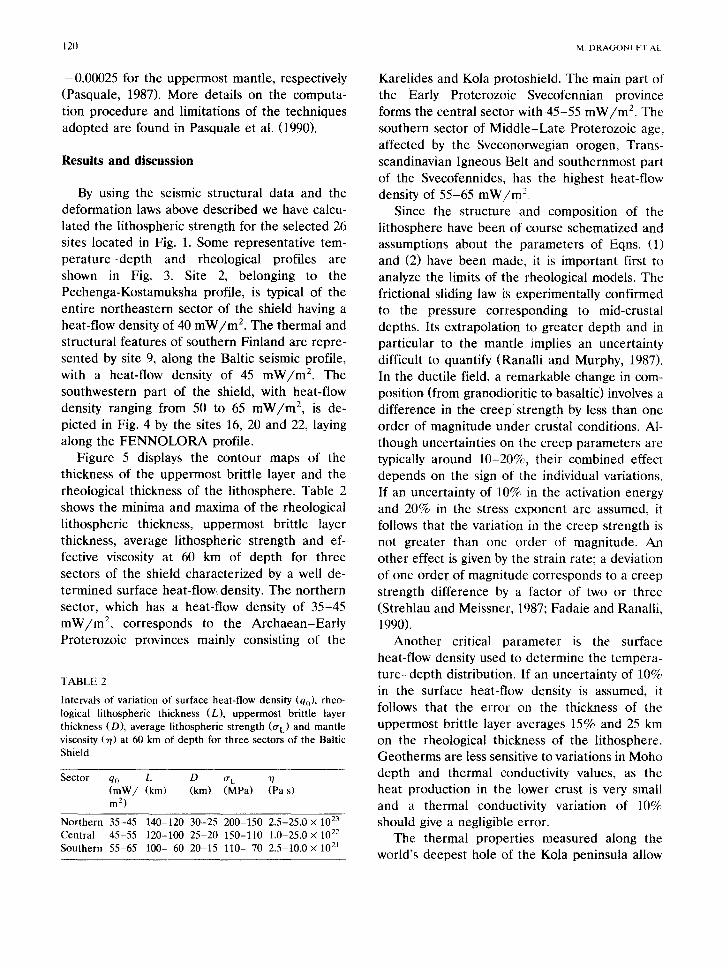
Fig. 6. Thermal model for the deep well at Kola Peninsula. A = vertical distribution of heat generat ion from Kremenetsky et al. (1989); B = thermal conductivity (the hatched line corre- sponds to est imated values) from Lubimova et ai. (1985); C = experimental tempera ture values (hatched line) from Lu- bimova et al. (1985) and geotherms calculated for surface heat-flow density of 35 and 45 m W / m z (this work). The inset shows the rock pressure derived from measurements of acous- tic-wave velocity through the rocks around the hole from Kozlovsky (1984); dotted line is the lithostatic pressure ex- pected in homogeneous materials.
to test the validity of the indirect method adopted to estimate the radiogenic contribution to the heat-flow density in the upper part of the crust. The average concentration of the radiogenic ele- ments, experimentally determined down to the hole bottom, gives a contribution to the heat-flow density of 9.7 m W / m 2 (Fig. 6). This value is very close to that predicted by means of the indirect approach here adopted (10.4 mW/m2). The dis- crepancy, about 7%, is of the same order of magnitude of the standard error on the heat generation determination from laboratory mea- surements (Rybach, 1988). The significative dif- ference consists in how the radioactive elements are vertically distributed, with depletion of the Proterozoic Pechenga sequence and enrichment
of the underlaying Archaean basement. However, this involves a difference of only about 10% per cent on the temperature at the depth of 11.5 km, as deducible from an one-dimensional thermal model.
In Fig. 6, besides the heat generation distribu- tion, temperature profile and thermal conductiv- ity are also presented together with two steady- state conductive geotherms calculated for surface heat-flow density values of 35 and 45 m W / m 2. In the uppermost 3000 m, the temperature distribu- tion superimposes the calculated geotherm of 35 mW/m 2, whereas from 7000 m down to the end of data--at 9000 m where the measured temper- ature is about 150°C--it gets closer to the geotherm of 45 m W / m 2. The geotherm which best matches the observed distribution should correspond to an intermediate heat-flow density of about 40 m W / m 2, as expected by the surface heat-flow density field. The observed tempera- ture values may be affected in the uppermost part by long term palaeoclimatic variations and by water migration as assessed in some boreholes in Finland (Kukkonen, 1989) and in the Danish basin (Bailing, 1990). The disproportionately low pressure, shown in the inset of same figure, from about 4000 to 9000 m marks a zone of fractured rocks strongly affected by mineralized waters, re- leased during kneading and baking of metamor- phism and confined by an overlying thick impervi- ous layer of anomalously high pressure (Kozlov- sky, 1984).
In spite of uncertainties on the parameters of the models and upon the possible role of trapped water or other fluids produced by metamorphic reactions, as observed in the Kola borehole, the rheological profiles mainly depend on the ther- mal field. In fact, the coldest geotherms, repre- sentative of the northern and northeastern parts of the investigated area, indicate a mean temper- ature of 360-400°C at 30 km of depth and 480- 545°C at the Moho typical of shields (Pasquale et al., 1991). This little lateral variation of the ther- mal field reflects on the thickness of the upper- most brittle layer, whose deviations from site to site are very small and lower than uncertainties given from variations of surface heat-flow density. For strike-slip faulting, the thickness of the up-
122 M. D R A G O N I E T AI
permost brittle layer is on average 28 km. The thickness of the underlaying crustal ductile layer is fairly constant (12-16 km) as the depth of the crust-mantle boundary is nearly the same. The mantle heat-flow density shows small variations (20-25 mW/m2) , falling within the range indi- cated by Sclater et al. (1981) for cratonic areas. By extrapolating the frictional shear failure law at greater depth and for a wet mantle rheology, a subcrustal brittle zone of a few kilometres has been found only for the coldest areas. The rheo- logical thickness of the lithosphere ranges from 120 to 140 km, being decidedly lower than that inferred from surface-wave and geothermal data.
The thermal and rheological characteristics sensibly vary with the decrease of the geological age. The southwestern sector of the shield shows a remarkably higher mantle heat-flow density of 30-45 m W / m z, a mean temperature at 30 km of the order of 475-550°C and of 650-900°C at the Moho. This implies a reduction of thickness of the crustal brittle zone, which ranges from 15 to 20 km. The underlaying crust and the upper mantle are entirely characterized by a ductile rheology. Jumps in the creep strength can be observed just below the upper crust and in corre- spondence of the Moho discontinuity. The litho- spheric thickness is reduced to 60-80 km.
Although a regional contrast in the rheological profiles occurs from northeast to southwest, the limiting temperature of the brittle uppermost layer is nearly constant and on average is 365 _+ 70°C. Thus, it is not surprising to find a negative dependence between the thickness of the upper- most brittle layer of the crust and the heat-flow density from the mantle which controls the deep temperatures. A correlation of the same type is also observable for the rheological lithospheric thickness.
As expected, the average lithospheric strength decreases with the temperature increase. Its mean value decreases from 200, in the northeast, to 70 MPa, in the southwest where thermal gradient at the top of the mantle attains the highest values of the shield (Pasquale et al., 1991).
By assuming the upper mantle to have Maxwell rheology, viscosity is about 10 21 Pa s at the rheo- logical lithosphere base. This value is of the same
order of that inferred from glacial rebound data in the north American Shield (Peltier, 1986) and comparable to the values obtained by other ob- servations (Sato, 1991). The effective viscosity computed by means of Eqn. (4) at a reference depth of 60 km clearly shows a strong lateral variation. From a value of 102~ Pa s in the south- ernmost sector of the shield, where the thickness of the rheological lithosphere is minimal, it northwardly increases to 10 ~4 Pa s (Table 2).
Lateral variations of several orders of magni- tude in mantle viscosity are also inferred from seismic tomography (e.g. Woodhouse and Dzie- wonski, 1984), on the basis of commonly accepted rheological laws. Viscosity variations of a few orders of magnitude in the upper mantle below deglaciated areas may be consistent with the ob- servation of ground deformation induced by deglaciation (Gasperini and Sabadini. 1989).
The resulting brittle-ductile transition depths and strength can be compared with the distribu- tion of seismicity vs. depth. In fact, the distribu- tion of the focal depths of continental earth- quakes demonstrates that the shallow crust is an elastic medium deforming in a brittle manner. whereas the deeper layers may fail by ductile flow and thus aseismically deform (Chen and Molnar. 1983; Meissner and Strehlau, 1982; Sibson 1982. 1983 and 1984: Dragoni et al., 1986; Dragoni and Pondrelli. 1991). Therefore. the occurrence of fracture and flow in the crust is depth-dependent. The brittle-ductile transition between these two modes of deformation is mainly governed by the increase of temperature with depth, causing a microseismicity cutoff at a critical temperature value above which the material plastically de- forms (Strehlau and Meissner, 1983). Seismicity is rarely observed in subcrustal regions; a seismic uppermost mantle is clearly evident only in recent continental convergence settings with thickened crust and therefore is a region of higher strength, where brittle deformation predominates.
A comparison of the rheological profiles with the seismicity vs. depth is not easy as accurate data are required. The Baltic Shield is an area of low seismicity and only during the last decades. with the increasing of the local array of stations, it has been possible to obtain reliable focal depths.
RHEOLOGICAL CONSEQUENCES OF LITHOSPHERIC THERMAL STRUCTURE IN FENNOSCANDIAN SHIELD 123
From a recent analysis by Ahjos and Uski (1992) it results that the seismic events, from 1965 to 1985 and with local magnitude equal to or greater than 2, are mostly located along the entire shield, excepting Kola Peninsula and southern Finland. The global distribution of the focal depths, hav- ing an uncertainty of at least 30%, shows that earthquakes occur in the first 10-20 km of the crust, the larger part at a depth lower than the brittle-ductile transition.
The 1976 earthquake of body-wave magnitude 4.5 in the Gulf of Finland, where the recent seismicity has been fairly scarce, seems to confirm this result. Its focal depth is 12 + 10 km and the fault mechanism inferred from surface wave recordings is mainly of strike-slip type, containing a significant part of reverse-slip faulting (Slunga, 1979). This compressional stress field is also ob- served in other areas of the shield, where focal mechanisms were determined for rather small earthquakes and mainly based on first motion of the seismic P-waves (Gregersen et al., 1991). The general stress pattern follows the one of northern Europe which, together with the seismic energy released pattern computed by Skordas et al. (1991), is an indication of a tectonic connection between the spreading of the north Atlantic ridge and intraplate seismicity of the shield (B~th, 1984).
The ductile behaviour of the deep crustal lev- els is confirmed by the very low seismicity. The sharp reduction of seismic events indicates a rela- tively low strength; the few earthquakes recorded can be ascribed to local instabilities in the ductile deformation (Hobbs et al., 1986). Moreover, in nature the brittle-ductile boundary is a zone of gradual change of strength, a few kilometres thick, deforming by both styles rather than a sharp transition. This latter consideration is also valid for the upper mantle which is essentially aseis- mic. In the sites characterized by the coldest geotherms, a very reduced brittle layer of a few kilometres may be found which may be deemed as a transition zone in which both types of defor- mation are likely to occur. However, the rare seismic events in the uppermost mantle may demonstrate that the strength is so low that the stress level necessary to generate earthquakes cannot accumulate.
Conclusions
The uniform strain rate assumption, the ex- trapolation of the friction failure law below 10 km and the necessity to use indirect methods to estimate the thermal parameters lead us to be- lieve that only the qualitative aspects of the strength profiles can be considered as valid. Therefore, the northeast-southwest variation of lithospheric thermal structure and, consequently, of the rheological one is a remarkable result which can be drawn from this study.
The northern and northeastern parts of the shield have low Moho temperature and mantle heat flow density, typical of cratonic areas. A distinctively different thermal regime was found for the southwestern sector, where strong lateral variations of the deep thermal regime occur. This involves that the depth of the brittle-ductile tran- sition in the uppermost crust is about 30 km in the northeast and halves southwest. However, the limiting temperature is about constant 365 + 70°C, corresponding to the maximum temperature of material in which crustal earthquakes occur be- neath platforms and shields (Chen and Molnar, 1983). In fact, the necessary temperature for rocks of the upper crust to start behaving in a ductile way is between 300 ° and 450°C (Sibson, 1984; Wilson, 1989). In this temperature range the main mineralogical component quartz and feldspars start to deform by grain boundary sliding or dislo- cation glide or show marginal recristallization (Ashby and Verrall, 1977; Tullis et al., 1982). The extrapolation of the frictional shear failure law to relevant pressure leads to a subcrustal brittle zone a few kilometres thick, in the northern part of the shield, becoming absent or negligible in the southern sector.
A negative dependence between the rheologi- cal thickness of the lithosphere and the heat-flow density is observed. To the north, where the mantle heat-flow density is typical of a shield, the thickness is of the order of 140 km, then reducing to about 60 k_rn next to the Sorgenfrei-Teisseyre Zone. The estimated average lithospheric strength falls within the range of values (70-200 MPa) characteristic of cratonic areas. These predicted values are comparable with those estimated for
124 M. D R A G O N 1 E T AL.
shield areas by Lynch and Morgan (1987) and by Fadaie and Ranalli (1990).
The viscosity corresponding to the depth at which a critical stress difference of 1 MPa is attained, i.e. at the rheological lithosphere base, has been estimated to be around 1021 Pa s. At the reference depth of 60 km, it ranges from 1021 to 1024 Pa s and increases with the geological age being maximum beneath the Kola nucleus. This well agrees with the values determined from ob- servations of seismic anaelasticity structure and other evidences (for a recent review, see Sato, 1991). Such lateral vatiations may be consistent with the observations of ground deformation fol- lowing deglaciation of the Fennoscandian ice sheet (Gasperini and Sabadini, 1989).
The most part of seismicity is confined within the crustal brittle layer and the essentially aseis- mic behaviour of the mantle is predicted by the estimated ductile deformation.
The present strong lateral variation of the rhe- ological structure is of course related to the geo- dynamic evolution of the shield which today is explained by the action of successive Proterozoic plate tectonic cycles with southwestwards episodic lateral crustal accretion. A vertical lithospheric thickening due to a gradual decrease with time of the geothermal gradient can have also taken place, changing the rheological properties of the upper mantle (Guggisberg and Berthelsen, 1987). The low shear-wave velocity in the astheno- spheric channel (Calcagnile, 1991) should confirm the younger regions of the shield have a thinner, hot lithosphere and a softer rheology of the up- per mantle.
References
Abzel, I.Y., Buyanov, A.F., lonkis, V.T., Sharov, N.V. and Sharova, V.P., 1989. Crustal structure of the Kola Penin- sula from inversion of deep seismic sounding data. In: R. Freeman, M. von Knorring, H. Korhonen, C. Lund and S. Mueller (Editors), The European Geotraverse, Part 5: The POLAR Profile. Tectonophysics, 162: 87-99.
Ahjos, T. and Uski, M., 1992. Earthquakes in northern Eu- rope in 1375-1989. In: R. Freeman and S. Mueller (Edi- tors), The European Geotraverse, Part 8. Tectonophysics, 207: t-23.
Ashby, M.F. and Verral, R.A., 1977. Micromechanisms of flow and fracture, and their relevance to the rheology of
the upper mantle. Philos. Trans. R. Soc. Lond., A288: 59-95.
Bailing, N., 1990. Heat flow and lithospheric temperature along the Northern Segment of the European Geotra- verse. In: R. Freeman and S. Mueller (Editors), Proc. 6th Workshop Eur. Geotraverse (EGT) Project: Data Compi- lations and Synoptic Interpretation, Einsiedlen, 1989. Eur. Sci. Found., Strasbourg, pp. 405-416.
B~th, M., 1984. Correlation between regional and global seis- mic activity. Tectonophysics, 104: 187-194.
Baumann, M. and Rybach, L., 1991. Temperature field mod- elling along the Northern Segment of the European Geo- traverse and the Danish Transition Zone. In: V. Cermfik and J.H. Sass (Editors), Forward and Inverse Techniques in Geothermal Modelling. Tectonophysics, 194: 387-407.
Byerlee, J.D., 1968. Brittle-ductile transition in rocks. J. Geo- phys. Res., 73: 4741-4750.
Calcagnile, G. and Panza, G.F., 1978. Crust and upper mantle structure under the Baltic shield and Barents sea from the dispersion of Rayleigh waves. Tectonophysics, 47: 59-71.
Calcagnile, G., 1991. Deep structure of Fennoscandia from fundamental and higher mode dispersion of Rayleigh waves. In: R. Freeman, M. Huch and S. Mueller (Editors), The European Geotraverse, Part 7. Teetonophysics, 195: 139-149.
Carter, N.L. and Tsenn, M.C., 1987. Flow properties of conti- nental lithosphere. Tectonophysics, 136: 27-63.
Cerm~k, V., 1982. Crustal temperature and mantle heat flow in Europe. In: M.L. Gupta (Editor), Terrestrial Heat Flow. Tectonophysics, 83: 123-142.
Cermhk, V. and Bodri, L., 1986. Two-dimensional tempera- ture modelling along five East-European geotraverses. J. Geodyn, 5: 133-163.
Chen, W.P. and Molnar, P., 1983. Focal depths of intraconti- nental and intraplate earthquakes and their implications for the thermal and mechanical properties of the litho- sphere. J. Geophys. Res., 88: 4183-4214.
Clowes, R.M., Gens-Lenartowicz, E., Demartin, M. and Saxov, S., 1987. Lithospheric structure in southern Sweden--re- sults from FENNOLORA. In: D.A. Galson and St. Mueller (Editors), The European Geotraverse, Part 3. Tectono- physics, 142: 1-14.
Dragoni, M. and Pondrelli, S.. 1991. Depth of brittle-ductile transition in a transcurrent boundary zone. Pageoph, 135: 447-461.
Dragoni, M., Bonafede, M. and Boschi, E., 1986. Shallow earthquakes in a viscoelastic shear zone with depth-depen- dent friction and rheology. Geophys. J.R. Astron. Soc., 86: 617-633.
EUGENO-S Working Group, 1988. Crustal structure and tectonic evolution of the transition between the Baltic Shield and the North German Caledonides (the EUGENO-S Project). In: R. Freeman, A. Berthelsen and S. Mueller (Editors), The European Geotraverse, Part 4. Tectonophysics, 150: 253-348.
Fadaie, K. and Ranalli, G., 1990: Rheology of the lithosphere in the East African Rift System. Geophys. J. Int., 102: 445-453.
Ga~it, G., Berthelsen, A., Gorbatschev, R., Kesola, R., Lehto- nen, M.I., Marker, M. and Raase, P., 1989. Structure and
RHEOLOGICAL CONSEQUENCES OF LITHOSPHER1C THERMAL STRUCTURE IN FENNOSCANDIAN SHIELD 125
composition of the Precambrian crust along the POLAR Profile in the northern Baltic Shield. In: R. Freeman, M. yon Knorring, H. Korhonen, C. Lund and S. Mueller (Editors), The European Geotraverse, Part 5: the POLAR Profile. Tectonophysics, 162: 1-25.
Gasperini, P. and Sabadini, R., 1989. Lateral heterogeneities in mantle viscosity and post-glacial rebound. Geophys. J. Int., 98: 413-428.
Glaznev, V.N., Raevsky, A.B. and Sharov, N.V., 1989. A model of the deep structure of the north eastern part of the Baltic Shield based on joint interpretation of seismic, gravity, magnetic and heat flow data. In: R. Freeman, M. von Knorring, H. Korhonen, C. Lund and S. Mueller (Editors), The European Geotraverse, Part 5: The PO- LAR Profile. Tectonophysics, 162: 151-163.
Grad, M. and Luosto, U., 1987. Seismic models of the crust of the Baltic shield along the Sveka profile in Finland. Ann. Geophys., 5B: 639-649.
Gregersen, S., Korhonen, H. and Husebye, E.S., 1991. Fennoscandian dynamics: Present-day earthquake activity. In: S. Bj6rnsson, S. Gregersen, E.S. Husebye, H. Korho- nen and C.-E. Lund (Editors), Imaging and Understanding the Lithosphere of Scandinavia and Iceland. Tectono- physics, 189: 333-344.
Guggisberg, B. and Berthelsen, A., 1987. A two-dimensional velocity-model for the lithosphere beneath the Baltic Shield and its possible tectonic significance. Terra Cog- nita, 7: 631-638.
Guggisberg, B., Kaminski, W. and Prodehl, C., 1991. Crustal structure of the Fennoscandian Shield: A traveltime inter- pretation of the long-range FENNOLORA seismic refrac- tion profile. In: R. Freeman, M. Huch and S. Mueller (Editors), The European Geotraverse, Part 7. Tectono- physics, 195: 105-137.
Hobbs, B.E., Ord, A. and Teyssier, C., 1986. Earthquakes in the ductile regime. Pure Appl. Geophys., 124: 309-336.
Kirby, S.H. and Kronenberg, A.K., 1987. Rheology of the lithosphere: selected topics. Rev. Geophys., 25: 1219-1244.
Kozlovsky, Y.A., 1984. The world's deepest well. Sci. Am., 251, 12: 98-104.
Kremenetsky, A.A., Milanovsky, S.Y. and Ovchinnikov, L.N., 1989. A heat generation model for continental crust based on deep drilling in the Baltic Shield. In: S. Uyeda, D. Chapman and H.J. Zwart (Editors), Thermal Aspects of Tectonics, Magmatism and Metamorphism. Tectono- physics, 159: 231-246.
Kukkonen, I.T., 1989. Terrestrial heat flow and radiogenic heat production in Finland, the central Baltic Shield. In: V. Cerm~ik, L. Rybach and E.R. Decker (Editors), Heat Flow and Lithosphere Structure. Tectonophysics, 164: 219-230.
Lachenbruch, A.H., 1970. Crustal temperature and heat pro- duction: implications of the linear heat-flow relation. J. Geophys. Res., 75: 3291-3300.
Litvinenko, I.V., Ankundinov, S.A., Sharov, N.V., Abzel, I.Y., Buyanov, A.F., Gavrilov, I.A., Goncharov, A.N., Dvoret- skaya, L.M., Ionkis, V.T., Kalnin, K.A., Matveeva, N.N., Platonenkova, L.N., Romanenko, N.G. and Suvorova, N.I., 1987. Deep seismic sounding in Kola peninsula and Kare-
lia. In: A.V. Chekunov (Editor), Lithosphere of Central and Eastern Europe. Geotraverse I, II, V. Naukova Dumka, Kiev, pp. 21-32 (in Russian).
Lubimova, E.A., Milanovsky, S.Y. and Smirnova, E.V., 1985. New data from heat flow studies at the Baltic Shield. In: The History of Development of Thermal Field in the Zones of Different Endogenic Regime in East European Countries. Nauka, Moscow, pp. 93-110 (in Russian).
Luosto, U., 1991. Crustal structures of Eastern Fennoscandia. In: S. Bj6rnsson, S. Gregersen, E.S. Husebye, H. Korho- nen and C.-E. Lund (Editors), Imaging and Understanding the Lithosphere of Scandinavia and Iceland. Tectono- physics, 189: 19-27.
Lynch, H.D. and Morgan, P., 1987. The tensile strength of the lithosphere and the location of extension. In: M.P. Cow- ard, J.F. Dewey and P.L. Hancock (Editors), Continental Extensional Tectonics. Geol. Soc. Lond. Spec. Publ., 28: 53-65.
Meissner, R. and Strehlau, J., 1982. Limits of stresses in continental crust and their relationship to depth-frequency distribution of shallow earthquakes. Tectonics, 1: 73-89.
Panza, G.F., Mueller, S. and Calcagnile, G., 1980. The gross features of the lithosphere-asthenosphere system in Eu- rope from seismic surfaces waves and body waves. Pure Appl. Geophys., 118: 1209-1213.
Pasquale, V., 1987. Possible thermal structure of the eastern part of the Central Alps. I1 Nuovo Cimento, 10C: 129-141.
Pasquale, V., Verdoya, M. and Cabella, C., 1989. Lithosphere thermal structure along the European Geotraverse--First results. Atti 6 °Conv. Grnppo Naz. Geofis. Terra Solida. CNR, Roma, pp. 653-664.
Pasquale, V., Cabella, C. and Verdoya, M., 1990. Deep tem- peratures and lithospheric thickness along the European Geotraverse. In: R. Freeman and S. Mueller (Editors), The European Geotraverse, Part 6. Tectonophysics, 176: 1-11.
Pasquale, V., Verdoya, M. and Chiozzi, P., 1991. Lithospheric thermal structure in the Baltic shield. Geophys. J. Int., 106: 611-620.
Peltier, W.R., 1986. Deglaciation-induced vertical motion of the north American continent and transient lower mantle rheoiogy. J. Geophys. Res., 91: 9099-9123.
Ranalli, G., 1987. Rheology of the Earth. Allen and Unwin, London, pp. 336.
Ranalli, G. and Murphy, D.C., 1987. Rheological stratification of the lithosphere. Tectonophysics, 133: 281-295.
Rybach, L., 1988. Determination of heat production rate. In: R. Haenel, L. Rybach and L. Stegena (Editors), Handbook of Terrestrial Heat-Flow Density Determination. Kluwer, Dordrecht, pp. 125-142.
Rybach, L. and Buntebarth, G., 1984. The variation of heat generation, density and seismic velocity with rock type in the continental lithosphere. In: V. Cerm~ik, L. Rybach and D.S. Chapman (Editors), Terrestrial Heat Flow Studies and the Structure of the Lithosphere. Tectonophysics, 103: 335-344.
Sato, H., 1991. Viscosity of the upper mantle from laboratory creep and anelasticity measurements in peridotite at high pressure and temperature. Geophys. J. Int., 105: 587-599.
126 M. DRAGONI ET AI.
Sclater, J.G., Jaupart, C. and Galson, D., 1980. The heat flow through oceanic and continent crust and the heat loss of the earth. Rev. Geophys. Space Phys., 18: 269-311.
Sclater, J.G., Parsons, B. and Jaupart, C., 1981. Oceans and continents: similarities and differences in the mechanisms of heat loss. J. Geophys. Res., 86: 11,535-11,552.
Skordas, E., Meyer, K., Olsson, R. and Kulhanek, O., 1991. Causality between interplate (North Atlantic) and in- traplate (Fennoscandia) seismicities. Tectonophysics, 185: 295-307.
Sibson, R.H., 1974. Frictional constraints on thrust, wrench, and normal faults. Nature, 249: 542-544.
Sibson, R.H., 1982. Fault zone models, heat-flow, and the depth distribution of earthquakes in the continental crust of the United States. Bull. Seismol. Soc. Am., 72: 151-163.
Sibson, R.H., 1983. Continental fault structure and the shal- low earthquake source. J. Geol. Soc. Lond., 140: 741-767.
Sibson, R.H., 1984. Roughness at the base of the seismogenic zone: contributing factors. J. Geophys. Res., 89: 5791-5799.
Slunga, R.S., 1979. Source mechanism of a Baltic earthquake inferred from surface-wave recordings. Bull. Seismol. Soc. Am., 69: 1963-1964.
Slunga, R.S., 1991. The Baltic Shield earthquake. In: S. Bj/Jrnsson, S. Gregersen, E.S. Husebye, H. Korhonen and
C.-E. Lund (Editors), Imaging and Understanding the Lithosphere of Scandinavia and Iceland. Tectonophysics, 189: 323-331.
Strehlau, J. and Meissner, R., 1983. Earthquakes in continen- tal crust: temperature dependence of maximum focal depth (abstract). Terra Cognita, 3: 89.
Strehlau, J. and Meissner, R., 1987. Estimation of crustal viscosities and shear stresses from an extrapolation of experimental steady state flow data. In: K. Fuchs and C. Froidevaux (Editors), Composition, Structure and Dynam- ics of the Lithosphere-Asthenosphere System (Geodyn. Ser., 16). Am. Geophys. Union, Washington, DC, pp. 69-87.
Tullis, J., Snoke, A.W. and Todd, V.R., 1982. Significance and petrogenesis of mylonitic rocks. Geology, 10: 227-230.
Vitorello, I. and Pollack, H.N, 1980. On the variation of continental heat flow with age and the thermal evolution of continents. J. Geophys. Res., 85: 983-995.
Wilson, D.S., 1989. Deformation of the so-called Gorda plate. J. Geophys. Res., 94: 3065-3075.
Woodhouse, J.H. and Dziewonski, A.M., 1984. Mapping the upper mantle: three-dimensional modeling of Earth struc- ture by inversion of seismic wave forms. J. Geophys. Res., 89: 5953-5986.