
Cloning and functional characterization of a folate transporter from the nematode Caenorhabditis...
51
Cloning and functional characterization of a folate transporter from the nematode, Caenorhabditis elegans Krishnaswamy Balamurugan 1, 2 *, Balasubramaniem Ashokkumar 1, 2 *, Mustapha Moussaif 3 , Ji Ying Sze 3 and Hamid M. Said 1, 2 1 VA Medical Center, Long Beach, CA; 2 Departments of Medicine (Nephrology) and Physiology/Biophysics; 3 Department of Anatomy and Neurobiology, School of Medicine, University of California, Irvine, CA 92697 * Both authors contributed equally in this work. Running title: Nematode folate uptake system Address all correspondence to H. M. Said, VA Medical Center-151, Long Beach, CA 90822 Tel: (562) 826-5811; Fax: (562) 826-5675; Email: [email protected] Page 1 of 51 Articles in PresS. Am J Physiol Cell Physiol (May 2, 2007). doi:10.1152/ajpcell.00516.2006 Copyright © 2007 by the American Physiological Society.
-
Upload
independent -
Category
Documents
-
view
0 -
download
0
Transcript of Cloning and functional characterization of a folate transporter from the nematode Caenorhabditis...

Cloning and functional characterization of a folate transporter from
the nematode, Caenorhabditis elegans
Krishnaswamy Balamurugan1, 2*, Balasubramaniem Ashokkumar1, 2*, Mustapha
Moussaif3, Ji Ying Sze3 and Hamid M. Said1, 2
1VA Medical Center, Long Beach, CA; 2Departments of Medicine (Nephrology) and
Physiology/Biophysics; 3Department of Anatomy and Neurobiology, School of Medicine, University of
California, Irvine, CA 92697
* Both authors contributed equally in this work.
Running title: Nematode folate uptake system
Address all correspondence to H. M. Said, VA Medical Center-151, Long Beach, CA 90822
Tel: (562) 826-5811; Fax: (562) 826-5675; Email: [email protected]
Page 1 of 51 Articles in PresS. Am J Physiol Cell Physiol (May 2, 2007). doi:10.1152/ajpcell.00516.2006
Copyright © 2007 by the American Physiological Society.

2
ABSTRACT
Two putative orthologs to the human reduced folate carrier (hRFC) folt-1 and folt-2 that
share a 40% and 31% identity, respectively, with the hRFC sequence have been identified in the
C. elegans genome. Functional characterization of the open reading frame of the putative folt-1
and folt-2 showed the folt-1 to be a specific folate transporter. Transport of folate by folt-1
expressed in a heterologous expression system showed an acidic pH-dependence, saturability
(apparent Km of 1.23 ± 0.18 µM), similar degree of inhibition by reduced and substituted folate
derivatives, sensitivity to the anti-inflammatory drug sulfasalazine (apparent Ki of 0.13 mM), and
inhibition by the anion transport inhibitors, e.g., 4,4'-diisothio-cyanatostilbene-2,2'-disulphonic
acid (DIDS). Knocking down (silencing) or knocking out the folt-1 gene led to a significant
inhibition in folate uptake by intact living C. elegans. We also cloned the 5’-regulatory region of
the folt-1 gene, and confirmed promoter activity of the construct in vivo in living C. elegans.
Using the transcriptional fusion construct (i.e., folt-1::GFP), the expression pattern of the folt-1
in different tissues of living animal was found to be highest in the pharynx and intestine.
Furthermore, the folt-1::GFP expression was developmentally and adaptively regulated in vivo.
These studies demonstrate for the first time the existence of a specialized folate uptake system in
C. elegans that has similar characteristics to that of the folate uptake process of the human
intestine. Thus, C. elegans provides a genetically tractable model that can be used for integrative
aspects of the folate uptake process in the context of the whole animal level.
Key words: C. elegans, integrative transport physiology, folate transport, transport regulation
Page 2 of 51

3
INTRODUCTION
Folate, a member of the B-class of water-soluble vitamins, is essential for normal cellular
functions and development. The vitamin acts as a coenzyme (one-carbon carrier) in a series of
metabolic reactions including the synthesis of precursors of DNA and RNA and the metabolism
of several amino acids including homocysteine (3, 36). Deficiency of this essential micronutrient
leads to a variety of abnormalities ranging from megaloblastic anemia to growth retardation and
neurological disorders. Humans and other mammals (as well as other multi-cellular eukaryotes)
are devoid of de novo biosynthesis of folate and therefore meet their folate requirement from
exogenous sources (5). The reduced folate carrier (RFC) is a major folate uptake system in
mammalian cells. The molecular identity of the RFC system has been delineated by cloning (21,
23, 40). The human RFC (hRFC) encodes a 591- amino acid plasma membrane protein that has a
predicted 12 transmembrane (TM) spanning domains, a long intracellular loop between trans-
membrane domains 6 and 7, and a short amino terminal (27 residues) and a long carboxy
terminal (138 residues) with both residing in the cytoplasm (9, 30). The 5’ flanking regulatory
regions of the RFC genes of human and a number of other mammalian species have been
characterized (19, 37). Other studies have shown that folate uptake in the mammalian cells to be
regulated by a variety of extracellular and intracellular factors (2, 16, 18, 25-27, 33). Much of
our recent knowledge on the physiology and biology of the folate uptake process was derived
from reductionist cell and molecular approaches. Much less is currently known about the
different parameters of the folate uptake process at the whole animal level. Such knowledge is
difficult to obtain in complicated organisms like mammals. The nematode Caenorhabditis
elegans has been used as an animal model in which to delineate molecular mechanisms of
complicated functions. (31-32). This animal model has a host of unique features that includes
Page 3 of 51

4
simple anatomy (it has a total of 959 highly differentiated cells), transparency, defined genomic
and tractable genetics, ease of maintenance and growth, a defined life cycle, and a short life-span
(2 to 3 weeks). In addition, many human physiological functions appear to have analogs in this
animal model, and many human genes have orthologs in the genome of this nematode, i.e.,
28.4% of the worm genome has one or more human orthologs and also 83% of worm proteins
have domains with significant similarity to human genes (24, 34). Furthermore, this animal
model allows great flexibility in manipulating physiological events and in performing certain
experiments that are otherwise difficult to perform at the whole animal level in vivo in more
complicated organisms (e.g., quantitative imaging and promoter analysis, can both be performed
at the whole animal level (31-32). Using this animal model, we have undertaken a series of
investigations into the integrative aspects of the folate uptake process. In this report, we present
our findings on the cloning of a C. elegans folate uptake system, the folt-1, the functional
characterization both in vitro and in vivo, and the effect of folt-1 on development and the
prevailing substrate level on different parameters of the folate uptake process at the level of
whole animal. Our results showed for the first time the existence of a specialized folate uptake
system (folt-1) in this species. This system appears to be similar in many ways to the folate
uptake process that operates in the human intestine, is being more active at acidic compared to
alkaline buffer pHs, having similar affinity to reduced and substituted folate derivatives, is
sensitive to the effects of the anti-inflammatory agent sulfasalazine, is inhibited by the anion
transport inhibitors DIDS and SITS, and has a similar apparent Km. In addition, the folt-1 system
was found to be expressed in different tissues of the nematode and appears to be
developmentally and adaptively regulated.
Page 4 of 51

5
MATERIALS AND METHODS
[3H]-Folic acid (specific activity, 26.2 Ci/mmol; radiochemical purity, 98.0%) was
obtained from Moravek Biochemicals (Brea, CA). Most of the fine quality analytical grade
chemicals, cell culture media and unlabeled compounds used in this investigation was obtained
from Sigma Chemical Co. (St. Louis, MO). Lipofectamine was purchased from Invitrogen
(Carlsbad, CA). The human retinal pigment epithelial (ARPE-19) cells were obtained from the
American Type Culture Collection, Inc. (Manassas, VA) and used in the studies to establish the
functionality of the cloned folts as done in similar previous investigations (6, 7, 41).
Nematode growth:
The wild-type nematode strain is Caenorhabditis elegans N2. For routine experiments,
the animals were maintained at 15-20°C on NGM agar plates, and Escherichia coli strain OP50
was used as the food source (4). Total RNA were prepared from worms by freezing the pelleted
worms in liquid nitrogen and grinding them in the presence of Trizol for total RNA preparation
as described by manufacturer’s protocol (Life Technologies, Rockville, MD).
Cloning of RFC-like transporters from C. elegans:
Three genes have been reported in the Worm genome (www.wormbase.org) as being
hRFC-like genes, C06H2.4, C50E3.11 and F37B4.7. These genes were named as folt-1, folt-2
and folt-3, respectively. Our own search of the C. elegans genome has confirmed that the C.
elegans genes 5L621 and 5D352 are indeed putative hRFC-like transporters sharing 40 and 31 %
identities with the hRFC but C50E3.11 did not show significant sequence homology with the
hRFC gene. Thus, we have renamed the putative folt-1 and folt-3 as folt-1 and folt-2, respectively
Page 5 of 51
6
to avoid confusion. To date no other gene with similarity to the hRFC gene was found. We also
searched for orthologs to the human folate receptor and the proton-coupled folate
transporter/heme carrier protein (PCFT/HCP1) in the worm genome but found none. We focused
our investigations on the putative folt-1 and folt-2. To clone these C. elegans RFC-like
transporters, we obtained an RT-PCR product using C. elegans poly (A)+ RNA and primers
designed on the basis of the predicted exonic sequences of these genes. Briefly, total RNA was
isolated from adult C. elegans using Trizol reagent. A pair of PCR primer specific for the
putative folt-1 and folt-2 genes was designed based on the sequences of the cosmids C06H2.4
and F37B4.7 (www.wormbase.org). Poly (A)+ RNA was used as template to perform the RT-
PCR employing the Superscript RT-PCR kit (Invitrogen, Carlsbad, CA) to synthesize first-strand
cDNA. To amplify the open reading frame (ORF) of the putative folt-1 and folt-2, we used the
following two gene-specific primers (for the folt-1, the forward primer was 5’-CCGCTC
GAGATGAGCTGGCGTACCAC-3’, and the reverse primer was 5’-CGGGATCCTCAATTTT
GGTCTAGAAAGACTG-3’; For the folt-2, the forward primer was 5’-ATGGAGCAATGGAA
AGTGATG-3’, and the reverse primer was 5’-TCAATTAGTACTCGTTTTGAAAAACCG-3’).
The PCR conditions used were: 95°C/10 min for 1 cycle; 95°C/30 sec., 54°C/1min., 72°C/3 min
for 40 cycles. A single PCR product was obtained for each ORF with an estimated size of ~1.2
and ~1.6 kb for the folt-1 and the folt-2 genes, respectively, as predicted by the distance between
these primers in each pair. The PCR products were gel-purified and sub cloned into pGEM-T
Easy Vector (Promega, Madison, WI). The molecular identity of the inserts was established by
sequencing (Laragen Inc, CA). The identified ORF were sub cloned into the mammalian
expression vector pLenti6/V5-Dest, again verified by sequencing, and then expressed in the
human retinal pigment epithelial cells (ARPE-19) to determine functionality.
Page 6 of 51

7
Functional expression of the cloned folt-1 and folt-2 in ARPE-19 cells using a lentiviral
expression system:
The ARPE-19 cells have been successfully used to functionally characterize cloned C.
elegans transporters (6, 7, 41). Using these cells, we expressed the putative folt-1 and the folt-2
using the lentivirus expression system as described previously (17, 22). Viral stocks were
prepared using folt-1 and folt-2-cDNA and the pLenti6/V5-Dest kit (Invitrogen Inc., Carlsbad,
CA) as per the manufacturer’s protocols. ARPE-19 cells (60-70% confluent) were transiently
transfected with 10 µl pLenti6/V5-DEST folt-1 or –2 cDNA virus/well of a 12-well plate in the
presence of polybrene (Fisher Scientific Inc., Tustin, CA), i.e., infected with a lentivirus at a
multiplicity of 5-10 plaque forming units/cell. The cells were incubated at 37°C for 72 h and
used for determination of transport activity. Cells transfected with vector alone without the
cDNA insert were used as the control to determine endogenous transport activity in these cells.
[3H]-Folate uptake was determined at 37°C in Krebs-Ringer buffer (in mM: 133 NaCl, 4.93 KCl,
1.23 MgSO4, 0.85 CaCl2, 5 glucose, 5 glutamine, 10 HEPES, and 10 MES, pH 5.5; unless
otherwise stated). The [3H]-radioactivity taken up by the cells was determined by means of
scintillation counting. Protein content of cell digests was measured in parallel wells using a Bio-
Rad protein assay kit (Bio-Rad, Richmond, VA). Transport activity attributable to the expressed
folt was determined by subtracting folate uptake by vector transfected ARPE-19 cells from total
uptake by folt-1 and folt-2 expressing cells.
Folate uptake by the whole C. elegans:
The simplicity of the C. elegans body and its demonstrated ability to take up large and
small molecules from the exogenous sources (e.g., large dsRNAs; 8, 15) have led us to test the
Page 7 of 51

8
[3H]-folic acid uptake at the whole animal level. To obtain synchronized populations, we isolated
eggs from gravid adult animals that were treated with a hypochlorite/NaOH solution (14) to
isolate eggs. Eggs were incubated in M9 buffer and allowed to hatch overnight (approx. 12 h) at
room temperature. The resulting synchronized L1-stage worms were put on standard NGM
plates with feeding bacteria (~25oC) to develop to different stages. Worms at different
developmental stages were collected, washed with M9 buffer (containing 0.01% Triton X-100;
Sigma, St. Louis, MO), gently pelleted by centrifugation, and washed several times to remove
residual OP50 bacteria. They were then used in functional uptake assays at the whole animal
level, determining mRNA levels, and GFP expression pattern. To examine the effect of folt-1
gene specific RNA-interference (RNAi) on folate uptake we used the protocol described by
Timmons and Fire (35). The commercially available folt-1 gene specific RNAi feeder clone,
obtained from Open Biosystems (Huntsville, AL) was transformed into an E. coli strain, HT115
(DE3). The transformed bacteria culture was grown overnight and then induced with 1 mM
isopropyl-beta-D-thiogalactopyranoside (IPTG) for 3 h, then seeded on NGM plates containing 1
mM of IPTG. To test the effect of folt-1RNAi, synchronized young adult C. elegans were
transferred to the plates, and the functional uptake assay was performed after 16 h of pre-
treatment. For the whole animal uptake studies, five age-synchronized individual young adult
nematodes were placed in a test-tube and were pre-incubated in Krebs-Ringer buffer for 20
minutes at room temperature. [3H]-Folic acid was then added and the reaction was terminated
after 5 min (initial rate; data not shown) by the addition of 1 ml of ice-cold Krebs-ringer buffer
followed by immediate placing of the animals on Millipore filters (0.22 micron) under negative
pressure followed by three times washing with ice-cold buffer. The filters with the animals on
Page 8 of 51

9
them (verified by microscope) were then transferred into vials containing scintillation fluid and
counted for radioactivity.
Semi-quantitative RT-PCR:
A RT-PCR assay (using folt-1-specific primers) was used to study the level of expression
of the endogenous folt-1 mRNA under different conditions [different developmental stages: early
larvae (L1-L3), young adult and adult; different level of exogenous folate]. Poly (A+) RNA was
used as a template to perform reverse transcription using an RT-PCR kit. The reverse
transcription was initiated with random oligos and carried out in a DNA thermal cycler (Light
Cycler PCR System, Bio-Rad Laboratories, Hercules, CA) as per the manufacturer’s procedures.
Reverse transcription was followed by real-time PCR in a single well format, in which the gene-
specific primers and the primers for the house keeping gene (β-actin) with their PCR mix (SYBR
green Kit, Qiagen, Valencia, CA) were combined separately at a predefined ratio. The PCR cycle
number was titrated according to the manufacturer’s protocol to ensure that the reaction was
within the linear range. The resultant PCR products were monitored during real-time and then
resolved in a 3.0% agarose gel for further confirmation. The steady state levels of folt-1 mRNA
were assessed from the relative cycle threshold (Ct) values during real-time PCR of the folt-1
specific RT-PCR product to the Ct values of the β-actin at each developmental stage/condition
and were calculated using a relative relationship method supplied by the iCycler manufacturer
(Bio-Rad).
Analyses of folt-1 knock out:
Page 9 of 51

10
To further our understanding of the role of folt-1 in folate uptake in C. elegans, we
obtained a deletion strain VC959 {Worm base deletion strain: VC959;tag-330(ok1460)V/nT1
[qIs51] (IV;V)) (C. elegans gene knockout consortium, Oklahoma Medical Research Foundation,
Oklahoma City, OK, USA)}, which has a deletion of ~1330 bp that covers part of the first exon
to the 3’-untranslated region of folt-1 (Fig. 7C) resulting in a complete removal of the coding
sequences which code for most of the transmembrane (TM) domains of folt-1. As per the KO
consortium report the homozygous ok1460 animals are sterile, but the basis of the sterility and at
what stage the sterility occurs is not clearly known. These animals do not produce offsprings, so
the ok1460 mutation has been balanced by nT1[qIs51]. The heterozygote strains can be
maintained and produce offsprings. The nT1[qIs51] animals are also not viable. So, the only
animals that were obtained on the plate were fertile heterozygotes and sterile ok1460
homozygotes. We furthered our studies with the sterile ok1460 homozygotes. We have selected
the homozygote worms on the basis of their phenotype (slow movement on the plate) and non-
GFP expression for uptake studies. The additional confirmations were performed by single worm
PCR (36) by using the following nested primers (Forwards 5’-TCTGCAACCGCAACGTATAA-
3’ and 5’-TTTCACCGGTCCATGAAAGT; Reverses 5’-TAACC-TTACTTCGACTT-3’ and 5’-
TCTT-GGCTCGGAGAA-3’) which produced a PCR product of ~2250 and 1040 bp for wild-
type and folt-1 KO animals, respectively.
Generation of transcriptional folt-1::GFP fusion construct and demonstration of its
promoter activity in vivo C. elegans:
To establish a genetically tractable model system in which to study the folate carrier, we
assessed the pattern of expression of the folt-1 in living nematodes. First, we cloned the 5’-
Page 10 of 51

11
regulatory region of the folt-1 gene using the sequence information deposited in Worm base
(accession number C06H2.4) for the folt-1 gene and flanking sequence and PCR. The 3’ end of
the adjacent up-stream gene was used as a 5’reference stop point. Two gene specific primers and
~50 ng of C. elegans genomic DNA were used to clone the entire (~1.4 kb) 5’-regulatory region
of the folt-1 gene (including its ATG). Then, we generated a transcriptional fusion construct that
contains 1.4 kb 5’-regulatory region of the folt-1 gene with the GFP reporter gene obtained from
the pPD 95.75 vector (gift from A. Fire, Carnegie Institution of Washington, Baltimore, USA) by
PCR (11). The fusion construct was verified by sequencing and was microinjected into the
syncytial gonad of adult wild-type C. elegans. The plasmid pRF4 containing the dominant
injection marker, Rol-6 (20) was coinjected as a transgenic marker. Transformants scored on the
basis of the roller phenotype behavior and GFP expression was observed under a fluorescence
microscope (Zeiss Axio plan II equipped with a fluorescence light source; Oberkochen,
Germany). Four independent lines carrying extra chromosomal arrays were obtained and all gave
similar patterns of GFP expression. The measurement of the GFP fluorescence was done at the
anterior, central, and posterior intestine of these transgenic lines. The transgenic animals were
recorded for their GFP fluorescence with fixed exposed time, and the intensities were measured
easily using Adobe Photoshop. The area of selection from each animal was identical for all of
our measurements.
Effect of exogenous folate level on expression of the folt-1 and on folate uptake by the whole
living C. elegans:
The effects of over-supplementation of the C. elegans with folate on the levels of
expression of the folt-1 and on the uptake of folate by the whole living C. elegans were
Page 11 of 51

12
examined. In these studies, wild-type and transgenic C. elegans expressing the transcriptional
construct folt-1::GFP were incubated for 24 h on nematode culture medium petridishes
supplemented with a larger dose of folate (1 mM) along with a E. coli OP50 bacteria lawn.
Findings with these animals were compared with findings in wild-type and transgenic nematodes
maintained in the absence of supplemented folate and fed bacteria that lacks the ability to
synthesize folate (Escherichia coli K12 MH828 and MH829 strains that are folA null mutants
(10); these strains were kindly provided by Dr. Muriel B. Herrington of Concordia University,
Montreal, Canada). The level of expression of the endogenous folt-1 mRNA, and in the level of
expression of the folt-1::GFP in transgenic C. elegans were then determined.
Statistical analysis:
All uptake studies were performed at least in triplicates on different occasions using
different batches of cells/nematodes and the data were expressed as mean ± SEM in mole/mg
protein/ unit time. Statistical analysis was performed using the Student’s t-test or one-way
Analysis of Variance followed by Tukey HSD test with statistical significance being set at 0.01
(p < 0.01). Kinetic parameters of the saturable folic acid uptake process were calculated using a
computerized model of the Michaelis-Menten equation as described previously by Wilkinson
(39). Uptake by the saturable process was determined by subtracting the diffusing component
(determined from the slope of the uptake line between a high pharmacological concentration of
folic acid of 1 mM and the point of origin) from the total uptake. Studies involving quantitative
PCR, analysis of promoter activity, and distribution of expression of folt-1 under different
conditions were performed on at least 20 to 30 different nematodes. For GFP analysis, 15-20
Page 12 of 51
13
age-synchronized nematodes were transferred to slides and were scored for fluorescence
intensity under identical times for comparison.
RESULTS
Cloning of the ORF of folt-1 and folt-2:
A search for genes in the C. elegans genome that have a reasonable degree of identity
with the hRFC resulted in the identification of two putative genes, folt-1 and folt-2. These genes
have 40% and 31 % identity with the hRFC, respectively. We cloned these two putative folate
transporters by RT-PCR using C. elegans poly (A)+ RNA and primers designed on the basis of
the predicted exon sequences of the individual gene. The size of the PCR products were ~1.23
and 1.6 kb for the folt-1 and folt-2, respectively, and their identities were confirmed by
sequencing. Of the two cloned sequences, only the folt-1 was found to have active folate
transporter activity (see below), and thus, we focused our characterization of this transporter. We
also did both 5’-RACE using Ambion’s FirstChoice RLM RACE Kit (Austin, TX) and 3’-RACE
using Invitrogen kit (Carlsbad, CA) to confirm the initiation and stop codons of folt-1. The
results confirmed the start and stop codons and showed lack of existence of any variance.
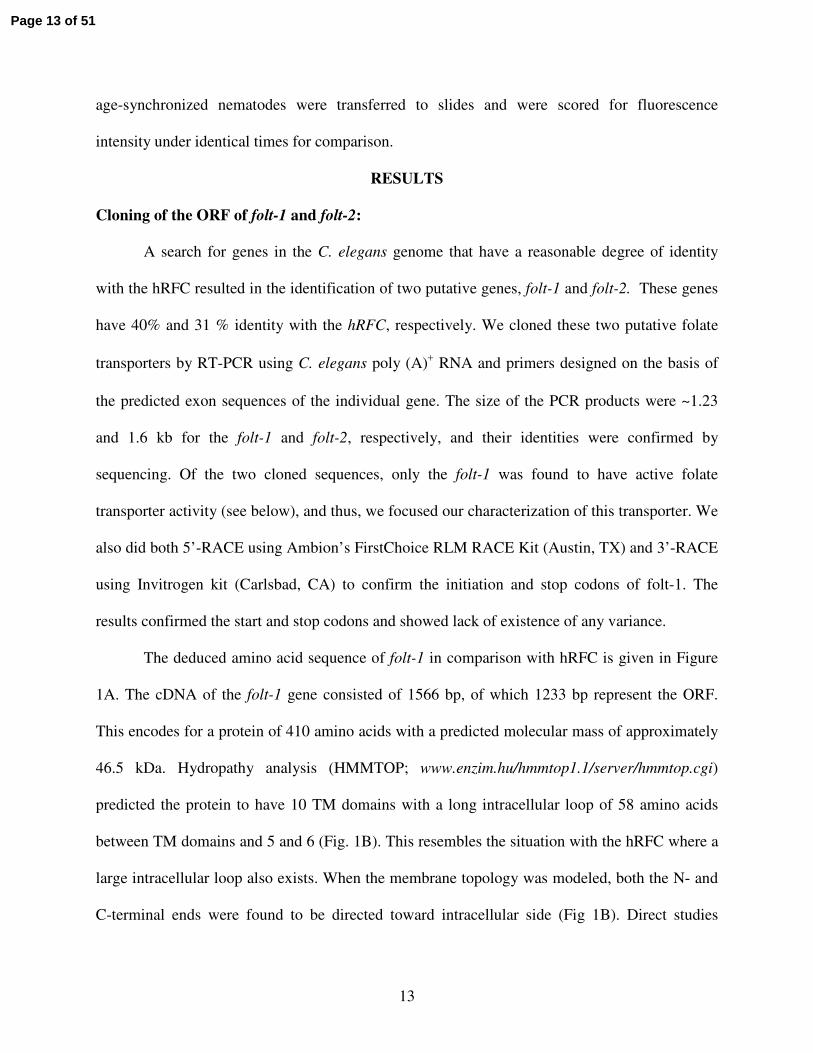
The deduced amino acid sequence of folt-1 in comparison with hRFC is given in Figure
1A. The cDNA of the folt-1 gene consisted of 1566 bp, of which 1233 bp represent the ORF.
This encodes for a protein of 410 amino acids with a predicted molecular mass of approximately
46.5 kDa. Hydropathy analysis (HMMTOP; www.enzim.hu/hmmtop1.1/server/hmmtop.cgi)
predicted the protein to have 10 TM domains with a long intracellular loop of 58 amino acids
between TM domains and 5 and 6 (Fig. 1B). This resembles the situation with the hRFC where a
large intracellular loop also exists. When the membrane topology was modeled, both the N- and
C-terminal ends were found to be directed toward intracellular side (Fig 1B). Direct studies
Page 13 of 51

14
however, are needed to establish the orientation of these terminals and the topology of the folt-1
transporter. The folt-1 polypeptide was predicted to carry two potential N- glycosylation sites
(Asn-36, Asn-260; NetNGlyc 1.0 server), five potential PKC phosphorylation sites (Ser-2, Ser-
186, Ser-192, Ser-212 and Ser-304) and two potential cAMP and cGMP-dependent protein
kinase phosphorylation sites (Lys-128 and Lys-226; NetPhos 2.0 server).
Functional characterization of the cDNAs of folt-1 and folt-2:
Functional identity of the cloned cDNAs of folt-1 and folt-2 was determined by
expressing them in a heterologous system of ARPE-19 cells followed by assaying for induction
in [3H]-folic acid uptake. Uptake of folic acid was investigated at 72 h following transfection and
data was compared to uptake by cells transfected with pLenti vector alone (control). First we
confirmed the expression of the folt-1 and folt-2 at the mRNA level in ARPE-19 cells (Fig. 2A).
Assay for [3H]-folic acid (16 nM) uptake then followed with results showing that the initial rate
of 3H-folic acid (16 nM) uptake was significantly (P < 0.01) (~6.5 folds) higher in cells
transfected with the full length folt-1 cDNA compared to control cells (8.96 ± 0.56 and 1.4 ±
0.15 fmol/mg protein/7 min for folt-1 transfected and control cells, respectively). Similar results
were obtained when a slightly shorter folt-1 protein (that lacks the last 53 AA that represents the
C-terminal tail and the last TM domain) was used, in that folic acid (16 nM) uptake was
significantly (P < 0.01) (8 folds) induced in cDNA transfected cells compared to control (Fig.
2B). The latter finding suggest that the C-terminal and last TM domain of folt-1 do not play a
role in the transport function of the carrier protein. Unless otherwise stated below, the functional
characterization studies were done using the slightly shorter form of folt-1.
Addition of unlabelled folic acid (50 µM) to the incubation medium led to a significant
(P < 0.01) inhibition in the initial rate of uptake of [3H]-folic acid (16 nM) by the cells
Page 14 of 51

15
transfected with shortened folt-1, while addition of the unrelated vitamins thiamin, biotin, and
ascorbic acid (all at 50 µM) failed to affect [3H]-folic acid uptake (Fig. 2B).
In contrast to folt-1, transfecting ARPE-19 cells with a cDNA for folt-2 failed to show
any increase in initial rate of folic acid (16 nM) uptake compared to controls, both at buffer pH
5.5 (2.19 ± 0.17 and 2.18 ± 0.05 fmol/mg protein/7 min, respectively) and buffer pH 7.4 (1.71 ±
0.07 and 1.69 ± 0.20 fmol/mg protein/7 min, respectively).
Effect of buffer pH and role of Na+ in folic acid uptake by the folt-1 system:
Effect of varying incubation buffer pH on the initial rate of folic acid (16 nM) uptake by
the induced carrier following transfection of ARPE-19 cells with cDNA of the shortened folt-1
was examined. The results showed an increase in folic acid uptake by the induced carrier as a
function of decreasing the incubation buffer pH; uptake was significantly (P < 0.01) higher at
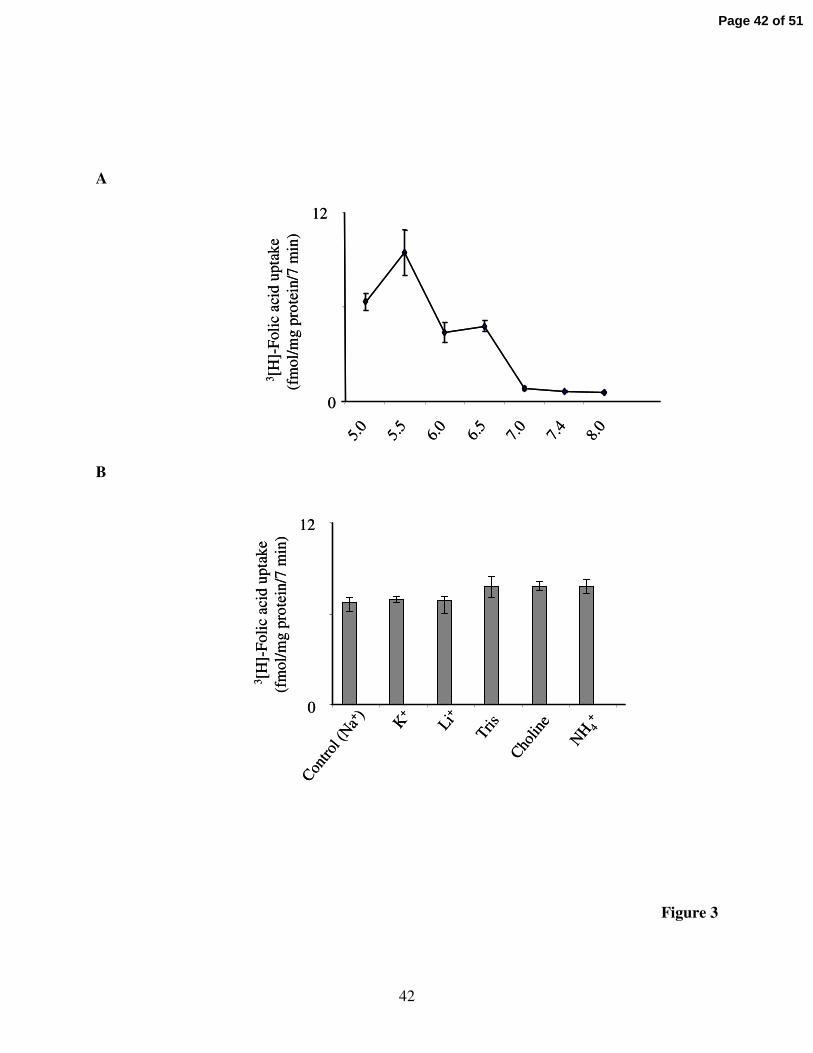
buffer pH 5.5 compared to pH 7.4 (Fig. 3A). Similarly, uptake of folic acid (16 nM) by ARPE-19
cells transfected with full-length folt-1 was found to be significantly (P < 0.01) higher at pH 5.5
compared to pH 7.4 (8.96 ± 0.56 and 0.19 ± 0.03 fmol/mg protein/7 min at pH 5.5 and 7.4,
respectively). Incubation buffer pH 5.5 was used in all subsequent investigations.
The role of Na+ in folic acid uptake via the folt-1 system was examined by testing the
effect of isoosmotic replacement of Na+ with other monovalent cations (K+, Li+, Tris, choline
and NH4+) on the initial rate of folic acid (16 nM) uptake by the induced system in shortened
folt-1 expressing cells. The results showed the induced folic acid uptake to be similar in the
presence and absence of Na+ both at pH 5.5 (Fig. 3B) or at pH 7.4 (uptake of 1.04 ± 0.02, 1.07 ±
0.03, 1.11 ± 0.01, 1.08 ± 0.01, 1.18 ± 0.1, and 1.13 ± 0.2 fmol/mg protein/7 min, for the
incubation medium containing Na+, K+, Li+, Tris, choline and NH4+, respectively). We also
Page 15 of 51

16
examined the effect of pre-treating (for 30 min) the shortened folt-1 expressing ARPE-19 cells
with the Na+-K+-ATPase inhibitor, ouabain (0.5 mM) on the initial rate of folic acid (16 nM)
uptake. The results show the induced folic acid uptake to be similar in ouabain-pretreated and
control cells (10.86 ± 1.0 and 11.61 ± 0.562 fmol/mg protein/7 min, respectively).
Kinetic parameters of the induced folic acid uptake by folt-1 expressing ARPE-19 cells:
In this study, we examined the initial rate of folic acid uptake by the induced system in
shortened folt-1 expressing ARPE-19 cells as a function of increasing substrate concentration in
the incubation medium (0.01–10 µM). Uptake by the induced folic acid transport system
includes a saturable component (Fig. 4). The apparent Km and Vmax of the saturable uptake
component were then calculated as described in “Methods” and found to be 1.23 ± 0.18 µM and
7.28 ± 1.1 pmol/mg protein/7 min, respectively.
Effect of folate structural analogs, the anti-inflammatory drug sulfasalazine, and the anion
transport inhibitors DIDS and SITS on folic acid uptake by the induced system in folt-1
expressing cells:
The effect of the different concentrations of the reduced [(folinic acid or 5-
formyltetrahydro-folate (5-FTHF)] and substituted (methotrexate, MTX) folate structural analogs
on the initial rate of [3H]-folic acid (16 nM) uptake by the induced carrier in shortened folt-1
expressing ARPE-19 cells was examined at buffer pH 5.5. The results showed that both
structural analogues inhibit, in a concentration dependent manner, the uptake of [3H]-folic acid
by the induced system (Fig. 5). In both cases the inhibition was competitive in nature with
apparent inhibition constants (Ki) of 2.1 ± 0.3 µM and 1.6 ± 0.2 µM for 5-FTHF and MTX,
Page 16 of 51

17
respectively. Similarly, uptake of folic acid (16 nM) by ARPE-19 cells expressing the full-length
folt-1 was significantly (P < 0.01 for all) inhibited by 5 and 20 µM 5-FTHF (8.80 ± 0.60, 2.96 ±
0.40 and 2.40 ± 0.32 fmol/mg protein/7 min for control and in the presence of 5 and 20 µM 5-
FTHF, respectively) and by 5 and 20 µM MTX (8.80 ± 0.60, 2.48 ± 0.16 and 1.92 ± 0.16
fmol/mg protein/7 min for control and in the presence of 5 and 20 µM MTX, respectively).
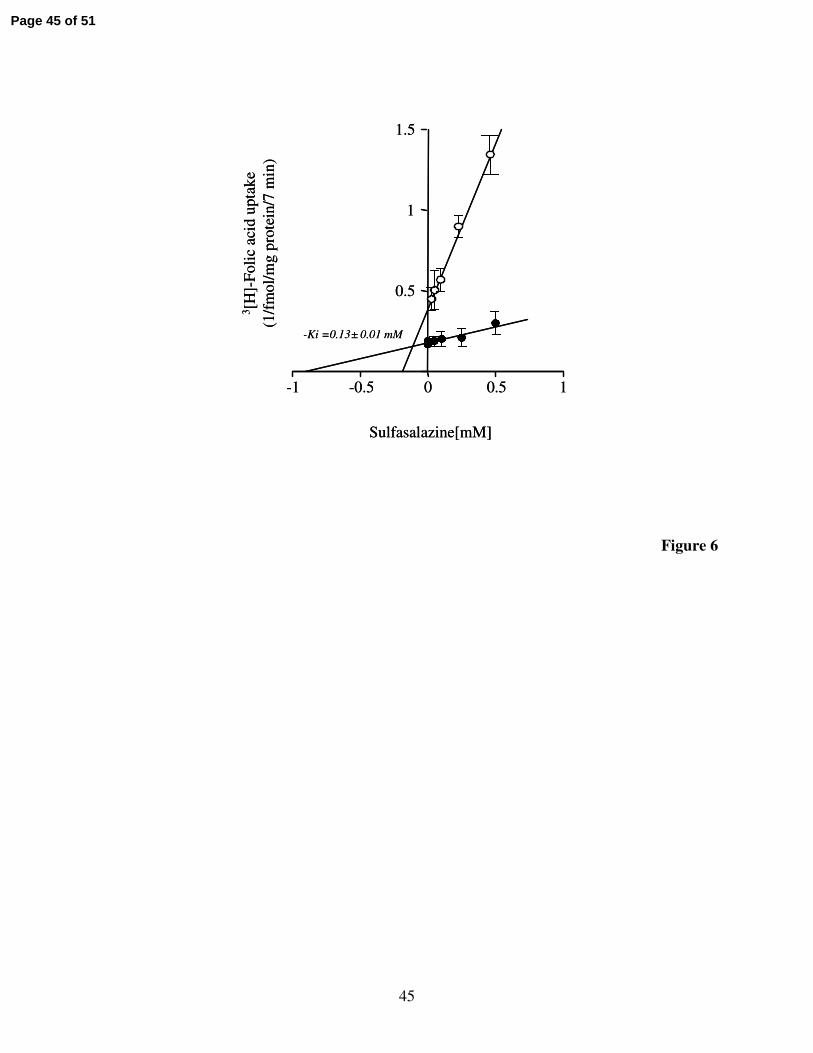
We also examined the effect of different concentrations of the anti-inflammatory drug
sulfasalazine on the initial rate of folic acid uptake by the induced carrier in shortened folt-1
expressing ARPE-19 cells. Sulfasalazine is an anti-inflammatory drug that is widely used for the
treatment of inflammatory bowel disease (IBD) and is known to competitively inhibit the human
intestinal folate uptake process (42). The results showed sulfasalazine to cause a concentration-
dependent inhibition in the induced folic acid uptake process with the inhibition being
competitive in nature (apparent Ki of 0.13 ± 0.01 mM) (Fig. 6). Similarly, uptake of folic acid
(16 nM) by ARPE-19 cells expressing the full-length folt-1 was significantly (P < 0.01)
inhibited by 0.25 and 0.5 mM sulfasalazine (8.80 ± 0.60, 3.44 ± 0.90 and 2.88 ± 0.24 fmol/mg
protein/7 min for control and in the presence of 0.25 and 0.5 mM sulfasalazine, respectively).
We have tested the effect of the anion transport inhibitors DIDS and SITS (inhibitors of
the human intestinal folate uptake process; 28-29) on the initial rate of folic acid uptake by
induced carrier in shortened folt-1 expressing ARPE-19 cells. The results showed both
compounds to cause a significant (P < 0.01) inhibition in folic acid (16 nM) uptake (8.01 ± 0.8,
0.98 ± 0.01 and 0.89 ± 0.05 fmol/mg protein/7 min, for control, and in the presence of DIDS and
SITS, respectively).
Page 17 of 51

18
Confirmation of functionality of the folt-1 as a folate transporter in vivo: Effect of folt-1
knock down (silencing) and knock out:
To establish the functionality of the folt-1 as a folate transporter in vivo in C. elegans, we
used two approaches. In the first, we examined the effect of specific folt-1 gene silencing on
whole animal folate uptake, with the use of a gene specific RNAi feeder clone. In these studies,
wild-type animals were fed with E. coli expressing the folt-1RNAi plasmids for 16 h; control C.
elegans were fed bacteria without the RNAi. Real-time PCR analysis was then performed on
samples from these animals with the results showing a significant (P < 0.01) reduction in mRNA
levels of folt-1 in the RNAi fed animals compared to controls (Fig. 7A). This reduction appears
to be specific for folt-1 as no change in the level of expression of the house keeping gene β-actin
was observed. Next, we examined the functional consequences of the folt-1 silencing on the
whole animal folate uptake [5 min; uptake by the whole animal was linear for up to 20 min (data
not shown)]. The results showed a significant (P < 0.01) reduction in folate (16 nM) uptake in
RNAi fed compared to control animals (Fig. 7B). Uptake of the unrelated ascorbic acid, on the
other hand, was similar in the two animal groups (Fig. 7B).
In the second approach, we used a folt-1 deletion strain (Fig. 7C) of the C. elegans and
performed similar functional folate uptake studies. Consistent with the KO consortium report, we
found the homozygotes of this mutant to be defective in reproduction (sterile) and displayed very
slow (sluggish) movement. The identity of the strain was confirmed by PCR (38) and by the
phenotypic characteristics. Wild-type animals showed a PCR product of ~2250 bp, whereas the
folt-1-/- KO animals showed a deletion product of ~1040 bp (Fig. 7D).
Using the homozygote folt-1-/- deletion strains, we examined folate uptake by these
animals and compared the findings to that in wild-type animals of identical stages
Page 18 of 51

19
(synchronized). The results showed a significantly (P < 0.01) lower folic acid (16 nM) uptake in
the homozygote folt-1-/- KO animals compared to wild-type (Fig. 7E). Uptake of the unrelated
biotin, on the other hand, by the homozygous folt-1-/- KO animals was similar to that of wild-
type animals (Fig. 7E).
Analyses the expression pattern of folt-1:
To study the pattern of expression of the folt-1 gene in the whole living nematode, a
transcriptional folt-1::GFP fusion was constructed (see “Method”), then used to generate
transgenic nematodes expressing this transgenic construct. In this transcriptional construct, the
expression of the GFP would be indicative of expression pattern of the folt-1 gene. The results
showed expression of the GFP in different C. elegans tissues thus establishing promoter activity
of the cloned genomic fragment. Expression was consistently higher in the pharynx and the
posterior part of intestine; it was also observed in the body wall muscles, head muscles and vulva
muscles of these transgenic animals (Fig. 8).
Developmental regulation of the folt-1 expression:
To study the effect of C. elegans development on the level of expression of the folt-1
gene, total RNA was isolated from whole synchronized C. elegans at different developmental
stages (larva 1, larva 2, young adult, and adult). Message level of the folt-1 was then determined
by means of quantitative real-time PCR (Fig. 9A) using poly (A+) RNA samples. Real-time PCR
analysis of β-actin transcripts from the same samples served as an internal control in these
experiments. There was a gradual decrease in the expression levels of the folt-1 mRNA with
Page 19 of 51

20
development with the decrease reaching a significant (P < 0.01) level when the animal reached
to the adult stage.
The effect of development on the level of expression of the folt-1 gene was also
determined in vivo using transgenic nematodes expressing the transcriptional construct folt-
1::GFP. In these studies we focused on studying the effect of development on level of
expression of folt-1 (i.e., on fluorescence intensity of the GFP) in the intestine due to our long-
standing interest in intestinal physiology. The results showed the level of GFP expression
(fluorescence intensity) in the intestine to be significantly (P < 0.01) higher at the early larva
stage compared to latter stages (Fig. 9B).
Effect of exogenous folate level on parameters of folate uptake and on the level of folt-1
expression:
The effect of maintaining (for 72 h) C. elegans in a culture medium containing high
concentrations of folic acid (1 mM) on the level of expression of the folt-1 mRNA and other
parameters of folate uptake was examined. Comparison was made to data from C. elegans
maintained in regular culture medium (no folate supplementation) and fed E. coli that lacks the
ability to synthesize folate (we used this type of E. coli in order to further minimize the level of
exogenous folate that is available to the animals so that a clearer comparison can be made). The
latter animals were considered as controls in this study. Results of the quantitative PCR assay
showed the level of the folt-1 mRNA to be significantly (P < 0.01) lower in the C. elegans
maintained in folate over-supplemented culture medium compared to the controls (Fig. 10A).
In a related study, we examined and compared the effect of maintaining C. elegans in
folate over-supplemented medium on short-term [3H]-folic acid (16 nM) uptake by the whole C.
Page 20 of 51

21
elegans. The results showed the uptake to be significantly (P < 0.01) lower in nematodes
maintained in folate over-supplemented medium compared to those of control (Fig. 10B).
However, the uptake of the unrelated vitamin, biotin (9.6 nM) by the whole C. elegans, on the
other hand, was similar in the two animal groups (0.25 ± 0.01 and 0.23 ± 0.05 fmol/5 animals/5
min, respectively). In another study we examined the effect of maintaining the folt-1 KO animals
on [3H]-folic acid (16 nM) uptake by the whole C. elegans. Results were compared to folic acid
uptake by KO animals maintained in control medium. The results showed similar uptake by the
folt-1 KO C. elegans under two folate conditions (0.02 ± 0.001 and 0.019 ± 0.004 fmol/5
animals/5 min, in folt-1 KO animals maintained in folate over supplemented and control
medium, respectively).
To link the above observed changes in the level of expression of the folt-1 mRNA and in
folic acid uptake upon folate over-supplementation with possible transcriptional regulatory
events, transgenic nematodes carrying the folt-1::GFP transcriptional construct were maintained
under folate over-supplemented and control conditions followed by determination of GFP
fluorescence intensity in the intestine. There was a significantly (P < 0. 01) lower level of GFP
expression in the intestine of the folate over-supplemented transgenic animals compared to
control (Figs. 11A, B and C).
DISCUSSION
Our aims in these investigations were to establish the nematode C. elegans as an in vivo
model system with which to study integrative aspects of folate uptake at the whole animal level
in vivo and to characterize the folate uptake system expressed in this animal species and study its
regulation. The suitability of C. elegans as a model system in such investigations has been well
Page 21 of 51

22
established with important findings being made which are of relevance to those found in higher
mammals like humans (31-32). In these investigations we used the information available in the
Worm database and our own search to identify two putative hRFC-like genes that were named as
folt-1 and folt-2. The products of these genes shared 40% and 31% identity with the hRFC,
respectively. To examine the possible role of these genes in folate uptake, we cloned the cDNAs
of both putative folate like transporters and tested their functionality as folate transporters in a
heterologous cellular system. Our results indicated that only the folt-1 to be the active folate
transporter. Comparing the protein sequence of the folt-1 with that of hRFC showed similarities
between the two sequences to be mainly localized to regions in TM domains 2, 3, 4, 5, 6 and 11
of hRFC. Interestingly, some of these hRFC domains or residues are involved in substrate
binding and functionality (12, 13). Further functional characterization of folt-1 showed that while
unlabelled folic acid inhibited [3H]-folic acid uptake by the induced system, neither the
structurally unrelated biotin nor ascorbic acid was found to affect the folate uptake. The later
findings indicate the specificity of the folt-1 as a folate uptake system. The induced folate uptake
in folt-1 expressing ARPE-19 cells was found to be saturable with an apparent Km of 1.23 ± 0.18
µM, pH (but not Na+)-dependent with a markedly higher uptake at acidic compared to neutral
and alkaline buffer pHs. Uptake by the induced carrier was also sensitive to the inhibitory effect
of the reduced folate structural analog 5-FTHF and the substituted analog MTX. Interestingly
the inhibition of [3H]-folic acid uptake by 5-FTHF and MTX was competitive in nature with an
apparent Ki of 2.1 and 1.6 µM, respectively. The similar apparent Km for folic acid uptake and
the inhibition constants of 5-FTHF and MTX suggest that these substrates have similar affinities
for the folt-1. The acidic pH dependence of the folate uptake process by folt-1 and its similar
Page 22 of 51

23
affinities to oxidized, reduced and substituted folate derivatives are similar to the characteristics
of the folate uptake process of the human intestine (28).
An interesting observation was the ability of the anti-inflammatory agent sulfasalazine to
competitively inhibit the induced folic acid uptake in the folt-1 expressing ARPE-19 cells.
Sulfasalazine is an anti-inflammatory agent that is widely used in the treatment of IBD and has
been shown to competitively inhibit folate uptake in the human intestine (42). In addition and as
seen with the human intestinal folate uptake process (28-29), the anion transport inhibitors DIDS
and SITS were both found to be strong inhibitors of folic acid uptake by the induced system in
the folt-1 expressing ARPE-19 cells. The latter two findings further indicate the similarity
between the functionality of the folate uptake process mediated by folt-1 in C. elegans and that
of the human intestinal folate uptake process.
To confirm the functionality of the folt-1 system in vivo, we utilized two different
approaches. In the first approach, we examined the effect of knocking down (silencing) the folt-1
gene with the use of gene-specific RNAi on folate uptake. In C. elegans, the RNAi -mediated
gene silencing process is so robust that exposure of the animals to RNAi in their environment is
sufficient to induce genetic interference (35). The results showed that silencing the folt-1 gene
leads to a substantial reduction in folate uptake compared to the control (Fig. 7B). In the second
approach, we used folt-1 knock out C. elegans and examined folate uptake; results were
compared to that of identical stage wild-type animals. The folt-1 knock out worms was obtained
from the deletion strain VC959. First, we selected the homozygote animals based on phenotype
and PCR data (genotyping). We then used these animals in folate uptake studies and compared
the findings to those of identical aged wild-type worms. The results showed folate uptake to be
Page 23 of 51

24
severely inhibited in the KO worms compared to controls. These findings collectively suggest
the critical role played by folt-1 in folate uptake in C. elegans in vivo.
To gain insight into the transcriptional regulation of the folt-1 gene, we cloned the 5’-
regulatory region of the gene, and fused the cloned genomic fragment to the GFP reporter gene.
Promoter activity of the cloned folt-1 genomic fragment was demonstrated in vivo by generating
transgenic worms expressing the folt-1::GFP which showed expression of the GFP in the living
animals. This study, in addition to demonstrating promoter activity of our cloned genomic
fragment also provided important information on the pattern of expression of the folt-1 in
different tissues of the intact whole C. elegans in vivo since expression of the GFP was driven by
the folt-1 promoter. The results showed the highest level of expression to be in two organs of the
digestive system, namely the pharynx and the (posterior portion of) intestine of the transgenic
animals. While the intestinal area is composed of highly differentiated epithelial cells, the
pharynx area contains different cell-types including epithelial cells, muscle cells, and secretory
glands (1). The latter cell-type is believed to be involved in the secretion of digestive enzymes
(1). The high level of expression of the folt-1 in the cells of digestive system raises the possibility
of its involvement in micro-nutrient absorption in this organism. Further studies are, however,
needed to confirm this suggestion.
We also investigated possible developmental regulation of folt-1 mRNA expression in
wild- type and in transgenic C. elegans expressing the transcriptional folt-1::GFP construct. The
results showed the highest level of expression of the folt-1 mRNA to be in the larva 1 stage but
the expression declined with maturation. This pattern of decline was also observed in the
intestine of transgenic animals expressing the transcriptional construct folt-1::GFP, thus,
confirming the in vitro observations. The observation that the folt-1 is developmentally regulated
Page 24 of 51

25
is similar to the observations reported for mammalian RFC, whose expression in the gut was
shown to be developmentally regulated and in a similar manner (2, 26).
Possible adaptive regulation of the folt-1 expression and function was investigated using
both wild-type and transgenic animals carrying the folt-1::GFP construct. Maintaining C. elegans
in culture medium over-supplemented with high pharmacological doses of folic acid was found
to lead to significant decrease in the level of mRNA expression of the folt-1. This decrease was
associated with a specific decrease in the level of folic acid uptake by wild-type C. elegans.
However, such a regulation by external folate level was not observed with KO worms, further
supporting the present data on the important role played by the folt-1 gene in folate uptake
process in C. elegans. These changes indicate that uptake of folate by the folt-1 is adaptively
regulated by exogenous substrate level. The observation of a decreased expression of folt-1::GFP
in the intestine of the C. elegans maintained in folate over-supplemented medium compared to
control suggest that transcriptional regulatory mechanism(s) may (at least in part) be involved in
mediating the observed adaptive response. Again, these observations are similar to those reported
with mammalian RFC in the intestine upon changing extra-cellular folate levels (27, 33, and
unpublished observations).
In summary, results of these investigations have identified for the first time the existence
of a functional and specialized folate uptake system in the nematode C. elegans and showed the
system to be similar to that of the human intestinal folate uptake process in being acidic pH-
dependent, having similar affinity to oxidized, reduced and substituted folate derivatives, is
sensitive to the inhibitory effects of the anti-inflammatory agent sulfasalazine, and is inhibited by
the anion transport inhibitors DIDS and SITS. In addition, functionality of this system was
confirmed in vivo by gene knock down and knock out approaches. Furthermore, the folt-1
Page 25 of 51

26
appears to be expressed in different tissues of the C. elegans (including the intestine) and that its
expression is regulated during development and by substrate level in the culture medium. These
studies establish the suitability of the C. elegans as a model for detailed investigations into
integrative aspects of the folate uptake process at the whole animal level.
ACKNOWLEDGEMENTS
We would like to express our sincere thanks to Dr. Kevin Strange (Vanderbilt University,
Tennessee) and Dr. Keith Nehrke (University of Rochester, New York) for their valuable
discussions and advices. We would also like to thank Dr. Bin Liang for his technical assistance
with microinjection and interesting discussions.
Page 26 of 51
27
REFERENCES
1. Albertson DG and Thomson JN. The pharynx of Caenorhabditis elegans. Philos Trans
R Soc Lond B Biol Sci 275: 299-325, 1976.
2. Balamurugan K and Said HM. Ontogenic regulation of folate transport across rat
jejunal brush-border membrane. Am J Physiol 285: G1068-1073, 2003.
3. Blakley RL and Whitehead VA. Folates and Pterins. Nutritional, Pharmacological and
Physiological Aspect, John Wiley and Sons, New York, 1986.
4. Brenner S. The genetics of Caenorhabditis elegans. Genetics 77: 71-94, 1974.
5. Brzezinska A, Winska P, and Balinska M. Cellular aspects of folate and antifolate
membrane transport. Acta Biochim Pol 47: 735-749, 2000.
6. Fei YJ, Inoue K, and Ganapathy V. Structural and functional characteristics of two
sodium-coupled dicarboxylate transporters (ceNaDC1 and ceNaDC2) from
Caenorhabditis elegans and their relevance to life span. J Biol Chem 278: 6136-6144,
2003.
7. Fei YJ, Liu JC, Inoue K, Zhuang L, Miyake K, Miyauchi S, and Ganapathy V.
Relevance of NAC-2, an Na+-coupled citrate transporter, to life span, body size and fat
content in Caenorhabditis elegans. Biochem J 379: 191-198, 2004.
8. Feinberg EH and Hunter CP. Transport of dsRNA into cells by the transmembrane
protein SID-1. Science 301: 1545-1547, 2003.
9. Ferguson PL and Flintoff WF. Topological and functional analysis of the human
reduced folate carrier by hemagglutinin epitope insertion. J Biol Chem 274: 16269-
16278, 1999.
Page 27 of 51

28
10. Herrington MB and Chirwa NT. Growth properties of a folA null mutant of
Escherichia coli K12. Can J Microbiol 45: 191-200, 1999.
11. Hobert O. PCR fusion-based approach to create reporter gene constructs for expression
analysis in transgenic C. elegans. Biotechniques 32: 728-730, 2002.
12. Hou Z, Stapels SE, Haska CL, and Matherly LH. Localization of a substrate binding
domain of the human reduced folate carrier to transmembrane domain 11 by radioaffinity
labeling and cysteine-substituted accessibility methods. J Biol Chem 280: 36206-36213,
2005.
13. Hou Z, Ye J, Haska CL, and Matherly LH. Transmembrane domains 4, 5, 7, 8, and 10
of the human reduced folate carrier are important structural or functional components of
the transmembrane channel for folate substrates. J Biol Chem 281: 33588-33596, 2006.
14. Johnson K and Hirsh D. Patterns of proteins synthesized during development of
Caenorhabditis elegans. Dev Biol 70: 241–248, 1979.
15. Kaletta T and Hengartner MO. Finding function in novel targets: C. elegans as a model
organism. Nat Rev Drug Discov 5: 387-398, 2006.
16. Kaufman Y, Ifergan I, Rothem L, Jansen G, and Assaraf YG. Coexistence of
multiple mechanisms of PT523 resistance in human leukemia cells harboring 3 reduced
folate carrier alleles: transcriptional silencing, inactivating mutations, and allele loss.
Blood 107: 3288-3294, 2006.
17. Kim EY, Hong YB, Lai Z, Kim HJ, Cho YH, Brady RO, and Jung SC. Expression
and secretion of human glucocerebrosidase mediated by recombinant lentivirus vectors in
vitro and in vivo: implications for gene therapy of Gaucher disease. Biochem Biophys Res
Commun 28: 381-390, 2004.
Page 28 of 51

29
18. Liu M, Ge Y, Payton SG, Aboukameel A, Buck S, Flatley RM, Haska C,
Mohammad R, Taub JW, and Matherly LH. Transcriptional regulation of the human
reduced folate carrier in childhood acute lymphoblastic leukemia cells. Clin Cancer Res
12: 608-616, 2006.
19. Matherly LH. Molecular and cellular biology of the human reduced folate carrier. Prog
Nucleic Acid Res. Mol Biol. 67: 131-162, 2001.
20. Mello CC, Kramer JM, Stinchcomb D, and Ambros V. Efficient gene transfer in C.
elegans: extrachromosomal maintenance and integration of transforming sequences.
EMBO J. 10: 3959-3970, 1991.
21. Moscow JA, Gong M, He R, Sgagias MK, Dixon KH, Anzick SL, Mettzer PS, and
Cowan KH. Isolation of a gene encoding a human reduced folate carrier (RFC1) and
analysis of its expression in transport-deficient, methotrexate-resistant human breast
cancer cells. Cancer Res 55: 3790-3794, 1995.
22. Naldini L, Blomer U, Gage FH, Trono D, and Verma IM. Efficient transfer,
integration, and sustained long-term expression of the transgene in adult rat brains
injected with a lentiviral vector. Proc Natl Acad Sci USA 93: 11382–11388, 1996.
23. Nguyen TT, Dyer DL, Dunning DD, Rubin SA, Grant KE, and Said HM. Human
intestinal folate transport: cloning, expression, and distribution of complementary RNA.
Gastroenterology 112: 783-791, 1997.
24. O'Brien, Remm M, and Sonnhammer ELL. Inparanoid: a comprehensive database of
eukaryotic orthologs. Nucleic Acids Res 33: D476-D480, 2005.
Page 29 of 51
30
25. Payton SG, Liu M, Ge Y, and Matherly LH. Transcriptional regulation of the human
reduced folate carrier A1/A2 promoter: Identification of critical roles for the USF and
GATA families of transcription factors. Biochim Biophys Acta 1731: 115-124, 2005.
26. Said HM, Ghishan FK, and Murrell JE. Ontogenesis of intestinal transport of 5-
methyltetrahydrofolate in the rat. Am J Physiol 249: G567-G571, 1985.
27. Said HM, Chatterjee N, Haq RU, Subramanian VS, Ortiz A, Matherly LH, Sirotnak
FM, Halsted C, and Rubin SA. Adaptive regulation of intestinal folate uptake: effect of
dietary folate deficiency. Am J Physiol 279: C1889-1995, 2000.
28. Said HM. Recent advances in carrier-mediated intestinal absorption of water-soluble
vitamins. Ann Rev Physiol 66: 419-446, 2004.
29. Said HM and Seetharam B. Intestinal absorption of water-soluble vitamins. In:
Physiology of the Gastrointestinal Tract. Edited by Leonard R. Johnson, Kim Barrett,
Fayez K. Ghishan, Juanita L. Merchand, Hamid M. Said, and Jakie D. Wood; 4th Edition,
Elsevier Press; San Diego, 2005.
30. Sirotnak FM and Tolner B. Carrier-mediated membrane transport of folates in
mammalian cells. Ann Rev Nutr 19: 91-122, 1999.
31. Strange K. From genes to integrative physiology: ion channel and transporter biology in
Caenorhabditis elegans. Physiol Rev 83: 377-415, 2003.
32. Strange K. Model organisms: comparative physiology or just physiology? Am J Physiol
279: C2050-C2051, 2000.
33. Subramanian VS, Chatterjee N, and Said HM. Folate uptake in the human intestine:
promoter activity and effect of folate deficiency. J Cell Physiol 196: 403-408, 2003.
Page 30 of 51

31
34. The C. elegans Sequencing Consortium. Genome sequence of the nematode C. elegans: a
platform for investigating biology. Science 282: 2012–2018, 1998.
35. Timmons L and Fire A. Specific interference by ingested dsRNA. Nature 395: 854,
1998.
36. Titus SA and Moran RG. Retrovirally mediated complementation of the glyB
phenotype. Cloning of a human gene encoding the carrier for entry of folates into
mitochondria. J Biol Chem 275: 36811-36817, 2000.
37. Whetstine JR, Flatley RM, and Matherly LH. The human reduced folate carrier gene
is ubiquitously and differentially expressed in normal human tissues: identification of
seven non-coding exons and characterization of a novel promoter. Biochem J 367: 629-
640, 2002.
38. Williams BD, Schrank B, Huynh C, Shownkeen R, and Waterston RH. A genetic
mapping system in Caenorhabditis elegans based on polymorphic sequence-tagged sites.
Genetics 131: 609-624, 1992.
39. Wilkinson GN. Statistical estimations in enzyme kinetics. Biochem J 80: 324–332, 1961.
40. Wong SC, Proefke SA, Bhusan A, and Matherly LH. Isolation of human cDNAs that
restore methotrexate sensitivity and reduced folate carrier activity in methotrexate
transport-defective Chinese hamster ovary cells. J Biol Chem 270: 17468-17475, 1995.
41. Wu X, Fei YJ, Huang W, Chancy C, Leibach FH, and Ganapathy V. Identity of the
F52F12.1 gene product in Caenorhabditis elegans as an organic cation transporter.
Biochim Biophys Acta 1418: 239-244, 1999.
Page 31 of 51

32
42. Zimmerman J. Drug interactions in intestinal transport of folic acid and methotrexate.
Further evidence for the heterogeneity of folate transport in the human small intestine.
Biochem Pharmacol 44: 1839-1842, 1992.
FOOTNOTES
• This study was supported by grants from the Department of Veterans Affairs and the
National Institutes of Health (DK58057 and DK075348 to H.M.S) and (MH64747 to J.S).
Page 32 of 51

33
FIGURE LEGENDS
Figure 1. (A) Comparison of amino acid sequences of C. elegans folt-1 and human RFC.
Alignment (www-archbac.u-psud.fr/genomics/multalin.html) of the amino acid
sequences of folt-1 (upper panel) with hRFC (lower panel). The symbols ($, % and #) denote
anyone of these residues (LM, FY and NDQEBZ, respectively). The symbol (∗) denotes the
length of the shortened folt-1 protein (357 AA). Transmembrane domains are in shaded boxes.
(B) Schematic representation of the predicted secondary structure of the folt-1 protein
determined by HMMTOP (www.enzim.hu/hmmtop1.1/server/hmmtop.cgi). The protein is
predicted to have ten transmembrane domains. The symbol (∗) denotes the length of the
shortened folt-1 protein (357 AA).
Figure 2. (A) Expression of the folt-1 and 2 at the mRNA level following transfection into
ARPE-19 cells.
Cells were transfected with folt-1 and 2 as described in “Methods”. Total RNA isolated
from these cells was analyzed by quantitative real-time PCR for the presence of folt-1 and 2
transcripts. Data were normalized relative to the house-keeping gene, β-actin.
(B) Functional identification of the cloned shorter form of folt-1 as a specific folate
transporter in ARPE-19 cells.
Confluent monolayers of ARPE-19 cells expressing the folt-1 were incubated with [3H]-
folic acid (16 nM) for 7 min (initial rate) at 37°C in Krebs-Ringer buffer pH 5.5 in the absence
(control) and presence of 50 µM of unlabeled folic acid, thiamin, biotin or ascorbic acid. Data
are mean ± SEM of at least three separate uptake determinations.
Page 33 of 51

34
Figure 3. Effect of incubation buffer pH (A) and Na+(B) on folate uptake by ARPE-19 cells
expressing the shortened folt-1.
Confluent monolayers of ARPE-19 cells expressing the shortened folt-1 were incubated
for 7 min (initial rate) at 37°C in Krebs-Ringer buffer. [3H]-folic acid (16 nM) was added to the
incubation medium at the onset of incubation. Data are mean ± SEM of at least 3 separate
uptake determinations.
Figure 4. Initial rate of folic acid uptake as a function of concentration by ARPE-19 cells
expressing the shortened folt-1.
Confluent monolayers of the ARPE-19 cells expressing the shortened folt-1 were
incubated in the presence of different concentrations of [3H]-folic acid. Uptake was determined
following 7 min of incubation in Krebs-Ringer buffer pH 5.5 at 37°C. Uptake by the saturable
component was calculated as described in “Methods”. Data are means ± SE of at least 3 separate
uptake determinations. When not shown, SE bars are within the symbol size.
Figure 5. Dixon plot for the effect of the folate structural analogues folinic acid (A) and
methotrexate (MTX) (B) on uptake of [3H]-folic acid by ARPE-19 cells expressing the
shortened folt-1.
Confluent monolayers of ARPE-19 cells expressing the shortened folt-1 were incubated
for 7 min (initial rate) at 37°C in Krebs-Ringer buffer pH 5.5. [3H]-Folic acid [0.1 (o) and 1 (●)
µM) and different concentrations of 5-formyltetrahydrofolic acid (folinic acid) and methotrexate
(MTX) were added at the onset of incubation. Data are mean ± SE of at least 3 separate uptake
determinations.
Page 34 of 51

35
Figure 6. Dixon plot for the effect of sulfasalazine on folic acid uptake by ARPE-19 cells
expressing the shortened folt-1.
Confluent monolayers of ARPE-19 cells expressing the shortened folt-1 were incubated
for 7 min (initial rate) at 37°C in Krebs-Ringer buffer pH 5.5. [3H]-Folic acid [0.1 (o) and 1 (●)
µM] and different concentrations of sulfasalazine were added at the onset of incubation. Data
are mean ± SE of at least 3 separate uptake determinations.
Figure 7. (A) Effect of silencing the folt-1 gene with RNAi on mRNA levels of the
endogenous folt-1.
Total RNA was isolated from the control and folt-1 gene specific RNAi fed animals and
was analyzed by quantitative real-time PCR for the level of folt-1 transcripts as described in
“Methods”. Data were normalized relative to the house-keeping gene, β-actin.
(B) Effect of silencing the folt-1 gene with RNAi on folate uptake by C. elegans.
Age synchronized young adult wild-type C. elegans fed with E. coli expressing folt-1
RNAi plasmids or with normal bacteria (control) for 16 h as described in “Methods”. Uptake by
the whole animal (at 21°C) was examined by incubating (5 min) in Krebs-Ringer buffer pH 5.5
in the presence of [3H]-folic acid (16 nM) or [14C]-Ascorbic acid (30 µM). Each data point
represents the mean ± SE of 3 to 6 separate uptake determinations from different batches of
animals. Five nematodes were added to each set of experiments. Notice the significant (p <
0.01) inhibition in carrier-mediated folate uptake but not in the uptake of the unrelated ascorbic
acid in the folt-1 RNAi fed C. elegans compared to controls.
Page 35 of 51

36
(C) Intron-exon organization of the folt-1 showing the deletion region in the KO
animals.
Exons are indicated in boxes. The KO consortium produced folt-1 gene knock-out allele,
is shown at the bottom (ok1460; dark box). The deletion covers most of coding regions and
functional sites including the predicted TM domains (2-10) of the folt-1. Figure adopted from
http://worm.imbb.forth.gr/db/gene/gene?name=WBGene00007388;class=Gene.
(D) Confirmation of folt-1 homozygote knock-outs from the deletion strain VC959 C.
elegans.
Single worm genomic DNA was analyzed by PCR for the presence of the full-length
wild-type folt-1 (~2250 bp) and the knock out folt-1 (~1040 bp) fragments. Lane 1 indicates the
DNA molecular weight markers. Lanes 2-5 include PCR products that indicate homozygote KO
folt-1, and lanes 6-9 include the PCR product indicate the wild-type folt-1.
(E) Effect of knocking out the folt-1 on folate uptake by the C. elegans.
Wild- type and folt-1 knockout C. elegans were incubated (at 21oC) for 5 min in Krebs-
Ringer buffer pH 5.5 in the presence of [3H]-folic acid (16 nM) or [3H]-biotin (9.6 nM). Each
data point represents the mean ± SE of 3 to 6 separate uptake determinations from different
batches of animals. Five nematodes were added to each incubation reaction. Notice the
significant (p < 0.01) inhibition in folate uptake, but not in the uptake of the unrelated biotin, in
the knockout C. elegans compared to wild-type.
Page 36 of 51

37
Figure 8. Activity of the folt-1 promoter in vivo.
A representative transgenic C. elegans showing the expression of full length promoter
fusion construct, folt-1::GFP. The construct was generated by fusing the folt-1 promoter with
pPD95.75 vector (see “Methods”). Transgenic animals carrying this transcriptional fusion
construct were maintained until F4 generation and scored for the level of GFP expression for the
next few generations. Bottom panel represents the bright field image of the same worm.
Figure 9. Effect of development on the level of folt-1 expression.
(A) Effect of development on the level of expression of the endogenous folt-1 mRNA.
PolyA+ RNA samples were isolated from synchronized C. elegans at different
developmental stages and were used for the real-time PCR analysis as described in “Methods”.
Data were normalized relative to a house-keeping gene, β-actin, and calculated using a relative
relationship method supplied by the manufacturer (Bio-Rad).
(B) Effect of development on the levels of expression folt-1::GFP in the intestine of
living transgenic C. elegans.
Synchronized C. elegans at different developmental stages were monitored for their GFP
fluorescence intensities in the intestinal area. The pixel values were recorded and compared
between each groups. Data are from at least 20 animals from each stage and were done at three
different occasions.
Figure 10. Effect of folate levels in culture media on endogenous folt-1 mRNA level (A) and
on [3H]-folic acid uptake (B) by whole living young adult C. elegans.
Page 37 of 51

38
Young adult wild-type C. elegans were maintained for 24 h in a culture medium
containing high (over-supplemented) and low (control) concentrations of folate as described in
“Methods”. (A) Poly A+ RNA isolated from these young adult nematodes under the above
mentioned conditions, were used for the real-time PCR analysis. Data were normalized relative
to a house keeping gene, β-actin. (B) [3H]-Folic acid (16 nM) uptake was examined following 5
min incubation at 37oC in Krebs-Ringer Buffer pH 5.5 as described in “Methods”. Each data
point represents the mean ± SE of 3 to 6 separate uptake determinations from different batches of
animals. Five young adult nematodes were used in each experiment.
Figure 11. Effect of maintaining C. elegans in growth media over-supplemented with folate
on the activity of the folt-1 promoter in living animals.
Transgenic C. elegans expressing the folt-1::GFP were maintained in control (A) and
folate over-supplemented (B) conditions. Intensity of the GFP fluorescence in the intestine of
transgenic animals was determined as described in “Methods”. (C) Represents comparison of the
level of folt-1::GFP expression in animals maintained under two different folate conditions.
Page 38 of 51

39
Folt-1 1 MSWRTTTAILCLYGAVKEFRPATPFLTPFLASPEKNIThRFC MVPSSPAVEKQVPVEPGPDPELRSWRHLVCYLCFYGFMAQIRPGESFITPYLLGPDKNFTConsensus ......................mSWRhltaiLCfYGama#fRPaepFiTP%LagP#KNfT
61Folt-1 LDELYSQVYPYWTYSYMLALIPMFILTDILRYKPIVMIEAIGLVATWALLVFGKGVWQMQhRFC REQVTNEITPVLSYSYLAVLVPVFLLTDYLRYTPVLLLQGLSFVSVWLLLLLGHSVAHMQConsensus l##ltn#itPvlsYSY$aaLiPmFiLTDiLRYkPil$i#aigfVatWaLLlfGhgVahMQ
121Folt-1 IMQVSFGVASAAEIAYYSYIYSIVDRKHYKRATSYIRAAALMGKLVAFGLGQTLISTHTShRFC LMELFYSVTMAARIAYSSYIFSLVRPARYQRVAGYSRAAVLLGVFTSSVLGQLLVTVGRVConsensus iM#lf%gVamAAeIAYsSYI%SiVdpahYkRaagYiRAAaL$GkftafgLGQlListgrs
181Folt-1 DYLVLNQISLGAVCLVTIIAIFLPRVKS EKAKVSMRAHEIVEQQTVESVESVQTPKhRFC SFSTLNYISLAFLTFSVVLALFLKRPKRSLFFNRDDRGRCETSASELERMNPGPGGKLGHConsensus d%ltLNqISLaalcfstiiAiFLkRpKr....#kadrgmcaheasEl#rm#pgeggklgh
241Folt-1 AVKMSYTREYFKKISEELQICSKNQELLKWSLWWALASCGVYQVQNYTQSLWKELQ NNhRFC ALRVACGDSVLARMLRELGDSLRRPQLRLWSLWWVFNSAGYYLVVYYVHILWNEVDPTTNConsensus AlkmacgdevfakileELgdclknp#LlkWSLWWafaSaGvYlVqnYthiLWkEl#..nN
301Folt-1 PDDVANGVVEFVNTALGAFLSLFIHHLSIDWT LRYVLRAhRFC SARVYNGAADAASTLLGAITSFAAGFVKIRWARWSKLLIAGVTATQAGLVFLLAHTRHPSConsensus padVaNGaa#aanTaLGAflSfaagflkIdWa................Lr%lLaa.....
361 Folt-1 NVAKELSSNNHGLIFGCNTFVAVCLQSLLTLVVVDhRFC SIWLCYAAFVLFRGSYQFLVPIATFQIASSLSKELCALVFGVNTFFATIVKTIITFIVSDConsensus .........................#iAkeLSk#lcaLiFGcNTFfAtclksiiTfiVsD
421 ∗Folt-1 SRFLHLDIRTQFVIYSGYFALVASIFAFFFMISLFSKSSNAH TAQTTYEATNEIQhRFC VRGLGLPVRKQFQLYSVYFLILSIIYFLGAMLDGLRHCQRGHHPRQPPAQGLRSAAEEKAConsensus sRfLgLdiRkQFqiYSgYFailaiI%affaMidgfrhcqnaH.....pAQglreAa#Eia
481Folt-1 EETVFLDQNhRFC AQALSVQDKGLGGLQPAQSPPLSPEDSLGAVGPASLEQRQSDPYLAQAPAPQAAEFLSPVConsensus a#alfl##k...................................................
Folt-1 541hRFC TTPSPCTLCSAQASGPEAADETCPQLAVHPPGVSKLGLQCLPSDGVQNVNQConsensus ...................................................
Figure 1A
Page 39 of 51

40
Predicted secondary structure
Figure 1B
1 2 3 4 5 6 7 8 9TMD
NH+
COO-
Asn 36Asn 260
10
Membrane
OUT
IN
*
1 2 3 4 5 6 7 8 9TMD
NH+
COO-
Asn 36Asn 260
10
Membrane
OUT
IN
*
Page 40 of 51

41
A
B
Figure 2
0
5
10
Contro
lfo
lt-1
mR
NA
exp
ress
ion
over
β-a
ctin
(in
fold
s)
folt-
2
0
5
10
Contro
lfo
lt-1
mR
NA
exp
ress
ion
over
β-a
ctin
(in
fold
s)
folt-
2
Cells expressing shortened folt-1
Contro
l Vec
tor
Folic
acid
Thiam
ine
Biotin
Ascor
bic a
cid
3 [H
] Fo
lic A
cid
upta
ke(f
mol
/mg
prot
ein/
7 m
in)
0
12
No ad
ditio
n
Cells expressing shortened folt-1
Contro
l Vec
tor
Folic
acid
Thiam
ine
Biotin
Ascor
bic a
cid
3 [H
] Fo
lic A
cid
upta
ke(f
mol
/mg
prot
ein/
7 m
in)
0
12
No ad
ditio
n
Page 41 of 51
42
A
B
Figure 3
0
12
5.0
5.5
6.0
6.5
7.0
7.4
8.0
3 [H
]-Fo
lic
acid
upt
ake
(fm
ol/m
g pr
otei
n/7
min
)
0
12
5.0
5.5
6.0
6.5
7.0
7.4
8.0
3 [H
]-Fo
lic
acid
upt
ake
(fm
ol/m
g pr
otei
n/7
min
)
0
12
Contro
l (Na+
)
K+
Li+
TrisCho
line
NH 4+
3 [H
]-Fo
lic
acid
upt
ake
(fm
ol/m
g pr
otei
n/7
min
)
0
12
Contro
l (Na+
)
K+
Li+
TrisCho
line
NH 4+
3 [H
]-Fo
lic
acid
upt
ake
(fm
ol/m
g pr
otei
n/7
min
)
Page 42 of 51

43
Figure 4
0
5
10
3 [H
]-Fo
lic
acid
upt
ake
(pm
ol/m
g pr
otei
n/7
min
)
5 10
Folic acid [µM]
Km= 1.23 ± 0.18 µMVmax= 7.28 ±1.1 pmol/mg protein/7 min
0
5
10
3 [H
]-Fo
lic
acid
upt
ake
(pm
ol/m
g pr
otei
n/7
min
)
5 10
Folic acid [µM]
0
5
10
3 [H
]-Fo
lic
acid
upt
ake
(pm
ol/m
g pr
otei
n/7
min
)
5 10
Folic acid [µM]
Km= 1.23 ± 0.18 µMVmax= 7.28 ±1.1 pmol/mg protein/7 min
Page 43 of 51

44
A
B
Figure 5
1.5
-20 -10
Methotrexate [µM]
0.5
1
Folic
aci
d up
take
(1
/fm
ol/m
g pr
otei
n/7
min
)
-Ki= 1.6 ± 0.2 µM)
0 10 20
1.5
-20 -10
Methotrexate [µM]
0.5
1
Folic
aci
d up
take
(1
/fm
ol/m
g pr
otei
n/7
min
)
-Ki= 1.6 ± 0.2 µM)
0.5
1
Folic
aci
d up
take
(1
/fm
ol/m
g pr
otei
n/7
min
)
-Ki= 1.6 ± 0.2 µM)
0 10 200 10 20
0 10 20
Folinic acid [µM]
0.5
1
Folic
aci
d up
take
(1/f
mol
/mg
prot
ein/
7 m
in)
-20 -10
-Ki = 2.1±0.3µM
0 10 20
Folinic acid [µM]
0.5
1
Folic
aci
d up
take
(1/f
mol
/mg
prot
ein/
7 m
in)
-20 -10
-Ki = 2.1±0.3µM
0.5
1
Folic
aci
d up
take
(1/f
mol
/mg
prot
ein/
7 m
in)
-20 -10
-Ki = 2.1±0.3µM
Page 44 of 51
45
Figure 6
0.5
1
1.5
3 [H
]-Fo
lic
acid
upt
ake
(1/f
mol
/mg
prot
ein/
7 m
in)
-1 -0.5 0 0.5 1
Sulfasalazine[mM]
-Ki =0.13±0.01 mM
0.5
1
1.5
3 [H
]-Fo
lic
acid
upt
ake
(1/f
mol
/mg
prot
ein/
7 m
in)
-1 -0.5 0 0.5 1
Sulfasalazine[mM]
-Ki =0.13±0.01 mM
Page 45 of 51

46
A
B
Figure 7 (contd.)
0
50
100
Contro
lfo
lt-1
RNAi
Who
le a
nim
al u
ptak
e (%
)
Contro
l
folt-
1RNAi
3[H]-Folic acid 14[C]-Ascorbic acid
0
50
100
Contro
lfo
lt-1
RNAi
Who
le a
nim
al u
ptak
e (%
)
Contro
l
folt-
1RNAi
3[H]-Folic acid 14[C]-Ascorbic acid14[C]-Ascorbic acid
0
3
6
Contro
lRel
ativ
e fo
lt-1
mR
NA
exp
ress
ion
over
β-a
ctin
(in
fol
ds)
folt-
1 RNAi
0
3
6
Contro
lRel
ativ
e fo
lt-1
mR
NA
exp
ress
ion
over
β-a
ctin
(in
fol
ds)
folt-
1 RNAi
Page 46 of 51

47
C
D
E
Figure 7
Mr folt-1-/- Wild-type
1 2 3 4 5 6 7 8 9
40,000
15,00010,0003,0542,0361,636
1,018
517
1040 bp
2250 bp
Mr folt-1-/- Wild-type
1 2 3 4 5 6 7 8 9
40,000
15,00010,0003,0542,0361,636
1,018
517
40,000
15,00010,0003,0542,0361,636
1,018
517
1040 bp1040 bp
2250 bp2250 bp
0
100
Wild
type
folt-
1-/-
KO
Wild
type
folt-
1-/- KO
Who
le a
nim
al u
ptak
e (%
)
3[H]-Folic acid
50
3[H]-Biotin
0
100
Wild
type
folt-
1-/-
KO
Wild
type
folt-
1-/- KO
Who
le a
nim
al u
ptak
e (%
)
3[H]-Folic acid
50
3[H]-Biotin
C. elegans genomic segment: V:11141304…11142870
11142 k
Exon 1 Exon 2 Exon 3 Exon 4 Exon 5
folt-1 (C06H2.4)
ok1460
Deleted region
C. elegans genomic segment: V:11141304…11142870
11142 k
Exon 1 Exon 2 Exon 3 Exon 4 Exon 5
folt-1 (C06H2.4)
ok1460
Deleted region
C. elegans genomic segment: V:11141304…11142870
11142 k
Exon 1 Exon 2 Exon 3 Exon 4 Exon 5
folt-1 (C06H2.4)
ok1460
Deleted region
Page 47 of 51

48
Figure 8
Page 48 of 51

49
A
B
Figure 9
0
3000
6000
9000
Fluo
resc
ence
Int
ensi
ty
(in
pixe
ls)
0
Larva 1
Adult
Larva
2
Young
Adu
lt0
3000
6000
9000
Fluo
resc
ence
Int
ensi
ty
(in
pixe
ls)
0
Larva 1
Adult
Larva
2
Young
Adu
lt
0
2.5
5
Larva
1
Larva
2
Young
Adu
lt
Adult
Rel
ativ
e m
RN
A e
xpre
ssio
n (i
n fo
lds)
0
2.5
5
Larva
1
Larva
2
Young
Adu
lt
Adult
Rel
ativ
e m
RN
A e
xpre
ssio
n (i
n fo
lds)
0
2.5
5
Larva
1
Larva
2
Young
Adu
lt
Adult
Rel
ativ
e m
RN
A e
xpre
ssio
n (i
n fo
lds)
0
2.5
5
Larva
1
Larva
2
Young
Adu
lt
Adult
Rel
ativ
e m
RN
A e
xpre
ssio
n (i
n fo
lds)
Page 49 of 51

50
A
B
Figure 10
0
1
2
Folate
over-
supp
lemen
tedCon
trolR
elat
ive
folt
-1m
RN
A e
xpre
ssio
nov
er β
-act
in (
in f
olds
) 0
1
2
Folate
over-
supp
lemen
tedCon
trolR
elat
ive
folt
-1m
RN
A e
xpre
ssio
nov
er β
-act
in (
in f
olds
)
0
0.5
1.0Fo
late
over
-supp
lemen
ted
Contro
l
[3 H]
-fol
ic a
cid
upta
ke(f
mol
/5 a
nim
als/
5 m
in)
0
0.5
1.0Fo
late
over
-supp
lemen
ted
Contro
l
[3 H]
-fol
ic a
cid
upta
ke(f
mol
/5 a
nim
als/
5 m
in)
Page 50 of 51

51
A) Control
B) Over supplemented
C) GFP expression levels in the intestine
Figure 11
0
50
100
Contro
l
Fola
te
over
supp
lem
ente
d
GFP
flu
ores
cenc
e in
tens
ity
(%)
0
50
100
Contro
l
Fola
te
over
supp
lem
ente
d
GFP
flu
ores
cenc
e in
tens
ity
(%)
Page 51 of 51