Impact of Folate Absorption and Transport for Nutrition and ...
260
Impact of Folate Absorption and Transport for Nutrition and Drug Targeting Dissertation zur Erlangung des Grades “Doktor der Naturwissenchaften” am Fachbereich Chemie, Pharmazie und Geowissenschaften der Johannes Gutenberg-Universität Mainz N. Ceren Alemdaroglu geb. in Ankara Mainz 2007
-
Upload
khangminh22 -
Category
Documents
-
view
0 -
download
0
Transcript of Impact of Folate Absorption and Transport for Nutrition and ...
Impact of Folate Absorption and Transport for
Nutrition and Drug Targeting
Dissertation
zur Erlangung des Grades
“Doktor der Naturwissenchaften”
am Fachbereich
Chemie, Pharmazie und Geowissenschaften
der Johannes Gutenberg-Universität Mainz
N. Ceren Alemdaroglu
geb. in Ankara
Mainz 2007

ii

v
Dedicated to my husband, Fikri…

vi
ix
TABLE OF CONTENTS
Acknowledgements………………………………………………………………......vii
Table of contents……………………………………………………………………..ix
List of abbreviations…………………………………………………………………xi
Chapter 1…...Chemistry, biochemical role, absorption and significance
of folic acid & general aspects of flavonoids…….…………………...1
Objectives……………………………………………………………35
References……………………………………………………………37
Chapter 2…..In vitro cell culture studies, drug- and nutrient- interactions
of folic acid ………………………....................................................51
Chapter 2.1…In vitro cell culture model for studying folic acid interactions……...53
Chapter 2.2…Expression of folate transport routes in Caco-2 cells: Reverse
transcription PCR (RT-PCR) and real-time PCR……………………79
Chapter 2.3…Effect of green tea catechins and tea extracts on folic acid uptake….90
Chapter 2.4…Investigation of the interaction between folic acid and selected
flavonoids at the level of intestinal absorption……………………...106
Chapter 2.5…Investigation of the interaction between folic acid and
antiepileptics at the level of intestinal absorption………………….. 114
Chapter 2.6…In vitro toxicology assays………………………………………….. 121
Chapter 2.7…Scintillation counting………………………………………………. 124
References………………………………………………………….. 126
Chapter 3…...Influence of green and black tea on folic acid
Pharmacokinetics in healthy volunteers: A potential risk of
diminished folic acid bioavailability……………………….……….137
x
References…………………………………………………………..161
Chapter 4…..Targeting of DNA block copolymer micelles to folate
receptors: A new system for selective drug delivery to FRα
expressing cancer cells …………………..........................................167
References…………………………………………………………..184
Chapter 5…...Summary............................................................................................191
Zusammenfassung…………………………………………………..194
Curriculum Vitae……………………………………………………197
Chapter 6…...Appendix……………………………………………………………199
xi
LIST OF ABBREVIATIONS
10-FTHF 10-Formyltetrahydrofolate
5,10-MeTHF 5,10-Methylenetetrahydrofolate
5-FTHF 5-Formyltetrahydrofolate
5-MTHF 5-Methyltetrahydrofolate
ABC ATP-binding cassette
ATCC American Type Culture Collection
BCRP Breast cancer resistance protein
BSA Bovine serum albumin
CLSM Confocal laser scanning microscopy
CV Coefficient of variation
CYP Cytochrome P450
DFE Dietary Folate Equivalent
DHF Dihydrofolate
DHFR Dihydrofolate reductase
DLS Dynamic light scattering
DMSO Dimethyl sulfoxide
DSMZ Deutsche Sammlung von Mikroorganismen und Zellkulturen
EC (-)-Epicatechin
ECG (-)-Epicatechin-3-gallate
EGC (-)-Epigallocatechin
EGCG (-)-Epigallocatechin-3-gallate
ESI-MS Electrospray ionization-mass spectrometry
FDA Food and Drug Administration
FPGS Folylpolyglutamate synthetase
FR Folate receptor
GAPDH Glyceraldehyde-3-phosphate dehydrogenase
HBSS Hank`s buffered salt solution
HEPES 2-[4-(2-Hydroxyethyl)-1-piperazinyl]-ethanesulfonic acid
Km Michaelis-Menten constant
IECs Intestinal epithelial cells
MCT Monocarboxylate transporter
xii
MDR Multidrug resistance
MES 2-Morpholinoethanesulfonic acid monohydrate
MRP Multidrug resistance protein
MTHFR Methylenetetrahydrofolate reductase
MTX Methotrexate
NHS N-hydroxysuccinimide
NTDs Neural tube defects
OATP Organic anion transporting polypeptides
OD Optical density
ODN Oligodeoxynucleotide
PAGE Polyacrylamide gel electrophoresis
PBS Phosphate buffered saline
PCFT Proton-coupled folate transporter
PCR Polymerase chain reaction
Peff Effective permeability coefficient
Pgp P-glycoprotein
pKa Dissociation constant
PPO Poly(propylene oxide)
RDA Recommended dietary allowance
RFC Reduced folate carrier
RT-PCR Reverse transcription PCR
SGLT1 Sodium-dependent glucose transporter
SLC Solute carrier
TEER Transepithelial electrical resistance
THF Tetrahydrofolate

CHAPTER ONE
CHEMISTRY, BIOCHEMICAL ROLE, ABSORPTION AND
SIGNIFICANCE OF FOLIC ACID
&
GENERAL ASPECTS OF FLAVONOIDS

CHAPTER 1
2
INTRODUCTION – A LITERATURE REVIEW
3
1.1 INTRODUCTION
FOLIC ACID
Chemistry and structure
Folic acid, also known as pteroylmonoglutamate or vitamin B9, is a water-soluble member of
B-complex family of vitamins. It is the most oxidized, stable and synthetic analog of the large
family of folates. The generic term “folate” refers to the class of compounds having a
chemical structure and nutritional activity similar to that of folic acid [1]. Folates are
chemically labile compounds [2]. The stability of reduced folates is pH-dependent, being
most stable at pH>8 and pH<2 and least stable between pH 4-6. The chemical reactivity of
some folates makes the vitamin vulnerable to losses during food processing. The losses were
reported to occur via oxidative degradation induced by oxygen, light and heat. Oxidation
results in a splitting of the molecule into biologically inactive forms [1]. Because of its
chemical stability, folic acid is the form, generally used in vitamin supplements and in
fortified food products [3].
2
N3
4
4a
8a
N1
N5
6
7N8
OH
H2N
9
NH10
4`
3`
2`
1`
6`
5`
NH
O
COOH
COOH6-methylpterin p-aminobenzoic acid
Glutamate
Pteroylglutamic acid (Folic acid)
Pteroic acid
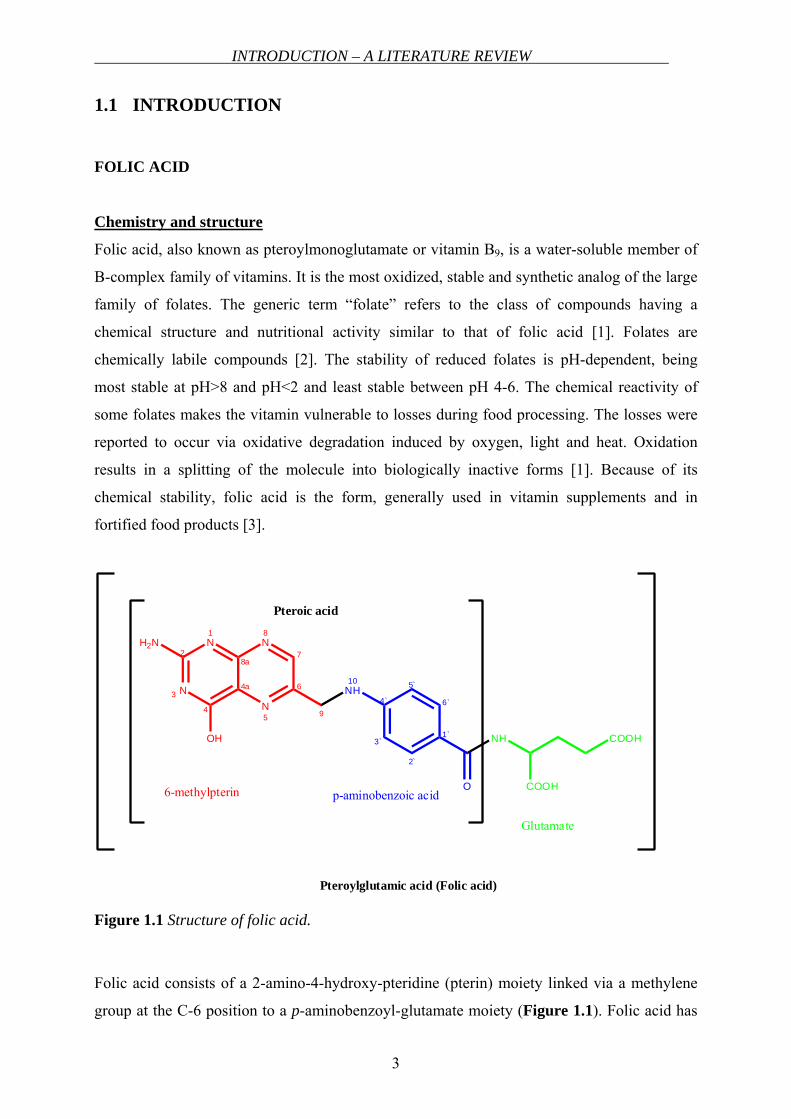
Figure 1.1 Structure of folic acid.
Folic acid consists of a 2-amino-4-hydroxy-pteridine (pterin) moiety linked via a methylene
group at the C-6 position to a p-aminobenzoyl-glutamate moiety (Figure 1.1). Folic acid has
CHAPTER 1
4
three dissociable groups on the molecule, the α- and γ-carboxyl groups of the glutamyl
moiety with dissociation constants (pKa values) of 3.46 and 4.98, respectively, and the N-1
nitrogen in the pteridine moiety with pKa 2.38 [4]. Folate is vital in humans for several
metabolic reactions involved in the formation and transfer of one-carbon units [5]. Due to its
beneficial role in preventing a range of disorders, such as megaloblastic anemia, neurological
disturbances, neural tube defects, vascular diseases and thrombosis, it has attracted
widespread attention since years [6]. In nature, the vitamin exists primarily as reduced, one-
carbon substituted forms of pteroylglutamates, differing in substituent and number of
glutamyl residues attached to the pteroyl group. Most of the naturally occurring dietary folates
have a side chain of five to seven glutamate residues connected by γ-peptide linkages.
Biochemical role of folates
Intracellular metabolism of folates involves:
• Polyglutamation
Before being stored in tissue or used as a coenzyme, monoglutamate folate is
converted to the polyglutamate form by the enzyme “folylpolyglutamate synthetase
(FPGS)”. This process is known as polyglutamation (also see below).
• Reduction of dihydrofolate (DHF) to tetrahydro- species
• One carbon transfer reactions
The main biochemical function of folates is the role in one-carbon transfer or methylation
reactions. There are five major one-carbon transfer reactions occurring within the cell.
Namely; conversion of serine to glycine, catabolism of histidine and synthesis of
thymidylate, methionine and purine. These reactions take place through various electron
transfer steps facilitated by specific enzyme systems and co-enzymes such as FADH2 and
NADPH [2].
Folates are present in blood as monoglutamates, primarily as 5-methyltetrahydrofolate (5-
MTHF). However virtually all cellular folates exist as long-chain polyglutamate derivatives.
In this biochemical transformation mediated by FPGS, glutamate molecules are added one by
one to the γ-carboxyl acid moiety of the pteroylglutamate molecule. This change results in the
retention of these polyglutamyl derivatives in cells, because these are not substrates for folate
transport systems. The polyglutamyl derivatives of most natural folates are better substrates
INTRODUCTION – A LITERATURE REVIEW
5
than their monoglutamyl form for tetrahydrofolate-cofactor-requiring enzymes. These are the
active forms of folate-cofactors in cells [7].
The rate and extent of polyglutamation in cells is determined by a variety of factors. First,
monoglutamate folate must be transported into the cell that is substrate for FPGS. The
concentration of free monoglutamylfolate is critical, as polyglutamates accumulate and
feedback inhibit FPGS. Natural folates utilize this enzyme to add glutamate residues. The
higher their level in cells, the lower is the rate of polyglutamation of the monoglutamate that
is present at much lower concentrations. At some point the level of polyglutamates in cells is
high enough to suppress the entry of monoglutamates into the polyglutamate pool completely.
At that point, the tetrahydrofolate-cofactor pool is at steady-state; the rate of monoglutamyl
glutamylation is equal to the rate of hydrolysis mediated by γ-glutamyl hydrolase and the very
low rates of leakage from cells. The steady-state level varies among different tissues. For
example, tumor cells use folates rapidly as they divide. Other tissues such as liver and kidney,
serve mainly as storage depots for folates [7].
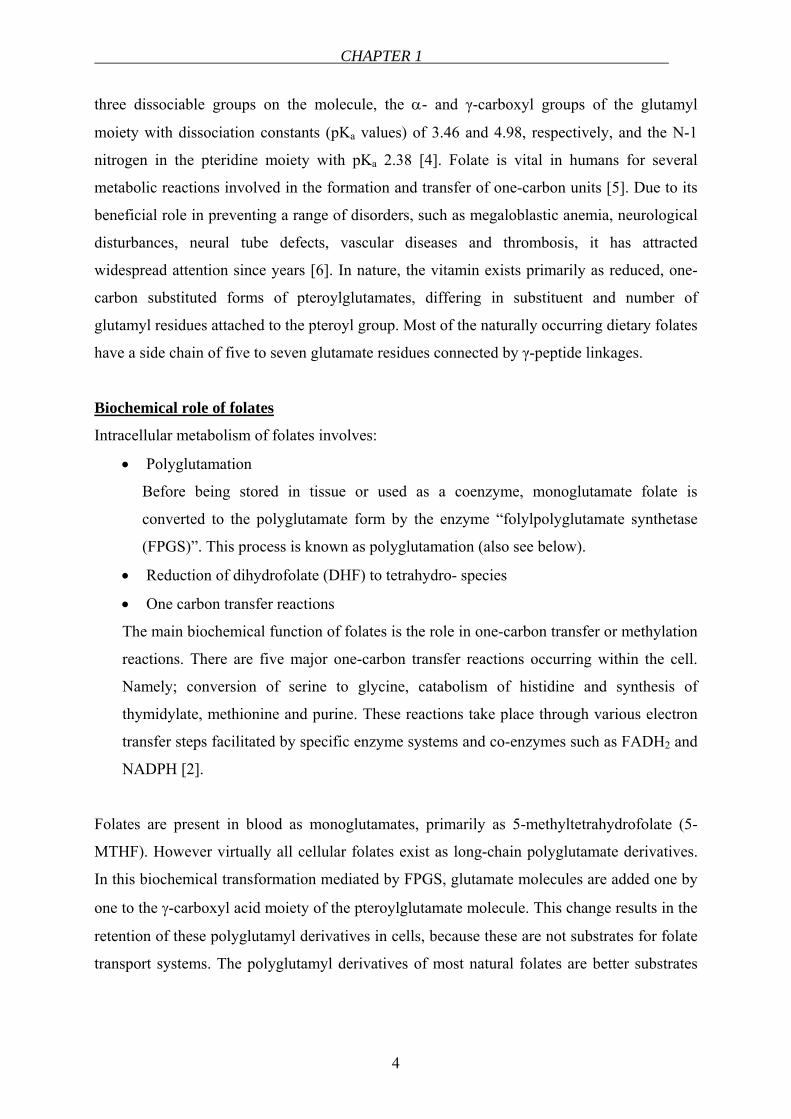
Before folate can carry a one-carbon unit, it must be reduced to the tetrahydro- form. This is
carried out by a single enzyme, dihydrofolate reductase (DHFR) (Figure 1.2) that reduces
folic acid to DHF and also DHF to tetrahydrofolate (THF). Folic acid is not a natural
compound but it is much more stable than the majority of the reduced folates. Folic acid is
also reduced to dihydro- and tetrahydro- forms by DHFR in order to serve as a vitamin [8].
Intracellular compartments where folate takes part in chemical reactions include both the
cytoplasm and mitochondria. Within the cytoplasm, folate is a cofactor in amino acid
metabolism, histidine catabolism, and the regeneration of methionine from homocysteine,
deoxyuridylate conversion to thymidylate, purine synthesis and the disposal of single carbon
species. Whereas in the mitochondria, folate is involved with the formation of glycine from
dimethylglycine, and serine as well as the oxidation of glycine to carbon dioxide and
ammonia [6].
The predominant plasma folate is 5-MTHF which is found in the cells together with other
THF cofactors. These THF-cofactors carry a one-carbon group at different oxidation states at
the N5 or N10 positions, or shared by both nitrogen atoms [7]. The folates get their one-
carbon groups from either the C-3 of serine or from formate (Figure 1.2).
CHAPTER 1
6
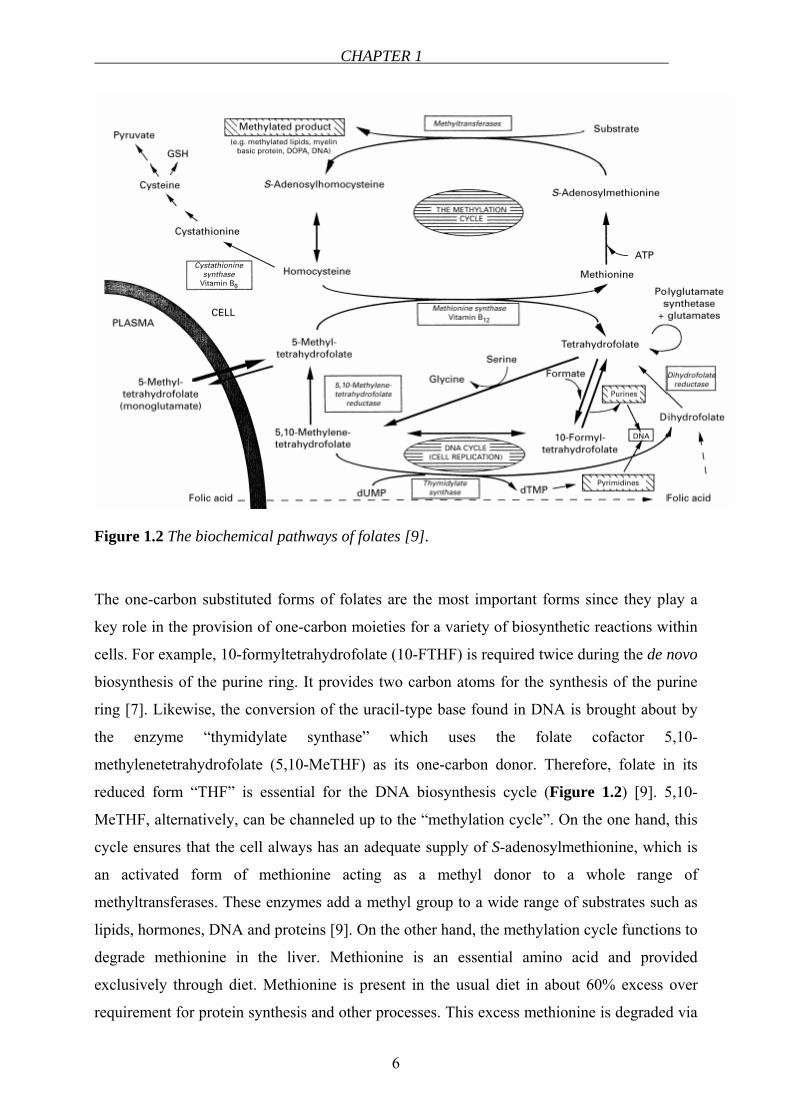
Figure 1.2 The biochemical pathways of folates [9].
The one-carbon substituted forms of folates are the most important forms since they play a
key role in the provision of one-carbon moieties for a variety of biosynthetic reactions within
cells. For example, 10-formyltetrahydrofolate (10-FTHF) is required twice during the de novo
biosynthesis of the purine ring. It provides two carbon atoms for the synthesis of the purine
ring [7]. Likewise, the conversion of the uracil-type base found in DNA is brought about by
the enzyme “thymidylate synthase” which uses the folate cofactor 5,10-
methylenetetrahydrofolate (5,10-MeTHF) as its one-carbon donor. Therefore, folate in its
reduced form “THF” is essential for the DNA biosynthesis cycle (Figure 1.2) [9]. 5,10-
MeTHF, alternatively, can be channeled up to the “methylation cycle”. On the one hand, this
cycle ensures that the cell always has an adequate supply of S-adenosylmethionine, which is
an activated form of methionine acting as a methyl donor to a whole range of
methyltransferases. These enzymes add a methyl group to a wide range of substrates such as
lipids, hormones, DNA and proteins [9]. On the other hand, the methylation cycle functions to
degrade methionine in the liver. Methionine is an essential amino acid and provided
exclusively through diet. Methionine is present in the usual diet in about 60% excess over
requirement for protein synthesis and other processes. This excess methionine is degraded via
INTRODUCTION – A LITERATURE REVIEW
7
the methylation cycle to homocysteine. At that point, homocysteine can either be catabolized
to sulfate and pyruvate, or can be remethylated back to methionine. Whether homocysteine is
degraded or conserved by its remethylation back to methionine depends on how well the cycle
is maintaining intracellular S-adenosylmethionine [9].
In this latter reaction, the methyl group of 5-MTHF is transferred to homocysteine, which is
catalyzed by methionine synthase. The result is the regeneration of THF and the formation of
methionine. The cofactor of methionine synthase is vitamin B12 (cobalamin). In the absence of
vitamin B12, 5-MTHF accumulates in the cell. This is an irreversible process (Figure 1.2) [6].
Thus, continuous transfer of methyl groups depends upon 5-MTHF and cobalamin. This is the
only known direct linkage of the two vitamins in man. Folate and cobalamin depend on and
utilize each other. In cobalamin deficiency, even when there are enough folates and 5-MTHF,
there can be an intracellular deficiency of biologically active THF. This is called the “folate
trap” [10]. 5-MTHF is increasingly “trapped” because it can neither be converted to THF nor
go back to 5,10-MeTHF. In this case, the very important methylation cycle will be reduced
which will lead to clinical implications such as:
• Cofactors of one-carbon transfer reactions are decreased and cell division rates are
limited.
• Polyglutamate synthesis ceases, limiting the pool to monoglutamates which are not
effectively retained by the cell.
• Methionine synthase activity is decreased due to insufficient cobalamin with
secondary reduction of folate metabolism and reduced de novo synthesis of purines
and pyrimidines.
Homocysteine is a sulfur-containing amino acid formed during the metabolism of methionine
(Figure 1.2). Homocysteine is metabolized by one of two routes: remethylation and
transsulfuration. In the remethylation cycle, homocysteine is metabolized by a reaction
catalyzed by a vitamin B12-dependent enzyme. Under conditions in which excess methionine
is present or cysteine synthesis is required, homocysteine enters the transsulfuration pathway.
This pathway involves a reaction catalyzed by a vitamin B6-dependent enzyme. The produced
cystathionine is subsequently hydrolyzed to cysteine that may be metabolized to glutathione
or further to sulfate and then excreted in the urine [11].
CHAPTER 1
8
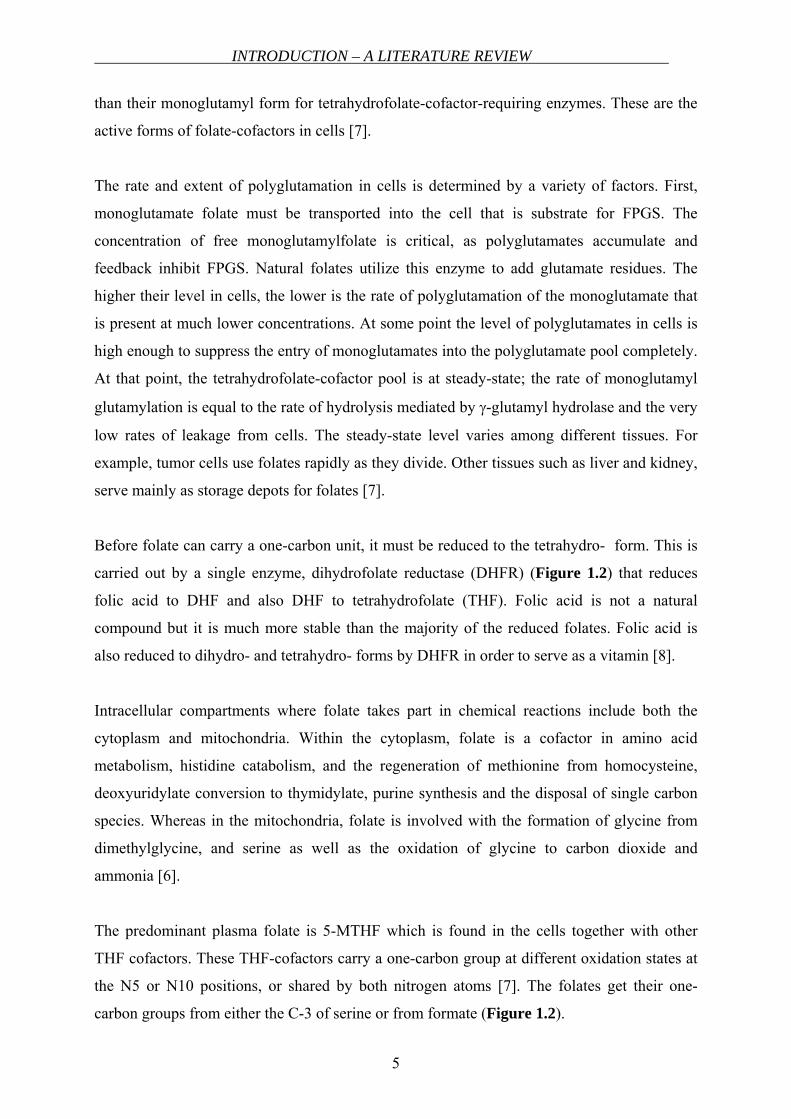
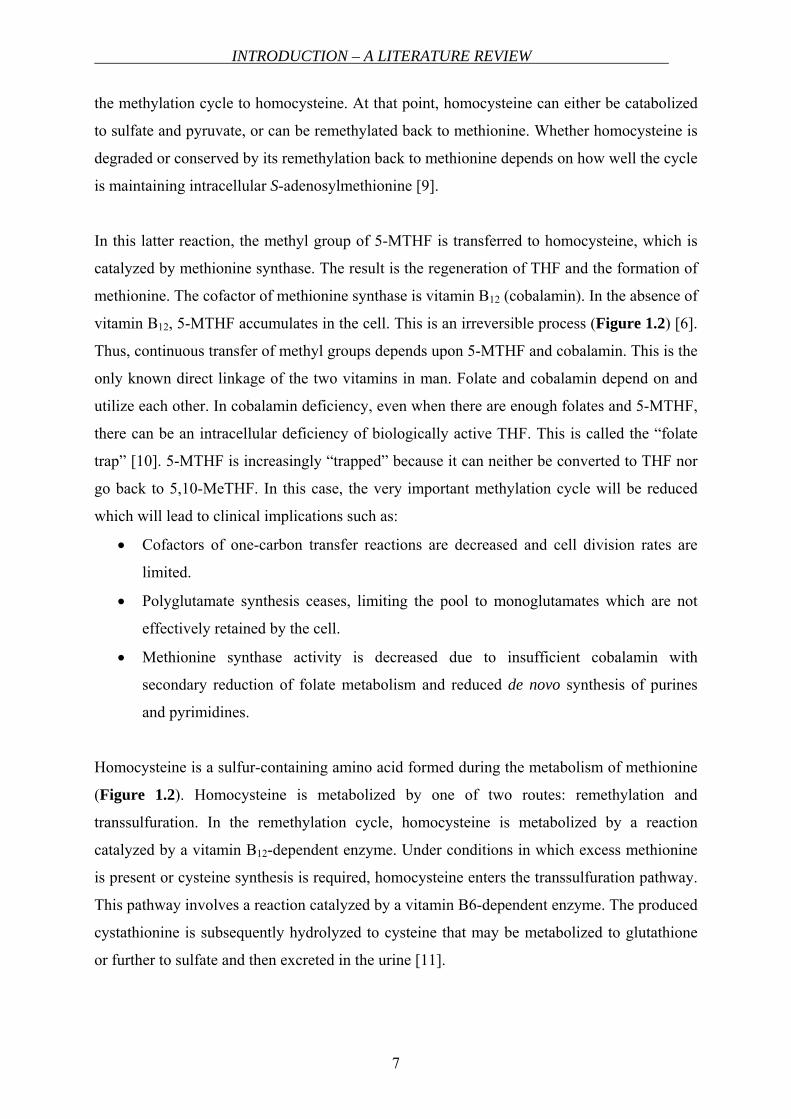
A lack of reduced folates (Figure 1.3) is firstly seen in rapidly dividing and proliferating cells
in hematopoesis in bone marrow [10]. Another clinical consequence of the inhibition of
methylation cycle and impairment of cellular functions is the demyelination of nerves,
resulting in neurological damage [9,10].
2
N3
4
N1
N5
6
7
HN
8
9
HN
10
HN
O
COOH
COOH
OH
H2N
Glutamate
Dihydrofolate
2
N3
4
N1
NH5
6
7
HN
8
9
HN
10
HN
O
COOH
COOH
OH
H2N
Glutamate
Tetrahydrofolate
2
N3
4
N1
NH5
6
7
HN
8
9
N 10
HN
O
COOH
COOH
OH
H2N
Glutamate
CHO
10-Formyltetrahydrofolate
INTRODUCTION – A LITERATURE REVIEW
9
2
N3
4
N1
N5
6
7
HN
8
9
N10
HN
O
COOH
COOH
OH
H2N
Glutamate
CH2
5,10-Methylenetetrahydrofolate
2
N3
4
N1
N5
6
7N8
9
HN
10
HN
O
COOH
COOH
OH
H2N
Glutamate
CH3
5-Methyltetrahydrofolate
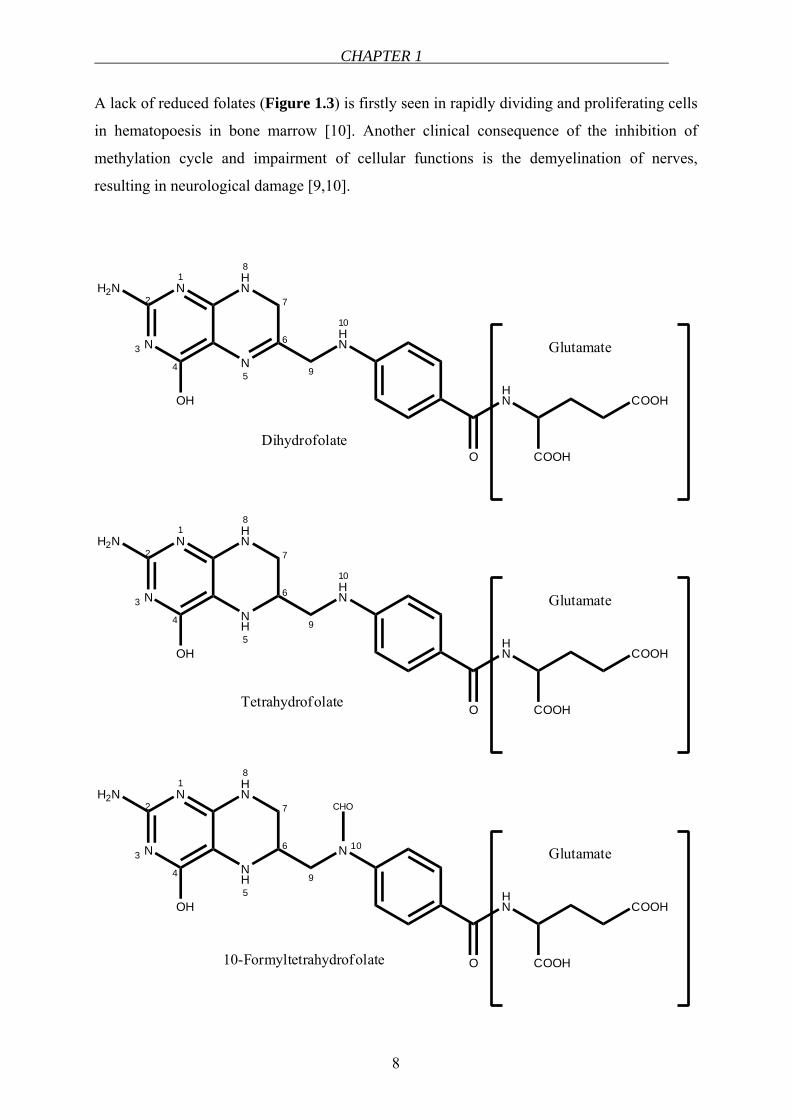
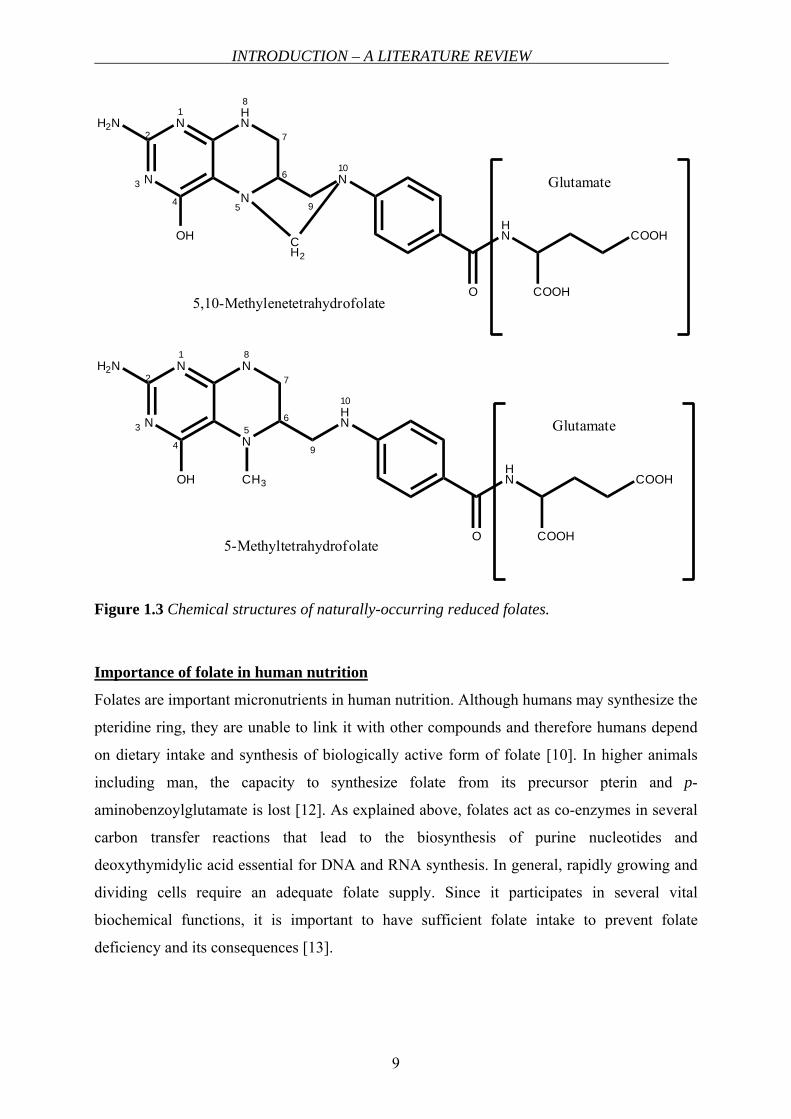
Figure 1.3 Chemical structures of naturally-occurring reduced folates.
Importance of folate in human nutrition
Folates are important micronutrients in human nutrition. Although humans may synthesize the
pteridine ring, they are unable to link it with other compounds and therefore humans depend
on dietary intake and synthesis of biologically active form of folate [10]. In higher animals
including man, the capacity to synthesize folate from its precursor pterin and p-
aminobenzoylglutamate is lost [12]. As explained above, folates act as co-enzymes in several
carbon transfer reactions that lead to the biosynthesis of purine nucleotides and
deoxythymidylic acid essential for DNA and RNA synthesis. In general, rapidly growing and
dividing cells require an adequate folate supply. Since it participates in several vital
biochemical functions, it is important to have sufficient folate intake to prevent folate
deficiency and its consequences [13].
CHAPTER 1
10
Disturbances related to folate status
Folate deficiency is developed due to malnutrition, low intake of folate-containing foods,
severe alcoholism as well as interaction with other drugs. Diseases affecting either intestinal
pH or the jejunal mucosa e.g., celiac disease also lead to folate deficiency caused by
malnutrition. Moreover, in the presence of an increased requirement like in the case of
pregnancy, folate deficiency can also develop [1]. In general, due to its important roles in
human cells, inadequate folate intake firstly leads to a decrease in serum folate concentration.
Then, a decrease in erythrocyte folate concentration, a rise in homocysteine concentration and
megaloblastic changes in the bone marrow and other tissues of rapidly dividing cells are
observed.
Growth rate
Cultured mammalian cells possess a decreased growth rate and increased size when deprived
of folate as bacteria do. Young children deficient in folate grow slowly like folate-deficient
animals such as rats, chicks, hogs and fish [12].
Hyperhomocysteinemia and vascular disease
Elevations in plasma homocysteine are generally caused either by genetic defects in the
enzymes involved in homocysteine metabolism or by nutritional deficiencies in vitamin
cofactors (folate, vitamin B12 and vitamin B6) (see Figure 1.2 and “Biochemical role of
folates” for details) [11]. Elevated plasma total homocysteine levels have been associated with
an increased risk of cardiovascular disease. Hyperhomocysteinemia is an independent risk
factor for atherosclerosis, coronary health disease and venous thromboembolism. As reviewed
by Welch and Loscalzo [11], in a study, 42% of patients with cerebrovascular disease, 28% of
patients with peripheral vascular disease and 30% of patients with coronary artery disease had
hyperhomocysteinemia. Although high homocysteine levels were associated with vascular
disease, the underlying reason for this relationship has not been elucidated.
Birth defects
The neural tube is the embryonic structure that develops into the brain and spinal cord. This
structure starts out as a tiny ribbon of tissue and folds inward to form a closed tube by the 28th
day after conception. Neural tube defects (NTDs) are malformations of the developing brain
and spine, most commonly spina bifida and anencephaly. Spina bifida (open spine) is a defect
of the spine that can cause paralysis and hydrocephalus. Children with the severe form of
INTRODUCTION – A LITERATURE REVIEW
11
spina bifida have some degree of leg paralysis and impaired bladder and bowel control.
Anencephaly is a fatal condition in which a baby is born with a severely under-developed
brain and skull [14]. Periconceptional intake of 0.4 mg folic acid daily was reported to reduce
the risk of NTDs [15].
Cancer
A relationship between folate status and several types of cancers including colorectal, breast,
cervical, pancreatic, brain and lung cancers has been observed. Among these types of cancers,
epidemiologic evidence for such a relationship is more convincing for colorectal cancer [16].
There are epidemiologic studies suggesting folate deficiency increases and folate
supplementation decreases the risk of colorectal cancer [17]. However there are contradicting
findings suggesting that a low folate status protects against colorectal cancer [18].
Down syndrome
Down syndrome is a genetic disease resulting from the presence and expression of three
copies of the genes located on chromosome 21 [19]. The origin of the extra chromosome is
maternal in 95% of the cases and is due to the failure of normal chromosomal segregation
during meiosis. In a study, it was shown that the risk of having a child with Down syndrome
is strongly associated with the MTHFR 677C→T mutation [20]. Moreover, maternal
homocysteine levels were found to be higher in mothers of Down syndrome infants, once
more attributing a preventive role to folic acid supplementation [21].
Dementia and Alzheimer`s disease
Elevated plasma homocysteine level is a strong, independent risk factor for the development
of dementia and Alzheimer`s disease [22]. Higher folate intake was suggested to decrease the
risk of Alzheimer`s disease independent of other risk factors and levels of vitamins B6 and B12
[23].
Impact of methylenetetrahydrofolate reductase enzyme (MTHFR)
MTHFR plays a central role in folate metabolism (Figure 1.2) by irreversibly converting
5,10-MeTHF to 5-MTHF, the primary circulating form of folate. 5-MTHF provides one-
carbon group for the remethylation of homocysteine to methionine [24]. The MTHFR gene is
highly polymorphic in the general population. A common polymorphism in the MTHFR gene
is 677C→T substitution that causes a substitution of valine for alanine in the functional
CHAPTER 1
12
enzyme [25]. This resulting enzyme is the thermolabile variant and was found to have lower
specific activity and higher sensitivity to heat [26]. It is one of the most important genetic
factors affecting the folate status of the body. Individuals with the TT genotype have lower
plasma total folate levels and higher plasma homocysteine levels [27]. Plasma total folate
levels were found significantly lower in the homozygous variants (MTHFR 677TT) compared
with homozygous wild-type (MTHFR 677CC) and heterozygote (MTHFR 677CT)
individuals. Moreover, the concentration of plasma 5-MTHF was lowest in the 677TT group
however; the difference was not statistically significant [28].
The occurrence of MTHFR polymorphism differs among different races. In German
Caucasian population the incidence of MTHFR polymorphism was found as CC, 41.8%; CT,
44.9%; TT, 13.3%, whereas in northern Chinese population it was reported as CC, 17.7%;
CT, 38.3% and TT, 44.0% [29].
Although there are conflicting reports in the literature, it was suggested that the MTHFR
677C→T polymorphism negatively affects the folate and homocysteine response in women
consuming low folate diets [30]. However, in a pharmacokinetic study, no significant
differences in pharmacokinetic parameters were found between patients with the TT genotype
and patients with CC genotype [31]. In another study, the heterozygous genotype (CT) was
shown to be responsible for at least as many NTDs in the population as the homozygous
genotype (TT). According to the report of the same group, the combined CT and TT
genotypes account for about 26% of NTDs in Ireland. Folate or folic acid was estimated to be
involved in about 50% to 70% of these defects [32]. CC genotype was also correlated with a
significantly reduced risk for the development of esophageal squamous cell carcinoma as
compared to the combination of CT and TT genotypes [29]. It was suggested that high intakes
of folate or folic acid would be able to overcome the negative effects of the polymorphism
[26]. Taking into account all those, the negative influence of MTHFR 677C→T
polymorphism on folate status and its clinical consequences are reasonably considerable.
Significance of folate fortification and supplementation
The important role of folates in DNA synthesis and cell replication was well elucidated. The
consequences of folate deficiency result in damage, in particular in tissues with a high
turnover of cells. For instance, the cells originating from bone marrow such as red blood cells
and the cells of intestine are the ones that are most vulnerable to folate deficiency.
INTRODUCTION – A LITERATURE REVIEW
13
Furthermore, the inverse relationship of high homocysteine levels and low folate levels is
linked to higher cardiovascular risk. In addition, in the prevention of NTDs, daily sufficient
folate intake plays an important function. Since the NTD occurs at an early stage of fetal
development, prevention would be the most effective at the earliest phase of pregnancy.
Because over half of all pregnancies are unplanned and because these defects occur in the
developing fetus before most women know they are pregnant, it is important that all women
of child-bearing age consume the needed 400 µg of folic acid daily. Daily recommended
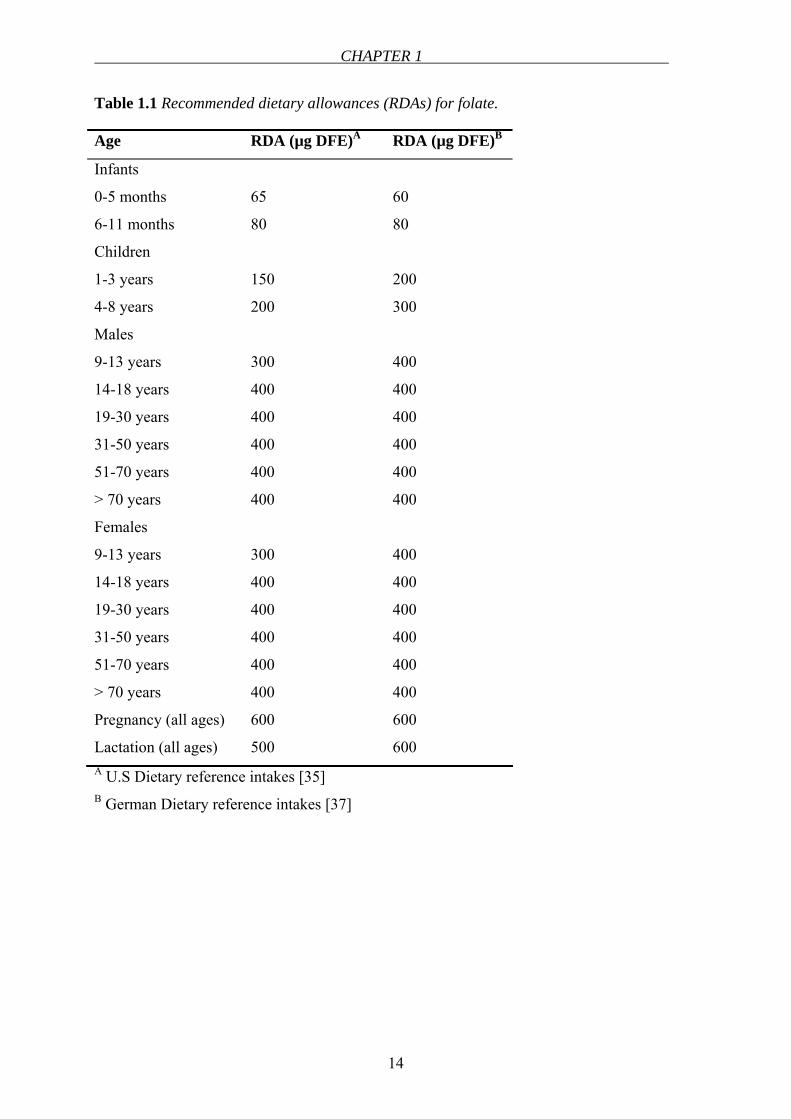
dietary allowances (RDA) for folate changes depending on age (see Table 1.1). The RDAs
for folate are expressed by a term called the “Dietary Folate Equivalent (DFE)”. DFE was
developed to help account for the differences in absorption of naturally occurring folate and
the bioavailable synthetic folic acid [33]. DFEs can be expressed as:
1 µg DFE = 1.0 µg food folate = 0.6 µg folic acid added to foods = 0.5 µg folic acid taken
without food
1 µg folic acid as a fortificant (folic acid added to food) = 1.7 µg DFE
1 µg folic acid as a supplement, fasting (folic acid taken as vitamin dosage forms) = 2.0 µg
DFE
To reduce the risk of NTDs in the U.S., Food and Drug Administration (FDA) mandated that
all enriched cereal grain products, breads, flours, corn meals, pastas, rice and other grain
products be fortified with folic acid as of January 1998 [14,34]. In addition, in 1998, the Food
and Nutrition Board of the Institute of Medicine made a specific recommendation that to
reduce the risk of neural tube defects, all women capable of becoming pregnant should take
400 µg of folic acid daily from fortified foods, supplements or both in addition to consuming
food folate from diet [35]. In other countries, such as several in Europe, folate fortification is
currently not permitted. In Germany, fortified flour and cereals are currently not offered
however since September 2002 folic acid enriched table salt is readily available in the markets
[36].
CHAPTER 1
14
Table 1.1 Recommended dietary allowances (RDAs) for folate.
Age RDA (µg DFE)A RDA (µg DFE)B
Infants
0-5 months
6-11 months
65
80
60
80
Children
1-3 years
4-8 years
150
200
200
300
Males
9-13 years
14-18 years
19-30 years
31-50 years
51-70 years
> 70 years
300
400
400
400
400
400
400
400
400
400
400
400
Females
9-13 years
14-18 years
19-30 years
31-50 years
51-70 years
> 70 years
Pregnancy (all ages)
Lactation (all ages)
300
400
400
400
400
400
600
500
400
400
400
400
400
400
600
600 A U.S Dietary reference intakes [35] B German Dietary reference intakes [37]
INTRODUCTION – A LITERATURE REVIEW
15
MEMBRANE TRANSPORT OF FOLATES
Folates are highly lipophilic bivalent anions that can only minimally traverse biological
membranes by simple diffusion such that their internalization through mammalian cell plasma
membranes must occur by means of a mediated process [38]. There are early studies reporting
the passive diffusion process of folic acid, however, it has been shown that folic acid transport
is mainly carrier-mediated [39,40]. The carrier-mediated transport of folic acid was
demonstrated to be pH-dependent, sodium-ion-dependent and metabolic inhibitor-sensitive.
Sodium ions indirectly influence the passive brush-border membrane transport by altering the
membrane potential difference [41]. One of the initial studies by Vincent et al. showed the
pH-dependency of folic acid transport [42]. Folate uptake declined rapidly between pH 5.8
and 7.5. In the same study, they suggested a dual uptake process for folates with a high rate of
uptake at folate concentrations below 20 nmol/mL and linear uptake characteristics at higher
concentrations. This study was also the first, proposing Caco-2 cell line as a model for folic
acid uptake studies. The naturally occurring folate, the 5-MTHF transport was demonstrated
to be composed of two systems. One is an active carrier-mediated system, which is significant
at low concentrations, and the other one, a diffusion system that is significant at high
concentrations. The Km of the active system was 0.3 µmol/L and accumulated against a
concentration gradient. It was inhibited by metabolic inhibitors, by oxidized and reduced
folate analogs, was temperature, sodium ion and glucose-dependent and required a substrate
concentration of less than 10-6 mol/L. The diffusion process showed linear increase in the
mucosal-to-serosal transport of 5-MTHF at the mucosal concentrations above 10-6 mol/L.
This process was energy-independent, pH-independent and temperature independent [43].
Similarly, Selhub and Rosenberg showed the transport characteristics of folic acid and
methotrexate (MTX) using isolated brush border membrane vesicles from rat intestine,
according to which the transport features of both were pH-dependent with a maximum uptake
at a medium pH near 5.0. The uptake at pH 5.5 exhibited both saturable and nonsaturable
components for folic acid and MTX. For MTX, Km for the saturable component was 1.5
µmol/L. Km for that of folic acid was 0.42 µmol/L. Folic acid competitively inhibited MTX
uptake with a Ki of 0.6 µmol/L [44]. Likewise, MTX accumulated in the intracellular fluid to
a concentration 3.5-fold higher than that of the medium at pH 5.5, but at pH 6.5 and 7.5, the
concentration was the same as that of the medium in a study performed using organ-cultured
endoscopic biopsy specimens of intestinal mucosa from normal subjects [45]. The transport
mechanisms of folates from the enterocytes were also investigated. The transport of folic acid
CHAPTER 1
16
was saturable as a function of concentration with an apparent Km of 0.6 µmol/L. It was
inhibited in a competitive manner by structural analogues such as 5-MTHF and MTX with Ki
values of 2 and 1.4 µmol/L, respectively. The transport was electroneutral, sodium-ion
independent and sensitive to the anion exchange inhibitor, indicating the existence of a
carrier-mediated transport system for folic acid in rat intestinal basolateral membrane [46].
These results clearly show the active transport characteristics of folates in mammalian cells.
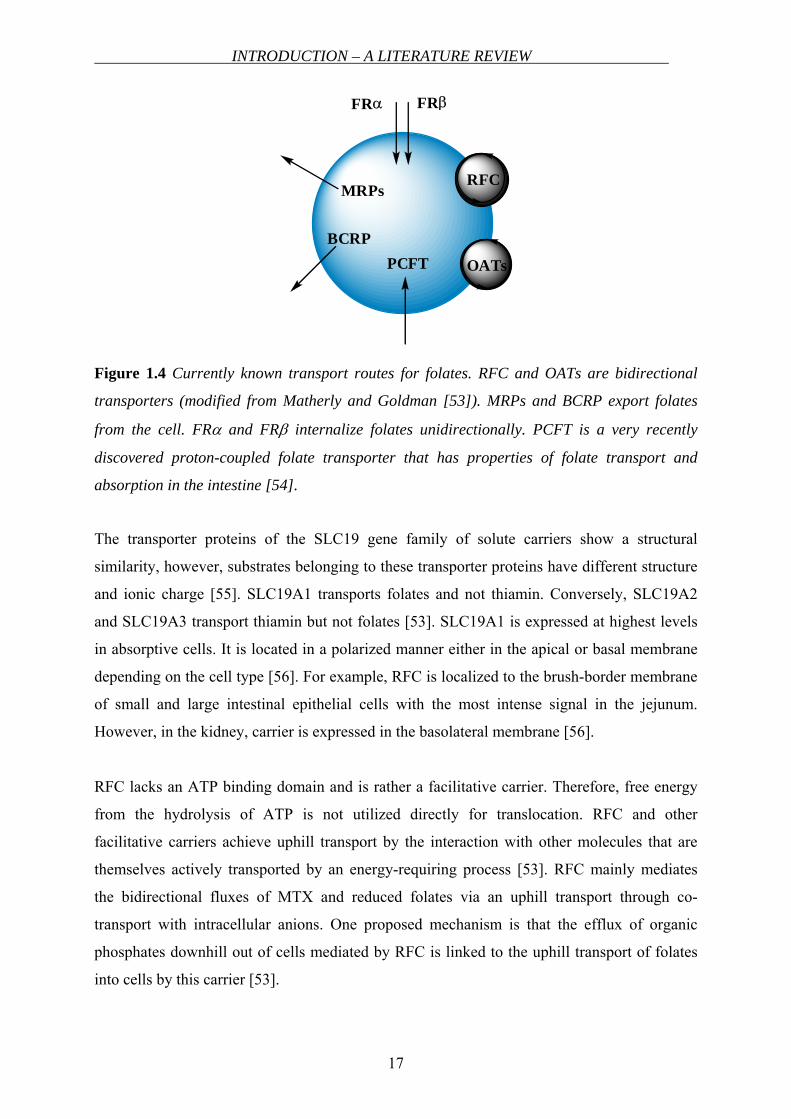
The transport of folates in mammalian cells is composed of a variety of processes (Figure
1.4). The best characterized transporter is the reduced folate carrier (RFC) which is a member
of the SLC19 family of facilitative carriers [47]. Other facilitative organic anion carriers
(SLC21) that are largely expressed in epithelial tissues, transport folates as well. Besides
those bi-directional transporter, the membrane-localized folate receptors α and β (FRα, FRβ)
transport folates unidirectionally. The members of multidrug resistance-associated proteins
(MRPs) [48-51] and breast cancer resistance protein (BCRP) [52] mediate the export of
folates from the cells. Lastly, transport routes that work at low pH were suggested for folates
[53]. Very recently, proton–coupled folate transporter (PCFT) a human proton-coupled, high-
affinity folate transporter that has properties of folate transport and absorption in intestine and
in various cell types was identified [54].
Reduced folate carrier (RFC, SLC19A1)
SLC superfamily of transporters is composed of 46 families (SLC1-SLC46). A total number
of 360 transporting proteins belong to this family (http: //www .bioparadigms. org /slc /menu
.asp). The SLC19 family (the folate/thiamine transporter family) of solute carriers consists of
three members: SLC19A1 (RFC, RFT, FOLT), SLC19A2 (ThTr1) and SLC19A3 (ThTr2).
INTRODUCTION – A LITERATURE REVIEW
17
FRα FRβ
MRPs
BCRPPCFT OATs
RFC
Figure 1.4 Currently known transport routes for folates. RFC and OATs are bidirectional
transporters (modified from Matherly and Goldman [53]). MRPs and BCRP export folates
from the cell. FRα and FRβ internalize folates unidirectionally. PCFT is a very recently
discovered proton-coupled folate transporter that has properties of folate transport and
absorption in the intestine [54].
The transporter proteins of the SLC19 gene family of solute carriers show a structural
similarity, however, substrates belonging to these transporter proteins have different structure
and ionic charge [55]. SLC19A1 transports folates and not thiamin. Conversely, SLC19A2
and SLC19A3 transport thiamin but not folates [53]. SLC19A1 is expressed at highest levels
in absorptive cells. It is located in a polarized manner either in the apical or basal membrane
depending on the cell type [56]. For example, RFC is localized to the brush-border membrane
of small and large intestinal epithelial cells with the most intense signal in the jejunum.
However, in the kidney, carrier is expressed in the basolateral membrane [56].
RFC lacks an ATP binding domain and is rather a facilitative carrier. Therefore, free energy
from the hydrolysis of ATP is not utilized directly for translocation. RFC and other
facilitative carriers achieve uphill transport by the interaction with other molecules that are
themselves actively transported by an energy-requiring process [53]. RFC mainly mediates
the bidirectional fluxes of MTX and reduced folates via an uphill transport through co-
transport with intracellular anions. One proposed mechanism is that the efflux of organic
phosphates downhill out of cells mediated by RFC is linked to the uphill transport of folates
into cells by this carrier [53].
CHAPTER 1
18
RFC has a higher affinity to reduced folates than the oxidized folic acid. For example, the Km
for 5-MTHF influx is ∼ 2 µmol/L and the Km for folic acid influx is ∼ 200 µmol/L [53,57].
RFC is expressed on the brush border membrane of intestinal cells. It has a neutral pH
optimum [58]. However, this is in contrast to what is observed in intestinal folate absorption
and transport into intestinal cells and cells of other tissue origin at low pH. Therefore, another
transporter system that transport folates at low pH environment was suggested.
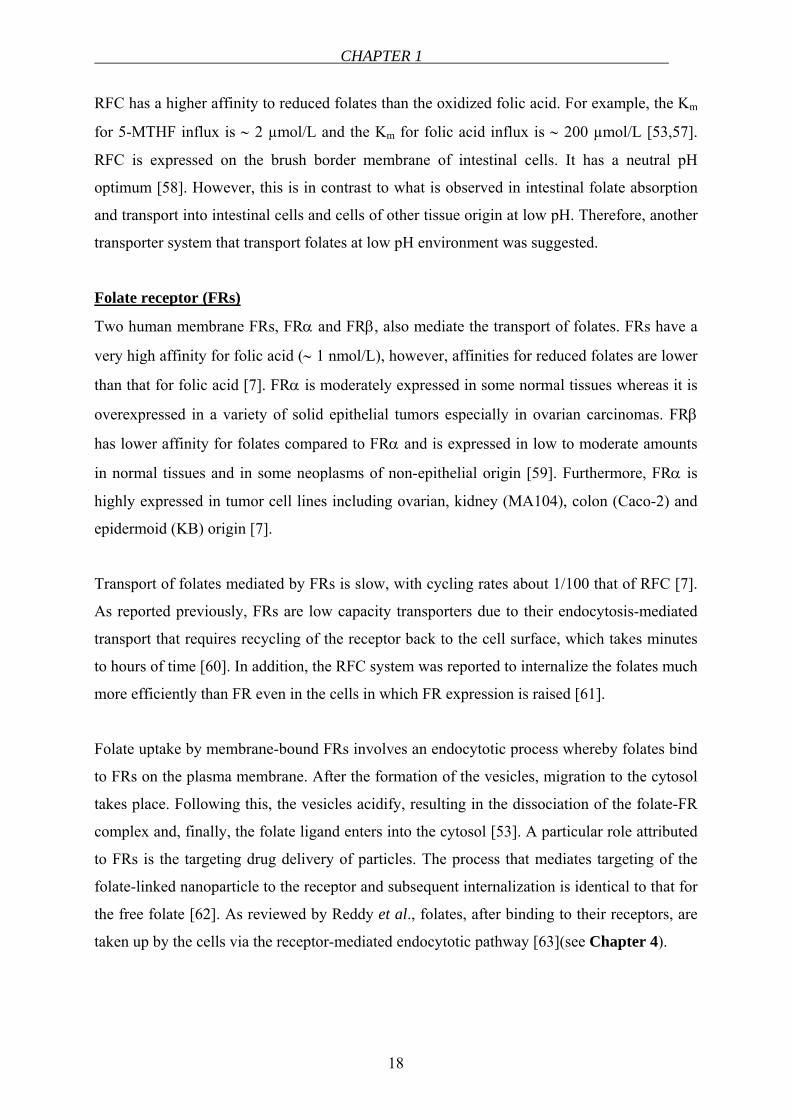
Folate receptor (FRs)
Two human membrane FRs, FRα and FRβ, also mediate the transport of folates. FRs have a
very high affinity for folic acid (∼ 1 nmol/L), however, affinities for reduced folates are lower
than that for folic acid [7]. FRα is moderately expressed in some normal tissues whereas it is
overexpressed in a variety of solid epithelial tumors especially in ovarian carcinomas. FRβ
has lower affinity for folates compared to FRα and is expressed in low to moderate amounts
in normal tissues and in some neoplasms of non-epithelial origin [59]. Furthermore, FRα is
highly expressed in tumor cell lines including ovarian, kidney (MA104), colon (Caco-2) and
epidermoid (KB) origin [7].
Transport of folates mediated by FRs is slow, with cycling rates about 1/100 that of RFC [7].
As reported previously, FRs are low capacity transporters due to their endocytosis-mediated
transport that requires recycling of the receptor back to the cell surface, which takes minutes
to hours of time [60]. In addition, the RFC system was reported to internalize the folates much
more efficiently than FR even in the cells in which FR expression is raised [61].
Folate uptake by membrane-bound FRs involves an endocytotic process whereby folates bind
to FRs on the plasma membrane. After the formation of the vesicles, migration to the cytosol
takes place. Following this, the vesicles acidify, resulting in the dissociation of the folate-FR
complex and, finally, the folate ligand enters into the cytosol [53]. A particular role attributed
to FRs is the targeting drug delivery of particles. The process that mediates targeting of the
folate-linked nanoparticle to the receptor and subsequent internalization is identical to that for
the free folate [62]. As reviewed by Reddy et al., folates, after binding to their receptors, are
taken up by the cells via the receptor-mediated endocytotic pathway [63](see Chapter 4).
INTRODUCTION – A LITERATURE REVIEW
19
Proton-coupled folate transporter (PCFT, SLC46A1)
Due to the discrepancy between the functionality of RFC and folate transport physiology and
characteristic of small intestine, existence and contribution of another transporter system
responsible for the transport of folates at low pH conditions had been suggested [64]. The
major transporter for folates and antifolates for instance in leukemia cells, is RFC. However,
this was in contrary for the transport in the intestine because, although the optimum pH of
RFC is 7.4, intestinal cells have a low-pH optimum for folate transport. Considering the
absorption of folates in duodenum and upper jejunum where the pH is relatively acidic, the
existence of an additional mechanism other than RFC for folate transport in intestinal cells
has been hypothesized. Very recently, a proton-coupled, high affinity folate transporter
(PCFT) was identified which meets the requirements of intestinal folate transport and solves
the discrepancy described above [54]. This protein was previously reported as heme carrier
protein (HCP1, SLC46A1) [65]. Therefore it is also called as PCFT/HCP1. Transport of
folates by this transporter was shown to be highly pH-dependent. Transport was higher at low
pH and it decreased as pH was increased. Km for folic acid uptake was 1.3 µmol/L and 56.2
µmol/L at pH 5.5 and 7.5, respectively that suggests a major role to PCFT in intestinal folate
absorption [54].
PCFT was detected in kidney, liver, placenta, small intestine and spleen and to a lower extent
in colon and testis. The expression in brain, lung, stomach, heart and muscle was very low.
The expression level of the mRNA was highest in duodenum and was expressed in jejunum to
a lesser extent. The expression in ileum, cecum, colon and rectum was low. Apart from
human tissues, it was detected in Caco-2 cell line and PCFT was proposed as the major low-
pH folate transporter in this cell line [54].
Other transporters that mediate folate transport
Besides RFC, FRs and PCFT, other transporters also contribute to the folate transport in a
variety of tissues. Multidrug resistance-associated proteins (MRPs), breast cancer resistance
protein (BCRP) and organic anion facilitative carriers (OATPs, SLC21) mediate the transport
of folates, as well [7,53]. Among the nine recently known members of MRPs (MRP1-9) that
belong to the ATP-binding cassette (ABC) superfamily, MRP1-4 were shown to export
folates and antifolates from the cell [49]. In intestinal cells, MPR2 possess a considerable
importance since it is localized on the apical membrane of small intestine [66-68] and may
contribute to the efflux of folates back to the intestinal lumen.
CHAPTER 1
20
Breast cancer resistance protein (BCRP, ABCG2) is another member of ABC transporters
known to export folates and antifolates form the cell interior [52]. BCRP is expressed in the
human jejunum at levels considerably higher than those of other ABC transporters [69]. Like
MRP2, BCRP is also localized apically in the small intestine, where it contributes to the
overall absorption of drugs by exporting them out into the intestinal lumen [70]. Therefore,
secretory transport of folates in the small intestine is feasible via the apically expressed MRP2
and BCRP.
Intestinal absorption and metabolism of folates
Humans are unable to synthesize folates and therefore should obtain it from nutritional
sources and supplements via intestinal absorption. The intestine is exposed to two sources of
folates, namely, dietary source and bacterial source. In the large intestine, the microflora of
many bacterial species synthesizes the vitamin and therefore forms a large pool of folate
[71,72]. However, the major source of folates is the one obtained through the diet and hence,
folate absorption in the small intestine has attracted considerable attention. Folates are
absorbed mainly in the duodenum and upper jejunum [57]. After oral administration of folic
acid, maximum plasma concentration (Cmax) is observed between 1-2 hours (tmax) [31,73,74].
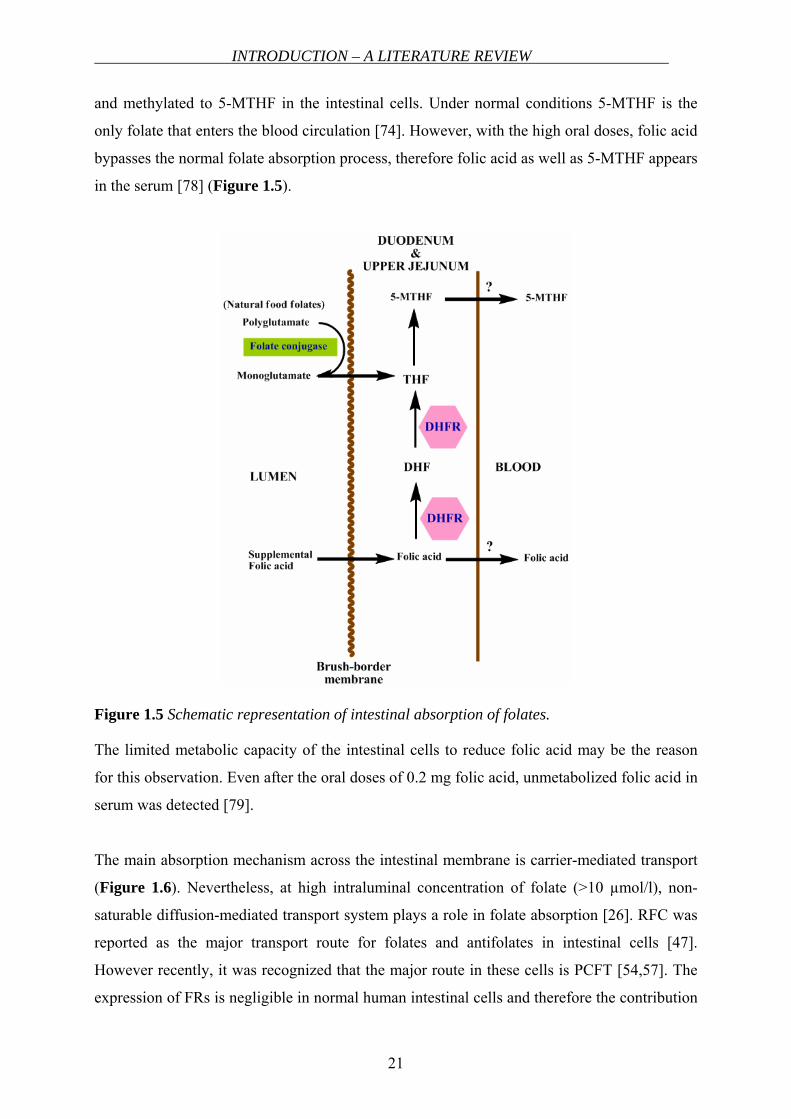
The natural folates, found both in animal and plant cells, are conjugated to a polyglutamyl
chain of different numbers of glutamic acid residues depending on the type of cells [9]. The
polyglutamate forms of folate have to be converted to the monoglutamate form prior to its
absorption in the small intestine. Hydrolysis of polyglutamates to monoglutamate forms is
mediated by the enzyme “folate hydrolase” (folate conjugase, folylpoly-γ-glutamate
carboxypeptidase, pteroylpolyglutamate hydrolase, pteroylpolyglutamate conjugase) which is
found as either a brush border or an intracellular form [75,76]. The brush border form is
mainly expressed in the proximal part of the small intestine whereas the intracellular form is
uniformly expressed along the entire small intestine [71]. Folate hydrolase was shown to be
inhibited by several varieties of foods such as orange juice and tomato juice and thus could
reduce the bioavailability of polyglutamyl folates [77]. The monoglutamate forms are then
reduced and methylated via one-carbon substitution to 5-MTHF in the enterocytes (see
Figure 1.5).
Folic acid is the synthetic, oxidized and stable form of folate and is uniquely used in
supplementation and food fortification. Prior to its absorption, folic acid is as well reduced
INTRODUCTION – A LITERATURE REVIEW
21
and methylated to 5-MTHF in the intestinal cells. Under normal conditions 5-MTHF is the
only folate that enters the blood circulation [74]. However, with the high oral doses, folic acid
bypasses the normal folate absorption process, therefore folic acid as well as 5-MTHF appears
in the serum [78] (Figure 1.5).
Figure 1.5 Schematic representation of intestinal absorption of folates.
The limited metabolic capacity of the intestinal cells to reduce folic acid may be the reason
for this observation. Even after the oral doses of 0.2 mg folic acid, unmetabolized folic acid in
serum was detected [79].
The main absorption mechanism across the intestinal membrane is carrier-mediated transport
(Figure 1.6). Nevertheless, at high intraluminal concentration of folate (>10 µmol/l), non-
saturable diffusion-mediated transport system plays a role in folate absorption [26]. RFC was
reported as the major transport route for folates and antifolates in intestinal cells [47].
However recently, it was recognized that the major route in these cells is PCFT [54,57]. The
expression of FRs is negligible in normal human intestinal cells and therefore the contribution
CHAPTER 1
22
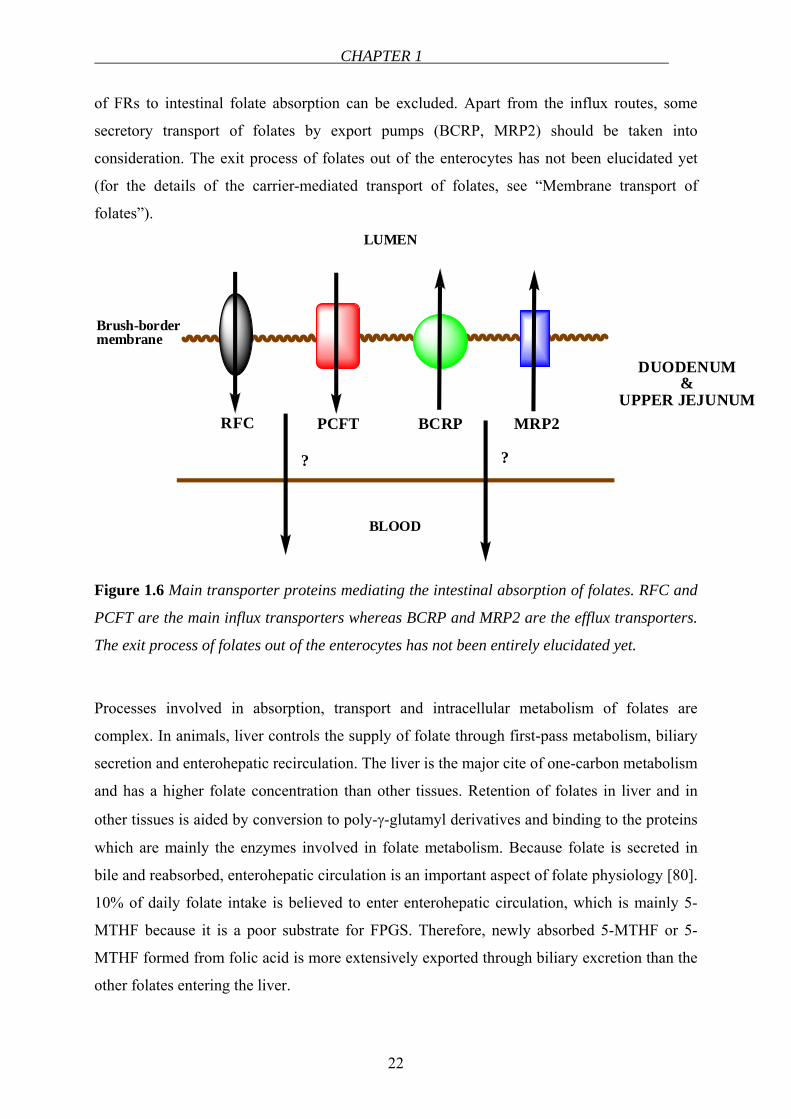
of FRs to intestinal folate absorption can be excluded. Apart from the influx routes, some
secretory transport of folates by export pumps (BCRP, MRP2) should be taken into
consideration. The exit process of folates out of the enterocytes has not been elucidated yet
(for the details of the carrier-mediated transport of folates, see “Membrane transport of
folates”).
RFC PCFT
Brush-bordermembrane
LUMEN
BLOOD
BCRP MRP2
DUODENUM&
UPPER JEJUNUM
? ?
Figure 1.6 Main transporter proteins mediating the intestinal absorption of folates. RFC and
PCFT are the main influx transporters whereas BCRP and MRP2 are the efflux transporters.
The exit process of folates out of the enterocytes has not been entirely elucidated yet.
Processes involved in absorption, transport and intracellular metabolism of folates are
complex. In animals, liver controls the supply of folate through first-pass metabolism, biliary
secretion and enterohepatic recirculation. The liver is the major cite of one-carbon metabolism
and has a higher folate concentration than other tissues. Retention of folates in liver and in
other tissues is aided by conversion to poly-γ-glutamyl derivatives and binding to the proteins
which are mainly the enzymes involved in folate metabolism. Because folate is secreted in
bile and reabsorbed, enterohepatic circulation is an important aspect of folate physiology [80].
10% of daily folate intake is believed to enter enterohepatic circulation, which is mainly 5-
MTHF because it is a poor substrate for FPGS. Therefore, newly absorbed 5-MTHF or 5-
MTHF formed from folic acid is more extensively exported through biliary excretion than the
other folates entering the liver.
INTRODUCTION – A LITERATURE REVIEW
23
Inhibition of folate transport by DHFR inhibitors
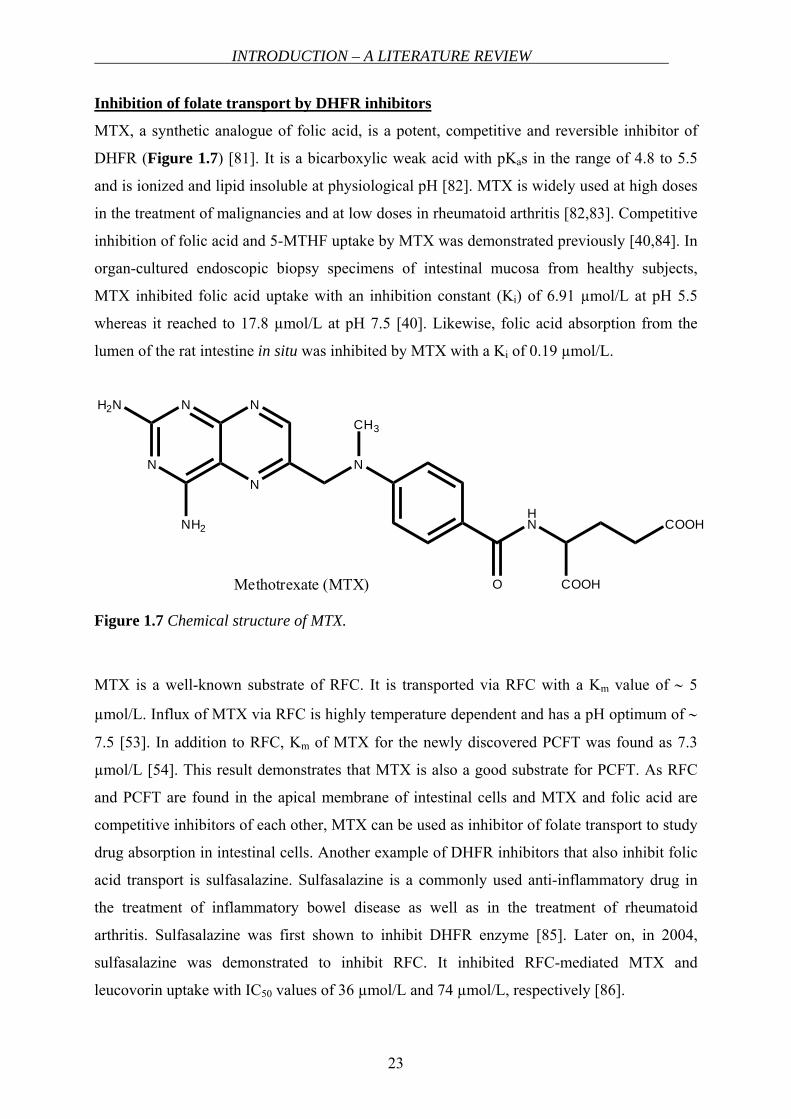
MTX, a synthetic analogue of folic acid, is a potent, competitive and reversible inhibitor of
DHFR (Figure 1.7) [81]. It is a bicarboxylic weak acid with pKas in the range of 4.8 to 5.5
and is ionized and lipid insoluble at physiological pH [82]. MTX is widely used at high doses
in the treatment of malignancies and at low doses in rheumatoid arthritis [82,83]. Competitive
inhibition of folic acid and 5-MTHF uptake by MTX was demonstrated previously [40,84]. In
organ-cultured endoscopic biopsy specimens of intestinal mucosa from healthy subjects,
MTX inhibited folic acid uptake with an inhibition constant (Ki) of 6.91 µmol/L at pH 5.5
whereas it reached to 17.8 µmol/L at pH 7.5 [40]. Likewise, folic acid absorption from the
lumen of the rat intestine in situ was inhibited by MTX with a Ki of 0.19 µmol/L.
N
N
N
NH2N
NH2
N
CH3
HN
O
COOH
COOHMethotrexate (MTX)
Figure 1.7 Chemical structure of MTX.
MTX is a well-known substrate of RFC. It is transported via RFC with a Km value of ∼ 5
µmol/L. Influx of MTX via RFC is highly temperature dependent and has a pH optimum of ∼
7.5 [53]. In addition to RFC, Km of MTX for the newly discovered PCFT was found as 7.3
µmol/L [54]. This result demonstrates that MTX is also a good substrate for PCFT. As RFC
and PCFT are found in the apical membrane of intestinal cells and MTX and folic acid are
competitive inhibitors of each other, MTX can be used as inhibitor of folate transport to study
drug absorption in intestinal cells. Another example of DHFR inhibitors that also inhibit folic
acid transport is sulfasalazine. Sulfasalazine is a commonly used anti-inflammatory drug in
the treatment of inflammatory bowel disease as well as in the treatment of rheumatoid
arthritis. Sulfasalazine was first shown to inhibit DHFR enzyme [85]. Later on, in 2004,
sulfasalazine was demonstrated to inhibit RFC. It inhibited RFC-mediated MTX and
leucovorin uptake with IC50 values of 36 µmol/L and 74 µmol/L, respectively [86].
CHAPTER 1
24
It was reported that the folate binding sites of the enzyme and the folate intestinal transport
system possess common structural properties that are independent of the oxidation state,
methyl group substitution or the presence of extra glutamic acid residue on the folate
molecules [85]. Nevertheless, this hypothesis may be possibly applicable to the compounds
that are not highly lipophilic. Since DHFR inhibitors such as pyrimethamine or trimetraxate,
are highly lipohilic (due to the lack of polar glutamate side chain) and therefore can rapidly
enter cells by an energy-independent process [81], they are not substrates for the common
active transport systems and the substrate overlapping of the transporter system (e.g. RFC)
and DHFR enzyme is not valid for such compounds.
FLAVONOIDS
Polyphenols are the compounds that are one of the most widely distributed groups of
substances in the plant kingdom [87]. Flavonoids and phenolic acids are the two main classes
of polyphenols. Flavonoids are the most abundant polyphenols, which are exposed via daily
nutrition. Flavonoids have attracted a great interest recently, due to their discovered health
beneficial properties. A number of research has been conducted regarding their antioxidant,
antiestrogenic, antiproliferative activities and the observed relationship between flavonoid
intake and cardiovascular diseases and cancer [87,88]. Several subclasses of flavonoids have
been described based upon variations in their structures including flavones, flavonols,
flavanones, flavanols (catechins), anthocyanidines and isoflavones. Most extensively found
in the leaves, seeds, bark and flower of plants, over 4,000 flavonoids have been identified so
far.
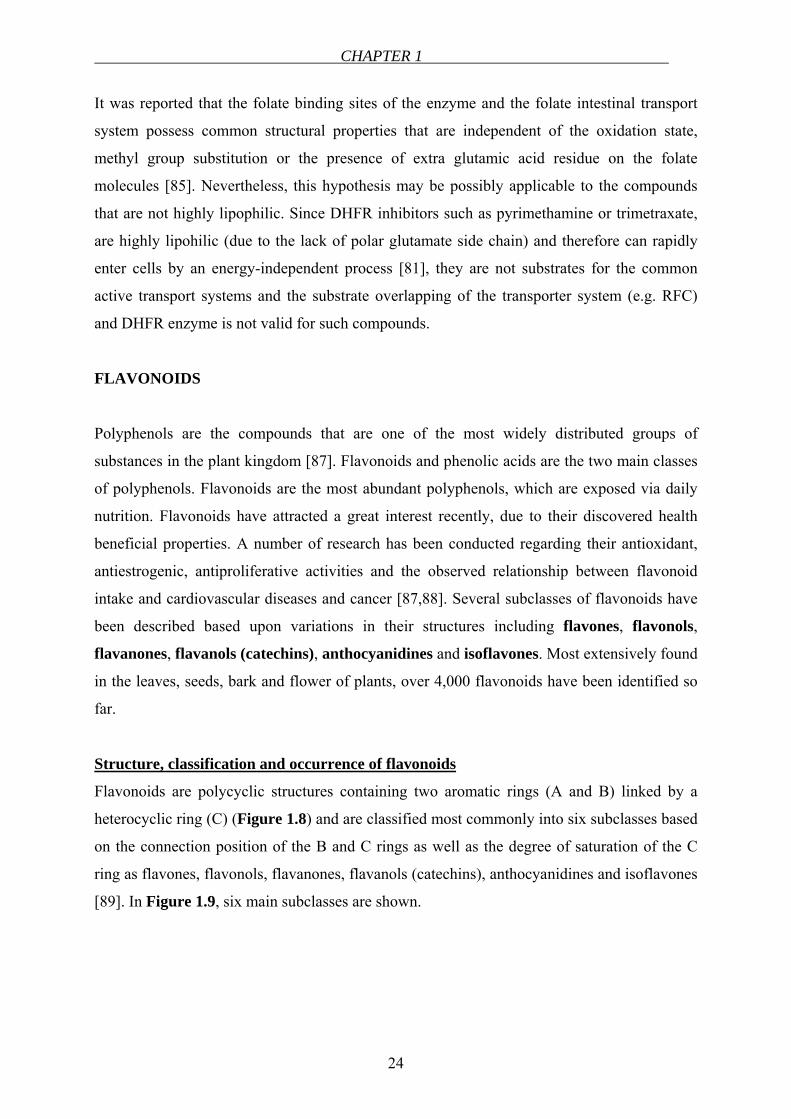
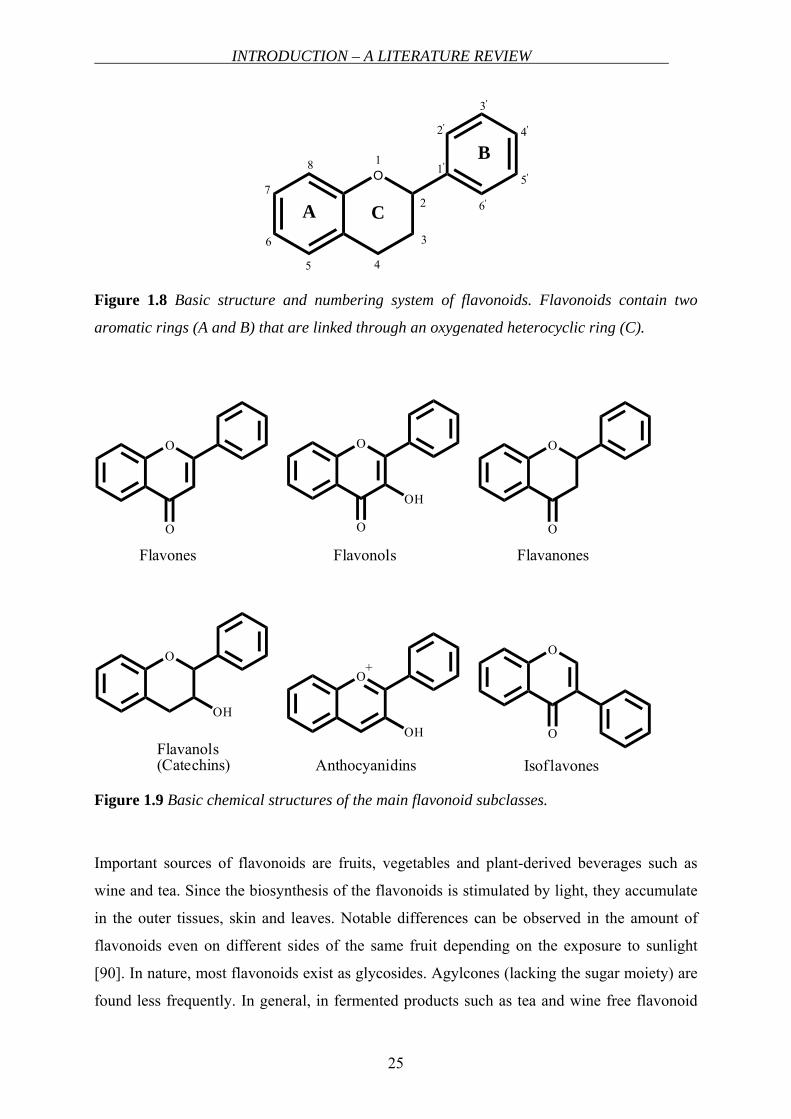
Structure, classification and occurrence of flavonoids
Flavonoids are polycyclic structures containing two aromatic rings (A and B) linked by a
heterocyclic ring (C) (Figure 1.8) and are classified most commonly into six subclasses based
on the connection position of the B and C rings as well as the degree of saturation of the C
ring as flavones, flavonols, flavanones, flavanols (catechins), anthocyanidines and isoflavones
[89]. In Figure 1.9, six main subclasses are shown.
INTRODUCTION – A LITERATURE REVIEW
25
O
A C
B1
2
3
45
6
7
8 1'
2'
3'
4'
5'
6'
Figure 1.8 Basic structure and numbering system of flavonoids. Flavonoids contain two
aromatic rings (A and B) that are linked through an oxygenated heterocyclic ring (C).
O
O
Flavones
O
O
OH
Flavonols
O
O
Flavanones
O
OH
Flavanols(Catechins)
O
OH
+
Anthocyanidins
O
O
Isof lavones
Figure 1.9 Basic chemical structures of the main flavonoid subclasses.
Important sources of flavonoids are fruits, vegetables and plant-derived beverages such as
wine and tea. Since the biosynthesis of the flavonoids is stimulated by light, they accumulate
in the outer tissues, skin and leaves. Notable differences can be observed in the amount of
flavonoids even on different sides of the same fruit depending on the exposure to sunlight
[90]. In nature, most flavonoids exist as glycosides. Agylcones (lacking the sugar moiety) are
found less frequently. In general, in fermented products such as tea and wine free flavonoid
CHAPTER 1
26
aglycones are identified. The position, nature and amount of glycosylation depend on the
plant species [91]. Flavonoid glycosides are mostly unmodified by various cooking methods
[92]. The associated sugar moiety is very often glucose or rhamnose, but other sugars may
also be involved (e.g. galactose, arabinose, xylose, glucuronic acid) [90]. Deglycosylation is
most likely the first step during the absorption of flavonoids. The glycosides undergo
hydrolysis by glycosidases present in the cells of the intestinal mucosa or secreted by the
colonic microflora [93]. The site of deglycosylation and transport across the intestinal
enterocytes depends on the nature of the flavonoid aglycone moiety, and nature and position
of the sugar moiety. Experimental data suggest that in the luminal hydrolysis of the
glycosides, lactase phlorizin hydrolase plays a major role in flavonoid absorption [94].
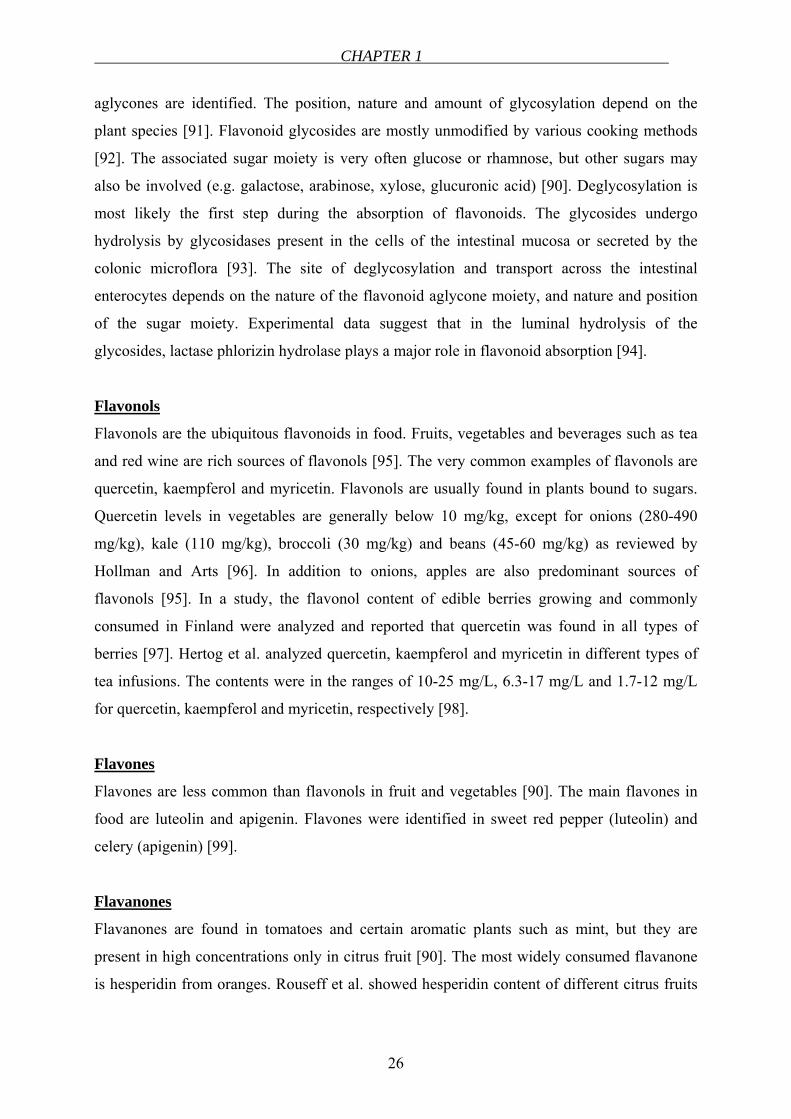
Flavonols
Flavonols are the ubiquitous flavonoids in food. Fruits, vegetables and beverages such as tea
and red wine are rich sources of flavonols [95]. The very common examples of flavonols are
quercetin, kaempferol and myricetin. Flavonols are usually found in plants bound to sugars.
Quercetin levels in vegetables are generally below 10 mg/kg, except for onions (280-490
mg/kg), kale (110 mg/kg), broccoli (30 mg/kg) and beans (45-60 mg/kg) as reviewed by
Hollman and Arts [96]. In addition to onions, apples are also predominant sources of
flavonols [95]. In a study, the flavonol content of edible berries growing and commonly
consumed in Finland were analyzed and reported that quercetin was found in all types of
berries [97]. Hertog et al. analyzed quercetin, kaempferol and myricetin in different types of
tea infusions. The contents were in the ranges of 10-25 mg/L, 6.3-17 mg/L and 1.7-12 mg/L
for quercetin, kaempferol and myricetin, respectively [98].
Flavones
Flavones are less common than flavonols in fruit and vegetables [90]. The main flavones in
food are luteolin and apigenin. Flavones were identified in sweet red pepper (luteolin) and
celery (apigenin) [99].
Flavanones
Flavanones are found in tomatoes and certain aromatic plants such as mint, but they are
present in high concentrations only in citrus fruit [90]. The most widely consumed flavanone
is hesperidin from oranges. Rouseff et al. showed hesperidin content of different citrus fruits
INTRODUCTION – A LITERATURE REVIEW
27
that varied between 122 and 254 mg/L of juice [100]. The other typical flavanones are
naringin, narirutin and eriocitrin [101].
Anthocyanidins
Anthocyanins (anthocyanidin glycosides) are pigments of red fruits such as cherries, plums,
strawberries, raspberries, grapes, red currants and black currants [102]. The most common
anthocyanidins in edible parts of plants are cyanidin, pelargonidin, peonidin, delphinidin,
petunidin and malvidin [103].
Isoflavons
Isoflavones have a limited distribution in nature. For example, the soybean, belonging to the
family of legumes, is essentially the only nutritionally relevant naturally occurring source of
these compounds. The primary isoflavones in soybeans are the glucosides genistin and
daidzin and their respective aglycones genistein and daidzein [104].
Flavanols (catechins)
Catechins are the major components of tea. They form about 30% of the dry weight of green
tea and 9% of the dry weight of black tea [105]. They usually occur as aglycones or as
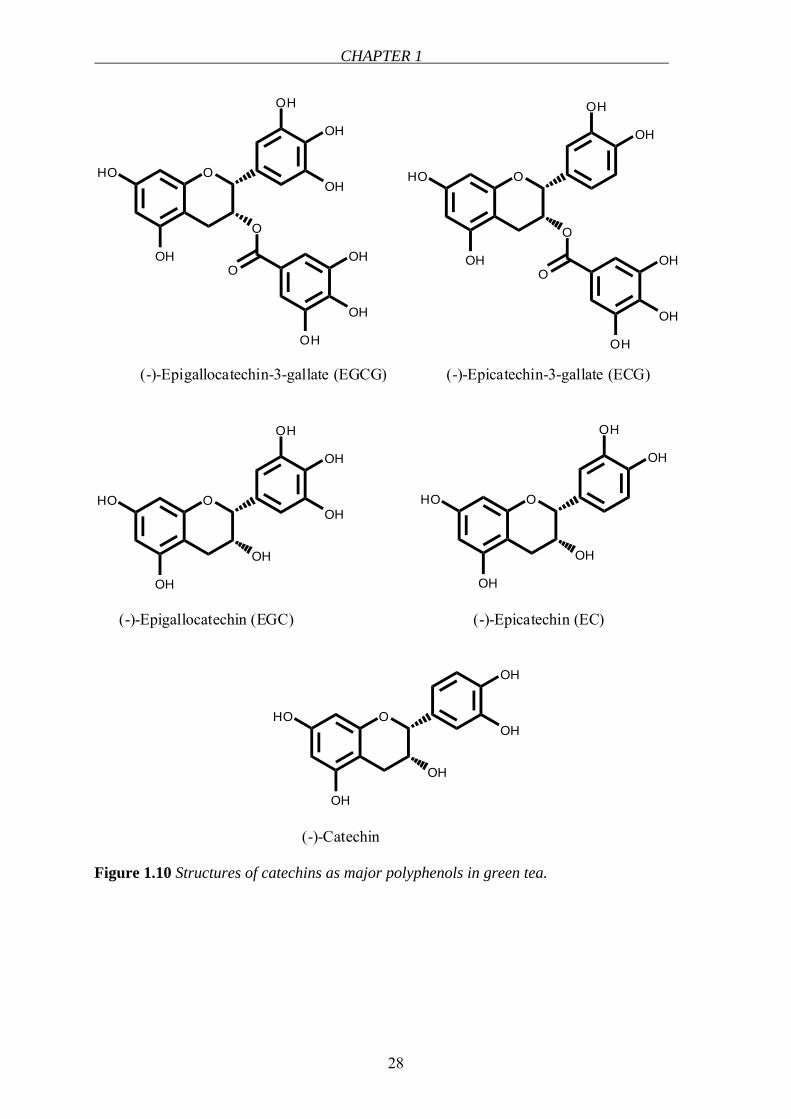
gallated forms. In green tea, catechins, namely, catechin, epicatechin (EC), epigallocatechin
(EGC), epicatechin gallate (ECG) and epigallocatechin gallate (EGCG) represent 80-90% and
flavonols, namely, kaempferol, quercetin and myricetin glycosides represent <10% of total
flavonoids [106,107] (Figure 1.10). Other sources of catechins can be listed as grape seeds
[108], chocolate, apples and pears [105]. The average daily catechin intake was calculated to
be ∼ 50 mg/day, however, this value may show variations depending on age, gender and
population [89,105].
CHAPTER 1
28
O
OH
HO
O
OH
OH
OH
OOH
OH
OH
(-)-Epigallocatechin-3-gallate (EGCG)
O
O
OH
HO
OH
OH
O
OH
OH
OH
(-)-Epicatechin-3-gallate (ECG)
O
OH
HO
OH
OH
OH
OH
(-)-Epigallocatechin (EGC)
O
OH
HO
OH
OH
OH
(-)-Epicatechin (EC)
O
OH
HO
OH
OH
OH
(-)-Catechin
Figure 1.10 Structures of catechins as major polyphenols in green tea.
INTRODUCTION – A LITERATURE REVIEW
29
TEA (CAMELLIA SINENSIS)
General aspects
Tea is the second most popular and consumed beverage in the world after water. It is
generally consumed as green, black or oolong tea, which are mainly the same plant (Camellia
Sinensis, Theaceae) but are manufactured by different processes. For the production of green
tea, freshly harvested leaves are rapidly steamed or pan-fried to inactivate enzymes.
Therefore, fermentation is prevented. However, for the production of black tea, the fresh
leaves are allowed to wither until they lose ∼45% of their water content. The withered leaves
are then rolled and crushed to initiate the fermentation of the polyphenols. During this process
the catechin content of tea plant is converted to theaflavins and thearubigins. The production
of oolong tea is slightly different than that of black tea. The leaves are fired shortly after they
are rolled to terminate oxidation and dry the leaves. Thus, oolong tea is thought to be about
half as fermented as black tea [109].
Polyphenolic compounds in green tea account for 30% of the dry weight of green tea leaves.
Catechins form the majority of polyphenols in green tea. The main catechins found in green
tea are EGCG, ECG, EGC and EC (Figure 1.10). Green tea contains ∼ 67 mg of total
catechins/g of dry matter, whereas in black tea it is 15.4 mg total catechin/g of dry matter
[110]. One cup (240 mL) of brewed green tea may contain up to 200 mg of EGCG which
translates into a molar concentration of 1.8 mmol/L [109]. Different daily dietary catechin
intakes were reported with respect to different populations. For example, in Holland average
intake is 72 mg/day, in Scotland, 59 mg/day and in Germany, 11 mg/day [89].
Health benefits of green tea
Green tea has been catching the attention of both scientists and public due to its increasingly
announced health-beneficial properties. Generally the major role is attributed to EGCG, which
is the main constituent of green tea. Green tea consumption has been linked to prevention
against cancer. Inhibition of carcinogenesis by tea was shown on different types of cancer
such as skin [111], lung [112], esophagus [113], stomach [114], liver [115], duodenum, small
intestine, colon [116], pancreas [117], bladder [118], prostate [119] and mammary gland
[120]. The consumption of green tea was shown to prevent against coronary heart diseases
[121]. Green tea was also demonstrated to have anti-inflammatory effect [122]. Furthermore,
it was reported to help in losing weight [123].
CHAPTER 1
30
The health benefits were related mostly to the antioxidant properties of polyphenols.
Polyphenols with catechol groups (aromatic rings with two hydroxyl groups in the ortho
position) were found to have greater antioxidant activity than those with simple phenol
groups. However, it should be emphasized that polyphenols are extensively metabolized in
the body where they are methylated, dehydroxylated or conjugated by O-glucuronidation and
formation of sulphate esters and the antioxidant effects are altered [88]. Therefore, health
benefits of tea should not be limited to only its antioxidant activity; other mechanisms such as
inhibition of certain enzymes [124] have to be considered.
Transport of catechins through intestinal membranes
There are published studies about the interaction of catechins with certain transporters. ECG
and EGCG inhibited the glucose uptake via sodium-dependent glucose transporter (SGLT1).
However, these catechins with galloyl residue act as antagonist-like molecules and they
themselves are not transported via this transporter but only inhibit the transport of glucose
[125]. Although only the gallated catechins were active in inhibiting the glucose transport,
gallic acid alone was less active in this process compared to ECG suggesting that not only the
galloyl residue but also the catechin structure plays role in this inhibition [125]. ECG was
found to be a substrate for a monocarboxylate transporter (MCT), presumably for MCT1
which is found in Caco-2 cells [126]. In the same study, in the presence of MK-571 – an
MRP1/MRP2 inhibitor – the accumulation of ECG in Caco-2 cells increased and in addition,
ECG efflux via MRP2 was demonstrated. Moreover, in MRP1 expressing CHO cells, in the
presence of MK-571, ECG dramatically increased. It has shown also that they are substrates
of MRP1 and MRP2 [126]. In BCRP-overexpressing cells, a BCRP substrate mitoxantrone
accumulation was shown to be increased by EGCG suggesting a role to BCRP in EGCG
efflux [127]. These results propose interactions of catechins with certain transporters,
however, the intestinal transport characteristics of green tea catechins have not been
elucidated completely and need to be clarified.
GENERAL ASPECTS OF INTESTINAL ABSORPTION AND INTERACTIONS
Intestine, as being the largest interface between human and his external environment,
possesses an important barrier function by allowing the movement of nutrients from the
intestinal lumen into the blood circulation as well as preventing the penetration of xenobiotics
[128]. The intestinal barrier is primarily formed by the intestinal epithelium [129]. The two
INTRODUCTION – A LITERATURE REVIEW
31
main routes for the transepithelial permeation of the substrate are the paracellular route and
the transcellular route. The space between adjacent cells forms the paracellular route. Tight
junctions that are localized between the adjacent cells attain the critical barrier. Transcellular
transport can be defined as the permeation through lipoidal membranes. Active carrier-
mediated transport plays the critical role in transcellular transport. The bioavailability of a
drug is determined by its physicochemical properties as well as the import and export proteins
and metabolizing enzymes involved during the absorption process [130,131]. Intestinal
epithelial cells (enterocytes) are equipped with a broad range of transporter proteins and
metabolizing enzymes [130]. The primary function of the intestinal transporters is to absorb
molecules that are ingested orally. However, in addition to the absorptive transporters, several
efflux transporters are located on the intestinal epithelium, which secrete the molecules back
to the lumen [130]. Transporters can be classified as passive (facilitated) and active
transporters. Facilitated transporters allow transport of solutes across membranes down their
electrochemical gradients, whereas active transporters use energy-coupling mechanisms. ABC
transporters are the primary-active transporters that include multidrug resistance (MDR) and
MRP transporters [132] which mainly mediate the efflux of compounds from the cell interior.
SLC superfamily is composed of facilitated transporters, ion-coupled transporters and
exchangers [133]. Examples of certain transporters involved in drug absorption are shown in
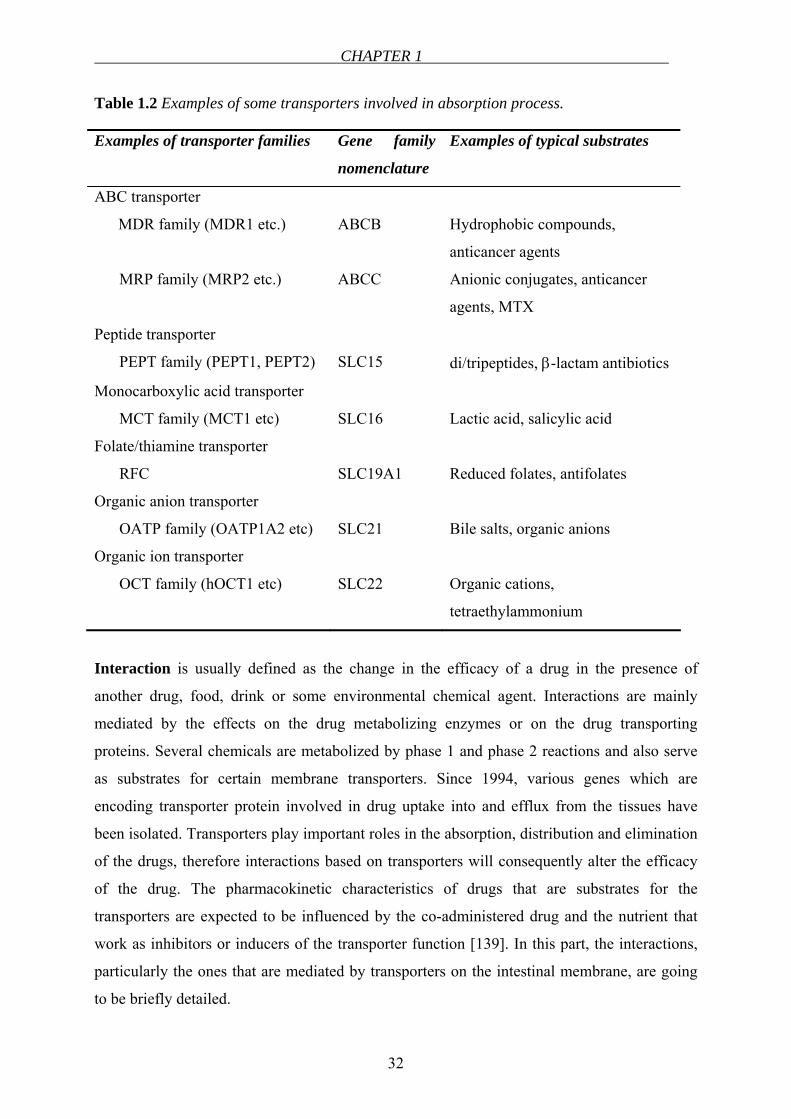
Table 1.2.
Beside its role as being the absorptive organ, small intestine has also the ability to metabolize
drugs by pathways involving phase 1 and phase 2 reactions. The cytochrome P450
isoenzymes (CYP) are the principle enzymes involved in the biotransformation of the
compounds [134]. CYP3A4 is the dominant CYP enzyme in the human small intestine
contributing to phase 1 metabolism and its regulation is linked to P-gylcoprotein (Pgp) [135].
Conjugation with glucuronic acid, glutathione and sulfate via UDP-glucuronosyltransferase
[136], glutathione S-transferase [137] and sulfotransferase, respectively, [138] represent the
major phase 2 pathways identified in small intestine.
CHAPTER 1
32
Table 1.2 Examples of some transporters involved in absorption process.
Examples of transporter families Gene family
nomenclature
Examples of typical substrates
ABC transporter
MDR family (MDR1 etc.)
MRP family (MRP2 etc.)
ABCB
ABCC
Hydrophobic compounds,
anticancer agents
Anionic conjugates, anticancer
agents, MTX
Peptide transporter
PEPT family (PEPT1, PEPT2)
SLC15
di/tripeptides, β-lactam antibiotics
Monocarboxylic acid transporter
MCT family (MCT1 etc)
SLC16
Lactic acid, salicylic acid
Folate/thiamine transporter
RFC
SLC19A1
Reduced folates, antifolates
Organic anion transporter
OATP family (OATP1A2 etc)
SLC21
Bile salts, organic anions
Organic ion transporter
OCT family (hOCT1 etc)
SLC22
Organic cations,
tetraethylammonium
Interaction is usually defined as the change in the efficacy of a drug in the presence of
another drug, food, drink or some environmental chemical agent. Interactions are mainly
mediated by the effects on the drug metabolizing enzymes or on the drug transporting
proteins. Several chemicals are metabolized by phase 1 and phase 2 reactions and also serve
as substrates for certain membrane transporters. Since 1994, various genes which are
encoding transporter protein involved in drug uptake into and efflux from the tissues have
been isolated. Transporters play important roles in the absorption, distribution and elimination
of the drugs, therefore interactions based on transporters will consequently alter the efficacy
of the drug. The pharmacokinetic characteristics of drugs that are substrates for the
transporters are expected to be influenced by the co-administered drug and the nutrient that
work as inhibitors or inducers of the transporter function [139]. In this part, the interactions,
particularly the ones that are mediated by transporters on the intestinal membrane, are going
to be briefly detailed.
INTRODUCTION – A LITERATURE REVIEW
33
In general, intestinal absorption of drugs is highly affected by co-existing compounds in the
lumen. Inhibition of enzyme activity and disturbance of intestinal transport systems may be
involved in the modulating effects of the co-existing compounds during the intestinal
absorption. Only a small portion of drug interactions are mediated via transporter compared
with those mediated via drug metabolizing enzymes. However, the possibility of serious
clinical outcome should be always taken into consideration [139]. The most common
interactions were reported via Pgp. Pgp shows extremely broad substrate specificity with a
tendency towards lipophilic, cationic compounds [132]. Due to its broad specificity, drug
interactions occur when Pgp substrates and inhibitor/inducers are co-administered. Pgp limits
the uptake of drugs from the gastrointestinal lumen into the enterocytes. Induction of Pgp,
leads to decreased bioavailability of the drug, whereas, inhibition of it causes increased
bioavailability. One of the most important drug-drug interactions is the one between digoxin
and quinidine. Both two are substrates for Pgp and in the case of co-administration in wild-
type mice; the plasma digoxin concentration was found to increase due to the inhibition of
Pgp mediated elimination of the drug [140]. In another study, intravenously applied talinolol`s
secretion into intestine was reduced by verapamil [141]. Since many drugs including oral β-
lactam antibiotics, anticancer agent bestatin and the angiotensin-converting enzyme inhibitors
enalapril and temocapril are absorbed by the peptide transporters (PEPTs), it is anticipated
that clinically relevant drug interaction between these drugs and cephalosporin may occur at
the level of intestinal absorption [142].
In human nutrition, drug interactions can also be due to the ingestion of food, either natural or
as processed food. There is a common but also erroneous belief in community that natural
products are safe and beneficial. There is little public understanding or appreciation of the fact
that these “all natural” extracts are in fact a combination of potentially biologically active
compounds that exist in these marketed products in unknown quantities [143]. Regardless of
being natural, they are composed of chemical structures that are substrates of several
metabolizing enzymes and membrane transporters in human similar like drugs. They have the
same fate like drugs as being absorbed, distributed, metabolized and eliminated. As a result,
nutrients may also cause interactions with drugs by increasing or decreasing their
bioavailability as well as the efficacies resulting in undesired effects. Flavonoids are a large
class of naturally occurring compounds widely present in the green plant world. They are an
integral part of human diet and are particularly abundant in vegetables, fruits and plant
derived beverages such as wine and tea [93]. There are a variety of examples in the literature
CHAPTER 1
34
related to food effect on drug absorption, such as influence of grapefruit juice [144-147],
orange juice [146,148,149], green tea extract [150] and others [151-154]. One of the most
widespread interactions is caused by grapefruit juice. The effect of grapefruit juice and seville
orange juice on the pharmacokinetics of dextromethorphan was shown. According to this
study, bioavailability of dextromethorphan increased significantly with grapefruit and seville
orange juice. This effect was found to be long-lasting, which returned to half the baseline
value after three days of washout. This result was proposed as an effect of irreversible
inhibition of gut CYP3A/Pgp [146]. In another study, absorption of talinolol, which is a
substrate of Pgp, increased by grapefruit juice due to the inhibition of the transporter by
grapefruit juice [144]. Very recently, the bioavailability of fexofenadine was found to be
diminished by grapefruit juice at a commonly consumed volume suggesting a possible role to
organic anion transporting polypeptides (OATP1A2) [155]. Flavonoids have been reported to
interact with Pgp, however the mechanism of this interaction remained to be unclear
(reviewed in [93]). Inhibition of Pgp by green tea polyphenols was reported [156]. In contrast,
in another study, elevation of Pgp activity by catechins was shown [157]. However, either
induction or inhibition may lead to alteration in the bioavailabilities of drugs that are extruded
by this transporter. Besides Pgp, MRP1 and MRP2 were also demonstrated to be inhibited by
a variety of flavonoids [158]. In summary, the increased intake of flavonoids might influence
the kinetics of pharmaceuticals taken simultaneously yielding an alteration in bioavailabilities.
OBJECTIVES
35
1.2 OBJECTIVES
Folic acid is an essential B group vitamin that plays a vital role in various biochemical
pathways in mammalian cells. The linkage between a low folate status and several
disturbances such as megaloblastic anemia, hyperhomocysteinemia, cardiovascular diseases,
some types of cancers and neurological diseases has been established. As folate cannot be
synthesized in the mammalian cells, it has to be obtained exogenously. For sustaining a
desired blood folate concentration, a sufficient folate intake and its bioavailability possess a
crucial role. Beside natural food folates, folic acid-fortified products and supplements are
ingested to achieve the required level. Like all other nutrients and pharmaceuticals, folic acid
bioavailability may decrease in the case of interactions at the level of intestinal absorption.
For instance concomitant administration of MTX and folic acid is known to interfere at the
site of cellular uptake. Recently, the DHFR enzyme inhibitory effects of some green tea
catechins, similar to that of MTX, were reported, which arose the question whether they
inhibit folate absorption through intestinal membranes.
Accordingly, the main goals of this thesis can be listed as:
• Establishment of an in vitro cell culture model to study folic acid uptake (Chapter 2)
• In vitro functional characterization of folic acid uptake (Chapter 2)
• Expression of some of the transport routes for folates in the cell culture model with
regard to mRNA (Chapter 2)
• Conducting in vitro cell culture experiments to testing various compounds for their
inhibitory behaviors including green tea and its catechins (Chapter 2)
• Performance of a clinical study on healthy human volunteers to investigate the in vivo
relevance of the in vitro interaction between folic acid and green tea (Chapter 3)
Alongside its importance in human nutrition, folic acid has been employed as a targeting unit
in polymeric drug delivery. Due to its small molecular size and high binding affinity for cell
surface FRs, folate conjugates have the ability to deliver a variety of molecular complexes to
pathologic cells without causing harm to normal tissues. Therefore, in Chapter 4, targeting of
folic acid conjugated nanoparticles to Caco-2 cells was investigated. DNA block copolymer
micelles equipped with folic acid moieties were targeted to FR expressing Caco-2 cells and
their uptake behaviors were optimized.

CHAPTER 1
36
REFERENCES
37
REFERENCES
1. Forssen KM, Jagerstad MI, Wigertz K, Witthoft CM. Folates and dairy products: A
critical update. Journal of the American College of Nutrition 2000;19:100S-110S
2. Lucock M. Folic acid: nutritional biochemistry, molecular biology, and role in disease
processes. Mol Genet Metab 2000;71:121-138
3. Eichholzer M, Tonz O, Zimmermann R. Folic acid: a public-health challenge. Lancet
2006;367:1352-1361
4. Szakacs Z, Noszai B. Determination of dissociation constants of folic acid,
methotrexate, and other photolabile pteridines by pressure-assisted capillary
electrophoresis. Electrophoresis 2006;27:3399-3409
5. Fowler B. The folate cycle and disease in humans. Kidney Int Suppl 2001;78:S221-
229
6. Donnelly JG. Folic acid. Crit Rev Clin Lab Sci 2001;38:183-223
7. Zhao R, Goldman ID. Resistance to antifolates. Oncogene 2003;22:7431-7457
8. Wagner C. Biochemical role of folate in cellular metabolism (Reprinted from Folate
and Health Disease, pgs 23-42, 1995). Clin Res Regul Aff 2001;18:161-180
9. Scott JM. Folate and vitamin B12. Proc Nutr Soc 1999;58:441-448
10. Stanger O. Physiology of folic acid in health and disease. Current drug metabolism
2002;3:211-223
11. Welch GN, Loscalzo J. Homocysteine and atherothrombosis. N Engl J Med
1998;338:1042-1050
12. Blakley RL, Benkovic SJ, Whitehead VM. Folates and pterins. New York: Wiley;
1984
13. Krishnaswamy K, Madhavan Nair K. Importance of folate in human nutrition. Br J
Nutr 2001;85 Suppl 2:S115-124
14. Green NS. Folic acid supplementation and prevention of birth defects. J Nutr
2002;132:2356S-2360S
15. Berry RJ, Li Z, Erickson JD, Li S, Moore CA, Wang H, Mulinare J, Zhao P, Wong
LY, Gindler J, Hong SX, Correa A. Prevention of neural-tube defects with folic acid
in China. China-U.S. Collaborative Project for Neural Tube Defect Prevention. N Engl
J Med 1999;341:1485-1490
16. Choi SW, Mason JB. Folate and carcinogenesis: an integrated scheme. J Nutr
2000;130:129-132
CHAPTER 1
38
17. Kim YI. Role of folate in colon cancer development and progression. J Nutr
2003;133:3731S-3739S
18. Van Guelpen B, Hultdin J, Johansson I, Hallmans G, Stenling R, Riboli E, Winkvist
A, Palmqvist R. Low folate levels may protect against colorectal cancer. Gut
2006;55:1461-1466
19. Coppede F, Marini G, Bargagna S, Stuppia L, Minichilli F, Fontana I, Colognato R,
Astrea G, Palka G, Migliore L. Folate gene polymorphisms and the risk of Down
syndrome pregnancies in young Italian women. American journal of medical genetics
2006;140:1083-1091
20. James SJ, Pogribna M, Pogribny IP, Melnyk S, Hine RJ, Gibson JB, Yi P, Tafoya DL,
Swenson DH, Wilson VL, Gaylor DW. Abnormal folate metabolism and mutation in
the methylenetetrahydrofolate reductase gene may be maternal risk factors for Down
syndrome. Am J Clin Nutr 1999;70:495-501
21. Martinez-Frias ML, Perez B, Desviat LR, Castro M, Leal F, Rodriguez L, Mansilla E,
Martinez-Fernandez ML, Bermejo E, Rodriguez-Pinilla E, Prieto D, Ugarte M.
Maternal polymorphisms 677C-T and 1298A-C of MTHFR, and 66A-G MTRR genes:
is there any relationship between polymorphisms of the folate pathway, maternal
homocysteine levels, and the risk for having a child with Down syndrome? American
journal of medical genetics 2006;140:987-997
22. Seshadri S, Beiser A, Selhub J, Jacques PF, Rosenberg IH, D'Agostino RB, Wilson
PW, Wolf PA. Plasma homocysteine as a risk factor for dementia and Alzheimer's
disease. N Engl J Med 2002;346:476-483
23. Luchsinger JA, Tang MX, Miller J, Green R, Mayeux R. Relation of higher folate
intake to lower risk of Alzheimer disease in the elderly. Archives of neurology
2007;64:86-92
24. Sharp L, Little J. Polymorphisms in genes involved in folate metabolism and
colorectal neoplasia: a HuGE review. Am J Epidemiol 2004;159:423-443
25. Bailey LB, Gregory JF, 3rd. Polymorphisms of methylenetetrahydrofolate reductase
and other enzymes: metabolic significance, risks and impact on folate requirement. J
Nutr 1999;129:919-922
26. Brouwer IA, van Dusseldorp M, West CE, Steegers-Theunissen RPM. Bioavailability
and bioefficacy of folate and folic acid in man. Nutrition Research Reviews
2001;14:267-293
REFERENCES
39
27. Jacques PF, Bostom AG, Williams RR, Ellison RC, Eckfeldt JH, Rosenberg IH,
Selhub J, Rozen R. Relation between folate status, a common mutation in
methylenetetrahydrofolate reductase, and plasma homocysteine concentrations.
Circulation 1996;93:7-9
28. Narayanan S, McConnell J, Little J, Sharp L, Piyathilake CJ, Powers H, Basten G,
Duthie SJ. Associations between two common variants C677T and A1298C in the
methylenetetrahydrofolate reductase gene and measures of folate metabolism and
DNA stability (strand breaks, misincorporated uracil, and DNA methylation status) in
human lymphocytes in vivo. Cancer Epidemiol Biomarkers Prev 2004;13:1436-1443
29. Zhang J, Zotz RB, Li Y, Wang R, Kiel S, Schulz WA, Wen D, Chen Z, Zhang L,
Wang S, Gabbert HE, Sarbia M. Methylenetetrahydrofolate reductase C677T
polymorphism and predisposition towards esophageal squamous cell carcinoma in a
German Caucasian and a northern Chinese population. J Cancer Res Clin Oncol
2004;130:574-580
30. Shelnutt KP, Kauwell GP, Chapman CM, Gregory JF, 3rd, Maneval DR, Browdy AA,
Theriaque DW, Bailey LB. Folate status response to controlled folate intake is
affected by the methylenetetrahydrofolate reductase 677C-->T polymorphism in
young women. J Nutr 2003;133:4107-4111
31. Willems FF, Boers GH, Blom HJ, Aengevaeren WR, Verheugt FW. Pharmacokinetic
study on the utilisation of 5-methyltetrahydrofolate and folic acid in patients with
coronary artery disease. Br J Pharmacol 2004;141:825-830
32. Kirke PN, Mills JL, Molloy AM, Brody LC, O'Leary VB, Daly L, Murray S, Conley
M, Mayne PD, Smith O, Scott JM. Impact of the MTHFR C677T polymorphism on
risk of neural tube defects: case-control study. Bmj 2004;328:1535-1536
33. Suitor CW, Bailey LB. Dietary folate equivalents: interpretation and application.
Journal of the American Dietetic Association 2000;100:88-94
34. Folic acid to fortify U.S. food products to prevent birth defects. Food and Drug
Administration (FDA) 1998
35. Standing Commitee on the Scientific Evaluation of Dietary Reference Intakes, Food
and Nutrition Board, Institute of Medicine. Dietary Reference Intakes for Thiamin,
Riboflavin, Niacin, Vitamin B6, Folate, Vitamin B12, Pantothenic acid, Biotin and
Cholin Washington DC: National Academy Press; 1999
36. Krawinkel M, Brönstrup A, Bechthold A, Biesalski HK, Boeing H, Elmadfa I,
Heseker H, Kroke A, Leschik -B, E., Stehle P. Strategien zur Verbesserung der
CHAPTER 1
40
Folatversorgung in Deutschland-Nutzen und Risiken. Bonn: Deutsche Gesellschaft für
Ernährung; 2006
37. Deutsche Gesellschaft für Ernährung, Österreichische Gesellschaft für Ernährung,
Schweizerische Gesellschaft für Ernährungsforschung, Schweizerische Vereinigung
für Ernährung (Hrsg.). Referenzwerte für die Nährstoffzufuhr. Frankfurt am Main:
Umschau/Braus; 2000
38. Sirotnak FM, Tolner B. Carrier-mediated membrane transport of folates in mammalian
cells. Annu Rev Nutr 1999;19:91-122
39. Mason JB, Shoda R, Haskell M, Selhub J, Rosenberg IH. Carrier affinity as a
mechanism for the pH-dependence of folate transport in the small intestine. Biochim
Biophys Acta 1990;1024:331-335
40. Zimmerman J. Folic acid transport in organ-cultured mucosa of human intestine.
Evidence for distinct carriers. Gastroenterology 1990;99:964-972
41. Zimmerman J, Selhub J, Rosenberg IH. Role of sodium ion in transport of folic acid in
the small intestine. Am J Physiol 1986;251:G218-222
42. Vincent ML, Russell RM, Sasak V. Folic acid uptake characteristics of a human colon
carcinoma cell line, Caco-2. A newly-described cellular model for small intestinal
epithelium. Hum Nutr Clin Nutr 1985;39:355-360
43. Said HM, Strum WB. A pH-dependent, carrier-mediated system for transport of 5-
methyltetrahydrofolate in rat jejunum. J Pharmacol Exp Ther 1983;226:95-99
44. Selhub J, Rosenberg IH. Folate transport in isolated brush border membrane vesicles
from rat intestine. J Biol Chem 1981;256:4489-4493
45. Zimmerman J. Methotrexate transport in the human intestine. Evidence for
heterogeneity. Biochem Pharmacol 1992;43:2377-2383
46. Said HM, Redha R. A carrier-mediated transport for folate in basolateral membrane
vesicles of rat small intestine. Biochem J 1987;247:141-146
47. Rajgopal A, Sierra EE, Zhao R, Goldman ID. Expression of the reduced folate carrier
SLC19A1 in IEC-6 cells results in two distinct transport activities. Am J Physiol Cell
Physiol 2001;281:C1579-1586
48. Zeng H, Chen ZS, Belinsky MG, Rea PA, Kruh GD. Transport of methotrexate
(MTX) and folates by multidrug resistance protein (MRP) 3 and MRP1: effect of
polyglutamylation on MTX transport. Cancer Res 2001;61:7225-7232
49. Hooijberg JH, Peters GJ, Assaraf YG, Kathmann I, Priest DG, Bunni MA, Veerman
AJ, Scheffer GL, Kaspers GJ, Jansen G. The role of multidrug resistance proteins
REFERENCES
41
MRP1, MRP2 and MRP3 in cellular folate homeostasis. Biochem Pharmacol
2003;65:765-771
50. Hooijberg JH, Jansen G, Assaraf YG, Kathmann I, Pieters R, Laan AC, Veerman AJ,
Kaspers GJ, Peters GJ. Folate concentration dependent transport activity of the
Multidrug Resistance Protein 1 (ABCC1). Biochem Pharmacol 2004;67:1541-1548
51. Hooijberg JH, Broxterman HJ, Kool M, Assaraf YG, Peters GJ, Noordhuis P, Scheper
RJ, Borst P, Pinedo HM, Jansen G. Antifolate resistance mediated by the multidrug
resistance proteins MRP1 and MRP2. Cancer Res 1999;59:2532-2535
52. Ifergan I, Shafran A, Jansen G, Hooijberg JH, Scheffer GL, Assaraf YG. Folate
deprivation results in the loss of breast cancer resistance protein (BCRP/ABCG2)
expression. A role for BCRP in cellular folate homeostasis. J Biol Chem
2004;279:25527-25534
53. Matherly LH, Goldman DI. Membrane transport of folates. Vitam Horm 2003;66:403-
456
54. Qiu A, Jansen M, Sakaris A, Min SH, Chattopadhyay S, Tsai E, Sandoval C, Zhao R,
Akabas MH, Goldman ID. Identification of an intestinal folate transporter and the
molecular basis for hereditary folate malabsorption. Cell 2006;127:917-928
55. Ganapathy V, Smith SB, Prasad PD. SLC19: the folate/thiamine transporter family.
Pflugers Arch 2004;447:641-646
56. Wang Y, Zhao R, Russell RG, Goldman ID. Localization of the murine reduced folate
carrier as assessed by immunohistochemical analysis. Biochim Biophys Acta
2001;1513:49-54
57. Zhao R, Goldman ID. The molecular identity and characterization of a Proton-
Coupled Folate Transporter-PCFT; biological ramifications and impact on the activity
of pemetrexed-12 06 06. Cancer Metastasis Rev 2007
58. Sierra EE, Brigle KE, Spinella MJ, Goldman ID. pH dependence of methotrexate
transport by the reduced folate carrier and the folate receptor in L1210 leukemia cells.
Further evidence for a third route mediated at low pH. Biochem Pharmacol
1997;53:223-231
59. Toffoli G, Cernigoi C, Russo A, Gallo A, Bagnoli M, Boiocchi M. Overexpression of
folate binding protein in ovarian cancers. Int J Cancer 1997;74:193-198
60. Theti DS, Jackman AL. The role of alpha-folate receptor-mediated transport in the
antitumor activity of antifolate drugs. Clin Cancer Res 2004;10:1080-1089
CHAPTER 1
42
61. Corona G, Giannini F, Fabris M, Toffoli G, Boiocchi M. Role of folate receptor and
reduced folate carrier in the transport of 5-methyltetrahydrofolic acid in human
ovarian carcinoma cells. Int J Cancer 1998;75:125-133
62. Leamon CP, Reddy JA. Folate-targeted chemotherapy. Adv Drug Deliv Rev
2004;56:1127-1141
63. Reddy JA, Allagadda VM, Leamon CP. Targeting therapeutic and imaging agents to
folate receptor positive tumors. Current pharmaceutical biotechnology 2005;6:131-150
64. Wang Y, Rajgopal A, Goldman ID, Zhao R. Preservation of folate transport activity
with a low-pH optimum in rat IEC-6 intestinal epithelial cell lines that lack reduced
folate carrier function. Am J Physiol Cell Physiol 2005;288:C65-71
65. Shayeghi M, Latunde-Dada GO, Oakhill JS, Laftah AH, Takeuchi K, Halliday N,
Khan Y, Warley A, McCann FE, Hider RC, Frazer DM, Anderson GJ, Vulpe CD,
Simpson RJ, McKie AT. Identification of an intestinal heme transporter. Cell
2005;122:789-801
66. Mottino AD, Hoffman T, Jennes L, Cao JS, Vore M. Expression of multidrug
resistance-associated protein 2 in small intestine from pregnant and postpartum rats.
Am J Physiol-Gastr L 2001;280:G1261-G1273
67. Kusuhara H, Han YH, Shimoda M, Kokue E, Suzuki H, Sugiyama Y. Reduced folate
derivatives are endogenous substrates for cMOAT in rats. Am J Physiol
1998;275:G789-796
68. Fromm MF, Kauffmann HM, Fritz P, Burk O, Kroemer HK, Warzok RW, Eichelbaum
M, Siegmund W, Schrenk D. The effect of rifampin treatment on intestinal expression
of human MRP transporters. Am J Pathol 2000;157:1575-1580
69. Taipalensuu J, Tornblom H, Lindberg G, Einarsson C, Sjoqvist F, Melhus H, Garberg
P, Sjostrom B, Lundgren B, Artursson P. Correlation of gene expression of ten drug
efflux proteins of the ATP-binding cassette transporter family in normal human
jejunum and in human intestinal epithelial Caco-2 cell monolayers. J Pharmacol Exp
Ther 2001;299:164-170
70. Xia CQ, Liu N, Yang D, Miwa G, Gan LS. Expression, localization, and functional
characteristics of breast cancer resistance protein in Caco-2 cells. Drug Metab Dispos
2005;33:637-643
71. Said HM. Recent advances in carrier-mediated intestinal absorption of water-soluble
vitamins. Annu Rev Physiol 2004;66:419-446
REFERENCES
43
72. Asrar FM, O'Connor DL. Bacterially synthesized folate and supplemental folic acid
are absorbed across the large intestine of piglets. J Nutr Biochem 2005;16:587-593
73. Ahn E, Kapur B, Koren G. Study on circadian variation in folate pharmacokinetics.
Can J Clin Pharmacol 2005;12:e4-9
74. Pentieva K, McNulty H, Reichert R, Ward M, Strain JJ, McKillop DJ, McPartlin JM,
Connolly E, Molloy A, Kramer K, Scott JM. The short-term bioavailabilities of [6S]-
5-methyltetrahydrofolate and folic acid are equivalent in men. J Nutr 2004;134:580-
585
75. Chandler CJ, Wang TT, Halsted CH. Pteroylpolyglutamate hydrolase from human
jejunal brush borders. Purification and characterization. J Biol Chem 1986;261:928-
933
76. Wang TT, Chandler CJ, Halsted CH. Intracellular pteroylpolyglutamate hydrolase
from human jejunal mucosa. Isolation and characterization. J Biol Chem
1986;261:13551-13555
77. Wei MM, Gregory JF. Organic acids in selected foods inhibit intestinal brush border
pteroylpolyglutamate hydrolase in vitro: Potential mechanism affecting the
bioavailability of dietary polyglutamyl folate. Journal of Agricultural and Food
Chemistry 1998;46:211-219
78. Kelly P, McPartlin J, Goggins M, Weir DG, Scott JM. Unmetabolized folic acid in
serum: acute studies in subjects consuming fortified food and supplements. Am J Clin
Nutr 1997;65:1790-1795
79. Sweeney MR, McPartlin J, Weir DG, Scott JM. Measurements of sub-nanomolar
concentrations of unmetabolised folic acid in serum. Journal of Chromatography B-
Analytical Technologies in the Biomedical and Life Sciences 2003;788:187-191
80. Gregory JF, 3rd, Quinlivan EP. In vivo kinetics of folate metabolism. Annu Rev Nutr
2002;22:199-220
81. Takimoto CH. New Antifolates: Pharmacology and Clinical Applications. Oncologist
1996;1:68-81
82. Bleyer WA. The clinical pharmacology of methotrexate: new applications of an old
drug. Cancer 1978;41:36-51
83. Alarcon GS. Methotrexate use in rheumatoid arthritis. A clinician's perspective.
Immunopharmacology 2000;47:259-271
CHAPTER 1
44
84. Chungi VS, Bourne DW, Dittert LW. Competitive inhibition between folic acid and
methotrexate for transport carrier in the rat small intestine. J Pharm Sci 1979;68:1552-
1553
85. Selhub J, Dhar GJ, Rosenberg IH. Inhibition of folate enzymes by sulfasalazine. J Clin
Invest 1978;61:221-224
86. Jansen G, van der Heijden J, Oerlemans R, Lems WF, Ifergan I, Scheper RJ, Assaraf
YG, Dijkmans BA. Sulfasalazine is a potent inhibitor of the reduced folate carrier:
implications for combination therapies with methotrexate in rheumatoid arthritis.
Arthritis Rheum 2004;50:2130-2139
87. Ross JA, Kasum CM. Dietary flavonoids: bioavailability, metabolic effects, and
safety. Annu Rev Nutr 2002;22:19-34
88. Scalbert A, Manach C, Morand C, Remesy C, Jimenez L. Dietary polyphenols and the
prevention of diseases. Crit Rev Food Sci Nutr 2005;45:287-306
89. Graf BA, Milbury PE, Blumberg JB. Flavonols, flavones, flavanones, and human
health: epidemiological evidence. J Med Food 2005;8:281-290
90. Manach C, Scalbert A, Morand C, Remesy C, Jimenez L. Polyphenols: food sources
and bioavailability. Am J Clin Nutr 2004;79:727-747
91. Nemeth K, Plumb GW, Berrin JG, Juge N, Jacob R, Naim HY, Williamson G,
Swallow DM, Kroon PA. Deglycosylation by small intestinal epithelial cell beta-
glucosidases is a critical step in the absorption and metabolism of dietary flavonoid
glycosides in humans. Eur J Nutr 2003;42:29-42
92. Price KR, Bacon JR, Rhodes MJC. Effect of storage and domestic processing on the
content and composition of flavonol glucosides in onion (Allium cepa). Journal of
Agricultural and Food Chemistry 1997;45:938-942
93. Morris ME, Zhang S. Flavonoid-drug interactions: effects of flavonoids on ABC
transporters. Life Sci 2006;78:2116-2130
94. Day AJ, Gee JM, DuPont MS, Johnson IT, Williamson G. Absorption of quercetin-3-
glucoside and quercetin-4'-glucoside in the rat small intestine: the role of lactase
phlorizin hydrolase and the sodium-dependent glucose transporter. Biochem
Pharmacol 2003;65:1199-1206
95. Aherne SA, O'Brien NM. Dietary flavonols: Chemistry, food content, and metabolism.
Nutrition 2002;18:75-81
96. Hollman PCH, Arts ICW. Flavonols, flavones and flavanols - nature, occurrence and
dietary burden. Journal of the Science of Food and Agriculture 2000;80:1081-1093
REFERENCES
45
97. Hakkinen SH, Karenlampi SO, Heinonen IM, Mykkanen HM, Torronen AR. Content
of the flavonols quercetin, myricetin, and kaempferol in 25 edible berries. Journal of
Agricultural and Food Chemistry 1999;47:2274-2279
98. Hertog MGL, Hollman PCH, Vandeputte B. Content of Potentially Anticarcinogenic
Flavonoids of Tea Infusions, Wines, and Fruit Juices. Journal of Agricultural and
Food Chemistry 1993;41:1242-1246
99. Hertog MGL, Hollman PCH, Katan MB. Content of Potentially Anticarcinogenic
Flavonoids of 28 Vegetables and 9 Fruits Commonly Consumed in the Netherlands.
Journal of Agricultural and Food Chemistry 1992;40:2379-2383
100. Rouseff RL, Martin SF, Youtsey CO. Quantitative Survey of Narirutin, Naringin,
Hesperidin, and Neohesperidin in Citrus. Journal of Agricultural and Food Chemistry
1987;35:1027-1030
101. Tomas-Barberen FA, Clifford MN. Flavanones, chalcones and dihydrochalcones -
nature, occurrence and dietary burden. Journal of the Science of Food and Agriculture
2000;80:1073-1080
102. Scalbert A, Williamson G. Dietary intake and bioavailability of polyphenols. J Nutr
2000;130:2073S-2085S
103. Kong JM, Chia LS, Goh NK, Chia TF, Brouillard R. Analysis and biological activities
of anthocyanins. Phytochemistry 2003;64:923-933
104. Messina M, Nagata C, Wu AH. Estimated Asian adult soy protein and isoflavone
intakes. Nutrition and Cancer-an International Journal 2006;55:1-12
105. Arts IC, Hollman PC, Feskens EJ, Bueno de Mesquita HB, Kromhout D. Catechin
intake and associated dietary and lifestyle factors in a representative sample of Dutch
men and women. Eur J Clin Nutr 2001;55:76-81
106. Wiseman S, Mulder T, Rietveld A. Tea flavonoids: bioavailability in vivo and effects
on cell signaling pathways in vitro. Antioxidants & redox signaling 2001;3:1009-1021
107. Riemersma RA, Rice-Evans CA, Tyrrell RM, Clifford MN, Lean ME. Tea flavonoids
and cardiovascular health. Qjm 2001;94:277-282
108. Fan PH, Lou HX, Yu WT, Ren DM, Ma B, Ji M. Novel flavanol derivatives from
grape seeds. Tetrahedron Lett 2004;45:3163-3166
109. Mukhtar H, Ahmad N. Tea polyphenols: prevention of cancer and optimizing health.
Am J Clin Nutr 2000;71:1698S-1702S; discussion 1703S-1694S
110. Khokhar S, Magnusdottir SG. Total phenol, catechin, and caffeine contents of teas
commonly consumed in the United kingdom. J Agric Food Chem 2002;50:565-570
CHAPTER 1
46
111. Nihal M, Ahmad N, Mukhtar H, Wood GS. Anti-proliferative and proapoptotic effects
of (-)-epigallocatechin-3-gallate on human melanoma: possible implications for the
chemoprevention of melanoma. Int J Cancer 2005;114:513-521
112. Liao J, Yang GY, Park ES, Meng X, Sun Y, Jia D, Seril DN, Yang CS. Inhibition of
lung carcinogenesis and effects on angiogenesis and apoptosis in A/J mice by oral
administration of green tea. Nutrition and cancer 2004;48:44-53
113. Gao YT, McLaughlin JK, Blot WJ, Ji BT, Dai Q, Fraumeni JF, Jr. Reduced risk of
esophageal cancer associated with green tea consumption. Journal of the National
Cancer Institute 1994;86:855-858
114. Horie N, Hirabayashi N, Takahashi Y, Miyauchi Y, Taguchi H, Takeishi K.
Synergistic effect of green tea catechins on cell growth and apoptosis induction in
gastric carcinoma cells. Biol Pharm Bull 2005;28:574-579
115. Nishikawa T, Nakajima T, Moriguchi M, Jo M, Sekoguchi S, Ishii M, Takashima H,
Katagishi T, Kimura H, Minami M, Itoh Y, Kagawa K, Okanoue T. A green tea
polyphenol, epigalocatechin-3-gallate, induces apoptosis of human hepatocellular
carcinoma, possibly through inhibition of Bcl-2 family proteins. Journal of hepatology
2006;44:1074-1082
116. Ju J, Hong J, Zhou JN, Pan Z, Bose M, Liao J, Yang GY, Liu YY, Hou Z, Lin Y, Ma
J, Shih WJ, Carothers AM, Yang CS. Inhibition of intestinal tumorigenesis in
Apcmin/+ mice by (-)-epigallocatechin-3-gallate, the major catechin in green tea.
Cancer Res 2005;65:10623-10631
117. Takada M, Nakamura Y, Koizumi T, Toyama H, Kamigaki T, Suzuki Y, Takeyama Y,
Kuroda Y. Suppression of human pancreatic carcinoma cell growth and invasion by
epigallocatechin-3-gallate. Pancreas 2002;25:45-48
118. Qin J, Xie LP, Zheng XY, Wang YB, Bai Y, Shen HF, Li LC, Dahiya R. A
component of green tea, (-)-epigallocatechin-3-gallate, promotes apoptosis in T24
human bladder cancer cells via modulation of the PI3K/Akt pathway and Bcl-2 family
proteins. Biochem Biophys Res Commun 2007;354:852-857
119. Patel SP, Hotston M, Kommu S, Persad RA. The protective effects of green tea in
prostate cancer. BJU Int 2005;96:1212-1214
120. Yang CS, Chung JY, Yang G, Chhabra SK, Lee MJ. Tea and tea polyphenols in
cancer prevention. J Nutr 2000;130:472S-478S
REFERENCES
47
121. Kuriyama S, Shimazu T, Ohmori K, Kikuchi N, Nakaya N, Nishino Y, Tsubono Y,
Tsuji I. Green tea consumption and mortality due to cardiovascular disease, cancer,
and all causes in Japan: the Ohsaki study. Jama 2006;296:1255-1265
122. Das M, Sur P, Gomes A, Vedasiromoni JR, Ganguly DK. Inhibition of tumour growth
and inflammation by consumption of tea. Phytother Res 2002;16 Suppl 1:S40-44
123. Shixian Q, VanCrey B, Shi J, Kakuda Y, Jiang Y. Green tea extract thermogenesis-
induced weight loss by epigallocatechin gallate inhibition of catechol-O-
methyltransferase. J Med Food 2006;9:451-458
124. Lambert JD, Yang CS. Mechanisms of cancer prevention by tea constituents. J Nutr
2003;133:3262S-3267S
125. Kobayashi Y, Suzuki M, Satsu H, Arai S, Hara Y, Suzuki K, Miyamoto Y, Shimizu
M. Green tea polyphenols inhibit the sodium-dependent glucose transporter of
intestinal epithelial cells by a competitive mechanism. J Agric Food Chem
2000;48:5618-5623
126. Vaidyanathan JB, Walle T. Cellular uptake and efflux of the tea flavonoid (-
)epicatechin-3-gallate in the human intestinal cell line Caco-2. J Pharmacol Exp Ther
2003;307:745-752
127. Zhang S, Yang X, Morris ME. Flavonoids are inhibitors of breast cancer resistance
protein (ABCG2)-mediated transport. Mol Pharmacol 2004;65:1208-1216
128. Farhadi A, Banan A, Fields J, Keshavarzian A. Intestinal barrier: an interface between
health and disease. Journal of gastroenterology and hepatology 2003;18:479-497
129. Turner JR. Molecular basis of epithelial barrier regulation: from basic mechanisms to
clinical application. Am J Pathol 2006;169:1901-1909
130. Suzuki H, Sugiyama Y. Role of metabolic enzymes and efflux transporters in the
absorption of drugs from the small intestine. Eur J Pharm Sci 2000;12:3-12
131. Katsura T, Inui K. Intestinal absorption of drugs mediated by drug transporters:
mechanisms and regulation. Drug Metab Pharmacokinet 2003;18:1-15
132. Chan LM, Lowes S, Hirst BH. The ABCs of drug transport in intestine and liver:
efflux proteins limiting drug absorption and bioavailability. Eur J Pharm Sci
2004;21:25-51
133. Hediger MA, Romero MF, Peng JB, Rolfs A, Takanaga H, Bruford EA. The ABCs of
solute carriers: physiological, pathological and therapeutic implications of human
membrane transport proteinsIntroduction. Pflugers Arch 2004;447:465-468
CHAPTER 1
48
134. Lin JH, Chiba M, Baillie TA. Is the role of the small intestine in first-pass metabolism
overemphasized? Pharmacological reviews 1999;51:135-158
135. Lindell M, Karlsson MO, Lennernas H, Pahlman L, Lang MA. Variable expression of
CYP and Pgp genes in the human small intestine. Eur J Clin Invest 2003;33:493-499
136. Strassburg CP, Kneip S, Topp J, Obermayer-Straub P, Barut A, Tukey RH, Manns
MP. Polymorphic gene regulation and interindividual variation of UDP-
glucuronosyltransferase activity in human small intestine. J Biol Chem
2000;275:36164-36171
137. Peters WH, Roelofs HM, Nagengast FM, van Tongeren JH. Human intestinal
glutathione S-transferases. Biochem J 1989;257:471-476
138. Glatt H, Meinl W. Pharmacogenetics of soluble sulfotransferases (SULTs). Naunyn-
Schmiedeberg's archives of pharmacology 2004;369:55-68
139. Tsuji A. Transporter-mediated Drug Interactions. Drug Metab Pharmacokinet
2002;17:253-274
140. Fromm MF, Kim RB, Stein CM, Wilkinson GR, Roden DM. Inhibition of P-
glycoprotein-mediated drug transport: A unifying mechanism to explain the
interaction between digoxin and quinidine [seecomments]. Circulation 1999;99:552-
557
141. Gramatte T, Oertel R. Intestinal secretion of intravenous talinolol is inhibited by
luminal R-verapamil. Clin Pharmacol Ther 1999;66:239-245
142. Endres CJ, Hsiao P, Chung FS, Unadkat JD. The role of transporters in drug
interactions. Eur J Pharm Sci 2006;27:501-517
143. Venkataramanan R, Komoroski B, Strom S. In vitro and in vivo assessment of herb
drug interactions. Life Sci 2006;78:2105-2115
144. Spahn-Langguth H, Langguth P. Grapefruit juice enhances intestinal absorption of the
P-glycoprotein substrate talinolol. Eur J Pharm Sci 2001;12:361-367
145. Charbit B, Becquemont L, Lepere B, Peytavin G, Funck-Brentano C. Pharmacokinetic
and pharmacodynamic interaction between grapefruit juice and halofantrine. Clin
Pharmacol Ther 2002;72:514-523
146. Di Marco MP, Edwards DJ, Wainer IW, Ducharme MP. The effect of grapefruit juice
and seville orange juice on the pharmacokinetics of dextromethorphan: the role of gut
CYP3A and P-glycoprotein. Life Sci 2002;71:1149-1160
REFERENCES
49
147. Reif S, Nicolson MC, Bisset D, Reid M, Kloft C, Jaehde U, McLeod HL. Effect of
grapefruit juice intake on etoposide bioavailability. Eur J Clin Pharmacol
2002;58:491-494
148. Lilja JJ, Juntti-Patinen L, Neuvonen PJ. Orange juice substantially reduces the
bioavailability of the beta-adrenergic-blocking agent celiprolol. Clin Pharmacol Ther
2004;75:184-190
149. Lilja JJ, Raaska K, Neuvonen PJ. Effects of orange juice on the pharmacokinetics of
atenolol. Eur J Clin Pharmacol 2005;61:337-340
150. Jang EH, Choi JY, Park CS, Lee SK, Kim CE, Park HJ, Kang JS, Lee JW, Kang JH.
Effects of green tea extract administration on the pharmacokinetics of clozapine in
rats. J Pharm Pharmacol 2005;57:311-316
151. Grenier J, Fradette C, Morelli G, Merritt GJ, Vranderick M, Ducharme MP. Pomelo
juice, but not cranberry juice, affects the pharmacokinetics of cyclosporine in humans.
Clin Pharmacol Ther 2006;79:255-262
152. Greenblatt DJ, von Moltke LL, Perloff ES, Luo Y, Harmatz JS, Zinny MA. Interaction
of flurbiprofen with cranberry juice, grape juice, tea, and fluconazole: in vitro and
clinical studies. Clin Pharmacol Ther 2006;79:125-133
153. Deferme S, Augustijns P. The effect of food components on the absorption of P-gp
substrates: a review. J Pharm Pharmacol 2003;55:153-162
154. Deferme S, Van Gelder J, Augustijns P. Inhibitory effect of fruit extracts on P-
glycoprotein-related efflux carriers: an in-vitro screening. J Pharm Pharmacol
2002;54:1213-1219
155. Dresser GK, Kim RB, Bailey DG. Effect of grapefruit juice volume on the reduction
of fexofenadine bioavailability: possible role of organic anion transporting
polypeptides. Clin Pharmacol Ther 2005;77:170-177
156. Jodoin J, Demeule M, Beliveau R. Inhibition of the multidrug resistance P-
glycoprotein activity by green tea polyphenols. Biochim Biophys Acta
2002;1542:149-159
157. Wang EJ, Barecki-Roach M, Johnson WW. Elevation of P-glycoprotein function by a
catechin in green tea. Biochem Biophys Res Commun 2002;297:412-418
158. van Zanden JJ, Wortelboer HM, Bijlsma S, Punt A, Usta M, Bladeren PJ, Rietjens IM,
Cnubben NH. Quantitative structure activity relationship studies on the flavonoid
mediated inhibition of multidrug resistance proteins 1 and 2. Biochem Pharmacol
2005;69:699-708

CHAPTER 1
50

CHAPTER TWO
IN VITRO CELL CULTURE STUDIES, DRUG- AND NUTRIENT-
INTERACTIONS OF FOLIC ACID

CHAPTER 2
52
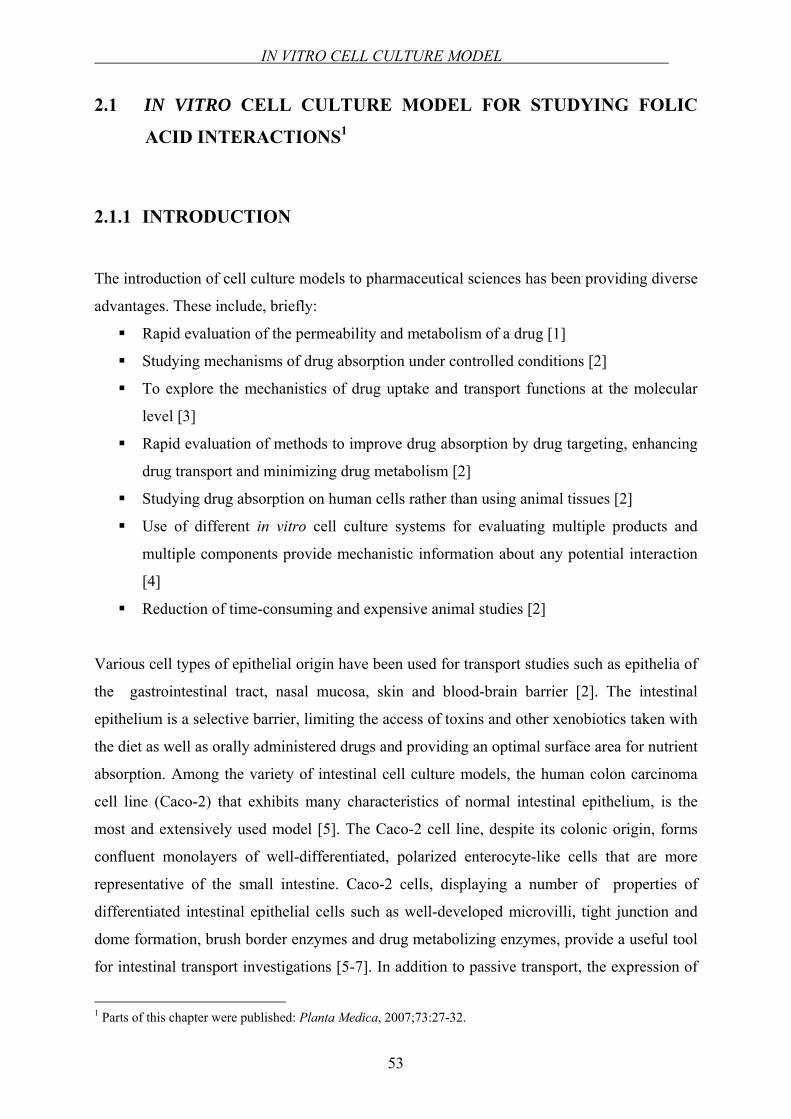
IN VITRO CELL CULTURE MODEL
53
2.1 IN VITRO CELL CULTURE MODEL FOR STUDYING FOLIC
ACID INTERACTIONS1
2.1.1 INTRODUCTION
The introduction of cell culture models to pharmaceutical sciences has been providing diverse
advantages. These include, briefly:
Rapid evaluation of the permeability and metabolism of a drug [1]
Studying mechanisms of drug absorption under controlled conditions [2]
To explore the mechanistics of drug uptake and transport functions at the molecular
level [3]
Rapid evaluation of methods to improve drug absorption by drug targeting, enhancing
drug transport and minimizing drug metabolism [2]
Studying drug absorption on human cells rather than using animal tissues [2]
Use of different in vitro cell culture systems for evaluating multiple products and
multiple components provide mechanistic information about any potential interaction
[4]
Reduction of time-consuming and expensive animal studies [2]
Various cell types of epithelial origin have been used for transport studies such as epithelia of
the gastrointestinal tract, nasal mucosa, skin and blood-brain barrier [2]. The intestinal
epithelium is a selective barrier, limiting the access of toxins and other xenobiotics taken with
the diet as well as orally administered drugs and providing an optimal surface area for nutrient
absorption. Among the variety of intestinal cell culture models, the human colon carcinoma
cell line (Caco-2) that exhibits many characteristics of normal intestinal epithelium, is the
most and extensively used model [5]. The Caco-2 cell line, despite its colonic origin, forms
confluent monolayers of well-differentiated, polarized enterocyte-like cells that are more
representative of the small intestine. Caco-2 cells, displaying a number of properties of
differentiated intestinal epithelial cells such as well-developed microvilli, tight junction and
dome formation, brush border enzymes and drug metabolizing enzymes, provide a useful tool
for intestinal transport investigations [5-7]. In addition to passive transport, the expression of
1 Parts of this chapter were published: Planta Medica, 2007;73:27-32.
CHAPTER 2
54
the carrier proteins (transporters) in Caco-2 cells allows to study carrier-mediated transport as
well [8]. Moreover, the use of Caco-2 monolayers to investigate particle uptake into human
intestinal epithelium has been suggested previously [9].
The mechanism of intestinal folate uptake has been investigated intensely over the last
decades. The underlying reason is its great importance in human nutrition for the essential
biochemical reactions (see Chapter 1). Transport of folate in mammalian cells is a
cooperation of diverse routes. The intestinal folate absorption occurs via an acidic pH-
dependent specialized mechanism that involves carrier-mediated transport (see Chapter 1)
[10].
Until today, numerous experimental models for the understanding of transport pathways and
contribution of transporter systems for folates in different tissues, modulation of folate
transport by drugs and evaluation of folate metabolism in vivo, have been used [11-17]. For
instance, for studying the role of RFC in intestinal folate uptake, Balamurugan and Said [10]
used intestinal epithelial cells (IECs) which were previously demonstrated as a suitable in
vitro model system to study cellular and molecular aspects of intestinal folate uptake [18].
Jansen et al., investigated the interaction of MTX and sulfasalazine at transporter level using
T cell origin (CEM) cells [19]. In another study, the effect of leucovorin calcium on the
intestinal absorption of MTX was investigated in rat intestine using an in situ rat gut
technique [20]. Similarly, Zimmerman et al. showed the competitive inhibition of folic acid
absorption by triamterene in rat jejunum [21]. Beside those, the well characterized Caco-2
cells have been widely used in folate uptake and transport studies [12,22-24].
The establishment of a good experimental model, that meets both the functional and
molecular requirements for drug transport and which mimics the in vivo conditions, is crucial.
Accordingly, our initial step in performing in vitro cell culture experiments was the selection
of an appropriate cell line for our further research on intestinal folic acid interactions. For this
purpose, preliminary folic acid transport experiments were conducted on T84 cells (human
carcinoma cell line derived from a lung metastasis of a colon carcinoma) and uptake
experiments on Caco-2 cells. Folic acid uptake characteristics of Caco-2 cells were first
shown in 1985 [25] and Caco-2 cells were used continuously. However, in the literature so
far, there have been no reported functional folic acid uptake and/or transport studies on T84
cells. Therefore, simultaneous experiments with T84 and Caco-2 cells were performed in
IN VITRO CELL CULTURE MODEL
55
order to select an appropriate cell line for the experiments to study the interaction of folic acid
with drugs and nutrients at the level of absorption.
2.1.2 EQUIPMENTS AND MATERIALS
Equipments
Incubator CO2-Incubator MCO 17 AI, Sanyo, distribution by MS
Laborgeraete, Wiesloch, Germany
Laminar Flow Hood Hera safe, Heraeus HSP12, Hanau, Germany
Centrifuge Eppendorf Centrifuge 5804R, Eppendorf-Netheler-Hinz
GmbH, Hamburg, Germany
Microscope Wilowert A Ph, Helmut Hund GmbH, Wetzlar,
Germany
Hemocytometer Thoma chamber, distribution by VWR, Darmstadt,
Germany
Volt-Ohm meter Millicell ERS, Millipore, Bedford, USA
pH meter pH 538 Multical, WTW GmbH, Weilheim, Germany
Cell culture flasks Cell culture flasks with filter cap, surface area 25 and
75 cm2, Greiner Bio-One GmbH, Frickenhausen,
Germany
Transwell® cell culture inserts 12 mm Transwell, polycarbonate membrane, sterile, 0.4
µm pore size, 1.13 cm2, Costar GmbH, Bodenheim,
Germany
24-well plates NunclonTM Multidishes, Nunc, Life Technologies
GmbH, Karlsruhe, Germany
96-well plates Greiner Bio-One GmbH, Frickenhausen, Germany
Shaker
Bühler shaker KMA vario, Johanna Otto GmbH,
Hechingen, Germany
Incubator Incubator BE 500, Memmert, Schwabach, Germany
CHAPTER 2
56
Materials
T84 cells were provided from American Type Culture Collection (ATCC), Rockville, MD,
USA. Caco-2 cells were purchased from Deutsche Sammlung von Mikroorganismen und
Zellkulturen (DSMZ), Braunschweig, Germany. All cell culture media and supplements were
from Biochrom KG, Berlin, Germany. MTX (Lantarel® FS) was from Wyeth Pharma GmbH,
Münster, Germany. 2-[4-(2-Hydroxyethyl)-1-piperazinyl]-ethanesulfonic acid (HEPES) and
2-Morpholinoethane sulfonic acid monohydrate (MES) were purchased from Merck,
Darmstadt, Germany. Non-labeled folic acid, leucovorin, trimethoprim, sulfasalazine and
mannitol were purchased from Sigma-Aldrich Chemie GmbH, Steinheim, Germany.
Triamterene was provided from Synopharm, Barsbüttel, Germany. Olsalazine was kindly
provided by UCB Manufacturing, NY, USA. [3H]folic acid (specific activity 20.0 Ci/mmol)
was obtained from Moravek Biochemicals, Inc., California, USA and [14C]mannitol (specific
activity 56.0 mCi/mmol) was obtained from PerkinElmer Life Sciences, Inc., Boston, USA.
Bio-Rad Protein Assay Kit was from Bio-Rad Laboratories GmbH, München, Germany.
2.1.3 METHODS
Experiments with T84 cells
Culture of T84 cells
T84 cells were cultured at 37°C in an atmosphere of 5% CO2 and 90% relative humidity in 75
cm2 cell culture flasks containing Dulbecco's MEM / HAM's F-12 supplemented with 10%
fetal bovine serum, 100 U/mL penicillin and 100 µg/mL streptomycin. The cells were
routinely split (once a week) and the medium was replaced three times a week. While
splitting, after washing the monolayer two times with PBS, cells were trypsinized with
trypsin/EDTA solution (0.25%/0.02%) and seeded in 75 cm2 cell culture flasks at a density of
2x10⁶ cells per flask.
Preparation of transwell plates for transport experiments
T84 cells (Passage 14) were seeded on polycarbonate membrane filters with a pore size of 0.4
µm at a density of 100,000 cells per cm2. Medium was replaced three times a week and
integrity of cells was monitored on the same days by measuring the transepithelial electrical
resistance (TEER) using a MillicellTM ERS and “chopstick” electrodes. The integrity of cell
monolayers was checked by measuring the flux of the paracellular marker D-mannitol. The
IN VITRO CELL CULTURE MODEL
57
T84 cell monolayers were used after 19 days of cultivation. Details about the transepithelial
transport studies are explained under related title.
Assessment of the integrity of the monolayers
The integrity of the monolayers were assessed by the measurement of the TEER values of
each filter before the transport experiment and the measurement of the mannitol flux during
the transport experiments. Mannitol is used as the marker of paracellular transport. The
addition of 0.1 mmol/L non-labeled and 1 µCi/mL labeled ([14C]) mannitol within the
incubation mixture to the donor compartment resulted in the mannitol flux through the
acceptor compartment. The cell monolayers with the effective permeability coefficients for
mannitol above 1.00 x 10⁻⁶ cm.s-1 were excluded from the study.
Preparation of buffer solutions for cell experiments
The buffer systems at pH 6.5 were prepared freshly on the day of experiments according to
the procedure as follows:
10 mmol/L MES was dissolved in Hank’s Balanced Salt Solution (HBSS). With the aid of a
small stir bar, the solution was allowed to mix on a magnetic stir plate, gently. While stirring,
the pH of the solution was adjusted to 7.4 by adding 1 mol/L HCl or 1 mol/L NaOH solutions.
Transepithelial transport studies
Prior to the experiment, the medium was removed, the cells were washed once and pre-
incubated with transport buffer (HBSS with 10 mmol/L MES), pH 6.5 at 37 °C for 15 min
with subsequent registration of the TEER. The donor solution containing 0.5, 2 and 5 µmol/L
of folic acid labeled with 1 µCi/mL, 4 µCi/mL and 10 µCi/mL [3H]folic acid, respectively.
0.1 mmol/L D-mannitol labeled with 1µCi/mL [14C]mannitol was added either to the apical
compartment for absorptive (a→b) transport or to the basolateral compartment for secretory
(b→a) transport. The opposite compartments served as the acceptor compartments and
contained the same medium but without any substrates (folic acid, mannitol). The volume of
the apical compartment was 0.6 mL and the volume of the basolateral compartment was 1.5
mL. The experiment was conducted on a shaker at 150 rpm in an atmosphere of 90% relative
humidity at 37 °C for 120 min. At time points 0 and 120 min, samples (10 µL) were
withdrawn from donor compartments whereas at time points 0, 30, 60, 90 and 120 min
samples (350 µL) were withdrawn from the acceptor compartment and replaced with the same
amount of blank buffer at pH 6.5. The samples withdrawn were mixed with 4 mL scintillation
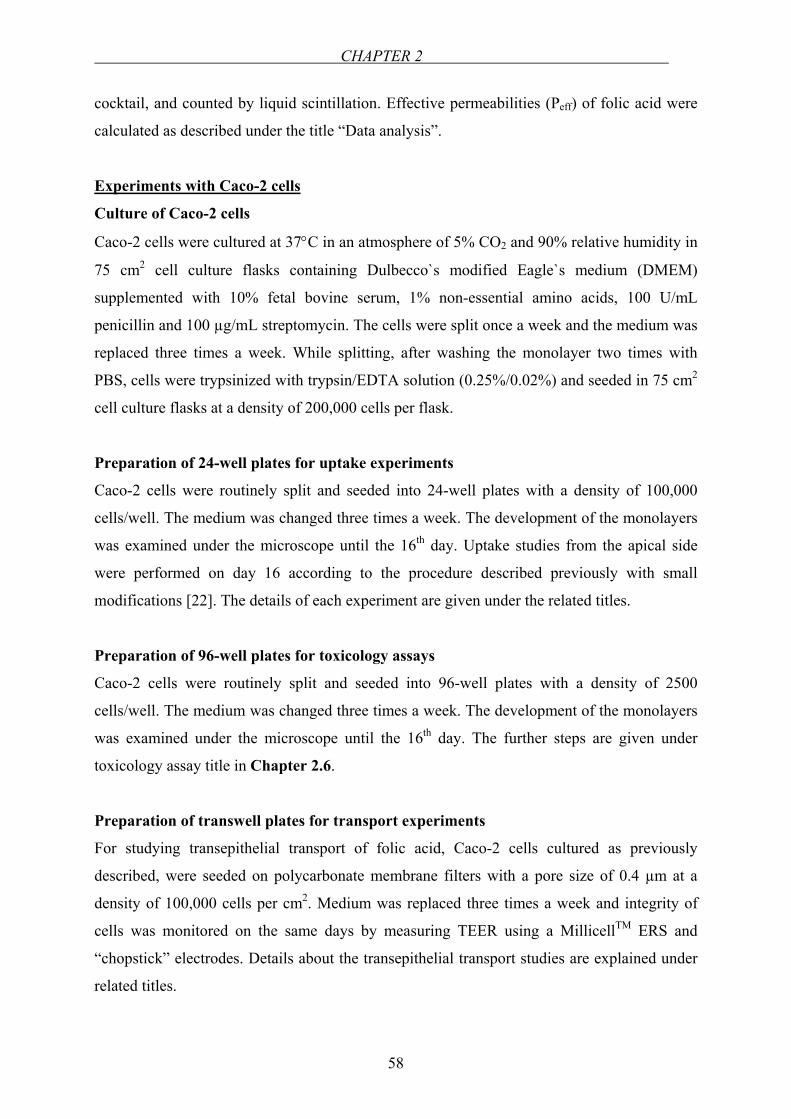
CHAPTER 2
58
cocktail, and counted by liquid scintillation. Effective permeabilities (Peff) of folic acid were
calculated as described under the title “Data analysis”.
Experiments with Caco-2 cells
Culture of Caco-2 cells
Caco-2 cells were cultured at 37°C in an atmosphere of 5% CO2 and 90% relative humidity in
75 cm2 cell culture flasks containing Dulbecco`s modified Eagle`s medium (DMEM)
supplemented with 10% fetal bovine serum, 1% non-essential amino acids, 100 U/mL
penicillin and 100 µg/mL streptomycin. The cells were split once a week and the medium was
replaced three times a week. While splitting, after washing the monolayer two times with
PBS, cells were trypsinized with trypsin/EDTA solution (0.25%/0.02%) and seeded in 75 cm2
cell culture flasks at a density of 200,000 cells per flask.
Preparation of 24-well plates for uptake experiments
Caco-2 cells were routinely split and seeded into 24-well plates with a density of 100,000
cells/well. The medium was changed three times a week. The development of the monolayers
was examined under the microscope until the 16th day. Uptake studies from the apical side
were performed on day 16 according to the procedure described previously with small
modifications [22]. The details of each experiment are given under the related titles.
Preparation of 96-well plates for toxicology assays
Caco-2 cells were routinely split and seeded into 96-well plates with a density of 2500
cells/well. The medium was changed three times a week. The development of the monolayers
was examined under the microscope until the 16th day. The further steps are given under
toxicology assay title in Chapter 2.6.
Preparation of transwell plates for transport experiments
For studying transepithelial transport of folic acid, Caco-2 cells cultured as previously
described, were seeded on polycarbonate membrane filters with a pore size of 0.4 µm at a
density of 100,000 cells per cm2. Medium was replaced three times a week and integrity of
cells was monitored on the same days by measuring TEER using a MillicellTM ERS and
“chopstick” electrodes. Details about the transepithelial transport studies are explained under
related titles.
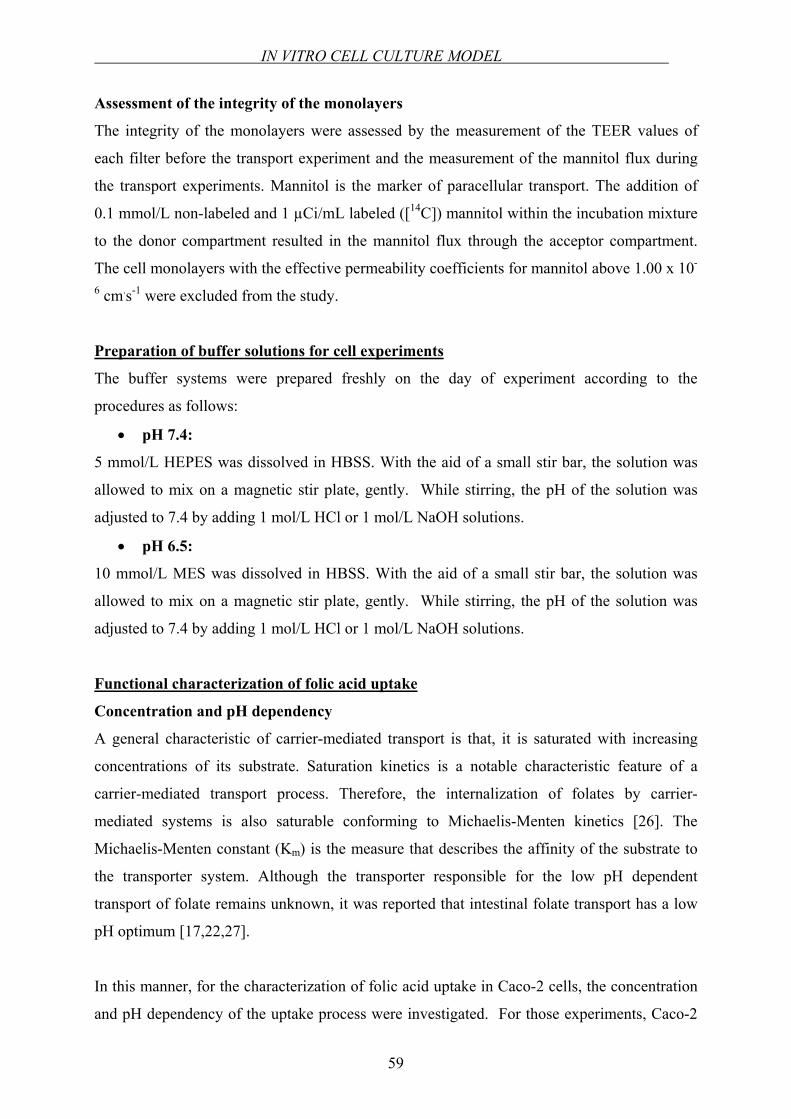
IN VITRO CELL CULTURE MODEL
59
Assessment of the integrity of the monolayers
The integrity of the monolayers were assessed by the measurement of the TEER values of
each filter before the transport experiment and the measurement of the mannitol flux during
the transport experiments. Mannitol is the marker of paracellular transport. The addition of
0.1 mmol/L non-labeled and 1 µCi/mL labeled ([14C]) mannitol within the incubation mixture
to the donor compartment resulted in the mannitol flux through the acceptor compartment.
The cell monolayers with the effective permeability coefficients for mannitol above 1.00 x 10-
6 cm.s-1 were excluded from the study.
Preparation of buffer solutions for cell experiments
The buffer systems were prepared freshly on the day of experiment according to the
procedures as follows:
• pH 7.4:
5 mmol/L HEPES was dissolved in HBSS. With the aid of a small stir bar, the solution was
allowed to mix on a magnetic stir plate, gently. While stirring, the pH of the solution was
adjusted to 7.4 by adding 1 mol/L HCl or 1 mol/L NaOH solutions.
• pH 6.5:
10 mmol/L MES was dissolved in HBSS. With the aid of a small stir bar, the solution was
allowed to mix on a magnetic stir plate, gently. While stirring, the pH of the solution was
adjusted to 7.4 by adding 1 mol/L HCl or 1 mol/L NaOH solutions.
Functional characterization of folic acid uptake
Concentration and pH dependency
A general characteristic of carrier-mediated transport is that, it is saturated with increasing
concentrations of its substrate. Saturation kinetics is a notable characteristic feature of a
carrier-mediated transport process. Therefore, the internalization of folates by carrier-
mediated systems is also saturable conforming to Michaelis-Menten kinetics [26]. The
Michaelis-Menten constant (Km) is the measure that describes the affinity of the substrate to
the transporter system. Although the transporter responsible for the low pH dependent
transport of folate remains unknown, it was reported that intestinal folate transport has a low
pH optimum [17,22,27].
In this manner, for the characterization of folic acid uptake in Caco-2 cells, the concentration
and pH dependency of the uptake process were investigated. For those experiments, Caco-2
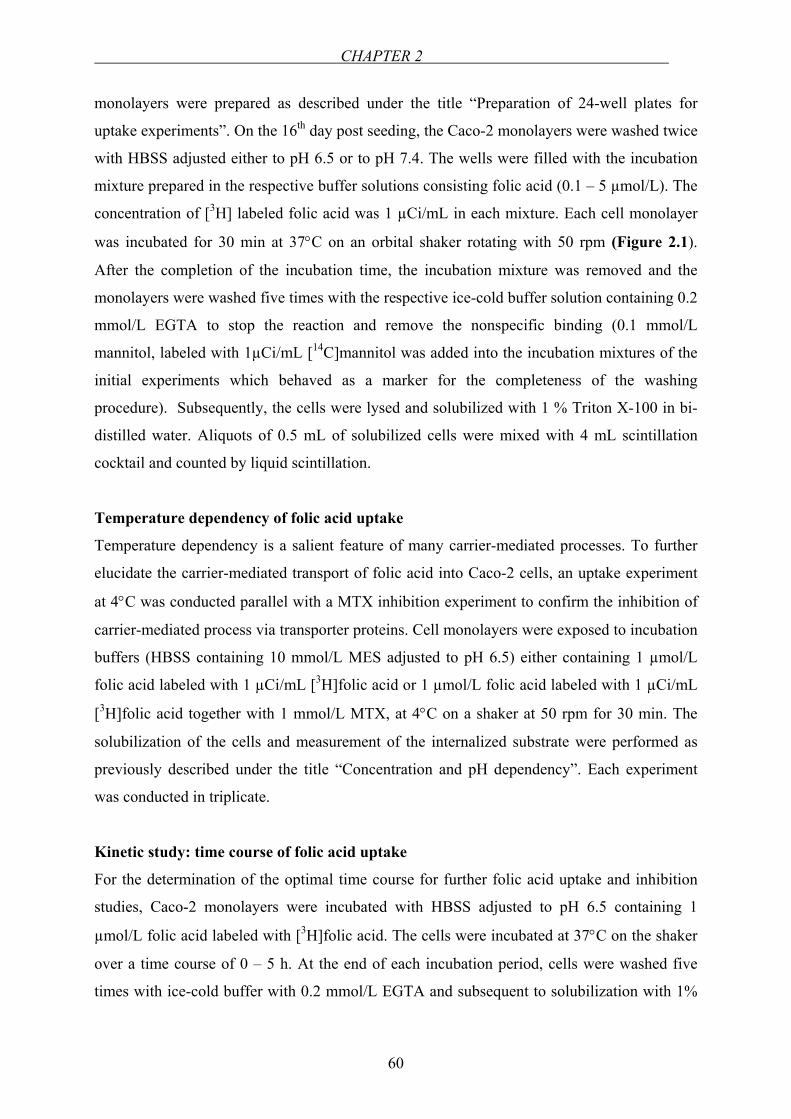
CHAPTER 2
60
monolayers were prepared as described under the title “Preparation of 24-well plates for
uptake experiments”. On the 16th day post seeding, the Caco-2 monolayers were washed twice
with HBSS adjusted either to pH 6.5 or to pH 7.4. The wells were filled with the incubation
mixture prepared in the respective buffer solutions consisting folic acid (0.1 – 5 µmol/L). The
concentration of [3H] labeled folic acid was 1 µCi/mL in each mixture. Each cell monolayer
was incubated for 30 min at 37°C on an orbital shaker rotating with 50 rpm (Figure 2.1).
After the completion of the incubation time, the incubation mixture was removed and the
monolayers were washed five times with the respective ice-cold buffer solution containing 0.2
mmol/L EGTA to stop the reaction and remove the nonspecific binding (0.1 mmol/L
mannitol, labeled with 1µCi/mL [14C]mannitol was added into the incubation mixtures of the
initial experiments which behaved as a marker for the completeness of the washing
procedure). Subsequently, the cells were lysed and solubilized with 1 % Triton X-100 in bi-
distilled water. Aliquots of 0.5 mL of solubilized cells were mixed with 4 mL scintillation
cocktail and counted by liquid scintillation.
Temperature dependency of folic acid uptake
Temperature dependency is a salient feature of many carrier-mediated processes. To further
elucidate the carrier-mediated transport of folic acid into Caco-2 cells, an uptake experiment
at 4°C was conducted parallel with a MTX inhibition experiment to confirm the inhibition of
carrier-mediated process via transporter proteins. Cell monolayers were exposed to incubation
buffers (HBSS containing 10 mmol/L MES adjusted to pH 6.5) either containing 1 µmol/L
folic acid labeled with 1 µCi/mL [3H]folic acid or 1 µmol/L folic acid labeled with 1 µCi/mL
[3H]folic acid together with 1 mmol/L MTX, at 4°C on a shaker at 50 rpm for 30 min. The
solubilization of the cells and measurement of the internalized substrate were performed as
previously described under the title “Concentration and pH dependency”. Each experiment
was conducted in triplicate.
Kinetic study: time course of folic acid uptake
For the determination of the optimal time course for further folic acid uptake and inhibition
studies, Caco-2 monolayers were incubated with HBSS adjusted to pH 6.5 containing 1
µmol/L folic acid labeled with [3H]folic acid. The cells were incubated at 37°C on the shaker
over a time course of 0 – 5 h. At the end of each incubation period, cells were washed five
times with ice-cold buffer with 0.2 mmol/L EGTA and subsequent to solubilization with 1%
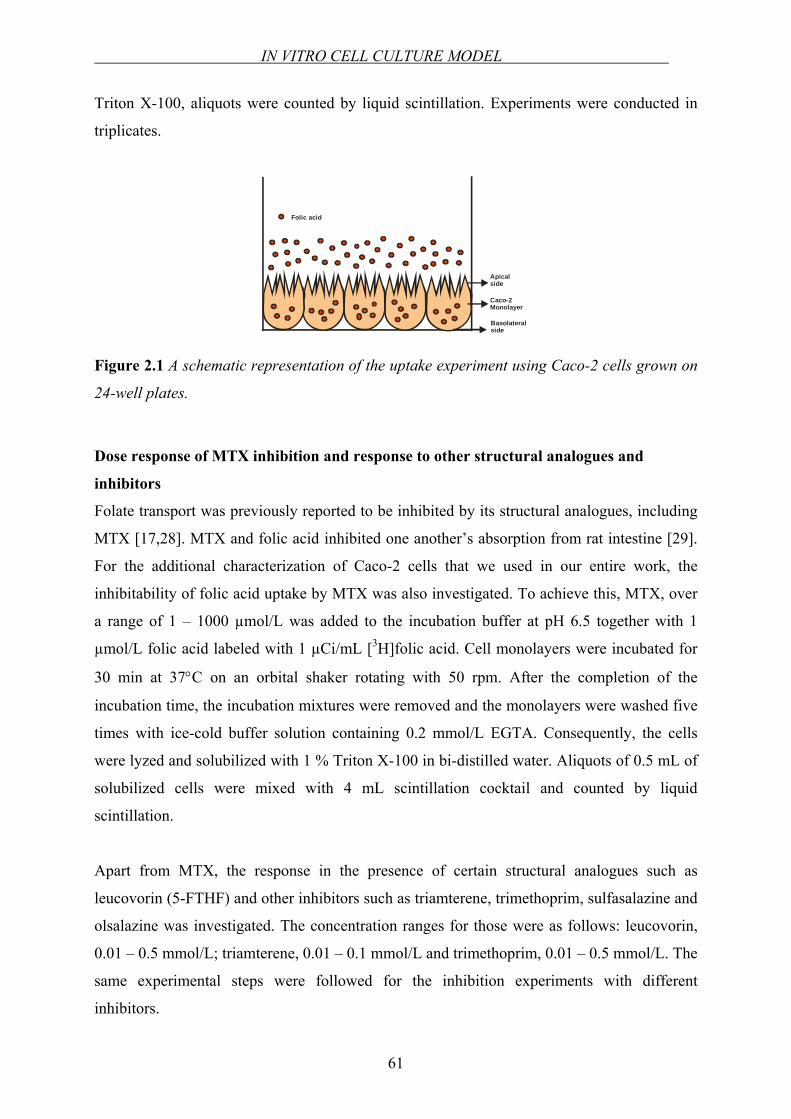
IN VITRO CELL CULTURE MODEL
61
Triton X-100, aliquots were counted by liquid scintillation. Experiments were conducted in
triplicates.
Folic acid
Apicalside
Basolateral side
Caco-2 Monolayer
Figure 2.1 A schematic representation of the uptake experiment using Caco-2 cells grown on
24-well plates.
Dose response of MTX inhibition and response to other structural analogues and
inhibitors
Folate transport was previously reported to be inhibited by its structural analogues, including
MTX [17,28]. MTX and folic acid inhibited one another’s absorption from rat intestine [29].
For the additional characterization of Caco-2 cells that we used in our entire work, the
inhibitability of folic acid uptake by MTX was also investigated. To achieve this, MTX, over
a range of 1 – 1000 µmol/L was added to the incubation buffer at pH 6.5 together with 1
µmol/L folic acid labeled with 1 µCi/mL [3H]folic acid. Cell monolayers were incubated for
30 min at 37°C on an orbital shaker rotating with 50 rpm. After the completion of the
incubation time, the incubation mixtures were removed and the monolayers were washed five
times with ice-cold buffer solution containing 0.2 mmol/L EGTA. Consequently, the cells
were lyzed and solubilized with 1 % Triton X-100 in bi-distilled water. Aliquots of 0.5 mL of
solubilized cells were mixed with 4 mL scintillation cocktail and counted by liquid
scintillation.
Apart from MTX, the response in the presence of certain structural analogues such as
leucovorin (5-FTHF) and other inhibitors such as triamterene, trimethoprim, sulfasalazine and
olsalazine was investigated. The concentration ranges for those were as follows: leucovorin,
0.01 – 0.5 mmol/L; triamterene, 0.01 – 0.1 mmol/L and trimethoprim, 0.01 – 0.5 mmol/L. The
same experimental steps were followed for the inhibition experiments with different
inhibitors.
CHAPTER 2
62
Transepithelial transport studies
MTX was used as a positive control for the inhibition folic acid transport. The integrity of cell
monolayers was checked by measuring the flux of the paracellular marker D-mannitol. Just
prior to the experiment, the medium was removed, the cells were washed once and pre-
incubated with transport buffer, pH 6.5 at 37 °C for 15 min with subsequent registration of the
TEER. The donor solution containing 1 µmol/L of folic acid labeled with 1µCi/ml [3H]folic
acid, 0.1 mmol/L D-mannitol, labeled with 1µCi/mL [14C]mannitol, and 1 mmol/L of MTX
was added to the apical compartment. The opposite (serosal) compartment served as acceptor
compartment and contained the same medium but without any substrates (MTX, folic acid,
mannitol). The experiment was conducted on a shaker at 150 rpm in an atmosphere of 90%
relative humidity at 37 °C for 120 min. At time points 0 and 120 min, samples (10 µL) were
withdrawn from donor compartments whereas at time points 0, 30, 60, 90 and 120 min
samples (350 µL) were withdrawn from the acceptor compartment and replaced with the same
amount of blank buffer at pH 6.5. The samples withdrawn were mixed with 4 mL scintillation
cocktail, and counted by liquid scintillation. Peff values of folic acid were calculated in the
presence and absence of MTX as described under the title “Data analysis”.
Determination of nonspecific binding
“Specific binding” is the binding to the target of interest, whereas binding to the other sites
such as binding to the proteins not of interest to the investigator or binding to the filters, is
called “nonspecific binding”. Nonspecific binding is detected by measuring radioligand
binding in the presence of a saturating concentration of a non-labeled drug that binds to the
proteins not of interest. Under these conditions, practically all the proteins are occupied by the
non-labeled drug so the radioligand can only bind to the nonspecific sites. To calculate the
specific binding, the nonspecific binding at a particular concentration is subtracted from the
total binding at that concentration. When the system has a lot of nonspecific binding washing
with a larger volume of buffer is recommended [30]. For this purpose, nonspecific binding is
determined from parallel studies in the presence of an excess amount of non-labeled folic acid
(900 µmol/L) for 30 min. The steps of the experiment were same as explained under the title
“Concentration and pH dependency”.
IN VITRO CELL CULTURE MODEL
63
The influence of culture time on folic acid uptake: comparison of an older and younger
passage
Intestinal epithelial cells are reported to be heterogeneous populations of cells. This means,
characteristics of a cell line is reproducible only if the ratios between the different
subpopulations are constant. In order to achieve this, the cell line should be used within a
defined and limited interval of passages. Moreover, by using a limited number of passages,
the genotyping variation can be minimized and therefore phenotypic variation will also be
reduced [1].
Throughout the entire work, Caco-2 cells between the passages 28 and 60 were used. In order
to check the influence of passage number of the cell model on uptake, functional control
experiments with a younger passage (P27) and an older passage (P64) were conducted. 24-
well plates with two different passage numbers were prepared on the same day with a
concentration of 100,000 cells/well. Cells were grown as explained previously. 16 days after
seeding, the experiment was carried out according to the protocol explained under the title
“Concentration and pH dependency”. The experiment was done in triplicate and results were
statistically compared. The determination of the folate influx routes in different passages of
Caco-2 cells by polymerase chain reaction was also conducted which is discussed later, in
Chapter 2.2.
Protein content of the cell monolayer
Folate uptake under different experimental conditions was normalized to the protein content
of each well determined by the method of Bradford [31]. The assay was carried out with Bio-
Rad Protein Assay Kit, according to the protocol of the manufacturer. It is a straightforward
and accurate procedure for determining concentration of solubilized protein that involves the
addition of an acidic dye to protein solution and subsequent measurement at 595 nm with a
spectrophotometer. For this analysis, Caco-2 cells were seeded into 24-well plates with two
different densities: 100,000 cells/well and 200,000 cells/well. On the 16th day post seeding,
the monolayers were washed twice with PBS. The cells in each well were dissolved with 1
mL of 1.25 mmol/L NaOH solution. With the aid of an automatic pipette, the solubilization
process was assisted. In a 1 mL cuvette, 20 µL of solubilized cell solution, 780 µL 1.25
mmol/L NaOH solution and 0.2 mL concentrate dye reagent was added and mixed. 15 min
after the addition of the dye reagent, the absorbance was measured at 595 nm wavelength
against the blank solution, which was composed of 0.8 mL 1.25 mmol/L NaOH solution, and
CHAPTER 2
64
0.2 mL concentrate dye reagent. For the assay, a standard curve in the range of 1.0 – 25
µg/mL with bovine serum albumin was prepared.
Data analysis
Transepithelial electrical resistance (TEER)
TEER of each cell monolayer grown on polycarbonate membrane inserts were calculated
according to the following formula:
[ ] ARRTEER filtertotal ×−= [Ω.cm2]
where Rtotal is the resistance measured [Ω], Rfilter is the resistance of the filter in complete
medium [Ω] without cells and A is the surface area of the insert [cm2].
Effective permeability coefficient (Peff)
The effective permeability coefficients (Peff) were calculated from the concentration-time
profiles using the equation below:
0CAVFPeff ×
×= [cm/s]
where F is the flux rate of the substrate across the monolayer (a→b or b→a) given in
mass/time such as [µg/s], [dpm/s], [mmol/s] calculated from the slope of cumulative substrate
appearance in the acceptor chamber versus time, V is the acceptor volume [cm3], A is the
surface area of the monolayer (insert) [cm2] and C0 is the initial donor concentration of the
substrate in [µg/mL], [dpm/mL] or [mmol/mL] [32,33]. The slope of the concentration-time
profile was calculated with Microsoft Excel 2000, Microsoft Corporation, USA.
Kinetic analysis (Michaelis-Menten equation)
Kinetic parameters as a function of substrate concentration for the uptake experiments were
obtained using GraphPad PrismTM version 3 (GraphPad Software, San Diego, USA) with the
following equation:
[ ][ ]SKSB
Vm +∗
= max0
where V0 is the uptake rate of the substrate, [S] is the substrate concentration, Km is the
Michaelis-Menten constant and Bmax is the maximum uptake rate.
IN VITRO CELL CULTURE MODEL
65
Sigmoidal dose-response analysis
The inhibitory constants (IC50) of the possible and known inhibitors of folic acid uptake were
calculated from sigmoidal dose-response (variable slope) analysis using GraphPad PrismTM
version 3 (GraphPad Software, San Diego, USA) with the following equation:
( )[ ]( )mCICC
EEEE loglog
00 50101 −+
−+=
where EC is the response (% of control) at various concentrations of test substance (inhibitor),
[C] is the concentration of test substance, E0 is non-specific effect, E is the total effect, IC50 is
the concentration of the test substance needed for the half-maximal effect and m defines the
hill slope of the curve.
Equilibrium dissociation constant (Ki)
Because IC50 values depend on the experimental conditions, in certain cases it may be useful
to convert IC50 to Ki. The Ki is the concentration of the competing ligand that will bind to half
the binding sites at equilibrium, in the absence of radioligand or other competitors. If the Ki is
low, the affinity of the receptor for the inhibitor is high [30]. This conversion is performed
according to the equation of Cheng and Prusoff [34]:
[ ]m
i
KligandIC
K+
=1
50
where, Ki is the equilibrium dissociation constant, IC50 is the concentration of the test
substance needed for the half-maximal effect, [ligand] is the concentration of the ligand and
Km is the Michaelis-Menten constant.
Statistical analysis
Means between the groups were compared using the unpaired two-tailed t-test with GraphPad
PrismTM version 3 (GraphPad Software; San Diego, CA, USA). Differences were accepted to
be statistically significant when p<0.05.
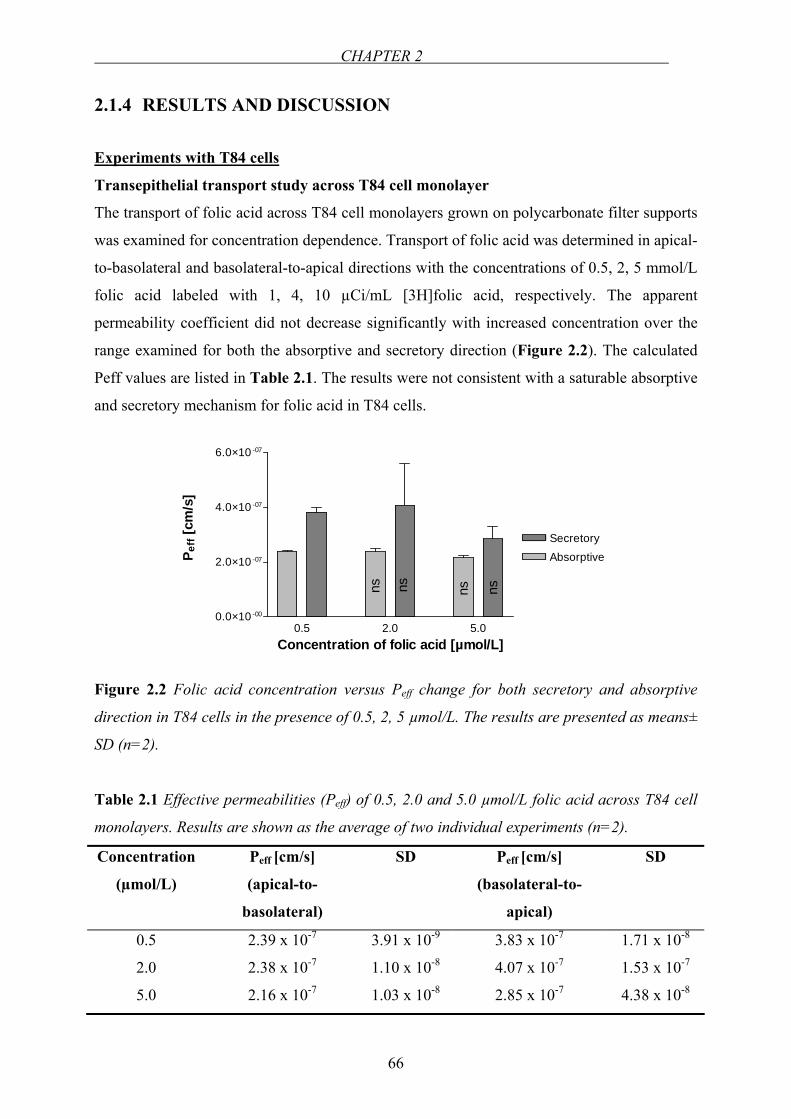
CHAPTER 2
66
2.1.4 RESULTS AND DISCUSSION
Experiments with T84 cells
Transepithelial transport study across T84 cell monolayer
The transport of folic acid across T84 cell monolayers grown on polycarbonate filter supports
was examined for concentration dependence. Transport of folic acid was determined in apical-
to-basolateral and basolateral-to-apical directions with the concentrations of 0.5, 2, 5 mmol/L
folic acid labeled with 1, 4, 10 µCi/mL [3H]folic acid, respectively. The apparent
permeability coefficient did not decrease significantly with increased concentration over the
range examined for both the absorptive and secretory direction (Figure 2.2). The calculated
Peff values are listed in Table 2.1. The results were not consistent with a saturable absorptive
and secretory mechanism for folic acid in T84 cells.
0.5 2.0 5.00.0×10 -00
2.0×10 -07
4.0×10 -07
6.0×10 -07
AbsorptiveSecretory
Concentration of folic acid [µmol/L]
P eff
[cm
/s]
ns ns ns ns
Figure 2.2 Folic acid concentration versus Peff change for both secretory and absorptive
direction in T84 cells in the presence of 0.5, 2, 5 µmol/L. The results are presented as means±
SD (n=2).
Table 2.1 Effective permeabilities (Peff) of 0.5, 2.0 and 5.0 µmol/L folic acid across T84 cell
monolayers. Results are shown as the average of two individual experiments (n=2).
Concentration
(µmol/L)
Peff [cm/s]
(apical-to-
basolateral)
SD Peff [cm/s]
(basolateral-to-
apical)
SD
0.5 2.39 x 10⁻⁷ 3.91 x 10⁻⁹ 3.83 x 10⁻⁷ 1.71 x 10⁻⁸
2.0 2.38 x 10⁻⁷ 1.10 x 10⁻⁸ 4.07 x 10⁻⁷ 1.53 x 10⁻⁷
5.0 2.16 x 10⁻⁷ 1.03 x 10⁻⁸ 2.85 x 10⁻⁷ 4.38 x 10⁻⁸
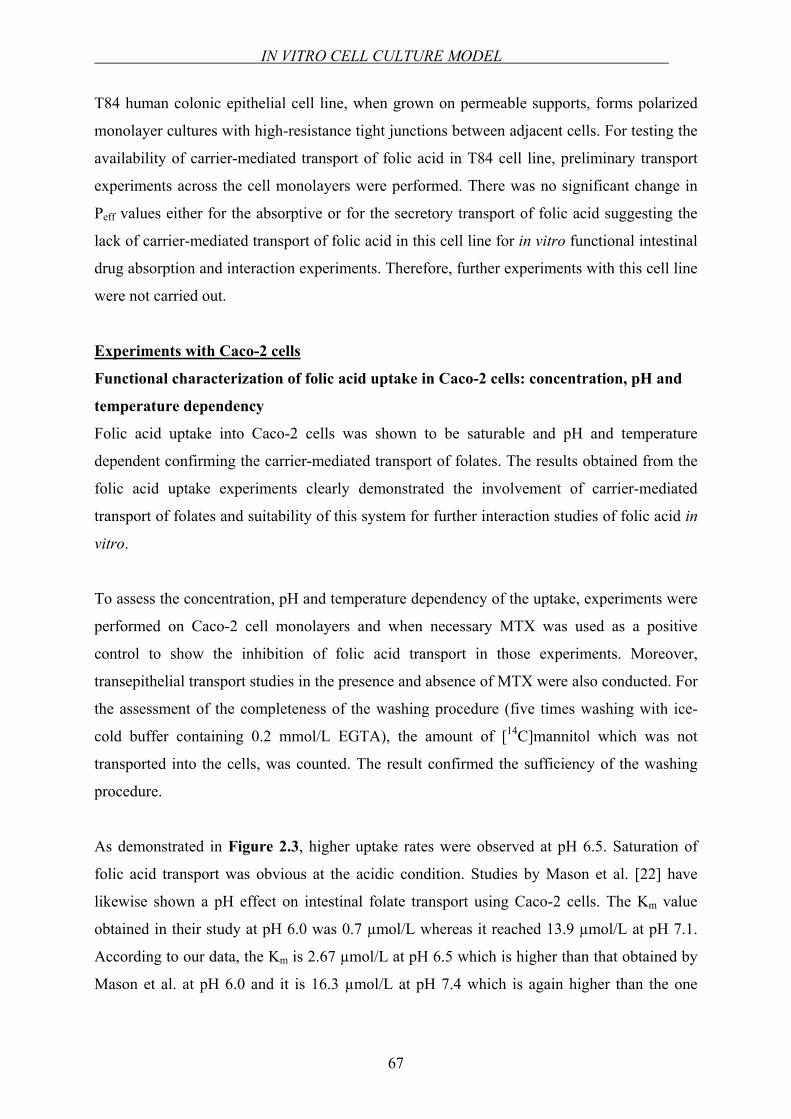
IN VITRO CELL CULTURE MODEL
67
T84 human colonic epithelial cell line, when grown on permeable supports, forms polarized
monolayer cultures with high-resistance tight junctions between adjacent cells. For testing the
availability of carrier-mediated transport of folic acid in T84 cell line, preliminary transport
experiments across the cell monolayers were performed. There was no significant change in
Peff values either for the absorptive or for the secretory transport of folic acid suggesting the
lack of carrier-mediated transport of folic acid in this cell line for in vitro functional intestinal
drug absorption and interaction experiments. Therefore, further experiments with this cell line
were not carried out.
Experiments with Caco-2 cells
Functional characterization of folic acid uptake in Caco-2 cells: concentration, pH and
temperature dependency
Folic acid uptake into Caco-2 cells was shown to be saturable and pH and temperature
dependent confirming the carrier-mediated transport of folates. The results obtained from the
folic acid uptake experiments clearly demonstrated the involvement of carrier-mediated
transport of folates and suitability of this system for further interaction studies of folic acid in
vitro.
To assess the concentration, pH and temperature dependency of the uptake, experiments were
performed on Caco-2 cell monolayers and when necessary MTX was used as a positive
control to show the inhibition of folic acid transport in those experiments. Moreover,
transepithelial transport studies in the presence and absence of MTX were also conducted. For
the assessment of the completeness of the washing procedure (five times washing with ice-
cold buffer containing 0.2 mmol/L EGTA), the amount of [14C]mannitol which was not
transported into the cells, was counted. The result confirmed the sufficiency of the washing
procedure.
As demonstrated in Figure 2.3, higher uptake rates were observed at pH 6.5. Saturation of
folic acid transport was obvious at the acidic condition. Studies by Mason et al. [22] have
likewise shown a pH effect on intestinal folate transport using Caco-2 cells. The Km value
obtained in their study at pH 6.0 was 0.7 µmol/L whereas it reached 13.9 µmol/L at pH 7.1.
According to our data, the Km is 2.67 µmol/L at pH 6.5 which is higher than that obtained by
Mason et al. at pH 6.0 and it is 16.3 µmol/L at pH 7.4 which is again higher than the one
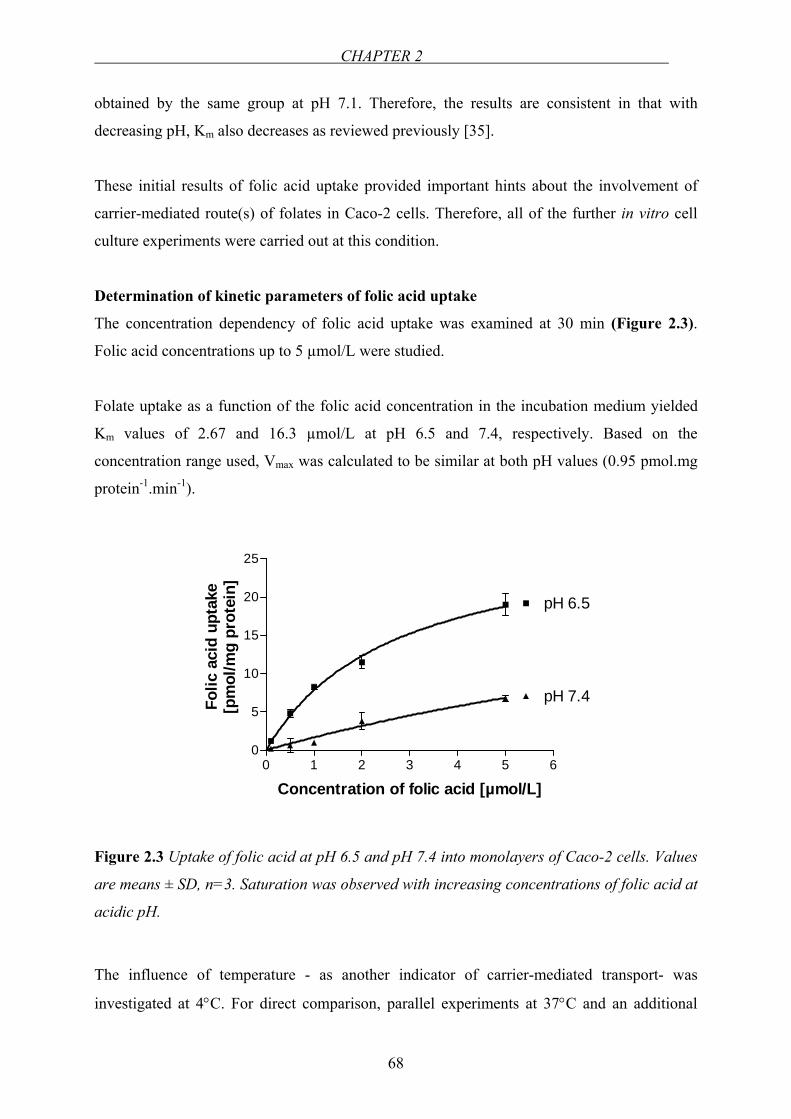
CHAPTER 2
68
obtained by the same group at pH 7.1. Therefore, the results are consistent in that with
decreasing pH, Km also decreases as reviewed previously [35].
These initial results of folic acid uptake provided important hints about the involvement of
carrier-mediated route(s) of folates in Caco-2 cells. Therefore, all of the further in vitro cell
culture experiments were carried out at this condition.
Determination of kinetic parameters of folic acid uptake
The concentration dependency of folic acid uptake was examined at 30 min (Figure 2.3).
Folic acid concentrations up to 5 µmol/L were studied.
Folate uptake as a function of the folic acid concentration in the incubation medium yielded
Km values of 2.67 and 16.3 µmol/L at pH 6.5 and 7.4, respectively. Based on the
concentration range used, Vmax was calculated to be similar at both pH values (0.95 pmol.mg
protein-1.min-1).
0 1 2 3 4 5 60
5
10
15
20
25
pH 6.5
pH 7.4
Concentration of folic acid [µmol/L]
Folic
aci
d up
take
[pm
ol/m
g pr
otei
n]
Figure 2.3 Uptake of folic acid at pH 6.5 and pH 7.4 into monolayers of Caco-2 cells. Values
are means ± SD, n=3. Saturation was observed with increasing concentrations of folic acid at
acidic pH.
The influence of temperature - as another indicator of carrier-mediated transport- was
investigated at 4°C. For direct comparison, parallel experiments at 37°C and an additional
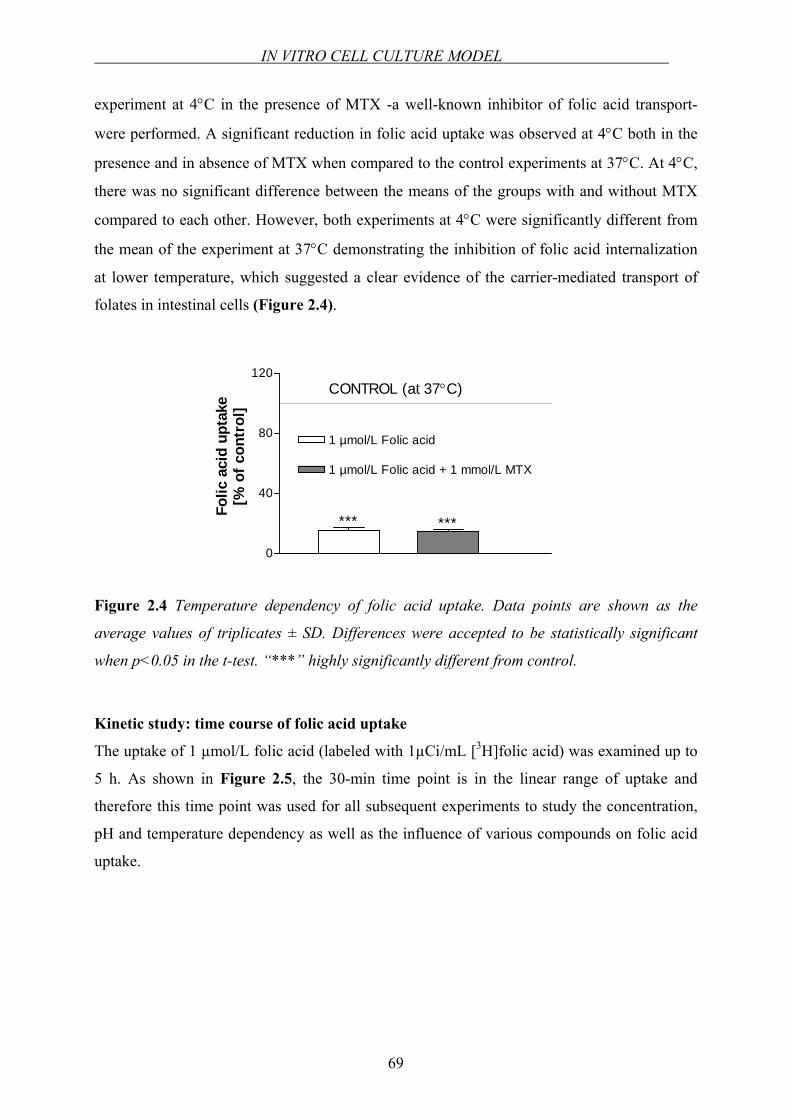
IN VITRO CELL CULTURE MODEL
69
experiment at 4°C in the presence of MTX -a well-known inhibitor of folic acid transport-
were performed. A significant reduction in folic acid uptake was observed at 4°C both in the
presence and in absence of MTX when compared to the control experiments at 37°C. At 4°C,
there was no significant difference between the means of the groups with and without MTX
compared to each other. However, both experiments at 4°C were significantly different from
the mean of the experiment at 37°C demonstrating the inhibition of folic acid internalization
at lower temperature, which suggested a clear evidence of the carrier-mediated transport of
folates in intestinal cells (Figure 2.4).
0
40
80
120
1 µmol/L Folic acid
1 µmol/L Folic acid + 1 mmol/L MTX
*** ***
CONTROL (at 37°C)
Folic
aci
d up
take
[% o
f con
trol
]
Figure 2.4 Temperature dependency of folic acid uptake. Data points are shown as the
average values of triplicates ± SD. Differences were accepted to be statistically significant
when p<0.05 in the t-test. “***” highly significantly different from control.
Kinetic study: time course of folic acid uptake
The uptake of 1 µmol/L folic acid (labeled with 1µCi/mL [3H]folic acid) was examined up to
5 h. As shown in Figure 2.5, the 30-min time point is in the linear range of uptake and
therefore this time point was used for all subsequent experiments to study the concentration,
pH and temperature dependency as well as the influence of various compounds on folic acid
uptake.
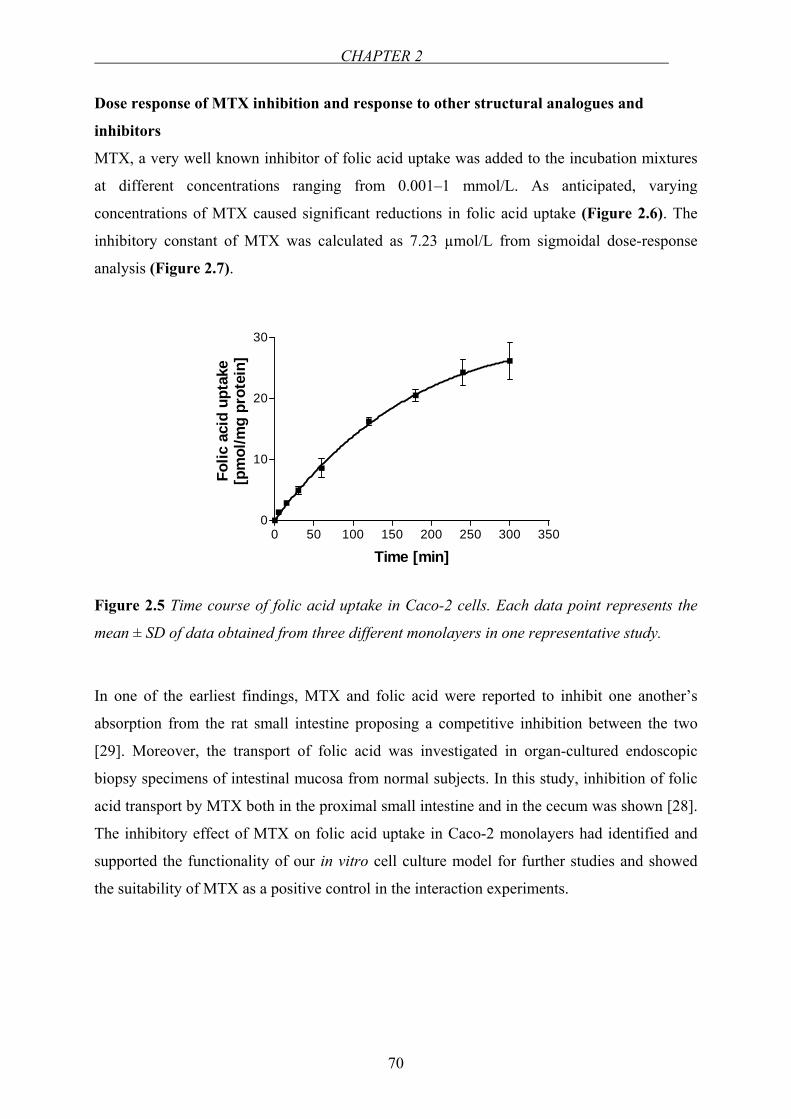
CHAPTER 2
70
Dose response of MTX inhibition and response to other structural analogues and
inhibitors
MTX, a very well known inhibitor of folic acid uptake was added to the incubation mixtures
at different concentrations ranging from 0.001–1 mmol/L. As anticipated, varying
concentrations of MTX caused significant reductions in folic acid uptake (Figure 2.6). The
inhibitory constant of MTX was calculated as 7.23 µmol/L from sigmoidal dose-response
analysis (Figure 2.7).
0 50 100 150 200 250 300 3500
10
20
30
Time [min]
Folic
aci
d up
take
[pm
ol/m
g pr
otei
n]
Figure 2.5 Time course of folic acid uptake in Caco-2 cells. Each data point represents the
mean ± SD of data obtained from three different monolayers in one representative study.
In one of the earliest findings, MTX and folic acid were reported to inhibit one another’s
absorption from the rat small intestine proposing a competitive inhibition between the two
[29]. Moreover, the transport of folic acid was investigated in organ-cultured endoscopic
biopsy specimens of intestinal mucosa from normal subjects. In this study, inhibition of folic
acid transport by MTX both in the proximal small intestine and in the cecum was shown [28].
The inhibitory effect of MTX on folic acid uptake in Caco-2 monolayers had identified and
supported the functionality of our in vitro cell culture model for further studies and showed
the suitability of MTX as a positive control in the interaction experiments.
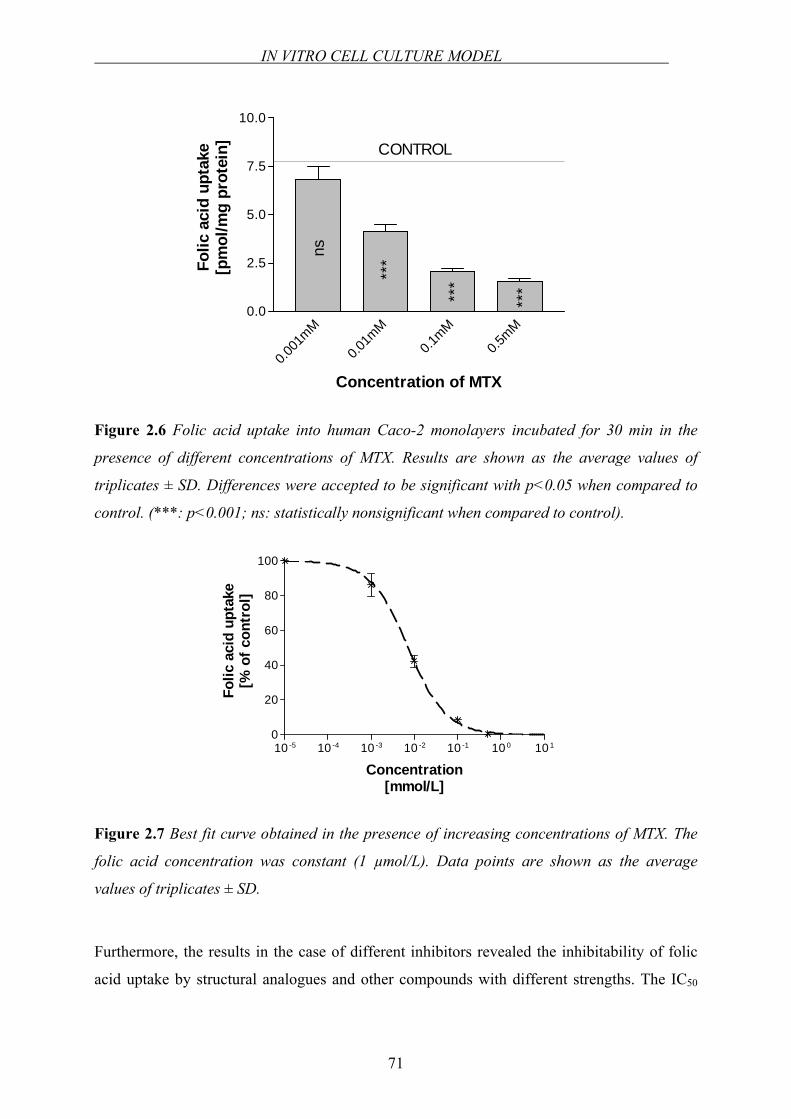
IN VITRO CELL CULTURE MODEL
71
0.001
mM
0.01m
M0.1
mM0.5
mM0.0
2.5
5.0
7.5
10.0
ns
***
***
***
Concentration of MTX
Folic
aci
d up
take
[pm
ol/m
g pr
otei
n] CONTROL
Figure 2.6 Folic acid uptake into human Caco-2 monolayers incubated for 30 min in the
presence of different concentrations of MTX. Results are shown as the average values of
triplicates ± SD. Differences were accepted to be significant with p<0.05 when compared to
control. (***: p<0.001; ns: statistically nonsignificant when compared to control).
10 -5 10 -4 10 -3 10 -2 10 -1 10 0 10 10
20
40
60
80
100
Concentration[mmol/L]
Folic
aci
d up
take
[% o
f con
trol
]
Figure 2.7 Best fit curve obtained in the presence of increasing concentrations of MTX. The
folic acid concentration was constant (1 µmol/L). Data points are shown as the average
values of triplicates ± SD.
Furthermore, the results in the case of different inhibitors revealed the inhibitability of folic
acid uptake by structural analogues and other compounds with different strengths. The IC50
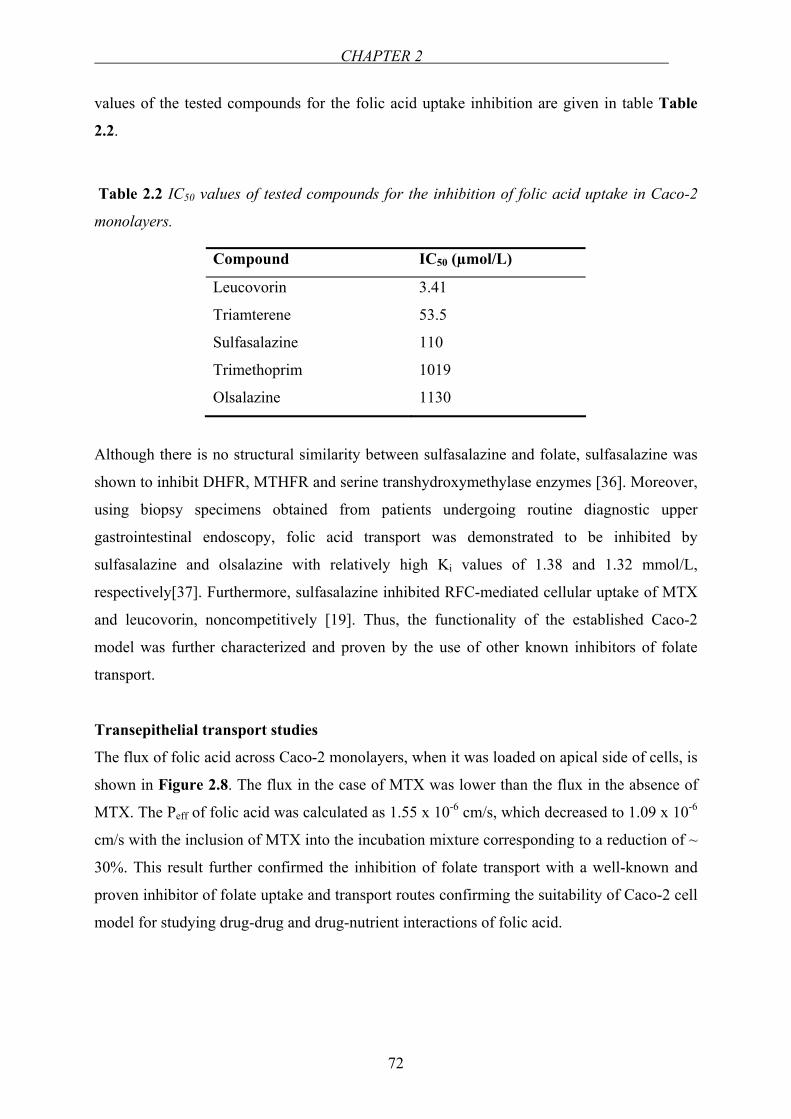
CHAPTER 2
72
values of the tested compounds for the folic acid uptake inhibition are given in table Table
2.2.
Table 2.2 IC50 values of tested compounds for the inhibition of folic acid uptake in Caco-2
monolayers.
Compound IC50 (µmol/L)
Leucovorin 3.41
Triamterene 53.5
Sulfasalazine 110
Trimethoprim 1019
Olsalazine 1130
Although there is no structural similarity between sulfasalazine and folate, sulfasalazine was
shown to inhibit DHFR, MTHFR and serine transhydroxymethylase enzymes [36]. Moreover,
using biopsy specimens obtained from patients undergoing routine diagnostic upper
gastrointestinal endoscopy, folic acid transport was demonstrated to be inhibited by
sulfasalazine and olsalazine with relatively high Ki values of 1.38 and 1.32 mmol/L,
respectively[37]. Furthermore, sulfasalazine inhibited RFC-mediated cellular uptake of MTX
and leucovorin, noncompetitively [19]. Thus, the functionality of the established Caco-2
model was further characterized and proven by the use of other known inhibitors of folate
transport.
Transepithelial transport studies
The flux of folic acid across Caco-2 monolayers, when it was loaded on apical side of cells, is
shown in Figure 2.8. The flux in the case of MTX was lower than the flux in the absence of
MTX. The Peff of folic acid was calculated as 1.55 x 10⁻⁶ cm/s, which decreased to 1.09 x 10⁻⁶
cm/s with the inclusion of MTX into the incubation mixture corresponding to a reduction of ~
30%. This result further confirmed the inhibition of folate transport with a well-known and
proven inhibitor of folate uptake and transport routes confirming the suitability of Caco-2 cell
model for studying drug-drug and drug-nutrient interactions of folic acid.
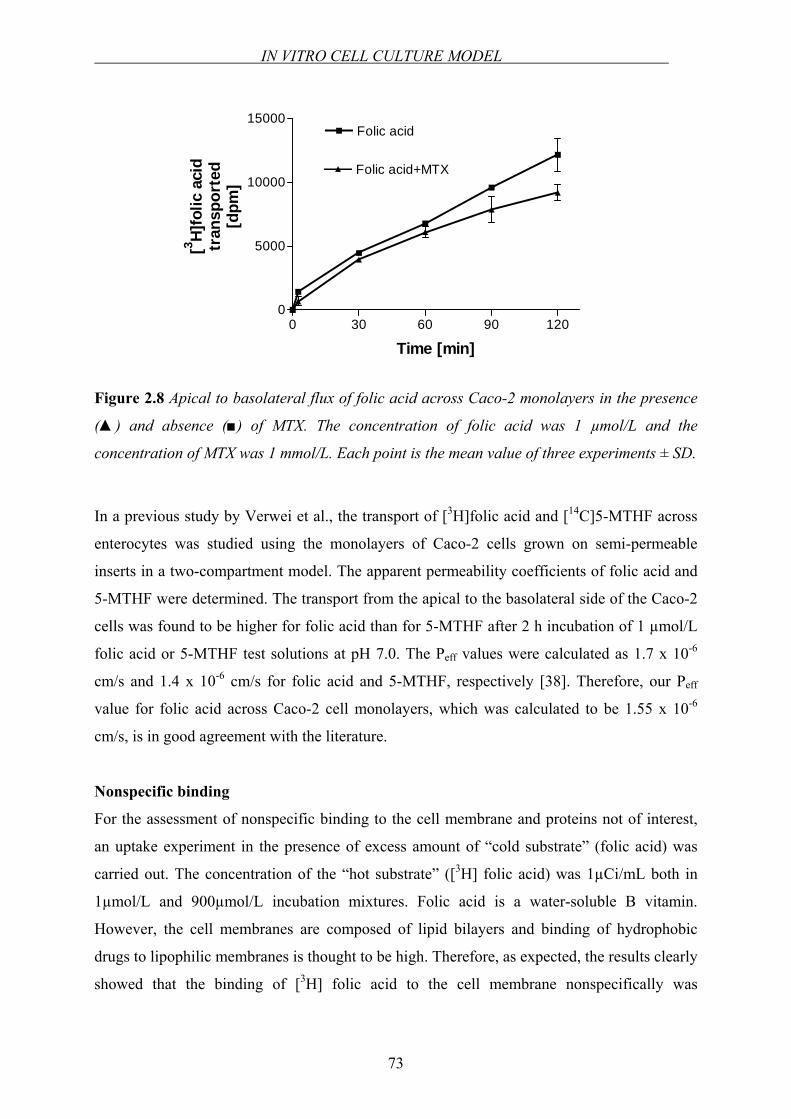
IN VITRO CELL CULTURE MODEL
73
0 30 60 90 1200
5000
10000
15000Folic acid
Folic acid+MTX
Time [min]
[3 H]fo
lic a
cid
tran
spor
ted
[dpm
]
Figure 2.8 Apical to basolateral flux of folic acid across Caco-2 monolayers in the presence
() and absence () of MTX. The concentration of folic acid was 1 µmol/L and the
concentration of MTX was 1 mmol/L. Each point is the mean value of three experiments ± SD.
In a previous study by Verwei et al., the transport of [3H]folic acid and [14C]5-MTHF across
enterocytes was studied using the monolayers of Caco-2 cells grown on semi-permeable
inserts in a two-compartment model. The apparent permeability coefficients of folic acid and
5-MTHF were determined. The transport from the apical to the basolateral side of the Caco-2
cells was found to be higher for folic acid than for 5-MTHF after 2 h incubation of 1 µmol/L
folic acid or 5-MTHF test solutions at pH 7.0. The Peff values were calculated as 1.7 x 10⁻⁶
cm/s and 1.4 x 10⁻⁶ cm/s for folic acid and 5-MTHF, respectively [38]. Therefore, our Peff
value for folic acid across Caco-2 cell monolayers, which was calculated to be 1.55 x 10⁻⁶
cm/s, is in good agreement with the literature.
Nonspecific binding
For the assessment of nonspecific binding to the cell membrane and proteins not of interest,
an uptake experiment in the presence of excess amount of “cold substrate” (folic acid) was
carried out. The concentration of the “hot substrate” ([3H] folic acid) was 1µCi/mL both in
1µmol/L and 900µmol/L incubation mixtures. Folic acid is a water-soluble B vitamin.
However, the cell membranes are composed of lipid bilayers and binding of hydrophobic
drugs to lipophilic membranes is thought to be high. Therefore, as expected, the results clearly
showed that the binding of [3H] folic acid to the cell membrane nonspecifically was
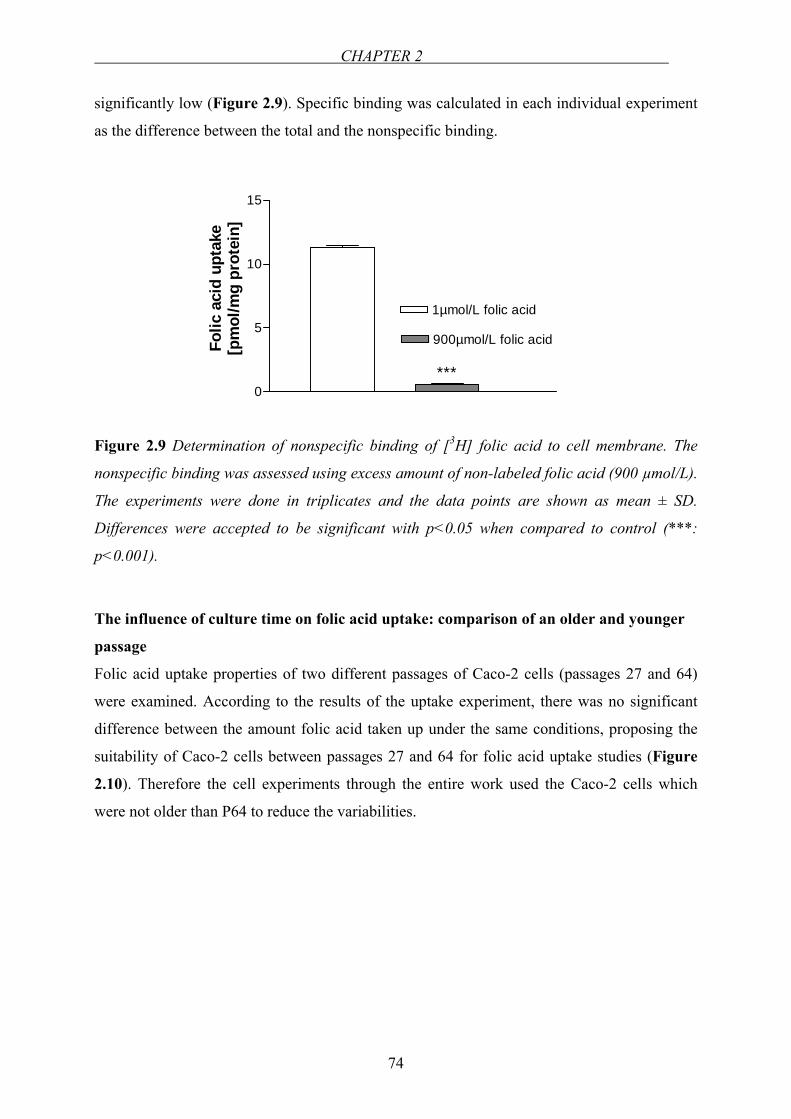
CHAPTER 2
74
significantly low (Figure 2.9). Specific binding was calculated in each individual experiment
as the difference between the total and the nonspecific binding.
0
5
10
15
1µmol/L folic acid
900µmol/L folic acid
***
Folic
aci
d up
take
[pm
ol/m
g pr
otei
n]
Figure 2.9 Determination of nonspecific binding of [3H] folic acid to cell membrane. The
nonspecific binding was assessed using excess amount of non-labeled folic acid (900 µmol/L).
The experiments were done in triplicates and the data points are shown as mean ± SD.
Differences were accepted to be significant with p<0.05 when compared to control (***:
p<0.001).
The influence of culture time on folic acid uptake: comparison of an older and younger
passage
Folic acid uptake properties of two different passages of Caco-2 cells (passages 27 and 64)
were examined. According to the results of the uptake experiment, there was no significant
difference between the amount folic acid taken up under the same conditions, proposing the
suitability of Caco-2 cells between passages 27 and 64 for folic acid uptake studies (Figure
2.10). Therefore the cell experiments through the entire work used the Caco-2 cells which
were not older than P64 to reduce the variabilities.
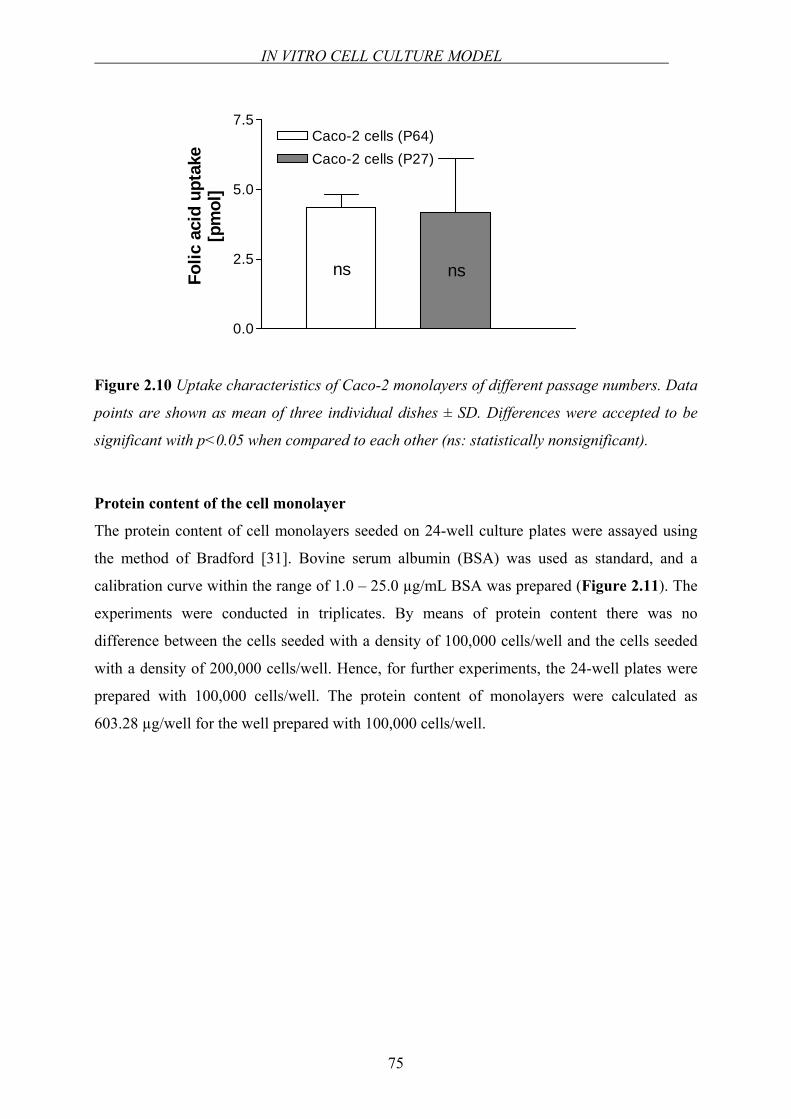
IN VITRO CELL CULTURE MODEL
75
0.0
2.5
5.0
7.5Caco-2 cells (P64)Caco-2 cells (P27)
ns nsFolic
aci
d up
take
[pm
ol]
Figure 2.10 Uptake characteristics of Caco-2 monolayers of different passage numbers. Data
points are shown as mean of three individual dishes ± SD. Differences were accepted to be
significant with p<0.05 when compared to each other (ns: statistically nonsignificant).
Protein content of the cell monolayer
The protein content of cell monolayers seeded on 24-well culture plates were assayed using
the method of Bradford [31]. Bovine serum albumin (BSA) was used as standard, and a
calibration curve within the range of 1.0 – 25.0 µg/mL BSA was prepared (Figure 2.11). The
experiments were conducted in triplicates. By means of protein content there was no
difference between the cells seeded with a density of 100,000 cells/well and the cells seeded
with a density of 200,000 cells/well. Hence, for further experiments, the 24-well plates were
prepared with 100,000 cells/well. The protein content of monolayers were calculated as
603.28 µg/well for the well prepared with 100,000 cells/well.
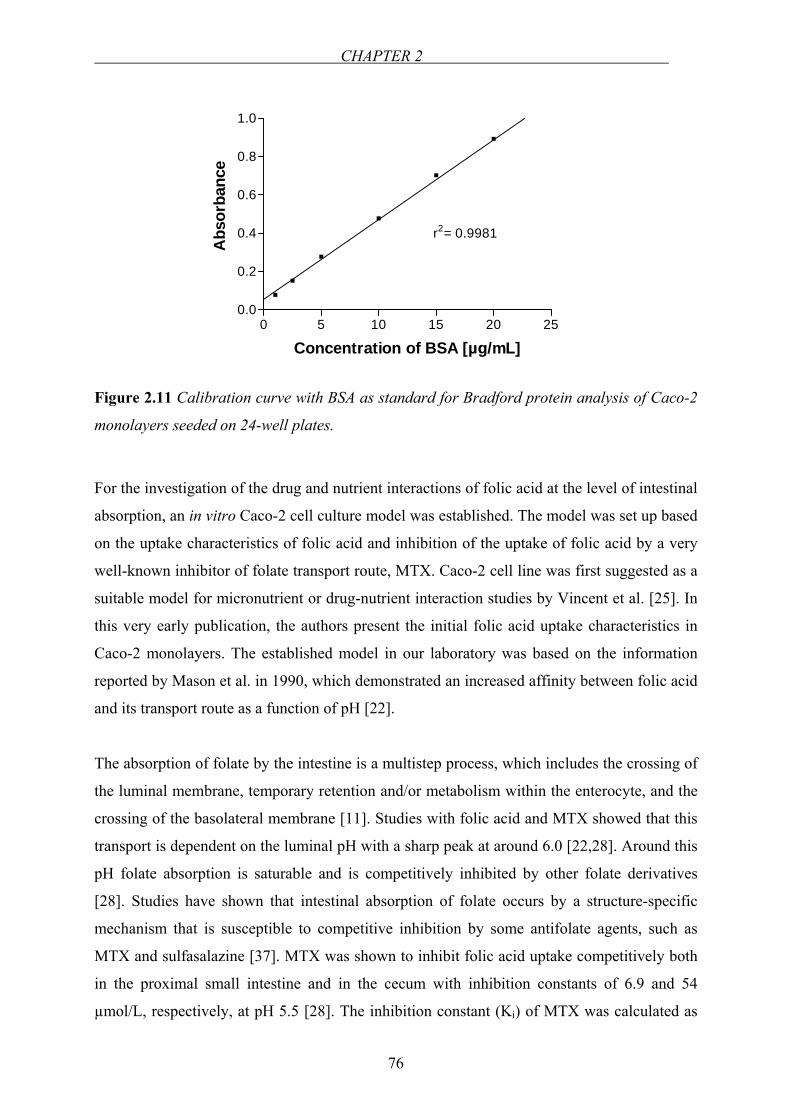
CHAPTER 2
76
0 5 10 15 20 250.0
0.2
0.4
0.6
0.8
1.0
Concentration of BSA [µg/mL]
Abs
orba
nce
r2= 0.9981
Figure 2.11 Calibration curve with BSA as standard for Bradford protein analysis of Caco-2
monolayers seeded on 24-well plates.
For the investigation of the drug and nutrient interactions of folic acid at the level of intestinal
absorption, an in vitro Caco-2 cell culture model was established. The model was set up based
on the uptake characteristics of folic acid and inhibition of the uptake of folic acid by a very
well-known inhibitor of folate transport route, MTX. Caco-2 cell line was first suggested as a
suitable model for micronutrient or drug-nutrient interaction studies by Vincent et al. [25]. In
this very early publication, the authors present the initial folic acid uptake characteristics in
Caco-2 monolayers. The established model in our laboratory was based on the information
reported by Mason et al. in 1990, which demonstrated an increased affinity between folic acid
and its transport route as a function of pH [22].
The absorption of folate by the intestine is a multistep process, which includes the crossing of
the luminal membrane, temporary retention and/or metabolism within the enterocyte, and the
crossing of the basolateral membrane [11]. Studies with folic acid and MTX showed that this
transport is dependent on the luminal pH with a sharp peak at around 6.0 [22,28]. Around this
pH folate absorption is saturable and is competitively inhibited by other folate derivatives
[28]. Studies have shown that intestinal absorption of folate occurs by a structure-specific
mechanism that is susceptible to competitive inhibition by some antifolate agents, such as
MTX and sulfasalazine [37]. MTX was shown to inhibit folic acid uptake competitively both
in the proximal small intestine and in the cecum with inhibition constants of 6.9 and 54
µmol/L, respectively, at pH 5.5 [28]. The inhibition constant (Ki) of MTX was calculated as
IN VITRO CELL CULTURE MODEL
77
5.26 µmol/L as described under “Data analysis” which is in the same range as the Ki
calculated by others [28]. Therefore, the suitability of MTX as a positive control in the
inhibition experiments was confirmed.
Leucovorin is a derivative of THF. Due to its ready conversion to other THF derivatives,
leucovorin is a potent antidote for both the hemotopoietic and reticuloendothelial toxic effects
of folic acid antagonists such as MTX and trimethoprim [20]. Leucovorin rescue is a
therapeutic approach in which 5-FTHF is administered at low doses following, or long after
(24-42 h), treatment with very high doses of MTX [39]. Leucovorin was previously shown to
inhibit MTX absorption and a common intestinal carrier system was proposed for the two
[20]. Triamterene is a pteridine derivative that bears a structural resemblance to folic acid.
Triamterene was shown to inhibit the enzyme DHFR like MTX. Moreover, Zimmerman et al.
demonstrated the competitive inhibition of folic acid absorption in rat jejunum by triamterene
[21]. Conversely, the inhibition of intestinal absorption of triamterene by folic acid and MTX
was also reported [40]. Similarly, trimethoprim which is also an inhibitor of DHFR enzyme,
was shown to be a weak competitive inhibitor of intestinal folate transport and it was
concluded that this inhibition occurs at the site of membrane transport and appears to be
unrelated to concurrent inhibition of DHFR activity in enterocytes [41]. Our results supported
the findings in the literature. The inhibitory potency against folic acid uptake followed the
order: leucovorin > triamterene > trimethoprim (see Table 2.2).
Km value of folic acid uptake in Caco-2 cells was found to be 2.67 µmol/L at pH 6.5 and
higher at pH 7.4 (see “Determination of kinetic parameters of folic acid uptake”) which is in
line with the findings by others [22,42]. The calculated Km values for folic acid uptake are all
in the micromolar range showing a high affinity to the transporter system. Comparable
transport characteristics for MTX were reported by Strum [43]. At pH 6.0, the transport
system for MTX was saturable with a Km of 2.8 µM and at pH 7.4 the system was not
saturable. The transport of methorexate was inhibited by folate, 5-FTHF (leucovorin) and 5-
MTHF [43]. Recently, the Km of folic acid uptake in PCFT expressing xenopus oocytes was
reported to be 2.7 µmol/L, which is the same value obtained from our studies in Caco-2 cells
(2.67 µmol/L). This may suggest a major role of PCFT in Caco-2 cells for folate transport
[44].
CHAPTER 2
78
In later years, it was elucidated that, in intestinal cells, the RFC system (SLC19A1) is the
main functioning folate uptake system [10]. SLC19A1 transports folate and its derivatives
that exist as anions at physiological pH. Folate influx into cells via SLC19A1 is stimulated by
an inwardly directed H+ gradient suggesting either folate/H+ symport or folate/OH- antiport as
the transport mechanism [45]. This might explain the higher affinities at lower pH conditions
for folic acid. In human, the intraluminal pH changes from highly acidic conditions in the
stomach to about pH 6.0 in the duodenum. The pH gradually increases in the small intestine
from pH 6.0 to about pH 7.4 in the terminal ileum [46]. Considering the absorption of folic
acid in the upper portions of the small intestine which has a pH of around 6.5 and the carrier-
mediated transport of folic acid at low pH conditions [22], it appears that pH 6.5 is an
appropriate condition for the performance of the in vitro cell culture experiments.
To conclude, in this part of the work, the experimental Caco-2 model used in our entire in
vitro experiments was proven as a suitable and reproducible model for studying folic acid
absorption in vitro. The conditions under which the further cell culture experiments would be
carried out were established and the transport characteristics of folic acid were shown.
EXPRESSION OF FOLATE TRANSPORT ROUTES IN CACO-2 CELLS
79
2.2 EXPRESSION OF FOLATE TRANSPORT ROUTES IN CACO-2
CELLS: REVERSE TRANSCRIPTION PCR (RT-PCR) AND REAL-
TIME PCR
2.2.1 INTRODUCTION
The transport and uptake characteristics of folic acid on Caco-2 monolayers were identified
by functional experiments using folic acid as a substrate and MTX as a well-known inhibitor
of folate transport (see Chapter 2.1). In this chapter of the work, for further identification of
influx transporter proteins of folate transport, mRNA expression of some of the known
transport routes of folates were investigated by polymerase chain reaction (PCR). Besides, the
levels of RFC, FRα and FRβ mRNA expression in Caco-2 cells were evaluated by real-time
quantitative reverse transcription PCR.
When the sequence of at least part of a DNA segment is known, the number of copies of that
DNA segment can be hugely amplified using the PCR. During PCR, two synthetic
oligonucleotides are synthesized, each complementary to sequences on opposite strands of the
target DNA at positions just beyond the ends of the segment to be amplified. The
oligonucleotides serve as replication primers, with the 3' ends of the hybridized probes
oriented toward each other and positioned to prime DNA synthesis across the desired DNA
segment [47]. The procedure has three steps:
1. Denaturation: DNA strands are separated by heating.
2. Annealing: Reaction mixture is cooled down to allow primers to form hydrogen
bonds with the ends of target sequence.
3. Extension (polymerization): DNA polymerase adds nucleotides to the 3' end of each
primer.
After the polymerization step, the process is repeated for 25 or 30 cycles. The enzyme DNA
polymerase is thermo-stable and remains active after every heating step. During each PCR
cycle, the target DNA sequence is doubled. The procedure produces an exponentially growing
population of identical DNA molecules.
CHAPTER 2
80
Among the variety of methods for the quantification of mRNA expression levels, real-time
PCR (TaqMan® analysis) has been reported to be the most sensitive and accurate. It is fast,
easy to use and highly reproducible. Common methods for RNA detection include Northern
blotting, in situ hybridization, qualitative RT-PCT, quantitative real-time PCR…etc.
Quantitative real-time PCR has become the most emerging method for quantification of
mRNA transcription levels in recent years due to its outstanding accuracy, broad dynamic
range and sensitivity. It is easy to use, highly reproducible, requiring a minimal amount of
RNA, no post-PCR handling and no radioactivity [48].
The real-time PCR system is based on the detection and quantitation of a fluorescent reporter.
The signal increases in direct proportion to the amount of PCR product in a reaction. By
recording the amount of fluorescence emission at each cycle, it is possible to monitor the PCR
reaction during the exponential phase where the first significant increase for product
correlates to the initial amount of target template. There are three main fluorescence-
monitoring systems for DNA amplification:
1. Hydrolysis probes
2. Hybridising probes
3. DNA-binding agents
The mostly used TaqMan probes are the hydrolysis probes. TaqMan probes are
oligonucleotides longer than the primers that contain a fluorescent dye usually on the 5' base,
and a quenching dye (usually TAMRA) typically on the 3' base. When irradiated, the excited
fluorescent dye transfers energy to the nearby quenching dye molecule rather than fluorescing
(FRET, fluorescence resonance energy transfer). The close proximity of the reporter and the
quencher prevents emission of any fluorescence while the probe is intact. TaqMan probes are
designed to anneal to an internal region of a PCR product. When the polymerase replicates a
template on which a TaqMan probe is bound, its 5' exonuclease activity cleaves the probe.
This ends the activity of quencher (no FRET) and the reporter dye starts to emit fluorescence,
which increases each cycle proportional to the rate of probe cleavage. By detecting the
emitted fluorescence, the quantification of the PCR product is monitored.
Accordingly, in Caco-2 cells, some of the known transport routes of folates (namely, RFC,
FRα and FRβ) into the cells were characterized by PCR and the relative comparison of the
expression levels of those proteins were carried out by RT real-time PCR.
EXPRESSION OF FOLATE TRANSPORT ROUTES IN CACO-2 CELLS
81
2.2.2 EQUIPMENTS AND MATERIALS
Equipments
Spectrophotometry GeneQuant Pharmacia Biotech, Freiburg,
Germany
Real-time PCR instrument Biorad iCycler, Bio-Rad Laboratories, USA
96-well plate Greiner Bio-One GmbH, Frickenhausen,
Germany
Materials
RNA STAT-60TM was purchased from Tel-Test Inc. (Friendswood, TX, USA). DNA-freeTM
purification kit was obtained from Ambion Ltd. (Cambridgeshire, UK). SuperScriptTM First-
Strand Synthesis System for RT-PCR, sense, and antisense primers were purchased from
InvitrogenTM Ltd. (Paisley, UK). ExpandTM High Fidelity PCR System Kit was provided from
Roche Diagnostics GmbH (Mannheim, Germany). GeneRulerTM was purchased from
Fermentas GmbH (Leon-Rot, Germany). QuantiTect Probe RT-PCR Kit and RNeasy Mini
Kit were from Qiagen GmbH (Hilden, Germany). Sense and antisense primers and TaqMan
probes for real-time PCR were purchased from Operon Biotechnologies (Cologne, Germany).
2.2.3 METHODS
Preparation of the Caco-2 monolayers for RT-PCR and Real-Time PCR
Caco-2 cells (passage 27, 62 and 54) were split and seeded into 24-well plates with a density
of 100,000 cells/well. The medium was changed three times a week. The development of the
monolayers was examined under the microscope until the 16th day. Total cellular RNA both
for RT-PCR and for real-time PCR was isolated from Caco-2 monolayers on the 16th day post
seeding.
CHAPTER 2
82
Isolation of total cellular RNA, reverse transcriptase reaction, PCR and gel
electrophoresis2
For the investigation of some of the known transport routes of folates into the cells, and
additionally the effect of passage number on the expression of those transport system, one
younger (passage 27) and one older (passage 62) passage was used. The RNA was isolated
from the cells using RNA STAT-60TM according to the company’s protocol for RNA
isolation:
1. Homogenization: Cells grown in monolayers were lysed directly in the culture dish
by adding the RNA STAT-60TM (1 mL / 3.5 cm dish) and passing the cell lysate
several times through a pipette.
2. RNA Extraction: Following homogenization, the homogenate was stored at room
temperature for 5 min to permit the complete dissociation of nucleoprotein
complexes. Then, 0.2 mL of chloroform per 1 mL of the RNA STAT-60TM was added
and shaked for 15 sec and let stay at room temperature for 2-3 min. Subsequently, the
homogenate was centrifuged at 12,000 g for 15 min at 4°C.
3. RNA extraction: The aqueous phase containing RNA was separated from the organic
phase containing DNA and proteins and transferred to a fresh tube. 0.5 mL of
isopropanol per 1 mL of RNA STAT-60TM (used for homogenization) was added and
mixed. The sample was stored at room temperature for 5-10 min and centrifuged at
12,000 g for 10 min at 4°C. RNA precipitate formed a white pellet at the bottom of
the tube.
4. RNA wash: Supernatant was removed and the RNA pellet was washed once with 1
mL 75% ethanol per 1 mL RNA STAT-60TM (used for the initial homogenization) by
vortexing and subsequent centrifugation at 7,500 g for 5 min at 4°C. Eventually, the
RNA pellet was dried by air-drying. 25 µL of RNase-free water was added to dissolve
the RNA and was purified using DNA-freeTM purification kit.
While measuring the optical density (OD) of the isolated RNA, 2 µL of RNA solution was
mixed with 198 µL of RNase-free water. Quantification of isolated RNA was based on
spectrophotometric analysis at 260 nm wavelength against RNase-free water (which served as
blank) according to which 1 OD corresponds to a concentration of 40 µg / mL RNA. The
integrity of the isolated RNA was checked by standard gel electrophoresis with 1% agarose in 2 PCR and gel electrophoresis studies were carried out together with Dr. Jean-Paul Boissel in the group of Prof. Dr. Ellen Closs at the Department of Pharmacology, Johannes Gutenberg-University, Mainz.
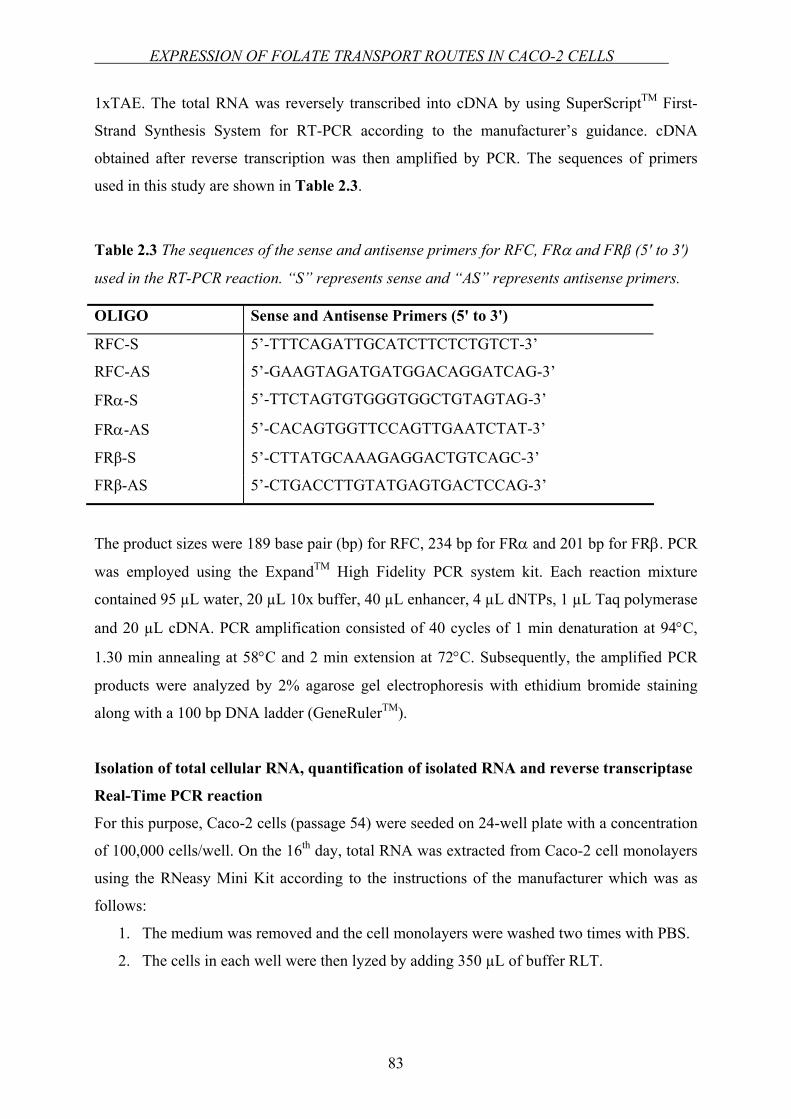
EXPRESSION OF FOLATE TRANSPORT ROUTES IN CACO-2 CELLS
83
1xTAE. The total RNA was reversely transcribed into cDNA by using SuperScriptTM First-
Strand Synthesis System for RT-PCR according to the manufacturer’s guidance. cDNA
obtained after reverse transcription was then amplified by PCR. The sequences of primers
used in this study are shown in Table 2.3.
Table 2.3 The sequences of the sense and antisense primers for RFC, FRα and FRβ (5' to 3')
used in the RT-PCR reaction. “S” represents sense and “AS” represents antisense primers.
OLIGO Sense and Antisense Primers (5' to 3')
RFC-S 5’-TTTCAGATTGCATCTTCTCTGTCT-3’
RFC-AS 5’-GAAGTAGATGATGGACAGGATCAG-3’
FRα-S 5’-TTCTAGTGTGGGTGGCTGTAGTAG-3’
FRα-AS 5’-CACAGTGGTTCCAGTTGAATCTAT-3’
FRβ-S 5’-CTTATGCAAAGAGGACTGTCAGC-3’
FRβ-AS 5’-CTGACCTTGTATGAGTGACTCCAG-3’
The product sizes were 189 base pair (bp) for RFC, 234 bp for FRα and 201 bp for FRβ. PCR
was employed using the ExpandTM High Fidelity PCR system kit. Each reaction mixture
contained 95 µL water, 20 µL 10x buffer, 40 µL enhancer, 4 µL dNTPs, 1 µL Taq polymerase
and 20 µL cDNA. PCR amplification consisted of 40 cycles of 1 min denaturation at 94°C,
1.30 min annealing at 58°C and 2 min extension at 72°C. Subsequently, the amplified PCR
products were analyzed by 2% agarose gel electrophoresis with ethidium bromide staining
along with a 100 bp DNA ladder (GeneRulerTM).
Isolation of total cellular RNA, quantification of isolated RNA and reverse transcriptase
Real-Time PCR reaction
For this purpose, Caco-2 cells (passage 54) were seeded on 24-well plate with a concentration
of 100,000 cells/well. On the 16th day, total RNA was extracted from Caco-2 cell monolayers
using the RNeasy Mini Kit according to the instructions of the manufacturer which was as
follows:
1. The medium was removed and the cell monolayers were washed two times with PBS.
2. The cells in each well were then lyzed by adding 350 µL of buffer RLT.
CHAPTER 2
84
3. To homogenize the sample, the cell lysate was pipetted directly onto a QIAshredder
spin column placed in a 2 mL collection tube and centrifuged for 2 min at maximum
speed.
4. 350 µL of 70% ethanol was added to the homogenized lysate, and mixed by pipetting.
The 700 µL of sample was applied to an RNeasy mini column placed in a 2 mL
collection tube. The tube was closed and centrifuged for 15 s at 10,000 rpm and the
flow-through was discarded.
5. After that, 700 µL of buffer RW1 was added to the RNeasy column. The tube was
closed and centrifuged for 15 s at 10,000 rpm to wash the column. The flow-through
was discarded.
6. The RNeasy column was transferred into a new 2 ml collection tube and 500 µL of
buffer RPE was added onto the RNeasy column. The tube was closed and then
centrifuged for 15 s at 10,000 rpm to wash the column, and the flow-through was
discarded.
7. Another 500 µL of buffer RPE was added to the RNeasy column and then centrifuged
for 2 min at 10,000 to dry the RNeasy silica-gel membrane. The RNeasy column was
placed in a new 2 ml collection tube, centrifuged at full speed for 1 min. The RNeasy
column was transferred to a new tube. 50 µL of RNase-free water was added directly
onto the RNeasy silica-gel membrane. The tube was closed gently and centrifuged for
1 min at 10,000 rpm to elute.
Quantification of isolated RNA was based on spectrophotometric analysis. 3 µL of isolated
RNA together with 97 µL of RNase-free water was read at 260 nm wavelength against
RNase-free water that served as blank. To perform the real-time PCR, QuantiTect Probe RT-
PCR Kit was used. The reactions were run in real-time PCR instrument. The sequences of
TaqMan probes, sense and antisense oligonucleotides are shown in Table 2.4 and Table 2.5,
respectively.
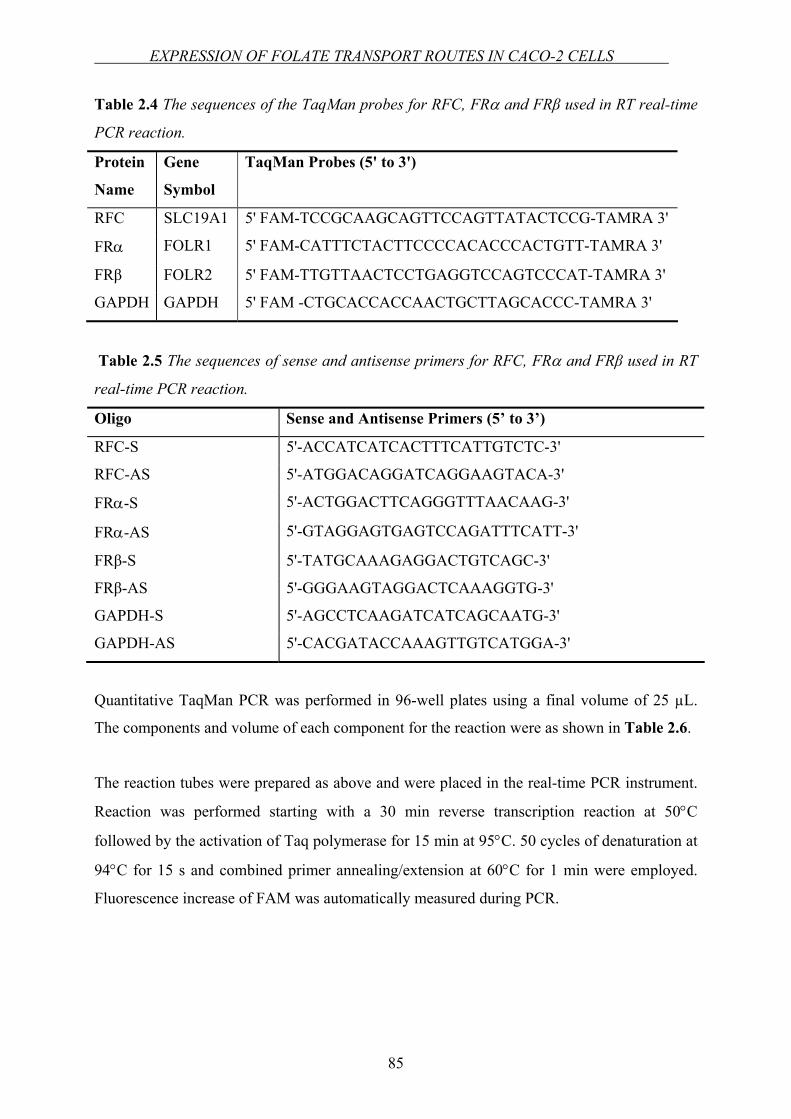
EXPRESSION OF FOLATE TRANSPORT ROUTES IN CACO-2 CELLS
85
Table 2.4 The sequences of the TaqMan probes for RFC, FRα and FRβ used in RT real-time
PCR reaction.
Protein
Name
Gene
Symbol
TaqMan Probes (5' to 3')
RFC SLC19A1 5' FAM-TCCGCAAGCAGTTCCAGTTATACTCCG-TAMRA 3'
FRα FOLR1 5' FAM-CATTTCTACTTCCCCACACCCACTGTT-TAMRA 3'
FRβ FOLR2 5' FAM-TTGTTAACTCCTGAGGTCCAGTCCCAT-TAMRA 3'
GAPDH GAPDH 5' FAM -CTGCACCACCAACTGCTTAGCACCC-TAMRA 3'
Table 2.5 The sequences of sense and antisense primers for RFC, FRα and FRβ used in RT
real-time PCR reaction.
Oligo Sense and Antisense Primers (5’ to 3’)
RFC-S 5'-ACCATCATCACTTTCATTGTCTC-3'
RFC-AS 5'-ATGGACAGGATCAGGAAGTACA-3'
FRα-S 5'-ACTGGACTTCAGGGTTTAACAAG-3'
FRα-AS 5'-GTAGGAGTGAGTCCAGATTTCATT-3'
FRβ-S 5'-TATGCAAAGAGGACTGTCAGC-3'
FRβ-AS 5'-GGGAAGTAGGACTCAAAGGTG-3'
GAPDH-S 5'-AGCCTCAAGATCATCAGCAATG-3'
GAPDH-AS 5'-CACGATACCAAAGTTGTCATGGA-3'
Quantitative TaqMan PCR was performed in 96-well plates using a final volume of 25 µL.
The components and volume of each component for the reaction were as shown in Table 2.6.
The reaction tubes were prepared as above and were placed in the real-time PCR instrument.
Reaction was performed starting with a 30 min reverse transcription reaction at 50°C
followed by the activation of Taq polymerase for 15 min at 95°C. 50 cycles of denaturation at
94°C for 15 s and combined primer annealing/extension at 60°C for 1 min were employed.
Fluorescence increase of FAM was automatically measured during PCR.
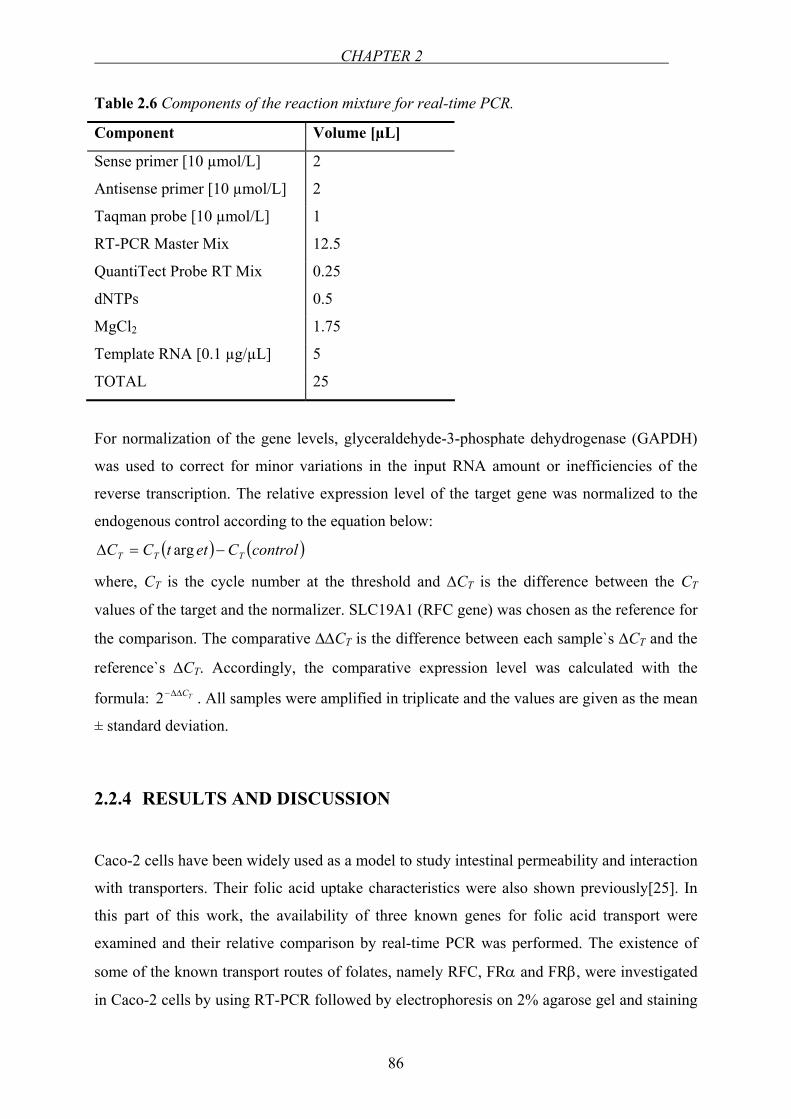
CHAPTER 2
86
Table 2.6 Components of the reaction mixture for real-time PCR.
Component Volume [µL]
Sense primer [10 µmol/L] 2
Antisense primer [10 µmol/L] 2
Taqman probe [10 µmol/L] 1
RT-PCR Master Mix 12.5
QuantiTect Probe RT Mix 0.25
dNTPs 0.5
MgCl2 1.75
Template RNA [0.1 µg/µL] 5
TOTAL 25
For normalization of the gene levels, glyceraldehyde-3-phosphate dehydrogenase (GAPDH)
was used to correct for minor variations in the input RNA amount or inefficiencies of the
reverse transcription. The relative expression level of the target gene was normalized to the
endogenous control according to the equation below:
( ) ( )controlCettCC TTT −=∆ arg
where, CT is the cycle number at the threshold and ∆CT is the difference between the CT
values of the target and the normalizer. SLC19A1 (RFC gene) was chosen as the reference for
the comparison. The comparative ∆∆CT is the difference between each sample`s ∆CT and the
reference`s ∆CT. Accordingly, the comparative expression level was calculated with the
formula: TC∆∆−2 . All samples were amplified in triplicate and the values are given as the mean
± standard deviation.
2.2.4 RESULTS AND DISCUSSION
Caco-2 cells have been widely used as a model to study intestinal permeability and interaction
with transporters. Their folic acid uptake characteristics were also shown previously[25]. In
this part of this work, the availability of three known genes for folic acid transport were
examined and their relative comparison by real-time PCR was performed. The existence of
some of the known transport routes of folates, namely RFC, FRα and FRβ, were investigated
in Caco-2 cells by using RT-PCR followed by electrophoresis on 2% agarose gel and staining
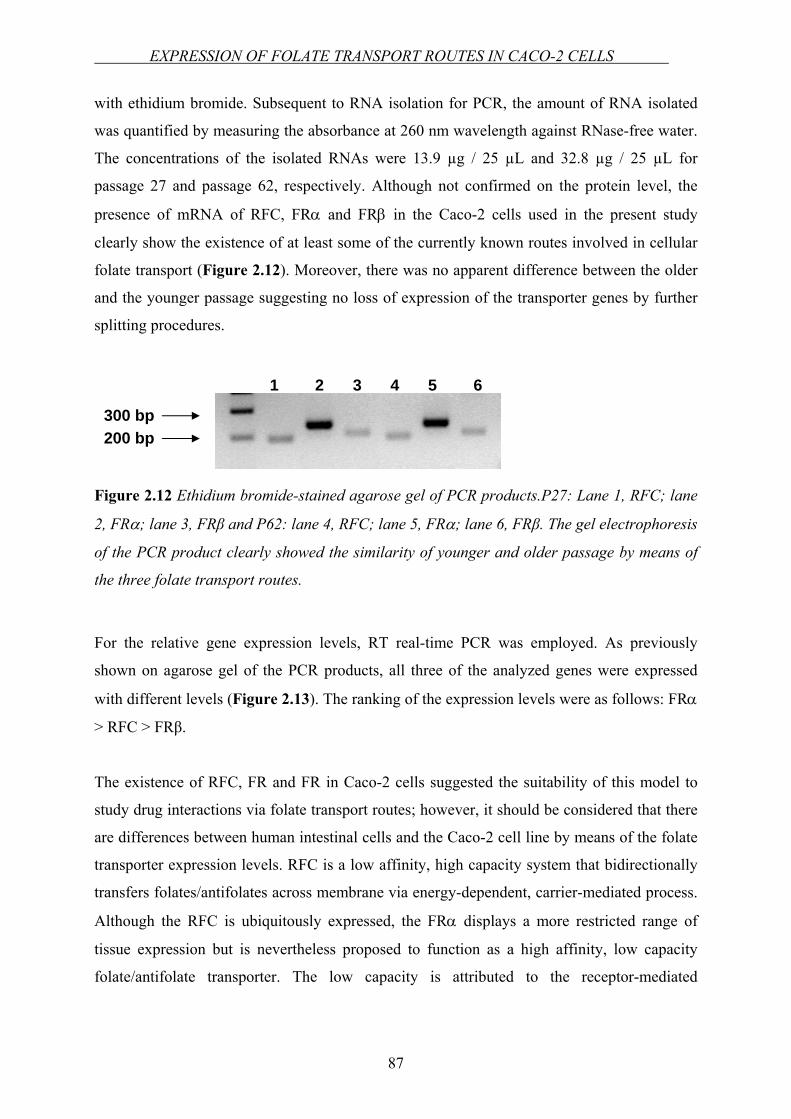
EXPRESSION OF FOLATE TRANSPORT ROUTES IN CACO-2 CELLS
87
with ethidium bromide. Subsequent to RNA isolation for PCR, the amount of RNA isolated
was quantified by measuring the absorbance at 260 nm wavelength against RNase-free water.
The concentrations of the isolated RNAs were 13.9 µg / 25 µL and 32.8 µg / 25 µL for
passage 27 and passage 62, respectively. Although not confirmed on the protein level, the
presence of mRNA of RFC, FRα and FRβ in the Caco-2 cells used in the present study
clearly show the existence of at least some of the currently known routes involved in cellular
folate transport (Figure 2.12). Moreover, there was no apparent difference between the older
and the younger passage suggesting no loss of expression of the transporter genes by further
splitting procedures.
Figure 2.12 Ethidium bromide-stained agarose gel of PCR products.P27: Lane 1, RFC; lane
2, FRα; lane 3, FRβ and P62: lane 4, RFC; lane 5, FRα; lane 6, FRβ. The gel electrophoresis
of the PCR product clearly showed the similarity of younger and older passage by means of
the three folate transport routes.
For the relative gene expression levels, RT real-time PCR was employed. As previously
shown on agarose gel of the PCR products, all three of the analyzed genes were expressed
with different levels (Figure 2.13). The ranking of the expression levels were as follows: FRα
> RFC > FRβ.
The existence of RFC, FR and FR in Caco-2 cells suggested the suitability of this model to
study drug interactions via folate transport routes; however, it should be considered that there
are differences between human intestinal cells and the Caco-2 cell line by means of the folate
transporter expression levels. RFC is a low affinity, high capacity system that bidirectionally
transfers folates/antifolates across membrane via energy-dependent, carrier-mediated process.
Although the RFC is ubiquitously expressed, the FRα displays a more restricted range of
tissue expression but is nevertheless proposed to function as a high affinity, low capacity
folate/antifolate transporter. The low capacity is attributed to the receptor-mediated
300 bp 200 bp
1 2 3 4 5 6
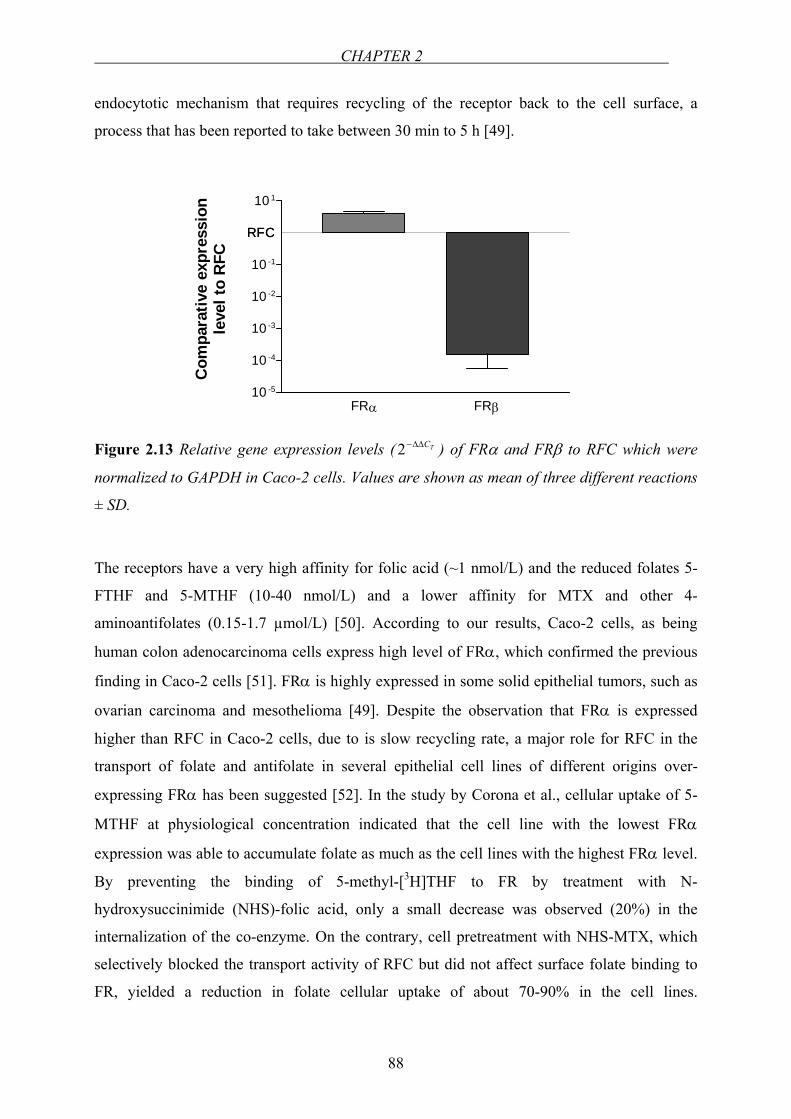
CHAPTER 2
88
endocytotic mechanism that requires recycling of the receptor back to the cell surface, a
process that has been reported to take between 30 min to 5 h [49].
RFC
FRα FRβ10 -5
10 -4
10 -3
10 -2
10 -1
10 1
RFC
Com
para
tive
expr
essi
onle
vel t
o R
FC
Figure 2.13 Relative gene expression levels ( TC∆∆−2 ) of FRα and FRβ to RFC which were
normalized to GAPDH in Caco-2 cells. Values are shown as mean of three different reactions
± SD.
The receptors have a very high affinity for folic acid (~1 nmol/L) and the reduced folates 5-
FTHF and 5-MTHF (10-40 nmol/L) and a lower affinity for MTX and other 4-
aminoantifolates (0.15-1.7 µmol/L) [50]. According to our results, Caco-2 cells, as being
human colon adenocarcinoma cells express high level of FRα, which confirmed the previous
finding in Caco-2 cells [51]. FRα is highly expressed in some solid epithelial tumors, such as
ovarian carcinoma and mesothelioma [49]. Despite the observation that FRα is expressed
higher than RFC in Caco-2 cells, due to is slow recycling rate, a major role for RFC in the
transport of folate and antifolate in several epithelial cell lines of different origins over-
expressing FRα has been suggested [52]. In the study by Corona et al., cellular uptake of 5-
MTHF at physiological concentration indicated that the cell line with the lowest FRα
expression was able to accumulate folate as much as the cell lines with the highest FRα level.
By preventing the binding of 5-methyl-[3H]THF to FR by treatment with N-
hydroxysuccinimide (NHS)-folic acid, only a small decrease was observed (20%) in the
internalization of the co-enzyme. On the contrary, cell pretreatment with NHS-MTX, which
selectively blocked the transport activity of RFC but did not affect surface folate binding to
FR, yielded a reduction in folate cellular uptake of about 70-90% in the cell lines.

EXPRESSION OF FOLATE TRANSPORT ROUTES IN CACO-2 CELLS
89
Consequently, it was concluded that the ovarian carcinoma cell lines internalized 5-MTHF
predominantly through RFC. Although this folate form has approximately 100-fold lower
relative affinity for RFC than for FRα, the carrier system appeared to internalize folate much
more efficiently than FR, also in cells in which FR expression was elevated [52]. Therefore,
despite the discrepancies between the expression levels of certain transporters in human
intestinal epithelia and Caco-2 monolayers, for the predictions of the relevant in vivo
outcomes of the folic acid related interactions, Caco-2 cells still keep their functional
characteristics and utility for the initial in vitro cell culture experiments.
CHAPTER 2
90
2.3 EFFECT OF GREEN TEA CATECHINS AND TEA EXTRACTS ON
FOLIC ACID UPTAKE
2.3.1 INTRODUCTION
Folic acid is the stable, synthetic and oxidized form of the water-soluble vitamin folate used
for supplementation and food fortification in human and animal nutrition. One major
biochemical role of reduced folates is to provide a methyl group for the re-methylation of
homocysteine to methionine [53]. Malabsorption of folate in humans might lead to folate
deficiency that may cause severe cases such as megaloblastic anemia, colon cancer,
cardiovascular disease and neural tube defects due to the fact that humans cannot synthesize
folates and therefore should obtain it from nutritional sources and supplements (see Chapter
1).
Tea, a traditional and widely consumed drink all over the world, which is prepared by
infusing the leaves of the plant Camellia sinensis in water, may have numerous health-
promoting properties [54,55], which are mainly attributed to the tea polyphenols. Green tea
contains polyphenolic compounds such as flavanols, flavandiols, flavonoids and phenolic
acids. The flavanols in green tea are known as catechins. The major catechins found in green
tea are EGCG, EGC, ECG and EC (see Chapter 1). The benefits of green tea are mostly
attributed to EGCG. The level of the flavonoids in green tea was found to be similar to the
flavonoids in black tea [56] and both have health beneficial properties. The dietary total intake
of polyphenols is ~ 1g/day [57] varying in different populations. For example, in Scotland, the
estimated dietary intake of catechins is 59 mg/day, in the Netherlands, it is 72 mg/day and in
Germany (Bavaria), it has a value of 11 mg/day [58]. The catechin intake also shows
variations in different age groups. The mean catechin intake is 25 mg/day in children, 56
mg/day in adults and 75 mg/day in elderly in a Dutch population [59].
Folic acid uptake can be inhibited by antifolates such as MTX (see Chapter 1) which is a
potent, competitive inhibitor of the enzyme DHFR [60] and is mainly used in the
chemotherapy of cancer. MTX competitively inhibits intestinal uptake of folic acid [28,29]
probably by sharing a common transporter system responsible for cellular uptake of folates.
EFFECT OF CATECHINS AND TEA EXTRACTS ON FOLIC ACID UPTAKE
91
The antifolate activity of tea catechins by inhibiting DHFR has been reported and EGCG has
been shown to inhibit DHFR in vitro [61]. The inhibition of DHFR leads to the depletion of
the intracellular reduced folate pools for the biosynthesis of purines and thymidine, which in
turn results in the inhibition of nucleic acid biosynthesis. This may be one possible
mechanism of the anticancer activity of green tea [61]. DHFR is also involved in the intestinal
absorption of folates, because the majority of dietary folates are transferred into the systemic
circulation in the reduced form [62].
Because catechins have been found to be inhibitors of DHFR – similar like MTX which is
known to inhibit intestinal uptake of folates – in the present chapter, it was investigated
whether catechins, either applied as pure substances or as tea extracts inhibit intestinal folate
uptake using Caco-2 cell monolayers as a model system. Composition of tea varies with
species, season, age of the leaf, climate and horticultural practices [63]. Based on this
information, in addition to commercial tea extracts, effects of different green tea samples on
folic acid uptake in vitro was further investigated.
2.3.2 EQUIPMENTS AND MATERIALS
Equipments
24-well plate NunclonTM Multidishes, Nunc, Life
Technologies GmbH, Karlsruhe, Germany
pH meter pH 538 Multical, WTW GmbH, Weilheim,
Germany
Shaker Bühler shaker KMA vario, Johanna Otto
GmbH, Hechingen, Germany
Incubator Incubator BE 500, Memmert, Schwabach,
Germany
Electrospray ionization-mass spectrometry
(ESI-MS)
QTof Ultima 3, Micromass/Waters, Milford,
MA, USA
Filter paper Filter Paper No.1, Whatman GmbH, Dassel,
Germany
CHAPTER 2
92
Freeze-dryer Ehrist ALPHA I-5, DAMON-IEC, Needam
Heights, MA, USA
Rotary evaporater Vac V-500, Büchi Labortechnik AG, Flawil,
Switzerland
Materials
EGCG, EGC, ECG, EC, Polyphenon 60, nonlabeled folic acid and sodium ascorbate were
purchased from Sigma-Aldrich Chemie GmbH, Steinheim, Germany. The purities were, ≥
95% for EGCG, ≥ 98% for EGC, ECG and EC according to the HPLC results by the
manufacturer. The identities of the compounds were verified by electrospray ionization-mass
spectrometry3 (ESI-MS) [64] (see Chapter 5, Appendix). Spray dried green tea powdered
extract (lot # PE 15202835), “organic” green tea powdered extract, (lot # PE 13100454),
black tea powdered extract (lot # PE 14104372) and “micromilled” black tea powdered
extract (lot # 14202740) were kindly provided by Plantextrakt, Vestenbergsgreuth, Germany.
As stated by the manufacturer, the extraction solvent was demineralised drinking water for all
extracts. Characterization of the tea extracts with respect to their catechin content by HPLC
yielded the following results4: EGCG: 207.7, 207.9, 4.4 and 0.3 µmol/g; ECG: 36.6, 32.5, 3.3
and 2.0 µmol/g; EC: 17.0, 19.7, 0.9 and 0.2 µmol/g for green tea extract, “organic” green tea
extract, black tea extract and “micromilled” black tea extract, respectively. The concentrations
of EGC were 102.3 µmol/g for green tea extract and 157.5 µmol/g for “organic” green tea
extract. MTX (Lantarel® FS) was from Wyeth Pharma GmbH, Münster, Germany. [3H]folic
acid (specific activity 20.0 Ci/mmol) was obtained from Moravek Biochemicals, Inc.,
California, USA. All the cell culture media and supplements were from Biochrom KG, Berlin,
Germany. MES was purchased from Merck, Darmstadt, Germany.
3 ESI-MS detections were performed in Institute of Chemistry, Johannes-Gutenberg University, Mainz, Germany. 4 HPLC analysis of the tea extracts were carried out in the group of Prof. Dr. Siegfried Wolffram, Institute of Animal Nutrition and Physiology, University of Kiel, Kiel, Germany.
EFFECT OF CATECHINS AND TEA EXTRACTS ON FOLIC ACID UPTAKE
93
Tea samples:
China Lung Ching (I) Tee Gschwender (No. 520), Mainz, Germany
China Mao Feng (II) Tee Gschwender (No. 515), Mainz, Germany
China Gunpowder (III) Alnaturna, Mainz, Germany
China Pai Mu Tan Typ (IV) Ronnefeldt, distributed by dm-drogerie
markt, Mainz, Germany
Japan Sencha (V) Tee Gschwender (No. 700), Mainz, Germany
Nepal Himalaya View® (VI) Tee Gschwender (No. 310), Mainz, Germany
2.3.3 METHODS
Preparation of Caco-2 monolayers for the studies
Caco-2 cells (passages 32-39) were cultured as previously described in Chapter 2.1. The
cells were routinely split and seeded into 24-well plates with 100,000 cells/well. The medium
was changed three times a week. The development of the monolayers was examined under the
microscope until the 16th day. The experiments were performed on the 16th post seeding.
Inhibition experiments
Inhibition experiments were conducted in the presence of:
a. Green tea catechins
b. Commercial green and black tea extracts
c. Produced green tea extracts from different green tea samples
d. Polyphenon 60
Due to the higher uptake rates of folic acid at pH 6.5 (see Chapter 2.1), all inhibition
experiments were performed at this condition. Prior to the inhibition experiments, the
cytotoxicity of test substances was investigated using both XTT in vitro toxicology assay kit
and trypan blue exclusion test (see Chapter 2.6).
For the inhibition experiments, on the 16th day postseeding, Caco-2 monolayers in the dishes
of the 24-well plates were washed twice with HBSS containing 10 mmol/L MES adjusted to
pH 6.5. The wells were filled and incubated with the incubation mixture for 30 min at 37 °C
on an orbital shaker at 50 rpm. After completion of the incubation period, the monolayers
were washed five times with ice-cold buffer solution at pH 6.5 containing 0.2 mM EGTA and
CHAPTER 2
94
subsequently solubilized with 1% Triton X-100 in water. Aliquots of 0.5 mL of solubilized
cells were mixed with 4 mL scintillation cocktail and counted by liquid scintillation.
Experiments were performed in triplicates and the resulting uptake data were expressed as
pmol of folic acid taken up per mg of protein or as % of control uptake (= 100%).
Concentration range for green tea catechins and green and black tea extracts for the
inhibition experiments
The concentration of EGCG in one cup of green tea may be up to 200 mg / 240 mL [54],
which translates into a molar concentration of approximately 1.8 mmol/L. Therefore, a
concentration range of 0.001 to 1 mmol/L was chosen for pure catechins tested in this study.
In the case of tea extracts, incubation solutions were adjusted to 0.12 – 60 mg extract/mL , in
accordance with the “German Revised Version of Guidelines for Tea, Herbal Infusions,
Extracts Thereof and Preparations” prepared by WKF (Wirtschaftsvereinigung Kräuter- und
Früchtetee e.V.) according to which a minimum extract concentration of 0.12 g/100 mL
should be employed for tea drinks.
Concentration range of Polyphenon 60 for the inhibition experiments
Polyphenon 60 from green tea is a mixture of polyphenolic compounds containing a
minimum of 60% total catechins. In addition to pure catechins and tea extracts, the effect of
Polyphenon 60 on folic acid uptake was investigated. Considering the ∼ 6-fold higher
catechin concentration of Polyphenon 60 compared to that of commercial green tea extract, a
concentration range of Polyphenon 60 (0.02 – 10 mg/mL) which corresponds to
concentrations 6-fold less than green tea extract was used.
Concentration of sodium ascorbate in the incubation mixtures
To prevent catechins from oxidation, 1 mmol/L sodium ascorbate was added to all incubation
solutions [61].
Concentration of folic acid in the incubation mixtures
Non-labeled and labeled folic acid concentrations in the incubation mixtures were 1 µmol/L
and 1 µCi/mL, respectively.
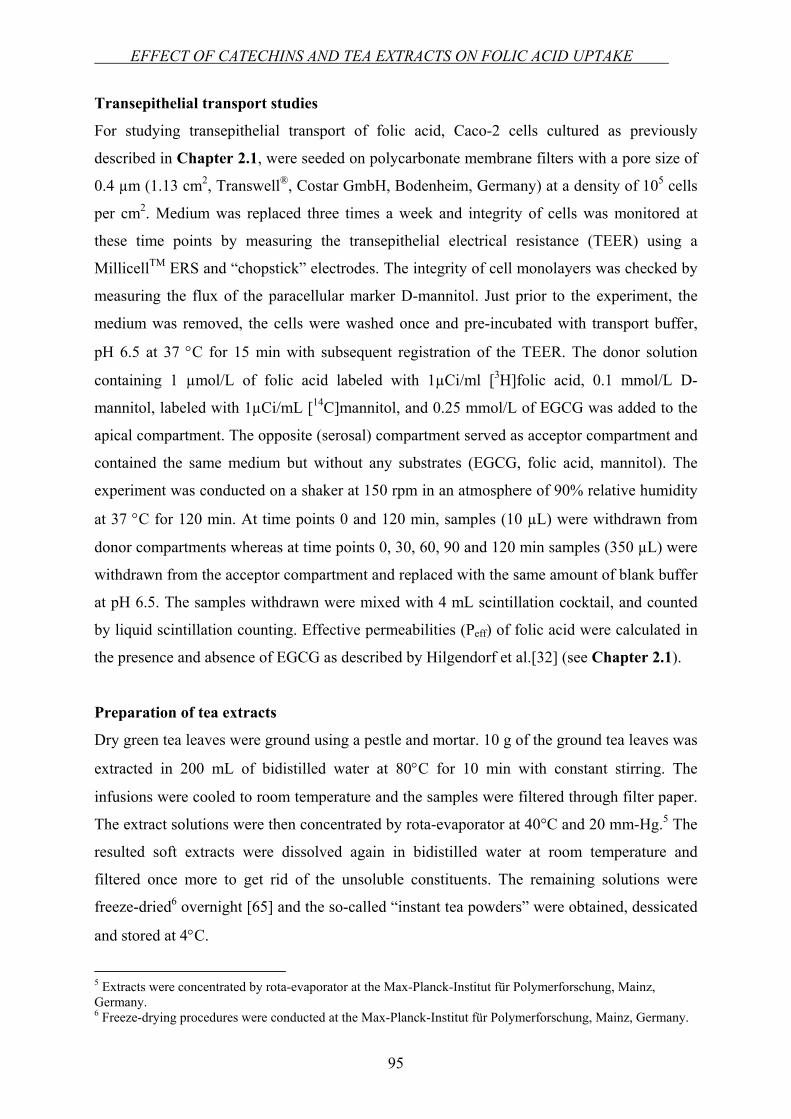
EFFECT OF CATECHINS AND TEA EXTRACTS ON FOLIC ACID UPTAKE
95
Transepithelial transport studies
For studying transepithelial transport of folic acid, Caco-2 cells cultured as previously
described in Chapter 2.1, were seeded on polycarbonate membrane filters with a pore size of
0.4 µm (1.13 cm2, Transwell®, Costar GmbH, Bodenheim, Germany) at a density of 105 cells
per cm2. Medium was replaced three times a week and integrity of cells was monitored at
these time points by measuring the transepithelial electrical resistance (TEER) using a
MillicellTM ERS and “chopstick” electrodes. The integrity of cell monolayers was checked by
measuring the flux of the paracellular marker D-mannitol. Just prior to the experiment, the
medium was removed, the cells were washed once and pre-incubated with transport buffer,
pH 6.5 at 37 °C for 15 min with subsequent registration of the TEER. The donor solution
containing 1 µmol/L of folic acid labeled with 1µCi/ml [3H]folic acid, 0.1 mmol/L D-
mannitol, labeled with 1µCi/mL [14C]mannitol, and 0.25 mmol/L of EGCG was added to the
apical compartment. The opposite (serosal) compartment served as acceptor compartment and
contained the same medium but without any substrates (EGCG, folic acid, mannitol). The
experiment was conducted on a shaker at 150 rpm in an atmosphere of 90% relative humidity
at 37 °C for 120 min. At time points 0 and 120 min, samples (10 µL) were withdrawn from
donor compartments whereas at time points 0, 30, 60, 90 and 120 min samples (350 µL) were
withdrawn from the acceptor compartment and replaced with the same amount of blank buffer
at pH 6.5. The samples withdrawn were mixed with 4 mL scintillation cocktail, and counted
by liquid scintillation counting. Effective permeabilities (Peff) of folic acid were calculated in
the presence and absence of EGCG as described by Hilgendorf et al.[32] (see Chapter 2.1).
Preparation of tea extracts
Dry green tea leaves were ground using a pestle and mortar. 10 g of the ground tea leaves was
extracted in 200 mL of bidistilled water at 80°C for 10 min with constant stirring. The
infusions were cooled to room temperature and the samples were filtered through filter paper.
The extract solutions were then concentrated by rota-evaporator at 40°C and 20 mm-Hg.5 The
resulted soft extracts were dissolved again in bidistilled water at room temperature and
filtered once more to get rid of the unsoluble constituents. The remaining solutions were
freeze-dried6 overnight [65] and the so-called “instant tea powders” were obtained, dessicated
and stored at 4°C.
5 Extracts were concentrated by rota-evaporator at the Max-Planck-Institut für Polymerforschung, Mainz, Germany. 6 Freeze-drying procedures were conducted at the Max-Planck-Institut für Polymerforschung, Mainz, Germany.
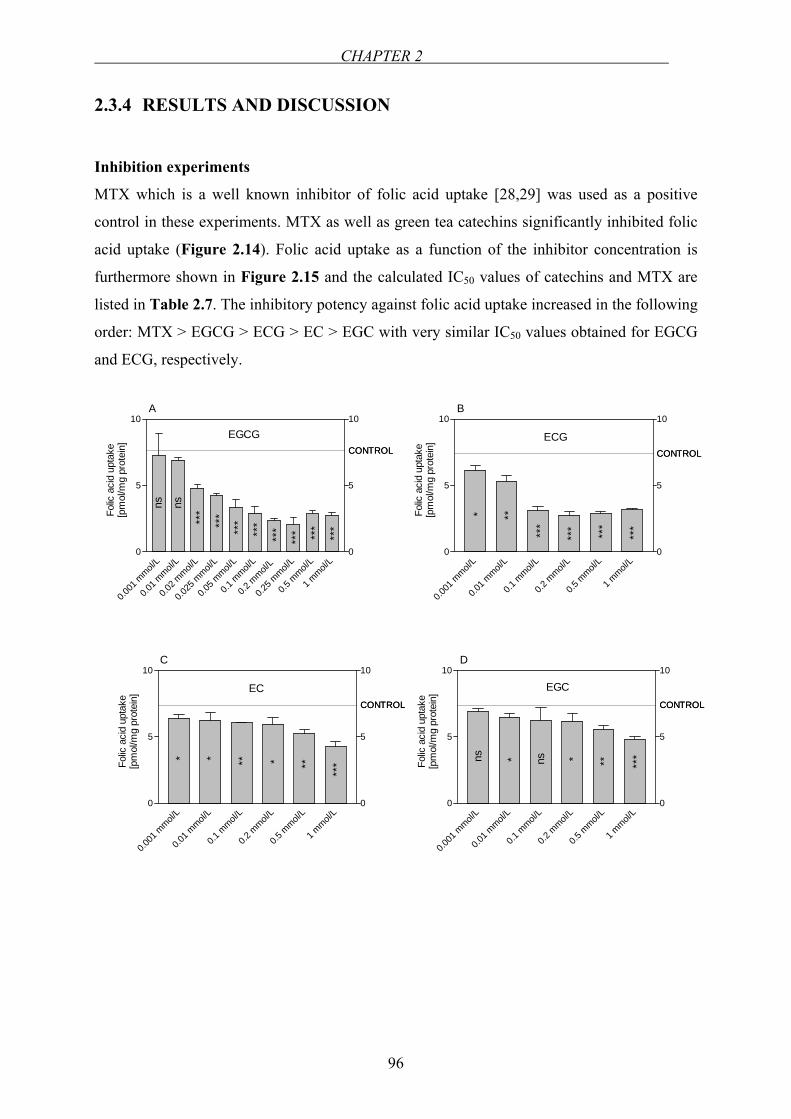
CHAPTER 2
96
2.3.4 RESULTS AND DISCUSSION
Inhibition experiments
MTX which is a well known inhibitor of folic acid uptake [28,29] was used as a positive
control in these experiments. MTX as well as green tea catechins significantly inhibited folic
acid uptake (Figure 2.14). Folic acid uptake as a function of the inhibitor concentration is
furthermore shown in Figure 2.15 and the calculated IC50 values of catechins and MTX are
listed in Table 2.7. The inhibitory potency against folic acid uptake increased in the following
order: MTX > EGCG > ECG > EC > EGC with very similar IC50 values obtained for EGCG
and ECG, respectively.
CONTROL
0.001
mmol/
L
0.01 m
mol/L
0.1 m
mol/L
0.2 m
mol/L
0.5 m
mol/L
1 mmol/
L0
5
10
0
5
10
CONTROL
ns ns
D
EGC
* * ** ***
Folic
aci
d up
take
[pm
ol/m
g pr
otei
n]CONTROL
0.001
mmol/
L
0.01 m
mol/L
0.1 m
mol/L
0.2 m
mol/L
0.5 m
mol/L
1 mmol/
L0
5
10
0
5
10
CONTROL
C
EC
* * *** **
***Fo
lic a
cid
upta
ke[p
mol
/mg
prot
ein]
CONTROL
0.001
mmol/
L
0.01 m
mol/L
0.1 m
mol/L
0.2 m
mol/L
0.5 m
mol/L
1 mmol/
L0
5
10
0
5
10
CONTROL
ECG
B
* **
***
*** ***
***
Folic
aci
d up
take
[pm
ol/m
g pr
otei
n]CONTROL
0.001
mmol/
L
0.01 m
mol/L
0.02 m
mol/L
0.025
mmol/
L
0.05 m
mol/L
0.1 m
mol/L
0.2 m
mol/L
0.25 m
mol/L
0.5 m
mol/L
1 mmol/
L0
5
10
0
5
10
CONTROL
EGCG
ns ns
A
***
***
***
***
***
*** ***
***
Folic
aci
d up
take
[pm
ol/m
g pr
otei
n]
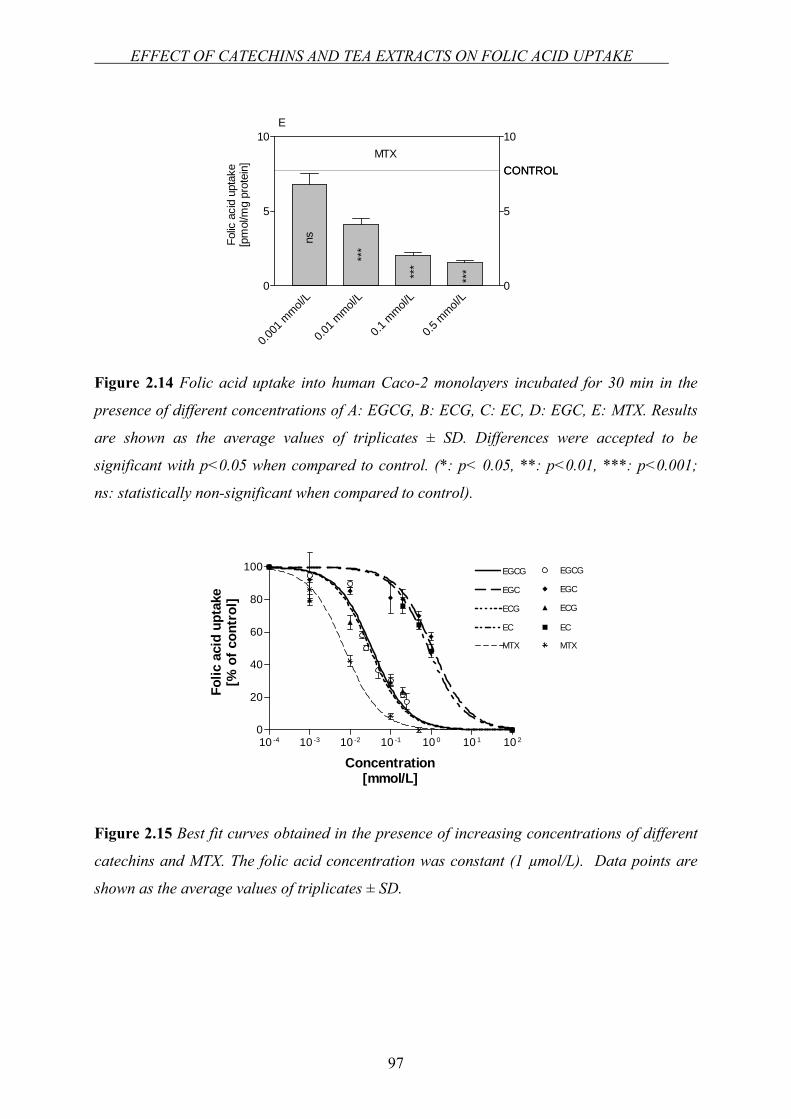
EFFECT OF CATECHINS AND TEA EXTRACTS ON FOLIC ACID UPTAKE
97
Figure 2.14 Folic acid uptake into human Caco-2 monolayers incubated for 30 min in the
presence of different concentrations of A: EGCG, B: ECG, C: EC, D: EGC, E: MTX. Results
are shown as the average values of triplicates ± SD. Differences were accepted to be
significant with p<0.05 when compared to control. (*: p< 0.05, **: p<0.01, ***: p<0.001;
ns: statistically non-significant when compared to control).
10 -4 10 -3 10 -2 10 -1 10 0 10 1 10 20
20
40
60
80
100 EGCG
EGC
ECG
EC
MTX
EC
ECG
EGCG
EGC
MTX
Concentration[mmol/L]
Folic
aci
d up
take
[% o
f con
trol
]
Figure 2.15 Best fit curves obtained in the presence of increasing concentrations of different
catechins and MTX. The folic acid concentration was constant (1 µmol/L). Data points are
shown as the average values of triplicates ± SD.
CONTROL
0.001
mmol/
L
0.01 m
mol/L
0.1 m
mol/L
0.5 m
mol/L
0
5
10
ns
***
***
***
0
5
10
CONTROLMTX
E
Folic
aci
d up
take
[pm
ol/m
g pr
otei
n]
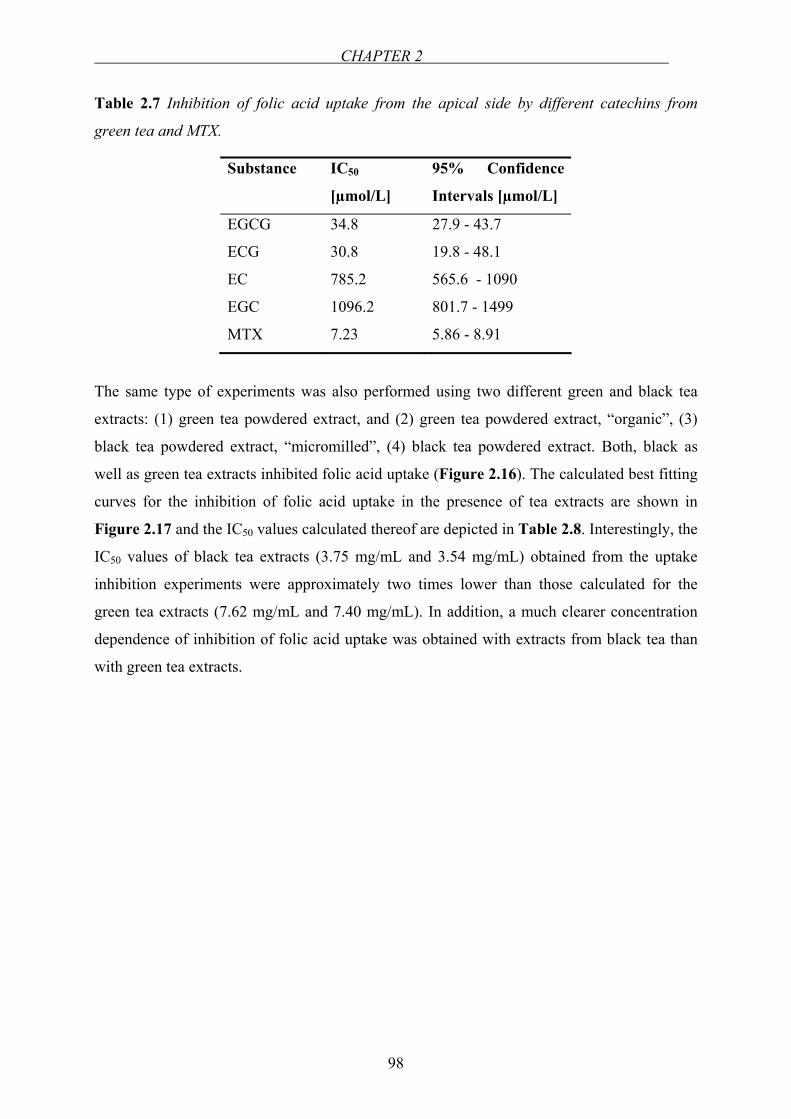
CHAPTER 2
98
Table 2.7 Inhibition of folic acid uptake from the apical side by different catechins from
green tea and MTX.
Substance IC50
[µmol/L]
95% Confidence
Intervals [µmol/L]
EGCG 34.8 27.9 - 43.7
ECG 30.8 19.8 - 48.1
EC 785.2 565.6 - 1090
EGC 1096.2 801.7 - 1499
MTX 7.23 5.86 - 8.91
The same type of experiments was also performed using two different green and black tea
extracts: (1) green tea powdered extract, and (2) green tea powdered extract, “organic”, (3)
black tea powdered extract, “micromilled”, (4) black tea powdered extract. Both, black as
well as green tea extracts inhibited folic acid uptake (Figure 2.16). The calculated best fitting
curves for the inhibition of folic acid uptake in the presence of tea extracts are shown in
Figure 2.17 and the IC50 values calculated thereof are depicted in Table 2.8. Interestingly, the
IC50 values of black tea extracts (3.75 mg/mL and 3.54 mg/mL) obtained from the uptake
inhibition experiments were approximately two times lower than those calculated for the
green tea extracts (7.62 mg/mL and 7.40 mg/mL). In addition, a much clearer concentration
dependence of inhibition of folic acid uptake was obtained with extracts from black tea than
with green tea extracts.
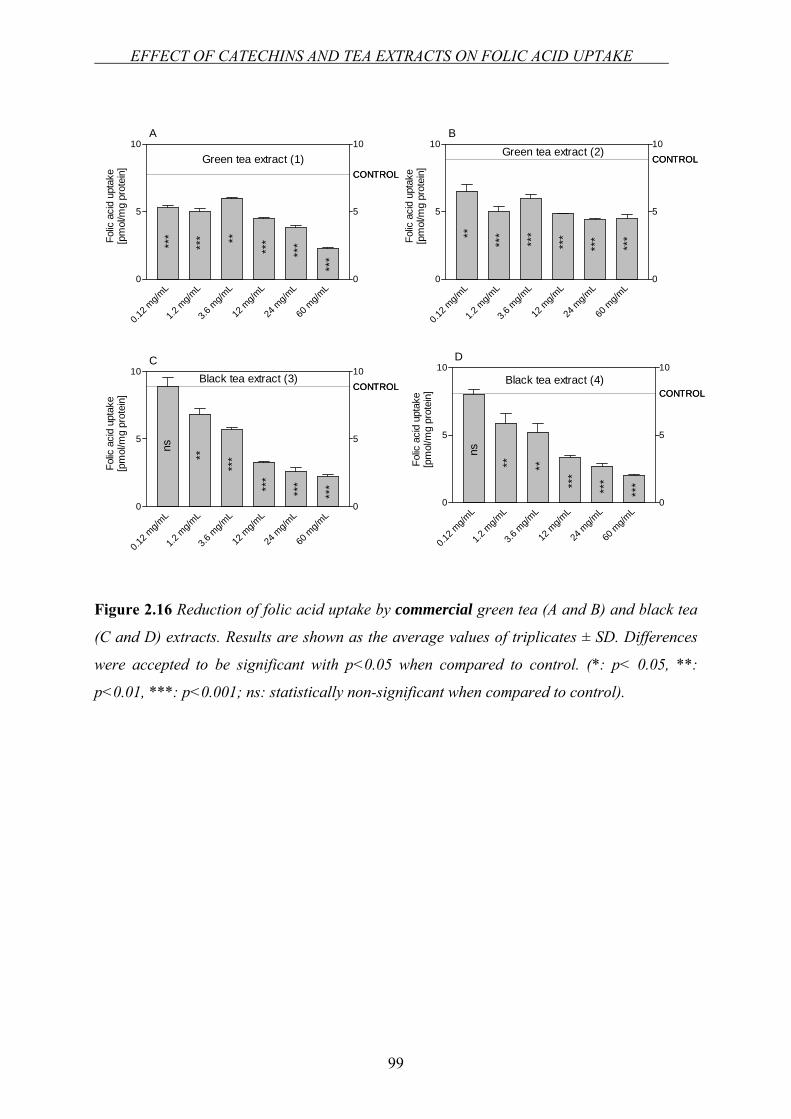
EFFECT OF CATECHINS AND TEA EXTRACTS ON FOLIC ACID UPTAKE
99
Figure 2.16 Reduction of folic acid uptake by commercial green tea (A and B) and black tea
(C and D) extracts. Results are shown as the average values of triplicates ± SD. Differences
were accepted to be significant with p<0.05 when compared to control. (*: p< 0.05, **:
p<0.01, ***: p<0.001; ns: statistically non-significant when compared to control).
CONTROL
0.12 m
g/mL
1.2 m
g/mL
3.6 m
g/mL
12 m
g/mL
24 m
g/mL
60 m
g/mL
0
5
10
0
5
10
CONTROLGreen tea extract (1)
A
***
***
***
***
***
**Folic
aci
d up
take
[pm
ol/m
g pr
otei
n]
CONTROL
0.12 m
g/mL
1.2 m
g/mL
3.6 m
g/mL
12 m
g/mL
24 m
g/mL
60 m
g/mL
0
5
10
0
5
10
CONTROLBlack tea extract (4)
ns
** **
***
***
***
D
Folic
aci
d up
take
[pm
ol/m
g pr
otei
n]
CONTROL
0.12 m
g/mL
1.2 m
g/mL
3.6 m
g/mL
12 m
g/mL
24 m
g/mL
60 m
g/mL
0
5
10
0
5
10CONTROL
Black tea extract (3)
ns
**
***
***
***
***
C
Folic
aci
d up
take
[pm
ol/m
g pr
otei
n]
CONTROL
0.12 m
g/mL
1.2 m
g/mL
3.6 m
g/mL
12 m
g/mL
24 m
g/mL
60 m
g/mL
0
5
10
0
5
10CONTROL
Green tea extract (2)B
**
***
***
***
***
***Fo
lic a
cid
upta
ke[p
mol
/mg
prot
ein]
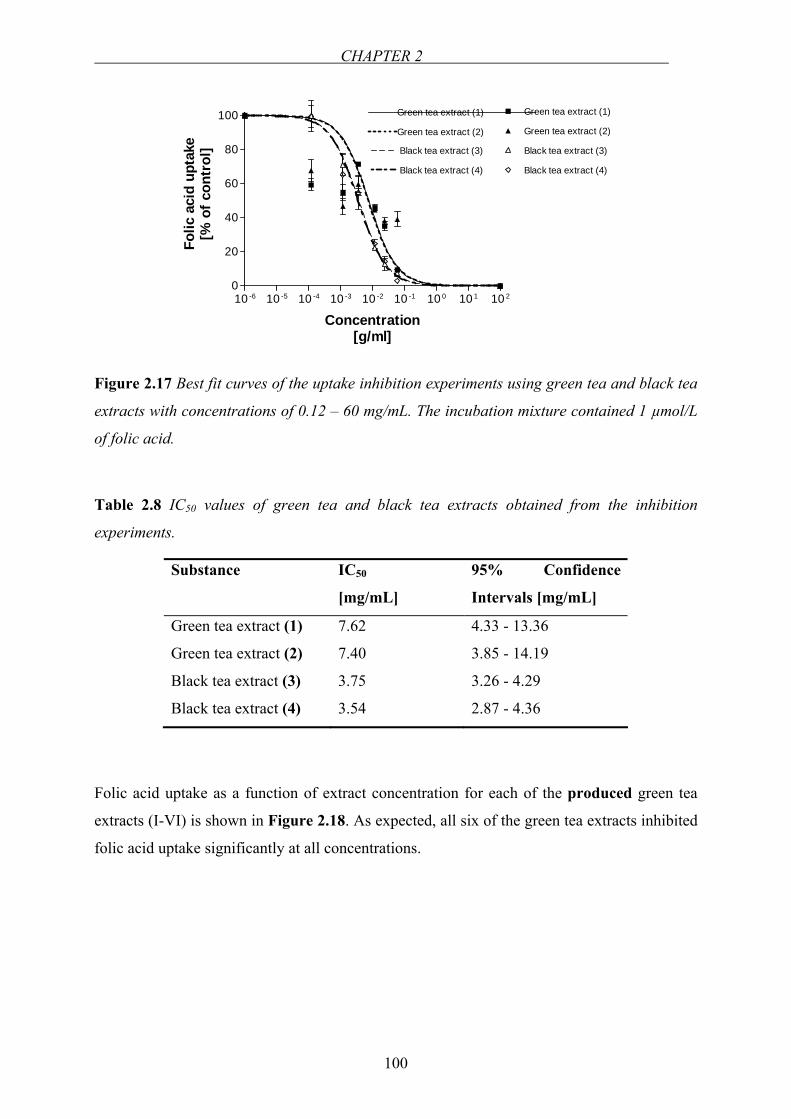
CHAPTER 2
100
10 -6 10 -5 10 -4 10 -3 10 -2 10 -1 10 0 10 1 10 20
20
40
60
80
100 Green tea extract (1)
Green tea extract (2)
Black tea extract (3)
Black tea extract (4)
Green tea extract (1)
Green tea extract (2)
Black tea extract (3)
Black tea extract (4)
Concentration[g/ml]
Folic
aci
d up
take
[% o
f con
trol
]
Figure 2.17 Best fit curves of the uptake inhibition experiments using green tea and black tea
extracts with concentrations of 0.12 – 60 mg/mL. The incubation mixture contained 1 µmol/L
of folic acid.
Table 2.8 IC50 values of green tea and black tea extracts obtained from the inhibition
experiments.
Substance IC50
[mg/mL]
95% Confidence
Intervals [mg/mL]
Green tea extract (1) 7.62 4.33 - 13.36
Green tea extract (2) 7.40 3.85 - 14.19
Black tea extract (3) 3.75 3.26 - 4.29
Black tea extract (4) 3.54 2.87 - 4.36
Folic acid uptake as a function of extract concentration for each of the produced green tea
extracts (I-VI) is shown in Figure 2.18. As expected, all six of the green tea extracts inhibited
folic acid uptake significantly at all concentrations.
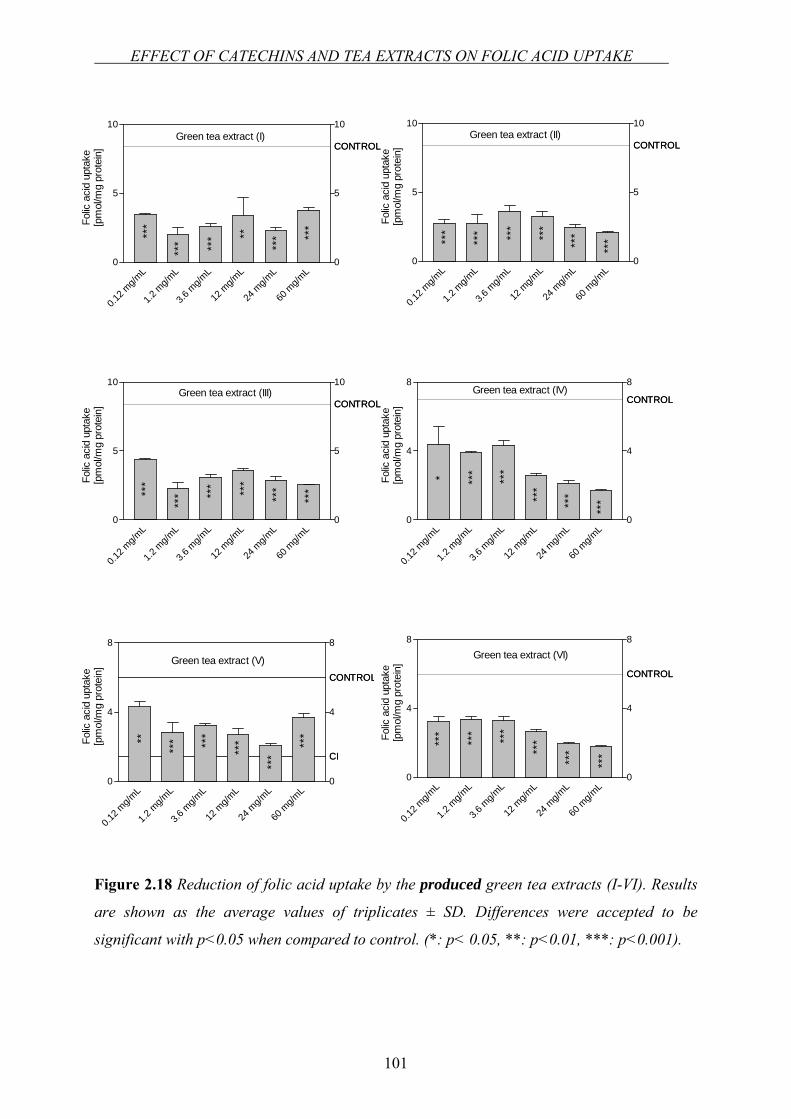
EFFECT OF CATECHINS AND TEA EXTRACTS ON FOLIC ACID UPTAKE
101
CONTROL
0.12 m
g/mL
1.2 m
g/mL
3.6 m
g/mL
12 m
g/mL
24 m
g/mL
60 m
g/mL
0
5
10
0
5
10
CONTROLGreen tea extract (I)
***
*** *** **
*** **
*Folic
aci
d up
take
[pm
ol/m
g pr
otei
n]
CONTROL
0.12 m
g/mL
1.2 m
g/mL
3.6 m
g/mL
12 m
g/mL
24 m
g/mL
60 m
g/mL
0
5
10
0
5
10
CONTROLGreen tea extract (II)
***
*** ***
***
***
***
Folic
aci
d up
take
[pm
ol/m
g pr
otei
n]CONTROL
0.12 m
g/mL
1.2 m
g/mL
3.6 m
g/mL
12 m
g/mL
24 m
g/mL
60 m
g/mL
0
5
10
0
5
10
CONTROL
***
*** **
* ***
***
***
Green tea extract (III)
Folic
aci
d up
take
[pm
ol/m
g pr
otei
n]
CI
CONTROL
0.12 m
g/mL
1.2 m
g/mL
3.6 m
g/mL
12 m
g/mL
24 m
g/mL
60 m
g/mL
0
4
8
0
4
8
CI
CONTROL
Green tea extract (V)
**
*** ***
***
***
***Folic
aci
d up
take
[pm
ol/m
g pr
otei
n] CONTROL
0.12 m
g/mL
1.2 m
g/mL
3.6 m
g/mL
12 m
g/mL
24 m
g/mL
60 m
g/mL
0
4
8
0
4
8
CONTROL
***
*** ***
***
***
***
Green tea extract (VI)
Folic
aci
d up
take
[pm
ol/m
g pr
otei
n]CONTROL
0.12 m
g/mL
1.2 m
g/mL
3.6 m
g/mL
12 m
g/mL
24 m
g/mL
60 m
g/mL
0
4
8
0
4
8
CONTROLGreen tea extract (IV)
* ***
***
***
***
***
Folic
aci
d up
take
[pm
ol/m
g pr
otei
n]
Figure 2.18 Reduction of folic acid uptake by the produced green tea extracts (I-VI). Results
are shown as the average values of triplicates ± SD. Differences were accepted to be
significant with p<0.05 when compared to control. (*: p< 0.05, **: p<0.01, ***: p<0.001).
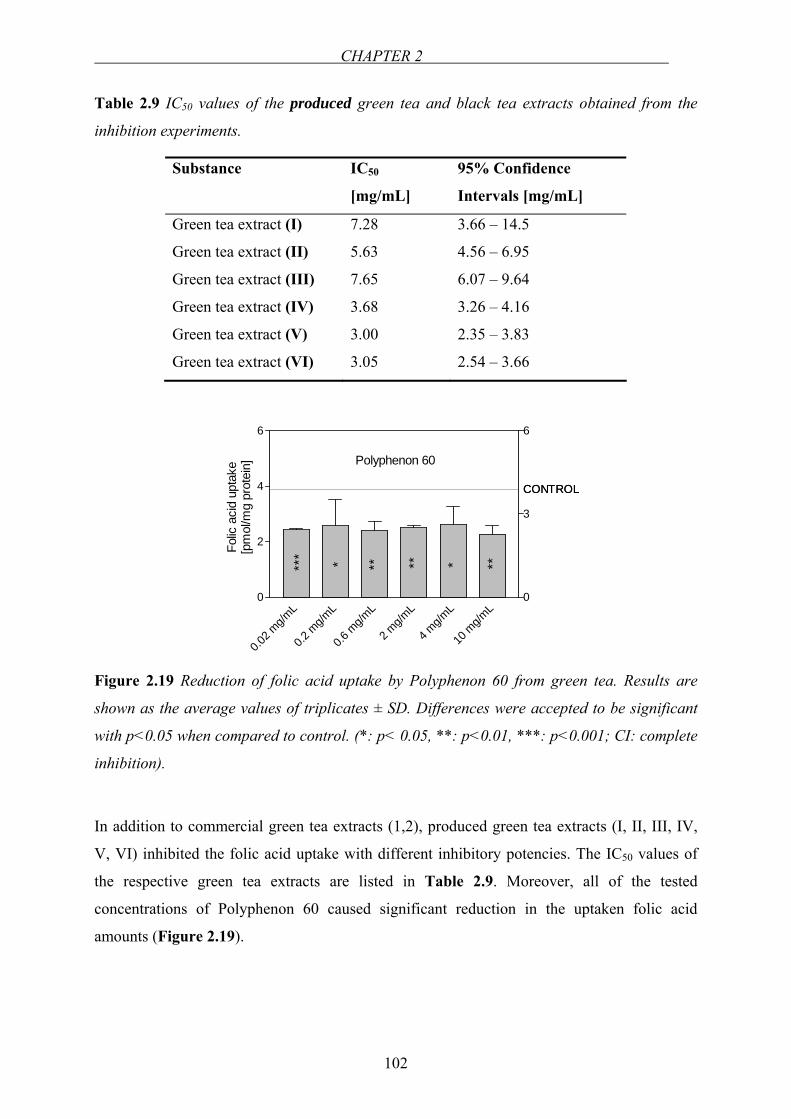
CHAPTER 2
102
Table 2.9 IC50 values of the produced green tea and black tea extracts obtained from the
inhibition experiments.
Substance IC50
[mg/mL]
95% Confidence
Intervals [mg/mL]
Green tea extract (I) 7.28 3.66 – 14.5
Green tea extract (II) 5.63 4.56 – 6.95
Green tea extract (III) 7.65 6.07 – 9.64
Green tea extract (IV) 3.68 3.26 – 4.16
Green tea extract (V) 3.00 2.35 – 3.83
Green tea extract (VI) 3.05 2.54 – 3.66
CONTROL
0.02 m
g/mL
0.2 m
g/mL
0.6 m
g/mL
2 mg/m
L
4 mg/m
L
10 m
g/mL
0
2
4
6
0
3
6
CONTROL
Polyphenon 60
***
*** ** * **
Folic
aci
d up
take
[pm
ol/m
g pr
otei
n]
Figure 2.19 Reduction of folic acid uptake by Polyphenon 60 from green tea. Results are
shown as the average values of triplicates ± SD. Differences were accepted to be significant
with p<0.05 when compared to control. (*: p< 0.05, **: p<0.01, ***: p<0.001; CI: complete
inhibition).
In addition to commercial green tea extracts (1,2), produced green tea extracts (I, II, III, IV,
V, VI) inhibited the folic acid uptake with different inhibitory potencies. The IC50 values of
the respective green tea extracts are listed in Table 2.9. Moreover, all of the tested
concentrations of Polyphenon 60 caused significant reduction in the uptaken folic acid
amounts (Figure 2.19).
EFFECT OF CATECHINS AND TEA EXTRACTS ON FOLIC ACID UPTAKE
103
Effect of EGCG on the transport of folic acid across Caco-2 cell monolayers
For studying inhibition of transepithelial transport of folate (1 µmol/L) by tea catechins,
EGCG was used at a concentration of 0.25 mmol/L (strongest inhibition, see also Figure
2.14). Under these conditions EGCG significantly reduced folate transfer from the donor into
the acceptor compartment. In the apical to basolateral transport direction, Peff was 1.07 x 10⁻⁶
cm/s in the absence of EGCG, whereas in the presence of EGCG, Peff turned out to be 7.68 x
10-7 cm/s. [14C]mannitol permeability was not different in the absence and presence of EGCG
indicating the absence of any effect of EGCG on the integrity of Caco-2 cell monolayers
throughout the experiment.
This present study investigates the potential inhibitory effect of green tea catechins and
additionally whole extracts of Camellia sinensis on the folic acid uptake in Caco-2 cells.
Catechins, as well as green and black tea extracts were shown to inhibit folic acid uptake into
Caco-2 cell monolayers. Green tea extracts, in the concentration range mentioned previously,
influenced folic acid uptake significantly. The analyses of the commercial green and black tea
extracts with respect to catechin levels showed that green tea extracts contain high amounts of
EGCG, ECG and EC whereas amounts of those in black tea are negligible (see Materials).
The inhibitory effect of green tea extract can be attributed to the catechins which was proved
by the inhibition experiments in the case of pure catechins. Besides, the inhibitory effect of
black tea which is even calculated higher than that of green tea, might also be due to the
existence of flavonoids, that however, differ between black and green tea such as theaflavins
or thearubigins. The results clearly suggest an interaction between tea polyphenols and folic
acid at the level of intestinal absorption and might be of nutritional significance because the
IC50 values calculated for catechins, especially for EGCG and ECG (see Table 2.7) are well
achievable by consumption of green tea. Green tea was reported to be one of the major
sources of folate in Japanese women. 20.7 µg/d folate is obtained from Sencha type, 11.8 µg/d
folate is obtained from Gyokuro type and 3.2 µg/d folate is obtained from Hojicha type green
tea in Japan [66]. Taking the folate content of green tea into consideration [66], on the one
hand, one could conclude that the actual IC50 of green tea could have been much lower than
the measured value. On the other hand, the folate supplied by green tea into the incubation
mixture, might have compensated for the inhibitory effect of the green tea extract. Therefore,
a higher IC50 of green tea extract may have been calculated than for black tea, which has
much lower folate content than the former. Interestingly, the results concerning inhibition of
folate uptake in the present study are in good agreement with the results on DHFR inhibition
CHAPTER 2
104
regarding the relative potency of the different tea polyphenols with the gallated derivatives
EGCG and ECG being much more potent than the non-gallated form EGC and EC (Table
2.7) [61,67].
The inhibitory potency of the produced green tea extracts were found even stronger than the
commercial green tea extracts. Even the lowest concentrations of the extracts inhibited folic
acid uptake significantly. This might be due to the culturing conditions of the green tea plant,
but as well, the condition under which the extract was produced, could be influential. Tea
plants are cultivated in India, China, Japan, Taiwan, Sri Lanka and Indonesia and in Central
Africa and hundreds of different teas are produced and sold all over the world. The
composition of tea varies with species, season, age of the leaves, agronomic condition,
manufacturing process and storage [68]. Hertog et al. had pointed out that, the size of the tea
leaves and consequently extraction surface were important in flavonoid levels in tea. The
difference in flavonoid levels between tea prepared with tea bags and tea prepared with loose
leaves could then be explained by the particle size of the leaves [56]. Thus, due to the
grinding step while preparing the tea extracts might have affected the catechin content in a
positive manner in our study. Moreover, the inhibitory effect of both commercial green and
black tea extracts showed a concentration dependency which was more apparent for black tea
extracts. However, in the case of produced green tea extracts, although the inhibition at each
extract concentration was significant, folic acid uptake levels demonstrated fluctuations by
increasing the extract concentration. This response might be due to the type and amount of
polyphenols in the produced extracts similar to the lower IC50 values of those compared to the
commercial green tea extracts. As mentioned in Chapter 1, gallated catechins were shown to
be substrates of SGLT1 and MCT [69,70]. Additionally, the efflux transporters MRP2 and
BCRP may contribute to the secretion of gallated catechins [70,71]. Due to the different type
and possibly high concentrations of polyphenols in different green tea extracts, there is an
increased potential of contribution of different transporters to the overall transport process
which might lead to the observed fluactuations in the inhibition experiments. The IC50 values
of the produced green tea extracts ranked in the following fashion: IC50 (III) > IC50 (I)> IC50 (II)>
IC50 (IV)> IC50 (VI)> IC50 (V). Based on the IC50 values the green tea “Japan Sencha” exhibited
the highest inhibition. This type of Japanese green tea was shown to express high levels of
catechins (13.61%) [72]. In a study, the antioxidant capacities of different green and black
teas were investigated. Teas from different regions of world had different capacities of
antioxidant effects, which could be associated with their different catechin contents. Likewise,
EFFECT OF CATECHINS AND TEA EXTRACTS ON FOLIC ACID UPTAKE
105
the different inhibitory strengths of folic acid uptake might be well related to the same
phenomena. Similar results were also observed for Polyphenon 60. The results do not give us
the possibility to make a comparison between green tea extracts and Polyphenon 60 because
of lack in the information regarding the exact catechin compositions of both. However, it can
be concluded that either pure catechins, or extracts inhibited the folic acid influx into Caco-2
cells considerably.
During intestinal absorption, folates are reduced and partially methylated to THF and 5-
MTHF, respectively, within the enterocytes prior to transfer into the blood. Thus, DHFR is
involved in intestinal absorption of folates. As reported previously [61,67], green tea
catechins competitively inhibit DHFR, which could at least partially explain a reduced
cellular uptake as well as a reduced transepithelial transfer of folates in the presence of
catechins. In the case of cellular uptake, an accumulation of non-reduced folates would hinder
further uptake of these forms across the brush-border membrane resulting in a reduced
cellular accumulation. Transport of folates by mammalian cells involves a variety of diverse
processes [27,35,45,73,74]. The presence of mRNA of RFC, FRα and FRβ in the Caco-2 cells
used in the present study (see Chapter 2.2) clearly show the existence of at least some of the
currently known routes involved in cellular folate transport. Regardless of the fact that the
experimental Caco-2 model used in this study might have differences in the expressed levels
of genes and proteins than in vivo, these results clearly indicate the alteration of folic acid
uptake by tea extracts. Taking all these into consideration, it might well be that inhibition of
cellular uptake of folic acid includes interaction of catechins with one or more of these
transporters although we cannot deduce the exact mechanism(s) responsible for our findings.
In summary, the results of the present study demonstrated an interaction between tea extracts
and catechins at the level of uptake which may turn out to influence the folate status of the
body. Low folate levels may be crucial in clinical cases such as pregnancy and cardiovascular
disturbances due to the low bioavailability of folic acid and may even result in the risk of
anencephaly and spina bifida [75] and hyperhomocysteinemia [76], respectively. Whether
these complications may result from ingestion of excessive amounts of tea, is currently
unknown and needs to be investigated further in in vivo animal and human studies. Along
with our recent findings and the reported transporter-related and enzyme-related interactions
of green tea [61,70,77], changes in the efficacy of the drugs cannot be ruled out at present.
CHAPTER 2
106
2.4 INVESTIGATION OF THE INTERACTION BETWEEN FOLIC
ACID AND SELECTED FLAVONOIDS AT THE LEVEL OF
INTESTINAL ABSORPTION
2.4.1 INTRODUCTION
Among the numerous members of flavonoids, hesperetin, kaempferol, naringenin and
quercetin were selected as the test compounds for the inhibition experiments to study the
inhibitory effects on folic acid uptake in Caco-2 monolayers. Although exact mechanisms of
intestinal absorption of flavonoids remain to be elucidated, there are a few proposals:
• It is generally believed that intact flavonoid glycosides are hardly absorbed from the
small intestine because sugar moieties elevate their hydrophilicity. Flavonoid
glycosides from diet are believed to pass through the small intestine and then enter the
cecum and colon, where they are hydrolyzed to aglycone by enterobacteria. Flavonoid
aglycone can be absorbed easily into the epithelial cells in the large intestine because
its lipophilicity facilitates its passage across phospholipid bilayer of cellular
membranes [78].
• It was reported that the position and nature of the sugar residue may increase the
uptake of the compound in the small intestine. Nevertheless, the aglycone has a higher
biological effect than the glycoside [79]. Therefore, deglycosylation via a β-
glucosidase would be an important step [80]. Human cells express some β-
glucusidases: lactase phlorizin hydrolase, glucocerebrosidase and cytosolic β-
glucosidase among which the lactase phlorizin hydrolase and the glucocerebrosidase
are membrane-bound, and the cytosolic β-glucosidase is a broad-specificity cytosolic
enzyme found in abundance in the liver, kidney and small intestine of mammals [80].
• Results of a study by Nemeth et al. showed that absorption involved degylcosylation
by the luminally-exposed lactase phlorizin hydrolase and by the cytosolic β-
glucosidase. Only substrates for these human β-glucosidases show significant
absorption from the small intestine, while non-substrates are absorbed from the colon
and exhibit reduced bioavailability [81].
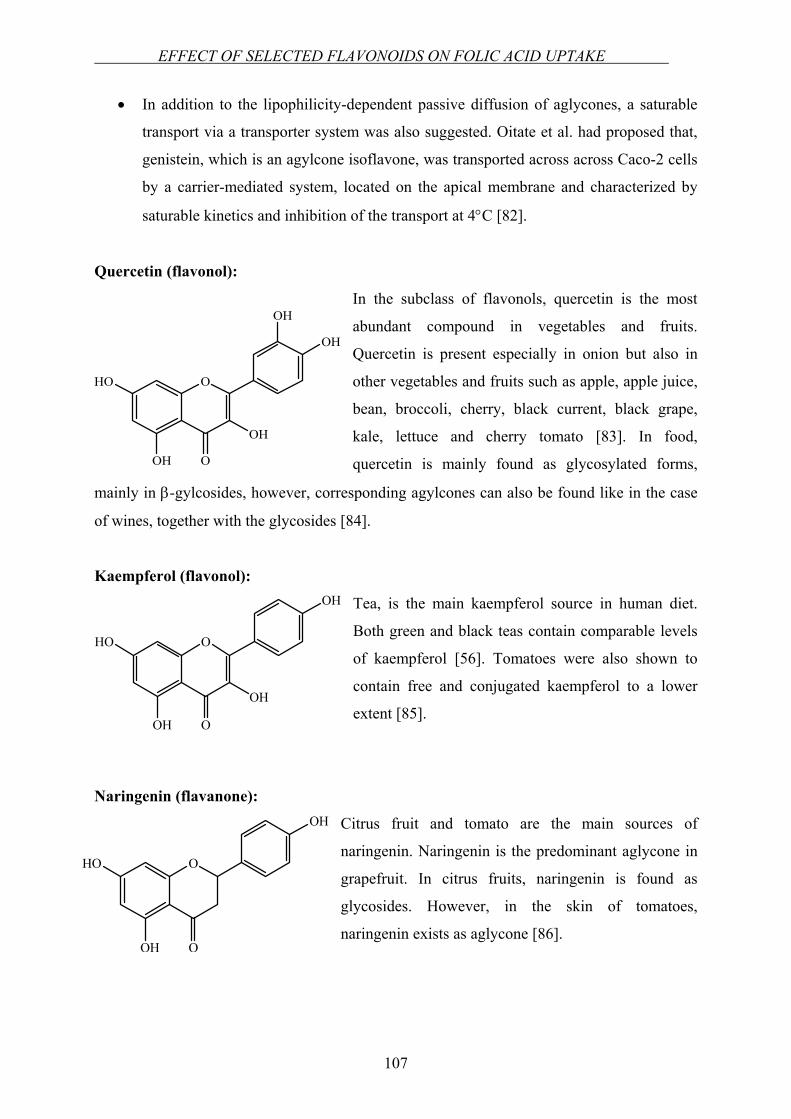
EFFECT OF SELECTED FLAVONOIDS ON FOLIC ACID UPTAKE
107
• In addition to the lipophilicity-dependent passive diffusion of aglycones, a saturable
transport via a transporter system was also suggested. Oitate et al. had proposed that,
genistein, which is an agylcone isoflavone, was transported across across Caco-2 cells
by a carrier-mediated system, located on the apical membrane and characterized by
saturable kinetics and inhibition of the transport at 4°C [82].
Quercetin (flavonol):
In the subclass of flavonols, quercetin is the most
abundant compound in vegetables and fruits.
Quercetin is present especially in onion but also in
other vegetables and fruits such as apple, apple juice,
bean, broccoli, cherry, black current, black grape,
kale, lettuce and cherry tomato [83]. In food,
quercetin is mainly found as glycosylated forms,
mainly in β-gylcosides, however, corresponding agylcones can also be found like in the case
of wines, together with the glycosides [84].
Kaempferol (flavonol):
Tea, is the main kaempferol source in human diet.
Both green and black teas contain comparable levels
of kaempferol [56]. Tomatoes were also shown to
contain free and conjugated kaempferol to a lower
extent [85].
Naringenin (flavanone):
Citrus fruit and tomato are the main sources of
naringenin. Naringenin is the predominant aglycone in
grapefruit. In citrus fruits, naringenin is found as
glycosides. However, in the skin of tomatoes,
naringenin exists as aglycone [86].
OHO
OH O
OH
OH
OH
OHO
OH O
OH
OH
OHO
OH O
OH
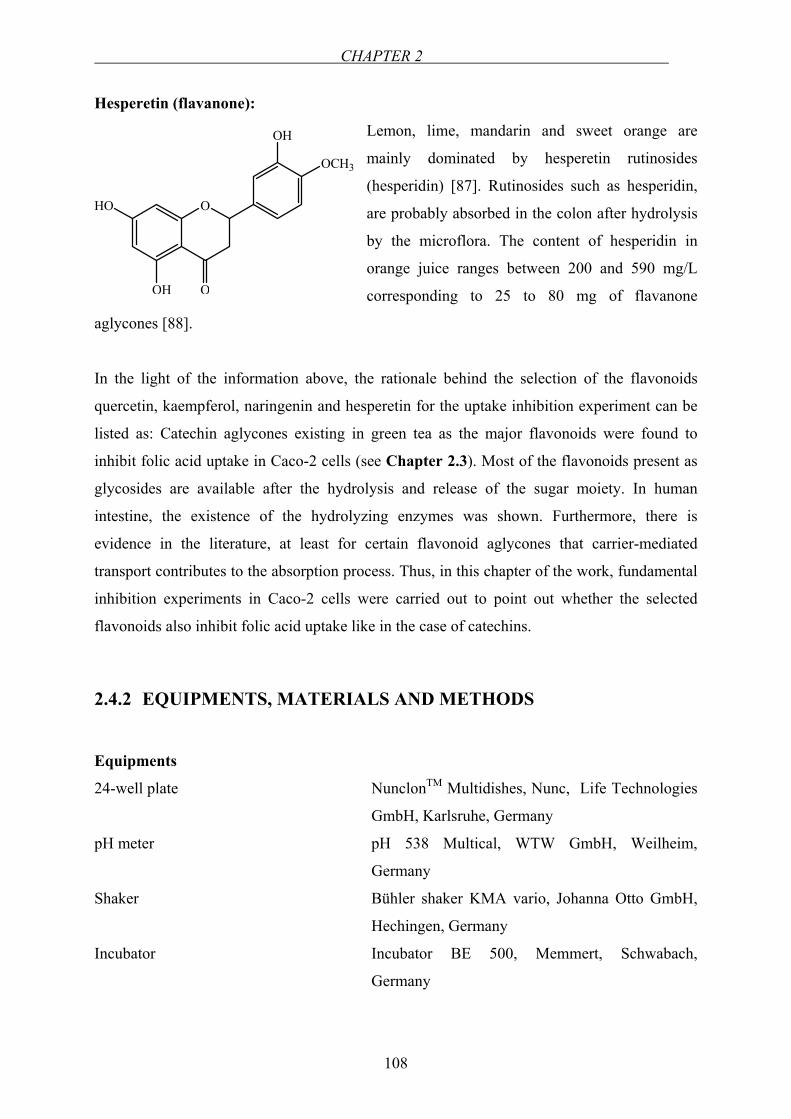
CHAPTER 2
108
Hesperetin (flavanone):
Lemon, lime, mandarin and sweet orange are
mainly dominated by hesperetin rutinosides
(hesperidin) [87]. Rutinosides such as hesperidin,
are probably absorbed in the colon after hydrolysis
by the microflora. The content of hesperidin in
orange juice ranges between 200 and 590 mg/L
corresponding to 25 to 80 mg of flavanone
aglycones [88].
In the light of the information above, the rationale behind the selection of the flavonoids
quercetin, kaempferol, naringenin and hesperetin for the uptake inhibition experiment can be
listed as: Catechin aglycones existing in green tea as the major flavonoids were found to
inhibit folic acid uptake in Caco-2 cells (see Chapter 2.3). Most of the flavonoids present as
glycosides are available after the hydrolysis and release of the sugar moiety. In human
intestine, the existence of the hydrolyzing enzymes was shown. Furthermore, there is
evidence in the literature, at least for certain flavonoid aglycones that carrier-mediated
transport contributes to the absorption process. Thus, in this chapter of the work, fundamental
inhibition experiments in Caco-2 cells were carried out to point out whether the selected
flavonoids also inhibit folic acid uptake like in the case of catechins.
2.4.2 EQUIPMENTS, MATERIALS AND METHODS
Equipments
24-well plate NunclonTM Multidishes, Nunc, Life Technologies
GmbH, Karlsruhe, Germany
pH meter pH 538 Multical, WTW GmbH, Weilheim,
Germany
Shaker Bühler shaker KMA vario, Johanna Otto GmbH,
Hechingen, Germany
Incubator Incubator BE 500, Memmert, Schwabach,
Germany
OHO
OH O
OH
OCH3
EFFECT OF SELECTED FLAVONOIDS ON FOLIC ACID UPTAKE
109
Materials
All cell culture media and supplements were from Biochrom KG, Berlin, Germany. 2-
Morpholinoethanesulfonic acid monohydrate (MES) was purchased from Merck, Darmstadt,
Germany. Non-labeled folic acid, dimethyl sulfoxide (DMSO), hesperetin, kaempferol and
naringenin were obtained from Sigma-Aldrich Chemie GmbH, Steinheim, Germany.
Quercetin was provided from Carl Roth GmbH & Co., Karlsruhe, Germany. MTX (Lantarel®
FS) was from Wyeth Pharma GmbH, Münster, Germany. MenoFit (CROWNVITA®, batch
no: 312163) was provided from Districon GmbH, Wehrheim, Germany and Multinorm®
(batch no: G006338) was provided from Sankt Pirmin® Naturprodukte GmbH, Ingelheim,
Germany. [3H]folic acid (specific activity 20.0 Ci/mmol) was obtained from Moravek
Biochemicals, Inc., California, USA.
2.4.3 METHODS
Preparation of Caco-2 monolayers for uptake studies
Caco-2 cells passages between 47 and 51 were cultured routinely according to the description
in Chapter 2.1. The cells were split and seeded into 24-well plates with 100,000 cells/well.
The medium was changed three times a week. The development of the monolayers was
examined under the microscope until the 16th day. The experiments were performed on the
16th day post seeding.
Inhibition experiments
On the 16th day postseeding, inhibition experiments were conducted at pH 6.5. The procedure
of the experiment was as described in Chapter 2.1. MTX was used as positive control. The
tested compounds and respective concentrations were as follows:
• Quercetin (0.001, 0.01, 0.02 and 0.03 mmol/L)
• Kaempferol (0.001, 0.01, 0.02 and 0.03 mmol/L)
• Naringenin (0.001, 0.01, 0.1, 0.2 and 0.3 mmol/L)
• Hesperetin (0.001, 0.01, 0.1, 0.2 and 0.5 mmol/L)
• MTX (0.1 mmol/L)
CHAPTER 2
110
While preparing the incubation solutions of quercetin, kaempferol, naringenin and hesperetin,
0.5% DMSO was used. Agylcones are low soluble due to the lack of the sugar moiety and
therefore the aid of DMSO was necessary. As it is shown in Chapter 2.5, DMSO can be used
up to a concentration of 2%, which was tested on Caco-2 cells and was shown to be non-
effective on folic acid uptake in this cell line. Besides the selected above mentioned
flavonoids, two commercially available extract and flavonoid-containing capsule and tablet
formulations were tested to check for the potential inhibitory effect on folic acid uptake.
Among those formulations, MenoFit tablets contain soyisoflavones (5 mg/tablet), vitamin E
(10 mg/tablet), grape seed extract (10 mg/tablet) and green tea extract (10 mg/tablet), whereas
Multinorm® capsules contain soyisoflavones (25 mg/capsule), vitamin B1 (1.4 mg/capsule),
vitamin B2 (1.6 mg/capsule), vitamin B6 (2 mg/capsule), vitamin B12 (1 µg/capsule), folic
acid (200 µg/capsule), vitamin C (30 mg/capsule), vitamin K1 (30 µg/capsule) and zink (2.5
mg/capsule). While preparing the solutions of the formulations, one MenoFit tablet was
dissolved in 50 mL of pH 6.5 HBSS buffer (stock). Assuming the stock solution as 100%,
different concentrations of incubation solutions of MenoFit tablet were prepared containing
100%, 50%, 5% and 0.5% of the stock MenoFit solution. Likewise, one Multinorm® capsule
was dissolved in 50 mL of the same buffer (stock). Assuming the stock solution as 100%,
different concentrations of incubation solutions of Multinorm® capsule were prepared
containing 100%, 50%, 10% and 1% of the stock Multinorm® solution. The same
experimental procedure was followed for the inhibition studies with these two formulations as
described in Chapter 2.1.
2.4.4 RESULTS AND DISCUSSION
Since the recognition of the interaction between foods and drugs, plenty of studies have been
undertaken at the enzyme [89,90] and transporter level [71,91-93]. Based on the interaction
observed between catechins and folic acid at the level of intestinal uptake [94], in this part, we
investigated whether a similar effect contributed during the intestinal absorption of folic acid
when applied concomitantly. In general, a clear modulation of folic acid uptake by the tested
flavonoids was not detected. The results of the experiments are shown in Figure 2.20.
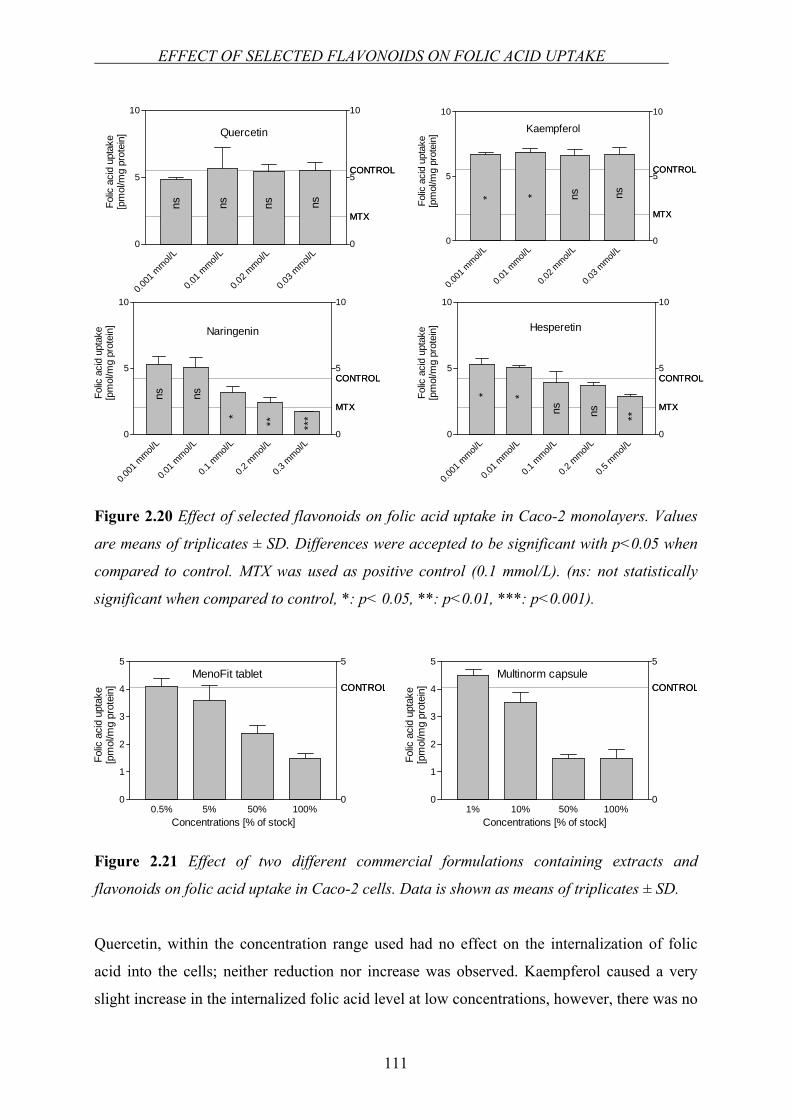
EFFECT OF SELECTED FLAVONOIDS ON FOLIC ACID UPTAKE
111
Figure 2.20 Effect of selected flavonoids on folic acid uptake in Caco-2 monolayers. Values
are means of triplicates ± SD. Differences were accepted to be significant with p<0.05 when
compared to control. MTX was used as positive control (0.1 mmol/L). (ns: not statistically
significant when compared to control, *: p< 0.05, **: p<0.01, ***: p<0.001).
Figure 2.21 Effect of two different commercial formulations containing extracts and
flavonoids on folic acid uptake in Caco-2 cells. Data is shown as means of triplicates ± SD.
Quercetin, within the concentration range used had no effect on the internalization of folic
acid into the cells; neither reduction nor increase was observed. Kaempferol caused a very
slight increase in the internalized folic acid level at low concentrations, however, there was no
MTX
CONTROL
0.001
mmol/
L
0.01 m
mol/L
0.1 m
mol/L
0.2 m
mol/L
0.5 m
mol/L
0
5
10
0
5
10
MTX
CONTROL
**
ns ns **
Hesperetin
Folic
aci
d up
take
[pm
ol/m
g pr
otei
n]
MTX
CONTROL
0.001
mmol/
L
0.01 m
mol/L
0.1 m
mol/L
0.2 m
mol/L
0.3 m
mol/L
0
5
10
0
5
10
MTX
CONTROL
nsns
* ** ***
Naringenin
Folic
aci
d up
take
[pm
ol/m
g pr
otei
n]
MTX
CONTROL
0.001
mmol/
L
0.01 m
mol/L
0.02 m
mol/L
0.03 m
mol/L
0
5
10
0
5
10
MTX
CONTROL
Quercetin
Folic
aci
d up
take
[pm
ol/m
g pr
otei
n]
ns ns nsns
MTX
CONTROL
0.001
mmol/
L
0.01 m
mol/L
0.02 m
mol/L
0.03 m
mol/L
0
5
10
0
5
10
MTX
CONTROL
Folic
aci
d up
take
[pm
ol/m
g pr
otei
n]
Kaempferol
* * ns ns
CONTROL
1% 10% 50% 100%0
1
2
3
4
5
0
5
CONTROLMultinorm capsule
Concentrations [% of stock]
Folic
aci
d up
take
[pm
ol/m
g pr
otei
n]CONTROL
0.5% 5% 50% 100%0
1
2
3
4
5
0
5
CONTROLMenoFit tablet
Concentrations [% of stock]
Folic
aci
d up
take
[pm
ol/m
g pr
otei
n]
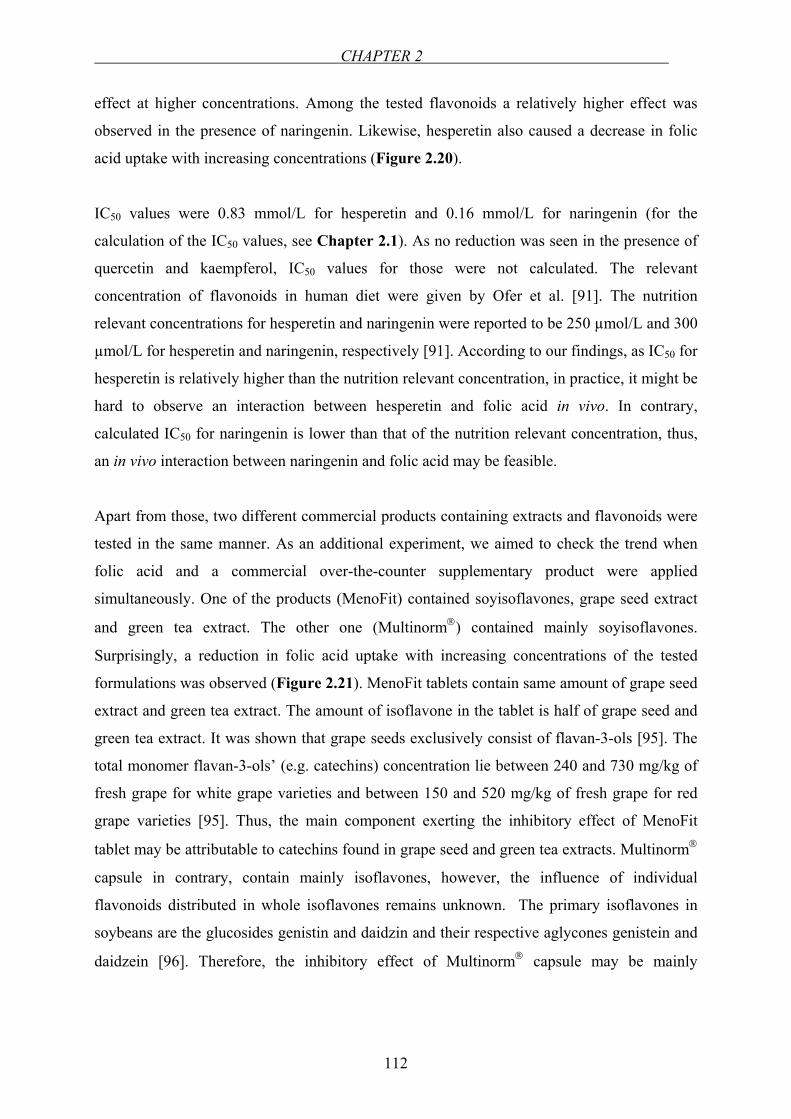
CHAPTER 2
112
effect at higher concentrations. Among the tested flavonoids a relatively higher effect was
observed in the presence of naringenin. Likewise, hesperetin also caused a decrease in folic
acid uptake with increasing concentrations (Figure 2.20).
IC50 values were 0.83 mmol/L for hesperetin and 0.16 mmol/L for naringenin (for the
calculation of the IC50 values, see Chapter 2.1). As no reduction was seen in the presence of
quercetin and kaempferol, IC50 values for those were not calculated. The relevant
concentration of flavonoids in human diet were given by Ofer et al. [91]. The nutrition
relevant concentrations for hesperetin and naringenin were reported to be 250 µmol/L and 300
µmol/L for hesperetin and naringenin, respectively [91]. According to our findings, as IC50 for
hesperetin is relatively higher than the nutrition relevant concentration, in practice, it might be
hard to observe an interaction between hesperetin and folic acid in vivo. In contrary,
calculated IC50 for naringenin is lower than that of the nutrition relevant concentration, thus,
an in vivo interaction between naringenin and folic acid may be feasible.
Apart from those, two different commercial products containing extracts and flavonoids were
tested in the same manner. As an additional experiment, we aimed to check the trend when
folic acid and a commercial over-the-counter supplementary product were applied
simultaneously. One of the products (MenoFit) contained soyisoflavones, grape seed extract
and green tea extract. The other one (Multinorm®) contained mainly soyisoflavones.
Surprisingly, a reduction in folic acid uptake with increasing concentrations of the tested
formulations was observed (Figure 2.21). MenoFit tablets contain same amount of grape seed
extract and green tea extract. The amount of isoflavone in the tablet is half of grape seed and
green tea extract. It was shown that grape seeds exclusively consist of flavan-3-ols [95]. The
total monomer flavan-3-ols’ (e.g. catechins) concentration lie between 240 and 730 mg/kg of
fresh grape for white grape varieties and between 150 and 520 mg/kg of fresh grape for red
grape varieties [95]. Thus, the main component exerting the inhibitory effect of MenoFit
tablet may be attributable to catechins found in grape seed and green tea extracts. Multinorm®
capsule in contrary, contain mainly isoflavones, however, the influence of individual
flavonoids distributed in whole isoflavones remains unknown. The primary isoflavones in
soybeans are the glucosides genistin and daidzin and their respective aglycones genistein and
daidzein [96]. Therefore, the inhibitory effect of Multinorm® capsule may be mainly
EFFECT OF SELECTED FLAVONOIDS ON FOLIC ACID UPTAKE
113
depending on one of these flavonoids or can be a mixed effect. Nonetheless, additional studies
would be helpful to clarify which flavonoids are responsible for this effect.
Whereas little information is available in the literature related to the carrier-mediated
transport of flavonoid glycosides [97,98], not much research has been conducted to date for
that of aglycones. Free aglycones enter the cells by passive diffusion or are taken up by a yet
unknown transporter system. Due to the lipophilic nature of sugar free flavonoids, the
transcellular transport of those were attributed to the passive diffusion, nevertheless, at least
for some aglycone flavonoids carrier-mediated transport was also mentioned [82], although
not confirmed by other groups so far.
Membrane transport of certain drugs were shown to be affected by flavonoids (aglycone or
glycoside), owing to a modulating effect on exsorptive transporters such as Pgp, MRP1,
MRP2 and BCRP [71,91,99,100]. The efflux of folates by MRP2 and BCRP were elucidated
[13,101,102]. Even though these two transporters contributed to the net transport of
hesperetin and naringenin as well, it would not be possible to mention any interaction on
those transporters since instead of an increase in the influx, we observed a reduction. To the
best of our knowledge, a common influx transporter for flavanones and folates has not been
reported. From the results presented in this chapter, however, the mechanism for the reduction
of folic acid uptake by two tested flavanones, namely, hesperetin and naringenin cannot be
pointed out. Our current study proposes preliminary findings on the possibility of an
interaction between folic acid and some of the flavanones which may be of clinical
significance, which however needs to be elucidated in further experiments. Involvement of
certain carriers in this inhibition process should be clarified in future studies.
CHAPTER 2
114
2.5 INVESTIGATION OF THE INTERACTION OF FOLIC ACID
WITH ANTIEPILEPTICS AT THE LEVEL OF INTESTINAL
ABSORPTION
2.5.1 INTRODUCTION
Chronically or long-term use of any medication has the inevitable risk of undesired clinical
cases. Such a relation was shown between the use of antiepileptic drugs and low blood folate
levels. Patients receiving certain antiepileptic drugs have the risk of reduced folate levels of
serum and red blood cells. Serum and red blood cell folate are reduced in up to 90% patients
receiving phenytoin, carbamazepine or barbiturates [103].
There are a number of clinical consequences of this adverse effect of antiepileptics. Severe
folate deficiency leads to megaloblastic anemia, and milder forms of folate deficiency may
lead to psychiatric, neurological and intellectual deficits. More than 60% of patients with
chronic epilepsy have a history of depressive spectrum disorders [104]. As discussed
elsewhere in this thesis, low folate levels in most cases cause high levels of homocysteine (see
Chapter 1). Homocysteine levels are elevated in patients receiving carbamazepine,
phenytoin, phenobarbital, and primidone [103,105]. In a study, the patients on carbamazepine
showed significantly lower concentrations of fasting serum folate [106]. In another study of
the same group revealed that patients using antiepileptic drugs carbamazepine, phenytoin,
phenobarbital and primidone, had higher fasting plasma homocysteine concentrations than the
controls [107]. Carbamazepine is known to be potent enzyme inducer. Patients on
carbamazepine had a significantly increased homocysteine levels. Since valproate has a less
enzyme-inducing activity, it is associated with only a small risk of folate deficiency
(discussed in [105]). Another important consequence of the folate deficiency in epilepsy
patients is the possibility of an increased risk for neural tube defect. During pregnancy,
valproate therapy results in a high incidence of spina bifida. In animal models, valproate
administration has been frequently used as a common strategy to induce neural tube defects
[108]. Folic acid 5 mg/day is recommended to epileptic women 3 months before conception
and during the first trimester to prevent folic acid deficiency-induced malformations [109].
Although all women capable of becoming pregnant should take folic acid daily, the dose
EFFECT OF ANTIEPILEPTICS ON FOLIC ACID UPTAKE
115
recommended is only 0.4 mg/day [110]. It is clear that high dose of folic acid is required to
compensate the need in folate status in epileptic pregnants.
For the antiepileptic-induced folate deficiency, several reasons have been suggested
[111,112]:
• Interference with absorption of folates from the intestinal lumen
• Induction of enzymes that increase the catabolism of folates
• Impairment of folate transport into tissues
• Interference with folate metabolism such that the more labile forms of folate
accumulate, leading to increased rates of folate loss
• An increased demand for folate as a cofactor in the hydroxylation of the
antiepileptic
Since the formation of the folate deficiency upon the use of an antiepileptic medication has
not been elucidated entirely, in this part of the work, the investigation of the in vitro
interaction between antiepileptics and folic acid at the level of intestinal absorption was
aimed.
2.5.2 EQUIPMENTS AND MATERIALS
Equipments
24-well plate NunclonTM Multidishes, Nunc, Life
Technologies GmbH, Karlsruhe, Germany
pH meter pH 538 Multical, WTW GmbH, Weilheim,
Germany
Shaker Bühler shaker KMA vario, Johanna Otto
GmbH, Hechingen, Germany
Incubator Incubator BE 500, Memmert, Schwabach,
Germany
CHAPTER 2
116
Materials
All cell culture media and supplements were from Biochrom KG, Berlin, Germany. MES was
purchased from Merck, Darmstadt, Germany. Non-labeled folic acid, dimethyl sulfoxide
(DMSO), 5,5-diphenylhydantoin (phenytoin), carbamazepine, valproic acid sodium salt,
phenobarbital and primidone were purchased from Sigma.Aldrich Chemie GmbH, Steinheim,
Germany. MTX (Lantarel® FS) was from Wyeth Pharma GmbH, Münster, Germany.
[3H]folic acid (specific activity 20.0 Ci/mmol) was obtained from Moravek Biochemicals,
Inc., California, USA
2.5.3 METHODS
Preparation of Caco-2 monolayers for uptake studies
Caco-2 cells passages between 48 and 54 were cultured routinely as explained in Chapter
2.1. The cells were split and seeded into 24-well plates with 100,000 cells/well. The medium
was changed three times a week. The development of the monolayers was examined under the
microscope until the 16th day. The experiments were performed on the 16th post seeding.
Inhibition experiments
Inhibition of uptake experiments were conducted at pH 6.5 due to the higher activity of
carrier-mediated transport at this condition (see Chapter 2.1). Prior to the inhibition
experiments toxicity of the tested substances were checked according to the prodecures in
Chapter 2.6. On the 16th day postseeding, inhibition experiments were conducted. The
procedure of the experiment was as described in Chapter 2.1. MTX was used as positive
control. The tested compounds and respective concentrations were as follows:
• Phenytoin (0.001, 0.01 and 0.1 mmol/L)
• Primidone (0.01, 0.1 and 0.5 mmol/L)
• Valproic acid (0.01, 0.1 and 1 mmol/L)
• Carbamazepine (0.001, 0.01 and 0.1 mmol/L)
• Phenobarbital (0.01, 0.1 and 1 mmol/L)
• MTX (0.1 mmol/L)
Primidone, phenobarbital, phenytoin and carbamazepine were solubilized using DMSO due to
their low water solubilities while preparing the incubation mixtures. Highest concentration of
EFFECT OF ANTIEPILEPTICS ON FOLIC ACID UPTAKE
117
DMSO was 2% and it was never exceeded. The functionality of Caco-2 cells in the presence
of 2% DMSO was checked and confirmed by performing an uptake experiment. The
intracellularly trapped radioactivity ([3H]folic acid ) over a time course of 30 min as the
incubation period was analyzed by scintillation counting. All of the experiments were
performed in triplicates and the resulting uptake data are presented as % of control. Means
between the control group and the treatment groups were compared using the unpaired two-
tailed t-test. Differences were accepted to be statistically significant when p<0.05.
2.5.4 RESULTS AND DISCUSSION
A relation between megaloblastic anemia and drugs used in the treatment of epilepsy was
recognized. The drugs involved are phenytoin, phenobarbital, primidone and less frequently,
other antiepileptic drugs [113]. Folate deficiency caused by the utilization of antiepileptic
drugs is the risk factor for this consequence. Controversial mechanisms by which
antiepileptics lead to folate deficiency have been proposed: effects on absorption of folates,
on the rate of catabolism of folates and interference in DNA synthesis at a stage beyond the
action of folate coenzymes [113]. To better understand the interaction of these antiepileptic
drugs and folate at the level of intestinal absorption, the uptake of folic acid in the case of
different antiepileptic drugs was investigated using Caco-2 monolayers as an in vitro model.
The results of the study are depicted in Figure 2.22. Phenytoin, primidone and carbamazepine
did not lead to any significant decrease on folic acid uptake within the concentration range
used throughout the experiments. Although valproic acid caused a decrease in the folic acid
uptake at the lowest concentration used (0.01 mmol/L), the effect was not significant either. In
addition, the standard deviations were high to conclude an interaction. Only the maximum
concentration of phenobarbital (1 mmol/L) significantly inhibited the folic acid uptake with
respect to control.
In a separate experiment, 2% DMSO was tested to see whether it affects the folic acid uptake
at the highest concentration used to solubilize the poor water-soluble antiepileptic drugs. As
seen in Figure 2.23, 2% DMSO did not make any significant effect on folic acid uptake in
Caco-2 monolayers.

CHAPTER 2
118
MTX
CONTROL
0.001
mmol/
L
0.01 m
mol/L
0.1 m
mol/L
0
5
10
15
0
20
MTX
CONTROL
Phenytoin
nsns nsFolic
aci
d up
take
[pm
ol]
MTX
CONTROL
0.01 m
mol/L
0.1 m
mol/L
1 mmol/
L0
5
10
15
0
15
MTX
CONTROL
*
Phenobarbital
ns nsFolic
aci
d up
take
[pm
ol]
MTX
CONTROL
0.01 m
mol/L
0.1 m
mol/L
0.5 m
mol/L
0
5
10
0
10
MTX
CONTROL
Primidone
ns ns nsFolic
aci
d up
take
[pm
ol]
MTX
CONTROL
0.01 m
mol/L
0.1 m
mol/L
1 mmol/
L0.0
2.5
5.0
7.5
0.0
7.5
MTX
CONTROL
Valproic acid
nsns nsFo
lic a
cid
upta
ke[p
mol
]
MTX
CONTROL
0.001
mmol/
L
0.01 m
mol/L
0.1 m
mol/L
0
5
10
15
0
15
MTX
CONTROL
Carbamazepine
**nsns
Folic
aci
d up
take
[pm
ol]
Figure 2.22 Effect of selected antiepileptic drugs on folic acid uptake in Caco-2 monolayers.
Values are means of triplicates ± SD. Differences were accepted to be significant with p<0.05
when compared to control. (ns: not statistically significant when compared to control, *: p<
0.05, **: p<0.01).
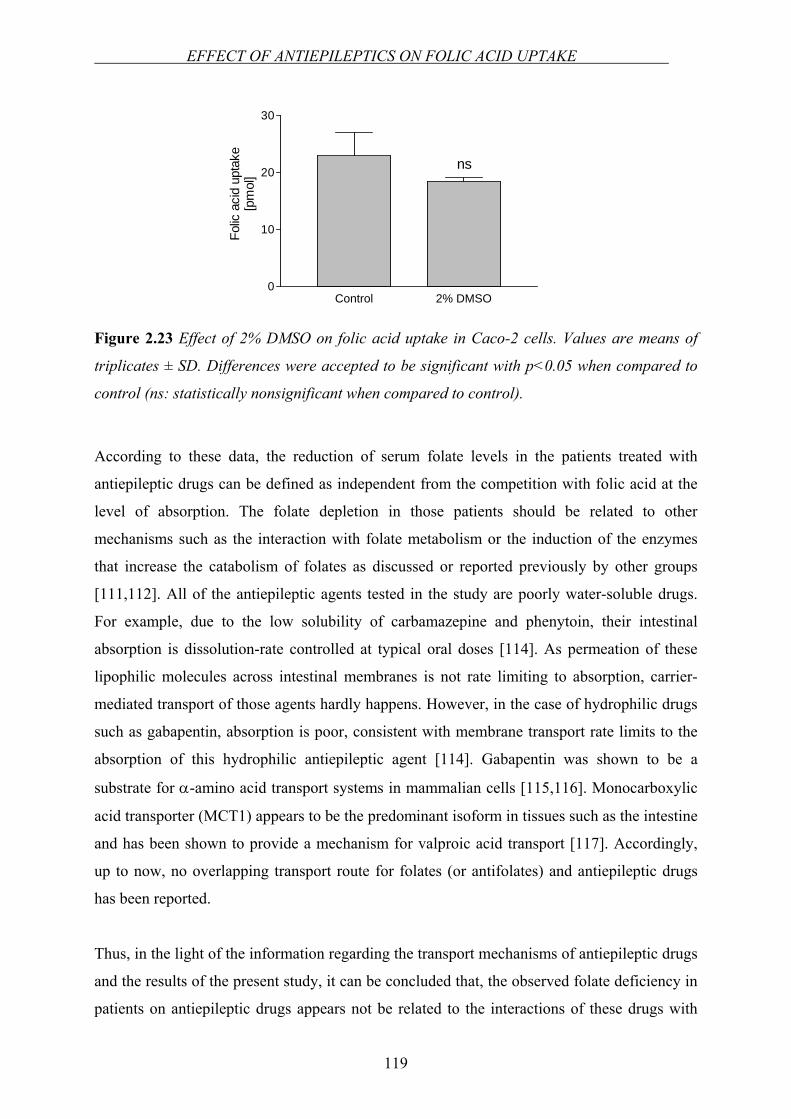
EFFECT OF ANTIEPILEPTICS ON FOLIC ACID UPTAKE
119
Control 2% DMSO0
10
20
30
ns
Folic
aci
d up
take
[pm
ol]
Figure 2.23 Effect of 2% DMSO on folic acid uptake in Caco-2 cells. Values are means of
triplicates ± SD. Differences were accepted to be significant with p<0.05 when compared to
control (ns: statistically nonsignificant when compared to control).
According to these data, the reduction of serum folate levels in the patients treated with
antiepileptic drugs can be defined as independent from the competition with folic acid at the
level of absorption. The folate depletion in those patients should be related to other
mechanisms such as the interaction with folate metabolism or the induction of the enzymes
that increase the catabolism of folates as discussed or reported previously by other groups
[111,112]. All of the antiepileptic agents tested in the study are poorly water-soluble drugs.
For example, due to the low solubility of carbamazepine and phenytoin, their intestinal
absorption is dissolution-rate controlled at typical oral doses [114]. As permeation of these
lipophilic molecules across intestinal membranes is not rate limiting to absorption, carrier-
mediated transport of those agents hardly happens. However, in the case of hydrophilic drugs
such as gabapentin, absorption is poor, consistent with membrane transport rate limits to the
absorption of this hydrophilic antiepileptic agent [114]. Gabapentin was shown to be a
substrate for α-amino acid transport systems in mammalian cells [115,116]. Monocarboxylic
acid transporter (MCT1) appears to be the predominant isoform in tissues such as the intestine
and has been shown to provide a mechanism for valproic acid transport [117]. Accordingly,
up to now, no overlapping transport route for folates (or antifolates) and antiepileptic drugs
has been reported.
Thus, in the light of the information regarding the transport mechanisms of antiepileptic drugs
and the results of the present study, it can be concluded that, the observed folate deficiency in
patients on antiepileptic drugs appears not be related to the interactions of these drugs with

CHAPTER 2
120
folates at the absorption level in the small intestine. Other mechanisms such as the
interference with enzymes, or interference in DNA synthesis should be taken into
consideration and further investigated.
IN VITRO TOXICOLOGAY ASSAY
121
2.6 IN VITRO TOXICOLOGY ASSAYS
2.6.1 EQUIPMENTS AND MATERIALS
Equipments
96-well plate Greiner Bio-One GmbH, Frickenhausen,
Germany
pH meter pH 538 Multical, WTW GmbH, Weilheim,
Germany
Shaker Bühler shaker KMA vario, Johanna Otto
GmbH, Hechingen, Germany
Incubator CO2-Incubator MCO 17 AI, Sanyo,
distribution by MS Laborgeraete, Wiesloch,
Germany
Hemocytometer Thoma chamber, distribution by VWR,
Darmstadt, Germany
Plate reader Spectramax M2, Molecular Devices
Corporation, Sunnyvale, CA, USA
Materials
MES was purchased from Merck, Darmstadt, Germany. HBSS was from Biochrom KG,
Berlin, Germany. XTT based toxicology assay kit and trypan blue were supplied from Sigma-
Aldrich Chemie GmbH, Steinheim, Germany.
2.6.2 METHODS
XTT Based Toxicology Assay
For the evaluation of the toxicity of the inhibitors over a concentration range, XTT based in
vitro toxicology assay was used. The XTT method is a simple, accurate and reproducible
assay. The main component is the sodium salt of XTT (2,3-bis[2-methoxy-4-nitro-5-
sulfophenyl]-2H-tetrazolium-5-carboxyanilide inner salt). Mitochondrial dehydrogenases of
CHAPTER 2
122
viable cells cleave the tetrazolium ring of XTT, yielding orange formazan crystals which are
soluble in aqueous solutions. The resulting orange solution is spectrophotometrically
measured. An increase or decrease in cell numbers results in a concomitant change in the
amount of formazan formed, indicating the degree of cytotoxicity caused by the test
substance. Before the assay, 5 mg of XTT powder in the vial was reconstituted with 5 mL of
DMEM cell culture medium without phenol red, serum, non essential aminoacids and
penicillin/streptomycin. Reconstituted XTT was mixed with the same cell culture medium as
the medium used for reconstitution at a ratio 1:4 (XTT:medium).
For the determination of the toxicity of the test substances, Caco-2 cells were seeded in 96-
well plates at a concentration of 2500 cells/well. On the 16th day post seeding, the cell
monolayers were washed once with HBSS containing 10 mmol/L MES adjusted to pH 6.5.
Incubation mixtures were prepared in the same buffer with different concentrations of the test
substance used in the uptake inhibition experiments. After incubating for 30 min at 37°C, the
incubation mixture was removed, monolayers were washed once with the buffer solution and
the reconstituted XTT was added into each well with a volume of 100 µL and incubated for 2
h at 37°C. Subsequently, absorbance was measured at a wavelength of 450 nm. A reference
measurement was also taken at a wavelength of 690 nm and subtracted from the measurement
at 450 nm. The viability of cells were calculated as % of control cells which were not exposed
to test substance and monolayers possessing ≥75% viabilities were assumed as nontoxic.
Trypan Blue Exclusion Test
The trypan blue exclusion test is used to determine the number of viable cells present in a cell
suspension. It is based on the principle that living cells possess intact cell membranes that
exclude trypan blue whereas dead cells do not.
The toxicity of test compounds within the range used in inhibition experiments, were assessed
employing trypan blue exclusion test. Caco-2 cells in a 75 cm2 flask were trypsinized with 2
mL of trypsin and subsequent to their detachment from the surface, 8 mL of cell culture
medium was added in order to discontinue the reaction by trypsin. Cell suspension was
centrifuged and cell medium was removed and cells were resuspended in pH 6.5 HBSS buffer
with 10 mM MES yielding a final concentration of 1x10⁶ cells/150 µL buffer. 150 µL of cell
suspension and 100 µL of test substance solution prepared in the same buffer were added into
IN VITRO TOXICOLOGAY ASSAY
123
an eppendorf tube, mixed and shaked for 30 min at 1200 rpm at 37°C. After the incubation
period of 30 min, 200 µL of 0.4% trypan blue solution in PBS was added. Because dead cells
are not able to maintain their membrane integrity to exclude trypan blue, they appear entirely
blue under the microscope and can be distinguished from intact cells which appear white [33].
The viable cells were counted using a hemocytometer under the microscope. The reference
solution contained 1x10⁶ cells/150 µL buffer and 100 µL of pH 6.5 HBSS buffer. The same
protocol was applied to the reference solution and the number of viable cells was determined.
The percentage of viable cells was calculated according to the equation below:
1001% ×⎥⎥⎦
⎤
⎢⎢⎣
⎡⎟⎟⎠
⎞⎜⎜⎝
⎛ −−=
reference
testreferenceviable Cells
CellsCellsCells
where, Cellsreference is the number of cells in blank buffer, Cellstest is the number of cells after
treatment with the test substance solution and %Cellsviable is the percentage of viable cells
after treatment with the test substance. For the inhibition experiments, concentrations of test
compounds resulting cell viabilities > 90% were accepted.
CHAPTER 2
124
2.7 SCINTILLATION COUNTING
2.7.1 EQUIPMENTS AND MATERIALS
Equipments
Scintillation counter Scintillation counter LS6000, Beckman
Coulter, Unterschleissheim, Germany
Scintillation vials with caps Mini vials A, Carl Roth GmbH & Co.,
Karlsruhe, Germany
Materials
Scintillation cocktail (Rotiszint® eco plus) was purchased from Carl Roth GmbH & Co.,
Karlsruhe, Germany.
2.7.2 METHODS
Uptake experiments
The amount of uptaken labeled folic acid in the cells were measured by scintillation counting.
For this purpose, 0.5 mL of solubilized cells (by adding 5 mL 1% triton X-100 solution on the
cells) were put into scintillation vials and mixed with 4 mL scintillation cocktail. 50 µL
control samples from the original incubation mixtures were also put into scintillation vials and
mixed with 4 mL scintillation cocktail. The vials were shaken properly and radioactivity
(disintegration per minute, dpm) in each sample was determined at least after one hour by
scintillation counting. Counting time was 5 min and counting was performed in two cycles.
Transepithelial transport studies
The amount of transported labeled folic acid and mannitol in the donor and acceptor
compartments were measured by scintillation counting. The aliquots of 350 µL from acceptor
compartments and 10 µL from donor compartments were put into scintillation vials and
mixed with 4 mL scintillation cocktail. Additionally, 50 µL control samples from the original
incubation mixtures were put into scintillation vials and mixed with 4 mL scintillation

SCINTILLATION COUNTING
125
cocktail. The vials were closed and shaken properly and radioactivity (disintegrations per
minute, dpm) in each vial was determined at last after one hour by scintillation counting.
Counting time was 5 min and counting was performed in two cycles.
CHAPTER 2
126
REFERENCES
1. Artursson P. Cell cultures as models for drug absorption across the intestinal mucosa.
Crit Rev Ther Drug Carrier Syst 1991;8:305-330
2. Audus KL, Bartel RL, Hidalgo IJ, Borchardt RT. The use of cultured epithelial and
endothelial cells for drug transport and metabolism studies. Pharm Res 1990;7:435-
451
3. Bailey CA, Bryla P, Malick AW. The use of the intestinal epithelial cell culture
model, Caco-2, in pharmaceutical development. Adv Drug Deliver Rev 1996;22:85-
103
4. Venkataramanan R, Komoroski B, Strom S. In vitro and in vivo assessment of herb
drug interactions. Life Sci 2006;78:2105-2115
5. Delie F, Rubas W. A human colonic cell line sharing similarities with enterocytes as a
model to examine oral absorption: advantages and limitations of the Caco-2 model.
Crit Rev Ther Drug Carrier Syst 1997;14:221-286
6. Hilgers AR, Conradi RA, Burton PS. Caco-2 cell monolayers as a model for drug
transport across the intestinal mucosa. Pharm Res 1990;7:902-910
7. Hidalgo IJ, Raub TJ, Borchardt RT. Characterization of the human colon carcinoma
cell line (Caco-2) as a model system for intestinal epithelial permeability.
Gastroenterology 1989;96:736-749
8. Hidalgo IJ, Li JB. Carrier-mediated transport and efflux mechanisms in Caco-2 cells.
Adv Drug Deliver Rev 1996;22:53-66
9. Pietzonka P, Rothen-Rutishauser B, Langguth P, Wunderli-Allenspach H, Walter E,
Merkle HP. Transfer of lipophilic markers from PLGA and polystyrene nanoparticles
to caco-2 monolayers mimics particle uptake. Pharm Res 2002;19:595-601
10. Balamurugan K, Said HM. Role of reduced folate carrier in intestinal folate uptake.
American Journal of Physiology-Cell Physiology 2006;291:C189-C193
11. Selhub J, Rosenberg IH. Folate transport in isolated brush border membrane vesicles
from rat intestine. J Biol Chem 1981;256:4489-4493
12. Subramanian VS, Chatterjee N, Said HM. Folate uptake in the human intestine:
promoter activity and effect of folate deficiency. J Cell Physiol 2003;196:403-408
13. Hooijberg JH, Peters GJ, Assaraf YG, Kathmann I, Priest DG, Bunni MA, Veerman
AJ, Scheffer GL, Kaspers GJ, Jansen G. The role of multidrug resistance proteins
REFERENCES
127
MRP1, MRP2 and MRP3 in cellular folate homeostasis. Biochem Pharmacol
2003;65:765-771
14. Horne DW, Reed KA. Uptake of 5-methyltetrahydrofolate into PC-3 human prostate
cancer cells is carrier-mediated. Journal of Nutritional Biochemistry 2003;14:473-479
15. Rajgopal A, Sierra EE, Zhao R, Goldman ID. Expression of the reduced folate carrier
SLC19A1 in IEC-6 cells results in two distinct transport activities. Am J Physiol Cell
Physiol 2001;281:C1579-1586
16. Sierra EE, Brigle KE, Spinella MJ, Goldman ID. pH dependence of methotrexate
transport by the reduced folate carrier and the folate receptor in L1210 leukemia cells.
Further evidence for a third route mediated at low pH. Biochem Pharmacol
1997;53:223-231
17. Dudeja PK, Kode A, Alnounou M, Tyagi S, Torania S, Subramanian VS, Said HM.
Mechanism of folate transport across the human colonic basolateral membrane. Am J
Physiol Gastrointest Liver Physiol 2001;281:G54-60
18. Said HM, Ma TY, Ortiz A, Tapia A, Valerio CK. Intracellular regulation of intestinal
folate uptake: Studies with cultured IEC-6 epithelial cells. American Journal of
Physiology-Cell Physiology 1997;41:C729-C736
19. Jansen G, van der Heijden J, Oerlemans R, Lems WF, Ifergan I, Scheper RJ, Assaraf
YG, Dijkmans BA. Sulfasalazine is a potent inhibitor of the reduced folate carrier:
implications for combination therapies with methotrexate in rheumatoid arthritis.
Arthritis Rheum 2004;50:2130-2139
20. CercosFortea T, Casabo VG, Nacher A, CejudoFerragud E, Polache A, Merino M.
Evidence of competitive inhibition of methotrexate absorption by leucovorin calcium
in rat small intestine. Int J Pharm 1997;155:109-119
21. Zimmerman J, Selhub J, Rosenberg IH. Competitive inhibition of folic acid absorption
in rat jejunum by triamterene. J Lab Clin Med 1986;108:272-276
22. Mason JB, Shoda R, Haskell M, Selhub J, Rosenberg IH. Carrier affinity as a
mechanism for the pH-dependence of folate transport in the small intestine. Biochim
Biophys Acta 1990;1024:331-335
23. Narawa T, Shimizu R, Takano S, Tsuda Y, Ono K, Yamada H, Itoh T.
Stereoselectivity of the reduced folate carrier in Caco-2 cells. Chirality 2005;17:444-
449
24. Martel F, Goncalves P, Azevedo I. Absorption of folate by Caco-2 cells is not affected
by high glucose concentration. Eur J Pharmacol 2006;551:19-26
CHAPTER 2
128
25. Vincent ML, Russell RM, Sasak V. Folic acid uptake characteristics of a human colon
carcinoma cell line, Caco-2. A newly-described cellular model for small intestinal
epithelium. Hum Nutr Clin Nutr 1985;39:355-360
26. Sirotnak FM, Tolner B. Carrier-mediated membrane transport of folates in mammalian
cells. Annu Rev Nutr 1999;19:91-122
27. Wang Y, Rajgopal A, Goldman ID, Zhao R. Preservation of folate transport activity
with a low-pH optimum in rat IEC-6 intestinal epithelial cell lines that lack reduced
folate carrier function. Am J Physiol Cell Physiol 2005;288:C65-71
28. Zimmerman J. Folic acid transport in organ-cultured mucosa of human intestine.
Evidence for distinct carriers. Gastroenterology 1990;99:964-972
29. Chungi VS, Bourne DW, Dittert LW. Competitive inhibition between folic acid and
methotrexate for transport carrier in the rat small intestine. J Pharm Sci 1979;68:1552-
1553
30. Motulsky HJ. Analyzing Data with GraphPad Prism. San Diego CA: GraphPad
Software Inc.; 1999
31. Bradford MM. A rapid and sensitive method for the quantitation of microgram
quantities of protein utilizing the principle of protein-dye binding. Anal Biochem
1976;72:248-254
32. Hilgendorf C, Spahn-Langguth H, Regardh CG, Lipka E, Amidon GL, Langguth P.
Caco-2 versus Caco-2/HT29-MTX co-cultured cell lines: permeabilities via diffusion,
inside- and outside-directed carrier-mediated transport. J Pharm Sci 2000;89:63-75
33. Koggel A. Influence of Secretory Transporters on the Intestinal Permeability of
Cationic Drugs. In, Biopharmacy and Pharmaceutical Technology. Mainz: Johannes
Gutenbers University; 2003:212
34. Cheng Y, Prusoff WH. Relationship between Inhibition Constant (K1) and
Concentration of Inhibitor Which Causes 50 Per Cent Inhibition (I50) of an
Enzymatic-Reaction. Biochemical Pharmacology 1973;22:3099-3108
35. Matherly LH, Goldman DI. Membrane transport of folates. Vitam Horm 2003;66:403-
456
36. Selhub J, Dhar GJ, Rosenberg IH. Inhibition of folate enzymes by sulfasalazine. J Clin
Invest 1978;61:221-224
37. Zimmerman J. Drug interactions in intestinal transport of folic acid and methotrexate.
Further evidence for the heterogeneity of folate transport in the human small intestine.
Biochem Pharmacol 1992;44:1839-1842
REFERENCES
129
38. Verwei M, van den Berg H, Havenaar R, Groten JP. Effect of folate-binding protein
on intestinal transport of folic acid and 5-methyltetrahydrofolate across Caco-2 cells.
Eur J Nutr 2005;44:242-249
39. Zhao R, Goldman ID. Resistance to antifolates. Oncogene 2003;22:7431-7457
40. Montalar M, Nalda-Molina R, Rodriguez-Ibanez M, Garcia-Valcarcel I, Garrigues
TM, Merino V, Bermejo M. Kinetic modeling of triamterene intestinal absorption and
its inhibition by folic acid and methotrexate. J Drug Target 2003;11:215-223
41. Zimmerman J, Selhub J, Rosenberg IH. Competitive inhibition of folate absorption by
dihydrofolate reductase inhibitors, trimethoprim and pyrimethamine. Am J Clin Nutr
1987;46:518-522
42. Kumar CK, Moyer MP, Dudeja PK, Said HM. A protein-tyrosine kinase-regulated,
pH-dependent, carrier-mediated uptake system for folate in human normal colonic
epithelial cell line NCM460. J Biol Chem 1997;272:6226-6231
43. Strum WB. A pH-dependent, carrier-mediated transport system for the folate analog,
amethopterin, in rat jejunum. J Pharmacol Exp Ther 1977;203:640-645
44. Qiu A, Jansen M, Sakaris A, Min SH, Chattopadhyay S, Tsai E, Sandoval C, Zhao R,
Akabas MH, Goldman ID. Identification of an intestinal folate transporter and the
molecular basis for hereditary folate malabsorption. Cell 2006;127:917-928
45. Ganapathy V, Smith SB, Prasad PD. SLC19: the folate/thiamine transporter family.
Pflugers Arch 2004;447:641-646
46. Fallingborg J. Intraluminal pH of the human gastrointestinal tract. Dan Med Bull
1999;46:183-196
47. Lehninger AL, Nelson DL, Cox MM. Lehninger principles of biochemistry. 3rd ed.
New York: Worth Publishers; 2000:1 v. (various pagings)
48. Radonic A, Thulke S, Mackay IM, Landt O, Siegert W, Nitsche A. Guideline to
reference gene selection for quantitative real-time PCR. Biochem Biophys Res
Commun 2004;313:856-862
49. Theti DS, Jackman AL. The role of alpha-folate receptor-mediated transport in the
antitumor activity of antifolate drugs. Clin Cancer Res 2004;10:1080-1089
50. Spinella MJ, Brigle KE, Sierra EE, Goldman ID. Distinguishing between Folate
Receptor-Alpha-Mediated Transport and Reduced Folate Carrier-Mediated Transport
in L1210 Leukemia-Cells. Journal of Biological Chemistry 1995;270:7842-7849
CHAPTER 2
130
51. Lacey SW, Sanders JM, Rothberg KG, Anderson RG, Kamen BA. Complementary
DNA for the folate binding protein correctly predicts anchoring to the membrane by
glycosyl-phosphatidylinositol. J Clin Invest 1989;84:715-720
52. Corona G, Giannini F, Fabris M, Toffoli G, Boiocchi M. Role of folate receptor and
reduced folate carrier in the transport of 5-methyltetrahydrofolic acid in human
ovarian carcinoma cells. Int J Cancer 1998;75:125-133
53. Lucock M. Folic acid: nutritional biochemistry, molecular biology, and role in disease
processes. Mol Genet Metab 2000;71:121-138
54. Mukhtar H, Ahmad N. Tea polyphenols: prevention of cancer and optimizing health.
Am J Clin Nutr 2000;71:1698S-1702S; discussion 1703S-1694S
55. Cooper R, Morre DJ, Morre DM. Medicinal benefits of green tea: Part I. Review of
noncancer health benefits. J Altern Complement Med 2005;11:521-528
56. Hertog MGL, Hollman PCH, Vandeputte B. Content of Potentially Anticarcinogenic
Flavonoids of Tea Infusions, Wines, and Fruit Juices. Journal of Agricultural and
Food Chemistry 1993;41:1242-1246
57. Scalbert A, Williamson G. Dietary intake and bioavailability of polyphenols. J Nutr
2000;130:2073S-2085S
58. Graf BA, Milbury PE, Blumberg JB. Flavonols, flavones, flavanones, and human
health: epidemiological evidence. J Med Food 2005;8:281-290
59. Arts IC, Hollman PC, Feskens EJ, Bueno de Mesquita HB, Kromhout D. Catechin
intake and associated dietary and lifestyle factors in a representative sample of Dutch
men and women. Eur J Clin Nutr 2001;55:76-81
60. Takimoto CH. New Antifolates: Pharmacology and Clinical Applications. Oncologist
1996;1:68-81
61. Navarro-Peran E, Cabezas-Herrera J, Garcia-Canovas F, Durrant MC, Thorneley RN,
Rodriguez-Lopez JN. The antifolate activity of tea catechins. Cancer Res
2005;65:2059-2064
62. Pentieva K, McNulty H, Reichert R, Ward M, Strain JJ, McKillop DJ, McPartlin JM,
Connolly E, Molloy A, Kramer K, Scott JM. The short-term bioavailabilities of [6S]-
5-methyltetrahydrofolate and folic acid are equivalent in men. J Nutr 2004;134:580-
585
63. Lin YL, Juan IM, Chen YL, Liang YC, Lin JK. Composition of polyphenols in fresh
tea leaves and associations of their oxygen-radical-absorbing capacity with
REFERENCES
131
antiproliferative actions in fibroblast cells. Journal of Agricultural and Food
Chemistry 1996;44:1387-1394
64. Mizooku Y, Yoshikawa M, Tsuneyoshi T, Arakawa R. Analysis of oxidized
epigallocatechin gallate by liquid chromatography/mass spectrometry. Rapid
Communications in Mass Spectrometry 2003;17:1915-1918
65. Zhang A, Zhu QY, Luk YS, Ho KY, Fung KP, Chen ZY. Inhibitory effects of jasmine
green tea epicatechin isomers on free radical-induced lysis of red blood cells. Life Sci
1997;61:383-394
66. Hiraoka M. Folate intake, serum folate, serum total homocysteine levels and
methylenetetrahydrofolate reductase C677T polymorphism in young Japanese women.
J Nutr Sci Vitaminol (Tokyo) 2004;50:238-245
67. Navarro-Peran E, Cabezas-Herrera J, Hiner AN, Sadunishvili T, Garcia-Canovas F,
Rodriguez-Lopez JN. Kinetics of the inhibition of bovine liver dihydrofolate reductase
by tea catechins: origin of slow-binding inhibition and pH studies. Biochemistry
2005;44:7512-7525
68. Shishikura Y, Khokhar S. Factors affecting the levels of catechins and caffeine in tea
beverage: estimated daily intakes and antioxidant activity. Journal of the Science of
Food and Agriculture 2005;85:2125-2133
69. Kobayashi Y, Suzuki M, Satsu H, Arai S, Hara Y, Suzuki K, Miyamoto Y, Shimizu
M. Green tea polyphenols inhibit the sodium-dependent glucose transporter of
intestinal epithelial cells by a competitive mechanism. J Agric Food Chem
2000;48:5618-5623
70. Vaidyanathan JB, Walle T. Cellular uptake and efflux of the tea flavonoid (-
)epicatechin-3-gallate in the human intestinal cell line Caco-2. J Pharmacol Exp Ther
2003;307:745-752
71. Zhang S, Yang X, Morris ME. Flavonoids are inhibitors of breast cancer resistance
protein (ABCG2)-mediated transport. Mol Pharmacol 2004;65:1208-1216
72. Fujiki H. Green tea: Health benefits as cancer preventive for humans. Chemical
Record 2005;5:119-132
73. Sabharanjak S, Mayor S. Folate receptor endocytosis and trafficking. Adv Drug Deliv
Rev 2004;56:1099-1109
74. Chen ZS, Robey RW, Belinsky MG, Shchaveleva I, Ren XQ, Sugimoto Y, Ross DD,
Bates SE, Kruh GD. Transport of methotrexate, methotrexate polyglutamates, and
CHAPTER 2
132
17beta-estradiol 17-(beta-D-glucuronide) by ABCG2: effects of acquired mutations at
R482 on methotrexate transport. Cancer Res 2003;63:4048-4054
75. Correa A, Stolley A, Liu Y. Prenatal tea consumption and risks of anencephaly and
spina bifida. Ann Epidemiol 2000;10:476-477
76. Moat SJ, Lang D, McDowell IF, Clarke ZL, Madhavan AK, Lewis MJ, Goodfellow J.
Folate, homocysteine, endothelial function and cardiovascular disease. J Nutr
Biochem 2004;15:64-79
77. Netsch MI, Gutmann H, Schmidlin CB, Aydogan C, Drewe J. Induction of CYP1A by
green tea extract in human intestinal cell lines. Planta Med 2006;72:514-520
78. Murota K, Terao J. Antioxidative flavonoid quercetin: implication of its intestinal
absorption and metabolism. Arch Biochem Biophys 2003;417:12-17
79. Williamson G, Plumb GW, Uda Y, Price KR, Rhodes MJ. Dietary quercetin
glycosides: antioxidant activity and induction of the anticarcinogenic phase II marker
enzyme quinone reductase in Hepalclc7 cells. Carcinogenesis 1996;17:2385-2387
80. Day AJ, DuPont MS, Ridley S, Rhodes M, Rhodes MJ, Morgan MR, Williamson G.
Deglycosylation of flavonoid and isoflavonoid glycosides by human small intestine
and liver beta-glucosidase activity. FEBS Lett 1998;436:71-75
81. Nemeth K, Plumb GW, Berrin JG, Juge N, Jacob R, Naim HY, Williamson G,
Swallow DM, Kroon PA. Deglycosylation by small intestinal epithelial cell beta-
glucosidases is a critical step in the absorption and metabolism of dietary flavonoid
glycosides in humans. Eur J Nutr 2003;42:29-42
82. Oitate M, Nakaki R, Koyabu N, Takanaga H, Matsuo H, Ohtani H, Sawada Y.
Transcellular transport of genistein, a soybean-derived isoflavone, across human colon
carcinoma cell line (Caco-2). Biopharm Drug Dispos 2001;22:23-29
83. Hollman PCH, Arts ICW. Flavonols, flavones and flavanols - nature, occurrence and
dietary burden. Journal of the Science of Food and Agriculture 2000;80:1081-1093
84. Castillo-Munoz N, Gomez-Alonso S, Garcia-Romero E, Hermosin-Gutierrez I.
Flavonol profiles of Vitis vinifera red grapes and their single-cultivar wines. J Agric
Food Chem 2007;55:992-1002
85. Stewart AJ, Bozonnet S, Mullen W, Jenkins GI, Lean ME, Crozier A. Occurrence of
flavonols in tomatoes and tomato-based products. J Agric Food Chem 2000;48:2663-
2669
86. Bugianesi R, Catasta G, Spigno P, D'Uva A, Maiani G. Naringenin from cooked
tomato paste is bioavailable in men. Journal of Nutrition 2002;132:3349-3352
REFERENCES
133
87. Tomas-Barberen FA, Clifford MN. Flavanones, chalcones and dihydrochalcones -
nature, occurrence and dietary burden. Journal of the Science of Food and Agriculture
2000;80:1073-1080
88. Manach C, Morand C, Gil-Izquierdo A, Bouteloup-Demange C, Remesy C.
Bioavailability in humans of the flavanones hesperidin and narirutin after the ingestion
of two doses of orange juice. Eur J Clin Nutr 2003;57:235-242
89. Foster BC, Vandenhoek S, Hana J, Krantis A, Akhtar MH, Bryan M, Budzinski JW,
Ramputh A, Arnason JT. In vitro inhibition of human cytochrome P450-mediated
metabolism of marker substrates by natural products. Phytomedicine 2003;10:334-342
90. Dresser GK, Wacher V, Wong S, Wong HT, Bailey DG. Evaluation of peppermint oil
and ascorbyl palmitate as inhibitors of cytochrome P4503A4 activity in vitro and in
vivo. Clin Pharmacol Ther 2002;72:247-255
91. Ofer M, Wolffram S, Koggel A, Spahn-Langguth H, Langguth P. Modulation of drug
transport by selected flavonoids: Involvement of P-gp and OCT? Eur J Pharm Sci
2005;25:263-271
92. Deferme S, Augustijns P. The effect of food components on the absorption of P-gp
substrates: a review. J Pharm Pharmacol 2003;55:153-162
93. Wang EJ, Barecki-Roach M, Johnson WW. Elevation of P-glycoprotein function by a
catechin in green tea. Biochem Biophys Res Commun 2002;297:412-418
94. Alemdaroglu NC, Wolffram S, Boissel JP, Closs E, Spahn-Langguth H, Langguth P.
Inhibition of folic acid uptake by catechins and tea extracts in Caco-2 cells. Planta
Med 2007;73:27-32
95. Montealegre RR, Peces RR, Vozmediano JLC, Gascuena JM, Romero EG. Phenolic
compounds in skins and seeds of ten grape Vitis vinifera varieties grown in a warm
climate. Journal of Food Composition and Analysis 2006;19:687-693
96. Messina M, Nagata C, Wu AH. Estimated Asian adult soy protein and isoflavone
intakes. Nutrition and Cancer-an International Journal 2006;55:1-12
97. Walgren RA, Lin JT, Kinne RK, Walle T. Cellular uptake of dietary flavonoid
quercetin 4'-beta-glucoside by sodium-dependent glucose transporter SGLT1. J
Pharmacol Exp Ther 2000;294:837-843
98. Wolffram S, Block M, Ader P. Quercetin-3-glucoside is transported by the glucose
carrier SGLT1 across the brush border membrane of rat small intestine. Journal of
Nutrition 2002;132:630-635
CHAPTER 2
134
99. Leslie EM, Mao Q, Oleschuk CJ, Deeley RG, Cole SP. Modulation of multidrug
resistance protein 1 (MRP1/ABCC1) transport and atpase activities by interaction with
dietary flavonoids. Mol Pharmacol 2001;59:1171-1180
100. Sesink AL, Arts IC, de Boer VC, Breedveld P, Schellens JH, Hollman PC, Russel FG.
Breast cancer resistance protein (Bcrp1/Abcg2) limits net intestinal uptake of
quercetin in rats by facilitating apical efflux of glucuronides. Mol Pharmacol
2005;67:1999-2006
101. Ifergan I, Shafran A, Jansen G, Hooijberg JH, Scheffer GL, Assaraf YG. Folate
deprivation results in the loss of breast cancer resistance protein (BCRP/ABCG2)
expression. A role for BCRP in cellular folate homeostasis. J Biol Chem
2004;279:25527-25534
102. Hooijberg JH, Broxterman HJ, Kool M, Assaraf YG, Peters GJ, Noordhuis P, Scheper
RJ, Borst P, Pinedo HM, Jansen G. Antifolate resistance mediated by the multidrug
resistance proteins MRP1 and MRP2. Cancer Res 1999;59:2532-2535
103. Morrell MJ. Folic Acid and Epilepsy. Epilepsy Curr 2002;2:31-34
104. Rosche J, Uhlmann C, Froscher W. Low serum folate levels as a risk factor for
depressive mood in patients with chronic epilepsy. J Neuropsychiatry Clin Neurosci
2003;15:64-66
105. Schwaninger M, Ringleb P, Winter R, Kohl B, Fiehn W, Rieser PA, Walter-Sack I.
Elevated plasma concentrations of homocysteine in antiepileptic drug treatment.
Epilepsia 1999;40:345-350
106. Apeland T, Mansoor MA, Strandjord RE, Vefring H, Kristensen O. Folate,
homocysteine and methionine loading in patients on carbamazepine. Acta Neurol
Scand 2001;103:294-299
107. Apeland T, Mansoor MA, Strandjord RE, Kristensen O. Homocysteine concentrations
and methionine loading in patients on antiepileptic drugs. Acta Neurol Scand
2000;101:217-223
108. Ubeda N, Alonso-Aperte E, Varela-Moreiras G. Acute valproate administration
impairs methionine metabolism in rats. J Nutr 2002;132:2737-2742
109. Nulman I, Laslo D, Koren G. Treatment of epilepsy in pregnancy. Drugs 1999;57:535-
544
110. Green NS. Folic acid supplementation and prevention of birth defects. J Nutr
2002;132:2356S-2360S
REFERENCES
135
111. Carl GF, Eto I, Krumdieck CL. Chronic treatment of rats with primidone causes
depletion of pteroylpentaglutamates in liver. J Nutr 1987;117:970-975
112. Kishi T, Fujita N, Eguchi T, Ueda K. Mechanism for reduction of serum folate by
antiepileptic drugs during prolonged therapy. J Neurol Sci 1997;145:109-112
113. Blakley RL, Benkovic SJ, Whitehead VM. Folates and pterins. New York: Wiley;
1984
114. Stevenson CM, Kim J, Fleisher D. Colonic absorption of antiepileptic agents.
Epilepsia 1997;38:63-67
115. Stevenson CM, Radulovic LL, Bockbrader HN, Fleisher D. Contrasting nutrient
effects on the plasma levels of an amino acid-like antiepileptic agent from jejunal
administration in dogs. J Pharm Sci 1997;86:953-957
116. Stewart BH, Kugler AR, Thompson PR, Bockbrader HN. A saturable transport
mechanism in the intestinal absorption of gabapentin is the underlying cause of the
lack of proportionality between increasing dose and drug levels in plasma. Pharm Res
1993;10:276-281
117. Tamai I, Takanaga H, Maeda H, Sai Y, Ogihara T, Higashida H, Tsuji A. Participation
of a proton-cotransporter, MCT1, in the intestinal transport of monocarboxylic acids.
Biochem Biophys Res Commun 1995;214:482-489

CHAPTER 2
136
CHAPTER THREE
INFLUENCE OF GREEN AND BLACK TEA ON FOLIC ACID
PHARMACOKINETICS IN HEALTHY VOLUNTEERS: POTENTIAL RISK
OF DIMINISHED FOLIC ACID BIOAVAILABILITY

CHAPTER 3
138
CLINICAL TRIAL
139
3.1 INTRODUCTION1
Food-drug interactions play an important role in the alteration of the pharmacokinetics as well
as pharmacodynamics of drugs in vivo. Due to these interactions, an increase or decrease in
the efficacy of a drug may be observed which may eventually lead to serious clinical
consequences. A considerable number of recent publications has addressed interactions
between natural herbal products and drugs [1-7]. In addition, there are several reports,
indicating an effect of food components, such as grapefruit juice [8-11], orange juice
[10,12,13], green tea extract [14], and others [15-18] on drug absorption. Based on those
findings, the interaction between drugs and certain components contained in food or food
supplements have a high potential to influence the bioavailability of various drugs and thus
might influence the efficacy of the drug.
One of the most popular and commonly consumed beverages is green tea (Camellia sinensis).
It has been widely used for its health beneficial properties such as anticancer, anti-
inflammatory and antioxidant effects and its promoting help in weight loss [19,20]. There are
several marketed products produced from the leaves of Camellia sinensis such as black and
green tea for infusion, instant tea powders, and a variety of non-prescription dietary
supplements containing extracts of the tea leaves.
Folic acid is a stable and synthetic form of the folates which belongs to the group of water-
soluble vitamins and needs to be provided through nutrition. Folates are essentially involved
in the transfer of one-carbon units obtained from various donor substrates to support the
biosynthetic pathways of several molecules such as purine and pyrimidine nucleotides [21].
This is of particular relevance in pregnant women since the relationship between the use of
folic acid and prevention of NTDs is well established [22,23]. Apart from its role in the
prevention of NTDs, folate is important in the homocysteine remethylation cycle. An elevated
homocysteine concentration in blood is associated with an increased risk of cardiovascular
diseases and decreased cognitive function. Low blood concentration of folate is associated
with elevated circulating homocysteine [24]. In addition, severe folate deficiency leads to
megaloblastic anemia. Inadequate folate intake has been also related to the development or
progression of certain types of cancer especially colorectal cancer because folate deficiency
1 Parts of this chapter were submitted for publication. (May 2007)
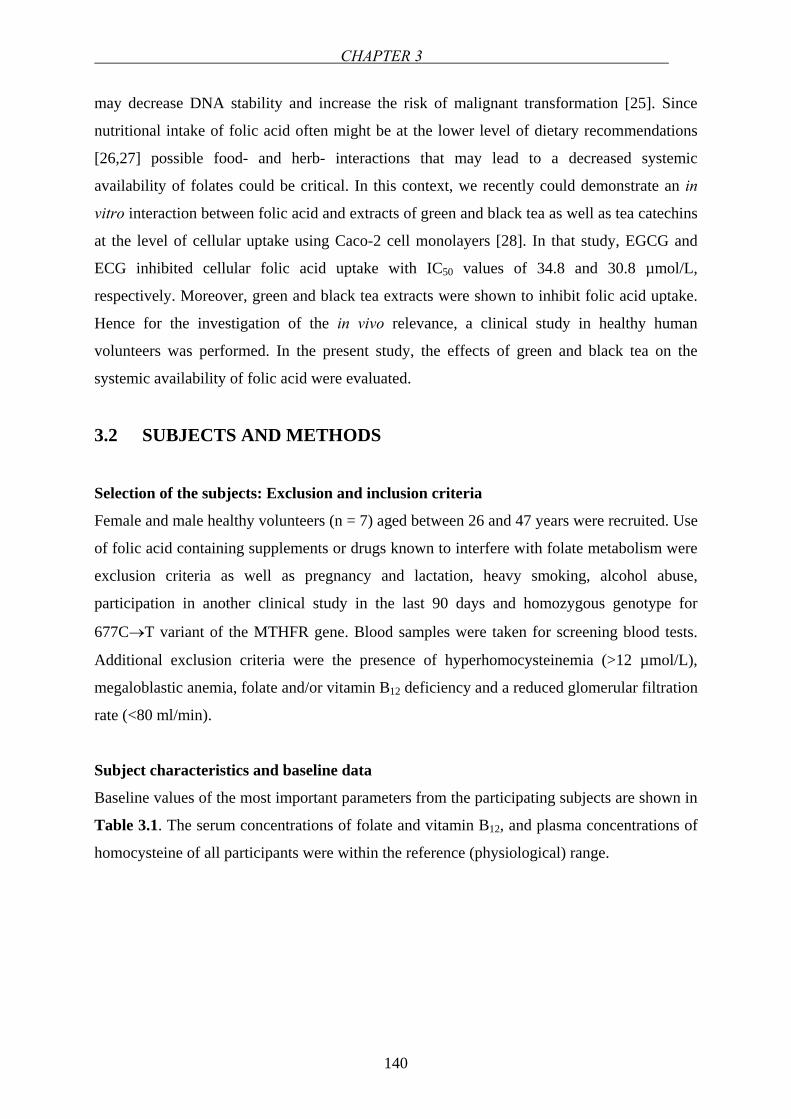
CHAPTER 3
140
may decrease DNA stability and increase the risk of malignant transformation [25]. Since
nutritional intake of folic acid often might be at the lower level of dietary recommendations
[26,27] possible food- and herb- interactions that may lead to a decreased systemic
availability of folates could be critical. In this context, we recently could demonstrate an in
vitro interaction between folic acid and extracts of green and black tea as well as tea catechins
at the level of cellular uptake using Caco-2 cell monolayers [28]. In that study, EGCG and
ECG inhibited cellular folic acid uptake with IC50 values of 34.8 and 30.8 µmol/L,
respectively. Moreover, green and black tea extracts were shown to inhibit folic acid uptake.
Hence for the investigation of the in vivo relevance, a clinical study in healthy human
volunteers was performed. In the present study, the effects of green and black tea on the
systemic availability of folic acid were evaluated.
3.2 SUBJECTS AND METHODS
Selection of the subjects: Exclusion and inclusion criteria
Female and male healthy volunteers (n = 7) aged between 26 and 47 years were recruited. Use
of folic acid containing supplements or drugs known to interfere with folate metabolism were
exclusion criteria as well as pregnancy and lactation, heavy smoking, alcohol abuse,
participation in another clinical study in the last 90 days and homozygous genotype for
677C→T variant of the MTHFR gene. Blood samples were taken for screening blood tests.
Additional exclusion criteria were the presence of hyperhomocysteinemia (>12 µmol/L),
megaloblastic anemia, folate and/or vitamin B12 deficiency and a reduced glomerular filtration
rate (<80 ml/min).
Subject characteristics and baseline data
Baseline values of the most important parameters from the participating subjects are shown in
Table 3.1. The serum concentrations of folate and vitamin B12, and plasma concentrations of
homocysteine of all participants were within the reference (physiological) range.
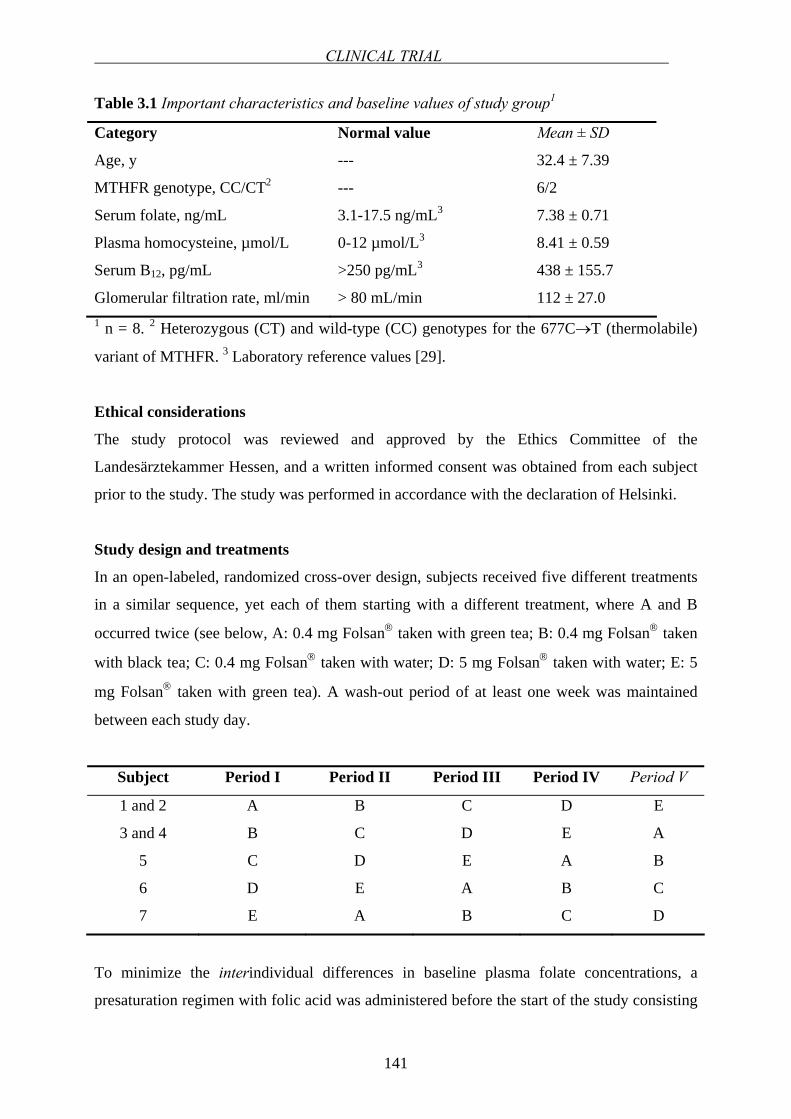
CLINICAL TRIAL
141
Table 3.1 Important characteristics and baseline values of study group1
Category Normal value Mean ± SD
Age, y --- 32.4 ± 7.39
MTHFR genotype, CC/CT2 --- 6/2
Serum folate, ng/mL 3.1-17.5 ng/mL3 7.38 ± 0.71
Plasma homocysteine, µmol/L 0-12 µmol/L3 8.41 ± 0.59
Serum B12, pg/mL >250 pg/mL3 438 ± 155.7
Glomerular filtration rate, ml/min > 80 mL/min 112 ± 27.0 1 n = 8. 2 Heterozygous (CT) and wild-type (CC) genotypes for the 677C→T (thermolabile)
variant of MTHFR. 3 Laboratory reference values [29].
Ethical considerations
The study protocol was reviewed and approved by the Ethics Committee of the
Landesärztekammer Hessen, and a written informed consent was obtained from each subject
prior to the study. The study was performed in accordance with the declaration of Helsinki.
Study design and treatments
In an open-labeled, randomized cross-over design, subjects received five different treatments
in a similar sequence, yet each of them starting with a different treatment, where A and B
occurred twice (see below, A: 0.4 mg Folsan® taken with green tea; B: 0.4 mg Folsan® taken
with black tea; C: 0.4 mg Folsan® taken with water; D: 5 mg Folsan® taken with water; E: 5
mg Folsan® taken with green tea). A wash-out period of at least one week was maintained
between each study day.
Subject Period I Period II Period III Period IV Period V
1 and 2 A B C D E
3 and 4 B C D E A
5 C D E A B
6 D E A B C
7 E A B C D
To minimize the interindividual differences in baseline plasma folate concentrations, a
presaturation regimen with folic acid was administered before the start of the study consisting
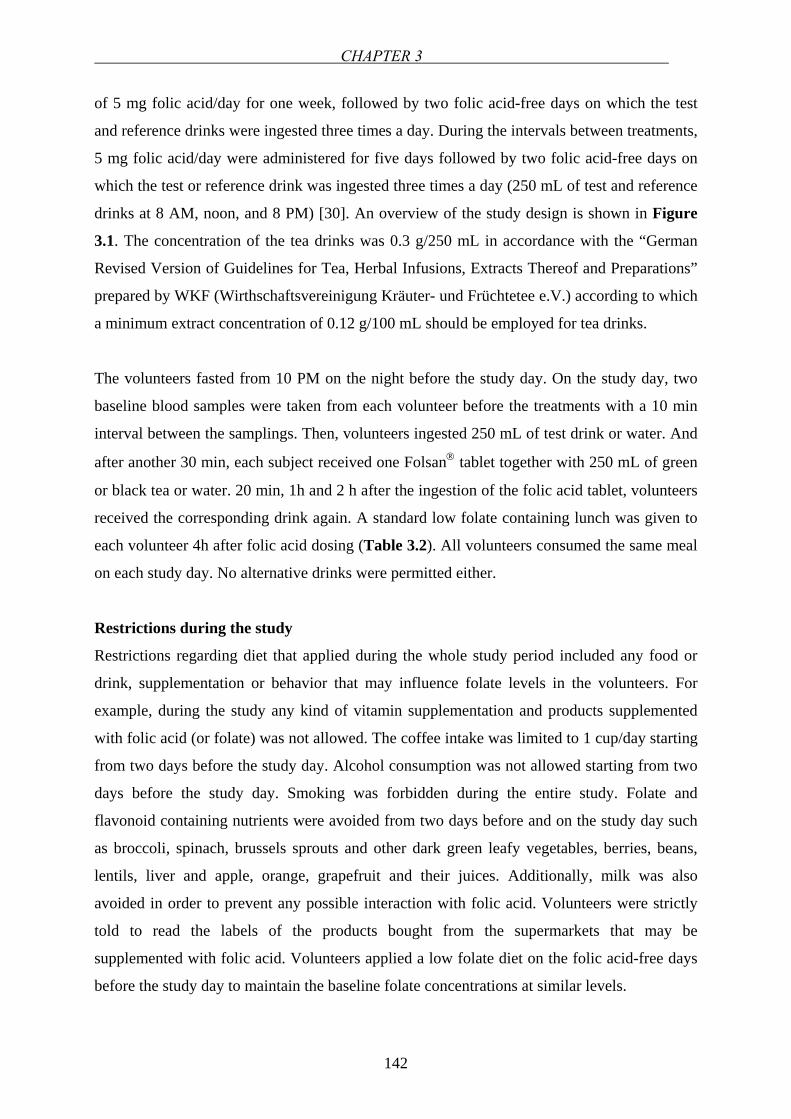
CHAPTER 3
142
of 5 mg folic acid/day for one week, followed by two folic acid-free days on which the test
and reference drinks were ingested three times a day. During the intervals between treatments,
5 mg folic acid/day were administered for five days followed by two folic acid-free days on
which the test or reference drink was ingested three times a day (250 mL of test and reference
drinks at 8 AM, noon, and 8 PM) [30]. An overview of the study design is shown in Figure
3.1. The concentration of the tea drinks was 0.3 g/250 mL in accordance with the “German
Revised Version of Guidelines for Tea, Herbal Infusions, Extracts Thereof and Preparations”
prepared by WKF (Wirthschaftsvereinigung Kräuter- und Früchtetee e.V.) according to which
a minimum extract concentration of 0.12 g/100 mL should be employed for tea drinks.
The volunteers fasted from 10 PM on the night before the study day. On the study day, two
baseline blood samples were taken from each volunteer before the treatments with a 10 min
interval between the samplings. Then, volunteers ingested 250 mL of test drink or water. And
after another 30 min, each subject received one Folsan® tablet together with 250 mL of green
or black tea or water. 20 min, 1h and 2 h after the ingestion of the folic acid tablet, volunteers
received the corresponding drink again. A standard low folate containing lunch was given to
each volunteer 4h after folic acid dosing (Table 3.2). All volunteers consumed the same meal
on each study day. No alternative drinks were permitted either.
Restrictions during the study
Restrictions regarding diet that applied during the whole study period included any food or
drink, supplementation or behavior that may influence folate levels in the volunteers. For
example, during the study any kind of vitamin supplementation and products supplemented
with folic acid (or folate) was not allowed. The coffee intake was limited to 1 cup/day starting
from two days before the study day. Alcohol consumption was not allowed starting from two
days before the study day. Smoking was forbidden during the entire study. Folate and
flavonoid containing nutrients were avoided from two days before and on the study day such
as broccoli, spinach, brussels sprouts and other dark green leafy vegetables, berries, beans,
lentils, liver and apple, orange, grapefruit and their juices. Additionally, milk was also
avoided in order to prevent any possible interaction with folic acid. Volunteers were strictly
told to read the labels of the products bought from the supermarkets that may be
supplemented with folic acid. Volunteers applied a low folate diet on the folic acid-free days
before the study day to maintain the baseline folate concentrations at similar levels.
CLINICAL TRIAL
143
Sampling and serum folate analysis
On the study days, a forearm vein was cannulated (Vasofix® Braunüle®, B.Braun Melsungen
AG, Meslsungen, Germany). The folic acid tablets were administered 8:30 AM on each study
day considering the lack of circadian variation in folate pharmacokinetics [31]. At time points
0 h, 0.5 h, 1 h, 1.5 h, 2 h, 3 h, 4 h, 5 h, 6 h and 8 h post dosing, 5 mL blood samples were
withdrawn using serum Monovette® (Sarstedt, Nümbrecht, Germany). After maintaining each
blood sample for 30 min at room temperature, they were centrifuged at room temperature at
1500 g for 10 min to separate serum. Thereafter, serum samples were instantly frozen on dry
ice and then stored at –84 °C until analysis. Serum folate analyses were carried out by a
chemiluminescent-competitive protein binding assay [32,33](ADVIA Centaur System,
Bayer, Fernwald, Germany). The total folate in the serum samples competes with acridinium
ester-labeled folate for a limited amount of biotin-labeled folate binding protein. Biotin-
labeled folate binding protein binds to avidin that is covalently coupled to paramagnetic
particles. In the ADVIA Centaur folate assay, the samples are pretreated to release the folate
from endogenous binding proteins in the sample. An inverse relationship exists between the
amount of folate in the sample and the amount of relative light units detected by the system.
The minimum detectable concentration (analytical sensitivity) is 0.35 ng/mL. The within-run
coefficient of variations (CV) were less than 6% at three different concentrations (at 12.56
ng/mL, 5.72 mg/mL and 2.91 ng/mL, the CVs were 4.28%, 3.57% and 5.15%, respectively).
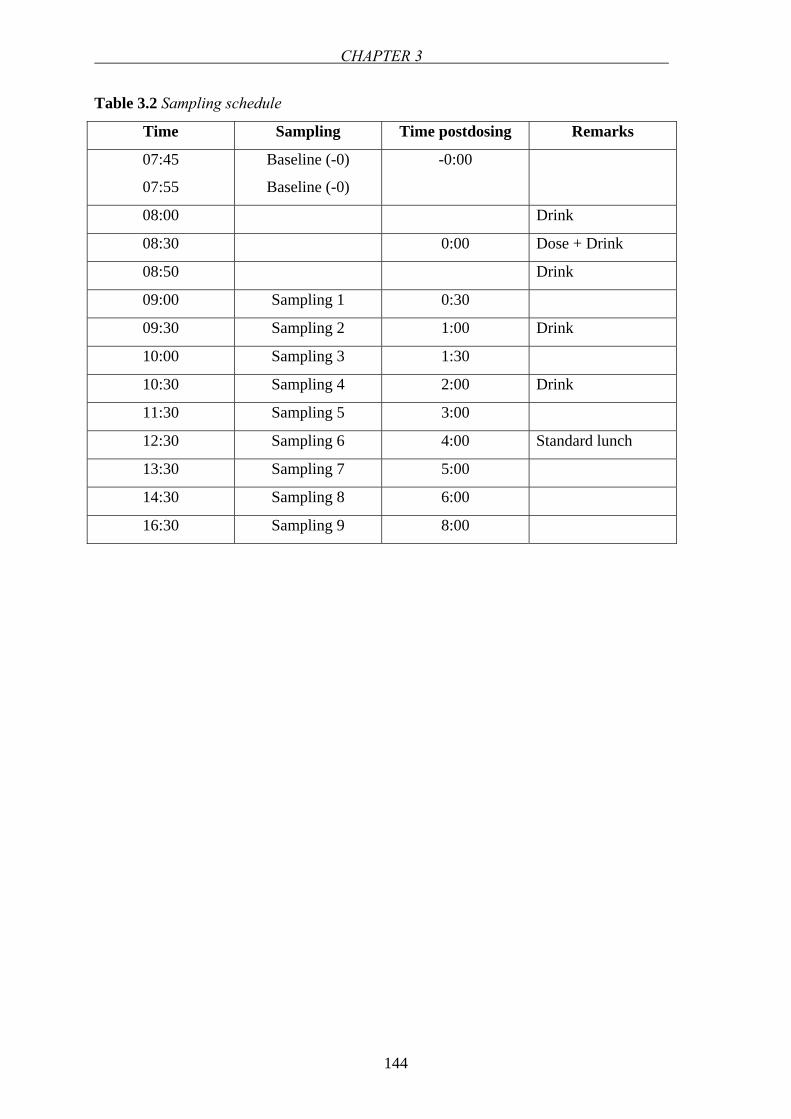
CHAPTER 3
144
Table 3.2 Sampling schedule
Time Sampling Time postdosing Remarks
07:45
07:55
Baseline (-0)
Baseline (-0)
-0:00
08:00 Drink
08:30 0:00 Dose + Drink
08:50 Drink
09:00 Sampling 1 0:30
09:30 Sampling 2 1:00 Drink
10:00 Sampling 3 1:30
10:30 Sampling 4 2:00 Drink
11:30 Sampling 5 3:00
12:30 Sampling 6 4:00 Standard lunch
13:30 Sampling 7 5:00
14:30 Sampling 8 6:00
16:30 Sampling 9 8:00
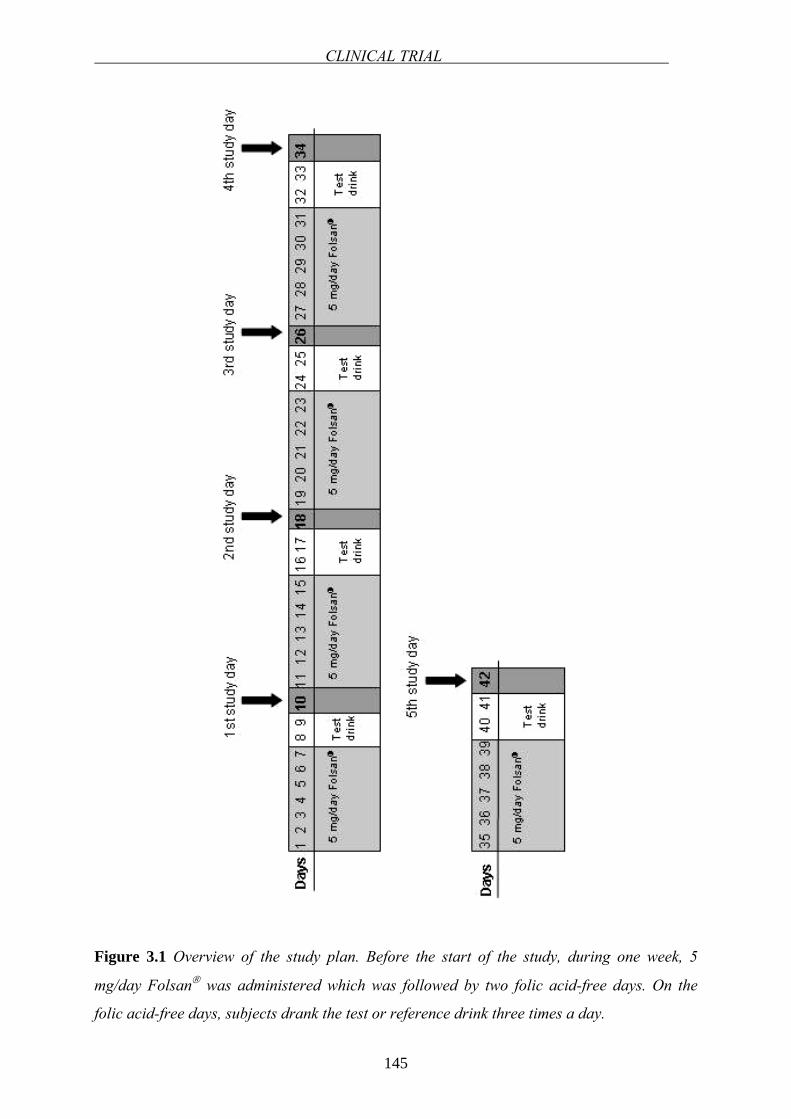
CLINICAL TRIAL
145
Figure 3.1 Overview of the study plan. Before the start of the study, during one week, 5
mg/day Folsan® was administered which was followed by two folic acid-free days. On the
folic acid-free days, subjects drank the test or reference drink three times a day.
CHAPTER 3
146
Pharmacokinetic data analysis
The pharmacokinetic parameters were calculated after a sampling period of 8 h, as
recommended in the literature for the evaluation of folate kinetics [32,34]. The serum folate
response to each of the five treatments was calculated for each individual by subtracting the
baseline serum folate value (average of the two samples taken before treatment) at each time
point. Pharmacokinetic parameters were calculated by non-compartmental analysis. The
maximum serum concentrations (Cmax) and times to reach Cmax (tmax) were read from the
observed data. The area under the serum concentration versus time curve (AUC0→t) was
calculated using the linear trapezoidal rule up to the last measured data point. The AUC was
extrapolated from the last measured time points to infinity by dividing Clast by the terminal
elimination rate constant λZ. The terminal elimination rate constant (λZ) was calculated by
log-linear regression of the terminal part of the serum folate concentration-time curve using at
least 3 points in the log-linear terminal phase. The terminal half-life (t1/2) was determined by
the following equation: t1/2 = ln2 / λZ. Tea induced changes in relative bioavailability were
quantified via the ratio of the geometric means of AUC0→∞. Absorption profiles of 0.4 and 5
mg folic acid for each volunteer were obtained independently by the Wagner-Nelson method
[35].
Statistical data analysis
Statistical analyses were performed using GraphPad PrismTM version 3 (GraphPad Software;
San Diego, CA, USA). AUC0→∞ and Cmax data were log-transformed and analyzed. Student`s
t-test was used to test for significant differences between the bioavailability parameters AUC
and Cmax for the tea-treated group versus the control group. Based on previous expectations
that tea would most likely diminish the bioavailability of folic acid, one-sided t-test was
applied (p<0.05). For testing of significant differences concerning the residual
pharmacokinetic parameters, the two-tailed t-test at a significance level of p<0.05 was used.
3.3 RESULTS
Intra- and interindividual variability
The intra- and interindividual variability during the entire study for the baseline folate levels
are presented in Tables 3.3 and 3.4, respectively.
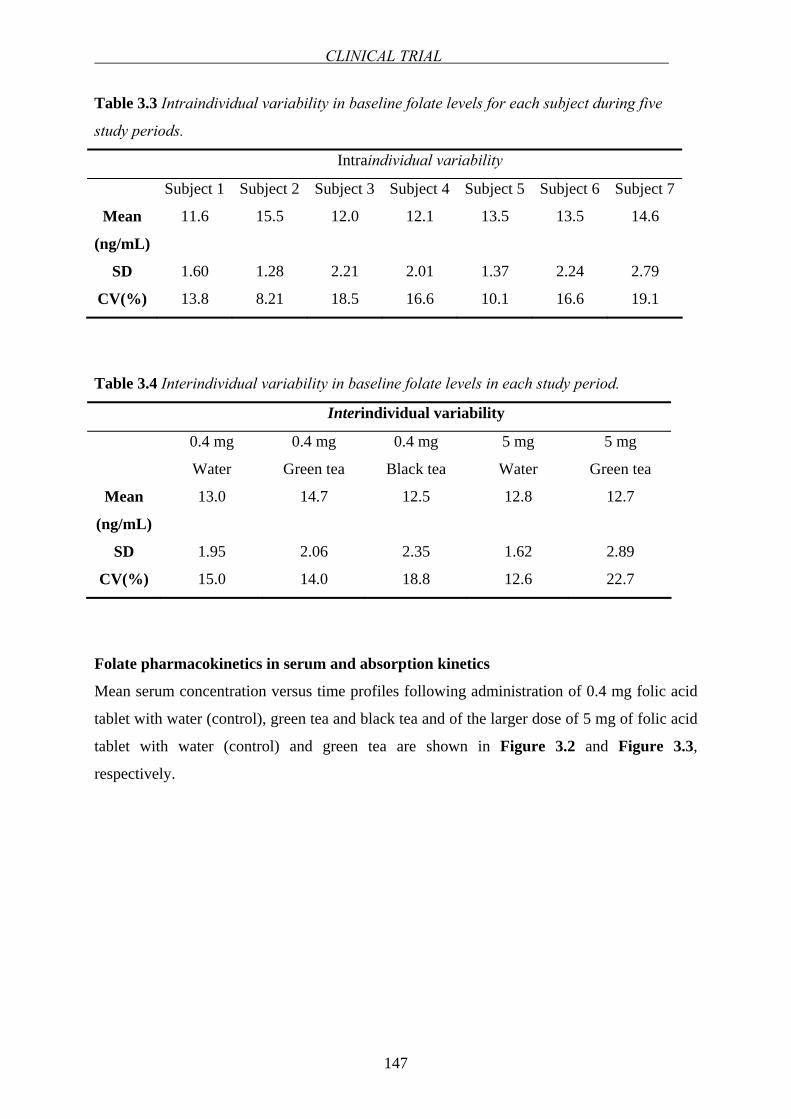
CLINICAL TRIAL
147
Table 3.3 Intraindividual variability in baseline folate levels for each subject during five
study periods.
Intraindividual variability
Subject 1 Subject 2 Subject 3 Subject 4 Subject 5 Subject 6 Subject 7
Mean
(ng/mL)
SD
CV(%)
11.6
1.60
13.8
15.5
1.28
8.21
12.0
2.21
18.5
12.1
2.01
16.6
13.5
1.37
10.1
13.5
2.24
16.6
14.6
2.79
19.1
Table 3.4 Interindividual variability in baseline folate levels in each study period.
Interindividual variability
0.4 mg
Water
0.4 mg
Green tea
0.4 mg
Black tea
5 mg
Water
5 mg
Green tea
Mean
(ng/mL)
SD
CV(%)
13.0
1.95
15.0
14.7
2.06
14.0
12.5
2.35
18.8
12.8
1.62
12.6
12.7
2.89
22.7
Folate pharmacokinetics in serum and absorption kinetics
Mean serum concentration versus time profiles following administration of 0.4 mg folic acid
tablet with water (control), green tea and black tea and of the larger dose of 5 mg of folic acid
tablet with water (control) and green tea are shown in Figure 3.2 and Figure 3.3,
respectively.
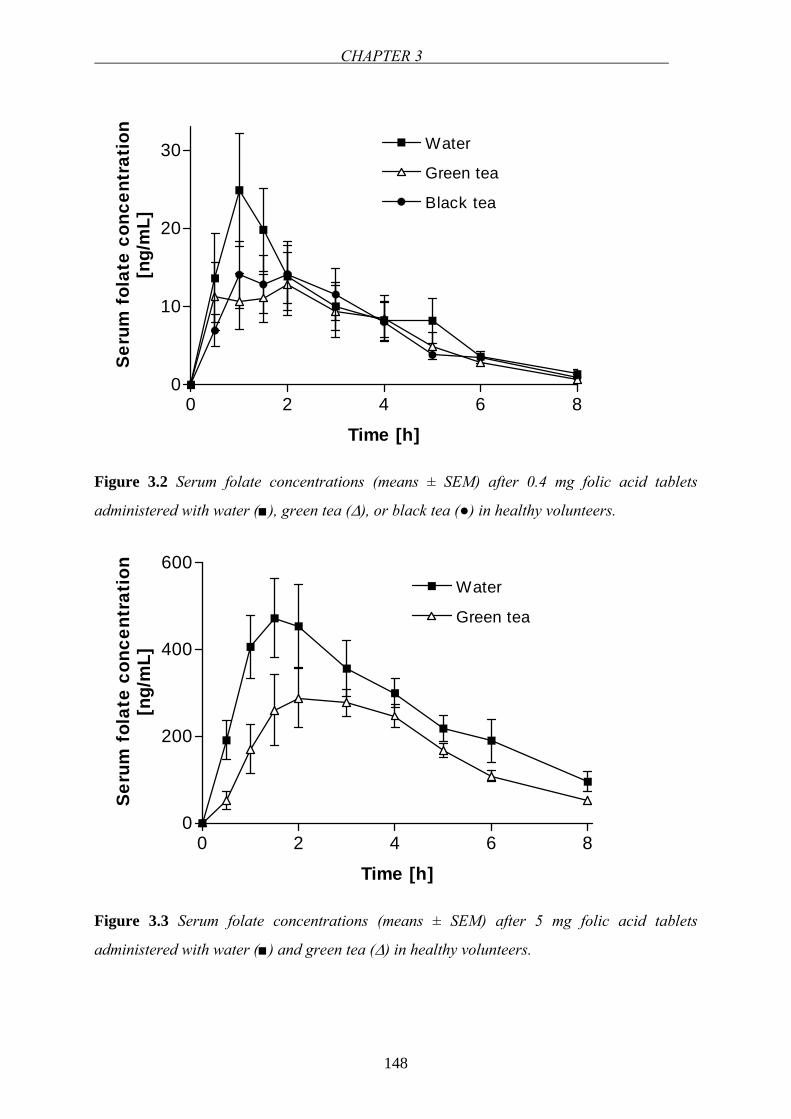
CHAPTER 3
148
0 2 4 6 80
10
20
30 Water
Green tea
Black tea
Time [h]
Seru
m f
olat
e co
ncen
trat
ion
[ng/
mL]
Figure 3.2 Serum folate concentrations (means ± SEM) after 0.4 mg folic acid tablets
administered with water (), green tea (∆), or black tea () in healthy volunteers.
0 2 4 6 80
200
400
600Water
Green tea
Time [h]
Seru
m f
olat
e co
ncen
trat
ion
[ng/
mL]
Figure 3.3 Serum folate concentrations (means ± SEM) after 5 mg folic acid tablets
administered with water () and green tea (∆) in healthy volunteers.
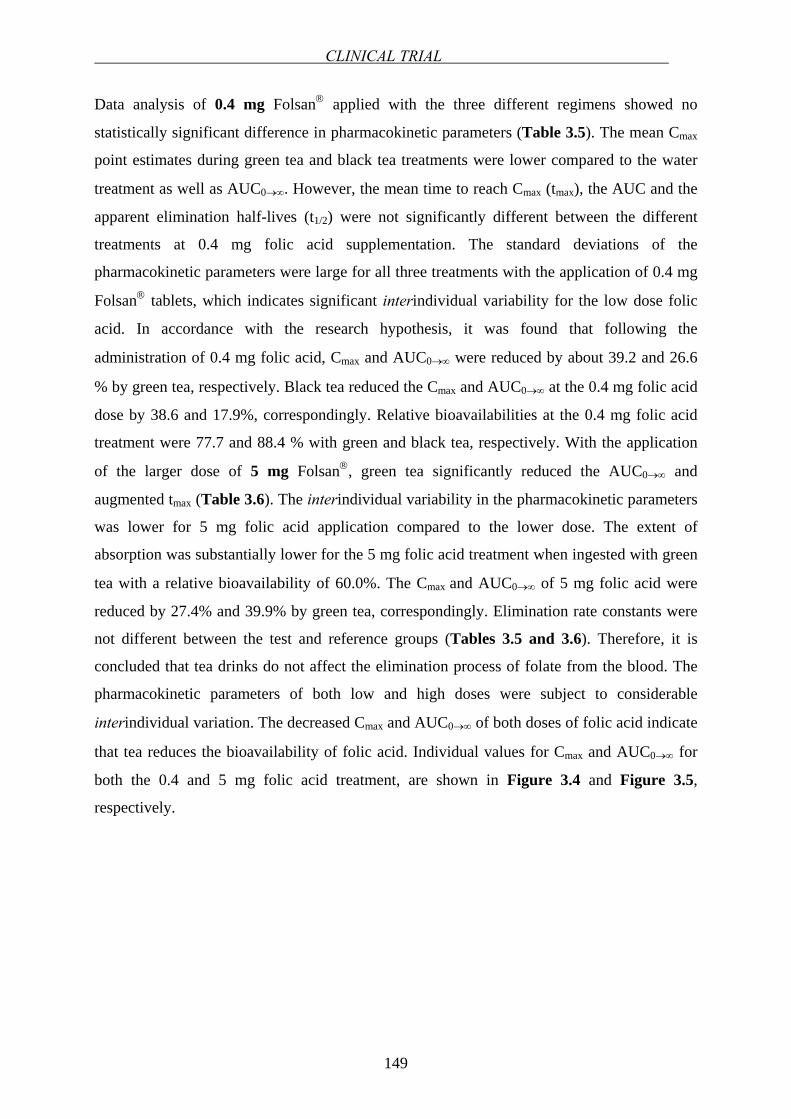
CLINICAL TRIAL
149
Data analysis of 0.4 mg Folsan® applied with the three different regimens showed no
statistically significant difference in pharmacokinetic parameters (Table 3.5). The mean Cmax
point estimates during green tea and black tea treatments were lower compared to the water
treatment as well as AUC0→∞. However, the mean time to reach Cmax (tmax), the AUC and the
apparent elimination half-lives (t1/2) were not significantly different between the different
treatments at 0.4 mg folic acid supplementation. The standard deviations of the
pharmacokinetic parameters were large for all three treatments with the application of 0.4 mg
Folsan® tablets, which indicates significant interindividual variability for the low dose folic
acid. In accordance with the research hypothesis, it was found that following the
administration of 0.4 mg folic acid, Cmax and AUC0→∞ were reduced by about 39.2 and 26.6
% by green tea, respectively. Black tea reduced the Cmax and AUC0→∞ at the 0.4 mg folic acid
dose by 38.6 and 17.9%, correspondingly. Relative bioavailabilities at the 0.4 mg folic acid
treatment were 77.7 and 88.4 % with green and black tea, respectively. With the application
of the larger dose of 5 mg Folsan®, green tea significantly reduced the AUC0→∞ and
augmented tmax (Table 3.6). The interindividual variability in the pharmacokinetic parameters
was lower for 5 mg folic acid application compared to the lower dose. The extent of
absorption was substantially lower for the 5 mg folic acid treatment when ingested with green
tea with a relative bioavailability of 60.0%. The Cmax and AUC0→∞ of 5 mg folic acid were
reduced by 27.4% and 39.9% by green tea, correspondingly. Elimination rate constants were
not different between the test and reference groups (Tables 3.5 and 3.6). Therefore, it is
concluded that tea drinks do not affect the elimination process of folate from the blood. The
pharmacokinetic parameters of both low and high doses were subject to considerable
interindividual variation. The decreased Cmax and AUC0→∞ of both doses of folic acid indicate
that tea reduces the bioavailability of folic acid. Individual values for Cmax and AUC0→∞ for
both the 0.4 and 5 mg folic acid treatment, are shown in Figure 3.4 and Figure 3.5,
respectively.
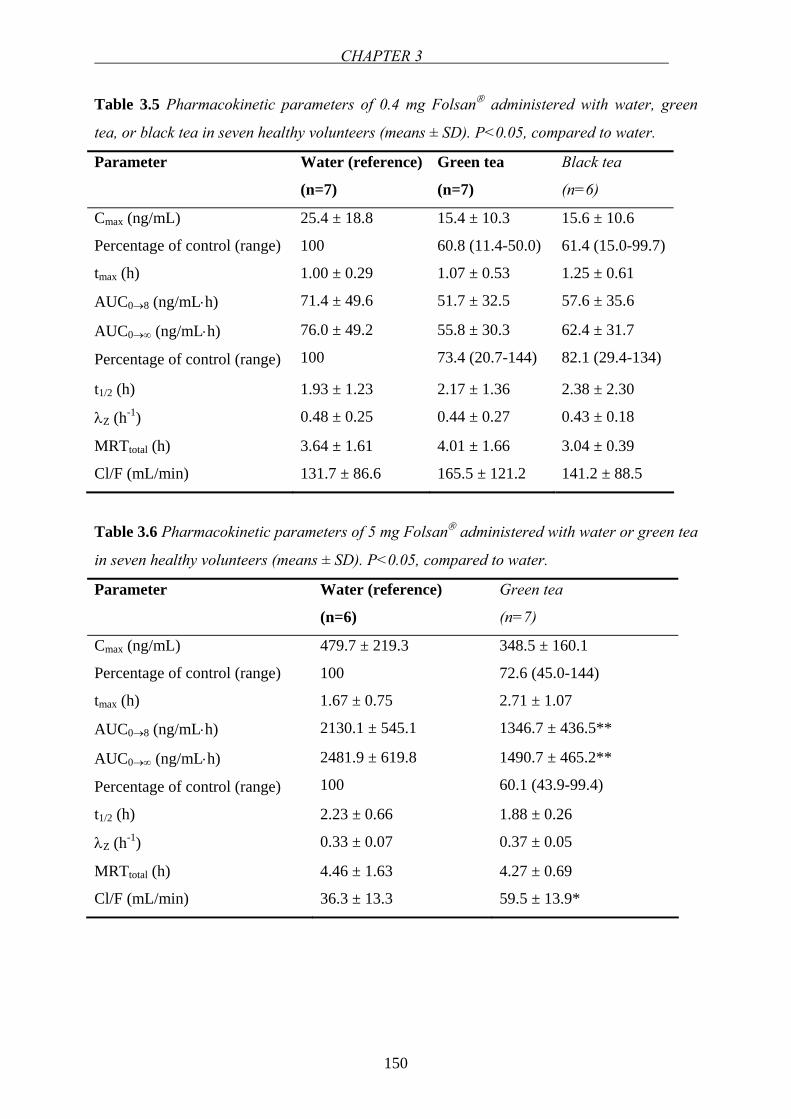
CHAPTER 3
150
Table 3.5 Pharmacokinetic parameters of 0.4 mg Folsan® administered with water, green
tea, or black tea in seven healthy volunteers (means ± SD). P<0.05, compared to water.
Parameter Water (reference)
(n=7)
Green tea
(n=7)
Black tea
(n=6)
Cmax (ng/mL)
Percentage of control (range)
25.4 ± 18.8
100
15.4 ± 10.3
60.8 (11.4-50.0)
15.6 ± 10.6
61.4 (15.0-99.7)
tmax (h) 1.00 ± 0.29 1.07 ± 0.53 1.25 ± 0.61
AUC0→8 (ng/mL⋅h) 71.4 ± 49.6 51.7 ± 32.5 57.6 ± 35.6
AUC0→∞ (ng/mL⋅h)
Percentage of control (range)
76.0 ± 49.2
100
55.8 ± 30.3
73.4 (20.7-144)
62.4 ± 31.7
82.1 (29.4-134)
t1/2 (h) 1.93 ± 1.23 2.17 ± 1.36 2.38 ± 2.30
λZ (h-1) 0.48 ± 0.25 0.44 ± 0.27 0.43 ± 0.18
MRTtotal (h) 3.64 ± 1.61 4.01 ± 1.66 3.04 ± 0.39
Cl/F (mL/min) 131.7 ± 86.6 165.5 ± 121.2 141.2 ± 88.5
Table 3.6 Pharmacokinetic parameters of 5 mg Folsan® administered with water or green tea
in seven healthy volunteers (means ± SD). P<0.05, compared to water.
Parameter Water (reference)
(n=6)
Green tea
(n=7)
Cmax (ng/mL)
Percentage of control (range)
479.7 ± 219.3
100
348.5 ± 160.1
72.6 (45.0-144)
tmax (h) 1.67 ± 0.75 2.71 ± 1.07
AUC0→8 (ng/mL⋅h) 2130.1 ± 545.1 1346.7 ± 436.5**
AUC0→∞ (ng/mL⋅h)
Percentage of control (range)
2481.9 ± 619.8
100
1490.7 ± 465.2**
60.1 (43.9-99.4)
t1/2 (h) 2.23 ± 0.66 1.88 ± 0.26
λZ (h-1) 0.33 ± 0.07 0.37 ± 0.05
MRTtotal (h) 4.46 ± 1.63 4.27 ± 0.69
Cl/F (mL/min) 36.3 ± 13.3 59.5 ± 13.9*
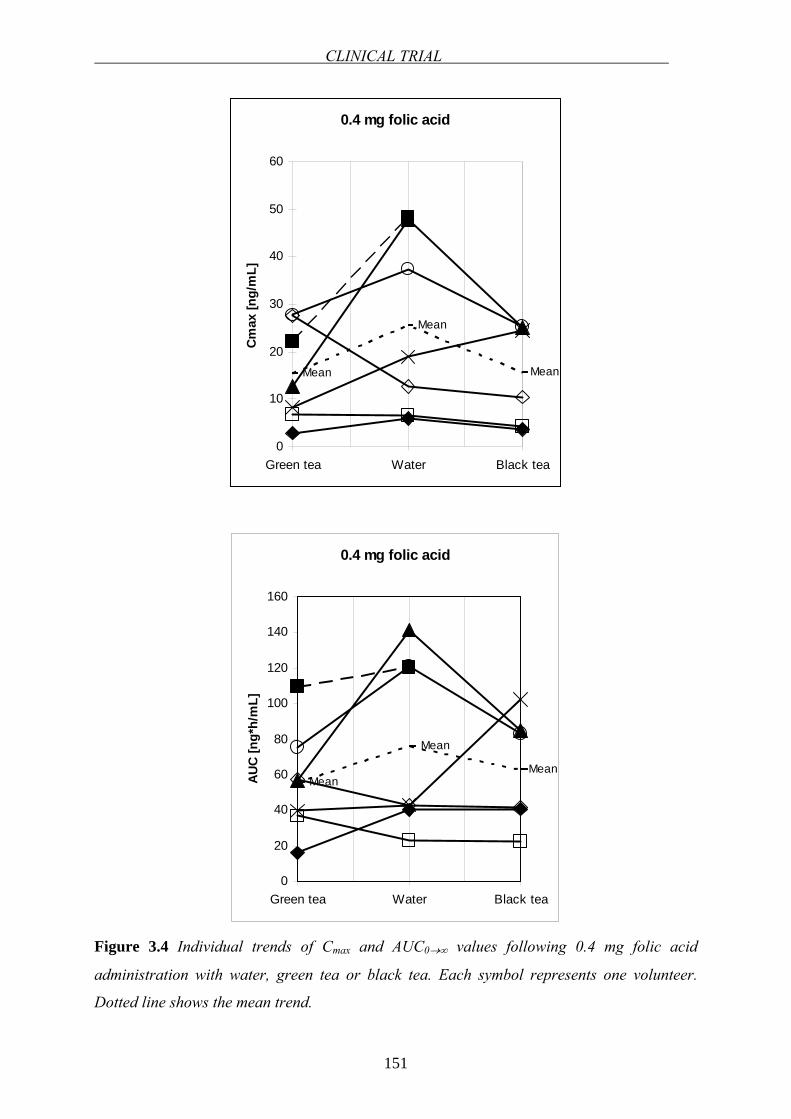
CLINICAL TRIAL
151
0.4 mg folic acid
Mean
Mean
Mean
0
10
20
30
40
50
60
Green tea Water Black tea
Cmax
[ng/
mL]
0.4 mg folic acid
Mean
Mean
Mean
0
20
40
60
80
100
120
140
160
Green tea Water Black tea
AUC
[ng*
h/m
L]
Figure 3.4 Individual trends of Cmax and AUC0→∞ values following 0.4 mg folic acid
administration with water, green tea or black tea. Each symbol represents one volunteer.
Dotted line shows the mean trend.
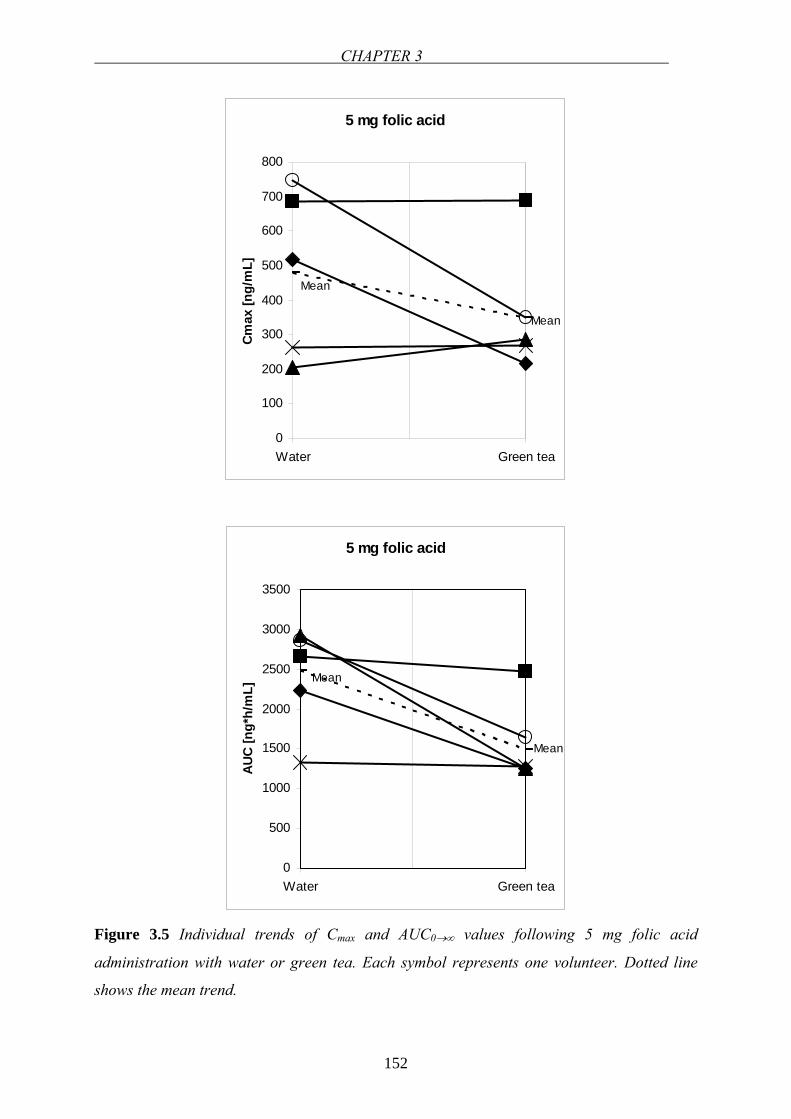
CHAPTER 3
152
5 mg folic acid
Mean
Mean
0
100
200
300
400
500
600
700
800
Water Green tea
Cmax
[ng/
mL]
5 mg folic acid
Mean
Mean
0
500
1000
1500
2000
2500
3000
3500
Water Green tea
AUC
[ng*
h/m
L]
Figure 3.5 Individual trends of Cmax and AUC0→∞ values following 5 mg folic acid
administration with water or green tea. Each symbol represents one volunteer. Dotted line
shows the mean trend.
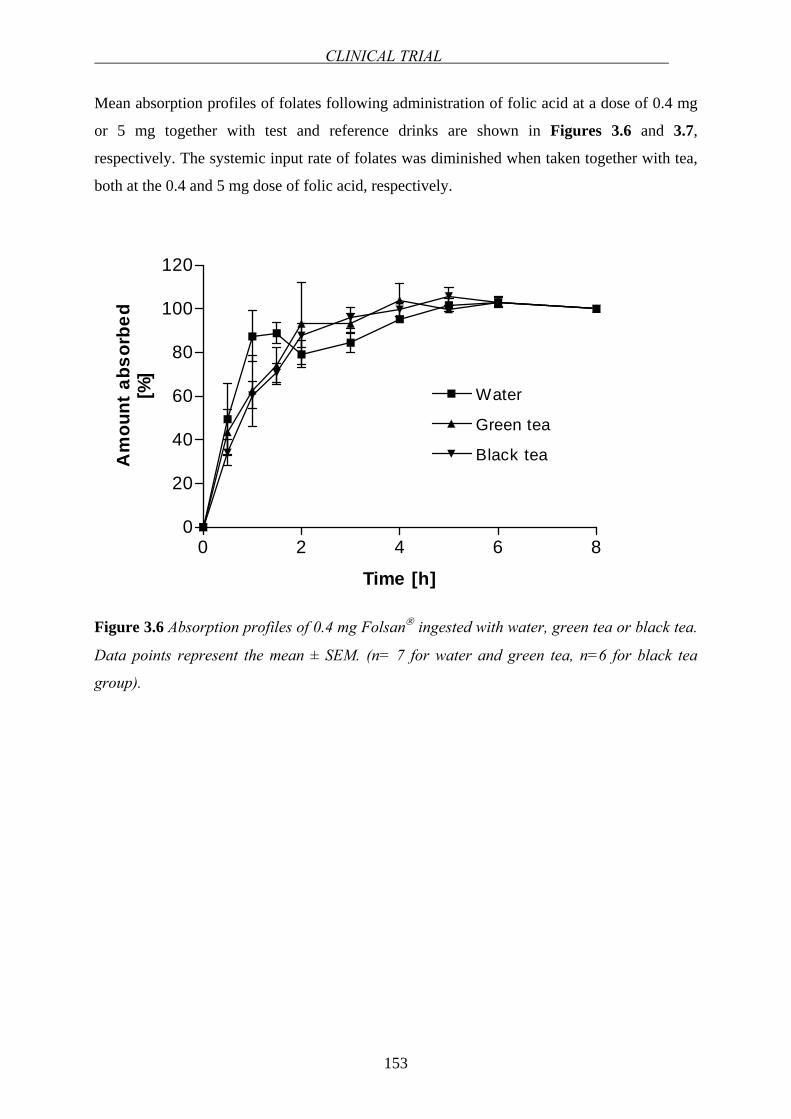
CLINICAL TRIAL
153
Mean absorption profiles of folates following administration of folic acid at a dose of 0.4 mg
or 5 mg together with test and reference drinks are shown in Figures 3.6 and 3.7,
respectively. The systemic input rate of folates was diminished when taken together with tea,
both at the 0.4 and 5 mg dose of folic acid, respectively.
0 2 4 6 80
20
40
60
80
100
120
Water
Green tea
Black tea
Time [h]
Am
ount
abs
orbe
d[%
]
Figure 3.6 Absorption profiles of 0.4 mg Folsan® ingested with water, green tea or black tea.
Data points represent the mean ± SEM. (n= 7 for water and green tea, n=6 for black tea
group).
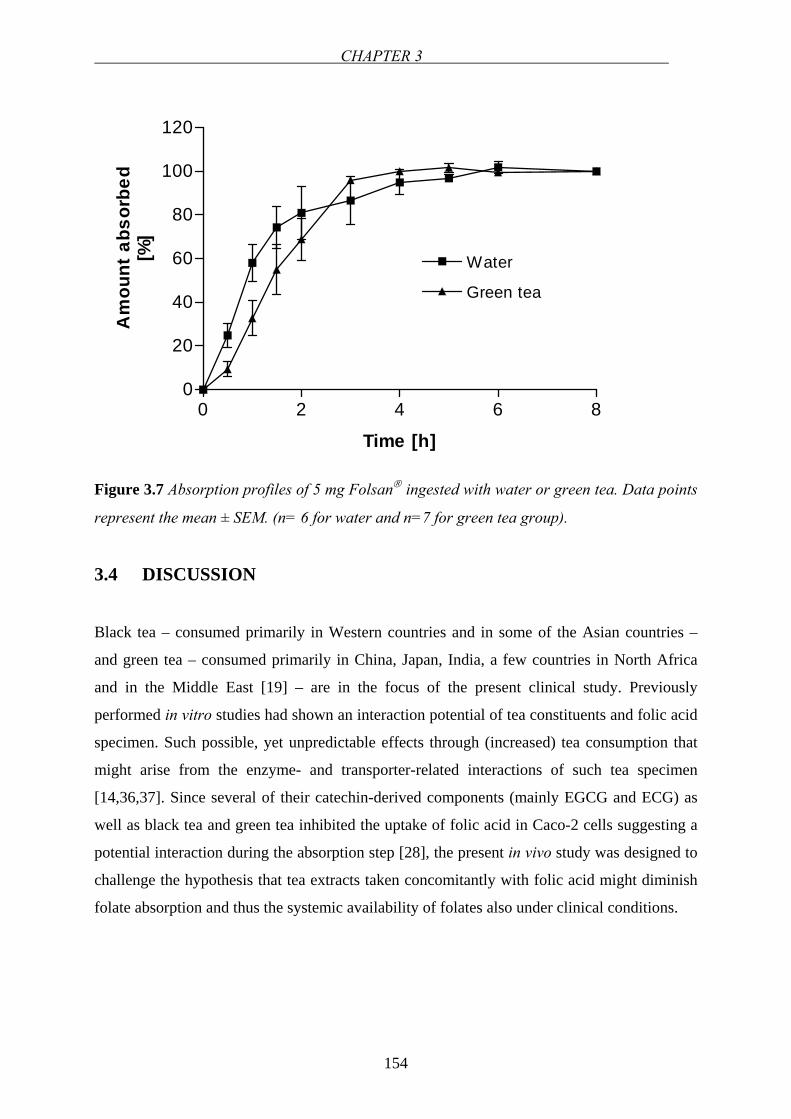
CHAPTER 3
154
0 2 4 6 80
20
40
60
80
100
120
Water
Green tea
Time [h]
Am
ount
abs
orbe
d[%
]
Figure 3.7 Absorption profiles of 5 mg Folsan® ingested with water or green tea. Data points
represent the mean ± SEM. (n= 6 for water and n=7 for green tea group).
3.4 DISCUSSION
Black tea – consumed primarily in Western countries and in some of the Asian countries –
and green tea – consumed primarily in China, Japan, India, a few countries in North Africa
and in the Middle East [19] – are in the focus of the present clinical study. Previously
performed in vitro studies had shown an interaction potential of tea constituents and folic acid
specimen. Such possible, yet unpredictable effects through (increased) tea consumption that
might arise from the enzyme- and transporter-related interactions of such tea specimen
[14,36,37]. Since several of their catechin-derived components (mainly EGCG and ECG) as
well as black tea and green tea inhibited the uptake of folic acid in Caco-2 cells suggesting a
potential interaction during the absorption step [28], the present in vivo study was designed to
challenge the hypothesis that tea extracts taken concomitantly with folic acid might diminish
folate absorption and thus the systemic availability of folates also under clinical conditions.
CLINICAL TRIAL
155
Pharmacokinetics of folic acid
After ingestion, folic acid appears to be rapidly absorbed mainly in the duodenum and upper
jejunum, since maximum plasma concentrations were achieved fast, i.e. within 1.5 h
following the administration of folic acid doses with water which is in accordance with the
literature (after a dose of 1.1 mg of folic acid, average = 1 ± 0.5 h [31] and tmax following the
ingestion of 0.5 mg folic acid tmax = 1.5 h [30]). Also AUC0→∞ following the administration of
a 0.4 mg folic acid tablet was found to be comparable with the values reported elsewhere
[30,31], the value for serum folate after administration of 1.1 mg folic acid was found to be ∼
335 nmol/L⋅h which translates into a concentration of ~ 150 ng/mL⋅h [31]. Likewise, AUC
was calculated as 145.8 nmol/L⋅h following 0.5 mg folic acid dose that corresponds to ~ 65
ng/mL⋅h [30]. After the oral administration of 0.4 mg and 5 mg folic acid tablets with water,
the increase in the serum concentration and AUC was not linear, since administration of 5 mg
folic acid resulted in a greater than predicted Cmax and AUC. This observation might be due to
the saturation of efflux pumps for folates that limit the bioavailability, such as MRP2 or
BCRP as detailed below, or the saturation of a metabolic step during first-pass.
To reduce the variability of folate baseline levels and standardize the starting point, a
presaturation regimen and restrictions regarding diet for the standardization of baseline folate
concentrations during the study was carried out. The intraindividual CVs obtained by
repetitive analysis of baseline folate ranged between 8.21% and 19.1%. The interindividual
CVs ranged between 12.6% and 22.7%. The interindividual variability in baseline folate
concentrations even after loading doses was in the same range as that previously reported
[38]. The overall variability in kinetic parameters may be related to variability in baseline
levels and/or deviations in clearance, e.g., as a consequence of variable expression of enzymes
or transporters [39].
Potential mechanisms of tea-induced reduction in folate bioavailability
In our previous study, the apparent interaction between folic acid and green tea catechins and
tea extracts at the level of intestinal uptake - shown using an in vitro absorption model (Caco-
2 cell monolayers) - was similar to the effect of the folate antagonist MTX (used as a positive
control). A reduction in carrier-mediated inside-directed transport of folic acid in the presence
of tea extracts - as depicted in Figure 3.8 - might also lead to a decrease in uptake transport
velocity. The half-maximal inhibitory concentrations for gallated catechins, calculated from
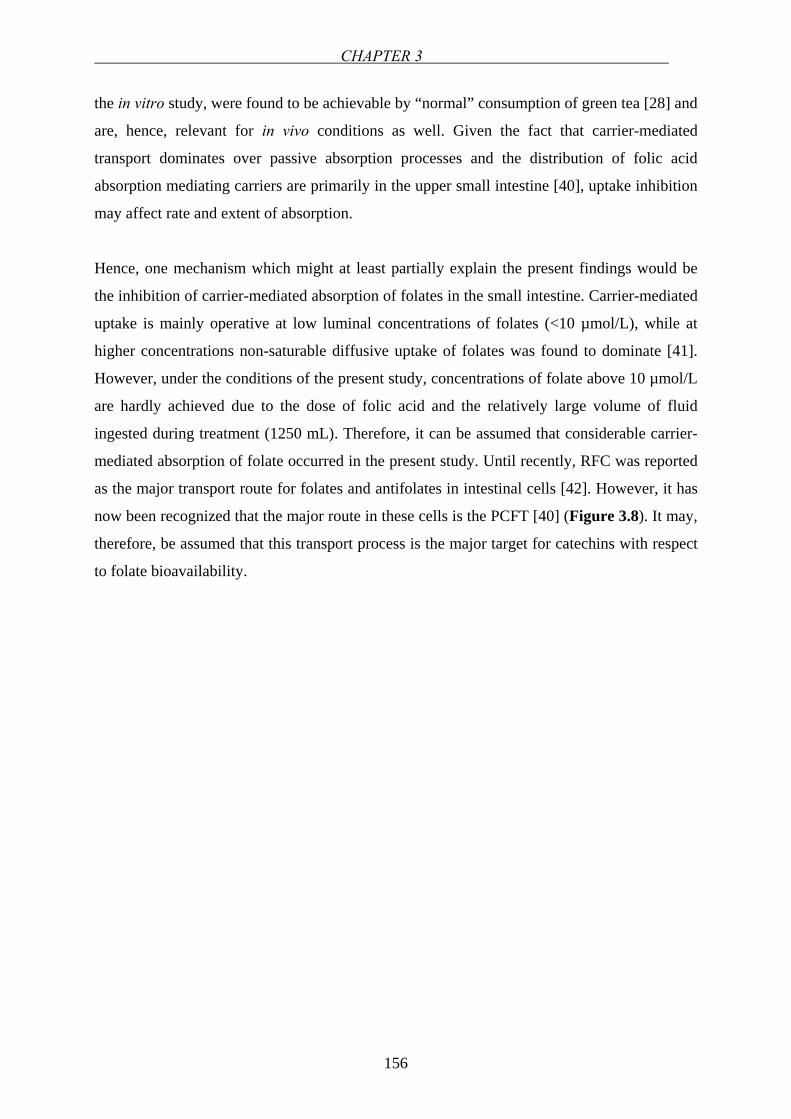
CHAPTER 3
156
the in vitro study, were found to be achievable by “normal” consumption of green tea [28] and
are, hence, relevant for in vivo conditions as well. Given the fact that carrier-mediated
transport dominates over passive absorption processes and the distribution of folic acid
absorption mediating carriers are primarily in the upper small intestine [40], uptake inhibition
may affect rate and extent of absorption.
Hence, one mechanism which might at least partially explain the present findings would be
the inhibition of carrier-mediated absorption of folates in the small intestine. Carrier-mediated
uptake is mainly operative at low luminal concentrations of folates (<10 µmol/L), while at
higher concentrations non-saturable diffusive uptake of folates was found to dominate [41].
However, under the conditions of the present study, concentrations of folate above 10 µmol/L
are hardly achieved due to the dose of folic acid and the relatively large volume of fluid
ingested during treatment (1250 mL). Therefore, it can be assumed that considerable carrier-
mediated absorption of folate occurred in the present study. Until recently, RFC was reported
as the major transport route for folates and antifolates in intestinal cells [42]. However, it has
now been recognized that the major route in these cells is the PCFT [40] (Figure 3.8). It may,
therefore, be assumed that this transport process is the major target for catechins with respect
to folate bioavailability.
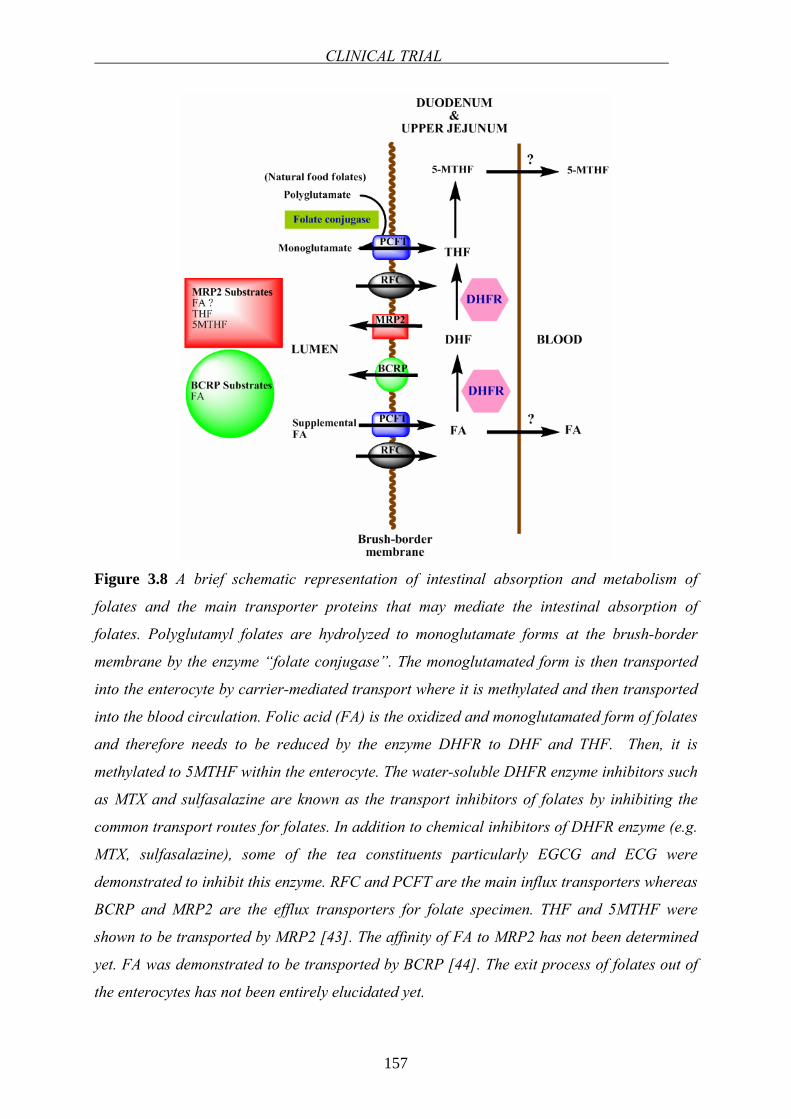
CLINICAL TRIAL
157
Figure 3.8 A brief schematic representation of intestinal absorption and metabolism of
folates and the main transporter proteins that may mediate the intestinal absorption of
folates. Polyglutamyl folates are hydrolyzed to monoglutamate forms at the brush-border
membrane by the enzyme “folate conjugase”. The monoglutamated form is then transported
into the enterocyte by carrier-mediated transport where it is methylated and then transported
into the blood circulation. Folic acid (FA) is the oxidized and monoglutamated form of folates
and therefore needs to be reduced by the enzyme DHFR to DHF and THF. Then, it is
methylated to 5MTHF within the enterocyte. The water-soluble DHFR enzyme inhibitors such
as MTX and sulfasalazine are known as the transport inhibitors of folates by inhibiting the
common transport routes for folates. In addition to chemical inhibitors of DHFR enzyme (e.g.
MTX, sulfasalazine), some of the tea constituents particularly EGCG and ECG were
demonstrated to inhibit this enzyme. RFC and PCFT are the main influx transporters whereas
BCRP and MRP2 are the efflux transporters for folate specimen. THF and 5MTHF were
shown to be transported by MRP2 [43]. The affinity of FA to MRP2 has not been determined
yet. FA was demonstrated to be transported by BCRP [44]. The exit process of folates out of
the enterocytes has not been entirely elucidated yet.
CHAPTER 3
158
Interference with intestinal metabolism of folic acid as potential additional interaction
mechanism
During absorption, folic acid is first reduced to DHF, then to THF and methylated to 5-MTHF
and this happens already inside intestinal epithelial cells (Figures 3.8). Under normal
conditions, 5-MTHF is the only folic acid derivative entering the blood circulation [30].
However, at high oral doses, folic acid may bypass the “normal” processes involved in folate
absorption and unchanged folic acid may – additionally – appear in serum [45]. A limited
metabolic capacity of intestinal epithelial cells for reduction of folic acid is regarded as the
reason for this observation (Figure 3.8).
Kelly et al. [45] had previously shown that unaltered folic acid appeared in the blood
circulation at a threshold intake of 266 µg of folic acid. Likewise, Sweeney et al. [46]
detected un-metabolized folic acid in serum even after an oral dose of 200 µg. Based on those
studies, it is most likely that in the present study unaltered folic acid contributed to the total
serum folate response. Taken into account that reduction of folic acid within the intestinal
epithelium is not a limiting factor for the absorption of total folates, the observed reduced
availability of total folate in serum is not primarily attributed to the inhibition of folate
metabolizing pathways in the intestine [47].
Possible involvement of efflux carriers
The transport routes of folates have been studied extensively [42,48-53]. In addition to the
influx transporters in intestinal cells (the RFC transporter [48] and the recently identified
PCFT transporter [40] (Figure 3.8)), folates and antifolates are exported from the cells by
different transport proteins: MRPs and BCRP were shown to mediate the efflux of folates.
MRP1-4, export folates and some antifolates out of cells [50,54-59]. Similarly, BCRP was
shown to export folates [53,60,61]. Any interaction with influx or efflux transporters that
transport folates potentially modulates the transport and absorption of folates.
The transport mechanisms of green tea catechins across human intestine have not been fully
elucidated until now, but they do appear to interact with drug transporters expressed in the
intestinal epithelium. Particularly non-gallated catechins from green tea appear to be subject
of MRP-mediated efflux [62,63]. In another study, a variety of flavonoids including EGCG
produced a significant increase in mitoxantrone (a well-known BCRP substrate) accumulation
in BCRP-overexpressing cells [64]. Inhibition of carrier-mediated absorption versus carrier-
CLINICAL TRIAL
159
mediated secretion may result in either improvement or reduction of bioavailability of a
substrate, respectively. Hence, it is concluded that the interaction mechanism of major
relevance in the case of the catechins is inhibition of carrier-mediated folate absorption.
Correlation between in vivo and in vitro results
In the previous in vitro study [28], a clear inhibition of folic acid uptake by pure catechins and
commercial tea extracts was shown. In that study, green tea extract at a concentration of 1.2
mg/mL, caused 43.5% reduction in the uptake of folic acid in Caco-2 monolayers. Moreover,
it was observed that there is an inverse relationship between the extract and/or catechin
concentration and the amount of folic acid internalized. The potency (in reducing Cmax and
AUC0→∞ values) of the same extract at the same concentration was found similar to in vitro
results. For example, in vivo at high folic acid dose, green tea extract caused 58.4% reduction
in Cmax and 43.9% decrease in AUC0→∞ for one volunteer. There may be qualitative and
quantitative differences between in vivo conditions and the in vitro system with respect to
membrane transporter and enzyme expression [65]. For example, Caco-2 cells are known to
express FRs, whereas healthy human intestinal cells are lacking those. In human small
intestine, the main transporter shown to play role is the PCFT [40]. Hence, the influx routes
involved in the transport of folates in Caco-2 cell line may be via RFC, PCFT, as well as FRs,
although the major system mediating the folate transport at low pH conditions was reported to
be PCFT [40].
Potential clinical consequences of interaction
Regardless of the mechanism leading to the decreased bioavailability of folic acid when taken
concomitantly with tea, possible consequences of this interaction should be taken seriously,
especially when high amounts of tea or tea catechins are consumed daily. Daily catechin
intake varies depending on the population as well as the tea preparation. For example, in
Germany the total catechin intake is 11 mg/day, in Scotland 59 mg/day and in Holland 72
mg/day [66]. However, in Japanese population where green tea is consumed widely, the
EGCG intake obtained only from green tea is ∼ 40 mg/day [67]. Because too low folate
concentrations have been connected to a variety of disturbances such as megaloblastic
anemia, growth retardation, hyperhomocysteinemia, and cardiovascular diseases, low
bioavailability of folic acid taken together with tea may possess vital clinical consequences.

CHAPTER 3
160
Maternal tea consumption was formerly linked to having a risk of anencephaly and spina
bifida [68]. Therefore, this interaction may have additional importance in pregnancy.
Moreover, the effect of tea on folic acid absorption may be concentration-dependent. In our
study, a low concentration of green and black tea was administered. The inhibiting potencies
of green and black tea extracts appears to increase with higher extract concentrations (in vitro
[28]), which should be subject of additional studies.
REFERENCES
161
REFERENCES
1. Izzo AA. Herb-drug interactions: an overview of the clinical evidence. Fundam Clin
Pharmacol 2005;19:1-16
2. Wang EJ, Barecki-Roach M, Johnson WW. Elevation of P-glycoprotein function by a
catechin in green tea. Biochem Biophys Res Commun 2002;297:412-418
3. Gelal A, Balkan D, Ozzeybek D, Kaplan YC, Gurler S, Guven H, Benowitz NL.
Effect of menthol on the pharmacokinetics and pharmacodynamics of felodipine in
healthy subjects. Eur J Clin Pharmacol 2005;60:785-790
4. Gurley BJ, Gardner SF, Hubbard MA, Williams DK, Gentry WB, Carrier J, Khan IA,
Edwards DJ, Shah A. In vivo assessment of botanical supplementation on human
cytochrome P450 phenotypes: Citrus aurantium, Echinacea purpurea, milk thistle, and
saw palmetto. Clin Pharmacol Ther 2004;76:428-440
5. Foster BC, Vandenhoek S, Hana J, Krantis A, Akhtar MH, Bryan M, Budzinski JW,
Ramputh A, Arnason JT. In vitro inhibition of human cytochrome P450-mediated
metabolism of marker substrates by natural products. Phytomedicine 2003;10:334-342
6. Morris ME, Zhang S. Flavonoid-drug interactions: effects of flavonoids on ABC
transporters. Life Sci 2006;78:2116-2130
7. Venkataramanan R, Komoroski B, Strom S. In vitro and in vivo assessment of herb
drug interactions. Life Sci 2006;78:2105-2115
8. Spahn-Langguth H, Langguth P. Grapefruit juice enhances intestinal absorption of the
P-glycoprotein substrate talinolol. Eur J Pharm Sci 2001;12:361-367
9. Charbit B, Becquemont L, Lepere B, Peytavin G, Funck-Brentano C. Pharmacokinetic
and pharmacodynamic interaction between grapefruit juice and halofantrine. Clin
Pharmacol Ther 2002;72:514-523
10. Di Marco MP, Edwards DJ, Wainer IW, Ducharme MP. The effect of grapefruit juice
and seville orange juice on the pharmacokinetics of dextromethorphan: the role of gut
CYP3A and P-glycoprotein. Life Sci 2002;71:1149-1160
11. Reif S, Nicolson MC, Bisset D, Reid M, Kloft C, Jaehde U, McLeod HL. Effect of
grapefruit juice intake on etoposide bioavailability. Eur J Clin Pharmacol
2002;58:491-494
12. Lilja JJ, Raaska K, Neuvonen PJ. Effects of orange juice on the pharmacokinetics of
atenolol. Eur J Clin Pharmacol 2005;61:337-340
CHAPTER 3
162
13. Lilja JJ, Juntti-Patinen L, Neuvonen PJ. Orange juice substantially reduces the
bioavailability of the beta-adrenergic-blocking agent celiprolol. Clin Pharmacol Ther
2004;75:184-190
14. Jang EH, Choi JY, Park CS, Lee SK, Kim CE, Park HJ, Kang JS, Lee JW, Kang JH.
Effects of green tea extract administration on the pharmacokinetics of clozapine in
rats. J Pharm Pharmacol 2005;57:311-316
15. Grenier J, Fradette C, Morelli G, Merritt GJ, Vranderick M, Ducharme MP. Pomelo
juice, but not cranberry juice, affects the pharmacokinetics of cyclosporine in humans.
Clin Pharmacol Ther 2006;79:255-262
16. Greenblatt DJ, von Moltke LL, Perloff ES, Luo Y, Harmatz JS, Zinny MA. Interaction
of flurbiprofen with cranberry juice, grape juice, tea, and fluconazole: in vitro and
clinical studies. Clin Pharmacol Ther 2006;79:125-133
17. Deferme S, Augustijns P. The effect of food components on the absorption of P-gp
substrates: a review. J Pharm Pharmacol 2003;55:153-162
18. Deferme S, Van Gelder J, Augustijns P. Inhibitory effect of fruit extracts on P-
glycoprotein-related efflux carriers: an in-vitro screening. J Pharm Pharmacol
2002;54:1213-1219
19. Mukhtar H, Ahmad N. Tea polyphenols: prevention of cancer and optimizing health.
Am J Clin Nutr 2000;71:1698S-1702S; discussion 1703S-1694S
20. Cooper R, Morre DJ, Morre DM. Medicinal benefits of green tea: Part I. Review of
noncancer health benefits. J Altern Complement Med 2005;11:521-528
21. Lucock M. Folic acid: nutritional biochemistry, molecular biology, and role in disease
processes. Mol Genet Metab 2000;71:121-138
22. Green NS. Folic acid supplementation and prevention of birth defects. J Nutr
2002;132:2356S-2360S
23. Berry RJ, Li Z, Erickson JD, Li S, Moore CA, Wang H, Mulinare J, Zhao P, Wong
LY, Gindler J, Hong SX, Correa A. Prevention of neural-tube defects with folic acid
in China. China-U.S. Collaborative Project for Neural Tube Defect Prevention. N Engl
J Med 1999;341:1485-1490
24. Moat SJ, Lang D, McDowell IF, Clarke ZL, Madhavan AK, Lewis MJ, Goodfellow J.
Folate, homocysteine, endothelial function and cardiovascular disease. J Nutr
Biochem 2004;15:64-79
25. Duthie SJ, Narayanan S, Blum S, Pirie L, Brand GM. Folate deficiency in vitro
induces uracil misincorporation and DNA hypomethylation and inhibits DNA excision
REFERENCES
163
repair in immortalized normal human colon epithelial cells. Nutrition and cancer
2000;37:245-251
26. Voutilainen S, Rissanen TH, Virtanen J, Lakka TA, Salonen JT. Low dietary folate
intake is associated with an excess incidence of acute coronary events - The Kuopio
Ischemic Heart Disease Risk Factor Study. Circulation 2001;103:2674-2680
27. de Bree A, van Dusseldorp M, Brouwer IA, van het Hof KH, Steegers-Theunissen RP.
Folate intake in Europe: recommended, actual and desired intake. Eur J Clin Nutr
1997;51:643-660
28. Alemdaroglu NC, Wolffram S, Boissel JP, Closs E, Spahn-Langguth H, Langguth P.
Inhibition of folic acid uptake by catechins and tea extracts in Caco-2 cells. Planta
Med 2007;73:27-32
29. Kratz A, Ferraro M, Sluss PM, Lewandrowski KB. Case records of the Massachusetts
General Hospital. Weekly clinicopathological exercises. Laboratory reference values.
N Engl J Med 2004;351:1548-1563
30. Pentieva K, McNulty H, Reichert R, Ward M, Strain JJ, McKillop DJ, McPartlin JM,
Connolly E, Molloy A, Kramer K, Scott JM. The short-term bioavailabilities of [6S]-
5-methyltetrahydrofolate and folic acid are equivalent in men. J Nutr 2004;134:580-
585
31. Ahn E, Kapur B, Koren G. Study on circadian variation in folate pharmacokinetics.
Can J Clin Pharmacol 2005;12:e4-9
32. Prinz-Langenohl R, Bronstrup A, Thorand B, Hages M, Pietrzik K. Availability of
food folate in humans. J Nutr 1999;129:913-916
33. Hiraoka M. Folate intake, serum folate, serum total homocysteine levels and
methylenetetrahydrofolate reductase C677T polymorphism in young Japanese women.
J Nutr Sci Vitaminol (Tokyo) 2004;50:238-245
34. Wright AJ, Finglas PM, Dainty JR, Hart DJ, Wolfe CA, Southon S, Gregory JF.
Single oral doses of 13C forms of pteroylmonoglutamic acid and 5-
formyltetrahydrofolic acid elicit differences in short-term kinetics of labelled and
unlabelled folates in plasma: potential problems in interpretation of folate
bioavailability studies. Br J Nutr 2003;90:363-371
35. Wagner JG. Fundamentals of clinical pharmacokinetics. 2nd ed. Hamilton: Drug
Intelligence Publications Inc.; 1979
36. Netsch MI, Gutmann H, Schmidlin CB, Aydogan C, Drewe J. Induction of CYP1A by
green tea extract in human intestinal cell lines. Planta Med 2006;72:514-520
CHAPTER 3
164
37. Vaidyanathan JB, Walle T. Cellular uptake and efflux of the tea flavonoid (-
)epicatechin-3-gallate in the human intestinal cell line Caco-2. J Pharmacol Exp Ther
2003;307:745-752
38. Brown JP, Scott JM, Foster FG, Weir DG. Ingestion and absorption of naturally
occurring pteroylmonoglutamates (folates) in man. Gastroenterology 1973;64:223-232
39. Berggren S, Gall C, Wollnitz N, Ekelund M, Karlbom U, Hoogstraate J, Schrenk D,
Lennernas H. Gene and Protein Expression of P-Glycoprotein, MRP1, MRP2, and
CYP3A4 in the Small and Large Human Intestine. Mol Pharm 2007;4:252-257
40. Qiu A, Jansen M, Sakaris A, Min SH, Chattopadhyay S, Tsai E, Sandoval C, Zhao R,
Akabas MH, Goldman ID. Identification of an intestinal folate transporter and the
molecular basis for hereditary folate malabsorption. Cell 2006;127:917-928
41. Brouwer IA, van Dusseldorp M, West CE, Steegers-Theunissen RPM. Bioavailability
and bioefficacy of folate and folic acid in man. Nutrition Research Reviews
2001;14:267-293
42. Rajgopal A, Sierra EE, Zhao R, Goldman ID. Expression of the reduced folate carrier
SLC19A1 in IEC-6 cells results in two distinct transport activities. Am J Physiol Cell
Physiol 2001;281:C1579-1586
43. Assaraf YG. The role of multidrug resistance efflux transporters in antifolate
resistance and folate homeostasis. Drug Resist Updat 2006;9:227-246
44. Chen ZS, Robey RW, Belinsky MG, Shchaveleva I, Ren XQ, Sugimoto Y, Ross DD,
Bates SE, Kruh GD. Transport of methotrexate, methotrexate polyglutamates, and
17beta-estradiol 17-(beta-D-glucuronide) by ABCG2: effects of acquired mutations at
R482 on methotrexate transport. Cancer Res 2003;63:4048-4054
45. Kelly P, McPartlin J, Goggins M, Weir DG, Scott JM. Unmetabolized folic acid in
serum: acute studies in subjects consuming fortified food and supplements. Am J Clin
Nutr 1997;65:1790-1795
46. Sweeney MR, McPartlin J, Weir DG, Scott JM. Measurements of sub-nanomolar
concentrations of unmetabolised folic acid in serum. Journal of Chromatography B-
Analytical Technologies in the Biomedical and Life Sciences 2003;788:187-191
47. Navarro-Peran E, Cabezas-Herrera J, Garcia-Canovas F, Durrant MC, Thorneley RN,
Rodriguez-Lopez JN. The antifolate activity of tea catechins. Cancer Res
2005;65:2059-2064
48. Matherly LH, Goldman DI. Membrane transport of folates. Vitam Horm 2003;66:403-
456
REFERENCES
165
49. Sirotnak FM, Tolner B. Carrier-mediated membrane transport of folates in mammalian
cells. Annu Rev Nutr 1999;19:91-122
50. Zeng H, Chen ZS, Belinsky MG, Rea PA, Kruh GD. Transport of methotrexate
(MTX) and folates by multidrug resistance protein (MRP) 3 and MRP1: effect of
polyglutamylation on MTX transport. Cancer Res 2001;61:7225-7232
51. Spinella MJ, Brigle KE, Sierra EE, Goldman ID. Distinguishing between Folate
Receptor-Alpha-Mediated Transport and Reduced Folate Carrier-Mediated Transport
in L1210 Leukemia-Cells. Journal of Biological Chemistry 1995;270:7842-7849
52. Said HM, Nguyen TT, Dyer DL, Cowan KH, Rubin SA. Intestinal folate transport:
identification of a cDNA involved in folate transport and the functional expression and
distribution of its mRNA. Biochim Biophys Acta 1996;1281:164-172
53. Ifergan I, Shafran A, Jansen G, Hooijberg JH, Scheffer GL, Assaraf YG. Folate
deprivation results in the loss of breast cancer resistance protein (BCRP/ABCG2)
expression. A role for BCRP in cellular folate homeostasis. J Biol Chem
2004;279:25527-25534
54. Hooijberg JH, Jansen G, Assaraf YG, Kathmann I, Pieters R, Laan AC, Veerman AJ,
Kaspers GJ, Peters GJ. Folate concentration dependent transport activity of the
Multidrug Resistance Protein 1 (ABCC1). Biochem Pharmacol 2004;67:1541-1548
55. Assaraf YG, Rothem L, Hooijberg JH, Stark M, Ifergan I, Kathmann I, Dijkmans BA,
Peters GJ, Jansen G. Loss of multidrug resistance protein 1 expression and folate
efflux activity results in a highly concentrative folate transport in human leukemia
cells. J Biol Chem 2003;278:6680-6686
56. Kusuhara H, Han YH, Shimoda M, Kokue E, Suzuki H, Sugiyama Y. Reduced folate
derivatives are endogenous substrates for cMOAT in rats. Am J Physiol
1998;275:G789-796
57. Hooijberg JH, Broxterman HJ, Kool M, Assaraf YG, Peters GJ, Noordhuis P, Scheper
RJ, Borst P, Pinedo HM, Jansen G. Antifolate resistance mediated by the multidrug
resistance proteins MRP1 and MRP2. Cancer Res 1999;59:2532-2535
58. Zeng H, Liu G, Rea PA, Kruh GD. Transport of amphipathic anions by human
multidrug resistance protein 3. Cancer Res 2000;60:4779-4784
59. Hooijberg JH, Peters GJ, Assaraf YG, Kathmann I, Priest DG, Bunni MA, Veerman
AJ, Scheffer GL, Kaspers GJ, Jansen G. The role of multidrug resistance proteins
MRP1, MRP2 and MRP3 in cellular folate homeostasis. Biochem Pharmacol
2003;65:765-771
CHAPTER 3
166
60. Xia CQ, Liu N, Yang D, Miwa G, Gan LS. Expression, localization, and functional
characteristics of breast cancer resistance protein in Caco-2 cells. Drug Metab Dispos
2005;33:637-643
61. Fromm MF, Kauffmann HM, Fritz P, Burk O, Kroemer HK, Warzok RW, Eichelbaum
M, Siegmund W, Schrenk D. The effect of rifampin treatment on intestinal expression
of human MRP transporters. Am J Pathol 2000;157:1575-1580
62. Zhang L, Zheng Y, Chow MS, Zuo Z. Investigation of intestinal absorption and
disposition of green tea catechins by Caco-2 monolayer model. Int J Pharm
2004;287:1-12
63. Vaidyanathan JB, Walle T. Transport and metabolism of the tea flavonoid (-)-
epicatechin by the human intestinal cell line Caco-2. Pharm Res 2001;18:1420-1425
64. Zhang S, Yang X, Morris ME. Flavonoids are inhibitors of breast cancer resistance
protein (ABCG2)-mediated transport. Mol Pharmacol 2004;65:1208-1216
65. Seithel A, Karlsson J, Hilgendorf C, Bjorquist A, Ungell AL. Variability in mRNA
expression of ABC- and SLC-transporters in human intestinal cells: comparison
between human segments and Caco-2 cells. Eur J Pharm Sci 2006;28:291-299
66. Graf BA, Milbury PE, Blumberg JB. Flavonols, flavones, flavanones, and human
health: epidemiological evidence. J Med Food 2005;8:281-290
67. Arai Y, Watanabe S, Kimira M, Shimoi K, Mochizuki R, Kinae N. Dietary intakes of
flavonols, flavones and isoflavones by Japanese women and the inverse correlation
between quercetin intake and plasma LDL cholesterol concentration. J Nutr
2000;130:2243-2250
68. Correa A, Stolley A, Liu Y. Prenatal tea consumption and risks of anencephaly and
spina bifida. Ann Epidemiol 2000;10:476-477
CHAPTER FOUR
TARGETING OF DNA BLOCK COPOLYMER MICELLES TO FOLATE
RECEPTORS: A NEW SYSTEM FOR SELECTIVE DRUG DELIVERY TO
FRα EXPRESSING CANCER CELLS

CHAPTER 4
168
TARGETING TO FOLATE RECEPTORS
169
4.1 INTRODUCTION1,2
Selective drug targeting of a specific organ or tissue is a challenging task. This holds
especially true for chemotherapeutic cancer treatment because most of the available
anticancer agents cannot distinguish between cancerous and healthy cells, leading to systemic
toxicity and undesirable side effects. An ideal targeted drug delivery approach would not only
increase therapeutic efficacy of drugs but also decrease the toxicity associated with drug to
allow lower doses of the drug to be used in therapy [1]. One effective approach to address this
problem is the application of polymeric nanoparticles equipped with targeting units for tumor-
specific delivery [2]. For instance dendrimers, highly branched macromolecules, can be
equipped with targeting units as well as with anticancer drugs due to their high number of
surface functionalities [3]. Amphiphilic block copolymers, which self-assemble in dilute
aqueous solutions into three-dimensional spherical micelles with a hydrophilic corona and a
hydrophobic core, are another attractive option. These nanosized objects, with a typical size
of 10 - 100 nm, are able to accommodate lipophilic drugs in their interior and alter their
kinetics in vitro and in vivo [4]. Different polymeric systems such as shell cross-linked
nanoparticles [5], poly(D,L-lactic-co-glycolic acid)-b-poly(ethylene glycol) [6], poly(ethylene
glycol-b-caprolactone) [7], block copolymers and poly(N-isopropylacrylamide acrylic acid)
[8] microgels have also been successfully utilized in combination with targeting units.
FRs, which are highly expressed on the surface of various cancer cells, emerged as new
targets for specific localization of chemotherapeutics incorporated into nanoparticle systems.
The family of FRs currently consists of three known isoforms: FRα, FRβ and FRγ [9]. FRα is
expressed primarily in cancer cells such as ovarian, testicular, breast, colon, renal and
malignant nasopharyngeal carcinomas [10-13]. FRs mediate the cellular uptake of folates with
high affinity to folic acid (see Chapter 1 for details). Folate targeted drug delivery has
emerged as an alternative therapy for the treatment and imaging of many cancers and
inflammatory diseases. Due to its small molecular size and high binding affinity for cell
surface FRs, folate conjugates have the ability to deliver a variety of molecular complexes to
pathologic cells without causing harm to normal tissues [14].
1 The work described in this chapter was carried out together with Fikri E. Alemdaroglu in the group of Dr. Andreas Herrmann at the Max Planck Insitute for Polymer Research in Mainz. 2 Parts of this chapter have been accepted for publication in Advanced Materials. (May 2007)
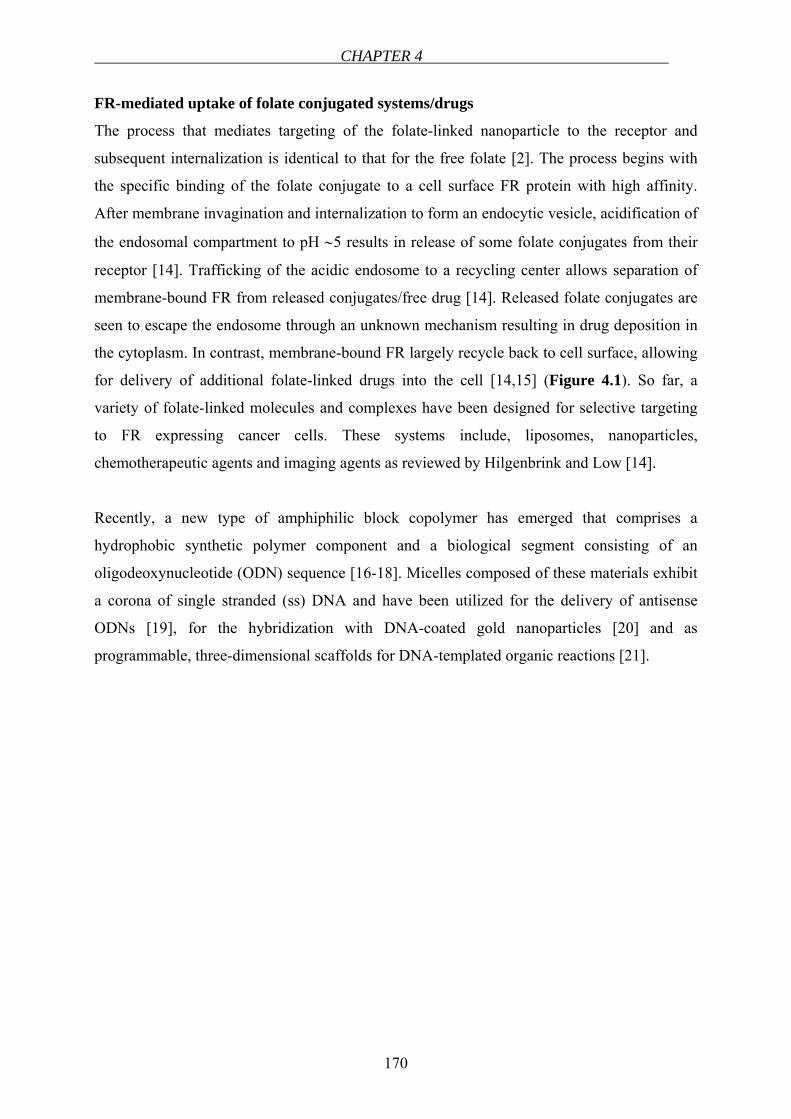
CHAPTER 4
170
FR-mediated uptake of folate conjugated systems/drugs
The process that mediates targeting of the folate-linked nanoparticle to the receptor and
subsequent internalization is identical to that for the free folate [2]. The process begins with
the specific binding of the folate conjugate to a cell surface FR protein with high affinity.
After membrane invagination and internalization to form an endocytic vesicle, acidification of
the endosomal compartment to pH ∼5 results in release of some folate conjugates from their
receptor [14]. Trafficking of the acidic endosome to a recycling center allows separation of
membrane-bound FR from released conjugates/free drug [14]. Released folate conjugates are
seen to escape the endosome through an unknown mechanism resulting in drug deposition in
the cytoplasm. In contrast, membrane-bound FR largely recycle back to cell surface, allowing
for delivery of additional folate-linked drugs into the cell [14,15] (Figure 4.1). So far, a
variety of folate-linked molecules and complexes have been designed for selective targeting
to FR expressing cancer cells. These systems include, liposomes, nanoparticles,
chemotherapeutic agents and imaging agents as reviewed by Hilgenbrink and Low [14].
Recently, a new type of amphiphilic block copolymer has emerged that comprises a
hydrophobic synthetic polymer component and a biological segment consisting of an
oligodeoxynucleotide (ODN) sequence [16-18]. Micelles composed of these materials exhibit
a corona of single stranded (ss) DNA and have been utilized for the delivery of antisense
ODNs [19], for the hybridization with DNA-coated gold nanoparticles [20] and as
programmable, three-dimensional scaffolds for DNA-templated organic reactions [21].
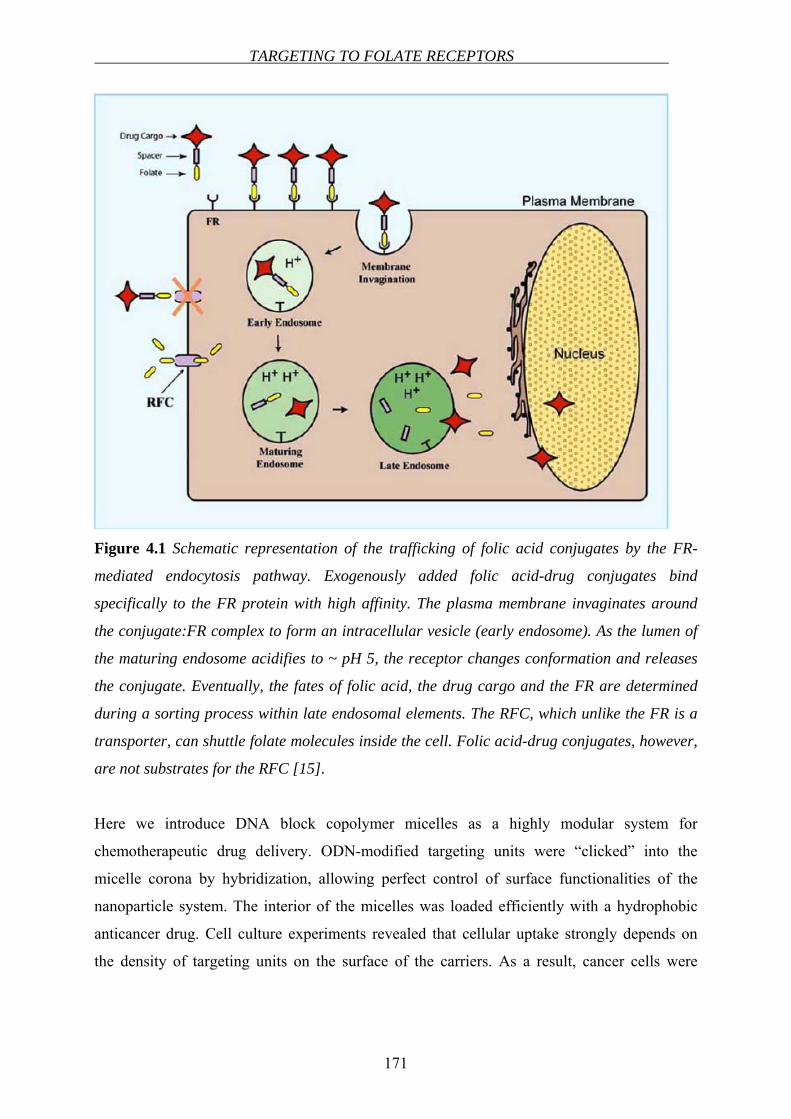
TARGETING TO FOLATE RECEPTORS
171
Figure 4.1 Schematic representation of the trafficking of folic acid conjugates by the FR-
mediated endocytosis pathway. Exogenously added folic acid-drug conjugates bind
specifically to the FR protein with high affinity. The plasma membrane invaginates around
the conjugate:FR complex to form an intracellular vesicle (early endosome). As the lumen of
the maturing endosome acidifies to ~ pH 5, the receptor changes conformation and releases
the conjugate. Eventually, the fates of folic acid, the drug cargo and the FR are determined
during a sorting process within late endosomal elements. The RFC, which unlike the FR is a
transporter, can shuttle folate molecules inside the cell. Folic acid-drug conjugates, however,
are not substrates for the RFC [15].
Here we introduce DNA block copolymer micelles as a highly modular system for
chemotherapeutic drug delivery. ODN-modified targeting units were “clicked” into the
micelle corona by hybridization, allowing perfect control of surface functionalities of the
nanoparticle system. The interior of the micelles was loaded efficiently with a hydrophobic
anticancer drug. Cell culture experiments revealed that cellular uptake strongly depends on
the density of targeting units on the surface of the carriers. As a result, cancer cells were
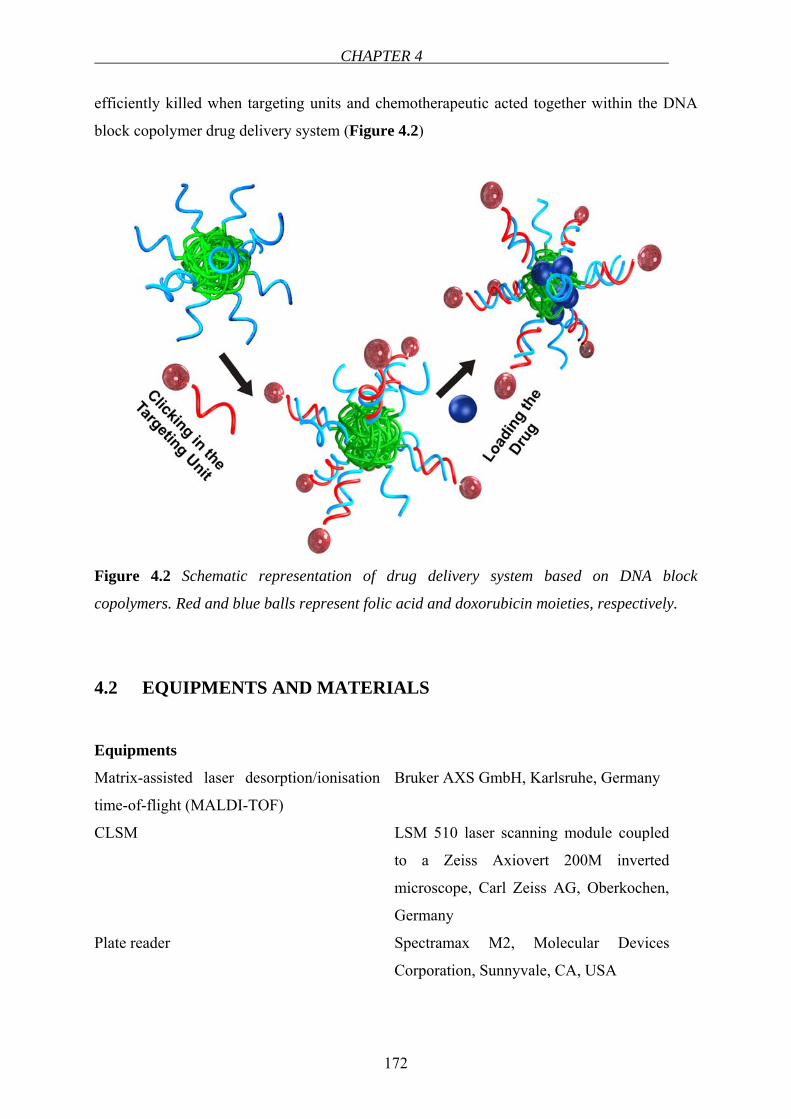
CHAPTER 4
172
efficiently killed when targeting units and chemotherapeutic acted together within the DNA
block copolymer drug delivery system (Figure 4.2)
Figure 4.2 Schematic representation of drug delivery system based on DNA block
copolymers. Red and blue balls represent folic acid and doxorubicin moieties, respectively.
4.2 EQUIPMENTS AND MATERIALS
Equipments
Matrix-assisted laser desorption/ionisation
time-of-flight (MALDI-TOF)
Bruker AXS GmbH, Karlsruhe, Germany
CLSM LSM 510 laser scanning module coupled
to a Zeiss Axiovert 200M inverted
microscope, Carl Zeiss AG, Oberkochen,
Germany
Plate reader Spectramax M2, Molecular Devices
Corporation, Sunnyvale, CA, USA
TARGETING TO FOLATE RECEPTORS
173
6-well plate NunclonTM Multidishes, Nunc, Life
Technologies GmbH, Karlsruhe, Germany
96-well plate Greiner Bio-One GmbH, Frickenhausen,
Germany
Chamber slides Lab-Tek® Chamber Slide System, Nunc,
Germany
Materials
Caco-2 cells were obtained from DSMZ (Deutsche Sammlung von Mikroorganismen und
Zellkulturen GmbH, Braunschweig, Germany). All the cell culture media and supplements
were purchased from Biochrom AG (Berlin, Germany). HEPES was provided from Merck
(Darmstadt, Germany). XTT based toxicology assay kit was purchased from Sigma-Aldrich
Chemie GmbH, Steinheim, Germany.
4.3 METHODS
Preparation of DNA block copolymer micelles
DNA block copolymer micelles were prepared in the group of Dr. Andreas Herrmann at the
Max Planck Institute for Polymer Research according to the following procedure:
Polypropylene oxide (PPO) was selected as the hydrophobic component of the DNA block
copolymer to provide a polymer with proven biocompatibility toward different cell types
when administered as a constituent component of amphiphilic block copolymer micelles [22].
For the generation of the DNA-b-PPO copolymer, a phosphoramidite-functionalized PPO
(Mn = 6800 g/mol) was synthesized and attached to the 5’ terminus of the nucleic acid
fragment (5’-CCTCGCTCTGCTAATCCTGTTA-3’, 22mer, Mw = 6700 g/mol) via
automated solid phase synthesis as reported previously [21]. The resulting block copolymer
was analyzed and purified by denaturing polyacrylamide gel electrophoresis (PAGE) and the
molecular weight confirmed by MALDI-TOF mass spectrometry (see Appendix). Dynamic
Light Scattering (DLS) measurements of the DNA block copolymer aggregates revealed the
formation of uniform micelles of diameter 10.8 ± 2.2 nm consistent with previous findings
[18,21]. For equipping these micelles with targeting units 5’- and 3’-amino-modified ODNs
CHAPTER 4
174
that encode the complementary sequence of DNA-b-PPO were reacted with folic acid in the
presence of DMT-MM [23] and purified by PAGE to generate the corresponding folic acid-
functionalized ODNs in 65 % yield. These conjugates can be hybridized with the micelles so
that the folic acid is either positioned at the periphery (5’) or in the core (3’) of the
nanoparticle.
Cell culture studies
Human colon adenocarcinoma (Caco-2) cells were employed as a cancerous cell line to study
the uptake of the differently decorated DNA block copolymer micelles since they have
already been used as a model to study nanoparticle uptake [24]. Moreover, their folic acid
uptake has been characterized previously [25]. The availability of three known genes for folic
acid transport, i.e. RFC, FRα and FRβ, were examined and their relative gene expression
levels measured by real-time polymerase chain reaction (see Chapter 2.2).
Preparation of Caco-2 monolayers for uptake studies
Caco-2 cells at passage 45 were cultured routinely according to the description in Chapter
2.1. The cells were routinely split and seeded into 6-well plates with 800.000 cells/well. The
medium was changed three times a week. The development of the monolayers was examined
under the microscope until the 21st day. Then the monolayer cultures were used for uptake
studies.
Before analyzing the uptake of DNA block copolymer micelles, their in vitro cytotoxicity was
determined based on the XTT cell proliferation assay (see Chapter 2 for details and below for
the procedure). The Caco-2 cells were incubated with different concentrations of DNA-b-PPO
copolymer and their folic acid-functionalized derivatives. Motivated by the non-toxic nature
of the nanoparticles, we proceeded to study their uptake into Caco-2 cells. For tracking
purposes 4% of the nanoparticles were additionally labelled with a fluorescent dye: PPO-b-
DNA micelles were hybridised with 3’-Alexa488-functionalized oligonucleotides encoding
the complementary sequence of the DNA corona so that the dye was located in the interior.
These micelles were then administered to the folate receptor-bearing Caco-2 cells.
Cytotoxicity Assay
For the determination of the toxicity of the micelles, Caco-2 cells were seeded in 96-well
plates at a concentration of 2500 cells/well. The cytotoxicity of the nanoparticles was checked
TARGETING TO FOLATE RECEPTORS
175
using an XTT in vitro toxicology assay kit following the procedure of the manufacturer. On
the 21st day post-seeding, the cell monolayers were washed once with HBSS containing 5
mmol/L HEPES adjusted to pH 7.4. Cells were incubated with different micelle solutions at a
DNA-b-PPO concentration of 325 µg/mL for 3 h at 37°C (in the case of doxorubicin-loaded
micelles, 24 h of incubation time was employed). After the incubation period, the medium
was removed, monolayers were washed once with the buffer solution and the reconstituted
XTT was added into each well with a volume of 100 µL and incubated for 2 h at 37°C.
Subsequently, absorbance was measured at a wavelength of 450 nm. A reference
measurement was also taken at a wavelength of 690 nm and subtracted from the measurement
at 450 nm. The cytotoxicity of folic acid conjugated nanoparticles were compared with the
cells without any treatment (control).
Uptake experiment
Caco-2 cells at passage 57 were seeded on 6-well plates with a density of 800,000 cells/well.
The medium in each well was changed every other day. On day 21, the medium was removed
and monolayers washed twice with HBSS containing 5 mmol/L HEPES adjusted to pH 7.4.
Incubation mixtures were prepared in pH 7.4 HBSS buffer at a DNA-b-PPO concentration of
325 µg/mL for Out 28, Out 11, Out 2, In 28, In 11 and In 2. After incubating with 2 mL of
micelle solutions for 3 h at 37°C on a rotating shaker at 50 rpm, incubation solutions were
removed and the monolayers were washed five times with ice-cold HBSS (pH 7.4).
Subsequently, cells in each well were lyzed with 0.6 mL of NaOH (1.25 mmol/L), cell lysates
were transferred into eppendorf tubes and shaken overnight at room temperature. The next
day, lysates were centrifuged and the fluorescence content of the supernatant in each tube was
measured (Exc: 500 nm, Em: 595 nm). Experiments were carried out in triplicates and the
resulting data were expressed as % of control (without any targeting unit).
The internalization of the micelles was determined by confocal laser scanning microscopy
(CLSM) and, after lysing the cells, by fluorescence spectroscopy. The latter method offers the
possibility to quantitatively compare the uptake of nanoparticles.
CHAPTER 4
176
Confocal laser scanning microscopy3
CLSM has proven to be a powerful tool for acquiring high resolution images, 3-D
reconstructions and visualisations of internalization of nanoparticles [26-29]. For the
microscopy analysis, Caco-2 cells were seeded at a density of 20,000 cells/cm2 on chamber
slides (Lab-Tek® Chamber Slide System, Nunc, Germany). The cell monolayers were
incubated with 325 µg/mL of the DNA-b-PPO labeled with Alexa488 for 3 h, washed 5 times
with pH 7.4 HBSS and after the addition of 100 µL of buffer the monolayers were analyzed
with confocal laser scanning microscopy (excitation 488nm).
Doxorubicin-loaded micelles
After the optimization of the targeting properties of the nanoparticles, the cytotoxicity of
DNA block copolymer micelles loaded with the widely used anticancer drug doxorubicin was
investigated. Doxorubicin is known to have side effects such as cardiotoxicity and
myelosuppression, therefore targeted delivery is vital [8]. The preparation of doxorubicin-
loaded micelles and the determination of loading content were carried out according to the
literature [30]. Briefly, DNA-b-PPO (5 mg) and doxorubicin (1 mg) were dissolved in
tetrahydrofuran (1 mL) in a glass vial. Afterwards, the solution was added dropwise to pure
water (8 mL) under vigorous stirring by using a magnetic stirrer. Tetrahydrofuran was
removed and the solution was concentrated to 5 mL under vacuum. It was then filtered and
dialyzed against MQ-water (Mw cut-off: 10,000 g/mol) to remove free doxorubicin dissolved
in the solution. Subsequently, the solution was freeze dried and the solid residue was
dissolved in the buffer (HBSS containing 5 mmol/L HEPES adjusted to pH 7.4) for the uptake
experiments.
The viability of Caco-2 cells after 24h incubation with doxorubicin-loaded DNA block
copolymer micelles was compared with several control experiments. The percentage of
surviving cells was acquired using a XTT cell proliferation assay.
3 CLSM visualization was carried out in collaboration with Dr. K. Koynov at the Max Planck Institute for Polymer Research in Mainz.
TARGETING TO FOLATE RECEPTORS
177
4.4 RESULTS AND DISCUSSION
In order to study the effect of folic acid density and position within the nanoparticles on the
targeting efficiency, DNA-b-PPO copolymers were hybridized in different ratios with the
targeting unit-bearing oligonucleotides. This convenient procedure resulted in micelles with
on average 2, 11 or 28 (fully hybridized) folic acids either at the periphery or at the
hydrophobic-hydrophilic interface of the micelles. The dimensions of the micelles were again
assessed by DLS, which revealed maintenance of their narrow size distribution. Moreover, the
diameter of the micelles was found to increase slightly with an increase in the number of folic
acid units. For 2, 11 and 28 folic acid moieties at the rim, micelle diameters of 11.2 ± 1.6 nm,
13.2 ± 2.4 nm and 14.4 ± 2.2 nm were measured, respectively. When folic acid is positioned
inside, diameters of 11.2 ± 1.8 nm, 12.2 ± 2.4 nm and 12.2 ± 2.0 nm were detected for the
same folic acid densities. Importantly, the nanoparticles were on the order of 10 nm, an
important design criterion for efficient tumor cell-specific delivery [31]. Although it has been
proven that polymer particles in the range of 100 nm exit the vasculature and enter tumor
tissue through a process known as the enhanced permeability and retention (EPR) effect [32-
34], it is in some cases favorable to make use of delivery independent of fenestrate pore cutoff
size. This can occur when particles have a diameter of less than 10 nm, as do albumin
molecules [35]. This is supported by recent computer simulations of cancer progression at the
tumoral level [36]. It was demonstrated that nanoparticles with a size range of 1-10 nm
diffuse directly and target the individual cell, which results in improved tumor response.
According to PCR experiments the three analyzed genes are expressed at different levels. The
Caco-2 cells express a high level of FRα, which is consistent with previous findings [9,37]
(see Chapter 2.2). FRα is also highly expressed in other solid epithelial tumors such as
ovarian carcinoma and mesothelioma. Thus this cell line is well suited to act as a model to
study the effect of targeting cancerous cells. According to the results of the XTT based in
vitro toxicology assay, viabilities of all treatment groups were above 75% when compared to
control (Figure 4.3).
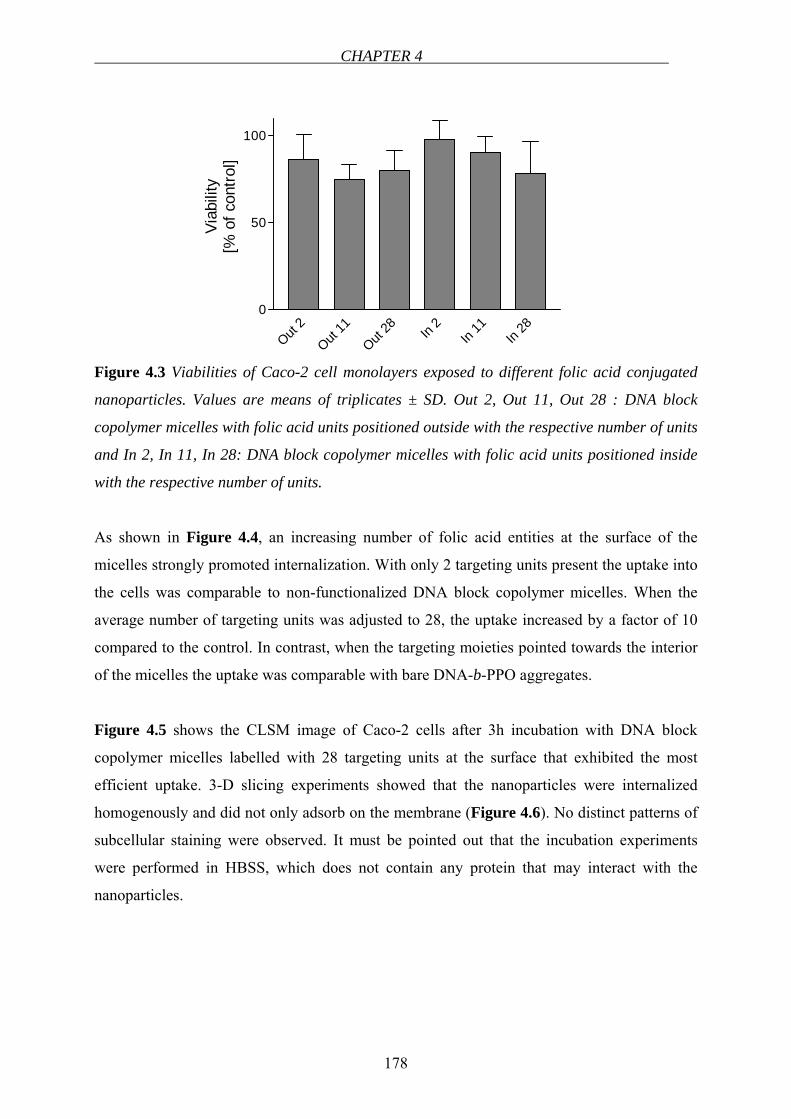
CHAPTER 4
178
Out 2
Out 11
Out 28 In
2In
11In
280
50
100
Viab
ility
[% o
f con
trol]
Figure 4.3 Viabilities of Caco-2 cell monolayers exposed to different folic acid conjugated
nanoparticles. Values are means of triplicates ± SD. Out 2, Out 11, Out 28 : DNA block
copolymer micelles with folic acid units positioned outside with the respective number of units
and In 2, In 11, In 28: DNA block copolymer micelles with folic acid units positioned inside
with the respective number of units.
As shown in Figure 4.4, an increasing number of folic acid entities at the surface of the
micelles strongly promoted internalization. With only 2 targeting units present the uptake into
the cells was comparable to non-functionalized DNA block copolymer micelles. When the
average number of targeting units was adjusted to 28, the uptake increased by a factor of 10
compared to the control. In contrast, when the targeting moieties pointed towards the interior
of the micelles the uptake was comparable with bare DNA-b-PPO aggregates.
Figure 4.5 shows the CLSM image of Caco-2 cells after 3h incubation with DNA block
copolymer micelles labelled with 28 targeting units at the surface that exhibited the most
efficient uptake. 3-D slicing experiments showed that the nanoparticles were internalized
homogenously and did not only adsorb on the membrane (Figure 4.6). No distinct patterns of
subcellular staining were observed. It must be pointed out that the incubation experiments
were performed in HBSS, which does not contain any protein that may interact with the
nanoparticles.
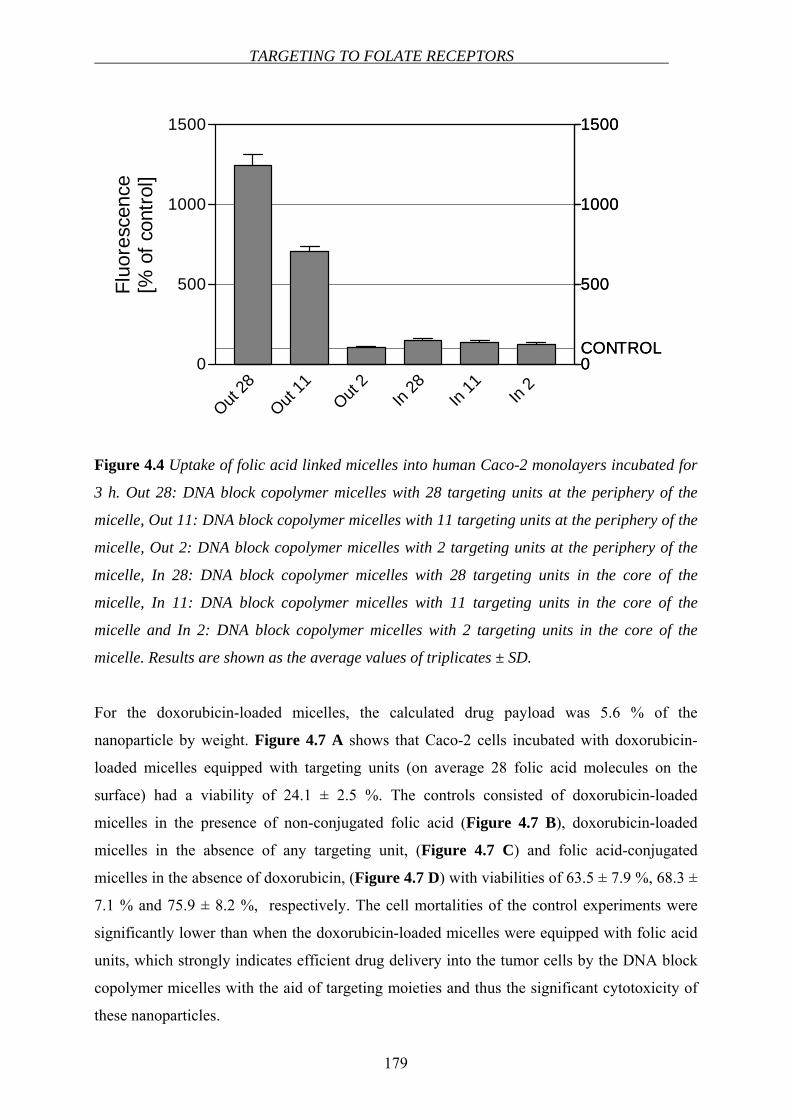
TARGETING TO FOLATE RECEPTORS
179
0
500
1000
1500
CONTROL
Out 28
Out 11
Out 2
In 28
In 11 In
2 0
500
1000
1500
0
500
1000
1500
CONTROL
Fluo
resc
ence
[% o
f con
trol]
Figure 4.4 Uptake of folic acid linked micelles into human Caco-2 monolayers incubated for
3 h. Out 28: DNA block copolymer micelles with 28 targeting units at the periphery of the
micelle, Out 11: DNA block copolymer micelles with 11 targeting units at the periphery of the
micelle, Out 2: DNA block copolymer micelles with 2 targeting units at the periphery of the
micelle, In 28: DNA block copolymer micelles with 28 targeting units in the core of the
micelle, In 11: DNA block copolymer micelles with 11 targeting units in the core of the
micelle and In 2: DNA block copolymer micelles with 2 targeting units in the core of the
micelle. Results are shown as the average values of triplicates ± SD.
For the doxorubicin-loaded micelles, the calculated drug payload was 5.6 % of the
nanoparticle by weight. Figure 4.7 A shows that Caco-2 cells incubated with doxorubicin-
loaded micelles equipped with targeting units (on average 28 folic acid molecules on the
surface) had a viability of 24.1 ± 2.5 %. The controls consisted of doxorubicin-loaded
micelles in the presence of non-conjugated folic acid (Figure 4.7 B), doxorubicin-loaded
micelles in the absence of any targeting unit, (Figure 4.7 C) and folic acid-conjugated
micelles in the absence of doxorubicin, (Figure 4.7 D) with viabilities of 63.5 ± 7.9 %, 68.3 ±
7.1 % and 75.9 ± 8.2 %, respectively. The cell mortalities of the control experiments were
significantly lower than when the doxorubicin-loaded micelles were equipped with folic acid
units, which strongly indicates efficient drug delivery into the tumor cells by the DNA block
copolymer micelles with the aid of targeting moieties and thus the significant cytotoxicity of
these nanoparticles.
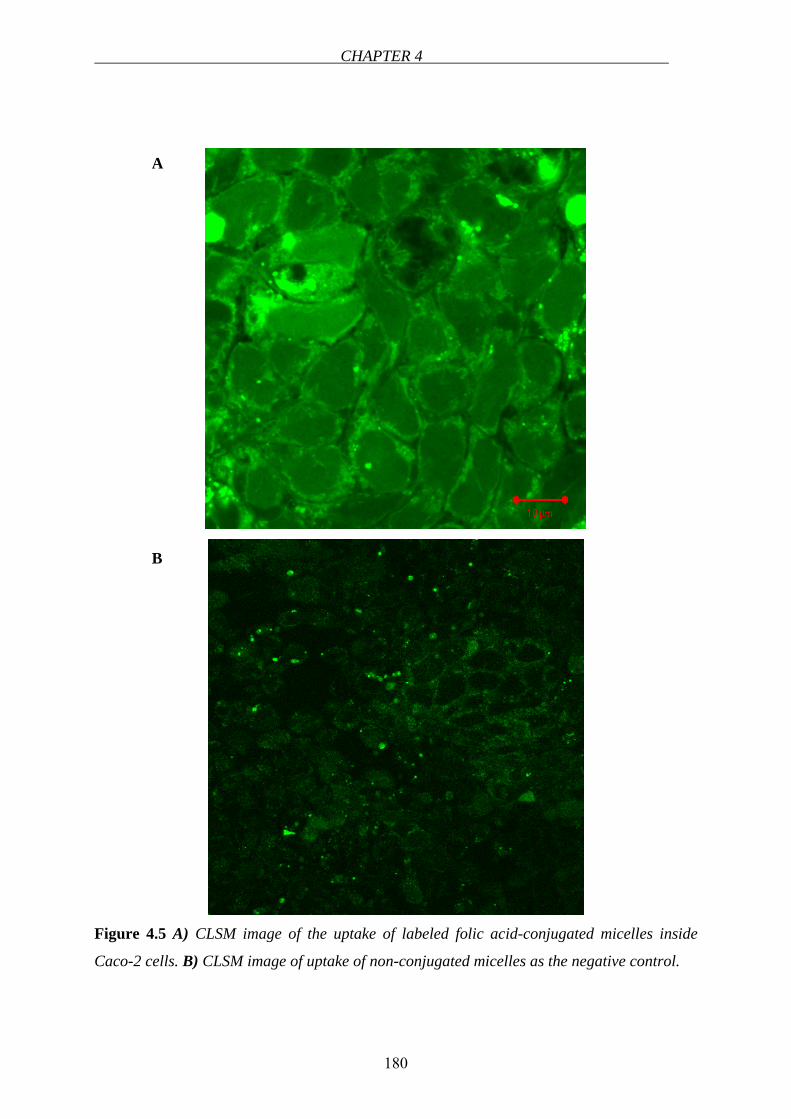
CHAPTER 4
180
Figure 4.5 A) CLSM image of the uptake of labeled folic acid-conjugated micelles inside
Caco-2 cells. B) CLSM image of uptake of non-conjugated micelles as the negative control.
A
B
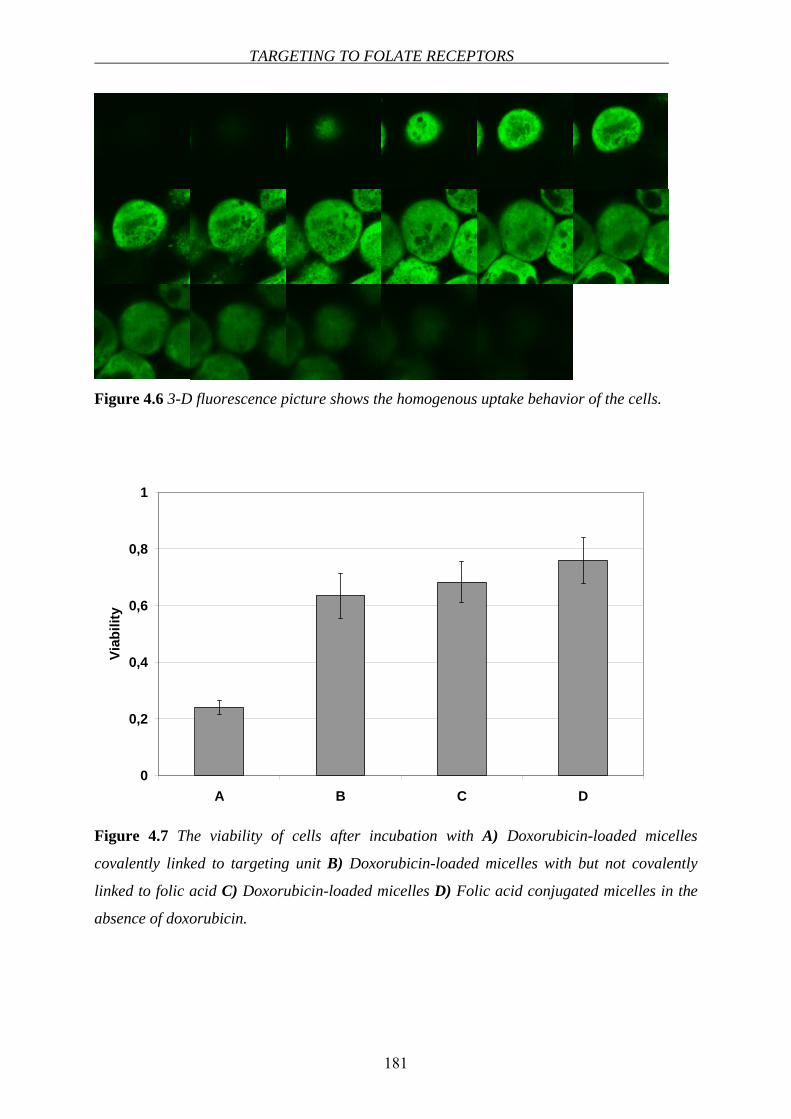
TARGETING TO FOLATE RECEPTORS
181
Figure 4.6 3-D fluorescence picture shows the homogenous uptake behavior of the cells.
0
0,2
0,4
0,6
0,8
1
A B C D
Viab
ility
Figure 4.7 The viability of cells after incubation with A) Doxorubicin-loaded micelles
covalently linked to targeting unit B) Doxorubicin-loaded micelles with but not covalently
linked to folic acid C) Doxorubicin-loaded micelles D) Folic acid conjugated micelles in the
absence of doxorubicin.
CHAPTER 4
182
4.3 DISCUSSION
Targeted drug delivery systems play an important role in the treatment of diseases particularly
in cancer chemotherapy. Drug targeting to specific cells has been explored utilizing the
presence of various receptors, antigens/proteins on the cell membrane. Certain receptors and
surface bound antigens are specifically expressed in diseased cells or their expression levels
might be higher as compared to the normal healthy cells. Therefore using specific ligands as
the agents for active targeting, these receptors allow us to target the drugs or the drug delivery
systems to specific cells.
Folic acid-conjugated drug delivery systems suggest the advantage of targeting to specific
cells which express FRs. Folic acid has a high affinity to FR therefore internalization of folic
acid conjugated drugs or drug delivery systems is readily carried out via those receptors.
In this study we showed the higher uptake of folic acid conjugated DNA block copolymer
micelles compared to control. Moreover, the effect of the number of the targeting units (folic
acid) on the nanoparticle system was shown. As the number of folic acid moiety was
increased at the rim of the micelle, the internalized particle amount increased proportionally.
However, when the ligands are positioned at the hydrophobic-hydrophilic interface, the
amount of targeting groups did not influence the uptake of the nanoparticles. From these
experiments three important conclusions can be drawn. The uptake of DNA block copolymer
micelles strongly depends on the number of targeting units at the rim. Furthermore, the higher
the number of folic acid entities, the more efficiently the nanoparticles are internalized.
Finally, when the targeting units are hidden inside the nanoparticles they cannot be
“recognized” by the folate receptors, indicating that the micelles remain intact and do not
dissociate into isolated block copolymers.
Although block copolymers have already been employed for drug delivery purposes [38,39],
we believe that the nucleic acid/polymeric hybrid materials presented here represent a
significant advantage in the field for several reasons. The DNA-b-PPO block copolymers that
were synthesized in a fully automated fashion were structurally well-defined because the
biological segment was monodisperse and contained defined end groups. Such a highly-
defined structure is an important criterion for approval of a drug or a delivery system.
TARGETING TO FOLATE RECEPTORS
183
Likewise, the resulting spherical micelles exhibited a narrow size distribution with
dimensions in the range of 10 nm. In this regime delivery is independent of the compromised
leaky vasculature of the tumor tissue. Most important, however, is the convenience of
functionalizing these DNA block copolymer nanoparticles. Different amounts of targeting and
reporter groups can be incorporated simultaneously at distinct positions on the nanoparticle by
hybridization. A variety of 5’- and 3’-modified ODNs bearing different functional groups are
commercially available allowing several coupling strategies for a wide range of ligands. In
contrast, functionalization of conventional block copolymers with targeting moieties is
demanding often requiring multi-step synthesis and separation of ligand-modified from
unmodified polymers [40-42]. Moreover, by employing negatively charged DNA with a
persistence length of 50 nm as the hydrophilic block, surface exposition of the targeting
moieties is guaranteed because, as is well accepted, the polymer chains of the corona in
polyelectrolyte block copolymer aggregates are well-ordered and completely stretched [43].
When folic acid is conjugated to other block copolymer systems, e.g. exhibiting a corona of
polyethylene glycol, this is not guaranteed to the same extent [41].
In summary, a novel micelle platform consisting of amphiphilic DNA block copolymers was
introduced for chemotherapeutic drug delivery, allowing for combinatorial testing of the drug
carrier system. Prior to the investigation of the DNA block copolymer micelles, the presence
of FRs in the cancerous cell line was confirmed and expression levels of three associated
genes determined. The corresponding ligand-conjugated ODNs were introduced into the
micelles as targeting units via hybridization. The incorporation of fluorescent reporter groups
by the same procedure revealed that receptor-mediated endocytotic uptake of the
nanoparticles with a diameter of approximately 10 nm was most efficient when the maximum
number of ligands was present on the rim of the micelles. Loading doxorubicin into the
hydrophobic interior of the ligand-containing micelles resulted in efficient cytotoxicity and
high mortality among the cancerous cells. Further studies will investigate targeting with
different combinations and ratios of ligands as well as the incorporation of various
hydrophobic cancer drugs into the DNA block copolymer micelles. Their potential as an
anticancer drug delivery vehicle in in vivo experiments should also be assessed in the future.
CHAPTER 4
184
REFERENCES
1. Vasir JK, Reddy MK, Labhasetwar VD. Nanosystems in drug targeting: Opportunities
and challenges. Curr Nanosci 2005;1:47-64
2. Leamon CP, Reddy JA. Folate-targeted chemotherapy. Adv Drug Delivery Rev
2004;56:1127-1141
3. Quintana A, Raczka E, Piehler L, Lee I, Myc A, Majoros I, Patri AK, Thomas T, Mule
J, Baker JR, Jr. Design and function of a dendrimer-based therapeutic nanodevice
targeted to tumor cells through the folate receptor. Pharm Res 2002;19:1310-1316
4. Savic R, Eisenberg A, Maysinger D. Block copolymer micelles as delivery vehicles of
hydrophobic drugs: Micelle-cell interactions. Journal of Drug Targeting 2006;14:343-
355
5. Pan D, Turner JL, Wooley KL. Folic acid-conjugated nanostructured materials
designed for cancer cell targeting. Chemical Communications 2003:2400-2401
6. Yoo HS, Park TG. Folate receptor targeted biodegradable polymeric doxorubicin
micelles. J Controlled Release 2004;96:273-283
7. Park EK, Kim SY, Lee SB, Lee YM. Folate-Conjugated methoxy poly(ethylene
glycol)/poly(E-caprolactone) amphiphilic block copolymeric micelles for tumor
targeted drug delivery. J Controlled Release 2005;109:158-168
8. Das M, Mardyani S, Chan WCW, Kumacheva E. Biofunctionalized pH-responsive
microgels for cancer cell targeting: Rational design. Adv Mater 2006;18:80-83
9. Matherly L, Goldman ID. Membrane transport of folates. Vitamins and Hormones
2003;66:403-456
10. Elnakat H, Ratnam M. Distribution, functionality and gene regulation of folate
receptor isoforms: implications in targeted therapy. Adv Drug Delivery Rev
2004;56:1067-1084
11. Toffoli G, Cernigoi C, Russo A, Gallo A, Bagnoli M, Boiocchi M. Overexpression of
folate binding protein in ovarian cancers. Int J Cancer 1997;74:193-198
12. Elwood PC. Molecular-Cloning and Characterization of the Human Folate-Binding
Protein Cdna from Placenta and Malignant-Tissue Culture (Kb) Cells. J Biol Chem
1989;264:14893-14901
13. Theti DS, Jackman AL. The role of alpha-folate receptor-mediated transport in the
antitumor activity of antifolate drugs. Clinical Cancer Res 2004;10:1080-1089
REFERENCES
185
14. Hilgenbrink AR, Low PS. Folate receptor-mediated drug targeting: from therapeutics
to diagnostics. J Pharm Sci 2005;94:2135-2146
15. Reddy JA, Allagadda VM, Leamon CP. Targeting therapeutic and imaging agents to
folate receptor positive tumors. Curr Pharm Biotechnol 2005;6:131-150
16. Alemdaroglu FE, Herrmann A. DNA Meets Synthetic Polymers – Highly Versatile
Hybrid Materials. Org Biomol Chem 2007;5:1311-1320
17. Alemdaroglu FE, Safak M, Wang J, Berger R, Herrmann A. DNA Multiblock
Copolymers. Chem Commun 2007:1358-1359
18. Ding K, Alemdaroglu FE, Börsch M, Berger R, Herrmann A. Engineering the
Structural Properties of DNA Block Copolymer Micelles by Molecular Recognition
Angew Chem, Int Ed 2007;46:1172-1175
19. Jeong JH, Park TG. Novel polymer-DNA hybrid polymeric micelles composed of
hydrophobic poly(D,L-lactic-co-glycolic acid) and hydrophilic oligonucleotides.
Bioconjugate Chemistry 2001;12:917-923
20. Li Z, Zhang Y, Fullhart P, Mirkin CA. Reversible and chemically programmable
micelle assembly with DNA block-copolymer amphiphiles. Nano Letters
2004;4:1055-1058
21. Alemdaroglu FE, Ding K, Berger R, Herrmann A. DNA-templated synthesis in three
dimensions: Introducing a micellar scaffold for organic reactions. Angew Chem, Int
Ed 2006;45:4206-4210
22. Miller DW, Batrakova EV, Waltner TO, Alakhov VY, Kabanov AV. Bioconjugate
Chem 1997;8:649
23. Kunishima M, Kawachi C, Hioki K, Terao K, Tani S. Formation of Carboxamides by
direct condensation of carboxylic acids and amines in alcohols using a new alcohol-
and water- soluble condensing agent: DMT-MM. Tetrahedron 2001;57:1551-1558
24. Pietzonka P, Rothen-Rutishauser B, Langguth P, Wunderli-Allenspach H, Walter E,
Merkle HP. Transfer of lipophilic markers from PLGA and polystyrene nanoparticles
to Caco-2 monolayers mimics particle uptake. Pharm Res 2002;19:595-601
25. Vincent ML, Russell RM, Sasak V. Folic-Acid Uptake Characteristics of a Human-
Colon Carcinoma Cell-Line, Caco-2 - a Newly-Described Cellular-Model for Small
Intestinal Epithelium. Hum Nutr Clin Nutr 1985;39C:355-360
26. White NS, Errington RJ. Fluorescence techniques for drug delivery research: theory
and practice. Adv Drug Delivery Rev 2005;57:17-42
CHAPTER 4
186
27. Mao S, Germershaus O, Fischer D, Linn T, Schnepf R, Kissel T. Uptake and transport
of PEG-graft-trimethyl-chitosan copolymer-insulin nanocomplexes by epithelial cells.
Pharm Res 2005;22:2058-2068
28. Lin YH, Chung CK, Chen CT, Liang HF, Chen SC, Sung HW. Preparation of
nanoparticles composed of chitosan/poly-gamma-glutamic acid and evaluation of their
permeability through Caco-2 cells. Biomacromolecules 2005;6:1104-1112
29. Ito S, Aoki H. Nano-imaging of polymers by optical microscopy. Polymer Analysis,
Polymer Theory 2005;182:131-169
30. Shuai XT, Ai H, Nasongkla N, Kim S, Gao JM. Micellar carriers based on block
copolymers of poly(e-caprolactone) and poly(ethylene glycol) for doxorubicin
delivery. J Controlled Release 2004;98:415-426
31. Serpe L. Conventional Chemotherapeutic Drug Nanoparticles for Cancer Treatment.
In: Kumar CSSR ed, Nanotechnologies for the Life Sciences. Weinheim: Wiley-VCH
Verlag; 2006
32. Tabata T, Murakami Y, Ikada Y. Tumor accumulation of poly(vinyl alcohol) of
different sizes after intravenous injection. J Controlled Release 1998;50:123-133
33. Matsumura Y, Maeda H. A New Concept for Macromolecular Therapeutics in Cancer-
Chemotherapy - Mechanism of Tumoritropic Accumulation of Proteins and the
Antitumor Agent Smancs. Cancer Res 1986;46:6387-6392
34. Uchiyama K, Nagayasu A, Yamagiwa Y, Nishida T, Harashima H, Kiwada H. Effects
of the Size and Fluidity of Liposomes on Their Accumulation in Tumors - a
Presumption of Their Interaction with Tumors. Int J Pharm 1995;121:195-203
35. Hobbs SK, Monsky WL, Yuan F, Roberts WG, Griffith L, Torchilin VP, Jain RK.
Regulation of transport pathways in tumor vessels: Role of tumor type and
microenvironment. Proceedings of the National Academy of Sciences of the United
States of America 1998;95:4607-4612
36. Zheng X, Wise SM, Cristini V. Nonlinear simulation of tumor necrosis, neo-
vascularization and tissue invasion via an adaptive finite-element/level-set method.
Bulletin of Mathematical Biology 2005;67:211-259
37. Lacey SW, Sanders JM, Rothberg KG, Anderson RGW, Kamen BA. Complementary-
DNA for the Folate Binding-Protein Correctly Predicts Anchoring to the Membrane
by Glycosyl-Phosphatidylinositol. J Clin Invest 1989;84:715-720
38. Torchilin VP. Micellar nanocarriers: Pharmaceutical perspectives. Pharm Res
2007;24:1-16
REFERENCES
187
39. Nishiyama N, Kataoka K. Nanostructured devices based on block copolymer
assemblies for drug delivery: Designing structures for enhanced drug function. Adv
Polymer Sci 2006;193:67-101
40. Nagasaki Y, Yasugi K, Yamamoto Y, Harada A, Kataoka K. Sugar-Installed Block
Copolymer Micelles: Their Preparation and Specific Interaction with Lectin
Molecules. Biomacromolecules 2001;2:1067-1070
41. Eun SL, Kun N, You HB. Polymeric micelle for tumor pH and folate-mediated
targeting J Controlled Release 2003:103-113
42. Vinogradov S, Batrakova E, Li S, Kabanov A. Polyion Complex Micelles with
Protein-Modified Corona for Receptor-Mediated Delivery of Oligonucleotides into
Cells. Bioconjugate Chem 1999;10:851-860
43. Zhang LF, Eisenberg A. Multiple Morphologies of Crew-Cut Aggregates of
Polystyrene-B-Poly(Acrylic Acid) Block-Copolymers. Science 1995;268:1728-1731

CHAPTER 4
188

CHAPTER FIVE
SUMMARY
ZUSAMMUNGFASSUNG
CURRICULUM VITAE

CHAPTER 5
190
SUMMARY
191
5.1 SUMMARY
In this thesis, interactions of folic acid with tea and tea components at the level of intestinal
absorption have been investigated. For the interaction studies two main approaches were
followed. Firstly, the interaction between folic acid and tea as well as tea catechins was
studied in vitro, using Caco-2 cell monolayers and secondly, a clinical trial was designed and
carried out. In addition, targeting of folic acid conjugated nanoparticles to FR expressing
Caco-2 cells was studied in order to evaluate the principle of nutrient-receptor-coupled
transport for drug targeting.
Folic acid has attracted considerable attention due to its numerous roles in maintaining health
and preventing against certain disturbances such as anemia, NTDs and cardiovascular
diseases. Since folate is involved in DNA biosynthesis and therefore cell replication in the
human body, folate deficiency affects mostly the rapidly-dividing cell types such as the cells
of bone marrow (e.g. red blood cells) and enterocytes. Moreover, during the nineties, it was
well understood that low folate levels play an important role in the occurrence of NTDs. For
the maintenance of the desired daily folate intake, there are two main factors. Sufficient folate
ingestion per day is the main requirement. Furthermore, the bioavailability of the ingested
folate determines the level of circulating folate. Drug-drug, food-drug and herb-drug
interactions play an important role in the alteration of the pharmacokinetics as well as
pharmacodynamics of drugs in vivo. Due to the interactions, an increase or decrease in the
efficacy of the drug may be observed which may lead to serious clinical consequences.
In the first part of this work, it was shown that EGCG and ECG inhibit folic acid uptake (IC50
of 34.8 and 30.8 µmol/L) comparable to MTX under these experimental conditions. The IC50
values for non-gallated catechins were higher compared to the gallated ones. Moreover,
commercial green and black tea extracts inhibited folic acid uptake with IC50 values of
approximately 7.5 and 3.6 mg/mL, respectively. In addition, six extracts of green tea samples
from different regions of the world inhibited folic acid uptake with IC50 values ranging from
3.00 mg/mL to 7.65 mg/mL. These results clearly indicate an interaction between folic acid
and green tea catechins at the level of intestinal uptake. The mechanism responsible for the
inhibition process might be the inhibition of the influx transport routes for folates such as via
RFC and/or PCFT. For understanding the in vivo relevance of this in vitro interaction, a phase
one, open-labeled, randomized, cross-over clinical study in seven healthy volunteers was
CHAPTER 5
192
designed. The clinical study was composed of five periods, in between which there were at
least seven days of wash-out period. The pharmacokinetic interaction between folic acid (0.4
mg and 5 mg tablets) and green and black tea was investigated. Water was used as the
reference drink. For the 0.4 mg folic acid dose, the mean Cmax decreased by 39.2% and 38.6%
and the mean AUC0→∞ decreased by 26.6% and 17.9% by green tea and black tea,
respectively. For the 5 mg folic acid dose, the mean Cmax decreased by 27.4% and mean
AUC0→∞ decreased by 39.9% when taken with green tea. The results of the clinical study
confirm the interaction between tea and folic acid in vivo leading to lower bioavailabilities of
folic acid.
Since low folate concentrations have been connected to a variety of disturbances such as
megaloblastic anemia, growth retardation, hyperhomocysteinemia and cardiovascular
diseases, low bioavailability of folic acid taken together with tea may possess vital clinical
consequences. Thus the interaction between tea and folic acid should be considered seriously.
In the second part of the thesis, targeting studies using folic acid conjugated nanoparticles
were conducted. An ideal targeted drug delivery approach would not only increase the
therapeutic efficacy of drugs but also decrease the toxicity associated with the drug to allow
lower therapeutic doses. One effective approach to address this problem is the application of
polymeric nanoparticles equipped with targeting units for tumor-specific delivery.
FRs are mainly expressed in cancer cells such as ovarian, testicular, breast, colon, renal and
malignant nasopharyngeal carcinomas. FRs mediate the cellular uptake of folates with high
affinity to folic acid. Folate targeted drug delivery has emerged as an alternative therapy for
the treatment and imaging of many cancers and inflammatory diseases. Due to its small
molecular size and high binding affinity for cell surface FRs, folate conjugates have the
ability to deliver a variety of molecular complexes to pathologic cells without causing harm to
normal tissues. Because FRs are specific to certain cancer cells, nanoparticles that are
equipped with folic acid units can be targeted to these cells selectively. Folic acid conjugated
nanoparticles were shown to be internalized by the cell via FR mediated endocytosis. In this
study, DNA block copolymer micelles equipped with 2, 11 and 28 folic acid units
respectively were applied on FR expressing Caco-2 cells. There was a direct proportion in the
amount of internalized nanoparticle and the number of folic acid units on the periphery of the
nanoparticle. The internalized particle level was considerably high for the micelles equipped
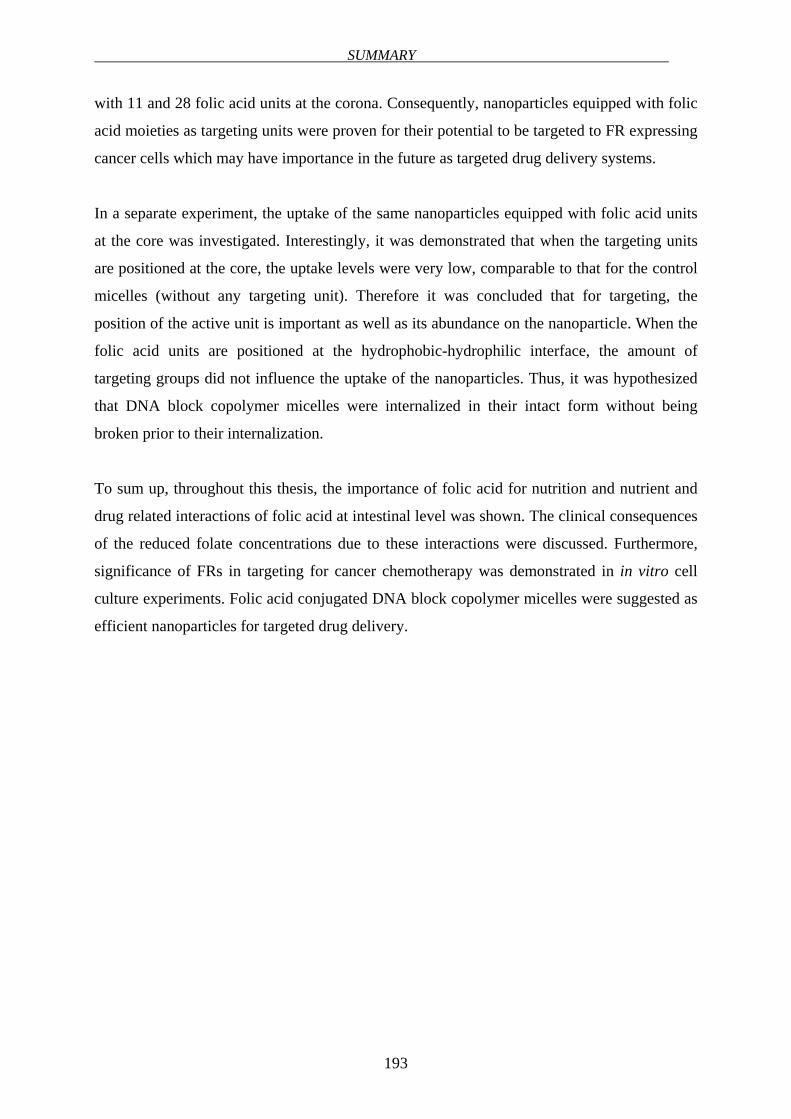
SUMMARY
193
with 11 and 28 folic acid units at the corona. Consequently, nanoparticles equipped with folic
acid moieties as targeting units were proven for their potential to be targeted to FR expressing
cancer cells which may have importance in the future as targeted drug delivery systems.
In a separate experiment, the uptake of the same nanoparticles equipped with folic acid units
at the core was investigated. Interestingly, it was demonstrated that when the targeting units
are positioned at the core, the uptake levels were very low, comparable to that for the control
micelles (without any targeting unit). Therefore it was concluded that for targeting, the
position of the active unit is important as well as its abundance on the nanoparticle. When the
folic acid units are positioned at the hydrophobic-hydrophilic interface, the amount of
targeting groups did not influence the uptake of the nanoparticles. Thus, it was hypothesized
that DNA block copolymer micelles were internalized in their intact form without being
broken prior to their internalization.
To sum up, throughout this thesis, the importance of folic acid for nutrition and nutrient and
drug related interactions of folic acid at intestinal level was shown. The clinical consequences
of the reduced folate concentrations due to these interactions were discussed. Furthermore,
significance of FRs in targeting for cancer chemotherapy was demonstrated in in vitro cell
culture experiments. Folic acid conjugated DNA block copolymer micelles were suggested as
efficient nanoparticles for targeted drug delivery.
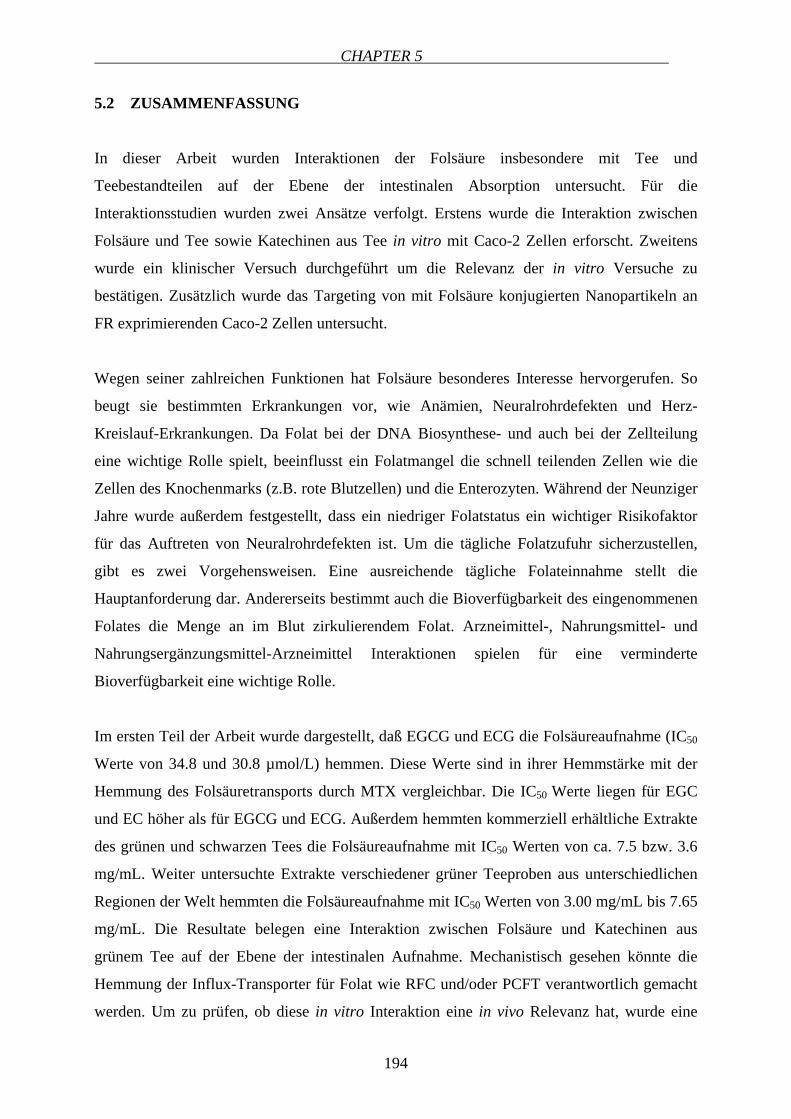
CHAPTER 5
194
5.2 ZUSAMMENFASSUNG
In dieser Arbeit wurden Interaktionen der Folsäure insbesondere mit Tee und
Teebestandteilen auf der Ebene der intestinalen Absorption untersucht. Für die
Interaktionsstudien wurden zwei Ansätze verfolgt. Erstens wurde die Interaktion zwischen
Folsäure und Tee sowie Katechinen aus Tee in vitro mit Caco-2 Zellen erforscht. Zweitens
wurde ein klinischer Versuch durchgeführt um die Relevanz der in vitro Versuche zu
bestätigen. Zusätzlich wurde das Targeting von mit Folsäure konjugierten Nanopartikeln an
FR exprimierenden Caco-2 Zellen untersucht.
Wegen seiner zahlreichen Funktionen hat Folsäure besonderes Interesse hervorgerufen. So
beugt sie bestimmten Erkrankungen vor, wie Anämien, Neuralrohrdefekten und Herz-
Kreislauf-Erkrankungen. Da Folat bei der DNA Biosynthese- und auch bei der Zellteilung
eine wichtige Rolle spielt, beeinflusst ein Folatmangel die schnell teilenden Zellen wie die
Zellen des Knochenmarks (z.B. rote Blutzellen) und die Enterozyten. Während der Neunziger
Jahre wurde außerdem festgestellt, dass ein niedriger Folatstatus ein wichtiger Risikofaktor
für das Auftreten von Neuralrohrdefekten ist. Um die tägliche Folatzufuhr sicherzustellen,
gibt es zwei Vorgehensweisen. Eine ausreichende tägliche Folateinnahme stellt die
Hauptanforderung dar. Andererseits bestimmt auch die Bioverfügbarkeit des eingenommenen
Folates die Menge an im Blut zirkulierendem Folat. Arzneimittel-, Nahrungsmittel- und
Nahrungsergänzungsmittel-Arzneimittel Interaktionen spielen für eine verminderte
Bioverfügbarkeit eine wichtige Rolle.
Im ersten Teil der Arbeit wurde dargestellt, daß EGCG und ECG die Folsäureaufnahme (IC50
Werte von 34.8 und 30.8 µmol/L) hemmen. Diese Werte sind in ihrer Hemmstärke mit der
Hemmung des Folsäuretransports durch MTX vergleichbar. Die IC50 Werte liegen für EGC
und EC höher als für EGCG und ECG. Außerdem hemmten kommerziell erhältliche Extrakte
des grünen und schwarzen Tees die Folsäureaufnahme mit IC50 Werten von ca. 7.5 bzw. 3.6
mg/mL. Weiter untersuchte Extrakte verschiedener grüner Teeproben aus unterschiedlichen
Regionen der Welt hemmten die Folsäureaufnahme mit IC50 Werten von 3.00 mg/mL bis 7.65
mg/mL. Die Resultate belegen eine Interaktion zwischen Folsäure und Katechinen aus
grünem Tee auf der Ebene der intestinalen Aufnahme. Mechanistisch gesehen könnte die
Hemmung der Influx-Transporter für Folat wie RFC und/oder PCFT verantwortlich gemacht
werden. Um zu prüfen, ob diese in vitro Interaktion eine in vivo Relevanz hat, wurde eine

ZUSAMMENFASSUNG
195
klinische Studie mit sieben gesunden Probanden durchgeführt. Diese offene, randomisierte,
cross-over Studie bestand aus fünf Perioden, zwischen denen eine mindestens sieben Tage
andauernde Wash-out-Phase lag. Es wurde eine mögliche pharmakokinetische Interaktion
zwischen Folsäure (0.4 mg und 5 mg Tabletten) und grünem sowie schwarzem Tee
untersucht. Als Referenzgetränk wurde Wasser eingesetzt. Bei der 0.4 mg Folsäure Dosis
verringerten sich die durchschnittlichen Cmax-Werte um 39.2% bzw. 38.6% und die AUC0→∞-
Werte um 26.6% und 17.9%, jeweils für grünen und schwarzen Tee. Für die 5 mg Folsäure
Dosis verringerten sich die durchschnittliche Cmax-Werte um 27.4% und die AUC0→∞-Werte
um 39.9%, wenn die Dosis gleichzeitig mit grünem Tee eingenommen wurde. Die Resultate
der klinischen Studie weisen auf eine in vivo Interaktion zwischen Tee und Folsäure hin, die
zu einer verminderten Bioverfügbarkeit der Folsäure führt.
Aufgrund von Hinweisen, dass erniedrigte Folatkonzentrationen mit mehreren Störungen wie
megaloblastischer Anämie, Wachstumshemmung, Hyperhomocysteinämie und Herz-
Kreislauf-Erkrankungen in Beziehung gebracht wurden, kann eine durch Tee hervorgerufene
verminderte Bioverfügbarkeit von Folsäure klinische Bedeutung haben. Daher sollte die
Interaktion zwischen Tee und Folsäure weiterhin in ausgedehnten Studien untersucht werden.
Im zweiten Teil der Dissertation wurden Targeting Studien mit an Nanopartikel konjugierter
Folsäure durchgeführt. „Targeted Drug Delivery“ würde nicht nur die therapeutische
Wirksamkeit des Arzneimittels erhöhen, sondern auch die Toxizität der Arzneimittel
verringern, so dass niedrigere Dosen des Arzneimittels z.B. bei einer Chemotherapie
eingesetzt werden könnten. Ein möglicher Ansatz wären Polymer-Nanopartikel, die mit den
Zieleinheiten für eine Tumor-spezifische Aufnahme funktionalisiert werden.
FRs werden hauptsächlich in Krebszellen wie Ovarial-, Testikular-, Brust-, Kolon-, Nieren-
und bösartigen Nasopharyngealkarzinomen exprimiert. FRs vermitteln die zelluläre
Aufnahme von Folat mit hoher Affinität zur Folsäure. Eine zielgesteuerte
Arzneimittelaufnahme hat sich als alternative Therapie für die Behandlung vieler Krebsarten
und entzündlicher Krankheiten erwiesen. Wegen ihres geringen Molekulargewichts und der
hohen Bindungsaffinität zu FRs an der Zelloberfläche haben Folatkonjugate die Fähigkeit,
eine Vielzahl von molekularen Komplexen direkt an pathologische Zellen zu liefern, ohne
Schäden am normalen Gewebe zu verursachen. Weil FRs für bestimmte Krebszellen
spezifisch sind, können Nanopartikel, die mit Folsäure-Einheiten funktionalisiert werden,
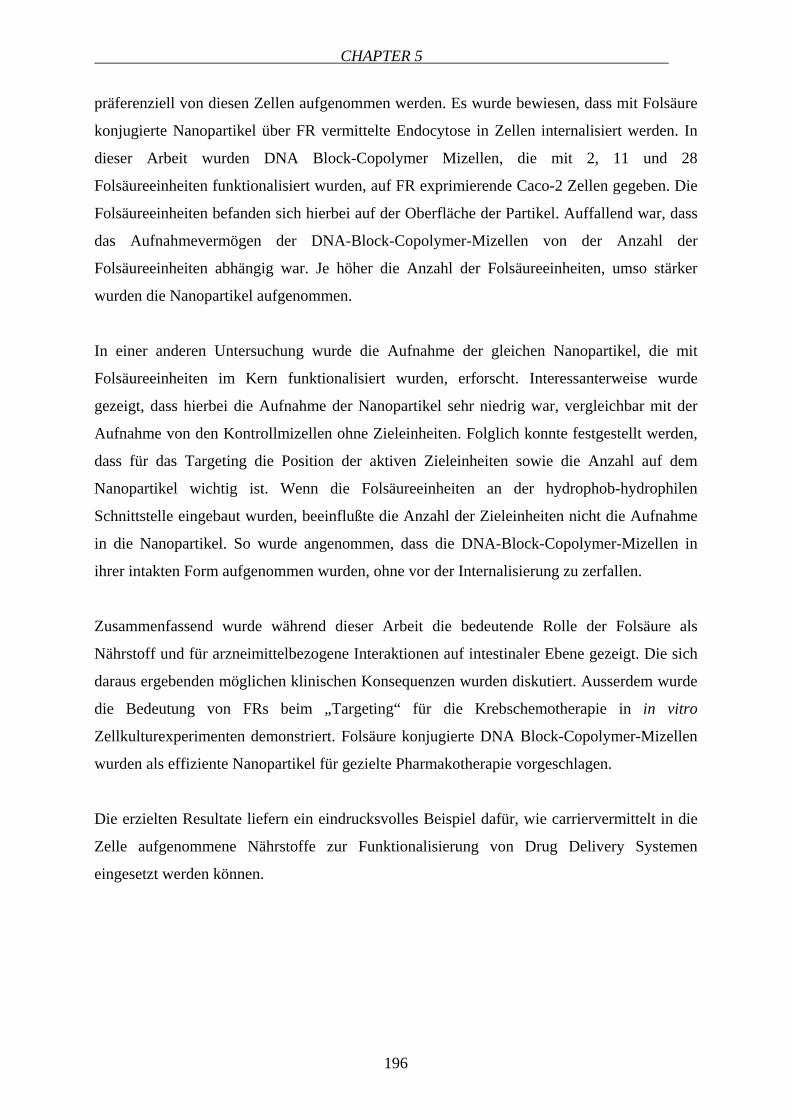
CHAPTER 5
196
präferenziell von diesen Zellen aufgenommen werden. Es wurde bewiesen, dass mit Folsäure
konjugierte Nanopartikel über FR vermittelte Endocytose in Zellen internalisiert werden. In
dieser Arbeit wurden DNA Block-Copolymer Mizellen, die mit 2, 11 und 28
Folsäureeinheiten funktionalisiert wurden, auf FR exprimierende Caco-2 Zellen gegeben. Die
Folsäureeinheiten befanden sich hierbei auf der Oberfläche der Partikel. Auffallend war, dass
das Aufnahmevermögen der DNA-Block-Copolymer-Mizellen von der Anzahl der
Folsäureeinheiten abhängig war. Je höher die Anzahl der Folsäureeinheiten, umso stärker
wurden die Nanopartikel aufgenommen.
In einer anderen Untersuchung wurde die Aufnahme der gleichen Nanopartikel, die mit
Folsäureeinheiten im Kern funktionalisiert wurden, erforscht. Interessanterweise wurde
gezeigt, dass hierbei die Aufnahme der Nanopartikel sehr niedrig war, vergleichbar mit der
Aufnahme von den Kontrollmizellen ohne Zieleinheiten. Folglich konnte festgestellt werden,
dass für das Targeting die Position der aktiven Zieleinheiten sowie die Anzahl auf dem
Nanopartikel wichtig ist. Wenn die Folsäureeinheiten an der hydrophob-hydrophilen
Schnittstelle eingebaut wurden, beeinflußte die Anzahl der Zieleinheiten nicht die Aufnahme
in die Nanopartikel. So wurde angenommen, dass die DNA-Block-Copolymer-Mizellen in
ihrer intakten Form aufgenommen wurden, ohne vor der Internalisierung zu zerfallen.
Zusammenfassend wurde während dieser Arbeit die bedeutende Rolle der Folsäure als
Nährstoff und für arzneimittelbezogene Interaktionen auf intestinaler Ebene gezeigt. Die sich
daraus ergebenden möglichen klinischen Konsequenzen wurden diskutiert. Ausserdem wurde
die Bedeutung von FRs beim „Targeting“ für die Krebschemotherapie in in vitro
Zellkulturexperimenten demonstriert. Folsäure konjugierte DNA Block-Copolymer-Mizellen
wurden als effiziente Nanopartikel für gezielte Pharmakotherapie vorgeschlagen.
Die erzielten Resultate liefern ein eindrucksvolles Beispiel dafür, wie carriervermittelt in die
Zelle aufgenommene Nährstoffe zur Funktionalisierung von Drug Delivery Systemen
eingesetzt werden können.

CHAPTER SIX
APPENDIX

CHAPTER 6
200
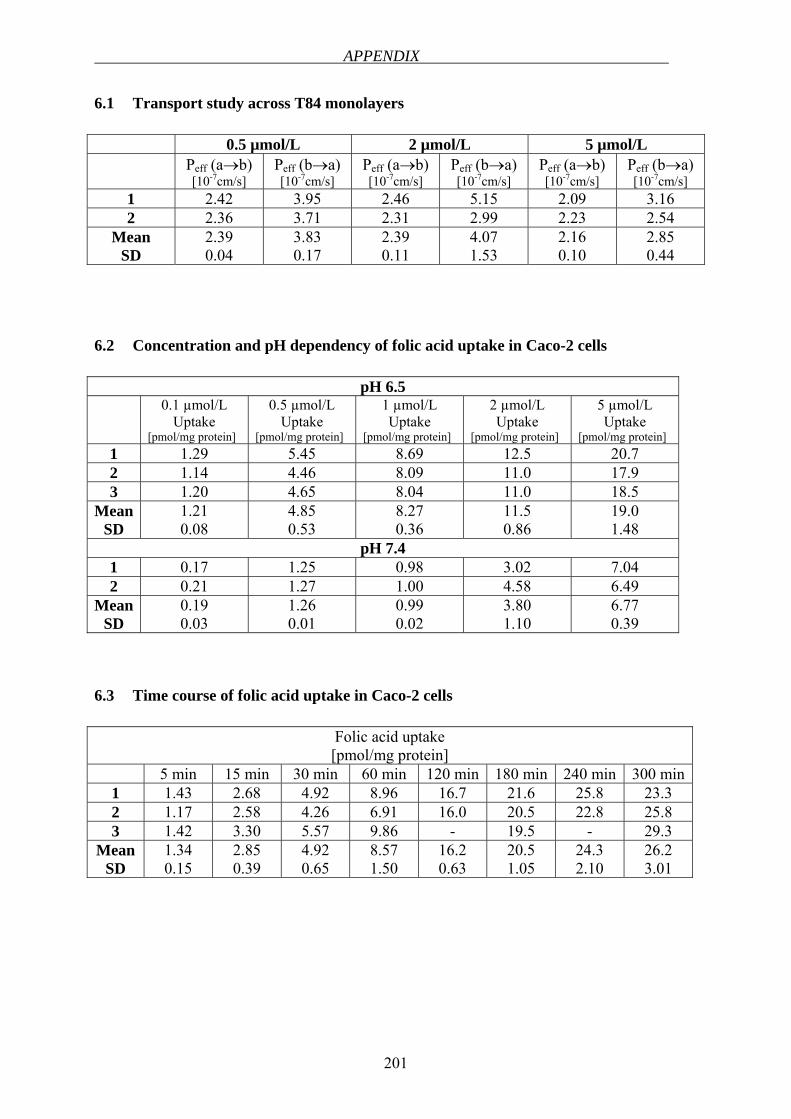
APPENDIX
201
6.1 Transport study across T84 monolayers 0.5 µmol/L 2 µmol/L 5 µmol/L Peff (a→b)
[10-7cm/s] Peff (b→a) [10-7cm/s]
Peff (a→b) [10-7cm/s]
Peff (b→a) [10-7cm/s]
Peff (a→b) [10-7cm/s]
Peff (b→a) [10-7cm/s]
1 2.42 3.95 2.46 5.15 2.09 3.16 2 2.36 3.71 2.31 2.99 2.23 2.54
Mean SD
2.39 0.04
3.83 0.17
2.39 0.11
4.07 1.53
2.16 0.10
2.85 0.44
6.2 Concentration and pH dependency of folic acid uptake in Caco-2 cells
pH 6.5 0.1 µmol/L
Uptake [pmol/mg protein]
0.5 µmol/L Uptake
[pmol/mg protein]
1 µmol/L Uptake
[pmol/mg protein]
2 µmol/L Uptake
[pmol/mg protein]
5 µmol/L Uptake
[pmol/mg protein] 1 1.29 5.45 8.69 12.5 20.7 2 1.14 4.46 8.09 11.0 17.9 3 1.20 4.65 8.04 11.0 18.5
Mean SD
1.21 0.08
4.85 0.53
8.27 0.36
11.5 0.86
19.0 1.48
pH 7.4 1 0.17 1.25 0.98 3.02 7.04 2 0.21 1.27 1.00 4.58 6.49
Mean SD
0.19 0.03
1.26 0.01
0.99 0.02
3.80 1.10
6.77 0.39
6.3 Time course of folic acid uptake in Caco-2 cells
Folic acid uptake [pmol/mg protein]
5 min 15 min 30 min 60 min 120 min 180 min 240 min 300 min1 1.43 2.68 4.92 8.96 16.7 21.6 25.8 23.3 2 1.17 2.58 4.26 6.91 16.0 20.5 22.8 25.8 3 1.42 3.30 5.57 9.86 - 19.5 - 29.3
Mean SD
1.34 0.15
2.85 0.39
4.92 0.65
8.57 1.50
16.2 0.63
20.5 1.05
24.3 2.10
26.2 3.01
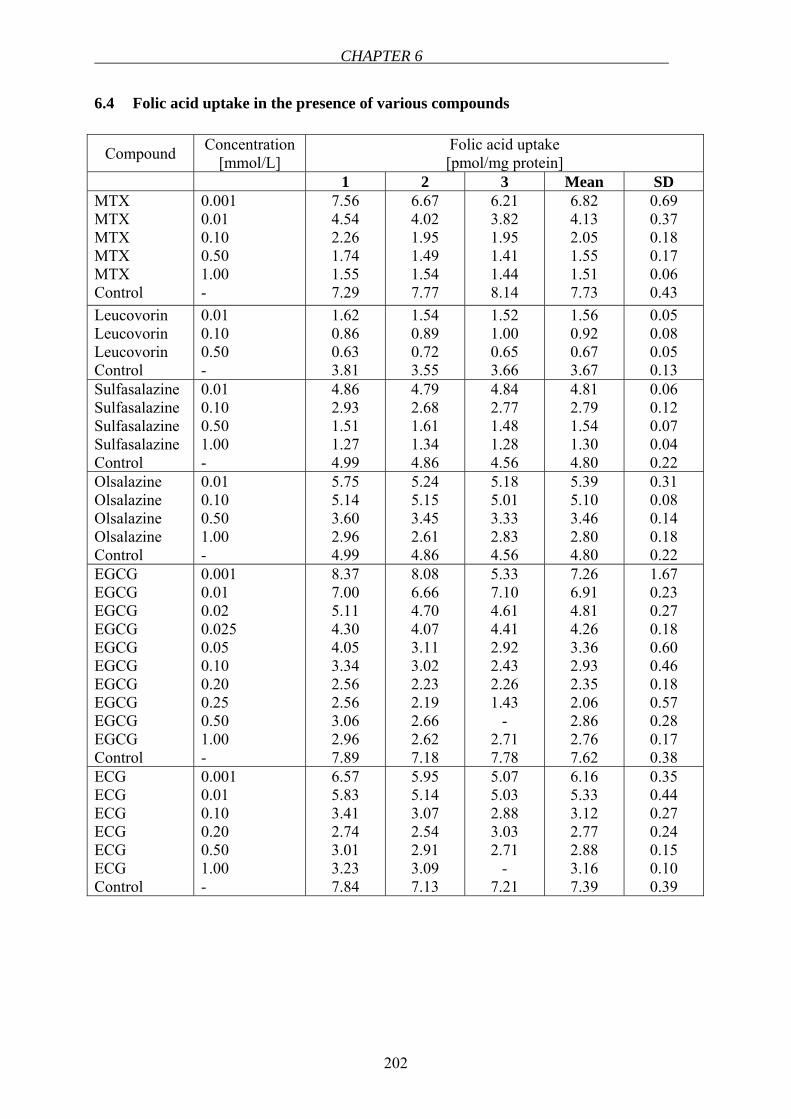
CHAPTER 6
202
6.4 Folic acid uptake in the presence of various compounds
Compound Concentration [mmol/L]
Folic acid uptake [pmol/mg protein]
1 2 3 Mean SD MTX MTX MTX MTX MTX Control
0.001 0.01 0.10 0.50 1.00 -
7.56 4.54 2.26 1.74 1.55 7.29
6.67 4.02 1.95 1.49 1.54 7.77
6.21 3.82 1.95 1.41 1.44 8.14
6.82 4.13 2.05 1.55 1.51 7.73
0.69 0.37 0.18 0.17 0.06 0.43
Leucovorin Leucovorin Leucovorin Control
0.01 0.10 0.50 -
1.62 0.86 0.63 3.81
1.54 0.89 0.72 3.55
1.52 1.00 0.65 3.66
1.56 0.92 0.67 3.67
0.05 0.08 0.05 0.13
Sulfasalazine Sulfasalazine Sulfasalazine Sulfasalazine Control
0.01 0.10 0.50 1.00 -
4.86 2.93 1.51 1.27 4.99
4.79 2.68 1.61 1.34 4.86
4.84 2.77 1.48 1.28 4.56
4.81 2.79 1.54 1.30 4.80
0.06 0.12 0.07 0.04 0.22
Olsalazine Olsalazine Olsalazine Olsalazine Control
0.01 0.10 0.50 1.00 -
5.75 5.14 3.60 2.96 4.99
5.24 5.15 3.45 2.61 4.86
5.18 5.01 3.33 2.83 4.56
5.39 5.10 3.46 2.80 4.80
0.31 0.08 0.14 0.18 0.22
EGCG EGCG EGCG EGCG EGCG EGCG EGCG EGCG EGCG EGCG Control
0.001 0.01 0.02 0.025 0.05 0.10 0.20 0.25 0.50 1.00 -
8.37 7.00 5.11 4.30 4.05 3.34 2.56 2.56 3.06 2.96 7.89
8.08 6.66 4.70 4.07 3.11 3.02 2.23 2.19 2.66 2.62 7.18
5.33 7.10 4.61 4.41 2.92 2.43 2.26 1.43
- 2.71 7.78
7.26 6.91 4.81 4.26 3.36 2.93 2.35 2.06 2.86 2.76 7.62
1.67 0.23 0.27 0.18 0.60 0.46 0.18 0.57 0.28 0.17 0.38
ECG ECG ECG ECG ECG ECG Control
0.001 0.01 0.10 0.20 0.50 1.00 -
6.57 5.83 3.41 2.74 3.01 3.23 7.84
5.95 5.14 3.07 2.54 2.91 3.09 7.13
5.07 5.03 2.88 3.03 2.71
- 7.21
6.16 5.33 3.12 2.77 2.88 3.16 7.39
0.35 0.44 0.27 0.24 0.15 0.10 0.39
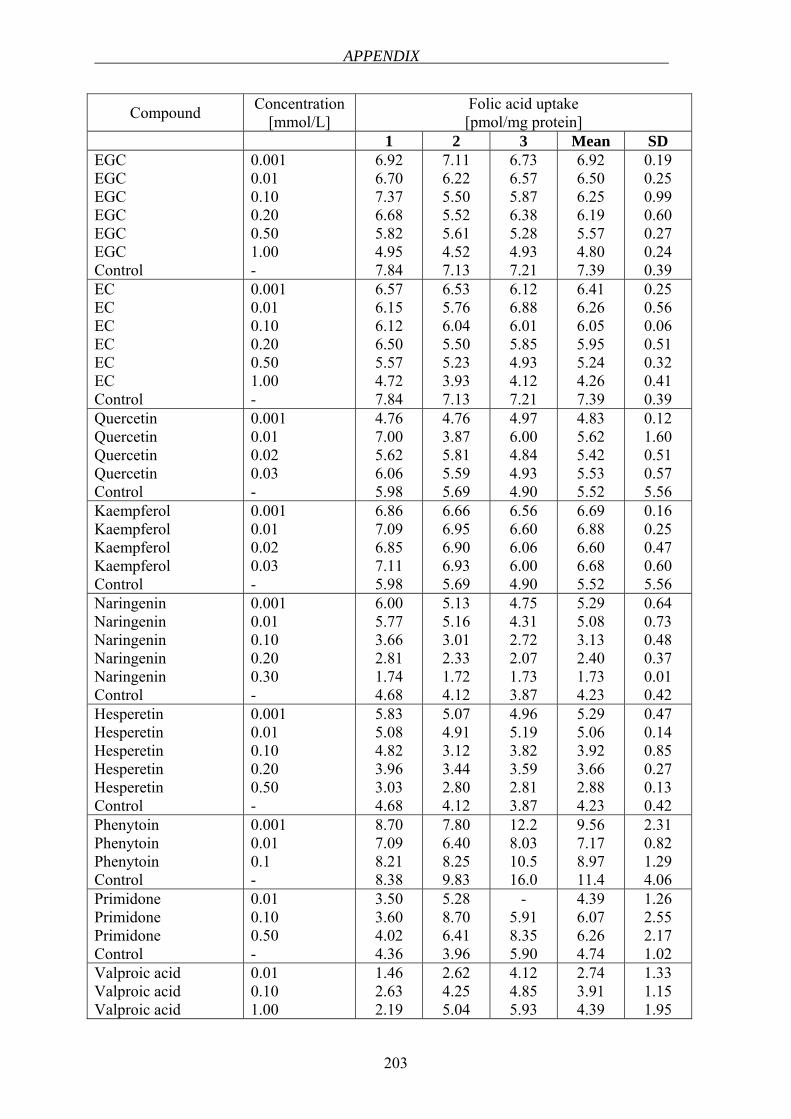
APPENDIX
203
Compound Concentration [mmol/L]
Folic acid uptake [pmol/mg protein]
1 2 3 Mean SD EGC EGC EGC EGC EGC EGC Control
0.001 0.01 0.10 0.20 0.50 1.00 -
6.92 6.70 7.37 6.68 5.82 4.95 7.84
7.11 6.22 5.50 5.52 5.61 4.52 7.13
6.73 6.57 5.87 6.38 5.28 4.93 7.21
6.92 6.50 6.25 6.19 5.57 4.80 7.39
0.19 0.25 0.99 0.60 0.27 0.24 0.39
EC EC EC EC EC EC Control
0.001 0.01 0.10 0.20 0.50 1.00 -
6.57 6.15 6.12 6.50 5.57 4.72 7.84
6.53 5.76 6.04 5.50 5.23 3.93 7.13
6.12 6.88 6.01 5.85 4.93 4.12 7.21
6.41 6.26 6.05 5.95 5.24 4.26 7.39
0.25 0.56 0.06 0.51 0.32 0.41 0.39
Quercetin Quercetin Quercetin Quercetin Control
0.001 0.01 0.02 0.03 -
4.76 7.00 5.62 6.06 5.98
4.76 3.87 5.81 5.59 5.69
4.97 6.00 4.84 4.93 4.90
4.83 5.62 5.42 5.53 5.52
0.12 1.60 0.51 0.57 5.56
Kaempferol Kaempferol Kaempferol Kaempferol Control
0.001 0.01 0.02 0.03 -
6.86 7.09 6.85 7.11 5.98
6.66 6.95 6.90 6.93 5.69
6.56 6.60 6.06 6.00 4.90
6.69 6.88 6.60 6.68 5.52
0.16 0.25 0.47 0.60 5.56
Naringenin Naringenin Naringenin Naringenin Naringenin Control
0.001 0.01 0.10 0.20 0.30 -
6.00 5.77 3.66 2.81 1.74 4.68
5.13 5.16 3.01 2.33 1.72 4.12
4.75 4.31 2.72 2.07 1.73 3.87
5.29 5.08 3.13 2.40 1.73 4.23
0.64 0.73 0.48 0.37 0.01 0.42
Hesperetin Hesperetin Hesperetin Hesperetin Hesperetin Control
0.001 0.01 0.10 0.20 0.50 -
5.83 5.08 4.82 3.96 3.03 4.68
5.07 4.91 3.12 3.44 2.80 4.12
4.96 5.19 3.82 3.59 2.81 3.87
5.29 5.06 3.92 3.66 2.88 4.23
0.47 0.14 0.85 0.27 0.13 0.42
Phenytoin Phenytoin Phenytoin Control
0.001 0.01 0.1 -
8.70 7.09 8.21 8.38
7.80 6.40 8.25 9.83
12.2 8.03 10.5 16.0
9.56 7.17 8.97 11.4
2.31 0.82 1.29 4.06
Primidone Primidone Primidone Control
0.01 0.10 0.50 -
3.50 3.60 4.02 4.36
5.28 8.70 6.41 3.96
- 5.91 8.35 5.90
4.39 6.07 6.26 4.74
1.26 2.55 2.17 1.02
Valproic acid Valproic acid Valproic acid
0.01 0.10 1.00
1.46 2.63 2.19
2.62 4.25 5.04
4.12 4.85 5.93
2.74 3.91 4.39
1.33 1.15 1.95
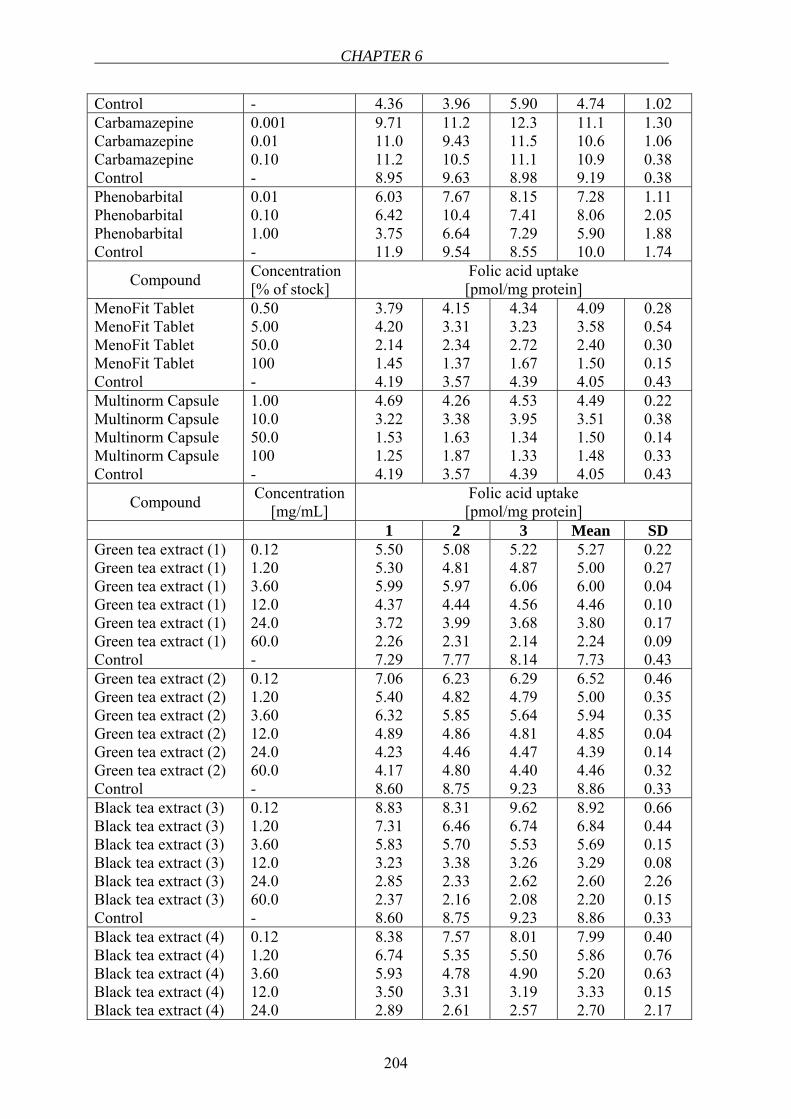
CHAPTER 6
204
Control - 4.36 3.96 5.90 4.74 1.02 Carbamazepine Carbamazepine Carbamazepine Control
0.001 0.01 0.10 -
9.71 11.0 11.2 8.95
11.2 9.43 10.5 9.63
12.3 11.5 11.1 8.98
11.1 10.6 10.9 9.19
1.30 1.06 0.38 0.38
Phenobarbital Phenobarbital Phenobarbital Control
0.01 0.10 1.00 -
6.03 6.42 3.75 11.9
7.67 10.4 6.64 9.54
8.15 7.41 7.29 8.55
7.28 8.06 5.90 10.0
1.11 2.05 1.88 1.74
Compound Concentration [% of stock]
Folic acid uptake [pmol/mg protein]
MenoFit Tablet MenoFit Tablet MenoFit Tablet MenoFit Tablet Control
0.50 5.00 50.0 100 -
3.79 4.20 2.14 1.45 4.19
4.15 3.31 2.34 1.37 3.57
4.34 3.23 2.72 1.67 4.39
4.09 3.58 2.40 1.50 4.05
0.28 0.54 0.30 0.15 0.43
Multinorm Capsule Multinorm Capsule Multinorm Capsule Multinorm Capsule Control
1.00 10.0 50.0 100 -
4.69 3.22 1.53 1.25 4.19
4.26 3.38 1.63 1.87 3.57
4.53 3.95 1.34 1.33 4.39
4.49 3.51 1.50 1.48 4.05
0.22 0.38 0.14 0.33 0.43
Compound Concentration [mg/mL]
Folic acid uptake [pmol/mg protein]
1 2 3 Mean SD Green tea extract (1) Green tea extract (1) Green tea extract (1) Green tea extract (1) Green tea extract (1) Green tea extract (1) Control
0.12 1.20 3.60 12.0 24.0 60.0 -
5.50 5.30 5.99 4.37 3.72 2.26 7.29
5.08 4.81 5.97 4.44 3.99 2.31 7.77
5.22 4.87 6.06 4.56 3.68 2.14 8.14
5.27 5.00 6.00 4.46 3.80 2.24 7.73
0.22 0.27 0.04 0.10 0.17 0.09 0.43
Green tea extract (2) Green tea extract (2) Green tea extract (2) Green tea extract (2) Green tea extract (2) Green tea extract (2) Control
0.12 1.20 3.60 12.0 24.0 60.0 -
7.06 5.40 6.32 4.89 4.23 4.17 8.60
6.23 4.82 5.85 4.86 4.46 4.80 8.75
6.29 4.79 5.64 4.81 4.47 4.40 9.23
6.52 5.00 5.94 4.85 4.39 4.46 8.86
0.46 0.35 0.35 0.04 0.14 0.32 0.33
Black tea extract (3) Black tea extract (3) Black tea extract (3) Black tea extract (3) Black tea extract (3) Black tea extract (3) Control
0.12 1.20 3.60 12.0 24.0 60.0 -
8.83 7.31 5.83 3.23 2.85 2.37 8.60
8.31 6.46 5.70 3.38 2.33 2.16 8.75
9.62 6.74 5.53 3.26 2.62 2.08 9.23
8.92 6.84 5.69 3.29 2.60 2.20 8.86
0.66 0.44 0.15 0.08 2.26 0.15 0.33
Black tea extract (4) Black tea extract (4) Black tea extract (4) Black tea extract (4) Black tea extract (4)
0.12 1.20 3.60 12.0 24.0
8.38 6.74 5.93 3.50 2.89
7.57 5.35 4.78 3.31 2.61
8.01 5.50 4.90 3.19 2.57
7.99 5.86 5.20 3.33 2.70
0.40 0.76 0.63 0.15 2.17
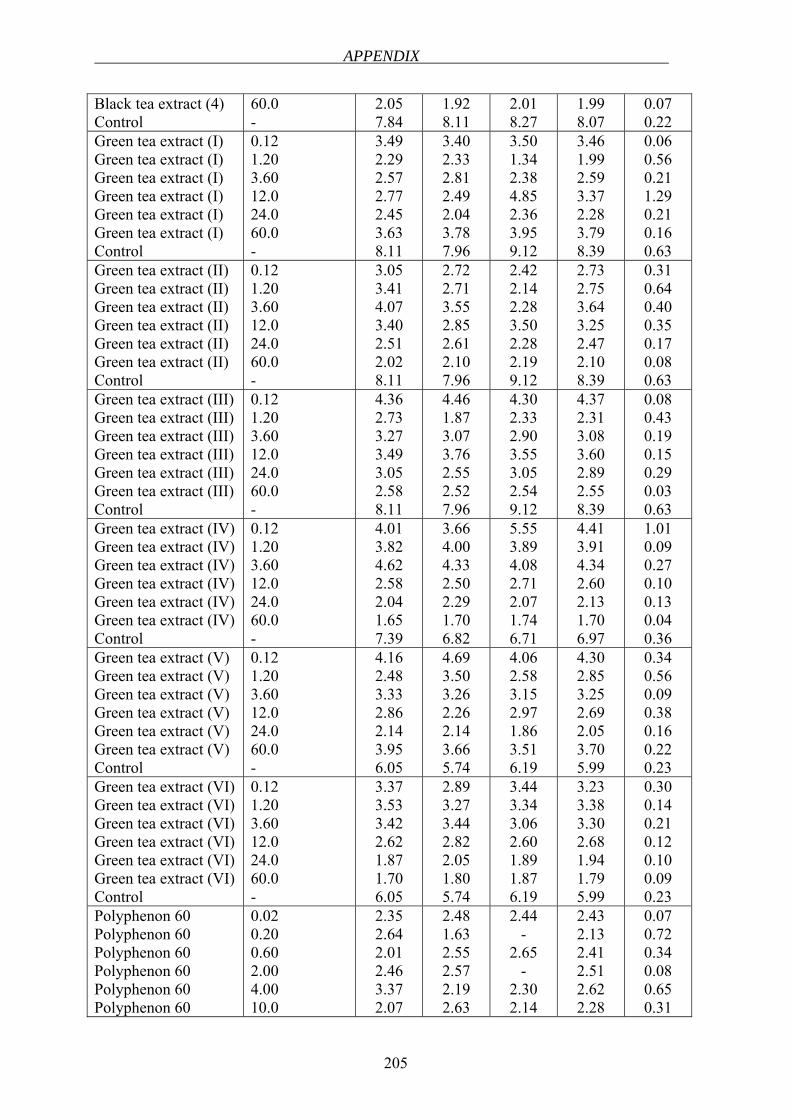
APPENDIX
205
Black tea extract (4) Control
60.0 -
2.05 7.84
1.92 8.11
2.01 8.27
1.99 8.07
0.07 0.22
Green tea extract (I) Green tea extract (I) Green tea extract (I) Green tea extract (I) Green tea extract (I) Green tea extract (I) Control
0.12 1.20 3.60 12.0 24.0 60.0 -
3.49 2.29 2.57 2.77 2.45 3.63 8.11
3.40 2.33 2.81 2.49 2.04 3.78 7.96
3.50 1.34 2.38 4.85 2.36 3.95 9.12
3.46 1.99 2.59 3.37 2.28 3.79 8.39
0.06 0.56 0.21 1.29 0.21 0.16 0.63
Green tea extract (II) Green tea extract (II) Green tea extract (II) Green tea extract (II) Green tea extract (II) Green tea extract (II) Control
0.12 1.20 3.60 12.0 24.0 60.0 -
3.05 3.41 4.07 3.40 2.51 2.02 8.11
2.72 2.71 3.55 2.85 2.61 2.10 7.96
2.42 2.14 2.28 3.50 2.28 2.19 9.12
2.73 2.75 3.64 3.25 2.47 2.10 8.39
0.31 0.64 0.40 0.35 0.17 0.08 0.63
Green tea extract (III) Green tea extract (III) Green tea extract (III) Green tea extract (III) Green tea extract (III) Green tea extract (III) Control
0.12 1.20 3.60 12.0 24.0 60.0 -
4.36 2.73 3.27 3.49 3.05 2.58 8.11
4.46 1.87 3.07 3.76 2.55 2.52 7.96
4.30 2.33 2.90 3.55 3.05 2.54 9.12
4.37 2.31 3.08 3.60 2.89 2.55 8.39
0.08 0.43 0.19 0.15 0.29 0.03 0.63
Green tea extract (IV) Green tea extract (IV) Green tea extract (IV) Green tea extract (IV) Green tea extract (IV) Green tea extract (IV) Control
0.12 1.20 3.60 12.0 24.0 60.0 -
4.01 3.82 4.62 2.58 2.04 1.65 7.39
3.66 4.00 4.33 2.50 2.29 1.70 6.82
5.55 3.89 4.08 2.71 2.07 1.74 6.71
4.41 3.91 4.34 2.60 2.13 1.70 6.97
1.01 0.09 0.27 0.10 0.13 0.04 0.36
Green tea extract (V) Green tea extract (V) Green tea extract (V) Green tea extract (V) Green tea extract (V) Green tea extract (V) Control
0.12 1.20 3.60 12.0 24.0 60.0 -
4.16 2.48 3.33 2.86 2.14 3.95 6.05
4.69 3.50 3.26 2.26 2.14 3.66 5.74
4.06 2.58 3.15 2.97 1.86 3.51 6.19
4.30 2.85 3.25 2.69 2.05 3.70 5.99
0.34 0.56 0.09 0.38 0.16 0.22 0.23
Green tea extract (VI) Green tea extract (VI) Green tea extract (VI) Green tea extract (VI) Green tea extract (VI) Green tea extract (VI) Control
0.12 1.20 3.60 12.0 24.0 60.0 -
3.37 3.53 3.42 2.62 1.87 1.70 6.05
2.89 3.27 3.44 2.82 2.05 1.80 5.74
3.44 3.34 3.06 2.60 1.89 1.87 6.19
3.23 3.38 3.30 2.68 1.94 1.79 5.99
0.30 0.14 0.21 0.12 0.10 0.09 0.23
Polyphenon 60 Polyphenon 60 Polyphenon 60 Polyphenon 60 Polyphenon 60 Polyphenon 60
0.02 0.20 0.60 2.00 4.00 10.0
2.35 2.64 2.01 2.46 3.37 2.07
2.48 1.63 2.55 2.57 2.19 2.63
2.44 -
2.65 -
2.30 2.14
2.43 2.13 2.41 2.51 2.62 2.28
0.07 0.72 0.34 0.08 0.65 0.31
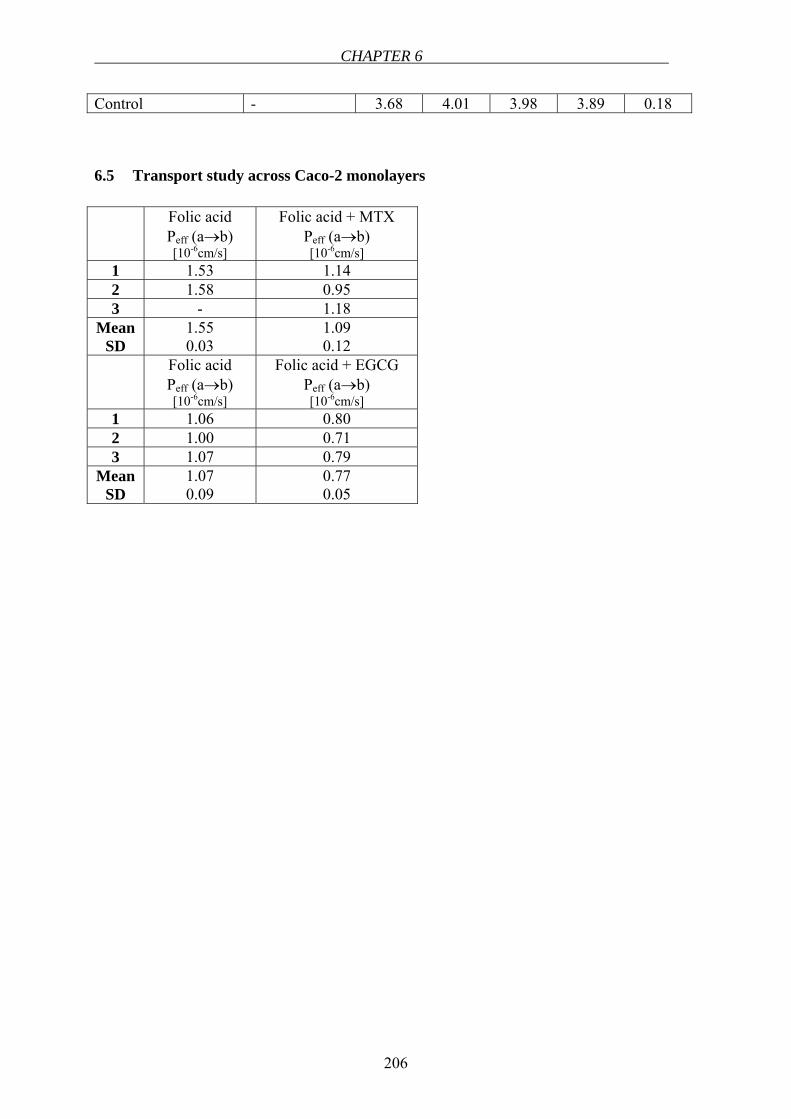
CHAPTER 6
206
Control - 3.68 4.01 3.98 3.89 0.18
6.5 Transport study across Caco-2 monolayers
Folic acid Peff (a→b) [10-6cm/s]
Folic acid + MTX Peff (a→b) [10-6cm/s]
1 1.53 1.14 2 1.58 0.95 3 - 1.18
Mean SD
1.55 0.03
1.09 0.12
Folic acid Peff (a→b) [10-6cm/s]
Folic acid + EGCG Peff (a→b) [10-6cm/s]
1 1.06 0.80 2 1.00 0.71 3 1.07 0.79
Mean SD
1.07 0.09
0.77 0.05
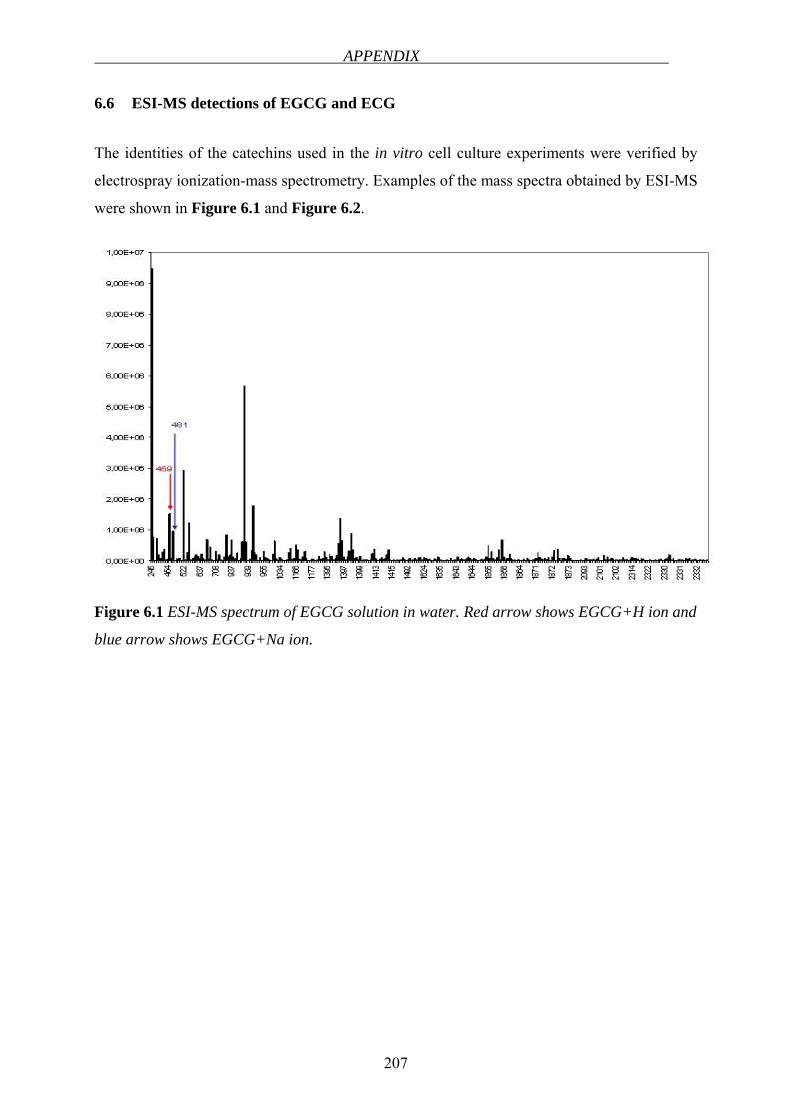
APPENDIX
207
6.6 ESI-MS detections of EGCG and ECG
The identities of the catechins used in the in vitro cell culture experiments were verified by
electrospray ionization-mass spectrometry. Examples of the mass spectra obtained by ESI-MS
were shown in Figure 6.1 and Figure 6.2.
Figure 6.1 ESI-MS spectrum of EGCG solution in water. Red arrow shows EGCG+H ion and
blue arrow shows EGCG+Na ion.
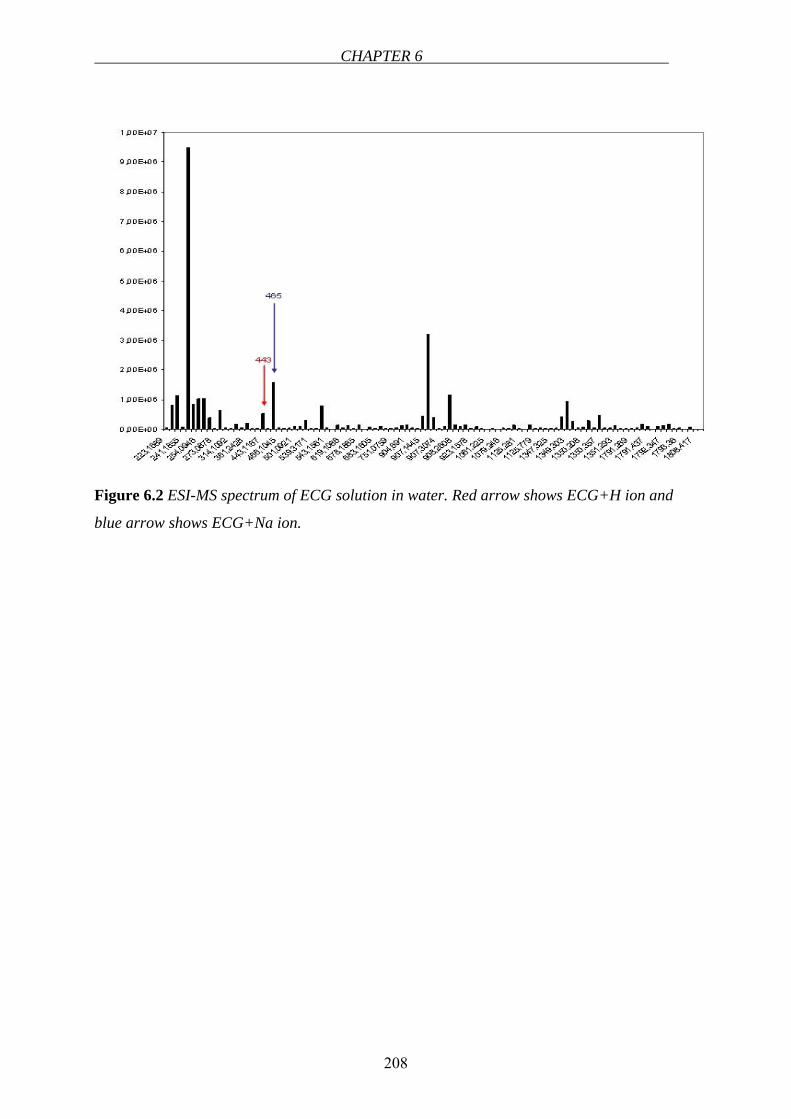
CHAPTER 6
208
Figure 6.2 ESI-MS spectrum of ECG solution in water. Red arrow shows ECG+H ion and
blue arrow shows ECG+Na ion.
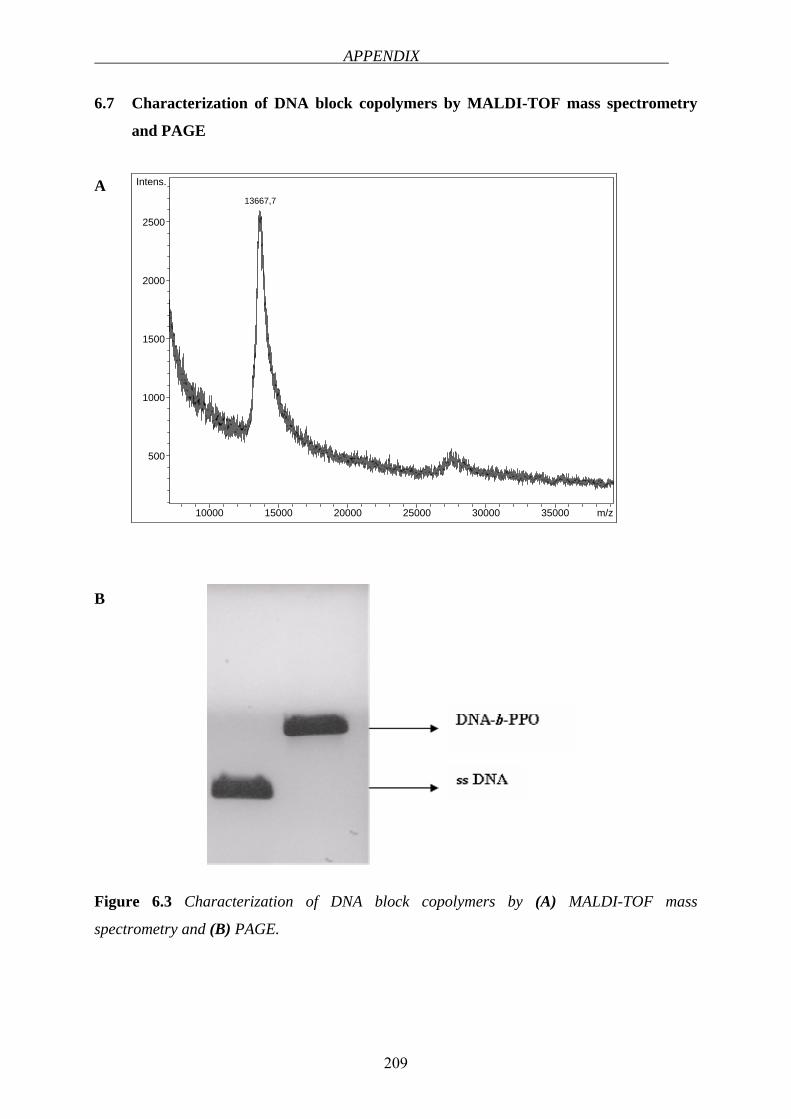
APPENDIX
209
10000 15000 20000 25000 30000 35000 m/z
500
1000
1500
2000
2500
Intens.
13667,7
6.7 Characterization of DNA block copolymers by MALDI-TOF mass spectrometry
and PAGE
A
B
Figure 6.3 Characterization of DNA block copolymers by (A) MALDI-TOF mass
spectrometry and (B) PAGE.
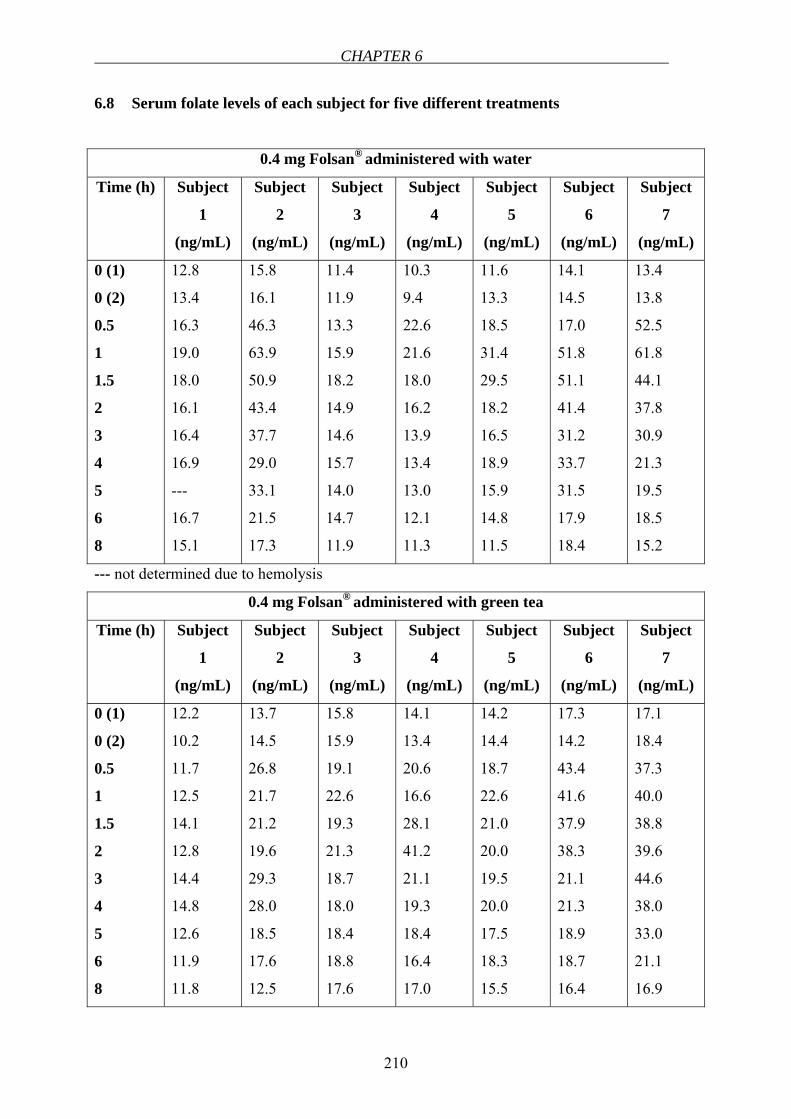
CHAPTER 6
210
6.8 Serum folate levels of each subject for five different treatments
0.4 mg Folsan® administered with water
Time (h) Subject
1
(ng/mL)
Subject
2
(ng/mL)
Subject
3
(ng/mL)
Subject
4
(ng/mL)
Subject
5
(ng/mL)
Subject
6
(ng/mL)
Subject
7
(ng/mL)
0 (1)
0 (2)
0.5
1
1.5
2
3
4
5
6
8
12.8
13.4
16.3
19.0
18.0
16.1
16.4
16.9
---
16.7
15.1
15.8
16.1
46.3
63.9
50.9
43.4
37.7
29.0
33.1
21.5
17.3
11.4
11.9
13.3
15.9
18.2
14.9
14.6
15.7
14.0
14.7
11.9
10.3
9.4
22.6
21.6
18.0
16.2
13.9
13.4
13.0
12.1
11.3
11.6
13.3
18.5
31.4
29.5
18.2
16.5
18.9
15.9
14.8
11.5
14.1
14.5
17.0
51.8
51.1
41.4
31.2
33.7
31.5
17.9
18.4
13.4
13.8
52.5
61.8
44.1
37.8
30.9
21.3
19.5
18.5
15.2
--- not determined due to hemolysis
0.4 mg Folsan® administered with green tea
Time (h) Subject
1
(ng/mL)
Subject
2
(ng/mL)
Subject
3
(ng/mL)
Subject
4
(ng/mL)
Subject
5
(ng/mL)
Subject
6
(ng/mL)
Subject
7
(ng/mL)
0 (1)
0 (2)
0.5
1
1.5
2
3
4
5
6
8
12.2
10.2
11.7
12.5
14.1
12.8
14.4
14.8
12.6
11.9
11.8
13.7
14.5
26.8
21.7
21.2
19.6
29.3
28.0
18.5
17.6
12.5
15.8
15.9
19.1
22.6
19.3
21.3
18.7
18.0
18.4
18.8
17.6
14.1
13.4
20.6
16.6
28.1
41.2
21.1
19.3
18.4
16.4
17.0
14.2
14.4
18.7
22.6
21.0
20.0
19.5
20.0
17.5
18.3
15.5
17.3
14.2
43.4
41.6
37.9
38.3
21.1
21.3
18.9
18.7
16.4
17.1
18.4
37.3
40.0
38.8
39.6
44.6
38.0
33.0
21.1
16.9
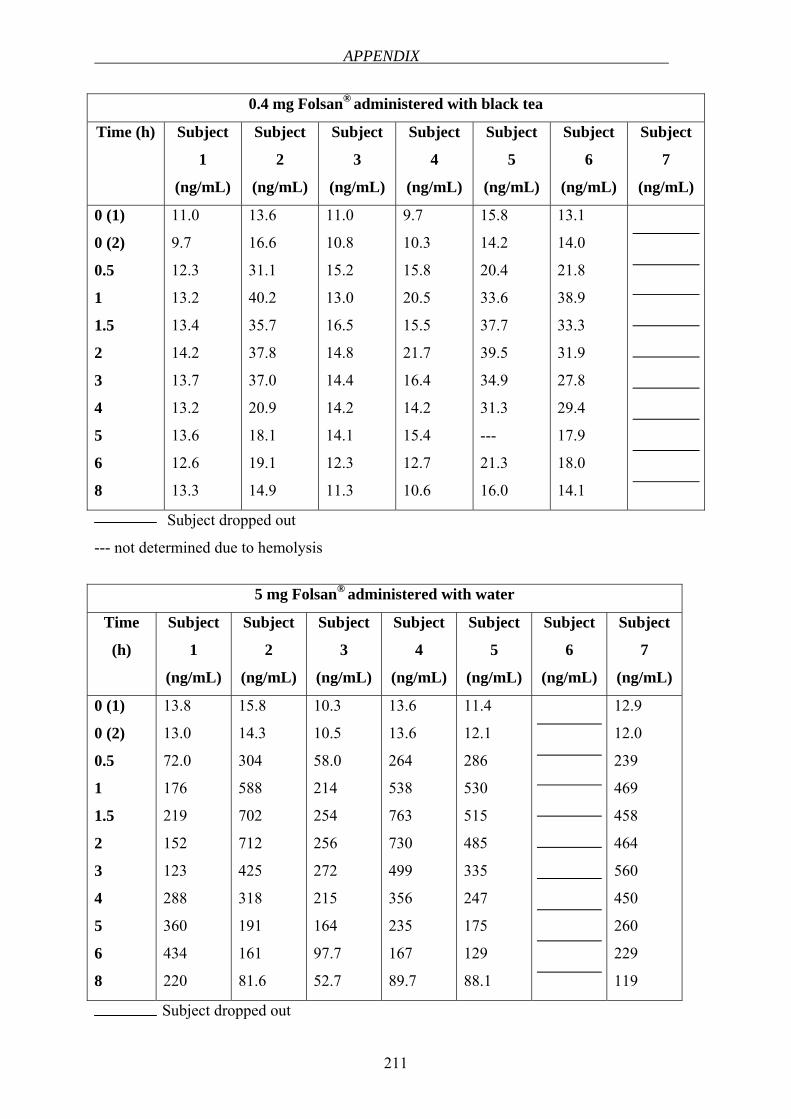
APPENDIX
211
0.4 mg Folsan® administered with black tea
Time (h) Subject
1
(ng/mL)
Subject
2
(ng/mL)
Subject
3
(ng/mL)
Subject
4
(ng/mL)
Subject
5
(ng/mL)
Subject
6
(ng/mL)
Subject
7
(ng/mL)
0 (1)
0 (2)
0.5
1
1.5
2
3
4
5
6
8
11.0
9.7
12.3
13.2
13.4
14.2
13.7
13.2
13.6
12.6
13.3
13.6
16.6
31.1
40.2
35.7
37.8
37.0
20.9
18.1
19.1
14.9
11.0
10.8
15.2
13.0
16.5
14.8
14.4
14.2
14.1
12.3
11.3
9.7
10.3
15.8
20.5
15.5
21.7
16.4
14.2
15.4
12.7
10.6
15.8
14.2
20.4
33.6
37.7
39.5
34.9
31.3
---
21.3
16.0
13.1
14.0
21.8
38.9
33.3
31.9
27.8
29.4
17.9
18.0
14.1
Subject dropped out
--- not determined due to hemolysis
5 mg Folsan®
administered with water
Time
(h)
Subject
1
(ng/mL)
Subject
2
(ng/mL)
Subject
3
(ng/mL)
Subject
4
(ng/mL)
Subject
5
(ng/mL)
Subject
6
(ng/mL)
Subject
7
(ng/mL)
0 (1)
0 (2)
0.5
1
1.5
2
3
4
5
6
8
13.8
13.0
72.0
176
219
152
123
288
360
434
220
15.8
14.3
304
588
702
712
425
318
191
161
81.6
10.3
10.5
58.0
214
254
256
272
215
164
97.7
52.7
13.6
13.6
264
538
763
730
499
356
235
167
89.7
11.4
12.1
286
530
515
485
335
247
175
129
88.1
12.9
12.0
239
469
458
464
560
450
260
229
119
Subject dropped out
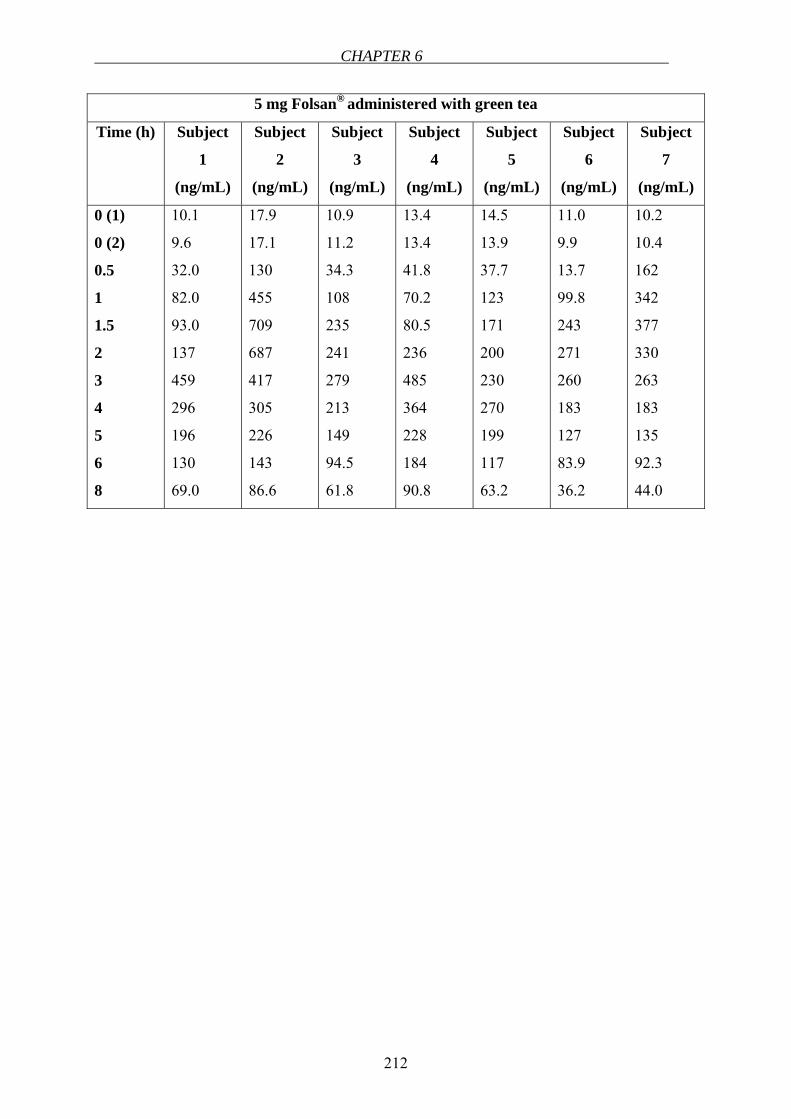
CHAPTER 6
212
5 mg Folsan® administered with green tea
Time (h) Subject
1
(ng/mL)
Subject
2
(ng/mL)
Subject
3
(ng/mL)
Subject
4
(ng/mL)
Subject
5
(ng/mL)
Subject
6
(ng/mL)
Subject
7
(ng/mL)
0 (1)
0 (2)
0.5
1
1.5
2
3
4
5
6
8
10.1
9.6
32.0
82.0
93.0
137
459
296
196
130
69.0
17.9
17.1
130
455
709
687
417
305
226
143
86.6
10.9
11.2
34.3
108
235
241
279
213
149
94.5
61.8
13.4
13.4
41.8
70.2
80.5
236
485
364
228
184
90.8
14.5
13.9
37.7
123
171
200
230
270
199
117
63.2
11.0
9.9
13.7
99.8
243
271
260
183
127
83.9
36.2
10.2
10.4
162
342
377
330
263
183
135
92.3
44.0
APPENDIX
215
6.10 Clinical trial protocol, declaration of consent and case report form
CLINICAL TRIAL PROTOCOL2 Investigation of the pharmacokinetic interaction between folic acid (Folsan® 0.4 mg and 5 mg tablets) and green tea/black tea in healthy volunteers in an
open-labeled randomized cross-over study Study-Number:
EudraCT-Number:
Principle Investigator:
[Name, Surname]
[Address]
[Tel]
[Fax]
[E-mail]
Sponsor:
[Name, Surname]
[Address]
[Tel]
[Fax]
[E-mail]
Clinical phase: I
Study centre:
[Address]
Study duration:
8 week
2 Names, addresses and telephone numbers were intentionally omitted for privacy reasons.
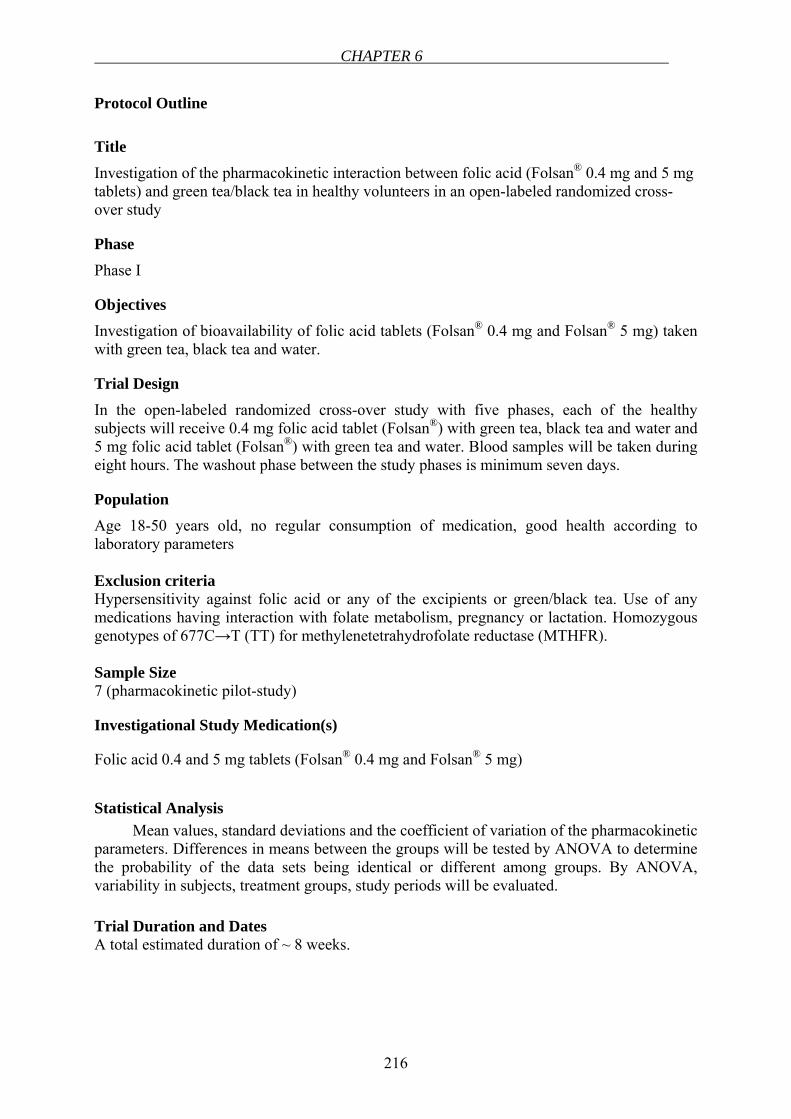
CHAPTER 6
216
Protocol Outline
Title Investigation of the pharmacokinetic interaction between folic acid (Folsan® 0.4 mg and 5 mg tablets) and green tea/black tea in healthy volunteers in an open-labeled randomized cross-over study
Phase
Phase I
Objectives Investigation of bioavailability of folic acid tablets (Folsan® 0.4 mg and Folsan® 5 mg) taken with green tea, black tea and water.
Trial Design In the open-labeled randomized cross-over study with five phases, each of the healthy subjects will receive 0.4 mg folic acid tablet (Folsan®) with green tea, black tea and water and 5 mg folic acid tablet (Folsan®) with green tea and water. Blood samples will be taken during eight hours. The washout phase between the study phases is minimum seven days.
Population Age 18-50 years old, no regular consumption of medication, good health according to laboratory parameters Exclusion criteria Hypersensitivity against folic acid or any of the excipients or green/black tea. Use of any medications having interaction with folate metabolism, pregnancy or lactation. Homozygous genotypes of 677C→T (TT) for methylenetetrahydrofolate reductase (MTHFR). Sample Size 7 (pharmacokinetic pilot-study)
Investigational Study Medication(s)
Folic acid 0.4 and 5 mg tablets (Folsan® 0.4 mg and Folsan® 5 mg)
Statistical Analysis
Mean values, standard deviations and the coefficient of variation of the pharmacokinetic parameters. Differences in means between the groups will be tested by ANOVA to determine the probability of the data sets being identical or different among groups. By ANOVA, variability in subjects, treatment groups, study periods will be evaluated. Trial Duration and Dates A total estimated duration of ~ 8 weeks.
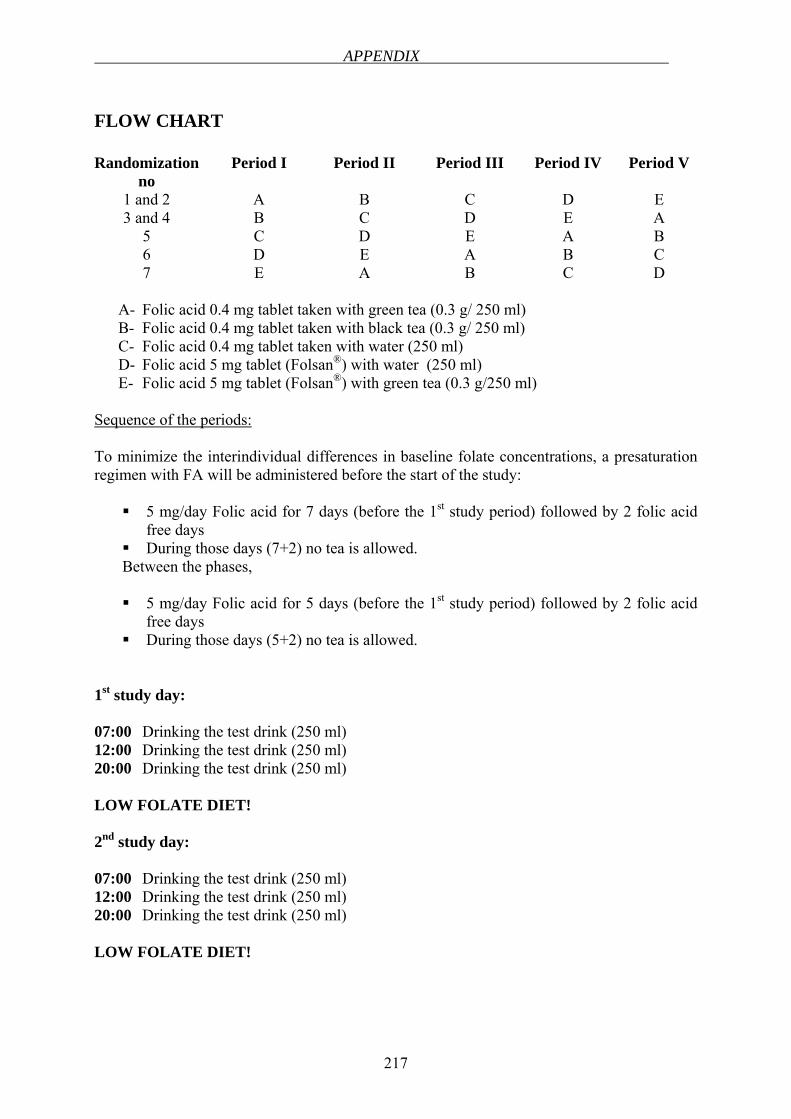
APPENDIX
217
FLOW CHART Randomization
no Period I Period II Period III Period IV Period V
1 and 2 A B C D E 3 and 4 B C D E A
5 C D E A B 6 D E A B C 7 E A B C D
A- Folic acid 0.4 mg tablet taken with green tea (0.3 g/ 250 ml) B- Folic acid 0.4 mg tablet taken with black tea (0.3 g/ 250 ml) C- Folic acid 0.4 mg tablet taken with water (250 ml) D- Folic acid 5 mg tablet (Folsan®) with water (250 ml) E- Folic acid 5 mg tablet (Folsan®) with green tea (0.3 g/250 ml)
Sequence of the periods: To minimize the interindividual differences in baseline folate concentrations, a presaturation regimen with FA will be administered before the start of the study:
5 mg/day Folic acid for 7 days (before the 1st study period) followed by 2 folic acid free days
During those days (7+2) no tea is allowed. Between the phases,
5 mg/day Folic acid for 5 days (before the 1st study period) followed by 2 folic acid
free days During those days (5+2) no tea is allowed.
1st study day: 07:00 Drinking the test drink (250 ml) 12:00 Drinking the test drink (250 ml) 20:00 Drinking the test drink (250 ml) LOW FOLATE DIET! 2nd study day: 07:00 Drinking the test drink (250 ml) 12:00 Drinking the test drink (250 ml) 20:00 Drinking the test drink (250 ml) LOW FOLATE DIET!
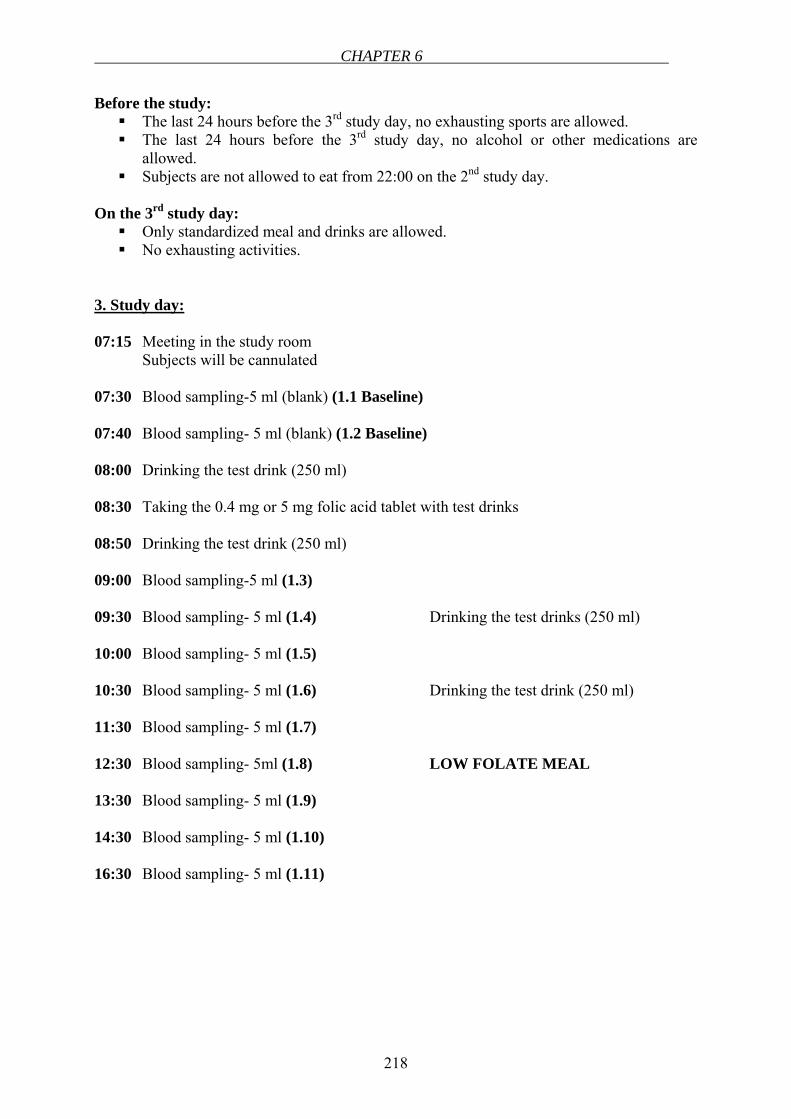
CHAPTER 6
218
Before the study: The last 24 hours before the 3rd study day, no exhausting sports are allowed. The last 24 hours before the 3rd study day, no alcohol or other medications are
allowed. Subjects are not allowed to eat from 22:00 on the 2nd study day.
On the 3rd study day:
Only standardized meal and drinks are allowed. No exhausting activities.
3. Study day: 07:15 Meeting in the study room Subjects will be cannulated 07:30 Blood sampling-5 ml (blank) (1.1 Baseline) 07:40 Blood sampling- 5 ml (blank) (1.2 Baseline) 08:00 Drinking the test drink (250 ml) 08:30 Taking the 0.4 mg or 5 mg folic acid tablet with test drinks 08:50 Drinking the test drink (250 ml) 09:00 Blood sampling-5 ml (1.3) 09:30 Blood sampling- 5 ml (1.4) Drinking the test drinks (250 ml) 10:00 Blood sampling- 5 ml (1.5) 10:30 Blood sampling- 5 ml (1.6) Drinking the test drink (250 ml) 11:30 Blood sampling- 5 ml (1.7) 12:30 Blood sampling- 5ml (1.8) LOW FOLATE MEAL 13:30 Blood sampling- 5 ml (1.9) 14:30 Blood sampling- 5 ml (1.10) 16:30 Blood sampling- 5 ml (1.11)
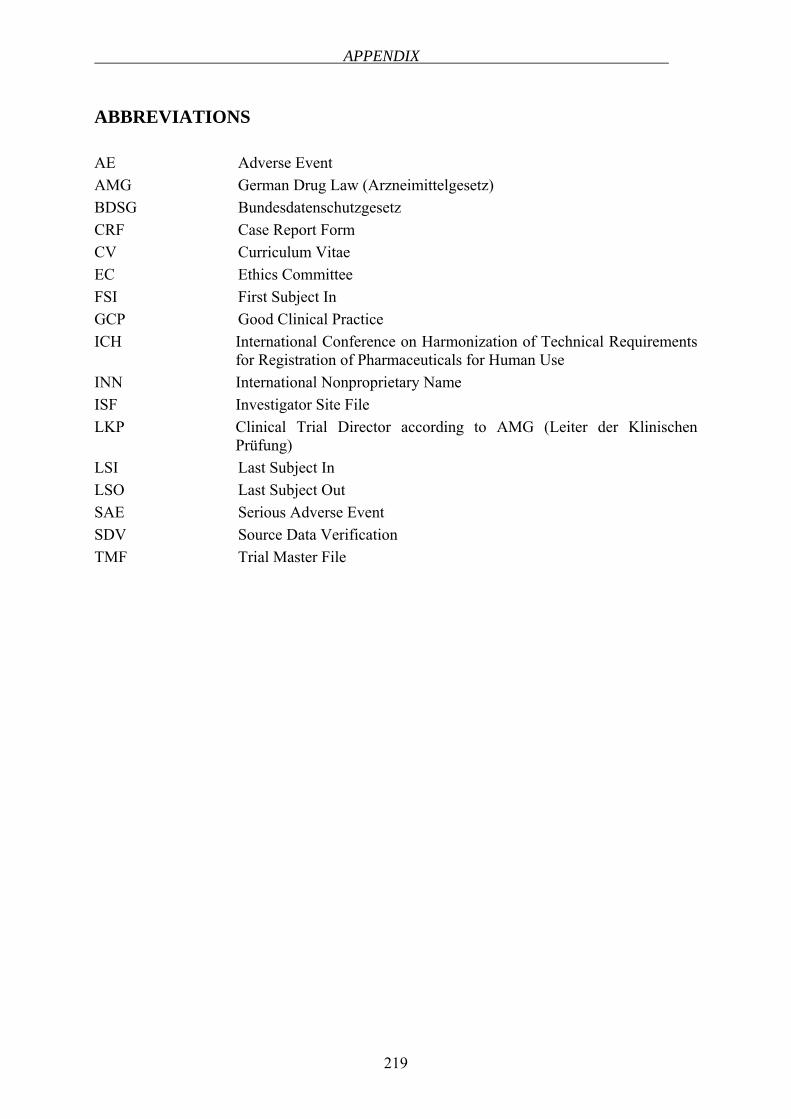
APPENDIX
219
ABBREVIATIONS AE Adverse Event AMG German Drug Law (Arzneimittelgesetz) BDSG Bundesdatenschutzgesetz CRF Case Report Form CV Curriculum Vitae EC Ethics Committee FSI First Subject In GCP Good Clinical Practice ICH International Conference on Harmonization of Technical Requirements
for Registration of Pharmaceuticals for Human Use INN International Nonproprietary Name ISF Investigator Site File LKP Clinical Trial Director according to AMG (Leiter der Klinischen
Prüfung) LSI Last Subject In LSO Last Subject Out SAE Serious Adverse Event SDV Source Data Verification TMF Trial Master File
CHAPTER 6
220
1 INTRODUCTION
1.1 Scientific Background
Folic acid is the stable, synthetic and oxidized form of the water-soluble vitamin folate used for supplementation and food fortification in human and animal nutrition. Folates are involved in several biological processes such as methionine, purine and pyrimidine biosynthesis (1). Humans cannot synthesize folate, therefore they should obtain it from nutritional sources. Dietary folates are a mixture of various mono- and pteroylpolyglutamates. After the ingestion of folates, in jejunum, polyglutamyl folates are deconjugated by the enzyme “pteroylpolyglutamate hydrolase (folate conjugase)” to a monoglutamyl form. Folic acid, as the fully oxidized and monoglutamated form of folate, is reduced to tetrahydrofolate by the contribution of “dihydrofolatereductase (DHFR)” and methylated within the enterocyte (1, 2). Under normal circumstances, only the methylated form of the vitamin, 5-methyltetrahydrofolate enters the circulation. However, with the high oral doses, folic acid bypasses the normal folate absorption process, therefore folic acid as well as 5-methyltetrahydrofolate appears in the serum (3). The limited metabolic capacity of the intestinal cells to reduce folic acid may be the reason for this observation. Reduced folate carrier (RFC) has been reported as the major transport route for folates and antifolates in intestinal cells (4). At high intraluminal concentration of folate (>10 µmol/l), non-saturable diffusion-mediated transport system plays a major role in folate absorption (2). Folic acid uptake is inhibited by several DHFR inhibitors such as methotrexate and trimethoprim.
Folic acid is absorbed mainly from the proximal part of the small intestine and rapidly appears in the blood. The biological half-life of folic acid was reported as 0.7 hours (5). Maximum serum concentration (Cmax) of 0.4 mg Folsan® is reached after 2.2 hours (Tmax) after oral administration. Tmax of 5 mg Folsan® is 1.6 hours after oral administration (see Patient Information Leaflet). There is no evidence of circadian variation in folate pharmacokinetics (6).
Tea is the second most consumed beverage after water all over the world. There are studies indicating the health benefits of tea polyphenols such as cancer preventive, antioxidative, atherosclerosis preventive, anti-inflammatory and antiviral effects (7, 8). A very new finding suggests an antifolate activity of tea catechins, namely, (-)-epigallocatechin-3-gallate (EGCG), (-)-epigallocatechin (EGC) (9). Based on this publication and the recent in vitro findings in our laboratory, a pharmacokinetic interaction between folic acid and green/black tea may be expected in vivo. Due to the inhibition of folic acid uptake and/or the inhibition of DHFR enzyme by tea, the bioavailability of folic acid which is administered by green and black tea is expected to decrease compared to control group in which folic acid tablet is administered with water.
Taking all those into consideration, in this clinical trial, it is planned to investigate the effects of green tea and black tea on the bioavailability of folic acid given as tablets simultaneously. The data obtained from the serum levels of folate will be compared statistically.
1.2 Trial rationale According to the in vitro cell experiments carried out in Caco-2 cell line in our
laboratory, a potent inhibition of folic acid uptake in the presence of green tea and black tea was observed. Based on those results, the relevance of this inhibition should be investigated in
APPENDIX
221
humans in order to draw a conclusion related to the consumption of either green tea or black tea together with folic acid intake.
It is well known that a sufficient folic acid intake is very crucial in pregnancy to reduce the risk of having a child with neural tube defects. It has been reported that the use of folic acid antagonists such as MTX, trimethoprim, sulfasalazine and aminopterin might increase the risk of neural tube defects (10, 11). A potential correlation between tea consumption during pregnancy and the risk of anencephaly and spina bifida has been reported (12), which might be explained by an inhibitory effect of tea catechins on DHFR as suggested by Nevarro-Peran et al.(9) and/or the inhibition of folic acid uptake by tea according to our recent findings.
1.3 Summarized risk-benefit assessment Folic acid is usually well tolerated. 15 mg folic acid given daily for one month to 20
healthy subjects caused no toxicity in a double-blind study. Folic acid, 15 mg daily for up to one year, produced no unwanted side effects in 30 epileptic patients who were also given phenytoin (5).
Without folic acid the living cell cannot divide but is halted in metaphase; this property underlies the use of folic acid antagonists in the treatment of neoplastic disease. Folic acid is reduced in the body to tetrahydrofolate, which is a coenzyme for various metabolic processes involving synthesis from one carbon units. It is necessary for the normal production of red blood cells. In the treatment of megaloblastic anemia, folic acid may be given orally in an initial dosage of 10 to 20 mg daily for 14 days, or until a haemopoietic response has been obtained; the daily maintanence dose is 2.5 to 10 mg. In the prophylaxis of megaloblastic anemia of pregnancy, the usual dose is 200 to 500 µg per day (5). Furthermore, folic acid is recommended to women at childbearing age to prevent neural tube defects such as spina bifida.
Tea is generally considered to be safe, even in large amounts and no toxicity has been reported.
2 TRIAL OBJECTIVES AND ENDPOINTS
2.1 Primary Objective and Primary Endpoint: The aim of this clinical trial is to investigate the pharmacokinetic interaction of green
and black tea with folic acid.
2.2 Secondary Objectives and Secondary Endpoints: “not applicable”
3 TRIAL DESIGN Open, randomized, cross over design in seven healthy volunteers.
CHAPTER 6
222
4 TRIAL DURATION AND SCHEDULE The total duration of the overall study will be 8 weeks. The actual overall duration or
recruitment may vary.
5 SELECTION OF SUBJECTS
5.1 Number of Subjects As calculated in section 9.1 (Sample Size Calculation), 7 subjects should be enrolled in
the clinical trial. Recruitment and treatment of subjects should be performed in one trial centre.
5.2 Inclusion Criteria Subjects meeting all of the following criteria will be considered for admission to the trial:
Age 18-50 years old, male or female No regular consumption of medication Ability of subject to understand character and individual consequences of clinical
trial Written informed consent must be available before enrolment in the trial For women with childbearing potential, adequate contraception.
5.3 EXCLUSION CRITERIA Subjects presenting with any of the following criteria will not be included in the trial:
Alcohol abuse Disease of liver and/or kidney and/or gastrointestinal tract: prior gastrointestinal
surgery, Chron´s disease, ulcerative colitis, evidence of pelvic infection or cervical disease; concomitant chronic illness (diabetes mellitus, hearth disease, renal insufficiency, hypertension, cancer, autoimmune diseases)
Megaloblastic anemia Clinically undesired laboratory blood values, hyperhomocysteinemia (> 12 µmol/l),
subjects having deficient status of folate or vitamin B12, subjects having a reduced glomerular filtration rate (GFR< 80 ml/min)
Use of any of the folate antagonists such as methotrexate, trimethoprim, sulfasalazine, triamterene etc.
Use of anti-inflammatory, antacid or anticonvulsant drugs, chronic consumption of aspirin or B vitamin supplements, or of other drugs or dietary supplements interfering with folate or homocysteine metabolism
Consumption of alcohol and nicotin during the study Heavy smokers (> 15/day) Subjects having a history of hepatic, gastrointestinal, renal, vascular, hematological or
neuropsychiatric disease
APPENDIX
223
Homozygous genotypes of 677C T (TT) for methylenetetrahydrofolate reductase (MTHFR)
Pregnancy and lactation History of hypersensitivity to the investigational medicinal product or to any drug with
similar chemical structure or to any excipient present in the pharmaceutical form of the investigational medicinal product
Participation in other clinical trials in the last 90 days Simultaneous participation in another clinical trial
No subject will be allowed to enrol in this trial more than once.
5.4 GENERAL CRITERIA FOR SUBJECT SELECTION “Not applicable”
5.5 CRITERIA FOR WITHDRAWAL
5.5.1 Withdrawal of Subjects Subject may be withdrawn from the trial for the following reasons
At their own request If, in the investigator’s opinion, continuation of the trial would be detrimental to the
subject’s well-being Occurrence of exclusion criteria Occurrence of serious adverse event caused by the investigational medicinal product Changes of laboratory values For women, if it becomes known that the subject is pregnant If, in the investigator’s opinion, protocol violations caused by the subject would lead
to invalid data (e.g. non-compliance with investigational medicinal product) The principle investigator decides about withdrawal of subjects from the clinical trial
in case of occurrence of criteria mentioned above. In all cases, the reason for withdrawal must be recorded in the CRF and in the subject’s medical records. In case of withdrawal of a subject at his/her own request, as far as possible the reason should be asked for as extensively as possible and documented. The subject must be followed up and as far as possible; all examinations scheduled for the final trial day must be performed on all subjects and documented. For that, the consent of the subject is necessary and will be requested (see 11.2).
All ongoing Adverse Events (AEs)/Serious Adverse Events (SAEs) of withdrawn subjects have to be followed up until no more signs and symptoms are verifiable or the subject is on stable condition.
5.5.2 Replacement of Subjects For compensation of more than two drop-outs, one new subject will be recruited.
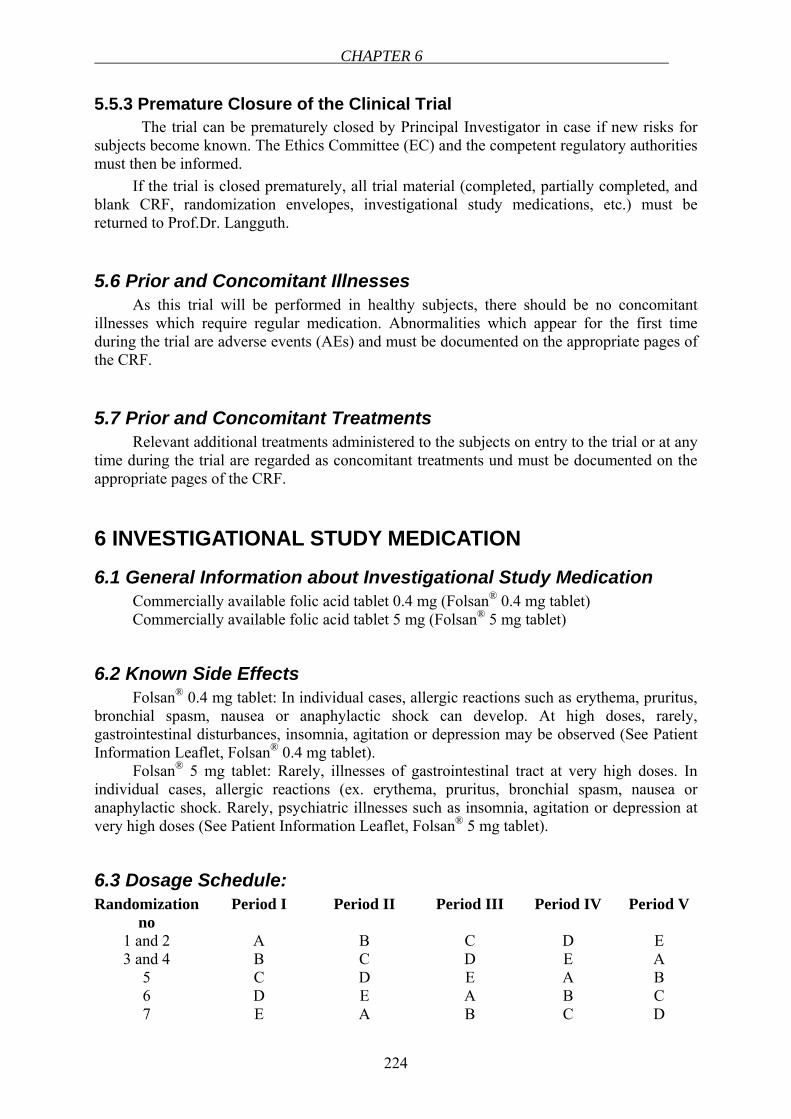
CHAPTER 6
224
5.5.3 Premature Closure of the Clinical Trial The trial can be prematurely closed by Principal Investigator in case if new risks for
subjects become known. The Ethics Committee (EC) and the competent regulatory authorities must then be informed.
If the trial is closed prematurely, all trial material (completed, partially completed, and blank CRF, randomization envelopes, investigational study medications, etc.) must be returned to Prof.Dr. Langguth.
5.6 Prior and Concomitant Illnesses As this trial will be performed in healthy subjects, there should be no concomitant
illnesses which require regular medication. Abnormalities which appear for the first time during the trial are adverse events (AEs) and must be documented on the appropriate pages of the CRF.
5.7 Prior and Concomitant Treatments Relevant additional treatments administered to the subjects on entry to the trial or at any
time during the trial are regarded as concomitant treatments und must be documented on the appropriate pages of the CRF.
6 INVESTIGATIONAL STUDY MEDICATION
6.1 General Information about Investigational Study Medication Commercially available folic acid tablet 0.4 mg (Folsan® 0.4 mg tablet) Commercially available folic acid tablet 5 mg (Folsan® 5 mg tablet)
6.2 Known Side Effects Folsan® 0.4 mg tablet: In individual cases, allergic reactions such as erythema, pruritus,
bronchial spasm, nausea or anaphylactic shock can develop. At high doses, rarely, gastrointestinal disturbances, insomnia, agitation or depression may be observed (See Patient Information Leaflet, Folsan® 0.4 mg tablet).
Folsan® 5 mg tablet: Rarely, illnesses of gastrointestinal tract at very high doses. In individual cases, allergic reactions (ex. erythema, pruritus, bronchial spasm, nausea or anaphylactic shock. Rarely, psychiatric illnesses such as insomnia, agitation or depression at very high doses (See Patient Information Leaflet, Folsan® 5 mg tablet).
6.3 Dosage Schedule: Randomization
no Period I Period II Period III Period IV Period V
1 and 2 A B C D E 3 and 4 B C D E A
5 C D E A B 6 D E A B C 7 E A B C D
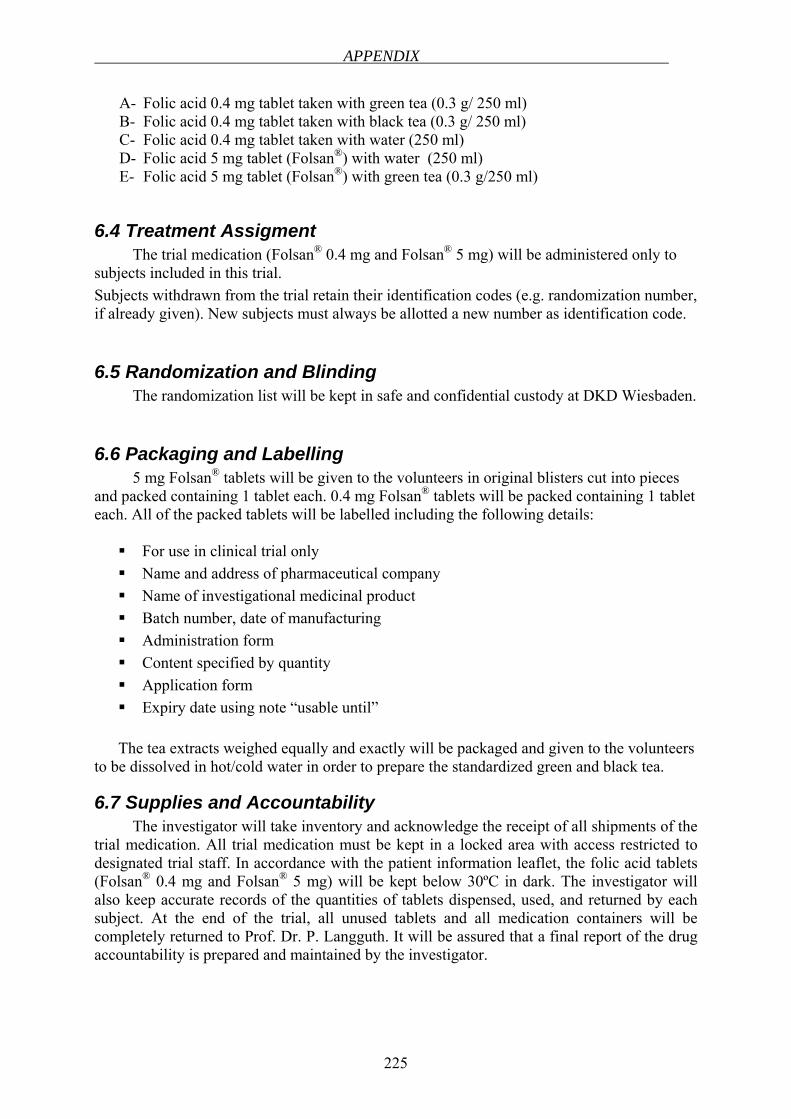
APPENDIX
225
A- Folic acid 0.4 mg tablet taken with green tea (0.3 g/ 250 ml) B- Folic acid 0.4 mg tablet taken with black tea (0.3 g/ 250 ml) C- Folic acid 0.4 mg tablet taken with water (250 ml) D- Folic acid 5 mg tablet (Folsan®) with water (250 ml) E- Folic acid 5 mg tablet (Folsan®) with green tea (0.3 g/250 ml)
6.4 Treatment Assigment The trial medication (Folsan® 0.4 mg and Folsan® 5 mg) will be administered only to
subjects included in this trial. Subjects withdrawn from the trial retain their identification codes (e.g. randomization number, if already given). New subjects must always be allotted a new number as identification code.
6.5 Randomization and Blinding The randomization list will be kept in safe and confidential custody at DKD Wiesbaden.
6.6 Packaging and Labelling 5 mg Folsan® tablets will be given to the volunteers in original blisters cut into pieces
and packed containing 1 tablet each. 0.4 mg Folsan® tablets will be packed containing 1 tablet each. All of the packed tablets will be labelled including the following details:
For use in clinical trial only Name and address of pharmaceutical company Name of investigational medicinal product Batch number, date of manufacturing Administration form Content specified by quantity Application form Expiry date using note “usable until”
The tea extracts weighed equally and exactly will be packaged and given to the volunteers to be dissolved in hot/cold water in order to prepare the standardized green and black tea.
6.7 Supplies and Accountability The investigator will take inventory and acknowledge the receipt of all shipments of the
trial medication. All trial medication must be kept in a locked area with access restricted to designated trial staff. In accordance with the patient information leaflet, the folic acid tablets (Folsan® 0.4 mg and Folsan® 5 mg) will be kept below 30ºC in dark. The investigator will also keep accurate records of the quantities of tablets dispensed, used, and returned by each subject. At the end of the trial, all unused tablets and all medication containers will be completely returned to Prof. Dr. P. Langguth. It will be assured that a final report of the drug accountability is prepared and maintained by the investigator.
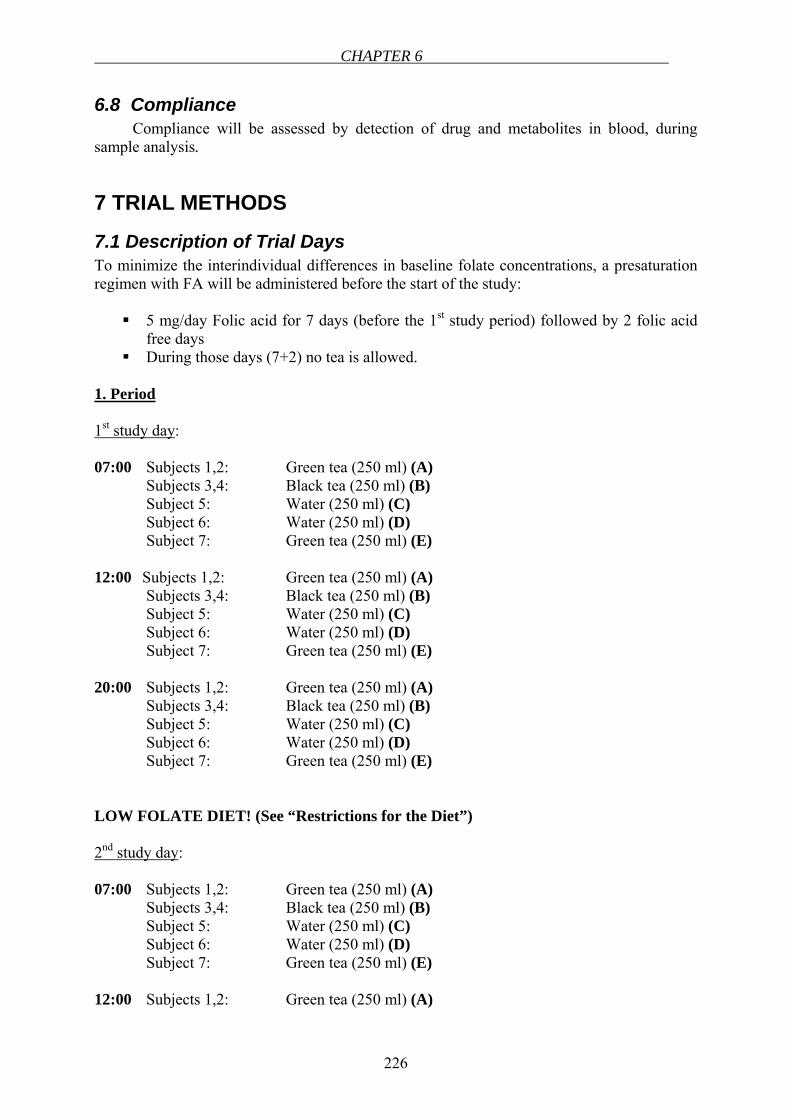
CHAPTER 6
226
6.8 Compliance Compliance will be assessed by detection of drug and metabolites in blood, during
sample analysis.
7 TRIAL METHODS
7.1 Description of Trial Days To minimize the interindividual differences in baseline folate concentrations, a presaturation regimen with FA will be administered before the start of the study:
5 mg/day Folic acid for 7 days (before the 1st study period) followed by 2 folic acid free days
During those days (7+2) no tea is allowed.
1. Period
1st study day: 07:00 Subjects 1,2: Green tea (250 ml) (A) Subjects 3,4: Black tea (250 ml) (B) Subject 5: Water (250 ml) (C)
Subject 6: Water (250 ml) (D) Subject 7: Green tea (250 ml) (E)
12:00 Subjects 1,2: Green tea (250 ml) (A) Subjects 3,4: Black tea (250 ml) (B) Subject 5: Water (250 ml) (C)
Subject 6: Water (250 ml) (D) Subject 7: Green tea (250 ml) (E)
20:00 Subjects 1,2: Green tea (250 ml) (A) Subjects 3,4: Black tea (250 ml) (B) Subject 5: Water (250 ml) (C)
Subject 6: Water (250 ml) (D) Subject 7: Green tea (250 ml) (E)
LOW FOLATE DIET! (See “Restrictions for the Diet”) 2nd study day: 07:00 Subjects 1,2: Green tea (250 ml) (A) Subjects 3,4: Black tea (250 ml) (B) Subject 5: Water (250 ml) (C)
Subject 6: Water (250 ml) (D) Subject 7: Green tea (250 ml) (E)
12:00 Subjects 1,2: Green tea (250 ml) (A)
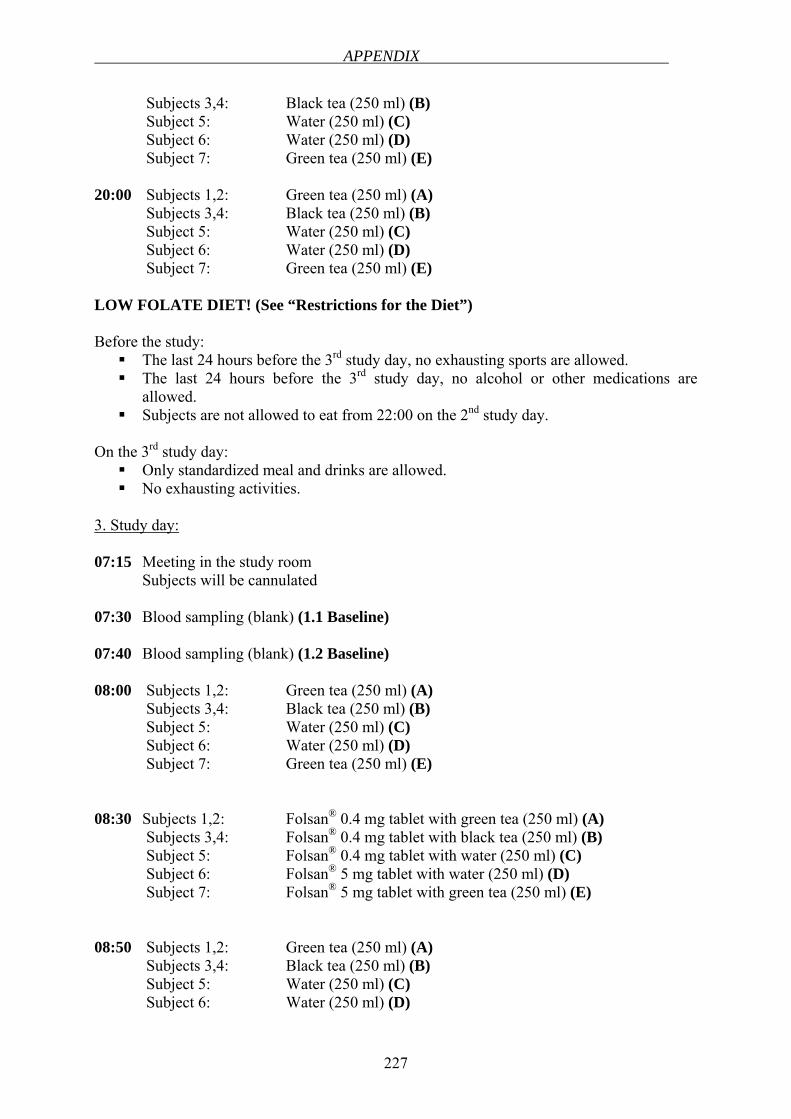
APPENDIX
227
Subjects 3,4: Black tea (250 ml) (B) Subject 5: Water (250 ml) (C)
Subject 6: Water (250 ml) (D) Subject 7: Green tea (250 ml) (E)
20:00 Subjects 1,2: Green tea (250 ml) (A) Subjects 3,4: Black tea (250 ml) (B) Subject 5: Water (250 ml) (C)
Subject 6: Water (250 ml) (D) Subject 7: Green tea (250 ml) (E) LOW FOLATE DIET! (See “Restrictions for the Diet”) Before the study:
The last 24 hours before the 3rd study day, no exhausting sports are allowed. The last 24 hours before the 3rd study day, no alcohol or other medications are
allowed. Subjects are not allowed to eat from 22:00 on the 2nd study day.
On the 3rd study day:
Only standardized meal and drinks are allowed. No exhausting activities.
3. Study day: 07:15 Meeting in the study room Subjects will be cannulated 07:30 Blood sampling (blank) (1.1 Baseline) 07:40 Blood sampling (blank) (1.2 Baseline) 08:00 Subjects 1,2: Green tea (250 ml) (A) Subjects 3,4: Black tea (250 ml) (B) Subject 5: Water (250 ml) (C)
Subject 6: Water (250 ml) (D) Subject 7: Green tea (250 ml) (E)
08:30 Subjects 1,2: Folsan® 0.4 mg tablet with green tea (250 ml) (A) Subjects 3,4: Folsan® 0.4 mg tablet with black tea (250 ml) (B) Subject 5: Folsan® 0.4 mg tablet with water (250 ml) (C)
Subject 6: Folsan® 5 mg tablet with water (250 ml) (D) Subject 7: Folsan® 5 mg tablet with green tea (250 ml) (E)
08:50 Subjects 1,2: Green tea (250 ml) (A) Subjects 3,4: Black tea (250 ml) (B) Subject 5: Water (250 ml) (C)
Subject 6: Water (250 ml) (D)
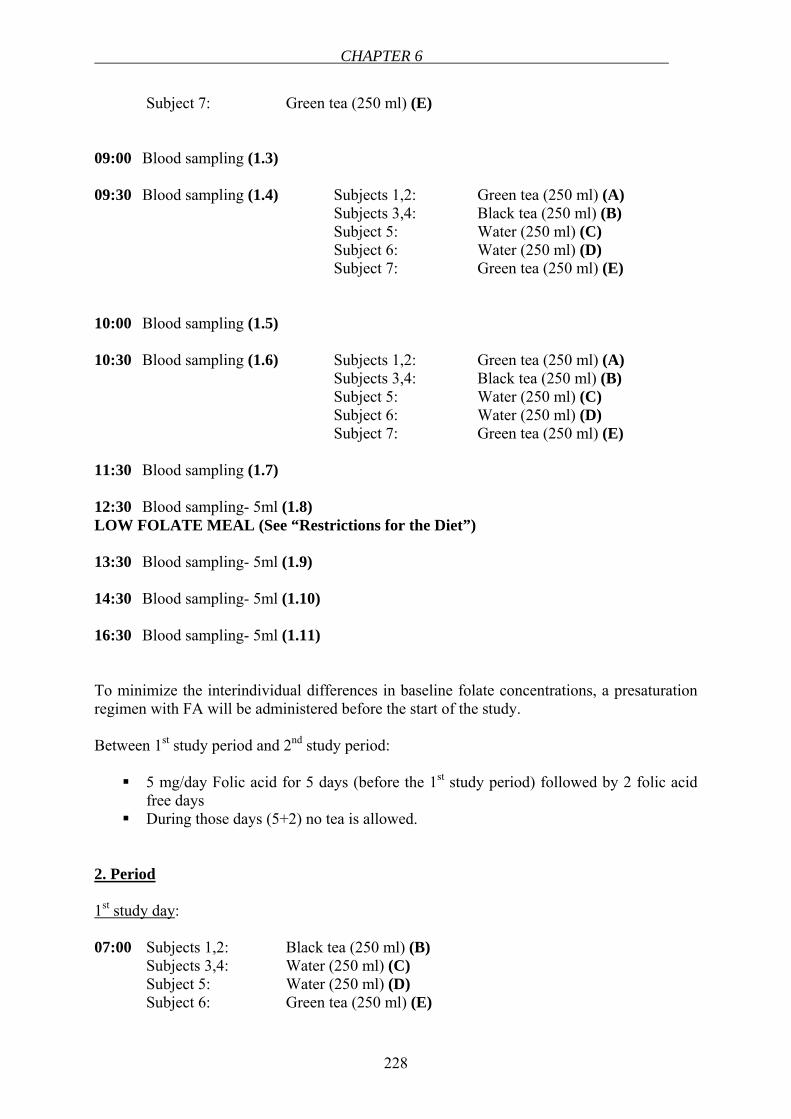
CHAPTER 6
228
Subject 7: Green tea (250 ml) (E) 09:00 Blood sampling (1.3) 09:30 Blood sampling (1.4) Subjects 1,2: Green tea (250 ml) (A) Subjects 3,4: Black tea (250 ml) (B) Subject 5: Water (250 ml) (C)
Subject 6: Water (250 ml) (D) Subject 7: Green tea (250 ml) (E) 10:00 Blood sampling (1.5) 10:30 Blood sampling (1.6) Subjects 1,2: Green tea (250 ml) (A) Subjects 3,4: Black tea (250 ml) (B) Subject 5: Water (250 ml) (C)
Subject 6: Water (250 ml) (D) Subject 7: Green tea (250 ml) (E) 11:30 Blood sampling (1.7) 12:30 Blood sampling- 5ml (1.8) LOW FOLATE MEAL (See “Restrictions for the Diet”) 13:30 Blood sampling- 5ml (1.9) 14:30 Blood sampling- 5ml (1.10) 16:30 Blood sampling- 5ml (1.11) To minimize the interindividual differences in baseline folate concentrations, a presaturation regimen with FA will be administered before the start of the study. Between 1st study period and 2nd study period:
5 mg/day Folic acid for 5 days (before the 1st study period) followed by 2 folic acid free days
During those days (5+2) no tea is allowed. 2. Period 1st study day: 07:00 Subjects 1,2: Black tea (250 ml) (B) Subjects 3,4: Water (250 ml) (C) Subject 5: Water (250 ml) (D)
Subject 6: Green tea (250 ml) (E)
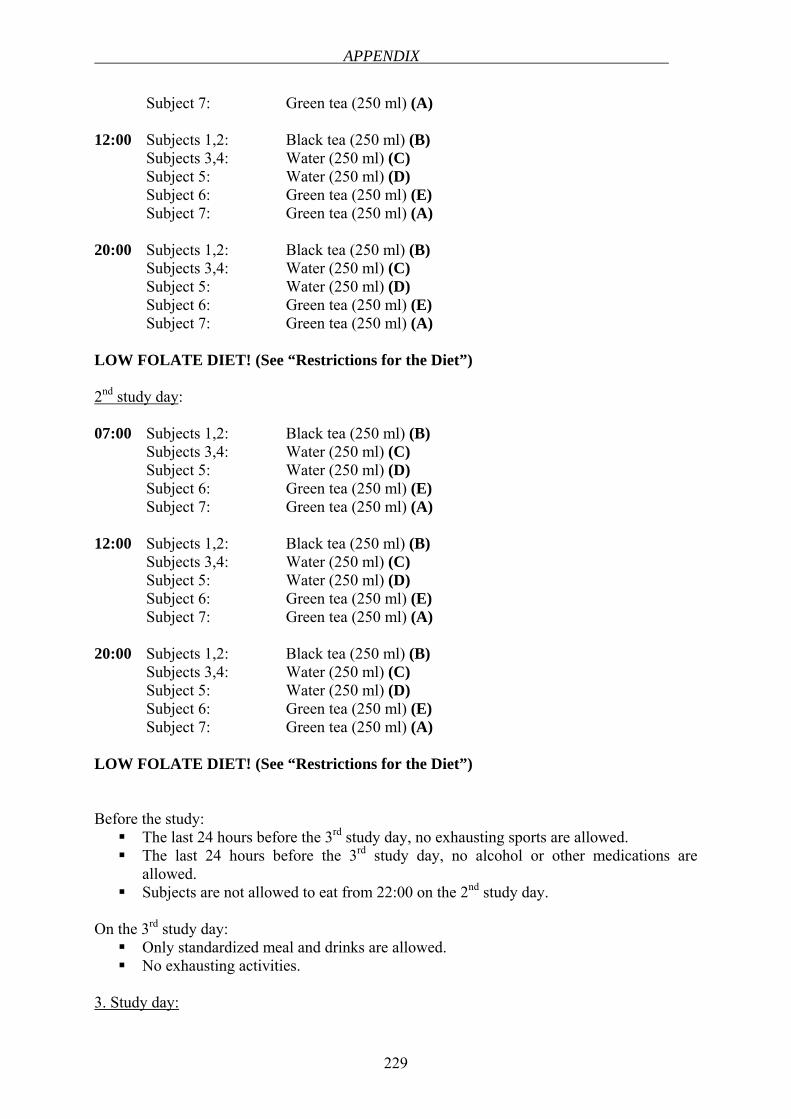
APPENDIX
229
Subject 7: Green tea (250 ml) (A) 12:00 Subjects 1,2: Black tea (250 ml) (B) Subjects 3,4: Water (250 ml) (C) Subject 5: Water (250 ml) (D)
Subject 6: Green tea (250 ml) (E) Subject 7: Green tea (250 ml) (A) 20:00 Subjects 1,2: Black tea (250 ml) (B) Subjects 3,4: Water (250 ml) (C) Subject 5: Water (250 ml) (D)
Subject 6: Green tea (250 ml) (E) Subject 7: Green tea (250 ml) (A) LOW FOLATE DIET! (See “Restrictions for the Diet”) 2nd study day: 07:00 Subjects 1,2: Black tea (250 ml) (B) Subjects 3,4: Water (250 ml) (C) Subject 5: Water (250 ml) (D)
Subject 6: Green tea (250 ml) (E) Subject 7: Green tea (250 ml) (A) 12:00 Subjects 1,2: Black tea (250 ml) (B) Subjects 3,4: Water (250 ml) (C) Subject 5: Water (250 ml) (D)
Subject 6: Green tea (250 ml) (E) Subject 7: Green tea (250 ml) (A) 20:00 Subjects 1,2: Black tea (250 ml) (B) Subjects 3,4: Water (250 ml) (C) Subject 5: Water (250 ml) (D)
Subject 6: Green tea (250 ml) (E) Subject 7: Green tea (250 ml) (A) LOW FOLATE DIET! (See “Restrictions for the Diet”) Before the study:
The last 24 hours before the 3rd study day, no exhausting sports are allowed. The last 24 hours before the 3rd study day, no alcohol or other medications are
allowed. Subjects are not allowed to eat from 22:00 on the 2nd study day.
On the 3rd study day:
Only standardized meal and drinks are allowed. No exhausting activities.
3. Study day:
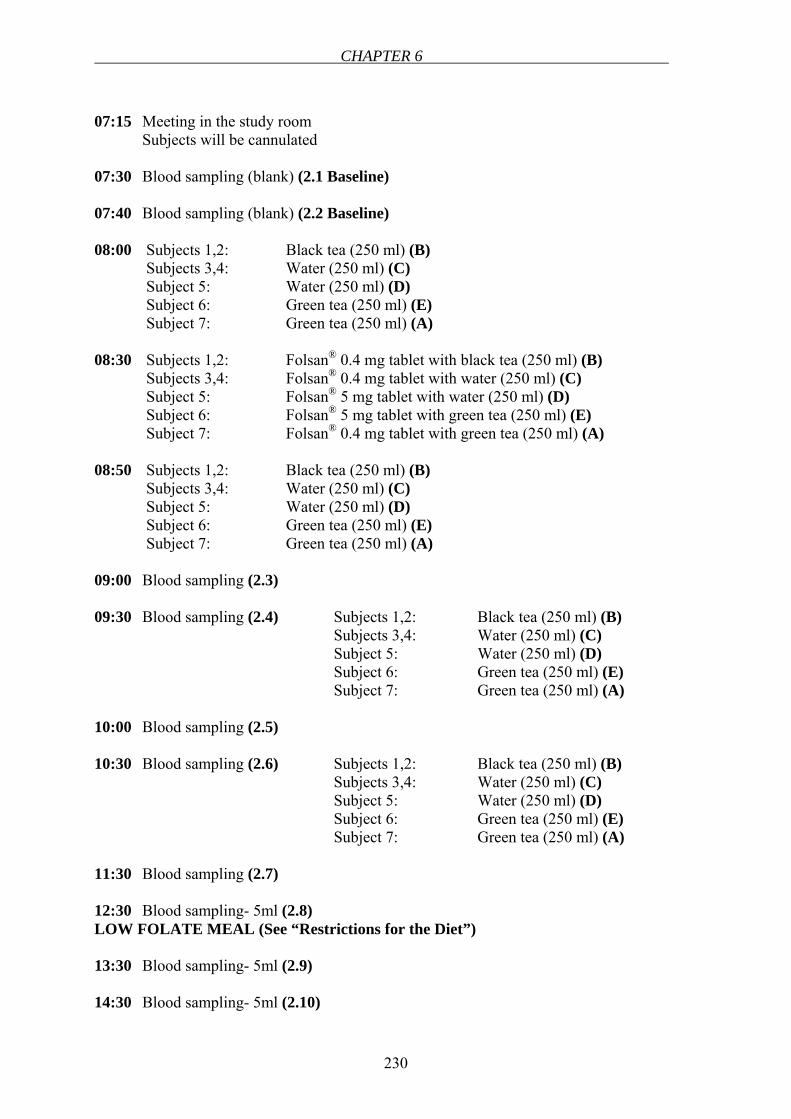
CHAPTER 6
230
07:15 Meeting in the study room Subjects will be cannulated 07:30 Blood sampling (blank) (2.1 Baseline) 07:40 Blood sampling (blank) (2.2 Baseline) 08:00 Subjects 1,2: Black tea (250 ml) (B) Subjects 3,4: Water (250 ml) (C) Subject 5: Water (250 ml) (D)
Subject 6: Green tea (250 ml) (E) Subject 7: Green tea (250 ml) (A) 08:30 Subjects 1,2: Folsan® 0.4 mg tablet with black tea (250 ml) (B) Subjects 3,4: Folsan® 0.4 mg tablet with water (250 ml) (C) Subject 5: Folsan® 5 mg tablet with water (250 ml) (D)
Subject 6: Folsan® 5 mg tablet with green tea (250 ml) (E) Subject 7: Folsan® 0.4 mg tablet with green tea (250 ml) (A) 08:50 Subjects 1,2: Black tea (250 ml) (B) Subjects 3,4: Water (250 ml) (C) Subject 5: Water (250 ml) (D)
Subject 6: Green tea (250 ml) (E) Subject 7: Green tea (250 ml) (A) 09:00 Blood sampling (2.3) 09:30 Blood sampling (2.4) Subjects 1,2: Black tea (250 ml) (B) Subjects 3,4: Water (250 ml) (C) Subject 5: Water (250 ml) (D)
Subject 6: Green tea (250 ml) (E) Subject 7: Green tea (250 ml) (A) 10:00 Blood sampling (2.5) 10:30 Blood sampling (2.6) Subjects 1,2: Black tea (250 ml) (B) Subjects 3,4: Water (250 ml) (C) Subject 5: Water (250 ml) (D)
Subject 6: Green tea (250 ml) (E) Subject 7: Green tea (250 ml) (A) 11:30 Blood sampling (2.7) 12:30 Blood sampling- 5ml (2.8) LOW FOLATE MEAL (See “Restrictions for the Diet”) 13:30 Blood sampling- 5ml (2.9) 14:30 Blood sampling- 5ml (2.10)
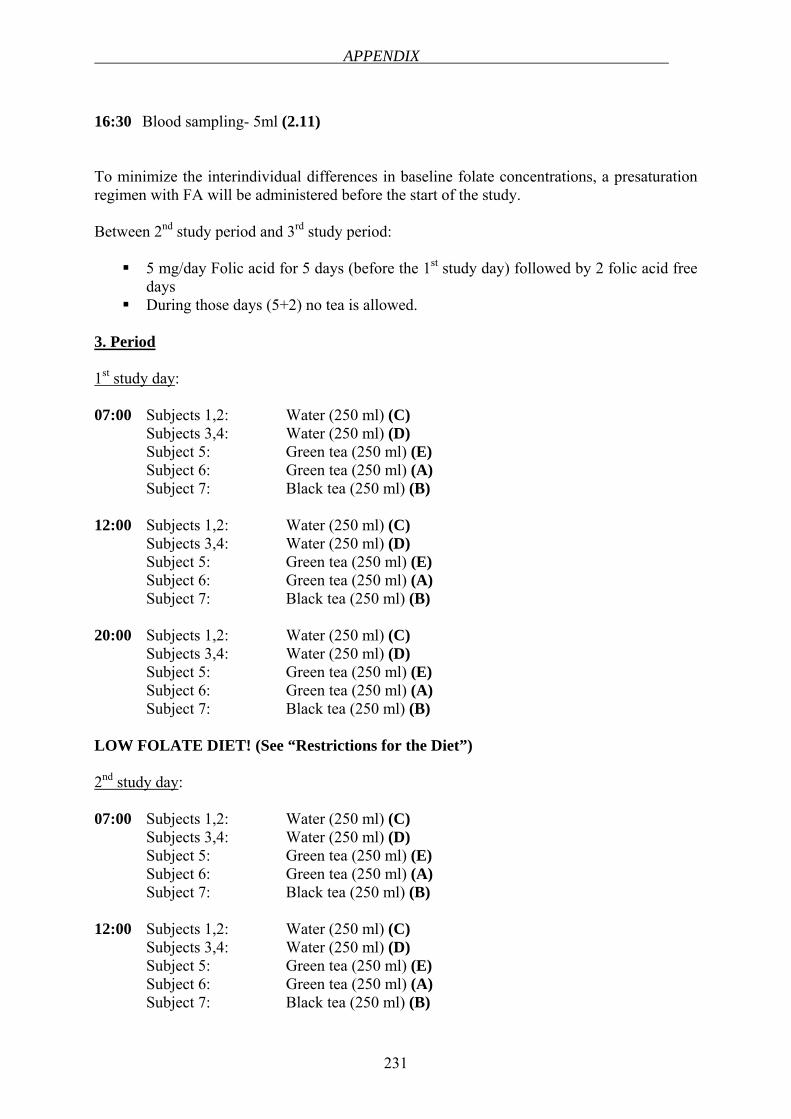
APPENDIX
231
16:30 Blood sampling- 5ml (2.11) To minimize the interindividual differences in baseline folate concentrations, a presaturation regimen with FA will be administered before the start of the study. Between 2nd study period and 3rd study period:
5 mg/day Folic acid for 5 days (before the 1st study day) followed by 2 folic acid free days
During those days (5+2) no tea is allowed. 3. Period 1st study day: 07:00 Subjects 1,2: Water (250 ml) (C) Subjects 3,4: Water (250 ml) (D) Subject 5: Green tea (250 ml) (E)
Subject 6: Green tea (250 ml) (A) Subject 7: Black tea (250 ml) (B) 12:00 Subjects 1,2: Water (250 ml) (C) Subjects 3,4: Water (250 ml) (D) Subject 5: Green tea (250 ml) (E)
Subject 6: Green tea (250 ml) (A) Subject 7: Black tea (250 ml) (B) 20:00 Subjects 1,2: Water (250 ml) (C) Subjects 3,4: Water (250 ml) (D) Subject 5: Green tea (250 ml) (E)
Subject 6: Green tea (250 ml) (A) Subject 7: Black tea (250 ml) (B) LOW FOLATE DIET! (See “Restrictions for the Diet”) 2nd study day: 07:00 Subjects 1,2: Water (250 ml) (C) Subjects 3,4: Water (250 ml) (D) Subject 5: Green tea (250 ml) (E)
Subject 6: Green tea (250 ml) (A) Subject 7: Black tea (250 ml) (B) 12:00 Subjects 1,2: Water (250 ml) (C) Subjects 3,4: Water (250 ml) (D) Subject 5: Green tea (250 ml) (E)
Subject 6: Green tea (250 ml) (A) Subject 7: Black tea (250 ml) (B)
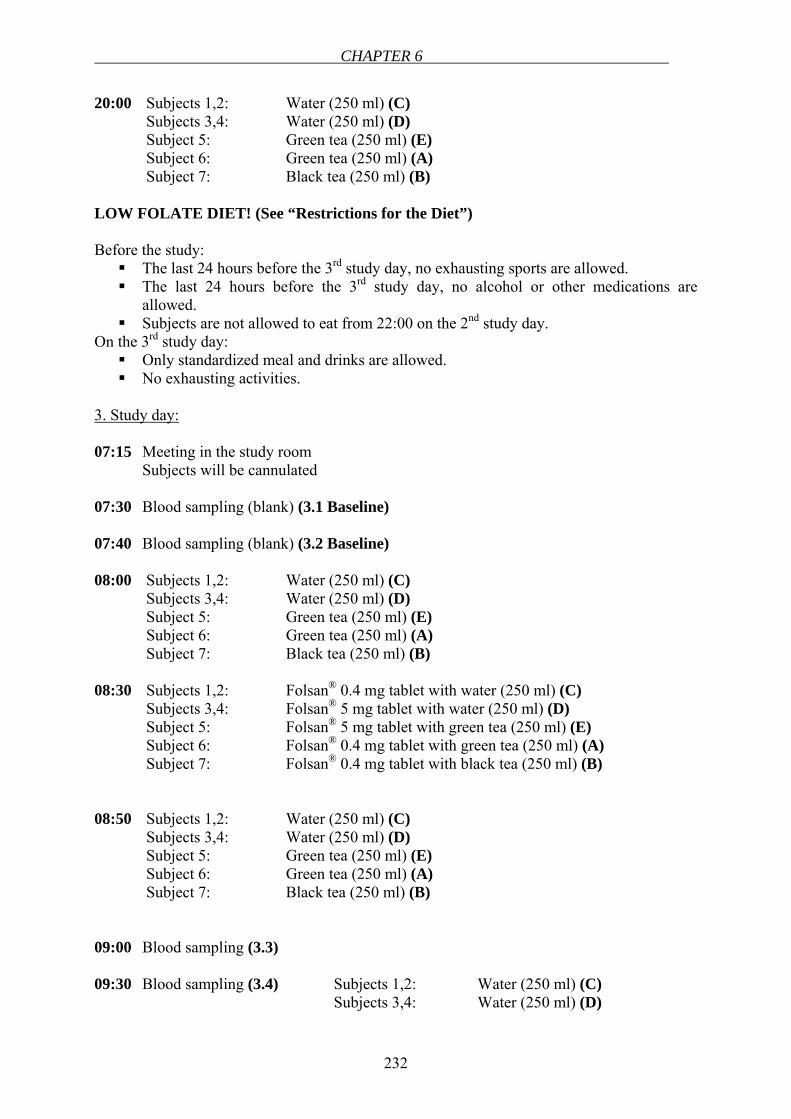
CHAPTER 6
232
20:00 Subjects 1,2: Water (250 ml) (C) Subjects 3,4: Water (250 ml) (D) Subject 5: Green tea (250 ml) (E)
Subject 6: Green tea (250 ml) (A) Subject 7: Black tea (250 ml) (B) LOW FOLATE DIET! (See “Restrictions for the Diet”) Before the study:
The last 24 hours before the 3rd study day, no exhausting sports are allowed. The last 24 hours before the 3rd study day, no alcohol or other medications are
allowed. Subjects are not allowed to eat from 22:00 on the 2nd study day.
On the 3rd study day: Only standardized meal and drinks are allowed. No exhausting activities.
3. Study day: 07:15 Meeting in the study room Subjects will be cannulated 07:30 Blood sampling (blank) (3.1 Baseline) 07:40 Blood sampling (blank) (3.2 Baseline) 08:00 Subjects 1,2: Water (250 ml) (C) Subjects 3,4: Water (250 ml) (D) Subject 5: Green tea (250 ml) (E)
Subject 6: Green tea (250 ml) (A) Subject 7: Black tea (250 ml) (B) 08:30 Subjects 1,2: Folsan® 0.4 mg tablet with water (250 ml) (C) Subjects 3,4: Folsan® 5 mg tablet with water (250 ml) (D) Subject 5: Folsan® 5 mg tablet with green tea (250 ml) (E)
Subject 6: Folsan® 0.4 mg tablet with green tea (250 ml) (A) Subject 7: Folsan® 0.4 mg tablet with black tea (250 ml) (B) 08:50 Subjects 1,2: Water (250 ml) (C) Subjects 3,4: Water (250 ml) (D) Subject 5: Green tea (250 ml) (E)
Subject 6: Green tea (250 ml) (A) Subject 7: Black tea (250 ml) (B) 09:00 Blood sampling (3.3) 09:30 Blood sampling (3.4) Subjects 1,2: Water (250 ml) (C) Subjects 3,4: Water (250 ml) (D)
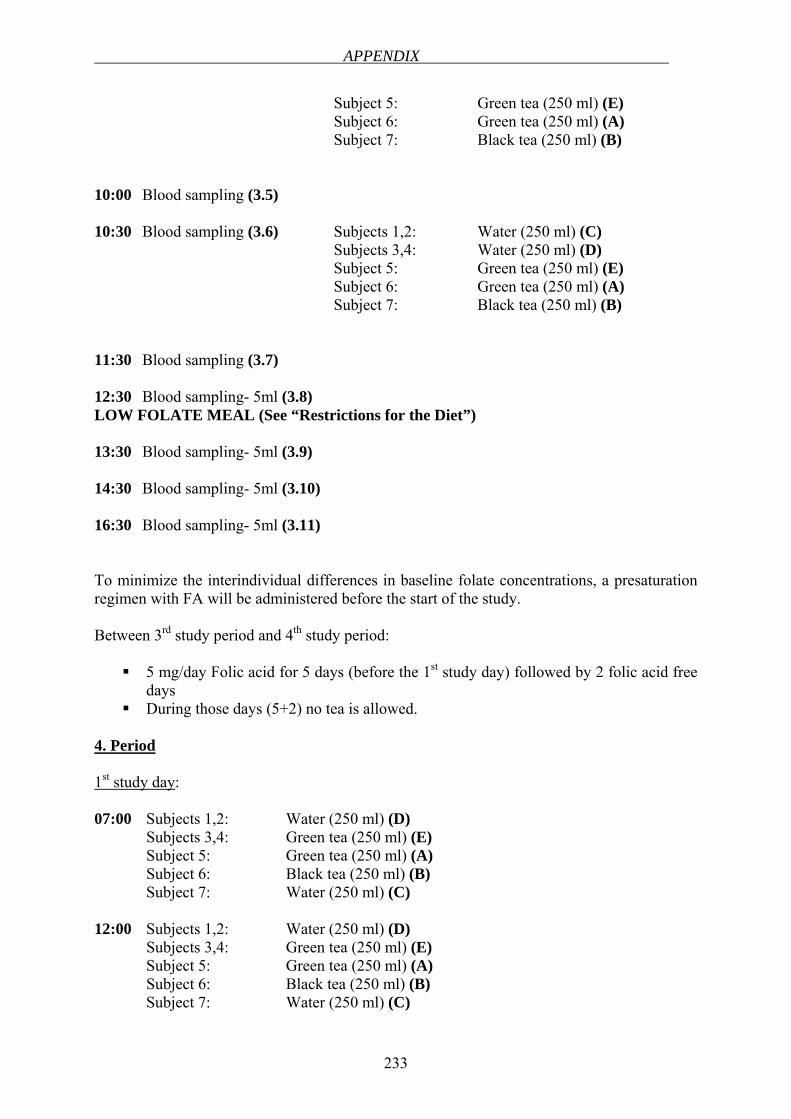
APPENDIX
233
Subject 5: Green tea (250 ml) (E) Subject 6: Green tea (250 ml) (A)
Subject 7: Black tea (250 ml) (B) 10:00 Blood sampling (3.5) 10:30 Blood sampling (3.6) Subjects 1,2: Water (250 ml) (C) Subjects 3,4: Water (250 ml) (D) Subject 5: Green tea (250 ml) (E)
Subject 6: Green tea (250 ml) (A) Subject 7: Black tea (250 ml) (B) 11:30 Blood sampling (3.7) 12:30 Blood sampling- 5ml (3.8) LOW FOLATE MEAL (See “Restrictions for the Diet”) 13:30 Blood sampling- 5ml (3.9) 14:30 Blood sampling- 5ml (3.10) 16:30 Blood sampling- 5ml (3.11) To minimize the interindividual differences in baseline folate concentrations, a presaturation regimen with FA will be administered before the start of the study. Between 3rd study period and 4th study period:
5 mg/day Folic acid for 5 days (before the 1st study day) followed by 2 folic acid free days
During those days (5+2) no tea is allowed. 4. Period 1st study day: 07:00 Subjects 1,2: Water (250 ml) (D) Subjects 3,4: Green tea (250 ml) (E) Subject 5: Green tea (250 ml) (A)
Subject 6: Black tea (250 ml) (B) Subject 7: Water (250 ml) (C) 12:00 Subjects 1,2: Water (250 ml) (D) Subjects 3,4: Green tea (250 ml) (E) Subject 5: Green tea (250 ml) (A)
Subject 6: Black tea (250 ml) (B) Subject 7: Water (250 ml) (C)
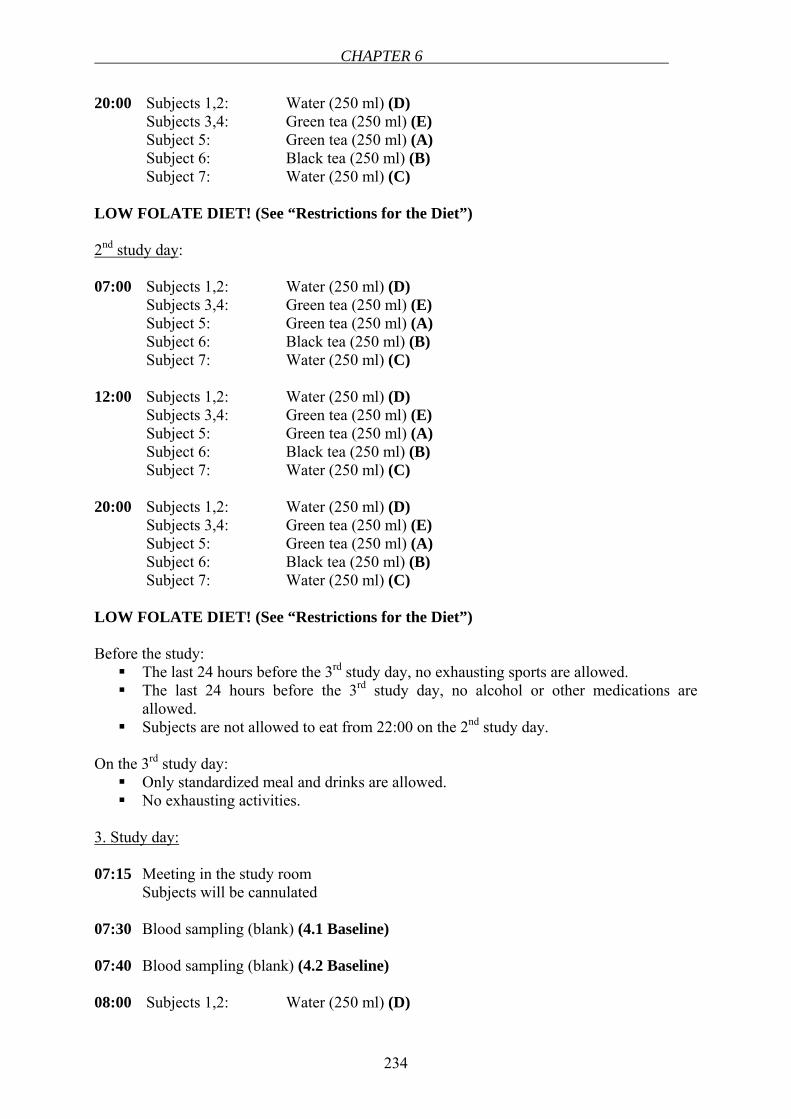
CHAPTER 6
234
20:00 Subjects 1,2: Water (250 ml) (D) Subjects 3,4: Green tea (250 ml) (E) Subject 5: Green tea (250 ml) (A)
Subject 6: Black tea (250 ml) (B) Subject 7: Water (250 ml) (C) LOW FOLATE DIET! (See “Restrictions for the Diet”) 2nd study day: 07:00 Subjects 1,2: Water (250 ml) (D) Subjects 3,4: Green tea (250 ml) (E) Subject 5: Green tea (250 ml) (A)
Subject 6: Black tea (250 ml) (B) Subject 7: Water (250 ml) (C) 12:00 Subjects 1,2: Water (250 ml) (D) Subjects 3,4: Green tea (250 ml) (E) Subject 5: Green tea (250 ml) (A)
Subject 6: Black tea (250 ml) (B) Subject 7: Water (250 ml) (C) 20:00 Subjects 1,2: Water (250 ml) (D) Subjects 3,4: Green tea (250 ml) (E) Subject 5: Green tea (250 ml) (A)
Subject 6: Black tea (250 ml) (B) Subject 7: Water (250 ml) (C) LOW FOLATE DIET! (See “Restrictions for the Diet”) Before the study:
The last 24 hours before the 3rd study day, no exhausting sports are allowed. The last 24 hours before the 3rd study day, no alcohol or other medications are
allowed. Subjects are not allowed to eat from 22:00 on the 2nd study day.
On the 3rd study day:
Only standardized meal and drinks are allowed. No exhausting activities.
3. Study day: 07:15 Meeting in the study room Subjects will be cannulated 07:30 Blood sampling (blank) (4.1 Baseline) 07:40 Blood sampling (blank) (4.2 Baseline) 08:00 Subjects 1,2: Water (250 ml) (D)
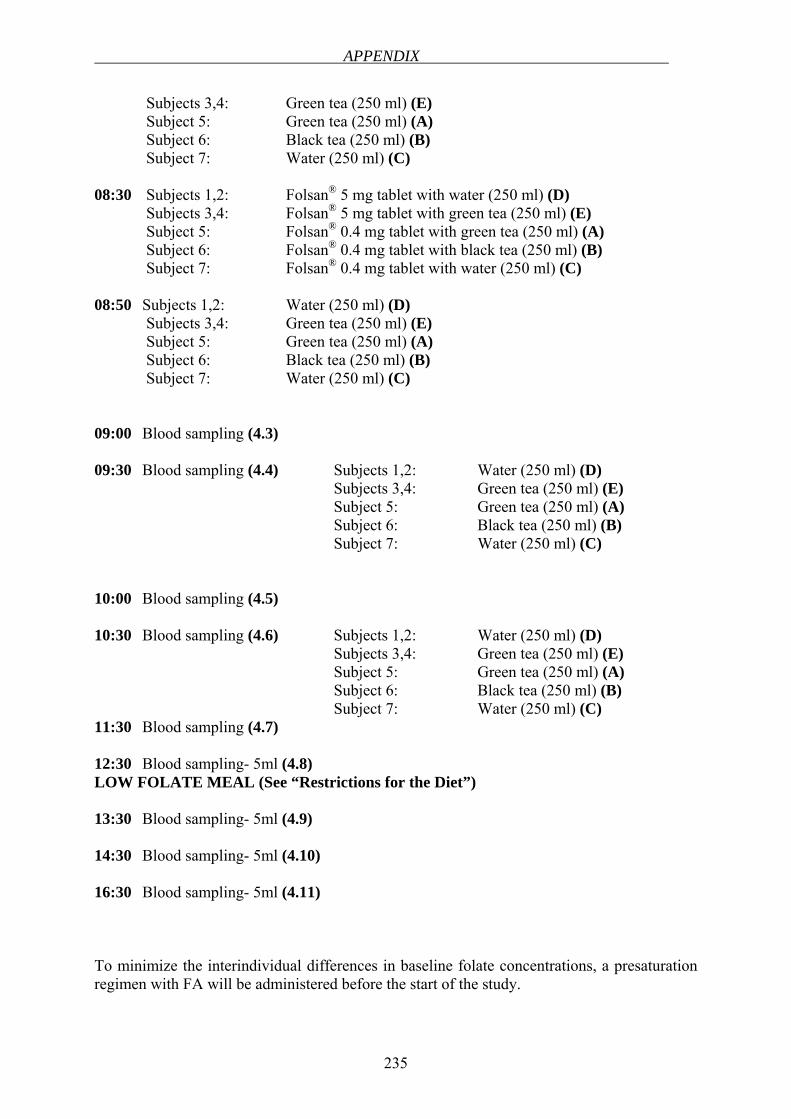
APPENDIX
235
Subjects 3,4: Green tea (250 ml) (E) Subject 5: Green tea (250 ml) (A)
Subject 6: Black tea (250 ml) (B) Subject 7: Water (250 ml) (C) 08:30 Subjects 1,2: Folsan® 5 mg tablet with water (250 ml) (D) Subjects 3,4: Folsan® 5 mg tablet with green tea (250 ml) (E) Subject 5: Folsan® 0.4 mg tablet with green tea (250 ml) (A)
Subject 6: Folsan® 0.4 mg tablet with black tea (250 ml) (B) Subject 7: Folsan® 0.4 mg tablet with water (250 ml) (C) 08:50 Subjects 1,2: Water (250 ml) (D) Subjects 3,4: Green tea (250 ml) (E) Subject 5: Green tea (250 ml) (A)
Subject 6: Black tea (250 ml) (B) Subject 7: Water (250 ml) (C) 09:00 Blood sampling (4.3) 09:30 Blood sampling (4.4) Subjects 1,2: Water (250 ml) (D) Subjects 3,4: Green tea (250 ml) (E) Subject 5: Green tea (250 ml) (A)
Subject 6: Black tea (250 ml) (B) Subject 7: Water (250 ml) (C) 10:00 Blood sampling (4.5) 10:30 Blood sampling (4.6) Subjects 1,2: Water (250 ml) (D) Subjects 3,4: Green tea (250 ml) (E) Subject 5: Green tea (250 ml) (A)
Subject 6: Black tea (250 ml) (B) Subject 7: Water (250 ml) (C) 11:30 Blood sampling (4.7) 12:30 Blood sampling- 5ml (4.8) LOW FOLATE MEAL (See “Restrictions for the Diet”) 13:30 Blood sampling- 5ml (4.9) 14:30 Blood sampling- 5ml (4.10) 16:30 Blood sampling- 5ml (4.11) To minimize the interindividual differences in baseline folate concentrations, a presaturation regimen with FA will be administered before the start of the study.
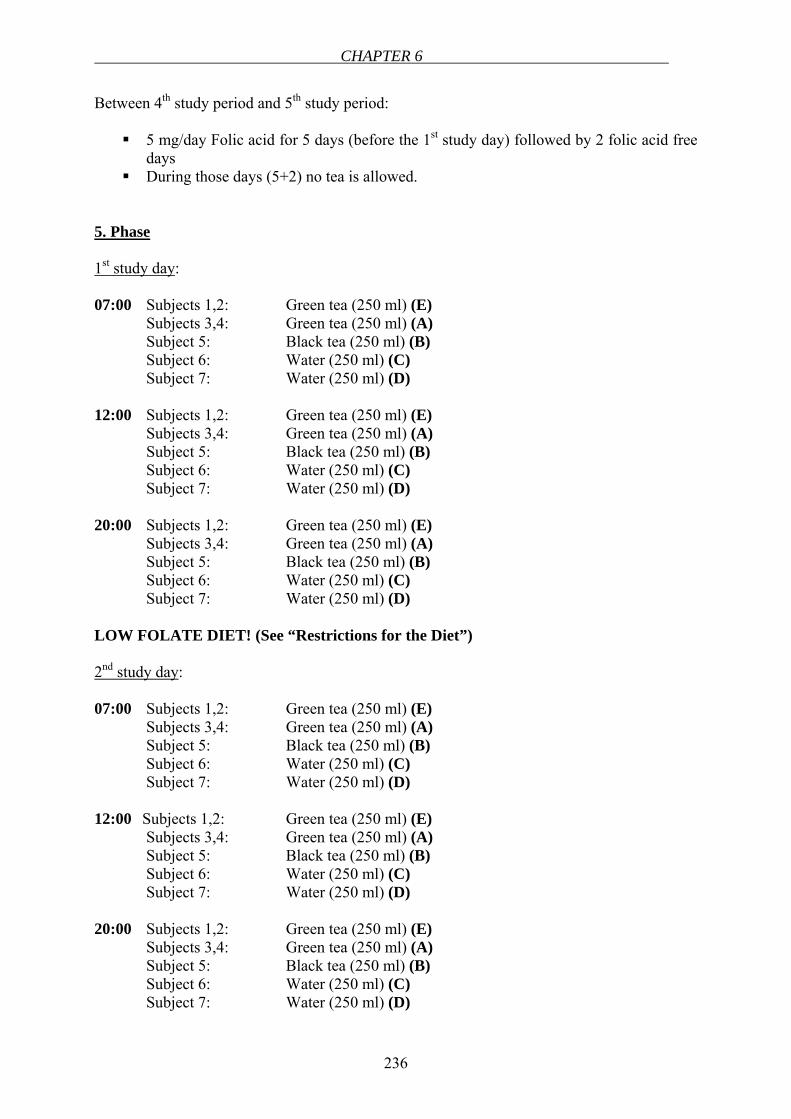
CHAPTER 6
236
Between 4th study period and 5th study period:
5 mg/day Folic acid for 5 days (before the 1st study day) followed by 2 folic acid free days
During those days (5+2) no tea is allowed. 5. Phase 1st study day: 07:00 Subjects 1,2: Green tea (250 ml) (E) Subjects 3,4: Green tea (250 ml) (A) Subject 5: Black tea (250 ml) (B)
Subject 6: Water (250 ml) (C) Subject 7: Water (250 ml) (D) 12:00 Subjects 1,2: Green tea (250 ml) (E) Subjects 3,4: Green tea (250 ml) (A) Subject 5: Black tea (250 ml) (B)
Subject 6: Water (250 ml) (C) Subject 7: Water (250 ml) (D) 20:00 Subjects 1,2: Green tea (250 ml) (E) Subjects 3,4: Green tea (250 ml) (A) Subject 5: Black tea (250 ml) (B)
Subject 6: Water (250 ml) (C) Subject 7: Water (250 ml) (D) LOW FOLATE DIET! (See “Restrictions for the Diet”) 2nd study day: 07:00 Subjects 1,2: Green tea (250 ml) (E) Subjects 3,4: Green tea (250 ml) (A) Subject 5: Black tea (250 ml) (B)
Subject 6: Water (250 ml) (C) Subject 7: Water (250 ml) (D) 12:00 Subjects 1,2: Green tea (250 ml) (E) Subjects 3,4: Green tea (250 ml) (A) Subject 5: Black tea (250 ml) (B)
Subject 6: Water (250 ml) (C) Subject 7: Water (250 ml) (D) 20:00 Subjects 1,2: Green tea (250 ml) (E) Subjects 3,4: Green tea (250 ml) (A) Subject 5: Black tea (250 ml) (B)
Subject 6: Water (250 ml) (C) Subject 7: Water (250 ml) (D)
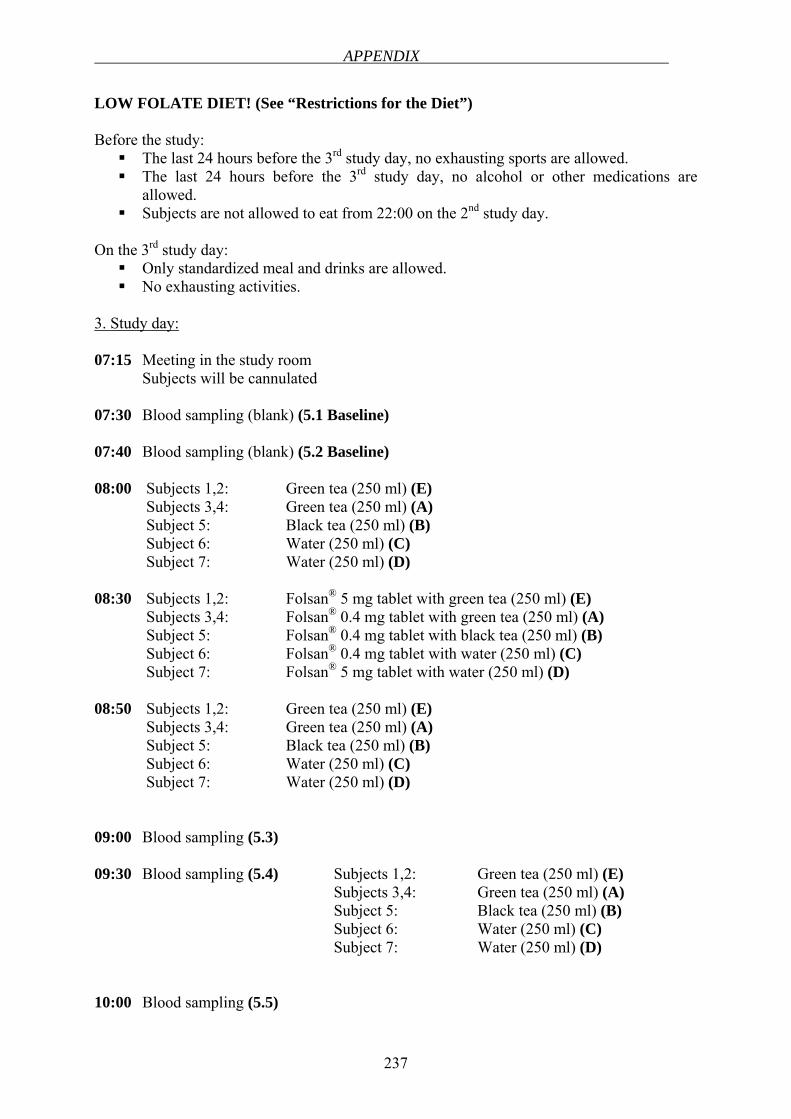
APPENDIX
237
LOW FOLATE DIET! (See “Restrictions for the Diet”) Before the study:
The last 24 hours before the 3rd study day, no exhausting sports are allowed. The last 24 hours before the 3rd study day, no alcohol or other medications are
allowed. Subjects are not allowed to eat from 22:00 on the 2nd study day.
On the 3rd study day:
Only standardized meal and drinks are allowed. No exhausting activities.
3. Study day: 07:15 Meeting in the study room Subjects will be cannulated 07:30 Blood sampling (blank) (5.1 Baseline) 07:40 Blood sampling (blank) (5.2 Baseline) 08:00 Subjects 1,2: Green tea (250 ml) (E) Subjects 3,4: Green tea (250 ml) (A) Subject 5: Black tea (250 ml) (B)
Subject 6: Water (250 ml) (C) Subject 7: Water (250 ml) (D) 08:30 Subjects 1,2: Folsan® 5 mg tablet with green tea (250 ml) (E) Subjects 3,4: Folsan® 0.4 mg tablet with green tea (250 ml) (A) Subject 5: Folsan® 0.4 mg tablet with black tea (250 ml) (B)
Subject 6: Folsan® 0.4 mg tablet with water (250 ml) (C) Subject 7: Folsan® 5 mg tablet with water (250 ml) (D) 08:50 Subjects 1,2: Green tea (250 ml) (E) Subjects 3,4: Green tea (250 ml) (A) Subject 5: Black tea (250 ml) (B)
Subject 6: Water (250 ml) (C) Subject 7: Water (250 ml) (D) 09:00 Blood sampling (5.3) 09:30 Blood sampling (5.4) Subjects 1,2: Green tea (250 ml) (E) Subjects 3,4: Green tea (250 ml) (A) Subject 5: Black tea (250 ml) (B)
Subject 6: Water (250 ml) (C) Subject 7: Water (250 ml) (D) 10:00 Blood sampling (5.5)
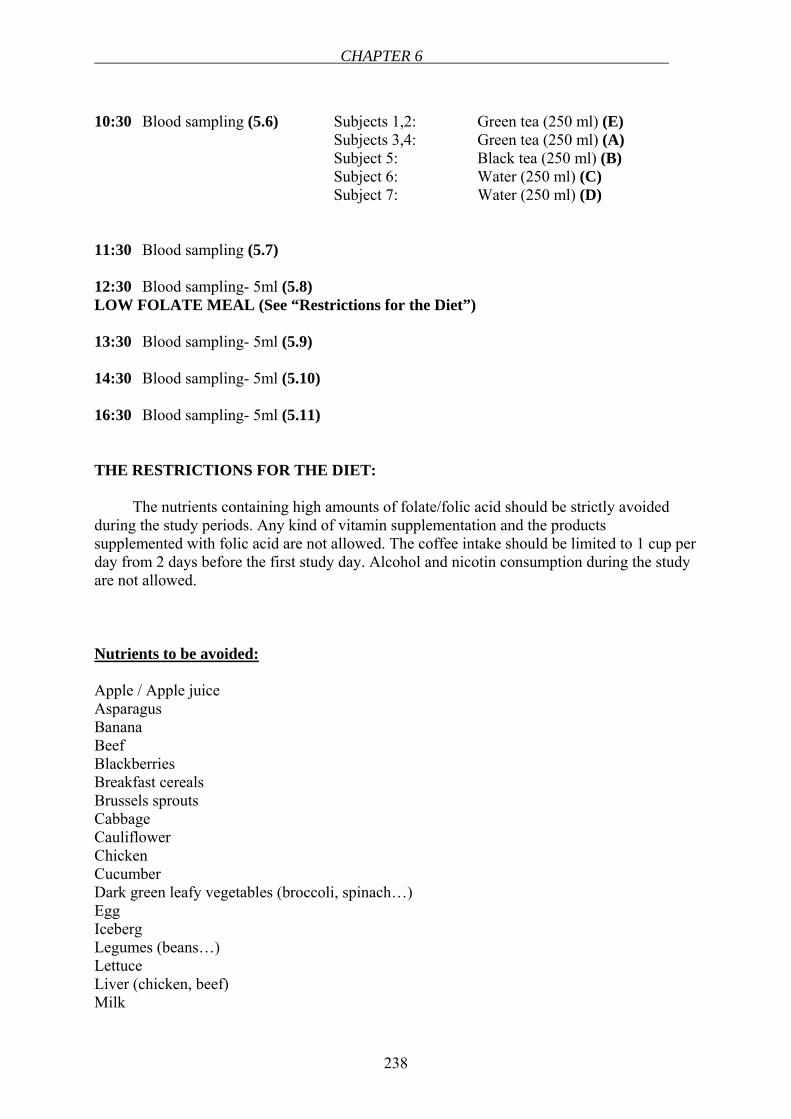
CHAPTER 6
238
10:30 Blood sampling (5.6) Subjects 1,2: Green tea (250 ml) (E) Subjects 3,4: Green tea (250 ml) (A) Subject 5: Black tea (250 ml) (B)
Subject 6: Water (250 ml) (C) Subject 7: Water (250 ml) (D) 11:30 Blood sampling (5.7) 12:30 Blood sampling- 5ml (5.8) LOW FOLATE MEAL (See “Restrictions for the Diet”) 13:30 Blood sampling- 5ml (5.9) 14:30 Blood sampling- 5ml (5.10) 16:30 Blood sampling- 5ml (5.11) THE RESTRICTIONS FOR THE DIET:
The nutrients containing high amounts of folate/folic acid should be strictly avoided during the study periods. Any kind of vitamin supplementation and the products supplemented with folic acid are not allowed. The coffee intake should be limited to 1 cup per day from 2 days before the first study day. Alcohol and nicotin consumption during the study are not allowed.
Nutrients to be avoided: Apple / Apple juice Asparagus Banana Beef Blackberries Breakfast cereals Brussels sprouts Cabbage Cauliflower Chicken Cucumber Dark green leafy vegetables (broccoli, spinach…) Egg Iceberg Legumes (beans…) Lettuce Liver (chicken, beef) Milk
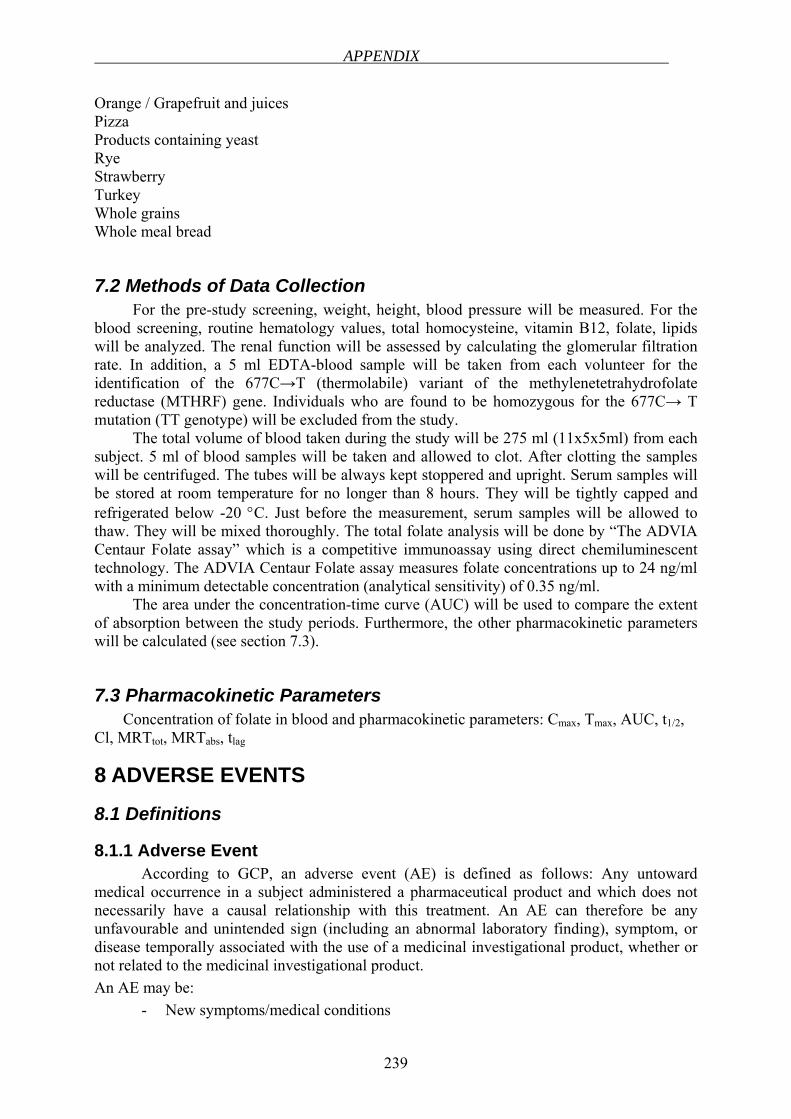
APPENDIX
239
Orange / Grapefruit and juices Pizza Products containing yeast Rye Strawberry Turkey Whole grains Whole meal bread
7.2 Methods of Data Collection For the pre-study screening, weight, height, blood pressure will be measured. For the
blood screening, routine hematology values, total homocysteine, vitamin B12, folate, lipids will be analyzed. The renal function will be assessed by calculating the glomerular filtration rate. In addition, a 5 ml EDTA-blood sample will be taken from each volunteer for the identification of the 677C→T (thermolabile) variant of the methylenetetrahydrofolate reductase (MTHRF) gene. Individuals who are found to be homozygous for the 677C→ T mutation (TT genotype) will be excluded from the study.
The total volume of blood taken during the study will be 275 ml (11x5x5ml) from each subject. 5 ml of blood samples will be taken and allowed to clot. After clotting the samples will be centrifuged. The tubes will be always kept stoppered and upright. Serum samples will be stored at room temperature for no longer than 8 hours. They will be tightly capped and refrigerated below -20 °C. Just before the measurement, serum samples will be allowed to thaw. They will be mixed thoroughly. The total folate analysis will be done by “The ADVIA Centaur Folate assay” which is a competitive immunoassay using direct chemiluminescent technology. The ADVIA Centaur Folate assay measures folate concentrations up to 24 ng/ml with a minimum detectable concentration (analytical sensitivity) of 0.35 ng/ml.
The area under the concentration-time curve (AUC) will be used to compare the extent of absorption between the study periods. Furthermore, the other pharmacokinetic parameters will be calculated (see section 7.3).
7.3 Pharmacokinetic Parameters Concentration of folate in blood and pharmacokinetic parameters: Cmax, Tmax, AUC, t1/2,
Cl, MRTtot, MRTabs, tlag
8 ADVERSE EVENTS
8.1 Definitions
8.1.1 Adverse Event According to GCP, an adverse event (AE) is defined as follows: Any untoward
medical occurrence in a subject administered a pharmaceutical product and which does not necessarily have a causal relationship with this treatment. An AE can therefore be any unfavourable and unintended sign (including an abnormal laboratory finding), symptom, or disease temporally associated with the use of a medicinal investigational product, whether or not related to the medicinal investigational product. An AE may be:
- New symptoms/medical conditions
CHAPTER 6
240
- New diagnosis - Changes of laboratory parameters - Intercurrent diseases and accidents - Worsening of medical conditions/diseases existing before clinical trial start - Recurrence of disease - Increase of frequency or intensity of episodical diseases. Surgical procedures themselves are not AEs; they are therapeutic measures for
conditions that require surgery. The condition for which the surgery is required may be an AE. Planned surgical measures permitted by the clinical trial protocol and the condition(s) leading to these measures are not AEs, if the condition leading to the measure was present prior to inclusion into the trial. AEs fall into the categories "non-serious" and "serious".
8.1.2 Serious Adverse Event A serious adverse event (SAE) is one that at any dose: - Results in death - Is life-threatening - Requires subject hospitalization or prolongation of existing hospitalization - Results in persistent or significant disability/incapacity or - Is a congenital anomaly/birth defect.
8.2 Period of Observation and Documentation All AEs reported by the subject or detected by the investigator, will be collected during
the trial and must be documented on the appropriate pages of the CRF. AEs must also be documented in the subject’s medical records. In this trial, all AEs that occur after the subject has signed the informed consent document will be documented on the pages provided in the CRF. All subjects who have AEs, whether considered associated with the use of the trial medication or not, must be monitored to determine the outcome. The clinical course of the AE will be followed up by the time of resolve or normalization of changed laboratory parameters or until it has changed to a stable condition. The intensity of an AE should be assessed by the investigator as follows: mild: temporary event which is tolerated well by the subject. moderate: event which results in discomfort for the subject and impairs his/her
normal activity. severe: event which results in substantial impairment of normal activities of
subject. The investigator will evaluate each AE occurred after administration of investigational medicinal product regarding the coherency with the administration of the investigational medicinal product possibly exist: certain: if there is a reasonable possibility that the event may have been caused
by trial participation. A certain event has a strong temporal relationship and an alternative cause is unlikely.
probable: An AE that has a reasonable possibility that the event is likely to have
APPENDIX
241
been caused by trial participation. The AE has a timely relationship to the trial procedure(s) and follows a known pattern of response, but a potential alternative cause may be present.
possible: An AE that has a reasonable possibility that the event may have been caused by trial participation. The AE has a timely relationship to the trial procedure(s); however, follows no known pattern of response, and an alternative cause seems more likely or there is significant uncertainty about the cause of the event.
unrelated: An AE that does not follow a reasonable temporal sequence from trial participation and that is likely to have been produced by the subject’s clinical state, other modes of therapy or other known etiology.
not assessed: inadequate data for assessment, no other data may be expected
8.3 Reporting of Adverse Events by Investigator SAEs must be reported to principal Investigator within 24 hours after the SAE becomes
known using the "Serious Adverse Event" form. The initial report must be as complete as possible including details of the current illness and (serious) adverse event and an assessment of the causal relationship between the event and the trial medication.
8.4 Emergency Treatment During and following a subject’s participation in the trial, the investigator should ensure
that adequate medical care is provided to a subject for any AEs including clinically significant laboratory values. The investigator should inform a subject when medical care is needed for intercurrent illness (es) of which the investigator becomes aware.
9 STATISTICAL PROCEDURES
9.1 Sample Size Calculation Number of subjects: 7, it is pilot pharmacokinetic study in humans to prove the
hypothesis that tea may have a negative effect on folic acid bioavailability.
9.2 Analysis Variables The aim of this clinical study is to investigate the pharmacokinetic interaction between
folic acid and green /black tea in human.
9.3 Statistical Methods Mean values, standard deviations and the coefficient of variation of the pharmacokinetic
parameters will be expressed. Differences in means between the groups will be tested by ANOVA to determine the probability of the data sets being identical or different among groups. By ANOVA, variability in subjects, treatment groups, study periods will be evaluated.
CHAPTER 6
242
10 DATA MANAGEMENT
10.1 Data Collection All findings including clinical and laboratory data will be documented in the CRF. The
investigator is responsible for ensuring that all sections of the CRF are completed correctly and that entries can be verified against source data. Any errors should have a single line drawn through them so that the original entry remains legible and the correct data should be entered at the side with the investigator's signature, date and reason for change. Self-explanatory corrections need not to be justified. Each individual CRF page and each completed CRF page of one trial visit, respectively, must be dated and signed by the responsible investigator upon completion.
10.2 Data Handling After first check for plausibility by eye, all data will be entered in a database as recorded
in the CRF. To ensure data quality a double data entry will be done. After completion of data entry checks for plausibility, consistency and completeness of the data will be performed. Based on this checks, queries will be produced combined with the queries generated by visual control. All missing data or inconsistencies will be reported back to the centre(s) and clarified by the responsible investigator. If no further corrections are to be made in the database it will be declared closed and used for statistical analysis.
10.3 Storage and Archiving of Data The investigator will archive all trial data (subject identification code list, source data
and investigator's file) and relevant correspondence in the Investigator Site File (ISF). The ISF, all source data and all documents itemized in section 8 of the ICH Consolidated Guideline on GCP will be archived after finalization of the trial according to the legal regulations.
11 ETHICAL AND LEGAL ASPECTS
11.1 Good Clinical Practice The procedures set out in this trial protocol, pertaining to the conduct, evaluation, and
documentation of this trial, are designed to ensure that all persons involved in the trial abide by Good Clinical Practice (GCP) and the ethical principles described in the current revision of the Declaration of Helsinki. The trial will be carried out in keeping with local legal and regulatory requirements.
The requirements of the AMG, the GCP regulation, and the Federal Data Protection Law (BDSG) will be kept.
11.2 Subject Information and Informed Consent Before being admitted to the clinical trial, the subject must consent to participate after
the nature, scope, and possible consequences of the clinical trial have been explained in a form understandable to him or her. The subject must give consent in writing.
APPENDIX
243
A copy of the signed informed consent document must be given to the subject. The documents must be in a language understandable to the subject and must specify who informed the subject.
11.3 Confidentiality The name of the subjects and other confidential information are subject to medical
professional secrecy and the regulations of the BDSG. During the clinical trial, subjects will be identified solely by means of an individual identification code (e.g. subject number, randomization number). Trial findings stored on a computer will be stored in accordance with local data protection law and will be handled in strictest confidence. For protection of these data, organizational procedures are implemented to prevent distribution of data to unauthorized persons. The appropriate regulations of local data legislation will be fulfilled in its entirety.
The subject will declare in the written consent to release the investigator from the medical professional secrecy to allow identification of subject’s name and/or inspection of original data for monitoring purposes by health authorities. The investigator will maintain a personal subject identification list (subject numbers with the corresponding subject names) to enable records to be identified.
11.4 Responsibilities of Investigator The investigator should ensure that all persons assisting with the trial are adequately
informed about the protocol, any amendments to the protocol, the trial treatments, and their trial-related duties and functions.
The investigator should maintain a list of subinvestigators and other appropriately qualified persons to whom he or she has delegated significant trial-related duties.
11.5 Approval of Trial Protocol and Amendments Before the start of the trial, the trial protocol, informed consent document, and any other
appropriate documents will be submitted to the independent Ethics Committee (EC). Formal approval by the EC should preferably mention the title of the trial, the trial code, the trial site, and any other documents reviewed. It must mention the date on which the decision was made and must be officially signed by a committee member. This documentation must also include a list of members of the EC present on the applicable EC meeting.
Before the first subject is enrolled in the trial, all ethical and legal requirements must be met.
The EC must be informed of all protocol amendments. The investigator must keep a record of all communications with the EC and the regulatory authorities.
11.6 Continuous Information to Independent Ethics Committee The EC must be informed of all subsequent protocol amendments which require
formally approval in accordance with local legal requirements.
CHAPTER 6
244
The independent EC must be informed of serious or unexpected AEs which occur during the trial and might affect the safety of subjects or the conduct of the trial if not otherwise stated in the vote.
The EC must be informed of trial process regularly if not otherwise stated in the vote. The EC must be informed of the end of the trial.
12 AGREEMENTS
12.1 Financing of the Trial The trial will be financed using funds of Sponsor: Prof. Dr. P. Langguth
12.2 Reports The final trial report will be prepared in 6 months after the end of clinic trial.
12.3 Publication All information concerning the trial is confidential before publication.
13 SIGNATURES The present trial protocol was subject to critical review and has been approved in the present version by the persons undersigned. The information contained is consistent with:
- the current risk-benefit assessment of the investigational study medication - the moral, ethical, and scientific principles governing clinical research as
set out in the Declaration of Helsinki and the principles of GCP. The investigator will be supplied with details of any significant or new finding including AEs relating to treatment with the investigational medicinal product. Date: ___________ Signature: ______________________________ Name (block letters): ______________________________
Function: Sponsor Date: ___________ Signature: ______________________________ Name (block letters): ______________________________
Function: Coordinating Investigator / LKP Date: ___________ Signature: ______________________________ Name (block letters): ______________________________ Function: Trial Coordinator
APPENDIX
245
14 DECLARATION OF INVESTIGATOR I have read the above trial protocol and I confirm that it contains all information to accordingly conduct the clinical trial. I pledge to conduct the clinical trial according to the protocol. I will enrol the first subject only after all ethical and regulatory requirements are fulfilled. I pledge to obtain written consent for trial participation from all subjects. I know the requirements for accurate notification of serious adverse events and I pledge to document and notify such events as described in the protocol. I pledge to retain all trial-related documents and source data as described. I will provide a Curriculum Vitae (CV) before trial start. I agree that the CV may be submitted to the responsible regulatory authorities. Date ___________ Signature: ______________________________ Name (block letters): ______________________________
Function: Investigator Trial Centre (address):______________________________
______________________________
______________________________
15 REFERENCES 1. Lucock M. Folic acid: nutritional biochemistry, molecular biology, and role in disease processes. Mol Genet Metab 2000;71(1-2):121-38. 2. Brouwer IA, van Dusseldorp M, West CE, Steegers-Theunissen RPM. Bioavailability and bioefficacy of folate and folic acid in man. Nutrition Research Reviews 2001;14(2):267-293. 3. Kelly P, McPartlin J, Goggins M, Weir DG, Scott JM. Unmetabolized folic acid in serum: acute studies in subjects consuming fortified food and supplements. Am J Clin Nutr 1997;65(6):1790-5. 4. Rajgopal A, Sierra EE, Zhao R, Goldman ID. Expression of the reduced folate carrier SLC19A1 in IEC-6 cells results in two distinct transport activities. Am J Physiol Cell Physiol 2001;281(5):C1579-86. 5. Wade A, editor. MARTINDALE The Extra Pharmacopoeia. Twenty-seventh ed. London: The Pharmaceutical Press; 1977. 6. Ahn E, Kapur B, Koren G. Study on circadian variation in folate pharmacokinetics. Can J Clin Pharmacol 2005;12(1):e4-9. 7. Mukhtar H, Ahmad N. Tea polyphenols: prevention of cancer and optimizing health. Am J Clin Nutr 2000;71(6 Suppl):1698S-702S; discussion 1703S-4S. 8. Cooper R, Morre DJ, Morre DM. Medicinal benefits of green tea: Part I. Review of noncancer health benefits. J Altern Complement Med 2005;11(3):521-8. 9. Navarro-Peran E, Cabezas-Herrera J, Garcia-Canovas F, Durrant MC, Thorneley RN, Rodriguez-Lopez JN. The antifolate activity of tea catechins. Cancer Res 2005;65(6):2059-64.

CHAPTER 6
246
10. Hernandez-Diaz S, Werler MM, Walker AM, Mitchell AA. Folic acid antagonists during pregnancy and the risk of birth defects. N Engl J Med 2000;343(22):1608-14. 11. Hernandez-Diaz S, Werler MM, Walker AM, Mitchell AA. Neural tube defects in relation to use of folic acid antagonists during pregnancy. Am J Epidemiol 2001;153(10):961-8. 12. Correa A, Stolley A, Liu Y. Prenatal tea consumption and risks of anencephaly and spina bifida. Ann Epidemiol 2000;10(7):476-477.
16 APPENDICES Declaration of Helsinki (current version)
APPENDIX
247
Probandeninformation Untersuchungsreihe der pharmakokinetischen Interaktionen zwischen Folsäure (Folsan® 0,4 mg und 5 mg Tabletten) und schwarzem/grünem Tee bei gesunden Probanden in einer offenen randomisierten Cross-over-Studie
Sehr geehrte Studienteilnehmerin, sehr geehrter Studienteilnehmer. Mit dieser Informationsschrift möchten wir Sie über den Sinn und Zweck der klinischen Studie und den damit verbundenen Risiken informieren. Folsäure ist als Vitamin ein essentieller Nahrungsbestandteil. Die Folate spielen bei lebenswichtigen Vorgängen in unserem Körper eine wichtige Rolle. Unser Körper kann die Folate selbst nicht synthetisieren, eine ausreichende Folsäureaufnahme soll durch Ernährung und Nahrungsergänzungsmitteln erfolgen. Experimentelle Untersuchungen haben gezeigt, dass die Aufnahme von Folsäure durch Grüntee- und Schwarzteeextrakte verhindert wird. Zwischen Tee und Folsäure kann es zu Wechselwirkungen kommen. Ziel der geplanten Studie ist es, den Einfluss von schwarzem und grünem Tee auf die Bioverfügbarkeit und die Pharmakokinetik von Folsäure, die über den Mund eingenommen wird, zu untersuchen. Jeder Proband erhält bei der Studie zu jeweils fünf Terminen eine Medikation, wobei zwischen diesen fünf Verabreichungen jeweils mindestens eine Woche liegt. Nach jeder Einnahme werden zu 11 definierten Zeitpunkten Blutproben von jeweils 5 ml innerhalb von 8 h aus einer Armvene entnommen. Das insgesamt zu entnehmende Blutvolumen beträgt ca. 275 ml (11 x 5 x 5 ml Blut = 275 ml) verteilt über einen Zeitraum von ca. acht Wochen. Das Vorgehen bei der Blutentnahme entspricht der üblichen Routine wie Sie es vielleicht vom Hausarzt oder Krankenhaus kennen. Das Blut wird in der Regel aus einer Vene in der Armbeuge entnommen. Außer einem kurzen Schmerz beim Einstich der Nadel kann es gelegentlich zu einer leichten Einblutung mit nachfolgendem Bluterguss („blauer Fleck“) kommen, der innerhalb weniger Tage verschwindet. Manche Personen reagieren auch auf eine kleine Blutentnahme mit einer Kreislaufreaktion. Um dies zu vermeiden, erfolgt die Blutentnahme bevorzugt im Liegen. Selbstverständlich wird das Personal entsprechende Maßnahmen ergreifen (z.B. Hochlagern der Beine), falls bei Ihnen eine Kreislaufreaktion auftritt. Andere Risiken der Blutentnahme wir Infektion, Thrombosierung oder die Verletzung von benachbartem Gewebe und Nerven durch die Blutentnahmenadel sind sehr selten und bei geschultem Personal so gut wie ausgeschlossen. Die Blutentnahmen werden in Räumen der Deutsche Klinik für Diagnostik (DKD, Aukammallee 33, 65191 Wiesbaden) durchgeführt. Die Probanden müssen sich während der Blutentnahme während der fünf Prüfungsphasen in den Räumen der DKD aufhalten. Die in der Studie eingesetzten Tabletten sind von einer Bundesbehörde zugelassen.
Außer einer eingehenden ärztlichen Untersuchung ihres Gesundheitszustands erfahren die Probanden keinen persönlichen gesundheitlichen Nutzen durch die Teilnahme an der Studie.
Jedem Probanden wird nach Abschluss der Studie ein Aufwandsentschädigung von 300.- € gezahlt.
CHAPTER 6
248
Für die Substitution von Folsäure gibt es pharmakologische Präparate mit unterschiedlichen Dosisstärken. Eine solche Substitution erfolgt z.B. bei Schwangeren in der Dosis 0,4 mg/Tag zur Prophylaxe von Neuralrohrdefekten der Embryonen. Auch für die Substitutionsbehandlung sind Nebenwirkungen beschrieben geworden, diese sind aber nur selten (<0,1%) und treten dosisabhängig auf. Hierzu zählen: Magen-Darm-Trakt Selten: gastrointestinale Störungen bei sehr hohen Dosierungen Immunsystem In Einzelfällen: allergische Reaktionen, z.B. als Erythem, Pruritus, Bronchospasmus, Übelkeit oder anaphylaktischer Schock Psychiatrische Erkrankungen Selten: Schlafstörungen, Erregung oder Depression bei sehr hohen Dosierungen
Auf Grund des gegenwärtigen Kenntnisstandes können die möglichen Gesundheitsrisiken als vetretbar und zu vernachlässigen angesehen werden. Die Einnahme der Prüfmedikation erfolgt in jeder der fünf Prüfphasen morgens gegen 8.30 Uhr in Räumen der DKD Wiesbaden (Aukammallee 33, 65191 Wiesbaden). Anschließend werden jedem Probanden über den Tag verteilt (nach 0; 0,2; 1,5; 2; 2,5; 3; 4; 5; 6; 7 und 9 Stunden) 11 Blutproben entnommen. Dazu wird ein Verweilkatheter (Braunüle) in eine Armvene gelegt. Bei Auffälligkeiten wird eine eingehende ärztliche Untersuchung durchgeführt und gegebenenfalls eine ärztliche Behandlung vorgenommen. Um das Risiko unerwünschter Wirkungen zu verringern sind an den Versuchstagen nach Einnahme der Prüfmedikation schwere körperliche Arbeiten sowie größere Anstrengungen zu vermeiden.
APPENDIX
249
Einverständniserklärung
Untersuchungsreihe der pharmakokinetischen Interaktionen zwischen Folsäure
(Folsan® 0,4 mg und 5 mg Tabletten) und schwarzem/grünem Tee bei gesunden
Probanden in einer offenen randomisierten Cross-over-Studie
Ich erkläre hiermit, dass ich über Ziel, Ablauf und Durchführung des Forschungsvorhabens
aufgeklärt worden bin, dass ich die Erläuterungen verstanden habe und meine Fragen zur
Zufriedenheit beantwortet wurden. Ich habe die Studieninformation in Kopie erhalten,
gelesen und verstanden. Ich weiß, dass ich auch weiterhin jederzeit Fragen stellen kann. Ich
wurde auch darüber aufgeklärt, dass ich ohne persönliche Nachteile und ohne Angabe von
Gründen nicht an der Studie teilzunehmen brauche. Ich hatte ausreichend Zeit, mich zur
Teilnahme an dieser Studie zu entscheiden und weiß, dass die Teilnahme freiwillig ist.
Außerdem kann ich meine Teilnahme an der Studie jederzeit ohne Angabe von Gründen durch
schriftlichen oder mündlichen Widerruf dieser Einwilligungserklärung ebenfalls ohne
persönliche Nachteile abbrechen.
Kopien der Probandeninformation, der Einwilligungserklärung, der Information und
Einwilligungserklärung zum Datenschutz sowie der Packungsbeilage für Folsan® Tabletten
habe ich erhalten.
Name des aufklärenden Prüfers: ____________________________
Ich bestätige, dass innerhalb der letzten 90 Tage vor Beginn der Studie nicht an einer anderen Studie teilgenommen haben und meine Angaben zur Einnahme von Medikamenten und Drogen der Wahrheit entsprechen.
Ich werde jeweils 12 h vor Einnahme der Prüfmedikation sowie bis 48 h danach keinen Alkohol zu mir nehmen. Am Vortag der Studie werde ich nach 2200 Uhr keine Mahlzeit mehr zu mir nehmen. Außerdem werde ich innerhalb von 24 Stunden nach Einnahme der Prüfmedikation keine schweren körperlichen Arbeiten verrichten und besondere Anstrengungen vermeiden, sowie nur die Nahrung zu mir nehmen, die ich während des stationären Aufenthaltes erhalte.
Ich bin bereit, freiwillig an der Studie teilzunehmen. Wiesbaden, den ____________________ ______________ ___________________
Proband Prüfer
CHAPTER 6
250
Titel der Studie: Untersuchungsreihe der pharmakokinetischen Interaktionen zwischen Folsäure (Folsan® 0,4 mg und 5 mg Tabletten) und schwarzem/grünem Tee bei gesunden Probanden in einer offenen randomisierten Cross-over-Studie
Einwilligungserklärung zum Datenschutz (Arzneimittelgesetz)
Bei klinischen Prüfungen werden persönliche Daten und medizinische Befunde über Sie er-hoben. Die Erhebung, Weitergabe, Speicherung und Auswertung dieser Angaben über ihre Gesundheit erfolgt nach gesetzlichen Bestimmungen und setzt vor Teilnahme an der klinischen Prüfung folgende freiwillige Einwilligung voraus, d. h. ohne die nachfolgende Einwilligung können sie nicht an der klinische Prüfung teilnehmen. 1) Ich erkläre mich damit einverstanden, dass im Rahmen dieser Studie erhobene Daten/ Angaben über meine Gesundheit auf Fragebögen und elektronischen Datenträgern aufge-zeichnet und ohne Namensnennung (pseudonymisiert) weitergeben werden an:
a) den Auftraggeber (Prof.Dr. Peter Langguth) der Studie zur wissenschaftlichen Auswertung, Bewertung von unerwünschten Ereignissen oder Beantragung der Zulassung; b) die zuständige Überwachungsbehörde(n) (Landesamt oder Bezirksregierung), Bundes-oberbehörde (Bundesinstitut für Arzneimittel und Medizinprodukte, Bonn), Ethik-Kommission und ausländischen Behörden und europäische Datenbank zur Überprüfung der ordnungsgemäßen Durchführung der Studie, zur Bewertung von Studienergebnissen und unerwünschter Ereignisse oder zur Beantragung der Zulassung.
∗Anschrift des Auftraggebers: _________________________ _________________________ 2) Außerdem erkläre ich mich damit einverstanden, dass ein autorisierter und zur Ver-schwiegenheit verpflichteter Beauftragter des Auftraggebers, der zuständigen inländischen und ausländischen Überwachungs- und Zulassungsbehörden in meine beim Prüfarzt vorhandenen personenbezogenen Daten Einsicht nimmt, soweit dies für die Überprüfung der Studie notwendig ist. Für diese Maßnahme entbinde ich den Prüfarzt von der ärztlichen Schweigepflicht. 3) Die Einwilligung zur Erhebung und Verarbeitung der Angaben über meine Gesundheit
ist unwiderruflich. Ich bin bereits darüber aufgeklärt worden, dass ich jederzeit die Teilnahme an der klinischen Prüfung beenden kann. Im Fall dieses Widerrufs erkläre ich mich damit einverstanden, dass die bis zu diesem Zeitpunkt gespeicherten Daten ohne Namensnennung weiterhin verwendet werden dürfen, soweit dies erforderlich ist, um a) Wirkungen des zu prüfenden Arzneimittels festzustellen, b) sicherzustellen, dass schutzwürdige Interessen der betroffenen Person nicht
beeinträchtigt werden, c) der Pflicht zur Vorlage vollständiger Zulassungsunterlagen zu genügen.
Name, Datum, Unterschrift

APPENDIX
251
Probandencode ___________ Prüfarzt ___________ Datum ________
Probanden-Daten
Case Report Form (CRF)
Name, Vorname _______________________________ Geburtsdatum:___________ Geschlecht: männlich / weiblich Größe:__________cm Gewicht:_________kg Ethnische Gruppe:_______________________
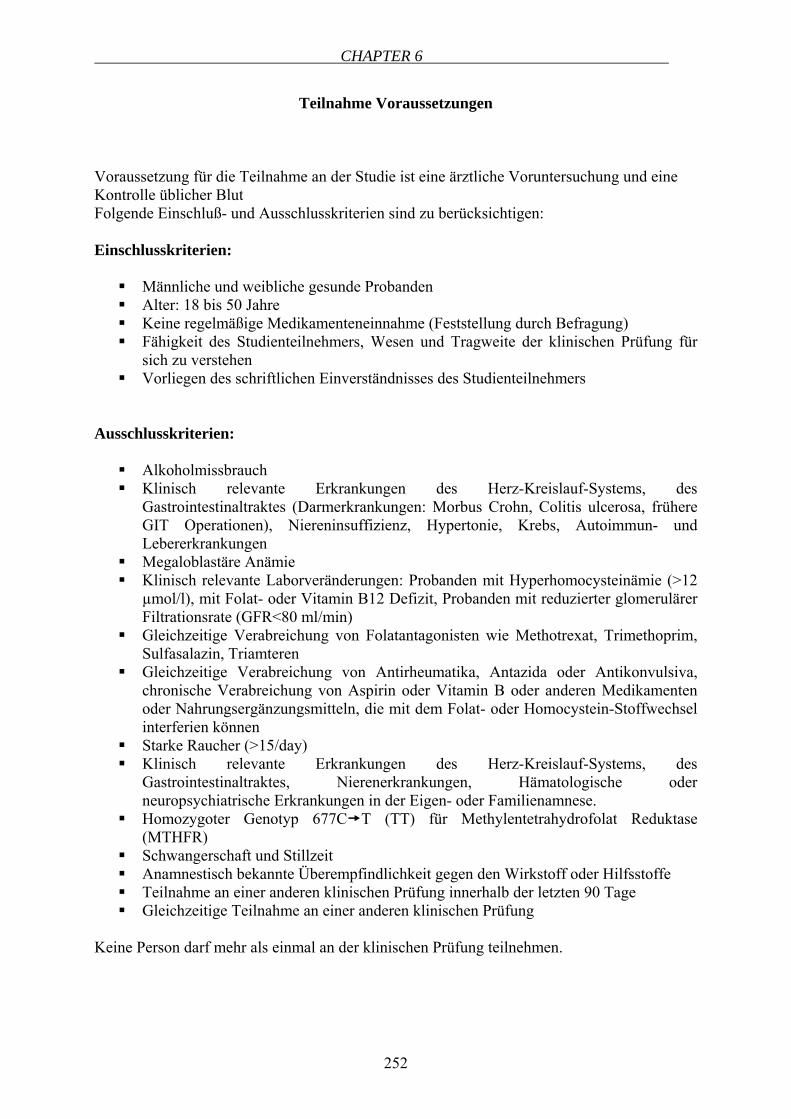
CHAPTER 6
252
Teilnahme Voraussetzungen
Voraussetzung für die Teilnahme an der Studie ist eine ärztliche Voruntersuchung und eine Kontrolle üblicher Blut Folgende Einschluß- und Ausschlusskriterien sind zu berücksichtigen: Einschlusskriterien:
Männliche und weibliche gesunde Probanden Alter: 18 bis 50 Jahre Keine regelmäßige Medikamenteneinnahme (Feststellung durch Befragung) Fähigkeit des Studienteilnehmers, Wesen und Tragweite der klinischen Prüfung für
sich zu verstehen Vorliegen des schriftlichen Einverständnisses des Studienteilnehmers
Ausschlusskriterien:
Alkoholmissbrauch Klinisch relevante Erkrankungen des Herz-Kreislauf-Systems, des
Gastrointestinaltraktes (Darmerkrankungen: Morbus Crohn, Colitis ulcerosa, frühere GIT Operationen), Niereninsuffizienz, Hypertonie, Krebs, Autoimmun- und Lebererkrankungen
Megaloblastäre Anämie Klinisch relevante Laborveränderungen: Probanden mit Hyperhomocysteinämie (>12
µmol/l), mit Folat- oder Vitamin B12 Defizit, Probanden mit reduzierter glomerulärer Filtrationsrate (GFR<80 ml/min)
Gleichzeitige Verabreichung von Folatantagonisten wie Methotrexat, Trimethoprim, Sulfasalazin, Triamteren
Gleichzeitige Verabreichung von Antirheumatika, Antazida oder Antikonvulsiva, chronische Verabreichung von Aspirin oder Vitamin B oder anderen Medikamenten oder Nahrungsergänzungsmitteln, die mit dem Folat- oder Homocystein-Stoffwechsel interferien können
Starke Raucher (>15/day) Klinisch relevante Erkrankungen des Herz-Kreislauf-Systems, des
Gastrointestinaltraktes, Nierenerkrankungen, Hämatologische oder neuropsychiatrische Erkrankungen in der Eigen- oder Familienamnese.
Homozygoter Genotyp 677C T (TT) für Methylentetrahydrofolat Reduktase (MTHFR)
Schwangerschaft und Stillzeit Anamnestisch bekannte Überempfindlichkeit gegen den Wirkstoff oder Hilfsstoffe Teilnahme an einer anderen klinischen Prüfung innerhalb der letzten 90 Tage Gleichzeitige Teilnahme an einer anderen klinischen Prüfung
Keine Person darf mehr als einmal an der klinischen Prüfung teilnehmen.

APPENDIX
253
Der Prüfer bestätigt, dass eine entsprechende Untersuchung durchgeführt wurde und der Proband an der Studie teilnehmen kann. Die Originaldaten der Untersuchung (Anamnese, Befund, Blut) werden beim untersuchenden Arzt über den gesetzlich vorgeschriebenen Zeitraum aufbewahrt. ___________________ ________________________ ________________ Name Prüfer Datum, Ort Unterschrift

CHAPTER 6
254
Probandencode ___________ Datum ___________
Prüfmedikationen Phase I: _____________________________ Datum der Einnahme: ____________ Phase II: _____________________________ Datum der Einnahme: ____________ Phase III _____________________________ Datum der Einnahme: ____________ Phase IV _____________________________ Datum der Einnahme: ____________ Phase V _____________________________ Datum der Einnahme: ____________
Prüfarzt___________

APPENDIX
255
Probandencode ___________ Datum ___________ Prüfphase , Medikation: ___________________________
Zeit nach Einnahme der Prüfmedikation (h): ___________
Ohne auffälligen Befund: ja / nein (Nichtzutreffendes streichen)
Bemerkungen:
_____________________________________________________________________________________________________________________________________________________________________________________________________________________________________________________________________________________________________________________________________________________________________________________________________________________________________________________________________________________________________________________________________________
Prüfarzt___________
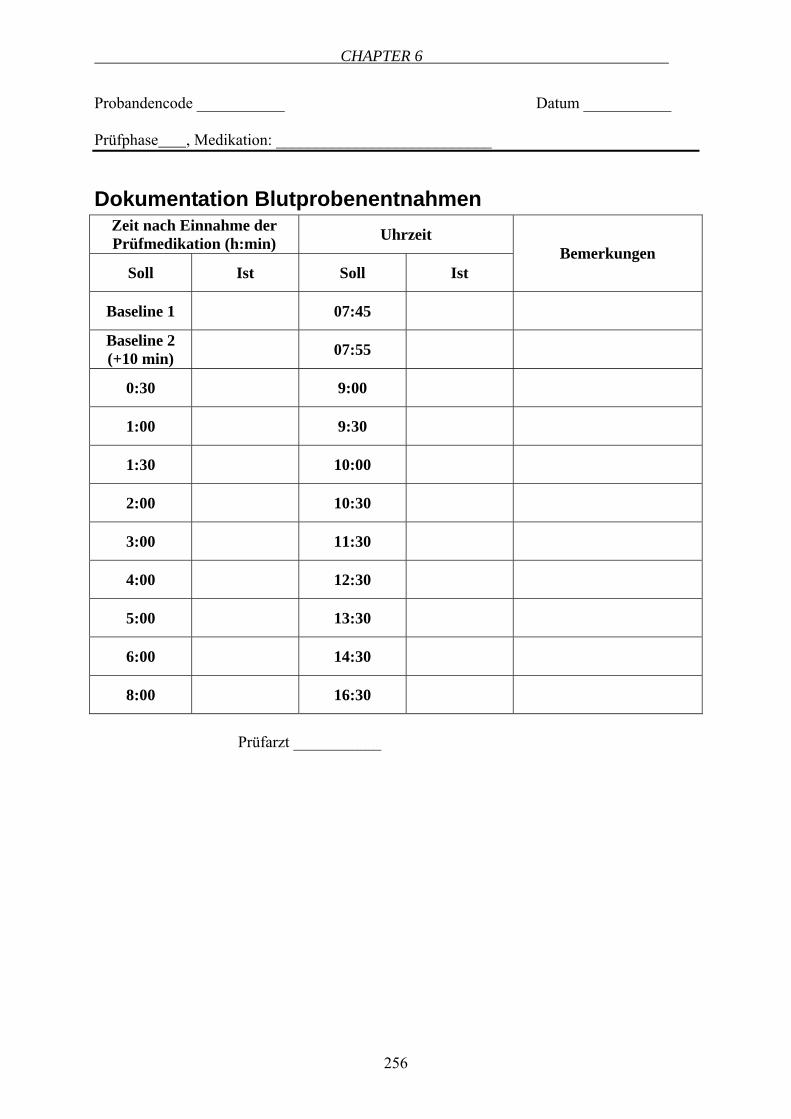
CHAPTER 6
256
Probandencode ___________ Datum ___________ Prüfphase , Medikation: ___________________________
Dokumentation Blutprobenentnahmen Zeit nach Einnahme der Prüfmedikation (h:min) Uhrzeit
Soll Ist Soll Ist Bemerkungen
Baseline 1 07:45
Baseline 2 (+10 min) 07:55
0:30 9:00
1:00 9:30
1:30 10:00
2:00 10:30
3:00 11:30
4:00 12:30
5:00 13:30
6:00 14:30
8:00 16:30
Prüfarzt ___________