Clonal Dynamics Reveal Two Distinct Populations of Basal Cells in Slow-Turnover Airway Epithelium
13
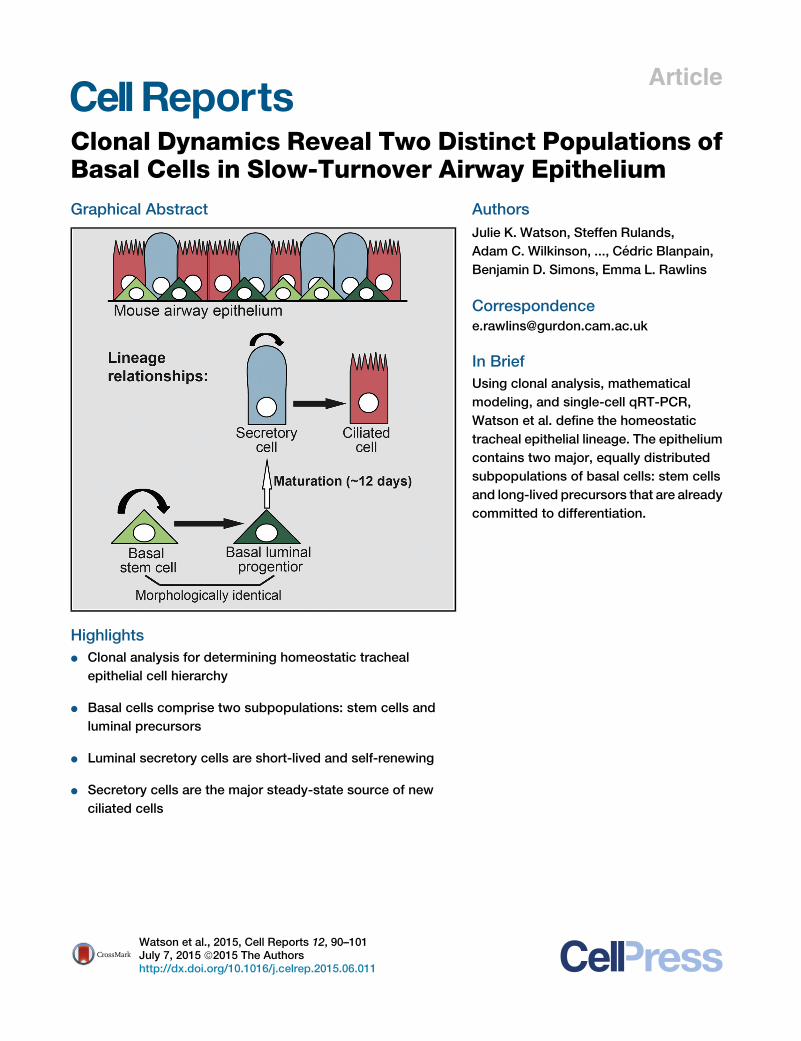
Article Clonal Dynamics Reveal Two Distinct Populations of Basal Cells in Slow-Turnover Airway Epithelium Graphical Abstract Highlights d Clonal analysis for determining homeostatic tracheal epithelial cell hierarchy d Basal cells comprise two subpopulations: stem cells and luminal precursors d Luminal secretory cells are short-lived and self-renewing d Secretory cells are the major steady-state source of new ciliated cells Authors Julie K. Watson, Steffen Rulands, Adam C. Wilkinson, ..., Ce ´ dric Blanpain, Benjamin D. Simons, Emma L. Rawlins Correspondence [email protected] In Brief Using clonal analysis, mathematical modeling, and single-cell qRT-PCR, Watson et al. define the homeostatic tracheal epithelial lineage. The epithelium contains two major, equally distributed subpopulations of basal cells: stem cells and long-lived precursors that are already committed to differentiation. Watson et al., 2015, Cell Reports 12, 90–101 July 7, 2015 ª2015 The Authors http://dx.doi.org/10.1016/j.celrep.2015.06.011
-
Upload
independent -
Category
Documents
-
view
4 -
download
0
Transcript of Clonal Dynamics Reveal Two Distinct Populations of Basal Cells in Slow-Turnover Airway Epithelium
Article
Clonal Dynamics Reveal T
wo Distinct Populations ofBasal Cells in Slow-Turnover Airway EpitheliumGraphical Abstract
Highlights
d Clonal analysis for determining homeostatic tracheal
epithelial cell hierarchy
d Basal cells comprise two subpopulations: stem cells and
luminal precursors
d Luminal secretory cells are short-lived and self-renewing
d Secretory cells are the major steady-state source of new
ciliated cells
Watson et al., 2015, Cell Reports 12, 90–101July 7, 2015 ª2015 The Authorshttp://dx.doi.org/10.1016/j.celrep.2015.06.011
Authors
Julie K. Watson, Steffen Rulands,
Adam C. Wilkinson, ..., Cedric Blanpain,
Benjamin D. Simons, Emma L. Rawlins
In Brief
Using clonal analysis, mathematical
modeling, and single-cell qRT-PCR,
Watson et al. define the homeostatic
tracheal epithelial lineage. The epithelium
contains two major, equally distributed
subpopulations of basal cells: stem cells
and long-lived precursors that are already
committed to differentiation.
Cell Reports
Article
Clonal Dynamics Reveal Two Distinct Populationsof Basal Cells in Slow-Turnover Airway EpitheliumJulie K. Watson,1,2,3 Steffen Rulands,1,2,4 Adam C. Wilkinson,2,5,6 Aline Wuidart,7 Marielle Ousset,7
Alexandra Van Keymeulen,7 Berthold Gottgens,2,5,6 Cedric Blanpain,7,8 Benjamin D. Simons,1,2,4
and Emma L. Rawlins1,2,3,*1Wellcome Trust/CRUK Gurdon Institute, University of Cambridge, Cambridge CB2 1QN, UK2Wellcome Trust-MRC Stem Cell Institute University of Cambridge, Cambridge CB2 3EG, UK3Department of Pathology, University of Cambridge, Cambridge CB2 3EG, UK4Cavendish Laboratory, Department of Physics, J. J. Thomson Avenue, Cambridge CB3 0HE, UK5Department of Haematology, University of Cambridge, Hills Road, Cambridge CB2 0XY, UK6Cambridge Institute for Medical Research, University of Cambridge, Hills Road, Cambridge CB2 0XY, UK7Institut de Recherche Interdisciplinaire en Biologie Humaine et Moleculaire, Universite Libre de Bruxelles, Brussels 1070, Belgium8Welbio, Universite Libre de Bruxelles, Brussels 1070, Belgium
*Correspondence: [email protected]
http://dx.doi.org/10.1016/j.celrep.2015.06.011This is an open access article under the CC BY license (http://creativecommons.org/licenses/by/4.0/).
SUMMARY
Epithelial lineages have been studied at cellular re-solution inmultiple organs that turn over rapidly. How-ever, many epithelia, including those of the lung, liver,pancreas, and prostate, turn over slowly and maybe regulated differently. We investigated the mousetracheal epithelial lineage at homeostasis by usinglong-term clonal analysis andmathematical modeling.This pseudostratified epithelium contains basal cellsand secretory and multiciliated luminal cells. Ouranalysis revealed that basal cells are heterogeneous,comprising approximately equal numbers of multi-potent stem cells and committed precursors, whichpersist in the basal layer for 11 days before differenti-ating to luminal fate. We confirmed the molecular andfunctional differences within the basal population byusingsingle-cell qRT-PCRand further lineage labeling.Additionally, we show that self-renewal of short-livedsecretory cells is a feature of homeostasis. We havethus revealed early luminal commitment of cells thataremorphologically indistinguishable from stem cells.
INTRODUCTION
The mouse trachea contains three major cell types: TRP63+,
KRT5+ basal cells (BCs); luminal secretory cells (SecCs, mostly
Scgb1a1+ Club/Clara-like cells); and luminal ciliated cells (CCs)
(Rock et al., 2010). Previous population-level lineage tracing
using transgenic Tg(KRT5-CreER) mice demonstrated that BCs
include self-renewing stem cells involved in tracheal growth, ho-
meostasis (at least for up to 16 weeks), and repair (Rock et al.,
2009). However, it is not known if BCs are a functionally hetero-
geneous population. A subset of tracheal BCs (<20%) express-
ing Krt14 (Keratin 14) was suggested to be a unipotent self-
renewing subpopulation at homeostasis (Ghosh et al., 2011).
90 Cell Reports 12, 90–101, July 7, 2015 ª2015 The Authors
Similar unipotent BCs have been postulated following injury
and in xenografts (Engelhardt et al., 1995; Ghosh et al., 2011;
Hong et al., 2004). Other repair studies described an early pro-
genitor (EP) cell as a proliferative KRT8+ (luminal type cytokera-
tin), TRP63� cell derived from BCs and controlled by Notch
signaling (Paul et al., 2014; Rock et al., 2011). In development,
KRT5+ TRP63� cells with basal morphology have recently
been described in germline Notch3 mutants and in embryonic
lungs deleted for Ezh2 (Mori et al., 2015; Snitow et al., 2015),
leading to the speculation that these are precursors of luminal
cells. Subsequently, an independent study showed that a popu-
lation of adult BCs (�12% of steady-state total), which express
low levels of transcription factors usually found in more differen-
tiated cells, are able to contribute disproportionally to regenera-
tion following injury (Pardo-Saganta et al., 2015). However, none
of these studies investigated the adult airway lineage at steady
state, leaving key questions unanswered. In particular, is there
is an engrained proliferative heterogeneity in the steady-state
basal layer? If so, what is the lineage relationship of cells within
the basal layer, and how do they connect to the luminal compart-
ments? How do distinct subpopulations of BCs function tomain-
tain normal homeostasis?
Within luminal cells, population lineage-labeling studies had
shown that SecCs can self-renew and generate CCs, but their
relative contribution to homeostasis was unclear (Rawlins
et al., 2009). CCs are post-mitotic, with an average loss-rate of
�6 months in the trachea (Rawlins and Hogan, 2008; Rawlins
et al., 2007). Molecular signals controlling the tracheal epithelium
are being determined (Brechbuhl et al., 2011; Giangreco et al.,
2012; Lu et al., 2013; Paul et al., 2014; Rock et al., 2011; Zhao
et al., 2014). However, the lack of a clearly defined epithelial
lineage impedes analysis of molecular function at cellular resolu-
tion. Human airways have a very similar cell lineage to mouse
trachea (Engelhardt et al., 1995; Hackett et al., 2011; Hajj
et al., 2007; Teixeira et al., 2013), but the limited resolution for
lineage studies in human means that complementary mouse
analysis is required to determine the detailed cellular hierarchy.
Here, we use clonal lineage labeling, coupled with biophysical
modeling and single-cell molecular analysis, to determine the
heterogeneity and functions of BCs andSecCs in the homeostat-
icmouse tracheal epithelium.We have rigorously obtained quan-
titative measures of division rates, cell-type abundance, and
rates of differentiation/loss. The model that we present thus pro-
vides a new experimental and theoretical foundation for studies
of airway homeostasis, injury, and disease. Moreover, we reveal
an unexpected mechanism of epithelial maintenance in a slowly
proliferating tissue: widespread early luminal commitment in
cells that are morphologically indistinguishable from stem cells.
RESULTS
Clonal-Level Lineage Analysis of BCs in theSteady-State Tracheal Epithelium Suggests aProliferative Hierarchy and the Presence of MoreThan One BC SubpopulationTo study maintenance of the tracheal epithelium, we first tested
whether homeostasis was maintained during our time course by
analyzing cell proliferation, composition, density, and tracheal
size (Figure S1). This confirmed that the tissue was homeostatic
for most of the time course, although the proportion of CCs
increasedby�30%, and cell density decreasedby�30%, in older
animals (1yearpost-labeling) consistentwithpreviousdata (Wans-
leeben et al., 2014). To label individualKrt5+BCs,we used a trans-
genic mouse line, Tg(KRT5-CreER) (Rock et al., 2009), with a
Rosa26-reporter driving membrane-targeted (farnesylated) EGFP
(Rawlins et al., 2009). Exposure of adult (>8 weeks) Tg(KRT5-
CreER);Rosa26R-fGFP mice to a single low dose of tamoxifen
(tmx) resulted in scattered individual lineage-labeled BCs in the
distal trachea (from the carina to six cartilage rings above on the
dorsal sideonly; Figure1A). Negligible labelingwasdetected in an-
imalswithout tmxexposure (twoclonesofone tosix cells in twoout
of four mice at 9–11 months age). Tracheas were harvested at in-
tervals from0.5 to74weekspost-tmx (Figure1A)andwhole-mount
immunostained to determine clone size and composition by
confocal microscopy (Figure 1B; Table S1). Clonal density varied
between mice. However, clones were always more frequently
located above the dorsal longitudinal smooth muscle, rather than
the cartilage rings. As clones grew, they remained cohesive, sug-
gesting little cell motility at steady state. Moreover, some larger
clones were observed to span the muscle-cartilage junction,
showing that this is not a compartment boundary.
At 0.5 weeks post-induction, clones consisted predominantly
of single BCs (99% one BC: 1% two BCs; n = 102 clones, four
mice). Rare labeled SecCs and CCs appeared at 3 and 6 weeks
post-induction, respectively, and their numbers rose steadily
thereafter (Figures 1B, 1F, and 1G), confirming that BCs generate
luminal cells. The size distribution of clones became increasingly
heterogeneous, but mean clone size increased in a remarkably
linear fashion over time (Figures 1C and 1D), consistent with
self-renewal of the labeled cells. From 3 weeks post-induction,
clones that contained only luminal (secretory and/or ciliated)
cells and no BCs emerged, showing that some labeled BCs
are lost to differentiation (Figures 1E and 1F). The increasingly
heterogeneous clonal composition and the emergence of clones
lacking BCs indicated that BCs can divide symmetrically and
asymmetrically at steady state, similar to progenitors in the in-
ter-follicular epidermis (Clayton et al., 2007; Mascre et al.,
2012). To determine if any of the clonal heterogeneity could be
attributed to animal-specific or regional differences in the tra-
chea, we graphed clones separately based on sex or location
(Figure S2). Although we observed some small systematic differ-
ences in the behavior of clones located over cartilage rings
versus dorsal longitudinal muscle, these were statistically insig-
nificant, andwe have treated the distal-dorsal trachea as a single
region (Supplemental Theory).
Strikingly, the mean number of BCs per clone rose abruptly
from an average of one to approximately two cells by 6 weeks
post-induction and thereafter remained remarkably constant
over the following 68 weeks (Figure 1G). Moreover, most two-
cell clones (88%) at 3 weeks post-induction contained precisely
two BCs. This was unexpected for a population in homeostasis.
By definition, the overall distribution of cell types within a tissue
stays constant at homeostasis. Hence, if the transgene targets
all BCs in a representative manner, the mean number of BCs
per clone should remain at one. The abrupt increase in the
average number of BCs per clone, and its near saturation at
approximately two BCs per clone over the long-term, indicate
that the lineage-labeling assay preferentially targets a subpopu-
lation of BCs, which maintains a second initially unlabeled pop-
ulation (Figures 1H and 1I). We therefore postulated that Krt5+
BCs contain two discrete populations organized in a hierarchy:
a multipotent basal stem cell (BSC; preferentially targeted by
the assay) and an additional BC subtype.
Biophysical Modeling of the Behavior of HomeostaticTracheal BCsTo resolve the cellular hierarchy, proliferation kinetics, and fate
potential in the trachea, we used a biophysical modeling
approach. We sought the simplest model that could describe
the observed distributions of clone sizes and composition and
provide testable predictions. To constrain the number of model
parameters, we first used the Tg(KRT5-CreER); Rosa26R-fGFP
clonal assay to infer the dynamics of the BCs alone. Indepen-
dently, we employed a second lineage-labeling assay that
targets SecCs to infer the dynamics of luminal cells alone.
Finally, we used the basal and luminal clonal fate data from the
Tg(KRT5-CreER); Rosa26R-fGFP experiment to challenge the
predictions of the model.
Focusing on BCs alone, we investigated whether a model
involving two distinct BC subtypes organized in a hierarchy
could predict the complex clonal evolution observed. We pro-
posed a model in which a self-renewing basal population
(termed BSCs) can divide asymmetrically, giving rise to a BSC
and a BC of a second subtype (termed ‘‘basal progenitor’’),
with the two cell types present in approximately equal numbers
within the tissue. To account for clonal loss from the basal
compartment, we further conjectured that BSCs are also
capable of symmetrical cell division, resulting in two BSCs or
two basal progenitors. To maintain homeostasis, these two out-
comesmust occur with equal probability (Figure 2A). From a fit of
this stochastic model to the clonal data, we found that a BSC di-
vides, on average, every 11 ± (confidence interval: 4, 4) days.
The vast majority of divisions 94 ± (3, 2)% result in asymmetric
fate outcome, with the remainder leading to balanced BSC
Cell Reports 12, 90–101, July 7, 2015 ª2015 The Authors 91
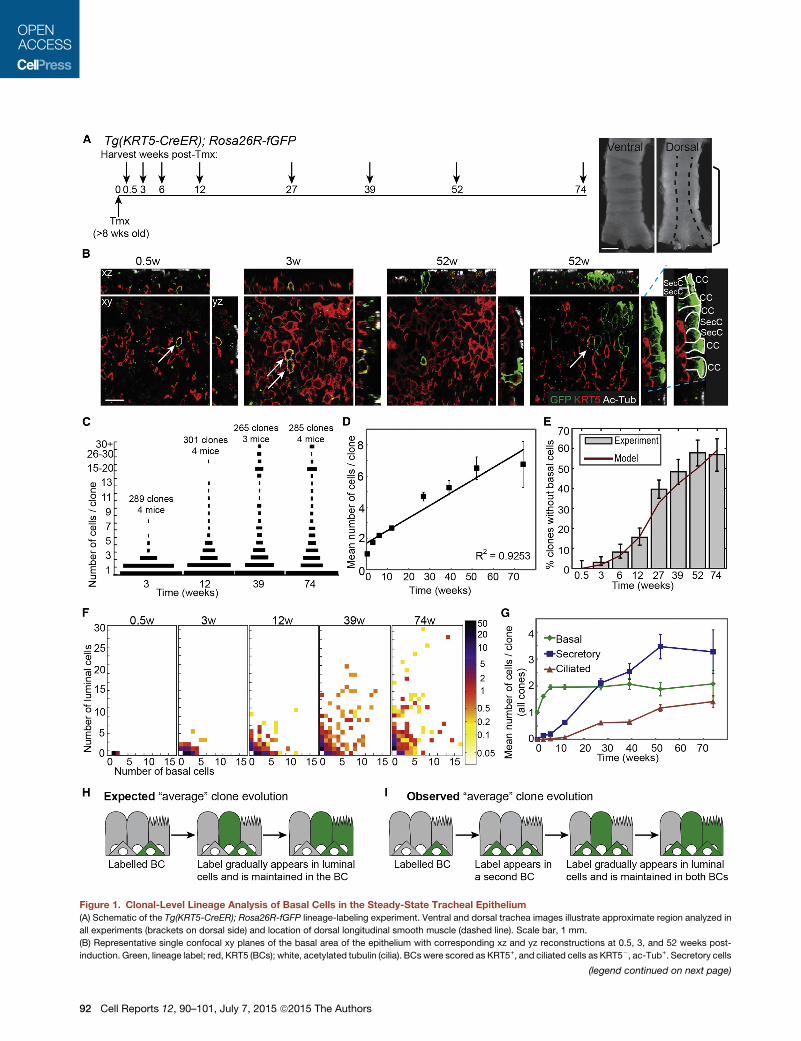
Figure 1. Clonal-Level Lineage Analysis of Basal Cells in the Steady-State Tracheal Epithelium
(A) Schematic of the Tg(KRT5-CreER); Rosa26R-fGFP lineage-labeling experiment. Ventral and dorsal trachea images illustrate approximate region analyzed in
all experiments (brackets on dorsal side) and location of dorsal longitudinal smooth muscle (dashed line). Scale bar, 1 mm.
(B) Representative single confocal xy planes of the basal area of the epithelium with corresponding xz and yz reconstructions at 0.5, 3, and 52 weeks post-
induction. Green, lineage label; red, KRT5 (BCs); white, acetylated tubulin (cilia). BCswere scored as KRT5+, and ciliated cells as KRT5�, ac-Tub+. Secretory cells
(legend continued on next page)
92 Cell Reports 12, 90–101, July 7, 2015 ª2015 The Authors
loss/replacement. Basal progenitors are lost, either to further dif-
ferentiation or death, on average every 11 ± (7, 4) days. With this
simple model, we obtained an excellent fit to the entire range of
BC clonal data (Figures 2B and 2C; Supplemental Theory).
Clonal Lineage Analysis of Luminal Cells Shows thatSecCs Are Short-Lived and Preferentially Self-Renew atHomeostasisTo independently investigate luminal cell behavior, we analyzed
the trachea of 6- and 12-month-old Scgb1a1-CreER; Rosa26R-
fGFPmice (SecC labeling) in which there was a low rate of spon-
taneous recombination of the reporter in SecCs in the absence
of tmx (Figures 2D and 2E). We observed scattered clones
throughout the epithelium and focused on the distal-dorsal re-
gion used in our BC experiments. Strikingly, the vast majority
of clones were small (compare Figures 2F and 1F), even though
SecCs divide (Figure S1D), suggesting that the loss rate of
SecCs exceeds their rate of self-renewal, necessitating con-
stant replacement by the multipotent BSCs. Nevertheless, we
observed labeled CCs, confirming that the SecCs do contribute
to the CC lineage at steady state (Figures 2E and 2F; Table S1).
To infer the rules of lineage specification in the luminal cells,
we again made use of a simple biophysical modeling scheme,
whereby SecCs may divide symmetrically or asymmetrically or
are lost through turnover, and CCs are post-mitotic and lost at
a rate of once every 6months (Rawlins and Hogan, 2008). Taking
into account the fact that labeling occurs continuously and
sporadically, we found that SecCs divide, on average, every 25
± (7, 5) days with almost all divisions (93 ± [2, 2]%) leading to
symmetrical duplication. The production of SecCs through dif-
ferentiation of BCs and self-duplication is balanced by a loss
rate of once per 14 ± (2, 2) days. From the quality of the fit to
the data (Figure 2G), we can infer that, at any given time, 44%
of SecCs are derived from the proliferation of a SecC and 56%
from differentiation of BCs (Supplemental Theory). Thus SecCs
make an important contribution to tracheal homeostasis but
do not function as a traditionally defined transit-amplifying
population.
Combining the Basal and Luminal Lineage ModelsAccurately Predicts the Range of the Full KRT5 ClonalDatasetWith the dynamics of the basal and luminal cells defined sepa-
rately, we then asked whether a combined model could predict
the full range of complex clonal data in the Tg(KRT5-CreER);
were scored as KRT5�, ac-TUB� cells whose apical surface reaches the tracheal
brush and neuroendocrine cells). See right yz panel for examples of labeled lumina
(C) Size distributions of clones at 3, 12, 39, and 74 weeks post-induction. Length
(D) Plot of the mean number of total cells per clone (all clones included). Error ba
(E) Plot of the percentage of clones that do not contain any labeled BCs (gray ba
predicted by the BC model (see Figures 2A–2C).
(F) Heatmaps to show the distribution of basal and luminal cells within each clone
clone type on a log scale.
(G) Plot of the mean number of cells of each type per clone (all clones included).
(H and I) Analysis of our lineage-labeling data at a population level (see Figures 1
suggests there are two BC subtypes and, moreover, that our experiments labeled
population (depicted in I).
See also Figures S1 and S2.
Rosa26R-fGFP mice. The simplest combined model is one in
which basal progenitors represent cells committed to a luminal
(depicted as secretory) fate (called basal luminal precursors
[BLPs]) (Figure 2H). Indeed, if these cells differentiate directly
to SecCs without division, the combined model accurately pre-
dicts the overall detailed clonal variation throughout the entire
long-term time course (Figure 3A). Production of new CCs hap-
pens rarely at homeostasis and, within the confidence limits of
our model, can be entirely accounted for by division of SecCs.
However, the resolving power of our clonal analysis is limited
for rare events and the direct steady-state production of CCs
from the BLPs cannot be altogether ruled out.
Are the BLPs a transit-amplifying population? To meet the
traditional definition of a transit-amplifying cell population (Watt
and Hogan, 2000), the BLPs would need to self-renew symmet-
rically at a greater rate than the stem cell in order to increase the
pool of undifferentiated cells. From the clonal data, we cannot
exclude the possibility that BLPs can self-renew symmetrically.
However, our observations of the rate of bromodeoxyuridine
(BrdU) incorporation in the steady-state trachea (Figures S1A–
S1D) set the overall rate of all BC divisions to 0.09 per day. If
we allowBLPs to divide symmetrically in themodel, the other pa-
rameters are such that we estimate the maximum rate at which
BLP division could occur is 0.045 cell divisions per day (Supple-
mental Theory). This is half the total number of observed cell di-
visions in the basal layer, suggesting that the BLPs do not divide
at a greater rate than the BSCs and are thus not a traditionally
defined transit-amplifying population.
A close inspection of the fit to the Tg(KRT5-CreER); Rosa26R-
fGFP data reveals that themodel provides a consistent slight un-
derestimate of single SecC clones (Figure 3A, blue charts). We
hypothesized that the excess single SecCs observed represent
rare brush and neuroendocrine (NE) cells that are of unknown
origin in the trachea (Krasteva et al., 2011; Saunders et al.,
2013). Indeed, when we stained Tg(KRT5-CreER); Rosa26R-
fGFP tracheas for an NE marker, we identified lineage-traced
NE cells (Figure 3B). This demonstrates that tracheal NE cells
can be derived from BSCs. However, brush and NE cells were
indistinguishable from SecCs in our quantitative experiments,
and we have not specifically included them in the model.
Independent Clonal and Proliferation Analysis Supportsthe Tracheal Lineage ModelTo further challenge the validity of themodel, we repeated part of
the BC lineage-tracing time course by using an independent
lumen (this definition will also include a small number of other cell types such as
l cells. GFP-labeled BCs are indicated by arrows on xy views. Scale bar, 15 mm.
of bar represents frequency.
rs represent SEM.
rs). Error bars represent 95% confidence intervals. Red line represents values
at 0.5, 3, 12, 39, and 74 weeks. Colors represent percentage frequency of each
Green, BCs; blue, secretory cells; red, ciliated cells. Error bars represent SEM.
C–1G) is inconsistent with an homogenous BC population (depicted in H) and
a basal stem cell (BSC) that maintains both the luminal cells and the second BC
Cell Reports 12, 90–101, July 7, 2015 ª2015 The Authors 93
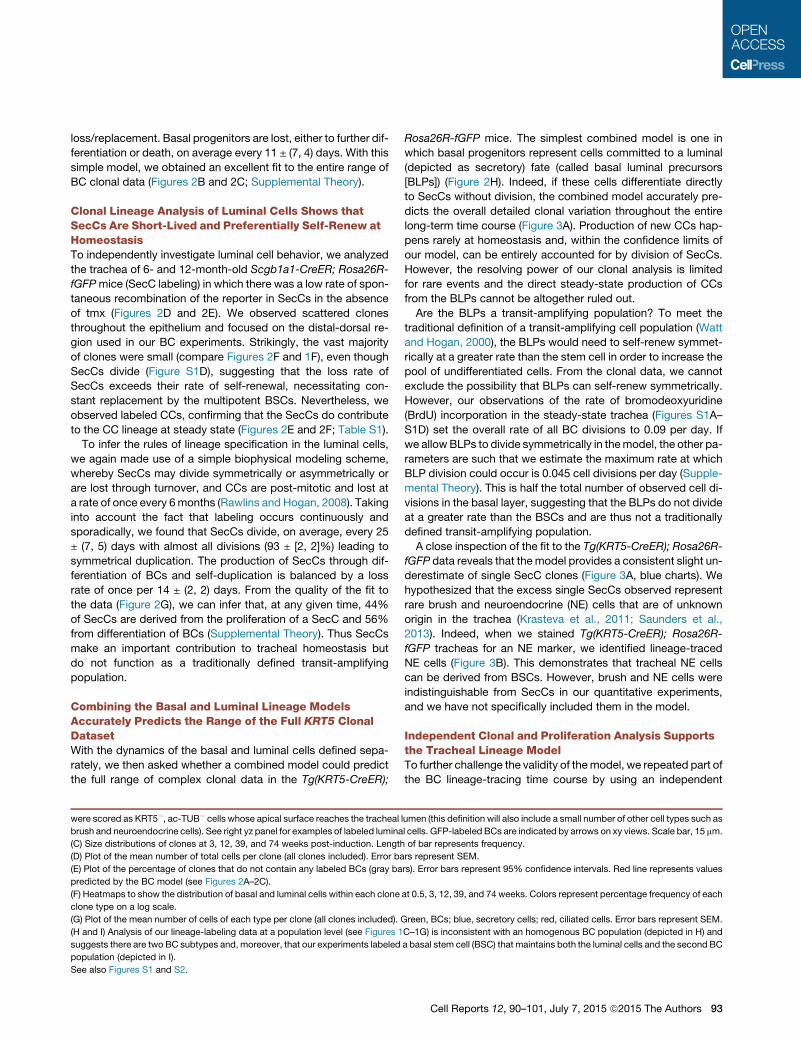
Figure 2. Lineage Model Development for the Basal and Luminal Epithelial Cells
(A) Cellular representation of themathematical model for BC behavior. Basal stem cells (BSCs) and BCprogenitors are present in the tissue in an�1:1 ratio. BSCs
divide symmetrically or asymmetrically every 11 days to either self-renew or produce BC progenitors in a balanced manner. BC progenitors are lost, to either
further differentiation or death, at a rate of every 11 days.
(B) Plot showing the experimental observation (boxes) and model prediction (line) of mean number of basal cells per clone (only clones containing BCs are
included in this plot and used for the generation of the BC model). Error bars represent SEM.
(C) Percentage frequency distribution of basal cell numbers per clone at 3, 12, 39, and 74weeks. Boxes, experimental observations; dark line, model prediction of
the BC model; shaded area, 95% confidence intervals of the model.
(D) Schematic of Scgb1a1-CreER; Rosa26R-fGFP lineage-labeling experiment.
(E) Representative xy, yz, and xz confocal sections of three different clones at 26 weeks. (By 26 weeks, the clonal size and composition had already reached a
steady state, and these images are representative of the full data range.) Green, lineage label; red, KRT5 (BCs); white, acetylated tubulin (cilia). Scale bar, 25 mm.
(F) Heatmaps to show the distribution of secretory and ciliated cells observed in all Scgb1a1-CreER; Rosa26R-fGFP clones over time. Colors represent per-
centage frequency of each clone type on a log scale.
(G) Frequency distribution of secretory or ciliated cell numbers per clone at 26 and 52 weeks. Blue, secretory; red, ciliated cells. Boxes, experimental obser-
vations; dark line, predictions of luminal cell model; shaded area, 95% confidence intervals of the luminal cell model.
(H) Cellular representation of the combinedmathematical model. BSCs (light green) divide on average once every 11 days in a balancedmanner to produce equal
numbers of new BSCs and BLPs (dark green). (Ratio of BSCs: BLPs within the epithelium is �1:1.) BLPs mature to a luminal cell fate (depicted as secretory, but
could be ciliated) once every 11 days. Secretory cells (blue) divide every 25 days to generate two new secretory cells (93%) or one secretory and 1 ciliated (red)
cell. The relative proportions of secretory and ciliated cells in the epithelium (�2:1) aremaintained by differential rates of loss (every 14 days for secretory cells and
every 236 days for ciliated cells).
Krt5-CreER knockin strain (Van Keymeulen et al., 2011) with a
Rosa-confetti reporter (Snippert et al., 2010) (Figure 3C; Table
S1). With the same cell kinetics and fate probabilities, we found
that the model reliably predicted the experimental observations
94 Cell Reports 12, 90–101, July 7, 2015 ª2015 The Authors
(Figure 3D), even though animals were exposed to a different
tmx-induction regimen. Similarly, as an additional consistency
check, we used Tg(Krt8-CreER); Rosa26R-fGFP animals (Van
Keymeulen et al., 2011) with a low dose of tamoxifen to label
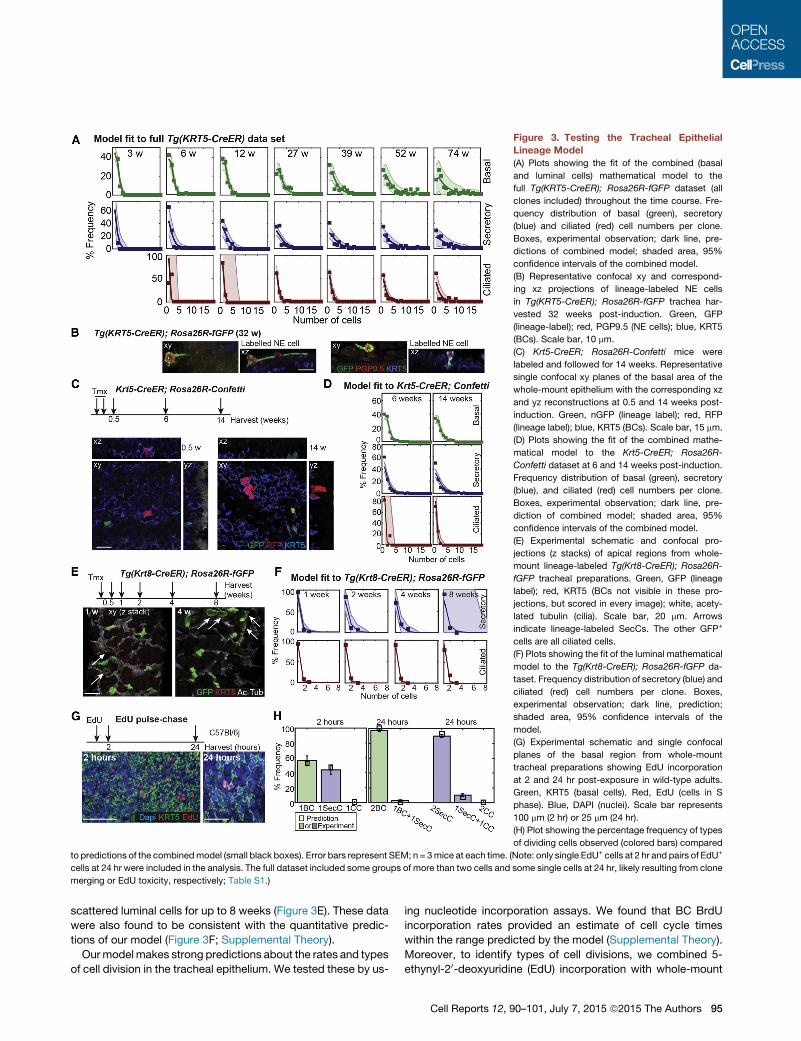
Figure 3. Testing the Tracheal Epithelial
Lineage Model
(A) Plots showing the fit of the combined (basal
and luminal cells) mathematical model to the
full Tg(KRT5-CreER); Rosa26R-fGFP dataset (all
clones included) throughout the time course. Fre-
quency distribution of basal (green), secretory
(blue) and ciliated (red) cell numbers per clone.
Boxes, experimental observation; dark line, pre-
dictions of combined model; shaded area, 95%
confidence intervals of the combined model.
(B) Representative confocal xy and correspond-
ing xz projections of lineage-labeled NE cells
in Tg(KRT5-CreER); Rosa26R-fGFP trachea har-
vested 32 weeks post-induction. Green, GFP
(lineage-label); red, PGP9.5 (NE cells); blue, KRT5
(BCs). Scale bar, 10 mm.
(C) Krt5-CreER; Rosa26R-Confetti mice were
labeled and followed for 14 weeks. Representative
single confocal xy planes of the basal area of the
whole-mount epithelium with the corresponding xz
and yz reconstructions at 0.5 and 14 weeks post-
induction. Green, nGFP (lineage label); red, RFP
(lineage label); blue, KRT5 (BCs). Scale bar, 15 mm.
(D) Plots showing the fit of the combined mathe-
matical model to the Krt5-CreER; Rosa26R-
Confetti dataset at 6 and 14 weeks post-induction.
Frequency distribution of basal (green), secretory
(blue), and ciliated (red) cell numbers per clone.
Boxes, experimental observation; dark line, pre-
diction of combined model; shaded area, 95%
confidence intervals of the combined model.
(E) Experimental schematic and confocal pro-
jections (z stacks) of apical regions from whole-
mount lineage-labeled Tg(Krt8-CreER); Rosa26R-
fGFP tracheal preparations. Green, GFP (lineage
label); red, KRT5 (BCs not visible in these pro-
jections, but scored in every image); white, acety-
lated tubulin (cilia). Scale bar, 20 mm. Arrows
indicate lineage-labeled SecCs. The other GFP+
cells are all ciliated cells.
(F) Plots showing the fit of the luminal mathematical
model to the Tg(Krt8-CreER); Rosa26R-fGFP da-
taset. Frequency distribution of secretory (blue) and
ciliated (red) cell numbers per clone. Boxes,
experimental observation; dark line, prediction;
shaded area, 95% confidence intervals of the
model.
(G) Experimental schematic and single confocal
planes of the basal region from whole-mount
tracheal preparations showing EdU incorporation
at 2 and 24 hr post-exposure in wild-type adults.
Green, KRT5 (basal cells). Red, EdU (cells in S
phase). Blue, DAPI (nuclei). Scale bar represents
100 mm (2 hr) or 25 mm (24 hr).
(H) Plot showing the percentage frequency of types
of dividing cells observed (colored bars) compared
to predictions of the combinedmodel (small black boxes). Error bars represent SEM; n = 3mice at each time. (Note: only single EdU+ cells at 2 hr and pairs of EdU+
cells at 24 hr were included in the analysis. The full dataset included some groups of more than two cells and some single cells at 24 hr, likely resulting from clone
merging or EdU toxicity, respectively; Table S1.)
scattered luminal cells for up to 8 weeks (Figure 3E). These data
were also found to be consistent with the quantitative predic-
tions of our model (Figure 3F; Supplemental Theory).
Ourmodel makes strong predictions about the rates and types
of cell division in the tracheal epithelium. We tested these by us-
ing nucleotide incorporation assays. We found that BC BrdU
incorporation rates provided an estimate of cell cycle times
within the range predicted by the model (Supplemental Theory).
Moreover, to identify types of cell divisions, we combined 5-
ethynyl-20-deoxyuridine (EdU) incorporation with whole-mount
Cell Reports 12, 90–101, July 7, 2015 ª2015 The Authors 95
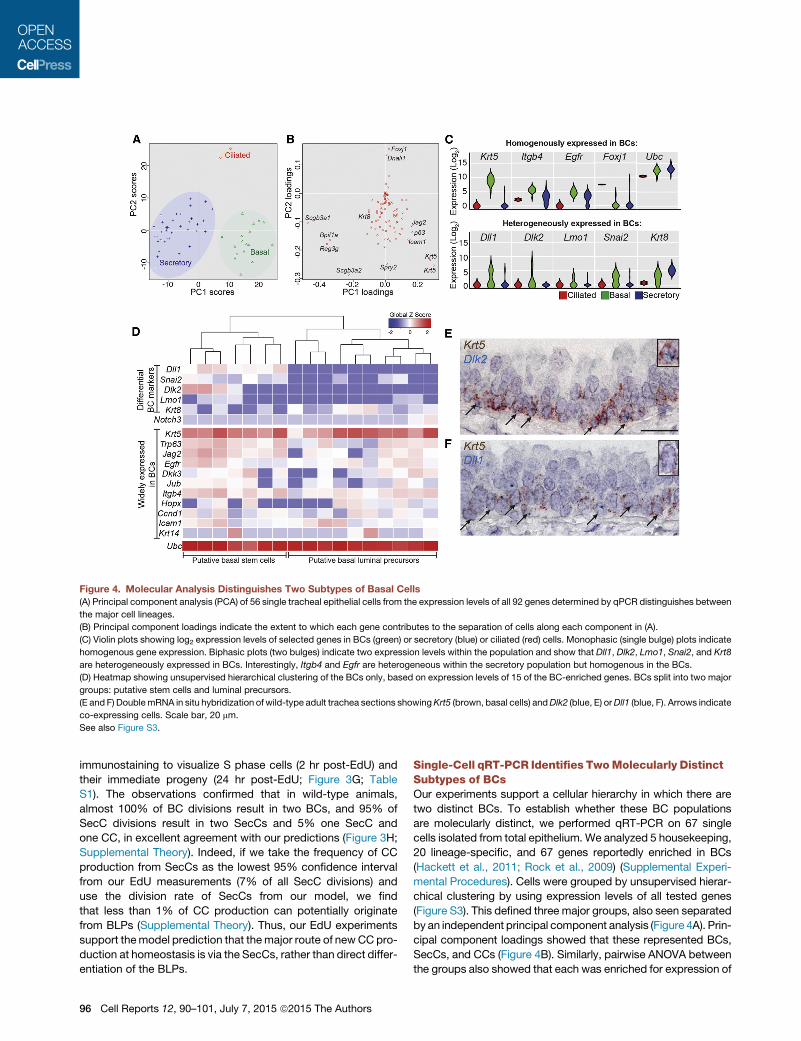
Figure 4. Molecular Analysis Distinguishes Two Subtypes of Basal Cells(A) Principal component analysis (PCA) of 56 single tracheal epithelial cells from the expression levels of all 92 genes determined by qPCR distinguishes between
the major cell lineages.
(B) Principal component loadings indicate the extent to which each gene contributes to the separation of cells along each component in (A).
(C) Violin plots showing log2 expression levels of selected genes in BCs (green) or secretory (blue) or ciliated (red) cells. Monophasic (single bulge) plots indicate
homogenous gene expression. Biphasic plots (two bulges) indicate two expression levels within the population and show that Dll1, Dlk2, Lmo1, Snai2, and Krt8
are heterogeneously expressed in BCs. Interestingly, Itgb4 and Egfr are heterogeneous within the secretory population but homogenous in the BCs.
(D) Heatmap showing unsupervised hierarchical clustering of the BCs only, based on expression levels of 15 of the BC-enriched genes. BCs split into two major
groups: putative stem cells and luminal precursors.
(E and F) DoublemRNA in situ hybridization of wild-type adult trachea sections showingKrt5 (brown, basal cells) andDlk2 (blue, E) orDll1 (blue, F). Arrows indicate
co-expressing cells. Scale bar, 20 mm.
See also Figure S3.
immunostaining to visualize S phase cells (2 hr post-EdU) and
their immediate progeny (24 hr post-EdU; Figure 3G; Table
S1). The observations confirmed that in wild-type animals,
almost 100% of BC divisions result in two BCs, and 95% of
SecC divisions result in two SecCs and 5% one SecC and
one CC, in excellent agreement with our predictions (Figure 3H;
Supplemental Theory). Indeed, if we take the frequency of CC
production from SecCs as the lowest 95% confidence interval
from our EdU measurements (7% of all SecC divisions) and
use the division rate of SecCs from our model, we find
that less than 1% of CC production can potentially originate
from BLPs (Supplemental Theory). Thus, our EdU experiments
support themodel prediction that themajor route of newCCpro-
duction at homeostasis is via the SecCs, rather than direct differ-
entiation of the BLPs.
96 Cell Reports 12, 90–101, July 7, 2015 ª2015 The Authors
Single-Cell qRT-PCR Identifies TwoMolecularly DistinctSubtypes of BCsOur experiments support a cellular hierarchy in which there are
two distinct BCs. To establish whether these BC populations
are molecularly distinct, we performed qRT-PCR on 67 single
cells isolated from total epithelium. We analyzed 5 housekeeping,
20 lineage-specific, and 67 genes reportedly enriched in BCs
(Hackett et al., 2011; Rock et al., 2009) (Supplemental Experi-
mental Procedures). Cells were grouped by unsupervised hierar-
chical clustering by using expression levels of all tested genes
(Figure S3). This defined three major groups, also seen separated
by an independent principal component analysis (Figure 4A). Prin-
cipal component loadings showed that these represented BCs,
SecCs, and CCs (Figure 4B). Similarly, pairwise ANOVA between
the groups also showed that each was enriched for expression of
definitive markers (Table S2). Analysis of gene expression levels
between individual cells within each group showed that Dlk2,
Dll1, Lmo1, Snai2, and Krt8 had biphasic patterns within BCs,
indicating heterogeneous expression (Figure 4C). This was in
agreement with independent unsupervised hierarchical clustering
performed on BCs alone (Figure 4D). In this analysis Dlk2, Dll1,
Lmo1, and Snai2 tended to be expressed together in one BC
population, while Krt8 (a luminal cell marker) was more highly
expressed in a second population. The only gene previously re-
ported as differentially expressed in BCs, Krt14, was detected
in a small number of cells in both subpopulations and is therefore
unlikely to distinguish them (Figure 4D).mRNA in situ hybridization
confirmed the heterogeneous distribution of Dlk2 and Dll1 within
BCs (Figures 4E and 4F). These data support our model of two
distinct BCsubpopulations.Moreover, they suggest that one sub-
population is upregulating luminal markers (Krt8), and we hypoth-
esized that this is the BLP.
Low-Level Krt8 Expression Characterizes a Populationof BCs that Are Lost Rapidly from the TrachealEpitheliumTo test the hypothesis that the tracheal epithelium contains a
widespread basal Krt8+ luminal precursor, we used Krt8-rtTA;
tetO-H2B-GFP animals. Two weeks of exposure to doxycycline
labeled�18%of BCs andmost SecCs (Figures 5A and 5B; Table
S1). Significantly, we found that SecC labeling was maintained
after a 6-week chase (Figure 5D), whereas BC labeling was
almost absent, consistent with our hypothesis (Figure 5E). More-
over, the loss rate of the GFP+ BCs fitted extremely well to an
exponential decay curve (R2 = 0.998867) giving a measured
loss rate of the BLPs of 16 days, in good agreement with our
predicted rate of 11 ± (7, 4) days. Immediately after induction,
labeled BCs had 3-fold lower levels of GFP than luminal cells
(Figure 5C; Table S1), consistent with a lower expression level
of Krt8 and further supporting our hypothesis that they are a
distinct, differentiating BC subpopulation. These data are
consistent with our model of two BC subpopulations, one of
which is fated as a luminal precursor (Figure 5F).
DISCUSSION
Uncovering the proliferative hierarchy, quantitative fate behavior,
and molecular profile of a slow-cycling tissue inevitably requires
detailed and long-term studies. By combining the results of
long-term lineage tracing using multiple drivers with single-cell
gene expression profiling, we have shown that tracheal KRT5+
BCs include two subpopulations: stem cells (BSCs) and luminal
precursors (BLPs). BSCs maintain epithelial homeostasis by
dividing in a balanced manner to self-renew and produce BLPs.
BLPs are widespread, long-lived (�2 weeks) luminal precursors,
which upregulate the luminal cytokeratin Krt8 before overt signs
of differentiation (Figure 5F). Our data suggest that these cells
do not function as a traditionally defined transit-amplifying popu-
lation. Rather, the existence of a widely distributed, luminal-fated,
long-lived precursor, which is morphologically indistinguishable
from the stem cell, is a surprising finding and has significant impli-
cations for fundamental and reparative biology, and disease initi-
ation, in the airways. In particular, our model suggests that there
must be at least two separate signaling events controlling luminal
cell differentiation: specification as a BLP (which may or may not
be concurrent with secretory/ciliated specification), and, sepa-
rately, maturation of that cell into a differentiated luminal cell.
We have therefore defined another event (maturation) at which
normal homeostasis can be perturbed in disease.
A KRT5+, KRT8+ parabasal cell population was recently de-
tected in wild-type adults (�25% of the total BC population).
The authors suggested that these cells were precursors of the
luminal cells and showed that their abundance is regulated by
NOTCH3 signaling (Mori et al., 2015). Interestingly, we observed
higher Notch3mRNA expression in a small number of BLPs that
also expressed Krt8 (Figure 4D). It is likely that the parabasal
cells and BLPs (which we propose comprise �50% of the total
BC population) are overlapping cell populations, but their exact
relationship is yet to be defined.
Our conclusion that BSCsmaintain the airways by a process of
stochastic homeostasis is in principle similar to themodel defined
for the BCpopulation in themouse inter-follicular epidermis (Clay-
ton et al., 2007). This means that each time a BSC divides, it has a
certain probability of making a symmetric or asymmetric division
(Figure 2H). The implication of this finding is that an individual
BSC can by chance make a large number of symmetric self-re-
newing divisions (compensated for, at a population level, by sym-
metric differentiation divisions of other BSCs) leading to neutral
drift in the population of clones. This is consistent with the model
proposed for human airway BSCs in vivo based on clonal analysis
of naturally occurring mitochondrial mutations (Teixeira et al.,
2013). Clonal experiments in mice provide us with richer datasets
than those available in human samples due to the defined time
courses and greater numbers of replicates. This has allowed us
to greatly extend the observations of Teixeira et al. and identify
the BLPs, the rapid rate of SecC turnover, and the production of
NE cells by BSCs. In the future, it will be important to test if these
observations are also recapitulated in human airways.
The KRT5+ BSC that we characterize achieves perfect self-
renewal for at least 17 months. We cannot exclude the existence
of an additional, rarely dividing, minority BSC in the trachea
(Borthwick et al., 2001). However, our data show that such a
cell is not required for homeostatic turnover. A subset (<20%)
of BCs express KRT14. These cells typically occur in clusters
and have been proposed to be unipotent stem cells at steady
state (Ghosh et al., 2011). We detected rare Krt14+ cells in
both the BSC and BLP populations, suggesting that KRT14 is
not a reliable marker of stem cell identity. Previous Tg(KRT14-
CreER) lineage labeling studies in which unipotent BC clones
were observed used a time course of �40 days (Ghosh et al.,
2011; Hong et al., 2004) and may not have allowed sufficient
time for BLPs to differentiate into luminal cells. We speculate
that the clustered distribution of KRT14+ BCs and the rapid up-
regulation of KRT14 levels post-injury indicate a structural role
for this intermediate filament protein.
The trachea does have an additional dividing cell population at
steady state: the SecC. We confirm that SecC to BC reversion
does not happen at homeostasis (Rawlins et al., 2009). More-
over, we show that SecCs have a short half-life compared to
CCs, are not traditionally defined transit-amplifying cells but do
preferentially self-renew, such that at any given time, �44% of
Cell Reports 12, 90–101, July 7, 2015 ª2015 The Authors 97
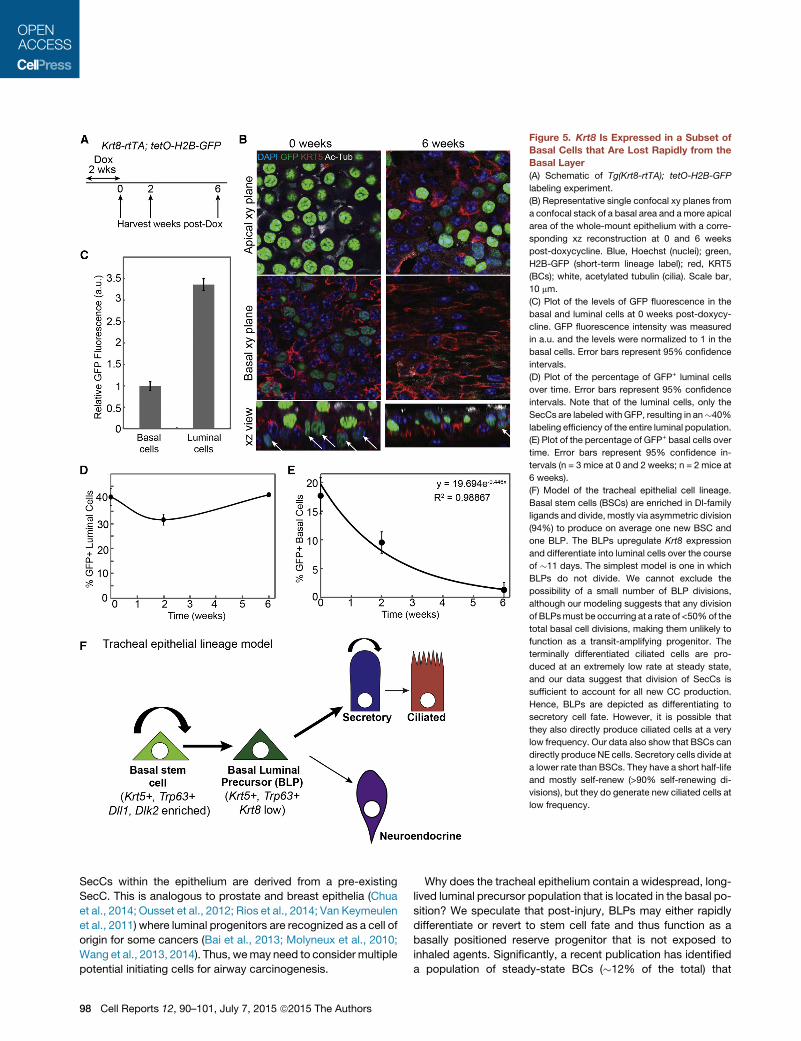
Figure 5. Krt8 Is Expressed in a Subset of
Basal Cells that Are Lost Rapidly from the
Basal Layer
(A) Schematic of Tg(Krt8-rtTA); tetO-H2B-GFP
labeling experiment.
(B) Representative single confocal xy planes from
a confocal stack of a basal area and amore apical
area of the whole-mount epithelium with a corre-
sponding xz reconstruction at 0 and 6 weeks
post-doxycycline. Blue, Hoechst (nuclei); green,
H2B-GFP (short-term lineage label); red, KRT5
(BCs); white, acetylated tubulin (cilia). Scale bar,
10 mm.
(C) Plot of the levels of GFP fluorescence in the
basal and luminal cells at 0 weeks post-doxycy-
cline. GFP fluorescence intensity was measured
in a.u. and the levels were normalized to 1 in the
basal cells. Error bars represent 95% confidence
intervals.
(D) Plot of the percentage of GFP+ luminal cells
over time. Error bars represent 95% confidence
intervals. Note that of the luminal cells, only the
SecCs are labeled with GFP, resulting in an�40%
labeling efficiency of the entire luminal population.
(E) Plot of the percentage of GFP+ basal cells over
time. Error bars represent 95% confidence in-
tervals (n = 3 mice at 0 and 2 weeks; n = 2 mice at
6 weeks).
(F) Model of the tracheal epithelial cell lineage.
Basal stem cells (BSCs) are enriched in Dl-family
ligands and divide, mostly via asymmetric division
(94%) to produce on average one new BSC and
one BLP. The BLPs upregulate Krt8 expression
and differentiate into luminal cells over the course
of �11 days. The simplest model is one in which
BLPs do not divide. We cannot exclude the
possibility of a small number of BLP divisions,
although our modeling suggests that any division
of BLPsmust be occurring at a rate of <50%of the
total basal cell divisions, making them unlikely to
function as a transit-amplifying progenitor. The
terminally differentiated ciliated cells are pro-
duced at an extremely low rate at steady state,
and our data suggest that division of SecCs is
sufficient to account for all new CC production.
Hence, BLPs are depicted as differentiating to
secretory cell fate. However, it is possible that
they also directly produce ciliated cells at a very
low frequency. Our data also show that BSCs can
directly produce NE cells. Secretory cells divide at
a lower rate than BSCs. They have a short half-life
and mostly self-renew (>90% self-renewing di-
visions), but they do generate new ciliated cells at
low frequency.
SecCs within the epithelium are derived from a pre-existing
SecC. This is analogous to prostate and breast epithelia (Chua
et al., 2014; Ousset et al., 2012; Rios et al., 2014; Van Keymeulen
et al., 2011) where luminal progenitors are recognized as a cell of
origin for some cancers (Bai et al., 2013; Molyneux et al., 2010;
Wang et al., 2013, 2014). Thus, wemay need to consider multiple
potential initiating cells for airway carcinogenesis.
98 Cell Reports 12, 90–101, July 7, 2015 ª2015 The Authors
Why does the tracheal epithelium contain a widespread, long-
lived luminal precursor population that is located in the basal po-
sition? We speculate that post-injury, BLPs may either rapidly
differentiate or revert to stem cell fate and thus function as a
basally positioned reserve progenitor that is not exposed to
inhaled agents. Significantly, a recent publication has identified
a population of steady-state BCs (�12% of the total) that
express low levels of transcription factors usually found in
more differentiated luminal cells. Rarely, these BCs were also
KRT8+ (Pardo-Saganta et al., 2015). Post-injury, the abundance
of luminal transcription factor-positive BCs increased to �50%
of the total BCs, and they were subsequently observed to
proliferate. Our model has BLPs present as �50% of the total
steady-state BC population. It is highly likely that the �12%
of transcription-factor-positive homeostatic BCs identified by
Pardo-Saganta et al. (2015) correspond to the most differenti-
ated of the homeostatic BLPs that we identified. If this hypothe-
sis is correct, the post-injury role of BLPs is indeed to both
rapidly differentiate and proliferate. However, exact testing of
this hypothesis will require more specific tools for lineage-label-
ing the BLP population. Given that the BLPs are a subpopulation
of BCs that, at homeostasis, are undergoing a slow differentia-
tion process to luminal fate, a unique transcription factor or other
specific molecular marker may be hard to find.
Are BLPs a unique aspect of airway stem cell biology, or could
other epithelia also contain fate-committed cells that are mor-
phologically indistinguishable from thestemcells?A recent report
using prospective isolation techniques suggests that there is a hi-
erarchy of BC organization in the mouse esophagus, with stem
cells beingmolecularly distinct frommore committed suprabasal
precursors (DeWardet al., 2014). Similarly,we note that theenter-
oblast (EB) cell in theDrosophilamidgut can only be distinguished
from the stem cell by expression of Dl (Micchelli and Perrimon,
2006; Ohlstein and Spradling, 2006, 2007) and occupies a similar
position in the cellular hierarchy to tracheal BLPs. We therefore
speculate that uncoupling division of the stem/progenitor from
morphological differentiation of the progeny may be a previously
undetected general phenomenon in epithelia, with steady-state
rates of cell maturation being controlled by cell-type-specific
mechanisms. Our strategy of long-term in vivo lineage tracing,
coupled with single-cell molecular analysis, should prove widely
applicable for the fine dissection of homeostatic lineage potential
in epithelia such as the esophagus, prostate, mammary gland,
and skin, where no obvious morphological stem cell niches exist.
EXPERIMENTAL PROCEDURES
See Supplemental Experimental Procedures for a full description of all mate-
rials and methods used.
Animals
All experiments were performed under license PPL80/2326. Tg(KRT5-CreER)
transgenic (Rock et al., 2009), Krt5-CreERT2 knockin (Van Keymeulen et al.,
2011), Scgb1a1-CreER (Rawlins et al., 2009), Tg(Krt8-CreER) (Van Keymeulen
et al., 2011), Rosa26R-fGFP (Rawlins et al., 2009), Rosa-confetti (Snippert
et al., 2010), and tetO-H2B-GFP (Tumbar et al., 2004) mice have been
described. Krt8-rtTA transgenic mice were generated by using a fragment of
the murine Krt8 gene. Males and females >8 weeks old were used in all exper-
iments. Wild-type mice were C57Bl/6J.
Lineage Tracing
Low-frequency activation of the reporter was achieved by a single intraperito-
neal injection of tamoxifen (Sigma-Aldrich, T5648) at a dose of 25 mg/g body
weight in Tg(KRT5-CreER); Rosa26R-fGFP or 13 mg/g body weight in
Tg(Krt8-CreER); Rosa26R-fGFP mice or with two doses of 5 mg tmx per
mouse spaced 48 hr apart in Krt5CreER/+; Rosa-confetti mice. Doxycycline
was administered to Krt8-rtTA; tetO-H2B-GFP mice in food at a dose of 10
g/kg (SAFE-DIETS) for 2 weeks. BrdU was given intraperitoneally at 30 mg/g
body weight and EdU at 50 mg per mouse.
Whole-Mount Immunostaining
For Rosa26R-fGFP and wild-type mice, tracheas were fixed overnight in 4%
paraformaldehyde at 4�C. Primary antibodies were anti-GFP (chicken,
1:1,000; Abcam, AB13970), anti-KRT5 (rabbit, 1:500; Covance, PRB-160P),
anti-acetylated tubulin (mouse, 1:1,000; Sigma, T7451), and anti-PGP9.5
(guinea pig, 1:500; Neuromics, GP14104). Secondary antibodies were Alexa
Fluor conjugates (Life Technologies, 1:2,000). Samples were processed to
97% TDE (2020-thiodiethanol) for mounting. For mice carrying tetO-H2B-GFP
or Rosa26R-confetti, the whole-mount protocol was adapted to enable direct
visualization of native fluorescence. Anti-GFP staining was omitted, and sam-
ples were mounted in Glycergel (Dako) + 2.5% DABCO.
Section Immunostaining
8- to 10-mm cryosections were stained with: anti-acetylated tubulin (mouse,
1:1,000; Sigma, T7451), anti-BrdU (mouse, 1:500; Sigma, B8434), anti-Ecad
(rat, 1:3000; Life Technologies, 13-1900), anti-Krt5 (rabbit, 1:500; Covance,
PRB-160P), anti-T1a (1:1,000; DSHB, 8.1.1), and anti-Scgb1a1 (rabbit,
1:500; Santa Cruz, sc25555). Antigen retrieval was used for BrdU (2 N HCl
30 min 37�C, 0.5% trypsin 5 min, room temperature).
mRNA In Situ Hybridization
Trachea were formalin-fixed for 24 hr at room temperature and paraffin
embedded. 5-mmsections were processed for RNA in situ with the RNAScope
2-plex Detection Kit (Chromogenic) according to the manufacturer’s standard
protocol (Advanced Cell Diagnostics). RNAscope probes were Krt5 (NM
027011.2, region 666–2,086), Dlk2 (NM 023932.3, region 267–1,279), and
Dll1 (NM 007865.3, region 888–1,883).
Microscopy and Image Scoring
z stacks of the full epithelial thickness were acquired at an optical resolution of
1,0243 1,024 with an optical z slice every 1 mm. Clones were scored manually
by looking through the entire z depth of the tracheal epithelium in FV viewer or
LAS AF software to score the identity of all labeled cells. For tetO-H2B-GFP
samples, z stacks were acquired at an optical resolution of 1,024 3 1,024,
with a z slice every 0.38 mm. Fluorescence intensity was assessed in Fiji, using
the Gurdon Institute Imaging Facility’s plugin, ObjectScan.
Cryosections for analysis of cellular composition/density were imaged on an
Olympus FV1000, using a 1003 oil objective (numerical aperture [NA] 1.4). The
length of the basement membrane in each image wasmeasured in Fiji. Density
was calculated as the number of cells present per mmof basement membrane.
Cryosections for BrdU analysis were imaged on a Zeiss AxioImager compound
microscope, using a 203 air objective (NA 0.8) and counted in Fiji.
Single-Cell qRT-PCR
The distal tracheal epithelium was peeled away from the underlying mesen-
chyme following a brief dispase digest and dissociated to single cells as
described previously (Rock et al., 2009). Unsorted epithelial cells were loaded
into a Fluidigm C1 machine on a 10- to 17-mm chip at a concentration of �400
cells/ml for cell capture, lysis, cDNA synthesis, and target pre-amplification. 67
single cells were used for subsequent qRT-PCR on a 96.96 Fluidigm Dynamic
array using a Biomark qPCR machine using TaqMan gene expression assays
(Life Technologies). Data analysis was performed in the Fluidigm Singular
Analysis Toolset 3.0 in R.
Modeling
See Supplemental Experimental Procedures and Supplemental Theory for all
details of model construction.
SUPPLEMENTAL INFORMATION
Supplemental Information includes Supplemental Experimental Procedures,
Supplemental Theory, three figures, and two tables and can be found with
this article online at http://dx.doi.org/10.1016/j.celrep.2015.06.011.
Cell Reports 12, 90–101, July 7, 2015 ª2015 The Authors 99
AUTHOR CONTRIBUTIONS
J.K.W. designed and performed experiments, analyzed data, and wrote the
manuscript. S.R. designed and executed the biophysical modeling and wrote
the manuscript. A.C.W. and B.G. assisted with qRT-PCR experimental design
and analysis and edited themanuscript. A.W., M.O., A.V.K., and C.B. provided
mice and trachea samples and assisted with experimental design. B.D.S. led
the biophysical modeling and edited the paper. E.L.R. conceived and led the
project, performed experiments, analyzed data, and wrote and edited the
manuscript.
ACKNOWLEDGMENTS
This study was supported by the Medical Research Council (G0900424 to
E.R.), European Union grant EuroSyStem (200720; FP7/2008), the Newton
Trust (to E.R.), the Wellcome Trust (098357/Z/12/Z to B.D.S.), and core grants
from the Wellcome Trust (092096) and Cancer Research UK (C6946/A14492).
Received: February 6, 2015
Revised: April 25, 2015
Accepted: June 2, 2015
Published: June 25, 2015
REFERENCES
Bai, F., Smith, M.D., Chan, H.L., and Pei, X.H. (2013). Germline mutation of
Brca1 alters the fate of mammary luminal cells and causes luminal-to-basal
mammary tumor transformation. Oncogene 32, 2715–2725.
Borthwick, D.W., Shahbazian, M., Krantz, Q.T., Dorin, J.R., and Randell, S.H.
(2001). Evidence for stem-cell niches in the tracheal epithelium. Am. J. Respir.
Cell Mol. Biol. 24, 662–670.
Brechbuhl, H.M., Ghosh, M., Smith, M.K., Smith, R.W., Li, B., Hicks, D.A.,
Cole, B.B., Reynolds, P.R., and Reynolds, S.D. (2011). b-catenin dosage is a
critical determinant of tracheal basal cell fate determination. Am. J. Pathol.
179, 367–379.
Chua, C.W., Shibata, M., Lei, M., Toivanen, R., Barlow, L.J., Bergren, S.K., Ba-
dani, K.K., McKiernan, J.M., Benson, M.C., Hibshoosh, H., and Shen, M.M.
(2014). Single luminal epithelial progenitors can generate prostate organoids
in culture. Nat. Cell Biol. 16, 951–961, 1–4.
Clayton, E., Doupe, D.P., Klein, A.M., Winton, D.J., Simons, B.D., and Jones,
P.H. (2007). A single type of progenitor cell maintains normal epidermis. Nature
446, 185–189.
DeWard, A.D., Cramer, J., and Lagasse, E. (2014). Cellular heterogeneity in the
mouse esophagus implicates the presence of a nonquiescent epithelial stem
cell population. Cell Rep. 9, 701–711.
Engelhardt, J.F., Schlossberg, H., Yankaskas, J.R., and Dudus, L. (1995). Pro-
genitor cells of the adult human airway involved in submucosal gland develop-
ment. Development 121, 2031–2046.
Ghosh, M., Brechbuhl, H.M., Smith, R.W., Li, B., Hicks, D.A., Titchner, T., Run-
kle, C.M., and Reynolds, S.D. (2011). Context-dependent differentiation of
multipotential keratin 14-expressing tracheal basal cells. Am. J. Respir. Cell
Mol Biol. 45, 403–410.
Giangreco, A., Lu, L., Vickers, C., Teixeira, V.H., Groot, K.R., Butler, C.R.,
Ilieva, E.V., George, P.J., Nicholson, A.G., Sage, E.K., et al. (2012). b-Catenin
determines upper airway progenitor cell fate and preinvasive squamous
lung cancer progression by modulating epithelial-mesenchymal transition.
J. Pathol. 226, 575–587.
Hackett, N.R., Shaykhiev, R., Walters, M.S., Wang, R., Zwick, R.K., Ferris, B.,
Witover, B., Salit, J., and Crystal, R.G. (2011). The human airway epithelial
basal cell transcriptome. PLoS ONE 6, e18378.
Hajj, R., Baranek, T., Le Naour, R., Lesimple, P., Puchelle, E., and Coraux, C.
(2007). Basal cells of the human adult airway surface epithelium retain transit-
amplifying cell properties. Stem Cells 25, 139–148.
100 Cell Reports 12, 90–101, July 7, 2015 ª2015 The Authors
Hong, K.U., Reynolds, S.D., Watkins, S., Fuchs, E., and Stripp, B.R. (2004).
In vivo differentiation potential of tracheal basal cells: evidence for multipotent
and unipotent subpopulations. Am. J. Physiol. Lung Cell. Mol. Physiol. 286,
L643–L649.
Krasteva, G., Canning, B.J., Hartmann, P., Veres, T.Z., Papadakis, T., Muhl-
feld, C., Schliecker, K., Tallini, Y.N., Braun, A., Hackstein, H., et al. (2011).
Cholinergic chemosensory cells in the trachea regulate breathing. Proc.
Natl. Acad. Sci. USA 108, 9478–9483.
Lu, L., Teixeira, V.H., Yuan, Z., Graham, T.A., Endesfelder, D., Kolluri, K., Al-
Juffali, N., Hamilton, N., Nicholson, A.G., Falzon, M., et al. (2013). LRIG1 reg-
ulates cadherin-dependent contact inhibition directing epithelial homeostasis
and pre-invasive squamous cell carcinoma development. J. Pathol. 229, 608–
620.
Mascre, G., Dekoninck, S., Drogat, B., Youssef, K.K., Brohee, S., Sotiropou-
lou, P.A., Simons, B.D., and Blanpain, C. (2012). Distinct contribution of
stem and progenitor cells to epidermal maintenance. Nature 489, 257–262.
Micchelli, C.A., and Perrimon, N. (2006). Evidence that stem cells reside in the
adult Drosophila midgut epithelium. Nature 439, 475–479.
Molyneux, G., Geyer, F.C., Magnay, F.A., McCarthy, A., Kendrick, H., Natrajan,
R., Mackay, A., Grigoriadis, A., Tutt, A., Ashworth, A., et al. (2010). BRCA1
basal-like breast cancers originate from luminal epithelial progenitors and
not from basal stem cells. Cell Stem Cell 7, 403–417.
Mori, M., Mahoney, J.E., Stupnikov, M.R., Paez-Cortez, J.R., Szymaniak, A.D.,
Varelas, X., Herrick, D.B., Schwob, J., Zhang, H., and Cardoso, W.V. (2015).
Notch3-Jagged signaling controls the pool of undifferentiated airway progen-
itors. Development 142, 258–267.
Ohlstein, B., and Spradling, A. (2006). The adult Drosophila posterior midgut is
maintained by pluripotent stem cells. Nature 439, 470–474.
Ohlstein, B., and Spradling, A. (2007). Multipotent Drosophila intestinal stem
cells specify daughter cell fates by differential notch signaling. Science 315,
988–992.
Ousset, M., Van Keymeulen, A., Bouvencourt, G., Sharma, N., Achouri, Y., Si-
mons, B.D., and Blanpain, C. (2012). Multipotent and unipotent progenitors
contribute to prostate postnatal development. Nat. Cell Biol. 14, 1131–1138.
Pardo-Saganta, A., Law, B.M., Tata, P.R., Villoria, J., Saez, B., Mou, H., Zhao,
R., and Rajagopal, J. (2015). Injury induces direct lineage segregation of func-
tionally distinct airway basal stem/progenitor cell subpopulations. Cell Stem
Cell 16, 184–197.
Paul, M.K., Bisht, B., Darmawan, D.O., Chiou, R., Ha, V.L., Wallace, W.D.,
Chon, A.T., Hegab, A.E., Grogan, T., Elashoff, D.A., et al. (2014). Dynamic
changes in intracellular ROS levels regulate airway basal stem cell homeosta-
sis through Nrf2-dependent notch signaling. Cell Stem Cell 15, 199–214.
Rawlins, E.L., and Hogan, B.L. (2008). Ciliated epithelial cell lifespan in the
mouse trachea and lung. Am. J. Physiol. Lung Cell. Mol. Physiol. 295, L231–
L234.
Rawlins, E.L., Ostrowski, L.E., Randell, S.H., and Hogan, B.L. (2007). Lung
development and repair: contribution of the ciliated lineage. Proc. Natl.
Acad. Sci. USA 104, 410–417.
Rawlins, E.L., Okubo, T., Xue, Y., Brass, D.M., Auten, R.L., Hasegawa, H.,
Wang, F., and Hogan, B.L. (2009). The role of Scgb1a1+ Clara cells in the
long-term maintenance and repair of lung airway, but not alveolar, epithelium.
Cell Stem Cell 4, 525–534.
Rios, A.C., Fu, N.Y., Lindeman, G.J., and Visvader, J.E. (2014). In situ identifi-
cation of bipotent stem cells in the mammary gland. Nature 506, 322–327.
Rock, J.R., Onaitis, M.W., Rawlins, E.L., Lu, Y., Clark, C.P., Xue, Y., Randell,
S.H., and Hogan, B.L. (2009). Basal cells as stem cells of the mouse trachea
and human airway epithelium. Proc. Natl. Acad. Sci. USA 106, 12771–12775.
Rock, J.R., Randell, S.H., and Hogan, B.L. (2010). Airway basal stem cells: a
perspective on their roles in epithelial homeostasis and remodeling. Dis.
Model. Mech. 3, 545–556.
Rock, J.R., Gao, X., Xue, Y., Randell, S.H., Kong, Y.Y., and Hogan, B.L. (2011).
Notch-dependent differentiation of adult airway basal stem cells. Cell Stem
Cell 8, 639–648.
Saunders, C.J., Reynolds, S.D., and Finger, T.E. (2013). Chemosensory brush
cells of the trachea. A stable population in a dynamic epithelium. Am. J. Respir.
Cell Mol. Biol. 49, 190–196.
Snippert, H.J., van der Flier, L.G., Sato, T., van Es, J.H., van den Born, M.,
Kroon-Veenboer, C., Barker, N., Klein, A.M., van Rheenen, J., Simons, B.D.,
and Clevers, H. (2010). Intestinal crypt homeostasis results from neutral
competition between symmetrically dividing Lgr5 stem cells. Cell 143,
134–144.
Snitow, M.E., Li, S., Morley, M.P., Rathi, K., Lu, M.M., Kadzik, R.S., Stewart,
K.M., and Morrisey, E.E. (2015). Ezh2 represses the basal cell lineage during
lung endoderm development. Development 142, 108–117.
Teixeira, V.H., Nadarajan, P., Graham, T.A., Pipinikas, C.P., Brown, J.M., Fal-
zon, M., Nye, E., Poulsom, R., Lawrence, D., Wright, N.A., et al. (2013). Sto-
chastic homeostasis in human airway epithelium is achieved by neutral
competition of basal cell progenitors. eLife 2, e00966.
Tumbar, T., Guasch, G., Greco, V., Blanpain, C., Lowry, W.E., Rendl, M., and
Fuchs, E. (2004). Defining the epithelial stem cell niche in skin. Science 303,
359–363.
Van Keymeulen, A., Rocha, A.S., Ousset, M., Beck, B., Bouvencourt, G., Rock,
J., Sharma, N., Dekoninck, S., and Blanpain, C. (2011). Distinct stem cells
contribute to mammary gland development and maintenance. Nature 479,
189–193.
Wang, Z.A., Mitrofanova, A., Bergren, S.K., Abate-Shen, C., Cardiff, R.D., Cal-
ifano, A., and Shen, M.M. (2013). Lineage analysis of basal epithelial cells
reveals their unexpected plasticity and supports a cell-of-origin model for
prostate cancer heterogeneity. Nat. Cell Biol. 15, 274–283.
Wang, Z.A., Toivanen, R., Bergren, S.K., Chambon, P., and Shen, M.M. (2014).
Luminal cells are favored as the cell of origin for prostate cancer. Cell Rep. 8,
1339–1346.
Wansleeben, C., Bowie, E., Hotten, D.F., Yu, Y.R., and Hogan, B.L. (2014).
Age-related changes in the cellular composition and epithelial organization
of the mouse trachea. PLoS ONE 9, e93496.
Watt, F.M., and Hogan, B.L. (2000). Out of Eden: stem cells and their niches.
Science 287, 1427–1430.
Zhao, R., Fallon, T.R., Saladi, S.V., Pardo-Saganta, A., Villoria, J., Mou, H., Vi-
narsky, V., Gonzalez-Celeiro, M., Nunna, N., Hariri, L.P., et al. (2014). Yap
tunes airway epithelial size and architecture by regulating the identity, mainte-
nance, and self-renewal of stem cells. Dev. Cell 30, 151–165.
Cell Reports 12, 90–101, July 7, 2015 ª2015 The Authors 101