Does Airway Pathology ents - Spiral@Imperial College London
282
1 Does airway pathology in severe preschool wheezers predict childhood asthma? Submitted for the degree of Doctor of Medicine (Research) in accordance with the regulations of Imperial College London 2012 Dr Ruth O’Reilly National Heart and Lung Institute Imperial College London
-
Upload
khangminh22 -
Category
Documents
-
view
0 -
download
0
Transcript of Does Airway Pathology ents - Spiral@Imperial College London

1
Does airway pathology in severe preschool wheezers predict childhood asthma?
Submitted for the degree of Doctor of Medicine (Research) in accordance with the regulations of
Imperial College London 2012
Dr Ruth O’Reilly
National Heart and Lung Institute Imperial College London

2
Contents
Abstract: Does airway pathology in severe preschool wheezers predict childhood asthma? .... 7
Acknowledgements .............................................................................................................................. 9
Declaration ........................................................................................................................................... 10
Publications and Abstracts that have resulted to date from the work performed in this thesis 12
Abbreviations ...................................................................................................................................... 13
List of Figures ..................................................................................................................................... 15
List of Tables ....................................................................................................................................... 20
Chapter 1: Preschool Wheeze ........................................................................................................... 22
1.1 Introduction ................................................................................................................................... 22
1.2 Difficulties in assessing wheeze prevalence ............................................................................. 23
1.3.1 Preschool wheezing – classification of phenotypes .............................................................. 26
1.3.2 The Tucson Children’s Respiratory Study (TCRS) ............................................................ 27 1.3.3 British Avon Longitudinal Study of Parents and Children (ALSPAC birth cohort) ........ 29 1.3.4 German Multicentre Allergy study (MAS) ............................................................................ 30 1.3.5 British Manchester Asthma and Allergy (MAAS) cohort study ........................................ 30 1.3.6 Perth study ............................................................................................................................. 32 1.3.7 Environment and Childhood Asthma (ECA) ....................................................................... 33 1.3.8 Copenhagen Study on Asthma in Childhood (COPSAC) .................................................. 33 1.3.9 Childhood Origins of Asthma birth cohort study (COAST) ............................................... 35 1.3.10 Clinical wheeze phenotypes:- European Respiratory Society classification of preschool wheeze ........................................................................................................................... 36
1.4 Early airway hyperresponsiveness ............................................................................................. 37
1.5. Lung function and asthma : school age to adulthood ............................................................. 38
1.6.1 Asthma Prediction Indexes ....................................................................................................... 39
1.6.2 ‘Castro-Rodriguez’ Asthma Predictive Index...................................................................... 41 1.6.3 ‘Isle of Wight’ Asthma Predictive Index .............................................................................. 42 1.6.4 ‘PIAMA’ Asthma Predictive Index ........................................................................................ 42 1.6.5 ‘Oslo’ Asthma Predictive Index ............................................................................................ 43 1.6.6 General Practice based Asthma Predictive Indices ........................................................... 43
1.7 Airway pathology and asthma ..................................................................................................... 46
1.7.1 Safety of endobronchial biopsies for assessing airway pathology ................................. 46 1.7.2 Airway pathology features typical of asthma ..................................................................... 46 1.7.3 Airway inflammation in asthma ............................................................................................ 47 1.7.4 Airway remodelling in asthma .............................................................................................. 48 1.7.5 Pathogenesis of asthma ....................................................................................................... 52
1.8 What is known about airway remodelling and inflammation in preschool children? ........... 53
1.9 Airway pathology not previously explored in severe recurrent preschool wheezers ........... 55
1.10 Hypotheses, Aims & Objectives ................................................................................................ 57
Chapter 2: Clinical Research visit ..................................................................................................... 60
2.1 Summary of study design ............................................................................................................ 60
2.2 Study details at preschool age .................................................................................................... 60
2.2.1 Patient characteristics of the preschool ‘wheezers’ group ............................................... 60 2.2.2 Patient characteristics of the preschool ‘controls’ group ................................................. 61 2.2.3 Use of video questionnaire to identify wheeze in the preschool group .......................... 61 2.2.4 Preschool atopic status ........................................................................................................ 62 2.2.5 Fibreoptic bronchoscopy and endobronchial biopsy ....................................................... 62
2.3 Aims of current study ................................................................................................................... 64

3
2.4 Difficulties in diagnosing asthma ................................................................................................ 64
2.5 Rationale for choosing assessment methods ........................................................................... 67
2.6 Ethical approval for the present study (the work of this thesis) .............................................. 68
2.7 Recruitment for the present study .............................................................................................. 68
2.8 Research visit ............................................................................................................................... 69
2.8.1 (I). Study consent ................................................................................................................... 69 2.8.2 (II). Height and weight ........................................................................................................... 70 2.8.3 (III). Multiple breath washout (MBW) .................................................................................... 70 2.8.4 (IV). Video questionnaire ....................................................................................................... 75 2.8.5 (V). Study questionnaire ....................................................................................................... 76 2.8.6 (VI). Salivary cotinine ............................................................................................................ 76 2.8.7 (VII). Exhaled Nitric Oxide (single expiratory flow rate 50ml/s) ........................................ 76 2.8.8 (VIII). Spirometry performance and quality control ............................................................ 78 2.8.9 (IX). Skin-prick testing for common aero and food allergens ........................................... 79 2.8.10 (X). Combined bronchial hyper-responsiveness and sputum induction ....................... 80
2.9 Completion of research visit ........................................................................................................ 83
2.10 School age atopy ........................................................................................................................ 83
2.11 Statistical analysis ...................................................................................................................... 83
2.12 Current Study:- Recruitment ...................................................................................................... 84
2.12.1 Children followed up at school age ................................................................................... 84 2.12.2 Co-morbid pathology at school age .................................................................................. 84 2.12.3 Children lost to follow up at school age ........................................................................... 88
2.13 Clinical characteristics of children followed up at school age .............................................. 88
2.13.1 Family history of asthma .................................................................................................... 88 2.13.2 School age allergic rhinitis and eczema ........................................................................... 90 2.13.3 School age asthma and preschool total IgE ..................................................................... 90 2.13.4 School age asthma status & preschool age RASTs ........................................................ 91
2.14 Prevalence of asthma at school age ......................................................................................... 93
2.15 Demographics of children who attended for a research visit ................................................ 95
2.15.2 Video questionnaire at school age .................................................................................... 96 2.15.3 Comparison of RASTs at preschool age with skin prick tests at school age ............... 97 2.15.4 Tobacco smoke exposure at school age .......................................................................... 98 2.15.5 Spirometry ............................................................................................................................ 99 2.15.6 Multiple breath washout.................................................................................................... 103
2.15.6.2 Lung Clearance Index ................................................................................................ 104 2.15.6.3 Scond & Sacin .................................................................................................................. 105
2.15.7 Exhaled nitric oxide ........................................................................................................... 108 2.15.8 Hypertonic saline challenge ............................................................................................. 109
2.15.8.2 Amount of inhaled hypertonic saline employed ..................................................... 110 2.15.8.3 Airway hyper-responsiveness, multiple breath washout and exhaled nitric oxide .................................................................................................................................................... 111 2.15.8.4 Induced Sputum ......................................................................................................... 111
2.16 Summary of Results ................................................................................................................. 112
2.17 Discussion ................................................................................................................................. 113
2.17.1 Review of aims and objectives ......................................................................................... 113 2.17.2 Limitations of the study .................................................................................................... 113 2.17.3 Strengths of the study ....................................................................................................... 114 2.17.4 Asthma diagnosis .............................................................................................................. 114 2.17.5 Lung function ..................................................................................................................... 115 2.17.6 Atopic status and school age asthma ............................................................................. 117 2.17.7 Airway hyper-responsiveness .......................................................................................... 118 2.17.8 Sputum induction .............................................................................................................. 119
2.18 Conclusion ................................................................................................................................. 120

4
Chapter3: Reticular basement membrane thickness in preschool wheezers and its relationship with childhood asthma. .................................................................................................................... 121
3.1 Introduction ................................................................................................................................. 121
3.1.2 Hypothesis ........................................................................................................................... 122 3.1.3 Aims and Objectives ........................................................................................................... 122
3.2 Methods: Measurement of reticular basement membrane thickness in preschool children ............................................................................................................................................................ 122
3.2.2 Statistical analysis ............................................................................................................... 123 3.3 Results ......................................................................................................................................... 124
3.3.1 Repeatability of RBM thickness measurements .............................................................. 124 3.3.2 Comparison with previous reticular basement membrane thickness measurements . 124 3.3.3 Reticular basement membrane thickness related to preschool clinical status…….. 125
3.3.4 Relationship of reticular basement membrane thickness at preschool age to asthma at school age ..................................................................................................................................... 127 3.3.5 Comparison of Dr Saglani’s reticular basement membrane measurements with asthma status at school age ..................................................................................................................... 128 3.3.6 Comparison of preschool reticular basement membrane thickness with clinical findings at school age .................................................................................................................. 130 3.3.7 Comparison of preschool reticular basement membrane thickness with measurements of airway inflammation and lung function at school age ......................................................... 132
3.4 Summary of findings RBM thickness ....................................................................................... 134
3.5 Discussion:-Preschool RBM thickness and school age asthma ........................................... 134
Chapter 4: Components of the reticular basement membrane in preschool wheezers and their relationship with childhood asthma. ............................................................................................... 138
4.1 Components of the reticular basement membrane ................................................................. 138
4.1.2 Tenascin-C expression during foetal lung development ................................................ 139 4.1.3 Tenascin-C expression in the lung during health and disease ...................................... 139 4.1.4 Tenascin-C expression in the airways in asthma ............................................................ 139
4.2.1 Methods- Tenascin–C immunohistochemistry staining ...................................................... 140
4.2.2. Quantification of tenascin-C within the reticular basement membrane ....................... 141 4.2.2.1 Method 1- Measurement of tenascin-C thickness using computer aided image analysis ..................................................................................................................................... 142 4.2.2.2 Method 2- Semi-quantitative measurement of tenascin-C using a picture grading system ....................................................................................................................................... 143 4.2.2.3 Method 3- Measurement of tenascin-C using stereology ........................................ 145
4.2.3 Repeatability of measurements ......................................................................................... 147 4.3 Results ......................................................................................................................................... 147
4.3.1 Biopsy size and number ..................................................................................................... 147 4.3.2 Comparing methods of quantifying TN-C ......................................................................... 148
4.4 RBM Tenascin-C compared by viral and multiple-trigger wheeze phenotypes ................... 152
4.5 Inhaled corticosteroids and RBM tenascin-C .......................................................................... 152
4.6 Relationship between reticular basement membrane tenascin-C expression and reticular basement membrane thickness ...................................................................................................... 154
4.7 Preschool reticular basement membrane tenascin-C and school age asthma .................... 154
4.8 Tenascin-C expression within the reticular basement membrane and age.......................... 156
4.9 Difficulties with tenascin-C staining in paraffin embedded tissue ........................................ 157
4.10 Summary of findings ................................................................................................................ 160
4.11 Discussion: RBM tenascin-C expression ............................................................................... 160
4.11.2 RBM TN-C and corticosteroid use ................................................................................... 162 4.11.3 Conclusion ......................................................................................................................... 162

5
Chapter 5: Airway smooth muscle in preschool wheezers and the development of school age asthma ................................................................................................................................................ 163
5.1. Introduction ................................................................................................................................ 163
5.1.2 Characteristics of increased airway smooth muscle in asthma ..................................... 163 5.1.3 Asthma duration and airway smooth muscle ................................................................... 164 5.1.4 Asthma severity and airway smooth muscle .................................................................... 164 5.1.5 Functional effects of increased airway smooth muscle .................................................. 164 5.1.6 Smooth muscle signalling pathways ................................................................................. 165 5.1.7 Airway smooth muscle cell migration ............................................................................... 166 5.1.8 Development of airway smooth muscle ............................................................................ 166 5.1.9 Airway smooth muscle in preschool wheezers ................................................................ 166 5.1.10 Hypotheses ........................................................................................................................ 167 5.1.11 Aims .................................................................................................................................... 167
5.2 Methods ....................................................................................................................................... 167
5.2.1 Characteristics of preschool wheezers ............................................................................. 167 5.2.2 Evaluable biopsies .............................................................................................................. 168 5.2.3 Measurement of airway smooth muscle ........................................................................... 168
5.3 Assessment of smooth muscle proliferation ........................................................................... 171
5.4.1 Biopsy size and quantity in Brompton preschool wheezers ............................................... 172
5.4.2 Repeatability of stereology and computer aided analysis methods .............................. 173 5.4.3 Comparing ASM volume-fraction measured with stereology and ASM area-fraction measured with computer aided image analysis ........................................................................ 174 5.4.4 Variability of ASM within and between biopsies .............................................................. 175 5.4.5 Airway smooth muscle area fraction measured using computer aided analysis ......... 176 5.4.6 Airway smooth muscle measured using stereology techniques ................................... 177 5.4.7 Volume fraction of ASM indexed to the surface area of RBM ......................................... 178
5.5 Atopic status and airway smooth muscle in preschool children .......................................... 179
5.6 Airway smooth muscle in different preschool wheeze phenotypes ...................................... 181
5.7 Inhaled corticosteroids and airway smooth muscle ............................................................... 181
5.8 School age asthma and preschool airway smooth muscle .................................................... 182
5.9 Age & preschool airway smooth muscle .................................................................................. 185
5.10 Airway smooth muscle hyperplasia ........................................................................................ 186
5.11 Can airway smooth muscle in endobronchial biopsies from preschool wheezers help predict school age asthma?............................................................................................................. 187
5.12 Preschool ASM and lung function at school age .................................................................. 190
5.13 Airway smooth muscle measurement in the ‘Helsinki’ wheezy infants .............................. 192
5.13.1 Clinical description of infant cohort ................................................................................ 192 5.13.2 Infant lung function ........................................................................................................... 193 5.13.3 Atopy ................................................................................................................................... 194 5.13.4 Rigid bronchoscopy and endobronchial biopsy ............................................................ 194 5.13.5 Quantification of RBM thickness ..................................................................................... 194 5.13.6 Quantification of smooth muscle ..................................................................................... 194 5.13.7 Number of children with airway smooth muscle in endobronchial biopsy ................. 195 5.13.8 Variability ............................................................................................................................ 195 5.13.9 Airway smooth muscle in each infant lung function group .......................................... 196 5.13.10 Atopy and airway smooth muscle in the wheezy infants (Helsinki) ........................... 198 5.13.11 Correlation of age and RBM thickness with smooth muscle in the wheezy infant cohort ............................................................................................................................................. 198
5.14 Discussion ................................................................................................................................. 199
5.14.1 Statement of principal findings ........................................................................................ 199 5.14.2 Strengths of study ............................................................................................................. 200 5.14.3 Limitations of study ........................................................................................................... 200 5.14.4 Airway smooth muscle and asthma ................................................................................ 203 5.14.5 Corticosteroid use and airway smooth muscle .............................................................. 203

6
5.14.6 Airway smooth muscle predicts school age asthma ..................................................... 204
Chapter 6: Airway Inflammation in Preschool Wheezers and its Relationship to School Age Asthma ............................................................................................................................................... 205
6.1 Introduction ................................................................................................................................. 205
6.2 Aims.............................................................................................................................................. 210
6.3 Methods ....................................................................................................................................... 210
6.3.1 Immunostaining ................................................................................................................... 210 Immunostaining mast cells .......................................................................................................... 211 6.3.2 Quantification of neutrophils, eosinophils, and CD4+, CD45+ and CD8+ lymphocytes ........................................................................................................................................................ 212 6.3.3 Quantification of smooth muscle and submucosal mast cells....................................... 213 6.3.4 Variability of inflammatory cell counts .............................................................................. 215
6.4 Results ......................................................................................................................................... 215
6.4.1 Variability .............................................................................................................................. 215 6.4.2 Subepithelial eosinophils ................................................................................................... 216 6.4.3 Other cell counts: neutrophils, CD45+, CD4+ and CD8+ lymphocytes .......................... 218 6.4.4 Mast cells in endobronchial biopsies from preschool wheezers ................................... 220 6.4.5 Smooth muscle mast cells.................................................................................................. 220 6.4.6 Submucosal mast cells ....................................................................................................... 221 6.4.7 Smooth muscle and submucosal mast cells & school age asthma ............................... 221 6.4.8 Airway smooth muscle and smooth muscle mast cells .................................................. 223
6.5 Discussion ................................................................................................................................... 224
6.5.1 Summary of Results ............................................................................................................ 224 6.5.2 Discussion of principal findings ........................................................................................ 226
Chapter 7: Discussion and Final Summary .................................................................................... 229
7.1 Strengths and novel data ........................................................................................................... 230
7.2 Limitations of this thesis ............................................................................................................ 231
Future work and unanswered questions ........................................................................................ 237
References ......................................................................................................................................... 246
Appendix 1 ......................................................................................................................................... 270
Appendix 2 ......................................................................................................................................... 271
Appendix 3 ......................................................................................................................................... 273
Appendix 4 ......................................................................................................................................... 276
Appendix 5 ......................................................................................................................................... 279
Appendix 6 ......................................................................................................................................... 280

7
Abstract: Does airway pathology in severe preschool wheezers predict
childhood asthma?
Although one third of all preschool children wheeze, only half of these will have
persistent symptoms and go on to have asthma at school age. Pathological changes
characteristic of asthma, including eosinophilic inflammation and increased reticular
basement membrane thickness, were evident in endobronchial biopsies from severe
recurrent wheezers aged 2-3 years when compared with age matched controls.
However, at the time of endobronchial biopsy it was not known which children would
persistently wheeze and develop asthma at school age.
The work of this thesis follows up this group of children, both preschool wheezers
(n=47) and non-wheezing controls (n=21), aged between 6-11 years and establishes
the presence or absence of school age asthma, relating this to pre-school airway
pathology. Children (n=51) were followed up at school age, and those who attended
for the research visit (n=39) were characterised in terms of atopic status, lung
function (spirometry, lung clearance index) and airway inflammation (exhaled nitric
oxide) at school age. Forty percent (15/37) of preschool wheezers had developed
asthma at school age. Although increased airway smooth muscle is an established
pathological feature of asthma in school age children, nothing is known about airway
smooth muscle in preschool wheezers, hence airway smooth muscle, smooth
muscle mast cells and reticular basement membrane tenascin-C were measured in
the endobronchial biopsies taken at preschool age. Next, airway remodelling
(increased airway smooth muscle and increased reticular basement membrane
thickness) and airway inflammation at preschool age were related to the presence or
absence of asthma at school age.
Sixty two percent (42/68) of children had one or more evaluable biopsies for airway
smooth muscle assessment. Although reticular basement membrane thickness and
submucosal eosinophils were significantly higher in preschool wheezers compared
with controls, they did not discriminate the children who developed asthma by school
age, suggesting these airway pathological features may be associated with current
symptoms rather than future asthma risk. In contrast preschool airway smooth
muscle was increased in those severe preschool wheezers who went on to develop

8
school age asthma (n=8, median age 8.2 [6-10.4] years, median ASM 0.12 [0.08-
0.16]) when compared with those who did not develop asthma (n=24, median age
7.3 [5.9-11] years, median ASM 0.07 [0.02-0.23]), p=0.007. These data suggest that
future studies investigating the mechanisms underlying the persistence of preschool
wheeze and its development to asthma should have a primary focus on airway
smooth muscle.

9
Acknowledgements
I was delighted to be given the opportunity to take on this project and am very
grateful for all the help, patience, encouragement and mentoring that I haven been
given along the way from my three supervisors Sejal Saglani, Andrew Bush and
Peter Jeffery. I have always felt very supported and have grown both as a person
and as a doctor over the past 3 years under their supervision.
I am grateful to Asthma UK for providing the funding for the project and to the
children and their parents for their time and cooperation in agreeing to take part in
the project. I am particularly grateful to those families who travelled very long
distances to attend for a research visits.
I am really grateful to Louise Fleming who answered most of the questions at the
start of my research project that I would have been too embarrassed to ask anyone
else, Samantha Irving for teaching me about multiple breath washout and Sarah
Donovan for her assistance on technical issues with spirometry. Dr Sejal Saglani, Dr
Jie Zhu and Mr Tim Oates taught me the practical aspects of endobronchial biopsy
measurements and the use of the microscope. Mr Winston Banya helped me with
statistical advice and data analysis.
As always I am grateful to my family, particularly my mother for pushing me and
motivating throughout my life always to achieve more. Finally, to my lovely husband
Ben who supported me when I often despaired with this thesis over the past years
and is looking forward to having a kitchen table that is not covered in journal papers.

10
Declaration
I confirm that I have performed the work described in this thesis. Where colleagues
have been involved, their contribution is acknowledged below. I have consulted all
cited references. The work of this thesis has not been submitted elsewhere for a
higher degree.
Contribution of work to this thesis attributable to Ruth O’Reilly and that
performed by other colleagues
Chapter 1
1. Figure 1.4 replicated from Lloyd et al, Nature Medicine 2010 with permission.
Chapter 2
1. Children were initially recruited at preschool age by Dr Sejal Saglani. At school
age all children were followed up by Ruth O’Reilly. All measurements and analysis of
lung function, airway inflammation and atopy were performed by Ruth O’Reilly. For a
subgroup of children multiple breath washout was performed and analysed in
conjunction with Ms Samantha Irving.
2. Figure 2.3 was adapted by Dr Samatha Sonnappa and replicated from her thesis
with permission.
3. Analysis of salivary cotinine was performed by Principal Biochemist, Ms Jackie
Donovan, Royal Brompton Hospital
Chapters 3-7- Evaluation of preschool endobronchial biopsies
1. Flexible bronchoscopy and endobronchial biopsy was performed by Professor
Andrew Bush, Dr Mark Rosenthal, Dr Ian Balfour-Lynn, Dr Jane Davies, Royal
Brompton Hospital, London at the time of preschool recruitment
2. Biopsy fixation and processing was performed by Department of Histopathology,
Royal Brompton Hospital, under the supervision of Professor Andrew Nicholson
4. Immunostaining was performed by Dr Jie Zhu and Dr Zhuo Wang, Lung
Pathology, NHLI and Mr Timothy Oates, Leukocyte Biology, NHLI
5. All biopsy counts and measurements were performed by Ruth O’Reilly except for
proliferating cell nuclear antigen smooth muscle counts which were measured by Mr

11
Timothy Oates. Dr Nicola Ullman was the second observer for inter-observer
repeatability of airway smooth muscle measurements. RBM thickness and
inflammatory cell counts had been measured by Dr Sejal Saglani at preschool age
but were repeated at school age by Ruth O’Reilly.
Chapter 6
Helsinki Infant study
1. Recruitment of infants by Dr Kristiina Malmstrom, Dr Anna Pelkonen, Department
of Allergology, Helsinki University Central Hospital, Helsinki
2. Infant lung function performed by Dr Pekka Malmberg, Department of
Allergology, Helsinki University Central Hospital, Helsinki
3. Rigid bronchoscopy and endobronchial biopsy performed by Mr Harry Lindahl,
Consultant Paediatric Surgeon, Hospital for Children and Adolescents, Helsinki
4. Biopsy fixation and processing performed by department of Histopathology, Skin
and Allergy Hospital, Helsinki University Hospital, Helsinki
5. Biopsy measurements (reticular basement membrane thickness and
inflammatory cell counts) were performed by Dr Sejal Saglani

12
Publications and Abstracts that have resulted to date from the
work performed in this thesis
Publications
Increased airway smooth muscle in preschool wheezers who develop school age
asthma
Ruth O’Reilly, Nicola Ullmann, Samantha Irving, Cara Bossley, Samatha Sonnappa,
Jie Zhu, Timothy Oates BSc, Winston Banya, Peter K Jeffery, Andrew Bush, Sejal
Saglani
Journal of Allergy and Clinical Immunology 2013 April;131(4):1024-32
Abstracts
1. More airway smooth muscle in preschool children increases risk of future asthma
R O’Reilly1, T Oates, J Zhu2, A Bush1, PK Jeffery2, S Saglani1
1. Respiratory Paediatrics, 2. Lung Pathology, NHLI, Imperial College London
Oral Presentation, European Respiratory Society September 2011
2. Increased reticular basement membrane thickness but NOT airway smooth
muscle in endobronchial biopsies of severe preschool wheezers
R O’Reilly1, J Zhu2, A Bush1, PK Jeffery2, S Saglani1
1. Respiratory Paediatrics, 2. Lung Pathology, NHLI, Imperial College London
Thorax 2010;65:A2-A3
Highly commended BTS/BLF/BALR Young Investigator’s Prize Dec 1st
2010- Oral Presentation
3. Comparison of three methods to quantify Tenascin C expression within the
bronchial reticular basement membrane of paediatric endobronchial biopsies
R O’Reilly1, J Zhu2, A Bush1, PK Jeffery2, S Saglani1
1. Respiratory Paediatrics, 2. Lung Pathology, NHLI, Imperial College London
Am. J. Respir. Crit. Care Med., May 2010; 181: A1060
Poster Discussion, American Thoracic Society, May 2010
Oral presentation, British Thoracic Society Winter Meeting, 2009

13
Abbreviations
AHR airway hyperresponsiveness
ALSPAC Avon Longitudinal study of Parents and Children
ASM airway smooth muscle
ATS American Thoracic Society
AUC area under the curve
BAL bronchoalveolar lavage
CI confidence interval
COAST Childhood Origins of Asthma
COPSAC Copenhagen prospective study on Asthma in Childhood
CoV coefficient of variation
CW confirmed wheezer at preschool age
EB endobronchial biopsy
ECM extracellular matrix
ERS European Respiratory Society
ETAC Early Treatment of the Atopic Child Trial
FeNO exhaled nitric oxide
FeNO50 exhaled nitric oxide at 50ml/s
FEV1 forced expiratory volume in 1 second
FRC functional residual capacity
FVC forced vital capacity
GINA Global Initiative for Asthma
ICC intraclass correlation coefficient
ICS inhaled corticosteriods
IgE immunoglobulin E
IL interleukin
ISAAC International Study of Asthma and Allergy in children
LCI lung clearance index
MAAS Manchester Asthma and Allergy Study
MAS Multicentre Allergy Study (German)
MBW multiple breath washout
MCT mast cell tryptase
MCTC mast cell chymase tryptase

14
MMP matrix metalloproteinases
NPV negative predictive value
OR odds ratio
PEAK Prevention of Early Asthma in Kids
PC provocation concentration
PIAMA Prevalence and Incidence of Asthma and /Mite Allergy
PPV positive predictive value
RAST radioallergosorbent test
RBH Royal Brompton Hospital
RBM reticular basement membrane
ROC receiver operator curve
RO’R Ruth O’Reilly
RSV respiratory syncytial virus
RW reported wheezer preschool age
Sacin acinar airways inhomogeneity
Scond conducting airways inhomogeneity
SF6 sulphur hexafluoride
SIII phase 3 slope
SnIII normalised phase III slope
SPT skin prick tests
SS Sejal Saglani
SD standard deviation
TCRS Tucson Children's Respiratory Study
TIMP tissue-specific inhibitors of metalloproteinase
TH T Helper cell
TNF tumor necrosis factor
Treg T lymphocyte regulatory cell
VOC volatile organic compound
Vmax FRC maximal flow at functional residual capacity

15
List of Figures
Figure 1.1: Cross-sectional z scores of height-adjusted maximal expiratory flows at ages 2.4 months and 6, 11, and 16 years for the preschool wheeze phenotypes ....................................... 29
Figure 1.2: Risk of recurrent wheeze. COPSAC showed a strong association between colonisation of the airways with common pathogenic bacteria and development of recurrent wheeze and asthma ............................................................................................................................ 35
Figure 1.3: A paediatric endobronchial biopsy showing epithelium, reticular basement membrane (RBM), submucosa and airway smooth muscle ........................................................... 49
Figure 1.4: Interactions between the environment, airway remodelling and inflammation are involved in the pathogenesis of asthma ........................................................................................... 52
Figure 1.5: Reticular basement membrane (RBM) thickness in preschool confirmed wheezers (CW) is increased when compared to non wheezing control subjects (Ctrl), but is significantly less than school-aged children with difficult asthma ..................................................................... 54
Figure 2.1: Wash-in phase of multiple breath washout .................................................................. 71
Figure 2.2: Multiple breath washout (SF6) ........................................................................................ 72
Figure 2.3: The contribution of convection dependant inhomogeneity cdi (Scond) and diffusion-convection dependant inhomogeneity dcdi (Sacin) to overall ventilation inhomogeneity ........... 74
Figure 2.4: Normalised alveolar slopes (SnIII) generated from a child with a normal multiple breath washout test represented as a function of lung turnover (TO) .......................................... 75
Figure 2.5: Exhaled nitric oxide measurement with visual feedback incentive ........................... 78
Figure 2.6: Skin prick tests ................................................................................................................ 80
Figure 2.7: Child inhaling 4.5% saline nebulised using an ultrasonic nebuliser (De Vilbliss 2000) ..................................................................................................................................................... 81
Figure 2.8: Study recruitment and alternative or co-morbid diagnosis at school age other than asthma .................................................................................................................................................. 86
Figure 2.9: Total IgE at preschool age related to (i) preschool wheeze and (ii) school age asthma status ...................................................................................................................................... 91
Figure 2.10: Sum of all aeroallergens is increased in those who developed school age asthma when compared with those who did not ........................................................................................... 92
Figure 2.11: School age follow up (2009-10) of preschool cohort, lung function, airway inflammation and skin prick test measurements at school age .................................................... 96
Figure 2.12: Salivary cotinine at school age compared between houses where one or more persons and non smoking homes ..................................................................................................... 98
Figure 2.13: No difference in school age spirometry related to school age asthma status ..... 101
Figure 2.14: Lung function measures compared between children with and without school age asthma after exclusion of children with comorbid respiratory diagnosis .................................. 102
Figure 2.15: Difference between lung clearance index measurements by Dr R O’Reilly (measurement 1) and Ms S Irving (measurement 2) plotted against the mean of the 2 measurements ................................................................................................................................... 103
Figure 2.16: Increased Scond in children with school aged asthma .............................................. 107
Figure 2.17: (i) FeNO50 greater in confirmed rather than reported wheezers, (ii) Increased FeNO50 in children with school age asthma when compared to children without asthma, (iii) Increased FeNO50 in children with school age atopy .................................................................... 108
Figure 2.18: Variability of amount of inhaled hypertonic saline (4.5%) inhaled at end point time of 15.5 minutes .................................................................................................................................. 111

16
Figure 3.1: Haematoxylin and eosin stained endobronchial biopsy section showing reticular basement membrane thickness measured at right angles to a tangent marking the outer perimeter of the reticular basement membrane at that point ....................................................... 123
Figure 3.2: A Bland-Altman plot showing variability between measurements as reported by observer 1 (RO’R) and observer 2 (SS) ........................................................................................... 125
Figure 3.3: Increased reticular basement membrane thickness in endobronchial biopsies from preschool wheezers when compared to age matched controls .................................................. 126
Figure 3.4: Increased reticular basement membrane thickness in preschool confirmed wheezers when compared to controls ............................................................................................ 126
Figure 3.5: No difference in preschool reticular basement membrane thickness when compared with presence or absence of asthma at school age (RO’R measurements – all children included) ............................................................................................................................. 127
Figure 3.6: No difference in reticular basement membrane thickness in severe recurrent preschool wheezers when compared with presence or absence of asthma at school age- (RO’R measurements-preschool wheezers alone) ................................................................................... 128
Figure 3.7: Dr S Saglani’s measurements showing increased reticular basement membrane thickness at preschool age in children with school age asthma (all children followed up) ..... 129
Figure 3.8: Dr S Saglani’s measurements showing increased reticular basement membrane thickness in severe recurrent preschool wheezers who developed school age asthma when compared to preschool wheezers who did not develop asthma ................................................. 129
Figure 3.9: Positive correlation with number of lifetime overnight admissions to hospital with wheeze reported at school age and reticular basement membrane thickness at preschool age ............................................................................................................................................................ 130
Figure 3.10: Negative correlation between reticular basement membrane thickness (n=23) at preschool age and Sacin at school age ............................................................................................ 132
Figure 3.11: No correlation between RBM thickness in preschool wheezers and (i) FEV1 and (ii) FeNO50 ................................................................................................................................................ 133
Figure 3.12: RBM thickness related to age in post-mortem sections from children without known lung pathology ...................................................................................................................... 136
Figure 4.1: (a): Measuring tenascin-C thickness ........................................................................... 142
Figure 4.1: (b): Tenascin-C positive staining in the RBM (magnification x400) ......................... 143
Figure 4.1: (c) Tenascin-C negative staining in the RBM (magnification x400) .......................... 143
Figure 4.2: Reference pictures used to grade tenascin-C expression in the reticular basement membrane using a semi quantitative scale .................................................................................... 144
Figure 4.3: Tenascin-C staining overlayed by graticule (magnification X1000) ......................... 146
Figure 4.4: Criteria for tenascin positive and negative points. .................................................... 147
Figure 4.5: Measurement of tenascin-C thickness within the reticular basement membrane of endobronchial biopsies at (a) magnification x400 and (b) magnification x1000 ........................ 149
Figure 4.6: Tenascin-C expression quantified by a semi quantitative scale. ............................. 150
Figure 4.7: Proportion of the RBM occupied by tenascin-C measured using stereology techniques ......................................................................................................................................... 151
Figure 4.8: No difference between (i) RBM tenascin-C thickness and (ii) proportion of RBM tenascin-C between viral and multiple-trigger wheezers at preschool age ................................ 152
Figure 4.9: No relationship between inhaled corticosteroids and (i) RBM tenascin-C thickness and (ii) proportion of RBM tenascin-C ............................................................................................ 153
Figure 4.10: Relationship between tenascin-C and total reticular basement membrane thickness when measured as (a) tenascin-C thickness within the reticular basement

17
membrane, and (b) as the proportion of tenascin-C occupying the reticular basement membrane. ......................................................................................................................................... 154
Figure 4.11: (a) No difference in reticular basement membrane tenascin-C thickness (method 1) at preschool age in children who developed school age asthma when compared with those who did not ........................................................................................................................................ 155
(b) No difference in the proportion of reticular basement membrane tenascin-C (method 3) at preschool age between children who developed asthma by school age and those who did not ........................................................................................................................................ 155
Figure 4.12: Relationship between age and (a) tenascin-C thickness within the reticular basement membrane and (b) the proportion of tenascin-C occupying the reticular basement membrane in control preschool children ....................................................................................... 156
Figure 4.13: Tenascin-C positive and negative staining of the tonsillar tissue ......................... 158
Figure 5.1: An evaluable biopsy for assessment of airway smooth muscle: endobronchial biopsy section stained with haematoxylin and eosin from a preschool child with epithelium, subepithelium, reticular basement membrane and smooth muscle ........................................... 168
Figure 5.2: Smooth muscle bundles were traced using a computer mouse and then the area was calculated using computer aided analysis. ............................................................................ 169
Figure 5.3: Smooth muscle volume fraction was quantified by overlaying a weibel grid (M168) at x 200 magnification over the section and performing point counting. Length between 2 points (68µm). .................................................................................................................................... 170
Figure 5.4: Airway smooth muscle biopsy quantity ...................................................................... 172
Figure 5.5: A Bland Altman plot showed good repeatability of ASM area-fraction measurements between observer 1 and observer 2 ..................................................................... 174
Figure 5.6: Correlation between measurements of airway smooth muscle volume fraction and airway smooth muscle area-fraction ............................................................................................... 174
Figure 5.7: Wide ASM variability within biopsy represented by a Bland Altman plot for (i) method 1 (ASM area fraction) and (ii) method 2 (ASM volume fraction) ..................................... 175
Figure 5.8: Airway smooth muscle area fraction in endobronchial biopsies measured using computer aided image analysis compared between (i) wheezers and controls and (ii) confirmed and reported wheezers and controls .............................................................................................. 176
Figure 5.9: Airway smooth muscle volume fraction in endobronchial biopsies measured using stereology compared between (i) wheezers and controls and (ii) confirmed wheezers, reported wheezers and controls ..................................................................................................................... 177
Figure 5.10: No difference in volume fraction of airway smooth muscle indexed to surface area of reticular basement membrane between (i) preschool wheezers and controls and (ii) confirmed and reported wheezers and controls ............................................................................ 178
Figure 5.11: No correlation between ASM area fraction and total preschool IgE in preschool wheezers ............................................................................................................................................ 180
Figure 5.12: No difference in ASM area fraction in endobronchial biopsies from children sensitised to one or more positive aeroallergens compared with children not sensitised to any aeroallergens ..................................................................................................................................... 180
Figure 5.13: Comparing airway smooth muscle area fraction in preschool children with viral and multiple-trigger wheeze............................................................................................................. 181
Figure 5.14: No difference in airway smooth muscle area-fraction compared between preschool wheezers on inhaled corticosteroids and those not on inhaled corticosteriods .... 182
Figure 5.15: Increased preschool airway smooth muscle with school age asthma status measured using (i) area fraction (computer aided image analysis) and (ii) volume fraction (stereology point counting techniques) ......................................................................................... 183

18
Figure 5.16: Increased preschool airway smooth muscle in preschool wheezers alone classified by the presence or absence of asthma at school age (i) area fraction and (ii) volume fraction ............................................................................................................................................... 183
Figure 5.17: No relationship between age and ASM volume fraction in non-wheezing controls ............................................................................................................................................................ 185
Figure 5.18: No difference in smooth muscle proliferation between wheezers and controls (figure A); No difference in smooth muscle proliferation between children with and without school age asthma (figure B). .......................................................................................................... 186
Figure 5.19: Area under the receiver-operator characteristics curve for airway smooth muscle area fraction (measured using computer aided analysis) in preschool wheezers in the diagnosis of future school age asthma was 0.88 (standard error 0.08, confidence interval (0.69-0.97)), p=0.005. ................................................................................................................................... 187
Figure 5.20: Receiver operator characteristics curve for airway smooth muscle volume fraction (measured using point counting) in preschool wheezers related to school age asthma (area under the curve 0.79, standard error 0.08, confidence intervals 0.61-0.91, p=0.0008). ............. 188
Figure 5.21: Receiver operator characteristics curve for wheeze severity score related to school age asthma (area under the curve 0.7, standard error 0.08, CI 0.53-0.84, p=0.01). ....... 189
Figure 5.22: Positive correlation between (i) FeNO50 and (ii) FEV1/FVC and ASM area fraction ............................................................................................................................................................ 190
Figure 5.23: Preschool airway smooth muscle compared with school age airway hyper-responsiveness or positive bronchodilator response .................................................................. 191
Figure 5.24: Evaluable endobronchial biopsy section from an infant stained with toludine blue showing with epithelium, RBM, submucosa and smooth muscle. .............................................. 195
Figure 5.25: Bland Altman plot of comparing interbiopsy variability of infant airway smooth muscle in the same child.................................................................................................................. 196
Figure 5.26: No increase in ASM area fraction in wheezy infants (Helsinki) with airflow obstruction and BDR when compared to infants with normal lung function. ............................ 197
Figure 5.27: No difference in airway smooth muscle between atopic and non-atopic wheezers ............................................................................................................................................................ 198
Figure 5.28: (i) Relationship between smooth muscle area and RBM thickness; (ii) Relationship between age and smooth muscle area fraction ............................................................................. 199
Figure 6.1: Nucleated immunostained stained neutrophil cells (positively stained cells) in an endobronchial preschool section stained with neutrophil elastase ........................................... 213
Figure 6.2: Preschool endobronchial biopsy showing enucleated mast cells stained red with mast cell tryptase in airway smooth muscle .................................................................................. 214
Figure 6.3: Preschool endobronchial biopsy showing enucleated mast cells stained red with mast cell tryptase in submucosa .................................................................................................... 214
Figure 6.4: Difference between measurements of subepithelial eosinophils in endobronchial biopsies measured by Dr Ruth O’Reilly (RO’R) and Dr S Saglani (SS) plotted against the mean of the 2 measurements ..................................................................................................................... 215
Figure 6.5: (i) Increased subepithelial eosinophils in severe recurrent preschool wheezers when compared to preschool controls. (ii) No difference in preschool subepithelial eosinophils between children who developed school age asthma and those who did not ........................... 216
Figure 6.6: Increased submucosal eosinophils as measured by Sejal Saglani when compared to school age asthma status ............................................................................................................ 217
Figure 6.7: A positive correlation between preschool subepithelial eosinophils and (i) FVC z score and (ii) FEV1 z score at school age ....................................................................................... 217
Figure 6.8: There was no difference in preschool subepithelial neutrophils, CD4, CD8 or CD45 cell counts measured by RO’R when compared by preschool wheeze group or with school age asthma status. ................................................................................................................................... 219

19
Figure 6.9: Mast cells per smooth muscle area (mm2) compared between (i) wheezers and
controls and (ii) confirmed wheezers, reported wheezers and controls ..................................... 220
Figure 6.10: Submucosal mast cells compared between (i) wheezers and controls and (ii) confirmed and reported wheezers and controls ............................................................................ 221
Figure 6.11: There was no difference in preschool smooth muscle mast cells when related to school age asthma status (i); or between preschool submucosal mast cells when related to school age asthma status (ii) ........................................................................................................... 222
Figure 6.12: No correlation between ASM and smooth muscle mast cells ................................ 223
Figure 7.1. Follow up of preschool wheezers at school age related to airway pathology measurements ................................................................................................................................... 232

20
List of Tables Table 1.1: Birth cohort studies from different regions report different prevalences of wheeze in
preschool years and subsequent school age asthma .................................................................... 25
Table 1.2: Comparison of preschool wheeze phenotypes and associated lung function in the Tucson Children’s Respiratory Study, Avon Longitudinal Study of Parents and Children and Manchester Asthma and Allergy Study ............................................................................................ 31
Table 1.3: Original and modified ‘Castro-Rodriguez’ asthma predictive index ................................ 41
Table 1.4: Asthma Predictive indexes for children with recurrent wheeze at preschool age have good negative but poor positive predictive values ......................................................................... 45
Table 2.1: Demographic details of all subjects and controls recruited at preschool age ............... 63
Table 2.2: Different criteria used for diagnosing asthma .................................................................... 66
Table 2.3: Characteristics of children followed up at school age from 2009-2010 .......................... 87
Table 2.4: No difference in clinical characteristics of preschool children followed up at school age and those lost to follow up ......................................................................................................... 88
Table 2.5: Contingency table of all children recruited comparing (i) parental history of asthma; (ii) doctor diagnosed maternal history of asthma; (iii) doctor diagnosed paternal history of asthma with school age asthma status .......................................................................................................... 89
Table 2.6: Contingency table comparing school age asthma and school age allergic rhinitis and eczema ................................................................................................................................................. 90
Table 2.7: Prevalence of asthma in preschool wheezers varies depending on definition used ..... 94
Table 2.8: Demographics of children who attended for research visit .............................................. 95
Table 2.9: Lung Clearance index, functional residual capacity, Scond and Sacin related to school preschool age wheeze status and school age asthma status...................................................... 106
Table 2.10: Acceptability and tolerance of bronchial challenge with hypertonic (4.5%) saline .... 110
Table 2.11: No significant difference between children with evidence of bronchodilator response or airway hyperresponsiveness and those without at school age .............................................. 112
Table 3.1: Variability between measurements in the same section by the same observer at day 1, day 7 and day 30 ............................................................................................................................... 124
Table 3.2: Clinical findings at school age related to reticular basement membrane thickness at preschool age .................................................................................................................................... 131
Table 3.3: Correlation of lung function and airway inflammation at school age with reticular basement membrane thickness at preschool age ......................................................................... 132
Table 3.4: Between biopsy variability of RBM thickness for 6 preschool children as measured by SS ........................................................................................................................................................ 135
Table 4.1: Number of patients in each group with at least 1 biopsy of good quality for (i) tenascin measurement, (ii) reticular basement membrane thickness ........................................................ 148
Table 4.2: Repeatability of measuring of tenascin-C thickness at x400 & 1000, and of measuring the proportion of tenascin-C occupying the reticular basement membrane using stereology x1000. ................................................................................................................................................. 151
Table 4.3: Summary of reticular basement membrane tenascin-C composition in preschool wheezers compared with preschool controls ................................................................................ 153
Table 5.1: No difference in clinical characteristics of children with and without ASM on evaluable endobronchial biopsies .................................................................................................................... 173
Table 5.2: No difference in clinical characteristics of children followed up at school age with ASM on endobronchial biopsy and those who were either lost to follow up or did not have ASM in endobronchial biopsy ....................................................................................................................... 173

21
Table 5.3: Characteristics of preschool children with airway smooth muscle on endobronchial biopsy ................................................................................................................................................. 179
Table 5.4: Clinical characteristics of children with ASM on their endobronchial biopsy related to school age asthma status ................................................................................................................ 184
Table 5.5. Sensitivity, specificity, positive and negative predictive values and likelihood ratios for a proportion of greater than 0.1 ASM area-fraction, Castro-Rodriguez ‘stringent index’ and Devulapalli wheeze severity score in preschool wheezers .......................................................... 189
Table 5.6: No difference in airway smooth muscle measurements between Helsinki infants with one or more biopsies ........................................................................................................................ 197
Table 6.1: Inflammatory cell counts in endobronchial biopsies taken at preschool age related to school age asthma status. ............................................................................................................... 218
Table 6.2: No difference in smooth muscle and submucosal mast cells between wheezers and controls at preschool age and those with and without asthma at school age. .......................... 223

22
Chapter 1
Preschool Wheeze
1.1 Introduction
Wheeze is a polyphonic, musical, whistling sound produced in the airways during
breathing. Around 1 in 3 children will have at least one episode of wheeze prior to
their third birthday(1) and by age 7 years 40% of children report at least 1 episode of
wheezing(2). It is estimated that children aged 1–5 years with wheeze cost the United
Kingdom (UK) health service a total of £53 million with the greatest expenditure
being £34 million in primary care(3).
Wheeze in preschool children is often associated with respiratory viral infection and
children may be completely asymptomatic between infections(4). Although most
cases of persistent asthma begin in early life, spontaneous resolution of wheezing
will occur in many young children(5). Only half of children with wheeze in preschool
age will go on to have asthma at school age(6). Those children who remain
symptomatic and develop asthma are the focus of this thesis. The diagnosis of
asthma is a clinical one and there are no standardised diagnostic criteria(7). Most
definitions include symptoms of wheeze, breathlessness, chest tightness or cough
coupled with physiological evidence of variable airflow obstruction. More recent
descriptions of asthma in children and in adults have included components of airway
hyper-responsiveness and airway inflammation. In particular the Global Initiative for
Asthma (GINA) guidelines define asthma as ‘a common chronic disorder of the
airways that is complex and characterised by variable and recurring symptoms,
airflow obstruction, bronchial hyperresponsiveness, and an underlying
inflammation’(8). However, how airway inflammation and airway hyper-
responsiveness (AHR) relate to each other and how they contribute to the clinical
manifestations of asthma is unclear. In many cases, neither will actually be
measured, and the evidence implicating eosinophilic inflammation in wheezing in
infancy is scanty.
The work described in this thesis is the follow up at school age of a previously
studied cohort of severe preschool wheezers (‘preschool’ is defined in this thesis as
aged between 3 months and 5 years)(9). The aim was to determine if airway

23
pathology, including airway inflammation and remodelling at preschool age can
predict school age asthma. There is no current treatment that is disease modifying,
namely which prevents the progression of preschool wheeze to asthma, but
determining which wheezers will have school age asthma may be the first step in
helping to identify which children to target for further investigation of the mechanisms
leading to the development of asthma. This chapter will focus on the early preschool
years, specifically in relation to the difficulties associated with correctly identifying
true wheeze, wheeze phenotypes and the usefulness of currently proposed clinical
asthma predictive indexes. Airway pathology that is characteristic of asthma will also
be reviewed.
1.2 Difficulties in assessing wheeze prevalence
There is considerable overlap between different preschool wheeze phenotypes. One
of the difficulties in untangling the different preschool wheeze phenotypes is the
reliance in longitudinal epidemiological studies on a parental report of wheeze to
assess prevalence, table 1.1(1;10-15). This is dependent on parental understanding of
the term “wheeze”, but parental and physician perception of wheeze is often very
different. One factor responsible for the poor prediction of which preschool children
with wheeze develop future asthma is the use of the word “wheeze” to describe
many disparate sounds.
At least 30% of parents use other words for wheeze and 30% of parents have
labelled other sounds as "wheeze" in research studies using video questionnaires as
the ‘gold standard’(16;17). In particular, incorrect labeling of upper airway noises such
as stertor, stridor or snoring as wheeze in young children may lead to an
overestimate of both prevalence and frequency of wheeze at preschool age(16;17). In
a large questionnaire based study of over 4000 children aged 6-10 years, only 30%
of families exclusively used the word “whistling” to describe wheezing, with a large
proportion of parents descibing other sounds as wheeze, most commonly rattly
breathing (43.1%), followed by wet cough (20%) and noises from the nose or throat
(20%) and least commonly snoring (3.2%)(17). Frequent attacks of reported wheeze,
maternal history of asthma and maternal education were significantly associated with
a correct identification of wheeze as a whistling / squeaking sound, while incorrect
identification was commoner in families of South Asian ethnicity, parents whose first

24
language was not English and families living in areas of social deprivation(17).
Interestingly, “whistling” was only mentioned by 11% of 200 parents of children with
‘asthma’, when asked what they understood by wheeze, although it features in most
wheeze epidemiology questionnaires(16). Video questionnaires of upper and lower
respiratory noises in parents of children with asthma or other respiratory conditions
show that the correct labelling of wheeze was 59% and 47% for other sounds such
as stridor, snoring, stertor(18). Conversely, the prevalence of wheeze may also be
underestimated, in one study 19% of children labelled as cough by parents were
diagnosed with wheeze on auscultation by physicians(19). Physicians were able to
reliably judge the presence and severity of wheeze, when compared with wheeze
analysed by acoustic techniques, whereas nurses and parents were much less
reliable(20).
The prevalence of preschool wheeze varies internationally between 17-50%, table
1.1. There were different definitions of ‘preschool’, which may contribute to some of
the variability in reported prevalence. Importantly, children with parentally reported,
but unconfirmed wheeze, have no difference in pulmonary function when compared
to those who never wheezed, whereas children with physician confirmed wheeze
have significantly poorer lung function(21). Table 1.1 summarises the main cohort
studies that report both preschool wheeze and school age asthma prevalence.

25
Table 1.1: Birth cohort studies from different regions report different prevalence’s of wheeze at preschool age and
subsequent school-age asthma
(* = % of asthma in whole cohort at school age, # = % of preschool wheezers with asthma at school age)
Author Birth Cohort Country Year of publication
Numberof
children
Subject Retention
Preschool wheeze prevalence
Wheeze Prevalence of school age
asthma
Caudri et al(10)
PIAMA Rotterdam, Netherlands
2009 3963 88% Age 1-4 years 55% Parental report
Age 7 years 11%*
Henderson et al(11)
Jackson et al
(22)
Bisgaard et al
(23)
ALSPAC COAST COPSAC
Avon, UK Wisconsin USA Denmark
2008
2008
2007
6265
289
411
54%
89%
79%
Age 1-5 years 40% Age 1-3 years (20-50%) Not assessed
Parental report
Doctor
diagnosed
Doctor diagnosed
Age 7 years 50%*
Age 6 years 28%*
Age 5 years 14%*
Lodrup Carlsen et al(14)
Environment and Childhood Asthma (ECA)
Oslo, Norway
2006 803 77% Age 0-3 years 21.4% Parental report
Age 10 years- 11%*
Age10 years -61%#
Kurukulaaratchy et al(12)
Isle of Wight Isle of Wight 2003 1456 71% Age 1-4 years 33% Parental report
Wheeze over past year Age 10 years 37%*
Lau et al
(24)
German MAS
Berlin Germany
2003
1314
71.5%
Age 1-7 years 17.4%
Parental
report
Age 7 years -10% current wheezing
#
-6.1% DD asthma#
Oddy et al(15)
Perth Perth. Australia
1999 2187 91% Age 1-6 years 22.5% Parental report
Age 6 years DD asthma 30.9%*
Martinez et al(1)
Tucson Tucson, Arizona, USA
1995 1246 66% Age 0-3 years 48.5% Parental report
Age 6 years 40%#

26
1.3.1 Preschool wheezing – classification of phenotypes
The roots of most cases of asthma are in early childhood and it is likely some
children are predisposed to asthma even before birth(5). Longitudinal cohort studies
from birth to adulthood have provided insight into the natural history of asthma and
have described several different wheeze phenotypes at preschool age. A phenotype
is defined in this thesis as a cluster of clinical or pathological features which tend to
be associated, and which are useful in some way, such as in managing the child or
understanding the mechanisms of a disease(25). Approaches to describing
phenotypes may be subjective, whereby children are divided into subsets based on a
hypothesis by a clinician (for example, induced sputum patterns of cellularity), or can
be objective, where phenotypes are mathematically derived in an unbiased manner
(for example, latent class analysis and systems biology approaches). The latter
avoids the constraints of investigator imposed classifications which are vulnerable to
bias. Latent class analysis is a form of cluster analysis in which subjects are grouped
according to similarities of response levels to a number of measured categorical
variables. However, it should be noted that so-called ‘objective’ methods of analysis
are also vulnerable to bias, in that the investigator has to determine which datasets
are actually included in the analysis.
Epidemiological studies using unselected or selected high risk populations have
demonstrated that different early wheeze patterns in terms of age of onset,
frequency, severity and triggers (viral or bacterial) have different natural histories.
Clinical phenotypes have also been described based on temporal wheeze patterns
(episodic viral and multiple trigger wheeze). However, there is overlap between
some of these described phenotypes. These can likely only be resolved by a large
multicentre, long-term study with antenatal recruitment and repeated objective
assessments using biomarkers (for example, exhaled nitric oxide (FeNO), exhaled
breath condensate or induced sputum) as proxy measurements of inflammation to
identify clinically useful phenotypes and early predictors of disease progression.
Systems biology is one such innovative research technique which looks at biology as
a group of connected pathways, using genetic, molecular, histopathology and
physiological data to create a mathematical or computational model using principal
component analysis that can then be used to define asthma phenotypes. The U-
BIOPred consortium is currently undertaking a large international study in asthma

27
using this approach(26). The next section of this thesis describes the main cohort
studies in which children were recruited either before or shortly after birth.
1.3.2 The Tucson Children’s Respiratory Study (TCRS)
TCRS was a landmark longitudinal epidemiological study which began in 1980 to
investigate potential risk factors during the first 3 years of life for the future
development of asthma(1). It was one of the first cohort studies to recruit unselected
infants at or shortly after birth. Its strengths include the large number of infants
(n=1246), measurements made in cord blood before the onset of any respiratory
illness and a long period of follow up with good retention of subjects. The TCRS has
made a large contribution to our knowledge of preschool wheezing, describing three
distinct wheezing phenotypes (transient infant wheezers, late onset wheezers and
persistent wheezers)(1). It was also the first longitudinal cohort study to develop an
asthma predictive index in preschool wheezers(27), discussed in section 1.6.
Tucson Children’s Respiratory Study - wheezing phenotypes
Transient wheezers
Transient wheezers were children who wheezed only during the first three years of
life and who had stopped by age 6 years. Lung function as measured by maximal
flow at functional residual capacity (Vmax FRC) was lower in transient wheezers than
their non wheezing peers(1) shortly after birth and at age 6 years and they continued
to have lower levels of forced expiratory flows at age 11 and 16 years(6), figure 1.1.
Their diminished lung function shortly after birth, before any postnatal respiratory
insult, suggests the need to focus on antenatal factors which may predispose these
children to wheezing. As the airways grow children are less likely to wheeze with
respiratory viral infections. Risk factors for transient wheezing include prematurity,
maternal smoking, maternal atopy, maternal hypertension and younger maternal
age(1;28-30).
Persistent Wheezers
Persistent wheezers referred to children who continued to wheeze throughout the
first 6 years of life. Persistent wheezers had higher total serum immunoglobulin E
(IgE) than non-wheezers at 9 months, despite no association between cord blood
IgE and persistent wheezing at 6 years suggesting IgE mediated sensitisation may at

28
least start to develop during the first year of life. Almost all the persistent wheezers
were sensitised to at least one aeroallergen by age 6 years. VmaxFRC in infancy in
persistent wheezers is similar to those children who subsequently never wheezed,
but by 6 years of age, these children had reduced pulmonary function which
subsequently tracks with time(1). Children with persistent wheezing were more likely
to have more severe symptoms, eczema, rhinitis apart from colds and a maternal
history of asthma.
Late onset wheezers
Late onset wheezers are those who wheeze at age 6 years but do not wheeze in the
first 3 years of life. Although late onset wheezers were as likely to remain
symptomatic to 16 years as persistent wheezers they had no significant deficits in
lung function. Children in the late onset wheezing group were more likely to be atopic
than those children that had never wheezed, but atopy was less prevalent in this
group than the persistent wheezers. Lung function tracks for all 3 phenotypes from
the preschool years to adolescence at least, figure 1.1. This suggests that lung
function deficits in children with asthma are already present by 6 years of age and
remain stable (or at least do not improve) throughout adolescence. While the Tucson
study has added greatly to our knowledge of the evolution of preschool wheeze,
epidemiological classifications can only be applied retrospectively and do not
contribute to the clinical management of the individual child. Furthermore, these
phenotypes are largely self-fulfilling as children were only assessed at 3 fixed time
points, and so could only have those 3 wheeze phenotypes.

29
Figure 1.1: Cross-sectional z scores of height-adjusted maximal expiratory
flows at ages 2.4 months and 6, 11, and 16 years for the preschool wheeze
phenotypes(6) Changes in pulmonary function are established by 6 years of age,
and track through to late adolescence
1.3.3 British Avon Longitudinal Study of Parents and Children (ALSPAC birth
cohort)
Although the wheeze patterns as defined by the TCRS(1) group were self-fulfilling,
the findings were largely confirmed by the British Avon Longitudinal Study of Parents
and Children (ALSPAC) birth cohort(6;11). This was a longitudinal birth cohort study in
which data on wheezing were available at 7 time points from birth to 7 years of age
in 6,265 (45%) of the 14,062 unselected children(11). Wheeze phenotypes were
determined using latent class analysis (which allows phenotypes to emerge from the
data, rather than be imposed on it as in the TCRS) and largely confirmed the
temporal wheezing patterns and associated risk factors of the TCRS(1). Two other
phenotypes were also described; “prolonged early wheeze” characterised by
wheezing in non atopic children from 6 to 54 months with low prevalence from age
69 months onwards and “intermediate onset wheeze” with onset between ages 18
and 42 months. These wheezing phenotypes were later confirmed in the Prevalence
and Incidence of Asthma and /Mite Allergy (PIAMA) Dutch birth cohort (also using
latent class analysis) adding further evidence to the existence of an intermediate-
onset phenotype with onset of wheeze after 2 years of age(31). Unlike in the Tucson
children(1) the intermediate phenotype had a stronger association with atopy than the

30
persistent or late onset wheezers. Childhood wheeze phenotypes most associated
with atopy and airway hyperresponsiveness (AHR) in this study had onset after 18
months. This cohort study suggests all wheezy phenotypes including the late onset
wheezers are associated with impaired lung function by school age(11).
1.3.4 German Multicentre Allergy study (MAS)
The German MAS was a birth cohort (n=1314) of healthy term infants (⅓ had 2
parents with atopy and increased cord blood IgE, and ⅔ had 1 parent with atopy)
recruited in 1990 and were followed up until 13 years of age. The purpose of the
study was to investigate the role of allergic sensitisation and allergen exposure in
early life in the development of asthma. Children were followed annually including
both clinical and lung function (body plethysmography) assessment, and also
measurement of specific IgE to food and aeroallergens. The study showed that
children with persistent or late onset wheeze have impaired pulmonary function at 7
years(13), similar to the findings of the Tucson study. In children with wheeze, lung
function tracked along values found at age 7, until age 10 and 13 years. However,
the course of lung function differed significantly between 7-13 years in atopic and
non atopic wheezers with impairment in all lung function indices only seen in atopic
wheezers. The MAS cohort was the only study which measured childhood lung
function at 10 and 13 years after bronchodilator treatment. This still showed reduced
lung function in wheezing children, but the differences were less(32).
In contrast to the TCRS study 90% of children with early wheeze, but no atopy, lost
their symptoms at school age and had normal lung function by puberty(32). This group
may represent children who wheezed with viral infections at preschool age.
Importantly, sensitisation to perennial allergens such as house dust mite, cat and
dog hair that developed in the first 3 years of life was associated with a loss of lung
function at school age. A positive family history of atopy, or early IgE sensitisation to
aeroallergens were the strongest factors predicting whether children wheezing early
in life will continue wheezing until puberty(32).
1.3.5 British Manchester Asthma and Allergy (MAAS) cohort study
The Manchester Asthma and Allergy Study (MAAS) is an unselected, population-
based study which recruited 1186 children antenatally(33). Children were followed

31
prospectively, and attended review clinics at ages 1, 3, 5 and 8 years where skin
prick tests were performed to aero- and food allergens. Lung function was measured
using whole body plethsmography at age 3 (49%) and 5 (67%) years and showed
reduced lung function in children with a history of transient and persistent wheeze
similar to the TCRS and ALSPAC studies, and similar to the TCRS showed no
difference in lung function between children who never wheezed and late-onset
wheezers at age 5(34).
Table 1.2:Comparison of preschool wheeze phenotypes and associated lung
function in the Tucson Children’s Respiratory Study (TCRS), Avon
Longitudinal Study of Parents and Children (ALSPAC) and Manchester Asthma
and Allergy Study (MAAS)
TCRS ALSPAC MAAS
Birth Age 6 yrs Age 8-9 yrs Age 3 yrs Age 5 yrs
Never Wheezed
Transient wheeze
Prolonged early wheeze
Intermediate Onset wheeze
Late onset Wheeze
Persistent Wheeze
N
↓
-
-
N
N
N
↓
(some catch up )
-
-
N
↓↓
N
↓
↓↓
↓↓
↓
↓↓
N
↓*
-
-
N
↓↓
N
↓
-
-
N
↓↓
TCRS: Lung function was measured by Vmax FRC at infancy and age 6 years(1)
ALSPAC: Lung function was not assessed at birth and FEV1 was measured at 8-9 years. All wheeze phenotypes were associated with decrements of FEV1 when compared with the never wheezed group
(11). The greatest decrements were associated with prolonged early, intermediate onset and
persistent wheezing(11)
. MAAS: Lung function measured by specific airways resistance at 3 and 5 years. *Children with transient wheeze had reduced lung function at 3 years when compared to non-wheezers but it was not statistically significant
(34)
Similar to the German MAS the MAAS study also showed that early sensitisation to
allergens (house dust mite, cat, dog, grasses, milk, egg) was associated with a
decrement in lung function. Children who had never wheezed in the first 3 years of
life had significantly higher specific airways resistance if they were atopic, or were at
high risk of atopy (i.e., if both parents were atopic)(33). The MAAS also adopted a
machine based learning approach for latent classes of sensitisation analysis which
suggested that IgE antibody responses do not reflect a single phenotype of atopy,
but rather multiple different atopic vulnerabilities(35). In particular children with
multiple early atopic vulnerability were more likely to persistently wheeze(35). This
study may in part explain the global variations in asthma and atopy, as atopic

32
vulnerabilities may differ in each location consequent to differences in genetic
predisposition and environmental exposures(35). The importance of early
environmental influences is highlighted by a study of asthma in South East Asian
women living in Leicester(36). Asthma prevalence in South East Asia is much lower
than in the UK(37). Women were born in South East Asia and immigrated to the UK in
the first 4 years of life acquired the asthma risk of the UK, whereas women
immigrating to the UK older than 5 years retained the South East Asian asthma
prevalence(36).
1.3.6 Perth study
The Western Australian pregnancy cohort study is a prospective birth cohort initially
established (198992) which recruited 253 healthy full term infants(38). The rapid
thoracoabdominal compression technique was used to determine VmaxFRC and AHR
in infancy (n=253) at 1 month, 6 months and 12 months of age. At 11 years of age
study participants (n=176) attended an assessment that included measurement of
spirometry, AHR to histamine and skin prick reactivity(39). However, contrary to the
TCRS study, the Perth study suggested that persistent wheezers had abnormal lung
function (VmaxFRC) at birth which did not deteriorate with time suggesting that
impaired lung function preceded the development of persistent wheezy disorders
and may predispose children to asthma(40). The question of whether decreased lung
function is a cause or consequence of asthma remains unresolved. The Perth study
also reported that children who transiently wheeze have reduced VmaxFRC at 4
weeks (similar to TCRS group), and reduced forced expiratory volume in one second
(FEV1) at 6 years, but normal FEV1 by 11 years(41).
In contrast TCRS transient wheezers have some lung function catch up with time but
remain impaired when compared with non-wheezers, figure 1.1. However, given the
much larger numbers in the TCRS study its results are more likely to be correct.
Secondly, spirometry is a crude measure of lung function in asthma(42) and other
assessments of lung function may have detected some decrements. The Perth study
also showed that children with house dust mite specific IgE titres of greater than 0.20
kU/L by age 2 years have a 12.7% risk of persistent wheeze, increasing
progressively to an 87.2% risk with increasing numbers of severe lower respiratory

33
tract illnesses experienced(43). The role of AHR and the future development of
asthma will be discussed in section 1.4.
1.3.7 Environment and Childhood Asthma (ECA)
In 1992 3754 unselected infants (with a birth weight greater than 2kg) born in Oslo,
Norway were enrolled at birth into the Environment and Childhood Asthma (ECA)
study. Information on the child’s health and environmental exposures was collected
from parents by questionnaires at birth and when the child was age 0.5, 1, 1.5, 2, 4,
and 10 years(14;44). Lung function was assessed shortly after birth (aged 2-3 days) in
802 infants while awake using tidal breathing techniques(45). Similar to the Perth
findings, infants with abnormal tidal breathing patterns (the fraction of expiratory time
to peak tidal expiratory flow to total expiratory time [tPTEF/tE]) were more likely to
have asthma at 10 years of age (77% follow-up)(45). The 10-year follow-up of the
Oslo birth cohort also showed that doctor diagnosed asthma before the age of 10
years was positively associated with early life respiratory infections including croup,
the common cold and otitis media as reported by parents at the 6 month and 12
month questionnaires(46).
1.3.8 Copenhagen Study on Asthma in Childhood (COPSAC)
The Copenhagen Prospective Study on Asthma in Childhood (COPSAC) is a single-
center, birth cohort study of children (n=411) born to asthmatic mothers between
1998 and 2001. Infants had lung function measured using the raised volume
thoracoabdominal compression technique, assessment of AHR using metacholine
and FeNO measured at 1 month of age. Children were reviewed at 6 monthly
intervals and followed up with a long-term diary card based on wheezy symptoms for
the first 6 years of life (76% follow up)(47). FeNO levels (measured in 62% of the
cohort) were increased in 1-month-old symptom-free babies who developed transient
early wheeze but not persistent wheeze, but was unrelated to neonatal lung
function(47). This suggests an early disease process unrelated to airway calibre
contributing to the transient wheeze phenotype(47).
Perhaps a more interesting finding was that infants colonised in the hypopharyngeal
region with S. pneumoniae, H. influenzae, or M. catarrhalis, or with a combination of
these organisms, at 1 month of age were at two fold increased risk for recurrent

34
wheeze and asthma early in life(23). Blood eosinophil counts and total IgE at 4 years
of age were significantly increased in children who were colonised as neonates(23).
Children in this study continued to have hypopharyngeal aspirates and
nasopharyngeal aspirates taken every 6 months at routine follow up visits and also
for any wheezy episode that lasted for 3 days or more(48). Wheezy episodes were
significantly associated with H influenzae, M catarrhalis, and S pneumonia, similar to
but independent of the association with virus infections(48), figure 1.2. It is unknown
whether the bacterial colonisation acts an environmental trigger in genetically
predisposed children, or there is a subtle immunodeficiency in children who develop
asthma leading to mucosal bacterial colonisation.
However, it is worth noting in this context that recent work has highlighted the
importance of airway bacteria in normal and abnormal immunological
development(49). Once thought to be sterile, it is now clear that there is a rich
bacterial flora in the human lower airway(50), although not all groups have reproduced
this finding(51). From animal work, it is clear that absence of the normal lower airway
flora leads to more pronounced TH2 inflammation(52) and that the airway microbiome
may modulate the response to inflammation(53;54). Human data are more indirect. A
recent manuscript linked increased environmental bacterial and fungal diversity to a
reduced risk of asthma and atopic disease in children from farming and non-farming
environments(49). Furthermore, babies delivered by caesarean section are at
increased risk of atopic disease(55), and this has been linked to altered intestinal
flora(56). Infants of atopic parents who had a home but not hospital normal vaginal
delivery had reduced risk of asthma and eczema at the same age(57). The area of the
interactions between the microbiomes of the intestine and the airway, and the
development of disease, is rapidly evolving.

35
Figure 1.2: Risk of recurrent wheeze. COPSAC showed a strong association
between colonisation of the airways with common pathogenic bacteria and
development of recurrent wheeze and asthma(58).
1.3.9 Childhood Origins of Asthma birth cohort study (COAST)
The Childhood Origins of Asthma (COAST) birth cohort study followed 289 children
at high risk of asthma from birth, focusing on viral infections in the first year of life. At
least 1 parent was required to have one or more positive skin prick tests to
aeroallergens or a history of doctor diagnosed asthma. Nasopharyngeal specimens
were taken during wheezy exacerbations during the first 3 years of life. The COAST
study confirmed that 50% of children wheeze with respiratory syncytial virus (RSV)
and 25% of children will wheeze with rhinovirus(59). Rhinovirus wheezing in early life
(0-3 years) was a better independent indicator of asthma risk at 6 years than RSV
associated wheezing or aero-allergen sensitisation(22). Nearly 90% of children
wheezing with rhinovirus at age 3 subsequently developed asthma regardless of the
presence or absence of aeroallergen sensitisation(22;59). Interestingly, allergic
sensitisation during early life predisposes children to more severe viral respiratory
illnesses and wheezing, particularly with rhinovirus, but that wheezing respiratory
illnesses do not increase the risk for the subsequent development of allergic
sensitisation(60).

36
1.3.10. Clinical wheeze phenotypes:- European Respiratory Society
classification of preschool wheeze
A major limitation of epidemiological wheeze phenotypes is that they can only be
applied retrospectively. Secondly, there is considerable overlap between phenotypes
that have been described. Patterns of temporal wheeze in preschool children as
described by the European Respiratory Society (ERS) Taskforce are multiple-trigger
and episodic (viral) wheeze(61). This classification of wheeze phenotypes is clinical
and can be applied by the physician prospectively at preschool age.
Episodic (viral) wheezers are children who wheeze during discrete time
periods usually with a cold or other clinically diagnosed viral respiratory tract
infection but who do not wheeze between episodes.
Multiple-trigger wheezers are children who wheeze both during
exacerbations and between episodes. This group of children are often, but not
always, also atopic.
Multiple-trigger wheezers have been shown to have pulmonary function
abnormalities as measured by increased ventilation inhomogeneity, particularly of
the conducting airways independent of atopic and current wheeze status and
evidence of airway pathology changes similar to asthma when compared to episodic
(viral) wheezers(62;63). Pulmonary function in episodic viral wheezers did not differ
significantly from control subjects(62). Multiple trigger wheezers also had increased
exhaled nitric oxide levels when compared to viral or episodic wheezers(62).
However, these wheeze phenotypes are not fixed and children can move from one to
the other. For example, episodic viral wheeze may evolve into a multiple-trigger
pattern, and multiple trigger wheeze may become episodic over time or with
treatment with inhaled corticosteroids. Multiple trigger and episodic wheeze
phenotype stability was assessed every 3 months over a 1 year period and only
remained stable in 50% of preschool children in a West Australian intervention
study(64). However, frequent monitoring may have changed our view of natural
history of wheeze in these children. It is possible that increased inhomogeneity of the
conducting airways in the multiple-trigger preschool wheezers may reflect increased
disease severity in a subgroup of preschool children who in response to viruses and
environmental stimuli have more prolonged periods of persistent airflow obstruction
or alternatively that multiple-trigger wheeze represent a different disease phenotype.

37
1.4 Early airway hyperresponsiveness
It is not clear whether increased premorbid AHR predisposes children to develop
asthma or whether AHR develops as part of the pathophysiology of asthma. Three
cohorts from London, Perth and Copenhagen have reported studies of AHR in early
infancy, before the onset of symptoms and prior to the establishment of allergic
airway inflammation(39;65-67).
The London cohort measured AHR to histamine (expressed as the provocative
concentration (PC) of histamine that induced a 30% (PC30) decrease in VmaxFRC) in
healthy term infants (n=73) with at least 1 atopic parent by using the rapid
thoracoabdominal compression technique(65). AHR in female infants but not in male
infants predicted subsequent wheezing in the first year of life. Children were followed
up age 10 years with 89% follow up for wheezing history and 50% follow up with
spirometry and methacholine challenge. An association was reported between
neonatal AHR and transient early wheeze but not persistent wheeze at 10 years(66).
Neonatal AHR also significantly predicted subsequent FEV1 at 10 years but there
was no correlation with subsequent AHR (PC20 the concentration of methacholine
causing a 20% drop in FEV1)(66).
The Perth cohort measured AHR to histamine (concentration provoking a 40%
reduction in VmaxFRC (PC40)) on 3 occasions at 1 month, 6 months and 12 months in
202 unselected infants using the rapid thoracoabdominal technique(68). Children were
followed up with assessments of lung function, AHR and asthma at age 6 and 11
years(39). AHR in late infancy at 1 year but not at 1 or 6 months (when reduced
VmaxFRC was present) was associated with wheeze persistence at 11 years(39).
Unlike with the London cohort although AHR at 1 month was associated with asthma
at 6 years, it was not at 11 years(39). Conversely, reduced airway function (VmaxFRC)
present in early infancy is also associated with persistence of wheeze at 11 years of
age, independent of the effect of increased AHR and atopy in childhood(40). Neither
the Perth nor the London cohort showed association between AHR in infancy and at
school age(39;66). However, the absence of increased AHR in both infancy and
childhood was associated with a zero incidence of asthma and wheeze age 10-11
years in both studies.

38
The COPSAC birth cohort also studied AHR (PC20 FEV0.5) to methacholine in 402
neonates(67). The 17q21 gene variants (ORMDL3) were associated with increased
AHR in infancy and at 4 years of age but not at 6 years of age, suggesting a genetic
determinant of neonatal AHR(67). There was no associated risk of eczema, rhinitis, or
allergic sensitization with the 17q21 gene variant.
The London and Perth cohort studies suggest that different factors drive AHR in
infancy and later in life. Genetic factors such as β- adrenoceptor polymorphisms may
influence AHR in the neonatal period(66), but other factors including early viral and
bacterial infections or development of atopy may predominate after this. It should
also be noted that measurements of AHR are very challenging in infants and
increased AHR may not have been detected in some. On the other hand AHR may
be detected in adults without respiratory symptoms. There is also a close link
between upper and lower airways with 30% of adults with moderate-severe allergic
rhinitis (perceiving only nasal symptoms) demonstrating AHR on methacholine
challenge(69).
The 3 studies assessing AHR in infants used direct methods of assessing AHR with
pharmacological stimuli such as histamine or metacholine causing constriction of the
airway smooth muscle, leading to airway narrowing and airflow limitation. Indirect
stimuli (allergens, cold air, exercise) act through one or more intermediate pathways,
many (but not all) of which involve release of mediators from inflammatory cells.
Bronchoconstriction from both direct and indirect airway challenges is reported to
induce airway remodelling in patients with asthma(70).
1.5. Lung function and asthma : school age to adulthood
Both the TCRS and German MAS studies have shown deficits in lung function in
those with persistent wheeze are present by 6 years and track through to
adolescence(6;32). The longest running cohort studies, Melbourne(71) and Dunedin(72),
have tracked deficits in lung function from time of recruitment at school age to
adulthood in asthmatics.
The Melbourne asthma study was the first longitudinal asthma cohort study which
followed randomly selected 7 year old school children at 7 year intervals until age 50

39
years between 1964 and 2007(71;73). The term wheezy bronchitis was used in the
1960s to refer to wheezing in association with a respiratory tract infection (which
would now be termed ‘episodic viral wheeze’). This cohort study is particularly
interesting as children were recruited in 1967 before the routine use of inhaled
steroids, β-agonists or sodium cromoglycate and helps to clarify the natural evolution
of early childhood wheezing to adult asthma without modern interventions. At 42
years only 5% of the original wheezy bronchitis group had persistent asthma but
70% of the asthma group and 90% of the severe asthma group were still
symptomatic. Most of the children with severe asthma had either a barrel chest
deformity or reduction in FEV1 at recruitment, rarely seen now in clinical practice.
Furthermore, children with severe asthma had more than 30 times the risk of
developing adult chronic obstructive lung disease (COPD) as adults compared to
children without asthma(73).
Children from Dunedin (n=1139) were recruited shortly after the children from the
Melbourne cohort study. The Dunedin cohort were born between 1972-1973 and
followed from 9 years at 2 or 3 yearly intervals until age 26 years(72). Subject
retention was 59%. Persistence of wheeze was associated with smoking at 21 years
(odds ratio (OR)=1.71), AHR (OR=3), female sex (OR=1.71) and sensitisation to
house dust mite (OR=2.41) at 13 years. However, history of early childhood
wheezing was retrospectively recalled when the children were 9 years old, which
may have predisposed the study to maternal recall bias.
1.6.1 Asthma Prediction Indices
Many preschool children with wheeze do not have asthma characterised by
eosinophilic inflammation and are unlikely to respond to asthma treatment. At
present there is no treatment able to prevent the development of school age asthma
in preschool children with wheeze. Studies have shown that neither intermittent(74)
nor continuous(75;76) inhaled corticosteroids (ICS) prevent the development of asthma
in episodic wheezers. Intermittent ICS therapy in the first 3 years of life had no effect
on the progression from episodic to persistent wheezing and no short-term benefit
during episodes of wheezing(74). Children at high risk of future asthma were enrolled
in the Prevention of Early Asthma in Kids study (PEAK)(77) to assess if chronic early
therapy with ICS initiated in children aged 2 to 3 years of age at high risk of asthma

40
can prevent the development of persistent asthma at 4 to 6 years of age. This
hypothesis was subsequently disproven in this group of high risk children(76).
Similarly, a subsequent study confirmed the early use of ICS in wheezy preschool
children 1-2 years had no effect on the natural history of asthma, and nor did
treatment prevent lung function decline or reduce airway reactivity by age 5 years(75).
Other approaches to prevent the development of asthma have used anti-histamine
treatment in high risk children with atopic dermatitis. The Early Treatment of the
Atopic Child (ETAC) trial randomised infants aged 1-2 years to cetirizine or placebo
for 18 months(78). There was no difference in wheeze prevalence for the group as a
whole at the three-year follow-up (18 months after randomization was complete) but
asthma was delayed in a subgroup of infants with atopic dermatitis sensitized to
grass pollen and house dust mite(78). A second study, using L-cetirizine, was
completely negative (Warner JO, personal communication).
Since loss of lung function takes place before 6 years of age, the preschool years
represent a potential window for intervention to modify the natural history of asthma.
Despite the body of literature regarding asthma and risk factors for its development,
surprisingly few studies give ‘predictive indices’ for the development of asthma in
young children with wheeze. Improved ability to predict which preschool wheezers
are at high risk of persistent wheeze and school age asthma would be useful firstly to
study mechanisms of conversion of episodic viral wheeze to asthma; and secondly
as a tool to define high risk groups to allow the appropriate selection of children for
future prevention strategies.
Cohort studies have been used to try to develop prediction indexes of the likelihood
of later asthma in children with wheeze at preschool age. There are four main
asthma predictive indices to date. The ‘Castro-Rodriguez’(27),‘Isle of Wight’(12), and
PIAMA birth cohort(10) indices are based on cohort studies with greater than 1000
patients and use asthma risk factors identified in epidemiological studies including
parental history of asthma and atopy, and presence of other atopic conditions such
as allergic rhinitis and eczema to develop a predictive index. The Oslo case control
study(79) is smaller and used a simple score based on frequency, persistence and
severity of wheeze to predict later asthma.

41
1.6.2 ‘Castro-Rodriguez’ Asthma Predictive Index
As part of the Tucson longitudinal birth cohort study parents with children who
wheezed had reported their severity on a scale (1-5, from 1= ‘very rarely’ to 5= ‘on
most days’) at the year 2 and 3 surveys. Children with a score of greater than 3 were
defined as frequent wheezers. To classify children at risk of asthma two indices, a
‘stringent index’ and a ‘loose index’ for the prediction of asthma were designed. For
the stringent index the child had to be an early frequent wheezer during the first 3
years of life and meet one major or 2 minor criteria. For the loose index the children
had to have wheeze at any time during the first 3 years and meet one major or 2
minor criteria, table 1.3. The ‘stringent index’ had good negative predictive value
(NPV) (86%) and very poor positive predictive value (PPV) (42%) for diagnosis of
asthma by 11 years. Conversely, a more 'loose index' which only required infrequent
wheezing episodes plus the same combination of other risk factors still had high
NPV (87%) but even lower PPV (27%). Sensitivity decreased with increasing age to
13 years, but specificity remained constant. The PEAK trial modified the published
‘Castro-Rodriguez’ asthma predictive index(27) to include children age 2 years and
markers of allergic sensitisation to improve future asthma prediction, table 1.3.
Table 1.3: Original and modified ‘Castro-Rodriguez’ asthma predictive index
Differences between the original and modified asthma predictive index are shown in
italics
The child must have a history of 4 or more wheezing episodes with at least 1 confirmed by a physician plus Major criteria Parental history of asthma Physician-diagnosed atopic dermatitis Allergic sensitisation to ≥ 1 aeroallergen Minor criteria Wheezing unrelated to colds Blood eosinophils ≤4% Doctor Diagnosed Allergic Rhinitis Allergic sensitisation to milk, egg or peanuts

42
1.6.3 ‘Isle of Wight’ Asthma Predictive Index
A randomly selected birth cohort was established on the Isle of Wight in 1989 to
prospectively study the natural history of childhood asthma(12). Enrolment was at
birth and information on family history of allergy (parental or siblings), household
pets, smoking habit, social class, birth weight was recorded and cord blood IgE
measured. Children were followed up at 1, 2, 4 and 10 years. Skin prick testing was
performed on most children seen at 4 years (n=981). Follow up was 71% (n=1034) in
children with information available from the 4 visits over the 10 year period. Risk
factors including family history of asthma, atopy as measured by skin prick tests at 4
years, recurrent chest infections and recurrent nasal symptoms (which were shown
to have a protective effect) were used to create a cumulative risk score (0-4) for
wheeze persistence. A maximum risk score of ‘4’ was associated with prevalence for
wheezing persistence of 83% at age 10 years while a ‘0’ score was associated with
prevalence for transient wheezing of 80%. A limitation of this index is that scores at
either extreme were only present in a few children. A score of 3 had a PPV of 68%
and a NPV of 74%. The likelihood ratio, which refers to sensitivity/(1-specificity) and
provides a direct estimate of how much the asthma predictive index will change the
odds of having a disease, was 3 for an asthma predictive score of 3.
1.6.4 ‘PIAMA’ Asthma Predictive index
The PIAMA birth cohort followed 3,963 children for 8 years in the Netherlands.
Between 0 and 4 years of age, 2,171 (55%) children reported ‘‘wheezing,’’ ‘‘coughing
at night without a cold,’’ or both(10). In these children possible predictors for later
asthma were assessed at the age respiratory symptoms were first reported. Eight
clinical parameters independently predicted asthma at 7 to 8 years of age: male sex,
post-term delivery, parental education less than third level, any parental inhaled
asthma medication use, wheezing frequency, wheeze / dyspnoea apart from colds,
respiratory infections, and eczema. A clinical risk score was developed (range, 0-55
points) based on these 8 clinical parameters at the time preschool children first
reported asthma. Eleven percent of children with symptoms at 0-4 years of age had
asthma at 7-8 years of age. The area under the receiver operating characteristic
curve (AUC) for this score is 0.74. The predictive power of this rule is not easily
comparable with that of other studies because of differences in study design. As with
all such studies, there was no second validation cohort. Symptomatic children with a

43
score of less than 10 points had a 3% risk of asthma, whereas children with a score
of 30 points or greater had a 42% risk of asthma.
1.6.5 ‘Oslo’ Asthma Predictive Index
The ‘Oslo’ asthma predictive index was derived from a nested case control study
within the ECA study(14), comprising 233 2-year-old subjects with recurrent (>2
episodes) bronchial obstruction and 216 subjects without bronchial obstruction(79). A
severity score (0-12 points) at 2 years was calculated by frequency and persistence
of bronchial obstruction and hospital admissions because of recurrent wheeze.
Wheeze sufficiently severe to require hospitalisation had been shown to be a risk
factor for the development of asthma(79). A severity score of greater than 5 is
predictive of asthma, PPV (44-51%) and NPV (78-87%). This score had a linear
increase with an increase in OR of 1.35 for each point increase in the severity score.
The OR for persistent wheeze increased from 3.7 to 9.8 as the severity score
increased from 1-12. However, there were very wide confidence intervals at both
extremes of the scale.
1.6.6 General Practice based Asthma Predictive Indices
Two general practice based studies also developed very simple asthma predictive
indices using postal questionnaires to diagnose asthma at school age(80;81). In a
British study of children aged 0-4 years, only wheeze after exercise and history of
eczema or hay fever at preschool age were predictive of wheezing 6 years after
follow up(80). Absence of these two factors reduced the likelihood of asthma at age 6
years by a factor of 5(80). Limitations of this study include the small numbers with
recurrent preschool wheeze (<150), poor subject retention and the lack of any
objective confirmation of wheeze. The general practices were situated on a housing
estate in Manchester with evidence of socioeconomic deprivation, which may limit
generalisability.
Eyesink et al(81), measured IgE in 654 children aged 1-4 years with persistent
coughing for greater than 5 days who presented to primary care in the Netherlands.
All children with a raised IgE (27%, n=96) but only a random sample of children
(n=96) with a negative IgE were followed up until age 6. In contrast to the German
MAS study(32), addition of specific IgE (for house dust mite, cat and dog dander) to a

44
prediction model based on age, wheeze and family history of pollen allergy had little
effect on the asthma predictive values. This study had several limitations including
loss of 25% of the atopic children to follow up, history of wheezing which was
retrospectively obtained from patient notes, and inclusion of children with isolated
recurrent cough, a very non-specific symptom of asthma.
Summary
Current asthma predictive indices have better negative predictive values than
positive predictive values. This suggests that the API models are better at excluding
asthma rather than identifying the children who will develop asthma at school age.
The PPVs for asthma predictive indices range from (27-68)% which is little better
than flipping a coin in predicting which preschool wheezers will persistently wheeze
and have asthma at school age. The four most clinically significant asthma predictive
indexes are summarised in table 1.4.

45
Table 1.4: Asthma Predictive indexes for children with recurrent wheeze at preschool age have good negative but poor positive predictive values
DD=doctor diagnosed; PPV=positive predictive value; NPV= negative predictive value
Study
Number of children
Asthma Predictive Index
Predictive value for asthma at age 10
Castro Rodriguez JA, 2000
(27)
(* asthma measured at age 11 years)
1,246
Major Criteria Parental DD asthma DD eczema Minor Criteria DD allergic rhinitis Wheezing apart from colds Peripheral blood eosinophilia Stringent Index Frequent wheeze plus One major or two minor criteria Loose index Any wheeze plus One major or two minor criteria
‘stringent index’ PPV (42%), NPV (86%) Specificity (97%) Sensitivity (16%) OR= 4.3-9.8 ‘loose index’ PPV (27%) NPV (87%) Sensitivity (40%) Specificity (80%) OR 2.6-5.5 Sensitivity decreased with increasing age, but specificity remained constant. The negative predictive values were high for all ages. If a ‘loose index’ is used a high proportion of children will not go on to have asthma.
Kurululaaratchy RJ, 2003
(12)
1,456
Score 0-4 Recurrent chest infections at 2 years Family history of asthma Atopic skin prick tests at 4 years Absence of nasal symptoms at 1 year
Score of ≥ 3 increases likelihood of asthma by 3 PPV (68%), NPV (74%) Sensitivity (52%) Specificity (84%) Likelihood ratio=3.4 Very few children with scores of either 0 or 4
Devulappalli CS, 2008(79)
449 Score 0-12 Frequency persistence of wheeze Persistence of wheeze Number of hospital admissions
Scores >5 are indicative of asthma PPV (43.9-51%), NPV (78-87%) Sensitivity (2-51%) Specificity (88-99%) 2 point score rise increased the OR by 1.82 (CI 1.57-2.11)
Caudri D, 2009(10)
3963
Score 0-55 Wheezing frequency Serious infections DD eczema Use of inhaled medications
Score ≥ 30 PPV 42%, NPV 91% Sensitivity 19% Specificity 97%

46
1.7 Airway pathology and asthma
Epidemiological studies have failed to provide us with a predictive index for
preschool wheeze which has a good positive predictive value for asthma at school
age. The pathology of asthma is characteristic and very different from the normal
airway; hence pathological indices may be better positive predictors of asthma
progression. The next section reviews what is known about the pathology of
paediatric preschool wheeze and asthma.
1.7.1 Safety of endobronchial biopsies for assessing airway pathology
Early evidence for airway changes associated with asthma came from post mortem
studies, often in adults who had died from fatal asthma exacerbations(82;83). More
recently routine use of bronchoscopy and endobronchial biopsy (EB) for purely
research purposes in adults has advanced our understanding of the pathology of
asthma, allowing the comparison of endobronchial tissue between asthmatic adults
with normal healthy individuals(84). There are guidelines on the most appropriate
research methods to perform, process and analyse endobronchial biopsies, with
specific guidelines for paediatric EB incorporated(85). The safety of EB has now been
reported for school aged and preschool children(86-90). In children, bronchoscopy can
only be performed if there is a clinical indication. However, it adds just 5 minutes to
the bronchoscopy procedure to obtain three endobronchial biopsies in children(91).
The taking of additional samples for research at the time of such a procedure can be
justified if the ethics committee approves, the carers consent, and the child gives age
appropriate assent.
1.7.2 Airway pathology features typical of asthma
Typical pathological abnormalities seen in EB from asthmatic adults and older
children include; airway inflammation (particularly eosinophils and T lymphocytes)
and airway remodelling (defined as structural changes in the airway wall including
increased reticular basement membrane (RBM) thickness, increased airway smooth
muscle (ASM), epithelial shedding, angiogenesis and goblet cell hyperplasia, figure
1.3 & 1.4(92-95). However, the role of airway remodelling and inflammation in disease
persistence and progression is not clear. Furthermore, the onset and course of
airway inflammatory changes and remodelling in children with asthma are not yet
fully characterised. One aim of this thesis is to further characterise airway pathology

47
in severe recurrent preschool wheezers and its relationship to future school age
asthma.
1.7.3 Airway inflammation in asthma
Airway inflammation in asthma involves multiple cells, particularly CD4+ T
lymphocyte cells, eosinophils and mast cells. Stimulation of these cells leads to
release of proinflammatory mediators and cytokines, which in turn cause vascular
leakage, smooth muscle contraction, inflammatory cell infiltration, mucus
hypersecretion and airway hyperresponsiveness.
T lymphocytes
T lymphocytes are particularly important in driving inflammation. When CD4+ T-
helper cells are activated, they differentiate depending on the local cytokine milieu
into distinct lineages of effector cells, called T helper (TH) cell types including TH1,
TH2, TH9, TH17 and TH22, or regulatory T cells (Tregs). TH1 cells contribute to
protection against viruses and bacteria, and TH2 cells protect against parasites and
helminths. Children and adults with asthma typically show a predominant TH2
immune inflammatory profile which develops after exposure to an inhaled
aeroallergen, characterised by cytokines such as interleukin (IL)-4, IL-5 and Il-13(96).
However, asthma has several subphenotypes and this is perhaps an oversimplified
approach. TH17 cells are reported to be mainly involved in neutrophilic asthma
phenotypes(97). At birth, there is a presumed fetal TH2 predominance, thought to be
necessary to prevent immune rejection of the fetus by the mother, but as exposure to
bacteria and viruses in infancy and early childhood drives a switch to a TH1
phenotype, characterized by the release of cytokines such as interferon-γ(96;98). The
TH1/TH2 balance may not be fully developed in infant and preschool wheezers.
Delayed maturation of TH1 responses in the neonate may contribute to the
development of atopy(99). Treg cells constitute 5–10% of the total CD4+ T cells and
control TH1 and TH2 immune responses. It is likely that primary functions of Treg cells
in the airways is to limit the inflammatory consequences of infection and to maintain
tolerance to harmless, inhaled aeroallergens(96). Steroid naive wheezy children aged
8-20 months at a high risk of developing asthma (using the Castro-Rodriguez
predictive index) had a significantly lower absolute number of Treg cells and lower

48
expression of IFN-γ following in vitro stimulation with house dust mite compared with
those at a low risk of future asthma(100).
Eosinophilic inflammation
Eosinophils are the prominent cell type in many asthmatics(101) and increased
eosinophils have been found in blood(102), sputum(103), bronchoalveolar lavage
(BAL)(104) and endobronchial biopsy tissue(105). Although not all children with asthma
show eosinophilic inflammation, adults and children with asthma who have tissue
eosinophilia have worse airway remodelling and more acute exacerbations(93;106;107).
1.7.4 Airway remodelling in asthma
Airway remodelling is a key pathological feature of asthma and is defined as the
presence of persistent changes to the normal airway wall structure involving changes
in the composition, organisation and function of structural cells including enhanced
turnover of extracellular matrix components(108). Remodelling can occur both during
normal lung growth and development and in response to injury and inflammation(109).
In asthma, it is uncertain whether airway remodelling occurs as a result of tissue
injury and repair or whether it is driven by (as yet undetermined) specific factor(s).
Features of airway remodelling, such as increased RBM thickness and increased
ASM mass in adult asthmatics are associated with persistent airflow limitation,
reduced lung function and AHR(110;111). However, it is unclear which individual
components of remodelling contribute to the clinical manifestations of asthma and in
fact whether all remodelling is detrimental in asthma or whether some aspects may
be protective. This thesis will focus primarily on the two most well-described aspects
of remodelling which have been consistently associated with lung function
abnormalities, increased RBM thickness(112) and increased ASM(110).

49
Figure 1.3: A paediatric endobronchial biopsy showing epithelium, reticular
basement membrane (RBM), submucosa and airway smooth muscle
Reticular basement membrane
The RBM is visible as an acellular layer directly beneath the epithelium, figure 1.3.
The RBM is not present in healthy airways of all species and its function and the
reason for its presence in healthy humans remain unclear. Recently the natural
history of RBM development has been described in humans(113). The RBM in
children is visible 30 weeks post conceptional age and increases in thickness with
age until birth, and subsequently increases rapidly until about 6 years of age(113).
RBM thickness continues to increase after age 6 years, but at a slower rate, until
about 17 years(113). However, there is considerable variability in RBM thickness
measurements in healthy school age children and adults(113).
Increased RBM thickness is the hallmark of established asthma in adults(114), and is
seen by school-age (6-16 years) in severe(115;116) and mild-moderate(93;117)
asthmatics. The abnormal thickening of the RBM begins early in childhood(9;116), and
is already maximally thickened in children aged 6–16 years with severe
asthma(116;118;119).
RBM Smooth muscle
Submucosa
Epithelium

50
Airway smooth muscle
Increased ASM mass is thought to account for most of the functional contribution of
airway remodelling to the pathophysiology of AHR(109;120). Increased smooth muscle
mass in the airway wall of asthmatic children and adults is due to both hypertrophy
and hyperplasia of smooth muscle cells(110;121;122) and has been linked to both
disease severity and duration(110;123). In particular, alterations in ASM are most
consistently associated with abnormalities in lung function. ASM hypertrophy and
hyperplasia in school aged children and adults with asthma have been significantly
related to bronchodilator responsiveness(110;121). Furthermore, the proportion of ASM
increases as airflow limitation worsens(124;125).
Epithelium and Epithelial Mesenchymal Trophic Unit
The bronchial epithelium acts as a barrier separating the external environment and
the lung parenchyma. The epithelium is emerging as an area of interest as new
research shows interactions between the epithelium and the immune system are
crucial in driving asthma(126). Genetic studies also suggest that the epithelium plays a
significant role in the allergic response. The protocadherin-1 gene on chromosome
5q31-q33, which is significantly associated with AHR, encodes an adhesion
molecule expressed in airway epithelium, which at least suggests that a structural
defect affecting the integrity of the airway epithelium contributes to the development
of AHR(127). Epithelial cells from children with mild asthma are intrinsically different
both biochemically and functionally compared with epithelial cells from children
without asthma(128). Asthmatic epithelial cells from children with asthma also
spontaneously produced significantly greater amounts of IL-6, prostaglandin E2, and
epidermal growth factor, and equivalent amounts of IL-1β and soluble intracellular
adhesion molecule-1, but significantly lower amounts of transforming growth factor
(TGF) β1(128).
Early adult asthmatic endobronchial biopsy studies showed epithelial
desquamation(129), but the implication of this is controversial as some evidence
suggests that epithelial damage may be due to tissue processing(130). The presence
of epithelial shedding in children is unclear. Children with mild-moderate asthma
(aged 2-15 years) had evidence of epithelial shedding on EB(94). However, no
differences in epithelial shedding was seen between atopic and non-atopic children

51
with mild-moderate asthma(107). In contrast, school age children (aged 5-16 years)
had similar epithelial shedding on EB when compared to nonasthmatic controls(119),
but atopic children with severe asthma had more epithelial shedding than non-atopic
children with severe asthma(119). It is possible that there is an increased influence of
atopy on epithelial shedding as asthma severity increases.
The bronchial epithelium and underlying RBM have a close spatial and functional
inter-relationship and are considered an epithelial-mesenchymal trophic unit (EMTU).
Many types of challenges to the epithelium, including pathogens, allergens,
environmental pollutants, cigarette smoke, and even mechanical forces, can elicit
production of mediators by the epithelium, which can be translated into remodelling
responses by the mesenchyme(131). Damage to epithelial cells is thought to stimulate
fibroblasts which lie directly underneath the epithelium to differentiate into
myofibroblasts that secrete extracellular matrix (ECM) proteins as well as
proinflammatory mediators(131). In asthma, it has been suggested that abnormal
mechanical susceptibility to injury and aberrant repair responses result in persistent
activation of the EMTU leading to tissue remodelling and altered airway function(131)
Angiogenesis
Angiogenesis, the formation of new blood vessels from pre-existing ones, is
recognised in both mild and severe asthma(132). Morphological analysis of the
vascular bed in biopsies from adults with asthma report an increase in both total
number of vessels and vascular area(132). Children with mild-moderate asthma and
atopic children without asthma had an increase in lamina propria vessels when
compared to normal non-atopic control children(94).
Goblet cell hyperplasia
Goblet cell hyperplasia has been established as a pathologic characteristic of mild,
moderate(133), and severe asthma in adults(134). Hypersecretion of mucus into the
airway lumen in asthmatic patients appears to be caused by both submucosal gland
hypertrophy and goblet cell hyperplasia(133;134). Abnormalities in goblet cell number
are accompanied by changes in stored and secreted mucin(133). Mild adult
asthmatics have increased stored mucin in the airway epithelium, whereas adults
with moderate asthma have both increased stored and secreted mucin(133). An

52
important factor causing the increased mucus production may be persistent allergen
inhalation. Neonatal mouse pups had evidence of goblet cell hyperplasia after 3
weeks of inhaled allergen challenge, however evidence of goblet cell hyperplasia
was no longer present 4 weeks after stopping allergen challenge(135). Goblet cell
hyperplasia, epithelial shedding or angiogenesis in EB from preschool children are
not discussed further in this thesis. In particular the epithelium was not intact in EB
from both preschool wheezers and controls, the subjects of this thesis, and thought
to be related to biopsy processing(130).
Figure 1.4: Interactions between the environment, airway remodelling and
inflammation are involved in the pathogenesis of asthma (Reproduced with
permission Llyod et al, Nature Medicine 2010)(126)
1.7.5 Pathogenesis of asthma
Several models of the onset of asthma pathophysiology have been proposed(136).
The initial assumption was that persistent chronic inflammation or recurrent episodes
of acute inflammation result in the development of chronic airway remodelling over
many years, and in a minority of patients resulting in irreversible airway obstruction.
This suggests that airway inflammation is an early event and remodelling late in the
pathogenesis of asthma. Recent findings challenge the hypothesis that inflammation
is the primary driver of pathological change in asthmatic airways.
Bronchoconstriction itself in adult asthmatics without additional inflammation has

53
been shown to induce airway remodelling(70). A more likely hypothesis is that airway
inflammation and airway remodelling occur in parallel driven by some ‘asthma
factor’(136). This is confirmed by animal data; neonatal mice exposed to inhaled
house dust mite developed eosinophilic inflammation, airway remodelling, and AHR
in parallel between 2-3 weeks of age(135).
It has also been suggested that in asthma a structurally and functionally defective
lower airways epithelium underlies abnormal responses to the inhaled environment
leading to enhanced signalling between the EMTU and immune cells(137). This in turn
promotes a microenvironment that facilitates allergic sensitisation, supports different
types of inflammation and predisposes the airways to exacerbations leading to
persistence of asthma during childhood(137).
1.8 What is known about airway remodelling and inflammation in preschool
children?
The natural history of the airway pathology associated with preschool wheeze is not
completely understood. School age children with mild asthma aged 4-12 years
already had evidence of both airway eosinophilia and increased RBM thickness,
suggesting that airway remodelling and inflammation began before age 4 years(93).
Infants aged 1 year recruited from Helsinki, Finland despite having severe wheeze
and reversible airflow obstruction, did not have features of either increased
subepithelial inflammation or increased RBM thickening in EB(138). However,
preschool children recruited from the Royal Brompton Hospital (RBH) London aged
2-3 years with confirmed severe, recurrent wheezing did have evidence of increased
subepithelial eosinophilic inflammation and RBM thickening in EB when compared to
age matched non-wheezing controls(9). Allowing for the limitations (these were two
separate cross sectional studies with different definitions of preschool wheeze),
these two studies suggest that there may be a window between the onset of
symptoms, and two years of age, during which features of airway remodelling and
inflammation consistent with asthma develops. This suggests that pathological
abnormalities characteristic of asthma become evident around 2 years of age, very
similar to the timing of onset of abnormal lung function in the TCRS persistent
wheezers and likely future asthmatics(6).

54
Importantly, non-atopic children (median age 5 years, range 2-15 years) with
multiple-trigger wheezing and bronchodilator reversibility had evidence of increased
RBM thickness, suggesting non-atopic wheezing in children is also associated with
this characteristic pathological features of asthma(107). In support of this, children who
had EB at RBH (median age 2 years) were compared by multiple-trigger and
episodic wheeze phenotypes at 4 years. Multiple-trigger wheezers had increased
RBM thickness and eosinophils when compared with episodic wheezers(63).
However, RBM thickness is not as great in the severe preschool school wheezers
when compared school age children with difficult-to-treat asthma, suggesting that
disease process may not be fully established at age 2-3 years, figure 1.5.
Figure 1.5: Reticular basement membrane (RBM) thickness in preschool
confirmed wheezers (CW) is increased when compared to non wheezing
control subjects (Ctrl), but is significantly less than school-aged children with
difficult asthma(9)
There are few data available on the school age respiratory outcomes for children
who had EB for wheezing at preschool age. Follow up of the wheezy 1 year old
infants from Helsinki at 3 years of age showed that individual values of RBM
thickness at 1 year of age correlated with higher respiratory morbidity and more
frequent purchase of ICS at 3 years, but follow up data at school age has not been
reported(139). EB were performed in Czech children (n=27) aged 1-12 years without a
diagnosis of asthma for recurrent or chronic respiratory symptoms and were followed
up at variable time periods after EB (22–80 months) to determine whether or not they

55
had subsequently developed asthma(140). Although, this study has several limitations
children who developed asthma following EB had increased eosinophilia and RBM
thickness suggesting pathological changes preceded the diagnosis of asthma(140).
Follow up of the severe, recurrent wheezers recruited from the RBH aged 4-5 years
showed that RBM thickness and subepithelial eosinophils correlated with FeNO but
not lung function(63). However, neither at this time (aged 4-5 years) nor at the time
the time of the original study, was it known which of the severe, recurrent preschool
wheezers recruited from the RBH would have developed asthma by school age.
Exploring the pathophysiology of severe recurrent wheeze in preschool children
further may help establish at what age different components of airway remodelling
appear and their relationship to future asthma. This is the first step in identifying the
remodelling components that could be potential targets for any future interventional
studies and at what point in the natural history treatment should be initiated to
achieve the best results. It is likely that early diagnosis and prevention of airway
remodelling has the potential to decrease disease severity and prevent disease
expression. Some aspects of airway remodelling are beneficial, for example tissue
repair following injury, so any future therapies will need to differentiate harmful and
beneficial remodelling. This thesis will explore airway pathology associated with
preschool wheeze further, and relate airway remodelling and inflammation at
preschool age to the presence or absence of asthma at school age.
1.9 Airway pathology not previously explored in severe recurrent preschool
wheezers
Airway pathology in children with severe recurrent wheeze is incompletely
understood. Nothing is known about the role of ASM, mast cells or tenascin-C a
component of the RBM in severe recurrent wheezers or their relationship to future
asthma at school age.
Tenascin -C
RBM thickness detects a group rather than individual difference between wheezers
and controls suggesting RBM thickness alone may not be a good marker of future
asthma in the individual child(9), figure 1.5. Tenascin-C (TN-C) is an extracellular
matrix glycoprotein component of the RBM and is almost absent in normal adult

56
tissues, but expression is increased during organogenesis and fibrotic, neoplastic
and inflammatory conditions. TN-C is expressed in both acute and chronic
inflammatory conditions(141) including increased expression in the RBM in asthma(142-
144). However, this has not previously been explored in the RBM of severe recurrent
preschool wheezers and may be more specific in detecting individual children who
will wheeze persistently and develop asthma. This will be discussed in detail in
chapter 4.
Airway Smooth Muscle
It has previously been shown that moderate to severe asthmatic children as young
as 8 years have increased ASM when compared to age matched controls(121).
Reversibility of bronchial obstruction in school age children with asthma has also
been associated with increased smooth muscle mass(121). However, although there
is increased RBM thickness in 2-3 year old severe recurrent wheezers nothing is
known concerning airway smooth muscle at pre-school age. Chapter 5 will discuss
ASM in preschool wheezers.
Mast cells
Mast cells are one of the cell types critical in mediating the acute response in
asthma. Amongst other mediators, mast cells secrete histamine, prostaglandin D2,
and leukotriene C4, which are capable of inducing bronchoconstriction, mucus
secretion, and mucosal oedema, all features of asthma(145). Increased mast cells
have been found in the epithelium(146), submucosa(147), and ASM(148-150) in EB from
adult asthmatics. In particular, mast cell infiltration of ASM distinguishes asthma from
eosinophilic bronchitis in adults and correlates with airway hyperresponsiveness(148-
150). Mast cells are found adjacent to the blood vessels in the lamina propria in
normal human airways but migrate to the ASM in adult asthmatics(148). Smooth
muscle mast cells have been associated with increased IL-4 and IL-13 positive cells
within smooth muscle(151). Activation of mast cell β-tryptase in the ASM bundle
promotes airway smooth muscle cell differentiation into a more contractile phenotype
possibly by the autocrine release of TGF-β(152).
Studies which reviewed the role of mast cells in children are limited. Children
(median age 12 years) with severe therapy resistant asthma had no associated mast

57
cell myositis(119). Furthermore, children (aged 4-12 years) with mild-moderate asthma
had no difference in submucosal mast cells when compared with atopic children
without asthma and children with no atopy or asthma(93). Infants with reversible
airflow obstruction (median age 1 year) from Helsinki had no increase in submucosal
mast cells(138). The role of mast cells (both submucosal and smooth muscle) in
children with severe recurrent preschool wheeze is unknown. Chapter 6 will discuss
submucosal airway inflammation including both submucosal and airway smooth
muscle mast cells.
1.10 Hypotheses, Aims & Objectives
In summary, a limitation of the previous study investigating the pathology of
preschool wheeze(9) is that at the time of biopsy it was not known which wheezers
would go on to develop asthma by school-age. The purpose of this thesis is to study
these children who are now at school age (6-11) years, establish current asthma
status and relate this to early pathological findings. Other features of airway
remodelling (increased ASM and RBM TN-C) and inflammation (mast cells) that
have not previously been explored in children with preschool wheeze will also be
investigated. In particular increased airway smooth muscle is a feature of established
asthma in adults and children as young as 7 years, but nothing is known about ASM
in preschool wheezers.
Hypotheses
1. School-aged children with asthma have evidence of airway remodelling
(increased reticular basement membrane thickness and ASM) and
eosinophilic airway inflammation in endobronchial biopsies taken while
symptomatic at preschool age, when compared to school-aged children
without asthma.
2. A combination of clinical and airway pathological characteristics at
preschool age may be used to predict asthma at school age, better than
clinical features alone.

58
Aims
1. To establish whether the preschool children (both wheezers and non-
wheezing controls) who had a bronchoscopy and endobronchial biopsy
between October 2002 and February 2005 (study number 02-061), and
are currently aged 6-11 years have asthma.
2. To extend the previously made observations on airway wall changes in
pre-school wheeze by quantifying tenascin-C, ASM and mast cells in
endobronchial biopsies
3. To determine whether any or all of pulmonary function, exhaled nitric
oxide, and airway hyperresponsiveness at school age relates to the airway
pathology in the preschool years.
4. To determine the relationships between combinations of clinical
characteristics and pathological markers on endobronchial biopsy at
preschool age and a diagnosis of asthma at school age.
Specific Objectives
1. To collect information from the children now aged 6-11 years who had an
endobronchial biopsy between 2002 and 2005 (study number 02-061) on
current symptoms (history and examination), atopic status (skin prick
tests), airway inflammation (exhaled nitric oxide, induced sputum
cytology), lung function (spirometry, multiple breath washout, and
hypertonic saline challenge).
2. To establish the most discriminative and repeatable method of measuring
tenascin-C expression within the reticular basement membrane
(comparing stereology and use of computer aided image analysis) in
endobronchial biopsies archived in paraffin.
3. To quantify both RBM thickness and RBM tenascin-C in preschool
endobronchial biopsies and relate the findings to any subsequent asthma
diagnosis

59
4. To quantify the proportion of ASM in the preschool endobronchial biopsies
and relate this to the presence or absence of asthma at school age
5. To measure submucosal eosinophil volume density by stereology, and
mast cell infiltration within the submucosa and ASM by total cell counts in
pre-school bronchial mucosal biopsies, and relate the findings to any
subsequent asthma diagnosis
6. To generate an asthma predictive index for school age asthma, based on
a combination of clinical and pathological features in the pre-school years

60
Chapter 2
Clinical Research visit
Subjects, Methods and Results
2.1 Summary of study design
This was a second cross-sectional study of children who are now at school age who
were originally prospectively recruited from the RBH between 2002 and 2005(9). The
group comprises preschool controls (children without lower respiratory symptoms)
and children who had severe, recurrent wheeze aged 3 months to 5 years and had
undergone bronchoscopy, EB and assessment of atopy at preschool age as part of
their clinical investigation. These children were followed up at age 6-11 years to
establish whether they had developed asthma. The children who agreed to return for
a research visit at school age underwent assessment of lung function, airway
inflammation and atopy (study number 6243). The investigator (RO’R) was blind to
the biopsy pathology results during the clinical visits and to all clinical data during the
airway pathology measurements.
2.2 Study details at preschool age
2.2.1 Patient characteristics of the preschool ‘wheezers’ group
These data have been reported before(9). In brief, all of the children (n=47) included
in the original study as wheezers had at least 3 severe episodes of wheeze (each
episode with symptoms for more than 3 days) in the previous 6 months(9). They had
all been referred to the RBH for specialist advice regarding management of their
respiratory symptoms. The majority of the children had at least 1 admission to
hospital. Almost all of the children had also undergone a trial of inhaled
corticosteroids (ICS) and had persistent symptoms despite use of prescribed
medications including inhaled β-agonists.
Children were characterised into wheeze phenotypes, namely episodic (symptoms
with viral colds, otherwise asymptomatic) and multi-trigger (acute exacerbations with
viral colds and interval symptoms between colds). The following exclusion criteria
had been applied at preschool age by Dr Sejal Saglani (SS) to ensure that those

61
included were not more likely to have a diagnosis other than asthma as an
explanation for their wheeze;
i) children with isolated cough without associated noisy breathing
ii) children whose main problem was recurrent lower respiratory tract infection
iii) children who were on long term oxygen therapy
iv) children with chronic lung disease of prematurity.
2.2.2 Patient characteristics of the preschool ‘Controls’ group
Controls (n=21) for the original study were obtained in one of two ways(9). The
majority were recruited from patients referred for further assessment of troublesome
stridor or to assess airway compression from a vascular ring. The remainder were
recruited from patients undergoing a clinically indicated right sided diagnostic cardiac
catheterisation and whose carers consented to a research bronchoscopy and EB
before the cardiac angiogram. None of the controls had a history of wheezing. The
ideal controls would have been truly normal children, but this would obviously not
have been ethical.
2.2.3 Use of video questionnaire to identify wheeze in the preschool group
Parent and physician perception of wheeze may be different making it difficult to
assess prevalence of asthma accurately(16-19;153;154). It has been shown that there
may be as little as 50% agreement between parents and clinicians’ findings of
wheeze(18). Therefore, all parents were shown a validated video questionnaire
containing 4 clips each lasting 1 minute of pre-school children making different
respiratory noises(18;153). The first showed an example of wheeze (male, 6 years), the
second stridor (male aged 6 months) and the other two clips showed different upper
respiratory noises (both female aged 10 and 24 months). The first upper respiratory
noise sounded like a child snoring, although she was awake and the second sound
resembled that of loud mouth breathing. Parents were asked “Which if any of the
noises in this video does your child make?” They were free to choose none, one or
more video clips.
Children were then classified as
Confirmed Wheeze (CW) (n=27)
- Children whose parents reported wheeze as their child’s main symptom and
also identified wheeze from the video questionnaire

62
Reported Wheeze (RW) (n=20)
- Children whose parents reported wheeze as their child’s main symptom but did
not recognise it on video questionnaire.
Controls (n=21)
-Children whose parents reported stridor or no symptoms from video
questionnaire.
2.2.4 Preschool atopic status
All children had atopic status assessed by measuring total IgE and
radioallergosorbent tests (RAST) to three food (milk, egg, peanut) and five aero-
allergens (grass and tree pollen, house dust mite, cat and dog). The sample of blood
was taken while the children were anesthetised for bronchoscopy. Eczema was
defined as a positive parental report of doctor diagnosed eczema at preschool age.
Atopic status was defined at preschool age as the presence of either or both of
eczema and at least one positive RAST to food or aero-allergens.
2.2.5 Fibreoptic bronchoscopy and endobronchial biopsy
Fibreoptic bronchoscopy and EB was performed under general anaesthetic at
preschool age by one of four respiratory paediatric consultants. A size 2.8mm
bronchoscope was used for children aged 3 months to 2 years, and a 3.6mm
bronchoscope was used for older children. After evaluation of the airway up to 4
endobronchial biopsies were taken from the sub-carinae of the 3rd and 4th generation
bronchi of the right lower lobe using rat tooth forceps (1mm, Olympus, Keymed, UK
serial number FB-56D-1) from all children.

63
Table 2.1: Demographic details of all subjects and controls recruited at
preschool age. (The children with confirmed wheeze were significantly older and
heavier than the other groups.)
Confirmed wheeze
n=27
Reported Wheeze
n=20
Controls
n=21
p
Male / Female 17 / 10 12 / 8 16 / 5 Age (months) Range (months)
29
(6-57)
15.5
(6-58)
15
(3-42)
0.005ⱡ
Weight (median kg) Range (kg)
14 (7.04-26.4)
9.37 (6.16-19.6)
11.2 (5.45-18.7)
0.009ⱡ ⱡ
Atopic* Eczema
16 (60%)
13
11 (55%)
6
7 (33%)
5
IgE (IU/ml) Range (IU/ml) Birth weight (median kg) Range
39.5
(1-2605)
3.43 (1.87-4.45)
14
(1-195)
3.5 (1.6-4.6)
13.5
(1-292)
3.26 (1.95-2.99)
0.22
0.66
Gestation (median weeks) Range (weeks)
39
(30-42)
40
(32-42)
39
(28-41)
0.58
Main reported symptom Wheeze Wheeze and cough (equal) Cough more than wheeze Barking cough Stridor Shortness of breath None
16 7 7 0 0 0 0
11 7 1 0 0 1 0
0 0 0 2
14 1
4**
Family history of asthma Maternal history of asthma Paternal history of asthma
3 6
4 2
5 1
Day care (< 1year) Pets (Cat/ Dog) Smoking Maternal smoking Paternal smoking Maternal smoking during pregnancy Treated with ICS Dose of ICS (mcg beclomethasone)*** Range (mcg)
5 4 7
12 11
14
800 (200-2000)
1 6 6 3 5
10
400 (100-1000)
2 5 3 5 1 3
500 (200-500)
*eczema and / or one or more positive RASTs to aero or food allergens **n=2 had cardiac angiogram, n=2 had bronchoscopy to assess severity of vascular ring ***Or beclomethasone equivalent Significant difference between ⱡCW and controls, ⱡⱡCW and controls & CW and RW

64
2.3 Aims of current study
The aims and objectives of this part of the study were to
1. To establish whether the preschool children (both wheezers (confirmed and
reported, n=48) and non-wheezing controls (n=21)) who had bronchoscopy and
EB between October 2002 and February 2005 and at the time of re-recruitment
were aged 6-11 years had a diagnosis of asthma.
2. To characterise the preschool cohort at school age in terms of lung function,
airway inflammation and atopy by collecting information on
- current symptoms (history and examination)
- atopic status (skin prick tests)
- lung function (spirometry, multiple breath washout (SF6), hypertonic saline
challenge)
- airway inflammation (exhaled nitric oxide, induced sputum cytology).
2.4 Difficulties in diagnosing asthma
One of the most difficult aspects of this thesis and a challenge in all asthma research
is the absence of a gold standard diagnostic test for the disease. Reported asthma
prevalence varies both with time and area partly due to the different criteria used to
define asthma, table 2.2(10;12;27;79;155). Criteria most often used to define asthma
include one or more of the following, wheeze, doctor’s diagnosis of asthma, asthma
medication use and positive bronchial challenge. Asthma prevalence rates vary
widely depending on the definition used for diagnosis. Prevalence rates of asthma
within a cohort of children can vary from 15% using a diagnosis of doctor diagnosed
asthma ever and wheeze in the last 12 months, to 50% using a definition of AHR and
symptoms and/or use of medication in the last 12 months(156).
The term asthma, as used today, is likely more inclusive compared with previous
physicians’ diagnoses, including many more children with milder symptoms who
might not have been diagnosed with asthma in the past. Increased awareness of
asthma as a disease both among parents and physicians is also likely to have
increased reporting. Doctor diagnosed asthma is often used in epidemiological
studies to qualify the diagnosis, but often there is little consensus on asthma
diagnosis between physicians. Studies have shown that up to 30% of adults with a
history of doctor diagnosed asthma did not have asthma after objective assessment

65
of lung function and AHR(157). In many, but not all, countries there is avoidance of the
term asthma until school age. Even the definition of the start of school age is
variable, being defined as anything between 4 and 8 years.
It is widely accepted that parental and physician perception of wheeze is often
different and in many cases parents may label other upper respiratory noises as
wheeze (section 1.2). Furthermore, lower prevalence rates have been found based
on written medical reports rather than the diagnosis of asthma based on parental
report of wheeze in the last 12 months on the International Study of Asthma and
Allergy in children (ISAAC) questionnaire(156;158). This may have been for several
reasons including incompleteness of records, errors in parental recall or often
physicians using asthma as an all embracing diagnosis for recurrent cough or
general respiratory symptoms without confirming the diagnosis.
Definition of current asthma in this study
There is no consensus as to what definition of asthma at school age should be used.
In the present study a diagnosis of asthma based on symptoms alone was made at
school age. Current ‘asthma’ at school age was defined for the purpose of this
research as a parental report of wheeze in the last 12 months and a parental report
of doctor diagnosed asthma ever. This information was available for all children
recruited at school age. Measures of lung function and lung inflammation were only
available in the subgroup who attended for a research visit. All references to school
age asthma in this thesis have used this definition.
The use of asthma medication was not part of the diagnostic criteria in this study.
ICS and inhaled salbutamol are often prescribed to children for the treatment of
general respiratory symptoms. Cough is a common complaint in childhood with 10%
of preschool and early school aged children having chronic cough without wheeze at
some time(159). Although persistent cough in children without wheeze is much less
likely to be asthma(160), children may often be prescribed ICS. Indeed, three of the
original group of controls were treated with ICS at preschool age for stridor and / or a
barking cough, although there is no evidence for efficacy in this group. Children with
chronic wet cough may have bronchiectasis or persistent bacterial bronchitis but may
also be prescribed inhaled corticosteroids(161).

66
Table 2.2: Different criteria used for diagnosing asthma
Study
Age (years)
Criteria for diagnosing asthma
Castro-Rodriguez Index AJRCCM 2000
(27)
6-13
asthma diagnosed by a physician with plus ≥ 1 episode of asthma during the previous year or
had >3 episodes of wheezing during the previous year regardless of asthma diagnosis
lsle of Wight Eur J Resp 2003
(12)
10
"Current wheeze" was recorded as having occurred in the prior 12 months.
Eysink et al BPGP 2005
(81)
6
combination of both symptoms and/or use of asthma medication and impaired lung function.
Symptoms were defined as current complaints or complaints during the previous 12 months of wheezing and/or shortness of breath and/or recurrent coughing.
Use of asthma medication was defined as use of ß2 agonists or inhaled corticosteroids currently or during the previous 12 months.
Impaired lung function was defined as a positive histamine test, (PC20 <8mg/ml).
Children with no wheeze in the last 12 months were not considered to have asthma.
Oslo severity score Thorax 2007
(79)
10
Two of the following three criteria (1) Dyspnoea, chest tightness and/or wheezing from 0 to 3 years and/or from 4 to 10 years of age (2) Doctor diagnosed asthma (3) Used asthma medication (inhaled corticosteroids, β2 agonists, sodium cromoglycate, leucotriene antagonists and/or aminophylline) at 0–3 years and/or 4–10 years
Current asthma was defined as asthma (see above) plus at least one of the following criteria positive:
(1) Dyspnoea, chest tightness and/or wheezing during the past 12 months (2) Use of asthma medication during the past 12 months (3) Positive exercise test
Frank et al BMJ 2008
(162)
8
wheeze reported in the ISAAC survey(158)
at age 8
Caudri et al JACI 2009
(10)
8
Positive asthma diagnosis if children had ≥1 positive items at 7 years and ≥1 positive items at 8 years.
(1) at least 1 episode of wheezing (2) inhaled steroids prescribed by a medical doctor (3) a doctor’s diagnosis of asthma (a parental report of a doctor’s diagnosis of asthma at any time and a parental report of asthma during the past 12 months).

67
2.5 Rationale for choosing assessment methods
Non-invasive, age appropriate methods were used to assess atopy (skin prick tests)
airway inflammation (FeNO and sputum eosinophilis), exposure to tobacco smoke,
lung function (spirometry and multiple breath washout (MBW)), and AHR. The
reasons for selecting these techniques are as follows:
Skin prick tests are an easy and acceptable method of establishing the atopic
status of a preschool child(163). Ideally atopy would have been measured using
both RAST and skin prick tests at school age as concordance for individual
allergens is poor(164). However, it was deemed not ethically appropriate to do a
further blood test at school age for research purposes alone. Furthermore,
inclusion of a blood test in the research protocol would certainly have
decreased the number of children recruited to the study.
FeNO is increasingly used as a biomarker of eosinophilic airway inflammation
in children and adults with asthma. FeNO is derived from endogenous nitric
oxide (NO) production by inducible NO synthase in airway epithelium and
inflammatory cells. FeNO can reliably be measured at 50ml/s in preschool and
school age children (section 2.8.7). In children with asthma, FeNO shows
some correlation with eosinophils in induced sputum(165) and with increased
submucosal eosinophils in EB tissue(63;166) particularly in steroid-naïve
children. However, raised FeNO is also associated with atopy in children
irrespective of whether they have asthma(167). Secondly, attempts to treat
asthma using FeNO levels to guide anti-inflammatory treatment have had
limited success(168). The use of FeNO as an inflammatory marker does not
reflect other inflammatory phenotypes in asthma such as neutrophilic airway
inflammation which is why sputum induction was attempted.
Exposure to passive smoking was assessed objectively as this is known to be
associated with increased symptoms and decreased lung function in school
children(169). This was done by measuring salivary cotinine the principal
metabolite of nicotine(170).
Lung function was measured using both spirometry and MBW. Spirometry
although routinely performed to monitor children with asthma, is unlikely to
detect subtle decrements in lung function(42). MBW has been shown to be a
more sensitive test in detecting ventilation heterogeneity in children with

68
asthma than spirometry(171;172). MBW has the advantage that unlike spirometry
measurements normal values outside the first year of life are for practical
purposes independent of age, gender and height(173;174). This will be
discussed in more detail in section 2.8.3.
Hypertonic saline was chosen to perform an indirect airway
hyperresponsiveness challenge as it is acceptable to parents and in principal
a combined sputum induction could be performed at the same time(175). The
advantage in using an indirect challenge, over a direct challenge (e.g.
histamine, metacholine) is that it is more physiological as most asthma stimuli
in real life are indirect (exercise, allergen, cold air). A significant positive
response suggests that inflammatory cells and their mediators are present in
the airways in sufficient numbers and concentration to suggest that asthma is
active at the time of testing(176). The corollary to this is that there can be a
negative test in children with known asthma suggesting good control or mild
disease(176). Induced sputum can be used to assess the inflammatory profile
of the airways in children with asthma. In particular sputum cytology is used
as a marker of airway inflammation in asthmatics(177).
2.6 Ethical approval for the present study (the work of this thesis)
Ethical approval was obtained from the Brompton, Harefield and NHLI NHS
Research Ethics Committee (08/H0708/93). The original ethics submission was
prepared by SS (the principal investigator). Ethical approval was given on
23/10/2008. The protocol was changed to include multiple breath washout as part of
the assessment of lung function which was approved as a substantial amendment on
23/01/09 prior to beginning recruitment.
2.7 Recruitment for the present study
Between 2009 and 2010 children who had participated in the original study were
identified and recruited for follow up. A study invitation letter and parent and child
information leaflets were mailed to each family, appendix 1-3. The letters were
followed after 10-14 days by a telephone call. The study was discussed at length on
the telephone and parents were given the opportunity to ask questions. If parents
had any concerns, no appointment was made and a second telephone call was
made 2-3 months later. Those interested in participation were then given an

69
appointment for a clinical research visit. Written confirmation of the appointment time
and advice to withhold ICS and long acting ß-agonists for 24 hours and short acting
ß-agonists for 12 hours prior to the appointment was sent. Children with severe
asthma on regular oral corticosteroids or immunomodulating steroid sparing agents
(such as cyclosporin, azathioprine or methotrexate) were advised not to withhold
treatment. Parents were advised not to withhold medication if their child was unwell.
The family was telephoned 1-2 days prior to the research visit to remind them of the
appointment time and that they needed to withhold ICS and ß-agonists as above. If
parents felt the child was unwell at time of telephone consultation the test was
deferred for at least 2 weeks. For those families that could not be traced from
hospital records, the general practitioner was approached for up to date contact
details. If this failed, the local referring paediatrician was also contacted for further
information. In all families contacted who did not wish to attend for a research visit a
telephone questionnaire was administered where possible.
2.8 Research visit
The research visit lasted 2.5-3 hours. The procedures were done in the order listed
below, and are discussed in more detail in subsequent sections.
I. Study consent
II. Height and weight
III. Lung clearance index
IV. Video questionnaire
V. Study questionnaire
VI. Salivary cotinine
VII. Exhaled nitric oxide (single expiratory flow rate 50ml/sec)
VIII. Spirometry
IX. Skin prick testing for common aero and food allergens
(cat, dog, grass, tree, house dust mite, aspergillus, egg, milk, peanut)
X. Combined AHR and sputum induction using nebulised hypertonic saline
(4.5%)(175).
2.8.1 (I). Study consent
All test procedures were explained and parents were asked to read and sign a
consent form, appendix 4. The child’s general practitioner was also informed of the

70
child’s participation in the study, appendix 5. Informed consent was given to use the
photographs in this chapter for illustration purposes.
2.8.2 (II). Height and weight
The child’s height without shoes was measured in centimetres to one decimal place
by a calibrated wall-mounted Harpenden stadiometer. Weight was measured in
kilograms to one decimal place with calibrated electronic scales, with the child
wearing minimal clothing.
2.8.3 (III). Multiple breath washout (MBW)
Multiple breath washout (MBW) is a test of distal airway gas mixing efficiency which
requires only passive co-operation, making it very attractive as a test in young
children. It requires the subject to breathe tidally an inert tracer gas such as nitrogen
(N2), helium (He), sulphur hexafluoride (SF6) or argon in a low concentration until
equilibrium is reached. The child is disconnected from the tracer gas during
expiration, and the tracer gas is then ‘washed out’ by continued tidal breathing of
room air(174;178;179). The longer the wash-out time, the more inefficient is distal airway
gas mixing. The use of this technique in children was first described in cystic fibrosis
in 1985(180). Prospective longitudinal studies in children with cystic fibrosis have
established that it is more sensitive to early lung disease than spirometry(181;182).
MBW has also been shown to be a sensitive indicator of pulmonary function
abnormalities in preschool wheezers and school age asthmatics(62;171).
MBW was measured in this study using the modified Innocor flow meter and side
stream gas analyser (Innovision, Denmark) and pneumotachograph (Hans Rudolph,
USA). This has been previously validated for use in adults and children as young as
five years(173). The gas analysis unit is calibrated once per year by an Innovision
engineer in line with manufacturer instructions. A calibration of the flowmeter and the
flow-gas delay was performed once a day. Further calibrations were also performed
if the gas sample line or the flowmeter screen was replaced. The flowmeter was
calibrated before each study visit using a 3 litre syringe at low, medium and fast flow
rates. The flow-gas delay was measured by assessing the carbon dioxide rise time
by initially making slow expirations followed by very fast inspirations until the Innocor
confirms measurement of the flow-gas delay. The inspirations have to be fast in

71
order to get a precise determination of the flow-gas delay. If one or two breaths failed
the software automatically filtered these results. The flow-gas delay did not vary
more than 20-40 ms from day to day in line with manufacturer instructions.
Children were seated with a nose clip and breathed 0.2% SF6 in medical air,
supplied from a compressed gas cylinder (BOC, Hertford, UK) via a mouthpiece and
flow past (bias flow) system until an alveolar plateau had been reached, figure 2.1.
The gas supply was then detached in expiration and patients breathed room air until
the measured end-tidal SF6 concentration was 1/40th of the starting concentration
(0.005%), figure 2.2. Tidal breathing was used throughout the test, each taking 5–10
min to complete. Washouts were repeated three times at each stage to obtain mean
values(183). Washouts were excluded if the measured functional residual capacity
(FRC) differed by more than 10% from both other repeat washouts(183).
Figure 2.1: Wash-in phase of multiple breath washout (Child seated with a nose
clip breathing 0.2% sulphur hexafluoride (SF6) in medical air).
Bias flow
SF6
Innocor
pneumotachograph

72
0 2000 4000 6000 8000 10000 12000
Samples
-5.0-4.5-4.0-3.5-3.0-2.5-2.0-1.5-1.0-0.50.00.51.01.52.02.53.03.54.04.55.0
Flo
w [
L/s
]
0.000
0.025
0.050
0.075
0.100
0.125
0.150
0.175
0.200
0.225
0.250
Co
ncen
tration
[%]
Figure 2.2: Multiple breath washout (SF6) The black trace represents flow and the
green trace SF6 concentration)
A - Gas wash-in until lung equilibrium reached (SF6 concentration 0.2%) B - Gas supply disconnected in expiration C - SF6 concentration falls with each expired breath Gas wash-out is complete when the concentration of expired inert gas falls to 1/40 the original value, i.e. 0.005%
Many indices have been used to describe the wash-out curve, of which the most
commonly reported is lung clearance index, for which functional residual capacity
also needs to be determined(184). However, wash-out curves do not provide
information on the sites of ventilation inhomogeneity, but this can be calculated from
the MBW if the phase III slope (SIII) is calculated for each breath(185;186). The slope of
phase 3 for each breath can then be used to calculate ventilation inhomogeneity
measured by convection in the conducting airways (Scond) and by diffusion-
convection in the acinar airways (Sacin).
The following measures from MBW are reported in this study:
• Lung Clearance Index (LCI)
• Functional Residual Capacity (FRC)
• Acinar Airways Inhomogeneity (Sacin)
• Conducting Airways Inhomogeneity (Scond)
Lung Clearance Index (LCI)
LCI is defined as the total cumulative expired volume (CEV) required to washout the
tracer gas to 1/40th of the starting value, divided by the measured FRC (CEV/FRC).
A B
C

73
Functional Residual capacity (FRC)
Functional residual capacity (FRC) was calculated from the total volume of expired
tracer gas (SF6) divided by the end-tidal SF6 concentration at completion of
washout(187). Washouts were excluded if there was a greater than 10% difference in
FRC from the other 2 washouts. LCI, FRC, Scond and Sacin are all calculated as the
mean of at least two reproducible measurements out of three washouts(171).
Calculation of phase III slope
The calculation of the SnIII compares the concentration differences between lung
units to the mean lung unit value. As the washout progresses this difference between
lung units initially increases, but then remains constant as the concentration gradient
between inspired gas and the resident gas in the two units falls. The progression of
SnIII through the washout allows the observed ventilation inhomogeneity to be
attributed to two separate mechanisms, convection dependent inhomogeneity and
diffusion-convection dependant inhomogeneity, figure 2.3. Scond represents
convection dependent inhomogeneity in the conducting airways and is predicted to
increase linearly throughout the MBW test(186). Sacin represents diffusion–convection
related ventilation inhomogeneity generated in the acinar airways and only increases
for the first 5 breaths or 1.5 lung turnovers(186). After the first 1.5 lung turnovers the
increase in SnIII is diffusion independent and represents convection dependent
inhomogeneity.
In this study each breath of the SF6 concentration was plotted as a function of
expired volume. A least-square fit of the slope of the alveolar phase (phase III slope,
SnIII) was done. The margins of the regressed portion were manually adjusted to
avoid phase II or phase IV elements, the influence of cardiogenic oscillations or
signal noise obviously distorting the slopes. The SIII was then normalised by the
mean tracer gas concentration over the phase III interval of interest, to account for
dilution, giving the normalised phase III slope (SnIII) for SF6(173).

74
Figure 2.3: The contribution of convection dependant inhomogeneity cdi
(Scond) and diffusion-convection dependant inhomogeneity dcdi (Sacin) to
overall ventilation inhomogeneity(174)(Adapted by Dr Sonnappa)
Conduction dependant inhomogeneity (CDI) has a linear relationship with expired volume when expressed as lung turnover (TO) Diffusion convection dependant inhomogeneity (DCDI) rises for the first 5 breaths, or 1.5 turnovers, and then is unchanged. The Scond index is calculated as the slope of the SnIII versus turnover CDI relationship. Sacin is the DCDI component of the first breath SnIII, calculated by subtracting the CDI component (see inset equation).
Calculation of Scond and Sacin
Sacin and Scond were calculated by the method described by Verbanck et al(185;188).
The SnIII for each breath was plotted as a function of lung turnover. Scond and Sacin
are derived from the normalised slope curves. Scond is the normalised difference per
unit lung turnover which is derived from lung turnovers 1.5-6 where only conductive
airways are known to contribute to the rate of rise of normalised slope, figure 2.4.
Sacin is derived from the normalised slope of the first breath which is predominantly
generated by the diffusion convection dependant ventilation inhomogeneity within
peripheral acinar lung units, figure 2.4. Sacin is determined by subtracting the slope of
the first breath against lung turnover.

75
Figure 2.4: Normalised alveolar slopes (SnIII) generated from a child with a
normal multiple breath washout test represented as a function of lung turnover
(TO) (Sacin is derived from the first breath and Scond from lung turnovers 1.5-6)
Sacin Scond
SnIII was not reported from any breaths that were not clearly visible, either because
of inadequate breath volume or signal noise. If the first breath from a run could not
be reported, or if more than one third of breaths over the Scond regression interval
could not be reported, then that MBW was excluded from analysis. Scond and Sacin
are only reported if results from two or more MBW runs were available. Tidal volume
was not restricted in the patients. Normalised phase III slope values were corrected
by multiplying by the breath volume before calculating Scond and Sacin to allow
comparison of the data with published work in adults who were limited to breaths of 1
litre(174;183). In using this protocol, negative Scond values may be seen in both healthy
volunteers and those with very mild disease. Although biologically this is impossible,
negative values are seen in practice owing to variation in tidal volume throughout the
washout and lack of progression of the normalised phase III slope(171;174).
2.8.4 (IV). Video Questionnaire
Parents were shown a modified video questionnaire with 4 clips; 1) wheeze (male 6
years), 2) nasal upper respiratory noises (female aged 10 months); 3) wet cough
(male 7 years); 4) stridor (male age 4 years). Video clips 1&2 were shown at
preschool and school age. The third and fourth video clips were changed from those
used at preschool age which showed children age 6 and 10 months to a more age
appropriate examples of stridor and wet cough. All video clips had been previously
TO

76
validated(18). Parents were again asked ‘Which if any of these noises does your child
make?‘. They were also asked ‘Has your child made any of these noises in the
past?’. They were free to choose one or more video clips.
2.8.5 (V). Study Questionnaire
The study questionnaire used was a modified ISAAC core questionnaire for asthma
age 6-7 years, and the ISAAC core questionnaires for eczema and allergic rhinitis
age 6-7 years(158). A second questionnaire recorded medication history including oral
and inhaled corticosteroid use, total number of hospital admissions with wheeze,
household pets, length of time spent in nursery and parental smoking. Parents were
also asked if their child’s symptoms were mainly associated with colds or with allergy
or if they were triggered by multiple stimuli. Although information such as family
history of asthma, birth details and parental smoking during pregnancy had
previously been recorded the answers were re-checked. Both questionnaires were
interviewer directed and the answers were recorded by the interviewer. The same
questionnaire was used for both the controls and wheezers, appendix 6.
2.8.6 (VI). Salivary Cotinine
Exposure to exhaled tobacco smoke is measured using the biomarker cotinine.
Cotinine is a metabolite of nicotine that can be measured in urine, serum, saliva, and
hair. Saliva was chosen as a non-invasive measurement of exposure to cigarette
smoking and collected using plain (non citric acid) cotton salivettes. The child was
asked to chew or suck the cotton salivette until it was saturated. Salivary cotinine
analysis was performed using a salivary cotinine quantitative enzyme immunoassay
analysis kit (Salimetrics®, USA). A salivary cotinine greater than 1.2ng/ml was
defined as evidence of passive cigarette smoke exposure(170).
2.8.7 (VII). Exhaled Nitric Oxide (FeNO) (single expiratory flow rate 50ml/s)
NO is formed in both the upper and lower respiratory tracts and diffuses into the
lumen by gaseous diffusion down a concentration gradient(189). Exhaled NO
concentrations from the lower respiratory tract are significantly flow dependent, with
a marked increase in exhaled FeNO concentration at low flows. This flow
dependence is characteristic of a diffusion based process for NO transfer from
airway wall to lumen and is explained by faster flows minimising the transit time of

77
alveolar gas in the airway, thereby reducing the amount of airway NO transferred(190).
The use of a constant expiratory flow of 50ml/s (FeNO50) is recommended to obtain
reproducible FeNO results which are comparable between groups(189). Multiple
exhalation flow FeNO has been previously used to calculate bronchial and alveolar
nitric oxide production in older school age children with a median age of 14 (8-18)
years(190). FeNO measurements at multiple exhalation flow rates was not done as
most of the children (median age 7 years) were unable to perform the manoeuvres at
higher flow values(190).
FeNO was measured using NiOX (Aerocrine AB, Solna Sweden). A constant
temperature of 22°C was maintained in the room in which the analyser was stored to
ensure optimal operating conditions. The ambient NO was recorded prior to each
reading and was always <300ppb in accordance with the manufacturer’s
recommendations. Calibration of the analyser was performed every 14 days
according to the manufacturer’s instructions. External gases required for calibration
were NO-free air and a calibration gas mixture of 1-200 ppb NO in N2 connected to
the instrument rear panel. Calibration was automatically carried out by pressing a
button on the keypad (one-button-calibration). In order to assure reliability of its
results the analyser has an integrated calibration module for zero level and the NO
reference gas. The flow head was calibrated daily prior to measurements using a
100ml calibration syringe. The equipment has an on-line display of flow control that
allows the selection of good exhalations and the rejection of suboptimal exhalations.
FeNO was always measured before forced expiratory manoeuvres such as
spirometry because these may cause a decrease in FeNO levels(191).
The procedure was explained and demonstrated to the child before beginning the
test. All measurements were made with the child sitting holding the instrument held
in front of them. A nose clip was not used. Children had several practise runs to
optimise technique before proceeding to an actual measurement. An online method
was used to measure FeNO where the expirate is continuously sampled by the
analyzer, and the resultant NO profile versus time or exhaled volume, together with
other exhalation variables (e.g., airway flow rate), is captured and displayed in real
time(189). For the measurement, NO-free air (generated by the NiOX module
internally from ambient air) was inhaled to near total lung capacity over a period of 2

78
to 3 seconds through the mouth-piece of the instrument. Then the child was asked to
exhale slowly, being encouraged to maintain a constant flow by a visual display on a
screen (blowing a little girl in a balloon between 2 cliffs), figure 2.5. There was
automatic control of exhaled flow rate to a constant 50ml/s, making it easier for the
child to comply. The NiOX analyser only accepts measurements as valid if the
expiratory flow is between 37.5 and 62.5 ml/s at every instant. If the flow was not
steady or decreased below 50ml/s the test was repeated. The exhaled NO value is
the mean NO level during a 3 second NO plateau. Three acceptable readings
(defined as agreement to within 10%) were performed with at least 30 second
intervals between manoeuvres. FeNO50 was calculated as the mean of the plateaus
from three technically satisfactory exhalations.
Figure 2.5: Exhaled nitric oxide measurement with visual feedback incentive
.
2.8.8 (VIII). Spirometry performance and quality control
Spirometry was performed using the Vitalograph Compact (Vitalograph,
Buckingham, UK). The spirometer was calibrated on the day of the study visit with a
one litre syringe. As for many of the children it was the first attempt at spirometry a
period of training was necessary. The child was familiarised with the equipment and
a demonstration was given. The child was observed closely to ensure that there was
no leak and that the manoeuvre was performed optimally. Manoeuvres were rejected

79
if the subject was thought to use sub-optimal effort, if a full inspiratory breath was not
taken, if there was coughing during the first second, if a plateau was not reached on
the volume-time curve, or if the blow was terminated prior to full expiration. The
highest sum of forced vital capacity (FVC) and FEV1 of the 3 manoeuvres was
recorded as per American Thoracic Society (ATS) / ERS guidelines(192). If the child
had difficulty performing the manoeuvre then interactive computerised incentive
spirometry was used (Vitalograph Pneumotrac, Spirotrac® IV software). As this
machine was situated in another room and was often in use for busy outpatient
clinics it was not possible to use it routinely. All spirometry results were compared to
appropriate recent reference ranges(193).
2.8.9 (IX). Skin-prick testing for common aero and food allergens
SPT were performed for three common food allergens (egg, cow’s milk and peanut)
and six common aero-allergens (cat & dog dander, grass & tree pollens, Aspergillus
fumigatus and Dermatophagoides pteronyssinus) (Soluprick SQ, Alk Abello,
Denmark)(163). A small drop of allergen extract was placed on the volar surface of the
arm and the skin was pierced with a 1mm lancet (ALK, Denmark) in the centre of the
droplet, ensuring a small amount of allergen penetrated into the skin, figure 2.6. A
positive (histamine) and a negative control were always performed at the same time.
The outer contour of the wheal reaction was outlined using a fine felt-tip pen, and the
result expressed as the mean of the lengths of the longest diameter and the
perpendicular line through its centre. The results were read 15 minutes after
application. SPT was regarded as positive if the wheal size was at least 3mm greater
than the negative control. The test was considered void if there was no reaction to
the positive control. If a child was uncomfortable or had large wheals, after the test
was read topical mepyramine maleate (Anthisan) was applied.

80
Figure 2.6: Skin prick tests (A droplet from allergen and from positive and negative
controls were placed on the skin)
2.8.10 (X). Combined bronchial hyper-responsiveness and sputum induction
A combined airway hyperresponsiveness and sputum induction test was
performed(175). Children were asked to rinse their mouth and blow their nose to
reduce squamous cell contamination before sputum induction was started. The
children were instructed how to cough and clear the throat in order to obtain the best
sample. The baseline FEV1 was recorded as the highest of the 3 manoeuvres from
satisfactory spirometric curves (above). Children were seated comfortably and asked
to inhale hypertonic (4.5%) saline for periods of increasing duration (0.5, 1, 2, 3 x 4
minute) using an ultrasonic nebuliser (De Vilbliss 2000, Somerset) as per the ISAAC
protocol(163). FEV1 was measured after each inhalation period and the higher of 2
readings were selected.
The initial 3 nebulisation periods of 30 seconds, 1 minute and 2 minutes were
performed without encouraging sputum production, figure 2.7. After each of the three
4 minute nebulisation periods children were encouraged to cough and expectorate
sputum into the falcon tube. If the FEV1 remained within 15% of the baseline value,
nebulisation was repeated. If, after two repetitions, the FEV1 was less than 15%

81
below the baseline value, the duration of the inhalation period was doubled again
according to the protocol. Clinical symptoms such as cough or wheeze were
recorded at each stage.
The bronchial challenge was stopped if either the FEV1 had fallen by 15% from
baseline or the total inhalation period of 15.5 min had been reached. The saline
canister was weighed on an electronic balance (Ohaus Scout pro, Switzerland)
before the first and after the last inhalation period in order to measure the aerosol
dose delivered. Children whose FEV1 had decreased by more than 15% were given
salbutamol (1000µg) through a large volume spacer and spirometry was repeated 10
minutes later to ensure return to baseline values before discharge. In children with a
baseline FEV1 of 75% of the predicted value, no bronchial challenge was performed.
Figure 2.7: Child inhaling 4.5% saline nebulised using an ultrasonic nebuliser
(De Vilbliss 2000)
Different statistical approaches have been proposed for the analysis of stepwise
provocation data such as a hypertonic saline challenge. AHR can be measured in
terms of provocation time causing a decrease in FEV1 (PT15). Insufficient numbers of
children in this study had a positive bronchial challenge and a PT15 slope could not
be calculated. In this study BHR was defined as a dichotomous variable (yes/no)
4.5% Saline
Ultrasonic
nebuliser

82
where a fall in FEV1 ≥ 15% was considered positive and < 15% fall in FEV1 was
considered negative.
Sputum processing
Sputum samples were stored on ice until ready for processing. All samples were
processed within 2 hours. The sample was poured into a petri dish, mucoid plugs
selected and removed with a forceps. A selected rather than whole sample
processing method was used to reduce salivary contamination(194) because this
improves intra-observer repeatability of differential cell counts. The selected sputum
was returned to a clean preweighed tube and weighed using a microbalance. One
percent stock Dithiothreitol (DTT) (0.1%) was then added to the sputum in the ratio
of 4 ml DTT to 1g sputum. The mixture was gently aspirated with a 3 ml disposable
wide bore plastic pipette and then gently agitated on a rolling mixer (Denley Spiramix
5, Denley Instruments, Colchester, UK) for 15 minutes. The sample was filtered
using a 48m pore nylon mesh filter. Phosphate buffered saline (PBS) (in the ratio of
4 ml PBS to 1g original sputum weight) was used to wash out the tube and added to
the filtrate (through the filter). The filtrate was centrifuged (Sorvall RT6000D, Thermo
Fisher Scientific Inc, Massachusetts, USA) at 4C for 10 minutes at 400g (1500rpm).
The remaining pellet was resuspended in 1ml PBS and mixed by gentle vortexing
(Vortex mixer, Vorsicht, Germany). 20µl of sputum cell suspension was added to
20µl trypan blue (1 in 2 dilution factor). 10µl of the mixture was placed under the light
microscope (Leitz, Wetzlar, Germany) using a haemocytometer (improved
Neubauer, BDH, Leicestershire, UK). All leukocytes (viable stained yellow and dead
stained blue) and squamous cells were counted in the bottom left middle and top
right quadrants of the haemocytometer grid. The total leukocyte count per ml was
calculated using the following formula:
Total leukocyte count =
mean number of viable and dead leukocytes X trypan blue dilution factor X104
After calculation of the total leukocyte count the sputum cell suspension was
adjusted to 200,000 cells/ml by diluting with PBS. Using 100 l of cell suspension per
slide, the mixture was centrifuged (Shandon Cytospin Preparation System, Thermo

83
Shandon, Cheshire, UK) at 450rpm for 3 min. If the total leukocyte count was less
than 2 x 10⁵ /ml aliquots of 200µl or 400µl of sputum cell suspension were loaded.
The 4 slides were left to air dry for 30 minutes and then fixed with methanol. The
slides were then stained with a modified Wright Giemsa stain Reastain® Quick-Diff
staining kit (Reagena Ltd. Toivala, Finland).
2.9 Completion of research visit
The children and parents were thanked for their time and participation. Study results
were detailed and subsequently mailed to all participants in the clinical research visit.
Travel expenses incurred in attending the RBH were reimbursed to the families.
2.10 School age atopy
Atopy was defined as either a parental report of eczema or allergic rhinitis in the
ISAAC core questionnaires(158) or the presence of 1 or more positive skin prick tests
at school age. This definition has been used throughout this thesis. Current eczema
was defined as yes to both of the questions ‘Has your child ever had an itchy rash
which was coming and going for at least 6 months?’ and ‘Has your child had this
itchy rash at any time in the last 12 months?’ Current allergic rhinitis was defined as
a positive response to ‘In the past 12 months, has your child had a problem with
sneezing, or a runny, or a blocked nose when he/she did not have a cold or the flu?’
2.11 Statistical analysis
The Mann Whitney U test was used to detect differences between 2 groups. Where
more than 2 groups were present Kruskal-Wallis test was used, followed by Dunn’s
post test to detect differences between groups. Categorical data was analysed using
Chi-squared or Fisher’s exact test as appropriate. Spearman rank correlation was
used to assess the relationship between numerical variables. Cohen's kappa
coefficient was used to measure the reliability or inter-rater agreement for qualitative
items. Coefficient of variation (CoV) was used to measure repeatability between
repeats of the same test on different occasions. Bland-Altman plots were used to
assess agreement between two investigators. Sample size was opportunistic,
determined by recruitment to the previous study and success of follow up at school
age; in any case, there are no data to inform a power calculation. Analyses were

84
performed using MedCalc v12.1.0, GraphPad Prism version 5.02(OR) and
SPSSv17.
2.12 Current Study:- Recruitment
2.12.1 Children followed up at school age
Thirty nine children attended for a research visit, figure 2.8. Twelve families were
either unable or did not wish to attend for a research visit but all subsequently
agreed to answer a telephone questionnaire (see appendix). Total recruitment for
either a full research visit or a telephone questionnaire was 51/68 (75%). Preschool
and school age clinical characteristics for children followed up at school age are
shown in table 2.3.
2.12.2 Co-morbid pathology at school age
Of the preschool CW group (n=21), two children had bronchiectasis at school age.
One of the children with bronchiectasis attended for a research visit and the family of
the second child answered a telephone questionnaire only, but the child’s clinical
notes were obtained from the local hospital with permission from her parents. One
child who completed the telephone interview had been removed from the care of his
mother age 4 because of fabricated and induced illness. His father who had been his
primary carer since then stated during telephone interview that he had never
wheezed in his care. Two children were being treated for severe asthma in the Royal
Brompton Hospital and were enrolled in a difficult asthma assessment during the
study recruitment period(195) and a third child had been treated with cyclosporin for
severe refractory asthma for several years in another hospital prior to assessment.
In the RW group (n=16) one girl was noted to have digital clubbing at the research
visit, was referred for follow up and subsequently diagnosed with bronchiectasis. A
boy from the RW group had a low FEV1 at the research visit and was subsequently
found to have evidence of air trapping and atelectasis in both lower lobes on high
resolution computerised tomography (CT) of the chest. One girl had motor and
learning difficulties and one boy had Carpenter’s syndrome and autistic spectrum
disorder at school age making it difficult for them to participate in many of the lung
function tests. Another boy was diagnosed in 2009 with cor triatriatum having had a
long history of being breathless on exertion. One girl had scimitar syndrome with an

85
associated congenitally small right lung. One child from the original RW group was
enrolled during the study period to our difficult asthma protocol(195).
Of the original group of preschool controls (n=14), 3 children had repaired complex
congenital heart disease in early childhood and were very well. A fourth child had a
Trisomy 14 mosaicism and a repaired Tetralogy of Fallot but was unable to attend for
assessment. A fifth child in the control group had congestive cardiac failure
secondary to a large ventricular septal defect at time of study recruitment; this was
subsequently repaired in 2010. One boy had mild tracheal compression secondary to
a right sided aortic arch. A girl who had a bronchoscopy at preschool age for
investigation of cyanotic episodes was subsequently diagnosed with ulcerative colitis
at age five, figure 2.8.

86
Figure 2.8: Study recruitment and alternative or co-morbid diagnosis at school age other than asthma
Figure 3.1: Study recruitment and alternative or co-morbid diagnosis at school age other than asthma ------------------------------------------------Recruited at school age-------------------------------------------------------------
--
-------------Children with alternative or co-morbid diagnosis (other than asthma) at school age---------------------------

87
Table 2.3: Characteristics of children followed up at school age from
2009-2010 (Children with school age asthma had higher preschool IgE, and
school age eczema and allergic rhinitis when compared to those without
asthma at school age.)
Asthma
16
No asthma
35
p
Male / Female Birth weight (kg) Gestation (weeks)
11 / 5
3.41 (1.87-4.21) 39 (30-42)
21 / 14
3.38 (1.6-4.41) 40 (34-42)
0.54 0.57 0.51
Age at FOB (months) Weight at FOB (kg)
28 (3-57) 13.35 (5.6-25)
17 (3-55) 11 (5.45-26.4)
0.01 0.043
Preschool IgE (IU/ml) Preschool ≥1 positive RAST, n (%) Age at first episode of wheeze (months)
70 (1-635) 6 (37.5)
14 (1.5-24)
9 (1-432)†
10 (31.3)†
6.5 (0.5-66)
0.04
0.75 0.21
Wheeze at preschool age
Confirmed wheezers Reported wheezers No wheeze
16 11 4 1
22 10 12 13
Parental history doctor diagnosed asthma‡
Paternal history doctor diagnosed asthma Maternal history doctor diagnosed asthma
13 5 5
17‡
1 7
0.04 0.01
0.28
Age at follow up (years) Reported wheeze in last 12 months Wheeze pattern
Episodic (with colds) Multiple trigger Frequency of wheeze
None 1-3 attacks of wheezing 4-12 attacks of wheezing >12 attacks of wheezing
8.2 (6-10.4)
16
3 13
0 4 8 4
7.3 (5.9-11)
7
5 2
28 4 2 1
0.1
Exercise induced wheeze
Dry cough at night§ Number of hospital admissions with wheeze ever Use of ICS at school age
Dose of ICS (mcg beclomethasone) ll Eczema
13 14
17 (0-160)
13
400 (200-1200)ll
12
2 7
3 (0-20)
4 300 (200-400)
4
0.005
0.0001
Allergic rhinitis
7
9
0.001
*Data is reported as median and range. †Results not available on 3 children
‡Family history was unknown in 2 children, as were both adopted at birth (previously in control group)
§Dry cough at night apart from a cough associated with a cold or chest infection
llOr beclomethasone equivalent (2 parents did not know the prescribed ICS dose)

88
2.12.3 Children lost to follow up at school age
Seventeen children were lost to follow up. I was unable to contact 16/17
children despite contacting both the referring paediatrician and their General
Practitioner at preschool age. One child who had a Trisomy 21 and complex
congenital heart disease died shortly after recruitment to the preschool study
at age 11 months from left ventricular infarction. There was no difference
between children who participated in the study and those lost to follow up in
terms of sex (p=0.77), or age at bronchoscopy and endobronchial biopsy
(p=0.77) or preschool IgE (0.99), table 2.4.
Table 2.4: No difference in clinical characteristics of preschool children
followed up at school age and those lost to follow up
Followed up n=51
Lost to follow up n=17
p
Age at biopsy* 19 (3-57) 15 (7-58) 0.77
Male/ Female 32/19 12/5 0.77
Wheezers/ Controls 37/14 10/7 0.36
Preschool IgE (IU/ml) 21 (1-635)† 18 (1-2605) 0.99
*Data is reported as median and range. †Results not available on 5 children
2.13. Clinical characteristics of children followed up at school age
2.13.1 Family history of asthma
Parents were asked if there was a history of maternal or paternal doctor
diagnosed asthma. Two children had been adopted shortly after birth and their
birth family history was unknown. Both of these children were in the ‘control’
preschool group.
Children with school age asthma were more likely to have a first degree family
member with asthma (13/16 versus 17/33, Fishers exact test, p=0.043).
Children with wheeze at preschool age (either reported or confirmed) and
school age asthma were also more likely to have either a maternal or paternal
(parental) history of asthma (Fischer’s exact test, p=0.038). Although a
paternal history of doctor diagnosed asthma increased the likelihood of school

89
age asthma (p=0.01), a maternal history of doctor diagnosed asthma
specifically did not (p=0.49), table 2.5.
Table 2.5: Contingency table of all children recruited comparing (i)
parental history of asthma; (ii) doctor diagnosed maternal history of
asthma; (iii) doctor diagnosed paternal history of asthma with school
age asthma status (Children with asthma at school age were more likely to
have a paternal history of asthma.)
(i) School age asthma
Total yes no
Family history asthma
yes no
13 17 30
3 16 19
Total 16 33 49
*Fishers exact test, p=0.043
(ii) School age asthma
Total yes no
Maternal history asthma
yes no
5 7 12
11 26 37
Total 16 33 49
*Fishers exact test, p=0.49
(iii) School age asthma
Total yes no
Paternal history asthma
yes no
5 1 6
11 32 43
Total 16 33 49
*Fishers exact test, p=0.01

90
2.13.2 School age allergic rhinitis and eczema
Parents were asked to complete the ISAAC core questionnaires(158) for
eczema and allergic rhinitis. Children with school age asthma were more likely
to have co-existing eczema (p=0.0001) and allergic rhinitis (p=0.001) than
those without, table 2.6.
Table 2.6: Contingency table comparing school age asthma and school
age allergic rhinitis and eczema (Children with school age asthma were
more likely to have school age eczema and allergic rhinitis.)
School age Allergic Rhinitis*
School age Eczema**
Total
Yes No Yes No
School age Yes 7 9 12 4 16
Asthma No 1 34 6 29 35
Total 8 43 18 33 51
Fishers exact test p=0.001*, p=0.0001**
2.13.3 School age asthma and preschool total IgE
There was no difference in preschool IgE between CW (n=26), RW (n=19)
and controls (n=18), (p=0.22), figure 2.9 (i). Total IgE at preschool age was
higher in those children who developed school age asthma (n=15) than those
who did not develop asthma (n=31), (p=0.036), figure 2.9 (ii), however there is
considerable overlap between the groups.

91
Figure 2.9: Total IgE at preschool age related to (i) preschool wheeze
and (ii) school age asthma status
p=0.22
CW (n=26) RW (n=19) Controls (n=18)0
1000
2000
3000
No difference in total IgE at preschool age betweenconfirmed and reported wheezers and controls
To
tal Ig
E (
IU/m
l)
p=0.036
Asthma (n=15) No asthma (n=31)0
100
200
300
400
500
600
Increased total IgE at preschool age in children who developed future asthma
To
tal Ig
E (
IU/m
l)
(i)
(ii)
2.13.4 School age asthma status & preschool age RASTs
Blood samples were taken to measure RASTs and total IgE while children
were anesthetised for bronchoscopy at preschool age. Atopic sensitisation
was initially considered as a simple dichotomous variable. Sensitisation was
considered positive if the RAST test had a value of 0.35 or higher. Of 48

92
children who had RASTs measured at preschool age for 3 common food and
5 aero-allergens, 16 children had one or more positive RAST test. There was
no increased risk of asthma at school age in this group (Pearson’s Chi Square
p=0.45). Further analysis excluding the subgroup of five children who had
isolated positive RASTs to milk showed there was still no increased risk of
asthma (Pearson’s Chi Square p=0.2). All 3 children had a positive RAST for
egg at preschool age who were followed up at school age had asthma.
Children with one or more positive aero-allergens (n=7) also did not have an
increased risk of asthma at school age (p=0.15).
School age asthma status was also compared with quantified atopy in the
preschool period, both as the sum of all specific IgE to both aero and food
allergens and as the sum of all aeroallergens (house dust mite, cat, dog,
grass and tree pollen)(196). The sum of all allergens showed was no difference
between those who developed school age asthma (n=14, median 2.72 (2.72-
110.2)KU/L) and those who did not (n=30, 2.72 (2.72-11.64)KU/L). However,
the sum of all aeroallergens was greater in those who developed asthma
(n=14, 1.7 (1.7-109.2)KU/L) when compared to those who did not (n=30, 1.7
(1.7-8.3)KU/L), p=0.009, figure 2.10.
Figure 2.10: Sum of all aeroallergens is increased in those who
developed school age asthma when compared with those who did not
p=0.009
Su
m a
ero
allerg
en
s K
U/L
Asthma (n=14) No asthma (n=30)0
50
100
150
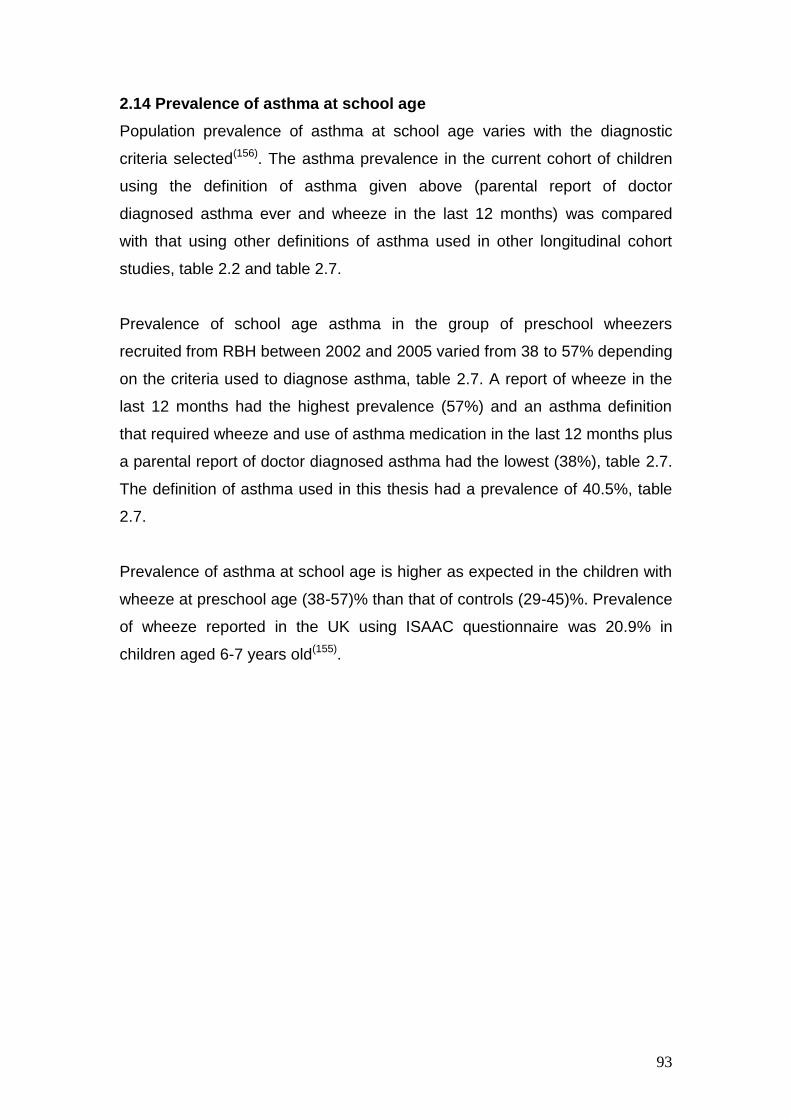
93
2.14 Prevalence of asthma at school age
Population prevalence of asthma at school age varies with the diagnostic
criteria selected(156). The asthma prevalence in the current cohort of children
using the definition of asthma given above (parental report of doctor
diagnosed asthma ever and wheeze in the last 12 months) was compared
with that using other definitions of asthma used in other longitudinal cohort
studies, table 2.2 and table 2.7.
Prevalence of school age asthma in the group of preschool wheezers
recruited from RBH between 2002 and 2005 varied from 38 to 57% depending
on the criteria used to diagnose asthma, table 2.7. A report of wheeze in the
last 12 months had the highest prevalence (57%) and an asthma definition
that required wheeze and use of asthma medication in the last 12 months plus
a parental report of doctor diagnosed asthma had the lowest (38%), table 2.7.
The definition of asthma used in this thesis had a prevalence of 40.5%, table
2.7.
Prevalence of asthma at school age is higher as expected in the children with
wheeze at preschool age (38-57)% than that of controls (29-45)%. Prevalence
of wheeze reported in the UK using ISAAC questionnaire was 20.9% in
children aged 6-7 years old(155).

94
Table 2.7: Prevalence of asthma in preschool wheezers varies depending on definition used
Original cohort
Number of children followed up at school age
Criteria for current asthma diagnosis at school age
Preschool wheezers
n=47
n=37 (78.7%)
All cohort
n=68
n=51 (75%)
Wheeze in last 12 months (ISAAC questionnaire)(12;80;158) 21 (56.7%) 23 (45%)
Wheeze in the last 12 months and parental report of doctor diagnosed asthma
ever(156)
15 (40.5%) 16 (31.4%)
Doctor’s diagnosis of asthma ever(156) 18 (48%) 20 (39.2%)
Wheeze in the last 12 months and one or both of(10)
doctor diagnosed asthma ever
use of asthma medications* during the past 12 months
19 (51%) 19 (37.3%)
Wheeze in the last 12 months and
Parental report of doctor diagnosed asthma ever
And use of inhaled corticosteroids during the past 12 months
14 (37.8%) 15 (29.4%)
*Asthma medication one or more of the following (inhaled corticosteroids, long or short-acting ß-agonists, sodium cromoglycate, leukotriene antagonists
and/or aminophylline)

95
2.15 Demographics of children who attended for a research visit
Thirty nine of the 51 children who answered the clinical questionnaire
attended for a research visit for lung function, airway inflammation and atopy
assessment, figure 2.11. Several children were less than seven years old or
had learning or behavioural problems (discussed above) which made it
difficult for them to complete all of the assessments.
Five children were unable to perform either exhaled FeNO50 or spirometry
- 3 of the children were aged 5.9-6.1 years (one of whom also had
learning disability)
- 1 child had behavioural problems and became very upset and refused
to participate
- 1 child had learning disability and was unable to perform either test
A further child refused to do FeNO50 but subsequently was persuaded to
perform spirometry. Demographics of children who attended for the research
visit are shown in table 2.8. All lung function analyses have been performed
for all children (both preschool wheezers and controls) with and without school
age asthma and both including children with other lower airway pathology and
also as a separate subgroup analysis excluding them.
Table 2.8: Demographics of children who attended for research visit
Asthma (n=12)
No Asthma (n=27)
p
Male / Female 8/4 17/10
Age (years) 8.2 (6-10.4) 7.3 (5.8-11) 0.09
Height (cm) Height (z score)
127.9 (110-157) -0.13 (-3.79-2.66)
135.4 (109-146.1) 0.06 (-3-2.16)
0.6 0.61
Weight (kg) Weight (z score)
24.7 (21.5-48) 0.26 (-1.66-3.13)
26 (16.7-37.1) 0.35 (-2.07-2.81)
0.64 0.98

96
Figure 2.11: School age follow up (2009-10) of preschool cohort, lung
function, airway inflammation and skin prick test measurements at
school age
2.15.2 Video questionnaire at school age
Of those parents who reported that their child had wheezed over the past 12
months and were shown a video questionnaire (n=17) only 12/17 (71%)
identified wheeze on the video questionnaire. There was no relationship
between reported wheeze frequency and parental identification of wheeze on
video questionnaire (Chi squared test, p=0.45) or between wheeze pattern
(episodic or multiple-trigger at school age) and video questionnaire (Chi
squared test, p=0.2). Furthermore, parents of children with current wheeze
and a diagnosis of current asthma were not more likely to identify wheeze on
video questionnaire than those who reported current wheeze but not a
doctor’s diagnosis of asthma (Fisher’s exact test p=0.47).
Children recruited 2002-2005 Wheezers (n=47) Controls (n=21)
Lost to follow up (n=17)
Successfully completed FeNO50 (n=33)
Spirometry (n=35) Multiple breath washout (n=36)
Skin prick tests (n=34)
Attended for research visit (n=39) Declined to attend (n=12)
Followed up by questionnaire (n=51)

97
5/17 children’s parents reported school age wheeze but did not identify it on
video questionnaire. All of these children were attending the Royal Brompton
Hospital for respiratory follow up. Two children were being followed with mild
to moderate asthma, one child had scimitar syndrome and a congenitally
small right lung, one child had Carpenter’s Syndrome with recurrent
respiratory infections and reported wheeze only with colds and one child had
bronchiectasis. Interestingly none of the parents recognised any other
respiratory noises on video questionnaire including stridor, wet cough or
stertor. Cohen's kappa coefficient showed moderate agreement between the
video and written questionnaire (kappa 0.46, p=0.005).
2.15.3 Comparison of RASTs at preschool age with skin prick tests at
school age
Thirty four children had atopy measured by skin prick tests at school age, of
whom 32 also had RASTS measured at preschool age. The skin prick tests
performed at school age were the same 3 food allergens (egg, milk, peanut)
and 6 aeroallergens (grass, tree, cat, dog, Aspergillus fumigatus and
Dermatophagoides pteronyssinus). Aspergillus RAST was not measured at
preschool age. Children with school age asthma (8/12) were more likely to
have one or more positive RASTs for aero-allergens than those without
asthma (3/22) (Fishers exact test p=0.005).
Of 23 children with no positive RASTs at preschool age, 5 (20%) had one or
more positive skin prick tests at school age. Total IgE at preschool age in
those with no positive RASTs at preschool age showed a trend for a higher
IgE in those that subsequently had one or more positive skin prick tests (n=5,
median IgE 42 (range 4-526)IU/ml) when compared with those who did not
(n=18, median IgE 5 (range 1-292)IU/ml) (p=0.16). Of the children (n=5) with
no positive RASTs at preschool age but with positive skin prick tests at school
age, all 5 had school age eczema, and 3 had asthma and allergic rhinitis.

98
2.15.4 Tobacco smoke exposure at school age
Thirty six children had salivary cotinine measured successfully and 3 children
refused to participate. Four samples had insufficient saliva collected. Of those
children (n=32) who had salivary cotinine measured only 4 families reported
one or more parents smoking. Five children had salivary cotinine levels
greater than the upper limit of normal (1.2μg/l)(170). One child had a salivary
cotinine level of 10.3μg/l. Mean reported salivary cotinine in children where
one or both parents smoked is reported as 3.7 (range 1.3-9.8)μg/l(170). There
was no difference in salivary cotinine from the homes where smoking was
reported (n=4 median 1.8 (range 0.1-10.3)μg/l) and those where it was not
(n=28, median 0.2 (range 0.1-1.8)μg/l), p=0.15, figure 2.12. There was no
difference in salivary cotinine between children with asthma (n=13, median
0.2 (range 0.1-10.3)μg/l) and children without school age asthma (n=19,
median 0.2 (range 0.1-1.7)μg/l), p=0.59.
Figure 2.12: Salivary cotinine at school age compared between houses
where one or more persons and non smoking homes (There is no
difference between the groups; the horizontal dotted line shows the upper limit
of normal for salivary cotinine 1.2µg/l)
p=0.15
Smoking (n=4) No smoking (n=28)0
5
10
15
No increase in salivary cotinine from childrenwhose parents smoked
Salivary
co
tin
ine (
ug
/l)

99
2.15.5 Spirometry
Spirometry was successfully performed in 35 children(192). All children had 3
flow volume loops recorded after a period of practice. Repeatability as
measured by the CoV between manoeuvres for FEV1 was 4.4% (standard
deviation 2.9)% and for FVC 5.6% (standard deviation 3.6)%.
There was a significant difference in FVC measured between preschool CW
(median z score -0.4) and RW (median z score -1.6), p=0.03, figure 2.13 (i).
However, there was no difference in school age FEV1 z score (p=0.45) or the
ratio of FEV1/FVC (p=0.14) between preschool wheezers (confirmed (n=12)
and reported (n=13)) and children with no lower respiratory symptoms at
preschool age (n=10), figure 2.13 (ii) and (iii). Children with asthma (n=12) at
school age had similar FEV1 (p=0.43), FVC (p=0.48) and FEV1/FVC (p=0.84)
z scores to those without asthma (n=23), figures 2.13 (iv)-(vi). A subgroup
analysis of children with persistent wheeze (n=15) (i.e. wheezing during
preschool years and reported wheeze in the previous 12 months) and children
who did not report wheeze either at preschool age or in the past 12 months
(n=9) again showed no significant difference in FEV1 (p=0.8), FVC (p=0.76) or
FEV1/FVC (p=0.18) z scores.
Four children with co-morbid lower airway pathology other than asthma known
to decrease spirometry were excluded for the purpose of comparing lung
function between asthmatics and non-asthmatics. The children excluded from
the second analysis are as follows;
- a girl with bronchiectasis at school age (school age asthma; FVC z score= -
0.3, FEV1 z score=-0.12)
- a boy with evidence of gas trapping and atelectasis on computerised
tomography at school age (no asthma at school age; FVC z score=-2.64,
FEV1 z score=-3.01)
- a girl with scimitar syndrome and a congenitally small right lung (no asthma
at school age; FVC z score= -2.69, FEV1 z score= -2.08)
- a boy with evidence of upper airway obstruction caused by tracheal
compression secondary to a right sided aortic arch (no asthma at school age;
FVC z score=-0.01, FEV1 z score= -0.29).

100
After exclusion of the 4 children with other airway pathology (1 with school
age asthma and 3 children without school age asthma) no difference was
seen between children with and without asthma at school age for FVC
(p=0.7), FEV1 (p=0.8) and FEV1/FVC, (p=0.76), figure 2.14.

101
Figure 2.13: No difference in school age spirometry related to school age asthma status
p=0.03
-3
-2
-1
0
1
2
Decreased FVC in RW compared to CW
FV
C (
z s
co
re)
p=0.45
-4
-2
0
2
4
No difference in FEV 1 between
CW, RW and controls
FE
V1
(z s
co
re)
p=0.14
-4
-2
0
2
4
No difference in ratio of FEV 1 to FVC
in CW, RW or controls
FE
V1/F
VC
(z s
co
re)
p=0.48
-3
-2
-1
0
1
2
No difference in FVC between childrenwith and without school age asthma
FV
C (
z s
co
re)
p=0.43
-4
-2
0
2
4
No difference in FEV 1 between children
with and without school age asthma
FE
V1
(z s
co
re)
p=0.84
-4
-2
0
2
4
No difference in ratio of FEV 1 to FVC in
children with and without school age asthma
FE
V1/F
VC
(z s
co
re)
School age spirometry related to presence of school age asthma
School age spirometry related to preschool wheeze status
Confirmed wheezers (CW) n=12
Reported Wheezers (RW) n=13
Controls n=10
(i) (ii) (iii)
(iv) (v) (vi)
Asthma (n=12)
No asthma (n=23)

102
Figure 2.14: Lung function measures compared between children with
and without school age asthma after exclusion of children with
comorbid respiratory diagnosis
p=0.7
-3
-2
-1
0
1
2Asthma (n=11)
No asthma (n=20)
No difference in FVC between childrenwith and without school age asthma
FV
C (
z s
co
re)
p=0.8
-4
-2
0
2
4
No difference in FEV1 between children
with and without school age asthma
FE
V1
(z s
co
re)
p=0.76
-4
-2
0
2
4
No difference in FEV1/FVC between children
with and without school age asthma
FE
V1/F
VC
(z s
co
re)
(i)
(ii)
(iii)

103
2.15.6 Multiple breath washout
Twenty two children had 3 acceptable washouts and 14 children had 2
acceptable washouts. Mean coefficient of variation between multiple breath
washout measurements in the same child with 3 acceptable washouts was
4.9% (standard deviation 2.5%). Similarly mean FRC was 1.08L (standard
deviation 0.28L) with the mean coefficient of variation between measures for
the same child of 5% (standard deviation 2.5%). A randomly selected subset
(n=14) of the multiple breath wash out studies were analysed by a second
more experienced observer, Ms Samantha Irving, to ensure quality control
and there was good correlation between the two observers (Bland Altman
plot, standard deviation +/-0.19, bias 0.14), figure 2.15.
Figure 2.15: Difference between lung clearance index measurements by
Dr R O’Reilly (measurement 1) and Ms S Irving (measurement 2) plotted
against the mean of the 2 measurements (No significant bias seen)
6 8 10 12
-0.2
0.0
0.2
0.4
0.6+2SD
Bias
-2SD
Mean of measurements 1 & 2Diffe
ren
ce o
f m
easu
rem
en
ts 1
-2

104
2.15.6.2 Lung Clearance Index
There was no difference in LCI between the children either stratified by their
preschool age wheeze status (n=36, p=0.44) or by the presence or absence
of asthma at school age (p=0.5), figures 2.16 (i) and (iv) and table 2.9.
Three children with airway pathology other than asthma known to affect the
distal airways were excluded from the MBW sub-analysis, bronchiectasis n=2,
(LCI=10.99, LCI=8.17), and atelectasis and gas trapping n=1, (LCI=7.98). I
included in this analysis the boy with tracheal compression (LCI=6.93) and the
girl with a congenitally small right lung (LCI=7.27) as both had normal LCIs.
There was still no difference between groups stratified either by preschool
wheeze status (CW [n=12, LCI median 7.23 (6.34-10.99)], RW [n=11 LCI
median 7.6 (6.2-7.75)] and controls [n=10, LCI median 7.4 (6.24-7.88)],
p=0.72, or by school age asthma status (asthma [n=11, LCI median 7.25
(6.34-10.99)] versus no asthma [n=22, LCI median 7.13 (6.2-7.83)]), p=0.3.
There was no difference in LCI between children that persistently wheezed
from preschool age and were still wheezing at school age (n=15, median LCI
7.37 [6.34-10.99]) and those who never wheezed (n=9 median LCI 6.94 [6.24-
7.88]), p=0.15. Similarly there was no difference in LCI between parental
reported wheeze phenotypes at school age, either multiple-trigger (n=10, LCI
median 7.44 [6.34-10.99]) or episodic (viral) wheeze (n=6, LCI median 7.24
[6.65-7.78]) and children who did not report wheeze at school age (n=20, LCI
median 7.12 [6.2-10.95]), p=0.33. FRC was similar in all groups, 1.05 (0.71-
2.09) litres, table 2.9.
The upper limits of normality for LCI reported in another study are 7.42, range
(7.25-7.59)(62). If these limits are applied to this study in the absence of
reference data from our own department, 12 children in this study had LCI
greater than 7.42. However seven of these were just above this range (7.42-
7.8). Of the remaining children (n=5) two had had evidence of mild to
moderate bronchiectasis on CT (LCI: 8.17, 10.95), the third had evidence of
gas trapping and atelectasis (LCI=7.98), and two children had no obvious
reasons (LCI 10.99, 8.41).

105
2.15.6.3 Scond & Sacin
Scond (conductive airways inhomogeneity) and Sacin (acinar airways
inhomogeneity) were analysed in 29 children who had two or more technically
acceptable washouts. Seven children were excluded because they did not
have two or more traces from which a phase III slope could be reproducibly
analysed.
There was no difference when Sacin was compared in preschool wheeze
(p=0.21), figure 2.16 (ii), or school age asthma status (p=0.97), figure 2.16 (v).
Although CW (n=9, 0.032) showed a trend to higher Scond when compared with
RW (n=11. 0.014) and controls (n=9, 0.015) it was not statistically significant
(p=0.2), figure 2.16 (iii). Children with asthma at school age (n=7, 0.043) had
a higher Scond when compared to those who did not (n=22, 0.014) p=0.049,
figure 2.16 (vi). However on exclusion of the 2 children included in the
analysis with co-morbid lower airway pathology (1 with a diagnosis of school
age asthma and 1 without asthma) there was still a trend to higher Scond in the
school age asthmatics (n=6, Scond=0.039, range [0.003-0.061]) compared to
those children without asthma at school age (n=21, Scond= 0.014, range [-
0.027-0.032]), but was no longer statistically significant, p=0.1. There was
also no difference when children were compared by preschool wheeze groups
episodic (viral) and multiple-trigger at school age.

106
Table 2.9: Lung clearance index, functional residual capacity, Scond and
Sacin related to school preschool age wheeze status and school age
asthma status. (Scond is increased in those children who developed school
age asthma)
Preschool age
Confirmed wheezers
n=13
Reported wheezers
n=13
Controls
n=10
p
FRC (l) Range
1.055 (0.75-2.09)
0.996 (0.71-1.61)
1.027 (0.75-1.43)
0.83
LCI Range
Scond Range Sacin
Range
7.37 (6.3-10.99)
n=9
0.032 (0.003-0.06)
0.099 (0.028-0.5)
7.25 (6.2-8.17)
n=11 0.014
(-0.027 -0.044) 0.13
(0.033-0.24)
7.17 (6.24-7.88)
n=9
0.015 (-0.027-0.023)
0.076 (0.034-0.62)
0.44
0.2
0.21
School age
Asthma n=12
No Asthma n=24
FRC 1.06 (0.75-2.09)
1.05 (0.71-1.61)
0.69
LCI Range
Scond Range Sacin
Range
7.33 (6.1-10.99)
n=7
0.043 (0.003-0.06)
0.08 (0.06-0.21)
7.24 (6.28-10.95)
n=22 0.014
(-0.027-0.03) 0.1
(0.028-0.62)
0.5
0.0498
0.97

107
p=0.44
CW (n=13) RW (n=13) Controls (n=10)4
6
8
10
12
No difference in school age LCI when comparedwith preschool wheeze status
LC
I
p=0.97
Asthma (n=7) No Asthma (n=22)0.0
0.2
0.4
0.6
No increase in S acin in children with
school age asthma
Sa
cin
p=0.2
CW (n=10) RW (n=12) Controls (n=10)-0.030
-0.005
0.020
0.045
0.070
Sco
nd
No difference in school age S cond when
compared with preschool wheeze status
p=0.50
Asthma (n=12) No Asthma (n=24)4
6
8
10
12
No increase in LCI in school age asthmatics
LC
I
p=0.21
CW (n=9) RW (n=11) Controls (n=9)0.0
0.2
0.4
0.6
0.8
No difference in school age S acin when
compared with preschool wheeze status
Sa
cin
p=0.0498
Asthma (n=7) No Asthma (n=22)-0.030
-0.005
0.020
0.045
0.070
Increased S cond in children with
school aged asthma
Sco
nd
School age multiple breath washout related to preschool wheeze status(i) (ii) (iii)
(iv) (v) (vi)
School age multiple breath washout related to school age asthma status
Figure 2.16: Increased Scond in children with school aged asthma

108
2.15.7 Exhaled nitric oxide
Thirty three children successfully performed FeNO50. CW (n=10, 11.95 [7.7-35] ppb)
had higher FeNO50 when compared to RW (n=13, 5.9 [2-20.6]ppb) but not controls
(n=10, 7.33 [3.8-42.6]ppb), p=0.06, figure 2.17 (i). Of the 2 children from the original
control group with raised FeNO50 one had asthma, eczema and positive skin pick
tests to cat, milk and peanut at school age and the second child had eczema and
allergic rhinitis but no positive skin prick tests. Children with school age asthma
(n=11, 13.3 [4.9-40.3] ppb) had higher FeNO50 when compared to children without
school age asthma 7.08 [2-42.6]ppb), p=0.02, figure 2.17(ii). FeNO50 was greater in
atopic (n=13, 16.3 [4.96-42.6]ppb) compared to non-atopic children (n=20, 7.15 [2-
20.6]ppb) irrespective of current wheeze status (p=0.01), figure 2.17 (iii).
Figure 2.17: (i) FeNO50 greater in confirmed rather than reported wheezers, (ii)
Increased FeNO50 in children with school age asthma when compared to
children without asthma, (iii) Increased FeNO50 in children with school age
atopy
p=0.06
CW (n=10) RW (n=13) Controls (n=10)0
10
20
30
40
50
p=0.02
Exhaled nitric oxide is higher in confirmed wheezers (CW) when compared with
reported wheezers (RW)
FeN
O5
0m
l/s (
pp
b)
(i)

109
p=0.02
Asthma (n=11) No asthma (n=22)0
10
20
30
40
50
Increased exhaled nitric oxide in children with asthmaat school age when compared to those without
FeN
O5
0m
l/s (
pp
b)
(iii)
p=0.01
Atopic (n=13) Non Atopic (n=20)0
10
20
30
40
50
Increased exhaled nitric oxide in childrenwith school age atopy
FeN
O5
0m
l/s (
pp
b)
2.15.8 Hypertonic saline challenge
Hypertonic saline (4.5%) provocation testing was used to measure AHR. The test
was considered complete if either the FEV1 had fallen by 15% from baseline or the
total inhalation period of 15.5 min had been reached. ß-agonists were withheld for
the previous 12 hours and inhaled corticosteroids for the previous 24 hours. Two
children with severe asthma requiring maintenance daily oral prednisolone were
asked not to withhold medication. Twenty six children had bronchial challenges: 22
were full studies and 4 studies had to be prematurely discontinued, table 2.10. Two
children disliked the salty taste and were reluctant to continue, a third child spat pink
liquid into the tubing and the fourth became bored and despite repeated
(ii)

110
encouragement was not using maximal effort at spirometry. The median participation
time in these children was 5.5 minutes (range 1.5-11.5 minutes).
In children (n=5) with FEV1≤75% bronchial challenge was not performed. Three of
the five children had bronchodilator reversibility (BDR) assessed 20 minutes after
inhalation of 1000mcg salbutamol. The fourth child had a congenitally small right
lung explaining her low lung function. The fifth child recently had surgery for Cor
Triatriatum and the mother was reluctant to give him medication. Four children were
unable to perform repeatable lung function and 4 children refused to participate,
table 2.10. The reasons given were ‘fear of the nebuliser and dislike of the salty
taste’.
Table 2.10: Acceptability and tolerance of bronchial challenge with hypertonic
(4.5%) saline
Assessment of bronchial hyper-responsiveness
Number
Full bronchial challenges 22
Incomplete bronchial challenges 4
Unable to perform repeatable lung function 4
Refused test 4
Not performed as lung function ≤75% 5
Total 39
2.15.8.2 Amount of hypertonic saline inhaled
There was considerable variation in the amount of saline inhaled among children
who completed the full inhalation period, figure 2.19. The median amount was 22.4g
(range 2-31.1g). Only 5 children inhaled > 23g of hypertonic (4.5%) saline. A further
5 children were just under this threshold value with amounts of inhaled saline
between 21-23g. There was only moderate correlation between duration of time and
amount of inhaled saline (Spearman r=0.59, p=0.004), figure 2.18. Two patients
were nebulised for an additional 4 minutes until an inhalation dose of 23g was
reached. The remainder of the children were reluctant to prolong the nebulisation
period.

111
Figure 2.18: Variability of amount of inhaled hypertonic saline (4.5%) inhaled at
end point time of 15.5 minutes
Spearman r=0.59, p=0.004
0 10 20 300
5
10
15
20
25
30
35
Duration of inhalation and amount of inhaled hypertonic (4.5%) saline
Duration of inhalation (minutes)
Sali
ne D
ose (
g)
2.15.8.3 Airway hyper-responsiveness, multiple breath washout and exhaled
nitric oxide
There was no relationship between either AHR or bronchodilator response to LCI or
Sacin. However, there was a trend towards higher FeNO50 in those with evidence of
bronchodilator reversibility or AHR, table 2.11. Scond was higher in those with reactive
airways although numbers are very small (n=4).
2.15.8.4 Induced Sputum
All except 3 of the children had a dry non-productive cough when sputum induction
was attempted (3/25, 12%). Several of the children on expectorating produced
samples of saliva which were not analysed as there were no sputum plugs. All the
children that produced a sample had a wet cough prior to induction despite parents
reporting absence of symptoms over the preceding 3 weeks. One of the sputum
samples was processed incorrectly and only 2 sputum results were obtained so no
further analysis has been performed. Both sputums were predominantly neutrophilic
(72% and 84%).

112
Table 2.11: No significant difference between children with evidence of
bronchodilator response or airway hyperresponsiveness and those without at
school age
Evidence of Airway Hyper-responsiveness or
Bronchodilator Reversibility
Positive n=5
Negative n=20
p
Male / Female 4/1 13/7 0.1
Age (range)
9.28 (7.15-10.4)
7.74 (6.8-9.8)
0.06
Symptomatic (wheezy, chest tightness)
3
0
Change in FEV1 ≥ 15% BDR ≥+15% AHR ≥-15%
n=2 17.7% n=3
-17 (15-36) %
n=1 9%
n=19 +2 (-14 to +17)%
Wheeze last 12 months
3
9
0.45
Asthma LCI (Range) Scond
(Range) Sacin (Range) FeNO(50ml/s ppb)
3
7.74 (n=5) (6.88-8.41)
0.0435 (n=4) (0.03-0.05)
0.1245 (n=4)
(0.028-0.2357)
(n=5) 19.4 (8.7-38)
9
7.24 (n=20) (6.21-10.99)
0.009 (n=17)
(-0.0275-0.061)
0.083 (n=17) (0.033-0.61)
(n=19)
8.1 (3.8-42.6)
0.38
0.29
0.01
0.89
0.055
2.16 Summary of Results
Seventy five percent of the original preschool cohort (51/68) were followed up
at school age
Forty percent of the original preschool wheezers that were followed up had a
diagnosis of asthma at school age (defined as parental report of wheeze in
the last 12 months and a doctor diagnosis of asthma ever)
Children with pre-school video confirmed wheeze at preschool age had a
higher risk of school age asthma compared with parental reported wheezers
and controls.

113
Children with school age asthma had increased prevalence of allergic rhinitis
(p=0.001), eczema (p=0.0001), positive skin prick tests (p=0.006) and FeNO50
(p=0.02) when compared to those without asthma.
Scond was higher in children in school age asthma and in children with airway
reactivity, but no difference was seen for spirometry measurements, LCI or
Sacin.
There was no correlation between AHR or bronchodilator reversibility and
wheeze in the last 12 months or current asthma, but the numbers who were
positive are too small for any conclusions to be drawn.
2.17 Discussion
2.17.1 Review of aims and objectives
The primary aims and objectives of this part of the study have been partly achieved
1) A diagnosis of asthma was established in 51/68 (75%) of the original
preschool cohort.
2) A subgroup of this cohort 39/68 (58%) were characterised in terms of lung
function and atopy.
2.17.2 Limitations of the study
The main limitation was that some children (18%) could not or would not attend for
the research visit so pulmonary function and atopy measurements were available in
all children. Final numbers followed up at school age were small and the preschool
‘control’ group while wheeze free at preschool age had other medical problems and
were not truly ‘normal controls’. Several of the children had co-morbid or alternative
diagnoses at school age. Importantly this group of preschool children represented a
cohort with severe recurrent wheeze with only 6 children reporting no hospital
admissions with wheeze at school age. Children had a median of 8 hospital
admissions with wheeze over their lifetime at follow up. These children are not
representative of preschool wheezers in the general population but rather a specific
group with more severe disease. This also partly explains why some of the children
had overlap with other respiratory pathology at school age.

114
2.17.3 Strengths of the study
Seventy five percent of the preschool children were followed up in one way or
another at school age, figure 2.11. Other studies report similar subject retention of
between 54-91%(1;10-12;14;15).
2.17.4 Asthma diagnosis
The absence of standardised criteria for the diagnosis of asthma in children was one
of the most challenging aspects of this study. Seventy eight percent of the original
preschool wheezers were followed up at school age. Asthma prevalence in this study
varies from 29 to 45% depending on the definition used, table 2.7. Although
symptoms (wheeze, chest tightness) are sensitive for the presence of asthma, they
may also be influenced by perception, culture and the interviewer. In order to prevent
interviewer bias as much as possible all parents that attended for a research visit
were shown the video questionnaire first followed by the written questionnaire and
questions were asked in the same order each time. In all but 3 families, the parents
that attended with the child for the research visit were Caucasian and English was
their first language.
Parental identification of wheeze on video questionnaire at preschool age improved
asthma prediction at school age (p=0.015). However, several of the parents still
reported wheeze at school age but did not identify it on a validated video
questionnaire, confirming that parental and physician perception of wheeze
differs(16;153). There was only moderate correlation between reporting wheeze in the
last 12 months and identifying it as a respiratory symptom in the last 12 months on
video questionnaire (kappa 0.46, p=0.005). A Canadian English speaking study has
also shown limited agreement between the ISAAC questionnaire and video
identification of wheeze(194). In a more recent ISAAC study involving over 40
countries responses to a video questionnaire gave lower prevalence’s of wheeze
than with the written questionnaire, which was more apparent in English speaking
countries(197). Parental recall bias may also contribute to this discrepancy with two
mothers who previously identified wheeze at preschool age no longer able to identify
it on video questionnaire at school age despite reporting persistent wheeze.

115
The definition of asthma used in this study was parental report of wheeze in the last
12 months and a parental report of doctor diagnosed asthma ever. This definition
has been used to assess wheeze and asthma prevalence in many studies(156;198-204).
The group of children with asthma at school age by this definition had higher
paternal history of doctor diagnosed asthma, higher IgE at preschool age, and a
greater prevalence of allergic rhinitis, eczema and FeNO50 at school age when
compared to those without, suggesting that this definition selected children likely to
have asthma. Spirometry did not detect significant differences between those with
and without school age asthma, however it is known to be a poor marker of asthma
severity(42;205).
Several longitudinal cohort studies have shown parental asthma to be an important
factor in predicting school age asthma(10;12;27). It is difficult to explain why paternal
asthma was associated with school age asthma, rather than maternal asthma which
has previously been shown to be a stronger predictor of school age asthma, table
2.5(72;204;206;207). Importantly, an objective report was not obtained from health care
providers for either maternal or paternal asthma. Paternal rather than maternal
history of asthma is associated with AHR, an important determinant of disease
severity in children with asthma(203). However, given the small size of the study,
which was not powered for or intended to study parental contributions to asthma in
the offspring, it would be wrong to draw any conclusions from these data.
2.17.5 Lung function
Previous large epidemiological studies have shown that early wheezing associated
with poor airway function in the late preschool years tracks with age and is
associated with asthma in adulthood(6;208). A limitation of this study was that
preschool lung function was not available and thus it was not possible to compare
preschool and school age lung function.
School age children who successfully performed spirometry were able to perform
very repeatable manoeuvres with less than 5% variability between attempts
comparable with other studies(209;210). Interestingly there was no difference in lung
function at school age as measured by spirometry between those with asthma and
those without, figure 2.13 (iv-vi). The ratio of FEV1/ FVC which has been shown to be

116
more sensitive in classifying asthma severity in children also showed no difference
between the children with and without asthma at school age(42). This may have been
because the study was not powered to detect a difference in lung function between
the two groups. Secondly, all children who attended for a research visit were
symptom free at the time. The majority of children with persistent asthma have
normal lung function during symptom-free periods with abnormal pulmonary function
only during acute exacerbations(42;211). Furthermore, spirometry is not a helpful
marker for asthma severity in children (above)(42;205).
The decision whether to include children in the lung function analysis with both
bronchiectasis and asthma was difficult. Confusion of asthma and bronchiectasis is
common and the diagnostic process is further complicated by the fact that the two
may co-exist(161). In adults with severe asthma, bronchiectasis is particularly
common(212). Secondly, it remains unclear whether bronchiectasis in patients with
asthma is a comorbidity or whether it represents structural change or remodelling
with natural progression of the disease(213). However, in this study data were
analysed both with and without these patients. When children with other airway
pathology at school age were excluded there was no longer a difference in FVC
between preschool RW and CW or between Scond in children with or without school
age asthma.
There was also no difference in LCI at school age by preschool wheeze phenotypes
(confirmed and reported, multi-trigger and episodic) or by school age asthma status.
This study showed a higher Scond in seven year old school age asthmatics (0.043)
when compared to children without school age asthma (0.014), p=0.049. However,
although there was still a trend towards higher Scond in school age asthmatics (Scond
asthma 0.039, range [0.003-0.061] versus non asthmatics 0.014, range [-0.027-
0.032]) this was no longer significant when children with lower airways disease not
due to asthma at school age were excluded. This study was not powered to detect a
difference between the two groups. The number of children necessary to detect a
10% difference in MBW indices between children with and without school age
asthma was calculated as 56 with 80% power at the 5% significance level(62).

117
Scond has been shown in other studies to be the most sensitive marker of small
airways disease in asthma(62;172). LCI in children with asthma, while often slightly
higher than controls is still within the normal range and cannot be used as a useful
indicator of disease in the individual child(62;171;172). Children aged 4-5 years with
multiple-trigger wheeze have been shown to have significantly higher LCI (multiple-
trigger 7.4 (7.1-7.8) vs episodic 6.7 (6.5-6.9) vs controls 6.6 (6.5-6.7)) and Scond
(multiple-trigger 0.042 (0.030-0.058) vs episodic 0.014 (0.009-0.023) vs controls
0.010 (0.007-0.014)) when compared to episodic wheezers and healthy controls(62).
The differences from the current study likely reflect the greater numbers reported by
Sonnapa et al(62). Older children with well controlled asthma aged 10 years also had
a higher LCI (6.69 (standard deviation (SD) 0.91) vs 6.24 (SD 0.47), p=0.02) and a
trend towards a higher Scond (0.026 (SD 0.02) vs 0.017 (SD 0.02)), p=0.06(171). A
Swedish study of asthmatic children with positive skin prick tests to aero-allergens
aged 13 years showed that elevated Scond correlated with increased levels of AHR
and exhaled NO(172). This study, although numbers were small (n=21), also showed
increased Scond in those children who demonstrated AHR or bronchodilator
reversibility but no relationship to exhaled NO. This again suggests that disease of
distal airways is an important part of asthma. It would have been useful to to
calculate alveolar NO and bronchial flux NO concentration in children as a marker of
distal airway inflammation, but the children were not able to perform FeNO at higher
flow rates(190).
2.17.6 Atopic status and school age asthma
Children with higher total IgE at preschool age were more likely to develop asthma at
school age, p=0.036. Sensitisation to one or more aeroallergens was not predictive
of asthma at school age, p=0.15, but the cumulative sum of sensitisation to all
aeroallergens was, p=0.009(196). Of the 37 preschool wheezers followed up at school
age over half had been atopic at preschool age (defined as the presence of eczema
and or one more positive RASTs tests). There was no difference between the atopic
preschool wheeze group when compared to the non-atopic preschool wheeze group
in prevalence of current wheeze (Fishers exact test p=0.74) or current asthma
(Fishers exact test p=0.73) at school age.

118
One third of the non atopic preschool wheeze group were still wheezing at school
age. In contrast the much larger German MAS study showed that 90% of children
with wheeze before age 3 years but no atopy lost their symptoms at school age(32).
Sensitisation to perennial allergens (house dust mite, cat and dog hair) developing in
the first 3 years of life was associated with persistent wheeze and loss of lung
function at school age(155). The difference in results is likely explained by the small
number of children in the current study and also that they represent a group of more
severe wheezers.
In early life IgE antibodies are often first directed to food allergens and later to indoor
and outdoor aero-allergens(214). As the median age of this group of children was just
2 years this would suggest that more children would become sensitised by school
age. In fact four children had no positive skin prick tests at school age having
previously had one or more positive RASTs at preschool age (3 children had positive
RASTs to milk and 1 child had a positive RAST to dog). Conversely, two children
who did not have a positive RAST at preschool age had one or more positive skin
prick tests to aeroallergens at school age. It is important to remember in comparing
RASTs that there is only limited agreement with skin prick tests and the extent of
agreement also varies between allergens(164;215).
2.17.7 Airway hyper-responsiveness
Twenty percent of children (5/25) demonstrated either AHR or bronchodilator
reversibility at the research visit. However, the bronchial challenge was poorly
tolerated with 8/30 either not completing the challenge or refusing to participate. This
may be attributed to the median age of the children involved being 7 years and
bronchial challenge being performed at the end of the assessment period when
children were more likely to be tired.
According to the protocol a complete bronchial challenge lasted 15.5 minutes and
23g of saline was nebulised(163). The correlation between amount of inhaled
hypertonic saline (4.5%) and time of inhalation was only moderate (Spearman
r=0.59) suggesting that there is either not consistent output from the nebulisers or
steady inhalation by the children. Similar lack of correlation between inhaled saline
and length of inhalation have been found in other studies of 9-11 year olds in

119
Germany(216). Other studies have also found variation in the output in different
models of the same nebuliser(217). Variable doses of hypertonic saline (2-31.1 g)
were nebulised over the 15.5 minute period with (12/25) children achieving a
nebulised concentration of 23g or just under of hypertonic saline. Similarly in a study
of German children aged 9-11 years the investigators found it was not possible to
nebulise 23g of hypertonic saline in 15.5 minutes in over half of the cohort(216). The
nebulisation period was extended by 4 minutes to achieve 23g of saline in 2 of the
children. However the remaining children declined to prolong the provocation test.
Other studies have also found that increasing the inhalation time is not practical in
this age group(216).
Previous epidemiological studies in children have shown that inhalation time as
opposed to hypertonic saline dose does discriminate between those with asthma and
those without(216). In contrast to this only 3 children in this study had a positive
bronchial challenge (defined as a dichotomous variable). All 3 children were
symptomatic with acute wheeze and chest tightness and also demonstrated ≥ 15%
bronchodilator reversibility on administration of 1000µg salbutamol following the
bronchial challenge. There was no relationship between AHR and presence of
wheeze in the last 12 months (p=0.45) or asthma (p=0.38). This may have been
because of the small numbers (n=22) that had a complete bronchial challenge. It is
not possible to exclude the possibility that variations in nebuliser output and
inhalation on the part of the child may also be partly responsible for the low numbers.
A washout period of 24 hours may not have been sufficient for ICS and may have
suppressed bronchial reactivity. Two children were also on maintenance oral
corticosteroids during the challenge.
2.17.8 Sputum induction
There was very poor success with sputum induction in this study. Jones et al
reported that it was more difficult to get an adequate sample of sputum using the
combined challenge protocol with 65% of children producing the sample compared
with a much higher rate of (92%) of children who had sputum induction alone(175). Of
note the mean age of children involved in that study was 11 years as opposed to 7
years in the current study. Furthermore success of sputum induction is better in
children older than 12 years(218).

120
2.18 Conclusion
There was reasonable subject retention for this preschool cohort at school age. A
diagnosis of asthma has been confirmed in 75% of the original cohort, which is
supported by higher levels of atopy, exhaled nitric oxide and Scond when compared to
those without school age asthma. There were insufficient AHR data to draw any
conclusions.
The next chapter will discuss the pathological changes in the preschool
endobronchial biopsies which have previously been associated with asthma in adults
and older children. In particular the next chapter will look at RBM thickness at
preschool age and relate this to the presence or absence of school age asthma.

121
Chapter 3
Reticular basement membrane thickness in preschool
wheezers and its relationship with childhood asthma.
3.1 Introduction
The bronchial epithelial basement membrane is an acellular matrix composed of two
structurally distinct layers, the basal lamina (true basement membrane) and the
RBM. The basal lamina can be visualised only by electron microscopy since its width
(~80nm) is below the resolution of the light microscope. In contrast, the RBM is
considerably thicker (~3-5µm in children)(9;87) and can be seen using light
microscopy. Abnormal thickening of the RBM is a feature of airway remodelling and
is seen in several inflammatory airway diseases including cystic fibrosis(219),
COPD(220), chronic cough(221) and post lung transplant(222) but is particularly
characteristic of asthma(95).
The relationship between RBM thickness and lung function remains uncertain. While
some adult studies show that increased RBM thickness is associated with worse
airway obstruction(112), others show that RBM thickening is associated with reduced
AHR(223). RBM thickness positively correlated with the dose of metacholine needed
to cause a 20% decrease in FEV1 and negatively correlated with the FVC/ FEV1 ratio
in adult patients (n=33) with asthma, allergic rhinitis or COPD(223). In contrast adults
with mild-moderate and severe asthma have demonstrated a relationship between
bronchodilator responsiveness and increased RBM thickness(224). However, in
children no association has been found between RBM thickness and lung
function(116;219).
Preschool children, median age 2-3 years, recruited from the Royal Brompton
Hospital from 2002-2005 with severe recurrent wheezing were found to have
increased RBM thickness when compared with non-wheezing controls(9). It was
unknown at that time which of the children with severe recurrent wheeze at
preschool age would persistently wheeze throughout childhood and develop
asthma(9). RBM measurements were repeated so there was consistency with only
one observer making all pathology measurements throughout this study.

122
3.1.2 Hypothesis
The hypothesis to be tested in this chapter:
Preschool wheezers who have asthma at school age have increased RBM thickness
in preschool endobronchial biopsies compared to wheezy preschool children whose
symptoms subsequently regressed.
3.1.3 Aims and Objectives
1. To re-measure RBM thickness in preschool endobronchial biopsies
(previously measured by Dr S Saglani) blinded to preschool and school age
clinical status
2. To relate RBM thickness at preschool age to the presence or absence of
asthma at school age
3.2 Methods: Measurement of reticular basement membrane thickness in
preschool children
Biopsy processing and evaluation
At the time of bronchoscopy and EB up to 4 biopsies had been taken and fixed in
10% formal saline and processed to paraffin blocks 4-24 hours after fixation. Three
5μm thick sections were then taken at 25-50μm step intervals, dependent on biopsy
size. These sections were stained using haematoxylin and eosin (H&E). Sections
containing only glandular tissue or strips of epithelium and RBM without associated
subepithelial mucosa were not used. Children had only 1 or 2 suitable biopsies for
analysis. Biopsies had previously been assessed for quality and suitability of
measurement of RBM thickness by 2 observers, Dr S Saglani (SS) and Dr D Payne.
A formal clinical report had also been provided by Professor A Nicholson, Royal
Brompton Hospital at the time of biopsy. For this thesis, sections were counted in
random order by Dr R O’Reilly (RO’R) blinded to both the children’s preschool group
(wheezer or control) and school age asthma status.
Measurement of RBM thickness
During the time period between 2005 and 2009 further sections had been cut and
stained with H&E so it is likely that different sections were measured for a given child
by SS and RO’R. Biopsies were considered suitable for RBM measurement if
epithelium, subepithelium and RBM were present. RBM thickness was measured

123
using computer aided image analysis (NIH image 1.55: National Institute of Health,
Bethesda MD) starting from the upper left corner of each biopsy and measured at
20µm intervals anticlockwise along a length of 1mm RBM for each biopsy. If the
RBM could not be recognised it was not measured. Each measurement was made
by drawing a line at a tangent to the luminal edge of the RBM (the luminal edge was
adjacent to the epithelium) across its full length, figure 3.1. Forty measurements
were made 20µm apart(225). The geometric mean of the 40 measurements taken was
used to represent the mean RBM thickness for that biopsy(225).
Figure 3.1: Haematoxylin and eosin stained endobronchial biopsy section
showing reticular basement membrane thickness measured at right angles to
a tangent marking the outer perimeter of the reticular basement membrane at
that point
3.2.2 Statistical analysis
This section describes the statistical methods used for chapters 3-6. Non-parametric
tests were applied in all calculations as the numbers of subjects in all groups were
small. Kruskal-Wallis was used to assess differences between 3 or more groups and
Dunn’s post test used to detect differences between pairs groups. The Mann
Whitney U test was used to detect differences between 2 groups. Repeatability for
repeated biopsy measurements over time was assessed using the CoV. Variability of
measurements within biopsy was also assessed using the CoV. Agreement between

124
2 observers was assessed using intraclass correlation coefficient and Bland-Altman
plots. Sample size was determined by recruitment to the previous study and success
of follow up at school age. However, for adult EB studies, 15 patients for
inflammatory studies and 10 for RBM thickness in each limb are usually sufficient to
give positive results(225).
3.3 Results
3.3.1 Repeatability of RBM thickness measurements
Three sections were measured on 3 occasions at intervals of a week and a month by
RO’R. The mean CoV for the 3 sections measured on 3 occasions was 5.7% (3.5%,
4.7% & 8.8%), table 3.1.
Table 3.1: Variability between measurements in the same section by the same
observer at day 1, day 7 and day 30
Day 1 µm
Day 7 µm
Day 30 µm
CoV %
Section 1 5.5 5.3 5.1 3.5
Section 2 5.1 4.8 5.2 4.7
Section 3 4.3 4.5 3.9 8.8
3.3.2 Comparison with previous reticular basement membrane thickness
measurements
The values for RBM thickness measured by RO’R are similar to those reported by
SS, in 2007(9). The ICC for measurements in the same child compared between
RO’R and SS is 0.67. There was no significant bias between the 2 observers shown
by using a Bland-Altman plot, figure 3.2.

125
Figure 3.2: A Bland-Altman plot showing variability between measurements as
reported by observer 1 (RO’R) and observer 2 (SS). No significant bias is
detectable
2 4 6 8
-4
-2
0
2
4
+2SD
-2SD
Mean of measurements from ROR &SS
Bias
Measu
rem
en
t R
OR
- M
easu
rem
en
t S
S
3.3.3 Reticular basement membrane thickness related to preschool clinical
status
Biopsies were suitable for measurement of RBM thickness in 37 wheezers. Children
had been further divided into 2 groups using the video questionnaire at preschool
age into CW (n=21) and RW (n=16). There were 16 controls. The RBM was
significantly thicker in all wheezers both confirmed and reported (median thickness
4.5µm [1.41-7.3µm]) compared to controls (median 3.58µm [1.2-5.99 µm]), p=0.009,
figure 3.3. The RBM was significantly thicker in CW (median 4.76µm [3.1-7.3µm])
compared to controls (median 3.58µm [1.2-5.99µm]), p=0.02, but there was no
difference between both CW and RW (median 4.19µm [1.4-5.77µm]), or RW and
controls, figure 3.4.

126
Figure 3.3: Increased reticular basement membrane thickness in
endobronchial biopsies from preschool wheezers compared to age matched
controls (RO’R measurements)
p=0.009
Wheezers (n=37) Controls (n=16)0
2
4
6
8R
BM
th
ickn
ess(
m)
Figure 3.4: Increased reticular basement membrane thickness in preschool
confirmed wheezers compared to controls (RO’R measurements)
(There was no difference between confirmed and reported wheezers or reported
wheezers and controls)
p=0.02
CW (n=21) RW (n=16) Controls (n=16)0
2
4
6
8
RB
M t
hic
kn
ess(
m)

127
3.3.4 Relationship of reticular basement membrane thickness at preschool age
to asthma at school age
Thirty nine children with RBM thickness measured at preschool age were followed
up at school age. There was no difference between children with RBM
measurements who were followed up at school age and those not followed up in
terms of age at EB (p=0.4), RBM thickness (p=0.54) or sex (p=1). Preschool RBM
thickness was similar in children with school age asthma (median 4.77µm [range
3.14-7.02µm]) when compared to those without asthma (median 4.14µm [range 1.2-
5.99µm]), p=0.15, figure 3.5.
Figure 3.5: No difference in preschool reticular basement membrane thickness
when compared with presence or absence of asthma at school age (RO’R
measurements – all children included)
p=0.15
Asthma (n=12) No asthma (n=27)0
2
4
6
8
RB
M t
hic
kn
ess(
m)
On examining the children who wheezed at preschool age (excluding preschool
controls), there was a trend towards increased RBM thickness in preschool
wheezers who developed childhood asthma (n=11, median 4.79 [3.38-7.02]µm),
when compared to those preschool wheezers who stopped wheezing (n=18, median
4.17 [1.4-5.72]µm) but it was not statistically significant, p=0.12, figure 3.6. There
was a significant difference between age at EB of those preschool wheezers who
developed school age asthma (42 [24-57] months) and the preschool wheezers who
did not (15.5 [7-55] months), p=0.002.

128
Figure 3.6: No difference in reticular basement membrane thickness in severe
recurrent preschool wheezers when compared with presence or absence of
asthma at school age- (RO’R measurements-preschool wheezers alone)
p=0.12
Asthma (n=11) No asthma (n=18)0
2
4
6
8
RB
M t
hic
kn
ess(
m)
3.3.5 Comparison of Dr Saglani’s reticular basement membrane measurements
with asthma status at school age
SS’s measurements of RBM thickness in preschool children showed a significant
difference between groups classified by asthma status at school age, in that those
children who developed asthma (n=11, median 5.1µm [range 3.1-8µm]) had
increased RBM thickness when compared with those who did not (n=28, median
3.94µm [range 2-5.44µm]), p=0.02, figure 3.7. However, individual measurements for
children showed no significant bias between the 2 observers. Further sections had
been cut and stained with H&E since the original study so one child with asthma at
school age had not had RBM measured by SS but had by RO’R.

129
Figure 3.7: Dr S Saglani’s measurements showing increased reticular
basement membrane thickness at preschool age in children with school age
asthma (all children followed up)
p=0.02
Asthma (n=11) No asthma (n=27)0
2
4
6
8
10
RB
M t
hic
kn
ess(
m)
Preschool wheezers compared with school age asthma status
On examining just the children who had wheeze at preschool age there was again
significantly greater RBM thickness in those who developed school age asthma
(n=10, median 5.25 [3.4-8]µm) compared with those who did not (n=18, median 4.15
[2.12- 5.44] µm), p=0.02, figure 3.8.
Figure 3.8: Dr S Saglani’s measurements showing increased reticular
basement membrane thickness in severe recurrent preschool wheezers who
developed school age asthma when compared to preschool wheezers who did
not develop asthma (preschool wheezers alone)
p=0.02
Asthma (n=10) No asthma (n=18)0
2
4
6
8
10
RB
M t
hic
kn
ess(
m)

130
3.3.6 Comparison of preschool reticular basement membrane thickness with
clinical findings at school age
All RBM thickness measurement reports are as measured by RO’R unless otherwise
stated. RBM thickness at preschool age correlated with the number of overnight
hospital admissions as reported by the child’s carer at school age over that child’s
lifetime (r=0.56, p=0.001), figure 3.9. However there was no association between
wheeze frequency at school age or reported medication use at school age, and RBM
thickness at preschool age, table 3.2.
Figure 3.9: Positive correlation with number of lifetime overnight admissions
to hospital with wheeze reported at school age and reticular basement
membrane thickness at preschool age
r=0.50, p=0.008
0 20 40 600
2
4
6
8
160
Number of hospital admissions
RB
M t
hic
kn
ess(
m)

131
Table 3.2: Clinical findings at school age related to reticular basement
membrane thickness at preschool age
Asthma No Asthma p
RBM (µm)
n=12
4.77(3.14-7.02)
n=27
4.14(1.2-5.99)
0.15
Age at asthma diagnosis (years) Age at FOB (months) Male/ Female Symptoms at school age
8.6 (6-10.4) 38.5 (3-57)
8/4
7.2 (5.9-11) 17 (6-55)
16/11
0.09 0.005 0.73
Wheeze in the last year RBM (µm)
n=17
4.55 (3.1-7.02)
n=22
4.11 (1.2-5.99)
0.41 Wheeze 4-12 times/ last year* RBM (µm)
n=12 4.63 (3.38-7.02)
n=12 3.73 (1.2-5.99)
0.16
Wheeze > 12 times/ last year* RBM (µm)
n=5 5.07 (3.38-7.02)
n=12 3.73 (1.2-5.99)
0.44
ICS use at school age RBM (µm)
n=13 4.76 (3.38-7.02)
n=16 4.19 (1.4-5.7)
0.39
Positive skin prick tests school age RBM (µm)
n=9
4.5 (1.4-4.97)
n=18
4.07(1.2-7.02)
0.37
*When compared to children who did not wheeze either at preschool or school age (All reported values are Dr R O’Reilly’s measurements)

132
3.3.7 Comparison of preschool reticular basement membrane thickness with
measurements of airway inflammation and lung function at school age
There was no correlation between spirometry, LCI or Scond and preschool RBM
thickness, table 3.3. Similarly there was no relationship between FeNO50 and RBM
thickness. There was a negative correlation between Sacin and RBM thickness at
preschool age (r=-0.53, p=0.008), figure 3.10.
Table 3.3: Correlation between lung function and airway inflammation at
school age with reticular basement membrane thickness at preschool age
RBM thickness (µm)
Correlation (Spearman)
p value
FEV1 (z score) n=27 FVC ( z score) n=27
0.18 -0.1
0.38 0.6
LCI n=28 Sacin
Scond
0.04 -0.54 0.22
0.82
0.008 0.29
FeNO (ppb) n=26
0.09
0.65
*Over child’s lifetime (with wheeze)
Figure 3.10: Negative correlation between reticular basement membrane
thickness (n=23) at preschool age and Sacin at school age
Spearman r=-0.53, p=0.008
0.0 0.2 0.4 0.6 0.80
2
4
6
8
Sacin
RB
M t
hic
kn
ess(
m)

133
On comparing RBM thickness in the preschool wheezers alone there was a non-
statistically significant trend with FEV1 (n=20, Spearman r=0.42), p=0.07, figure 3.11
(i) and FeNO50 (n=19, Spearman r=0.44), p=0.06, figure 3.11 (ii). There was no other
positive correlation between preschool wheezers and lung function measurements.
Figure 3.11 No correlation between RBM thickness in preschool wheezers and
(i) FEV1 and (ii) FeNO50 at school age
Spearman r=0.42, p=0.066
-2 -1 0 1 2
2
4
6
8
FEV1 z score
RB
M t
hic
kn
es
s (
m)
Spearman r=0.44, p=0.06
0 10 20 30 400
2
4
6
8
FeNO50 (ppb)
RB
M t
hic
kn
es
s (
m)
(i)
(ii)

134
3.4 Summary of findings RBM thickness
Review of hypothesis
Preschool wheezers who persistently wheeze and have asthma at school age have
increased RBM thickness on endobronchial biopsy compared to those wheezy
preschool children whose symptoms subsequently regressed.
In summary;-
Measurement of RBM thickness by a second blinded observer (RO’R)
confirmed previous findings showing increased RBM thickness in severe
recurrent wheezers when compared with non wheezing controls
There was no difference in preschool RBM thickness as measured by RO’R
when compared with presence or absence of school age asthma. The SS
measurements showed increased RBM thickness in preschool wheezers who
developed school age asthma. Both observers had similar coefficients of
variation of RBM measurements, and this discrepancy (which likely arises
because different sections were analysed by the two observers) makes RBM
thickness unlikely to be a robust predictor of school age asthma in the
individual child.
RBM thickness at preschool age correlated with the number of lifetime
hospital admissions with wheeze (at the time of the research visit)
3.5 Discussion:-Preschool RBM thickness and school age asthma
RBM thickness in severe recurrent wheezy preschool children, at least as measured
by RO’R, did not discriminate which children developed school age asthma,
suggesting RBM thickness in preschool wheezers may relate to current symptoms
rather than future asthma risk. Even the SS measurements showed a marked
overlap between the two groups. RBM thickness in severe recurrent CW (median 4.6
µm [3.1-7.3µm]) is greater than controls (median 3.5µm [1.2-5.99 µm]), but much
less than older children with severe asthma (median 8.2µm [range 5.4–11.1µm])(116)
and adults with asthma (8.1µm [5.8–10.0µm])(116). This suggests remodelling is not
yet fully developed in the RBM of children with preschool wheeze which may reflect
symptom duration. It would have been very interesting but unethical to repeat the

135
endobronchial biopsy at time of asthma diagnosis to correlate RBM thickness at
preschool and school age.
There was a discrepancy between measurements of RBM thickness by RO’R and
SS related to school age asthma status. The CoV for SS (mean 7%) for
measurement of RBM thickness was very similar to RO’R (mean 6%). It is likely
observers did not measure the same section for a given child and there can be
between biopsy variability for the same child as reported by SS which may have
contributed to the different results. The between biopsy variability for RBM thickness
was assessed by SS for 6 patients who had 2 good quality biopsies. The results are
shown in table 3.4.
Table 3.4: Between biopsy variability of RBM thickness for 6 preschool
children as measured by SS
Subject number
RBM thickness (μm)
Biopsy 1 Biopsy 2
1 6.0 5.7
2 4.9 4.9
3 3.9 3.8
4 4.3 4.8
5 3.3 4.0
6 6.0 7.0
Unfortunately but unavoidably, there was also a significant difference between age of
EB in children with RBM measured who developed asthma at school age (median
age 38.5 months) and those who did not develop asthma (median age 17 months),
p=0.002. The natural history of RBM development has been recently established and
shows that RBM thickness increases during infancy, childhood and adolescence until
age 17 years, figure 3.12(113). In particular the rate that RBM thickness increase is
greater in children less than 6 years old than in children older than 6 years(113). Data
suggests that RBM thickness should increase at least 1µm between age 1 year and
2.5 years, which is approximately the difference in RBM thickness and difference in
age at EB seen between children with and without school age asthma as measured
by SS. This suggests that the increased RBM thickness in the preschool years seen
in those who went on to develop school age asthma may be related to age rather

136
than airway remodelling. However, a larger study with age-matched controls is
required to confirm or refute this.
Figure 3.12: RBM thickness related to age in post-mortem sections from
children without known lung pathology (Adapted from Tsartsali et al)(113)
Severity of wheeze (as measured by the number of overnight hospital admissions
with wheeze over the child’s lifetime to point of research visit) was related to RBM
thickness at preschool age (Spearman r=0.56, p=0.001). This observation is
vulnerable to recall bias over a 7-10 year time period. Other markers of severity
including frequency of wheeze over the past 12 months or current use of ICS were
not related to RBM thickness at preschool age. There is no obvious reason why Sacin,
a measure of ventilation inhomogeneity in the acinar airways correlated with RBM
thickness, measured in larger, very proximal airways.
RBM thickness did correlate weakly with FeNO50 at age 7 years, but only in the
children who had wheezed at preschool age. This was similar to the findings when
some of this group of wheezers were followed up at 5 years(63). There was also a
non-significant association between FEV1 z score at school age and RBM thickness
at preschool age in the preschool wheeze group, with those with increased RBM
thickness having better lung function. It is unlikely this is related to a protective effect
of RBM thickness on the airway as suggested by other studies(223;226), but rather that
several of the wheezy children had other lower airway pathology at school age.
Increased RBM thickness has been reported in adults with chronic cough(221) and in

137
children with bronchiectasis (related to cystic fibrosis)(219). Finally, the small numbers
preclude definitive conclusions.
At preschool age there was a large overlap in RBM thickness between wheezers and
controls suggesting that RBM thickness alone was unlikely to be a good predictor for
future asthma. This was confirmed when preschool RBM thickness was compared
with school age asthma status. The next hypothesis to be tested was that individual
components of the RBM may be a more sensitive marker of future asthma in
preschool wheezers.

138
Chapter 4
Components of the reticular basement membrane in
preschool wheezers and their relationship
with childhood asthma.
4.1 Components of the reticular basement membrane
The extracellular matrix (ECM) which includes the interstitial matrix and the RBM is
composed of macromolecules that form the scaffolding of the airways. It consists of
a complex network of proteins which affect many aspects of cellular behaviour
including proliferation, differentiation, survival, adhesion and migration(227). Increased
thickness of the reticular basement membrane results from increased extracellular
matrix protein deposition. There are many extracellular matrix glycoproteins including
collagen I, III and V, fibronectin, laminan, versican and tenascin(227). The quantity of
ECM proteins is increased in asthmatic airways(227). This may be due to increased de
novo protein synthesis, decreased activity of their degrading enzymes, i.e. matrix
metalloproteinases (MMPs), or increased activity of tissue-specific inhibitors of
metalloproteinase (TIMPs).
Tenascin-C (TN-C) is a particularly relevant ECM glycoprotein as its expression is
increased in lung development and in inflammatory, fibrotic and neoplastic diseases
but is almost absent otherwise. Five isoforms of tenascin (TN) have been
characterised, namely TN-C, TN-R, TN-X, TN-Y and TN-W(228). TN-R is found in the
developing and adult nervous system, TN-X is primarily found in loose connective
tissue, TN-W is found in the kidney and in developing bone and TN-Y in the
developing skeleton of zebra fish(141). TN-C was the first to be identified and it is the
best studied(229). It is TN-C that is referred to throughout this thesis. TN-C was
selected for further investigation, in particular since its absence in health and
presence in disease states in the airways suggested it may be a more accurate
predictor of future asthma in preschool children than RBM thickness alone(141).
Limited biopsy tissue was available for staining and for this reason TN-C was the
only component of the RBM that could be studied.

139
4.1.2 Tenascin-C expression during foetal lung development
During foetal development TN-C is expressed maximally at 12-23 weeks gestation,
particularly at sites of airway branching during the canalicular phase (17-23 weeks)
of development(230). During the saccular phase (24-40 weeks) of development TN-C
expression is weaker but still present below the alveolar and bronchiolar epithelium,
and strongly expressed in the RBM(230;231). It has been suggested that the increased
expression of TN-C in basement membranes surrounding the glandular, acinar and
vascular structures of the developing lung might have an important function in the
morphogenesis of the dividing bronchial and vascular trees, and in determining
whether specific cells will adhere to the matrix(231). This is further supported by
evidence from embryonic mice TN-C(-/-) who had significantly decreased airway
branching when compared to wild type mice(232).
4.1.3 Tenascin-C expression in the lung during health and disease
TN-C expression is associated with tissue injury and repair(141). TN-C has also been
shown to be specifically and transiently upregulated during acute inflammation and
persistently expressed in chronic inflammation(141). In the lung increased TN-C
expression in the pleura can be used as a marker of active pleural involvement in
inflammatory and fibrotic diseases(233). The most positive areas of TN-C
immunoreactivity are newly formed areas of fibrosis(233), suggesting it may be active
in acute inflammation. TN-C concentration in the airway epithelial lining fluid is
increased in patients with usual interstitial pneumonia, sarcoidosis, and extrinsic
allergic alveolitis(234). It is also widely expressed in the stroma of lung
carcinomas(235;236).
4.1.4 Tenascin-C expression in the airways in asthma
TN-C expression is also increased within the RBM in asthma(142-144). TN-C
expression within the RBM is elevated in adult asthmatics when compared with non-
asthmatic, non-atopic controls(144). TN-C thickness within the RBM was shown to be
significantly thicker in atopic when compared to non-atopic adult asthmatics (7.6 vs
6.3µm)(143). The thickness of TN-C correlated with eosinophils, T lymphocytes,
macrophage counts and IL-4 positive submucosal cells only in atopic asthmatics(143).
Acute inhalational allergen challenge of atopic adult patients with asthma increased
collagen synthesis and TN-C deposition within the RBM(237). This was associated

140
with increased eosinophilic inflammation and evidence of IL-4 / IL-13 expression in
the airway epithelium(237). However, TN-C deposition within the RBM was only
increased at 24 hours post allergen challenge, and had returned to baseline levels
by 7 days(238).
It has been shown that TN-C(-/-) mice that had been sensitised and challenged with
ovalbumin had decreased airway hyperreactivity, NF-kB activation and
concentrations of monocyte chemoattractant protein-1, IL-5, IL-13,
metalloproteinase-9 and IgE in the bronchoalveolar lavage fluid compared to their
wild type counterparts(239). The authors suggested that future work should explore
TN-C in the pathogenesis of bronchial asthma(239).
The next hypothesis tested was that TN-C expression
1) is greater in preschool children with recurrent wheeze when compared with age
matched controls.
2) is greater in preschool children with recurrent wheeze who develop future asthma
Aims and objectives
1. To establish the most discriminative and repeatable method of measuring TN-
C expression within the reticular basement membrane in endobronchial
biopsies archived in paraffin.
2. To compare TN-C expression at preschool age between wheezers and
controls and with presence or absence of asthma at school age
4.2.1 Methods- Tenascin–C immunohistochemistry staining
All previous studies in adult asthmatics quantifying TN-C expression in the RBM
have used snap frozen endobronchial tissue and either immunofluorescence(142-144)
or immunohistochemistry(220). All preschool endobronchial biopsies archived from
2002-2005 had been formalin fixed and paraffin embedded and there was no frozen
tissue available. However, TN-C expression has been measured in paraffin
embedded neoplastic breast tissue(240), myocardium(241), glomeruli(242) and the
developing fetal lung(230;231;243). This is the first attempt at quantifying TN-C in the
RBM of endobronchial biopsies processed in paraffin.

141
Details of endobronchial biopsy procedure, processing and evaluation are given in
chapters 2 and 3. The preschool endobronchial biopsy tissue studied in this chapter
was processed and stained by Dr J Zhu. Unstained tissue sections (5µm) from
biopsy blocks were plated on poly-l-lysine-coated glass slides then deparaffinised in
xylene and dehydrated. Next all sections were treated for 30 min with 1.5% hydrogen
peroxide in distilled water to quench endogenous peroxidase activity. Sections were
rinsed and bathed in phosphate buffered saline (PBS) twice for 5 minutes each time
and then treated with 10% normal goat serum in PBS for 20 minutes. Slides were
then incubated with mouse monoclonal antibody to tenascin-C (T2H5 ABCAM cat:
3970)(240) dilution 1:40 with PBS at room temperature for 2 hours. Sections were
again rinsed and bathed in PBS twice for 5 minutes each time. The sections were
then incubated with HRP labelled polymers (which did not contain avidin-biotin
complex) conjugated with secondary antibodies at room temperature for 40 minutes
(Dako EnVision+ system, HRP, K4007). Rinsing and bathing with PBS twice for 5
minutes was repeated. The antigen–antibody reaction was visualized using 3,3′-
diaminobenzidine tetrahydrochloride (DAB) substrate chromagen which results in a
brown coloured precipitate at the antigen site. The slides were then rinsed in distilled
water and counterstained in Harris’ H&E stain, dehydrated and mounted.
4.2.2. Quantification of tenascin-C within the reticular basement membrane
It was important to establish a method that was both discriminative and repeatable in
quantifying TN-C expression within the RBM of immunohistochemically stained
sections. Three different methods were used -
1) measurement of TN-C thickness using computer aided image analysis
2) a semi-quantitative method using a picture grading system
3) measurement of TN-C using stereology techniques.
All biopsies were identified by number only. TN-C was measured in all sections that
included recognisable epithelium, RBM and subepithelial mucosa. Leica DM2500
microscope, Leica DFC 300fx camera and LEICA Qwin version 3 software were
used for all 3 methods.

142
4.2.2.1 Method 1- Measurement of tenascin-C thickness using computer aided
image analysis
The mean of all TN-C thickness measurements at 20µm intervals along the whole
RBM, using computer aided image analysis were calculated. This method has
previously been used to measure total RBM thickness(225), see chapter 3. The first
measurement was taken at the upper right hand corner and the biopsy followed
anticlockwise with subsequent measurements at 20 µm intervals for the whole length
of the RBM. At each point a line perpendicular to the length of RBM was drawn,
figure 4.1 (a), and TN-C was considered positive if any level of staining was present,
figure 4.1 (b). ‘0’ was recorded if no staining for TN-C was present, figure 4.1 (c).
The mean of all measurements was taken to represent RBM TN-C thickness for that
biopsy.
Figure 4.1: (a): Measuring tenascin-C thickness
TN-C thickness is measured perpendicular to the length of RBM

143
Figure 4.1: (b): Tenascin-C positive staining in the RBM (magnification x400)
Figure 4.1: (c) Tenascin-C negative staining in the RBM (magnification x400)
4.2.2.2 Method 2- Semi-quantitative measurement of tenascin-C using a picture
grading system
A semi quantitative scale was used to grade the TN-C positive proportion of RBM in
the biopsy. Similar scales have been used to quantify TN-C expression in the
myocardium of patients with myocarditis(241), the glomeruli of adults with IgA
nephropathy(242) and within the RBM of adults with COPD and asthma(220). Each
30µm

144
section was photographed at magnification X100 and re-numbered by an
independent observer (Dr N Ullmann). Where more than one photomicrograph of a
section was taken it was labelled with the same number and the pictures were
reviewed together. The photographs were scored 0, 1 or 2 using a picture coded
scale one week later, figure 4.2. Grade 0 represented <1/3 of the RBM stained
positive for TN. Grade 1 represented 1/3-2/3 of the RBM stained positive for TN and
grade 2 represented > 2/3 of the RBM stained positive for TN-C. They were
assessed by a single blinded observer (RO’R) on a computer screen with the picture
scale as reference. The same photographs were again reassessed by RO’R using
the same method 1 week and 1 month later, in each case blinded to any previous
measurements.
Figure 4.2: Reference pictures used to grade tenascin-C expression in the
reticular basement membrane using a semi quantitative scale
Grade 0: <1/3 of the total RBM stained positive for tenascin-C

145
Grade 1: 1/3-2/3 of the RBM stained positive for tenascin-C
Grade 2: ≥ 2/3 of the RBM stained positive for tenascin-C
4.2.2.3 Method 3- Measurement of tenascin-C using stereology
Stereology is the study of the three-dimensional properties of objects usually seen in
two dimensions. Thus, by using stereology-based techniques, one can obtain
quantitative three-dimensional information from measurements in the two
dimensions of conventional histology(85). The biopsy section was examined using oil
emersion at magnification x1000. The image was projected onto a computer screen
and a virtual graticule containing 100 points each a fixed distance apart was overlaid
on the top right hand corner of the biopsy at random but it was ensured that at least
TN

146
one point landed on the RBM, figure 4.3. The graticule was then moved along the
total length of the RBM. Care was taken not to overlap the graticule overlay by using
biopsy landmarks.
Figure 4.3: Tenascin-C staining overlayed by graticule (magnification X1000)
Only TN-C positive and negative points within the RBM were counted. A point on the
graticule was considered positive if it overlay an area stained positive for TN-C. Two
quadrants or more, or the top right hand quadrant had to overlay an area stained
with TN-C to be considered positive, figure 4.4. Similarly the same criteria applied to
all points falling on the RBM. The number of points that were TN-C positive were
expressed as a proportion of the total number of points on the RBM.
20µm

147
Figure 4.4: Criteria for tenascin positive and negative points.
A point was positive if it overlayed 2 or more quadrants or the upper right quadrant
+ + + + A point was negative if it overlayed 1 or less than 1 single quadrant other than the
upper right quadrant
+ + + +
4.2.3 Repeatability of measurements
The intra-observer repeatability of measurements was calculated by assessing the
same biopsy 3 times at least a week and a month apart, and represented as the
CoV. This was done for the same 4 sections using both methods 1&3. The mean of
the 4 measurements of the CoV was used as a measure of repeatability for that
method. The intraclass correlation coefficient was used to measure the repeatability
of method 2 where all biopsies were assessed using a semi-quantitative scale a
week and a month apart.
4.3 Results
4.3.1 Biopsy size and number
Biopsies of good quality to assess RBM TN-C were available in 48 preschool
children, of which there were 31 wheezers (median age 24 months) and 8 controls
(median age 19.5 months). Wheezers were subdivided into CW (n=15, median age
31 months) and RW (n=16, median age 15.5 months). Length of RBM was
measured at magnification x100 using computer aided image analysis. There was no
significant difference in the length of RBM measured between wheezers and controls
(p=0.29). RBM thickness measured by RO’R and not that measured by SS in 2007(9)
was compared with RBM TN-C expression.
X
X X
X X
X

148
Table 4.1: Number of patients in each group with at least 1 biopsy of good
quality for (i) tenascin measurement, (ii) reticular basement membrane
thickness
CW RW Control P
Number of patients with biopsies available for TN measurement Number of patients with good quality biopsy for RBM and TN measurement Median length of RBM in (µm) (Tenascin immunostained biopsies) Range (µm)
15
15
1509
729-6412
16
15
2130
881-5248
8 7
1760
998-2233
0.4
4.3.2 Comparing methods of quantifying TN-C
1. To compare 3 methods of quantifying TN-C expression within the RBM in
endobronchial biopsies from preschool wheezers and controls to find the
most discriminative and repeatable method for measuring TN-C
Method 1- Measurement of tenascin-C thickness using computer aided image
analysis
There was no significant difference between the 3 groups at magnification X400
(p=0.07), figure 4.5 (a). The median TN RBM thickness did show a trend for higher
values in CW (2.7µm) when compared with controls (0.89µm) and RW (0.85µm),
p=0.07. The CoV for biopsies from 4 children measured on 3 occasions a week and
a month later was 34%, 29%, 8.8% and 8.25% giving a mean of 20%.
Measurement of TN-C thickness at higher magnification (x1000) improved
repeatability of measurements and again showed a trend for a difference between
CW (2.35µm) and controls (0.96µm) (p=0.05), figure 4.5 (b). However, Dunns post
test did not detect a difference between confirmed CW, RW or controls. Mann
Whitney U test detected a significant difference between CW and controls (p=0.02).
Repeatability was also improved at X1000, the coefficient of variation in the same 4
biopsies was 29%, 10.5%, 3% and 1.1%, giving a mean of 10.9%. RBM TN-C

149
measurements at magnification 400 and 1000 correlated well (Spearman r =0.91, (CI
0.84-0.95), p<0.0001).
Figure 4.5: Measurement of tenascin-C thickness within the reticular basement
membrane of endobronchial biopsies at (a) magnification x400 and (b)
magnification x1000
(a) Magnification X400
p=0.19
Wheezers (n=31) Controls (n=8)0
2
4
6
8
TN
-C t
hic
kn
ess (
m)
p=0.07
CW (n=15) RW (n=16) Controls (n=8)0
2
4
6
8
TN
-C t
hic
kn
ess (
m)
(i) (ii)
(b) Magnification X1000
p=0.32
Wheezers (n=31) Controls (n=8)0
2
4
6
8
TN
-C t
hic
kn
ess (
m)
p=0.056
CW (n=15) RW (n=16) Controls (n=8)0
2
4
6
8
TN
-C t
hic
kn
ess (
m)
(i) (ii)

150
Method 2 – Semi-quantitative method using a picture grading system
The scale completely failed to differentiate the groups, figure 4.6. Repeatability for
this method was measured using the ICC, a week and a month later. All biopsies
were assessed on each occasion. The ICC was 0.93 (p<0.001) and 0.87 (p<0.001)
at 1 week and 1 month respectively.
Figure 4.6: Tenascin-C expression quantified by a semi quantitative scale.
p=0.38
Wheezers (n=31) Controls (n=8)0.0
0.5
1.0
1.5
2.0
2.5
Sem
i Q
uan
tita
tive s
cale
p=0.39
CW (n=15) RW (n=16) Controls (n=8)0
1
2
Sem
i Q
uan
tita
tive s
cale
(i) (ii)
Method 3:- Measurement of tenascin-C using stereology techniques
The third method assessed the proportion of the RBM that stained positive for TN-C.
This showed significant difference between CW (median 83%) and controls (median
38%) (p=0.04), figure 4.7(ii). Although the Kruskal Wallis test was significant
(p=0.04), Dunns post test did not detect a difference between the 3 groups. Mann
Whitney U test detected a difference between CW and controls (p=0.04).
Repeatability for this method was assessed measuring the same 4 biopsies on 3
occasions a week and a month apart. CoV were 23%, 12.5%, 1% and 2.5%
respectively, mean of 9.75%.

151
Figure 4.7: Proportion of the RBM occupied by tenascin-C measured using
stereology techniques
p=0.25
Wheezers (n=31) Controls (n=8)0
20
40
60
80
100
Pro
po
rtio
n o
f T
N-C
in
RB
M (
%)
p=0.04
CW (n=15) RW (n=16) Controls (n=8)0
20
40
60
80
100
Pro
po
rtio
n o
f T
N-C
in
RB
M (
%)
(i) (ii)
Summary
Intra-observer repeatability (CoV) was more reliable at higher magnification (x1000)
for method 1 (measuring TN-C thickness) and method 3 (measuring proportion of
TN-C occupying the RBM), table 4.2, as it was easier to distinguish TN-C positive
and negative areas of the RBM at higher magnification. Both methods also showed
TN-C expression to be increased in CW when compared with controls when
quantified as TN-C thickness within the RBM and proportion of the RBM occupied by
TN-C. Method 2 (semi-quantitative scale) had excellent repeatability (ICC= 0.87) but
very poor group discrimination. Either method 1 or 3 was therefore suitable for
quantifying TN-C at magnification 1000, as both have similar repeatability. It is these
results that are reported throughout the rest of the analysis.
Table 4.2: Repeatability of measuring of tenascin-C thickness at x400 & 1000,
and of measuring the proportion of tenascin-C occupying the reticular
basement membrane using stereology x1000.
Coefficient of Variation (%)
TN thickness x400 TN thickness x1000 Stereology x1000
Biopsy 1 Biopsy 2 Biopsy 3 Biopsy 4
34 29 8.8
8.25
29 10.5
3 1.1
23 12.5
1 2.6
Mean 20 10.9 9.75

152
4.4 RBM Tenascin-C compared by viral and multiple-trigger wheeze
phenotypes
There was no difference in TN-C thickness (n=6, 1.59(1.04-2.64)µm vs n=25,1.66(0-
7.2)µm, p=0.98) or proportion of RBM TN-C (n=6, 82.5 (43.5-92.9)% vs n=25, 57 (0-
100)%, p=0.26) between children with viral or multiple-trigger wheeze at preschool
age, figure 4.8.
Figure 4.8: No difference between (i) RBM tenascin-C thickness and (ii)
proportion of RBM tenascin-C between viral and multiple-trigger wheezers at
preschool age
p=0.98
Viral (n=6) Multiple-trigger (n=25)0
2
4
6
8
TN
-C t
hic
kn
ess (
m)
p=0.26
Viral (n=6) Multiple-trigger (n=25)0
20
40
60
80
100P
rop
ort
ion
of
TN
-C in
RB
M (
%)
(i) (ii)
4.5 Inhaled corticosteroids and RBM tenascin-C
There was no difference in RBM TN-C thickness between those treated with ICS
(n=16, median 1.44(0-7.2)µm) at time of EB and those who were not treated with
ICS (n=15, median 2.28 (0-4.25)µm), p=0.62, figure 4.9 (i). Similar results were seen
for proportion of RBM TN-C. Four of the children not on ICS had been treated with
oral corticosteroids in the month prior to biopsy. However there was still no
difference when children on oral corticosteroids were included in the analysis.

153
Figure 4.9: No relationship between inhaled corticosteroids and (i) RBM
tenascin-C thickness and (ii) proportion of RBM tenascin-C
p=0.62
ICS (n=16) No ICS (n=15)0
2
4
6
8
RB
M T
N-C
th
ick
ne
ss
(
m)
p=0.41
ICS (n=16) No ICS (n=15)0
20
40
60
80
100
Pro
po
rtio
n o
f T
N-C
in
RB
M (
%)
(i) (ii)
Table 4.3: Summary of reticular basement membrane tenascin-C composition
in preschool wheezers compared with preschool controls. There is an increased
proportion of RBM tenascin-C in preschool wheezers when compared to controls.
Wheezers n=31
Controls
n=8
P
CW n=15 RW n=16
Median age (months) (Range)
24 (7-58)
19.5
(11-42)
0.9
CW=31 (7-57)
RW=15.5 (8-58)
0.23
Male/ Female 17/14 4/4
1
CW=7/8 RW=10/6
0.65
Inhaled corticosteroids* Median BDP (mcg)* (Range mcg)
n=16 800
(200-2000)
n=3 500
(200-500)
0.2
CW n=8 900
(500-2000)
RW n=8 400
(200-1000)
0.025
Magnification x400 TN-C thickness (µm) Median (range)
1.89 (0-7.47)
0.895
(0-2.77)
0.19
CW=2.74 (0-7.47)
RW=0.85 (0-5.03)
0.07
Magnification x1000 TN-C thickness (µm) Median (range)
1.66 (0-7.2)
0.97 0-2.7
0.32
CW=2.35 (0.29-7.2)
RW=1.02 (0-4.25)
0.056
Magnification x1000 Proportion of RBM TN-C median % (Range)
61.5 (0-100)
41.2
(0-92)
0.25
CW=82.9 (12.6-100)
RW=37.7 (0-94.7)
0.04

154
4.6 Relationship between reticular basement membrane tenascin-C expression
and reticular basement membrane thickness
There was a weak correlation between RBM TN-C thickness (method 1) and total
RBM thickness (Spearman r=0.34, CI= (0.012-0.61), p=0.04, figure 4.10 (a).
However, comparing RBM TN-C (method 3) and RBM thickness (Spearman r=0.33,
p=0.04), the confidence interval included zero (-0.001-0.60) showing it is not
significant, figure 4.10 (b).
Figure 4.10: Relationship between tenascin-C and total reticular basement
membrane thickness when measured as (a) tenascin-C thickness within the
reticular basement membrane, and (b) as the proportion of tenascin-C
occupying the reticular basement membrane.
(a) (b)
Spearman r=0.34, p=0.04
0 2 4 6 80
2
4
6
8
RBM thickness (m)
TN
-C t
hic
kn
ess (
m)
Spearman r=0.33, p=0.04
0 2 4 6 80
20
40
60
80
100
RBM thickness (m)
Pro
po
rtio
n o
f T
N-C
in
RB
M (
%)
4.7 Preschool reticular basement membrane tenascin-C and school age
asthma
RBM TN-C thickness (method 1) at preschool age was similar in children who
developed school age asthma (n=9, median 2.27 [0.29-7.2]µm) and children who did
not develop asthma (n=20, median 1.35 [0-3.67]µm), p=0.1, figure 4.11 (a). The
proportion of the RBM occupied by TN-C was also similar in those that did and did
not develop asthma (method 3) (median 61.5 [12.6-100]%) vs (median 50.4% [0-
94.7]%), p=0.11, figure 4.11 (b). When preschool wheezers alone were considered,
there was no difference in RBM TN-C thickness between those who developed
asthma (median 2.27µm [range 0.29-7.2]µm) and those who did not (median 1.99µm

155
[range 0 -3.67]µm), p=0.18. Similarly, there was no difference in the proportion of
RBM TN-C between those preschool wheezers who developed school age asthma
(median 61.5% [range 12.6-100]%) and those who did not (median 62.3% [range 0-
94]%), p=0.19. There was however a significant difference between age at EB in
children who had RBM TN-C measured who developed school age asthma (42 [24-
57] months) and those who did not (17.5 [7-55] months), p=0.003.
Figure 4.11:
a) No difference in reticular basement membrane tenascin-C thickness
(method 1) at preschool age in children who developed school age
asthma when compared with those who did not
p=0.1
Asthma (n=9) No asthma (n=20) 0
2
4
6
8
RB
M T
N-C
th
ickn
ess (
m)
b) No difference in the proportion of reticular basement membrane
tenascin-C (method 3) at preschool age between children who
developed asthma by school age and those who did not
p=0.11
Asthma (n=9) No asthma (n=20)0
50
100
150
Pro
po
rtio
n o
f T
N-C
in
RB
M (
%)

156
4.8 Tenascin-C expression within the reticular basement membrane and age
While TN-C expression is absent in developed lungs, the age at which normal
developmental TN-C expression ceases in the lungs is unknown. There was no
relationship between RBM TN-C expression and age in the controls, figure 4.12.
However, the numbers studied (n=8) are very small. It was not possible to assess
the relationship of TN-C expression within the RBM with age further because of
subsequent difficulties with immunostaining described below.
Figure 4.12: Relationship between age and (a) tenascin-C thickness within the
reticular basement membrane and (b) the proportion of tenascin-C occupying
the reticular basement membrane in control preschool children
(a)
spearman r=0.33, p=0.43
0 10 20 30 40 500
1
2
3
Age (months)
RB
M T
N-C
th
ickn
ess (
m)
n=8
spearman r=0.4, p=0.32
0 10 20 30 40 500
20
40
60
80
100
Age (months)
Pro
po
rtio
n o
f T
N-C
in
RB
M (
%)
n=8
(b)

157
4.9 Difficulties with tenascin-C staining in paraffin embedded tissue
The sections from the severe preschool wheezers and age matched controls were
stained successfully in 2 batches in 2007. The immunohistochemistry run was kept
constant on both occasions. It had been planned to explore the role of TN-C in older
children with severe asthma and also the natural history of TN-C expression in the
RBM of infants and children. However, subsequent immunohistochemical staining for
TN-C expression in the RBM of paraffin embedded tissue from adult resected
neoplastic lung tissue, and from endobronchial biopsies from older children with
severe asthma failed on several occasions in 2009 and 2010. Endobronchial tissue
archived in paraffin both before and after 2005 was used. The antibody initially used
in 2007 had been used up. The experiment was repeated by Dr J Zhu using two
further antibodies for TN-C from batches of mouse monoclonal antibody from the
original source (T2H5 cat no. abcam ab3970) using the previously successful
method, but still no TN-C staining was found on the previous positive controls of
tonsillar tissue.
A second investigator, Mr T Oates also tried staining the paraffin embedded
endobronchial tissue by changing reagents and the initial protocol in stages with no
success. The changes to the initial experiment are listed below.
1. The first change made was to dewax the slides from Histoclear® through alcohol
to PBS and this was done for all subsequent experiments.
2. After dewaxing sections an antigen retrieval step was added. The sections were
microwaved in pre-heated 10mM sodium citrate (2.941g in 1 litre milliQ water) on 3
occasions for 3 minutes. After each 3 minutes of heating a small amount of citrate
liquid was poured out and topped up.
3. The incubation period with mouse monoclonal antibody to tenascin-C (T2H5
ABCAM cat: 3970) was increased to 12 hours.
4. The sections were incubated with an avidin-biotin complex using biotinylated
mouse IgG (Vectastain Immunoperoxydase Elite ABC kit Cat No. PK6102, Vector
Laboratories) instead of labelled polymer HRP (Dako EnVision+ system, HRP,
K4007).

158
After these changes to the original protocol failed, a second TN-C mouse antibody
(Clone T2H5 Monosan, Cat No. MON7025) from a different manufacturer was used
throughout all the following experiments (numbers 5-7).
5. After dewaxing the sections the slides were left for 1 hour in PBS containing 1%
saponin to permeabilise the cell membranes. The same protocol was followed as in
the original experiment except PBS containing 1% saponin was used throughout all
incubations and washes. The slides were incubated with tenascin mouse antibody
(Clone T2H5 Monosan, Cat No. MON7025) overnight.
6. Antigen retrieval was performed by incubating the sections with pronase (1mg/ml)
at room temperature for 10 minutes (Sigma Aldrich, Cat No. 81748).
7. Finally, antigen retrieval was tried using Tris ethylenediaminetetraacetic acid
(EDTA) after dewaxing slides. The sections were treated with pre-heated Tris-EDTA
plus 0.05% Tween (pH 8.0) and heated for 4 times for 5 minutes topping up with
more Tris-EDTA after each 5 minutes. Slides were left to cool for 20 minutes after
treatment. This initially stained positive for tenascin-C on the tonsillar positive control
with completely clear negative IgG controls, figure 4.13 (a). However on repeating
the experiment 3 days later there was no tenascin-C staining of the same tonsillar
controls, figure 4.13 (b). This suggests that TN-C monoclonal antibody is unreliable
in paraffin embedded tissue.
Figure 4.13:
(a) Tenascin-C positive staining of the tonsillar tissue

159
(b) Absent tenascin-C staining of the same tonsillar tissue 3 days later.
Part of the difficulty in achieving consistent runs with the antibody may have been
because the endobronchial tissue had been processed in paraffin. In order to
compare TN-C measurement in paraffin sections and frozen tissue, 2 pieces of
adjacent lung tissue from excised solid lung tumours (n=5) were immersed in
formalin and preserved in paraffin, or snap frozen (-80C). The biopsies were snap
frozen by submerging in thawing iso-pentane, which had previously been frozen
solid in liquid nitrogen after mounting in optimum cutter (Bayer UK Ltd, United
Kingdom) on a cork base. They were then stored at -80C. 5μm sections were cut
from the frozen biopsies and were stained using the immunoperoxidase protocol
(Vectastain Immunoperoxidase Elite ABC kit Cat No. PK6102, Vector Laboratories).
The sections were incubated for 1 hour at room temperature with tenascin mouse
antibody (Clone T2H5 Monosan, Cat No. MON7025). Three of the 4 sections with
RBM stained strongly positive for TN-C despite no staining having been evident in
repeated experiments where immediately adjacent tissue had been processed in
paraffin.
The conclusion is TN–C staining using immunohistochemistry is not consistent in
paraffin processed tissue. It is unclear despite repeated experiments whether this is
due to length of tissue fixation or to a change in tenascin antibody since 2005. For
this reason a decision was made not to proceed with TN-C in further paraffin
embedded tissue sections.

160
4.10 Summary of findings
Review of hypothesis
School-aged children with asthma have evidence of airway remodelling and airway
inflammation in endobronchial biopsies taken while symptomatic at preschool age,
when compared to school-aged children without asthma.
TN-C within the RBM was greater in preschool children with severe recurrent
wheeze when compared with age matched controls, but did NOT discriminate which
children developed future asthma.
In the initial, successful staining runs:
Measurement of TN-C thickness was both discriminative and repeatable using
stereology techniques at magnification X1000. Higher magnification aided
discrimination of TN-C positive areas within the RBM. TN-C staining in some
biopsies extended from the RBM into the surrounding stroma making it
difficult to quantify at lower magnification.
TN-C expression within the RBM is increased in CW compared with controls,
(p=0.04)
There was no difference in RBM TN-C at preschool age between children that
developed asthma and those that did not.
However, TN-C staining in paraffin embedded tissue was not repeatable in
subsequent runs.
4.11 Discussion: RBM tenascin-C expression
Strengths
This is the first study to stain for TN-C in the RBM of preschool wheezers and to
relate this to the presence or absence of school age asthma. Although RBM TN-C
expression was increased in preschool confirmed wheezers when compared to
preschool controls, p=0.04, it did not discriminate between those children who
developed asthma at school age and those who did not develop asthma. This
suggests that TN-C expression, similar to RBM thickness, may relate to current
symptoms rather than future asthma prognosis. Importantly, there was no difference
in age between wheezers and controls at the time of EB for this part of the study,

161
suggesting the differences in RBM TN-C expression directly related to wheezy
symptoms. However, the reported thickness of TN-C within the RBM (6-7µm)
measured in adult studies(143;144) was significantly greater than in the preschool
wheezers (2.35µm). There are three possible reasons for this; 1) different
methodology used in adult studies, immunofluorescence in frozen sections rather
than immunohistochemistry in paraffin sections(142-144); 2) development of TN-C
within the RBM continues throughout childhood similar to RBM development(113); 3)
longer duration of symptoms in adults when compared to preschool children. The
data reported here are not able to distinguish between these possibilities.
This is the first study to relate TN-C within the RBM to total RBM thickness. Previous
adult studies did not measure TN-C as a proportion of the RBM or relate TN-C
expression in the RBM to its thickness(142-144). The role of TN-C in contributing to
RBM thickening is unknown. TN-C knockout mice sensitised with ovalbumin had
decreased airway hyper-reactivity and airway goblet cells when compared with wild
type mice(239). However, other markers of airway remodelling such as peri-
bronchiolar collagen deposition were not measured. Adult asthmatics showed no
increase in collagen III (the predominant collagen in the RBM) but an increase in TN-
C 24 hours post allergen challenge, but after 7 days the reverse was shown, TN-C
levels had returned to baseline and collagen III levels significantly increased(238). This
suggests that increased RBM TN-C expression and RBM thickening may occur via
different mechanisms.
Limitations
The biggest limitation of this study is that TN-C staining is not consistent in paraffin
embedded tissue. Children in whom TN-C was quantified within the RBM, and who
developed asthma were older at time of EB when compared to those who did not (42
vs 17.5 months). The natural history of TN-C expression in early childhood is
unknown and it was not possible to characterise the relationship of RBM TN-C with
age further because of difficulties with immunohistochemistry staining as previously
described. TN-C is absent in adult lungs but present at birth(230). It is likely that it is
still present in the lungs during the alveolar phase (where terminal saccules, alveolar
ducts, and alveoli increase in number), and it is not known when this is complete.

162
Although the control subjects in the current study (median 41%, range 0-92%) had
significantly less TN-C within RBM when compared with CW (median 83%, range
12.6-100%), only 1 control child had no detectable RBM TN-C. The thickness of the
RBM TN-C layer was significantly less in the RBM of controls compared to CW
(0.77µm versus 2.35µm). Interestingly, there was no correlation between RBM TN-C
and age in controls. This may have been because of the small number of patients
(n=8), and the likely natural biological variability of TN-C expression in healthy
controls. However, given the small sample size this study is not able to answer this
question.
4.11.2 RBM TN-C and corticosteroid use
RBM TN expression was decreased in atopic adults with seasonal asthma after 4-6
weeks of treatment with inhaled budesonide (400µg) twice a day(144). In addition, in
vitro studies have shown fluticasone decreases TN-C expression in human lung
fibroblasts(244). In the present study, there was no difference in TN-C expression
between wheezers treated with either inhaled or oral corticosteroids at time of
endobronchial biopsy and those not on steroid treatment. However, information on
length of treatment with inhaled corticosteroids and adherence to prescribed therapy,
prior to endobronchial biopsy is not available, and it is not possible to draw any firm
conclusions.
4.11.3 Conclusion
There is considerable overlap between total RBM thickness and RBM TN-C
expression between preschool wheezers and controls, and neither total RBM
thickness nor TN-C within the RBM are predictive of asthma at school age. It is
possible that both RBM thickness and RBM TN-C are related to current symptoms
rather than future asthma risk, and that neither will be useful in predicting outcome.
Hence an alternative approach is needed.
Increased airway smooth muscle is another characteristic feature of airway
remodelling in adults and older children with asthma but has not previously been
explored in preschool children with severe recurrent wheeze. The next chapter will
examine smooth muscle in preschool children and determine whether this feature of
airway pathology is a more accurate predictor of school age asthma.

163
Chapter 5
Airway smooth muscle in preschool wheezers and the
development of school age asthma
5.1. Introduction
ASM is now recognised as playing a pivotal role in the pathophysiology of asthma, in
particular inducing airway narrowing (bronchoconstriction) in asthma after exposure
to stimuli such as allergens, infection, exercise or environmental triggers (for
example, cold air)(245). The ASM cell is also pro-inflammatory and immunomodulatory
by virtue of producing a variety of cytokines and chemokines and expression of cell
surface receptors(246). Increased ASM is an established feature of chronic asthma in
adults and school aged children(114;121). In particular, alterations in ASM are most
consistently associated with abnormalities in lung function. Increased ASM in school
aged children with asthma has been significantly related to reversible airflow
obstruction(118;121) and increased asthma symptoms(118). Bronchial thermoplasty, a
therapy aimed to reduce ASM mass in the airways using thermal energy has been
used in adult patients with severe asthma who continue to be symptomatic despite
maximal medical treatment(247). Randomized controlled clinical trials of bronchial
thermoplasty have suggested an improvement in quality of life and reduction in the
rate of severe exacerbations in adults with severe asthma, but have not been able to
show a reduction in AHR or change in FEV1(247).
5.1.2 Characteristics of increased airway smooth muscle in asthma
Increase in ASM mass in children and adults with asthma results both from smooth
muscle hyperplasia and hypertrophy(110;121;122). Further ultrastructural analysis shows
that the increase in bronchial muscle bundle mass in asthma is multifactorial and
includes ASM cell hypertrophy, basal lamina thickening, increased extracellular
matrix deposits, and collagen deposition within and around ASM bundles(248).
However, not all authors agree that myocyte hypertrophy is present in all asthmatics
and suggest it may only be a feature of increasing asthma severity. In a group of
adults with mild-moderate asthma, Woodruff et al found that there was hyperplasia of
airway smooth muscle myocytes, but that myocyte hypertrophy was absent(122).

164
However, Benyaoun et al suggested that the increase in ASM size was secondary to
myocyte hypertrophy with the severest asthmatics having the largest myocyte
size(110). Most recently it has been shown that hypertrophy occurs in adults with both
non-fatal (history of asthma but died from other causes) and fatal cases of asthma,
but hyperplasia is present predominantly in cases of fatal asthma and involves large
and small airways(249). In school age children with moderate-severe asthma both
hypertrophy and hyperplasia contributed to increased ASM(121). It is likely that
increases in ASM mass are secondary to both cell hypertrophy and hyperplasia, and
that this varies both with asthma duration, severity and phenotype.
5.1.3 Asthma duration and airway smooth muscle
There are conflicting reports of ASM and asthma duration. A post-mortem study
showed that ASM was four fold greater in adults aged 40-49 years than age matched
controls when compared to younger adults (17-23 years) with fatal asthma where it
was 2 fold greater than age matched controls(123). However a more recent autopsy
study in fatal and non-fatal asthma suggests that ASM thickness (indexed to the
perimeter of the basement membrane) in adults with an asthma duration of 7-27
years was not related to duration of asthma, age of onset of asthma, sex or
smoking(125). However, these studies measured ASM in different ways which may
account for the disparity in their results.
5.1.4 Asthma severity and airway smooth muscle
ASM increases with severity of asthma, with the proportion of smooth muscle in the
airway increasing with worsening airflow limitation(124;125). In adult asthmatics with
intermittent, mild-moderate and severe asthma fibroblast numbers and ASM cell size
were negatively associated with pre and post bronchodilator spirometry(110). The
thickness of the ASM layer has also been associated with asthma severity as
determined by oral corticosteroid use, reported asthma hospitalisations and
frequency of symptoms(125).
5.1.5 Functional effects of increased airway smooth muscle
Increased airway smooth muscle mass in asthmatics is thought to generate
increased ASM shortening velocity, leading to increased AHR(250). Muscle
contraction is triggered by phosphorylation of myosin, catalyzed by calcium /

165
calmodulin-dependent myosin light chain kinase (MLCK), which in turn is activated
as calcium increases. Airway smooth muscle cells from mild-moderate adult
asthmatics isolated from endobronchial biopsies showed significant increases in
maximum shortening capacity when compared with controls, which was associated
with increases in smooth muscle types of MCLK(251). Myocyte hypertrophy was also
associated with an increase MCLK in adults with asthma(110), which was further
amplified in patients with severe persistent asthma(110). Contractile proteins,
associated with increased ASM shortening velocity, including myosin isoforms,
transgelin and MCLK are also increased in endobronchial biopsies from adults with
mild asthma(252). However, in contrast there was no evidence of increased gene
expression levels of contractile proteins, MCLK or α-smooth muscle actin in adults
with mild-moderate asthma with ASM hyperplasia but not hypertrophy(122). This may
suggest that variations in gene expression levels of contractile proteins considered
markers of a hypercontractile phenotype may vary with disease severity and
duration.
5.1.6 Smooth muscle signalling pathways
Early research studies regarding ASM function in asthma focussed on its contractile
properties, however a growing body of evidence suggests the ASM cell also displays
proinflammatory and immunomodulatory functions(246). Smooth muscle may
contribute to bronchial inflammation by secreting a range of mediators, recruiting and
activating inflammatory cells, such as mast cells, T lymphocytes or eosinophils in
response to a variety of triggers, including allergens, viruses or bacteria(245;246). In
particular ASM cells participate in the inflammatory and remodelling process by
expression of cellular adhesion molecules, receptors for cytokines (e.g., TNF-α),
chemokines (RANTES, eotaxin, macrophage inflammatory protein 1a and IL-8), and
Toll-like receptors(246).
Recent evidence suggests that airway constriction itself promotes remodelling,
presumably via effects on ASM(70). Endobronchial biopsies from adult asthmatics
showed similar increases in collagen III deposition in the RBM and epithelial TGF-β
expression 4 days after methacholine (not pro-inflammatory) challenges and allergen
(pro-inflammatory) challenges(70). ASM cells can release biologically active TGF-β,
which is involved in various structural alterations such as epithelial cell apoptosis

166
resulting in the detachment of epithelial cells, increased RBM thickness, mucus
hypersecretion, goblet cell hyperplasia, and angiogenesis(253). TGF-β is increased in
the airways of patients with severe asthma compared with patients with less severe
disease(253).
5.1.7 Airway smooth muscle cell migration
Cell migration could be partly responsible for the pathogenesis of ASM cell
hyperplasia and hypertrophy in asthma. TGF-β in the presence of platelet-derived
growth factor, upregulates the expression of MMPs and TIMPs in ASM cells, thereby
enhancing ASM cell migration toward the epithelium to form new bundles(254).
5.1.8 Development of airway smooth muscle
Smooth-muscle cells are present in the human fetal trachea, primary, and lobar
bronchi by the 6th-8th week of gestation(255) and ASM can be identified by light
microscopy in the small bronchi of fetal airways from 24 weeks gestation(256). Early in
gestation ASM becomes innervated and responsive to contractile and relaxing
stimuli, where changes in intraluminal pressure are suggested to produce a
mechanical signal, resulting in the release of growth factors, signalling molecules, or
the regulation of gene expression(255). It has been suggested that in particular ASM
helps regulate early lung morphogenesis by fibroblast growth factor 10 production
necessary for branching morphogenesis and pulmonary differentiation(257). However,
little is known about the natural history of ASM postnatally. A single post-mortem
study measured ASM in the lungs from infants (n=20) without cardiopulmonary
disease, who died aged 22 weeks postconceptional age to 8 months postnatal age
and showed a linear increase in ASM when related to airway size(256).
5.1.9 Airway smooth muscle in preschool wheezers
Although ASM has been extensively investigated in adult asthmatics, little is known
about its role in children with asthma. Children with asthma as young as 7 years
have evidence of increased ASM(121), but nothing is known about ASM in preschool
wheezers. Therefore, the next hypothesis developed in this thesis is that increased
ASM may already be present in severe recurrent preschool wheezers and
particularly in those children who go on to develop asthma at school age. This
chapter will compare ASM in endobronchial biopsies at preschool age from severe

167
recurrent wheezers to age matched controls, and relate preschool ASM to school
age asthma status.
5.1.10 Hypotheses
The overarching hypotheses of this thesis are:
1. School-aged children with asthma have evidence of airway remodelling and
airway inflammation in endobronchial biopsies taken at preschool age when
compared to school-aged children without asthma.
2. A combination of clinical and airway pathological characteristics at preschool
age may be able to be used to predict asthma at school age, better than clinical
features alone.
In this chapter, the contribution of ASM to remodelling and prediction of future
asthma will be explored.
5.1.11 Aims
1. To quantify ASM in endobronchial biopsies from wheezy preschool children
2. To relate ASM at preschool age to the presence of asthma at school age in
the Royal Brompton cohort
5.2 Methods
5.2.1 Characteristics of preschool wheezers
The clinical characteristics of preschool wheezers recruited from the Royal Brompton
Hospital have been discussed in detail in chapter 2. Children had severe recurrent
noisy breathing which had been assessed as wheeze during acute symptoms or
from parental reports. Children were divided into confirmed wheezers (CW) and
reported wheezers (RW) on the basis of parental identification of wheeze on video
questionnaire. Exclusion criteria were children with isolated cough, those whose
main problems were recurrent lower respiratory tract infections, chronic lung disease
of prematurity and a history of long term oxygen therapy. Use of inhaled or oral
steroids was not an exclusion criterion. Non-wheezing controls were children who
mainly had bronchoscopy for evaluation of upper airway problems including stridor.

168
5.2.2 Evaluable biopsies
Details of the flexible bronchoscopy and EB processing are reported in chapter 2 and
3. Children with total area of evaluable biopsy tissue ≤0.2mm2 were excluded.
Smooth muscle was quantified in biopsies fulfilling the following criteria:
i. presence of recognisable epithelium, RBM, subepithelial tissue and smooth
muscle
ii. minimal crush artefact, oedema or blood within the biopsy, figure 5.1.
Figure 5.1: An evaluable biopsy for assessment of airway smooth muscle:
endobronchial biopsy section stained with haematoxylin and eosin from a
preschool child with recognisable epithelium, subepithelium, reticular
basement membrane and smooth muscle
5.2.3 Measurement of airway smooth muscle
The area below the RBM and epithelium is referred to as the subepithelium and
includes both ASM, mucosa (lamina propria) and submucosal glands (if present).
Lamina propria is recognised as a highly cellular loose connective tissue, located
beneath the RBM. Smooth muscle cells were recognised by their characteristic
spindle shape of variable size with a longitudinal orientation and a centrally placed
Smooth muscle
Subepitheliummmucosa
RBM
Epithelium

169
nucleus per cell. Clusters of smooth muscle cells are organised as smooth muscle
bundles. ASM was measured in two ways.
Method 1:
Areas of ASM and subepithelial area were identified by morphologic examination.
ASM area and total subepithelial area were measured at magnification x100 by
drawing around the outer limits of the smooth muscle bundles and the subepithelial
area of the biopsy(221), figure 5.2. The subepithelial and ASM area was then
calculated using computer aided image analysis (Leica DM2500 microscope, Leica
DFC 300fx camera and Leica Qwin version 3 software, Olympus BH2, Japan). ASM
mass was then expressed as a fraction of the total subepithelial area.
Figure 5.2: Smooth muscle bundles were traced using a computer mouse and
then the area was calculated using computer aided analysis. (Scale not shown-
image shown for illustration purposes)

170
Method 2:
ASM was measured using a stereology technique, point and line intersection
counting, allowing three dimensional information from measurements in the two
dimensions of conventional histology(85). The is done by using a multipurpose test
system, a Weibel M168 grid which combines area, point and lines which has the
advantage of allowing a large amount of information to be collected from a single
grid, figure 5.3(258).
Figure 5.3: Smooth muscle volume fraction was quantified by overlaying a
weibel grid (M168) at x 200 magnification over the section and performing
point counting. Length between 2 points (68µm).
A virtual Weibel (M168) grid was overlaid the section at random and moved
systematically until the whole section had been measured. Point counting was used
to measure ASM. Each end of the horizontal lines on the grid represented a point. A
point was recorded as smooth muscle if it entirely fell on smooth muscle. Points
falling on the total subepithelial area (submucosa, ASM and glands) were also
recorded but those falling on empty space were not. ASM volume fraction was
measured at magnification x200 and expressed as a fraction of the total number of
points falling on smooth muscle over the total number of points falling on the
subepithelium(118;121). The formula used to calculate this was:
Vv (sm/subepithelium) = (Σ points on ASM) / (Σ points on subepithelial tissue).

171
As there was considerable variation in biopsies between children, the hypothesis
was that relating ASM to the RBM surface area may reduce variability, rather than
indexing ASM to total subepithelial area. ASM volume fraction was indexed to the
surface area of the RBM by counting the number of lines intersecting the apical
surface of the RBM. The line had to completely cross the RBM to be counted. Lines
that only partly crossed the RBM were not counted(121). The following formula was
used:
volume fraction of ASM indexed to surface area of RBM: V/S (sm/rbm) = (Σpoints on
ASM x l(p)) / (2 x Σ line intersections with RBM) where l(p) denotes the length per
point (68µm).
Inter-observer repeatability
ASM area-fraction was measured by a second observer (Dr N Ullmann) blinded to
clinical and pathological details of the children using method 1. Measurements for
ASM area-fraction by the 2 observers are represented by a Bland-Altman plot.
5.3 Assessment of smooth muscle proliferation
Children who had remaining EB tissue had anti-proliferating cell nuclear antigen
(PCNA) monoclonal antibody applied to paraffin sections to identify proliferating
smooth muscle cells by Mr Tim Oates(118). Paraffin sections were dewaxed in xylene
and endogenous peroxidase activity was quenched by immersing sections in 3%
H2O2 for 30 mins at room temperature. Sections were then incubated with primary
mouse anti PCNA (Dako) followed by incubation with biotinylated mouse IgG (Vector
Laboratories). Slides were counterstained with H&E. All nucleated PCNA positive
smooth muscle cells were enumerated and expressed per mm2 smooth muscle(118).
Statistical analysis
Data was analysed on a per individual as opposed to a per biopsy basis, e.g. the
sum of all measurements obtained from all biopsies of a given child was taken as the
value for this child(121). Non parametric tests were used. Sample size was
opportunistic as the number of children in this group was predetermined based on
the cohort of preschool children recruited between 2002 and 2005. Any power
calculations performed are retrospective and of limited value. However, power
calculations showed that the groups (wheezers (n=28) and controls (n=14)) had 80%

172
power to detect a difference between means of 0.06 ASM area-fraction or ASM
volume fraction with a significance level of p<0.05 (two-tailed t test).
5.4.1 Biopsy size and quantity in Brompton preschool wheezers
At least 1 good quality biopsy was available from 56 patients. 42/68 children were
included in the preschool ASM analysis. Forty children had 1 evaluable biopsy and 2
children had 2 evaluable biopsies. Reasons for exclusion were: no evaluable biopsy
(n=12), no identifiable ASM (n=7) and total cumulative biopsy area < 0.2mm2 (n=7, 1
control and 6 wheezers), figure 5.4
Figure 5.4: Airway smooth muscle biopsy quantity
There was no difference between children with ASM on endobronchial biopsy and
those without ASM in EB in terms of age at fibreoptic bronchoscopy, sex, preschool
wheeze status and IgE at the time of EB, table 5.1. Similarly there was no difference
between those children with ASM in EB who were followed up and the rest of the
preschool cohort, table 5.2.
Preschool children
n=68
Evaluable biopsies
n=56
Biopsies with smooth muscle
n=49
Biopsies ≥ 0.2mm2
n=42
12 biopsies excluded
evaluable
7 children no ASM

173
Table 5.1: No difference in clinical characteristics of children with and without
ASM in evaluable endobronchial biopsies
ASM n=49
No ASM n=7
p
Age at biopsy* 19(3-58) 13(6-55) 0.39
Male/ Female 31/18 3/4 0.42 0.67
Wheezers/ Controls 34/15 4/3
Preschool IgE (IU/ml) 16 (1-635)† 17 (2-559) 0.89
*Data is reported as median and range. †Results not available on 3 children
Table 5.2: No difference in clinical characteristics of children followed up at
school age with ASM in endobronchial biopsy and those who were either lost
to follow up or did not have ASM in endobronchial biopsy
Followed up
n=32
Lost to follow up
n=36
p
Age at biopsy* 18.5 (3-57) 20 (3-58) 0.5
Male Female 19/13 25/11 0.45
0.6 Wheezers/ Controls 21/11 26/10
Preschool IgE (IU/ml) 28.5 (1-635)† 17 (1-2605) ‡ 0.99
*Data is reported as median and range. †Results not available on 2 children ‡Results not available on 3 children
5.4.2 Repeatability of stereology and computer aided analysis methods
The CoV was calculated for ASM volume fraction and ASM area fraction
measurement as a measure of variability. Each method was assessed by measuring
4 biopsies at 3 intervals with the following 2 measurements a week and a month
later. The mean CoV for 4 biopsies measured using computer aided image analysis
was 7.5% (3.6%, 6.1%, 9.6% and 10.8%). The mean coefficient of variation for ASM
measured using stereology was higher at 15% (2.9%, 15.8%, 18% and 23.8%). The
higher CoV associated with the stereology technique is probably because the
average number of points counted per patient was low (median 79 (range 28-276)).
ASM area-fraction was measured by a second observer showing good agreement
between observers (Bland Altman plot, bias 0.0074, SD +/- 0.037, (-0.066-0.081))
figure 5.5. The mean CoV for V/S (ASM indexed RBM surface area) was very poor
121% (50.7%, 76.2%, 209.4%, 148.9%). The mean number of line intersections with

174
the RBM per section was low 3.85 (standard deviation +/-2.7) for all biopsies
measured.
Figure 5.5: A Bland Altman plot showed good repeatability of ASM area-
fraction measurements between observer 1 and observer 2
0.05 0.10 0.15 0.20 0.25
-0.25
0.00
0.25
+2SD
-2SD
Bias
Mean of measurements 1&2
Diffe
ren
ce o
f m
easu
rem
en
t 1&
2
5.4.3 Comparing ASM volume-fraction measured using stereology and ASM
area-fraction measured using computer aided image analysis
There was good correlation between ASM volume fraction measured using
stereology and ASM area-fraction measured using computer aided analysis,
Spearman r=0.75, p=0.001, figure 5.6. The ICC using computer aided analysis and
point and line counting method to measure ASM was 0.78.
Figure 5.6: Correlation between measurements of airway smooth muscle
volume fraction and airway smooth muscle area-fraction
Spearman r=0.75, p=0.001
0.0 0.1 0.2 0.3 0.40.00
0.05
0.10
0.15
0.20
0.25
ASM area fraction
AS
M v
olu
me f
racti
on

175
5.4.4 Variability of ASM within and between biopsies
Fourteen children had 3 or more sections measured from the same biopsy. The
within biopsy CoV for ASM was very high both for method 1 (ASM area fraction
measured using computer aided analysis, median 37% (range 4-70%) and for
method 2 (ASM volume fraction measured using stereology, median 57% (range 5-
79%)). Within biopsy variability for the 12 children who had 2 sections measured by
both methods is represented by a Bland Altman plot for method 1, figure 5.7 (i) and
method 2, figure 5.7 (ii). Between biopsy variability is described for the 2 children
who had two biopsies measured (ASM area-fraction (child 1; biopsy 1= 0.112, biopsy
2= 0.102) and (child 2; biopsy 1=0.1246, biopsy 2=0.08)).
Figure 5.7: Wide ASM variability within biopsy represented by a Bland Altman
plot for (i) method 1 (ASM area fraction) and (ii) method 2 (ASM volume
fraction). There is no significant bias.
0.05 0.10 0.15
-0.20
-0.15
-0.10
-0.05
-0.00
0.05
0.10
Method 2
2SD
-2SD
Bias
Mean of measurements 1-2
Average
Dif
fere
nc
e o
f m
ea
su
rem
en
ts 1
-2
0.05 0.10 0.15
-0.12
-0.02
Mean of measurements 1-2
Method 1
2SD
-2SD
Bias
Dif
fere
nc
e o
f m
ea
su
rem
nts
1-2
(i)
(ii)

176
5.4.5 Airway smooth muscle area fraction measured using computer aided
analysis
There was no difference in ASM area fraction between preschool wheezers (n=28,
median 0.08 (range 0.038-0.163)mm2) and controls (n=14, median 0.077 (range
0.02-0.23)mm2), p=0.96, figure 5.8 (i). Similarly there was no difference in ASM area
fraction between CW (n=15, median 0.096 (range 0.04-0.16)mm2), RW (n=13,
median 0.075 (range 0.04-0.16)mm2) and controls (n=14, median 0.077 (range 0.02-
0.23)mm2), p=0.32, figure 5.8 (ii).
Figure 5.8: Airway smooth muscle area fraction in endobronchial biopsies
measured using computer aided image analysis compared between (i)
wheezers and controls and (ii) confirmed and reported wheezers and controls
p=0.96
Wheezers (n=28) Controls (n=14)0.00
0.05
0.10
0.15
0.20
0.25
No difference in airway smooth musclebetween preschool wheezers and controls
sm
/ su
bep
ith
eliu
m
p=0.32
CW (n=15) RW (n=13) Controls (n=14)0.00
0.05
0.10
0.15
0.20
0.25
No difference in airway smooth mucle betweenconfirmed and reported wheezers, and controls
sm
/ su
bep
ith
eliu
m
(i)
(ii)

177
5.4.6 Airway smooth muscle measured using stereology techniques
There was no difference in ASM volume fraction between preschool wheezers
(n=28, median 0.1088 (range (0.018-0.27)) and controls (n=14, median 0.099 (range
0.016-0.314)mm2), p=0.6, figure 5.9 (i). Similarly there was no difference in ASM
volume fraction between CW (n=15, median 0.11 (range 0.018-0.27)), RW (n=13,
median 0.076 (range 0.059-0.23)) and controls (n=14, median 0.099 (range 0.016-
0.314)), p=0.77, figure 5.9 (ii).
Figure 5.9: Airway smooth muscle volume fraction in endobronchial biopsies
measured using stereology compared between (i) wheezers and controls and
(ii) confirmed wheezers, reported wheezers and controls
p=0.6
Wheezers (n=28) Controls (n=14)0.0
0.1
0.2
0.3
0.4
No difference in airway smooth muscle measuredusing stereology between wheezers and controls
sm
/ su
bep
ith
eliu
m
p=0.77
CW (n=15) RW (n=13) Controls (n=14)0.0
0.1
0.2
0.3
0.4
No difference in airway smooth muscle measuredusing stereology between
confirmed and reported wheezers, and controls
sm
/ su
bep
ith
eliu
m
(i)
(ii)

178
5.4.7 Volume fraction of ASM indexed to the surface area of RBM
The volume fraction of ASM indexed to surface area of RBM (V/S) was also
compared between wheezers (n=28, median 34.5 (range 4.25-340)) and controls
(n=14, median 45.9 (range 5.7-374)), p=0.25, figure 5.10 (i). There was also no
difference between subgroups, confirmed wheezers (n=15 median 34.95 (range
4.25-136)), reported wheezers (n=13, median 34, (range 17-340)) and controls,
p=0.19, figure 5.10 (ii). There was also no correlation between RBM thickness and
either ASM area-fraction or ASM volume-fraction.
Figure 5.10: No difference in volume fraction of airway smooth muscle indexed
to surface area of reticular basement membrane between (i) preschool
wheezers and controls and (ii) confirmed and reported wheezers and controls
p=0.25
Wheezers (n=28) Controls (n=14)0
100
200
300
400
No difference between wheezers and controls
V/S
(rb
m/s
ub
ep
ith
eli
um
)
m2/
m3 p=0.19
CW (n=18) RW (n=15) Controls (n=14)0
100
200
300
400
No difference between confirmed wheezers,reported wheerers and controls
V/S
(rb
m/s
ub
ep
ith
eli
um
)
m2/
m3
(i) (ii)

179
Table 5.3: Characteristics of preschool children with airway smooth muscle in
endobronchial biopsy
Wheezers
n=28
Controls
n=14
p
Age (months) 25.5 (7-58) 17.5 (4-42) 0.18
(CW=31 (8-58) / RW=17 (7-57)) 0.25
Male/ Female 16/12 10/4 0.5
(CW= 8/7 / RW= 9/4)
Inhaled
corticosteroids*
(BDP (mcg)*)
14 (50%)
(500 (200-2000))
2 (14%)
500
0.04
CW= 8 (53%) / RW=6 (46%)
(CW 800 (200-2000) /RW 400 (200-1000))
Biopsy area (mm2) 0.49 (0.26-1.27) 0.66 (0.27-1.54) 0.26
(CW=0.5 (0.29-1.15) /RW=0.49 (0.26-1.27)) 0.52
ASM
area-fraction
0.08 (0.038-0.163) 0.077 (0.02-0.23) 0.97
(CW=0.096 (0.04-0.16) / RW=0.075 (0.04-0.16)) 0.33
ASM
volume-fraction
0.1088 (0.018-0.27) 0.099
(0.016-0.314)
0.6
(CW=0.11 (0.018-0.27) / RW=0.076 (0.059-0.23)) 0.77
V/S 34.5 (4.25-340) (n=13)
45.9 (5.7-374)
0.25
(CW=34.95(4.25-136)/ RW= 34(17-340)) 0.19
All data expressed as median and range. CW= Confirmed preschool wheezers RW= Reported preschool wheezers *BDP= Beclometasone dipropionate or equivalent V/S volume fraction of smooth muscle indexed to surface area of reticular basement membrane
5.5 Atopic status and airway smooth muscle in preschool children
There was no correlation between ASM and total serum IgE at preschool age
(Spearman r=-0.08, p=0.62), figure 5.11. There was also no difference in ASM
between children who had one or more positive aeroallergens and children who were
not sensitised to any aeroallergens, figure 5.12. Analysis of ASM volume fraction
showed similar results.

180
Figure 5.11: No correlation between ASM area fraction and total preschool IgE
in preschool wheezers
r=-0.08, p=0.62
0.00 0.05 0.10 0.15 0.20 0.250
200
400
600
800
No correlation between airway smooth muscle and total preschool IgE
smooth muscle/ subepithelium
To
tal Ig
E (
iu/m
l)
Figure 5.12: No difference in ASM area fraction in endobronchial biopsies from
children sensitised to one or more positive aeroallergens compared with
children not sensitised to any aeroallergens
p=0.15
+ve aeroallergens no aeroallergens0.00
0.05
0.10
0.15
0.20
0.25
No increase in ASM in children sensitized to one or more aeroallergens at preschool age
sm
/su
bep
ith
eli
um

181
5.6 Airway smooth muscle in different preschool wheeze phenotypes
Children were divided into clinical wheeze phenotypes viral (episodic) or multiple-
trigger wheezers at preschool age(61). Thirty four children had ASM in their biopsy, of
these 6 were excluded because the biopsy size was less than 0.2mm2. There was
no difference in ASM area fraction between the 2 phenotypes, viral (n=5, median
ASM 0.096 (range 0.056-0.163)) and multiple-trigger (n=23, median ASM 0.077
(range 0.038-0.156)), p=0.33, figure 5.13. However, numbers of children with
episodic or viral wheeze are small. Similar results were shown for ASM volume
fraction.
Figure 5.13: Comparing airway smooth muscle area fraction in preschool
children with viral and multiple-trigger wheeze
p=0.33
Multiple trigger (n=23) Episodic (n=5)0.00
0.05
0.10
0.15
0.20
sm
oo
th m
uscle
/ s
ub
ep
ith
eliu
m
5.7 Inhaled corticosteroids and airway smooth muscle
Almost all of the preschool wheezers had a trial of ICS of varying duration before
proceeding to bronchoscopy and endobronchial biopsy. There was no difference in
ASM area fraction between those prescribed ICS (n=13, median 0.096 (range 0.039-
0.156)) at the time of EB and those who not prescribed ICS (n=15, median 0.069
(range 0.038-0.163)), p=0.40, figure 5.14. Six of the children on daily ICS and 5 of
the children not on ICS had been treated with oral corticosteroids in the month prior
to biopsy. However there was still no difference when this was considered: (n=18,
ICS and / or oral corticosteroids in the last month) and (n=10, no ICS / oral
corticosteroids), p=0.48.

182
Figure 5.14: No difference in airway smooth muscle area-fraction compared
between preschool wheezers on inhaled corticosteroids and those not on
inhaled corticosteriods
p=0.4
ICS No ICS0.00
0.05
0.10
0.15
0.20
No difference in ASM in wheezers treated withICS at time of biopsy and those not
sm
/ subepit
helium
5.8 School age asthma and preschool airway smooth muscle
Of 51 children followed up at school age, 38 children had ASM in their EB. Six
children were excluded as they had a biopsy area of less than 0.2mm2. The clinical
characteristics of children with ASM in their endobronchial biopsy at preschool age
and who were followed up at school age are reported in table 5.4.
Children with asthma at school age had increased ASM area fraction (n=8, median
0.12, (range 0.08-0.16)) when compared to those without (n=24, median 0.066,
(range 0.024-0.23)), p=0.007, figure 5.15 (i). These findings were confirmed with
increased ASM volume fraction in children with school age asthma (n=8, median
0.153, (range 0.094-0.266)) when compared with those without school age asthma
(n=24, median 0.097, range (0.02-0.314)), p=0.016, figure 5.15 (ii). However, there
was no relationship between ASM indexed to the surface area of the RBM between
children who did and did not develop asthma at school age, p=0.15.

183
Figure 5.15: Increased preschool airway smooth muscle in children with
asthma at school age measured using (i) area fraction (computer aided image
analysis) and (ii) volume fraction (stereology point counting techniques)
p=0.0066
Asthma (n=8) No asthma (n=24)0.00
0.05
0.10
0.15
0.20
0.25
ASM area fraction
sm
/ su
bep
ith
eliu
m
p=0.0158
Asthma (n=8) No asthma (n=24)0.0
0.1
0.2
0.3
0.4
ASM volume fraction
sm
/ su
bep
ith
eliu
m
(i) (ii)
When preschool wheezers were considered alone, those who developed asthma
had increased ASM area-fraction (n=7, median 0.127, [range 0.083-0.156]) when
compared with those who did not develop asthma (n=14, median 0.058, [range
0.038-0.163]), p=0.006, figure 5.16 (i). Similarly ASM volume fraction was increased
in children with school age asthma (n=7, median 0.16, [range 0.094-0.266]) when
compared with those who did not develop asthma (n=14, median 0.08, [range 0.033-
0.227]), p=0.006, figure 5.16 (ii).
Figure 5.16: Increased preschool airway smooth muscle in preschool
wheezers alone classified by the presence or absence of asthma at school age
(i) area fraction and (ii) volume fraction
p=0.0065
Asthma (n=7) No asthma (n=14)
0.00
0.05
0.10
0.15
0.20
sm
/ s
ub
ep
ith
eliu
m
p=0.0065
Asthma (n=7) No asthma (n=14)0.0
0.1
0.2
0.3
sm
/ s
ub
ep
ith
eliu
m
ASM area fraction ASM volume fraction

184
Table 5.4: Clinical characteristics of children with ASM in endobronchial biopsy related to school age asthma status. (Children with asthma at school age had increased ASM, were younger at time of biopsy and had higher preschool IgE.)
Asthma (n=8) No asthma (n=24) p
Male/ Female 5/3 10/14 0.1
Age at FOB, months, median (range) Weight at FOB (kg)
45 (3-57) 14.75 (5.6-25)
17 (6-55) 11.25 (7-18.7)
0.01 0.03
Birth Weight, kg, median (range) 3.49 (2.72-3.8) 3.5 (2.55-4.99) 0.71
Gestation, weeks, median (range) 40 (33-42) 40 (35-42) 0.6
Preschool group Confirmed wheezer Reported wheezer Control Preschool wheeze phenotype Viral Multiple trigger Age at onset, months median (range) Admission to hospital Preschool inhaled/ Oral steroids, n (%) Parental history of asthma Maternal asthma Paternal asthma Enviroment Maternal smoking in pregnancy Maternal / paternal smoking
6 1 1
7 0 7
15.5 (3-24) 7
7 (87.5)
4 2 2
2 3
6 8 10
14 2 12
7 (0.5-66) 10/14
9 (37.5)
7* 6 1
2 5
0.15
0.41
Day care < 1 year Pets (Cat/ Dog) Preschool IgE (IU/ml) ≥1 positive RAST, n (%) ≥1 positive RAST aero-allergen, n (%) Preschool eczema, n (%) Preschool ASM measurements ASM area fraction
2 0
126.5 (4-635) 5 (62.5) 3 (37.5)
6 (75)
0.12 (0.08-0.16)
4 5
8.5 (1-292)# 6# (25) 3 (13.6)
6 (25)
0.066 (0.024-0.23)
0.01
0.1 0.3
0.006
Median biopsy area mm2
0.81 (0.35-1.27) 0.52 (0.26-1.54) 0.043
V/v – sm/ subepithelium 0.153 (0.094-0.266) 0.097 (0.02-0.314) 0.015
V/S 73.45 (28.3-127.7) 34 (9.3-374) 0.15
Clinical details at school age Frequency of wheeze
None 1-3 attacks of wheezing 4-12 attacks of wheezing >12 attacks of wheezing Exercise induced wheeze
Dry cough at night§ Number of hospital admissions with wheeze No of children taking ICS at school age Dose of ICS (mcg)** Immunomodulating agent
0 2 3 3 6 7
10 (1-160)
6 800 (400-1000)
1
21 2 0 1 1 6
6 (0-20)
3 400 (200-400)
0
*Family history unknown in 2 children, #IGE or Specific RASTs not known in 2 children
**mcg Budesonide or equivalent, §Dry cough at night apart from a cough associated with a cold or chest
infection, V/v volume fraction of smooth muscle indexed to subepithelium V/S volume fraction of smooth muscle indexed to surface area of reticular basement membrane

185
5.9 Age & preschool airway smooth muscle
When considering just children with ASM in EB, children with school age asthma
(median 45 (range 3-57) months) were older than those who did not have school age
asthma (median 17 (range 6-55) months) at time of biopsy, p=0.01. There was no
relationship between age and ASM volume-fraction or ASM area-fraction in the
controls, but the numbers were small.
To assess the relationship between ASM and age further, endobronchial biopsies
from non-wheezing school-aged children had ASM volume fraction measured using
point counting by a second investigator CB(119). These children had been recruited as
controls for a study investigating airway remodelling and inflammation in children
with severe therapy resistant asthma(119). Children (n=13) median age 10.5, range
(5.9-14.2) years had clinically indicated bronchoscopy for evaluation of recurrent
croup or a barking cough (n=6), noisy breathing (n=1), stridor (n=2) and shortness of
breath (n=1). Three children had bronchoscopy for investigation of haemoptysis but
had normal anatomical appearances on bronchoscopy. All parents consented to EB
for research purposes. Biopsies were processed and stained in an identical manner
to the preschool EBs. There was no correlation between age and ASM volume
fraction in non-wheezing preschool children (n=14) and school age children (n=13),
aged (0.25-14.2) years, Spearman r=0.027, p=0.89, figure 5.17.
Figure 5.17: No relationship between age and ASM volume fraction in non-
wheezing controls
Spearman r=0.027, p=0.89
0 5 10 15 200.0
0.1
0.2
0.3
0.4
n=27
Age (years)sm
oo
th m
us
cle
/ s
ub
ep
ith
eliu
m

186
5.10 Airway smooth muscle hyperplasia
ASM proliferation was assessed by myocyte proliferating cell nuclear antigen in
children with remaining EB tissue, and no difference was seen between wheezers
(n=12) and controls (n=3) or those with school age asthma (n=3) and those without
school age asthma (n=7), figure 5.18.
Figure 5.18: No difference in smooth muscle proliferation between wheezers
and controls (figure A); No difference in smooth muscle proliferation between
children with and without school age asthma (figure B).
A
wheezers (n=12) Controls (n=3)0
100
200
300
400
500
PC
NA
+ve A
SM
cells /
mm
2A
SM
B
Asthma (n=3) No asthma (n=7)0
100
200
300
400
500
PC
NA
+ve A
SM
cells /
mm
2A
SM

187
5.11 Can airway smooth muscle in endobronchial biopsies from preschool
wheezers help predict school age asthma?
The receiver operator curve (ROC) evaluates the discriminatory power of a test, in
this case using ASM in endobronchial biopsies at preschool age to discriminate
between preschool wheezers who developed school age asthma and those whose
symptoms resolved. An area under the curve (AUC) of 1 would represent 100%
sensitivity (no false negatives) and 100% specificity (no false positives). The area
under the ROC curve in this case is 0.88 (standard error 0.08, CI (0.69-0.97),
p=0.005) for ASM area fraction, figure 5.19, and similarly the AUC was 0.79
(standard error 0.08, CI (0.61-0.91), p=0.0008) for ASM volume fraction, figure 5.20.
The ROC curve being based on sensitivity and specificity does not take any account
of asthma prevalence. The PPV of ASM area fraction >0.1 at preschool age in
preschool wheezers for asthma at school age was 75% (35-96%) and NPV was 92%
(64-99%), table 5.5.
Figure 5.19: Area under the receiver-operator characteristics curve for airway
smooth muscle area fraction (measured using computer aided analysis) in
preschool wheezers in the diagnosis of future school age asthma was 0.88
(standard error 0.08, confidence interval (0.69-0.97)), p=0.005. (Confidence
intervals are represented by broken line, area under the curve by the continuous
line)
AUC=0.88
0 20 40 60 80 100
0
20
40
60
80
100
100-Specificity%
Se
nsitiv
ity%

188
Figure 5.20: Receiver operator characteristics curve for airway smooth muscle
volume fraction (measured using point counting) in preschool wheezers
related to school age asthma (area under the curve 0.79, standard error 0.08,
confidence intervals 0.61-0.91, p=0.0008). (Confidence intervals are represented
by broken line, area under the curve by the continuous line)
AUC=0.79
0 20 40 60 80 100
0
20
40
60
80
100
100-Specificity%
Se
nsitiv
ity%
Asthma predictive indexes
Preschool ASM was compared to two other asthma predictive indexes, the Castro-
Rodriguez ‘stringent index’(27) and a wheeze severity score(79). Clinical data at
preschool age was used to classify preschool wheezers using the Castro-Rodriguez
stringent index, frequent wheeze plus 1 major or 2 minor criteria (major criteria;
parental doctor diagnosed asthma or doctor diagnosed eczema in the child, minor
criteria; wheezing apart from colds or peripheral blood eosinophilia)(27). A history of
doctor diagnosed allergic rhinitis had not been recorded so wheezing apart from
colds or peripheral blood eosinophilia were used as the minor criteria. All children
had at least 3 episodes of wheeze at the time of EB, however the exact number was
not recorded. For application of the wheeze severity score 3-4 episodes of wheeze
plus the number of hospital admissions was used to approximate the score(79). Both
clinical predictive indexes were compared with current asthma at school age. Of the
children followed up at school age (37/47), data was available to apply the Castro-
Rodriguez ‘stringent predictive index’ to 34 children, 22 satisfied the criteria (major
(n=21) and minor (n=1))(27). This index did not significantly predict the development
of asthma in this group of preschool wheezers, p=0.27, table 5.5. When the wheeze

189
severity score (wheeze frequency and hospital admissions) was compared with
current asthma at school age, the area under the curve (AUC) was 0.70 (standard
error 0.08, [CI 0.53-0.84], p=0.01), figure 5.21, and in this group of preschool
wheezers a score >6 was predictive of asthma(79). There was no significant
difference between the AUC for ASM or for the wheeze severity score, p=0.13. As
the study number was small all predictive indices and ROC curves have very wide
confidence intervals.
Figure 5.21: Receiver operator characteristics curve for wheeze severity score
related to school age asthma (area under the curve 0.7, standard error 0.08, CI
0.53-0.84, p=0.01). (Confidence intervals are represented by broken line, area under
the curve by the continuous line)
AUC=0.70
0 20 40 60 80 100
0
20
40
60
80
100
100-Specificity%
Sensitiv
ity %
Table 5.5: Sensitivity, specificity, positive and negative predictive values and
likelihood ratios for a proportion of endobronchial biopsy greater than 0.1 ASM
area-fraction, Castro-Rodriguez ‘stringent index’ and Devulapalli wheeze
severity score in preschool wheezers
Sensitivity (%)
Specificity (%)
NPV (%) PPV (%) p Likelihood ratio
ASM area-fraction> 0.1
86 (42-99)
86 (57-98)
92 (64-100)
75 (35-97)
0.003 6
Stringent index 79 (49-95)
45 (23-69)
50 (28- 72)
75 (49-94)
0.27 1.6
Severity score >6 60 (32-84)
77 (55-92)
64 (35-87)
74 (52-90)
0.03 2.6
*ASM measured using computer aided analysis as a proportion of the total subepithelial area

190
5.12 Preschool ASM and lung function at school age
There was no correlation between preschool ASM area fraction and school age lung
function; LCI (n=28, Spearman r=0.12, p=0.54), Sacin (n=23, Spearman r=0.04,
p=0.87), Scond (n=23, Spearman r=-0.1, p=0.63), FEV1 z score (n=28, Spearman r=-
0.12, p=0.53), FVC z score (n=28, Spearman r=-0.18, p=0.35), FEV1/FVC (n=28,
Spearman r=0.09, p=0.35). Similar results were seen for ASM volume fraction. When
the preschool wheezers were considered alone there was a positive correlation
between school age FeNO50 and both preschool ASM area fraction (Spearman
r=0.58, p=0.01), figure 5.22 (i), and ASM volume fraction (Spearman r=0.44,
p=0.08). There was also a positive correlation between FEV1 / FVC and both ASM
area fraction (Spearman r=0.52, p=0.03), figure 5.22 (ii) and ASM volume fraction
(Spearman r=0.49, p=0.04).
Figure 5.22: Positive correlation between (i) FeNO50 and (ii) FEV1/FVC and ASM
area fraction
Spearman r=0.58, p=0.01
ASM area fraction
FeN
O5
0
0.00 0.05 0.10 0.15 0.200
10
20
30
40
n=16
Spearman r=0.52, p=0.03
ASM area fraction
FE
V1/F
VC
0.05 0.10 0.15 0.20
-4
-2
0
2
4
n=17
(i)
(ii)

191
Eighteen children with ASM in endobronchial biopsy had assessment of AHR using
hypertonic saline (defined as positive airway challenge if there was a decrease in
FEV1≥ 15%). A further child with ASM on EB and lung function less than 75% had
assessment of BDR (≥15% increase in FEV1 20 minutes post bronchodilator
challenge). Two children were excluded because biopsy size was less than 0.2mm2.
There was no difference in ASM at preschool age between children who had either
positive bronchodilator response (n=1) or a positive AHR challenge (n=2), [(n=3,
median ASM= 0.127, range (0.05-0.156)], to those who did not at school age [n=14,
median ASM 0.08, range (0.03-0.199)], p=0.57, figure 5.23. However, the numbers
who were reactive were so small that no firm conclusion can be drawn.
Figure 5.23: Preschool airway smooth muscle is not increased in those with
school age airway hyper-responsiveness or positive bronchodilator response
p=0.57
AHR/BHR (n=3) No AHR/BHR (n=14) 0.00
0.05
0.10
0.15
0.20
sm/ subepithelium

192
In summary
Although there was no difference in ASM at preschool age between wheezers and
controls, preschool wheezers who went on to develop school age asthma had
increased ASM at preschool age when compared to those who did not. One
limitation of the study was that lung function at the time of the EB was not available.
ASM has been significantly related to airflow obstruction in adults and children. In
particular ASM in the airway wall increases as airflow limitation worsens in
adults(124;125). Furthermore, increased ASM has been related to reversible airflow
obstruction in older school age children with asthma(118;121). Infants with AHR at 1
year of age are more likely to have asthma at age 11 years, which might suggest
ASM is already increased at this age(39). A previous study showed no evidence of
increased RBM thickness or subepithelial eosinophils in wheezy infants (median age
1 year) who had lung function measured at time of EB(138). However, the next step
further to explore the role of ASM was to study these wheezy infants with reversible
airflow obstruction aged 1 year.
5.13 Airway smooth muscle measurement in the ‘Helsinki’ wheezy infants
5.13.1 Clinical description of infant cohort
The characteristics of the infant cohort have previously been reported. The infants
were originally recruited by Dr K Malmstrom and co workers in Helsinki, Finland and
all clinical assessments were performed there. Dr Sejal Saglani measured both
reticular basement membrane thickness and quantified submucosal eosinophils in
these infant endobronchial biopsies(138).
Infants were recruited between 3 months and 2 years of age from 2 paediatric
centres, The Skin and Allergy Hospital and the Hospital for Children and
Adolescents, Helsinki where they had been referred for assessment for chronic
dyspnoea, cough and wheeze. Children were referred for evaluation by
bronchoscopy and lung function tests if clinically indicated in order to guide future
management. Rigid bronchoscopy was routine clinical practice in both hospitals at
that time and was performed under general anaesthesia, with a 3.0mm rigid
bronchoscope, using biopsy forceps (No. 10378L; Karl Storz, GmbH and Co.,
Tuttingen, Germany) at the carina.

193
Infants all had clinically indicated bronchoscopy for wheeze and cough. Exclusion
criteria were:
1. 3 days of oral corticosteroids in the previous 8 weeks
2. >400µg of inhaled corticosteroids within 4 weeks of the assessment and
lung function
3. non-Caucasian ethnicity
4. birth at gestational age < 36 weeks or small for gestational age (birth
weight <-2SD)
5. respiratory distress syndrome
6. bronchopulmonary dysplasia
7. respiratory infection in the 14 days preceding lung function
8. severe atopic dermatitis (>20% of area at the first visit)
9. obvious bronchomalacia or other anatomical malformation on
bronchoscopy
10. specific airways conductance (sGaw)< 35% predicted for age combined
with dyspnoea at rest
5.13.2 Infant Lung Function
Lung function was assessed with an infant body plethsmograph up to 3 weeks
before the bronchoscopy (BabyBody, Jaeger GmbH, Wurtzburg, Germany)(259).
Paired sets of measurements of FRC and sGaw were performed and between test
variability assessed. FRC higher than the 95th centile (z score ≥ 1.65) and sGaw
lower than that of the 5th centile (z score ≤1.65) of the reference range were
considered abnormal. Bronchodilator response was assessed by repeating the
measurements 15 minutes after inhalation of 600mcg (Ventolin® Glaxo, United
Kingdom) delivered with a metallic spacer (Nebunettte®, Astra, Sweden).
Bronchodilator response was considered significant if there was increase in sGaw of
at least 30% and if the increase exceeded 2 standard deviations of the variability(259).
Infants were divided into 3 groups based on the basis of their lung function
Group A: reduced airways conductance with bronchodilator response
Group B: reduced airways conductance, no bronchodilator response
Group C: normal lung function

194
5.13.3 Atopy
Atopy was defined in all subjects by a positive skin prick test (Solu-Prick Sq, Alk-
Abello, Horsholm, Denmark) for at least one of the test allergens (birch, timothy,
grass, cat, dog, Dermatophagoides pteronyssinus, latex, egg, cows milk).
5.13.4 Rigid bronchoscopy and endobronchial biopsy
All bronchoscopies were performed for clinical indications in Finland; however
endobronchial biopsies were taken for research purposes under direct visualisation
from the main carina. Up to 2 biopsies were fixed in 2.5% glutaraldehyde in 0.05-M
sodium cacodylate buffer (pH=7.4) for a duration of 2 weeks to 3 months and
transported to the Royal Brompton Hospital. Secondary fixation was in 1% osmium
tetroxide in sodium cacodylate buffer for 1.5 hours. Biopsies were dehydrated and
embedded in epoxy resin (Araldite). Plastic sections (1µm thick) were cut using a
microtome (Reichert-Jung, Leica UK) and stained with toluidine blue (1% toluidine
blue in 1% sodium tetraborate).
5.13.5 Quantification of RBM thickness
Sections stained with toludine blue that contained epithelium, RBM and
subepithelium were used to measure RBM thickness by Dr Saglani using the
methods described in chapter 3(138). Briefly, RBM thickness was determined using
computer aided image analysis as the mean of 40 measurements made at 20µm
intervals(225). These results have previously been reported(138).
5.13.6 Quantification of smooth muscle
ASM area fraction was measured in evaluable biopsies stained with toludine blue
using computer aided analysis, figure 5.24. ASM is reported as a fraction of the
subepithelial area. Results are reported as the mean of all tissue sections measured.

195
Figure 5.24: Evaluable endobronchial biopsy section from an infant stained
with toluidine blue showing epithelium, RBM, submucosa and smooth muscle.
Results
5.13.7 Number of children with airway smooth muscle in endobronchial biopsy
71 sections from 53 infants with evaluable biopsies were reviewed. Of those, 33
sections from 24 children did not contain ASM. There was no difference in age
(p=0.45) or atopic status (p=0.65) between children with ASM and without ASM on
endobronchial biopsy. Twenty nine children had between 1-3 sections with ASM with
a mean number of 1.3 sections per child. Median biopsy area measured 0.85 (range
0.21-1.71)mm2.
5.13.8 Variability
Intra-observer repeatability was assessed by measuring 3 sections chosen randomly
on 3 occasions a week and a month apart. The mean coefficient of variation for the 3
biopsies was 4%. The coefficient of variation values for each of the 3 biopsies were
1%, 4% and 7%. Only 5 children had more than 1 biopsy with ASM from which to
assess between biopsy variability. Four children had 2 sections with ASM and 1 child

196
had three sections with ASM. The coefficient of variation between the 3 sections was
very high at 89%. Furthermore a Bland-Altman plot of the 4 children with 2 sections
also shows high variability, figure 5.25.
Figure 5.25: Bland Altman plot of comparing interbiopsy variability of infant
airway smooth muscle in the same child
0.05 0.10 0.15 0.20
-0.05
-0.03
-0.01
0.01
0.03
0.05
0.07
0.09
0.11+2SD
Bias
-2SD
Mean of measurement 1&2Diffe
ren
ce o
f m
easu
rem
en
t 1&
2
5.13.9 Airway smooth muscle in each infant lung function group
Clinical characteristics of the Helsinki infants with ASM in EB are reported in table
5.6. Although these children were followed up at 3 years of age in Helsinki, this
clinical data is not available to me. If anything, there was a trend towards decreased
ASM area fraction in the infants with airflow obstruction and bronchodilator
reversibility, group A (n=9, median=0.04, (range 0.008-0.18)), when compared with
group B (n=11, median=0.099, (range 0.016-0.498)) and group C (n=9,
median=0.099, (range 0.029-0.23)), but this was not statistically significant, figure
5.26.

197
Figure 5.26: No increase in ASM area fraction in wheezy infants (Helsinki) with
airflow obstruction and bronchodilator reversibility when compared to infants
with normal lung function.
p=0.062
Gro
up A (n
=9)
Gro
up B (n
=11)
Gro
up C (n
=9)
0.0
0.1
0.2
0.3
0.4
0.5
0.6
sm
/ su
bep
ith
eliu
m
Table 5.6: No difference in airway smooth muscle measurements between
Helsinki infants with one or more biopsies
Group A
n=16
Group B
n=22
Group C
n=15
p
Age (median months) Range
11.6 (3.8-18)
12.36 (5-25.9)
11.52 (3.36-24.2)
0.57
Sex (male)
Age of onset of symptoms (months) Range
Parental asthma
RBM (median µm) Range
8 (50%)
4.5 (0-16)
8 (50%)
4.35 (2.8-9.2)
18 (82%)
5 (0-14)
10 (45%)
4 (2.7-5.8)
17 (73%)
2 (0-13.5)
3 (20%)
3.8 (2.7-5.8)
0.58
No. of children with ASM 9 (56%) 11 (50%) 9 (60%)
Age (months) Range
7.3
(3.8-17.64)
12
(5-18.24)
16.08
(4.44-24.2)
0.07
No. of children with atopy 3 2 4 0.44
Total IgE (median IU/ml) Range
Median biopsy (area mm2)
Range
16 (2-86)
0.88 (0.22-0.92)
20 (2-377)
0.859 (0.3-1.71)
17 (7-406)
0.854 (0.215-2.8)
0.2
0.79
Mean ASM (median mm2)
Range 0.04
(0.008-0.18) 0.099
(0.016-0.498) 0.099
(0.029-0.23) 0.06

198
5.13.10 Atopy and airway smooth muscle in wheezy infants (Helsinki)
There was no difference in ASM between atopic (n=9, median 0.08 (range 0.034-
0.176)mm2) and non atopic infant wheezers (n=20, median 0.098 (range 0.008-
0.49)mm2), figure 5.27. There was also no difference in total IgE between the 3
groups (p=0.2).
Figure 5.27: No difference in airway smooth muscle between atopic and non-
atopic wheezers
p=0.65
Atopy (n=9) No atopy (n=20)0.0
0.2
0.4
0.6
No difference in ASM between atopic and non-atopic wheezers
sm
/ s
ub
ep
ith
eliu
m
5.13.11 Correlation of age and RBM thickness with smooth muscle in the
wheezy infant cohort
There was no correlation between RBM thickness and fraction of smooth muscle
(Spearman r=-0.06. p=0.72), figure 5.28 (i). There was also no correlation between
age of infants with normal lung function and airway smooth muscle, figure 5.28 (ii).
Biopsies were taken from the carina in infants (Helsinki cohort) and from 3rd and 4th
generation bronchi in the preschool group (RBH cohort), so ASM results may not be
directly comparable. ASM distribution is not homogenous throughout the airways
with the proportion of smooth muscle in the airway wall being relatively more in the
peripheral airway walls (non cartilaginous, 10%) when compared with the central
airways (cartilaginous airways, 2.8%)(260).

199
Figure 5.28: (i) Relationship between smooth muscle area and RBM thickness;
(ii) Relationship between age and smooth muscle area fraction
Spearman r=-0.03, p=0.72
0 1 2 3 4 5 6 70.0
0.1
0.2
0.3
0.4
0.5
0.6
No correlation between RBM thickness and ASM
RBM (m)
sm
oo
th m
uscle
are
a/
su
bep
ith
eli
al
are
a
Spearman r=-0.03, p=0.86
0 5 10 15 20 25 300.0
0.1
0.2
0.3
0.4
0.5
0.6
No correlation between ASM and age
Age (months)
are
a s
mo
oth
mu
scle
/ su
bep
ith
eli
al
are
a
5.14 Discussion
5.14.1 Statement of principal findings
Hypothesis
School-aged children with asthma had evidence of airway remodelling and airway
inflammation in endobronchial biopsies taken at preschool age, when compared
to school-aged children without asthma.
The main finding of this study is that airway wall smooth muscle area fraction or
volume fraction, as measured in EB, discriminates to some extent in this highly
(i)
(ii)

200
selected group between those severe preschool wheezers who will develop asthma
at school age and those who will not. This strongly supports the hypothesis that
evidence of airway remodelling is already present in those severe recurrent
preschool wheezers who go on to develop asthma.
Summary of findings in this chapter
No difference in ASM between preschool wheezers (RBH cohort, median age 2
years) and controls
Increased ASM at preschool age in children who go on to develop school age
asthma
No difference in ASM between wheezy infants (Helsinki cohort, median age 1
year) with reversible airflow obstruction and those with normal lung function
No correlation between age and ASM
5.14.2 Strengths of study
This is the first study to quantify ASM in endobronchial biopsies from preschool
wheezers (RBH) and to relate pathological findings at preschool age with asthma
status at school age. ASM in the biopsies was measured by a single blinded
observer using two very different techniques, both giving the same results. Findings
were confirmed by a second independent observer. ASM indexed to the surface area
of RBM failed to show a difference between children with and without school age
asthma however repeatability (CoV 121%) for this method was poor.
5.14.3 Limitations of study
Results may not be applicable to other wheezy preschool children
An important limitation was that the preschool wheezers (RBH) enrolled in the
original study were of necessity very severe otherwise they would not have
undergone bronchoscopy. Numbers are relatively small, and only 32/42 with ASM in
endobronchial biopsy could be followed up at school age and only 8 (25%) of these
children had developed asthma. However, there was no difference in terms of age at
biopsy, sex or atopy between those analysed at school age and those who were not
suggesting drop-outs are not likely to have introduced a significant bias. Of the 7
children with preschool wheeze who had asthma at school age and ASM on their

201
endobronchial biopsy, 4 had been enrolled in the difficult asthma program RBH(195)
and were prescribed high dose ICS to control their symptoms (median 800mcg
beclomethasone equivalent).
Lung function measurement
Unfortunately, lung function measurements were not performed in the preschool
children prior to endobronchial biopsy, as standards for measuring lung function in
preschool wheezers had not been established at the time of the original study(9). No
correlation was seen at school age between AHR or lung function and preschool
ASM (RBH), but this is likely to be both due to the delay of several years between
biopsy and assessing lung function and small sample size. However, wheezy infants
(Helsinki) with reversible airflow obstruction showed no increase in ASM. This may
suggest that ASM may not be the driving factor in AHR in this age group. However,
the sample size is too small to draw any firm conclusions and these infant samples
were taken at the bifurcation of the trachea where there is typically much less ASM
(3%) compared with more peripheral airway walls (10%) from where the RBH
biopsies were taken(260).
Variability of ASM measurements
Biopsy size
The bronchoscope used to biopsy preschool children (2.8 or 3.6mm) was much
smaller than that used in adults and older children (>4mm). The biopsy channel was
correspondingly smaller (1.2mm vs >2mm), and as a result the minimum amount of
tissue measured (0.2mm2) was much less than in studies in adults and older children
(1mm2).
Within and between biopsy variability
There is considerable variability in structural characteristics between endobronchial
biopsies and between sections within biopsies. Within and between biopsy variability
for the same child was up to 37% (range 4-70)% for ASM. The majority of children
just had a single good quality biopsy for assessment. Previous studies have also
shown that the thickness of airway smooth muscle relative to the airway diameter
varied 10 fold within the same group of airways(260). For this reason ASM was

202
analysed on a per child basis (the mean of the measurements obtained from all
sections from the 1 or more biopsies available). However, not all sections from the
preschool children that were assessed for ASM were consecutive as sections had
also been stained for other inflammatory cell populations. A very superficial EB could
also underestimate ASM.
Inter and Intra-observer repeatability of ASM measurements
ASM area fraction measurements showed good correlation between 2 observers.
The variability for repeated measures of the same section by the same observer was
higher for point counting than using the computer aided analysis program. The
increased CoV is likely because of the small number of points counted per subject in
the preschool biopsies (median 79 (range 28-276), median biopsy area 0.49mm2)
when compared with (571 (295–864), median biopsy area 1mm2) points per subject
in older children(121). However, there was good correlation between the 2 methods
(ICC=0.78).
Age and airway smooth muscle
Children with school age asthma were older at the time of EB when compared to
children without school age asthma. Similarly the children with school age asthma
also had increased endobronchial tissue measured when compared with controls.
Data on normal ASM development is scanty. However there was no relationship
between age and ASM in the preschool and school age non-wheezing controls. A
post-mortem study showed that ASM increased linearly with airway diameter during
infancy and childhood(256), but although adults have increased absolute amounts of
ASM when compared to children, the proportion of ASM, which is what we quantified
in the airway wall remains similar(261).
Quantifying smooth muscle further
Previous studies have shown the distance between the submucosal limit of
subepithelial basement membrane and the ASM layer is increased in asthmatics(110).
However, it was not possible to assess this in the preschool or infant wheezers as
the orientation of biopsies was very variable. Secondly, this study did not assess
whether the increase in ASM in the subgroup of children who had asthma at school

203
age was secondary to cell hypertrophy or hyperplasia, or both. However, PCNA
staining to assess smooth muscle hyperplasia was performed in a small number of
children (n=10) followed up at school age, but showed no increase in PCNA positive
cells in those with asthma (n=3).
5.14.4 Airway smooth muscle and asthma
The proportion of ASM in endobronchial biopsies from severe recurrent preschool
wheezers is less than in older children and adults with asthma. The subgroup of
children who developed asthma at school age had 12% (8-16)% of the subepithelium
occupied by ASM, which is similar to the values reported in adults (16-18)% with
mild-moderate asthma(110;122). Further increases in ASM have been reported with
increasing asthma severity, with 16-27% of subepithelial tissue occupied by ASM in
school age children with moderate-to-severe asthma(118;121), compared with 40% in
adults with severe asthma(110). The proportion of ASM occupying the subepithelial
tissue in the preschool wheezers and controls who did not develop asthma was 6-
9% (depending on the method used) similar to that reported for children aged 6-16
years without lower airway disease (4%)(121), but less than that reported in adults
with no respiratory symptoms (9-11.5%)(110;221). ASM has traditionally thought to
occupy approximately 10% of non-cartilaginous airways(262). Larger biopsy forceps in
adults would likely have taken larger and deeper biopsies containing more ASM.
5.14.5 Corticosteroid use and airway smooth muscle
There is little reported on the action of corticosteroids on smooth muscle of the
asthmatic airway in adults, and none in young children. Half (14/28) of the preschool
wheezers had been treated with regular ICS or a course of oral prednisolone in the
month preceding the biopsy, but no difference was seen in the proportion of ASM in
the subepithelial area. This is despite the children being treated with high doses of
ICS (500mcg of budesonide or equivalent). In contrast animal studies have shown
that ovalbumin sensitised female BALB/c-mice who were treated with intranasal
fluticasone which was inhaled into the airways had decreased thickening of smooth
muscle(263).

204
5.14.6 Airway smooth muscle predicts school age asthma
Increased ASM was evident at preschool age in those children with school age
asthma when compared to children without school age asthma. The AUC of the
ROC was high (0.87), but numbers are small with wide confidence intervals. This is
comparable with scores for wheeze severity age 2 years in children from Oslo
predicting asthma at 10 years with an area under the ROC of 0.78, and when the
score was applied to the RBH group of preschool wheezers AUC of 0.70(79).
However, a higher severity score was needed to predict asthma in this group of
preschool children compared to the Oslo cohort (>6 versus >5)(79). The median age
at follow up for the present study was 8 years. By comparison with the Castro-
Rodriguez ‘stringent predictive index’ for asthma at 8 years, ASM biopsy proportion
>10% had similar NPV (93% versus 88%) but improved PPV (72% versus 44%)(27).
However, when the ‘stringent index’ was applied to this present group of children it
did not significantly predict asthma. This is likely because the RBH group of children
represented a much severer preschool wheeze phenotype and study numbers were
much smaller. Secondly, some features of the index (i.e. doctor diagnosed allergic
rhinitis) could not be applied to the present study group.
In summary
Although increased ASM in preschool wheezers increases the risk of school age
asthma, the overlap in ASM between children who developed childhood asthma and
those who did not is too great to be of any clinical prognostic value. However, this
data suggests that future studies exploring the mechanisms underlying the
persistence of preschool wheeze and its progression to asthma might profitably
focus on airway smooth muscle.
Airway inflammation also plays an important role in asthma pathogenesis. However,
its role in disease progression or disease persistence in preschool wheezers is
unknown. The next chapter will relate airway inflammation at preschool age to school
age asthma status.

205
Chapter 6
Airway Inflammation in Preschool Wheezers and its
Relationship to School Age Asthma
6.1 Introduction
Airway inflammation plays an important role in the pathophysiology of school age
asthma, and indeed the presence of inflammation is built into some definitions of the
disease(8). Currently anti-inflammatory therapy, particularly ICS, is central to long
term asthma management. Several cell types are implicated in airway inflammation
including eosinophils, neutrophils, CD4+ T lymphocytes and mast cells. In particular
mast cells and eosinophils are thought to play a pivotal role in adult asthma.
Eosinophils
Eosinophils in sputum(177), BAL(264) and endobronchial biopsies(93;94;265;266) are an
established feature of asthma in school age children. Eosinophils may also be
increased in non-wheezing children with atopy. BAL eosinophils and eosinophilic
cationic protein, were increased in school age asthmatic children when compared to
non-atopic controls but not in controls with atopy(264). The presence of eosinophilic
inflammation in endobronchial biopsies is well established in both mild-
moderate(93;94) and severe asthma(119;265;266) in school age children.
The role of eosinophils in preschool children with wheeze is unclear. Wheezy
children aged 3-6 years had increased BAL eosinophils (labelled asthmatic)(264)
when compared to age matched non-atopic non-asthmatic controls, however there
was no difference in BAL eosinophils seen in children aged less than 3 years when
compared with controls(264). Asthmatic children aged <6 in the reported study likely
represented multiple-trigger wheezers as they had repeated episodes of wheezing,
breathlessness and cough, particularly at night and early morning, which were
present apart from colds(264). All ‘asthmatic children’ had to be responsive to
bronchodilators by definition(264). Similarly, wheezy infants (median age 1 year) with
reversible airflow obstruction had no increase in subepithelial eosinophils in EB(138),
but children with severe recurrent wheeze aged 2-3 years recruited from the RBH did

206
have evidence of increased subepithelial eosinophils when compared to non-
wheezing preschool controls(9). In children with multiple-trigger wheezing aged 5
years, eosinophilic inflammation has been demonstrated in endobronchial biopsies
irrespective of the presence or absence of atopy when compared with controls(107).
Studies also suggest that airway inflammation is present prior to the onset of asthma
diagnosis. EB performed in 27 children (median age 8 years) who were
bronchoscoped because of recurrent or chronic respiratory symptoms, subsequently
followed up 2-6 years later, showed those who were later diagnosed with asthma
had increased submucosal eosinophils at EB(140). However, this study was limited by
small numbers, only 3 children were less than 5 years at EB (age range 1.2-11
years), and there was variable time of follow up post EB. It is likely that several of the
children had established asthma, reporting chronic cough and wheezing with viral
infections, although not clinically diagnosed at time of EB(140). A BAL study also
suggested airway inflammation is present prior to the onset of asthma(267). Children
(n=81) with a median age 3.2 years who had never wheezed had a non-
bronchoscopic BAL performed during elective surgery for non-pulmonary disease
and were followed up 7 years later to ascertain whether any children had
subsequently developed wheezing or other atopic disease (eczema, allergic rhinitis)
using a modified ISAAC questionnaire(267). Children who were clinically
asymptomatic in terms of wheeze before the BAL and subsequently developed late
onset wheezing in childhood had evidence of increased eosinophils on BAL when
compared with children who did not develop late onset wheezing(267). The increase in
BAL eosinophils was not associated with elevated TH2 cytokines as observed in
children with established asthma. Furthermore, preschool atopy did not predict
eosinophilic airway inflammation as there were no significant differences in blood
and BAL eosinophils between those who became atopic but never wheezed and
non-atopic children who did not develop wheeze(267).
Mast cells
Mast cells are also thought to play an important role in asthma pathogenesis. Mast
cell activation occurs in response to allergen presentation following IgE mediated
crosslinking of the membrane bound IgE high affinity receptor (FcεRI) causing
degranulation and the release of mediators (histamine, leucotrine C4, prostaglandin

207
D2) and cytokines (IL-4, IL-5 and IL-13)(268). Mast cells originate from pluripotent
hematopoietic stem cells which circulate as CD34+ precursors until they migrate into
tissues where they mature into long living effector cells(268). In humans mast cell
subtypes are classified by their protease content, mast cell tryptase (MCT) cells
store primarily tryptase in their granules and are found predominantly in the lung and
the intestinal muscosa. Mast cell tryptase chymase (MCTC) cells store both
chymase, tryptase and carboxypeptidase in their granules and are found in the skin,
lymph nodes and submucosa of the stomach and intestine(268). Normally, MCT cells
predominate in the lung, whereas MCTC cells represent less than 20% of lung mast
cells. Mast cells are implicated in asthma pathogenesis, but their phenotype, location
and activation varies with asthma severity(147). In adults with asthma, mast cells
migrate into the epithelium(146), airway submucosa(147) and ASM(148;150;248).
Epithelial mast cells
The expression of mast cell tryptases and carboxypeptidase A3 (CPA3) in the airway
epithelium of steroid naive adult asthmatic subjects (n=42) is increased when
compared to healthy control subjects (n=28)(146). Mast cell gene expression in the
airway epithelium related closely to the expression of IL-13 signature genes and
correlated positively with lung function improvements with subsequent ICS
treatment(146). The number of intraepithelial mast cells (measured only in those with
intact epithelium) was higher in those adult asthmatics with high TH2 cytokine profile
when compared with those with a low TH2 cytokine profile or healthy controls(146).
Intraepithelial mast cells were similar between asthmatics with a low TH2 cytokine
profile and healthy adults. Epithelial chymase positive mast cells were not reported in
steroid naive asthmatics(146), but epithelial MCTC have been reported in mild
asthmatics using ICS(147) and in severe adult asthmatics(147).
Submucosal mast cells
The USA National Heart, Lung, and Blood Institute’s Severe Asthma Research
Program investigated the expression of epithelial and submucosal mast cells from
adults with range of asthma severity and normal control subjects(147). Submucosal
MCT cells were shown to be highest in adults with mild asthma not being treated
with ICS and decreased with increasing asthma severity(147). In contrast, in severe
asthma the mast cell population is dominated by the chymase-positive phenotype

208
(MCTC) in submucosa and in the epithelium(147). A limitation of this study is that it did
not quantify ASM mast cells.
Airway smooth muscle mast cells
The morphology of mast cells in the ASM of asthmatic patients seen on electron
microscopy when compared to control groups are of smaller cells with fewer
cytoplasmic pseudopods with partial or total degranulation(248). Furthermore, in vitro
studies have shown that ASM hyperplasia may be driven by mast cell derived
chemokine ligand 19 via the activation of chemokine receptor 7 in ASM(269). The
relationship between mast cell myositis and asthma severity is unclear. Bequeret et
al reported no relationship to asthma severity, as measured by AHR and infiltration
of the ASM by mast cells(248). In contrast, Siddiqui reported location of mast cells in
the smooth muscle bundle but no other features of airway remodelling were
associated with AHR in asthma(149). Furthermore, mast cells localised in the smooth
muscle bundle in contrast to mast cells localised in the submucosa expressed
fibroblast markers that correlated strongly with the degree of AHR (r=0.61,
p=0.004)(150). In vitro studies showed that these fibroblastoid mast cells have an
increased expression of chymase and are in a heightened state of activation with
increased release of histamine(150). Mast cells and their relationship to both smooth
muscle and submucosa have not previously been explored in preschool wheezy
children. Epithelial mast cells in this current study were not quantified as the
epithelium was not intact in either the RBH preschool wheezers or controls.
T lymphocyte cells
A predominance of subepithelial TH cells (CD4+) cells in endobronchial biopsies from
children with well established severe asthma (median age 13 years) is associated
with persistent airflow limitation(226). Furthermore in two groups of adolescent
asthmatic children (one with persistent symptoms and the second with few
symptoms) there were increases in the TH2 cytokines, IL-4 and IL-5 in
bronchoalveolar lavage(115). However, in the adolescent group with persistent asthma
symptoms TH2 type inflammation was associated with the presence of activated
eosinophils in the bronchial epithelium, whereas in children with few asthma
symptoms there was an increase in levels of the TH1 cytokine IFN and IFN/IL-4

209
ratio, in bronchoalveolar lavage(115). However, in more severe asthma there is limited
evidence for the role of TH2 cytokines. A recent study showed that children with
severe therapy resistant asthma were characterised by eosinophilic inflammation
without increase in TH2 cytokines (IL-4, IL-5 or IL-13) in most patients(119).
The pattern of airway inflammation is less clear in infants and preschool children with
wheeze. Children (median age 8 (range 1-15) years) with asthma and atopy had
evidence of ongoing airways inflammation (increased eosinophils and mast cells) on
BAL collected during elective surgery while asymptomatic, when compared to
children with virus associated wheeze or atopy alone(270). Significant T-cell-driven
airway inflammation (IFN-, IL-2, IL-4, IL-5, and IL-10) is absent in mild or non-atopic
children (mean age 5 years) with an episodic wheeze pattern who were
asymptomatic at time of bronchoalveolar lavage(271). However, a BAL study of
wheezy 1 year olds with persistent symptoms had significantly higher CD8+
lymphocytes (a marker for TH1 response), in wheezers compared to controls,
suggesting the contribution of viruses in the pathophysiology of wheezing in this age
group(272). However, in this study controls were not free of lower respiratory
symptoms and were older than the wheezers (mean age 2 years) which may also
explain the TH1 predominance(272).
Neutrophils
The role of neutrophils in childhood severe asthma is controversial. In adults with
chronic severe asthma neutrophils have been consistently increased in BAL fluid,
sputum and in both endobronchial and transbronchial biopsies(273;274). Measures of
airflow obstruction, such as FEV1, correlate with the degree of neutrophilia in sputum
in adults with chronic severe asthma(274). School age children with severe asthma
and reduced FEV1 (mean 82%) had raised blood neutrophils(275), however it is
possible that the apparent increase may be related to ongoing corticosteroid therapy.
In contrast school age children with severe asthma did not have evidence of
neutrophilia in bronchoalveolar lavage or EB(119).
Neutrophils have also been shown to have a role in infant and preschool wheezing.
There are difficulties in interpreting these studies as neutrophilic inflammation in

210
studies that have used BAL may be confounded by coexistent viral or bacterial
infection. In particular persistent bacterial bronchitis may mimic asthma. A BAL study
in wheezy children aged 4-32 months, showed a higher neutrophil count but normal
eosinophil counts in those with recurrent wheeze compared to controls(276). Over half
of the infants with wheezing for whom bacterial analysis of BAL was performed had
positive culture results(276). However, controls who did not wheeze, but did have
other lower airway pathology did not show an increase in neutrophils despite having
similar bacteriological growth frequency on BAL. In another BAL study in children
aged 2.5 years with at least a 6 month history of wheezing, 80% of children had
evidence of neutrophilic inflammation(277). However, half of this subgroup had raised
bacterial counts suggesting infection. Furthermore, a weakness of all these studies is
the lack of molecular data on the airway microbiome.
Current study
Severe recurrent wheezers recruited from the RBH had increased subepithelial
eosinophils but no increase in subepithelial neutrophils, CD4+, CD8+ and CD45+ (a
pan leucocyte marker of subepithelial inflammation) cell counts when compared to
preschool controls(9). Airway inflammation will be related to asthma at school age in
this chapter. Mast cells will be quantified for the first time in preschool endobronchial
biopsies from the RBH.
6.2 Aims
1. To relate airway inflammatory cells (subepithelial eosinophils, neutrophils,
CD4+, CD8+ and CD45+) from the preschool endobronchial biopsies to
school age asthma status
2. To quantify ASM and submucosal infiltration by mast cells in severe recurrent
preschool wheezers and relate these findings to school age asthma status
6.3 Methods
6.3.1 Immunostaining
Immunostaining: Leucocytes (CD45+), neutrophils, eosinophils, CD4+ & CD8+
cells
Immunostaining for eosinophils, neutrophils, CD4+, CD8+ and CD45+ cells had been
performed previously(9). Inflammatory cells including CD45+ cells, neutrophils and

211
eosinophils within paraffin sections were identified using the EnVision-alkaline
phosphatase (EV-AP) technique (DAKO Ltd, Cambridge, UK), and identification of
CD4+ and CD8+ cells was performed using the EnVision Peroxidase staining
method (DAKO Ltd, Cambridge, UK), according to the supplier’s instructions.
Monoclonal antibodies were applied which had been raised from mouse against
human intracellular epitopes, neutrophil elastase (NE) (Dako, Ely) for neutrophils,
human eosinophilic cationic protein and eosinophil protein X (EG2) (Pharmacia &
Upjohn Diagnostics AB, Uppsala, Sweden) for eosinophils, and against the
membrane-associated epitopes CD4+/CD45RO+ (OPD4) (Dako, Ely, UK) for CD4+
T-cells and CD8 (Dako, Ely, UK ) for CD8+ cells. After dewaxing, sections were
immunostained with the appropriate antibodies for 1 hour. Sections were then
washed and incubated with labelled polymer, AP (pre-diluted secondary antibodies,
rabbit anti-mouse/rabbit) (DAKO, Carpinteria, USA). After a further wash, bound
alkaline phosphatase was detected as a red product following incubation with the
chromogen, New Fuchsin substrate system. For CD4+ and CD8+ the sections were
incubated with peroxidase-blocking solution. The sections were incubated with
EnVision secondary antibody solution for 30 minutes (DAKO). After a further wash,
sections were incubated with chromogen (liquid DAB and peroxide buffer). Stained
antigen sites were detected as a brown product. Slides were counterstained with
H&E to provide nuclear and morphological detail, and mounted in mounting medium.
Antibody diluents without primary antibody were used as negative controls. Sections
of resected human tonsillar tissue were used as positive controls.
Immunostaining mast cells
Endobronchial tissue was only available in small numbers of the original preschool
cohort and in this study only MCT was stained. Sections were stained for MCT by Mr
Tim Oates. Children with remaining endobronchial tissue archived in paraffin had
single sections cut and dewaxed with xylene. They were rehydrated through
decreasing alcohol concentrations (100%, 90% and 70%) to water. Sections were
then microwaved in pre-heated 10mM sodium citrate (2.941g in 1 litre water).
Sections were air dried and washed in Tris Buffer Saline. Biopsies were blocked with
horse serum to reduce background staining (VECTASTAIN® Elite ABC, Vector
Laboratories). Sections were then incubated with mast cell tryptase (Dako, Clone
AA1, Mouse Monoclonal) diluted 1 in 200 in TBS containing 10% normal human

212
serum for 1 hour at room temperature. Sections were incubated with secondary
biotinylated mouse IgG in blocking serum followed by incubation with avidin biotin
complex (VECTASTAIN® Elite ABC, Vector Laboratories) to block endogenous biotin
activity. MCT positive cells were visualised as red nucleated cells when stained with
chromogen Fast Red. Levamisole was used to suppress endogenous phosphatase
activity and reduce background staining. Sections were counterstained with H&E.
Slides were mounted aqueous mountant (Faramount, Dako).
6.3.2 Quantification of neutrophils, eosinophils, and CD4+, CD45+ and CD8+
lymphocytes
Inflammatory cells had previously been quantified by SS(9). Details of biopsy
processing and evaluation are reported in chapter 3. Neutrophils, eosinophils, CD4+,
CD45+ and CD8+ cells were assessed by point counting. Point counting is based on
stereological principles, which is the study of the three-dimensional properties of
objects seen in two dimensions(278;279). Using point counting, the determination of
volume density of objects in a reference volume can be estimated using the
formula(278):
VVO, R = PO/ PR
where Vvo, R denotes the volume of objects (O) contained in a reference volume
(R). PO is the number of points from a grid falling onto the structure of interest and PR
is the number of points falling into the reference space. Vv is the volume density and
corresponds to the volume proportion that the structure of interest (the cell) occupies
in the reference space (the tissue compartment).
In this study, point-counting was performed using a 100 point graticule and light
microscopy (Leica DM2500 microscope, Leica DFC 300fx camera and LEICA Qwin
version 3 software, Olympus BH2, Japan) at x400 magnification. The image was
projected onto a computer screen and a virtual graticule (100 point) was moved
systematically until all of that particular section had been measured. Points falling on
smooth muscle, blood vessels, gland and artefactual spaces caused by the
processing were not recorded. All points falling on positively stained cells were
counted as positive and those and those falling on cells in other areas of the
submucosa were counted as negative, figure 6.1. For all cell types, in each child the

213
value for volume density was calculated as the sum of all the positive points (Po) in
one section analysed for that subject, divided by the total number of points counted
in the sections (PR), and then multiplied by 100 to express the value as a
percentage.
Figure 6.1: Nucleated cells stained with neutrophil elastase in an
endobronchial biopsy section from a preschool child
6.3.3 Quantification of smooth muscle and submucosal mast cells
Mast cells were counted as total number of cells per unit area(148). Areas of airway
smooth muscle and submucosa (lamina propria) were identified by morphologic
examination. The area of submucosa (excluding areas of smooth muscle, blood
vessels, gland and artefactual spaces caused by the processing) was calculated by
tracing around the submucosa with a computer mouse and the area was calculated
by a computer analysis system (Leica DM2500 microscope Leica DFC 300fx camera
and Leica Qwin version 3 software, Olympus BH2, Japan). The area of smooth
muscle was calculated in the same way. Nucleated, immunostained cells were
enumerated in the submucosal tissue and airway smooth muscle, and the number of
cells was expressed as the number per square millimeter of submucosa and smooth
muscle, figure 6.2 and 6.3. Cells were counted within the bundles of smooth muscle
Positively
stained cells
Negatively
stained cells

214
but those in the adjacent areas were counted as submucosal mast cells. The total
number of cells was counted for mast cells rather than volume density of cells to
allow direct comparison with adult ASM and submucosal mast cell counts(148).
Figure 6.2: Preschool endobronchial biopsy showing nucleated mast cells
stained red with mast cell tryptase within airway smooth muscle
Smooth muscle
mast cell
Smooth muscle
mast cell
Legend: Both masts cells indicated here were counted as ASM mast cells
Figure 6.3: Preschool endobronchial biopsy showing nucleated mast cells
stained red with mast cell tryptase in submucosa
mast cells
50µm
mast cells
50µm
mast cellsmast cells
50µm

215
6.3.4 Variability of inflammatory cell counts
The intra-observer variability of inflammatory cell counts, quantified using both
methods (point counting and expressing total cell counts per unit area), was
calculated from counts of the same section on 3 separate occasions, at least 3 days
apart. As the tissue was limited and biopsies were relatively small, only a very limited
number of biopsies (n=3) had more than one section stained per inflammatory cell
for the original study(9). Intra-biopsy variability was assessed in 3 biopsies, from 3
children, stained with EG2 for eosinophils. Inter-observer variability was assessed
using Bland Altman plots and the intraclass correlation coefficient for cell counts
performed by both SS and RO’R.
6.4.1 Results: Variability
Repeatability for eosinophils, represented by the CoV, for repeated measurements in
the same section was 20% (20, 22 and 24%). The variability between sections from
the same biopsy was also high with a coefficient of variation for 3 children 0%
(biopsy with no eosinophils), 20.7% and 25.6%. On comparing measurements of
subepithelial eosinophils between 2 observers, there was good agreement in
children with cell volume density less than 1% but significantly more variability in cell
volume densities greater than this, figure 6.4. The intraclass correlation coefficient
for measurements of subepithelial eosinophils by SS and RO’R was 0.68.
Figure 6.4: Difference between measurements of subepithelial eosinophils in
endobronchial biopsies measured by RO’R and SS plotted against the mean of
the 2 measurements
1 2 3 4
-4
-3
-2
-1
0
1
2
Mean of measurements ROR & SS
+2SD
-2SD
Bias
Measu
rem
en
t R
OR
- M
easu
rem
en
t S
S

216
6.4.2 Subepithelial eosinophils
Severe recurrent wheezers (n=29, 1.47 [range 0-3.33]%) had increased subepithelial
eosinophils when compared to controls (n=8, 0 [range 0-0.8]%), p=0.01. Children
with CW (0.78, [range 0-3.33]%) had no difference in subepithelial eosinophils when
compared to RW (0.7, [range 0-2.8]%) but were increased when compared with
controls, p=0.04. However, subepithelial eosinophils in EB were not increased in
those children who went on to develop school age asthma, p=0.14, figure 6.5, table
6.1. There was no difference when preschool wheezers (excluding controls) who did
and did not develop school age asthma were compared, p=0.43. There was no
correlation between eosinophils and RBM thickness as measured by RO’R.
Figure 6.5: (i) Increased subepithelial eosinophils in severe recurrent
preschool wheezers when compared to preschool controls. (ii) No difference in
preschool subepithelial eosinophils between children who developed school
age asthma and those who did not
p=0.01
Wheezers (n=29) Controls (n=8)0
1
2
3
4
Su
be
pit
he
lia
l e
os
ino
ph
ils
(%
) p=0.14
Asthma (n=8) No asthma (n=19)0
1
2
3
4
Su
be
pit
he
lia
l e
os
ino
ph
ils
(%
)
(i) (ii)
Preschool subepithelial eosinophils (measured by SS) were significantly different in
children who developed school age asthma (n=8, 2.19 [range 0-3.52]%) compared to
those who did not (n=19, 0.69 [range 0-1.85]%), p=0.02, figure 6.6.

217
Figure 6.6: Increased submucosal eosinophils as measured by SS when
compared to school age asthma status
p=0.02
Asthma (n=8) No asthma (n=19)0
1
2
3
4
Su
be
pit
he
lia
l e
os
ino
ph
ils
(%
)
6.4.2.2 Relationship of subepithelial eosinophils and lung function and airway
inflammation at school age
There was a positive correlation between school age FEV1 z score (n=22, Spearman
r=0.54, p=0.01) and FVC z score (n=22, Spearman r=0.49, p=0.02) and subepithelial
eosinophils at preschool age measured by RO’R, figure 6.7. Similar correlations
between subepithelial eosinophils in preschool wheezers (n=18) between FEV1 z
score (Spearman r=0.54, p=0.02) and FVC z score (Spearman r=0.47, p=0.05). No
correlation was seen between eosinophils and FeNO50 or MBW indices.
Figure 6.7: A positive correlation between preschool subepithelial eosinophils
and (i) FVC z score and (ii) FEV1 z score at school age
Spearman r=0.49, p=0.02
1 2 3 4
-3
-2
-1
0
1
2
Subepithelial eosinophils (%)
FV
C (
z s
co
re)
Spearman r=0.54, p=0.01
1 2 3 4
-3
-2
-1
0
1
2
Subepithelial eosinophils (%)
FE
V1
(z s
co
re)
(i) (ii)

218
6.4.3 Other cell counts: neutrophils, CD45+, CD4+ and CD8+
There was no difference in neutrophil, CD45+, CD4+ and CD8+ cell counts either
between severe recurrent preschool wheezers and non wheezing preschool controls
or between children with or without school age asthma, table 6.1 and figure 6.8. The
cells counts measured by SS also showed no difference. There was no difference for
any of the inflammatory cell counts when wheezers were divided at preschool age
into CW and RW. There was no correlation with lung function measurements and
FeNO50 at school age.
Table 6.1: Inflammatory cell counts in endobronchial biopsies taken at
preschool age related to school age asthma status.
Asthma No asthma p
Submucosal eosinophils (n) Median (Range) %
8 1.47 (0-3.33)
19 0 (0-11)
0.14
Neutrophils (n) Median (Range) %
8 0 (0-3)
13 0 (0-3.17)
0.48
CD4+ (n) Median (Range) %
8 7.23 (0-22)
13 6.6 (0-33.8)
0.71
CD8+ (n) Median (Range) %
8 7.375 (0-18.1)
12 10.9 (1.2-32)
0.35
CD45+ (n) Median (Range) %
8 28.3 (3.6- 53.6)
12 31.2 (8.9-49.8)
0.67

219
Figure 6.8: There was no difference in preschool subepithelial neutrophils,
CD4+, CD8+ or CD45+ cell counts measured by RO’R when compared by
preschool wheeze group or with school age asthma status.
Preschool age School age
p=0.13
Wheezers (n=29) Controls (n=9)0
1
2
3
4
Neutrophils
Ne
utr
op
hil v
olu
me
de
ns
ity
%
p=0.48
Asthma (n=8) No asthma (n=13)0
1
2
3
4
Neutrophils
Ne
utr
op
hil v
olu
me
de
ns
ity
%
p=0.64
Wheezers (n=29) Controls (n=8)0
10
20
30
40
CD4+
CD
4+
vo
lum
e d
en
sity
(%
)
p=0.71
Asthma (n=8) No asthma (n=13)0
10
20
30
40
CD4+C
D4
+ v
olu
me
de
ns
ity
(%
)
p=0.09
Wheezers (n=28) Controls (n=8)0
10
20
30
40
CD8+
CD
8+
vo
lum
e d
en
sity
(%
)
p=0.35
Asthma (n=8) No asthma (n=12)0
10
20
30
40
CD8+
CD
8+
vo
lum
e d
en
sity
(%
)
p=0.26
Wheezers (n=26) Controls (n=8)0
20
40
60
80
CD45+
CD
45+
vo
lum
e d
en
sit
y (
%) p=0.67
Asthma (n=8) No asthma (n=12)0
20
40
60
CD45+
CD
45
+ v
olu
me
de
ns
ity
(%
)

220
6.4.4 Mast cells in endobronchial biopsies from preschool wheezers
A subgroup of children (n=34), 25 wheezers and 9 controls, with remaining biopsy
tissue had further sections stained for MCT. Two biopsies were excluded (2 controls)
because of crush or distortion of the biopsy. There was very limited endobronchial
tissue and MCT positive cells were only assessed in 1 section from each child.
Repeatability, measured by the CoV, for repeated measurements in the same
section was 5.3% (4.4, 5.4 and 6.2%).
6.4.5 Smooth muscle mast cells
Twelve children (12/32) did not have smooth muscle in the sections stained with
MCT. There was a trend to higher mast cells per smooth muscle area in controls
(n=5, median 88.5 (range 63.8-396.6)/mm2) when compared with wheezers (n=15,
median 33.6 (range 0-239.3)/mm2) but this was not statistically significant, p=0.08,
figure 6.9 (i). On analysis of subgroups there was no difference between CW (n=8,
33.4, (0-239.3)/mm2), RW (n=7, median 33.6 (0-206.4/mm2) and controls, p=0.19,
figure 6.9(ii).
Figure 6.9: Mast cells per smooth muscle area (mm2) compared between (i)
wheezers and controls and (ii) confirmed wheezers, reported wheezers and
controls. There was a counter intuitive trend towards increased mast cells in the
control group.
p=0.08
Wheezers (n=15) Controls (n=5)0
100
200
300
400
No difference in smooth muscle mast cellsbetween wheezers and controls
ma
st
ce
ll / m
m2
p=0.19
CW (n=8) RW (n=7) Ctrl (n=5)0
100
200
300
400
No difference in smooth muscle mast cellsbetween CW, RW and controls
ma
st
ce
lls
/ m
m2
(i)(ii)

221
6.4.6 Submucosal mast cells
There was no difference in submucosal MCT positive cells between wheezers (n=25,
median 139.3 (39.5-552.3)/mm2) and controls (n=7, median 117.4 (61.3-
278.6)/mm2), p=0.41, figure 6.10 (i). Similarly there was no difference when the
subgroups of wheezers with CW (n=13, median 139.3 (40.8-552.3)/mm2) and RW
(n=12, 135.4 (range 39.5-327.8)/mm2) were compared with controls, p=0.6, figure
6.10 (ii).
Figure 6.10: Submucosal mast cells compared between (i) wheezers and
controls and (ii) confirmed and reported wheezers and controls
p=0.41
Wheezers (n=25) Controls (n=7)0
100
200
300
400
500
600
No difference in submucosal mast cells betweenpreschool wheezers and controls
mas
t c
ells / m
m2
p=0.68
CW (n=13) RW (n=12) Controls (n=7)0
100
200
300
400
500
600
No difference in submucosal mast cellsbetween CW, RW and controls
mas
t c
ells / m
m2
(i) (ii)
6.4.7 Smooth muscle and submucosal mast cells & school age asthma
Irrespective of school age asthma status, there was no difference in preschool
smooth muscle MCT positive cells, figure 6.11 and table 6.2. Similarly, there was no
difference in submucosal MCT positive cells when compared with the presence or
absence of asthma, figure 6.11 and table 6.2.

222
Figure 6.11: There was no difference in preschool smooth muscle mast cells
when related to school age asthma status (i); or between preschool
submucosal mast cells when related to school age asthma status (ii)
p=0.16
Asthma (n=5) No asthma (n=10)0
100
200
300
400
500
Mast
cells/
sm
oo
th m
uscle
are
a (
mm
2)
p=0.28
Asthma (n=7) No asthma (n=17)0
200
400
600
Mast
cells/
su
bm
uco
sal are
a (
mm
2)
(i)
(ii)

223
Table 6.2: No difference in smooth muscle and submucosal mast cells
between wheezers and controls at preschool age and those with and without
asthma at school age.
Wheezers Controls p
Submucosal
Mast cells (mm2)
n=25
139.3 (39.5-552.3) n=7
117.4 (61.3-278.6)
0.41
CW n=13 / RW n=12
139.3 (40.8-552.3) / 135.4(39.5-327.8)
0.6
Smooth muscle
Mast cells (mm2)
n=15
33.6 (0-239.3)
n=5
88.5 (63.8-396.6)
0.08
CW n=8 / RW n=7
33.4 (0-239.3) / 33.6 (0-206.4)
0.19
School age asthma No asthma
Smooth muscle
Mast cells (mm2)
n=5
22.9 (0-239.2) n=10
91.9 (0-396)
0.16
Submucosal
Mast Cells (mm2)
n=7
188.3 (40.8-552.3)
n=17
129.5 (51.3-278.6)
0.28
6.4.8 Airway smooth muscle and smooth muscle mast cells
There was no correlation between ASM area fraction and smooth muscle MCT
positive cells (Spearman r=-0.01. p=0.94), figure 6.12. Similar, results were seen
when MCT positive cells were correlated with ASM volume fraction (Spearman r=-
0.03, p=0.86).
Figure 6.12: No correlation between ASM and smooth muscle mast cells
Spearman r=-0.01, p=0.94
0.00 0.05 0.10 0.15 0.200
100
200
300
400
500
smooth muscle/ subepitheliumSm
oo
th m
us
cle
ma
st
ce
lls
/ m
m2

224
6.5 Discussion
6.5.1 Summary of Results
Although there was a significant difference in submucosal eosinophil volume
density between wheezers and non-wheezing controls at preschool age, no
difference was seen in submucosal eosinophil volume density when
compared by presence or absence of asthma at school age when measured
by RO’R. However, SS’s eosinophil measurements in contradiction did show
a significant increase in children who developed school age asthma,
underscoring that this variable measurement is unlikely to be clinically useful.
No difference was seen in neutrophils, CD4+, CD8+, CD45+ and mast cells in
those who did and did not wheeze at preschool age or in those who did or did
not have asthma at school age.
Strengths
This is the only study where tissue inflammatory cell counts in children with recurrent
wheeze at preschool age have been related to asthma at school age. Furthermore,
this was the first time that both ASM and submucosal mast cells were stained for and
quantified in endobronchial biopsies from severe recurrent preschool wheezers.
Limitations
Study size
The number of preschool children who had sections stained for inflammatory cells
and also the number of children who were followed up at school age was small. This
study was not powered to detect a difference between groups at school age. A
minimum sample size of 15 subjects per group has been suggested for studies of
inflammatory cells in adult endobronchial biopsies(280). Furthermore, a sample size of
13-48 subjects per group is needed to detect at least one doubling difference in cell
number per 0.1 mm2 of tissue, for a particular inflammatory cell type, in a study with
a parallel group design(281). The majority of children in this study had only 1 section
from a single biopsy stained per inflammatory cells. However inflammatory cell
biopsy studies of adults with chronic obstructive airways disease suggest one biopsy
taken from each of two airway generations, from each subject, should be examined

225
in order to maximise statistical power to detect differences between study groups
(282).
Variability
The CoV for repeated measurements using the point counting method in this study
was (0-22)%, similar to that reported by SS (0-17)%. Different factors which
contribute to the overall variance for point counting have been estimated and include
70% variability between subjects, 20% between biopsy blocks, 5% between
sections, 3% between light microscopy fields, and 2% between measurements(85).
The CoV reported for measuring mast cells (expressed per mm2) was (4-6)%
comparable with inflammatory cell counts in adult studies (2.3%)(282).
Secondly, there was also considerable variability between observers (RO’R and SS)
in measuring inflammatory cell counts. However, for consistency, all cell counts
analysed in this study were performed by a single observer (RO’R) which eliminated
any inter-observer bias that could have been introduced. Variability between biopsies
was only assessed for eosinophils because of limited endobronchial tissue.
Variability was similar between biopsies from the same child (20-25%) to variability
between children with and without asthma at school age (15%).
Endobronchial biopsy size
It would have been useful to stain endobronchial tissue for both MCT and MCTC.
However, this was not possible because there was no endobronchial tissue
remaining.
One single measurement of inflammation
As in all chronic diseases, one single measurement of inflammation in an EB at a
single point in time is unlikely to represent the full inflammatory picture. Other
assessments of inflammation such as BAL inflammatory cell counts were not
available in this group of children who had bronchoscopy at preschool age. Sputum
inflammatory phenotypes were not stable in school age children with severe
asthma(165), which may suggest that neither are submucosal inflammatory cell
counts. Secondly, airway submucosa inflammation does not necessarily correlate
with blood, sputum or BAL inflammation(283). This may be attributed to the fact that

226
sputum and BAL sample the airway lumen, whereas the cellular inflammation in the
airway submucosa may be distinct. It is not known which compartment is more
important.
6.5.2 Discussion of principal findings Subepithelial eosinophils
Subepithelial eosinophils at preschool age did not predict wheeze persistence at
school age when measured by RO’R. Although subepithelial endobronchial
eosinophil measurements performed by Dr S Saglani did show a significant
difference between children with and without school age asthma, the number of
subjects was small and variability was large both intra-observer and between biopsy.
A larger sample size with a least 2 good quality biopsies per child may conclusively
answer this question. It is possible that increased eosinophils at preschool age may
represent current symptoms rather than future asthma prognosis, but this study is
unable to confirm or refute this. Interestingly, children aged 1-3 years with
eosinophils in nasal secretions during an acute respiratory tract infection had
significantly higher risk of wheezing over the following 2 months but not over the
longer term, at 12 months(284).
Features of airway remodelling that are typical of asthma develop in asthmatic
children even in the absence of a prominent eosinophilic infiltrate, indicating that
other mechanisms, besides eosinophilic inflammation, may promote airway
remodelling (increased RBM thickness and epithelial cell loss) early in life(285). There
are conflicting reports about the correlation between subepithelial eosinophils and
RBM thickness in children and adults with asthma. Adults with asthma showed a
positive correlation between subepithelial eosinophils and RBM thickness(286). In
contrast there was no correlation between subepithelial eosinophils in school age
children with difficult-to-treat asthma(116) or children with mild-moderate asthma(285)
and RBM thickness. Supepithelial eosinophils correlated with RBM thickness in the
severe recurrent preschool wheezers(9), but repeat measurements by a second
observer (RO’R) showed no correlation. Most of the preschool children were treated
with ICS at time of EB, however airway inflammation and increased RBM thickness
do not respond concordantly to ICS treatment(287). Adults with asthma (n=35) who

227
were treated with inhaled fluticasone and had BAL and EB at baseline, 3 months and
12 months showed a decreased in BAL inflammatory cells at 3 months but not in
RBM thickness until 12 months after treatment with ICS(287).
Eosinophilic inflammation correlated positively with both FEV1 and FVC z scores at
school age. Children with no subepithelial eosinophils were more likely to have lower
FEV1 and FVC at school age, which is counter-intuitive. Several of these children
had alternative diagnoses at school age unrelated to asthma (including scimitar
syndrome and a small congenital right lung and repaired congenital heart disease)
that likely accounted for this. However, although there was a correlation between
eosinophilic airway inflammation in preschool wheezers and FeNO50 when followed
up age 5 years(63), there was no correlation with FeNO50 at age 7 years.
Mast cells within airway smooth muscle
Infiltration of ASM by mast cells is thought to be responsible for the increase in ASM
mass in adult asthmatics(148). There was no difference in MCT positive cells per ASM
area between preschool wheezers and controls, or children with or without school
age asthma. The number of MCT positive cells per ASM area is much higher for both
wheezers and controls (median 64 (range 0-396) mast cells/mm2) when compared to
adult asthmatics (median 5.1 (range 0-33) mast cells/mm2)(148). However the
absolute values for MCT positive cells seen in ASM were similar in children (median
2 (range 0-12)) and adults (median 2 (range 0-8))(148). Preschool children did
however have a much smaller ASM area (median 0.02 (0.01-0.12mm2) measured
than adult patients (ASM area median 0.3 (0.16-0.97) mm2)(148). Although only cells
within the bundles of smooth muscle were counted, serial sections were not
available to confirm that mast cells were not juxtaposed from submucosal tissue onto
smooth muscle owing to biopsy artefact(148). There was no relationship between total
ASM and mast cells within smooth muscle. However, sample sizes are very small
and any conclusions drawn are preliminary.
Submucosal mast cells
There was no difference in numbers of submucosal MCT positive cells between
wheezers and controls or between children with and without school age asthma.
However, mast cells quantified in the infant cohort recruited from Helsinki, Finland

228
with reversible airflow obstruction (median age 1 year) had a weakly positive
correlation with symptom persistence as measured by asthma medication purchase
at 3 years but school age follow up is not available to date(139). However, mast cell
quantification in that study was performed using electron microscopy which
recognises mast cells by their ultra-structural features and included all mast cells
(chymase and tryptase), so a direct comparison is impossible(138).
Similarly, there was no difference in submucosal mast cells between school age
children with mild-moderate asthma (most of whom were not treated with ICS) and
atopic and non-atopic school age controls(93). However in a recent study submucosal
MCT positive cells were shown to be highest in adults with mild asthma not being
treated with ICS and decreased with increasing asthma severity(147). In contrast
MCCT cells were the predominant mast cell phenotype in severe adult
asthmatics(147). Children with severe therapy resistant asthma also did not have an
increase in mast cells within smooth muscle or the submucosa(119). A limitation of the
current study is that 9 wheezers were being treated with ICS and a further 3
wheezers with oral corticosteroids at the time of biopsy.
Summary
There was no relationship between inflammatory cell counts at preschool age and
school age asthma. ASM mast cells were not related to ASM area fraction or volume
fraction.

229
Chapter 7
Discussion and Final Summary
Principal findings reported in this thesis
The aim of this final chapter is to summarise and discuss (i) the implications of the
results reported in this thesis with regard to the relationship between preschool
airway pathology and school age asthma status and (ii) how the findings from this
thesis suggest research directions for future studies.
The hypotheses tested in this thesis were:
School-aged children with asthma have evidence of airway remodelling and
airway inflammation in endobronchial biopsies taken at preschool age when
compared to school-aged children without asthma.
This hypothesis was discussed in chapters 3-6 and found to be partly true.
Although EB eosinophilia, RBM thickness (at least as measured by RO’R) and
RBM TN-C (with all its questionable reliability) were significantly higher at
preschool age in wheezers compared with controls, they did not discriminate
between the children who developed asthma by school age and those who
did not. ASM from preschool endobronchial biopsies to some extent
discriminated those severe preschool wheezers who developed asthma at
school age. However, there is significant overlap in ASM (expressed as the
proportion of the EB area) between preschool wheezers who did and did not
develop asthma at school age and also between controls who never
wheezed. This suggests that ASM mass will not be a useful test in predicting
children who develop asthma but rather points to ASM as a new focus to
determine what drives the evolution of preschool wheeze to asthma. This
study has only focussed on quantifying the amount of ASM in preschool
biopsies, but has not assessed early function, and this may be an important
determinant of future asthma. The numbers are small, and the results
hypothesis generating, but this is the key novel finding arising from the work
of this thesis, and forms the focus of much of this final chapter. Unfortunately

230
there was no further biopsy tissue available in which to perform mechanistic
studies.
A combination of clinical and airway pathological characteristics at preschool
age may be able to be used to predict asthma at school age, better than
clinical features alone.
Only 7 preschool wheezers who had asthma at school age had airway
pathology measurements for RBM, ASM and eosinophils. Numbers were too
small to develop a predictive score and test the hypothesis. Furthermore,
there was not a second cohort available in which to validate any predictive
score.
7.1 Strengths and novel data
This is the first study to quantify ASM, TN–C within the RBM and mast cell infiltration
of smooth muscle and submucosa in EBs from severe recurrent preschool
wheezers. All measurements were made by a single observer, blind to both
preschool and school age clinical status. Secondly, this is the first study to relate
pathological findings at preschool age with asthma status at school age.
ASM is increased in those preschool children with severe wheeze who go on to
develop asthma at school age. Neither RBM thickness nor subepithelial eosinophils
(as measured by RO’R) were significantly increased in those who developed asthma
at school age. Although SS did show that RBM thickness was increased in those
who developed asthma, this was likely related to the 12 month age difference in time
of EB between those who did and did not develop asthma at school age. This could
suggest that RBM thickness and subepithelial eosinophils at preschool age could be
related to current symptoms rather than future prognosis, but even this must be
considered as a preliminary, hypothesis-generating finding, given the variability of
the measurements. The fact that two experienced observers obtained differences in
results, which may be in part be due to counting different slides from the same
patient, underscores the difficulty of using these methods. There was no relationship
between school age asthma and any other inflammatory cell count at preschool age
including submucosal and smooth muscle mast cells.

231
This thesis reports on the previously recruited wheezers and non-wheezing controls,
who were well characterised at entrance to the study at preschool age, at aged 6-11
years. To my knowledge, this is the only prospective preschool group followed
longitudinally who had bronchoscopy and EB at entrance to the study in the pre-
school years. Subject retention to school age (75%) was comparable to other studies
(54-91%)(1;10-12;14;15). Wheeze had been confirmed at preschool age using a video
questionnaire(9;153), and at school age confirmed wheeze at preschool age was a
significant predictor of asthma. However, assessment of wheeze at school age
showed only limited agreement between the video and written questionnaire (kappa
0.46, p=0.005). Failure of carers who reported wheeze to identify it on video
questionnaire was more common in children with milder wheeze who may not have
been as symptomatic as the child in the video questionnaire having an acute asthma
exacerbation. The majority of children in this study had had at least 1 admission to
hospital with wheeze and had wheeze confirmed by a doctor at least once.
7.2 Limitations of this thesis
Small sample size
The most obvious limitation of this study was the small numbers with biopsies
followed up at school age, figure 7.1. Only 8 children with ASM in their EB had
asthma when followed up at school age. Secondly, not all children had
complete data sets available for measurements of airway pathology at
preschool age or measurements of airway inflammation and lung function at
school age. Multiple comparisons were made in a small number of patients
which could have generated spurious associations. In any case no second
validation cohort was available so all findings must be considered hypotheses
generating.

232
Figure 7.1: Follow up of preschool wheezers at school age related to airway
pathology measurements
Wheezers at preschool age
An important limitation was that the wheezers enrolled in the original study
were of necessity very severe otherwise they would not have undergone
bronchoscopy. Children with asthma at school age had many reported
admissions with wheeze as the main symptom (median n=17). These children
are not representative of preschool wheezers in the general population but
rather a specific group with more severe disease and so the findings in this
thesis may not be applicable to children with less severe wheeze. However,
those early severe wheezers who go on to wheeze persistently have the
largest early reduction in lung function, which is why this group is important in
studying the factors driving the development of asthma(6). Although recruiting
children at or shortly after birth as in the Tuscon(1) or COAST(59) cohorts is
preferable to preschool age, the numbers needed to capture enough
wheezers severe enough to warrant bronchoscopy at preschool age would be
impractical. Even by recruiting children with increased risk of wheeze (i.e.
infants of asthmatic mothers) such as in the COPSAC(48) cohort, the study
numbers needed to capture those severe preschool wheezers who would
warrant bronchoscopy is clinically not feasible. The number of children who
have bronchoscopy for investigation of recurrent wheeze at preschool age is
Children recruited 2002-2005
Wheezers (n=47)
Controls (n=21)
Lost to follow up (n=17)
Followed up by questionnaire (n=51)
Children with preschool biopsy measurements of:
Reticular basement membrane thickness (n=39)
Airway smooth muscle (n=32)
Subepithelial eosinophils (n=27)
Mast cells within smooth muscle (n=15)

233
likely less than 1% of all children, suggesting a sample size of 100 undergoing
bronchoscopy would require a total recruitment cohort of 10,000.
Absence of truly healthy controls
A further limitation of this thesis is the absence of healthy, asymptomatic
controls. Genuine, healthy asymptomatic controls could not be obtained in
view of the invasive nature of the initial study. Unlike in adults, it is not
ethically acceptable to perform bronchoscopy in infants or children solely for
the purpose of research. Several of the control children had other pathology
including congenital heart disease at preschool age and a diagnosis of
ulcerative colitis at school age. This made it difficult to compare assessments
of lung function at school age.
Absence of bronchoalveolar lavage at preschool age
At the time of the original study at preschool age BAL was not included in the
research protocol. The main reason for this was logistic; there was no core
facility for quantitative cell counting and storage of fluid at the time. Although
BAL samples from the wheezers were done for clinical reasons at preschool
age there was variability in methods used to obtain the lavage. However,
subsequent cohort studies since recruitment of the original preschool RBH
group have highlighted the importance of bacterial (COPSAC)(48) and viral
(COAST)(59) infection in early wheezers in wheeze persistence and the
development of asthma, and the absence of data on infection is an
acknowledged weakness of the study.
Misclassification of asthma at school age
Defining asthma in young children is difficult(156). In the present study, several
children without asthma reported a dry cough at night (n=7), wheeze (n=7)
and use of ICS (n=4) but none of these children had ever had a doctor
diagnosis of asthma and many had a history of upper airway noises or co-
morbid pathology. Of the children who did not have asthma at school age 4
had congenital heart disease, 1 had a vascular ring causing some mild airway
compression, 1 had ulcerative colitis, 1 had non cystic fibrosis bronchiectasis
likely related to an initial, severe viral bronchiolitis and 1 child had a diagnosis

234
of scimitar syndrome. The children with asthma who attended for clinical
assessment had higher IgE at preschool age, were more likely to be atopic,
have allergic rhinitis and eczema at school age recruitment, suggesting that a
group likely to have asthma was selected. However, it is possible some
children may have been misclassified as non-asthmatic at school age. The
effect of this would have been to reduce the chances of showing differences
between the groups
Possible confounding effects of ICS/ oral corticosteroids
The majority of preschool wheezers had been treated with either or both of
ICS and oral glucocorticosteroids prior to bronchoscopy and EB. Despite this
there was still a difference in RBM thickness and RBM TN-C expression and
tissue eosinophilia seen between preschool wheezers and controls. No
difference in ASM was shown between preschool wheezers and healthy
controls when compared as groups. It is possible that treatment with ICS and
/or oral steroids may have masked a difference between these 2 groups.
However, in adult asthmatics ASM mitogenesis and growth are resistant to
glucocorticoids(288). In vitro studies suggest absence of CCAAT / Enhancer
binding protein α (which binds to the glucocorticoid receptor to inhibit cell
proliferation) in adult asthmatics is responsible for the enhanced proliferation
of ASM cells and the failure of glucocorticoids to inhibit proliferation(288). On
the other hand RBM TN-C has been shown to decrease in adult asthmatics
with ICS therapy(144;244). There have been contradictory reports on the effect of
ICS on RBM thickness, with some studies showing a reduction with treatment
with ICS in adult asthmatics over varying time periods from 6 weeks(289) to 1
year(286) to no treatment effect with ICS(290). ICS are also known to reduce
tissue eosinophils(287) and mast cells(147). It may be that the preschool children
were not prescribed high enough amounts or a long enough duration of
treatment with ICS, or more likely inadequate drug delivery or poor
compliance in this young age group. A further weakness is that ICS
compliance was not assessed prior to bronchoscopy and EB at preschool
age.

235
Age of endobronchial biopsy when compared with school age asthma
status
A major strength of the original study was that wheezers and controls were
age matched(9). However, when followed up at school age unavoidably
children with school age asthma (median age 8.2 years) were older at the
time of EB (28 months versus 17 months) when compared to children without
school age asthma (median age 7.3 years). This means that age difference of
EB between those who developed asthma at school age and those who did
not may have affected the interpretation of some of the results.
The natural history of airway pathology in preschool wheeze has not been
explored, but it is likely that other structural airway changes, like RBM
thickness, will also evolve throughout childhood and adolescence. RBM TN-C
developmental expression is unclear, it is known that there is a small amount
present at birth but none in adulthood(141), but it remains unknown when RBM
TN-C disappears. RBM TN-C may disappear when RBM reaches adult
thickness(113). In this thesis, the age discrepancy at the time of biopsy may be
a confounder, because those without asthma at school age were younger
when biopsied, and may have had normal but increased RBM TN-C than the
children who went on to develop asthma. In this regard, the failure of
subsequent runs of TN-C staining meant that developmental changes in TN-C
expression could not be explored.
Data on normal ASM development are scant. A post-mortem study showed
that ASM increased linearly from 22 weeks post conceptual age to 8 months,
and then two to four fold to early adulthood(256). Although adults have more
ASM in real terms when compared to children, the proportion of ASM in the
airway wall remains similar(261). Although the children with asthma were older
than those without asthma, no correlation was found between ASM and age in
non-wheezing preschool and school age children. This is likely because ASM
was quantified as a proportion of the EB rather than the actual mass of ASM.

236
All data are from single time points
This thesis reports essentially two cross-sectional datasets, relying on
retrospective recall of disease severity. In this study data are available on
clinical symptoms (age 2-3 years and age 7-8 years), airway pathology (age
2-3 years) and lung function and non-invasive airway inflammation
assessment (age 7-8 years) from single time points. It would have been very
useful to repeat endobronchial biopsies at school age to compare preschool
and school age airway pathology, but ethically impossible in clinically well
children. An attempt was made to collect details of medication use between
the two study time points; however, quite often parents were unable to recall
their child’s prior medication history.
Meaning of the study
Early childhood may be an important time when disease modifying or preventative
therapies could be applied before the persistent asthma phenotype becomes
established. The purpose of this research was to try and understand what features of
airway pathology changes might be related to wheeze persistence and the
development of childhood asthma. The data suggests that a future focus on ASM
may be key in helping understand what drives some children to develop school age
asthma.
Study numbers were too small to allow identification of a specific endotype
associated with increased ASM. However, those children with asthma (and ASM on
their EB) had more severe disease at school age. Almost all children (7/8) with
asthma at school age were still attending tertiary services for asthma management,
had persistent asthma symptoms despite treatment with high dose ICS (6/8) and 4
children were classified as severe asthma at school age(195). The data suggests that
increased ASM is associated with severe preschool wheeze, suggesting that intrinsic
abnormalities in ASM may predispose children to developing asthma and particularly
severe asthma at school age. Longitudinal studies have suggested that children with
severe wheeze early in life are more likely to have severe asthma later in life(71).

237
Future work and unanswered questions
As there is no remaining endobronchial tissue from the preschool wheezers recruited
between 2002 and 2005, future studies will need to recruit a second cohort of
preschool wheezers. Although it would be interesting to recruit preschool children
with a wider spectrum of wheeze severity, bronchoscopy and EB will be only
clinically indicated in those children with severe recurrent wheeze and these are the
group of children most likely to have pathological abnormalities. A future study would
recruit recurrent preschool wheezers with assessments of lung function (measured
by MBW and specific airways resistance) and BDR measured at entrance to the
study, followed by clinically indicated bronchoscopy, bronchoalveolar lavage and EB.
MBW is currently the most sensitive indicator of airway abnormality in young children
with wheeze(62;172) and bronchodilator reversibility has been successfully performed
using both specific airways resistance and MBW in the preschool age group(62).
FeNO50 was assessed in the present study but more distal inflammation was not
assessed as children were too young to perform FeNO at multiple flows. Preschool
RBM correlated with FeNO50 at age 4-5 years(63) and a non-significant trend with
FeNO50 at school age in those with preschool wheeze. It would be interesting to
follow up the RBH cohort at age 10 years or older to measure fractional exhaled NO
to calculate alveolar and bronchial flux NO and relate this to preschool RBM
thickness(190). BAL should be assessed by bacterial culture and molecular studies
(16s rRNA) and molecular techniques (including polymerase chain reaction) for
common viruses. The BAL cytokine, microbiome and metabolome profile in
preschool wheezers should also be measured. The airway microbiome is discussed
in more detail in the ‘Novel areas for possible further exploration’ section which
follows.
Exploring airway smooth muscle further in preschool wheezers
To date airway remodelling and airway inflammation has been quantified in
preschool wheezers and compared to age matched controls, but no assessment has
been made as to whether different structural components of the airway wall are
inherently functionally different in preschool wheezers who develop asthma when
compared to children who do not. In particular pilot data from this study suggests
that a focus on ASM may yield some answers as to why some preschool children
with wheeze develop asthma.

238
Although it was not possible to further characterise the mechanisms underlying ASM
increase in this group of preschool wheezers as there was no remaining EB tissue,
both smooth muscle hypertrophy and hyperplasia contribute to the increase in ASM
in adults and school-age children with asthma(110;121;122;249). There is an increasing
body of evidence that ASM is fundamentally different in asthmatics compared to
healthy controls suggesting that abnormalities in ASM cells may play a critical role in
the development of the abnormal physiology in asthma and may contribute to the
persistent airway inflammation(291). Recent evidence suggests that ASM from adult
asthmatics is intrinsically hyper-contractile and exhibits an increased oxidative stress
burden when compared to healthy controls(291). Nicotinamide adenine dinucleotide
phosphate oxidase (NOX)4 expression is increased in asthma and its inhibition or
siRNA knockdown normalises this airway smooth muscle hyper-contractility(291).
Cultured adult asthmatic (n=9) ASM cells in gel contraction assays have also shown
an increased velocity of contraction in response to histamine when compared to
adults without asthma(292). It is possible but unproven that the ASM cells in those
children with preschool wheeze who develop asthma are functionally distinct
compared with children who do not develop asthma. ASM in preschool wheezers
may also be intrinsically hypercontractile before children develop persistent wheeze
and asthma. Future work needs to be undertaken to characterise ASM from
preschool wheezers further, and will likely include the isolation of primary ASM
bundles from EBs and culture of ASM cells(293). ASM cell responses in preschool
wheezers to allergen(70), virus(59) and bacterial exposure(23) may be a fruitful source
of future work since all have been implicated in the evolution of preschool wheeze
into persistent wheeze and asthma.
ASM cells also express a wide variety of mediators, and in particular recent research
highlights the innate cytokines thymic stromal lymphopoietin (TSLP) and IL-33 as
mediators of AHR, with increased ASM expression of these mediators in severe
adult asthmatics(294-296). It may be that these or other ASM derived mediators are
important in the switch from severe preschool wheeze to school age asthma. The
identification of key mediators regulating the contribution of ASM to asthma may
provide new opportunities for therapeutic intervention(297).

239
However, the airway epithelium also plays a central role in the pathogenesis of
asthma, and the role of the epithelium has not yet been explored in severe preschool
wheezers who develop asthma at school age(126). There is evidence that
dysregulated epithelial repair originates in childhood asthma and is a critical
determinant of disease progression into adulthood(128). Bronchial epithelial cells from
asthmatic children function abnormally even in the absence of inflammation with
decreased production of TGF-β and the release of anti-inflammatory mediators(128).
There is also some in vitro evidence that an injured airway epithelium stimulates
ASM cell hyperplasia, through IL-6, IL-8, monocyte chemotactic protein-1, and MMP-
9 dependent mechanisms(298). It is therefore possible that severe recurrent preschool
wheezers who develop asthma at school age have inherently functionally different
epithelial cells which thus respond abnormally to viral, bacterial or environmental
stimuli leading to ASM hyperplasia. To address this hypothesis, a co-culture model
of epithelial cells and ASM cells isolated from EB from severe recurrent wheezers
could be compared with age matched non-wheezing controls(298) to analyse epithelial
production of chemokines, cytokines, and growth factors and identify what stimulates
ASM hyperplasia(246).
Serially monitoring preschool wheezers
It is likely that airway remodelling changes in preschool wheezers who develop
school age asthma evolve gradually between preschool and school age. An
important part of future studies will be to serially monitor airway remodelling,
inflammation and ongoing symptoms. Most of the methods used to monitor
remodelling require invasive procedures, use of a general anaesthetic in children or
ionising radiation. High resolution CT has shown a positive correlation with RBM
thickness in adult asthmatics, but overlap among the groups limits the diagnostic
value in individual adult patients(112). In children with problematic severe asthma
there are conflicting reports on whether HRCT correlates with RBM thickness in
children(299;300). In any case, concerns regarding radiation exposure means this is
unlikely to be a useful tool to monitor disease progression in wheezy preschool
children through to school age(301). Endobronchial ultrasound is a radiation free new
technique that enables the assessment of bronchial wall layers(302). In adults there
was no significant difference in the measurements of total bronchial wall thickness
between endobronchial ultrasound and high resolution CT scanning, suggesting it

240
may be a radiation free way of monitoring disease progression in adults.
Furthermore, the thickness of the bronchial wall positively correlates with RBM
thickness and negatively correlates with FEV1 in adults with asthma(302). However,
this technique in children while radiation free will still require a general anaesthetic
and is unlikely to be an acceptable technique to use serially. Novel areas such as
exhaled breath condensate analytes could be investigated further to see if they could
provide a serial marker for airway remodelling.
Asthmatic symptoms in young children are due to a heterogeneous group of
diseases. Although symptoms are the primary endpoint in both research and clinical
management, there is no standardised method of symptom assessment.
Assessment of ongoing disease is also important and wheeze severity has shown to
be a risk factor for future asthma(79). Daily diaries have been used to assess
symptoms and endotype asthma(303). A symptom algorithm based on a predefined
number of days and episodes of troublesome lung symptoms rather than disease
categorisation using qualitative characteristics or temporal patterns of wheeze
showed a stronger relation to an underlying ORMDL3 genetic variant which is
associated to asthma susceptibility in those of North European descent(303). In future
cohorts a daily symptom diary which also records medication use and is submitted
weekly either electronically or by telephone interview may help record disease
persistence more accurately.
Novel areas for possible further exploration
There are several new areas of research which may be fruitful in exploring the
development of asthma in preschool wheezers. Non-invasive methods of serially
assessing airway inflammation and remodelling are an attractive way of improving
our understanding of the progression of early wheezing to asthma. Exhaled
biomarkers which could be used to serially monitor inflammation are volatile organic
compounds (VOCs) and non-volatile organic compounds in exhaled breath
condensate. Recent research has also suggested a focus on the airway microbiome
may also be important.

241
Volatile organic compounds
VOCs are groups of exhaled biomarkers which are gaining interest as a method to
serially monitor airway inflammation in preschool wheezers. Breath testing dates
back to the early history of medicine, when ancient physicians tried to use the
specific smell on the human breath to recognise illness such as diabetes or liver
disease. VOCs are carbon‐based chemicals that are volatile at room temperature
and are formed during several pathophysiological processes, including airway
inflammation(304). During inflammatory processes free radicals are produced leading
to lipid peroxidation and formation of volatile products including hydrocarbons such
as ethane, pentane, hexanal, octanal, nonanal, propanol and butanol. Once VOCs
are formed they enter the bloodstream and are excreted in the breath and can be
measured by collection of exhaled breath and analysed by gas chromatography and
mass spectrometry or the electronic e-nose. Hundreds of different VOCs are present
in human breath, and their relative concentrations may alter in the presence of the
disease. VOCs in exhaled air can be used to distinguish children with cystic
fibrosis(305) and asthma from healthy children(306). In children and adults with cystic
fibrosis (aged 8-29 years), the VOC pentane was much higher than in healthy
controls, and higher in those with more severe lung disease or those having
concurrent pulmonary exacerbations(305). A total of 945 VOCs were screened to
profile which hydrocarbons could differentiate between asthmatic and healthy
children (aged 5-16 years)(306). Eight VOCs discriminated between asthmatic and
healthy children with a 92% positive predictive index, achieving a sensitivity of 89%
and a specificity of 95%(306).
One hypothesis is that the exhaled VOC profile is different in those severe recurrent
wheezing preschool children when compared to healthy controls, and in particular in
those wheezers who will go on to develop school age asthma. The e-nose technique
creates a ‘breath‐print’ of multiple different VOCs and is quick, easy to use and not
very expensive, which suggests it could be used to serially monitor the exhaled VOC
pattern in children over time. However, exhaled compounds can be affected by
various factors including ambient VOCs, exhaled flow, and prior consumed food and
before VOCs can be used in clinical practice standardisation and validation of VOC
profiling is essential.

242
Exhaled breath condensate
Exhaled breath condensate analysis has also been successfully used in infant and
preschool wheezers to monitor inflammation(307). Exhaled breath condensate mainly
consists of water droplets but also contains small amounts of non‐volatile molecules.
Airway turbulence during breathing is thought to cause the release of small aerosols
of the epithelial lining fluid and to serve as a proxy method of monitoring airway
inflammation. A modified gas chromatography system with a closed-glass condenser
which enables recirculation of exhaled breath, increases the condensate collection 2
fold and enables collection in less than 10 minutes in young children(307).
The exhaled breath condensate cytokine profile has been able to differentiate
between recurrent wheezers and non-wheezing controls in the Asthma DEtection
and monitoring (ADEM) study(307). The ADEM study started in 2006 in the
Netherlands and recruited 258 preschool children (aged 1.9-4.5 years), who were
divided into children who never wheezed (n=57), children with 1-3 wheezing
episodes (n=78) and children who experienced more than 3 wheezing episodes
during life (recurrent wheezers, n=123). Recurrent wheezers had elevated TH2
cytokines (IL-4, IL-5, IL-13), a proinflammatory cytokine (IL-1a), a TH1 cytokine (IL-2),
a chemokine (IL-8), an anti-inflammatory cytokine (IL-10), and an adhesion molecule
(sICAM) when compared to controls(307). The elevated levels of different types of
cytokines fit the concept that in wheezing preschool children, more than one immune
mechanism is involved. Children were followed up until age 6 years and those
children with persistent wheeze had raised IL-2, IL-4, IL-8 and IL-10 at preschool age
when compared to children who never wheezed(308). However, exhaled breath
condensate measurements at 2 and 3 years, did not differentiate between the
transient and persistent wheezing phenotype(308). The cytokine content of exhaled
breath condensate could in the future be used to serially monitor inflammation in
preschool wheezers, but more validation work is needed.
Several mediators of airway remodelling can be assessed in exhaled breath
condensate including MMPs, TIMPs, cysteinyl leukotrienes and endothelins(309-311).
Endothelins mediate increased proliferation of ASM cells and thickening of the
RBM(311). Endothelin-1 was higher in exhaled breath condensate from adult

243
asthmatics, particularly in those with uncontrolled asthma, when compared with
healthy controls(311). Cysteinyl leukotrienes also increase ASM cell proliferation and a
pilot study showed a correlation between cysteinyl leukotrienes and RBM thickness
in school aged children with asthma(310). However, ASM was not quantified in this
study(310). MMPs, particularly MMP-9, are also key mediators in airway remodelling
(particularly increased RBM thickness), and have been investigated for their role in
the pathogenesis of asthma. MMP-9 levels have been recently shown to be elevated
in exhaled breath condensate from children with asthma and inversely correlated
with lung function and had a positive correlation with other inflammatory markers
such as IL-4 and IL10 in exhaled breath condensate(309). Exhaled breath condensate
could be used to measure mediators of airway remodelling, particularly of ASM
hyperplasia and hypertrophy, including alpha-smooth muscle actin, endothelins,
cysteinyl leukotrienes on the day of bronchoscopy and EB and relate this to
quantified ASM. Serial measurements of exhaled breath analytes could then
potentially be used as markers to monitor changes in ASM with wheeze persistence
or remission.
The Airway Microbiome
Although the human airways were traditionally thought to be sterile, and there is now
evidence that the respiratory tract harbors microbes including bacteria, yeasts,
viruses and bacteriophages(50). The airway microbiome refers to all microbes, their
genomes, and environmental interactions in the lower airways. The respiratory tract
is likely to be repetitively inoculated with the normal flora of the pharynx and the
bacterial load in the airways has been proposed to be in the order of 2000 bacterial
genomes per cm2 of surface area(50).
Dysregulation of interactions between the immune system and commensal bacteria
is one factor that underpins the development of many inflammatory diseases(312).
Several animal studies have investigated the respiratory microbiome and its
relationship to the development of allergic diseases such as asthma. Pulmonary
exposure of mice to Escherichia Coli results in protection against the development of
allergic airways disease(54). Secondly, mice who were intratracheally infected or
treated with killed Streptococcus pneumoniae before, during or after ovalbumin
sensitisation and subsequent challenge had suppression of hallmark features of

244
allergic airways disease with increased Tregs which reduced T cell proliferation and
cytokine release(53). Gastrointestinal Helicobacter pylori infection protected
ovalbumin stimulated mice from AHR, tissue inflammation, and goblet cell
hyperplasia and prevented bronchoalveolar infiltration with eosinophils, TH2 cells,
and TH17 cells(313). This was more pronounced in those neonatally infected mice
than adult mice(313). In contrast germ free mice (that lack pathogenic and non-
pathogenic organisms) develop worse allergic airways disease than those with a
normal host flora(52).
Further evidence for the role of the microbiome in the development of allergic
disease is that children who grow up in environments with a wide range of microbial
exposures, such as traditional farms, are protected from childhood asthma and
atopy(49). In two recent European cross-sectional studies, microbial diversity and the
prevalence of asthma were compared in children living on farms and children who
were not farm-dwellers. The PARSIFAL (Prevention of Allergy-Risk Factors for
Sensitization in Children Related to Farming and Anthroposophic Lifestyle) study in
Bavaria, Germany screened samples of the children’s mattress dust for bacterial
DNA with the use of single-strand conformation polymorphism analyses to detect
environmental bacteria that cannot be measured by means of culture techniques(49).
The GABRIELA (Multidisciplinary Study to Identify the Genetic and Environmental
Causes of Asthma in the European Community) based in five rural areas in southern
Germany, Switzerland, Austria and Poland evaluated samples of settled dust from
children's rooms for bacterial and fungal taxa with the use of culture techniques in
five rural areas in southern Germany, Switzerland, Austria and Poland(49). In both
studies, children who lived on farms had lower prevalence’s of asthma and atopy
and were exposed to a greater variety of environmental microorganisms than the
children who did not live full time on farms(49). Diversity of microbial exposure was
inversely related to the risk of asthma in both the PARSIFAL and GABRIELA
studies(49).
School-aged asthmatic children have an abundant lower airway bacterial flora, which
is different to that of controls(50). Futhermore, a pilot study in adults with uncontrolled
asthma, showed AHR correlated strongly with airway microbiota composition and
diversity(314). The influence of microbial exposures in infancy and their effects on

245
asthma development are now recognised(48;49;55).The COPSAC cohort study
highlighted the importance of bacteria in the development of asthma(48). Neonates
colonized in the hypopharyngeal region with Streptococcus pneumoniae,
Haemophilus influenzae, or Moraxella. catarrhalis or with a combination of these
organisms, are at increased risk for recurrent wheeze and asthma early in life(48).
However, more recent developments have demonstrated that the composition of
bacterial communities colonising mucosal surfaces, rather than simply the presence
of individual species, is important in the pathogenesis of disease(49).
The airway microbiota composition of preschool wheezers is unknown, but it is likely
the microbial flora influences host innate immune responses to infection and
allergens in preschool wheezers who develop future asthma. It is also possible that
microbial flora will differ between those wheezers whose symptoms remit and those
who go on to persistently wheeze. Conventional microbial cultures are inadequate to
identify microbiota and only reveal part of the airway microbiome. However,
bronchial epithelial brushings or BAL from children and adults with asthma have
previously been used to profile the microbiome with high-density 16S ribosomal RNA
microarray and parallel clone library-sequencing analysis(314). A trial of antibiotic
therapy could then be initiated and microbial flora, inflammation and immune
responses (TH2, TH1, TH17 and Tregs) and mediators of airway remodelling assessed
before and after antibiotic therapy. Key of course would be long-term outcome.
Conclusion
In summary, the work of this thesis has showed for the first time that ASM is
increased in those preschool children with severe wheeze who go on to develop
asthma at school age. The numbers are small and represent children with
particularly severe wheeze at preschool age, such that the findings cannot be
assumed to be applicable to children with less severe wheeze. However, the data
indicate that future studies exploring the mechanisms underlying the persistence of
preschool wheeze and its progression to asthma might profitably focus on changes
in airway smooth muscle.

246
References
(1) Martinez FD, Wright AL, Taussig LM, Holberg CJ, Halonen M, Morgan WJ. Asthma and wheezing in the first six years of life. The Group Health Medical Associates. N Engl J Med 1995; 332(3):133-8.
(2) Caudri D, Wijga A, Gehring U, Smit HA, Brunekreef B, Kerkhof M et al. Respiratory symptoms in the first 7 years of life and birth weight at term: the PIAMA Birth Cohort. Am J Respir Crit Care Med 2007; 175(10):1078-85.
(3) Stevens CA, Turner D, Kuehni CE, Couriel JM, Silverman M. The economic impact of preschool asthma and wheeze. Eur Respir J 2003; 21(6):1000-6.
(4) Message SD, Johnston SL. Viruses in asthma. British Medical Bulletin 2002; 61(1):29-43.
(5) Yunginger JW, Reed CE, O'Connell EJ, Melton LJ, III, O'Fallon WM, Silverstein MD. A community-based study of the epidemiology of asthma. Incidence rates, 1964-1983. Am Rev Respir Dis 1992; 146(4):888-94.
(6) Morgan WJ, Stern DA, Sherrill DL, Guerra S, Holberg CJ, Guilbert TW et al. Outcome of asthma and wheezing in the first 6 years of life: follow-up through adolescence. Am J Respir Crit Care Med 2005; 172(10):1253-8.
(7) British Guideline on the Management of Asthma. Thorax 63[Suppl 4], iv1-iv12. 2008.
(8) Global initiative for asthma. Global strategy for asthma management and prevention.www.ginasthma.org. 2007.
(9) Saglani S, Payne DN, Zhu J, Wang Z, Nicholson AG, Bush A et al. Early detection of airway wall remodeling and eosinophilic inflammation in preschool wheezers. Am J Respir Crit Care Med 2007; 176(9):858-64.
(10) Caudri D, Wijga A, CM AS, Hoekstra M, Postma DS, Koppelman GH et al. Predicting the long-term prognosis of children with symptoms suggestive of asthma at preschool age. J Allergy Clin Immunol 2009; 124(5):903-10.
(11) Henderson J, Granell R, Heron J, Sherriff A, Simpson A, Woodcock A et al. Associations of wheezing phenotypes in the first 6 years of life with atopy, lung function and airway responsiveness in mid-childhood. Thorax 2008; 63(11):974-80.
(12) Kurukulaaratchy RJ, Matthews S, Holgate ST, Arshad SH. Predicting persistent disease among children who wheeze during early life. Eur Respir J 2003; 22(5):767-71.
(13) Lau S, Illi S, Sommerfeld C, Niggemann B, Volkel K, Madloch C et al. Transient early wheeze is not associated with impaired lung function in 7-yr-old children. Eur Respir J 2003; 21(5):834-41.

247
(14) Lodrup Carlsen KC, Haland G, Devulapalli CS, Munthe-Kaas M, Pettersen M, Granum B et al. Asthma in every fifth child in Oslo, Norway: a 10-year follow up of a birth cohort study. Allergy 2006; 61(4):454-60.
(15) Oddy WH, Holt PG, Sly PD, Read AW, Landau LI, Stanley FJ et al. Association between breast feeding and asthma in 6 year old children: findings of a prospective birth cohort study. BMJ 1999; 319(7213):815-9.
(16) Cane RS, Ranganathan SC, McKenzie SA. What do parents of wheezy children understand by "wheeze"? Arch Dis Child 2000; 82(4):327-32.
(17) Michel G, Silverman M, Strippoli MP, Zwahlen M, Brooke AM, Grigg J et al. Parental understanding of wheeze and its impact on asthma prevalence estimates. Eur Respir J 2006; 28(6):1124-30.
(18) Cane RS, McKenzie SA. Parents' interpretations of children's respiratory symptoms on video. Arch Dis Child 2001; 84(1):31-4.
(19) Elphick HE, Ritson S, Rodgers H, Everard ML. When a "wheeze" is not a wheeze: acoustic analysis of breath sounds in infants. Eur Respir J 2000; 16(4):593-7.
(20) Levy ML, Godfrey S, Irving CS, Sheikh A, Hanekom W, Bush A et al. Wheeze detection: recordings vs. assessment of physician and parent. J Asthma 2004; 41(8):845-53.
(21) Lowe L, Murray CS, Martin L, Deas J, Cashin E, Poletti G et al. Reported versus confirmed wheeze and lung function in early life. Arch Dis Child 2004; 89(6):540-3.
(22) Jackson DJ, Gangnon RE, Evans MD, Roberg KA, Anderson EL, Pappas TE et al. Wheezing rhinovirus illnesses in early life predict asthma development in high-risk children. Am J Respir Crit Care Med 2008; 178(7):667-72.
(23) Bisgaard H, Hermansen MN, Buchvald F, Loland L, Halkjaer LB, Bonnelykke K et al. Childhood asthma after bacterial colonization of the airway in neonates. N Engl J Med 2007; 357(15):1487-95.
(24) Lau S, Illi S, Sommerfeld C, Niggemann B, Bergmann R, von ME et al. Early exposure to house-dust mite and cat allergens and development of childhood asthma: a cohort study. Multicentre Allergy Study Group. Lancet 2000; 356(9239):1392-7.
(25) Stein RT, Holberg CJ, Morgan WJ, Wright AL, Lombardi E, Taussig L et al. Peak flow variability, methacholine responsiveness and atopy as markers for detecting different wheezing phenotypes in childhood. Thorax 1997; 52(11):946-52.
(26) http://www.ubiopred.european-lung-foundation.org/
(27) Castro-Rodriguez JA, Holberg CJ, Wright AL, Martinez FD. A clinical index to define risk of asthma in young children with recurrent wheezing. Am J Respir Crit Care Med 2000; 162(4 Pt 1):1403-6.

248
(28) Stick SM, Burton PR, Gurrin L, Sly PD, LeSouef PN. Effects of maternal smoking during pregnancy and a family history of asthma on respiratory function in newborn infants. Lancet 1996; 348(9034):1060-4.
(29) Stein RT, Holberg CJ, Sherrill D, Wright AL, Morgan WJ, Taussig L et al. Influence of parental smoking on respiratory symptoms during the first decade of life: the Tucson Children's Respiratory Study. Am J Epidemiol 1999; 149(11):1030-7.
(30) Soyseth V, Kongerud J, Boe J. Postnatal maternal smoking increases the prevalence of asthma but not of bronchial hyperresponsiveness or atopy in their children. Chest 1995; 107(2):389-94.
(31) Savenije OE, Granell R, Caudri D, Koppelman GH, Smit HA, Wijga A et al. Comparison of childhood wheezing phenotypes in 2 birth cohorts: ALSPAC and PIAMA. J Allergy Clin Immunol 2011; 127(6):1505-12.
(32) Illi S, von ME, Lau S, Niggemann B, Gruber C, Wahn U. Perennial allergen sensitisation early in life and chronic asthma in children: a birth cohort study. Lancet 2006; 368(9537):763-70.
(33) Lowe L, Murray CS, Custovic A, Simpson BM, Kissen PM, Woodcock A. Specific airway resistance in 3-year-old children: a prospective cohort study. Lancet 2002; 359(9321):1904-8.
(34) Lowe LA, Simpson A, Woodcock A, Morris J, Murray CS, Custovic A. Wheeze phenotypes and lung function in preschool children. Am J Respir Crit Care Med 2005; 171(3):231-7.
(35) Simpson A, Tan VY, Winn J, Svensen M, Bishop CM, Heckerman DE et al. Beyond atopy: multiple patterns of sensitization in relation to asthma in a birth cohort study. Am J Respir Crit Care Med 2010; 181(11):1200-6.
(36) Kuehni CE, Strippoli MP, Low N, Silverman M. Asthma in young south Asian women living in the United Kingdom: the importance of early life. Clin Exp Allergy 2007; 37(1):47-53.
(37) Worldwide variation in prevalence of symptoms of asthma, allergic rhinoconjunctivitis, and atopic eczema: ISAAC. The International Study of Asthma and Allergies in Childhood (ISAAC) Steering Committee. Lancet 1998; 351(9111):1225-32.
(38) Young S, Arnott J, O'Keeffe PT, Le Souef PN, Landau LI. The association between early life lung function and wheezing during the first 2 yrs of life. Eur Respir J 2000; 15(1):151-7.
(39) Turner SW, Young S, Goldblatt J, Landau LI, Le Souef PN. Childhood asthma and increased airway responsiveness: a relationship that begins in infancy. Am J Respir Crit Care Med 2009; 179(2):98-104.
(40) Turner SW, Palmer LJ, Rye PJ, Gibson NA, Judge PK, Cox M et al. The relationship between infant airway function, childhood airway responsiveness, and asthma. Am J Respir Crit Care Med 2004; 169(8):921-7.

249
(41) Turner SW, Palmer LJ, Rye PJ, Gibson NA, Judge PK, Young S et al. Infants with flow limitation at 4 weeks: outcome at 6 and 11 years. Am J Respir Crit Care Med 2002; 165(9):1294-8.
(42) Bacharier LB, Strunk RC, Mauger D, White D, Lemanske RF, Jr., Sorkness CA. Classifying asthma severity in children: mismatch between symptoms, medication use, and lung function. Am J Respir Crit Care Med 2004; 170(4):426-32.
(43) Holt PG, Rowe J, Kusel M, Parsons F, Hollams EM, Bosco A et al. Toward improved prediction of risk for atopy and asthma among preschoolers: a prospective cohort study. J Allergy Clin Immunol 2010; 125(3):653-9, 659.
(44) Lodrup Carlsen KC. The environment and childhood asthma (ECA) study in Oslo: ECA-1 and ECA-2. Pediatr Allergy Immunol 2002; 13 Suppl 15:29-31.
(45) Haland G, Carlsen KC, Sandvik L, Devulapalli CS, Munthe-Kaas MC, Pettersen M et al. Reduced lung function at birth and the risk of asthma at 10 years of age. N Engl J Med 2006; 355(16):1682-9.
(46) Nafstad P, Brunekreef B, Skrondal A, Nystad W. Early respiratory infections, asthma, and allergy: 10-year follow-up of the Oslo Birth Cohort. Pediatrics 2005; 116(2):e255-e262.
(47) Chawes BL, Buchvald F, Bischoff AL, Loland L, Hermansen M, Halkjaer LB et al. Elevated exhaled nitric oxide in high-risk neonates precedes transient early but not persistent wheeze. Am J Respir Crit Care Med 2010; 182(2):138-42.
(48) Bisgaard H, Hermansen MN, Bonnelykke K, Stokholm J, Baty F, Skytt NL et al. Association of bacteria and viruses with wheezy episodes in young children: prospective birth cohort study. BMJ 2010; 341:c4978.
(49) Ege MJ, Mayer M, Normand AC, Genuneit J, Cookson WO, Braun-Fahrlander C et al. Exposure to environmental microorganisms and childhood asthma. N Engl J Med 2011; 364(8):701-9.
(50) Hilty M, Burke C, Pedro H, Cardenas P, Bush A, Bossley C et al. Disordered microbial communities in asthmatic airways. PLoS One 2010; 5(1):e8578.
(51) Charlson ES, Bittinger K, Haas AR, Fitzgerald AS, Frank I, Yadav A et al. Topographical continuity of bacterial populations in the healthy human respiratory tract. Am J Respir Crit Care Med 2011; 184(8):957-63.
(52) Herbst T, Sichelstiel A, Schar C, Yadava K, Burki K, Cahenzli J et al. Dysregulation of allergic airway inflammation in the absence of microbial colonization. Am J Respir Crit Care Med 2011; 184(2):198-205.
(53) Preston JA, Thorburn AN, Starkey MR, Beckett EL, Horvat JC, Wade MA et al. Streptococcus pneumoniae infection suppresses allergic airways disease by inducing regulatory T-cells. Eur Respir J 2011; 37(1):53-64.

250
(54) Nembrini C, Sichelstiel A, Kisielow J, Kurrer M, Kopf M, Marsland BJ. Bacterial-induced protection against allergic inflammation through a multicomponent immunoregulatory mechanism. Thorax 2011; 66(9):755-63.
(55) Bager P, Wohlfahrt J, Westergaard T. Caesarean delivery and risk of atopy and allergic disease: meta-analyses. Clin Exp Allergy 2008; 38(4):634-42.
(56) Dominguez-Bello MG, Costello EK, Contreras M, Magris M, Hidalgo G, Fierer N et al. Delivery mode shapes the acquisition and structure of the initial microbiota across multiple body habitats in newborns. Proc Natl Acad Sci U S A 2010; 107(26):11971-5.
(57) van Nimwegen FA, Penders J, Stobberingh EE, Postma DS, Koppelman GH, Kerkhof M et al. Mode and place of delivery, gastrointestinal microbiota, and their influence on asthma and atopy. J Allergy Clin Immunol 2011; 128(5):948-55.
(58) Bisgaard H, Bonnelykke K. Long-term studies of the natural history of asthma in childhood. J Allergy Clin Immunol 2010; 126(2):187-97.
(59) Lemanske RF, Jr., Jackson DJ, Gangnon RE, Evans MD, Li Z, Shult PA et al. Rhinovirus illnesses during infancy predict subsequent childhood wheezing. J Allergy Clin Immunol 2005; 116(3):571-7.
(60) Jackson DJ, Evans MD, Gangnon RE, Tisler CJ, Pappas TE, Lee WM et al. Evidence for a causal relationship between allergic sensitization and rhinovirus wheezing in early life. Am J Respir Crit Care Med 2012; 185(3):281-5.
(61) Brand PL, Baraldi E, Bisgaard H, Boner AL, Castro-Rodriguez JA, Custovic A et al. Definition, assessment and treatment of wheezing disorders in preschool children: an evidence-based approach. Eur Respir J 2008; 32(4):1096-110.
(62) Sonnappa S, Bastardo CM, Wade A, Saglani S, McKenzie SA, Bush A et al. Symptom-pattern phenotype and pulmonary function in preschool wheezers. J Allergy Clin Immunol 2010; 126(3):519-26.
(63) Sonnappa S, Bastardo CM, Saglani S, Bush A, Aurora P. Relationship between past airway pathology and current lung function in preschool wheezers. Eur Respir J 2011; 38(6):1431-6.
(64) Schultz A, Devadason SG, Savenije OE, Sly PD, Le Souef PN, Brand PL. The transient value of classifying preschool wheeze into episodic viral wheeze and multiple trigger wheeze. Acta Paediatr 2010; 99(1):56-60.
(65) Clarke JR, Salmon B, Silverman M. Bronchial responsiveness in the neonatal period as a risk factor for wheezing in infancy. Am J Respir Crit Care Med 1995; 151(5):1434-40.
(66) Wilson NM, Lamprill JR, Mak JC, Clarke JR, Bush A, Silverman M. Symptoms, lung function, and beta2-adrenoceptor polymorphisms in a birth cohort followed for 10 years. Pediatr Pulmonol 2004; 38(1):75-81.

251
(67) Bisgaard H, Bonnelykke K, Sleiman PM, Brasholt M, Chawes B, Kreiner-Moller E et al. Chromosome 17q21 gene variants are associated with asthma and exacerbations but not atopy in early childhood. Am J Respir Crit Care Med 2009; 179(3):179-85.
(68) Young S, Le Souef PN, Geelhoed GC, Stick SM, Turner KJ, Landau LI. The influence of a family history of asthma and parental smoking on airway responsiveness in early infancy. N Engl J Med 1991; 324(17):1168-73.
(69) Cirillo I, Pistorio A, Tosca M, Ciprandi G. Impact of allergic rhinitis on asthma: effects on bronchial hyperreactivity. Allergy 2009; 64(3):439-44.
(70) Grainge CL, Lau LCK, Ward JA, Dulay V, Lahiff G, Wilson S et al. Effect of Bronchoconstriction on Airway Remodeling in Asthma. New England Journal of Medicine 2011; 364(21):2006-15.
(71) Phelan PD, Robertson CF, Olinsky A. The Melbourne Asthma Study: 1964-1999. J Allergy Clin Immunol 2002; 109(2):189-94.
(72) Sears MR, Greene JM, Willan AR, Wiecek EM, Taylor DR, Flannery EM et al. A longitudinal, population-based, cohort study of childhood asthma followed to adulthood. N Engl J Med 2003; 349(15):1414-22.
(73) Tai A S, Tran H, Roberts M, Clarke N, Wilson JW, Robertson CF. Pediatric origins of adult chronic obstructive pulmonary disease. American Thoracic Society 2010, A2275.
(74) Bisgaard H, Hermansen MN, Loland L, Halkjaer LB, Buchvald F. Intermittent inhaled corticosteroids in infants with episodic wheezing. N Engl J Med 2006; 354(19):1998-2005.
(75) Murray CS, Woodcock A, Langley SJ, Morris J, Custovic A. Secondary prevention of asthma by the use of Inhaled Fluticasone propionate in Wheezy INfants (IFWIN): double-blind, randomised, controlled study. The Lancet 368(9537):754-62.
(76) Guilbert TW, Morgan WJ, Zeiger RS, Mauger DT, Boehmer SJ, Szefler SJ et al. Long-term inhaled corticosteroids in preschool children at high risk for asthma. N Engl J Med 2006; 354(19):1985-97.
(77) Guilbert TW, Morgan WJ, Krawiec M, Lemanske RF, Jr., Sorkness C, Szefler SJ et al. The Prevention of Early Asthma in Kids study: design, rationale and methods for the Childhood Asthma Research and Education network. Control Clin Trials 2004; 25(3):286-310.
(78) Warner JO. A double-blinded, randomized, placebo-controlled trial of cetirizine in preventing the onset of asthma in children with atopic dermatitis: 18 months' treatment and 18 months' posttreatment follow-up. J Allergy Clin Immunol 2001; 108(6):929-37.

252
(79) Devulapalli CS, Carlsen KC, Haland G, Munthe-Kaas MC, Pettersen M, Mowinckel P et al. Severity of obstructive airways disease by age 2 years predicts asthma at 10 years of age. Thorax 2008; 63(1):8-13.
(80) Frank PI, Morris JA, Hazell ML, Linehan MF, Frank TL. Long term prognosis in preschool children with wheeze: longitudinal postal questionnaire study 1993-2004. BMJ 2008; 336(7658):1423-6.
(81) Eysink PE, Ter RG, Aalberse RC, van Aalderen WM, Roos CM, van der Zee JS et al. Accuracy of specific IgE in the prediction of asthma: development of a scoring formula for general practice. Br J Gen Pract 2005; 55(511):125-31.
(82) Bai TR. Abnormalities in airway smooth muscle in fatal asthma. Am Rev Respir Dis 1990; 141(3):552-7.
(83) Carroll N, Elliot J, Morton A, James A. The structure of large and small airways in nonfatal and fatal asthma. Am Rev Respir Dis 1993; 147(2):405-10.
(84) Elston WJ, Whittaker AJ, Khan LN, Flood-Page P, Ramsay C, Jeffery PK et al. Safety of research bronchoscopy, biopsy and bronchoalveolar lavage in asthma. Eur Respir J 2004; 24(3):375-7.
(85) Jeffery P, Holgate S, Wenzel S. Methods for the assessment of endobronchial biopsies in clinical research: application to studies of pathogenesis and the effects of treatment. Am J Respir Crit Care Med 2003; 168(6 Pt 2):S1-17.
(86) Payne D, McKenzie SA, Stacey S, Misra D, Haxby E, Bush A. Safety and ethics of bronchoscopy and endobronchial biopsy in difficult asthma. Arch Dis Child 2001; 84(5):423-6.
(87) Regamey N, Hilliard TN, Saglani S, Zhu J, Scallan M, Balfour-Lynn IM et al. Quality, size, and composition of pediatric endobronchial biopsies in cystic fibrosis. Chest 2007; 131(6):1710-7.
(88) Regamey N, Hilliard TN, Saglani S, Zhu J, Balfour-Lynn IM, Rosenthal M et al. Endobronchial biopsy in childhood. Chest 2008; 133(1):312.
(89) Saglani S, Payne DN, Nicholson AG, Scallan M, Haxby E, Bush A. The safety and quality of endobronchial biopsy in children under five years old. Thorax 2003; 58(12):1053-7.
(90) Salva PS, Theroux C, Schwartz D. Safety of endobronchial biopsy in 170 children with chronic respiratory symptoms. Thorax 2003; 58(12):1058-60.
(91) Regamey N, Balfour-Lynn I, Rosenthal M, Hogg C, Bush A, Davies JC. Time required to obtain endobronchial biopsies in children during fiberoptic bronchoscopy. Pediatr Pulmonol 2009; 44(1):76-9.
(92) Jeffery PK. Comparative morphology of the airways in asthma and chronic obstructive pulmonary disease. Am J Respir Crit Care Med 1994; 150(5 Pt 2):S6-13.

253
(93) Barbato A, Turato G, Baraldo S, Bazzan E, Calabrese F, Tura M et al. Airway inflammation in childhood asthma. Am J Respir Crit Care Med 2003; 168(7):798-803.
(94) Barbato A, Turato G, Baraldo S, Bazzan E, Calabrese F, Panizzolo C et al. Epithelial damage and angiogenesis in the airways of children with asthma. Am J Respir Crit Care Med 2006; 174(9):975-81.
(95) Jeffery P. Inflammation and remodeling in the adult and child with asthma. Pediatr Pulmonol Suppl 2001; 21:3-16.
(96) Lloyd CM, Hawrylowicz CM. Regulatory T cells in asthma. Immunity 2009; 31(3):438-49.
(97) Cosmi L, Liotta F, Maggi E, Romagnani S, Annunziato F. Th17 cells: new players in asthma pathogenesis. Allergy 2011; 66(8):989-98.
(98) Hawrylowicz C, Ryanna K. Asthma and allergy: the early beginnings. Nat Med 2010; 16(3):274-5.
(99) Conrad ML, Ferstl R, Teich R, Brand S, Blumer N, Yildirim AO et al. Maternal TLR signaling is required for prenatal asthma protection by the nonpathogenic microbe Acinetobacter lwoffii F78. J Exp Med 2009; 206(13):2869-77.
(100) Borrego LM, Arroz MJ, Videira P, Martins C, Guimaraes H, Nunes G et al. Regulatory cells, cytokine pattern and clinical risk factors for asthma in infants and young children with recurrent wheeze. Clin Exp Allergy 2009; 39(8):1160-9.
(101) Sampson AP. The role of eosinophils and neutrophils in inflammation. Clin Exp Allergy 2000; 30 Suppl 1:22-7.
(102) Bousquet J, Jeffery PK, Busse WW, Johnson M, Vignola AM. Asthma. From bronchoconstriction to airways inflammation and remodeling. Am J Respir Crit Care Med 2000; 161(5):1720-45.
(103) Jatakanon A, Lim S, Barnes PJ. Changes in sputum eosinophils predict loss of asthma control. Am J Respir Crit Care Med 2000; 161(1):64-72.
(104) Azzawi M, Johnston PW, Majumdar S, Kay AB, Jeffery PK. T lymphocytes and activated eosinophils in airway mucosa in fatal asthma and cystic fibrosis. Am Rev Respir Dis 1992; 145(6):1477-82.
(105) Saetta M, Turato G. Airway pathology in asthma. Eur Respir J Suppl 2001; 34:18s-23s.
(106) Wenzel SE. Eosinophils in asthma--closing the loop or opening the door? N Engl J Med 2009; 360(10):1026-8.
(107) Turato G, Barbato A, Baraldo S, Zanin ME, Bazzan E, Lokar-Oliani K et al. Nonatopic children with multitrigger wheezing have airway pathology comparable to atopic asthma. Am J Respir Crit Care Med 2008; 178(5):476-82.

254
(108) Lloyd CM, Robinson DS. Allergen-induced airway remodelling. Eur Respir J 2007; 29(5):1020-32.
(109) Durrani SR, Viswanathan RK, Busse WW. What effect does asthma treatment have on airway remodeling? Current perspectives. J Allergy Clin Immunol 2011; 128(3):439-48.
(110) Benayoun L, Druilhe A, Dombret MC, Aubier M, Pretolani M. Airway structural alterations selectively associated with severe asthma. Am J Respir Crit Care Med 2003; 167(10):1360-8.
(111) Siddiqui S, Sutcliffe A, Shikotra A, Woodman L, Doe C, McKenna S et al. Vascular remodeling is a feature of asthma and nonasthmatic eosinophilic bronchitis. J Allergy Clin Immunol 2007; 120(4):813-9.
(112) Kasahara K, Shiba K, Ozawa T, Okuda K, Adachi M. Correlation between the bronchial subepithelial layer and whole airway wall thickness in patients with asthma. Thorax 2002; 57(3):242-6.
(113) Tsartsali L, Hislop AA, McKay K, James AL, Elliot J, Zhu J et al. Development of the bronchial epithelial reticular basement membrane: relationship to epithelial height and age. Thorax 2011; 66(4):280-5.
(114) Jeffery PK. Remodeling in asthma and chronic obstructive lung disease. Am J Respir Crit Care Med 2001; 164(10 Pt 2):S28-S38.
(115) de BJ, Tillie-Leblond I, Tonnel AB, Jaubert F, Scheinmann P, Gosset P. Difficult asthma in children: an analysis of airway inflammation. J Allergy Clin Immunol 2004; 113(1):94-100.
(116) Payne DN, Rogers AV, Adelroth E, Bandi V, Guntupalli KK, Bush A et al. Early thickening of the reticular basement membrane in children with difficult asthma. Am J Respir Crit Care Med 2003; 167(1):78-82.
(117) Cokugras H, Akcakaya N, Seckin, Camcioglu Y, Sarimurat N, Aksoy F. Ultrastructural examination of bronchial biopsy specimens from children with moderate asthma. Thorax 2001; 56(1):25-9.
(118) Gupta A, Sjoukes A, Richards D, Banya W, Hawrylowicz C, Bush A et al. Relationship between Serum Vitamin D, Disease Severity, and Airway Remodeling in Children with Asthma. Am J Respir Crit Care Med 2011; 184(12):1342-9.
(119) Bossley CJ, Fleming L, Gupta A, Regamey N, Frith J, Oates T et al. Pediatric severe asthma is characterized by eosinophilia and remodeling without T(H)2 cytokines. J Allergy Clin Immunol 2012; 129(4):974-82.
(120) McParland BE, Macklem PT, Pare PD. Airway wall remodeling: friend or foe? J Appl Physiol 2003; 95(1):426-34.
(121) Regamey N, Ochs M, Hilliard TN, Muhlfeld C, Cornish N, Fleming L et al. Increased airway smooth muscle mass in children with asthma, cystic fibrosis,

255
and non-cystic fibrosis bronchiectasis. Am J Respir Crit Care Med 2008; 177(8):837-43.
(122) Woodruff PG, Dolganov GM, Ferrando RE, Donnelly S, Hays SR, Solberg OD et al. Hyperplasia of smooth muscle in mild to moderate asthma without changes in cell size or gene expression. Am J Respir Crit Care Med 2004; 169(9):1001-6.
(123) Bai TR, Cooper J, Koelmeyer T, Pare PD, Weir TD. The effect of age and duration of disease on airway structure in fatal asthma. Am J Respir Crit Care Med 2000; 162(2 Pt 1):663-9.
(124) Kaminska M, Foley S, Maghni K, Storness-Bliss C, Coxson H, Ghezzo H et al. Airway remodeling in subjects with severe asthma with or without chronic persistent airflow obstruction. J Allergy Clin Immunol 2009; 124(1):45-51.
(125) James AL, Bai TR, Mauad T, Abramson MJ, Dolhnikoff M, McKay KO et al. Airway smooth muscle thickness in asthma is related to severity but not duration of asthma. Eur Respir J 2009; 34(5):1040-5.
(126) Lloyd CM, Saglani S. Asthma and allergy: the emerging epithelium. Nat Med 2010; 16(3):273-4.
(127) Koppelman GH, Meyers DA, Howard TD, Zheng SL, Hawkins GA, Ampleford EJ et al. Identification of PCDH1 as a novel susceptibility gene for bronchial hyperresponsiveness. Am J Respir Crit Care Med 2009; 180(10):929-35.
(128) Kicic A, Sutanto EN, Stevens PT, Knight DA, Stick SM. Intrinsic biochemical and functional differences in bronchial epithelial cells of children with asthma. Am J Respir Crit Care Med 2006; 174(10):1110-8.
(129) Jeffery PK, Wardlaw AJ, Nelson FC, Collins JV, Kay AB. Bronchial biopsies in asthma. An ultrastructural, quantitative study and correlation with hyperreactivity. Am Rev Respir Dis 1989; 140(6):1745-53.
(130) Ordonez C, Ferrando R, Hyde DM, Wong HH, Fahy JV. Epithelial desquamation in asthma: artifact or pathology? Am J Respir Crit Care Med 2000; 162(6):2324-9.
(131) Davies DE. The role of the epithelium in airway remodeling in asthma. Proc Am Thorac Soc 2009; 6(8):678-82.
(132) Ribatti D, Puxeddu I, Crivellato E, Nico B, Vacca A, Levi-Schaffer F. Angiogenesis in asthma. Clin Exp Allergy 2009; 39(12):1815-21.
(133) Ordonez CL, Khashayar R, Wong HH, Ferrando R, Wu R, Hyde DM et al. Mild and moderate asthma is associated with airway goblet cell hyperplasia and abnormalities in mucin gene expression. Am J Respir Crit Care Med 2001; 163(2):517-23.
(134) Jeffery PK, Laitinen A, Venge P. Biopsy markers of airway inflammation and remodelling. Respir Med 2000; 94 Suppl F:S9-15.

256
(135) Saglani S, Mathie SA, Gregory LG, Bell MJ, Bush A, Lloyd CM. Pathophysiological features of asthma develop in parallel in house dust mite-exposed neonatal mice. Am J Respir Cell Mol Biol 2009; 41(3):281-9.
(136) Bush A. How early do airway inflammation and remodeling occur? Allergol Int 2008; 57(1):11-9.
(137) Holgate ST. Has the time come to rethink the pathogenesis of asthma? Curr Opin Allergy Clin Immunol 2010; 10(1):48-53.
(138) Saglani S, Malmstrom K, Pelkonen AS, Malmberg LP, Lindahl H, Kajosaari M et al. Airway remodeling and inflammation in symptomatic infants with reversible airflow obstruction. Am J Respir Crit Care Med 2005; 171(7):722-7.
(139) Malmstrom K, Pelkonen AS, Malmberg LP, Sarna S, Lindahl H, Kajosaari M et al. Lung function, airway remodelling and inflammation in symptomatic infants: outcome at 3 years. Thorax 2011; 66(2):157-62.
(140) Pohunek P, Warner JO, Turzikova J, Kudrmann J, Roche WR. Markers of eosinophilic inflammation and tissue re-modelling in children before clinically diagnosed bronchial asthma. Pediatr Allergy Immunol 2005; 16(1):43-51.
(141) Chiquet-Ehrismann R, Chiquet M. Tenascins: regulation and putative functions during pathological stress. J Pathol 2003; 200(4):488-99.
(142) Flood-Page P, Menzies-Gow A, Phipps S, Ying S, Wangoo A, Ludwig MS et al. Anti-IL-5 treatment reduces deposition of ECM proteins in the bronchial subepithelial basement membrane of mild atopic asthmatics. J Clin Invest 2003; 112(7):1029-36.
(143) Karjalainen EM, Lindqvist A, Laitinen LA, Kava T, Altraja A, Halme M et al. Airway inflammation and basement membrane tenascin in newly diagnosed atopic and nonatopic asthma. Respir Med 2003; 97(9):1045-51.
(144) Laitinen A, Altraja A, Kampe M, Linden M, Virtanen I, Laitinen LA. Tenascin is increased in airway basement membrane of asthmatics and decreased by an inhaled steroid. Am J Respir Crit Care Med 1997; 156(3 Pt 1):951-8.
(145) Bradding P, Walls AF, Holgate ST. The role of the mast cell in the pathophysiology of asthma. J Allergy Clin Immunol 2006; 117(6):1277-84.
(146) Dougherty RH, Sidhu SS, Raman K, Solon M, Solberg OD, Caughey GH et al. Accumulation of intraepithelial mast cells with a unique protease phenotype in T(H)2-high asthma. J Allergy Clin Immunol 2010; 125(5):1046-53.
(147) Balzar S, Fajt ML, Comhair SA, Erzurum SC, Bleecker E, Busse WW et al. Mast Cell Phenotype, Location and Activation in Severe Asthma. Data from The Severe Asthma Research Program. Am J Respir Crit Care Med 2010.
(148) Brightling CE, Bradding P, Symon FA, Holgate ST, Wardlaw AJ, Pavord ID. Mast-cell infiltration of airway smooth muscle in asthma. N Engl J Med 2002; 346(22):1699-705.

257
(149) Siddiqui S, Mistry V, Doe C, Roach K, Morgan A, Wardlaw A et al. Airway hyperresponsiveness is dissociated from airway wall structural remodeling. J Allergy Clin Immunol 2008; 122(2):335-41, 341.
(150) Kaur D, Saunders R, Hollins F, Woodman L, Doe C, Siddiqui S et al. Mast cell fibroblastoid differentiation mediated by airway smooth muscle in asthma. J Immunol 2010; 185(10):6105-14.
(151) Brightling CE, Symon FA, Holgate ST, Wardlaw AJ, Pavord ID, Bradding P. Interleukin-4 and -13 expression is co-localized to mast cells within the airway smooth muscle in asthma. Clin Exp Allergy 2003; 33(12):1711-6.
(152) Woodman L, Siddiqui S, Cruse G, Sutcliffe A, Saunders R, Kaur D et al. Mast cells promote airway smooth muscle cell differentiation via autocrine up-regulation of TGF-beta 1. J Immunol 2008; 181(7):5001-7.
(153) Saglani S, McKenzie SA, Bush A, Payne DN. A video questionnaire identifies upper airway abnormalities in preschool children with reported wheeze. Arch Dis Child 2005; 90(9):961-4.
(154) Mellis C. Respiratory noises: how useful are they clinically? Pediatr Clin North Am 2009; 56(1):1-17, ix.
(155) Asher MI, Montefort S, Bjorksten B, Lai CK, Strachan DP, Weiland SK et al. Worldwide time trends in the prevalence of symptoms of asthma, allergic rhinoconjunctivitis, and eczema in childhood: ISAAC Phases One and Three repeat multicountry cross-sectional surveys. Lancet 2006; 368(9537):733-43.
(156) Van Wonderen KE, Van Der Mark LB, Mohrs J, Bindels PJ, van Aalderen WM, Ter RG. Different definitions in childhood asthma: how dependable is the dependent variable? Eur Respir J 2010; 36(1):48-56.
(157) Pakhale S, Sumner A, Coyle D, Vandemheen K, Aaron S. (Correcting) misdiagnoses of asthma: a cost effectiveness analysis. BMC Pulm Med 2011; 11:27.
(158) Asher MI, Keil U, Anderson HR, Beasley R, Crane J, Martinez F et al. International Study of Asthma and Allergies in Childhood (ISAAC): rationale and methods. Eur Respir J 1995; 8(3):483-91.
(159) Chang AB. Chronic non-specific cough in children. Paediatr.Child Health 18:7, 333-9. 2008.
Ref Type: Generic
(160) van Asperen PP. Cough and asthma. Paediatr Respir Rev 2006; 7(1):26-30.
(161) Chang AB, Redding GJ, Everard ML. Chronic wet cough: Protracted bronchitis, chronic suppurative lung disease and bronchiectasis. Pediatr Pulmonol 2008; 43(6):519-31.

258
(162) Frank PI, Frank TL, Cropper J, Hirsch S, Niven RM, Hannaford P et al. The use of a screening questionnaire to identify children with likely asthma. Br J Gen Pract 2001; 51(463):117-20.
(163) Weiland SK, Bjorksten B, Brunekreef B, Cookson WO, von ME, Strachan DP. Phase II of the International Study of Asthma and Allergies in Childhood (ISAAC II): rationale and methods. Eur Respir J 2004; 24(3):406-12.
(164) Frith J, Fleming L, Bossley C, Ullmann N, Bush A. The complexities of defining atopy in severe childhood asthma. Clin Exp Allergy 2011; 41(7):948-53.
(165) Fleming L, Tsartsali L, Wilson N, Regamey N, Bush A. Sputum inflammatory phenotypes are not stable in children with asthma. Thorax 2012.
(166) Silkoff PE, Lent AM, Busacker AA, Katial RK, Balzar S, Strand M et al. Exhaled nitric oxide identifies the persistent eosinophilic phenotype in severe refractory asthma. J Allergy Clin Immunol 2005; 116(6):1249-55.
(167) Franklin PJ, Turner SW, Le Souef PN, Stick SM. Exhaled nitric oxide and asthma: complex interactions between atopy, airway responsiveness, and symptoms in a community population of children. Thorax 2003; 58(12):1048-52.
(168) de Jongste JC, Carraro S, Hop WC, Baraldi E. Daily telemonitoring of exhaled nitric oxide and symptoms in the treatment of childhood asthma. Am J Respir Crit Care Med 2009; 179(2):93-7.
(169) Moshammer H, Hoek G, Luttmann-Gibson H, Neuberger MA, Antova T, Gehring U et al. Parental smoking and lung function in children: an international study. Am J Respir Crit Care Med 2006; 173(11):1255-63.
(170) Jarvis MJ, Strachan DP, Feyerabend C. Determinants of passive smoking in children in Edinburgh, Scotland. Am J Public Health 1992; 82(9):1225-9.
(171) Macleod KA, Horsley AR, Bell NJ, Greening AP, Innes JA, Cunningham S. Ventilation heterogeneity in children with well controlled asthma with normal spirometry indicates residual airways disease. Thorax 2009; 64(1):33-7.
(172) Keen C, Olin AC, Wennergren G, Gustafsson P. Small airway function, exhaled NO and airway hyper-responsiveness in paediatric asthma. Respir Med 2011; 105(10):1476-84.
(173) Horsley AR, Gustafsson PM, Macleod KA, Saunders C, Greening AP, Porteous DJ et al. Lung clearance index is a sensitive, repeatable and practical measure of airways disease in adults with cystic fibrosis. Thorax 2008; 63(2):135-40.
(174) Aurora P, Kozlowska W, Stocks J. Gas mixing efficiency from birth to adulthood measured by multiple-breath washout. Respir Physiol Neurobiol 2005; 148(1-2):125-39.
(175) Jones PD, Hankin R, Simpson J, Gibson PG, Henry RL. The tolerability, safety, and success of sputum induction and combined hypertonic saline challenge in children. Am J Respir Crit Care Med 2001; 164(7):1146-9.

259
(176) Anderson SD. Indirect challenge tests: Airway hyperresponsiveness in asthma: its measurement and clinical significance. Chest 2010; 138(2 Suppl):25S-30S.
(177) Fleming L, Wilson N, Regamey N, Bush A. Use of sputum eosinophil counts to guide management in children with severe asthma. Thorax 2012; 67(3):193-8.
(178) Gustafsson PM, Aurora P, Lindblad A. Evaluation of ventilation maldistribution as an early indicator of lung disease in children with cystic fibrosis. Eur Respir J 2003; 22(6):972-9.
(179) Gustafsson PM, Johansson HJ, Dahlback GO. Pneumotachographic nitrogen washout method for measurement of the volume of trapped gas in the lungs. Pediatr Pulmonol 1994; 17(4):258-68.
(180) Couriel JM, Schier M, Hutchison AA, Phelan PD, Landau LI. Distribution of ventilation in young children with cystic fibrosis. Pediatr Pulmonol 1985; 1(6):314-8.
(181) Aurora P, Bush A, Gustafsson P, Oliver C, Wallis C, Price J et al. Multiple-breath washout as a marker of lung disease in preschool children with cystic fibrosis. Am J Respir Crit Care Med 2005; 171(3):249-56.
(182) Aurora P, Gustafsson P, Bush A, Lindblad A, Oliver C, Wallis CE et al. Multiple breath inert gas washout as a measure of ventilation distribution in children with cystic fibrosis. Thorax 2004; 59(12):1068-73.
(183) Beydon N, Davis SD, Lombardi E, Allen JL, Arets HG, Aurora P et al. An official American Thoracic Society/European Respiratory Society statement: pulmonary function testing in preschool children. Am J Respir Crit Care Med 2007; 175(12):1304-45.
(184) Larsson A, Jonmarker C, Werner O. Ventilation inhomogeneity during controlled ventilation. Which index should be used? J Appl Physiol 1988; 65(5):2030-9.
(185) Verbanck S, Schuermans D, Noppen M, Van MA, Paiva M, Vincken W. Evidence of acinar airway involvement in asthma. Am J Respir Crit Care Med 1999; 159(5 Pt 1):1545-50.
(186) Verbanck S, Schuermans D, Van MA, Melot C, Noppen M, Vincken W et al. Conductive and acinar lung-zone contributions to ventilation inhomogeneity in COPD. Am J Respir Crit Care Med 1998; 157(5 Pt 1):1573-7.
(187) Gustafsson PM, Kallman S, Ljungberg H, Lindblad A. Method for assessment of volume of trapped gas in infants during multiple-breath inert gas washout. Pediatr Pulmonol 2003; 35(1):42-9.
(188) Verbanck S, Schuermans D, Van MA, Paiva M, Noppen M, Vincken W. Ventilation distribution during histamine provocation. J Appl Physiol 1997; 83(6):1907-16.

260
(189) ATS/ERS recommendations for standardized procedures for the online and offline measurement of exhaled lower respiratory nitric oxide and nasal nitric oxide, 2005. Am J Respir Crit Care Med 2005; 171(8):912-30.
(190) Paraskakis E, Brindicci C, Fleming L, Krol R, Kharitonov SA, Wilson NM et al. Measurement of bronchial and alveolar nitric oxide production in normal children and children with asthma. Am J Respir Crit Care Med 2006; 174(3):260-7.
(191) Silkoff PE, Wakita S, Chatkin J, Ansarin K, Gutierrez C, Caramori M et al. Exhaled nitric oxide after beta2-agonist inhalation and spirometry in asthma. Am J Respir Crit Care Med 1999; 159(3):940-4.
(192) Miller MR, Hankinson J, Brusasco V, Burgos F, Casaburi R, Coates A et al. Standardisation of spirometry. Eur Respir J 2005; 26(2):319-38.
(193) Stanojevic S, Wade A, Stocks J, Hankinson J, Coates AL, Pan H et al. Reference ranges for spirometry across all ages: a new approach. Am J Respir Crit Care Med 2008; 177(3):253-60.
(194) Pizzichini MM, Rennie D, Senthilselvan A, Taylor B, Habbick BF, Sears MR. Limited agreement between written and video asthma symptom questionnaires. Pediatr Pulmonol 2000; 30(4):307-12.
(195) Bush A, Saglani S. Management of severe asthma in children. Lancet 2010; 376(9743):814-25.
(196) Marinho S, Simpson A, Soderstrom L, Woodcock A, Ahlstedt S, Custovic A. Quantification of atopy and the probability of rhinitis in preschool children: a population-based birth cohort study. Allergy 2007; 62(12):1379-86.
(197) Crane J, Mallol J, Beasley R, Stewart A, Asher MI. Agreement between written and video questions for comparing asthma symptoms in ISAAC. Eur Respir J 2003; 21(3):455-61.
(198) Illi S, von ME, Lau S, Nickel R, Gruber C, Niggemann B et al. The natural course of atopic dermatitis from birth to age 7 years and the association with asthma. J Allergy Clin Immunol 2004; 113(5):925-31.
(199) Oddy WH, Sherriff JL, de Klerk NH, Kendall GE. Breastfeeding, body mass index, and asthma and atopy in children. Adv Exp Med Biol 2004; 554:387-90.
(200) Celedon JC, Milton DK, Ramsey CD, Litonjua AA, Ryan L, Platts-Mills TA et al. Exposure to dust mite allergen and endotoxin in early life and asthma and atopy in childhood. J Allergy Clin Immunol 2007; 120(1):144-9.
(201) Arshad SH, Kurukulaaratchy RJ, Fenn M, Matthews S. Early life risk factors for current wheeze, asthma, and bronchial hyperresponsiveness at 10 years of age. Chest 2005; 127(2):502-8.
(202) Ramsey CD, Gold DR, Litonjua AA, Sredl DL, Ryan L, Celedon JC. Respiratory illnesses in early life and asthma and atopy in childhood. J Allergy Clin Immunol 2007; 119(1):150-6.

261
(203) Raby BA, Celedon JC, Litonjua AA, Phipatanakul W, Sredl D, Oken E et al. Low-normal gestational age as a predictor of asthma at 6 years of age. Pediatrics 2004; 114(3):e327-e332.
(204) Celedon JC, Wright RJ, Litonjua AA, Sredl D, Ryan L, Weiss ST et al. Day care attendance in early life, maternal history of asthma, and asthma at the age of 6 years. Am J Respir Crit Care Med 2003; 167(9):1239-43.
(205) van DC, Harding E, Parkin J, Cheng S, Pearce N, Douwes J. Suitability of forced expiratory volume in 1 second/forced vital capacity vs percentage of predicted forced expiratory volume in 1 second for the classification of asthma severity in adolescents. Arch Pediatr Adolesc Med 2008; 162(12):1169-74.
(206) Wright AL, Stern DA, Halonen M. The association of allergic sensitization in mother and child in breast-fed and formula-fed infants. Adv Exp Med Biol 2001; 501:249-55.
(207) Celedon JC, Litonjua AA, Ryan L, Platts-Mills T, Weiss ST, Gold DR. Exposure to cat allergen, maternal history of asthma, and wheezing in first 5 years of life. Lancet 2002; 360(9335):781-2.
(208) Stern DA, Morgan WJ, Halonen M, Wright AL, Martinez FD. Wheezing and bronchial hyper-responsiveness in early childhood as predictors of newly diagnosed asthma in early adulthood: a longitudinal birth-cohort study. Lancet 2008; 372(9643):1058-64.
(209) Chavasse R, Johnson P, Francis J, Balfour-Lynn I, Rosenthal M, Bush A. To clip or not to clip? Noseclips for spirometry. Eur Respir J 2003; 21(5):876-8.
(210) Phillips GE, Thomas S, Heather S, Bush A. Airway response of children with primary ciliary dyskinesia to exercise and beta2-agonist challenge. Eur Respir J 1998; 11(6):1389-91.
(211) Spahn JD, Cherniack R, Paull K, Gelfand EW. Is forced expiratory volume in one second the best measure of severity in childhood asthma? Am J Respir Crit Care Med 2004; 169(7):784-6.
(212) Gupta S, Siddiqui S, Haldar P, Raj JV, Entwisle JJ, Wardlaw AJ et al. Qualitative analysis of high-resolution CT scans in severe asthma. Chest 2009; 136(6):1521-8.
(213) Takemura M, Niimi A, Minakuchi M, Matsumoto H, Ueda T, Chin K et al. Bronchial dilatation in asthma: relation to clinical and sputum indices. Chest 2004; 125(4):1352-8.
(214) Wahn U, Bergmann R, Kulig M, Forster J, Bauer CP. The natural course of sensitisation and atopic disease in infancy and childhood. Pediatr Allergy Immunol 1997; 8(10 Suppl):16-20.
(215) Hill DJ, Heine RG, Hosking CS. The diagnostic value of skin prick testing in children with food allergy. Pediatr Allergy Immunol 2004; 15(5):435-41.

262
(216) Buchele G, Rzehak P, Weinmayr G, Keil U, Leupold W, von ME et al. Assessing bronchial responsiveness to hypertonic saline using the stepwise protocol of Phase Two of the International Study of Asthma and Allergies in Childhood (ISAAC II). Pediatr Pulmonol 2007; 42(2):131-40.
(217) Riedler J, Reade T, Dalton M, Holst D, Robertson C. Hypertonic saline challenge in an epidemiologic survey of asthma in children. Am J Respir Crit Care Med 1994; 150(6 Pt 1):1632-9.
(218) Lex C, Payne DN, Zacharasiewicz A, Li AM, Wilson NM, Hansel TT et al. Sputum induction in children with difficult asthma: safety, feasibility, and inflammatory cell pattern. Pediatr Pulmonol 2005; 39(4):318-24.
(219) Hilliard TN, Regamey N, Shute JK, Nicholson AG, Alton EW, Bush A et al. Airway remodelling in children with cystic fibrosis. Thorax 2007; 62(12):1074-80.
(220) Liesker JJ, Ten Hacken NH, Zeinstra-Smith M, Rutgers SR, Postma DS, Timens W. Reticular basement membrane in asthma and COPD: similar thickness, yet different composition. Int J Chron Obstruct Pulmon Dis 2009; 4:127-35.
(221) Niimi A, Torrego A, Nicholson AG, Cosio BG, Oates TB, Chung KF. Nature of airway inflammation and remodeling in chronic cough. J Allergy Clin Immunol 2005; 116(3):565-70.
(222) Ward C, De SA, Fisher AJ, Pritchard G, Forrest I, Corris P. A descriptive study of small airway reticular basement membrane thickening in clinically stable lung transplant recipients. J Heart Lung Transplant 2005; 24(5):533-7.
(223) Milanese M, Crimi E, Scordamaglia A, Riccio A, Pellegrino R, Canonica GW et al. On the functional consequences of bronchial basement membrane thickening. J Appl Physiol 2001; 91(3):1035-40.
(224) Bourdin A, Neveu D, Vachier I, Paganin F, Godard P, Chanez P. Specificity of basement membrane thickening in severe asthma. J Allergy Clin Immunol 2007; 119(6):1367-74.
(225) Sullivan P, Stephens D, Ansari T, Costello J, Jeffery P. Variation in the measurements of basement membrane thickness and inflammatory cell number in bronchial biopsies. Eur Respir J 1998; 12(4):811-5.
(226) Payne DN, Qiu Y, Zhu J, Peachey L, Scallan M, Bush A et al. Airway inflammation in children with difficult asthma: relationships with airflow limitation and persistent symptoms. Thorax 2004; 59(10):862-9.
(227) Bosman FT, Stamenkovic I. Functional structure and composition of the extracellular matrix. J Pathol 2003; 200(4):423-8.

263
(228) Jones FS, Jones PL. The tenascin family of ECM glycoproteins: structure, function, and regulation during embryonic development and tissue remodeling. Dev Dyn 2000; 218(2):235-59.
(229) Hsia HC, Schwarzbauer JE. Meet the tenascins: multifunctional and mysterious. J Biol Chem 2005; 280(29):26641-4.
(230) Kaarteenaho-Wiik R, Kinnula V, Herva R, Paakko P, Pollanen R, Soini Y. Distribution and mRNA expression of tenascin-C in developing human lung. Am J Respir Cell Mol Biol 2001; 25(3):341-6.
(231) Lambropoulou M, Limberis V, Koutlaki N, Simopoulou M, Ntanovasilis D, Vandoros GP et al. Differential expression of tenascin-C in the developing human lung: an immunohistochemical study. Clin Exp Med 2009; 9(4):333-8.
(232) Roth-Kleiner M, Hirsch E, Schittny JC. Fetal lungs of tenascin-C-deficient mice grow well, but branch poorly in organ culture. Am J Respir Cell Mol Biol 2004; 30(3):360-6.
(233) Kaarteenaho-Wiik R, Lakari E, Soini Y, Pollanen R, Kinnula VL, Paakko P. Tenascin expression and distribution in pleural inflammatory and fibrotic diseases. J Histochem Cytochem 2000; 48(9):1257-68.
(234) Kaarteenaho-Wiik R, Mertaniemi P, Sajanti E, Soini Y, Paakko P. Tenascin is increased in epithelial lining fluid in fibrotic lung disorders. Lung 1998; 176(6):371-80.
(235) Soini Y, Paakko P, Nuorva K, Kamel D, Linnala A, Virtanen I et al. Tenascin immunoreactivity in lung tumors. Am J Clin Pathol 1993; 100(2):145-50.
(236) Kusagawa H, Onoda K, Namikawa S, Yada I, Okada A, Yoshida T et al. Expression and degeneration of tenascin-C in human lung cancers. Br J Cancer 1998; 77(1):98-102.
(237) Phipps S, Benyahia F, Ou TT, Barkans J, Robinson DS, Kay AB. Acute allergen-induced airway remodeling in atopic asthma. Am J Respir Cell Mol Biol 2004; 31(6):626-32.
(238) Kariyawasam HH, Aizen M, Barkans J, Robinson DS, Kay AB. Remodeling and airway hyperresponsiveness but not cellular inflammation persist after allergen challenge in asthma. Am J Respir Crit Care Med 2007; 175(9):896-904.
(239) Nakahara H, Gabazza EC, Fujimoto H, Nishii Y, D'Alessandro-Gabazza CN, Bruno NE et al. Deficiency of tenascin C attenuates allergen-induced bronchial asthma in the mouse. Eur J Immunol 2006; 36(12):3334-45.
(240) Ioachim E, Charchanti A, Briasoulis E, Karavasilis V, Tsanou H, Arvanitis DL et al. Immunohistochemical expression of extracellular matrix components tenascin, fibronectin, collagen type IV and laminin in breast cancer: their prognostic value and role in tumour invasion and progression. Eur J Cancer 2002; 38(18):2362-70.

264
(241) Morimoto S, Imanaka-Yoshida K, Hiramitsu S, Kato S, Ohtsuki M, Uemura A et al. Diagnostic utility of tenascin-C for evaluation of the activity of human acute myocarditis. J Pathol 2005; 205(4):460-7.
(242) Masaki T, Yorioka N, Taniguchi Y, Ogawa T, Naito T, Nishiki T et al. Role of tenascin in human immunoglobulin A nephropathy. J Int Med Res 1997; 25(5):247-54.
(243) Kaarteenaho-Wiik R, Kinnula VL, Herva R, Soini Y, Pollanen R, Paakko P. Tenascin-C is highly expressed in respiratory distress syndrome and bronchopulmonary dysplasia. J Histochem Cytochem 2002; 50(3):423-31.
(244) Degen M, Goulet S, Ferralli J, Roth M, Tamm M, Chiquet-Ehrismann R. Opposite effect of fluticasone and salmeterol on fibronectin and tenascin-C expression in primary human lung fibroblasts. Clin Exp Allergy 2009; 39(5):688-99.
(245) Bara I, Ozier A, Tunon de Lara JM, Marthan R, Berger P. Pathophysiology of bronchial smooth muscle remodelling in asthma. Eur Respir J 2010; 36(5):1174-84.
(246) Ozier A, Allard B, Bara I, Girodet PO, Trian T, Marthan R et al. The pivotal role of airway smooth muscle in asthma pathophysiology. J Allergy (Cairo ) 2011; 2011:742710.
(247) Wahidi MM, Kraft M. Bronchial thermoplasty for severe asthma. Am J Respir Crit Care Med 2012; 185(7):709-14.
(248) Begueret H, Berger P, Vernejoux JM, Dubuisson L, Marthan R, Tunon-de-Lara JM. Inflammation of bronchial smooth muscle in allergic asthma. Thorax 2007; 62(1):8-15.
(249) James AL, Elliot JG, Jones RL, Carroll ML, Mauad T, Bai TR et al. Airway smooth muscle hypertrophy and hyperplasia in asthma. Am J Respir Crit Care Med 2012; 185(10):1058-64.
(250) Bullimore SR, Siddiqui S, Donovan GM, Martin JG, Sneyd J, Bates JH et al. Could an increase in airway smooth muscle shortening velocity cause airway hyperresponsiveness? Am J Physiol Lung Cell Mol Physiol 2011; 300(1):L121-L131.
(251) Ma X, Cheng Z, Kong H, Wang Y, Unruh H, Stephens NL et al. Changes in biophysical and biochemical properties of single bronchial smooth muscle cells from asthmatic subjects. Am J Physiol Lung Cell Mol Physiol 2002; 283(6):L1181-L1189.
(252) Leguillette R, Laviolette M, Bergeron C, Zitouni N, Kogut P, Solway J et al. Myosin, transgelin, and myosin light chain kinase: expression and function in asthma. Am J Respir Crit Care Med 2009; 179(3):194-204.
(253) Halwani R, Al-Muhsen S, Al-Jahdali H, Hamid Q. Role of transforming growth factor-beta in airway remodeling in asthma. Am J Respir Cell Mol Biol 2011; 44(2):127-33.

265
(254) Ito I, Fixman ED, Asai K, Yoshida M, Gounni AS, Martin JG et al. Platelet-derived growth factor and transforming growth factor-beta modulate the expression of matrix metalloproteinases and migratory function of human airway smooth muscle cells. Clin Exp Allergy 2009; 39(9):1370-80.
(255) Nakamura KT, McCray PB, Jr. Fetal airway smooth-muscle contractility and lung development. A player in the band or just someone in the audience? Am J Respir Cell Mol Biol 2000; 23(1):3-6.
(256) Hislop AA, Haworth SG. Airway size and structure in the normal fetal and infant lung and the effect of premature delivery and artificial ventilation. Am Rev Respir Dis 1989; 140(6):1717-26.
(257) Featherstone NC, Connell MG, Fernig DG, Wray S, Burdyga TV, Losty PD et al. Airway smooth muscle dysfunction precedes teratogenic congenital diaphragmatic hernia and may contribute to hypoplastic lung morphogenesis. Am J Respir Cell Mol Biol 2006; 35(5):571-8.
(258) Weibel ER, Hsia CC, Ochs M. How much is there really? Why stereology is essential in lung morphometry. J Appl Physiol 2007; 102(1):459-67.
(259) Malmberg LP, Pelkonen A, Hakulinen A, Hero M, Pohjavuori M, Skytta J et al. Intraindividual variability of infant whole-body plethysmographic measurements: effects of age and disease. Pediatr Pulmonol 1999; 28(5):356-62.
(260) Ebina M, Yaegashi H, Takahashi T, Motomiya M, Tanemura M. Distribution of smooth muscles along the bronchial tree. A morphometric study of ordinary autopsy lungs. Am Rev Respir Dis 1990; 141(5 Pt 1):1322-6.
(261) James A, Carroll N. Airway smooth muscle in health and disease; methods of measurement and relation to function. Eur Respir J 2000; 15(4):782-9.
(262) Matsuba K, Thurlbeck WM. A morphometric study of bronchial and bronchiolar walls in children. Am Rev Respir Dis 1972; 105(6):908-13.
(263) Lee SY, Kim JS, Lee JM, Kwon SS, Kim KH, Moon HS et al. Inhaled corticosteroid prevents the thickening of airway smooth muscle in murine model of chronic asthma. Pulm Pharmacol Ther 2008; 21(1):14-9.
(264) Snijders D, Agostini S, Bertuola F, Panizzolo C, Baraldo S, Turato G et al. Markers of eosinophilic and neutrophilic inflammation in bronchoalveolar lavage of asthmatic and atopic children. Allergy 2010; 65(8):978-85.
(265) Lex C, Ferreira F, Zacharasiewicz A, Nicholson AG, Haslam PL, Wilson NM et al. Airway eosinophilia in children with severe asthma: predictive values of noninvasive tests. Am J Respir Crit Care Med 2006; 174(12):1286-91.
(266) Payne DN, Bush A. "Refractory" eosinophilic airway inflammation in severe asthma. Am J Respir Crit Care Med 2004; 170(12):1385-6.

266
(267) Thavagnanam S, Williamson G, Ennis M, Heaney LG, Shields MD. Does airway allergic inflammation pre-exist before late onset wheeze in children? Pediatr Allergy Immunol 2010; 21(7):1002-7.
(268) Reuter S, Stassen M, Taube C. Mast cells in allergic asthma and beyond. Yonsei Med J 2010; 51(6):797-807.
(269) Kaur D, Saunders R, Berger P, Siddiqui S, Woodman L, Wardlaw A et al. Airway smooth muscle and mast cell-derived CC chemokine ligand 19 mediate airway smooth muscle migration in asthma. Am J Respir Crit Care Med 2006; 174(11):1179-88.
(270) Stevenson EC, Turner G, Heaney LG, Schock BC, Taylor R, Gallagher T et al. Bronchoalveolar lavage findings suggest two different forms of childhood asthma. Clin Exp Allergy 1997; 27(9):1027-35.
(271) Maclennan C, Hutchinson P, Holdsworth S, Bardin PG, Freezer NJ. Airway inflammation in asymptomatic children with episodic wheeze. Pediatr Pulmonol 2006; 41(6):577-83.
(272) Arnoux B, Bousquet J, Rongier M, Scheinmann P, de BJ. Increased bronchoalveolar lavage CD8 lymphocyte subset population in wheezy infants. Pediatr Allergy Immunol 2001; 12(4):194-200.
(273) Wenzel SE, Szefler SJ, Leung DY, Sloan SI, Rex MD, Martin RJ. Bronchoscopic evaluation of severe asthma. Persistent inflammation associated with high dose glucocorticoids. Am J Respir Crit Care Med 1997; 156(3 Pt 1):737-43.
(274) Little SA, MacLeod KJ, Chalmers GW, Love JG, McSharry C, Thomson NC. Association of forced expiratory volume with disease duration and sputum neutrophils in chronic asthma. Am J Med 2002; 112(6):446-52.
(275) Just J, Gouvis-Echraghi R, Rouve S, Wanin S, Moreau D, Annesi M, I. Two novel severe asthma phenotypes identified during childhood using a clustering approach. Eur Respir J 2012.
(276) Le BM, Goncalves M, Le CL, Benoist MR, Fournet JC, Scheinmann P et al. Bronchoalveolar cells in children < 3 years old with severe recurrent wheezing. Chest 2002; 122(3):791-7.
(277) Schwerk N, Brinkmann F, Soudah B, Kabesch M, Hansen G. Wheeze in preschool age is associated with pulmonary bacterial infection and resolves after antibiotic therapy. PLoS One 2011; 6(11):e27913.
(278) Hsia CC, Hyde DM, Ochs M, Weibel ER. An official research policy statement of the American Thoracic Society/European Respiratory Society: standards for quantitative assessment of lung structure. Am J Respir Crit Care Med 2010; 181(4):394-418.
(279) Ochs M. A brief update on lung stereology. J Microsc 2006; 222(Pt 3):188-200.

267
(280) Richmond I, Booth H, Ward C, Walters EH. Intrasubject variability in airway inflammation in biopsies in mild to moderate stable asthma. Am J Respir Crit Care Med 1996; 153(3):899-903.
(281) Sont JK, Willems LN, Evertse CE, Hooijer R, Sterk PJ, van Krieken JH. Repeatability of measures of inflammatory cell number in bronchial biopsies in atopic asthma. Eur Respir J 1997; 10(11):2602-8.
(282) Gamble E, Qiu Y, Wang D, Zhu J, Vignola AM, Kroegel C et al. Variability of bronchial inflammation in chronic obstructive pulmonary disease: implications for study design. Eur Respir J 2006; 27(2):293-9.
(283) Silkoff PE, Trudeau JB, Gibbs R, Wenzel S. The relationship of induced-sputum inflammatory cells to BAL and biopsy. Chest 2003; 123(3 Suppl):371S-2S.
(284) Shinohara M, Wakiguchi H, Saito H, Matsumoto K. Presence of eosinophils in nasal secretion during acute respiratory tract infection in young children predicts subsequent wheezing within two months. Allergol Int 2008; 57(4):359-65.
(285) Baraldo S, Turato G, Bazzan E, Ballarin A, Damin M, Balestro E et al. Noneosinophilic asthma in children: relation with airway remodelling. Eur Respir J 2011; 38(3):575-83.
(286) Ward C, Reid DW, Orsida BE, Feltis B, Ryan VA, Johns DP et al. Inter-relationships between airway inflammation, reticular basement membrane thickening and bronchial hyper-reactivity to methacholine in asthma; a systematic bronchoalveolar lavage and airway biopsy analysis. Clin Exp Allergy 2005; 35(12):1565-71.
(287) Ward C, Pais M, Bish R, Reid D, Feltis B, Johns D et al. Airway inflammation, basement membrane thickening and bronchial hyperresponsiveness in asthma. Thorax 2002; 57(4):309-16.
(288) Roth M, Johnson PR, Borger P, Bihl MP, Rudiger JJ, King GG et al. Dysfunctional interaction of C/EBPalpha and the glucocorticoid receptor in asthmatic bronchial smooth-muscle cells. N Engl J Med 2004; 351(6):560-74.
(289) Chetta A, Zanini A, Foresi A, Del DM, Castagnaro A, D'Ippolito R et al. Vascular component of airway remodeling in asthma is reduced by high dose of fluticasone. Am J Respir Crit Care Med 2003; 167(5):751-7.
(290) Boulet LP, Turcotte H, Laviolette M, Naud F, Bernier MC, Martel S et al. Airway hyperresponsiveness, inflammation, and subepithelial collagen deposition in recently diagnosed versus long-standing mild asthma. Influence of inhaled corticosteroids. Am J Respir Crit Care Med 2000; 162(4 Pt 1):1308-13.
(291) Sutcliffe A, Hollins F, Gomez E, Saunders R, Doe C, Cooke M et al. Increased nicotinamide adenine dinucleotide phosphate oxidase 4 expression mediates intrinsic airway smooth muscle hypercontractility in asthma. Am J Respir Crit Care Med 2012; 185(3):267-74.

268
(292) Matsumoto H, Moir LM, Oliver BG, Burgess JK, Roth M, Black JL et al. Comparison of gel contraction mediated by airway smooth muscle cells from patients with and without asthma. Thorax 2007; 62(10):848-54.
(293) Johnson PR, Roth M, Tamm M, Hughes M, Ge Q, King G et al. Airway smooth muscle cell proliferation is increased in asthma. Am J Respir Crit Care Med 2001; 164(3):474-7.
(294) Prefontaine D, Nadigel J, Chouiali F, Audusseau S, Semlali A, Chakir J et al. Increased IL-33 expression by epithelial cells in bronchial asthma. J Allergy Clin Immunol 2010; 125(3):752-4.
(295) Moffatt MF, Gut IG, Demenais F, Strachan DP, Bouzigon E, Heath S et al. A large-scale, consortium-based genomewide association study of asthma. N Engl J Med 2010; 363(13):1211-21.
(296) Kaur D, Doe C, Woodman L, Wan H, Sutcliffe A, Hollins F et al. Mast cell-airway smooth muscle crosstalk: the role of thymic stromal lymphopoietin. Chest 2011.
(297) Yeganeh B, Xia C, Movassagh H, Koziol-White C, Chang Y, Al-Alwan L et al. Emerging mediators of airway smooth muscle dysfunction in asthma. Pulm Pharmacol Ther 2012.
(298) Malavia NK, Raub CB, Mahon SB, Brenner M, Panettieri RA, Jr., George SC. Airway epithelium stimulates smooth muscle proliferation. Am J Respir Cell Mol Biol 2009; 41(3):297-304.
(299) de BJ, Tillie-Leblond I, Emond S, Mahut B, Dang Duy TL, Scheinmann P. High-resolution computed tomography scan and airway remodeling in children with severe asthma. J Allergy Clin Immunol 2005; 116(4):750-4.
(300) Saglani S, Papaioannou G, Khoo L, Ujita M, Jeffery PK, Owens C et al. Can HRCT be used as a marker of airway remodelling in children with difficult asthma? Respir Res 2006; 7:46.
(301) Brenner DJ, Hall EJ. Computed tomography--an increasing source of radiation exposure. N Engl J Med 2007; 357(22):2277-84.
(302) Soja J, Grzanka P, Sladek K, Okon K, Cmiel A, Mikos M et al. The use of endobronchial ultrasonography in assessment of bronchial wall remodeling in patients with asthma. Chest 2009; 136(3):797-804.
(303) Bisgaard H, Pipper CB, Bonnelykke K. Endotyping early childhood asthma by quantitative symptom assessment. J Allergy Clin Immunol 2011; 127(5):1155-64.
(304) Buszewski B, Kesy M, Ligor T, Amann A. Human exhaled air analytics: biomarkers of diseases. Biomed Chromatogr 2007; 21(6):553-66.

269
(305) Barker M, Hengst M, Schmid J, Buers HJ, Mittermaier B, Klemp D et al. Volatile organic compounds in the exhaled breath of young patients with cystic fibrosis. Eur Respir J 2006; 27(5):929-36.
(306) Dallinga JW, Robroeks CM, van Berkel JJ, Moonen EJ, Godschalk RW, Jobsis Q et al. Volatile organic compounds in exhaled breath as a diagnostic tool for asthma in children. Clin Exp Allergy 2010; 40(1):68-76.
(307) van de Kant KD, Klaassen EM, Jobsis Q, Koers K, Rijkers GT, van der Grinten CP et al. Wheezing in preschool children is associated with increased levels of cytokines/chemokines in exhaled breath condensate. J Allergy Clin Immunol 2010; 126(3):669-71.
(308) van de Kant KD, Jansen MA, Klaassen EM, van der Grinten CP, Rijkers GT, Muris JW et al. Elevated inflammatory markers at preschool age precede persistent wheezing at school age. Pediatr Allergy Immunol 2012; 23(3):259-64.
(309) Karakoc GB, Yukselen A, Yilmaz M, Altintas DU, Kendirli SG. Exhaled breath condensate MMP-9 level and its relationship with asthma severity and interleukin-4/10 levels in children. Ann Allergy Asthma Immunol 2012; 108(5):300-4.
(310) Lex C, Zacharasiewicz A, Payne DN, Wilson NM, Nicholson AG, Kharitonov SA et al. Exhaled breath condensate cysteinyl leukotrienes and airway remodeling in childhood asthma: a pilot study. Respir Res 2006; 7:63.
(311) Zietkowski Z, Skiepko R, Tomasiak MM, Bodzenta-Lukaszyk A. Endothelin-1 in exhaled breath condensate of stable and unstable asthma patients. Respiratory Medicine 2008; 102(3):470-4.
(312) Marsland BJ. Regulation of inflammatory responses by the commensal microbiota. Thorax 2012; 67(1):93-4.
(313) Arnold IC, Dehzad N, Reuter S, Martin H, Becher B, Taube C et al. Helicobacter pylori infection prevents allergic asthma in mouse models through the induction of regulatory T cells. J Clin Invest 2011; 121(8):3088-93.
(314) Huang YJ, Nelson CE, Brodie EL, Desantis TZ, Baek MS, Liu J et al. Airway microbiota and bronchial hyperresponsiveness in patients with suboptimally controlled asthma. J Allergy Clin Immunol 2011; 127(2):372-81.

270
ppendix 1- Letter of invitation
Department of Respiratory Paediatrics
Royal Brompton Hospital
Sydney Street
London, SW3 6NP
Tel: 020 7352 8121
Mr & Mrs NAME
ADDRESS
DATE
Dear Mr & Mrs NAME
I am writing to ask whether you would consider allowing NAME to take part in a research
project at the Brompton Hospital.
You will remember that NAME had a camera test called a bronchoscopy at the Brompton
Hospital when he was a baby. At that time you very kindly agreed for us to use any samples
that were taken, and were left over after his clinical tests, for a research project looking at
asthma in young children. We have now completed that study, and have found that overall
children that were wheezy when they had their bronchoscopy did have features in their
airway samples that suggested asthma. But at that time, we could not say for certain which
children would have asthma when they got older and which would no longer be wheezy.
In order to see whether the samples that we took at that young age will help us to see whether
a child will have asthma when they are older, we want to ask whether you would bring
NAME back to the Brompton Hospital to answer a few questions about his breathing and to
do some very simple blowing tests (no bronchoscopy). Details of all of the tests, how long
they take and the reasons for doing this study are given in the information sheet enclosed with
this letter.
We are very grateful to you for taking the time to read this information.
The doctor doing the research will contact you in a week or so to ensure you have received
this information, and at the same time will be very happy to explain the research to you
further and answer any questions that you might have. Please bear in mind that you are under
no obligation to take part, and you may refuse without giving any reason.
Thank you again for your time and help in considering this information.
Yours sincerely
Dr Ruth O’ Reilly
Clinical Research Fellow
Appendix 1- Letter of invitation

271
WHEEZING AND ASTHMA IN CHILDREN
Children’s Information Sheet
THANK YOU for taking the time to read this leaflet. We are doing a research study looking at
breathing problems in children.
What is research? Research is done to try and find out answers to important questions.
What is this research about? By doing this research we hope to find out more about why some very young toddlers that have
noisy breathing get asthma when they get older.
Why have I been asked to take part? When you were a young toddler you had a special camera test of your lungs called a
bronchoscopy at the Brompton Hospital. As you’ve had this special test, we now want to
ask whether you would take the time to read on and consider taking part in our study.
What is wheezing? Wheezing is a type of noise that comes from the chest. It can cause difficulty in breathing.
Wheezing is very common and can sometimes make children very ill. Luckily, most children grow
out of the problem, but some continue to wheeze as they get older and they can develop a
problem called asthma. At the moment we can’t tell which children will carry on wheezing and get
asthma.
Why is this research important?
We want to know whether you have any noisy breathing or wheezing, and whether you might
have asthma.
We want to know whether we can recognize who will have asthma at your age by looking at
the results of the special bronchoscopy test that you and other children had when you were
toddlers.
Appendix 2

272
What happens if I agree to take part? We will ask you and your mum or dad to answer some questions about your breathing
We will ask you to do 2 blowing tests
We will do some special tests on your forearm to see if you have any allergies
We will ask you to breathe in some misted air that tastes a bit salty, and then see if you can
cough up some phlegm, and ask you to do some blowing tests after you’ve breathed in the
misted air.
We will ask you to sit still and breathe air mixed with a small amount of a harmless gas
called a ‘tracer gas’ slowly from a mouth piece. This gas is not absorbed by your body at all.
You may watch a DVD or read a book during this test so you don’t get bored.
We will explain all of the tests and the results to you
All of the tests can be done in one visit to the hospital. You will be at the hospital for
about 3 hours.
Do I have to take part? You do not have to take part in the project. You do not have to say why not, either.
Will joining in with the research help me? We cannot promise that taking part will help you, but the information that we get will help us to
treat other toddlers and children with wheezing and asthma early and stop them from getting
very ill.
What if I don’t have asthma? We would still like you to take part so that we can tell the difference between children
with and without asthma
What if I already have asthma? You may already know whether you have asthma, and if so, we will be happy to give you all
of the results from the tests and answer any of your questions.
Taking part will not affect your asthma medicines, or the way your doctors treat you in
any way
What do I do next? If you would like to know more, or are interested in taking part in the study please tell your
mum or dad and they will tell the doctors that are doing the study.
What if I change my mind and don’t want to do the research anymore? If you agree to take part in the research, you can still change your mind and stop doing the
research at anytime. This will not change your normal treatment in any way. You do not have to
say why you have changed your mind.
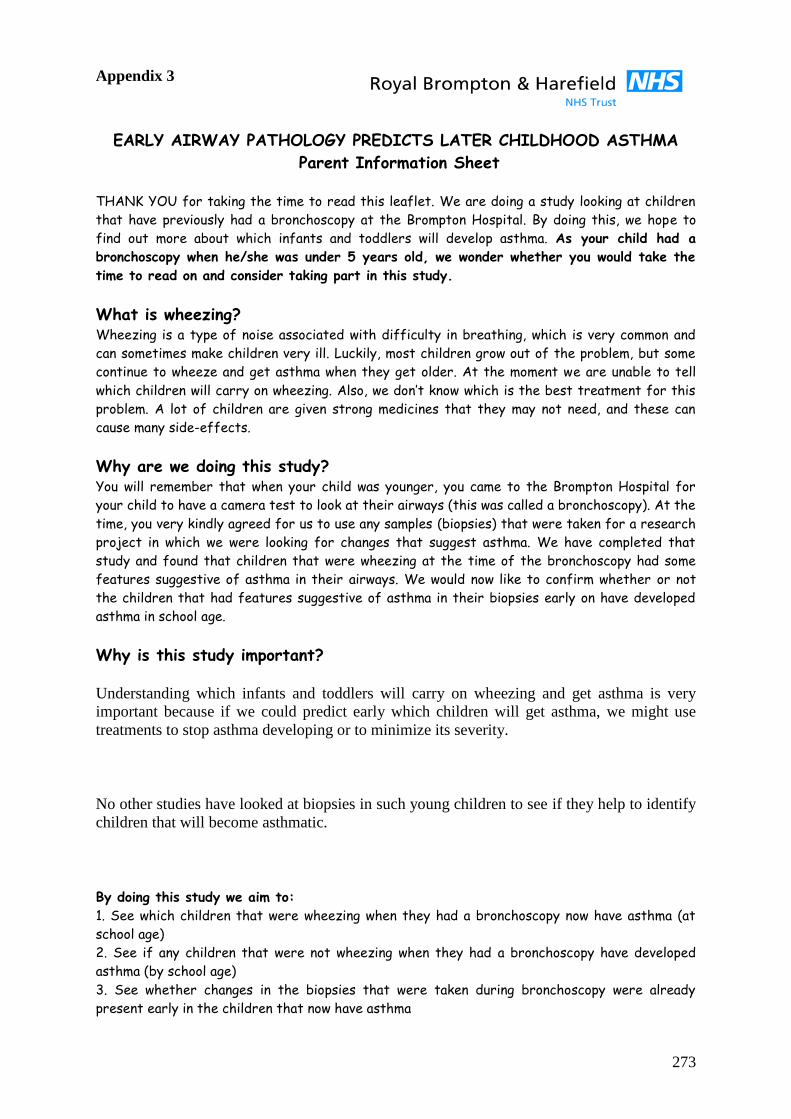
273
EARLY AIRWAY PATHOLOGY PREDICTS LATER CHILDHOOD ASTHMA
Parent Information Sheet
THANK YOU for taking the time to read this leaflet. We are doing a study looking at children
that have previously had a bronchoscopy at the Brompton Hospital. By doing this, we hope to
find out more about which infants and toddlers will develop asthma. As your child had a
bronchoscopy when he/she was under 5 years old, we wonder whether you would take the
time to read on and consider taking part in this study.
What is wheezing? Wheezing is a type of noise associated with difficulty in breathing, which is very common and
can sometimes make children very ill. Luckily, most children grow out of the problem, but some
continue to wheeze and get asthma when they get older. At the moment we are unable to tell
which children will carry on wheezing. Also, we don’t know which is the best treatment for this
problem. A lot of children are given strong medicines that they may not need, and these can
cause many side-effects.
Why are we doing this study? You will remember that when your child was younger, you came to the Brompton Hospital for
your child to have a camera test to look at their airways (this was called a bronchoscopy). At the
time, you very kindly agreed for us to use any samples (biopsies) that were taken for a research
project in which we were looking for changes that suggest asthma. We have completed that
study and found that children that were wheezing at the time of the bronchoscopy had some
features suggestive of asthma in their airways. We would now like to confirm whether or not
the children that had features suggestive of asthma in their biopsies early on have developed
asthma in school age.
Why is this study important?
Understanding which infants and toddlers will carry on wheezing and get asthma is very
important because if we could predict early which children will get asthma, we might use
treatments to stop asthma developing or to minimize its severity.
No other studies have looked at biopsies in such young children to see if they help to identify
children that will become asthmatic.
By doing this study we aim to:
1. See which children that were wheezing when they had a bronchoscopy now have asthma (at
school age)
2. See if any children that were not wheezing when they had a bronchoscopy have developed
asthma (by school age)
3. See whether changes in the biopsies that were taken during bronchoscopy were already
present early in the children that now have asthma
Appendix 3

274
What happens if you agree to take part in the study? We ask you to answer some questions about any wheezing or related problems, like
eczema and hay fever in your family
We ask you to answer some more specific questions about your child’s chest symptoms
(if they have any)
We would like your child to perform a blowing test so that we can assess how well their
lungs are working (test takes 5 minutes)
We would like your child to perform a second blowing test to see if they have inflamed
airways (test takes 5 minutes)
We would like to test your child for allergies to things like cat, dog, house dust and
pollen using skin prick tests (takes about 20 minutes).
We would like to see if your child has a tendency to be asthmatic by asking him/her to
inhale a salty mist for 5 minutes and then doing the blowing test for lung function again.
This would be repeated four times for a maximum of up to 20 minutes. During this test
we would also see if your child can cough up a sample of sputum. This would then be used
to look for inflammation in the airways. A small part of this sample would be frozen and
stored for future tests to help identify asthma. (test takes about 40 minutes).
We would like to do another test to see how the smaller airways in your child’s lungs are
working by asking him/her to breathe in air with a small amount of a harmless ‘tracer
gas’ while breathing normally. This gas is not taken up by the body at all, it is just
breathed out again unchanged, and is harmless. After a few minutes the gas will be
disconnected and we will continue to measure breathing while they breathe normal room
air again. This would be repeated 3 times. This test is a measure of how well gases are
mixed in the lungs and will tell us if there is any obstruction in the smaller airways that
may not be picked up by the previous blowing tests. This test has been performed
before in hundreds of babies, children and adults with no problems. (test takes about 45
minutes).
We will be very happy to tell you the results once they are available.
All information relating to your child will be completely confidential.
Where will the tests be done? All of the tests will be done at the Brompton Hospital.
They can all be completed in one visit lasting approximately 3 hours.
We will reimburse your reasonable travel fare to and from the hospital.
What will happen once the tests have been done? Once the tests have been completed, we will look at the results to see whether your
child has asthma.
We will then go back to the biopsies that we took when they had a bronchoscopy. The
biopsies will be looked at in detail under the microscope to see if they have features of
asthma.
Results from the current tests and previous biopsies will then be put together to see
whether or not the early biopsies correctly predicted asthma in school age.

275
Will we be told the results?
We will be very happy to tell you the results of the study, once it has been completed.
If the tests show your child has asthma, or there are any other findings that you did not know
about, we will tell you and will advise on any appropriate treatment that is needed. Your GP
will also be informed of the results.
What happens next? If you would like to know more, or are interested in taking part in the study, please
contact:
Dr Ruth O’Reilly, Clinical Research Fellow, by phoning 077 72056622 or 020 73528121
Extension 2257
email [email protected]
OR
Dr Sejal Saglani, Clinical Senior Lecturer, by phoning 020 7594 3167 or email
What if we change our mind? If you and your child agree to take part in the study, but then either or both of you change your
mind, you may withdraw at anytime. This will not change your child’s normal treatment in any
way. You do not have to give any reason for withdrawing, or not taking part at all.
What if we don’t take part in the study? It is fine to decline to take part. You do not have to give a reason. If you do not wish your child
to take part in the study, this will not alter your child’s normal treatment in any way.
Imperial College London holds insurance policies which apply to this study. If your child
experiences harm or injury as a result of taking part in this study, you may be eligible to claim
compensation without having to prove that Imperial College is at fault. This does not affect your
legal rights to seek compensation
If your child is harmed due to someone’s negligence, then you may have grounds for a legal
action. Regardless of this, if you wish to complain, or have any concerns about any aspect of the
way your child has been treated during the course of this study then you should immediately
inform the Investigator (Dr Sejal Saglani, Tel: 0207 594 3167). The normal National Health
Service complaint complaints mechanisms are also available to you. If you are still not satisfied
with the response, you may contact the Imperial College Clinical Research Governance Office.
THANK YOU VERY MUCH FOR YOUR TIME AND PATIENCE IN READING
THIS LEAFLET

276
Royal Brompton & Harefield NHS Trust & National Heart and Lung Institute
STUDY INFORMATION & CONSENT FORM
Title of project: Early airway pathology predicts later childhood asthma
EXPLANATION OF PROJECT
We would like to invite you and your child to take part in this clinical study which we hope
will help us to understand more about which wheezy infants will go on to develop asthma.
We know from previous research that although many children under 5 years old suffer from
wheezing, only about one-third of wheezers develop asthma by school age. The aim of this
study is to see if we can use information from tiny pieces of tissue (biopsies) taken from a
child’s airways to predict which wheezy infants and preschool children will develop asthma.
If we can find a predictor of future asthma, then we can look for treatments that can be used
very early to either stop the development of asthma or minimise its severity.
You will remember that when your child was very young, you came to the Brompton
Hospital for them to have a camera test to look at their airways (this was called a
bronchoscopy). At the time, you very kindly agreed for us to use any samples that were taken
for a research project in which we were looking for changes that suggest asthma. We have
completed that study and found that children that were wheezing at the time of the
bronchoscopy had some features suggestive of asthma in their airways.
We would now like to confirm whether the children that had features suggestive of asthma
early on are still wheezing and whether they have developed asthma in school age.
In order to do this, we would like to ask whether you would consider coming back to the
Brompton Hospital with your child for the following tests:
i) We would ask you and your child some questions about their breathing, and how
they have been since the bronchoscopy. This takes about 40 minutes
ii) We would like your child to perform a blowing test so that we can assess how well
their lungs are working. This takes about 5 minutes
iii) We would like to perform a second blowing test to see if your child has inflamed
airways. This also takes about 5 minutes
iv) We would like to test your child for allergies using skin prick tests. This takes
approximately 20 minutes
v) We would like to see if your child has a tendency to be asthmatic by asking him/her
to inhale a salty mist for 5 minutes and then doing the blowing tests for lung
function again. This would be repeated four times for a maximum of up to 20
minutes. During this test we would also see if your child can cough up a sample of
sputum. This would then be used to look for inflammation in the airways. A small
part of this sample would be frozen and stored for future tests to help identify
asthma.
Appendix 4

277
vi) We would like to do another test to look at how well your child’s airways are
working by asking him/her to inhale air containing a small amount of a harmless
‘tracer gas’ while breathing normally. We will then see how quickly the ‘tracer gas’
is removed from the lungs during continued normal breathing. This will be repeated
3 times and will take approximately 45 minutes.
All of this would be done on one day and would take approximately 3 hours.
The tests will all be done by a children’s doctor. If any of the tests make your child feel
uncomfortable, then they will be stopped.
The information obtained from the answers to the questions and the tests will allow us to
work out whether or not your child now has asthma. We will then relate this back to the
biopsies that we took from your child when they had their bronchoscopy to see if early
information from the biopsies tallies with whether your child now has asthma or not.
Although taking part in this study will not benefit your child directly, it will allow us to help
other children in the future. We will know whether information from airway biopsies taken
early from wheezy preschool children can be used to identify which children will develop
asthma.
Please take the chance to discuss this study fully, asking any questions that you need to,
before deciding whether or not to take part. If you do not wish your child to take part,
this will not affect his or her current or future treatment at the Brompton Hospital. If
you and your child do agree to take part, but later decide you would like to withdraw
from the study, you may do so at any time, and you do not have to give a reason and this
will not affect your child’s treatment in any way. Thank you very much for your time.

278
12/01/2009 Study number: __________________
CONSENT FORM FOR PARENTS & CHILDREN
Title of project: Early airway pathology predicts later childhood asthma
Name of researcher:
1. I confirm that I / my child have read and understand the information sheet dated 12th
Jan 2009 v3 for the above study. I have had the opportunity to ask questions and have
had these answered satisfactorily.
2. I understand that my child’s participation is voluntary and that we as parents or he/she
is free to withdraw at any time without giving any reason and without their medical
care or legal rights being affected.
3. I understand that sections of my child’s medical notes may be looked at by
responsible individuals from the Brompton Hospital where it is relevant to my child
taking part in this research. I give permission for these individuals to access my
child’s records that are relevant to this research.
4. I understand that samples from the study will be stored and may be used in future for
similar tests.
5. The compensation arrangements have been discussed with me.
6. I agree to the child named below taking part in this study, and I am their parent / legal
guardian.
___________________________ _______________________ _________
Name of child Signature Date
___________________________ _______________________
__________
Name of parent/legal guardian Signature Date
___________________________ ________________________
__________
Name of person taking consent Signature Date

279
Royal Brompton & Harefield NHS Trust & National Heart and Lung Institute
Study Information Leaflet
Project title: Early airway pathology predicts later childhood asthma
Dear Doctor
This is to inform you that your patient __________________________, DOB:____________
is taking part in the above research project being carried out at the Royal Brompton Hospital,
London.
This study is following up children that have previously had a bronchoscopy at the Brompton
hospital, aged 3 months to 5 years, between October 2002 and May 2005. We are looking at
the current asthma status of the previously bronchoscoped children, and will relate this to
pathological findings in airway biopsies that were taken during the bronchoscopy to see
whether early airway pathology in the infant and preschool years predicts the development of
asthma by school-age.
The children will undergo the following:
1. An interview / questionnaire with parents to assess current asthma symptoms
2. Skin prick tests to 5 common aero-allergens and 3 common food allergens
3. Spirometry
4. Measurment of exhaled nitric oxide
5. Combined sputum induction and assessment of airway hyperresponsiveness using 4.5%
nebulised saline
6. Measurement of Lung Clearance Index (lung function test that gives a measure of
small airways function)
All tests will be performed at the Brompton Hospital. Parents and children will be told the
results. If any previously unknown results are found, we will write to you and let you know
these, with our recommendations for future management and follow-up.
There are no implications for the treatment of the child or long term follow-up.
If you have any questions relating to this study, please do not hesitate to contact the Principle
Investigator:
Dr Sejal Saglani
Clinical Senior Lecturer & Honorary Consultant in Respiratory Paediatrics
Imperial College London & The Royal Brompton Hospital
374 Sir Alexander Fleming Building
Exhibition Road, London SW7 2AZ
Tel: 020 7594 3167
Thank you
Yours sincerely
Dr Sejal Saglani BSc, MBChB, MRCPCH, MD
Appendix 5

280
Appendix 6 Date:
Birth History: Gest _________ Wgt_________ Scubu/NICU Yes/ No Vent Days_______ Cpap Days_______ Smoking Smoking during pregnancy (mother) Smoking during pregnancy father (lived in house) Does anyone in the house smoke now? Father Mother Other adult Day Care Did your child attend nursery? What age_______months Length of time________ months Animals Do you live on a farm? Do you have pets at home? If so which cat dog other Medications in First 2 years of life Inhaled Corticosteriods ____________________ Spacer Yes/ No Inhaled Salbutamol ______________________ Spacer Yes/ No No of courses of Oral Steroids _____________ Monteleukast Yes /No Medications Aged 2-5 years Inhaled Corticosteriods ____________________ Spacer Yes/ No Inhaled Salbutamol ______________________ Spacer Yes/ No Monteleukast Yes /No Number of courses of Oral steroid/year Age 3_________ Age 4_________ Age 5_________ Medications Age 5 to date Inhaled Corticosteriods ____________________ Spacer Yes/ No Inhaled Salbutamol ______________________ Spacer Yes/ No Monteleukast Yes /No
Name
Hospital No
DOB
Address
Telephone
Y N
Y N
Y N
Y N
Y N
Y N
Y N
Y N

281
Number of courses of Oral steroid/year Age 5-7_________ Age 7+ _________ ISAAC Core questionnaire wheezing module for 6–7 year olds 1. Has your child ever had wheezing or whistling in the chest at any time in the past? Y/ N IF YOU ANSWERED "NO" PLEASE SKIP TO QUESTION 6 When was the first time? ______________ Age months 2. Has your child had wheezing or whistling in the chest in the last 12 months? Y/N IF YOU ANSWERED "NO" When was the last time your child had wheeze __________ Age months Continue to question 6 3. How many attacks of wheezing has your child had in the last 12 months? None [ ] 1 to 3 [ ] 4 to 12 [ ] More than 12 [ ] On average how many attacks does your child have per year? None [ ] 1 to 3 [ ] 4 to 12 [ ] More than 12 [ ] 4. In the last 12 months, how often, on average, has your child's sleep been disturbed due to wheezing? Never woken with wheezing [ ] Less than one night per week [ ] One or more nights per week [ ] 5. In the last 12 months, has wheezing ever been severe enough to limit your child's speech to only one or two words at a time between breaths? Y/N 6. Has your child ever had asthma? Y/ N Please Circle Doctor diagnosed Parent diagnosed 7. In the last 12 months, has your child's chest sounded wheezy during or after exercise? Y/N 8. In the last 12 months, has your child had a dry cough at night, apart from a cough associated with a cold or a chest infection? Y/N 9. Does your child wheeze only with colds multi trigger Atopic 10. Any hospital visits with wheeze?__________________Number If yes Age of last admission:_________ years Family History of Asthma yes/ No Who? Isaac Core questionnaire rhinitis module for 6–7 year olds 11. Has you child ever had a problem with sneezing, or a runny, or a blocked nose when he/she DID NOT have a cold or the flu? Y/N IF YOU ANSWERED "NO" PLEASE SKIP TO QUESTION 16

282
12. In the past 12 months, has your child had a problem with sneezing, or a runny, or a blocked nose when he/she DID NOT have a cold or the flu? Y/N IF YOU ANSWERED "NO" PLEASE SKIP TO QUESTION 16 13. In the past 12 months, has this nose problem been accompanied by itchy-watery eyes? Y/N 14. In which of the past 12 months did this nose problem occur? (please tick any which apply) January [ ] February [ ] March [ ] April [ ] May [ ] June [ ]July [ ] August [ ] September [ ] October [ ] November [ ] December [ ] 15. In the past 12 months, how much did this nose problem interfere with your child's daily activities? Not at all [ ] A little [ ] A moderate amount [ ] A lot [ ] 16. Has your child ever had hay fever? Y/N Core questionnaire eczema module for 6–7 year olds 17. Has your child ever had an itchy rash which was coming and going for at least 6 months? Y/N IF YOU ANSWERED "NO" PLEASE SKIP TO QUESTION 22 18. Has your child had this itchy rash at any time in the last 12 mths? Y/N IF YOU ANSWERED "NO" PLEASE SKIP TO QUESTION 22 19. Has this itchy rash at any time affected any of the following places: the folds of the elbows, behind the knees, in front of the ankles, under the buttocks, or around the neck, ears or eyes? Y/N 20. At what age did this itchy rash first occur? Under 2 years [ ] Age 2–4 [ ] Age 5 or more [ ] 21. Has this rash cleared completely at any time during the last 12 months? Y/N 22. In the last 12 months, how often, on average, has your child been kept awake at night by this itchy rash? Never in the last 12 months [ ] Less than one night per week [ ] One or more nights per week [ ] 22. Has your child ever had eczema? Y/N