CLirrent Economic Position and Prospects of Ecuador - World ...
422
Report No. 1382-EC FILE COPY CLirrent Economic Position and Prospects of Ecuador April 'I, 1977 Latin A/merica and Caribbean Region FOR OFFICIAL USE ONLY Document of the World Bank This document has a restri ted distribution and may be used by recipients only in i he performance ol their official Cluties Its c onlents may not otherw se he disclosed without World Bank authorization Public Disclosure Authorized Public Disclosure Authorized Public Disclosure Authorized Public Disclosure Authorized
-
Upload
khangminh22 -
Category
Documents
-
view
2 -
download
0
Transcript of CLirrent Economic Position and Prospects of Ecuador - World ...

Report No. 1382-EC FILE COPYCLirrent Economic Position andProspects of EcuadorApril 'I, 1977
Latin A/merica and Caribbean Region
FOR OFFICIAL USE ONLY
Document of the World Bank
This document has a restri ted distribution and may be used by recipientsonly in i he performance ol their official Cluties Its c onlents may nototherw se he disclosed without World Bank authorization
Pub
lic D
iscl
osur
e A
utho
rized
Pub
lic D
iscl
osur
e A
utho
rized
Pub
lic D
iscl
osur
e A
utho
rized
Pub
lic D
iscl
osur
e A
utho
rized
CURRENCY EQUIVALENTS
1 Sucre = uS$o.o4
1 US$ = 25 Sucre
Fiscal Year: January 1 to December 31

FOR OFFICIAL USE ONLY
Glossary of Ecuadorean Institutions (Abbreviations)
BNF Banco Nacional de Fomento
CEDEGE Comision de Estudios para el Desarrollo de la Cuenca delRio Guayas
CEPE Corporacion Estatal de Petroleo Ecuatoriana
CREA Centro de Reconversion Economica del Azuay, Caflar y Morona-Santiago
ENAC Empresa Nacional de Almacenamiento yComercializacionAgropecuarios
ENPROVIT Empresa Nacional de Productos Vitales
FONADE Fondo Nacional de Desarrof o
FONAPAR Fondo National de Participacion
INECEL Instituto Ecuatoriano de Electrificacion
INIAP Instituto Nacional de Investigaciones Agropecusrias
JUNAPLA Junta Nacional de Planificacion
MAG Ministerio de Agriculture y Ganaderia
MOP Ministerio de Obras Publicas
PREDESUR Programa de Desarrollo del Sur
This document has restricted distribution and may be used by recipients only in the performanceof their official duties. Its contents may not otherwise be disclosed without World Bank authorization.


TABLE OF CONTENTS
COUNTRY DATA Page No.
MAP
SUMMARY AND CONCLUSIONS ....................................... i - vii
Chapter I: RECENT ECONOMIC DEVELOPMENT ...................... 1
The Impact of Petroleum .. ............... .......... *. ISocial Development . ............................. .. ....... 3Investment and Savings ............................. 3Public Finances . ....................... .. ..................... . 4
Balance of Payments ......... 8
Chapter II: MAJOR SECTORAL ISSUES ........................... 11
Petroleum ........................ *.. .......... 11
Agriculture ........................................................... 15Industry ............................. *....... .. .. 20
Electric Power .......................................... ....... .... 21Transport ......................... 0........* *............. 23Education .................................. ...... 24
Housing and Urban Development ............... ............. 27
Chapter III: PUBLIC INVESTMENT PROGRAM AND DEVELOPMENTPROSPECTS .................................. 29
Growth and Petroleum Prospects ..... ...................... 29Public Sector Prospects ...... . ............................ 30
Public Investment Program ...... .......................... 32Balance of Payrnents and Creditworthiness ........ ......... 39
STATISTICAL APPENDIX
This economic report is based on the work of a mission that was in Ecuadorfrom August 15 to September 10, 1976 and on discussions of a first draft withthe Ecuadorean authorities in February 1977. The mission comprised GuyPfeffermann (Chief), Juan Giral (General Economist), Carmen Martinez (Invest-ment Analyst), Rangaswamy Vedavalli (Petroleum Economist), Nathan Koenig(Consultant, Agriculture), Eugenio Salazar (Consultant, Electric Power), JoseVeniard (Transport Specialist), Ruth McCrea (Research Assistant) and AmaliaKriegsman (Secretary). Michaela Rubin helped edit the report.
Three annexes complete the main volume: Annex I on agriculture, Annex IIon public investment projects and Annex III on population.

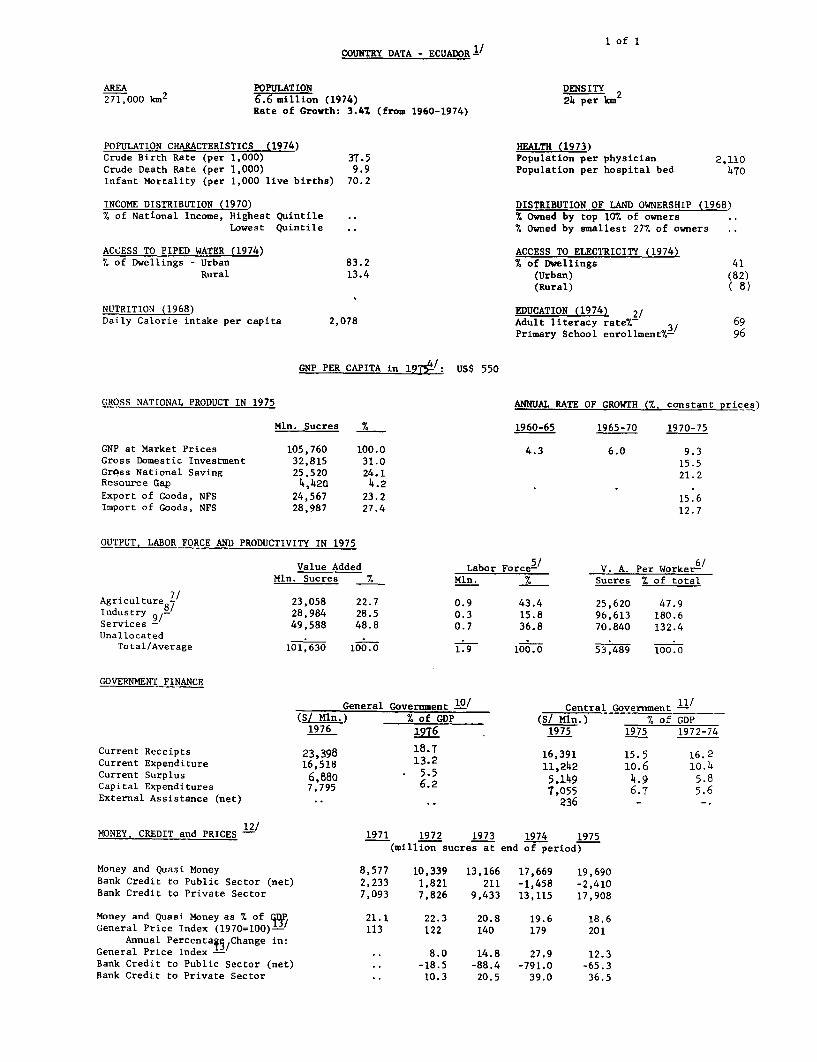
COUNTRY DATA -ECUADOR 1 of 1
AREA POPULATION DENSITY271,000 km2 6.6 million (1974) 24 per km
2
Rate of Growth: 3.4% (from 1960-1974)
POPULATION CHARACTERISTICS (1974) HEALTH (1973)Crude Birth Rate (per 1,000) 37.5 Population per physician 2,110Crude Death Rate (per 1,000) 9.9 Population per hospital bed 470Infant Mortality (per 1,000 live births) 70.2
INCOME DISTRIBUTION (1970) DISTRIBUTION OF LAND OWNERSHIP (1968)7. of National Income, Highest Quintile .Oeyp Owned by top 107o of owners
Lowest Quintile .. % Owned by smallest 277. of owners
ACCESS TO PIPED WATER (1974) ACCESS TO ELECIRICITY (1974)% of Dwellings - Urban 83.2 % of Dwellings 41
Rural 13.4 (Urban) (82)(Rural) C 8)
NUTRITION (1968) EDUCATION (1974) 2/Daily Calorie intake per capita 2,078 Adult literacy rate77 3/ 69
Primary School enrollment7%- 96
GNP PER CAPITA in 19 US!: us$ 550
GROSS NATIONAL PRODUCT IN 1975 ANNUAL RATE OF GROWTH (%. constant prices)
Mln. Sucres % 1960-65 1965-70 1970-75
GNP at Market Prices 105,760 100.0 4.3 6.0 9.3Gross Domestic Investment 32,815 31.0 15.5GrOss National Saving 25,520 24.1 21.2Resource Gap 4,420 4.2Export of Goods, NFS 24,567 23.2 15.6Import of Goods, NFS 28,987 27.4 12.7
OUT. LABOR FORCE AND PRODUCTIVITY IN 1975
Value Added Labor Force5/ V. A. Per Worker6/Mln. Sucres % Mln. % Sucres X of total
Agriculture 7/ 23,058 22.7 0.9 43.4 25,620 47.9Industry 87 28,984 28.5 0.3 15.8 96,613 180.6Services - 49,588 48.8 0.7 36.8 70.840 132.4Unallocated . , .__
Total/Average 101,630 100.0 1.9 100.0 53,489 100.0
GOVERNMENT FINANCE
General Government i0/ Central Government _(S/ Mln.) % of GDP (S/I Mln.) % of GDP1976 1976 1975 1975 1972-74
Current Receipts 23,398 18.7 16,391 15.5 16.2Current Expenditure 16,518 13.2 11,242 10.6 10.4Current Surplus 6,880 5.5 5,149 4.9 5.8Capital Expenditures 7,795 6.2 t,055 6.7 5.6External Assistance (net) .. 236 - -,
MONEY. CREDIT and PRICES - 1971 1972 1973 1974 1975(million sucres at end of period)
Money and Quasi Money 8,577 10,339 13,166 17,669 19,690Bank Credit to Public Sector (net) 2,233 1,821 211 -1,458 -2,410Bank Credit to Private Sector 7,093 7,826 9,433 13,115 17,908
Money and Quasi Money as % of qeji 21.1 22.3 20.8 19.6 18.6General Price Index (1970=100)- 113 122 140 179 201
Annual Percentais/Change in:General Price Index - .. 8.0 14.8 27.9 12.3Bank Credit to Public Sector (net) .. -18.5 -88.4 -791.0 -65.3Bank Credit to Private Sector .. 10.3 20.5 39.0 36.5

2 of 2
COUNTRY DATA - ECUADOR (CONT)
BALANCE OF PAYMENTS MERCHANDISE EXPORTS (AVERAGE 1972-76)
1974. 1975 1976 US $ Mln %
(Millions of US $) Bananas 135 15.3Coffee 90 10.2
Exports of Goods, NFS 1,235 1,073 1,362 Cocoa 45 5.1
Imports of Goods, NFS 1,043 1,192 1,277 Sugar 18 2.0
Resource Gap (deficit = -) 192 -119 85 Petroleum 484 54.9
Factor Payments (net) -183 -78 -T6 All Other Co dities 109 12.5
Net Transfers 18 29 21 Total 7FT lOO.O
Balance on Current Account 27 -168 30Direct Foreign Investment 77 41 20
Net MLT Borrowing -15 93 EXTERNAL DEBT, DECEMBER 31. 1975
Disbursements 65 142
Amortization 80 50 *. US $ Mln.
Capital Grants 14/ - - -
Other Capital (net) 23 -24 .. Public Debt, incl. Guaranteed 429.5
Increase in Reserves -112 58 -189 Non-Guaranteed Private Debt
(- increase) Total Outstanding & Disbursed 429.5
Gross Reserves (end year) 349.9 285.6 514.6
Net Reserves (end year) 339.4 245.5 435.0 15/
DEBT SERVICE RATIO for 1975
RATE OF EXCHANGE (OFFICIAL) x
Through - 1971 Public Debt, incl. guaranteed 4.TNon-Guaranteed Private Debt --
US $ 1.00 = S/ 25.00 Total Outstanding & Disbursed 4.7S/ 1.00 = US $0.04
IBRD/IDA LENDING (DECEMBER 31. 1975) (MILLION US$)
Since - 1971IBRD IDA
US $ 1.00 = S/ 25.00S/ 1.00 = US $0.04 Outstanding & Disbursed 43.0 28.4
Undisbursed 36.2 10.1Outstanding incl. Undisbursed 79.2 38.5
not availablenot applicable
1/ Data from National Institute of Statistics, or Ministry of Public Health, unless otherwise noted.
2/ From 1974 Population Census, persons 10 years old and over.
3/ Ministry of Education4/ World Bank AElas , 19765/ Total labor force figures from 1974 census; unemployed persons are allocated to the sector of their normal occupation.
6/ Very rough estimate, as value added figures are for 1975 while labor force figures are for 1974.
7/ Includes agriculture, livestock, forestry, fishing, and hunting.
8/ Includes manufacturing, mining, public utilities and construction.2/ Includes trade, transportation and public and private services.
10/ Includes Central Government, FONADE, FONAPAR and other special accounts.
11/ Includes Central Government, FONADE and FONAPAR.12/ IMF data.13/ GDP deflator.14/ SDR Allocation.15/ Ratio of debt service to exports of goods and non-factor services.

EICnen ~'~ Omgo QUIT
GALAPAGOS ISLAN/OS 7E0oan 73Do OrulE
P 4 0 I C(AI Rp e
AAt t .OPNOC Pa,ZtIOG ~ tttQt- .T, 01tI SCF tAR,E
'Orh~~~~~~~~~~~~~~~~~~~~~~~~~~~~~~~~~~~~~~~~~~~~~~~~~~~~~~~~~~~~~~9~
__~~~~~~~~~O
s D ROC~~~~~~~~~~~~~~~~~~~~~~~~~~~~~~~~tO ~ ~ ~ ~ 00t ,OOtM onons~~~~~~~~4
~~~~~~~~~~~~~~~~~~~~~~~~~~~~~~~I
'-a--~~~~~~~~~~~~~~~~~~~~~~~~~~~~~~~~~~~~~~m.
tOO G~~~~~ALIA ~ ~ ~ ~ ~ ~ ~ ~ ~ ~ ~ ~ ~ ~ ~ ~ ~ ~ ~ ~ ~ ~~~~
KLMER A ILOMA ZRA
COT Guaya.600 . 9'0' 7'0


SUMMARY AND CONCLUSIONS
General
i. The development performance of Ecuador since World War II has beengood. National accounts do not do full justice to the improvements andchanges that have transformed the quality of life during these decades,and to the further progress achieved since petroleum began to be exportedin 1972. The country's economy, which was quite undeveloped thirty years ago,has reached the stage where production is fairly diversified and where thestandard of living of the Andean population is somewhat higher than in neigh-boring countries owing mainly to better soil and climate. Of course, Ecuadorstill has a long way to go, and while petroleum exports of about US$75 perperson per year undoubtedly help, considerable domestic efforts as well asexternal assistance will continue to be needed to diversify exports and toimprove the quality and range of social services, particularly education. Butwith gradual improvements in public administration and rising petroleumrevenues, Ecuador's outlook is better than it was in the past. The Governmentintends to step up public investment in an effort to address some of the maineconomic and social problems of the country. The revenues from petroleumprovide the financial basis for an ambitious public investment program in twoways: in the form of export earnings and of public revenues that can be usedas counterpart to externally borrowed funds. The ability of the Government tofinance such an investment program depends largely on the rate of growth ofpetroleum production and exports. Perhaps the most critical focus of economicmanagement and development policy is the maintenance of a balance betweenpetroleum revenues on the one hand and the ability of the public sector tocarry out effective investment projects on the other. Until now this balancehas been maintained by and large, but the growth performance would undoubtedlysuffer should petroleum revenues cease to grow or should public investmentexceed the physical and administrative absorptive capacity of the economywhich remains limited.
ii. Petroleum policies will have a decisive influence on Ecuador'sgrowth prospects. The central problem is that conventional crude reservesare now being extracted faster than they are being replaced, owing to thevirtual absence of exploration and development activity. Unless sustainedinvestment in exploration and development is resumed, crude petroleum exportsare likely to fall after 1980. Owing to managerial, technical and financiallimitations, the State Petroleum Corporation (CEPE) cannot yet be expectedto undertake alone an investment program including substantial explorationand development on the one hand and various other projects on the other (suchas further refining capacity, a natural gas plant, a petro-chemical complexand various pipelines). Therefore cooperation between CEPE and foreignpetroleum enterprises under a workable arrangement is necessary to ensurecontinued expansion of petroleum production.

- ii -
iii. Domestic consumption of petroleum products has been rising at twicethe average rate for all Latin American countries, spurred on by retail priceswhich are among the lowest in the world. Premium gasoline is now being soldat less than US020/gallon at the pump. A very substantial increase in gaso-line prices is urgently needed to discourage wasteful consumption, and toprovide CEPE with a reasonable amount of savings.
iv. In order to avoid a drop in petroleum exports the Government intendsto stimulate investment in the sector. The allocation of public funds to CEPEis to be increased and investment by Texaco (CEPE's minority partner in themajor production area) is to be encouraged. Increased investment in explora-tion, development and transport could lead to an increase in production from65.9 million barrels in 1976 to around 85 million barrels in 1979. A sustainedinvestment program of about US$50 million per year would make it possible forthe Government to step up petroleum output further during the 1980's. Thecountry's in situ petroleum reserves are large enough to warrant such aninvestment.
Fiscal and Monetary Management
v. The fiscal situation of Ecuador has improved in two importantrespects during the past few years. First, the emergence of petroleum reve-nues has relaxed the public savings constraint that had in the past held backthe pace of progress in the public sector. Second, a significant number ofearmarked revenues have been consolidated, affording the Central Governmentbetter control over fiscal management. Perhaps the most important recentpolicy measure in the field of public finances has been the creation of FONADE(National Development Fund), which channels petroleum revenues into publicinvestment. While this might be considered another case of earmarking, thereis no doubt that the Fund is of utmost importance for what it achieves (thepossibility to finance priority investment projects) as well as for what itavoids (the allocation of petroleum revenues, which are non-renewable, togovernment consumption expenditure). Nevertheless problems of fiscal manage-ment have not been eliminated. For example, in 1975 when petroleum revenuesdeclined a serious problem had to be confronted, reflecting the public sector'sdependence on the level of petroleum production and the weakness of non-petroleum revenue collection. But a basis has now been laid for a moreambitious public investment effort, which did not exist in the past.
vi. The need to strengthen non-petroleum public revenues will becomemore acute as more public investment projects are prepared, and as the improv-ing absorptive capacity of public agencies makes it possible to carry more ofthem out. The Government is in a relatively fortunate position owing to theconsiderable scope that exists now for increasing non-petroleum revenues.Possible areas for action include income taxes (only 180,000 persons now payincome tax), real estate taxes, import duties, and a host of tax exemptionsmany of which are not clearly justified. Ample scope also exists for increas-ing prices of goods and services sold by publicly owned agencies, particularlyINECEL (electric power) and CEPE (petroleum products).

- iii -
vii. The fiscal problems of 1975 have now been resolved, and the remain-ing Central Government deficit is compatible with an improvement in thebalance of payments and a reduction of inflation. It is clear, however, thatthe present austerity policies will have to continue during the next few yearsin order (a) to maintain the Central Government deficit within reasonablelimits, (b) to maintain a sufficient public savings capacity to limit the needfor external borrowing once public investment acquires greater momentum, and*(c) to allow for an increasing flow of banking credit to the private sector.A 15 percent annual average rate of increase in current expenditures incurrent prices can be considered reasonable in the public sector. This rateis based on the assumption that the impact of inflation on public wages andsalaries is minimized, that other current expenditures are closely scrutinizedand that new additions to the Government's labor force are limited to aminimum consistent with development objectives and the public investmentprogram. A faster rate of increase could be reflected in a significantreduction in public savings. Even at 15 percent per year it is likely thatcurrent savings will decline in the early 1980s in the absence of new revenuemeasures. But the scope for new revenue measures is wide, as suggested inparagraph v above. Monetary management has traditionally been particularlyimportant in Ecuador. The Central Bank plays a decisive role in regulatingimports. Monetary management and import regulation have been fairly restric-tive since mid-1975. The main instruments used to this effect are the minimumreserve requirement on demand deposits of private banks, ceilings on creditsfor a wide range of purposes, and advance import deposit requirements.Furthermore, the import of private automobiles has been banned between mid-1975and early 1977. As a result of these measures and of the favorable exportgrowth, the international reserve position of Ecuador has improved sharplyduring 1976, and inflation has been cut down from a peak of about 23 percentin 1974 to about 11 percent in 1976.
Sectoral Issues
viii. Ecuador is among the few developing countries with enough fertile landto expand agricultural and livestock output at reasonable cost. Over the yearsagriculture has been the most important sector in employment, exports and out-put, but for much of the past decade production has lagged behind the rate ofgrowth of the population. This report suggests a package approach that couldlead to more dynamic growth. A package could comprise the following elements:
(a) a departure from the "crop-by-crop" system of technical assistanceto farmers and the creation of an extension service that wouldadvise farmers as farm operators;
(b) more emphasis on research in oilseeds, grain sorghum, fruits,vegetables, poultry and pulses, and a wider diffusion ofimprovements in livestock nutrition and health;

- iv -
(c) further expansion of medium and long-term agricultural credit not
only through the Banco Nacional de Fomento but also other insti-
tutional channels, and a diversification away from excessiveconcentration of credit on rice and cotton;
(d) a thorough independent study of agricultural subsidies, which
have been unnecessarily costly in the past and have neither
helped raise output nor contain inflation;
(e) investment and training to create a more effective agricultural
marketing system, particularly an expansion of private andpublic storage facilities;
(f) the continuation of the on-going feeder road construction programwith a view to increasing the all-weather feeder road networkby 3,000 km within the.next five years;
(g) the formulation of clear priorities for rural development and
the creation of a national program which might include the regionalinstitutions now active in this field as well as an effectivecentral office which would coordinate and allocate the material
and financial resources on a project-by-project basis.
These measures are complementary and mutually supportive. They can achieve
a broad improvement in the condition of the bulk of the population in a rela-
tively short time while serving national development objectives. Even a
slight absolute improvement in the living standards of the bulk of the rural
population would represent a substantial relative improvement for the persons
concerned.
ix. A recent World Bank report reviews the main issues relating to
industry. 1/ Ecuador's industrial development has been quite successful so
far, based on the expansion of small private firms in a great variety of
activities. As some of the main obstacles to development are gradually
removed (especially the shortage of medium and long-term credit and the
deficient physical infrastructure), continued rapid growth can be expected
without departing greatly from the successful historical pattern. The intro-
duction of large industrial projects involving substantial direct public
intervention might divert scarce physical, financial, technical and managerial
resources to the detriment of the economy, unless the economic and social
merits of such projects match those of private projects.
x. Ecuador is among the Latin American countries with the lowest elec-
tric power capacity per head, and demand is expected to grow rapidly in thenext ten years. Fortunately the country's hydroelectric potential is good.
The main issues relate to the financing of sector expansion and to the
capability of INECEL -- a public corporation recently put in charge of an
1/ "Industrial Development Problems and Prospects" (No. 1186-EC, October 7,
1976).

- v -
ambitious national power expansion program -- to plan and manage its oper-ations. A review of the national electrification investment program isadvisable, given the magnitude of the problems to be resolved prior to imple-mentation and the heavy impact which its financing may have on Ecuador'sfuture indebtedness. In addition to strengthening INECEL's capability to planand manage its own operations, the Government may consider whether it isrealistic to expect the utility to discharge the wide range of functionsallocated to it. The Government has adopted sound legislation on the pricingof electric power. It should now decide whether to continue subsidizing theuse of petroleum in electric power generation.
xi. The first priority in transport is to improve road maintenance toobviate the need for periodical reconstruction, and to improve the trunknetwork between major towns. Secondly, the national feeder road constructionprogram mentioned in paragraph (viii) above deserves the continued support ofthe Government. Thirdly, only ports and pipelines cover their expendituresout of revenues earned for the services provided. The extraordinarily lowprice of gasoline has encouraged road transport, and user charges do not coverthe costs of an adequate level of maintenance. Consequently, there is anurgent need on these grounds alone to raise the domestic price of petroleumderivates. The sharp decline in rail freight during the past decade is alsoassociated with the subsidization of road transport. Investment in railroadsis not warranted so long as this discrimination continues.
xii. Strengthening education and making it more responsive to the needsof an expanding economy are necessary conditions for further social andeconomic progress. A major effort is required to improve the quality ofprimary schools and to make full primary education available to all, parti-cularly in the rural areas. The on-going rural development program("nuclearizacion") is a step in the right direction. Another critical issueis the recent deterioration in the quality of higher education, as a result ofa relaxation of entrance requirements for secondary school leavers. Thispolicy will not contribute to alleviate the country's shortage of qualifiedcadres, nor will it improve the social and economic opportunities of thepoorer students, since very few of them have access to secondary school orindeed to complete primary education. What is needed is an increase in theshare of public resources allocated to primary and technical education ratherthan to the universities, which have absorbed a very large share of funds inthe past few years.
xiii. The housing shortage cannot be estimated precisely but a need forimprovement is clear. The greatest need is for water supply in the ruralareas and in the suburbs of Guayaquil. The situation in Quito also requiresinvestment. At the moment the slum families are spending more for waterbought from trucks than the more affluent families pay for piped water. Evenif full operating and maintenance costs were charged for public water supplythe poorer residents would pay less than they do now. The Ecuadorean HousingBank has introduced some imaginative policies to help low income familiesacquire houses, but its scope is very small. Experiments with self-helphousing have not been successful in Ecuador, and an expansion of credit for

- vi -
cheap conventional housing possibly coupled with "sites and services" invest-
ment may be the most promising way to reduce the housing shortage.
Public Investment
xiv. Project preparation has improved in the public sector, but weak
project preparation, which has traditionally been one of the major obstacles
to social and economic development in Ecuador, remains a major problem. Much
remains to be done to improve project preparation, particularly in agriculture
and rural development, education, health and public industries. Such improve-
ment is essential when public investment projects are to be submitted to
external financing agencies. One of the most serious new problems confronting
the Government of Ecuador is the need to set out priorities among competing
agencies and investment projects. In the past, the small number of projects
under preparation attenuated the need for planning in this respect. In the
future this need will increase as more projects are prepared, owing partly to
the activities of FONAPRE, and as petroleum revenues cease to grow at a fast
rate.
xv. This report includes a public investment program which would meet
the priority needs of the country without intolerably straining the physical
and financial capacity of the public sector. In all likelihood such a program
would be consistent with continued rapid growth without undue pressure on
prices or on the external debt servicing capacity, especially as many of the
investment projects will take longer to be carried out than is projected by
the Government because of probable delays. Investment in petroleum aims at
increasing production to 260,000 barrels/day by 1979. As mentioned earlier,
this will require financial and technical involvement on the part of foreign
petroleum enterprises. The program also includes a natural gas plant and some
pipelines. The electric program of the Government includes the completion of
the Pisayambo hydro-electric plant, the completion of the larger Paute hydro-
electric plant, thermal units for Guayaquil, Quito and Santo Domingo, the
ancillary transmission investment, and a rural electrification program. Work
is also expected to begin on the Toachi dam in the 1980s. The Government's
industrial program includes a fertilizer plant feeding on the natural gas
deposits of the Gulf of Guayaquil, an African palm oil refinery, investment in
cement plants and several industrial parks. In transport, the program includes
highway construction and investment in ports and small airports. An ambitious
hospital construction program is included in the program but is stretched out
over five years rather than two years contemplated by the Ministry of Public
Health. A large number of agricultural investments are included in the
program, but a number of rural development and irrigation projects which seem
to duplicate other proposed projects are left out. The large Daule-Peripa
Project has been replaced by smaller rural development and irrigation projects
in the same area. A rural telecommunications project and a rural education
project are also included in the program. Further projects are listed in
Annex II but are not included in the public investment program for 1977-81
because the thorough studies that are called for are likely to move most of
these projects beyond 1981. These projects include a steel mill based on

- vii -
imported pellets and natural gas from the Gulf of Guayaquil, an automotiveindustry foreseen by agreements with other Andean Group member countries, twonew airports at Quito and Guayaquil, and a petro-chemical complex to be fed byadditional petroleum production.
xvi. The total cost of the public investment program, including financ-ial investment, is in the order of US$4.3 billion over the five-year period1977-1981 (commitments). The annual expenditure on public investment would befairly even over the years, and would average about US$650 million per year at1976 prices, or over US$800 million in current prices. The program involvescommitments from external sources in the order of US$2.8 billion over thefive-year period. The domestic savings required to carry out the programshould pose no problem so long as petroleum output rises.
Balance of Payments and Creditworthiness
xvii. The balance of payments problems of Ecuador hinge essentially onpetroleum policies discussed in the sectoral chapter and on the pace ofexecution of the public investment program. Traditional exports (bananas,coffee and cocoa) are not expected to rise much in the future, and otherexports (fish, manufactures, tourism, etc.), even though quite dynamic, aretoo small to make much difference before the 1980s. The current accountbalance of payments deficit can be expected to widen significantly towardsthe end of the decade unless sufficient petroleum development and explorationinvestment is begun soon. Even if the petroleum expansion program goesforward, the current account deficit can be expected to widen from US$36million (1972-76 average) to about US$216 million by 1981. Gross externalborrowing in the order of US$290 million per year will be required. Theincrease in debt service that would result from external borrowing a scaleshould not pose serious problems. Ecuador's debt service ratio is low (4.7%in 1975 and 6.8% in 1976) and may increase to about 12.3% by 1981 if theexternal financing required to carry out the public investment program wereobtained. This is a tolerable level, so long as the bulk of external creditsis used for productive projects with relatively short gestation periods. Onbalance, the development prospects of Ecuador are favorable so long as asubstantial petroleum development and exploration program goes ahead as soonas possible.


Chapter I. RECENT ECONOMIC DEVELOPMENTS
The Impact of Petroleum
1. Before petroleum became the major export item in 1973, Ecuador'sGDP growth was led by agricultural production for exports, mainly cocoa,
coffee and bananas. The average annual GDP growth rate was 5.5% from 1960
to 1972. The terms of trade deteriorated sharply during this period, mainly
because of steadily declining world prices for bananas. Toward the end of
that period heavy investment in petroleum began to yield output and the
economy gained a new impetus as a result. The following sections trace some
of the effects of petroleum on the economy, particularly on growth, public
finances and the balance of payments.
2. Petroleum exports started in 1972 and by the end of 1973 a substan-
tial volume (53.6 million barrels) was being exported; the increase in world
prices for petroleum in 1973 and 1974 further strengthened Ecuador's export
performance and terms of trade turned sharply in favor of that country.
Petroleum exports have influenced the growth of GDP, government revenues and
foreign exchange earnings decisively, and have enabled Ecuador to break two
major constraints that had held back more rapid development in the past: low
domestic savings and the limited import capacity. These had required frequent
emergency economic measures in the past.
3. The real rate of GDP growth averaged nearly 9% between 1972 and
1976. Petroleum accounted for 13% of GDP and over one-half of total exportearnings in 1975. The following model is an attempt to show the impact of
petroleum on the economy. The table below is based on the relationship
between import capacity and GDP and compares the actual 1972-75 trends with
the hypothetical trends that would have prevailed in the absence of petroleum
exports. Even in 1972, the first year when petroleum was exported, GDP
would have been smaller by 12% in the absence of petroleum exports; by 1975GDP would have been 38% below the actual value, about US$300 per capita
rather than about US$500.

- 2 -
THE ECONOMY WITHOUT PETROLEUM
(in millions of 1970 sucres)
1972 1973 1974 1975
A. Actual Economy (including petroleum)
GDP 37,986 44,944 51,036 53,719Real Purchasing Power of Exports
(including petroleum) 6,330 9,271 14,179 11,242Imports 6,559 7,322 11,323 12,108
B. "No Petroleum" Economy
GDP Estimates 33,783 35,381 39,987 33,400Real Purchasing Power of
Non-Petroleum Exports 6,247 4,864 3,781 3,740Import Estimates 5,465 5,241 5,871 6,220
C. Ratios A/B
GDP 1.124 1.270 1.276 1.608Real Purchasing Power of Exports 1.013 1.906 3.750 3.006Imports 1.200 1.397 1.929 1.947
Source: Mission estimate
4. The petroleum boom quickened the pace of development in most sectorsof the economy, notably industry, commerce, transport and power (these sectorsare reviewed in Chapter II). Agriculture, which remains the single largestcontributing sector to GDP and the country's largest employer, has not bene-fited as much as other sectors from the new petroleum revenues (see Chapter IIand Annex I). Petroleum production reached a peak in 1973 and declined in1974 and 1975, but growth resumed in 1976.
5. The rapid expansion of aggregate demand was accompanied by infla-tionary pressures, particularly in 1974 when imported inflation was at itsstrongest in recent years. Inelastic domestic supply of many food items(wheat, vegetable oils) compounded the pressures. The consumer price indexrose from an annual rate of 9% in 1971 and 8% in 1972 to 13% in 1973, 23% in1974, and slowed down to 14.5% in 1975 and 10.6% in 1976.

-3-
Social Development
6. There are so few statistics on social development and income dis-tribution and employment in Ecuador that discussion of these issues can onlybe limited. However, social progress over the last decade is apparent froma number of indicators. Urban surveys registered an open unemployment rateof 5.5% in 1968 and 5.3% in 1975, which, if accurate, would be low comparedwith other Latin American countries. Health facilities have been growing, andgeneral and infant mortality rates have declined, even though malnutritionstill exists in part of the Coastal areas and of the Sierra. Housing con-ditions have improved with the construction boom. More homes are connected toelectricity services, water supply and sewerage. Petroleum revenues alsoallowed the Government to give substantial financial support to the educa-tional system, and teacher employment increased. School enrollment, however,grew even faster and the student/teacher ratio worsened, particularly in theuniversities. The population has increased at a rapid rate. The Costa hasbecome the most populous region, owing largely to migration from poorer areasin the Sierra, while the Quito area has also attracted a large number ofmigrants. Fertility levels are high and although regional and rural-urbanfertility differentials do exist, the fertility of urban areas is stillquite high. An analysis of population growth and composition, fertility,mortality, family formation and migration, family planning and populationprojections is presented in Annex III. The Annex is based on imperfect dataand its major conclusion--the rapid rate of growth of population--is subjectto the uncertainty of the data base, an assessment of which lies beyond thescope of this report.
Investment and Savings
7. Private and public investment as well as the country's savingscapacity have expanded considerably since 1970, even though the nationalaccounts may exaggerate the share of investment in GDP. External capitalinflows for petroleum investment in the early 1970s, and later the expansionof the savings capacity, were undoubtedly associated with a rising investment/GDP ratio. Investment in construction, industrial machinery and transportequipment rose considerably. Private investment was stimulated by strongdemand pressures, increased access to credit and high profit margins. Grossnational savings financed a rising share of total investment as petroleumrevenues increased (see tables below).

- 4 -
GROSS DOMESTIC INVESTMENT AND GDP /1
(ratios)
1970 1971 1972 1973 1974 1975
Gross domestic fixed investment/GDP .17 .24 .21 .19 .22 .28Private fixed investment/GDP .12 .18 .16 .13 .16 .19Public fixed investment/GDP .05 .06 .05 .06 .06 .09Public fixed investment/Gross
domestic fixed investment .31 .26 .24 .33 .28 .31Changes in stocks/GDP .04 .03 .02 .05 .03 .03
/1 Current prices.
Source: Central Bank of Ecuador and mission estimates.
FINANCING OF INVESTMENT
(in percentages)
1970 1971 1972 1973 1974 1975
Gross National Savings 64 66 80 97 101 85
Net Capital Inflows 36 34 20 3 -1 15
Source: Central Bank of Ecuador
Public Finances
8. The increase in the rate of growth of public investment in recentyears directly reflects the emergence of petroleum revenues as a major sourceof public sector financing. Until 1971 public sector revenues and savingswere low and social and economic infrastructure lagged behind needs. Thefiscal burden of the General Government amounted to only 12% of GDP. Periodicrevisions of the tax system were undertaken to raise additional revenues andmaintain equilibrium in the fiscal accounts in the face of rising currentexpenditures. Petroleum exports and the increase in petroleum prices improvedpublic sector finances substantially after 1972. The induced expansion of

- 5 -
economic activities also resulted in higher yields from non-petroleum taxes.The fiscal burden of the General Government reached 18.1% in 1975 (see Table5.7, Statistical Appendix).
9. Between 1971 and 1974 current expenditures doubled and investmentexpenditures tripled in current terms. Public sector deposits in the bankingsystem went up, whereas net credit to the public sector and foreign indebted-ness was reduced as revenues outpaced expenditures. At the same time, risingpublic expenditures fed inflation. In the second half of 1974, a decline inpetroleum production slowed down the flow of government revenues and in 1975a more cautious expenditure policy was pursued. This policy also helpedreduce demand pressures and slowed down the rate of inflation. While centralgovernment expenditures grew at a much lower rate in 1975 and 1976, they stillgrew faster than revenues, and the total budget including FONADE and FONAPARmoved from a surplus to a deficit position of 7% and 8% of current revenuesin these two years.
10. In the past, revenues were earmarked for special agencies andaccounts, where at times they lay idle. This made it difficult to managepublic sector finances properly. The creation in 1971 of the NationalParticipation Fund (FONAPAR) helped rationalize the allocation of fiscalrevenues among provincial councils, municipalities and other public sectorentities. To gain more control over expenditures, tax resources were alsoreallocated between the Central Government and the public agencies. In 1974the National Development Fund (FONADE) was established to channel petroleumtax revenues into development projects, concentrating on fixed and financialinvestments. 1/ The recent establishment of a unified account for the CentralGovernment budget and the extrabudgetary special accounts will help avoid someof the difficulties associated with the earmarking of funds at the CentralGovernment level.
11. At present government finances are administered through the CentralGovernment budget; extrabudgetary accounts, including the Armed Forces; FONADE,and FONAPAR. Together they are here referred to as "General Government".
12. Total current revenues of the General Government grew at 35.7% peryear between 1970 and 1975, increasing their share in GDP from 12% to around18%; buoyancy of total revenues to GDP was 1.71. 2/ The importance of petro-leum in the performance of the fiscal accounts becomes evident when onecompares it with non-petroleum revenues and their buoyancy to non-petroleumGDP of .98 for the same period.
1/ FONADE's share of income taxes on petroleum was 47.7% in 1976. A break-down of its expenditures is presented in Table 5.6 of the StatisticalAppendix.
2/ Excludes petroleum revenues allocated to INECEL and CEPE (see Table 5.7,Statistical Appendix).

- 6 -
13. Nevertheless, the Central Government budget depends on non-petroleumtaxes for about 79% of its revenues. Customs duties, income taxes and salestaxes are the main sources, and together they had a .86 buoyancy to non-petroleum GDP for the period 1970-75. While sales taxes and customs dutieshave responded well, income taxes have lagged behind total GDP but have keptslightly ahead of non-petroleum GDP. Tax exemption have been partly respon-sible for reducing the dynamism of these taxes. Over the past few years,non-petroleum export taxes have not been dynamic because of the sluggishperformance of traditional exports. There is a need to improve the buoyancyof non-petroleum taxes.
14. Total Central Government expenditures amounted to about S/ 17.5billion or 16.5% of GDP by 1975. 1/ In 1976 these expenditures are estimatedat S/ 21.4 billion. Current expenditures of the Central Government budgetrose at an annual rate of 28.8% between 1971 and 1975 and the real rate ofexpansion is estimated at about 11% per year partly reflecting more publicemployment. A July 1975 Census registered 110,000 employees for the CentralGovernment as compared to 55,000 and 61,000 in tabulations of the Ministry ofFinance for 1971 and 1972. 2/ Capital expenditures (excluding amortization)in the budget grew at an annual rate of 14.9% from 1971 to 1975, reaching alevel of S/ 2.4 billion. These expenditures were mainly for fixed investment.A substantial proportion was for highway construction by the Ministry ofPublic Works.
15. While consolidated figures of the public sector savings and invest-ment performance are not reliable, the accounts of the Central Government aremore accurate. The Central Government provided the main source of domesticfinancing for public investment in the period 1971-75. Central Governmentsavings (including FONADE and FONAPAR) rose from 2% of current revenues in1970 to 39% by 1974, allowing for a high fraction of investment to be financedout of current savings. 3/ Although savings declined following the 1975 fallin petroleum revenues, they were still at a level of around 30% in 1976.
16. Fixed public investment in the early seventies was highly concen-trated in highways (about 40%). Other sectors followed at a distance: energy(5%), water and sewerage (about 8%), and agriculture and irrigation (9%).Health and education investment were low (4% and 5.7% respectively). (SeeTable 5.11, Statistical Appendix.) More recently public investment in elec-tric power and petroleum have gained in importance. By 1975 electric power
1/ Excluding extrabudgetary accounts that cover a group of earmarked fundshandled by the Treasury. Sources of revenues are taxes, transfers fromFONAPAR, Central Government budget, etc. Only S/ 1.7 billion are fi-nanced out of taxes and services provided.
2/ Although the figures do not have the same coverage they are a roughindication of the increase in Central Government employment.
3/ In 1973 and 1974 current savings exceeded capital expenditures.

represented about 14% of public fixed investment, petroleum 18% and agri-culture 19%, while transport investment was reduced to 27%. 1/ The shift inthe pattern of public investment reflects to a large extent the earmarking ofpetroleum royalties and heavy FONADE support for investment in petroleum(mainly the Esmeraldas oil refinery).
17. By 1975, public fixed investment reached S/ 9,013 million (US$360million), 3.5 times the current 1971 level. In 1976 a further increase toS/ 11.5 billion (US$460 million) is estimated. Together with the surge inprivate construction activity, public investment has put pressure on theproductive capacity, particularly in cement and iron. Imports of theseproducts have increased sharply.
18. Petroleum Taxes. Petroleum taxation was modified at the end of1975. 2/ The new system is in line with the practice in most OPEC countriesof applying royalty and income taxes on petroleum. The changes brought theroyalties to a level of 17% on total production 3/ and the income tax to 71.4%of taxable profits. 4/ Royalty revenues distribution among INECEL, the ArmedForces and Esmeraldas Province stayed the same. 5/ Taxes on exports of theEcuadorean State Petroleum Corporation (CEPE) remained the same. The mainrecipients of the estimated revenues for 1976 from petroleum taxes and CEPE'sshare from exports are the Central Government (26.3%), FONADE (32.8%), theArmed Forces (10.8%), INECEL (10.3%), CEPE (7.8%) and special accounts of theCentral Government (6.2%). (See Table 8.1, Statistical Appendix.)
19. On balance, fiscal management, which had been expansionary in 1973and 1974 in the wake of booming petroleum revenues, has been prudent in 1975and 1976, in line with the decline in petroleum exports since mid-1974 and theanti-inflation policy of the Government. Real expenditures rose appreciablyover the two-year period, particularly in education, health and defense, butthe main fiscal problem lies not so much with an increase in expenditure aswith the low level of non-petroleum public revenues.
1/ This reduction in relative terms does not reflect a reduction inabsolute terms.
2/ Decree No. 982, Official Registry No. 945, December 4, 1975.Decree No. 151, Official Registry No. 43, Mlarch 12, 1976.
3/ Based on .85 of the reference price minus production and transport costsfor the Consortium, and the selling price minus export tax and transportcost through the pipeline for CEPE.
4/ Total revenue from exports and domestic consumption minus production andtransport costs; royalty payments and some minor taxes.
5/ 47%, 50% and 3% respectively.

-8-
Balance of Payments
20. The impact of petroleum revenues on the balance of payments has, ofcourse, been particularly dramatic. In the late 1960's the combination ofrising imports, notably for expanded public expenditure and for investment inpetroleum, and of stagnating traditional exports resulted in a widening cur-rent account deficit. By 1971 net international reserves amounted to onlyone month's imports, in spite of high direct investment in petroleum and in-creased external borrowing. Even though the value of imports doubled in 1974(reflecting a 60% real increase and a 28% increase in import prices) netinternational reserves increased to nearly US$340 million at the end of thatyear, reflecting the dramatic increase in petroleum export earnings. The risein imports was related to: (a) international inflation; (b) rising domesticdemand for agricultural products in the face of inelastic supply; (c) steppedup economic activity reflected in rising demand for imported capital goods andintermediate goods; and (d) a reduction in customs duties in April 1974. Thestructure of imports (net of petroleum derivates) changed during the past fewyears. Capital goods imports increased their share from 39% of imports in1970 to 47% in 1975 (see Table 3.5, Statistical Appendix).
21. Despite the sharp rise in import prices the terms of trade becamevery favorable to Ecuador from 1973 onward as a result, mainly, of higherpetroleum prices (see table below).
IMPORTS AND GROSS DOMESTIC PRODUCT
(in millions of sucres)
1970 1971 1972 1973 1974 1975
Imports of goods (current prices) 4,788 /1 7,670 7,105 9,938 20,345 25,148 /2
GDP (current prices) 33,970 40,569 46,405 63,141 90,152 105,760Ratio M/GDP .141 .189 .153 .157 .226 .238
Imports of goods (constant1970 prices) 4,788 5,550 4,829 5,895 9,351 10,593 /3
GDP (constant 1970 prices) 33,970 35,926 38,039 43,701 46,187 49,537Ratio at constant prices M/GDP .141 .154 .127 .135 .202 .214
Terms of Trade Adjustment (1970=100) - -829 -1,134 +380 +4,251 +5,511
/1 Exchange rate used S/. 19.18 = 1 dollar./2 Exchange rate used S/. 25.50 = I dollar./3 Preliminary figure.
Source: Central Bank and mission estimate.

- 9 -
22. Until recently foreign investment was low. 1/ Petroleum explorationand production since the late 1960s has brought substantial new investment toEcuador. By 1973 the stock of foreign direct investment reached US$571million of which 60% was in petroleum. Some increases were also registered inindustry and commerce. As a result, profits on foreign investment startedto rise from the US$12 million annual average for 1966-70 to US$128 millionannual average for 1972-74, owing mainly to petroleum investment. Profitremittances abroad also increased (see Table 3.8, Statistical Appendix).Ecuador remains one of the countries with the least foreign investment inLatin America, with the exception of petroleum.
23. Starting in late 1974 petroleum production declined for reasonsmentioned in paragraph 26 below, showing that increased dependence on petro-leum has not obviated occasional short-term management problems. A substantialcutback in imports became necessary, and the Government took the followingmeasures.
(i) the minimum reserve requirement on demand deposits ofprivate banks was increased gradually to 35%, effectiveJanuary 1, 1975;
(ii) credit ceilings were frozen at the level reached onMay 31, 1975; except for some production credits and forimports of raw materials intermediate products and capitalgoods for industry and agriculture; 2/
(iii) advance import deposit requirements were reintroduced;
(iv) private automobile imports were banned by Monetary BoardResolution No. 774;
(v) import items on List I and List II were reclassified; 3/a 20% duty surcharge was imposed on category "B" goods,and a 30% duty surcharge was imposed on all List IIimports.
1/ The total stock of foreign investment totalled US$103 million in 1966.
2/ As of December 31, 1975 the credit ceiling stood at S/ 6,232 million,approximately 50% of the private banks' amount of credit outstanding tothe private sector.
3/ List I has two categories: "A" - essential goods, "B" semi-essentialgoods. List II includes non-essential and luxury goods.

- 10 -
24. Despite these measures the current account of the balance of pay-ments was negative in 1975 and international reserves declined. However,the package of measures listed above, the prudent fiscal policies that accom-panied them, as well as a significant reduction in international inflationresulted in a slow-down in imports during the second half of 1975 and averteda larger decline in international reserves. 1/ During 1976 the balance ofpayments improved. Net international assets increased by US$189 million byDecember 31.
25. In sum, while the rise in petroleum exports undoubtedly benefitedthe development of Ecuador, it has not obviated the need for skillfull short-term macro-economic management. The Ecuadorean authorities have been fairlysuccessful in adjusting to short-term export shortfalls through a combinationof direct import restrictions, monetary measures and prudent fiscal manage-ment. The authorities have also been prudent in their external borrowingpolicies. The debt service ratio reached 7.6% in 1974, 4.7% in 1975 and 6.8%in 1976. The low level reflects moderate external borrowing and the rapidrise in exports.
1/ A net gain of US$54.7 million was registered from August to December1975.
- 11 -
Chapter II. MAJOR SECTORAL ISSUES
Petroleum
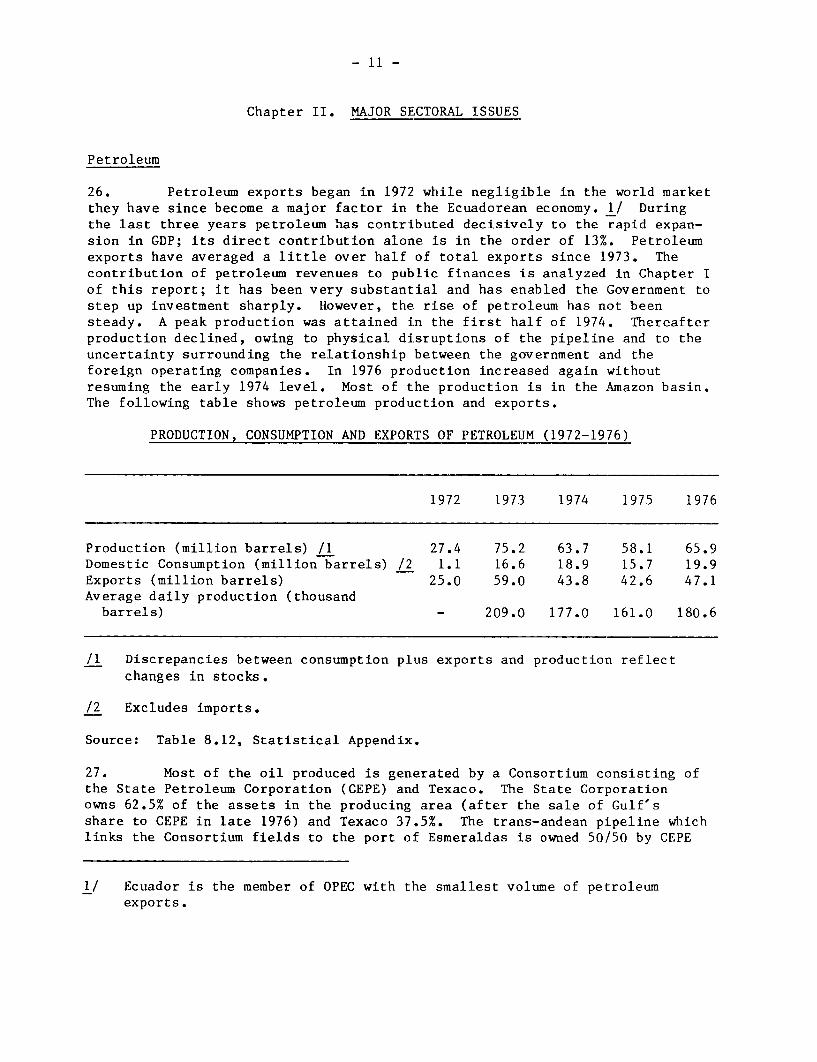
26. Petroleum exports began in 1972 while negligible in the world marketthey have since become a major factor in the Ecuadorean economy. 1/ Duringthe last three years petroleum has contributed decisively to the rapid expan-sion in GDP; its direct contribution alone is in the order of 13%. Petroleumexports have averaged a little over half of total exports since 1973. Thecontribution of petroleum revenues to public finances is analyzed in Chapter Iof this report; it has been very substantial and has enabled the Government tostep up investment sharply. However, the rise of petroleum has not beensteady. A peak production was attained in the first half of 1974. Thereafterproduction declined, owing to physical disruptions of the pipeline and to theuncertainty surrounding the relationship between the government and theforeign operating companies. In 1976 production increased again withoutresuming the early 1974 level. Most of the production is in the Amazon basin.The following table shows petroleum production and exports.
PRODUCTION, CONSUMPTION AND EXPORTS OF PETROLEUM (1972-1976)
1972 1973 1974 1975 1976
Production (million barrels) /1 27.4 75.2 63.7 58.1 65.9Domestic Consumption (million barrels) /2 1.1 16.6 18.9 15.7 19.9Exports (million barrels) 25.0 59.0 43.8 42.6 47.1Average daily production (thousand
barrels) - 209.0 177.0 161.0 180.6
/1 Discrepancies between consumption plus exports and production reflectchanges in stocks.
/2 Excludes imports.
Source: Table 8.12, Statistical Appendix.
27. Most of the oil produced is generated by a Consortium consisting ofthe State Petroleum Corporation (CEPE) and Texaco. The State Corporationowns 62.5% of the assets in the producing area (after the sale of Gulf'sshare to CEPE in late 1976) and Texaco 37.5%. The trans-andean pipeline whichlinks the Consortium fields to the port of Esmeraldas is owned 50/50 by CEPE
1/ Ecuador is the member of OPEC with the smallest volume of petroleumexports.

- 12 -
and Texaco. The pipeline has a capacity of 250,000 barrels/day and could beexpanded to a maximum capacity of 400,000 barrels/day. The Government is alsocontemplating exports of petroleum by river to the Atlantic.
28. Ecuador has substantial proven reserves of petroleum. At thepresent state of technology the ultimate recoverable oil reserves in situ areestimated to be in the order of 5.3 billion barrels. This includes about1.5 billion barrels of proved reserves lying in the Consortium area as wellas probable reserves requiring further exploration.
29. Exploration has come to a virtual standstill, as evidenced bythe falling number of exploration wells completed: 1970 (20), 1971 (17), 1972(20), 1973 (9), 1974 (6), 1975 (3), 1976 (1). It would take some US$375 - 400million in additional investment over five to seven years to increase provedreserves from two to about three billion barrels. This is required if theproduction level is to be increased to 350,000 or 400,000 barrels/day (about115 - 130 million barrels/year) in the 1980's and sustained at that levelwithout decline in the reserve/production ratio. Such an investment programwould mainly include further development drilling, additional productionfacilities, secondary recovery facilities, the connection of new oil fields tothe production facilities and the expansion of the throughput capacity of thepipeline; unless undertaken, the decline rate of output may be sharp in theearly 1980s.
30. CEPE has assumed a broad range of responsibilities in production,transport, refining, distribution, etc., and is yet to be equipped withsufficient technical, managerial and financial capabilities to undertake onits own an ambitious exploration and development program. The Government isaware of the need to stimulate investment in petroleum. It's policy is tostrengthen the financial capacity of CEPE by allocating additional investmentresources to the corporation. CEPE plans to step up exploration and develop-ment investment during 1977. At the same time private investment will beencouraged.
31. As a result of this investment effort petroleum production shouldgradually increase without decline in the reserve/production ratio, which is alittle under 20 years. If the effort begins in 1977 production could beexpected to reach 250,000 barrels/day sometime during 1978 and to average260,000 barrels/day in 1979, including some 10,000 barrels/day shipped to theAtlantic by river. Further expansion of petroleum output would require theexpansion of the throughput capacity of the trans-andean pipeline and/or thedevelopment of fields outside the Consortium area. Ecuador's in situ reserveswarrant an expansion of production, should the Government wish to step uppetroleum exports. But it might be unrealistic to expect petroleum productionto reach 350,000 to 400,000 barrels/day before the mid-1980's.
32. The trend in domestic consumption of petroleum products plays acentral part in shaping the sectoral potential. The increase in domesticconsumption has been sharper in Ecuador than in most other Latin Americancountries (12.1% per year during 1970-75, compared to about 6% for Latin

- 13 -
America). There is no doubt that this trend is related to the heavy subsidi-
zation of petroleum products in Ecuador. The following table shows recent
retail prices in US cents per gallon 1/ for a range of common petroleum
products in selected countries:
COMPARATIVE PETROLEUM PRODUCT PRICES
(USe/gallon)
Ecuador Peru Venezuela Mexico Colombia
Premium gasoline 18.6 121.0 31.0 61.7 18.5
Regular gasoline 16.4 76.0 - 43.1 -
Diesel 14.2 10.9 - 9.8 -
Kerosene 10.4 11.3 - - -
Residual fuel 8.56 10.0 - 5.3 -
Ecuadorean prices are among the lowest in the world and entail an implicit
subsidy estimated at US$440 million during the 1972-75 period. The subsidy
involves a squeeze on revenues for producers of petroleum and petroleum
products for the domestic market.
33. Continued underpricing of petroleum products will erode export
earnings to the extent that domestic consumption is allowed to continue grow-
ing unreasonably fast. The value of continued subsidies at the present level
will be at least US$250 million per year by 1980 at 1976 prices. 2/ Given the
lack of large and dynamic non-petroleum exports, the country would pay a very
heavy price for continued subsidies in slower growth and lower government
revenues. The Government has been studying a revision of petroleum subsidies,
but no decision has been taken yet to increase prices. The main directbeneficiary of present prices is the transport sector, which "absorbs" 70% of
subsidies, followed by industry (23%), commerce (4%) and-home consumption
(3%). 3/
1/ Gallons are often 3.75 liters in Ecuador rather than 3.785; the difference
does not alter the conclusion that petroleum products are extremely under-
priced.
2/ Based on difference between domestic sales at present prices (US$1.48/
barrel) and domestic sales reflecting world prices for petroleum.
3/ No study exists of the ultimate incidence of the subsidy; given the fact
that the trucking and busing industry is fairly competitive in Ecuador,
it may be presumed that the main beneficiaries are the ultimate users
of transport services and the producers of transported commodities.
- 14 -
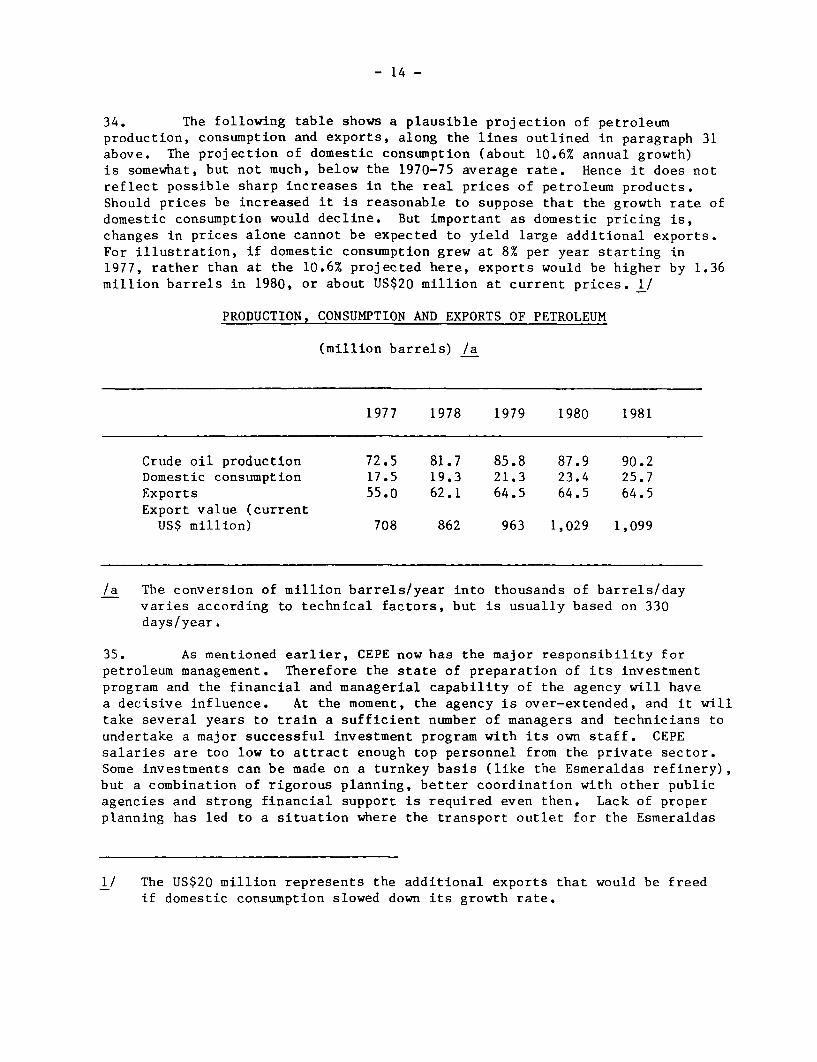
34. The following table shows a plausible projection of petroleumproduction, consumption and exports, along the lines outlined in paragraph 31above. The projection of domestic consumption (about 10.6% annual growth)is somewhat, but not much, below the 1970-75 average rate. Hence it does notreflect possible sharp increases in the real prices of petroleum products.Should prices be increased it is reasonable to suppose that the growth rate ofdomestic consumption would decline. But important as domestic pricing is,changes in prices alone cannot be expected to yield large additional exports.For illustration, if domestic consumption grew at 8% per year starting in1977, rather than at the 10.6% projected here, exports would be higher by 1.36million barrels in 1980, or about US$20 million at current prices. 1/
PRODUCTION, CONSUMPTION AND EXPORTS OF PETROLEUM
(million barrels) /a
1977 1978 1979 1980 1981
Crude oil production 72.5 81.7 85.8 87.9 90.2Domestic consumption 17.5 19.3 21.3 23.4 25.7Exports 55.0 62.1 64.5 64.5 64.5Export value (current
US$ million) 708 862 963 1,029 1,099
/a The conversion of million barrels/year into thousands of barrels/dayvaries according to technical factors, but is usually based on 330days/year.
35. As mentioned earlier, CEPE now has the major responsibility forpetroleum management. Therefore the state of preparation of its investmentprogram and the financial and managerial capability of the agency will havea decisive influence. At the moment, the agency is over-extended, and it willtake several years to train a sufficient number of managers and technicians toundertake a major successful investment program with its own staff. CEPEsalaries are too low to attract enough top personnel from the private sector.Some investments can be made on a turnkey basis (like the Esmeraldas refinery),but a combination of rigorous planning, better coordination with other publicagencies and strong financial support is required even then. Lack of properplanning has led to a situation where the transport outlet for the Esmeraldas
1/ The US$20 million represents the additional exports that would be freedif domestic consumption slowed down its growth rate.
- 15 -
refinery will be completed only several months after the refinery has becomeoperational, thereby immobilizing about US$150 million in new investment, andcausing a loss of revenue for CEPE. Furthermore, the subsidization of domesticsales of petroleum products deprives CEPE of revenue and makes it dependent ongovernment transfers for its investment.
36. Among CEPE's major investment projects are additional explorationand development of CEPE areas, further refining capacity, a natural gas plantat Shushufindi, an ammonia/urea/methanol plant based on the natural gas of theGulf of Guayaquil, a petrochemical complex, and various pipelines. Many ofthese projects may require external financing.
37. In sum, the central problem is that conventional crude reserves inthe Amazon basin are now being extracted faster than they are being replacedowing to the virtual absence of exploration and development activity. Unlesssustained investment in exploration and development is resumed crude petroleumexports are unlikely to increase and may well decline soon. In order to avoidsuch a situation the Government plans to step up public investment in thepetroleum sector during 1977 and to encourage complementary private investment.As a first step the Government intends to increase output to the presentcapacity of the trans-andean pipeline by 1978. Further increases in productionare feasible during the 1980's, provided the investment effort is sustainedover the next five to six years.
38. Ecuador also may have good prospects for natural gas exploitation inthe Gulf of Guayaquil. The geological possibilities of discovering commercialreserves are to be explored. If sufficient amounts of natural gas are found,this could be used as feedstock for a proposed fertilizer industry. It istherefore urgent to step up exploratory drilling activities.
Agriculture 1/
39. Ecuador is among the few developing countries with enough fertileland to expand output at reasonable cost. The Guayas Basin, the NorthernCosta (particularly the province of Esmeraldas which includes areas thathave yet to be opened up) as well as parts of the Sierra (where there ismuch scope for yield increases) are promising in this respect. Over the years,years, agriculture, including livestock and fisheries, has played a leadingrole in employment, exports and output, but its relative contribution hasgradually declined as other sectors grew rapidly. Over much of the pastdecade agricultural production has lagged behind the needs of the expandingpopulation, and this has been reflected in a steady rise in food imports(imports of wheat, vegetable oils, animal fats, milk products and oats aloneincreased from US$14.5 million in 1970 to about US$60 million in 1975). Manyof the imported items could be economically produced in Ecuador, but this
1/ A more detailed discussion is presented in Annex I.

- 16 -
would require an effective extension system, improved marketing conditions anda re-orientation of research (see recommendations below). More rapid agricul-tural growth is required if the living standard of the majority of the poorerEcuadoreans is to improve.
40. A basis for increasing agricultural production has been laid throughthe work of INIAP (Instituto Nacional de Investigaciones Agropecuarias), theagricultural research institute of the Ministry of Agriculture. Over the past14 years INIAP has been concerned with research and experimentation on rice,corn, wheat, barley, oats, oilseeds, oil palm, bananas, cocoa, coffee andlivestock, including beef, dairy animals and swine. Through these effortsINIAP has accumulated valuable information and technology adapted to some ofthe country's major needs. The problem is to transfer this to the majority offarmers and enable them to put it to use. A policy package involving exten-sion, research, credit, price supports, marketing and rural developmentincluding a national program of all-weather feeder roads could go a long waytoward solving this most difficult problem and giving the sector a renewedimpetus.
41. The present technical assistance service provided by the Ministryof Agriculture does not meet the needs of the farmers. First, the technicalassistance personnel is small and its services reach a minority of farmers.Second, the technicians specialize in individual crops, and do not advisefarmers from the standpoint of their total farm operations. The existingsystem could be replaced by an agricultural extension service capable ofadvising on "farm management". The organization would absorb the staff nowemployed in crop-by-crop technical assistance, improve training, and hireadditional staff in order to reach more farmers.
42. While INIAP is the research arm of the Ministry of Agriculture,an established agricultural extension service could be its educational arm.Both could have the same organizational status. Such an undertaking wouldalso require developing a national extension training program and establishinginstitutional relationships (e.g. with universities) to help build capabili-ties with improvements in agricultural curricula including extension tech-niques. With necessary backstopping of qualified subject-matter specialistsand trained supervisors such an extension service would operate on a regionalbasis through offices and sub-offices providing services tailored to meetlocal farm needs.
43. An effective extension service would bring more and more farm prob-lems into the open. Thus, INIAP needs to intensify and expand its researchand development work in anticipation of oncoming requirements. INIAP couldincrease its emphasis on applied or adaptive research in such areas as fruits,vegetables, poultry and pulses. Attention should be given to oilseeds,particularly soybeans in view of the need to increase output to replaceimports. Practical research is also needed to bring about the introduction ofgrain sorghum, which could lower feed grain prices. While INIAP had doneconsiderable work in cattle, there remains a need for more aggressive applied
- 17 -
research. The general areas involve nutrition and health deficiencies,conception and reproduction failures, high mortality rates among calves, andother problems of a similar nature, which have held down meat and milk produc-tion. Small farm management studies should be undertaken and incorporatedinto the applied research program.
44. Even though the volume of agricultural credit has increased rapidlyduring the 1970s, only a small fraction of farmers (under 10%) have access tocredit from institutional sources. 1/ The Banco Nacional de Fomento (BNF),provides almost 70% of total institutional credit to agriculture. Cropsfinanced by BNF cover only about 13% of the country's total harvested area.Furthermore, agricultural credit is concentrated on a few crops: of BNF'stotal 1975 credits for crop production, 42% was for rice and 17.6% for cotton.BNF can undoubtedly improve its credit operations particularly by increasingthe volume of medium and long term credit. Other institutional sources ofcredit such as private banks and the Cooperatives' Bank should also play alarger role. Since institutional credit is generally less costly than otherforms of credit, the critical issue is access and improved institutionalcapability. Finally, the basis for lending should be the individual farm asa business enterprise, its credit needs and creditworthiness.
45. Price policies are carried out through price supports and subsidies,price controls, and different regulatory actions affecting exports and imports.Policy remains heavily consumer-oriented, even though in the past two yearsthere has been a modest change in favor of producers. Price controls orguidelines are in effect at the wholesale and retail levels for a large numberof food items, including meat, milk, sugar, rice and wheat flour. Producerprices notably of wheat, milk and rice, have been influenced by the Government.In 1975 a support price for wheat was announced shortly before planting time,but was later modified to the detriment of producers. At the same time,imported wheat sold to millers has been subsidized at substantial cost to theGovernment. Until a recent increase, the price ceiling on fluid milk (atproducer and consumer levels) has led to diversion of production to cheese,butter and other dairy products, resulting in a shortage of consumer fluidmilk supplies. The rice subsidy has been particularly costly in 1976. Pro-ducer prices were set so high that the production of rice increased sharply,exceeding domestic demand; owing to a lack of storage space and a decline inthe world price of rice 26,000 tons had to be exported, at a cost to theGovernment exceeding US$4.6 million. 2/
1/ It is not possible to estimate the share of investment credit, owingto the nature of credit statistics.
2/ Farmers were paid US$300-317 per ton; the f.o.b. price (Guayaquil) wasUS$177 per ton. Furthermore, the Government incurred marketing andstorage costs.

- 18 -
46. From the standpoint of producers, price supports and subsidies canbe useful tools as production incentives, provided they are suitably timedand directed, and are broadly consistent with the realities of the market-place. In order to avoid costly experiences, price supports should not as arule exceed international price levels that may conservatively be expected toprevail once a crop is harvested. An analysis leading to specific recommen-dations on agricultural subsidies in Ecuador is beyond the scope of thisreport, but an effort of this kind is urgently called for. Such an exam-ination for each commodity covered should be concerned with the respectiveinterests of producers and consumers (especially as classified by incomelevels), as well as with the costs and benefits to the national economy.
47. The present agricultural marketing system provides weak productionincentives and lacks the facilities required in producing and marketing centersfor orderly handling, storage, distribution, and utilization of output withoutundue waste. The most acute shortage is in adequate storage space, particularlyin producing areas and at commodity assembly points. Small farmers have virtu-ally no on-farm storage facilities, and the harvest consequently may be left inthe open. The price small farmers obtain for their marketed crops is dras-tically depressed owing to lack of storage. The total deficiency in storagefacilities amounts to at least 250,000 metric tons. About 120,000 metric tonsof storage space in the form of silos and warehouses is needed to meet therequirements of ENAC, the State Marketing Agency, for grain alone. Also,there is a need to improve facilities in major market centers, particularly inwholesaling foodstuffs in Guayaquil.
48. There is need for a package approach to the marketing problem, whichat the start could consist of the following components: silos and warehouses,refrigerated facilities, wholesale market in Guayaquil, technical assistanceand training in marketing, and the establishment of grades and standards aswell as a market news service. In addition to public marketing improvements,encouragement should also be given to private enterprises, for example throughgovernment loans for private construction and maintenance of facilities forstoring and handling agricultural products in the marketing chain.
49. Another serious problem is the lack of feeder roads which inhibitsproduction and seriously impedes the rapid farm-to-market movement of products,especially perishables. The poorer producers who live farthest from the mainroads are particularly affected. While a start has been made by the Ministryof Public Works in expanding the system of all-weather feeder roads, a strongercommitment is needed to ensure continuity of construction over a reasonablylong period. 1/ It calls for a national strategy consistent with the require-ments for profitable agricultural expansion in the different provinces. For-mulation of this kind of strategy would not only involve the Ministry of PublicWorks, but also other government agencies, notably the Ministry of Agriculture.
1/ See Transport Section below.

- 19 -
50. Several regional public organizations are engaged in rural develop-ment. 1/ These include the Southern Development Program (PREDESUR), CREA,which operates in the Cuenca area, CEDEGE in the Guayas basin and others.One of the most active development organizations is PREDESUR. It channelspublic funds and external loans into 57 projects, most of them small. PREDESURhas a limited but high-caliber staff and operates through contracts with publicand private agencies and firms for works such as construction of access roads,agricultural technical assistance services, reforestation, agricultural exper-imental stations, potable water facilities, experimental fish and shrimp farms,etc. PREDESUR uses petroleum revenues and external loans in a manner thatbrings public agencies into competition with private contractors. The experi-ence of PREDESUR and of the other regional development agencies may providea basis for a national rural development program which would include all suchagencies. A national rural development policy defining expenditure prioritiesand an effective administrative framework are needed as a basis for sucha program. The recent creation of a rural development task force in thePlanning Office (JUNAPLA) may help in defining a policy in this respect.Perhaps the most effective organization would combine a flexible field struc-ture with an operational central governing body in the capital, which wouldcoordinate and allocate the material and financial resources on a project-by-project basis. In this way all relevant public agencies as well as privatecontractors could become involved in what might become a most importantlong-term effort to bring to the poorer areas the means for improving livingstandards.
51. There is need for departure from the piecemeal approach in planningand programming agriculture in favor of more comprehensive short-term andlong-term goals. Coupled with this are the requirements for strengthenedadministration, control of sectoral activities, closer monitoring of programs,and improved overall integration and coordination. The major responsibilitywill continue to be with the Ministry of Agriculture. Besides improvedcourses of action and a more effective marshalling of human and financialresources, the Ministry of Agriculture needs to address the problems and needsof the individual farmers, because the farm operator and his or her motivationfor producing, in the final analysis, determine actual output levels. A majorconcern of the Ministry of Agriculture should be to overcome existing programfragmentation with the resulting dispersion and duplication of effort andinternal competition for limited financial and trained manpower resources.
52. In sum, unlike most developing countries, Ecuador has a goodpotential for agricultural expansion, including livestock and fisheries.The different lines of action mentioned earlier all form part of a package.They are complementary and mutually supportive. If a serious effort ismade on such a package of policies and programs, there is no doubt that agri-cultural and livestock development will accelerate. This policy package could
1/ These organizations are trying to deal with regional development. Thediscussion in this section is concerned only with rural aspects of theiractivity.
- 20 -
achieve a broad improvement in the living conditions of the bulk of thepopulation, while at the same time serving the national development objec-tives. Furthermore, even a slight absolute improvement in the standard ofliving of the bulk of the rural population would represent a substantialrelative improvement for the persons concerned.
Industry
53. The manufacturing sector has developed quite rapidly during thepast decade, owing to the existence of an active domestic entrepreneurialgroup and of a liberal environment including a fairly adequate institutionaland legal framework. Because of the country's small size most manufacturinghas been for import-substitution. A total of about 800 establishments (aboutone-half of all industrial establishments in Ecuador) have benefited from taxand import duty exemptions under the industrial development law. While thisliberal environment may have led to excessive imports of capital goods inrelation to Ecuador's resource endowment, it has undoubtedly encouraged thedevelopment of a reasonably profitable and dynamic manufacturing sectorconsisting almost exclusively of small firms. The main obstacles to furtherdevelopment are the shortage of medium and long-term investment credit, 1/ theuncertainty surrounding the treatment of foreign investment and the uncertainprospects for continued rapid expansion of export earnings, which may bringabout a scarcity of imported equipment and raw materials. If physical condi-tions such as power shortages, poor communications, water and fuel shortagesimprove, this will also help stimulate industry, outside Guayaquil where theseproblems are not acute.
54. A recent report 2/ analyzes the main issues relating to the indus-trial sector. The Government is considering an ambitious industrial develop-ment strategy predicated on continued progress in Andean Group integration,which includes Venezuela, Colombia, Ecuador, Peru and Bolivia. This strategynotably includes the development of a steel industry based on the natural gasof the Gulf of Guayaquil, of a petrochemical complex, of an automobile indus-try, and of the further development of metal-mechanical and agro-industries.A thorough study of the viability of the steel industry is required before
1/ Resolutions No. 894 and 927 of the Monetary Board have recently estab-lished a new system of commissions for medium and long-term financing,which raises effective interest rates to an average of about 15 percent;this is intended to promote the development of financieras and therebyto increase the supply of medium and long-term industrial financing.These rates also apply to loans in other productive sectors.
2/ "Industrial Development Problems and Prospects -- Ecuador" (Report No.1186-EC, October 7, 1976).

- 21 -
proceeding with the project because Ecuador has no iron ore and the costs ofproduction are likely to be high, especially if the required port facilitiesare included in the costs. Furthermore, natural gas might be used moreeconomically for other purposes. An efficient petrochemical complex requireslarge additional amounts of refined petroleum products. Therefore it may notbe warranted to plan on building a petrochemical complex before the 1980s.The prospects for setting up a viable automotive industry producing for Andeanmarket should be thoroughly reviewed before a decision involving public fundsis made, so as to avoid the high unit costs typical of similar enterprises inother Latin American countries. Conversely, good prospects for growth andexports exist in agro-industries, particularly if agricultural and livestockpolicies develop along the lines outlined elsewhere in this report. Likewise,there is scope for expansion in many light metal-mechanical industries.Finally, the feasibility of the ammonia-urea plant will depend on whetherenough natural gas is found in the Gulf of Guayaquil and on the world marketfor fertilizer.
55. In sum, Ecuador's industrial sector has been quite successful sofar, based on the expansion of small private firms in a great variety ofactivities. As some of the main obstacles to development are graduallyremoved (especially the shortage of medium and long-term credit and the defi-cient infrastructure) continued rapid expansion can be expected withoutdeparting greatly from the successful historical pattern. The introductionof large-scale industrial projects involving substantial direct public par-ticipation might divert scarce physical, financial, technical and managerialresources to the detriment of the economy, unless the economic and socialmerits of such projects at least equal those of private projects.
Electric Power
56. Even though electricity output and consumption have increasedrapidly in recent years, Ecuador is among the Latin American countries withthe lowest installed capacity per head. Demand, which has been growing atmore than 13% per year in the recent past, is forecast by INECEL to continueto grow at a rate of 12-13% per year during the next decade. Consequently,there is a need for expansion in generation and transmission. Fortunately,Ecuador has a good potential for hydroelectric expansion.
57. Substantial progress has been made toward the creation of a unifiednational power system. INECEL is responsible for power sector planning andfinancing, construction and operation of a national grid, organization andsupervision of regional systems for power distribution and sector regulation,including the setting of tariffs. INECEL receives some US$60 million eachyear in petroleum revenues. Tariff regulations have been set out by decree,which prescribe that all electric power companies will have to revalue assetsand attain an 8.5% rate of return on investment by the early 1980s. In thepast INECEL's role was limited to providing subsidies to small power companies,most of which operate at a loss, owing to low productivity and low tariffs.
58. INECEL's proposed National Electrification Program provides for thecompletion of the Pisayambo plant (a 70 MW hydroelectric plant which will

- 22 -
serve parts of the Sierra including the Quito area) , and of the Paute plant(a 500 M4W hydroelectric plant in the Cuenca area, 200 MW of which should beinstalled by 1982). Work on another hydroelectric project (Toachi) mightbegin in the early 1980s. In addition, INECEL plans several complementarythermal units (204 MW for the Guayaquil area to be completed by 1979, 30 MWfor Quito planned for completion in late 1977 and 100 MW for Santo Domingonow at a preliminary stage of study). Finally, transmission investment inthe order of US$220 million is being contemplated. Altogether these works,which do not include rural electrification, would cost some US$1.2 billionover the 1977-85 period and would increase Ecuador's installed capacity from551 MW to about 1,455 MW.
59. Clearly this program is ambitious, especially in the light of INECEL'slimited experience, which may lead to substantial delays. The problems en-countered in the construction of the Pisayambo hydroelectric plant point topossible pitfalls. The concept of the plant was changed (from multi-purposeto pure energy generation) and, owing to construction delays, costs have es-calated substantially. As a result, the cost of electricity from Pisayambosold in Quito will exceed 30 US mills per KWH, which is high for hydro-generated power. The completion date of the much larger Paute project hasalso been postponed several times.
60. The need for substantial foreign and local financing may also resultin delays in implementing the program. Until the Paute unit begins to producepower in 1982, petroleum revenues allocated to INECEL and the utility's owninternal cash generation (which is expected to be very small), may cover aboutone-half of the annual investment costs. The balance of the requirementswould have to be borrowed, and the amounts involved are large for Ecuador.
61. Part of INECEL's present financial difficulties reflect the oper-ating deficits of nearly all regional distribution companies which INECEL hasa legal obligation to support. Only the Quito enterprise can do withoutINECEL subsidies. Substantial tariff increases would be required in all powercompanies, especially in the local and municipal ones, if the 8.5% rate ofreturn on investment prescribed by the electricity legislation is to beattained.
62. Owing to government regulations, the fuel purchased by all thermalgenerating plants in the country (including private factory-owned units) issold at less than one-third of the world price. If the world price werecharged, electricity rates would have to go up by at least 50% to maintainpresent rates of return of the power companies. This subsidy favors the useof petroleum products and cannot easily be justified socially and economically.
63. The Government plans to expand the electrification of the ruralareas and has instituted a 10% surcharge on industrial and commercial tariffsto finance such a program. At present only about 8% of the rural populationis connected to a source of electric power. Owing to low per capita incomesand the geographical dispersion of the rural population, rural electrification

- 23 -
cannot be expected to be financed by users alone. The amount of the neededgovernment contribution will depend in part on the extent to which the program(which has not yet been formulated) emphasizes social improvements in the formof domestic consumption, or economic improvements in the form of farm electri-fication. The technical aspects of rural electrification do not pose problems,but the program would add further to INECEL's managerial burden. Its finan-cial viability will hinge largely on the careful selection of investments, theapplication of appropriate tariff policies and on effective collection of therural electrification surcharge. In view of INECEL's other urgent tasks, astep-by-step approach might be most prudent (for example a US$20 millionprogram over three or four years to begin with).
64. A review of the national electrification investment program isadvisable, given the magnitude of the problems to be resolved prior to itsimplementation and the heavy impact which its financing will have on Ecuador'sfuture indebtedness. INECEL should update the underlying market forecast andconsider which items could be reduced or postponed in order to make theprogram more manageable and financially viable. In addition to strengtheningINECEL's capability to plan and manage its operations, the Government willhave to consider whether it is realistic to expect the utility to dischargethe wide range of functions allocated to it. Finally, the Government shoulddecide whether to continue subsidizing the use of petroleum products inelectricity generation.
Transport
65. Ecuador's geography is forbidding from the transport point of view.The railroad between the coast and the Sierra, for example, is one of thesteepest of its kind, ascending by about 10,000 feet in less than 50 miles.The Sierra itself is divided into numerous separate valleys. While the Costais relatively flat, high rainfall in some areas and adverse soil charac-teristics make highway construction and maintenance costly. Most transport inEcuador is by road.
66. The institutions dealing with transport at the levels of municipal-
ities, provinces, and local entities are greatly affected by regionalism.This makes it difficult for the Central Government to devise or carry out abalanced national program. Furthermore, coordination between the transport
sector and other sectors of the economy, notably agriculture, is limited.This is important, for example, in planning feeder roads.
67. The first priority should be to improve road maintenance. Thesorry condition of many main roads suggests that much more could be done inthis area. Better maintenance would obviate the need for periodical recon-struction of highways. A substantial proportion of the rural population iscut off from the highway system, particularly when it rains. This impedesagricultural progress among the poorer farmers (see agricultural sectionabove). The Government's national feeder road program, which absorbs aboutone-third of the Ministry of Public Works' investment budget should thereforecontinue to receive the highest priority. Second, there is a need to improve

- 24 -
the trunk road network between the major towns. The ambitious railroadmodernization program prepared by SOFRERAIL cannot be justified so long asroad transport is subsidized to the extent it is now. Even under the mostfavorable set of circumstances the proposed railroad modernization program isunlikely to have a positive rate of return on investment. Expansion of smallairports and of small ports (notably Esmeraldas) should all be weighed oncethe feasibility studies have been critically reviewed. In sum, the mainpriorities in transport are (a) improving road maintenance while completingthe trunk road system; (b) carrying on with the feeder road program, and (c)increasing road user charges to a more realistic level.
68. Only ports and pipelines cover their expenditures from revenuesearned for the services provided. The extraordinarily low price of gasolinehas encouraged road transport, and user charges do not cover the costs of anadequate level of maintenance. Consequently, there is an urgent need onthese grounds alone to raise the domestic price of petroleum derivates tocover at least their costs of production. The sharp decline in rail freightduring the past few years is also associated with the subsidization of roadtransport.
Education
69. There is scope for increasing the number of well trained personnelin the public sector, industry and other productive sectors of the economy.Strengthening the education system and making it more responsive to the needsof an expanding economy are necessary conditions for further social andeconomic progress. There are no plans at present, however, to strengthen theeducation system.
70. Household survey show, as might be expected, a close relationshipbetween education and income. Furthermore, the following table suggests thatthe income spread between persons without schooling, and persons with primaryand secondary education has remained stable between 1968 and 1975.

- 25 -
INCOME AND EDUCATION
Index of Index ofAverage Average
Education Level Income /1 Income /2(1968) (1975)
None 100 100
Lower primary education 133166
Upper primary education 173
Lower secondary education 228268
Upper secondary education 382
Higher education (lower) 570461
Higher education (upper) 882
Average 230
/1 Urban and rural.
/2 Urban only.
Source: Sector Analysis of Elementary Education, Ministry of Education, 1975,and Encuesta de Poblacion y Ocupacion, Area Urbana, 1975.
Since the mid-1960s most of the expansion in the education system has been atthe secondary and higher levels, where, as the above table suggests, thescarcity of graduates is greatest. The following table shows the respectivetrends:

- 26 -
TEACIHERS AND STUDENTS (1965-74)
Indices (1965-66 = 100)1965-66 1970-71 1974-75 1970-71 1974-75
Primary students 800,507 1,018,438 1,234,217 127 154
Primary teachers 21,429 26,625 31,114 124 145
Ratio (primary) 37.4/1 38.3/1 39.7/1 - -
Secondary students 117,268 216,727 334,465 184 285
Secondary teachers 9,230 15,699 20,677 170 224
Ratio (secondary) 12.7/1 13.8/1 16.2/1 - -
University students 15,395 38,857 114,389 252 743
University teachers 1,754 2,867 4,771 163 272
Ratio (higher) 8.8/i 13.6/1 24/1 - -
Ratio of secondary/primary students 14.6/100 21.3/100 27.1/100 -
Ratio of university/primary students 1.9/100 3.8/1 9.3/100 -
Source: Ministry of Education.
While primary school coverage increased during the last decade, the qualityof education has not improved. Many rural schools only offer one, two orthree grades. This level of education is associated with an income well belowthe average. Furthermore, curricula in rural areas have not, with a very fewexceptions, evolved toward preparing children for earning a living in agri-culture or livestock activities. The continued severe deficiency in primaryeducation has been accompanied by substantial increases in costs: primaryteachers' basic salaries went up from about S/.600/ month in 1966 to aboutS/.3,000/month in 1976, more than doubling in real terms, without apparentimprovement in quality. There is a clear need for more efforts to make fullprimary education available, particularly in the rural areas, and to shiftinstruction to subjects that will be useful to pupils once they leave school.The ongoing rural development ("nuclearizacion") program is a first steptoward providing at least the physical facilities required.
71. The table on teachers and students suggests that the number ofuniversity students has increased much beyond the ability of the system to

- 27 -
educate them. This is a result of a more and more liberal access policy forsecondary school leavers, which has been reflected in a sharp decline inquality of instruction. So, for example, there are now 500 - 600 medicalstudents at the Quito University, when capacity is about 100. In the countryas a whole, there are now over 2,000 medical students when the capacity is500. A policy which centers on the quantity of students at the cost of a sharpdecline in quality will not contribute to alleviating the country's acuteshortage of qualified cadres. Far from reducing inequality at the universitylevel, the lowering of standards puts an extra premium on education abroad,which only very few Ecuadorians are in a position to obtain, and thus exacer-bates the difference between the majority of students and a small privilegedminority. Nor will this policy improve the social and economic opportunitiesof the poorer people, since very few of them have access to secondary schoolor indeed to complete primary school. What is needed is an increase in theshare of resources for primary and technical education (along the lines ofSECAP with emphasis on agriculture as well as industry), and a correspondingdecrease in the share for universities, which have absorbed a disproportionatelylarge share of funds in the past few years.
Housing and Urban Development
72. The housing shortage cannot be estimated quantitatively in theabsence of relevant statistics. But the need for improvement is clear fromthe 1974 housing census and from a household survey of Guayaquil slum dwellers.The census suggests that lack of adequate water supply is a pervasive problem.Of all houses only 42% benefit from public water supply (whether in the houseor in a nearby street). The worst shortage is in the rural areas (87% ofhouses without connection); among urban centers, the worst shortage exists inthe Guayaquil area, in the northern province of Imbabura, and in the coastalprovinces of Esmeraldas, Manabi and Los Rios. Altogether, over one millionurban population have to rely on wells, cisterns, or have to purchase waterfrom trucks (usually at high cost). About 5% of houses, probably shelteringsome 350,000 persons, rely on trucks for water; of these, 65% are in theGuayaquil area.
73. Of Ecuador's total population of 6,552,046 (1974 population census),41% are urban (2,706,677). The census data underestimate the urban popula-tion, however, because the distinction between "urban" and "rural" is adminis-trative and does not depend on the size of the towns and villages wherepeople live. The Guayaquil area has experienced the fastest large scaleurbanization, owing to a high birth rate and to considerable migration. Theslums surrounding Guayaquil are therefore of particular interest. Most housesare built on stilts above the rivers. There is no industry in the slum area,apart from a few small businesses (making cement blocks, furniture, matresses,clothing, etc.) and artisan shops. Of persons over the age of seven, 42% arefunctionally illiterate 1/ and umemployment is very high. Of those employed,most men are craftsmen, workers or vendors, and most women are employed in
1/ A.I.T.E/R.E.D.A.M. "Encuesta socio-economica", August 1974.

- 28 -
personal services or as craftswomen. Expenditure on food absorbs 42% offamily income. Interviews with "community leaders" clearly show the perceivedpriorities: 53% of those interviewed stated that potable water was the firstpriority; the next priorities perceived are sewerage, drains and publiclighting. Significantly, the poorest slum families spend almost 2% of theirincome on water; their absolute expenditure on water exceeds that of the moreaffluent residents. Even if full operating and maintenance costs are chargedfor public water supply, the poorer residents would pay less than they do nowpurchasing water from trucks. Further investment in water supply is alsorequired in the areas surrounding the city of Quito.
74. The Ecuadorean Housing Bank has introduced some imaginative policiesto help low income families acquire houses. Interest rates on mortgages varyaccording to income; no downpayment is required in certain cases for low in-come families. Furthermore, the Bank has legal powers to expropriate landagainst compensation and to prepare "sites and services". The cheapesthouses financed in 1976 cost about US$3,000. Unfortunately, the scope ofthe Housing Bank is very small in relation to the needs. Since experimentswith self-help housing construction have not been successful in Ecuador,an expansion of housing credit for conventional construction possibly coupledwith investment in "sites and services" might be the most appropriate way toreduce the housing shortage.

- 29 -
CHAPTER III
PUBLIC INVESTMENT PROGRAM AND DEVELOPMENT PROSPECTS
75. The Government is expected to undertake a significant developmenteffort in the next five years through stepped up public investment in keysectors of the economy. The main sources of financing are expected to beincreasing petroleum revenues and substantial foreign financing. Ecuador'sability to achieve its development objectives will be closely related to thefollowing issues:
(a) the maintenance of a reasonable balance between petroleumproduction, domestic consumption and exports on the one handand the absorptive capacity of the economy and in particularof the public sector on the other;
(b) the continuation of austerity measures in the public sectorto generate adequate savings to finance the local cost contri-bution to a significantly expanded public investment program;
(c) careful consideration by the Government to project selectionand their priorities, as well as to a balanced composition ofpublic investment;
(d) measures to accelerate the growth of agriculture and sustain themomentum of industry to increasingly satisfy domestic demand andgenerate new sources of exports and growth.
The first three issues are dealt with in the following sections. The lastone in Chapter II.
Growth and Petroleum Prospects
76. The economic outlook is closely related to petroleum developmentsand public investment levels. In the immediate future petroleum productionand exports are the main determinants of GDP growth. In order to raise petro-leum production it will be necessary to channel substantial revenues intoinvestment for exploration and development. At present it seems feasible toincrease production to 260,000 barrels/day by 1979, provided the measures out-lined in paragraphs 30 and 31 above are taken. This is one of the mostcritical issues for economic management and the development prospects of thecountry.
77. Assuming petroleum production of 260,000 barrels/day by 1979 andpublic investment growth of about 12% per annum (in real terms), the real rateof growth of the economy can be expected to exceed 6% per year for the period

- 30 -
1977-81. 1/ Growth rates might be even higher if petroleum production israised above 260,000 barrels/day. Growth projections for the public invest-ment program represent a significant slowdown from the 28% real annual rate ofthe last three years. Yet public investment would still grow faster thanprivate investment, and increase its share in GDP. Public investment projec-tions take into account the preparation stage of projects and the absorptivecapacity of the public agencies involved. Absorptive capacity is low in someof the key agencies of the public sector, and the projections aim at a real-istic assessment of what can be done without seriously straining the construc-tion sector and without exerting undue inflationary pressures.
78. As the investment plans are implemented, fixed private investmentmay rise at a real rate of 9% per year in the period 1977-81. Private invest-ment was very dynamic in 1974 and 1975, particularly in the industrial sector.Some slowdown occurred in 1976, perhaps because of over-expansion in earlieryears. It is assumed that private investment will regain its dynamism,spurred on by domestic demand and the expansion of exports.
79. Total investment would expand at a rate of 11% per year in realterms during 1977-81 if public and private investment grew as projected above.A substantial increase in external financing would be needed as the resourcegap and the current account deficit of the balance of payments widen. Thesavings rate (domestic savings as a percent of GDP) would remain high duringthe period. If the ratio of investment over GDP goes up as projected, theshare of investment financed out of foreign savings would have to increaseslightly (see Table 2.9 Statistical Appendix).
80. Government consumption is expected to grow at a real rate of 6%per year compatible with operating expenditures related to the investmentprogram and other services. This expansion would be in line with recenttrends and with the Government's policy of avoiding excessive demand pres-sures originating in public expenditure. Private consumption could underthese assumptions follow a growth path somewhat below that of non-petroleumGDP (about 5% real annual growth).
Public Sector Prospects
81. Given the substantial public investment effort contemplated by theGovernment, present austerity measures would have to be continued in thefuture to (a) maintain the global deficit of the Central Government at a levelcompatible with liquidity conditions and price stability; (b) maintain thecurrent savings capacity of the public sector and allow the financing of asignificant share of the public investment program, and (c) allow an increasingflow of banking credit to the private sector.
1/ Price rises for the period 1977-81 are considered to be at the level of8-10% experienced lately. This is based on a rate of internationalinflation of 7.5% per year for the period and the continuation of presentprudent monetary and fiscal policies.

- 31 -
82. Revenue projections hinge on developments in the petroleum sector.In 1975, petroleum revenues (including royalties and CEPE's surplus on oilexports) represented about 9.5% of total GDP and almost 47% of total fiscalrevenues. If petroleum output rises to 260,000 barrels/day by 1979, petroleumrevenues of the public sector can be expected to grow by 17.5% per year toUS$1,080 million in current prices by 1981. 1/ If most of the increase inpetroleum revenues is channeled to FONADE and CEPE the annual rate of growthof current revenues of the Central Government would be 14.3% at current prices(see Tables 5.8 and 5.10, Statistical Appendix), but unless measures aretaken, non-petroleum revenues are not likely to be very dynamic.
83. Assuming the continuation of austerity policies, current expendi-tures are projected to increase at an average annual rate of 6% in real terms.This rate is based on the assumption that the inflationary impact on wages andsalaries in the public sector, as well as increases in public employment areminimized, yet be consistent with development objectives and the investmentprogram. Nevertheless, in view of the rising level of public investment it isreasonable to assume a need for higher current savings in the early 1980s. Toachieve higher public savings, the Government could:
(a) reallocate present petroleum revenues as well as channel newincreases in petroleum revenues into investment;
(b) raise tariffs and prices of goods and services provided bypublic agencies, particularly for electricity, gasoline andpetroleum products so that energy agencies can finance areasonable share of their investment out of their own savings;
(c) improve tax administration and revise non-petroleum taxes.
84. Should petroleum revenues become less dynamic, non-petroleum taxeswill have to provide additional revenues. To this end, overall tax adminis-tration and control needs to be greatly improved. For the short run theGovernment has already devised measures to minimize income tax evasion 2/ suchas changing inspection methods, more frequent inspections, and computerizingtaxpayers roll. For the medium and long term more strict and comprehensivetax measures may be called for. With improved cadastral information a raisedassessment value and tax rate on real estate could make the municipalities andprovincial councils less dependent on Central Government budget support. Salestax yields have been inadequate owing to evasion in retail and wholesale trade,hotels and restaurants. An increase in the value added tax would offset theslow growth of foreign trade tax revenues reflecting continued progress inAndean group integration. Corporate exemptions merit careful review--withindustrial development the revenue loss may prove to be substantial.
1/ Including general government and petroleum revenues of INECEL and CEPE.
2/ At present only 180,000 people pay income taxes.
- 32 -
85. Since gasoline prices at present are among the lowest in the world,gasoline taxation increases are especially warranted. Increases in thegasoline tax and/or prices are particularly important because of its distri-butive incidence and because of the need to cut down domestic consumption.One portion of the price raise could accrue to CEPE for savings, while anothercould go to the Central Government for allocation to other agencies. With theCEPE refinery at Esmeraldas due to start operations during 1977, there is anopportunity to revise the subsidy on gasoline.
86. In sum, present austerity policies of the public sector would haveto continue in the future in order to maintain an adequate level of currentsavings and provide the local counterpart funds required for the expandedpublic investment. Given the magnitude of the proposed public investmenteffort additional measures might be required in non-petroleum taxes and gaso-line taxation.
Public Investment Program
87. Weak project preparation has traditionally been one of the majorobstacles to social and economic development in Ecuador and improvement isparticularly needed in agriculture and rural development, education, healthand industry. The creation of the National Preinvestment Fund (FONAPRE)in 1974 is an important step in the direction of better project preparation.Nevertheless, much remains to be done in this area. Over the next five yearsthe government plans to make a substantial investment effort consistent withthe likely financial resources of the country and the anticipated improvementsin project preparation and execution. The program would involve an annualincrease in public investment of about 20% per year (12% in real terms).
88. Public investment has increased rapidly during the past three yearsand is estimated to have reached a level of US$460 million in 1976. TheGovernment's public investment program for the years 1977-81 is likely toaverage disbursements of about US$654 million per year during 1977-81. Thetotal commitment cost of the public investment projects requiring externalfinancing for this period is in the order of US$4.3 billion (US$3.8 billionwithout financial investment). Tables 1 and 2 of Annex II show the list ofpublic investment projects, their likely costs and the distribution of exter-nal loan commitments over the 1977-81 period. tlajor investment is concen-trated in agriculture, petroleum, power, transport and industry. The program(including financial investment) would require external financial commitmentsin the order of US$2.8 billion.
89. The following table shows the distribution of public investment bysectors. Investment in the order of US$900 million is included as "OtherInvestment" to accommodate projects identified in the project list whoseeconomic feasibility has not yet been determined. These commitments aremostly in 1980 and 1981. Financial investment by public intermediariesmostly for agriculture and industry is also included.

- 33 -
PUBLIC INVESTMENT PROGRAM 1977-81
Sector Estimated Total Cost Distribution(US$ million) (percent)
Agriculture 407.3 9.5Petroleum 531.3 12.3Power 645.0 15.0Industry 354.1 8.2
Transport 376.6 8.7Tourism 26.6 0.6Telecommunications 95.4 2.2Public Health 105.5 2.5
Education 36.5 0.8Urban Development 88.0 2.0Water and Sewerage 131.8 3.1Fisheries 67.5 1.6Preinvestment 30.0 0.7
Other Investment /1 900.0 21.0
Total 3,795.6 88.2
Lines of Credit 505.7 11.8
Grand Total 4,301.1 100.0
/1 Refers to projects included in the Project List, whose economicfeasibility has not yet been determined.
Agriculture
90. The Government's public investment program in agriculture representsa substantial increase over the past levels. It reflects a desire to increaseinvestment in rural development projects while continuing investment in
commodity-centered projects. The following table shows an investment level ofUS$407.3 million for 12 projects There would be an additional level of commit-
ments of financial investment, in the form of agricultural production creditsto farmers, mostly through Banco Nacional de Fomento (BNF). Of particularimportance is a US$75.0 million credit for a Cocoa Rehabilitation Program
which would provide credit to the cocoa farmer, giving particular attention
to the needs of the small farmer.

- 34 -
PUBLIC INVESTMENT PROJECTS IN AGRICULTURE 1977-81
Total Estimated EstimatedEstimated External Year of
Project Cost Financing Commitment(US$ million) (US$ million)
1. Agricultural Marketingand Storage 58.6 12.0 1977
10.0 197820.0 1979
2. Tungurahua Rural Development 30.0 15.0 19783. Puerto Ila-Chone 40.0 20.0 19794. Milagro II 40.0 20.0 19785. Guayas Water Management 40.0 20.0 19816. Cayambe Rural Development 20.0 10.0 19807. Forestry Development 20.0 10.0 19818. Esmeraldas Rural Development 50.0 25.0 19819. Manuel J. Calle Irrigation 21.0 10.9 1978
10. Latacunga-Ambato Irrigation 18.2 10.0 197711. Colonization Nangaritza 19.2 11.5 197812. Carrizal Chone Irrigation 28.8 14.2 197913. Forestry Development 21.5 2.4 1979
Total 407.3 211.0
Source: Annex II, Table 2.
Petroleum
91. Public investment in petroleum is to be carried out by CEPE. Amajor portion of the programmed investment involves the five-year developmentprogram, aimed at a gradual increase of petroleum production in line with theGovernment's policies outlined in Chapter II. This program will require com-plementary private investment. Public investment in development and explora-tion has been estimated at US$230.9 million. The table does not includefinancial investment involved in payments for purchase by CEPE of Consortiumshares of the Gulf Oil Corporation. Other major investment includes theexploitation of the Gulf of Guayaquil gas through the construction of anammonia-methanol plant.

- 35 -
PUBLIC INVESTMENT PROJECTS IN PETROLEUM 1977-81
Total Estimated EstimatedEstimated External Year of
Project Cost Financing Commitment(US$ million) (US$ million)
1. Development Program 230.9 10.0 197734.7 197834.7 197934.7 198034.7 1981
2. Esmeraldas MaritimeTerminal (Phase II) 35.0 15.0 1978
3. Shushufindi Gas Plant 21.0 16.0 19784. Shushufindi Poliduct 36.0 30.0 19785. Esmeraldas Quito Poliduct 45.4 36.4 19776. Amonia-llethanol Plant
(Guayaquil Gulf Gas) 163.0 81.5 1979
Total 531.3 327.7
Source: Annex II, Table 2.
Power
92. Investment in electric power is the responsibility of INECEL. Theprojects listed below are part of Ecuador's efforts to increase electricityproduction and distribution in line with the policies reviewed in Chapter II.The "Regional Distribution System" is a five-year program aiming at the purchaseby INECEL of the small regional distribution companies.

- 36 -
PUBLIC INVEST1MENT PROJECTS IN POWER 1977-81
Total Estimated EstimatedEstimated External Year of
Project Cost Financing Commitment(US$ million) (US$ million)
1. National Transmission System(Paute Phases C, D) 73.0 44.0 1977
2. Regional Distribution System 178.0 16.4 197716.4 197816.4 197916.4 198016.4 1981
3. Toachi Hydroelectric Project 334.0 176.0 19814. Rural Electrification 60.0 45.0 1979
Total 645.0 347.0
Source: Annex II, Table 2.
Industrv
93. The Covernment's industrial investment program is designed to meetdemand for such products as vegetable oil, sugar and cement, and to stimulatedevelopment outside the Quito and Guayaquil areas. These projects will becarried out through Corporacion Financiera Nacional (CV-CFN). The total costof these projects is US$354.1 million.

- 37 -
PUBLIC INVESTMENT PROJECTS IN INDUSTRY 1977-81
Total Estimated EstimatedEstimated External Year of
Project Cost Financing Commitment(US$ million) (US$ million)
1. African Palm Oil 25.0 15.0 19782. New Sugar Mills 150.0 25.0 1978
65.0 19793. Cemento Cotopaxi 74.7 35.5 19784. Cayapas Pulp and Paper 92.1 55.3 19815. Industrial Parks 12.3 7.8
Total 354.1 203.6
Source: Annex II, Table 2.
Transport
94. Public investment in transport will be heavily concentrated in roads,in line with the priorities listed in Chapter II above. The Quito-Aloag free-way project is included assuming that the economic assessment of that sectionof the Pan-American Highway warrants that investment.

- 38 -
PUBLIC INVESTMENT PROJECTS IN TRANSPORT 1977-81
Total Estimated EstimatedEstimated External Year of
Project Cost Financing Commitment(US$ million) (US$ million)
Road Transport
1. Duran-Boliche 20.0 8.0 19772. Puerto Ila-Garrapata 13.0 5.2 19773. Quito-Aloag Expressway 35.0 21.0 19784. Cumbe-Pasaje 30.0 18.0 19775. Quininde-Chila 6.1 3.7 19786. Loja-Zamora 8.0 4.8 19787. Quiroga-Pichincha 7.7 4.6 19788. Cuenca-Azogues 9.0 5.4 19799. Cumbe-Loja 25.2 15.1 1979
10. Sesme-Jama 8.2 4.9 197911. Suma-Pedernales 17.2 10.8 198012. National Feeder Road 144.0 11.0 1978
11.0 197911.0 198011.0 1981
Total Road Transport 323.4 145.5
Airports
Cuenca, Machala, Cocaand Pastaza 32.0 24.0 1978
Total Airports 32.0 24.0
Ports
Esmeraldas Phase I 21.0 12.8 1978
Total Ports 21.0 12.8
Source: Annex II, Table 2.
- 39 -
Other Major Projects
95. Annex II of the Report includes a detailed brief for each publicinvestment project under preparation. Thus, a number of projects that haveyet to be justified or that may not be ready for commitment during the 1977-81period are included. The most important of these projects are a petrochemicalcomplex based on increased petroleum production. The economic feasibilityof this project will hinge on Ecuador's petroleum production in the 1980s.Feasibility studies are expected to begin in 1977. The Government recentlyinitiated studies for a steel plant based on imported pellets and on the(yet uncertain) natural gas deposits of the Gulf of Guayaquil. The economicand technical feasibility of this project seems uncertain at this point.In electric power, Annex II includes the Coca Hydroelectric Project whichmay be justified in the early 1980s. The automotive industry project isalso included for the early 1980s. As mentioned in Chapter II, the economicfeasibility of this project, which would serve the Andean Group market,remains to be established. The Quito and Guayaquil airport projects may beeconomically justified in the 1980s, but require thorough further analysis;project briefs are included in Annex II.
Balance of Payments and Creditworthiness
96. Balance of payments developments will be largely influenced by therate of execution of public investment programs and by government decisionson petroleum (see para 38 above). Petroleum output and exports will havea major influence on the level of public investment that Ecuador can finance,both because of the foreign exchange generated and because of the contribu-tion to the local counterpart funds required to complement external borrowing.The investment program outlined in this report may cause financial strainsunless petroleum output rises to 260,000 barrels/ day by 1979.
97. It is clear that the growth of exports will depend heavily on petro-leum. Other traditional exports are not expected to increase much above the(high) 1976 level, given foreseeable production and marketing conditions. 1/Presently, there are no new exports that can be expected to contribute much tototal economic growth.
98. Around 1980, new export items will be required to provide a furtherstimulus to the economy. As mentioned earlier, new production and exportpossibilities exist in further expansion of petroleum as well as in agro-industries, forestry, mining, natural gas and industrial products.
1/ An increasing proportion of cocoa is being processed and exported asindustrial products. Exports of these products are estimated to expandin the near future at 14% per year. Banana sales to EEC countries andJapan recently registered a decline; no substantial expansion in exportsis foreseen for the period 1977-81. Coffee and cocoa export volumes areprojected to grow slowly. Sugar exports may grow at 4.5% per year involume.

- 40 -
99. Exports to the Andean Group may have been adversely affected byeffective devaluations in other member countries, placing the sucre at a dis-advantage. Tourism has been growing by US$3-3.5 million per year but re-presents less than 2% of total exports of goods and non-factor services. Inthe long run tourism could be a much more significant source of growth andforeign exchange.
100. As noted earlier, import management has been fairly successfulin the past and is expected to continue to be so in the future. Total importsof goods are expected to continue to be regulated by the use of credit poli-cies and other restrictions including, if necessary, measures such as anew ban on private automobile imports. Total imports of goods and non-factorservices are projected to grow at a real rate of 5.1% per year as a result offurther increases in capital goods imports associated with the public invest-ment program, and of continued fairly rapid growth in imports of primary andintermediate goods (about 8.4% per year in real terms) reflecting continuedindustrial growth. Fuel and lubricant imports will be significantly reducedon account of the new Esmeraldas refinery.
101. Under the assumptions of petroleum output at 260,000 barrels/day andexports at 64.5 million barrels by 1979, the current account deficit of thebalance of payments is expected to increase from an average US$62 million peryear (1977-79) to over US$200 million per year around 1981. Detailed balanceof payments projections are presented in Statistical Appendix Table 3.10.
102. New private direct foreign investment is not expected to be verydynamic, in spite of the likely expansion of foreign investment in industryand commerce. The lack of dynamism in the other sectors reflects the Govern-ment's petroleum policies as well as uncertainty surrounding Andean Groupregulations on foreign private investment.
103. Average external borrowing in the order of US$290 million per yearwould be required to finance the public investment program outlined in thisreport, and to cover the widening current balance of payments deficit whileamortizing debts and maintaining about 4 months' imports in reserves. Theincrease in debt service that would result from external borrowing at such ascale should not pose serious problems. The debt service ratio would increaseto about 12.3% by 1981 if the external financing required by the publicinvestment program is obtained. This is a tolerable level, so long as thebulk of external credits is used for productive projects with relatively shortgestation periods. On balance, the development prospects of Ecuador arefavorable so long as a substantial petroleum development and explorationprogram goes ahead as soon as possible.

CURRENT ECONOMIC POSITION AND PROSPECTS
OF ECUADOR
ANNEX I AGRICULTURE

AGRICULTURE
1. Ecuador is among the few developing countries with fertile landresources and growth potential. The Guayas basin, the Northern Costa (parti-cularly the province of Esmeraldas which includes areas that have yet to beopened up) as well as parts of the Sierra (where there is much scope foryield increases) are particularly promising in this respect. With a popula-tion of around 7 million increasing at a rate of about 3.4 percent per year,the country's economy is primarily oriented to agriculture which in 1975contributed one-fifth of total GDP (at constant 1970 prices). Until therecen-t development of the petroleum resource, agriculture was the main sourceof foreign exchange earnings derived primarily from exports of bananas, cacao,coffee, and sugar.
2. About one-fourth of Ecuador's land area comprises the Costa, orcoastal plain, which stretches from the Pacific Ocean to the Andes Mountains.This part of the country has mostly medium-sized and large farms. It producesthe important export crops in addition to supplying the economy with a rangeof other commodities including rice, oilseeds, cotton and other fibers, tobac-co, various tropical fruits, and livestock products.
3. Another fourth of the land consists of the Sierra or highlands,situated between two Andean chains, the Western and Eastern Cordilleras, andincludes an inhabited plateau 3,000 meters above sea level. Most of the coun-try's small to medium-sized farms are located in the Sierra and there is aconsiderable amount of farming on a subsistence basis. This region is animportant producer of potatoes, various fruits and vegetables, milk and milkproducts, meat and other livestock products, pulses, wheat, corn barley, andoats.
4. The remaining one-half of the Ecuadorian mainland comprises theOriente, or eastern jungle, which is formed by the gentle slopes east of theAndes, covered with dense tropical forests, and the flat valleys of the upperreaches of the Amazon tributaries. This part of the country is associatedwith recent developments in petroleum and interest in colonization. Relativelylittle is known, however, about its agricultural potential. Ecuador's popula-tion is about equally divided between the Costa and the Sierra with only about3 percent in the Oriente.
5. The following sections review the main problems of the sector(paragraphs 6-51) and offer policy and program recommendations (paragraphs52-66).
A. Recent Performance
6. Over the years, agriculture, including forestry and fisheries, hasbeen by far the largest single employer. In 1971 agriculture employed morethan one-half of the labor force, contributed 26.8 percent of the GDP (inconstant 1970 prices), and was the source of over 90 percent of the country'sexport earnings. By 1975, agriculture provided about 45 percent of the

- 2 -
employment in the country, contributed 20.6 percent of the GDP, and was the
source of 44 percent of the total value of exports that year. Despite defi-ciencies in the available data, the general evidence confirms the trend
indicated by the statistics.
7. Over much of the past decade agricultural production has lagged
behind the needs of the country's expanding population. Using 1961-65 as abase of 100, the indices of per capita agriculture and per capita food pro-
duction averaged well below that level during the 1966-69 period after whichthere was some increase. This was followed by a decline in these indices in1974 which continued into 1975. The lagging overall performance of theEcuadorian agricultural sector and the population growth trend since the1961-65 base period are indicated in the following table:
INDICES OF AGRICULTURE AND FOOD PRODUCTION
(1961-65=100)
AverageProduction Item 1966-69 1970 1971 1972 1973 1974 1975
Crops 110 133 132 136 136 136 143
Total Agriculture 111 133 133 139 140 141 147
Total Food 110 131 133 139 144 140 152
Per Capita Agriculture 96 105 102 103 100 98 98
Per Capita Food 95 104 102 103 103 97 102
Index of Population(1961-65 Pop. 4,824,000=100) 116.1 126.0 130.4 135.0 139.7 144.5 149.3
Source: Economic Research Service, U.S. Department of Agriculture.
8. In the overall rather flat trend of agricultural production, the
best showing has been made in some of the food items. This has been particu-larly true recently in the case of rice, potatoes, corn, bananas, sugar, andlivestock products especially milk. The production levels for different com-
modities over recent years in Ecuador are shown in the following table:
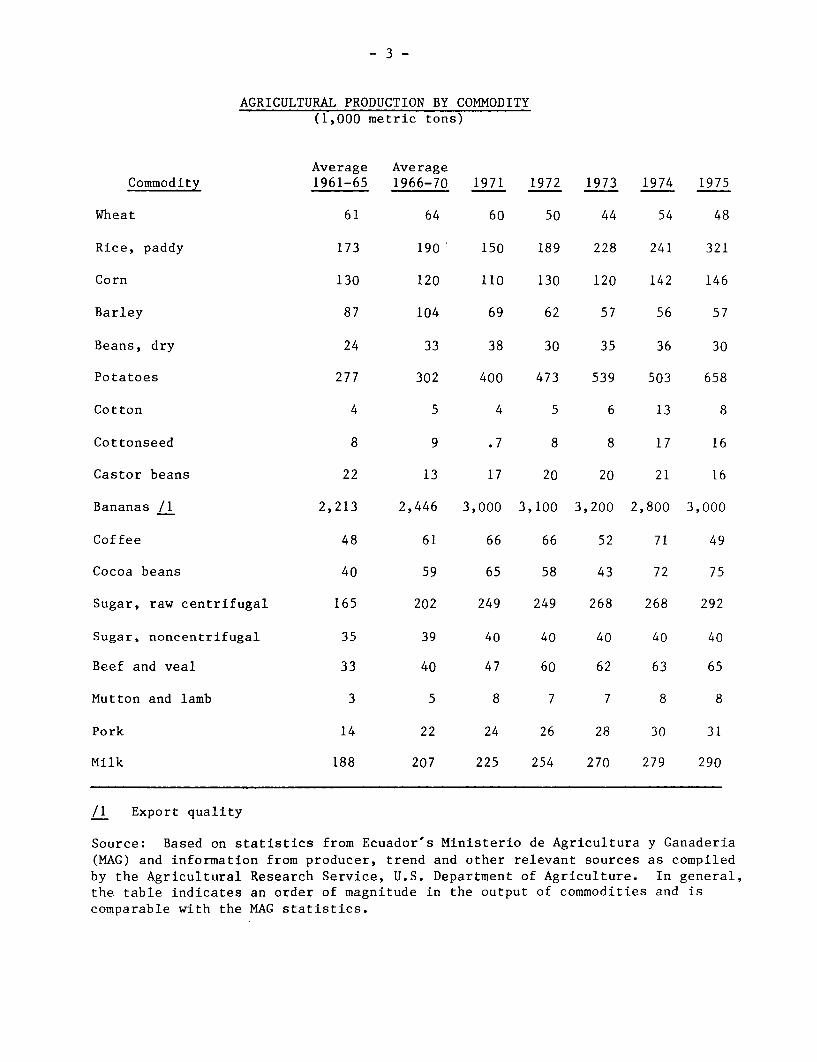
- 3 -
AGRICULTURAL PRODUCTION BY COMMODITY(1,000 metric tons)
Average AverageCommodity 1961-65 1966-70 1971 1972 1973 1974 1975
Wheat 61 64 60 50 44 54 48
Rice, paddy 173 190 150 189 228 241 321
Corn 130 120 110 130 120 142 146
Barley 87 104 69 62 57 56 57
Beans, dry 24 33 38 30 35 36 30
Potatoes 277 302 400 473 539 503 658
Cotton 4 5 4 5 6 13 8
Cottonseed 8 9 .7 8 8 17 16
Castor beans 22 13 17 20 20 21 16
Bananas /L 2,213 2,446 3,000 3,100 3,200 2,800 3,000
Coffee 48 61 66 66 52 71 49
Cocoa beans 40 59 65 58 43 72 75
Sugar, raw centrifugal 165 202 249 249 268 268 292
Sugar, noncentrifugal 35 39 40 40 40 40 40
Beef and veal 33 40 47 60 62 63 65
Mutton and lamb 3 5 8 7 7 8 8
Pork 14 22 24 26 28 30 31
Milk 188 207 225 254 270 279 290
/1 Export quality
Source: Based on statistics from Ecuador's Ministerio de Agricultura y Ganaderia(MAG) and information from producer, trend and other relevant sources as compiledby the Agricultural Research Service, U.S. Department of Agriculture. In general,the table indicates an order of magnitude in the output of commodities and iscomparable with the MAG statistics.

- 4 -
9. To the extent that domestic agricultural production has fallen shortof consumption requirements, imports have had to fill the gap. This has en-tailed an increasingly heavy expenditure of foreign exchange. Food importexpenditures rose from US$14.5 million in 1970 to around US$60 million a yearin 1974 and 1975. Among the food commodities imported, the greatest costs haveconsistently involved wheat whose imports rose steadily from somewhat over80,000 metric tons in 1970 to more than 200,000 in 1975. Other leading foodimports included vegetable oils, animal fats, milk products, and oats as shownin the following table:
PRINCIPAL FOOD COMMODITY IMPORT EXPENDITURES(1,000 US dollars - c.i.f.)
Item 1970 1971 1972 1973 1974 1975
Wheat 6,662.8 3,917.8 9,924.0 16,494.0 35,473.6 33,518.4
Vegetable oils 3,338.5 6,479.1 6,920.2 11,333.5 4,647.0 12,311.1
Animal fats 3,515.6 2,878.8 1,760.0 732.4 7,960.0 7,418.2
Milk products 954.1 968.1 1,553.8 2,041.9 1,529.9 3,044.7
Oats 775.9 840.1 825.5 929.9 1,836.9 2,901.5
Source: 1970-73, Anuarios de Comerio Exterior.1974-75, Banco Central del Ecuador import permits granted.
10. The continuing shortfall in food production in relation to the needsof an expanding population has been reflected in consumer prices. 1/ Using1970 as a base of 100, the consumer food price index for 1975 stood at 215.5while the general price index was at 186.9. By mid-1976 the food priceindex had risen to 234.2 while the general price index had moved up to 207.9with the monthly rate of increase for each being somewhat slower than in theprevious year.
B. Productivity
11. In the past, gains in agricultural output have been achieved byincreasing total area in production. The country's biggest need now is to
1/ Official consumer price index covering low and medium income families ofQuito, Guayaquil, Cuenca, and Portoviejo - four major population centers.

- 5 -
increase land and labor productivity. To accomplish this objective wouldrequire a far greater application of science and technology than hitherto.
12. A scientific and technological basis for increasing agriculturalproduction (especially in the Sierra) has been laid through the work of theInstituto Nacional de Investigaciones Agropecuarias (INIAP), an autonomousagency under the Ministerio de Agricultura y Ganaderia (MAG). Over the past14 years INIAP has been concerned with research and experimentation to developtechniques for increasing crop and livestock production, including rice, corn,wheat, barley, oats, oilseeds, oil palm, bananas, cacao, coffee, as well asbeef, dairy animals and swine. 1/ INIAP plans to expand its investigationactivities to include fruits, vegetables, poultry, and it is just startingwork with pulses.
13. Through its efforts INIAP has accumulated valuable information andtechnology adapted to the needs of Ecuadorian agriculture. The problem liesin transferring this knowledge to the majority of the country's farmers. Aneffective agricultural extension service would be the appropriate medium.
14. The first formal agricultural extension program in Ecuador -- underthe Servicio Cooperativo Interamericano de Agricultura (SCIA) -- dates back tothe early 1950s. Until the early 1960s the extension service was reasonablywell administered. Regional supervisors were trained by sub-agencies in thedifferent geographical zones of the county, and SCIA essentially functioned asa mobile educational and training medium. After the mid-1960s SCIA's effec-tiveness declined sharply, mainly as a result of high personnel turnover andreduced efficiency and morale of staff members. By 1967, SCIA's budget wasdepleted. 2/
15. At the same time, a number of affiliates of MAG emerged with special-ize commodity production programs. Today there are six agencies of this king:Programa Nacional Del Banano y Frutas Tropicales; Programa Nacional de Arroz,Maiz y Control de Piladoras y Molinos; Programa Nacional del Algodon y FibrasVegetables; Programa Nacional de Granos Clima Templado; Programa Nacional delCafe; and Programa Nacional de Cana de Azucar. These commodity programs pro-vide "technical assistance" rather than "extension".
16. Nowhere in the current organization chart of MAG is there an indi-cation of the existence of an agricultural extension service. This reflects atransition from farmer education to dispensing individual commodity programtechnology (including related seeds, fertilizers, insecticides).
17. Under the present organization commodity program specialists pro-viding technical assistance no longer see the problems and needs of an indi-vidual farm as a whole since their aim is to promote a specific crop or
1/ The private sugar mills have their own technical assistance.
2/ Extension agents had to buy their own gasoline for driving from thecity to rural areas.

- 6 -
product. This has led to competition between specialists (agents and inspec-tors) in their attempt to get farmers to plant a specific crop. The focus ofattention is on the large farms where the least promotional effort is needed,while small farms are neglected.
18. Approximately 1,300 professionals, including agricultural engineers,veterinarians, and agronomists, are employed by the different agencies pro-viding technical assistance in the field. Their training is generally limitedto learning one "technological package" which they promote. In addition, morethan 500 professionals are engaged in field work for at least six other publicagencies, providing technical assistance in connection with developing otherprojects or supervising farm credit. Many farmers think that few "technicalassistance workers" have a feel for agriculture because of their urban back-ground.
19. Prospects for improvement in agricultural performance are poorunless the needs of the individual farm as an operating unit are dealt withrealistically. Conveying to most farmers the knowledge and technology neededto increase output calls for a vigorous program of institutional developmentand related manpower training. Without adequate extension and teachinginstitutions agriculture will continue to grow too slowly for the expandingpopulation. (For recommendations see paragraph 55-58.)
20. Agricultural performance has also suffered from:
(a) Some government policies, particularly with respect to commodityprices;
(b) Inadequate physical infrastructure;
(c) Basic deficiencies in the marketing system and structure;
(d) Lack of institutional credit for small and medium farmers; and
(e) Fragmentation of programs and the multiplicity of governmentagencies engaged in such activities as increasing production ofa specific commodity, directing individual rural development proj-ects, or promoting particular irrigation or drainage operations.The respective agencies and programs compete with each other forthe very limited financial and trained manpower resources avail-able, resulting in considerable dispersion and duplication ofeffort.
C. Major Government Policies
21. Apart from general objectives of improving output and providing moreadequate supplies from national sources, there is a lack of long-range agri-cultural policy and strategy. Agricultural program planning and policy imple-mentation have been mostly on a piecemeal basis with usually a maximum 5-yearhorizon.

-7-
Price Policies
22. - Policies affecting commodity prices have been most uncertain.Carried out through various means including price supports and subsidies,price controls, and different regulatory actions affecting exports and imports,agricultural price policy remains heavily consumer-oriented. In the last twoyears there has been some change in orientation in favor of producers tostimulate production of certain commodities for the domestic market. But inmost instances, the incentive has not been sufficient.
23. Price controls are in effect at the wholesale and retail levels fora large number of food items in an effort to regulate inflation. Fixed pricesare set for such key foods as meat, milk, sugar, rice, and wheat flour. Numer-ous products are covered by guideline prices which are not as closely observedas are the fixed prices. The guidelines cover such items as fruits, vegetables,beans, potatoes, and eggs.
24. Farmers have not in the past been assured that a government policywill remain effective for the stated period. In 1975, for example, the Govern-
ment announced 1-2 months before planting time that the price of wheat wouldbe supported at 250 sucres per quintal (100 pounds). 1/ Shortly after thefarmers had planted their wheat, the Government announced a support pricechange from 250 sucres per quintal to 200 sucres per quintal. 2/ The farmerswould get the difference in the form of a certificate good for 30 sucres infertilizer and 20 sucres in improved seed. Since seed and fertilizer werenot needed until the next planting cycle many small producers sold theircertificates to intermediaries at a heavy discount.
25. Despite production incentives total wheat output is short of re-quirements and imports have to fill the gap. Since July 1973, the Governmenthas been paying millers a subsidy on the cost of imported wheat above 3,224sucres (US$129) per metric ton c.i.f. Guayaquil, in an effort to maintain anational wholesale flour price of 253 sucres per quintal (US$10.12 per hundred-weight) at the mill.
26. While the milling industry has been generally satisfied with thewheat import program, the cost to the Government has been significant as worldwheat prices rose substantially after the subsidy was instituted. Neverthe-less the wheat import subsidy has not stabilized the price of bread.
27. In the case of milk, until recently the Government fixed maximumprices on all sales in the chain from the producer to the consumer. As anincentive to the producion of fluid milk and to prevent increases in consumerprices, the Government paid dairy farmers a subsidy on their deliveries offluid milk to receiving plants. Producers who sold their fluid milk to otherplaces did not receive the subsidy. For fluid milk delivered to processingplants, producers received a subsidy payment of 54 centavos per liter in the
1/ US$220/metric ton.2/ US$176/metric ton.
- 8 -
form of fertilizer and a balanced feed for their cattle. The subsidy hasresulted in some production increases. Since fluid milk prices were con-trolled more rigidly than prices of other dairy products, plant operatorstended to use greater quantities of their fluid milk for more profitable dairyproducts such as butter and cheese. This resulted in shortages of fluid milksupplies for the consumer. The subsidy was ended effective September 25,1976 and fluid milk prices were raised at producer and resale levels.
28. As an incentive to expand rice production, the Government establishedproducer support prices equ4l to or above international levels. With a con-siderable amount of technical assistance and related credit made availableunder its national rice program, both small and large producers brought aboutincreases in output which reached a peak in 1975. Unforeseen marketing prob-lems, however, made the distribution of the large crop difficult and costly.There was a great shortage of storage space. International rice prices haddeclined sharply in relation to Ecuador's high official price and manyfarmers were unable to repay Government loans because intermediaries were notpaying the official rice prices.
29. The Government dealt with this problem through its storage andmarketing organization, Empresa Nacional de Almacenamiento y ComercializacionAgropecuarios (ENAC) affiliated to MAG. ENAC agreed to purchase rice from anumber of mills at the official price of 360 sucres per quintal 1/ for longgrain milled rice and 340 sucres per quintal 2/ for medium grain rice. Riceacquired by ENAC is either resold in the domestic market or exported. Fordomestic sale, the rice is turned over by ENAC to Empresa Nacional de ProductosVitales (ENPROVIT) at a margin over cost and the grain is resold to the trade.Surplus rice is sold by ENAC for export.
30. Out of the 1975 crop, the initial sale of surplus rice for exportamounted to 26,000 metric tons. The price paid was US$177 per metric ton,f.o.b. Guayaquil. This particular lot of rice represented an average cost toENAC equivalent to US$352 per metric ton, not counting procurement, handling,and other costs entailed in the transaction. Thus, the cost to the publicsector of this transaction exceeded US$4.6 million. (For recommendations oncommodity price supports and subsidies see paragraphs 61-62).
Infrastructure and Marketing
31. To get farm production to the market requires physical infrastructureand auxiliary services, both of which are presently inadequate, and have heldback agricultural growth. For many farmers, and particularly small producers,ready access to commodity collection or market centers is limited because ofa lack of all-weather secondary or feeder roads. The marketing system neitherprovides strong production incentives, nor does it afford the facilities requiredfor orderly handling, storage, distribution, and use of the total output without
1/ US$317/metric ton.2/ US$300/metric ton.
- 9 -
undue waste. The prevailing uncertainties and deficiencies tend to increasemarket risks and result in wider handling and distribution margins to the detri-ment of producers and consumers in terms of costs and deterioration or waste ofproduct.
32. The biggest handicap is the insufficient adequate storage space avail-able to government and to the private sector. The problem has been particularlyserious in the case of rice, but also for corn, wheat, oilseeds, and cotton. Itprevails throughout the agricultural production and marketing chain, from pro-ducer to intermediary to the ultimate distributor.
33. The shortages of storage facilities are particularly acute in the pro-ducing areas and at commodity assembly points. Small farmers have virtuallyno on-farm storage facilities and at times, as in the case of cotton, the pro-duct is stored in producer homes. For the most part, the harvest of smallfarmers is left in the field until sold.
34. In the case of potatoes, for example, both small and large farmersusually sell their crop to intermediary buyers as soon as it comes out of theground and even earlier in some instances. For a short time supplies areabundant and prices low. Produccers forego the opportunity for a higherreturn which they could have achieved with adequate storage facilities.
35. The total deficiency in storage facilities amounts to at least250,000 metric tons total capacity. About 120,000 metric tons of storagespace in the form of silos and warehouses is needed to meet the requirementsof ENAC for grain alone. The need for additional storage facilities may beexpected to increase further by 1985. (For recommendations see paragraphs63-64).
36. The Government has only recently placed priority on expandingsecondary or feeder road construction. The funding of the Ministerio de ObrasPublicas (MOP) for building feeder roads has been increased from 300 millionsucres in 1974 to 600 million sucres in 1976. These funds represent aboutone-third of the total MOP budget. Construction will center on feeder roadson which trucks can travel under all weather conditions. Construction costsare stimated by MOP at about 1 million sucres per kilometer.
37. The lack of feeder roads which permit all-weather transport ofagricultural commodities seriously impedes rapid farm-to-market deliveries.This is particularly critical for perishables such as milk, fruits andvegetables. Poorer producers who live farthest from the main roads sufferthe greatest losses. Their production potential is weakened while consumersare deprived of more ample supplies which otherwise would be available atperhaps a lower cost. (For recommendations see paragraphs 69-70.)

- 10 -
Credit
38. For the most part, the supply of agricultural credit has been ona selective basis and has fallen far short of needs. 1/ Most farmers have torely on trade intermediaries, suppliers, or money lenders, while largerproducers usually have access to credit from banks and other institutionalsources.
39. Of the total volume of credit supplied in 1975 by the bankingsystem, 16.6 percent (or the equivalent of US$186 million) went to the agri-cultural sector. This compared with 17.6 percent in 1974 and an average of13.4 percent during the previous five years. The US$186 million figure isequivalent to about 20 percent of agricultural value added. Countries thathave a more developed agriculture have a higher ratio of farm credit to totalvalue added in agriculture.
40. The leading supplier of agricultural credit is the public BancoNacional de Fomento (BNF). In 1975, loans made by this institution representednearly 69 percent of the total credit extended to agriculture by the entirebanking system. This compares with an average of 36 percent in the 1970-72period, about 48 percent in 1973, and close to 70 percent in 1974. Trends inagricultural lending by the Banco Nacional de Fomento are shown in the fol-lowing table:
VOLUME AND NUMBER OF LOANS MADE BY THE BANCO NACIONAL DE FOMENTO,AVERAGE 1970-72 AND ANNUALLY 1973 THROUGH 1975
(volume in millions of sucres)
Average1970-1972 1973 1974 1975
Purpose Volume Number Volume Number Volume Number Volume Number
Crop production 233.3 11,702 593.4 16,219 1,405.3 25,053 1,766.3 29,314
Livestock 238.9 7,450 412.0 9,064 856.6 13,467 1,013.9 11,937
Machinery,equipment andinfrastructure 75.7 863 123.1 1,187 359.6 2,608 275.9 2,063
Totals 547.9 20,015 1,128.5 26,470 2,621.5 41,128 3,056.1 43,314
Source: Banco Nacional de Fomento
1/ It is not possible to separate out investment credit, owing to the natureof the statistics.

- 11 -
41. While the funds lent by BNF rose substantially between 1970 and1974, the increase between 1974 and 1975 was negligible. The average size ofloans, which increased during the early 1970's, stabilized in real terms in1975 (for crops, machinery and other investment, the average loan size wentdown in real terms; loans for livestock continued to increase in real terms).In spite of the rapid increase in agricultural lending since 1970, the vastmajority of farmers have no access to institutional credit.
AVERAGE SIZE L OF BANCO NACIONAL DE FOMENTO AGRICULTURAL LOANS
Current Sucres Constant 1970-72 SucresAverage Average
Purpose 1970-72 1973 1974 1975 1970-72 1973 1974 1975
Crop production 19,900 36,600 56,100 60,300 19,900 30,100 37,500 35,200
Livestock 32,100 45,500 63,600 84,900 32,100 37,500 42,500 49,600
Machinery,equipment andinfrastructure 87,700 103,700 137,900 133,700 87,700 85,400 92,200 78,100
/L Rounded figures based on volume and number of BNF loans.
42. Most of the loans made by BNF have been for crop production largelyon a short-term basis but usually for no more than one year. Next have beenthe livestock loans which may also include financing for pastures. Of thelivestock loans made in 1975, somewhat over 50 percent were for a period ofnot over two years with about 38 percent exceeding five years. In the categoryof machinery, equipment and infrastructure, about 40 percent of such 1975 loanswere for one to two years and somewhat less for over five years.
43. In its peak lending year, 1975, BNF financed crop production onabout 214,500 hectares of land. This is equivalent to only about 13 percentof Ecuador's total land area from which crops were harvested, of which 38percent was in rice.
44. Almost 60 percent of total BNF credit for the 1975 crop productionwent to finance only two crops, 42 percent going to rice and 17.6 percentto cotton. Next was corn with 9.6 percent of the total, while 5 percentwent for the production of potatoes, 3.4 percent for coffee and smallerpercentages to 33 additional crops.
45. In summary, the record shows that BNF credit has served a relativelysmall part of the country's need for agricultural financing and loans were tooconcentrated to enhance overall national output. Too few of the farmers havebeen reached by this institution's lending operations. (For recommendations,see paragraphs 59-60.)

- 12 -
Land Reform
46. Since tabulation of the 1974 agricultural census has not beencompleted, the 1968 National Agricultural and Livestock Survey providesthe only basis for ascertaining the magnitude of changes in land tenurestructure sinced 1954. 1/ Between 1954 and 1968, there was an increasein the number of farms but a decline in the average farm size, attributed,inter alia, to implementation of agrarian reform (titles to subsistenceplots given to tenants), colonization programs, fragmentation resultingfrom inheritances, and subdivision of estates by larger landowners in anattempt to minimize loss under agrarian reform. Despite the increase inthe number of farm holdings, the overall distribution pattern by farm sizehas not changed significantly in this period. Based on 1968 data, about85% of all farm units may be classified as "subfamily," i.e., too small toprovide full and productive employment. 2/ Partial data from the 1974census - suggests that the number of holdings increased to 600,000 and thetotal area to 8 million ha. This would imply a further reduction in averagefarm size from 14.9 ha in 1968 to 13.3 ha in 1974.
47. In spite of an increasing trend in the number of farms, landdistribution still remains relatively skewed. The Gini coefficient of landdistribution in 1968 was estimated at 0.82, declining from 0.86 in 1954, thussuggesting only minimal improvement in the land distribution from 0.86 in1954, thus suggesting only minimal improvement in the land distributionpattern. 3/ Slightly more than 470,000 farms, almost 74% of total landholdings, had less than 5 ha, accounting for only 10% of total area and lessthan 20% of the total value of crop production. It is this stratum whichmakes up the mass of campesinos representing almost 90% of the rural laborforce.
48. At the other end of the scale, nearly 10,000 farms, each with over100 ha, account for slightly over 47% of total farmland and 35% of the valueof agricultural products. Private ownership of farms between 1954 and 1968increased two-fold. In 1968, about 76% of the total number of holdings(480,000 farms) were owner-operated. The remaining 24% consisted of renters,sharecroppers and other mixed forms of tenure.
1/ An agricultural census was taken in 1954 and an agricultural surveywas completed in 1968. The latter is not entirely comparable withthe 1954 census data and seriously deficient with respect to datareliability.
2/ CIDA. Tenencia de la Tierra y Desarrollo Socio-Economico del SectorAgricola, Ecuador. Washington, D.C.: Organization of AmericanStates, 1965. The study considers farms of less than 10 ha as sub-family units.
3/ C.S. Blankstein and Clarence Zuvekas, Jr., "Agrarian Reform in Ecuador:An Evaluation of Past Efforts and the Development of a New Approach,"in Economic Development and Cultural Change, XXIII, 1; (October, 1973),p. 84.

- 13 -
49. The enactment of the Land Reform, Idle Lands and Settlement Act inmid-1964 provided the foundation for increased efforts toward modernizing
the land tenure systems. The law was revised in 1967, and in 1973 a newlaw was passed. The chief executing agency is the Ecuadorian Institutefor Agrarian Reform and Colonization (Il.RAC), which also has responsibilityfor supervising "planned" and "spontaneous" colonization schemes.
50. Until now, the measures which have been introduced have been sporadicand modest in scope and results have fallen short of expected targets. Fromits inception until 1974, the program has had about 55,000 recipients (lessthan 10% of farm holdings), redistribut:ing about 1 million ha of arableland. The impact of the program has fluctuated considerably on an annualbasis as well as by regions. Almost 80% (about 797,000 ha) of the totalland transferred resulted from colonization schemes. The most pronouncedeffect of the agrarian reform has been the transformation of haciendaretainers and workers into minifundistas; by and large, the holdings of thebeneficiaries are too small to provide a family with adequate farm income.
51. The weakness of the program is reflected in the institutional arrange-ments themselves. In part, the disappointing results can be attributed to(a) failure of IERAC to mobilize adequate financial resources; (b) lack ofsupport and cooperation among other governmental agencies (technical servicesand infrastructure facilities for IERAC projects); (c) rapid turnover of offi-cials; and (d) absence of sound, efficient and prompt legal procedures. 1/
D. Policy and Program Recommendations
Approach and Orientation
52. A departure from the piecemeal approach in planning and programmingin favor of more comprehensive goals both on a short-term and long-range basisis badly needed. Coupled with this are requirements for strengthened adminis-tration, effective control of sectoral activities, closer monitoring of prog-rams, and improved integration and coordination.
53. The national planning office, Junta Nacional de Planificacion(JUNAPLA), could play a key role in providing the basis for the transformationrequired in agriculture. Major responsibility, however, will continue to restwith MAG. Both institutions need to strengthen their organizational capacityand staffing capabilities.
54. A major concern of MAG should be to overcome existing program frag-mentation with the resulting dispersion and duplication of effort and internal
1/ The 1973 Law, unlike previous laws, places greater emphasis on thequestion of criteria for expropriation. However, the controversialArticle 25 which provided for expropriation of "insufficientlyexploited" land starting 1 January 1976 is, for the time being, inlimbo.
- 14 -
competition for limited financial and trained manpower resources. Actionshould focus on the farmers' needs and be guided by feasibility. The farmerand his motivations for producing ultimately determine output levels.
Extension
55. The present system of technical assistance oriented to specificcrops could be replaced by an agricultural extension service capable of dealingwith the needs of the individual farmer from the standpoint of his total farmoperation. The organization would absorb the presently employed commoditytechnical assistance specialists and provide training to broaden the base oftechnical know-how. Through additional qualified personnel such an improvedextension service would permit diffusion of knowledge and transfer of tech-nology already accumulated through agricultural research. The objective wouldbe to reach the majority of the country's farmers and help them improve theirperformance.
56. While INIAP serves as the research arm of MAG, an established agri-cultural extension service could be its educational arm. Both could have thesame organizational status. Such an undertaking would also require a nationalextension training program and institutional relationships (e.g. with univer-sities) to improve agricultural curricula including extension. With necessarybackstopping of qualified subject matter specialists and trained supervisors,such an extension service would operate on a regional basis through officesand sub-offices providing services tailored to meet local farm needs.
Research
57. An effective extension service would bring more and more farm prob-lems into the open and this will require expansion and possibly a reorienta-tion of agricultural research. In anticipation of future requirements researchshould be conducted on the possible exploitation of land resources in the highplateau ("paramo") of the Sierra as well as in the Oriente region. INIAPcould also expand its applied or adaptive research to fruits, vegetables,poultry, and pulses. Particular attention should be given to oilseeds in viewof growing vegetable oil imports. Research work could center on soybeanssince it is not only a valuable provider of vegetable oil but also an impor-tant source of protein for human and animal consumption. Likewise there isa need in getting practical research underway so that grain sorghum may beintroduced. This could rapidly add to assured grain supplies for livestockfeeding at more reasonable prices, and go some way toward overcoming nutri-tional deficiencies and expanding the output of livestock products. At present,hard corn is virtually the only feed grain grown in the country.
58. While INIAP has done a considerable amount of work relating tocattle, several paramount problems can only be dealt with through an aggresiveprogram of applied research. The general areas involve nutrition and healthdeficiencies, conception and reproduction failures, high mortality rates amongcalves, and other problems of a similar nature. All these have long held downlevels of meat and milk production and have seriously inhibited increases in

- 15 -
cattle numbers. The application of research results with the advice andguidance of extension should move forward with an initial goal of cutting calfmortality in half and increasing calving rates by one-third.
Credit Availability and Distribution
59. Between the lending institution on the one hand and the farmerborrower on the other there are ample opportunities for improving agriculturalcredit practices to the benefit of both. The amount of medium and long-termagricultural credit needs to be increased substantially. Credit should bemade available to far more farmers and be more equitably distributed among thedifferent crops of the country. BNF as the major source of agriculturalfinancing can improve its operations. But institutional sources of credit,such as private banks and the Cooperatives' Bank, should play a much biggerrole in agricultural lending.
60. The criterion for lending should be the farmer's creditworthinessrather than the size of the farm. Since institutional credit is generallyless costly than other forms of credit, the critical issue is access ratherthan the precise cost of credit. Nevertheless the recent increase in interestrates for agricultural credit (13 percent maximum rate including commissionssince late 1976) might lead to a broader coverage as lending for agriculturehas become more attractive. The farm should be financed as an operatingunit, and credit be geared to its overall needs as well as to its productionpotential.
Commodity Price Supports and Subsidies
61. Experience indicates that even with the best of intentions, pricesupports and subsidies do not always achieve the desired results as productionincentives for a variety of reasons linked largely to inadequate planning. Inorder to prevent costly experiences, price supports--as, for example, in thecase of rice--should not exceed international price levels that may be expectedto prevail after the crop is harvested. Otherwise, marketing difficulties arealmost certain to be encountered and losses incurred.
62. Considering the use made of commodity price supports and subsidiessince their initial introduction by the Government in 1973, an in-depth studyand analysis of their operation and impact is now timely. Such an examinationfor each commodity covered should be concerned with the respective interestsof producers and consumers as well as the costs and benefits from the stand-point of the national economy.
Agricultural Marketing Needs
63. The most pressing shortage is in storage facilities available toENAC, the government market intervention agency. Also, there is a need toimprove facilities in major market centers, particularly in wholesaling food-stuffs in Guayaquil. The development of vocational skills in the public and

- 16 -
private sectors, provision of basic marketing services and promotion of agro-industries might contribute to increasing efficiency in the marketing systemand lowering distribution costs.
64. A package approach to the marketing problem could consist of thefollowing components: Silos and warehouses, refrigerated facilities, whole-sale market in Guayaquil, technical assistance and training in marketing, andthe establishment of grades and standards as well as a market news service.The private sector should be encouraged to invest in marketing facilities.Incentives could be in the form of government loans to finance private con-struction and maintenance of storage facilities.
Rural Development Program
65. Ecuador does not have a national rural development policy or program.Regional public organizations engaged in rural development do exist, however. I/These include Programa de Desarrollo del Sur (PREDESUR), Centro de ReconversionEconomica de Azuay (CREA), Comision de Estudios para el Desarrollo de la Cuencadel Rio Guayas (CEDEGE), and others. Each of these regional agencies operatesindependently, thereby precluding a unified approach.
66. One of the most active of the public organizations engaged in ruraldevelopment is PREDESUR which operates in the southern parts of the country.It receives financing from the Fondo Nacional de Desarrollo (FONADE), theInter-American Development Bank, and other sources. At present 57 projectsare being implemented most of which are small. PREDESUR has a limited buthigh-caliber staff. It operates through contracts ("convenios") with publicand private agencies for works such as construction of access roads, agricul-tural technical assistance services, reforestation, etc. PREDESUR thus usespetroleum revenues and external loans in a manner that brings public agenciesinto competition with private contractors.
67. The experience of PREDESUR and other regional development agenciesmay provide a basis for a national rural development program, which could in-clude all such agencies. What is needed is a national rural development policydefining expenditure priorities and an effective administrative framework.The recent creation of a rural development task force in the Planning Office(JUNAPLA) may help in defining a policy in this respect. Perhaps the mosteffective organization would combine a flexible field structure and a centralgoverning body in the capital. The field organization would channel projectproposals to the central office, which would coordinate and allocate materialand financial resources on a project-by-project basis.
68. In this way all relevant public agencies as well as private con-tractors could become involved in a most important long-term effort--improvingthe living standards of the poorer areas of Ecuador.
1/ These organizations are trying to deal with regional development. Thediscussion in this section is concerned with the rural aspects only.

- 17 -
All-Weather Feeder Roads
69. While a start has been made by MOP in expanding the system of all-weather feeder roads, a commitment is needed to insure continuity of construc-tion over a reasonable period of time. Such a course calls for a national
strategy consistent with the requirements for profitable agricultural expan-
sion in the different provinces.
70. Formulation of this kind of strategy could not only involve MOP butalso other government agencies including MAG in particular. It should be
feasible to increase the all-weather feeder road network from 8,000 kilometers
at present to 11,000 in the next five years. The expenditure involved wouldbe in the order of US$24 million per year.
Conclusion
71. Unlike most developing countries, Ecuador has an excellent potentialfor agricultural expansion. The preceding recommendations attempt to outlinethe main areas where action is possible and likely to yield good results. The
different lines of action (creation of an extension system geared to needs of
the farm as an operating unit, research in promising import-substituting cropsand livestock, much broader availability of credit, more rational and less
costly price policies, the setting up of an adequate marketing system, an
effort at nationwide rural development, and the establishment of a 5-yearprogram for all-weather rural roads) all form part of a package. They are
complementary and mutually supportive.
72. If a serious effort is made on such a package of policies and
programs, there is little doubt that agricultural and livestock developmentwill accelerate. This set of development policies can achieve a broad
improvement in the living conditions of the bulk of the population, while at
the same time serving the national development objectives. Furthermore, evena slight absolute improvement in the standard of living of the bulk of therural population would represent a substantial relative improvement for thepersons concerned.

CURRENT ECONOMIC POSITION AND PROSPECTS
OF ECUADOR
ANNEX II LIST OF PROJECTS


ANNEX II
LIST OF CONTENTS
1. Introduction
2. Table 1: Public Investment Program 1977-1981Totals by Sector
3. Table 2: Public Investment Program 1977-1981List of Projects by Sector
4. Description of Public Sector Projects for External Financing


ECUADOR
LIST OF PROJECTS SUITABLE FOR EXTERNAL FINANCING
Introduction
1. As indicated in Volume I, Ecuador's economic prospects will be sig-
nificantly affected by the choices made in the decisions regarding public
investment. The findings of this Report indicate that:
a) Investment is needed in the petroleum sector to sustain the
momentum of growth and to provide the basis for diversification
of exports and renewal of the agricultural base;
b) Agriculture is of the highest priority for Ecuador's long-term
future and employment requirements, social progress and national
integration goals; and
c) Improvements in electrical energy deserve particular attention.
2. There has been some progress in Ecuador in laying the foundations for
development-oriented investments, somewhat in contrast with the past situation.
There has been a substantial improvement in project preparation activity.
3. This volume contains the complete list of projects of the public sec-
tor of Ecuador as of February 1977 for which external financing is sought for
the years 1977-1981. The projects included in the list represent the efforts
in project preparation of all public sector institutions and do not necessarily
reflect the priorities of the Government. The projects are listed individually
in Table 3. As the gross total of these projects exceeds the improving but
still modest absorptive capacity of the economy, there has been a classification
of their priorities. Those considered to be of the highest priority are pre-
sented in Table 2 and are part of the public investment program for years 1977-
1981.

A summary of this list according to sector is in Table 1. The public invest-
ment program proposes a total external financing of $2.8 billion in a five year
program, and it provides a basis for a substantial rate of commitments. 1/
4. The total project list reflects the basic objectives of Ecuador's
development strategy. Major shares of the total external financing are directed
to petroleum, agriculture and power in the first years, while industry and
transport increase in later years.
5. Petroleum investment is geared to an increase in production to 250,000
barrels per day in 1978, and to a gradual increase in production to 350,000-
400,000 barrels per day in 1985. In addition, the Government of Ecuador plans
to install a large petrochemical complex, but its economic feasibility is tied
on Ecuador's ability to reach production of 350,000-400,000 barrels per day in
1985, and an Amonia-Methanol Plant that will exploit the natural gas resources
located at the Guayaquil Gulf.
6. The agricultural sector includes various irrigation and rural develop-
ment projects. Two projects are of special importance, the Agricultural Market-
ing Project, providing storage facilities for agricultural production; a a proj-
ect for the rehabilitation and renovation of cacao orchards, and for oilseed
plantations. This project will increase foreign exchange earnings and substi-
tute oilseed oil imports.
7. Energy projects have been selected from the National Electrification
Program approved by the Government.
8. Industrial projects are few, and of minor importance, with the exception
of the Iron Ore Project, the Naval Shipyard, and the Automotive Industry Development
Project, that represent a total investment of $654.8 million. The economic feasibility
1/ All value figures in this annex are in current US dollars. They rest on amoderate inflation expectation (about 7% per year). To the extent that futurecost increses are understated, these figures may have to be increased accordingly.
of these projects is contingent upon several factors presently being studied
by the Government.
9. Two other large projects, the Guayaquil and Quito international air-
ports are being analyzed by the Government, but final feasibility studies are
not completed.
10. In order to increase the development of technical and managerial
capabilities, the Government of Ecuador aims at attracting foreign investment
participation in mixed enterprises, while maintaining a suitable degree of
domestic participation in each enterprise. To this end, the petrochemical
complex and the large industrial projects in the list, are designed to invite
proposals of joint ventures from experienced companies in each field, and to
seek external financing.


Table 1: ECUADOR: PUBLIC INVESTMENT PROGRAM 1977-1981 TOTALS BY SECTOR
(In millions of US Dollars)
TotalEstimated Estimated External Financing Commitments
Sector Cost 1977 1978 1979 1980 1981
I. Agriculture 407.3 22.0 67.4 56.6 10.0 55.0II. Fisheries 67.5 30.0 10.5 13.0 - -III. Petroleum 531.3 62.4 79.7 116.2 34.7 34.7IV. Power 645.0 60.4 16.4 61.4 16.4 192.4V. Industry 354.1 - 83.3 65.0 - 55.3
VI. Road Transport 323.4 31.2 45.1 36.4 21.8 11.0VII. Airports 32.0 - 24.0 - - -
VIII. Ports 21.2 - 12.8 - - -IX. Tourism 26.6 - 20.2 - - -X. Telecommunications 95.4 65.5 - - - -
XI. Health 105.5 37.0 27.5 11.0 -XII. Education 36.5 - 13.2 - - -
XIII. Urban Development 88.0 - 20.0 - 25.0 _XIV. Water and Sewerage 131.8 27.0 26.0 28.1 - -XV. Preinvestment 30.0 8.0 - 6.0 10.0 -
XVI. Other Projects /1 900.0 - - 100.0 420.0 240.0
Sub-Total Sectors 3,795.6 343.5 446.1 493.7 537.9 588.4
XVII. Lines of Credit1. Banco Nacional de Fomento
(Agriculture) /2 339.7 65.8 66.3 28.8 48.8 28.82. CV-Corp. Financiera Nacional
(Industry) 166.0 16.7 61.2 24.0 20.0 30.0Sub-Total Lines of Credit 505.7 86.5 127.5 52.8 68.8 58.8
GRAND TOTAL 4,301.1 430.0 573.6 546.5 605.8 647.2
/1 Refers to projects included in the Project List (Annex 2) but whose economic feasibility has not yet beendetermined.
/2 Financial investment for agriculture is mostly by Banco Nacional de Fomento but includes a small portionby private banks.

Table 2: ECUADOR: PUBLIC INVESTMENT PROGRAM 1977-1981 LIST OF PROJECTS BY SECTOR
(In millions of US Dollars)
TotalExecuting Proposed Estimated Estimated External Financing Commitments
Sector/Name of Project Agency Lender Cost 1977 1978 1979 1980 1981
I. Agriculture1. Agricultural Marketing IBRD/IDB/
and Storage ENAC Others 58.6 12.0 10.0 20.0 - -2. Tungurahua Rural Dev. MAG/INHERI IBRD 30.0 - 15.0 - -
3. Puerto Ila Chone MAG IBRD 50.0 - - 20.0 -4. Milagro II Irrigation INHERI IBRD 40.0 - 20.0 - - -5. Guayas Water Management INHERI/CEDEGE IBRD 40.0 - - - - 20.06. Cayambe Rural Dev. MAC Undetermined 20.0 - - - 10.0 -7. Forestry Development MAC IBRD 20.0 - - - - 10.08. Esmeraldas Rural Dev. MAG/INHERI IBRD 50.0 - - - 25.09. Manuel J. Calle Irrig. INHERI Undetermined 21.0 - 10.9 - -
10. Latacunga-Ambato Irrig. INHERI IDB 18.2 10.0 - - -11. Colonization Nangaritza PREDESUR IDB 19.2 - 11.5 - - -12. Carrizal Chone Irrig. C.R.M. Undetermined 28.8 - - 14.2 - -13. Forestry Development MAG IDB 21.5 - - 2.4 - -
Total Agriculture 407.3 22.0 67.4 56.6 10.0 55.0
II. Fisheries1. Posorja Fishing Port Min.Natural
Resources Undetermined 8.8 - 5.3 - - -2. Manta Fishing Port Manta Port
Authority IBRD 8.7 _ 5.2 -3. Artisan Fishing Project Min.Natural
Resources IDB 20.0 - - 13.04. Fishing Vessels Min.Natural
Resources Undetermined 30.0 30.0 - -
Total Fisheries 67.5 30.0 10.5 13.0

Table 2: (cont'd) ECUADOR: PUBLIC INVESTMENT PROGRAM 1977-1981 LIST OF PROJECTS BY SECTOR (page 2)
(In millions of US Dollars)
TotalExecuting Proposed Estimated Estimated External Financing Commitments
Sector/Name of Project Agency Lender Cost 1977 1978 1979 1980 1981
III. Petroleum1. Development Program CEPE Undetermined 230.9 10.0 34.7 34.7 34.7 37.72. Esmeraldas Maritime
Terminal (Phase II) CEPE Undetermined 35.0 - 15.0 - - -3. Shushufindi Gas Plant CEPE IDB 21.0 16.0 - - _ _4. Shushufindi Poliduct CEPE Undetermined 36.0 - 30.0 - - -5. Esmeraldas-Quito Poliduct CEPE Undetermined 45.4 36.4 - - -6. Amonia-Methanol Plant
(Guayaquil Gulf Gas) CEPE Undetermined 163.0 - - 81.5 - -
Total Petroleum 531.3 62.4 79.7 116.2 34.7 34.7
IV. Power1. National Transmission
System (Paute Phase C.D.) INECEL Undetermined 73.0 44.0 - - - -2. Regional Distribution
System INECEL Undetermined 178.0 16.4 16.4 16.4 16.4 16.43. Toachi Hydroelectric Proj. INECEL Undetermined 334.0 - - - - 176.04. Rural Electrification INECEL IBRD/Other 60.0 - - 45.0 - -
Total Power 645.0 60.4 16.4 61.4 16.4 192.4

Table 2: (gont'd) ECUADOR: PUBLIC INVESTMENT PROGRAM 1977-1981 LIST OF PROJECTS BY SECTOR (page 3)(In millions of US Dollars)
TotalExecuting Proposed Estimated Estimated External Financing CommitmentsSector/Name of Project Agency Lender Cost 1977 1978 1979 1980 1981
V. Industry1. African Palm Oil CV-CFN IBRD 25.0 - 15.0 - - -2. New Sugar Mills CV-CFN Undetermined 150.0 - 25.0 65.0 -3. Cemento Cotopaxi CV-CFN Undetermined 74.7 - 35.5 - - -4. Cayapas Pulp & Paper Cayapas Industries Undetermined 92.1 - - - -55.35. Industrial Parks CV-CFN Undetermined 12.3 - 7.8 - _ -
Total Industry 354.1 - 83.3 65.0 - 55.3
VI. Road Transport1. Duran Boliche 2OP TBRD 20.0 8.0 - - -2. Puerto-Ila Carrapata MOP IBRD 13.0 5.2 - _ _3. Quito-Aloag Expressway HOP Undetermined 35.0 - 21.0 - -4. Cumbe-Pasaje MOP Kuwait 30.0 18.0 - - - -5. Quininde-Chila MOP Kuwait 6.1 - 3.7 - _6. Loja-Zamora MOP Undetermined 8.0 - 4.8 - -7. Quiroga-Pichincha htOP Undetermined 7.7 - 4.6 - _ _8. Cuenca-Azogues MOP Undetermined 9.0 - - 5.4 -
9. Cumbe-Loja MOP Undetermined 25.0 - - 15.1 - -10. Sesme-Jama MOP Undetermined 8.2 - - 4.9 - _11. Suma-Pedernales MOP Undetermined 17.2 - - - 10.8 -12. National Feeder Road MOP Undetermined 144.0 - 11.0 11.0 11.0 11.0
Total Road Transport 323.4 31.2 45.1 36.4 21.8 11.0

Table 2: (cont'd) ECUADOR: PUBLIC INVESTMENT PROGRAM 1977-1981 LIST OF PROJECTS BY SECTOR (page 4)
(In millions of US Dollars)
TotalExecuting Proposed Estimated Estimated External Financing Commitments
Sector/Name of Project Agency Lender Cost 1977 1978 1979 1980 1981
VII. Airports1. Cuenca, Machala, Coca
and Pastaza DAC Undetermined 32.0 - 24.0 - - -
Total Airports 32.0 - 24.0 - - -
VIII. Ports
1. Esmeraldas Phase I EsmeraldasPort Auth. Undetermined 21.2 - 12.8 - - -
Total Ports 21.2 - 12.8 - - -
IX. Tourism1. Guayaquil Hotel Dir.Turismo/
CV-CFN Undetermined 11.4 - 8.0 - - -2. Various Hotels Dir.Turismo/
CV-CFN Undetermined 15.2 - 12.2 - - -
Total Tourism 26.6 - 20.2
X. Telecommunications1. Rural Telecommunications IETEL IDB 18.0 12.0 - - - -2. Expansion of Local
Telephone System IETEL ERICSSON 77.4 53.5
Total Telecommunications 95.4 65.5

Table 2: (cont'd) ECUADOR: PUBLIC INVESTMENT PROGRAM 1977-1981 LIST OF PROJECTS BY SECTOR (page 5)
(In millions of US Dollars)
TotalExecuting Proposed Estimated Estimated External Financing Commitments
Sector/Name of Project Agency Lender Cost 1977 1978 1979 1980 1981
XI. Health1. Quevedo Hospital Min.Health Undetermined 1.1 1.1 - -2. Esmeraldas Hospital "i 2.5 2.5 - - - -3. Manta Hospital " " 5.8 2.9 - - - -4. Chone Hospital " " 3.4 1.7 - - - -5. Azogues Hospital " ' 3.4 1.7 - - -6. Santo Domingo Hospital t" 3.4 1.7 - - - _7. Pasaje Hospital t" 3.4 1.78. 21 hospitals & health centers " " 8.9 4.1 - - - _9. Guayaquil Children's Hospital " ' 14.6 7.3 - - - -
10. South Quito Hospital " t 5.0 5.0 - - -11. Machala Hospital " i 3.5 3.5 - - -12. Guaranda Hospital " 2.1 2.1 - - - =13. Rural Hospitals and
sub-centers " 45.0 - 27.5 11.0 - _
Total Health 105.5 37.0 27.5 11.0 - _
XII. Education1. Rural Education Min.Education IBRD 36.5 - 13.2 - - -
Total Education 36.5 - 13.2 - - -
XIII. Urban Development1. Guayaquil Municip.Guayaquil IDB 50.0 - - - 25.0 -2. Quito Municip.Quito IDB 38.0 - 20.0 - - _
Total Urban Development 88.0 - 20.0 - 25.0
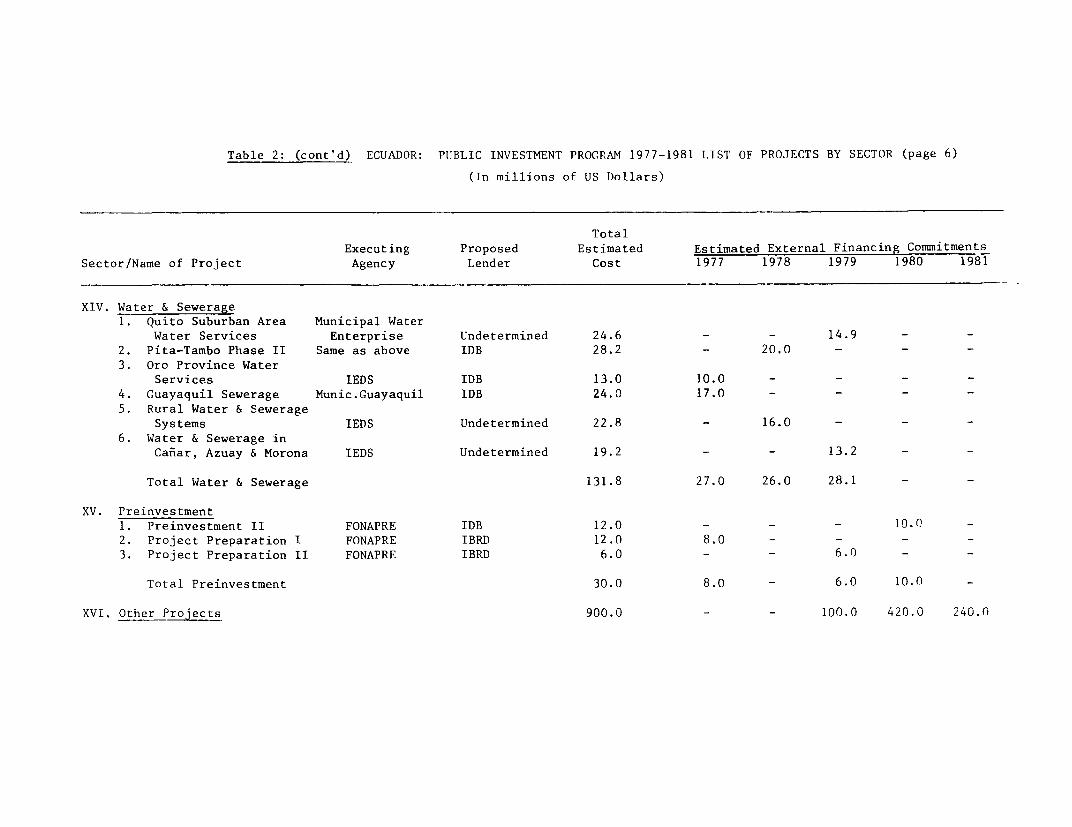
Table 2: (cont'd) ECUADOR: P11BLIC INVESTMENT PROGRAM 1977-1981 LIST OF PROJECTS BY SECTOR (page 6)
(In millions of US Dollars)
TotalExecuting Proposed Estimated Estimated External Financing Commitments
Sector/Name of Project Agency Lender Cost 1977 1978 1979 1980 1981
XIV. Water & Sewerage1. Quito Suburban Area Municipal Water
Water Services Enterprise Undetermined 24.6 - - 14.92. Pita-Tambo Phase II Same as above IDB 28.2 - 20.0 -3. Oro Province Water
Services IEDS IDB 13.0 10.0 - -
4. Guayaquil Sewerage Munic.Guayaquil IDB 24.0 17.0 - -5. Rural Water & Sewerage
Systems IEDS Undetermined 22.8 - 16.0 -6. Water & Sewerage in
Caniar, Azuay & Morona IEDS Undetermined 19.2 - - 13.2
Total Water & Sewerage 131.8 27.0 26.0 28.1 -
XV. Preinvestment1. Preinvestment II FONAPRE IDB 12.0 - - - 10.02. Project Preparation I FONAPRE IBRD 12.0 8.0 - - -3. Project Preparation II FONAPRE IBRD 6.0 - - 6.0 -
Total Preinvestment 30.0 8.0 - 6.0 10.0 -
XVI. Other Projects 900.0 - - 100.0 420.0 240.0
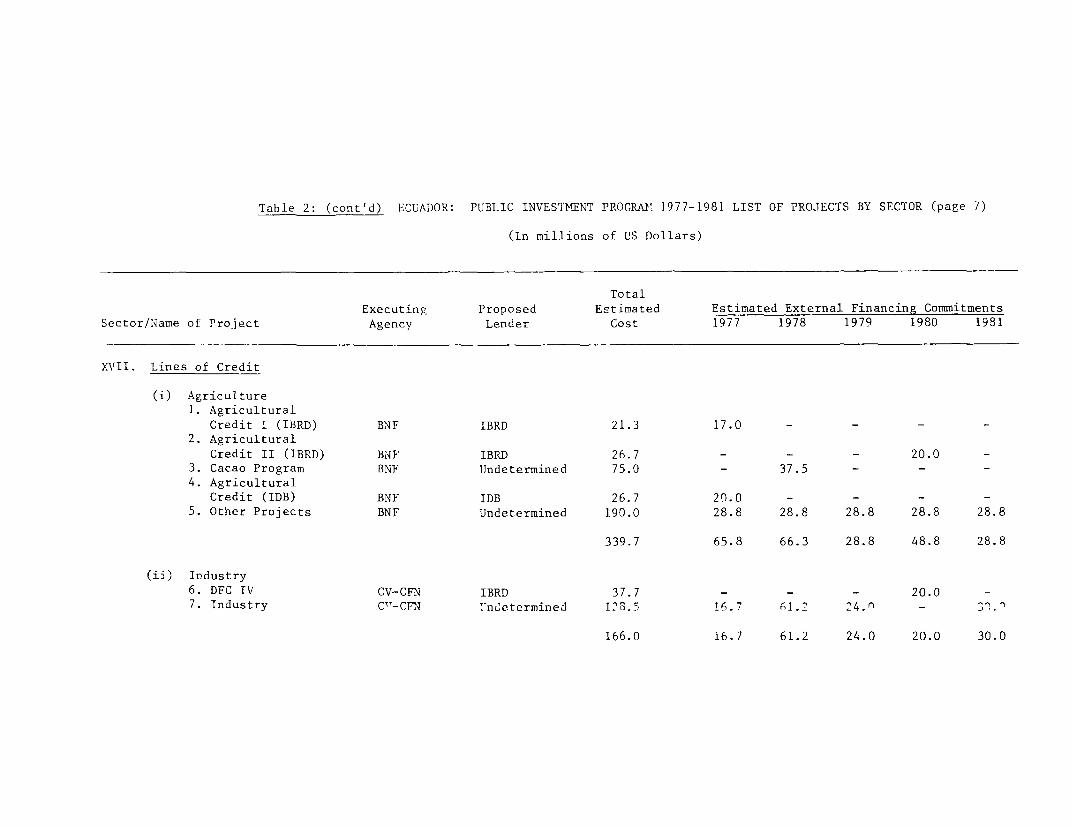
Table 2: (cont'd) ECUADOR: PUBLIC INVESTMENT PROGRAlK 1977-1981 LIST OF PROJECTS BY SECTOR (page 7)
(In millions of US Dollars)
TotalExecuting Proposed Estimated Estimated External Financing Commitments
Sector/Name of Project Agency Lender Cost 1977 1978 1979 1980 1981
XVII. Lines of Credit
(i) Agriculture1. Agricultural
Credit I (IBRD) BNF IBRD 21.3 17.0 - - - -2. Agricultural
Credit II (IBRD) B'NF IBRD 26.7 - - 20.0 -3. Cacao Program BNF Undetermined 75.0 - 37.5 - - _4. Agricultural
Credit (IDB) BNF IDB 26.7 20.0 - - - -5. Other Projects BNF Undetermined 190.0 28.8 28.8 28.8 28.8 28.8
339.7 65.8 66.3 28.8 48.8 28.8
(ii) Industry6. DFC IV CV-CFN IBRD 37.7 - - - 20.0 -7. Industry C1T -CFN '-ndetermined 1°3.5 16.7 61.2 24.n _ 3r.
166.0 16.7 61.2 24.0 20.0 30.0
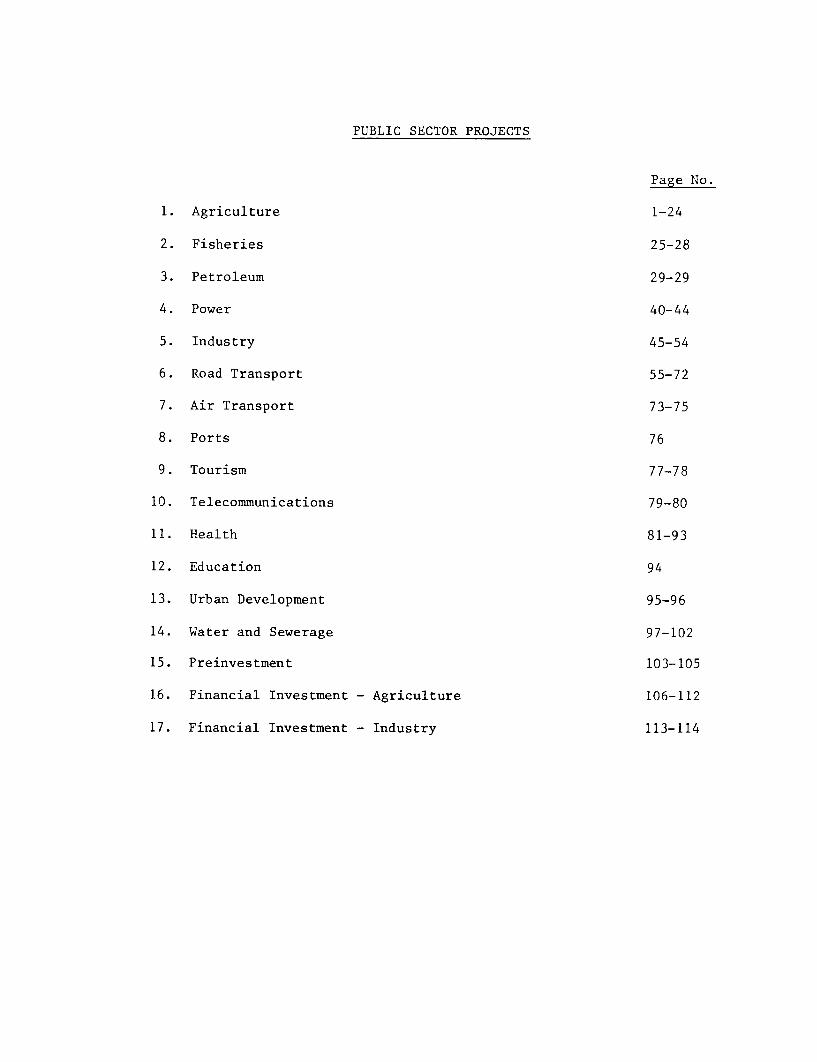
PUBLIC SECTOR PROJECTS
Page No.
1. Agriculture 1-24
2. Fisheries 25-28
3. Petroleum 29-29
4. Power 40-44
5. Industry 45-54
6. Road Transport 55-72
7. Air Transport 73-75
8. Ports 76
9. Tourism 77-78
10. Telecommunications 79-80
11. Health 81-93
12. Education 94
13. Urban Development 95-96
14. Water and Sewerage 97-102
15. Preinvestment 103-105
16. Financial Investment - Agriculture 106-112
17. Financial Investment - Industry 113-114


- 1 -
AGRICULTURE - 1
1. Name of the project: Agricultural Marketing Project
2. Location: National
3. Executing agency: Empresa Nacional de Almacenamiento y Comercialization (ENAC)
4. Total estimated cost: $58.6 million
5. External financing requested: $29.3 million
6. Expected year of commitment: 1977-1979
7. Purpose of the project: To improve the agricultural marketing system throughthe construction of additional storage and other facilities and provision oftechnical assistance, training and marketing services (grades and standardsand a market news service).
8. Description of the project: The project will be developed in various steps,as follows:
I. Construction of silos and warehouses in four stages1.1 Storage facilities for the coastal region with a capacity of
59,500 metric tons, distributed in each province in the region,in accordance with their needs.
I.2 Storage terminal complex for the city of Guayaquil, with acapacity of 35,000 metric tons.
I.3 Expansion of the two previous stages (1980-85) with an addi-tional capacity of 75,000 metric tons.
I.4 Storage facilities in the rest of the country, in Oriente andSierra.
II. Cold storage facilities at a national level for vegetables and fruits.
III. Wholesale market for Guayaquil.
IV. Terminal storage in Quito with capacity in the first stage of 18,200metric tons, and reaching 24,000 metric tons at the end of one year.
V. Technical assistance, training of personnel, and provision of market-ing services.
Estimated project costs:
I. Storage facilities $46.0 millionII. Cold storage 0.9 million
III. Wholesale market (Guayaquil) 6.9 millionIV. Terminal storage (Quito) 1.8 millionV. Technical assistance, training of personnel,
and provision of marketing services 3.0 million

Agriculture - 1 - 2 -
9. Present status:
Stage I
I.1 Contract has been awarded for the construction of 8 silosin the costal region. A complete survey will be initiatedin mid-1977 to determine the need for additional storagefacilities, their type and location.
I.2 Will be evaluated in June 1977.1.3 Prefeasibility study was prepared by ENAC and MAG in June 1976.
Bids are under negotiation for the preparation of feasibilitystudies. Feasibility studies are expected to be completed in1977.
I.4 Prefeasibility studies will be completed by ENAC and MAG inJune 1977.
Stages II and III feasibility studies have been started and will be com-pleted in early 1978.
Stage IV Preliminary engineering studies will be completed in early 1978.
The IBRD is considering to partially finance this project. Bank appraisalcould be completed early 1978 if the results of the survey are positiveand if project preparation work proceeds as scheduled.
10. Period of execution:
I.1 one year and a halfI.2 one year and a halfI.3 one year and a half1.4 one year and a halfII, III one yearIV one yearV three years
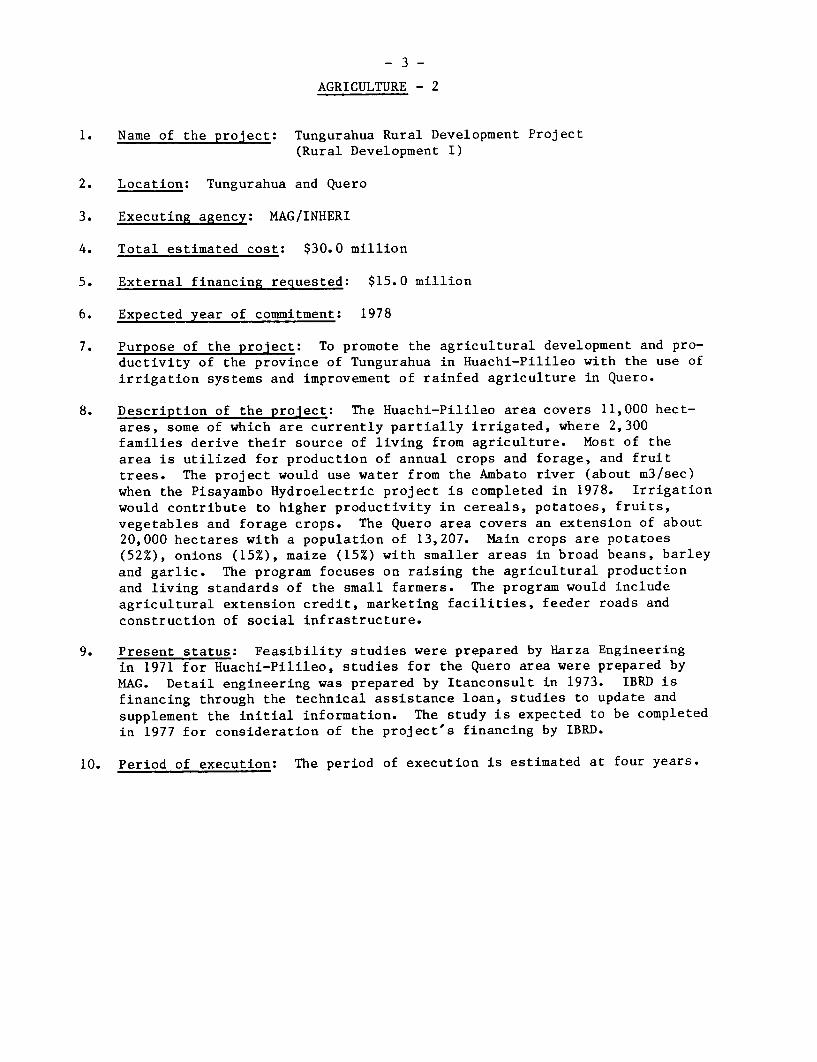
- 3 -
AGRICULTURE - 2
1. Name of the project: Tungurahua Rural Development Project(Rural Development I)
2. Location: Tungurahua and Quero
3. Executing agency: MAG/INHERI
4. Total estimated cost: $30.0 million
5. External financing requested: $15.0 million
6. Expected year of commitment: 1978
7. Purpose of the project: To promote the agricultural development and pro-ductivity of the province of Tungurahua in Huachi-Pilileo with the use ofirrigation systems and improvement of rainfed agriculture in Quero.
8. Description of the project: The Huachi-Pilileo area covers 11,000 hect-ares, some of which are currently partially irrigated, where 2,300families derive their source of living from agriculture. Most of the
area is utilized for production of annual crops and forage, and fruittrees. The project would use water from the Ambato river (about m3/sec)when the Pisayambo Hydroelectric project is completed in 1978. Irrigation
would contribute to higher productivity in cereals, potatoes, fruits,
vegetables and forage crops. The Quero area covers an extension of about20,000 hectares with a population of 13,207. Main crops are potatoes(52%), onions (15%), maize (15%) with smaller areas in broad beans, barley
and garlic. The program focuses on raising the agricultural productionand living standards of the small farmers. The program would includeagricultural extension credit, marketing facilities, feeder roads and
construction of social infrastructure.
9. Present status: Feasibility studies were prepared by Harza Engineeringin 1971 for Huachi-Pilileo, studies for the Quero area were prepared byMAG. Detail engineering was prepared by Itanconsult in 1973. IBRD isfinancing through the technical assistance loan, studies to update and
supplement the initial information. The study is expected to be completedin 1977 for consideration of the project's financing by IBRD.
10. Period of execution: The period of execution is estimated at four years.

- 4 -AGRICULTURE - 3
1. Name of the project: Puerto Ila-Chone Rural Development(Rural Development II)
2. Location: Pichincha and Manabi Provinces
3. Executing agency: Ministry of Agriculture
4. Total estimated cost: $40.0 million
5. External financing requested: $20.0 million
6. Expected year of commitment: 1979
7. Purpose of the project: To increase productivity and to raise incomelevels of families settled in the area.
8. Description of the project: The proposed construction of the Puerto Ila-Garrapata Road would serve to open an approximate 100,000 hectares tofurther agricultural development and to facilitate improved marketing ofits crops in major distribution areas. The project will help increaseproductivity through credit availability and extension services for pro-duction of livestock, coarse fibers, oilseeds, african palm and forestry.
9. Present status: The project was studied with the Puerto Ila-GarrapataRoad Project, by the group Tams-Astec in February 1975. A feasibilitystudy will be prepared with IBRD financed resources (Fourth Highway Proj-ect). The feasibility report is expected to be completed in mid-1977.The project will be evaluated by IBRD staff in early 1978 for possibleIBRD financing.
10. Period of execution: The period of execution is estimated at four years.

-5-AGRICULTURE - 4
1. Name of the project: Milagro II Irrigation Project
2. Location: Guayas Province
3. Executing agency: INHERI
4. Total estimated cost: $40.0 million
5. External financing requested: $20.0 million
6. Expected year of commitment: 1978
7. Purpose of the project: To increase agricultural production in the GuayasProvince through the use of irrigation and drainage systems, roads andon-farm development.
8. Description of the project: The project will provide irrigation and drain-age systems partially in conjunction with flood control measures, on-farmdevelopment and roads to an area of about 12,000 hectares that will in-crease production and raise the living standard of the rural population.The total level of production would also be increased by water controland improved agricultural techniques. The project will also providesupporting services and extension assistance, training of extension
agents and farmers, and consultant services.
9. Present status: An IBRD financed feasibility study is being prepared byFAO and is expected to be completed in June 1977. Appraisal is expected
to take place in later in 1977. IBRD will finance the project.
10. Period of execution: The period of execution is estimated at six years.

- 6 -AGRICULTURE - 5
1. Name of the project: Guayas Water Management
2. Location: Lower Guayas Delta
3. Executing agency: INHERI/CEDEGE
4. Total estimated cost: $40.0 million
5. External financing requested: $20.0 million
6. Expected year of commitment: 1980
7. Purpose of the project: To provide the lower Guayas Basin with adequatedrainage and flood control, to promote agricultural and rural development.
8. Description of the project: The project will cover approximately 100,000hectares, and is expected to include the following components: (a) drain-age and flood control, (b) agriculture and rural development, oriented toincrease agricultural production and to improve the living conditions ofthe rural poor, and (c) possibly infrastructure and supplementary irri-gation.
9. Present status: The project is still in the stages of identification.Feasibility studies will be financed with the IBRD technical assistanceloan for agriculture and rural development. IBRD will finance the proj-ect. INHERI is presently hiring international consultants who will assistin selecting project areas. Feasibility studies are expected to be carriedour starting in 1978.

AGRICULTURE - 6
1. Name of the project: Forestry Plantation Project
2. Location: Jubones Hydrographical Basin
3. Executing agency: Ministry of Agriculture
4. Total estimated cost: $21.5 million
5. External financing requested: $2.4 million
6. Expected year of commitment: 1979
7. Purpose of the project: Forestry plantation for: (a) the conservation offorestry resources at the Jubones River Basin, and (b) the production offorestry products for industrial purposes.
8. Description of the project: The project will cover an area of 20,000hectares at Jubones and 5,000 hectares in the high region of Ona.
9. Present status: Prefeasibility studies were prepared in 1975. Feasibilitystudies are expected to be completed in 1978. IDB will consider financingthis project.
10. period of execution: The period of execution is estimated at eight years.

- 3 -AGRICULTURE - 7
1. Name of the project: Forestry Project
2. Location: Sierra region and Cotopaxi area
3. Executing agency: Mfinistry of Agriculture/Direccion General de DesarrolloForestal (DGDF)
4. Total estimated cost: $20.0 million
5. External financing requested: $10.0 million
6. Expected year of commitment: 1979
7. Purpose of the project: To preserve natural forest resources and to
ensure its orderly exploitation. Afforestation with pines in the Sierra
to provide long fiber raw material for industrial purposes. Planting
eucalyptus and other hardwood special for local fuel wood needs.
8. Description of the project:- Establishment and maintenance of large scale performance trials of
promising pulpwood species at nine locations.
- Planting of 25,000 ha of eucalyptus on community lands for local use
throughout the ten Sierra provinces, at an annual rate rising from
3,000 ha in the first year to 7,000 ha in the last year of the project.
- Establishment of 6,500 ha of government-owned Pinus Radiata IndustrialPlantations at Cotopaxi, at a rate rising from 800 to 1,500 ha per year.
- To improve DGDF's general operating effectiveness (assistance in im-
proving the mobility of field operations.
9. Present status: The FAO/IBRD cooperative program (CP) has prepared a
report on the project proposal. The Government has been reviewing that
report and is engaged in completing the additional project preparation
requirements it identified. IBRD will consider financing the project.

- 9 -AGRICULTURE - 8
1. Name of the project: Esmeraldas Rural Development(Rural Development III)
2. Location: Esmeralda Basin
3. Executing agency: Ministry of Agriculture/IERAC
4. Total estimated cost: $50.0 million
5. External financing requested: $25.0 million
6. Expected year of commitment: 1981
7. Purpose of the project: Ecuador's Esmeraldas River Basin has sufferedfrom a decline in banana production; has relatively low population densityand suitable conditions for oil palm, cotton and pastures. The Governmentseeks to expand the agricultural development, taking advantage of theagricultural potential that is now inadequately exploited. There is thepossibility of creating regional activity and absorbing migrating popula-tion from other agricultural areas.
8. Description of the project: One project envisages the development ofabout 100,000 ha in an area of about 200,000 ha located between the Canadeand Blanco Rivers whose soils seem adequate for permanent crops and cattle.The production of abaca would be considered also in the event internationalmarket conditions improve. The proposed project would include constructionof a road network. The project also includes a number of agro-industries,with the capacity of processing the raw materials produced.
9. Present status: Prefeasibility studies were prepared under OAS financingby a combined OAS-INERHI unit ("The Esmeraldas Project"). These identifiedsome 40 project possibilities which the Government has been renewing. Itis expected that several of these would be advanced by the preparation offeasibility studies, to be financed with the IBRD technical assistanceloan to JUNAPLA for agriculture and rural development. These are expectedto be complete in mid-1979.
10. Period of execution: The period of execution is estimated at ten years.

- 10 -
AGRICULTURE - 9
1. Name of the project: Tabacundo Irrigation Project
2. Location: Pichincha Province
3. Executing agency: INHERI
4. Total estimated cost: $3.4 million
5. External financing requested: $1.7 million
6. Expected year of commitment: 1978
7. Purpose of the project: To promote agricultural development through theestablishment of irrigation systems.
8. Description of the project: The project is located at Pedro Moncayo andit includes the areas to Tupigachi, Tabacundo and Esperanza, of approxi-mately 10,000 hectares. The hydrological source for the project's systemis the Chimba River, at approximately 3,170 meters above sea level. Theclimatic conditions are semiarid, with an average temperature of 13 C.
9. Present status: A prefeasibility study was prepared by INHERI in 1974.The feasibility study is in early stages of preparation by INHERI, andis expected to be completed in mid-1977. Financial arrangements havenot yet been made.
10. Period of execution: The period of execution is estimated at four years.

- 11 -
AGRICULTURE - 10
1. Name of the project: Manuel J. Calle Irrigation Project
2. Location: Canar and Guayas Provinces
3. Executing agency: INHERI
4. Total estimated cost: $21.0 million
5. External financing requested: $10.9 million
6. Expected year of commitment: 1978
7. Purpose of the project: To promote agricultural development in theprovinces of Canar and Guayas by improving the present irrigation system.
8. Description of the project: The project is located at Manuel J. Calle andEl Triunfo. The total surface area is of 20,000 hectares gross, withapproximately 15,000 hectares under irrigation. The climatic conditionsof the area are humid with an average temperature of 24.6 C suitable forbanana, cacao, sugar cane and pastures. The project has developed someinfrastructure; listed below are the most important:
(a) main canal(b) distribution system(c) tertiary canal system
_ain canal with a capacity of 12 m /sec. and 6,160 meter of length;Distribution system with two canals, Vainillo and Manuel J. Calle, of
28,500 meters and 9,500 meters respectively;Tertiary canal systems, starting from the Vainillo Canal, of 4,000 meters;
and starting from the Manuel J. Calle, of 2,300 meters.
9. Present status: The feasibility study is being prepared by INHERI and isexpected to be completed in mid-1977. No financial arrangements have yetbeen made.
10. Period of execution: The period of execution is estimated at four years.

- 12 -AGRICULTURE - 11
1. Name of the project: Latacunga-Ambato Irrigation Project
2. Location: Tungurahua and Cotopaxi Provinces
3. Executing agency: INHERI
4. Total estimated cost: $15.7 million
5. External financing requested: $7.9 million
6. Expected year of commitment: 1977
7. Purpose of the project: To develop agriculture in the provinces ofTungurahua and Cotopaxi through the use of improved irrigation systems.
8. Description of the project: The project includes the Holguin, Mulalo,Pansaleo and Atahualpa areas, located in Latacunga, Salcedo and Ambato.The hydrological sources are the Cutuchi and Pamachunchi Rivers. Themain canal will be approximately 39 kilometers long with secondary canalsand tunnels. Some preliminary work is underway, such as investments onaccess roads, tunnel excavation and purchase of some equipment.
9. Present status: The topographical studies have been completed, socio-economic studies are under preparation to complete feasibility. The Inter-American Development Bank is presently appraising the project and is ex-pected to reach a decision on its financing in early 1977.
10. Period of execution: The period of execution is estimated at four years.

- 13 -AGRICULTURE - 12
1. Name of the project: Pillaro Irrigation Project
2. Location: Tungurahua Province
3. Executing agency: INHERI
4. Total estimated cost: $12.0 million
5. External financing requested: $7.3 million
6. Expected year of commitment: 1979
7. Purpose of the project: To expand agriculture through the use of improvedirrigation systems in the Tungurahua Province.
8. Description of the project: The project will incorporate approximately7,800 hectares under irrigation in the areas of Guapante, Chuapi, Rosarioand Teran, constituting the irrigation district of Pillaro. The hydro-logical sources will be the Yanayacu River, also utilized for hydroelectricproduction (Pisayambo Project). The water volume to be used for irrigationpurposes is of 4.0 m3/sec. The project will increase agricultural produc-tion, thus benefiting about 5,000 families presently at subsistence levels.
9. Present status: The feasibility studies were prepared by Harza EngineeringCo. in 1971. Detailed engineering studies were prepared by Itaconsult in1973. Additional work is now in process to update feasibility studies andfinal design work. No financial arrangements have yet been made. Thisproject and the Huachi-Pilileo and Quero Project are components of theProvince of Tungurahua irrigation plan.
10. Period of execution: The period of execution is estimated at three years.

- 14 -AGRICULTURE - 13
1. Name of the project: Jubones Irrigation Project
2. Location: Oro Province
3. Executing agency: INHERI/Municipality
4. Total estimated cost: $48.5 million
5. External financing requested: $24.3 million
6. Expected year of commitment: 1977
7. Purpose of the project: To promote agricultural development in the lowerbasin of the Jubones River through drainage and irrigation. The projectwill also provide flood control and hydroelectric energy.
8. Description of the project: The project area will cover 55,000 hectares.For purposes of the project, the Jubones Basin has been divided in twoareas: the lower basin with slopes of 0.15%, and the location of theproject, with 55,000 hectares with positive agricultural potential forbanana, cacao and other tropical crops. The upper basin area is 30 kilo-meters long, with gentle slopes and lesser agricultural potential. Theproject in this area will control the water flows and generate hydro-electric energy, with the construction of a dam along the river. Prelimi-nary project works have begun in the area.
9. Present status: The feasibility studies are being prepared by interna-tional consultants and INHERI, and are expected to be finished in early1977. No financial arrangements have yet been made.
10. Period of execution: The period of execution is estimated at six years.
- 15 -AGRICULTURE - 14
1. Name of the project: Cayambe Rural Development
2. Location: Cayambe and Tabacundo areas
3. Executing agency: Ministry of Agriculture
4. Total estimated cost: $20.0 million
5. External financing requested: $10.0 million
6. Expected year of commitment: 1980
7. Purpose of the project: Better utilization of natural resources and toincrease the living standards of the rural population with an increaseof income through agricultural activity and to create new employment inthe industrial sector.
8. Description of the project: The project will be located at lower Cayambe,upper Cayambe and Tabacundo. In this area, the Government plans to:(a) increase the size of farm plots by consolidating the presentlylimited sized plots, and by providing farm land through the redistributionof land ownership to establish economically viable farm units in parts ofthe Cayambe project, executed by IERAC, and of the farm "La Remonta", withthe purpose of helping low income families; (b) create a small industrialpark to release pressure on agricultural production in this area;(c) establish a pilot district for land conservation in sloped areas sub-ject to erosion; and (d) water services, for domestic and irrigation pur-poses, parallel to redistribtuion of parcels. The project will try toovercome the difficulties of the present pattern of very small farms, withinadequate crops, land erosion and with low productivity and incomes. Theproject will produce alternate sources of employment for the populationof the area, thus reducing the pressure on the land. To increase theincome levels of families classified as "poor" (S/27,100 per year or less),it will not be sufficient to increase farm size, but to redistribute largefarms that are presently underutilized. The "Agricultural Credit I" willcontribute to this project in making credit available to the elegiblecooperatives.
9. Present status: Prefeasibility studies were prepared by the EsmeraldasProject Unit in 1975. Feasibility studies are expected to begin during1977. No discussions with external lenders have been initiated.
10. Period of execution: The period of execution is estimated at ten years.

- 16 -AGRICULTURE - 15
1. Name of the project: Qumiag-Penepe Rural Development
2. Location: Chimborazo Province
3. Executing agency: INHERI/Ministry of Agriculture
4. Total estimated cost: $4.8 million
5. External financing requested: $2.4 million
6. Expected year of commitment: 1978
7. Purpose of the project: To improve the living conditions of the poorfarmer.
8. Description of the project: The project will be located in the northeasternregion of the Chimborazo province, with a total surface area of 31,470 hawith a population of 13,312. In this area, the Government plans to attemptsome structural changes in the pattern of land destribution, bringing aboutmodel holdings of 10 families per 100 ha farms. The project is intended tocomplement this approach providing inputs to improve agricultural develop-ment of the area. Its components would be the following:(a) Agricultural Program: The adoption of a new planting system, adjusted
to the soil characteristics of the area; the improvement of plantingtechniques of short-cycle and permant crops, through the use of fer-tilizers, pesticides. Incattle, the use of an intensified system ofexploitation will be promoted. In forestry, 7,500 ha will be usedfor eucalyptus planting in altitudes of 2,400 to 2,800 meters, andpinus radiata in altitudes of 2,800 to 3,800 meters.
(b) Marketing Program: A plan has been designed where 88% of the farmersin the area will be assisted in dealing with surplus production inthe area, an organized system of storage and distribution.
(c) Health Program: A better health through an education program; con-struction of clinics, subcenters and health posts; water servicesand sewerage.
(d) Infrastructure: Feeder road construction and maintenance, communalhousing and coordination with INECEL and INHERI for electrificationand irrigation.
(e) Technical Assistance.
9. Present status: Feasibility studies were prepared in August 1975 by theMinistry of Agriculture, Office of Rural Development and JUNAPLA. Nodiscussions for financial arranagements have been initiated.
10. Period of execution: The period of execution is estimated at 10 years.

- 17 -AGRICULTURE - 16
1. Name of the project: Rural Development of Puyango, Tumbes, Catamayo,Chira
2. Location: Loja Province
3. Executing agency: Subcomision de Desarrollo de las Provincias del Sur(PREDESUR)
4. Total estimated cost: $12.8 million
5. External financing requested: $8.0 million
6. Expected year of commitment: 1978
7. Purpose of the project: To promote integral development of the area throughprograms in various economic and social sectors. To improve productionsystems and to create others with a view of employment creation. To improve
the standard of living of the rural poor. To administer and protect thenatural resources of the area.
8. Description of the project: The "Pilot Basin Project" covers a total area
of 82,000 hectares in the areas of Puyango, Tumbes, Catamayo and Chira,located near the Pindo and Calvas rivers. The project components includethe productive and social sectors, as follows:Productive Sectors
Strategic crops 20,000 hectaresPasture and cattle improvement 15,000 hectaresForestry 15,000 hectaresIrrigation systems 2,000 hectares
Fish cultureArtesan industries
Social SectorsRural educationHealthTechnical assistance
Some preliminary work has begun in the area, by Predesur, since 1974:forestry nurseries to produce three million plants per year, pilot fish
culture ponds. The Inter American Development Bank is presently fi-nancing and irrigation project with the same name and in similar areas.
9. Present status: Predesur started the program and has financed it out of
its annual budget. Feasibility studies are in initial preparation stagesand will be completed in early 1977. No discussions for financial ar-
rangements have been initiated.
10. Period of execution: The period of execution is etimated at five years.

- 18 -AGRICULTURE - 17
1. Name of the project: Daule-Peripa Project
2. Location: Guayas Basin
3. Executing agency: CEDEGE
4. Total estimated cost: $400.0 million
5. External financing requested: $200.0 million
6. Expected year of commitment: 1979
7. Purpose of the project: Irrigation, drainage and flood control to thetotal surface area of the project. Potable water services to the cityof Guayaquil. A second irrigation system in the Santa Elena Peninsula.
8. Description of the project: The following are the project components:(a) Daule-Peripa Dam: 65 meters high, with a capacity of 2,300 million
cubic meters. During its construction the Daule River will be di-verted through a tunnel of 16.25 meters in diameter with a capacityof 2,391 m3/sec. For the intake works, a derivation tunnel will beincorporated into all other structures, that tunnel will entail acanal for irrigation and two pressured pipelines for a powerhouse.Additional works will be composed of a spillway with three radialfloodgates 15 meters high; the capacity of the spillway is of 5,200m3/sec. The area flooded will be an area of 100 square kilometers.There are no important towns, infrastructure of agricultural pro-duction in the area to be flooded.
(b) A derivation dam of concrete 78 meters long and 16 meters high, withfive radial floodgates, at the right bank of the Daule river; theworks continue with an earth dam, and other works. The purpose ofthe works is to increase the water volumes, starting from the Daule-Peripa dam in order to divert the water by gravity to the irrigationsubzone.
(c) Irrigation Systems to cover 55,000 hectares. The water will be dis-tributed at subzone III by gravity from the derivation structuresthrough a main canal designed to hold a maximum of 50 m3/sec. Themain canal will have an approximate length of 22.5 kilometers untilit branches out at each side of the Daule River. The canal at theright bank of the river will be supplied with a maximum capacity of26 m3/sec. and it will service an area of 16,000 hectares. The canalat the left bank of the river will have an initial capacity of 23m3/sec. and it will service 16,000 hectares. The total capacity ofthe canal will be such that, with another derivation scheme at thePula River, an additional area of 23,000 hectares could be served.The secondary canal systems are 280 kilometers long in the right bankand 160 kilometers long in the left bank of the river. The drainage has

Agriculture - 17 - 19 -
been designed as an "open" system; that is, collecting canalsreverting to the Daule River. This alternative was selected becausethe storage dam has a capacity to regulate increasing volumes up to
25 years of recurrence.
(d) A Hydroelectric Power Station, with an installed capacity of 60 to70 MW, with a maximum volume of 85 cubic meters per second.
9. Present status: Prefeasibility studies were completed by the group Tams-AHT-Integral for the Daule-Peripa dam and the Derivation dam in early
1976. Feasibility and design studies will be prepared by the same groupduring 1977. Total feasibility study will be completed in a 14 monthperiod. No discussions for financial arrangements have been initiated.
10. Period of execution: The period of execution is estimated at four years.

- 20 -
AGRICULTURE - 18
1. Name of the Project: Caracol Irrigation Project
2. Location: Guayas Province
3. Executing agency: CEDEGE
4. Total estimated cost: $5.2 million
5. External financing requested: $2.6 million
6. Expected year of commitment: 1979
7. Purpose of the project: To increase agricultural production through theutilization of irrigation systems.
8. Description of the project: The project considers a total surface areaof 12,000 hectares with 8,200 hectares net under irrigation near theCatarama River. The project components are the following:
(a) A pumping station on the left bank of the river Catarama-Zapatal,three kilometers from the Catarama village; the station will have sixmixed canal pumps, with a discharge capacity of 2.0 cubic meters persecond.
(b) The primary canal will be 21 kilometers long, with the followingcapacities:
- 12.2 i3/sec from the station to kilometer 2- 8.8 m3/sec from kilometer 2 to 10- 7.9 m3/sec from kilometer 10 to 17- 3.2 m /sec from kilometer 17 to 21.The tertiary system will be equipped with intakes at 0.5 kilometerintervals to supply the individual parcels, complemented with adrainage system.
(c) An access road along the occidental portion of the area betweenBabahoyo and the pumping station. A second access road will bebuilt along the Tablas River connected to the main canal.
9. Present status: Prefeasibility studies were prepared by GuayasconsultCo. in 1970. Feasibility studies will be carried out during 1977. Nodiscussions for financial arrangements have been initiated.
10. Period of Execution: The period of execution is estimated at four years.

- 21 -
AGRICULTURE - 19
1. Name of the Project: San Juan Irrigation Project
2. Location: Guayas Province
3. Executing agency: CEDEGE
4. Total estimated cost: $12.3 million
5. External financing requested: $6.1 million
6. Expected year of commitment: 1980
7. Purpose of the project: Agricultural development through the use of irri-gation systems.
8. Description of the project: Located between the rivers Catarama andPuebloviejo, the project contemplates a total surface area of 5,800hectares with about 4,425 hectares for irrigation. The pumping stationwill be located at approximately 15 meters from the right bank of theCatarama river; with a discharge capacity of 1.4 cubic meters per secondunder a total dynamic load of 9 meters. The main irrigation canal willcover an extension of 7.5 kilometers from the pumping station to thesecondary canal, designed to transport 5.6 cubic meters per second. Fromthe first to the sesond canal there will be a distance of 3 kilometers,its capacity of 5 m /sec. The three secondary canals will conduct 1.7 msec. From the secondary canals, tertiary canals will bring service tothe individual parcels. The project contemplates the construction of adrainage canal 12 kilometers long, and of access roads.
9. Present status: Prefeasibility studies were prepared by Guayasconsult Inc.in 1970. Feasibility studies will be prepared in 1977. No discussions forfinancial arrangements have been initiated.
- 22 -
AGRICULTURE - 20
1. Name of the project: Nangaritza Colonization Project
2. Location: Zamora Province
3. Executing agency: PREDESUR/IERAC
4. Total estimated cost: $19.2 million
5. External financing requested: $11.5 million
6. Expected year of commitment: 1978
7. Purpose of the Project: To incorporate new areas to agricultural produc-tion. To increase the incomes of the farmers in the area through newemployment opportunities in agriculture and services.
8. Description of the project: Rural settlement in the valleys of Nangaritzaand Zamora. The project aims at the rehabilitation and rationalizationof the 100,000 ha, including land not presently cultivated to benefit2,500 families, of which 70% will be farmers and 30% of families engagedin agriculture-related activities. The project will also include acomponent for infrastructure. This will permit the integration of allactivities in the area.
9. Present status: The project has been presented to IDB for financing.Project preparation is underway by a joint group integrated by PREDESUR/IERAC and IDB staff. A minor portion of infrastructure works have begun.
10. Period of execution: The period of execution is estimated at five years.

- 23 -
AGRICULTURE - 21
1. Name of the project: Carrizal-Chone Irrigation Project
2. Location: Manabi Province
3. Executing agency: C.R.M. (Centro de Rehabilitacion de Manabi)
4. Total estimated cost: $28.8 million
5. External financing requested: $14.2 million
6. Expected year of commitment: 1979
7. Purpose of the Project: To primary objective of the project is to regulatethe water volumes of the Carrizal River in order to partially prevent theflooding of the lower basin. During the rainy season, and to construct adam with 400 m3/H capacity to irrigate an area of 18,000 ha during the dryseason.
8. Description of the project: During the first phase of the project, theconstruction of the "La Esperanza Dam" is proposed. The dam will be35 meters high with a capacity of 400 million m3/S. During construction,the Carrizal river will be diverted through a tunnel 220 meters in lengthand 1.6 meters in diameter during the dry season. During the rainy season,the excess floods will be carried through a tunnel 283 m long and a diameterof 4 meters. The second phase of the project proposed an irrigationsystem to cover 18,000 ha. The project will also include the constructionof a permanent road between Quiroga and the dam, and service roads to thespillway and diversion tunnel.
9. Present status: Prefeasibility studies have been completed. Feasibilityand design studies will be prepared during 1978. No discussions for finan-cial arrangements have been initiated.
10. Period of execution: The period of execution is estimated at four years.

- 24 -
AGRICULTURE - 22
1. Name of the project: Montalvo-Ventanas Project
2. Location: Guayas Province
3. Executing agency: CEDEGE
4. Total estimated cost: $13.5 million
5. External financing requested: $6.7 million
6. Expected year of commitment: 1981
7. Purpose of the Project: To increase productivity in animal crops throughcredit and technical assistance.
8. Description of the project: The area selected is irregular, thus makingirrigation difficult, rainfall permits the development of agriculturebased in permanent crops. The project considers a total area of 38,000hectares, close to the Andes, between the towns of Montalvo and Ventanas,for growing cacao, coffee and banana, and use of pastures and forests.Low productivity prevails because of aging plantations, pests and the lackof fertilizers. A program making credit available and technical assis-tance could improve productivity and farmers' incomes. Extension special-ists would provide assistance to farmers, and supervise available credit.
9. Present status: Prefeasibility studies were prepared in 1970 byGuayasconsult Inc. Feasibility studies will be prepared in 1979. Nodiscussions for financial arrangements have been initiated.
- 25 -
FISHERIES - I
1. Name of the project: Posorja Fishing Port
2. Location: Manabi Province
3. Executing agency: Ministerio de Recursos Naturales
4. Total estimated cost: $8.8 million
5. External financing requested: $5.3 million
6. Expected year of commitment: 1978
7. Purpose of the project: To promote the expansion of the fishing trade
in Ecuador through port infrastructure improvements.
8. Description of the project: The Posorja Port includes the constructionof:a) an inner harbor,b) unloading facilities of 270 meters,c) marketing facilities,d) mooring facilities,e) a dock for repairs and maintenance, 140 meters long,
f) a fish processing area, with a total surface area of 16,500 m2
g) shipyards.
9. Present status: A feasibility study under an IBRD loan was conducted by
the firm CISYCA-Scandia Consult and an Ecuadorian firm and concluded in
November 1974. Further work was needed covering the economic feasibility
of the project, and a second study was prepared and completed in September
1976. No discussions with external lenders have been initiated.
10. Period of execution: The period of execution is estimated at three years.

- 26 -
FISHERIES - 2
1. Name of the project: Manta Fishing Port
2. Location: Manabi Province
3. Executing agency: Manta Port Authority
4. Total estimated cost: $8.7 million
5. External financing requested: $5.2 million
6. Expected year of commitment: 1978
7. Description of the project: The Manta Port includes the construction of:(a) an inner harbor, (b) unloading facilities of 270 meters, (c) marketingfacilities, (d) mooring facilities, (e) a dock for repairs and maintenance140 meters long (f) breakwater alignment (g) dredging, (h) a fish process-ing area (i) ship yards.
8. Present status: A feasibility study under an IBRD loan was conducted bythe firm CISYCA-Scandia Consult and an Ecuadorian firm and concludedin November 1974. Further work was needed covering the economic feasi-bility of the project, and a second study was prepared and completed inSeptember 1976. Its results have been discussed with the Government.IBRD will finance the project.
9. Period of execution: The period of execution is estimated at three years.
- 27 -
FISHERIES - 3
1. Name of the project: Artisan Fisheries
2. Location: Various locations on cost of Ecuador
3. Executing agency: Ministry of Natural Resources/National FisheriesInstitute
4. Total estimated cost: $20.0 million
5. External financing requested: $13.0 million
6. Expected year of commitment: 1979
7. Purpose of the project: To establish "support centers" along theEcuadorian coast and the Galapagos Archipelago, in areas where largefishing communities are located, with the objective of providing assist-ance in the creation of small fishing enterprises and cooperatives, thusincreasing employment opportunities. This will permit the rapid develop-ment of the small fisheries sector, and would include provisions for moreadequate conservation measures and marketing facilities. The projectwill, in addition to increasing the income potential of these communities,improve the nutritional standards of the Ecuadorian population.
8. Description of the project: The "Support Centers" will consist of coolingplants, equipment and the technical assistance necessary for a normaldevelopment of the sector. The "Support Centers" will serve the followingpurposes: (a) to provide facilities for purchasing fish catches from thefishermen, (b) marketing the products for the domestic market, (c) makingavailable supplies and equipment to the fishermen, and (d) providing themalso technical assistance. They would promote the creation of coopera-tives. In addition, the project will include the purchase of a smallnumber of fishing vessels, communications equipment and refrigerationequipment.
9. Present status: A feasibility study is being prepared by a group fromthe technical staff of the Ministry of Natural Resources, IDB staff andinternational consultants financed with IDB funds. IDB will finance theproject.
10. Period of execution: The period of execution is estimated at four years.

- 28 -
FISHERIES - 4
1. Name of the project: Tuna Fishing Fleet
2. Location:
3. Executing agency: Ministry of Natural Resources
4. Total estimated cost: $30.0 million
5. External financing requested: $30.0 million
6. Expected year of commitment: 1977
7. Purpose of the project: To increase the Ecuadorian Fishing Fleet; toincrease its capacity per catch through the rational utilization of theavailable tuna resources; to expand Ecuador's utilization of its avail-able tuna resources, which have only begun to be exploited, enhanced bythe application of the 200-mile limit and increased world demand for fishproducts.
8. Description of the project: The Project contemplates the purchase of 34fishing vessels with 1,000 ton capacity each, and of 23 fishing vesselswith 200 ton capacity in order to increase Ecuador's fishing fleet forenlarged catches. Ultimate ownership and control of the vessels wouldbe vested in all likelihood in private, perhaps mixed, venture companies,but these arrangements are still to be settled.
9. Present status: The Ministry of Natural Resources expects to financethe total cost of the vessels from external sources. No discussion forfinancial arrangements have been initiated.
10. Period of execution: The period of execution is estimated at two years.

- 29 -
PETROLEUM - 1
1. Name of the Project: Development Program I
2. Location:
3. Executing agency: CEPE
4. Total estimated cost: $12.5 million 1/
5. External financing requested: $10.0 million
6. Expected year of commitment: 1977
7. Purpose of project: To increase foreign exchange earnings through anincrease in petroleum exploitation.
8. Description of the project: To increase petroleum production to250,000 BPD by raising the capacity of the pipeline and the provisionof additional pumping facilities. The project costs represent CEPE'sparticipation in the three year production expansion program to theconsortium Texaco/CEPE.
9. Present status: The program has first priority by the Government ofEcuador and should start no later than 1977. No feasibility studies areneeded. No discussions for financial arrangements have been initiated.
10. Period of execution: The period of execution is estimated at two years.
1/ This is the cost to the public sector. A private sector complement of$7.5 million is required.

- 30 -
PETROLEUM - 2
1. Name of the Project: Development Program II
2. Location:
3. Executing agency: CEPE
4. Total estimated cost: $218.4 million 1/
5. External financing requested: $174.7 million
6. Expected year of commitment: 1978-1982
7. Purpose of project: To increase foreign exchange earnings through anincrease in petroleum exploitation.
8. Description of the project: To increase petroleum production to350,000-400,000 BPD. The project costs represent CEPE's participation ina five year production expansion program in the consortium Texaco/CEPE.The program consists of (a) installation of recovery facilities, (b)connection of different oil fields, (c) raise the capacity of the pipelineby providing additional pumping facilities.
9. Present status: The program should start in early 1978 in order to beable to commence production of 350,000-400,000 BPD in 1985. Unless pro-duction increases, the economic feasibility of the Petrochemical ComplexProject will not be proven.
10. Period of execution: The period of execution is estimated at five years.
1/ This is the cost to the public sector. A private sector complement of$131.6 million is required.

- 31 -
PETROLEUM - 3
1. Name of the Project: Esmeraldas Maritime Terminal Phase II
2. Location: Esmeraldas Province
3. Executing agency: CEPE
4. Total estimated cost: $35.0 million
5. External financing requested: $15.0 million
6. Expected year of commitment: 1978
7. Purpose of project: To transport oil produced in the Esmeraldas Refineryto other ports in Ecuador, for internal purposes, and for exports.
8. Description of the project: The project includes the design and construc-tion of an expanded maritime terminal including: (a) land works, such asa pipeline from the refinery to Balao, (b) the construction of a watertreatment plant, and (c) maritime works, including submarine pipelines ineight lines from the shore to the platform, with a length of five kilo-meters per line. This pipeline is a continuation of the land pipelinefrom the platform to the unballast pools and the loading platform.
9. Present status: The feasibility studies were prepared by Sir WilliamHalcrow and partners in 1975 for the first terminal and expansion.Detail engineering was prepared by the same firm and completed in 1976.No discussions for financial arrangements have been initiated.
10. Period of execution: The period of execution is estimated at two years.

- 32 -
PETROLEUM - 4
1. Name of the Project: Shushufindi Gas Plant
2. Location: Napo Province
3. Executing agency: CEPE
4. Total estimated cost: $21.0 million
5. External financing requested: $16.0 million
6. Expected year of commitment: 1977
7. Purpose of project: To exploit the natural gas available in the area
through the construction of the recuperation plant for LPG and gasoline
for domestic use.
8. Description of the project: The recovery plant will process about 25
mms of gas. Detailed description of the project is not available at this
point. It is expected the plant will produce about 390 metric tons ofLPG and 127 metric tons of natural gasoline.
9. Present status: A contract was awarded to the firm SAETRAME in May 1976
for the design and construction of the plant. Several European and US
banks have shown interest in financing the project, but no decision has
yet been made.
10. Period of execution: The period of execution is estimated at two years.

- 33 -
PETROLEUM - 5
1. Name of the Projlect: Poliducto Shushufindi-Quito
2. Location: Napo and Pichinche Province
3. Executing agency: CEPE
4. Total estimated cost: $31.6 million
5. External financing requested: $25.3 million
6. Expected year of commitment: 1977
7. Purpose of project: As integral part of the gas development programs,the poliduct will transport the processed gas and natural gasoline fromthe plant to be constructed at Shushufindi and the production surplusof the Oriente Refinery.
8. Description of the project: The poliduct will have a length of 324 kilo-meters of which 295 kilometers will have piping of 6.625" and the remaining29 kilometers will have piping of 4.500". Two pumping stations will beconstructed in Sacha (Oriente Refinery) and Shushufindi of 1800 HP, andthree intermediate stations of 1575 HP. The maximum capacity of thesystem will be of 7,132 barrels per day diesel, equivalent to 9,000barrels per day of LPG.
9. Present status: Feasibility studies were prepared by CEPE in early 1976.A contract has been awarded to William Brothers Engineering Co. for thedesign of the project. This is expected to be completed in December 1976.The Inter-American Development Bank (IDB) has shown interest in financingthis project.
10. Period of execution: The period of execution is estimated at three years.

- 34 -
PETROLEUM - 6
1. Name of the Project: Poliducto Esmeralda-Quito
2. Location: Esmeraldas and Pichincha Provinces
3. Executing agency: CEPE
4. Total estimated cost: $45.4 million
5. External financing requested: $36.4 million
6. Expected year of commitment: 1977
7. Purpose of project: To transport petroleum products from the state-ownedEsmeraldas refinery, to the consumer areas of the country.
8. Description of the project: The construction of 164 kilometers of pipelinewith a 14" diameter, and 95" kilometers of 12.750"; four pumping stationsof 4,500 HP and a storage terminal of 69,000 barrels in Santo Domingo delos Colorados. The poliduct will transport gas, kerex, kerosene anddiesel, with a maximum capacity of 58,000 barrels of diesel per day, thatwill meet consumer demands until 1987.
9. Present status: The feasibility studies were prepared by CEPE in 1975.William Brothers Engineering Co. is preparing design studies. These areexpected to be completed in December 1976. The Inter-American DevelopmentBank (IDB) has shown interest in financing this project.
10. Period of execution: The period of execution is estimated at three years.

- 35 -
PETROLEUM - 7
1. Name of the Project: Libertad-Guayaquil Poliduct
2. Location: Esmeraldas and Guayas Provinces
3. Executing agency: CEPE
4. Total estimated cost: $15.0 million
5. External financing requested: $12.0 million
6. Expected year of commitment: 1979
7. Purpose of project: To transport petroleum derivatives and fuel from thePeninsula and Esmeraldas refineries to the city of Guayaquil.
8. Description of the project: The project will cover 135 kilometers. Thepiping will have a diameter of 10", with a maximum capacity of 30,000barrels per day. The project will include the construction of a pumpingstation with a maximum capacity of 468 HP.
9. Present status: A Prefeasibility studies were prepared by CEPE in 1975.A feasibility study will be prepared early in 1977. No discussions forfinancial arrangements have been initiated.
10. Period of execution: The period of execution is estimated at two years.

- 36 -
PETROLEUM - 8
1. Name of the Project: CIBAMBE-Cuenca Poliduct
2. Location: Cuenca Provinces
3. Executing agency: CEPE
4. Total estimated cost: $15.0 million
5. External financing requested: $12.0 million
6. Expected year of commitment: 1979
7. Purpose of project: To supply fuels to the southern region of the country.
8. Description of the project: The project will cover 165 kilometers. Thepipiline will have a diameter of 6", with a maximum capacity of 7,000barrels per day. The project will include a pumping station with amaximum installed capacity of 300 HP.
9. Present status: Prefeasibility studies were prepared by CEPE in 1975.A feasibility study will be prepared in the course of 1977. Nodiscussions for financial arrangements have been initiated.
10. Period of execution: The period of execution is estimated at two years.

- 37 -
PETROLEUM - 9
1. Name of the Project: Tivacuno-Auca Oleoduct
2. Location: Napo Provinces
3. Executing agency: CEPE
4. Total estimated cost: $16.0 million
5. External financing requested: $12.8 million
6. Expected year of commitment: 1979
7. Purpose of project: To increase national crude petroleum production withthe connection of the oilfields of Auca or Yuca to the Transecuadorianoleoduct.
8. Description of the project: The oleoduct will be 60 kilometers longtransporting about 30,000 barrels per day of crude petroleum.
9. Present status: Prefeasibility studies were prepared by CEPE in 1975.A feasibility study will be prepared in 1977. No discussions forfinancial arrangements have been initiated.
10. Period of execution: The period of execution is estimated at two years.
- 38 -
PETROLEUM - 10
1. Name of the Project: Petrochemical Complex
2. Location: Not defined
3. Executing agency: CEPE
4. Total estimated cost: $1,500.0 million
5. External financing requested: $600.0 million
6. Expected year of commitment: 1980
7. Purpose of project: To produce petrochemicals for export to the AndeanRegion.
8. Description of the project: In accordance with Clause 44 of the AndeanMarket Agreement, Ecuador has been assigned the production of petro-chemical products for export to the region. The complex will have thefollowing components:- A petroleum refinery to produce the necessary fuels and raw materials
for the petrochemical plant- A petrochemical plant- Processing plants of intermediary and final products.The processing capacity of the plant, the final site and other projectcomponents have not yet been decided, as feasibilty of the project iscontingent upon an increase in production to 350,000-400,000 BPD by 1985.To insure the increase, the Government will begin additional investmentsin early 1978.
9. Present status: Prefeasibility studies were prepared by CEPE in 1975.Feasibility studies will begin in 1978, and are expected to be completedin mid-1979. No discussions for financial arrangements have been ini-tiated.
10. Period of execution: The period of execution is estimated at five years.

- 39 -
PETROLEUM - 11
1. Name of the Project: Amonia-Methanol Plant
2. Location: Guayas Province
3. Executing agency: CEPE
4. Total estimated cost: $163.0 million
5. External financing requested: $81.5 million
6. Expected year of commitment: 1979
7. Purpose of project: To permit the exploitation and industrialization ofnatural gas resources at the Gulf of Guayaquil.
8. Description of the project: The project will exploit the proven reserveslocated at the sedimentary basin of the Gulf of Guayaquil, to permitindustrialization as follows:- An amonia processing plant with a capacity of 1,000 metric tons per
day (chemical grade)- A methanol processing plant with a capacity of 1,000 metric tons per
day- Storage facilities for methanol chemical products.
9. Present status: Prefeasibility studies were prepared by De Gauller andMac Naulton in 1975. Final feasibilty studies are expected to be preparedin the course of 1978 under CEPE's contractual arrangements with North-West. No final arrangements have yet been made to finance the project.
10. Period of execution: The period of execution is estimated at four years.

- 40 -POWER - 1
1. Name of the Project: l'oachi Hydroelectric Project (225 MW)
2. Location: Pichincha Province
3. Executing agency: INECEL
4. Total estimated cost: $334.0 million
5. External financing requested: $176.0 million
6. Expected year of commitment: 1981
7. Purpose of project: To make use of the electrical generation potentialof the Toachi and Pilaton rivers to supply energy to the country, throughthe National Interconnecting System.
8. Description of the project: The project is located in the Province ofPichincha, 80 kilometers west of Quito. The project includes the installa-tion of three turbine generating units of 75 MW each, with the possibilityof expanding the project to include a fourth unit of 75 MW. A decision toinvest in this project will be made when final feasibility studies of theCoca Hydroelectric Project are completed in some 12 months. The Coca proj-ect is being considered as an alternate to this project.
9. Present status: Feasibility studies were prepared by Mobessco (Switzerland)in May 1973. A second contract was awarded to Mobessco and a localfirm for detail engineering studies. These are expected to be completedin late 1977. No discussions have been initiated with external lendersto finance the project.
10. Period of execution: The period of execution is estimated at six years.

- 41 -
POWER - 2
1. Name of the Project: Coca Hydroelectric Project
2. Location: Pichincha Province
3. Executing agency: INECEL
4. Total estimated cost: $800.0 million
5. External financing requested: $480.0 million
6. Expected year of commitment: 1981
7. Purpose of project: To meet future energy demand through the use ofhydroelectric resources at the Coca-Quijos river.
8. Description of the project: The project area is located in the CentralAndean region, north-east of Quito. The project is divided into threephases, with a total energy production of 3100 MW.- Phase I - three generating units of 75 MW each, with a total approxi-
mate cost of $350 million. Construction would begin in 1981.- Phase II and III - would not be considered until 1988 or 1989.The project is being contemplated as an alterantive to the construction ofthe Toachi Hydroelectric Project, but decision will not be reached untilfinal feasibility studies are completed.
9. Present status: Prefeasibility studies are being prepared by groupHydroservice, Integral, Ingeconsult, ADEC and IDCO. The final study isexpected to be completed in mid 1978 with financing being provided by IDB.No discussions have been initiated with external lenders to finance theproject.
10. Period of execution: The period of execution is estimated at six yearsfor Phase I.

- 42 -
POWER - 3
1. Name of the Project: National Transmission System (Paute, Phases C and D)
2. Location: National
3. Executing agency: INECEL
4. Total estimated cost: $73.0 million
5. External financing requested: $44.0 million
6. Expected year of commitment: 1977
7. Purpose of project: To interconnect the central generating units with therest of the country, in order to facilitate electrical distribution.
8. Description of the project: The last phases of the Paute TransmissionSystem; Phase C includes transmission lines to the cities of: Quevedoand Portoviejo, 138 KW and one circuit, servicing an area of 120 kilo-meters; Milagro-Babahoyo, 138 KW, one circuit and covering an area of40 kilometers; Santo Domingo-Esmeraldas, 138 KW, one circuit, and servicingan area of 150 kilometers. Phase C also includes substations at Porto-viejo, Babahoyo and Esmeraldas. These works are expected to be completedin 1981. Phase D includes transmission lines to the following cities;Milagro-Machala, 138 KW, one circuit, and services an area of 125 kilo-meters; Pascuales-Santa Elens, Cuenca-Loja, and Paute-Mendez with thesame services, but covering different distances. Phase D also includessubstations in Machala, Santa Elena, Loja and Mendez.
9. Present status: This is part of a national project, partly being financedby the Inter-American Development Bank, Mitsui, and Mitsubishi. However,Phases C and D have not been financed.
10. Period of execution: The period of execution is estimated at four years.
- 43 -
POWER - 4
1. Name of the Project: Rural Electrification
2. Location: National
3. Executing agency: INECEL
4. Total estimated cost: $60.0 million
5. External financing requested: $45.0 million
6. Expected year of commitment: 1979
7. Purpose of project: To supply the rural population of Ecuador withelectrical services for domestic use, and to increase agricultural pro-
ductivity through electrification and mechanization of production.
8. Description of the project: The project will be divided in two or threephases. Phase I will include a selected pilot area with an approximatetotal cost of $25 million. As experience is gained with the developmentof Phase I, two more areas will be selected for Phase II and III.
9. Present status: INECEL is presently working in the preparation of the
project, and in the selection of the first area. Feasibility studieswill be prepared in the course of 1977. IBRD is interested in partialfinancing of this project.

- 44 -
POWER - 5
1. Name of the Project: Regional Distribution System
2. Location: National
3. Executing agency: INECEL
4. Total estimated cost: $178.0 million
5. External financing requested: $82.0 million
6. Expected year of commitment: 1977-1981
7. Purpose of project: T'o incorporate all small local enterprises to aregional electrical distribution system, in accordance to the NationalElectrification Plan. This is intended to make the regional enterprisesprofitable and capable institutions, and to meet the need for a conti-nuous and efficient electrical service.
8. Description of the project: The project Comprises a Five Year Programincluding:(a) The purchase of 51% of all assets of some 50 small electric
enterprises;(b) The consolidation of all these enterprises into nine regional
distribution systems, as follows:
1. North (Carchi, Imbadura)2. Pichincha3. North-Center (Chimborazo, Cotopaxi, Bolivar, Tungurahua)4. South-Center (Canar, Azuay)5. South (Loja)6. Esmeraldas7. Manabi8. Guayas-Los Rios9. El Oro
(c) Technical assistance to the regional enterprises.
9. Present status: The project is part of the national program already underexecution. No discussions with external lenders have been initiated.
10. Period of execution: The period of execution is estimated at five years.

- 45 -
INDUSTRY - 1
1. Name of the Project: African Palm Oil Refinery
2. Location: Esmeraldas Province
3. Executing agency: Corporacion Financiera Nacional (CV-CFN)
4. Total estimated cost: $25.0 million
5. External financing requested: $15.00 million
6. Expected year of commitment: 1978
7. Purpose of project: To produce african palm oil to continue a longterm effort. To reach self-sufficiency in edible oils production.To develop a rural agro-industry, services and new employment in thearea.
8. Description of the project: 5,000 ha of oil palm plantation undermanagement of "PALMESA", a joint venture, including 1,000 ha. plantedby independent out-growers. An oil extraction plant with 30 ton per hourcapacity. Rural infrastructure: roads, bridges, power supply, water
and sewerage.
9. Present status: A pre-feasibility study was prepared by H.V.A. inter-national and CV-CFN. Final studies are expected to be completed by April1977. Studies will be reviewed by IBRD staff for possible bank financing.
10. Period of execution: The period of execution is estimated at four years.

- 46 -
INDUSTRY - 2
1. Name of the Project: Pineapple Processing Plant
2. Location: Guayas Province
3. Executing agency: MAG/National Banana and Tropical Fruits Program
4. Total estimated cost: $3.5 million
5. External financing requested: $1.5 million
6. Expected year of commitment: 1979
7. Purpose of project: To utilize existing pineapple production and toinclude new areas of production, for export, through a process ofindustrialization.
8. Description of the project: A project to be located at Milagro, GuayasProvince will be developed in two stages:First stage: The planting of 600 hectares of a new type of pineappleand an increase in production of the present planted area.Second stage: The installation of a processing plant with a production of9,000 tons of canned fruit, and 4,500 tons of canned juices for export tothe US market.250 tons of vinegar and 1,250 tons of balanced animal feeds for the internalmarket.The fruit will be packed in sugar syrup, in 700 gram cans. The juice willbe a concentrate packed in cans of 2,500 grams
9. Present status: Prefeasibility studies were prepared by the National Bananaand Tropical Fruits Program in 1975. A feasibility study will be preapredin 1977. No discussions with external lenders have been initiated.
10. Period of execution: The period of execution is estimated at three years.

- 47 -
INDUSTRY - 3
1. Name of the Project: New Sugar Mills
2. Location: Guayas Province
3. Executing agency: National Sugar Program
4. Total estimated cost: $150.0 million
5. External financing requested: $90.0 million
6. Expected year of commitment: 1978-1979
7. Purpose of project: To increase sugar production through an expansionof planted areas and the construction of new sugar mills. To increaseexports and to satisfy internal demand.
8. Description of the project:(a) Renovation of 10,500 hectares in plantations owned by the large mills,
thus obtaining an increase in production, to 1,224,000 metric tons ofsugar.
(b) The project will also incorporate 10,000 hectares of new planted areasinto production, with an estimated 80-90 metric tons per hectare.
(c) An increase in installed capacity of the largest existing mills.(d) The construction of two sugar mills with a processing capacity of
5,000 MT per day each, starting 1980, at 60% of full productioncapacity.
9. Present status: H.V.A. International of Netherlands, Motor Columbus ofSwitzerland and INCONEL of Ecuador are preparing a feasibility study,expected to be completed in mid-1977. No discussions with externallenders have been initiated.
10. Period of execution: The period of execution is estimated at four years.

- 48 -
INDUSTRY - 4
1. Name of the Project: Cementos Cotopaxi
2. Location: Cotopaxi Province
3. Executing agency: CV-Corporacion Financiera Nacional
4. Total estimated cost: $74.7 million
5. External financing requested: $35.5 million
6. Expected year of commitment: 1978
7. Purpose of project: The construction of a cement plant to supplydomestic demand and to substitute imports.
8. Description of the project: Reserves of raw materials have been determinedin the Zumbahua zone of the Cotopaxi Province in sufficient quantities topermit the installation of a plant with a production of one ton per dayduring a period of 60 years. A company has been created to develop andmanage the project.
9. Present status: The geological feasibility of the project and industrialprefeasibility studies were prepared by the group Watts Griffis & McOnattof Canada, and CIC of Ecuador. Final feasibility will be completed earlyin 1977 by German consultants. No discussions with external lenders havebeen initiated.
10. Period of execution: The period of execution is estimated at four years.

- 49 -
INDUSTRY - 5
1. Name of the Project: Cuenca Industrial Park
2. Location: Azuay Province
3. Executing agency: CENDES/Corporacion Financiera Nacional
4. Total estimated cost: $5.6 million
5. External financing requested: $3.0 million
6. Expected year of commitment: 1978
7. Purpose of project: To promote the industrial development of the region,through the installation of new industries, and through the expansion andthe strengthening of established existing industries, in accordance withthe urban development plan of the region.
8. Description of the project: The industrial park at Cuenca will beexpanded in a total area of 67 hectares, with basic infrastructure andservices. The project components are the following:(a) Modular standard buildings(b) Road infrastructure(c) Services, such as: electrical, water and sewerage, telephone
systems.(d) Other services: health units, telex and telecommunications, banks,
etc.(e) Communal areas: storage facilities, laboratories, workshops, and
technical assistance.
9. Present status: The feasibility are being prepared by foreign consultantsand a local firm. The studies are expected to be completed in mid-1977.IBRD might consider financing this project.

- 50 -
INDUSTRY - 6
1. Name of the Project: Ambato Industrial Park
2. Location: Tungurahua Province
3. Executing agency: CENDES/Corporacion Financiera Nacional
4. Total estimated cost: $6.7 million
5. External financing requested: $3.8 million
6. Expected year of commitment: 1978
7. Purpose of project: To promote the industrial development of the region,through the creation of new industries and the strengthening of establishedindustries, in accordance with the urban development plan the area.
8. Description of the project: The Industrial Park will be developed in anarea of 100 hectares. The project components are the following:(a) construction of modular standard buildings;(b) road infrastructure(c) basic infrastructure services: water and sewerage, electrical services,
telephone system and technical assistance;(d) other communal services: workshop, laboratories, storage system and
technical assistance.
9. Present status: The feasibility study is being prepared by CENDES andis expected to be completed in July 1977. No discussions with externallenders have been initiated.
10. Period of execution: The period of execution is estimated at four years.
- 51 -
INDUSTRY - 7
1. Name of the Project: Iron Ore Integrated Project
2. Location: Guayas Province
3. Executing agency: ECUASIDER/Direccion de Industrias de las Fuerzas
Armadas
4. Total estimated cost: $288.0 million
5. External financing requested: $172.9 million
6. Expected year of commitment: 1980
7. Purpose of project: To plan, promote, install and exploit industrialplants for the production of iron, steel and finished products.
8. Description of the project: The project contemplates the installation ofa plant with a capacity of 400,000 metric tons per year oF basic steelproduction for the internal market, based on:- 700,000 Mi/yr of imported iron pellets- 570,000 m per day of natural gas, supplied from the gas resources
of the Gulf- 78,000 KW of installed electric energy- 2,100 g5llons per day of fuel oil- 7,500 m per day of water
- social infrastructure for 3,000 workers.The project is intimately linked to the Amonia-Methanol Project, beingdeveloped by CEPE and Northwest, as the availability of natural gas inthe quantities needed and on a timely basis is vital to this project.The iron pellets will be imported from Peru.
9. Present status: The company that will develop and manage the project(ECUASIDER) has been created. Feasibility studies will be prepared by
international consultants and ECUASIDER during 1977. No discussions withexternal lenders have been initiated.
10. Period of execution: The period of execution is estimated at five years.
- 52 -INDUSTRY - 8
1. Name of the project: Naval Shipyards (ASTINAVE)
2. Location: Guayas Province
3. Executing agency: Direccion General de Desarrollo Maritimo de laFuerza Armada del Ecuador (DIMERC)
4. Total estimated cost: $177.0 million
5. External financing requested: $106.2 million
6. Expected year of commitment: 1980
7. Purpose of the project: Foreign exchange savings and generation. Thegeneration of new sources of employment.
8. Description of the project: The project will develop an industry for theconstruction and maintenance of ships. It will be divided in severalphases:
I. The construction of a shipyard with a capacity of 1,000 tons for theconstruction and maintenance of ships. Total cost $13.0 million.
II. A dry dock for maintenance of ships of 40,000 DWT. Total cost $84.0million.
III. A construction platform for the construction of ships of 6,000 DWT.IV. A dry dock for the construction of cargo ships of 16,000 DWT, or
petroleum ships of a higher capacity. Total cost of Phases III &IV $80.0 million.
Astinave, the company that will develop and managed the project, will bea mixed enterprise. Foreign participation is being invited.
9. Present status. A pre-feasibility study was completed in July 1977 byDIMERC and foreign consultants. Several shipyard companies have showninterest in participation in the purchase of assets (Japan, Germany andBrazil). However, final studies will not be prepared until 1978. No dis-cussions with foreign lenders for the financing of the project have beeninitiated.
10. Period of execution. The period of execution is estimated at nine years.

- 53 -INDUSTRY - 9
1. Name of the project: Automotive Industry Development
2. Location:
3. Executing agency: Ministry of Industries/CORDINAUTO
4. Total estimated cost: $166.8 million
5. External financing requested: $100.0 million
6. Expected year of commitment: 1981
7. Purpose of the project: The production of automotive parts and automobileassembly for the domestic market and for export to the Andean market.
8. Description of the project: The project will be implemented in severalphases:
I. The construction of a plant for the assembly and production ofautomobiles assigned to Ecuador in the Andean Agreement.
II. The production of automotive parts.III. Forging and casting.The project has not been approved by Andean Market members, but is expectedto be considered in mid-1977. If approved, the Government of Ecuador willrequest foreign participation from major automobile manufacturers.
9. Present status: Market studies for the Andean region were prepared by theMinistry of Industries in 1975. The Government of Ecuador is contemplatingthe creation of a mixed enterprise (CORDINAUTO). Final feasibility studiesmust be carried out by the foreign manufacturer selected to participate inthe project. No discussions with foreign lenders have been initiated.
10. Period of execution: The period of execution is estimated at five years.

- 54 -
INDUSTRY - 10
1. Name of the project: Cayapas Forestry
2. Location: Northwest Region
3. Executing agency: Cayapas Industry
4. Total estimated cost: $92.1 million
5. External financing requested: $55.3 million
6. Expected year of commitment: 1981
7. Purpose of the project: The industrialization of natural tropical forestresources in an area of 213,000 ha. And the establishment of a rapidgrowth of coniferous plantation for the production of corrugating mediumand linerboard.
8. Description of the project: This is a phased project, the first phase isnow in o eration and it involves a sawmill with a capacity to produce90,000 m of sawnwood per year. The second phase involves a corrugatingmedium plant with a production of 50,000 metric tons per year plus aplant for the production of 115,000 metric tons per year of linerborad.
9. Present status: In order to prove the economic ad technical feasibilityof the second phase of the project, Cayapas Industry proposes to carryout a series of tests, which include: (a) determination of lower limits ofrequired utilization of long-fiber pulp through extensive pilot planttests with various mixes, (b) confirm the technical and economic viabi-lity of the more promising mixes by making commercial sized tests, (c)carry-out management inventories covering in detail the species, sizes,quality and logging methods required to feed the proposed mills. Inaddition, the feasibility of a rapid growth coniferous plantation for theproduction of long-fiber pulp must be proven. These tests will begin inthe course of 1977 and are expected to be carried in a three year period.IBRD has shown some interest in financing the project.
10. Period of execution: The second phase of the project is expected to beexecuted in a period of four years.
- 55 -
ROAD TRANSPORT - 1
1. Name of the project: Duran-Boliche Highway
2. Location: Guayas Province
3. Executing agency: Ministry of Public Works
4. Total estimated cost: $20.0 million
5. External financing requested: $8.0 million
6. Expected year of commitment: 1977
7. Purpose of the project: The construction of approximately 26 kilometersof road to respond to increasing needs for transport routes from Cuencato Guayaquil. This part of the road goes through the Guayas Province,through extensive productive areas.
8. Description of the project: This project constitutes the first stage ofan improved Cuenca-Guayaquil route. It contemplates construction of ahighway with an average daily traffic of 3,000 to 8,000 vehicles. Becauseof its location, the project is of fundamental importance to the nationalroads system, as it connects with the Cajabamba-Bucay, Gun-Chochangay, andLa Troncal-Naranjal-Machala roads.
9. Present status: The feasibility studies were prepared by the group Tams-Astec in 1975. Detail engineering were finished in December 1976.Contract bidding is expected to start in June 1977 but is subject tochanges, pending financing of the project. IBRD is considering financingthe project, which was appraised in October 1976.
10. Period of execution: The period of execution is estimated at four years.

- 56 -ROAD TRANSPORT - 2
1. Name of the project: Puerto Ila-Garrapata Road
2. Location: Provinces of Pichincha and Manabi
3. Executing agency: Ministry of Public Works
4. Total estimated cost: $13.0 million
5. External financing requested: $5.2 million
6. Expected year of commitment: 1977
7. Purpose of the project: To mobilize increased agricultural productionand to incorporate new areas of production through the construction ofthe road.
8. Description of the project: The new road has been designed according tospecifications for Class III Roads, with a low structural level and witha double bituminous treatment to sub-base level in the initial stage.The road will hold an average vehicle traffic from 300 to 1,000 per dayand covers an extension of 86 kilometers. This project represents thefirst stage of a Rural Development Project. The second stage is thePuerto Ila-Chone Rural Development Project (Agriculture, Project 4),also being considered for IBRD financing.
9. Present status: The feasibility studies were prepared by Tams-Astec in1975. Detail engineering is expected to be finished in December 1976.Contract bidding is expected to start in June 1977 but is subject tochanges, pending financing of the project. IBRD has shown interest infinancing the project, which was appraised in October 1976.
10. Period of execution: The period of execution is estimated at three years.

- 57 -ROAD TRANSPORT - 3
1. Name of the project: Guayaquil-Daule Expressway
2. Location: Guayas Provinces
3. Executing agency: Ministry of Public Works
4. Total estimated cost: $39.0 million
5. External financing requested: $23.4 million
6. Expected year of commitment: 1979
7. Purpose of the project: To alleviate traffic congestion through theconstruction of an expressway.
8. Description of the project: The project considers the construction of26 kilometers of road with expressway characteristics, designed to holdtraffic of more than 8,000 vehicles daily.
9. Present status: The feasibility studies are being prepared by the Con-sortium Hidroservice (Brazil) and Astec (Ecuador) and are expected to befinished by April 1977. Offers from consultants for detailed engi-neering are being evaluated and contract bidding is expected to startin July 1977 but is subject to changes, pending financing of theproject. No discussions with external lenders have been initiated.
10. Period of execution: The period of execution is estimated at two years.

- 58 -
ROAD TRANSPORT - 4
1. Name of the project: Quito-Aloag Expressway
2. Location: Province of Pichincha
3. Executing agency: Ministry of Public Works
4. Total estimated cost: $35.0 million
5. External financing requested: $21.0 million
6. Expected year of commitment: 1978
7. Purpose of the project: To satisfy future demand of traffic and to alle-viate saturation caused by the present road system. The new expresswaywill benefit users with lower transport costs.
8. Description of the project: The project considers the construction of 22kilometers of expressway, designed to carry an average daily traffic of8,000 or more vehicles.
9. Present status: The feasibility studies are being prepared by theConsortium Hidroservice (Brazil) and Astec (Ecuador) and are expected tobe finished by April 1977. Offers from consultants for detailed engi-neering are being evaluated, and contract bidding is expected to startin September 1977, but is subject to change, pending financing of theproject.
10. Period of execution: The period of execution is estimated at two years.

- 59 -ROAD TRANSPORT - 5
1. Name of the project: Cumbe-Pasaje Road
2. Location: Provinces of Azuay and El Oro
3. Executing agency: Ministry of Public Works
4. Total estimated cost: $30.0 million
5. External financing requested: $18.0 million
6. Expected year of commitment: 1977
7. Purpose of the project: The project corresponds to Route 80 of theNational Road Program and connects the provinces of Azuay and El Oro,permitting the commercial and social exchange between the Sierra andthe Costa, and the utilization of Puerto Bolivar to the benefit of theInterandean Central Region.
8. Description of the project: Construction of a new road between Porteteand the San Francisco River, and an improvement to the existing route ofgravel, and with one way traffic in certain areas. The new road willhave Class III designs, with a low structural level, of double bituminoustreatment, designed to hold traffic of 300 to 1,000 vehicles daily. Thenew road starts at Cumbe, where it meets the Panamerican Highway, located15 kilometers from Cuenca. The road crosses a topography ondulated (20%)and mountainous (80%) until it reaches Pasaje, 25 kilometers from PuertoBolivar.
9. Present status: Feasibility studies were prepared by the group Tams-Astecin 1975. Detailed engineering is expected to be finished in March 1977by the firm Contec. Contract bidding is expected to begin September 1977but is subject to changes, pending financing of the project. The Govern-ment of Kuwait will finance the project.
10. Period of execution: The period of execution is estimated at four years.

- 60 -ROAD TRANSPORT - 6
1. Name of the project: Quininde-Chila Road
2. Location: Esmeraldas and Manabi Provinces
3. Executing agency: Ministry of Public Works
4. Total estimated cost: $6.1 million
5. External financing requested: $3.7 million
6. Expected year of commitment: 1978
7. Purpose of the project: The construction of this road will benefit poten-
tial production zones of the Esmeraldas province in the south-west, and
north in the Mlanabi province; these areas lack access roads and adequate
transport. The road will benefit an area of 64,000 hectares.
8. Description of the project: The road will be constructed parallel to the
Quininde River, 66 kilometers long. The northern end of the road is lo-
cated six kilometers south of the Quininde-Santo Domingo Road. The south-
ern end is located at the Chila River, connecting with the Suma-PedernalesRoad. The new road will have Class III road characteristics, with a low
structural level and double bituminous treatment at the initial stage.
The road is designed to hold a daily average traffic of 300 to 1,000
vehicles.
9. Present status: The feasibility studies were prepared by the group Tams-
Astec in 1975. Detailed engineering was completed by IECA in December
1975. Contract bidding is expected to start in October 1977 but is sub-
ject to change, pending the financing of the project. The Government of
Kuwait will finance the project.
10. Period of execution: The period of execution is estimated at 3.5 years.
- 61 -ROAD TRANSPORT - 7
1. Name of the project: Boliche-El Triunfo Road
2. Location: Guayas Province
3. Executing agency: Ministry of Public Works
4. Total estimated cost: $7.6 million
5. External financing requested: $4.6 million
6. Expected year of commitment: 1978
7. Purpose of the project: The construction of approximately 30 kilometersof road to respond to increasing needs for transport routes from Cuencato Guayaquil. This road goes through the Guayas Provinces, throughextensive productive areas.
8. Description of the project: This project constitutes the second stage ofthe Cuenca-Guayaquil route and is 30 kilometers long. The road will be afirst class road to be converted to a highway in the future. As in thefirst stage of the route (Duran-Boliche), the project is of fundamentalimportance to the National Road System, as it connects with the Cajabamba-Bucay-Gun-Chochangay, and La Troncal-Naranjal-Machala roads.
9. Present status: The feasibility studies were prepared by the group Tams-Astec in 1975. Detailed engineering is expected to be finished in April1977. Contract bidding is expected to start in March 1978. No discus-sions with external lenders have been initiated.
10. Period of execution: The period of execution is estimated at four years.

- 62 -ROAD TRANSPORT - 8
1. Name of the project: Alamor-Arenillas Road
2. Location: Lojas Province
3. Executing agency: Ministry of Public Works
4. Total estimated cost: $9.1 million
5. External financing requested: $5.5 million
6. Expected year of commitment: 1978
7. Purpose of the project: The construction of the project will permitthe direct transit to the coast from border towns such as Marara,Zapotillo and others. The road will also contribute to the developmentof programs executed by Predesur.
8. Description of the project: This road will be the continuation of theCelica-Alamor Road and its construction will have the technical charac-teristics of a Class III road, with low structural land level, doublebituminous treatment, designed to hold a daily average traffic of 300 to1,000 vehicles.
9. Present status: The prefeasibility studies were prepared by the groupTams-Astec in February 1973 and are part of the National Road Plan. Acontract is being signed with consultants for the preparation of feasi-bility studies. Detailed engineering is expected to be completed inFebruary 1978. No discussions for financial arrangements have beeninitiated.
10. Period of execution: The period of execution is estimated at four years.

- 63 -ROAD TRANSPORT - 9
1. Name of the project: Loja-Zamora Roads
2. Location: Lojas and Zamora Provinces
3. Executing agency: Ministry of Public Works
4. Total estimated cost: $8.0 million
5. External financing requested: $4.8 million
6. Expected year of commitment: 1978
7. Purpose of the project: The construction and improvement of this roadwill promote the integral development of the region. This demands anadequate road infrastructure, to reinforce product exchange, agriculturaldevelopment and forestry exploitation programmed by Predesur in this area.
8. Description of the project: The project will be located in the south-central region between the provinces of Loja and Zamora, connecting theirrespective capitals. The cosntruction of the road will have technicalcharacteristics of Class III roads, with low structural level and doublebituminous treatment, designed to hold a daily average traffic of 300 to1,000 vehicles.
9. Present status: The prefeasibility studies were prepared by the Tams-Astedgroup in August 1973 as part of the National Road Plan. Contract biddingis expected to begin in March 1977 with international consultants for thepreparation of feasibility studies. No discussions for financialarrangements have been initiated.
10. Period of Execution. The period of execution is estimated at three years.

- 64 -ROAD TRANSPORT - 10
1. Name of the project: Quiroga-Pichincha Road
2. Location: Manabi Province
3. Executing agency: Mlinistry of Public Works
4. Total estimated cost: $7.7 million
5. External financing requested: $4.6 million
6. Expected year of commitment: 1978
7. Purpose of the project: The construction of this road will help torehabilitate areas that are only partially populated; also, it willbring greater agricultural and commercial development to the eastern-central zone of M4anabi.
8. Description of the project: The Quiroga-Pichincha road goes through theManabi Province from east to west and is 68 kilometers long. The onlyexisting road, a summer road, will soon disappear as a result of theconstruction of La Esperanza dam. The road will have Class IV charac-teristics, of gravel, designed to hold a daily average traffic of 100to 300 vehicles. The road will connect with the Quevedo-Manta and withthe Tosagua-Calceta-Quiroga roads.
9. Present status: The feasibility studies have been prepared by the groupTams-Astec in February 1975. Detail engineering was prepared by Cie.General de Geotecnica in December 1975. Contract bidding is expected tostart in July 1978 but is subject to change pending financing of the proj-ect. No discussions for financial arrangements have been initiated.
10. Period of execution: The period of execution is estimated at three years.

- 65 -ROAD TRANSPORT - 11
1. Name of the project: Cuenca-Azogues Road
2. Location: Azuay and Canar Provinces
3. Executing agency: Ministry of Public Works
4. Total estimated cost: $9.0 million
5. External financing requested: $5.4 million
6. Expected year of commitment: 1979
7. Purpose of the project: The Cuenca-Azogues existing road is insufficientfor present traffic, and there will be even more future traffic in theshort term because of the construction of a new cement plant and of thePaute Hydroelectric Project. The proposed project is to expand agricul-tural production and commercial exchange between the Azuay and Canar Prov-inces.
8. Description of the project: The project will be located in the SierraRegion, between the provinces of Azuay and Canar. The new road will sub-stitute the existing one, with Class I design, paved. The road will cover45 kilometers.
9. Status of the project: Pre-feasibility studies were prepared in August1973 by the group Tams-Astec and are part of the National Road Plan. Bidshave been submitted by consultants for the preparation of feasibilitystudies; these are to be finished in May 1977. No discussions for finan-cial arrangements have been initiated.
10. Period of execution: The period of execution is estimated at three years.

- 66 -ROAD TRANSPORT - 12
1. Name of the project: Cumbe-Loja Road
2. Location: Azuay and Loja Provinces
3. Executing agency: Ministry of Public Works
4. Total estimated cost: $25.2 million
5. External financing requested: $15.1 million
6. Expected year of commitment: 1979
7. Purpose of the project: The construction and improvement of this roadwill be of importance in the development of the Austral Region in Ecuador.
8. Description of the project: The project in an integral part of the Pan-american Highway and connects the provincial capitals of Cuenca and Loja.It includes the construction and improvement of the existing route. Theroad will have the technical characteristics of a Class III road, with lowstructural level and double bituminous treatment. It will be 200 kilo-meters long.
9. Present status: Prefeasibility studies were prepared by the group Tams-Astec in August 1973 and are part of the National Road Plan. Bids havebeen submitted by consultants for the preparation of feasibility studies,which are expected to be finished in September of 1978. No discussionsfor financial arrangements have benn initiated.
10. Period of execution: The period of execution is estimated at four years.

- 67 -ROAD TRANSPORT - 13
1. Name of the project: Hollin-Loreto-Coca Road
2. Location: Napo Province
3. Executing agency: Ministry of Public Works
4. Total estimated cost: $13.8 million
5. External financing requested: $8.3 million
6. Expected year of commitment: 1979
7. Purpose of the project: The interconnection of the fundamental road sys-tem with the petroleum-producing region of Oriente to facilitate its inter-communication with the rest of the country and to promote the agriculturaldevelopment of the Napo Province.
8. Description of the project: The road will be 115 kilometers long; itstarts in the town of Hollin, located at La Selva (Baeza-Cotundo) road.It continues to the north-east to Francisco de Orellana or Coca, where itconnects with the Coca-Lago Agrio Road. The road will have Class IV tech-nical characteristics, of gragel.
9. Present status: Prefeasibility studies were prepared by the group Tams-Astec. Contract will be awarded shortly for the preparation of feasibilitystudies. These are expected to be finished in June 1978. No discussionsfor financial arrangements have been initiated.
10. Period of execution: The period of execution is estimated at three years.

- 68 -ROAD TRANSPORT - 14
1. Name of the project: Casa de Maquinas-Mendez Road
2. Location: Azuay, Morona and Santiago Provinces
3. Executing agency: Ministry of Public Works
4. Total estimated cost: $7.2 million
5. External financing requested: $4.3 million
6. Expected year of commitment: 1979
7. Purpose of the project: The interconnection of the provinces of Azuay-Morona-Santiago with a better road, and to provide better access to thePaute Hydroelectric Project.
8. Description of the project: The road will start at Casa de Maquinas tothe town of Limon, connecting the Zamora-Gualaquiza-Macas Road. The roadwill have Class IV characteristics, of gravel, designed to hold a dailyaverage traffic of 100 to 300 vehicles.
9. Present status: Prefeasibility studies were prepared by the group Tams-Astec. Bids have been submitted by consultants for the preparation offeasibility studies, these are expected to be finished by October 1978.No discussions for financial arrangements have been initiated.
10. Period of execution: The period of execution is estimated at three years.
- 69 -ROAD TRANSPORT - 15
1. Name of the project: Sesme-Jama Road
2. Location: Manabi Province
3. Executing agency: Ministry of Public Works
4. Total estimated cost: $8.2 million
5. External financing requested: $4.9 million
6. Expected year of commitment: 1979
7. Purpose of the project: The construction of this road will result infaster mobility of production to consumer centers. It will also permitan increase in productivity in the area, as cultivated areas are smallbecause of the lack of permanent and accessible roads.
8. Description of the project: The Sesme-Jama Road goes through the ManabiProvince from east to west. Sesme is the connecting point of the SantoDomingo-Chone Road, at the other extreme of Jama, near the Pacific Ocean,north of the Cacaquez Bay. The road has Class IV characteristics, ofgravel, according to design standards adopted by the Ministry of PublicRoads. The road is 60 kilometers long.
9. Present status: The feasibility studies were prepared by the group Tams-Astec in February 1975. Detail engineering was prepared by ADEC inDecember 1975. Contract bidding is expected to start in June 1979, pend-ing financing of the project. No discussions for financial arrangementshave been initiated.
10. Period of execution: The period of execution is estimated at three years.

- 70 -
ROAD TRANSPORT - 16
1. Name of the project: Yangana-Zumba Road
2. Location: Loja and Zamora Provinces
3. Executing agency: Ministry of Public Works
4. Total estimated cost: $13.8 million
5. External financing requested: $8.3 million
6. Expected year of commitment: 1980
7. Purpose of the project: To better integrate into the economy of the coun-try the valleys of Valladolid, Panda and Zumba, rich in cattle and agri-culture to major market areas in that region.
8. Description of the project: The road will be located in the south-eastregion of the Loja province and south of the Zamora-Chinchipe provinces.It will connect with the Loja-Yangana road. The road will have Class IVtechnical characteristics, of gravel, and will be 115 kilometers long.
9. Present status: A contract will be signed shortly with consultants forthe preparation of feasibility studies, these are expected to be finishedin September 1978. No discussions for financial arrangements have beeninitiated.
10. Period of execution: The period of execution is estimated at four years.

- 71 -ROAD TRANSPORT - 17
1. Name of the project: Suma-Pedernales Road
2. Location: Manabi Province
3. Executing agency: Ministry of Public Works
4. Total estimated cost: $17.9 million
5. External financing requested: $10.8 million
6. Expected year of commitment: 1980
7. Purpose of the project: With the construction of this road, 48,500 hect-ares will be incorporated to the National Production System. Agriculture,cattle and forestry will be promoted. The road will also help fishingdevelopment in the Pedernales coast.
8. Description of the project: Located in the Manabi Province, Suma is theconnecting point with the Santo Domingo-Chone road at 230 meters of alti-tude. The road goes through the mountains of Cuaque and Meche at 440meters until it reaches Pedernales in the Ecuadorian coast. The road hasClass III technical characteristics with a low structural level and doublebituminous treatment, and is 89 kilometers long.
9. Present status: Feasibility studies were prepared by the group Tams-Astecin February 1975. Detailed engineering studies were prepared by CIAR inDecember 1975. Contract bidding is expected to start in June 1979, pendingthe financing of the project. No discussions for financial arrangementshave been initiated.
10. Period of execution: The period of execution is estimated at four years.

- 72 -ROAD TRANSPORT - 18
1. Name of the project: National Feeder Road Program
2. Location: National coverage
3. Executing agency: Ministry of Public Works
4. Total estimated cost: $144.0 million
5. External financing requested: $55.0 million
6. Expected year of commitment: 1978-1982
7. Purpose of the project: The project is for incremental financing of theconstruction of feeder roads in major production areas in order to in-crease agricultural production and to facilitate marketing.
8. Description of the project: The construction of 600 kilometers of feederroads per year to incure continuity of the program over a period of fiveyears.
9. Present status: The proposed project is intended to supplement the Govern-ment's own financing of the feeder road program and to enable its planningand execution to proceed on a more rational long-term basis than has beenpossible to date. Feasibility studies could be carried out in the firstpart of 1977. No discussions for financial arrangements have been initi-ated.
10. Period of execution: The period of execution is estimated at six years.
- 73 -AIR TRANSPORT - 1
1. Name of the project: Quito International Airport
2. Location: Puembo
3. Executing agency: Direccion de Aviacion Civil (National Civil AviationAgency)
4. Total estimated cost: $197 million
5. External financing requested: $157.6 million
6. Expected year of commitment: 1980
7. Purpose of the project: To provide the city of Quito with an airport inaccordance with international and domestic air traffic demand and inoperation 24 hours per day.
8. Description of the project: The project will be located at Puembo, on arelatively flat plateau at approximately 30 kilometers from Quito. Theproject will have the following facilities:1) Airfield: a maximum of 4,300 meters with parallel runaway airfield
layouts.2) Terminal complex: includes passenger terminal, automobile parking,
flight center, support facilities and on-airport access roadways.3) Military area: an area of 100 hectares will be reserved for develop-
ment of military facilities.4) Civilian plane park: the exact size and configuration has not been
defined.
Airport development costs: total $197.0 millionLand acquisition 10.4 millionAccess highway 34.3 millionUtilities 4.2 millionSite preparation 25.0 millionAirfield development 46.7 millionNavigation and landing aids 3.7 millionTerminal area development 70.0 millionInternal access and vehicle parking 2.6 million
9. Present status: Feasibility studies were prepared by the group Inter-national Engineering (US) and Consultores Asociados Ecuatorianos inAugust 1976. Final technical-economic feasibility studies are scheduledto be concluded in mid-1978. No discussions for financial arrangementshave been initiated.
10. Period of execution: The period of execution is estimated at four years.

- 74 -AIR TRANSPORT - 2
1. Name of the project: Guayaquil International Airport
2. Location: Chongon
3. Executing agency: Direccion de Aviacion Civil (National Civil AviationAgency)
4. Total estimated cost: $140.0 million
5. External financing requested: $112.0 million
6. Expected year of commitment: 1980
7. Purpose of the project: To provide the city of Guayaquil with a newairport that will meet future requirements, in operation 24 hours perday.
8. Description of the project: The Guayaquil International Airport will in-clude the construction of a runway that will satisfy air demand for thenext 25 years, with parallel taxiways. Two terminals, one internationaland one domestic, with possibilities for expansion. The construction ofthe new airport at Chongon will implicate the closing of the existingairport.
Airport development costs: total $140.0 millionLand acquisition 6.9 millionAccess highway 6.9 millionUtilities 4.1 millionSite preparation 7.4 millionAirfield development 39.9 millionNavigation and landing aids 3.7 millionTerminal area development 69.2 millionInternal access and vehicle parking 1.9 million
9. Present status: Feasibility studies were prepared by the group Inter-national Engineering Co. (US) and Consultores Asociados Ecuatorianos.Final economic feasibility studies are expected to be ready in mid-1978.No discussions for financial arrangements have been initiated.
10. Period of execution: The period of execution is estimated at four years.

- 75 -AIR TRANSPORT - 3
1. Name of the project: Cuenca, Machala, Coca and Pastaza airports
2. Location: Same
3. Executing agency: Direccion de Aviacion Civil (National Civil AviationAgency)
4. Total estimated cost: $32.0 million
5. External financing requested: $24.0 million
6. Expected year of commitment: 1978
7. Purpose of the project: To improve the present infrastructure by theconstruction of four domestic airports in regions of the country.
8. Description of the project: The four airports have been considered asone global project because of technical and economic reasons. The projectwill include:
a) the construction of paved runwaysb) terminal buildingsc) access roadsd) communication and radio aids networke) improvement of safety operations
9. Present status: Feasibility studies are expected to be completed inJune 1977 by the firm Sir Frederick Snow. Advanced engineering studiesshould be completed by Sir Frederick Snow in December 1977. No discus-sions for financial arrangements have been initiated.
10. Period of execution: The period of execution is estimated at three years.

- 76 -PORTS - I
1. Name of the project: Esmeraldas Port, Part I
2. Location: Esmeraldas Province
3. Executing agency: Esmeraldas Port Authority
4. Total estimated cost: $21.2 million
5. External financing requested: $12.7 million
6. Expected year of commitment: 1978
7. Purpose of the project: The construction of the Esmeraldas Port isdesigned to handle a future traffic demand of 440,000 annual tons.
8. Description of the project: The project will be completed in two steps.Part I includes:
a) dredging and placing of fill materialb) stability and alignment of breakwaterc) the construction of two wharfsd) storage facilitiese) administration buildings, port equipment roads and paved
areas, utilities.
9. Present status: Feasibility study and detail engineering was preapredby Livessey and Henderson in 1975. Offers of credit in the order of $13.0million have been presented to the National Port Authority by severalbanks. No final decision has been made in the external financing of theproject.
10. Period of execution: The period of execution is estimated at two years.

- 77 -TOURISM - I
1. Name of the project: Guayaquil Hotel
2. Location: Guayas Province
3. Executing agency: Direccion Nacional de Turismo/Corporacion FinancieraNacional
4. Total estimated cost: $8.0 million
5. External financing requested: $6.4 million
6. Expected year of commitment: 1978
7. Purpose of the project: To provide the city of Guayaquil with a firstclass hotel.
8. Description of the project: The construction of a five star hotel with 19floors and 392 double rooms and 28 suites. The hotel will also provideservices normally provided with first class hotels. In addition, thehotel will have a heliport, and other facilities.
9. Present status: A feasibility study is being prepared by the firmFrederic Harris and ICA of Ecuador. The study is expected to be completedin early 1977. The Inter-American Development Bank has shown interest infinancing the project.
10. Period of execution: The period of execution is estimated at three years.

- 78 -TOURISM - 2
1. Name of the project: Hotels construction
2. Location: Various cities
3. Executing agency: Direccion Nacional de Turismo/Corporacion FinancieraNacional
4. Total estimated cost: $15.2 million
5. External financing requested: $12.2 million
6. Expected year of commitment: 1978
7. Purpose of the project: To promote tourism. To provide various tradeand production centers with hotel facilities.
8. Description of the project: The construction of hotels in various areasof the country:Esmeraldas: The construction of a 100 room hotel with a total estimatedcost of $2.8 million. The hotel is designed to provide facilities to anincreasing number of business visitors.Ambato: The construction of a 40 room hotel with an approximate cost of$1.8 million.Banos: The construction of a 40 room hotel with an approximate totalcost of $1.8 million.Atacama: (Esmeraldas) The construction of a 40 room hotel with a totalcost of $2.2 million.Sua: (Esmeraldas) The construction of a 40 room hotel with a total costof $2.2 million.Huaynacapac: (Cuenca) The construction of a 100 room first class hotelwith an approximate cost of $4.4 million.
9. Present status: All projects are at a prefeasibility study level, withthe exception of the Esmeraldas and Huaynacapac hotels. Feasibilitystudies are being prepared by Proconsult and Inter-Consult for Esmeraldasand Huaynacapac and are expected to be completed in early 1977. No dis-cussions with foreign lenders have been initiated.
10. Period of execution: The period of execution is estimated at three years.

- 79 -TELECOMMUNICATIONS - 1
1. Name of the project: Rural Telecommunications
2. Location: National
3. Executing agency: Instituto Ecuatoriano de Telecomunicaciones (IETEL)
4. Total estimated cost: $18.0 million
5. External financing requested: $12.0 million
6. Expected year of commitment: 1977
7. Purpose of the project: To incorporate into the national communicationssystem those areas with no telecommunication, or with a partial system.
8. Description of the project: The project will connect and incorporate397 areas to major cities and trade centers. The are involved are townswith a population of 1,500 or less. Of these, four areas will have anurban telephone system and automatic long distance calling; 119 areaswill have an automatic urban telephone system and manual long distance;20 areas will have an urban telephone system and manual long distance.Of the total areas included, 254 will have telephone cabins. The projectwill require 1,268 urban connection switches, and 721 long distance cir-cuits.
9. Present status: A feasibility study was prepared by IETEL and UIT in 1975.IDB is considering financing the project.
10. Period of execution: The period of execution is estimated at five years.
- 80 -TELECOMMUNICATIONS - 2
1. Name of the project: Expansion of Local Telephone System
2. Location: National
3. Executing agency: Instituto Ecuatoriano de Telecomunicaciones (IETEL)
4. Total estimated cost: $77.4 million
5. External financing requested: $53.5 million
6. Expected year of commitment: 1977
7. Purpose of the project: To increase the national telecommunicationssystems.
8. Description of the project: The expansion of the local telephone system.This expansion will involve the installation of 239,000 new telephonelines.
9. Present status: This is an ongoing program. Ericcson International willfinance the project.
10. Period of execution: The period of execution is estimated at five years.

- 81 -
HEALTH - 1
1. Name of the Project: Quevedo Hospital
2. Location: Los Rios Province
3. Executing agency: Ministry of Health
4. Total estimated cost: $1.1 million
5. External financing requested: $1.1 million
6. Expected year of commitment: 1977
7. Purpose of the project: To supply the Quevedo area with hospital andhealth services. The hospital, in this case, is considered as a planningunit for the area, offering not only hospital beds and services, butother medical and sanitary services.
8. Description of the project: The project involves the construction of ahospital for 70 beds. Physical construction is almost complete. Thetotal cost refers to purchase of equipment.
9. Present status: This is part of two-year national health program.Feasibility studies are available. No discussions with external lendershave been initiated.
10. Period of Execution: The period of execution is estimated at one years.

- 82 -
HEALTH - 2
1. Name of the Project: Esmeraldas Hospital
2. Location: Esmeraldas Province
3. Executing agency: Ministry of Health
4. Total estimated cost: $2.5 million
5. External financing requested: $2.5 million
6. Expected year of commitment: 1977
7. Purpose of the project: To provide the Esmeraldas Province with hospitaland health services.
8. Description of the project: The project involves the construction of ahospital with 125 beds. Physical works are almost complete. The totalcost refers only to purchase of hospital equipment.
9. Present status: This project is an ongoing project and is part of a two-year national health program. Feasibility studies are available. Nodiscussion with external lenders have been initiated.
10. Period of Execution: The period of execution is estimated at one years.

- 83 -
HEALTH - 3
1. Name of the Project: Manta Hospital
2. Location: Manabi Province
3. Executing agency: Ministry of Health
4. Total estimated cost: $5.8 million
5. External financing requested: $2.9 million
6. Expected year of commitment: 1977
7. Purpose of the project: To provide the area with hospita; and generalhealth services.
8. Description of the project: The project includes the construction of ahospital for 220 beds. The project costs are as follows:
Construction $2.9 millionEquipment $2.9 million
9. Present status: Prefeasibility studies were prepared by the Ministry ofHealth. Feasibility studies are expected to be completed in mid-1977.No discussion with external lenders have been initiated.
10. Period of Execution: The period of execution is estimated at two years.

- 84 -
HEALTH - 4
1. Name of the Project: Chone Hospital
2. Location: Manabi Province
3. Executing agency: Ministry of Health
4. Total estimated cost: $3.4 million
5. External financing requested: $1.7 million
6. Expected year of commitment: 1977
7. Purpose of the project: To provide hospital and general health services
to the area of Bahia.
8. Description of the project: The project includes the construction of a
hospital for 120 beds. The project costs are as follows:
Construction $1.7 millionEquipment $1.7 million
9. Present status: This project is part of the national health plan. Feasi-
bility studies were prepared in May 1976. No discussions with external
lenders have been initiated.
10. Period of Execution: The period of execution is estimated at two years.
- 85 --
HEALTH - 5
1. Name of the Project: Azogues Hospital
2. Location: Canar Province
3. Executing agency: Ministry of Health
4. Total estimated cost: $3.4 million
5. External financing requested: $1.7 million
6. Expected year of commitment: 1977
7. Purpose of the project: To provide hospital and general health servicesto the Azogues area.
8. Description of the project: The project contemplates the construction of ahospital for 110 beds. The total project costs are as follows:
Construction $1.7Equipment $1.7
9. Present status: Feasibility studies were prepared in early 1976. Nodiscussions with external lenders have been initiated.
10. Period of Execution: The period of execution is estimated at two years.

- 86 -
HEALTH - 6
1. Name of the Project: Tena Hospital
2. Location: Napo Province
3. Executing agency: Ministry of Health
4. Total estimated cost: $3.4 million
5. External financing requested: $1.7 million
6. Expected year of commitment: 1977
7. Purpose of the project: To provide hospital and general health servicesin the area.
8. Description of the project: The construction of a hospital with 110beds. The project costs are as follows:
Construction $1.7Equipment $1.7
9. Present status: Feasibility studies were completed in early 1976. Nodiscussions with external lenders have been initiated.
10. Period of Execution: The period of execution is estimated at threeyears.

- 87 -
HEALTH - 7
1. Name of the Project: Santo Domingo Hospital
2. Location: Pichincha Province
3. Executing agency: Ministry of Health
4. Total estimated cost: $3.4 million
5. External financing requested: $1.7 million
6. Expected year of commitment: 1977
7. Purpose of the project: To provide hospital and general health servicesin the area.
8. Description of the project: The construction of a hospital with 110beds. The project costs are as follows:
Construction $1.7Equipment $1.7
9. Present status: Feasibility studies were prepared in early 1976. Nodiscussions with external lenders have been initiated.
10. Period of Execution: The period of execution is estimated at threeyears.

- 88 -
HEALTH - 8
1. Name of the Project: 21 Hospitals and Health Centers
2. Location: National
3. Executing agency: Ministry of Health
4. Total estimated cost: $8.9 million
5. External financing requested: $4.1 million
6. Expected year of commitment: 1978
7. Purpose of the project: To provide hospital and general health servicesto small communities in rural areas.
8. Description of the project: The construction of small hospital and healthcenters, each with 15 to 25 beds. The centers will be equipped to givehospital, educational and other health services.
9. Present status: Feasibility studies were completed in 1976. No dis-cussions with external lenders have been initiated.
10. Period of Execution: The period of execution is estimated at threeyears.

- 89 -
HEALTH - 9
1. Name of the Project: Children's Hospital
2. Location: Guayaquil
3. Executing agency: Ministry of Health
4. Total estimated cost: $14.6 million
5. External financing requested: $7.3 million
6. Expected year of commitment: 1977
7. Purpose of the project: To provide hospital and general health servicesto children in the Guayaquil areas.
8. Description of the project: The construction of a hospital for 364 beds.The total project costs are as follows:
Construction $7.3 millionEquipment $7.3 million
9. Present status: Feasibility studies were prepared in 1975. No dis-cussions with external lenders have been initiated.
10. Period of Execution: The period of execution is estimated at threeyears.

- 90 -
HEALTH - 10
1. Name of the Prolect: South Quito Hospital
2. Location: Quito
3. Executing agency: Ministry of Health
4. Total estimated cost: $5.0 million
5. External financing requested: $5.0 million
6. Expected year of commitment: 1977
7. Purpose of the project: To provide the city of Quito with adequate andsufficient hospital services.
8. Description of the project: The construction of a hospital with 320 beds.Physical construction has already begun. Total project costs refer onlyto equipment costs.
9. Present status: This is an ongoing project. Feasibility studies areavailable. No discussions with external lenders have been initiated.
10. Period of Execution: Period of execution is estimated at one years.

- 91 -
HEALTH - 11
1. Name of the Project: Machala Hospital
2. Location: El Oro Province
3. Executing agency: Ministry of Health
4. Total estimated cost: $3.5 million
5. External financing requested: $3.5 million
6. Expected year of commitment: 1977
7. Purpose of the project: To provide hospital and general health servicesto the area of Machala.
8. Description of the project: The construction of a hospital with 220 beds.The physical construction is almost complete. The project costs listedabove are for purchase of equipment only.
9. Present status: Feasibility studies were prepared in 1975. No arrange-ments with external lenders have been initiated.
10. Period of Execution: The period of execution is estimated at one years.

- 92 -
HEALTH - 12
1. Name of the Project: Guaranda Hospital
2. Location: Bolivar Province
3. Executing agency: Ministry of Health
4. Total estimated cost: $2.1 million
5. External financing requested: $2.1 million
6. Expected year of commitment: 1977
7. Purpose of the project: To provide the community with hospital and
general health services.
8. Description of the project: The construction of a hospital with 140 beds.Physical construction is near completion. The project costs listedabove refer to the purchase of equipment only.
9. Present status: Feasibility studies were prepared in 1975. No arrange-
ments with external lenders have been initiated.
10. Period of Execution: The period of execution is estimated at one years.
- 93 -
HEALTH - 13
1. Name of the Project: Rural Hospitals and Sub-Centers
2. Location: National
3. Executing agency: Ministry of Health
4. Total estimated cost: $45.0 million
5. External financing requested: $38.5 million
6. Expected year of commitment: 1978
7. Purpose of the project: To provide hospital and general services to therural areas. This is a national project.
8. Description of the project: The project includes the construction ofthree hundred hospitals and sub-centers. The rural hospitals and sub-centers will offer general health services and education in sanitation,and improvement on living conditions.
9. Present status: A feasibility study is in preparation, f'nanced by FONAPRE.The study is expected to be completed in mid-1977. The Inter-AmericanDevelopment Bank has shown interest in partially financing this project.

- 94 -
EDUCATION - 1
1. Name of the Project: Rural Education
2. Location: National
3. Executing agency: Ministry of Health
4. Total estimated cost: $36.5 million
5. External financing requested: $13.2 million
6. Expected year of commitment: 1978
7. Purpose of the project: To provide basic education to the rural popu-lation of Ecuador.
8. Description of the project: The project includes the creation of 100units covering a population of about one million, as follows:(a) Primary Education, covering of population six years and older, of
580,000;(b) Generalized Education, covering a population of 420,000, six to
24 years old.As this is an ongoing program, the Ministry of Education has completed23 units. Total project costs refer to the remaining 77 units coveredin the program.
9. Present status: Feasibility studies were prepared in May 1973 by theMinistry of Education. The study was updated in early 1975. IBRD willappraise the project late 1977 and will consider financing.
10. Period of execution: The period of execution is estiamted at four years.

- 95 -
URBAN DEVELOPMENT - 1
1. Name of the Project: Guayaquil Urban Development
2. Location: Guayas Province Project
3. Executing agency: PREDAM/Municipality of Guayaquil
4. Total estimated cost: $50.0 million
5. External financing requested: $25.0 million
6. Expected year of commitment: 1980
7. Purpose of the project: To improve the living conditions of the Guayaquilurban poor, and to alleviate the inadequacy of present services.
8. Description of the project: Preliminary project components are thefollowing:(a) Shelter and Environmental Improvements, such as the upgrading of
existing low-income settlements and the provision of new develop-ment areas with credit provided for sites and services (water,sewerage, electricity, waste disposal, etc.),
(b) Communal facilities and social services, including markets,community centers, health units and schools, job training, etc.
(c) Employment generation: credit and assistance to small scaleindustries.
Final determination of the project is to be coordinated with the Inter-American Development Bank which is presently providing technical assist-ance in this area.
9. Present status: The UNDP mission financed a team to produce an urbandevelopment plan. The plan will be completed in mid 1977. A number ofprojects listed in the plan will be consolidated in the preparation ofthis project. IDB will cooperate in the preparation of the project forconsideration of IDB financing.
10. Period of execution: The period of execution is estiamted at six years.

- 96 -
URBAN DEVELOPMENT - 2
1. Name of the project: Quito Urban Development
2. Location: Pichincha Province
3. Executing agency: Municipality of Quito
4. Total estimated cost: $38.0 million
5. External financing requested: $20.0 million
6. Expected year of commitment: 1978
7. Purpose of the project: To improve the living conditions of the Quitourban poor, and to alleviate the inadequacy of present services.
8. Description of the project: Preliminary project components are thefollowing:(a) Shelter and Environmental Improvements, such as the upgrading of
existing low-income settlements and the provision of new developmentareas with credit.
(b) Communal facilities and social services, including markets, commu-nity centers, health units and schools, job training, etc.
(c) Employment generation: credit and assistance to small scaleindustries.
9. Present status: The municipality of Quito and IDB staff are preparingstudies. These are expected to be completed at end-1977. IDB willpartially finance the project.
10. Period of execution: The period of execution is estimated at six years.

- 97 -
WATER AND SEWERAGE - 1
1. Name of the Project: Quito Suburban Area Water Services
2. Location: Pichincha Province
3. Executing agency: Empresa Municipal de Agua Potable de Quito
4. Total estimated cost: $24.6 million
5. External financing requested: $14.9 million
6. Expected year of commitment: 1979
7. Purpose of the project: To provide potable water services to thesmaller towns adjacent to the city of Quito, where existing systemsare inadequate or inefficient, and in areas without services.
8. Description of the project: The project will provide potable waterto various areas with project costs as follows:
Total Cost(In US$ millions)
- San Antonio, Potomasqui 2.4- Calderon 4.0- Cumbaya, Tumbaca 3.0- Puembo, Pifo 1.9- Conocoto, Ataguasi, La Merced,
Guangopolo, San Pedro de Taboada,San Rafael and Sangolgui 13.4
Pumping systems will be installed where adequate, and gravity systemswhere the location requires them. The project includes the followingworks:(a) Spillways and water storage systems,(b) Water treatment (cooling and desinfecting systems),(c) Transmission systems,(d) Distribution systems.
9. Present status: Prefeasibility studies will be completed in December1976. The prefeasibility and feasibility studies are being prepared bythe firm Camp-Dressner & McKee International and Consultores Ecuato-rianos Asociados. No discussions with external lenders have beeninitiated.
10. Period of execution: The period of execution is estimated at five years.

- 98 -
WATER AND SEWERAGE - 2
1. Name of the Project: Pita-Tambo Phase II
2. Location: Pichincha Province
3. Executing agency: Empresa Municipal de Agua Potable de Quito
4. Total estimated cost: $11.2 million
5. External financing requested: $6.7 million
6. Expected year of commitment: 1978
7. Purpose of the project: To provide the city of Quito with an additionalpotable water volume, to sustain its social and economic growth.
8. Description of the project: This project represents the second stage ofthe Pita-Tambo Project. The first stage was financed by the Inter-AmericanDevelopment Bank and works are near completion. The second stage willprovide the city of Quito with an additional potable water volume of 1,400liters per second. The project works are the following:(a) The construction of a second water intake,(b) Canal works,(c) The expansion of the water treatment plant,(d) Distribution systems.
9. Present status: The feasibility study is being prepared by Camp-Dressner& McKee International and Consultores Ecuatorianos. The study is expectedto be completed in mid-1977. The Inter-American Development Bank willconsider financing the project.
10. Period of execution: The period of execution is estimated at five years.

- 99 -
WATER AND SEWERAGE - 3
1. Name of the project: Oro Province Water Services
2. Location: Oro Province
3. Executing agency: IEOS
4. Total estimated cost: $13.0 million
5. External financing requested: $10.0 million
6. Expected year of commitment: 1977
7. Purpose of the project: To provide potable water services to twelve townsin the Oro Province, where existing systems are inadequate of inefficient,and in areas without services.
8. Description of the project: The project will provide potable waterservices to a population of 116,414. The project constitutes a regionalpotable water system to provide the two principal towns: Machala andPuerto Bolivar with adequate water services.The project includes services to ten smaller towns mostly with individualservices, but in some cases it will provide only public water outlets.The project includes the following works:(a) spillway 1.80 meters with a capacity of 650 liters per sec.(b) water storage systems(c) water treatment (cooling and desinfecting systems)(d) transmission systems(e) distribution systemsThis is a phased project. This first phase proposes to install half of thecapacity of the systems, planning to increase to full capacity in 15 years.
9. Present status: This is part of a rural sanitation program. The preparationof this project is being accomplished by IEOS and IDB staff. IDB is consi-dering financing this project.
10. Period of execution: The period of execution is estimated at five years.

- 100 -
WATER AND SEWERAGE - 4
1. Name of the project: Guayaquil Sewerage
2. Location: Guayas Province
3. Executing agency: Municipality of Guayaquil
4. Total estimated cost: $24.0 million
5. External financing requested: $17.0 million
6. Expected year of commitment: 1977
7. Purpose of the project: To provide the city of Guayaquil with adequatesewerage services.
8. Description of the project: The project constitutes the Second Phase ofan IDB-financed project which provided collection and treatment systemsin the north and southern sections of the city.The Second Phase consists of:(a) Sanitary Sewerage Systems to provide the existing low income settle-
ments (Guayaquil Suburbio) with secondary collection systems toserve 22,000 dwellings.
(b) Pluvial Sewerage Systems in the same area to recollect rain water,thus improving the health conditions of the settlements.
9. Present status: A feasibility study was prepared by Parsons N.Y. andEcuadorian consultants. Additional information is needed in the prepara-tion of this project. This is now being prepared by Municipality staffand IDB. IDB is considering financing the project.
10. Period of execution: The period of execution is estimated at six years.

- 101 -
WATER AND SEWERAGE - 5
1. Name of the project: Rural Water and Sewerage
2. Location: various areas
3. Executing agency: IEOS
4. Total estimated cost: $22.8 million
5. External financing requested: $16.0 million
6. Expected year of commitment: 1978
7. Purpose of the project: To provide a number of rural areas with potablewater and sewerage systems, thus improving the general health conditionsof the rural population.
8. Description of the project: This is part of a National Sanitation Pro-gram. The program is underway, with 70 potable water systems completedor in process of completion, 28 sewerage systems now in execution, and18 water systems to begin during 1977. This project includes the waterand sewerage systems of the areas of Ambato, Babahoyo and the expansionof the Esmeraldas Systems.
9. Present status: The feasibility studies are now in preparation by alocal consulting firm and are expected to be completed in early 1978.No discussions with external lenders have been initiated.
10. Period of execution: The period of execution is estimated at five years.

- 102 -
WATER AND SEWERAGE - 6
1. Name of the project: Rural Water and Sewerage
2. Location: Canar, Azuay and Morona/Santiago
3. Executing agency: IEOS
4. Total estimated cost: $19.2 million
5. External financing requested: $13.2 million
6. Expected year of commitment: 1979
7. Purpose of the project: To provide the above mentioned areas with potable
water and sewerage services thus improving the general health conditions
of the rural population.
8. Description of the project: The project will service the areas of Canar,
Azuay, Morona/Santiago, and other rural areas. The project will execute
approximately 47 water and 58 sewerage systems, and an additional number
of systems in near areas, which will be determined when the feasibility
study is completed.
9. Present status: A feasibility study will be carried out with inter-
national consultants and IEOS staff. Studies will begin in late 1977
with IBRD financing. No discussions with external lenders have been
initiated.
10. Period of execution: The period of execution is estimated at five years.

- 103 -
PREINVESTMENT - 1
1. Name of the Project: Project Preparation I
2. Location:
3. Executing agency: Fondo Nacional de Preinversion (FONAPRE)
4. Total estimated cost: $10.0 million
5. External financing requested: $8.0 million
6. Expected year of commitment: 1977
7. Purpose of the project: To accelerate economic and social developmentthrough the execution of project studies, including final design studies,specifically those whose scale and importance represent significant in-vestment in the sectors of great priority.
8. Description of the project: The funds, to supplement Government of Ecuadorallocations, will be used to finance project studies for execution by theMinistries and other public agencies. The funds will be available tofinance studies in several sectors and specific projects have beenselected, in accordance with government priorities.
9. Present status: IBRD will finance the project.
10. Period of execution: The period of execution is estimated at three years.

- 104 -
PREINVESTMENT - 2
1. Name of the pro-lect: Project Preparation II
2. Location:
3. Executing agency: Fondo Nacional de Preinversion (FONAPRE)
4. Total estimated cost: $8.0 million
5. External financing requested: $6.0 million
6. Expected year of commitment: 1978
7. Purpose of the prolect: To accelerate economic and social developmentthrough the execution of project studies, including final design studies,specifically those whose scale and importance represent significantinvestment in the sectors of great priority.
8. Description of the project: The funds to supplement Government ofEcuador allocations will be used to finance project studies for executionby the Ministries and other public agencies. The funds will be availableto finance studies in several sectors and specific projects will beselected, in accordance with Government priorities.
9. Present status: IBRD will finance the project.
10. Period of execution: The period of execution is estimated at three years.

- 105 -
PREINVESTMENT - 3
1. Name of the project: Technical Assistance II
2. Location:
3. Executing agency: Fondo Nacional de Preinversion (FONAPRE)
4. Total estimated cost: $12.0 million
5. External financing requested: $10.( million
6. Expected year of commitment: 1979
7. Purpose of the project: To accelerate economic and social development
through the execution of project studies, including final design studies,specifically those whose scale and importance represent significantinvestment in the sectors of great priority.
8. Description of the project: The funds to supplement Government of
Ecuador allocations will be used to finance project studies for execution
by the Ministries and other public agencies. The funds will be availableto finance studies in various sectors and specific projects will be
selected, in accordance with Government priorities.
9. Present status: IDB is considering financing the project.
10. Period of execution: The period of execution is estimated at three years.

- 106 -FINANCIAL INVESTMENT -
AGRICULTURE - I
1. Name of the project: Agricultural Credit I
2. Location:
3. Executing agency: Banco Nacional de Fomento and other Banks
4. Total estimated cost: $34.0 million
5. External financing requested: $17.0 million
6. Expected year of commitment: 1977
7. Purpose of the project: To increase livestock and crop production byincreasing productivity and achieving crop diversification among large,medium and small farmers. To stimulate the banking system to providegreater amounts of long-term credit to agriculture and to improve theiroperating procedures. To encourage MAC to improve its extension serviceswhich would be linked to provision of credit.
8. Description of the project: Continuation of the Government's program foragricultural and livestock development partially financed by IBRD. Thenew project includes: (a) medium- and long-term investments for on-ranchand on-farm improvements, (b) land leveling, on-farm irrigation works,pasture improvements, (c) construction and installations, fencing, on-farmbuildings, (d) machinery and agro-industries. In addition to extendingfurther credit to medium and large-scale farms and ranches, the projectcontemplates more emphasis on smaller producers, especially those livingon the low lands of the eastern slopes.
9. Present status: The feasibility studies were prepared by a project prep-aration group, integrated by the MAG staff and consultants, and evaluated byIBRD staff in September 1976. IBRD will finance the project.
10. Period of execution: The period of execution is estimated at four years.

- 107 -
FINANCIAL INVESTMENTAGRICULTURE - 2
1. Name of the project: Agricultural Credit II
2. Location:
3. Executing agency: BNF and Banks
4. Total estimated cost: $40.0 million
5. External financing requested: $20.0 million
6. Expected year of commitment: 1978
7. Purpose of the Project: To increase livestock and crop production byincreasing productivity and achieving crop diversification among large,medium and small farmers. To stimulate the banking system to providegreater amounts of long-term credit to agriculture and to improve theiroperating procedures. To encouarge MAG to improve its extension serviceswhich would be linked to provision of credit.
8. Description of the project: Continuation of the Government's programfor agricultural and livestock development partially financed by IBRD.The new project includes: (a) medium- and long-term investment for on-ranch and on-farm improvements, (b) land leveling, on-farm irrigation works,pasture improvements, (c) construction and installations, fencing, on-farmbuildings, (d) machinery and agro-industries. In addition to extendingfurther credit to medium and large-scale farms and ranches, the projectcontemplates more emphasis on smaller producers.
9. Present status: The project is in early stages of preparation. IBRD isconsidering financing the project.
10. Period of execution: The period of execution is estimated at four years.

- 108 -
FINANCIAL INVESTMENTAGRICULTURE - 3
1. Name of the prolect: National Oilseed and Cacao Program
2. Location: National
3. Executing agency: Ministry of Agriculture/National Agricultural Develop-ment and Diversification Program
4. Total estimated cost: $75.0 millionCacao program 20.8 millionOilseed program 54.2 million
5. External financing requested: $37.5 millionCacao program 10.4 millionOilseed program 27.1 million
6. Expected year of commitment: 1978
(See individual projects)

- 109 -FINANCIAL INVESTMENT
AGRICULTURE - 3A
1. Name of the project: National Cacao Program
2. Location: National
3. Executing agency: Ministry of Agriculture/National Agricultural Develop-ment and Diversification Program
4. Total estimated cost: $20.8 million
5. External financing requested: $10.4 million
6. Expected year of commitment: 1978
7. Purpose of the project: To increase cacao production through the rehabil-itation and renovation of the national orchards, to increase cacao exportsand foreign exchange earnings and to create employment.
8. Description of the project: The project will help finance the replantingand rehabilitation of 32,500 hectares of cacao. Some 4,000 hectares havealready been replanted and rehabilitated with AID financing which hasalready terminated. The project components are the following:(a) To promote through credit the rehabilitation and renovation of:
Year Total Rehabilitation Replanting1978 4,500 hectares 1,500 ha 3,000 ha1979 7,000 hectares 2,000 ha 5,000 ha1980 9,000 hectares 3,000 ha 6,000 ha1981 12,000 hectares 4,000 ha 8,000 ha
Rehabilitation costs per hectare: $320. Replanting costs per hectare:$720.(b) Technical assistance to farmers to improve farming techniques, in
pest control and in replanting.(c) Provision of equipment for the maintenance of feeder roads(d) Marketing services(e) Institutional Reinforcement to the National Agricultural Development
and diversification Program to better administer the project unit.
Total Project Costs: (In US$ millions)(a) Rehabilitation and Renovation 19.2(b) Technical Assistance 0.8(c) Equipment for Feeder Roads 0.3(d) Marketing Services 0.3(e) Institutional Reinforcement 0.2
9. Present status: This is an ongoing program. The Ministry of Agricultureand international consultants will prepare a feasibility study in 1977 inorder to make this program suitable for external financing. No discus-sions for financial arrangements have been initiated.
10. Period of execution: The period of execution is estimated at four years.

- lic -FINANCIAL INVESTMENT
AGRICULTURE - 3B
1. Name of the project: National Oilseed Program
2. Location: National
3. Executing agency: Ministry of Agriculture/National Agricultural Develop-ment and Diversification Program
4. Total estimated cost: $54.2 million
5. External financing requested: $27.1 million
6. Expected year of commitment: 1978
7. Purpose of the prolect: To increase cultivated areas with short cycleoilseed production to supply national demand of edible oils and fats inorder to replace vegetable oil imports.
8. Description of the project: The project will increase cultivated areas.Some 18,000 ha have been planted with AID financing. In order to totallysubstitute imports, an area of 80,000 ha will have to be planted. Afirst phase of the national program contemplates a cultivated area of27,120 hectares as follows:
1977 4,860 hectares1978 5,760 hectares1979 8,340 hectares1980 8,160 hectares
9. Present status: The program began in 1973 with AID financing; additionalfunds are needed to continue the program. No discussions for financialarrangements have been initiated.
10. Period of execution: The period of execution is estimated at four years.

- iii -
FINANCIAL INVESTMENTAGRICULTURE - 4
1. Name of the project: Agricultural Credit
2. Location:
3. Executing agency: Banco Nacional de Fomento and other Banks
4. Total estimated cost: $26.7 million
5. External financing requested: $20.0 million
6. Expected year of commitment: 1977
7. Purpose of the Project: To increase livestock and crop production byincreasing productivity and achieving crop diversification among large,medium and small farmers. To stimulate the banking system to providegreater amounts of long-term credit to agriculture and to improve theiroperating procedures. To encouarge MAG to improve its extension serviceswhich would be linked to provision of credit.
8. Description of the project: The project includes: (a) medium- andlong-term investment for on-ranch and on-farm improvements, (b) landleveling, on-farm irrigation works, pasture improvements, (c) construc-tion and installations, fencing, on-farm buildings, (d) machinery andagro-industries. In addition to extending further credit to medium andlarge-scale farms and ranches, the project contemplates more emphasis onsmaller producers, expecially those living on the low lands of theeastern slopes.
9. Present status: The feasibility studies were prepared by a project pre-paration group, integrated by the MAG staff and consultants, and evaluatedby IDB staff in December 1976. IDB is considering financing this project.
10. Period of execution: The period of execution is estimated at four years.

- 112 -
FINANCIAL INVESTMENTAGRICULTURE - 5
1. Name of the project: Lines of Credit for Agriculture
2. Location:
3. Executing agency: BNF
4. Total estimated cost: $38.0 million per year
5. External financing requested: $28.8 million per year
6. Expected year of commitment: 1977-1981
7. Purpose of the project: To stimulate the banking system to providegreater amounts of medium term credit to Agriculture and to increaseproduction.
8. Description of the project: Agricultural and livestock developmentfinanced by lines of credit to provide: (a) medium term investmentsfor on farm and on-ranch imporvements, (b) land leveling and on-farmirrigation works, (c) construction and installation of fencing, on-farmbuildings, (d) machinery and agro-industries.
9. Present status: These are yearly requirements on lines of credit.No discussions with financial institutions have been initiated.
10. Period of execution: The period of execution is estimated at three years.

- 113 -
FINANCIAL INVESTMENTINDUSTRY - 1
1. Name of the project: DFC IV
2. Location:
3. Executing agency: CV-CFN
4. Total estimated cost: $37.5 million
5. External financing requested: $20.0 million
6. Expected year of commitment: 1980
7. Purpose of the project: Industrial development through participation ofDFC's, of equity capital and term financing for industrial companies forthe development of productive facilities and resources in Ecuador.
8. Description of the project: The project would be two-fold, First: tosupport improvements in Ecuador's industrial sector, particularlyregarding the interest rate structure. Second: to support the finan-cing of 12.6% of the estimated foreign exchange requirements of the majorregions, participating DFC's during the period 1980-1984.
9. Present status: Feasibility studies will be prepared in 1978. IBRD isconsidering financing this project.
10. Period of execution: The period of execution is estimated at four years.
- 114 -
FINANCIAL INVESTMENTINDUSTRY - 2
1. Name of the project: Lines of Credit - Industry
2. Location:
3. Executing agency: CV-CFN
4. Total estimated cost: $78.5 million
5. External financing requested: $128.5 million
6. Expected year of commitment: 1977-1981
7. Purpose of the project: To stimulate industrial investment by providinggreater amounts of medium term credit to industry and to increase produc-tivity.
8. Description of the project: Industrial development financed by lines ofcredit, to provide medium term investment for: (a) industrial improve-ments, (b) construction and installment of plants, and (c) other indus-trial development.
9. Present status: Total five-year requirements of lines of credit. Nodiscussions with financial institutions have been initiated.
10. Period of execution: The period of execution is estimated at four years.
CURRENT ECONOMIC POSITION AND PROSPECTS
OF ECUADOR
ANNEX III POPULATION


ANNEX III
POPULATION
Page No.
Data .................................................. I
Population Size, Distribution and Growth .... .......... 1
Age and Sex Composition of the Population .... ......... 7
Mortality ........... .................................. 7
Fertility ........... .................................. 16
Trends in Marital Composition of the Population ....... 22
Migration ........... .................................. 27
Population Prospects: Family Planning .... ............ 30
Population Projectons 1970-2000 ....................... 33
Summary and Conclusions ............................... 33
This Annex provides a succinct description of the demographic
situation in Ecuador: past trends, present situation and future prospects.
The discussion of these matters is treated at the national and regional
levels. This Annex was prepared by the staff of the Population and Human
Resources division of the World Bank.


Data
1. The data utilized in this report are drawn from two primarysources: the population censuses of 1950, 1962 and 1974; and the vitalstatistics registration system. Both these sources have shortcomingsfor the purpose at hand. Vital statistics registration data vary in cover-age from approximately 70% to 90%, and the data often relate to the year ofregistration rather than to the year in which the event occurred. Populationdata from the censuses also appear to be of variable, if undetermined, qual-ity. The first population census, taken in 1950, appears to be a reasonablyaccurate count, while the 1962 census is estimated to have underenumeratedthe population by 3 or 4%. Estimates of the quality of the 1974 census, interms of under enumeration, are not yet publicly available.
2. In spite of these weaknesses, the data are sufficiently reliable toestablish broad trends and orders of magnitude for the variables of interest.Where the data appear biased, comments are offered on the probable sources anddirections of such errors.
Population Size, Distribution and Growth
3. Data illustrating historical and recent trends in population sizeand growth for Ecuador are presented in Table I. Total population, althoughstill fairly small in comparison to other South American countries, iscurrently growing at an extremely rapid pace -- in fact, the 3.4% per annumaverage growth rate estimated for the period 1965 to 1975 is among the highestrecorded for any country in the world. From a historical perspective, theevolution of Ecuador's population growth can be separated into 3 stages:the first (from the year 1920 to 1945) is characterized by a fairly steadypace of population growth of around 2.3% p.a.; in the second (1945-60), thegrowth rate accelerates sharply from 2.4% p.a. to 3.3% by the end of thisperiod; in the third stage (1960-75) this rate stabilizes at its currentlevel of 3.4% p.a. If sustained, the country's population will double itssize before the end of this century.
4. Total population has been distributed very unevenly throughout thefour main geographical regions and their rates of growth since the 1950census have also varied considetably between them. The Sierra and Costaregions are the largest in size: at each census these regions contained atleast 97% of total national population, compared to the maximum of 2.7%enumerated in the Oriente region in 1974, with the tiny balance distributedover the Territorio Insular and Zonas en Discusion. The Costa region hasshown an increase in relative size during the 1950-74 interval and is pres-ently the most populous region. Although it was about the same size as theSierra region in 1974, this represents a significant change from 1950 whenit was 17% smaller than the Sierra Region. Within regions there is alsovery unequal distribution of population among provinces. Manabi, Guayasand Pichincha provinces constituted approximately 42% of total nationalpopulation in 1950 and this proportion grew to about one half in 1974. Ofthe three, Guayas was the largest throughout the 1950-74 interval, whilePichincha, third largest in 1950 and 1962, had become the second largest

- 2 -
Table I: ESTIMATED OR ENUMERATED POPULATION, PERCENTAGE CHANGE,AVERAGE ANNUAL RATE OF GROWTH AND YEARS REQUIRED
FOR THE POPULATION TO DOUBLE IN SIZE: ECUADOR, 1920-1975
(Population is given in thousands,Growth Rates in percentages)
Estimated Percentage Average Annual Years Requiredor change Growth Rate for the
Enumerated for the for the Population toYear Population Interval Interval Double in Size
1920 1,556 -1925 1,739 11.8 2.2 31.51930 1,958 12.6 2.4 28.91935 2,210 12.9 2.5 27.71940 2,481 12.3 2.3 30.11945 2,796 12.7 2.4 28.91950 3,202 /a 14.5 2.7 25.7
1955 3,710 15.9 3.0 23.11960 4,358 17.5 3.3 21.01965 5,150 18.2 3.4 20.41970 6,093 18.3 3.4 20.41975 7,185 17.9 3.4 20.4
Notes: /a From a census enumeration.
Sources: Departmento de Estadistica, Secretaria General
de la Organizacion De Los Estados Americanos:Boletin Estadistico, No.122, Washington, D.C.,August 1975. Table 1.

TABLE II: GEOGRAPHICAL DISTRIBUTION OF THE POPULATION OF ECUADORGIVEN IN THE CENSUSES OF 1950, 1962 AND 1974
POPULATION IN 1974 POPULATION IN 1962 POPULATION IN 1950Percentage Percentage Percentageof Total of Total of TotalNational Sex National Sex National Sex
Region and Province Total Population Male Female Ratio/L Total Population Male Female Ratio Total Population Male Female Ratio
National Total 6,552,046 100.0 3,282,348 3,269,698 100.3 4,476,007 100.0 2,236,476 2,239,531 99.9 3,202,757 100.0 1,594,803 1,607,954 99.2
Sierra Region 3,167,428 48.3 1,550,028 1,617,400 95.8 2,271,345 50.7 1,111,257 1,160,088 95.8 1,856,445 57.8 906,928 949,517 95.5Azuay 384,278 5.9 178,428 205,850 86.7 274,642 6.1 128,127 146,515 87,4 250,975 7.8 119,304 131.671 90.6Bolivar 145,012 2.2 71,399 73,613 97.0 131,651 2.9 66,310 65,341 101.5 109,305 3.4 54,476 54.829 99.4Canar 145,411 2.2 70,166 75,245 93.3 112,733 2.5 54,177 58,556 92.5 97,681 3.0 47,637 50,044 95.2Carchi 122,163 1.9 60,811 61,352 99.1 94,649 2.1 46,566 48,083 96.8 76,595 2.4 37,580 39,015 96.3Chimborazo 308,296 4.7 150,111 158,185 94.9 276,668 6.2 137,943 138,725 99.4 218.130 6.8 107,218 110,912 96.7Cotopaxi 238,306 3.6 115,983 122,323 94.8 154,971 3.5 76,418 78,553 97.3 165,602 5.2 81,122 84,480 96.0Imbabura 218,063 3.3 106,909 111,154 96.2 174,039 3.9 85,029 89,010 95.5 146,893 4.6 71,368 75,525 94.5Loja 346,434 5.3 173,905 172,529 100.8 285,448 6.4 142,554 142,894 99.8 216,802 6.8 108,728 108,074 100.6Pichincha 978,627 14.9 483,656 494,971 97.7 587,835 13.1 287,053 300,782 95.4 386,520 12.0 187,256 199,264 94.0Tungurahua 280,838 4.3 138,660 142,178 97.5 178,709 4.0 87,080 91,629 94.7 187,942 5.8 92.239 95,703 96.4
Costa Region 3,188,883 48.6 1,626,265 1,562,618 104.1 2,127,358 47.6 1,083,527 1,043,831 103.8 1,298,495 40.6 662,266 636,229 104.1Esmeraldas 204,680 3.1 106.141 98,539 107.7 124.881 2.8 64,325 60,556 106.2 75,407 2.4 38,823 36,584 106.1Manabi 819,845 12.5 413,644 406,201 101.8 612,542 13.7 307,892 304,650 101.1 401,378 12.5 201,002 200,376 100.3Los Rios 391,706 6.0 207,565 184,141 112.7 250,062 5.6 131,983 118,079 111.8 150,260 4.7 78.609 71,651 109.7Guayas 1,502,443 22.9 756,689 745,754 101.5 979,223 21.9 493,171 486,052 101.5 582,144 18.2 296,295 285,849 103.7El Oro 270,209 4.1 142,226 127,983 111.1 160,650 3.6 86,156 74,494 115.7 89,306 2.8 47,537 41,769 113.8
Oriente Region 173,505 2.7 93,909 79,596 118.0 74,913 1.6 40,374 34,539 116.9 46,471 1.5 24,841 21,630 114.8Napo 62,235 1.0 34,392 27,843 123.5 24,253 .5 12,973 11,280 115.0 25,425 4.8 13,540 11,885 113.9Pastaza 23,465 .4 12,642 10,823 116.8 13,693 .3 7,683 6,010 127.8Morona Santiago 53,312 .8 28,156 25,156 111.9 25,503 .6 . 13,422 12,081 111.1 21,046 .7 11,301 9,745 115.9Zamora Chinchipa 34,493 .5 18,719 15,774 118.7 11,464 .2 6,296 5,168 121.8 0 . 1 9 115.9
Territorio InsularGalapages 4,037 .1 2,355 1,682 140.0 2,391 .1 1,318 1,073 122.8 1,346 .1 768 578 132.9
,.onas en Doscusion 18,193 .3 9,791 8,402 116.5 _- - -
Sources 1974 Departmento De Estadistica, Secretaria General De La Organizacion De Los Estados Americanos; Boletin Estadistico, No.122, Washington, D.C., Table 2, Page 2.
1962 Dlsvision De Estadistica Y Censos, Junte Nacional De Planificacion Y Coordinacion Economica; Segundo Censo de Poblacion y Primer Censo de Vivenda. Quito. Ecuador,Volume 1, Table 1, Pages 1-5, 1964.
1950 Division De Estadistica Y Censos, Junte Nacional De Planificacion Y Coordinacion Ecoonomica; Primer Censo de Poblacion del Ecuador, 1950, Volume 1, PoblacionPor Edad Y Sexo. Quito. Ecuador, Tables 1-193
/1 Ratio of males to feeales.

- 4 -
province by 1974. At the other extreme, the four provinces in the Orienteregion, together with the Galapagos contained less than 3% of the country'spopulation in 1974.
5. Table III presents data on population growth by region and pro-vince for the 1950-74 period. The growth rates for Costa and Oriente haveexceeded the national rate during the two inter-censal periods while therate for Sierra was consistently below the national rate. All provincesof the Sierra region, excepting Pichincha, exhibited growth rates belowthe national rate for the period 1950-62, while all of the provinces ofthe Costa and Oriente regions exceeded the national rate. Cotopaxi andTungurahua are the only provinces showing loss of population during the1950-62 interval, and this may be due to measurement errors. There islittle information on the completeness of the 1962 census count by pro-vince. Consequently, the population of these areas may have been under-counted in that census. Additionally, there is little available docu-mentation on the realignment of provincial boundaries that took placebetween 1950-62. In this interim, the provincial boundaries of Cotopaxiand Tungurahua may have been redrawn to exclude areas that may have beenpart of these provinces in 1950.
6. While national population is still predominantly rural (60% in1974), the percentage of urban population had increased from approximately28% in 1950 to 40% in 1974 (Table IV). Approximately 50% of the urban popu-lation is concentrated in the cities of Quito and Guayaquil. The growthrates for urban areas were higher than rural areas for all intercensal peri-ods, although the trends in growth differed. Urban areas grew at a veryhigh pace of about 4.7% p.a. between 1950 to 1962, slowing somewhat to4.4% p.a. during 1962-64. Rural areas, on the other hand, accelerated theirgrowth rate from a slow pace of 1.8% p.a. during the earlier intercensalperiod to 2.5% p.a. for the latter period. (See Table V).
7. On the regional level, Costa has the largest urban population,closely followed by the Sierra region (Appendix Table I). Differential trendscan be seen in the growth rate of regional urban populations (Table IV). Theurban population of the Costa region grew at a higher rate in the 1950-62interval than in the 1962-74 interval; the reverse took place in the Sierraregion. The Oriente region, which has the largest proportion of rural popu-lation, showed consistently high rates of growth in urban population. Ruralpopulation growth in both absolute numbers and rates of growth has been con-sistently less than urban growth in both Costa and Sierra for both inter-censal intervals. The pattern was seen in Oriente for the 1950-62 intervalbut reversed itself during the 1962-74 period. The majority of provincesin the Sierra region exhibited rates of growth for both urban and ruralpopulation that were less than national growth rates in both intercensalintervals. The reverse was true for the urban and rural population of pro-vinces in the Costa and Oriente regions.
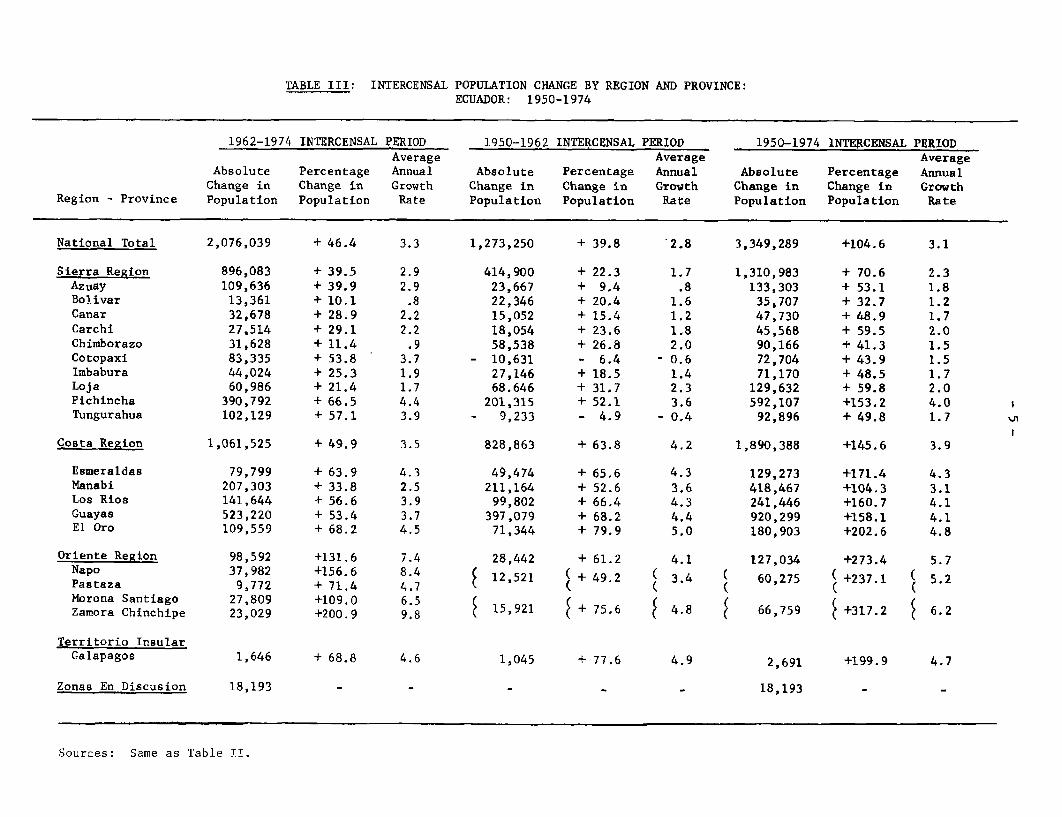
TABLE III: INTERCENSAL POPULATION CHANGE BY REGION AND PROVINCE:ECUADOR: 1950-1974
1962-1974 INTERCENSAL PERIOD 1950-1962 INTERCENSAL PERIOD 1950-1974 INTERCENSAL PERIODAverage Average Average
Absolute Percentage Annual Absolute Percentage Annual Absolute Percentage AnnualChange in Change in Growth Change in Change in Growth Change in Change in Growth
Region - Province Population Population Rate Population Population Rate Population Population Rate
National Total 2,076,039 + 46.4 3.3 1,273,250 + 39.8 '2.8 3,349,289 +104.6 3.1
Sierra Region 896,083 + 39.5 2.9 414,900 + 22.3 1.7 1,310,983 + 70.6 2.3Azuay 109,636 + 39.9 2.9 23,667 + 9.4 .8 133,303 + 53.1 1.8Bolivar 13,361 + 10.1 .8 22,346 + 20.4 1.6 35,707 + 32.7 1.2Canar 32,678 + 28.9 2.2 15,052 + 15.4 1.2 47,730 + 48.9 1.7Carchi 27,514 + 29.1 2.2 18,054 + 23.6 1.8 45,568 + 59.5 2.0Chimborazo 31,628 + 11.4 .9 58,538 + 26.8 2.0 90,166 + 41.3 1.5Cotopaxi 83,335 + 53.8 3.7 - 10,631 - 6.4 - 0.6 72,704 + 43.9 1.5Imbabura 44,024 + 25.3 1.9 27,146 + 18.5 1.4 71,170 + 48.5 1.7Loja 60,986 + 21.4 1.7 68.646 + 31.7 2.3 129,632 + 59.8 2.0Pichincha 390,792 + 66.5 4.4 201,315 + 52.1 3.6 592,107 +153.2 4.0Tungurahua 102,129 + 57.1 3.9 - 9,233 - 4.9 - 0.4 92,896 + 49.8 1.7
Costa Region 1,061,525 + 49.9 3.5 828,863 + 63.8 4.2 1,890,388 +145.6 3.9
Esmeraldas 79,799 + 63.9 4.3 49,474 + 65.6 4.3 129,273 +171.4 4.3Manabi 207,303 + 33.8 2.5 211,164 + 52.6 3.6 418,467 +104.3 3.1Los Rios 141,644 + 56.6 3.9 99,802 + 66.4 4.3 241,446 +160.7 4.1Guayas 523,220 + 53.4 3.7 397,079 + 68.2 4.4 920,299 +158.1 4.1El Oro 109,559 + 68.2 4.5 71,344 + 79.9 5.0 180,903 +202.6 4.8
Oriente Region 98,592 +131.6 7.4 28,442 + 61.2 4.1 127,034 +273.4 5.7Napo 37,982 +156.6 8.4 S 12,521 ( + 49.2 3.4 ( 60,275 ( +237.1 ( 5.2Pastaza 9,772 + 71.4 4.7 ( ( ( ( (Morona Santiago 27,809 +109.0 6.5 15,921 + 75.6 4.8 66,759Zamora Chinchipe 23,029 +200.9 9.8 +317.2 6.2
Territorio InsularGalapagos 1,646 + 68.8 4.6 1,045 + 77.6 4.9 2,691 +199.9 4.7
Zonas En Discusion 18,193 - - - - - 18,193 - -
Sources: Same as Table Ti.

I a z q C i a b>>@t__
_5X.De~~~~. 0-_wv C 0uvo,w r
a0a 00- OarO D .l -00
00 0sMsW 00-a, 0 00
0000,00 00- 000000 a-oaa,oaO
r~0 o sc
a _ . 00> _ o ( a -_ 0wX- ,a ' . ,. C 0- @<~>>w^i
..0C..0Cra0o00-a0_000wa_-000o 00-0- o c0O- wC.
0 -_ ,- -d _ o. -_c ae
| _ £ rX >qr > ; r Q > 9w - - _ 0c0
0-.00.0 ow< X <vv a.0 0..C.o0.C00(. aCZ0 CC o e
_~~~~~~~~~~ _ a -0 C
a a .Co°aa W W@O C oaoD -0-8 aC O E
C nO 000
0 - 0 .00-00.0 D-0a
00.0o 0. 00 C- a
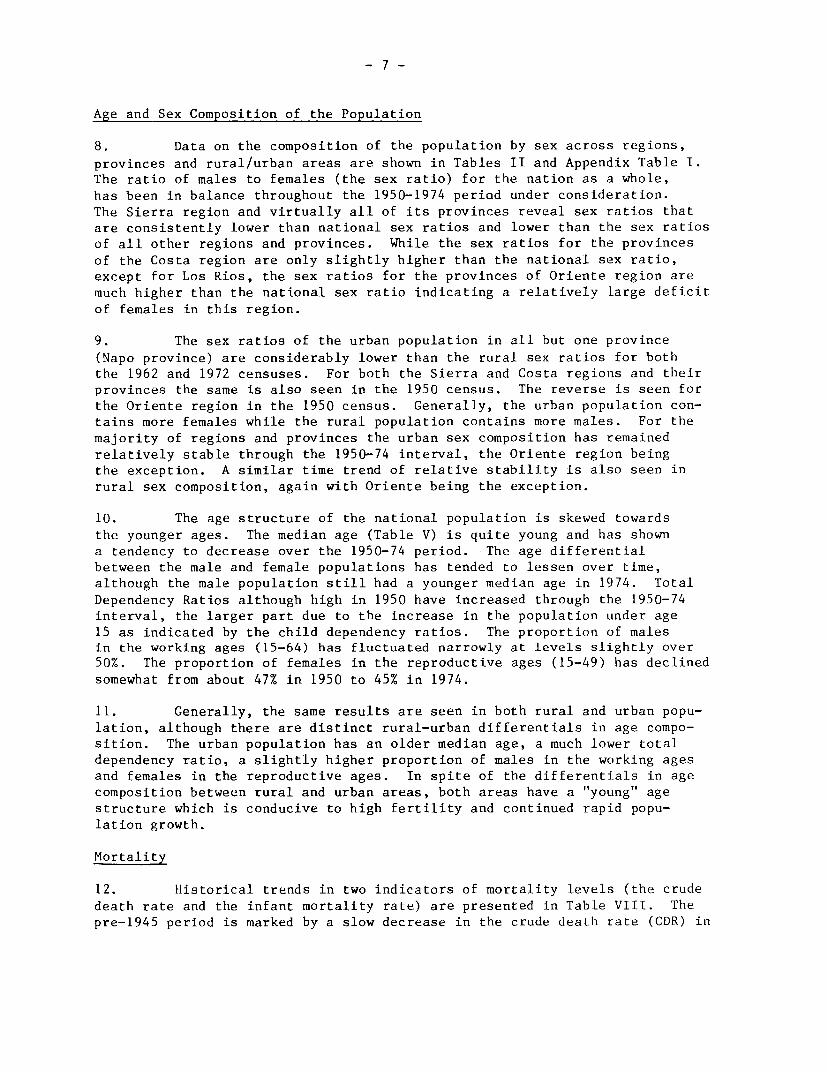
- 7 -
Age and Sex Composition of the Population
8. Data on the composition of the population by sex across regions,provinces and rural/urban areas are shown in Tables II and Appendix Table I.The ratio of males to females (the sex ratio) for the nation as a whole,has been in balance throughout the 1950-1974 period under consideration.The Sierra region and virtually all of its provinces reveal sex ratios thatare consistently lower than national sex ratios and lower than the sex ratiosof all other regions and provinces. While the sex ratios for the provincesof the Costa region are only slightly higher than the national sex ratio,except for Los Rios, the sex ratios for the provinces of Oriente region aremuch higher than the national sex ratio indicating a relatively Large deficitof females in this region.
9. The sex ratios of the urban population in all but one province(Napo province) are considerably lower than the rural sex ratios for boththe 1962 and 1972 censuses. For both the Sierra and Costa regions and theirprovinces the same is also seen in the 1950 census. The reverse is seen forthe Oriente region in the 1950 census. Generally, the urban population con-tains more females while the rural population contains more males. For themajority of regions and provinces the urban sex composition has remainedrelatively stable through the 1950-74 interval, the Oriente region beingthe exception. A similar time trend of relative stability is also seen inrural sex composition, again with Oriente being the exception.
10. The age structure of the national population is skewed towardsthe younger ages. The median age (Table V) is quite young and has showna tendency to decrease over the 1950-74 period. The age differentialbetween the male and female populations has tended to lessen over time,although the male population still had a younger median age in 1974. TotalDependency Ratios although high in 1950 have increased through the 1950-74interval, the larger part due to the increase in the population under age15 as indicated by the child dependency ratios. The proportion of malesin the working ages (15-64) has fluctuated narrowly at levels slightly over50%. The proportion of females in the reproductive ages (15-49) has declinedsomewhat from about 47% in 1950 to 45% in 1974.
11. Generally, the same results are seen in both rural and urban popu-lation, although there are distinct rural-urban differentials in age compo-sition. The urban population has an older median age, a much lower totaldependency ratio, a slightly higher proportion of males in the working agesand females in the reproductive ages. In spite of the differentials in agecomposition between rural and urban areas, both areas have a "young" agestructure which is conducive to high fertility and continued rapid popu-lation growth.
Mortality
12. Historical trends in two indicators of mortality levels (the crudedeath rate and the infant mortality rate) are presented in Table VIII. Thepre-1945 period is marked by a slow decrease in the crude death rate (CDR) in

TASLE V POPULATION BY AGE AND SEX AS GIVEN IN TIE CENSUISESOF ECUADOR 1950, 1962 and 1974
CENSUS OF 1974 CENSUS OF 1962 CENSUS OF 19503, DOst. % Ds%t. 7 Dtn % Dist. 7. Dist. 7 Dist. b Dist. % Dist. 7. DEat.Total Male Female Total Male Female Total Male FemalePo,pulation Total Popula- Popula- Popula- Total Popula- Popula- Popula- Total Popula- Populs- Popula-by Age Population Male Female tion tion tion Population Male Femalc tion Lion tion Population Male Female tion tion tion
Total 6,552,046 3,282,348 3,269,698 1007. 100% 100% 4,476,007 2,236,476 2,239,531 1007. 1007. 100% /a 3,202,757 1a 1,594,803/a 1,607,954 100% 1t070 100%0- 4 1,053,258 533,948 519,310 16.1 16.3 15.9 762,660 386,287 376,373 17.1 17.3 16.8 533,238 270,636 262,602 16.7 17.0 16.35- 9 990,030 500,533 489,492 15.1 15.2 15.( 698,085 354,566 343,519 15.6 15.8 15.3 455,019 231,445 223,574 14.2 14.5 13.910-14 877,807 447,060 430,747 13.4 13.6 13.1 553,760 285,084 268,676 11.9 12.7 1Z.0 371,433 193,173 178,260 11.6 12.1 11.115-19 70i4,177 351,136 353,041 10 8 10.7 10.8 435,120 214,241 220,879 9.8 9.6 9.9 317,508 157,523 159,985 9.9 9,9 9.920-24 584,438 288,242 296,196 8 9 8.8 9.1 378,530 183,267 195,263 8.6 8.2 8.7 288,698 140,290 148,408 9.0 8.8 9.225-29 445,663 220,877 224,786 6.8 6.7 6.9 325,123 156,692 168,431 7.3 7.0 7.5 244,765 118,829 125,936 7.6 7.4 7.830-34 361,513 182,099 179,414 5.5 5.5 5.3 269,817 135,623 134,194 6.0 6.1 6.0 189,495 93,613 95,882 5.9 5.9 6 035-39 320,913 156,109 164,804 4.9 4.8 S.0 238,217 116,382 121,835 5.3 5.2 5.4 185,675 91,106 94,569 5.8 5.7 5.940-44 277,829 140,394 137,435 4.2 4.3 4.2 192,353 97,178 95,175 4.3 4.3 4.2 141,134 68,455 72,679 4.4 4.3 4.545-49 221,622 110,475 111,147 3.4 3 4 3.4 155,534 77,273 78,261 3.5 3.5 3.5 114,611 55,236 59,375 3.6 3.4 3.750-54 191,063 96,518 94,545 2.9 2.9 2.9 137,619 69,356 68,263 3.1 3.1 3.1 109,303 56,494 52,809 3.4 3.5 3.355-59 134,799 67,534 67,265 2 1 2.1 2.1 88,252 44,672 43,580 2.0 7.0 2.0 67,954 34,425 33,529 2.1 2.2 2.160-64 139,181 69,743 69,438 2.1 2.1 2.1 97,178 47,975 49,203 2.2 2.2 2.2 69,541 32,558 36,983 2.2 2.0 2.365-69 81,839 40,120 41,719 1.2 1.2 1.3 47,128 23,611 23,517 1.1 1.0 1.1 36,585 17,505 18,880 1 2 1.1 1.270-74 79,031 38,826 40,205 1.2 1 2 1.2 43,330 70,361 22,969 1.0 1.0 1.0 33,463 14,506 18,957 1.0 1.0 1.275+ 88,932 38,748 50,184 1.4 1.2 1.5 53,301 23,980 29,393 1.2 1.0 1.3 43,668 18,558 25,130 1.4 1.2 1.6
Median Age(years) 16.5 16.3 16.8 - - - 16.8 16.2 17.0 - - - 17.8 17.2 18.4 - - -
Percentageof Males15-64 - 51.37. - - - - - 51.1% - - - - 53.22% - - - -Percentageof Females15-49 - - 44.9% - _ _ - - 45,37. - - _ - - 47.11% - - -TotalDependencyRatio 93.8 - - - _ - 93.1 - - _ - _ 85.2 - -ChildDependencyRatio 86 4 - 86.9 - - - - _ 78.6 -AgedDependencyRatio 7.4 - - - 6,2 - - - 6.6 -
Notes- /a Indicates that persons not reporting age in the 1950 census are included in the totals.
Sources 1974 Departmento De Fstadistic, Secretaria General De La Organizacion De Tos Estados Americanos; Boletin Estadistico, Washington, D.C., No.122, Table 3,Page 2, 1975 Washington, D.C.
1962 Division De EstadisLLCs Y Censos, Junta Nacional De Planificacion Y Coordina,ion Economica; Segundo Censo de Poblecion y Primer Cenao de Vivenda.Volume I, Quito, Ecuador, Table 7, Page 35, 1964.
1950: Direccion General de Estadistic Y Cenaoa, Ministerio De Econovsia, Informacion Censal, Quito, Ecuador, Table 4, Page 27, 1952.

TABLE VI URBAN POPULATION BY AGE AND SEX AS GIVEN IN ThE CENSUSESOF ECUADOR: 1950, 1962 and 1974
CENSUS OF 1974 CENSUS OF 1962 CENSUS OF 1950% Dist. % Dist. % Dist. % Dist. % Dist. 7. Dist. % Dist. % Dist. % Dist.Total Total of Male of Female Total Total of Male of Female Total Total of Male of FemalePopulation Urban Popula- Popula- Popula- Urban Popula- Popula- Popula- Urban Popula- Popula- Popula-by Age Population Male Female tion tion tion Population Male Female tion tion tion Population Male Female tion tion tion
Total 2,706,677 1,304,303 1,402,374 100% 100% 100% 1,612,346 771,484 840,862 100% 100% 1007 /a 913,932 /a 434,470 479,462 100% 100% 100%0- 4 386,388 194,653 191,735 14.3 14.9 13.7 265,459 134,094 131,365 16.5 17.4 15.6 143,291 72,609 70,682 15.6 16.6 14.75-9 382,525 191,009 191,516 14.1 14.6 13.7 238,950 119,391 119,559 14.8 15.5 14.2 117,321 58,772 58,549 12.8 13.4 12.210-14 364,368 117,559 186,809 13.5 13.6 13.3 202,546 99,221 103,325 12.5 12.9 12.3 101,286 49,849 51,437 11.1 11.5 10.715-19 328,833 154,607 174,226 12.2 11.8 12.4 169,278 78,317 90,961 10.5 10.0 10.8 90,042 44,505 51,537 10.5 10.2 10.820-24 273,067 128,632 144,435 10.1 9.9 10.3 138,107 (3,241 74,866 8.6 8.2 8.9 89,956 41,778 48,178 9.8 9.6 10.125-29 199,580 95,293 104,287 7.4 7.3 7.4 115,787 53,029 62,758 7.2 6.9 7.5 73,662 33,902 39,760 8.1 7.8 8.330-34 155,408 75,881 79,527 5.7 5.8 5.7 100,841 48,493 52,348 6.2 6.3 6.2 57,682 27,385 30,297 6.3 6.3 6.335-39 131,202 60,763 70,439 4 9 4.7 5.0 85,409 39,014 46,395 5.3 5.0 5.5 55,134 24,738 30,396 6.0 5.7 6.340-44 114,024 54,285 59,739 4.2 4.2 4.2 69,491 33,341 36,150 4.3 4.3 4.3 42,823 20,113 22,710 4.7 4.6 4.745-49 90,480 42,808 47,672 3.3 3.3 3.4 57,151 26,531 30.620 3.5 3.4 3.7 34,889 15,732 19,157 3.8 3.6 4.050-54 76,358 36,750 39,608 2.8 2.8 2.8 49,917 23,645 26,272 3.1 3.0 3.1 31,512 15,085 16,427 3.5 3.5 3.455-59 55,820 26,729 29,091 2.1 2.1 2.1 34,231 16,225 18,006 2.1 2.1 2.1 21,031 9,944 11,087 2.3 2.3 2.360-64 52,463 24,230 28,233 1.9 1.9 2.0 33,460 15,112 18,348 2.1 1.9 2.2 18,630 7,854 10,776 2.1 1.8 2.365-69 32,502 !4,504 17,998 1.2 1.1 1.3 18,266 8,353 9,913 1.1 1.1 1.2 11,116 4,968 6,148 1.2 1.1 1.370-74 30,080 13,614 16,466 1.1 1.0 1.2 14,844 6,337 8,507 1.0 1.0 1.0 8,544 3,305 5,239 1.0 I.0 1.175+ 33,618 13,001 20,617 1.2 1.0 1.5 18,609 7,140 11,469 1.2 1.0 1.4 10,764 3,813 6,951 1.2 1.0 1.5
Median Age(in years) 17.3 16.9 17.8 - - - 16.9 16.1 17.7 - - - 19.0 18.1 19.7 - - -
Percentageof Males15-64 - 53.7 - - - - - 51.5 - - - - - 55.5 - -Percentageof Females15-49 - - 48.5 - - _ _ - 46.9 - - - - - 50.5TotalDependencyRatio 83.2 - - - - - 88.9 - - 75.2 - -ChildDependencyRatio 76.7 - _ _ _ _ 82.8 - - - 69.4 -AgedDependencyRatio 6.5 - - - - - 6.1 - - - - - 5.8 -
Notes /a Indicares that persons not reporting age in the 1950 census are included in the totals.
Sources' 1974: Same as Table VI.
1962 Same as Table VI.
1950: Junta Nacional de Planificacion Y Coordinacion Economica, La Poblacion del Ecuador, Cuenca, Ecuador, Annex Table 5, Page 36, 1960.

TABLE VII: RURAL POPULATION BY AGE AND SEX AS GIVEN IN THE CENSUSESOF ECUADOR: 1950, 1962 anid 1974
C E N S U S O F 1974 C E N S U S O F 1962 C E N SUS O F 1950Poula4lon Percentaee Distribution P--,,lAtlen Percenrage Distribution Pepulation Percentage D0atributionTotal Total Male Female Total Male Female Total Total r male emalePopulation Rural Popula- Popula- Popula- Popula- Popula- Popula- Rural Popula- Popula- Popula-
by Age Population Male Female tion tion tion Population Male Female tion tion tion Pupulatiom Male Female tion tion tion
Total 3,845,369 1,978,045 1,867,324 100% 100% 100% 2,863,661 1,464,992 1,398,669 100°/. 100% 100% /a 2,288,825 /a 1,160,333/a 1,128,492 100% 100% 1007
0- 4 666,870 339,315 327,555 17.3 17.1 17.5 497,201 252,193 245,008 17.4 17.2 17.5 389,947 198,027 191,920 17.0 17.0 17.05- 9 607,505 309,529 297,976 15.8 15.6 16.0 459,135 235,175 223,960 16.0 16.0 16.0 337,698 172,673 165,025 14.8 14.9 14.610-14 513,439 269,501 243,938 13.3 13.6 13.1 351,214 185,863 165,351 12.3 12.7 11.8 270,147 143,324 126,823 11.8 12.3 11.311-19 375,344 196,529 178,815 9.8 9.9 9.6 265,842 135,924 129,918 9.3 9.3 9.3 221,466 113,018 108,448 9.7 9.7 9.720-24 311,371 159,610 151,761 8.1 8 1 8 1 240,423 120,026 120,397 8.4 8.2 8.6 198,742 98,512 100,230 8.7 8.5 8.925-29 245,083 125,584 120,499 6.4 6.4 6.4 209,336 103,663 105,673 7.3 7.1 7.6 171,103 84,927 86,176 7.5 7.3 7.630-34 206,105 106,218 99,887 5.4 5.4 5.3 168,976 87,130 81,846 5.9 6.0 5.9 131,803 66,228 65,585 5.8 5.7 5.835-39 189,711 95,346 94,365 4 9 4.8 5 1 152,808 77,368 75,440 5.3 5.3 5.4 130,541 66,368 64,173 5.7 5.6 5.740-44 163,805 86,109 77,696 4.3 4.1 4,2 122,862 63,837 59,025 4.3 4.4 4.2 98,311 48,342 49,969 4.3 4.1 4.445-49 131,142 67,667 63,475 3.4 3.4 3.4 98,383 50,742 47,641 3.4 3.5 3.4 79,722 39,504 40,218 3.5 3.4 3.650-54 114,705 59,768 54,937 3.0 3.0 2.9 87,702 45,711 41,991 3.1 3.1 3.0 77,791 41,409 36,382 3.4 3.5 3.255-59 78,979 40,805 38,174 2.0 2.1 2 0 54,021 28,447 25,574 1.9 1.9 1.8 46,923 24,481 22,442 2.0 2.1 2.060-64 86,718 45,513 41,205 2.3 2.3 2.2 63,718 32,863 30,855 2.2 2.2 2.2 50,911 24,704 26,207 2.2 2.1 2.365-69 49,337 25,616 23,721 1.3 1.3 1.3 28,862 15,258 13,604 1.0 1.0 1.0 25,269 12,537 12,732 1.1 1.1 1.170-74 48,951 25,212 23,739 1.3 1.3 1.3 28,486 14,024 14,462 1.0 1.0 1.0 24,919 11,201 13,718 1.1 1.0 1.275+ 55,314 25,747 29,567 1.4 1.3 1 6 34,692 16,768 17,924 1.2 1.1 1.3 32,924 14,745 18,179 1.4 1.7 1.6
Median Age(in years) 15.9 15.8 16.9 - - - 16.3 16.2 16.5 - - - 17.3 17.0 17.7 - - -
PercentageMales15-64 - 49.7 - - - - 50 9 - - - - 52.4 -
PercentageFemal es15-49 - - 42.1 - - - - - 44.3 - - - - - 45.6 _ _ _
TotalDependencyRatio 102 0 - - - - - 95.6 - - - 89.5 - -
Chi IdDependencyRatio 93 9 - 8 - - - 89.3 - - - - - 82.6 -
Aged
DependencyRatio 8.1 - - - - - 6.3 - - - - - 6.9 -
Notes /a IndicateS that persons not reporting age in the 1950 census are included in the totals
Sources- 1974: Same as Table VI.
1962 Same as Table VII.
1950: Same as Table VIII.

- 11 -
contrast to the rapid decline of the 1945-1970 period. To reduce the crudedeath rate from 30 per thousand in 1915-19 to 0 per thousand in 1945-49, ittook approximately 30 years. But to reduce the crude death rate, anotherten points to around 10 per thousand took only 20 years. The Infant MortalityRate (IMR) also exhibits its largest sustained percentage declines in the1949-67 interval. Both the crude death rate and the infant mortality ratehave declined to less than one half of their 1915 levels in approximately twogenerations. By 1974, both mortality indicators were low relative to othercounties in Ecuador's per capita income rage. 1/
13. Table IX presents estimates of life expectancy at birth for certainavailable years and multi-year averages. This measure is a better indicatorof the level of overall mortality than either the crude death rate or theinfant mortality rate. Although the estimates vary, they tend to locate lifeexpectancy in the mid to upper 40's for 1950 and all estimates show largegains in life expectancy for both the 1950-60 and 1960-70 intervals. As usual,the sex differential in mortality favors females and female life expectancyvaries between 3 and 4 years longer than male life expectancy.
14. Data indicating the regional patterns of mortality are presentedin Table X and XI. Given the dubious quality of vital registration data inEcuador, these estimates should be regarded as rough orders of magnitude ofregional mortality. They should be, however, indicative of the regional andlongitudinal mortality trends in recent years.
15. Tables X and XI show that, as with other demographic variables,mortality varies from region to region. In terms of the levels of the twomortality measures, crude death rates and the infant mortality rates, theSierra region as a whole generally has rates higher than the national average.The Costa region generally has lower crude death rates and the Oriente lowerinfant mortality rates. The pattern is not perfectly consistent for allprovinces within the regions.
16. The crude death rate fell in all provinces of the Sierra andCosta regions between the 1965-69 and 1970-74 periods. The Oriente regionexhibited declines in this rate in two provinces and increases in the othertwo. The abnormal increase in the crude death rate in these two provincesof Oriente was accompanied by increases in the infant mortality rate. Inall other provinces except for the Esmeraldas province of the Costa region,the infant mortality rate has fallen.
1/ In 1970, the group averages for 26 countries with per capita incomebetween US$201-375 were: CBR=12.6 and IMR=100.2.(Source: World Bank's Social Indicator Tables, December 1975,Table 1, p. 1).

- 12 -
TABLE VIII: MORTALITY INDICES ECUADOR: 1915-1974
Year or Interval Crude Death Percentage Infant Mortal- PercentageRate/i Change ity Rate/2 Change
1915-ln 30.2 - 1881920-24 28.9 -4.3 176 -6.41925-29 28.2 -2.4 167 -5.11930-34 25.7 -8.9 154 -7.81935-39 25.6 -.4 157 +1.91940-44 24.0 -6.3 149 -5.11945-49 20.0 -16.7 134 -10.11950-54 17.6 -12.0 120 -10.41955-59 15.7 -10.8 112 -6.71960-64 14.7 -6.4 96.1 -14.21964 12.1 -17.7 94.0 -2.21965 11.7 -3.3 93.0 -1.11966 11.2 -4.3 90.4 -2.81967 10.6 -5.4 87.3 -3.41968 10.8 +1.9 86.1 -1.41969 10.9 -.9 91.0 +5.71970 9.9 -9.2 76.6 -15.81971 10.1 +2.C 78.5 +2.51972 10.4 +3.0 81.9 +4.31973 9.8 -5.8 75.8 -7.41974 9.9 +1.0 70.2 -7.4
Sources: 1915-1959, O.A. Collver: Birth Rates in Latin America: New Estimates ofHistorical Trends and Fluctuations, Berkeley: Institute of InternationalStudies, University of California, 1965. Research Series, No.7, pages 116-117,1960-1964, United Nations, Demographic Yearbook, 1966, Table 14, page 288,Table 17, page 346.
1964-1974: Ministerio de Salud Publica, Division Nacional de ServicosTecnicos, Dept. Nacional de Estadisticas: Indicadores Basicos De Salud,1974, Tables 5, 6. May 1976.
/1 Annual deaths per thousand persons in mid-year total population; (forfive year intervals, the average for three years is estimated).
/2 Annual deaths of infants under one year of age per thousand live births(eadem for five year intervals).

- 13 -
TABLE IX: ESTIMATED LIFE EXPECTANCY AT BIRTH BY SEX FORECUADOR: VARIOUS DATES, 1950-1970
Life Expectancy at BirthSource of Estimate Time Both Sexes Male Female
Reference
Centro de Analisis Demografico 1950a/ - 43.5 47.41962a' - 49.9 53.3l9S '/ - 49.3 52.1
1962 b/ - 56.1 58.51950-62-k - 52.6 55.2
Centro Latino Americano deDemografia 1950-55 47.2 45.8 48.7
1955-60 51.0 49.6 52.51960-65 54.2 52.9 55.71965-70 57.2 55.8 58.7
Arriaga, E. 1950 47.9 46.7 49.0
1960 54.7 53.2 56.2
Notes: a/ Values computed upon adjusted data.b/ Values computed upon unadjusted registration data.
Sources: Centro de Analisis Demografico, Junta Nacional De Planificacion yCoordinacion Economica: Tables De Wbrt Alidad Por Sexos Del Ecuador,1950-1962, Quito, Ecuador 1974, Annex 2: Tables 1-6, Annex 4: Tables1-4.
Centro Latinoamericano de Demografia: Boletin Demografico: Volume 7,No.13, 1974 Table 5.
Arriaga, E.: New Life Tables for Latin America: Berkeley Instituteof International Studies, University of California, Research Series:Table VIII-5.

TABLE X: RECENT TRENDS IN CRUDE DEATH RATES BY PROVINCE AND REGION:ECUADOR, 1964-1974
Average Rate PercentageY E A R for the Interval Change
BetweenRegion - Province 1964 1965 1966 1967 1968 1969 1970 1971 1972 1973 1974 1965-69 1970-74 Intervals
National Total 12.1 11.7 11.2 10.6 10.8 10.9 9.9 10.1 10.4 9.8 9.9 11.0 10.0 - 9.2
Sierra RegionAzuay 14.9 15.1 14.6 14.7 15.9 14.5 13.8 14.8 13.9 14.5 12.7 15.0 13.9 - 6.8
Bolivar 11.9 12.0 11.1 11.1 12.8 10.7 9.7 11.4 10.7 10.8 14.1 11.5 11.3 - 1.7
Canar 15.0 13.5 14.1 14.1 14.9 12.8 12.5 12.2 12.7 10.2 12.4 13.9 12.0 - 13.5
Carchi 14.6 13.3 13.6 12.8 12.1 12.2 11.1 11.9 12.0 11.0 10.6 12.8 11.3 - 11.6
Chimborazo 17.4 17.7 16.6 14.7 16.7 15.6 14.7 14.4 15.2 14.9 17.4 16.3 15.3 - 5.8
Cotopaxi 18.7 20.3 19.4 20.0 19.8 20.5 20.4 18.5 20.6 17.7 20.1 20.0 19.5 - 2.7
Imbabura 18.8 18.4 19.9 17.4 18.1 18.4 16.9 16.2 19.4 15.5 16.9 18.4 17.0 - 7.9
Loja 7.9 8.6 7.2 7.6 7.5 8.0 6.9 7.6 6.3 6.4 7.9 7.8 7.0 - 9.8
Pichincha 10.9 10.9 10.6 9.9 10.3 10.5 10.3 9.8 9.9 9.6 9.1 10.4 9.7 - 6.7
Tungurahua 17.1 17.0 17.7 15.2 16.9 18.5 16.3 15.5 17.0 15.3 15.2 17.1 15.9 - 7.0
Costa RegionEsmeraldas 8.5 9.1 8.7 8.6 9.2 9.0 9.0 8.5 9.7 8.5 7.9 8.9 8.7 - 2.2 H
Manabi 7.9 7.5 7.1 7.0 7.0 7.3 6.4 7.1 6.9 6.6 6.8 7.2 6.8 - 5.9 t
Los Rios 8.7 11.6 10.9 10.5 9.7 9.6 8.4 9.4 8.8 8.3 7.6 10.5 8.5 - 18.7
Guayas 10.1 9.7 9.0 8.4 7.9 8.6 7.1 7.8 8.4 8.1 7.7 8.7 7.8 - 10.3
El Oro 9.3 8.5 8.2 7.4 7.4 8.5 8.1 7.4 8.0 7.4 6.2 8.0 7.4 - 7.3
Oriente RegionNapo 5.3 6.6 7.1 5.2 4.9 5.4 5.6 8.6 6.8 7.4 5.7 5.8 6.8 + 16.8
Pastaza 10.0 10.2 10.8 9.3 8.6 9.7 9.2 9.2 8.2 8.5 7.3 9.7 8.5 - 12.8
Mbrona Santiago 12.8 10.9 10.1 10.4 13.1 10.9 13.1 10.7 11.1 8.4 8.4 11.1 10.3 - 6.7
Zamora Chinchipe 12.9 11.3 10.5 13.7 16.7 18.5 16.2 18.7 19.7 15.6 10.1 14.1 16.1 + 13.6
Sources: 1964-1968: Instituto Nacional de Estadistica: Anuario De Estadisticas- 1963-1968, Table 16, Page 21, Quito, Ecuador, 1971.
1969: Instituto Nacional de Estadistica: Anuario De Estidisticas: 1967-72, Table 18, Page 38, Quito, Ecuador.
1970-1974: Ministerio De Salud Publica, Division Nacional de Servicios Tecnicos, DPTO. Nacional De Estadisticas,
Indicadores Basicos De Salud, Quito, Ecuador, 1974.

TABLE XI: RECENT TRENDS IN INFANT MORTALITY RATES BY
PROVINCE AND REGION: ECUADOR, 1964-1974
(All rates per thousand live births)
Average Rate PercentageY E A R for the Interval Change
Be tweenRegion - Province 1964 1965 1966 1967 1968 1969 1970 1971 1972 1973 1974 1965-69 1970-74 Intervals
National Total 94.0 93.0 90.4 87.3 86.1 91.0 76.6 78.5 81.9 75.8 70.2 89.6 76.6 - 14.5
Sierra RegionAzuay 102.0 90.7 94.8 102.0 98.8 90.7 81.6 84.4 81.9 81.6 84.6 95.4 82.3 - 13.2Bolivar 94.3 94.0 72.9 89.6 94.4 89.4 68.7 76.2 72.9 78.1 71.7 88.1 73.5 - 16.5
Canar 82.7 80.1 88.1 94.3 103.7 90.8 80.8 70.6 71.8 55.7 64.5 91.4 68.7 - 24.9Carchi 126.0 115.6 126.5 119.6 108.3 105.5 96.1 105.8 102.9 107.9 98.8 115.1 102.3 - 11.1Chimborazo 128.1 124.3 125.0 125.5 125.9 127.1 112.7 105.2 113.3 114.8 105.7 125.6 110.3 - 12.1Cotopaxi 130.4 136.6 137.8 148.3 140.0 141.7 129.0 125.8 130.9 113.0 122.1 140.9 124.2 - 11.9Imbabura 131.2 132.9 145.3 128.8 118.9 122.0 108.7 105.7 117.5 107.2 100.4 129.6 107.9 - 16.7Loja 52.9 54.2 46.2 54.1 50.2 60.9 47.6 51.9 45.9 51.9 45.4 53.1 48.5 - 8.6Pichincha 94.3 93.2 89.1 87.4 94.1 95.4 92.3 86.2 82.7 76.5 75.0 91.8 82.5 - 10.1Tungurahua 121.4 130.4 122.9 109.8 127.8 138.8 116.6 107.9 111.8 102.8 98.4 125.9 107.5 - 14.6 H
Costa ReRionEsmeraldas 82.8 80.4 76.7 84.2 86.4 86.2 86.6 89.0 103.1 84.8 76.5 82.8 87.9 + 6.2
Manabi 65.4 62.9 59.4 54.1 48.8 55.5 44.0 50.9 50.5 46.5 38.5 56.1 46.1 - 17.9Los Rios 107.0 101.3 96.8 94.2 78.3 80.4 64.3 66.1 75.8 62.9 54.4 90.2 64.7 - 28.3Guayas 95.2 100.9 93.7 83.6 85.7 93.9 67.3 78.3 90.0 82.0 71.5 91.6 77.8 - 15.0El Oro 67.5 65.0 66.3 56.4 51.9 71.0 71.1 59.7 58.5 51.6 45.6 62.1 57.3 - 7.8
Oriente RegionNapo 32.9 28.6 33.9 30.0 38.2 28.9 27.0 47.1 36.4 39.3 43.1 31.9 38.6 + 20.9Pastaza 76.2 70.8 66.6 71.4 73.5 79.1 81.4 63.5 59.2 67.2 59.7 72.3 66.2 - 8.4Morona Santiago 109.2 76.1 74.9 72.7 84.5 78.5 80.6 71.6 85.0 56.8 60.8 77.3 71.0 - 8.3Zamora Chinchipe 95.1 83.4 54.1 84.0 77.8 76.7 71.4 78.5 102.3 82.0 72.5 75.2 81.3 + 8.2
Sources Same as Table XI.
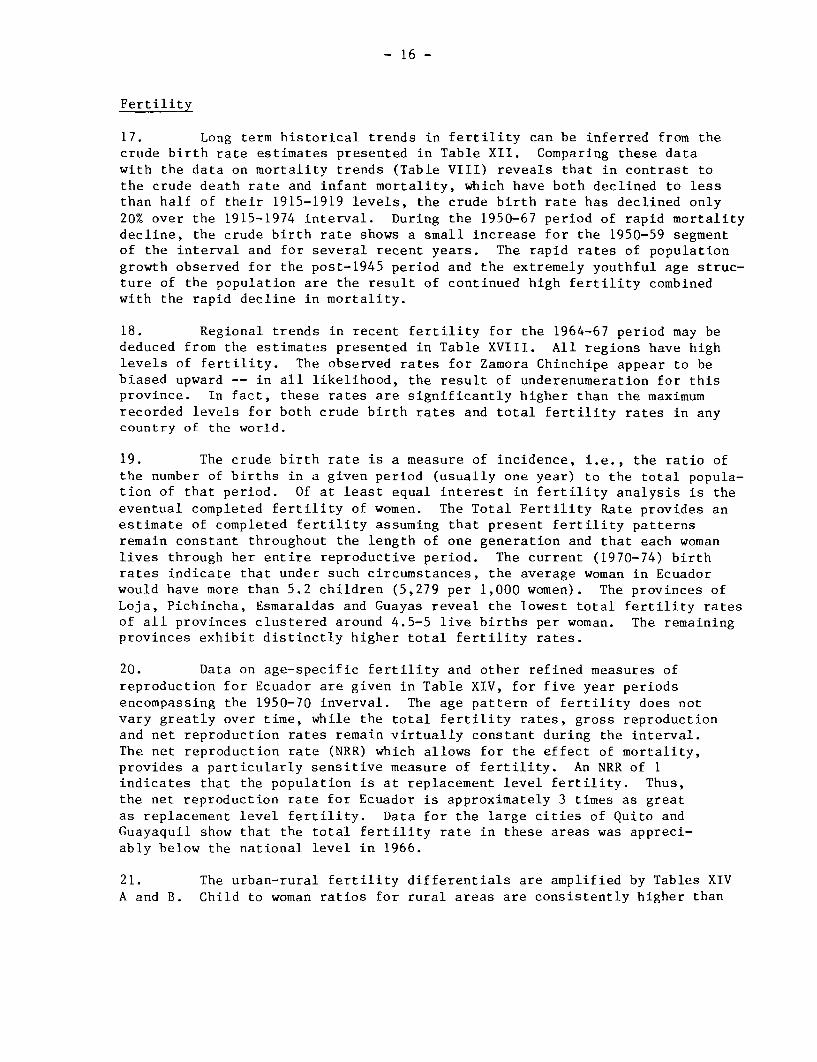
- 16 -
Fertility
17. Long term historical trends in fertility can be inferred from thecrude birth rate estimates presented in Table XII. Comparing these datawith the data on mortality trends (Table VIII) reveals that in contrast tothe crude death rate and infant mortality, which have both declined to lessthan half of their 1915-1919 levels, the crude birth rate has declined only20% over the 1915-1974 interval. During the 1950-67 period of rapid mortalitydecline, the crude birth rate shows a small increase for the 1950-59 segmentof the interval and for several recent years. The rapid rates of populationgrowth observed for the post-1945 period and the extremely youthful age struc-ture of the population are the result of continued high fertility combinedwith the rapid decline in mortality.
18. Regional trends in recent fertility for the 1964-67 period may bededuced from the estimates presented in Table XVIII. All regions have highlevels of fertility. The observed rates for Zamora Chinchipe appear to bebiased upward -- in all 'Likelihood, the result of underenumeration for thisprovince. In fact, these rates are significantly higher than the maximumrecorded levels for both crude birth rates and total fertility rates in anycountry of the world.
19. The crude birth rate is a measure of incidence, i.e., the ratio ofthe number of births in a given period (usually one year) to the total popula-tion of that period. Of at least equal interest in fertility analysis is theeventual completed fertility of women. The Total Fertility Rate provides anestimate of completed fertility assuming that present fertility patternsremain constant throughout the length of one generation and that each womanlives through her entire reproductive period. The current (1970-74) birthrates indicate that under such circumstances, the average woman in Ecuadorwould have more than 5.2 children (5,279 per 1,000 women). The provinces ofLoja, Pichincha, Esmaraldas and Guayas reveal the lowest total fertility ratesof all provinces clustered around 4.5-5 live births per woman. The remainingprovinces exhibit distinctly higher total fertility rates.
20. Data on age-specific fertility and other refined measures ofreproduction for Ecuador are given in Table XIV, for five year periodsencompassing the 1950-70 inverval. The age pattern of fertility does notvary greatly over time, while the total fertility rates, gross reproductionand net reproduction rates remain virtually constant during the interval.The net reproduction rate (NRR) which allows for the effect of mortality,provides a particularly sensitive measure of fertility. An NRR of 1indicates that the population is at replacement level fertility. Thus,the net reproduction rate for Ecuador is approximately 3 times as greatas replacement level fertility. Data for the large cities of Quito andGuayaquil show that the total fertility rate in these areas was appreci-ably below the national level in 1966.
21. The urban-rural fertility differentials are amplified by Tables XIVA and B. Child to woman ratios for rural areas are consistently higher than

- 17 -
TABLE XII: HISTORICAL ESTIMATES OF THE CRUDE BIRTH RATE
Ecuador: 1915-1974
(per 1000 povulation)
Year or Interval Crude Birth Rate Percentage Change
1915-19 46.5
1920-24 47.7 +2.6
1925-29 49.1 +2.9
1930-34 48.5 -1.2
1935-39 47.7 -1.6
1940-44 46.0 -3.6
1945-49 45.9 -0.2
1950-54 46.4 +1.1
1955-59 46.5 +0.2
1960-64 45.4 -2.4
1964 44.9 -1.1
1965 44.0 -2.0
1966 41.5 -5.7
1967 40.4 -2.7
1968 39.6 -2.0
1969 37.4 -5.6
1970 37.8 +1.1
1971 38.7 +2.4
1972 37.3 -3.6
1973 36.3 -2.7
1974 37.5 +3.3
Sources: 1915-59: 0. A. Collver: Birth Rates in Latin America: NewEstimates of Uistorical Trends and Fluctuations: Berkeley:Institute of International Studies, University of California,1965. Research Series, No. 7., page 117.1960-64: Population Division, Department of Economic andSocial Affairs, United Nations Secretariat: Selected WorldDemographic Indicators By Countries. 1950-2000 ESA/P/WP 55May 1975, page 89.
1964-74: Ministerio de Salud Publica, Division NacionalDe Servicos Technicos, Dept. Nacional de Estadisticas:Indicatores Basicos De Salud: 1974, Table 4. May 1976.

TABLE XIII: RECENT TRENDS IN CRUDE BIRTH RATES BY PROVINCE AND REGION:ECUADOR, 1964-1974
(All rates per thousand population)
Percentage EstimatedAverage Rate Change Total
Y E A R for the Interval Between FertilityInterval Rate
Region - Province 1964 1965 1966 1967 1968 1969 1970 1971 1972 1973 1974 1965-69 1970-74 Averages 1970-1974
National Total 44.9 44.0 41.5 40.4 39.6 37.4 37.8 38.7 37.3 36.3 37.5 40.6 37.5 - 7.5 5,279
Sierra RegionAzuay 47.8 48.2 45.3 44.1 45.7 43.9 44.1 46.7 45.4 46.2 36.6 45.4 43.8 - 3.6 6,148Bolivar 43.1 43.2 42.9 40.2 42.1 39.4 39.0 38.2 38.4 36.6 47.6 40.9 40.0 - 2.4 5,624Canar 47.5 51.9 43.2 43.2 41.8 41.4 37.4 43.3 41.4 39.5 38.0 44.3 39.9 - 9.9 5,610Carchi 44.8 45.4 43.2 40.4 38.8 39.3 36.8 39.0 36.4 35.7 37.2 41.4 37.0 - 10.6 5,210Chimborazo 41.2 39.2 38.6 35.4 36.6 35.3 35.0 36.7 34.8 34.4 42.0 37.0 36.6 - 1.2 5,155Cotopaxi 46.8 46.8 47.1 44.7 46.3 45.8 44.2 45.4 43.3 43.1 43.5 46.1 43.9 - 4.9 6,162Imbabura 44.9 43.1 43.1 42.8 42.4 42.4 40.8 41.1 40.4 37.6 41.4 42.6 40.3 - 5.4 5,665Loja 43.9 44.3 41.7 41.5 40.5 32.4 35.5 34.9 29.6 28.5 41.0 40.1 33.9 - 15.4 4,787Pichincha 40.5 40.6 39.4 37.2 34.4 33.0 32.6 34.6 34.4 34.5 32.8 36.9 33.8 - 8.5 4,769Tungurahua 43.4 43.9 44.6 45.4 41.4 41.6 40.5 40.0 38.4 36.3 37.6 43.4 38.6 - 11.1 5,431
Costa Region c
Esmeraldas 39.3 42.8 33.0 37.5 36.4 37.1 35.0 36.1 34.4 32.8 36.7 37.4 35.0 - 6.3 4,934Manabi 46.1 48.3 44.9 45.0 49.5 43.3 45.0 44.9 45.8 42.7 47.7 46.2 45.2 - 2.1 6,341Los Rios 49.4 48.9 44.2 42.6 45.1 42.5 40.1 44.2 38.8 40.1 39.0 44.7 40.4 - 9.5 5,679Guayas 42.1 40.2 37.2 36.4 31.6 31.2 33.5 33.5 31.8 31.1 31.4 35.3 32.3 - 8.7 4,562El Oro 48.6 48.0 41.9 41.7 39.2 35.5 36.8 35.5 38.4 36.2 31.1 41.3 35.8 - 13.2 5,044
Oriente RegionNapo 50.1 50.1 46.0 49.5 46.2 45.5 52.3 45.2 54.2 54.6 39.3 47.4 49.1 + 3.5 6,879Pastaza 39.2 43.5 49.3 41.4 41.1 42.6 38.2 41.7 39.7 37.1 36.5 43.6 38.6 - 11.3 5,431Morona Santiago 43.2 44.3 44.2 44.5 51.3 49.7 47.0 48.1 45.9 44.7 36.4 46.8 44.4 - 5.1 6,231Zamora Chinchipe 52.7 57.1 58.5 61.5 78.3 81.6 77.9 84.0 80.4 70.8 42.8 67.4 71.2 + 5.6 9,927
Notes: Total fertility rates expressed per one thousand women.
Sources: 1964-1968: Instituto Nacional de Estadistica: Anuario De Estadisticas, 1963-1968: Table 13, Page 18, Quito, Ecuador, 1971.
1969: Instituto Nacional de Estadistica: Anuario De Estadisticas, 1967-1972: Table 17, Page 37, Quito, Ecuador, 1974.
1970-1974: Ministerio De Salud Publica, Division Nacional De Servicios Tecnicos, DPTO. Nacional De Estadisticas,Indicadores Basicos De Salud: 1974, Quito, Ecuador, 1974.

- 19 -
TABLE XIV: RECENT ESTIMATED AGE SPECIFIC FERTILITY AND OTHERFERTILITY IIDICES
Ecuador: 1950-1970
(All rates per thousand women in age group unless indicated otYerwise)
Quito GuayaquilAge of Women 1950-55 1955-60 1960-65 1965-70 (1966) (1966)
l5-l9/l 47.7 47.4 45.6 42.6 89.0 171.0
20-24 321.9 330.9 321.8 310.2 286.0 307.0
25-29 335.3 344.8 336.6 346.4 267.0 301.0
30-34 270.8 265.5 266.0 273.9 270.0 224.0
35-39 204.7 235.9 239.2 241.7 157.0 186.0
40-44 88.1 91.3 101.6 99.4 71.0 38.0
/245-49-- 27.5 29.7 35.2 31.8 - -
Total Fertility Rate 6480 6730 6730 6730 5700 6135
Gross Reproduction Rate 3078 3197 3197 3197 - -
Net Reproduction Rate/ 3.0 3.1 3.1 3.1 - -
Notes: /1 Includes births to women less than 15 years of age.
/2 Includes births to women greater than 49 years of age.
/3 Net reproduction rate is given on a per woman basis, Total fertilityRates Gross Reproduction rates are given per 1,000 women.
Sources: Centro Latinoamericano De Demografia: Boletin Demografico,Volume VII, No. 14. Table 7, page 58, Santiago Chile. 1974.
United Nations: Demographic Yearbook: 1965, 1969; Tables 17 and 18respectively, New York, 1965, 1969.
For Quito (1966) and Guayaquil (1966): Centro Latinamericano deDemografia, Santiago, Chile and Community and Family Study Center,University of Chicago: Fertility and Family Planning In LatinAmerica: Table 2.1. Medium (most likely) estimates. page 12,Chicago, 1972.
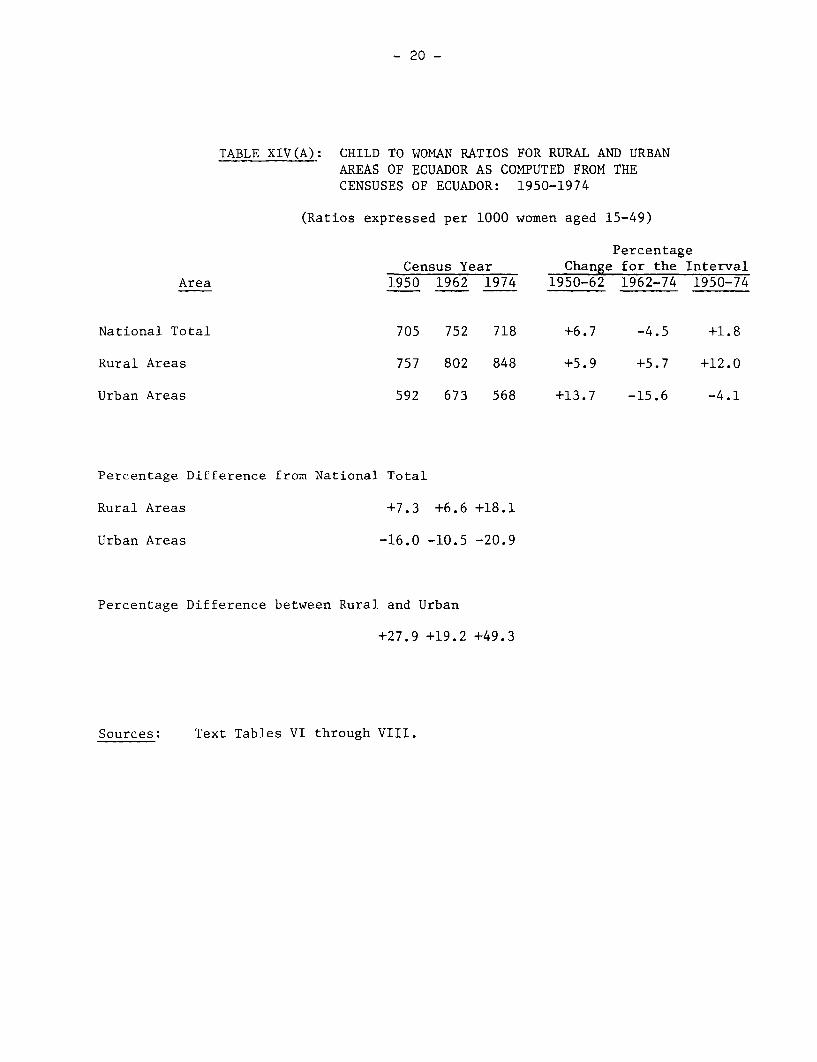
- 20 -
TABLE XIV(A): CHILD TO WOMAN RATIOS FOR RURAL AND URBANAREAS OF ECUADOR AS COMPUTED FROM THECENSUSES OF ECUADOR: 1950-1974
(Ratios expressed per 1000 women aged 15-49)
PercentageCensus Year Change for the Interval
Area 1950 1962 1974 1950-62 1962-74 1950-74
National Total 705 752 718 +6.7 -4.5 +1.8
Rural Areas 757 802 848 +5.9 +5.7 +12.0
Urban Areas 592 673 568 +13.7 -15.6 -4.1
Percentage Difference from National Total
Rural Areas +7.3 +6.6 +18.1
Urban Areas -16.0 -10.5 -20.9
Percentage Difference between Rural and Urban
+27.9 +19.2 +49.3
Sources: Text Tables VI through VIII.

- 21 -
TABLE XIV(B): CHILDREN EVER BORN PER 1000 WOMEN BY AGE AND PLACE OF BIRTH:
ECUADOR 1967
Place of BirthUrban Areas by Region
Age Rural Urban Sierra Region Costa Region
Total 3667 3171 2918 3471
15-19 270 232 108 350
20-24 1857 1353 1044 1685
25-29 3219 2942 2667 3294
30-34 4800 4465 4086 4918
35-39 5147 5340 5036 5664
40-44 6936 5457 4750 6444
45-49 6559 5264 4563 6732
Sources: Departmento Tecnico, Division De Estadistica y Censos, Encuestade Fecundidad, Levantada en las Principales Ciudades y enalgunas Parroquias Rurales del Pais: Table 2, pages 2-3.Quito, Ecuador; 1967.
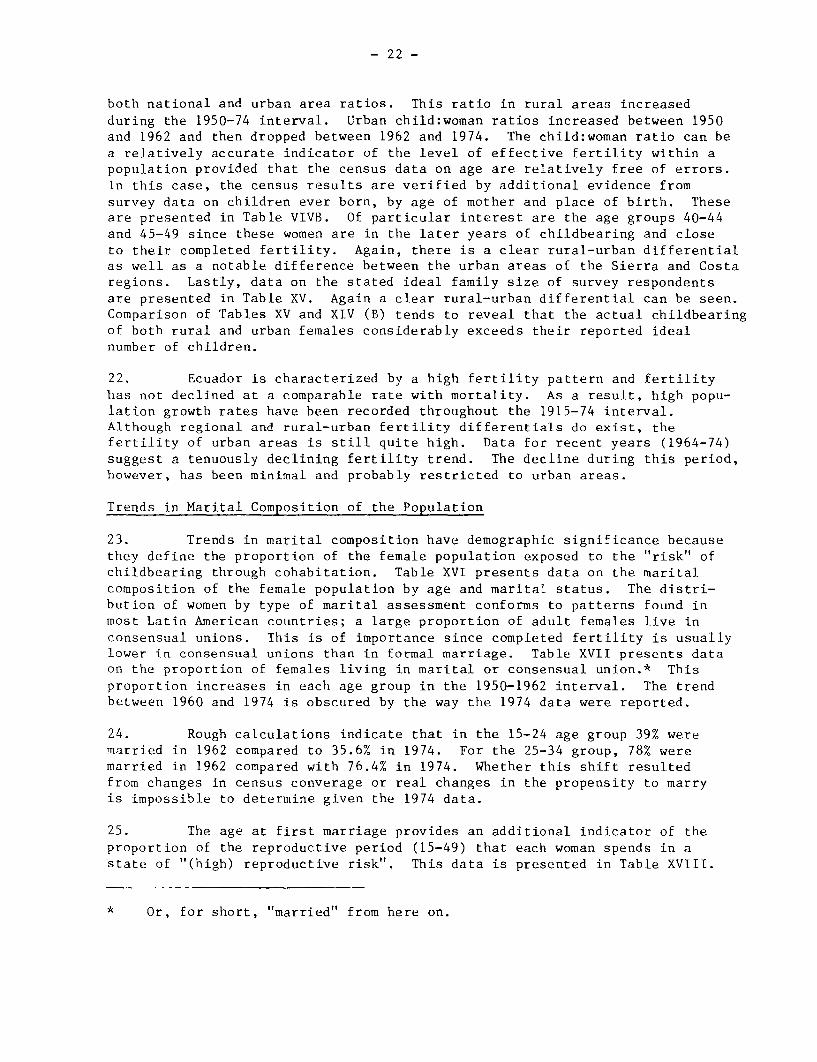
- 22 -
both national and urban area ratios. This ratio in rural areas increasedduring the 1950-74 interval. Urban child:woman ratios increased between 1950and 1962 and then dropped between 1962 and 1974. The child:woman ratio can bea relatively accurate indicator of the level of effective fertility within apopulation provided that the census data on age are relatively free of errors.In this case, the census results are verified by additional evidence fromsurvey data on children ever born, by age of mother and place of birth. Theseare presented in Table VIVB. Of particular interest are the age groups 40-44and 45-49 since these women are in the later years of childbearing and closeto their completed fertility. Again, there is a clear rural-urban differentialas well as a notable difference between the urban areas of the Sierra and Costaregions. Lastly, data on the stated ideal family size of survey respondentsare presented in Table XV. Again a clear rural-urban differential can be seen.Comparison of Tables XV and XIV (B) tends to reveal that the actual childbearingof both rural and urban females considerably exceeds their reported idealnumber of children.
22. Ecuador is characterized by a high fertility pattern and fertilityhas not declined at a comparable rate with mortality. As a result, high popu-lation growth rates have been recorded throughout the 1915-74 interval.Although regional and rural-urban fertility differentials do exist, thefertility of urban areas is still quite high. Data for recent years (1964-74)suggest a tenuously declining fertility trend. The decline during this period,however, has been minimal and probably restricted to urban areas.
Trends in Marital Composition of the Population
23. Trends in marital composition have demographic significance becausethey define the proportion of the female population exposed to the "risk" ofchildbearing through cohabitation. Table XVI presents data on the maritalcomposition of the female population by age and marital status. The distri-bution of women by type of marital assessment conforms to patterns found inmost Latin American countries; a large proportion of adult females live inconsensual unions. This is of importance since completed fertility is usuallylower in consensual unions than in formal marriage. Table XVII presents dataon the proportion of females living in marital or consensual union.* Thisproportion increases in each age group in the 1950-1962 interval. The trendbetween 1960 and 1974 is obscured by the way the 1974 data were reported.
24. Rough calculations indicate that in the 15-24 age group 39% weremarried in 1962 compared to 35.6% in 1974. For the 25-34 group, 78% weremarried in 1962 compared with 76.4% in 1974. Whether this shift resultedfrom changes in census converage or real changes in the propensity to marryis impossible to determine given the 1974 data.
25. The age at first marriage provides an additional indicator of theproportion of the reproductive period (15-49) that each woman spends in astate of "(high) reproductive risk". This data is presented in Table XVIII.
* Or, for short, "married" from here on.

- 23 -
TABLE XV: IDEAL FAMILY SIZE FOR FEMALE RESPONDENTS ASSUMING THERESPONDENT COULD BEGIN HER CHILD-BEARING PERIOD OVER AGAIN:SELECTED AREAS OF ECUADOR, 1966-67
(Percentage Distribution of Survey Respondents)
Survey AreasMetropolitan Areas of
Number of Children Rural Other Urban Quito Guayguil
Total 100% 100% 100% 100%
None or one child 1.1 .9 4.1 7.5
Two children 9.3 13.7 27.2 29.3
Three children 15.0 23.6 29.8 22.4
Four children 23.1 27.8 24.1 20.4
Five children 8.6 7.5 4.8 4.5
Six children 12.9 10.6 5.2 9.0
Seven or more 9.1 4.4 1.6 2.3
Whatever comes 9.1 5.9 1.4 2.5
No response 11.8 5.9 1.8 2.0
Median Ideal Size 4.2 3.4 2.6 2.5
Sources: For Qui,to and Guayaquil: Centro Latinamericano de Demografia,Santiago Chile and Community and Family Study Center, Universityof Chicago: Fertility And Family Planning in Metropolitan LatinAmerica: Table 6-7, page 103. Chicago 1972.
For Rural and Other Urban Areas: Departamento de Estadistica y Censos:Encuesta De Fecundidad Levantada en Los Principales Cuidades Y enAegunas Parroquias Ruales Del Pais: Table 22: pages 52-53, QuitoEcuador 1967.

-24 -
TABLE XVI:. PERCENTAGE MARRIED,X AMONG WOMEN IN EACH AGE GROUP ATDI-fFEtKKNT CENSUS DATES: tuuni)i, l950-1974
Year of Census
Age Group in Years 1950 1962 1974
15-19 17.4 19.4 )35.6
20-24 55.9 59.5 3
25-29 72.3 76.1 )) 76.4
30-34 75.9 80.4 )
35-39 75.7 81.0 )) 79.3
40-44 71.4 77.3 )
45-49 68.8 74.5) 72.9
50-54 )
Notes Data refer to the female population "exposed" to the risk ofreproduction thru formal or legal marriage and consensualunions.
Sources:
1950: Direcion General De Estadistica y Censos: InformacionCensal, Resumen de los resultados definitinos del CensoNacional de poblacion de 1950: Table 7, page 42,Quito, Ecuador, 1952.
1962: Divison De Estadistica y Censos, Junta Nacional DePlanificacion y Coordinacion Economica: SegundoCenso de Poblacion y Primer Censo de Vivienda: Table 15,Page 146, Quito, Ecuador, 1964.
1974: Secretaria, General De La Organizacion De Los EstadosAmericanos, Departmento de Estadistica BoletinEstadico: No. 122, Table 4, page 3. Washington, D. C.

TABLE XVII: PERCENTAGE DISTRIBUTION OF THE FEMALE POPULATION12 YEARS OF AGE AND OLDER BY MARITAL STATUS AND AGE
AS REPORTED IN THE CENSUSES OF ECUADOR
CENSUS QF 1974 CENSUS qF 1962 CENSUS QF 1950In Con- In Con- In Con-sensual sensual sensual
Age Group Single Married Unions Other La Single Married Unions Other La Single Married Unions Other /a
Total 38.2 38.0 13.1 10.7 39.2 40.7 12.5 7.6 40.4 38.4 11.9 -
12-14 94.5 .4 .4 4.7 99.4 .4 .2 0 98.9 .4 .2 .515-19 60.7 23.4 12.2 3.7 80.4 12.9 6.5 .2 82.2 11.6 5.8 .420-24 ( ( ( ( 39.7 42.6 16.9 .8 42.9 39.5 16.4 1.225-29 ( 17.5 ( 56.5 20.0 6.0 22.3 56.1 20.0 1.6 25.3 52.7 19.7 2.330-34 16.6 61.3 19.2 2.9 20.0 56.7 19.3 4.035-39 1 (0.14.4 61.9 19.1 4.6 18.2 56.9 18.8 6.140-44 (14.2 60.5 16.8 8.5 18.6 55.6 15.8 10.045-49 (iO.8 57.8 ( 15.1 ( 16.3 14.0 60.5 14.0 11.5 17.5 56.5 12.3 13.750-54 ( ' 15.6 54.1 11.6 18.7 18.2 51.3 9.6 20.9
Netes: /a Other includes widowed, separated, divorced and marital status not declared.
Sources: Same as Table XVII.

- 26 -
TABLE XVIII: IDEAL AGE AT FIRST MARRIAGE IN SELECTED AREAS OF ECUADOR 1966-1967
(Percentage Distribution of Survey Responses)
Survey AreasIdeal Age at Metropolitan Areas ofFirst Marriage Rural Other Urban Quito Guayaquil
Total 100% 100% 100% 100%
Early Marriage
18 years or less 12.2 10.7 4.0 6.1
19 years .7 2.1 2.1 3.0
"Normal" Age at Marriage
20 years 41.3 36.1 27.7 38.0
21 years 2.7 4.3 4.8 5.0
22 years 6.3 8.4 11.3 9.6
23 years 1.6 3.6 4.2 3.9
24 years 1.4 4.2 6.5 4.3
Late Marriage
25 years 18.6 21.1 32.6 24.6
26 years or older 5.4 5.5 6.4 4.7
No response 9.8 4.0 .5 .9
Median Ideal Age 19.9 20.3 23.0 21.5
Median Actual Age atMarriage 18.1 19.0 20.1 19.1
Sources: For Quito and Guayaquil: Centro Latinamericano de Demografia, SantiagoChile and Community and Family Study Center, University of Chicago:Fertility and Family Planning in Metropolitan Latin America: Table 6,Page 93. Chicago 1972.
For Rural and other Urban Areas: Departamento Tecnico, Division de Estadica yCensos: Encuesta De Fecundidad, Levantada en Las Principales Ciudades yen Algunas Parroquias Rurales Del Pais: Table 24, page 56-7, Quito,Ecuador 1967.

- 27 -
A slight rural-urban differential in the median age at marriage is seen aswell as an intra-urban differential between Quito and Guayaquil. As wasthe case with ideal number of children, the median age at first marriage islower than the stated ideal age at first marriage. In all areas, the ageat first marriage is quite low causing women to spend almost 100% of theirchildbearing years in reproductive unions. Rural women spend approximately91% of their reproductive life exposed to childbearing, urban women from85% (Quito) to 88% (other urban).
Migration
26. Data on the percentage of net lifetime migrants (persons whoseplace of birth is different from their place of residence at the time ofthe census enumeration) is presented in Table XIX by type of migration fromthe 1962 and 1974 census returns. The distinction is made between internaland international migration. The percentage of national and provincialpopulation born abroad is extremely small in both censuses, indicating theminimal role net immigration has played in the rapid population growth ofEcuador.
27. Internal migration is further refined into the categories of intra-provincial and inter-provincial migrants. Trends in inter-provincial migra-tion and its role in provincial population growth are evident in the prov-inces of the Oriente region where one-third to one-half of the total provin-cial population is composed of lifetime migrants. Inter-provincial migrantsare also a sizeable proportion of provincial population in the Costa region(excluding Manabi province) and the provinces of Azuay, Imbabura and Pichinchain the Sierra region. Intra-provincial migrants generally follow a similarpattern. In the Costa region they comprise approximately 10-20% of provin-cial population (1974), 8-15% in the Oriente region and 0 to 17% in theSierra region. An increase in the proportion of provincial population thatare lifetime internal migrants is seen between the 1962-1974 intercensalperiod, while increases in lifetime international migrants are minimal.
28. The sex composition of lifetime migrants differs by the type ofmigration, as seen in Table XX. In the Sierra region the sex ratio ofmigrants is seen to rise as the type of migration changes from intra-provincial migration to immigration. However, for the provinces ofImbabura, Loja, Pichincha, and Tungurahua in the Sierra region, all typesof migration reveal high sex ratios. A similar finding is seen for allprovinces of the Costa region. For the Oriente region the trends of sexratios of lifetime migrants vary. In the provinces of Pastaza and MloronaSantiago all types of migration reveal more female migrants than male mi-grants, while the opposite is seen in the province of Napo and ZamoraChinchipe.
29. Estimates of net migration rates per thousand population forregions and provinces were prepared for the 1950-62, 1962-74 and 1950-74intervals. These estimates are presented in Table XXI and they generallyconform to the patterns of provincial and regional population growth. The

TABLE XIX: LIFETIME NET MIGRANTS BY TYPE OF MIGRATION EXPRESSED - 28 -
AS A PERCENTAGE OF TOTAL PROVINCIAL POPULATIONAS DERIVED FROM THE CENSUSES OF ECUADOR: 1962-1974
C E N S U S O F 1974 C E N S U S O F 1962Type of Migration Type of Migration
Total TotalNet Intra- Inter- Immi- Net Intra- Inter Immi-
Region and Province Migrants Provincial Provincial gration Migrants Provincial Provincial gration
National Total 1,734,610 11.28 14.09 .60 573,316 .55 11.70 .56
Sierra RegionAzuay 55,999 .10 13.88 .25 12,718 .14 4.38 .10Bolivar 29,751 17.17 3.22 .07 6,188 .23 4.40 .08Canar 22,882 9.39 6.15 .05 8,840 .38 7.44 .03Carchi 34,216 14.80 6.93 6.13 10,779 .76 5.56 5.07Chimborazo 46,170 9.09 5.45 .07 14,176 .38 4.69 .06Cotopaxi 26,270 5.09 5.60 .05 7,782 .25 4.70 .07Imbabura 58,238 10.75 14.90 .76 18,913 .99 9.04 .83Loja 55,464 12.39 3.33 .14 7,008 .23 2.05 .18Pichincha 341,802 8.69 24.48 1.27 135,621 .81 21.06 1.20Tungurahua 48,476 8.45 8.17 .19 14,984 .39 7.87 .12
Costa RegionEsmeraldas 71,785 15.02 17.81 1.86 17,328 1.2 10.01 2.67Manabi 165,655 17.09 2.60 .09 11,274 .15 1.63 .05Los Rios 117,482 13.22 16.26 .12 43,483 1.49 15.70 .20Guayas 443,150 11.41 16.98 .49 196,621 .i4 19.42 .52El Oro 111,888 18.37 22.41 .19 43,072 2.72 24.01 .08
Oriente RegionNapo 30,024 15.36 30.77 1.94 3,931 .96 12.92 2.33Pastaza 10,690 7.85 35.78 .32 6,196 4.06 40.75 .44Morona Santiago 22,721 14.99 27.20 .23 7,741 3.28 26.92 .16Zamora Chinchipe 20,319 10.18 48.40 .20 5,504 1.50 46.0 .51
Territorio Insular
Galapagos 1,988 7.01 39.61 1.78 1,157 .04 46.26 2.09
Sources: 1974: Departmento de Estadistica, Secretaria General De La Organizacion De Los EstadosAmericanos: Boletin Estadistico: No. 122, Table 5, Page 4. Was.ington, D.C., 1975.
1962: Division De "stadistica Y Censos, Junta Nacional De Planificacion Y Coordinacion Economica:Segundo Censo de Poblacion y Primer Censo de Vivienda, Volume I, Table 8, pp.56-57, Quito,Ecuador, 1964.

TABLE XX: SEX RATIO OF LIFETIME NET MIGRANTS BY TYPE OF MIGRATION - 29 -
AS DERIVED FROM THE 1962 CENSUS OF ECUADOR
Type of MigrationIntra Inter
Provincial ProvincialRegion - Province Migrants Migrants Immigrants
National Total 108 105 108
Sierra Region
Azuay 71 87 139
Bolivar 78 107 102
Cauar 95 115 175
Carchi 94 ].06 90
Chimborazo 94 108 104
Cotopaxi 76 91 127
Imbabura 121 146 134
Loja 117 130 121
Pichincha 109 102 127
Tungurahua 104 96 93
Costa Region
Esmaraldas 122 120 111
Manabi 109 134 205
Los Rios 123 137 182
Guayas 196 126 150
El Oro 106 173 112
Oriente Region
Napo 138 144 150
Pastaza 98 89 99
Marona Santiago 80 92 92
Zamora Chinchipe 123 144 103
Territorio Insular
Galapagos /1 150 150
Notes: There were no femalelifetime migrants.
Sources: Same as Table XX.

- 30 -
provinces of Oriente region reveal the highest rates of net in-migration
and it appears that net in-migration increased throughout the 1950-74
interval. The provinces of the Costa region reveal net in-migration forthe 1950-74 period, except for the province of Manabi. The rates of in-migration in the Costa region are greater during the 1950-62 portion of
the interval. All provinces of the Sierra region show net out-migrationfor the 1950-74 interval except for Pichincha province.
30. Estimates of net migrants by age and sex, both internal and inter-
national, to urban areas were prepared for the 1950-62 and 1962-74 census
intervals (Table XXII). These estimates include both internal and inter-
national migrants, but the contribution of the latter is extremely small.
The volume of net migration to urban areas has increased by approximately
65% between intervals (108% increase for males and only 29% for females).
Characteristic of rural-urban migration in Latin America, the sex ratios of
net migrants to urban areas is low, indicating a preponderance of females, but
the predominance of females was reduced between 1950-62 and 1962-74. The age
structure is also skewed towards the younger ages with approximately 50% of
the net migrants of both sexes under the age of 24.
31. The predominant type of migration seen in Ecuador through the
1950-74 interval has been internal migration. As a result of minimal changes
in net international migration, national population growth has been primarily
determined by fertility and mortality. On a regional basis, however, net
internal migration is partially responsible for the rapid growth rates of
both the Costa and Oriente regions, while it has tended to reduce the growth
rate of the Sierra region. The volume of net immigration to urban areas has
increased considerably while the majority of these migrants are in the
younger ages and predominantly female.
Population Prospects: Family Planning
32. In previous sections several demographic facts about Ecuador have
become quite obvious. In recent years, Ecuador has had one of the mostrapidly growing population in the world. This has been due primarly to high
rates of natural increase since immigration has been negligible. Natural
increase has resulted from a reduction in the crude death rate of over 50%
since 1915-19 while crude birth rates have fallen by less than 20% during
the period.
33. The prospect for future population growth depends largely on what
happens to fertility since the crude death rate is already very low. Future
fertility depends on the fertility desires of couples and their ability to
implement those desires. As shown in Table XIVB and XV, in 1967 ideal family
size was substantially below the average number of children ever born, to
women who have completed childbearing. This indicates a potential for lower
fertility. The ability to implement fertility desires depends to some extent
on the availability of family planning service. Private family planning
associations began offering services in 1966 and the government began offer-
ing services in 1968. Table XXIII shows the amount of such services offered
in recent years. The utilization of those programs is represented in
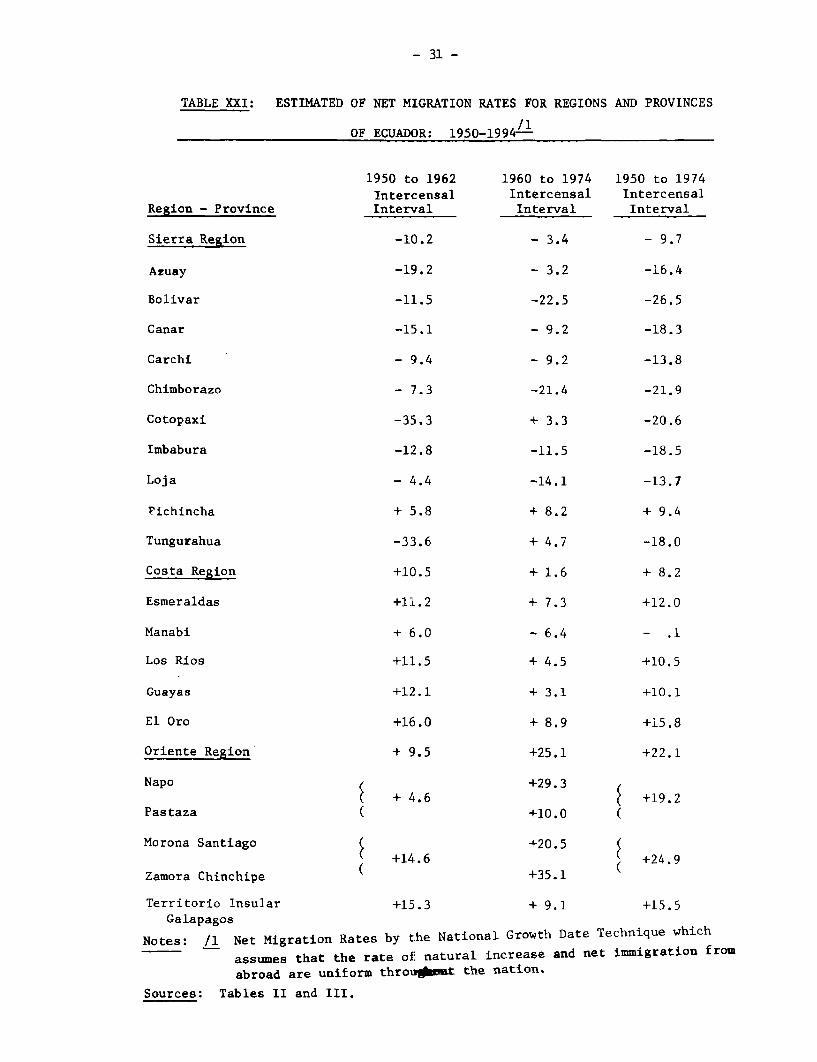
- 31 -
TABLE XXI: ESTIMATED OF NET MIGRATION RATES FOR REGIONS AND PROVINCES
/1OF ECUADOR: 1950-1994-
1950 to 1962 1960 to 1974 1950 to 1974Intercensal Intercensal Intercensal
Region - Province Interval Interval Interval
Sierra Region -10.2 - 3.4 - 9.7
Azuay -19.2 - 3.2 -16.4
Bolivar -11.5 -22.5 -26.5
Canar -15.1 - 9.2 -18.3
Carchi - 9.4 - 9.2 -13.8
Chimborazo - 7.3 -21.4 -21.9
Cotopaxi -35.3 + 3.3 -20.6
Imbabura -12.8 -11.5 -18.5
Loja - 4.4 -14.1 -13.7
Pichincha + 5.8 + 8.2 + 9.4
Tungurahua -33.6 + 4.7 -18.0
Costa Region +10.5 + 1.6 + 8.2
Esmeraldas +11.2 + 7.3 +12.0
Manabi + 6.0 - 6.4 - .1
Los Rios +11.5 + 4.5 +10.5
Guayas +12.1 + 3.1 +10.1
El Oro +16.0 + 8.9 +15.8
Oriente Region- + 9.5 +25.1 +22.1
Napo +29.3Nap + 4.6 2 +19.2
Pastaza ( +10.0 (
Morona Santiago 1 +20.5 2+14.6 +24.9
Zamora Chinchipe ( +35.1
Territorio Insular +15.3 + 9.1 +15.5Galapagos
Notes: /1 Net Migration Rates by the National Growth Date Technique which
assumes that the rate of natural increase and net immigration fromabroad are uniform throulpnut the nation.
Sources: Tables II and III.
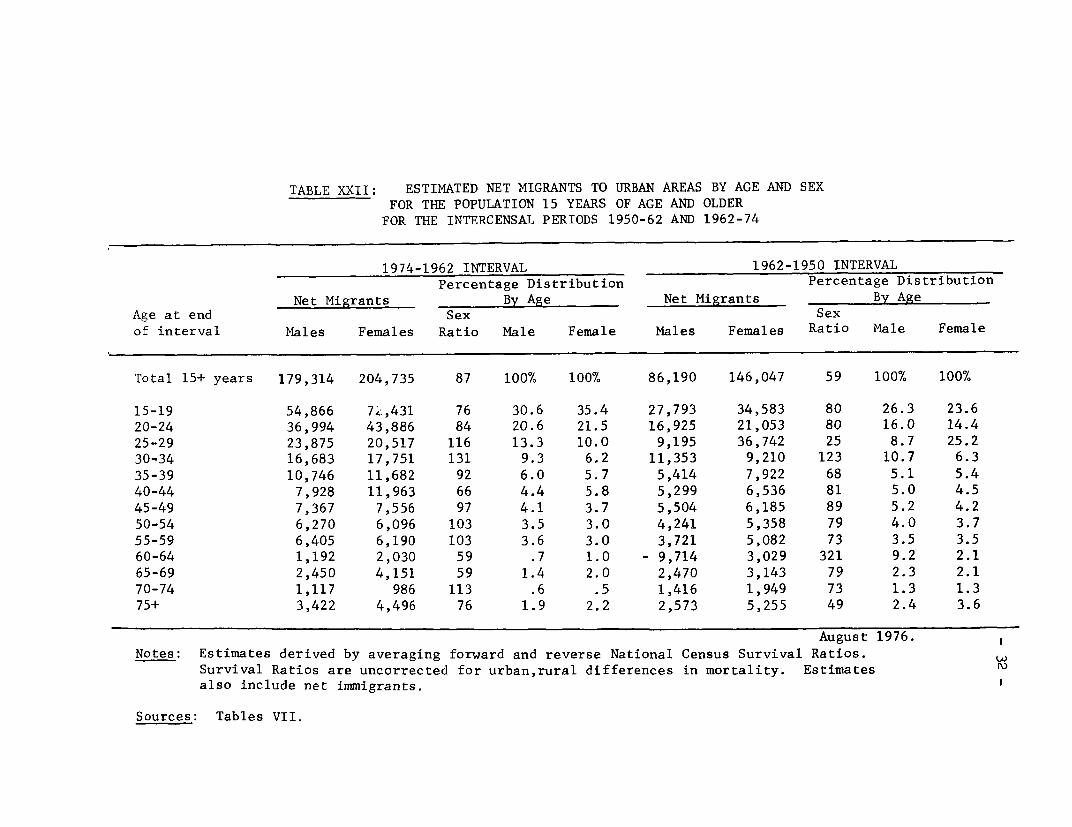
TABLE XXII: ESTIMATED NET MIGRANTS TO URBAN AREAS BY AGE AND SEXFOR THE POPULATION 15 YEARS OF AGE AND OLDER
FOR THE INTERCENSAL PERIODS 1950-62 AND 1962-74
1974-1962 INTERVAL 1962-1950 INTERVALPercentage Distribution Percentage Distribution
Net Migrants By Age Net Migrants By AgeAge at end Sex Sexof interval Males Females Ratio Male Female Males Females Ratio Male Female
Total 15+ years 179,314 204,735 87 100% 100% 86,190 146,047 59 100% 100%
15-19 54,866 7h,431 76 30.6 35.4 27,793 34,583 80 26.3 23.620-24 36,994 43,886 84 20.6 21.5 16,925 21,053 80 16.0 14.425-29 23,875 20,517 116 13.3 10.0 9,195 36,742 25 8.7 25.230-34 16,683 17,751 131 9.3 6.2 11,353 9,210 123 10.7 6.335-39 10,746 11,682 92 6.0 5.7 5,414 7,922 68 5.1 5.440-44 7,928 11,963 66 4.4 5.8 5,299 6,536 81 5.0 4.545-49 7,367 7,556 97 4.1 3.7 5,504 6,185 89 5.2 4.250-54 6,270 6,096 103 3.5 3.0 4,241 5,358 79 4.0 3.755-59 6,405 6,190 103 3.6 3.0 3,721 5,082 73 3.5 3.560-64 1,192 2,030 59 .7 1.0 - 9,714 3,029 321 9.2 2.165-69 2,450 4,151 59 1.4 2.0 2,470 3,143 79 2.3 2.170-74 1,117 986 113 .6 .5 1,416 1,949 73 1.3 1.375+ 3,422 4,496 76 1.9 2.2 2,573 5,255 49 2.4 3.6
August 1976.Notes: Estimates derived by averaging forward and reverse National Census Survival Ratios.
Survival Ratios are uncorrected for urban,rural differences in mortality. Estimates Nalso include net immigrants.
Sources: Tables VII.

- 33 -
Table XXIV. The number of acceptors of program methods each year has grown700% in a five year time period. This indicates the extent of latent demandfor birth control in the population. It is too early to determine if theaddition of sterilization to the methods being provided will attract evenmore acceptors.
34. The potential impact of the program on the birth rate can be approxi-mated by reviewing the age and number of children already born to the womenwho are accepting contraceptive methods and the methods they are adopting(Table XXIV and XXV). The average age of acceptors is quite young. Twenty-six years for the IUD and 25.2 for the pill. This compares with a median ageof acceptors in most developing countries of between 27 and 30 years. Thisearly usage of highly effective methods would indicate the program may have asubstantial impact on the average number of children per family. Birth rates,however, will continue to remain fairly high for some years despite reductionsin children per woman because of the age structure of the population.
Population Projections 1970-2000
35. Table XXVII presents figures on certain key variables associatedwith three population projections for Ecuador prepared by the U.N. Thesethree projections have the same demographic characteristics in 1970 butdeviate substantially by the year 2000. The three projections differ asa result of differences in the assumed course of fertility. In all threecases, migration is negligible and mortality is assumed to decline so thatby the year 2000 life expectancy for the general population will reach 69.4years.
36. Of the three projections, the high projections seem somewhatunlikely given the high crude birth rate estimated for the 1970-75 period.This rate is 42% which is substantially above the observed rates around37.5 given in Table XIII for this period. The corresponding rates for themedium and low projections respectively are 41.8 and 40.7. On these groundsone might prefer the low projection; however that projection is associatedwith a reduction of the crude birth rate to 25.1 by the period 1995-2000,while the intermediate projection implies a rate of 31.2 at that time. Tobe on the conservative side we have included detailed information on themedium projection only (see Appendix Table 2). This medium projectionimplies a doubling of population between 1975 and 2000 despite a reductionin the crude birth rate to 31.2.
Summary and Conclusions
37. Ecuador is a country experiencing a fast rate of population growth.The crude death rate is already very low and will probably not fall furtherdespite the fact that life expectancy will hopefully rise further. Althoughthe crude birth rate has already begun to fall and acceptance of familyplanning indicates it will probably fall more, it is unlikely to fall suffi-ciently to prevent the doubling of Ecuador's population by 2000. These highgrowth rates imply a continued high dependency rate and increased populationpressure.

TABLE XXIII: ECUADOR, PERSONNEL AND FACILITIES ALLOCATED FOR FAMILY
PLANNING SERVICES. DATA FOR RECENT YEARS
Personnel FacilitiesYear Type Number Type, Location or Auspices Number
1971 Physicians Health Ministry 47
Full Time 14 Defense Ministry 8
Part Time 100 Family PlanningAssociation 5
Collaborating Social Security 1Physicians 20
1973 Physicians and Hospitals 28Obstetricians 256
Hospital Centers 6Auxiliaries 1,100
Health Centers 148
Family Planning Clinics 8
1974 Physicians 256 Hospitals 16
Auxiliaries 1,100 Maternity Hospitals 2
Health Centers 103
Health Sub-Centers 117
Family Planning Clinics 8
Source: Nortman, D.: "Population and Family Planning Programs: A Factbook",Number 2, fifth edition - Table 7, Sept. 1973.Number 2, sixth edition - Table 14, Dec. 1974.Nuber 2, seventh edition - Table 14, Oct. 1975
Reports on Population/Family Planning: Population Council, New York.

- 35 -
TABLE XXIV: FAMILY PLANNING ACCEPTORS BY METHOD OF FAMILY PLANNING ACCEPTED
AND YEAR OF ACCEPTANCE: ECUADOR, 1969-1974
(All figures given in thousands)Other
Oral ProgramYear All Program Methods I.U.D. Contraceptives Sterilization Methods
1969 5.2 3.0 1.8 - .4
1970 9.0 4.8 3.3 - 1.0
1971 14.9 6.5 6.6 - 1.7
1972 17.4 8.3 7.2 - 1.9
1973 26.9 13.6 10.9 - 2.5
1974 34.5 14.0 15.5 1.1 3.9
Notes: Figures may not add horizontally to totals since totals may or may nothave been adjusted to take account of duplication of acceptors.
Sources: Nortman, D., "Population and Family Planning Programs: 17 Factbook".
Number 2, Sixth Edition, Table 16, December 1974.Number 2, Seventh Edition, Table 16, October 1975.
Reports on Population/Family Planning: Population Council,New York.

- 36 -
TABLE XXV: MEDIAN AGE AND MEDIAN NUMBER OF LIVING CHILDREN
IN FAMILY PLANNING ACCEPTORS BY METHOD:ECUADOR, SELECTED DATES, 1971-1973
(Acceptors are given in thousands)
Acceptor Sample Acceptor CharacteristicsPeriod of Median NumberAccept- Number of Median of Living
Method ance Acceptors Age Children
IUD 1973 5.1 26.4 -1973 5.9 - 3.7
1-8/1971 1.0 - 4.0
Oral Contra- 1-8/1971 .9 28.2 3.3ceptives 1973 1.2 25.2 2.5
Source: Same as Table XXIV.

- 37 -
TABLE XXVI: ESTIMATED USERS OF FAMILY PLANNING SERVICESBY METHOD FOR ECUADOR, 1974-1975
(Figures may not add due to rounding,and refer to January 1 of given year)
OralContra- Steril-
Year Methods I.U.D. ceptives ization Other
1974 28.4 17.0 9.4 - 2.11975 51.7 26.9 19.0 1.1 4.7
USERS AS A PERCENTAGE OF MARRIED WOMENAGED 15-44
1974 3% 2% 1% - .2%1975 6.3% 3.3% 2.3% .1% .6%
Source: Same as Table XXV.

-<4>.-- ,- ror�,-o>o� <1,.3.�0 04304>>o4 -
-'-40404 1� �''2l> '71 '13� 3040400t 04
-, I >0�-0�0-'-. 00004-nt 03-0000 0>,� '0404 0 4 0'
I II� -- ,-"�� -0o04o04041 III HO 0I'> o'n 0 o04zniC Ill, I> 0---rn> fl 30.1110 >3- : :��?!�? 0 0 .�
I' 3 In -na-nOon> -n-n040nna'- 00ZlOXfln 0� C I> I00 An3A A A 04 >30 A m>0�-4-004c2 040404>4030 >* 04 04 0I- oO- 00404 -04-00IZ�04 0 04 .. 1 0
04- go >-..--'on n>rfl0 a'0 >0 04.-On- I> 0404040'04 0�4--04no4.0>J,>-nr-4 04 0>00471004) 04---000404m04 a'-n--r 0404040400001x-.0>n04o 04,13.0-. 4>)) I-n>)> nr-.n>>o >310,1 I 1303.-<300043 04 043-041371 l*104>0
3'404> I�S0-4 04"�00330 04 'AIZOH--)I71 >->3r-, ---n010 04>044>04>> . '-0<04 . . .11 04'.041004 -04n04-304 r >> n04In --<04 0>> -0404 CA 3'0 304. 2)30 304> 00 30 0'AO -,0404 00 000-�713 nn >0A33 04040404>04 0 30' �fl3 00404 >00040
Z�0 00 0> 004>04.0> 1- 00 2> 004>04-'.- 040 z�-o CC Co -- >� 30403:33>3 -- .� 33 0>>3>33 - o..� --* 0>14 3 - 0>0303,03 <'13 - - >>3.!'1>04 0 4 . 0404 4 - 0
>3043-I C 04 0oO 0�.1 A <111111 S 3-0>141 <o A - "-.0404040411110 04 -a'0� 0-1'tlj 1113 04 0 3 >1404' 1113 14: A 04 1404� �14040404)'
3.3 > >113 0 A�- - >113 A � 3. 0 OIl -A0� 3� 110 -- 0 -�0 0 0. A>. <n.-0 0110 3C. 00004 0 --- 0** II> 0>04 0 --- 0 .�II3� 0-. 00004 0 Cl* .0000 - 0 31-.. IIC1 too - 0 <I-... IC. . . 403A - 0 04
0---- l04lC�. 0 33 0---- I '1410. C� a'.. A00 0� 004*.---0 3... II> 0�*-'-'� ---- 3�*� II> C*� ---. 04..--->
0* . >�*�-'* 3 0� 04-�� 3
A - - - 304 - - 04 304 - 004 4-i-s--c ->' 4-04>040'---- 0 04 >5>04 -4>0 0 04>0 03-330 04 30404<>-)- 03A30404304 304-1431110433. I �> 04-00.71.043>040 0 -.04031 I 04043. I 04>04 04-@woooo 04043 0 0
-'-Co 0 . . '�1� . 3>21 0 �3 0 -.. .. . -03 0 >330404 4. 00> A-)3044'3 040030400404> 334) 0>0 4-0001>3040>04> '4110404 0000 01 >304>3040030400404>
- o-.ztL-o o-�.-.--o� >ot� �>0 tb- 0 >�.-.-�-> 04 00>04 >ooOO.-04304 >003�0010>'- >04>>3303>r-.104->04 All I004. I --.104>0404>oo>040404o
*> 0 .440 0 .... 1 . - 04 ... .. .004-0 0.1.043> 0333>0>3>04000-040 >0004 3040> C >1.1040404-3>040>04�040 000404 3040> 0 3304040>3> 0403C.-�040
->04 - 3 0' -004 - 3 04 �04->>03 0 0>3>003-33> 31 0000 t3 '02)3)> 3.'�33> 04 0>00 '->33 0 o-003 >0 0333> 04
I I 04-10 0430A<3040430>030
I 'I�>�3
- £31 AO'1C)7 >3�'3 04 >0400' I 30>. 030040>0>> >04--o '-3.0404-� 0 ... >043 0.3 04 >040 0£>0404>A3033.'3> >033304 304>3 04>0 3-3>040--13-304 33040 04 >00400>33o.-3> 04033304
3 04 �0404 - 3 0 *�>04 - 3 04 �%3 t-I>000 ->33>00>0>0033430040000 ->3�100-3>0>> <3�3.-.4 04 0000 ->300330>0>003-3303 t�I
Ii>0. I 04>030> 043-�04>0 0 0 30403,11343. 1 >>032'>043--.3000 4 30400'' 1>3. I 04>030> 043-..0400 C 04.- 3 -. .. 0004 0 .. 0 - -. . .. 11004 0 .3 3 -. .. 0004 043-040 C> 0430 04>043003.3A0 4>04040 33040 0>043 0>>30000000 040404>0 30040 004043 0 004>3300303040404040
04>1>30>00 0 0-C->3>003-o0-04 04 004000430 >0000-003>0 03'-330 04 0>004 03o >0'0 0 3''000>0 03'0304 0404-04>-. .043'* I 04> '30004300404000 04040>.. 333. I 043->000430040400C 3 04-0403.. 04.3. I 040-30304300404 000 0 I-'* -.4.04....- 3 �.01110 0 .�.. 004... 0 3 3.....030 0 . . .. 04>0...> .-. .3.00-0 C
043301>04>>0>0>040300>04 0>0-- 0433043000043> 0 -304 '-�1104C0404o040-- 043303.00043> 03040.304004040040.-n
- 3 -3> - - 3 *-'04> - - 3 304>.33 4' i004>1 >03110-1 3 >004 >13. >000>-0304 >A03-333>>>043033..00>71�000t0403 033 04330>4.. 0430. 4- 04�-'>o>o 0 - -30042-. .0-0. I 3'->--> 3330404)0- - >300404.* I >> ->043-04304003
-004...-1 4 � . zOO 0 .. .3>0... 0 04 3..,..4043 04 . . .. >004... - 04 3.....>04 A304>>0040340>>400>00-04 '-3000>3>>>> 0 00>0-.1>33-103-->04Jl -3-000400>3004 0040'403340433033040
- 04 �304 - - - -0404 - - 04 330423-0>'330330 >0. 0404)3>4-04 0 >0
043A33>00 0>-'00>>OOo-4'>04 £11304>>J' -. 3304>-> 4-03304� .003 - PA�0404 >33�-033>0 >>o>>..33 0� I � "0004>3304-.--.1104
- . .�.11...> 0 3.3304 0 . . .. 3040.3 11 . .01104...)> 04 �. >040 0
.00400> >033A0404>>0-333'.3>3>3 .1104 -n>>OCoo>o2>3<04> 4040430>0>3 3>04333>-On 04004330�-043C3 -0-Zoo
a)- '>� - - 3 '> - - �>04 - CI)3)040> �3 033> >3003>0 03->>> 04 0404�>oo> 403 0 >0 >34-0 >31->> 0404 >04>04>33 0330 >-0>-,>o 00.-.>> 04 04304*' >3->.41300>,J0>> 04 04�><0�. >00. I 043-011>'3-->>0> 3 04>>>>..>>� I 3>'-0>04>o03040404> 04
'->30..�2 41 �. 3034 0 . . . *><��*� 0 �.>3>���> 04 0�.... 00404 04>04 04<>04o04o> C. 0404>04.'.33- 00404040- >->043033--0404 0 >040404040004>,...'>3> 0
- 3 -.I13 - - - 3 33> - - - 0 0404 - ->>>�3� 1133 0>03>>0404>0400 04 04 >0404o33 0000 04- 0 -.>3A3--.,A- 0 04>04>>33 030 0 0-0040>003-00- 040>>04>�. 0>0. I 04> 0>11-11>A>0>3 0 04>0'04,1� 0043. I 3330>0033333113 0 04004100..0o04. I '04-'0 04>00>04040>3 04
304>.....3 0 � . 33> 0 . *04>04�.� 3 04 -. >3 0 . - . .303... 04 0 >�. '..3-104 0-04>>> >0040.of>>>0430>- '300 -> 04>03>300304>33>0>0-,0>3>> co. 3 >>303.>0400003>04>>0> - >04033
- �.40 - - - -. ---> - - - 3 -0-3 - -4'.> 040 3'�> A303-00>A11-0>3 04 043>>�33 000> 3-04>>! >3-330 0 > >>>'3 o3714> 04.-0004-0 043 04>3 0
.71>04. I �0�00-> -0>0000 04 04-30-.. 0>. I 04>3> >A>3-.-o0> 3 >�3040� . 0-04. I >33304 04'00204004 3.0 3 >'.0>04 0, . . . *-o*.* - 11 .. ,-... > . - . *>���.*> 3 >.'.y
4-3004303-0 02033>04-3>---3304--. >3�043>0- 0043 20033033>3>3003 >-
->4 - 3 -33 - 3 3043 - 3>30>30> >3>03 0 1�-0- 04)0 >3-30> 003303473-3-0430 0 303->>1.4>04>3330 -'.03> 0 A. -3> 0 00'- --,…-�0> 3710 .A 3�>3-> >303.3-1--
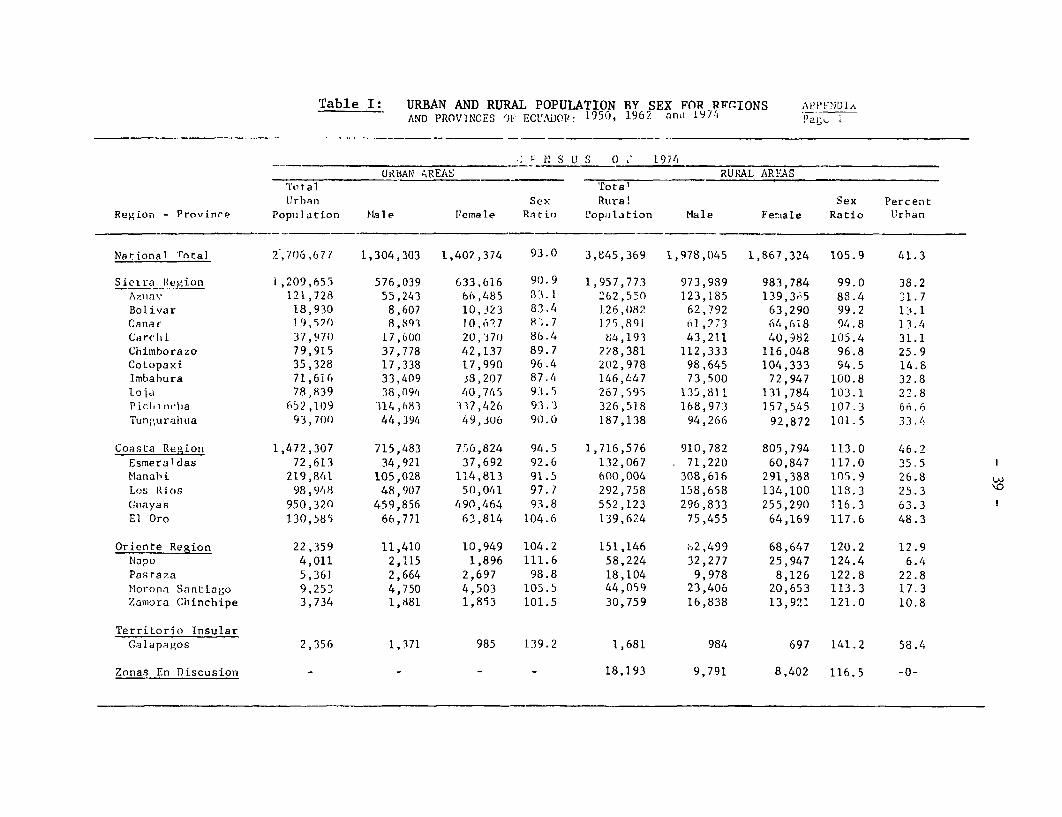
Table I: URBAN AND RURAL POPULATION BY SEX FAR RPnIONS APPFN?DIXAND PROVINCES OF ECUAiXor: 1950, 1962 anaf 1974
. N S U S 0 . 1974
URBiAN AREAS RU_RA'L AREASTotal Totallrban Sex Rural Sex Percent
Region - Province Popuilation MaIle Female R.tinr Popujlation Male Fe-iale Ratio Urban
National 'rl ta! 2,/06,677 1,304,303 1,402,374 93.0 3,845,369 1,978,045 1,867,324 105.9 41.3
Sieira Hegion I,209,655 576,039 633,616 9(.9 1,957,773 973,989 983,784 99.0 38.2Azuav 121,728 55,243 bb,485 3:1.1 262,550 123,185 139,3.;5 88.4 31.7Bolivar 18,930 8,607 10,323 83.4 126,082 62,792 63,290 99.2 lj.1Cana( 19,520 8,8(3 10,6.7 8g. 7 175,891 61,973 64,;8 94.8 13 .4Carchli 37,97() 17,6(00 20,i7o) 86.4 84,193 43,211 40,982 105.4 31.1Chimborazo 79,915 37,778 42,137 89.7 228,381 112,333 116,048 96.8 25.9Cotopaxi 35,328 17,338 17,990 96.4 202,978 98,645 104,333 94.5 14.8Imbahura 71,616 33,409 38,207 87.4 146,447 73,500 72,947 100.8 32.8Ioja 78,839 38,094 40,745 93.5 267,595 135,811 131,784 103.1 22.8P icit I n(:ha 652,109 '314 ,t,83 337,426 93.3 326,518 168,973 157,545 107.3 66.6Tungurahua 93,701) 44,394 49,306 90.0 187,138 94,266 92,872 101.5 33.4
Coasta Region 1,472,307 715,483 756,824 94.5 1,716,576 910,782 805,794 113.0 46.2Esmeraldas 72,613 34,921 37,692 92.6 132,067 71,220 60,847 117.0 35.5Manabi 219,841 105,028 114,813 91.5 600,004 308,616 291,388 105.9 26.8Los oi os 98,948 48,907 50,041 97.7 292,758 158,658 134,100 118.3 25.3Guayas 950,320 459,856 490,464 93.8 552,123 296,833 255,290 116.3 63.3El Oro 130,585 66,771 63,814 104.6 139,624 75,455 64,169 117.6 48.3
Oriente Region 22,359 11,410 10,949 104.2 151,146 o2,499 68,647 120.2 12.9Napo 4,011 2,115 1,896 111.6 58,224 32,277 25,947 124.4 6.4Pasraza 5,361 2,664 2,697 98.8 18,104 9,978 8,126 122.8 22.8ior-ona Santiago 9,253 4,750 4,503 105.5 44,059 23,406 20,653 113.3 17.3
Zamora Chinchipe 3,734 1,881 1,853 101.5 30,759 16,838 13,92' 121.0 10.8
Territorio InsularGalapagos 2,356 1,371 985 139.2 1,681 984 697 141.2 58.4
Zonas En Discusion - - - - 18,193 9,791 8,402 116.5 -0-

T]'-L,E 1.- URBAN AND RURAL PCPt-VA'r7ON B'. S`X FOR REGIONS Pv'e 2Con t U ) Aiil) PRO\ NAES OF !NtIAl(TiT': ;,0, l' and' ]'74
C N SUS O r 1962URBAN AREAS RURAL AREAS
total Cotal UJrhban Sex. Rural Sex Percent
Re:'ion - Irovince Po nilat on Ma]e Female Rat o Population Male Female Ratio Urban
Th.l ionflil T.lola] 1 6] 2 ,'Vi6 771,484 840,862 91.7 2,86'i,661 1,464,992 1,398,669 104.7 36.0
Sicrra Rcgion 744,387 348,964 395,423 88.s 1,526,958 762,293 764,665 99.7 32.8Azuay 49,7?? 31,223 38,499 81.1 204,920 96,904 108,016 i'9.7 25.4Bolivar 15,422 7,150 8,272 86.', 116,229 59,160 57,069 103.7 11.7Canar 14,801 6,710 8,091 82. 7 97,932 47,467 50,465 94.1 13.1Carchi 27,260 12,666 14,594 86.8 67,389 33,900 33,489 101.2 28.8Chimborazo 59,878 27,818 32,060 86.3 216,790 110,125 106,665 103.2 21.6CoLopaxi 24,294 11,358 12,936 87., 130(,677 65,060 65,617 99.2 15.7Imbabtira 47,538 22,259 25,279 88.1 126,501 62,770 63,731 98.5 27.3[,o ja 1, .4 48,73)1 2?,642 26,109 86. 7 236,697 119,912 116,785 102.7 17.1Pichinclha 374,3(18 177,545 196,763 91).' 213,527 109,508 104,019 105.3 63.7Tungtirahuia 62,413 29,593 32,820 90.2 116,296 57,487 58,809 97.8 34.9
Costa Be-ion 857,533 417,129 440,404 94.7 1,269,825 666,398 604,127 110.3 40.3 11'smeralIlas 39,619 19,197 20,422 94.0 85,262 45,128 40,134 112.4 31.7ilanal)i 124,914 59,251 65,723 9().2 487,568 248,641 238,927 104.1 20.4 0Los lios 51,288 25,508 25,780 98.9 198,774 106,475 92,999 114.5 20.5 l(3iavas 574,197 278,670 295,527 94.s 405,026 214,501 190,525 112.6 58.6El Oro 67,455 34,503 32,952 104.7 93,195 51,653 41,542 124.3 42.0
Oriente Region 10,426 5,391 5,035 107.1 64,487 34,983 29,504 118.6 13.9;:apo 1,809 984 825 119.3 22,444 11,989 10,455 114.7 7.5Pastaza 2,290 1,178 1,112 105.9 11,403 6,505 4,898 132.8 16.7NIorona Santiago 4,442 2,240 2,202 101.7 21,061 11,182 9,879 113.2 17.4Zamora Chinchipe 1,185 989 896 110.4 9,579 5,307 4,272 124.2 16.4
Territ-orio InsularGalapagos _ - - - 2,391 1,318 1,073 122.8 0
Zonas En Di:;cusion - _ _ _ _ _ _ _
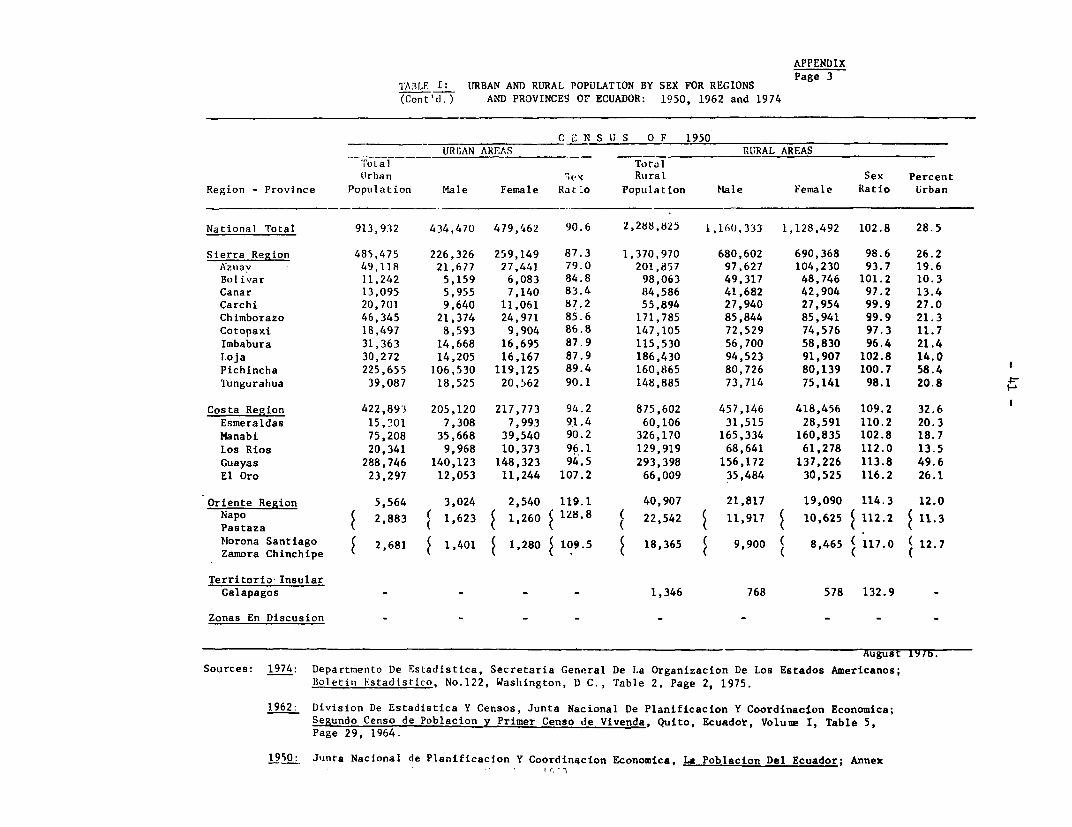
APPENDIX
TABLE I: URBAN AND RURAL POPULATION BY SEX FOR REGIONS Page 3(Cont'd.) AND PROVINCES Or ECUADOR: 1950, 1962 and 1974
C E N S U S O F 1950URIAN AREAS RURAL AREAS
ToLal TotalUrban I e x Rural Sex Percent
Region - Province Population Male Female Rat7o Population Male Female Ratio Urban
National Total 913,932 434,470 479,462 90.6 2,288,825 1,160,333 1,128,492 102.8 28.5
Sierra Region 485.475 226,326 259,149 87.3 1,370,970 680,602 690,368 98.6 26.2Azulav 49,118 21,677 27,441 79.0 201,857 97,627 104,230 93.7 19.6Bolivar 11,242 5,159 6,083 84.8 98,063 49,317 48,746 101.2 10.3Canar 13,095 5,955 7,140 83.4 84,586 41,682 42,904 97.2 13.4Carchi 20,701 9,640 11,061 87.2 55,894 27,940 27,954 99.9 27.0Chimborago 46,345 21,374 24,971 85.6 171,785 85,844 85,941 99.9 21.3Cotopaxi 18,497 8,593 9,904 86.8 147,105 72,529 74,576 97.3 11.7Imbabura 31,363 14,668 16,695 87.9 115,530 56,700 58,830 96.4 21.4Loja 30,272 14,205 16,167 87.9 186,430 94,523 91,907 102.8 14.0Pichincha 225,655 106,530 119,125 89.4 160,865 80,726 80,139 100.7 58.4lungurahua 39,087 18,525 20,562 90.1 148,885 73,714 75,141 98.1 20.8
Costa Region 422,893 205,120 217,773 94.2 875,602 457,146 418,456 109.2 32.6Esmeraldas 15,301 7,308 7,993 91.4 60,106 31,515 28,591 110.2 20.3Manabi 75,208 35,668 39,540 90.2 326,170 165,334 160,835 102.8 18.7Los Rios 20,341 9,968 10,373 96.1 129,919 68,641 61,278 112.0 13.5Guayas 288,746 140,123 148,323 94.5 293,398 156,172 137,226 113.8 49.6El Oro 23,297 12,053 11,244 107.2 66,009 35,484 30,525 116.2 26.1
Oriente Region 5,564 3,024 2,540 119.1 40,907 21,817 19,090 114.3 12.0Napo t 2,883 2 1,623 2 1,260 1288 22,542 % 11,917 t 10,625 $ 112.2 11.3Pas taza .''
I
Morona Santiago $ 2,681 $ 1,401 t 1,280 ( 109.5 18,365 ( 9,900 ( 8,465 ( 117.0 ( 12.7Zamora Chinchipe ( * ( ( ( (
Territorio InsularGalapagos - - - - 1,346 768 578 132.9 -
Zonas En Discusion - - - - - - - - -
August I/b.Sources: 1974: Departmento De Estadistica, Secretaria General De La Organizacion De Los Estados Americanos;
Boletin Fstadistico, No.122, Washington, D C., Table 2, Page 2, 1975.
1962: Division De Estadistica Y Censos, Junta Nacional De Planificacion Y Coordinacion Economica;Segundo Censo de Poblacion y Primer Censo de Vivenda, Quito, Ecuador, Volune I, Table 5,Page 29, 1964.
1950: Junta Nacional de Planificacion Y Coordinacion Economica, La Poblacion Del Ecuador; Annex

U s2 U e u 6 1 0 s I U I I 0 b 0 9 * O b
C-e' bi u4ei ),e ( i¾2 U041 Ca0M UIt 1c0S
o Q9 U ss 0o, 4 U 9bi Ues o S2 0 12 fl-o
1) Lh o es li 'k o'l es 'Qs o-laf? o 7 U-b cs-S
u -i SI o el I u-se,96 utew 0o69 o-bS 0-o0 q9-O0
tortl u09*L 0%el 0-901 (016 /9±i O-tq o5-SS
4-S2Z O-D7t u's l /1 U I u-tII Qtdt O0-S ns-os
ut-ne /teie u-ze9 0-es1 0-9Sl U-OZI -tbOI 07-Sr
0'4S u Ubee u- se u-OOl 9,Lg9 U-Sb I O-2i r"-on
0 0-UrD U-b9C oSbi -'and u I 02 oI li I -b O S) i-Si
o0-nis I/sen Ueni uto I/ 9o2 /oIsez uI/eu t S-o
0-1 I-S oDD o , iS b7t 04i O'o bS O'SZ c oe Io 2-s2
0,20i O-S19 o-Das O-r -es O-OOSi 060 O-SSZ P2-02
oa/ og IotL o-oe9 oItps 0O-es 04L9e O1it el-s.
o Lob U 609oi o o I o) lie9 o s5 oss o lb D I 'O I)
I/tot a Og1 I e iti /h199 I/too I/lye (/16 1,-a
O- 6 ) 0ee o - I6 0-128 0 -ozs 0-L55 0-9 6'5~ 7-
0I/ott IoleVS O/119 0I/alty (0909r o*j.s OI/,.qeVll Rvo-esul I/rool I/vie O-OZr I/cot IO-Ob9 0-lto 1-U
I/9904 I/gitSQ I/6±9S I/goon I/Csla 0-9SSS OI/oSo 633, Vie 31ww.
0002 5eel Oooi 5Sol 0960 SteL 0461_- ........ _">._ ...................... _o...._w ............. -Z................. -- eX.................... _ z------------------------...... _* _
uiocvnos
IN3Wdu IAju j UNS NOIll)rbSNU)3d 0OJ )Ih'V lYhOlglhNd3i.1 3ty QpNy xis As SI1womflO2 gliwIw 0991 (s0*lGnom± MI) NCIUI±YflO1
sa2ed v ° I *Iii arivi xiuxaaav

. . C
'. '.. D O' .41 ' C C 4 O ., N - W - 0l 0
O .4 O O O 4, O O4 C O O O4 O OJ O O I O C
* _4 _ "_ _ Cu .4 wA C C t 11 "* -* _ _ w c Cr e C CJ e _ o c o C a C - Ciu * - -a O1 D - C S_- 0O-s~1
I I- , I
a Iq a aC Wo-D~1etso*esr, . . . .. . . . . . . . . . . . . .1 SDS
O o m o O z zo O O a O O O O O ° ° -I I I !C
:~~~ ~ ~~~~~~~~~~~ :: 0I . . ra . I I~~~~~~ C .I t
| _ _ _ _ nj N - c - v ob s e s *~~~~| _ vse t X _ o o_ a t W o oX o & @ Z
I I
* - C V'I O .4 D _ - .41 O C .4 _ 5 0 -4 -I 010 -
* 0u c C C 0 r CD 0 C C 5 0 D C 0 0^ _ 0_0 C I I _ .,It_o __vvoc|o|c
I I __ _ _ ~ s ! 'a °eq

APPENDIX TABLE IIP. 3 of 4 pages
MALE PnPULATION(IN OI4DUSANOS) AGED 5 TO 24 :11RD MEMBER COUNTRIE3 1970 * ?000I1ETE0NA1TnNAL RANK Fnu RECnflISTUCYT!N AND nFvF2 nPMFNT
ErUADOR
19700 1978 1980 IOQS 19q0' 1s9 200n
-------- S----t--S r o.n.................................... I.0...................IS.0 5.0........... 7.0...Is..n.....04ALF3 AGE 5 2o.n0. 129.0 132.0 151.0 iii.0 290.0 208.0
6 97.C 115.0 1?9.o 17.0 2h8.n 188.0 ?03.0
7 91,0 . 1 1 0 . . 1225.0n 14S.0 262.0 2 82.0 200.0
s 9n.n 10A.0 . 22..0 09.0 I58.0 1278.0 196.0
9 n7.0 104.0 .m 19 . n I38 154.0 174.n 293.0
o0 84.0 200.0 217.0 111.0 150.0 170.0 209.0
II 82.0 96.0 124. 0 12A.0 I a h. 0 14.0 I 0.0 n
12 78.n ( 9?.0 II11 . 0 22.0 I ?2 .0 12.h2.0 8P7.A
13 75.0r 89.0 207.n 1222.0 n I38.n 57.0 I7A.0
14 7?.0 88.0 I 03.0n I 2.n I04. n I '0. n 170.n
I5 b8,0 .0 r 43.0 99.m I1 0 .n I21. n I 2u1.I 29.0
26 88.0 80.A . .. 9s .0 ( 211A . 227. n I. 0 n
17 o,,. n0 78.0 92I. 2n IIn . I.0 24.n I l.) .n
I8 .10.0 7n 4 8.n A07.0n . 2 .12.n 2. 37.0 I,7.0
I 5 7.0 . 71.0n S.nt0 . .. 20n II I0u.n I n.
?0 S5.n 640. b8 .0 9A.4*0 II?. 22 . A I 13
2 1 53.n . . ...... ....... . .. bu.n . ...... . .... t 9.o o.n I II ... s7n . . s2 6. 0 u Q..
22 2.0n 62.22 77.n so ).n I2.0.0 123.n I.0
23 4 0. n 59.0 7 7.n s . 20n.n 220.n
2u 4 7. ... . .. S6.o . 7n.n 41.n (. .Au... n In 1 . A I I I .3n -
-43 -
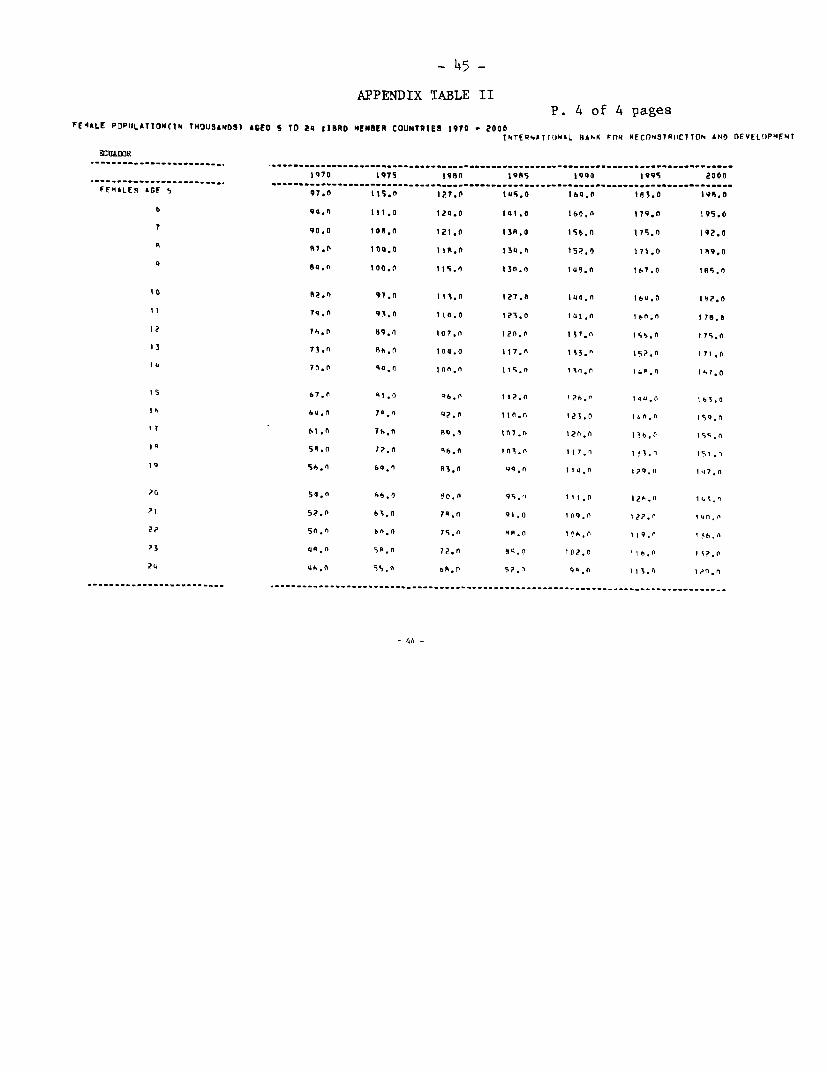
- 45 -
APPENDIX TABLE IIP. 4 of 4 pages
FE46LE POPULATIONCIN THlOUSANDS) AGED S TO 24 sIBRD MEMBER COUNTRTES 1970 - 2000INTEQNATTOJNAL BANK Fnl6 RECO)NSIRIICOTCN AND DEVELOPMENT
EOISDOR
Iq70 1975 1qso 1985 1990 1995 2000
FEMALES AGE S 97. 115.O 127.0 145.0 Ih4 ¶9e80 19S.O
b 94,4 111.0 124.0 141.0 160.a 17.q0 t95.0
7 90.0 104.0 121.0 153.0 Is6.n 175.0 102.0
4 97*0 O lO.0 IiR.0 130.0 1 o?0 171.0 1H9.0
684.0 100.0 1iS.0 130.0 Io9.o t67.0 ¶65.0
tG 82.n 97.0n 1A.0n 127. 40a.n I60.0 192.0
11 79n °89.n INo.0 129.0 4.A 16. n 16 n .0
12 1S.0 H9.0 t07.0 1 2n. n I3 7 lA.I 175.n
13 73.n 46.* 100.0 117.4n I3.n 15?.n 17l.a
¶1 70.0 .0.0 14.0n 11S n i3noo i s.I h17.0
15 61.0 51.0 46.0 112.0 126.f 1. 1b1.0
16 64.M 75 .,I Q47n Inj 125.0 Q04.0 IS.n
i 6b.0 7t.0 n qm 1 tn7 n t 2n.n t 36.O 1s.n
IA 5s.0 12.0 zb.0 ¶03.0 117.0 ¶33. I I
to 56.n 69bn R53.0 9q.0 I11 179.0 Ia7,n
2n 54.0 h6 0 eo.o 95.1i 111.0 12 n. 14*.
21 52.n bP.0 74.0 91.0 109.0 122.o I n.n
22 54.n 60.0 7s.0 (5.n0 1no,.r 9.n 136.n
Z3 4.0n 55.M 72.n 9c.e 0 I.0 126.n
2U 4S.0 SS0, bA.0 52.' I'g0 11.0 120.0
-_44 -

CURRENT ECONOMIC POSITION AND PROSPECTS
OF ECUADOR
STATISTICAL APPENDIX


ECUADOR - STATISTICAL APPENDIX
TABLE OF CONTENTS
I. POPULATION, EMPLOYMENT AND SOCIAL INDICATORS
Table Number
1.1 Estimated Total Population, 1950-1974
1.2 Demographic Indicators, 1950-1975
1.3 Population by Province, 1950, 1962, 1974
1.4 Migration Indicators, 1974
1.5 Employment of Public Servants, By Province, 1975
1.6 Employed Persons by Level of Income, 1974 Estimate
1.7 Persons Employed in Medical and Para-Medical Positions,and Relation to Population, by Region and Province, 1974
1.8 Live Births, Total Deaths and Infant Mortality, by Region1968-1973
1.9 Housing Conditions, 1974
1.10 Literacy Rates, by Area and Province, 1950, 1962, 1974
II. NATIONAL ACCOUNTS
2.1 GDP, GNP and National Income, 1970-1975
2.2 GDP, GNP and National Income, 1970-1975 in 1970 Sucres
2.3 Savings and Investment, 1970-1975
2.4 Savings and Investment, 1970-1975 in 1970 Sucres
2.5 GDP by Industrial Origin, 1965-1975
2.6 GDP by Industrial Origin, 1965-1975 in 1970 Sucres
2.7 Percent of GDP by Industrial Origin, 1965-1975
2.8 GDP by Industrial Origin, 1965-1975 - Growth Rates
2.9 GDP by Sector and Expenditures and Projections
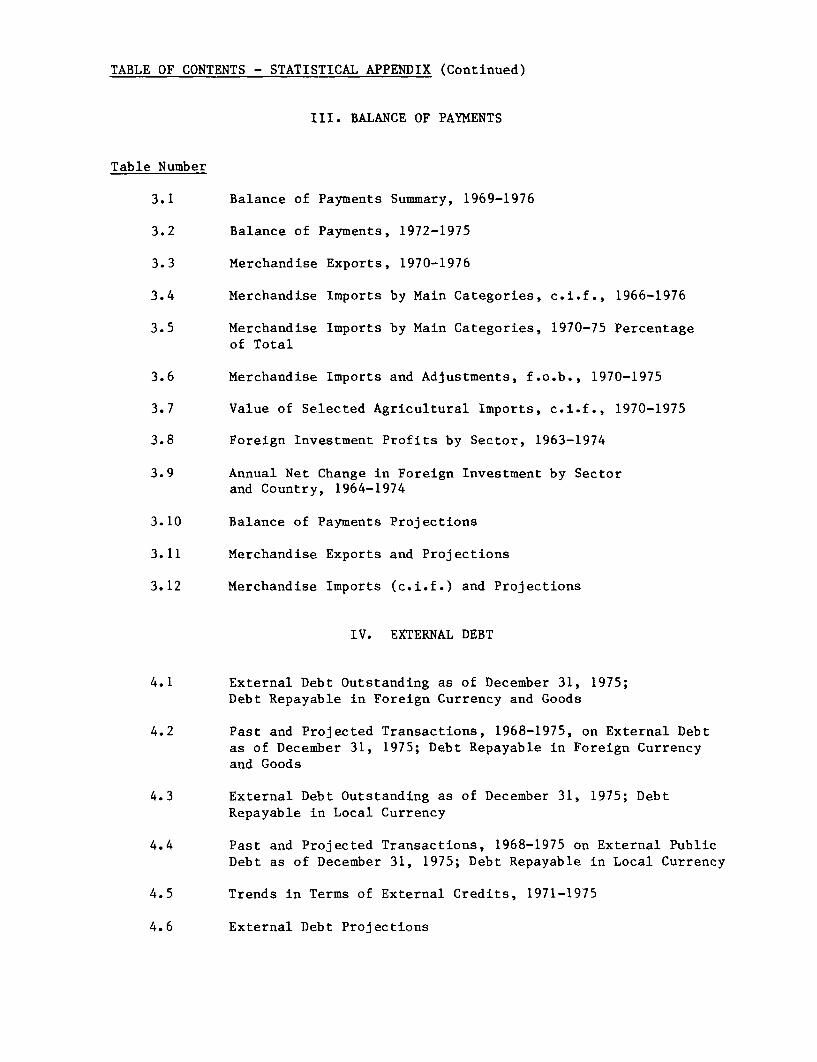
TABLE OF CONTENTS - STATISTICAL APPENDIX (Continued)
III. BALANCE OF PAYMENTS
Table Number
3.1 Balance of Payments Summary, 1969-1976
3.2 Balance of Payments, 1972-1975
3.3 Merchandise Exports, 1970-1976
3.4 Merchandise Imports by Main Categories, c.i.f., 1966-1976
3.5 Merchandise Imports by Main Categories, 1970-75 Percentageof Total
3.6 Merchandise Imports and Adjustments, f.o.b., 1970-1975
3.7 Value of Selected Agricultural Imports, c.i.f., 1970-1975
3.8 Foreign Investment Profits by Sector, 1963-1974
3.9 Annual Net Change in Foreign Investment by Sectorand Country, 1964-1974
3.10 Balance of Payments Projections
3.11 Merchandise Exports and Projections
3.12 Merchandise Imports (c.i.f.) and Projections
IV. EXTERNAL DEBT
4.1 External Debt Outstanding as of December 31, 1975;Debt Repayable in Foreign Currency and Goods
4.2 Past and Projected Transactions, 1968-1975, on External Debtas of December 31, 1975; Debt Repayable in Foreign Currencyand Goods
4.3 External Debt Outstanding as of December 31, 1975; DebtRepayable in Local Currency
4.4 Past and Projected Transactions, 1968-1975 on External PublicDebt as of December 31, 1975; Debt Repayable in Local Currency
4.5 Trends in Terms of External Credits, 1971-1975
4.6 External Debt Projections

TABLE OF CONTENTS - STATISTICAL APPENDIX (Continued)
V. PUBLIC FINANCE
Table Number
5.1 Summary Operations of the Central Government, 1970-1976
5.2 Central Government Operations, 1970-1975
5.3 Summary Operations of the Central Government Budget, 1970-1976
5.4 Current Revenues of the Central Government Budget, 1970-1975
5.5 Central Government Budgetary Expenditures by FunctionalClassification, 1970-1976
5.6 FONADE Disbursements, 1974-April 1976
5.7 Fiscal Performance of the General Government
5.8 Summary Operations of the General Government, Projections
5.9 Summary Operations of the Central Government, Projections
5.10 Summary of Revenues of the Public Sector, Projections
5.11 Public Investment by Sector, 1969-1974 in Constant 1972 Sucres
5.12 Public Investment Program (Disbursements) 1976-81
VI. M4ONEY AND BANKING
6.1 Summary of Accounts of the Banking System, 1973-1975
6.2 Summary of Accounts of Other Financial Intermediaries,1973-1975
6.3 Credit of the Banking System by Origin and Destination,1973-1975
6.4 Credit Supplied by the Banking System by Economic Activity,1970-1975

TABLE OF CONTENTS - STATISTICAL APPENDIX (Continued)
VII. AGRICULTURE
Table Number
7.1 Agriculture Crop Areas, Yields and Production, 1966-1975
7.2 Volume of Bank Credit to the Agricultural Sector, 1965-1975
7.3 Value Added and Overall Economic Position of the AgriculturalSector, 1970-1975
7.4 Distribution of Agricultural Land by Type of Tenure, 1968
7.5 Number of Farm Holdings and Area, by Size, 1968
VIII. PETROLEUM
8.1 Distribution of Petroleum Revenues, 1976 Estimate
8.2 Domestic Prices of Petroleum Products as of August 31, 1976
8.3 Drilling Statistics, 1970-July 1976
8.4 Structures Drilled by CEPE-Taxaco-Gulf as of July 31, 1976
8.5 Price per Barrel of Crude Oil for Domestic Consumption
8.6 Party Months of Geological and Geophysical Activity, 1967-1975
8.7 Oil Contracts in Ecuador
8.8 Estimation of Recoverable Reserves from CEPE-Taxaco-GulfFields as of May 31, 1976
8.9 Exports of Crude Petroleum by Country of Destination, 1972-1976
8.10 Petroleum Production Costs per Barrel
8.11 Private and Public Investment in Petroleum 1970-1976
8.12 Production, Domestic Consumption and Exports of Petroleum,1972-1976

TABLE OF CONTENTS - STATISTICAL APPENDIX (Continued)
IX. EDUCATION
Table Number
9.1 Public Expenditure in Education, 1971-1975
9.2 Education Ratios - Comparison of School Year 1965-66 and1974-75
9.3 Number of Teachers and Pupils, by Educational Level, 1965-66and 1974-75
X. INDUSTRY
10.1 Production of Cement and Structural Steel, 1965-1976
10.2 Incentive Legislation - Principal Features - 1973
XI. PRICES
11.1 Weighted Consumer Price Index for Medium and Low-IncomeFamilies by Major Cities, 1965-1976
11.2 Weighted Consumer Price Index for Medium and Low-IncomeFamilies by Major Groups, 1965-1976

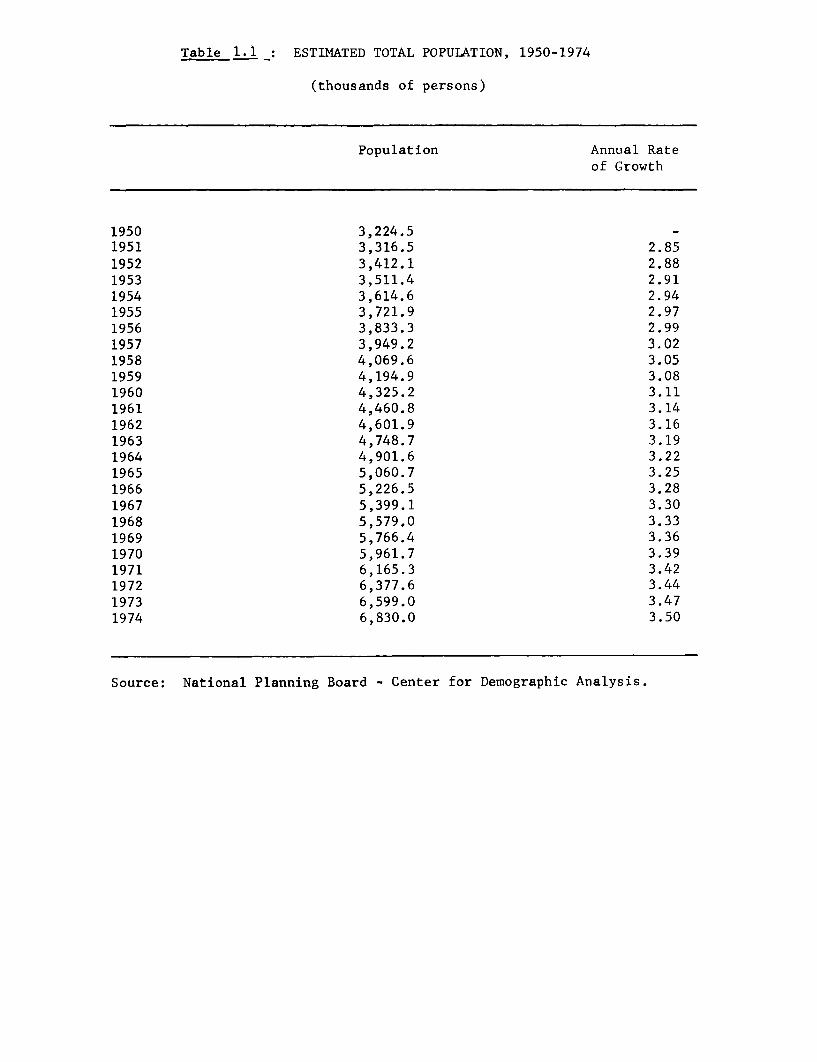
Table 1.i ESTIMATED TOTAL POPULATION, 1950-1974
(thousands of persons)
Population Annual Rateof Growth
1950 3,224.51951 3,316.5 2.851952 3,412.1 2.881953 3,511.4 2.911954 3,614.6 2.941955 3,721.9 2.971956 3,833.3 2.991957 3,949.2 3.021958 4,069.6 3.051959 4,194.9 3.081960 4,325.2 3.111961 4,460.8 3.141962 4,601.9 3.161963 4,748.7 3.191964 4,901.6 3.221965 5,060.7 3.251966 5,226.5 3.281967 5,399.1 3.301968 5,579.0 3.331969 5,766.4 3.361970 5,961.7 3.391971 6,165.3 3.421972 6,377.6 3.441973 6,599.0 3.471974 6,830.0 3.50
Source: National Planning Board - Center for Demographic Analysis.

Table 1.2: DEMOGRAPHIC INDICATORS, 1950-1975
(Thousands of persons)
1950 1955 1960 1965 1970 1975 /1
Population (Total) 3,225 3,700 4,328 5,095 6,031 7,090
Male 1,609 1,849 2,167 2,556 3,031 3,568
Female 1,616 1,851 2,161 2,539 3,000 3,522
Population as a % of total 100.0 100.0 100.0 100.0 100.0 100.0
0-4 yrs. 17.5 18.0 18.7 18.6 18.6 17.8
5-14 yrs. 25.8 26.3 26.7 27.6 28.0 28.3
15-64 yrs. 53.2 53.0 52.0 51.3 50.8 51.2
over 64 yrs. 3.5 2.7 2.6 2.5 2.6 2.7
under 20 yrs. 53.5 54.4 55.4 56.3 56.9 56.8
Women 15-49 yrs. as % of females 46.6 46.2 45.2 44.3 43.9 44.4Dependency ratios (per 1,000) /2 881.3 888.4 922.1 950.5 970.2 951.9
Child-woman ratios (per 1,000) /3 748.4 779.5 829.3 842.0 852.1 804.3Sex ratios (males per 100 females) 99.6 99.9 100.3 100.7 101.0 101.3
Median age (yrs.) 18.3 17.8 17.3 16.9 16.6 16.8Proportion of urban to total population 28.4 31.3 33.7 36.4 38.7 41.6Population density (per sq. km.) /4 11 13 15 18 21 25
1950-55 1955-60 1960-65 1965-70 1970-75 1975-80
Rate of growth (%) /5 2.8 3.1 3.3 3.4 3.2 3.2
Crude birth rate (x) 46.0 46.6 45.4 44.6 41.8 39.7
Crude death rate (%) 18.5 15.3 12.9 11.0 9.5 8.2
Life expectancy (yrs.) 47.2 51.0 54.2 57.2 59.6 62.1
Male 45.8 49.6 52.9 55.8 58.2 60.5
Female 48.7 52.5 55.7 58.7 61.2 63.7
/1 Estimated./2 Persons under 15 yrs. plus persons over 64 yrs., per 1,000 persons aged 15-64 yrs.
/3 Persons under 5 yrs. per 1,000 women 15-49 yrs./4 Calculated on the basis of the 1973 land area./5 Average annual exponential rate of growth of the total population.
Source: "Selected World Demographic Indicators, by Country, 1950-2000,"Population Division, Department of Economic and Social Affairsof the U.N. Secretariat, May 28, 1975.

Table 1.3 : POPULATION BY PROVINCE - 1950, 1962, 1974
CENSUSES OF 1950, 1962, 1974
(thousands of persons)
POPULATION ABSOLUTE CHANGE AVE. ANNUAL RATE OF GROWTH
1950 (%) 1962 (%) 1974 (%) 1950-62 1962-74 1950-62 1962-74
Total 3,203 (100.0) 4,721 (100.0) 6,830 (100.0) 1.518 2.109 3.3 3.1
Sierra 1.857 (58.0) 2.461 (52.0) 3,309 (48.4) 605 848 2.4 2.5Carchi 77 99 127 22 28 2.1 2.1Imbabura 147 181 230 34 49 1.8 2.0Pichincha 386 612 1,034 226 422 3.9 4.5Cotopaxi 166 202 248 37 46 1.7 1.7Tungurahua 188 225 291 37 66 1.5 2.2Bolivar 109 144 154 35 10 2.3 0.6Chimborazo 218 296 323 78 27 2.6 0.7Canar 98 117 155 20 38 1.5 2.4Azuay 251 286 385 35 99 1.1 2.5Loja 217 298 362 81 64 2.7 1.6
Costa 1.298 (40.5) 2.179 (46.2) 3,339 (49.0) 880 1,160 4.4 3.6Esmeraldas 75 128 214 52 86 4.5 4.4Manabi 401 627 852 226 225 3.8 2.6Los Rios 150 256 405 106 149 4.5 3.9Guayas ,581 1,003 1,594 421 591 4.6 3.9El Oro 89 165 274 75 109 5.2 4.3
Oriente 47 (1.5) 79 (1.8) 178 (2.6) 32 99 4.5 7.0
Galapagos Islands 1 2 4 1 2 5.6 5.9
Source: National Institute of Statistics, Office of the National Censuses, (census information 1950, 1962, corrected data from 1974 census).

Table 1.4: MIGRATION INDICATORS, 1974(percentages)
A B C D E F G H ITotal Population Emigrat In Immigraeyon External Migratory5, Rate of5, Rural Index 6/ Rural Index of
(thous of (% of Rate - Rate - Immigrrtion Balance - Migration - of Fertility- Illiteracypersons) total) Rate - (thou of persons)
1/Total - 826 100.0 25.4 26.3 14.6 .. .. .. 37.0
Sierra 3.309 48.5 26.1 22.8 13.4 .. .. .. 39.0Carchi 127 1.9 44.0 28.0 13.2 -19.6 -16.0 9.9 17.8Imbabura 230 3.4 29.8 26.6 16.0 -7.1 -3.2 8.0 48.5Pichincha 1,034 15.1 15.5 35.0 26.2 +189.9 +19.5 7.3 27.3Cotopaxi 248 3.6 26.0 11.0 6.0 -35.8 -15.0 7.5 51.7Tungurahua 291 4.3 27.0 17.0 8.8 -27.4 -10.0 5.9 37.8Bolivar 154 2.3 47.0 21.0 3.5 -37.9 -26.0 8.6 43.8Chimborazo 323 4.7 28.5 15.0 6.0 -42.1 -13.5 3.9 57.0Canar 155 2.3 28.5 16.0 6.0 -18.1 -12.5 10.9 34.0Azuay 385 5.6 27.0 14.5 8.0 -47.7 -12.5 7.1 30.5Loja 362 5.3 34.0 16.0 3.6 -62.8 -18.0 12.5 29.6
Costa 3,339 48.9 24.8 28.5 14.6 .. .. .. 36.0Esmeraldas 214 3.1 27.0 35.0 20.0 +16.9 43.0 14.7 40.7Manabi 852 12.5 33.0 20.0 3.2 -105.0 -13.0 16.5 36.0Los Rios 405 5.9 31.0 30.0 16.5 -4.4 -1.0 15.7 38.4Guayas 1,594 23.3 17.5 29.5 18.0 +179.8 +12.0 13.7 34.7El Oro 274 4.1 31.0 41.5 23.0 +28.8 +10.5 10.1 16.3
Oriente 178 2.6 22.1 48.5 35.1 .. .. .. 30.0Napo 63 0.9 19.5 48.5 33.0 +17.6 +29.0 10.5 31.7Pastaza 24 0.4 30.0 45.0 39.0 +3.5 +15.0 4.7 36.5Morona-Santiago 55 0.8 23.0 43.0 26.0 +10.6 +20.0 10.6 28.6zamora-Chinchipe 36 0.5 20.0 59.0 50.0 +13.7 +39.0 11.8 19.7
1/ Excluding Galapagos and zones under discussion.2! Emigration Rate: Number of persons who have left their place of residence as a percentage of total population of the province. This includes
persons who have moved within the province and those who have left the prouince.3/ Immigration Rate: Number of persons who have settled in the province as a percentage of total population of the province. This includes persons
who have moved within the samc province. Though less significant than the emigration rate, this index was calculated for use in obtaining the rate of migration.4/ External Immigration Rate: Number of persons who have settled in the province from other provinces or countries as a percentage of the province's
total population.5/ Rate of Migration = F/A -- The difference between total immigrants and total emigrants in the same province - (F = migratory balance) expressed as a
percentage of the province's total population, A.6/ One measure of fertility, calculated by the number of women 15 years and over in rural ar.as who h-'e had 10 or more children born live as a
percentage of all women 15 years and over living in rural areas.
Source: Population figures - 1974 Population Census,Other data - Ministry of Agriculture, Department of Planning (O.R.S.T.O.M. Study: "Population Migrations in Ecuador").

Table 1.5 EMPLOYMENT OF PUBLIC SERVANTS, BY PROVINCE - 1975
% of TotalRegional & Autonomous Regional & Autonomous
Total /1 Central Government Municipal Agencies Total Central Government Municipal AgenciesEducation Health Others Education Health Others
Total 150,552 48,018 10.037 51.961 24.855 15,681 100.0 100.0 100.0 100.0 100.0 100.0
Sierra 84.377 25,460 5,541 33,695 12,797 6,884 56.1 53.0 55.2 64.8 51.5 44.0Carchi 2,673 1,064 226 945 348 90 1.8 2.2 2.2 1.8 1.4 0.6Imbarura 3,668 1,834 321 1,001 753 59 2.4 3.2 3.2 1.9 3.0 0.4Pichincha 44,450 8,894 2,125 22,648 6,247 4,536 29.5 18.5 21.2 43.6 25.1 28.9Cotopaxi 3,888 1,642 327 1,012 819 88 2.6 3.4 3.3 1.9 3.3 0.5Tungurahua 4,600 2,039 456 1,064 915 126 3.1 4.2 4.5 2.0 3.7 0.8Chimborazo 5,202 2,212 545 1,449 727 269 3.5 4.6 5.4 2.8 2.9 1.7Bolivar 2,608 1,144 199 982 240 43 1.7 2.4 2.0 1.9 1.0 0.3Canar 2,492 1,023 222 553 539 155 1.7 2.1 2.2 1.1 2.2 1.0Azuay 8,110 2,870 689 2,329 1,314 908 5.4 6.0 6.9 4.5 5.3 5.8Loja 6,686 3,038 431 1,712 895 610 4.4 6.4 4.3 3.3 3.6 4.0
Costa 62,066 20.987 4.126 16,856 11,528 8,569 41.3 43.6 41.1 32.5 46.4 54.6Esmeraldas 3,905 2,009 385 663 612 236 2.6 4.2 3.8 1.3 2.5 1.5Manabi 10,021 4,478 920 2,528 1,347 748 6.7 9.3 9.2 4.9 5.4 4.7Guayas 37,217 10,201 2,017 10,741 7,598 6,660 24.7 21.2 20.1 20.7 30.6 42.5Los Rios 5,260 2,175 342 1,504 973 266 3.5 4.5 3.4 2.9 3.9 1.7El Oro 5,663 2,124 462 1,420 998 659 3.8 4.4 4.6 2.7 4.0 4.2
Oriente 3,807 1.453 271 1,366 491 226 2.4 3.1 2.7 2.6 2.0 1.4
Galapagos 302 118 99 44 39 2 0.2 0.3 1.0 0.1 0.1 -
L] Does not include approximately 23,000 persons employed in the Armed Forces.
Source: National Planning Board Office of the National Censuses.

Tablel.6 EMPLOYED PERSONS BY LEVEL OF INCOME - 1974 ESTIMATE /1
(Thousands of persons)
Level of Annual Employed Percent ofIncome (Sucres) Persons /2 Total
Less than 2,000 245.7 13.01 5152,000 - 5,000 727.6 38.5 55,000 - 10,000 302.4 16.0t 24.0
10,000 - 15,000 151.2 8.0)15,000 - 30,000 283.5 1530,000 - 50,000 102.1 5. 24.550,000 - 100,000 54.8 2.9More than 100,000 22.7 1.
Total 1,890.0 100.0
/1 Base of the estimates: two inquiries of 1965 and 1968, and a samplesurvey conducted in the Quito and Guayaquil areas in 1973.
/2 Heads of families.
Source: National Planning Board.

Table 1.7: PERSONS EMPLOYED IN MEDICAL AND PARA-MEDICALPOSITIONS AND RELATION TO POPULATION,
BY REGION AND PROVINCE, 1974
PersonsPersons Other Persons Persons Per
per Profes-l per Other per OtherDoctors Doctor sionals-/ Professional Nurses Nurse Others Position
Total 2,619 2,608 592 11,537 797 8,570 332 20,572
Sierra 1,46o 2,266 311 10,640 554 5 973 179 18,486Carchi 26 4,885 21,167 7 3 42,333Imbabura 53 4,340 16 14,375 16 14,375 4 57,500Pichincha 928 1,114 178 5,809 420 2,462 135 7,659Cotopaxi 51 4,863 14 17,714 14 17,714 5 49,600Tungurahua 104 2,798 23 12,652 35 8,314 6 48,500Bolivar 32 4,812 6 25,667 5 30,800 2 77,000Chimborazo 55 5,873 18 17,944 19 17,000 9 35,889Ca±'ar 23 6,739 9 17,222 5 31,000 1 155,000Azuay 132 2,917 20 19,250 23 16,739 10 38,500Loja 56 6,464 21 17,238 10 36,200 4 90,500
Costa 1,119 2,984 260 12,842 219 15,247 149 22,409Esmeraldas 31 6,903 4 53,500 10 21,400 53,500Manabi 136 6,265 28 30,429 14 60,857 17 50,118Los Rios 47 8,617 i6 25,312 11 36,818 1 405,000Guayas 847 1,882 196 8,133 174 9,161 117 13,624El Oro 58 4,724 16 17,125 10 27,400 10 27,400
Oriente 36 4,944 20 8,900 23 7,739 4 44,500Napo 11 5 10 -Pastaza 13 7 10 4Morona Santiago 6 5 1 -Zamora Chinchipe 6 3 2
Galapagos 4 1,000 1 4,ooo 1 4,0- -
1/ Includes dentists, pharmacists, biochemists and obstetricians.L/ Includes social workers, medical technologists, psychologists, health instructors, nutritionists,
engineers, etc.
Source: National Institute of Statistics, "Health Resources and Activities, 1974"

Table 1.8: LIVE BIRTHS, TOTAL DEATHS AND INFANt MORTALITY, BY REGION - 1968-1973
(per 1,000 inhabitants a
1968 1969 1970 1971 1972 1973Live Infant Live Infant Live Infant Live Infant Live Infant Live InfatBirths Deaths Mortality Births Deaths Mortality Births Deaths Mortality Births Deaths Mortality Births Deaths Mortality Births Deaths Mortality
Total 39.6 10.8 86.1 37.4 10.9 91.0 37.8 9.9 766 38.7 10.1 78.5 37.3 10.4 81.9 36.3 9.8 75, 8
Sierra 40.0 13.7 102.9 37.8 13.4 105.2 37.3 12.6 93.1 38.6 12.5 90.7 37.0 12.8 91.6 36 3 12.0 87.1Carchi 38.8 12.1 108.3 39.3 12.2 105.5 36.8 11.0 96.0 38.9 11.9 105.7 36.4 12.0 102.9 35.6 11.0 107.9lababura 42.4 181 118.9 42.4 18.4 122.0 40.8 16.9 108.7 41.0 16.2 105.7 40.4 19.4 117.5 37.6 15.5 107,2Pichincha 34.4 10.3 94.1 33.0 10.5 95.4 32.6 10.3 92.3 34.6 9.8 82.6 34.4 9.9 82.7 34.0 9.6 76.5Cotopaxi 46.3 19.8 140.1 45.8 20.5 141.7 44.2 20.3 129.0 45.3 18.4 125.8 43.3 20.6 130.8 43.0 17.6 112.9Tongurah.s 41.4 16.9 127.8 41.6 18.5 138.8 40.5 16.2 116.0 40.0 15.4 107.9 38.4 17.0 111.7 36.3 15.2 102.8Bolivar 42.1 12.8 94.4 39.4 10.7 89.4 38.9 9.7 68.6 38.2 11.4 76.1 38.4 10.6 72.9 36.6 10.7 78.1Chimsborazo 36.6 16.7 125.9 35.3 15.6 127.1 34.9 14.6 112.7 36.7 14.4 105.2 34.8 15.2 113.3 34.4 14.9 114.8Canar 41.8 14.9 103.7 41.4 12.8 90.8 37.3 12,5 80.7 43.2 12.2 70.6 41.4 12.7 71.8 39.5 10.2 55.7Azeay 45.7 15.9 98.8 43.9 14.5 90.7 44.1 13.8 81.6 46.7 14.8 84.4 45.4 13.9 81.9 46.2 14.5 81.5Loja 40.5 7.5 50.2 32.4 8.0 60.9 35.5 6.9 47.6 34.9 7.5 51.9 29.5 6.2 45.9 28.5 6.4 51.8
Costa 3. 7.9 69.0 36.6 8.4 77,3 37.7 7.2 60.7 38.2 7.8 67.0 37.1 73.1 35.8 JLj 65.7Esisraldas 36.4 9,2 86.4 37.1 9.0 86.2 34.9 9.0 86.5 36.0 8.5 89.0 34.4 9.6 103.0 37.8 8.5 84.8Manabi 49.5 7.0 48.8 43.3 7.3 55.5 44.9 6.3 44.0 44.9 7.1 50.8 45.8 6.9 50.5 42.7 6.6 46.4Los Rios 45.1 9.7 78.3 42.5 9.6 80.4 40.1 8.3 64.3 44.2 9.3 66.1 38.8 8.8 75,7 40.1 8.3 62.9Guayas 31.6 7.9 85.7 31.2 8.6 93.9 33.5 7.0 67.3 33.4 7.8 76.2 31.7 8.3 90.0 31.0 8.1 82.0El Oro 39.2 7.4 51.9 33.5 8.5 71.0 36.7 8.1 71.1 35.4 7.4 59.6 38.3 8.9 58.5 36.1 7.4 51.6
Oriente 51.9 10.1 68.0 51.9 10.1 64.1 50.2 IO.4 63.0 52.9 10.9 63.3 52.7 10.4 68.3 50.5 9.2 57.5Napo 46,2 4.9 38.2 45.5 5.4 28.9 47.4 5.5 29.7 49.8 8.5 42.7 54.2 6.7 33.3 54.5 7.4 39.2Pastaza 41.1 8.6 73.5 42.6 9.7 79.1 38.1 9.2 81.4 41.6 9.1 63.5 39.7 8.2 59.2 37.0 8.5 67.1Morona Santiago 51.3 13.1 84.5 49.7 10.9 78.5 47.0 13.1 80.6 48.1 10.6 71.5 45.8 1130 85.0 44.7 8.4 56.7Zmoora Chinchipe 78.3 16.7 77.8 81.6 18.5 76.7 77.9 16.2 71.4 83.9 18.6 78.4 80.3 19.6 102.2 70.7 15.6 81.9
Galapagos - - - - - - 30.3 2.8 18,5 27.8 3.1 18.3 23.4 4.8 54.3 26,0 3.4 28.0
L Except infant moortality -- deaths of infants less than one year per 1,000 live births,
Source: National Institute of Statistics, "Statistical Series, 1968-1973".

Table 1.9: HOUSING CONDITIONS - 1974
(Thousands of houses)
HousesConnected
Total to Public Electric Service Hvgiene Services Elimination of Used WaterOccupied Water Public Private Private Common Drain,Houses/l Supply Network Plant None Use Use Latrine None Sewage Well None
Total 1,201 502 479 8.6 714 221 168 115 698 331 155 716Urban 489 407 400 2.8 86 197 155 61 76 314 93 81Rural 712 95 79 5.8 628 24 13 54 622 17 62 635
Sierra 643 287 259 2.7 382 101 102 25 416 200 27 417Urban 236 213 209 0.5 27 92 97 10 37 188 12 36Rural 407 74 50 2.2 355 9 5 15 379 12 15 381
Costa 524 209 216 5.5 303 119 65 87 254 129 125 271Urban 248 190 188 2.2 58 104 57 50 38 124 80 44Rural 276 19 28 3.3 245 15 8 37 216 5 45 227
Oriente 30 5 4 0.4 26 1.4 1.7 2.1 25.5 __2,3 2.4 25.8Urban 4 3 3 0.1 1 1 1.2 0.7 1.5 1.8 1.1 1.5Rural 26 2 1 0.3 25 0.4 0.5 1.4 24 0.5 1.3 24.3
Galapagos 0.8 0.5 0.4 - 0.3 0.2 0.1 0.1 _04 0.2 0.2 0.4Urban 0.5 0.4 0.4 - - - - - 0.1 - - -Rural 0.3 0.1 - - - - - - 0.3 _- -
Disputed Zones (rural) 3 - 0.2 - 3 - - 0.4 2.3 - 02 2.6
L Occupied at the time of the Census.
Source: Office of the National Censuses.

Tablel.10: LITERACY RATES 1-, BY AREA AND PROVINCE -- 1950, 1962, 1974
--------- 1950 --------- -- 1962 ------ 1974-
Total Urban Rural Total Urban Rural Total Urban Rural
TOTAL REPUBLIC 56 83 45 70 89 58 75 90 63
Sierra 54 82 44 67 89 56 73 91 61Carchi 70 82 66 79 89 75 85 92 82Imbabura 46 79 38 56 85 46 62 86 51Pichincha 68 84 46 79 90 59 95 92 72Cotopaxi 39 76 34 54 85 48 54 88 48Tungurahua 53 82 45 69 88 60 71 90 61Bolivar 51 82 48 60 88 57 60 88 56Chimborazo 40 79 30 46 85 35 54 86 42Canar 47 79 42 58 88 54 69 97 66Azuay 55 82 48 69 89 62 76 92 69Loja 59 84 54 76 91 72 75 91 70
Costa 60 85 47 73 90 61 76 89 64Esmeraldas 49 74 42 63 80 55 67 85 56Manabi 49 78 42 63 84 57 70 86 63Los Rios 42 74 37 61 81 56 66 81 61Guayas 71 88 52 81 92 64 82 91 64El Oro 73 85 68 85 90 81 87 92 83
Oriente 42 72 38 60 88 55 73 91 70
Galapagos 81 -- 81 91 -- 91 94 96 90
Literate population 10 years and over1/ Literacy Rate = Total population 10 years and over x 100
Source: Population and Housing Census of 1950, 1962, and 1974.

Table 2.1: GDP, GNP AND NATIONAL INCOME, 1970-1975
(millions of current sucres)
---------------- Growth Rates-------------------1970 1971 1972 1973 1974 1975 1970-71 1971-72 1972-73 1973-74 1974-75
Available Resources 35.515 43.950 46,741 59,854 85,285 110,180 23.8 6.3 28.1 42.5 29.2Consumption 28.309 32.697 35.997 45,069 62.289 77.365 15.5 10.1 25.2 38.2 24.2Private 24,157 28,066 30,660 38,410 52,709 65,999 16.2 9.2 25.3 37.2 25.2Public ( Gen. Govt.) 4,152 4,631 5,337 6,659 9,580 11,366 11.5 15.2 24.8 43.9 18.6Gross Domestic Investment 7,206 11,253 10 744 14,785 22 996 32,815 56.2 -4.5 37.6 55. 42.7Change in Stocks 1,525 1,362 1 149 2,909 3,067 3,497 -WIT -15.6 153.2 5.4 14.0Gross Domestic Fixed Investment 5,681 9,891 9,595 11,876 19,929 29,318 74.1 -3.0 23.8 67.8 47.1Private 3,894 7,312 7.278 7,925 14,323 20,305 87.8 -0.5 8.9 80.7 41.8Public 1,787 2,579 2,317 3,951 5,606 9,013 44.3 -10.2 70.5 41.9 60.8Exports of Gds & NFS 5,121 6,708 9,312 15,632 29,5051/ 24,5671' 31.0 38.8 67.9 88.7 -16.9Less: Imports of Gds & NFS -6,666 -10,089 -9,648 -12,345 -24,638 -28,987 51.4 -4.4 28.0 99.6 17.7GDP (a Market Prices 3 .470 40.569 i6.405 63.141 S,3.1521/ 105, 7601 19.4 14,A 361 42.8 17-3Less: Net Factor Payments -1,034 -982 -2,035 -3,794 -5.998 -2,875 -5.0 107.2 86.4 58.1 -52.1GNP @ Market Prices 32,936 39,587 44,370 59,347 84,154 102,885 20.2 12.1 33.8 41.8 22.3Less: Net Indirect Taxes --2,133 -2,564 -3,325 -4,208 -5,692 -5,831 20.2 29.7 26.6 35.3 2.4GNP @ Factor Cost 30,803 37,023 41,045 55,139 78,462 97,054 20.2 10.9 34.3 42.3 23.7Less: Depreciation -3,014 -3,904 -4,438 -5,229 -7,041 -8,099 29.5 13.7 17.8 34.7 15.0National Income 27,789 33,119 36,607 49,910 71,421 88,955 19.2 10.5 36.3 43.1 24.5
1/ Has been adjusted downward due to valuation of petroleum at market prices rather than at reference prices.
Source: Central Bank of Ecuador

Table 2. 2 GDP, GNP AND NATIONAL INCOME, 1970-1975
(millions of 1970 sucres)
1970 1971 1972 1973 1974 1975 1970-71 1971-72 1972-73 1973-74 1974-75
Available Resources 35.515 38,788 38,280 43.033 48.i77 54.110 9.2 -1.3 12.4 12.0 12.3
Consumption 28,309 29.465 30.124 33,218 36,489 39.290 4.1 2.2 10.3 9.8 7.7Private 24,157 25,466 25,806 28,472 31,149 33,740 5.4 1.3 10.3 9.4 8.3Public (Gen. Govt.) 4,152 3,999 4,318 4,746 5,340 5,550 -7.7 8.0 9.9 12.5 3.9
Gross Domestic Investment 7,206 9,323 8 156 9,815 11,688 14,820 29.4 -12.5 20.3 19.1 26.8Change in Stocks 1,525 1,300 1,054 2,050 1 7517 _ -T" -=1 r3 -T1 472
Gross Domestic Fixed Investment 5,681 8,023 7,102 7,765 10,002 13,063 41.2 -11.5 9.3 28.8 30.6Private 3,894 5,806 5,278 5,027 6,980 8,759 49.1 -9.1 -4.8 38.8 25.5Public 1,787 2,217 1,824 2,738 3,022 4,304 24.1 -17.7 50.1 10.4 42.4
Experts of Gds & NFS 5,121 4,854 6,330 9,271 13,4312 10,5712/ -5.2 30.4 46.5 44.9 -21.3Less: Imports of Gds & NFS -6,666 -7,300 -6,559 -7,322 -11,323 -12,108 9.5 -10.2 11.6 54.6 6.9
GDP @ Market Prices 33,970 35,926 37,986 44,944 50 2852/ 52.573-/ 5.8 5.7 18.3 11.9 4.5
Less: Net Factor Payments -1,034 -710 -1,383 -2,249 -2,757 -1,200 -31.3 94.8 62.6 22.6 -56.5GNP @ Market Prices 32,936 35,216 36,603 42,695 47,528 51,373 6.9 3.9 16.6 11.3 8.1
Less: Net Indirect Taxes -2,133 -2,269 -2,725 -3,006 -3 180 -2,901 6.4 20.1 10.3 5.8 -8.8GNP @ Factor Costs 30,803 32,947 33,878 39,689 44,348 48,47' 7.0 2.8 17.2 11.7 9.3
Less: Depreciation -3,014 -3,166 -3,285 -3,420 -3,533 -3,609 5.0 3.8 4.1 3.3 2.1National Income 27,789 29,781 30,593 36,269 40,815 44,863 7.2 2.7 18.6 12.5 9.9
1/ Deflated using GDP deflator; i.e. 100 113 122 140 179 201
2/ has been adjusted downward due to valuation of petroleum at market prices rather than at reference prices.
Source: Central Bank of Ecuador

Table 2.3: SAVINGS AND INVESTMENT, 1970-1975
(millions of current sucres)
-_---____---- AS % OF GDP 1' -------1970 1971 1972 1973 1974 1975 1970 1971 1972 1973 1974 1975
Gross Domestic Savings andGross Domestic Investment by Sector
Domestic SectorGross Domestic Savings 5,661 7,872 10,408 18,072 27,863 28,395 16.7 19.4 22.4 28.6 30.9 26.8Gross Domestic Investnent 7,206 11,253 10,744 14,785 22,996 32,815 21.2 27.7 23.2 23.4 25.5 31.0
(Private) (5,291) (8,561) (8,337) (10,589) (17,132) (23,507) (15.6) (21.1) (18.0) (16.8) (19.0) (22.2)(Public) (1,915) (2,692) (2,407) (4,196) (5,864) (9,308) (5.6) (6.6) (5.2) (6.6) (6.5) (8.8)
Foreign Sector 2/Net Imports of Gds & NFS 1,545 3,381 336 -3,287 -4,867- 4,420- / 4.5 8.3 0.7 -5.2 -5.4 4.2Plus: Net Factor Payments 1,034 982 2,035 3,794 5,998 2,875 3.0 2.4 4.4 6.0 6.7 2.7Net Capital Inflow 2,579 4,363 2,371 507 1,131 7,295 7.5 10.7 5.1 0.8 -1.3 6.9
Net Current Transfers 292 366 361 639 423 705 0.9 0.9 0.8 1.0 0.5 0.7
Source of Savings
Gross Domestic Product at Market Prices 33,970 40,569 46,405 63,141 90,152-/ 105, 7 6 0-/ 100.0 100.0 100.0 100.0 100.0 100.0Less: Consumption -28,309 -32,697 -35,997 -45,069 -62,289 -77,365 83.3 80.6 77.6 71.4 69.1 73.1Gross Domestic Savings 5,661 7,872 10,408 18,072 27,863 28,395 16.7 19.4 22.4 28.6 30.9 26.8
GDS (Including net current transfers) 5,953 8,238 10,769 18,711 28,286 29,100 17.5 20.3 23.2 29.6 31.4 27.5
GDS (including net current transfers) 4,919 7,256 8,734 14,917 22,288 26,225 14.5 17.9 18.8 23.6 24.7 24.8
Financing of Gross Domestic Investment
Gross Domestic Investment 7,206 11,253 10,744 14,785 22,996 32,8L5 21.2 27.7 23.2 23.4 22.5 31.0Less: Net Capital Inflow -2,579 -4,363 -2,371 -507 -1,131 -7,295 7.5 10.7 5.1 0.8 1.3 -6.9Gross National Savings 4,627 6,890 8,373 14,278 21,865 25,520 14.0 17.4 18.9 24.1 24.3 24.1
Less: Depreciation -3,014 -3,904 -4,438 -5,229 -7,041 -8,099 8.9 9.6 9.6 8.3 7.8 7.7
Net National Savings 1,613 2,986 3,935 9,049 14,824 17,421 4.9 7.5 8.9 15.2 16.4 16.5
1/ Except gross national savings and net national savings, which are expressedas percentages of GNP.
2/ Export componenit has been adjusted downward due to valuation of petroleum at market prices rather than at reference prices.
Source: Central Bank of Ecuador

Table 2.4: SAVINGS AND INVESTMENT, 1970-1975
(millions of 1970 sucres)
--------------- Growth Rates ---------------
1970 1971 1972 1973 1974 1975 1970-71 1971-72 1972-73 1973-74 1974-75
Gross Domestic Savings andGross Domestic Investment by Sector
Domestic SectorGross Domestic Savings 5,661 6,461 7,862 11,726 13,796 13,283 14.1 21.7 49.1 17.7 -3.7Gross Domestic Investment 7,206 9,323 8,156 9,815 11,688 14,820 29.4 -12.5 20.3 19.1 26.8
(Private) (5,291) (6,998) (6,248) (6,905) (8,524) (10,367) 32.3 -10.7 10.5 23.4 21.6(Public) (1,915) (2,325) (1,908) (2,910) (3,164) (4,453) 21.4 -17.9 52.5 8.7 40.7
Foreign SectorNet Imports of Gds & NFS 1,545 2,446 229 -1,949 -2,1081/ 1,537-1/Plus: Net Factor Payments 1,034 710 1,383 2,249 2,757 1,200 -31.3 94.8 62.6 22.6 -56.5Net Capital Inflow 2,579 3,156 1,612 300 649 2,737 22.4 -48.9 -81.4 116.3 321.7Net Current Transfers 292 264 245 379 195 294 -9.6 -7.2 54.7 -48.5 50.8
Source of Savings
Gross Domestic Product at Market Prices 33,970 35,926 37,986 44,944 50,2851/ 52,5731/ 5.6 5.7 18.3 11.9 4.5Less: Consumption -28,309 -29,465 -30,124 -33,218 -36,489 -39,290 4.1 2.2 10.3 9.8 7.7Gross Domestic Savings 5,661 6,461 7,862 11,726 13,796 13,283 14.1 21.7 49.1 17.7 -3.7GDS (including net current transfers) 5,953 6,725 8,107 12,105 13,991 13,577 13.0 20.6 49.3 15.6 -3.0GDS (including net current transfers) 4,919 6,015 6,724 9,856 11,234 12,377 22.3 11.8 46.6 14.0 10.2
- Net Factor Payments
Financing of Gross Domestic Investment
Gross Domestic Investment 7,206 9,323 8,156 9,815 11,688 14,820 29.4 -12.5 20.3 19.1 26.8Less: Net Capital Inflow -2,579 -3,156 -1,612 -300 -649 -2,737 22.4 -48.9 -81.4 116.3 321.7Gross National Savings 4,627 6,167 6,544 9,515 11,039 12,083 33.3 6.1 45.4 16.0 9.5Less: Depreciation -3,014 -3,166 -3,285 -3,420 -3,533 -3,609 5.0 3.8 4.1 3.3 2.2Net National Savings 1,613 3,001 3,259 6,095 7,506 8,474 86.1 8.6 87.0 23.1 12.9
/ Export component has been adjusted downward due to valuation of petroleum at market prices rather than at reference prices.
Source: Central Bank of Ecuador

Table 2.5 : GDP BY INDUSTRIAL ORIGIN, 1965-1975
(millions of current sucres)
1965 1966 1967 1968 1969 1970 1971 1972 1973 1974 1975
1/Agriculture 6,188 7,383 8,372 7,760 8,241 9,087 10,092 10,998 14,307 19,141 23,058Mintng & Quarrying 298 292 334 372 432 301 382 1,139 3,112 6,069 5,710
(Petroleum) - - - - - (33) (32) (798) (2,597) (5,265) (4,602)(Other Minerals) - - - - - (268) (350) (341) (515) (804) (1,108)
Manufacturing 3,091 3,604 3,686 4,186 4,832 5,671 6,866 7,824 9,515 12,803 16,442Electricity, Gas & Water 199 228 256 316 363 396 478 558 632 784 918ConstructLon 610 647 797 990 1,100 1,440 2,419 2,023 2,707 4,008 5,914Trade & Commerce 2,795 2,985 3,378 3,764 3,808 4,763 6,029 7,190 11,694 20 156 20,574
(Petroleu-) - - - - - (14) (17) (534) (3,260) (9,572)5 (8,526)5/(other Products) - - - - - (4,749) (6,012) (6,656) (8,434) (10,584) (02,048)
Transportation 1,167 1,269 1,431 1,556 1,764 2,158 2,810 3,249 3,943 4,281 5,094(By Ptper)ne) _ - - - - - - (104) (305) (264) (244)
g37 - _ - (2,158) (2,810) (3,145) (3,638) (4,017) (4,850)Banking - 633 695 787 961 1,111 1,356 1,598 1,914 2,212 2,918 3,850Ownership of Dwellings 1,293 1,421 1,565 1,679 1,850 1,948 2,278 2,691 3,370 4,538 5,896Government SerTes 1,537 1,736 1,791 2,385 2,791 3,275 3,628 4,278 5,116 7,473 8,940Other Services - 1,582 1,696 1,841 2,112 2,360 2,325 2,799 3,166 4,081 5,553 6,710Minus: Imputed cost of banking and
other financial services -265 -306 -336 -405 -460 -593 -687 -768 -887 -1,144 -1,476Value Added in Domestic Production
(at prices of producer) 19,128 21.650 23.902 25,676 28.182 32.127 38,692 44.264 59,802 86,580 101,630
Plus: Import Duties 1,018 1,201 1,568 1,703 1,739 1,843 1,877 2,141 3,339 3,573 4,130
Gros LDobestic Product(at prices of purchaser) 20.146 22,851 25.470 27,379 29.921 33.970 40,569 46.405 63,141 90,152 105.760
I/ Includes agriculture, forestry, hunting, and fishing.2/ Includee passengers, cargo, storage, and communications,31 Includes banking and insurance.4/ Includes domestic services, private non-lucrative services and others.
5/ Has been adjusted downward due to valuation of petroleum at marketprices rather than at reference prices.
Source: Central Bank of Ecuador
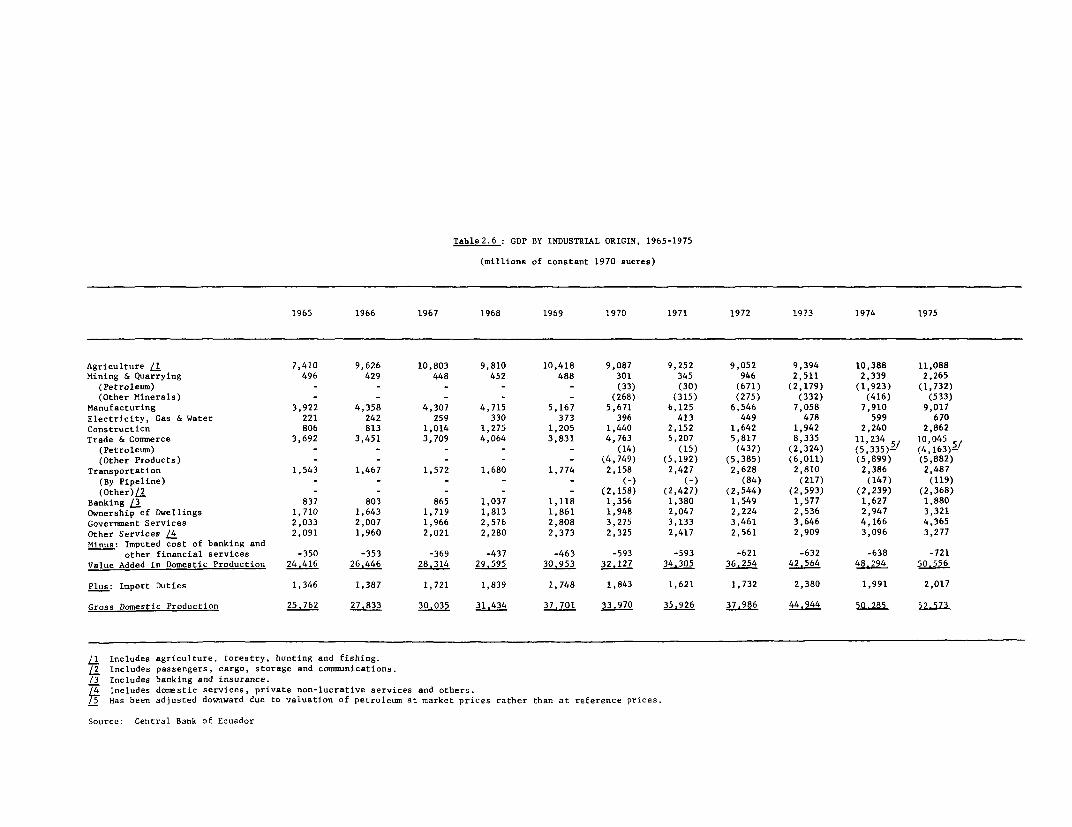
Table2.6 : GDP BY INDUSTRIAL ORIGIN, 1965-1975
(millions of constant 1970 sucres)
1965 1966 1967 1968 1969 1970 1971 1972 1973 1974 1975
Agriculture L. 7,410 9,626 10,803 9,810 10,418 9,087 9,252 9,052 9,394 10,388 11,088Mining & Quarrying 496 429 448 452 488 301 345 946 2,511 2,339 2,265
(Petroleum) - - - - - (33) (30) (671) (2,179) (1,923) (1,732)(Other Minerals) - - - - - (268) (315) (275) (332) (416) (533)
Manufacturing 3,922 4,358 4,307 4,715 5,167 5,671 6,125 6,546 7,058 7,910 9,017Electricity, Gas & Water 221 242 259 330 373 396 413 449 478 599 670Construction 806 813 1,014 1,275 1,205 1,440 2,152 1,642 1,942 2,240 2,862Trade & Commerce 3,692 3,451 3,709 4,064 3,831 4,763 5,207 5,817 8,335 11,234 10 045
(Petroleum) - - - - - (14) (15) (432) (2,324) (5,335)5/ (4,163)-/(Other Products) - - - - - (4,749) (5,192) (5,385) (6,011) (5,899) (5,882)
Transportation 1,543 1,467 1,572 1,680 1,774 2,158 2,427 2,628 2,810 2,386 2,487(By Pipeline) - - - - -_ (84) (217) (147) (119)(Other)/2 - - - - - (2,158) (2,427) (2,544) (2,593) (2,239) (2,368)
Banking /3 837 803 865 1,037 1,118 1,356 1,380 1,549 1,577 1,627 1,880Ownership of Dwellings 1,710 1,643 1,719 1,813 1,861 1,948 2,047 2,224 2,536 2,947 3,321Government Services 2,033 2,007 1,966 2,576 2,808 3,275 3,133 3,461 3,646 4,166 4,365Other Services A 2,091 1,960 2,021 2,280 2,373 2,325 2,417 2,561 2,909 3,096 3,277Minus: Imputed cost of banking and
other financial services -350 -353 -369 -437 -463 -593 -593 -621 -632 -638 -721Value Added in Domestic Production 24.416 26,446 28.314 29.595 30,953 32,127 34,305 36.254 42,564 48,294 50.556
Plus: Import Duties 1,346 1,387 1,721 1,839 1,748 1,843 1,621 1,732 2,380 1,991 2,017
Gross Domestic Production 25.762 27,833 30.035 31.434 37.701 33,970 35.926 37,986 44.944 SO-285 592_73
L1 Includes agriculture, forestry, hunting and fishing./2 Includes passengers, cargo, storage and communications./3 Includes banking and insurance.4 Includes donestic services, private non-lucrative services and others.5 Has been adjusted downward due to -valuation of petroleum at market prices rather than at reference prices.
Source: Central Bank of Ecuador

Table 2.7 : PERCENT OF GDP BY INDUSTRIAL ORIGIN, 1965-1975
(based on current prices)
1965 1966 1967 1968 1969 1970 1971 1972 1973 1974 1975
Agriculture 30.7 32.3 32.9 28.3 27.5 26.8 24.9 23.7 22.7 21.2 21.8Mining & Quarrying 1.5 1.3 1.3 1.4 1.4 0.9 1.0 2.5 4.9 6.7 5.4
(Petroleum) _ - - - - (0.1) (0.1) (1.7) (4.1) (5.8) (4.4)(Other Minerals) - - -u m (0.8) (0.9) (0.7) (0.8) (0.9) (1.0)
Manufacturing 15.3 15.8 14.5 15.3 16.1 16.7 16.9 16.9 15.1 14.2 15.5Electricity, Gas & Water 1.0 1.0 1.0 1.2 1.2 1.2 1.2 1.2 1.0 0.9 0.9Construction 3.0 2.8 3.1 3.6 3.7 4.2 6.0 4.4 4.3 4.4 5.6Trade and Commerce 13.9 13.1 13.3 13.8 12.8 14.0 14.9 15.5 18.5 22.4 19.5
(Petroleum) - - - - - (-) (0.1) (1.2) (5.2) (10.6) (8.1)(Other Products) - - - - - (14.0) (14.8) (14.3) (13.3) (11.7) (11.4)
Transportation 5.8 5.6 5.6 5.7 5.9 6.4 6.9 7.0 6.2 4.7 4.8(By Pipeline) - - - - - (-) (-) (0.2) (0.5) (0.3) (0.2)
(Other) - - - - - (6.4) (6.9) (6.8) (5.7) (4.5) (4.6)Banking 3.1 3.0 3.1 3.5 3.7 4.0 3.9 4.1 3.5 3.2 3.6Ownership of Dwellings 6.4 6.2 6.1 6.1 6.2 5.7 5.6 5.8 5.3 5.0 5.6Government Services 7.6 7.6 7.0 8.7 9.3 9.6 8.9 9.2 8.1 8.3 8.5Other Services 7.9 7.3 7.2 7.7 7.9 6.8 6.9 6.8 6.5 6.2 6.3Minus: Imputed cost of banking and
other financial services -1.3 -1.3 -1.3 -1.5 -1.5 -1.7 -1.7 -1.7 -1.4 -1.3 -1.4Value Added in Domestic Production 94.9 94.7 93.8 93.8 94.2 94.6 95.4 95.4 94.7 96.0 96.1
Plus: Import Duties 5.1 5.3 6.2 6.2 5.8 5.4 4.6 4.6 5.3 4.0 3.9
GDP at Market Prices 100.0 100.0 100.0 100.0 100.0 100.0 100.0 100.0 100.0 100.0 100.0
Source: Central Bank of Ecuador

Table 2.8 : GDP BY INDUSTRIAL ORIGIN - GROWTH RATES
BASED ON CONSTANT 1970 VALUES, 1965-1975
1965-66 1966-67 1967-68 1968-69 1969-70 1970-71 1971-72 1972-73 1973-74 1974-75
,griculture 29.9 12.2 -9.2 6.2 -12.8 1.8 -2 2 3.8 10.6 637Mining & Quarrying -Z3.5 4.4 0.9 8.0 -38.3 14.6 174.2 165.4 -6.9 -3.2(Petroleum) - - - - (-9.1) (2,136.7) 224.7) (-11.8) (-9.9)(Other Minerals) - - - - - (17.5) (-12.7) (20.7) (25.3) (28.1)Manufacturing 11,1 -1.2 9.5 9.6 9.8 8.0 6.9 7.8 12.1 14.0Electricity, Gas & Water 9.5 7.0 27.4 13.0 6.2 4.3 8.7 6.5 25.3 11.9Construction 0.9 24.7 25.7 -5.5 19.5 49.4 -23.7 18.3 15.3 27.8Trade & Cosmmerce -6.5 7.5 9.6 -5.7 24.3 9.3 11.7 43.3 34.8 -10.6(Petroleum) - - - - - (7.1) (2,780.0) (438.0) (129.6) (-220)(Other Products) - - - - - (9.3) (3.7) (11.6) (-1.9) (-0.3)Transportation -4.9 7.2 6.9 5.6 21.6 12.5 8.3 6.9 -15.1 4.2(By Pipeline) - - - - - (-) (158.3) (-32.3) (-19.0)(Other) - - - - - (12.5) (4.8) (1.9) (-13.7) (5.8)Banking -4,1 7.7 19.9 7.8 21.3 1.8 12.2 1.8 3.2 15.6Ownership of Dwellings -3.9 4.6 5.5 2.6 4.7 5,1 8.6 14.0 16,2 12.7Goverrusent Services -1.3 -2.0 31.0 9.0 16.6 -4.3 10.5 5.3 14.3 4.8Other Services -6.3 3.1 12.8 4.1 -2.0 4.0 6.0 13.6 6.4 5.8Minus: Imputed cost of banking andother financial services 0.9 4.5 18.4 5.9 28.1 0.0 4.7 1.8 0.9 13.0Value Added in Domestic Production 8.3 7.1 4.5 4.6 3.8 6.8 5.7 17.4 13.5 426
Plus: Import Duties 3.0 24.1 6.9 -4.9 5.4 -12.0 6.8 37.4 -16.3 1.3GDP at Market Prices 8.0 7.9 4.7 19.9 -9.9 5.8 5.7 18.3 11.9
Source: Central Bank of Ecuador

Table 2.9: GDP BY SECTOR AND EXPENDITURES, PROJECTIONS
(millions of 1976 Sucres)Table 2.9: GDP BY SECTOR AND EXPENDITURES, PROJECTIONS
(millions of 1976 Sucres) Annual RateEstimate Projections of Growth
Annual RateAgriculture 26 Aftmate 27,337 28.431 PA93i8tions 30,751 31,981 4s GrowthIndustrv _ _ 35,0"76 38.051977 41,26W78 44, 1"79 47,07X980 50,16i81 7.W81/1976Services 63,441 67,469 72,831 77,583 82,138 87,009 6.5GDP O*rimuuademrices) 124,7SM,286 132,8.V,337 142,5n,431 151,3129,568 159,95%,751 169,15-%,981 6.3 4.0Industry 35,070 38,051 41,260 44,192 47,070 50,168 7.4Of wlEitv:ic%stroleum (14,815A,441 (17,13Y),469 (19,32)?,831 (20,150),583 (20,22O, 138 (20,3 3M,009 6.4 6.5GDP CMUrr(aM npxhfstprices) 124, 7014,797 143,4IM,857 166,flM,522 190,6Ml,343 217, SZB,958 248,50,158 14.8 6.3Terms of Trade Adjustment - -1,353 -1,385 -1,915 -1,940 -1,265 -Of which: Petroleum (14,879) (17,150) (19,325) (20,150) (20,225) (20,300) 6.4Gros& Obi68zdkenDnqtakges) 124, A,797 131,%43,486 141, M,238 149,4LM,649 158,G0WY,621 167,",549 6.1 14.8Impothmwf c2oVduLdrnkd&Stment 31,925- 33,14-i,353 35,016,385 35,39-1,915 37,87-1,940 41,0391,265 5.2 -Exports of Goods and NFS 34,098 32,155 34,895 36,385 37,358 39,023 2.7Resot4mmsB4rnustic Income -2, II,797 991M,504 M 1,137 -S9",428 5U5B,018 2,OW?f,893 - 6.1Imports of Goods and NFS 31,925 33,145 35,016 35,391 37,873 41,039 5.2ResodxFvWV%Mi9a10titmd NFS 122,62X,098 132,4932,155 141,2514,895 148,43*,385 158,53W,358 169,9gC,023 6.7 2.7ConsdbqVVi=(lEA0u1v14vres 89,51&,173 93,978 990 98,573 121 103,582-994 108,749 515 114,176,016 5.0 -Private Consumption 75,878 79,520 83,337 87,337 91,529 95,923 4.8Pub 1:Fir i abiIities 13,6kW!,624 14,4,%,494 15,Z261,258 16,N, 434 17,=$,533 18,2M9,9O9 6.0 6.7Inve9kn=H*Aaid&WLwWitureS 33,109,518 38,5VW,978 42,60,573 44,& 8f,582 49,7Ig0,749 55, l'M,176 11.0 5.0Chan&iWtft&dkwumption 6775,878 2,879,520 3,39V3,337 1, 5sW,337 2,101,529 3,20,923 - 4.8Fixe(PtitQOg wimption 32,42W,640 35,68134,458 39,29U, 236 43,25%,245 47,64127,220 52 4 18,253 10.0 6.0F i xe dl nvfbe-rVLtures 11,5dM,106 12, 8 -,516 14,4M,685 16,15(,852 18,1 9,784 20,2V,733 12.0 11.0Fixef l:ent 20,929 677 22,81Y,833 24,8693,395 27,104, 598 29,541,142 32,20Q13,282 9.0 -Fixed Investment 32,429 35,683 39,290 43,254 47,642 52,451 10.0Gros! efi3Es ment 35,2t1,500 37,5U,870 42,5&6h,425 45,846,150 49,26,8,100 53,720,250 8.8 12.0Fixed Private Investment 20,929 22,813 24,865 27,104 29,542 32,201 9.0GDI/GDP 26.5 29.0 29.9 29.6 31.1 32.9GDS/(2ss Domestic Savings 28;3i,279 28 X7,526 29.4!,564 30.4:,846 30.4',269 31.,717 8.8Resource Balance/GDP -1.7 0.7 0.1 -0.7 0.3 1.2Impo£fW(W 25.6 26.5 24.9 29.0 24.6 29.9 23.3 29.6 23.7 31.1 24.3 32.9Expo //6l W 27.3 28.3 25.2 28.2 25.5 29.8 25.3 30.3 24.6 30.8 23.8 31.8ExpoEBooAma,wpIDvdW)/GDJp 27.3-1.7 24.2 0.7 24.5 0.1 24.0-0.7 23.4 0.3 23.1 1.2Term9MWPrMV(DPAdj./GDP - 25.6 -1.o 24.9 -1.0 24.6 -1.323.3 -1.2 23.7 -0.724.3Exports/GDP 27.3 25.2 25.5 25.3 24.6 23.8Exports (import capacity)/GDP 27.3 24.2 24.5 24.0 23.4 23.1erms of Trade Adj./GDP - -1.0 -1.0 -1.3 -1.2 -0.7
2/25/77

Table 3.1_: BALANCE OF PAYMENTS SUMMARY. 1969-1976
(millions of dollars)
1969 1970 1971 1972 1973 1974 1975 1976
1. Imports of Goods and.NFS 295.5 359.6 401.8 392.0 509.1 1,043.3 1,191.9 1,277.2Merchandise (FOB)-' 218.7 249.6 306.8 284.2 397.5 813.8 986.2 1,057.2Non-factor services 76.8 110.0 95.0 107.8 111.6 229.5 205.7 220.0
2. Exports of Goods and NFS 215.7 258.9 265.6 364.9 627.0 1,234.9 1,072.6 1.362.5Merchandise (FOB) 193.4 234.9 238.0 323.2 584.7 1,187.3 1,012.9 1,295.8Non-factor services 22.3 24.0 27.6 41.7 42.3 47.6 59.7 66.7
3. Resources balance -79.8 -100.7 -136.2 -27.1 117.9 191.6 -119.3 85.3
4. Net factor services -28.0 -29.2 -35.7 -65.6 -138.2 -182.9 -77.8 -76.o
5. Transfers, net 12.3 16.9 15.7 15.3 26.8 17.9 29.3 21.0
6. Balance on current account -95.5 -113.0 -156.2 -77.4 6.5 26.6 -167.8 30.3
7. Long-term capital 67.7 110.4 181.3 164.1 80.4 66.5 109.2 249.0(Direct investment) (38.6) (88.6) (161.6) (80.8) (52.3) (77.0) (40.7) (20.0)
8. Short-term capital 32.0 -2.2 -58.5 7.5 1.5 21.6 -13.2 -lQO.3
9. Banking system (net) -9.9 16.7 19.3 -23.6 1.3 -2.7 13.5 10.0
10. Allocation of SDR's - 4.2 3.5 3.8 - - -
11. Net international assets( - increase) 5.7 -16.1 10.6 -74.4 -89.7 -112.0 58.3 -189.0
12. Debt service ratio 9.7 9.0 12.3 10.1 7.4 7.6 4.6 7.3
1/ Includes non-monetary gold.
Source: Central Bank of Ecuador

Table 3.2 BALANCE OF PAYMENTS, 1972 - 1975
(mllons of dollars)
1972 1973 1974 - 1975 -Credit Debit Credit Debit Credit Debit Credit Debit
A. Goods and Services 367.0 459.7 633.0 653.3 1,264.2 1,255.5 1.089.eb 1.286.7
Merchandise, FOB 323.2 280.8 583.3 396.8 1,187.3 813.1 1,012.9 985.0Non-Monetary Gold - 3.4 1.4 0.7 - 0.7 - 0.5MarketLng Costs - 42.4 3.5 35.3 2.0 114.0 9.8 104.8
(Freight Charges) _ (39.3) (3.5) (33.9) (2.0) (109.8) (9.7) (100.8)(Insurance) _ (3.1) - (1.4) - (4.2) (0.1) (4.0)
Other Transportation Costs 6.0 8.9 7.9 10.7 8.0 10.0 8.0 10.7Travel 10.0 14.4 13.2 18.5 16.5 20.5 20.0 25.4Investment Income 2.1 67.7 6.0 144.2 29.3 212.2 17.0 94.8
(From Direct Investment) - (55.0) - (124.8) - (192.0) - (71.5)(From Others) (2.1) (12.7) (6.0) (19.4) (29.3) (20.2) (17.0) (23.3)
Government Transactions, n.e.i. 4.4 3.5 5.0 3.8 5.0 4.3 9.0 6.2Miscellaneous 21.3 38.6 12.7 43.3 16.1 80.7 12.9 58.6
(Insursnce,excluding market-ng insurance) (3.3) (7.5) (3.3) (7.5) (4.0) (9.0) (2.5) (5.0)(Other) (18.0) (31.1) (9.4) (35.8) (12.1) (71.7) (10.4) (53.6)
Net Goods and Services - 92.7 - 20.3 8.7 - - 197.1
B. Transfers 16.1 0.8 28.0 1.2 20.8 2.9 30.4 1.
Private 7.8 - 8.3 - 7.0 - 9.5Central Government 8.3 0.8 19.7 1.2 13.8 2.9 20.9 1.1Net Transfers 15.3 - 26.8 - 17.9 - 29.3 -
Current Account Balance - 77.4 6.5 - 26.6 - - 167.8
C. Capital Account 148.0 - 83.2 - 85.4 - 109.5 -
Direct Investment 80.8 - 52.3 - 77.0 - 40.7 -Other Private Long-Tenm Capital 6.5 - - 0.6 - 1.6 - 2.9
(Disbursements) (7.9) - (1.1) - (5.5) - (2.4) -(Anortization - (1.4) _ (1.7) - (7.1) * (5.3)
Private Short-Term Capital 21 13.2 - 4.7 - 25.7 - - 12.5Local Governments 3.5 - 9.7 - 14.9 - 1.0 -
(Disbursements) (8.9) - (14.9) - (17.5) - (10.0) -(Amortizations) - (5.4) - (5.2) - (2.6) - (9.0)
Central Government 67.6 - 15.8 _ _ 27.9 69.7(Disbursements) (96.3) - (45.1) - (41.5) - (98.2)(Anortizations) - (23.0) - (26.1) _ . (65.3) _ (27.8)(Liabilities to lnternatroa.I Orgasizations) - (4.7) - (3.2) - (0.5) - (0.7)(United States Government) - (1.0) - - - (3.6) -
Commercial Banks 0.5 - - 3.1 - 0.3 - 7.4(Liabilities) (1.5) - (2.2) - - (4.5) (2.8) -(Assets) - (1.0) - (5.3) (4.2) - - (10.2)
Central Bank - 24.1 4.4 - - 2.4 20.9 -(Loana and Credits) _ (28.7) (5.1) - (0.5) - (31.8) -(Payment Agreements - Liabilitles) (1.8) - _ (0.2) (0.2) - i (1.0)(IBRD and IDB) (4.2) - (3.2) - - (0.8) - (7.0)(Payment Agreements - Assets) - (1.4) - (3.7) _ (2.3) - (2.9)
D. Allocation of SDR's 3.8 - - - - -
E. Reserves _ 74.4 - 89.7 _ 112.0 58.3
LiabilitLes (IMF credit sa) 3.0 - - 9.9 -Assets - 77.4 - 79.8 - 112.0 58.3
(Monetary Gold) (6.7) - - (1.3) _ (0.2) -(SDR's) - (3.7) (1.4) - _ (1.2) (0.2) -(IMF Reserve Position) - - - (6.7) _ (4.4) _ (4.8)(Interest) - (80.4) - (73.2) - (106.2) (62.9) -
1/Provisional
21Includes errors and omissions
Source Central Bank of Ecoador

Table 3.3: MERCHANDISE EXPORTS, 1970 - 1976
(millions of dollars)
Est.1970 1971 1972 1973 1974 1975 - 1976
Bananas 125.5 124.2 125.3 125.3 124.9 156.9 144.2Cacao 22.2 24.3 23.6 26.0 102.9 37.7 33.2Coffee 50.0 36.1 47.0 65.4 67.4 64.3 204.5Sugar 8.0 13.2 13.2 12.5 42.6 15.1 4.9Cacao Products 2.6 4.5 6.5 8.8 22.7 2/ 33.0 2/ 60.3Petroleum - - 59.5 282.1 737.3 - 616.8 - 725.8Others 26.6 35.7 48.1 64.6 89.5 89.1 122.9
Total Merchandise Exports 234.9 238.0 323.2 584.7 1,187.3 1,012.9 1,295.8
GDP (millions of currentsucres) 33,970 40,569 46,405 63,141 90,152 105,760 124,797
Ratio Exports/GDP .143 .147 .174 .232 .329 .239 .266
Purchasing Power of Exports(millions of 1970 sucres) 4,848 4,854 6,330 9,271 14,179 11,242 11,938
GDP (millions of 1970sucres) 33,970 35,926 38,039 43,701 46,187 49,537 50,500
Ratio Purchasing Power 3of Exports/GDP .143 - .135 -166 .212 .307 .227 .236
1/ Preliminary Figures.
2/ Includes adjustment for compensated exports.
Source: Central Bank of Ecuador.

Table 3.4: MERCHANDISE IMPORTS BY MAIN CATEGORIES, CIF,,,1966-1976
(milaions of dollars)
--------- Estimates I/_---------1966 1967 1968 1969 1970 1971 1972 1973 1974 1975 1976
TOTAL IMPORTS 174,129 214,210 255.465 241,838 273,849 340.103 318.599 447,782 2/ _9155671/ 1.141.151 1,207,000 -
Primary and intermediate Goods 81,365 91,365 130.058 113,972 137,070 158.592 135,042 173.829 300.162 4 426.675' 519,000Agriculture 3,734 3,770 4,302 4,729 5,552 3,695 4.557 5,746 42,000 40,900 ,n000Industry 65,402 75,763 101.312 96,110 116,084 118,163 105,595 149,349 205,7.62 317,775 385,000Construction 12,229 11,832 24,444 13,133 15,434 36,734 24,890 18,734 53,000 68,000 102,000
Capital Goods 52.297 67,875 77,700 75,558 8t2047 114349 125,687 147.856 27459 467,000- 425,000Agriculture 4,057 4,637 6,643 6,135 7,557 6,670 4,370 5,695 8,843 21,340 n.a.Industry 29,889 40,536 41,446 37,161 41,904 63,120 76,316 83,992 133,020 309,050 n.a.Transpore Equipment 18,351 22,702 29,611 32,262 32,586 44,559 45,001 58,169 132,296 136,610 n.a.
Consumer Goods 33071 33,022 37.041 34,866 36,198 38.234 46,228 64,064 108.246 - 102,576- 1059002Food 3,475 3,443 4,498 4,256 3,639 3,182 3,894 4,706 19,780 17,440 n.a.Pharmaceucical Products 9,990 10,769 12,181 14,766 14,606 14,949 17,049 20,248 30,805 24,243 n.a.
Clothing and Textiles 654 872 680 664 766 471 413 563 833 727 n.a.Others 18,952 17,938 19,682 15,180 17,187 19,632 24,872 38,547 56,828 60,166 n.s.
Fuels and Lubricants 4.873 20,825 9,323 15,893 17,193 27688 10602 683/ 232 000 143,900 3/ 127,000 -
Others 2.523 1.123 1.343 1,549 1,341 1,240 1 040 350 1,000 1,000 31,000
I/ Estimates on the basis of import permits and balance of payments statistics.2/ Does not include US$ 10 a of border transactions for each year and US$ 22 m of temporary imports in 1974.3/ Includes reconscituted oil imports CIF USS 50.5 m in 1973; US$ 222 m in 1974, US$ 133.9 m in 1975 and us$ 117 m in 1976.4/ Mission estimates.
Source: Central Bank of Ecuador and Ministry of F,nance

Table 3.5: MERCHANDISE IMPORTS BY MAIN CATEGORIES-/, 1970-1975
(in percentages of the total)
1970 1971 1972 1973 1974 1975
Primary and intermediate goods 50.0 46.6 42.4 43.8 46.3 39.8Agriculture 2.0 1.1 1.4 1.5 6.4 2.5Industry 42.4 34.7 33.2 37.6 33.0 31.1Construction 5.6 10.8 7.8 4.7 6.9 6.2
Capital Goods 30.0 33.7 39.5 37.2 40.5 47.5Agriculture 2.8 2.0 1.4 1.4 1.7 2.7Industry 15.3 18.6 24.0 21.1 25.0 30.4Transport 11.9 13.1 14.1 14.7 13.8 14.4
Consumer Goods 13.2 11.2 14.5 16.1 11.3 10.9Food 1.3 0.9 1.2 1.2 2.1 1,8Pharmaceutical products 5.3 4.4 5.4 5.1 3.2 2.6Clothing and textiles 0.3 0.1 0.1 0.1 0.1 0.1Others 6.3 5.8 7.8 9.7 5.9 6.4
Fuels and lubricants 6.3 8.1 3.3 2.8 1.7 1.4
Others, n.e.i. 0.5 0.4 0.3 0.1 0.2 0.4
TOTAL 100.0 100.0 100.0 100.0 100.0 100.0
1/ 1970-1973 on the basis of customs data; 1974 and 1975 on the basis of import permits. Figures havenot been adjusted and so differ from figures on Table 3.4.
Source: Central Bank of Ecuador.

Table 3..6 : MERCHAiM)ISE IMPORTS AND ADJUSTMENTS (FOB), 1970-1975
(Millions of Dollars)
1970 1971 1972 1973 1974 1975
Customs (FOB) - 238.3 297.4 274.8 344.5 592.7 861.7
Non-Monetary Gold -0.9 -1.3 -3.4 -0.7 -1.0 -0.5
Diplomats -0.7 -0.6 -0.6 -0.2 -0.7 -
Border Traffic 10.0 10.0 10.0 10.0 10.0 10.0
Petroleum (Reconstituted) - - - 43.2 189.8 114.5
Temporary Imports - - - - 22.0 -
Total (FOB) 246.7 305.5 280.8 396.8 812.8 985.7
Total (CIF) 273.8 340.1 318.6 457.8 947.6 1,151.2
Source: Central Bank of Ecuador, Monetary Studies Division
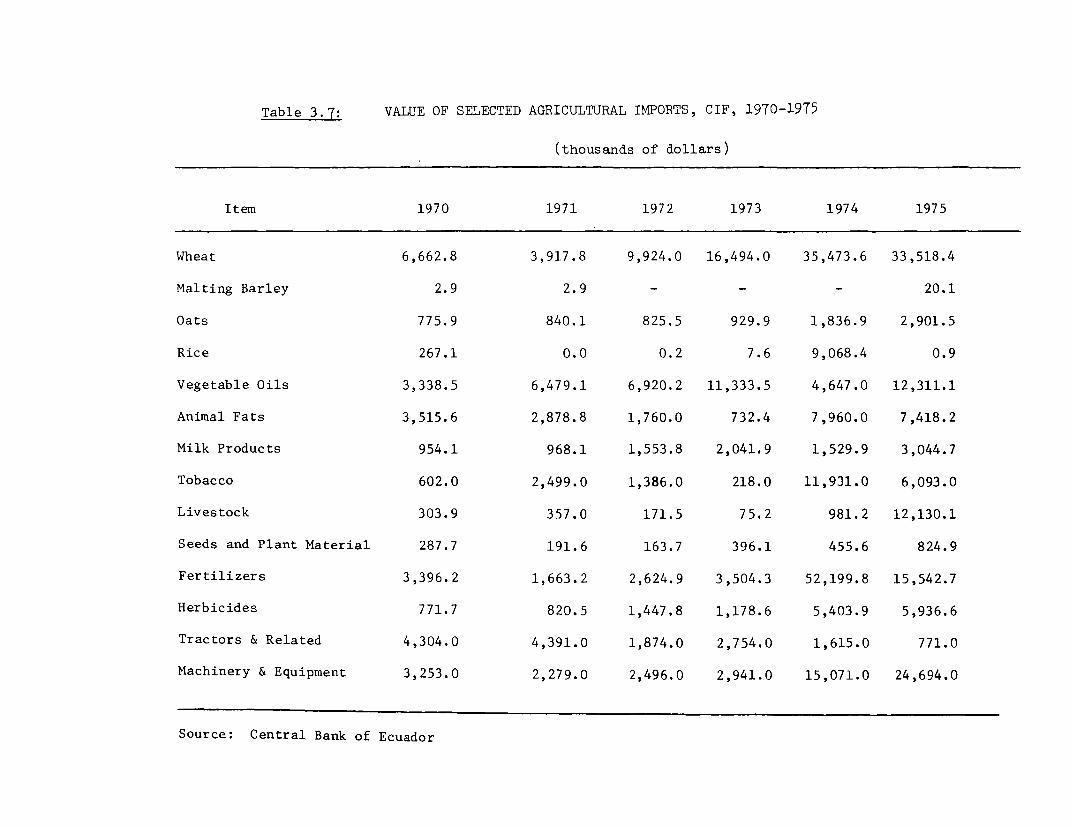
Table 3.7: VALUE OF SELECTED AGRICULTURAL IMPORTS, CIF, 1970-1975
(thousands of dollars)
Item 1970 1971 1972 1973 1974 1975
Wheat 6,662.8 3,917.8 9,924.0 16,494.0 35,473.6 33,518.4
Malting Barley 2.9 2.9 - - - 20.1
Oats 775.9 840.1 825.5 929.9 1,836.9 2,901.5
Rice 267.1 0.0 0.2 7.6 9,068.4 0.9
Vegetable Oils 3,338.5 6,479.1 6,920.2 11,333.5 4,647.0 12,311.1
Animal Fats 3,515.6 2,878.8 1,760.0 732.4 7,960.0 7,418.2
Milk Products 954.1 968.1 1,553.8 2,041.9 1,529.9 3,044.7
Tobacco 602.0 2,499.0 1,386.0 218.0 11,931.0 6,093.0
Livestock 303.9 357.0 171.5 75.2 981.2 12,130.1
Seeds and Plant Material 287.7 191.6 163.7 396.1 455.6 824.9
Fertilizers 3,396.2 1,663.2 2,624.9 3,504.3 52,199.8 15,542.7
Herbicides 771.7 820.5 1,447.8 1,178.6 5,403.9 5,936.6
Tractors & Related 4,304.0 4,391.0 1,874.0 2,754.0 1,615.0 771.0
Machinery & Equipment 3,253.0 2,279.0 2,496.0 2,941.0 15,071.0 24,694.0
Source: Central Bank of Ecuador

Table 3.8: FOREIGN INVESTMENT PROFITS BY SECTOR, 1963-1974
(thousands of dollars)
1963 1964 1965 1966 1967 1968 1969 1970 1971 1972 1973 1974
Agriculture 17 -60 -7 -203 -338 -140 -432 -342 255 537 69 1,448
Mining andPetroleum 972 2,656 3,712 958 983 1,402 1,124 1,6i8 _ 17,635 88,559 157,397
Industry 2,796 3,003 4,825 5,163 6,038 6,725 7,829 6,135 11,779 19,708 17,328 21,697
Construction -233 -149 115 143 42 183 72 210 232 809 1,228 761
Commerce 842 1,211 1,932 2,802 3,027 2,472 4,197 2,691 4,578 13,328 5,007 13,263
Public Service 802 1,091 1,365 582 1,124 1,393 1,706 913 1,146 12,552 4,462 822
Finance 87 163 223 282 99 271 133 572 1,362 1,933 3,362 4,072
TOTAL 5.283 72915 12,165 9727 10,975 12,306 14,629 11,797 19,352 66,502 120,015 197,938
Source; Ministry of Finance.

Table 3.9: ANNUAL NET CHANGE IN FOREIGN INVESTMENT BY SECTOR AND COUNTRY, 1964-1974 1-
(thousands of dollars)
1964 1965 1966 1967 1968 1969 1970 1971 1972 1973 1974
SECTORAgriculture 232 791 -481 4,825 -985 1,823 678 2,168 2,970 -2,758 -1,831
Mining & Petroleum 981 3,062 -1,051 9,316 9,862 18,962 81,800 146,510 15,855 38,308 -35,951
Industry 4,107 1,033 6,556 9,146 4,350 7,700 3,646 8,037 19,411 7,455 21,657
Construction 241 81 -871 192 992 -276 -369 2,120 2,346 465 1,341
Trade & Commerce 2,668 1,211 6,924 -4,356 4,651 3,109 2,165 5,667 8,507 4,889 9,908
Public Service 1,717 1,119 4,834 -4,740 10,797 6,628 11 -3,940 8,233 18,759 -1,827
Finance 210 178 45 2,046 -425 653 666 1,538 1,483 7,202 13,747
Total 10,156 7.475 15.956 16J429 29,24a 38,599 88.597 162,100 58.805 74.320 7,044
COUNTRY
United States 4,536 2,925 19,784 11,236 22,680 34,761 77,008 192,094 32,713 -30,273 -8,676
Great Britain 2,774 3,406 -4,213 2,274 610 742 12,298 -29,984 16,691 1,196 -3,056
Germany, Fed. Rep. of 949 206 -30 -1,168 766 324 475 48 1,406 -755 -216
Italy 32 97 935 -77 880 329 -550 434 1,002 917 -2,668
Netherlands 385 400 163 139 69 348 856 48 399 -610 3,408
Sweden 64 181 -215 -2 66 5 -75 -6 237 -314 39
Switzerland 197 100 -460 407 3,435 629 -3,270 -18 1,801 -966 692
Colombia 133 172 429 569 -39 118 1,122 -19 805 1,858 -1,533
Venezuela 381 223 -1,111 305 136 1,022 -1,057 88 334 -59 333
Other South American nations 517 -234 -645 1,279 -1,014 64 -565 -18 2,359 59,623 10,451
Others 188 -1 1,319 1,467 1,653 257 2,355 -567 1,058 43,703 8,270
Total 10.156 7,475 15,956 16 29242 38599 88,597 162100 58,805 74,320 7,044
1/ Inflows minus outflows.
Source: Central Bank of Ecuador, Department of Economic Indicators,"Foreign Investment in Ecuador," August 1976.

Page 1 of 2
Table 3.10: BALANCE OF PAYMENTS, PROJECTIONS
(millions of dollars)
Estimate Proj ections1976 1977 1978 1979 1980 1981
I. Resource Balance
Exports 1,295.8 1,297.2 1,496.7 1,666.5 1,820.2 1,998.5Non-Factor Services 66.7 70.0 75.0 80.0 85.0 90.0Exports and Non-Factor
Services 1,362.5 1,367.2 1,571.7 1,746.5 1,905.2 2,088.5
Imports of Goods (CIF) 1,207.0 1,359.3 1,522.1 1,638.8 1,866.5 2,126.4Other Non-Factor Services 70.0 50.0 55.0 60.0 65.0 70.0Imports and NFS 1,277.0 1,409.3 1,577.1 1,698.8 1,931.5 2,196.4Resource Balance 85.3 -42.1 -5.4 47.7 -26.3 -107.9
II. Net Factor Services -76.0 -69.o -88.o -104.1 -118.1 -138.0
III. Transfer 21.0 25.0 25.0 25.0 25.0 30.0
IV. Balance on Current Account 30.3 -86.1 -68.4 -31.4 -119.4 -215.9
V. Medium- and Long-Term Capital
Direct Investment 20.0 -59.4 - -3.0 - 35.0 40.0 45.0Public M and LT Capital 231.0 191.0 176.0 171.0 176.0 159.0Disbursements (298.0) (263.0) (284.o) (285.0) (299.0) (316.0)Amortization (-67.0) (-72.0) (-108.0) (-114.0) (-124.0) (-157.0)
Private Sector (-2.0) - - - - -
Capital Transactions n.i.e. -90.0 -20.0 -/ -36.4 - -36.4 2/ -16.4 - -16.4 21
Sub-Total 159.0 111.6 136.6 169.6 199.6 187.6
VI. Changes in Reserves(- increase) -189.0 -25.5 -68.2 -138.2 -80.2 28.3
Net International Assets(end of period) 435 460 528 666 746 718
1/ Includes US$82 million for the purchase of Gulf shares in the consortium. The rest
(US$35.6 million) is considered in 1978.2/ There are unreported external credits for which no precise information exists. The
US$20 million represents an estimate of the annual amortization. Also from 1979onwards includes amortization for the US$82 million in 1977 for the purchase of Gulfassets.
2/28/77

Page 2 of 2
Table 3.10: BALANCE OF PAYMENTS, 1976 AND PROJECTIONS
Projection Assumptions
I. Trade Balance
Exports of goods From Table 3.11 connected to 1976 pricesImports of goods From Table 3.42connected to 1976 prices
II. NFS Balance
Receipts Constant increment on the basis ofhistorical experience
Payments As a constant ratio to FOB imports
IV. Net Factor Services
Interest Existing debt interest on the basis offigures as of Dec. 31, 1975 plus newdebt interest computed in accordancewith the terms of the source of financing
Profit remittances On the basis of historical experience.Figures reduced to take into account thetransfer of Gulf's shares in theconsortium to CEPE at the end of 1976.
V. Transfers Constant at the historical level
VII. Medium and Long-Term Capital
Direct Investment Takes into account the transfer of Gulf'sshares in the consortium to CEPE at theend of 1976. Payment of US$82 in 1977and up to US$35.6 in 1978. Moderateexpansion thereafter.
VIII. Official Credits
Disbursements and Amortization Undisbursed debt as of Dec. 31, 1975projected on the basis of debt tables.New debt assumes usual terms for IDB,IBRD; 2 year grace period, 7 yearamortization period and 8-1/2 interestfor suppliers' credit and private banks.
XI. Short-Term Capital and On the basis of historical experience.Banking System Assumes special arrangements in 1977 and
1978 to finance purchase of Gulf sharesin the consortium. Also some unreporteddebts. See footnote 2.

Table 3.11: MERCHANDISE EXPORTS, PROJEC(TIONS
(Million US$)
Actual Estimate Projected1973 1974 1975 1976 1977 1978 1979 1980 1981
A. Constant Prices
(1974 = l0O)Bananas 126.6 125.0 123.8 132.7 132.9 125.4 133.1 138.3 138.7Coffee 71.5 67.4 65.2 76.3 67.3 69.4 71.4 72.6 74.5Cocoa 40.9 102.9 49.5 30.1 57.4 66.4 81.4 82.9 83.0Sugar 27.4 42.5 18.5 12.0 27.5 29.6 30.8 32.9 34.6Petroleum 757.4 737.3 606.3 656.8 597.3 673.3 700.9 700.8 699.6Others 89.8 112.2 106.6 150.1 158.2 168.1 181.7 203.5 233.1Total goods 1,113.5 1,187.3 969.9 1,058.0 1,040.6 1,132.2 1,199.3 1,231.0 1,263.5Non-factorservices 51.8 47.6 52.1 54.7 53.0 52.5 52.1 51.7 51.4
Total goodsand NFS 1,165.4 1,234.9 1,022.0 1,112.7 1,093.6 1,184.7 1,251.4 1,282.7 1,314.9
B. Price Indices
(1974 = lo0)Bananas 99.0 100.0 126.7 108.7 116.9 126.2 132.0 140.1 153.1Coffee 91.5 100.0 98.6 268.o 220.1 222.0 225.8 235.4 242.6Cocoa 63.5 100.0 76.2 110.3 112.3 97.0 82.7 83.7 86.5Sugar 45.6 100.0 81.6 40.8 42.2 61.5 66.4 70.6 75.5Petroleum 37.2 100.0 109.2 110.5 118.6 128.0 137.4 146.8 157.1Others 81.7 100.0 114.5 122.0 132.2 142.8 153.4 164.3 175.2Total goods 52.5 100.0 104.4 122.5 124.7 132.2 139.0 147.9 158.2Non-factor
services 81.7 100.0 114.5 122.0 132.2 142.8 153.4 164.3 175.2Total goods
and NFS 53.8 100.0 105.0 122.5 125.0 132.7 139.6 148.5 158.8
C. Current PricesBananas 125.3 125.0 156.9 144.2 155.4 158.2 175.7 193.7 212.4Coffee 65.4 67.4 64.3 204.5 148.2 154.0 161.3 170.8 180.8Cocoa 26.0 102.9 37.7 33.2 64.5 64.4 67.3 69.3 71.8Sugar 12.5 42.5 15.1 4.9 11.6 18.2 20.5 23.2 26.1Petroleum 282.1 737.3 616.8 725.8 708.4 861.8 963.0 1,028.8 1,099.1Others 73.4 112.2 122.1 183.2 209.1 240.2 278.7 334.4 408.3Total goods 5814.7 1,187.3 1,012.9 1,295.8 1,297.2 1,496.7 1,666.5 1,820.2 1,998.5Non-factor
services 42.3 47.6 59.7 66.7 70.0 75.0 80.0 85.0 90.0Total goodsand NFS 627.0 1,234.9 1,072.6 1,362.5 1,367.2 1,571.7 1,746.5 1,905.2 2,088.5
2/28/77
<^--"cp: ?ission estimates

Table 3.12: MERCHANDISE IMPf,RTS, PROJECTIONS
(Million US$)
Actual Estimate Projected
1973 1974 1975 1976 1977 1978 1979 1980 1981
A. Constant Prices (1974=1OO)
Primary and inter-
mediate goods 204.7 300.2 320.6 363.7 394.2 427.3 463.2 502.1 544.2Capital goods 160.7 274.2 397.4 342.3 373.0 406.4 442.9 482.7 526.4Consumer goods 86.0 109.2 95.0 120.2 224.6 215.5 153.4 157.4 161.5Fuels and lubricants 118.7 232.0 134.6 116.2 8.4 9.4 10.2 4.7 12.8Total goods 570.1 915.6 947.6 942.4 1,000.2 1,058.6 1,069.7 1,146.9 1,244.9Non-factor services 74.9 127.7 47.7 57.4 37.8 38.5 39.1 39.6 39.9
Total goods and NFS 645.0 1,043.3 995.3 999.8 1,038.0 1,097.1 1,108.8 1,186.5 1,284.8
B. Price Indices (1974=100)Primary and inter-
mediate goods 84.9 100.0 133.4 142.7 151.3 160.4 170.0 180.2 191.0Capital goods 92.0 100.0 117.5 124.1 130.4 136.9 143.7 150.9 158.4Consumer g ods 74.9 100.0 108.0 113.1 118.8 124.7 131.0 137.5 144.4Fuels and lubricants 52.0 100.0 106.9 109.3 118.8 127.3 136.6 147.4 156.2Total goods 78.6 100.0 120.4 123.1 135.9 143.8 153.2 162.8 170.8Non-factor services 81.8 100.0 106.3 121.9 132.2 142.8 153.4 164.3 175.2
Total goods and NFS 78.9 100.0 119.8 127.7 135.8 143.8 153.2 162.8 170.9
C. Current PricesPrimary and inter-mediate goods 173.8 300.2 427.7 519.0 596.4 685.2 787.4 904.7 1,039.4
Capital goods 147.8 274.2 467.0 425.0 486.2 556.2 636.5 728.4 833.8Consumer goods 64.4 109.2 102.6 136.0 266.8 268.7 200.9 216.4 233.2Fuels and lubricants 61.7 232.0 143.9 127.0 10.0 12.0 14.0 17.0 20.0Total goods (CIF) 447.8 915.6 1,141.2 1,207.0 1,359.3 1,522.1 1,638.8 1,866.5 2,126.4Non-factor services 61.3 127.7 50.7 70.0 50.0 55.0 60.0 65.0 70.0
Total goods and NFS 509.1 1,043.3 1,191.9 1,277.0 1,409.3 1,577.1 1,698.8 1,931.5 2,196.4
2/28/77

CONFlDflIT1AL07/24/76
TABLE 4.1 PAGE I
EXTERNAL PUBLIC DEBT OUTSTANOING INCLUOING UNOISRURSEO AS OF OEC. 31, 1975DEBT REPAYABLE IN FOREtGN CURRENCY AND GOODS
(IN THOUSANDS OF U.S. DOLLARS)
D E 8 T O U T S T A N D I N GTYPE,OF CREDITOR-
CReDITOR COUNTRY DISBURSED sUNDISBURSED: TOTAL…____________-____ _--------… …s - - ----- …
SUPPLIERS CREDITSARGENTINA 156 123 2798ft ZIL - 723 723FRANCE 3,825 8,500 12,325GERMANY, FED.REP. OF 2,940 1,763 4,703ITALY 13,424 - 13,424JAPAN 1,688 3,166 10.854MEXICO 720 - 720SPAIN 5.944 2,589 8,533SWEDEN 19,010 8,704 27,714UNITED KINGDOM 941 - 941UNITED STATES 5,214 - 5,214
TOTAL SUPPLIERS CREDITS 59,862 25,568 85,430
PRIVATE BANK CREDITSFRANCE 30,000 - 30,000SWITZERLAND 1,619 415 2,034UNITED STATES 13,987 30,9836 104,823
TOTAL PRIVATE BANK CREDITS 105,606 31,251 136,857
PUBLICLY ISSUED 8ONDSUNITED KINGnOM 1.3Z8 - 1,328UNITED STATFS 943 - 943
TOTAL PUBLICLY ISSUED BONDS 2,211 - 2,271
OTHER PRIVATE DEBTARGENTIINA - 589 589FRAZIL 292 - 292FRANCE 911 - 911UNITED STATES 3,090 6,925 109015MULTIPLE LENDERS 6,554 - 6,554
TOTAL OTHFR PRIVATE DEBT 10.841 7,514 18,361
LOANS FROM INTERNATIONAL ORG.CORP. ANDINA FOMENTO 2,873 17,168 20,041IBRO 43,032 36,188 79,220IDA 28.404 10,l30 38,534IDB 56,862 115,365 172,227
TOTAL LOANS FROM INTERNATIONAL ORG. 131,17t 178,851 310,022
LUANS FRUM GOVEERNMENTSCANADA 14,127 9,073 23,200CZECHOSLOVAK IA 102 3,044 3,146DENMARK 1,595 24 1.619

07/24/76
TABLE 4.1 PAGE 2
EXTERNAL PUBLIC DEBT OUTSTANDING INCLUDING UINDISOURSED AS OF DEC. 31. 1975DEBT REPAYABLE IN FOREIGN CURRENCY AND GOODS
IIN THOUSANDS OF U.S. DOLLARS$
D E 8 T O U T S T A N D I N GTYPE OF CREOITOR -------------------------------- ,
CPEDITOR COUNTRY DISBURSED sUNDISBURSED: TOTAL- - ----------------------- …--…--- _-- - I
GERMANY, FED.REP. OF 16,344 10,561 26,905HUNGARY 652 _ 652JAPAN 4,352 29,638 33,990POLAND 1,029 - 1.029SPAIN 266 668 934UNITED KINGDOM 3,814 10,008 13,8Z2UNITED STATES 17,471 17,999 95,410
TOTAL LOANS FROM GOVERNMENTS 119,752 81.015 200,767
TOTAL EXTERNAL PUBLIC DEBT 429,509 324,199 753,108,
NOTES: (Li ONLY DEBTS WITH AN ORIGINAL OR EXrENOED MATURITY OF OVER ONE YEAR ARE INCLUOED IN THIS TABLE.(21 DEBT OUTSTANDING INCLUDES PRINCIPAL IN ARREARS BUT EXCLUDES INTEREST IN ARREARS.13) THE FOLLOWING UNCOMMITTED PARTS OF FRAME AGREEMENTS AND STANDBYS ANE NOT INCLUDED IN THIS TABLE.
LOANS FROM GOVERNMENTSPOLAND 2,152
TOnTL 2,152
TOTAL UNCOMMITTED FRAME AGREEMENTS AND STANDBYS 2,152
EXTERNAL DISBT DIVISIONECONOIKC ANALYSIS & PROJECTICNS DEPARTHENT
JULY 28, 1976

CONFIDENTIAL
07/24/76TABLE PAGE 1
SERVICE PAYMENTS, COMMITMENTS. DISBURSEMENTS AND OUTSTANDING AMOUNTS OF EXTERNAL PUBLIC DEBT
PROJECTIONS BASED ON DEBT OUTSTANDING INCLUDING UNDIS8URSED AS OF DEC. 31, 1975DEBT REPAYABLE IN FOREIGN CURRENCY AND GOODS
(IN THOUSANDS OF U.S. DOLLARSITOTAL
YEAR : DEBT OUTSTANDING AT : T R A N S A C T I n N S D U R I N G PER 1 0 0 : OTHER CHANGES: BEGINNING OF PERIOD t t
… - - - _ _ - - - _ _ _ _ __ __ - - - _ _ _ _ - - __ -__ S - - - - - - - - - - - - - - - - - - - - - - - - - - - -_
: DISBURSED a INCLUDING s COMMIT- A DISBURSE- : S E R V I C E P A V M E N T S * CANCEL- s ADJUST-r ONLY IUNDISBURSED: MENTS i RENTS :-----------:-----------:-----------: LATIONS M MENT *
: * : * PRINCIPAL : INTEREST : TOTAL 2: (1 : 12 : (3) ( 14 * 15) * 16 s (77 : 8I) 191
1968 143,889 256,803 47,864 41,558 13,132 6,273 19,405 128 -1231969 172,182 291,284 13,529 24,592 14,122 6,837 20,959 310 291910 183,16E 290,410 77,090 41,920 16,109 1,078 23,187 4,251 -1231971 208,869 347,017 80,754 40,818 24,746 7,883 32,629 2,524 3,9131972 226,618 404,414 113,902 101,025 26,638 10,381 37,019 21,789 1,3581973 301,892 471,247 1089268 52,496 30,752 15,387 46,139 7,696 7,5301974 328,174 548,597 131,205 70,740 17,271 16,615 93,892 10,310 3,9471975 323,995 596,242 205,405 141,523 32,451 17,263 49,714 9,056 -6,4311976 429,509 753,709
* * * * * * THE FOLLOWING FIGURES ARE PROJECTED * * * * * *
1976 429,509 753,709 - 129,625 63,189 24,450 87,639 -1977 495,946 690,519 - 79,668 72,174 25,894 98,068 -1978 503,442 618,348 - 49,697 67,776 23,865 91,641 -1979 485,361 550,570 - 32,455 53,530 22,126 75,656 -1980 464,298 497,049 - 20,746 48,657 20,371 69,028 -1981 436,392 448,397 - 9,876 38,892 18,071 56,963 -1982 407,383 409,512 - 2,124 33,982 1.5829 49,811 -1983 375,528 375,533 - 5 29,641 13,747 43,394 -1984 345,885 345,885 - - 26,036 12,335 38,371 -1985 319,848 319,848 - - 24,395 11,242 35,637 -1986 295,463 295,463 - - 23,143 9,964 33,107 -1987 272,315 272,315 - - 21,706 9,825 30,531 -1988 250,612 250,612 - - 20,571 1,765 28,336 -1989 230,041 230,041 - - 17,414 6,820 24,234 -1990 212,628 212,628 - - 17,646 6,047 23,693 -1991 194,984 194,984 - - 14,819 5,271 20,090 -1992 180,169 180,169 - - 15,070 4,762 19,832 -1993 165,099 165,099 - - 15,098 4,161 19,259 -1994 150,003 150,003 - - t4,635 3,558 18,193 -1995 135,367 t35,367 - - 11,533 3,012 14,545 -NOTE: INCLUDES ALL DEBT LISTED UN TABIE 1,PR:PAPFl) JiILY 28. 1976.;
* THIS COLUMN SHOWS THE AMCUNT CF ARITHMETIC IMBALANCE IN THE AMOUNT OUTSTANDING INCLUDING UNOISBURSED FROM ONEYEAR To THE NEXT. THE MOST COMMON CAUSES OF IMBALANCES ARE CHANGFS IN EXCHANGE RATES AND TRANSFER OF DEBTSFROM ONE CATEGORY TC ANOTHFR IN tRE TABLE.

ID/24/76TABLE 4.2
PAGE 2SERVICE PAYMENTS, COMMITMENTS, DISBURSEMENTS AND OUTSTANDING AMOUNTS OF EXTERNAL PUBLIC DEBT
PROJECTIONS BASED ON DEST OUTSTANDING INCLUDING UNDIS8URSED AS OF DEC. 31, 1975DEBT REPAYABLE tN FOREIGN CURRENCY AND GOODS
(IN THOUSANDS OF U.S. DOLLARS)TYPE OF CREDITOR SUPPLIERS CREDITS
TOTALYEAR : DEBT OUTSTANDING AT : T R A N S A C T I 0 N S D U R I N G P E R I 0 D : OTHER CHANGES
: BEGINNING d2F PERIOD : I… - s---- …
DISBURSED : INCLUDING s COMMIT- t DISBURSE- 2 S E R V I C E P A Y M E N T S 2 CANCEL- s ADJUST-' ONLY 2UNO(SOURSEOt MENTS : MENTS 2 ……----------------------I----------- LATIONS 2 MENT *
I I PRINCIPAL s INTEREST * TOTAL 2 2
III : {2) : (3) t (43 s (5 (6) 17) : (8) 2 19
1968 13,730 62,156 25,036 22,347 5,049 1,341 6,390 - 21969 31,030 82,145 3,962 8,646 3,891 1,731 5,628 - -1171970 36,399 82,099 35,506 22,173 5,115 1,692 1,401 178 -1971 52,857 111,712 44,574 14,321 109609 1,766 12,375 554 1,9521972 57,572 147,075 4,187 29,382 12,429 2,249 14,678 21,400 4291973 74,818 118,462 18,736 16,610 14,833 4,217 19,050 5,023 2,5781974 78,141 119,920 788 4,492 20,611 4,955 25,566 3,802 2721975 62,319 96,567 9,952 11,739 13,688 3,603 I7,291 6,682 -7191976 59,862 85,430
* * * * * * THE FOLLOWING FIGURES ARE PROJECTED * * * * * *
1976 59,862 85,430 - 14,363 22,161 3,133 25,894 -1917 52,064 63,269 - 7,311 21,662 2,938 24,600 _1978 37,714 41,608 - 2,817 20,597 1,867 22,464 -1979 19,932 21,010 - 1,077 7,306 1,176 8,482 -1980 13,706 13,706 - - 6,679 833 7,512 -1981 7,028 7,028 - - 1,240 464 1,704 -1982 5,788 5,188 - - 717 392 1,109 -1983 5,071 5,071 - - 677 341 1,018 -1984 4,393 4,393 - - 677 292 969 -1985 3,716 3,716 - - 677 244 921 -1986 3,039 3,039 - - 605 197 802 -1987 2,434 2,434 - - 605 154 759 -
1988 1,828 1,828 - - 605 112 t17 -1989 1,224 1,224 - - 272 75 347 -1990 952 952 - - 272 57 329 -1991 680 680 - - 272 40 312 -1992 408 408 - - 272 22 294 -1993 136 136 - - 136 4 140 -
* THIS COLUMN SHOWS THE AMOUNT CF ARITHMETIC IMBALANCE IN THE AMOUNT OUTSTANDING INCLUDING UNDISBURSED FROM ONEYEAR TO THE NEXT. THE MOST COMMON CAUSES OF IMBALANCES ARE CHANGES IM EXCHANGE RATES AND TRANSFER OF DEBTSFROM ONE CATEGORY TO ANOTHER IN THE TABLE.

07/24/76TA8LE 4.2
PACE 3SERVICE PAYMENIS, COMMITMENTS, DISBURSEMENTS AND OUTSTANDING AMOUNTS OF EXTERNAL PUBLIC DEBT
PROJECTIONS BASED ON DEBT OUTSTANDING INCLUOING UNDISBURSED AS OF DEC. 31, 1975DEBT REPAYABLE IN FOREIGN CURRENCY AND GOODS
IIN THOUSANDS OF U.S. DOLLARS)TYPE OF CREDITOR PRIVATE BANK CREDITS
TOTALYEAR s DEBT OUTSTANOING AT S T R A N S A C T I O N S D U R I N G P E R I O D : OTHER CHANGES
B 8EGINNI;NG OF PERIOD :s -- ------ -…-……… --D DISBURSED 2 INCLUDING s COMMIT- s DISBURSE- 2 S E R V I C E P A Y M E N T S : CANCEL- * ADJUST-
t ONLY tUNDISBURSEDO MENTS : MENTS 2---------------------------- LATIONS M HENT *: 2 I PRINCIPAL t INTEREST t TOTAL t t
t (11 a (2) : (3) (4) t 15 (6) 1 t 71 t l8) * (93
1968 1,802 5,994 2,530 2,152 775 331 1,106 - 131969 3,181 7,762 885 301 1,180 285 1,465 - -2351970 2,306 7,232 6,000 1,143 705 186 891 1,800 -291971 2,741 10,698 1,515 343 847 283 1,130 - 3271972 2,272 11,693 53,650 44,650 613 1,696 2,309 190 1231973 46,321 64,663 21,087 8,951 991 4,288 5,279 2,673 3801974 54,331 82,466 18,270 33,856 42,308 3,824 46,132 3,377 3891975 46,047 55,440 86,740 64,855 5,256 5,049 10,305 - -671976 105,606 136,857
* * * * * * THE FOLLOWING FIGURES ARE PRnJECTED * * * * i *
1976 105,606 136,857 - 22,802 20,068 9,061 29,129 -1977 108,340 116,789 - 4,973 26,824 8,933 35,757 -1978 86,492 89,968 - 2,991 22,835 7,091 29,926 -1979 66,649 67,134 - 485 22,835 5,270 28,105 -1980 44,301 44,301 - - 15,185 3,463 18,648 -1981 29,117 29,117 - - 11,512 2,410 13,922 -1982 17,608 17,608 - - 6,512 1,590 8,102 -1983 11,096 11,096 - - 3,083 1,060 4,143 -1984 8,014 8,014 - - 2,468 722 3,190 -1985 5,546 5,546 - - 1,444 495 1,939 -1986 4,102 4,102 - - 796 343 1,139 -1987 3,306 3.306 - - 245 288 533 -1988 3,061 3,061 - - 245 266 511 -1989 2,816 2,816 - - 245 245 490 -1990 2,571 2,571 - - 245 223 468 -1991 2,327 2,321 - - 245 201 446 -1992 2,082 2,082 - - 245 179 424 -1993 1,837 1,837 - - 245 158 403 -1994 1,592 1,592 - - 245 136 381 -1995 1,347 1,347 - - 245 114 359 -
* THIS COLUMN SHOWS THE AMOUNT CF ARITHMETIC IMBALANCE IN THE AMOUNT OUTSTANDING INCLUDING UNDISBURSED FROM ONEYEAR TO THE NEXT. THE MOST COMMON CAUSES OF IMBALANCES ARE CHANGES I4 EXCHANGE RATES AND TRANSFER OF DEBTSFROM ONE CATEGORY TO ANOTHER IN THE TABLE.

07/24/76TABLE 4.2
PAGE 4SERVICE PAYMENTS, COIMITMENTS9 DISBURSEMENTS AND OUTSTANDING AMOUNTS OF EXTERNAL PUBLIC DEBT
PROJECTICNS BASED ON DEBT OUTSTANDING INCLUDING UNDISBURSED AS OF DEC. 31, 1975DEBT REPAYABLE IN FOREIGN CURRENCY AND GOODS
IIN THOUSANDS OF U.S. DOLLARSITYPE OF CREDITOR PUBLICLY ISSUED BONDS
TOTALYEAR DEBT OUTSTANOING AT : T A A N S A C T I 0 N S 0 U R I N G P E R I 0 0 s OTHER CHANGES
BEGINNING OF;PERIOD s… -------. ~~~~--- - -…--- - -* …--- - -- - --- ---- -- - -- - -…- -
s DISBURSED : INCLUDING s COMMIT- s DISBUPSE- s S E R V I C E P A Y M E N T S s CANCEL- s ADJUST-O ONLY :UNDISPURSED: MENTS s MENTS s-------- ----------- …-----------: LATIONS MENT *
: I : : PRINCIPAL : INTEREST : TOTAL s s: 111 : l(21 s 131 2 141 : 151 1 16) 1 (7 18) s (9)
1968 3,875 3,875 - _ 179 101 280 - -1221969 3,574 3,574 - - 182 85 267 - -1421970 3,250 3,250 1,429 1,429 192 75 267 - -1581971 4,329 4,329 - - 908 19 927 - -321972 3,389 3,389 1,195 1,000 244 96 340 195 -1271973 4,018 4,018 - - 732 156 888 - 871974 3,313 3,373 - - 840 100 940 - 151975 2,548 2,548 - - 265 43 308 - -121976 2,271 2,271
* * * * * * THE FOLLOWING FIGURES ARF PROJECTEO * * * * * *
1976 2,271 2,271 - - 856 63 919 - -1977 1,415 1,415 - - 563 42 605 - 11978 853 853 - - 255 23 278 - _1979 598 598 - - 258 16 274 - I1980 341 341 - - 266 8 274 - -1981 75 75 - - 75 1 76 - -
* THIS COLUMN SHOWS THE AMOUNT CF ARITHMETIC IMBALANCE IN THE AMOUNT OUTSTANDING INCLUDING UNDISBURSEO FROM ONEYEAR TO THE NEXT. THE MOST COMMON CAUSES OF IMBALANCES ARE CHANGES IN EXCHANGE RATES AND TRANSFER OF DEBTSFROM ONE CATEGOPY TO ANOTHER IN THE TABLE.

07/24/16TABLE 4.2 PAGE 5
SERVICE PAYMENTS, COMMITMENTS* DISBURSEMENTS AND OUTSTANDING AMOUNTS OF EXTERNAL PUBLIC DEBT
PROJECTICNS BASED ON DEBT OUTSTANDING INCLUDING UNDISBURSED AS OF DEC. 31, 1975DEBT REPAYABLE IN FOREIGN CURRENCY AND GOODS
(IN THOUSANDS OF U.S. DOLLARS)TYPE OF CREDITOR OTHER PRIVATE DEBT
TOTALYEAR : DEBT OUTSTANDING AT : 7 R A N S A C T I 0 N S 0 U R I N G P E R I 0 0 : OTHER CHANGES: BEGINNI;NG OF PERIOD s
… _ _ _ …_ …_…_…_…--------__s------ --------------------------------------------------- …-------------------------
DISBURSED : INCLUDING t COMMIT- : DISBURSE- z S E R V I C E P A Y N E N T S : CANCEL- ADJUST-ONLY :UNDISBURSED2 MENTS i MENTS :--------- - ------ - s… : LATIONS s MENT *
s s s : sPRINCIPAL s INTEREST s TOTAL s ss (113 s 23 313 f4l a 15) s 16) s 17) s (8) s (9)
1968 - - 6,601 - - - - - -1969 - 6,601 - 2,200 - - - -1970 2,200 6,601 11,068 1,555 1,755 346 2,1011971 2,000 15,914 9,379 2,896 2,906 684 3,590 - 3461972 1,990 22,733 - 6,985 4,117 930 5,047 - 1311973 4,848 18,747 2,657 6,626 3,364 560 3,924 _ 4461974 7,939 18,486 - 3.123 1,906 492 2,398 1,223 3631975 9,373 15,720 3,969 2,802 1,167 876 2,043 112 -491976 10,847 15,361
* * * * * * THE FOLLOWING FIGURES ARE PROJECTED s s * o s *
1976 10,847 18,361 - 4,717 3,761 1,085 4,846 -1971 11,803 14,600 - 2,007 3,T98 1,083 4,881 _1978 10,013 10,803 - 790 3,739 832 4,571 -1979 7,062 7,062 - - 3,338 541 3,879 -1980 3,724 3,724 - - 2,743 259 3,002 -1981 982 982 - - T98 52 850 -1982 184 184 - - T4 12 86 -1983 110 110 - - 74 7 81 -1984 37 37 - - 37 1 38 -
* THIS COLUMN SHOWS THE AMOUNT OF ARITHMETIC IMBALANCE IN THE AMOUNT OUTSTANDING INCLUDING UNDISBURSED FROM ONEYEAR TO THE NEXT. THE MOST COMMON CAUSES OF IMBALANCES ARE CHANGES IN EXCHANGE RATES AND TRANSfER OF DEPTSFRCM ONE CATEGORY TO ANOTHER IN lHE TABLE.

07/24/76TABLE 4.2 PAGE 6
SERVICE PAYMENTS, COPMITMENTS, DISBURSEMENTS AND OUTSTANDING AMOUNTS OF EXTERNAL PUBLIC DEBT
PROJECTIONS BASED ON DEBT OUTSTANDING INCLUDING UNDIS0URSED AS OF DEC. 31, 1975DEBT REPAYABLE IN FOREIGN CURRENCY AND GOODS
(IN THOUSANDS OF U.S. DOLLARS)TYPE CF CREDITOR LOANS FROM INTERNATIONAL ORG.
CREDITOR COUNTRY CORP. ANDINA FOMENTOYEAR DEBT OUTSTANOING AT t T R A N S A C T I O N S O U R I N G P E R I O O OTHER CHANGES
BEGINNING OF;PERIOD *…………… 5 --------- …--------------
DISBURSED : INCLUDING C COWI T- I DISBURSE- : S E R V I C E P A Y M E N T S * CANCEL- t ADJUST-: ONLY sUNDIS8URSEDs MENTS s MENTS s-----------:- -- -----------… LATIONS : MENT *
: PRINCIPAL a INTEREST 2 TOTAL : as (Ip a (2) s (33 : 1 a s 5) s 16) 47) t (8) ( 19
1968 - - - -19691970 - - - - - - -
1971 - - 5001972 - 500 1,412 1,225 - - -1973 1,225 1,912 25 339 41 79 0ZO1974 1,523 1,896 1,266 1,056 115 106 2211975 2,464 3,047 17,168 583 174 146 3201976 2,873 20,041
* * ** * * $THE FOLLOWING FIGURES ARE PROJECTED * * * * * *
1976 2,873 20,041 - 4,418 653 424 1,077 -
1977 6,638 19,388 - 4,420 1,079 711 1,790 -
1978 9,979 18,309 - 2,890 2,991 872 3,863 -
1979 9,877 15,317 - 2,210 3,008 832 3,840 -
1980 9,079 12,309 - 1,700 3,058 745 3,803 -
1981 7,722 9,252 - 1,190 3,173 612 3,785 -
1982 5,740 6,080 - 340 2,743 419 3,162 -
19B3 3,337- 3,331 - - 1,622 213 1,835 -
1984 1,714 1,714 - - 571 126 697 -1985 1,143 1,143 - - 571 80 651 -
1986 571 511 - - 571 34 605 -
* THIS COLUMN SHOWS THE AMOUNT OF ARITHMETIC IMBALANCE IN THE AMOUNT OUTSTANDING INCLUDING UNDIS8URSED FROM ONEYEAR TO THE NEXT. THE MOST COMMON CAUSES OF IMBALANCES ARE CHANGES IN EXCHANGE RATES AND TRANSFER OF DEBTSFROM ONE CATEGORY TO ANOTHER IN THE TABLE.

01/24/76TABLE 4.2 PAGE 7
SERVICE PAYMENTS, CO1MlTMENTS, DISBURSEMENTS AND OUTSTANDING AMOUNTS OF EXTERNAL PUBLIC DEBT
PROJECTICNS BASEO ON DEBT OUTSTANDING INCLUDING UNDISBIJRSED AS OF DEC. 31, 1975DEBT REPAYABLE IN FOREIGN CURRENCY AND GOODS
1IN THOUSANDS OF U.S. DOLLARSITYPE OF CREDITOR LCANS FROM INTERNATIONAL ORG.
CREDITOR COUNTRY IBRDYEAR s DEBT OUTSTANOING AT : T R A N S A C T I 0 N S 0 U R I N G P E R I 0 0 2 OTHER CHANGES
BEGINNING OF PERIOD t t…--2-…---- - - - ----- -…-…… -- ------
D DISBURSED I INCLUDINGs COMMIT- s DISBURSE- : S E R V I C E P A Y M E N T S s CANCEL- s ADJUST-ONLY :UNDISSURSEDS MENTS 2 MENTS 2-----------:-----------:-----------… LATIONS s MENT *
52: 2 : I PRINCIPAL : INTEREST : TOTAL :II t (2) 131 : (4) 152 : (63 : (7a s (9)
1968 34,079 41,284 5,300 1,913 1,616 1,930 3,746 - -
1969 34,076 44.768 - 1,808 2,038 1,994 4,032 - -
1910 33,846 42,130 - 2,059 2,281 2,025 4,3061971 33,624 40,449 8,000 735 2,401 1,990 4,397 - -
1972 31,952 46,042 - 4,892 2,550 1,937 4,487 - -
1973 34,294 43,492 20,000 4,424 2,913 2,277 5,190 - -
1974 35,805 60,579 23,200 5,061 3,674 2,805 6,479 1,015 -
1915 37,192 19,090 4,000 9,710 3,870 2,440 6,310 - -
1976 43,032 79,220
S * * * * * THE FOLLOWING FIGURES ARE PROJECTED S * * * * *
1976 43,032 79,220 - 11,805 4,656 2,851 7,507 -1977 50,181 74,564 - 6,754 4,715 3,241 7,956 -1978 52,220 69,849 - 5,172 3,355 3,506 6,861 -1979 54,037 66,494 - 6,671 3,835 3,703 7,538 -1980 56,873 62,659 - 4,103 4,195 3,948 8.143 -1981 57,381 58,464 - 991 4,570 3,965 8,535 -1982 53,802 53,894 - 87 4,870 3,712 8,582 -1983 49,019 49,024 - 5 5,166 3,387 8,553 -1984 43,858 43,858 - - 4,410 3,052 7,462 -1985 39,448 39,448 - - 4,439 2,744 7,183 -1986 35,009 35,009 - - 3,560 2,454 6,014 -1987 31,449 31,449 - - 3,790 2,204 5,994 -1988 27,659 27,659 - - 4,054 1,939 5,993 -1989 23,605 23,605 - - 3,805 1,662 5,467 -1990 19,800 19,800 - - 4,315 1,402 5,717 -1991 15,485 15,485 - - 1,405 1,121 2,526 -1992 14,080 14,080 - - 1,495 1,015 2,510 -1993 12,585 12,585 - - 1,585 902 2,487 -1994 11,000 11,000 - - 1,695 783 2,478 -1995 9,305 9,305 - - 1,800 655 2,455 _
* THIS COLUMN SHOWS THE AMOUNT OF ARITHMETIC IMBALANCE IN THE AMOUNT OUTSTANDING INCLUDING UNDISBURSED FROM ONEYEAR TO THE NEXT. THE MOST COMMON CAUSES OF IMBALANCES ARE CHANGES IN EXCHANGE RATES AND TRANSFER OF DEBTSFROM ONE CATEGOPY TO ANOTHER IM THE TABLE.

07/24/76TABLE .?
PAGE 8SERVICE PAYMENTS, COMMITMENTS, DISBURSEMENTS AND OUTSTANOING AMOUNTS OF EXTERNAL PUBLIC DEBT
PROJECTICNS BASED ON DEBT OUTSTANDING INCLUDING UNDISBURSED AS OF DEC. 31, 1975DEBT REPAYABLE IN FOREIGN CURRENCY AND GOODS
(IN THOUSANDS OF U.S. OOLLARS)TYPE CF CREOITOR LOANS FROM INTERNATIONAL ORG.
CREOITOR COUNTRY IDAYEAR : DEBT OUTSTANOING AT I r R A N S A C T I a N S 0 U R I N G P E B I a 0 : OTHER CHANGES
: BEGINNING OF;PFRIOD S…~~~- - - - - - --- -- - - - - - - - - - - - - - - - - ----------……- ---- ------ -- - - -- -… -- - - -
DISBURSED : INCLUDING S COMMIT- : DISBURSE- s S E A V I C E P A Y M E N T S : CANCEL- I ADJUST-: OILY tUNDIS8URSED: MENTS : MENTS -----------……---------:---------- LATIONS , MENT *: : t 2 : PRINCIPAL I INTEREST 2 TOTAL : 3(1) (21 * (3) : 14) f IS) : 16) 1i71 : 981 S £91
1968 432 8,000 5,100 1,492 - 32 32 _1969 19924 13,100 - 1,774 - 61 61 -1970 3,698 t3,100 t1,500 2,143 - - - -1971 5,841 24,600 - 2,024 - 43 43 -1972 7,865 24,600 6,800 3,215 - 74 74 - 7191973 11,799 32,119 5,500 4,413 - 121 121 - 1,4181974 17,630 39,037 - 3,734 47 130 177 _1975 21,317 38,991 - 7,539 93 168 261 362 -21976 28,404 38,534
* * * * * THE FOLLOWING FIGURES ARE PROJECTED * * * * * *
1976 28,404 38,534 - 4,164 171 215 386 -1977 32,397 38,363 - 2,821 ITt 240 411 -1978 35,048 38.193 - 2,023 197 261 458 -1979 36,874 37,996 - 722 223 273 496 -1980 37,373 31,713 - 271 241 278 519 -1981 37,403 37,532 - 112 342 279 621 -1982 37,174 379191 - 17 412 278 690 -1983 3b,780 36,780 - - 440 273 713 -1984 36,341 36,341 - - 638 271 909 -1985 35,703 35,703 - - 808 265 1,073 _1986 34,895 34,895 - - 808 259 1,061 -1987 34,087 34,087 - - 808 253 1,061 -1988 33,280 33,280 - - 860 245 1,105 -1989 32,418 32,418 - - 912 240 1,152 -1990 31,505 31,505 - - 947 233 1,180 -1991 30,558 30,558 - - 1,149 227 1,376 -1992 29,408 29,408 - - 1,290 217 1,501 -1993 28,119 28,119 - 1,345 Z07 1,552 -1994 26,773 26,773 - 1 1,400 196 1,596 -1995 25,372 25,312 - - 1,400 186 1,586 -
* THIS CCLUMN SHOWS THE AMOUNT CF APITHMETIC IMBALANCE IN THE AMOUNT OUTSTANDING INCLUDING UNDISSURSEO FROM ONEYEAR TO THE NEXT. THE MOST COMMON CAUSES OF IMBALANCES ARF CHANGES IN EXCHANGE RATES AND TRANSFER OF DEBTSFRCM ONE CATEGORY TC ANOTHER IN THE TABLE.

07/24/76TABLE 4.2 PAGE 9
SERVICE PAYMENTS, COPMITMENTS, DISBURSEMENTS AND OUTSTANDING AMOUNTS OF EXTERNAL PUBLIC DEBT
PROJECTIONS BASED ON DEBT OUTSTANDING INCLUDING UNDISBURSED AS OF DEC. 31, 1975DEBT PEPAYABLE IN FOREIGN CURRENCY AND GOODS
(IN THOUSANDS OF U.S. DOLLARS)TYPE CF CREDITOR LOANS FROM INTERNATIONAL ORG.
CREDITOR COUNTRY iisYEAR : DEBT OUTSTANDING AT : T R A N S A C T I 0 N S 0 U R I N G P E R I 0 D : OTHER CHANGES
B: EGINNiNG OF PERIOD * t
D DISBURSED I INCLUDING s COMMIT- 2 DISBURSE- * S E R V I C E P A V H1 E N T S 2 CANCEL- t ADJUST-s ONLY :UNDISBURSED: MENTS : MENTS …-…---------2- LATIONS z MENT *: : : * I PRINCIPAL s INTEREST t TOTAL : s2 (11 : (2) s 43) : (4) 2 (53 2 (61 s (71 ( a8 19*
1968 27,t51 41.000 2,000 6,797 1,436 948 2,384 2 -21969 33,111 41,560 - 3,901 1,586 1,096 2,682 310 -1970 35,426 39,664 4,500 1,601 IT87 1.241 3,034 2,021 11971 35,241 40,357 196 3,289 2,252 1,310 3,622 - -11972 36,283 35,300 10,000 1,494 2,131 19324 3,455 - 31973 35,644 46,172 32,600 1,484 2,499 1,545 4,044 - 1461914 34,812 76,419 85,100 7,014 2,894 1,879 4,173 - 4071975 38,932 159,032 16,100 20,834 2,760 2,466 5,226 - -1451976 56,862 172,227
* h* t* * * THE FOLLOWING FIGURES ARE PROJECTED * * * * * *
1976 56,862 172,227 - 33,315 2,316 2,640 4,956 -1977 87,861 169,911 - 28,898 3,238 3,655 6,893 -1918 113,520 166,672 - 19,922 3,238 4,319 7,557 -1919 130,202 163,432 - 14,421 3,238 4,765 8,003 -1980 141,395 160,198 - 11,047 6,301 5,003 11,304 -1981 146,139 153,895 - 6,350 6,301 4,919 11,220 -1982 146,188 147,594 - 1,406 6,301 4,643 10,944 -1903 141,293 141,293 - - 6,121 4,341 10,462 -1984 135,170 135,170 - - 6,979 4,348 11,327 -1985 128,189 128,189 - - 8,199 4,333 12,532 -1986 119,993 119,993 - - 8.250 3,942 12,192 -1987 111,738 111,738 - - 8,077 3,539 11,616 _1988 103,662 103,962 - - 7,168 39151 10,319 -1989 96,494 96,494 - - 7,053 2,822 9,875 -1990 89,439 89,439 - - 6,939 2,504 9,443 -1991 82,500 82,500 - - 6,816 2,193 9,009 -1992 15,683 75,683 - - 6,831 1,885 8,716 -1993 68,851 68,851 - - 6,846 1,581 8,421 -1994 62,001 62,007 - - 6,349 1,276 7,625 -1995 55,651 55,657 - - 3,887 1,024 4,911 -
* THIS COLUMN SHOWS THE AMOUNT CF ARITHMETIC IMBALANCE IN THE AMCUNT OUTSTANDING INCLUDING UNDISBURSED FROM ONEYEAR TO THE NEXT. THE POST COMMON CAUSES OF IMBALANCES ARE CHANGES IN EXCHANGE RATES AND TRANSFER OF DEBTSFROM ONE CATEGORY TO ANOTHER IN THE TABLE.

O7/24/76TABLE 4.2
PAGE 10SERVICE PAYMENTS, COMMITMENTS, OISBURSEMENTS AND OUTSTANDING AMOUNTS OF EXTERNAL PUBLIC DEBT
PROJECTIONS BASED ON DEBT OUTSTANDIhG INCLUDING UNDISB'JRSED AS OF DEC. 31, 1975DEBT REPAYABLE IN FOREIGN CURRENCY AND GOODS
IIN THOUSANDS OF U.S. DOLLARS)TYPE CF CREDITOR LOANS FROM INTERNATIONAL ORG.
TOTALYEAR : DEBT OUTSTANDING AT T T R A N S A C T I 0 N S D U R I N G P E R I 0 D 2 OTHER CHANGES
BEGINNING 0F~ PERIOO :
s DIlBURSED 2 INCLUDING 2 COMMIT- 2 DISBURSE- 2 S E R V I C E P A Y M E N T S 5 CANCEL- * ADJUST-dNLY :UNDISBURSED2 MENTS 2 MENTS :----------:----- :----------- LATIONS 2 MENT *
2 : 2 2 PRINCIPAL 2 INTEREST : TOTAL 2 2: (1) :* (21 (3)(43 : 4151 2 (6) 471 2 (81 t (91
1968 62,262 90,284 12,400 10,102 3,252 2,910 6,162 2 -21969 69,111 99,428 - 7,483 3,624 3,151 6,T75 310 -1970 72,970 95,494 16,000 5,809 4,068 3,272 7,340 2,021 !1971 74,712 105,406 8,696 6,048 4,659 3,403 8,062 - -11972 76,100 109,442 18,212 10,826 4,681 3,335 8,016 - 7221973 82,962 123,695 50,125 10,660 5,453 4,022 9,475 - 1,5641974 89,770 177,931 109,566 16,865 6,730 4,920 11,650 1,015 4081975 99,905 280,160 31,268 38,666 6,897 5,220 12,117 362 -1471976 131,171 310,022
* * ** * * THE FOLLOWING FIGURES ARE PROJECTED * * * * * *
1976 131,171 310,022 - 53,702 7,796 6,130 13,926 -1977 177,017 302,226 - 42,893 9,203 7,847 17,050 -1978 210,767 293,023 - 30,007 9,781 8,958 18,739 -1979 230,990 283,239 - 24,030 10,304 9,573 19,877 -1980 244,720 272,939 - 17,721 13,795 9,974 23,769 -1981 248,645 259,143 - 8,643 14,386 9,775 24,161 -1982 242,904 244,759 - 1,850 14,326 9,052 23,378 -1983 230,429 230,434 - 5 13,349 8,214 21,563 -1984 217,083 217,083 - - 12,598 7,797 20,395 -1985 204,483 204,483 - - 14,017 7,422 21,439 -
1986 190.468 190,*68 - - 13,189 6,689 19,878 -1987 177,274 177,274 - - 12,675 5,996 18,671 -1988 164,601 164,601 - - 12,082 5,335 17,417 -1989 152,517 152,517 - - 11,770 4,724 16,494 -1990 140,744 140,744 - - 12,201 4,139 16,340 -1991 128,543 128,543 - - 9,310 3,541 12,911 -1992 119,171 119,171 - - 9,616 3,117 12,733 -1993 109,555 109,555 - - 9,776 2,690 12,466 -1994 99,780 99,780 - - 9,444 2,255 11,699 -1995 90,334 90,334 - - 7,08r 1,865 8,952 -
* THIS COLUMN SHOWS THE AMOUNT OF ARITHMETIC IMBALANCE IN THE AMOUNT OUTSTANODNG INCLUDING UNDISBURSED FROM ONEYEAR TO THE NEXT. THE MOST COMMON CAUSES OF IMBALANCES ARE CHANGES IN EXCHANGE RATES AND TRANSFER OF DEBTSFROM ONE CATEGORY TO ANOTHER IN THE TABLE.

TABLE 4.2 PAGE 11SERVICE PAYMENTS, COMMITMENTS, DISBURSEMENTS AND OUTSTANDING AMOUNTS OF EXTERNAL PUBLIC DEBT
PROJECTIONS BASED ON DEBT CUTSTANOING INCLUDING UNDISBURSED AS OF DEC. 31, 1975DEBT REPAYABLE IN FOREIGN CURRENCY AND GOODS
(IN THOUSANDS OF U.S. DOLLARS)TYPE OF CREDITOR LCANS FROM GOVERNMENTS
CREDITOR COUNTRY CANADAYEAR : DEBT OUTSTANDING AT 2 T R A N S A C T I 0 N S D U R I N G P E R I 0 D OTHER CHANGES
2 BEGINNIIG OF PERIOD… - -- ------ ----s----2
D DISBURSED : INCLUDING : COMMIT- * DISBURSE- s S E R V I C E P A Y H E N T S s CANCEL- : ADJUST-' ONLY sUNDISBURSEDI MENTS * MENTS --------- - I----------- LATIONS : MENT *
I s : : s PRINCIPAL t INTEREST I TOTAL :: (1) s 12) 2 (3) * 4) 2 (5) £ (6) (7) (9)
1968 - 1,166 - 536 - 14 14 - -1969 536 1,166 - 451 - 15 15 - -1970 993 1,166 - 107 - 16 16 - 701971 1,156 1,236 2,781 956 - 23 23 - 421972 2,139 4,059 8,972 959 - 52 52 - -181973 3,108 13,013 - 1,059 - 74 74 - -21974 4,171 13,011 - 1,499 - 75 75 - 601975 5,669 13,071 10,447 8,593 - 74 74 - -3161976 14,127 23,202
* * * * * * THE FOLLOWING FIGURES ARE PROJECTED * * * * * *
1976 14,127 23,202 - 4,567 630 441 1,071 -1977 18,065 22,570 - 3,100 1,261 763 2,024 -1978 19,903 21,309 - 1,406 1,261 779 2,040 -1979 20,049 20,049 - - 1,261 719 1,980 -1980 18,789 18,789 - - 1,261 619 1,880 -1981 17,528 17,528 - - 1,329 520 1,849 -1982 16,200 16,200 - - 1,545 421 1,966 -1983 14,656 14,656 - - 1,545 319 1,864 -1984 13,110 13,110 - - 1,545 217 1,762 -1985 11,566 11,566 - - 315 139 454 -1986 11,251 11,251 - - 315 135 450 -1987 10,937 10,937 - - 315 131 446 -1988 10,622 10,622 - - 315 127 442 -1989 10,307 10,307 - - 315 123 438 -1990 9,993 9,993 - - 315 120 435 -1991 9,678 9,678 - - 315 116 431 -1992 9,363 9,363 - - 315 113 428 -1993 9,049 9,049 - - 315 108 423 -1994 8,733 8,733 - - 315 104 419 -1995 8,419 8,419 - - 315 101 416 -
* THIS COLUMN SHOWS THE AMOUNT OF ARITHMETIC IMBALANCE IN THE AMOUNT OUTSTANDING INCLUDING UNOISBURSED FROM ONEYEAR TO THE NEXT. THE MOST COMMON CAUSES OF IMBALANCES ARE CHANGES IN EXCHANGE RATES AND TRANSFER OF DEBTSFRUM ONE CATEGORY TO ANOTHER IN THE TABLE.

07/24t76TABLE 4.2
PA(;E 12SERVICE PAYMENTS, COMMITMENTSt DISBUJRSEMENTS AND OUTSTANDING AMOUNTS OF EXTERNAL PUBLIC DEBT
PROJECTIONS BASED ON DEBT OUTSTANDING INCLUDING UNDISCURSED AS OF DEC. 31, 1975DEBT REPAYABLE IN FOREIGN CURRENCY ANO GOODS
(IN THOUSANDS OF U.S. OOLLARS)TYPE OF CREDITOR LOANS FROM GOVERNMENTS
CREDITOR COUNTRY COLOMBIAYEAR : DEBT OUTSTANDING AT s T a A N S A C t I 0 N S D U R I N G P E R I 0 D * OTHER CHANGES
: BEGINNING OF PERIOO s
: DISBURSED : INCLUDING : COMMIT- I DISBURSE- : S E R V I C E P A Y M E N T S i CANCEL- ADJUST-!51 UNDISBURSED: ETS a ENS……… :LATIONS aMENT: NLY MuDsusD ENTS M ENTS *-----------:-----------:-----------2LlOS sMN : : s s s PRINCIPAL : INTEREST TOTAL s s
s (II : lZ) s (3J : (4) S 151 : 161 a 174 1 1510 2 191
1968 323 323 - - 45 18 63 - -1Z1I 69 266 266 - - 44 [0 54 - -81970 214 214 - - 42 9 51 - -61971 166 166 - 41 6 47 - -61972 119 119 _ - 39 5 44 _ -31973 77 IT - - 39 2 41 - -11974 37 37 - - 36 2 38 - -I1975 - - - - - -1976 -
* THIS COLUMN SHOWS THE AMOUNT CF ARITHPETIC IMBALANCE IN THE AMOUNT OUTSTANDING INCLUDING UNDIS8URSED FROM ONEYEAR TO THE NEXT. THE MOST COMMON CAUSES OF IMBALANCES ARE CHANGES IN EXCHANGE RATES AND TRANSFER OF DEBTSFROM ONE CATEGORY tO ANOTHER IN tPFE TABLE.

07/24/76TABLE 4.2 PAGE 13
SERVICE PAYMENTS, COMMITMENTS, DISBURSEMENTS AND OUTSTANDING AMOUNTS OF EXTERNAL PUBLIC DEBT
PROJECTIOINS BASED ON DEBT OUTSTANDING INCLUDING UNDISPURSED AS OF DEC. 31, 1975DEBT REPAYABLE IN FOREIGN CURRENCY AND GOODS
IIN THOUSANDS OF U.S. OCLLARS)TYPE CF CREDITOR LCANS FRCM GOVERNMENTS
CREDITOR COUNTRY CZECHOSLOVAKIAYEAR DEBT OUTSTANDING AT T R A N S A C T I O N S D U R I N G P E R I O D OTHER CHANGES
… : BEGINNiNG OF PERIOD : I- -…
s DISBURSED * INCLUDING : COMMIT- * DISBURSE- * S E R V I C E P A Y M E N T S s CANCEL- : ADJUST-s ONLY sUNDISBURSEDs MENTS t MENTS -…-…-…- L----------- LATIONS : MENT *: s s s * PRINCIPAL: INTEREST * TOTAL s :
(1) s 21 : s 3) : (4) * (5) : (6) (7) S 48) : (9)
1968 - 5,000 - 621 - - - - -1969 621 5,000 - - 209 3 212 - -1970 412 4,791 - 1,202 182 83 265 - -1971 1,432 4,609 - 8 297 112 469 - -1972 1,143 4,312 - 12 296 148 444 - -1973 859 4,016 - - 290 185 475 - -1974 569 3,726 - - 213 20 233 - -1975 356 3,513 _ 113 367 10 377 - _1976 102 3,146
* * * * * * THE FOLLOWING FIGURES ARE PROJECTED ¢ * * * * *
1976 102 3,146 - 1,544 699 67 766 -1977 947 2.447 - 900 699 80 779 -1978 1,148 1,748 - 450 699 69 768 -1979 899 1,049 - 150 699 43 742 -1980 350 350 - - 350 9 359 -
* THIS COLUMN SHOWS THE AMOUNT OF ARITHMETIC IMBALANCE IN THtE AMOUNT OUTSTANDING INCLUDING UNDISBWRSED FROM ONEYEAR TO THE NEXT. THE MOST COMMON CAUSES OF IMBALANCES ARE CHANGES IN EXCHANGE RATES AND TRANSFER OF DEBTSFROM ONE CATEGORY TC ANOTHER IN tHE TABLE.

07/24/76TABLE 4.2
PAOE 14iSERVICE PAYMENTS, COMMITMENTS, DISBURSEMENTS AND OUTSTANDING AMOUNTS OF EXTERNAL PUBLIC DEBT
PROJECTICNS BASED ON DEBT OUTSTANDING INCLUDING UNDIS8URSED AS OF DEC. 31, 1975DEBT REPAYABLE IN FOREIGN CURRENCY AND GOODS
IIN THOUSANDS OF U.S. DOLLARSITYPE CF CREDITOR LCANS FRCM GOVERNMENTS
CREDITOR COUNTRY DENMARKYEAR s DE0T OUTSTANDING AT : T R A N S A C T I O N S D U R I N G P E R IOD S OTHER CHANGES
8EGINNING 0 PERIOD :… -_ -_ -------------------------------- _--_- --------------……S--
* DISOURSED 3 INCLUDING 2 COMMIT- * DISBURSE- t S E R V I C E P A Y M E N T S : CANCEL- : ADJUST-* OkLY tUNDISBURSED2 MENTS I MENTS 2__…---______-----------I-----------2 LATIONS : MENT *
I * PRINCIPAL I INTEREST I TOTAL * a* Ii) * (23 433 (43 a (5) :63 * 171 : t8o * (93
1968 - _ _ _1969 - - - - - _ _ _ _1970 - - - - - - -
19TI - - 1,349 405 - - - - 671972 425 1,416 - 287 - - - - 451913 730 1,461 - 332 - - - - 1291974 1,113 1,590 - 469 - - - - too1975 1,744 1,770 - - - - - - -1511976 1,595 1,619
* * * * * * THE FOLLOWING FIGURES ARE PROJECTED S * * * * *
1976 1,595 1,619 - 24 - - -
1977 1,619 1,619 - - - - -1978 1,619 1,619 - - 90 - 90 -
1979 1,529 1,529 - - 90 - 90 -
1980 1,439 1,439 - - 90 - 90 -
1981 1,349 1,349 - - 90 - 90 -
1982 1,259 1,259 - - 90 - 90 -
1983 1,169 1,169 - - 90 - 90 -
1984 1,079 1,079 - - 90 - 90 -
1985 989 989 - - 90 - 90 -
1986 899 899 - - 90 - 90 -
1987 810 810 - - 90 - 90 -
1988 720 720 - - 90 - 90 -1969 630 630 - - 90 - 90 -
1990 540 540 - - 90 - 90 -
1991 450 450 - - 90 - 90 -1992 360 360 - - 90 - 90 -1993 270 270 - - 90 - 90 -1994 ISO 180 - - 90 - 90 -
1995 90 90 - 90 - 90 -
* THIS COLUMN SHOWS THE AMOUNT CF ARITHMETIC IMBALANCE IN THE AMOUNT OUTSTANOING INCLUDING UNDISBURSED FROM ONEYEAR TO THE NEXT. THE MOST COMMON CAUSES OF IMBALANCES ARE CHANGES IN EXCHANGE RATES AND TRANSFER OF DEBTSFROM ONE CATEGORY TO ANOTHER IN THE TABLE.

OT/24/76TABLE 4.2
PAGE 15SFRVICE PAYMENTS, COMMITMENTS, DISBURSEMENTS AND OUTSTANDING AMOUNTS OF EXTERNAL PUBLIC DEBT
PROJECTICNS BASED ON DEBT OUTSTANDING INCLUDING UNOISBURSED AS OF DEC. 31, 1975DEBT REPAYA8LE IN FOREIGN CURRENCY AND GOODS
IIN THOUSANDS OF U.S. DOLLARS)TYPE OF CREDITOR LCANS FRCM GOVERNMENTS
CREDITOR COUNTRY GERMANY, OEM. REP.OFYEAR s DEBT OUTSTANDING AT : T R A N S A C T I O N S D U R I N G P E R I O D OTHER CHANGES
s BEGINNIIG OF PERIOD :
D DISBURSED t INCLUDING * COMMIT- s DISBURSE- t S E R V I C E P A Y M E N T S * CANCEL- * ADJUST-' ONLY SUNOISBURSED: MENTS t MENTS :----------- - ---------s LATIONS * MENT *
s * PRINCIPAL * INTEREST t TOTAL * s* - l t 12) : (31 * (4 (5) 5 (6) 2 (7 l a8) * 9)
19681969 - - - - - _ _ _ _1970 - - - - - - _ _ _1971 - - 222 222 1 - 1 -1972 222 222 - - 44 17 611973 178 178 - - 45 22 671974 133 133 - - 133 22 1551975 - - - - -1976
T tHIS COLUMN SHOWS THE AMOUNT OF ARITHMETIC IMBALANCE IN THE AMOUNT OUTSTANDING INCLUDING UNDIS8URSED FROM ONEYEAR TO THE NEXT. THE MOST CCMMON CAUSES OF IMBALANCES ARE CHANGES IN EXCHANGE RATES AND TRANSFER OF DEBTSFROM ONE CATEGORY TO ANOTHER IN THE TABLE.

07/24/16TABLE 4.2 PAGE 16
SERVICE PAYMENTS, COMMITMENTS, DISBURSEMENTS AND OUTSTANDING AMOUNTS OF EXTERNAL PUBLIC DEBT
PROJECTIONS BASED ON OEBT OUTSTANDING INCLUDING UNDISBURSED AS OF DEC. 31, 1975DEBT REPAYABLE IN FOREIGN CURRENCY AND GOODS
(IN THOUSANDS OF U.S. DOLLARSlTYPE OF CREOITOR LCANS FROM GOVERNMENTS
CREDITOR COUNTRY GERMANY, FED.REP. OFYEAR : DEST OUTSTANDING AT s T R A N S A C T I 0 N S 0 U R I N G P E R I 0 0 2 OTHER CHANGES
s BEGINNING OF PERIOO :s……-------…-- - _____ I----- - ---- ___________----_- _- - 2----------------2 OInBURSED 3 INCLUDING s COMMIT- I DISBURSE- 2 S E R V I C E P A Y M E N T S s CANCEL- t ADJUST-
ONLY :UNOISSURSEDs MENTS s MENTS : ---- _ --- -----------S LATIONS s MENT *s * * * t PRINCIPAL : INTEREST : TOTALI (1it 1 23) s : 151 : (61 s T1 s9
1968 83 4,211 - 45 - - - - -21969 126 4,209 2,047 636 - 21 21 - 5311970 816 6,787 - 1,509 - 33 33 - -11971 2,325 6,786 3,777 3,727 - 134 134 1 1,067197Z 6,579 11,629 3,136 967 - 226 226 - 2261973 7,677 14,991 - 755 - 203 203 - 2,7681974 9,834 17,759 - 3,787 - 262 262 - 2,1621975 15,095 19,921 9,359 2,859 217 526 743 - -2,1591976 16,344 26,904
* * *.* * * THE FOLLOWING FIGURES ARE PROJECTED * * * * * *
1976 16,344 26,904 - 3,987 496 701 1,203 -1977 19,835 26,409 - 2,441 790 762 1,552 -1978 21,486 25,618 - 1,844 790 772 1,562 -1979 22,540 24,828 - 991 852 813 1,665 -1950 22,679 23,976 - 610 914 834 1,748 -1981 22,375 23.062 - 534 914 808 1,722 -1982 21,995 22,148 - 153 914 173 1,687 -1983 21,235 21,235 - - 1,105 732 1,83T -1984 20,130 20,130 - - 1,105 683 1,188 -1985 19,025 19,025 - - 1,105 633 1,738 -1986 17,921 17,921 - - 1,301 585 1,886 -1987 16,620 16,620 - - 1,496 528 2,024 -1988 15,125 15,125 - - 1,496 471 1,967 -1989 13,629 13,629 - - 1,372 415 1,T81 -1990 12,257 12.257 - - 1,169 370 1,S39 -1991 11,068 11,088 - - 1,169 333 1,502 -1992 9,921 9,921 - - 1,169 291 1,466 -1993 8,752 8,752 - - 1,169 260 1,429 -1994 7,503 7,583 - - 1,169 223 1,392 -1995 6,415 6,415 - - 1,169 186 1,355 -
* THIS COLUMN SHOWS THE AMOUNT CF ARITHMETIC IMBALANCE IN THE AMOUNT OUTSTANDING INCLUDING UNDISOURSED FROM ONEYEAA TO THE NEXT. THE MOST COMMON CAUSES OF IMBALANCES ARE CHANGES IN EXCHANGE RATES AND TRANSFER OF DE8TSFROM ONE CATEGORY TO ANCTHER IN TIE TABLE.

07/24/76TABLE 4.2 PAGE 17
SERVICE PAYMENTS, COMMITMENTS, DISBURSEMENTS AND OUTSTANDING AMOUNTS OF EXTERNAL PUBLIC DEBT
PROJECTIONS BASED ON DEBT OUTSTANDING INCLUDING UNDISBURSED AS OF DEC. 31, 1975DEBT REPAYABLE IN FOREIGN CURRENCY AND GOODS
IIN THoUSANDS OF U.S. DOLLARS)TYPE OF CREDITOR LOANS FRCM GOVERNMENTS
CREDITOR COUNTRY HUNGARYYEAR DEST OUTSTANDING AT : T R A N S A C T I O N S D U R I N G P E R I OD OTHER CHANGES
: BEGINNI4G OF PERIOD 3 s…---------- ----- - -- ------------------------ _________ --------- ---------…-----…
I DISBURSED 2 INCLUDING s COMMIT- s DISBURSE- s S E R V I C E P A Y H E N t S CANCEL- I ADJUST-'2 ONLY aUNDISBURSEDs MENTS s MENTS : ---------- I----------s I LATIONS : MENT *
s2 s s sPRINCIPAL INTEREST I TOTAL s sit) s 12 : 131 ( 14) s 451 s 161 171 ( a8 (9)
1968 - _ _ _ _1969 _ _ _ _ _ _ _ _ _1970 - - 1,481 - - - - -1971 - 1,481 - 1,281 90 15 105 - -1972 1,191 1,391 - 200 384 - 384 - -1973 1,007 1,007 - - 118 83 201 - -1974 889 889 - 119 42 161 - -1975 770 770 - - 118 54 172 - -1976 652 652
* * * * * * THE FOLLOWING FIGURES ARE PROJECTED * * * * * *
1976 652 652 - - 130 43 173 -1977 522 522 - - 130 34 164 -1978 391 391 - - 130 25 155 _1979 261 261 - - 130 16 146 -1980 130 130 - - 130 7 137 -
* THIS COLUMN SHOWS THE AMOUNT OF ARITHMETIC IMBALANCE IN THE AMCUN1 OUTSTANDING INCLUDING UNDISBURSFD FROM ONEYEAR TO THE NEXT. THE MOST COMMON CAUSES OF IMBALANCES ARE CHANGES IN EXCHANGE RATES AND TRANSFER OF DEBTSFROM ONE CATEGORY TO ANOTHFR IN THE TABLE.
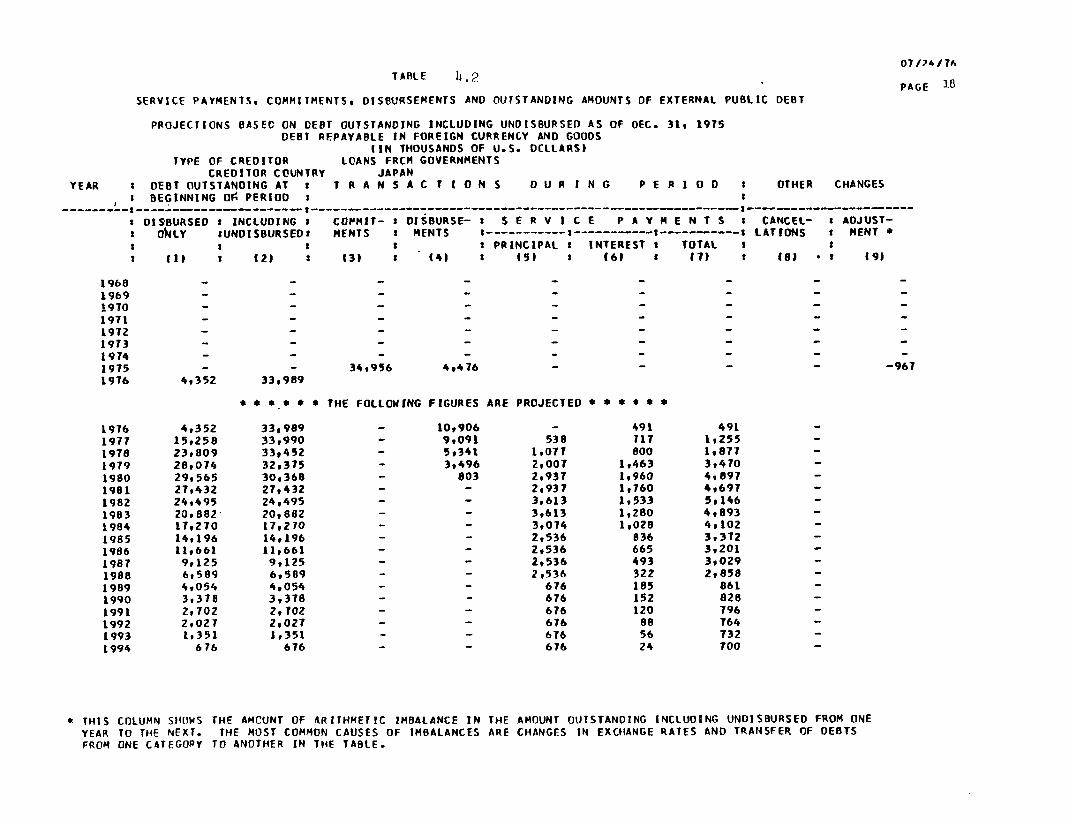
07/24 71TABLE 4.2
PAGE 1SERVICE PAYMENTS, COMMITMENTS, DISBURSEMENTS AND OUTSTANDING AMOUNTS OF EXTERNAL PUBLIC DEBT
PROJECTIONS BASEC ON DEBT OUTSTANDING INCLUDING UNDISBURSED AS OF DEC. 31, 1975DEST REPAYABLE IN FOREIGN CURRENCY AND GOODS
IIN THOUSANDS OF U.S. OCLLARS)TYPE OF CREDITOR LOANS FRCM GOVERNMENTS
CREDITOR COUNTRY JAPANYEAR t DEBT OUTSTANDING AT s T R A N S A C T I O N S D U R I N G P E R IOD 2 OTHER CHANGES
B BEGINNING OF PERIOD : I
s DISBURSED s INCLUDING I CO?tMIT- I DISBURSE- t S E R V I C E P A Y M E N T S t CANCEL- : ADJUST-I O(LY tUNDISBURSEDZ MENTS t MENTS ,___…_______,____________----------t LATIONS t MENT *t t * * t PRINCIPAL : INTEREST t TOTAL I tt 1) 2 12) t 13) 2 1 (5) t (61 t (71 t I91
19681969 _1970 _ _ _ _ _ _ _ _1971 - - - - - - - -1972 - - _ _ _ _ _ _1973 - - - - - - _ _1974 - - - - - - _ _1975 - - 34,956 4,476 - - - - -9671976 4,352 33,989
* * * * S * THE FOLLOWING FIGURES ARE PROJECTED * * * * * *
1976 4,352 33,989 - 10,906 - 491 4911977 15,258 33,990 - 9,091 538 117 1,2551978 23,809 33,452 - 5,341 1,077 800 1,8771979 28,074 32,375 - 3,496 2,007 1,463 3,4101980 29,565 30,368 - 803 2,93T 1,960 4,8971981 27,432 27,432 - - 2,937 1,760 4,6971982 24,495 24,495 - - 3,613 1,533 5.1461983 20,882 20,882 - - 3,613 1,280 4,8931984 IT,270 17,270 - _ 3,074 1,028 4,102 -1985 14,196 14,196 - - 2,536 836 3,312 -1986 11,661 11,661 - - 2,536 665 3,201 -1987 9,125 9,125 - - 2,536 493 3,029 -1988 6,589 6,589 - - 2,536 322 2,858 -1989 4,054 4,054 - - 676 185 861 -1990 3,378 3,378 - - 676 152 828 -1991 2,702 2,102 - - 676 120 796 -1992 2,027 2,027 - - 676 88 764 -1993 1,351 1,351 - - 676 56 732 -1994 676 676 - - 676 24 700 -
* THIS COLUMN SHOWS THE AMCUNT OF ARITHMETIC IMBALANCE IN THE AMOUNT OUTSTANDING INCLUDING UNDISBURSED FROM ONEYEAR TO THE NEXT. THE MOST COMMON CAUSES OF IMBALANCES ARE CHANGES IN EXCHANGE RATES AND TRANSFER OF DEBTSFROM ONE CATEGOPY TO ANOTHER IN THE TABLE.

07/24/76TABLE 4.2
PAGE 19SERVICE PAYMENTS, COPMITMENTS, DISBURSEMENTS ANO OUTSTANDING AMOUNTS OF EXTERNAL PUBLIC DEBT
PROJECTIONS BASED ON DEBT OUTSTANDING INCLUDING UNOISBURSED AS OF DEC. 31, 1975DEBT REPAYABLE IN FOREIGN CURRENCY AND GOODS
IIN THOUSANDS OF U.S. DOLLARS)TYPE OF CREOITUR LGANS FROM GOVERNMENTS
CREDITOR COUNTRY MEXICOYEAR : DEBT OUTSTANOING AT T R A N S A C T I O N S D U R I N G P E R I O : OTHER CHANGES
: BEGINNING OF PERIOD I…… : -------- …… … …-… _________________________- _____________________
:.DISBURSED s INCLUDING COMMIT- s DISBURSE- : S E R V I C E P A Y N E N T S : CANCEL- s ADJUST-:' ONLY :UNDISBURSEDt MENTS t MENTS S …---------- s-----------…----------- LATIONS : MENT *s t s t * PRINCIPAL : INTEREST 2 TOTAL ts (15 : (21 t (3) -s (4) s (5) s (61 1 7) 2 (8) 2 19)
1968 - 500 - 500 50 16 66 - -1969 450 450 - - 150 18 168 - -1970 300 300 - - 100 e 1081971 200 200 - - 104 11 115 - 41972 100 100 - - 50 8 58 - -1973 50 50 - - 50 2 52 - -1974 - - - - _ _ - _ _1975 - - - - - _ _ _ _1976 -
* THIS COLUMN SHOWS THE AMOUNT OF ARITHMETIC IMBALANCE IN THE AMOUNT OUTSTANDING INCLUDING UNDISBURSED FROM ONEYEAR TO THE NEXT. THE MOST COMMON CAUSES OF IMBALANCES ARE CHANGES IN EXCHANGE RATES AND TRANSFER OF DEBTSFROM ONE CATEGORY TO ANOTHER IN THE TABLE.

07/24/76TABLE
PAGE 20SERVICE PAYMENTS, COMMITMENTS, DISBURSEMENTS AND OUTSTANDING AMOUNTS OF EXTERNAL PUBLIC DEBT
PROJECTICNS BASED ON OEBT OUTSTANDING INCLUDING UNDISBURSED AS OF DEC. 31, 1915DEBT REPAYABLE IN FOREIGN CURRENCY AND GOODS
(IN THOUSANDS OF U.S. DOLLARSITYPE OF CREDITOR LOANS FROM GOVERNMENTS
CREDITOR COUNTRY NETHERLANDSYEAR : DEBT OUTSTANDING AT : T R A N S A C T I 0 N S D U R I N G P E R I 0 0 OTHER CHANGES
t BEGINNING OF;PERIOD s…_____ --- _ -- -_-----------_ --- _-…- --- _- -- _ ------ _ -_-_-----__ -________-__---_ -__________--------
DISBURSED s INCLUDING s COMMIT- : DISBURSE- s S E R V I C E P A Y M E N T S s CANCEL- s ADJUST-: oNLY ZUNDOSBURSED: MENTS s MENTS -----------2----------- ----- L----- tATIONS I MENT *
s : s s : PRINCIPAL : INTEREST s TOTAL t s(1t 42) 1 I3) 2 14) s (51 1 (6) s 17) 2 8) s 19)
1968 - - 497 - _ - _ _ _1969 - 497 - _ _ _ _ _ -1970 - 497 -_ - _ _ _ _1971 - 49T - - - - - 514 171972 - -1973 - -1974 - -1975 - -1976 - -
* THIS COLUMN SHOWS THE AMOUNT CF ARITHMETIC IMBALANCE IN THE AMOUNT OUTSTANDING INCLUDING UNDISBURSED FROM ONEYEAR TO THE NEXT. THE MOST COMMON CAUSES OF IMBALANCES ARE CHANGES IN EXCHANGE RATES AND TRANSFER Of DEBTSFROM ONE CATEGORY TC ANOTHER IN THE TABLE.
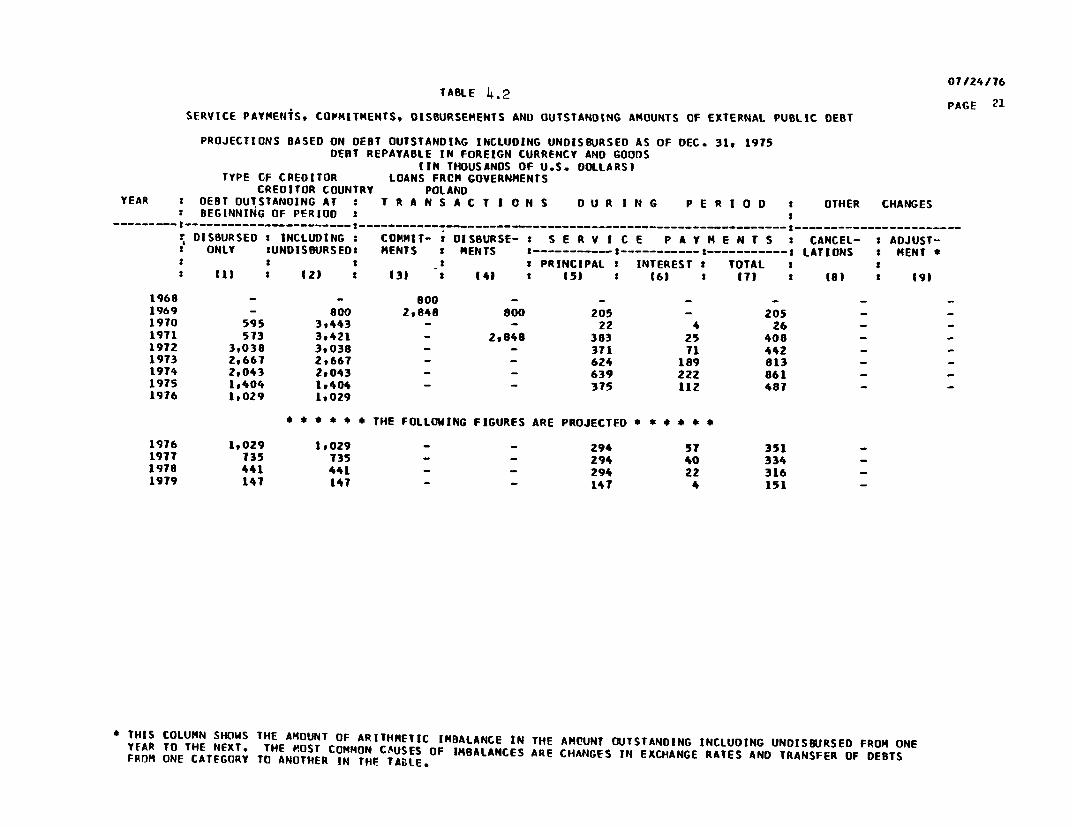
07/24/76TABLE 4.2 PAGE 21
SERVICE PAYMENTS, COPHITHENTS, DISBURSEMENTS AND OUTSTANDING AMOUNTS OF EXTERNAL PUBLIC DEBT
PROJECTIONS BASED ON OEBT OUTSTANDIIG INCLUDING UNOISBURSED AS OF DEC. 31, 1975DEBT REPAYABLE IN FOREIGN CURRENCY AND GOODS
IIN THOUSANDS OF U.S. DOLLARS)TYPE CF CREDITOR LOANS FRCH GOVERNMENTS
CREDITOR COUNTRY POLANDYEAR : OEBT OUTSTANDING AT : T R A N S A C T I O N S O U R I N G P E R I O O * OTHER CHANGES
: BEGINNING OF PERIOD s 2_________ _________-… - ----------------------…---…2…-…----2- --- -
D DISBURSED : INCLUDING COMMIT- * DISBURSE- : S E R V I C E P A Y H E N T S : CANCEL- s ADJUST-O ONLY *UNDIS8URSED, MENTS 2 HENTS 2---- t-----------…:----------2 LATIONS t MENT *
s 2 s 2 * PRINCIPAL : INTEREST 2 TOTAL 2 s: ) 111 s ) 1 131 ' I4) 15J (6) t IT) 2 8o) 191
1968 - - Boo - - - -1969 - 800 2,848 800 205 - 205 - -
1970 595 3,443 - - 22 4 26 - -
1971 573 39421 - 2,848 383 25 408 _ _1972 3,038 3,038 - - 371 71 442 - _1973 2,661 2,667 - - 624 189 813 - -
1974 2,043 2,043 - - 639 222 861 -1975 1,404 1,404 - - 375 112 487 - _1976 1,029 1,029
* * * * * * THE FOLLOWING FIGURES ARE PROJECTED * * * * * *
1916 1,029 1,029 - - 294 57 351 -1977 735 735 - - 294 40 334 -
1978 441 441 - - 294 22 316 -
1979 147 147 - - 147 4 151 -
* THIS COLUMN SHOWS THE AMOUNT OF ARITHMETIC IMBALANCE IN THE AMIUNT OUTSTANDING INCLUDING UNDIS8URSED FROM ONEYFAR TO THE NEXT. THE MOST COMMON CAUSES OF IMBALANCES ARE CHANGES IN EXCHANGE RATES AND TRANSFER OF DEBTSFROM ONE CATEGORY TO ANOTHER IN THF TABLE.

07/24/76TABLE 4.2
PAGE 22SERVICE PAYMENTS, COFMITMENTS, DISBURSEMENTS AND OUTSTANDING AMOUNTS OF EXTERNAL PUBLIC DEBT
PROJECTIONS BASED ON DEST OUTSTANDING INCLUDING UNDISBURSED AS OF DEC. 31. 1975DEBT REPAYABLE IN FOREIGN CURRENCY ANO GOODS
(IN THOUSANDS OF U.S. DOLLARS)TYPE CF CREDITOR LOANS FROM GOVERNHENTS
CREDITOR COUNTRY SPAINYEAR DEBT OUTSTANDING AT s T R A N S A C T I O N S OU R I N G P E R I OD I OTHER CHANGES
B IEGINNING OF PERIOD s…s-t…____…… ……-…- - - …- - ---- _ - -_ ----- _- - -*… ----: DIS URSEO : INCLUDING s COMMIT- DISBURSE- I S E R V I C E P A Y M F N T S t CANCEL- s ADJUST-
S hLY SUNOtSBURSE: HMENTS HENTS t---------- -----------s----------- LATIONS s MENT: I PRINCIPAL t INTEREST s TOTAL 5
I1) : (2) t 13) : (41 * 45( 16) : I7) 2 l8e 1 19
1968 _1969 - - - _ _ _ _1970 _ _ _ _ _ _ _1911 _ _ _ _ _ _ _1972 1973 - - - - - _ _1974 - - - - - - _195 - - 934 266 - - _1976 266 934
* *** * * THE FOLLOWING FIGURES ARE PROJECTED * * * * * *
1976 266 934 - 299 - 22 ZZ1971 565 934 - 196 - 51 511918 761 934 - 121 110 60 2301919 712 764 - 52 170 54 2241980 594 594 - - 1T0 42 Z121981 425 425 - - IT0 29 1991982 255 255 - - 110 16 1861983 85 85 - - 85 3 88
* THIS COLUMN SHOWS THE AMOUNT OF ARITHMETIC IMBALANCE IN THE AMOUNT OUTSTANDING INCLUDING UNOISBURSEO FROM ONEYEAR ro THE NFXT. THE MOST COMMON CAUSES OF IMBALANCFS ARE CHANGES IN EXCHANGE RATES AND TRANSFER OF DEBTSFROM ONf CArFGORY TO ANOTHER IN THE TABLE.

07/24/76TABLE 4.2
PAGE 23SERVICE PAYMENTS, COMMITMENTS, DISBURSEMENTS AND OUTSTANDING AMOUNTS OF EXTERNAL PUBLIC DEBT
PROJECTICNS BASED ON DEBT OUTSTANDING INCLUDING UNDIS8URSED AS OF DEC. 31, 1975OEBT REPAYABLE IN FOREIGN CURRENCY AND GOODS
IIN THOUSANDS OF U.S. DOLLARS)TYPE OF CREDITOR LCANS FReM GOVERNMENTS
CREDITOR COUNTRY UNITED KINGDOMYEAR DEBT OUTSTANDING AT : T R A N S A C T I 0 N S D U R I N G P E R I 0 D s OTHER CHANGES
: BEGINNINd OF PERIOD :______ _ _ _- - - - -------------------- …-… …-- -- …- --- - ----
2 DISBURSED I INCLUDING : COMMIT- : DISBURSE- :. S E R V I C E P A Y M E N T S t CANCEL- : ADJUST-5 ' ONLY *UNDISBURSED: MENTS : MENTS 2- - -------- s:------- - ------------ : LATIONS : MENT *: t s 2 2 PRINCIPAL : INTEREST * TOTAL :t 111 * (2) t (31 i (41 : 51 t (6) t I7l : 18) 1 (9)
1968 619 1,440 - 514 - 50 50 - -
1969 1,133 1,440 492 185 - 62 62 - -
1970 1,318 1,932 - 122 - 79 79 - -
1971 1,440 1,932 731 251 93 110 203 499 1291972 1,697 2,200 - 410 105 108 213 - -1701973 1,848 1,925 7,663 336 105 98 203 - -4161974 2,046 9,067 - 961 103 87 190 - 991975 2,931 9,063 6,710 1,522 107 169 276 - -1,8431976 3,814 13,823
* * * * * * THE FOLLOWING FIGURES ARE PROJECTED * * * * * *
1976 3,814 13,823 - 3,302 73 209 282 -1977 7,043 13,149 - 2,697 179 293 472 -
1978 9,562 13,570 - 1,483 374 347 721 -1979 10,671 13,196 - 1,151 374 373 747 -1980 11,448 12,822 - 826 665 387 1,052 -1981 11,609 12,157 - 427 665 380 1,045 -1982 11,371 11,492 - 121 665 366 1,031 -1983 10,827 10,827 - - 665 346 1,011 -1984 10,161 10,161 - - 665 323 988 -1985 9,496 9,496 - - 665 301 966 -1986 8,830 8,830 - - 665 279 944 -1987 8,165 8,165 - - 665 257 922 -1988 7,500 7,500 - - 665 235 900 -1989 6,835 6,835 - - 665 213 878 -1990 6,170 6,170 - - 665 190 855 -1991 5,505 5,505 - - 665 168 833 -1992 4,840 4,840 - - 665 146 811 -1993 4,175 4,175 - - 665 124 789 -1994 3,509 3,509 - - 665 102 767 -1995 2,844 2,844 - - 592 81 673 -
* THIS COLUMN SHOWS THE AMCUNT CF ARITHMETIC IMBALANCE IN THE AMOUNT OUTSTANDING INCLUDING UNDISBURSED FROM ONEYEAR To THF NEXT. THE MOST COMMON CAUSES OF IMBALANCES ARE CHANGES IN EXCHANGE RATES AND TRANSFER OF DEBTSFRCH ONE CATEGORY TO ANOTHER IN THE TABLE.

07/24/76TABLE 4.2
PAGE 21SERVICE PAYMENTS, COPMITMENTS, DISBURSEMENTS AND OUTSTANDING AMOUNTS OF EXTERNAL PUBLIC DEBT
PROJECTIONS BASED ON DEBT OUTSTANDING INCLUDING UNOIS8URSED AS OF DEC. 31, 1975DEBT REPAYABLE IN FOREIGN CURRENCY AND GOODS
(IN THOUSANDS OF U.S. DOLLARS)TYPE CF CREDITOR LOANS FROM GOVERNMENTS
CREDITOR CCUNTRY UNITED STATESYEAR : DEBT OUTSTANDING AT : T R A N S A C T I 0 N S D U P I N G P E R I 0 D OTHER CHANGES
: BEGINNING OF PERIOD :_____,_____--------- 7---s-------------------I---------------------- ---------------- ;-- ---------------
D OIS,8URSED I INCLUDING : COMMIT- : DISBURSE- : S E R V I C E P A Y H E N T S : CANCEL- s ADJUST-ONLY :UNDISeURSED: MENTS s MENTS :…--------- I-----------…----------- LATIONS t MENT *
I I: :PRINCIPAL: INTEREST: TOTAL : a: 1i (2) 1 (3) 441 : 5) : (61 (7) (8) s (9)
1968 61,195 81985' - 4,741 3,782 1,492 5,274 1261969 62,154 771946 3,295 3,875 4,637 1,450 6,087 -1970 61,395 76,604 5,606 6,871 3,328 1,275 4,603 2521971 64,938 78,630 1,730 7,512 3,808 1,232 5,040 9561972 68,642 81,596 23,950 5,347 3,265 1,440 4,705 4 _1973 70,724 102,277 - 7,167 4,108 1,286 5.394 - -31974 73t785 98,166 2,661 5,688 3,639 1,592 5,231 893 -1975 75,634 96,295 5,070 5.632 3,994 1,527 5,521 1,900 -11976 77,471 95,410
* * . * * * THE FOLLOWING FIGURES ARE PROJECTED * * * * * *
1976 77,471 95,470 - 9,412 6,225 2,341 8,566 -1977 60,658 89.245 - 4,059 6,233 2,311 8,544 -1978 78,483 83,011 - 2.447 5,684 2,220 7,904 -1979 75,248 771329 - 1,023 3,159 2,065 5,824 -1980 729512 13,570 - 786 3,472 1,976 5,448 -1981 69,827 70,099 - 272 4,776 1,872 6,648 -1982 65,324 65,324 - - 5,356 1,674 7,030 -1983 59,968 59,968 - - 5,361 1,445 69806 -1984 54,608 54,608 - - 3,77t 1,272 5,049 -1985 50,831 50,831 - - 3,546 1,172 4,718 -1986 47,292 47,292 - - 3,646 1,071 4,7t1 -1987 43,644 43,644 - - 3,079 978 4,057 -1988 40,566 40,566 - - 2,537 897 3.434 -1989 38,029 38,029 - - 2,009 840 2,849 -1990 36,023 36,023 - - 2,013 796 2,809 -1991 34.011 349011 - - 2,017 752 2,769 -1992 31.997 31,997 - - 2,022 800 2,822 -1993 29,974 29,974 - - 2,026 761 2.787 -1994 27,950 27.950 - - 29031 714 29745 -1995 25,918 25,918 - - 2,035 665 2,700 -
* THIS COLUMN SHOWS THE AMOUNT OF ARITHMETIC IMSALANCE IN THE AMOUNT OUTSTANDING INCLUDING UNDIS8URSED FROM ONEYEAR TO THE NEXT. THE MOST COMMON CAUSES OF IMBALANCES ARE CHIANGES IN EXCHANGE RATES AND TRANSFER OF DEBTSFROM ONE CATEGORY TO ANOTHER IN THE TABLE.
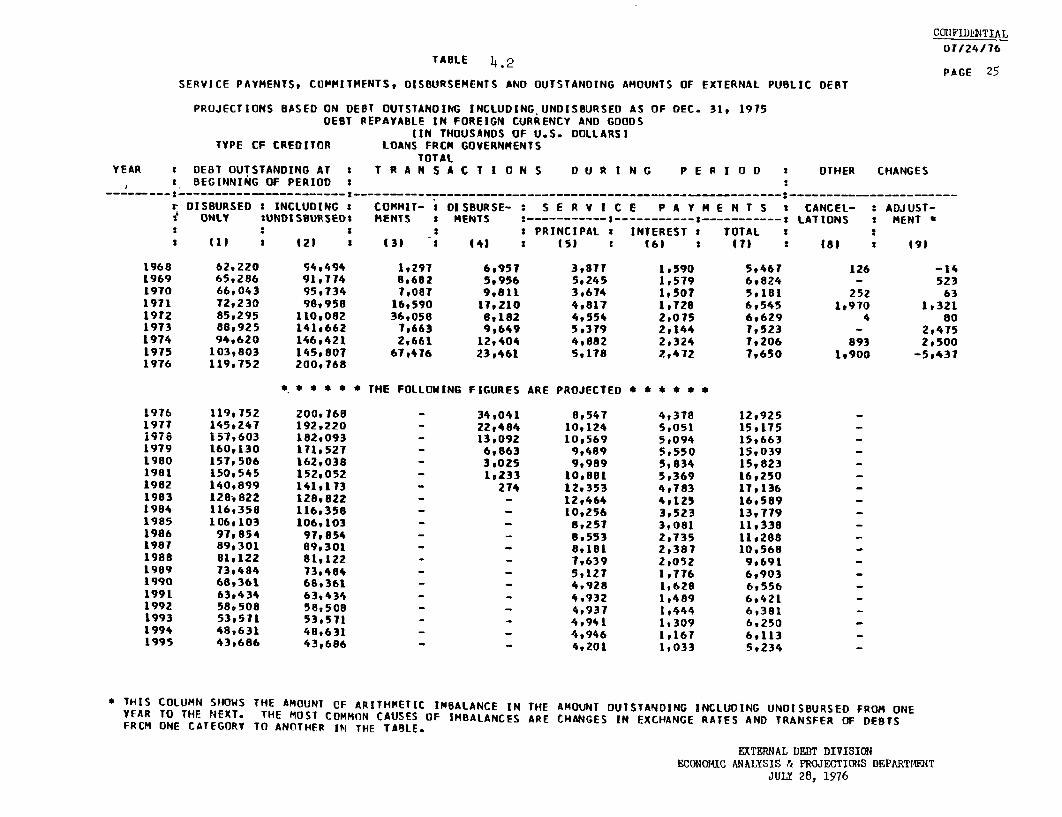
COIFID2ITIAL
07/24/76TABLE 4.2
PAGE 25SERVICE PAYMENTS, COPMITMFNTS, DISBURSEMENTS AND OUTSTANDING AMOUNTS OF EXTERNAL PUBLIC DEST
PROJECTIONS BASED ON DEBT OUTSTANDING INCLUDING UNDISBURSED AS OF DEC. 31, 1975DEBT REPAYABLE IN FOREIGN CURRENCY AND GOODS
(IN THOUSANDS OF U.S. DOLLARS)TYPE CF CREDITOR LOANS FRCM GOVERNMENTS
TOTALYEAR DEBT OUTSTANDING AT s T R A N S A C T I O N S O U R I N G P E 0 I 2 OTHER CHANGES
BEGINNING OF PERIOD 2
…--- -- -- -- -__ __-- - --------- _- --- …s DISBURSED 2 INCLUDING s COMMIT- : DISBURSE- : S E R V I C E P A Y H E N T S 2 CANCEL- : ADJUST-
ONLY :UNDISBURSEDa MENTS s MENTS :----------- …_------- -------------… LATIONS 2 MENT *
s 2 2 5 * PRINCIPAL : INTEREST: TOTAL s(1) 2 £21 £31 (4) s £51 : 6) (7) : l8e 191
1968 62,220 54,494 1,297 6,951 3,871 1.590 5,467 126 -141969 65,286 91,714 s,682 5,956 5,245 1,579 6,824 - 5231970 66,043 95,734 7,087 9,811 3,674 1507 5,181 252 631971 12,230 98,958 16,590 17,210 4,817 1,728 6,545 1,970 1.3211972 85,295 110,052 36,05e 8,152 4,554 2,075 6,629 4 801973 88,925 141,662 1,663 9,649 5,379 2,144 7,523 - 2,4751974 94,620 146,421 2,661 12,404 4,882 2,324 7,206 893 2,5001975 103,803 145,807 67,416 23,461 5,178 2,472 7,650 1,900 -5,4371976 119,752 200,768
* s * * * THE FOLLOWING FIGURES ARE PROJECTED * * * * * S
1976 119,752 200,76e - 34,041 8,547 4,378 12,925 -1977 145,247 192,220 - 22,484 10,124 5,051 15,175 -i978 157.603 182,093 - 13,092 10,569 5,094 15,663 -1979 160,130 171,527 - 6,863 9,489 5,550 15,039 -1980 157,506 162,038 - 3,025 9,989 5,834 15,823 -1981 150,545 152,o52 - 1,233 10,881 s,369 t6,250 -1982 140,899 141,173 - 274 12,353 4,783 11,136 -1983 128,822 128,822 - - 12,464 4,125 16,589 -1984 116,358 116,358 - - 10,256 3,523 13,779 -1985 106,103 106,103 - - 5,257 3,081 11,338 -1986 97,854 97,854 - - e,553 2,735 11,288 -1987 59,301 89,301 - - 8,181 2,387 10,568 -1988 81,122 51,122 - - 7,639 2,052 9,691 -1989 73,484 73,484 - - 5,127 1,776 6,903 _1990 68,361 68,361 - - 4,928 1,628 6,556 -1991 63,434 63,434 - - 4,932 1,489 6,421 -1992 58,508 58,508 - - 4,937 1,444 6,381 -1993 53,571 53,571 - - 4,941 1,309 6,250 -1994 48,631 48,631 - 4,946 1,167 6,113 -1995 43,686 43,686 - - 4,201 1,033 5,234 -
* THIS COLUMN SHOWS THE AMOUNT CF ARITHMETIC IMBALANCE IN THE AMOUNT OUTSTANDING INCLUDING UNDIS8URSED FROM ONEYEAR TO THE NEXT. THE MOST COMMON CAUSES OF IMBALANCES AAE CHANGES IN EXCHANGE RATES AND TRANSFER OF DEBTSFRCM ONE CATEGORY TO ANOTHER IN THE TABLE.
EXTERNAL DEBT DIVISIONECONOIIIC AINALYSIS A PROJECTIONS DEPARTMET
JULY 28, 1976
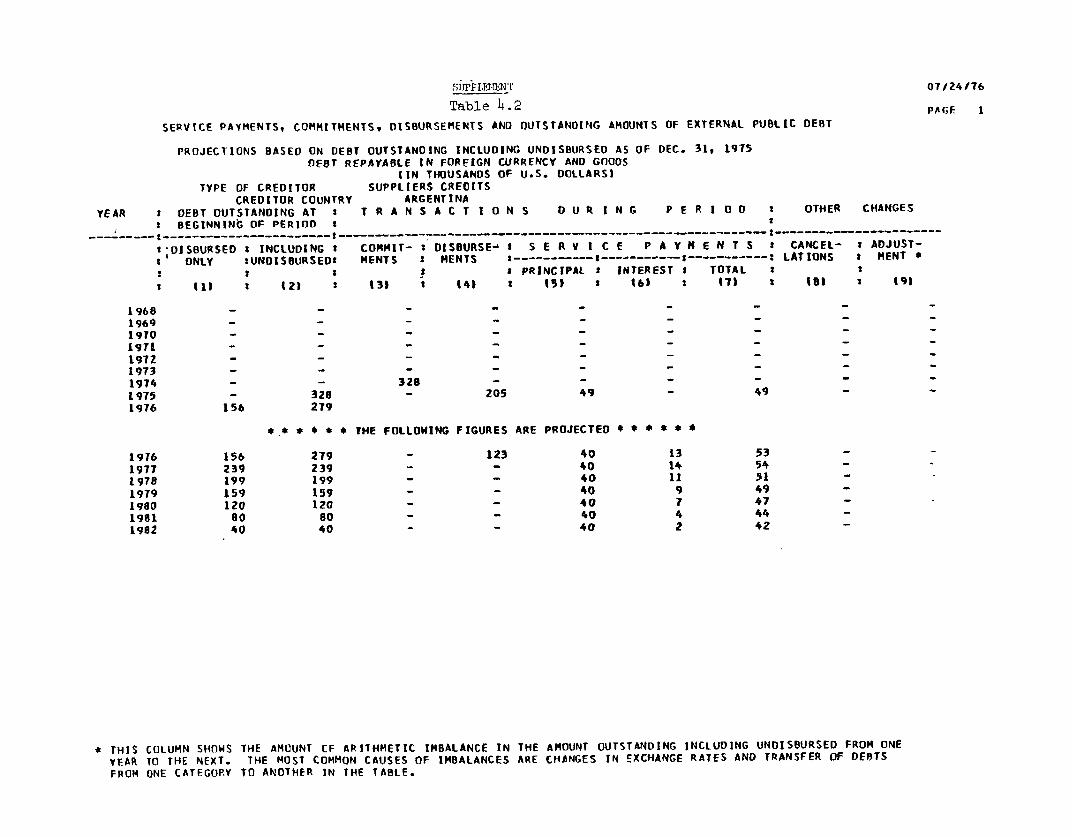
SimleFIJ-,11' 07/24/176
Table 4.2 PAGE ISERVICE PAYMENTS, COMMITMENTS, DISBURSEMENTS AND OUTSTANDING AMOUNTS OF EXTERNAL PUBLIC DEBT
PROJECTIONS BASEO ON DEST OUTSTANDING INCLUDING UNDISBURSED AS OF DEC. 31, 1975OEBT REPAYABLE IN FOREIGN CURRENCY ANO GOODS
(IN THOUSANDS OF U.S. DOLLARS)TYPE OF CREDITOR SUPPLIERS CREOITS
CREDITOR COUNTRY ARGENTINAYEAR s DEBT OUTSTANOING AT : T R A N S A C T I 0 N S O U R I N G P E R I a 0 2 OTHER CHANGES
BEGINNING OF PERIOD I… … … ……-… 2 - - - -- ------- -- ---_--__------------- -- _-_______-______'DISBURSED * INCLUDING 3 COMMIT- : DISBURSE- I S E R V I C E P A Y N E N T S s CANCEL- * ADJUST-
s ONLY 2UNDISGURSED2 MENTS * MENTS 2---- ------- --… - ---- : LATIONS t MENT *: s t : t PRINCIPAL 2 INTEREST t TOTAL 2 t
S 1 ll s 42) : {131 a 41 2 15) 2 I6) t 47) s 18) 2 19)
1968 _1969 - -1970 - - - _ - _ _ _ _1971 - - - - - - - - -1972 - - - - - - - _ _1973 - _ _ _ _ _ _ _ _1974 - - 328 - - - - - -1975 - 328 - 205 49 - 49 - -1976 156 279
* * * * * * THE FOLLOWING FIGURES ARE PROJECTED * * * * * *
1976 156 279 - 123 40 13 53 - -19717 239 239 - - 40 14 54 - -1978 199 199 - - 40 11 51 -1979 159 159 - - 40 9 49 -1980 120 120 - - 40 7 47 -1981 80 80 - - 40 4 44 -1982 40 40 - - 40 2 42 -
* THIS COLUMN SHOWS tHE AMOUNT CF ARITHMETIC IMBALANCE IN THE AMOUNT OUTSTANDING INCLUDING UNDISWURSEO FROM ONEYEAR TO THE NEXT. THE MOST COMMON CAUSES OF IMBALANCES ARE CHANGES IN EXCHANGE RATES AND TRANSFER OF DE8TSFROM ONE CATEGORY TO ANOTHER IN THE TABLE.

SUrPr1fiNT 07/24/76
Table )'." PAGE 2SERVICE PAYMENTS, COMMITMENTS, OISBURSEMENTS AND OUTSTANDING AMOUNTS OF EXTERNAL PUBLIC DEBT
PROJECTIONS BASED ON OEBT OUTSTANDING INCLUDING UNDISBURSED AS OF DEC. 31, 1975DEBT REPAYABLE IN FOREIGN CURRENCY AND GOODS
IIN THOUSANDS OF U.S. DOLLARS)TYPE OF CREDITOR SUPPLIERS CREDITS
CREDITOR COUNTRY BELGIUMYEAR DEBT OUTSTANDING AT : T R A N S A C T I 0 N S D U R I N G P E R I 0 0 : OTHER CHANGES
BEGINNING OF PERIOD :5 …-2……… s…
DIS'BURSED 2 INCLUDING COMMIT- 2 DISBURSE- s S E R V I C E P A Y M E N T S * CANCEL- s ADJUST-* O'LY tUNDISBURSEDS MENTS * MENTS 2-----------I---------- :--------: LATIONS 2 MENT *
:2: s 2 : PRINCIPAL 2 INTEREST 2 TOTAL ** {1) : (2) : (3) 2 (41 : (51 2 (6) (7 (a) : (91
1968 210 210 - - TO - 70 - -1969 140 140 - - - - -1970 140 140 - - - - _1971 140 140 - - 140 - 1401972 - - - -1913 - -1974 - -1975 - -1976 - _
* THIS COLUMN SHOWS THE AMOUNT OF ARITHMETIC IMBALANCE IN THE AMOUNT OUTSTANDING INCLUDING UNDISBURSED FROM ONEYEAR TO THE NEXT. THE MOST COMMON CAUSES OF IMBALANCES ARE CHANGES IN EXCHANGE RATES AND TRANSFER OF DEBTSFROM ONE CATEGORY TO ANOTHER IN THE TABLE.
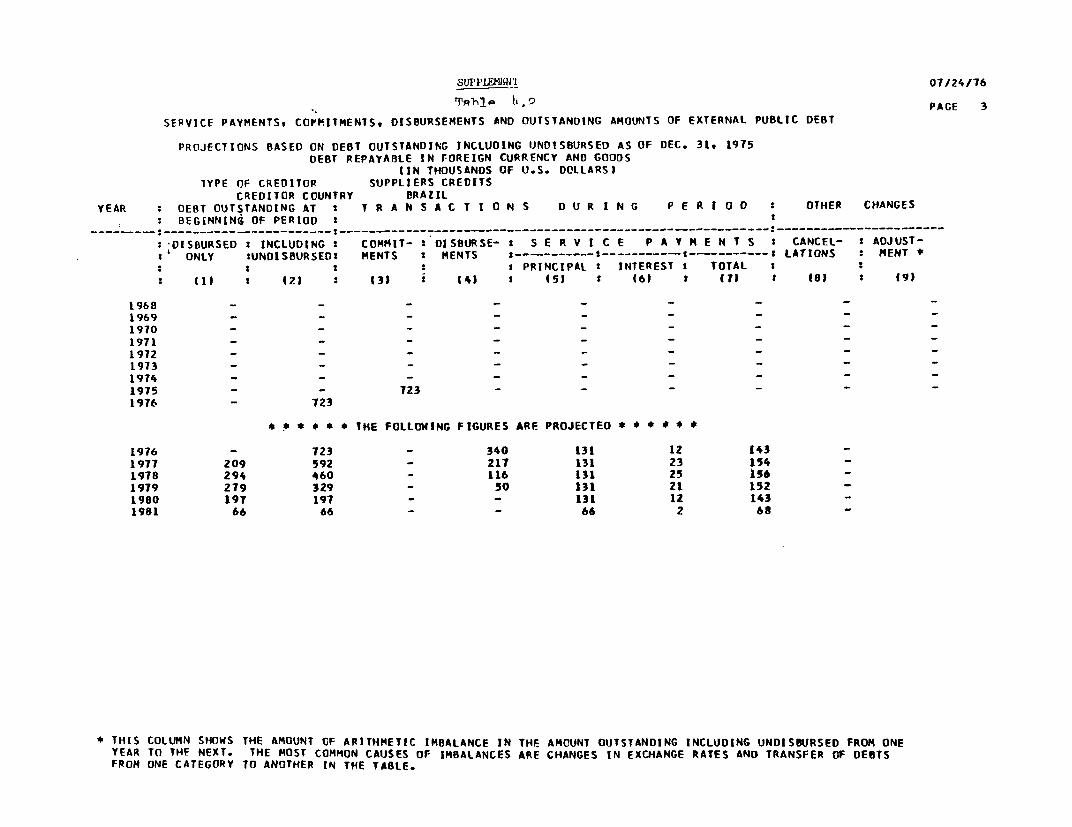
SUPPLEMj'I,l 07/24/76
Tph1h a h.9 PAGE 3SERVICE PAYMENTS, COPMITMENTS, OtSBURSEMENTS AND OUTSTANDING AMOUNTS OF EXTERNAL PUBLIC DEBT
PROJECTIONS BASED ON DEBT OUTSTANDING INCLUDING UNOISPURSED AS OF DEC. 31, 1975DEBT REPAYABLE IN FOREIGN CURRENCY AND GOODS
IIN THOUSANOS OF U.S. DOLLARS)IYPE OF CREDITOR SUPPLIERS CREOITS
CREDITOR COUNTRY BRAtILYEAR : OEBT OUTSTANDING AT T R A N S A C T I O N S D U R I N G P E R I OD OTHER CHANGES
: BEGINNING OF PERIOD s… -…-:_ - _ _----__ _ - _--_-- - ----------- _______________________
:DISBURSED 2 INCLUDING : COMMIT- O 0ISBURSE- s S E R V I C E P A Y M E N T S CANCEL- s ADJUST-ONLY sUNDISBURSEDI MENTS I MENTS :-- -------…----------- --- ATIONS s MENT *s s s s s PRINCIPAL t INTERESTt TOTAL
: 11) : (22 s 13) i (4) : (5) 1 (61 s (7) i s8) s I9)
1968 _ _1969 _ _ _ _ _ _ _1970 - _ _ _ _ _ _1971 - - - _ _ _ _1972 - - - - - - _1973 - - - - _ _ _1974 - - - - _ - _1975 - - 723 - - - -1976 - 723
* * * * * * THE FOLLOWING FIGURES ARE PROJECTEO * * * * * *
1976 - 723 - 340 131 12 1431977 209 592 - 217 131 23 1541978 294 460 - 116 131 25 1561979 279 329 - 50 131 21 1521980 197 197 - _ 131 12 1431981 66 66 - - 66 2 68
* THIS COLUMN SHOWS THE AMOUNT OF ARITHMETIC IMBALANCE IN THE AMOUNT OUTSTANDING INCLUDING UNDIS WRSED FROM ONEYEAR TO THE NEXT. THE MOST COMMON CAUSES OF IMBALANCES ARE CHANGES IN EXCHANGE RATES AND TRANSFER OF DEBTSFROM ONE CATEGORY TO ANOTHER IN THE TABLE.

SUpp]ZWENT 07/24*/16
Table 4. P'AGE 4SERVICEF PAYMENTS, COMMITMENTS, OIS8URSEMENTS AND OUTSTANDING AMOUNTS OF EXTERNAL PUBLIC DEBT
PROJECTIONS BASED ON OEBT OUTSTANDING INCLUDING UNDISBURSED AS OF DEC. 31, 1975DEBT REPAYABLE IN FOREIGN CURRENCY AND GOODS
(IN THOUSANDS OF U.S. DOLLARSITYPE OF CREDITOR SUPPLIERS CREDITS
CREDITOR COUNTRY FRANCEYEAR : DEBT OUTSTANODING AT 2 T R A N S A C T I O N S O U R I N G P E R I O D : OTHER CHANGES
: BEGINNING OFr PERIOD :
DISPURSED : INCLUDING * COMMIT- 2 DISBURSE- s S E R V I C E P A Y M E N T S i CANCEL- 5 ADJUST-: ONLY IUNDISBURSED: MENTS I MENTS :……----- …-----------…: LATIONS s MENT *
s s s s s PRINCIPAL a INTEREST * TOTAL 2 ts II : t (21 : (3) : (3 s (51 a (6) : t7) 2 8) a (9)
1968 2,137 3,271 4,108 426 61 38 99 - -11969 2,501 7,317 2,659 732 615 34 649 - -9611970 2,387 8,400 13,430 2,024 810 160 970 178 -1971 3,601 20,842 - 3,960 1,792 139 1,931 - 3851972 6,0B4 19,435 192 3,266 1,944 112 2,056 - 14019T3 7,524 17,9823 - 500 2,107 148 2,255 23 5691974 6,401 16,262 587 1,943 175 2,118 757 691975 5,131 13,631 - - 1,321 137 1,458 - 151976 3,825 12,325
* * *.* * * THE FOLLOWING FIGURES ARE PROJECTEO * * * * t *
1976 3,825 12,325 - 3,800 3,206 207 3,413 -1977 4,419 9,119 - 2,700 2,117 271 2,988 -1978 4,402 6,402 - 1,500 2,231 Z86 2,517 -1979 3,671 4,171 - 500 2,231 232 2,463 -1980 1,940 1,940 - - 1,940 109 2,049 -
* THIS COLUMN SHOWS THE AMOUNT OF ARITHMETIC IMBALANCE IN THE AMOUNT OUTSTANDING INCLUDING UNDISBURSED FROM ONEYEAR TO THE NEXT. THE MOST COMMON CAUSES OF IMBALANCES ARE CHANGES IN EXCHANGE RATES AND TRANSFER OF DERTSFROM ONE CATEGORY TC ANOTHER IN THE TABLE.
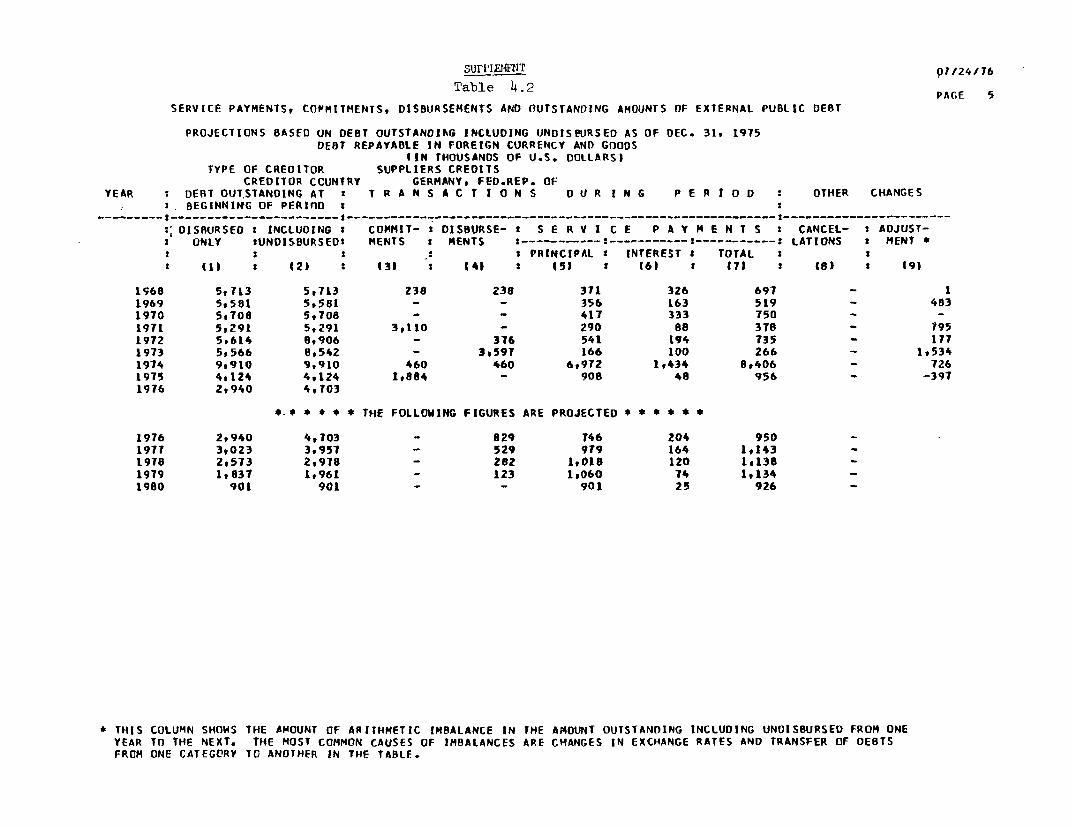
SUPPILU,0T PI/24/76
Table 4.2 PAGE 5SERVICE PAYMENTS, COPMITMENTS, DISBURSEMENTS AND OUTSTANDING AMOUNTS OF EXTERNAL PUBLIC DEBT
PROJECTIONS BASED ON DEBT OUTSTANOIAG INCLUDING UNDISeURSED AS OF DEC. 31, 1975DEBT REPAYABLE IN FOREIGN CURRENCY AND GOODS
uIN THOUSANDS OF U.S. DOLLARS)TYPE OF CREDITOR SUPPLIERS CREOITS
CREDITOR CCUNTRY GERMANY, FEO.REP. OFYEAR DEBT OUTSTANDING AT 2 T R A N S A C t I 0 N S O U R I N G P E R I 0 D OTHER CHANGES
BEGINNING OF PFRInD t
:, DISBURSED s INCLUDING 2 COMMIT- I DISBURSE- t S E R V I C E P A Y M E N T S CANCEL- 5 AOJUST-s ONLY sUNDISBURSEDt MENTS i MENTS S-…______--: --- I--------- LATIONS , MENT *: I I PRINCIPAL 2 INTEREST I TOTAL 2 s
: 11 t (2) s (3) s I41 s (51 (6) * 47) : (8) : I91
1968 5,T13 5,713 Z38 238 371 326 691 - 11969 5,5081 5,581 - - 356 163 519 - 4831970 5,708 5,708 - - 417 333 750 - -1971 5,291 5,291 3,110 - 290 88 3t8 - 7951972 5,614 8,906 - 376 541 194 735 - I771973 5,566 8,542 - 3,59t 166 100 266 - 1,5341974 9,910 9,910 460 460 6,972 1,434 8,406 - 7261975 4,124 4,124 1,884 - 908 48 956 - -3971976 2,940 4,703
*.* * * * * THE FOLLOWING FIGURES ARE PROJECTED * * * * * *
1976 2,940 4,703 - 829 T46 204 950 -197T 3,023 3,957 - 529 979 164 1,143 -1978 2,573 2,9978 - 282 1,018 120 1,138 -1979 1,837 1,961 - 123 1,060 74 1,134 -1980 901 901 - - 901 25 926 -
* THIS COLUMN SHOWS THE AMOUNT OF ARITHMETIC IMBALANCE IN tHE AMOUNT OUTSTANDING INCLUDING UNDIS8URSED FROM ONEYEAR TO THE NEXT. THE MOST COMMON CAUSES OF IMBALANCES ARE CHANGES IN EXCHANGE RATES AND TRANSFER OF DEBTSFROM ONE CATEGORY TO ANOTHER IN THE TABLE.

SIFFLE&1ET 07/24/76Tab le 4.2
PAGE 6SERVICE PAYMENTS, COMMITMENTS, DISBURSEMENTS AND OUTSTANDING AMOUNTS OF EXTERNAL PUBLIC DEBT
PROJECTIONS BASED ON DEBT OUTSTANDING INCLUDING UNDISBURSED AS OF OEC. 31, 1975DEBT REPAYABLE IN FOREIGN CURRENCY AND GOODS
(IN THOUSANDS OF U.S. OCLLARS)TYPE eF CREDITOR SUPPLIERS CREDITS
CREDITOR COUNTRY ITALYYEAR s DEBT OUTSTAN[DING AT : T R A N S A C T I O N S D U R I N G P E R I O D OTHER CHANGES
: BEGINNING OP PERIOD : …
_- … -------- -- - -_--- ___ ___ _________ -
: OIS)3URSED : INCLUDING : COMMIT- : DISBURSE- : S E R V I C E P A Y H E N T S : CANCEL- * ADJUST-S ONLY :UNDISBURSED2 MENTS t MENTS …---- t---------- t- ---- LATIONS 2 MENT *
s S I s I PRINCIPAL t INTEREST s TOTAL : s2 (1) * 12) : 133 * (41 s (5) s (6) : 71 a (8) : (9)
1968 - 22,290 1,769 13,296 2,138 399 2,537 - -1969 11,158 21,921 - 2,543 192 664 856 - 3621970 13,872 22,091 ,o000 7,407 528 - 528 - -1971 20,751 29,563 2,000 4,294 3,839 50 3,889 554 831972 21,281 27,253 - 2,646 3,505 648 4,153 - 301973 20,452 23,778 - 2,561 3,820 924 4,744 - -331974 19,160 19,925 - 765 2,459 701 3,160 - -481975 17,418 17,418 1,500 1,500 5,485 904 6,389 - -91976 13,424 13,424
* * *.* * * THE FOLLOWING FIGURES ARE PROJECTED * * * * * *
1976 13,424 13,424 - - 4,431 865 5,296 -1977 8,993 8,993 - - 4,285 550 4,835 -1978 4,709 4,709 - - 2,656 244 2,900 -1979 2,053 2,053 - - 1,027 117 1,144 -1980 1,027 1,027 - - 1,027 50 1,077 -
* THIS COLUMN SHOWS THE AMOUNT OF ARITHMETIC IMBALANCE IN THE AMOUNT OUTSTANDING INCLUDING UNDISBURSED FROM ONEYEAR TO THE NEXT. THE MOST COMMON CAUSES OF IMBALANCES ARE CHANGES IN EXCHANGE RATES AND TRANSFER OF DEBTSFROM ONE CATEGORY TO ANOTHER IN THE TABLE.

SUPPLEMKT 0T/24/T6Tab le 4.2 PAGE 7
SERVICE PAYMENTS, COMMITMENTS, DISBURSEMENTS AND OUTSTANDING AMOUNTS OF EXTERNAL PUBLIC DEBT
PROJECTIONS BASED ON DEBT OUTSTANDING INCLUOING UNOISBURSEO AS OF DEC. 31, 1975DEBT REPAYABLE IN FOREtGN CURRENCY AND GOODS
(IN THOUSANDS OF U.S. DOLLARSITYPE OF CREDITOR SUPPLIERS CREDITS
CREDITOR COUNTRY JAPANYEAR : DEBT OUTSTANDING AT s T R A N S A C t I 0 N S D U R I N G P E R I 0 D : OTHER CHANGES
: BEGINNING OF PERIOD *_________ XI- --------- ------------- -------- …-…--- --------- ------ ------ ------- --- ----------- -______________________
:;DISBURSED : INCLUDING : COMMIT- O DISBURSE- * S E R V I C f P A Y H E N T S : CANCEL- * ADJUST-2 ONLY tUNDISBURSEDI MENTS M MENTS I…------- -- ……----------S…-----------I LATIONS : MENT *
: s : : s PRINCIPAL I INTEREST t TOTAL(1: (23 : I3p i (4) * (5) s (6) s (7) s (8) * (9
1968 - _ _ _1969 _ -1970 - - 431 - - - - - -1971 - 431 5,152 - - - - - 5701972 - 6,153 4,595 6,409 963 20 983 - 2511973 7,524 10,036 736 3,323 994 619 1,613 - 5041974 10,062 10,282 - 192 999 668 1,66t - -4901975 8,793 8,793 3,256 - 1,035 582 1,617 - -1601976 7,688 10,854
* * * * * * THE FOLLOWING FIGURES ARE PROJECTED * * * * * *
1976 7,688 10,854 - 1,488 962 516 1,4781977 8,214 9,892 - 950 858 449 1,3071978 8,305 9,033 - 505 858 389 1,2411979 7,952 8,175 - 223 1,025 446 1,47t1980 7,150 7,150 - - 961 484 1,4451981 6,190 6,190 - - 730 420 1,1501982 5,460 5,460 - - 605 368 9731983 4,855 4,855 - - 605 325 930 -1984 4,249 4,249 _ - 605 282 88t -1985 3,644 3,644 - - 605 240 8451986 3,039 3,039 - - 605 191 802 -1987 2,434 2,434 - - 605 154 759 -1988 1,828 1,828 - - 605 112 717 -1989 1,2Z4 1,224 - - 272 75 341 -1990 95Z 952 - - 272 57 329 -1991 680 680 - - 272 40 312 -1992 408 408 - - 2T2 22 294 -1993 136 136 - - 136 4 140 -
* THIS COLUMl SHOWS THE AMOUNT OF ARITHMETIC IMBALANCE IN THE AMOUNT OUTSTANDING INCLUDING UNDISBURSED FROM ONEYEAR TO THE NEXT. THE MOST CCMMON CAUSES OF IMBALANCES ARE CHANGES IN EXCHANGE RATES AND TRANSFER OF DEBTSFROM ONE CATEGORY TO ANOTHFR IN THE TABLE.

SUPPLEI-IT 07/24/76
Table 4.2PAGE aSERVICE PAYMENTS, COKMITMENTS, DISBURSEMENTS AND OUTSTANDING AMOUNTS OF EXTERNAL PUBLIC DEBT
PROJECTIONS BASEC ON DEBT OUTSTANDING INCLUDING UNDISBURSEO AS OF DEC. 31. 1975DEBT REPAYABLE IN FOREIGN CURRENCY AND GOODS(IN THOUSANDS OF U.S. DOLLARSI
TYPE OF CREDITOR SUPPLIERS CREOITSCREDITOR COUNTRY MEXICO
YEAR : DEBT OUTSTANOING AT T R A N S A C T I O N S D U R I N G P E R IO D OTHER CHANGES: BEGINNING OF PERIOD t
2 DISBYRSED : INCLUDING t COMMIT- * DISBURSE- : S E R V I C E P A V M E N T S 2 CANCEL- 5 ADJUST-ONEY :UNDIS8URSED: MENTS z MENTS s------ -- :2 --------- LATIONS M HENT *: : 1 2 I PRINCIPAL s INTEREST t TOTAL s 5II I 123 : 31 s 441 15) s 16) 2 171 * I8) 2 19)1968 - - 6,830 - - - - -1969 - 6,830 - 1,09T 34 - 34 - -1970 1.063 6,796 2,049 2,518 430 - 430 - -1971 3,151 8,415 - 1,030 790 126 916 - _1.972 3,391 7,625 - 422 149 571 - -1973 2,969 7#203 - 552 959 258 1,217 _1974 2,562 6,244 - - 1,205 188 1,393 - -1975 1.357 5,039 - - 637 70 707 3,682 -1976 720 720
* * * * * * THE FOLLOWING FIGURES ARE PROJECTED * * * * * *
1976 720 720 - - 72 56 128 -1977 648 648 - - 72 50 122 -1978 576 576 _ - 72 45 117 -1979 504 504 - - 12 39 111 1980 432 432 - 1 72 33 105 -1981 360 360 - - 12 27 99 -19B2 288 288 - - 72 22 94 _1983 216 216 - - T2 16 881984 144 144 - - 72 10 82 _1985 TZ 72 - - 12 4 76 -
* THIS COLUMN SHOWS THE AMOUNT OF ARITHMETIC IMBALANCE IN THE AMOUNT OUTSTANDING INCLUDING UNDISBURSED FROM ONEYEAR To THE NEXT. THE MOST COMMON CAUSES OF IMBALANCES ARE CHANGES IN EXCHANGE RATES AND TRANSFER OF DEBTSFROM ONE CATEGORY TO ANOTHER IN THE TABLE.

SUtPLP04T 07 /24 /76
Table 4.2PAGE 9
SERVICE PAYMENTS, COMMITMENTS, DISBURSEMENTS AND OUTSTANDING AMOUNTS OF EXTERNAL PUBLIC DEBT
PROJECTIONS BASED ON DEBT OUTSTANDING INCLUDING UNDISPURSED AS OF DEC. 31, 1975DEBT REPAYABLE IN FOREIGN CURRENCY ANO GOODS
IIN THOUSANDS OF U.S. OCLLARS)TYPE OF CREDITOR SUPPLIERS CREDITS
CREDITOR COUNTRY SPAINYEAR : DEBT OUTSTANDING AT T R A N S A C T I O N S O U R I N G P E R I O OTHER CHANGES
2 BEGINNING OF PERIOD 2…:------------ -…--- - - - - - - - - - - -- _
V DISBURSED O INCLUDING I CCMMIT- I DISBURSE- 2 S E R V I C E P A Y M E N T S t CANCEL- t ADJUST-s ONLY :UNDISBURSEDS MENTS t HENTS …------ ----s-----------t--- -------2 LATIONS MENT *
t X : t t PRINCIPAL t INTEREST a TOTAL t :: 111 t 1(21 2 431 2 4) 2 (5) t (61 t (?7 s 18) t 19)
1968 - 14,697 - 4,500 884 - 884 - -
1969 3,616 13,813 1,303 2,742 1,710 413 2,123 - -11970 4,641 13,405 8,000 8,005 1,131 678 1,609 - -1971 11,521 20,274 - 753 827 735 1,562 - -1972 11,447 19,447 - - 1,989 292 2,281 - -1973 9,458 17,458 - - 1,563 1,025 2,588 5,000 -1974 7,895 10,895 - - 1,252 761 2,013 - -
1975 6,643 9,643 2,589 - 699 378 1,077 3,000 -1976 5,944 8,533
* * * * * THE FOLLOWING FIGURES ARE PROJECTED * * * * * *
1976 5,944 8,533 - 1,217 1,786 201 1,987 -1977 5,375 6,747 - 77T 2,065 200 2,265 -1978 4,087 4,682 - 414 3,243 116 3,359 -1979 1,251 1,438 - 181 575 90 665 -1980 863 863 - - 5T5 50 625 -1981 288. 288 - - 288 10 298 -
* THIS COLUMN SHOWS THE AMOUNT OF ARITHMETIC IMBALANCE IN THE APCUNT OUTSTANDING INCLUDING UNDISWURSED FROM ONEYEAR TO THE NEXT. THE MOST CCMMON CAUSES OF IMBALANCES ARE CHANGES IN EXCHANGE RATES AND TRANSFER OF DEBTSFROM ONE CATEGORY TO ANOTHFR IN THE TABLE.

suppLE,MFNT 07/24 16
Table 4.2PAGE 10
SERVICE PAYMENTS, COIMITMENTS, DISBURSEMENTS ANO OUTSTANDING AMOUNTS OF EXTERNAL PUBLIC DEBT
PROJECTICNS BASED ON DEBT OUTSTANDING INCLUDING UNDISBURSED AS OF DEC. 31, 1975OEBT REPAYABLE IN FOREIGN CURRENCY AND GOODS
(IN THOUSANDS OF U.S. OCLLARS)TYPE OF CREDITOR SUPPLIERS CREDITS
CREDITOR COUNTRY SWEDENYEAR : DEBT OUTSTANOING AT : T R A N S A C T I O N S D U R I N G P E R I O D OTHER CHANGES
: BEGINNING OF;PERIOD t…___ __ ____ __-.--__------- … s---- …- - ------------- … -- ----------------- -------------- - -------------------
OISpURSED s INCLUDING t COFMIT- s DISBURSE- I S E R V I C E P A Y M E N T S t CANCEL- t ADJUST-t O4LY 2UNDISBURSEDt MENTS t MENTS I---------:-----------… 2 …---------- LATIONS s MENT *
: s s t PRINCIPAL t INTEREST s TOTAL : s
: (1) 12 (31 a (4 a (5) s (6 : (7) s (8o f (93
1968 5,670 15,250 12,091 3,162 1,379 533 1,912 -
1969 7,454 25,963 - 1,532 839 426 1,265 - -
1970 8,147 25,124 - 2,219 2,254 493 2,747 - -
1971 8,112 22,870 - 3,484 2,785 611 3,396 - -
1972 8,811 20,085 - 4,496 2,600 706 3,306 - -
1973 10,707 17,485 18,000 3,645 2,861 T18 3,579 - -
1974 11,491 32,624 - 2.395 3,612 599 4,211 - -
1975 10,274 29,012 - 10,034 1,298 937 2,235 - -
1976 19,010 27,714
* * * * * THE FOLLOWING FIGURES ARE PROJECTED * * * * * *
1976 19,010 27,714 - 6,566 9,308 1,217 10,5251977 16,268 18,406 - 2,138 9,203 887 10,0901978 9,203 9,203 - - 9,203 396 9,599
* THIS COLUMN SHOWS THE AMOUNT OF ARITHMETIC IMBALANCE IN THE AMOUNT OUTSTANDING INCLUDING UNDISBURSED FROM ONEYEAR TO THE NEXT. THE MOST CCMMON CAUSES OF IMBALANCES ARE CHANGES IN EXCHANGE RATES AND TRANSFER OF DEBTSFROM ONE CATEGORY TO ANOTHER IN THE TABLE.

SUPPLF0I1T 07/24/76
Table 4.2PAGE It
SERVICE PAYMENTS, COMMITMENTS, DISBURSEMENTS AND OUTSTANDING AMOUNTS OF EXTERNAL PUBLIC DEBT
PROJECT IONS BASED ON DEBT OUTSTANDING INCLUDING UNDISBURSEO AS OF OEC. 31, 1975DEBT REPAYABLE IN FOREIGN CURRENCY AND GOODS
(IN THOUSANDS OF U.S. DOLLARS)TYPE OF CREDITOR SUPPLIERS CREDITS
CREDITOR COUNTRY UNITEO KINGDOMYEAR : DEBT OUTSTANDING AT s T R A N S A C T I 0 N S D U R I N G P E R 1 0 D 2 OTHER CHANGES
: BEGINNING OF PERIOD_…2…… ----- ---- --------------------- --__ _ _ _ _ _ _ - _- _ _ ___-… -_ - -- ___
t; DISBURSED : INCLUDING s COMMIT- I DISBURSE- 3 S E R V I C E P A Y M E N T S : CANCEL- ADJUST-ONLY sUNDISBURSED2 MENTS s MENTS :…__- ---------------------…: LATIONS s MENT *
s t : PRINCIPAL * INTEREST 5 TOTAL :I I 1 I f 12) 131 (4) 2 (5) (6) 2 (I : (8 19)
1968 - - - - - - -1969 - - - - - - -1970 - _ 1,157 - - - _1971 - 1,157 957 - - - - - 1191972 - 2,233 - 968 148 65 213 - -1691973 770 1,916 - 1,197 461 108 569 - 41974 1,459 1,459 - - 65 23 88 - 151975 1,409 1,409 - - 300 82 382 - -1681976 941 941
* * * * * * THE FOLLOWING FIGURES ARE PROJECTED * * * * * *
1976 941 941 - - 202 51 2531977 739 739 - - 202 40 2421978 538 538 - - 202 28 2301979 335 335 - - 202 16 2181980 133 133 - - 89 6 951981 44 44 - - 44 1 45
* THIS COLUMN SHOWS THE AMOUNT OF ARITHMETIC IMBALANCE IN THE AMOUNT OUTSTANDING INCLUDING UNOISBURSED FROM ONEYEAR TO THE NEXT. THE MOST COMMON CAUSES OF IMBALANCES ARE CHANGES IN EXCHANGE RATES AND TRANSFER OF DEBTSFROM ONE CAtEGORY TO ANOTHER IN THE TABLE.

sUpPL14NT 07/24/76Table 4.2
PAGE 12SERViCE PAYMENTS, CGOMITMENTS, DISBURSEMENTS AND OUTSTANDING AMOUNTS OF EXTERNAL PUBLIC DEBT
PROJECTIONS BASED ON DEBT OUTSTANDING INCLUDING UNDISBURSED AS OF DEC. 31, 1975DEeT REPAYABLE IN FOREIGN CURRENCY AND GOODS
(IN THOUSANDS OF U.S. DOLLARS)TYPE OF CREDITOR SUPPLIERS CREDITS
CREDITCR COUNTRY UNITEO STATESYEAR : DEST OUTSTANOING AT s T R A N S A C T I O N S D U R I N G P E R I O : OTHER CHANGES
: BEGINNING OF'PERIOD 2 I_________ ____ _____ -- _---- - - - - - -- ------ ----- -------- -------- -------- ------- - ----- - - - --- -------- ----- - - --:- -------- --- --- -------- ----
OISgURSED s INCLUDING I COMMIT- : DISBURSE- 5 S E R V I C E P A Y M E N T S * CANCEL- 2 ADJUST-ONLY SUNDISBURSED: MENTS I MENTS -------------------2--- LATIONS 2 MENT *s * 2 : : PRINCIPAL i INTEREST : tOTAL 2 :
: (1) * (21 (3) S (4) : (51 s 961 : (7) s (81 t (91
1968 - - - - - -1969 -- - - - - -1970 - - 2,439 -1971 - Z,439 33,355 900 - - - -1972 000 35,794 - 9,221 173 53 226 21,4001973 9,848 14,221 - 1,235 1,902 317 2,219 -1974 9.181 12,319 - 93 2,104 406 2,510 3,0451975 7,170 7,170 - - 1,956 465 2,421 -1976 5,214 59214
e * * * * THE FOLLOWING FIGURES ARE PROJECTED * * 4 4 * *
1976 5,214 5,214 - - 1,277 391 1,668 -1977 3,937 3,937 - - 1,110 290 1,400 -1978 2,826 2,828 - - 943 201 1,150 -1979 1,885 1,B85 - - 943 132 1,075 -1980 943 943 - - 943 57 1,000 -
* THIS COLUMN SHOWS THE AMOUNT CF ARITHMETIC IMBALANCE IN THF AMOUNT OUTSTANDING INCLUDING UNDISBURSED FROM ONEYEAR To THE NEXT. THE MOST COMMoN CAUSES OF IMBALANCES ARE CHANGES IN FXCHANGE RATES AND TRANSFER OF DEBTSFROM ONE CATEGORY TO ANOTHER IN THE TABLE.

SUPPLFIEIT 01/24/76Table 4.2
' ~~~~~~~~~~~~PAGE 13SERVICE PAYMENTS, COMMITMENTS, DISBURSEMENTS AND OUTSTANOING AMOUNTS OF EXTERNAL PUBLIC DEBT
PROJECTIONS BASED ON DEBT OUTSTANOING INCLUDING UNDISBURSED AS OF DEC. 31, 1975DEBT REPAYABLE IN FOREIGN CURRENCY AND GOODS
(IN THOUSANDS OF U.S. DOLLARSITYPE OF CREDITOR SUPPLIERS CREDITS
CREDITOR COUNTRY VENEZUELAYEAR : DEBT OUTSTANDING AT s T R A S A Ct I O N S O U R I N G P E R I O O OTHER CHANGES: BEGINNINd OF PERIOD :
2… - :------ - - - -__ --_ _ _ _ _ _ - -___ ____ _,__ ____-_- -_-_----
:DISBURSED : INCLUDING a COMMIT- s DISBURSE- : S F B V I C E P A Y N E N T s : CANCEL- : ADJUST-:' ONLY t:UNOISBURSEDa MENTS i MENTS I… ---- … _ _-- … ------- LATIONS : MENT *9 I 1 2 t PRINCIPAL t INTEREST : TOTAL :(1) ( (21 : 31 2 (4) 3 t5) (6) S (7I) : : 4911968 - 725 - 725 146 45 191 -1969 580 580 - - 145 37 182 - -1910 435 435 - - 145 28 173 - -1971 290 290 - - 146 17 163 - -1972 144 144 - - 144 10 154 _ -1973 - - - - - - - _ _1974 - -1975 - -1976 -
* THIS COLUMN SHOWS THE AMCUNT OF ARITHMETIC IMBALANCE IN THE AMOUNT OUTSTANDING INCLUDING UNDISBURSED FROM ONEYEAR TO THE NEXT. THE MOST COMMON CAUSES OF IMBALANCES ARr CHANGES IN EXCHANGE RATES AND TRANSFER OF DEBTSFROM ONE CATEGORY TO ANOTHER IN THE TABLE.

07/24/76
Table 4.2 PAGE
SERVICE PAYMENTS, COMMITMENTS, DISBURSEMENTS AND OUTSTANDING AMOUNTS OF EXTERNAL PUBLIC DEBT
PPOJECTIONS BASEC ON DEBT OUTSTANDING INCLUDING UNDISBURSED AS OF DEC. 31, 1975DEBT REPAYABLE IN FOREIGN CURRENCY AND GOODS
(IN THOUSANDS OF U.S. DOLLARS)TYPE OF CREDITOR PRIVATE BANK CREDITS
CREDITOR COUNTRY FRANCEYEAR : DEBT OUTSTANDING AT s T R A N S A C T I O N S D U R I N G P E R I O D OTHER CHANGES
2 BEGINNING OF;PERIOD :…_______-- ------------------ ---…--------…--- -------------------- -……… -…
DISBURSED S tNCLUDING z COMMIT- I DISBURSE- 2 S E R V I C E P A Y M E N T S 2 CANCEL- * ADJUST-a dNLY :UNDISBURSED: MENTS I MENTS -------------: LATIONS 2 MENT s
s : s s2s PRINCIPAL 2 INTEREST t TOTAL s 2s 1) : 121 t 13) S (41 a (5) s 16) t (7) s (8) (9)
1968 - 2,026 - - - - - _1969 - 2,026 885 178 - 16 16 - -2261970 178 2,685 - 208 - 10 10 1,800 -1971 386 885 - 309 16 49 65 -1972 679 869 - - 226 42 268 1901973 453 453 - - 453 28 481 -1974 - - - - - -_1575 - - 30,000 30,000 - - - -1976 30,000 30,000
s * * * * THE FOLLOWING FIGURES ARE PROJECTED * * * * s s
1976 30,000 30,000 - - 6,667 2,400 9,067 -1977 23,333 23,333 - - 6,667 1,835 8,502 -1978 16,667 16,667 - - 6,667 1,271 7,938 -1979 10,000 t0,000 - - 6,667 706 7,373 -1980 3,333 3,333 - - 3,333 141 3,474 -
* THIS COLUMN SHOWS THE AMOUNT CF ARITHMETIC IMBALANCE IN THE AMOUNT OUTSTANDING INCLUDING UNDISBURSED FROM ONEYEAR TO THE NEXT. THE MOST COMMON CAUSES OF IMBALANCES ARE CHANGES IN EXCHANGE RATES AND TRANSFER OF DEBTSFROM ONE CATEGORY TC ANOTHER IN THE TABLE.

SUPPLEMENT 07/24/76
Table 4.2 PEPAfiE Ir
SERVICE PAYMENTS, COMMITMENTS, DISBURSEMENTS AND OUTSTANDING AMOUNTS OF EXTERNAL PUBLIC DEBT
PROJECTIONS BASEC ON DEBT OUTSTANDING INCLUDING UNDISBURSED AS OF DEC. 31, 1975
DEBT REPAYABLE IN FOREIGN CURRENCY AND GOODS(IN THOUSANDS OF U.S. DOLLARSI
TYPE OF CREDITOR PRIVAIE BANK CREDITSCREDITOR COUNTRY ITALY
YEAR s DEBT OUTSTANDING AT : T R A N S A C T I 0 N S D U R I N G P E R I 0 D OTHER CHANGESBEGINNING OF PERIOD :
__~~~~ ___ -__--_ _--___--___--___-- --- - - - ---__- --_ ---__--___--___--_ -- --_ _---_ _---_ _---_ _---_ _- --_ _- -_ _ -- -- --_ --s
: I1SBURSED s INCLUDING s COMMIT- t DISBURSE- : S E R V I C E P A Y M E N T S s CANCEL- s ADJUST-ONLY :UNDISeURSEDt MENTS s MENTS ---------… IL---------- t LATIONS : MENT *
: : : s PRINCIPAL i INTEREST TOTAL :
: I} a 123 s (3) s 14) s 52 2 £6 s I £71 2 893
196819691970 - _ _1971 - - 1,515 - - - _ _ 651972 - 1,580 - - - - - - 311973 - 1,611 - - - - - - -681974 - 1,543 - - - - - 1,439 -1041975 - _- -1976
* THIS COLUMN SHOWS THE AMOUNT OF ARITHMETIC IMBALANCE IN THE AMOUNT OUTSTANDING INCLUDING UNDISBURSED FROM ONEYEAR TO THE EtXT. THE MOST COMMON CAUSES OF IMBALANCES ARF CHANGES IN EXCHANGE RATES AND TRANSFER OF DEBTSFROM ONE CATEGORY TO ANOTHER IN THE TABLE.

SU'PLEHEIIT 07/24/76Table 4.2
PAGE 16SERVICE PAYMENTS, COMMITMENTS, DISBURSEMENTS AND OUTSTANDING AMOUNTS OF EXTERNAL PUBLIC DEBT
PROJECTIONS BASED ON DEBT OUTSTANDING INCLUDING UNDISURSED AS OF DEC. 31, 1975DEBT REPAYABLE IN FOREIGN CURRENCY AND GOODS
IIN THOUSANDS OF U.S. DOLLARS)TYPE OF CREDITOR PRIVATE BANK CREDITS
CREDITOR COUNTRY NETHERLANDSYEAR DEBT OUTSTANDING AT : T R A N S A C T I O N S D U R I N G P E R I OD OTHER CHANGES
: BEGINNING OF;PERIOO sIs---- S -
s DISpURSED I INCLUDING s COMMIT- t DISBURSE- S E R V I C E P A Y N E N T S t CANCEL- s ADJUST-s ONLY :UNDISBURSEDS MENTS s MENTS ---------------------------- I LATIONS t MENT *
: : : s : PRINCIPAL s INTEREST s TOTAL s ss Ii) : (2) s 131 t 14) t5l t 16) s £7) s (1) s £9)
1968 791 791 - - 511 149 660 - -1969 280 280 - - 187 57 244 - -1970 93 93 - - 93 29 122 - -1971 - - - - - - -1972 - -1973 - -1974 - -1975 - -1976 - -
* THIS COLUMN SHOWS THE AMOUNT OF ARITHMeFTIC IMBALANCE IN THE AMOUNT OUTSTANDING INCLUDING UNDISOURSED FROM ONEYEAR TO THI NEXT. THE MOST COMMON CAUSES OF IMBALANCES ARE CHANGES IN EXCHANGE RATES AND TRANSFER OF DEBTSFRUM ONE CATEGORY To ANOTHEP IN THE TABLE.

SurriLp'i'LT 07/24/T6Table 4.2
PAGE 17SERVICE PAYMENTS, COMMITMENTS, 0IS8URSEMENTS AND OUTSTANOING AMOUNTS OF EXTERNAL PUBLIC DEBT
PROJECTIONS AASED ON DEBT OUTSTANDING INCLUDING UN9ISRURSED AS OF DEC. 319 1975DEBT REPAYABLE IN FOREIGN CURRENCY AND GOODS
fIN THOUSANDS OF U.S. DOLLARS$TYPE OF CREDITOR PRIVATE BANK CREDITS
CREDITOR COUNTRY SWITLERLANDYEAR s DEBT OUTSTANDING AT T P A N S A C T I 0 N S 0 U R I N G P E R I 0 D : OTHER CHANGES
: BEGINNING OF PERIOD : :________X__----------------- ___________…------------- --------- …
DISBURSED : INCLUDING s COMMIT- s DISBURSE- s S E P V I C E P A Y M E N T S s CANCEL- ADJUST-ONLY !UNOISBURSED: MENTS s MENTS r--- -----------…--------- LATIONS 2 MENT *
: s s t: PRINCIPAL s INTEREST 2 TOTAL * :llI : I) s12) (3) ( (51 : 15) 161 : is) t (5) 5 (9)
1968 146 29312 - 52 - 11 11 - 131969 200 2,325 - 129 22 8 30 - -91970 305 2,294 - 5 - 2 2 - -291971 307 2265 - 34 46 23 69 - 2621972 330 29481 3,000 1,000 41 21 62 - 921973 1,301 5,532 1,58r 426 t1 124 195 2,673 4481974 1,706 4,823 - 505 1,433 105 1,538 1,638 4931975 946 2,245 - 857 144 5t 201 - -611976 1,619 2,034
* ** * * * THE FOLLOWING FIGURES ARE PROJECTED * * * * * *
1976 1,619 2,034 - 304 293 53 346 -1977 1,630 1,t41 - III 293 47 340 -1978 1,448 1,448 - - 193 38 231 _1979 1,255 1,255 - - 193 33 226 -1980 1,062 19062 - - 193 28 221 -1981 869 869 - - 193 23 216 -1982 676 676 - - 193 17 210 -1983 483 483 - - 193 12 205 -1984 290 290 - - 193 1 200 -1985 97 97 - - 97 1 98 -
* tHIS COLUMN SHOWS THE AMOUNT CF ARITHMETIC IMBALANCE IN THF AMOUJNT OUTSTANDING INCLUDING UNDISWURSEO FROM ONEYEAR TO THE NEXT. THE MOST COMMON CAUSES OF IMBALANCES ARE CHANGES IN EXCHANGE RATES AND TRANSFER OF DEBTSFROM ONE CATEGORY TO ANCTHER IN THE TABLE.
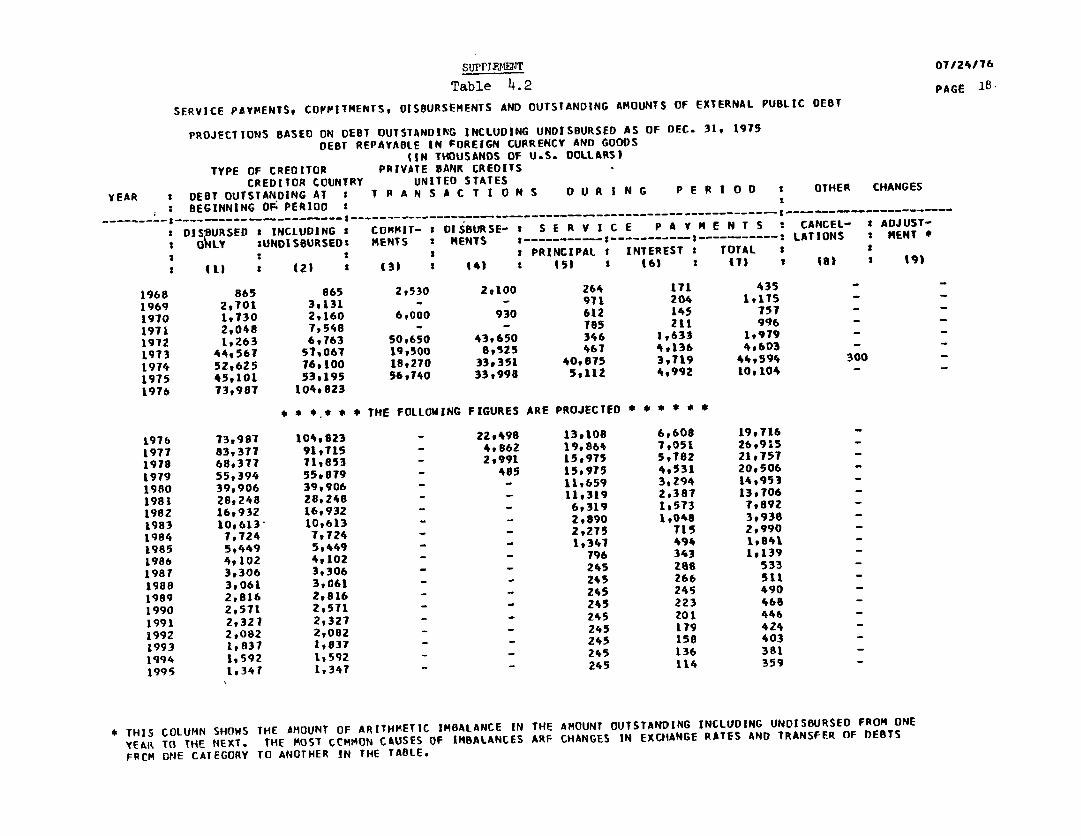
SumpPalENT 07/z4/7Table 4.2 PAGE 18
SERVICE PAYMENTS, COPPITMENTS, DOISURSEMENTS AND OUTSTANDING AMOUNTS Of EXTERNAL PUBLIC DEBT
PROJECTIONS BASED ON DEBT OUTSTANDING INCLUDING UNDISBURSED AS OF DEC. 31, 1975DEST REPAYABLE IN fOREIGN CURRENCY AND GOODS
(IN THOUSANDS OF U.S. DOLLARS)TYPE OF CREDITOR PRIVATE BANK CREDITS
CREDITOR COUNTRY UNITED STATESYEAR s DEBT OUTSTANOING AT s T R A N S A C T I 0 N S 0 U A I N G P E R I 0 D s OTHER CHANGES
: BEGINNING OF. PERioo s… - - -- _------ __ -_ -- - ------…---------------………- :- ----- --- …
* DISBURSED a INCLUDING S COMMIT- : DISBURSE- * S E R V I C E P A Y M E N T S : CANCEL- t ADJUST-t 6NLY :UNDISBURSEDS MENTS I MENTS s-----------s --- ---- - LATIONS t KENT *
: s s s X PRINCIPAL t INTEREST 2 TOTAL 2 2I £1.1 s (2) I * 3i s 14) t £51 t {1) t (7) 2 18) 2 19)
1968 865 865 2,530 2,100 264 171 435 - -1969 2,701 3,131 - - 971 204 1,,1151970 1,730 2,160 6,000 930 612 145 757 - -1971 2,048 7,548 - - 785 Zl1 9 q6 - _1912 1,263 6,763 50,650 43,650 346 1,633 1,99791913 44,567 57,067 19,500 8,525 467 4,136 4,603 - -1914 52,625 16,100 18,270 33,351 40,875 3,719 44,594 300 -1975 45,101 53,195 56.740 33,998 5,112 4,992 10,104 - -1976 73,907 104,823
* * *.* * * THE FOLLOWING FIGURES ARE PROJECTED * * * * * *
197b 73,987 104,823 - 22,498 13,108 6,608 19,716 -1977 83,377 91,115 - 4,862 19,864 7,051 26,915 -1978 68,377 71,853 - 2,991 15,975 5,182 21,757 -1979 55,394 55,019 - 485 15,975 4,531 20,506 -1980 39,906 39,906 - - 11,659 3,Z94 14,953 -1981 28,248 28,248 - - 11,319 2,387 13,706 -1982 16,932 16,932 - - 6,319 1,5T3 7,892 _1983 10,613 10,613 - - 2,890 1,048 3,938 -1984 7,724 7,724 - - 2,275 T15 2,990 -1985 5,449 5,449 - - 1,341 494 1,841 -1986 4,102 4,102 - - 796 343 1,139 -198? 3,306 3.306 - - 245 28a 533 -1988 3,061 3,061 - - 245 266 511 -1989 2,816 2,816 - - 245 245 490 -1990 2,571 2,571 - - 245 223 468 -1991 2,327 2,327 - - 245 217 446 -1992 2,082 2,082 - - 245 179 423 -1993 1,837 1,837 - - 245 150 403 -1594 1,592 1,592 - - 245 136 381 -1995 1,347 1,347 - - 245 114 359 -
* THIS COLUMN SHOWS THE AMOUNT OF ARITHMETIC IMBALANCE IN THE AMOUNT OUTSTANDING INCLUOING UNDIS8URSED FROM ONEYEAR TO THE NEXT. THE MOST CCMMON C4USES OF IMBALANCES ARF CHANGES IN EXCHA4GE RATES AND TRANSFER OF DEBTSFUCM ONE CATEGORY TO ANOTHER IN THE TABLE.

SUPPIZ&MT 07/24/76
Table 4.2PAGE 19
SEPVICF PAYMENTS, COMMITMENTS, DISBURSEMENTS AND OUTSTANDING AMOUNTS OF EXTERNAL PUBLIC DEST
PROJECTIONS BASED ON DEBT OUTSTANDING INCLUDING UNDISBURSED AS OF DEC. 31, 1975DESBT REPAYABLE IN FOREIGN CURRENCY AND GOODS
IIN THOUSANDS OF U.S. DOLLARS)TYPE OF CREOITOR PUBLICLY ISSUED BONDS
CREDITOR COUNTRY GERMANY, FED.REP. OFYEAR DEBT OUTSTANDING AT T R A N S A C T I 0 N S 0 U R I N G P E R I 0 D : OTHER CHANGES
BEGINNING DF PERIOD : D_______-_ - -- - --------- - -- - --- -
95SBURSED : INCLUDING COMMIT- t DISBURSE- s S E R V I C E P A Y H E N T S z CANCEL- : ADJUST-s ONLY !UNDISBURSED: MENTS s MENTS : …------------s LATIONS MENT *
I 3 s PRINCIPAL * INTEREST 2 TOTAL :(1) 1 (3) 15) s 6) * 78 (91
1968 -1969 - - - - - _ _ _ _1970 - - 1,429 1,429 - - -1971 1.429 19429 - - 704 - 704 - 1251972 850 850 - - - 44 44 - 181973 868 868 - - 490 117 607 - 1691974 547 547 - - 571 78 649 - 241975 - - - - - - -1576 -
* THIS COLUMN SHOWS THE AMGUNT OF ARITHMETIC IMBALANCE IN THE AMOUNT OUTSTANOING INCLUOING UND1S8URSED FROM ONEYEAR TO THE NEXT. THE MOST COMMON CAUSES OF IMBALANCES ARE CHANGES IN EXCHANGE RATES AND TRANSFER OF OEBTSFROM ONE CATEGORY TC ANOTHFR IN THE TABLE.

SUPPLSE1 T 07/24/76Table 4.2 PAGE 20
SERVICE PAYMENTS, COPMITMENTS, DISBURSEMENTS AND OUTSTANDING AMOUNTS OF EXTERNAL PUBLIC DEBT
PPOJECTIONS BASED ON DEBT OUTSTANDING INCLUDING UNDISBURSED AS OF DEC. 31, 1975DEBT REPAYABLE IN FOREIGN CURRENCY AND GOODS
uIN THOUSANDS OF U.S. DOLLARS)TYPE OF CREDITOR PUBLICLY ISSUED BONDS
CREDITOR COUNTRY UNITED KINGDOMYEAR : DEBT OUTSTANDING AT : T R A N S A C T I 0 N S 0 U P I N G P E R I 0 D Z OTHER CHANGES
BEGINNING OF;PERIOD :______ ___…________-- _ - ____--……__ * - -_ ______________________--------
:DIS URSED : INCLUDING : COMMIT- z DISBURSE- I S E R V I C E P A Y M E N T S s CANCEL- : ADJUST-s OILY *UNDIS8URSEDs MENTS s MENTS s- -- -- ---- -- …-----I--- LATIONS 2 KENT *
IsI I I PRINCIPAL : INTEREST I TOTAL s s(12 s 122 s 31 14) s s 58 t 161 1 (7) 1 (81 2 19)
1968 3,730 3,730 - - 167 98 265 - -1211969 3,442 3,442 - - 169 82 251 - -1361970 3.137 3,137 - - 185 74 259 - -1591971 2,793 2,793 - - 190 16 206 - -1561972 2,447 2,447 - - 207 50 257 - -1441973 2,096 2,096 - - 207 37 244 - -821974 1,807 1,807 - - 231 20 251 - -91975 1,567 19567 - - 227 42 269 - -121976 1,328 1,328
* * ** * * THE FOLLOWING FIGURES ARE PROJECTED * * * * * *
1976 1,328 1,328 - - 236 38 274 -1977 1,092 1,092 - - 244 30 274 -1978 849 849 - - 251 23 274 -1979 598 598 - - 258 16 274 -1980 341 341 - - 266 8 274 -1981 75 75 - - 75 1 76 -
* THIS COLUMN SHOWS THE AMOUNT CF ARITHMETIC IMBALANCE IN THE AMOUNT OUTSTANDING INCLUDING UNDISURSED FROM ONEYEAR TO THE NEXT. THE MOST COMMON CAUSES OF IMBALANCES ARF CHANGES IN EXCHANGE RATES AND TRANSFER OF DEBTSFROM ONE CATEGORY TC ANOtHER IN THE TABLE.

SUPPIENfiT 07/24/76Table 4.2
PAGE 21SERVICE PAYMENTS, COMMITMENTS, OISBURSEMENTS AND OUTSTANDING AMCUNTS OF EXTERNAL PUBLIC OEBT
PROJECTIONS BASEC ON DEBT OUTSTANDING INCLUDING UNOIS6URSED AS OF DEC. 319 1975DEBT REPAYABLE IN FOREIGN CURRENCY AND GOODS
(IN THOUSANDS OF U.S. DOLLARS)TYPE Of CREODTOR PUBLICLY ISSUED BONDS
CREDITOR COUNTRY UNITED STATESYEAR : DEBT OUTSTANDING AT : T R A N S A C T'I O N S D U R I N G P E R I 0 D I OTHER CHANGFS
: BEGINNiNG;OF PERIOO D…-- -- - -------- --- ----------------------…-
I )DISSURSED I INCLUDING s COMMIT- D OISBURSE- s S E R V I C E P A Y N E N T S * CANCEL- * ADJUST-ONLY ?UNDISBURSEDI MENTS M NENTS s---- -S------------ LATIONS a MENt *
s s 1 s * PRINCIPAL s INTEREST s TOTAL s s: 11) 2 (2Z : (33 a (43 a (5) 2 161 5 (71 181 : (9I
1968 145 145 - - 12 3 15 - -11969 132 132 - - 13 3 16 - -61970 113 113 - - I 1 8 -1971 107 107 - - 14 3 17 - -11972 92 92 1,195 1,000 37 2 39 195 -11973 1,054 1,054 - - 35 2 37 - -1974 1,019 1,019 - - 38 2 40 - -1975 981 981 - - 38 1 39 - -1976 943 943
* * * * * * THE FOLLOWING FIGURES ARE PROJECTED * * * * * *
1916 943 943 - - 620 25 645 -1977 323 323 - - 319 12 331 -1978 4 4 4 - 4 -
* THIS COLUMN SHOWS THE AMOUNT OF ARITHMETIC IMBALANCE IN THE AMOUNT OUtSTANDING INCLUDING UNDISBURSED FROM ONEYEAR TO THE NEXT. THE MOST COMMON CAUSES OF IMBALANCES ARE CHANGES IN EXCHANGE RATFS AND TRANSFER OF DEBTSFROM ONE CATEGORY TO ANOTHER IN THE TABLE.

SUTPLpE?IT 0o/24/76
Table 4.2 22PAGE 2?
SERVICE PAYMENTS, COMMITMENTS, DISBURSEMENTS AND OUTSTANDING AMOUNTS OF EXTERNAL PUBLIC DEBT
PROJECTIONS BASEC ON DEPT OUTSTANDING INCLUDING UNDISURSED AS OF DEC. 31, 1975DEBT REPAYABLE IN FOREIGN CURRENCY AND GOODS
(IN THOUSANDS OF U.S. OCLLARSITYPE OF CREDITOR CTHER PRIVATE DEBT
CREDITOR COUNTRY ARGENTINAYEAR 2 DEBT OUTSTANDING AT T R A N S A C T I O N S D U R I N G P E R I O OTHER CHANGES
2 BEGINNING OF-PERIOD s 2…s------------ -- -- --- - ---………- -- …
s DISBURSED I INCLUDING 2 COMMIT- I DISBURSE- I S E R V I C F P A Y M E N t S : CANCEL- I ADJUST-s ODPLY 2UNDISBURSED: MENTS S MENTS t …----------- --------- I----------- LATIONS £ MENT*
2 2 3 2 s PRINCIPAL I INTEREST I TOTAL s 22 (1) t 42) a 431 2 44) 2 45) t 161 a (7) (8t 2 (9)
1968 -1969 - - - - -1970 - - _ _ _ _ _1971 - - - _ _ _ _1972 - - _ _ _ _1973 - - - - _ _ _1974 - - - - - _ _1975 - - 589 - - - -1976 - 589
* - * 9 * * THE FOLLOWING FIGURES ARE PROJECTED * * * * * *
1976 - S89 - 393 37 7 441971 356 552 - 196 74 33 1071978 479 479 - - 74 35 1091979 405 405 - - 74 29 103198O 331 331 - - 74 23 971981 258 258 - - 74 iB 921982 154 184 - - 74 12 861583 110 110 - - 74 7 811984 37 37 - - 37 1 38
* THIS COLUMN SHOWS THE AMOUNT OF ARITHMETIC IMBALANCE IN THE AMOUNT OUTSTANDING INCLUDING UNDISBURSED FROM ONEYEAR TO THE NEXT. THE mOST COMmoNa CAUISES OF IMBALANCES ARE CHANGES IN EXCHANGE RATES AND TRANSFER OF DEBTSFROM ONE CATFGCRY TO ANOTHER IN THE TABLE.

SUFpIFENT 07/24/76Table 4.2
PAGE 23SERVICE PAYMENTS, CGPMITMENTS. DISBURSEMENTS AND OUTSTANDING AMOUNTS OF EXTERNAL PUBLIC DEBT
PROJECTIONS BASED ON DEBT OUTSTANDING INCLUOING UNDIS8URSED AS OF DEC. 31, 1915DEBT REPAYABLE IN FOREIGN CURRENCY AND GODOS
(IN THOUSANDS OF U.S. DOLLARS)TYPE OF CREOITOR OTHER PRIVATE DEBT
CREOITCR COUNTRY BRAZILYEAR : DEBT OUTSTANDING AT T R A N S A C T I 0 N S D U R I N G P E R I 0 O s OTHER CHANGES
s BEGINNING OF PERIOD t_________ _ ----------- --------------……-----…--- -
sI S8URSED : INCLUDING : COMMIT- s DISBURSE- t S E R V I C E P A Y N E N T S CANCEL- * ADJUST-I ONLY IUNDISBURSEDI MENTS I MENTS I--------------- --- ------- LATIONS * MENT *
: : : sXt PRINCIPAL 5 INTEREST : TOTAL ss (1) : 121 s (3) (43 s 151 s (61 1 (7) s8) s (9)
1968 - - - - - - -19S9 - _1970 - - - _ - _ _1971 - - - - - - -1972 -1973 - - 427 427 - - -1974 427 427 - - 75 25 1001975 352 352 - - 60 15 751976 292 292
* ** * * * THE FOLLOWING FIGURES ARE PROJECTED * * * * * *
1976 292 292 - - 117 20 137197? 175 175 I _ 117 11 1281978 58 58 - _ 58 2 60
* THIS COLUMN SHnWS THE AMOUNT OF ARITHMETIC IMBALANCE IN THE AMOUNT OUTSTANDING INCLUDING UNDISWURSED FROM ONEYEAR TO THE NEXT. THE MOST COMMON CAUSES OF IMBALANCES ARE CHANGES IN EXCHANGE RATES AND TRANSFER OF DEBTSfROM ONE CATEGORY TO ANOTHER IN THE TABLE.

SUPPLEKMT 07/24 /76Table 4.2
PAGE 2I,SERVICF PAYMENTS, COMaITMENTS, OISBURSENENTS AND OUTSTANDING AMOUNTS OF EXTERNAL PUBLIC DEBT
PROJECTIONS BASED ON DEBT OUTSTANDING INCLUDING UNDISOURSED AS OF DEC. 31, 1975DEBT REPAYABLE IN FOREIGN CURRENCY AND GOODS
(IN THOUSANDS OF U.S. DOLLARS)TYPE CF CREDITOR OTHER PRIVATE DEBT
CREDITOR COUNTRY FRANCEYEAR : DEBT OUTSTANDING AT : T R A N S A C T I O N S O U R I N G P E R I 0 D OTHER CHANGES
: BEGINNING OF PERIOD I
D OISBURSED I INCLUDING * COMMIT- 2 DISBURSE- 2 S E R V I C F P A Y M E N T S : CANCEL- s AOJUST-2 dNLY SUNOISBURSEDs MENTS I MENTS 2-----------:-----------:-------- --- LATIONS , MENT *
t : PRINCIPAL INTEREST s TOTAL s: II {1 121 ( 13) (4) 15) 16) 2 (7) * 18 (9)
1968 - _1969 - - _ _ _ _ _1970 - - -_ -_ _1911 - - 3,082 - - - -1972 _ 3,082 - 2,073 142 12 1541973 1,931 29940 - - 269 25 2941974 1,662 2,671 - - 173 108 281 1,2231975 1,275 1.275 - - 364 82 446 -1976 911 911
* * 4 * * * THE FOLLOWING FIGURES ARE PROJECTED * S * *
1976 911 911 - _ 260 59 3191977 651 651 - - 260 41 3011978 390 390 - - 260 Z3 2831979 130 130 - _ 130 5 135
* THIS COLUMN SHOWS THE AMOUNT CF ARITHMETIC IMBALANCE IN THE AMOUNT OUTSTANDING INCLUDING UNOISSURSED FROM ONEYEAR TO THE NEXT. THE MOST CCMMON CAUSES OF IMBALANCES ARE CHANGES IN EXCHANGE RATES AND TRANSFER OF DEBTSFROM ONE CATEGORY TO ANOTHER IN THE TABLE.

5UPFPJEENT 07/24/76Table 4.2 PAGE 25
SERVICE PAYMENTS, COMMITMENTS, DISBURSEMENTS AND OUTSTANDING AMOUNTS OF EXTERNAL PUBLIC DEBT
PROJECTIONS eASED ON DEBT OUTSTANDING INCLUOING UNDtSBURSED AS OF DEC. 31, 1975DEBT REPAYABLE IN FOREIGN CURRENCY ANO GOODS
(IN THOUSANDS OF U.S. DOLLARSITYPE OF CREDITOR OTHER PRIVATE DEBT
CREOITOR COUNTRY SPAINYEAR DEBT OUTSTANDING AT T R A N S A C T I O N S D U R I N G p f R I D 2 OTHER CHANGES
I BEGINNING;OF PERIOD t- ~-- --- --- ---- - -- -- -- - -7------- - -- - -- - -- - -- --…- …-- --- …
a qISBURSEO 2 tNCLUDING t cOMMtr- : DISBURSE- : S E R V I C E P A Y M E N T S s CANCEL- : ADJUST-: ONLY aUNDISOURSED, MENTS s MENTS …-----------t-Z LATIONS : MENT *
: s s * t PRINCIPAL I INTEREST i TOTAL s5 (II(21) 2) : 3) 2 I1) s (5) s 16 17) l ) 2 19)
1968 _1969 --
1970 - - - _ _ _ _1971 - 327 - - - -1972 - 327 - 100 - - -1973 100 327 - 227 - - -1974 327 321 - - 131 20 1511975 196 196 - - 196 - 1961976 - -
* THIS COLUMN SHOWS THE AMOUNT OF ARITHMETIC IMBALANCE IN THE AMOUNT OUTSTANDING INCLUOING UNOISBURSEO FROM ONEYEAR TO THE NEXT. THE MOST CCMMON CAUSES OF IMBALANCES ARE CHANGES IN EXCHANGE RATES ANO TRANSFER OF DEBTSFRCM ONE CATEGORY TO ANOTHER IN THE TABLE.

SUP'PLEENT 07/24/76
Table 4.2PPAGE 26
SERVICE PAYMENTS, COMMITMENTS* DISBURSEMENTS AND OUTSTANDING AMOUNTS OF EXTERNAL PUBLIC DEBT
PROJECTICNS BASEC ON DEBT OUTSTANDING INCLUDING UNDISBURSED AS OF DEC. 31, 1975DEBT REPAYABLE IN FOREIGN CURRENCY AND GOODS
IIN THOUSANDS OF U.S. DOLLARS)TYPE OF CREDITOR OTHER PRIVATE DEBT
CREDITOR COUNTRY UNITED STATESYEAR : DEST OUTSTANOING AT : T R A N S A C T I 0 N S D U R I N G P E R I 0 D : OTHER CHANGES
B BEGINNING OF;PERIOD I I…______-__________-__-______--- s---------------- ------ ------------------------------- ---------- - ---…
DISBURSED : INCLUDING I COMMIT- : DISBURSE- S E R V I C E P A Y M E N T S t CANCEL- 2 ADJUST-: ONLY :UNOISBURSEDt MENTS s MENTS …----------- ------ s-- LATIONS I MENT *
: s : s f PRINCIPAL INTEREST a TOTAL I *2 Iti s 121 2 13) s 144 a (51 s 6) a (7) a (a) 2 49)
1968 - - 6,601 - - - - - -1969 - 6,601 - 2,200 - - - - _1970 2.200 6.601 11,068 1,555 1,755 346 2,101 -1971 2,000 15,914 - 2,896 2,906 684 3,590 - -
1972 1,990 13,008 - 3,595 3,373 918 4,291 - -
1973 2,212 9,635 - 1,076 2,12Z 212 2,334 - -
1974 1,166 7,513 - - 508 63 571 - -
1975 658 7,005 3,380 2,802 370 61 431 - -1976 3,090 10,015
* * * * * * THE FOLLOWING FIGURES ARE PROJECTED * * * * * *
1976 3,090 10,015 - 4,324 1,474 512 1,986 -1977 5,940 8,541 - 1,811 1,474 661 2,135 -1978 6,277 7,067 - 790 1,474 585 2,059 -1979 5,591 5,591 - - 2.198 470 2,668 -1980 3,393 3.393 - - 2,669 236 2,905 -1981 724 724 - - 724 34 758 -
* THIS COLUMN SHOWS THE AMOUNT OF ARITHMETIC IMBALANCE IN THE AMOUNT OUTSTANDING INCLUDING UNDISBURSED FROM ONEYEAR TO THE NfXT. THE MOST CCMMCN CAUSES OF IMBALANCES ARE CHANGES IN EXCHANGE RATES AND TRANSFER OF DEBTSFPOM ONE CATEGORY TO ANOTHER IN THE TABLE.

SUPPIFIDENT 07124/76
Table 4.2 PAGE 27SERVICE PAYMENTS, COMMITMENTS, DISBURSEMENTS AND OUTSTANDING AMOUNTS OF EXTERNAL PUBLIC OEBT
PROJECTICNS BASED ON DEBT OUTSTANDING INCLUDING UNDIS8URSED AS OF DEC. 31, 1975DEBT REPAYABLE IN FOREIGN CURRENCY AND GOODS
IIN THOUSANDS OF U.S. DOULLARS)TYPE OF CREDITOR OTHER PRIVATE DEST
CREDITOR COUNTRY MULTIPLE LENDERSYEAR : DEBT OUTSTANDING AT : T R A N S A C T I 0 N S D U R I N G P E R I 0 0 : OTHFR CHANGES
2 BEGINNING:OF PERIOD :…_ ___ - --- ----- -…- -__ __ - -_____ ______ -___ ___ -__ _ _ _ ______ _ _- _ -_ -_ - -_ _____-- -_ _… -_ -___DISBURSED : INCLUDING I COMMIT- DISBURSE- : S E R V I C r P A Y M E N T S * CANCEL- : ADJUST-: ONLY tUNOISBURSED: MENTS * MENTS …:-… ------ --------- ---------- : LATIONS : MENT *
: PRINCIPAL : INTEREST : TOTAL: (13 I 121 (31 : (43 s (5) : (6) 2 (73 I (81 (91
1968 - - - - - - - - -1969 - - - - _ _ _ _ _1970 - - - - - _ _ _ _1971 - - 5,970 - - - - - 3461912 - 6,316 - 1,21? 602 - 602 - 1311973 605 5,845 2.230 4,896 973 323 1,296 - 4461974 4,357 7,548 - 3,123 1,019 276 1,295 - 3631975 6,892 6,892 - - 177 718 895 112 -491976 6.554 6,554
* * * * * * THE FOLLOWING FIGURES ARE PROJECTED * * * * * *
1976 6,554 6,554 - _ 1,873 497 2,3601977 4,681 4,681 - - 1,873 337 2,2101918 2Z809 2,809 - - 1,073 187 2,0601979 936 936 - - 936 37 973
* THIS COLUMN SHOWS THE AMOUNT CF ARITHMETIC IMBALANCE IN THE AMOUNT OUTSTANDING INCLUDING UNDIS8URSED FROM ONEYEAR TO THE NEXT. tHE MOST COMMON CAUSES OF IMBALANCES ARE CHANGES IN EXCHANGE RATES AND TRANSFER OF DEBTSFROM ONE CATFGORY TO ANOTHER IN THE TABLE.
EXTERNAL DEBT DIVISIONECONOMIC ANALYSIS & PROJECTIONS DEPABRTMNT
JULY 28, 1976
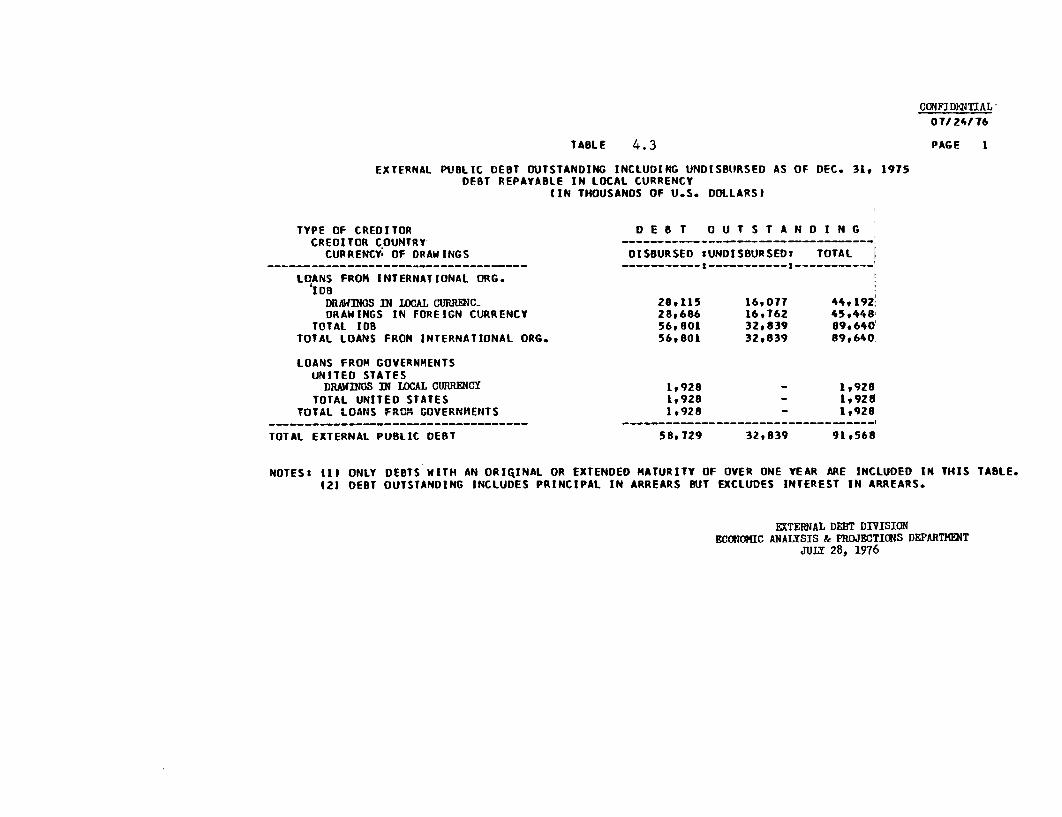
CONFIDkN4TIAL
07/24/76
TABLE 4.3 PAGE I
EXTERNAL PUBLIC DEBT OUTSTANDING INCLUDING UNDISBURSED AS OF DEC. 31, 1975DEBT REPAYABLE IN LOCAL CURRENCY
IIN THOUSANDS OF U.S. DOLLARS)
TYPE OF CREDITOR D E B T O U T S T A N D I N GCREDITOR COUNTRY
CURRENCY; OF DRAWINGS DISBURSED tUNDISBURSED: TOTAL- _- _ __-_ __-_ __-_ __ __ __ __ --_… _ _______,___________,
LOANS FROM INTERNATIONAL ORG.'108
DRAWINOS IN LOCAL CURRENC- 28.115 16,077 44,192DRAWINGS IN FOREIGN CURRENCY 28,686 16,762 45,448'
TOTAL IDB 56,801 32,839 09,640TOTAL LOANS FROM INTERNATIONAL ORG. 56,801 32,839 89,640.
LOANS FROM GOVERNMENTSUNITED STATES
DRAWINGS IN LOCAL CURRNCY 1,928 - 1,928TOTAL UNITED STATES 1,928 - 1,920
TOTAL LOANS FROM GOVERNMENTS 1,928 - 1,928
TOTAL EXTERNAL PUBLIC DEBT 58,129 32,839 91,568
NOTES: III ONLY DEBTS WITH AN ORIgINAL OR EXTENDED MATURITY OF OVER ONE YEAR ARE INCLUOED IN THIS TABLE.(2) DEBT OUTSTANDING INCLUDES PRINCIPAL IN ARREARS BUT EXCLUDES INTEREST IN ARREARS.
EXTERNAL DEBT DIVISIONECONOMIC ANALYSIS & PROJECTIONS DEPARTMET
JULY 28, 1976

CUIFIDENTIAL07/Z4/76
TABLE 4.4PAGE 1)
SERVICE PAYMENTS, COMMITMENTS, DISBURSEMENTS AND OUTSTANDING AMOUNTS OF EXTERNAL PUBLIC DEBT
PROJECTIONS BASED ON DEBT OUTSTANDING INCLUDING UNOISBUPSED AS OF DEC. 31, 1975OE8T REPAYABLE IN LOCAL CURRENCY
IIN THOUSANDS OF U.S. DOLLARSITOTAL
YEAR DEBT OUTSTANDING AT * T R A N S A C T I 0 N S D U R I N G P E R 1 0 D * OTHER CHANGES: BEGINNING OF PERIOD 2 g
DISBURSED : INCLUDING : COMMIT- DISBURSE- : S E R V I C E P A Y N E N T S CANCEL- t ADJUST-: ONLY ?UNDISOURSED: MENTS : MENTS :-----------I-----------:-----------: LATIONS : MENT t
2t t PRINCIPAL t INTEREST : TOTAL t tII) t 42) : (31 t (4) t (5) t 161 1 (7) t lB) t (9)
1968 12,948 28,286 1,000 466 1.408 740 2,148 238 11969 12,007 27,641 1,133 2,744 1,516 507 2,023 - -11970 13,235 27,857 41,087 5,393 2.402 554 2,956 1,000 -5181971 15,711 65.024 - 5,953 1,829 874 2,703 - 381972 19,835 63,233 21,500 6,417 1,320 1,057 2,377 6,500 -61973 24,923 76,907 11,400 7,126 1,317 1,408 2,725 - 461974 30,733 87,036 7,800 17,381 1,634 1,590 3,224 1,631 281975 46,480 91,599 2,000 14,281 2,029 1,802 3,831 - -21976 58,729 91,568
* * * * * * THE FOLLOWING FIGURES ARE PROJECTED * * * * * *
1976 58,729 91,568 - 19,933 4,172 2,206 6,378 -1977 74,492 e7,398 - 4,787 4,851 2,215 7,066 -1978 74,433 82,551 - 3,427 4,185 2,144 6,329 -1979 73,678 78,368 - 2,417 4,171 2,065 6,236 -1980 71,925 74,198 - 1,836 4,156 1,964 6,120 -1981 69,608 70,045 - 167 4,156 1.852 6,008 -1982 65,621 65,890 - 107 4,102 1,707 5,809 -1983 61,629 61,790 - 107 4,005 1,596 5,601 -1984 57,734 57,788 - 54 4,359 1,573 5,932 -1985 53,431 53,431 - - 4,28Z 1,482 5,764 -1986 49,149 49,149 - - 4,015 1,346 5,361 -1987 45,136 45,136 - - 39902 1,215 5,117 -1988 41,235 41,235 - - 3,789 1,090 4,879 -1989 37,447 37,447 - - 3,779 971 4,750 -1990 33,674 33,674 - - 3,691 849 4,540 -1991 29,984 29,984 - - 3,343 737 4,080 -1992 26,641 26,641 - - 3,348 632 3,980 -1993 23,295 23,295 - - 2,962 529 3,491 -.1994 20,335 20,335 - - 2,96T 434 3,401 -1995 17,369 17,369 - - 2,903 340 3,243 -
* THIS COLUMN SHOWS THE AMOUNT CF ARITHMETIC IMBALANCE IN THE AMOUNT OUTSTANDING INCLUDING UNDIS8URSED FROM ONEYEAR TU THE NEXT. THE MOST COMMON CAUSFS OF IMBALANCES ARE CHANGES IN EXCHANGE RATES ANO TRANSFER OF DEBTSFROM ONE CATEGORY TC ANCTHER IN THE TABLE.

07/24/76TABLE 4.4
PAGE 2SERVICE PAYMENTS, COMMITMENTS, DISBURSEMENTS AND OUTSTANDING AMOUNTS OF EXTERNAL PUBLIC DEBT
PROJECTIONS BASED ON DEBT OUTSTANDING INCLUDING UNOISeURSED AS OF DEC. 31, 1975DEBT REPAYABLE IN LOCAL CURRENCY
(IN THOUSANDS OF U.S. DOLLARS)TYPE OF CREDITOR SUPPLIERS CREDITS
CREDITOR COUNTRY UNITED KINGDOMCURRENCY QF DRAWINGS DRAWINOS IN LOCAL CURRENCY
YEAR DEST OUTSTANDING AT : T R A N S A C T I 0 N S D U R I N G P E R I 0 D 2 OTHER CHANGESBEGINNING OF PERIOD 5
…_-… -_ - -___ -_____.___ _____ _-- -_____ ____ ____ _- -__ -__ -__ -_DISBuRSED s INCLUDING 2 COMMIT- t DISBURSE- i S E R V I C E P A Y M E N T S s CANCEL- s ADJUST-S ONLY *UNDIS0URSEDs MENTS * MENTS : _---…__---__…---…__--------------s LATIONS * MENT *
2 I s PRINCIPAL 2 INTEREST s TOTAL Is 413 s 42 II t(331 t 43 (51 3 16) I (73 * (8e * (9)
1968 -1969 - _ _1970 - - 187 - - _ _ _ _1971 - 187 - - - - - - 121972 - 199 - 158 23 10 33 - -141973 127 162 - 37 56 - 56 - 11974 107 107 - - 47 - 47 - 11975 61 61 - - 58 2 60 - -31976 - _
* THIS COLUMN SHOWS THE AMOUNT OF ARITHMETIC IMBALANCE IN THE AMCUNT OJTSTANDING INCLUDING UNDISBURSED FROM ONEYEAR TO THE NEXT. THE MOST COMMON CAUSES OF IMBALANCES ARE CHANGES IN EXCHANGE RATES AND TRANSFER OF DEBTSFROM ONE CATEGORY TC ANOTHER IN THE TABLE.

07/24/76TABLE 4.4
PAGE 3SERVICE PAYMENTSt COP*ITMENTS, DISBURSEMENTS AND OUTSTANDING AMOUNTS OF EXTERNAL PUBLIC OfET
PROJECTIONS BASED ON DEBT OUTSTANDING INCLUOINC UNOIS8URSEO AS OF DEC. 31, 1975DEBT REPAYABLE IN LOCAL CURRENCY
(IN THOUSANDS OF U.S. DOLLARS)TYPE OF CREDITOR SUPPLIERS CREDITS
CREDITCR COUNTRY UNITED KINGDOMTOTAL
YEAR D OEBT OUTSTANOING AT T R A N S A T I O N S D U R I N G P E R I O D OTHER CHANGESBEGINNING OF PERIOD :
2---- -----DISBURSED : INCLUDING : COMMIT- s DISBURSE- : S E R V I C E P A Y M E N T S s CANCEL- s ADJUST-
S ONLY :UNOISBURSEDS MENTS s JENTS s…------------…-----s LATIONS t MENT *s I I s PRINCIPAL I lNTEREST : TOTAL ss (1I (2? ( 13) s (4) s 15) 2 (6) t 1t7 (82 : 9 19
1960 -1969 - - _ _ _ - _ _ _1970 - I 18T _ _ _ _ _ _1971 - 187 - - - - - -Z1912 - 199 - 158 23 10 33 - -141973 127 162 - 37 56 - 56 -1974 107 107 - - 47 - 47 -1975 61 61 - - 58 2 60 - -31976 - _
* THIS COLUMN SHOWS THE AMOUNT OF ARITHMETIC IMBALANCE IN THE AMOUNT OUTSTANDING INCLUDING UNDIS8URSED FROM ONEYEAR TO THE NEXT. THE MOST CCMMON CAUSES OF IMBALANCES ARE CHANGES IN EXCHANGE RAtES AND TRANSFER OF DEBTSFROM ONE CATEGORY TO ANOTHFR IN THE TABLE.

07/24/76TABLE 4.4
PAGE4SERVICE PAYMENTS. COMMITMENTS, DISBURSEMENTS AND OUTSTANDING AMOUNTS OF EXTERNAL PUBLIC DEBT
PROJECTIONS BASED ON DEBT OUTSTANDING INCLUDING UNDISBURSED AS Of DEC. 31. 1975DEBT REPAYABLE IN LOCAL CURRENCY
(IN THOUSANDS OF U.S. DOLLARSITYPE OF CREDITOR SUPPLIERS CREDITS
TOTALYEAR s DEBT OUTSTANDING AT s T R A N S A C T I 0 N S D U R I N G P E R I 0 D 2 OTHER CHANGES
BEGINNING OF PERIOD 2 s___ ___ __, … _ _ __ -____________________ _ _ _ _ _ _ _ _ _ _ _ _ _ ___--------------- - --- ,-__…______________- --
2 DISBqRSED 2 INCLUDING I COMMIT- I DISBURSE- I S E R V I C E P A Y M E N T S : CANCEL- 2 ADJUST-S ONLY ZUNDISBURSED: NENTS * MENTS s--------s…- ----------- : LATIONS s MENT *S 2 2 : t PRINCIPAL I INTEREST 2 TOTAL 2a (1) a 121 s 431 (41 s 15) t 16 (7) 2 (8) t (9)
19681969 -1970 - - 187 - - - - - -1971 - 187 - - - - - - 121972 - 199 - 158 23 10 33 - -141973 127 162 - 37 56 - 56 - 11974 107 107 - - 47 - 47 - 11975 61 61 - - 58 2 60 - -31976 -
* THIS COLUMN SHOWS THE AMOUNT CF ARITHMETIC IMBALANCE IN THE AMOUNT OUTSTANDING INCLUDING UNOISOURSED FROM ONEYEAR TO THE NEXT. THE MOST COMMON CAUSES OF IMBALANCES ARE CHANGES IN EXCHANGE RATES AND TRANSFER OF DEBTSFROM ONE CATEGORY TO ANOTHER IN THE TABLE.

07/24/76TABLE 4.4
PAGE 5SERVICE PAYMENTS, COMMITMENTS, DISBURSEMENTS AND OUTSTANDING AMOUNTS OF EXTERNAL PUBLIC DEBT
PRCJECTIONS BASED ON OEBT OUTSTANDING INCLUOING UND1SBURSED AS OF DEC. 31, 1975OEBT REPAYABLE IN LOCAL CURRENCY
IIN THOUSANDS OF U.S. DOLLARSITYPE OF CRECITOR LCANS FROM INTERNATIONAL ORG.
CREDITOR COUNTRY IDSCURRENCY OF DRAWINGS DRAWINGS IN LOCAL CURRENCY
YEAR DEBT OUTSTANOING AT : T R A N S A C T I O N S D U R I N G P E R I O O OTHER CHANGES2 BEGINNING OF PERIOD *
…______ , ___-----_____________ -- --- …------------- s--
: DISBURSED I INCLUDING * COMMIT- 2 DISBURSE- * S E R V I C E P A Y ' E N T S * CANCEL- * ADJUST-ONLY :UNDISBURSEDt MENTS s MENTS … -- s----- --- … LATIONS t MENT *
2 * t t I PRINCIPAL * INTEREST t TOTAL * t* {II : (21 : 131 z 14) 2 15 2 (61 * (75 (8) t 49)
1968 312 2,212 1,000 - 27 28 55 - -1969 285 3,185 100 7Z5 33 32 65 - -
19TO 911 3,252 4,500 1,966 85 78 163 1,000 -1971 2,858 6,667 - 1,712 104 150 254 - -
1972 4,466 6,563 18,900 880 83 238 321 - -1973 59263 25,380 11,400 3,321 I7 391 468 - 1851974 8,508 36,888 7,0o0 11,110 183 562 745 - -1975 19,435 44,505 - 8,993 313 714 1,027 - -
1976 28,115 44,192
* * i * * * THE FOLLOWING FIGURES ARE PROJECTED * * * * * *
1976 28,115 44,t92 - 5,313 670 778 1,448 -1977 32,758 43,522 - 49017 1,460 827 2,287 -1978 35,320 42,066 - 2,881 1,460 856 2,316 -1979 36,742 40,606 - 1,957 1,460 863 2,323 -1980 37,240 39,147 - 1,530 1,460 849 2,309 -1981 37,311 31,688 - 107 1,460 825 2,285 -1982 35,960 36,229 - 107 1,460 773 2,233 -1983 34,610 34,771 - 107 1,526 742 2,268 -1984 33,191 33,245 - 54 1,834 793 2,627 -1985 31,413 31,413 - - 1,944 788 2,732 -1986 29,468 29,468 - - 1,863 726 2,589 -1987 27,606 271606 - - 1,750 666 2,416 -1988 25,858 25,858 - - 1,637 612 2,249 -1989 24,221 24,221 - - 1,627 562 2,189 -1990 22,598 22,598 - - 1,605 511 2,116 -1991 20,994 20,994 - - 1,551 465 2,016 -1992 19,442 19,442 - - 1,556 417 1,973 -1993 17,887 17,887 - - 1,487 371 1,858 -1994 16,402 16,402 - - 1,492 326 1,818 -1995 14,909 14,909 - - 1,493 281 1,774 -
* THIS COLUMN SHOWS THE AMOUNT OF ARITHMETIC IMBALANCE IN T11E AMOUNT OUTSTANDING INCLUDING UNDISBURSED FROM ONEYEAR TO THE NEXT. THE MOST COMMON CAUSES OF IMBALANCES ARE CHANGES IN EXCHANGE RATES AND TRANSFER OF DEBTSFROM ONE CATEGURY TO ANOTHER IN THE TABLE.
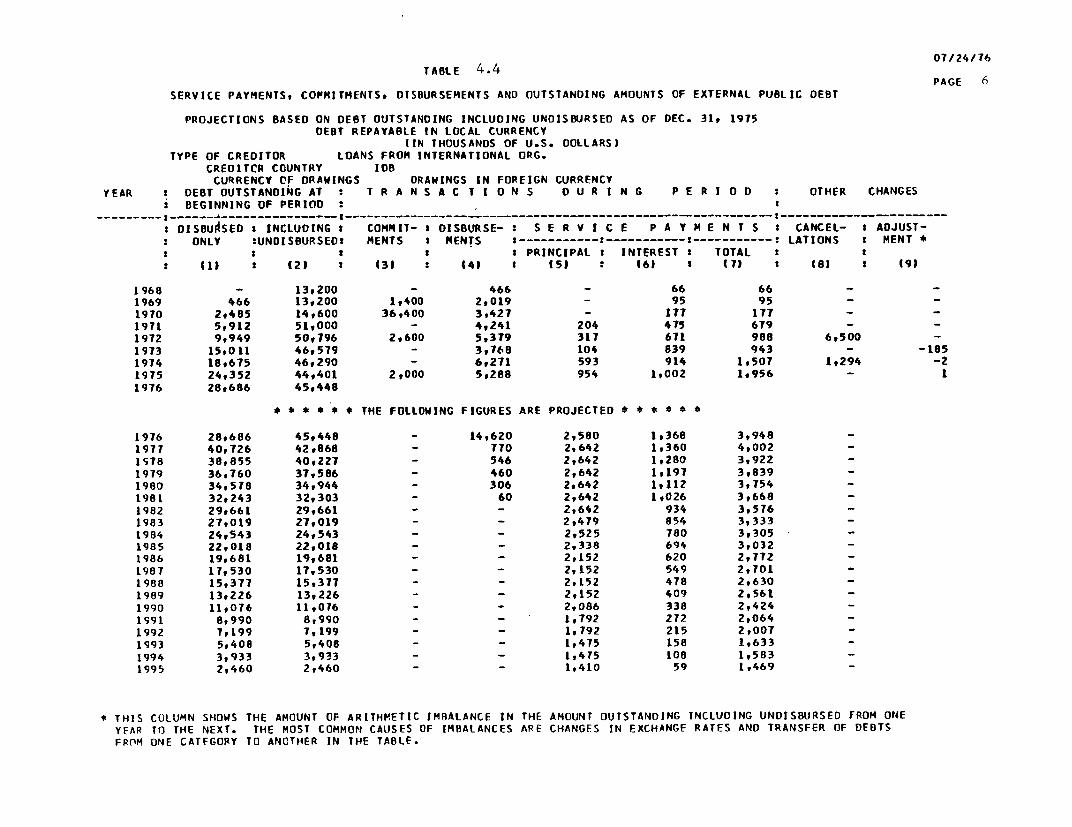
07/24/76TABLE 4.4
PAGE 6SERVICE PAYMENTS, COFMITMENTS. DISBURSEMENTS AND OUTSTANDING AMOUNTS OF EXTERNAL PUBLIC DEST
PROJECTIONS BASED ON DEBT OUTSTANDING INCLUDING UNDISBURSED AS OF DEC. 31, 1975DEBT REPAYABLE IN LOCAL CURRENCY
(IN THOUSANDS OF U.S. DOLLARS)TYPE OF CREDITOR LOANS FROM INTERNATIONAL ORG.
CREDITCR COUNTRY IDBCURRENCY OF DRAWINGS ORAWINGS IN FOREIGN CURRENCY
YEAR t DEBT OUTSTANDING AT : T R A N S A C T I 0 N S 0 U R I N G P E R I 0 0 OTHER CHANGESi BEGINNING OF PERIOD : t
…--… - ---- _- -_______-- - --------OISBURSED : INCLUDING s COMMIT- DISBURSE- : S E R V I C E P A Y M E N T S s CANCEL- s ADJUST-
ONLY :UNDISSURSED: MENTS 2 MENTS 2-----------…-----------:-----------: LATIONS s MENT *: a 2 s PRINCIPAL : INTEREST 2 TOTAL sa { s(1) (21 s 433 : 443 s 15) : 6) s (7 i8) ( 19)
1968 - 13,200 - 466 - 66 66 - -1969 466 13,200 1,400 2,019 - 95 95 - -1970 2,485 14,600 36,400 3,427 - 177 177 - -
1971 5,912 51,000 - 4,241 204 475 679 - -1972 9,949 50,796 2,600 5,379 317 671 988 6,500 -1973 15,011 46,579 - 3,768 104 839 943 - -1851974 18,675 46,290 - 6,271 593 914 1,507 1,294 -21975 24,352 44,401 2t000 5,288 954 1,002 1,956 - 11976 28,686 45,448
* * * * * * THE FOLLOWING FIGURES ARE PROJECTED e * * e 4 *
1976 28,686 45,448 - 14,620 2,580 1,368 3,948 -1977 40.726 42,868 - TTO 2,642 1,360 4,002 -IS8 38,855 40,227 - 546 2,642 1,280 3,922 -1979 36,760 37,586 - 460 2,642 1,197 3,839 -1980 34,518 34,944 - 306 2,642 1,112 3,754 -1981 32,243 32,303 - 60 2,642 1,026 3,668 -1982 29,661 29,661 - - 2,642 934 3,576 -1983 27,019 27,019 - - 2,479 854 3,333 -1984 24,543 24,543 - - 2,525 780 3,305 -1985 22,018 22,018 - - 2,338 694 3,0321986 19,681 19,681 - - 2,152 620 2,7721987 17,530 17,530 - - 2,152 549 2,7011988 15,377 15,377 - - 2,152 478 2,6301989 13,226 13,226 - - 2,152 409 2,5611990 11,076 11,076 - - 2,086 338 2,424 -1591 8,990 8,990 - - 1,792 272 2,064 -1992 7,199 7,199 - - 1,792 215 2,007 -1993 5,408 5,408 - - 1,475 158 1,633 -1994 3,933 3,933 - - 1,475 108 1,583 -1995 2,460 2,460 - - 1,410 59 1,469 -
* THIS COLUMN SHOWS THE AMOUNT CF ARITHMETIC IMBALANCE IN THE AMOUNT OUTSTANDING INCLUDING UNOISBURSED FROM ONEYEAR TO THE NEXT. THE MOST COMMON CAUSES OF IMBALANCES ARE CHANGES IN EXCHANGE RATES AND TRANSFER OF DEBTSFROM ONE CATFGORY TO ANOTHER IN THE TABLE.
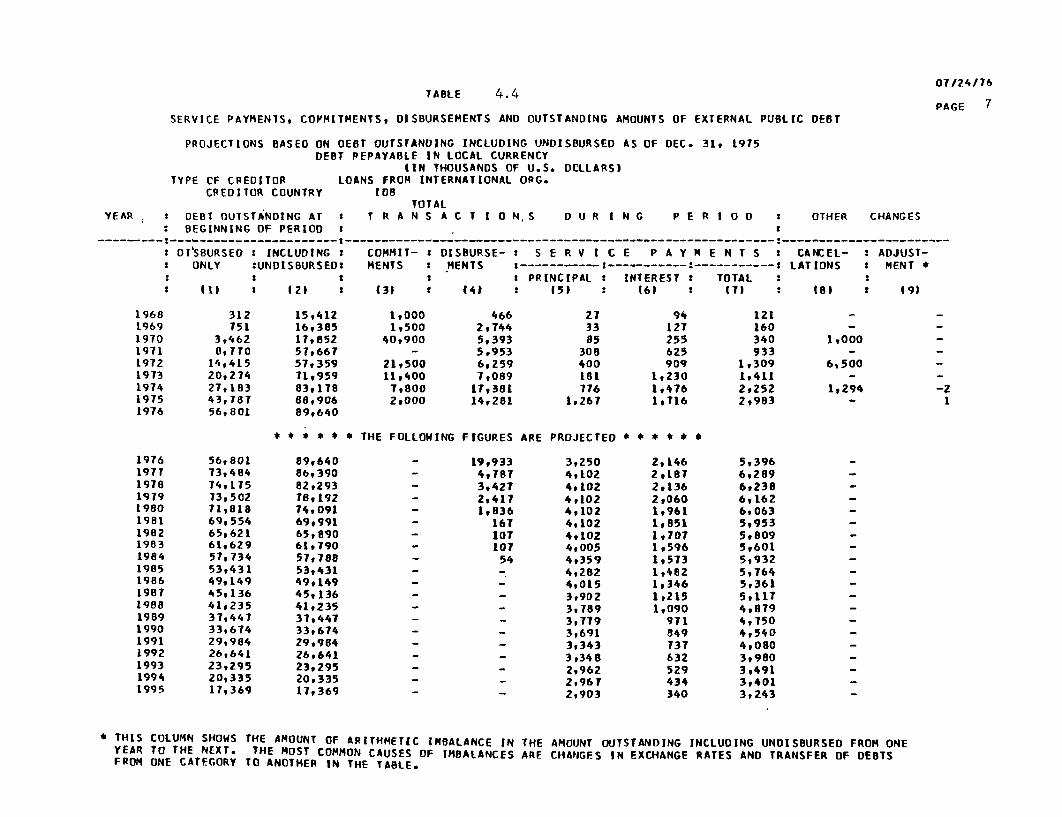
07/24/76TABLE 4.4
PAGE 7SERVICE PAYMENTS, CO'MITMENTS, DISBURSEMENTS AND OUTSTANDING AMOUNTS OF EXTERNAL PUBLIC DEBT
PROJECTIONS BASED ON OEBT OUTSTANDING INCLUDING UNDISBURSED AS OF DEC. 31, 1975DEST REPAYABLE IN LOCAL CURRENCY
(IN THOUSANDS OF U.S. DWLLARS)TYPE CF CREDITOR LOANS FROM INTERNATIONAL ORG.
CREDITOR COUNTRY [DeTOTAL
YEAR , DEBT OUTSTkNDING AT T T R A N S A C T I 0 N S D U R I N G P E R I 0 0 2 OTHER CHANGESBEGINNING OF PERIOD s… _ _ _… …_ _ -____ _ _ -------------------------------------- -----------------------
DI0SURSEO : INCLUDING COMMIT- s DISBURSE- s S E R V I C E P A Y M E N T S 5 CANCEL- s ADJUST-ONLY :UNDISBURSED: MENTS : MENTS I…--------s---------------------… LATIONS * MENT *
2 : PRINCIPAL t INTEREST : TOTALI 1I : (21 * £31 2 14) s 15) 161 s T71 I £8) I £91
1968 312 15,412 1,000 466 27 94 121 -1969 751 16,385 1,500 2,744 33 12T 160 - -1970 3,462 17,852 40,900 5,393 85 255 340 1,000 -1971 ,7TTO 57,667 - 5,953 308 625 933 - -1972 14,415 57,359 21,500 6,259 400 909 1,309 6,500 -1973 20,274 71,959 11,400 7,089 181 1,230 1,411 - -1974 27,183 83,178 7,800 1?,381 776 1.476 2,252 1,294 -21975 43,787 88,906 2,000 14,281 1,267 1,716 2,983 - I1976 56,801 89,640
* * * * * * THE FOLLOWING FIGURES ARE PROJECTED * * * * * *
1976 56,801 89,640 - 19,933 3,250 2,146 5,396 _1971 73,484 86,390 - 4,787 4,102 2,187 6,289 -1978 74,175 82,293 - 3,427 4,102 2,136 6,238 -1979 73,502 78,192 - 2,417 4,102 2,060 6,162 -1980 71,818 74,091 - 1,836 4,102 1,961 6,063 -1981 69,554 69,991 - 167 4,102 1,851 5,953 -1982 65,621 65,890 - 107 4,102 1,707 5,809 -1983 61,629 61,790 - 107 4,005 1,596 5,601 -1984 57,134 57,788 - 54 4,359 1,573 5,932 _1985 53,431 53,431 - _ 4,282 1,482 5,764 _1986 49,149 49,149 - - 4,015 1,346 5,361 -1987 45,136 45,136 - - 3,902 1,215 5,11T 71988 41,235 41,235 - - 3,789 1,090 4,879 _1989 37,447 37,447 - - 3,779 971 4,750 -1990 33,674 33,674 - - 3,691 849 4,540 -1991 29,984 29,984 - - 3,343 737 4,080 -1992 26,641 26,641 - - 3,348 632 3,980 -1993 23,295 23,295 - - 2,962 529 3,491 _1994 20,335 20,335 - - 2,967 434 3,401 -1995 17,369 17,369 - - 2,903 340 3.243 _
* THIS COLUMN SHOWS THE AMOUNT OF ARITHMETIC IMBALANCE IN THE AMOUNT OUTSTANDING INCLUDING UNDISBURSED FROM ONEYEAR to THE NEXT. THE MOST COMMON CAUSES OF IMBALANCES ARE CHANGES IN EXCHANGE RATES AND TRANSFER OF DEBTSFROM ONE CATFGORY TO ANOTHER IN THE TABLE.

0/24/76TABLE 4.4 PAGE 8
SERVICE PAYMENTS, COMMITMENTS9 OISBURSEMENTS ANO OUTSTANOING AMOUNTS OF EXTERNAL PUBLIC DEBT
PROJECTIONS BASED ON DEBT OUTSTANDING INCLUDING UNDISRURSED'AS OF DEC. 31, 1975DEST REPAYABLE IN LOCAL CURRENCY
IIN THOUSANDS OF U.S. DOLLARS)TYPE OF CREDITOR LOANS FROM INTERNATIONAL ORGC
TOTALYEAR s DEBT OUTSTANDING AT : t R A N S A C T I 0 N S 0 U R I N G P E R I 0 D : OTHER CHANGES
: BEGINNING OF PERIOD : %… … s----…--
DsISBUOSED : INCLUDING s COMMIt- I DISBURSE- t S E R V I C E P A Y M E N T S : CANCEL- s ADJUST-ONLY :UNDISBURSED2 MENTS i MENTS -- …----__--:----------------------: LATIONS s MENT *
: : : X PRINCIPAL t INTEREST r TOTAL : 2: 111 s 423 : (3) : (41 s (51 (6) : (71 s (8) s 9)
L968 312 15,412 1,000 466 27 94 1Z1 - -1969 751 16,385 1,500 2,744 33 127 160 - -1970 3,462 17,852 40,900 5,393 85 255 340 1,000 -1971 8,T70 57,667 - 5,953 306 625 933 - -1972 14,415 57,359 21,500 6,259 400 909 1,309 6,500 -1973 20,274 71,959 11,400 7,089 181 1,230 1,411 - -1974 27,183 83,178 7,800 17,381 776 1,476 2,252 1,294 -Z1975 43,787 88,906 2,000 14,281 1,267 1,716 2,983 - I1976 56,801 89,640
* * * *.* * THE FOLLOWING FIGURES ARE PROJECTED * * * * * *
1976 56,801 89,640 - 19,933 3,250 2,146 5,3961977 73,484 86,390 - 4,787 4,102 2,187 6,289 -1978 74,175 82,293 - 3,427 4,102 2,136 6,238 -1979 73,502 78,192 - 2,417 4,102 2,060 6,162 -1980 71,818 74,09l - 1,836 4,102 1,961 6,063 -1981 69,554 69,991 - 167 4,102 1,851 5,953 -1982 65,621 65,890 - 101 4.102 1,707 5,809 _1983 61,629 61,790 - 107 4,005 1,596 5,601 -1984 57,734 57,788 - 54 4,359 1,573 5,9321985 53,431 53,431 - - 4,282 1,482 5,7641986 49,149 49,149 - - 4,015 1,346 5,361 -1987 45,136 45,136 - - 3,902 1,2$5 5,117 -1988 41,235 41,235 - - 3,789 1,090 4,879 -1989 37,447 37,447 - - 3,719 971 4,750 -1990 33,674 33,674 - - 3,691 849 4,540 -1991 29,984 29,984 - - 3,343 737 4,080 -1992 26,641 26,641 - - 3,348 632 3980 -1993 23,295 23,295 - - 2,962 529 3,491 -1994 209335 20,335 - - 2,967 434 3,401 -1995 17,369 17,369 - - 2,903 340 3,243 -
* THIS COLUMN SHOWS THE AMOUNT CF ARITHMETIC IMBALANCE IN THE AMOUNT OUTSTANOING INCLUDING UNDISBURSED FROM ONEYEAR TO THE NEXT. THE MOST COMMON CAUSES OF IMBALANCES ARE CHANGES IN EXC1JANGE RATES AND TRANSFER OF DEBTSFROM ONE CATEGORY TO ANOTHER IN THE TABLE.

TABLE 4.4PAGE 9
SERVICE PAYMENTS, COPMITMENTS, DISBURSEMENTS AND OUTSTANDING AMOUNTS OF EXTERNAL PUBLIC DEBT
PROJECTIONS BASED ON DEBT OUTSTANDING INCLUDING UNDISBURSED AS OF DEC. 31, 1975DEBT REPAYABLE IN LOCAL CURPENCY
I1N THOUSANDS OF U.S. DOLLARS)TYPE OF CREDITOR LOANS FROM GOVERNMENTS
CREDITOR CCUNTRY SWITlERLANDCIJRRENCY OF DRAWINGS DRAWrNGS IN LOCAL CURRIENCY
YEAR s DEBT OUTSTANDING AT s T R A N S A C T I 0 N S D U R I N G P E R I 0 0 OTHER CHANGESBEGINNING OF PERIOD s
… ---- -… -s DISBURSED s INCLUDING COMMIT- DISBURSE- s S E R V I C E P A Y M E N T S : CANCEL- : ADJUST-
ONLY sUNDISBURSED: MENTS 2 MENTS … - ---- : --------- LATIONS s MENT *s s : s PRINCIPAL t INTEREST : TOTAL : S
: II ) 12I : 13) 5 14) s5) (6) : (7) (81 191
1968 -1969 - - 233 - - - - - -11970 - 232 - - - - - - -31971 - 229 - - - - - - 261972 - 255 - _ _ _ _ _ 91973 _ 264 - - - - - - 441974 - 308 - - - - - 337 291975 - - - -1976
* THIS COLUMN SHOWS THE A14OUNT CF ARITHPETIC IMBALANCE IN THE AMOUNT OUTSTANDING INCLUDING UNDISBURSED FROM ONEYEAR 1T THE NEXT. THE MOST COMMON CAUSES OF IMBALANCES ARE CHANGES IN EXCHANGE RATES AND TRANSFER OF DEBTSFROM ONE CATFGORY TO ANOTHER IN THE TABLE.

07/24/76TABLE 4.4 PAGE 10
SERVICE PAYMENTS, COIMITMENTS. DISBURSEMENTS AND OUTSTANDING AMCUNTS OF EXTERNAL PUBLIC DEBT
PROJECTIONS BASED ON DEBT OUTSTANDING INCLUDING UNDISBURSED AS OF DEC. 31, 1975DEBT REPAYABLE IN LOCAL CURRENCY
ItN THOUSANDS OF U.S. DOLLARSITYPE OF CREDITOR LOANS FROM GOVERNMENTS
CREDITOR COUNTRY SWITZERLANDTOTAL
YEAR O DEBT OUTSTAND;ING AT 2 T P A N S A C T I 0 N S 0 U R I N G P E R I 0 0 : OTHER CHANGESBEGINNING OF PERIOD s
: s&--- --- s
DISB6RSED : INCLUDING : COMMIT- : DISBURSE- : S E R V I C E P A Y M E N T S s CANCEL- s ADJUST-
: ONLY tUNDISBURSEoS MENTS s MEtTS S-----------I----------------------s LATIONS : MENT *
s t PRINCIPAL 5 INTEREST : TOTAL I ss 1(s1) (21 12(331 s (41 (51 (61 s I7) s 1 s 93
1968 -1969 - - 233 - - - - - -11970 - 232 - - - - - - -3
1971 - 229 - - - - - - 261972 - 255 - - - - - - 91973 - 264 - - - - - - 441974 - 308 - - - - - 337 29
1975 - - - - _ _ _ _ _
1976
* THIS COLUMN SHOWS THE AMOUNT OF ARI7HMETIC IMBALANCE IN THE AMOUNT OUTSTANDING INCLUDING UNDISBURSED FROM ONE
YFAR To THE NEXT. THE MOST COMMON CAUSES OF IMBALANCES ARE CHANGES IN FXCHANGE RATES AND TRANSFER OF DEBTSFROM ONE CATEGORY TO ANOTHER IN TPE TABLE.

07/24/76TABLE 4.4
PAGE 11SERVICE PAYMENTS, COMMITMENTS, DISBURSEMENTS AND OUTSTANDING AMOUNTS OF EXTERNAL PUBLIC DEBT
PROJECTIONS BASED ON DEBT OUTSTANDING INCLUDING UNOISBURSED AS OF DEC. 31, 1975DEBT REPAYABLE IN LOCAL CURRENCY
IIN THOUSANDS Of U.S. OOLLARSITYPE OF CREDITOR LOANS FROM GOVERNMENTS
CREDITOR CCUNTRY UNITED STATESCURRENCY OF DRAWINGS DRAWINGS IN LOCAL CURMUCY
YEAR DEBT OUTSTANOING AT : T R A N S A C T I 0 N S 0 U R I N G P E R I 0 D OTHER CHANGESBEGINNING OF PERIOD t
…____ ___ ___--- -…____ _____ -___ ------------- - _--- ___-s-----2…DISBURSED : INCLUDING : COMMIT- s DISBURSE- S E R V I C E P A Y H E N T S s CANCEL- t ADJUST-ONLY :UNOISBURSED: MENTS : MENTS ----------- - ----------- LATIONS : KENT *
a : : s : PRINCIPAL s INTEREST a TOTAL : 2s ( 211 s 121 2 131 2 143 153 s 6p a 171 s 18) 191
1968 12,636 12,814 - - 1,381 646 2,027 238 11969 I1,256 11,256 - - 1,483 380 1,863 - -1970 9,773 9,173 - - 2,317 299 2,616 - -5151971 6,941 6,941 - - 1,521 249 1,770 - -1972 5,420 5,420 - - 89T 138 1,035 - -11973 4,522 4,522 - - 1,080 178 1,258 - 11974 3,443 3,443 - - 811 114 925 - -1975 2,632 2,632 - - 704 84 788 - -1976 1,928 1,928
* * * * * * THE FOLLOWING FIGURES ARE PROJECTED * * * * * *
1976 1,928 1,928 - - 922 60 982 -1971 1,008 1,008 - - 749 28 117 -1978 258 258 - - 83 8 91 -1979 176 176 - - 69 5 74 -1980 107 107 - - 54 3 57 -1981 54 54 - - 54 1 55 _
* THIS COLUMN SHOWS THE AMOUNT OF ARITHMETIC IMBALANCE IN THE APCUNT OUTSTANDING INCLUDING UNOIS8URSED FROM ONEYEAR TO THE NEXT. THE MOST CCMMON CAUSES OF IMBALANCES ARE CHANGES IN EXCHANGE RATES AND TRANSFER OF DEBTSFROM ONE C4TEGORY TO ANOTHER IN THE TABLE.

07/24/76TABLE 4.4
PAGE 12SERVICE PAYMENTS, COMMITMENTS, DISBURSEMENTS AND OUTSTANDING AMOUNTS OF EXTERNAL PUBLIC DEBT
PROJECTIONS BASED ON DEBT OUTSTANDING INCLUDING UNDIS8URSEO AS OF DEC. 31, 1975DEBT REPAYABLE IN LOCAL CURRENCY
(IN THOUSANDS OF U.S. DOLLARSITYPE OF CREDITOR LOANS FROM GOVERNMENTS
CREDITOR COUNTRY UNITED STATESTOTAL
YEAR : DEBT OUTSTANDING AT t T R A N S A C T I 0 h S D U R I N G P E R t OD D OTHER CHANGESBEGINNING OF PERIOD s s
DISWIRSED : INCLUOING 2 COMMIT- I DISBURSE- s S E R V I C E P A Y M E N T S : CANCEL- S ADJUST-: ONLY SUNOISBURSEDS MENTS I MENTS I-----------:--------- t-----------: LATIONS M MENT *
: I I PRINCIPAL * INTEREST s TOTAL s :: (1) : (Z : 131 * (4) * (5) 2 161 * T7) ) s (91
1968 12,636 12,874 - - 1,381 646 2,027 238 11969 11,256 11,256 - - 1,483 3e0 1,863 - -1970 9,773 9,773 - - 2,317 299 2.616 - -5151971 6,941 69941 - - 1,521 249 1,770 - -1972 5.420 5.420 - - 897 138 1,035 - -11973 4,522 4,522 - - 1,080 178 1,258 - I1974 3,443 3,443 - - 511 114 925 - -1975 2,632 2.632 - - 704 84 788 - -1976 1,928 1,928
* * e * * 0 THE FOLLOWING FIGURES ARE PROJECTEO * * * * * *
1976 1,928 1,928 - - 922 60 982 -1977 1,008 1,008 - - 749 28 77 -1198 256 258 - - 83 8 91 -1979 176 176 - - 69 5 74 -1980 107 107 - - 54 3 57 -1981 54 54 - - 54 1 55 -
* THIS COLUMN SHOWS THE AMOUNT OF ARITHMETIC IMBALANCE IN THE AHCUNT OUTSTANDING INCLUDING UNDISBURSED FROM ONEYEAR TO THE NEXT. THE MOST COMMON CAUSES OF IMBALANCES ARF CHANGES IN EXCHANGE RATES AND TRANSFER OF DEBTSFROM ONE CATEGORY TO ANOTHER IN TH~E TABLE.
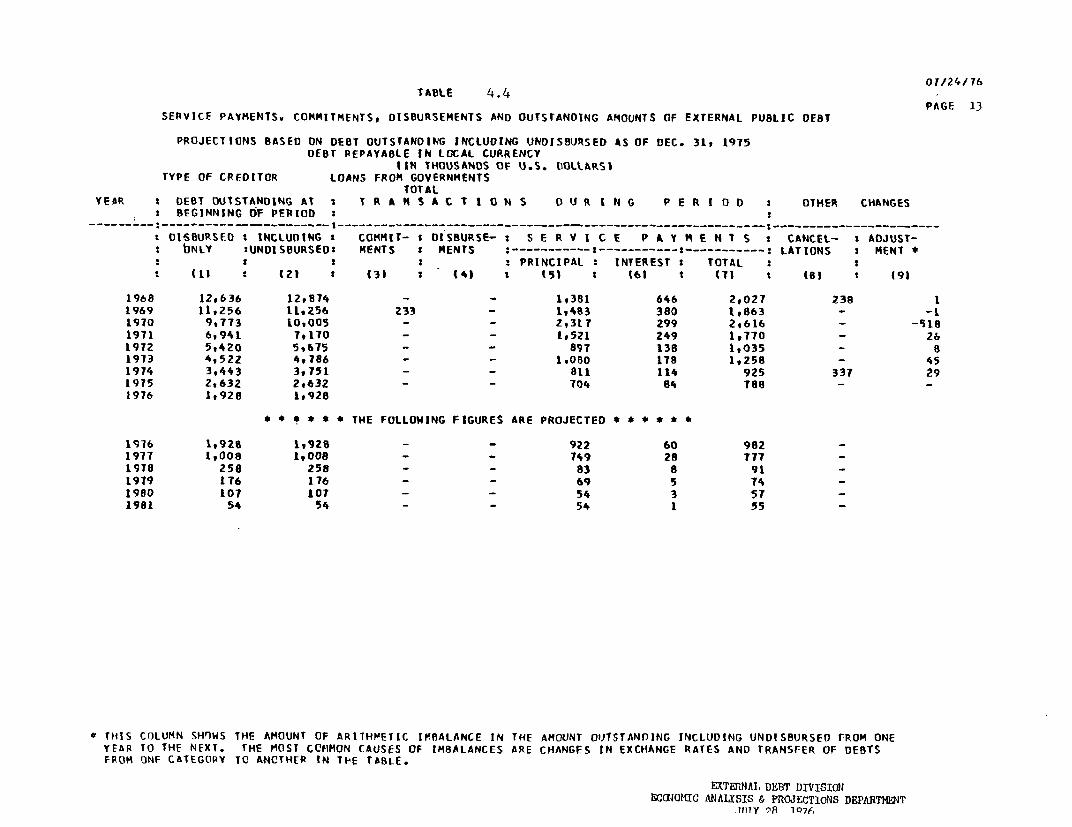
01/24/ 76TABLE 4.4
PAGE 13
SERVICE PAYMENTSv COMMITMENTS, DISBURSEMENTS AND OUTSTANOING AMOUNTS Of EXTERNAL PUBLIC DEBT
PROJECTICNS BASED ON DEBT OUTSTANDING INCLUDING UNDISBURSED AS OF DEC. 31, 1975
DEBT REPAYAOLE IN LOCAL CURRENCYIIN THOUSANDS OF U.S. (I3LLARS)
TYPE OF CREDITOR LOANS FROM GOVERNMENTSTOTAL
YEAR t DEBT OUTSTANDING At T R A N S A C t 1 0 N S D U R I N G P E R I n D 3 OTHER CHANGES
2 BEGINNING OF PERIOD I_________---- ______ - -- -- -- I- -- - -- -- -- -- -- -- -- -- - _________________________ -___ __ ______ -----------------------
OISBURSED : INCLUDING t COMMIT- t DISBURSE- s S E R V I C E P A Y M E N T S s CANCEL- t ADJUST-
s bNLY !UNDISBURSED: MENTS s MENTS …_…---- I …------------- LATIONS s MENT *
: sS : PRINCIPAL INTEREST 2 TOTAL 2
(1) : (21 (31 s (4) s (5) : (61 t (TI t (81 1 (9)
1968 12,636 12,874 - - 1,381 646 2,027 238 1
1969 11,256 11,256 233 - 1,483 380 1,863 - -L
1970 9,773 10.005 - - 2,317 299 2,616 - -518
1971 6,941 7,170 - - 1,521 249 1,770 - 26
1972 5,420 5,675 - - 897 138 1,035 - a
1973 4,522 4,786 - - 1,080 178 1,258 - 45
1974 3,443 3,751 - - 811 114 925 337 29
1975 2,632 2t632 - - 704 84 788 - -
1976 1,928 1,928
* * * * * * THE FOLLOWING FIGURES ARE PROJECTED * * * * S *
1T16 1,928 1,928 - - 922 60 982 -
1977 1,008 1,008 - - 749 28 T77 -
1978 258 258 - - 83 8 91 -
1919 176 176 - - 69 5 74 -
1980 107 107 - - 54 3 57 -
1981 54 54 - - 54 1 55 -
e THIS COLUMN SHOWS THE AMOUNT CF ARITHMETIC IMBALANCE IN THE AMOUNT OUTSTANDING INCLUDING UNDISBURSED FROM ONE
YEAR TO THE NEXT. THE MOST CCfOMON CAUSES OF IMBALANCES ARE CHANGES IN EXCHANGE RATES AND TRANSFER OF DEBTS
FROM ONE CATEGORY TC ANCTHEP IN THE TABLE.
EXTEnIAL DEFBT DIVISIONECONOMIC ANILYSIS & PROJECTIONS DEPARTMENT
wVrY oRq 107f.

Table 4-5 TRENDS IN TERMS OF EXTERNAL CREDITS, 1971-1975
(annual flow)
1971 1972 1973 1974 1975
Private Credits
Average Interest (%) 7.862 6.473 7.514 9.609 6.932Average Maturity (years) 10.4 7.0 10.6 9.2 6.5Average Grace (years) 4.9 2.7 1.8 1.4 1.6
Multilateral Loans
Average Interest (%) 7.190 5.172 3.197 4.801 7.451Average Maturity (years) 15.4 27.4 33.4 28.6 16.4Average Grace (years) 5.1 6.4 7.3 7.5 3.8
Official Bilateral Loans
Average Interest (%) 3.018 2.364 3.000 6.000 4.892Average Maturity (years) 23.3 36.4 25.0 6.8 15.7Average Grace (years) 7.1 8.1 4.5 2.3 4.9
Total
Average Interest (%) 3.934 4.964 4.877 5.523 6.351Average Maturity (years) 17.0 19.6 23.8 25.3 11.4Average Grace (years) 1.5 5.0 5.0 6.6 3.1
Source: IBRD, Economic Analysis and Projections Department

Table 4.6: EXTERNAL DEBT PROJECTIONS
(million US$)
Actual Estimated Projected1973 1974 1975 1976 1977 1978 1979 1960 1981
A. Medium and Long-Term Debt
1. Total Debt Outstanding 328 320 430 660 852 1,029 1,190 1,366 1,5252. Included Undisbursed 549 596 7543. Public Debt Service 46 94 50 92 119 171 190 230 256
Amortization 31 77 33 67 72 108 114 124 157Interest 15 17 17 25 47 63 76 86 97
4. Total Disbursements 52 71 142 298 263 284 275 299 316
B. Debt Burden
1. Public Debt Service Ratio 7.3 7.6 4.7 6.8 8.7 10.9 10.9 12.1 12.32. Public Debt Service /GDP 1.8 2.6 1.2 1.8 2.1 2.6 2.5 2.6 2.63. Public Debt Service/Central
Government Revenue 12.5 14.3 7.6 11.6 12.6 15.1 14.5 15.6 15.5
Source: Mission Estimates
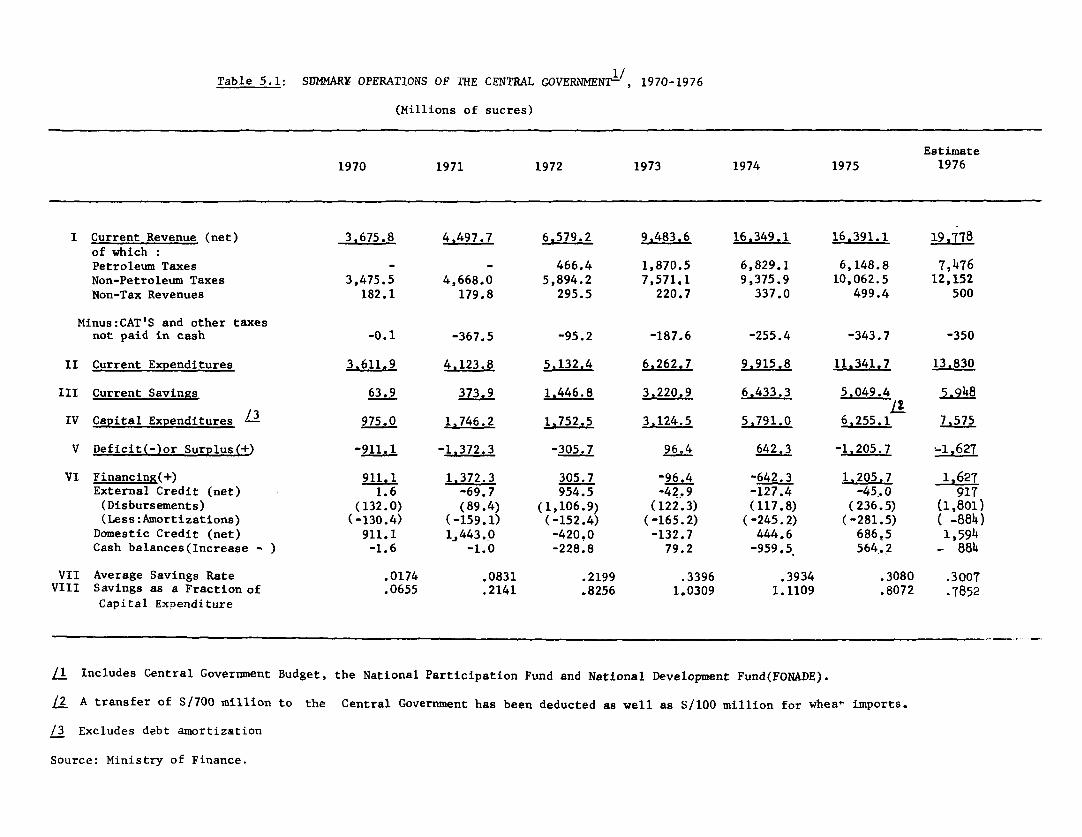
Table 5.1: SUMMARY OPERATIONS OF THE CENTRAL GOVERNMENT , 1970-1976
(Millions of sucres)
Estimate1970 1971 1972 1973 1974 1975 1976
I Current Revenue (net) 3.675.8 4.497.7 6,579.2 9,483.6 16,349.1 16,391.1 19,778of which :Petroleum Taxes - - 466.4 1,870.5 6,829.1 6,148.8 7,476Non-Petroleum Taxes 3,475.5 4,668.0 5,894.2 7,571.1 9,375.9 10,062.5 12,152Non-Tax Revenues 182.1 179.8 295.5 220.7 337.0 499.4 500
Minus:CAT'S and other taxesnot paid in cash -0.1 -367.5 -95.2 -187.6 -255.4 -343.7 -350
II Current Expenditures 3.611.9 4.123.8 5,132.4 6,262.7 9,915.8 11.341.7 13.830III Current Savings 63.9 373.9 1.446.8 3,220.9 6,433.3 5.049.4 5.948IV Capital Expenditures /3 975.0 1.746.2 1,752.5 3,124.5 5,791.0 6,255.1 7-575V Deficit(-)or Surplus(+) -911.1 -1,372.3 -305.7 96.4 642.3 -1.205.7 .1,627
VI Financing(+) 911.1 1,372.3 305.7 -96.4 -642.3 1,205.7 1,627External Credit (net) 1.6 -69.7 954.5 -42.9 -127.4 -45.0 917(Disbursements) (132.0) (89.4) (1,106.9) (122.3) (117.8) (236.5) (1,801)(Less:Amortizations) (-130.4) (-159.1) (-152.4) (-165.2) (-245.2) (-281.5) ( -884)Domestic Credit (net) 911.1 1,443.0 -420.0 -132.7 444.6 686.5 1,594Cash balances(Increase - ) -1.6 -1.0 -228.8 79.2 -959.5 564.2 884VII Average Savings Rate .0174 .0831 .2199 .3396 .3934 .3080 .3007VIII Savings as a Fraction of .0655 .2141 .8256 1.0309 1.1109 .8072 .7852Capital ExDenditure
Li Includes Central Government Budget, the National Participation Fund and National Development Fund(FONADE).
/2 A transfer of S/700 million to the Central Government has been deducted as well as S/100 million for wheat imports.
/3 Excludes debt amortization
Source: Ministry of Finance.

Table 5.2: CEcTIAL GOVERf4tErT OPERATIONS - 1970-1975
(millions of .. re-)
1970 1971 1972 1973 1397. 1975
isUXGET BUDGET FONAPAR TOTAL BOECET FOeP0 AR TOTAL BUDGET FOPA6A TOTAL BUDGET FObPAYM FOP1L0D TOTAL BuDGETQ FOI R2U P082OE TOTAL
1. Correct ROreot.. 3 4.096,3 401.4 4_497.7 5.418,4 1. 6,519 2 7993.1 1.510.5 9,483.6 106,73.5 2.133 9 3.34.1.7 5 91 1230977 1,589.4 1 4,0 160391.1NaB Pctrole,f 3,675.9 4.463 0 401.4 4,E65 2 5,008.6 1369 6,141.5 6342 1,617.7 7,791.9 78.4 1,940.6 - 9760 9, 844.9 1490- 1,8.P*gog ,rr - - -3 505.0 23.9 5209 .786.35 92.8 1,B79.3 3,303.5 193.3 3,341.7 6,838.5 2,586.5 159.4 3,414.0 5,450.2Mjj, Pay=eo.a In tr .e-dit. 0.1 367.5 _ 367.5 95 2 - 95.2 187.6 - 187.6 255.4 - - 2S5.4 343.7 - - 343.0
2. Total neeeditftres 3 4,5_86.9
51330.0 54_00 jfL0_Q 5,736.5 1l14E.4 6.884, 9 7E859.6 1.527,6 _7 11,394.1 1.9y99, 2,312.9 7 S.70 13.059.6 /4 1.893.5 f 3.343_7 1926.4 /6Correct 3,611.9 3,961.8 162.0 4,123.8 4,787.9 344.5 5,131.4 59804.4 458.3 6,262.7 E,797.9 599.9 518.0/ 9,397.8 10,673.6 568.1 7.9 11,241.7CApLaI Q 975.0 1,368.2 378,0 1,746.2 948.6 803.9 1.752.5 2,035.2 1,069,3 3,120.9 2,596.2 1,399.9 1.794.9L1 6,309.0 2,386.0 1,32534 3,336.2/i 7.05. 13 seeIb t+l or defletr t-) -911.1 -1,233.7 -138.6 -i-372,3 .318,1 i2.4 -301.7 113.5 -17.1 96.4 .520.6 34.1 I.026.E 642.3 -971.9 -304.1 70.3 -1.205.74. eloa 911.1 1,233.7 13_86 1,6372_3 318.1 -12.4 305.7 -113.5 17.1 -96.4 520.6 .14_1 -1.028.B .642,3 971.9 304,1 70,3 -45.0a. RIt forefig borronlno 1.6 -69.7 69.7 954.5 - 924.5 -42.9 - -47.9 -027.4 - -1277.4 24, 8 - 19998 236.5Olahoesncarte ~~~~~~132.0 89.4 - 9.4 1,106. 9 1.1069 122.3 - 113.3 117.0 117.8 36,7 - 199.8 -281.1b.em tial -130.4 -159.1 - -159,1 -152.4 - -152.4 -165.2 - -165.2 .245.2 - -245.2 -281.5b. 9.r d.-ten homrngn 911.1 1,304.4 138.6 1,443.0 -412.7 -7.3 -420.0 -145.1 12.4 -132.7 558.3 -113 7 - 444.6 1,003.2 283.3 -600.0 686.5Bonds 107.6 286.0 - 286.0 -18.1 - -188.1 37.2 - 37.2 -328.3 . - -328.3 -639.0 - - .639.0Ireetnos 530.9 609.4 - 609.4 329.9 - 3 9 502.7 5 102.7 614.7 . - 614.7 369,8 - - 369.8A-ortisttor -423.3 523.4 - 5 23.4 -518.0 -518.0 -545.5 -541.5 -943 0 -943.0 -1,088.8 - - -1,0088Central EacIk 1,052.0 746.35 746635 - - 118.7- 159.7 63.9-- 43.9 - 230.0 - 220.0oS,-i .Iecooccte 41.2 55.9 55.9 9.7 30.0 39.7 326.6 326.6 25.0 0- 20.0252 % - - - - - - - 6088-- 008.9FObAPF rasore. -
5- 16.1 - - 516.1 - _ _ _PoRAt - - - - - - . - - 600.0 - -60.E -IN trotorsf- for the cot budgnt -299.7 216.0 138 6 354.6 -234.3 -37.3 -271.6 -341,0 12.4 -329.6 -113.7 -113.7 217.2 33.3 - 250.8c. Cash balar rs loa- + i-re.se. ) .1.6 -1.0 - .1.0 -223.7 -5.1 -229.8 74.5 4.7 79.2 89.7 -20 4 -1,028.8 -959.5 213.5 70.8 329.9 364.2
a Iroludnd sopplc-eot-l appr-pri...on flur 1970-1974. Only colh trion-otlo for 1975.
f2 Prelll-nry figure-
erludro debt o-rti-atif
o I-ludes S/1,309.9 illi-ul peid en Jan 1976
/5 ncudeS Sl332.2 ed to p-rticipcrtn c-cc lIed to 1976.
6 Elcludinr tr-atfer- oo9 fBodr,
a C-rrert and rep les cEpe-dl[cres of FON*PA are rough cetloco t. LOrludan dolt unooroorcoo
a Figrea adjoeted
Source. Mlotry of Fjoo-ce

Table 5.3: SUMMARY OPERATIONS OF THE CENTRAL GOVERNMENT BUDGET, 1970-1976
(Millions of sucres)
Estimate1970 1971 1972 1973 1974 1975 1976
I Current Revenue 3,675.8 4,096.3 5,418.4 7,973.1 10,873.5 12,087.7 14.311of which :
Petroleum Revenue - - 442.5 1,777.7 3,294.1 2,584.4 3,211Non-Petroleum Taxes 3,475.5 4,266.6 4,757.3 6,153.4 7,435.3 8,623.5 10,750Non-tax revenues /2 182.1 179.8 295.5 220.7 337.0 499.4 700Transfers 18.3 17.4 18.3 8.9 62.5 724.1/a 50
Minus:CAT'S and other taxes -0.1 -367.5 -95.2 -187.6 -255.4 -343.7 -4oonot paid in cash
II Current Expenditures 3.611.9 3,961.8 4,787.9 5,804.4 8.797.9 10,673.6 13.050
III Savings on Current Account 63.9 134.5 630.5 2.168.7 2.075.6 1.414.1
IV Capital Expenditure v 975.0 1,368.2 948.6 2,055.2 2,596.2 2,386.0 2.800
V Deficit(-)or Surplus(+) -911.1 -1.233.7 -318.1 113.5 -520.6 -971.9 -1 Fm
VI Financing 911.1 1,233.7 318.1 -113.5 520.6 971.9.53Net foreign borrowing 1.6 -69.7 954.5 -42.9 -127.4 -244.8 634
(Disbursements) (132.0) (89.4) (1,106.9) (122.3) (117.8) (36.7) (1,218)(Amortizations) (-130.4) (-159.1) (-152.4) (-165.2) (-245.2) (-281.5) &584)
Net domestic borrowing 911.1 1,304.4 -412.7 -145.1 558.3 1,003.2 1,330Cash balances(Increase - ) -1.6 -1.0 -223.7 74,5 89.7 213.5 _425
VII Average Savings Rate .0174 .0328 .1164 .2720 .1909 .1170 .o88
VIII Savings as a Fraction of .0655 .0983 .6646 1.0552 .7995 .5927 .450Capital Expenditures
1/ Includes a S/700 million transfer from FONADE in 1975.2/ Includes petroleum surface rights.3/ Excludes debt amortizations.
Source: Ministry of Finance.

Table 5.4 : CURRENT REVENUES OF THE CENTRAL GOVERNMENT BUDGET, 1970-1975
(millions of sucres)
1970 1971 1972 1973 1974 1975
I. Total Cash Revenue 3,675.8 4,096.3 5,418.4 7,973.1 10,873.5 12,087.7Taxes Not Paid in Cash 0.1 367.5 95.2 187.6 255.4 343.7
II. Total Revenue 3,675.9 4,463.8 5,513.6 8,160.7 11,128.9 12.431.4A.Tax Revenue 3,475.5 4,266.6 5,199.8 7,931.1 10.729.4 11,207.91.Non-Petrolem Taxes 3475.5 4,266.6 4,757.3 6,153.4 7,435. 8,623.5Income Tax 540.5 753.4 874.7 975.6 1,209.5 1,597.2Export Tax 481.7 512.7 193.6 386.1 447.2 304.1Import Duties 1,088.7 1,536.7 1,932.6 2,847.2 3,275.2 3,810.3Sales Tax 238.6 469.3 607.7 793.8 1,086.7 1,380.7Other Taxes on Production 320.9 474.7 663.5 711.6 834.1 918.0and ConsumptionTaxes on Financial Transactions 134.7 -178.5 217.6 111.0 199.4 177.6Other Taxes 670.4 337.0 267.6 328.1 383.2 435.6
2.Petroleum Taxes - - 442.5 1,777.7 3,294,5 2,584.4Income Tax - - 208.5 822.9 1,754.4 1,528.2Export Tax (15% ad-valorum FOB) - - 223.1 887.6 1,381.0 962.460% Exchange Profits Tax - - 10.9 44.0 137.2 83.7Other Taxes - - - 6.7 - -
B.Non-Tax Revenues 182.1 179.8 295.5 220.7 337.0 499.4l.Non-Petroleum 123.9 171.7 233.0 211.9 327.6 497.3
2.Petroleum 58.2 8.1 62.5 8.8 9.4 2.1Surface Rights 21.5 4.3 62.5 8.8 9.4 2.1Royalties 36.7 3.8 - - - -
C.Transfers 18.3 17.4 18.3 8.9 62.5 724.1
1/ Includes S/700 million from FONADE
Source: Ministry of Finance

Table 5.5: CENTRAL GOVERNMENT BUDGETARY EXPENDITURELI
BY FUNCTIONAL CLASSIFICATION, 1970-76
(in millions of sucres)
1970 1971 1972 1973 1974 1975 1976(Estimate)
Total expenditure 4,656.8 5,056.5 5,753.5 7.859.6 11,362.9 13.059.6 15,850.0
General services 1,125.9 1.217.3 1.346.8 2,242.7 3,232.3 4.176.9 4,656.8Legislature 20.3 1.7 8.3 5.7 6.7 7.0 7.9Judiciary 40.8 52.7 62.2 90.2 121.0 134.9 164.2Presidency 8.3 12.3 13.7 60.7 102.3 105.1 110.7Ministry of Interior 192.7 218.9 243.7 426.6 597.7 892.5 1,110.6Ministry of Foreign Affairs 58.1 73.9 82.8 118.2 158.3 170.2 200.4Ministry of Defense 699.4 774.7 850.0 1,262.7 1,870.3 2,470.0 2,592.1Ministry of Finance 106.3 83.1 86.1 173.9 196.5 256.5 340.4Other - - 104.3 179.5 140.7 130.5
Social development 1.136.9 1.343.1 1.701.5 2,716.8 3.553.7 4,411.1 5,928.7Ministry of Education 961.0 1,137.1 1,534.0 2,289.2 2,631.1 3,386.5 4,487.0Ministry of Social Welfare 28.2 29.5 33.9 65.4 111.6 126.9 163.6Ministry of Public Health 147.7 176.5 133.6 362.1 811.0 897.7 1,278.1Economic development 634.6 979.2 751.2 2,216.2 3,494.2 3,121.1 4.119.5Ministry of Public Works 531.1 760.4 584.3 1,501.3 1,742.8 1,525.9 2,054.0Ministry of Natural Resourcesand Energy 28.3 110.4 46.0 115.5 135.6 125.5 188.7Ministry of Agriculture - - 537.0 1,505.3 1,346.4 1,734.0Ministry of Industry and Commerce 75.2 108.4 120.9 62.3 110.6 123.3 142.8
Other expenditure 1,759.4 1.516.9 1.954.0 683.9 1,082.7 1,350.5 1,145.7Interest on public debt 505.0 447.7 625.9 683.7 811.9 719.9 1,026.8(Domestic) (64.1) (69.9) (114.3) (511.0) (639.3) (604.0) (754.2)(Foreign) (440.9) (377.8) (511.6) (172.6) (172.6) (115.9) (272.6)Global allocations 1,254.4 1,069.2 1,328.1 0.2 270.8 630.6 118.9
Li Excluding debt amortization
Source: Ministry of Finance and Central Bank of Eculador

Table 5.6 FONADE DISBURSENMTS, 1974 - APRIL 1976
(Thousands of dollars)
TOTAL Jan. -April1974-1976 1974 1975 1976
State Refinery Construction 91,153.1 21,440.1 57,666.8 12,046.2
Ministry of Education 11,704.8 3,589.0 4,519.8 3,596.0
National Development Bank 20,074.9 20,074.9
Emergency Works 20,202.0 20,202.0
Tariff Commission (CVN) 10,090.8 9,990.8 100.0
Ministry of Public Works 18,258.7 2,954.4 13,711.3 1,593.0
Refinery Expansion on the Peninsula 352.8 - 352.8
Universities 12,404.1 - 8,416.0 3,988.1
Cultural Development 888.3 516.3 300.0 72.0-
CEDEGE 1,187.1 591.2 514.8 81.1
INER?I 808.1 412.0 792.1 396.0
Financial Funds 8,000.0 8,000.0 - -
IGM 1,414.1 1,414.1 -
IETEL 255.5 - 255.5
CRM 412.8 412.8 - -
FONAPRE 3,366.1 - 2,000.0 1,366.1
Ministr.y of Industry 2,920.0 2,920.0
Grancolombian Merchant Fleet 5,278.9 - 5,278.9
Central Government Budget 28,000.0 - 28,000.0
Wheat Imports 4,000.0 - 4,000.0
Cattle Imports 1,240.0 - 1,240.0
Financial Investment 5,600.0 - 5,600.0
Loan to Central Government Budget 24,000.0 - 24,000.0
Loan to Esmeraldas Port Authority 1,000.0 - 1,000.0
Loan to Solivar Port Authority 1,771.2 - - 1,771.2
IEOS 2,400.0 - - 2,400.0
Agricultural Mechanization 9.9 - - 9.9
Interest Payments 2 625.0 - - 625.0
TOTAL 277,418.2 92,517.6 157,748.0 27,152.6_ _ _ __ _ _ _ _ _ ,_ _ _ 1 5 7 4 8 _ _
1/This value has been distributed in the following form:
Ambato Music Conservatory 32.0Otavalaa Anthropologic Institute 40.0
2/Interest payments for a loan granted [n 1975.
Source: Department of Fiscal Studies, National Office of the Budget.

Table 5.7: FISCAL PERFORMANCE OF THE GENERAL GOVERNMENT
(millions of sucres)
1970 1975 Buoyancy BuoyancyGDP non-petroleum GDP
TOTAL GDP 33,970 105,760PETROLEUM VALUE-ADDED 47 13,372NON-PETROLEUM GDP 33,923 92,388
A. General Government Plus Total RoyaltiesTotal Revenues 4,1i4 20,192 1.83 2.24Non-Petroleum Taxes 4,147 11,155 .80 .98Total Burden .122 .191Non-Petroleum Burden .122 .121
B. General GovernmentTotal Revenues 4,h47 19,092 1.71 2.14Non-Petroleum Taxes 4,147 11,155 .80 .98Total Fiscal Burden .122 .181Non-Petroleum Fiscal Burden .122 .121
C. Central Government (Including FONADE and FONAPAR)Total Revenues 3,476 16,211 1.73 2.13Non-Petroleum Taxes 3,476 10,063 0.90 1.10Total Fiscal Burden .102 .153Non-Petroleum Fiscal Burden .102 .109
D. Central Government BudgetCustom Duties 1,089 3,810 1.18 1.45Income Taxes 541 1,597 0.92 1.13Sales Tax 239 1,381 2.26 2.77Non-Petroleum Taxes 3,476 8,624 0.70 0.86Petroleum Revenues 58 2,586 20.65 0.15Total Tax Revenues 3,476 11,208 1.05 1.29Total Fiscal Burden .102 .106Non-Petroleum Fiscal Burden .102 .093
Source: Ministry of Finance and mission estimates.

tfage 1 of 2
Table 5.8: SUMMARY OPERATIONS OF THE GENERAL GOVERNMENT 1/, PROJECTIONS(millions of sucres)
--------------- - Projections -----------------------Estimate
1976 1977 1978 1979 1980 1981
1. Revenues 23,398 27,314 3/ 32,081 36,863 41,043 45,606 3/
II. Current Expenditures 16,518 18,929 21,794 24,772 28,078 31,940Central Government (13,830) (15,904) (18,290) (21,034) (24,190) (27,820)other Accounts (2,688) (3,025) (3,504) (3,738) (3,888) (4,120)
III. Current Savings 6,880 8,385 10,287 12,091 12,966 13,746Central Government 2/ (5,948) (7,742) (9,950) (11,797) (12,612) (13,392)Other Accounts C 932) C 642) C 337) ( 294) C 354) ( 354)
IV. Capital Expenditures 7,795 9,618 10,787 11,539 12,159 13,499Central Government 2/ (7,575) (9,350) (10,467) (11,194) (11,803) (13,116)Other Accounts (220) (268) (320) (345) (356) (383)Of Which: Fixed Investment (6,795) (8,118) (9,310) (10,037) (10,676) (11,749)
V. Deficit (-) -915 -1,233 -500 552 807 247Central Government (-1,627) (-1,608) (-517) (603) (809) (276)Other (712) (3T4) (17) (-51) (-2) (-29)
VI. Average Savings Ratio .294 .307 .321 .328 .316 .301
VII. Savings as a Fraction ofCapital Expenditures .883 .872 .954 1.048 1.066 1.018
1/ Central Government Budget, FONADE PONAPAR and other special accounts.2/ Including FONADE and FONAPAR3/ Assumes petroleum revenues from higher prices are allocated to FONADE and also that half of the total revenues
cut of increases in petroleum exported by volume accrues to FONADE. The other half is allocated to CEPE.Actual allocation may differ from projection assumptions.
Source: Mission estimates.

Page 2 of 2
Table 5.8: SUMMARY OPERATIONS OF THE GENERAL GOVERNMERT, PROJECTIONS
Projection Assumptions
I. Revenues See Table 5.10
II. Current Expenditures
Central Government See Table 5.9Other Accounts 9% rate of growth
IV. Capital ExDenditures
Central Government See Table 5.9
Other Accounts Assumes limited increase in investmenton the basis of historical experience.Rate of growth 11.7%.

Page I of 2
Table 5.9: SUMMARY OPERATIONS OF THE CENTRAL GOVERNMENT PROJECTIONS
(millions of sucres)
____-__------------- Ptojections 2/ ---------------------Estimate
1976 1977 1978 1979 1980 1981
I. Current Revenues lq-T78 23646 28,2432,831 36802 41212of which:Petroleum Taxes 7,476 9,644 12,297 11,326 12,536 13,831Non-Petroleum Taxes 12,152 13,853 15,793 18,004 20,524 23,397Non-Tax Revenues 500 500 520 525 530 540
Minus: CAT's & Other Taxesnot paid in cash -350 -350 -370 -380 -380 -400
II. Current Expenditures 13,830 15,904 18.290 21.034 24.190 27,820
III. Current Savings 5.948 7,742 9,950 11,797 12,612 13,392
IV. Capital Expenditures 7,575 9,350 10.467 11.194 11,803 13,116
of which:Fixed Investment (6,575) (7,850) (8,990) (9,694) (10,320) (11,366)
V. Deficit (-) -1-62T -1608 -517 603 809 276
VI. Average Savings Ratio .3007 .3274 .3523 .3593 .3427 .3250
VII. Savings as a Fraction ofCapital Expenditures .7852 .8280 .95o6 1.0539 1.0685 1.0210
1/ Includes Central Government Budget, FONADE and FONAPAR.
2/ Assumes higher revenues due to price increases are allocated to FONADE. Also public sector revenues from production
increases over 47.5 million barrels a year are allocated 50% to CEPE and 50% to FONADE. Actual allocation may
differ from projection assumptions.
Source: Mission estimates.

Page 2 of 2
Table 5.9: SUMMARY OPERATIONS OF THE CENTRAL GOVERNMENT, PROJECTIONS
Projection Assumptions
I. Current Revenues
Petroleum Taxes On the basis of a production of 260,000 b/dfor 330 days by 1979. Thereafter exportsare constant.
Non-petroleum Taxes On the basis of Central Government budgetprojections with a buoyancy of .98 for non-petroleum GDP in money terms.
II. Current Expenditures On the basis of a conservative expenditurepolicy. Growth rate of 15%; Real growthrate 9%.

Table 5.10: SUMMARY OF REVENUES OF THE PUBLIC SECTOR, PROJECTIONS
(millions of Sucres)
Estimate Projections1976 1977 1978 1979 1980 1981
I Non-Petroleum Revenues 2/ 13,882 15,741 17,855 20,252 22,987 26,082
1. Central Government 12,302 14,003 15,943 18,149 20,674 23,537Non-Petroleum Taxes 12,152 13,853 15,793 18,004 20,524 23,397
Non-Tax Revenues 500 500 520 525 530 540
Minus: CAT's and other
Taxes not paid in cash -350 -350 -370 -380 -380 -400
2. Special Accounts 1,580 1,738 1,912 2,103 2,313 2,545
II Petroleum Revenues 3/ 12,011 15,875 19,968 23,517 25,198 26,998
1. Central Government 7,476 8,891 10,104 11,326 12,536 13,831
Budget 3,211 3,466 3,466 3,466 3,466 3,466
'I FONAPAR 272 249 249 249 249 249
FONADE 3,993 4,131 4,131 4,131 4,131 4,131FONADE 4/ - 1,045 2,258 3,480 4,690 5,985
2. Special Accounts 2,040 1,929 1,929 1,929 1,929 1,929
Ministry of Health 151 153 153 153 153 153
Universities 178 81 81 81 81 81
Ministry of Labor 303 305 305 305 305 305
Armed Forces Royalty 1,317 1,302 1,302 1,302 1,302 1,302
Esmeraldas Region 80 78 78 78 78 78
Educational Credit 11 10 10 10 10 10
3. Public Enterprises 5/ 2,015 3,042 3,042 3,042 3,042 3,042
INECEL 1,246 1,228 1,228 1,228 1,288 1,288
CEPE 769 1,814 1,814 1,814 1,814 1,814
4. Other 480 508 508 508 508 508
Housing Bank 303 305 305 305 305 305
Central Bank and others 177 203 203 203 203 203
5. Unallocated 6/ 1,505 4,385 6,712 7,183 7,688
Total Revenue 25,893 31,616 37,823 32,769 48,185 53,080
1/ It only covers partially the revenues of some of the main public enterprises.
2/ On the basis of the present tax system. Reforms noted in the text will mean additional revenues.
3/ Revenue projections for each participant are calculated on the basis of 4,715 million barrels
exported from a basic production of 67.5 million barrels (185,000 barrels per day for 365 days).
Price increases above present levels are allocated to FONADE. Export volume increases over 47.5
are shown under global allocations.4/ Price increases above percent levels are assumed to be allocated to FONADE.
5/ Includes only petroleum revenues from oil production.
6/ Global allocations cover revenue from increases in exported volume due to the 260,000 barrels per
day production level projected for 1979.
2/25/77

Table 5.11 : PUBLIC INVESTMENT BY SECTOR ,1969-1974
(millions of 1972 sucres)
1969 1970 1971 1972 1973 1974
Petroleum - - 95 545
Electric Power 120 105 117 162 669 678
Agriculture I/ 192 250 201 120 213 454
Industry 1 1 1 - - 15
Transportation 1,000 1,117 1,247 835 1,394 2,217
(Highways) (883) (974) (1,110) (681) (1,295 (2,049)
(Railroads) (76) (94) (82) (77) (33) (
(Airports and Planes) (27) (33) (37) (30) (17) (32)
(Ports) (14) (16) (18) (48) (49) (136)
Tourism _2/ 2/
Health 77 95 95 59 180 111
Education 104 140 88 153 206 377
Telecommunications 104 104 42 122 48 92
Water 110 158 154 201 239 265
Other 366 424 404 235 418 663
Total 2,074 2,394 2,349 1,887 3,462 5,417
1/Includes rural development and agrarian reform.
2/0.lm 1972 sucres in 1973; 0.2m 1972 sucres in 1974.
Source: National Planning Board

Table 5.12: PUBLIC INVESTMENT PROGRAM: DISBURSEMENTS
(1976 prices)
1977 1978 1979 1980 1981
Petroleum 1o4 128 108 105 105
Electric Power 153 116 108 125 151
Agriculture 53 62 83 83 68
Industry 8 22 38 42 46
Fisheries 15 15 3 6 6
Highways 85 106 93 74 66
Airports 10 11 11 10 -
Ports 25 42 35 6 _
Tourism - 6 9 8 -
Health 60 60 60 27 14
Education 29 34 25 15 4
Telecommunications 6 21 24 24 22
Water 9 12 19 20 18
Preinvestment 1 4 8 9 -
Other - - - 53 120
Total 558 639 624 607 620
Total (adjusted) 1/ 474 536 604 674 760
Other unidentified 41 41 42 50 50
Public Investment (1976 prices) 515 577 646 724 810
Public Investment (current prices) 556 673 814 940 1,086
1/ Assumes slippage of some projects and the addition of new projectsto the list in 1980-81.
Source: Mission estimates.
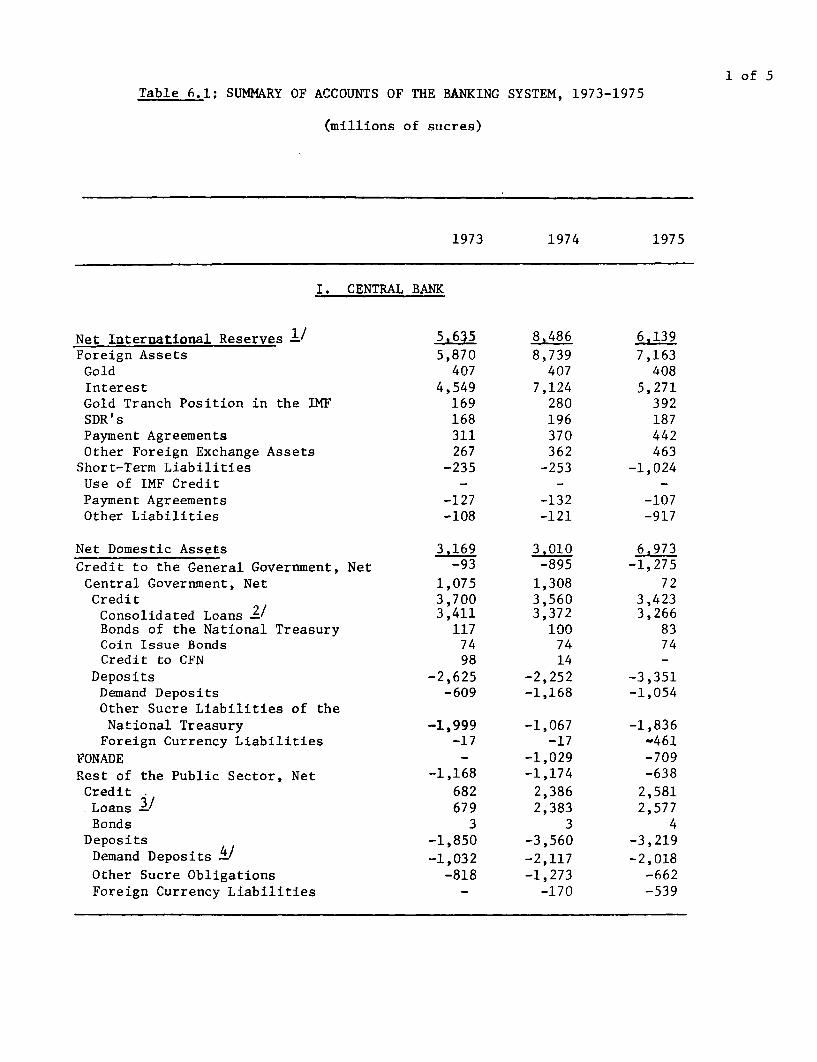
1 of 5Table 6.1; SUMMARY OF ACCOUNTS OF THE BANKING SYSTEM, 1973-1975
(millions of sucres)
1973 1974 1975
I. CENTRAL BANK
Net Interuational Reserves 1/ 5,635 8,486 6,139Foreign Assets 5,870 8,739 7,163Gold 407 407 408Interest 4,549 7,124 5,271Gold Tranch Position in the IMF 169 280 392SDR's 168 196 187Payment Agreements 311 370 442Other Foreign Exchange Assets 267 362 463
Short-Term Liabilities -235 -253 -1,024Use of IMF Credit - - -Payment Agreements -127 -132 -107Other Liabilities -108 -121 -917
Net Domestic Assets 3,169 3,010 6.973Credit to the General Government, Net -93 -895 -1,275Central Government, Net 1,075 1,308 72Credit 3,700 3,560 3,423Consolidated Loans 2/ 3,411 3,372 3,266Bonds of the National Treasury 117 100 83Coin Issue Bonds 74 74 74Credit to CFN 98 14 -
Deposits -2,625 -2,252 -3,351Demand Deposits -609 -1,168 -1,054Other Sucre Liabilities of theNational Treasury -1,999 -1,067 -1,836
Foreign Currency Liabilities -17 -17 -461FONADE - -1,029 -709Rest of the Public Sector, Net -1,168 -1,174 -638Credit . 682 2,386 2,581Loans 2/ 679 2,383 2,577Bonds 3 3 4
Deposits -1,850 -3,560 -3,219Demand Deposits 4/ -1,032 -2,117 -2,018Other Sucre Obligations -818 -1,273 -662Foreign Currency Liabilities - -170 -539

2 of 5Table 6.1: SUMMARY OF ACCOUNTS OF THE BANKING SYSTEM
1973 1974 1975
Private Bank Credit 108 402 766National Development Bank Credit 800 2,187 3,504Private Sector Credit 1,057 1,406 2,178Non-Classified Assets 1,297 -90 1,800
Tiabilities to International DevelopmentOrganizations 311 239 175IBRD 2 1 -IDB 291 220 157AID 18 18 18
Liabilities to Private Banks 3,316 4,260 4,426Cash 265 303 380Demand Deposits 2,941 3,726 3,796Other Sucre Liabilities 26 18 30Development Bonds - 38 44Foreign Exchange Liabilities 84 175 176
Liabilities to the Development Bank 324 531 340Cash 80 136 145Demand Deposits 239 394 193Other Sucre Liabilities 5 1 2Foreign Exchange Liabilities - - -
Liabilities to the Private Sector 4.579 6,127 7,838Currency in Circu ation 3,538 4,640 5,241Demand Deposits 5 90 114 186Quasi-Money - - -Advance Import Deposits 14 8 859Stabilization Bonds 360 183 328Other Sucre Liabilities 383 433 495Foreign Exchange Liabilities 25 52 53Private Capital, Reserves 169 697 676
SDR Allocation 288 339 333
Adjustments -14 - -
II. PRIVATE BANKS
Net International Reserves 81 73 289Assets 242 358 643Liabilities -161 -285 -354
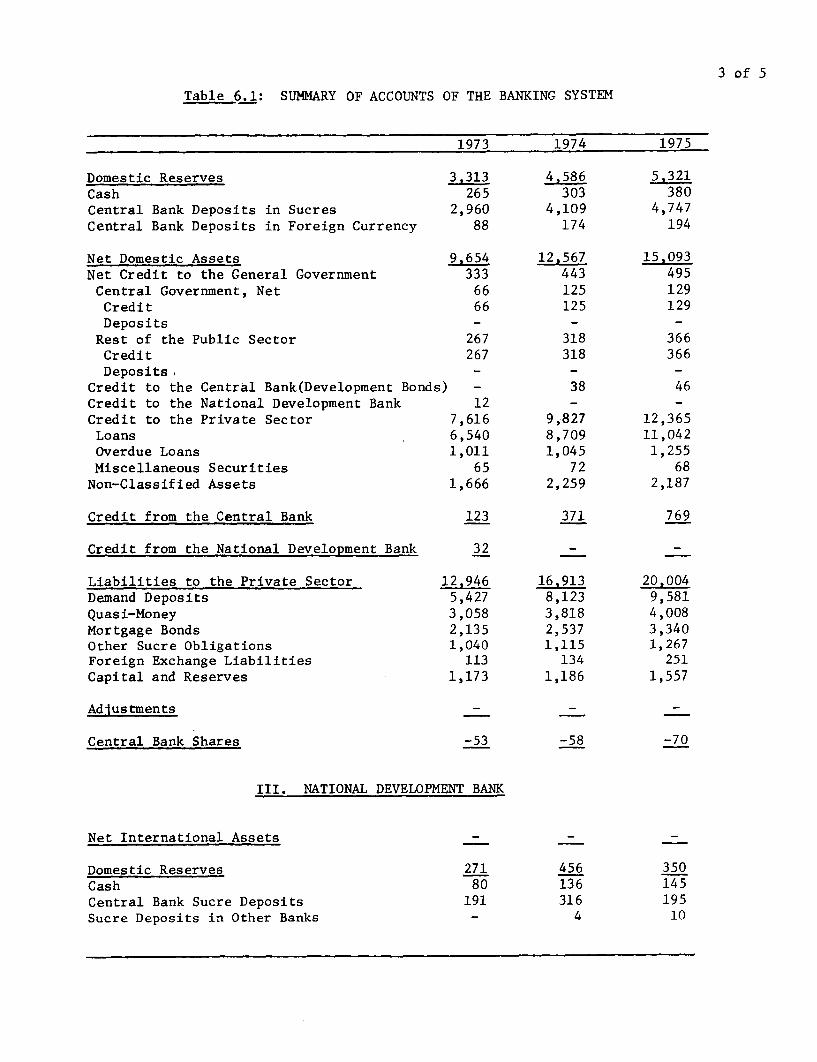
3 of 5
Table 6.1: SUMMARY OF ACCOUNTS OF THE BANKING SYSTEM
1973 1974 1975
Domestic Reserves 3.313 4,586 5,321
Cash 265 303 380Central Bank Deposits in Sucres 2,960 4,109 4,747Central Bank Deposits in Foreign Currency 88 174 194
Net Domestic Assets 9.654 12,567 15,093
Net Credit to the General Government 333 443 495Central Government, Net 66 125 129Credit 66 125 129Deposits - - -
Rest of the Public Sector 267 318 366Credit 267 318 366Deposits,
Credit to the Central Bank(Development Bonds) - 38 46Credit to the National Development Bank 12 - -Credit to the Private Sector 7,616 9,827 12,365Loans 6,540 8,709 11,042Overdue Loans 1,011 1,045 1,255
Miscellaneous Securities 65 72 68
Non-Classified Assets 1,666 2,259 2,187
Credit from the Central Bank 123 371 769
Credit from the National Development Bank 32 - -
Liabilities to the Private Sector 12,946 16,913 20,004Demand Deposits 5,427 8,123 9,581
Quasi-Money 3,058 3,818 4,008Mortgage Bonds 2,135 2,537 3,340Other Sucre Obligations 1,040 1,115 1,267Foreign Exchange Liabilities 113 134 251
Capital and Reserves 1,173 1,186 1,557
Ad lustments - -
Central Bank Shares -53 -58 -70
III. NATIONAL DEVELOPMENT BANK
Net International Assets -
Domestic Reserves 271 456 350
Cash 80 136 145Central Bank Sucre Deposits 191 316 195Sucre Deposits in Other Banks - 4 10

4 of 5
Table 6.1: SUMMARY OF ACCOUNTS OF THE BANKING SYSTEM
1973 1974 1975
Net Domestic Assets 1,698 3,317 5.121Net Credit to the General Government -471 -941 -1,210Central Government, Net - - -CreditDeposits - - -
Rest of the Public Sector -471 -941 -1,210Credit - - -Deposits -471 -941 -1,210
Credit to Private Banks - - -Credit to the Private Sector 2,785 5,216 7,656Loans 1,968 3,820 5,070Overdue Loans 331 524 921Miscellaneous Securities 486 872 1,665Non-Classified Assets 223 674 667Capital and Reserves -839 -1,632 -1,992
Liabilities to International DevelopmentOrganizations 176 251 392IDB 176 212 324Other Foreign Obligations - 39 68
Medium and Long-Term Foreign Liabilities 83 45 45
Liabilities to the Central Bank 855 1,982 3,419
Liabilities to the Private Banks 213 282 350
Private Sector Liabilities 642 1,213 1,265Demand Deposits 264 505 531Quasi-Money 138 230 269Bonds -8 2 1Other Sucre Obligations 248 476 464
IV. CONSOLIDATED BANKING SYSTEM (I+II+III)
Net International Reserves 5,716 8,559 6,428International Assets 6,112 9,097 7,806Short-Term Liabilities -396 -538 -1,378
Net Domestic Assets 13,242 16,510 23,554Net Credit to the General Government -231 -1,393 -1,990Central Government, Net 1,141 1,433 201Credit 3,766 3,685 3,552Deposits -2,625 -2,252 -3,351
FONADE - -1,029 -709Rest of the Public Sector -1,372 -1,797 -1,482Credit 949 2,704 2,947Deposits -2,321 -4,501 -4,429

5 6f 5
Table 6.1: SUMMARY OF ACCOUNTS OF THE BANKING SYSTEM
1973 1974 1975
Official Capital and Reserves -839 -1,632 -1,992Credit to the Private Sector 11,458 16,449 22,199Non-Classified Assets 3,213 2,843 4,654Interbank Float -359 243 683
Liabilities to International DevelopmentOrganizations 487 490 567
Medium and Long-Term Liabilities 83 45 45
Liabilities to the Private Sector 18,114 24,195 29,037Currency in Circulation 3,538 4,640 5,241Demand Deposits 5,781 8,742 10,298Quasi-Money 3,196 4,048 4,277Advance Import Deposits 14 8 859Stabilization Bonds 360 183 328Mortgage Bonds 2,127 2,539 3,341Other Sucre Liabilities 1,671 2,024 2,226Foreign Exchange Liabilities 138 186 304Private Capital and Reserves 1,289 1,825 2,163
SDR Allocations 288 339 333
Adjustments -14 - -
1/Excluding Foreign Exchange Loans in Ecuador.
2/Including Foreign Exchange Credit for Livestock Imports.
3/Including Foreign Exchange Credit for the Purchase of Shares of Texac'o-Gulf
4/Including the Deposits of Official Agencies such as IESS, CENDES, IEOS, etc.
5/Excluding the Deposits in Official Agencies.
Source: Central Bank of Ecuador, Division of Monetary Studies.

1 of 2
Table 6-2: SUMMARY OF ACCOUNTS OF OTHER FINANCIAL INTERMEDIARIES, 1973-1975
(millions of sucres)
1973 1974 1975
I. NATIONAL FINANCIAL CORPORATION -- COMISISN DE VALORES
Cash and Bank Deposits 31 29 66Domestic Credit 1,253 1,904 2,357(Public Sector, Net) (158) (-64) (-180)(Private Sector) (1,073) (1,991) (2,581)(Non-Classified Assets) (22) (-23) (-44)
Medium and Long-Term Liabilities 645 794 960Bond Issues - 156 453Liabilities to the Central Bank 38 93 29Official Capital and Reserves 601 890 981
II. ECUADORIAN HOUSING BANK (BEV)
Cash and Bank Deposits 71 70 55Domestic Credit 1,152 1,777 2,700
(Public Sector, Net) (36) (56) (69)(Private Sector) (479) (632) (984)(Deposits in Savings & Loan Associations) (139) (204) (224)(Real Estate) (357) (790) (1,246)(Non-Classified Assets) (141) (95) (177)
Medium and Long-Term Liabilities 415 444 460Savings and Time Deposits 112 299 654Liabilities to the Central Bank - - 146Bond Issues 332 314 391Official Capital and Reserves 364 790 1,104
III. SAVINGS AND LOAN ASSOCIATIONS
Cash and-Bank Deposits 82 206 254Domestic Credit 871 1,349 1,764(Private Sector) (550) (907) (1,354)(Non-Classified Assets) (321) (442) (410)
Deposits in the Housing Bank 139 204 224Savings and Time Deposits 802 1,331 1,762Private Capital and Reserves 12 20 32

2 of 2Table 6.2: SUMMARY OF ACCOUNTS OF OTHER FINANCIAL INTERMEDIARIES
1973 1974 1975
IV. ECUADORIAN FINANCIAL CORPORATION (COFIEC)
Cash and Bank Deposits 46 58 69Domestic Credit 337 413 570(Private Sector) (486) (818) (1,149)(Non-Classified Assets (-149) (-405) (-579)
Medium and Long-Term Liabilities 220 215 363Foreign Exchange Liabilities 11 15 5Bond Issues 33 87 90Private Capital and Reserves 119 154 181
V. COOPERATIVE BANKS
Cash and Domestic Deposits 6 4 8Domestic Credit 55 75 113(Public Sector, Net) (-16) (-26) (-33)(Private Sector) (70) (93) (138)(Non-Classified Assets) (1) (8) (8)
Medium and Long-Term Liabilities 36 42 59Deposits 3 8 29Demand Deposits (3) (5) (23)Savings and Time Deposits - (3) (6)Private Capital and Reserves 22 29 33
VI. CONSOLIDATION OF ACCOUNTS OF I - V
Cash and Bank Deposits 236 367 452Domestic Credit 3,529 5,314 7,280(Public Sector, Net) (178) (-34) (-144)(Private Sector) (2,658) (4,441) (6,206)(Real Estate) (357) (790) (1,246)(Non-Classified Assets) (336) (117) (-28)
Medium and Long-Term Liabilities 1,316 1,495 1,842Liabilities to the Private Sector 1,446 2,413 3,630Demand Deposits (3) (5) (23)Savings and Time Deposits (914) (1,633) (2,422)Bond Issues (365) (557) (934)Foreign Exchange Liabilities (11) (15) (5)Private Capital and Reserves (153) (203) (246)
Liabilities to the Central Bank 38 93 175Official Capital and Reserves 965 1,680 2,085
Source: Superintendency of Banks; Central Bank of Ecuador,Division of Monetary Studies

Table 5.3: CREDIT OF THE BANKING SYSTEM BY ORIGIN AND DESTINATION, 1973 - 1975
(charges in millions of sucres)
March June Sept Dec.1973 1974 1975 1975 1975 1975
Origin 464 3,268 5,353 8,261 7,718 7,844
Central Bank -1,229 -197 2,177 5,100 4,678 3,955Commercial Banks 1,722 2,619 2,620 2,237 2,108 2,162National Development Bank 333 244 45 432 523 487Net Interbank Float -362 602 511 492 409 440
Destination 464 3.268 51353 8,261 7,718 7,044
Net Credit to the Public Sector -1,754 -1,162 -91 1,901 1,584 -597(Central Government, Net) (-1,024) (292) (154) (1,057) (-75) (-1,232)(Rest of the Public Sector, Net) (-730) (-425) (198) (971) (948) (315)(FONADE) - (-1,029) (-261) (-127) (711) (320)
Official Capital, Reservesand Profit -146 -793 -811 -628 -576 -360
Private Sector 2,151 4,991 5,709 6,028 5,684 5,750Net Unclassified Assets 575 -370 -147 468 617 1,811Net Interbank Float -362 602 511 492 409 440
Source: Central Bank of Ecuador, Division of Monetary Studies

Table 6.4: CREDIT SUPPLIED BY THE BANKING SYSTEM BY ECONOMIC ACTIVITY
(in millions of sucres)
Year Agriculture Commerce Industry Other Total
1971 1,648 7,329 2,370 1,257 12,604
1972 2,044 8,344 2,443 1,609 14,441
1973 2,791 9,865 3,028 1,804 17,488
1974 4,830 12,214 4,454 3,948 25,446
1975 6,924 15,016 6,647 4,529 33,117
Source: Central Bank of Ecuador
3/1/77

Page 1 of 4
Table 7.1: AGRICULTURAL CROP AREAS, YIELDS AND PRODUCTION, 1966-1975
Average AverageProducts Units 1966 1967 1968 1969 1970 1966-70 1971 1972 1973 1974 1975 1971-75
CerealsBarley Area/'000 ha 143 144 135 126 134 136 120 119 93 61 72 93
Yield kg/ha - - - - - 618 - - - - - 708Production 1000 t. 77 81 76 73 110 84 69 73 79 56 63 68
Corn (soft) Area/'000 ha - - - 215 211 213 241 150 124 90 109 163Yield kg/ha - - - - - 728 - - - - - 690Production '000 t. - - - 141 168 155 140 171 100 61 90 112
Corn (hard) Areaj'000 ha - - - 77 80 79 111 102 141 120 166 128Yield kg/ha - - - - - 1,165 - - - ^ - 1,108Production '000 t. - - - 81 102 92 121 101 153 131 203 142
Corn (total) Area/'ooo ha 267 364 255 292 291 294 352 352 265 210 -Yield kg/ha - - - - - 697 - - - --Production '000 t. 175 228 129 222 270 205 261 272 253 192 -
Rice (milled) Area/'000 ha 111 114 112 92 87 103 57 91 85 93 122 90Yield kg/ha _ - - - - 942 - - - - - 1,522Production '000 t. 111 111 65 83 117 97 82 105 134 157 207 137
Wheat Area/'000 ha 65 80 79 100 76 80 76 56 47 56 70 61Yield kg/ha - - - - - 1,000 - - - - - 931Production '000 t. 63 79 83 94 81 80 68 51 45 55 65 57
FibersAbaca Area/ 000 ha - _ - 2 2 2 2 3 7 7 8 5
Yield kg/ha _- - 2,000 - - - - - 1,260Production '000 t. - - - 4 4 4 5 4 7 8 10 7
Cotton (seed Area/'000 ha 24 24 21 22 9 20 8 14 23 43 37 25cotton) Yield kg/ha - - - - - 800 - - - - - 848Production '000 t. 18 16 14 24 8 16 11 12 20 33 30 21
Source: Ministry of Agriculture

Page 2 of 4
Table 7.1: AGRICULTURAL CROP AREAS, YIELDS AND PRODUCTION (CONT)
Average AverageProducts Units 1966 1967 1968 1969 1970 1966-70 1971 1972 1973 1974 1975 1971-75
Tubers and RootsCassava Area/'000 ha 28 27 27 35 35 30 37 41 54 54 43 46Yield kg/ha - - - - - 10,633 - - - - - 11,910Production '000 t. 276 323 234 390 371 319 383 277 741 741 597 548Potatoes Area/'000 ha 44 48 49 41 47 46 53 38 44 48 39 44Yield kg/ha - - - - - 9,804 - - - - - 11,955Production '000 t. 347 399 511 457 452 451 681 473 539 438 L99 526Sweet potatoes Area/'000 ha 3 2 2 3 3 3 2 3 2 2 3 2Yield kg/ha - - - - - 3,000 - - - - - 5,000Production '000 t. 8 8 7 1 10 9 7 9 8 8 14 10
PulsesBeans Area/'000 ha 82 79 86 85 82 83 67 62 66 50 63 62Yield kg/ha - - - - - 458 - - - - - 445Production '000 t. 36 38 35 38 41 38 30 26 32 24 26 28Broad beans Area/'000 ha 35 34 34 21 24 29 23 13 17 17 19 18Yield kg/ha - - - - - 586 - - - - - 771Production '000 t. 21 20 20 11 15 17 15 9 12 12 16 13Lentils Area/'OOO ha 3 3 2 2 2 2 3 2 4 4 4 3Yield kg/ha - - - - - 383 - - _- - 480Production '000 t. 1 1 1 1 1 1 1 1 2 2 2 2Lupins (edible) Area/'000 ha 3 3 3 3 4 3 3 3 2 2 1 2Yield kg/ha - - - - - 845 - - - - - 700Production '000 t. 3 2 3 1 3 3 2 2 1 1 1 1Peas Area/'000 ha 31 31 41 23 30 31 23 17 16 13 17 17Yield kg/ha - - - - - 581 - - - - - 588Production 18 18 22 11 21 18 14 9 9 7 10 10
Source: Ministry of Agriculture
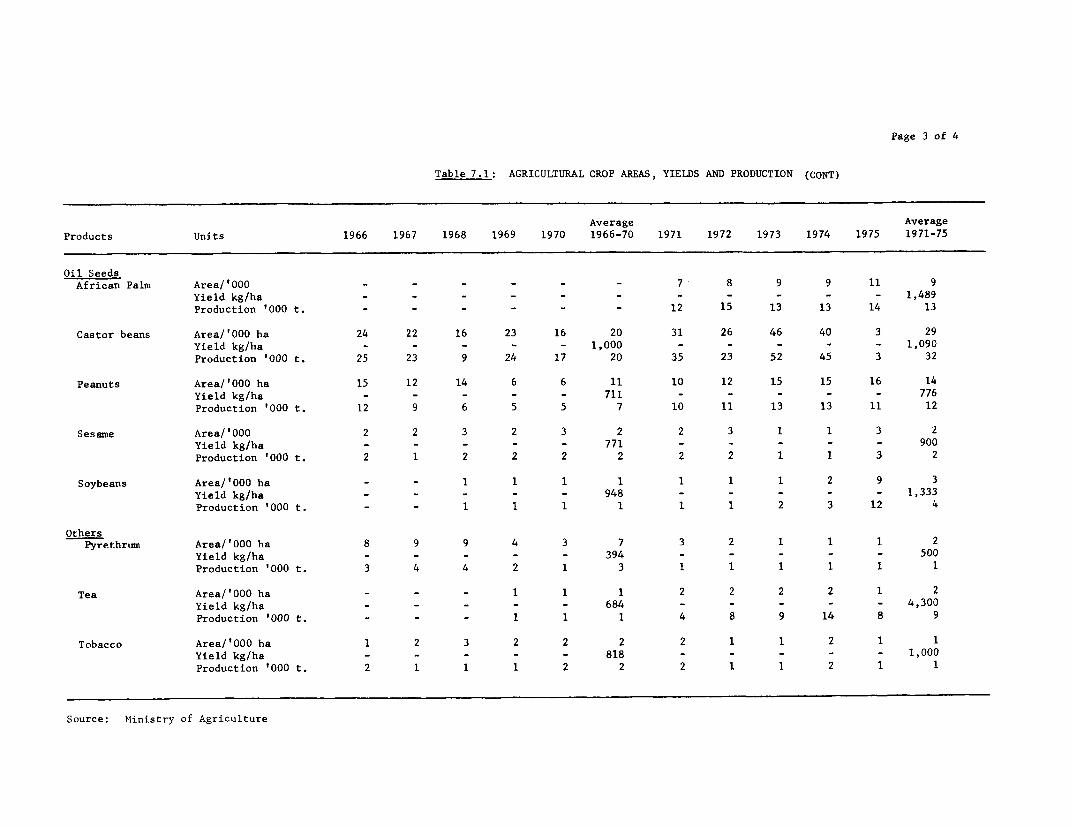
Page 3 of 4
Table 7.1: AGRICULTURAL CROP AREAS, YIELDS AND PRODUCTION (CONT)
Average AverageProducts Units 1966 1967 1968 1969 1970 1966-70 1971 1972 1973 1974 1975 1971-75
Oil SeedsAfrican Palm Area/'OO0 - - - - - - 7 8 9 9 11 9
Yield kg/ha - - - - - 1,489Production '000 t. - - - - - - 12 15 13 13 14 13
Castor beans Area/'000 ha 24 22 16 23 16 20 31 26 46 40 3 29Yield kg/ha - - - - - 1,000 - - - - - 1,090Production '000 t. 25 23 9 24 17 20 35 23 52 45 3 32
Peanuts Area/'000 ha 15 12 14 6 6 11 10 12 15 15 16 14Yield kg/ha - - - - - 711 - - - - - 776Production '000 t. 12 9 6 5 5 7 10 11 13 13 11 12
Sesame Area/'000 2 2 3 2 3 2 2 3 1 1 3 2Yield kg/ha - - - - - 771 - - - - - 900Production '000 t. 2 1 2 2 2 2 2 2 1 1 3 2
Soybeans Area/'000 ha - - 1 1 1 1 1 1 1 2 9 3Yield kg/ha - - - - - 948 - - - - - 1,333Production '000 t. - - 1 1 1 1 1 1 2 3 12 4
OthersPyrethrum Area/'000 ha 8 9 9 4 3 7 3 2 1 1 1 2
Yield kg/ha - - - - - 394 - - - - - 500Production '000 t. 3 4 4 2 1 3 1 1 1 1 1 1
Tea Area/'000 ha - - - 1 1 1 2 2 2 2 1 2Yield kg/ha - - - - - 684 - - - - - 4,300Production '000 t. - - - 1 1 1 4 8 9 14 8 9
Tobacco Area/'000 ha 1 2 3 2 2 2 2 1 1 2 1 1Yield kg/ha - - - - - 818 - - - - - 1,000Production '000 t. 2 1 1 1 2 2 2 1 1 2 1 1
Source: Ministry of Agriculture
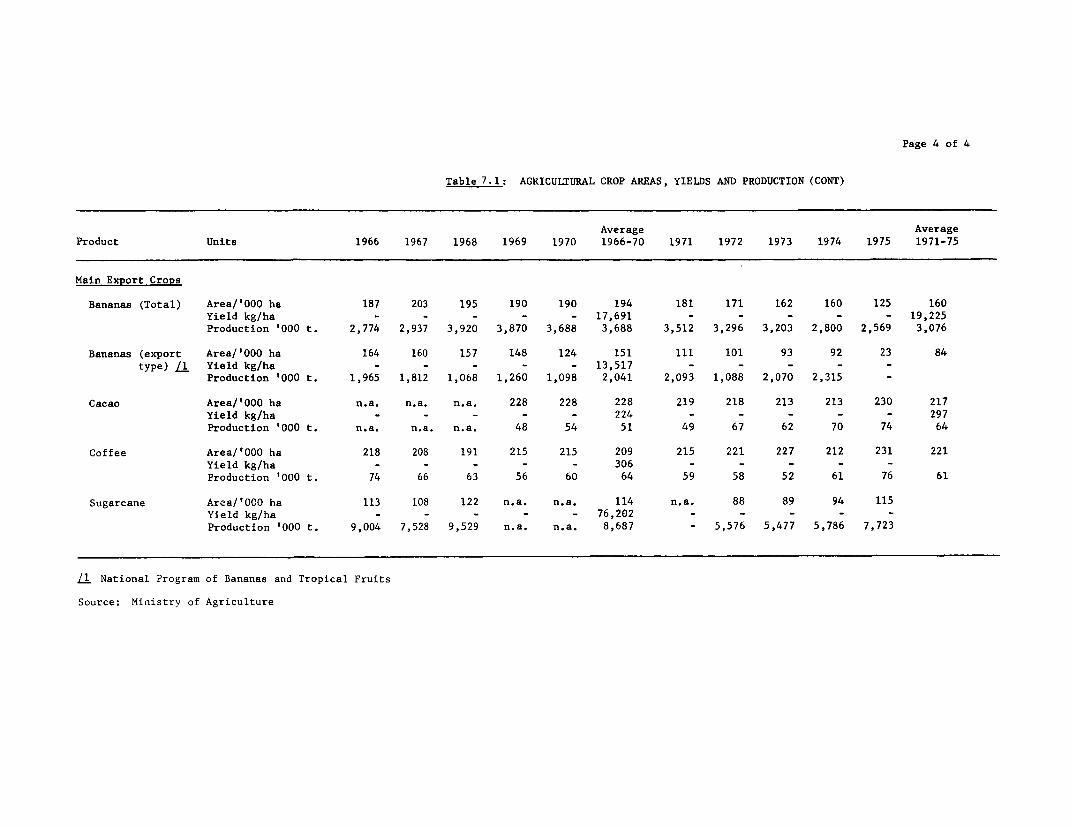
Page 4 of 4
Table 7.1: AGRICULTURAL CROP AREAS, YIELDS AND PRODUCTION (CONT)
Average AverageProduct Units 1966 1967 1968 1969 1970 1966-70 1971 1972 1973 1974 1975 1971-75
Main Export Crops
Bananas (Total) Area/'000 ha 187 203 195 190 190 194 181 171 162 160 125 160Yield kg/ha - - - - - 17,691 - - - - - 19,225Production '000 t. 2,774 2,937 3,920 3,870 3,688 3,688 3,512 3,296 3,203 2,800 2,569 3,076
Bananas (export Area/'000 ha 164 160 157 148 124 151 111 101 93 92 23 84type) /1 Yield kg/ha - - - - - 13,517 - - - - -
Production '000 t. 1,965 1,812 1,068 1,260 1,098 2,041 2,093 1,088 2,070 2,315 -
Cacao Area/'000 ha n.a. n.a. n.a. 228 228 228 219 218 213 213 230 217Yield kg/ha - - - - - 224 - - - - - 297Production '000 t. n.a. n.a. n.a. 48 54 51 49 67 62 70 74 64
Coffee Area/'000 ha 218 208 191 215 215 209 215 221 227 212 231 221Yield kg/ha - - - - - 306 - - - - -Production '000 t. 74 66 63 56 60 64 59 58 52 61 76 61
Sugarcane Area/'OC0 ha 113 108 122 n.a. n.a. 114 n.a. 88 89 94 115Yield kg/ha - - - - - 76,202 - - - - -Production '000 t. 9,004 7,528 9,529 n.a. n.a. 8,687 - 5,576 5,477 5,786 7,723
/1 National Program of Bananas and Tropical Fruits
Source: Ministry of Agriculture

Table7.2 : VOLUME OF BANK CREDIT TO THE AGRICULTURAL SECTOR, 1965 THROUGH 1975
(millions of sucres)
Agricultural Credit By TypeOf Banking Institution Agricultural
Year Banco Nacional Central Private Total Total Credit as percent ofde Fomento Bank Banks Agri. Credit Bank Credit Total Bank Credit
1965 253.4 133.1 344.0 730.5 6,292.8 11.6
1966 304.8 153.2 482.4 940.4 6,487.0 14.5
1967 368.9 186.3 469.8 1,025.0 7,592.0 13.5
1968 445.3 148.1 481.4 1,074.8 8,984.5 12.0
1969 488.6 198.1 585.3 1,272.0 9,303.6 13.7
1970 543.5 215.3 840.5 1,599.3 11,309.6 14.1
1971 593.0 159.0 748.7 1,500.7 12,205.0 12.3
1972 587.0 109.1 1,035.2 1,731.3 13,895.6 12.5
1973 1,135.9 123.9 1,103.3 2,363.1 16,624.0 14.2
1974 2,775.9 88.9 1,122.7 3,987.5 22,621.0 17.6
1975 3,187.1 190.6 1,274.5 4,652.2 28,046.4 16.6
Source: Central Bank of Ecuador, Superintendency of Banks

Table 7.3: VALUE ADDED AND OVERALL ECONOMIC POSITION OF THE AGRICULTURAL SECTOR, 1970-1975
1970 1971 1972 1973 1974 1975 1971 1972 1973 1974 1975(millions of current sucres) (millions of 1970 sucres)
Crops 6,374 6,678 6,721 9,102 12,114 13,982 6,356 6,031 6,188 6,880 7,191
Animal Products 1,782. 2,146 2,661 3,032 4,248 5,498 1,910 2,137 2,178 2,322 2,475
Forestry 696 828 985 1,290 1,606 1,865 711 726 808 860 896
Fisheries 211 412 599 846 1,128 1,660 245 129 195 301 499
Hunting 2 3 3 3 4 4 3 2 2 2 2
Goods Produced By:Public Administration 4 5 7 10 14 19 5 6 7 8 10
Agricultural Services 18 20 22 24 27 30 22 21 17 15 15
Total 9,087 10.092 10,998 14,307 19,141 9,252 9,052 9,394 10,388 11,088
Share of Agriculture in GDP (Percent) Annual Growth Rates (Percent)
Crops 18.8 16.5 14.5 14.4 13.2 12.9 -0.3 -5.1 2.6 11.2 4.5
Animal Products 5.3 5.3 5.7 4.8 4.7 5.1 7.2 11.9 1.9 6.6 6.6
Forestry 2.0 2.0 2.1 2.1 1.8 1.7 2.2 2.1 11.2 6.6 4.2
Fisheries 0.6 1.0 1.3 1.3 1.2 1.5 16.1 -47.4 51.2 54.4 65.8
Hunting - - - - - - 50.0 -33.3 - - -
Goods Produced By:Public Administration - - - - - - 25.0 20.0 16.7 14.3 25.0
Agricultural Services 0.1 0.1 0.1 0.1 - 0.1 22.2 -4.5 -19.1 -11.8 -
Total 26.8 24.9 23.7 22.7 20.9 21.3 1.8 -2.2 3.8 10.6 6.7
Source: Central Bank of Ecuador

Table 7.4: DISTRIBUTION OF AGRICULTURAL LAND BY TYPE OF TENURE, 1968
(areas in thousands of hectares)
Number …------------------------- Cropland ----------------------------- -- Other---of Total Semi- Tot&l
Type of Farms Farm Annual Permanent Permanent Artificial IrrigatedTenure (thous.) Area Total Crops Crops Crops Fallow Pasture Total Area
Owner 480.5 5,736.4 3,144.0 872.6 353.4 481.9 378.6 1,057.4 2,592.4 388.2Renter 79.9 594.2 351.8 193.2 24.0 53.0 35.4 46.2 242.3 48.9Sharecropper 26.7 74.1 53.0 40.0 4.4 1.6 4.- 2.1 21.1 6.2Colono 3.7 171.8 38.9 3.6 6.1 4.7 2.3 22.1 133.0 -Comunero 1.8 1.5 1.2 1.1 - - 0.019 0.101 0.308 -Other simple
forms 8.2 77.1 29.5 12.3 1.7 5.4 5.2 4.9 47.6 6.3Owner-renter 14.4 161.9 112.4 50.4 5.2 22.2 9.3 25.3 49.5 8.6Other mixed
forms 15.4 104.0 74.5 44.2 1.4 2.5 9.4 16.9 29.5 3.8Unknown 2.6 16.5 10.6 3.1 0.282 4.5 0.865 1.7 5.9 1.3
TOTAL 633.2 6,937.5 3,815.8 1,220.6 396.6 575.9 446.o 1,176.8 3,121.71 463.2
1/ Includes natural pasture (866,000 ha); woods (870,000 ha); unused lands (957,000 ha); unproductive land (428,000 ha).
Source: Encuesta Agropecuaria Nacional 1968.
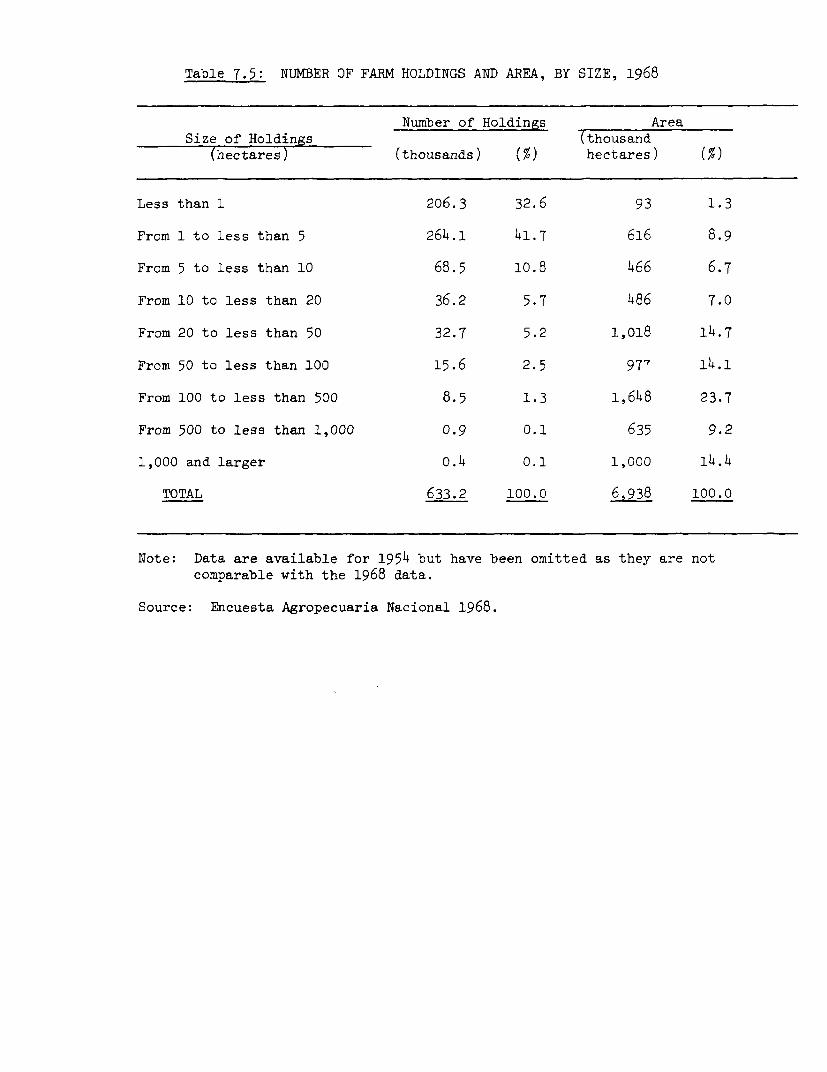
Table 7.5: NUMBER OF FARM HOLDINGS AND AREA, BY SIZE, 1968
Number of Holdings AreaSize of Holdings (thousand
(hectares) (thousands) (%) hectares) (%)
Less than 1 206.3 32.6 93 1.3
From 1 to less than 5 264.1 41.7 616 8.9
From 5 to less than 10 68.5 10.8 466 6.7
From 10 to less than 20 36.2 5.7 486 7.0
From 20 to less than 50 32.7 5.2 1,018 14.7
From 50 to less than 100 15.6 2.5 977 14.1
From 100 to less than 500 8.5 1.3 1,648 23.7
From 500 to less than 1,000 0.9 0.1 635 9.2
1,000 and larger 0.4 0.1 1,000 14.4
TOTAL 633.2 100.0 6,938 100.0
Note: Data are available for 1954 but have been omitted as they are notcomparable with the 1968 data.
Source: Encuesta Agropecuaria Nacional 1968.

Page I of 3Table 8.1 : DISTRIBUTION OF PETROLEUM REVENUES IN 1976 (Estimated)
Gulf-Texaco - C E P E Total
Item Distribution US$ per barrel Total Revenue Distribution US$ per barrel Total Revenue(in thousand (in thousand (in thousand (in milliondollars) 3 dollars) 3/ dollars) sucres)
Royalties (17%) 100 % 2.5586 $ 86.s32.7 100 % 1.6900 $ 19.012.5 $105.365.2 2,634.1of whichINECEL 47 1.2025 40,584.4 47 .7943 8,935.9 49,520.3 1,238.0Armed Forces 50 1.2793 43,176.3 50 .8450 9,506.3 52,681.6 1,317.1Province of Esmeraldas 3 .0768 2,592.0 3 .0507 570.4 3,162.4 79.1
Income Tax (71.42%) or 7.6496 258,164.6 7.3800 83,025.0 341,189.6 8,529.7equivalent for CEPEof which:
CEPE .2000 6,750.0 - - 6,750.0 168.8Income Tax or Similar for Distribution to; 100.0 7. 7.4495 251.4141Central Government Budget 36.4673 2.7166 91,65853 2.9893 -/ 33,629.7 125,315.0 3.132.9National Dev. Fund 47.7182 3.5548 119,974.5 3.5336 39,753.0 159,927.5 3,993.2National Participation Fund 3.4855 .2595 8,758.1 .1887 2,122.9 10,881.0 272.0Central Bank fee .0271 .0020 67.5 .0020 22.5 90.0 2.3National Electrification Fund .1195 .0089 300.4 - - 300.4 7.5CEPE .1263 .0094 317.3 _ 317.3 7.9Esmeraldas Development Account .0081 .0006 20.3 - - 20.3 .5Educational Credit (IECE) .1439 .0107 361.1 .0080 90.0 451.1 11.3Public Universities 2.4835 .1850 6,243.8 .0189 212.6 6,456.4 161.4Private Universities .24835 .0185 624.4 - - 624.4 15.6Housing Bank 3.6689 .2733 9,223.9 .2558 2,877.8 12,101.7 302.5Ministry of Health 1.8344 .1367 4,613.6 .1279 1,438.9 6,052.5 151.3Ministry of Labor and Social Welfare 2.7523 .2050 6,918.8 .2558 2,877.8 12,101.7 302.5Patronato Nacional del Nino .9165 .0683
Share of CEPE 2/ 2.7469 30,902.4 30,902.4 772.6Other Taxes .2409 8,130.4 .1831 2,059.9 10.190.3 254.8Tariff on pipeline .0140 472.5 .0140 157.5 630.0 15.7Shipping Tax .0120 405.0 .0120 135.0 540.0 13.5Exchange Tax (Central Government 607) .0780 2,632.5 o445 500.6 3,133.1 78.3Exchange Tax (Central Bank 5 %t) .0065 219.4 .0037 41.6 261.0 6.5Exchange Tax (Public Universities 35%) .0455 1,535.6 .0260 292.5 1,828.1 45.7Tax on freight charges .0120 405.0 .0120 135.0 54o.o 13.5Other .0729 2,460.4 .0709 797.6 3,258.0 81.5
Total 10.4492 352,64T.4 3.2.0000 135,000.0 487,647.4 12,191.2
1/ Includes revenues from 15% export tax (US$1.468 per barrel) and income tax (US$1.9425 per barrel) excluding FONAPAR's share of US$0.1887 per barrel).2/ Without deductions for the cost of petroleum exported. If these are deducted CEPE's share is US$23.5 million and the total US$455.9 million.
i/ un tne Dasis ot revenue from 45 million barrels (Texaco-Gulf 75%, CEPE 25%).
Source: Mission estimates.

Page 2 of 3
Table 8.1: DISTRIBUTION OF PETROLEUM REVENUES, est. 1976
(thousands of dollars)
Estimate -
1976
INECEL 49 ,820.7Royalties 49,520.3Electrification Fund 300.4
Armed Forces Royalties 52,686.6
Esmeraldas 3 182 7Esmeraldas Province Royalties 3,162.Esmeraldas Development (Income Tax) 20.3
CEPE 30,769.7US$0.20 per Barrel 6,750.0Profits (Share net ofproduction costs 23,702.4
Income Tax 317.3
Central Government 128,448.1Income Tax 91,685.3Export Tax on CEPE and Income Tax 33,629.7Exchange Tax -- Texaco (60%) 2,632.5Exchange Tax -- CEPE 500.6
FONADE 159,727.6Income Tax 115,974.5Participation in CEPE's Revenues 39,753.1
FONAPAR 10 881.0Income Tax 8:758.1Participation in CEPE's Revenues 2,122.9
UNIVERSITIES 7 129.2Public 6:504.8
(Income Tax) C 6,243.8)(Exchange Tax) ( 261.0)
Private 624.4
Educational Credit 45,1.1From Texaco 361.1From CEPE 90.0
Housing Bank 12,101.7Income Tax 9,223.9Participation in CEPE's Revenues 2,877.8
Ministry of Health 6 052.5Income Tax , 13.Participation in CEPE's Revenues 1,438.9
Ministry of Labor and Patronato 12,101.7Nacional Del Nino 12,101.7Income Tax 9,223.9Participation in CEPE's Revenues 2,877.8
Other Participants 7,o94.8
TOTAL 480,447.4
I/ Estimated on the basis of 45 million barrels liquidated.Exports are estimated at 47 million barrels with someslippages on liquidations.
Source: Mission estimates.
3/1/77

Page 3 of 3
Table 8.1: DISTRIBUTION OF PETROLEUM REVENUES, 1976
Distribution As established in the legislation forconsortium exports (Decrees No. 982/75,151/76 and 365/76) and for CEPE exports(Inter Ministerial Agreement No. 12605/75and Decree 492/75). Figures on the Tableare a consolidation of both.
Ownership Starting in 1977 assumes CEPE holds62.5% and Texaco 37.5% of the consortiumshares.

Table8.21: DONESTIC PRICES OF PETROLEUM PRODUCTS
AS OF AUGUST 31, 1976
(Sucres per gallon)
Gasoline GasolineSpecial Ordinary Diesel KeroseneOct. 62 Oct. 63
Tulcan 4.80 4.30 4.20 4.00Ibarra 4.80 4.30 3.75 3.35Quito 4.65 4.10 3.55 3.35Latacunga 4.65 4.10 3.70 3.30Ambato 4.65 4.10 3.60 3.20Guaranda 4.65 4.10 3.75 3.30Rio Bamba 4.65 4.10 3.70 3.45Azogues 4.65 4.40 3.45 2.95Cuenca 5.05 4.40 3.45 2.95Loja 5.05 4.40 3.45 2.95Esmeraldas 4.90 4.50 3.80 3.60Portoviejo 4.80 4.40 3.80 3.00Guayaquil 4.65 4.10 3.15 2.65Babahoyo 5.20 4.60 3.60 3.00Machala 4.80 4.30 3.35 2.80Zamora 5.60 5.10 4.20 _Macas 5.60 - 4.50Tena 5.70 4.70 4.25 _Puyo 5.30 4.65 4.95 3.85
Source: CEPE

Table 8. 3: - DRILLING STATISTICS, 1970 - 1976
Total Wells Exploration Wells Successful ExplorationCompleted Completed Wells
1970 37 20 14
1971 62 17 8
1972 59 20 7
1973 58 9 2
1974 37 6 1
1975 15 3 2
1976 2 0 0(Jan-July)
Source: Ministry of Natural Resources,Department of Hydrocarbons

Table 8.4: STRUCTURES DRILLED BY CEPE-TEXACO-GULF,
AS OF JULY 31, 1976
Structures Wells Capable Dry Wells or Total Wellsof Production - Non Commercial Drilled
Productive 198 5 203
Lago Agrio 27 1 28Shushufindi 57 1 58Sacha 75 1 76Atacapi 1 0 1Dureno 1 0 1Aguarico 9 0 9Auca 18 0 18Yuca 1 0 1Parahuacu 1 0 1Coca 1 0 1Cononaco 1 0 1Culebra 0 1 1Bermejo 2/ 3 1 4Charapa 2/ 1 0 1Pucuna 2/ 1 0 1Cuyabeno 2/ 1 0 1
Dry 0 7 7
Condor 2/ 0 1 1San Francisco 2/ 0 1 1Yuralpa - 0 1 1Cofane 2/ 0 1 1Farfam East 2/ 0 1 1Palo Rojo 0 1 1Zorro 0 1 1
With the exception of Lago Agrio, Shushufindi, Sacha,Aguarico andAuca all other productive structures are shut-in. Most of thesemust be drilled further before producing facilities can be installed.
2/ Structures which have reverted to CEPE (100%)
Source: Ministry of Natural Resources,Department of Hydrocarbons
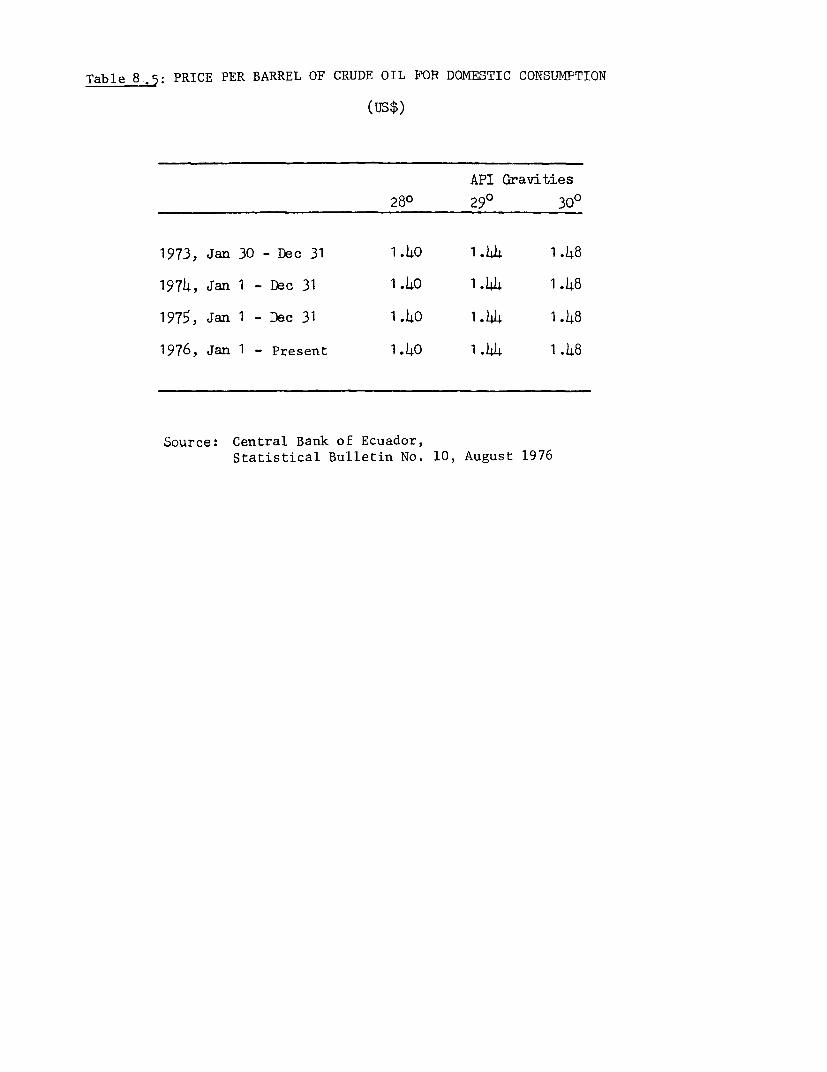
Table 8.95: PRICE PER BARREL OF CRUDE OIL FOR DOMESTIC CONSUMPTION
(us$)
API Gravities
280 290 300
1973, Jan 30 - Dec 31 1.4o 1.44 1.48
1974, Jan 1 - Dec 31 1.40 1.44 1.48
1975, Jan 1 - Dec 31 1.40 1.44 1.48
1976, Jan 1 - Present 1.40 1.44 1.48
Source: Central Bank of Ecuador,Statistical Bulletin No. 10, August 1976

Table 8.6 - PARTY MONTHS OF GEOLOGICAL AND GEOPHYSICAL ACTIVITY,
1967-1975
Year Surface Seismic Other TotalGeology Survey 1/
1967 16.00 26.50 0.2511 42.75
1968 14.25 30.50 2.751/+ 1.502/ 49.0
1969 14.0 34.0 4.01/+ 1.02/ 53.0
1970 11.2 57.6 0.53/ 69.3
1971 7.2 70.3 77.5
1972 2.2 63.7 65.9
1973 4.5 2.5 7.0
1974 6.0 0.0 6.0
1975 1.0 6.0 4.04Q/ 11.0
1 Includes air-magnotometer surveys.
2/ Air Photo
3/ Gravity
- Tppographic mapping
Source: Ministry of Natural Resources,Department of Hydrocarbons

Table 8.7 OIL CONTRACTS IN ECUADOR
Concession AreaOil Companies As of June 30, 1976 Province Date of Contract Decree No.
(hectares)
CEPE 1,601,000 Napo 6-8-74 666CEPE 41,860 Guayas 6-6-72 430Texaco-Gulf- CEPE 491,357 Napo 8-6-73 925Supco City Company- 211,980 Napo 10-23-73 11600. K. C. 94,979 Napo 10-19-73 116.CEPECA 17,613 Guayas 10-5-73 1i54INCASFALTO 17,000 Napo 4-22-75 12484Northwest Ecuador CIA 200,000 Guayas 4-30-75 330
YACIMIENTOS Petroliferos FiscalesArgentinos (YPF) 200,000 Pastaza 1-22-75 57
Total Concession Area 2,675,789
I/ Transferred from Cayman Company
Source: Ministry of Natural Resources, "Petroleum Statistics, First Semester 1976"

Table 8 8 ESTIMATION OF RECOVERABLE RESERVES
FROM CEPE-TEXACO-GULF FIELDS AS OF MAY 31, 1976
(millions of barrels)
CumulativeActual Reserves New Reserves Production /I Remaining Re-Not Structural Secondary Explored but Total until serves as ofField Developed Developed Total Interpretation Recovery Not Developed Total Reserves June 30, 1992 June 30, 1992
Aguarico 49,257 - 49,257 - 39,405 - 39,405 88,662
eAtacapi 2,005 2,029 4,034 17,186 13,793 30,979 35,013
Auca 95,482 84,804 180,286 77,788 37,879 - 115,667 295,953Coca 700 904 1,604 20,414 - - 20,414 22,018Cononaco 5,000 35,000 40,000 38,194 - 38,194 78,194Durano 1,858 7,350 9,208 5,534 - - 5,534 14,742Lago Agrio 191,178 - 191,178 - 13,383 - 13,383 204,561
Parahuacu 1,352 25,116 26,468 - 17,204 - 17,204 43,672Sacha 632,547 - 632,547 - 130,679 - 130,679 763,226Shushufindi 483,936 - 483,936 - 379,491 - 379,491 863,427
Yuca 4,431 108,047 112,478 127,468 142,462 - 269,930 382,408
Structures Not Developed - - - - - 375,000 375,000 375,000
TOTAL 1,467.746 2631?$0 1.730.996 286,584 774.296 3752000 1Q4358.77.9 L51. 8
/L Cumulative production is calculated on the basis of average production rate of 206,000 b/d in 1976, 235,000 b/d in 1977 and 250,000 b/d until June 30, 1992j
Source: Ministry of Natural Resources

Table 8-_. EXPORTS OF CRUDE PETROLEUM
BY COUNTRY OF DESTINATION, 1972 - 1976
1972 1/ 1973 1974 1975 1976 2/
(--------- Thousands of Barrels ------------)
Brazil .6 .2 - _Canada 3.8 1.3 2.0 - 0.2Mexico - .5 - _Netherlands Antilles - 3.8 0.4 -
Panama 3.1 11.2 10.8 11.3 5.9Puerto Rico 2.0 1.9 7.0 4.1 1.0Trinidad & Tobago 6.8 16.4 9.5 - 1.United States 6.0 18.9 16.5 19.9 9.1Curazao 0.2 6.4 2.0 0.3 2.2Chile 1.5 3.9 5.5 5.2 2.3Peru 0.9 6.4 6.0 11.5 6.4Colombia - - - - 1.3
TOTAL 2h.9 7039- 59.7 52.3 229.8
(- - - - - Percentage Distribution - - - - -
Brazil 2.h 0.3 - _Canada 15.3 1.8 3.3 - .7Mexico - 0.7 -7
Netherlands Antilles - 5.4 0.7 - _Panama 12.4 15.8 18.2 21.6 19.8Puerto Rico 8.0 2.7 11.8 7.9 3.4Trinidad & Tobago 27.3 23.2 16.2 - 4.6United States 24.2 26.6 27.8 38.1 30.5Curazao 0.8 9.0 3.4 0.5 7.4Chile 6.0 5.5 9.2 9.9 7.7Peru 3.6 9.0 9.4 22.0 21.5Colombia - - - - 4.4
TOTAL 100.0 100.0 100.0 100.0 100.0
1, Exports began in August.
2/ January to June only.
Source: Ministry of Natural Resources, Department of Hydrocarbons

Table 8.10: PETROLEUM PRODUCTION COSTS PER BARREL (FOR TAX PURPOSES)
Decree Period Cost (uS$)
1. Decree No. 707 July 29, 1972 July 29, 1972 0.45 -R.O. No. 116 August 4, 1972
2. Decree No. 1445 December 28, 1973 0.45R.O. No. 468 January 9, 1974
July 8, 1975
3. Decree No. 569 July 6, 1975 July 9, 1975 0.512R.O. No. 846 July 15, 1975
September 30, 1975
4. Decree No. 1056 December 17, 1975 October 1, 1975 0.50625R.O. No. 960 December 26, 1975
May 31, 1976
5. Decree No. 365 May 20, 1976 June 1, 1976 o.60R.O. No. 97 May 31, 1976
1/ For 1972 the cost of production has been established at US$0.35299per barrel by Acdo. No. 12520, May 8, 1976.
Source: Central Bank of Ecuador.

Table 8.11: PRIVATE AND PUBLIC INVESTMENT IN PETROLEUM, 1970 76
(millions of dollars)
e/1970 1971 1972 1973 1974 1975 1976 -
Texaco-Gulf l/ 53.54 88.37 42.25 17.34 82.94 14.51 17.04
Anglooriente 5.21 12.10 14.71 1.4o - - _
Cayman (Supco) 1.54 2.98 5.22 4.05 12.05 13.62 9.06
O.K.C. 2.38 0.72 0.93 2.32 0.94 - -
YPF - - - - - 1.59 1.57
North West Pipeline - - - - 3.11 12.24
Total Private Sector 62.68 104.17 63.12 25.10 95.93 32.83 39.91
Total Public Sector - - - 0.79 70.08 126.12 183.83
Total Investment in 62.68 104.17 63.12 25.89 166.01 158.95 223.69Petroleum, Natural Gasand Petrochemicals
- Until 1977, it is Texaco-Gulf. From 1977 it is only Texaco's shareof 37.5% in the CEPE-Texaco consortium.
Source: Ministry of Natural Resources, Department of Hydrocarbonsand CEPE. Figures for 1976 are mission estimates.
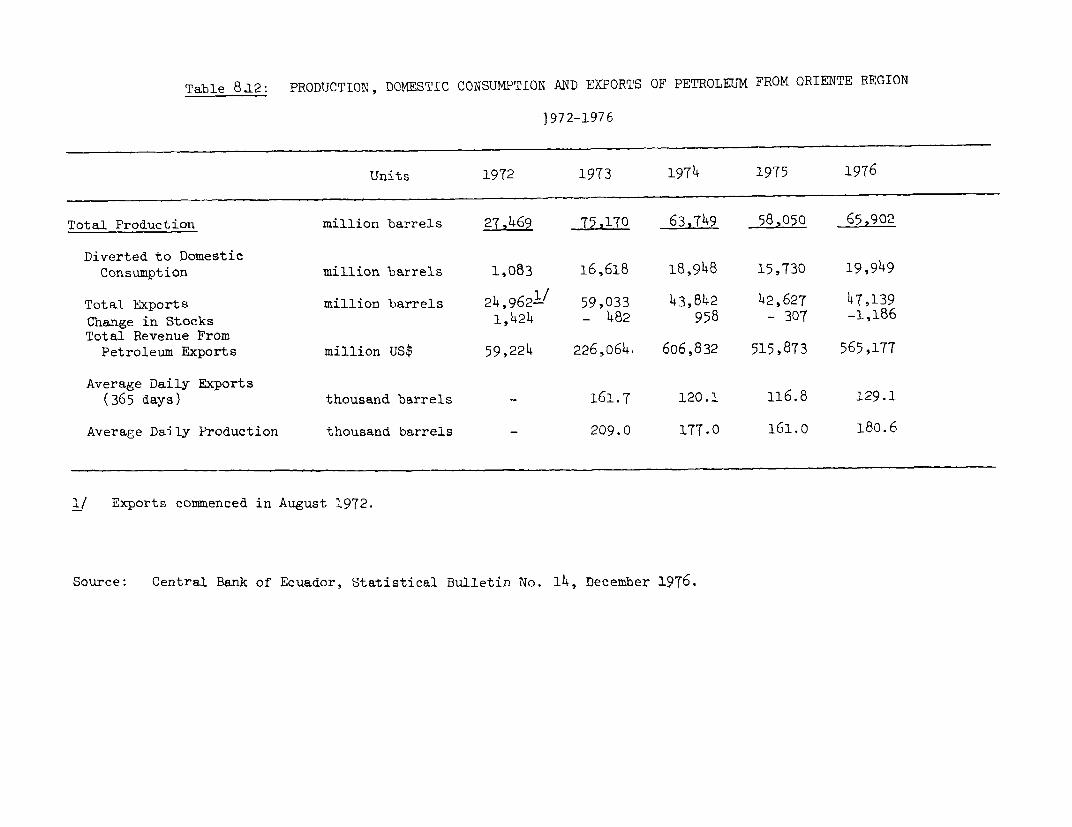
Table 8.12: PRODUCTION, DOMESTIC CONSUMPTION AND EXPORTS OF PETROLEUM FROM ORIENTE REGION
J972-1976
Units 1972 1973 1974 1975 1976
Total Production million barrels 27,469 75-,170 63,749 58,050 65,902
Diverted to DomesticConsumption million barrels 1,083 16,618 18,948 15,730 19,949
Total Exports million barrels 2 4,9 6 21/ 59,033 43,842 42,627 47,139Change in Stocks 1,424 - 482 958 - 307 -l,86Total Revenue From
Petroleum Exports million US$ 59,224 226,064, 606,832 515,873 565,177
Average Daily Exports(365 days) thousand barrels - 161.7 120.1 116.8 129.1
Average Daily Production thousand barrels - 209.0 177.0 161.0 180.6
1/ Exports commenced in August 1972.
Source: Central Bank of Ecuador, Statistical Bulletin No. 14, December 1976.

Table 9.1: PUBLIC EXPENDITURE IN EDUCATION, 1971-1975
(in thousands of sucres)
1971 1972 1973 1974 1975
TOTAL 1.188,464.5 1,656.715.1 2.489.305.4 3.081.410.9 3.971.940.8
I. Budget 1,157,964.5 1,532,839.3 2,289,256.1 2,616,902.0 3,3Z8,249.5-
Administration 3,890.5 4,526.7 53,327.6 60,177.2 65,984.4Educational Planning 1,942.6 2,456.1 3,883.3 4,520.0 -Pre-School & Primary Education 558,293.4 704,568.5 970,073.9 1,067,640.5 1,390,602.8Intermediate Education 467,672.4 632,605.8 878,177.8 942,162.4 1,305,041.0Higher Education 118,846.0 177,169.9 344,661.5 403,229.0 414,386.5Literacy & Adult Education 4,677.6 5,228.9 9,291.8 8,233.5 7,169.3Cultural Enrichment 2,642.0 6,283.4 20,616.9 78,907.4 17,397.9Quotas & Int'l Agreements - - 8,695.7 12,003.4 9,343.1Other - - 527.6 40,028.6 118,324.5
II. FONADE - - - 102,632.5 330,895.0
School Construction - - - 89,725.0 112,995.0Higher Education - - - - 210,400.0Cultural Development - - - 12,907.5 7,500.0
III. FONAPAR 30,500.0V/ 3/ 9 1, 90 0 .031 64,000.0 73,015.6 79,421.0
4/Higher Education - - 54,449.0 73,015.6 79,421.0-Others - 9,551.0 - -
IV. Petroleum Resources - 31,975.8-/ 136,049.3 288,860.8 233,375.3
Higher Education - 31,975.8 136,049.3 288,860.8 233.375.3
1/ Does not include expenses incurred in January 1976. 4/ Allowance based on the Ley de Participaciones.
2/ Since its creation in August 1971. 5/ Data subject to revision.
3/ Not itemized by level of education 6/ Since August 1972
Source: Department of Fiscal Studies -- National Office of the Budget

Table 9. 2 : EDUCATION RATIOS - COMPARISON OF SCHOOL
YEARS 1965-66 AND 1974-75
1965-66 1974-75
Population 5-14 years. 1,397,000 1,883,000Primary School Pupils 800,507 1,234,217
as percents of pop. 5-14 years. 57.3 65.5(% in public, govt. schools) (40.3) (48.6)(% in private, municipal schools) (17.0) (16.9)
Students Per TeacherPrimary Schools, Total 37.4 39.7
(Govt. Schools) (39.9) (41.5)(Other) (32.4) (35.2)
Secondary Schools, Total 12.7 16.2
Universities, Total 8.8 24.0(Govt. Universities) (8.8) (11.6)(Other) (8.8) (27.1)
Comparative Structure of EducationStudents (number of primary students = 100)Secondary Students 14.6 27.1University Students 1.9 9.3
Teachers (number of primary teachers = 100)Secondary teachers 43.1 66.5University teachers 8.2 15.3
Source: Ministry of Education.

Table9.3 : NUMBER OF TEACHERS AND PUPILS, BY EDUCATIONAL LEVEL
1965-66 to 1974-75
1965-66 1966-67 1967-68 1968-69 1969-70 1970-71 1971-72 1972-73 1973-74 1974-75
Primary Education
Teachers 21,429 22,118 23,673 24,426 25,679 26,625 27,474 28,510 29,732 31,114(Government) (14,088) (14,659) (15,512) (16,407) (17,568) (18,449) (18,902) (19,653) (20,940) (22,034)(Other) (7,341) (7,459) (8,161) (8,019) (8,111) (8,176) (8,572) (8,857) (8,792) (9,080)
Pupils 800,507 841,752 897,539 928,687 976,229 1,018,438 1.052,484 1,100,264 1,169,994 1,234,217(Government) (562,352) (602,871) (637,245) (66, 709) (704,955) (740,035) (767,107) (802,337) (870,240) (914,664)(Other) (238,155) (238,881) (260,294) (261,978) (271,274) (278,403) (285,377) (297,927) (299,754) (319,553)
Secondary Education
Teachers 9,230 10,395 11,433 12,434 14,109 15,699 17,419 18,498 19,612 20,677Pupils 117,268 134,307 151,202 173,614 194,183 216,727 239,581 267,925 299,876 334,465
University Education
Teachers 1,754 1,995 1,969 2,256 2,649 2,867 3,635 5,337 5,364 4,771(Government) (1,427) .. ,. ., .. .. .. (3,813)(other) (327) *- .. - *- . .. (958)
Pupils 15,395 16,047 19,600 22,637 31,921 38,857 51,321 68,528 98,168 114,389(Government) (12,526) .. , , . , .. .. (103,302)(Other) (2,869) ,, * * - -*- (11,087)
Source: Ministry of Education.

TablelO.1: PRODUCTION OF CEMENT AND STRUCTURAL STEEL (1965-1976)
(Thousands of kilos)
AND INDICES OF PRODUCTION (1970=100)
Cement Structural SteelThousands Thousandsof kilos Index of kilos Index
1965 297,053 66.0 - -
1966 310,502 69.0 2,289 9.0
1967 382,398 84.9 8,732 34.2
1968 434,027 96.4 13,079 51.3
1969 456,581 101.4 12,676 49.7
1970 450,266 100.0 25,508 100.0
1971 484,336 107.6 21,020 82.4
1972 523,002 116.2 30,879 121.1
1973 483,964 107.5 46,340 181.7
1974 582,743 129.4 50,435 197.7
1975 /_ 603,722 134.1 48,165 188.8
1976 /1 607,948 135.0 58,713 230.2
/1 Preliminary
Source: Central Bank of Ecuador

Table 10.2: INCENTIVE LEGISLATION - PRINCIPAL FEATURES - 1973 -
Special Category Category A Category B Registered
21 3/ 2/ 31 21 2/ 3/ 3/ 2/ 3/ 3/Existing 2/ Zone 1 Zone 2 Existing Zone 1 Zone 2 Existing Zone 1 Zone 2 Existing Zone 1 one 2
1. Tax exonerations 100% 1007% 1007. - 1007. 100% 100% 100%(except income tax 5 initial 10 initial 10 initial 5 initial 5 initial , 3 initial 3 initial - - -and sales tax) years years years years years years years
II. Exonerations of importcustoms for new 1007. 100% 1007. 1007. 100% 100% 1007. 1007. 1002 30% 50% 70%machinery, auxiliaryequipment and parts
III. Exoneraticns of 80% 90% 1007 up to up to up to In special 10% 20%import duties on 5 initial 5 initial 5 initial 657. 75% 85% cases up In special In special - -raw materials (not years; 707 years; 80% years; 90% to 40% cases, up cases, upproduced in the thereafter thereafter thereafter to 50% to 60%country),
IV- Exoneration of taxon transfers of 100% 100%/ 1007 1007 100% 100% 50% 75% _ -
real estate
V. Tax deduction fornew investment
(a) Fixed capital 507% 75% 1007. 507 75% 100% 50% 75% 1007. _ -
(b) New equity - 50% 100% - 50% 1007 - 50% 100% _ _
1/ Reflecting changes introduced in November 1973.2/ Benefits given prior to November 1973 in the Law of Industrial Development, Chapter V.3/ Zone I includes the provinces of Imbabura, Cotopaxi, Tungurabus, Chimborazo, Azuay, Esmeraldas, Manabi and El Oro;
Zone 2 includes Los Rios, Carchi, Bolivar, Cafar, Loja and the Oriente provinces.
Source: CENDES

Table 11.1 WEIGHTED CONSUMER PRICE INDEX FOR MEDIUM AND LOW INCOME FAMILIES, BY MAJOR CITIES
1970=100 /1
Index Annual Average (% change)Porto- Porto-
General Quito Guayaquil Cuenca viejo General Quito Guayaquil Cuenca viejo
1965 80.4 79.4 81.2 - - 4.28 3.25 5.05 - -1966 83.4 82.6 83.9 - - 3.73 4.03 3.33 - -1967 87.4 85.8 88.6 - - 4.80 3.87 5.60 - -1968 90.0 89.4 90.4 - - 2.97 4.20 2.03 - -1969 94.7 95.2 94.7 92.4 - 5.22 6.49 4.76 - -1970 100.0 100.0 100.0 100.0 100.0 5.60 5.04 5.60 8.23 -1971 109.4 108.4 109.8 113.2 108.8 9.40 8.40 9.80 13.20 8.801972 117.9 117.0 118.0 121.6 121.0 7.77 7.93 7.47 7.42 11.211973 132.4 132.1 131.7 133.9 143.3 12.30 12.91 11.61 10.12 18.431974 163.2 163.0 160.9 165.0 197.7 23.26 23.39 22.17 23.23 34.471975 186.9 188.0 182.6 190.7 228.6 14.52 15.34 13.49 15.58 15.63
1976 206.7 208.1 200.5 209.7 271.0 10.59 10.69 9.80 9.96 18.55
/l Of Quito, Guayaquil, Cuenca and PortoviejoOriginal base: Quito - 1965=100
Guayaquil - 1967=100Cuenca - Aug. '68 to July '69-100Portoviejo - Aug. '69 to July '70=100
Not available
Source: National Institute of Statistics, Institute of Economic Investigations and Statistics, Technical Universityof Manabi.
Computation; Division of Economic Studies, , Department of Economic Indicators, Central Bank of Ecuador.

Table 11.2 WEIGHTED CONSUMER PRICE INDEX FOR MEDIUM AND LOW INCOME FAMILIES, BY MAJOR GROUPS1970=100 /1
Index Annual Average (% change)Foods & Foods &
General Beverages Housing Clothing Misc. General Beverages Housing Clothing Misc.
1965 /2 80.4 77.3 85.8 81.3 81.9 4.28 4.74 4.37 2.13 3.801966 /2 83.4 81.1 88.2 84.6 85.4 3.73 4.91 2.79 4.05 4.271967 /2 87.4 86.3 89.9 84.3 90.9 4.80 6.41 1.92 -0.36 8.641968 /2 90.0 89.6 91.7 85.4 92.5 2.97 3.82 2.00 1.30 1.761969 /3 94.7 96.6 93.3 90.8 94.1 5.22 7.81 1.74 6.32 1.721970 100.0 100.0 100.0 100.0 100.0 5.60 3.51 7.18 10.13 6.261971 109.4 107.8 111.0 112.8 109.7 9.40 7.80 11.00 12.80 9.701972 117.9 119.0 118.2 120.3 113.5 7.77 10.38 6.48 6.64 3.461973 132.4 139.8 125.7 133.1 121.4 12.30 17.47 6.34 10.64 6.961974 163.2 184.4 141.6 161.3 136.2 23.26 31.90 12.65 21.19 12.191975 186.9 215.1 161.1 187.2 145.3 14.52 16.65 13.77 16.06 6.681976 206.7 236.4 180.8 208.8 159.6 10.59 9.90 12.23 11.54 9.84
/1 Of Quito, Guayaquil, Cuenca and PortoviejoOriginal base: Quito - 1965=100
Guayaquil - 1967=100Cuenca - Aug. '68-July '69=100Portoviejo - Aug. '69-July '70'100
/2 Calculated on the basis of Quito and Guayaquil.
/3 Calculated on the basis of Quito, Guayaquil and Cuenca.
Source:National Institute of Statistics, Institute of Economic Investigations and Statistics, Technical Universityof Manabi.
Computation: Division of Economic Studies, Department of Economic Indicators, Central Bank of Ecuador.