Current Economic Position and Prospects of Venezuela
278
Report No.1268b-VE Current Economic Position and Prospects of Venezuela In Three Volumes) VolumeIll: Employment Situation in Venezuela March 15, 1977 I atin Americaand the Caribbean Regional Office . g I fl 3 T r vr IFOR OFFICIAL USE ONLY t . r at Documentof the World Bank Thisdocument hasa restricteddistribution and maybe usedby recipients only in the performance of their official duties. Its contents maynot otherwise be disclosed without World Bank authorization. Public Disclosure Authorized Public Disclosure Authorized Public Disclosure Authorized Public Disclosure Authorized
-
Upload
khangminh22 -
Category
Documents
-
view
2 -
download
0
Transcript of Current Economic Position and Prospects of Venezuela

Report No. 1268b-VE
Current Economic Positionand Prospects of VenezuelaIn Three Volumes)
Volume Ill: Employment Situation in VenezuelaMarch 15, 1977
I atin America and the Caribbean Regional Office . g I fl 3 T r vr IFOR OFFICIAL USE ONLY t . r at
Document of the World Bank
This document has a restricted distribution and may be used by recipientsonly in the performance of their official duties. Its contents may nototherwise be disclosed without World Bank authorization.
Pub
lic D
iscl
osur
e A
utho
rized
Pub
lic D
iscl
osur
e A
utho
rized
Pub
lic D
iscl
osur
e A
utho
rized
Pub
lic D
iscl
osur
e A
utho
rized

CURRENCY EQUIVALENTS
General Rate: US$1 = Bs 4.285Bs 1 = US$0.2337
Petroleum Rate: US$1 = Bs 4.20Bs 1 - US$0.238
GOVERNMENT OF VENEZUELAFISCAL YEAR
January 1 to December 31

FOR OFFICIAL USE ONLY
This volume is based on the findings of a missionwhich visited Venezuela in the period April-June 1975.The mission was headed by Mr. Felipe Pazos (consul-tant) and composed of Messrs. Enrique Low and WolfgangWipplinger of the Bank and Messrs. Harold Goldstein,Ernesto Kritz and Richard Webb (consultants) andMr. Hugo Aleman of the OAS.
Tbi document has a resticled distribution and mm be wed by recipients only in the performanueof thir official dutie Its contents may not othwse be discloed without World Bank authocition.


TABLE OF CONTENTS
Page No.
SUMMARY AND CONCLUSIONS ......................................... 1-vi
INTRODUCTION ............................................. .. 1
CHAPTER I - EVOLUTION OF EMPLOYMENT AND EARNINGS. .. . 7
A. Trends in Population Growth. 7B. Trends of the Labor Force ........ ...................... 9C. Trends in Employment, 1961-1974. 11D. Trends in Productivity and Employment
by Sectors: 1961-1974...... . 13
(i) Agriculture... 13
(ii) Manufacturing ..... ......... 19
(iii) Construction. . . ..... 23
(iv) Utilities .... 25(v) Transport, Storage and Communications. 25(vi) Commerce and Finance . .27(vii) Services . 31
E. Evolution of Earnings ....................................... 33
(i) Wages and Salaries . . .34(ii) Proportion of workers earning
substandard incomes . . .37F. General Appraisal of the Evolution of Employment
and Earnings .... .... 39
CHAPTER II - THE EMPLOYMENT SITUATION IN 1974 . . .42
A. The Working Population ....... 42B. Structure of Employment and the demand for Labor .45C. Unemployment. .. 50
Composition of the Unemployed. 57Long-term Unemployment . ... 60
D. Hidden Unemployment and Underemployment . . .62Hidden Unemployment ..... 62Underemployment. ....... ... 63
Part-time Work.... 65Low Income ..... 65Employees ................ 70
Self-employed . ................ ......... 70

TABLE OF CONTENTS (Cont'd)
Page No.
E. Employment and Poverty In the Metropolitan Area ........... .. 72Income Distribution In the Metropolitan Area ......... .. 78Unemployment Rates by Income Levels .................... 79Poverty ................................................ 79
Per Capita Income ...... ............................... * 83
Type of Employment ..................................... 86
F. The Informal Sector ....... ................................. 87Size and Composition of the Informal Sector ........ -o 88Characteristics of Informal Sector Workers ............. 89Summary .... o .......................................... 90
CHAPTER III - NATURE OF THE PROBLEM, PROSPECT AND POLICIES ....... 92
Manpower Shortages in the midst of Unemploymentand Low Productive Employment ..... ....................... 92
Nature of Venezuela's Current Unemployment . ................. 92Population and Labor Force Projections ...................... 95Future Educational Level of the Labor Force ................ * 97Employment Prospects ........................................ 98Government Programs .. ................... o ................... 99Limited Applicability of Standard Employment Policies ....... 101Policy Recommendations .... . ... ................. ......... ... 102
Frictional Unemployment ...... ................... ........... . 102
Structural Unemployment ...... ............................... 103Low Productive Employment ................................... 105
APPENDIX
I. Statistical Tables ............................. . i-v, 1-116
II. Evaluation of the Statistics on theEmployment Situation .................... 1General Comments ................... 1................ IThe Household Survey ................... 1o ............ IEarnings Statistics .......... o............... 3Recommendations for the Household Survey ............ 41971 Census of Population ........................... 7Employment and Earnings Statistics ofthe Ministry of Labor ............................. 8
Recommendations for Ministry of Labor Statistics .... 9Future Manpower Requirements andInformation for Education ................. ......... 10
Note A: Evaluation of the Data on Employmentand Underemployment ..... ................. 12
Note B: Evaluation of the Data on the Accuracyof Incomes of Workers in the HouseholdSurvey ... .. ....... .. ...................... 19

TABLE OF CONTENTS (Cont'd)
APPENDIX
Page No.
Note C: Concerning the Decline of ParticipationRates in the Labor Force between theCensus of 1961 and that of 1971 .... ...... 22
Note D: The Adjustment of 1971 Census Data onEmployment by Branches of Industryfor Venezuela ............................ 30


SUMMARY AND CONCLUSIONS
Close Relationships between Unemployment and Low Productive Employment
i. The present report examines the evolution of employment in Venezuelain recent years, and its situation in the second half of 1974, in order toobtain an overall picture of the structure and operation of the country'slabor market that may serve as a base to draw guidelines for an employmentpolicy. In its study of manpower underutilization in the country, the reportfocuses as much attention on low productive employment as on unemployment,and makes a new attempt to solve the old problem of identifying and measuringunderemployment, although slightly changing its definition and giving itanother name.
ii. In fully industrialized nations, unemployment is the basic formof maladjustment between labor supply and demand, and a rather well definedconcept that makes it possible to measure its level with reasonable precision;but in partly industrialized countries there are other, and more widespread,forms of labor underutilization, that may be jointly studied, as done in thisreport, under the general category of low productive employment. Low produc-tive employment overlaps with unemployment and detracts precision from itsmeasurement. Unemployed and low productive workers are parallel sources ofmanpower supply for the modern sector of the economy, that may draw from oneor the other to fill productive jobs, and, being pools with a common outlet,their levels are interdependent. Furthermore, in the low income strata ofthe population they cannot be distinguished; among the poor, unemployedworkers take occasional odd jobs such as washing cars, painting walls, mowinglawns or pedding merchandise in the streets, making their classification asemployed or unemployed a purely definitional question.
Open Unemployment
iii. In the second half of 1974, there were in Venezuela about 200,000unemployed workers outside agriculture and around 20,000 in rural areas, fora total of 220,000, equivalent to 6.3% of the national labor force. Such arate is lower than that prevailing in the United States and Canada, and alsolower than the rate registered in most developing countries in recent years,but substantially higher than the level of unemployment in industrial countriesin times of economic expansion.
iv. As in most countries, unemployment affects youth very strongly.Among men and women below 25 years of age, the unemployment rate was 12% andabove that age it was 4.5%. In parallel fashion, the rate among family depend-ents was 11.5% and only 3.1% among household heads. As in other developingcountries, the rate increases with the educational level up to secondary
- ii -
education and then drops sharply for college graduates, among whom it wasonly 2.3%.
v. About one-third of the unemDloved had been in that condition forless than 5 weeks, another third between 5 and 15 weeks and a final third,more than 15 weeks. Of this latter group, about one half have been unemployedfor more than 27 weeks.
vi. Workers with less than 5 weeks unemployment are those in transitionfrom one job to another, or new entrants to the labor force seeking theirfirst job. This type of transitional unemployment, known as frictionalunemployment, is low in countries with little labor turnover, as Japan; butin the Unted States and Canada it is estimated to amount to about 2.0% ofthe labor force, which is more or less the magnitude of short-term unemploy-ment in Venezuela.
vii. A large part of the unemployed belong to extremely poor familieswhich, in turn, are extremely poor owing to the high rate of unemployment orintermittent low productive employment among their members. In Caracas, 25%of the unemployed are members of families with incomes below Bs 500 per month.But a close look at the figures shows that unemployed workers in this grouphave characteristics very different from those in other groups. In familieswith incomes below Bs 500 per month -- the direly poor families -- the un-ployment rate is 34.8%, seven times the average in all families excludingthis group; and, contrary to the general pattern, the rate among householdheads is higher than among other members of the family, instead of beingmany times lower. These differences are explained by the special workingconditions prevailing at very low income levels. As said before, amongstthe direly poor families, most workers lack a permanent job and earn theirliving in intermittent activities. The unemployed among them are, therefore,occasional workers that have not done any odd jobs during the week of theinterview, or ambulant vendors that have not sold anything, or so littlethat they did not consider that those meager sales should be declared aswork done during the week. The unemployed in this group can be classifiedas such or as partially and precariously employed workers depending on thedefinition that is used. They are members of the lowest stratum of lowproductive workers, and are in the borderline between employment and un-employment. If the distribution of the different types of unemployedworkers in the whole of Venezuela was the same as in Caracas, one-fourthof the nation's unemployed, equivalent to 1.6% of the labor force, would beof this special type.
Low Productive Urban Employment
viii. In the second half of 1974, there were in Venezuela 285,000 employeesoutside agriculture receiving wage or salary below Bs 100 per week, and 191,000self-employed, also outside agriculture, earning an income below Bs 500 per

- iii -
month. Adding the two, there are 476,000 workers, or 19.6% of the urban laborforce, that may be considered as low productive workers. 1/
ix. Low productive employment affects almost two and a half as manyworkers as unemployment, and three times as many family heads. In the secondhalf of 1974, about 160,000 family heads held nonagricultural jobs payingless than a subsistence income, whereas only 54,000 household heads wereopenly unemployed.
x. Practically all, if not all, low productive employees work in smallestablishments, employing five workers or less, because large establishmentsgenerally operate with modern methods and appropriate equipment, and cannotafford to pay substandard wages and salaries. Low productive employeeswork in what is now usualy called the informal sector, i.e. that part of theeconomy made up of small firms, self-employed persons (except those withuniversity education) and domestic servants.
xi. Low earning self-employed workers also operate in the informalsector or, more precisely, in the low strata of the informal sector, ascobblers with few customers or ambulant vendors. As a rule, self-employed lowearners are much older than low earning employees, and there are many morefamily heads among them. In the second half of 1974, 52% of employees withlow incomes were younger than 25 years, but only 14% of the low earning self-employed were below that age. Among low productive employees, 19% were familyheads, but among unproductive self-employed, 54% were the main supporters oftheir families.
xii. In 1971, about 23% of employees earned less than Bs 82 per week,and in the first half of 1974 the proportion of employees earning less thanBs 100 (roughly the equivalent of Bs 82 in 1971) was also 23%; but suchfigure dropped sharply to 15.5% in the second half of 1974, apparently asa direct effect of the decrees raising wages and salaries and establishinga lower limit to their level. But low earning self-employed do not seemto have improved their situation. In 1971, about 28% of the self-employedearned less than Bs 410 per month; in the first half of 1974, 34% of themearned less than Bs 500, showing a deteriorated situation; and in the secondhalf of 1974, the proportion of low earners had diminished to 29%, but thismeant only a recovery of the ground lost of the previous two and a half years.
1/ The division line between "productive" and "low productive" jobs is ofcourse arbitrary. The idea has been to trace the line somewhere belowone half the country's average labor earnings, and to select a figurethat was statistically workable. The levels selected met all theseconditions: Bs 100 per week is about 35% of the average labor earningsin Caracas and is, at the same time, the limit of an income group used inthe Household Surveys to classify employees earnings; and Bs 500 permonth is about 40% of Caracas' average labor earnings, and the upperlimit of the lowest income group of the self-employed. Last, but notleast, both levels are only slightly above the minimum legal wage estab-lished by the Government in 1974.

- iv -
The low earnings and precarious situation of substandard self-employedworkers is one of the most important employment problems of Venezuela, andone of the most complex and difficult to solve.
Manpower Shortages
xiii. Simultaneously with the existence of unemployed and badly employedworkers, there is at present in Venezuela an acute shortage of managementpersonnel, technicians and skilled workers of all types -- from engineersand accountants to lathe operators and stenographers -- and a relativelytight supply of agricultural workers, which are very scarce in some areas.
xiv. The coexistence of surpluses of unskilled workers and deficits ofqualified personnel is a common occurrence in developing countries, whichtextbooks consider as an almost necessary pattern of the industrializationprocess; but the current situation in Venezuela presents two characteristicsthat deserve examination, which are: (a) the wide spectrum and acuteness ofthe shortages; and (b) the existence of unemployment among the educatedyouth in spite of such shortages. The first characteristic is a logicalconsequence of the great speed and strength of Venezuela's current economicexpansion; but the amplitude and intensity of the unsatisfied demand showthat before the current expansion accelerated its pace, the unused reservesof qualified manpower were not very large and, hence, that in precedingyears the modern sector of the economy had been absorbing it at a fairlysatisfactory rate.
xv. The existence of unemployment among the educated youth in thesecond half of 1974 could be due to market imperfections, but only to alimited extent, because the demand for qualified workers has been widelyadvertised. Current youth unemployment rather reflects a lack of coincidencebetween the skills demanded and those possessed by the unemployed youngsters;and since the spectrum of demand is very wide, it may also indicate thatpart of the unsuccessful job seekers are not well prepared in the fieldsin which they received training.
xvi. The relatively tight labor supply in rural areas and its scarcityin some regions, in times when there are surpluses of unused and badly usedmanpower in the cities, seems to show that the direction of rural urbanmigration is not reversible, and also that agriculture has not been ableto raise workers' earnings to the level necessary to offset the lure ofcities and stop the one-way flow. Even when they have employment at home,young rural workers are willing to give it up and take the risk of becomingunemployed or badly employed urban workers, attracted by the hope of obtain-ing a well paid job in the urban modern sector. Such hope has probablyrisen considerably in recent months with the acceleration of the country'seconomic expansion.
Nature of Venezuela's current Unemployment
xvii. The characteristics of unemployed and low productive workers,described in previous pages, and the labor shortages that have just been

v
examined, indicate that current unemployment in Venezuela originates in severaldifferent factors and circumstances, the most important of which seems to bethe following: (a) employment conditions associated with extreme poverty;(b) labor turnover (frictional unemployment); (c) lack of coincidence betweenskills demanded and supplied; and (d) lack of coincidence between wages paidin agriculture and those that might be desired by urban unemployed to returnto rural areas.
xviii. The first group is not usually classified as a special type of un-employment but in Venezuela it has so many special characteristics, and repres-ents such a large proportion of the total, that it has a well defined identity.As said before, most of this unemployment does not reflect the loss of a stablejob, but a temporary period of inactivity between intermittent occasional jobs,which is the type of work prevailing at extremely low income levels. At theselevels, workers experience great difficulties in finding stable jobs. Theyare handicapped by lack of skills, lack of contacts and even lack of steadyworking habits. And to make a bad situation worse, they are severely limitedin their search and access to jobs by the obligation of presenting police andhealth certificates, which they often cannot obtain. Minor police infractionssharply constrain the job opportunities of many youths (and divert them toillegal activity); while others, with no police record, fail to obtain therequired police and health certificates owing to ignorance, lack of contactsor bad luck with bureaucratic complications. Furthermore, at these incomelevels there are many female heads of family. These women have to seek employ-ment to maintain themselves and their children, but are severely constrainedby the time demands of the household, which prevent them from accepting workfar off from where they live or attending their jobs regularly, even whenthey are located in the vicinity. Measures to reduce this type of unemploymentare obviously very close to those designed to combat urban poverty and theireffects will be entirely parallel.
xix. Frictional unemployment is an almost necessary consequence of laborturnover; workers leaving a job, voluntarily or involuntarily, do not alwaysfind another one immediately, nor do entrants to the labor force find theirfirst job the day they begin to seek it. The rate of frictional unemploymentdepends on: (a) the volume of labor turnover; and (b) the organization ofthe labor market, i.e. the facility of communication between demanders andsuppliers of jobs. In countries where labor turnover is very low, as in Japan,frictional unemployment is practically inexistent, but in those, as in theUnited States and Canada, where workers change jobs frequently, frictionalunemployment rarely descends below 2%. Labor turnover in Venezuela is probablymuch nearer the levels of the United States and Canada than those of Japan and,hence, frictional unemployment must have a relatively high floor, but it seemsthat it could be substantially reduced, particularly among youth, if theorganization of the market is improved. In chapter III of this report, themission makes recommendations to that end.
xx. Unemployment originating in the insufficient preparation of theunemployed to occupy vacant positions has only one logical solution: educa-tion. Unfortunately, education takes time to produce effects. The Venezuelan

- vi -
Government is fully aware of the problem, as well as of its prospective aggra-vation, and has launched crash education programs, both at home and abroad,that the mission find highly commendable.
xxi. Unemployment originating in the unwillingness of the urban employed(and the urban low productive workers) to return to the countryside to fillthe unsatisfied demand for farmhands, shows that agriculture is not payinghigh enough wages to compensate for the disutility of working, and living,in rural areas. The cure for this kind of unemployment would obviously beto raise agriculture's productivity, and/or its terms of trade with industry,in order to enable it to pay much higher wages; but such type of cure requiresthe solution of the current complex problems of Venezuela's agriculture, whichthe mission has not studied nor is it supposed to study, except in its employ-ment implications. There is, however, an aspect of the problem -- agriculturalmechanization -- which falls entirely within the mission's terms of reference,and on this aspect of the problem, it is most willing to give its advice:Venezuela should not hamper agricultural mechanization in the fear of aggravat-ing unemployment, but should foster it as much and as rapidly as it can beefficiently applied. The number of workers displaced by increased mechaniza-tion will not be larger than the number that would have migrated to the cities,in any case, attracted by the hope of higher incomes. By raising agriculturalproductivity and the earning level of rural workers, mechanization may evenslow down rural-urban migration; but if not, it will contribute to improve thestandards of living in agriculture which, in average, are the lowest in thecountry.
Prospects
xxii. According to mission estimates, based on those of the General Officeof Statistics, the labor force will accelerate its annual rate of growth from4.0% in 1971-74 to 4.9% in 1974-1986. To absorb such growth, the economy willhave to expand at 8% per year, assuming that productivity will not increaseat a rate faster than 3.0%.
xxiii. It seems reasonable to expect that in the immediate years aheadVenezuela will attain a rate of growth around the above mentioned level, orperhaps higher; and it is also reasonable to believe that increases inproductivity will not hamper the expansion of employment. The first expec-tation does not need to be explained, and the second is based on the followingreasons: First, Venezuela produces with modern equipment and modern techniquesand is not, therefore, at a stage in which its economy may experience greatleaps in productivity. Second, the country will probably accelerate thedevelopment, already well started, of capital goods and durable consumer goodsindustries which, contrary to a widespread belief, are labor intensive. Third,the high levels of income and consumption of the country's upper income groupswill probably continue to promote a rapid expansion of modern sector services,that employ large amounts of personnel. Fourth, public and private construc-tion will continue to increase at a very fast rate, and will absorb progres-sively larger amounts of employment. And fifth, in the years to come thepublic sector's share in the total economy is expected to grow, and suchincrease will probably raise the economy's coefficient of labor absorption.

- vii -
xxiv. If past trends are maintained, the expansion of employment in the
modern sector will be somewhat faster than in the informal sector or, atleast not slower; and low productivity employment will decrease in relativeterms or, at least, will not increase. It should not be expected, therefore,that fast economic growth will rapidly upgrade the productivity of low earningjobs or make possible the rapid transfer of its holders to modern sector jobs.It should not be expected, either, that rapid economic growth will reducestructural and frictional unemployment. This will require Government action.The basic guidelines of such action could be the following:
a. Intensification of the programs to raise income levels,housing standards, health standards and general educationof the urban poor, and to facilitate their training inspecific skills, in order to reduce their present handicapsin seeking and obtaining stable jobs in the modern sector.
b. Intensification of programs to prepare management personnel,technicians and skilled workers of all types, in order toreduce unemployment and low producing employment, directlyor indirectly, by filling the present vacancies and coveringthe future demand for qualified personnel.
c. Improvement of employment services and creation of placementservices for youths, in order to reduce frictional unemploy-ment, especially among new entrants to the labor force; and
d. Intensification of policies to raise production and produc-tivity in agriculture, including the promotion of a fasterpace mechanization, in order to enable agriculture to payhigher wages and slow down migration to cities.
None of these policies will produce instantaneous effects, but their coordi-nated and steady application, in times of rapid economic expansion, shouldgive productive employment to a larger number of unemployed and low productiveworkers each year, fully integrating them to Venezuelan society and enablingthem to contribute effectively to the economic and social development of thecountry.


INTRODUCTION
Origin and purposes of the report
1. Last December, Venezuela requested technical advice on employmentpolicy from the World Bank and agreed on the need for a prior study thatwould serve as a base for the formulation and discussion of such advice.To this effect, the Bank organized a group of external consultants andmembers of its own staff, and assigned them the following tasks:
a. To evaluate Venezuela's employment statistics;
b. To study the magnitude and nature of labor underutilizationin the country, including both unemployment and underemploy-ment in its several forms;
c. To examine the evolution of employment in recent years,analyzing the principal factors influencing labor's supplyand demand;
d. To examine existing programs to accelerate the training oftechnicians and skilled workers; and
e. To analyze the employment effects of current and announceddevelopment policies and programs.
2. Since the Government of Venezuela was in the course of formulatingthe country's economic and financial policies, and could not wait indefinitelyfor the requested study, the group was given a very short span of time thatdid not permit it to examine thoroughly all the points included in the aboveterms of reference. The group, thus, concentrated its efforts on the firstthree items, which it considered to be those of highest priority, and wasunable to devote enough attention to the other two. Furthermore, it couldnot examine the agricultural aspects of the problems studied and had to relyon the findings of a recent report on Venezuela's agriculture prepared bythe Latin American Institute of Economic and Social Planning. Nevertheless,the group hopes that its work may contribute to a better understanding ofVenezuela's employment situation, and serve as a base for further studiesby Venezuelan economists, sociologists and statisticians.
Composition of the group
3. The study group was formed by the following members: Felipe Pazos,Economic Consultant, Caracas, who served as coordinator; Harold Goldstein,Economic Consultant, Washington, D.C.; Hugo Aleman, Organization of AmericanStates, Mexican Office, Mexico, D.F.; Ernesto Kritz, Economic Consultant,

Buenos Aires; Eduardo Troncoso, Employment Program for Latin America andthe Caribbean, (PREALC), Venezuelan Office, Caracas; Richard Webb, PrincetonUniversity, Princeton; Enrique Low, Economist, World Bank, Washington, D.C.;and Wolfgang Wipplinger, Economist, World Bank, Washington, D.C..
4. The group worked jointly in Caracas from April 18 to May 16, 1975and several of its members stayed in the city for a longer time and madefurther visits during the following weeks. 1/ July 14-18, 1975, the groupmet in Washington to prepare the present report.
Cooperation received from Venezuelan officials and scholars
5. The group is deeply grateful to Drs. Helly Tineo, Director Generalof the President's Office of Coordination and Planning (CORDIPLAN) and NestorHerrera, Director General of the Department of Statistics and National Censuses,for having placed at their disposal the full facilities of their departmentsand given them their personal advice. In similar fashion, the group wishes tothank Drs. Nelson Ramirez, Secretary of the Employment Policy Commission, andZaida de Kepets, of the same Commission, for their cooperation in acting asliaison officers with the Government and, in fact, as members of the group;and expresses its deep appreciation for the collaboration received fromDr. Luis Jose Montero, Julio Paez, Pedro Isea, Gloria Vila and CristobalBonnin, and Messrs. Nestor Ramirez, Emigdio Marin and John Hernandez, of theDepartment of Statistics and National Censuses, without whose help and advicethe group would not have been able to perform its work. The group alsoreceived valuable cooperation from Drs. Max Contasti and Evencio Mosquera,as well as Lic. Jose Castro, from CORDIPLAN, and Drs. Antonio Fernandez,Modesto Freites, Lourdes de Ferran, Romano Suprani and Asdrubal Grilletfrom the Banco Central de Venezuela.
6. Members of the group are thankful to the numerous officials theyvisited, whose names appear in the list of interviews, and want to registertheir debt to Drs. Carlos Guzman Roca and Michael Bamberger, of the Centrode Estudios Sociales, and to Profs. Hector Valecillors T., of the UniversidadCentral de Venezuela, and Chi-yi Chen, of the Universidad Catolica AndresBello, for the information and orientation derived from their papers onthe subject.
Evaluation of data
Evaluation of the Available Information of Employment
7. The mission devoted much of its time to the study of the statis-tical deficiencies which induced the General Office of Statistics and National
1/ In addition to their stay in Caracas during the group's joint field work,the following members made further visits to Venezuela; Harold Goldstein,June 24-27; Ernesto Kritz, June 21-23 and July 6-13; Richard Webb, June5-23; and Enrique Low, June 18-July 3. Both Messrs. Troncoso and Pazoslive in Venezuela.

-3-
Censuses in 1972 to suspend publication of the Household Survey figuresand subsequently to introduce corrections in the sampling methods, inconsultation with experts from other agencies and from abroad. The missionalso studied the differences registered in the 1961 and 1971 Censuses betweenthe participation rates of the labor force in both years which have beena source of concern to Venezuelan economists and served as a basis of varioushypotheses about hidden unemployment.
8. In reviewing the data for Venezuela, the mission notes thatemployment statistics are usually more accurate than statistics on unemploy-ment or labor force participation, for two principal reasons. The firstis that whether a person was employed in a particular period of time isusually easy to establish on the basis of objective facts, while if he wasnot working the determination of whether he should be classified as un-employed or not economically active depends on subjective information asto desire or intentions. The degree of subjectivity is reduced somewhat bybasing the classifiction on objective facts such as whether he was actuallylooking for work or took any overt steps to find work (as is now done in theHousehold Survey in Venezuela); but the seriousness and intensity with whichhe was looking for work, or whether he refused a job offered or failed topursue a job opportunity for "adequate" or "inadequate" reasons are stillnot measured by the surveys upon which we depend for statistics on employ-ment and unemployment. 1/
9. The second reason for the greater accuracy of statistics on employ-ment is that employment can be measured by completely independent surveys --through interviews in households and through reports by establishments --and the results compared, making it possible to identify and correct grosserrors in either or both of the surveys. One of the steps the mission tookto evaluate the accuracy of the employment statistics of Venezuela was tomake such comparisons.
10. The mission found that the general design and methods used inVenezuela to measure employment and unemployment through the HouseholdSurvey are those approved by international statistical agencies. The missionagrees entirely with the diagnosis made by Venezuelan technical experts inconsultation with Dr. Benjamin Tepping of the Bureau of the Census in theUnited States. Their conclusions pointed to the deficiency in the samplingmethods used in 1971 in the Household Survey and made recommendations tocorrect them. The mission considers as appropriate the changes made between1972 and 1974 to correct these deficiencies. The mission feels that thesurveys of the Caracas Metropolitan Areas number XI and XII, and the NationalSurvey's numbers XIX and XX, corresponding to the first and second halves of1974, have been executed with technically improved methods and adequatelyreflect the real situation as to employment and unemployment within the margin
1/ Julius Shiskin and Robert Stein, "Problems in Measuring Unemployment",Monthly Labor Review, August, 1975, pp. 3-10.

-4-
of error to be expected in sampling surveys. The mission strongly recommendscontinuation of the improvements in the Survey that have already been begun(See Annex B).
11. As can be seen in Annex B, the mission considers that the drop inthe male participation rate between the 1961 and 1971 Censuses can be explained,to a large extent, by the increase in school registrations and by the greaterprecision of the questionnaire used in the 1971 Census. It is still possiblethat some small understatement of unemployment and labor force participationis reflected in the 1971 Census.
12. Due to the methodological deficiencies in the Household Surveystaken from 1967 to 1973, the results are not comparable with those of the1974 Survey and should be used with much care in analyzing the trends inemployment between 1961, 1971 and 1974. The results of the 1961 and 1971Censuses are not strictly comparable, nor are the two censuses with the House-hold Survey of 1974, so that the figures must be interpreted with some carein analyzing the trends in employment and unemployment. Nevertheless, therapid rate of growth in employment from 1971 to 1974 is confirmed by independ-ent sources and appears to be substantially correct.
Attention Given to Low Productive Employment
13. In its examination of Venezuela's employment problems, the grouphas focused as much attention on underutilized labor as on unemployment,and has made a new attempt to solve the old riddle of how to identify andmeasure underemployment.
14. In fully industrialized nations, unemployment is the basic formof maladjustment between labor supply and demand, and a rather well definedconcept that makes it possible to measure its level with reasonable precision.But in partly industrialized countries there are other, and more widespread,forms of labor underutilization that overlap with unemployment and detractprecision from its measurement. These other forms of underutilized andbadly paid labor are parallel sources of manpower supply for the modernsector of the economy, that may draw from them or from unemployment to fillproductive jobs. They are pools with a common outlet and their levels areclosely interdependent. Furthermore, in the low income strata of the popula-tion they cannot be distinguished; among the poor, unemployed workers takeoccasional odd jobs such as washing cars, painting walls, mowing lawns orpeddling merchandise in the streets, making their classification as employedor unemployed a purely definitional question.
15. The fact that unemployment is not the only, or even the princi-pal, form of labor underutilization in agricultural and semi-industrialcountries, has been well known since underdevelopment became a major preoccu-pation of economists during the final years of the Second World War. Butsuch knowledge has not been fully applied owing to the difficulty of measuringunderemployment. In general, workers are considered to be underemployed ifthey: (a) involuntarily work less than the normal number of hours per week;

-5-
(b) attend their place of employment every day for a full working day but
effectively work a fraction of the time; (c) are employed at less productiveactivities than they are capable of realizing; or (d) perform work which ifeliminated would not reduce the social product. With the exception of thefirst, none of these forms of underemployment are easy to measure statistically,even though methods have been devised to do it, such as the one recentlytried in the Dominican Republic. 1/ The difficulties in directly measuringunderemployment could be bypassed by measuring it indirectly. Since acutecases of underemployment are characterized by very low productivity andminimal earnings, underemployed workers could be defined as those receiving anincome below a certain fraction of the average labor earnings in the countryor, alternatively, below the minimum legal wage established by the Government.This approach to measuring underemployment is recommended by Turnham 2/ andhas very practical advantages.
16. The income method may be objected to on the grounds that it mergesthe concepts of underemployment and underequipment that are different, andshould be kept separate. The objection has merit from a conceptual, but notfrom a pragmatic point of view. For the purposes of social policy, the jointclassification of workers receiving low incomes because they are not fullyusing their time, energy and ability, and those working hard but earning littleowing to their obsolete equipment, does not represent any shortcoming, becausewhat interests social policy is the substandard incomes they receive. And forthe purposes of employment theory and policy, grouping together the two cate-gories is very useful because it permits measuring the reserves of manpowerthat compete with the unemployed, and with the new entrants to the laborforce, for the new jobs that are created in the modern sector. As far as theyearn substandard incomes, both underutilized and underequipped workers arepotential suppliers of manpower to the modern sector and, thus, importantobstacles to the reduction of unemployment.
17. Given the fact that the term underemployment has been used for along time to mean underutilization of human energy and talent without refer-ence to the instruments with which they are applied, it may be clearer to useanother term to denote the concept of low productive and badly paid work thatoriginates either in the deficient utilization of human capacity or in theinadequacy of the equipment used or in the low yield of the land tilled. Suchterm could simply be "low productive employment".
1/ Programa Mundial del Empleo, Generacion de Empleo Productivo y CrecimientoEconomico, El caso de la Republica Dominicana, Oficina Internacional delTrabajo, Ginebra, 1975.
2/ David Turnham, The Employment Problem in Less Developed Countries, OECD,Paris, 1971.
-6-
Contents
18. This report has three chapters: Chapter I describes the evolutionof employment and earnings in the light of the recent historical experience,the trends of the economy and the changes of productivity; Chapter II eval-uates the employment situation in 1974, and studies poverty in the metropolitanareas and its link to labor markets; Chapter III explains the nature of theproblems of employment and unemployment, deals with the important policyissues and makes some recommendations. Two Appendices are added to supportthe main conclusions: Appendix I contains statistical tables; Appendix IIevaluates these and recommends means for their improvement.

- 7 -
CHAPTER I
EVOLUTION OF EMPLOYMENT AND EARNINGS
19. In the last thirteen years, employment in Venezuela seems to havegrown more rapidly than the labor force. Between 1961 and 1974, employmentincreased at an annual rate of about 3.7%, while unemployment declined frommore than 10.0% to 6.3%. Employment in the modern sector of the economy seemsto have grown at about the same rate as total employment and real labor earn-ings are estimated to have increased at about 2.4% per year. However, un-employment among the youth remains high and a large part of the labor forceworks in low productive jobs that yield an income below the level correspond-ing to the legal minimum wage. The present chapter will be divided into fivesections dealing with the evolution of (a) population; (b) labor supply;(c) overall employment; (d) productivity and employment by sectors; and(e) labor income. To limit the chapter's length, some material has beensegregated from the text and incorporated in Appendix III.
A. Trends in Population Growth
20. The annual rate of population growth in Venezuela stepped up fromless than 2.0% in the 1930s to 3.0% in the 1940s and 4.0% in the 1950s,having declined since then to 3.4% in the 1960s and 3.1% in the early 70s.Three factors have brought about this evolution. First, a rapid decline inthe rate of mortality, as fast as any other in Latin America, from 17.8 perthousand in the 1930s to 7.3 per thousand in the middle 1960s and 6.6 perthousand at present. Second, a rise in the birth rate from 30.7 per thousandin 1930 to 45.8 in 1950, and then a gradual decline to 38.4 in 1970 and 37.6in 1974, mostly as an effect of the urbanization and industrialization process,but reinforced by the work of family planning services. 1/ Third, the ebbsand tides of immigration, both legal and illegal, mainly from Europe andneighbor countries. Census figures do not reflect illegal immigrants, whodeclare themselves to be natives, but even restricting the analysis to censusdata, the importance of immigration becomes evident. In 1941, 1.2% of the popu-lation was composed of foreigners. In 1971 the share of foreigners hadincreased to 4.4%.
21. Europeans are the largest group of foreign migrants appearing inthe census data, because a large part of the immigrants from Colombia and theCaribbean are illegal. The official figures are therefore incomplete butthe real volume of immigration is difficult to estimate because illegalimmigrants are obviously not registered when they enter the country; nor arethey classified as foreigners in subsequent censuses, in which they claimVenezuelan birth. In order to make a rough estimate of the volume of immigra-ton, a comparison was made of the population shown by the 1971 census in eachage and sex group with an estimate of the survivors from the 1961 population,
1/ Ramon Gonzalez Cernetto and Snehendu B. Kar, Country Profiles: Venezuela.Population Council, New York, N.Y., June 1975.

- 8 -
Table I.1: POPULATION GROWrH
Year Birth Death Growthrate /1 rate/1 rate /2
1941 43.0 21.1 2.81950 hU.0 13.7 3.01961 45.0 7.L L.o1971 38.4 6.6 3A.1974* 37.6 6.6 3.1
*Estimate: /1 Per thousand; /2 Percent.
Source: Direccion General de Estadistica y Censos. (Censo y Encuesto deloaares expandida, 1974).
Table I.2: POPULATION BY PLACE OF BIRTH
(Thousands of persons)
Nationality 19h1 1950 1961 1971
TOTAL 3,851 5,o35 7 10,7228 LL fi5. _., 22
Venezuelan 3,803 4,841 7,062 10,258Born in the country 3,795 4,826 6,98T 10,1h2Born in other countries 56 209 5Q 597
With Venezuelanparents 6 2 15 11Naturalized 2 13 65 109Foreigners 48 1 04 462 -477
Source: Direccion General de Estadistica: various censuses.

- 9 -
Table I.3: MIGRATION BY PLACE OF ORIGIN - 1971(Thousands of persons)
Place of Origin Total % Men v Women %
Total 597 100.0 319 100.0 278 100.0
America 240 40.2 115 36.1 125 45.0Colombia (180) (30.2) (84) (26.3) (96) (34.5)
Europe 330 55.3 188 58.9 142 51.1Asia 24 4.0 15 4.7 9 3.2Africa 3 0.5 1 0.3 3 0.7
Source: Direccion General de Estadistica: Census, 1971.
using life tables developed by the United Nations. In ages 15-29 (those atwhich people are most prone to migration) the population shown by the 1971census exceeded the estimated survivors by about 200,000 -- 140,000 womenand 60,000 men. Assuming no errors in the censuses and the applicability ofU.N. life tables to Venezuela, the excess can be explained only by net immi-gration. This would imply that an average of 20,000 immigrants enteredVenezuela annually in the decade. Assuming labor force participation ratesfor the immigrants to be somewhat higher than those of natives in each ageand sex group (since immigrants enter the country mainly to seek work) itmay be estimated that about half of the immigrants, or 100,000 people, werein the Venezuelan labor force by 1971. Thus immigration contributed aboutone-eighth of the increase in the labor force in the decade 1961-1971 (Table1.5, Appendix I).
B. Trends of the Labor Force
92. The labor force has grown at a high rate, owing to natural popula-tion growth, to immigration and to increased participation. In recent yearsthe growth rate has accelerated: from 1961 to 1971 the labor force increasedby an average of 80,000 per year, or at an annual average rate of 3.0%; andfrom 1971 to 1974 it grew by 130,000 per year, at a rate of 4.0%. In theentire thirteen year period, the growth rate was 3.2% (Table 2.8, Appendix I).
23. The labor force has changed in composition as a result of changesin the population profile as well as changes in labor force participationrates. Women's participation is rising rapidly, as everywhere in the world,owing to changing scales of values, improved women's education and risingemployment opportunities in the kinds of occupations women typically enter --education, office work, sales, professional and non-professional services,etc. Women were 17.7% of the labor force in 1950, 22.4% in 1971, and 24.4%in the second half of 1974. Labor force participation of women is risingat nearly every age as shown in Table I.4. The exceptions are ages 15-19,

- 10 -
Table I-4: PARTICIPATION RATES (BY SEX AND AGE GROUPS)
1961 1971 1974 (II)
Both sexes 55.4 51.1 52.1
15-24 49.2 43.7 40.525-54 61.2 59.9 63.655 and over 44.5 37.5 41.3
Men 89.5 80.3 79.8
15-24 76.5 63.9 58.125-54 97.7 94.7 96.755 and over 83.5 69.0 74.6
Women 20.2 22.6 25.3
15-2h 21.7 2h.3 23.225-5L 21.8 24.9 30.855 and over 12.2 9.1 10.5
Source: Table 2.1, Statistical Appendix.
Table I-<: PARTICIPATION RATES IN CARACAS AND IN THE COUNTRI AS A WHOLE
1961 1971 1974 II
Both sexes
Venezuela 55.4 51.1 52.1Caracas 53.6 57.7 57.9
Men
Venezuela 89,5 80.3 79.8Caracas 77.9 81.9 79.8
Women
Venezuela 20.2 22.6 25.3Caracas 29.1 35.5 37.8
Source: Tpbles 2.1, 2.2, Statistical Appendix.

- II -
as girls remain in school longer, and ages 55 and over, as the developmentof social security gives women as well as men, the possibility of earlierretirement.
24. Labor force participation for men has declined at ages 15-24 and55 and over. As explained in detail in Appendix II, the decrease for youngmen is mainly associated with longer schooling, but may also reflect somewithdrawal from the labor force because of inability to get work, as evidencedby the high unemployment rates for men in these ages. The decline for oldermen partly reflects the development of social security and partly the movementinto urban areas. Older men living on farms usually have higher participationrates, since they can readily engage in some farm work on their own land, with-out having to go through the process of looking for a job.
25. The effect of urbanization can be seen in Table I.5 by comparingparticipation rates in Caracas with those in the country as a whole: women'sparticipation is markedly higher in each age group in Caracas, while partici-pation of men is generally lower in Caracas than in the country as a whole.
C. Trends in Employment, 1961-1974
26. Since 1961, total employment has been growing at a rate of about3.7%, apparently faster than the labor force. In fact, a comparison of the1961 Census and 1974 Household Survey data 1/ indicates that employmentprobably grew even faster than the labor force, absorbing some of the highcyclical unemployment recorded in 1961. Urban employment also seems to havekept pace with the rapid growth of the urban labor force; thus, non-agricul-tural employment grew at about 6.2% annually between 1961 and 1974. Inabsolute numbers, non-agricultural employment increased by almost 1.4 millionworkers, from 1.15 million in 1961 to 2.52 million in 1974.
27. This rapid rate of job creation brought about great changes in thestructure of employment in which the share of agriculture in total employmentdecreased from 35% in 1961 to 22% in 1974, while that of manufacturing in-creased from 19% to 23% in 1974, and those of other urban activities also rosesubstantially. The modern sector as a whole (defined as all establishmentswith five or more workers, plus government employees and professionals)appears to have grown as fast as total employment. This at least was thecase in Caracas while cruder data for other urban areas did not support anyconclusion.
28. The larger number of jobs created by modern manufacturing industryis borne out by several sets of data: the Population Censuses, the HouseholdSurveys, the Industrial Censuses and the statistics collected by the Hlinistriesof Labor and Fomento. Examination of the different statistical sources, andof the definitions they use, seems to show that the number of jobs created in
1/ See Appendix II for a discussion of the comparability of thesc tl')sets of data.

- 12 -
Table I-6: EVOLUTION OF EMPLO6IENT BY SECTORSl9l-1974
1961 1974 Growth AnnualThousands Thousands Thousands rate
of % of % of % ofpersons persons persons growth
Agriculture 721.3 35.3 719.5 21.9 - 1.8 - .1 - 0.1Mining 45.6 2.2 51.1 1.6 5.5 .4 0.8Manufacture 246.9 18.7 590.6 23.0 343.7 27.6 6.9Construction 81.6 4 .0 219.7 6.7 138.1 11.1 7.9Utilities (excludingtransport) 21.2 1.0 49.0 1.5 27.9 2.3 6.8Commerce 266.2 13.0 557.4 17.0 291.2 23.4 5.8Transport 96.5 L.7 206.3 6.3 109.8 8.8 6.0Services 505.4 24.7 889.5 27.1 384.1 30.9 4.4Not knovm 58.0 2.8 3.2 .1 - 54.8 - . -
TOTAL 2,082.5 64.7 3t286.2 78.1 1,132.7 100.0 3.7
Sou-rce: Direccion General de Estadistica: Censo de Foblacion y Vivienda, 1961,Household Survey, 197h.

- 13 -
manufacturing industry, as now defined by the United Nations, has been some-
what smaller than shown in Table 1.6, but, in any case, very large. Possibleexplanations of the employment absorptive capacity of industry in Venezuelaare presented in a later section.
D. Trends in Productivity and Employment by Sectors: 1961-1974
29. Between 1961-1974, the real gross domestic product of Venezuelaincreased at a rate of 5.8%. Given the 3.7% growth of employment, produc-tion per worker rose at a 2.0% rate. However, this rate is influenceddownwards by the slow growth of petroleum extraction and petroleum refining,which generated 31.5% GDP in 1961 and only 16.8% in 1974. Given such areduction in the share of activities that are several times more productivethan the rest of the economy, average production per worker increased lessin the whole economy than in the nonpetroleum activities. In 1961-1974, theGDP of Venezuela, excluding petroleum, increased at a 7.2% annual rate inreal terms. Production per worker outside petroleum grew, therefore, at a3.3% annual rate.
30. A breakdown of the evolution of production per worker during 1961-1974 in the main economic sectors of the economy cannot be made with a satis-factory degree of accuracy, owing to the margin of error in the employmentfigures, to the lack of full comparability of the national income figuresbefore and after 1969, and to the differences in the definition of sectorsin the employment and national account series. But despite the large marginsof error involved, it has been considered useful to put together the figuresof Table I.7 and I.8 to show the broad trends in the evolution of produc-tivity on the different sectors.
31. Comments on the table will be made in the following pages, in theanalyses of the behavior of employment, productivity and labor income in theprincipal sectors.
(i) Agriculture, Fishing and Forestry
32. The study group did not have agricultural experts among its members,nor had it time to examine the employment situation in this sector. Butshortly before the group began its work, the Latin American Institute ofEconomic and Social Planning (ILPES) had completed an excellent report onVenezuela's agriculture, in which the employment situation in the sector isexamined. 1/
33. The ILPES report stresses two basic trends in the evolution of agri-culture during the period under study: one, that agricultural output grewfaster than population, with an average annual rate of growth of 5.1%; and
1/ ILPES: Elementos para una Interpretacion del Desarrollo Historico dela Agricultura Venezolana, Caracas, Informe Mimeografiado, 31 de enerode 1975.

Table I-7: EMPLOYMENT, VALUE ADDED AND PRODJCTIVITY
Employment Value added Productivity(thousands of workers) (millions Bs at 1968 (Bs at 1968 prices)
prices)1961 1974 1961 1974 1961 1974
Agriculture 721.3 719.5 2,115 4,035 2,932 5,608Mining 8.7 14.4 817 1,216 93,908 84,t444Manufacturing (excl. refining) 206.4 440.9 3,211 9,044 15,557 20,513Factory manufacturing 137.0 273.9 2,915 8,276 21,277 30,215Handicraft 69.4 167.0 296 768 4,260 4,600Construction 81.6 219.7 1,409 3,169 17,243 14,424Electm city, gas and water 21.2 49.0 274 1,234 12,925 25,184Other 959.6 1,796.9 12,810 32,718 13,304 18,208
Total (excl. petroleum) 1,996.6 3,240.9 20,477 50,898 10,256 15,707Petroleum extraction 36.9 36.7 6,804 6,933 l84, 390 188,910Petroleum refining 9.0 9.1 1,434 1,873 204,857 205,824
TOTAL ECONOMY 20,42.5 3,286.2 28,715 59,704 14,059 18,168
LIncludes: transport, commerce and finance and services. Repair shops are included in the service sector.
Sources: Central Bank, 1961 Census, 1974 Household Survey and mission estimates.

- 15 -
Table I-8: ANNUAL RATES OF GROWTH OF EMPLOYMENT, VALUE ADDED ANDPRODUCTIVITY, (1961-1974)
valueEmployment added Productivity
Agriculture - 0.1 5.1 5.2Mining 4.0 3.1 - 0.9Manufacturing (excl. refining) 6.o 8.3 2.2Factory manufacturing 5.5 8.4 2.7Handicraft 7.0 7.6 0.6Construction 7.9 6.4 - 1.4Electricity, gas and water 6.8 2,3 5.1Other 4.9 7.5 2.5
Total (excl. petroleum) 3.8 7.3 3.3
Petroleum extraction - 0.1 0.1 0.2Petroleum refining 2.0 2.1 0.1
TOTAL ECONOMY 3.7 5.8 2.0
Source: Table II-7.

- 16 -
two, that this rapid growth resulted entirely from mechanization and bettercultivation techniques, making agricultural employment decline slightly.
34. These major trends brought about three consequences concerning employ-
ment in agriculture: (i) the proportion of the sector in the country's laborforce declined; (ii) the number of days worked increased; and (iii) theproductivity of labor increased.
(i) Low standards of living in agriculture and the lure ofcities induced rural population to urban centers, while largeproducers introduced mechanized processes of production. As
a result, employment in rural areas did not increase between1961 and 1974, but actually declined slightly in absolutenumbers and steeply in relative terms. Table I.9 presentsthe number of agricultural workers in Venezuela.
(ii) According to ILPES, labor utilization in agriculture increasedfrom 170 working days per worker in 1961 to 275 in 1971. Thisincrease resulted from an expansion of the land under cultiva-tion from 2.4 million hectares in 1961 to 2.6 million in 1971.Also an increase in the proportion of wage earners in the agri-cultural labor force contributed to increase the time workedper worker. The modernization of agriculture in the lastfifteen years brought about changes in the structure of thelabor force: the proportion of wage earners increased as aresult of the reduction in the number of small farms and theincrease in the number of middle and large agricultural enter-prises of a commercial character.
(iii) The increase of agricultural productivity in the last fifteenyears has been impressive: average output per employed personincreased at an annual rate of 5.3% between 1961 and 1974.
35. As said before, employment in the sector has not been increasingbut actually declining slightly. Between 1961 and 1974, employment inagriculture proper and in forestry decreased, while that in fishing expanded,but in a somewhat smaller amount. The evolution of employment in the varioussubsectors of agriculture can be seen in Table 1.11.
36. Three other significant changes have taken place within the sector.First, there has been some sensible shifting in the regional distribution ofemployment. Agricultural development in areas of concentrated industrializa-tion, particularly in the Capital Region and in Aragua and Carabobo havetaken place, while net gains in agricultural employment can be observed inother zones where commercialized non-traditional production has been suc-cessfully .introduced and expanded. Barinas, Anzoategni, the Maracaibo Basinand parts of the West-Central Region are examples of such expanded job oppor-tunities in agriculture.

- 17 -
Table I-9:1POPULATION 10 YEARS OR OLDER WORKING IN AGRICULTURE
1961 1974Number of workers in agriculture 721.3 719.5Percentage of the labor force 35.3 21.9
Source: DGYEC - Census 1961, Household Survey No. XVIII.
/I ILPES, -Elementos para una Interpretaci6n del Desarrollo Historico de laAgricultura Venezolana."
Table 1-10 :AANIML RATE OF GROWTH, 1961 - 1974
Employment - 0.1Output 5.1Productivity 5.3
Source: Direccion General de Estadistica: Censo de Poblacion y Vivienda,1961,Household Survey, 1974.
Table I-ll: EMPLOYMENT IN AGRICULTURE
1961 1974 AnnualThousands Thousands rate
of % of % ofpersons Dersons growth
Agriculture 704.0 97.6 68O.o 91.6 - 0.3Forestry 2.0 0.3 1.2 0.2 - 3.7Fishing 15.2 2.1 37.5 1.2 7.0Hunting 0.1 - - - -
TOTAL 721.3 100.0 719.5 100.0 - 0.1
Source: Direccion General de Estadistica: Censo de Poblacion y Vivienda, 1961,Household Surve , 1971, 1974.

- 18 -
37. Second, since migration to urban areas has been concentrated onthe younger age groups the agricultural labor force has perceptibly changedits age composition and shows clear signs of overaging. While in 1974 theagricultural sector accounted for 20% of the total employed labor force ofVenezuela, agriculture employed 35% of the total labor force between 55 and64 years of age and 46% of the labor force 65 years and older. The deteri-orating age structure of the agricultural labor force is also observed inthe resettlement programs carried out by the Agrarian Reform Institute.In 1974, the average age of the beneficiaries was 45 years.
38. Third, agricultural employment has been favorably stimulated bythe diversification of production and the increasing importance of non-traditional products, particularly dairy and livestock products, poultry,oilseed, and fruits and vegetables. The steady trend towards these produc-tions, which has been aided to some extent by government credit, price supportand technical assistance, has increased the demand for labor and signifi-cantly reduced the extent of under-employment. The annual employment perworker has extended over an increasing number of days, reflecting in partthe substantial expansion in animal production which provides for year-roundemployment. In the traditional crops, however, labor inputs have been generallystagnant. There have been absolute declines in employment in some industrialcrops and in crops that typically have been cultivated by small subsistencefarmers.
39. The expansion of agricultural activities into animal husbandryand new industrial crops has been a major factor behind the remarkable paceof growth of agricultural production and of value added per worker. It shouldbe noted, however, that although increasing in real terms, the value addedper worker in agriculture in 1974, was still less than one-third the averagein the whole economy (See Table I.7).
40. Agricultural growth in recent years has been largely in animalproduction. In 1974 the value of animal production was about 52% of the totalvalue of output in the agricultural sector, including forestry and fisheries,compared to about 38% in 1960. Responding to the rapid increases in domesticdemand for meat and meat products, milk and eggs, a number of modern special-ized farms have emerged, mainly in the area between Caracas and Valencia andin the southern part of the Maracaibo Basin. The shift towards modern ranchingand poultry farming has recently made animal production the leading agricul-tural activity involving new demands for labor and labor earnings derived inthose activities improved considerably. It is estimated that animal productionaccounted essentially for all increases in labor inputs in agriculture(expressed in workdays) between 1960 and 1973.
41. Fishing is one of the traditional but minor occupations in Venezuelaemploying about 38,000 in 1974. Employment is concentrated on offshore, andlagoon fishing operations, accounting for about 90% of the employed force butfor less than one-third of the total value of catches. Operations are typicallylabor-intensive and show strong seasonal fluctuations. During offseason, whichin some cases may extend up to eight months, there is high open unemployment

- 19 -
and the average labor income in this type of operation is below Bs 220 a month.Trawling and high sea fishing employ perhaps 3,500-3,600 workers but accountfor about two-thirds of the output and essentially all increase in catches inrecent years. In this more modern type of operation, the average daily wagestood at Bs 18 a day in 1974. If the available data can be believed, laborinputs in the fishing subsector as a whole have increased more than the totalfisheries output suggesting a decline in labor productivity. This could bea result of declining catches in traditional branches because of overfishingand should serve as a warning signal to the Government. Women's participa-tion in fishing is extremely small; in the second half of 1974, of a totalfishing labor force of 37,456, only 143 were women.
42. Employment in forestry has increased rapidly in recent years,particularly in Guayana. Nevertheless, total employment barely exceeded1,200 workers in 1974, showing very clearly the incipient character of thissector in Venezuela.
(ii) Manufacturing
43. In most developing countries, employment growth in manufacturinghas been sharply limited by rapid gains in production per worker. In lowincome countries, already established industries generally operate withobsolete and deteriorated equipment that requires renewal as an essentialstep in the march towards development; but renewals bring about big leaps inproductivity that raise output, but not employment. New import substitutingindustries have a productivity several times higher than the country's average,and they also induce big leaps in productivity that push up real income verysteeply, but create few jobs. Furthermore, in their initial steps in indus-trialization, countries establish consumer goods industries -- food processing,beverages, cigarettes, textiles, that, contrary to a widespread belief, aremuch more capital intensive than those that produce equipment and durableconsumer goods. 1/
44. In Venezuela, none of the above three factors operates: (a) replace-ment of equipment has not brought about big jumps in productivity, but justgradual increases in output per man, in step with technological progress,because existing machinery has been renewed at normal intervals; (b) pro-ductivity levels in new import substituting industries have not been out ofline with the rest of the economy, which already operates at relative highlevels of production per worker; and (c) many of the new plants installedin the last decade have been metal-mechanic industries, which are very laborintensive.
45. Table I.12 shows the distribution by industrial branches of the344,000 new jobs created in the manufacturing sector (including repair
1/ Victor E. Tokman, Distribucion del Ingreso, Tecnologia y Empleo,Cuadernos del Instituto Latinoamericano de Planificacion, Economicay Social, Santiago, Chile, 1975.

- 20 -
Table I-12: EM4PLOYMENT IN MANUFACTUIRING
(Thousands of persons)
1961 1974 GrowthThousands Thousands Thousands Annualof persons of persons of persons rate
Traditional industries
Food 42.3 88.3 46.o 5.8Beverages 8.2 13.4 5.2 3.9Textiles 16.2 31.7 15.5 5.3Clothing 55.8 9016 34.8 3.8Wood and cork 19.6 28.7 9.1 3.0Furniture 6.1 26.6 20.5 12.0Tobacco 3.8 3.2 - 0.6 - 1.1Shoes 2.2 6.6 4.4 8.9
i77.72 229.1 131. 9
Basic industries
Paper 3.3 9.9 6.6 8.9Rubber 2.6 5.2 2.6 5.5Chemicals 11.9 31.0 19.1 7.7Non-metalic minerals 9.8 30.3 20.5 9.1Basic metals 1.6 12.2 10.6 16.9
29.2 88.6 59.4 8.9
Metal mechanic
Metal products 9.1 42.3 33.2 12.5Nonelectric machinery 1.0 3.6 2.6 10.4Electric machinery 6.9 43.4 36.5 15.2Transport equipment 29.6 91.5 61.9 9.1
46.6 180.8 134.2 11.0
Residual group
Printing 6.9 16.4 9.5 6.8Other 9.7 15.9 6.2 3.8
16.6 32.3 15.7 5.2
TOTAL 2L6.9 590.8 344.2 6.9
Source: 1961 Census and XX Household Survey, Second Half of 1974.

- 21 -
activities) during the period 1961-1974. As may be readily seen, nearly
one-fifth of these jobs were generated in the production and repair ofautomobiles, and another fifth in the production and repair of electricaland non-electrical machinery, as well as in the processing of metal products.Metal mechanic industries accounted for almost 40% of the increase in manu-facturing employment (including repair activities).
46. Food processing industries created 13% of the additional jobs;clothing, 10%; furniture and non-metalic industries, 6% each; chemicals(including pharmaceuticals), nearly 6% and textiles somewhat less than5%.
47. Attention must be called to the fact that, out of the 344,000
new jobs, about 140,000 were generated in repair activities, which theHousehold Surveys have continued to include within the manufacturing sector,following the old United Nations definitions. When these activities areclassified as services, 1/ the rate of employment growth in manufacturingdecreases from 6.9% per year to 5.9% per year, and that for services risesfrom 4.4% to 5.1%.
48. According to national account figures, value added in the manufac-turing sector (excluding repairs) increased at a 6.8% annual rate from 1961 to1974. Since employment expanded at a 5.9% rate, production per worker in-creased at an 0.9% annual rate, which is far below the 2.5-3.0% annual rate atwhich manufacturing productivity increased in industrial countries duringthe period -- which roughly measures technological progress. The low rateof productivity growth in Venezuela's overall manufacturing sector is explainedby the small increase of production in petroleum refining and the slow rise inproductivity in handicrafts, as may be seen in Table I.8 above. Value addedper worker in modern industry other than petroleum refining increased at a2.7% annual pace which is within the range of the corresponding rate in theUnited States and other industrial countries. But even this relatively highrate is below the non-weighted average of the rates in individual industries,because labor intensive industries, e.g. metal-mechanic industries, whichgenerate lower value added per worker than capital intensive industries, grewat a faster pace during the period, and pushed down somewhat the weightedaverage rate of increase in productivity.
1/ Since both the Household Surveys and the population censuses reporttogether employment in manufacturing proper and in tepairing, thefigures for repairing have to be estimated. For 1974, a rough estimatecan be made by comparing employment figures in those industries in whichrepairing is important (transport equipment, electrical machinery, non-electrical machinery, furniture, shoes, clothing, etc.) in the HouseholdSurvey, that includes repairing, and in the Industrial Survey, thatexcludes it. For 1961, the figure has been calculated backwards byassuming very rapid rates of growth for repair activities in cars and
- 22 -
49. The rapid growth of employment in manufacture has taken place notwith-standing the existence of governmental policies that have lowered the price ofcapital and raised the price of labor, thus introducing a technological biasin favor of capital intensive technology. Following the pattern in otherdeveloping countries, Venezuela has raised customs duties on machinery andequipment much less than on consumer goods; has granted tax exemptions tofixed investment; has maintained its exchange rate at a relatively overvaluedlevel; and has subsidized industrial loans through lower interest rates andeasier terms for repayment, thus lowering the cost of capital to largeborrowers; and has issued labor legislation and strengthened the bargainingpower of trade unions, thus increasing the price of labor.
50. The rapid growth of employment in manufacturing in Venezuela showsthat although the above described policies have probably favored capitalintensive methods, their effect on employment has been more than overcome bythe fast growth of the economy and its entrance into a stage of developmentin which some important industries are labor intensive.
51. Between 1971 and 1974 employment in modern manufacture appears tohave increased faster than employment in the sector as a whole. Two factorssuggest this trend: first, wage-earners as a percentage of total workers inthe sector increased from 73.5% in 1971 to 77.7% in 1974; second, the propor-tion of low paid jobs diminished appreciably. In 1971, about 15% of wagerecipients in manufacture received less than Bs 82 per week, 1/ while in1974 only 10.2% of wage and salary workers received less than 100 Bs. per week.
52. The proportion of low yielding activities among the self-employedin manufacture also decreased, although less markedly. According to themission's estimates, about 35.0% of the self-employed received less thanBs. 410 per month in 1971 while 38% of them earned less than Bs 500 in 1974.Counting both types of employment, the proportion of low productive badlypaid jobs diminished from 20% in 1971 to 16% in 1974, but this is still ahigh figure that deserves the prior attention of governmental policies.
53. Between 1966 and 1971, 89% of the new jobs were created in theMetropolitan Area and in the country's central region. There has been aprogressive concentration of industrial employment in and near the capital,while other regions have deteriorated in relative as well as absolute terms.The Government has adopted a policy of decentralization that is describedin Appendix III. This policy gives incentives to the establishment of newplants outside the Metropolitan Area of Caracas in order to distribute thebenefits of industrialization throughout the country.
1/ In 1971, 12.1% of wage and salary workers earned less than Bs 75 and22.0% less than Bs 100. Taking these two figures as reference points,it may be estimated that about 15% of wage and salary workers earnedless than Bs 82.

- 23 -
Table 1.13: REGIONAL DISTRIBUTION OF NEW EMPLOYMENT IN MANUFACTURING, 1966-71(Percentages)
Region 1966-1971
Capital 42.0Central 47.0West-Central 2.5Zulia 6.2Andean 1.4Southern 0.0Northern -0.8Guayana 1.6
Source: CORDIPLAN: Industrial Census, 1960, 1971.
(iii) Construction
54. Employment in construction increased at a 7.9% rate between 1961 and1974, having accounted for about one tenth of the jobs created in the countryduring the period. In 1971-1974, employment growth in this sector acceleratedto 14% per year and generated one-fifth of the jobs.
55. The behavior of employment, value added and productivity in thesector are shown in Table I.14.
56. The small increase in average value added per worker in 1961-71 andits decrease from 1971 to 1974 does not reflect productivity changes in theindividual branches that form the sector, but the faster expansion of one ofthem -- residential building -- which is much more labor intensive than theother types of construction, especially road construction. As Table I.15shows, the share of house building in total construction increased from 32.5%in 1969 to 41.7% in 1973.
57. As in most other activities, employment in construction seems tohave grown faster in the modern sector than in the informal. In 1971, 64.4%of construction workers were wage-earners and in 1974, the percentage increasedto 67.3% and the proportion of low paid workers declined from 16.9% in 1971to 10.1% in 1974. Among self-employed construction workers, the percentageof substandard workers diminished from an estimated 22.2% in the first ofthe two mentioned years, to 17.6% in the second.
58. As was the case in other sectors, the generation of new employmentwas highly concentrated in the Metropolitan Area and Central region of thecountry.

- 24 -
Table I-14: PRODUCTIVITY CHANGES IN CONSTRUCTION
(Annual rates of change in %)
1961-71 1971-74 1961-74
Employment 6;1 14.3 7.9Value added 6.4 12.6 7.9Productivity 0.3 - 1.6 - 0.2
Source: Central Bank, Direccion General de Estadistica, Household Survey,1971, 1974.
Table 1-15: SHARE OF HOUSE BUTIDING IN TOTAL CONSTRUCTIONI
(in %)
1969 1973
Residential construction 32.5 41.7Private non-residential construction 33.5 21.0Public works 34.0 35.4
100.0 100.0
Source: Central Bank.
Table I-16: GENERATION OF NEW EMPLOYMT INTHE CONSTRUCTION SECTOR (1961-1971)
Region Thousands of persons Percent
CaUital 21b . 38Cent,ral 10.8 17Centiral-West 7.0 11Zulian 7.8 12Andean 6.2 9Southern 0.7 1NIortheast 6.5 10Guayana 1.3 2
TOTAL 65.2 100.0
Source: Central Bank.
- 25 -
(iv) Utilities
59. Employment has grown very rapidly in the utilities (which includeselectricity, gas, water and sewage system), but the number of new jobs createdfrom 1961 to 1974 was 28,000 both because the sector is small and becauseof the large ratio of fixed capital to labor that characterizes utilities.
60. Value added in the sector has increased very rapidly, owing mainlyto the fast development of electric power, and productivity has also risenat a high rate. In 1971-74, average productivity in the sector declinedslightly, owing to the quick expansion during those years of water supplyservices, that generate a much lower value added per worker than electricity.
61. Practically all the workers of this sector are wage-earners: 98.7%in 1971 and 99.2% in 1974, according to the Household Surveys; and the immensemajority of them earn incomes above the legal minimum wage. In 1971, onlyabout 5.3% received less than Bs 82 and in 1974 the proportion receivingless than Bs 100 had come down to 3.3%. Both figures are too small to bemeaningful, but may be interpreted, nevertheless, as indicative of thetrend.
(v) Transport, Storage and Communications
62. Employment in the transport sector has grown at an annual rate of6% between 1961 and 1974, having generated almost 7.0% of the country's addi-tional jobs. Growth was particularly fast in land and air transportation,deposit and storage, communications and tourism, and only moderate in seatransportation.
63. The growth of employment in the sector was faster in l96L-7l thanin 1971-74 probably owing to the faster expansion of those activities withinthe sector that have higher productivity.
64. A comparison between the 1971 and 1974 Household Surveys s'nows arelatively large increase in professional personnel, managers and officeemployees and a decrease in manual operators, which may be partly due to themargin of inaccuracy in sampling procedure, but that may also indicate amovement towards more modern forms of organization in the sector.
65. In fact, between 1971 and 1974 the percentage of wage earners intotal employment in the sector remained constant at 58.5%. However, thepercentage of wage earners receiving substandard income declined from 16.2%in 1971 to 9.3% in 1974. The percentage of low income earners among thesector's self-employed came down from around 11.2% in 1971 to 3.2% in 1974.The large amount of self-employed workers in transportation and the rela-tively small percentage of them that receive substandard earnings can beexplained by the fact that a large proportion of the workers are independenttaxi drivers.

- 26 -
Table 1-17: EMPLOYMENT 21 THE UTIITIES SECTOR
1961 19ThThousands Thousands Annual rateof persons of persons of growth
Electricity 7.4 14.9 5.5Gas .9 3.4 - 10.7Water 8.2 18.2 6.3Sanitary services 4.8 12..
TOTAL 21.2 49.o 6.8
Source: Direccion General de Estadistica: Censo de Poblacion y Vivienda, 1961,Household Survey, 1974.
Table T-18: CHANGES IN ERPLOYMENT AND PRODJCTIVITY IN THE UTILITIEs S.ECTOR
(Annual rates of change in )
1961-1971 1971-1974 1961-1974
Employment 6.0 9.4 6.7Value added 13.2 9.1 12.3Productivity 6.7 - 0.3 5.2
Source: Direccion General de Estadistica, Censo de Poblacion y Vivienda, 196.1,Household Survey, 1971, 1974.

- 27 -
(vi) Commerce and Finance
66. According to the figures shown by the 1961 Census and the 1971and 1974 Household Surveys, employment in commerce and finance grew at 7.3%annual rate between 1961 and 1971, and at a 1.3% annual rate between 1971and 1974, for an average 5.8% rate during the whole period. Even allowingfor the imperfect comparability of the data and for the margin of inaccuracyin sampling procedure, the large drop in the rate of job creation indicatesthat the growth of employment in the sector must have slowed down.
67. The steep fall in the growth of employment in the sector in 1971-74was the effect of (a) a drop of similar magnitude in the growth rate inmerchandise trade (which is the subsector that employs more workers); (b) asmall decrease in the volume of employment in real estate, banking and financecompanies; and (c) a rapid increase in insurance, that did not have a signif-icant effect on the sector's total, because insurance employs few people.The slowdown of employment growth in trade can be clearly attributed to theemergence and development of supermarkets, made possible by the rapid expansionin car ownership. The small decrease in banking may either reflect samplinginaccuracies or the introduction of computerized accounting, or both. And therapid increase in insurance employment seems to indicate an increase in thenumber of insurance salesmen.
68. A breakdown by occupation of the changes in employment in the sector,in 1971-74 tends to strengthen the above explanation: see Table 1.23.

- 28 -
Trable I-19: -IPLOYIENT IIN TI-E TR!'AIIS PRT SECTOR
1961 1971,Thous,ands Thousands Anrual rateof persons of persons of gro;wth
I-and transport 62.6 137.0 6.2' transport. l6.1 25.6 3.1.Mir transport 3.7 9.7 7.7)EPposit and storage .9 3.5 l.0C I) nui^ic Ptions 1'2.7 27.0' 6.2T _ o JriS2. ST, .L) 2.8 l4. i
TOTAL 96.5 206.3 6.0
Source: Direccion General de Estadistica, Censo de Poblacion y Vivienda,1961,Household Survey, 1974;.
Table 1-20: CHANGES IN EMPLOYMENT AND PRODUCTIVITY IN THE TRANSPORT SECTOR
(Annual rates in )
1961-1971 1971-1974 1961-1974
Enplo3r-ent 6.9 3.0 6.0Value added 7.0 7.3 7.1Productivity 0.1 4.2 1.0
Source: Central Bank, Direccion General de Estadistica, Censo de Poblacion yVivienda, 1961, Household Survey, 1971, 1,97Ji
Table I-21: COxiPCS:TION OF EMPLOY-IENT IN THE TRAf.SPORT SECTOR
97.1 1974 Growth'Thousands Thousands Thou=_-ndsof persons of persons cf nersons
Professionals andtechnicians 3.1 50 1.9
Meanagers and adm.inistrators 3. 5.4 2.0Office employees 15.3 23.3 8.0Salesmen 0.9 0.4 - 0.5Drivers and other
communications experts 150.8 1J7.9 - 2.9Blue-collar machine
operators 3.6 6.9 3.3Other blue-collar 8.8 11.1 2.3Service wor'-ers 2.6 6.1Unknown 1.8 2.0 0.2
Source: Direccion General de Estadistica, Household Survey, 1971, 1971.

- 29 -
Table T-22: EMPLOYMENT IIN COMMERCE AND FINANCE
(By branches)
2rployed workers Rates of growth(000) (%)
1961 1971 1.?7 1961-71 1971-7'h 19l6i-71
'.l-oles-le and retailtrade 236.9 472.5 4h2.5 7.1 1.i 5j7
veal estate, bankingand finance companies 26.2 57-4 55.h 8.o - 0.6 5.9
Insurance 3.0 6.9 9.5 3.7 11.2 9,'
TOTAL 266.2 536.9 557.4 7.3 1.3 5.3
Source: Direccaon uenera.L ia bazaow.LtaxaI 'ienso de Poblacion y Vivienda 1961,Household Survey, 1971, 197h.
Table 1-23: E74PLOYMENT IN COMMERCE AND FINANCE
(By types of occupation)
ETaplcyed t!workers Annual rate of
(000) change (,)197' 197!
Professionals, technicians,
managers and officeworkers 103.9 129.4 7.6
Salesmen 378.4 356.2 - 1.9Other employees 54.6 71.8 9.6
TOTAL 536.9 557. 1.3
Source: Direccion General de Estadistica: Household Survey, 1971, 197!.

- 30 -
Table I-24: SALARIED AND SELF-E4PLOYED WORKERS I1 COMMERCE AND FINANCE
Employed workers Annual rate of(000) - change (%)
1971 1974
Salaried 253.0 272.3 2.2Self-employed 2h9.2 251.4 0.5Not specified 34.7 33.7 0.9
TOTAL 536.9 557.4 1.3
Source: Direccion General de Estadistica: Household Survey, 1971, 1974.

- 31 -
69. The small increase in the sector's employment from 1971 to 1974 waspractically all in wage and salary earners, with self-employed workers in-creasing less than the margin of error in the sample.
70. The very small increase, or lack of increase, in the number of self-employed workers in commerce could be interpreted to mean that the supermarketshave prevented the growth of small merchants, but if this was the case, thenumber of self-employed workers should have decreased instead of remainingstable. This could mean, however, that supermarkets have displaced small andmedium size merchants rather than street peddlers.
71. Between 1971 and 1974 earnings of wage earners apparently improved.In 1971 about 31.0% of the wage earners received less than the equivalent ofthe present minimum legal wage and such percentage declined to 12.7% in 1974.But the situation of the sector's self-employed worsened: in 1971, about21.4% of the self-employed received less than Bs 410 per month and in 1974the proportion of substandard earners had increased to 30.5%.
(vii) Services
72. According to the 1961 Census figures and those of the 1974 HouseholdSurvey, employment in services increased at a 4.5% annual rate during theperiod; but if repair workers are included, the annual growth rate may haveamounted to 5.1%. The rate was probably even higher because household surveysseem to underestimate employment in government services, which in 1974 theyregister at practically the same level as did the Census in 1961. Such under-estimation may be due to differences in definition, but probably reflectsmainly the fact that household surveys register only people living at home,and, hence, omit military personnel living at army garrisons. Thus, CORDIPLAN,using national accounts data, reports an annual rate of growth of governmentemployment since 1960 of about 6.0%.
73. The comparability of 1961 and 1974 data seems to be more imperfectin services than in other sectors both in overall figures and in their break-down by branches of activity. The comparison between 1961 and 1974 data showspatterns of behavior that do not look logical; but some of the inconsistenciescan be explained by bringing the figures for 1971 into the picture, and byexamining the data more closely. The surveys for those years, for instance,record a rapid growth of government employment, suggesting that Venezuela isnot different from other countries in this respect, although it should benoted that employment in the government does not seem to be expanding fasterthan in other services.
74. Given the rapid expansion of employment in domestic service between1971 and 1974, shown by the comparison between the Household Surveys of thoseyears, the slow growth of the 1961-1971 decade does not seem plausible and aclose examination of 1961 Census figures confirms the skepticism. About one-fourth of the workers classified in domestic service in the 1961 Census arelisted as receiving daily wages or weekly salaries, which are not usual types
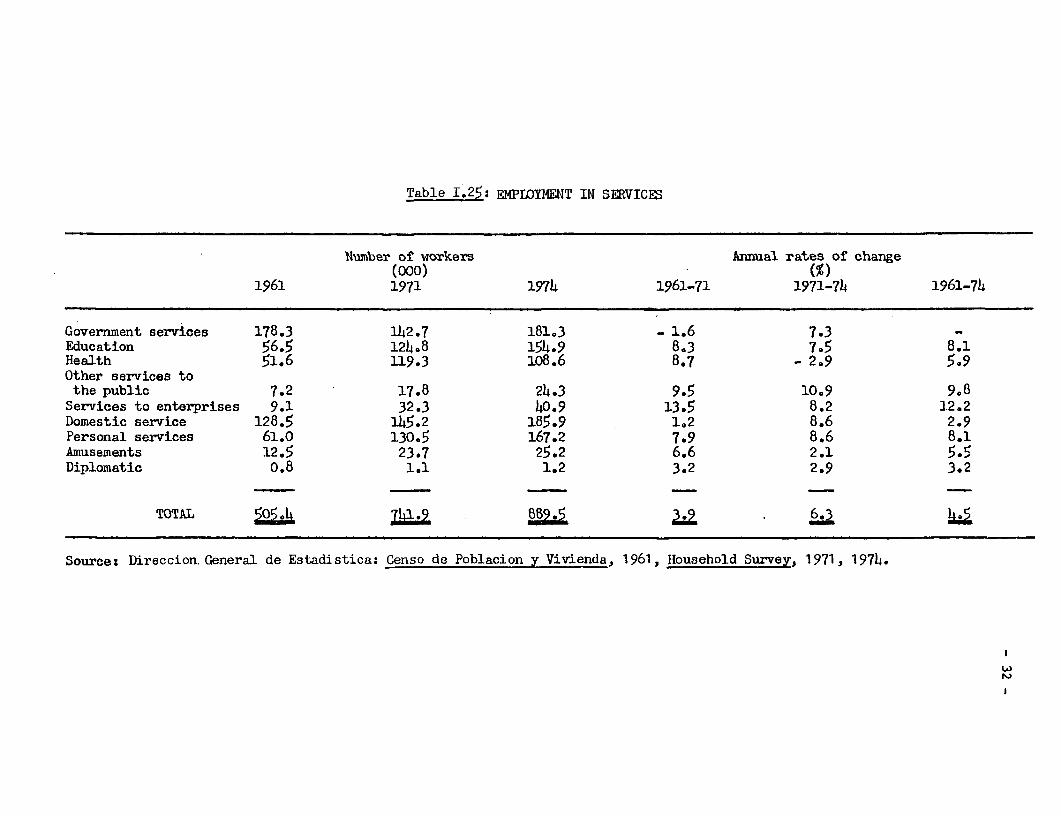
Table I.25: EMPIOYMENT IN SERVICES
Number of morkeTs Annual rates of change(000) (%)
1961 1971 1974 1961-71 1971-74 1961-74
Government services 178.3 142.7 181.3 - 1.6 7.3 -Education 56.5 124.8 154.9 8.3 7.5 8.1Health 51.6 119.3 108.6 8.7 _ 2.9 5.9Other services tothe public 7.2 17.8 24.3 9.5 10.9 9.8Services to enterprises 9.1 32.3 40.9 13.5 8.2 12.2Domestic service 128.5 145.2 185.9 1.2 8.6 2.9Personal services 61.0 130.5 167.2 7.9 8.6 8.1Amusements 12.5 23.7 25.2 6.6 2.1 5.5Diplomatic 0.8 1.1 1.2 3.2 2.9 3.2
TOTAL > 0jo'd5. . -.X
Source: Direccion. General de Estadistica: Censo de Poblacion y Vivienda, 1961, Household Survey, 1971, 1974.

- 33 -
of remuneration in this occupation. Most probably these were cleaning workersin hospitals, hotels and office buildings classified as domestic employees in1961 but not in 1971 and 1974. If these workers are deducted from the 1961figure, the employment growth rate in domestic service increases to 3.8% in1961-1971 and 4.8% in 1961-1974.
75. The comparison of the 1961 Census figures and those of the 1974Hlousehold Survey gives an initial impression that the service sector hasplayed a less important employment role in Venezuela than in other developingcountries; but the closer examination of the figures that has been made aboveshows that this is not the case. Of the 1,250,000 new jobs (in round numbers)created between 1961 and 1974, not less than 480,000, or 38% of the total,were generated in the service sector; and in 1971-74, about 40% of the in-crease in employment positions were service jobs.
76. Apparently, employment in the service sector has been growing asrapidly in modern and well organized activities as in the more traditionaland informal ones. Wage earners as a percentage of total employment remainedconstant at 87.3%. In 1971 about 29% of wage earners received substandardincomes and that percentage declines to 24.1% in 1974, showing improvementof the lower wage strata. But incomes of the self-employed deteriorated.In 1971, around 26.8% of the self-employed received less than Bs 410 permonth, and in 1974, the proportion earning less than the equivalent of thatamount had increased to 41%.
E. Evolution of Earnings
77. According to the available information, from 1961 to 1974 wage andsalaries (including fringe benefits) increased at a 5.3% annual rate atcurrent prices, equivalent to 2.4% in real terms.
78. There is no data for the whole period on the proportion of workersearning substandard incomes, but for 1971-1974 the Household Surveys supplythe information that has been examined in previous pages. In 1971, 28.9% ofwage and salary workers earned less than Bs 100 per week and in the secondhalf of 1974 such proportion had fallen to 16.1%. Adjusting the 1971 figurefor the lower prices prevailing that year, it may be estimated that about23.0% of wage and salary workers had weekly earnings below Bs 82, which atthe time had the purchasing power of Bs 100 in 1974. 1/ The reduction from23.0% to 16.1% in the proportion of lowly paid wage and salary earnersreflects a clear improvement in their situation.
1/ In 1971, 21.0% of wage and salary workers earned less than Bs 75 and28.9% of them, less than Bs 100. Taking these two figures as referencepoints, it may be estimated that about 23.0% wage and salary workersearned less than Bs 82 that year.

- 34 -
79. The lower income brackets of wage and salary workers experienced asubstantial rise in real earnings between 1971 and the second half of 1974,but this was not the case with self-employed workers. From 1971 to 1974 theproportion of self-employed workers earning substandard incomes (Bs 410 in1971 and Bs 500 in 1974) seems to have remained at practically the same level.Neither the rapid growth of the economy, nor the measures taken by the Govern-ment seem to have had any favorable effect on the situation of the lowerstrata of self-employed workers.
(i) Wages and Salaries
80. CORDIPLAN Industrial Census offers information on wages, salariesand social benefits in industry for 1961, 1966 and 1971. Between 1961 and1971, wages of blue collar workers increased at a 1.7% annual rate and sala-ries of white collar employees increased at a 3.5% rate. Fringe benefits(including severance payments, seniority benefits, profit sharing, socialsecurity, etc.) and other remunerations (basically production incentives)increased at a much faster rate, making total earnings of blue collar workersrise at a 4.4% rate and those of white collar workers at 5.3% for an averageof 4.8% for both types of workers. 1/ In real terms (using a cost of livingindex as a deflator), earnings increased at an annual rate of 2.3%.
81. Wages and salaries increased faster in the first five-year period(1961-1966) than in the second half of the decade (1966-1971). The increaseof social benefits, however, was larger in the period 1966-1971 as a resultof the 1967 reforms of the Labor Law. In fact, social security benefits andother fringe benefits were created by those reforms. The increase of socialbenefits seems to have brought about a slowdown of the rate of growth of wagesand salaries, having apparently helped entrepreneurs to resist somewhat laborpressures for higher wages and salaries.
82. The faster growth of labor earnings in the first period than in thesecond may also be explained by other factors. For one, unions grew rapidlyafter 1958. Between 1961 and 1966 the number of unions registered in theMinistry of Labor increased from 3,106 to 5,341; but in the second half of thedecade the growth of unions was not quite as slow. At the end of 1971, theMiinistry of Labor registered 6,813 unions in the country. Furthermore, afaster increase of labor productivity took place between 1961 and 1966, thanbetween 1966 and 1971. As pointed out elsewhere, productivity (in real terms)in factory manufacture increased at an annual rate of 2.8% in the first periodand at an annual rate of 2.4% in the second period.
1/ CORDIPLAN's data does not allocate fringe benefits and "other remunera-tions" between blue and white collar workers; but the mission distributedthem on the assumption that fringe benefits had been proportional towages and salaries, and that production incentives had been paid onlyto blue collar workers. However, even using this extreme assumptionblue collar workers increased their earnings less rapidly than whitecollar workers.

-35-
Table I-26: EARNINGS IN INTDUSTRY1961-1971
In millions of Es. 1961-1971 1961-1971per annum Nominal Real terms
1961 1971 terms annualannnal rate ofrate of growthgrowth
TOTAL ANNLTAL EARININGSBlue collar wages 770 1,430 6.4 3.8White collar salaries h63 1,170 9.7 7.1Social benefits 259 803 30.5 27.4Other remunerations 25 335 12.0 9.4
TOTAL 1, T 7 3,738
ATNUAL EARNŽINGS PER WORC-RKR In thousands of Bs.1961 1971
Blue collar wages 6.6 7.8 1.7 - 0.7White collar salaries 14.3 20.2 3.5 1.0Earnings of blue collar 8.1 12.4 4.4 1.9Earnings of white collar 17.6 29.7 5.3 2.7Average earrings per worker 9.7 15- 5 7 2.3
source: Industrial Censuses, 1961 and 1971, CORDIPLAN.
Table I-27: ANVITAL RATES OF GROWTH OF WAGES, SALARIESANTD SOCIAL BENEFITS
1961-1971
(In percentages)
1961-1966 1966-1971 1961-1971
Average earnings per worker 5.4 4.0 4.8
Wrages (blue collar) 3.4 1 i.7
Salaries (white collar) 6.6 0.3 3.5
Social benefits 4.3 9.4 6.a
Source: Industrial Censuses, 1961 and 1971, CORDIPLAN.

-36-
Table I-28: A>,L R.ATE OF GRO-H C AVEAGE EjR1rTGS PER ITORPKE, 1961-1971
-*~~ e
Tar,e industrL: 3.3
>¶edium size indu stryZ2 3.4
'edium small size industr,A 2.6
"all industrv1h 3.3
L-f:ore than 100 workers.
Lzetween 51 and 100 workers.
zet,een 21 and 5C -orkers.
5-2C workers.
Scurze: Industrial Censuses, 1961 and 1971, OCRDIPL.N.
Table 1-29: AITT7TAL PATES OF GR0qTTH OF EAPFI11SS, 1970-1974
At current prices At constant prices
TOTCA. 8.3 3.4
anud'acture 7.5 2.7Banks 1C.C 5.1Hotels 6.8 2.0Laundri-es 6.8 2.C
Soarce: i'inistry of Labor
Table 1-30: EARiams, 1961-1974
Indexes (1971=100) Rates of Growth1961 1971 1974 1961-1971 1971-1974 1961-197l4
Earnings (nominal) 62.7 1CO 127.0 4.3 8.3 5.6
Price level 79.7 100 116.2 2.4 5.0 2.9
Earnings (real) 78.5 100 109.3 2.3 3.0 2.4
ocurce: Industrial Censuses, 1961 and 1971 , CORDIPLAN, iEn- stry of Labor.

- 37 -
83. The Industrial Censuses also show that for wages and salaries, the
rate of increase was higher in basic industries than in traditional manufac-turing and moved roughly in proportion to the size of the plant. The highincrease registered in small industries seems to reflect the change in com-position of these categories of industries, which in 1961 and 1966 includedautomobile repair shops, but not in 1971, in compliance with the changes thathave been made in U.N. definitions.
84. The Censuses cover only plants employing more than five workers inthe manufacturing sector and do not go beyond 1971. For later years, theMinistry of Labor provides data on labor income in several sectors of theeconomy. The figures seem to have some upward bias owing to the weight givento large establishments in the overall sample but, although they probably over-estimate somewhat the level of wages and their rate of increase, the figuresgive an idea of the trend of earnings in recent years.
85. The Venezuelan Institute of Social Security provides additionalindependent information concerning the level and trends of wages and salaries,that is independent from the former. The Institute registers the number ofworkers who are beneficiaries oL the Social Security System and the wages andsalaries paid to them (excluding fringe benefits). lhese Lwo sets of figuresshow a very slow growth rate of wages and salaries in the period 1967-1971(less than 1% annual rate), and a more rapid increase in 1971-1974 (3.5% for1971-1973 and 18% for 1974). These figures, from an independent source, con-firm the basic trend of wages pointed out above. Table 1.30 presents an esti-mate of earnings for the thirteen year period. In the period 1961-1974, earn-ings for white and blue collar workers increased at an annual average rate of5.6%. Deflated by the low rate of inflation during the period (2.9% perannum), real earnings increased at an annual rate of 2.4%.
(ii) Proportion of Workers Earning Substandard Incomes
86. As stated above, from 1971 to the second half of 1974 the proportionof wage and salary workers earning substandard incomes fell substantially, butthat of self-employed workers remained at practically the same level. AsTable 1.31 shows, the proportion of substandard wage and salary earners fellfrom 23.0% to 16.1% whereas that of self-employed workers registers a smallincrease, fom 28.4% to 29.5%, that is, however, well below the margin ofsampling errors. In two sectors, commerce and services, the proportion ofself-employed workers earning low incomes increased noticeably. From 1971 to1974, the standards of living of the lower strata of self-employed workers donot seem to have improved.
87. Table I.31 shows very clearly the large proportion of self-employedthat earn meager incomes and the lack of response of these low incomes togeneral economic expansion and to Government policies designed to help labor.Both in 1971 and in 1974 the proportion of men and women earning substandard
incomes was much larger among self-employed workers than among those thatreceived a wage or salary; and while the condition of these latter respondedto the rise in the national product and to Government policies, the situationof the former did not improve at all.

-38-
Table I-31: PROPORTION OF WORKERS EAIRNfITG LOW INCONA
(Percent of total workers in group)
Wage and salary7 Self-employed 111workers workers workers
1971 1974 1971 197h 1971 1974
Manufacturing 15.1 11.2 35.o 37.7 2?:.L 16.3Construction, energy andtransport 15.0 3.8 15. .9*"1.3 9.1
Commerce and finance 31.0 12.7 21.4 3°.5 26.3 20.8Services 29.1 21i.1 26.' 41.6 29.2 26.3
All sectors 23.4 15.8 24.i 2c.7 23.6 1°.4
/1-Low income bracket in constant 127W prices as defined in source tables 5-.4(a) and (b) in theStatistical Appendix.
Source: Table 5.;(a) and (b), Statistical Appendix.

- 39 -
88. The low earnings and precarious situation of substandard self-employed workers is one of the most important employment problems of Venezuela,and one of the most complex and difficult to solve.
F. General Appraisal of the Evolution of Employment and Earnings
89. The comparison of 1961 and 1974 data, as well as partial evidencefor years within that period, yields an impressive picture of a rapid andparallel growth in population, labor force and employment. This overallgrowth was accompanied by a remarkable shift of people from rural to urbancenters: despite population growth rates between three and four percent overthe period, the rural population remained almost constant in absolute numbers.At the same time, urban areas were absorbing not only this massive rural tourban migration but also a substantial foreign immigration.
90. Economic activity responded favorably to these demographic trends.In agriculture, farm productivity rose rapidly to compensate the loss of farmworkers and the aging of the farm labor force. In other sectors, productiongrew in a relatively balanced fashion, except for the stagnation of oil out-put. Urban output and employment was led by manufacturing, but the governmentand other tertiary activities appear to have grown rapidly. Labor produc-tivity and earnings also rose continuously, but more moderately than has oftenbeen the case in LDC's. The growth in output was therefore paralleled by asubstantial rate of increase in employment.
91. The rapid expansion of modern sector jobs and incomes suggests thatthe informal sector has not played a residual employment role. The low un-employment rate, other evidence of strong demand for labor, and earnings datawhich show that a majority of informal sector workers earn at least as wellas unskilled employees in large establishments all tend to cqrroborate thispicture.
92. At the same time there is partial evidence of lagging incomes amongthe poorest or residual group of informal sector workers, particularly self-employed workers. This evidence, cited above, is statistically open toquestion, given the changes in the sample base between 1971 and 1974, whichincreased the weight of poorer slum areas. Nevertheless, the income lagrecorded by the surveys is significant, particularly since there is no similarlag in wages even though a large proportion of low-income wage-earners alsolive in slum areas. It is clearly imperative that more data and analysis becarried out on this issue since the low-income group in question are a prior-ity target of the Government's social policies.

- 40 -
C~~~~~~~~~~~~~~\
-- - - --------- . *-. . 0 ~

-41-
/G1DX OF -AJCR '4ACR0EC00TC ross Fixed Investment
-VARIABLES, 1,960 - 197h2L0 (1961 = 100)
220
220 / / rGD? (NIonpetroleurn)
210
200 GD?
190
180
1 70
160
14~0
130
120
1100
100
80
ON N ON ON CO oN CN ONi- so - So - t o No r- - - - r- - -

- 42 -
II. THE EMPLOYMENT SITUATION IN 1974
93. The employment situation in the second half of 1974 was characterizedby a strong demand for managerial personnel, technicians and skilled labor andby low rates of open unemployment -- except for young workers -- but there wasstill a considerable amount of low productivity and low income employment,especially in the informal sectors of the urban economy and in agriculture.
A. The Working Population
94. Of the 6.6 million persons who were 15 years and older in Venezuela,in the second half of 1974, 3.4 million were economically active -- eitheremployed or looking for work (Table II.1). The others were housewives,students, retired persons, and those unable to work. Among them were somewho were only temporarily inactive, and who had either worked at some timerecently or who intended to work in the near future.
95. One out of four of the labor force were women, and their proportionhas been increasing. Among women 15 years and over, 25% were economicallyactive. In the Caracas metropolitan area, where one-quarter of the laborforce lives, the participation rate for women is much higher -- 38% --reflecting the effects of urbanization, easier housekeeping, and the largernumber of opportunities in occupations in which women are typically employed(Table II.2).
96. Because of high birth rates and rapid population increase, fully29% of the labor force were under 25 years of age, a high proportion consid-ering the large number in this age group who are students (Table 2.1, Appen-dix I).
97. Among men in the prime working ages, 25-53, those not in the laborforce amount to less than 4% of the population. Half of those currentlyinactive had worked at some time -- most of them in the past year, suggestingthat working is part of the pattern of their lives even though they are notcurrently participating (Table 2.4, Appendix I). Among young men 15-24, onthe other hand, more than 90% of those not in the labor force were reported asnever having worked in a regular full-time job. Part of the difficultyyoung workers have in the labor market, illustrated in their high unemploymentrates and low earnings, may be associated with their lack of any serious workexperience while in school.
98. Among women in ages above 25, only a small proportion of the in-active group have had any recent labor force attachment; less than 4% workedin the past year. This suggests that there is little temporary entrance ofwomen for seasonal or occasional jobs and that for the great bulk of adultwomen a stable pattern of life has developed which excludes work outside thehome.
99. The fact that relatively few nonworking women and students enterthe labor force temporarily casts significant light on the meaning of open

- 43 -
Table II-1: DISTRIEUTION OF POPULATION 15 YEARS OR OLDER (1974)
(Thousands of persons)
Total Men Women
L. Total Population15 years or older 6,578 3,246 3,332
2. In the labor force 3,428 2,586 842(Participation Rate) (52.1) (79.8) (25.3)Employed 3,211 2,419 789Unemployed 217 164 53(Unemployment Rate) ( 6.3) ( 6.3) ( 6.3)
3. Not in the labor force 3,150 660 2,490
Table II-2: LABOR FORCE PARTICIPATION RATES IN CARACASAND VENEZUETA (For 15 years or older)
(1961-1974)
1961 1971 1974
Caracas
Men 77.9 81.9 79.8Women 29.1 35.5 37.8
TOTAL 53.6 57.7 57.9
Venezuela
Men 89.5 80.3 79.8Women 20.5 22.6 25.3
TOTAL 55.4 51.1 52.1

- 44 -
Table II-3: PERSONS NOT IN THE LABOR FORCE, BYTHE AMOUNT OF TIME THAT HAS PASSED SINCE THEIR LAST
JOB, BY AGE AND SEX, II 1974 (15 years and over)
Percent of population15 years and over
Men Women
Persons in the labor force 79.8 25.3
Persons not in the labor force 20.2 74.7
Last worked:- less than one year ago 1.2 3.1more than one year ago 1.5 8.9
Never had a regular full-time job 17.5 62.7

- 45 -
unemployment in Venezuela. In the United States unemployment rates for youthand women are typically higher than for adult men, and most of the differenceresults from job seeking by new entrants or reentrants in the labor force. InVenezuela, on the other hand, the unemployment rates for women are equal to orbelow those for men. The higher rates for workers 15 to 24 years of age inVenezuela must result from factors other than their frequent entrance to thelabor force. Similarly, the fact that a smaller proportion of the unemployedin Venezuela are short-term unemployed (one-third being unemployed for lessthan 5 weeks, compared to about one-half in the United States) can also beexplained in part by the smaller numbers of students and adult women enteringthe labor force to seek temporary jobs.
100. The labor force of Venezuela has a high degree of literacy, espe-cially among young people, more than 90% of whom are literate. In the workforce as a whole, only 16.5% were illiterate, and nearly two-thirds had atleast 4 years of primary schooling (Table II.4). The most common level ofeducation reported was 4-6 years of primary schooling, held by 38.5% of thelabor force; 15.2% had secondary education; and 10% had some form of post-secondary education, of which more than one-third, or 3.7% of all workers,reported higher education.
101. The effect of extension of schooling to a broader sector of thepopulation in recent years is seen in the percent of illiterates at each agelevel (Table 1.4, Appendix I). Among 15-19 year olds, 94% of the boys and 92%of the girls were literate in II 1974; literacy rates fell off steadily withage, reaching 49% of the men and 65% of the women at ages 55-64. In theCaracas metropolitan area, literacy rates were, of course, higher -- 98% forboys and girls 15-19, and 76% for men and 91% for women at age 55-64.
102. Among occupational groups, professional and technical workers werethe best-educated: 63% of them had one or another form of post-secondaryeducation (superior, technical or normal, or "other branches," which includesprivate technical or business schools) (Table II.6). Of the office workers,74% had at least a secondary education, and one-third of these had some formof post-secondary education. Among the major groups of manual workers --artisans, operatives and drivers in transportation -- the most common educa-tional level was 4-6 years of primary school, reported by between 50 and 60%of each of these groups. Altogether, 74% of the drivers, and about 85% ofthe artisans and operatives had a primary schooling or less. Among agricul-tural workers the educational level was lowest; 47% were illiterate, andanother 31% had less than 4 years of primary schooling.
B. Structure of Employment and the Demand for Labor
103. Venezuela's economy resembles that of highly industrialized coun-tries in the fact that a high proportion of its employment is in the "ter-tiarv" or service sectors. Employment in the informal sector of the economyis a significant part of the total, as is illustrated by the large proportionof self-employed workers. In the nonagricultural sector, 655,000 workers, or25.8% of the total, are self-employed, while another 14% are employees in

- 46 -
Table II.4: EDUCATIONAL LEVEL OF THE LABOR FORCE, II 1974
Percent of total
TOTAL 100.0
Illiterate 16.5No formal education 5.2Primary: 1-3 years l4.9
4-6 years 38.5Secondary 15.2Technical and normal 2.6Higher education 3.7Other branches 3.4
Source: Appendix Table 2.7
Table II.5: LITERACY RATES IN VEIEZUELA - 1974
(Percentages of population of the age group)
Age group Total Rural UrbanMen Women Men Women Men TWomen
15-25 92 94 80 82 96 9625-64 74 73 61 50 91 8365 and over 54 46 29 18 67 56

- 47 -
Tabua II.6: EMPLOYMENT BY EIUCATIONAL LEVELOCCUPATION, 1974 (II)
(percentages)
Primaryeducation Normal or
Illiterate 1-3 4-6 Secondary Technical Superior Other
TOTAL 17.1 15X1 37.9 14.8 2.6 3.8 3
Professionals andtechnicians 0.2 1.2 15.2 20.4 23.9 30.3 8.4
Managers andadministrators 1.6 5.4 39.4 34.6 2.2 11.4 2.8
Office workers 0.2 1.1 2h.8 48.7 1.2 6.2 17.5Salesmen 11.8 14-.C 43.1 17.3 0.2 1.5 2.2Agriculturalworkers 46.9 22.0 19.8 1.9 0.1 0.3 0.3
Miners 13.5 10.3 45.8 16.2 8.3 -- 3.7Drivers andcommunicationsoperators 5.3 16.5 57.8 12.8 0.2 0.2 1.6
Artisans andoperatives 9.3 15.6 53.1 13.3 1.6 0.3 1.8
Service workers 18.6 19.2 46.5 7.8 0.1 0.3 1.2
Source: Table 1.3

- 48 -
small (under five employees) firms. The self-employed are concentrated inseveral occupations. In many cases, as will be seen later, this self-employment brings in very low incomes (Table II.7 and Table 5.1, Appendix I).
104. The high current demand for labor may be illustrated by severalfacts:
(a) The rate of employment growth has been high in recent years,averaging 4.3% annually from 1971 to 1974.
(b) Rates of open unemployment for adult workers over 35 years ofage are at low levels -- less than 3% for men, and less than 2%for women (Table II.9). The total unemployment rate of 6.3%is below the rates typical of developing countries, althoughsubstantially above those in industrial countries at timesof rapid economic expansion.
(c) The newspapers are currently printing many advertisements forqualified workers, evidence that the easier channels for hiringsuch workers -- word of mouth and receipt of applications -- arenot producing all the workers needed. Analysis of one day'sadvertisements in El Universal (Table 11.18) shows that whilethe occupations specified included mostly highly qualifiedworkers there were a considerable number of requests for salespersons, clerical workers and manual workers. The advertisementsfrequently specified that experienced workers were required.
(d) The strong demand for qualified workers is also illustratedby the experience of recent graduates of training programsconducted by INCE: virtually all the graduates of programsin the metal trades in the Caracas area, for example, werehired immediately.
(e) Looking ahead, the ongoing development programs of such largeemployers as C.V.G., the agency charged with development ofthe steel, aluminum and electric power industries in theprovince of Guyana, the Ministry of Public Works, the FondoAgropecuario and the Ministry of Education all show verysubstantial needs for additional professional, technical andskilled workers in the next few years.
105. Because of the dynamic nature of the employment situation, theresults of the Household Survey for the first half of 1975, which will soonbe available, will be of considerable interest.

- 49 -
Table -II.7: STRUCTURE OF IFLOY1MT
Percent of total em-ployment, II 1974
Primary sector (agricultureand mining) 22.6
Secondary sector (manufacturing,construction, electricity, gas,water and sanitary services) 26.5
Tertiary sector (services,commerce, finance, transporta-tion and communications) 50.8
(Data from Table 3.1)
Table II.8: PRINCIPAL OCCUPATIONS OF SELF-EMPLOYED WORKERS, II 1974
% of Totalself-emnloved
Sales workers (including thosein stores and street vendors) 33.9
Artisans and operatives 28.3
Drivers in transportation 13.3
Service occupations 10.2
(Source: Table 5.13)
Table II.9: UNEI4JOYMIT RATES BY AGE AND SEX, II 1974
Both sexes Men WomenTOTAL 6.3 6.3 6.3
15-19 13.1 1 -2' 1S7--20-24 11.5 12.1 10.225-34 6.1 6.3 5.635-44 2.8 3.0 1.945-54 2.6 3.1 .955-64 2.8 2.9 1.765 and over 1.8 2.0 0.0Source: Appendix Table 4.1

- 50 -
C. Unemployment
106. In the second half of 1974, about 220,000 people were reported asunemployed 1/ in the Household Survey, 166,000 men and 54,000 women. Theunemployment rate was 6.3% of the labor force for both men and women (TableII.10). Rates for men were slightly higher than for women at every age except15-19. This contrasts with the situation in 1961 and in 1971, when theaverage rates for men were reported to be nearly twice as high as those forwomen.
107. The rate of unemployment in Venezuela is considerably higher thanthat in industrial countries in terms of economic expansion, but no higherthan the rate of about 9.0% now prevailing in the United States and Canada,nor the typical rates on developing countries (6 to 7% in Chile, 9 to 10% inPanama, Korea, Malaysia, and the Philippine Islands, 10 to 12% in Colombiaand Puerto Rico, 14 to 15% in the Dominican Republic, Trinidad and Tobago andCeylon, 18% in Curacao and 21% in Guyana).
108. Unemployment in Venezuela presents some characteristics similar tothose generally found in both industrialized and developing countries, othersthat correspond to the typical patterns of the latter, and others peculiarto Venezuela.
109. Unemployment is usually higher in urban areas, since farm workerswho have land of their own are likely to have done some work on it and thosewho have no land help their relatives when they are out of work, or move tothe nearest center. In 1971 and 1974, the rate in Caracas was about the sameas in Venezuela as a whole -- 6.3%. In other cities it was higher -- 8.3%; andin the rural areas it reached only 2.1% (Tables II.10, II.11 and II.22).
110. The rates for 15-24 year old workers were the highest; in 1974rates for this age group were nearly twice as high as the average for all agegroups (Table 11.10). This relationship is typical of developing countries,and is found in Colombia, Chile, Guyana, Trinidad and Tobago, the DominicanRepublic, the Philippine Islands, Ceylon and India. In the United States therate for workers 16-24 is also about twice the average and a little more whentotal unemployment is low.
111. Among the reasons for the high unemployment rate for young workersin comparison with that for other workers may be the large increase in popu-lation in this age group. Since young workers are confined to a narrowerrange of occupations than mature workers because of their limited skills andthe cost of training them, the economy finds it difficult to absorb a suddenpopulation surge in this age group. The population in ages 15 to 24 has
1/ Open unemployment is defined as the number of persons who did no work inthe previous week but who were actively looking for work. A person whosays he was looking for work but can report no step he took to find workis classified as "not in the labor force" or inactive.

'U
It t~~~~~~~~~~~~~~~~~~~I
s c I c ri~~~~~~~~~~~~~~~~~~~~~~~~~~~~~~~~~~I-
J ~ -1 (I ( 1 I l t - - . A L -- L. I -t -_ .-I - - - - - -L I J I I I I

- 52 -
Table II-10: NUMTER OF UNEMPLOYED WORKERS AND UNMIPLOY.MENT RATES (1974 II)(Population 15 years and over)
(Numbers in thousands)
Age group Number of unemployed Unemployment rateTotal Men Women Total Men Women
TCTAL 216.9 163.6 53.2 6.3 6.3 6.3
15-1-c 43.3 37.3 17.0 13.1 12.4 15.120-2L 67.1 49.2 17.9 11.5 12.1 10.225-3;- 54.7 41.1 13.6 6.1 6.3 5.6
20.4 17.0 3.3 2.8 3.0 1.95-5u 12.0 11.2 .8 2.6 3.1 .9
6.6 6.o .6 2.3 2.9 1.745 and over 1.9 1.9 - 1.3 2.2' -
ou.rce: Table L4.1 Statistical Appendix.
Table II-11: CARACAS - UNEMPLOYMENT RATES 1974 (II)
Age groups Total Men Women
i5-19 16.3 19.7 11.620-24 9.3 10.6 9.425-3L 5.5 5.8 4.835-4h 2.9 3.0 2.745-54 2.6 3.0 1.755-64 3.4 4.4 0.765 and over 2.4 2.9 _
TOTAL 6.3 6.8 5.3
Source: Table 4.2 Statistical Appendix

- 53 -
Table II.12: VENEZUELA: PERCENT INCREASE IN
POPULATION BY AGE GROUP, 1961 TO 1971
Age in 1971, years Percent Increase
TCTAL L2.50-h 26.35-9 W 410-14 61.315-l 9 79.520-2h 55.725-29 26.930-3h 16.935-39 33.140-44 41.7'5-49 33.',5-59 38.855-59 39.560-6h h5. 8
Source: DGE & CN, X Censo de Poblaci6n y Vivienida, Venezuela:Resumen General, Caracas, 197h, p. 7.

- 54 -
increased more rapidly from 1971 to 1974 than that in any other working-agegroup, as can be inferred from Table II.12. From 1961 to 1971 the fastest-growing age groups were those 15-19 and 10-14; by 1974 the peak of thispopulation wave had moved up into the 20-24 age group. The situation is seenmore sharply in the fact that the 10-19 age cohort in 1971, which had movedsubtantially into the 15-24 age group by 1974, was more than twice the size ofthe 15-24 age group in 1961. (2,673,000 and 1,297,000 respectively).This is likely to have taxed the absorptive capacity of industry.
112. Although in some other countries, such as the United States,unemployment rates for young workers are high because they enter or reenterthe labor market frequently while they are students, seeking part-time orvacation jobs, such frequent work experience is not typical in Venezuela, asnoted above. This explains why the proportion of unemployed youth who havebeen unemployed for only a short time is low in Venezuela -- no higher thanat other ages -- and why one-quarter of the 15-19 year olds and more thanone-third of the 20-24 year olds who are unemployed have been unemployed for15 weeks or more (Table II.13).
113. The introduction of a minimum wage in June 1974 does not seem tohave been a factor in youth unemployment. Examination of the labor forcestatus of young workers shows no significant change from the first to thesecond halves of 1974 (Table 4.2, Appendix I) with the possible exception ofan increase in unemployment for girls 15-19.
114. The unemployment rate of family heads was low -- half the average --not only because they have the labor market advantages of mature and exper-ienced workers, but also because they have to have income and so take any workthey can get. The unemployment rate for sons and daughters living with theirfamilies was twice the average, consistent with the high rates for youngworkers (Table II.15).
115. The association of unemployment with lower levels of education,which we generally expect, is not evident in the data (Table II.16). Highestunemployment rates were those for workers with special types of secondaryeducation (14.2% unemployed) and regular secondary education (8.6%), whileunemployment among the least educated was below the average. This is probablydue to the high unemployment rates for youth, who are, on the average, bettereducated than adults. If a separate tabulation on educational levels by agefor the unemployed were available it might show the expected correlation.
116. The occupations suffering the highest rates of unemployment in 1974,in Venezuela and in Caracas were the artisans -- both those in factories andothers. Their unemployment rates were in the range of 8 to 9%, compared toan average of 6.3% for all workers (Table II.17). (In the second half of1974, a higher rate was shown for mine workers, but their number is small andsampling variability is high; in the first half their rate was close to theaverage.)
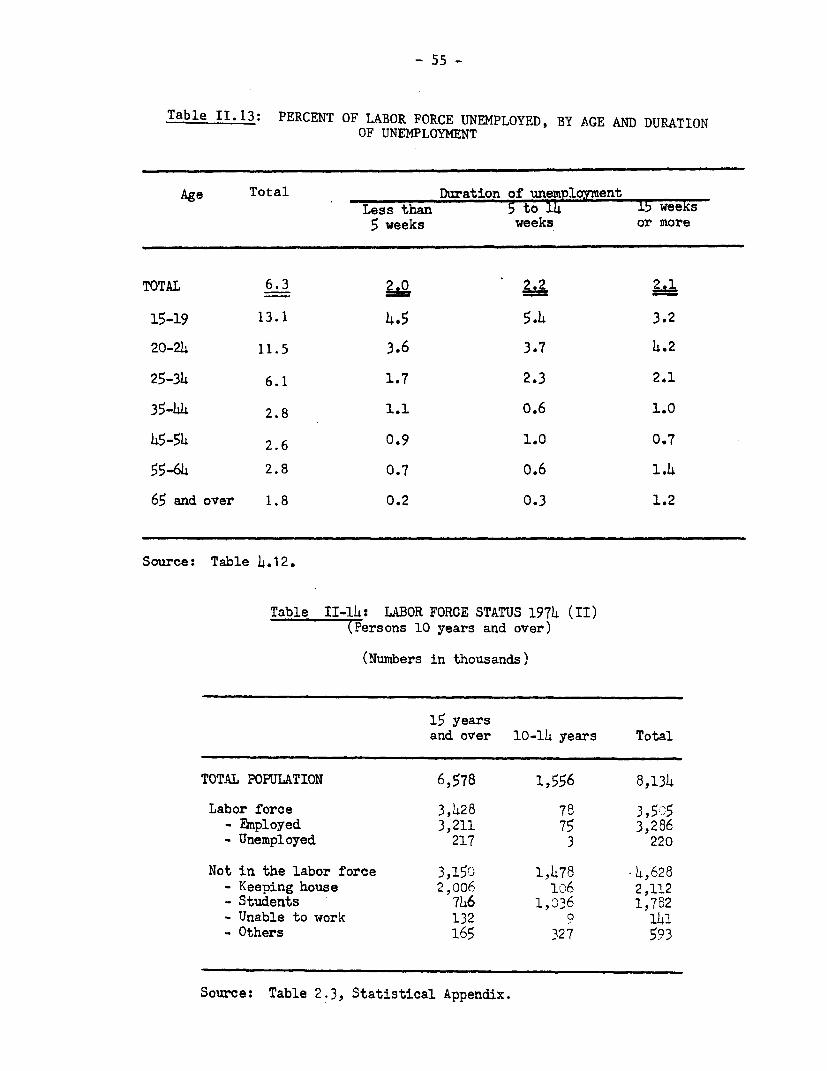
- 55 -
Table I1.13: PERCENT OF LABOR FORCE UNEMPLOYED, BY AGE AND DURATIONOF UNEMPLOYMENT
Age Total Duration of unemploymentLess than 5 to 14 15' weekcs5 weeks weeks or more
TOTAL 6.3 2.0 _2.1
15-19 13.1 4.5 5.4 3.2
20-2h 11.5 3.6 3.7 4.2
25-34 6.1 1.7 2.3 2.1
35-44 2.8 1.1 0.6 1.0
45-54 2.6 0.9 1.0 0.7
55-64 2.8 0.7 0.6 1.4
65 and over 1.8 0.2 0.3 1.2
Source: Table 4.12.
Table II-14: LABOR FORCE STATUS 1974 (II)Wersons 10 years and over)
(Numbers in thousands)
15 yearsand over 10-14 years Total
TOTAL POPULATION 6,578 1,556 8,134
Labor force 3,428 78 3,5:5- 5nployed 3,211 75 3,286- Unemployed 217 3 220
Not in the labor force 3,150 1,478 *4,628- Keeping house 2,oo6 1o6 2,112_ Students 746 1,C6 1,782- Unable to work 132 9 141- Others 165 327 593
Source: Table 2.3, Statistical Appendix.

- 56 -
Table II.15: UNEMPLOYED PERSONS BY POSITION IN FAMILY AND SEX, I 1974
Numbers (in thousands) Unemployment ratesTotal Men Women Total Men Women
TOTAL 208.1 161.2 46.9 6.1 6.2 5.7
Family head 55.7 51.5 4.3 3.1 3.2 2.5Spouse or companion 6.1 -- 6.1 2.6 -- 2.6Son or daughter 104.1 77.2 26.9 11.7 11.7 11.8Other relatives 39.1 30.1 8.9 11.2 11.5 10.1No relatives 3.0 2.4 .7 1.9 4.2 .7
Source: Table 4.3.
Table II.16:UNEMPLOYED PERSONS BY EDUCATIONAL LEVEL AND SEX, I 1974
Numbers (in thousands) Unemployment ratesTotal Men Women Total Men Women
TOTAL /a206.3 159.9 46.4 6.1 6.2 5.7
Illiterate 16.7 15.5 1.3 2.7 3.1 1.1Without formal education 3.0 2.5 .5 1.8 1.8 1.7Primary: 1-3 years 120.6 102.3 18.3 5.1 5.5 3.2
4-6 years 27.7 24.2 3.5 7.2 7.8 5.2Secondary 42.3 30.4 11.9 8.6 8.9 8.oTechnical and normal school 4.5 1.7 2.8 5.4 5.9 5.2Higher education 5.1 2.5 2.6 4.1 2.7 8.5Other branches 15.8 6.3 9.6 14.2 11.3 17.0
/a Total excludes 1,800 persons 10-14 years of age who are included in the otherlines.

- 57 -
Composition of the Unemployed
117. The foregoing discussion has described the incidence of unemploymentupon various groups in the working population, as shown by their unemploymentrates. It is also useful to examine the characteristics of the unemployed interms of the composition of the unemployed group.
118. Three-quarters of the unemployed in the second half of 1974 weremen; 56% were concentrated in the 15-24 year age group. The age and sexcharacteristics of the unemployed were as follows:
Both sexes Men Women
All ages 100% 75 25
15-24 years 56% 40 1625 years and older 44% 35 9
119. Thus, the largest group of unemployed is the youth, and among youngworkers, men outnumber women by more than two to one.
120. One-quarter of the unemployed were family heads, and half were sonsand daughters living with their families (Table II.15). The remaining one-quarter were mostly other relatives living in the household; wives of familyheads amounted to only 3% of the unemployed. From this point of view theunemployment problem does not appear as acute as if family heads were thebulk of the unemployed. But, as the discussion of family income later in thischapter will show, many families depend heavily on income from secondaryearners, and a great deal of poverty and deprivation is associated with theirunemployment.
121. The educational level of the unemployed reflects the same generalunderlying situation as does their occupational experience: more than two-thirds of them had a primary education or less. There was, however, a substan-tial proportion with a secondary education (Table 11.16).
122. The bulk of unemployed workers were manual workers, mostly with lowlevels of skill. One-third of them had last been employed as artisans oroperatives, about one-tenth as sales workers and an equal number in serviceoccupations. One out of six of the unemployed was seeking work for the firsttime. Taking together the professional, technical, managerial and officeworkers, who comprise the bulk of white-collar workers, they amounted to only14% of the unemployed (Table II.17). These numbers may be contrasted withthe current demand for more highly qualified workers suggested by the news-paper advertisements mentioned above (Table II.18).

- 58 -
Table II.17: UNEMPLOYMENT RATES, BY OCCUPATION, 1974
Occupation 1974I 1974II
TOTAL 6.1 6.3
Professional, technical 3.7 3.5Managerial 2.4 2.1Office workers 7.8 6.5Sales workers 5.0 6.0Farm workers 1.7 1.6Mine workers 6.2 12.4Drivers in transport 5.2 7.2Artisans and operatives in factories 9.0 8.3Other artisans and operatives 8.1 8.1Service workers 4.5 4.6Occupation not identifiable 7.0 8.6
Source: Direccion General de Estadistica, Household Survey 1974.
Table II.18: HELP-WANTE ADVERTISEMENTS IN EL UNIVERSAL FOR APRIL 21, 1975
Advertisements EmploymentOccupation Number Percent in Caracas
of Total (Percent of Total)
TOTAL 168 100.0 100.0
Professional, technical 43 25.5 13.2
Managerial 20 11.9 5.5
Office workers 43 25.5 12.9
Sales workers 26 15.L 11.0
Transportation equipmentoperators a 2.3 7.0
Artisans and operatives 32 19.0 27.0
Service workers - - 19.7
Other and unspecified - - 1.3

- 59 -
Table II.19: UNEMPLOYED, BY INDUSTRY OF LAST JOB, AND SEX, II 1974
(In thousands)
TotalIndustry Number Percent Men Women
TOTAL 219.5 100.0 165.7 X3.7xz=~=
Agriculture, etc. 15.4 7.0 1h.4 1.0
Mining 3.3 1.5 2.9 .Manufacturing 38.3 17.4 32.7 5.6Construction 34.0 15.5 33.5 .5Electricity, gas, etc. 1.7 .8 1.5 .2Commerce 36.2 16.5 27.6 8.5Transport 13.1 6.o 12.1 .9Services(public and private) 41.0 18.7 24.0 17.0
Not specified .7 .3 .7
Seeking work for the firsttime 35.8 16.3 16.3 19.5
Source: Table L.6, Statistical Appendix.
- 60 -
123. With respect to the industry in which they were last employed,roughly equal numbers had been in services, manufacturing, commerce and con-struction -- about one-sixth of the total in each case (Table II1.9). It isnoteworthy that these were the fastest-growing industries in Venezuela, sothat in terms of their employment experience many of the unemployed are goodcandidates for jobs; to some extent their unemployment is frictional only,and these individuals may be expected to get jobs soon.
Long-term Unemployment
124. About one-third of the unemployed in the second half of 1974 wereexperiencing severe difficulties in getting work, as shown by the fact thatthey had been seeking work for 15 weeks or more. On the other hand, one-thirdof the unemployed had been seeking work less than 5 weeks; in this group arethe frictionally unemployed, those workers who have no particular difficultyin finding work, but take a few weeks to get a job after they start looking.
125. The proportion of unemployed young workers who were out of work15 weeks or more is no higher than the average for all ages -- about one-third(Table 4.8). But when long-term unemployed are calculated as a percent of thelabor force (rather than of the unemployed it can be seen that a high propor-tion of the young workers in the labor force were long-term unemployed(Table II.13). In fact, the long-term unemployment rate for youth is higherthan the total unemployment rate for adults, illustrating the seriousnessof unemployment for some young people.
126. Most of the unemployed workers 55 and over had been out of work morethan 15 weeks. Few workers at this age become unemployed, but when they do,they remain unemployed very long (Table II.13).
127. While unemployment affects the less-skilled workers more than thosewith the highest skill levels, when professional, technical or other white-collar workers were unemployed they remained unemployed longer than those withlower levels of skill (Table 4.9). This may reflect a higher level of familyincome that enables these workers to wait longer periods for a job they con-sider suitable to their training or expectations.
128. The same patterns can be seen in the data on educational level; morethan 40% of the unemployed with a secondary or higher level of education werelong-term unemployed, compared to less than 30% of those less educated(Table 4.16).
129. Among different members in a family there appear to be no signifi-cant differences in the duration of unemployment (Table II.20).
130. Long-term unemployment among men is more prevalent in Caracas thanin the country as a whole. This is true for workers at every educationallevel except for those with higher education, who remain unemployed longerin the rest of the country than they do in the capital. For women, the pro-portion of long-term unemployed is about the same in Caracas as in the countryas a whole (Table 4.16, Appendix).

- 61 -
Table 11.20: UNEMPLOYED, BY DURATION OF UNEMPLOYMENT, POSITIONIN FAMILY, AND SEX, II 1974
(10 years and over)
Position in family Percent distribution by durationof unemployment
Less than15 weeks 15-26 weeks 27 or more weeks
Total, both sexes 66.9 15.7 127M
Head of family 68.h 16.1 15.5Spouse or companion 70.4 9.4 20.2Son or daughter 64.7 15.8 19.5Other relative 69.8 16.3 13.9Not related 72.3 12.0 15.7
Total, men 67.2 17.1
Head of family 70.3 15.0 14.7Son 63.4 16.8 19.8Other relative 71.7 1.2 14.1Not related 73.6 13.9 12.5
Total, women 9 1.7 18.
Head of family 54.8 2L .3 20.9Spouse or companion 70.4 9.h 20.2Daughter 68.1 13.1 18.8Other relative 63.9 22.9 13.2Not related 69.5 8.2 22.3
Source: Table 4.10.

- 62 -
D. Hidden Unemployment and Underemployment
131. Unemployment as it is defined is the most obvious aspect of aninadequate employment situation, but often there are equally serious conditionsnot so easily measured. One of these is hidden unemployment -- the withdrawalfrom job-seeking by people who need and want work but believe there is nouse in looking for it because they could not get work. The second, and mostwidely prevalent, is underemployment, defined in several different ways, butgenerally connoting employment that in one way or another is inadequate, butwhich people engage in for lack of anything better.
Hidden Unemployment
132. Since the unemployed are defined basically as persons who had nojob in a particular week and were looking for work, many people who need anddesire work but did not look for work at the time because they believed thesearch would be useless are missed in the unemployment count. These have beencalled the "hidden unemployed". Data for the United States shows that at alltimes there are some people in this category, ranging from about one-half ofone percent of the labor force when employment opportunities are relativelygood up to about twice that proportion when jobs are difficult to get.Typically these people remain inactive for only limited periods of time; mostof them test the labor market from time to time. Others, however, drop out ofthe labor force more permanently, particularly those approaching retirementage.
133. The evidence of hidden unemployment may be found in declines inrates of participation in the labor force. The mission examined particularlythe experience in Venezuela in recent years to see if the decline in openunemployment, accompanied by a drop in participation rates for men, from 1961to 1971, reflected an increase in hidden unemployment (see Appendix 2, Note C).This analysis concludes that most of the decline in participation rates foryoung men is associated with longer periods of education; that some of theapparent decline was caused by a change in the questions asked in the censusto make the definition of unemployment more restrictive, throwing more mennot currently employed into the inactive category; but that some part of thedeclines in labor force participation from 1961 to 1971 did indeed reflectwithdrawal because of discouragement with employment prospects. The improvedemployment situation by 1974 brought many of these men back to work.
134. Nonparticipation because of discouragement with employment oppor-tunities is more difficult to identify among women, since their labor forceparticipation has been rising steadily, and there are no periods in which itdrops, as has been the case for men. The data for the United States, referredto above, is based on special questions asked of people not in the laborforce, and more women than men are in the "discouraged worker" category.

- 63 -
135. Additional insight as to the extent to which the participation ratesfor men reflect hidden unemployment can be gained by comparing rates inVenezuela with those in other countries. Since labor force participation isgenerally higher in agricultural areas because of the opportunities for workon one's own farm, the most valid comparisons are to countries with about thesame portion of their labor force engaged in agriculture. Among South Americancountries, only Argentina, Chile and Uruguay had proportions in agriculturesimilar to the 21.7% found in Venezuela. Japan, with a similar proportion inagriculture, and with a very low unemployment rate and probably minimal hiddenunemployment, provides an interesting comparison. All these comparisons mustbe interpreted cautiously since the data are for different periods from 1960to 1970, and for most of these countries there are no data on unemployment atthe time. The comparative data for Venezuela and other countries is shown inTable II.23.
136. In all age groups from 30 to 64, participation rates for men inVenezuela are equal to or above those in Argentina, Chile and Uruguay, butbelow those in Japan. At ages 20-24 and 25-29, on the other hand, the ratesin Venezuela are below rates in all four of the other countries. A highrate of school attendance accounts for some of the low participation atages 20-24, and at this age participation in Venezuela is not far below thatin Chile and Japan. At ages 15-19, participation rates in Venezuela arewell below those in Argentina and Uruguay, but above those in Chile andJapan.
137. The evidence from these comparisons is consistent with a moderategeneral unemployment rate in Venezuela, but high unemployment for youngworkers. The comparison with Japan suggests the possibility of a small amountof hidden unemployment in Venezuela, amounting to a few percentage points, buteconomic and social differences between the two countries make one hesitantto draw conclusions.
Underemployment
138. The study of underemployment encounters grave difficulties inmeasurement, since, with a single exception, its manifestations are not regis-tered statistically. Underemployment has been variously defined as employment(1) that provides only part-time work to people who want full-time work,(2) that provides only sub-marginal income (defined as that below a level ofminimum adequacy, or below a poverty level, or below the established minimumwage), (3) that is below the level of skill possessed by the worker, (4) thatis below the level of skill he is capable of attaining if given the oppor-tunity, (5) that is at a level of productivity below that attainable with theexisting technology, (6) that is such that if the worker were to stop workingthere would be no net reduction in output, or (7) that is irregular from weekto week in hours worked and earnings, so that in some weeks the worker earnsless than he is capable of when fully employed. The usual statistics availablemeasure only the first type of underemployment with precision.

- 64 -
Tabie I. 21: wr ".S 1C YEARS A.N OVER WHO WORKED LESS THAT30 OTPRS A WEEK, BY REASON FOR WORKING PART-TPME, I AND II 1974
(Numbers in thousands)
1974 T _1074 IIPeason for WœTorking Percen+ of Percent ofPart-time Total labor force Total labor force
TCYTA' 191 5.6 118 3.4
w. Working part-time foreconomic reasons 40 1.2 25 0.7
Slack Worlk 37 1.1 21 0.6
2. Working part-time fornoneconomic reasons L51 4.4 93 2.7
Do not wantfull-time 'ork 45 1.3 41 1.2ItCtlherll reasons 99 2.9 43 1.2
Data from Table 3.9, Statistical Appendix

- 65 -
Part-time Work
139. There seems to be relatively little part-time work in Venezuela, andmost of it is voluntary on the worker's part. Defining part-time work as lessthan 30 hours a week, we find (Table II.21) that in 1974 I, 191,000 workers(5.6% of the labor force) worked part-time, but 151,000 of these (4.4% of thelabor force) did so for personal reasons rather than because full-time workwas not available. Only 1.2% worked part-time involuntarily. Involuntarypart-time work was even less in 1974 II (Table II.21). (In contrast, in theUnited States, with about the same average level of unemployment in 1974,about 15% of the labor force worked less than 30 hours a week, and about 3%worked short hours involuntarily. U.S. Department of Labor, Employment andEarnings, January 1975, pages 141 and 151.)
Low Income
140. For purposes of this discussion, low income is defined somewhatarbitrarily in the same way as it has been defined in a publication of theDGE & CN: income of less than Bs 100 a week (equivalent to Bs 430 a month)for an employee, or less than Bs 500 a month for a self-employed or own-account worker. The minimum wage enacted in the Spring of 1974 is Bs 15 aday, or the equivalent of Bs 387 a month for a fully employed worker.
141. Setting the low-income criterion at a higher level for self-employed allows for a return on capital investment in the business; theperson reporting is not likely to distinguish his gross income from his netentrepreneurial income. Moreover, while most employees have many fringebenefits in addition to their wages, the self-employed do not.
142. While no single income criterion is completely appropriate formeasuring the complex phenomenon of underemployment, the characteristics ofpersons whose income from work is below this level are probably reasonablyrepresentative of those who would be defined by other criteria of underemploy-ment.
143. The Household Survey does not report the earnings of agriculturalworkers and the Mission had to limit this analysis to urban unemployment.
144. Since reporting of income in household surveys is often inaccurate(most often understated), an attempt was made to check the reported incomeagainst other data. The results of this are shown in Appendix 2, Note B.The conclusion reached is that the income data reported to the HouseholdSurvey are inaccurate, as expected, but not grossly understated, and in somecases overstated by as much as 20%. They are usable only as rough approxi-mations of true income.

- 66 -
Table TI.22: UNEMPIQY MIT RATES BY AREA AND SEX, II 1974
Venezuela Metro- Other Ruralpolitan cities AreaArea
Both sexes 6.3 6.3 8.3 2.1
Men 6.3 6.8 8.7 1.9
Women 6.3 5.3 7.4 4.1
Source: Encuestas de Hogares, XX Naoonal y XII AreaMetropolitana, Ministerio de Fomento, DGE Y CN.

Table II.23: LABOR FORCE PARTICIPATION RATES FOR MEN, BY AGE, IN VENEZUELA AND VARIOUS OTHER COUNTRIES
Venezuoln Argentina ChAin UrilgJlay BraM.l Colombin Feru Mextco Jap,in UnJit.,i "t. 'sAge XI 1971 Average,
1971 30.IX.1960 22.TV.1970 16.X.1960 1.IX.1970 15.VII.1964 2.VII.1961 28.1.1970 1.X.1910 I.IV.1970
Less than 15 -- 8.0 2.3 .8 3.4 5.8 4.3 1.9 2.2 -- .9I1'-19g 50.2 43.1 72.1 42.3 70.0 62.1 66.3 54.9 49.9 36.5 10.320-21 81.9 79.2 90.3 83.0 93.3 88.6 89.8 91.6 79.6 83.5 0(?.925-29 93.0* 95.0* 96.8 95.1 97.1 9h.2 95.9 97.5 90.6 98.2 92.930-1i9 97.0* 97.0* 96.9 95.3 96.5 911.8 97.2 98.7 93.8 g8.1, 9)4.950-54 91.-5 94.0* 87.2 87.2 86.8 87.7 95.1 97.7 92.3 97.3 91.955-59 85.o* 87.5* 71.5 80.7 72.8 82.6 92.5 96.2 90.6 911.2 86.1)6o-64 75.0* 78.5* 57.0 71.2 53.1 73.5 86.8 91.9 86.1 85.8 73.065 and over 50.1 57.9 38.3 40.3 21.1 51.0 58.9 68.7 70.4 54.5 214.8
Percent of laborforce employed inngriculture ** 21.7 17.8 21.2 18.1 44.4 47.2 46.9 39.2 19.1 4.2
* Interpolated values. Actual data for 1974 were: 25-34, 96.1%; 35-44, 97.7%; 45-54, 95.9%; 55-64, 85.9%. Data for 1971 were: 25-34, 97.7%; 35-b4,96.11; 45-54, 93.6%; 55-64, 81.24.
** See 197h figure. Census 1971 data by branch of activity are subject to large error from inadequate reporting.
Source: Venezuela - Household Survey and 1971 Census. Other countries: ILO Yearbook of Labour Statistics, 1973, Tables 1 and 2.

- 68 -
145. Incomes reported on the Household Survey increased substantiallyfrom the first half of 1974 to the second half, in part because of the pro-mulgation of a minimum wage law and a general increase in wages and salaries(Table II.24). This affected the proportion of wage and salary workers whoseearnings were below the low-income level. Early in the year 23% of all non-farm wage and salary employees in Venezuela reported usual weekly incomes ofless than Bs 100. In the second half of the year, the figure dropped byone-third to 285,000 or 15.5% of all wage and salary employees. In Caracas,where earnings were higher, the proportion of low-wage workers was 15.3% inthe first half and 10% in the second half -- also a one-third reduction.Many more of the women wage and salary workers were low-income earners thanof the men.
146. The reported incomes of self-employed workers also rose in thesecond half of 1974, partly reflecting higher levels of spending. Neverthe-less, the problem of low incomes is considerably more serious among self-employed workers than among wage and salary workers. A significantly higherproportion of the self-employed than of employees were in the low-incomegroup -- 35% earned less than Bs 500 a month in the first half of the year,and 29.2% in the second half. The number earning less than Bs 500 monthly inthe second half of the year was 191,000. In Caracas, the figures were 19%and 17% respectively. Again, a higher proportion of the women were low-earners than of the men.
147. Taking wage and salary workers and self-employed workers together,there were 476,000 workers earning low incomes in Venezuela in the second halfof 1974. To understand the employment problems of the country it is essentialto get some insight into who these people are and the circumstances associatedwith their low earning capacity.

- 69 -
Ya.)Ie 'T.2L: LOW-INCOME WvORKERS AS A PERCENT OF ALL WORKERS 15 AND OVERBY CLASS OF WORKERS AND SEX, VENEZUELA AND CARACAS, FIRST
AND SECOND HALVES OF 1974
(Agricultural workers are excluded)
First half Second half
Venezuela
/aEmployees, TOTAL - 23.2 15.5
Men ih.7 7.8Women 40.0 31.2
/bSelf-employed, TOTAL- 3h.9 29.2
Men 2h.6 18.7Women 72.8 68.4
Caracas
Employees, TOTAL/ 15.3 10.0
Men 6.6 3.9Women 30.0 21.1
Self-employed, TOTAL- 19.1 16.9
Men 11.3 10.1Women 52.3 46.9
/a Low-income employees are defined as those earning usual weekly incomesof less than lOOBs.
/b Low-income self-employed are defined as those earning usual monthlyincomes of less than 50OBs.
joulroe: able 5. ', at'stical1 Append`x.
- 70 -
Employees
148. In the second half of 1974, 285,000 employees, 15.5% of (total wageand salary workers), earned less than Bs 100 a week (Table II.25). Low incomeis heavily concentrated among younger employees: 52% of the low earners wereunder age 25 in 1974 II, while only 32% of all employees were in this agegroup. Above age 25 about 11% earned less than Bs 100 weekly (Table 5.6,Appendix I).
149. The occupations in which low incomes were most typical in 1974 IIwere service occupations (in which 42% of the workers earned less than Bs 100),sales occupations (21%), and artisans other than those who worked in factories(11%). Three out of five of the low-income workers were service workers(Table 5.9, Appendix I). Nearly two-thirds of the women in service occupa-tions were low-income workers, probably mostly those in domestic service, whousually receive income in kind as well as cash wages. Women in serviceoccupations amounted to 55% of all low-income workers. 1/
150. Of the family heads working as employees, 7% earned low incomes,while among sons and daughters living at home, 20% earned low incomes, reflect-ing the low incomes of young workers (Table 11.27). One out of five of thelow-income employees were family heads. Among women living with families butnot members of the families -- many of whom must have been domestic servants-- 74% earned less than Bs 100 (Table 5.7, Appendix I).
Self-employed
151. With 191,000 self-employed workers, 29.2% of the total in the non-farm economy, earning low incomes, it is apparent that for many workers self-employment is not a matter of choice or an evidence of free enterprise, butan alternative to unemployment.
152. Among the low-income self-employed there are many more matureworkers than among either the unemployed or the low-paid wage and salary em-ployees. While 52% of the employees with low incomes in 1974 were under age25, 86% of the own-account workers with low incomes were over that age (Table5.10, Appendix I). The incidence of low incomes was highest among the youngerand the older own-account workers (Table II.28).
153. The largest numbers of low-income, self-employed workers were work-ing as salesmen (including street vendors), and artisans and operatives infactories (Table 5.13, Appendix I). As among the employees, the highestincidence of low incomes among the own-account workers was reported forservice workers -- 64%; in this case, however, domestic servants were notinvolved. Among artisans not working in factories, 59% earned low incomes.About one-third of the self-employed salesmen and artisans and operatives inmanufacturing workshops earned low incomes (Table 1I.29).
1/ For further detail see Table 5.9.

- 71 -
Table II.25: PERCENT OF EMPLOYEES EARNING LESS THAN 100 Bs WEEKLYBY AGE AND SEX (NONFARM ONLY). 1974 (II)
Both Sexes Men Women
TOTAL 15.4 7.8 2
15-19 41.2 26.7 61.320-24 15.6 8.7 27.525-34 10.6 5.3 21.535-)44 10.7 4.2 26.245-54 10.2 3.1 31.555-64 14.3 7.9 35.565 and over 21.4 13.4 65.6
Source: Table 5.6
Table II.26: PERCENT OF EMPLOYEES EARNING LESS THAN 100 Bs WEEKLYBY OCCUPATION AND SEX (NONFARM ONLY), 1Q74 (II)
Both Sexes Men Women
TOTAL L.5 7.8 31.2
Professional 2.8 1.8 3.7Managerial 1.4 1.1 5.7Office 6.3 3.5 9.2Sales 20.7 17.8 30.9Drivers 9.8 9.9 2.2Artisans in factory 10.0 8.6 19.0Other artisans 11.0 9.6 21.4Services 42.4 U.n. 64.1
Source: Table 5.9

- 72 -
154. The branches of economic activity with the highest concentrationof low income self-employed were commerce, manufacturing (in small work-shops), and services (Table 5.12, Appendix I).
155. More than half the self-employed low earners -- 105,000 workers --
were family heads, and over one-third of these family heads were women (TableII.30B). The most severe impact of low earnings among self-employed workerswas on women: more than two-thirds of self-employed women, including womenwho were family heads, had low earnings.
156. Their educational level correlated inversely with income: 54% ofthe illiterate self-employed, but only 0.8% of those with higher educationhad low incomes (Table II.30A). Of all low-income self-employed, 62% hadless than four years of primary schooling.
157. To recapitulate the information on the underemployed in such a wayas to examine the composition of this large group, we find that they amountto 285,000 wage and salary employees and 191,000 self-employed workers (TableII.31). Two-thirds of the employees, but just under half the self-employedwho were underemployed were women. The employees were mostly under 25 yearsof age, but 86% of the self-employed were over 25. Among the employees one-third were the sons or daughters of the head of the household, and one-quarter were unrelated persons; only one out of five were family heads. Onthe other hand, more than half of the self-employed were family heads. Sixout of ten of the employees were service workers (mainly women in domesticservice), while the largest groups of self-employed were sales workers andartisans and other manual workers. What this adds up to is that underemploy-ment among the self-employed has a much greater impact on the incomes andliving standards of the families involved than does low-wage employment amongwage and salary workers.
E. Employment and Poverty in the Metropolitan Area
158. In previous sections, the focus of the analysis was the effect ofmanpower underutilization on individuals in the labor force. In this one, itwill be the effect on households. Although not exclusively, the main emphasiswill be on poor households since it is the improvement of their living condi-tions, not that of rich families, which is a major priority concern of socialand economic policies. Owing to the greater reliability of income data in theMetropolitan Area, the analysis is limited to this area. The figures used arefrom the Household Survey, Second Half of 1974, specially tabulated for theMission by the Centro Electronico, Direccion General de Estadistica y CensosNacionales.

- 73 -
Table II.27: PERCENT OF EMPLOYEES EARNIIS LESS THAN lOOPs WEEKLYPY POSITION IN FAMLY AND SEX (NONFARM ONLY)1974 (II)
Both Sexes Men Womer,
TOTAL 15.5 7.8 31.2
Fam'ily Head 6.7 3.8 27.9Spouse or companion 16.7 -- 16.7Sor or daughter 20.3 17.4 25.1Other relative 16.0 11.7 24.7No relations 26.9 12.2 74.2
Source: Table 5.7
Table II.28: PERCENT OF SEIF-EMPLOYED EARNING LESS THAN 500BsMONTHLY, BY AGE AND SEX (NONFARM ONLY), 1974 (II)
Both Sexes Men Women
TOTAL (15 and over) 29.2 18.7 68.4
15-19 62.9 59.0 85.720-24 4C.3 29.9 81.125-34 23.7 12.8 63.835-44 24.3 12.4 64.445-55 27.4 16.5 66.155-64 34.4 24.6 78.165 and over h4.2 36.9 87.8
Source: Table 5.10, Statistical Appendix

- 74 -
Table II.29: PERCENT OF SELF-EMPLOYED EARNING LESS THAN Bs500MONTHLY, BY OCCUPATION (NONFARM ONLY), 1974 (II)
MajorOccupationalGroup Both Sexes Men Women
TOTAL 29.2 18.7 68.4
Professional andtechnical 10.8 6.8 22.5
Managerial 2.0 1.8 6.7Office workers 15.4 13.6 25.0Sales workers 33.l 27.9 59.5Mine workers 35.3 35.3 --Drivers in transport 9.2 8.6 35.7Artisans andoperatives infactories 31.8 18.7 80.9
Other artisans andoperatives 59.2 39.0 84.9
Service wiorkers 63.5 36.7 78.6
Source: Table 5.13, Statistical Appendix

- 75 -
Table II.30(A): SELF-EMPLOYED WORKERS EARNING LESS THAN BS 500 MONTHLY,
BY EDUCATIONAL LEVEL, II 1974 (NONFARM ONLY)
(Numbers in thousands)
All EarningEducational level workers less than Percent
500 Bs
TOTAL- 655.o 191.0 29.2
Illiterates 86.8 55.1 63.5
Without formaleducation 51.1 19.7 38.6
Primary school
1-3 years 112.3 43 04 38.6
4-6 years 285.3 63.8 22.4
Secondary school 82.6 10.2 12.3
Technical andnormal school 3.8 o6 15.8
Higher education 25.3 .2 .8
Other branches 11.3 1.2 10.6
a/ Total excludes 3400 persons 10-14 years of age who are included in the otherlines.
.ource: fable .1L, 3tatistical Append xx.

- 76 -
Table II.30(B): SELF-EMPLOYED WORKERS EARNING LESS THAN BS 500 MONTHLY,
BY POSITION IN FAMILY, II 1974 (NONFARM ONLY)
(Numbers in thousands)
All Earning PercentPosition in family workers less than
500 Bs
TOTAL, both sexes-/ 655.o 191.0 29.2
Head of family 48602 105.0 21.6Spouse or companion 56.1 38.0 67.7Son or daughter 65.7 30.0 45.7Other relatives 44.3 18.2 41.1No relative 6.1 300 49.2
Men, total 520.3 99.6 19.1Head of family h27.7 66.0 15.4
Son 51.9 20.3 39.1Other relatives 35.3 11.0 31.2No relative 5.3 2.3 4 3.1
Women, total 138.2 9406 68.5Head of family 58.5 38.9 6605Spouse or companion 56.1 38.0 67.7Daughter 13.8 9.7 7003Other relative 9.0 7.2 8000No relative .8 .7 87.5
a/ Total excludes 3400 persons 10-1l years of age who are included in the otherlines.
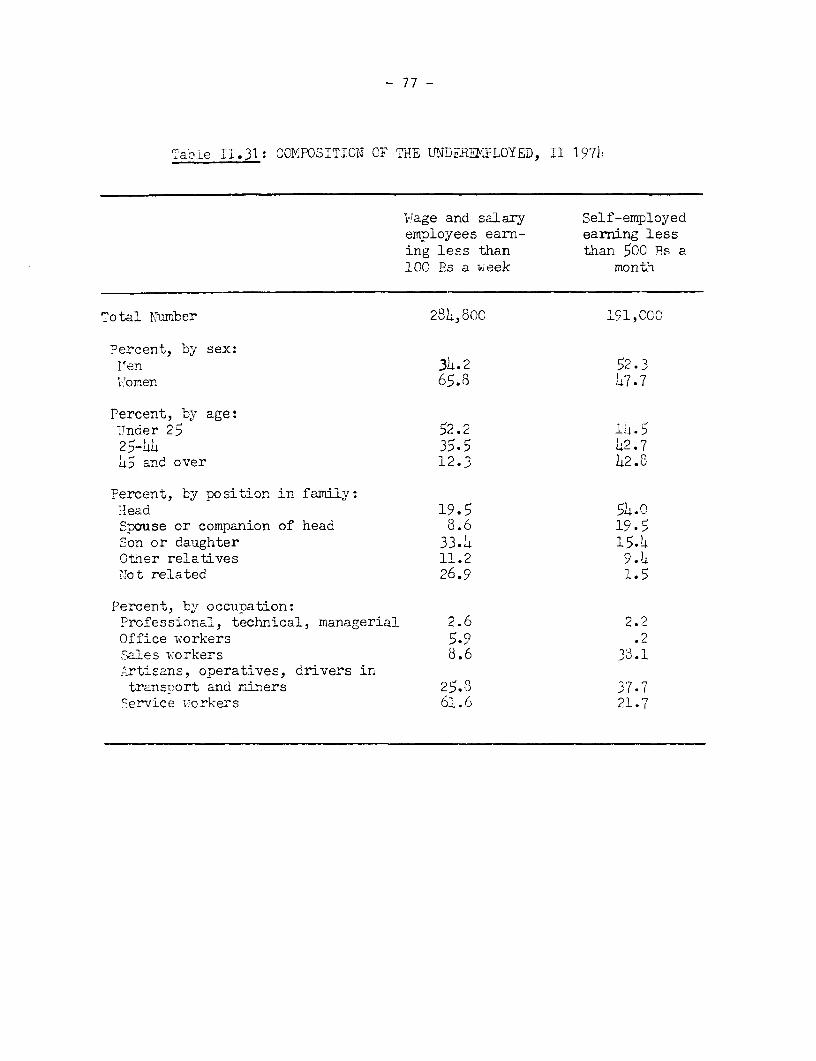
- 77 -
'a-Le 1.31: CO1fPO31TO OF THE UNDFRErIPaLOYED, II 1971
JWage and salary Self-employedemployees earn- earning lessing less than than 500 Ps a1OC Ps a week monti
Total Number 284,800 191,0CC
Percent, by sex:l'en 34.2 52.3IVomen 65.8 47.7
Percent, b7y age:Tnder 25 52.2 18.525-44 35.5 42.7
45 and over 12.3 42.8
Percent, by position in family:lead 19.5 51.".Soause or companion of head 8.6 19.5Son or daughter 33.4 15.4Other relatives 11.2 9.4r.ot related 26.9 1.5
Percent, by occupation:Professional, technical, managerial 2.6 2.?Office workers 5.9 .2Sales w;orkers 8.6 38.1Artisans, operatives, drivers in
transrort and miners 25.3 37.7.ervice -vorkers 61.6 21.7

- 78 -
Income Distribution in the Metropolitan Area
159. Table I1.32 shows the distribution of labor earnings by families inthe Metropolitan Area. Although not worse than that for most Latin Americancountries, 1/ the figures present a picture of great inequality, with thetop decile of the households getting about 30% of total earnings, a proportionabout equal to that obtained by the six lowest deciles. In turn, the jointearnings of the three poorest deciles account for less than 8% of the total.The average family earnings of the top decile is about Bs 6,000 per month, afigure eleven times higher than the average labor income of the poorestthree deciles (Bs 530). 2/ The Gini coefficient 3/ of this distribution
(0.426) is heavily influenced by the extremely low share of the poorestdecile, which only reaches to 0.31% of the total. This low share of thepoorest decile is, as will be seen later, largely due to unemployment.
160. The distribution of individual worker earnings is, as would beexpected, very similar to that of families; it has a Gini coefficient of0.434, a point above that of the households (Table II.32). The average earn-ings per worker in the top decile is near Bs 3,900 per month, while it aver-ages only Bs 330 in the three poorest deciles. It is important to observethat this last figure is 30% below the legal minimum wage for a month'swork.
161. The distribution of individual earnings is also heavily influencedby unemployment. When only the employed population is tabulated, the Ginicoefficient drops to 0.388 (Table 11.32), an improvement of nearly fivepoints which -- as known -- is quite remarkable for this coefficient. Thislarge drop in the inequality index shows the great importance of employmentpolicy as an instrument to improve income distribution. But even if un-employment were eliminated, there would still exist a considerable in-equality in the incomes of the employed population. As will be seen later,the "quality" of the work is, to a great extent, responsible for thissituation.
1/ In a study of the 14 Latin American cities made by the Program of JointStudies on Latin American Economic Integration (ECIEL), Caracas had thesecond lowest Gini coefficient, and Maracaibo the fifth lowest. (AdolfoFigueroa and Richard Weisskoff, "Vision de las Piramides Sociales: Dis-tribucion del Ingreso en America Latina," Ensayos Eciel, No. 1,November 1974, p. 137.
2/ Possibly the difference is even higher since a considerable degree ofunderstatement could be expected as regards the top decile's actualearnings.
3/ The Gini coefficient is a measure of the degree of equality in an incomedistribution: a perfectly equal distribution of incomes would have a Ginicoefficient of zero, while a perfectly unequal distribution -- in which onemember of the population received all the income -- would have a coefficientof 1.

- 79 -
Unemployment Rates by Income Levels
162. The relationships between unemployment and income level arefurther, and impressively, illustrated in Table II.33. Families with in-comes below Bs 500 per month have a 34.8% unemployment rate, five and ahalf times higher than the average rate in the Metropolitan Area (seventimes if the group of families is excluded); the rate drops to 8.7% infamilies with incomes between Bs 500 and Bs 1,000; and then declinessteadily to a low of 1.9% in the highest earning families.
163. The high rate of unemployment among poor families has a first,obvious, explanation in the fact that families are poor because many oftheir members are unemployed; but the relationship operates also in theother direction: Table II.34 shows that earnings of employed family membersare much lower in the first group than in the second, and keep the samearrangement as total family income in all groups.
164. Table II.33 shows great discontinuity between the unemploymentrates in the lowest income group and the following ones, not only in theaverage rate, but also in the relative level of unemployment of householdheads and family dependents. In every other group, the rate among householdheads is only a fraction (as low as one-tenth in some groups) of the rateamong dependents. But in the first group it is more than one and a halftimes higher. These differences are explained by the special working condi-tions prevailing at very low income levels. As said before, amongst thedirely poor families, most workers lack a permanent job and earn their livingin intermittent activities. The unemployed among them are, therefore, occa-sional workers that have not done any odd jobs during the week of the inter-view, or ambulant vendors that have not sold anything, or so little that theydid not consider that those meager sales should be declared as work doneduring the week. The unemployed in this group can be classified as such or aspartially and precariously employed workers depending on the definition thatis used. They are members of the lowest stratum of low productive workers,and are in the borderline between employment and unemployment. If the distri-bution of the different types of unemployed workers in the whole of Venezuelawas the same as in Caracas, one-fourth of the nation's unemployed, equivalentto 1.6% of the labor force, would be of this special type.
Poverty
165. The study of poverty is highly facilitated by setting a level belowwhich a family is considered as poor; but the establishement of a povertyline is necessarily an arbitrary exercise and some principle must be adoptedto eliminate, or minimize, the arbitrariness. Such principle can be thecriterion of the Government on the subject, i.e., the family income impliedin the minimum legal wage. In 1974, such family income in Venezuela wouldhave been Bs 690, that is, the monthly equivalent of the minimum wage (Bs 430)multiplied by 1.6, which is the number of occupied workers in the averagefamily. However, owing to the arrangement of the available data on earningsit has been necessary to establish two lines: Bs 1,000 and Bs 500, which maybe called poverty and dire poverty lines. Tracing the lines at the abovelevels, the following figures are found:

- 80 -
Table II.32: METROPOLITAN AREA: DISTRIBUTION OF EARNINGS OF
FAMILY AND INDIVIDUAL INCOME, 1974 II
Individual incomeFamily income Workers only Workers and employers
Percentage Average Percentage Average Percentage Averageof income monthly of income monthly of income monthly
income (Bs) income income
Top decile 30.0 6000 33.0 3878 31.3 4019Six lowestdeciles 29,1 969 29.1 548 31.9 757Three lowestdeciles 8.0 531 8.3 327 11.3 983
Gini Coefficient 0.426 0.434 0.388

Table II.33: METROPOLITAN AREA: UNEMPLOYMENT RATES BY FAMILY INCOME, 1974 II
(In percentage and Bs)
Up to 501 to 1001 to 1501 to 2001 to 2501 to 3501 to 4500500 1000 1500 2000 2500 3500 45oo and up
Heads of household 45.9 3.6 2.2 0.7 o.6 0.7 0.9 --
Other family members 28.h 14.5 11.3 7-5 6.1 5.8 5.3 3.0
Total labor force 3h.8 8.7 6.7 4.6 4.1 4.1 3.9 1.9
, * .~~~~~~0
Source: Household Surveys, special tabulations prepared for the Mission by the staff of the DGE & CN. m
Table II.34: METROPOLITAN AREA: AVERAGE INCOME PER FAMILY AND PER EMPLOYED PERSON,
BY FAMILY GROUPS, 1974 II
Up to 501 to 1001 to 1501 to 2001 to 2501 to 3501 to 4500500 1000 1500 2000 2500 3500 4500 and up
Average familyincome (Bs) 156 815 1,294 1,807 2,301 2,974 4,025 6,317
Number of employedpersons per family 0.47 1.18 1.43 1.73 2.07 2.18 2.39 2.19
Average income ofoccupied familymembers (Bs) 331 691 904 1,044 1,112 1,364 1,684 2,884
Source: Household Surveys, special tabulations prepared for the Mission by the staff of the DGE & CN.

Percent
All labor force ONLUIS1iPLOYPi,ENT RATES BY FAILY INC0lxE
wO F ~~~~~~~~~~~~~~~~~~Household headsE.40 CARACAS,, 1971
OAIRACA3, 197r Other family members C
) I 20 X _ k _ \ _t _ _ __ _ _ _ _ _ _
7~
13
12 i1
1 to 501 to 1001 to 1 01 to 2001 to 2501 to 3501 to Iviore than500 1 000 1 500 2000 2500 3500 4500 4500

- 83 -
(a) Eleven percent of households in the Metropolitan Area, accountingfor 8% of the population, had family incomes not higher than Bs 500per month, and an additional 19% of the households, accounting for19% of the population, had family incomes between Bs 501 and Bs1,000 per month. In absolute numbers, the "dire poverty" familiesamounted to 53,000 households with 190,000 people; and the "poverty"families to 91,000 households with 425,000 people.
(b) "Direly poor" families had an average labor income of Bs 156 permonth and "poor" families Bs 815 per month, as compared withBs 1,200 per month in average households (Table II.36).
(c) "Direly poor" families are smaller than average families (3.56members as compared to 4.85 in average families) (Table II.35); havefewer children (1.37 vs. 1.82); fewer adults (persons 15 years ofage and over) (2.19 vs. 3.02); far less members in the labor force(0.72 vs. 1.70) and even fewer employed workers (0.47 vs. 1.59).The proportion of children among total family members is somewhathigher (38.4% vs. 37.5%, as calculated from the figures citedabove); the rate of dependency much higher (86.8% vs. 67.3%); andthe proportion of non-workers -- either inactive or unemployed --in the adult population enormously higher (78.5% vs. 46.1%) thanin average families. The unemployment rate is 34.8% vs. 6.3% in theaverage household.
(d) Poor families have the same characteristics as "direly poor"families, but their differences from the average are not so great:their size is smaller (4.64 vs. 4.85 members); they have morechildren (2.18 vs. 1.82); fewer adults (2.46 vs. 3.02) and fewermembers in the labor force (1.29 vs. 1.83). The proportion ofchildren in these families is much larger than average (47.0 vs.37.5); the rate of dependency substantially higher (74.6% vs. 67.3%)and the proportion of non-workers -- inactive plus unemployed --among adult members significantly higher (52.1% vs. 46.1%) than inthe average family. The unemployment rate is 8.7% as comparedwith 6.3% among all households.
166. The above figures show very clearly that poverty has a strong rela-tionship with employment: low rate of participation in the labor force, highunemployment and very low earnings among those who work. It may be noticedthat among the "direly poor" families, the low rate of participation may belargely explained by the much fewer adults in the family -- two instead ofthree -- which in many situations leaves only one able to work outside thehousehold.
Per capita income
167. Poverty also can be measured by family per capita income, insteadof total family income. Given the average number of persons per family inthe Metropolitan District (4.85), two per capita income levels may be
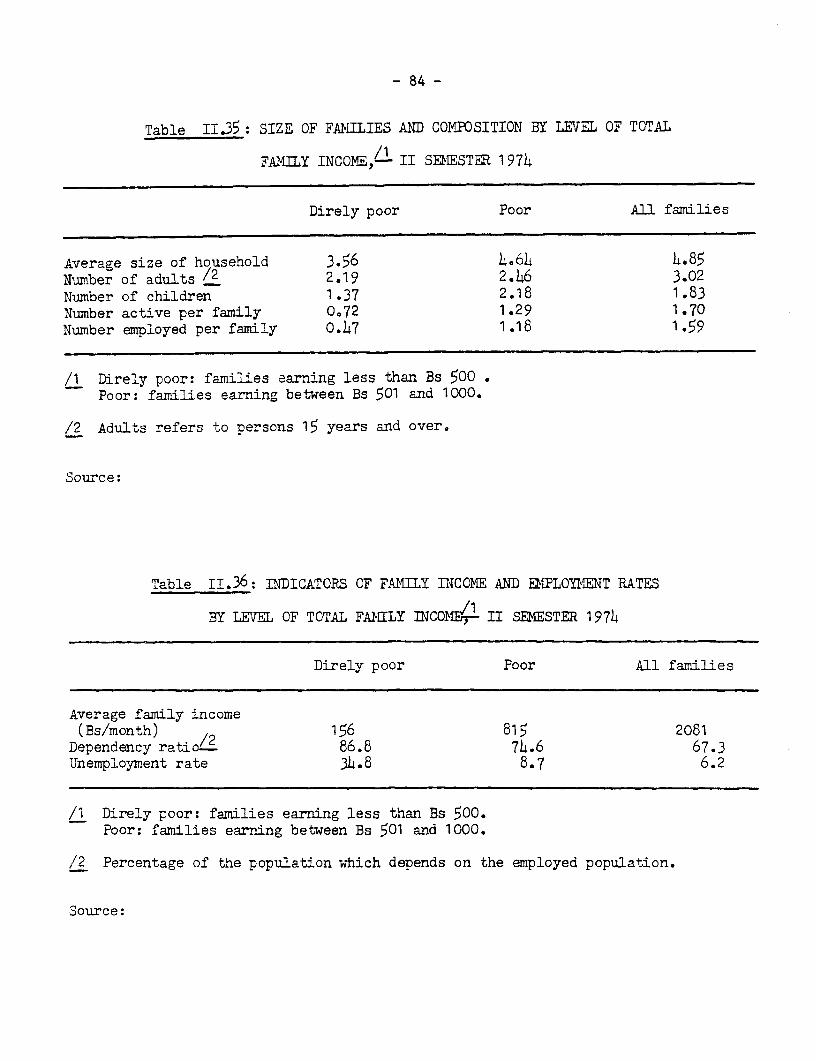
- 84 -
Table II.35: SIZE OF FAKILIES AND COXPOSITION BY LEVEL OF TOTAL
FAMILY INCOME,/ II Sa1ESTER 1974
Direly poor Poor All families
Average size of household 3.56 4.64 L.85Number of adults /2 2.19 2.146 3.02Number of children 1.37 2.18 1.83Number active per family 0072 1.29 1.70Number employed per family 0o47 1.18 1.59
/1 Direly poor: families earning less than Bs 500 .Poor: families earning between Bs 501 and 1000.
/2 Adults refers to persons 15 years and over.
Source:
Table II.36: INDICATORS OF FANITY INCOME AND aLPLCYUMNT RATES
BY LEVEL OF TOTAL FA,*:LY INCOME4E- II SEMESTER 1974
Direly poor Poor All families
Average family income(Bs/month) 156 815 2081Dependency ratio/2 86.8 741.6 67.3Unemployment rate 31.8 8.7 6.2
/1 Direly poor: families earning less than Bs 500.Poor: families earning between Bs 501 and 1000.
/2 Percentage of the population which depends on the employed population.
Source:

- 85 -
established: Bs 100 and Bs 200, corresponding to the Bs 500 and Bs 1,000levels of family incomes denoting dire poverty and poverty, respectively.
168. As Table II.37 shows, when per capita income is taken as a measure,the pattern is very similar to the one just described: the number of adultsin families earning less than Bs 100 per capita is smaller, the childrenmore numerous (much more so in this case), the rate of dependency much higher,the proportion of non-workers enormously higher and the rate of unemploymentalso five and a half times higher than the national average.
169. The similarities of the family characteristics in the two methodsof measurement is not surprising since they are, to a large extent, the samefamilies. In fact, 70% of the families earning up to Bs 1,000 have percapita incomes not higher than Bs 200 and 78% of the households with percapita incomes of that level receive total earnings not higher than Bs 1,000.As may be noted, the size of the very poor and poor families is smaller thanthe average, when the total income criteria is used, and larger when the percapita method is applied; but in both cases, the age composition is younger inthe poorer than in the richer households. The age structure of the populationis a very important factor, not only because the number of dependents islarger, but, even more, because the number of earners is smaller. As seenbefore, in direly poor households (measured by total family income) the numberof adults is two, instead of three, and this makes necessary for one of themto stay at home, leaving only one to sustain the family.
Table II.37: SIZE OF FAMILIES AND COMPOSITION BY LEVEL OFPER CAPITA INCOME, /1 II SEMESTER 1974
Direly poor Poor All families
Average size of household 5.11 6.40 4.85Number of adults /2 2.64 3.16 3.02Number of children 2.47 3.24 1.83Number of active per family 0.85 1.55 1.70Number employed per family 0.55 1.39 1.59
/1 Direly poor: families earning less than Bs 500.Poor: families earning between Bs 501 and 1000.
/2 Adults refers to persons 15 years and over.
Source: D.G.E.C.N. Household Surveys

- 86 -
Table II.38: INDICATORS OF PER CAPITA INCOME AND EMPLOYMENTRATES BY LEVEL OF PER CAPITA INCOME, /1 II SEMESTER 1974
Direly poor Poor All families
Average per capita income(Bs/month) 50 155 429
Dependency ratio /2 89.1 78.4 67.3Unemployment rate 34.7 11.1 6.2
/I Direly poor: families earning less than Bs 100.Poor: families earning between Bs 501 and 1,000.
/2 Percentage of the population which depends on the employed population.
Source: D.G.E.C.N. Household Surveys
Type of Employment
170. The size and age composition of the family, and the working status ofits members, is one part of the story. The other part, as important or more,is the type of work held. In the direly poor families, 43% of their membersholding a job were self-employed workers, or family workers without remunera-tion, 49% were wage or salary earners in the private sector and 8% publicemployees, whereas in average families these proportions were 16%, 57% and 22%respectively (with an additional 5% registered as employers) (Table II.39).Most of the members of direly poor families working for a wage or salary inthe private sector were probably employed in small establishments and not inlarge enterprises. According to the 1971 Survey of Manufacturing Industries,practically no plant employing more than 5 workers paid wage or salaries lowerthan Bs 500 per month.
171. In the Bs 500 to Bs 1,000 families, the distribution of their workingmembers by type of job was much closer to that in the average household: 22%were self-employed or family workers, 18% were government employees, 59% earneda wage or salary in the private sector, and 1% classified themselves as employers.

- 87 -
Table II.39: PERCENTAGE DISTRIBUTION OF WORKERS BY FAMILYINCOME, LEVEL /1 AND TYPE OF WORK HELD
Direly poor Poor All families
Employed 100.0 100.0 100.0
Private sector 48.5 58.8 54.9Public sector 8.0 18.0 23.2Employers 0.4 1.4 4.8Self-employed 39.6 20.5 15.9Nonpaid family workers 3.5 1.3 1.2
Unemployed /2 100.0 100.0 100.0
Private sector 67.9 82.1 76.4Public sector 16.9 11.4 14.0Employers 1.6 -- 0.4Self-employed 13.6 6.5 9.2
/1 Direly poor: families earning less than Bs 100.Poor: families earning between Bs 501 and 1,000.
/2 Last job held by unemployed.
Source: Household Survey, 1974 II.
F. The Informal Sector
172. About half of the Venezuelan urban labor force is employed in an in-formal or traditional sector made up of small firms (here defined as under fivepersons), self-employed persons, (except those with some university education)and domestic servants. Urban poverty and underemployment tend to be associatedwith this sector. This section reviews some of the main features of informalsector employment in Venezuela as a basis for explaining income and employmentlevels. The main issue can be stated as follows. Over the last quarter century,national and international migration, plus a high rate of natural populationincrease caused an exceptionally rapid growth in the urban labor force: between1950 and 1974 the urban labor force expanded by 1.8 million, of which about half,or 0.9 million found jobs in modern sector firms or in the Government. How dothe other 0.9 million earn their living? What was the impact of the influx ontheir capacity to find work, and their incomes? What will be the impact offuture labor foce and modern sector job trends on urban income and employmentlevels?

- 88 -
173. Only very tentative answers are given here because none of theexisting information sources in Venezuela are adequately geared to a studyof the informal sector. In particular, the employment surveys of the DGECfail to distinguish employment by size of firm. The available data, however,does suggest some generalizations. More detailed and more reliable conclu-sions will become possible within a few months, since both the DGEC and theCentral Bank have added questions on firm size to ongoing household surveys.
Size and Composition of the Informal Sector
174. As shown in Tables II.40 and I1.41 below, the informal sector com-prise just under half (44%) of the urban labor force as a whole, and isslightly larger in smaller urban areas (47%) than in Caracas (40%). A trendestimate was possible only for Caracas, and is presented in Table 11.41:employment in the two sectors has been growing at about the same rate (3.8%in the formal vs. 4.0% in the informal) since 1961. Both of these resultsare surprising in view of the rapid rates of rural to urban migration andnatural population increase in the cities on the one hand, and the highlydualistic productive structure on the other. It would have seemed reasonableto predict an informal sector that was larger at present, and that had grownmore rapidly since 1961.
175. Some insight into this apparent paradox can be obtained by examiningthe sectoral and occupational composition of employment in the formal andinformal sectors (Appendix Table 8.1). The formal sector is, by definition,made up almost entirely of employees. In Caracas, about half are in govern-ment or manufacturing, which in other urban areas these sectors account fortwo-thirds of the modern sector. Modern service and commercial establishmentsare thus a large source (41%) of formal sector employment in Caracas. Thosethree components of the modern sector have been growing at about the same rate(4.4 to 4.7%) since 1961. (Almost half of the growth in government employment,however, has been the result of a spread of government into manufacturing,commercial and other business activities.)
Table 11.40: URBAN EMPLOYMIENT BY SECTOR AND AREA, 1974
(In thousands)
All Urban % Caracas % Rest %
Total Urban 2,214 100 790 100 1,424 100
Informal Sector 978 44 314 40 664 47
Formal Sector 1,236 56 476 60 760 53
Note: See Appendix I for coverage sources, Table 8.1.

- 89 -
Table II.41: GROWTH OF EMPLOYMENT BY SECTOR,
1961 - 1974: CARACAS
(In thousands)
1961 1974 Growth p.a.
Total 483 790 3.9
Informal 188 314 4.0
Formal 295 476 3.8
176. The informal sector, by contrast, has a large number of self-employedpersons. Including proprietors of small firms, these amounted to 49% of totalurban informal sector employment in 1974, 46% in Caracas and 50% in other urbanareas. Domestic servants account for another 18% in all urban areas, and 21%in Caracas. Employees of small establishments thus make up the remaining third.
177. The composition of the informal sector by productive activities isshown in Appendix Table 8.2. The bulk of the sector is engaged in commercialand service activities. Manufacturing absorbs only 18% of employment, and ofthat, 5% are quasi-service jobs in car and electrical equipment repair.Commerce and domestic service alone comprise almost half (46%) of the sector,both in Caracas and in smaller urban centers. Overall, the mix of activitiesdoes not differ significantly between Caracas and other urban areas. Caracasappears to have more domestic servants (21% of the sector, and thus, 8% oftotal city employment) and more small-scale service and manufacturing estab-lishments, but much of the difference shown by Appendix Table 8.2 woulddisappear once the "unspecified" workers had been distributed.
Characteristics of Informal Sector Workers
178. The following description of the informal sector labor force appliesonly to the self-employed, proprietors, family workers and domestic servants,thus excluding employees; the household surveys did not provide separateinformation on employees of small establishments, who comprise about one-thirdof the sector.
179. In most respects, the profile of informal sector workers does notsupport the common impression of a marginal labor force. As Table 11.42 shows,proprietors and own-account and workers in this sector have a smaller propor-tion of secondary-income earners than employees in the modern sector. Theratios of women and of non prime age workers (25-54 years) is somewhathigher in the informal sector, but this difference is entirely due to domestic

- 90 -
servants who are overwhelmingly young women. Excluding domestics, the ratiosof women and non-prime age workers are actually lower in this sector. A moresignificant difference does exist with regard to schooling where the ratiosof illiterate and workers with incomplete primary schooling are indeed higheramongst both own-account workers and domestics than amongst modern sectoremployees. On the other hand small-scale proprietors tend to be as well-schooled as government employees.
Table II.42: PROFILE OF INFORMAL SECTOR: TOTAL URBAN 1974 /a
Informal Sector Modern SectorOwn-
Account Pro-Domestics Workers prietors Total Private Public Total
Family heads (%) /b 72.1 89.2 (b) 50.0 55.4 52.0
Women (%) 93.9 22.2 5.5 35.1 20.8 36.8 25.8
Under 4 yearsschooling 43.3 42.5 17.7 38.3 27.6 15.2 23.8
Prime age (25-54) 23.3 69.8 79.5 58.4 60.1 76.0 65.0
/a Includes family workers./b Undetermined.
Summary
180. The information base is as yet too thin to offer more than a broad,speculative interpretation of the urban informal sector in Venezuela. On thebasis of the data cited above, as well as of other, less systematic informa-tion obtained from interviews and documents, we suggest the following genera-lizations. The formal-informal distinction is not as relevant to urban incomedifferentials, and particularly to urban poverty in Venezuela, as it is oftenargued. Several factors probably explain this. One is that union and laborlegislation appear to have played a less powerful role in segmenting the labormarket than in many other LDC's. Generalized minimum wages are a surprisinglyrecent (1974) introduction given the relatively open political system of thelast two decades, and the general level of economic and institutional develop-ment. Also until recently, employers had more freedom in most Latin americancountries to fire employees. The lesser distorting impact of unions may berelated to a somewhat broader role of industrial as against company unions.The latter tend to maximize wage distortion by taking full advantage of inter-firm productivity levels. A second and related cause of lesser segmentation

- 91 -
may be the more developed and complex nature of the urban economy. Growingcomplexity may be expected to increase the role of skills as a determinantof job opportunities and earnings. Third, a relatively strong demand forlabor by modern sector establishments would reduce the residual role of theinformal sector creating instead, a broader and more integrated urban labormarket. Finally, there also appears to have been much upgrading within theinformal sector. Educational levels, physical capital and incomes all seemto have risen significantly. This process has been accompanied by a declinein self-employment relative to small establishments, and by some shift inthe mix of activities towards newer needs such as equipment and car repairs,though the traditional activities -- commerce and domestic services -- stillpredominate.

- 92 -
III. NATURE OF THE PROBLEMS, PROSPECTS AND POLICIES
Manpower Shortages in the Midst of Unemployment and Low Productive Employment
181. As seen in previous chapters, there is at present in Venezuela anacute shortage of management personnel, technicians and skilled workers ofall types -- from engineers and accountants to lathe operators and steno-graphers -- and a relatively tight supply of agricultural workers, whichare very scarce in some areas.
182. The coexistence of surpluses of unskilled workers and deficits ofqualified personnel is a common occurrence in developing countries, whichtextbooks consider as an almost necessary pattern of the industrializationprocess; but the current situation in Venezuela presents two characteristicsthat deserve examination, which are: (a) the wide spectrum and acuteness ofthe shortages; and (b) the existence of unemployment among the educated youthin spite of such shortages. The first characteristic is a logical consequenceof the great speed and strength of Venezuela's current economic expansion; butthe amplitude and intensity of the unsatisfied demand show that before thecurrent expansion accelerated its pace, the unused reserves of qualified man-power were not very large and, hence, that in preceding years the modern sectorof the economy had been absorbing it at a fairly satisfactory rate.
183. The existence of unemployment among the educated youth in the secondhalf of 1974 could be due to market imperfections, but only to a limited extent,because the demand for qualified workers has been widely advertised. Currentyouth unemployment rather reflects a lack of coincidence between the skillsdemanded and those possessed by the unemployed youngsters; and since the spec-trum of demand is very wide, it may also indicate that part of the unsuccess-ful job seekers are not well prepared in the fields in which they receivedtraining.
184. The relatively tight labor supply in rural areas and its scarcity insome regions, in times when there are surpluses of unused and badly used man-power in the cities, seems to show that the direction of rural-urban migrationis not reversible, and also that agriculture has not been able to raiseworker's earnings to the level necessary to offset the lure of cities and stopthe one-way flow. Even when they have employoment at home, young rural workersare willing to give it up and take the risk of becoming unemployed or badlyemployed urban workers, attracted by the hope of obtaining a well paid job inthe urban modern sector. Such hope has probably risen considerably in recentmonths with the acceleration of the country's economic expansion.
Nature of Venezuela's Current Unemployment
185. The characteristics of unemployed and low productive workers, des-cribed in previous chapters, and the labor shortages that have just beenexamined, indicate that current unemployment in Venezuela originates inseveral different factors and circumstances, the most important of which seem

- 93 -
to be the following: (a) employment conditions associated with extremepoverty; (b) labor turnover (frictional unemployment); (c) lack of coinci-dence between skills demanded and supplied; and (d) lack of coincidencebetween wages paid in agriculture and those that might be desired by urbanunemployed to return to rural areas.
186. The first category is not usually classified as a special type ofunemployment but in Venezuela it has so many special characteristics, andrepresents such a large proportion of the total, that it has a well definedidentity. As said before, most of this unemployment does not reflect theloss of a stable job, but a temporary period of inactivity between intermittentoccasional jobs, which is the type of work prevailing at extremely low incomelevels. At these levels, workers experience great difficulties in findingstable jobs. They are handicapped by lack of skills, lack of contacts andeven lack of steady working habits. And to make a bad situation worse, theyare severely limited in their search and access to jobs by the obligation ofpresenting police and health certificates, which they often cannot obtain.Minor police infractions sharply constrain the job opportunities of many youths(and divert them to illegal activity); while others, with no police record,fail to obtain the required policy and health certificates owinR to ignorance,lack of contacts or bad luck with bureaucratic complications. Furthermore,at these income levels there are many female heads of family. These womenhave to seek employment to maintain themselves and their children, but areseverely constrained by the time demands of the household, which prevent themfrom accepting work far off from here they live or attending their jobsregularly, even when they are located in the vicinity. Measures to reducethis type of unemployment are obviously very close to those designed to combaturban poverty and their effects will be entirely parallel.
187. Frictional unemployment is an almost necessary consequence of laborturnover; workers leaving a job, voluntarily or involuntarily, do not alwaysfind another one immediately, nor do entrants to the labor force find theirfirst job the day they begin to seek it. The rate of frictional unemploymentdepends on (a) the volume of labor turnover and (b) the organization of thelabor market, i.e., the facility of communication between demanders andsuppliers of jobs. In countries where labor turnover is very low, as Japan,frictional unemployment is practically inexistent, but in those as Canada andthe United States, where workers change jobs frequently, frictional unemploy-ment rarely descends below 2.0%. Labor turnover in Venezuela is probablymuch nearer the levels of the U.S. and Canada than those of Japan and, hence,frictional unemployment must have a relatively high floor, but it seems thatit could be reduced significantly, particularly among youth, if the organiza-tion of the market is improved. In Chapter III of this report, the missionmakes recommendations to that end.
188. Unemployment originating in the insufficient preparation of the un-employed to occupy vacant positions has only one logical solution: education.Unfortunately, education takes time to produce effects. The VenezuelanGovernment is fully aware of the problem, as well as of its prospective aggra-vation, and has launched crash education programs, both at home and abroad,that the mission find highly commendable.

- 94 -
189. Unemployment originating in the unwillingness of the urban unem-ployed (and the urban low productive workers) to return to the countrysideto fill the unsatisfied demand for farmhands, shows that agriculture is notpaying high enough wages to compensate for the disutility of working, andliving, in rural areas. The cure for this kind of unemployment wouldobviously be to raise agriculture's productivity, and/or its terms of tradewith industry, in order to enable it to pay much higher wages; but such typeof cure requires the solution of the current complex problems of Venezuela'sagriculture, which the mission has not studied, nor is it supposed to study,except in its employment implications. There is, however, an aspect of theproblem -- agricultural mecahnization -- which falls entirely within themission's terms of reference and, on this aspect of the problem, it is mostwilling to give its advice: Venezuela should not hamper agricultural mecha-nization in the fear of aggravating unemployment, but should foster it asmuch and as rapidly as it can be efficiently applied. The number of workersdisplaced by increased mecahnization will not be larger than the number thatwould have migrated to the cities, in any case, attracted by the hope of higherincomes. By raising agricultural productivity and the earning level of ruralworkers, mechanization may even slow down the rural-urban migration; but ifnot, it will contribute to improve the standards of living in agriculturewhich, in average, are the lowest in the country.
190. The basic policies to reduce unemployment seem, therefore, to be:
(a) Intensification of the programs to raise income levels,housing standards, health standards and general educationof urban poor, and to facilitate their training in specificskills, in order to reduce their present handicaps inseeking and obtaining employment.
(b) Intensification of programs to prepare management personnel,technicians and skilled workers of all types, in order toreduce unemployment and low producing employment, directlyor indirectly, by filling the present vacancies and coveringthe future demand for qualified personnel.
(c) Improvement of employment services and creation of placementservices for youths, in order to reduce frictional unemploy-ment, especially among new entrants to the labor force; and
(d) Intensification of policies to raise production and produc-tivity in agriculture, including the promotion of a fasterpace mechanization, in order to enable agriculture to payhigher wages and slow down migration to cities.
191. These are the basic policy guidelines for the present, but tojudge whether they should also be the guidelines for the future, or whetherthey should be complemented by other policies, it is necessary to examine theprospects of employment in the years to come, that is, to examine the fore-seeable evolution of the labor force, of the gross domestic product and ofproductivity.

- 95 -
Population and Labor Force Projections
192. Even though the birth rate is falling steadily, Venezuela's popula-tion will continue to grow at a fast rate in the years to come. Demographersof the Statistics Office have made projections of the population using variousassumptions as to the most uncertain variable -- birth rates. Six alternativeprojections were made up to the year 2001 1/, using different assumptions asto fertility rates, but no matter which of them is used, the rate of growth ishigh; the range is from 16.5 to 17.5 million population by 1986, or from 54 to67% above the 1971 level, implying growth rates of 2.9-3.5% annually. 2/
193. While there is obviously considerable uncertainty as to future birthrates and therefore the growth of the population, projections of the laborforce for up to 15 years in the future can be made with more certainty, sinceall the people who will be in the labor force 15 years hence have already beenborn. The variable that must be taken into account is labor force participa-tion rates; but the range of possible error is small because changes in par-ticipation rates usually have less effect on the size of the labor force thandoes the growth of the adult population itself.
194. The mission reviewed several projections of the labor force of Vene-zuela, but found that some of the participation rates projected do not appearreasonable in the light of developments since the projections were made. Themission therefore made a new projection to the years 1980 and 1985, drawing asmuch as possible on the judgments embodied in the projections reviewed. 3/
195. The projections of population by the demographers of the DireccionGeneral de Estadistica y Censos were used as the basis for these projections.The various alternatives are identical as to population over age 15 up to theyear 1986, but the low birth rates of Alternative No. II, considered most
1/ The highest projection, in effect, implied that gross reproduction rateswould be maintained at the 1971 level (2.62), for the entire period ofthe projection; the lowest implied that the gross reproduction ratewould gradually decline to 1.1 by the year 2001. The most probablealternative in the opinion of demographers at the agency is No. II,which implies that the rate will decline to 1.6 by 2001. DGE & CN,Proyeccion de la Poblacion de Venezuela, (undated), Tomo I.
2/ Another set of projections, based on alternative assumptions as to netreproduction rates, show a more modest expansion -- to between 12.4 and16.5 million by 1985. The Population Council, Perspectivas por Paises -Venezuela. New York, 1975.
3/ DGE & CN, Proyeccion de la Poblacion de Venezuela, op. cit., p. 181, andDireccion de Planificacion Social y Cultural, Departamento de RecursosHumanos, Conclusiones y Recomendaciones del Proyecto sobre Investigaciony Planificacion de los Recursos Humanos de Venezuela, undated.

- 96 -
probable, were consistent with the assumption of a continued increase in laborforce participation by adult women. In general, the labor force participationrates assumed were those that would prevail in an economy of high employmentand favorable job opportunities. Continued increases in the proportion of theyoung people attending school were assumed, (consistent with plans of theMinistry of Education), as well as a continuation -- but at a slower rate --of earlier retirement by older men.
196. Table III.1 summarizes the projections of the labor force: thegrowth of the labor force will be very rapid, as it will go from 3.4 millionworkers in 1974 to 4.3 million in 1980, to 5.2 in 1985.
Table III.1: PROJECTIONS OF THE LABOR FORCE(15 years and over)
(Thousands of persons)
1974 II 1980 1985
TOTAL 3,428.0 4,346.2 5,173.4
Men 2,586.4 3,229.8 3,788.5Women 841.6 1,116.4 1,384.9
197. These projections make no allowance for net immigration. Between1961 and 1971 the population of Venezuela in ages 15-29 increased by about200,000 more than can be accounted for by the survivors of the population10 years younger in 1961. This reflects immigration in these age groups.Unless immigration is likely to stop, it needs to be taken into account inappraising Venezuela's future manpower resources. While the immigrants thatmight be expected in a decade on the basis of the experience from 1961 to1971 do not amount to much in comparison with the growth of the total popula-tion, they make an appreciable difference in the age groups in which they areconcentrated.
198. Thus, a projection of the labor force that incorporates the effectof immigration was made and is presented in Table III.2. The main assumptionof this projection is that immigration will continue the pattern that it hadin the period 1961-1971. The labor force participation of immigrants wasassumed to be high, since they come primarily for the purpose of working.For men, the highest participation rates for men were used; for immigrantwomen, rates 10 percentage points higher than for Venezuelan women at thesame ages were assumed. This implies that many of the women who immigrateto seek work will, by the end of the period, have withdrawn from the laborforce to have families.

- 97 -
Table III.2: PROJECTIONS OF THE LABOR FORCE WITH IMMIGRATIONASSUMED TO BE AT THE SAME RATE AS 1961-1971
(Thousands of workers)
1974 II 1980 1985
TOTAL 3,428.0 4,446.3 5,331.9
Men 2,586.4 3,283.7 3,872.2Women 841.6 1,162.6 1,459.7
199. The projected labor force for 1980 is 4.4 million, one million higherthan that for 1974 as estimated in the Household Survey. For 1985 a furthergrowth of 0.9 million is projected, to a level of 5.3 million. Average annualincreases of about 170,000 are implied; the growth rate from 1974 to 1980would be at an annual rate of 4.4% (the same as that from 1971 to 1974);from 1980 to 1985 the growth rate projected is 3.7%. (See Table 2.8, AppendixI).
Future Educational Level of the Labor Force
200. This larger labor force will be better-educated than the presentlabor force. This is true partly because of the extension of education thathas already been achieved and which is evident in the higher educational levelof young workers than of older workers; even if no further extension were tooccur the aging of the labor force would raise the average educational level.Current plans of the Ministry of Education call, however, for a further ex-tension of secondary and higher education, as shown in the following tablewhich shows the range of alternative plans for 1985-86.
Table III.3: PERCENT OF POPULATION ENROLLED
1973-74 1985-86
Basic cycle (age 13-15) 51 80-90Diversified cycle (ages 16-19) 18 30-36Higher education 16 20-24
Source: Ministerio de Educacion, Oficina Sectorial de Planificacion yPresupuesto, V Plan de la Nacion: Sector Educativo, 1976-80,Caracas, June, 1975; Borrador de trabajo - version preliminar paraconsulta.

- 98 -
201. The plans contemplate a faster development of technical educationat the upper secondary level, with a shift in enrollments to scientific andtechnical fields, and a shift in emphasis in higher education toward teachertraining and non-university technical school, and away from the humanities.The plans also include substantial expansion of enrollments at the primaryand pre-primary levels, creating a major expansion in the need for teachers;at the same time, the training of primary teachers is to be upgraded. These
plans may create a bottleneck in the supply of teachers in the next few years,which, in turn, could delay the achievement of goals for the expansion oftechnical and professional education.
Employment Prospects
202. The mission considered whether it should attempt to make projectionsof employment in the various sectors, but decided not to do so. The Governmentof Venezuela has already contracted with the Massachusetts Institute ofTechnology to produce projections of human resources according to a highlytechnical econometric method. The mission could not do any serious work onthis matter, given its time constraints, and considering that the subject wasalready being covered by the work in progress at M.I.T. Moreover, projectingtrends of employment, output and productivity using historical data is hazard-ous in the case of Venezuela. It is obvious that future economic trends inVenezuela will show a break from historical trends since the changes in theprices of petroleum have had a major impact on the economy of Venezuela. Anyserious analysis of employment in Venezuela ought to consider these majorchanges and the use of historical data for projections of the economy might bemisleading and at best underestimate the employment level of Venezuela in thefuture.
203. It is useful, however, to speak of employment targets; not what theeconomy is likely to do without any Government action, but rather what increasein employoment and in production must be attained if the country is to achievefull employment. The answer to this question depends on three elements: one,the conceptual definition of full employment; two, the assumptions concerningthe growth of production in the various sectors of the economy; and, three,the rate of change of productivity in each sector.
204. The definition of full employment is difficult to translate intospecific figures. Some frictional unemployment always prevails even ineconomies that are growing at rapid rates. This kind of unemployment willprobably persist in Venezuela as well. No definitive estimate of the amountof unemployment required to provide minimal frictional unemployment has beenmade, although estimates in the range of 2 or 3% have been suggested forvarious economies. Clearly, the level depends on the freedom workers have toquit their jobs, the efficiency of labor markets and similar factors. More-over, if the target of full employment includes the progressive reductionof low productivity employoment, part of the additional jobs in the modernsector will be covered by workers holding low productive jobs and not bynew entrants to the labor foce, or by unemployed workers. Thus, a 4% rateof unemployment may be suggested as the interim "target" level to be reachedby the economy by 1980.

- 99 -
205. From the projections of the labor force set forth above, thismeans that 4,173,000 workers would have to be employed in 1980 to attain thisdegree of full employment. (If we allow for immigration, 4,268,000 would haveto be employed in 1980.) This represents an increase of nearly one millionover the employment of 3,211,000 in 1974, or an annual rate of increase of4.5% (4.9% allowing for immigration).
206. The rate of growth of economic activity that would be necessary toachieve this employment target depends on the rate of growth of productivity.For the reasons given in Chapter I it is important to look at the economyexcluding petroleum. The annual rate of growth of productivity in the non-petroleum economy has been 3.0% in the recent past; if this continues, agrowth of 7.6% in output will be needed to meet the employment target, exclud-ing immigration. Should immigration follow the pattern projected in TableIII.2, the required annual rate of growth of the GDP will need to be 8.0%.
207. It seems reasonable to expect that in the immediate years aheadVenezuela will attain a rate of growth around the abovementioned level, orperhaps higher. And it is also reasonable to expect that increases in pro-ductivity will not be higher than in the past.
208. The reasons why it is reasonable to expect that Venezuela will growin the years to come at an annual rate of 8.0%, or more, do not need explana-tion; but the probability that production per man will not increase at afaster rate than in the recent past is not so obvious, and needs to be ex-plained. The reasons to expect that the increase in productivity will notreduce employment absorption below the rate at which the labor force isexpected to grow are the following: First, Venezuela produces with modernequipment and modern techniques and is not, therefore, at a stage in whichits economy may experience great productivity leaps. Second, the country willprobably accelerate the development, already well started, of capital goodsand durable consumer goods industries which, as said in a previous chapter,are labor intensive. Third, the high levels of income and consumption of thecountry's upper income groups will probably continue to promote a rapid expan-sion of modern sector services, that are highly labor intensive. Fourth,public and private construction will continue to increase at a very fast rate,as fast as capacity will permit, and will absorb progressively large amountsof employment. And fifth, in the years to come the public sector's share inthe total economy is expected to grow, and such increase will probably raisethe economy's coefficient of labor absorption.
Government Programs
209. At present, the Government carries out a development policy thatwill probably have important effects on the level of employment and product-ivity in the near future. First, priority has been given to the executionof a program of industrialization that has direct and indirect impacts on thelevel of employment and productivity. Various industrial projects, includinga steel mill, two aluminum smelters, new energy developments and a few minorindustrial projects in the Guyana region will generate approximately 30,000

- 100 -
direct jobs in the construction period and 9,000 permanent direct jobs in theperiod of production. Certainly, backward and forward linkages will generateadditional employment opportunities; while basic metals are, in general,capital intensive industries, the metal products industries are labor inten-sive. Thus, the employment effects of forward linkages of new steel andaluminum plants on the Guayana region will probably be substantial. Not lessthan 20,000 new permanent indirect employments are expected to result fromthese new developments.
210. Second, public works play an important role for employment creationin Venezuela. Their labor capital ratio is high and their magnitude verylarge. Table III.4 reproduces the magnitude of the employment in publicworks for the next five years.
Table II1.4: AVERAGE ANNUAL EMPLOYMENT IN PUBLIC WORKSFOR THE PERIOD 1975-1979
(Thousands of persons)
Region Highways Buildings Water Resources Total
Capital 12.4 10.8 0.2 23.4Central 4.8 6.6 1.8 13.2West-Central 3.7 4.5 5.6 13.8Eastern 3.7 4.9 2.1 10.7Zulian 2.2 3.2 2.0 7.4Andean 4.1 4.6 1.9 10.6Southern 1.4 1.4 0.8 3.6Guyana 1.7 1.8 0.1 3.6
TOTAL 34.0 37.8 14.5 86.3
Source: Ministry of Public Works
211. These figures indicate the magnitude of the absorption of manpower ofthe program of public works over the whole five year period. They lead to anestimated annual increase of about 20,000 new direct employments. The employ-ment effects are larger than this immediate impact, since indirect employmentwill be created to meet the requirement of additional materials used in publicconstruction.
212. Another major government program requiring substantial increases inmanpower is that of education. The growth of the population alone impliesthe need for more manpower in education, but in addition Venezuela is deter-mined to enhance and improve the education of its people. The potential

- 101 -
demand is suggested by the plan recently drawn up by the Ministry of Education. 1/The requirements for teachers at all levels under "Alternative C," a conser-vative one, are as follows:
In service, 1973-74 98,100Requirements:
1976-77 114,5001980-81 149,0001985-86 175,0001990-91 198,000
213. In addition to teachers other school employees will be needed, someof them, like teachers, requiring relatively high levels of skill.
214. In addition to the direct employment effect of the above referred-toprograms, the general guidelines of the economic and social policy announcedby the Government in the areas of agricultural development and agrarian reform,industrialization, decentralization, housing, health, education, and socialsecurity, will help to improve the employment situation, even when they haveother primary objectives.
Limited Applicability of Standard Employment Policies
215. The measures usually recommended to reduce unemployment in partlyindustrialized countries are: (a) to increase public expenditure in laborintensive projects (low cost housing, road maintenance, education, etc.);(b) to stimulate labor intensive private activities (tourism, forestry laborintensive export crops, partial processing and re-exporting of semi-finishedlabor intensive goods, etc.); (c) to eliminate investment incentives thatsubsidize capital and stimulate the application of capital intensive tech-niques; and (d) to regulate mechanization, permitting the use of highlyautomatic equipment in some sectors (e.g., industries, involved in foreigntrade, power, communications, transportation, etc.), but restricting it inothers.
216. Given the current and prospective economic situation of Venezuela,and the structural and frictional nature of its unemployment, some of thesemeasures would be clearly inadvisable (e.g., to increase public expenditures,to restrict mechanization); some would be infeasible (e.g., to establishprocessing re-export industries based on cheap labor); and some would not beeffective (e.g., to promote labor intensive crops for export). One of them,however, should be applied as soon as possible, although not for its immediateeffects on employment, but for its general economic effects. Subsidies tocapital should be eliminated in order to redress the distorted relations
1/ Ministry of Education, Office of Planning and Budget, V Plan de la Nacion:Sector Educativo, 1976-80, Caracas, June 1975, Table de PlanificacionNo. 9, Alternativo C.

- 102 -
between factor prices; and they should be discontinued in the immediatefuture, when there would be no danger that their elimination would reducethe volume of overall investment.
Policy Recommendations
217. The examination of Venezuela's employment prospects in the immediateyears ahead seems to show that, except for the probable aggravation of theshortages of qualified personnel and the possible reduction (at least, inrelative terms) of low productive workers, the employment situation willmaintain its present characteristics. The policy guidelines outlined beforecontinue to be valid. Employment policy should be directed to eradicate, orreduce, the economic, sociological and cultural factors responsible for thethree types of structural unemployment currently affecting Venezuela, and toimprove labor market mechanisms, in order to reduce frictional unemployment.Beginning by these latter objectives, to proceed afterwards with the others,the mission considers that the following measures might be helpful.
Frictional Unemployment
218. The mobility of labor should be enhanced by improving the functioningof labor market mechanisms:
(a) The public employment service should be made a more effective agency.
(i) Coordination with other agencies active in areas relatedto employment (such as the Ministry of Education, INCE,Ministry of Public Works, Ministry of Development andCORDIPLAN) should become more continuous and effective.
(ii) The labor market research functions of the Ministry ofLabor should be strengthened and focused on not onlyproviding information to guide the operations of theemployment service and to inform workers about jobopportunities, but also to evaluate the effectivenessof employment service methods and identify industries,occupations and geographical areas where greater effortwould have the maximum effect in increasing services.
(iii) Courses, seminars and other methods of in-servicetraining of staff should be emphasized.
(b) The participation of women in the labor force and especiallythose who are heads of families should be made easier, so thatindividual women have more of a choice as to whether they wantto work. Pilot programs should be set up to provide daynurseries for young children of working mothers, both in theneighborhoods where they live and close to the work places.

- 103 -
(c) The mobility of workers to get to where the jobs are withinlarge urban areas should be increased both by continuingand intensifying present efforts to improve public trans-portation and by the creation of industrial parks nearwhere workers live. Related to this is the policy of decen-tralization of industry, which help to avoid the concentrationof workers in very large urban areas.
Structural Unemployment
219. The skills of workers, should be enhanced and adapted to the needsof the growing modern sector. Steps are needed both to improve the educationalsystem in this respect and to provide for training or retraining of adultworkers. The Mission's recommendations deal with the planning and coordinationof education and training, measures to improve the effectiveness of theeducational system in preparing youth for work, and measures to provide moretraining opportunities for adults.
(a) Planning and coordination of education:
(i) There are great risks to face again in the future shortages ofskilled workers as potentially costly for the nation as thecurrent one. Such shortages could be avoided by planning andtraining on the basis of the Government's own development pro-grams. It is recommended that CORDIPLAN establish a continuingprogram of research on human resources and future manpowerrequirements for educational planning, working in closecollaboration with the Ministries of Education, Labor andDevelopment. What is needed is not a single massive effort,the results of which are likely to become obsolete, but rathera continuing program, adapting the projections to changingeconomic circumstances and revised development plans.
(ii) As secondary schools increasingly emphasize broad vocationalpreparation, leaving the specific vocational training (otherthan professional and technical training at the post-secondarylevel) to INCE and on-the-job training, it becomes essentialto coordinate the formal and informal, the general educationand the specific vocational training, in order to assure thatgraduates and students who drop out of school before completingit, have adequate preparation for work.
It is recommended that a study of the entire formal and informalvocational preparation system of Venezuela be studied to see howthey relate to each other and how they are coordinated.

- 104 -
(b) Improving the preparation of youth for work
A number of steps should be taken within the education systemitself to improve the preparation of youth for work.
(i) Vocational guidance
Students and young workers need information on the labormarket and on their own abilities so that they can makerational choices in investing their time and effort ineducation. It is recommended that the staff of trainedvocational counselors in the upper and lower secondary schoolsand the universities be strengthened, and that information onfuture employment opportunities be published.
(ii) Evaluation of the work experience of graduates
Education and training institutions need to determine howeffective they are in preparing youth for work. It is recom-mended that tracer or follow-up surveys of graduates be con-ducted regularly to find out their employment and earningsexperience and the usefulness of the various elements of theirin-work training.
(iii) Work experience for students
A rigid separation between the years of education and those ofwork results in many young people being entirely unprepared forwork when they finally enter the labor market. Most of theadvertisements in newspapers offering jobs mention that exper-ience is required. The transition to the labor market would beeasier and more efficient if student had work experiencein the course of their education, either as a result of theirown efforts or as part of a formally arranged and supervisedwork-study program. Work should be seen as part of the educa-tional experience. It is recommended that a study be made ofthe feasibility of setting up work-study programs at thesecondary school level, and that pilot programs be undertakenin a number of different localities for several years.
(iv) Placement services for youth
The transition from school to work could be made more efficientby an effective placement service that is experienced in thespecial problems of young workers. In some countries theschools take on responsibility for placing their graduates anddrop-outs; in others the public employment service takesresponsibility, setting up special youth placement offices orstaff. Giving responsibility to the schools, it is argued,

- 105 -
gives them a clearer sense of accountability for the effec-tiveness of their educational programs and makes follow-up ortracer studies of the work experience of graduates more feasible.Assignment of the responsibility to the public employmentservice is defended on the basis that it is in close touch withthe labor market and is able to expose youth to the widestrange of employment opportunities in the community. It isrecommended that the Ministries of Labor and Education jointlyconsider how best to set up placement services for youngworkers, and how to cooperate in this area.
(c) Education for workers
The rigid separation between a period of education and a periodof work in people's lives also should be broken down on the otherside, by increasing the opportunities for adult workers to getfurther education or training. Adults often need training toenhance their skills -- especially in a period of rapid economicdevelopment -- or replace skills made obsolete by technologicalchange, or make up for incomplete education in their youth.Easy access to courses in professional, technical and businesssubjects in the evenings or on weekends should be provided. It isrecommended that the Ministry of Education study and use of presentfacilities for adult technical education, the unmet demands foradditional services, and the difficulties faced by adults who wishto take such training, and develop a program to meet the needs.
Low productive employment
220. The thrust of policies to reduce low productive employment should beboth to improve the informal sector of the economy by raising the productivityof its workers and the efficiency of its business enterprises, so that earningsof workers in this sector can be improved, and to make it possible for workersin the informal sector to find employment in the modern sector if they wantit. These aims are mutually supporting: some of the same measures (e.g.,improving work skills) contribute to both ends, and to the extent that workersleave the informal sector competition is reduced and earnings can improve.
(a) Skill improvement would be achieved by some of the measuresdiscussed above under "structural unemployment", such asopportunities for the education, training and retrainingof adults.
(b) The efficiency and viability of enterprises in the informalsector can be enhanced by further development of thoseinstitutions, as Corpo-industria, that are at presentgiving technical and financial assistance to small businesses.One effective way to assist small business would be to givethem opportunities to subcontract on government contracts.

- 106 -
(c) Low productive workers in rural areas can be effective onlythrough measures to raise production and productivity inagriculture. The mission is not in a position to giveadvice on general agricutural policy; but, within its field,considers that agricultural mechanization should not bedeterred but fostered. Agriculture is currently losingbadly needed workers, that migrate to cities to become un-employed or lowly employed workers. Mechanization would notdisplace more workers than are now moving to urban areas. Bymaking it possible to raise wages, mechanization may slowdown migration to the cities, thus helping to reduce unem-ployment and low productive employment in urban areas.
(d) Extremely low productive workers in cities may be aseffectively helped by general programs to combat povertythan by specific employment measures.
221. Given the structural character of unemployment and low productiveemployment, and the frictional nature of a substantial part of unemployment,they will not be easy to reduce; but a coordinated policy of well conceivedmeasures could do much to give productive employment to a larger number ofunemployed and low productive workers each year, integrating them fully toVenezuelan society and enabling them to contribute effectively to theeconomic and social development of the country.

APPENDIX I
STATISTICAL TABLES
Table Number
I. POPULATION
1.1 Total Population by Sex and Age Group: 1961, 1971, 19741.2A Population by Place of Birth1.2B Migration by Place of Origin - 19711.3 Bkuployment by Occupation and Educational Level 19741.4 Literacy of the Population 10 Years and Over by Age Groups; Caracas
and Venezuela, 19741.5 Survivors of 1961 Population by Age and Sex, Using UN Life Tables,
Compared to Actual 1971 Population
II. LABOR FORCE
2.1 Labor Force by Sex and Age, and Participation Rates,1950, 1961, 1971, 1974 I and 1974 II
2.2 Labor Force Participation Rates, Caracas 1961, 1971, 1974 I,and 1974 II
2.3 Changes in Labor Force Status by Age and Sex, 1974 I to 1974 II2.4 Persons Not in the Labor Force, by the Amount of Time That Has
Passed Since Their Last Regular Job, by Age and Sex, 1974 II2.5 Women Not in the Labor Force, by the Amount of Timie That Has Passed
Since Their Last Regular Job, for Venezuela and the UnitedStates, by Age, 1974
2.6 Labor Force Participation Rptes for Men, by Age, in Venezuela andVarious Other Countries
2.7 Educational Level of the Labor Force, Employed and Unemployed,197L II
2.8 Venezuela: Age and Sex Composition of the Labor Force 1950-1971and Projected to 1980 and 1985
III. EMP1LOYMENT
3.1 Emiployment by Branch of Industry, Venezuela and the Federal District,1950, 1961, 1971, 1974
3.2 EBnployment by Branch and Sub-branch of Economic Activity(10 Years and Over in Thousands)
3.3 Emnployment by Branch and Sub-branch of Economic Activity(Percentage Distribution)
3.4 Emiployment by Branch of Economic Activity and Occupation3.5 Manpower Absorption Among Industries 1961-1971, 1961-1966, 1966-19713.6 Government Workers, by Branch of Economic Activity, 1974 I3.7 Government Workers, by Occupation, 1974 I3.8 Persons Employed in Public and Private Services Activity, by Detailed
Branch of Industry and Sex, 1961 and 1974 II3.9 Workers 10 Years and Over who Worked Less than 30 Hours a Week, by
Reason for Working Part-time, 1974 I and 1974 II3.10 Help-wanted Advertisements in El Universal for April 21, 1975

- ii -
Ta',le Nurrber
IV. UNEKPLOYMENT
Number af Unemployed Workers, and Unemployment Rates, by Sexand Age, 1961, 1971, 1971 I and 1974 II
Caracas: Unemployment Rates by Sex and Age, 1961, 1971, 1974 Iand 1971 II
Unemployed Persons by Position in Family and Sex, 1974 IUnemployment R'tes, by Occupation and Sex, 1974 I and 1974 IIUnemployed, by Occupation and Sex, 1971 IIUnemployed, by Industry of Last Job, and Sex, 197? Il
L.7 Unemployed Persons by Educational Level, and Unemployment Pntesby Educational Level and Sex, 1974 II
Unemployed Persons by Duration of Unemployment and Age, 197T II* .9 Unemployed, by Duration of Unemployment, and Occupation, 197L IIk~.10 Unemployed, by Duration of Unemployment, Position in Family, and
Sex, 197L II.^.1i Unemployed, by Duration of Unemployment, by Sex, 197 ILL4.12 Percent of Labor Force Unemployed, by Age and Duration of
Unemployment, II 1974Persons Unemployed 15 Weeks or More, by Position in Family and
Sex, 197L II--ersoris Unemployed 15 Weeks or More, by Age, 1974 II
Unemployment Rates by Area and Sex, 197L IIPercent distribution of Unemployed at Each Educational Level, by
Duration of Unemployment, for Both Sexes, Male & Female, 1974
V. EARNINGS AND INCOME
Nonagriculture Wage Earners and Self-employed by Sector:1961, 1971, 1974
5.2 Distribution of Earnings Among Nonagriculture Workers byOccupation and Income Bracket, 1971-1974
1., Distribution of Earnings Among Nonagr:iculture Workers byBranc- of Toonomic Activity and Income Bracket, 1971-19714
-.2A Distribuition of Income Among Self-employed in NonagriculturalActivities by Branch of Economic Activity and Income Level
B. Distribution of income Among Wage Earners in NonagriculturalActivi ties by Branch of Economic Activity and Income Level
Low-income Worcers as a Percent of all Workers 15 and Over by Classo^ Worke.s and Sex, Venezuela and Caracas, 1974 I and 1974 II
- c nlNplovees Earning Less Than 100 Bs Weekly, by Age and Sex,7L II (Nonfarm only)
.:imployees Earning Less Than 100 Bs Weekly, by Position in Familyand Sex, 1971 II
Employees Earning Less Than 100 Bs Weekly, by Branch of Industryanrd > 9714 l (Nonfarm only)
Employeex Ea.ming Less Than 100 Bs Weekly, by Occupation andSex, 1974 II (Nonfarm only)
<.!-; Self-employed Workers Earning Less Than 500 Bs Monthly, by Ageand Sex, 1974 lI (Nonfarm only)
.(11 Self-employed Workers Earning Less than 500 Bs Monthly, byPosition in Family, 1971 II (Nonfarm only)
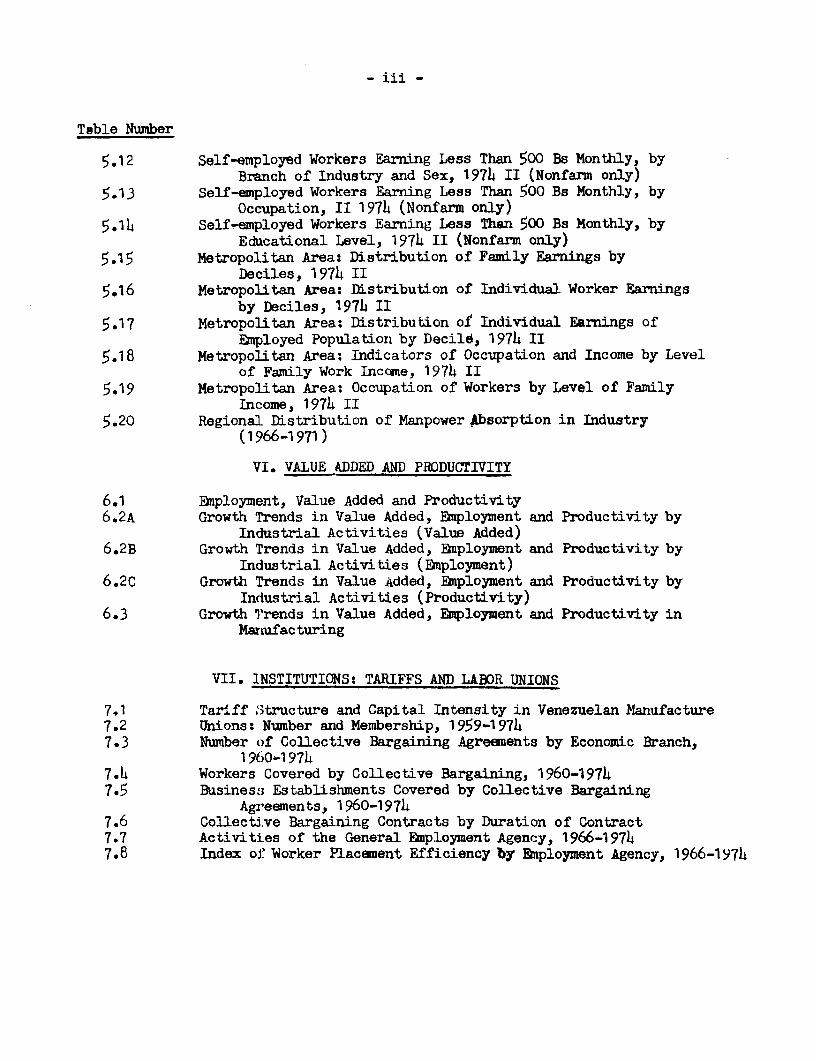
- iii -
Table Number
5.12 Self-employed Workers Earning Less Than 500 Bs Monthly, byBranch of Industry and Sex, 1974 II (Nonfarm only)
5.13 Self-employed Workers Earning Less Than 500 Bs Monthly, byOccupation, II 1974 (Nonfarm only)
5.14 Self-employed Workers Earning Less Than 500 Bs Monthly, byEducational Level, 1974 II (Nonfarm only)
5.15 Metropolitan Area: Distribution of Family Earnings byDeciles, 1974 II
5.16 Metropolitan Area: Distribution of Individual Worker Earningsby Deciles, 1974 II
5.17 Metropolitan Area: Distribution oI Individual Earnings ofEmployed Population by Decile, 1974 II
5.18 Metropolitan Area: Indicators of Occupation and Income by Levelof Family Work Income, 1974 II
5.19 Metropolitan Area: Occupation of Workers by Level of FamilyIncome, 1974 II
5.20 Regional Distribution of Manpower Absorption in Industry(1966-1971)
VI. VALUE ADDED AND PRODUCTIVITY
6.1 Employment, Value Added and Productivity6.2A Growth Trends in Value Added, Employment and Productivity by
Industrial Activities (Value Added)6.2B Growth Trends in Value Added, Employment and Productivity by
Industrial Activities (Employment)6.2C Growth Trends in Value Added, Employment and Productivity by
Industrial Activities (Productivity)6.3 Growth Trends in Value Added, Employment and Productivity in
Mianufacturing
VII. INSTITUTIONS: TARIFFS AND LAEOR UNIONS
7.1 Tarsiff 3tructure and Capital Intensity in Venezuelan Manufacture7.2 Unions: Number and Membership, 1959-1974703 Number of Collective Bargaining Agreements by Economic Branch,
1960-19747.4 Workers Covered by Collective Bargaining, 1960-19747.5 Business Establishments Covered by Collective Bargaining
Agreements, 1960-19747.6 Collecti.ve Bargaining Contracts by Duration of Contract7.7 Activities of the General Employment Agency, 1966-19747.8 Index of1 Worker Placement Efficiency by Employment Agency, 1966-1974

- iv -
Table Number
VIII. THE INFORMAL SECTOR AND POVERTY IN THE METROPOLITAN AREA
8.1 Size and Composition of Urban Labor Force, 19748.2 Composition of Urban Informal Sector, 19748.3 Metropolitan Area: Indicators of Occupation and Income by
Level of Per Cppita Family Income, 1974 II8.4A Metropolitan Area: Number of Family Members According to
Family Income Levels, 1974 II8.4B Metropolitan Area: Distribution of Homes by Number of
Family Members and by Family Income Levels8.AC Metropolitan Area: Distribution of Homes by Number of Members
in the Family and According to Family Income Levels8.4D Metropolitan Area: Distribution of Homes by Family Income and
F"mily Members8.5A Metropolitan Area: Number of Family Members According to
Family Income Levels, 1974 II8.5B Metropolitan Area: Distribution of Homes by Number of Family
Members and by Family Income Levels8.5C Metropolitan Area: Distribution of Homes by Number of Members
ir the Family and According to Fami]y Income Levels8.5D Metropolitan Area: Distribution of Homes by Family Income
and Family Members8.6A Metropolitan Area: Distribution of Per Family Income According
to Levels of Per Capita Income8.6B Metropolitan Area: Distribution of Per Family Income According
to Levels of Per Capita Income (Percentages of each class)8.6C Metropolitan Area: Distribution of Per Family Income According
to Levels of Per Capita Income (Percentages of each group)8.6D Metropolitan Area: Distribution of Per Family Income According
to Levels of Per Capita Income (Percentages of total)8.7A Distribution of Population 15 Years and Over by Family Income
and Per Capita Income in the Family8.7B Distribution of Population 15 Years and Over by Family Income
and Per Capita Income in the Family (Percentage of each class)8.7C Distribution of Population 15 Years and Over by Family Income
and Per Capita Income in the Family (Percentage of group)8.7D Distribution of Population 15 Years and Over by Family Income
and Per Capita Income in the Family (Percentage of total)8.8 Metropolitan Area: Average Number of Persons Per Home by F"mily
and Per Capita Income, 1974 II8.9A Metropolitan Area: Occupational Situation by Family Income and
Per Capita Income8.9B Metropolitan Area: Occupational Situation by Family Income and
Per Capita Income8.9C Metropolitan Area: Occupational Situation by Family Income and
Per Capita Income8.9D Metropolitan Area: Occupational Situation by Family Income and
Per Capita Income

Table Number
8.10A Metropolitan Area: Distribution of Workers and Earnings by Levelof Personal Income According to Income Level of Families toWhich They Belong, 1974 II
8.10B Metropolitan Area: Distribution of Workers and Earnings by Levelof Personal Income According to Per Capita Income Level ofFamilies to Which They Belong, 197k II
8.11A Metropolitan Area: Distribution of Workers by Level of PersonalIncome According to the Income Level of the Families toWhich They Belong, 1974 II
8.11B Metropolitan Area: Distribution of Workers by Level of PersonalInccme According to the Level of Per Capita Income of theF,milies to Which They Belong, 1974 II
8.12A Metropolitan;Area: Relative Earnings of Workers by Level ofPersonal Income and Position in the Family According toIncome Level of Families to Which They Belong, 1974 II
8.12B Metropolitan Area: Relative Earnings of Workers by Level of PerCapita Income of Families to Which They Belong, 197k II
8.13 Metropolitan Area: Distribution of Workers by Category ofOccupation and Position in the Family According to Level ofPersonal Income, 1974 II
8.1LA Metropolitan Area: Distribution of Workers by Category ofOccupation and Position in the Family, According to Level ofPersonal Income, 1974 II
8.1LB Metropolitan Area: Distribution of Workers by Category ofOccupation and Position in the Family, According to Level ofPersonal Income, 1974 II
8.15 Metropolitan Area: Relative Earnings of Workers by Category ofOccupation and Position in the Family According to Level ofPersonal Income, 1974 II
8.16 Metropolitan Area: Size of the Families, Active and Inact-vePopulations and Employment Situation by Level of TotalFamily Income, 1974 II
8.17 Metropolitan Area: Size of the Families, Active and InactivePopulations and Employment Situation by Level of PerCapita Income, 1974 II


Table 1.1: TOTAL POPULATION BY SEX AND AGE GROUP: 1961, 1971, 1974
II Semester 1974 I Semester 1974 *1971 Census 1961 CensusAge Group Total Male Female Total Male Female Total Male Female Total Male Female
TOTAL 11,728 5,859 5,869 11,571 5,779 5,792 10,722 5,350 5,372 7,524 3,822 3,702
0 - 9 3,594 1,818 1,776 3,553 1,800 1,753 3,370 1,705 1,665 2,537 1,290 1,24710 - 24 4,019 2,008 2,011 3,970 1,978 1,992 3,637 1,803 1,834 2,200 1,110 1,09025 - 34 1,399 678 721 1,366 666 700 1,287 632 655 1,054 548 50635 - 44 1,137 572 565 1,129 566 563 1,008 511 497 737 385 35245 - 54 747 383 364 735 376 359 678 348 330 499 258 24155 - 64 478 239 239 470 235 235 425 210 215 299 146 15365 and over 354 161 193 348 158 190 317 141 176 198 85 113
PERCENTAGES
TOTAL 100.0 100.0 100.0 100.0 100.0 100.0 100.0 100.0 100.0 100.0 100.0 100.0
0 - 9 30.6 31.0 30.3 30.7 31.1 30.3 31.4 31.9 31.0 33.7 33.8 33.710 - 24 34.3 34.3 34.3 34.3 34.2 34.4 33.9 33.7 34.1 29.2 29.0 29.425 - 34 11.9 11.6 12.3 11.8 11.5 12.1 12.0 11.8 12.2 14.0 14.3 13.735 - 44 9.7 9.8 9.6 9.8 9.8 9.7 9.4 9.6 9.3 9.9 10.1 9.545 - 54 6.4 6.5 6.2 6.3 6.5 6.2 6.3 6.5 6.1 6.6 6.8 6.555 - 64 4.1 4.1 4.0 4.1 4.1 4.0 4.0 3.9 4.0 4.0 3.8 4.165 and over 3.0 2.7 3.3 3.0 2.8 3.3 3.0 2.6 3.3 2.6 2.2 3.1
Source: Direccion General de Estadistica; Censo de Poblacion y Vivienda 1961; Household Survey 1971, 1974.

Table 1.2 A: POPULATION PY PLACE OF BIRTH
(thousands of persons)
Nationality 1 911 1950 1961 1971
TOTAL 53351 7,524 10,722
Venezuelan 3,803 4.,814 7,062 10,258Born in the country 3,795 4,826 6,982 10,142Born in other countries 56 209 51X2 597
With Venezuelanparents 6 2 15 11Naturalized 2 13 65 109Foreigners 48 194 462 1477
Source: Direccion General de Estadistica: Various surveys.
Table 1.2 B : MIGRATION BY PLACE (F ORIGIN - 1971
(thousands of persons)
ce of o ilftn Total %An Waien
TOTAL 1007 l00.o 39 100l0 278 100.0
America 240 40.2 115 36.1 125 45.0Colombia (180) (30.2) (84) (26.3) (96) (34.5)
Europe 330 55.3 188 58.9 142 51.1Asia 24 4.0 15 4.7 9 3.2Africa 3 0.5 1 0.3 3 0.7
Source: Direccion General de Estadistica: Various surveys.

Table 1.3: EMPLOYMENT BY OCCUPATION AND EDUCATIONAL LEVEL 1974
(10 jears and over, percent distribution)
Without Primary school Secondary Technical Higher OtherTotal Illiterates formal 1-3 years 4-6 years school & normal education branches
education school
Caracas:
TOTAL 100.0 4.6 d 9. 42.1 25.5 2.1 8.8 4.7
Professional 100.0 -- -- 0.6 14.0 23.7 10.9 42.3 8.5Managerial 100.0 0.9 1.1 2.5 34.0 39.6 1.2 17.4 3.3Office workers 100,0 0.1 0.1 0.5 19.7 56.0 1.2 8.6 13.8Sales workers 100.0 4.5 3.8 10.7 46.0 27.9 0.3 4.4 2.4Agricultural workers 100.0 29.2 8.2 9.5 36.6 13.1 -- 1.6 1.8Mine workers 100.0 -- -- 50.3 49.7 -- -- -- --
Drivers in transport 100.0 2.7 3.8 13.0 63.1 15.9 0.2 0.3 1.0Artisans and operatives infactories 100.0 4.4 2.9 11.6 57.5 19.0 1.4 0.8 2.4
Other artisans and opera-tives 100.0 6.0 3.7 18.3 55.3 13.2 0.4 0.7 2.4Service workers 100.0 11.9 4.8 18.5 50.6 11.6 0.2 0.8 1.6Occupation not identifiable 100.0 -- -- -- 25.5 57.2 -- 13.5 3.8
Venezuela:
First Semester 1974
TOTAL 100 0 18.6 5.2 16.1 37.1 13.9 2.9 3.7 3.0
Professional 100.0 0.3 0.5 1.2 16.6 19.5 23.0 30.6 8.3Managerial 100.0 0.6 2.4 5.1 38.8 34.0 1.3 13.0 4.8Office workers 100,0 0.2 0.4 1.9 26.2 49.0 1.5 5.0 15.8Sales workers 100.0 11.6 7.3 18.2 42.9 16.9 0.3 1.2 1.6Agricultural workers 100.0 49.8 8.2 22.2 18.1 1.4 -- 0.1 0.2Mine workers 100.0 5.6 4.0 14.5 63.9 9.1 2.0 -- 2.9Drivers in transport 100.0 4.7 4.5 18.1 59.0 11.8 0.3 0.3 1.3Artisans and operatives infactories 100.0 10.3 5.5 17.3 51.5 12.1 1.4 0.3 1.6
Other artisans and opera-tives 100.0 16.9 5.2 17.6 50.5 8.1 0.2 0.6 0.8
Service workers 100.0 19.4 5.3 21.3 44.0 8.3 0.3 0.3 1.1Occupation not identifiable 100.0 8.6 0.6 6.7 39.1 38.2 0.2 4.8 1.8
Second Semester 1974
TOTAL 100.0 17.1 15.1 37.9 14.8 2.6 3.
Professional 100.0 0.2 0.4 1.2 15.2 20.4 23.9 30.3 8.4
Managerial 100.0 1.6 2.6 5.4 39.4 34.6 2.2 11.4 2.8Office workers 100.0 0.2 0.3 1.1 24.8 48.7 1.2 6.2 17.5Sales workers 100.0 11.8 6.9 14.0 43.1 17.3 0.2 1.5 2.2Agricultural workers 100.0 46.9 8.8 22.0 19.8 1.9 0.1 C.3 0.3Mine workers 100.0 13.5 2.2 10.3 45.8 16.7 8.3 -- 3.7Drivers in transport 100.0 5.3 5.6 16.5 57.8 12.8 0.2 0.2 1.6
Artisans and operatives infactories 100.0 9.3 5.0 15.6 53.1 13.3 1.b 0.3 1.8
Other artisans and opera-tives 100.0 12.5 5.3 18.3 51.5 10.9 0.2 0.4 0.9Service workers 100.0 18.6 6.3 19.2 46.5 7.8 0.1 0.3 1.2Occupation not identifiable 100.0 6.7 2.6 4.8 35.4 45.3 0.3 3.6 1.3
Source: Direccion General de Estadistica: Household Survey, 1974.

Table 1.l: LITERACY OF THE POPULATION 10 YEARS AND OVER BY AGE GROUPS; CARACAS
AND VENEZUELA, 1974
(Literacy as percent of total population)
VenezuelaCaracas First semester 1974 Second semester 197L
Male Female Male Female Male Female
TGTAL, 10 years andover 92.6 96.1 80.5 81,6 81.6 66.0
10_-14 9P.1 96.5 93.3 91.5 94.5 92.998.3 97.9 94.2 91.1 94.0 92.2
20-2L 9702 97.6 90.1 91.4 91.5 92.,2-_ 5-3L 95.1 97.6 83.8 88.3 84.9 98.735-4L 90.1 96.0 72.1 82.1 74.1 F3.LLi-5L 85.4 94.3 59.9 74.2 61.7 76,055-61 75.5 90.7 15.5 62.1 48.7 65<.365 and over 71.2 84.6 15.3 52.5 46.1 53.5
Urban population, 10years and over 92.6 96.1 86.6 92.0 87.3 92.9
10-1L1 98.1 96.5 96.3 95.4 96.8 96.215-19 98.3 97.9 96.5 96.1 96.3 96.f20-24 97.2 97.6 94.3 95.9 95.1 96.525-34 95.1 97.6 90.4 93.9 90.9 91.935-IL 90.1 9600 82.2 92.3 83.1 93.145-5Li 85.4 94.3 69.6 85.9 71.7 87.555'-6L 75.5 90.7 55.7 76.9 59.1 77.965 and over 71.2 84.6 54.2 64.3 55.6 67.2
:turai population, 10years and over -- -- 59.1 64.8 61.4 67.0
10-11 -- -- 84.5 81.6 87.4 81l.915-19 __ __ 84.0 76.9 8h.1 79.520-2Ll 74. 74.1 76.3 76.125-34 -- -- 59.4 70.3 62.2 73.135-4L __ __ 36.6 53.7 42.1 56.015-5h -- -- 29.7 41.O 28.9 2h.955-6L __ __ 16.1 3306 18.3 39.565 and over -- -- 17.7 30.1 18.1 29.1
Source: Direccion General de Estadistica: Household Survey, 1974.
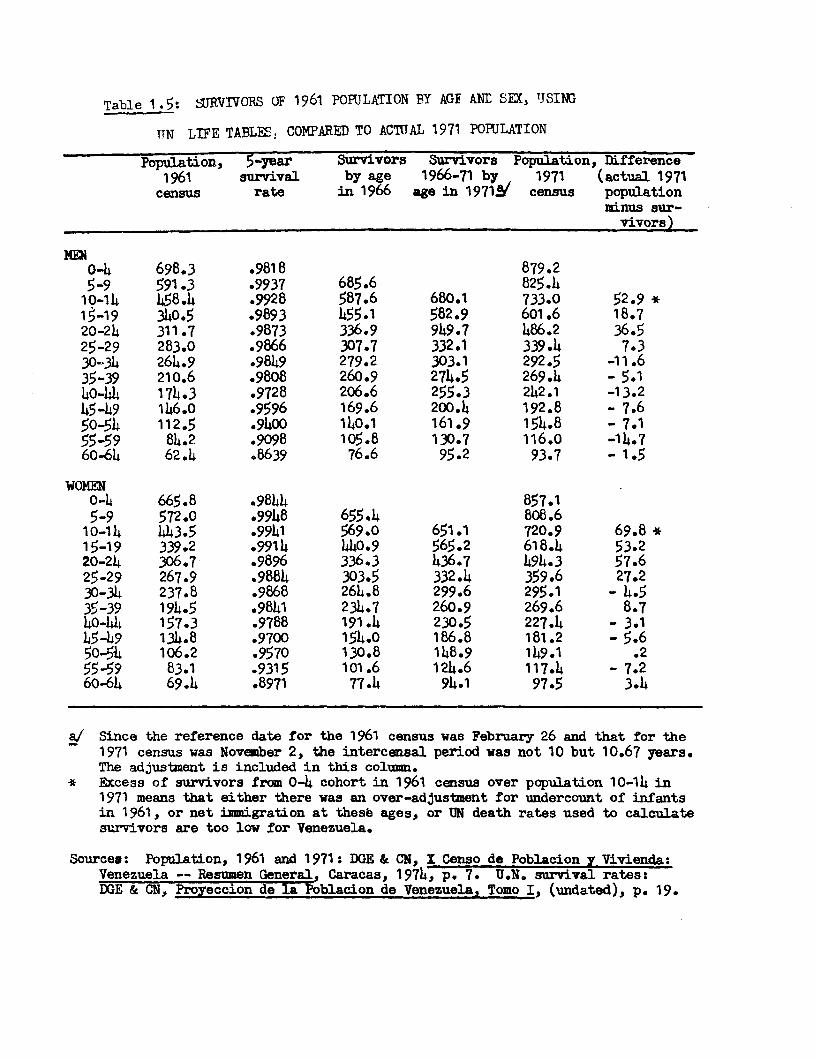
Table 1.5: SURVIVORS OF 1961 POPULATION BY AGE AN: SEX, TJSING
TTN LIFE TABLE5 COMPARED TO ACTUAL 1971 PORJLATION
Population, 5-year Survivors Survivors Population, Difference1961 survivaJ by age 1966-71 by 1971 (actual 1971
census rate in 1966 age in 1971 a census populationminus sur-
vivors)
0-4 698.3 .9818 879.25-9 591.3 .9937 685.6 825.410-14 458.4 .9928 587.6 680.1 733.0 52.9 *15-19 340.5 .9893 455.1 582.9 601.6 18.720-24 311.7 .9873 336.9 949.7 486.2 36.525-29 283.0 .9866 307.7 332.1 339.4 7.330-34 264.9 .9849 279.2 303.1 292.5 -11.635-39 210.6 .9808 260.9 274.5 269.4 - 5.1W-44 174.3 .9728 206.6 255.3 242.1 -13.245-49 146.0 .9596 169.6 200.4 192.8 - 7.650-54 112.5 .9400 140.1 161.9 154.8 - 7.155-59 84.2 .9098 105.8 130.7 116.o -14.760-64 62.4 .8639 76.6 95.2 93.7 - 1.5
WOMEN0-4 665.8 .9844 857.15-9 572.0 .9948 655.4 808.610-14 443.5 .9941 569.0 651.1 720.9 69.8 *15-19 339.2 .9914 440.9 565.2 618.4 53.220-24 306.7 .9896 336.3 436.7 494.3 57.625-29 267.9 .9884 303.5 332.4 359.6 27.230-34 237.8 .9868 264.8 299.6 295.1 - 4.535-39 194-5 .9841 234.7 260.9 269.6 8.740-44 157.3 .9788 191.4 230.5 227.4 - 3.145-49 134.8 .9700 154.0 186.8 181.2 - 5.650-54 106.2 .9570 130.8 148.9 149.1 .255-59 83.1 .9315 101.6 124.6 117.4 - 7.260-64 69.4 .8971 77.4 94.1 97.5 3.4
a/ Since the reference date for the 1961 census was February 26 and that for the1971 census was November 2, the intercensal period was not 10 but 10.67 years.The adjustment is included in this column.
* Excess of survivors frwm 0-4 cohort in 1961 census over population 10-14 in1971 means that either there was an over-adjustment for undercount of infantsin 1961, or net immigration at these ages, or TUN death rates used to calculatesurvivors are too low for Venezuela.
Sources: Population, 1961 and 1971: DGE & CN, I Censo de Poblacion y Vivienda:Venezuela -- Resumen General, Caracas, 1974, p. 7. U.N. survival rates:DGE & CN, Proyeccion de la Poblacion de Venezuela, Tomo I, (undated), p. 19.

Table 2.1: LABOR FORCE BY SEX AND AGE, AND PARTICIPATION RATESS,1950, 1961, 1971, 1974 I and 1974 II
(Numbers in thousands)
Both sexes, by age 1950 1961 1971 1974 I 1974 II
Labor forceTotal, age 10 and over -- -- -- 3,433.2 3,505.7Total, age 15 and over 1,628.2 2,261.7 3,014.7 3,355.2 3,428.0
10 - 14 -- - -- (78.0) (77.7)15 - 19 249.2 272.1 430.0 409.6 413.420 - 24 276.0 366.5 524.6 573.7 583.825 - 34 428.1 653.5 783.2 865.0 894.435 - 44 321.3 453.3 613.4 717.6 733.745 - 54 202.1 294.9 385.7 451.6 459.255 - 64 100.3 154.5 196.1 234.8 240.065 and over 47.7 66.9 81.8 102.8 103.4Age not reported 3.5 -- -- -- --
-articipation rates(percent of population)Total, age 15 and over 55.7 55.4 51.1 51.9 52.1
10 - 14 -- -- -- (5.o) (5.0)15 - 19 30.0 40.0 35.1 29.9 29.520 - 24 58.3 59.3 54.9 5b.6 55.125 - 34 58.8 62.0 60.9 63.3 63.935- 44 59.4 61.5 60.8 63.6 64.545 - 54 57.8 59.0 57.1 61.5 61.555 - 64 51.6 51.7 46.0 49.9 50.265 and over 35.8 33.8 25.7 29.5 29.2
(continued)

Table 2.1: LABOR FORCE BY SEX AND AGE, AND PARTICIPATION RATES,1950, 1961, 1971, 1974 I and 1974 II (continued)
(Numbers in thousands)
Men, by age 1950 1961 1971 1974 I 1974 II
Labor forceTotal, age 10 and over -- -- -- 2,607.5 2,650.1Total, age 15 and over 1,339.2 1,855.1 2,338.6 2X545.5 2,586.4
10 - 14 -- -- -- (62.0) (63.7)15 - 19 193.6 211.3 304.2 302.9 300.520 - 24 220.1 287.4 379.5 397.8 408.125 - 34 356.4 535.1 598.0 639.6 652.935 - 4 270.2 377.4 491.9 552.0 559.415 - 54 171.4 250.8 322.8 359.9 367.255 - 64 85.0 134.3 170.6 202.1 204.965 and over 39.8 58.7 71.6 91.1 93.4Age not reported 2.9 -- -- -- --
Participation rates7percent of population)Total, age 15 and over 91.1 89.5 80.3 79.6 79.8
10 - 14-- - -- (7) (8.0)15 - 19 79.3 62.1 50.2 43.6 42.720 - 24 93.2 92.2 81.9 79.2 79.225 - 34 95.7 97.7 94.7 96.0 96.235 - 44 96.1 98.0 96.1 97.6 97.845 - 54 95.0 97.0 93.3 95.8 96.055 - 64 90.5 91.6 81.2 86.0 85.865 and over 72.0 70.1 50.1 57.7 58.0
(continued)

Table 2.1: LABOR FORCE BY SEX AND AGE, AND PARTICIPATION RATES,
1950, 1961, 1971, 1974 I and 1974 II (continued)
(Numbers in thousands)
Women, by age 1950 1961 1971 1974 I 1974 II
Labor forceTotal, age 10 and over -- -- -- 825.6 855.6Total, age 15 and over 288.9 407.0 676.1 809.6 841.6
10 - 14 -- -- -- (16.0) (14.0)15 - 19 55.6 60.8 125.8 106.7 112.920 - 24 55.9 79.1 145.0 175.9 175.725 - 34 71.7 118.3 185.1 225.4 241.535- 44 51.1 75.9 121.4 165.6 174.345 - 54 30.7 44.1 62.9 91.6 91.955 - 64 15.3 24.2 25.5 32.7 35.165 and over 7.9 8.2 10.2 11.7 10.1Age not reported .6 -- -- -- --
Participation rates(percent of population)Total, age 15 and over 19.8 20.2 22.6 24.7 25.3
'LO- 14 _ __ __ (2.1) (1.8)15 - 19 22.0 17.9 20.3 15.8 16.220 - 24 23.5 25.8 29.3 32.1 33.525 - 34 20.2 23.4 28.2 32.2 33.5315- 1414 19.7 21.6 24.4 29.4 30.85- 54 18.2 18.3 19.1 25.5 25.3
-5 _ 64 15.2 13.2 11.8 13.9 14.765 and over 10.2 7.2 5.9 6.1 5.2
.ource: 1950, 1961, 1971: Direcci6n General de Estadistica y Censos Nacionales, X Censode Foblaci6n y Vivienda: Resumen General, Caracas, 1974, p. 48.
1974: Encuesta de Hogares tabulations.

Table 2.2: LABOR FORCE PARTICIPATION RATES, CARACAS
1961, 1971, 1974 I, AND 1974 II
(Numbers in thousands)
Wb191971 __74 I 1974 I Total Men Women Total Men Women Total Men Women Total Men Women
TOTAL 53.6 7.9 29.1 § X1.9 . 51.9 79.6 36.1 52. 1 7.8 37.8
15-19 42.3 54.3 31.3 38.0 46.5 30.4 31.0 38.0 24.8 31.4 38.0 25.320-24 67.4 88.9 43.4 62.6 82.4 14.5 61.6 78.2 46.5 64.0 81.0 48.825-34 70.1 97.8 38.1 68.6 95.4 42.9 69.6 95.9 4..7 70.1 96.0 46.235-44 68.4 98.3 35.1 68.3 97.2 39.4 70.0 98.2 42.2 72.1 98.0 46.645-54 61.7 96.6 27.5 61.3 94.8 32.1 65.4 94.1 36.7 66.1 96.2 36.255-64 47.0 88.0 16.2 47.4 80.7 19.4 47.2 81.6 20.0 49.2 82.6 22.465 and over 23.4 57.9 7.0 22.0 47.8 7.9 21.9 46.9 7.0 20.4 45.3 5.04
Source: Direccion General De Estadistica: Censo de Poblacion y Vivienda 1961, Household Survey 1971, 1974.

Table 2.3: CHANGES IN LABOR FORCE STATUS BY AGE AND SEX, 1974 I TO. 1974 II
(Persons 10 years and over)
Total 10 -l4 15 - 19 20 - 24 25 - 34I II I II I II I II I II
TOTAL POPTLATION 8.017.7 8.134.0 1,549.5 1.556.6 1,370.2 1,402.1 1,050.2 1,060.2 1,366.2 1.32 9.3
Labor force 3,433.2 3,505.7 78.0 77.7 409.6 413.4 573.7 583.8 865.0 894.4
Employed 3,225.1 3,286.2 76.3 75.1 360.1 359.1 509.9 516.6 814.8 839.8Unemployed 208.1 219.5 1.8 2.6 49.6 54.3 63.7 67.1 50.3 54.7
Not in labor force 4,584.5 4,628.3 1,471.4 1,478.9 960.5 988.6 476.5 476.4 501.1 504.9Keeping house 2,099.9 2,112.4 95.3 105.7 229.6 236.3 304.3 299.6 461.5 464.0Students 2,087.3 1,782.2 1,263.0 1,036.8 660.1 585.1 142.2 138.4 19.4 19.9Unable to work 134.8 141.2 9.8 9.1 9.5 10.8 7.7 8.o 10.1 11.5Others 262.6 592.5 103.4 327.3 61.4 156.3 22.3 30.5 10.1 9.6
Source: Direccion General De Estadistica: Household Survey 1974.

Table ?2*4:
PERSONS NOT IN THE LABDR FORCE, BY THE AMOUNT OF TIME
THAT HAS PASSED SINCE THEIR LAST REGULAR JOB,
BY AGE AND SEX, 1974 II(15 YEARS AND OVER)
P6rcent of total populatdonPersons Persons not in the labor forcein the Last worked: Never
Sex and age labor Total Less More had aforce than one than one regular
year ago year ago full-timejob
Men, total 79.8 20.2 1.2 1.5 17.5
15-19 42.7 57.3 14 55420-24 79.2 20.8 1.4 .7 18.725-34 96.2 3.8 .5 .2 3.035-44 97.8 2.2 .8 .4 1.045-54 96.0 4.O 1.4 .8 1.955-64 85.8 14.2 2.1 5.3 6.765 years and over 58.0 42.0 3.1 13.0 25.8
Women, total 25.3 74.7 3.1 8.9 62.7
15-19 16.2 83.8 3.6 3.2 77.020-2h 33.5 66.5 4.6 9.0 52.925-34 33.5 66.5 3.5 12.4 50.635-44 30.8 69.2 2.8 10.5 55.845-54 25.3 74.7 2.0 9.3 63.355-64 14.7 85.3 1.7 10.2 73.465 years and over 5.2 94.8 .9 7.7 86.3
Note: The item on the questionnaire is "Cuando dej6 de trabajar por ultima vezen un empleo a tiempo campleto que durara dos o mas semanas consecutivas?"and the interviewer is given lines to enter day, month, year, and a boxmarked "Nunca trabajo" to check. It is possible that some reported asnever having worked may have worked, but not at a full-time job lastingtwo or more weeks.

Table _25: WONEN NOT IN THE LABOR FORCE,
BY THE AMOUNT OF TIME THAT HAS PASSED SINCE THEIR LAST REGULAR JOB,
FOR VENEUELA AND THE UNITED STATES, Br AGE, 1974
Percent of total population
Venezuela!/ United Statesa
Ages Ages Ages AgesTotal 15-24 25-54 Total 15-24 25-59
Total not inlabor force 74.7 76.8 69.2 54.3 43.3 47.0
Never worked 62.7 66.9 55.2 9.9 17.3 4.9
Worked morethan one year ago 8.9 5.8 11.1 36.2 10.0 35.1
Worked lessthan one year ago 3.1 4.1 2.9 8.3 16.0 7.0
a/ II 1974, population 15 years and over. Data from Table 41.
b/ Average, 1974. U.S. Department of Labor, Employment and Earninge,January, 1975, pages 160 and 137.

Table 2.6: LABOR FORCE PARTICIPATION RATES EDR MEI, BY AGE, IN VENEZUELA AND VARIOUS OTHER COUWNTRIES
Venezuela Argentina Chile Uruguay Brazil Colombia Peru Mexico Japan United States
Age XI 1971 Average,1971 30.IX.1960 22.IV.1970 16.X.1960 1.TX.1970 15.VII.1964 2.VII.1961 28.1.1970 1.X.1970 1.IV.197C
Less than 15 -- 8.0 2.3 .8 3.4 5.8 4.3 1.9 2.2 -- .9
15-19 50.2 43.1 72.1 42.3 70.0 62.1 66.3 54.9 49.9 36.-5 10.3
20-24 81.9 79.2 90.3 83.0 93.3 88.6 89.8 91.6 79.6 83.5 80.9
25-29 93.0* 95.0* 96.8 95.1 97.1 94.2 95.9 97.5 90.6 98.2 92.9
30-49 97.0* 97.0* 96.9 95.3 96.5 94.8 97.2 98.7 93.8 98.h 94.5
50-54 91.5* 94.0* 87.2 87.2 86.8 87.7 95.1 97.7 92.3 97.3 91.L4
55-59 85.0* 87.5* 71.5 80.7 72.8 82.6 92.5 96.2 90.6 94.2 86.8
60-64 75.o* 78.5* 57.0 71.2 53.1 73.5 86.8 91.9 86.1 85.8 73.0
65 and over 50.1 57.9 38.3 40.3 21.1 51.0 58.9 68.7 70.4 54.5 24.8
Percent of laborforce employed inagriculture ** 21.7 17.8 21.2 18.1 44.4 47.2 46.9 39.2 19.1 4.2
* Interpolated values. Actual data for 1974 were: 25-34, 96.1%; 35-44, 97.7%; 45-54, 95.9%; 55-64, 85.91. Data for 1971 were: 25-34, 97.7%; 35-44,
96.11; 45-54, 93.6%; 55-64, 81.21.
** See 1974 figure. Census 1971 data by branch of activity are subject to large error from inadequate reporting.
Source: Venezuela - Household Survey and 1971 Census. Other countries: ILO Yearbook of Labour Statistics. 1973, Tables 1 and 2.

Table 2.7: EDUCATIONAL LEVEL OF THE LABOR FORCE,
EMPLOYED AND UNEMPLOYED, 1974 II
(Persons 10 years and over; numbers in thousands)
Labor force Fmployed UnemployedNumber Percent Number Percent Number Percent
TOTAL 205.7 100.0 3286.1 100.0 212.6 100.0
Illiterate 580.0 16.5 564.2 17.2 17.1 7.8No formal
education 181.0 5.2 177.3 5.4 3.6 1.6Primary:1-3 years 523.4 14.9 494.2 15.0 27.6 12.64-6 years 13h9.4 38.5 1247.8 38.0 100.7 45,9
Secondary 533.5 15.2 485.1 14.8 47.9 21.8Technical and
normal 90.8 2.6 85.1 2.6 5.7 2.6Higher education 128.5 3.7 124.5 3.8 3.8 1.7Other branches 120.2 3,4 107.1 3.3 13.1 6.0
Source: Direccion General de Estadistica, Household Survey, 1974.
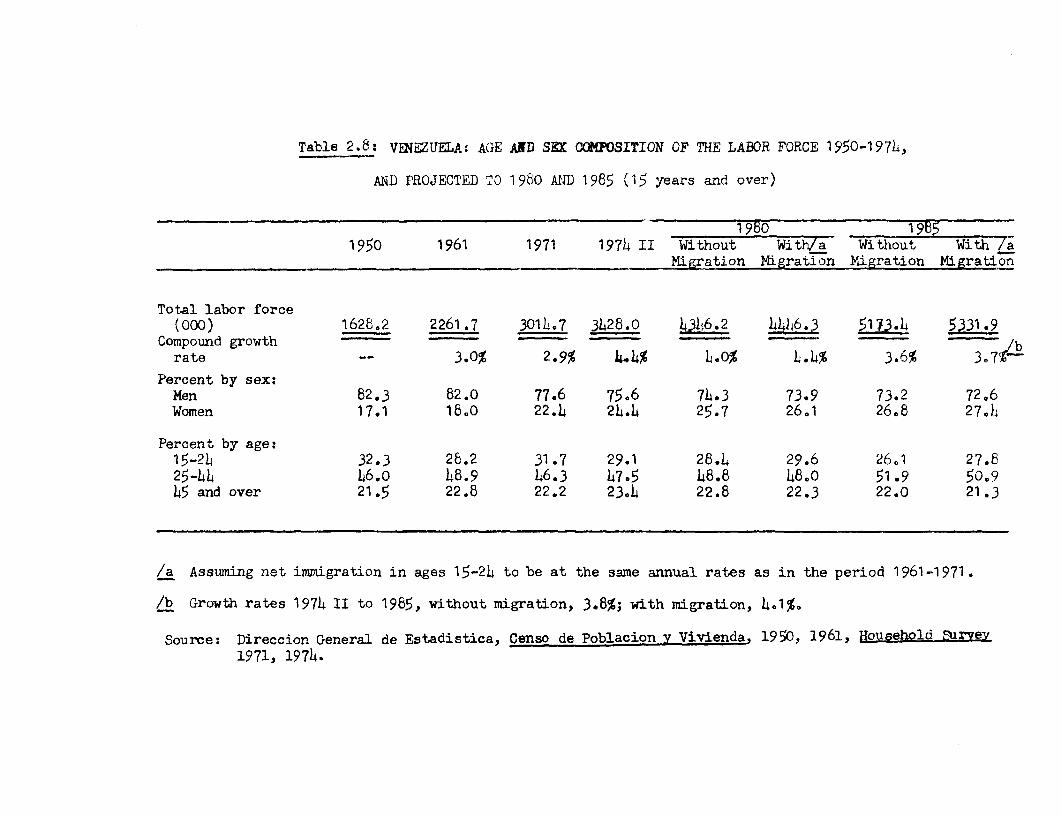
Table 2.8: VENEZUELA: AGE AND SX CUMPOSITION OF THE LABOR FORCE 1950-197L,
AND PROJECTED TO 1980 AID 1985 (15 years and over)
1950 19E51950 1961 1971 1974 II Without With/a Without With /a
Migration Migration Migration Migration
Total labor force(000) 1628.2 2261.7 3010,7 3428.0 L6.2 h4U6.3 5173.4 5331.9
Compound growth -
rate -- 3.0% 2.9% 4l 4% L.0% l .14% 3.6% 3 -Percent by sex:Men 82.3 82.0 77.6 75,6 74.3 73.9 73.2 72e6Women 17.1 18,0 22.L 24.4 25.7 26.1 26.8 27A1
Percent by age:15-2L 32.3 28.2 31.7 29.1 28.4 29.6 2601 27.825-L L46.o 48.9 46.3 47.5 48.8 48eO 51.9 50,945 and over 21.5 22.8 22.2 23.4 22.8 22.3 22.0 21.3
/a Assuming net immigration in ages 15-2L to be at the same annual rates as in the period 1961-1971.
/b Growth rates 1974 II to 1985, without migration, 3.8%; with migration, 141%,
Source: Direccion General de Estadistica, Censo de Poblacion y Vivienda, 1950, 1961, Household 5curvey1971, 1974.

Table 3.1 : EMPLOYMENT BY BRANCH OF INDUSTRY, VENEZUELAAND THE FEDERAL DISTRICT, 1950, 1961, 1971, 1974
(Population 15 years of age and over)
(Numbers in thousands)
1950 1961 1971 a 1974 I 1974 II
Venezuela
TOTAL 1,523.5 1.960.1 2.828.7 3?148.8 3,211.1
Agriculture and fishing 654.6 662.7 605.1 693.6 675.1Petroleum and mining 49.2 45.5 36.5 48.3 51.1Manufactring 164.7 244.0 386.3 569.8 585.7Construction 90.4 81.1 146.3 211.6 218.0Electricity, gas, sanitary 5.2 21.2 32.6 44.0 49.0
servicesCommerce 147.1 262.3 366.2 524.8 548.oTransportation 51.9 96.2 119.9 198.6 205.9Se-vices 324.4 491.6 757.2 856.0 875.3Not specified 36.0 55.4 378.5 2.1 3.2
Federal District
TOTAL 258.1 389.3 611.9 791.7 821.8
Agriculture and fishing 9.2 7.4 6.7 7.2 7.0Petroleum and mining 3.5 2.9 2.4 4.9 4.2Manufacturing 51.6 72.4 124.1 190.8 203.3Construction 30.3 16.7 33.6 55.8 52.8Electricity, gas, sanitary 2.0 9.4 11.0 14.8 18.1
seri 'ces
Commerce 40.8 76.0 103.1 160.7 169.8Transportation 13.8 30.3 38.9 50.8 52.0Services 96.7 158.8 227.5 305.3 312.6Not specified 10.3 15.4 64.7 1.5 1.8
/a Because 378,500 people could not be classified by industry, the figures for someindividual industries are substantially understated. See Technical Note.
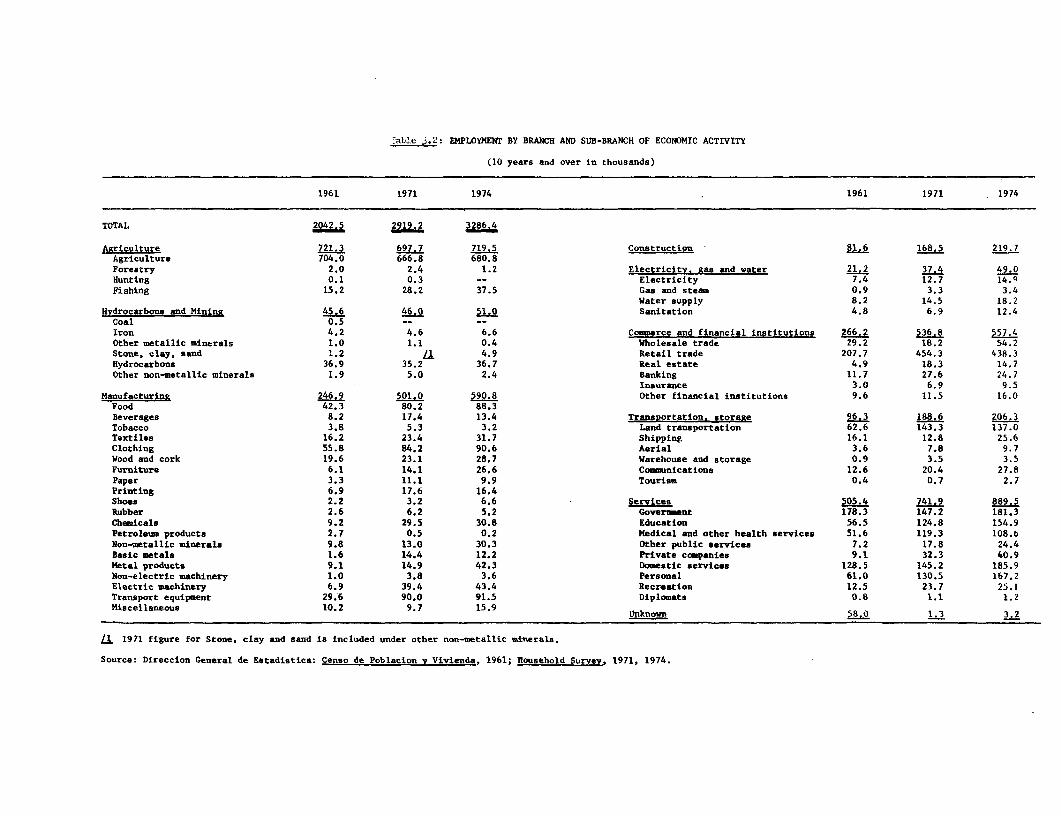
lable 3.2 EMPLOYMENT BY BRANCH AND SUB-BRANCH OF ECONOMIC ACTIVITY
(10 years and over in thousands)
1961 1971 1974 1961 1971 1974
TOTAL 2042.5 2919.2 3286.4
Aariculture 721.3 697.7 719.5 Construction 81.6 168.5 219.7Agriculture 704.0 666.8 680.8
Forestry 2.0 2.4 1.2 Electricity. gas and water 21.2 37.4 49.0Hunting 0.1 0.3 -- Electricity 7.4 12.7 14.9Fishing 15.2 28.2 37.5 Gas and steam 0.9 3.3 3.4
Water supply 8.2 14.5 18.2Hydrocarbons and Mining 45.6 46.0 51.0 Sanitation 4.8 6.9 12.4
Coal 0.5
Iron 4.2 4 .6 6.6 Commerce and financial institutions 266.2 536.8 557.4Other metallic minerals 1.0 1.1 0.4 Wholesale trade 29.2 18.2 54.2
Stone, clay, sand 1.2 L 4.9 Retail trade 207.7 454.3 438.3Hydrocarbons 36.9 35.2 36.7 Real estate 4.9 18.3 14.7
Other non-metallic minerals 1.9 5.0 2.4 Banking 11.7 27.6 24.7Insurance 3.0 6.9 9.5
Manufacturing 246.9 501.0 590.8 Other financial institutions 9.6 11.5 16.0Food 42.3 80.2 88.3Beverages 8.2 17.4 13.4 Transportation, storage 96.3 188.6 206.3Tobacco 3.8 5.3 3.2 Land transportation 62.6 143.3 137.0Textiles 16.2 23.4 31.7 Shipping 16.1 12.8 25.6Clothing 55.8 84.2 90.6 Aerial 3.6 7.8 9.7Wood and cork 19.6 23.1 28.7 Warehouse and storage 0.9 3.5 3.5
Furniture 6.1 14.1 26.6 Communications 12.6 20.4 27.8
Paper 3.3 11.1 9.9 Tourism 0.4 0.7 2.7Printing 6.9 17.6 16.4Shoes 2.2 3.2 6.6 Services 505.4 741.9 889 5
Rubber 2.6 6.2 5.2 Government 178.3 147.2 181.3
Chemicals 9.2 29.5 30.8 Education 56.5 124.8 154.9
Petroleum products 2.7 0.5 0.2 Medical and other health services 51.6 119.3 108.6
Non-metallic minerals 9.8 13.0 30.3 Other public services 7.2 17.8 24.4Basic metals 1.6 14.4 12.2 Private companies 9.1 32.3 40.9Metal products 9.1 14.9 42.3 Domestic services 128.5 145.2 185.9Non-electric machinery 1.0 3.8 3.6 Personal 61.0 130.5 167.2
Electric machinery 6.9 39.4 43.4 Recreation 12.5 23.7 25.1Transport equipment 29.6 90.0 91.5 Diplomats 0.8 1.1 1.2Miscellaneous 10.2 9.7 15.9 Unkn9 58.0 LI 3.2
L 1971 figure for Stone, clay and sand is included under other non-metallic minerals.
Source: Direccion General de Estadistica: Censo de Poblacion v Vivienda, 1961; Household Survey, 1971, 1974.

TaLe _,: EMPLOYMENT BY BRANCH AND SUB-BRANCH OF ECONOMIC ACIIVITY
(Percentage distribution)
1961 1971 1974 1961 1971 1974
TOTAL 100.0 100,0
Agriculture 35.3 100.0 23.9 100.0 21.9 100.0 Construction 4 0 100.0 5.8 100.0 6,7 100.0Agriculture 34.5 97.6 22.8 95.6 20.8 94.6Forestry 0.1 0.3 0.1 0.3 -- 0.2 Electricity, gas and water 1.0 100.0 1.3 100.0 1 5 100.0Hunting -- -- -- -- -- -- Electricity 0.4 34.9 0.4 34. 0 0.5 30.4Fishing 0.7 2.1 1.0 4.0 1.1 5.2 Gas and steam 0.1 4.2 0.1 8.8 0.1 6.9
Water supply 0.3 38.5 0.6 38.8 0.6 ',.I.Hydrocarbons and mining 2 2 100 0 1 6 100 0 1 5 100.0 Sanitation 0.2 22.4 0.2 18.4 0.3 25.6
Coal -- 1.1 -- -- -- --Iron 0.2 9.2 0.2 10.0 0.2 12.9 Commerce and financial institutions 13.0 100.0 18.4 100 0 17.0 100.0Other metallic minerals 0.1 2.2 -- 2.4 -- 0.8 Wholesale 1.4 11.0 0.6 3.4 1.7 9.7Stone, clay and sand 0.1 2.5 L /lI 0.1 9.6 Retail 10.2 78.0 15 7 84.7 13.3 78.6Hydrocarbons 1.8 80.8 1.2 76.5 1.1 72.0 Real estate 0.2 1.8 0.6 3.4 0.4 2.6Other non-metallic minerals 0.1 4.2 0.2 10.9 0.1. 4.7 Banking 0.5 4.4 0.9 5.1 .0.8 4.5
Brokers 0.2 1.1 0.2 1.3 0.3 1.7Manufacturina 12.2 100.0 17 1 100,0 18.0 100.0 Other financial institutions 0.5 3.7 0.4 2.1 0.5 2.9Food 2.1 17.1 2.7 16.0 2.7 14.9Beverages 0.4 3.3 0.6 3.5 0.4 2.3 Transportation, storage 4j 100.0 6.5 100.0 6.2 100.0Tobacco 0.2 1.5 0.2 1.1 0.1 0.5 Land transportation 3.1 64.9 49 76 .0 4.2 66.4Textiles 0.8 6.6 0.8 4.7 1.0 5.4 Shipping 0.7 16.7 0.4 6.8 0.8 12.4Clothing 2.6 22.6 2.9 16.8 2.8 15.3 Aerial transportation 0.2 3.8 0.3 4.1 0.3 4.7Wood and cork 1.0 7.9 0.8 4.6 0.9 4.9 Warehousing and storage 0.1 0.9 0.1 1.9 0.1 1.7Furniture 0.3 2.5 0.5 2.8 0.8 4.5 Cocmunications 0.6 13.3 0.8 10.8 0.8 13.5Paper 0.2 1.3 0.4 2.2 0.3 1.7 Tourism 0.0 0.4 -- 0.4 -- 1.3Printing 0.3 2.8 0.6 3.5 0.5 2.8Shoes 0.1 0.9 0.1 0.6 0.2 1.1 Services 24 8 100 0 25 4 100 0 27.1 100 0Rubber 0.1 1.1 0.2 1.2 0.2 0.9 Government 8.7 35.3 5.0 19.8 5.6 20.4Chemicals 0.5 3.7 1.0 5.9 0.9 5.2 Education 2.7 11.2 4.3 16.8 4.7 17.4Petroleum products 0.1 1.1 -- 0.1 -- -- Medical and other health services 2.5 10.2 4 1 16.1 3.3 12.2Non-metallic minerals 0.5 4.0 0.4 2.6 0.9 5.1 Other public services 0.4 1.4 0.6 2.4 0.7 2.7Basic metals 0.1 0.6 0.5 2.9 0.4 2.1 Private companies 0.5 1.7 1.1 4.4 1.2 4.7Metal products 0.5 3.7 0.5 3.0 1.3 7.2 Domestic services 6.3 25.4 5.0 19.6 5.7 20.9Non-electric machinery 0.1 0.4 0.1 0.8 0.1 0.6 Personal 3.1 12.1 4.5 17.6 5.1 18.8Electric machinery 0.3 2.8 1.4 7.9 1.3 7.3 Recreation 0.6 2.5 0.8 3.2 0.8 2.8Transport equipment 1.5 12.0 3.1 18.0 2.8 15.5 Diplomats 0.0 0.2 __ 0.1 __ 0.1Miscellaneous 0.5 4.1 0.3 1.8 10.6 2.7
Unknown 2.8 100.0 -- 100.0 0.1 100.0
Ll 1971 Figure for Stone, clay and sand is included under other non-metallic minerals.
Source: Table 3.L

Tal 3 tF1 0qIWK 31T SY RA OF DCOOUC ACTIVITY AND OCCUPATION
(10 yers and over in thousda)
I KIlaini & C0Otruc- Clectri- Co_rce Tranaspor-Total Agriculfe petrolm Industry tion city.gas & financial tation, Services Other
& water institutions storage& coun-ications
1974
TOTAL J6a.1 Z= 1. 590.6 29 NU 574 206.3 889.5 3.0
Profesaioeal sdtechnicia 271.5 3.1 5.7 17.0 5.1 3.2 12.6 5.0 219.7 0.1Managerial 115.1 0.4 5.6 24.9 7.3 1.1 39.4 5.4 30.7 0.4Office worker 273.9 0.5 4.5 40.5 3.8 9.2 77.4 23.3 113.5 1.1Sales workers 371.1 - 0.1 7.3 0.4 0.4 356.2 0.4 6.3 -Farm workers 706.1 706.1 _ ,- - -Mine workers 16.1 - 15.0 - 0.5 0.1 -- 0.6Drivers in transport 230.0 4.2 6.1 12,7 3.5 7.1 27.3 147.9 21.2 0.2Artisens and operativea
in factoriea 608.5 2.1 11.5 338.2 195.7 13.3 9.2 6.9 32.3Other artisans andoperatives 181.4 0.1 0.7 136.5 1.0 3.1 11.9 11.1 15.6 0.8
Service workera 493.5 3.0 1.9 11.9 2.0 11.4 23.2 6.1 433.8 0.3Occupation not identifiable 18.9 . 0.9 0.5 1.6 0.4 0.1 0.3 0.3 15.7 0.1
1971
TOTAL 2919.9 501.1 168.7 4 56.9 188.6 741.9 1.3
Profeasonal andtechnicias 250.5 4.6 3.8 13.9 4.5 3.4 15.0 3.1 202.1 -
Managerial 70.7 0.5 3.5 12.8 6.1 1.7 20.4 3.4 22.5 -Office workers 256.1 2.1 6.4 38.2 5.0 10.1 68.5 15.3 110.5 0.1Sales workers 399.8 0.8 0.2 11.1 - 0.8 378.4 0.9 7.6 -Farm workers 678.9 678.9 0.5 - - - - -
Mine workers 21.3 - 21.1 - 0.3 --
Drivers in trnsport 191.8 2.7 2.3 9.0 1.3 * 2.2 tl.4 150.8 11.9Artisans and operatives
in factories 499.9 5.3 7.3 294.7 149.9 9.1 8.2 3.6 22.0Other artisas and
operative 163.6 0.7 0.7 117.9 - 6.5 14.3 8.8 13.8 0.5Service workers 378.4 2.0 0.7 3.5 1.6 3.7 20.7 2.6 343.3 0.3occupation not identifiable 8.9 - - - - - - - 8.3 0.4
1961
TOTAL 2041.9 721. 54 81.2 2 66.0. 96.2 505.1 58.7
Professional andtechniciaus 117.9 1.9 4.1 4.7 3.0 0.9 4.7 0.9 96.3 1.4
Managerial 30.9 0.1 0.6 5.7 3.4 0.2 4.8 0.9 14.5 0.7Office workers 136.4 1.3 9.3 12.4 2.2 4.2 30.9 7.2 56.9 12.0Sales workers 206.5 0.4 - 1.8 - 0.1 200.5 0.4 2.8 0.5Farm workers 723.0 712.7 0.3 0.7 0.2 0.1 0.5 0.2 7.4 0.9Mine workers 14,9 - _ 14.7 - - - - 0.2 -Drivers in tranport 12t.5 2. 6.6 2.S 2.1 9.0 80.3 14.2 1.1Artisans and operative
in factorie 298.9 1.6 9.2 150.2 68.9 8.3 7.4 4.6 45.9 2.8other artisans andoperatives 63.2 - 0.1 60.9 0.1 - 0.5 0.1 0.7 0.8
Service workers 246.1 0.9 1.4 2.9 0.9 4.4 6.2 1.2 225.5 2.7Occupation not identifiable 80.6 0.4 0.3 0.9 - 0.6 1.5 0.4 40.7 35.8
Source: Direccion General de Eatadistica, Censo de Poblacion v Viviinda: 1961. Konaebold SJer 1971, 197L.

Table 3.5:
HANPOWR ABSORPTION AMONG INDUSTRIES 1961-1971
(Absolute Increases in Number of Persons)
of Large Medium-sized Medium-sized 9a1U1971 which Industries Industries Industries Industries1961 in: >100 2mpl. 51-100 Dmpl. 21-50 Empl. 5-20 Empl.
Total Manufacturing 85,458 10(% 73,866 (86.4) 15,583 (18.2) 6,930 (8.1) -l1,921(-12.t)
(Traditional Industries) (29,41.7) (34 . (30,704) (3,883) (843) (-6,013)Food 18,221 15,790 1,126 265 1,040Beverfges -155 259 475 342 -1,231Tobacco -149 161 -73 -10 -227Textiles 5,722 6,354 -146 -93 -393Clothing and Footwear 4,951 5,635 1,606 752 -3,042Leather -212 72 134 49 -637Wood and Cork 3,14o 1,548 376 822 394Furniture -2,101 885 385 -1,454 -1,917
(Intermediate Industries)(34,363) (40.2) (25,077) (5,690) (5,151) (-670)Paper 3,824 2,986 215 830 -207Chemical Products 10,399 7,603 2,307 933 -444Petrochemical Products(incl. Plastics) 2,837 -463 1,097 1,247 956
Rubber 1,615 1,731 230 20 -366Non-metallic Minerals 6,551 4,457 1,358 1,602 -866Metals 9,137 7,878 483 519 257
(Mechanical Industries) (17,760)(a18) (17,862) (4,412) (800) (-5,314)Metal Products 10,440 3,847 1,666 2,309 2,618Non-electric Machinery 3,070 1,356 283 924 507Electric Machinery
aid Equipment 4,295 4,421 1,218 -368 -976Transport Equipment -45 8,238 1,245 -2,o65 -7,463
(Residual Group) - (3,918)(4.6) (1,108) (1,598) (136) (1,076)Printing 2,650 1,065 887 15 683Miscellaneous 1,268 43 711 121 393

Table 3.5 (cont.):
M4ANPOWER ABSORPTION AMONG INIDJSTRIES 1961-1966
(Absolute Increases in Number of Persons)
of Large Medium-sized Medium-sized inal11966 which Industries Industries Industries Industries1961 in: >100 Enpl. 51-100 Empl. 21-50 mnpi. 5-20 Empl.
Total Manufacturing 43,098 100% 38,162 (8&5) 6,344 4.7) 5,529(12.8) -6,937(-16.0)
(Traditional Industries) (11,489)(26.t (15,191) (1,447) (1,575) (-6,724)Food 8,212 6,358 351 1,378 125Beverages -705 _995 34 995 739Tobacco -166 -187 -176 265 -68Textiles 6,668 5,554 308 538 268Clothing and Footwear -746 2,104 754 -461 -3,143Leather -224 309 -147 32 -418Wood and Cork 1,505 1,304 333 -75 -57Furniture -3,055 744 -10 -1,097 -2,692
(Intermediate Industries)(17,895)(41b. (13,066) (1,983) (3,698) (-852)Paper 2,784 1,973 200 491 120Chemical Products 6,130 4,140 1,290 975 -275Petrochemical Products(incl. Plastics) -1,637 -1,676 -32 65 6
Rubber 331 470 -42 39 -136Non-metallic Minerals 3,457 1,959 205 1,861 -568Metals 6,830 6,200 362 267 1
(Mechanical Industries) (9,804)(22.7 (8,930) (1,897) (-525) (-498)Mietal Products 4,641 1,858 896 1,063 823Non-electric Machinery 1,531 305 42 194 990Electric Machinery
and Eauipment 1,844 2,458 687 -902 -399Transport Equipment 1,788 4,309 272 -881 -1,912
(Residual Group) (3,910)(9.1) (975) (1,017) (781) (1,137)Printing 1,060 608 136 207 109Miscellaneous 2,850 367 881 574 1,028
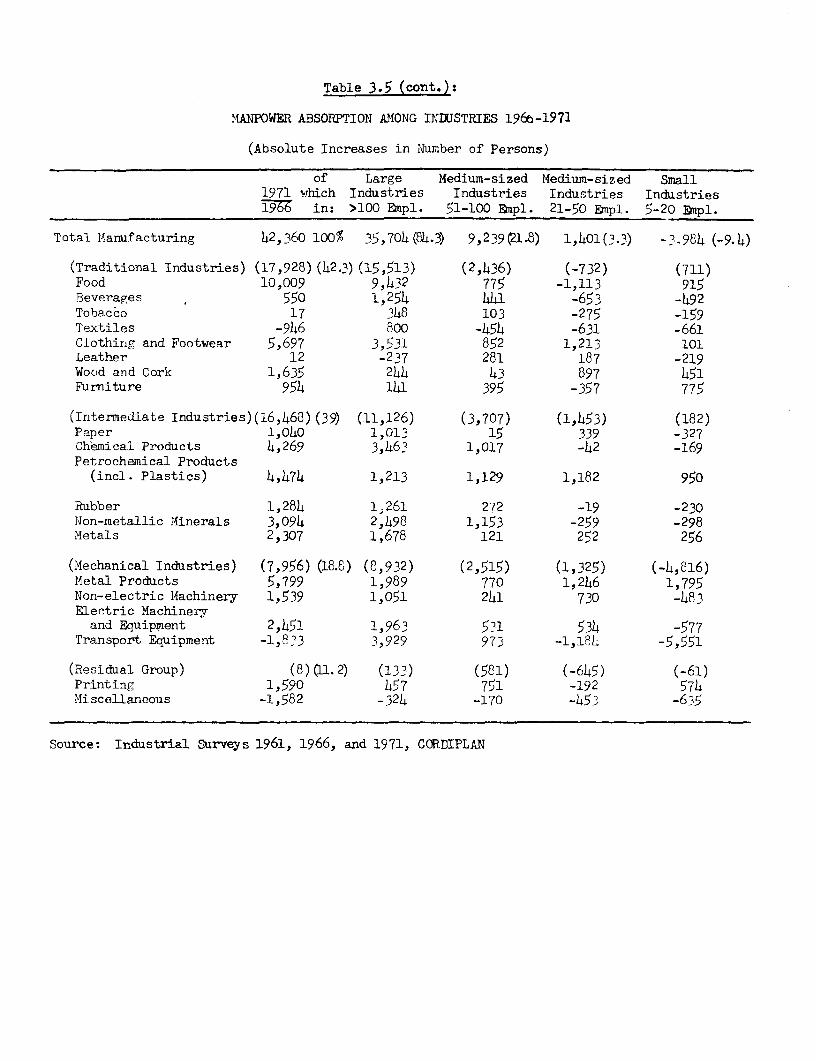
Table 3.5 (cont.):
MANPOWER ABSORPTION AMONG INDWUSTRIES 196%-1971
(Absolute Increases in Number of Persons)
of Large Medium-sized Medium-sized Small1971 which Industries Industries Industries Industries1796 in: >100 Empl. 51-100 Empl. 21-50 Empl. 5-20 Empl.
Total Manufacturing 42,360 10o% 35,704(84.3) 9,239 1.8) 1,1401(3.3) -3.984 (-9.4)
(Traditional Industries) (17,928) (42.3) (15,513) (2,436) (-732) (711)Food 10,009 9,432 775 -1,113 915Beverages 550 1,254 411 -653 -492Tobacco 17 2148 103 -275 -159Textiles -946 800 -454 -631 -661Clothing and Footwear 5,697 3,531 852 1,213 101Leather 12 -237 281 187 -219Wood and Cork 1,635 244 43 897 451Furniture 954 141 395 -357 775
(Intermediate Industries)(16,468)(39) (11,126) (3,707) (1,453) (182)Paper 1,040 1,013 15 339 -327Chemical Products 4,269 3,463 1,017 -42 -169Petrochemical Products(incl. Plastics) 4,474 1,213 1,129 1,182 950
Rubber 1,284 1,261 272 -19 -230Non-metallic Minerals 3,094 2,498 1,153 -259 -298Metals 2,307 1,678 121 252 256
(Mechanical Industries) (7,956) (18.8) (8,932) (2,515) (1,325) (-4,816)Metal Products 5,799 1,989 770 1,246 1,795Non-electric Machinery 1,539 1,051 241 730 -483Electric Machineryand Equipment 2,451 1,963 531 534 -577
Transport Equipment -1,833 3,929 973 -1,184 -5,551
(Residual Group) (8) (1.2) (133) (581) (-645) (-61)Printing 1,590 457 751 -192 574Miscellaneous -1,582 -324 -170 -453 -635
Source: Industrial Surveys 1961, 1966, and 1971, CORDIPLAN

Table 3.6; GOVERNMENT WORKERS, BY BRANCH OF ECONOMIC ACTIVITY, 1974 I
Branch Total Men Women
TOTAL 26.3 .6 190.7
Agriculture 11.3 10.2 1.1Petroleum and mining 3.7 2.8 .9Manufacturing 11.4 10.7 .7Construction 10.1 9.9 .1Electricity, gas, sanitary services 31.1 28.2 2.9Commerce 19.2 14.8 4.4Transportation 48.6 36.7 11.9Services (public and private) 390.9 222.1 168.7Not specified -- -- --
Source: Direccion General de Estadistica, Household Survey 1974.

Table 3.7: GOVERNMENT WORKERS, BY OCCUPATION, 1974 I
Branch Total Men Women
TOTAL 526.3 335.6 190.7
Professional, technical 170.0 64.2 105.8Managerial 14.3 13.5 .9Office workers 94.5 47.4 47.1Salespersons 2.0 1.4 .6Farmers 6.3 6.1 .2Mining and quarry workers .3 .3 --Drivers 40.8 35.7 5.1Artisans and operatives in factories 53.8 53.0 .8Other artisans and operatives 25.2 24.4 .7Service workers 103.5 74.1 29.4Not specified 15.6 15.6 .1
Source: Direccion General de Estadistica, Household Survey 1974.

Table 3.8: PERSONS EMPLOYED IN PUJBLIC AND PRIVATE SERVICES ACTIVITY,
BY DETAILED BRANCH OF INIIJST1RY AND SEX, 1961 and 1974 I1
(Numbers in thousands)
Detailed branch 1961 1974 IIof industry Total Men Women Total Men Women
TOTAL SERVICES 505.4 269.0 236.4 889.5 407.8 481.7(public and private) -
Government services 178.3 159.4 18.9 181.3 143.6 37.5Educational services 56.4 18.1 38.3 154.9 56.5 98.4Medical and sanitary 51.6 18.7 32.9 108.6 33.1 75.5
servicesOther services to the 7.2 5.5 1.7 24.3 18.2 6.1
publicBusiness services 9.1 7.7 1.4 40.9 30.7 10.2Miscellaneous services 12.5 10.6 1.9 25.2 19.9 5.3Domestic services 128.5 8.7 119.8 185.9 11.4 174.14Other personal services 61.0 39.8 21.2 167.2 93.4 73.8Diplomatic, consular .8 .6 .2 1.2 .7 .5
and technical services
Sources: 1961, DGEYCN Noveno Censo General de Poblaci6n (Feb. 26, 1961), Resumen General dela Republica, Caracas 1967. Partes B y C, P. 566.
1974 Household Survey.

Table 3.9:
WORKERS 10 YEARS AND OVER WHO WORKED LESS THAN 30 HOURS A WEEK,
BY REASON FOR WORKING PART-TIME, 1974 I AND 1974 II
(Numbers in thousands)
I 1974 II 1974Reason for working Percent Usually UsuaUy Percent Usually Usuallypart-time of total work work of total work work
Total labor full- part- Total labor fall- part-force time time force time time
Total 191 5.6% 86 105 118 3.4% 19 99
Working part-timefor economic reasons 40 1.2% 7 33 25 .7% 4 21
Slack work 37 1.1% 6 31 21 .6% 3 18
Working part-timefor non-economicreasons 151 4.4% 79 72 93 2.7% 15 78
Do not wantfunl-time work 45 1.3% -- 45 41 1.2% * 40
"Other" reasons 99 2.9% 74 25 43 1.2% 7 36
* Less than 500.
Source: Direccion CGeneral de vstadistica, Ho'. sehold Silire; 1974.

Table_3.10 : HELP-WANTED ADVERTISEMENTS IN EL UNIVERSAL FOR APRIL 21, 1975
Advertisements EmploymentOccupation Number Percent in Caracas
of Total (Percent of Total)
TOTAL 168 100.0 100.0_ -_
Professional, technical 43 25.5 13.2
Managerial 20 11.9 5.5
Office workers 43 25.5 L4.9
Sales workers 26 15.4 11.0
Transportation equipmentoperators 4 2.3 7.0
Artisans and operatives 32 19.0 27.0
Service workers - - 19.7
Other and unspecified - 1.3
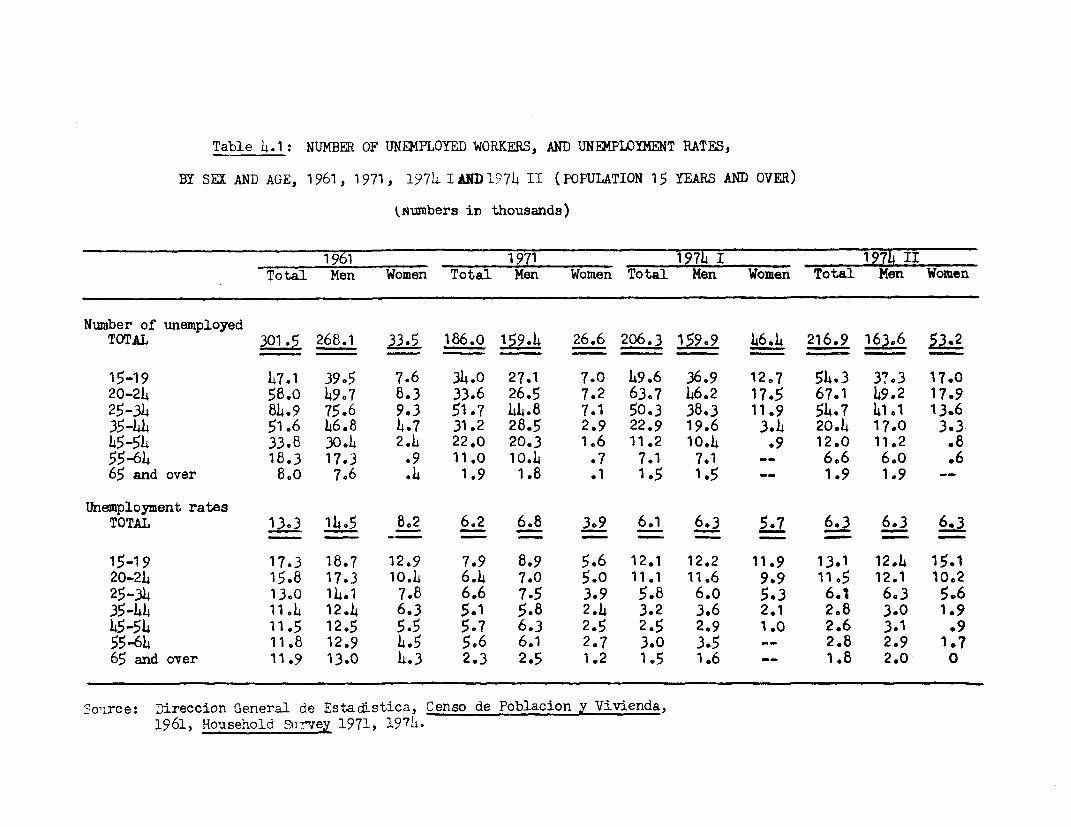
Table 14.1: NUMBER OF UNEMPLOYED WORKERS, AND UNEMPLOYMENT RATES,
BY SEX AND AGE, 1961, 1971, 1974- I AND 1974 TI (POPULATION 15 YEARS AND OVER)
tNrunbers in thousands)
1961 1971 197.4 I 19h IITotal Men Women Total Men Women Total Men Women Total Men Women
Number of unemployedTOTAL 301.5 268.1 33.5 186.0 159.4 26.6 206.3 159.9 46.4 216.9 163.6 5.2
15-19 47.1 39.5 7.6 34.0 27.1 7.0 49.6 36.9 12,7 54.3 37.3 17.020-24 58.o 49.7 8.3 33.6 26.5 7.2 63.7 46.2 17.5 67.1 49.2 17.925-34 84.9 75.6 9.3 51.7 44.8 7.1 50.3 38.3 11.9 54.7 41.1 13.635-44 51.6 46.8 4.7 31.2 28.5 2.9 22.9 19.6 3.4 20.4 17.0 3.345-54 33.8 30.4 2.4 22.0 20.3 1.6 11.2 10.4 .9 12.0 11.2 .855-64 18.3 17.3 .9 11.0 10.4 .7 7.1 7.1 -- 6.6 6.0 .665 and over 8e0 7.6 .4 1.9 1.8 .1 1.5 1.5 -- 1.9 1.9 --
Unemployment ratesTOTAL 13.3 14.5 8.2 6.2 6.8 3.9 6.1 6.3 5.7 6.3 6.3 6.3
15-19 17.3 18.7 12.9 7.9 8.9 5.6 12.1 12.2 11.9 13.1 12.4 15.120-24 15.8 17.3 10.4 6.4 7.0 5.0 11.1 11.6 9.9 11.5 12.1 10.225-34 13.0 14.1 7.8 6.6 7.5 3.9 5.8 6.0 5.3 6.1 6,3 5.635-44 11.14 12.14 6.3 5.1 5.8 2.4 3.2 3.6 2.1 2.8 3.0 1.945-54 11.5 12.5 5.5 5.7 6.3 2.5 2.5 2.9 1.0 2.6 3.1 .955-64 11.8 12.9 4.5 5.6 6.1 2.7 3.0 3.5 -- 2.8 2.9 1.765 and over 11.9 13.0 4.3 2.3 2.5 1.2 1.5 1.6 __ 1.8 2.0 0
Solirce: Direccion General de Estadstica, Censo de Poblacion y Vivienda,1961, Household Survey 1971, 1971 .

Table 4.2: CARACAS: UNEMPLOYMNET RATES BY SEX AND AGE,
1961, 1971, 1974 I AE 1974 II
(Numbers in thousands)
1961 -1971 I 197-4 II 19714Both Men WoEen Both Men Women Both Men Women Both Men Women-
TOTAL 17.2 19.5 11.2 5.6 6.6 3.4 6.5 6.9 5.5 6.3 6.8 5.3
15-19 24.3 30.4 14.9 7.8 9.7 5.1 14.4 16.2 12.0 16.3 19.7 11.620-24 18.9 21.5 12.7 5.9 7.0 4.0 11.1 12.4 8.9 9.3 10.6 7.425-314 15.8 17.6 10.4 5.6 6.6 3.5 5.7 6.2 4.7 5.5 5.8 14.835-414 14.6 16.3 9.3 4.5 5.4 2.2 2.9 3.3 2.0 2.9 3.0 2.745-54 16.1 18.1 9.2 5.0 5.9 2.2 2.7 3.1 1.7 2.6 3.0 1.755-64 18.6 21.2 8.0 5.6 6.14 2.8 3.3 4.4 -- 3.1 4.4 0-765 and over 20.9 23.9 9.3 3.4 4.1 1.0 -- -- -- 2.4 2.9 __
Source: Direccion General de Estadistica: Censo de Poblacion y Vivienda 1961, Household Survey1971, 1974

Table 4s3: UNEMPLOYED PERSONS BY POSITION IN FAMILY AND SEX, 1974 I
Numbers (in thousands) Unemployment ratesTotal Men Women Total Men Women
TOTAL 208.1 161.2 46.9 6.1 6.2
Family head 55.7 51.5 4.3 3.1 3.2 2.5Spouse or compnion 6.1 -- 6.1 2.6 -- 2.6Son or daughter 104.1 77.2 26.9 11.7 11.7 11.8Other relatives 39.1 30.1 8.9 11.2 11.5 10.1No relatives 3.0 2.4 .7 1.9 4.2 .7
&n-17ce: Direccion General de Estadistica, Household Survey 1974.

Table 4.4: UNEMPLOYMENT RATES, By OCCUPATION AND SEX, 1974 I AND II
1974 I 1974 IIBoth sexes men Women Both sexes men Women
TOTAL 6.1 63 Z A X
Professional, 3.7 3.5 4.0 3.5 4.8 2.3technicalManagerial 2.4 2.4 3.1 2.1 2.2 1.8Office workers 7.8 7.4 8.3 6.5 6.2 6.7Sales workers 5.0 5.2 3.9 6.o 5.9 6.4Farm workers 1.7 1.7 2.2 1.6 1.6 3.1Mine workers 6.2 6.2 --- 12.4 11.2 *
Drivers in transport 5.2 5.4 7.2 7.4 1.5Artisans and operatives 9.0 9.9 2.9 8.3 9.1 3.1in factoriesOther artisans and 8.1 9.2 3.8 8.1 8.2 7.4operativesService workers 4.5 7.4 2.5 4.6 6.9 3.0Occupation not 7.0 5.3 - 8.6- 8.6 8.1identifiable
*Number too small to compute rate.
Source: Direccion General de Estadistica, Household Rnrvey 1974.

Table 4.5t UNEMPLOYED, BY OCCUPATION AND SEx4 1974 II
(Ten years or older, in thousands)
Occupation Total Men Women
TOTALm , 16.
Professionals technical 9.9 6.8 3.2Managerial 2.5 2.4 .1Office workers 18.9 8.5 io.4Sales workers 23.7 18.0 5.7Farmers, etc. 11.5 10.8 .7Miners, etc. 2.3 2.0 .3Drivers in transport 18.0 17.9 .1Artesans and operatives in factories 55.4 52.9 2.5Other artesans and operatives 16.0 13.4 2.3Service workers 23.8 14.8 9.0Occupation not identified 1.8 1.7 *Seeking work for the first time 35.8 16.3 19.5
Less than 50.
Source: DiLreccion General do Estadistica, Household Survey 1974.

Table 4.6: UNEMPLOYED, BY INDUSTRY OF LAST JOB, AND SEX, 1974 II
(In thousands)
TotalIndustry Number Percent Men Women
TOTAL 219.5 100.0 6f.7 53.7
Agriculture, etc. 15.4 7.0 14.4 1.0
Mining 3.3 1.5 2.9 .4Manufacturing 38.3 17.4 32.7 5.6Construction 34.0 15.5 33.5 .5Electricity, gas, etc. 1.7 .8 1.5 .2Commerce 36.2 16.5 27.6 8.5Transport 13.1 6.o 12.1 .9Services(public and private) 41.0 18.7 24.0 17.0
Not specified .7 .3 .7
Seeking work for the firsttime 35.8 16.3 16.3 19.5
Source: Direccion General de Estadistica, Household Survey 1974.

Table 4.7: UNEMPLOYED PERSONS BY EDUCATIONAL LEVtjL, AND UNEMPLOYMENTRATES BY EDUCATIONAL LEVEL AND SEX, 1974 II
Number Unemployment Rates(in 000s) Total Men Women
TOTAL/ 216.9 63 63 3
Illiterate 17.1 2.9 3.1 2.1Without formaleducation 3.6 1.9 1.5 4.0
Primary: 1-3 years 27.6 5.4 5*9 3.64-6 years 100.7 7.5 7.8 6.5
Secondary 47.9 8.9 8.8 9.1
Technical andnormal school 5.7 6.2 9.8 4.3
Higher education 3.8 3.0 2.3 5.0Other branches 13.1 10.9 7.9 13.4
/a Excludes 2,600 persons 10-14 years of age included in the other lines.
Source: Direccion General de Estadistica, Household Survey 1974.

Table 4.8: UNEMPLOYED PERSONS BY DURATION OF UNEMPLOYMENT AND AGE, 1974 II
(Numbers in thousands)
Percent,by weeksunemployed
Age TotalLess than 5-14 15 weeks5 weeks, weeks or more
TOTAL 216.9 4 .8
15-19 54.3 34.6 41.1 24.320-24 67.1 31.0 32.2 36.825-34 54.7 28.0 37.7 34.43i5-44 20.4 39.7 23.5 36.845-54 12.0 34.2 37.0 28.355-6h 6.6 25.3 23.0 51.765 and over 1.9 13.5 19.2 67.2
Source: Direccion General de Estadistica, Household Survey 1974.

Table 4.9: UNEMPLOYED, BY DURATION OF UNEMPLOYMENTT,AND OCCUPATION, 197 II
Occupation of last job Percent distribution by durationof unemployment
Less than15 weeks 15-26 weeks 27 or more weeks
TOTAL, Both sexes 66.9 15.7 17.4
Professional, technical 57.3 13.8 28.9Managerial 57.4 20.7 21.9Office workers 54.2 20.3 25.5Sales workers 64.o 16.6 19.4Farm workers 79.7 12.3 8.0Mine workers 76.1 10.7 13.2Drivers in transport 69.7 15.8 14.5Artisans and operatives in factories 73.7 13.8 12.5Other artisans and operatives 56.6 22.8 20.6Service workers 71.3 14.1 14.6Occupations not identifiable 96.3 -- 3.7Seeking work for the first time 62.2 16.2 21.6
Source: Direccion General de Estadistica, Household Survey 1974.

Table 4.10: UNEMPLOYED, BY DURATION OF UNEMPLOYMENT, POSITIONIN FAMILY, AND SEX, 1974 II
(10 years and over)
Position in family Percent distribution by durationof unemployment
Less than15 weeks 15-26 weeks 27 or more weeks
Total, both sexes 66.9 15.7
Head of family 68.4 16.1 15.5Spouse or companion 70.4 9.4 20.2Son or daughter 64.7 15.8 19.5Other relative 69.8 16.3 13.9Not related 72.3 12.0 15.7
Total, men 67.2 1
Head of family 70.3 15.0 14.7Son 63.4 16.8 19.8Other relative 71.7 14.2 14.1Not related 73.6 13.9 12.5
Total, women 15.7 18.h
Head of family 54.8 24.3 20.9Spouse or companion 70.4 9.4 20.2Daughter 68.1 13.1 18.8Other relative 63.9 22.9 13.2Not related 69.5 8.2 22.3
Source: Direccion General de Estadistica, Household Survey 1974.

Table 4.11: UNEMPLOYED, BY DURATION OF UNEMPLOYMENT, BY SEX. 1974 IT
(15 years and over)
Numbers in thousands
Both sexes Men WomerNumber Percent Number Percent Number Percent
TOTAL 216.9 100.0 163.6 100.0 53.2 100.0
Less than 5 weeks 69.1 31.9 52.3 32.0 16.8 31.65-lb weeks 75.7 34.9 57.5 35.1 18.2 34.215 weeks or more 72.2 33.3 53.9 32.9 18.3 34.415-26 weeks 34.5 15.9 26.0 15.9 8.5 16.026 weeks or more 37.7 17.4 27.8 17.0 9.9 18.6
Source: Direccion General de Estadistica, Household Survey 1974.

Table 4.12: PERCENT OF LABOR FORCE UNEMPLOYED, BY AGE AND DURATION OFUNEMPLOYMENT, II 1974
Total Duration of unemploymentAge Less than 5 to 14 15 weeks
5 weeks weeks or more
TOTAL 6.3 2.0 2.2 2.1
15-19 13,1 4.5 5.4 3.2
20-24 11.5 3.6 3.7 4.2
25-34 6.1 1.7 2.3 2.1
35-44 2.8 1.1 0.6 1.0
45-5h 2.6 0.9 1.0 0.7
55-64 2.8 0.7 0.6 1.4
65 and over 1.8 0.2 0.3 1.2
Source: Direccion General de Estadistica, Household Survey 1974.
Totals do not check because of rounding.

Table 4.13: PERSONS UNEMPLOYED 15 WEEKSOR MORE BY POSITION IN FAMILY AND SEX,
1974 II
(10 years of age and over)
Number Percent of(000) total
TOTAL, Both sexes 72a 100.
Family head 18.7 25.8Spouse or companion 1.8 2.4Son or daughter 39.7 54.5Other relatives 11.6 15.9Not related 1.0 1.4
TOTAL, Men 8
Family head 15.5 21.3Son 30.0 41.3Other relatives 8.3 11.3Not related .6 .9
TOTAL, Women 1 M
Family head 3.3 4.5Spouse or companion 1.8 2.4Daughter 9.6 13.2Other relatives 3.3 4.5Not related .4 .5
Source: Direccion General de Estadistica, HouseholdSurvey 1974.

Table 4.14: PERSONS UNEMPLOYED 15 WEEKS OR MORE,By AGE, 1974 II
(Age 15 and over)
Number Percent(000) of total
/aTOTAL- 72.2 100.0
15-19 13.2 18.2
20-24 24.7 23.1
25-34 18.8 26.0
35-44 7.5 10.3
45-54 3.4 4.7
55-64 3.4 4.7
65 and over 1.3 1.7
/a There were, in addition, 2,600 persons 10-14years of age who had been unemployed 15 weeksor more.
Source: Direccion General de EstaUistica, HouseholdSurvey 1974.

Table 4.15: TINEMPLOYMENT RATES BY AREA AND SEX, 1974 II
Venezuela Metro- Other Ruralpolitan cities Area
Area
Both sexes 6.3 6.3 8.3 2.1Men 6.3 6.8 8.7 1.9Women 6.3 5.3 7.4 4.1
Source: Encuestas de Hogares, XX Nacional y XII AreaMetropolitana, Menisterio de Fomento, DGE Y CN.

Table 4.16: PERCENT DISTRIBUTION OF UNEMPLOYED AT EACH EDUCATIONAL LEVEL, BY DURATION OF
UNEMPLOYMENT, FOR BOTH SEXES, MALE AND FEMALE, 1974
CARACAS VENEZUELA: I SEMESTER VENEZUELA: II SEMESTER
less than 15 weeks 27 weeks less than 15 weeks 27 weeks less than 15 weeks 27 weeks
15 weeks and over and over 15 weeks and over and over 15 weeks and over and over
BOTH SEITS
TOTAL UNRMPLOYED 59.3 4O.7 21.6 66.3 33.7 15.4 66.9 33.1 17.4
Illiterates 65.9 34.1 21.4 77.1 22.0 8.2 74.6 25.4 1i4.3Without formal education 87.3 12.1 -- 88.2 11.8 3-1 70.5 29.5 16.2
Primary school 62.3 37.7 19.6 69.7 30.3 13.0 70.8 29.2 13.8
1-3 years 59.1 40.9 19.0 73.9 26.1 13.1 71.6 28.4 12.6
4-6 years 63.1 36.9 19.7 68.5 31.5 13.0 70.5 29.5 14.2
Secondary school 52.8 47.2 26.6 58.1 41.9 20.3 57.5 42.5 24.0
Technical and normal school 39.0 61.0 22.4 45.5 54.5 40.7 55.1 44.9 30.9
Higher education 67.0 33.0 20.9 45.1 54.9 21.8 56.2 43.6 36.6
Other branches 56.6 43.4 20.3 59.7 40.3 20.8 59.5 40.5 21.1
MALE
TOTAL UNEMPWYED 58.4 41.6 21.8 67.6 32.4 14.3 67.2 32.8 17.1
Illiterates 58.2 41.8 29.8 75.2 24.8 8.9 71.1 28.9 16.7
Without formal education 75.1 24.9 -- 85.9 14.1 3.8 71.6 28.4 24.3
Primary school 62.8 37.2 17.6 69.5 30.5 13.0 72.1 27.9 13.0
1-3 years 63.2 36.8 15.5 73.2 26.8 14.7 71.7 28.3 13.1
4-6 years 62.7 37.3 18.2 68.3 31.7 12.5 72.2 27.8 13.0
Secondary school 50.2 49.8 30.0 59.4 40.6 20.5 53.1 46.9 26.2
Technical and normal school 21.3 78.7 19.1 57.2 42.8 20.2 59.0 41.0 23.8
Higher education 69.4 30.6 23.0 36.5 63.5 20.5 45.4 54.6 50.3
Other branches 53.8 46.2 19.3 66.0 34.0 18.4 55.5 44.5 22.2
FE2ALE
TOTA1 UNENPIOYED 61.4 38.6 21.1 62.0 38.0 19.1 65.9 34.1 18.4
Illiterates 85.7 14.3 -- 100.0 -- -- 96.2 3.8
Without formal edacation 100.0 -- -- 100.0 -_ -- 68.3 31.7 __
Primary school 60.4 39.6 26.5 71.2 28.1 12.9 64.6 35.4 17.6
1-3 years 42.0 58.0 33.7 78.6 21.4 2.5 70.7 29.3 9.7
4-6 years 64.3 35.7 25.0 69.5 3o.5 15.3 63.3 36.7 19.2
Secondary school 59.2 40.8 18.3 54.6 45.4 19.8 67.8 32.2 18.9
Technical and normal _chool 50.6 49.4 24.6 38.6 61.4 52.7 50.4 49.6 39.9
Higher education 64.0 36.0 18.3 53.6 46.4 23.2 70.6 29.4 18.5
Other branches 58.14 41.6 2U.5 55.5 44.5 22.4 61.4 38.6 20.5
Source: Direccion General de Estadistica: Household Survey 1974.

Table 5.1: NONAGRICULTURE WAGE EARNERS AND SELF-aIPLOYED BY SECTOR: 1961, 1971, 197L
(10 years and over in thousands)
1961 1971 197bWage Self- Wage Self- Wage Self-earners employed earners employed earners employed
TOTAL 892.4 259.4 1554.6 618.0 1859.1 658.4
Mining and petroleum 43.0 1.9 42.5 3.3 49.4 1.8lanufacturing 14L.0 80.1 366.6 130.3 451.9 129.6Construction L5.9 31.8 110.0 61.7 148.5 72.9Electricity, gas andwater 20.8 0.2 36.9 0.5 48.5 O.Commerce and financialinstitutions 116.5 126.3 253.0 249.2 270.3 253.4Transportation, storage andcomunnications 53.2 41.3 11101 79.2 121.5 86.6Services 444.3 49.o 640.2 92.9 766.2 112.9Occupation not elsewhereclassified 24.7 8.9 0.2 0.9 2.9 0.3
PERCENTAGE DISTRIBUTION -
TOTAL 77.5 71.6 28.- - 76.2
Mining and petroleum 95.8 4.2 9W.8 7.2 96.5 3.5Manufacturing 64.3 35.7 73.8 26.2 77.7 22.3Construction 59.1 40.9 64.1 35.9 67.1 32.9Electricity, gas andwater 99.0 10 98.7 1.3 99.2 0.8Commerce and financialinstitutions 48.0 52.0 50.h L9.6 51.6 L.4Transportation, storage andcommunications 57.5 42.5 58.L L1.6 58.4 L1.6Services 90.1 9.9 87.3 12.7 87,2 12.8Occupation not elsewhereclassified 73.5 26.5 18&2 81.8 90.6 9.4
Source: Direccion General de Estadistica: Censo de Poblacion y Vivienda:1961, Household Survey, 1971, 1974.

Tal,le 5.2: UIcTRIFUTION OF EAFNINGS AMOW, NONAGRICTILTURE WORKERS BYOCCUPATION AND INCO1E BRACKET - (1971-1974) (Continued)(10 ytrs and over in thousands, current prices)
________________ ______ 19 74
Profes- Managerial Office Siales Mine Drivers in Artisans Other Service Occupation Totalsional workers workers workers transport & opera- arti- workers not iden- of in-
tives in sans & tifiable comefactories opera- bracket
tives
Wage earners
TOTAL 2L0.5 ' oi 268.5 118.5 U43 1L0.2 L3 83 156.8 413.4 !L.5 1859.1
0- 24 O _.L 1.6 - o.6 3.2 0.5 22.1 - 28.325- 49 o.6 - 3.L 5.6 0.3 1 .5 7.4 3.2 0.5 22.1 81.650- 74 2.2 0.3 3.6 9.9 - 6.5 17.4 7.9 55.6 0.1 103.475- 99 4.0 0.4 10.1 7.4 0.5 5.1 13.9 5.5 38.2 0.2 S5.2
100-149 18.4 1.0 4802 39.5 0,8 26.8 121.3 57.6 113.9 2.4 429.7150-199 23.3 2.2 57.6 16.5 - 23.8 94.1 45.9 63.5 2.5 329.4200-2L9 19.0 3.7 55.4 12.0 1.5 30.9 72.8 20.0 26.3 3.5 24L.8250-374 75.6 11.5 63.6 12.0 7.2 31.9 70.9 12.3 22.0 3.7 310.8375-499 30.9 8.5 13.9 6.6 3.2 5.4 21.6 2.7 3.5 2.4 9&.7500-over 63.1 21.9 8.0 6.5 1.0 5e5 11.2 0. 2.6 3.6 123.8Not declared 3.4 0.7 4.0 1.0 - 2.2 4.0 1.0 3.8 - 3e4Income in kind 0.3 - - - - - 0.5 - 2.7 - 20.0
Self-employed
TOTAL 26.6 64.0 2.6 222.0 1,7 86.6 163.7 21.1 66e2 0.3 654.8
0- 499 3.0 1.3 0.4 74.1 o.6 7.9 52.2 12.5 42.2 - 195.2500- 999 3.5 6.5 0.4 86.7 0.4 36.4 64.0 5.4 lb7 0.3 218.7
1000-1499 1.7 7.8 0.7 30.1 0.7 22.6 25.7 1.0 4.2 - 94.81500-1999 1.3 10.6 0.5 13.5 - 12.6 10.8 1.1 3.8 - 54.32000-2499 3.4 13.0 0.5 8e6 - 3.3 5.6 0.4 0.3 - 35.02500-2999 20L L.L - 2.8 - 005 2.6 0.3 0.9 - 14.13000-over 11e3 20.4 O.I 4.L4 - 303 2.6 0.4 0.1 - 42.7
Source: Direccion General de Estadistica, Censo de Poblacion y Vivienda: 1971, 1974.

Table 5.3: DI.'TST11TICN OF FARNITNGS AMO)IG 7J')I. '.EIT TLr>-t lO?KriK
BY ERANrH OF ECONOMIC ACTIVITY AND INCOME FRACKEr, 1974-1971
(10 years and over in thousands, current price)
1971Electri- Commerce Trans- Occupation Total of
Mining and Manu- Construc- city, gas and finan- portation, Services not else- incomepetroleum facturing tion water cial insti- storage, where clas- bracket
tutions communica- sified. _ t~~~~~~~~~~~~~~~~~~~~~lions
Wage earners
TOTAL L2.7 360.6 110.0 36.9 253.0 111.1 640.2 0.2 155L.6
0- 25 Bs. 0.6 3.3 0.6 _ 14.1 1.3 53.2 - 7 226- 49 1.1 114.5 4.3 0.6 22.3 5.6 70.1 - 150- 74 1.4 25.8 11.7 0.9 35.9 8.8 50.5 - T31°975- 99 1.0 35.8 6.5 1.6 20.2 7.7 49.7 - 12
100-149 3.6 101.2 41.8 11.7 52,5 24L. 123.1 0.3 3150-199 2.7 60.9 171L 8.5 37.3 22,5 89,1 -200-249 6.9 45.9 11.0 4.8 24.0 16.7 52.6 - .0250-37L 12.9 41.0 9.7 6.4 18.9 1141 83,9 I -
375-499 3.6 13.1 2.7 0.8 10o6 3.7 20,5 -500-over 8.4 13.2 3.5 1.4 10.2 3.6 30,9 - 71.2Not reported 3.5 -Income in kind 0.5 6.0 0.7 0.2 7,1 2.7 13.2 -
Self-employed
TOTAL 3e4 129.2 60.3 0.5 214.8 78.7 92.6 0.9 610,4
0- L99 2.4 69.3 20.5 - 80.1 13.5 38.1 0.9 224.8500- 999 0.3 29.8 25.5 - 86.6 37.0 21.1 - 200.3
1000-1h99 0.3 11.8 6.6 0.3 33.2 12.0 10.1 - 71431500-1999 - 6.6 1.6 - 16.8 8.5 7.5 - 41.02000-2199 0,2 5.1 2.1 0.2 12,0 3,3 7.5 - 30072500-2999 0.2 3.1 1.9 - 1101 0.9 6.1 - 23,33000-over - 3.2 2.1 - 5.0 3.5 2.2 - 16.0

Table 5.3: JIvI71ET14TIQON OF EA?NINGS AHOIONG .N G;iLTUTKS WuRiS
PY BRANCH OF ECONOMIC ACTIVITY AND INCOME BRACKET, 1974-1971
(10 years and over in thouisands, current price) (continued)
197_4Electri- Commerce Trans- Occupation Total of
Mining and Manu- Construc- city, gas and finan- portation, Services not else- incomepetroleum facturing tion water cial insti- storage, where clas- bracket
tutions communica- sifiedtions
Wage earners
TOTAL L9.4 451.9 148.5 48.5 270.3 121.5 766.2 2.9 1859.1
0- 25 Bs. 0.3 2.9 1.0 - 2.1 0.3 21.8 - 28.326- 19 0.6 7.2 3.5 0.7 8.2 1.1 60.3 - 81.650- 74 0.3 19.1 6.6 0.3 13.5 4.8 58.7 - 103.475- 99 0.5 16.8 3.9 O.6 14.4 5.1 43.8 - 85.2100-149 2.4 137.0 39.7 6.6 77.2 19,5 146.8 0.14 29,7150-199 1.0 92.2 38.9 12.8 44.8 24.2 114.6 0.7 329.b200-249 3.2 67.4 23.3 10.5 35.L 22.7 81.7 0.7 244.8250-37k 18.0 63.6 20.7 10.2 41.5 25.9 130.6 0.2 310.8375-499 9.1 20.5 5.2 2.6 13.8 8.6 38.6 0.2 98.7500-over 14.0 20.0 4.5 3.6 16,4 7.14 57.8 0.2 123.6Not reported - 4.7 0.9 0.7 2.4 1.9 8.9 0.4 20.0Income in kind - 0.4 0.1 - 0.4 - 2.6 - 3-.
Self-employed
TOTAL 1.8 129.6 72.2 0.4 251.7 86.2 111.1 0.3 653.3
0- 499 0.8 48.9 12.7 - 76.8 8.8 46.2 - 19142500- 999 0.2 35.6 3414 0.2 88.8 34.4 214,1 0.2 217.8
1000-1099 0.6 15.7 13.2 - 32.8 22.6 9.5 0.1 94.51500-1999 0,2 10.7 3.2 - 18.1 12.2 9.8 - 54.52000-2499 - 7.0 3.5 - 15.2 3.6 6.3 - 35.62500-2999 _ 3.2 0.9 - 5.2 0.8 3.9 - 11L.13000-over _ 8.5 4.3 0.2 14.5 3.8 11.3 - 42.6
Source: Direccion General de Estadistica: Censo de Poblacion y Vivienda 1971-1074.

Table 5.4A: DISTRIBUTION OF INCOME AMONG SELF-EMPLOYED IN NONAGRICULTURAL ACTIVITIES
BY BRANCH OF ECONOMIC ACTIVITY AND INCOME LEVEL
(With inflationary adjustment)
1971 (Current Prices) 1974
IncL e level LC Income levelTotal/2 Lower Middle Upper Total Lower Middle Upper
Self-employed:
TOTAL 610.4 224.8 274.6 111.0 653.3 194.2 312.4 146.7
Mining and petroleum 3.4 2.4 0.6 0.4 1.8 0.8 0.8 0.2Manufacturing 129.2 69.3 41.6 18.3 129.6 48.9 51.3 29.4Construction 60.3 20.5 32.1 7.7 72.2 12.7 47.6 11.9Electricity, gas andwater 0.5 -- 0.3 0.2 0.4 -- 0.2 0.2Commerce and finan-cial institutions 244.8 80.1 119.8 44.9 251.7 76.8 121.6 53.3Transportation, stor-age, communications 78.7 13.5 49.0 16.2 86.2 8.8 57.0 20.4Services 92.6 38.1 31.2 23.3 111.1 46.2 33.6 31.3Occupation not else-where classified 0.9 0.9 -- -- 0.3 -- 0.3 --
(Constant 1974 prices)'3
TOTAL 610.4 147.1 270,8 192.5 653.3 194.2 312.4 146.7
Mining and petroleum 3.4 1.6 0.8 1.0 1.8 0.8 0.8 0.2Manufacturing 129.2 45.2 44.7 39.3 129.6 48.9 51.3 29.4Construction 60.3 13.4 32.0 14.9 72.2 12.7 47.6 11.9Electricity, gas andwater 0.5 -- 0.2 0.3 0.4 __ 0.2 0.2
Commerce and finan-cial institutions 244.8 52.4 115.8 76.6 251.7 76.8 121.6 53.3
Transportation, stor-age, communications 78.7 8.8 43.0 24.9 86.2 2.8 57.0 20.4Services 92.6 24.8 32.3 35.5 111.1 46.2 33.6 31.3Occupation not else-where classified 0.9 0.9 -- -- 0.3 -- 0.3 --
A Lower level: Less than 500 Bs. per month.Middle level: Between 500-1499 Bs. per month.Upper level: More than 1500 Bs. per month.
12 The figure for total self-employed does not include those persons in the survey whose income level was unknown since the datafor this category was not available by sector.
/3 The following method was used to calculate distributio,n of income in constant prices: to adjust thL number of self-employed in thelower income bracket a subsistence incom(! or 250 Bs. with a linear relatio. between income and percer- of all workers was assumed.By using the equation for the line, and deflating 500 Bs. to 413.2 Bs. at 1974 prices, it was possible tj calculate the percent o'the ertpl(yud in the lower income bracket at 1974 prices. The adjustments made for the u,per and middle levels are identical tothose used in the Table on wage earners.
Source: Direccion General de Estadistica: Household Survev,1971, 1974.

Table 5.4B: DISTRlBUTION OF INCOME AMONG WAGE EARNERS IN NONAGRICULTURAL ACTIVITIES
BY BRANCH OF ECONOMIC ACTIVITY AND INCOME LEVEL
(With inflationary adjustment)
1971 tCurrent prices) 1974
Income levell Income levelTotal Lower Middle Upper Unknown Total Lower Middle Upper Unknown
Wage earners:
TOTAL 1555.3 449.0 759. 313.5 33.8 1888.7 298.4 1033.4 537.3 19.6
Mining and petroleum 42.7 4.1 13.2 25.4 0.5 49.4 1.7 6.6 41.1 --
Manufacturing 360.6 79.4 208.0 67.3 6.0 451.9 46.0 296.6 104.1 5.2
Construction 110.0 23.1 70.3 15.9 0.7 148.3 15.0 101.9 31.3 0.1
Electricity, gas andwater 36.9 3.1 25.0 8.6 0.2 48.5 1.6 29.8 17.1 --
Commerce and finan-cial institutions 253.0 92.4 113.8 39.7 7.1 300.0 38.2 187.2 71.8 2.8
Transportation, stor-age, communications 111.1 23.4 63.6 21.4 2.7 121.5 11.3 66.4 43.8 --
Services 640.1 223.5 264.8 135.2 16.6 766.2 184.6 343.1 227.0 11.5
Occupation not else-where classified 0.3 -- 0.3 -- -- 2.9 -- 1.8 1.1 --
(Constant 1974 Prices)L2
TOTAL 1555.3 363.7 630.0 528.0 33.7 lt88.7 298.4 1033.4 537,3 19.6
Mining and petroleum 43.7 3.4 7.8 32.0 0.5 49.4 1.7 6.6 41.1 --
Manufacturing 360.6 54.5 171.4 128.7 6.0 451.9 46.0 296.6 104.1 5.2
Construction 110.0 18.6 61.2 29.5 0.7 148.3 15.0 101.9 31.3 0.1
Electricity, gas andwater 36.9 2.0 21.0 13.7 0.2 48.5 1.6 29.8 17.1 --
Commerce and finan-cial institutions 253.0 78.4 99.8 72.6 7.2 300.0 38.2 187.2 71.8 2.8
Transportation, stor-age, communications 111.1 18.0 49.8 40.6 2.6 121.5 11.3 66.4 43.8 --
Services 640.1 188.9 223.8 210.9 16.5 766.2 184.6 343.1 227.0 11.5
Occupations not else-where classified 0.3 -- 0.3 -- -- 2.9 -- 1.8 1.1 --
L1 Lower level: Less than 100 Bs. per week.Middle level: Between 100 Bs. and 249 Bs. per week.Upper level: More than 250 Bs. per week.
/2 The following method was used to calculate distribution of income in constant prices: the price deflator used was the cost of
living index for Caracas. The rise in prices from 1971 to 1974 was 21%. The value of 100 Bs. at 1974 prices in 1971 was 82.6 Bs.
The distribution of workers within an income bracket was assumed to be linear, so that it was possible to pro-rate the number of
workers between the three income brackets based on the proportion of the respective values defining an interval at current prices
and at constant prices. For example, at constant 1974 prices, the value defining the "lower income level" bracket becomes 82.6 Bs.,
this is 69% distance between 75 Bs. and 100 Bs., the former representing the next lowest income bracket under 100 Bs. found in
original data.
Source: Direccion General de Estadistica: Household Survey, 1971, 1974.

TRhip 5.5 : LOW-INCOE WORKERS AS A PEPCENT OF ALL WORKERS 15 AND OVERBY CLASS OF WORKERS AND SEX, VENEZUELA ADD CARACAS,
1974 I AND 1974 IT
(Agricultural workers are excluded)
First half Second half
Venezuela
/aEmployees, TOTAL/ 23.2 15.5
Men 14.7 7.8Women 40.0 31.2
Self-employed, TOTAL 34.9 29.2
Men 24.6 18.7Women 72.8 68.4
Caracas
Employees, T¶OTAL/a 15. 10.0
Men 6.6 3.9Women 30.0 21.1
Self-employed, TOTAIX 19. 16.9
Men 11.3 10.1Women 52.3 46.9
/a Low-income employees are defined as those earning usual weekly incomesof less than lOOBs.
lb Low-income self-employed are defined as those earning usual monthlyincomes of less than 500Bs.
Source: Direccion Genercil de Eatadistica, Household Survey 1974.

Table 5.6: EMPLOYEES EARNING LESS THAN 100 Bs WEEKLY,
BY AGE AND SEX, 1974 II (NONFARM CNLY)
(Numbers in thousands)
Both sexes Men WomenAll Earning Percent Percent All Earning Percent All Earning Percent
AGE workers less than of workers less than workers less than100 Bs total 100 BS 100 Bs
TOTAL 1841.8 284.8 15, 4 100.0 1241 ,4 2J 7.8 600.1 187.2 31.2
15-19 215.8 89.0 41.2 31.2 126.7 33.9 26.7 89.1 54.6 61.320-24 383.0 59.7 15.6 20.9 239.6 20.8 8.7 143.14 39.5 27.525-34 566.2 60,1 10.6 21.1 381.5 20.4 5e3 184.7 39.7 21.535-44 380.1 40.9 10.7 14.14 267.4 11.2 4.2 112.7 29.6 26.245-54 207.5 21.1 10.2 7.4 156.1 4.8 3.1 51.4 16.2 31.555-64 70.7 10.1 14.3 3.5 55.2 4.4 7.9 15.5 5.5 35.565 and over 18.2 3.9 21.14 1.5 14.9 2.0 13.4 - 3.2 2-.1 65.6l
Source: Direccion General de Estadistica, Household Survey 197h.

Table 5.7: EMPLOYEES EARNING LESS THAN 100 Bs WEEKLY,
BY POSITION IN FAMILY AND SEX, 1974 II
(Numbers in thousands)
Both sexes Men WomenPer- Per- Per-
Earning cent Earning cent Earning cent
All less than Per- of All less than Per- of All less than Per- of
workers 100 Bs cent total workers 100 Bs cent total workers 100 Bs cent total
TOTA 'V 18141.7 284.7 15.5 100.0 12141.6 97.4 7.8 100.0 600.1 187.3 31X. 100.0
Family head 871.9 58.3 6.7 19.5 767.1 29.0 3.8 27.9 104.7 29.3 27.9 1-51
Spouse orcompanicn 153.5 25.7 16.7 8.6 -- -- 153.5 25.7 16.7 13.2
Son or daughter 491.1 99.7 20.3 33.4 310.7 54.2 17.4 52.2 180.4 45.4 25.1 23,3
Other relatives 209.9 33.6 16.0 11.2 142.8 16.8 11.7 16.2 67.1 16.6 24.7 8.5
No relatives 132.4 80o5 60.8 26.9 28.6 3,5 12.2 3.7 103.8 77.0 74.2 39.6
a/ Total excludes 17,00 persons 10-14 years of age who are included in the other lines.
Source: LireccLon General de B adirtica, Household Survey 1974.

Table 5.8: EKPLOYEES EARNING LESS THAN 100 Bs WEEKLY,
BY BRANCH OF INDUSTRY AND SEX, 107L TT (NONFARM ONLY)
(Numbers in thousands)
Both sexes Men WomenBranch of All Earning Percent AI1 Earning Percent All Earning Percent
industry workers less than of workers less than of workers less than of100 Be total 100 Bs total 100 Bs total
TOTALa/ 1841.7 28)47 15.5 1241,6 97.4 7.8 600.1 187.3 31.2
Petroleum and mining 49.4 1.6 3.2 47e7 1.3 2.7 1.7 .3 17.6Manufacturing )451.9 )46.1 10.2 370.5 31.3 8.4 81.3 15.1 18.6Construction 1)48.5 15.1 10.2 146.6 14.8 10.1 1.9 .3 15.8Electricity, gas andsanitary services 48.5 1.6 3.3 43.6 1.6 3.6 4l.9 -- --
Coamuerce 270.3 38.3 14,2 193,0 23.8 12.3 77.3 14.5 18.7Transportation 121.5 11.3 9.3 104.0 10.)4 10.0 17.5 .9 5.1Services 766.2 184.5 24.1 342.0 20.7 6.o 424.2 163.8 38.6
Not specified 2.9 -- 2.0 -- .9 --
a/ Total excludes 17,400 persons 10-14 years of age who are included in the other lines,
Source: Direccion General de Estadistica, Household Survey 197h.

Table 5.9: EMPLOYEES EARNING LESS THAN 100 Bs WEEKLY, BY OCCUPATION AND SEX, 197,4 II (NONFARM ONLY)
(Numbers in thousands)
Occupation Both sexes Men WomenAll Earning Percent All Earning All Earning
workers less than Percent composi- workers less than Percent workers less than Percent100 Bs tion 100 Bs IOO Bs
TOTAIE 1,841.7 .7 15. 100.0 1,241.6 97.4 7.8 600.1 18. 31.2
Professional 240.6 6.8 2.8 2.4 no.1 2.0 1.8 130.5 4.8 3.7Managerial 50.1 .7 1A .2 46.6 .5 1.1 3.5 .2 5.7Office 268.2 16.8 6.3 5.9 127.2 4.4 3.5 141.0 13.0 9.2Sales 118.5 24.5 20.7 8.6 92.6 16.5 17.8 25.9 8.0 30.9Mining 14.3 .8 5.6 .3 14.1 .5 3.5 .3 .3 10O.0Drivers 140.2 13.7 9.8 4.8 135.7 13.4 9.9 4.5 .1 2.2Artesans, fabricas 438.3 41.9 10.0 14.7 397.3 34.1 8.6 41.0 7.8 5r. oOther artesans 156.8 17.2 11.0 6.o 138.7 13.3 9.6 18.2 3.9 21.4Services 413.5 175.4 42.4 61.6 169.0 18.8 11.1 244.5 156.7 64.1Not identified 18.5 .4 -- .1 18.2 .4 .4 *3 -- --
/a Excludes 17,400 persons 10-14 years old who are included in other lines.
Source: Direccion General de Estadistica, Household Sirvey 1974.

Table 5.10: SELF-EM4PLOYED WORKERS EARNING LESS THAN 500 Bs MONTHLY, BY AGE AND SEX, 1974 IT (NONFARM ONLY)
(Numbers in thousands)
Age Both sexes Men WomenAll Earning Percent All Earning All Earning
workers less than Percent composi- workers less than Percent workers less than Percent500 Bs tion 500 Bs 500 Bs
TOTAL.(15 and over) 655.0 191.0 29.2 100.0 517.4 9 18.7 137.8 94.2 68.4
15 -19 14.3 9.0 62.9 4.7 12.2 7.2 59.0 2.1 1.8 85.720 - 24 46.6 18.8 40.3 9.8 37.1 11.1 29.9 9.5 7.7 81.125 - 34 139.0 33.0 23.7 17.3 109.1 14.o 12.8 29.8 19.0 63.835 - 44 199.2 48.5 24.3 25.4 153.3 19.0 12.4 45.8 29.5 64.445 - 54 138.4 37.9 27.4 19.8 108.0 17.8 16.5 30.4 20.1 66.155 -64 83.2 28.6 34.4 15.0 68.2 16.8 24.6 15.1 11.8 78.165 and over 34.4 15.2 44.2 8.0 29.5 10.9 36.9 4.9 4.3 87.8
Source: Direccion General de Estadistica, Household Survey 1974.

Table 5.11: SEF-WIPIOYED WORKERS EARNING LESS THAN 500 Ps Monthly,
BY POSITION IN FAMILY, 1974 II (NONFARM ONLY)
(Numbers in thousands)
All Earning PercentPosition in fwaily workers less than
500 Bs
TOTAL,, both seesa/ 655 0 191.0 29.2
Head of family 486.2 105.0 21.6Spouse or companion 56.1 38.0 67.7Son or daughter 65.7 30.0 45.7Other relatives 44-3 18.2 41.1No relative 6.1 3.0 49.2
Men, total 520.3 99.6 19.1Head of family 427.7 66.0 15.4
Son 51.9 20.3 39.1Other relatives 35.3 11.0 31.2No relative 5.3 2.3 3-4
Women, total 138.2 94.6 68.5Head of family 58.5 38.9 66.5Spouse or companion 56.1 38.o 67.7Daughter 13.8 9.7 70.3Other relative 9.0 7.2 80.0No relative .8 .7 87.5
a/ Total excludes 3100 persons 10-l4 years of age who are included in the otherlines.
Source: Direccion General de Estadistica, Household Survey 1974.

Table 5.12: SEIF-EMPLOYED WORKERS EARNING LESS THAN 500 Bs MONTHLY,
BY BRANCH OF INDUSTRY AND SEX, 1974 TT (NONFARM ONLY)
(Numbers in thousands)
Both sexes Men WomenBranch Earning Earning Earning
All less than Per- All less than Per- All less than Per-workers 500 Bs cent workers 500 Be cent workers 500 Bs cent
TOTAL- _____ 191.0 29.2 517 964 96e 18.7 137.8 94.2 68.4
Petroleum andmining 1.7 .8 47.0 1.7 .8 47.0 __ __
Hanufacturing 129.6 48.8 37.6 86.1 13.6 15.8 43.5 35.2 80.9Construction 72.8 12.7 1704 72.8 12.7 17.4 __ __Electricity, gas andsanitary services .4 -- .4 - -_
Commerce 253.9 76.8 30.2 212.6 52.9 24.9 41.3 23.9 57.8Transportation 86.6 8.8 10.1 85.3 8.3 9.7 1.3 .5 38.4Services (public andprivate) 112.9 46.2 40.9 60.8 11.2 18.4 52.0 34.9 67.1
Not specified .3 __ .3 __ __
a/ Total excludes 3,200 persons 10-14 years of age who are included in the other lines.
Source: Direccion General de Estadistica: Household Survey 1974.

Table 5.13: SEFI-EMPLOYED WORKERS EARNIG LESS THAN 500 Bs MONTHLY,
BY OCCUPATION, 1974 II (NONFARM ONLY)
(Numbers in thousands)
Both sexes Men WomenMajor Earning Earning EarningOccupa- All 3J.ss Per- All less Per- All less Per-tional workers than cent workers than cent workers than centGroup 500 Bs 500 Be 500 Be
TOTAL' 655.0 191.0 29.2 517.4 96.9 18.7 137.8 94.2 68.4
Professional,technical 27.7 3.0 10.8 20.7 1.4 6.8 7.1 1.6 22.5
Managerial 65.3 1.3 2.0 60.9 1.1 1.8 4.5 .3 6.7
Officeworkers 2.6 .4 15.4 2.2 .3 13.6 .4 .1 25.0
Salesworkers 222.0 74.1 33.4 183.5 51.2 27.9 38.5 22.9 59.5
Mineworkers 1.7 .6 35.3 1.7 .6 35.3 -_ __ __
Drivers intransport 87.0 8.0 9.2 85.7 7.4 8.6 1.4 .5 35.7
Artisans &operatives infactories 164.2 52.2 31.8 129.6 24.2 18.7 334.6 28.0 80.9
Other arti-sans & oper-atives 21.1 12.5 59.2 11.8 4.6 39.0 9.3 7.9 84.9
Serviceworkers 66.5 42.2 63.5 24.0 8.8 36.7 42.5 33.4 78.6
Occupationnot identi-fiable .3 * .3 * - -
a/ Total excludes 3400 persons 10-14 years of age who are included in the otherlines.
Source: Direccion General de Estadistica, Household Survey 1974.

Table 5.1h: SELF-EMPLOYED WORKERS EARNING LESS THAN 500 Bs MONTHLY,
BY EDUCATIONAL LEVEL, 1974 II (NONFARK ONLY)
(Numbers in thousands)
All EarningEducational level workers less than Percent
500 Bs
TOTALI'> 65.0 191.0 29.2
Illiterates 86.8 55.1 63.5
Without formaleducation 51.1 19.7 38.6
Primary school
1-3 years 112.3 k43. 38.6
4-6 years 285.3 63.8 22.4
Secondary school 82.6 10.2 12.3
Technical andnormal school 3.8 .6 15.8
Higher education 25.3 .2 .8
Other branches 11.3 1.2 10.6
a/ Total excludes 3400 persons 10-14 years of age who are included in the otherlines.
Source: Direccion General de Estadistica, Household Survey 1974.

Table 5.15: METROPOLITAN AREA: DISTRIBUTION OF FAMILY EARNINGS
BY DECILES, 197h 4II/
Cumulative Average in- Cumulative 2/Deciles Percent of percent of come in the average income-
income income decile(Bs/month) (Bs/month)
First 0.38 0.38 76.67 76.67Second 3.10 3.48 620.58 348.63Third 4.47 7.95 895.51 530.92Fourth 5.61 13.56 1122.85 678.41Fifth 6.99 20.55 1397.91 822.71Sixth 8.52 29.07 1704.09 969.60Seventh 10.4O 39.47 2079.81 1128.21Eighth 13.28 52.75 2655.59 1319.13Ninth 17.19 69.94 3436.47 1554.39Tenth 30.06 100.00 6000.22 1998.97
Gini Coefficient = 0.426
Souirce: Direccion General de Estadistico y Censo, Household Survey 1974,Special Tabulations for the mission.
1/ Including families with zero income. Excluding non-relatives.
2/ Cumulative average income is the sum of all the income earned byfamilies below the top of this decile, divided by the number offamilies.
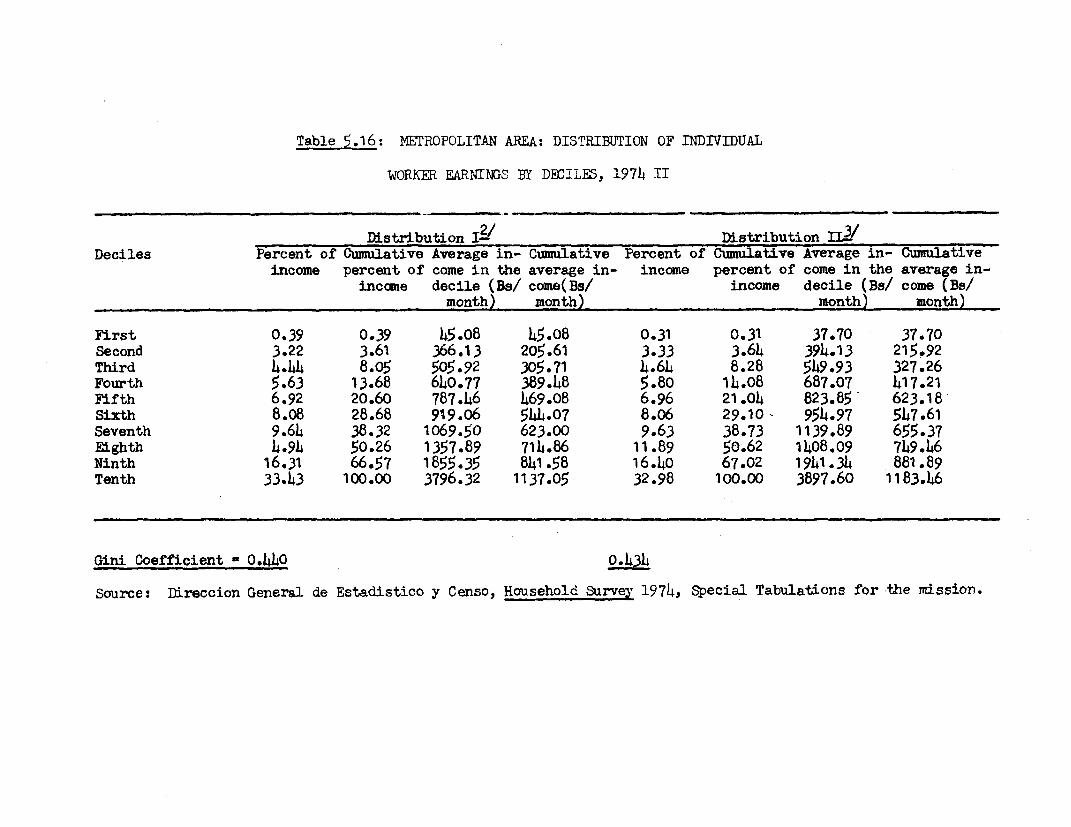
Table 5.16: METROPOLITAN AREA: DISTRIBUTION OF INDIVIDUAL
WORKER EARNINGS BY DECILES, 1974 II
Distribution I2/ Distribution II31Deciles Percent of Cumulative Average in- Cumulative Percent of Cumulative Average in- Cumulative
income percent of come in the average in- income percent of come in the average in-income decile (Bs/ come(Bs/ income decile (Bs/ come (Bs/
month) month) month) month)
First 0.39 0.39 45.08 45.08 0.31 0.31 37.70 37.70Second 3.22 3.61 366.13 205.61 3.33 3.64 394.13 215.92Third 4.44 8.05 505.92 305.71 4.64 8.28 549.93 327.26Fourth 5.63 13.68 640.77 389.48 5.80 14.08 687.07 417.21Fifth 6.92 20.60 787.46 469.08 6.96 21.04 823.85 623.18Sixth 8.08 28.68 919.06 544.07 8.06 29.10 - 954.97 547.61Seventh 9.64 38.32 1069.50 623.00 9.63 38.73 1139.89 655.37Eighth 4.9L 50.26 1357.89 714.86 11.89 50.62 1408.09 749.46Ninth 16.31 66.57 1855.35 841.58 16.40 67.02 1941.34 881.89Tenth 33,43 100.00 3796.32 1137.05 32.98 100.00 3897.60 1183.46
Gini Coefficient - 0.440 o.h34
Source: Direccion General de Estadistico y Censo, Household Survey 1974, Special Tabulations for -the mission.

Table 5.17: METROPOLITAN AREA: DISTRIBUTION OF INDTVTT)TJAIJ EAREINGS OF
]!IFLOYED POPiLATION BY DBCILE, 19714 II
Distribution I/ Distribution II/Deciles Percent of Cumulative Average in- Cumulative Percent of Cumulative Average in- Cumulative
income percent of come in the average in- income percent of come in the average in-income decile (Ba come (Bs/ income decile (Bsl come (Bs/
month) month) month) month)
First 2.35 2.35 289.38 289.39 2.50 2.50 321.87 321.87Second 3.75 6.10 460.88 375.14 3.88 6.38 498.09 409.99Third 4.73 10.83 581.41 443.90 4.91 11.29 630.31 483.43Fourth 5.81 16.64 714.71 511.61 5.94 17.23 763.65 816.95Fifth 6.80 23.44 836.35 576.56 6.78 24.01 870.81 682.59Sixth 7.85 31.29 964.53 641.22 7.87 31.88 1010.80 756.96Seventh 9.39 40.68 1153.39 696.20 9.37 41.23 1203.18 847.21Eighth 11.56 52.24 1420.11 802.61 11.52 52.77 11478.89 947.21Ninth 15.91 68.15 1954.38 930.58 15.91 68.68 2042.18 979.88Tenth 31.85 100.00 3906.31 1228.15 31.32 100.00 4018.81 1283.57
Gini Coefficient - 0.347 0.388
Source: Direccion General de Estadistico y Censo, Household Survey 19714, Special Tabulations for the mission.

Table 5.18: NETROPOLITAN AREA: INDICATORS OF OCCUPATION AND INCOME BY LEVEL OF FANILY WORK INCOME, 1974 II /1
Indicators Total Level of family income (Be/month) Non-Up to 501- 1001- 1501- 2001- 2501- 3501- 4501 and Rleativeli500 1000 1500 2000 2500 3500 4500 over
% of families 100.0 11.3 19.4 18.4 15.5 8.9 12.7 6.0 7.8 __
7. of work income 100.0 0.8 7.6 11.4 13.5 9.8 18.2 11.6 23.6 3.4
Family work income(Bs/month) 2,081 156 815 1,294 1,807 2,301 2,974 4,025 6,317 --
Per capita familyincome 429 44 175 270 363 435 556 724 1,217 --
Average earnings perworker (Bs/month) 1,212 332 690 905 1,046 1,108 1,366 1,685 2,890 549
% of total persons ofactive ageL. 100.0 7.8 15.0 15.7 15.4 9.9 14.9 7.6 8.9 4.87. of total active 100.0 4.4 13.7 15.4 15.4 10.5 15.8 8.1 9.5 7.2Z of total inactive 100.0 12.2 16.8 16.1 15.3 9.1 13.7 7.0 8.2 1.6% of total employed 100.0 3.1 13.3 15.3 15.6 10.8 16.2 8.3 9.9 7.5% of total un-employed 100.0 24.9 19.3 16.7 11.5 7.0 10.4 5.1 2.9 2.2
Rate ofparticipation 57.5 32.9 52.5 56.5 57.5 61.0 60.9 61.2 60.9 85.7- Primarypopulation 97.6 78.5 97.5 99.4 98.5 99.1 98.9 99.2 98.7 --
- Secondarypopulation 43.1 24.6 34.5 39.3 43.9 49.9 51.1 51.8 50.1 --
Employment Rate 53.9 21.5 42.9 52.7 54.8 58.5 58.4 58.9 59.7 84.1- Primary
population 94.3 42.5 94.0 97.3 97.8 98.6 98.3 98.3 98.7 --
- Secondarypopulation 39.4 17.6 29.5 34.9 40.6 46.8 48.1 49.0 48.6 --
Unemployment Rate 6.2 34.8 8.7 6.7 4.6 4.1 4.1 3.9 1.9 1.9- Primary
population 3.4 45.9 3.6 2.2 0.7 0.6 0.7 0.9 -- --
- Secondarypopulation 8.7 28.4 14.5 11.3 7.5 6.1 5.8 5.3 3.0 --
No. of persons ofactive age perfamily 3.03/L4 2.19 2.46 2.71 3.15 3.55 3.72 4.06 3.66 -No. active per 0family 1.70 2 0.72 1.29 1.53 1.81 2.16 2.27 2.49 0.23
No. inactive per 1family 1.33 S 1.47 1.17 1.18 1.34 1.38 1.46 1.57 1.48
No. employed perfamily 1.59- 0.47 1.18 1.43 2.07 2.18 2.39 2.19
No. unemployed perfamily 0.11/8 0.25 0.11 0.10 0.08 0.09 0.09 0.10 0.04 __
/1 Refers to job earnings only.
/2 The income of the families to which they belong are not known. The majority are domestic servants.
/3 Refers to persons of 15 years or older.
4 Excludes non-relatives. If this category is included, the average is 3.18.
/5 Excludes non-relatives. If this category is included, the average is 1.83.
16 Excludes non-relatives. If this category is included, the average is 1.35.
/7 Excludes non-relatives. If this category is included, the average is 1.72.
/8 Excludes non-relatives. If this category is included, the average is 0.11.
Source: Direccion General de Estadistica y Censo, Household Survey 197h, specialtabulations for the mission.

Table 5.19: METROPOLITAN AREA: OCCUPAT}ON OF WORKERS BY
LEVEL OF FAMILY IMNCOE, 1974-TI
_ > el of famidl income jN/j2ionth) Non-Occupation Total Up to 501- 1001- 1501- 2001- 2501 3501- 2401& rela-
_ _ 500 1000 1500 2000 2500 3500 -4500 over tives2/
TOTAL (A+B) 1502156 1164449 22 23549 230588 148990 223957 114600 134199 ,7279
A. In the laborforce (1+2)--- -559 38315 118258 133032 129573 90933 136418 70172 81699 62159
1. Work-ng 810114 24978 107950 124123 126445 87205 130841 67450 80129 60990-Privatesector 463067 12123 63488 70046 71300 48838 69965 35447 36706 55154-Publicsector 178872 1997 19463 25674 26286 22203 33795 21740 24553 3161-Emaployers 107 1497 3738 7218 2881 8518 3021 9269 204-Self-employed 122132 9897 22152 22528 20287 12131 17418 6540 9007 2175-Non-paidfamilyworkers 2990 854 1350 2137 1354 1152 1148 702 597 296
2. Not workingka+b) 53445 )3337 10308 8909 6128 3728 5574 2722 1570 1169a. Unemployed 7 11975 9183 7723 4825 3226 4754 1909 989 1169
-Privatesector o6135 7543 5633 4029 2350 4°45 13214 796 882
-Publ.csector 2022 1050 1279 296 585 495 489 - 180
-Boployers 192 192 - - - - - - - -
-Self-employed 4228 1626 590 611 500 291 214 96 193 107
b. New workers 9 1362 1125 1186 1303 502 820 813 584 -
B. Not in the
labor force 6 8597 79134 107201 102463 98015 58057 87539 44.28 52420 10340-Household 44527 74051 66272 58912 30715 46687 22148 26185 6061-Students 14390 20976 22080 27772 18412 26623 14757 18629 2778
-Unable towork 14494 2315 2727 2573 2393 2022 1417 726 407-Others 7734T 14723 9859 11384 8758 6537 12207 6106 6880 1094
Source: Direccion General de Estadistico y Censo, Household Survey 1974, Special Tabulations for the mission.

Table 5.20: 1/
REGIONAL DISTRIBUTION OF 1ANPOWER ABSORPTION IN INI{iSTRY (1966-71)
Number of AbsoluteEmployed Persons Changre
1966 1971 1966-71
Total Manufacturing 200,036 242,396 212,360 100of which: Capital Region ,7,664 117,754Z
Central Re-ion 50,232 70,202 19.920 47.0West-Central aegion 15,604 16,6P1 1,077 2.5Zulia Region 12,910 15,535 2,625 6.2Lns Aiides Re.ion 7,825 8,436 611 1.4Southern Reg on 281 290 9 0Niortheastern Region 12,324 11,968 -356 -0.8Guayana Region 8,146 8,825 679 1.6
Traditiornal Industries 10, 192 121 '20 17,92P 100of vhich: Capital Res-ion 9, 7,70- -,40 .4
Central Region 29,200 29y,775 6,175 314.4Wtlest-C,entral Region 7,503 9,927 2,r144 13.1Zulia Region 7,907 9,456 1,549 8.6Los Andes lle,ion 5,1145 6,oL o9'' 5.0Southerr. Region 161 227 63 0.14Nlortheastern Region 8,142 8,094 -338 -1.9Guayana Region 1,130 1,117 -13 0
Interned"a+e Tn'3.1 vtrics 52.006 68 474 16 4f, 100of vhich: Capital Region 19,307 27,721 77.l
Central Region 14,949 21,702 6,753 41.0West-Centrtal Region 5,519 5,042 -477 -2.9Zulia Region 2,21t2 3,213 971 5.9Los Andes Reg7ion 1,105 1,151 46 0.3Southern Region 20 32 12 0.1Northeastern Region 2,406 2,466 60 °-Guayana Region 6,458 7,147 689 4.2
2/Mechanical Industries 44 6'P 52 602 79964 1100of which: Capital Region F ;72 25, 131 .Ff
Central Region 12,133 19,125 6,992 87.PWest-Central, Region 2,502 1,712 -790 -9.9Zulia Region 2,761 2,866 105 1.3Los Andes Region 1,575 1,242 -3 -4.2Southern Region 97 31 -66 -0.8Northeastern Region 1,486 1,408 -7P -1.0Guayana Region 558 561 3 0
1/ Establishments of 5 or more persons7/ Includes printing, toys and other branches included in "'Personal Group"Source: CORDIPLAil, Industrial Surveys 1966 and 1971
Capital Region - Distrito Federal (Caracas), Edo. MirandaCentral Region - Edos. Aragua, Carabobo, Cojedes, GuaricoWest-Central Region-Edos. Falc6n, Lara, Portuguesa, GaracuyZulia Region - Edos. ZuliaLos Andes Region - Edos. Barinas, Mgrida, Tachira, TrujilloSouthern Region - Edos. Apure, Territorio Federal AmazonasNortheastern Region-Edos. Anzoategui, Monagas, Nueva Espasta, SucreGuayana Region - Edos. Edoa. Bolivas, Territorio Federal Delta de Amacuro
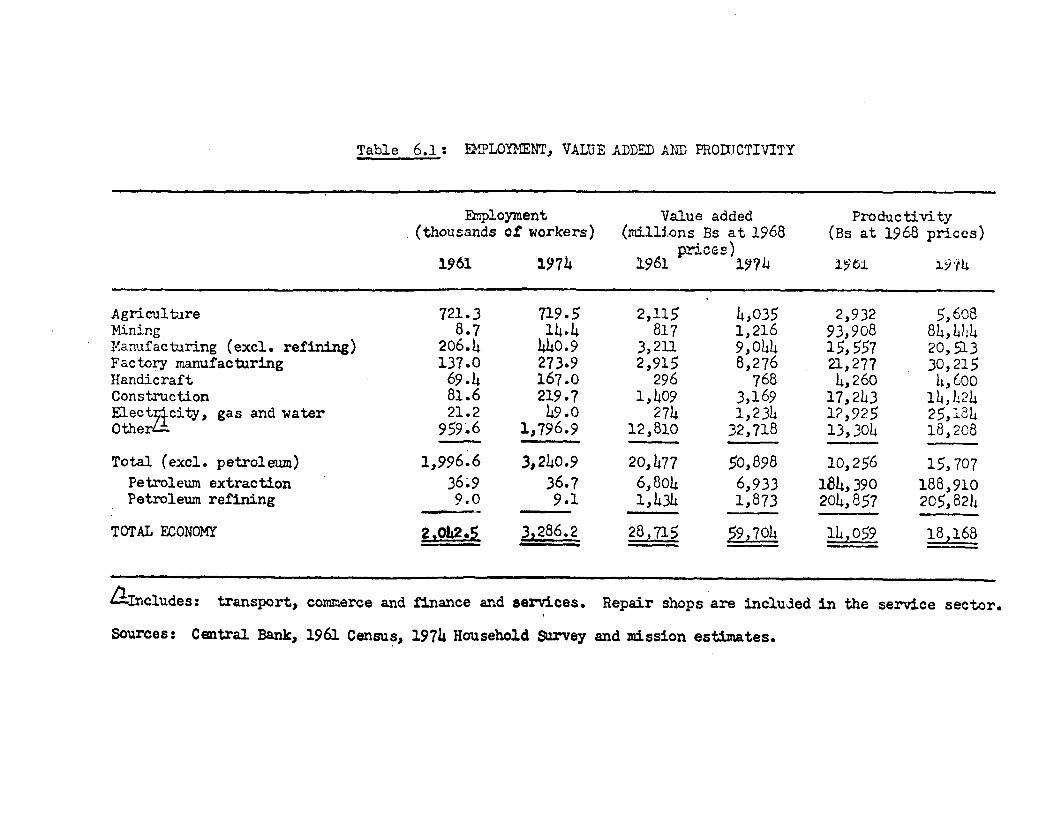
Table 6.1: F2OLYnENT, VALUE ADDED AND PRODJCTIVITY
Sruployment Value added Productivity(thousands of workers) (millions Bs at 1968 (Bs at 1968 prices)
1961 1974 1961 p 1es) 1161 i4
Agriculture 721.3 719.5 2,115 4,035 2,932 5,608Mining 8.7 14.4 817 1,216 93,908 84,U4Ylanufactaring (excl. refining) 2o6.4 440.9 3,211 9,044 15,557 20,513Factory manufactaring 137.0 273.9 2,915 8,276 21,277 30,215Handicraft 69.4 167.0 296 768 4,260 It,600Construction 81.6 219.7 1,409 3,169 17,243 1414.)2hElect city, gas and water 21.2 49.0 274 1,234 12,925 25, laOtherL. 959.6 1,796.9 12,810 32,718 13,304 18,208
Total (excl. petroleum) 1,996.6 3,240.9 20,477 50,898 10,256 15,707Petroleum extraction 36.9 36.7 6,804 6,933 184,390 188,910Petroleum refining 9e0 9.1 1,434 1,873 204,857 205,824
TOTAL ECONOMY 2L04.1 3,286.2 28,715 59,704 14,059 18)168
LIncludes: transport, commerce and finance and services. Repair shops are included in the service sector.
Sources: Central Bank, 1961 Census, 1974 Household Survey and mission estimates.

Table 6.2 A : GROWTH TRENDS IN VAIUE ADDED, MPWlYMENT AND PROIUCTIVITY
BY INDJSTRIAL ACTIVITIES
Average Annual Growth- in Percent -
1961 1966 1971 1961-66 1966-71 1961-71
I VALUE ADDED (million Bs.)
TOTAL MANUFACTURING 292 7j02o 102356 Il.9 8.1 10.0
(Traditional Industries) (2,161) (3,205) (4,470) (8.2) (6.9) (7.5)Foodstuffs 655 1,1,1 1,737 U.5 9.0 10.2Beverages 516 639 909 4.4 7.3 5.8Tobacco 234 345 149 8.1 -8.1 -4.5Textiles 255 473 698 13.2 8.1 10.6Clothing Incl. Incl. 458 3.1 6.4 4.7Leather 42 55 64 5.5 3.1 4.3Shoes 289 336 139Wood and Cork 41 76 132 13.1 11.7 12.4Furniture 128 150 184 3.2 4.2 3.7
(Intermediate Industries) (1,297) (2,461) (3,795) (13-7) (9.1) (11-3)Paper 116 257 410 17.2 9.8 13.5Chemical Products 289 562 974 14.2 11.6 12.9Petrochemical Products Incl. Incl. 798 9.6 3.1 6.3Rubber 122 186 256 8.8 6.6 7.7Plastics 513 811 145Non-metallic Minerals 226 418 642 13.1 9.0 11.0Metals 31 227 570 48.9 20.7 33.8
(Mechanical Industries) (388) (1,011) (1,693) (21.1) (10.9) (15.9)Metal Products 100 286 533 23.4 13.3 18.2Non-electric Machinery 11 43 111 31.3 20.9 26.0Electric Machinery andEquipment 64 224 350 28.5 9.3 18.5
Transport Equipment 213 458 699 16.5 8.8 12.6
(Residual Group) (154) (343) (398) (17.4) (3.0) (10.0)Printing 116 188 280 10.1 8.3 9.2Miscellaneous 38 155 118 32.4 -5.2 12.0
Sources: Industrial Censuses 1961, 1966, 1971, Cordiplan

Table 6.2 B: GROWTH TRENDS IN VALUE ADDED, ENPLOYMENT AND PRODUCTIVITY
BY INDUJSTRIAL ACTIVITIES
Average Annual Growth- in Percent -
1961 1966 1971 1961-66 1966-71 1961-71
II EMPLOYMENT (No. of Persons)
TOTAL MANUFACTURING 156,93 8 200,036 242,396 ,0 3.9 4.4
(Traditional Industries) (91,903) (103,392) (121,320) (2.4) (3.3) (2.8)Foodstuffs 28,644 36,856 46,865 5.2 4.9 5.0Beverages 9,278 8,573 9,123 -1.4 1.3 -0.2Tobacco 2,853 2,687 2.,704 -1.2 0.1 -0.5Textiles 14,684 21,352 20,406 7.8 -0.9 6.8Clothing Incl. Incl. 16,205 -0.8 5.4 2.3Leather 2,445 2,221 2,233 -1.8 0.1 -0.9Shoes 19,767 19,021 8,513Wood and Cork 3,332 4,837 6,472 7.7 6.0 6.9Furniture 10,900 7,845 8,799 -6.5 2.3 -2.1
(Intermediate Industries) (34,111) (52,006) (68,,474) (8.8) (5.7) (7.2)Paper 4,170 6,954 7,994 10.8 2.8 6.8Chemical Products 7,455 13,585 17,854 12.7 5.6 9.1Petrochemical Products Incl. Incl. 5,083 -5.2 13.0 3.4Rubber 3,755 4,086 5,370 1.7 5.6 3.6Plastics 6,969 5,332 4,723Non-metallic Minerals 9,906 13,363 16,457 6.2 4.3 5.2Metals 1,865 8,686 10,993 36.0 4.8 19.4
(Mechanical Industries) (22,215) (32,019) (39,975) (7.6) (4.5) (6.1)Metal Products 5,399 10,040 15,839 13.2 9.5 11.4Non-electric Machinery 498 2,029 3,568 32.4 11.9 21.7Electric Machinery andEquipment 3,424 5,268 7,719 9.0 7.9 8.5
Transport Equipment 12,894 14,682 12,849 2.6 -2.8 -0.01
(Residual Group) (8,709) (12,619) (12,627) (7.7) (0) (3.8)Printing 5,986 7,o46 8,636 3.3 4.2 3.7Miscellaneous 2,723 5,573 3,991 15.4 -6.5 3.9
Sources: Industrial Censuses 1961, 1966, 1971, Cordiplan
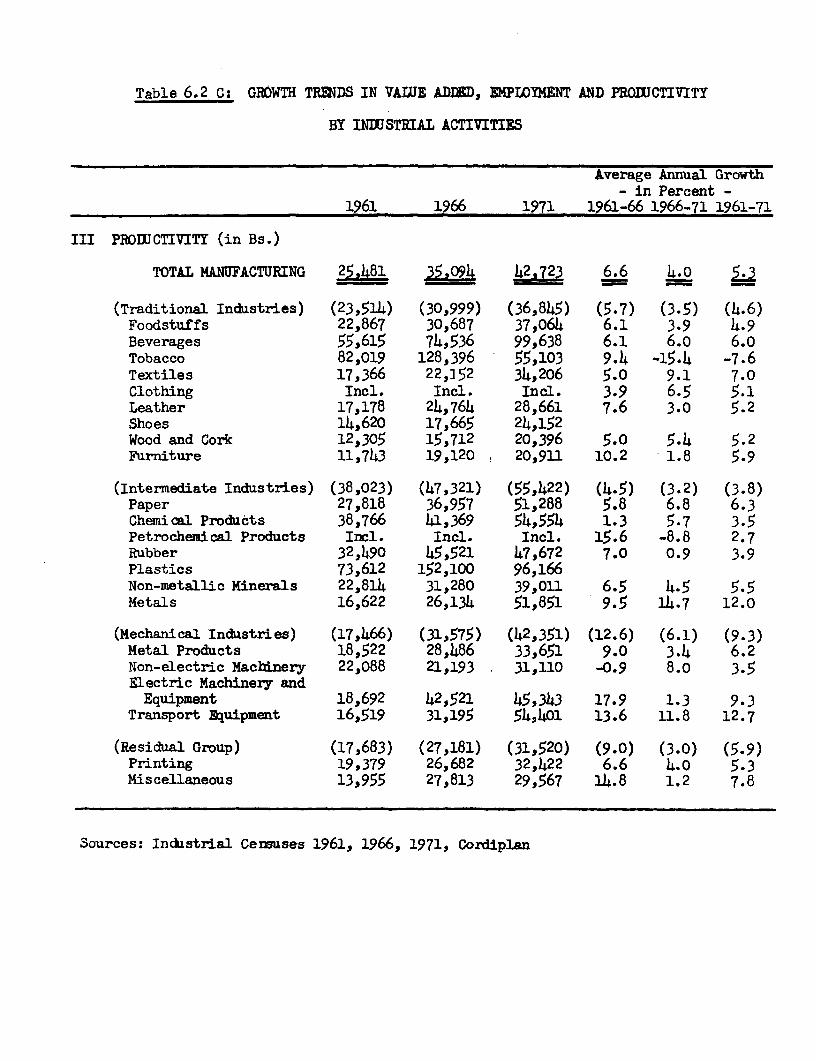
Table 6.2 C: GROWTH TRENDS IN VA W E ADDED, DEPI09MENT AND PRODJCTIVITY
BY INDUSTRIAL ACTIVITIES
Average Annual Growth- in Percent -
1961 1966 1971 1961-66 1966-71 1961-71
III PROUJCTIVITY (in Bs.)
TOTAL MANUFACTURING 25,481 35O9h 42,723 6.6 4.0 5.3
(Traditional Industries) (23,514) (30,999) (36,845) (5.7) (3.5) (4.6)Foodstuffs 22,867 30,687 37,064 6.1 3.9 4.9Beverages 55,615 74,536 99,638 6.1 6.o 6.0Tobacco 82,019 128,396 55,103 9.4 -15.4 -7.6Textiles 17,366 22,]52 34,206 5.0 9.1 7.0Clothing Incl. Incl. Incl. 3.9 6.5 5.1Leather 17,178 24,764 28,661 7.6 3.0 5.2Shoes 14,620 17,665 24,152Wood and Cork 12,305 15,712 20,396 5.0 5.4 5.2Furniture 11,743 19,120 20,911 10.2 1.8 5.9
(Intermediate Industries) (38,023) (47,321) (55,422) (4.5) (3.2) (3.8)Paper 27,818 36,957 51,288 5.8 6.8 6.3Chemical Products 38,766 41,369 54,554 1.3 5.7 3.5Petrochemical Products Incl. Incl. Incl. 15.6 -8.8 2.7Rubber 32,490 45,521 47,672 7.0 0.9 3.9Plastics 73,612 152,100 96,166Non-metallic Minerals 22,814 31,280 39,011 6.5 4.5 5.5Metals 16,622 26,134 51,851 9.5 14.7 12.0
(Mechanical Industries) (17,466) (31,575) (42,351) (12.6) (6.1) (9-3)Metal Products 18,522 28,486 33,651 9.0 3.4 6.2Non-electric Machinery 22,088 21,193 31,110 -0.9 8.0 3.5Electric Machinery and
Equipment 18,692 42,521 45,343 17.9 1.3 9.3Transport Equipment 16,519 31,195 54,401 13.6 11.8 12.7
(Residual Group) (17,683) (27,181) (31,520) (9.0) (3.0) (5.9)Printing 19,379 26,682 32,422 6.6 4.0 5.3Miscellaneous 13,955 27,813 29,567 14.8 1.2 7.8
Sources: Industrial Cenuses 1961, 1966, 1971, Cordiplan

Table 6.3: GROWTH TRENDS IN VAIUE ADDED, EMPIOYMENT AND PRODUCTIVITY
IN MANUFACTURING
Average Annual Growthi- in Percent -
1961 1966 1971 1961-66 1966-71 1961-71
I VALUE ADDED (million Bs.)
TOTAL MANUFACTURING 3.999 7,020 10,356 8.1 10.0- -
Large Industries( 100 Employees) 2,378 4,479 7,259 13.5 10.2 11.8
Medium-sized Industries(51-100 Employees) 305 625 1,003 15.4 9.9 12.7
Medium-sized Industries(21-50 Employees) 523 93 8 1,013 12.4 1.6 6.8
Small Industries(5-20 Employees) 793 978 1,081 4.3 2.0 3.1
II EMPLOYMENT (No. of Persons)
TOTAL MANUFACTURING 156.938 200,036 242.396 5.0 3.9 4-4
Large Industries( 100 Employees) 58,,427 96,589 132,293 LO.6 6.5 8.5
Medium-sized Industries(51-100 Employees) 11,690 18,034 27,273 9.1 8.6 8.8
Medium-sized Industries(21-50 Employees) 29,333 34,862 36,263 3.5 0.8 2.1
Small Industries(5-20 Employeed) 57,,488 50,551 46,567 .2.4 -1.7 -2.0
III PRODUCTIVITY (in Bs.)
TOTAL MANUFACTURING 25,481 94 42X723 6.6 4.0 5.3
Large Industries( 100 Employees) 40,700 46,372 54,871 2.6 3.4 3.0
Medium-sized Industries(51-100 Enployees) 26,091 56,643 36,776 16.8 -8.2 7.1
Medium-sized Industries(21-50 Employees) 17,830 26,906 27,935 8.6 0.8 4.6
Small Industries(5-20 Employees) 13,794 19,347 23,214 7.0 3.7 5.3
Sources: Industrial Censuses 1961, 1966, 1971, Cordiplan

Table 7.1: TARIFF STRUCTWRE AND CAPITAL INTENJSITYIN VEUEZUELAN MANUFACTURE
Ranking on Pro- Ranking onEstimated Aver- Capital-Labor tection (From Capital-Intensityage Protection Ratio (Thousands Lowest to (From Lowest
(Percentage) of Bs. per Man) Highest) to Highest)
ProcessedFood 113 24.1 16 13
Beverages 155 31.8 17 15Tobacco 231 19.6 20 11Textiles- 163 22.9 18 12Clothing &Shoes 184 7.2 19 2
Leather 110 15.4 15 7Wood &Cork 51 18.8 11 4
Furniture 93 6.4 14 1Paper 4 37.3 7 18Chemicals 34 27.7 4 15Petroleum, OilProduction 24 314.2 2 20
Rubber 51 27.0 11 14Non-MetallicMinerals 47 25.8 9 17
Basic Metals 24 131.8 2 19MetallicProducts 34 19.2 4 10
Nonelectric-Machinery 12 12.8 1 5
Electric 41 18.6 6 9Vehicles 44 14.7 7 6Printing 48 17.2 10 8Various 56 8.1 13 3
Source: Arancel de Aduanas, Central Bank, CORDIPLAN and ffission Estimates.

Table 7.2: UNIONS: NUMBER AND MDEBERSHIP 1959-1974
Unions Percentage ofNew Total Members of Membership in
Years Unions Number New Unions-/ New Union 2
1959 778 1,484 42,800 55.01960 1,167 2,651 68,1400 58.61961 455 3,106 22,800 50.11962 562 3,669 31,100 55.31963 415 4,083 21,600 52.01964 322 4,405 17,800 55.21965 428 4,821 20,800 48.61966 536 5,341 27,100 50.61967 363 5,704 18,700 51.51968 379 6,083 20,400 53.81969 342 6,428 17,300 50.61970 222 6,643 12,093 54.51971 179 6,813 9,003 50.31972 219 7,032 11,851 54.11973 190 7,222 10,968 57.71974 193 7,415 10,101 52.3
Source: Ministry of Labor
1/ Total number of workers in the new unions each year.2/ Average number of workers in the unions created each year.

Table 7.3: NUMBER OF COLLECTIVE BARGAINING AGREEMENTS BY ECONOMIC BRANCH 1960-1974
Collective Bargaining Agreements
1960 1962 1963 1964 1965 1966 1967 1968 1969 1970 1971 1972 1973 1974
TOTAL 661 642 783 884 1,004 1,066 1,051 1,062 1,140 1,422 1,445 1,292 1,383 1,171
Agriculture 8 9 8 2 39 41 38 40 72 73 69 50 46 74Petroleum and Mining 25 2 20 11 5 17 8 11 7 26 16 6 35 11Manufacturing 256 275 356 450 495 503 501 531 541 613 735 653 627 610Construction 24 15 25 7 20 10 10 18 28 42 28 33 37 71Energy 22 16 31 11 23 16 8 20 25 31 17 22 22 15Commerce 155 158 157 185 189 205 231 225 236 294 334 271 324 ?55Transport - Communications 55 36 60 48 60 61 53 57 71 82 64 58 77 44
Services 116 131 126 170 173 213 202 160 160 261 182 199 215 191
(PERCENTAGES) (Percentages)
TOTAL 100.00 100.00 100.00 100.00 100.00 LOO.00 100.00 100. 00 100.00 100.1n0 (1o.00 100.0( 100.00 100.00
Agriculture 1.21 1.40 1.02 0.23 3.88 3.85 3.62 3.77 6.3 5.1 4.8 3.9 3.3 7.0Petroleum and Mining 3.75 0.31 2.56 1.24 0.50 1.59 0.76 1.03 0.6 1.8 1.1 0.5 2.5 0.9Manufacturing 38.73 42.84 45.47 50.91 49.30 47.19 47.67 50.00 47.5 43.1 50.9 50.5 45.3 5?.1Construction 3.63 2.34 3.19 0.79 1.94 0.94 0.95 1.69 2.5 3.0 1.9 2.5 2.7 1.8Energy 3.33 2.49 3.96 1.24 2.29 1.50 0.76 1.88 2.2 2.2 1.2 1.7 1.6 1.3Commerce 23.45 24.61 20.05 20.93 18.83 19.23 21.98 21.19 20.7 20.6 23.1 21.0 23.4 71.8Transport - Communications 8.32 5.61 7.66 5.43 5.98 5.72 5.04 5.37 6.2 5.8 4.4 4.5 5.6 3.8Services 17.55 20.40 16.09 19.23 17.23 19.98 19.22 15.07 14.0 18.4 12.6 15.4 15.6 16.3
Source: Ministry of Labor

Table 7.4: WORKERS COVERED BY COLLECTIVE BARGAININC 1960-1974
Workers Covered by Collective BargainingBranch of Economic Activity 1960 1962 1963 1964 1965 1966 1967 1968 1969 1970 1971 1972 1973 1974
TOTAL 77,080 33,317 115,785 102,053 83,565 163,474 80,466 202,305 164,010 178,207 263,132 98,326 282,824 151,812
Agriculture 304 848 1,363 42 2,691 3,354 1,014 2,028 2,646 2,432 2,561 2,001 1,842 748Petroleum and Mining 26,699 31 33,939 3,235 487 25,861 617 4,007 950 20,115 1,948 2,945 17,672 3,086Manufacturing 18,445 17,504 22,361 42,605 37,924 34,239 43,589 48,670 33,816 97,782 72,301 47,933 45,359 106,750Construction 2,733 1,508 4,460 31,220 15,617 1,570 1,942 121,878 17,970 5,547 153,734 3,243 17,873 3,962Energy 3,841 1,606 7,292 4,920 2,088 11,727 368 1,594 4,586 18,947 1,350 4,356 24,123 1,596Commerce 7,541 5,951 9,220 8,278 7,875 14,040 10,400 2,317 13,098 17,250 15,120 15,565 23,703 12,693Transport - Communications 2,079 1 ,357 8,783 2,855 2,897 22,277 4,850 3,135 29,089 6,516 6,332 4,389 39,708 4,671Services 5,418 4,512 28,363 8,898 15,986 50,408 17,666 11,676 61,855 59,618 9,787 17.894 112,544 18,356
(Percentages)
TOTAL 100.00 100.00 100.00 100.00 100.00 100.00 100.00 100.00 100.00 100.00 100.00 100.00 100.00 100.00
Agriculture 0.39 2.54 1.18 0.04 3.22 2.05 1.26 1.00 1.6 1.4 1.0 2.0 0.7 0.5Petroleum and Mining 47.61 0.09 29.31 3.17 0.58 15.82 0.77 1.48 0.6 11.3 0.7 3.0 6.3 7.0Manufecturing 23.93 52,53 19.31 41.75 42.99 20.94 54.18 24.06 20.6 26.8 27.5 48.8 16.0 70.3Construction 3.55 4.52 3.85 30.59 18.69 0.96 2.41 60.24 11.0 3.1 58.4 3.3 6.3 7.6Energy 5.01 4.82 6.30 4.82 2.50 7.17 0.46 0.79 2.8 10.6 0.5 4.4 8.5 1.1Commerce 9.78 17.89 7.96 8.11 9.42 8.59 12.93 4.61 8.0 9.7 5.8 15.8 8.4 8.4Transport - Communications 2.70 4.07 7.59 2.80 3.47 13.63 6.03 1.55 17.7 3.7 2.4 4.5 14.0 3.0Services 7.03 13.54 24.50 8.72 19.12 30.84 21.96 5.77 37.7 33.4 3.7 18.2 39.8 19.1
Source: Ministry of Labor

Table 7.5: BUSINESS ESTABLISHMENTS COVERED BY COLLECTIVE BARGAINING AGREEMENTS 1960-1974
Establishments Covered by Collective Bargaining Agreements
Branch of EFconomic Activity 1960 1962 1963 1964 1965 1966 1967 1968 1969 1970 1971 1972 1973 1974
TOTAL 907 766 929 1,441 1,326 1,837 2,247 1,936 1,430 1,848 3,018 2,293 1,815 3,316
Agriculture 8 9 9 2 77 53 50 69 91 109 98 121 68 28
Petroleum and Mining 25 2 20 11 55 17 8 14 7 26 16 13 35 19
Manufacturing 418 375 456 848 611 864 1,582 825 612 889 3,033 1,081 810 2,559
Construction 24 15 25 136 20 10 10 147 28 42 27 33 38 21
Energy 22 16 31 11 23 16 8 20 25 32 17 22 22 15
Commerce 210 164 157 202 221 315 309 245 364 314 496 335 467 285
Transporc - Communications 55 36 60 48 64 61 56 57 87 139 145 69 86 84
Services 145 149 171 183 305 501 224 559 216 297 186 619 289 305
(Percentages)
TOTAL 100.00 100.00 100.00 100.00 100.00 100.00 100.00 100.00 100.00 100.00 100.00 100.00 100.00 100.00
Agriculture 0.88 1.17 0.97 0.14 5.81 2.89 2.23 3.57 6.4 5.9 3.2 5.3 3.8 0.8
Petroleum and Mining 2.76 0.26 2.15 0.76 0.38 0.83 0.36 0.72 0.5 1.4 0.5 0.6 1.9 0.6
Manufacturing 46.09 48.96 49.08 58.85 46.08 47.03 70.40 42.61 42.8 48.1 67.4 47.1 44.6 77.2
Construction 2.65 1.96 2.69 9.44 1.51 0.54 0.44 7.59 2.0 2.3 0.9 1.4 2.1 0.6
Energy 2.42 2.09 3.34 0.76 1.73 0.87 0.36 1.03 1.7 1.7 0.6 1.0 1.2 0.5
Coserce 23.15 21.41 16.90 14.02 16.67 17.15 13.75 12.66 25.4 17.0 16.4 14.6 5.7 8.6
Transport - Comnunications 6.06 4.70 6.46 3.33 4.82 3.32 2.49 2.95 6.1 7.5 4.8 3.0 4.8 2.5
Services 15.99 19.45 18.41 12.70 23.00 27.27 9.97 28.87 15.1 16.1 6.2 27.0 15.9 9.2
Source: Ministry of Labor

Table 7.6: COLLECTIVE BARGAINING CONTRACTS BY DURATION OF CONTRACT
1960 1963Daration in Months Contracts Workers Contracts Workers
No. dNo. % No. % No.
TOTAL 661 100.00 77,080 100.00 783 100.00 115,785 100.00
Up to 12 months 168 25.41 5,183 6.72 106 13.54 4,781 4.1313-18 months 75 11.35 4,081 5.30 70 8.94 32,226 27.8319-24 months 296 44.78 20,873 27.08 318 40.61 22,431 19.3725-30 months 40 6.05 37,224 9.37 86 10.98 8,702 7.5231-36 months 76 12.50 39,256 51.28 201 25.67 47,468 41.0037 months and over 5 0.76 113 0.15 2 0.26 177 0.15Not specified 1 0.15 80 0.10 - - -

Table 7.6 (Continued): COLLECTIVE BARGAINING CONTRACTS BYDURATION OF CONTRACT
1966 1970 1974
Duration in Months Contracts Workers Contracts Workers Contracts WorkersNo. %No. 2No. 74No. %No. _ 2No.2
TOTAL 1,066 100.00 163,575 100.00 1.422 100.00 178,207 100.00 1,171 100.00 151,812 100.00
Up to 12 months 79 7.41 2,771 1.70 43 3.0 1,087 0.6 363 31.0 11,571 7.613-18 months 26 2.44 969 0.59 24 1.7 3,048 1.7 10 0.8 2,282 1.519-24 months 278 26.08 9,947 6.08 277 19.5 15,459 8.7 176 15.0 14,219 9-425-30 months 66 6.19 8,153 4.99 86 6.0 24,274 13.6 30 2.6 3,419 2.231-36 months 606 56.85. 140,724 86.08 897 63.1 130,455 73.2 585 50.0 119,390 78.637 months and over 7 0.65 680 0.42 94 6.6 3,869 2.1 6 0.5 699 0.5Not specified 4 0.38 230 0.14 1 0.1 15 0.1 1 0.1 232 0.2
Source: Ministry of Labor Yearbook, various years.

Table 7.7: ACTIVITIES OF THE GENERAL EMPLOYMENT AGENCY 1966-74
Visits to Workers Workers sentEmployment Agency Registered companies interviewed to companies Hired
Caracas 69,340 55,799 34,876 29,235 13,478Petare 22,008 24,807 13,379 8,912 6,055Oeste 17,381 13,829 7,548 7,645 4,270Ciudad Bolivar 4,777 7,612 2,300 2,196 1,166Maracay 31,327 21,526 13,532 13,454 6,959La Victoria 12,427 6,714 6,606 5,622 3,282Cagua 5,364 4,107 2,774 2,864 1,769Vslencia 37,771 41,337 22,669 22,715 11,789Barquisimeto 20,205 23,372 9,842 11,055 4,628San Cristobal 18,745 5,902 12,558 9,572 7,001Punto Fijo 6,733 11,136 6,280 5,791 5,291Puerto La Cruz 14,1W44 16,186 9,059 9,484 4,889Puerto Ordaz 11,702 22,157 5,867 4,783 3,871Merida 1,0340 615 874 614 304Cumana 10,517 22,774 5,458 6,505 4,911Lagunillas 1,259 1,436 757 687 641Puerto Cabello 9,260 10,454 6,373 5,639- 2,792Maracaibo 21,355 36,233 11,005 10,087 6,932Cabinas 341 572 169 164 153Valera 2,072 2,848 1,536 1,238 878Acarigua 3,047 3,848 1,348 928 701Porlamar 1,362 642 518 679 376Carupano 261 848 295 258 258
Total 322,477 333,896 175,328 159,869 92,136

Table 7.8: INDEX OF WORKER PLACEMENT EFFICIENCY
BY D4PLOYMENT AGENCY 1966-1974
Workers sent Index ofto the Workers Placement
Employment Agency Companies Hired Efficiency(1) (2) 3=2/1
TOTAL 159,869 92,136 57.6
Caracas 29,235 13,478 46.1Petare 8,912 6,055 67.9Oeste 7,645 4,270 55.8Ciudad Bolivar 2,196 1,166 53.1Maracay 13,454 6,959 51.7La Victoria 5,622 3,282 58.4Cagua 2,864 1,769 61.8Valencia 22,715 11,789 51.9Barquisimento 11,055 - 4,628 41.9San Cristobal 9,572 7,001 73.1Punto Fijo 5,791 5,291 91.4Puerto La Cruz 9,484 4s,889 51.5Puerto Ordiz 4L,783 3,871 80.9M6rida 614 304 49.5Cumana 6,505 41,911 75.5Lagunillas / 687 641 93.3Puerto Cabello 5,639 2,792 49.5Maracaibo 10,087 6,932 68.7Cabinas3/ 164 153 93.3Valera 1,238 878 70.9Acarigua 928 701 75.5Porlamar 679 376 55 .4Cardpano4/ 258 258
1/ The efficiency index represents the percentage of workers sent to thecompanies who were hired.
2/ Established in 1967.3/ Operated in 1966 only.17/ Established in 1969.

table 8.1: STZE AID OOMPOSITION OF URBAN LABOR FORCE, 1974
(In thousands)
All Urban Caracas Rest
Informal Sector 978 (44%) 314 (39.7) 664; (46.6)
Self-employed 395 117 278Proprietors of small firms 82 30 52Fairly Workers 48 11 37Domestics 173 65 108fluployees in small finns 280 91 189
Farmi.- Sectpr 1236 476 76o
Governent 471 133 338Minerals (oil) 42 5 37Electricity, gas & water 11 15 (-4)Manufacturing 265 116 149Service 405 193 212Professionals and Pidp rietors 42 14 28
Total 22114 790 11424
Source: Direccion de Estadistica y Censor

Tpble 8.2:
COMPOSITION OF URBAN INFORTMAL SECTOR, 1974(in thousands)
All Urban Caracas Other Urban('000) % ('000) % (1000) %
Manufacturing 174 17.8 68 21.7 106 16.0Bakeries & other foods 79- 1.9 -7 -T7 T17 2.1Weavers & tailors 40 4.1 19 6.o 21 3.2Shoemakers 12 1.2 2 0.6 10 1.5Carpenters 19 1.9 9 2.9 10 1.5Electric equipment repairs 18 1.8 8 2.5 1C 1.5Car repairs 35 3.6 10 3.2 25 3.8Others 31 3.2 17 5.4 14 2.1
Construction 79 8.1 29 9.2 50 7.5
Transport 74 7.6 25 8.0 49 7.4
Commerce 280 28.6 79 25.2 201 3Shopkeepers i1- 14.7 3Z- 11.5 105 16.3Shop employees 97 9.9 34 10.8 63 9.5Streetsellers 39 4.0 9 2.5 30 4.5
Services 115 11.8 .47 15.0 68 10.2
Dorne-stic Servants 173 17.8 65 20.7 108 16.3
Unspecified 82 8.4 82 12.3
Total. 978 100.0 314 100.0 664 100.0
Source: Direccion de Estadistica y Censor

'dt}.___ i: iETROPOLITAN AREA: INDICATORS OF OCCUPATION AND INCONE BY LEVEL OF PER CAPITA FAMILY INCOME, 1974 II /1
Indicators Total Level of per capita income (Bs/month) Non-Up to 101- 201- 301- 401- 501- 701- 901 and Relatives/2
100 200 300 400 500 700 900 over
'of am-lies 100.0 11.8 15.7 16.2 12.7 9.7 11.8 7.1 15.0 --
o of work income 100.0 1.5 7.5 11.7 10.9 9.6 14.1 10.0 31.3 3.4
Per capita income(Bs/month) 429 50 155 258 352 455 593 788 1,418 --
Family work income(Bs/month) 2,081 256 991 1,499 1,794 2,030 2,483 2,944 4,342 __
Average earningsper worker(Bsimonth) 1,212 461 715 813 993 1,125 1,280 1,624 2,690 549
%'. of total personsof active age /3 100.0 9.7 15.6 17.8 13.2 9.8 11.6 6.4 11.1 4.8
% of total active 100.0 5.5 13.4 12.4 13.2 9.9 12.8 7.2 13.4 7.22 of total inactive 100.0 15.6 18.6 18.4 13.3 9.3 9.8 5.4 8.1 1.67 of total employed 100.0 3.8 12.7 17.4 13.3 10.3 13.4 7.5 14.1 7.5
of total un-employed 100.0 30.6 23.8 17.9 11.4 4.3 4.8 2.5 2.4 2.2
Rate ofparticipation 57.5 32.2 49.1 56.1 57.4 59.2 63.9 64.5 69.1 85.7- Primary
population 97.6 82.4 97.9 98.0 98.7 99.4 99.1 99.6 99.5 --- Secondarv
population 43.1 22.6 33.8 44.7 45.0 46.5 53.2 51.6 54.3 --
Employment Rate 53.9 21.0 43.8 52.6 54.3 57.6 62.4 63.1 68.3 84.1- Primary
population 94.3 53.4 93.9 96.0 99.1 98.6 98.6 99.6 99.1 --
- Secondarypopulation 39.4 14.8 27.9 40.7 41.3 44.7 51.4 49.7 53.4 --
Unemployment Rate 6.2 34.7 11.1 6.4 5.3 2.7 2.3 2.1 1.1 1.9- Primary
population 3.4 35.0 4.1 2.1 0.7 0.8 0.5 -- 0.4 --- Secondary
population 8.7 34.5 17.4 9.0 8.4 4.0 3.4 3.6 1.8 --
No. of persons ofactive age per
pamer 3.03/4 2.64 3.16 3.50 3.32 3.17 3.11 2.87 2.36 --
No. ac Ave perawmily 1.70/5 0.85 1.55 1.97 1.91 1.87 1.99 1.85 1.63 __
No. inactive perfamily 1.33Lt 1.79 1.60 1.54 1.42 1.29 1.12 1.02 0.73 --
NoS. employed per /
famity 1.59-epr 0.55 1.39 1.84 1.80 1.94 1.94 1.81 1.61 --
No. Linemployed perfoir.nly 0.11/8 0.30 0.17 0.13 0.11 0.05 0.05 0.04 0.02 --
/1 Refers to job earnings only.
!2 The income of the families to which they belong are not known. The majority are domestic servants.
/3 Refers to persons of 15 years or older.
/4 Excludes non-relatives. If this category is included, the average is 3.18.
/5 Excludes non-relatives. If this category is included, the average is 1.83.
/6 Excludes non-relatives. If this category is included, the average is 1.35.
/7 Excludes non-relatives. If this category is included, the average is 1.72.
/8 Excludes non-relatives. If this category is included, the average is 0.11.
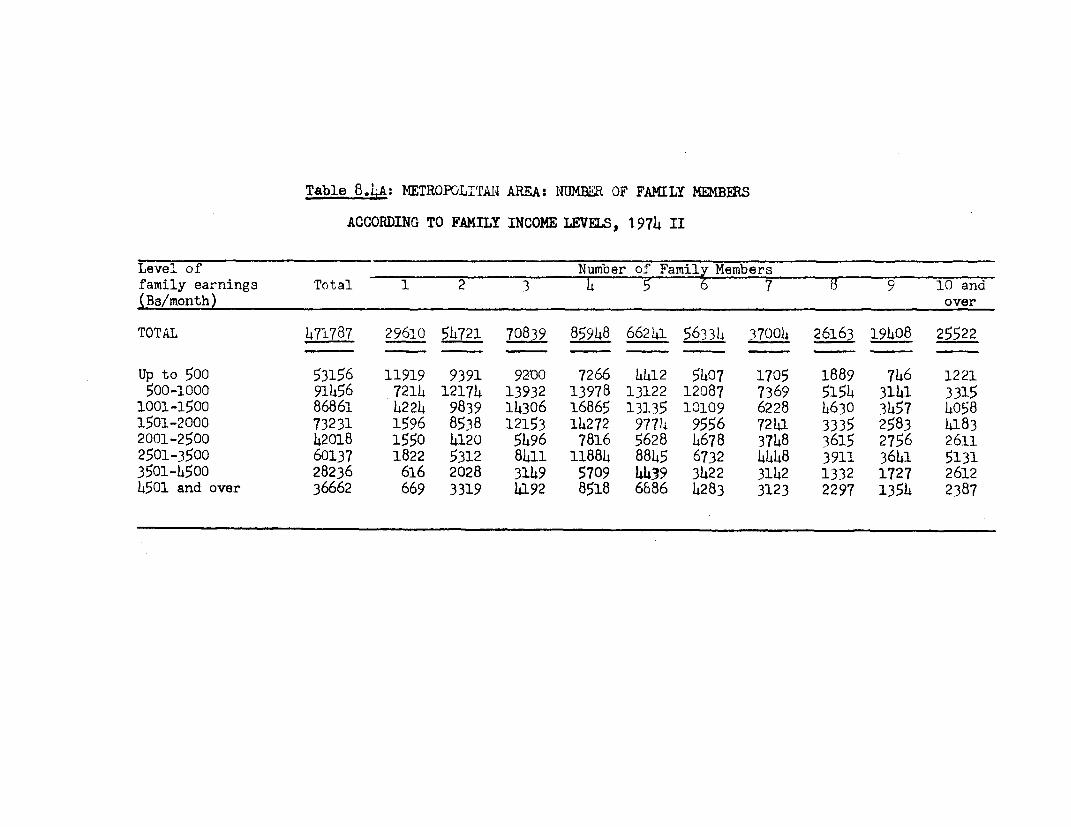
Table 8.iA: METROPOLITAN AREA: IRNUMR OF FAMILY MEMBERS
ACCORDING TO FAMILY INCOME LEVELS, 19714 II
Level of Number of Family Membersfamily earnings Total 1 2 3 4 5 6 7 8 9 10 and(Bs/month) over
TOTAL 471787 29610 54721 70839 85948 662411 5633h 37004 26163 19408 25522
Up to 500 53156 11919 9391 9200 7266 4412 5407 1705 1889 7L46 1221500-1000 91456 7214 12174 13932 13978 13122 12087 7369 5154 3141 3315
1001-1500 86861 4224 9839 14306 16865 13135 10109 6228 4630 3457 40581501-2000 73231 1596 8538 12153 14272 9774 9556 7241 3335 2583 41832001-2500 42018 1550 14120 5496 7816 5628 4678 3748 3615 2756 26112501-3500 60137 1822 5312 8411 11884 8845 6732 4448 3911 3641 51313501-4500 28236 616 2028 3149 5709 41439 3422 3142 1332 1727 26124501 and over 36662 669 3319 4192 8518 6586 4283 3123 2297 1354 2387

Table 8.4B: METROPOLITAN AREA: DISTRIBUTION OF HOMES 13Y NUMBER OF
FAMILY MEMERS AND BY FAMILY INCOME LEVELS
(Percentages of each class)
Level of Number of Family MembersFamily earnings Total 1 2 3 4 5 6 7 8 9 10 andDs/month) over
TOTAL 100.0 6.3 11.6 15.0 18.2 14.0 11.9 7.8 5.6 4.1 5_.4
Up to 500 100.0 22.4 17.7 17.3 13.7 8.3 10.2 3.2 3.6 1.4 2.350fl-1000 100.0 7.9 13.3 15.2 15.3 14.3 13.2 8.1 3.6 3.4 3.61001-1500 lCO.0 4.9 11.3 16.5 19.4 15.1 11.6 7.2 5.3 4.0 4.71501-2000 100.0 2.2 11.7 16.6 19.5 13.4 13.1 9.9 4.6 3.5 5.72001-2500 100.0 3.7 9.8 13.1 18.6 13.14 11.1 8.9 8.6 6.6 6.22501-3500 100.3 3.0 8.8 14.0 19.8 14.7 11.2 7.4 6.5 6.1 8.53501-4500 100.0 2.2 7.2 11.2 20.2 15.7 12.3 11.1 4.7 6.1 9.34501.and over 100.0 1.8 9.1 11.4 22.3 18.8 11.7 8.5 6.3 3.7 6.5

Table 8.4C: METROPOLITAN AREA: DISTRIBUTION OF HOMES BY NUMBER OF MEMBERS
IN THE FAMILY AND ACCORDING TO FAMILY INCOME LEVELS
(Percentages of each group)
Level of Number of Family Membersfamily earnings Total 1 2 3 4 5 6 7 8 9 10and(Bs/month) over
TOTAL 100.0 100.0 100.0 100.0 100.0 100.0 100.0 100.0 100.0 100.0 100.0
Up to 500 11.3 40.3 17.2 13.0 8.5 6.7 9.6 4.6 7.2 3.8 9.8501-1000 19.4 24.4 22.3 19.7 16.3 19.8 21.5 19.9 19.7 16.2 13.0
1001-1500 i8. 4 1h.3 18.0 20.2 19.6 19.8 17.9 16.8 17.7 17.8 15.91501-2000 15.5 5.4 15.6 17.2 16.6 14.8 12.0 19.6 12.8 13.3 16.42001-2500 8.9 5.2 7.' 7.8 9.1 8.5 8.3 10.1 13.8 1h.2 10.22501-3500 12.8 6.2 9.7 11.9 13.8 13.4 12.0 12.0 15.0 18.8 20.13501-4500 6.0 2.1 3.7 4.5 6.6 6.7 6.2 8.5 5.1 8.9 10.24501 and over 2.8 2.3 6.1 5.9 9.5 1C.4 7.6 8.4 8.8 7.0 9.3

Table 8.4D: METROPOLITAN AREA: DISTRIBUTION OF HOMES BY
FAMILY INCOME ANID FAMILY MEMBERS
(Percentages of total)
Level of Number of Family Membersfamily earnings Total 1 2 3 4 5 6 7 8 9 10 and(Bs/month) over
TOTAL 100.0 6.3 11.6 15.0 18.2 14.0 11.9 7.8 5.6 4.1 5.4
Up to 500 11.3 2.5 2.0 2.0 1.5 0.9 1.2 0.4 0.4 0.2 0.3501-1000 19.4 1.5 2.6 3.0 3.0 2.8 2.6 1.6 1.1. 0.7 0.71001-1500 18.4 0.9 2.1 3.0 3.6 2.8 2.1 1.3 1.0 0.7 0.91501-2000 15.5 0.3 1.8 2.6 3.0 2.1 2.0 1.5 0.7 0.6 0.92001-2500 8.9 0.3 0.9 1.2 1.2 1.2 1.0 0.8 0.8 0.6 0.62501-3500 12.8 0.4 1.1 1.8 2.5 1.9 1.4 0.9 0.8 0.8 1.13501-4500 6.o 0.1 0.4 0.7 1.2 0.9 0.7 0.7 0.3 0.4 o.64501 and over 7.8 0.1 0.7 0.9 1.7 1.5 0.9 0.7 0.5 0.3 0.5

Table 8.5A: METROPOLITAN AREA: NUMBER OF FAMILY MEKBERS
ACCORDING TO FAMILY INCOME LEVELS, 197I II
Level of Number of Family Membersper capitd income Total 1 2 3 5 6 7 8 9 10 and(Bs/'month) over
TOTAL 421787 29610 54721 70839 85948 66241 56334 37004 26163 19405 25522
Uptolo3 55410 7579 6633 6578 5470 4412 7000 4187 3807 3598 5846101-200 74177 641 1697 3895 8614 13122 14741 9958 8238 5466 7805201-300 76369 1040 2643 8018 14107 13135 11365 8975 5822 4767 6497301-400 59791 1056 4662 9609 13102 9774 7601 4211 9099 2877 2800401-500 45849 1303 5930 9338 11088 5628 5341 3408 1423 1343 1047501-700 55832 3237 7529 12825 10629 8845 5411 4388 1232 870 866701-900 33506 2725 6426 6187 9464 4439 1947 786 676 48L 372901 and over 70853 11729 19201 14389 13474 6836 2928 1091 866 - 289

Table 8.5B: METROPOLITAN AREA: DISTRIBUTION OF HOMES BY NUMBER OF
FAMILY MFIBERS AND BY FAMILY INCOME LEVELS
(Percentages of each class)
Level of Number of Family Membersper capita Income Total 1 2 3 4 6 7 9 la andBs/month) over
TOTAL 100.0 6. 11.6 18.2 114.0 11.9 7.8 5.6 14.1 5.14
Up to 100 100.0 114.2 12.0 11.9 9.9 8.0 12.6 7.6 6.9 6.5 10.6101-200 100.0 0.9 2.3 5.2 11.6 17.7 19.9 13.4 11.1 7.14 10.5201-300 100.0 1.14 3.5 10.5 18.5 17.2 14.9 11.7 7.6 6.2 8.5301-400 100.0 1.8 7.8 16.1 21.9 16.3 12.7 7.0 6.9 14.8 L4.7401-500 100.0 2.8 12.9 20.14 24.2 12.3 11.7 7.4 3.1 2.9 2.3501-700 100.0 5.8 13.5 23.0 19.0 15.8 9.7 7.9 2.2 1.6 1.6701-900 100.0 8.1 19.2 18.5 28.2 13.3 5.8 2.3 2.0 1.4 1.1901 and over 100.0 16.6 27.1 20.3 19.0 9.7 4.1 1.5 1.2 - 0.14

Tpble 8.5C: METROPOLITAN AREA: DISTRIBUTION OF HOMES BY NUMBER OF MEMBERS
IN THE FAMILY AND ACCORDING TO FAMILY INCOME LEVELS
(Percentages of each group)
Level of Number of Family Membersper capita Income Total 1 2 3 4 5 6 7 8 9 10 and(Bs/month) over
TOTAL 100.0 100.0 100.0 100.0 100.0 100.0 1C0.0 100.0 100.0 100.0 100.0
Up to 100 11.7 26.6 12.1 9.3 6.h 6.7 12.4 11.3 14.5 18.5 22.9101-200 15.7 2.2 3.1 5.5 10.o 19.8 26.2 26.9 31.5 28.2 30.6201-300 16.2 3.5 h.8 11.3 16.h 19.8 20.2 24.3 22.2 2h.6 25.5301-h00 12.7 3.6 8.5 13.6 15.2 14.8 13.5 11.h 15.7 1).8 11.0h01-500 9.7 4-h 10.8 13.2 12.9 8.5 9.5 9.2 5.h 6.9 4.1501-700 11.8 10.9 13.8 18.1 12.4 13.4 9.6 11.9 4.7 4.5 3.4701-900 7.1 9.2 11.7 8.7 11.0 6.7 3.5 2.1 2.6 2.5 1.5901 and over 15.0 39.6 35.1 20.3 15.7 10.h 5.2 3.0 3.3 - 1.1
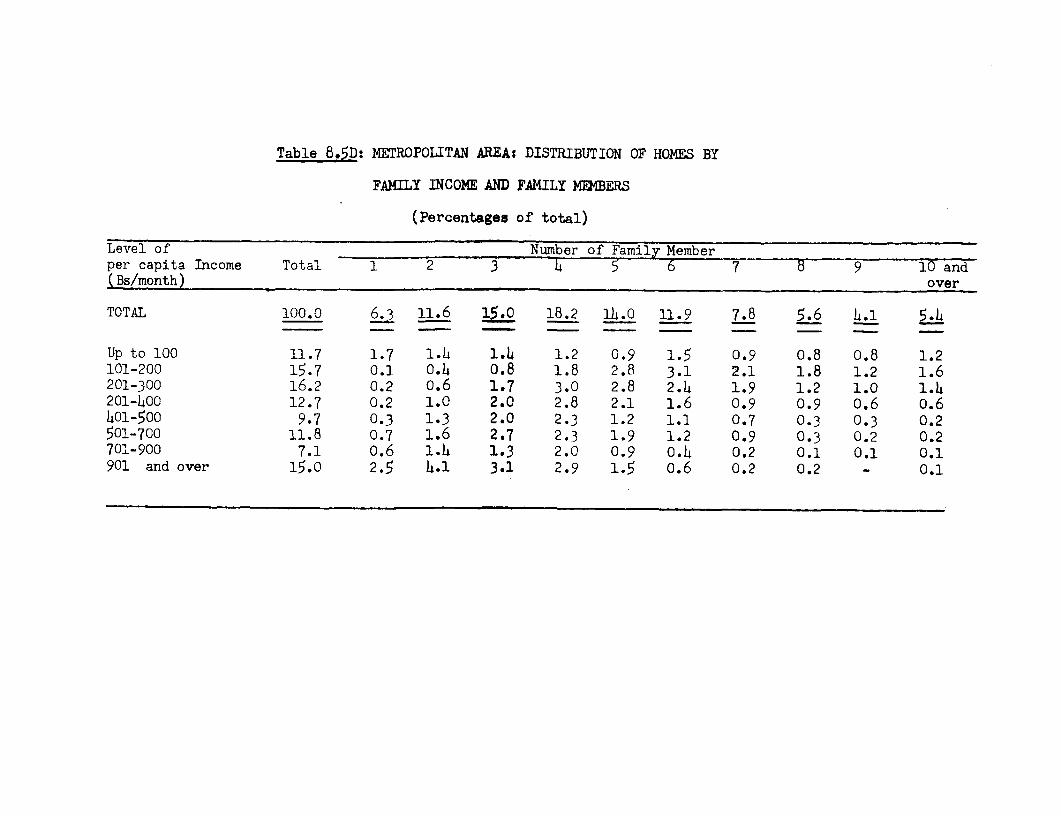
Table 8.5D: METROPOLITAN AREA: DISTRIBUTION OF HOMES BY
FAMILY INCOME AND FAMILY MEMBERS
(Percentages of total)
Level of Number of Family Memberper capita Income Total 1 2 3 4 5 6 7 8 9 10 and(Bs/month) over
TOTAL 100.0 6-3 11.6 15.0 18.2 14.o 11.9 7.8 5.6 4.1 5.4
Up to 100 11.7 1.7 1.h 1.4 1.2 0.9 1.5 0.9 0.8 0.8 1.2101-200 15.7 0.1 0.4 0.8 1.8 2.8 3.1 2.1 1.8 1.2 1.6201-300 16.2 0.2 o.6 1.7 3.0 2.8 2.4 1.9 1.2 1.0 1.4201-400 12.7 0.2 1.0 2.0 2.8 2.1 1.6 0.9 0.9 0.6 0.6h01-500 9.7 0.3 1.3 2.0 2.3 1.2 1.1 0.7 0.3 0.3 0.2501-700 11.8 0.7 1.6 2.7 2.3 1.9 1.2 0.9 0.3 0.2 0.2701-900 7.1 0.6 1.4 1.3 2.0 0.9 0.4 0.2 0.1 0.1 0.1901 and over 15.0 2.5 4.1 3.1 2.9 1.5 0.6 0.2 0.2 - 0.1

Table 8.6A: METROPOLITAN AREA: DISTRIBUTION OF PER FAMILY INCOME
ACCORDING TO LEVELS OF PER CAPITA INCOME
Level of total Level of per cagita income (Bs/month)family income Total Up to 100 101-200 01-300 301-40 401-500 501-70 701-900 and
(Bs/month) over
TOTAL 471,787 55.410 74,177 76,369 59.791 48t849 55,832 06 70,853
Up to 500 53,156 41,940 6,756 2,101 1,056 1,303 --
501-1000 91,486 12,160 400,119 16,760 9,303 5,930 3,237 2,725 1,2521001-1500 66861 1,118 20,355 27,101 14,886 9,338 7,529 2,310 4,2241501-2000 73,231 192 6,083 16,570 17,011 11,088 12,153 h,116 6,0182001-2500 42.018 -- 767 8,036 7.I4j5 6,758 8o488 4,824 5,6702501-3500 0,137 97 5,302 7,756 8,187 14,179 10,434 4l,1823501-4500 28236 - -- 499 2,119 2,576 6,509 5,424 11,1094501 and over 36-662 -- -- -- 185 669 3,737 3,673 28,398

Table 8.6B: METROPOLITAN AREA: DISTRIBUTION OF PER FAMILY INCOME
ACCORDING TO LEVELS OF PER CAPITA INCOME
(Percentages of each class)
Level of total Level of per capita income (Bs/month)family income Total Up to 100 101-200 201-300 301-400 401-500 501-700 701-900 901 and
(Bs/month) over
TOTAL 100.0 11.8 15.7 16.2 12.7 9.7 11.8 7.1 15.0
Up to 500 100.0 78.9 12.7 4.0 2.0 2.4 - - -
501-1000 100.0 13.3 43.9 18.3 10.2 6.5 3.5 3.0 1.41001-1500 100.0 1.3 23.4 31.2 17.1 10.8 8.7 2.7 4.91501-2000 100.0 0.3 8.3 22.6 23.2 15.1 16.6 5.6 8.22001-2500 100.0 - 1.8 19.1 17.8 16.1 20.2 11.5 13.52501-3500 100.0 - 0.2 8.8 12.9 13.6 23.6 17.4 23.63501-4500 100.0 - _ 1.8 7.5 9.1 23.1 19.2 39.34501 and over 100.0 - - - 0.5 1.8 10.2 10.0 77.5

Table 8.6C: METROPOLITAN AREA: DISTRIBUTION OF PER FAMILY INCOME
ACCORDING TO LEVELS OF PER CAPITA INCOME
(Percentages of each group)
Leve'L of total Level of per capita income (Bs/month)family income Total Up to 100 101-200 201-300 301-400 401-500 501-700 731-900 901 and(Bs/month) over
Total 100.0 100.0 100.0 100.0 100.0 100.0 100.0 100.0 100.0
Up to 500 11.3 75.6 9.1 2.8 1.8 °.8 - - -
500-1000 19 J 22.0 5h.1 22.0 15.6 12.9 5.8 8.1 1.81001-1500 7 2.0 27.h 35.5 24.9 20.5 13.5 6.9 6.o1501-2000 17.5 0.b 8.2 21.7 28.5 2h.2 21.8 12.3 8.52001-2500 77__ - 1.8 19.1 17.8 14.7 15.2 14.4 8.02501-3500 12.7 - 0.1 6.9 13.0 17.9 15.4 31-;I 20.0!5o1-4500 6.0 - - 0.7 3.5 5.6 11.7 16.2 15.7LSol and over T_7 - - - 0.3 1.5 6.7 11.0 40.1

Table 8.6D: METROPOLITAN AREA: DISTRIBUTION OF PER FAMILY INCOME
ACCORDING TO LEVELS OF PER CAPITA INCOME
(Percentages of total)
Level of total Level of per capita income (Bs/month)family income Total Up to 100 101-200 201-300 301-400 401-500 501-700 701-900 901 and(Bs/month) over
TOTAL 100.0 11.8 7 16.2 12.711.8 7.1 15.O
Up to 500 11.3 8.9 1.4 0.5 0.2 0.3 - - -501-1000 9 2.6 8.5 3.6 2.0 1.3 0.7 0.6 0.31001-1500 18.4 0.2 4.3 5.7 3.2 2.0 1.6 0.5 0.91501-2000 " 1.3 3.5 3.6 2.3 2.6 0.9 1.32001-2500 - 0.2 1.7 1.6 1.4 1.8 1.0 1.22501-3500 12.7 1.1 1.6 1.7 3.0 2.2 3.03501-4500 .- - 0.1 0.5 0.6 1.4 1.1 2.34501 and over _ _ - - " 0.1 0.8 0.8 6.o

Table 8.7A: DISTRIBUTION OF POPULATION 15 YEARS AND OVER BY
FAMILY INCOME AND PER CAPITA INCOME IN THE FAMILY
Level of total Level of per capita income (Bs/month)family income Total Up to 100 101-200 201-300 301-400 401-500 501-700 701-900 901 and
(Bs/month) over
TOLTAL 1,429,657 146.405 234,539 267.774 198.745 145.123 173,581 96,247 167.243
*T to 50Cj 116 449 97,318 13,523 3,249 1,056 1,303 - - -1/()1-1000 225 459 42,186 108,819 37,541 18,530 11,169 3,237 2,725 1,252ilO0-li00 _______ 5,975 73,856 75,076 36,150 21,097 14,634 4,483 4,2241',01-2000 230,585 926 31,792 68,057 52,658 29,872 28,,942 7,986 10,35520(1-2500 148-990 _ 5,635 42,905 32,628 23,260 23,793 11,306 9,4632501-350 22397u - 914 36,090 40,856 36,814 50,108 29,693 29,4823501-h500 114 600 _ - 4,9856 i14,887 16,288 32,366 18s778 27,S254501 and over U4119 - - - 1,980 5,320 20,501 21,276 85,0142

Table 8.7B: DISTRIBUTION OF POPULATION 15 YEARS AND OVER BY
FAMILY INCOME AND PER CAPITA INCOME IN THE FAMILY
(Percentage of each class)
Level of total Level of per capita income (Bs/month)family income Total Up to 100 101-200 201-300 301-400 401-500 501-700 701-900 901 and(Bs/month) over
TOTAL 100.0 10.2 16.4 15.7 13.9 10.2 12.1 6.7 11.7
Up to 500 100.0 83.6 11.6 2.8 0.9 1.1 - - _501-1000 100.0 18.7 48.3 16.7 8.2 5.0 1.4 1.2 0.61001-1500 100.0 2.5 31.4 31.9 15.4 9.0 6.2 1.9 1.81501-2000 100.0 0.4 13.8 29.5 22.8 13.0 12.6 3.5 4.42001-2500 100.0 - 3.8 28.8 21.9 15.6 16.0 7.6 6.32501-3500 100.0 - 0.4 16.1 18.2 16.4 22.4 13.3 13.23501-4500 100.0 _ - 4.2 13.0 14.2 28.2 16.4 23.94501 and over 100.0 _ - _ 1.5 4.0 15.3 15.9 63.4

Table 8.7C: DISTRIBUTION OF POPULATION 15 YEARS AND OVER BY
FAMILY INCOME AND PER CAPITA INCOME IN THE FAMILY
(Percentage of group)
Level of total Level of per capita income (Bs/month)family income Total Up to 100 101-200 201-300 301 -400 401-500 501-700 701-900 901 and
(B s/month) over
TOTAL 100.0 100.0 100.0 100.0 100.0 100.0 100.0 100.0 100.0
Up to 500 8.2 66.5 5.8 1.2 0.5 0.9 - - -501-1000 28.8 46.4 14.0 9.3 7.7 1.9 2.8 0.81001-1500 1 4.1 31.5 28.0 18.2 14.5 8.4 4.7 2.51501-2000 16.1 o.6 13.6 25.4 26.5 20.6 16.7 8.3 6.22001-2500 10.4 - 2.4 16.0 16.4 16.0 13.7 11.7 5.72501-3500 1!.7 - 0.4 13.5 20.6 25.4 28.9 30.9 17.63501-4500 77. - - 1.8 7.5 11.2 18.6 19.5 16.44501 and over 7 - - - 0.1 3.7 11.8 22.1 50.8
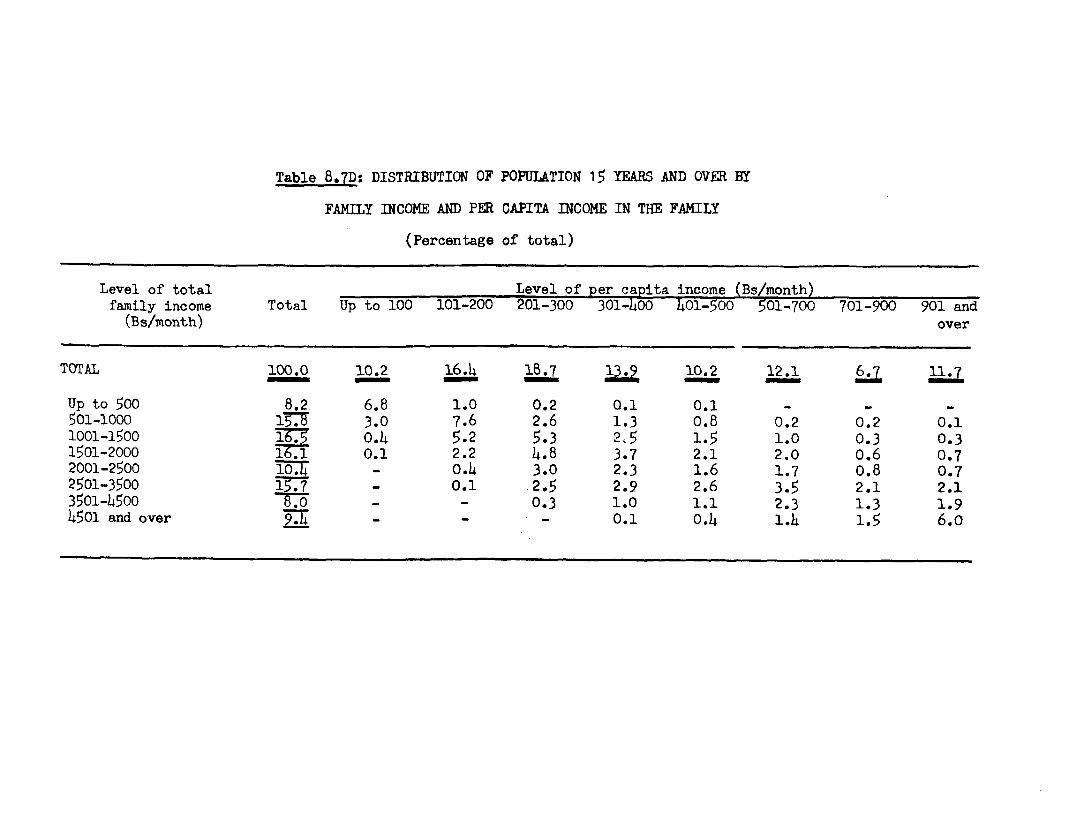
Table 8.7D: DISTRIBUTION OF POPULATION 15 YEARS AND OVER BY
FAMILY INCOME AND PER CAPITA INCOME IN THE FAMILY
(Percentage of total)
Level of total Level of per capita income (Bs/month)family income Total Up to 100 101-200 201-300 301-400 401-500 501-700 701-900 901 and
(Bs/month) over
TOTAL 100.0 10.2 16.4 18.7 13.9 10.2 12.1 6.7 11.
Up to 500 8.2 6.8 1.0 0.2 0.1 0.1 - - -
501-1000 17.7 3.0 7.6 2.6 1.3 0.8 0.2 0.2 0.11001-1500 0.4 5.2 5.3 2,5 1.5 1.0 0.3 0.31501-2000 16.T 0.1 2.2 4.8 3.7 2.1 2.0 0.6 0.72001-2500 1o0.7 - 0.4 3.0 2.3 1.6 1.7 0.8 0.72501-3500 15.7 - 0.1 .2.5 2.9 2.6 3,5 2.1 2.13501-45.00 8. - - 0.3 1.0 1.1 2.3 1.3 1.94501 and over -97 - - - 0.1 0.4 1.4 1.5 6.o

Table 8.8: METROPOLITAN AREA: AVERAGE NUMBER OF PERSONS PER HOME Er
FAMILY AND PER CAPITA INCOME, 1974 II
Level of tota; Level of per capita income (Bs/month)family income Total Up to 100 101-200 201-300 301-400 401-500 501-700 701-900 901 and
(Bs/month) over
TOTAL 3.03 2.64 3.16 3.50 33.32 16 3.11
Up to 500 2.19 2.32 2.00 1.55 1.00 1.00 - _501-1000 2.7 3.47 2.71 2.24 1.99 1.88 1.00 1.00 1.001001-1500 2.71 5.30 3.63 2.77 2.43 2.26 1.94 1.94 1.001501-2000 3.15 4.80 5.23 4.11 3.10 2.69 2.38 1.94 1.722001-2500 3 - 7.34 5.34 4.36 3.44 2.80 2.34 1.672501-3500 3.72 - 9.42 6.81 5.27 4.50 3.53 2.85 2.083501-4500 .406 - - 9.73 7.03 6.32 4.92 3.46 2.474501 and over -39- - - 10.70 7.95 5.49 5.79 2.99

Table 8.9A: METROPOLITAN AREA: OCCUPATIONAL SITUATION
BY FAMILY INCOME AND PER CAPITA INCOME
Level of family income per apita (Bs/month) Non-Occupation Total Up to 101'- 201- 301- 401- 501- 701- 901 & rela-
100 200 300 1400 500 700 900 over tives
TOTAL (A+B) 1502156 146405 L14539 26777L 19874 145123 173581 96247 167243 72499
A. In the laborforce (1+2) 8 L7093 115221 150348 113999 85904 110874 62053 11560e 621591. working lo0114 30736 10277& 140705 107906 8358& 10&286 60739 114326 60990-Privatesector 463067 16109 62434 87392 58851 145062 57612 28987 51L61 55154
-Publicsector 178872 5649 20489 26872 26452 19482 28334 16039 3239L 3161-Employers 36453 107 775 104l, 3372 14346 5513 4845 15217 204-Self-employed 122132 7598 18218 22697 17724 13483 15703 10212 14292 2175
-Non-paidfamilyworkers 9590 1273 857 1760 1507 1215 1124 626 932 296
2ab Not3Lorki5 16357 12743 9583 6093 2316 2588 1314 1282 1169a. Unemployed 47 14878 10828 8384 L789 2022 2088 805 790 1169-Privatesector 34937 10750 8778 6632 3667 1629 1294 612 693 882
-Publicsector 6966 2204 1267 1249 620 189 591 96 - 180
-Employers 19z 192 - - - - - - - --Self-employed 4228 1732 783 503 502 204 203 97 97 107
b. New workers 7b 1479 1915 1199 1304 294 500 509 492 -
B. Not in thelabor force 638597 99312 119018 117426 84746 59219 62707 34194 51635 103140
-Household 31558 56192 74266 70156 48169 33510 37563 18247 3094l 6061-Students 166417 20551 26921 30255 25285 18663 16990 11726 13548 2778-Unable towork 19074 4398 3972 4333 2118 772 1373 1075 626 407
-Others 77548 18171 13859 12682 8724 6274 7081 3146 6517 1094

Table 8.9B: METROPOLITAN AREA: OCCUPATIONAL SITUATION BY
FAMILY INCOME AND PER CAPITA INCOME
Level of family income percapita (Bs/month) Non-Occupation Up to 101- 201- 301- 401- 501- 701- 901 & reta-
Total 100 200 300 400 500 700 900 over tives
TOTAL(A+B) 100.0 9.7 15.6 17.8 13.2 9.8 11.6 6.4 11.1 4.8
A. In theLabEor orce(1+2) 100.0 5.5 13.h 17.4 13.2 9.9 12.8 7.2 13.4 7.21. Working 100.0 3.8 12.7 17.4 13.3 10.3 13.4 7.5 14.1 7.5-Privatesector 100.0 3.5 13.5 18.9 12.7 9.7 12.4 6.3 11.1 11.9-Publicsector 100.0 3.2 11.5 15.0 14.8 10.9 14.8 9.0 18.1 1.8
- Employers 100.0 0.3 2.1 5.6 9.3 11.9 15.1 13.3 41.9 0.6-Self-employed 100.0 6.2 14.9 18.6 14.5 11.0 12.9 8.4 11.7 1.8
-Non-paidfamilyworkers 100.0 13-3 8.9 18.4 15.7 12.7 11.7 6.5 9.7 3.1
2. No t working(a_+b) 100.0 30.6 23.8 12.9 11.4 4.3 4.8 2.5 2.4 2.2a. Unemployed 100.0 32.5 23.7 18.3 10.5 4.4 4.6 1.8 1.7 2.6-Privrate
se^-or 100.0 30.8 25.1 19.0 10.4 4.7 3.7 1.8 2.0 2.5
sector 100.0 34.5 19.8 19.5 9.7 3.0 9.2 1.5 - 2.8-Emnroyers l(10.C 100.0 - - - - - - - -
- Self-employed 100.0 141.0 18.5 11.9 11.9 4.8 4.8 2.3 2.3 2.5
b. New Wforkers 100.0 19.2 24.9 15.6 17.0 3.8 6.5 6.6 6.4 -
9. Not in thelabor fcrce 100.0 15.6 18.6 18.h 13.3 9.3 9.8 5.4 8.1 1.6-Household 100.0 15.0 19.8 18.7 12.9 8.9 10.0 4.8 8.2 1.6-Students 100.0 12.3 16.2 18.1 15.2 11.2 10.2 7.0 8.1 1.7-Unable towork 100.0 23.1 20.8 22.7 11.1 4.0 7.2 5.6 3.3 2.1-Others 100.0 23.4 17.9 16.3 11.2 8.1 9.1 4.1 9.4 1.4

Table 8.9C: METROPOLITAN AREA: OCCUPATIONAL SITUATION BY
FAMILY INCOME AND PER CAPITA INCOME
Level of fainIy income per capita (Bs/month) Non-Occupation Total Up to 101- 201- 301- 401- 501- 701- 901 & rela-
100 200 300 400 500 700 900 over tives
TOTAL (A+B) 100.0 100.0 10o.o 100.0 100.0 100.0 100.0 100.0 100.0 100.0
A. In the laborforce (1+2) 57.5 32.3 49.2 56.2 57.4 59.2 63.9 64.5 69.1 85.71. Working 53.9 21.0 43.8 52.6 51.6 57.6 62.4 63.1 68.3 84.1
-Privatesector 30.8 11.0 26.6 32.6 29.6 31.1 33.2 30.1 30.8 76.1
-Publicsector 11.9 3.9 8.7 10.0 13.3 13.4 16.3 16.7 19.1 1.4-Employers 2.4 0.1 0.3 0.8 1.7 3.0 3.2 5.0 9.1 0.3-Self-
employed 8.1 5.2 7.8 8.5 8.9 9.3 9.0 10.6 8.5 3.0-Non-paidfamilyworkers 0.6 0.9 0.4 0.7 0.8 0.8 0.6 0.7 0.5 0.4
2. Not workinJa= 5 3.6 11.2 5.4 3.6 3.1 1.6 1.5 1.1 0.8 1.6a. Unemployed 3.0 10.2 4.6 3.1 2.4 1.1 1.2 0.8 0.5 1.6-Privatesector 2.3 7.3 3.7 2.5 1.8 1.1 0.7 0.6 0.4 1.2
-Publicsector 0.4 1.5 0.5 0.5 0.3 0.1 0.3 0.1 - 0.3-=Eployers n 0.1 - - - - - -
-Self-employed 0.3 1.2 0.3 0.2 0.3 0.1 0.1 0.1 0.1 0.2
b. New workers 0.5 1.0 0.8 0.4 0.7 0.2 0.3 0.5 0.3 -
B. Not in thelabor force 142.5 67.8 50.8 43.8 42.6 40.8 36.1 35.5 30.9 14.3
-Household 25.0 38.4 31.7 26.2 24.5 23.1 21.6 18.9 18.5 8.4-Students 11.1 14.0 11.5 11.3 12.7 12.9 9.6 12.2 8.1 3.8-Unable towork 1.3 3.0 1.7 1.6 1.1 0.5 0.8 1.1 0.4 0.6-Others 5.2 12.4 5.9 4.7 4.4 4.3 4.1 3.3 3.9 1.5
(fi) - Insignificant

Table 8.9D: METROPOLITAN AREA: OCCUPATIONAL SITUATION BY
FAMILY INCOME AND PER CAPITA INCOME
Level of family income per capita (B/month) Non-Occupation Up to 101- 201- 301- 401- 501- 701- 901 & rela-
Total 100 200 300 400 500 700 900 over tives
TOTAL(A+B) 100.0 9.7 15.6 17.8 13.2 9.8 4.6 6.4 11.1 4.8
A. In thelabor force(1+2) 57.5 3.4 7.7 10.0 7.6 5.7 7.4 4.1 7.7 4.11. Working 53.9 2.0 6.8 9.4 7.2 5.6 7.2 4.0 7.6 4.4
-Privatesector 30.8 1.1 4.2 5.8 3.9 3.0 3.8 1.9 3.4 3.7-Publicsector 11 0.4 1.4 1.8 1.8 1.3 1.9 1.1 2.1 0.2
-Employers 2. " 0.1 0.2 0.3 0.4 0.3 1.0-Self-employed 8.1 0.5 1.2 1.5 1.2 0.9 1.0 0.7 1.0 0.1-Non-paidfamilyworkers 0.6 0.1 " 0.1 0.1 0.1 0.1 " 0.1 t
2. Notworking3.6 1.1 0.8 0.6 0.4 0.2 0.2 0.1 0.1 0.1a. Unemployed 3.0 1.0 0.7 0.6 0.3 0.1 0.1 O 0.1-Privatesector 2.3 0.7 0.6 0.4 0.2 0.1 0.1 " 0.1-Publicsector 0-4 0.1 0.1 0.1 " " i ', _ n
-Employers - _ - _ _ _ _ _
-Self-employed 20. 0.1 0.1 0.1 " " " t "I
b. New Workers 0 0.1 0.1 0.1 0.1 " o.1 "
B. Not in thelabor force 2 6.6 7.9 7.8 5.6 3.9 4.2 2.3 3.4 0.7
-Household g 3.7 4.9 4.7 3.2 2.2 2.5 1.2 2.1 0.1-Students 11,1 1.14 1.. 2.0 1.7 1.2 1.1 0.8 0.9 0.2-Unable towork 1 0.3 0.3 0.3 0.1 0.1 0.1 0.1 "
-Others $ 1.2 0.9 0.8 0.6 0.4 0.5 0.2 0.4 0.1
( H) -Lnsignificant

P0 !'I01,1', AREA: D1ISTRIDBUTION OF WORKERS AND LAKNIN(,S lY 1.''1,. OF 1'L>tiE.L. INCOA E ACCORDING 10 INO ECOL GLUE 1, FAI IfLLh,
TO WHICH THEY BELONG, 1974 II /1
(In percentages)
Level of family income (Bs/month) Non Rela-Level of personal Total Up to 500 501-1000 10]-150o 15071-2000 2001-2500 2501-350o0 3501-45oo 4501 & OVe tives
income os o%of < of ' of T T -T7f % of % of % of % of %of of %of sof %of %of %of of %of Iof(Bs/month) work- earn- work- earn- work- earn- work- earn- work- earn- work- earn- work- earn- work- earn- work- earn- work- earn-
ers ings ers ings ers ings ers ings ers ings ers ings ers ings ers ings ers ings ers ings
A. GENERAL TOTAL 100.0 100.0 3.1 0.9 13.3 7.6 15.3 11.4i 15.6 13.5 10.8 9.8 16.2 18.2 8.3 11.6 23.6 3.4
Up to 449 13.7 3.2 2.2 0.5 1.9 o.4 1.9 0.4 1.3 0.3 1.1 0.3 0.9 0.2 0.5 0.1 0.2 0.1 3.8 1.o450-550 10.0 4.0 0.9 0.4 1.4 0.6 1.8 0.7 1.6 0.6 0.8 0.3 1.4 0.5 0.4 0.2 0.2 0.1 1. 0.6551-650 8.9 4.5 - - 2.4 1.2 1.4 0.7 1.4 0.7 1.0 0.5 1.1 0.6 0.5 0.3 0.4 0.2 0.7 0.3651-1000 27.5 19.2 - - 7.6 5.4 2.8 1.9 5.2 3.6 3.0 2.1 4.6 3.2 2.1 1.5 1.1 0.8 1.0 0.71001-1500 19.1 20.0 - - - - 7.4 7.7 2.1 2.1 2.8 2.9 3.2 3.4 1.5 1.6 1.8 1.9 0.4 0.)41501-2500 12.2 20.0 - - - - - - 4.1 6.2 2.1 3.8 2.5 4.0 1.6 2.6 1.8 3.1 0.2 0.22501 and over 8.6 29.1 - - - - - - - - - - 2.5 6.2 1.8 5.3 4.3 17.4 " 0.1
B. PRIMARY POPULIATION (Heads of family under 60 years of age)
TOTAL _ 55.4 __ 8.1 38.1 4.1 5.3 9. .5.6
Up to 449 1.1 0.3' 0.6 0.2 0.2 0.1 0.1 "1 0.1 " " l " 't , n -
450-550 1.0 0.4 0.3 0.1 0.4 0.2 0.2 0.1 n n 0.1 " " n551-650 2.1 1.0 - - 1.3 0.6 0.4 0.2 0.2 0.1 0.1 0.1 " -_651-1000 10.4 7.4 - - 5.6 4.0 1.6 1.1 1.6 1.2 0.6 0.4 o.8 o.6 0.2 0.2 n1001-1500 10.6 11.0 - - - - 5.8 6.1 1.6 1.6 1.5 1.6 1.1 1.2 0.3 0.4 0.2 0.21501-2500 8.1 13.2 - - - - - - 3.5 5.2 1.8 3.2 1.6 2.6 0.8 1.4 0.5 0.82501 and over 6.3 22.1 - - - - - - - - - - 2.0 5.0 1.4 4.4 2.9 12.7
C. SECONDARY POPULATION (Remaining relatives)
TOTAL = 141.2 2.1 0.6 5.9 2.8 7.2 4.0 8.7 5.4 6.7 4.5 10.6 b.7 5.5 5.3 6.3 9.8
Up to 449 8.8 2.0 1.5 0.3 1.7 o.4 1.8 0.4 1.2 0.3 1.0 0.2 0.9 0.2 0.5 0.1 0.2 0.1450-550 7.5 3.0 0.6 0.2 1.0 0.4 1.7 0.7 1.5 0.6 0.7 0.3 1.3 0.5 0.4 0.2 0.2 0.1551-650 6.2 3.1 - - 1.1 0.6 1.0 0.5 1.2 0.6 0.9 0.5 1.1 0.6 0.5 0.3 0.4 0.2651-1000 16.0 11.1 - - 2.1 1.4 1.3 0.8 3.5 2.4 2.4 1.7 3.8 2.7 1.9 1.3 1.1 0.81001-1500 8.1 8.5 - - - - 1.5 1.6 0.5 0.5 1.3 1.3 2.1 2.2 1.1 1.2 1.6 1.71501-2500 4.0 6.5 - - - - - - 0.6 1.0 0.2 0.6 0.9 1.4 0.8 1.3 1.4 2.32501 and over 2.2 6.9 - - - - - - - - - _ 0.5 1.2 0.3 1.0 1.4 4.7
/ Only work earnings. The percentages from parts B and C refer to the general total in part A.
t Not significant.

Table 8. 10B: ETROPOLITAN AREA: DISTRIBUTION OF WORKERS AND EARNINGS BY LEVEL OiF PERSONAL INCOME ACCORDING TO PER CAPITA INCOME LEVEL OF
FAMILIES TO WHICH THEY BELONG, 1974 II /1
(In percentages)
Level of Der caPita iJlcome (Ba/month) _ IUon Rela-Level of personal Total Up to 100 101-200 201-300 301-400 401-500 501-700 701-900 901 and over tivbs
income % of % of o I of % of % of xof 7r of % of o% of % of-7-of o-f ioof o T %R o % vf % of -f-o(Bs/month) work- earn- work- earn- work- earn- work- earn- work- earn- work- earn- work- earn- work- earn- work- earn- work- earn-
ers tngs era ings era ings ers ings ers ings ers ings ers ings ers tngs ers ings ers ing3
A. GEM-AL TOTAL 100.0 100.0 ~~ . 1. A.8~ I. 3 10.0 JI.1 A. GENEBALTCA10. 1 003814 12.7 17.4 1.7 13.3 10.9 1 039.6 13.4 14.1 7.5 10.0 7.5 t
Up to 449 13.7 3.2 1.7 0.3 2.4 0.6 2.4 0.6 1.4 0.3 0.9 0.2 0.7 0.2 0.2 " 0.3 " 3.8 1.0450-550 lo. 4.o 0.7 0.3 1.8 0.7 2.2 0.9 1.4 0.6 1.1 0.4 0.9 0.4 0.1 n 0.1 0.1 1.4 0 6551-650 8.9 4.5 0.7 0.3 1.6 .:0.8 2.5 1.3 1.1 o.6 0.7 0.4 1.1 0.5 0.3 0.2 0.2 0.1 0.7 Ci,651-iaoo 27.5 19.2 0.6 0.4 5.0 3.5 5.9 4.1 4.4 3.1 3.1 2.2 3.6 2.5 2.2 1.6 1.5 1.2 1.0 0.71001-1500 19.1 20.0 0.1 0.1 1.7 1.7 3.5 3.6 3.1 3.2 2.3 2.5 3.4 3.6 1.7 1.9 2.7 2.9 0.4 0.41501-2500 12.2 20.0 - - 0.2 0.2 0.8 1.2 1.8 2.8 1.7 2.8 2.6 4.2 1.5 2.4 3.6 6.0 0.1 0.22501 and over 8.6 29.1 - - - - - - 0.2 0.4 0.3 0.9 1.0 2.8 1.3 3.8 5.7 21.0 a 0.1
B. PRIMARY POPULATION (Heads of family under 60 years of age)
TOTAL 39.5 55.4 1.6 0.7 6.6 4.8 6.8 6.1 5.5 6.1 4.2 5.4 4.9 7.2 3.2 5.8 6.? 19.3
Up to 449 1.1 0.3 0.4 0.1 0.3 0.1 0.2 0.1 0.1 n 0.1 n 0.1 n n n n450-550 1.0 0.4 0.2 0.1 0.3 0.1 0.2 0.1 n n 0.1 " 0.1 n - _ _ _551-650 2.1 1.0 0.3 0.2 0.7 0.3 0.5 0.3 0.1 0.1 0.1 0 0.3 0.1 n n n651-1000 10.4 7.4 0.4 0.3 3.6 2.5 2.4 1.8 1.6 1.2 0.9 0.6 0.6 0.5 0.5 0.4 0.2 0.21001-1500 10.6 U1.0 0.1 0.1 1.5 1.5 2.7 2.8 2.0 2.1 1.4 1.6 1.3 1.3 0.6 0.6 0.9 1.01501-2500 8.1 13.2 - - 0.2 0.2 0.7 1.1 1.5 2.4 1.4 2.2 1.7 2.9 0.9 1.6 1.6 2.82501 and over 6.3 22.1 - - - - - - 0.2 0.4 0.3 0.8 0.8 2.3 1.1 3.2 3.9 15.3
C. SEOCNDARY POPITIATTON (R#mvlninW relatives)
TOTAL 53.0 41.2 2.2 0. 6.1 2.7 10.5 6.1 . 2 - -2 74 12.0
Up to 449 8.8 2.0 1.3 0.2 2.1 0.5 2.2 0.5 1.3 0.3 0.8 0.2 0.7 0.2 0.2 " 0.3 "
450-550 7.5 3.0 0.4 0.2 1.5 0.6 2.0 0.8 1.4 0.6 1.o 0.14 0.8 0.3 0.3 0.1 0.1 0.1551-650 6.2 3.1 0.3 0.2 1.0 0.5 2.0 1.0 1.0 0.5 0.6 0.3 0.8 0.1 0.3 0.2 0.2 0.1651-1000 16.0 11.1 0.2 0.1 1.4 0.9 3.4 2.3 2.8 1.9 2.3 1.6 3.0 2.1 1.6 1.2 1.3 1.01001-1500 8.1 8.5 - - 0,.2 0.2 0.8 0.8 1.1 1.1 0.9 1.0 2.2 2.2 1.2 1.2 1.8 1.91501-2500 4.0 6.5 - - - - 0.1 0.1 0.3 0.4 0.4 o.6 0.8 1.3 0.5 0.9 1.9 3f22501 and over 2.2 6.9 - - - - - - a we 0.1 0.2 0.4 0.2 0.6 1.8 5.7
L Only work earnings. The percentages from parts B and C refer to thi general total in part A.
Not significant.

TaLbl. 8.1 ;A MTflOPOLITANl A811 DISTRIBUTION1 OF 9081183 BY LEIL. OF PE8SGI6L INCOME ACCONIN81 TO THlE INCOME L1V11. 09W THE 1A1LU8 TO 09208 T SUSNLUI 1974 15 LI
Tot.1 LoveI of F..11V Ino"m. (39/"Mth)1,0,01 00~~~~~~~~~U to 500 501-1000 1001-1500 1501-2000 2001-2500 250t-3500 3501.4500 4501 end ov,r
Of I =Ir A-.o.t Avg. Bosher Asmoot Avg. Ranker Asgm..t Avg. lN-bar Anoant Ang. WeV A-.to Avg. lkbeet Asm.t Ang. 90.6er As6.t Avg. lb-.hr Amec Avg. P.ber A-oot Avg. Nnbor A-oIt Avg.P., el o f m. e.- f o Cm- 1&... o of Cm- Zeoo- of of Cms- beru- of of Cms- Zero, of of Co.- gRo- of of Cos,- 140r.- of of Co.- ar..- of of Cm- Er."- of of Co.- tar.-
.n= Work.r. ..ont.- "ing S ar.pen.- logo W.offor. pence- iogs Worker. p.sas- ogo Workers penSa. inmp Workers p0.ne- loge Workers p in. sg 'dOo'kre, Pease- togs WorkA." p n.. - L-g. Wrkn. p.... - iog.(50/soolA) tio. (as) tim (86) tio. (S.) tion (B.) tion (855 tLon (B-) tIm (851 tis (Is) lion (I-) tion (9-)
('000 of ('000 of ('5000 of ('000 of ('000 of ('000 of ('000 of ('00 of ('000 of (000 ofgo) me) Be) B.) as) as) 6-) Be) DO) DO)
CINgOALTO16L 810.111. 481.1965 .22 2.97 8 33M 2 107 4.950 690) 2.123 112.434 &5126.4 3 1.046 *LJ9 6.670 1 150 84 178.8161 1,6 67.450 113.6 1 J..± 00.129 231.597 2.890 600 31S4
uIp to449 111.225 31.889 286 17.574 4,775 271 15.123 3,997 264 15.419 4,092 265 10,609 3.065 288 6,800 2.451 279 7,179 2.140 39 4.050 1.205 298 2.016 ss9 267 30,475 9,618 315
450.530 80,663 39,311 487 7.404 3,529 478 11.376 5,615 493 14,981 7.505 487 12.702 6.160 484 6.530 3.202 480 11.054 53.76 486 3,073 1.409 484 1.893 730 491 11,650 2.704 489551-410 72,422 44,220 610 -- - - 19.651 12.011 611 11,190 6.796 607 11.234 6.901 6t4 8,400 3.119 609 9,279 5.687 612 4.147 2,514 604 3.048 1.874 614 5,473 3.319 4(11651-1000 222.603 188.729 847 -- - - 61,800 52.942 856 22.930 18.715 816 41.726 3.540 845 24.800 20,486 855 57,284 51,714 851 17.236 14,677 051 9.230 8.181 886 8.409 6.864 911,1001-
1500 154.658 195.996 1.267 59 - - 60-3. 75.526 1.267 16,&v9 20.196 1.199 21.620 28.343 1,261 25,841 33.431 1,293 12.057 15,505 1.285 14.3322 18.580 1.296 3.366 4,216 1.2521501-
2500 99,265 196.184 1,976 - . - - - - - - - 33.335 60,873 1.826 18.847 36.052 2.107 20.163 39,514 1.959 12,715 25,978 2.043 14.961 30.527 2.010 1.244 2.441 1.91.42501 and
over 69.276 285.636 4.123 -- - - - - - - - - - . - . 20.084 60.990 3,040 14,190 59,296 3.685 34.649 170.966 4,934 373 L.375 3.685
P12861 PC9OITIUM (Needs of fondly .. der 60 yreer of -g.)
TOrAL 32000 344IJ .179 0 791 271 362 60.263 6720 6551B 7227 7.1 40, 0J~ 9 4 203 2140 1223.3 9715268 4a.5
449 9.126 2.806 307 5,143 1.370 305 1.647 314 313 978 275 le1 579 175 in8 194 152 391 289 102 351 98 07 172 - - -450-550 8.159 4.047 494 2,448 1.100 482 3.057 1.329 300 1.487 743 501 184 92 476 493 249 505 384 203 428 -- - -96 48 Soo551-650 16,428 10.063 612 -- - . 10,469 6,423 613 3,143 1,919 810 1.273 787 618 1.157 698 404 192 120 622 -- . - 194 116 600631-1000 84.463 72.682 860 -. - . 45,110 )8.604 860 12.565 10.478 833 13.235 11.583 873 4,735 4.107 884 6.494 5.658 871 1,938 1, 66 860 386 323 0381001-
1300 85.588 108.383 1,2686 - - - - - - 47.347 29,810 1.263 L2.719 15.223 1,196 12.087 15,470 1.279 9.050 12,145 L.336 2.708 3.521 9.300 1.639 23.51 1.3511501-2300 65.269 129. 642 1,988 6- - - - - - - - 28,114 5.126 1.823 1t6,353 31.570 2.185 12.784 21.005 2.018 6.552 12.382 2.106 2.663 7.811 2.132
2301 sodov. 50.967 216,554 4,248-- - - . . - - - - - - - 16,069 " .994 'S.068 11.389 42,806 3.754 15.509 124.756 5,50b
OgCONOAgY POSIItATI09 (8Immettg reItel-.)
TOTAL 429 124 604.247 942 17.387 319 47 ~667 jL27. 572 3927J LU~IU l LL M~ L *aljM *LJi 1.003 44A 96 2.6 UM 50.4 9632 1952
Up to449 71,624 19,463 271 12.431 3,205 257 13,476 3.483 258 14,4.43 3.817 264 10.030 2.892 288 8.406 2,303 274 6.590 2.039 295 3.934 1,187 301 2.016 539 267
450-550 60.886 29.550 ASS 4.956 2,349 473 8,319 4.085 491 13.4946,5.60 686 12,906 6.068 "S5 6.037 2.953 489 10.670 5,17 684 3.575 1,499 484 1.797 882 490551-650 50,321 30.838 4510 - -- 9,182 5,189 009 9,047 4,877 606 9,981 6.114 613 7,243 4,419 610 9.097 S.567 611 4.147 2,514 606 2.638 1.759 615651-1000 129,731 109,103 841 -- 16,690 14.137 847 10.365 8.238 794 26,491 23,577 827 19.273 16.309 846 30.770 26.055 846 15,298 13.009 050 8.94" ?.88 a881001-1500 65,704 83,395 1,269 -- - - 12,256 15,715 1,282 4,120 6,972 1.206 10.533 13,073 t.241 16,755 21,286 1.270 9,349 11.984 1.281 12,693 16.366 1,289
I501-2500 32,572 64,102 1.957…- - - - - - ,221 9.597 1.858 2.492 5.682 2.199 7.379 13.709 1,857 6,362 12,$96 1,979 11.298 22.71S 2,010
2501 endonr 17,936 67,707 3,774…- - - - - - - - - - - 3.995 12.004 3.005 2.80t 9,690 3.988 11.140 £6,215 4.148
LI, Jab eanleg only.
Soores: Speolel tabulltons, for rhe L.iaci for tk.n 111 nwe,.s.ld Ho.oy of the Ibtrpolicso Are (oot de Mop.r.. del Aree I6.trepolltsee. 0,G,1. y C.8.).

Table 8.211- METROPOLITAN AISA' DISTISUTO9 OF 6008158 BY LEV9tL OF P250561 I6C(UM ACCORDIN TO TR1 LEVEL1 OF PER CAPITA 13z136 OF THE0 FAMILIES1 TO WHIC T9L h5LON 1974 II
Tout1 l...0 of Par CapIta 1,0.o.. fawlsoothS Io1o.io
14.eI up to 100 1-00201-_300 301 -409 401-20 0190 700.0 01c4erof W,b-r Aso,.t A.S. 74n00r A-t.. An.. gwab.r Aorni An. H.".r. Saa.t A.S. -.2.r Aftort Ang. Nsa.4. .rr Aerft A. :::, Aao-rt An. obr0or 0. I4..M-. A.- -A"r .ot A' *.4.6.. Lo.t Ao..
persooAI of of Co.- Ker- of ' Co- As,- fO f Co.- Ke- of of Co.- Kerr of of Co.- Rare- of f0 Co- Ear- . of Co. E.- .f '.1 Co.- oR.- of of Cm.- Eso'- 'If ..0 Co.- Ko.
Ircf Workers pose&- logs Io.rk.r. P...o.- 1log0 Works'. P-.*.- 1oga Work.rs pmo.- i.ag Wforkr. p-fl- 1.8. Work.r p-e08- top. Workers p..... I o. SeCto- p ... a- Iag be. ur.. p.o..s- I.. Worke. pos0- Ea.go
(ke./aimth) itO. (A.) t1.0 (511 tito (8.) t105 (CB. El" (5.) tim (5.) tOo. (In) tOo. (5.) rio. (5) 01.0 (ao
('000 of ('000 of ('000 of ('000 of ('000 of ('000 of ('000 of ('000 of ('000 of ('000 ol
8.) ma) 5.5 S*) 5.) 5)so) 5. -) c
CI1ISAL103 50114 n 1.212 LI ~4M 461 MAUSz U6AW 7 140. 763 107.9la 04m 007.4 93 ILm &am Lm.U "Lin amu a a~m .Uz M L3 uij6 au La -Lm aI w
Up to449) 111.225 31.868 284 13,713 3.175 231 19.256 5,677 894 k9,669 5.757 291 11.027 5.160 288 7.238 2.044 281 8,063 1,680 276 1,500 322 214 2.080 605 195 26,475 9.408 3US
450-51o080.463 39.311 487 5.496 1,496 490 14.701 7,119 484 17,454 .499 486 11.281 5.472 485 9.071 4.300 484 1.509 .1615 496 2.511 7.225 696 1.151 583 493 11.430 3.709 "S9
3314650 72,422 44.1I0 610 5.528 53533 606 13.057 7.945 410 30.545 12.55 409 5M.914 S.487 611 3.784 5.549 413 5.027 53,56 510 2,9 1.5 89I. 612 (.496 0.040 6i5 1.473 7.319 006431.1000 222.4491518.729 547 5.230 4.087 781 60.806 54,275 S40 47.631 39.881 836 33.591 30.162 847 253.27 121120 5S" 29,505 54,719 543 17.612 13.251 665 12.474 11.347 Oil 9.409 4.546 5161091.1500 154.658 I93.996 1,247 76 674 1.136 13.705 16.339 1.192 59.721 35.642 1.241 25.155 31.488 1.231 19.002 24,993 1.535 27.943 55.163 1.235 16,149j 18.491 1.303 21.828 28.770 1,315 31.546 4.210 7,3
1501-2500 9, 265 194.144 1.976---- -. 1.251 2.124 1.697 6.345 12.144 10,55 14,589 27.683 1,883 14.150 27.744 (.962 20. 740 4t.046 1.977 77.9ff 23.964 2.0W 28,526 9. 258 2.05S 0. 24 2.441 1,4(of
2501 and500 69.276 285.434 4.123-- . - 1,549 3,974 1,947 2.790 9.215 3.502 5.095 27.091 3.341 10.415 57,030 3.626 46.240 206.208 4,459) 37373 .75 ,483
P1109* 106V2ArTTU (Af44.0 of "l o.d.r 60 years of ago)
Up to449 9.024 2.1 507 3. 483 967 277 2.332 750 512 1.749 39S 340 474 234 349 587 154 513 192 53 275 107 43 40kw -
430.550 5.159 4.067 494 2.064 1.012 495 2.672 1.309 489 1.380 069 50 9 43 450 877 438 498 1,090 349 Sol -- - - - -
551-450 16,438 10.063 412 2.0 1 703 406 5,539 ".9 613 4.514 1767 415 5003 5SW 622 580 548 00 2.042 1.26 614 107 44 02 194 116 400651-1000 54,443 72.8528 s I4 344 2,729 757 29.392 2.11000 530 19.753 i17.207 5D" 514 150 7 7.194 6.2644 7 .4 .5 6 . .7 7 ,7 .5 2
1000 $55,8 105.35 1.244 749 574 1,134 12.134 14,408 1.187 22,102 27.401 1.148 14.515 50,891 1.264 11.J50 15.425 1,358 10.423 13.082 1.255 4.756 6.335 1.331 7,547 8.748 0.3231201-250 65.299 MAU6 1.0.64…1.251 3.123 I.997 5.791 10.742 1.658 12.562 23.128 1.8619 11.011 I1.%?7 1,995 14.175 28,394 2,002 7,657 15.541 2,029 13.149 27.476 2.010
2501 m ~ 30,947 216.334 4,248…0 - - - - 1.231 3.481 2.942 2,500 5,191 3.276 6.741 22.691 3.566 6.671 51.540 3.659 50.304 130,620 6.729
u 1 POA120 m0.fnsl relatives)
' _ *UWA 04L EL LUL As= IL lUl YAL alLU LULUllM AS MM LMAR ZM hUM MAJL SU AM hUM MA LAA lU l 1.0 Pum 11L91t jeup to449 71,48 1M.46 27! 10,1228 1,506 215 16.528 4.947 2902 IS,J00 5.193 254 10.353 X.944 286 6,671 10,63 279 5.875 1.427 277 1. 313 280 200 7.080 403 113
450.33 40.434 "9.S3 48I35.432 1.4482 J47 12.029 5.810 "I2 16.074 74003 485 11.163 5.428 48S 5.19 5,940 485 6,219 3,047 493 2.518 1.225 484 1.191 593 492
555465e scsn2 50.65 610 2.715 1,450 606 7,409 4,671 404 14.031 9.72 we6 4,111 4,987 614 5.266 5.200 614 6.745 4,119 408 2,489 1.323 412 1 I502 924 614
631.100 129,752 109,183 41I 1.762 1.353 770 11.414 9.277 412 27.568 22.675 803 22.449 18.642 631 1,1.333 15.454 5S" 24.063 20,244 542 13.163 11.5719 8KA 00.699 9.7,19 g0?
1001-1353 65,704 53.395 1.209-1.34 1.931 1,250 6.619 8,M4 1.217 6,640 10.596 0.226 7,482 9.5S" 1.278 17,352 27,041 1.260 9,605 12.06 1.291 14.461 19.001 1.913
1301-236 32.752 44,102 t,957…74- - ?4 0,404 1,558 2,347 4.355 1.855 3,139 5,797 1,5044 4.543 12,411 1.911 4.262 9,423 1,976 05,677 21.512 2,010
2301 miee 17.936 67.707 3.774…SO9 295 5,010 290 1.024 3.52, 1.355 4.368 3.215 1,754 6.245 3,559 14,437 55.770 3,S43

Table 8.12A: METROPOLITAN AREA: RELATIVE EARNINrS OF WORKERS BY LEVEL OF PERSONAL INCOME AND POSITION IN THE FAMILY
ACCORDING TO INCOME LEVEL OF FAMILIES TO WHICH THEY BELONG, 1974 II L1(Index: Average earnings of working population - 100)
Level of personal Total Level of familr income (Ba/month) Non Rela-income (Bs/month) and Up to 501- 1001- 1501- 2001- 2501- 3501- 4501 and tives
position in the 500 1000 1500 2000 2500 3500 4500 overfamily
TOTAL WORKERS 100 27 IL 1 L6 Li I13 139 238la
llp to 4L9 2h 22 22 22 24 23 25 25 22 26450-550 40 39 41 40 40 40 40 40 1 40551-650 50 - 50 50 51 50 51 50 51 50651-1000 70 - 71 67 69 70 70 70 73 671001-1500 105 - - 105 99 104 107 107 107 1031501-2500 163 - - - 151 180 162 169 168 1622501 and over 340 - - - - - 251 30L Ls0
7304
B. PRIMARY POPUIATION (Heads of fanny under 60 years of age)
TOTAL 140 LO 22 116 129 169 225 376
Up to 449 25 25 26 23 25 32 29 14 -450-550 h1 40 41 41 39 42 4 - 41551-650 51 - 51 50 51 50 51 - 49651-1000 71 - 71 69 72 73 72 71 691001-1500 104 - _ 104 99 106 110 107 1111501-2500 164 - - 150 180 166 174 1762501 and over 350 - - - 251 310 438
C. SECONDARY POPULATIOC (Remaining relativ-e)
TaYAL 78 26 L 62 68 1 5?7
Up to 449 22 21 21 22 24 23 24 25 22450-550 40 39 41 40 40 40 40 40 40551-650 50 - 50 50 51 50 51 50 51651-1000 69 - 70 66 68 70 70 70 731001-1500 105 - - 106 100 102 105 106 1061501-2500 161 - - - 152 181 153 163 1662501 and over 311 - - - - - 248 280 342
/1 Only job earnings.
Source: Table

Table 8.12B: MENROPOLITA.N AREA: RELATIVE EARBhT'GS OF WORKERS BY LEVEL OF PER CAPITA INCOME OF FAMILIES
TO WHICH THEY BEWING, 1974 II /
(Index: Average earnings of working population - 100)
Level of personal Total Level of per caoita income (Bs/month) Non Rela-income (Bs/month) and Up to 901 and tives
position in the 100 101-200 201-300 301-400 401-500 501-700 701-900 overfamily
'TYrAL WORKERS 100 38 59 67 82 3106 13h 222
Up to U9 2h 19 2h 24 2h 23 23 18 16 26450-550 40 LO h0 ho hO 4o 41 4o h1 hO551-650 5o 50 50 50 51 51 50 50 51 So651-1000 70 6h 69 69 70 71 70 71 75 671001-1500 105 91 98 102 103 109 lo 108 109 1031501-2500 163 - 1140 153 155 162 163 166 170 1622501 and over 340 _- - 243 272 276 299 368 305
B. PRIMARY POPULATION (Heads of family under 60 years of age)
TOTAL 110 L8 73 89 111 127 1h6 184 2BB
Tip to )1,!9 25 23 26 28 29 26 23 33 -
1450-550 hi L1 Lo L2 37 41 42 - -
551-650 51 50 51 51 51 50 51 50 L9651-1000 71 65 70 72 72 72 70 72 771000-1500 104 9h 98 103 104 110 104 110 1091501-2500 164 - 140 153 156 165 165 167 17112501 and over 350 - - - 243 270 277 300 390
. SECONDARY POPULATION (Remaining relatives)
TOTAL 78 31 hL I 62 69 B2 97 162
Up to 449 22 18 24 2h 23 23 23 17 16h50-550 ho ho LO 4o hO hO 41 40 h1551-650 50 50 50 50 51 51 50 51 51651-1000 69 61 67 67 69 71 70 71 751001-1500 105 - 102 100 101 106 104 107 1081501-2500 151. - 152 153 152 158 163 1662501 and over 311 - - - 248 291 266 294 319
/ Only job earnings.

Table 6.53: METROPOLITAN AREA: DlSTRIBUTIOB OF WORKERS 8Y CATEGORY OF OCCUPATION AND POSITION IN THE FAIMII.Y ACCORI3NCb TO LEVEL OF PERSONAL 18NC1)8. 1974 11 Ii
T.t.1 n.~~~~~~~~~~~~~~~~~~~~eelo eroa neeL (88/m..nEt)Ut to 449 1.10.55950 9,50-5000 190150901-2500So-zo 2501 -ndoe
Number Aount Avg. Number Ao.nnt Avg. Number Amount Avg. ober A55 nt A_ g. uM5be- 0-ont Avg. Number Amont Av. unr A nt Avg. N-ber A mont Avg.Category of oCcupation and of of Com- Earn- of of Con- Earn- of of Co- Earn- of of Cot- Earn- of of Con- E-rn- of of Com- Earn- of of Con- Earn- ,f of Com- tarn-pOsitito in the fanily Workers pn.ea- tigS Workre- pen-e- in&e Workers pen.a- ita. Worur- pe-s inFg W-orker- pnea.- iKs- Worker- pen. - 1mg. Workere pence- i.t.S W-rk-rr p-ron -,gu
tion (Be) tnon (t3) ion (Bs) Cien (8.) tinn (Be) tlion (.) tlion (B-) tIf.i (Sn)('000 nf ('000 nf ( 000 of (°000 of ('000 nf ('050 of ('000 of ('000 of
8-) B-) B.) 84) W.) BR) e-) Os)
TOTAL W0ORKERS 81014 98 1.965 1. 212 .. AZ25 31.A 86 860.665 39.11 III72, 422 44 220 610 222,603 188I729 847 154.658 195 996 1,267 99.265 196,185 1,976 69,27t 2B536 3
Private eployees andJtaoorer 463,067 469,669 1,014 71,308 22,747 319 68,484 33,227 485 52,710 32,121 609 129.385 108,285 836 76.435 96.220 1,258 40,855 80,585 1,972 23 990 96,483 4,0138
Puhbli airptoy..e andlaborers 178,872 264,480 1.428 4,525 1,474 325 5,984 2,973 497 10,412 6,344 609 57,894 49,776 859 50,213 62.446 1,243 28.409 55,254 i,944 21,435 80.212 ,022
Petro-on and Amplnye 56,453 98,988 2,715 318 84 264 193 92 475 275 165 600 4,644 4,275 920 5,870 8,164 1,390 10,829 22,125 2,043 14,324 64,084 4,473St2f-onplnyed -orkers 122,132 148,828 1,218 25,484 7,582 297 6,004 3,019 503 9,025 5,590 619 30,680 26,392 860 22.140 29,167 1,317 19,172 38,221 1.993 9,627 38,957 4.0)36Unpeid f.nIly help 9,590 -- -. 9.590 -- - --
PRIMARY P0OPULATION 2 320,000 544,179 1 9,126 2806 307 8,159 4,047 696 16.428 I^v,b 3 6U 8663 72,682 860 B.588 1.315 1.266 65.269 1.9S6 0267 21962b5
frinete emrllots andImb-rer. 152,284 228,531 1,500 3,326 994 298 5,045 2,493 494 10,325 6,317 611 45,768 38,925 850 43,759 54,841 1,253 26,450 52,065 11,q6 173,31 72,895 4,114
PobIic enplnyees andIsborers 74,221 134,900 1,817 587 165 281 1,381 690 500 2,921 1.787 611 18,804 26.385 871 21,646 26.735 1,235 14,161 27,940 1.971 14,721 61.98 4,157Petro-os end enplpyers 26,418 78,369 2,966 -- -- -- 9b 48 500 Si 58 600 1,945 1.791 921 4,134 5,850 1,415 8,857 18,151 2,04q 11,299 52,470 4,b47
SelI-e_ployed yorkers 66,980 102,379 1,528 5,116 1,646 321 1,637 817 499 3,085 1,901 616 17,966 15,580 867 16,049 20,959 1,305 15.801 31,485 1,Q92 7,320 29,991 4,093O.npold family h.lp 97 -- -- 97 -- -- -- - - -- -- - -- - - -- - --
SECOAiDRY pOpULATIO 13 29.124 404,247 942 71.624 19.463 271 .856 9.55 86 , 30.38 610 129.731 109.183 841 65.704 83.395 1.269 32.752 61 17.95 67,717 J 774
Private employes endlIborars 255,629 213,236 834 38,784 12,437 320 51,789 25,028 483 37.019 22.550 609 77,292 64,295 831 31,034 39,273 1,265 13,728 27,101 1,924 5,983 22,553 2.769
PublIc employees endlaborers 101,490 126,113 1,242 3,650 1,199 328 4,603 2,283 496 7,491 4,557 608 38,112 32,564 854 27,142 34,009 1,252 13,278 26,486 1.922 6,714 25,014 1.725
POtron-s end .eploycr 9,831 20,119 2,046 318 84 264 97 44 450 178 107 600 2,699 2,464 920 1,629 2.153 1.321 1.972 3,973 2.014 2,938 11,274 3.837SeIf-neployrd eorktr. 52,977 44,779 845 19,675 5,743 291 4,367 2,203 30 5,833 3,624 621 11.628 9,840 846 9,899 7.960 1,349 3,274 6,342 1,998 2,301 8,867 3,f53Ounpeld faily help 9,97 ._ -- 9,197 -- -- - - - -. - -- -- - - - -. -- -
W-g.RELATIV8s 60,690 33.539 549 30,475 9,618 315 11.650 5.706 5.473 9 6 9,409 6.864 3.36b 4 1,252 1,244 2.4 1 ,96, 373 1 375 3.6MS
Privati m"ployee" endleborer. 55,154 27,902 505 29,108 9,316 319 11,650 5.706 490 5,366 3,234 606 6,345 5,065 798 1,642 2,106 1,282 677 1,419 2.095 276 1.535 3,751
Pubtin neploy.n. andloburera 3,161 3,468 1,097 288 110 382 -- . -- ._ -_ 978 827 845 1,425 1,702 1,194 470 828 1.761 -. - -P8tronoe end employer 204 500 2,450 -~ -- -- - -- -- .- 107 161 1,500 -- -- -- 97 340 5.51)0
SoIf-emptnynd aortae. 2,175 1.669 767 693 192 277 -_ __ -, 107 64 600 1,086 972 894 192 247 1,287 97 194 2,000 -- --UnpaId fte,tly help . 296 -. __ 296 .. .- - -- -- -- -- -- -- -- -- -- -- .- -- -- .- -_
L Job earninge only.
2 Heads of family emder 60 yeere of age.
/3 Remain.nig T8l*tive.
Sogrce: Speetal tabeletione for tbe mis-ion of the XII HN--ehOld 8-rvey of the Hetropeliten Are. (XII En.cesta do H.geres del A,.& N-tropOlitiEn. D.C.E. y C.N.).

Table 8.14A: METROPOLITAN AREA: DISTRIBUTION OF WORKERS BY CATEGORY OF OCCUPATION AhND POSITION IN THE FAIMILY
ACCORDING TO LEVEL OF PERSONAL INCOME, 1974 II 'I
(In percentages)
Category of occupation and Total Level of personal income (Bs/month)position in the family Up to 450- 551- 651- 1001- 1501- 2501 and
449 550 650 1000 1500 2500 over
TOTAL WORKERS 100.0 13.7 10.0 8.9 27.5 19.1 12.3 8.5
Private employees andlaborers 100.0 15.4 14.8 11.4 27.9 16.5 8.9 5.2
Public employees andlaborers 100.0 2.5 3.3 5.8 32.4 28.1 15.9 12.0
Patronos and employers 100.0 0.9 0.5 0.8 12.7 16.1 29.7 39.3
Self-employed workers 100.0 20.9 4.9 7.4 25.1 18.1 15.7 7.9Family help notcompensated 100.0 100.0 - - - - - -
PRIMARY POPULATIONL2
100.0 2.9 2.5 5.1 26.4 26.7 20.4 15.9
Private employees andlaborers 100.0 2.2 3.3 6.8 30.0 28.7 17.4 11.6Public employees andlaborers 100.0 0.8 1.9 3.9 25.3 29.2 19.1 19.8Patronos and employers 100.0 - 0.4 0.4 7.4 15.6 33.5 42.7Self-employed workers 100.0 7.6 2.4 4.6 26.8 24.0 23.6 10.9Family help notcompensated 100.0 100.0 - - - - - -
SECONDARY POPULATIONM 100.0 16.7 14.2 11.8 30.2 15.3 7.6 4.2
Private employees andlaborers 100.0 15.2 20.3 14.5 30.2 12.1 5.4 2.3
Public employees andlaborers 100.0 3.6 4.5 7.4 37.6 26.7 13.6 6.6
Patronos and employers 100.0 3.2 1.0 1.8 27.5 16.6 20.1 30.0Self-employed workers 100.0 37.1 8.2 11.0 21.9 11.1 6.2 4.3Family help notcompensated 100.0 100.0 - - - - - -
NON-RELATIVES 100.0 50.0 19.1 9.0 13.8 5.5 2.0 0.6
Private employees andlaborers 100.0 52.9 21.1 9.7 11.5 3.0 1.2 0.5Public employees andlaborers 100.0 9.1 - - 30.9 45.1 14.9 -Patronos and employers 100.0 - - - - 52.5 - 47.5Self-employed workers 100.0 31.9 - 4.9 49.9 8.9 4.5 -Family help notcompensated 100.0 100.0 - - - - - -
!I Only job earnings.
/2 Heads of family under 60 years of age.
i3 Remaining relatives.

laDle d.146: METROPOLITAN AREA: DISTRIBUTION OF WORKERS BY CATEGORY OF OCCUPATION AND POSITION IN LE FANILY,
ACCORDING TO LEVEL OF PERSONAL INCOME, 1974 II /1
(In percentages)
Category of occupation and Total Level of personal income (Bs/month)position in the family Up to 450- 551- 651- 1001- 1501- 2501 and
449 550 650 1000 1500 2500 over
TOTAL WORKERS 100.0 100.0 100.0 100.0 100.0 100.0 100.0 100.0
Private employees andlaborers 57.2 64.1 84.9 72.8 58.1 49.4 41.2 34.5
Public employees andlaborers 22.1 4.1 7.4 14.4 26.0 32.5 28.6 30.9
Patronos and employers 4.5 0.3 0.2 0.4 2.1 3.8 10.9 20.7Self-employed workers 15.1 22.9 7.4 12.5 13.8 14.3 19.3 13.9Family help notcompensated 1.2 8.6 - - - - - -
PRIMARY POPULATION"2 100.0 100.0 100.0 100.0 100.0 100.0 100.0 100.0
Private employees andlaborers 47.6 36.4 61.8 62.9 54.2 51.1 40.5 34.6
Public employees andlaborers 23.2 6.4 16.9 17.8 22.3 25.3 21.7 28.9
Patronos and employers 8.3 - 1.2 0.6 2.3 4.8 13.6 22.1Self-employed workers 20.9 56.1 20.1 18.8 21.3 18.8 24.2 14.4Family help notcompensated 20.9 1.1 - - - - - -
SECONDARY POPULATION/L3 100.0 100.0 100.0 100.0 100.0 100.0 100.0 100.0
Private employees andlaborers 59.6 54.1 85.1 73.3 59.5 47.2 41.9 33.4
Public employees andlaborers 23.7 5.1 7.6 14.8 29.4 41.3 42.1 37.4
Patronos and employers 2.3 0.4 0.2 0.4 2.1 2.5 6.0 16.4Self-employed workers 12.3 27.5 7.2 11.5 9.0 9.0 10.0 12.8Family help notcompensated 2.1 12.8 - - - - - -
NON-RELATIVES 100.0 100.0 100.0 100.0 100.0 100.0 100.0
Private employees andlaborers 90.4 95.8 100.0 98.0 75.5 48.8 54.4 74.0Public employees andlaborers 5.2 0.9 - - 11.6 42.3 37.8 -Patronos and employers 0.3 - - - - 3.2 - 26.0Self-employed workers 3.6 2.3 - 2.0 12.9 5.7 7.8 -Family help notcompensated 0.5 1.0 - - - - - -
/I Only job earnings.
/2 Heads of family under 60 years of age.
/3 Remaining relatives.

Table 8.15: METROPOLITAN AREA: RELATIVE EARNINGS OF WORKERS BY CATEGORY OF OCCUPATIO,- AND POSITION TN THE FAMILY,
ACCORDING TO LEVEL OF PERSONAL INCOME, 1974 II /1
(Index: Average earnings of working population - 100)
Category of occupation and Total Level of personal income (Bs/month)position in the family Up to 450- 551- 651- 1001- 1501- 2501 and
449 550 650 1000 1500 2500 over
TOTAL WORKERS 100 24 40 50 70 105 163 340
Private employees andlaborers 84 26 40 50 69 104 163 333Public employees and
laborers 122 27 41 50 71 103 160 332Patronos and employers 224 22 39 50 76 115 169 369Self-employed workers 100 25 72 51 71 109 164 333
PRIMARY POPULATION 140 25 41 50 71 104 164 350
Private employees andlaborers 124 25 41 50 70 103 162 341
Public employees andlaborers 150 23 41 50 72 102 163 343
Patronos and employers 245 - 41 50 76 117 169 383
Self-employed workers 126 26 41 51 72 108 164 338
SECONDARY POPULATION- 78 22 40 50 69 105 161 311
Private employees andlaborers 69 26 40 50 69 104 163 311
Public employees andlaborers 102 27 41 50 70 103 159 307
Patronos and employers 169 22 37 50 76 109 166 317Self-employed workers 70 24 42 51 70 111 165 318
NON-RELATIVES 45 16 40 50 67 103 162 304
Private employees andlaborers 42 26 40 50 66 106 173 309
Public employees andlaborers 91 32 - - 70 99 145 -
Patronos and employers 202 - - - - 124 - 289Self-employed workers 63 23 - 50 74 106 165 -
LI Only job earnings.
/2 Heads of family under 60 years of age.
/3 Remaining relatives.

Table 8.16: METROPOLITAN AREA: SIZE OF THE FAMILIES, ACTIVE AND INACTIVE POPULATIONS AND EMPLOYMENT SITUATION BY LEVEL OF
TOTAL FAMILY INCOME, 1974 ll 1i
Level of total family income (Bs/month)
Indicators Total Up to 501- 1001- 1501- 2001- 2501- 3501- 4501 and100 1000 1500 2000 2500 3500 4500 over
a. Total population 2,288,289 189,059 424,951 417,106 365,052 222,431 321,466 156,967 191,257
b. Population of 15 yearsand older 1,429,657 116,449 225,459 235,495 230,588 148,990 223,957 114,600 134,119
c. Population under 15 yearsof age 858,642 72,610 199,492 181,611 134,464 73,441 97,509 42,367 57,138
d. Active population 801,400 38,315 118,258 133,032 129,573 90,933 136,418 70,172 81,699
e. Employed population 749,124 24,978 107,950 124,123 126,445 87,205 130,844 67,450 80,129
f. Number of households 471,787 53,156 91,486 86,861 73,231 42,018 60,137 28,236 36,662
g. Average size of households 4.85 3.56 4.64 4.80 4.98 5.29 5.35 5.56 5.22
(Number of persons per household)
h. Population of 15 years as a
percent of the total population 62.5 61.6 53.0 56.5 63.2 67.0 69.7 73.0 70.1
i. Active population as a percentof total population 35.0 20.3 27.8 31.9 35.5 40.9 42.4 44.7 42.7
i. Employed population as a percentof total population 32.7 13.2 25.4 29.7 34.6 39.2 40.7 42.9 41.9
k. Active population as a percent ofpopulation of 15 years and older(Participation Rate) 56.0 32.9 52.5 56.5 57.5 61.0 60.9 61.2 60.9
1. Dependency Ratio. Percentage ofthe population which depends onthe employed population. Alsomay be calculated as: 1 - J. 67.3 86.8 74.6 70.3 65.4 60.8 59.3 57.1 58.1
L1 Excludes non-relatives. This exclusion is reflected in the totals of (a), (b). (c), (d) and (e), for which reason they do not coincide with
the totals in the other tables.

Table 8.1I: MFTROPOLITAN AREA: SIZE OF THE FAMILIES, ACTIVE AND INACTIVE POPULATIONS AND EMPLOYMENT SITUATION BY TRVEL OF
eER CAPITA INCOME, 1974 II /1
Level of per capita income (Bs/month)Indicators Total Up to 101- 201- 301- 401- 501- 701- 901 and
100 200 300 400 500 700 900 over
a. Total population 2,288,289 283,272 474,891 444,444 305,053 204,559 233,905 125,229 216,936
b. Population of 15 years andolder 1,429,657 146,405 234,539 267,774 198,745 451,123 173,581 96,247 167,243
c. Population under 15 years ofage 858,642 136,867 240,352 176,670 106,308 59,436 60,324 28,982 49,693
d. Active population 801,400 47,093 115,221 150,348 113,999 85,904 110,874 62,053 115,608
e. Employed population 749,124 30,736 102,778 140,765 107,906 83,588 108,286 60,739 114,326
f. Number of households 471,787 55,410 74,177 76,369 59,791 45,849 55,832 33,506 70,853
g. Average size of households(Number of persons per household) 4.85 5.11 6.40 5.82 5.10 4.46 4.19 3.74 3.06
h. Population of 15 years as apercent of the total population 62.5 51.7 49.4 60.3 65.2 70.9 74.2 76.9 77.1
i. Active population as a percentof total population 35.0 16.6 24.3 33.8 37.4 42.0 47.4 49.6 53.3
J. Employed population as a percentof total population 32.7 10.9 21.6 31.7 35.4 40.9 46.3 48.5 52.7
k. Active population as a percent ofpopulation of 15 years and older(Participation Rate) 56.0 32.1 49.2 56.1 57.4 59.2 63.9 64.5 69.1
1. Dependency Ratio. Percentage ofthe population which depends onthe employed population. Alsomay be calculated as: 1 - j 67.3 89.1 78.4 68.3 64.6 59.1 53.7 51.5 47.3
a Excludes non-relatives. This exclusion is reflected in the totals of (a), (b), (c), (d) and (e),for which reason they do not coincide withthe totals in the other tables.


APPENDIX II
EVALUATION OF THE STATISTICS ON THE EMPLOYMENT SITUTATION
1. The mission's terms of reference included not only evaluating theactual situation with respect to employment, but also reviewing the toolsfor this evaluation -- the statistics on employment, manpower and relatedsubjects -- and making recommendations for their improvement. Accordingly,the members of the mission examined the statistics in the course of analy-zing the employment situation, and also spent some time with the technicalstaffs of the agencies producing the statistics in order to avail themselvesof the judgment, experience and expert knowledge of the statisticians closestto the data. The issue of reliability of statistics was especially acutebecause publication of the results of the Household Survey was suspendedseveral years ago as a result of doubts about its accuracy, and their publi-cation has not yet been resumed. The following are the observations andrecommendations of the mission on the subject of statistics.
I. General Comments
2. Because the requirements for economic information for policymakingare more demanding in a rapidly developing country than in stable or slowlydeveloping country, Venezuela must consider whether the existing statisticalinformation on the operation and performance of its economy is adequate to thepresent situation. Information needs are even more acute for a country heavilyinvolved in world marekts, since international events move with great speed inaffecting individual country economics.
3. The statistics required for policy decisions should accurately measureall of the strategic aspects of the functioning of the economy; they should besensitive enough to pick up small changes that may become significant; and pro-duced rapidly enough so that action can be taken promptly when necessary. Thefindings of the Employment Mission offer solid basis for optimism: Venezuelanstatisticians have developed the foundations on which an adequate statisticalsystem can be built. But the findings also make it clear that a number ofimprovements -- the need for which is already recognized in Venezuela -- should
be made as soon as possible.
II. The Household Survey
1. Employment Statistics
4. In the area of employment, the only comprehensive information cover-ing the entire economy is that generated by surveys of the population includingthe decennial censuses and the Household Survey. For any analysis of theentire situation it is essential to use this information. At the same time,other statistics, based on reports from employing establishments, includingenterprises and government agencies, give more specific -- and sometimes moreprecise and more quickly available -- information on such critical and rapidly-changing sectors as manufacturing, mining and construction. These should be

- 2 -
seen as complementary statistical programs. It is essential to develop bothpopulation-based and establishment-based statistics, for several reasons:(1) to get both comprehensive coverage of the economy and precise informationon strategic industry sectors and geographic areas; (2) to get both informa-tion that can be related to the characteristics of workers (age, sex, familyposition, income, education, occupation, etc.) -- information uniquelyavailable from population surveys -- and information that can be related tothe characteristics of enterprises (kinds and amounts of production, size ofplant, investment, productivity, etc.) -- information that can be collectedonly from establishment surveys; and, (3) to get information from each ofthese sources that can be used to evaluate the accuracy of the other source,since each is completely independent of the other.
5. The Mission emphasizes the importance of strengthening both typesof statistics, not only because of the unique advantages of each in providingcertain types of information, but also because there is always the danger thata single statistical system may develop cumulative errors that are not recog-nizable until long after they have become severe and the information has be-come worthless for policy determination. This can be prevented by maintainingthe two types of statistics in such a way that they can be continually com-pared and disparities can be identified. Complete matching is rarely achievedbecause of differences in concept and definition, errors on the part of therespondents in giving the information, and errors in the design and managementof the surveys -- errors which occur even in the most advanced statisticalsystems. But if information is collected and analyzed in such a way as tomake it easier to match the results of the two systems each can be used tomonitor the accuracy of the other. The mission has some specific recommen-dations to accomplish this.
6. The Mission evaluated the accuracy of the population-based dataof the Census and Household Survey by reviewing the survey methods, byexamining the internal consistency of the data, and by checking for consis-tency with completely independent surveys measuring employment. The House-hold Survey, initiated in 1967, follows the general model of the AtlantidaProgram, as do similar surveys in other Latin American countries. The con-cepts and definitions used are those generally accepted and recommended by theInternational Labor Office, as are the methods followed in conducting thesurveys. When the 1971 Population Census results were received, the publica-tion of the Household Survey data was discontinued because serious questionsarose as to the quality of the data. Publication has not been resumed.
7. Following analyses of the problems of the survey by the staff andby an outside expert they consulted, Dr. Benjamin Tepping of the Bureau ofthe Census of the United States, a series of improvements have been made,described in Note A. The mission considers that the improvements alreadymade have substantially increased the reliability of the survey, and urgesthat the improvements program be continued.
8. Because of the improvements made after this review of the survey'sproblems in 1972, the mission used only the 1974 results of the HouseholdSurvey in its analysis of the employment situation in Venezuela.

- 3 -
9. The internal consistency of the data could be seen both by com-paring the Household Survey data for both halves of 1974 with each otherand with data for the decennial censuses, and by seeing whether the employ-ment, unemployment and labor force participation measured bore some logicalrelationships or followed explicable patterns. Admittedly this is a farfrom rigorous test. It was noted that the survey sensitively picks up theeffects of such events as general wage changes and minimum wage legislation(Table 32). Between the first and second half of 1974 the survey reporteda 7.7% drop of total employees in the low income category and 5.7% in thecase of the self-employed.
10. A check was made with independent data by comparing the level andthe rate of change of employment in manufacturing industries as shown by theCensuses and the Household Survey, on one hand, and as shown by industrialsurveys based on reports from establishments, on the other. While it wouldbe more conclusive if checks could be made for all industries, it is reason-able to conclude that if two completely independent systems yield closeresults in measuring even a single sector of the economy, and if there is noreason to assume that that sector is measured more accurately than othersectors by either system, the comparison supports the accuracy of both systems.
11. The results of these comparisons are described in Note A. The con-clusions reached were that a rapid growth in employment did take place inrecent years, as shown by the Household Survey, and the pattern shown by thesurvey of distribution of employment among industries is generally confirmed.For 1971-1974 the trends shown by the two series are similar, but from 1961to 1971 the Household Survey shows a faster employment growth than othersurveys, and this may point to deficiencies in either or both of the series.Further continuous analysis of the behavior of both types of statistics isnecessary.
2. Earnings statistics
12. Since the Mission uses data on earnings from the Household Surveyto analyze underemployment and distributions of families by their income andother characteristics, it is necessary to verify the accuracy of reports onearnings obtained in this Survey. Reporting on earnings and income by house-holds is usually subject to some margin of error, and it was important tocheck it against independent data -- in this case reports of establishmentsto the Ministry of Labor.
13. This analysis, discussed more fully in Note B, shows that whilevery large apparent differences appear when the raw figures are first com-pared, the differences are reduced substantially when the figures are ad-justed to make them more comparable. The conclusion reached is that theearnings data from reports of people in households is roughly in line withthat reported by establishments from their payroll records -- in somecases somewhat lower, in other cases somewhat higher -- and can be usedwith some caution for analysis of individual and family income.

-4-
3. Recommendations for the Household Survey
14. The Mission concluded that the results of the Household Survey,both on employment and on earnings, appeared to represent the employmentand economic situation in the country in a generally accurate way. At thesame time it strongly recommends that continued study of the accuracy of thesurvey be made a regular part of the work of the Direccion General deEstadistica y Censos Nacionales and the steps toward improvement alreadytaken or projected should be pursued vigorously.
15. It has a number of recommendations to make toward these ends.
i. It is recommended that the DGE & CN take steps to makepossible more precise comparisons of data from householdsand from business establishments. The agency has alreadytaken an important step, by adding a question on theHousehold Survey to determine whether each employedperson is working in an establishment employing fewerthan five employees. Beginning with the survey for thesecond half of 1975, the questionnaire asks "How manypersons work in the business or establishment (where thisperson is employed)?" It may be found that the respondentis often unable to answer this question, especially formedium size or large establishments, and it may benecessary to modify the question to ask whether more thanfour workers are employed -- a question which workers orother members of the household should generally be ableto answer with reasonable accuracy. This question alsoprovides a significant research potential since it wouldmake it possible to use the survey to collect informationon the "informal sector". Another step in reconciliationof data from different sources would be to tabulate thedata on employment by class of workers (private wage orsalary workers, public wage or salary workers, "patronos",other self-employed workers, and unpaid family workers) ingreater industrial detail; it is now tabulated only formajor branches of industry. A third step to aid incomparisons would be to tabulate the earnings data in thehighest class intervals of the present distribution ingreater detail -- not necessarily for publication, butfor computation of average (mean) earnings by industrythat could be compared with the averages shown by estab-lishment surveys.
ii. Study should be made of the possiblity of adding an allow-ance for net immigration to the projections of populationby age and sex used for the control totals to which thesurvey results are "blown up" or expanded. It is recog-nized that this is no simple matter, because of thedifficulty of projecting future migration by age and sex.
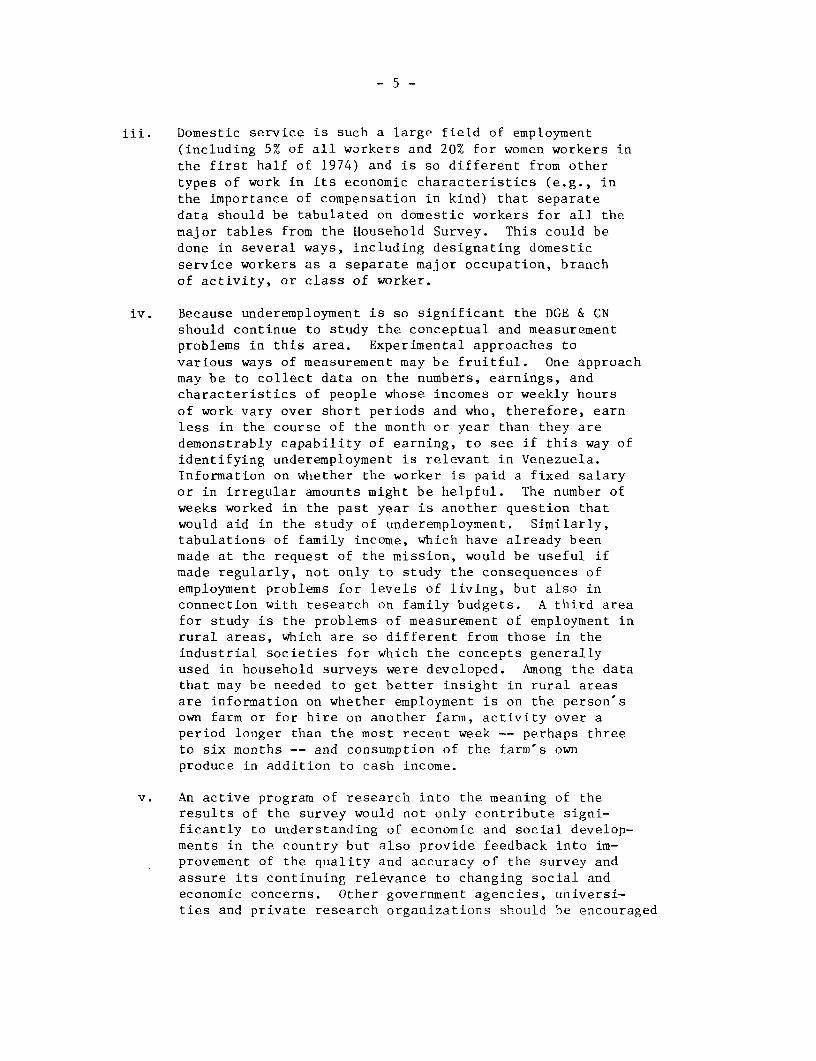
- 5 -
iii. Domestic service is such a large field of employment(including 5% of all workers and 20% for women workers inthe first half of 1974) and is so different from othertypes of work in its economic characteristics (e.g., inthe importance of compensation in kind) that separatedata should be tabulated on domestic workers for all themajor tables from the Household Survey. This could bedone in several ways, including designating domesticservice workers as a separate major occupation, branchof activity, or class of worker.
iv. Because underemployment is so significant the DGE & CNshould continue to study the conceptual and measurementproblems in this area. Experimental approaches tovarious ways of measurement may be fruitful. One approachmay be to collect data on the numbers, earnings, andcharacteristics of people whose incomes or weekly hoursof work vary over short periods and who, therefore, earnless in the course of the month or year than they aredemonstrably capability of earning, to see if this way ofidentifying underemployment is relevant in Venezuela.Information on whether the worker is paid a fixed salaryor in irregular amounts might be helpful. The number ofweeks worked in the past year is another question thatwould aid in the study of underemployment. Similarly,tabulations of family income, which have already beenmade at the request of the mission, would be useful ifmade regularly, not only to study the consequences ofemployment problems for levels of living, but also inconnection with research on family budgets. A third areafor study is the problems of measurement of employment inrural areas, which are so different from those in theindustrial societies for which the concepts generallyused in household surveys were developed. Among the datathat may be needed to get better insight in rural areasare information on whether employment is on the person'sown farm or for hire on another farm, activity over aperiod longer than the most recent week -- perhaps threeto six months -- and consumption of the farm's ownproduce in addition to cash income.
v. An active program of research into the meaning of theresults of the survey would not only contribute signi-ficantly to understanding of economic and social develop-ments in the country but also provide feedback into im-provement of the quality and accuracy of the survey andassure its continuing relevance to changing social andeconomic concerns. Other government agencies, universi-ties and private research organizations should be encouraged

-6-
and helped to use the data analytically, but also theDGE & CN should conduct some research on its own, with
a staff of two or three persons as a beginning.
vi. No matter how elaborate the regular tabulations of theHousehold Survey, there will frequently be need for specialtabulations for analysis. At present this becomes difficultbecause each request requires the development of a specialcomputer program, which takes much time from the other tasksof the programming staff, thus discouraging use of the data.It is recommended that the DGE & CN obtain a packaged program
appropriate for exploiting the Household Survey. If this isdone, there may be savings, since fewer regular tabulationswould have to be made.
vii. The mission recommends the development of wider interestin, use of, and support for the Household Survey. Withits technical problems surmounted, the survey can providea reasonably fast and sensitive measure of vital economicand social variables about which a developing country needscurrent intelligence. Moreover, it is a flexible instrumentthe Government can use to get current information on suchsubjects as migration, educational attainment of adults,school enrollment of youth in relation to personal andfamily characteristics, housing, nutrition, health andfamily income and expenditures. A useful initiative wastaken in 1974 in the formation of a consultative councilon the Household Survey in which other government agencieswere represented. Such a continuing organization, if itis maintained actively, can be a major vehicle forexchange of views as to subjects for survey, technicalimprovement, relating the effort to other surveys, andserving the needs of other agencies. In the process suchan ongoing council can help to develop understanding andsupport for the survey. The mission strongly endorsesthis initiative and urges that it be pursued vigorously.
16. In addition to these specific recommendations, the mission would liketo call attention to some fundamental questions concerning the conceptual frame-work of the Household Survey.
17. As is true in the majority of the Latin American countries the House-hold Survey of Venezuela follows in general terms the model proposed by theAtlantida Program. This model is supported by a theoretical framework inwhich the basic assumptions are those of homogeneity of the labor market andof the universality of the categories for analysis of employment. In thiscontext one deals fundamentally with the situation of the individual with res-pect to this single labor market, and the categories which are of most interestare those of employment or unemployment, taking these conditions as oppositeand mutually exclusive. The primary emphasis is placed on the measurement of

- 7 -
unemployment as it appears openly, which is considered as an indicator of theamount of underutilization of manpower.
18. Nevertheless, in the countries in the processs of development, as isthe case of Venezuela, the reality is different. The labor market is nothomogeneous but rather is segmented, this being a consequence of the techno-logical heterogeneity and of the coexistence of distinct modes of productionwithin the economic system. In these conditions the degree of underutiliza-tion of the labor force does not depend only on the conditions of being or notbeing employed, but rather and fundamentally on the manner in which each personenters the productive system or, in more precise terms, on the segment of thatsystem into which each person enters. From this at least two consequences canbe deduced:
a. It is not possible to postulate general and universal employ-ment categories, but rather specific categories which wouldreflect the segmentation of the labor market; and
b. It is necessary to increase considerably the effort tomeasure underemployment among the employed population.
19. From the first of these one can conclude that the present focusresults in inappropriate or at least insufficient information to analyze theemployment problem in Venezuela. The categories that are used are far frommaking possible a general analysis and serve only to quantify the character-istics of a part of the labor force; concretely, that which is involved inthe modern or "formal" segment of the market. On the other hand, these cate-gories do not serve to analyze the important fraction of the labor marketwhich is involved in the backward or informal segment of the market. Forexample, to try to measure underemployment of the working population in thissegment by the number of hours worked is irrelevant, since the time the workerremains at his post is, in many cases, nominal and does not truly reflect hiseffective working time.
20. These considerations are not only of academic interest but aboveall are of policy interest, since the worst problems of employment are con-centrated in the informal sector and constitute the fundamental basis ofpoverty. For these reasons it is necessary to redefine thetheoretical frame-work, adapting it to these realities of heterogeneity which have been mentionedearlier. Among the different labor markets which are to be considered are onewhich includes workers on fixed salary; one which includes workers whose in-comes are inherently unstable, such as self-employed professionals, proprietorsof businesses, and other self-employed workers; one which includes occasional orcasual workers; and one which includes unpaid workers in family enterprises.
III. 1971 Census of Population
21. In the course of analyzing recent trends in the unemployment situationin Venezuela, the mission found certain problems having to do with the census ofpopulation taken in 1971.

- 8 -
22. One of these problem areas had to do with the interpretation to begiven to the declines in unemployment and in participation in the labor forceamong men shown in the 1971 Census as compared with that of 1961. The questionthat concerned the Mission was whether these declines represented a form of"hidden unemployment". The analysis, described in Note C, concludes that foryouths under age 25 the decline in labor force participation was associatedmainly with a lengthening period of education; that for adults some part ofthe drop in participation was accounted for by a change in the wording ofthe question on the 1971 census from that used in 1961 -- a change whichlimited the persons classified as unemployed to those who were actuallycurrently looking for work, and thus threw into the inactive group some menwho on the much more loosely framed questionnaire in 1961 classified them-selves as "unemployed"; and, finally, that some additional part of the drop inunemployment and in the labor force did represent hidden unemployment ordeficiencies in the census that resulted in a small overstatement of theinactive group and understatement of the unemployed.
23. The second problem area of the 1971 Census of Population had to dowith the fact that in the tabulations on employment by industry sector, whichare essential in tracing the evolution of the various sectors in recent years,the number of workers for whom the census staff was unable to identify theproper sector was very large -- amounting to 378,000 workers, or 13% of allemployed persons. The absence of these workers from their proper industryclassification distorted the employment figures for the industries, and madeanalysis of the trends impossible. The mission reviewed various methods thathave been tried by Venezuelan statisticians for allocating these 378,000workers to their proper industries, and attempted several additional alloca-tion methods (Note D). It concluded that the use of the Household Surveyindustry distribution of employment for the last four-month period of 1971 toallocate the total found by the Census produced the most reasonable results,but that none of the methods is wholly satisfactory.
IV. Employment and Earning Statistics of the Ministry of Labor
24. The Ministry of Labor conducts two surveys collecting employment andearnings data.
25. The Annual Survey collects employment in establishments employing5 or more workers, which are registered with the Ministry. In September 1973,19,600 privately and publicly owned establishments employing 639,000 workerswere included. The extent of coverage differs among industries. The dataare published by detailed industry sector and by State, and show salaried andwage workers separately, by sex.
26. Since it is incomplete and the extent of completeness -- even forplants of 5 or more -- differs among sectors, it cannot be readily used as ameasure of employment. Nor can it be used to show the trend of employment,since, as the Ministry points out, the data are not comparable from year toyear because the coverage is improved as more plants are added. (If new plantswere picked up in their first year of operation it would be valid to include

- 9 -
them as an increase in employment over the previous year; but if plants alreadyin business are added a false increase over the previous year is shown.)
27. Monthly Indexes of Employment have been compiled since 1963 for 23industries (of which 16 are in manufacturing) from a sample of 600 establishments.Since new plants are not added to the sample, it consistently understates thegrowth of employment. The extent of understatement is suggested by an esti-mate based on the Annual Survey data adjusted to eliminate the effect of changes
in coverage. From September 1971 to September 1973 this showed an increase of9% in manufacturing, while the Monthly Index showed a 5% increase. The Monthly
Index is of limited use for another reason: the indexes for individual sectorsare not additive, so that (except for a total for manufacturing) no idea ofthe changes in employment for Venezuela's economy can be obtained.
28. Estimates of average monthly earnings are prepared from the sampleof 600 establishments. The averages are different from -- generally higherthan -- those which the Ministry has calculated from its full Annual Surveyin 1972 for each industry, suggesting that the sample is inappropriatelyweighted, and possibly overweighted with large establishments, which haveconsistently higher earnings.
29. In summary, the Ministry of Labor collects a great deal of data onemployment and earnings, offering a great potential for the quick reportingof employment and earnings levels and changes in specific industries, whichis invaluable in keeping up with economic developments and measuring theimpact of current economic events on the various industries and their workers.Unfortunately, for the reasons stated, the data derived are not usable forthese purposes and in fact the Ministry staff informed the "fission that theyare not widely used.
Recommendations for Ministry of Labor Statistics
30. The potential could be realized in a reasonably short time and withmodest additional costs. The mission recommends that the Government ofVenezuela look into what can be done along the following lines:
i. Develop an annual estimate of total employment and averageearnings in each sector by building on the base of the mostcomplete listing of establishments and their employment thatcan be made, using both the Annual Survey and the SocialSecurity summary of employment in plants paying payrolltaxes. (Since the latter reports are essential for taxcollection, consideration might be given to eliminating theseparate collection by the Ministry of Labor and using themoney saved to improve the Social Security data coverage or toimprove the monthly reporting sample, as suggested below.) TheSocial Security data include plants with less than 5 workers,but their coverage is about the same as that of the AnnualSurvey of the Ministry of Labor. Studies would have to be madeof employment in uncovered plants to develop a reasonably

- 10 -
accurate estimate of total employment in each sector; ourrecommendations on collection of size of plant on the HouseholdSurvey are relevant to this point. This annual listing andestimate, based on an improved coverage of the Social Securitydata, could provide a sampling frame for industrial surveys.
ii. Redesign and reweight the monthly reporting sample, augmentingit as necessary, so that it gives an accurate average earningsfor each industry, using the Annual Survey or Social Securitydata as a criterion.
iii. Use the percent changes shown by the monthly sample to carryforward the total employment in each specific sector shownby the annual estimate of total employment developed underthe first recommendation.
iv. As soon as each new annual estimate of total employoment andaverage earnings is prepared, the monthly estimates shouldbe reviewed and revised as necessary to the correct new levels,since the monthly sample is likely to develop cummulativeerrors.
v. To develop more meaningful statistics on earnings, two itemsof information now collected should be tabulated separately:amounts paid "por sueldos y jornales", and amounts paid"por otros conceptos."
vi. Separate employment data for men and women should be omittedfrom the monthly questionnaire and collected only once a year,since the sex composition of employment changes slowly.
V. Future Manpower Requirements Information for Educational Planning
31. The Ministry of Education's staff emphasized their need for projec-tions of the future requirements of the developing economy for workers in thevarious occupations requiring long periods of education and training, as aninput into planning higher education and technical education. The Ministry'sFive Year Plan attempts to use part of the CORDIPLAN report on human resourcesas basis for its planning of higher education, but the CORDIPLAN study doesnot take account of the subsequent changes in the price of oil and recenteconomic development planning. The Guyana Corporation (Corporacion Venezolanade Guyana, CVG) which has direct responsibility to staff first the constructionwork force and then the operating work force of its plants -- a peak number ofsome 30,000 employees -- has made careful, time-phased estimates of its futureneeds for professional, technical and highly-skilled workers; but in attemptingto assess the future supply out of which these human resources are to be re-cruited, the agency has run into the stone wall of complete ignorance of thefuture demands for such workers arising out of the general growth off industryin Venezuela. The same is true of other development programs, siichi as theshipbuilding program.

- 11 -
32. No one is currently putting together the whole picture. In an eco-nomy developing as rapidly as Venezuela's, and with the Government taking suchan important role in stimulating certain kinds of development, the possibilityof planning education and training on the basis of reasonable prospective man-power needs is not too difficult to attain and the prospective cost of bottle-necks and program delays resulting from skilled worker shortages is so greatthat the systematic effort to develop projections would be well worthwhile.It is recommended that CORDIPLAN take the initiative in establishing a conti-nuing and coordinated program of research on human resources and future man-power requirements for educational planning. Studies such as that undertakenin cooperation with economists from Ohio State University contribute todevelopment of methodology in this area, but it is recommended that ratherthan conducting massive studies that may become obsolete, the program beoperated by a small staff as a continuing effort, adapting the projections tochanging economic circumstances and to revised development plans of thegovernment agencies and major industries, and keeping close contact with theMinistry of Education and other major users of the projections.
33. The mission has learned that the Mariscal de Ayacucho ScholarshipProgram has contracted with a United States consulting firm to have an analysismade of future manpower needs of Venezuela's economy as an aid in educationalplanning. The mission was unfortunately unable to ascertain the specificmethods it was proposed to follow or the specific information that would beprovided, and so can make no evaluation of this plan.

- 12 -
APPENDIX II: NOTE A
Evaluation of the Data on Employment and Unemployment in the
Household Survey
I. Methodological problems and steps taken to overcome them
1. The studies by the staff of the DGE & CN, and the report ofDr. Tepping identified certain problems:
i. The data from the survey are used to determine the charac-teristics of the population, and the actual estimates aremade by weighting the characteristics up to independentlyprojected "control totals" of the population. Previouslythe control totals were projections of the population fromthe most recent census to the current period by sex, age,urban/rural residence and those economically active orinactive. There is, however, no basis for accuratelyprojecting labor force participation from the most recentcensus forward for as much as 10 years -- indeed, laborforce participation is one of the variables sensitive to theeconomic situation which the survey is needed to measure,and therefore cannot be stipulated in advance. Recognizingthis, the DGE &CN revised the procedure to use only projec-tions of age and sex and rural-urban residence as controltotals.
No projections of immigration are added to the controltotals, which are based on natural population growth alone;as noted elsewhere in this report, immigration amounted to200,000 in the 1961-71 decade, and had a palpable effect onthe population in age groups 15 to 29 where it was concen-trated. If immigration continues at the same rate, ignoringit would result in an understatement of about 100,000 inthe labor force and employment by 1981.
ii. The sample had been allowed to deteriorate. New residenceswere not systematically added, as shown by the fact that,while the population of Venezuela was increasing at a rateof more than 3% annually, the population that could beestimated from the raw data from the survey was declin-ing. To correct this, a systematic program of addingnew residences has been introduced. The houses are identi-fied and listed by visual inspection of each sample area,and added to the sample annually; this procedure may bemodified to add new households only once every two years.It is vital that this essential sample maintenance becontinued.

- 13 -
iii. Since independent surveys were being conducted in severalof the major regions of the country, sometimes with differ-ent timing, duplicating the sample collected for thenational survey at additional cost, the decision was madeto conduct the survey in a coordinated fashion in eightmajor regions, expanding the sample to 32,000 householdsenumerated every six months. Separate estimates are deve-loped for each region and a combined sample is used for thecountry as a whole. While internal migration makes itdifficult to project age and sex population controls foreach region with accuracy, and therefore the regionalestimates are subject to some error, regional stratifica-tion of the results as well as the larger sample shouldimprove the estimates for Venezuela as a whole.
iv. Systematic review of the quality of the interviews andof the accuracy with which responses are recorded has beenintroduced by means of a reinterview by supervisors of asample of 15% of all household interviews. Its presentpurpose is to induce the enumerators to be careful, but thestaff intends to summarize and analyze the results regularly,beginning late this year. From such summarizations it willbe possible to estimate interview error rates and see towhat extent there is systematic biasing of the results.Most important, however, is the improvement of supervisionwhich will be possible.
V. Routine estimation of sampling variance is now beingprogrammed for the computer. When this is done it willpermit continuing evaluation of the efficiency of thesample, as a guide to necessary sample improvement andefficient use of resources, and also publication of esti-mates of average sampling errors for the information ofusers of the data.
II. Comparison with other measures of employment
2. The comparisons were made for manufacturing, a critical and rapidlychanging sector, employing 18% of all workers in Venezuela in 1974. Estab-lishment surveys of manufacturing were made in 1961 and 1971 by CORDIPLAN, andboth an annual survey and a monthly index of employment are available from theMinistry of Labor for the period since 1968. Comparison is made difficult bycertain differences between the two statistical systems; the population-baseddata includes self-employed and family workers, while the establishment datacovers only wage and salary workers; and the establishment data do not coversmall firms employing less than 5 workers. For manufacturing as a whole thepopulation-based surveys tabulate wage and salary workers separately, but thisis not done for the individual sectors within manufacturing except in 1961.

- 14 -
3. The results of the comparisons are summarized in Table A-1. The
population-based figures are 6% higher than the establishment based statisticsin measuring wage and salary workers for 1961, 45% higher for 1971, and 47%higher for 1974. The difference results from two principal factors: employ-ment in small establishments of less than 5 employees, and the statisticalerrors in both bodies of data.
4. That a substantial proportion of the employment in manufacturing inVenezuela is found in small establishments is generally recognized. Whenthe data from the two sources for specific sectors within manufacturing arecompared for 1971 and for 1961 (Tables A-2 and A-3), the general picturegiven is a plausible one: In 1971 the Census and Household Survey resultsexceed those from establishment surveys in most cases, not only because ofemployment in small plants, but also because self-employed and family workers-- accounting for 23.6% of all manufacturing workers -- could not be excludedfrom the data for individual sectors. The greatest excesses occur in theindustries known to have many small establishments, such as food industries(because of the many small bakeries), clothing (where there are many smallworkshops making clothing to order or doing alteration work), printing,machinery and transportation equipment (repair shops). Considering thesampling error to be expected in the Household Survey data used for 1971,which should particularly affect small numbers, and the possiblities ofmisclassification of the industrial attachment of establishments or workers,it is not surprising to find a few cases in which the establishment surveydata are higher than the populated-based data.
5. The figures for 1961 are even closer, especially those excludingown-account workers (columns 1 and 3) (which are not completely comparable,because the Census data for this column include the unemployed, of whomthere were 40,451 in manufacturing, mostly wage and salary workers). Consi-dering that the employees of establishments with less than 5 workers areincluded in the Census data, they should exceed the CORDIPLAN figures by morethan appears in Tables A-3.
6. It is probable, therefore, that the 1961 Census figures understateemployment in manufacturing. One possibility is that people working in bak-eries, clothing shops and other small enterprises engaged in both makingproducts and selling them (in many cases also selling purchased products)were classified by Census in commerce rather than in manufacturing. If thisis true the manufacturing figure for 1961 understates employment while thatfor commerce overstates employment in that sector.
7. While a higher employment figure in the population-based data ascompared with that from establishments is generally plausible, the differinggrowth trends in the two sets of data are difficult to explain (Table 61).The Household-based data should a 8.1% average annual increase in wage andsalary employees from 1961 to 1971, compared to 4.7% for establishment-based data. The difference continues after 1971 but is smaller. Has employ-ment in small plants of less than 5 workers been growing faster than in

- 15 -
larger plants? If this were the only reason for the faster growth of employ-ment in the population-based data, it would imply that employment in smallplants has grown from about 9,000 in 1961 to 111,900 in 1971. Moreover, thereis evidence in the CORDIPLAN industrial surveys for 1961 and 1971, that thesmallest size class measured (5-20 employees) had little or no increase inthat period, while the fastest growth took place in medium and large plants;this seems difficult to square with faster employment growth in plants of lessthan 5 workers. On the other hand, a substantial part of the very fast growthshown by the Household data is in four industries in which it is likely thatvery small shops expanded greatly: food, clothing, electrical machinery andautomobile repair. Their expansion of 160,000 amounts to nearly two-thirds ofthe total expansion in manufacturing employment from 1961 to 1971, accordingto the population-based data.
8. In summary, comparison of the data on manufacturing employment fromcompletely independent sources shows:
i. The fact that manufacturing employment rose rapidly inVenezuela over the past 13 years is confirmed by all thestatistics available. It can be inferred from this thatthe measurement of employment in other industries by theHousehold Survery is generally supported.
ii. Examination of the figures for individual industries withinmanufacturing shows a generally reasonable and consistentpattern of differences and, therefore, the ability of theHousehold Survey to measure small sectors with at leastrough accuracy is confirmed.
iii. Nevertheless, a widening difference between the statisticsfor the period 1961-1971 -- a faster growth rate for thepopulation-based data -- is only partly explained by morerapid growth of the "informal sector" of small workshopsand may point to statistical errors in either or both ofthe series. Possible understatement in the 1961 Censusdata resulting from misclassification of manufacturingestablishments as being in retail trade is suggested.
iv. From 1971 to 1974 the rates of growth in the two measuresof employment are closer to each other; the rapid growthrate for employment in the whole economy shown by theHousehold Survey for this period is supported by theindependent establishment statistics for the criticalmanufacturing sector.
9. Further continuous analysis of the behavior of both the Householdand the establishment-based statistics is necessary.

Table A-1: CCjTARiSUJi OF POPULATION-iASED AflD ESTABLISILiEWiT-uASED STATISTICS ueN JLUFACTu62ia6 ifL(LOY.i T1961, 1971, 19774
1971 1974 II
(numbers ilt thousands)a d L f
1 . household-based daLa, TUTAL 24u.9 $01.1 /O9.6
2.. Self-employed and farnily workers 81 ,2 140.5 138.53. Wage and salary Wilorkers 165.7L._ b 360.6 451.9
L. Establishment-based data, TOTAL 156.9 S 2242.4 e 307.2 LE(Wage and salary workers inplants with 5 or iore employees) h
5. Automobile and machinery repair shops -- 6.8 --6. Adjusted TOTAL (L-5) 156.9 2149.2 307.2
7. Difference(H-ousehold-based minus establishment-based data, 3-6) 8.8 111.4 144.7
8. Differe-ce as a percent of employees in establishrment-based data (7 * 6) 5.4. 1.7 1 47.1,
Average annual growi-th rate in mniber of eraployees (percent) 1961 -71 1972-74 ON
9. Household-based data (3) 8.1% 7.8%
10. Establishment-based data (6) L.7% 7.2%
a Census of iPopulation - 1 961. General Summary, Parts B and C , p. 5L3.b Ibid.,p.592. As.-uiies that the 40,451 unemployed were distributed proportionately between own account
worlcers and wage and salary workers.c First Industrial Survey, Cordiplan
/1 d XIV Household Survey, 'Tovember, 1 971E~ Third Industrial Survey, Cordiplan
/f~f XIX 1Household Survey, I 1974
9 .inistry of Labor Annual Survey, Sentember, 1973 (261h,000 employees in public and private manufacturingplants) carried to IL 1974, by change shown in miinistry of Labor Index or i4anufacturilng Employment (+7.1percent), and adjusted for undercount by c?rmparison of k.inistry of Labor data for Septemiber, 1971 and('ordiplan Tndustrial Survey for that year (+ .7 percent).
L T'rhene i-apair shops were included in manufacturing in the 1 961 Cordiplan Survey but were excluded in 1 271as more properly classified in Service Industries. They are included in Uanufacturing in the Census andHlousehold Survey. The figure is from the ilnistry of Labor Annual Survey for 1,971, covering plants of 5or m.ore employees. They are added in this Table to make the data comparable, but repair shop employmentshould be excluded from manufacturing to -ake data comparable wTith the national accounts.

- 17 -
Table A-2: EfPLOMIET IN MANUFACTURING INDUSTRIES, 1971,
ACCORDING TO THE INDUSTRIAL SURVET BY CORDIPLAN AND
THE HOUSEHOID SURVEY
CORDIFLAA/ Household(000) Survey b/
TOTAL Lh24. _____
Food 46.9 80.2Beverages 9.1 17.4Tobacco 2.7 5.3Textiles 20.4 28.4Clothing 16.2 814.2Wood and cork 6.5 23.1Furniture 8.8 1Ii.1Paper 8.8 11.1Shoes 2.2 3.2Printing 8.6 17.6Rubber 5.4 6.2Chemicals and petroleum products 27.7 30.0Non-metallic minerals 16.5 13.0Basic metals 11.0 14.4Metal products 15.3 1IU.9Nonelectrical machinery 3.5 3.8Electrical equipment 7.?a 1 39.4Transportation equipment 12.8!/ 90.0Miscellaneous 4.0 9.0
a/ Includes wage and salary workers in establishments of 5 or moreemployees.
b/ Includes all workers -- public and private wage and salary workers,self-employed, and family workers.
c/ Excludes employment in repair work.

- 18 -
Table A-3: EFLOCYMENT IN MANUFACTURING INDUSTRIES, 1961
ACCORDING TO INDUSTRIAL SURVEY BY CORDIPLAN AND
THE CENSUS OF POPULATION
(In thousands)
CENSUSAll employed Labor force/C
CORDIFLAN/a persons/b Ukployees, Own-arcountproprietors workersfamily andother workers
TOTAL 156.9 246.9 207.2 80.1
Food 28.6 h2.3 32.9 13.1Reverages 9.3 8.2 9.3 *1Tobacco 2.9 3.8 3.5 .6Textiles 14.7 18.2 14.5 3.5Clothing, shoes and leather 22.2 58.0 30e5 33.6WJood and cor: 3.3 19.6 15.7 9.74urniture 10.9 6.1 6.0 1.3Paner 4.2 3.3 3,3 3Printing 6.o 6.9 7.8 5,iubber 3,8 2.6 2.8 .2Chemicals and petroleum products 14.4 11.9 13.3 3Ion-metallic ninerals 9.9 9.8 10.7 .8.;asic metals 1.9 1.6 1e8 1Iletal products 5.4 9.1 9.5 1.9,achinery .5 1.0 1.0 2L ectrical equipmerlt 3.4 6.9 6.1 2.82ransportation equiprent 12.9 29.6 27.0 9.1*1i scellaneous 2.7 10.2 9.9 2.0
/a includes 7000 proprietors and family workers
/b Includes all workers -- public and private wage and salary workers, self-employedand family workers.
/c Includes employed and unermployed. There were 40,451 unemployed workers whose last jobswere in manufacturing, of whom,perhaps, three-quarters were wage and salary workers andmost of the rest were own-account uorkers. The labor force includes 194,384 wage andsalary workers, 80,084 own-account workers,10,002 proprietors, 1,872 family workers, and1,002 other workers (e.g. members of cooperatives, members of religious orders).

- 19 -
APPENDIX II: NOTE B
Evaluation of the Accuracy of Data on Usual Incomes of Workers in
the Household Survey
1. Reporting of income in household surveys is typically inaccurate,and tends to be biased downward because people in responding to an inter-viewer tend to forget some types of income, because often the respondent isnot the earner and has imperfect information, and possibly also because somepeople do not want the government to know how much they earn for fear oftaxation. Checks against other sources of income information in the UnitedStates, for example, have shown understatement in household surveys of theorder of 11%; while wage and salary income and non-farm self-employment incomeare reported fairly accurately, people are more likely to under-report invest-ment income (interest, dividends, rents), employees' transfer payments (un-employment compensation, compensation for work accidents, government pensions,veterans' benefits), and welfare (public assistance) payments. (The subjectis discussed in U.S. Bureau of the Census, Money Income in 1973 of Familiesand Persons in the United States, p. 60, No. 97, 1975).
2. The Household Survey for Venezuela asks, "What was the most recentapproximate monthly or weekly income which you obtained for all your work,including tips and commissions and excluding travel expenses?" Thus the incomerequested was income from work, or, more precisely, earnings -- the kind ofincome reported most accurately in the experience of the United States referredto above. Data are tabulated separately for non-farm self-employed workers andfor non-farm wage and salary workers.
3. To check the accuracy of the reporting, the results were comparedwith data reported by the establihments to the Ministry of Labor. The compari-son could be made for wage and salary workers only. It was made for threesectors of industry -- manufacturing, petroleum and mining, and electricity,gas and sanitary services. The Ministry's regular monthly income data werenot used, since they are based on reports from a sample of about 600 estab-lishments which is not augmented by adding new establishments, and which hasan upward bias, possibly because it includes a disproportionate number oflarger establishments without appropriate weighting. Instead, a specialtabulation of the data for all 18,470 establishments reporting to the Ministryof Labor's annual survey for September 1972 was used. This showed averageearnings by size of establishments. The average was lower than that reportedin the Ministry's monthly sample survey for September 1972.
4. There were a number of differences between the two bodies of databeing compared: (1) The Household Survey data were for 1974 (the average forboth halves of the year) while the Ministry of Labor data were for September1972; (2) The Ministry of Labor data include fringe benefits not paid direct-ly to the worker and which he probably does not include in his income in

- 20 -
reporting to the Household Survey; (e) The Ministry of Labor data excludeestablishments of less than 5 employees and publicly owned enterprises.
5. To make the data more comparable, the Ministry of Labor data wereadjusted to eliminate the differences (see accompanying table). It wasassumed that earnings in the public sector in each industry were the sameas in the private sector, and that earnings in establishments of less than5 employees were the same as in the smallest size class for which data weretabulated -- those with 5-9 employees (since it was observed that averagewages in each industry were highly correlated with size of establishment.)It was also assumed that employment in small establishments accounts for allof the difference between the total wage and salary employment in each indus-try shown by the Ministry of Labor Survey for September 1972 and that shownby the Household Survey (adjusted for the change in employment from September1972 to the average for 1974 by the monthly employment indexes published bythe Ministry of Labor). The average earnings shown by the Ministry of Laborannual survey for September 1972 were first adjusted to include the estimatedaverages for workers in public enterprises and in small establishments; theadjusted averages were then increased to 1974 levels by the percent changeshown by the Ministry of Labor monthly series on average wages; finally, theproportion of total income represented by fringe benefits was deducted, usingdata from CORDIPLAN, Tercera encuesta Industrial, 1971.
6. The resulting estimates of currently paid out wage and salary incomewere compared with the average usual weekly income reported by wage and salaryemployees in the Household Survey. An element of uncertainty enters into theHousehold Survey average because the highest class-interval of weekly income,Bs 500 and over, is open-ended. In order to calculate a mean for the wholedistribution, two assumptions were made as to the means for ths class-interval-- one assumption was that the mean was Bs 700; the other , that it wasBs 1,000 -- this would be possible only if a number of very high salariedofficers of corporations were included. The higher assumption seems moreplausible in the petroleum and mining industry, in which 21.4% of the wage andsalary workers earned over Bs 500 a week, than in manufacturing (4%) orelectricity, gas and sanitary services (5.5%), where a figure closer toBs 700 seems reasonable.
7. It should be obvious, from the assumptions and the numerous adjust-ments that had to be made, that the comparison is extremely rough. What itshows is that in the petroleum and mining industry the Household Survey dataare close to, or somewhat below, those reported by employers to the Ministryof Labor; in the electricity, gas and sanitary services industry about 14%below; and in manufacturing about 18% higher. The analysis suggests that theearnings data reported in the Household Survey are inaccurate, as expected,but not grossly understated, and in some cases moderately overstated. Theyare usable as only very rough approximations of true levels of earnings.
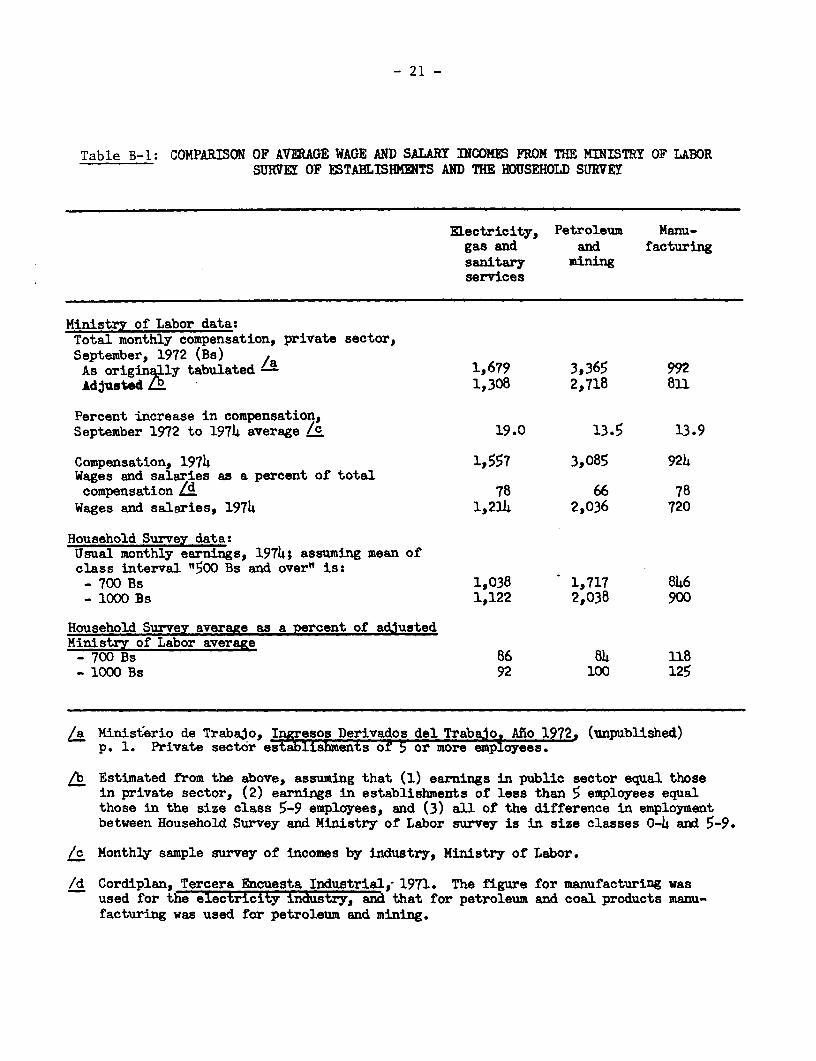
- 21 -
Table B-1: COMPARISON OF AVERAGE WAGE AND SALARY INCOMES FROM THE MINISTRY OF LABORSURVEY OF ESTABLISHKHETS AND THE HOUSEHOLD SURVEY
Electricity, Petroleum Manu-gas and and facturingsanitary miningservices
Ministry of Labor data:Total monthly compensation, private sector,September, 1972 (Bs) /a
As originXlly tabulated 1,679 3,365 992AdvusWd L-a 1,308 2,718 811
Percent increase in compensation,September 1972 to 1974 average /c 19.0 13.5 13.9
Compensation, 1974 1,557 3,085 924Wages and salaries as a percent of totalcompensation {d 78 66 78
Wages and salaries, 1974 1,214 2,036 720
Household Survey data:Usual monthly earnings, 1974; assuming mean ofclass interval "500 Bs and over" is:
- 700 Bs 1,038 1,717 846- 1000 Bs 1,122 2,O38 900
Household Survey average as a percent of adjustedMinistry of Labor average- 700 Bs 86 84 118- 1000 Bs 92 100 125
/a Ministerio de Trabajo, Ingresos Derivados del Trabajo Afio 1972 (unpublished)p. 1. Private sector establishments of 5 or more employees.
b Estimated from the above, assuming that (1) earnings in public sector equal thosein private sector, (2) earnings in establishments of less than 5 employees equalthose in the size class 5-9 employees, and (3) all of the difference in employmentbetween Household Survey and Ministry of Labor survey is in size classes 0-4 and 5-9.
/c Monthly sample survey of incomes by industry, Ministry of Labor.
/d Cordiplan, Tercera Encuesta Industrial,- 1971. The figure for manufacturing wasused for the electricity industry, and that for petroleum and coal products manu-facturing was used for petroleum and mining.

- 22 -
APPENDIX II: NOTE C
Concerning the Decline of Participation Rates in the Labor Force Between
the Census of 1961 and that of 1971
1. One of the aspects which requires attention in analyzing thecensuses of 1961 and 1971 is the decline in the rates of participation formen. This phenomenon is not limited to the extreme age groups, but it extendsto the central age groups -- 25-54 years. The changes are shown in the chartson pages 23 and 24 for Venezuela and Caracas.
2. For this reason the Mission considered it necessary to examinethis problem with great care. The analysis is divided into two parts, thefirst considering the extreme age groups and the second the central agegroup.
A. The Participation of the Extreme Age Groups
3. In the long run it is to be expected that the participation of thesegroups will decrease, in the case of young men because of extension of school-ing, in the case of older men because of the extension of social security.
4. Venezuela experienced a great increase in the number of studentsregistered in school during the period 1961 to 1971. According to the censusdata in this period the number of men who were attending school and were inthe age groups 15-29 years increased by more than 200,000. (Unfortunately,we are not able to get data separately for the group 20-24 years of age.)Of the 200,000 increase in enrollments, about 150,000 are in the age group15-19, and the rest in the age group 20-29 years.
5. At the same time the rates of participation of these groups droppedsharply by about 20% for the 15-19 year olds, and 11% among the 20-25 year olds.Among the group 25-29 the decline in participation was about 4%.
6. One way of determining the effect of the increase in school enroll-ment on the participation rates is to estimate what would have been the levelof the labor force in 1971 in these age groups if the rates of participationhad not changed; this hypothetical number could be compared with the laborforce actually counted in the 1971 census and the difference which is obtainedcan be related to the increase in the number of students between the twocensus years. The results are the following:

VENEZUELA: MALE POPULATION -PERCENT DISTRIBUTION BY LABOR FORCESTATUS, BY AGE, 1961, 1971, 1974 11
PERCENT AGE
OF POPULATION15-19 20-24 25-34 35-44 45-54 55-64 65 AND OVER
100 ~ ~ ~ ~ ~ ~ ~ ~ ~ ~ ~ ~ ~ ~ ~ -~ 10a
930 90
50~~~~~~~~~~~~~~~~~~~~~~~~~~~~~~~~~~~~~~~~7
30
|~~~~~X r 60TTrW ]!T
61 71 74 61 71 74 61 71 74 61 71 74 61 71 74 61 7174.4 617 74
TOTAL POPULATION f2~ NOT IN LABOR FORCE m UNEMPLOYED m EMPLOYED

CARACAS: MALE POPULATION - PERCENT DISTRIBUTION BY LABOR FORCESTATUS, BY AGE, 1961, 1971, 1974 II
PERCENT AGE --- *
OF POPU15-19T0-2425-34 35-44 45-54564 65 AND OVER100 1-1 '02~-00
90 *.p...'>A 1 ~~~~~~~~~~~~~~~~~~~~~~~~~~~~~~~~909o~~~~~~~~ .
'7~~~~~~~~~~~~~~~7
70 so 47X
%X, X,4 , \XN4
60 I~~~~~~~~~~~~~~~~~~~~~~~~~~~~~~~~~~~~4
30 ~ ~ ~ ~ ~ ~ ~ ~ ~ ~ ~ ~ ~~ 4 A/4 30
'/0>~~~~~~~~~~~~~~~~~~~~~~~~~~~~~~~6 1 7174 1 71 74 1 717426 71 74 6v 1717 6'17 6 17
50TL PPULTIO >NOT /NLAO FRC % NEPOYD50LOE

- 25 -
Age Groups15-19 20-24 25-29
(1) Population, 1971 601,632 468,221 339,373
(2) Participation rates, 1961 62.1 92.2 97.3
(3) Hypothetical labor force, 1971(1 x 2) 373,613 431,700 330,216
(4) Labor force reported in 1971 census 302,019 383,473 317,658
(5) Difference -72,594 -48,227 -12,558
(6) Increase in persons enrolled inschool, 1961-1971 147,762 53,015
7. As can be seen, in the case of the 15-19 year-old group the increasein the number of students substantially exceeded the difference which appearsin line 5, from which we can conclude that the expansion in enrollments ex-plains the decline in participation in this age group.
8. In the case of the age groups 20-24 and 25-29, considering them toge-ther, it can be seen that the increment in the number of students amounted to87% of the differences in line 5.
9. It seems, therefore, that the expansion in enrollments has had apowerful impact on labor participation of the young men. Nevertheless, it ispossible that this conclusion is not entirely accurate; there are persons whowork at the same time they study. While the data available do not permit usto identify the number of students who were also in the labor force, it isnecessary to admit that the differences above are surely over-estimates. (Asis pointed out elsewhere in this report, few students in Venezuela had everheld regular full-time jobs.) In any case there can be no doubt that, if notall, at least a substantial part of the drop in participation of young men islegitimate, in the sense that it represents a true preference for non-workactivity rather than hidden unemployment. With respect to the older men thereis no data available which permits us to make such an estimate. The increasein their labor force participation from 1971 to 1974 (as shown in the twocharts referred to above), however, makes it seem plausible that some of thedecline in participation between 1961 and 1971 represented a form of hiddenunemployment or withdrawal from the labor force because of inability to findwork. In view of the low level of unemployment reported by the 1971 census,it is possible that some men in these age groups were improperly classified asout of the labor force instead of being classified as unemployed.

- 26 -
B. Labor Force Participation in the Central Age Groups
10. It is difficult to understand the decline registered in the partici-pation of the central age groups, since for an adult man who enjoys good healththere are very few valid alternatives to work. For these reasons the declinesobserved in these age groups require special investigation. These declinessuggest the presence of hidden unemployment among inactive workers; that is,they may represent workers who left the labor force because their hopes offinding work were so small that they concluded that it was not worth thetrouble to look for employment. This hypothesis appears plausible except forone crucial point: withdrawal from the labor market normally increases whenthe conditions of the market get worse and not when they get better, but be-tween 1961 and 1971 the conditions of the market improved. In fact, if onelooks at the rate of employment (that is the number of employed workers asa percentage of the population) in both censuses, one finds that in 1971 theyare higher than in 1961 in all the age groups between 25 and 54 years.
Percent of the Population EmployedAge Groups 1961 1971 Increase
25-29 83.1 86.0 3.530-34 84.1 89.4 5.535-39 85.8 90.9 5.940-44 85.9 90.1 4.945-49 85.5 89.1 4.250-54 84.0 85.5 1.8
11. Under these conditions in which the rate of employment increased,it is difficult to conclude that withdrawal from the labor force was produced;the expected result would be the opposite. If this is the case, for whatreason did the rates of participation in these age groups decline?
12. Not entirely but at least in part the answer is to be found in aproblem of definition. When one analyzes the questionnaires of 1961 and 1971one finds that in fact there was an important change in the definitions of theemployment situation of the individual.
13. In the questionnaire for 1961 appeared the following questions:
"In the week before the day of the census in which of thefollowing situations were you? Mark an "X" in the corres-ponding box:
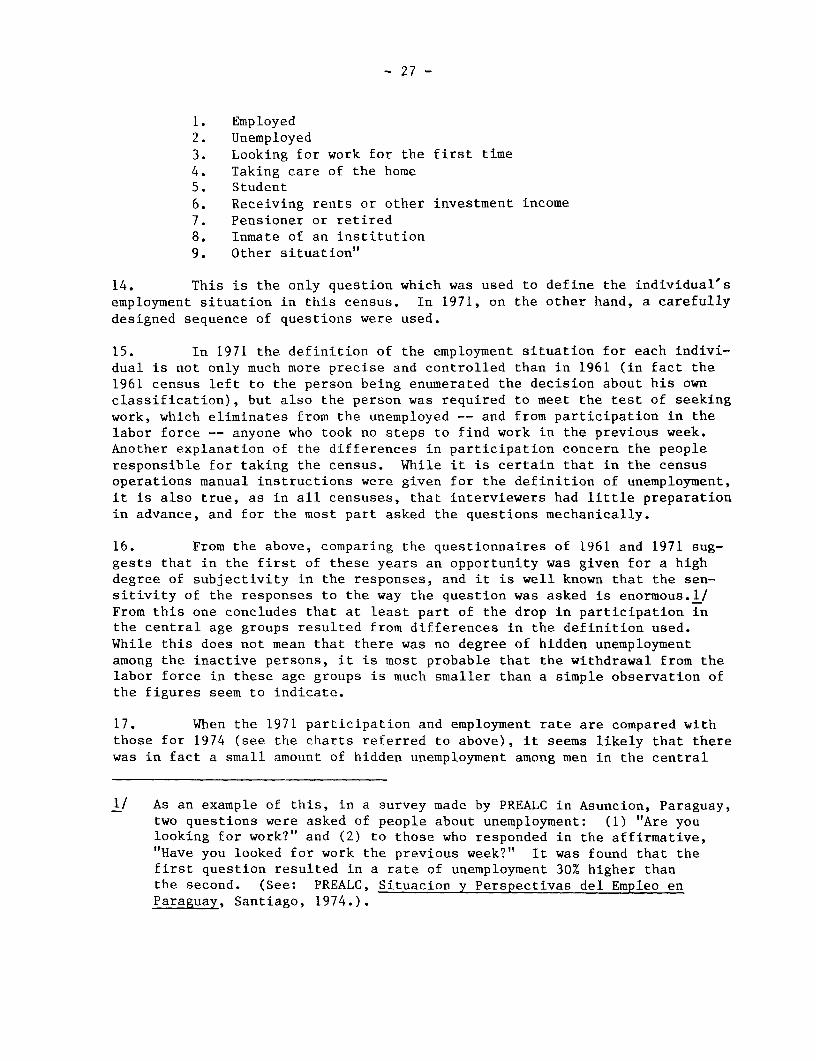
- 27 -
1. Employed2. Unemployed3. Looking for work for the first time4. Taking care of the home5. Student6. Receiving rents or other investment income7. Pensioner or retired8. Inmate of an institution9. Other situation"
14. This is the only question which was used to define the individual'semployment situation in this census. In 1971, on the other hand, a carefullydesigned sequence of questions were used.
15. In 1971 the definition of the employment situation for each indivi-dual is not only much more precise and controlled than in 1961 (in fact the1961 census left to the person being enumerated the decision about his ownclassification), but also the person was required to meet the test of seekingwork, which eliminates from the unemployed -- and from participation in thelabor force -- anyone who took no steps to find work in the previous week.Another explanation of the differences in participation concern the peopleresponsible for taking the census. While it is certain that in the censusoperations manual instructions were given for the definition of unemployment,it is also true, as in all censuses, that interviewers had little preparationin advance, and for the most part asked the questions mechanically.
16. From the above, comparing the questionnaires of 1961 and 1971 sug-gests that in the first of these years an opportunity was given for a highdegree of subjectivity in the responses, and it is well known that the sen-sitivity of the responses to the way the question was asked is enormous.l/From this one concludes that at least part of the drop in participation inthe central age groups resulted from differences in the definition used.While this does not mean that there was no degree of hidden unemploymentamong the inactive persons, it is most probable that the withdrawal from thelabor force in these age groups is much smaller than a simple observation ofthe figures seem to indicate.
17. When the 1971 participation and employment rate are compared withthose for 1974 (see the charts referred to above), it seems likely that therewas in fact a small amount of hidden unemployment among men in the central
1/ As an example of this, in a survey made by PREALC in Asuncion, Paraguay,two questions were asked of people about unemployment: (1) "Are youlooking for work?" and (2) to those who responded in the affirmative,"Have you looked for work the previous week?" It was found that thefirst question resulted in a rate of unemployment 30% higher thanthe second. (See: PREALC, Situacion y Perspectivas del Empleo enParaguay, Santiago, 1974.).

- 28 -
ages in 1971. With employment somewhat higher in 1974, participation rateswere also higher and close to those in 1961. This was true both in Venezuelaand in Caracas. It appears likely, therefore, that some adult men shown bythe 1971 census as inactive entered the labor force as employment opportuni-ties improved.
C. Decline in Unemployment Rates between the Censuses of 1961 and 1971
18. Closely related to the theme of the decline in rates of participa-tion are the drops in unemployment rates. In fact the latter have been evengreater in relative terms, reaching about 50% below the levels of 1961.
19. The causes of these declines could be of various kinds, some ofwhich were discussed in the previous section. Among them might be:
(a) That in fact in the initial year, 1961, unemployment had beenvery high because of the recession in the economy.
(b) That in the decade the employment situation had really improved,resulting in the decline in unemployment.
(c) That the differences could be in part the change in definitionsalready discussed.
(d) That the statistics were affected by the fact that the censuseswere taken in different months (1961 in the Spring; 1971 inNovember).
(e) That in one or both censuses there were errors of enumerationand/or classification.
(f) That there were changes in the criteria and in editing the indi-vidual census returns.
20. As can be seen, the possible causes are multiple, and not necessarilymutually exclusive. Unfortunately, there is little basis for evaluating themand even less by which to weigh the effect of each of them and the differences.
21. Nevertheless there are several observations to be made on the signif-icance and importance of these differences.
22. In the first place, the census is not the most ideal instrument formeasuring the employment situation of the population, and even less thespecific situation of unemployment. In fact, in the context of a segmentedproductive sector and with a heterogeneous labor market, as is the case inVenezuela, the boundaries between employment and unemployment are far frombeing clear and precise; there are many "gray areas" in which the definitionof one or the other category depends on the subjective estimation of theperson being interviewed. This is the case, for example, of the casual oroccasional workers who have no regular jobs and who could classify themselves

- 29 -
as employed or unemployed, depending on many factors, including the way inwhich the questions are asked. (This is especially true in the 1961 census;the questions in 1971 were somewhat more precise, as noted earlier.)
23. If this is generally true, even in a survey, how much more true itis in the case of a census, which, by its very character is not able to inves-tigate in depth the situation of each person. For this reason the censusfigures do not necessarily reflect the true employment situation of an impor-tant fringe of the labor force. Even when the same question is asked of indi-viduals in a similar situation, the responses could be different; moreover,one can get different responses from the same person at different times.
24. In addition, one should remember that in the case of Venezuela in1961 the individual was asked if he was employed or unemployed, with no out-side control. It is highly probable that many occasional workers reportedthey were unemployed, because among them to be employed means to have a stableor regular job. (In surveys made by PREALC, about one-third of those who callthemselves unemployed are really occasional workers; see PREALC, The Under-utilization of Urban Manpower in Developing Countries, Santiago, 1974.
25. In 1971, on the other hand, various checking questions were used tofind out if those who declared they were unemployed or inactive had actuallyhad any work in the previous week. (By seeing in how many cases a person'soriginal report of "unemployed" in answer to the first question, No. 19, waschanged as a result of his answers to later questions, we would be able tomeasure the importance of this factor.). In other words, these checking ques-tions have in all probability reduced the number reported as unemployed andraised the number of employed.
26. Together with the factors mentioned above, it is possible to con-clude that the figures on unemployment in the two censuses are not altogethercomparable, and that the differences are not a result of changes in objectiveconditions but rather changes in the criteria and in the special limitationsof the census instrument.
27. Nevertheless this does not eliminate the possibility that otherfactors were at work. There really was a recession in the late fifties affect-ing unemployment in 1961, and the labor market was more depressed than in 1971.
28. Finally, if one concludes that the 1961 census overestimated theunemployed, it is likely that the 1971 census underestimated them. In theyounger groups the unemployment rates in 1971 were hardly higher than theaverage for all ages, although experience, including the Household Surveysmade at the same time, shows that they should be substantially higher.

- 30 -
UNEMPLOYMENT RATES BY SEX AND AGE, 1971
A g e s65 and
Total 15-19 20-24 25-34 35-44 45-54 55-64 over
Both Sexes
Census 6.2 7.9 6.4 6.6 5.1 5.7 5.6 2.3XIV Household Survey 5.0 9.2 10.5 4.9 2.4 2.0 1.7 0.8
Men
Census 6.8 8.9 7.0 7.5 5.8 6.3 6.1 2.5XIV Household Survey 5.2 9.2 11.1 5.6 2.7 2.4 2.0 0.9
Women
Census 3.9 5.6 5.0 3.9 2.4 2.5 2.7 1.2XIV Household Survey 4.3 9.0 9.1 2.9 1.4 0.5 - -
29. As can be seen, in the age group 20-24 the census rates are muchlower than those in the Household Survey, and close to the average. On theother hand, in ages 25 and over, the census figures exceed those of the House-hold Survey.
30. The relationships among age groups shown by the Household Survey ismore in line with experience in Venezuela (in 1961 and 1974) and in othercountries than is that shown by the Census for 1971.

- 31 -
APPENDIX II: NOTE D
The Adjustment of 1971 Population Census Data on Employmentby Branches of Industry for Venezuela
1. In the 1971 Census of Population the data on employment by branchof industry are made virtually useless by the fact that 378,000 persons, 13.3%of the total, are shown under a heading, "activity not well-specified or notreported".
2. In comparison, a more complete allocation by branches of industrywas achieved in earlier censuses of population. In 1950, 7.6% of employedworkers were unidentified by industry, and in 1961, 4.0%. A similar problemarose in identifying occupations in the 1971 Census -- 10.5% of the employedworkers were in unidentified occupations. In contrast, the Household Survey,with more experienced and better-supervised interviewers and with a muchsmaller volume of questionnaires to classify by industry and occupation, showsonly about 0.1% unidentified by industry.
3. With such a large proportion missing from the data on each industry,no conclusions can be drawn about industry growth rates or productivity. Themission therefore attempted to investigate ways of estimating the allocationof these 378,000 persons to the proper branches of industry.
4. Several methods have been followed by Venezueluan statisticians(see Appendix Table D-1):
5. In Method A the undistributed 13.3% were allocated among industrieson the assumption that their distribution was the same as that of personswhose industries were specified. This was done by CORDIPLAN in an extensivestudy in which employment requirements in each sector were projected to 1985.
6. In Method B the Census staff, in a technical study, allocated theundistributed persons to industries by a procedure which compared key charac-teristics of each individual with those of others whose industries werereported, selected on a random basis, and allocated individuals with matchingcharacteristics to the same industries. This resulted in an allocation ofover half the 378,000 to industries, but left 170,000, or 6% of the total,unallocated. Some of the items of information on personal characteristicsused in the random allocation procedure were not available for this group(Method C). The mission attempted an extension of Method B by distributingthe remaining 6% in the same way that the first 7.3% were allocated, on theassumption that the remaining unallocated had the same industrial characteris-tics.
7. It is a plausible hypothesis that the reasons for incomplete or vaguereporting of industry are associated with the nature of the various industriesand the difficulties people have in distinguishing among them in reporting to

- 32 -
a survey. If this is so, some industries are more likely to be under-reportedthan others. The simple proportionate allocation of those not identified byindustry according to the distribution of those identified is, therefore,likely to be inaccurate. The allocation of workers to industries by matchingtheir personal characteristics with those of workers who did report industriesis slightly preferable, since it is not based solely on the industrial distri-bution of those reporting industry, but rather on the hypothesis that workerswith similar personal characteristics are likely to work in similar industries.
8. When the results of the three methods are compared, they are foundto be very similar, the major differences being that Method C allocates 0.6% toAgriculture and 0.5% more to Construction than Method A; Method B is, ofcourse, intermediate. Apparently the characteristics of those whose industrywas not specified were more like those of construction workers than agriculturalworkers.
9. A fourth method was tried by the mission: using the distributionof employed workers by industry found by the Household Survey in November 1971(the period of the 1971 Census) to distribute the total found by the Census(Method D). As noted above, there is reason to believe that the interviewersin the Household Survey are more experienced and better supervised than thelarge number of interviewers recruited for the temporary census task, and theprocedures for industrial coding of the Household Survey are more careful thanthose of the massive population census. On the other hand, the HouseholdSurvey results have been questioned on the grounds that the balance of urbanand rural areas is distorted so that an unduly high proportion of the popula-tion is shown as having urban characteristics. The data used to distributeemployment by occupation were from the Household Survey corrected by the censusstaff for urban/rural bias by using the urban and rural populations shown bythe census of 1971 as controls, but some residual bias may remain. A smallerproportion are found in agriculture, for example, than in the 1971 Censusstatistics adjusted by Methods A, B or C. This itself is not, however, neces-sarily a decisive test of Method D, since the results of the other methods arethemselves open to question.
10. One apparent defect in Method D is the fact that fewer workers areshown in Service industries (718,500) than in the original data from the 1971Census (757,200). If the latter is viewed as a minimum, to be enlarged bysome allocation from among the 378,000 workers for whom industry was not shownin the 1971 Census data, the estimate based on the Household Survey must betoo low, because of systematic bias of some kind or because of sampling error.It is possible, of course, that the superior interviewing and industrial codingof the Household Survey produced more accurate results than the Census.
11. In the last analysis, internal tests of the accuracy of the variousadjustments cannot be decisive; external tests must also be applied. One typeof external test is to examine the trends shown by the various adjusted levelsof industrial employment produced for 1971 in comparison with the levels ofthe censuses of 1950 and 1961 and those of the 1974 Household Survey, whichappears to be more accurate than those of earlier years. A second external

- 33 -
test is to compare the employment with production data from independentsources and evaluate the reasonableness of the implicit productivity measures.
12. Comparison of the trends (see Table D-1) shows that Methods A and C
given an unreasonably high 1971 estimate for the Service Sector (870,000) in
comparison with that for 1961 (492,000) and that for 1974 (875,000); it implies
a 5.9% annual growth from 1961 to 1971 and a 0.2% growth from 1971 to 1974.The changes shown using the 1971 figure from Method D are 3.9% for 1961-1971
and the same for 1971-1974. (As noted above, the 718,000 figure estimatedfor 1971 by Method D is below that found by the 1971 Census (757,000) beforeany allocation of the persons not identified by industry.)
13. The figure for Manufacturing from Method C implies a 6.4% annual
increase from 1961 to 1971 followed by a 9.0% annual increase from 1971 to1974, while that from Method D implies a more rapid growth of 7.3% a year from
1961 to 1971 and slower growth of 5.7% annually from 1971 to 1974. The morerapid increase from the depressed levels of 1961 seems more reasonable.
14. On the other hand, Method D shows a figure for Commerce and Finance(529,000) increasing by 7.3% annually from 1961 to 1971 and only 1.1% annuallyfrom 1971 to 1974, when employment in the economy as a whole was rising at a4.4% rate.
15. On balance, Method D seems more reasonable, both on an a prioribasis (the better supervision and industrial classification work made possibleby a sample survey probably offsets the effect of a possible remaining rural/urban bias) and on the basis of comparison of trends. Nevertheless, it isclear that none of the methods gives completely reliable results, and theindustry employment data of the 1971 population census has to be used withcaution.

Table D-1: VENEZUELA - EMPLOYMENT BY BRANCH OF ECONOMIC ACTIVITY, 1971 CENSUS, AND ALTERNATIVE METHODS OFALLOCATING THOSE WHOSE BRANCH OF ACTIVITY WAS NOT SPECIFIED
Branch of industry Original Method A Jb Method B /c Method C /d Method Ddata La Number Percent Number Percent Number Percent Number Percent
distribution distribution distribution distributionof those of those of those of thoseallocated allocated allocated allocated
TOTAL 2,828.7 2,825 100.0 2,828.7 -- 2s828.7 100.0 2,828.7 100.0
Total allocated 2,450.2 2,659.0 100.0
Agriculture, fishing 605.1 699 24.7 645.9 24.3 680.8 24.1 647.8 22.9Petroleum and mining 36.5 42 1.5 40.2 1.5 43.3 1.5 45.3 1.6Manufacturing 386.3 445 15.8 422.6 15.9 452.1 16.0 495.0 17.5Construction 146.3 169 6.0 166.3 6.3 182.6 6.5 166.9 5.9Electricity, etc. 32.6 38 1.3 35.4 1.3 37.6 1.3 36.8 1.3Commerce and finance 366.2 422 14.9 399.1 15.0 425.7 15.0 529.0 18.7Transportation, communi- 119.9 138 4.9 129.3 4.9 136.9 4.8 186.7 6.6cations
Services 752.2 872 30.9 819.2 30.8 869.7 30.7 718.5 25.4
Not specified 378.5 __ __ 169.7
a Direcci6n General de Estadistica y Censos Nacionales, X Censo de Poblaci6n y Vivienda. Resumen General, Caracas1974; P. 58.
b "Not specified" distributed proportionately. Cordiplan (Direcci6n de Planificaci6n Social y Cultural), fnc1=3a.ignusy Recomendaciones del Provecto Sobre Investigaci6n r Planificaci6n de los Recursos Humanos en Venezuela (undated).p. 20-21.
L "Not specified" distributed by random matching of personal characteristics. DGE y CN, Programa de Encuesta deHogares: Un Analisis Preliminar. (1974), P. 54.
d "Not specified" in Method B distributed in proportion to those identified by Method B.
/. All employees in 1971 Census distributed by industry employment in Nov. 1971 Household Survey. Data taken fromtabulations of the Household Survey, Nov. 1971 (No. XIV), "corrected for urban/rural bias".