
Clinical Application of Ocular Imaging
17
Clinical Application of Ocular Imaging Zach Nadler, BS, Gadi Wollstein, MD, Hiroshi Ishikawa, MD, and Joel S. Schuman, MD UPMC Eye Center, Eye & Ear Institute, Ophthalmology and Visual Science Research Center, Department of Ophthalmology, University of Pittsburgh School of Medicine, Pittsburgh, Pennsylvania (ZN, GW, HI, JSS), and Department of Bioengineering, Swanson School of Engineering, University of Pittsburgh, Pittsburgh, Pennsylvania (HI, JSS) Abstract The broadening frontier of technology used in ocular imaging is continuously affecting the landscape of clinical eye care. With each wave of enhanced imaging modalities, the field faces the difficulties of optimally incorporating these devices into the clinic. Ocular imaging devices have been widely incorporated into clinical management after their diagnostic capabilities have been documented in a wide range of ocular disease. In this review we are presenting the main commercially available devices for imaging of the posterior segment of the eye. Keywords ocular imaging devices; optical coherence tomography; scanning laser ophthalmoscopy; scanning laser polarimetry In the past two decades eye care has seen the emergence of three major technologies for diagnostic imaging of the posterior segment of the eye: Scanning Laser Polarimetry (SLP), Confocal Scanning Laser Ophthalmoscopy (CSLO), and Optical Coherence Tomography (OCT). All three devices provide real-time, non-invasive and high-resolution images of the eye. These devices went through the challenging process of translating technological advances into meaningful, robust and validated applications that are clinically useful and have become an integral part of clinical eye care management in detecting and monitoring various ocular pathologies. While each deserves its own separate consideration, this manuscript will serve as an overview of the primary state-of-the-art technologies found in the clinic for imaging the posterior segment of the eye and providing quantitative measurements of the ocular structures. The manuscript will first describe each technology, followed by their applications in monitoring and diagnosing ocular diseases. Scanning Laser Polarimetry Scanning Laser Polarimetry (SLP) determines the thickness of nerve tissue by examining the birefringence of polarized light as it is reflected from the eye. The size, orientation, and more specifically the microtubular structure of the nerve fibers cause birefringence of incident light. 1 The projected polarized light is subject to reflected phase delay (retardation) that provides a means to estimate tissue thickness. 2 Because other ocular structures in addition to the retina exhibit birefringence, current commercial devices examine and compensate for corneal and other confounding birefringence by using the radial birefringence of Henle’s fiber layer in the macula as a reference. This approach substantially Corresponding author: Gadi Wollstein, UPMC Eye Center, Department of Ophthalmology, University of Pittsburgh School of Medicine, 203 Lothrop St, Eye and Ear Institute, Suite 834, Pittsburgh, PA 15213, fax: (412) 647-5119, [email protected]. NIH Public Access Author Manuscript Optom Vis Sci. Author manuscript; available in PMC 2013 May 01. Published in final edited form as: Optom Vis Sci. 2012 May ; 89(5): E543–E553. doi:10.1097/OPX.0b013e31824f164d. NIH-PA Author Manuscript NIH-PA Author Manuscript NIH-PA Author Manuscript
-
Upload
independent -
Category
Documents
-
view
2 -
download
0
Transcript of Clinical Application of Ocular Imaging
Clinical Application of Ocular Imaging
Zach Nadler, BS, Gadi Wollstein, MD, Hiroshi Ishikawa, MD, and Joel S. Schuman, MDUPMC Eye Center, Eye & Ear Institute, Ophthalmology and Visual Science Research Center,Department of Ophthalmology, University of Pittsburgh School of Medicine, Pittsburgh,Pennsylvania (ZN, GW, HI, JSS), and Department of Bioengineering, Swanson School ofEngineering, University of Pittsburgh, Pittsburgh, Pennsylvania (HI, JSS)
AbstractThe broadening frontier of technology used in ocular imaging is continuously affecting thelandscape of clinical eye care. With each wave of enhanced imaging modalities, the field faces thedifficulties of optimally incorporating these devices into the clinic. Ocular imaging devices havebeen widely incorporated into clinical management after their diagnostic capabilities have beendocumented in a wide range of ocular disease. In this review we are presenting the maincommercially available devices for imaging of the posterior segment of the eye.
Keywordsocular imaging devices; optical coherence tomography; scanning laser ophthalmoscopy; scanninglaser polarimetry
In the past two decades eye care has seen the emergence of three major technologies fordiagnostic imaging of the posterior segment of the eye: Scanning Laser Polarimetry (SLP),Confocal Scanning Laser Ophthalmoscopy (CSLO), and Optical Coherence Tomography(OCT). All three devices provide real-time, non-invasive and high-resolution images of theeye. These devices went through the challenging process of translating technologicaladvances into meaningful, robust and validated applications that are clinically useful andhave become an integral part of clinical eye care management in detecting and monitoringvarious ocular pathologies. While each deserves its own separate consideration, thismanuscript will serve as an overview of the primary state-of-the-art technologies found inthe clinic for imaging the posterior segment of the eye and providing quantitativemeasurements of the ocular structures. The manuscript will first describe each technology,followed by their applications in monitoring and diagnosing ocular diseases.
Scanning Laser PolarimetryScanning Laser Polarimetry (SLP) determines the thickness of nerve tissue by examining thebirefringence of polarized light as it is reflected from the eye. The size, orientation, andmore specifically the microtubular structure of the nerve fibers cause birefringence ofincident light.1 The projected polarized light is subject to reflected phase delay (retardation)that provides a means to estimate tissue thickness.2 Because other ocular structures inaddition to the retina exhibit birefringence, current commercial devices examine andcompensate for corneal and other confounding birefringence by using the radialbirefringence of Henle’s fiber layer in the macula as a reference. This approach substantially
Corresponding author: Gadi Wollstein, UPMC Eye Center, Department of Ophthalmology, University of Pittsburgh School ofMedicine, 203 Lothrop St, Eye and Ear Institute, Suite 834, Pittsburgh, PA 15213, fax: (412) 647-5119, [email protected].
NIH Public AccessAuthor ManuscriptOptom Vis Sci. Author manuscript; available in PMC 2013 May 01.
Published in final edited form as:Optom Vis Sci. 2012 May ; 89(5): E543–E553. doi:10.1097/OPX.0b013e31824f164d.
NIH
-PA Author Manuscript
NIH
-PA Author Manuscript
NIH
-PA Author Manuscript

reduced the occurrence of atypical retardation pattern that hampered the images at earlierversion of this technology. The most recent commercially available SLP device, GDx PRO(Carl Zeiss Meditec, Dublin, CA), uses a diode laser with a wavelength of 785 nm, andacquires data from 40° × 20° area of retina. Current scanning pattern starts with scanning ofthe macular region to determine the proper eye-specific corneal compensation properties,followed by scanning centered on the optic nerve head. An annulus centered on the opticnerve head is sampled from which the retinal nerve fiber thickness is automaticallyquantified and reported, both as a thickness map and by the TSNIT thickness measurementand profile (Figure 1). The measured thickness is compared to normative thickness valuesand reported as a deviation map where areas with either statistically significant thinning orthickening of the RNFL are highlighted. The machine also provides the Nerve fiber index(NFI), which is generated by an artificial intelligence algorithm that takes into accountmultiple variables and reports a value that has been shown to correspond to diseasestatus.3–6
Confocal Scanning Laser OphthalmoscopyConfocal Scanning laser ophthalmoscopy (CSLO) is a confocal microscopy technique withthe advantage of having high transverse resolution. CSLO focuses a beam onto tissue andfilters reflecting light from outside the focal point by use of a confocal pinhole situated infront of a photodetector at a focal conjugate. The commercially available CSLO device,Heidelberg Retina Tomography III (HRT III; Heidelberg Engineering, Heidelberg,Germany) uses a diode laser beam with a wavelength of 670 nm and captures a series ofevenly spaced 16–64 sequential 2-dimensional frames each covering an area of 15° × 15°.The optical transverse resolution of the HRT is 10μm and the axial resolution is 300μm.The initial scans are focused anterior to the retina, and the last scans are posterior to thebottom of the optic cup and the depth of optic nerve head dictates the number of frames. Foreach focal plane the HRT acquires 384 × 384 samplings which records a reflection intensityvalue at each of the particular (x, y) coordinates of the focal plane. For each (x, y) point, themachine determines the surface location in the z-axis derived from the center of gravity ofthe reflected light along the frames. Three sets of scans are acquired in a rapid successionand aligned and the average of the three scans is used for the analysis. The operator isrequired to trace the optic nerve head margin and accordingly the device automaticallydefines a reference plane to differentiate between the cup and the neuroretinal rim structures.The acquired scans are summarized as a reflectance image resembling the clinical view ofthe optic nerve head region along with topographic map overlaid with the cup and discboundaries (Figure 2). Additionally, the machine provides numerous parameters whichquantify the optic nerve head region. HRT III also provides another method for analyzingthe optic nerve head structure without the need of manual delineation of the optic discmargin. This method, the Glaucoma Probability Score, is based on fitting a predefinedmodel of the optic nerve head region and provides global and sectoral quantification of theregion.7
Optical Coherence TomographyOptical Coherence Tomography (OCT) uses low-coherence interferometry, wherebackscattered light is interfered with a reference beam to create an axial scan (A-scan) ofdepth resolved tissue reflectivity. Consecutive beams are scanned transversely to recreate across-sectional slice of scattering media (B-scan).8 Initially, OCT was conducted in the timedomain (TD-OCT), where a reference mirror was moved to acquire a depth reflectivityprofile for a particular locale in the tissue. The physical limitation of a moving referencemirror restricts the speed of TD-OCT systems to ~400 A-scans/second. In order to limit thedeleterious effect of eye movements, corneal dryness, and blinking, the available scanning
Nadler et al. Page 2
Optom Vis Sci. Author manuscript; available in PMC 2013 May 01.
NIH
-PA Author Manuscript
NIH
-PA Author Manuscript
NIH
-PA Author Manuscript

patterns were limited to a circumpapillary scan or six radial slices in a spoke configurationcentered on either the macula, or the optic nerve head. More recently, spectral domain OCT(SD-OCT) has been introduced eliminating the need of physically moving mirror, the devicesamples broad spectral information for a particular location in the tissue. By Fouriertransforming the power spectra it is able to recover tissue reflectivity information. SD-OCTuses a spectrometer and charge-coupled-device (CCD) camera to separate and detect thespectrally resolved signal.9 With the dramatic increase in speed and axial resolution affordedby SD-OCT over TD-OCT a full three dimensional volumetric imaging reconstructed fromrapid raster scan patterns can be obtained.10
Several SD-OCT commercial devices are currently available, each offering their owndistinct advantages. Most operate at a speed around 27,000 A-scans/second, with a currentmaximum of 52,000 A-scans/second (SOCT Copernicus; Optopol, Miami, FL). Axialresolutions range from 3μm (SOCT Copernicus), 3.9μm (Spectralis; HeidelbergEngineering, Heidelberg, Germany; Figure 3) and 4μm (Bioptigen SDOIS; Bioptigen,Durham, NC) to 6μm (Spectral OCT SLO, OPKO Health, Miami, FL). Cirrus HD-OCT(Carl Zeiss Meditec, Dublin, CA; Figure 4), RTVue-100 (Optovue, Fremont, CA; Figure 5),and SOCT Copernicus all include progression analysis software for monitoring pathologies.The Bioptigen device is more geared towards research and permits user control over thescanning protocol. Some devices incorporate features of other imaging modalities: the 3D-OCT 2000 device (Topcon, Tokyo, Japan; Figure 6) has a built in high-resolution funduscamera for improved registration. The OPKO device includes an SLO image andmicroperimetry. The Spectralis device includes eye-tracking, and SLO coupled withfluorescein angiography, and autofluorescence in addition to the OCT system. Theautofluorescence uses a 488 nm wavelength light source to illuminate the retina, inducingfluorescence without injecting dye. This highlight structures such as drusens and improvethe ability of detecting these structures. It should be noted that both fluorescein angiographyand autofluorescence lack the quantitative analysis characteristic of the other modes but areclinically very useful for visualizing retinal pathologies.
The parameters provided vary among the devices though most report the retinal nerve fiberlayer thickness globally and in sectors. Macula scans are typically quantified by the totalretinal thickness or volume and some devices provide further segmentation of the macularlayers (Cirrus and RTVue).
Imaging PathologiesThe imaging technologies outlined above provide a detailed view and structural quantitativemeasures at the posterior segment of the eye. Considering their attributes, the mostprominent use of the ophthalmic imaging devices is for retinal diseases and glaucoma. Theenhanced visualization has been shown to be of important diagnostic value in diabeticmacular edema, age related macular degeneration (AMD; Figure 7), macular hole (Figure 8),vitreomacular traction, epiretinal membrane, and others.11–15 Hard drusen, a hallmark ofAMD, appears as highly reflective deposits underneath the retinal pigment epithelium layer,in OCT scans. The number and size of the drusen can be quantified by OCT and has beenshown to be associated with the risk of AMD.16–19 Ocular imaging devices have been usedfor grading macular holes and accordingly dictate the preferred surgical approach.20–23
Similarly, the ability to visualize the epiretinal membrane and vitreomacular traction strandassist in determining the surgical approach and treatment outcome.24–27 The devices havealso been valuable in assessing central serous chorioretinopathy without the need of invasivetesting such as fluorescein angiography.11 In some instances the break of the retinal pigmentepithelium through which the leakage occur could be detected by OCT.28 Consecutiveimaging allows tracing the longitudinal dynamic of the serous collection and treatment
Nadler et al. Page 3
Optom Vis Sci. Author manuscript; available in PMC 2013 May 01.
NIH
-PA Author Manuscript
NIH
-PA Author Manuscript
NIH
-PA Author Manuscript

response. The ability to quantify the retinal thickness is of use in assessing pathologies suchas macular edema and the response to treatment.29, 30 These examples illustrate some of theclinical uses of the imaging devices from a wide array of indications. Recently, anautomated method of classifying macular hole, macular edema, and AMD, has been shownto successfully identify these macular pathologies.31
Ocular imaging devices have become pivotal in clinical glaucoma assessment due to theirability of obtaining micron scale measurements. Glaucoma is a slow progressing andirreversible neurodegenerative disease that remains mostly asymptomatic until late stages.The disease manifests as the thinning of retinal layers, as well as cupping of the ONH. Thedevices have been shown to provide highly reproducible measurements of the retinal nervefiber layer and optic nerve head structures.32–42 These measurements can quantify thethinning of the retinal nerve fiber layer, the typical enlargement of the optic disc cup and thethinning of the neuroretinal rim. The improved segmentation ability of recent iteration of theOCT allows the quantification of the macular ganglion cell layer that has been shown to bean alternative sampling location for glaucoma diagnosis.43–46 Numerous studies havedemonstrated good discrimination ability of the devices between healthy and glaucomatouseyes.47–53 Using cross-sectional data it has been shown that in early stages of glaucoma,thinning of the retinal nerve fiber layer thickness, as measured by OCT, occurs withoutchanges in visual field as measured by current technology.54 After reaching a threshold levelthere is a decline by both structure and function that might indicate that structural changesprecede functional changes in some glaucoma patients further emphasizing the benefit ofocular imaging devices. Furthermore, baseline HRT and GDx measurements have beendemonstrated to predict future development of glaucomatous visual field damage.4, 55–57
Taken together, the important role of ophthalmic imaging devices in glaucoma assessmenthas been widely accepted.
Longitudinal StudiesA focal point of clinical research is understanding the trajectory a pathology takes in anindividual subject. One of the most powerful means of examining this is a longitudinalstudy, where subjects are followed over an extended period of time. However, longitudinalstudies of clinical subjects are laced with difficulty. Diseases can be slow progressing, andthe technology involved in data acquisition is imperfect and constantly changing.Comparing scans longitudinally requires registration of spatially coincident informationcollected at different time points. The great challenge of rapidly evolving technology ismaintaining congruence by finding ways to translate between generations so that past datacan be still used. Furthermore, numerous manufacturers are currently available for OCT, yetno standard of scan patterns or analysis were established and therefore measurementsobtained with one OCT instrument are not interchangeable with measurements obtainedfrom an instrument manufactured by another company. At the time of writing this reviewthere is no universal reader for OCT that can be used with all available devices.
In many retinal diseases, the ability to obtain consecutive highly detailed visualization overtime is sufficient for qualitative assessment of the disease process. For example, thedisappearance of retinal puckers after peeling of epiretinal membrane will be evaluated byvisualizing the images. However, in many instances, precise quantification of the changesoccurring along the disease process is desirable. Due to the high reproducibility of themeasurements obtained by optical imaging devices, any change exceeding the inherentmeasurement variability might be attributed to the disease process. HRT defines themeasurements variability for each eye by assessing the difference between several baselineimages and accordingly sets the limit for any follow-up image.58 Other technologies use thevariability as recorded in population based studies. This method is often described as an
Nadler et al. Page 4
Optom Vis Sci. Author manuscript; available in PMC 2013 May 01.
NIH
-PA Author Manuscript
NIH
-PA Author Manuscript
NIH
-PA Author Manuscript

event analysis and it is mainly useful for situations where changes are expected to occur in astepwise manner or in acute events. Another approach, called trend analysis, is based oncomputing the slope of change over time either by a regression analysis or Bayesiananalysis.59 A slope that statistically significantly exceeds the rate of zero change is markedor when the rate of progression exceeds the normal age related rate of change. This methodis mostly suitable for situations where the disease is progressing in a homogenous orcontinuous pattern. A few studies have shown that the ocular imaging devices are capable ofdetecting changes over time in healthy and glaucomatous subjects.60–62 However, thecorrespondence between progression as detected by visual field and imaging devices invarious glaucoma studies was limited, as was the agreement on progression between thevarious devices.61–63 These results might be explained either by the different time scale forstructure and function progression or by the different physical properties of the variousdevices that might be suitable for disease detection in different stages of the disease. Furtherstudies with larger cohorts and longer period of follow-up are needed to fully elucidate therole of imaging devices in longitudinal assessment in glaucoma.
CONCLUSIONSThe current forefront of technological advancement in ocular imaging plays a major role inclinical assessment and monitoring of the posterior segment of the eye. Clinical studiesevaluating current commercial technology have demonstrated the ability to proficientlydetect disease. However, characterizing the trajectory of a disease felt by individualsremains incomplete. The rapid evolution of the imaging devices hold promise for furtherstrengthening of their roles in clinical practice.
AcknowledgmentsThe research described was supported in part by National Institutes of Health contracts R01-EY013178, R01-EY013516, P30-EY008098 (Bethesda, MD); Eye and Ear Foundation (Pittsburgh, PA); and unrestricted grantsfrom Research to Prevent Blindness (New York, NY). The sponsor or funding organization had no role in thedesign or conduct of this research.
Dr. Schuman received royalties for intellectual property licensed by Massachusetts Institute of Technology to CarlZeiss Meditec.
References1. Huang XR, Knighton RW. Microtubules contribute to the birefringence of the retinal nerve fiber
layer. Invest Ophthalmol Vis Sci. 2005; 46:4588–93. [PubMed: 16303953]
2. Weinreb RN, Shakiba S, Zangwill L. Scanning laser polarimetry to measure the nerve fiber layer ofnormal and glaucomatous eyes. Am J Ophthalmol. 1995; 119:627–36. [PubMed: 7733188]
3. Reus NJ, Lemij HG. Diagnostic accuracy of the GDx VCC for glaucoma. Ophthalmology. 2004;111:1860–5. [PubMed: 15465547]
4. Da Pozzo S, Iacono P, Marchesan R, Fantin A, Ravalico G. Scanning laser polarimetry with variablecorneal compensation and detection of glaucomatous optic neuropathy. Graefes Arch Clin ExpOphthalmol. 2005; 243:774–9. [PubMed: 15756574]
5. Iester M, Perdicchi A, De Feo F, Fiesoletti E, Amodeo S, Sanna G, Leonardi A, Calabria G.Comparison between GDx VCC parameter and achromatic perimetry in glaucoma patients. JGlaucoma. 2006; 15:281–5. [PubMed: 16865003]
6. Medeiros FA, Vizzeri G, Zangwill LM, Alencar LM, Sample PA, Weinreb RN. Comparison ofretinal nerve fiber layer and optic disc imaging for diagnosing glaucoma in patients suspected ofhaving the disease. Ophthalmology. 2008; 115:1340–6. [PubMed: 18207246]
7. Swindale NV, Stjepanovic G, Chin A, Mikelberg FS. Automated analysis of normal andglaucomatous optic nerve head topography images. Invest Ophthalmol Vis Sci. 2000; 41:1730–42.[PubMed: 10845593]
Nadler et al. Page 5
Optom Vis Sci. Author manuscript; available in PMC 2013 May 01.
NIH
-PA Author Manuscript
NIH
-PA Author Manuscript
NIH
-PA Author Manuscript

8. Huang D, Swanson EA, Lin CP, Schuman JS, Stinson WG, Chang W, Hee MR, Flotte T, GregoryK, Puliafito CA, et al. Optical coherence tomography. Science. 1991; 254:1178–81. [PubMed:1957169]
9. Drexler W, Fujimoto JG. State-of-the-art retinal optical coherence tomography. Prog Retin Eye Res.2008; 27:45–88. [PubMed: 18036865]
10. Wojtkowski M, Srinivasan V, Fujimoto JG, Ko T, Schuman JS, Kowalczyk A, Duker JS. Three-dimensional retinal imaging with high-speed ultrahigh-resolution optical coherence tomography.Ophthalmology. 2005; 112:1734–46. [PubMed: 16140383]
11. Drexler W, Sattmann H, Hermann B, Ko TH, Stur M, Unterhuber A, Scholda C, Findl O, WirtitschM, Fujimoto JG, Fercher AF. Enhanced visualization of macular pathology with the use ofultrahigh-resolution optical coherence tomography. Arch Ophthalmol. 2003; 121:695–706.[PubMed: 12742848]
12. Srinivasan VJ, Wojtkowski M, Witkin AJ, Duker JS, Ko TH, Carvalho M, Schuman JS,Kowalczyk A, Fujimoto JG. High-definition and 3-dimensional imaging of macular pathologieswith high-speed ultrahigh-resolution optical coherence tomography. Ophthalmology. 2006;113:2054 e1–14. [PubMed: 17074565]
13. Huang LL, Levinson DH, Levine JP, Mian U, Tsui I. Optical coherence tomography findings inidiopathic macular holes. J Ophthalmol. 2011; 2011:928205. [PubMed: 21811669]
14. Gallemore RP, Jumper JM, McCuen BW 2nd, Jaffe GJ, Postel EA, Toth CA. Diagnosis ofvitreoretinal adhesions in macular disease with optical coherence tomography. Retina. 2000;20:115–20. [PubMed: 10783942]
15. Ko TH, Fujimoto JG, Schuman JS, Paunescu LA, Kowalevicz AM, Hartl I, Drexler W, WollsteinG, Ishikawa H, Duker JS. Comparison of ultrahigh- and standard-resolution optical coherencetomography for imaging macular pathology. Ophthalmology. 2005; 112:1922 e1–15. [PubMed:16183127]
16. Schuman SG, Koreishi AF, Farsiu S, Jung SH, Izatt JA, Toth CA. Photoreceptor layer thinningover drusen in eyes with age-related macular degeneration imaged in vivo with spectral-domainoptical coherence tomography. Ophthalmology. 2009; 116:488–96. [PubMed: 19167082]
17. Chen Y, Vuong LN, Liu J, Ho J, Srinivasan VJ, Gorczynska I, Witkin AJ, Duker JS, Schuman J,Fujimoto JG. Three-dimensional ultrahigh resolution optical coherence tomography imaging ofage-related macular degeneration. Opt Express. 2009; 17:4046–60. [PubMed: 19259245]
18. Yi K, Mujat M, Park BH, Sun W, Miller JW, Seddon JM, Young LH, de Boer JF, Chen TC.Spectral domain optical coherence tomography for quantitative evaluation of drusen andassociated structural changes in non-neovascular age-related macular degeneration. Br JOphthalmol. 2009; 93:176–81. [PubMed: 18697811]
19. Freeman SR, Kozak I, Cheng L, Bartsch DU, Mojana F, Nigam N, Brar M, Yuson R, FreemanWR. Optical coherence tomography-raster scanning and manual segmentation in determiningdrusen volume in age-related macular degeneration. Retina. 2010; 30:431–5. [PubMed: 19952989]
20. Inoue M, Watanabe Y, Arakawa A, Sato S, Kobayashi S, Kadonosono K. Spectral-domain opticalcoherence tomography images of inner/outer segment junctions and macular hole surgeryoutcomes. Graefes Arch Clin Exp Ophthalmol. 2009; 247:325–30. [PubMed: 19018552]
21. Michalewska Z, Michalewski J, Cisiecki S, Adelman R, Nawrocki J. Correlation between fovealstructure and visual outcome following macular hole surgery: a spectral optical coherencetomography study. Graefes Arch Clin Exp Ophthalmol. 2008; 246:823–30. [PubMed: 18386040]
22. Oh J, Smiddy WE, Flynn HW Jr, Gregori G, Lujan B. Photoreceptor inner/outer segment defectimaging by spectral domain OCT and visual prognosis after macular hole surgery. InvestOphthalmol Vis Sci. 2010; 51:1651–8. [PubMed: 19850825]
23. Ip MS, Baker BJ, Duker JS, Reichel E, Baumal CR, Gangnon R, Puliafito CA. Anatomicaloutcomes of surgery for idiopathic macular hole as determined by optical coherence tomography.Arch Ophthalmol. 2002; 120:29–35. [PubMed: 11786054]
24. Chang LK, Fine HF, Spaide RF, Koizumi H, Grossniklaus HE. Ultrastructural correlation ofspectral-domain optical coherence tomographic findings in vitreomacular traction syndrome. Am JOphthalmol. 2008; 146:121–7. [PubMed: 18439563]
Nadler et al. Page 6
Optom Vis Sci. Author manuscript; available in PMC 2013 May 01.
NIH
-PA Author Manuscript
NIH
-PA Author Manuscript
NIH
-PA Author Manuscript

25. Koizumi H, Spaide RF, Fisher YL, Freund KB, Klancnik JM Jr, Yannuzzi LA. Three-dimensionalevaluation of vitreomacular traction and epiretinal membrane using spectral-domain opticalcoherence tomography. Am J Ophthalmol. 2008; 145:509–17. [PubMed: 18191099]
26. Mojana F, Cheng L, Bartsch DU, Silva GA, Kozak I, Nigam N, Freeman WR. The role ofabnormal vitreomacular adhesion in age-related macular degeneration: spectral optical coherencetomography and surgical results. Am J Ophthalmol. 2008; 146:218–27. [PubMed: 18538742]
27. Uchino E, Uemura A, Doi N, Ohba N. Postsurgical evaluation of idiopathic vitreomacular tractionsyndrome by optical coherence tomography. Am J Ophthalmol. 2001; 132:122–3. [PubMed:11438072]
28. Fujimoto H, Gomi F, Wakabayashi T, Sawa M, Tsujikawa M, Tano Y. Morphologic changes inacute central serous chorioretinopathy evaluated by fourier-domain optical coherence tomography.Ophthalmology. 2008; 115:1494–500. [PubMed: 18394706]
29. Hatef E, Colantuoni E, Wang J, Ibrahim M, Shulman M, Adhi F, Sepah YJ, Channa R, Khwaja A,Nguyen QD, Do DV. The relationship between macular sensitivity and retinal thickness in eyeswith diabetic macular edema. Am J Ophthalmol. 2011; 152:400–5. [PubMed: 21696702]
30. Virgili G, Menchini F, Murro V, Peluso E, Rosa F, Casazza G. Optical coherence tomography(OCT) for detection of macular oedema in patients with diabetic retinopathy. Cochrane DatabaseSyst Rev. 2011:CD008081. [PubMed: 21735421]
31. Liu YY, Ishikawa H, Chen M, Wollstein G, Duker JS, Fujimoto JG, Schuman JS, Rehg JM.Computerized macular pathology diagnosis in spectral domain optical coherence tomographyscans based on multiscale texture and shape features. Invest Ophthalmol Vis Sci. 2011; 52:8316–22. [PubMed: 21911579]
32. Budenz DL, Chang RT, Huang X, Knighton RW, Tielsch JM. Reproducibility of retinal nerve fiberthickness measurements using the stratus OCT in normal and glaucomatous eyes. InvestOphthalmol Vis Sci. 2005; 46:2440–3. [PubMed: 15980233]
33. Strouthidis NG, Demirel S, Asaoka R, Cossio-Zuniga C, Garway-Heath DF. The Heidelberg retinatomograph Glaucoma Probability Score: reproducibility and measurement of progression.Ophthalmology. 2010; 117:724–9. [PubMed: 20045564]
34. DeLeon Ortega JE, Sakata LM, Kakati B, McGwin G Jr, Monheit BE, Arthur SN, Girkin CA.Effect of glaucomatous damage on repeatability of confocal scanning laser ophthalmoscope,scanning laser polarimetry, and optical coherence tomography. Invest Ophthalmol Vis Sci. 2007;48:1156–63. [PubMed: 17325159]
35. Ng D, Zangwill LM, Racette L, Bowd C, Pascual JP, Bourne RR, Boden C, Weinreb RN, SamplePA. Agreement and repeatability for standard automated perimetry and confocal scanning laserophthalmoscopy in the diagnostic innovations in glaucoma study. Am J Ophthalmol. 2006;142:381–6. [PubMed: 16935580]
36. Garas A, Toth M, Vargha P, Hollo G. Comparison of repeatability of retinal nerve fiber layerthickness measurement made using the RTVue Fourier-domain optical coherence tomograph andthe GDx scanning laser polarimeter with variable or enhanced corneal compensation. J Glaucoma.2010; 19:412–7. [PubMed: 19855292]
37. Mai TA, Reus NJ, Lemij HG. Retinal nerve fiber layer measurement repeatability in scanning laserpolarimetry with enhanced corneal compensation. J Glaucoma. 2008; 17:269–74. [PubMed:18552611]
38. Krebs I, Smretschnig E, Moussa S, Brannath W, Womastek I, Binder S. Quality andreproducibility of retinal thickness measurements in two spectral-domain optical coherencetomography machines. Invest Ophthalmol Vis Sci. 2011; 52:6925–33. [PubMed: 21791591]
39. Langenegger SJ, Funk J, Toteberg-Harms M. Reproducibility of retinal nerve fiber layer thicknessmeasurements using the eye tracker and the retest function of Spectralis SD-OCT in glaucomatousand healthy control eyes. Invest Ophthalmol Vis Sci. 2011; 52:3338–44. [PubMed: 21330656]
40. Mwanza JC, Chang RT, Budenz DL, Durbin MK, Gendy MG, Shi W, Feuer WJ. Reproducibilityof peripapillary retinal nerve fiber layer thickness and optic nerve head parameters measured withcirrus HD-OCT in glaucomatous eyes. Invest Ophthalmol Vis Sci. 2010; 51:5724–30. [PubMed:20574014]
Nadler et al. Page 7
Optom Vis Sci. Author manuscript; available in PMC 2013 May 01.
NIH
-PA Author Manuscript
NIH
-PA Author Manuscript
NIH
-PA Author Manuscript

41. Garas A, Vargha P, Hollo G. Reproducibility of retinal nerve fiber layer and macular thicknessmeasurement with the RTVue-100 optical coherence tomograph. Ophthalmology. 2010; 117:738–46. [PubMed: 20079538]
42. Menke MN, Dabov S, Knecht P, Sturm V. Reproducibility of retinal thickness measurements inpatients with age-related macular degeneration using 3D Fourier-domain optical coherencetomography (OCT) (Topcon 3D-OCT 1000). Acta Ophthalmol. 2011; 89:346–51. [PubMed:20039855]
43. Ishikawa H, Stein DM, Wollstein G, Beaton S, Fujimoto JG, Schuman JS. Macular segmentationwith optical coherence tomography. Invest Ophthalmol Vis Sci. 2005; 46:2012–7. [PubMed:15914617]
44. Mwanza JC, Oakley JD, Budenz DL, Chang RT, Knight OJ, Feuer WJ. Macular ganglion cell-inner plexiform layer: automated detection and thickness reproducibility with spectral domain-optical coherence tomography in glaucoma. Invest Ophthalmol Vis Sci. 2011; 52:8323–9.[PubMed: 21917932]
45. Tan O, Chopra V, Lu AT, Schuman JS, Ishikawa H, Wollstein G, Varma R, Huang D. Detection ofmacular ganglion cell loss in glaucoma by Fourier-domain optical coherence tomography.Ophthalmology. 2009; 116:2305–14. [PubMed: 19744726]
46. Guedes V, Schuman JS, Hertzmark E, Wollstein G, Correnti A, Mancini R, Lederer D, VoskanianS, Velazquez L, Pakter HM, Pedut-Kloizman T, Fujimoto JG, Mattox C. Optical coherencetomography measurement of macular and nerve fiber layer thickness in normal and glaucomatoushuman eyes. Ophthalmology. 2003; 110:177–89. [PubMed: 12511364]
47. Medeiros FA, Zangwill LM, Bowd C, Weinreb RN. Comparison of the GDx VCC scanning laserpolarimeter, HRT II confocal scanning laser ophthalmoscope, and stratus OCT optical coherencetomograph for the detection of glaucoma. Arch Ophthalmol. 2004; 122:827–37. [PubMed:15197057]
48. Burgansky-Eliash Z, Wollstein G, Bilonick RA, Ishikawa H, Kagemann L, Schuman JS. Glaucomadetection with the Heidelberg retina tomograph 3. Ophthalmology. 2007; 114:466–71. [PubMed:17141321]
49. Wollstein G, Garway-Heath DF, Hitchings RA. Identification of early glaucoma cases with thescanning laser ophthalmoscope. Ophthalmology. 1998; 105:1557–63. [PubMed: 9709774]
50. Reddy S, Xing D, Arthur SN, Harizman N, Dorairaj S, Ritch R, Liebmann JM. HRT III glaucomaprobability score and Moorfields regression across the glaucoma spectrum. J Glaucoma. 2009;18:368–72. [PubMed: 19525726]
51. Sung KR, Wollstein G, Schuman JS, Bilonick RA, Ishikawa H, Townsend KA, Kagemann L,Gabriele ML. Scan quality effect on glaucoma discrimination by glaucoma imaging devices. Br JOphthalmol. 2009; 93:1580–4. [PubMed: 19692363]
52. Mai TA, Reus NJ, Lemij HG. Diagnostic accuracy of scanning laser polarimetry with enhancedversus variable corneal compensation. Ophthalmology. 2007; 114:1988–93. [PubMed: 17459481]
53. Leite MT, Zangwill LM, Weinreb RN, Rao HL, Alencar LM, Sample PA, Medeiros FA. Effect ofdisease severity on the performance of Cirrus spectral-domain OCT for glaucoma diagnosis. InvestOphthalmol Vis Sci. 2010; 51:4104–9. [PubMed: 20335619]
54. Wollstein G, Kagemann L, Bilonick RA, Ishikawa H, Folio LS, Gabriele ML, Ungar AK, DukerJS, Fujimoto JG, Schuman JS. Retinal nerve fibre layer and visual function loss in glaucoma: thetipping point. Br J Ophthalmol. 2012; 96:47–52. [PubMed: 21478200]
55. Bowd C, Zangwill LM, Medeiros FA, Hao J, Chan K, Lee TW, Sejnowski TJ, Goldbaum MH,Sample PA, Crowston JG, Weinreb RN. Confocal scanning laser ophthalmoscopy classifiers andstereophotograph evaluation for prediction of visual field abnormalities in glaucoma-suspect eyes.Invest Ophthalmol Vis Sci. 2004; 45:2255–62. [PubMed: 15223803]
56. Zangwill LM, Weinreb RN, Beiser JA, Berry CC, Cioffi GA, Coleman AL, Trick G, LiebmannJM, Brandt JD, Piltz-Seymour JR, Dirkes KA, Vega S, Kass MA, Gordon MO. Baselinetopographic optic disc measurements are associated with the development of primary open-angleglaucoma: the Confocal Scanning Laser Ophthalmoscopy Ancillary Study to the OcularHypertension Treatment Study. Arch Ophthalmol. 2005; 123:1188–97. [PubMed: 16157798]
Nadler et al. Page 8
Optom Vis Sci. Author manuscript; available in PMC 2013 May 01.
NIH
-PA Author Manuscript
NIH
-PA Author Manuscript
NIH
-PA Author Manuscript

57. Alencar LM, Bowd C, Weinreb RN, Zangwill LM, Sample PA, Medeiros FA. Comparison ofHRT-3 glaucoma probability score and subjective stereophotograph assessment for prediction ofprogression in glaucoma. Invest Ophthalmol Vis Sci. 2008; 49:1898–906. [PubMed: 18436823]
58. Chauhan BC, McCormick TA, Nicolela MT, LeBlanc RP. Optic disc and visual field changes in aprospective longitudinal study of patients with glaucoma: comparison of scanning lasertomography with conventional perimetry and optic disc photography. Arch Ophthalmol. 2001;119:1492–9. [PubMed: 11594950]
59. Medeiros FA, Leite MT, Zangwill LM, Weinreb RN. Combining structural and functionalmeasurements to improve detection of glaucoma progression using Bayesian hierarchical models.Invest Ophthalmol Vis Sci. 2011; 52:5794–803. [PubMed: 21693614]
60. Leung CK, Cheung CY, Weinreb RN, Qiu K, Liu S, Li H, Xu G, Fan N, Pang CP, Tse KK, LamDS. Evaluation of retinal nerve fiber layer progression in glaucoma: a study on optical coherencetomography guided progression analysis. Invest Ophthalmol Vis Sci. 2010; 51:217–22. [PubMed:19684001]
61. Leung CK, Liu S, Weinreb RN, Lai G, Ye C, Cheung CY, Pang CP, Tse KK, Lam DS. Evaluationof retinal nerve fiber layer progression in glaucoma a prospective analysis with neuroretinal rimand visual field progression. Ophthalmology. 2011; 118:1551–7. [PubMed: 21529958]
62. Wollstein G, Schuman JS, Price LL, Aydin A, Stark PC, Hertzmark E, Lai E, Ishikawa H, MattoxC, Fujimoto JG, Paunescu LA. Optical coherence tomography longitudinal evaluation of retinalnerve fiber layer thickness in glaucoma. Arch Ophthalmol. 2005; 123:464–70. [PubMed:15824218]
63. Leung CK, Ye C, Weinreb RN, Cheung CY, Qiu Q, Liu S, Xu G, Lam DS. Retinal nerve fiberlayer imaging with spectral-domain optical coherence tomography a study on diagnosticagreement with Heidelberg Retinal Tomograph. Ophthalmology. 2010; 117:267–74. [PubMed:19969364]
Nadler et al. Page 9
Optom Vis Sci. Author manuscript; available in PMC 2013 May 01.
NIH
-PA Author Manuscript
NIH
-PA Author Manuscript
NIH
-PA Author Manuscript

Figure 1.Scanning laser polarimetry printout with the GDx PRO; the left eye has a near normalRetinal Fiber Layer Map appearance as evidenced by the thickening (red color) superior andinferior to the optic nerve with a small and early localized thinning at the inferior temporalaspect of the disc noticeable in the Deviation Map. The right eye exhibits extensive thinningin the superior and inferior regions, marked by red and yellow indicators in the deviationmap. The center table contains the quantitative measurements with the color codedcomparison to normative database. Figures 1–3 were all acquired from the same subjectusing different imaging devices.
Nadler et al. Page 10
Optom Vis Sci. Author manuscript; available in PMC 2013 May 01.
NIH
-PA Author Manuscript
NIH
-PA Author Manuscript
NIH
-PA Author Manuscript

Figure 2.Confocal scanning laser ophthalmoscopy printout of the HRTIII with quantitativeparameters shown in the center. The right eye shows signs of glaucomatous damage ashighlighted by the red and yellow warning markings on the reflectance image shown in thecenter. The topography image (uppermost) demonstrates enlarged optic nerve head cuppingmarked by the red color. The left eye falls within the normal limits.
Nadler et al. Page 11
Optom Vis Sci. Author manuscript; available in PMC 2013 May 01.
NIH
-PA Author Manuscript
NIH
-PA Author Manuscript
NIH
-PA Author Manuscript
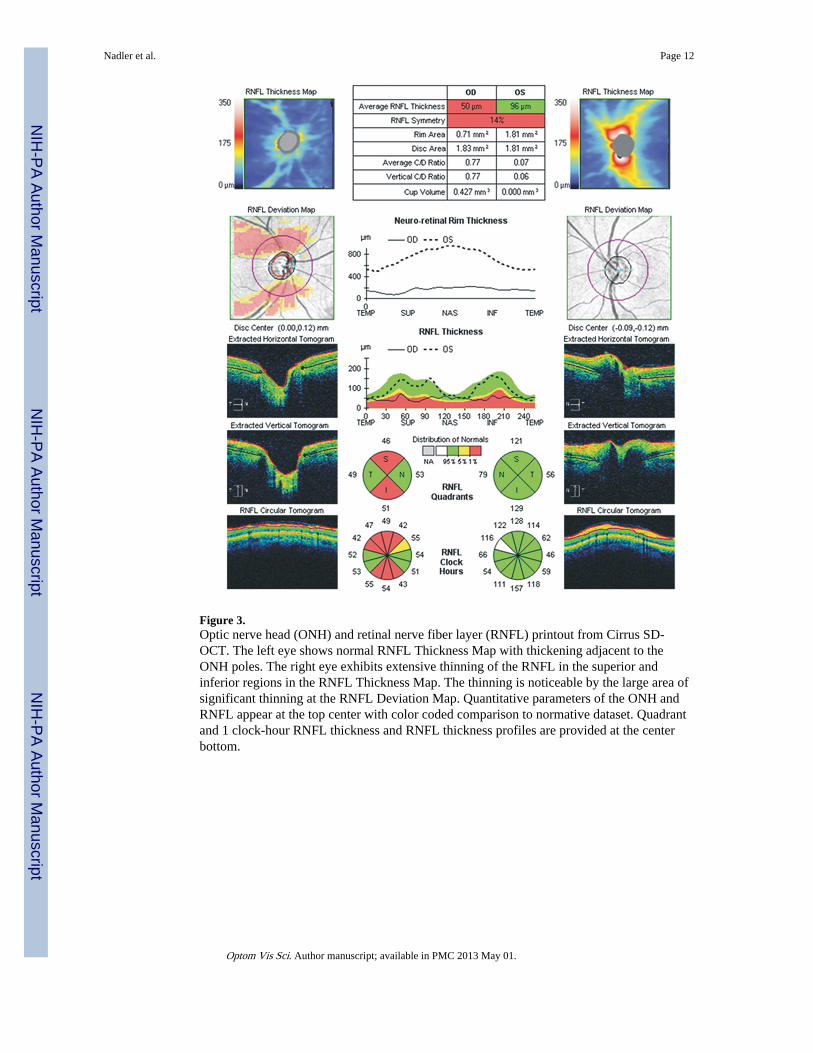
Figure 3.Optic nerve head (ONH) and retinal nerve fiber layer (RNFL) printout from Cirrus SD-OCT. The left eye shows normal RNFL Thickness Map with thickening adjacent to theONH poles. The right eye exhibits extensive thinning of the RNFL in the superior andinferior regions in the RNFL Thickness Map. The thinning is noticeable by the large area ofsignificant thinning at the RNFL Deviation Map. Quantitative parameters of the ONH andRNFL appear at the top center with color coded comparison to normative dataset. Quadrantand 1 clock-hour RNFL thickness and RNFL thickness profiles are provided at the centerbottom.
Nadler et al. Page 12
Optom Vis Sci. Author manuscript; available in PMC 2013 May 01.
NIH
-PA Author Manuscript
NIH
-PA Author Manuscript
NIH
-PA Author Manuscript

Figure 4.Cross sectional (B-scan) image taken with the Spectralis. The green line in the fundus imageon the left represents the placement of the OCT scan extending through the entire maculaand most of the optic nerve head. The layered pattern of the retina is clearly evident in theimage.
Nadler et al. Page 13
Optom Vis Sci. Author manuscript; available in PMC 2013 May 01.
NIH
-PA Author Manuscript
NIH
-PA Author Manuscript
NIH
-PA Author Manuscript
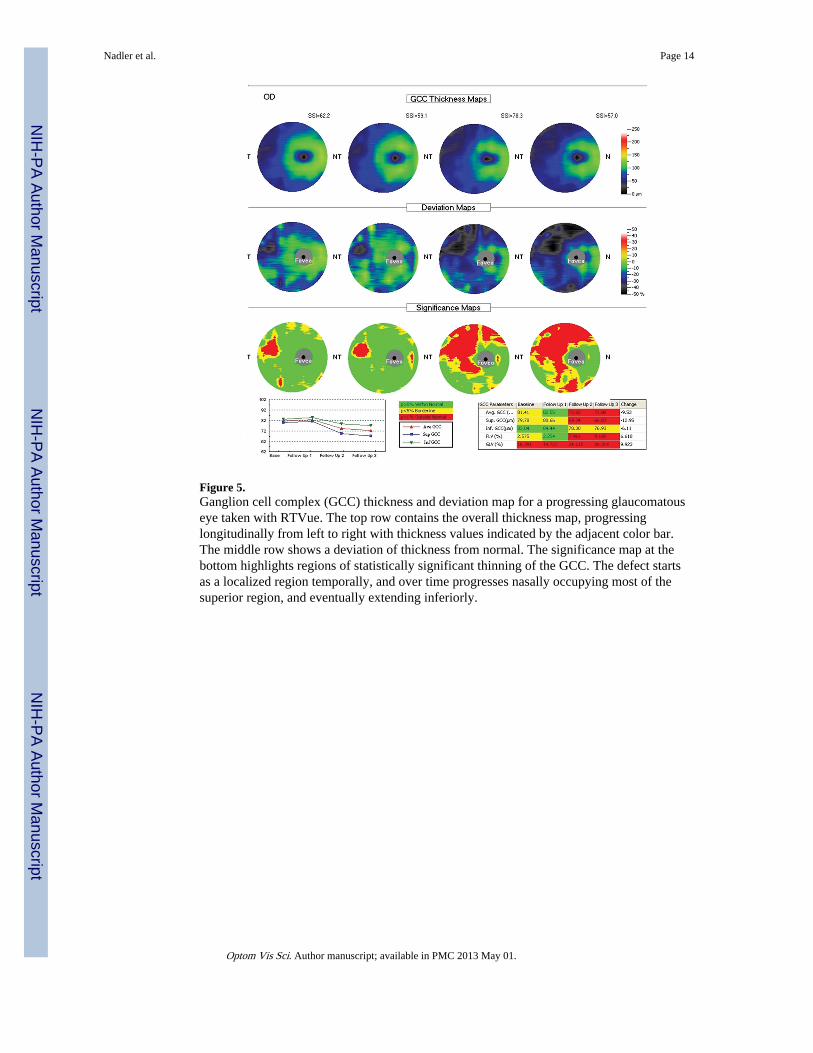
Figure 5.Ganglion cell complex (GCC) thickness and deviation map for a progressing glaucomatouseye taken with RTVue. The top row contains the overall thickness map, progressinglongitudinally from left to right with thickness values indicated by the adjacent color bar.The middle row shows a deviation of thickness from normal. The significance map at thebottom highlights regions of statistically significant thinning of the GCC. The defect startsas a localized region temporally, and over time progresses nasally occupying most of thesuperior region, and eventually extending inferiorly.
Nadler et al. Page 14
Optom Vis Sci. Author manuscript; available in PMC 2013 May 01.
NIH
-PA Author Manuscript
NIH
-PA Author Manuscript
NIH
-PA Author Manuscript

Figure 6.Three-dimensional reconstruction of the optic nerve head morphology by the Topcon 3D-OCT 2000. Cross-section maps occur at the margin of the cube.
Nadler et al. Page 15
Optom Vis Sci. Author manuscript; available in PMC 2013 May 01.
NIH
-PA Author Manuscript
NIH
-PA Author Manuscript
NIH
-PA Author Manuscript

Figure 7.High definition raster scan printout of age-related macular degeneration from the Cirrus HD-OCT. The scan includes 5 linear scans (top left) with the center scan magnified at thebottom. Marked elevation of the foveal region is evident with irregularity at the retinalpigment epithelium photoreceptor layer.
Nadler et al. Page 16
Optom Vis Sci. Author manuscript; available in PMC 2013 May 01.
NIH
-PA Author Manuscript
NIH
-PA Author Manuscript
NIH
-PA Author Manuscript

Figure 8.High definition raster scan printout of macular hole from the Cirrus HD-OCT. Full thicknesshole with intra-retinal edema at the hole margin occurring as the black spaces are clearlyvisible.
Nadler et al. Page 17
Optom Vis Sci. Author manuscript; available in PMC 2013 May 01.
NIH
-PA Author Manuscript
NIH
-PA Author Manuscript
NIH
-PA Author Manuscript