Dual energy CT imaging for preclinical and clinical radiotherapy
220
Dual energy CT imaging for preclinical and clinical radiotherapy Citation for published version (APA): Schyns, L. E. J. R. (2019). Dual energy CT imaging for preclinical and clinical radiotherapy. [Doctoral Thesis, Maastricht University]. ProefschriftMaken Maastricht. https://doi.org/10.26481/dis.20191009ls Document status and date: Published: 01/01/2019 DOI: 10.26481/dis.20191009ls Document Version: Publisher's PDF, also known as Version of record Please check the document version of this publication: • A submitted manuscript is the version of the article upon submission and before peer-review. There can be important differences between the submitted version and the official published version of record. People interested in the research are advised to contact the author for the final version of the publication, or visit the DOI to the publisher's website. • The final author version and the galley proof are versions of the publication after peer review. • The final published version features the final layout of the paper including the volume, issue and page numbers. Link to publication General rights Copyright and moral rights for the publications made accessible in the public portal are retained by the authors and/or other copyright owners and it is a condition of accessing publications that users recognise and abide by the legal requirements associated with these rights. • Users may download and print one copy of any publication from the public portal for the purpose of private study or research. • You may not further distribute the material or use it for any profit-making activity or commercial gain • You may freely distribute the URL identifying the publication in the public portal. If the publication is distributed under the terms of Article 25fa of the Dutch Copyright Act, indicated by the “Taverne” license above, please follow below link for the End User Agreement: www.umlib.nl/taverne-license Take down policy If you believe that this document breaches copyright please contact us at: [email protected] providing details and we will investigate your claim. Download date: 10 Jul. 2022
-
Upload
khangminh22 -
Category
Documents
-
view
0 -
download
0
Transcript of Dual energy CT imaging for preclinical and clinical radiotherapy
Dual energy CT imaging for preclinical and clinicalradiotherapyCitation for published version (APA):
Schyns, L. E. J. R. (2019). Dual energy CT imaging for preclinical and clinical radiotherapy. [DoctoralThesis, Maastricht University]. ProefschriftMaken Maastricht. https://doi.org/10.26481/dis.20191009ls
Document status and date:Published: 01/01/2019
DOI:10.26481/dis.20191009ls
Document Version:Publisher's PDF, also known as Version of record
Please check the document version of this publication:
• A submitted manuscript is the version of the article upon submission and before peer-review. There canbe important differences between the submitted version and the official published version of record.People interested in the research are advised to contact the author for the final version of the publication,or visit the DOI to the publisher's website.• The final author version and the galley proof are versions of the publication after peer review.• The final published version features the final layout of the paper including the volume, issue and pagenumbers.Link to publication
General rightsCopyright and moral rights for the publications made accessible in the public portal are retained by the authors and/or other copyrightowners and it is a condition of accessing publications that users recognise and abide by the legal requirements associated with theserights.
• Users may download and print one copy of any publication from the public portal for the purpose of private study or research.• You may not further distribute the material or use it for any profit-making activity or commercial gain• You may freely distribute the URL identifying the publication in the public portal.
If the publication is distributed under the terms of Article 25fa of the Dutch Copyright Act, indicated by the “Taverne” license above,please follow below link for the End User Agreement:
www.umlib.nl/taverne-license
Take down policyIf you believe that this document breaches copyright please contact us at:
providing details and we will investigate your claim.
Download date: 10 Jul. 2022
Dual energy CT imaging for preclinical and clinical radiotherapy
Lotte E J R Schyns
Dual energy CT imaging for preclinical and clinical radiotherapy
Lotte E J R Schyns
Dual energy CT imaging for
preclinical and clinical radiotherapy
Lotte E J R Schyns

ISBN/EAN: 978-94-6380-508-7
Layout and printed by: ProefschriftMaken – www.proefschriftmaken.nl
Dit proefschrift is gedrukt op 100% gerecycled papier

Dual energy CT imaging for preclinical and clinical radiotherapy
DISSERTATION
to obtain the degree of Doctor at Maastricht University,on the authority of the Rector Magnificus,
prof.dr. Rianne M. Letschert,in accordance with the decision of the Board of Deans,
to be defended in publicon Wednesday the 9th of October 2019 at 16:00 hours
by
Lotte Elisabeth Josephine Regine Schyns

Supervisor:
Prof.dr.ir. A.L.A.J. Dekker
Assessment Committee:
Prof.dr. D.K.M. De Ruysscher (chair)Dr. C. Coolens, University of Toronto, Ontario, CanadaProf.dr. P.A.M. HofmanProf.dr.ir. J.-J. Sonke, University of Amsterdam, Netherlands
Table of contents
Chapter 1 Introduction and outline of the thesis 7
Chapter 2 Optimizing dual energy cone beam CT protocols for preclinical imaging and radiation research 25
Chapter 3 The effect of different image reconstruction techniques on preclinical quantitative imaging and dual energy CT 47
Chapter 4 Murine vs human tissue compositions: implications of using human tissue compositions for photon energy absorption in mice 71
Chapter 5 The impact of dual energy CT imaging on dose calculations for preclinical studies 91
Chapter 6 Dual energy CT quantitative imaging: a comparison study between twin-beam and dual-source CT scanners 123
Chapter 7 Human tissue compositions and densities revisited after 60 years: an in vivo dual energy CT study for radiotherapy 149
Chapter 8 General discussion and future perspectives 175
Summary 189
Samenvatting 195
Valorisation addendum 201
Curriculum vitae 209
List of publications 213

Lotte E J R Schyns
Introduction and outline of the thesis
Chapter 1 2 3 4 5 6 7 8


9
Introduction and outline of the thesis
1Cancer
Causing about 1 in 6 deaths worldwide, cancer is a major health problem that accounts for an estimated 9.6 million deaths in 2018. 1 Cancer is a generic term for a large group of diseases in which the rapid creation of abnormal cells results in non-functional tissues called tumors. These tumors can invade adjoining organs and spread throughout the body while competing with healthy tissues. As a result, the healthy tissue’s biological processes can be severely compromised, eventually leading to organ failure and death if the cancer is left untreated for too long.
Cancer treatments can be grouped in three different categories. The first category is surgery, in which one or multiple tumors are removed from the body. The second category is systemic therapy, such as chemotherapy and immunotherapy, in which substances are administered that travel through the bloodstream, reaching and affecting cells all over the body. The third and final category is radiotherapy, in which tumors are targeted using radiation (from external beams or internal sources). Most cancer patients are treated using a combination of these categories. This thesis, however, focuses only on external beam radiotherapy.
Radiotherapy
The aim of radiotherapy is to kill tumor cells using ionizing radiation. During the radiotherapy treatment, a large amount of energy is deposited in the tumor via photon, electron, proton or heavy ion sources. This causes DNA strands in the tumor cells to break and destroys the cells’ ability to divide and grow, which effectively kills the tumor. Not only tumor cells are affected by radiation. Cells in the healthy tissues surrounding the tumor and cells through which the radiation beam passes can be damaged or killed during the radiotherapy treatment. This can cause both acute (short-term) and chronic (long-term) side effects.
To maximize the quality of life after radiotherapy, limiting the side effects is important. This can be done by sparing as much healthy tissue as possible, meaning that the surrounding organs at risk receive an extremely low radiation dose while the tumor receives an extremely high radiation dose. From a physical perspective, this can be challenging and may not even be possible. Therefore, the optimal radiotherapy treatment plan is a compromise between these two objectives.

10
Chapter 1
As there are many factors and compromises involved, accurate radiotherapy treatment planning requires sophisticated software to find the optimal radiotherapy treatment plan. First, a CT image of the patient is acquired to determine the location and borders of the tumor and the surrounding organs at risk. Clinical treatment planning software is then used to aim virtual radiation beams at the tumor in the CT image and to calculate a virtual radiation dose distribution for both the tumor and the surrounding organs at risk. Based on these dose calculations, multiple parameters such as the direction, shape, intensity and duration of the radiation beams are adjusted, followed by a new dose calculation and assessment. This process is repeated until the optimal radiotherapy treatment plan is found.
Preclinical studies
To better understand the effects of radiation on both tumors and healthy tissues, preclinical studies are sometimes required which are performed on cells (in vitro) or living animals (in vivo) in a laboratory setting before the knowledge obtained from these studies reaches the patient in the clinic. Due to ethical and financial reasons, it is preferred to test new hypotheses on cells or animals first. Fundamental preclinical studies investigate the role of certain genes and/or molecules in biological processes. Translational preclinical studies investigate new treatment possibilities, such as combining new chemotherapeutic agents with radiotherapy.
The complexity of cancer models used in preclinical studies ranges from isolated cancer cells in a petri dish to patient-derived tumors that are transplanted into an animal with genetically modified characteristics. A growing awareness of the fact that factors outside the cancer cells (e.g. vasculature and immune system) have a significant impact on the tumor response has led to the development of improved cancer models, which are better representations of cancers found in patients.
It is important to replicate clinical treatment conditions in preclinical studies as accurately and faithfully as possible. Useful conclusions cannot be drawn from studies that are too far removed from the clinical scenario. This is true for the cancer model, but it is also true for the equipment that is used to irradiate the cells or animals.
11
Introduction and outline of the thesis
1Image-guided small animal irradiators
Although it is possible to perform preclinical studies using clinical hardware and software that are intended to treat humans, 2–6 a number of problems arise due to the large difference in size between small animals and humans. 7,8
The first problem is the beam size. The smallest beams that can be accurately delivered by unmodified clinical systems are in the order of 5 x 5 mm2. This limitation is caused by both hardware and software issues. The hardware issues are related to the design of the linear accelerator head, the available energies and the targeting precision (combined positioning, stability and reproducibility). 7 The software issues are related to the accuracy of dose calculations for small fields in clinical treatment planning systems. It has been shown that the uncertainties in dosimetry and dose calculations increase rapidly with decreasing field sizes. 9,10
For humans, 5 x 5 mm2 beams are relatively small; it is even possible to cover specific subsections of a tumor. For small animals, however, 5 x 5 mm2 beams are relatively large and can even span multiple organs in addition to the tumor, which would drastically influence the outcome of a study. In general, only crude experiments in which large areas of the animal are irradiated are possible when using clinical systems.
The second problem is the energy of the beam. The typical megavoltage beams used in clinical external beam radiotherapy reach the maximum radiation dose after traveling through a few centimeters of tissue (the so-called buildup region). In the case of small animals, this means that the buildup region is as large as the animal itself. Furthermore, the amount of tissue in the beam is considerably lower for small animals than for humans, which causes a comparative lack of backscatter. The buildup and backscatter issues result in a substantial amount of radiation passing through the animal without depositing energy. This can be solved by switching from megavoltage beams to kilovoltage beams, which have additional advantages, such as sharper penumbras (edges of the beam) and a more compact x-ray source that is able to fit in a self-shielding cabinet and that can also be used for CT imaging.
The third problem is the imaging. As explained previously, a CT image is required in the treatment planning process. Clinical CT scanners can acquire images with discrete voxels (three-dimensional pixels) that have a length of 1.0 mm (or 0.5 mm) at best. In the case of a mouse with a typical 3 cm diameter, this means that a single CT slice would be a 30 x 30 pixel (or 60 x 60 pixel) image. A higher resolution is required, which can be achieved by using a high-resolution imaging

12
Chapter 1
panel and by increasing the magnification factor (e.g. by positioning the animal closer to the x-ray source).
The fourth problem is the dose calculation. Aside from the obvious issue that the typical dose grids in clinical treatment planning systems are too large for small animals, these systems are typically designed for usage with clinical hardware and megavoltage beams only. Clinical treatment planning systems use different variations of the superposition-convolution method to calculate dose distributions. While this method is relatively fast, it is unable to fully account for tissue heterogeneity (see next problem). A more suitable method for preclinical dose calculations is the Monte Carlo method, which involves simulating the transport of individual particles.
The fifth problem is tissue heterogeneity. Not all tissues in the beam have the same elemental composition. Different tissues contain different amounts of chemical elements, such as hydrogen (H), carbon (C), nitrogen (N), oxygen (O), phosphorus (P) and calcium (Ca). Bone tissues, for example, have higher Ca mass percentages than soft tissues. When performing dose calculations for megavoltage beams, tissue heterogeneity is generally not an issue. It is often assumed that all tissues in the beam are water, which is sufficient in most cases. For kilovoltage beams, however, the energy deposition is strongly influenced by the elemental composition of the tissue. Therefore, it is important to segment the CT image into different tissue types and assign the correct elemental composition to each tissue type before starting the dose calculation. A more detailed explanation is provided in the next section.
It can be concluded from the above that clinical systems are suboptimal if not unsuitable for performing preclinical studies. A completely new approach to external beam radiotherapy is required, which has led to the development of dedicated hardware and software. Image-guided small animal irradiators allow accurate targeting of tumors with narrow kilovoltage beams and small animal treatment planning systems are able to perform accurate dose calculations for these beams. 7,8 Commercial systems are now available from several manufacturers. 11,12 In addition to these systems, academic research institutes are developing their own non-profit systems. 13,14 Small animal treatment planning systems are also available. 15,16
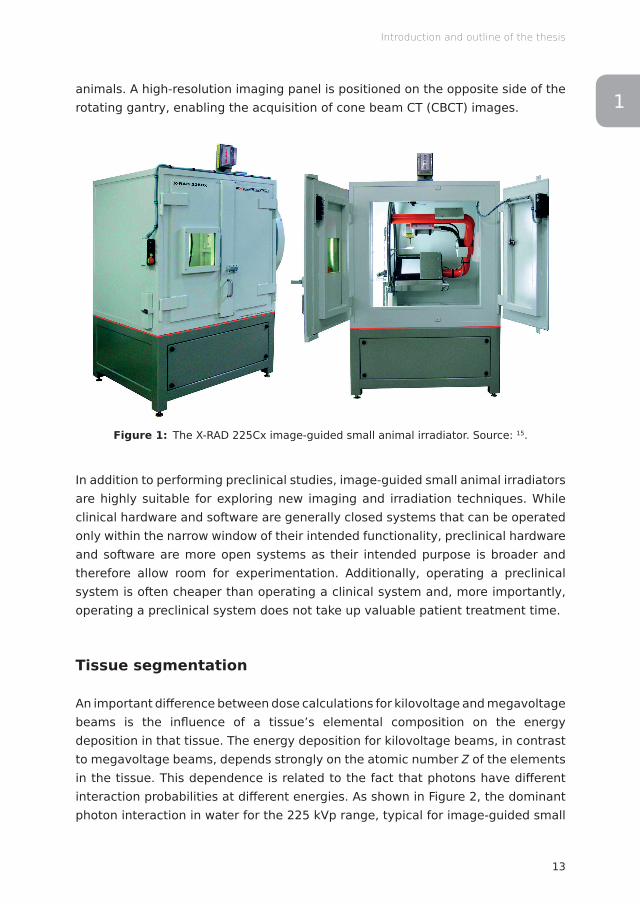
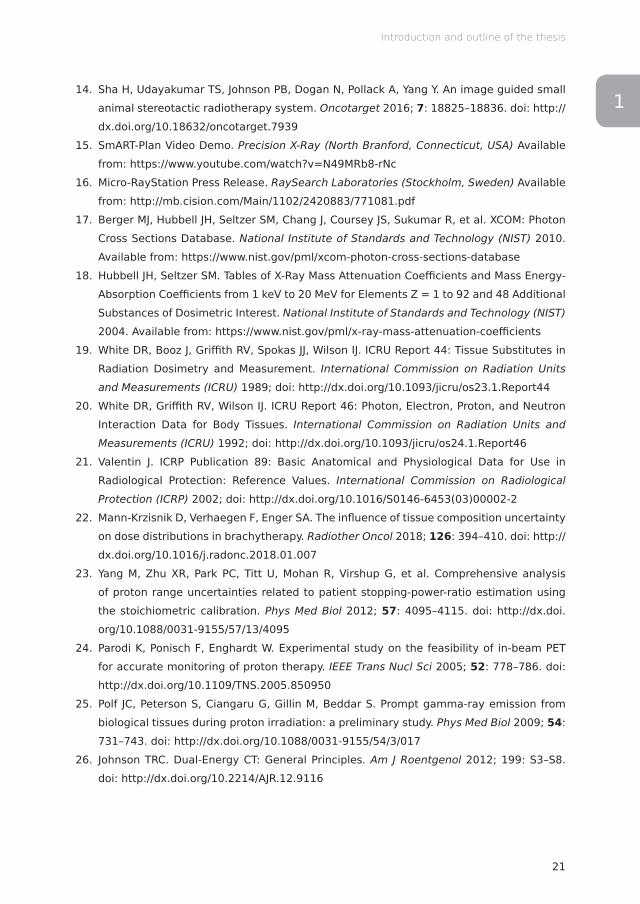
Figure 1 shows an example of an image-guided small animal irradiator, the X-RAD 225Cx (Precision X-Ray, North Branford, Connecticut, USA). This system has a kilovoltage x-ray source that can be used for both irradiating and imaging small
13
Introduction and outline of the thesis
1animals. A high-resolution imaging panel is positioned on the opposite side of the rotating gantry, enabling the acquisition of cone beam CT (CBCT) images.
Figure 1: The X-RAD 225Cx image-guided small animal irradiator. Source: 15.
In addition to performing preclinical studies, image-guided small animal irradiators are highly suitable for exploring new imaging and irradiation techniques. While clinical hardware and software are generally closed systems that can be operated only within the narrow window of their intended functionality, preclinical hardware and software are more open systems as their intended purpose is broader and therefore allow room for experimentation. Additionally, operating a preclinical system is often cheaper than operating a clinical system and, more importantly, operating a preclinical system does not take up valuable patient treatment time.
Tissue segmentation
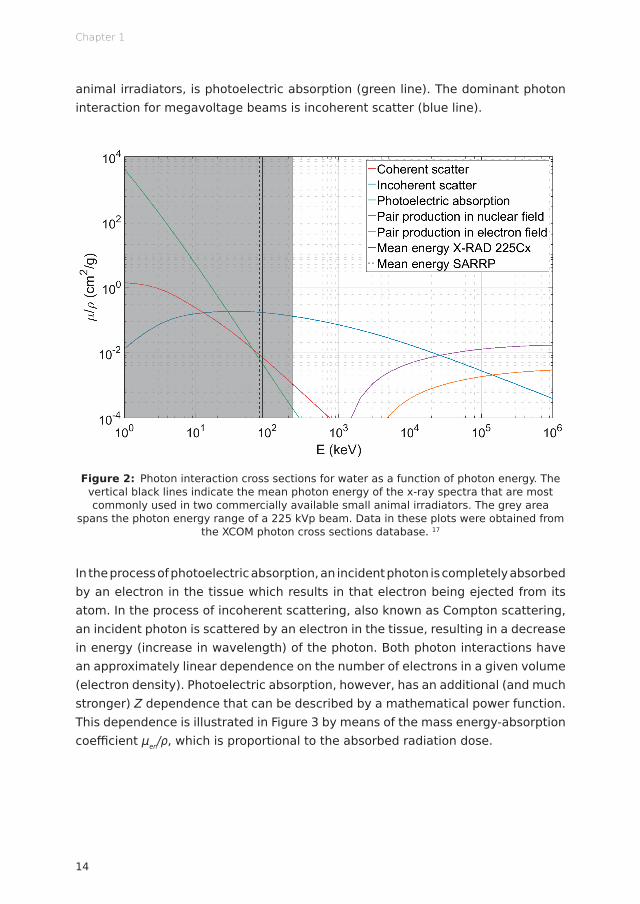
An important difference between dose calculations for kilovoltage and megavoltage beams is the influence of a tissue’s elemental composition on the energy deposition in that tissue. The energy deposition for kilovoltage beams, in contrast to megavoltage beams, depends strongly on the atomic number Z of the elements in the tissue. This dependence is related to the fact that photons have different interaction probabilities at different energies. As shown in Figure 2, the dominant photon interaction in water for the 225 kVp range, typical for image-guided small
14
Chapter 1
animal irradiators, is photoelectric absorption (green line). The dominant photon interaction for megavoltage beams is incoherent scatter (blue line).
Figure 2: Photon interaction cross sections for water as a function of photon energy. The vertical black lines indicate the mean photon energy of the x-ray spectra that are most commonly used in two commercially available small animal irradiators. The grey area
spans the photon energy range of a 225 kVp beam. Data in these plots were obtained from the XCOM photon cross sections database. 17
In the process of photoelectric absorption, an incident photon is completely absorbed by an electron in the tissue which results in that electron being ejected from its atom. In the process of incoherent scattering, also known as Compton scattering, an incident photon is scattered by an electron in the tissue, resulting in a decrease in energy (increase in wavelength) of the photon. Both photon interactions have an approximately linear dependence on the number of electrons in a given volume (electron density). Photoelectric absorption, however, has an additional (and much stronger) Z dependence that can be described by a mathematical power function. This dependence is illustrated in Figure 3 by means of the mass energy-absorption coefficient μen/ρ, which is proportional to the absorbed radiation dose.

15
Introduction and outline of the thesis
1
Figure 3: Mass energy-absorption coefficients for several tissues as a function of photon energy. The vertical black lines indicate the mean photon energy of the x-ray spectra that are most commonly used in two commercially available small animal irradiators. The grey area spans the photon energy range of a 225 kVp beam. Data in these plots were obtained from the NIST tables of photon mass attenuation coefficients and mass energy-absorption
coefficients. 18
For photon energies above 200 keV, the difference in μen/ρ for the different tissues is negligible. As the photon energy decreases, the differences between the different tissues become more pronounced. The bone tissues (femur and rib) stand out from the soft tissues (adipose, muscle and thyroid) due to the higher mass percentage of calcium (Z = 20). The thyroid tissue has the highest μen/ρ among the soft tissues due to the iodine (Z = 53) that is present in the thyroid. Even though the concentration of iodine in the thyroid is only 0.1 mass percent, 19–21 the strong Z dependence results in a noticeable impact on μen/ρ and thus on the absorbed radiation dose.
The problem of tissue heterogeneity in kilovoltage beams is not limited to the field of small animal radiotherapy. In the field of brachytherapy, radiation sources are placed inside the patient to reach the tumor from a close distance. These sources emit photons in the kilovoltage energy range, resulting in a similar Z dependence of the absorbed radiation dose. 22 In addition to brachytherapy, tissue composition is also an important factor in proton therapy and proton range verification techniques. 23–25
16
Chapter 1
Since the absorbed radiation dose for tissues in kilovoltage beams depends strongly on the elemental composition of the tissues, they need to be taken into account when performing (pre)clinical dose calculations. Currently, the elemental tissue compositions that are used in these dose calculations are taken from the reference data for human tissue compositions and mass densities, listed in several reports by the International Commission on Radiation Units and Measurements (ICRU) and the International Commission on Radiological Protection (ICRP). 19–21
Instead of relying on the human reference data, it would be preferable to extract information about the elemental composition of the tissues from CT images which are used in the treatment planning process. This information, in contrast to density information, cannot be obtained from conventional single energy CT (SECT) images. A new technique is required. When combining two CT or CBCT images that are acquired with different x-ray spectra, it is possible to extract additional information from these images. This technique is called dual energy CT (DECT). 26–28
Dual energy CT
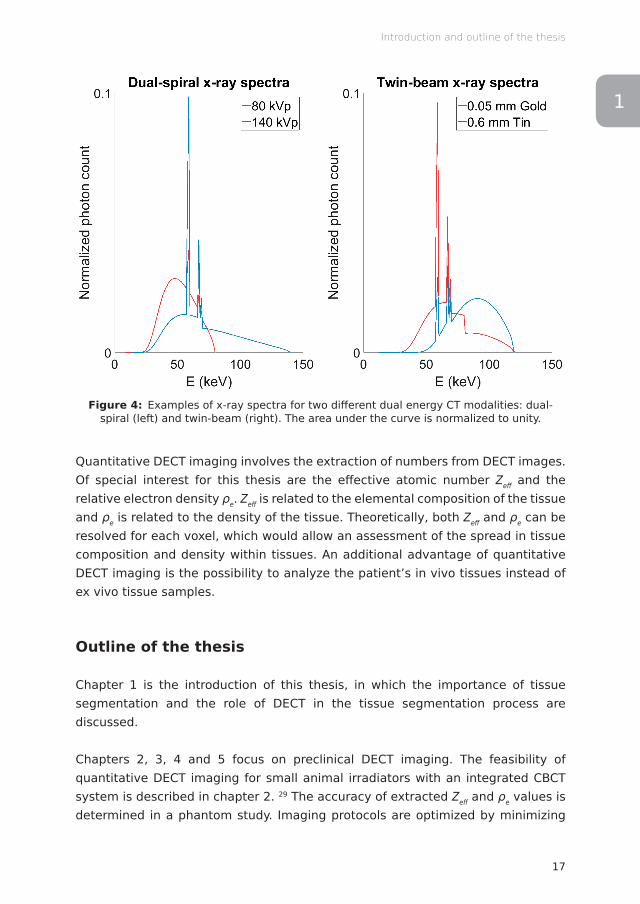
Two CT images with different x-ray spectra can be obtained by acquiring two CT images in two consecutive scans with different x-ray tube voltages (dual-spiral), by rapidly switching the tube voltage during the acquisition (rapid kilovoltage switching), by dividing the x-ray beam in two halves using different filters (twin-beam), by using two different detector layers (dual-layer) or by using two x-ray sources and two sets of detectors (dual-source). The different DECT modalities result in different combinations of x-ray spectra. As an example, Figure 4 shows the x-ray spectra for a dual-spiral DECT scanner and a twin-beam DECT scanner.
17
Introduction and outline of the thesis
1
Figure 4: Examples of x-ray spectra for two different dual energy CT modalities: dual-spiral (left) and twin-beam (right). The area under the curve is normalized to unity.
Quantitative DECT imaging involves the extraction of numbers from DECT images. Of special interest for this thesis are the effective atomic number Zeff and the relative electron density ρe. Zeff is related to the elemental composition of the tissue and ρe is related to the density of the tissue. Theoretically, both Zeff and ρe can be resolved for each voxel, which would allow an assessment of the spread in tissue composition and density within tissues. An additional advantage of quantitative DECT imaging is the possibility to analyze the patient’s in vivo tissues instead of ex vivo tissue samples.
Outline of the thesis
Chapter 1 is the introduction of this thesis, in which the importance of tissue segmentation and the role of DECT in the tissue segmentation process are discussed.
Chapters 2, 3, 4 and 5 focus on preclinical DECT imaging. The feasibility of quantitative DECT imaging for small animal irradiators with an integrated CBCT system is described in chapter 2. 29 The accuracy of extracted Zeff and ρe values is determined in a phantom study. Imaging protocols are optimized by minimizing

18
Chapter 1
the difference between extracted and reference Zeff and ρe values. An additional simulation study investigates the influence of beam hardening effects and the performance of a beam hardening correction on the accuracy of extracted Zeff and ρe values.
The effect of different image reconstruction techniques on quantitative DECT imaging is analyzed in chapter 3. 30 Phantom images are reconstructed with different image reconstruction techniques and a quantitative DECT analysis is performed on these images to determine if there is any benefit in choosing an iterative reconstruction technique instead of the conventional backprojection reconstruction technique. For clinical DECT imaging, a clear benefit was found in the form of noise reduction and improved dose calculation accuracy. 31 For preclinical DECT imaging, however, there might be no benefit in choosing an iterative reconstruction technique.
The implications of using human tissue compositions for dose calculations in mice are investigated in chapter 4. 32 In this study, the previously introduced DECT technique is used to extract Zeff and ρe distributions for different tissues in DECT images of mice. μen/ρ distributions are calculated from the extracted Zeff and ρe distributions and compared to μen/ρ values that are calculated from the ICRU and ICRP reference data. Since differences in μen/ρ are proportional to differences in absorbed radiation dose, relative dose calculation differences between murine tissues (extracted values) and human tissues (reference values) tissues can be obtained.
The feasibility of using preclinical DECT images for tissue segmentation and its potential dose calculation accuracy gain are considered in chapter 5. 33 Both SECT and DECT tissue segmentation techniques are performed on CT images of a phantom and an ex vivo mouse. Both tissue segmentation techniques are used with a number of different material maps to perform Monte Carlo dose calculations and investigate the impact of the tissue segmentation technique on the calculated dose distributions.
Moving from the preclinical environment to the clinical environment, chapters 6 and 7 focus on clinical DECT imaging. A novel twin-beam DECT scanner is assessed in chapter 6. 34 At the time, this scanner was being considered for purchase by the clinic. Since quantitative DECT data was not yet available for this scanner, measurements were performed using a prototype in the Siemens factory in Forchheim, Germany. A phantom study compares extracted Zeff and ρe values between the twin-beam DECT scanner and two dual-source DECT scanners. The

19
Introduction and outline of the thesis
1extracted values are also compared to reference values provided by the phantom manufacturers to investigate which DECT scanner provides the most accurate DECT data.
The well-established ICRU and ICRP reference data for elemental tissue compositions and tissue densities are reevaluated in chapter 7. 35 The first DECT images that were acquired using the clinic’s new dual-spiral DECT scanner are used to extract Zeff and ρe distributions for different in vivo tissues in cancer patients. μen/ρ distributions are calculated from the extracted Zeff and ρe distributions and compared to μen/ρ values that are calculated from the ICRU and ICRP reference data. This chapter follows the approach of chapter 4 and adds an additional analysis of the influence of beam hardening artifacts as well as the influence of motion and image registration artifacts on the extracted Zeff and ρe distributions.
Chapter 8 contains a general discussion of the previous chapters and sheds light on a number of future perspectives regarding the improvement of tissue segmentation.
20
Chapter 1
References
1. Reboux G. Cancer Fact Sheet. World Health Organization (WHO) 2018. Available from: https://www.who.int/news-room/fact-sheets/detail/cancer
2. Trani D, Reniers B, Persoon L, Podesta M, Nalbantov G, Leijenaar RTH, et al. What Level of Accuracy Is Achievable for Preclinical Dose Painting Studies on a Clinical Irradiation Platform? Radiat Res 2015; 183: 501–510. doi: http://dx.doi.org/10.1667/RR13933.1
3. Trani D, Yaromina A, Dubois L, Granzier M, Peeters SGJA, Biemans R, et al. Preclinical Assessment of Efficacy of Radiation Dose Painting Based on Intratumoral FDG-PET Uptake. Clin Cancer Res 2015; 21: 5511–5518. doi: http://dx.doi.org/10.1158/1078-0432.CCR-15-0290
4. Yaromina A, Granzier M, Biemans R, Lieuwes N, van Elmpt W, Shakirin G, et al. A novel concept for tumour targeting with radiation: Inverse dose-painting or targeting the “Low Drug Uptake Volume”. Radiother Oncol 2017; 124: 513–520. doi: http://dx.doi.org/10.1016/j.radonc.2017.04.020
5. Koontz BF, Yan H, Kimura M, Vujaskovic Z, Donatucci C, Yin FF. Feasibility Study of an Intensity‐Modulated Radiation Model for the Study of Erectile Dysfunction. J Sex Med 2011; 8: 411–418. doi: http://dx.doi.org/10.1111/j.1743-6109.2010.02125.x
6. Parsons D, Church C, Syme A. Toward a pre-clinical irradiator using clinical infrastructure. Phys Med 2019; 58: 21–31. doi: http://dx.doi.org/10.1016/j.ejmp.2019.01.006
7. Verhaegen F, Granton P, Tryggestad E. Small animal radiotherapy research platforms. Phys Med Biol 2011; 56: R55–R83. doi: http://dx.doi.org/10.1088/0031-9155/56/12/R01
8. Verhaegen F, van Hoof S, Granton PV, Trani D. A review of treatment planning for precision image-guided photon beam pre-clinical animal radiation studies. Z Med Phys 2014; 24: 323–334. doi: http://dx.doi.org/10.1016/j.zemedi.2014.02.004
9. Das IJ, Ding GX, Ahnesjö A. Small fields: Nonequilibrium radiation dosimetry. Med Phys 2008; 35: 206–215. doi: http://dx.doi.org/10.1118/1.2815356
10. Fogliata A, Lobefalo F, Reggiori G, Stravato A, Tomatis S, Scorsetti M, et al. Evaluation of the dose calculation accuracy for small fields defined by jaw or MLC for AAA and Acuros XB algorithms: Small fields MU calculation with AAA and Acuros. Med Phys 2016; 43: 5685–5694. doi: http://dx.doi.org/10.1118/1.4963219
11. X-RAD SmART Technical Brochure. Precision X-Ray (North Branford, Connecticut, USA) Available from: https://www.accela.eu/files/products/133/x-rad-smart-technical-brochure.pdf
12. SARRP Website. Xstrahl (Camberley, Surrey, UK) Available from: https://xstrahl.com/life-science-systems/small-animal-radiation-research-platform/
13. Tillner F, Thute P, Löck S, Dietrich A, Fursov A, Haase R, et al. Precise image-guided irradiation of small animals: a flexible non-profit platform. Phys Med Biol 2016; 61: 3084–3108. doi: http://dx.doi.org/10.1088/0031-9155/61/8/3084
21
Introduction and outline of the thesis
114. Sha H, Udayakumar TS, Johnson PB, Dogan N, Pollack A, Yang Y. An image guided small
animal stereotactic radiotherapy system. Oncotarget 2016; 7: 18825–18836. doi: http://dx.doi.org/10.18632/oncotarget.7939
15. SmART-Plan Video Demo. Precision X-Ray (North Branford, Connecticut, USA) Available from: https://www.youtube.com/watch?v=N49MRb8-rNc
16. Micro-RayStation Press Release. RaySearch Laboratories (Stockholm, Sweden) Available from: http://mb.cision.com/Main/1102/2420883/771081.pdf
17. Berger MJ, Hubbell JH, Seltzer SM, Chang J, Coursey JS, Sukumar R, et al. XCOM: Photon Cross Sections Database. National Institute of Standards and Technology (NIST) 2010. Available from: https://www.nist.gov/pml/xcom-photon-cross-sections-database
18. Hubbell JH, Seltzer SM. Tables of X-Ray Mass Attenuation Coefficients and Mass Energy-Absorption Coefficients from 1 keV to 20 MeV for Elements Z = 1 to 92 and 48 Additional Substances of Dosimetric Interest. National Institute of Standards and Technology (NIST) 2004. Available from: https://www.nist.gov/pml/x-ray-mass-attenuation-coefficients
19. White DR, Booz J, Griffith RV, Spokas JJ, Wilson IJ. ICRU Report 44: Tissue Substitutes in Radiation Dosimetry and Measurement. International Commission on Radiation Units and Measurements (ICRU) 1989; doi: http://dx.doi.org/10.1093/jicru/os23.1.Report44
20. White DR, Griffith RV, Wilson IJ. ICRU Report 46: Photon, Electron, Proton, and Neutron Interaction Data for Body Tissues. International Commission on Radiation Units and Measurements (ICRU) 1992; doi: http://dx.doi.org/10.1093/jicru/os24.1.Report46
21. Valentin J. ICRP Publication 89: Basic Anatomical and Physiological Data for Use in Radiological Protection: Reference Values. International Commission on Radiological Protection (ICRP) 2002; doi: http://dx.doi.org/10.1016/S0146-6453(03)00002-2
22. Mann-Krzisnik D, Verhaegen F, Enger SA. The influence of tissue composition uncertainty on dose distributions in brachytherapy. Radiother Oncol 2018; 126: 394–410. doi: http://dx.doi.org/10.1016/j.radonc.2018.01.007
23. Yang M, Zhu XR, Park PC, Titt U, Mohan R, Virshup G, et al. Comprehensive analysis of proton range uncertainties related to patient stopping-power-ratio estimation using the stoichiometric calibration. Phys Med Biol 2012; 57: 4095–4115. doi: http://dx.doi.org/10.1088/0031-9155/57/13/4095
24. Parodi K, Ponisch F, Enghardt W. Experimental study on the feasibility of in-beam PET for accurate monitoring of proton therapy. IEEE Trans Nucl Sci 2005; 52: 778–786. doi: http://dx.doi.org/10.1109/TNS.2005.850950
25. Polf JC, Peterson S, Ciangaru G, Gillin M, Beddar S. Prompt gamma-ray emission from biological tissues during proton irradiation: a preliminary study. Phys Med Biol 2009; 54: 731–743. doi: http://dx.doi.org/10.1088/0031-9155/54/3/017
26. Johnson TRC. Dual-Energy CT: General Principles. Am J Roentgenol 2012; 199: S3–S8. doi: http://dx.doi.org/10.2214/AJR.12.9116
22
Chapter 1
27. Johnson TRC, Krauß B, Sedlmair M, Grasruck M, Bruder H, Morhard D, et al. Material differentiation by dual energy CT: initial experience. Eur Radiol 2007; 17: 1510–1517. doi: http://dx.doi.org/10.1007/s00330-006-0517-6
28. McCollough CH, Leng S, Yu L, Fletcher JG. Dual- and Multi-Energy CT: Principles, Technical Approaches, and Clinical Applications. Radiology 2015; 276: 637–653. doi: http://dx.doi.org/10.1148/radiol.2015142631
29. Schyns LEJR, Almeida IP, van Hoof SJ, Descamps B, Vanhove C, Landry G, et al. Optimizing dual energy cone beam CT protocols for preclinical imaging and radiation research. Br J Radiol 2016; 90: 20160480. doi: http://dx.doi.org/10.1259/bjr.20160480
30. Vaniqui A, Schyns LEJR, Almeida IP, van der Heyden B, Podesta M, Verhaegen F. The effect of different image reconstruction techniques on pre-clinical quantitative imaging and dual-energy CT. Br J Radiol 2018; 92: 20180447. doi: http://dx.doi.org/10.1259/bjr.20180447
31. Landry G, Gaudreault M, van Elmpt W, Wildberger JE, Verhaegen F. Improved dose calculation accuracy for low energy brachytherapy by optimizing dual energy CT imaging protocols for noise reduction using sinogram affirmed iterative reconstruction. Z Med Phys 2016; 26: 75–87. doi: http://dx.doi.org/10.1016/j.zemedi.2015.09.001
32. Schyns LEJR, Eekers DBP, van der Heyden B, Almeida IP, Vaniqui A, Verhaegen F. Murine vs human tissue compositions: implications of using human tissue compositions for photon energy absorption in mice. Br J Radiol 2018; 92: 20180454. doi: http://dx.doi.org/10.1259/bjr.20180454
33. Vaniqui A, Schyns LEJR, Almeida IP, van der Heyden B, van Hoof SJ, Verhaegen F. The impact of dual energy CT imaging on dose calculations for pre-clinical studies. Radiat Oncol 2017; 12: 12:181. doi: http://dx.doi.org/10.1186/s13014-017-0922-9
34. Almeida IP, Schyns LEJR, Öllers MC, van Elmpt W, Parodi K, Landry G, et al. Dual-energy CT quantitative imaging: a comparison study between twin-beam and dual-source CT scanners. Med Phys 2017; 44: 171–179. doi: http://dx.doi.org/10.1002/mp.12000
35. Schyns LEJR, van der Heyden B, Almeida IP, Vaniqui A, Eekers DBP, Verhaegen F. Human tissue compositions and densities revisited after 60 years: an in vivo dual energy CT study for radiotherapy. In preparation for submission 2019;

1

Lotte E J R SchynsIsabel P Almeida
Stefan J van HoofBenedicte Descamps
Christian VanhoveGuillaume LandryPatrick V GrantonFrank Verhaegen
Published in the British Journal of Radiology (2016)http://dx.doi.org/10.1259/bjr.20160480
Optimizing dual energy cone beam CTprotocols for preclinical imaging
and radiation research
Chapter 1 2 3 4 5 6 7 8
26
Chapter 2
Abstract
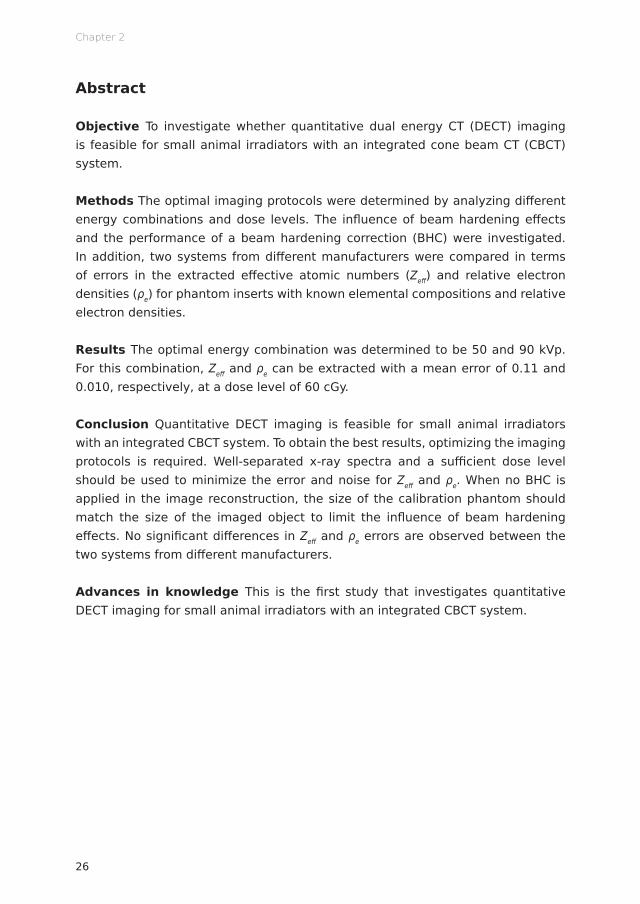
Objective To investigate whether quantitative dual energy CT (DECT) imaging is feasible for small animal irradiators with an integrated cone beam CT (CBCT) system.
Methods The optimal imaging protocols were determined by analyzing different energy combinations and dose levels. The influence of beam hardening effects and the performance of a beam hardening correction (BHC) were investigated. In addition, two systems from different manufacturers were compared in terms of errors in the extracted effective atomic numbers (Zeff) and relative electron densities (ρe) for phantom inserts with known elemental compositions and relative electron densities.
Results The optimal energy combination was determined to be 50 and 90 kVp. For this combination, Zeff and ρe can be extracted with a mean error of 0.11 and 0.010, respectively, at a dose level of 60 cGy.
Conclusion Quantitative DECT imaging is feasible for small animal irradiators with an integrated CBCT system. To obtain the best results, optimizing the imaging protocols is required. Well-separated x-ray spectra and a sufficient dose level should be used to minimize the error and noise for Zeff and ρe. When no BHC is applied in the image reconstruction, the size of the calibration phantom should match the size of the imaged object to limit the influence of beam hardening effects. No significant differences in Zeff and ρe errors are observed between the two systems from different manufacturers.
Advances in knowledge This is the first study that investigates quantitative DECT imaging for small animal irradiators with an integrated CBCT system.
27
Optimizing preclinical DECT protocols
2
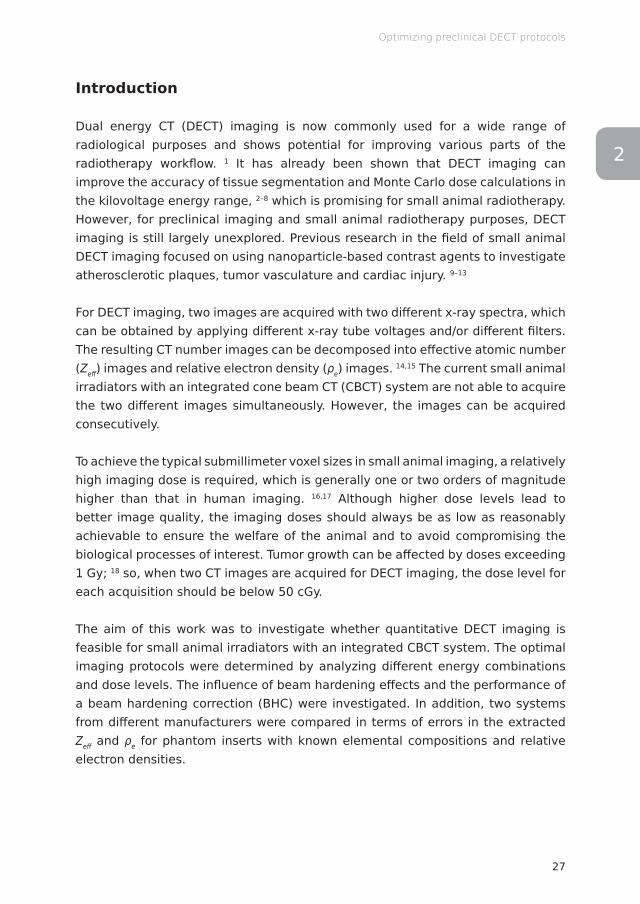
Introduction
Dual energy CT (DECT) imaging is now commonly used for a wide range of radiological purposes and shows potential for improving various parts of the radiotherapy workflow. 1 It has already been shown that DECT imaging can improve the accuracy of tissue segmentation and Monte Carlo dose calculations in the kilovoltage energy range, 2–8 which is promising for small animal radiotherapy. However, for preclinical imaging and small animal radiotherapy purposes, DECT imaging is still largely unexplored. Previous research in the field of small animal DECT imaging focused on using nanoparticle-based contrast agents to investigate atherosclerotic plaques, tumor vasculature and cardiac injury. 9–13
For DECT imaging, two images are acquired with two different x-ray spectra, which can be obtained by applying different x-ray tube voltages and/or different filters. The resulting CT number images can be decomposed into effective atomic number (Zeff) images and relative electron density (ρe) images. 14,15 The current small animal irradiators with an integrated cone beam CT (CBCT) system are not able to acquire the two different images simultaneously. However, the images can be acquired consecutively.
To achieve the typical submillimeter voxel sizes in small animal imaging, a relatively high imaging dose is required, which is generally one or two orders of magnitude higher than that in human imaging. 16,17 Although higher dose levels lead to better image quality, the imaging doses should always be as low as reasonably achievable to ensure the welfare of the animal and to avoid compromising the biological processes of interest. Tumor growth can be affected by doses exceeding 1 Gy; 18 so, when two CT images are acquired for DECT imaging, the dose level for each acquisition should be below 50 cGy.
The aim of this work was to investigate whether quantitative DECT imaging is feasible for small animal irradiators with an integrated CBCT system. The optimal imaging protocols were determined by analyzing different energy combinations and dose levels. The influence of beam hardening effects and the performance of a beam hardening correction (BHC) were investigated. In addition, two systems from different manufacturers were compared in terms of errors in the extracted Zeff and ρe for phantom inserts with known elemental compositions and relative electron densities.
28
Chapter 2
Methods and materials
Mini phantoms
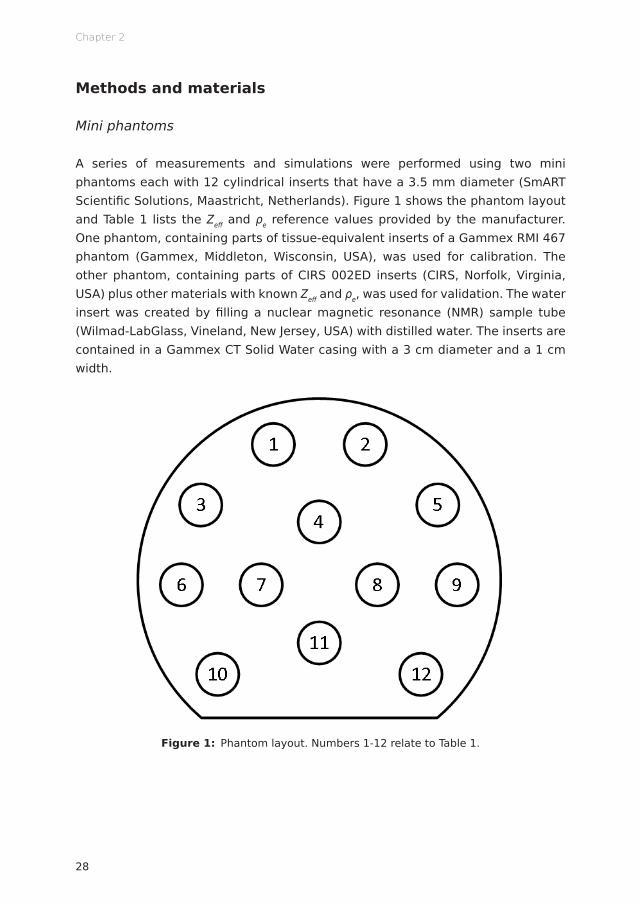
A series of measurements and simulations were performed using two mini phantoms each with 12 cylindrical inserts that have a 3.5 mm diameter (SmART Scientific Solutions, Maastricht, Netherlands). Figure 1 shows the phantom layout and Table 1 lists the Zeff and ρe reference values provided by the manufacturer. One phantom, containing parts of tissue-equivalent inserts of a Gammex RMI 467 phantom (Gammex, Middleton, Wisconsin, USA), was used for calibration. The other phantom, containing parts of CIRS 002ED inserts (CIRS, Norfolk, Virginia, USA) plus other materials with known Zeff and ρe, was used for validation. The water insert was created by filling a nuclear magnetic resonance (NMR) sample tube (Wilmad-LabGlass, Vineland, New Jersey, USA) with distilled water. The inserts are contained in a Gammex CT Solid Water casing with a 3 cm diameter and a 1 cm width.
Figure 1: Phantom layout. Numbers 1-12 relate to Table 1.

29
Optimizing preclinical DECT protocols
2
Table 1: Effective atomic number (Zeff) and relative electron density (ρe) reference values provided by the manufacturer.
Calibration phantom Validation phantom
Nr Insert name Zeff ρe Nr Insert name Zeff ρe
1 Gammex AP6 Adipose 6.21 0.928 1 Gammex BR12 Breast 6.93 0.956
2 Gammex CT Solid Water 7.74 0.992 2 Teflon 8.46 1.860
3 Gammex IB3 Inner Bone 10.42 1,086 3 Lucite 6.53 1.146
4 Gammex SR2 Brain 6.09 1.047 4 Air 7.71 0.001
5 Gammex CB2-30% CaCO3 10.90 1.276 5 PMMA 6.53 1.156
6 Gammex BR12 Breast 6.93 0.956 6 Paraffin Wax 5.48 0.959
7 Air 7.71 0.001 7 Water 7.48 1.000
8 Water 7.48 1.000 8 CIRS Muscle 7.59 1.041
9 Gammex B200 Bone Mineral 10.42 1.103 9 Air 7.71 0.001
10 Gammex LV1 Liver 7.74 1.064 10 Air 7.71 0.001
11 Gammex SB3 ortical Bone 13.64 1.695 11 CIRS Adipose 6.44 0.956
12 Gammex CB2-50% CaCO3 12.54 1.469 12 CIRS Bone 11.90 1.507
Imaging protocols
For the first set of measurements, the mini phantoms were imaged using an X-RAD 225Cx system (Precision X-Ray, North Branford, Connecticut, USA). 19 The images were acquired for a series of x-ray tube voltages ranging from 40 to 100 kV in 10 kV increments. Each of the seven x-ray spectra were filtered with 2 mm of aluminum. The acquired images were reconstructed into a 328 x 311 x 591 matrix with a 103 x 103 x 103 μm3 voxel size using a Feldkamp backprojection algorithm. 20 To achieve an equivalent dose level of 30 cGy for each energy (60 cGy for any combination of two energies), the exposures (product of tube current and exposure time) listed in Table 2 were used. To verify the dose level for each energy, measurements using a TN30012 Farmer ionization chamber (PTW, Freiburg, Germany) were performed according to the AAPM TG-61 protocol for kilovoltage x-ray beam dosimetry to determine the absorbed dose to water at the surface of the phantom. 21 The dose inside the phantom is considerably lower than the surface dose.
30
Chapter 2
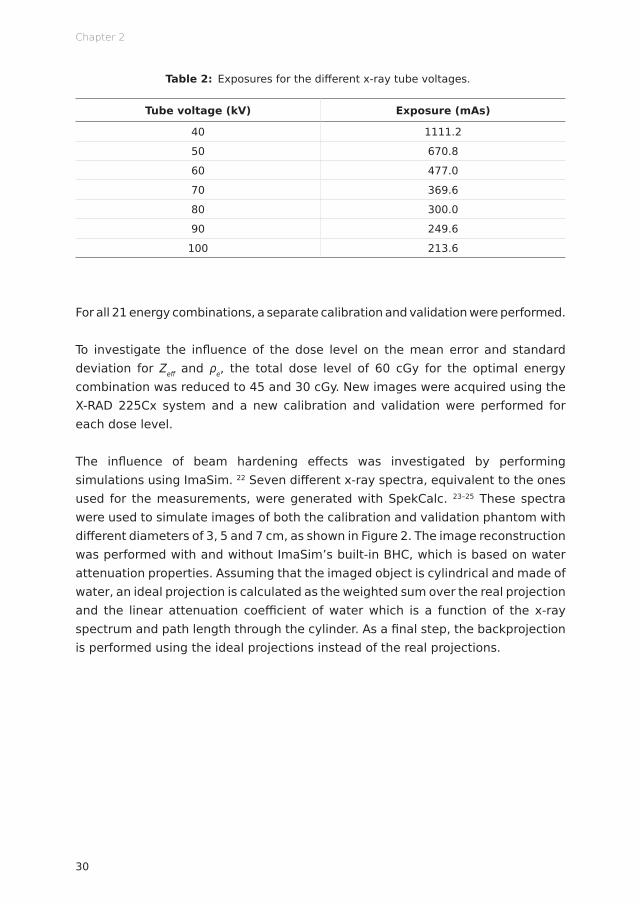
Table 2: Exposures for the different x-ray tube voltages.
Tube voltage (kV) Exposure (mAs)
40 1111.2
50 670.8
60 477.0
70 369.6
80 300.0
90 249.6
100 213.6
For all 21 energy combinations, a separate calibration and validation were performed.
To investigate the influence of the dose level on the mean error and standard deviation for Zeff and ρe, the total dose level of 60 cGy for the optimal energy combination was reduced to 45 and 30 cGy. New images were acquired using the X-RAD 225Cx system and a new calibration and validation were performed for each dose level.
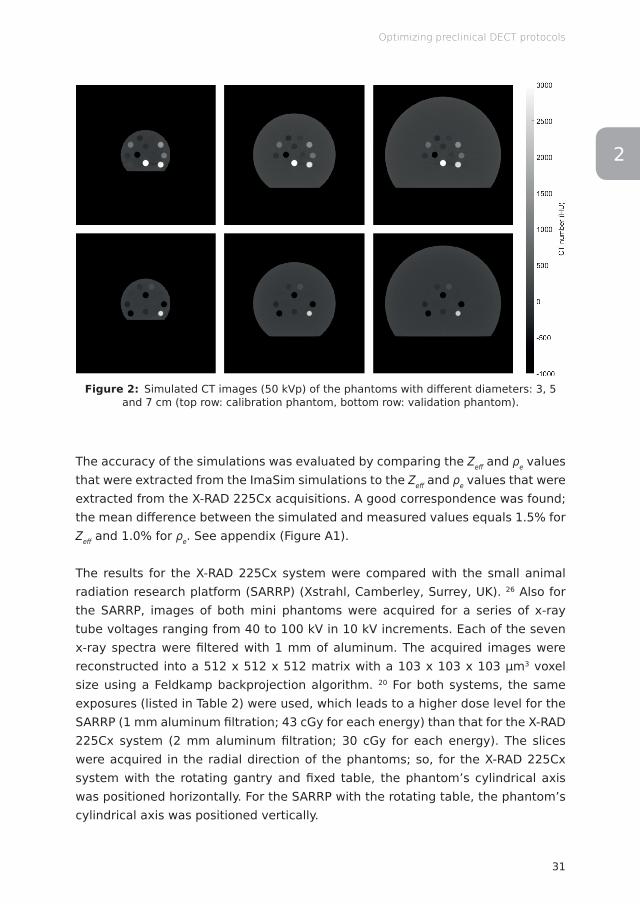
The influence of beam hardening effects was investigated by performing simulations using ImaSim. 22 Seven different x-ray spectra, equivalent to the ones used for the measurements, were generated with SpekCalc. 23–25 These spectra were used to simulate images of both the calibration and validation phantom with different diameters of 3, 5 and 7 cm, as shown in Figure 2. The image reconstruction was performed with and without ImaSim’s built-in BHC, which is based on water attenuation properties. Assuming that the imaged object is cylindrical and made of water, an ideal projection is calculated as the weighted sum over the real projection and the linear attenuation coefficient of water which is a function of the x-ray spectrum and path length through the cylinder. As a final step, the backprojection is performed using the ideal projections instead of the real projections.
31
Optimizing preclinical DECT protocols
2
Figure 2: Simulated CT images (50 kVp) of the phantoms with different diameters: 3, 5 and 7 cm (top row: calibration phantom, bottom row: validation phantom).
The accuracy of the simulations was evaluated by comparing the Zeff and ρe values that were extracted from the ImaSim simulations to the Zeff and ρe values that were extracted from the X-RAD 225Cx acquisitions. A good correspondence was found; the mean difference between the simulated and measured values equals 1.5% for Zeff and 1.0% for ρe. See appendix (Figure A1).
The results for the X-RAD 225Cx system were compared with the small animal radiation research platform (SARRP) (Xstrahl, Camberley, Surrey, UK). 26 Also for the SARRP, images of both mini phantoms were acquired for a series of x-ray tube voltages ranging from 40 to 100 kV in 10 kV increments. Each of the seven x-ray spectra were filtered with 1 mm of aluminum. The acquired images were reconstructed into a 512 x 512 x 512 matrix with a 103 x 103 x 103 μm3 voxel size using a Feldkamp backprojection algorithm. 20 For both systems, the same exposures (listed in Table 2) were used, which leads to a higher dose level for the SARRP (1 mm aluminum filtration; 43 cGy for each energy) than that for the X-RAD 225Cx system (2 mm aluminum filtration; 30 cGy for each energy). The slices were acquired in the radial direction of the phantoms; so, for the X-RAD 225Cx system with the rotating gantry and fixed table, the phantom’s cylindrical axis was positioned horizontally. For the SARRP with the rotating table, the phantom’s cylindrical axis was positioned vertically.
32
Chapter 2
Extracting the effective atomic number and relative electron density
Zeff was extracted using the tissue substitute method described by Landry et al, 14
which is based on a parameterization of the ratio of high and low energy linear attenuation coefficients μ. The ratio is defined as μratio=μLowEnergy/μHighEnergy and is calculated for each individual voxel. The mean μratio for each insert was calculated in a circular region of interest in the four central slices of the calibration phantom. The mean μratio for the different inserts was plotted as a function of the reference Zeff. The following calibration curve was fitted through these points (equation 1). In this equation, both μLowEnergy and μHighEnergy are relative to the linear attenuation coefficient of water and A, B, C, D, E, F, n and m are fit parameters.
HU=1000⋅μ−μwater
μwater−μair
Zeff=n√∑i
ωi Zi
Ai
Zin /∑i
ωi Z i
Ai
μratio=μLowEnergy
μHighEnergy
μratio=μLowEnergy
μHighEnergy
=A+B⋅Zeff
n−1+C⋅Zeffm−1
D+E⋅Zeffn−1+F⋅Zeff
m−1
ρe=ρ∑i
ωi Zi
Ai
/ρe ,water
ΔHUHU=(1+α)⋅HUHighEnergy−α⋅HULowEnergy
ρe=a⋅(1+α)⋅HUHighEnergy−α⋅HULowEnergy
1000+b
ωi=ai⋅ρe+bi⋅Zeff+ci⋅ρeZeff+di
σtissue=√σmeasured2 −σnoise
2
σnoise=a⋅Db+c
CNR=Ī tissue−Ī background
√σtissue2 −σbackground
2
CNR=|HUROI−HUbackground|
noise
MTF (f )=π√24
⋅M(f )M0
MTF=Intensitystrip−Intensitygap
Intensitystrip+ Intensitygap
‖Rf−p‖2
argminf
‖Rf −p‖2
2RT (Rf−p)
ρ=1.073ρe−0.04
ΔHUD=(DDECT−DRef)/DRef⋅100%
(1)
For the validation, Zeff was solved separately for each voxel by calculating μratio from the corresponding voxels in the images that were acquired with the low and high energy x-ray spectra. The mean Zeff for each insert was calculated in a circular region of interest in the four central slices of the validation phantom and then compared with the reference value that is provided by the manufacturer.
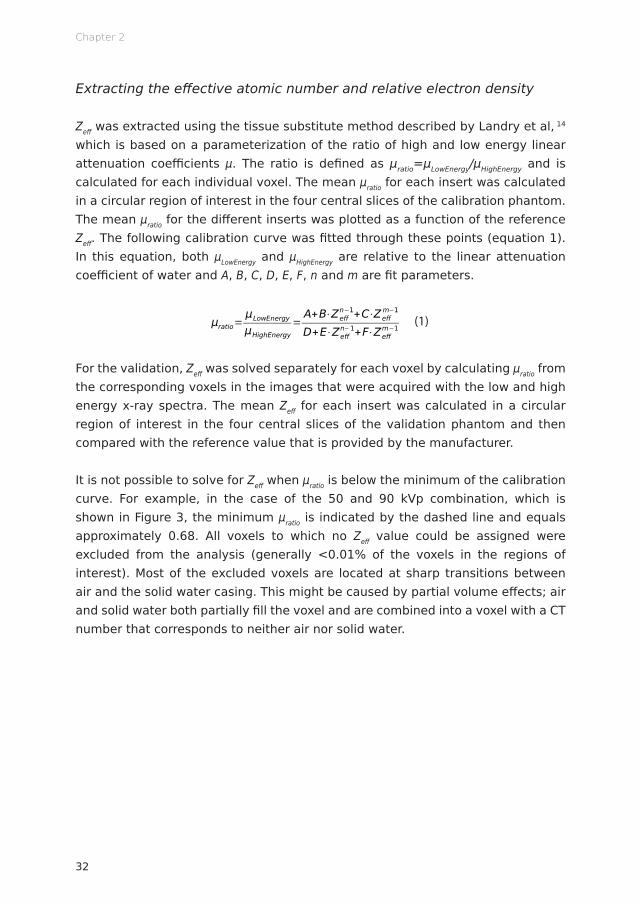
It is not possible to solve for Zeff when μratio is below the minimum of the calibration curve. For example, in the case of the 50 and 90 kVp combination, which is shown in Figure 3, the minimum μratio is indicated by the dashed line and equals approximately 0.68. All voxels to which no Zeff value could be assigned were excluded from the analysis (generally <0.01% of the voxels in the regions of interest). Most of the excluded voxels are located at sharp transitions between air and the solid water casing. This might be caused by partial volume effects; air and solid water both partially fill the voxel and are combined into a voxel with a CT number that corresponds to neither air nor solid water.

33
Optimizing preclinical DECT protocols
2
Figure 3: (Zeff,μratio) calibration curve (50 and 90 kVp combination, X-RAD 225Cx). The dashed line indicates the minimum μratio for which a Zeff value can be assigned.
ρe was extracted using a method described by Saito, 15 which is based on a single linear relationship between a weighted subtraction of CT numbers and ρe. The weighted subtraction of CT numbers is defined as ΔHU=(1+α)⋅HUᐃHighEnergy-α⋅ HULowEnergy in which α is the weighting factor. The mean HULowEnergy and HUHighEnergy for each insert were calculated in a circular region of interest in the four central slices of the calibration phantom. The reference ρe was plotted as a function of the mean HULowEnergy and HUHighEnergy for the different inserts. The following calibration curve was fitted through these points (equation 2). In this equation, a, b and α are fit parameters.
HU=1000⋅μ−μwater
μwater−μair
Zeff=n√∑i
ωi Zi
Ai
Zin /∑i
ωi Z i
Ai
μratio=μLowEnergy
μHighEnergy
μratio=μLowEnergy
μHighEnergy
=A+B⋅Zeff
n−1+C⋅Zeffm−1
D+E⋅Zeffn−1+F⋅Zeff
m−1
ρe=ρ∑i
ωi Zi
Ai
/ρe ,water
ΔHUHU=(1+α)⋅HUHighEnergy−α⋅HULowEnergy
ρe=a⋅(1+α)⋅HUHighEnergy−α⋅HULowEnergy
1000+b
ωi=ai⋅ρe+bi⋅Zeff+ci⋅ρeZeff+di
σtissue=√σmeasured2 −σnoise
2
σnoise=a⋅Db+c
CNR=Ī tissue−Ī background
√σtissue2 −σbackground
2
CNR=|HUROI−HUbackground|
noise
MTF (f )=π√24
⋅M(f )M0
MTF=Intensitystrip−Intensitygap
Intensitystrip+ Intensitygap
‖Rf−p‖2
argminf
‖Rf −p‖2
2RT (Rf−p)
ρ=1.073ρe−0.04
ΔHUD=(DDECT−DRef)/DRef⋅100%
(2)
For the validation, ρe was solved separately for each voxel by calculating ΔHU from the corresponding voxels in the images that were acquired with the low and high energy x-ray spectra. The mean ρe for each insert was calculated in a circular region of interest in the four central slices of the validation phantom and then compared with the reference value that is provided by the manufacturer.
34
Chapter 2
Results
Optimal energy combination
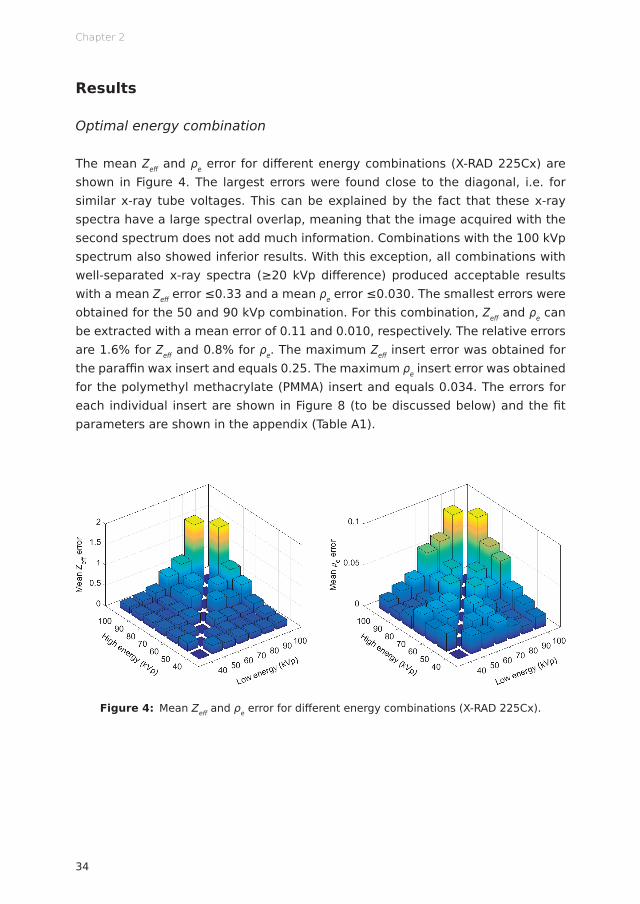
The mean Zeff and ρe error for different energy combinations (X-RAD 225Cx) are shown in Figure 4. The largest errors were found close to the diagonal, i.e. for similar x-ray tube voltages. This can be explained by the fact that these x-ray spectra have a large spectral overlap, meaning that the image acquired with the second spectrum does not add much information. Combinations with the 100 kVp spectrum also showed inferior results. With this exception, all combinations with well-separated x-ray spectra (≥20 kVp difference) produced acceptable results with a mean Zeff error ≤0.33 and a mean ρe error ≤0.030. The smallest errors were obtained for the 50 and 90 kVp combination. For this combination, Zeff and ρe can be extracted with a mean error of 0.11 and 0.010, respectively. The relative errors are 1.6% for Zeff and 0.8% for ρe. The maximum Zeff insert error was obtained for the paraffin wax insert and equals 0.25. The maximum ρe insert error was obtained for the polymethyl methacrylate (PMMA) insert and equals 0.034. The errors for each individual insert are shown in Figure 8 (to be discussed below) and the fit parameters are shown in the appendix (Table A1).
Figure 4: Mean Zeff and ρe error for different energy combinations (X-RAD 225Cx).

35
Optimizing preclinical DECT protocols
2
Different dose levels
Figure 5 shows the mean error and standard deviation for Zeff and ρe for different dose levels (50 and 90 kVp combination, X-RAD 225Cx). A decrease in dose leads to an increase in both the error and the standard deviation in quantitative DECT imaging. For the lower dose levels, fewer photons at the level of the source result in fewer photons at the level of the imaging panel. This generates a lower signal, which leads to relatively more noise. The results show that this noise also propagates into Zeff and ρe.
Figure 5: Mean error and standard deviation for Zeff and ρe for different dose levels (50 and 90 kVp combination, X-RAD 225Cx).
Beam hardening effects
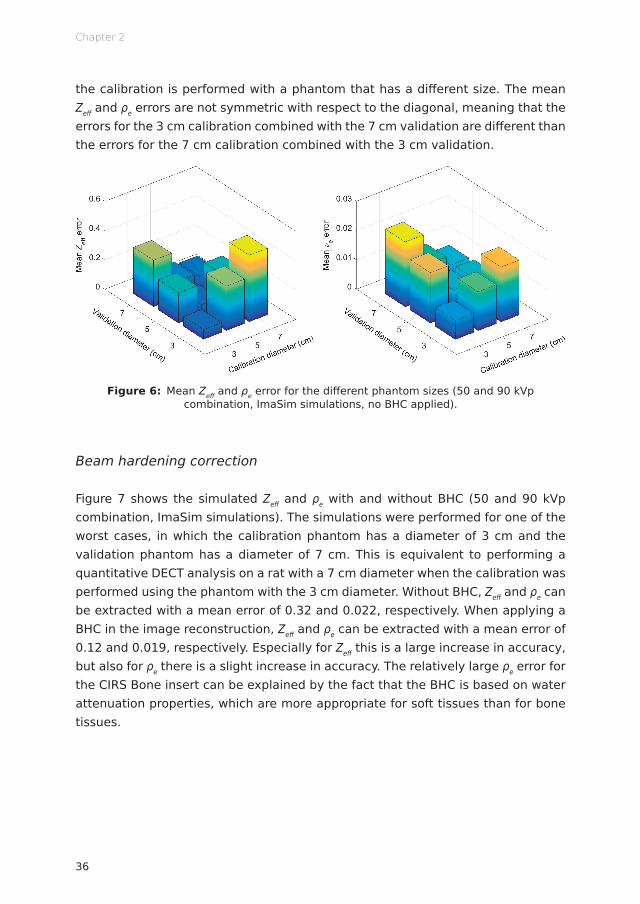
The mean Zeff and ρe errors for the different phantom sizes (50 and 90 kVp combination, ImaSim simulations, no BHC applied) are shown in Figure 6. The smallest errors were found close to the diagonal, i.e. for matching sizes of the calibration phantom and validation phantom. The larger errors for the different (non-matching) phantom sizes are caused by beam hardening effects; a thicker object increases the mean energy of the x-ray spectra by filtering out the low energy photons. This change in mean energy is not accounted for in the calibration when
36
Chapter 2
the calibration is performed with a phantom that has a different size. The mean Zeff and ρe errors are not symmetric with respect to the diagonal, meaning that the errors for the 3 cm calibration combined with the 7 cm validation are different than the errors for the 7 cm calibration combined with the 3 cm validation.
Figure 6: Mean Zeff and ρe error for the different phantom sizes (50 and 90 kVp combination, ImaSim simulations, no BHC applied).
Beam hardening correction
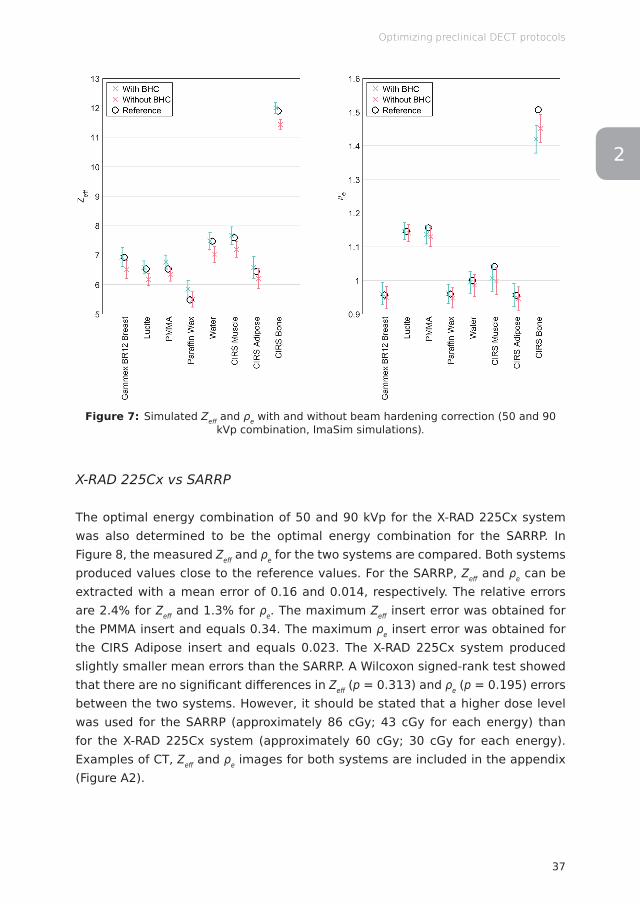
Figure 7 shows the simulated Zeff and ρe with and without BHC (50 and 90 kVp combination, ImaSim simulations). The simulations were performed for one of the worst cases, in which the calibration phantom has a diameter of 3 cm and the validation phantom has a diameter of 7 cm. This is equivalent to performing a quantitative DECT analysis on a rat with a 7 cm diameter when the calibration was performed using the phantom with the 3 cm diameter. Without BHC, Zeff and ρe can be extracted with a mean error of 0.32 and 0.022, respectively. When applying a BHC in the image reconstruction, Zeff and ρe can be extracted with a mean error of 0.12 and 0.019, respectively. Especially for Zeff this is a large increase in accuracy, but also for ρe there is a slight increase in accuracy. The relatively large ρe error for the CIRS Bone insert can be explained by the fact that the BHC is based on water attenuation properties, which are more appropriate for soft tissues than for bone tissues.
37
Optimizing preclinical DECT protocols
2
Figure 7: Simulated Zeff and ρe with and without beam hardening correction (50 and 90 kVp combination, ImaSim simulations).
X-RAD 225Cx vs SARRP
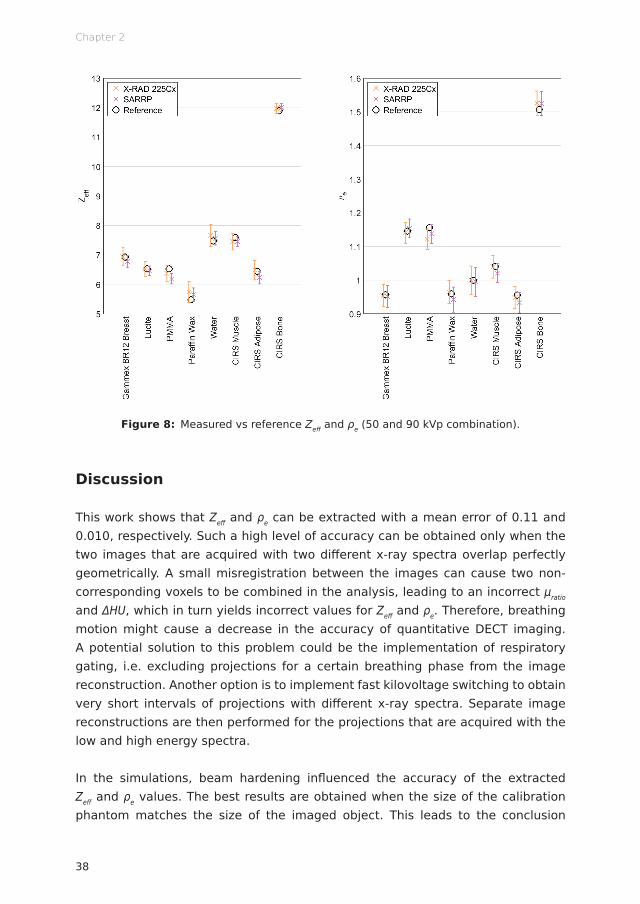
The optimal energy combination of 50 and 90 kVp for the X-RAD 225Cx system was also determined to be the optimal energy combination for the SARRP. In Figure 8, the measured Zeff and ρe for the two systems are compared. Both systems produced values close to the reference values. For the SARRP, Zeff and ρe can be extracted with a mean error of 0.16 and 0.014, respectively. The relative errors are 2.4% for Zeff and 1.3% for ρe. The maximum Zeff insert error was obtained for the PMMA insert and equals 0.34. The maximum ρe insert error was obtained for the CIRS Adipose insert and equals 0.023. The X-RAD 225Cx system produced slightly smaller mean errors than the SARRP. A Wilcoxon signed-rank test showed that there are no significant differences in Zeff (p = 0.313) and ρe (p = 0.195) errors between the two systems. However, it should be stated that a higher dose level was used for the SARRP (approximately 86 cGy; 43 cGy for each energy) than for the X-RAD 225Cx system (approximately 60 cGy; 30 cGy for each energy). Examples of CT, Zeff and ρe images for both systems are included in the appendix (Figure A2).
38
Chapter 2
Figure 8: Measured vs reference Zeff and ρe (50 and 90 kVp combination).
Discussion
This work shows that Zeff and ρe can be extracted with a mean error of 0.11 and 0.010, respectively. Such a high level of accuracy can be obtained only when the two images that are acquired with two different x-ray spectra overlap perfectly geometrically. A small misregistration between the images can cause two non-corresponding voxels to be combined in the analysis, leading to an incorrect μratio and ΔHU, which in turn yields incorrect values for Zeff and ρe. Therefore, breathing motion might cause a decrease in the accuracy of quantitative DECT imaging. A potential solution to this problem could be the implementation of respiratory gating, i.e. excluding projections for a certain breathing phase from the image reconstruction. Another option is to implement fast kilovoltage switching to obtain very short intervals of projections with different x-ray spectra. Separate image reconstructions are then performed for the projections that are acquired with the low and high energy spectra.
In the simulations, beam hardening influenced the accuracy of the extracted Zeff and ρe values. The best results are obtained when the size of the calibration phantom matches the size of the imaged object. This leads to the conclusion

39
Optimizing preclinical DECT protocols
2
that for the imaging of larger animals, such as rats or rabbits, a larger calibration phantom is required. To limit the contribution of beam hardening effects, a circular phantom in which the x-rays travel through the same amount of material for each projection is preferred. The X-RAD 225Cx system with the fixed table and rotating x-ray source and imaging panel acquires slices in the axial plane of the mouse; so, the x-rays travel through the same amount of material for each projection. The SARRP with the rotating table and fixed x-ray source and imaging panel acquires slices in the coronal plane. For some angles, the x-rays travel through the long (craniocaudal) axis of the animal and for other angles, the x-rays travel through the short (lateral) axis of the animal. This implies that for the SARRP, a decrease in the accuracy of quantitative DECT imaging can be expected for animals and other non-circular objects. Applying a BHC in the image reconstruction showed to increase the accuracy of the extracted Zeff and ρe values. At the moment, however, neither the X-RAD 225Cx system nor the SARRP have a BHC implemented in their image reconstruction software.
To achieve a high accuracy in tissue segmentation and Monte Carlo dose calculations, it is important to reduce Zeff and ρe errors. Quantitative DECT imaging can be further optimized, for example by applying different levels of filtration to the low and high energy x-ray spectra to improve the spectral separation. Simulation models are a useful tool to explore different kinds of optimization possibilities.
Conclusion
It can be concluded that quantitative DECT imaging is feasible for small animal irradiators with an integrated CBCT system. To obtain the best results, optimization of the imaging protocols is required. Well-separated x-ray spectra (≥20 kVp difference) and a sufficient dose level (approximately 60 cGy; 30 cGy for each energy) should be used to minimize the error and noise for Zeff and ρe. When no BHC is applied in the image reconstruction, the size of the calibration phantom should match the size of the imaged object to limit the influence of beam hardening effects. No significant differences in Zeff and ρe errors are observed between the X-RAD 225Cx system and the SARRP.
40
Chapter 2
Acknowledgments
The authors would like to thank Gammex (Middleton, Wisconsin, USA) and CIRS (Norfolk, Virginia, USA) for providing the elemental compositions of the phantom inserts.
Conflicts of interest
FV, PG and SvH are the founders of SmART Scientific Solutions (Maastricht, Netherlands). In addition, FV, PG and SvH declare that they have received research funding from Precision X-Ray (North Branford, Connecticut, USA) and have commercial interests with this company.
Appendix
In Figure A1, the Zeff and ρe values that were extracted from the ImaSim simulations are compared with the Zeff and ρe values that were extracted from the X-RAD 225Cx acquisitions. The simulations and measurements were performed for the 50 and 90 kVp combination at a total dose level of 60 cGy. No BHC was applied in the image reconstruction. The calibration and validation were performed separately for the simulations and measurements using the phantoms with a 3 cm diameter. The mean difference between the simulated and measured values equals 1.5% for Zeff and 1.0% for ρe.

41
Optimizing preclinical DECT protocols
2
Figure A1: Simulated vs measured Zeff and ρe (50 and 90 kVp combination).
Table A1 shows the fit parameters for the (Zeff,μratio) calibration (A, B, C, D, E, F, n, m) and (ΔHU,ρe) calibration (a, b, α). The fit parameters for the optimal energy combination of 50 and 90 kVp are listed together with the minimum and maximum values that were found for the 21 energy combinations (X-RAD 225Cx).
Table A1: Fit parameters for the (Zeff,μratio) calibration (A, B, C, D, E, F, n, m) and (ΔHU,ρe) calibration (a, b, α).
Parameter 50 and 90 kVp Minimum value Maximum value
A (x10-1) 4.98 1.53 5.68B (x10-3) 5.59 1.62 11.55C (x10-5) 1.45 0.61 2.77D (x10-1) 7.34 2.35 7.89E (x10-3) 2.96 1.34 11.24F (x10-7) 8.35 3.74 10.00
n 3.20 2.85 3.20m 4.16 4.07 4.45a 0.94 0.57 1.07b 1.01 0.97 1.03α 1.32 0.77 10.06
42
Chapter 2
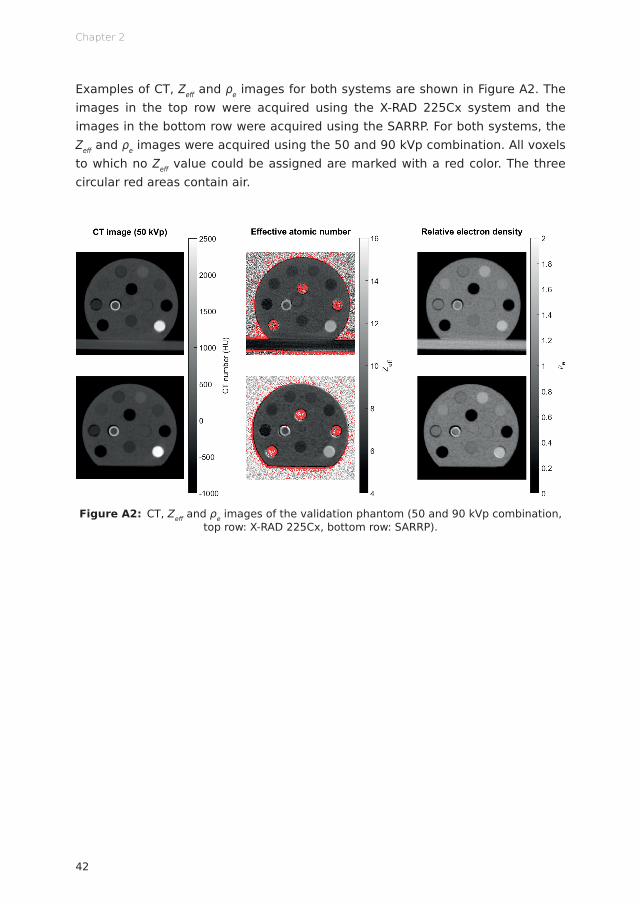
Examples of CT, Zeff and ρe images for both systems are shown in Figure A2. The images in the top row were acquired using the X-RAD 225Cx system and the images in the bottom row were acquired using the SARRP. For both systems, the Zeff and ρe images were acquired using the 50 and 90 kVp combination. All voxels to which no Zeff value could be assigned are marked with a red color. The three circular red areas contain air.
Figure A2: CT, Zeff and ρe images of the validation phantom (50 and 90 kVp combination, top row: X-RAD 225Cx, bottom row: SARRP).
43
Optimizing preclinical DECT protocols
2
References
1. van Elmpt W, Landry G, Das M, Verhaegen F. Dual energy CT in radiotherapy: Current applications and future outlook. Radiother Oncol 2016; 119: 137–144. doi: http://dx.doi.org/10.1016/j.radonc.2016.02.026
2. Bazalova M, Carrier JF, Beaulieu L, Verhaegen F. Tissue segmentation in Monte Carlo treatment planning: A simulation study using dual-energy CT images. Radiother Oncol 2008; 86: 93–98. doi: http://dx.doi.org/10.1016/j.radonc.2007.11.008
3. Bazalova M, Carrier JF, Beaulieu L, Verhaegen F. Dual-energy CT-based material extraction for tissue segmentation in Monte Carlo dose calculations. Phys Med Biol 2008; 53: 2439–2456. doi: http://dx.doi.org/10.1088/0031-9155/53/9/015
4. Landry G, Reniers B, Murrer L, Lutgens L, Bloemen-Van Gurp E, Pignol JP, et al. Sensitivity of low energy brachytherapy Monte Carlo dose calculations to uncertainties in human tissue composition: Sensitivity of brachytherapy dose calculations to compositional uncertainties. Med Phys 2010; 37: 5188–5198. doi: http://dx.doi.org/10.1118/1.3477161
5. Bazalova M, Graves EE. The importance of tissue segmentation for dose calculations for kilovoltage radiation therapy: Tissue segmentation for kilovoltage radiotherapy. Med Phys 2011; 38: 3039–3049. doi: http://dx.doi.org/10.1118/1.3589138
6. Landry G, Granton PV, Reniers B, Öllers MC, Beaulieu L, Wildberger JE, et al. Simulation study on potential accuracy gains from dual energy CT tissue segmentation for low-energy brachytherapy Monte Carlo dose calculations. Phys Med Biol 2011; 56: 6257–6278. doi: http://dx.doi.org/10.1088/0031-9155/56/19/007
7. Landry G, Reniers B, Granton PV, van Rooijen B, Beaulieu L, Wildberger JE, et al. Extracting atomic numbers and electron densities from a dual source dual energy CT scanner: Experiments and a simulation model. Radiother Oncol 2011; 100: 375–379. doi: http://dx.doi.org/10.1016/j.radonc.2011.08.029
8. Côté N, Bedwani S, Carrier JF. Improved tissue assignment using dual-energy computed tomography in low-dose rate prostate brachytherapy for Monte Carlo dose calculation. Med Phys 2016; 43: 2611–2618. doi: http://dx.doi.org/10.1118/1.4947486
9. Bhavane R, Badea C, Ghaghada KB, Clark D, Vela D, Moturu A, et al. Dual-Energy Computed Tomography Imaging of Atherosclerotic Plaques in a Mouse Model Using a Liposomal-Iodine Nanoparticle Contrast Agent. Circ Cardiovasc Imaging 2013; 6: 285–294. doi: http://dx.doi.org/10.1161/CIRCIMAGING.112.000119
10. Clark DP, Ghaghada K, Moding EJ, Kirsch DG, Badea CT. In vivo characterization of tumor vasculature using iodine and gold nanoparticles and dual energy micro-CT. Phys Med Biol 2013; 58: 1683–1704. doi: http://dx.doi.org/10.1088/0031-9155/58/6/1683
11. Moding EJ, Clark DP, Qi Y, Li Y, Ma Y, Ghaghada K, et al. Dual-Energy Micro-Computed Tomography Imaging of Radiation-Induced Vascular Changes in Primary Mouse Sarcomas. Int J Radiat Oncol Biol Phys 2013; 85: 1353–1359. doi: http://dx.doi.org/10.1016/j.ijrobp.2012.09.027

44
Chapter 2
12. Ashton JR, Clark DP, Moding EJ, Ghaghada K, Kirsch DG, West JL, et al. Dual-Energy Micro-CT Functional Imaging of Primary Lung Cancer in Mice Using Gold and Iodine Nanoparticle Contrast Agents: A Validation Study. PLoS One 2014; 9: e88129. doi: http://dx.doi.org/10.1371/journal.pone.0088129
13. Lee CL, Min H, Befera N, Clark D, Qi Y, Das S, et al. Assessing Cardiac Injury in Mice With Dual Energy-MicroCT, 4D-MicroCT, and MicroSPECT Imaging After Partial Heart Irradiation. Int J Radiat Oncol Biol Phys 2014; 88: 686–693. doi: http://dx.doi.org/10.1016/j.ijrobp.2013.11.238
14. Landry G, Seco J, Gaudreault M, Verhaegen F. Deriving effective atomic numbers from DECT based on a parameterization of the ratio of high and low linear attenuation coefficients. Phys Med Biol 2013; 58: 6851–6866. doi: http://dx.doi.org/10.1088/0031-9155/58/19/6851
15. Saito M. Potential of dual-energy subtraction for converting CT numbers to electron density based on a single linear relationship: Conversion of energy-subtracted CT number to electron density. Med Phys 2012; 39: 2021–2030. doi: http://dx.doi.org/10.1118/1.3694111
16. Ford NL, Thornton MM, Holdsworth DW. Fundamental image quality limits for microcomputed tomography in small animals. Med Phys 2003; 30: 2869–2877. doi: http://dx.doi.org/10.1118/1.1617353
17. Verhaegen F, Granton P, Tryggestad E. Small animal radiotherapy research platforms. Phys Med Biol 2011; 56: R55–R83. doi: http://dx.doi.org/10.1088/0031-9155/56/12/R01
18. Workman P, Aboagye EO, Balkwill F, Balmain A, Bruder G, Chaplin DJ, et al. Guidelines for the welfare and use of animals in cancer research. Br J Cancer 2010; 102: 1555–1577. doi: http://dx.doi.org/10.1038/sj.bjc.6605642
19. Clarkson R, Lindsay PE, Ansell S, Wilson G, Jelveh S, Hill RP, et al. Characterization of image quality and image-guidance performance of a preclinical microirradiator: Characterization of a preclinical microirradiator. Med Phys 2011; 38: 845–856. doi: http://dx.doi.org/10.1118/1.3533947
20. Feldkamp LA, Davis LC, Kress JW. Practical cone-beam algorithm. J Opt Soc Am A 1984; 1: 612. doi: http://dx.doi.org/10.1364/JOSAA.1.000612
21. Ma CM, Coffey CW, DeWerd LA, Liu C, Nath R, Seltzer SM, et al. AAPM protocol for 40–300 kV x-ray beam dosimetry in radiotherapy and radiobiology. Med Phys 2001; 28: 868–893. doi: http://dx.doi.org/10.1118/1.1374247
22. Landry G, deBlois F, Verhaegen F. ImaSim, a software tool for basic education of medical x-ray imaging in radiotherapy and radiology. Front Phys 2013; 1: doi: http://dx.doi.org/10.3389/fphy.2013.00022
23. Poludniowski G, Landry G, DeBlois F, Evans PM, Verhaegen F. SpekCalc: a program to calculate photon spectra from tungsten anode x-ray tubes. Phys Med Biol 2009; 54: N433–N438. doi: http://dx.doi.org/10.1088/0031-9155/54/19/N01

45
Optimizing preclinical DECT protocols
2
24. Poludniowski GG, Evans PM. Calculation of x-ray spectra emerging from an x-ray tube. Part I. Electron penetration characteristics in x-ray targets. Med Phys 2007; 34: 2164–2174. doi: http://dx.doi.org/10.1118/1.2734725
25. Poludniowski GG. Calculation of x-ray spectra emerging from an x-ray tube. Part II. X-ray production and filtration in x-ray targets. Med Phys 2007; 34: 2175–2186. doi: http://dx.doi.org/10.1118/1.2734726
26. Wong J, Armour E, Kazanzides P, Iordachita I, Tryggestad E, Deng H, et al. High-Resolution, Small Animal Radiation Research Platform With X-Ray Tomographic Guidance Capabilities. Int J Radiat Oncol Biol Phys 2008; 71: 1591–1599. doi: http://dx.doi.org/10.1016/j.ijrobp.2008.04.025


Ana Vaniqui*Lotte E J R Schyns*
Isabel P AlmeidaBrent van der Heyden
Mark PodestaFrank Verhaegen
*Equal contributions
Published in the British Journal of Radiology (2018)http://dx.doi.org/10.1259/bjr.20180447
The eff ect of diff erent image reconstruction techniques on preclinical quantitative
imaging and dual energy CT
Chapter 1 2 3 4 5 6 7 8
Chapter 3
48
Abstract
Objective To analyze the effect of different image reconstruction techniques on image quality and dual energy CT (DECT) imaging metrics.
Methods A software platform for preclinical cone beam CT image reconstruction was built using the open source reconstruction toolkit (RTK). Preprocessed projections were reconstructed with filtered backprojection and iterative algorithms, namely Feldkamp-Davis-Kress (FDK), iterative FDK, simultaneous algebraic reconstruction technique (SART), simultaneous iterative reconstruction technique (SIRT) and conjugate gradient (CG). Imaging metrics were quantitatively assessed using a quality assurance phantom and a DECT analysis was performed to determine the influence of each reconstruction technique on the relative electron density (ρe) and effective atomic number (Zeff) values.
Results Iterative reconstruction had favorable results for the DECT analysis: a significantly smaller spread for each material in the (ρe,Zeff) space and lower Zeff and ρe residuals (on average 24 and 25% lower, respectively). In terms of image quality assurance, the techniques FDK, iterative FDK and SART provided acceptable results. The three reconstruction methods showed similar geometric accuracy, uniformity and CT number results. The technique SART had a contrast-to-noise ratio up to 76% higher for solid water and twice as high for Teflon, but resolution was up to 28% lower when compared to the other two techniques.
Conclusion Advanced image reconstruction can be beneficial, but the benefit is small and calculation times may be unacceptable with current technology. The use of targeted and downscaled reconstruction grids with larger, yet practicable, voxel sizes and graphics processing units (GPUs) are recommended.
Advances in knowledge An iterative CBCT reconstruction platform was built using RTK.
49
CT image reconstruction techniques
3
Introduction
Preclinical cone beam CT (CBCT) x-ray image reconstruction is typically described by the Feldkamp-Davis-Kress (FDK) algorithm 1 to solve the inverse Radon transform through filtered backprojection (FBP). While the FDK algorithm produces usually acceptable images, it copes poorly with noise. Iterative reconstruction (IR) algorithms use multiple repetitions in which a current solution converges towards a better solution. Subsequent to projection acquisition, a forward projection creates artificial data, which is compared with measured projections to compute a correction term. In case of discrepancy, the first image estimate is updated based on the characteristics of the underlying algorithm. Image and projection data correction are repeated until a condition predefined by the algorithm is satisfied and the final image is generated. 2
IR algorithms may allow considerable dose reduction due to a more precise modeling of the acquisition process, which can reduce image noise. They avoid introducing new artifacts due to approximations and are suited for dealing with missing data or irregular sampling. The main drawback of IR is the increased computational cost of the iteration cycle.
It has been suggested 3–5 that IR algorithms could provide superior material segmentation when performing dual energy CT (DECT). Radiotherapy applications in which tissue segmentation accuracy plays an important role have benefited by DECT 6 and a number of preclinical studies has also shown advantages of DECT. 4,7,8 Furthermore, DECT can improve Monte Carlo dose calculations accuracy for low energy photons and protons. 3,6,9,10
This work presents a software platform for preclinical CBCT image reconstruction, built using the open source reconstruction toolkit (RTK), 11 which comprises FBP and four IR algorithms. Imaging parameters were quantitatively assessed and a DECT analysis was performed to determine the influence of each reconstruction technique on the image quality.

Chapter 3
50
Methods and materials
(Pre)image acquisition
Image projections for this study were acquired using the CBCT electronic portal imaging device integrated in the small animal irradiator X-RAD 225Cx (Precision X-Ray, North Branford, Connecticut, USA), illustrated in Figure 1f. The irradiator consists of a dual focus x-ray tube with a maximum tube potential of 225 kV (MXR-225/22, Comet, Flamatt, Switzerland) and a 20° angled tungsten stationary target. Using the small focal spot (1.0 mm), the x-ray tube acts as photon source for CT imaging. Photons are filtered through a 0.8 mm beryllium exit window and an additional 2.0 mm aluminum filter. The source to isocenter distance was fixed at 303.6 mm. The electronic portal imaging device (XRD-0820-AN3-ES, Perkin Elmer, Waltham, Massachusetts, USA) has 1024 x 1024 active pixels in an area of 20 x 20 cm.
The preprocessing of the raw data is described in Figure 1a-e and the appendix. Table 1 shows scan presets for this study. The exposures were chosen to yield an average dose of 30 cGy for each energy in a DECT scenario. The absorbed dose to water at a solid water phantom surface was verified using a TN30012 Farmer ionization chamber (PTW, Freiburg, Germany) according to the AAPM TG-61 protocol for 40-300 kV x-ray beam dosimetry (in-air calibration method). 12

51
CT image reconstruction techniques
3
Figure 1: Image acquisition and reconstruction workfl ow. Preacquisition corrections: (a) defective pixels, (b) dark fi eld, (c) fl ood fi eld, (d) lateral and (e) longitudinal off set for each
gantry angle (fl exmap). (f) CBCT acquisition, x-ray tube and the fl at panel rotate 360° around the object and generate the preprocessed projection data. (g) Reconstruction cycle
with or without cupping correction. (h) Iterative reconstruction cycle.
Chapter 3
52
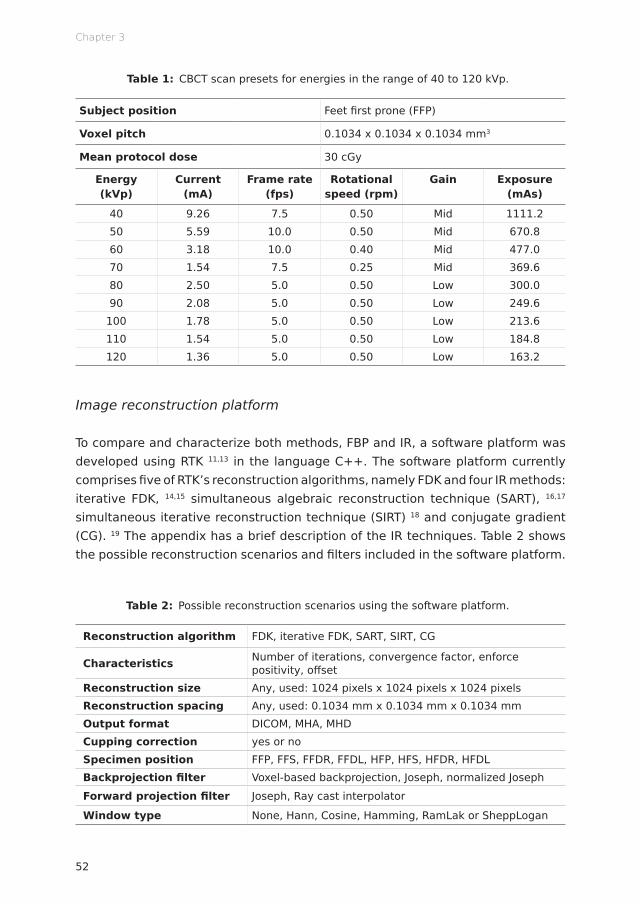
Table 1: CBCT scan presets for energies in the range of 40 to 120 kVp.
Subject position Feet first prone (FFP)
Voxel pitch 0.1034 x 0.1034 x 0.1034 mm3
Mean protocol dose 30 cGy
Energy (kVp)
Current (mA)
Frame rate (fps)
Rotational speed (rpm)
Gain Exposure (mAs)
40 9.26 7.5 0.50 Mid 1111.250 5.59 10.0 0.50 Mid 670.860 3.18 10.0 0.40 Mid 477.070 1.54 7.5 0.25 Mid 369.680 2.50 5.0 0.50 Low 300.090 2.08 5.0 0.50 Low 249.6
100 1.78 5.0 0.50 Low 213.6110 1.54 5.0 0.50 Low 184.8120 1.36 5.0 0.50 Low 163.2
Image reconstruction platform
To compare and characterize both methods, FBP and IR, a software platform was developed using RTK 11,13 in the language C++. The software platform currently comprises five of RTK’s reconstruction algorithms, namely FDK and four IR methods: iterative FDK, 14,15 simultaneous algebraic reconstruction technique (SART), 16,17 simultaneous iterative reconstruction technique (SIRT) 18 and conjugate gradient (CG). 19 The appendix has a brief description of the IR techniques. Table 2 shows the possible reconstruction scenarios and filters included in the software platform.
Table 2: Possible reconstruction scenarios using the software platform.
Reconstruction algorithm FDK, iterative FDK, SART, SIRT, CG
Characteristics Number of iterations, convergence factor, enforce positivity, offset
Reconstruction size Any, used: 1024 pixels x 1024 pixels x 1024 pixels Reconstruction spacing Any, used: 0.1034 mm x 0.1034 mm x 0.1034 mm Output format DICOM, MHA, MHD Cupping correction yes or no Specimen position FFP, FFS, FFDR, FFDL, HFP, HFS, HFDR, HFDL Backprojection filter Voxel-based backprojection, Joseph, normalized Joseph Forward projection filter Joseph, Ray cast interpolator
Window type None, Hann, Cosine, Hamming, RamLak or SheppLogan
53
CT image reconstruction techniques
3
A cupping correction 20 was included in the software platform. As cupping artifacts are induced by nonlinearities in the projection data, a polynomial precorrection was applied to the attenuation data for linearization. In the image domain, for each energy and reconstruction algorithm, polynomial coefficients were determined once using a homogeneous water cylinder (with a diameter of 4 cm) as a calibration scan. A series of basis images were fitted to a template image, obtained from the preprocessed calibration scan, to generate the coefficients. Raw data were passed through the polynomial and precorrected.
Figure 1 shows the image acquisition/reconstruction workflow. After initial corrections (Figure 1a-e) the object was scanned (Figure 1f). If no cupping correction was applied, the cycle would follow the upper part of the diagram (Figure 1g). A single reconstruction of the object was generated with the software platform, followed by a MATLAB R2017b (MathWorks, Natick, Massachusetts, USA) routine to determine air and water grey levels (rescale function), and a second reconstruction with corrected levels to yield Hounsfield Units (HUs). In case of cupping correction, to determine the coefficient cn of the term xn of the polynomials, 20 (n+1) reconstructions of the water phantom were performed. The coefficients were determined through a MATLAB script (cupping function), followed by a final reconstruction with the identified polynomial values. No further correction was necessary; this method results in attenuation images which are subsequently converted to HU; 𝐻𝐻𝐻𝐻 = 1000 ⋅
𝜇𝜇 − 𝜇𝜇)*+,-𝜇𝜇)*++,- − 𝜇𝜇*.-
where μ, μwater and μair are respectively the linear attenuation coefficients of the medium, water and air. For the two cycles, apart from the correction coefficients, all other parameters were maintained for both reconstruction rounds.
Image quality assurance
A quantitative image analysis was performed to verify the impact of the different reconstruction techniques using the mCTP-610 phantom (Shelley Medical Imaging Technologies, Toronto, Ontario, Canada), 21 Figure 2a-e. It is a single device with modular plates, each designed to assess one aspect of image quality, such as CT number, image uniformity, geometric accuracy, spatial resolution and noise. The plates used in this study are enclosed in a polycarbonate cylindrical housing of 8.4 cm length, 7.0 cm diameter and 4.8 mm thickness. The analysis following previously published methods 21–23 is briefly described.
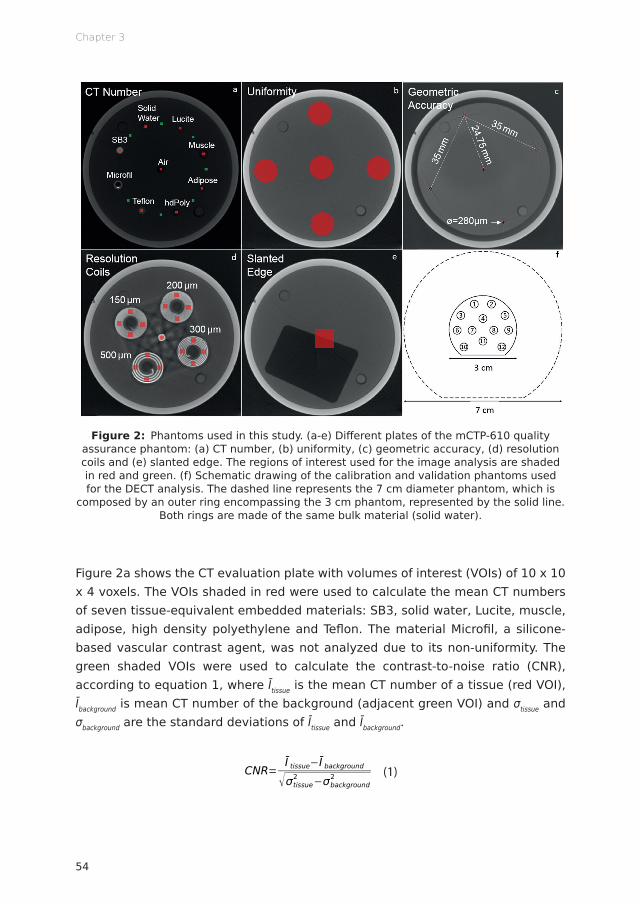
Chapter 3
54
Figure 2: Phantoms used in this study. (a-e) Diff erent plates of the mCTP-610 quality assurance phantom: (a) CT number, (b) uniformity, (c) geometric accuracy, (d) resolution coils and (e) slanted edge. The regions of interest used for the image analysis are shaded in red and green. (f) Schematic drawing of the calibration and validation phantoms used for the DECT analysis. The dashed line represents the 7 cm diameter phantom, which is
composed by an outer ring encompassing the 3 cm phantom, represented by the solid line. Both rings are made of the same bulk material (solid water).
Figure 2a shows the CT evaluation plate with volumes of interest (VOIs) of 10 x 10 x 4 voxels. The VOIs shaded in red were used to calculate the mean CT numbers of seven tissue-equivalent embedded materials: SB3, solid water, Lucite, muscle, adipose, high density polyethylene and Tefl on. The material Microfi l, a silicone-based vascular contrast agent, was not analyzed due to its non-uniformity. The green shaded VOIs were used to calculate the contrast-to-noise ratio (CNR), according to equation 1, where Ītissue is the mean CT number of a tissue (red VOI), Ībackground is mean CT number of the background (adjacent green VOI) and σtissue and σbackground are the standard deviations of Ītissue and Ībackground.
HU=1000⋅μ−μwater
μwater−μair
Zeff=n√∑i
ωi Zi
Ai
Zin /∑i
ωi Z i
Ai
μratio=μLowEnergy
μHighEnergy
μratio=μLowEnergy
μHighEnergy
=A+B⋅Zeff
n−1+C⋅Zeffm−1
D+E⋅Zeffn−1+F⋅Zeff
m−1
ρe=ρ∑i
ωi Zi
Ai
/ρe ,water
ΔHUHU=(1+α)⋅HUHighEnergy−α⋅HULowEnergy
ρe=a⋅(1+α)⋅HUHighEnergy−α⋅HULowEnergy
1000+b
ωi=ai⋅ρe+bi⋅Zeff+ci⋅ρeZeff+di
σtissue=√σmeasured2 −σnoise
2
σnoise=a⋅Db+c
CNR=Ī tissue−Ī background
√σtissue2 −σbackground
2
CNR=|HUROI−HUbackground|
noise
MTF (f )=π√24
⋅M(f )M0
MTF=Intensitystrip−Intensitygap
Intensitystrip+ Intensitygap
‖Rf−p‖2
argminf
‖Rf −p‖2
2RT (Rf−p)
ρ=1.073ρe−0.04
ΔHUD=(DDECT−DRef)/DRef⋅100%
(1)
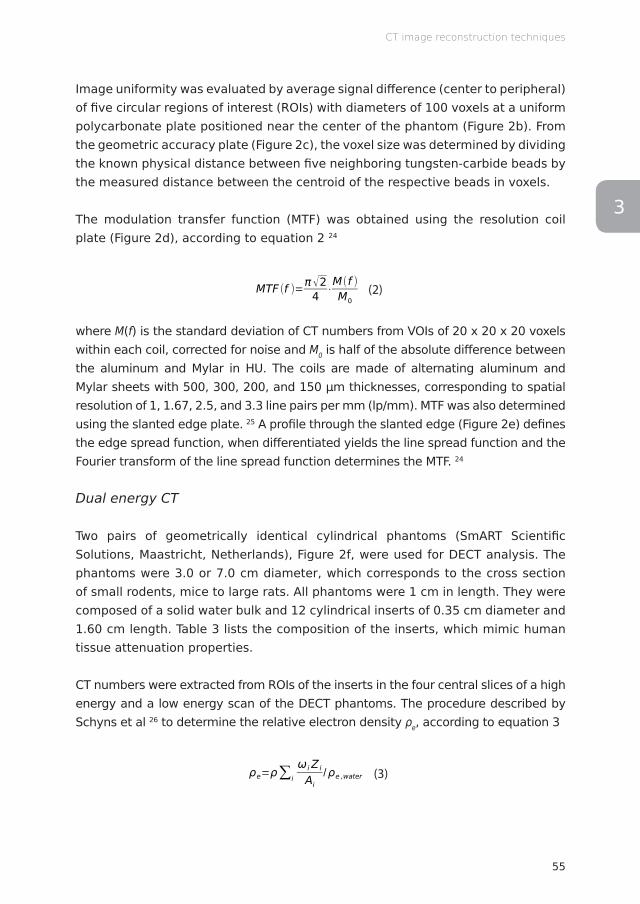
55
CT image reconstruction techniques
3
Image uniformity was evaluated by average signal difference (center to peripheral) of five circular regions of interest (ROIs) with diameters of 100 voxels at a uniform polycarbonate plate positioned near the center of the phantom (Figure 2b). From the geometric accuracy plate (Figure 2c), the voxel size was determined by dividing the known physical distance between five neighboring tungsten-carbide beads by the measured distance between the centroid of the respective beads in voxels.
The modulation transfer function (MTF) was obtained using the resolution coil plate (Figure 2d), according to equation 2 24
HU=1000⋅μ−μwater
μwater−μair
Zeff=n√∑i
ωi Zi
Ai
Zin /∑i
ωi Z i
Ai
μratio=μLowEnergy
μHighEnergy
μratio=μLowEnergy
μHighEnergy
=A+B⋅Zeff
n−1+C⋅Zeffm−1
D+E⋅Zeffn−1+F⋅Zeff
m−1
ρe=ρ∑i
ωi Zi
Ai
/ρe ,water
ΔHUHU=(1+α)⋅HUHighEnergy−α⋅HULowEnergy
ρe=a⋅(1+α)⋅HUHighEnergy−α⋅HULowEnergy
1000+b
ωi=ai⋅ρe+bi⋅Zeff+ci⋅ρeZeff+di
σtissue=√σmeasured2 −σnoise
2
σnoise=a⋅Db+c
CNR=Ī tissue−Ī background
√σtissue2 −σbackground
2
CNR=|HUROI−HUbackground|
noise
MTF (f )=π√24
⋅M(f )M0
MTF=Intensitystrip−Intensitygap
Intensitystrip+ Intensitygap
‖Rf−p‖2
argminf
‖Rf −p‖2
2RT (Rf−p)
ρ=1.073ρe−0.04
ΔHUD=(DDECT−DRef)/DRef⋅100%
(2)
where M(f) is the standard deviation of CT numbers from VOIs of 20 x 20 x 20 voxels within each coil, corrected for noise and M0 is half of the absolute difference between the aluminum and Mylar in HU. The coils are made of alternating aluminum and Mylar sheets with 500, 300, 200, and 150 μm thicknesses, corresponding to spatial resolution of 1, 1.67, 2.5, and 3.3 line pairs per mm (lp/mm). MTF was also determined using the slanted edge plate. 25 A profile through the slanted edge (Figure 2e) defines the edge spread function, when differentiated yields the line spread function and the Fourier transform of the line spread function determines the MTF. 24
Dual energy CT
Two pairs of geometrically identical cylindrical phantoms (SmART Scientific Solutions, Maastricht, Netherlands), Figure 2f, were used for DECT analysis. The phantoms were 3.0 or 7.0 cm diameter, which corresponds to the cross section of small rodents, mice to large rats. All phantoms were 1 cm in length. They were composed of a solid water bulk and 12 cylindrical inserts of 0.35 cm diameter and 1.60 cm length. Table 3 lists the composition of the inserts, which mimic human tissue attenuation properties.
CT numbers were extracted from ROIs of the inserts in the four central slices of a high energy and a low energy scan of the DECT phantoms. The procedure described by Schyns et al 26 to determine the relative electron density ρe, according to equation 3
HU=1000⋅μ−μwater
μwater−μair
Zeff=n√∑i
ωi Zi
Ai
Zin /∑i
ωi Z i
Ai
μratio=μLowEnergy
μHighEnergy
μratio=μLowEnergy
μHighEnergy
=A+B⋅Zeff
n−1+C⋅Zeffm−1
D+E⋅Zeffn−1+F⋅Zeff
m−1
ρe=ρ∑i
ωi Zi
Ai
/ρe ,water
ΔHUHU=(1+α)⋅HUHighEnergy−α⋅HULowEnergy
ρe=a⋅(1+α)⋅HUHighEnergy−α⋅HULowEnergy
1000+b
ωi=ai⋅ρe+bi⋅Zeff+ci⋅ρeZeff+di
σtissue=√σmeasured2 −σnoise
2
σnoise=a⋅Db+c
CNR=Ī tissue−Ī background
√σtissue2 −σbackground
2
CNR=|HUROI−HUbackground|
noise
MTF (f )=π√24
⋅M(f )M0
MTF=Intensitystrip−Intensitygap
Intensitystrip+ Intensitygap
‖Rf−p‖2
argminf
‖Rf −p‖2
2RT (Rf−p)
ρ=1.073ρe−0.04
ΔHUD=(DDECT−DRef)/DRef⋅100%
(3)
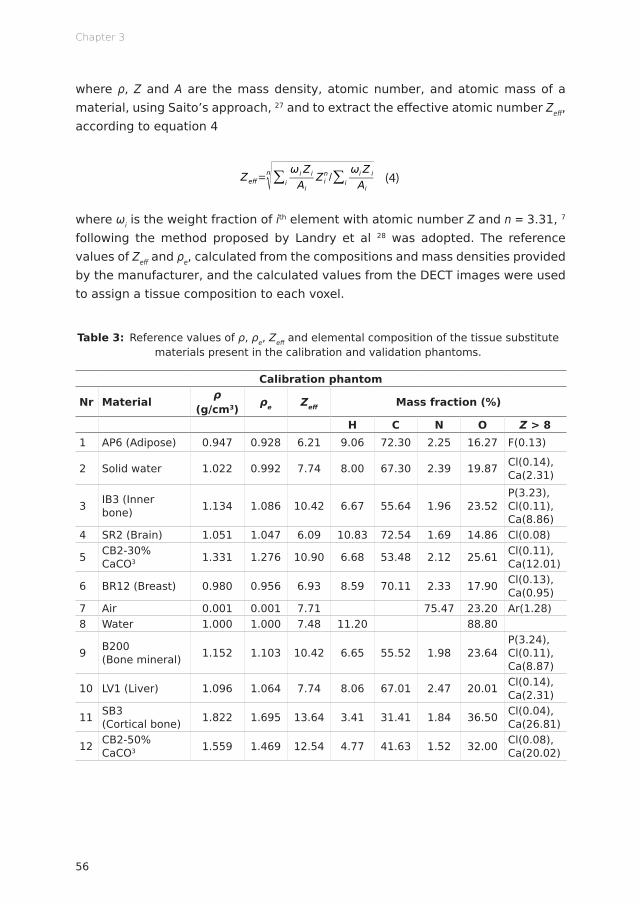
Chapter 3
56
where ρ, Z and A are the mass density, atomic number, and atomic mass of a material, using Saito’s approach, 27 and to extract the effective atomic number Zeff, according to equation 4
HU=1000⋅μ−μwater
μwater−μair
Zeff=n√∑i
ωi Zi
Ai
Zin /∑i
ωi Z i
Ai
μratio=μLowEnergy
μHighEnergy
μratio=μLowEnergy
μHighEnergy
=A+B⋅Zeff
n−1+C⋅Zeffm−1
D+E⋅Zeffn−1+F⋅Zeff
m−1
ρe=ρ∑i
ωi Zi
Ai
/ρe ,water
ΔHUHU=(1+α)⋅HUHighEnergy−α⋅HULowEnergy
ρe=a⋅(1+α)⋅HUHighEnergy−α⋅HULowEnergy
1000+b
ωi=ai⋅ρe+bi⋅Zeff+ci⋅ρeZeff+di
σtissue=√σmeasured2 −σnoise
2
σnoise=a⋅Db+c
CNR=Ī tissue−Ī background
√σtissue2 −σbackground
2
CNR=|HUROI−HUbackground|
noise
MTF (f )=π√24
⋅M(f )M0
MTF=Intensitystrip−Intensitygap
Intensitystrip+ Intensitygap
‖Rf−p‖2
argminf
‖Rf −p‖2
2RT (Rf−p)
ρ=1.073ρe−0.04
ΔHUD=(DDECT−DRef)/DRef⋅100%
(4)
where ωi is the weight fraction of ith element with atomic number Z and n = 3.31, 7 following the method proposed by Landry et al 28 was adopted. The reference values of Zeff and ρe, calculated from the compositions and mass densities provided by the manufacturer, and the calculated values from the DECT images were used to assign a tissue composition to each voxel.
Table 3: Reference values of ρ, ρe, Zeff and elemental composition of the tissue substitute materials present in the calibration and validation phantoms.
Calibration phantom
Nr Material ρ (g/cm3) ρe Zeff Mass fraction (%)
H C N O Z > 81 AP6 (Adipose) 0.947 0.928 6.21 9.06 72.30 2.25 16.27 F(0.13)
2 Solid water 1.022 0.992 7.74 8.00 67.30 2.39 19.87 Cl(0.14), Ca(2.31)
3 IB3 (Inner bone) 1.134 1.086 10.42 6.67 55.64 1.96 23.52
P(3.23), Cl(0.11), Ca(8.86)
4 SR2 (Brain) 1.051 1.047 6.09 10.83 72.54 1.69 14.86 Cl(0.08)
5 CB2-30% CaCO3 1.331 1.276 10.90 6.68 53.48 2.12 25.61 Cl(0.11),
Ca(12.01)
6 BR12 (Breast) 0.980 0.956 6.93 8.59 70.11 2.33 17.90 Cl(0.13), Ca(0.95)
7 Air 0.001 0.001 7.71 75.47 23.20 Ar(1.28)8 Water 1.000 1.000 7.48 11.20 88.80
9 B200 (Bone mineral) 1.152 1.103 10.42 6.65 55.52 1.98 23.64
P(3.24), Cl(0.11), Ca(8.87)
10 LV1 (Liver) 1.096 1.064 7.74 8.06 67.01 2.47 20.01 Cl(0.14), Ca(2.31)
11 SB3 (Cortical bone) 1.822 1.695 13.64 3.41 31.41 1.84 36.50 Cl(0.04),
Ca(26.81)
12 CB2-50% CaCO3 1.559 1.469 12.54 4.77 41.63 1.52 32.00 Cl(0.08),
Ca(20.02)
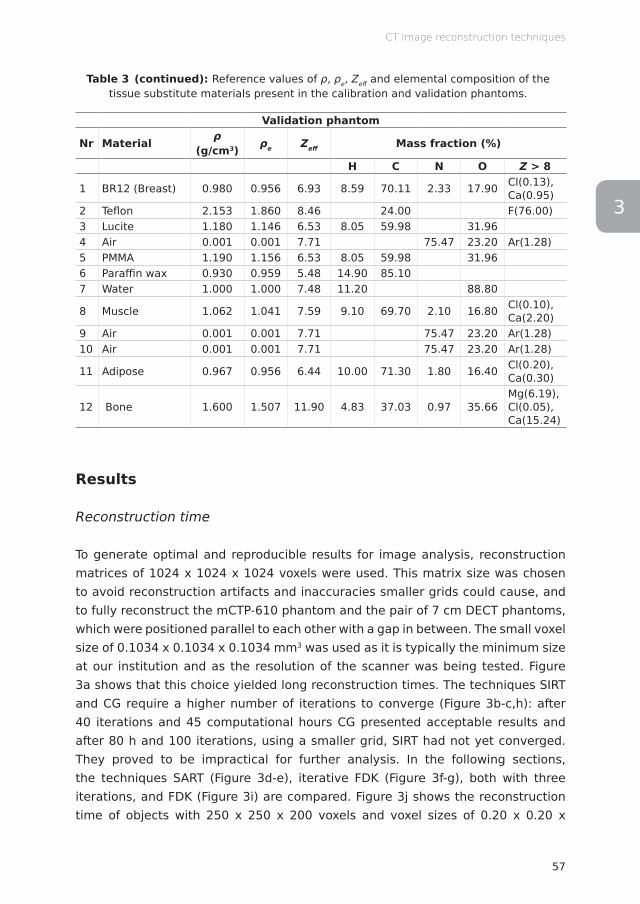
57
CT image reconstruction techniques
3
Table 3 (continued): Reference values of ρ, ρe, Zeff and elemental composition of the tissue substitute materials present in the calibration and validation phantoms.
Validation phantom
Nr Material ρ (g/cm3) ρe Zeff Mass fraction (%)
H C N O Z > 8
1 BR12 (Breast) 0.980 0.956 6.93 8.59 70.11 2.33 17.90 Cl(0.13), Ca(0.95)
2 Teflon 2.153 1.860 8.46 24.00 F(76.00)3 Lucite 1.180 1.146 6.53 8.05 59.98 31.96 4 Air 0.001 0.001 7.71 75.47 23.20 Ar(1.28)5 PMMA 1.190 1.156 6.53 8.05 59.98 31.96 6 Paraffin wax 0.930 0.959 5.48 14.90 85.10 7 Water 1.000 1.000 7.48 11.20 88.80
8 Muscle 1.062 1.041 7.59 9.10 69.70 2.10 16.80 Cl(0.10), Ca(2.20)
9 Air 0.001 0.001 7.71 75.47 23.20 Ar(1.28)10 Air 0.001 0.001 7.71 75.47 23.20 Ar(1.28)
11 Adipose 0.967 0.956 6.44 10.00 71.30 1.80 16.40 Cl(0.20), Ca(0.30)
12 Bone 1.600 1.507 11.90 4.83 37.03 0.97 35.66Mg(6.19), Cl(0.05),Ca(15.24)
Results
Reconstruction time
To generate optimal and reproducible results for image analysis, reconstruction matrices of 1024 x 1024 x 1024 voxels were used. This matrix size was chosen to avoid reconstruction artifacts and inaccuracies smaller grids could cause, and to fully reconstruct the mCTP-610 phantom and the pair of 7 cm DECT phantoms, which were positioned parallel to each other with a gap in between. The small voxel size of 0.1034 x 0.1034 x 0.1034 mm3 was used as it is typically the minimum size at our institution and as the resolution of the scanner was being tested. Figure 3a shows that this choice yielded long reconstruction times. The techniques SIRT and CG require a higher number of iterations to converge (Figure 3b-c,h): after 40 iterations and 45 computational hours CG presented acceptable results and after 80 h and 100 iterations, using a smaller grid, SIRT had not yet converged. They proved to be impractical for further analysis. In the following sections, the techniques SART (Figure 3d-e), iterative FDK (Figure 3f-g), both with three iterations, and FDK (Figure 3i) are compared. Figure 3j shows the reconstruction time of objects with 250 x 250 x 200 voxels and voxel sizes of 0.20 x 0.20 x
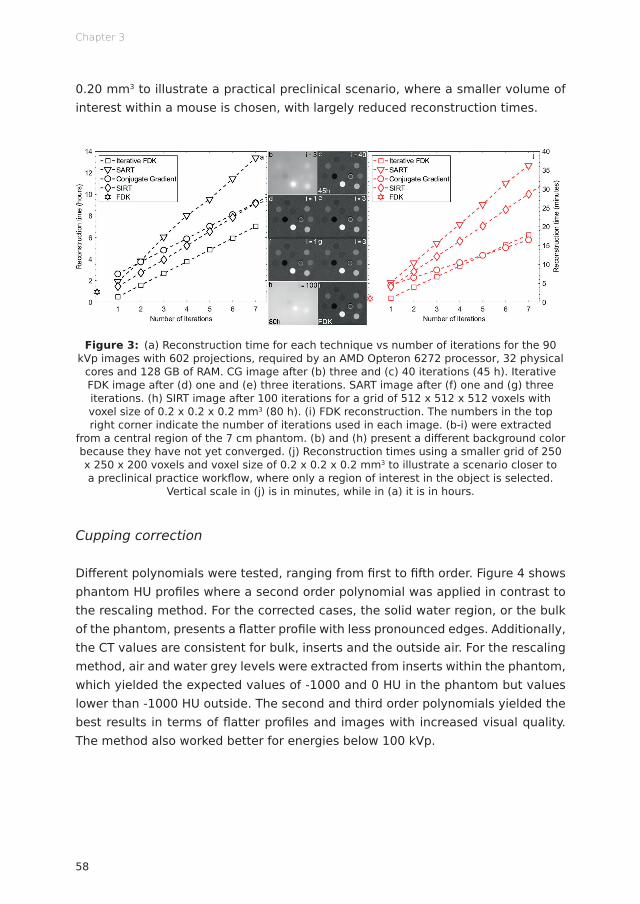
Chapter 3
58
0.20 mm3 to illustrate a practical preclinical scenario, where a smaller volume of interest within a mouse is chosen, with largely reduced reconstruction times.
Figure 3: (a) Reconstruction time for each technique vs number of iterations for the 90 kVp images with 602 projections, required by an AMD Opteron 6272 processor, 32 physical
cores and 128 GB of RAM. CG image after (b) three and (c) 40 iterations (45 h). Iterative FDK image after (d) one and (e) three iterations. SART image after (f) one and (g) three iterations. (h) SIRT image after 100 iterations for a grid of 512 x 512 x 512 voxels with voxel size of 0.2 x 0.2 x 0.2 mm3 (80 h). (i) FDK reconstruction. The numbers in the top right corner indicate the number of iterations used in each image. (b-i) were extracted
from a central region of the 7 cm phantom. (b) and (h) present a diff erent background color because they have not yet converged. (j) Reconstruction times using a smaller grid of 250 x 250 x 200 voxels and voxel size of 0.2 x 0.2 x 0.2 mm3 to illustrate a scenario closer to a preclinical practice workfl ow, where only a region of interest in the object is selected.
Vertical scale in (j) is in minutes, while in (a) it is in hours.
Cupping correction
Diff erent polynomials were tested, ranging from fi rst to fi fth order. Figure 4 shows phantom HU profi les where a second order polynomial was applied in contrast to the rescaling method. For the corrected cases, the solid water region, or the bulk of the phantom, presents a fl atter profi le with less pronounced edges. Additionally, the CT values are consistent for bulk, inserts and the outside air. For the rescaling method, air and water grey levels were extracted from inserts within the phantom, which yielded the expected values of -1000 and 0 HU in the phantom but values lower than -1000 HU outside. The second and third order polynomials yielded the best results in terms of fl atter profi les and images with increased visual quality. The method also worked better for energies below 100 kVp.

59
CT image reconstruction techniques
3
Figure 4: Comparison of phantom HU profi les for diff erent reconstruction methods with and without cupping correction for the 40 kVp scan, where cupping is most evident, of the
7 cm phantom using a second order polynomial (C2).
Quantitative image analysis
Figure 5a shows the voxel size values derived from the geometric accuracy plate. The values found for the diff erent reconstruction methods and energies were within 0.2 to 0.3% in agreement with the value of 103.4 μm, used in this study. Figure 5b,d show the CNR for Tefl on and solid water. While similar values are obtained for FDK and iterative FDK, within -0.05 to 0.3%, SART yields a higher ratio, up to 76% higher for solid water and 2.09 times higher for Tefl on, which can be explained by the lower levels of noise associated with this technique. Additionally, the panel gain is set to low for energies higher than 70 kVp, to avoid saturation. The uniformity in terms of center to peripheral average signal diff erence (Figure 5c) also yielded similar results for the three methods, with a variation of 12 to 148 HU among the nine investigated energies. CT numbers of seven tissue-equivalent materials for energies between 40 and 120 kVp (Figure 5e) showed little variation, with a maximum standard deviation of 45 HU among techniques. The values for soft and osseous (or high atomic number) tissues are also within the expected literature values. The 80 kVp acquisition presets changes, in terms of gain and frame rate, are possibly the underlying reason for its decreased uniformity.
Figure 5f shows that the MTF for both the slanted edge and the resolution coil methods were similar. The highest resolution in terms of equivalent lp/mm at the

Chapter 3
60
10% MTF (2.5 lp/mm is comparable to 200 μm), 21 was found for 50 kVp, with values of 173.6 μm (2.73 lp/mm) for both FDK and iterative FDK and 181.1 μm (2.72 lp/mm) for SART, and the lowest for 120 kVp with 201.4 μm (2.39 lp/mm), 201.3 μm (2.38 lp/mm) and 234.4 μm (2.07 lp/mm) for FDK, iterative FDK and SART, respectively. Resolution results for SART were consistently lower when compared to the other two techniques, from 2% lower, for 60 kVp, to 28%, for 100 kVp.
Figure 5: Quantitative image analysis tests with the mCTP-610 phantom. (a) Geometric accuracy, the blue horizontal line represents the utilized pixel size. (b) CNR for Tefl on. (c) Uniformity. (d) CNR for solid water. (e) CT number for tissue-equivalent materials for 40 to 120 kVp, the marker’s color shade darkens as the energy increases. (f) MTF using both SE
and RC techniques for the 50 kVp image. The line indicates the MTF at 10%.
Dual energy CT analysis
Figure 6 shows the relationship between Zeff and ρe for the materials of the validation phantom. All voxels to which no Zeff value could be assigned, predominantly located at sharp transitions between air and the solid water bulk, were excluded from the analysis (<0.01% in the ROIs). Ellipses were drawn considering the direction of the eigenvectors of the covariance matrix. Thus, each distribution confi dence ellipse defi nes the region that contains 95% of all samples that can be drawn from the underlying Gaussian distribution, with the mean value indicated by the circle, triangle or square. Although the data distribution is similar for FDK and iterative

61
CT image reconstruction techniques
3
FDK, the smaller spread of the SART ellipses indicate a reduced image noise eff ect, expected for an iterative method.
Figure 6: (ρe,Zeff ) plot for the 7 cm validation DECT phantom and the energy combination 50 and 90 kVp. The colors and the lines indicate the tissue-equivalent inserts and
reconstruction methods. Histograms of ρe and Zeff values are illustrated on top and on the right, respectively. The circles, triangles and squares indicate the mean value of each
distribution for FDK, iterative FDK and SART, respectively.
Figure 7a-b show the mean residuals (absolute diff erence between the calculated and reference value) of Zeff and ρe using the three reconstruction techniques, for a number of energy combinations, where the diff erence between low and high energy was at least 20 kV apart to avoid large spectral overlap, maximizing the amount of information provided by each energy. For all shown combinations, Zeff
and ρe residuals were on average 24 and 25% lower, respectively, using SART in comparison with iterative FDK and FDK, which were within 0.2 and 0.05% in agreement with each other in terms of Zeff and ρe residuals, respectively. Additionally, the mean standard deviations were on average 20 and 30% lower with SART in comparison to the other two reconstruction techniques, which once more showed little variation among themselves (average diff erences of 0.4 and 0.02% for Zeff and ρe residuals).

Chapter 3
62
Figure 7: Mean (a) Zeff and (b) ρe residuals, and mean (c) Zeff and (d) ρe standard deviations for a number of DECT energy combinations.
Discussion
Iterative reconstructions used in this study were computationally costly and would be impractical for studies with live animals under anesthesia. The decision to favor the reproducibility, repeating a same grid of 1024 x 1024 x 1024 voxels for diff erent objects, and using the smallest voxel size of the CBCT scanner of our institution for a thorough image analysis, aff ected the speed of the IR. Smaller grids and larger voxel sizes are more typical in preclinical practice. In such cases, IR methods were found to be feasible, with reconstruction times under 20 min for three iterations (Figure 3j). Additionally, increased computational power by means of graphics processing units (GPUs) would highly increase the IR speed.
The correction for cupping artifacts included in the software platform provided accurate CT numbers. The second and third order polynomials yielded the best results, a higher number of coeffi cients caused further instability and overfi tting. The method was more eff ective for energies below 100 kVp, as the cupping eff ect is more pronounced for lower energies. For IR techniques, reconstructing an object a number of times to derive a polynomial, which will correct a fi nal reconstruction, is a lengthy process. Applications that require increased image quality and larger objects, more prone to beam hardening, could benefi t from this approach. For the rescaling method, the coeffi cients to correct for air and water grey levels are
63
CT image reconstruction techniques
3
derived from values within the object to account for the beam hardening and other artifacts the object is subjected to, as it would be the case of an air pocket within a mouse, for example.
IR provided favorable results for the DECT analysis. SART resulted in a significantly smaller spread for each material in the (ρe,Zeff) space (Figure 6) and the residuals on Zeff and ρe were on average 24 and 25% lower in comparison to FDK, with an increasing number of iterations, the residuals decreased further. In terms of image quality, the techniques FDK, iterative FDK and SART provided acceptable results. Regarding geometric accuracy, the voxel size agreement was within 0.2 to 0.3% with the used value of 103.4 μm. The three techniques showed similar uniformity and CT number results, with the latter presenting a maximum standard deviation of 45 HU among techniques and soft and osseous tissues within the expected literature values. Although the CNR presented by SART was compelling, a ratio up to 76% higher for solid water and over twice higher for Teflon, the resolution results were up to 28% lower when compared to the other two techniques. Because of the iterative cycle, IR techniques may produce smoother images, less affected by noise.
Accuracy on the image metrics listed above is crucial for dose calculations, which are based on the CBCT image of small animals. Accuracy of contours of anatomical structures can suffer from reduced resolution, abundance of noise or non-uniformity. Different reconstruction techniques could be used for alternative purposes. 29 In a possible irradiation workflow, following the CBCT scan of a mouse, the projections could be quickly reconstructed using the iterative FDK method. Availing from the increased resolution and diminished presence of artifacts, the images could be contoured while the projections are reconstructed using the SART technique. The user could see the result of each iteration, choose the most adequate image, and stop the iterative cycle. The iteratively reconstructed image could be used for dose calculations, which could benefit from the lower levels of noise.
The influence of the scanning parameters and the reconstruction filters could be further investigated. The imaging presets were adopted from previous studies, 26 where they were deemed optimal. IR could provide satisfactory results with decreased tube current or scanning time and consequently decreased imaging dose, which although worth to investigate was outside the scope of the present study. Lastly, one should be aware of the biological consequences of high CT imaging doses which may even alter the experimental outcome. 22

Chapter 3
64
Conclusion
An image reconstruction platform for modern image-guided small animal irradiators was built using RTK. The platform includes backprojection, different iterative algorithms, filters and cupping correction. Preprocessed projections reconstructed with the platform showed acceptable results regarding image quality assurance and DECT Zeff and ρe residuals. The iterative technique SART showed improved results regarding noise, which may be important for tissue assignment for dose calculations. In a nutshell, advanced image reconstruction can be beneficial, but the benefit is rather small and calculation times may be unacceptable with current technology.
Acknowledgments
The authors would like to thank Dr Simon Rit and Dr Cyril Mory from Creatis (Lyon, France) for many useful discussions regarding the use of RTK. In addition, the authors would like to thank Steve Ansell from the Princess Margaret Hospital (Toronto, Ontario, Canada) for technical support regarding the X-RAD 225Cx system.
Funding
AV acknowledges financial support from CAPES Scholarship and Science without Borders program from Brazil (BEX 12030/13-9).
Conflicts of interest
FV is a founder of SmART Scientific Solutions (Maastricht, Netherlands), which works with the company Precision X-Ray (North Branford, Connecticut, USA) on commercial development of small animal treatment planning software.
65
CT image reconstruction techniques
3
Appendix
Image preprocessing
Prior to image acquisition, the system was calibrated for dark current, differences in pixel gain, defective pixels and mechanical flex (Figure 1a-e). For dark current, the electric current that flows through the flat panel when the x-ray tube is inactive, fifty images were collected with the beam switched off and averaged to generate the mean dark image. For the pixel sensitivity, which varies due to fluctuations in gain associated with the analogue amplifier, fifty beam-on images were collected without any objects in the field. The flood field also corrects for non-flat beam profiles. Subsequent scans were divided by the corrected flood image, the averaged flood field minus the mean dark image, to correct for gain differences. Defective pixels were identified statistically: the variability of each pixel was indicated by the standard deviation of the mean dark and flood images, from which a bad pixel map was generated. To correct for mechanical flex, where CBCT scans are shifted by a lateral and longitudinal offset for each gantry angle due to mechanical sagging, a ball bearing was placed in the irradiator isocenter, imaged from all directions and its location was identified on each image to map the offset, generating a flexmap.
Iterative methods: brief description
Iterative FDK, SART, SIRT and CG minimize the same cost function using different algorithms. The cost function is defined as
HU=1000⋅μ−μwater
μwater−μair
Zeff=n√∑i
ωi Zi
Ai
Zin /∑i
ωi Z i
Ai
μratio=μLowEnergy
μHighEnergy
μratio=μLowEnergy
μHighEnergy
=A+B⋅Zeff
n−1+C⋅Zeffm−1
D+E⋅Zeffn−1+F⋅Zeff
m−1
ρe=ρ∑i
ωi Zi
Ai
/ρe ,water
ΔHUHU=(1+α)⋅HUHighEnergy−α⋅HULowEnergy
ρe=a⋅(1+α)⋅HUHighEnergy−α⋅HULowEnergy
1000+b
ωi=ai⋅ρe+bi⋅Zeff+ci⋅ρeZeff+di
σtissue=√σmeasured2 −σnoise
2
σnoise=a⋅Db+c
CNR=Ī tissue−Ī background
√σtissue2 −σbackground
2
CNR=|HUROI−HUbackground|
noise
MTF (f )=π√24
⋅M(f )M0
MTF=Intensitystrip−Intensitygap
Intensitystrip+ Intensitygap
‖Rf−p‖2
argminf
‖Rf −p‖2
2RT (Rf−p)
ρ=1.073ρe−0.04
ΔHUD=(DDECT−DRef)/DRef⋅100%
in which f is the sought
volume, p the projections and R the forward projection matrix. Iterative FDK starts with a normal FDK backprojection for f and calculates the difference between the forward projected volume Rf and the projections p. This difference is multiplied by a small constant λ and the result is backprojected and added to the volume f. The next iteration starts again with forward projecting f to obtain Rf etc. SART and SIRT involve a gradient descent algorithm: as the gradient of ‖𝑅𝑅𝑅𝑅 − 𝑝𝑝‖& is 2𝑅𝑅((𝑅𝑅𝑅𝑅 − 𝑝𝑝) is ‖𝑅𝑅𝑅𝑅 − 𝑝𝑝‖& is 2𝑅𝑅((𝑅𝑅𝑅𝑅 − 𝑝𝑝) in which RT is the transpose of R (the backprojection matrix), the algorithm needs one forward and one backprojection from all angles at each iteration. SART splits the cost function into individual projections and minimizes the cost function for each projection, whereas SIRT uses a single cost function in which all projections are combined. CG minimizes the cost function using a conjugate gradient algorithm in which the step size is calculated analytically at each iteration and the descent direction is a combination of the gradient at the current iteration and the descent direction of the previous iteration.
Chapter 3
66
References
1. Feldkamp LA, Davis LC, Kress JW. Practical cone-beam algorithm. J Opt Soc Am A 1984; 1: 612. doi: http://dx.doi.org/10.1364/JOSAA.1.000612
2. Beister M, Kolditz D, Kalender WA. Iterative reconstruction methods in X-ray CT. Phys Med 2012; 28: 94–108. doi: http://dx.doi.org/10.1016/j.ejmp.2012.01.003
3. Vaniqui A, Schyns LEJR, Almeida IP, van der Heyden B, van Hoof SJ, Verhaegen F. The impact of dual energy CT imaging on dose calculations for pre-clinical studies. Radiat Oncol 2017; 12: 12:181. doi: http://dx.doi.org/10.1186/s13014-017-0922-9
4. Bouckaert C, Vandeghinste B, Vanhove C, Vandenberghe S. Dual energy microCT for small animal bone-iodine decomposition. IEEE NSS/MIC 2012; 3769–3774. doi: http://dx.doi.org/10.1109/NSSMIC.2012.6551865
5. Willekens I, Buls N, Lahoutte T, Baeyens L, Vanhove C, Caveliers V, et al. Evaluation of the radiation dose in micro-CT with optimization of the scan protocol. Contrast Media Mol Imaging 2010; 5: 201–207. doi: http://dx.doi.org/10.1002/cmmi.394
6. van Elmpt W, Landry G, Das M, Verhaegen F. Dual energy CT in radiotherapy: Current applications and future outlook. Radiother Oncol 2016; 119: 137–144. doi: http://dx.doi.org/10.1016/j.radonc.2016.02.026
7. Landry G, Granton PV, Reniers B, Öllers MC, Beaulieu L, Wildberger JE, et al. Simulation study on potential accuracy gains from dual energy CT tissue segmentation for low-energy brachytherapy Monte Carlo dose calculations. Phys Med Biol 2011; 56: 6257–6278. doi: http://dx.doi.org/10.1088/0031-9155/56/19/007
8. Clark DP, Ghaghada K, Moding EJ, Kirsch DG, Badea CT. In vivo characterization of tumor vasculature using iodine and gold nanoparticles and dual energy micro-CT. Phys Med Biol 2013; 58: 1683–1704. doi: http://dx.doi.org/10.1088/0031-9155/58/6/1683
9. Landry G, Reniers B, Granton PV, van Rooijen B, Beaulieu L, Wildberger JE, et al. Extracting atomic numbers and electron densities from a dual source dual energy CT scanner: Experiments and a simulation model. Radiother Oncol 2011; 100: 375–379. doi: http://dx.doi.org/10.1016/j.radonc.2011.08.029
10. Almeida IP, Schyns LEJR, Vaniqui A, van der Heyden B, Dedes G, Resch AF, et al. Monte Carlo proton dose calculations using a radiotherapy specific dual-energy CT scanner for tissue segmentation and range assessment. Phys Med Biol 2018; 63: 115008. doi: http://dx.doi.org/10.1088/1361-6560/aabb60
11. Rit S, Vila Oliva M, Brousmiche S, Labarbe R, Sarrut D, Sharp GC. The Reconstruction Toolkit (RTK), an open-source cone-beam CT reconstruction toolkit based on the Insight Toolkit (ITK). J Phys Conf Ser 2014; 489: 012079. doi: http://dx.doi.org/10.1088/1742-6596/489/1/012079
12. Ma CM, Coffey CW, DeWerd LA, Liu C, Nath R, Seltzer SM, et al. AAPM protocol for 40–300 kV x-ray beam dosimetry in radiotherapy and radiobiology. Med Phys 2001; 28: 868–893. doi: http://dx.doi.org/10.1118/1.1374247
67
CT image reconstruction techniques
3
13. Geyer LL, Schoepf UJ, Meinel FG, Nance JW, Bastarrika G, Leipsic JA, et al. State of the Art: Iterative CT Reconstruction Techniques. Radiology 2015; 276: 339–357. doi: http://dx.doi.org/10.1148/radiol.2015132766
14. Mory C, Auvray V, Zhang B, Grass M, Schäfer D, Rit S, et al. Removing streak artifacts from ECG-gated reconstructions using deconvolution. J Xray Sci Technol 2014; 22: 253–270. doi: http://dx.doi.org/10.3233/XST-140423
15. Sunnegårdh J. Iterative Filtered Backprojection Methods for Helical Cone-Beam CT (PhD Thesis). Linköping University 2009. Available from: http://urn.kb.se/resolve?urn=urn:nbn:se:liu:diva-20035
16. Gordon R, Bender R, Herman GT. Algebraic Reconstruction Techniques (ART) for three-dimensional electron microscopy and X-ray photography. J Theor Biol 1970; 29: 471–481. doi: http://dx.doi.org/10.1016/0022-5193(70)90109-8
17. Andersen AH, Kak AC. Simultaneous Algebraic Reconstruction Technique (SART): A Superior Implementation of the Art Algorithm. Ultrason Imaging 1984; 6: 81–94. doi: http://dx.doi.org/10.1177/016173468400600107
18. Gilbert P. Iterative methods for the three-dimensional reconstruction of an object from projections. J Theor Biol 1972; 36: 105–117. doi: http://dx.doi.org/10.1016/0022-5193(72)90180-4
19. Fletcher R, Reeves CM. Function minimization by conjugate gradients. Comput J 1964; 7: 149–154. doi: http://dx.doi.org/10.1093/comjnl/7.2.149
20. Kachelrieß M, Sourbelle K, Kalender WA. Empirical cupping correction: A first-order raw data precorrection for cone-beam computed tomography. Med Phys 2006; 33: 1269–1274. doi: http://dx.doi.org/10.1118/1.2188076
21. Du LY, Umoh J, Nikolov HN, Pollmann SI, Lee TY, Holdsworth DW. A quality assurance phantom for the performance evaluation of volumetric micro-CT systems. Phys Med Biol 2007; 52: 7087–7108. doi: http://dx.doi.org/10.1088/0031-9155/52/23/021
22. Johnstone CD, Lindsay P, Graves EE, Wong E, Perez JR, Poirier Y, et al. Multi-institutional MicroCT image comparison of image-guided small animal irradiators. Phys Med Biol 2017; 62: 5760–5776. doi: http://dx.doi.org/10.1088/1361-6560/aa76b4
23. Sharma S, Narayanasamy G, Clarkson R, Chao M, Moros EG, Zhang X, et al. Study of Image Qualities From 6D Robot–Based CBCT Imaging System of Small Animal Irradiator. Technol Cancer Res Treat 2017; 16: 811–818. doi: http://dx.doi.org/10.1177/1533034617700558
24. Droege RT, Morin RL. A practical method to measure the MTF of CT scanners. Med Phys 1982; 9: 758–760. doi: http://dx.doi.org/10.1118/1.595124
25. Judy PF. The line spread function and modulation transfer function of a computed tomographic scanner. Med Phys 1976; 3: 233–236. doi: http://dx.doi.org/10.1118/1.594283
26. Schyns LEJR, Almeida IP, van Hoof SJ, Descamps B, Vanhove C, Landry G, et al. Optimizing dual energy cone beam CT protocols for preclinical imaging and radiation research. Br J Radiol 2016; 90: 20160480. doi: http://dx.doi.org/10.1259/bjr.20160480

Chapter 3
68
27. Saito M. Potential of dual-energy subtraction for converting CT numbers to electron density based on a single linear relationship: Conversion of energy-subtracted CT number to electron density. Med Phys 2012; 39: 2021–2030. doi: http://dx.doi.org/10.1118/1.3694111
28. Landry G, Seco J, Gaudreault M, Verhaegen F. Deriving effective atomic numbers from DECT based on a parameterization of the ratio of high and low linear attenuation coefficients. Phys Med Biol 2013; 58: 6851–6866. doi: http://dx.doi.org/10.1088/0031-9155/58/19/6851
29. Landry G, Gaudreault M, van Elmpt W, Wildberger JE, Verhaegen F. Improved dose calculation accuracy for low energy brachytherapy by optimizing dual energy CT imaging protocols for noise reduction using sinogram affirmed iterative reconstruction. Z Med Phys 2016; 26: 75–87. doi: http://dx.doi.org/10.1016/j.zemedi.2015.09.001

3


Lotte E J R SchynsDaniëlle B P Eekers
Brent van der HeydenIsabel P Almeida
Ana VaniquiFrank Verhaegen
Published in the British Journal of Radiology (2018)http://dx.doi.org/10.1259/bjr.20180454
Murine vs human tissue compositions:implications of using human tissue
compositions for photon energyabsorption in mice
Chapter 1 2 3 4 5 6 7 8
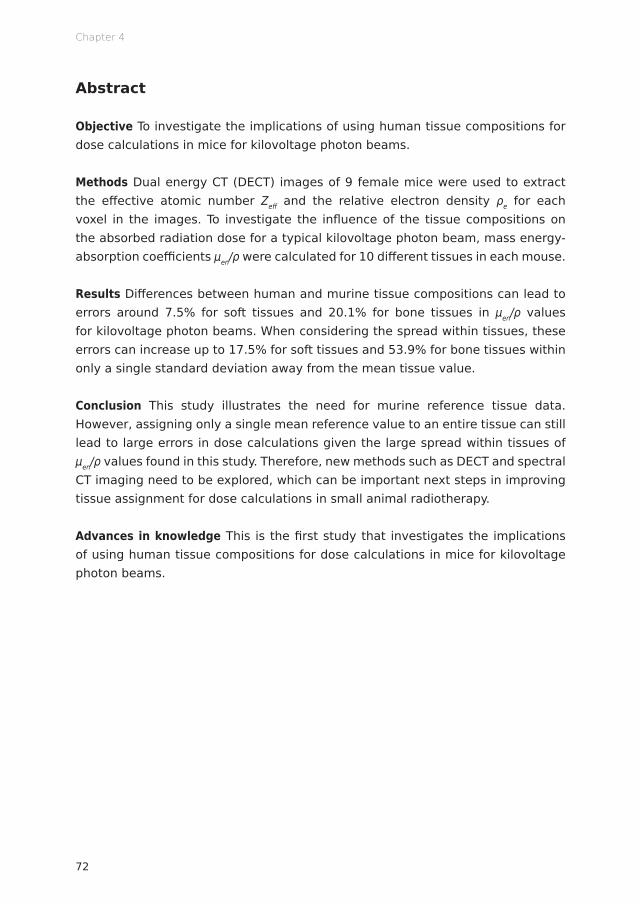
Chapter 4
72
Abstract
Objective To investigate the implications of using human tissue compositions for dose calculations in mice for kilovoltage photon beams.
Methods Dual energy CT (DECT) images of 9 female mice were used to extract the effective atomic number Zeff and the relative electron density ρe for each voxel in the images. To investigate the influence of the tissue compositions on the absorbed radiation dose for a typical kilovoltage photon beam, mass energy-absorption coefficients μen/ρ were calculated for 10 different tissues in each mouse.
Results Differences between human and murine tissue compositions can lead to errors around 7.5% for soft tissues and 20.1% for bone tissues in μen/ρ values for kilovoltage photon beams. When considering the spread within tissues, these errors can increase up to 17.5% for soft tissues and 53.9% for bone tissues within only a single standard deviation away from the mean tissue value.
Conclusion This study illustrates the need for murine reference tissue data. However, assigning only a single mean reference value to an entire tissue can still lead to large errors in dose calculations given the large spread within tissues of μen/ρ values found in this study. Therefore, new methods such as DECT and spectral CT imaging need to be explored, which can be important next steps in improving tissue assignment for dose calculations in small animal radiotherapy.
Advances in knowledge This is the first study that investigates the implications of using human tissue compositions for dose calculations in mice for kilovoltage photon beams.
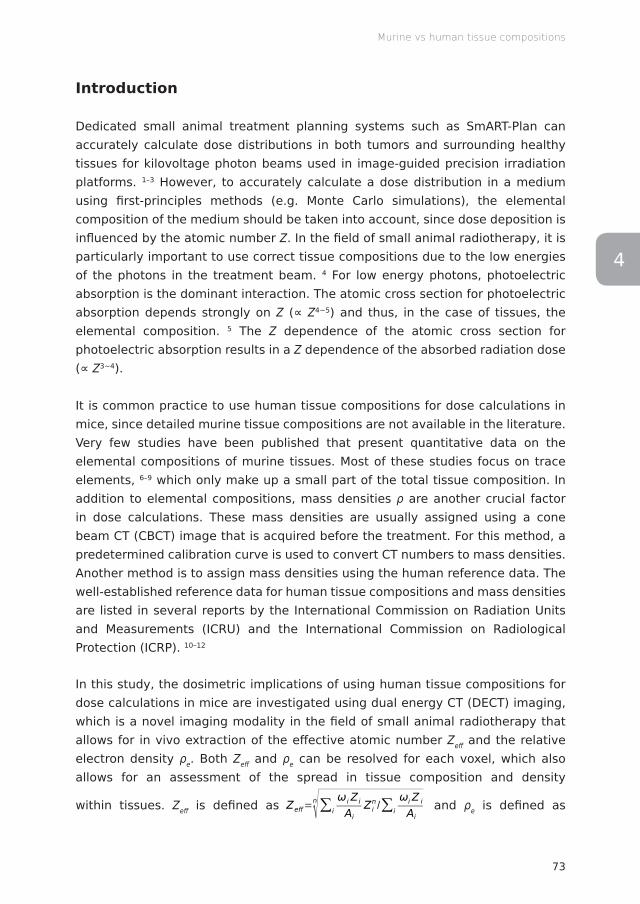
73
Murine vs human tissue compositions
34
Introduction
Dedicated small animal treatment planning systems such as SmART-Plan can accurately calculate dose distributions in both tumors and surrounding healthy tissues for kilovoltage photon beams used in image-guided precision irradiation platforms. 1–3 However, to accurately calculate a dose distribution in a medium using first-principles methods (e.g. Monte Carlo simulations), the elemental composition of the medium should be taken into account, since dose deposition is influenced by the atomic number Z. In the field of small animal radiotherapy, it is particularly important to use correct tissue compositions due to the low energies of the photons in the treatment beam. 4 For low energy photons, photoelectric absorption is the dominant interaction. The atomic cross section for photoelectric absorption depends strongly on Z (∝ Z4~5) and thus, in the case of tissues, the elemental composition. 5 The Z dependence of the atomic cross section for photoelectric absorption results in a Z dependence of the absorbed radiation dose (∝ Z3~4).
It is common practice to use human tissue compositions for dose calculations in mice, since detailed murine tissue compositions are not available in the literature. Very few studies have been published that present quantitative data on the elemental compositions of murine tissues. Most of these studies focus on trace elements, 6–9 which only make up a small part of the total tissue composition. In addition to elemental compositions, mass densities ρ are another crucial factor in dose calculations. These mass densities are usually assigned using a cone beam CT (CBCT) image that is acquired before the treatment. For this method, a predetermined calibration curve is used to convert CT numbers to mass densities. Another method is to assign mass densities using the human reference data. The well-established reference data for human tissue compositions and mass densities are listed in several reports by the International Commission on Radiation Units and Measurements (ICRU) and the International Commission on Radiological Protection (ICRP). 10–12
In this study, the dosimetric implications of using human tissue compositions for dose calculations in mice are investigated using dual energy CT (DECT) imaging, which is a novel imaging modality in the field of small animal radiotherapy that allows for in vivo extraction of the effective atomic number Zeff and the relative electron density ρe. Both Zeff and ρe can be resolved for each voxel, which also allows for an assessment of the spread in tissue composition and density
within tissues. Zeff is defined as
HU=1000⋅μ−μwater
μwater−μair
Zeff=n√∑i
ωi Zi
Ai
Zin /∑i
ωi Z i
Ai
μratio=μLowEnergy
μHighEnergy
μratio=μLowEnergy
μHighEnergy
=A+B⋅Zeff
n−1+C⋅Zeffm−1
D+E⋅Zeffn−1+F⋅Zeff
m−1
ρe=ρ∑i
ωi Zi
Ai
/ρe ,water
ΔHUHU=(1+α)⋅HUHighEnergy−α⋅HULowEnergy
ρe=a⋅(1+α)⋅HUHighEnergy−α⋅HULowEnergy
1000+b
ωi=ai⋅ρe+bi⋅Zeff+ci⋅ρeZeff+di
σtissue=√σmeasured2 −σnoise
2
σnoise=a⋅Db+c
CNR=Ī tissue−Ī background
√σtissue2 −σbackground
2
CNR=|HUROI−HUbackground|
noise
MTF (f )=π√24
⋅M(f )M0
MTF=Intensitystrip−Intensitygap
Intensitystrip+ Intensitygap
‖Rf−p‖2
argminf
‖Rf −p‖2
2RT (Rf−p)
ρ=1.073ρe−0.04
ΔHUD=(DDECT−DRef)/DRef⋅100%
and ρe is defined as

Chapter 4
74
𝜌𝜌" = 𝜌𝜌∑%&'&(&/𝜌𝜌",+,-"..
ω and A represent the elemental weight fraction and mass
number, respectively, for element i. ρ is the mass density, ρe,water is the electron density of water (≈ 0.555 mole electrons/cm3) and the exponent n is defined as 3.3, which was determined to be optimal in a previous study. 13 To investigate the influence of tissue compositions on the absorbed radiation dose for a typical kilovoltage photon beam, the mass energy-absorption coefficient μen/ρ was calculated for 10 different tissues in a series of 9 mice. μen/ρ can be multiplied by the photon energy fluence to calculate the dosimetric quantity collision kerma, which is closely related to absorbed radiation dose. Assuming an approximately linear relationship between μen/ρ and the absorbed radiation dose for kilovoltage photon beams (i.e. the potential photon fluence perturbation by the different media is ignored), differences in μen/ρ are proportional to differences in absorbed radiation dose.
Methods and materials
Figure 1 shows the workflow of the methods used in this study. First, CBCT images were acquired with two different x-ray spectra, which were then registered before applying the DECT methods to obtain Zeff and ρe images. These images were used to calculate the means and standard deviations for both Zeff and ρe for 10 different tissues in each mouse. A noise correction was applied to the standard deviations which were then used to calculate the ±1 standard deviation ranges of Zeff and ρe to represent the spread in tissue composition and density, respectively. The mean tissue composition and its spread were then used to calculate the mean μen/ρ and its spread. The following sections explain these steps in greater detail.

75
Murine vs human tissue compositions
34
Figure 1: Workflow of the methods used in this study. The top half shows how the elemental compositions are calculated from the 50 and 90 kVp CBCT images and the
bottom half shows how μen/ρ is calculated from these compositions.
Image acquisition
The X-RAD 225Cx system (Precision X-Ray, North Branford, Connecticut, USA) was used to image 9 female NMRI nude mice. 14 For each mouse, two CBCT images were acquired with two different peak voltages: 50 and 90 kVp. This combination was determined to be optimal in terms of Zeff and ρe errors, as shown in a previous study. 15 The acquired images were reconstructed using the Feldkamp backprojection algorithm that is implemented in an in-house developed software platform for preclinical CBCT image reconstruction, built using the open source software RTK (Creatis, Lyon, France). 16,17 The DECT imaging protocols are summarized in Table 1.
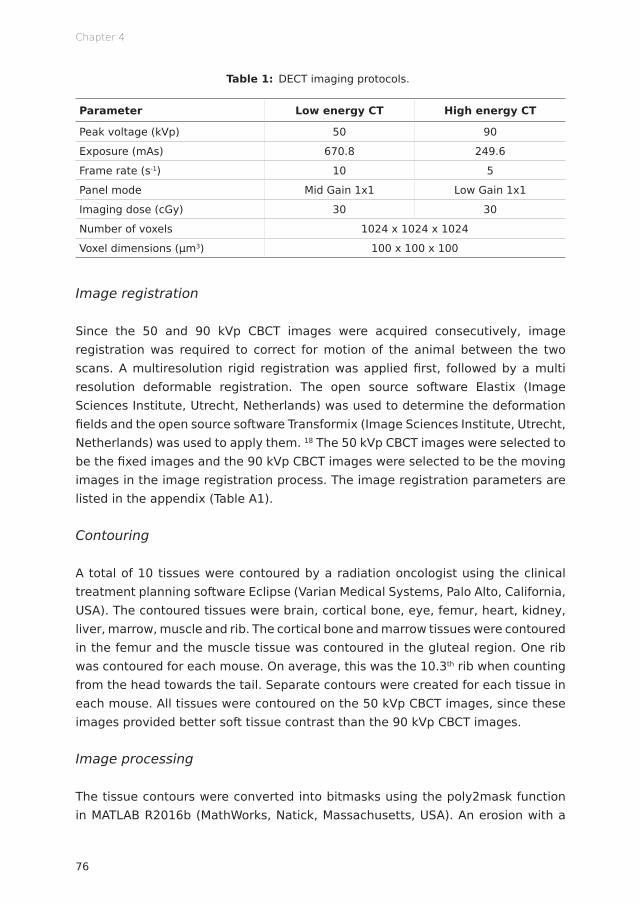
Chapter 4
76
Table 1: DECT imaging protocols.
Parameter Low energy CT High energy CT
Peak voltage (kVp) 50 90
Exposure (mAs) 670.8 249.6
Frame rate (s-1) 10 5
Panel mode Mid Gain 1x1 Low Gain 1x1
Imaging dose (cGy) 30 30
Number of voxels 1024 x 1024 x 1024
Voxel dimensions (μm3) 100 x 100 x 100
Image registration
Since the 50 and 90 kVp CBCT images were acquired consecutively, image registration was required to correct for motion of the animal between the two scans. A multiresolution rigid registration was applied first, followed by a multi resolution deformable registration. The open source software Elastix (Image Sciences Institute, Utrecht, Netherlands) was used to determine the deformation fields and the open source software Transformix (Image Sciences Institute, Utrecht, Netherlands) was used to apply them. 18 The 50 kVp CBCT images were selected to be the fixed images and the 90 kVp CBCT images were selected to be the moving images in the image registration process. The image registration parameters are listed in the appendix (Table A1).
Contouring
A total of 10 tissues were contoured by a radiation oncologist using the clinical treatment planning software Eclipse (Varian Medical Systems, Palo Alto, California, USA). The contoured tissues were brain, cortical bone, eye, femur, heart, kidney, liver, marrow, muscle and rib. The cortical bone and marrow tissues were contoured in the femur and the muscle tissue was contoured in the gluteal region. One rib was contoured for each mouse. On average, this was the 10.3th rib when counting from the head towards the tail. Separate contours were created for each tissue in each mouse. All tissues were contoured on the 50 kVp CBCT images, since these images provided better soft tissue contrast than the 90 kVp CBCT images.
Image processing
The tissue contours were converted into bitmasks using the poly2mask function in MATLAB R2016b (MathWorks, Natick, Massachusetts, USA). An erosion with a
77
Murine vs human tissue compositions
34
spherical structuring element (radius 2 pixels) was applied to the bitmasks for all tissues in all mice to remove boundary voxels that might be affected by partial volume effects. The bitmasks were applied to the Zeff and ρe images to obtain Zeff and ρe values for each voxel in the contoured tissue. Mean values and standard deviations were calculated for the Zeff and ρe voxels in each bitmask of 10 tissues in all of the 9 mice.
Calibrations
The procedure to calibrate for Zeff and ρe was adopted from a previous study. 15 A mouse-sized phantom with 12 cylindrical inserts (SmART Scientific Solutions, Maastricht, Netherlands) was used to establish a calibration curve for both Zeff and ρe. Zeff images were calculated using the tissue substitute method described by Landry et al and ρe images were calculated using a method described by Saito. 13,19 Equation 1 was used to fit Zeff and equation 2 was used to fit ρe. In equation 1, μ is the mean linear attenuation coefficient for each phantom insert calculated from the measured CT numbers, Zeff is the reference effective atomic number calculated from the elemental compositions provided by the manufacturer and A, B, C, D, E, F, n and m are fit coefficients. In equation 2, HU is the mean CT number for each phantom insert, ρe is the reference relative election density calculated from the mass densities and elemental compositions provided by the manufacturer and a, b and α are fit parameters.
HU=1000⋅μ−μwater
μwater−μair
Zeff=n√∑i
ωi Zi
Ai
Zin /∑i
ωi Z i
Ai
μratio=μLowEnergy
μHighEnergy
μratio=μLowEnergy
μHighEnergy
=A+B⋅Zeff
n−1+C⋅Zeffm−1
D+E⋅Zeffn−1+F⋅Zeff
m−1
ρe=ρ∑i
ωi Zi
Ai
/ρe ,water
ΔHUHU=(1+α)⋅HUHighEnergy−α⋅HULowEnergy
ρe=a⋅(1+α)⋅HUHighEnergy−α⋅HULowEnergy
1000+b
ωi=ai⋅ρe+bi⋅Zeff+ci⋅ρeZeff+di
σtissue=√σmeasured2 −σnoise
2
σnoise=a⋅Db+c
CNR=Ī tissue−Ī background
√σtissue2 −σbackground
2
CNR=|HUROI−HUbackground|
noise
MTF (f )=π√24
⋅M(f )M0
MTF=Intensitystrip−Intensitygap
Intensitystrip+ Intensitygap
‖Rf−p‖2
argminf
‖Rf −p‖2
2RT (Rf−p)
ρ=1.073ρe−0.04
ΔHUD=(DDECT−DRef)/DRef⋅100%
(1)
HU=1000⋅μ−μwater
μwater−μair
Zeff=n√∑i
ωi Zi
Ai
Zin /∑i
ωi Z i
Ai
μratio=μLowEnergy
μHighEnergy
μratio=μLowEnergy
μHighEnergy
=A+B⋅Zeff
n−1+C⋅Zeffm−1
D+E⋅Zeffn−1+F⋅Zeff
m−1
ρe=ρ∑i
ωi Zi
Ai
/ρe ,water
ΔHUHU=(1+α)⋅HUHighEnergy−α⋅HULowEnergy
ρe=a⋅(1+α)⋅HUHighEnergy−α⋅HULowEnergy
1000+b
ωi=ai⋅ρe+bi⋅Zeff+ci⋅ρeZeff+di
σtissue=√σmeasured2 −σnoise
2
σnoise=a⋅Db+c
CNR=Ī tissue−Ī background
√σtissue2 −σbackground
2
CNR=|HUROI−HUbackground|
noise
MTF (f )=π√24
⋅M(f )M0
MTF=Intensitystrip−Intensitygap
Intensitystrip+ Intensitygap
‖Rf−p‖2
argminf
‖Rf −p‖2
2RT (Rf−p)
ρ=1.073ρe−0.04
ΔHUD=(DDECT−DRef)/DRef⋅100%
(2)
Zeff and ρe were combined to obtain elemental weight fractions using a method described by Hünemohr et al. 20 In this method, weight fractions for the ith element were derived by a linear fit of Zeff, ρe and an interaction of both. The weight fractions for the individual elements were combined to obtain tissue compositions. Negative weight fractions were replaced by zero and the summed weight fractions were normalized to unity. In contrast to the fitting procedure for Zeff and ρe, (which was applied to the phantom tissues), the fitting procedure for the elemental weight fractions was applied to the 71 human reference tissues listed by Schneider et al. 21 However, the lung tissue was excluded from the fitting procedure due to its aberrant

Chapter 4
78
values. A calibration curve (equation 3) was fitted through the 70 remaining points. A separate fit was performed for the soft tissues (Zeff < 8.2) and the bone tissues (Zeff ≥ 8.2). In this equation, a, b, c and d are fit parameters. The index i iterates over the six most abundant elements in the human body, which are hydrogen (H), carbon (C), nitrogen (N), oxygen (O), phosphorus (P) and calcium (Ca).
HU=1000⋅μ−μwater
μwater−μair
Zeff=n√∑i
ωi Zi
Ai
Zin /∑i
ωi Z i
Ai
μratio=μLowEnergy
μHighEnergy
μratio=μLowEnergy
μHighEnergy
=A+B⋅Zeff
n−1+C⋅Zeffm−1
D+E⋅Zeffn−1+F⋅Zeff
m−1
ρe=ρ∑i
ωi Zi
Ai
/ρe ,water
ΔHUHU=(1+α)⋅HUHighEnergy−α⋅HULowEnergy
ρe=a⋅(1+α)⋅HUHighEnergy−α⋅HULowEnergy
1000+b
ωi=ai⋅ρe+bi⋅Zeff+ci⋅ρeZeff+di
σtissue=√σmeasured2 −σnoise
2
σnoise=a⋅Db+c
CNR=Ī tissue−Ī background
√σtissue2 −σbackground
2
CNR=|HUROI−HUbackground|
noise
MTF (f )=π√24
⋅M(f )M0
MTF=Intensitystrip−Intensitygap
Intensitystrip+ Intensitygap
‖Rf−p‖2
argminf
‖Rf −p‖2
2RT (Rf−p)
ρ=1.073ρe−0.04
ΔHUD=(DDECT−DRef)/DRef⋅100%
(3)
Standard deviations
The standard deviations in Zeff and ρe represent the spread in tissue composition and density. However, the measured spread in Zeff and ρe is not solely caused by the heterogeneity of the tissues. When acquiring measurements of homogeneous materials such as phantom inserts, a small spread in Zeff and ρe can be observed, which is mainly caused by imaging noise in the CBCT images. Since this study focuses on the actual heterogeneity of the tissues (σtissue), the contribution of noise to the spread in Zeff and ρe needs to be removed first. To this end, data from a previous study were used in which the same imaging protocols were used and thus the same noise levels can be expected. 15 From these data, standard deviations for eight homogeneous validation phantom inserts were obtained (σnoise). The validation phantom in the previous study contained 3 out of 12 empty insert positions and a Teflon insert which yielded aberrant results. The empty insert positions and the Teflon insert were left out. The standard deviations were then quadratically subtracted from the standard deviations that were obtained in the present study (σmeasured) using equation 4. In this equation, the mean standard deviation σnoise equals 0.30 for Zeff and 0.034 for ρe.
HU=1000⋅μ−μwater
μwater−μair
Zeff=n√∑i
ωi Zi
Ai
Zin /∑i
ωi Z i
Ai
μratio=μLowEnergy
μHighEnergy
μratio=μLowEnergy
μHighEnergy
=A+B⋅Zeff
n−1+C⋅Zeffm−1
D+E⋅Zeffn−1+F⋅Zeff
m−1
ρe=ρ∑i
ωi Zi
Ai
/ρe ,water
ΔHUHU=(1+α)⋅HUHighEnergy−α⋅HULowEnergy
ρe=a⋅(1+α)⋅HUHighEnergy−α⋅HULowEnergy
1000+b
ωi=ai⋅ρe+bi⋅Zeff+ci⋅ρeZeff+di
σtissue=√σmeasured2 −σnoise
2
σnoise=a⋅Db+c
CNR=Ī tissue−Ī background
√σtissue2 −σbackground
2
CNR=|HUROI−HUbackground|
noise
MTF (f )=π√24
⋅M(f )M0
MTF=Intensitystrip−Intensitygap
Intensitystrip+ Intensitygap
‖Rf−p‖2
argminf
‖Rf −p‖2
2RT (Rf−p)
ρ=1.073ρe−0.04
ΔHUD=(DDECT−DRef)/DRef⋅100%
(4)
Mass energy-absorption coefficients
To investigate the influence of tissue compositions on the absorbed radiation dose, μen/ρ was calculated using the NIST tables of photon mass attenuation coefficients and mass energy-absorption coefficients. 22 The 225 kVp spectrum for the X-RAD 225Cx system including 0.3 mm copper filtration was calculated using SpekCalc. 23–25 This spectrum, which is assumed to be invariant throughout the mouse, has a mean photon energy of 86.1 keV and a half value layer of 0.975 mm copper or 11.6 mm aluminum. μen/ρ values for the 225 kVp spectrum were calculated for
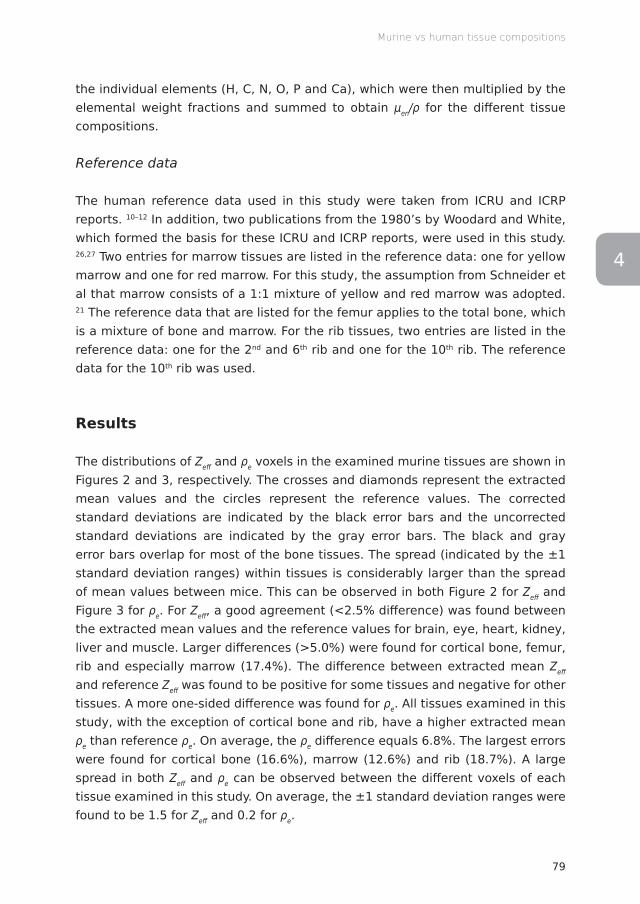
79
Murine vs human tissue compositions
34
the individual elements (H, C, N, O, P and Ca), which were then multiplied by the elemental weight fractions and summed to obtain μen/ρ for the different tissue compositions.
Reference data
The human reference data used in this study were taken from ICRU and ICRP reports. 10–12 In addition, two publications from the 1980’s by Woodard and White, which formed the basis for these ICRU and ICRP reports, were used in this study. 26,27 Two entries for marrow tissues are listed in the reference data: one for yellow marrow and one for red marrow. For this study, the assumption from Schneider et al that marrow consists of a 1:1 mixture of yellow and red marrow was adopted. 21 The reference data that are listed for the femur applies to the total bone, which is a mixture of bone and marrow. For the rib tissues, two entries are listed in the reference data: one for the 2nd and 6th rib and one for the 10th rib. The reference data for the 10th rib was used.
Results
The distributions of Zeff and ρe voxels in the examined murine tissues are shown in Figures 2 and 3, respectively. The crosses and diamonds represent the extracted mean values and the circles represent the reference values. The corrected standard deviations are indicated by the black error bars and the uncorrected standard deviations are indicated by the gray error bars. The black and gray error bars overlap for most of the bone tissues. The spread (indicated by the ±1 standard deviation ranges) within tissues is considerably larger than the spread of mean values between mice. This can be observed in both Figure 2 for Zeff and Figure 3 for ρe. For Zeff, a good agreement (<2.5% difference) was found between the extracted mean values and the reference values for brain, eye, heart, kidney, liver and muscle. Larger differences (>5.0%) were found for cortical bone, femur, rib and especially marrow (17.4%). The difference between extracted mean Zeff and reference Zeff was found to be positive for some tissues and negative for other tissues. A more one-sided difference was found for ρe. All tissues examined in this study, with the exception of cortical bone and rib, have a higher extracted mean ρe than reference ρe. On average, the ρe difference equals 6.8%. The largest errors were found for cortical bone (16.6%), marrow (12.6%) and rib (18.7%). A large spread in both Zeff and ρe can be observed between the different voxels of each tissue examined in this study. On average, the ±1 standard deviation ranges were found to be 1.5 for Zeff and 0.2 for ρe.
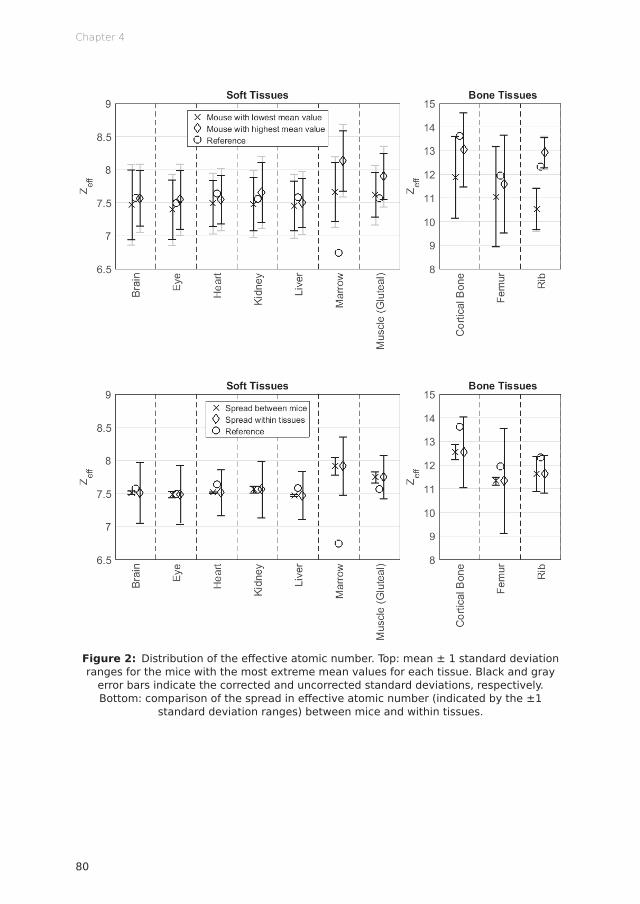
Chapter 4
80
Figure 2: Distribution of the effective atomic number. Top: mean ± 1 standard deviation ranges for the mice with the most extreme mean values for each tissue. Black and gray
error bars indicate the corrected and uncorrected standard deviations, respectively. Bottom: comparison of the spread in effective atomic number (indicated by the ±1
standard deviation ranges) between mice and within tissues.
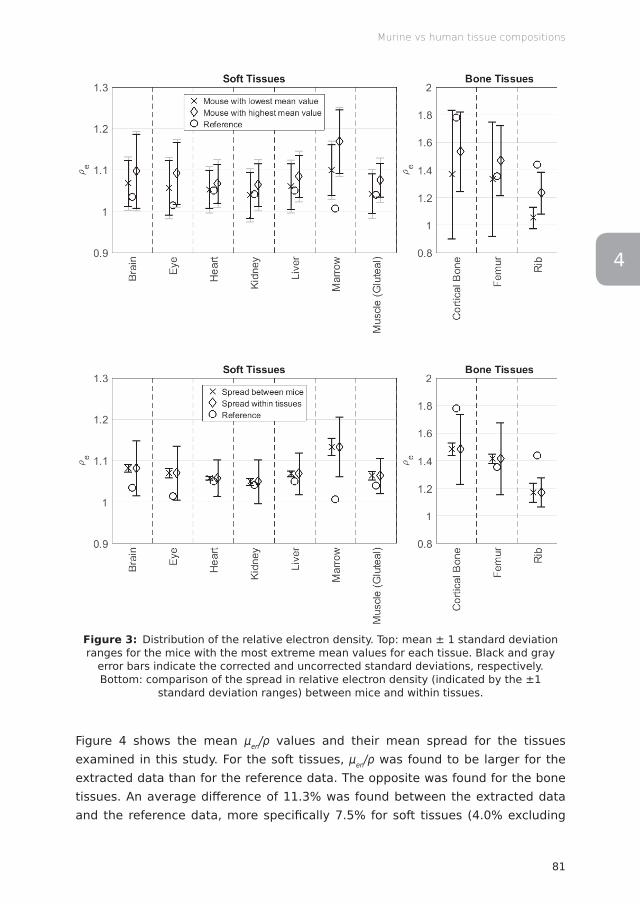
81
Murine vs human tissue compositions
34
Figure 3: Distribution of the relative electron density. Top: mean ± 1 standard deviation ranges for the mice with the most extreme mean values for each tissue. Black and gray
error bars indicate the corrected and uncorrected standard deviations, respectively. Bottom: comparison of the spread in relative electron density (indicated by the ±1
standard deviation ranges) between mice and within tissues.
Figure 4 shows the mean μen/ρ values and their mean spread for the tissues examined in this study. For the soft tissues, μen/ρ was found to be larger for the extracted data than for the reference data. The opposite was found for the bone tissues. An average difference of 11.3% was found between the extracted data and the reference data, more specifically 7.5% for soft tissues (4.0% excluding

Chapter 4
82
marrow) and 20.1% for bone tissues. When considering the spread within tissues, errors ranging from −5.5% (eye) to +17.5% (marrow) were found for the soft tissues and errors ranging from –53.9% to +38.0% (both femur) were found for bone tissues. Both error ranges apply to the ±1 standard deviation interval, which only makes up 68% of the voxels in the case of a normal distribution.
Figure 4: Distribution of the mass-energy absorption coefficients. The crosses represent the mean values (±1 standard deviation ranges) extracted using the dual energy CT
method. The circles represent the mass-energy absorption coefficients calculated from the reference data.
Discussion
This work shows that differences between human and murine tissue compositions can lead to errors around 7.5% for soft tissues and 20.1% for bone tissues in μen/ρ values. Assuming an approximately linear relationship between μen/ρ and the absorbed radiation dose for kilovoltage photon beams (i.e. the potential photon fluence perturbation by the different media is ignored), differences in μen/ρ are proportional to differences in absorbed radiation dose. Therefore, errors around 7.5% for soft tissues and 20.1% for bone tissues can be expected in dose calculations for kilovoltage photon beams. When considering the spread within tissues, these errors can increase up to 17.5% for soft tissues and 53.9% for bone tissues within only a single standard deviation away from the mean tissue value. Even larger errors can be expected for softer x-ray spectra (i.e. when using lower tube voltages or thinner filters for the treatment beam) in which μen/ρ differs even
83
Murine vs human tissue compositions
34
more between different tissues. 2 Although an overall good agreement was found between the extracted and reference Zeff, the strong dependence of the atomic cross section for photoelectric absorption on Z leads to large differences in μen/ρ and thus in the absorbed radiation dose. The one-sided difference that was found between the extracted (murine) and reference (human) ρe could lead to errors in methods that rely on the reference data for densities. For example, errors in CT number predictions could occur when using the stoichiometric method described by Schneider et al. 28 When assigning densities using the human reference data, the differences in ρe could also lead to errors in dose calculations.
The accuracy of the extracted Zeff and ρe is influenced by a number of different factors. One of these factors is imaging noise. In this study, the extracted standard deviations are corrected for the contribution of noise based on measurements in a phantom with homogeneous tissue-equivalent inserts. Another factor is beam hardening, which could be a possible explanation for the large difference found between the extracted and reference values for marrow. The marrow tissue is surrounded by dense cortical bone tissue, which could substantially harden the x-ray spectrum and thus influence the CT numbers from which Zeff and ρe are calculated. Other imaging artifacts, such as scatter, partial volume effects and motion of the animal could also compromise the accuracy of CT numbers. More research is required to investigate the influence of these factors on Zeff and ρe derived from DECT.
The discrepancies for the marrow tissue could also be caused by the fact that the assumption that marrow consists of a 1:1 mixture of yellow and red marrow is not accurate for mice. For the femur, any discrepancies between the measured and reference values could be caused by a difference in bone/marrow ratio between mice and humans. Rib tissue discrepancies could be caused by the fact that the different ribs in the thorax contain different amounts of cartilage. This could also explain the large difference between the mouse with the lowest value and the mouse with the highest value in Figures 2 and 3. Aside from being different to human tissues, murine tissues might also vary between different strains, sexes and ages.
Uncertainties in tissue compositions lead to an additional uncertainty in dose calculations. As a first step to investigate the magnitude of this uncertainty, μen/ρ was calculated for 10 different murine tissues and compared to μen/ρ values that were calculated from the human reference data. To investigate the accumulated dose difference to an actual tumor, dose calculations are required to account for differences in absorption and attenuation of the treatment beam which are caused
Chapter 4
84
by differences in the elemental compositions and densities of the tissues through which the beam passes.
Conclusion
This study illustrates the need for murine reference tissue data. However, a large collection of data would be required to include all different strains, sexes and ages. Moreover, assigning only a single mean reference value to an entire tissue can still lead to large errors in dose calculations given the large spread within tissues of μen/ρ values found in this study. Therefore, new methods such as DECT and spectral CT imaging need to be explored, which can be important next steps in improving tissue assignment for dose calculations in small animal radiotherapy. 29
Funding
AV acknowledges financial support from CAPES Scholarship and Science without Borders program from Brazil (BEX 12030/13-9).
Conflicts of interest
FV is a founder of SmART Scientific Solutions (Maastricht, Netherlands), which works with the company Precision X-Ray (North Branford, Connecticut, USA) on commercial development of small animal treatment planning software.
Appendix
The image registration parameters that were used to register the 90 kVp CBCT images to the 50 kVp CBCT images are listed in table A1.
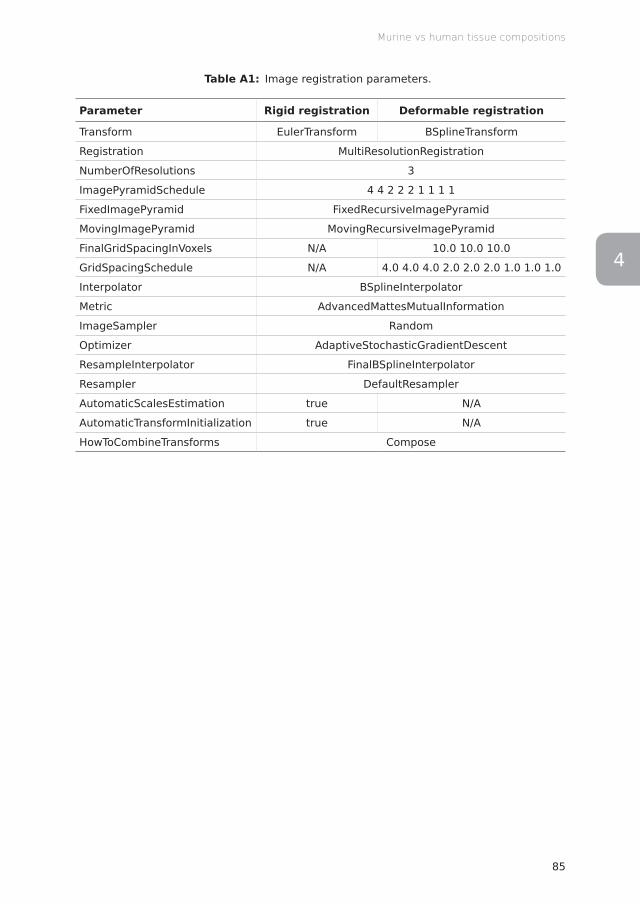
85
Murine vs human tissue compositions
34
Table A1: Image registration parameters.
Parameter Rigid registration Deformable registration
Transform EulerTransform BSplineTransform
Registration MultiResolutionRegistration
NumberOfResolutions 3
ImagePyramidSchedule 4 4 2 2 2 1 1 1 1
FixedImagePyramid FixedRecursiveImagePyramid
MovingImagePyramid MovingRecursiveImagePyramid
FinalGridSpacingInVoxels N/A 10.0 10.0 10.0
GridSpacingSchedule N/A 4.0 4.0 4.0 2.0 2.0 2.0 1.0 1.0 1.0
Interpolator BSplineInterpolator
Metric AdvancedMattesMutualInformation
ImageSampler Random
Optimizer AdaptiveStochasticGradientDescent
ResampleInterpolator FinalBSplineInterpolator
Resampler DefaultResampler
AutomaticScalesEstimation true N/A
AutomaticTransformInitialization true N/A
HowToCombineTransforms Compose
Chapter 4
86
References
1. van Hoof SJ, Granton PV, Verhaegen F. Development and validation of a treatment planning system for small animal radiotherapy: SmART-Plan. Radiother Oncol 2013; 109: 361–366. doi: http://dx.doi.org/10.1016/j.radonc.2013.10.003
2. Verhaegen F, van Hoof S, Granton PV, Trani D. A review of treatment planning for precision image-guided photon beam pre-clinical animal radiation studies. Z Med Phys 2014; 24: 323–334. doi: http://dx.doi.org/10.1016/j.zemedi.2014.02.004
3. Verhaegen F, Granton P, Tryggestad E. Small animal radiotherapy research platforms. Phys Med Biol 2011; 56: R55–R83. doi: http://dx.doi.org/10.1088/0031-9155/56/12/R01
4. Bazalova M, Graves EE. The importance of tissue segmentation for dose calculations for kilovoltage radiation therapy: Tissue segmentation for kilovoltage radiotherapy. Med Phys 2011; 38: 3039–3049. doi: http://dx.doi.org/10.1118/1.3589138
5. White DR. An analysis of the Z-dependence of photon and electron interactions. Phys Med Biol 1977; 22: 219–228. doi: http://dx.doi.org/10.1088/0031-9155/22/2/003
6. Debernardi N, Roijers RB, Krams R, de Crom R, Mutsaers PHA, van der Vusse GJ. Microcalcifications in atherosclerotic lesion of apolipoprotein E-deficient mouse. Int J Exp Pathol 2010; 91: 485–494. doi: http://dx.doi.org/10.1111/j.1365-2613.2010.00729.x
7. Bäurle J, Kučera J, Frischmuth S, Lambertz M, Kranda K. Dynamics of Trace Element Concentration During Development and Excitotoxic Cell Death in the Cerebellum of Lurcher Mutant Mice. Brain Pathol 2009; 19: 586–595. doi: http://dx.doi.org/10.1111/j.1750-3639.2008.00200.x
8. Dey S, Arjun J, Das M, Bhattacharjee CR, Dkhar PS. Effect of prenatal lead toxicity on surface ultrastructural features, elemental composition and infrared absorption characteristics of the skin of albino mice. Cytobios 2001; 106 Suppl 2: 245–254.
9. Anniko M, Wroblewski R. Elemental Composition of the Developing Inner Ear. Ann Otol Rhinol Laryngol 1981; 90: 25–32. doi: http://dx.doi.org/10.1177/000348948109000107
10. White DR, Booz J, Griffith RV, Spokas JJ, Wilson IJ. ICRU Report 44: Tissue Substitutes in Radiation Dosimetry and Measurement. International Commission on Radiation Units and Measurements (ICRU) 1989; doi: http://dx.doi.org/10.1093/jicru/os23.1.Report44
11. White DR, Griffith RV, Wilson IJ. ICRU Report 46: Photon, Electron, Proton, and Neutron Interaction Data for Body Tissues. International Commission on Radiation Units and Measurements (ICRU) 1992; doi: http://dx.doi.org/10.1093/jicru/os24.1.Report46
12. Valentin J. ICRP Publication 89: Basic Anatomical and Physiological Data for Use in Radiological Protection: Reference Values. International Commission on Radiological Protection (ICRP) 2002; doi: http://dx.doi.org/10.1016/S0146-6453(03)00002-2
13. Landry G, Seco J, Gaudreault M, Verhaegen F. Deriving effective atomic numbers from DECT based on a parameterization of the ratio of high and low linear attenuation coefficients. Phys Med Biol 2013; 58: 6851–6866. doi: http://dx.doi.org/10.1088/0031-9155/58/19/6851
87
Murine vs human tissue compositions
34
14. Clarkson R, Lindsay PE, Ansell S, Wilson G, Jelveh S, Hill RP, et al. Characterization of image quality and image-guidance performance of a preclinical microirradiator: Characterization of a preclinical microirradiator. Med Phys 2011; 38: 845–856. doi: http://dx.doi.org/10.1118/1.3533947
15. Schyns LEJR, Almeida IP, van Hoof SJ, Descamps B, Vanhove C, Landry G, et al. Optimizing dual energy cone beam CT protocols for preclinical imaging and radiation research. Br J Radiol 2016; 90: 20160480. doi: http://dx.doi.org/10.1259/bjr.20160480
16. Feldkamp LA, Davis LC, Kress JW. Practical cone-beam algorithm. J Opt Soc Am A 1984; 1: 612. doi: http://dx.doi.org/10.1364/JOSAA.1.000612
17. Rit S, Vila Oliva M, Brousmiche S, Labarbe R, Sarrut D, Sharp GC. The Reconstruction Toolkit (RTK), an open-source cone-beam CT reconstruction toolkit based on the Insight Toolkit (ITK). J Phys Conf Ser 2014; 489: 012079. doi: http://dx.doi.org/10.1088/1742-6596/489/1/012079
18. Klein S, Staring M, Murphy K, Viergever MA, Pluim JPW. elastix: A Toolbox for Intensity-Based Medical Image Registration. IEEE Trans Med Imaging 2010; 29: 196–205. doi: http://dx.doi.org/10.1109/TMI.2009.2035616
19. Saito M. Potential of dual-energy subtraction for converting CT numbers to electron density based on a single linear relationship: Conversion of energy-subtracted CT number to electron density. Med Phys 2012; 39: 2021–2030. doi: http://dx.doi.org/10.1118/1.3694111
20. Hünemohr N, Paganetti H, Greilich S, Jäkel O, Seco J. Tissue decomposition from dual energy CT data for MC based dose calculation in particle therapy. Med Phys 2014; 41: doi: http://dx.doi.org/10.1118/1.4875976
21. Schneider W, Bortfeld T, Schlegel W. Correlation between CT numbers and tissue parameters needed for Monte Carlo simulations of clinical dose distributions. Phys Med Biol 2000; 45: 459–478. doi: http://dx.doi.org/10.1088/0031-9155/45/2/314
22. Hubbell JH, Seltzer SM. Tables of X-Ray Mass Attenuation Coefficients and Mass Energy-Absorption Coefficients from 1 keV to 20 MeV for Elements Z = 1 to 92 and 48 Additional Substances of Dosimetric Interest. National Institute of Standards and Technology (NIST) 2004. Available from: https://www.nist.gov/pml/x-ray-mass-attenuation-coefficients
23. Poludniowski G, Landry G, DeBlois F, Evans PM, Verhaegen F. SpekCalc: a program to calculate photon spectra from tungsten anode x-ray tubes. Phys Med Biol 2009; 54: N433–N438. doi: http://dx.doi.org/10.1088/0031-9155/54/19/N01
24. Poludniowski GG, Evans PM. Calculation of x-ray spectra emerging from an x-ray tube. Part I. Electron penetration characteristics in x-ray targets. Med Phys 2007; 34: 2164–2174. doi: http://dx.doi.org/10.1118/1.2734725
25. Poludniowski GG. Calculation of x-ray spectra emerging from an x-ray tube. Part II. X-ray production and filtration in x-ray targets. Med Phys 2007; 34: 2175–2186. doi: http://dx.doi.org/10.1118/1.2734726

Chapter 4
88
26. Woodard HQ, White DR. The composition of body tissues. Br J Radiol 1986; 59: 1209–1218. doi: http://dx.doi.org/10.1259/0007-1285-59-708-1209
27. White DR, Woodard HQ, Hammond SM. Average soft-tissue and bone models for use in radiation dosimetry. Br J Radiol 1987; 60: 907–913. doi: http://dx.doi.org/10.1259/0007-1285-60-717-907
28. Schneider U, Pedroni E, Lomax A. The calibration of CT Hounsfield units for radiotherapy treatment planning. Phys Med Biol 1996; 41: 111–124. doi: http://dx.doi.org/10.1088/0031-9155/41/1/009
29. Trojanova E, Schyns LEJR, Dubois L, Jakubek J, Le Pape A, Sefc L, et al. Tissue sensitive imaging and tomography without contrast agents for small animals with Timepix based detectors. J Instrum 2017; 12: C01056. doi: http://dx.doi.org/10.1088/1748-0221/12/01/C01056

34


Ana VaniquiLotte E J R Schyns
Isabel P AlmeidaBrent van der Heyden
Stefan J van HoofFrank Verhaegen
Published in Radiation Oncology (2017)http://dx.doi.org/10.1186/s13014-017-0922-9
The impact of dual energy CT imaging ondose calculations for preclinical studies
Chapter 1 2 3 4 5 6 7 8
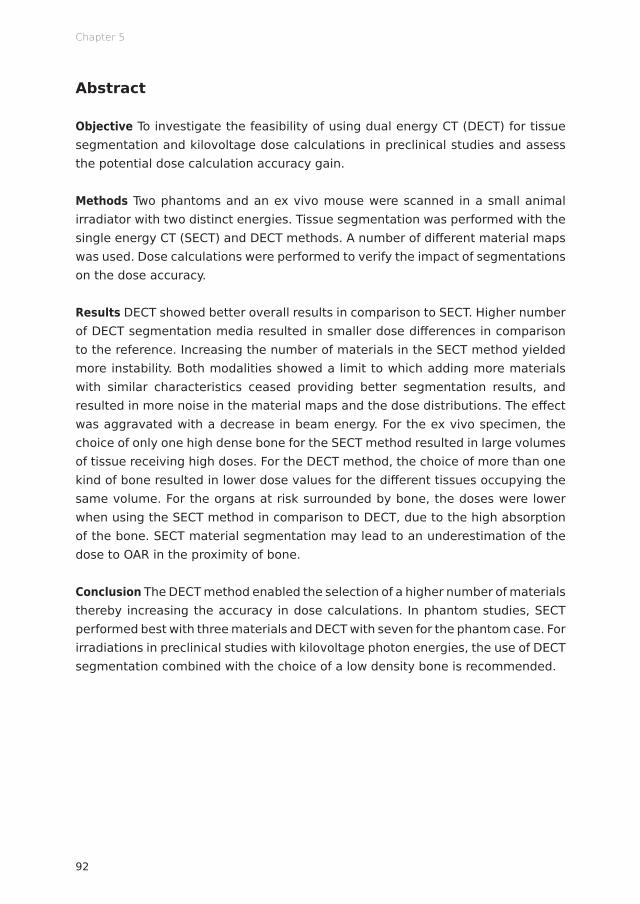
Chapter 5
92
Abstract
Objective To investigate the feasibility of using dual energy CT (DECT) for tissue segmentation and kilovoltage dose calculations in preclinical studies and assess the potential dose calculation accuracy gain.
Methods Two phantoms and an ex vivo mouse were scanned in a small animal irradiator with two distinct energies. Tissue segmentation was performed with the single energy CT (SECT) and DECT methods. A number of different material maps was used. Dose calculations were performed to verify the impact of segmentations on the dose accuracy.
Results DECT showed better overall results in comparison to SECT. Higher number of DECT segmentation media resulted in smaller dose differences in comparison to the reference. Increasing the number of materials in the SECT method yielded more instability. Both modalities showed a limit to which adding more materials with similar characteristics ceased providing better segmentation results, and resulted in more noise in the material maps and the dose distributions. The effect was aggravated with a decrease in beam energy. For the ex vivo specimen, the choice of only one high dense bone for the SECT method resulted in large volumes of tissue receiving high doses. For the DECT method, the choice of more than one kind of bone resulted in lower dose values for the different tissues occupying the same volume. For the organs at risk surrounded by bone, the doses were lower when using the SECT method in comparison to DECT, due to the high absorption of the bone. SECT material segmentation may lead to an underestimation of the dose to OAR in the proximity of bone.
Conclusion The DECT method enabled the selection of a higher number of materials thereby increasing the accuracy in dose calculations. In phantom studies, SECT performed best with three materials and DECT with seven for the phantom case. For irradiations in preclinical studies with kilovoltage photon energies, the use of DECT segmentation combined with the choice of a low density bone is recommended.

93
DECT for preclinical dose calculations
5
Introduction
Preclinical radiation studies with small animal models play a significant role in the understanding of cancer radiobiology. Such studies also aim towards mimicking human treatment capabilities so that specific validated radiation therapies in animal models can be successfully translated into patient radiotherapy (RT) trials. 1 Accurate preclinical radiation targeting requires accurate image guiding. For the various stages of target delineation, treatment planning, dose calculation, beam delivery and subsequent outcome assessments, precise identification of different tissues and structures is of paramount importance.
Computed Tomography (CT) is the most frequently used imaging modality for RT. 2 Commercial preclinical irradiators are equipped with an x-ray tube, which besides the irradiation, is used to acquire high-resolution cone beam CT (CBCT) images (about 100-200 μm). 3
Small animal irradiation is preferably performed with kilovoltage photons, 4 in contrast to human radiotherapy which is mostly performed with megavoltage photons. In the kilovoltage energy range, photoelectric absorption is increasingly important and its interaction probability is strongly dependent on the effective atomic number Z of the tissues (∝ Z4~5). 3 In current practice, quantitative information on tissues is mostly obtained by single energy CT (SECT) in the form of attenuation coefficients (or CT numbers, expressed in Hounsfield Units, HU). In Monte Carlo (MC) dose calculations, every voxel of the CT scan has a mass density assigned based on the CT number through an empirical calibration.
Tissue identification based on SECT has been shown to lead to errors in dose calculations in the kilovoltage (and megavoltage) energy range 5 and due to the strong dependence of the photoelectric absorption cross sections on the atomic number of the tissues, such errors are amplified in the low energy photon range. 6 In addition, dose calculation algorithms for kilovoltage irradiations of small animals need supplementary information to voxel densities, such as tissue type - as it cannot be assumed the medium is water in kilovoltage irradiations. This information can be provided from either SECT or dual energy CT (DECT) images.
The aim of this study is to investigate the feasibility of using dual energy CBCT for tissue segmentation and kilovoltage dose calculations in preclinical studies. The main objectives are to assess potential dose calculation accuracy gain from DECT and to establish imaging protocols that allow accurate dose calculations.
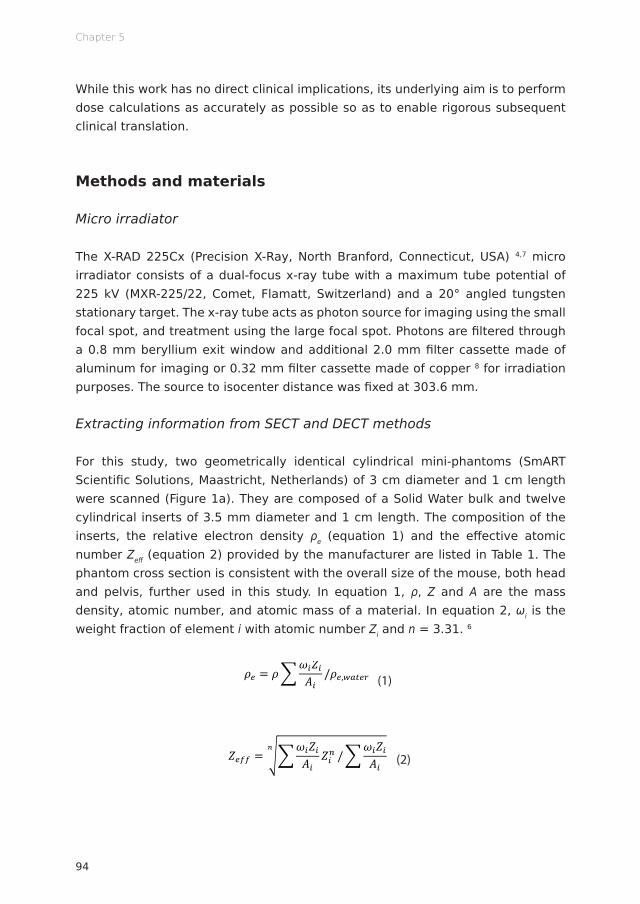
Chapter 5
94
While this work has no direct clinical implications, its underlying aim is to perform dose calculations as accurately as possible so as to enable rigorous subsequent clinical translation.
Methods and materials
Micro irradiator
The X-RAD 225Cx (Precision X-Ray, North Branford, Connecticut, USA) 4,7 micro irradiator consists of a dual-focus x-ray tube with a maximum tube potential of 225 kV (MXR-225/22, Comet, Flamatt, Switzerland) and a 20° angled tungsten stationary target. The x-ray tube acts as photon source for imaging using the small focal spot, and treatment using the large focal spot. Photons are filtered through a 0.8 mm beryllium exit window and additional 2.0 mm filter cassette made of aluminum for imaging or 0.32 mm filter cassette made of copper 8 for irradiation purposes. The source to isocenter distance was fixed at 303.6 mm.
Extracting information from SECT and DECT methods
For this study, two geometrically identical cylindrical mini-phantoms (SmART Scientific Solutions, Maastricht, Netherlands) of 3 cm diameter and 1 cm length were scanned (Figure 1a). They are composed of a Solid Water bulk and twelve cylindrical inserts of 3.5 mm diameter and 1 cm length. The composition of the inserts, the relative electron density ρe (equation 1) and the effective atomic number Zeff (equation 2) provided by the manufacturer are listed in Table 1. The phantom cross section is consistent with the overall size of the mouse, both head and pelvis, further used in this study. In equation 1, ρ, Z and A are the mass density, atomic number, and atomic mass of a material. In equation 2, ωi is the weight fraction of element i with atomic number Zi and n = 3.31. 6
𝜌𝜌" = 𝜌𝜌$𝜔𝜔&𝑍𝑍&𝐴𝐴&
/𝜌𝜌",+,-". (1)
𝑍𝑍"## = %&𝜔𝜔(𝑍𝑍(𝐴𝐴(
𝑍𝑍(* /&𝜔𝜔(𝑍𝑍(𝐴𝐴(
, (2)
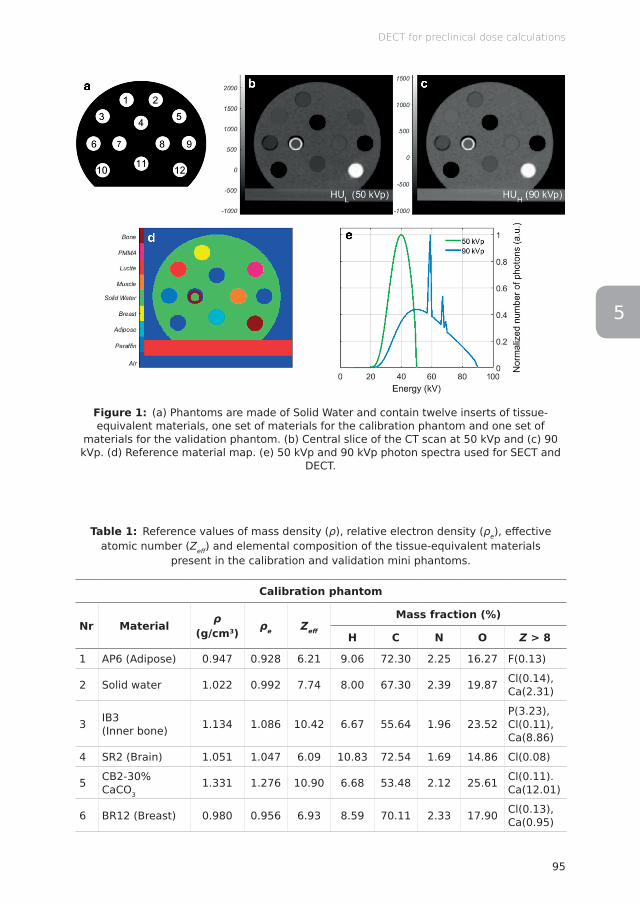
95
DECT for preclinical dose calculations
5
Figure 1: (a) Phantoms are made of Solid Water and contain twelve inserts of tissue-equivalent materials, one set of materials for the calibration phantom and one set of
materials for the validation phantom. (b) Central slice of the CT scan at 50 kVp and (c) 90 kVp. (d) Reference material map. (e) 50 kVp and 90 kVp photon spectra used for SECT and
DECT.
Table 1: Reference values of mass density (ρ), relative electron density (ρe), eff ective atomic number (Zeff ) and elemental composition of the tissue-equivalent materials
present in the calibration and validation mini phantoms.
Calibration phantom
Nr Material ρ (g/cm3) ρe Zeff
Mass fraction (%)
H C N O Z > 8
1 AP6 (Adipose) 0.947 0.928 6.21 9.06 72.30 2.25 16.27 F(0.13)
2 Solid water 1.022 0.992 7.74 8.00 67.30 2.39 19.87 Cl(0.14),Ca(2.31)
3 IB3 (Inner bone) 1.134 1.086 10.42 6.67 55.64 1.96 23.52
P(3.23),Cl(0.11),Ca(8.86)
4 SR2 (Brain) 1.051 1.047 6.09 10.83 72.54 1.69 14.86 Cl(0.08)
5 CB2-30% CaCO3
1.331 1.276 10.90 6.68 53.48 2.12 25.61 Cl(0.11).Ca(12.01)
6 BR12 (Breast) 0.980 0.956 6.93 8.59 70.11 2.33 17.90 Cl(0.13),Ca(0.95)
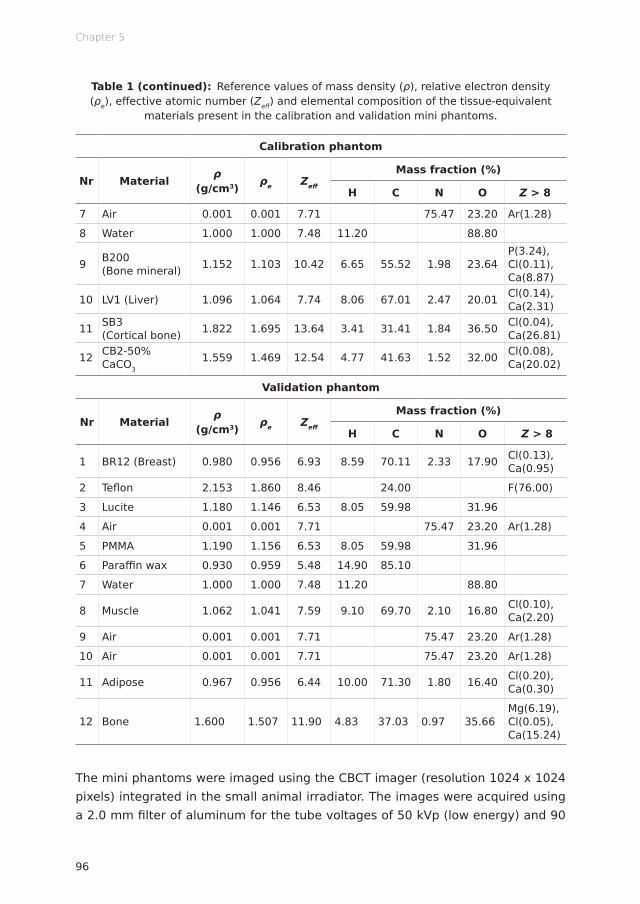
Chapter 5
96
Table 1 (continued): Reference values of mass density (ρ), relative electron density (ρe), effective atomic number (Zeff) and elemental composition of the tissue-equivalent
materials present in the calibration and validation mini phantoms.
Calibration phantom
Nr Material ρ (g/cm3) ρe Zeff
Mass fraction (%)
H C N O Z > 8
7 Air 0.001 0.001 7.71 75.47 23.20 Ar(1.28)
8 Water 1.000 1.000 7.48 11.20 88.80
9 B200 (Bone mineral) 1.152 1.103 10.42 6.65 55.52 1.98 23.64
P(3.24), Cl(0.11), Ca(8.87)
10 LV1 (Liver) 1.096 1.064 7.74 8.06 67.01 2.47 20.01 Cl(0.14), Ca(2.31)
11 SB3 (Cortical bone) 1.822 1.695 13.64 3.41 31.41 1.84 36.50 Cl(0.04),
Ca(26.81)
12 CB2-50% CaCO3
1.559 1.469 12.54 4.77 41.63 1.52 32.00 Cl(0.08), Ca(20.02)
Validation phantom
Nr Material ρ (g/cm3) ρe Zeff
Mass fraction (%)
H C N O Z > 8
1 BR12 (Breast) 0.980 0.956 6.93 8.59 70.11 2.33 17.90 Cl(0.13), Ca(0.95)
2 Teflon 2.153 1.860 8.46 24.00 F(76.00)
3 Lucite 1.180 1.146 6.53 8.05 59.98 31.96
4 Air 0.001 0.001 7.71 75.47 23.20 Ar(1.28)
5 PMMA 1.190 1.156 6.53 8.05 59.98 31.96
6 Paraffin wax 0.930 0.959 5.48 14.90 85.10
7 Water 1.000 1.000 7.48 11.20 88.80
8 Muscle 1.062 1.041 7.59 9.10 69.70 2.10 16.80 Cl(0.10), Ca(2.20)
9 Air 0.001 0.001 7.71 75.47 23.20 Ar(1.28)
10 Air 0.001 0.001 7.71 75.47 23.20 Ar(1.28)
11 Adipose 0.967 0.956 6.44 10.00 71.30 1.80 16.40 Cl(0.20), Ca(0.30)
12 Bone 1.600 1.507 11.90 4.83 37.03 0.97 35.66Mg(6.19), Cl(0.05), Ca(15.24)
The mini phantoms were imaged using the CBCT imager (resolution 1024 x 1024 pixels) integrated in the small animal irradiator. The images were acquired using a 2.0 mm filter of aluminum for the tube voltages of 50 kVp (low energy) and 90

97
DECT for preclinical dose calculations
5
kVp (high energy) with corresponding currents of 5.59 and 2.08 mA. Figure 1e shows both photon spectra. The exposures used were of 670.8 mAs and 249.6 mAs yielding the dose of 30 cGy for each energy. The absorbed dose to water at the phantom surface was verified using a TN30012 Farmer ionization chamber (PTW, Freiburg, Germany) according to the AAPM TG-61 protocol for 40–300 kV x-ray beam dosimetry (in-air calibration method). 9 The images were reconstructed using a Feldkamp-Davis-Kress (FDK) backprojection algorithm, 10 in a matrix of 341 x 324 x 96 with 103.4 x 103.4 x 103.4 μm3 voxel size. The acquisition time difference between the two images was of 7 min.
SECT methodIn the SECT approach, a relationship between CT number and mass density (ρ) was generated in the form of a (HU,ρ) calibration curve. HU are defined as 𝐻𝐻𝐻𝐻 = 1000 ⋅
𝜇𝜇 − 𝜇𝜇)*+,-𝜇𝜇)*+,- − 𝜇𝜇*.-
where μ, μwater and μair are respectively the linear attenuation
coefficients of the scanned medium, water and air. Relative electron density ρe can be converted into mass density ρ through a linear relationship. A piecewise bi-linear (HU,ρ) relationship was generated using the mean HU values of the selected materials in the calibration phantom (Figure 2). The material segmentation is indicated with vertical lines according to the selected HU ranges. Figure 3 shows the CT number histogram for 50 and 90 kVp. From the (HU,ρ) calibration curve, a density map of the phantom was created. A density to material curve was derived from the density map, which generated the material map. The curve material thresholds were set based on visual inspection of the CT scan as well as on the knowledge of the maximum and minimum HU of each material. In this example, seven materials were chosen for the segmentation. Table 2 shows the mean HU values for each material. A density map was then generated and, according to the chosen segmentation intervals, a material map was generated.
The tissue segmentation, i.e. the process of assigning tissue type and mass density to each voxel, was performed with the SECT image (either the 50 or the 90 kVp scan) and the calibration curve, a two-segment linear relationship (HU,ρ), shown in Figure 2. Different SECT segmentation schemes were derived based on three, four or seven materials to evaluate the effect of the number of media on the segmentation (see Table 3).
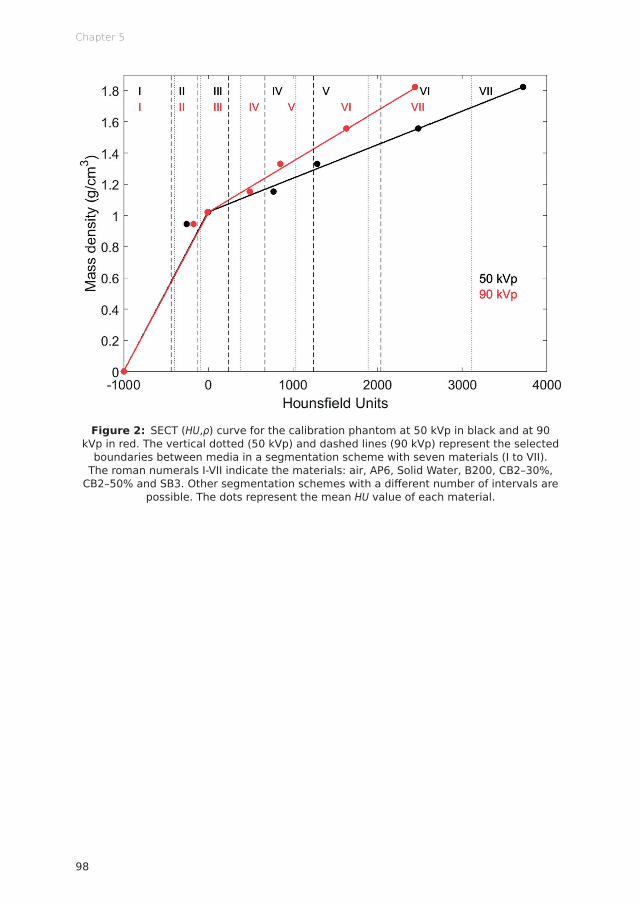
Chapter 5
98
Figure 2: SECT (HU,ρ) curve for the calibration phantom at 50 kVp in black and at 90 kVp in red. The vertical dotted (50 kVp) and dashed lines (90 kVp) represent the selected
boundaries between media in a segmentation scheme with seven materials (I to VII). The roman numerals I-VII indicate the materials: air, AP6, Solid Water, B200, CB2–30%,
CB2–50% and SB3. Other segmentation schemes with a diff erent number of intervals are possible. The dots represent the mean HU value of each material.
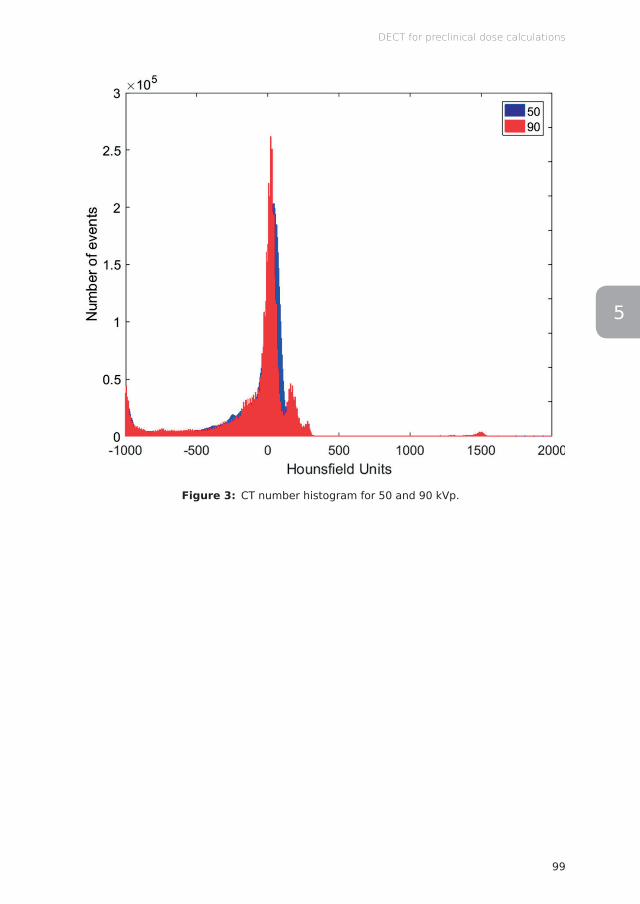
99
DECT for preclinical dose calculations
5
Figure 3: CT number histogram for 50 and 90 kVp.

Chapter 5
100
Table 2: Mean HU ± standard deviation (σ) per insert for the calibration and validation phantoms for 50 and 90 kVp.
Calibration phantom
MaterialMean HU ± σ
Insert Nr50 kVp 90 kVp
Air -1000 ± 19 -1000 ± 13 7
AP6 -248 ± 17 -173 ± 16 1
BR12 -171 ± 19 -115 ± 16 6
SR2 -147 ± 18 -64 ± 15 4
Solid Water -2 ± 22 -7 ± 20 2
Water 0 ± 22 0 ± 17 8
LV1 69 ± 23 68 ± 20 10
IB3 729 ± 54 456 ± 38 3
B200 768 ± 38 482 ± 31 9
CB2–30% 1297 ± 22 857 ± 16 5
CB2–50% 2483 ± 28 1632 ± 16 12
SB3 3723 ± 25 2448 ± 17 11
Validation phantom
MaterialMean HU ± σ
Insert Nr50 kVp 90 kVp
Air -1000 ± 17 -1000 ± 13 4, 9, 10
Paraffin -281 ± 13 -178 ± 11 6
Adipose -226 ± 16 -147 ± 13 11
BR12 -146 ± 16 -106 ± 13 1
PMMA -73 ± 12 10 ± 11 5
Water -36 ± 15 -15 ± 12 7
Lucite -31 ± 13 46 ± 12 3
Muscle 2 ± 14 25 ± 12 8
Bone 2230 ± 29 1508 ± 22 12
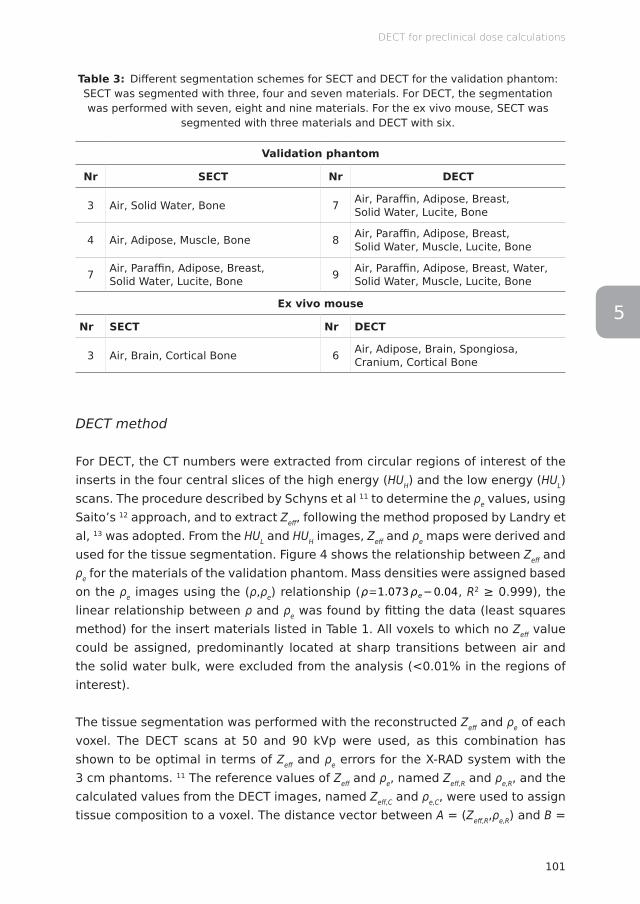
101
DECT for preclinical dose calculations
5
Table 3: Different segmentation schemes for SECT and DECT for the validation phantom: SECT was segmented with three, four and seven materials. For DECT, the segmentation was performed with seven, eight and nine materials. For the ex vivo mouse, SECT was
segmented with three materials and DECT with six.
Validation phantom
Nr SECT Nr DECT
3 Air, Solid Water, Bone 7 Air, Paraffin, Adipose, Breast, Solid Water, Lucite, Bone
4 Air, Adipose, Muscle, Bone 8 Air, Paraffin, Adipose, Breast, Solid Water, Muscle, Lucite, Bone
7 Air, Paraffin, Adipose, Breast, Solid Water, Lucite, Bone 9 Air, Paraffin, Adipose, Breast, Water,
Solid Water, Muscle, Lucite, Bone
Ex vivo mouse
Nr SECT Nr DECT
3 Air, Brain, Cortical Bone 6 Air, Adipose, Brain, Spongiosa, Cranium, Cortical Bone
DECT method
For DECT, the CT numbers were extracted from circular regions of interest of the inserts in the four central slices of the high energy (HUH) and the low energy (HUL) scans. The procedure described by Schyns et al 11 to determine the ρe values, using Saito’s 12 approach, and to extract Zeff, following the method proposed by Landry et al, 13 was adopted. From the HUL and HUH images, Zeff and ρe maps were derived and used for the tissue segmentation. Figure 4 shows the relationship between Zeff and ρe for the materials of the validation phantom. Mass densities were assigned based on the ρe images using the (ρ,ρe) relationship (
HU=1000⋅μ−μwater
μwater−μair
Zeff=n√∑i
ωi Zi
Ai
Zin /∑i
ωi Z i
Ai
μratio=μLowEnergy
μHighEnergy
μratio=μLowEnergy
μHighEnergy
=A+B⋅Zeff
n−1+C⋅Zeffm−1
D+E⋅Zeffn−1+F⋅Zeff
m−1
ρe=ρ∑i
ωi Zi
Ai
/ρe ,water
ΔHUHU=(1+α)⋅HUHighEnergy−α⋅HULowEnergy
ρe=a⋅(1+α)⋅HUHighEnergy−α⋅HULowEnergy
1000+b
ωi=ai⋅ρe+bi⋅Zeff+ci⋅ρeZeff+di
σtissue=√σmeasured2 −σnoise
2
σnoise=a⋅Db+c
CNR=Ī tissue−Ī background
√σtissue2 −σbackground
2
CNR=|HUROI−HUbackground|
noise
MTF (f )=π√24
⋅M(f )M0
MTF=Intensitystrip−Intensitygap
Intensitystrip+ Intensitygap
‖Rf−p‖2
argminf
‖Rf −p‖2
2RT (Rf−p)
ρ=1.073ρe−0.04
ΔHUD=(DDECT−DRef)/DRef⋅100%
, R2 ≥ 0.999), the linear relationship between ρ and ρe was found by fitting the data (least squares method) for the insert materials listed in Table 1. All voxels to which no Zeff value could be assigned, predominantly located at sharp transitions between air and the solid water bulk, were excluded from the analysis (<0.01% in the regions of interest).
The tissue segmentation was performed with the reconstructed Zeff and ρe of each voxel. The DECT scans at 50 and 90 kVp were used, as this combination has shown to be optimal in terms of Zeff and ρe errors for the X-RAD system with the 3 cm phantoms. 11 The reference values of Zeff and ρe, named Zeff,R and ρe,R, and the calculated values from the DECT images, named Zeff,C and ρe,C, were used to assign tissue composition to a voxel. The distance vector between A = (Zeff,R,ρe,R) and B =

Chapter 5
102
(Zeff ,C,ρe,C) was calculated and the reference tissue minimizing the distance length was assigned to the voxel. The Mahalanobis distance was used as it is less aff ected by imaging noise, following the method described by Landry et al. 6
Diff erent DECT segmentation schemes were also investigated with seven, eight and nine materials. Table 3 shows the schemes.
Figure 4: DECT tissue segmentation for all voxels of the (a) calibration and (b) validation phantoms.
Reference phantom
A reference phantom serves as standard for the material segmentation and the dose calculations. It is a mathematical structure created with thresholds and masks for each phantom. It has a single reference value for each material property. The material assignment to the reference phantom is indicated in Figure 1a, according to Table 1.
Figure 1d shows the nine materials used, with densities ranging from 0.001 to 1.6 g/cm3 (air - bone). In all phantom cases in this study, a broad beam impinges on the phantom from the right-left direction and encompasses its entire volume. The dose is normalized to the maximum dose value in the reference phantom.
All the results are compared to the segmentation and the dose calculation of the reference phantom.
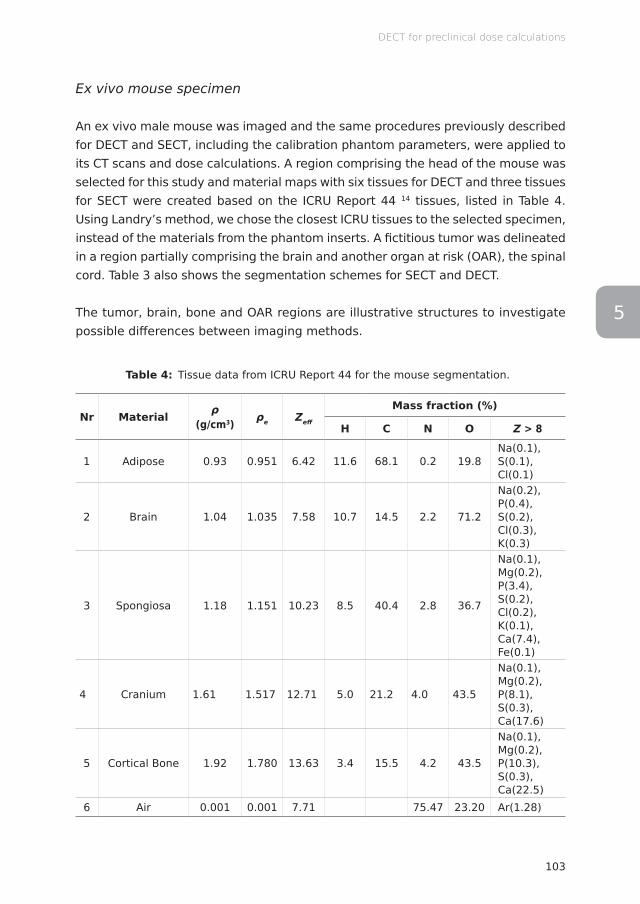
103
DECT for preclinical dose calculations
5
Ex vivo mouse specimen
An ex vivo male mouse was imaged and the same procedures previously described for DECT and SECT, including the calibration phantom parameters, were applied to its CT scans and dose calculations. A region comprising the head of the mouse was selected for this study and material maps with six tissues for DECT and three tissues for SECT were created based on the ICRU Report 44 14 tissues, listed in Table 4. Using Landry’s method, we chose the closest ICRU tissues to the selected specimen, instead of the materials from the phantom inserts. A fictitious tumor was delineated in a region partially comprising the brain and another organ at risk (OAR), the spinal cord. Table 3 also shows the segmentation schemes for SECT and DECT.
The tumor, brain, bone and OAR regions are illustrative structures to investigate possible differences between imaging methods.
Table 4: Tissue data from ICRU Report 44 for the mouse segmentation.
Nr Material ρ (g/cm3) ρe Zeff
Mass fraction (%)
H C N O Z > 8
1 Adipose 0.93 0.951 6.42 11.6 68.1 0.2 19.8Na(0.1), S(0.1), Cl(0.1)
2 Brain 1.04 1.035 7.58 10.7 14.5 2.2 71.2
Na(0.2), P(0.4), S(0.2), Cl(0.3), K(0.3)
3 Spongiosa 1.18 1.151 10.23 8.5 40.4 2.8 36.7
Na(0.1), Mg(0.2), P(3.4), S(0.2), Cl(0.2), K(0.1), Ca(7.4), Fe(0.1)
4 Cranium 1.61 1.517 12.71 5.0 21.2 4.0 43.5
Na(0.1), Mg(0.2), P(8.1), S(0.3), Ca(17.6)
5 Cortical Bone 1.92 1.780 13.63 3.4 15.5 4.2 43.5
Na(0.1), Mg(0.2), P(10.3), S(0.3), Ca(22.5)
6 Air 0.001 0.001 7.71 75.47 23.20 Ar(1.28)

Chapter 5
104
Dose calculations
After the segmentation procedures based on SECT and DECT, dose calculations were performed to verify the impact of these segmentations on the dose accuracy.
The dedicated small animal radiotherapy planning system SmART-Plan (research version 1.5, Precision X-Ray, North Branford, Connecticut, USA) was used to calculate the dose distributions. 15 The dose engine used by SmART-Plan is the MC code EGSnrc/DOSXYZnrc. 16,17 The first step was to provide the material datasets for subsequent use by EGSnrc. Photons were transported down to an energy cutoff (PCUT) of 10 keV and the electron energy cutoff (ECUT) was set to a total energy value of 736 keV (225 kV kinetic energy, meaning no secondary electrons were transported). The photon spectra for the irradiation were calculated using SpekCalc 18,19 for 100, 160, and 225 kVp, according to the x-ray tube parameters. Exclusively for the ex vivo mouse simulations, phase-space files for 225 kVp and 100 kVp with a 5 mm beam diameter were used, preserving the above-mentioned characteristics. For the phantom dose calculations, broad beams that covered the phantom were used.
Geometry input files for the phantoms and the animal specimen were created with a MATLAB R2016a (MathWorks, Natick, Massachusetts, USA) routine according to the SECT or DECT material segmentation.
The mass density values of liquid and solid water differed only by 2.2%, therefore Solid Water was solely used in both phantoms. For the calibration phantom, material maps were made either using Liver and Inner Bone or Brain and Bone Mineral, and the remaining media, due to the proximity in density values. For the validation phantom, the insert Teflon was not used and Lucite and PMMA were regarded as Lucite, once more due to their similar compositions. Different material maps were also investigated to achieve a better segmentation using fewer media.
The planned dose to water was set to 2 Gy at the isocenter and the number of MC histories with no particle recycling used to achieve a 3% statistical uncertainty for dose calculations with 103.4 x 103.4 x 103.4 μm3 voxels was set to 5·109 photons for the mini phantoms. The beam field size was set to 3.5 x 1 cm, comprising the selected region of the mini phantom completely. For the mouse, two parallel opposed beams, at 29° and 209°, and 9·107 particles were used, achieving 1% statistical uncertainty for a dose of 2 Gy at the isocenter.
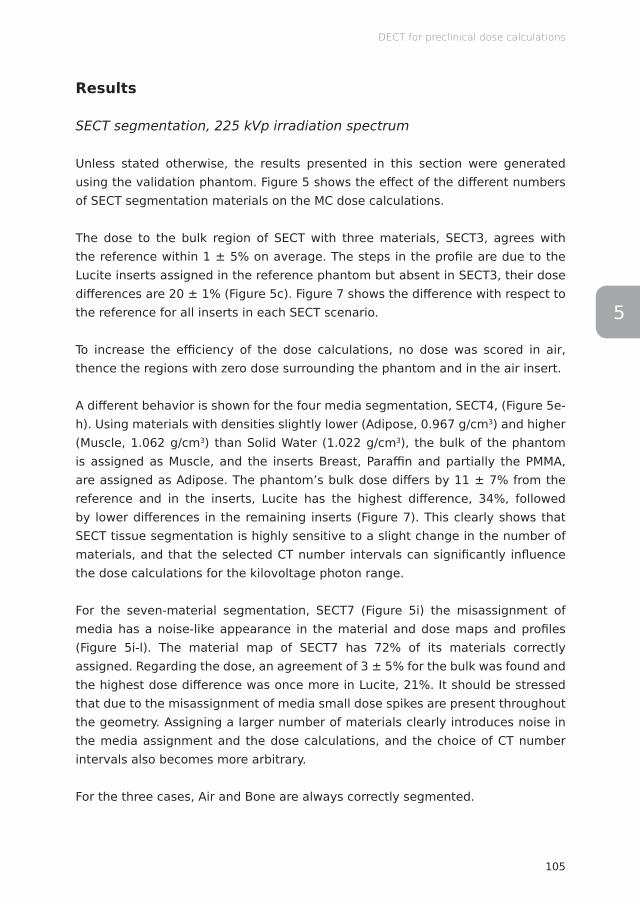
105
DECT for preclinical dose calculations
5
Results
SECT segmentation, 225 kVp irradiation spectrum
Unless stated otherwise, the results presented in this section were generated using the validation phantom. Figure 5 shows the effect of the different numbers of SECT segmentation materials on the MC dose calculations.
The dose to the bulk region of SECT with three materials, SECT3, agrees with the reference within 1 ± 5% on average. The steps in the profile are due to the Lucite inserts assigned in the reference phantom but absent in SECT3, their dose differences are 20 ± 1% (Figure 5c). Figure 7 shows the difference with respect to the reference for all inserts in each SECT scenario.
To increase the efficiency of the dose calculations, no dose was scored in air, thence the regions with zero dose surrounding the phantom and in the air insert.
A different behavior is shown for the four media segmentation, SECT4, (Figure 5e-h). Using materials with densities slightly lower (Adipose, 0.967 g/cm3) and higher (Muscle, 1.062 g/cm3) than Solid Water (1.022 g/cm3), the bulk of the phantom is assigned as Muscle, and the inserts Breast, Paraffin and partially the PMMA, are assigned as Adipose. The phantom’s bulk dose differs by 11 ± 7% from the reference and in the inserts, Lucite has the highest difference, 34%, followed by lower differences in the remaining inserts (Figure 7). This clearly shows that SECT tissue segmentation is highly sensitive to a slight change in the number of materials, and that the selected CT number intervals can significantly influence the dose calculations for the kilovoltage photon range.
For the seven-material segmentation, SECT7 (Figure 5i) the misassignment of media has a noise-like appearance in the material and dose maps and profiles (Figure 5i-l). The material map of SECT7 has 72% of its materials correctly assigned. Regarding the dose, an agreement of 3 ± 5% for the bulk was found and the highest dose difference was once more in Lucite, 21%. It should be stressed that due to the misassignment of media small dose spikes are present throughout the geometry. Assigning a larger number of materials clearly introduces noise in the media assignment and the dose calculations, and the choice of CT number intervals also becomes more arbitrary.
For the three cases, Air and Bone are always correctly segmented.
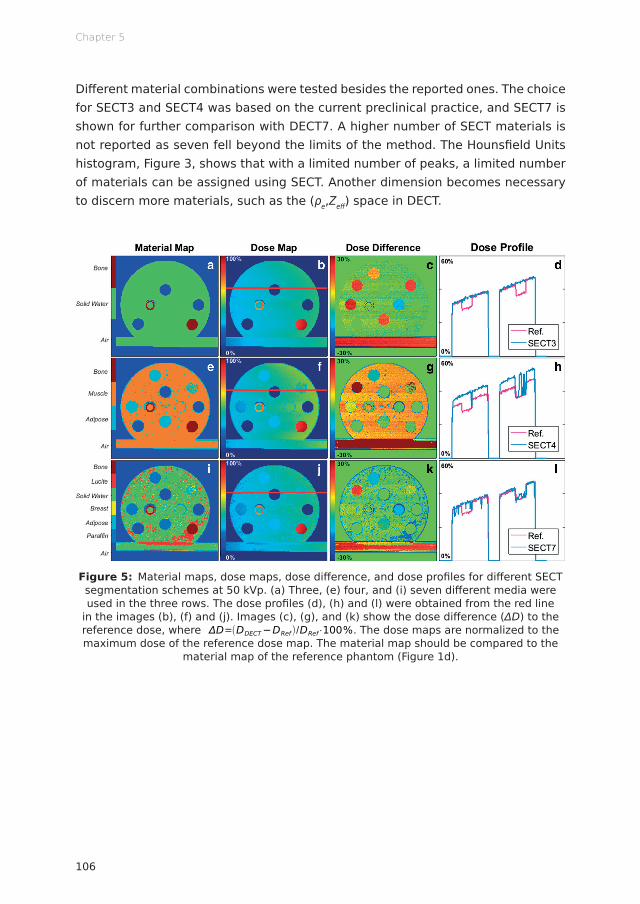
Chapter 5
106
Diff erent material combinations were tested besides the reported ones. The choice for SECT3 and SECT4 was based on the current preclinical practice, and SECT7 is shown for further comparison with DECT7. A higher number of SECT materials is not reported as seven fell beyond the limits of the method. The Hounsfi eld Units histogram, Figure 3, shows that with a limited number of peaks, a limited number of materials can be assigned using SECT. Another dimension becomes necessary to discern more materials, such as the (ρe,Zeff ) space in DECT.
Figure 5: Material maps, dose maps, dose diff erence, and dose profi les for diff erent SECT segmentation schemes at 50 kVp. (a) Three, (e) four, and (i) seven diff erent media were used in the three rows. The dose profi les (d), (h) and (l) were obtained from the red line
in the images (b), (f) and (j). Images (c), (g), and (k) show the dose diff erence (ΔD) to the reference dose, where
HU=1000⋅μ−μwater
μwater−μair
Zeff=n√∑i
ωi Zi
Ai
Zin /∑i
ωi Z i
Ai
μratio=μLowEnergy
μHighEnergy
μratio=μLowEnergy
μHighEnergy
=A+B⋅Zeff
n−1+C⋅Zeffm−1
D+E⋅Zeffn−1+F⋅Zeff
m−1
ρe=ρ∑i
ωi Zi
Ai
/ρe ,water
ΔHUHU=(1+α)⋅HUHighEnergy−α⋅HULowEnergy
ρe=a⋅(1+α)⋅HUHighEnergy−α⋅HULowEnergy
1000+b
ωi=ai⋅ρe+bi⋅Zeff+ci⋅ρeZeff+di
σtissue=√σmeasured2 −σnoise
2
σnoise=a⋅Db+c
CNR=Ī tissue−Ī background
√σtissue2 −σbackground
2
CNR=|HUROI−HUbackground|
noise
MTF (f )=π√24
⋅M(f )M0
MTF=Intensitystrip−Intensitygap
Intensitystrip+ Intensitygap
‖Rf−p‖2
argminf
‖Rf −p‖2
2RT (Rf−p)
ρ=1.073ρe−0.04
ΔHUD=(DDECT−DRef)/DRef⋅100%. The dose maps are normalized to the maximum dose of the reference dose map. The material map should be compared to the
material map of the reference phantom (Figure 1d).

107
DECT for preclinical dose calculations
5
DECT segmentation, 225 kVp irradiation spectrum
For the DECT segmentation, maps with seven (DECT7), eight (DECT8), and nine materials (DECT9) were tested (Figure 6a,e,i). Similar to SECT, a number of material combinations were tested. The reported DECT combinations were selected based on the highest separation between relative electron density and effective atomic number values, and increased accuracy on the segmentation in comparison to the reference.
Increasing the number of materials does not automatically imply a better segmentation for DECT, similar as for SECT. The media misassignment, over 52% for DECT8 and 54% for DECT9, again exhibits noise in the dose maps and profiles (Figure 6b,f,j,d,h,l) with small dose spikes. The material map of DECT7 was only 16% in disagreement with the reference. For DECT8 and DECT9, the dose difference in the bulk region is, on average, of 5 ± 6% higher than the reference. The insert materials were mostly correctly assigned in the three cases. Figure 7 shows that the highest difference is for the material Muscle in DECT7, 12 ± 1% – Muscle is not one of the media segmented in DECT7. From Figure 6c,g,k it is clear that the tissue segmentation scheme may influence the dose accuracy. It should be noted that for DECT the highest dose differences are concentrated in the boundary regions.
Figure 7 shows that dose differences relative to the reference phantom are much higher for the SECT segmentations in comparison to the DECT ones. For kilovoltage energies, DECT segmentation yields better results, increasing the dose calculation accuracy when compared to the SECT method.
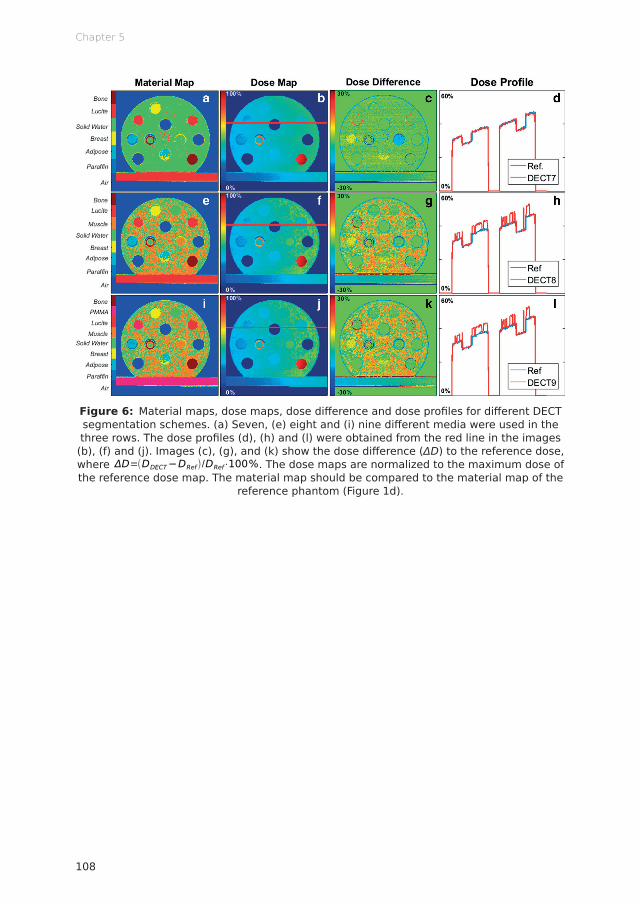
Chapter 5
108
Figure 6: Material maps, dose maps, dose diff erence and dose profi les for diff erent DECT segmentation schemes. (a) Seven, (e) eight and (i) nine diff erent media were used in the three rows. The dose profi les (d), (h) and (l) were obtained from the red line in the images (b), (f) and (j). Images (c), (g), and (k) show the dose diff erence (ΔD) to the reference dose, where
HU=1000⋅μ−μwater
μwater−μair
Zeff=n√∑i
ωi Zi
Ai
Zin /∑i
ωi Z i
Ai
μratio=μLowEnergy
μHighEnergy
μratio=μLowEnergy
μHighEnergy
=A+B⋅Zeff
n−1+C⋅Zeffm−1
D+E⋅Zeffn−1+F⋅Zeff
m−1
ρe=ρ∑i
ωi Zi
Ai
/ρe ,water
ΔHUHU=(1+α)⋅HUHighEnergy−α⋅HULowEnergy
ρe=a⋅(1+α)⋅HUHighEnergy−α⋅HULowEnergy
1000+b
ωi=ai⋅ρe+bi⋅Zeff+ci⋅ρeZeff+di
σtissue=√σmeasured2 −σnoise
2
σnoise=a⋅Db+c
CNR=Ī tissue−Ī background
√σtissue2 −σbackground
2
CNR=|HUROI−HUbackground|
noise
MTF (f )=π√24
⋅M(f )M0
MTF=Intensitystrip−Intensitygap
Intensitystrip+ Intensitygap
‖Rf−p‖2
argminf
‖Rf −p‖2
2RT (Rf−p)
ρ=1.073ρe−0.04
ΔHUD=(DDECT−DRef)/DRef⋅100%. The dose maps are normalized to the maximum dose of the reference dose map. The material map should be compared to the material map of the
reference phantom (Figure 1d).
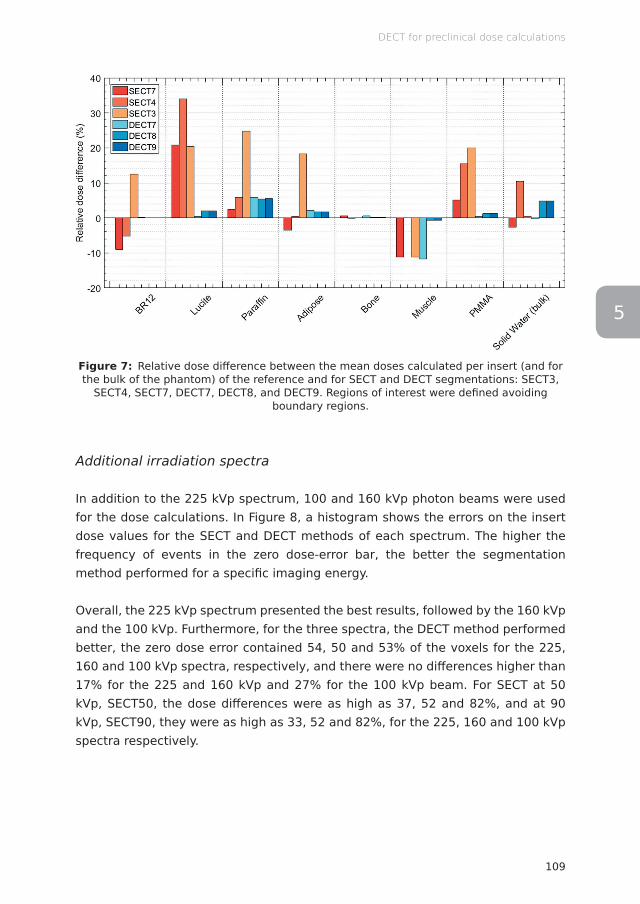
109
DECT for preclinical dose calculations
5
Figure 7: Relative dose diff erence between the mean doses calculated per insert (and for the bulk of the phantom) of the reference and for SECT and DECT segmentations: SECT3,
SECT4, SECT7, DECT7, DECT8, and DECT9. Regions of interest were defi ned avoiding boundary regions.
Additional irradiation spectra
In addition to the 225 kVp spectrum, 100 and 160 kVp photon beams were used for the dose calculations. In Figure 8, a histogram shows the errors on the insert dose values for the SECT and DECT methods of each spectrum. The higher the frequency of events in the zero dose-error bar, the better the segmentation method performed for a specifi c imaging energy.
Overall, the 225 kVp spectrum presented the best results, followed by the 160 kVp and the 100 kVp. Furthermore, for the three spectra, the DECT method performed better, the zero dose error contained 54, 50 and 53% of the voxels for the 225, 160 and 100 kVp spectra, respectively, and there were no diff erences higher than 17% for the 225 and 160 kVp and 27% for the 100 kVp beam. For SECT at 50 kVp, SECT50, the dose diff erences were as high as 37, 52 and 82%, and at 90 kVp, SECT90, they were as high as 33, 52 and 82%, for the 225, 160 and 100 kVp spectra respectively.

Chapter 5
110
Figure 8: Histogram of the dose disagreement with the reference in the insert regions for DECT, SECT50 and SECT90 at 225, 160 and 100 kVp.
Ex vivo mouse
In this section the emphasis is on the diff erence between the dose calculations based on the two imaging methods as it was not possible to produce a reference ex vivo mouse – it would require precise knowledge of all its tissues and structures. Although material and dose diff erences in the bulk of the phantom were shown in the previous section, this concept does not apply to the specimen, as there is no bulk of the mouse.
The SECT (SECT50 and SECT90) and DECT segmentation schemes were used as shown in Table 3. The choice for three media for SECT was based on current
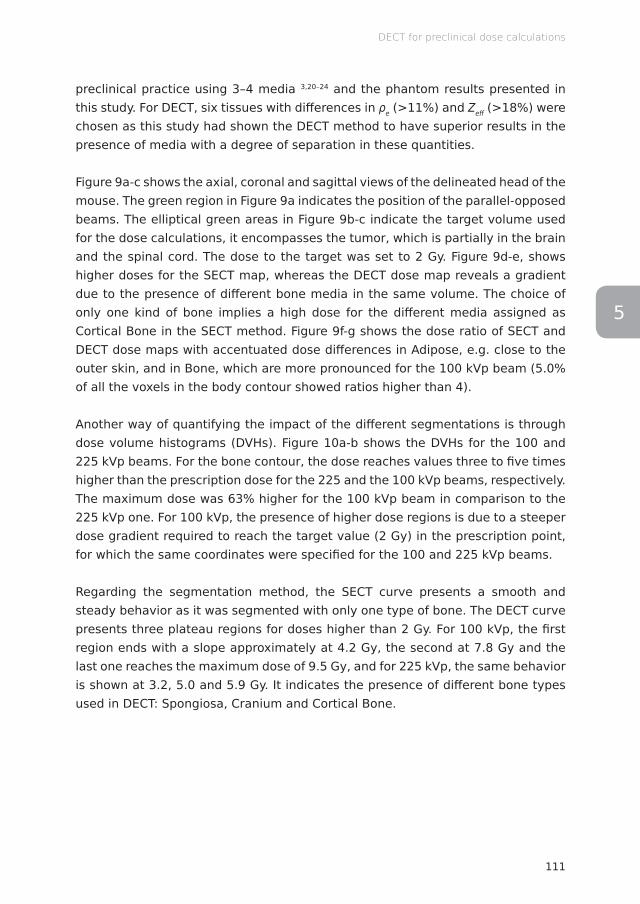
111
DECT for preclinical dose calculations
5
preclinical practice using 3–4 media 3,20–24 and the phantom results presented in this study. For DECT, six tissues with differences in ρe (>11%) and Zeff (>18%) were chosen as this study had shown the DECT method to have superior results in the presence of media with a degree of separation in these quantities.
Figure 9a-c shows the axial, coronal and sagittal views of the delineated head of the mouse. The green region in Figure 9a indicates the position of the parallel-opposed beams. The elliptical green areas in Figure 9b-c indicate the target volume used for the dose calculations, it encompasses the tumor, which is partially in the brain and the spinal cord. The dose to the target was set to 2 Gy. Figure 9d-e, shows higher doses for the SECT map, whereas the DECT dose map reveals a gradient due to the presence of different bone media in the same volume. The choice of only one kind of bone implies a high dose for the different media assigned as Cortical Bone in the SECT method. Figure 9f-g shows the dose ratio of SECT and DECT dose maps with accentuated dose differences in Adipose, e.g. close to the outer skin, and in Bone, which are more pronounced for the 100 kVp beam (5.0% of all the voxels in the body contour showed ratios higher than 4).
Another way of quantifying the impact of the different segmentations is through dose volume histograms (DVHs). Figure 10a-b shows the DVHs for the 100 and 225 kVp beams. For the bone contour, the dose reaches values three to five times higher than the prescription dose for the 225 and the 100 kVp beams, respectively. The maximum dose was 63% higher for the 100 kVp beam in comparison to the 225 kVp one. For 100 kVp, the presence of higher dose regions is due to a steeper dose gradient required to reach the target value (2 Gy) in the prescription point, for which the same coordinates were specified for the 100 and 225 kVp beams.
Regarding the segmentation method, the SECT curve presents a smooth and steady behavior as it was segmented with only one type of bone. The DECT curve presents three plateau regions for doses higher than 2 Gy. For 100 kVp, the first region ends with a slope approximately at 4.2 Gy, the second at 7.8 Gy and the last one reaches the maximum dose of 9.5 Gy, and for 225 kVp, the same behavior is shown at 3.2, 5.0 and 5.9 Gy. It indicates the presence of different bone types used in DECT: Spongiosa, Cranium and Cortical Bone.
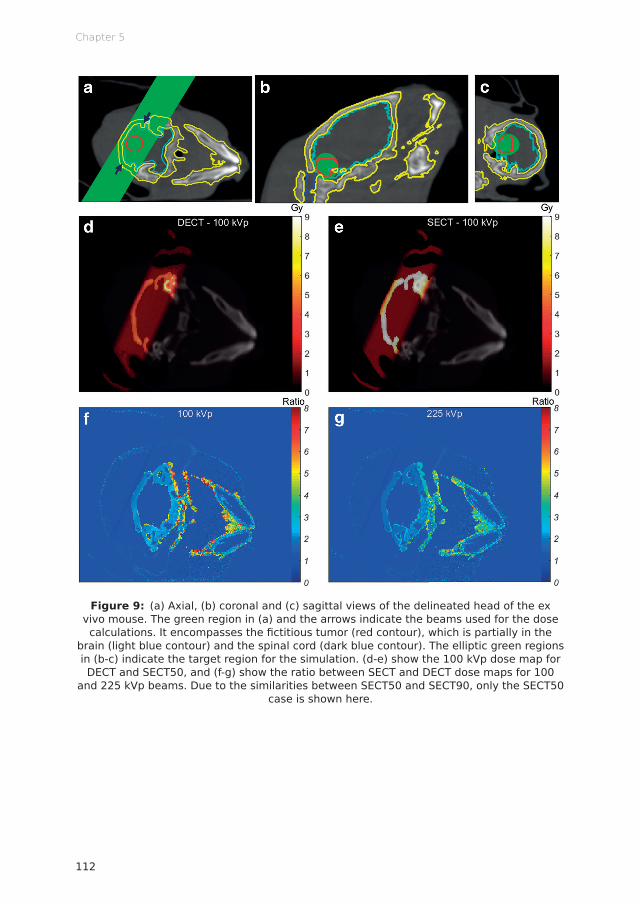
Chapter 5
112
Figure 9: (a) Axial, (b) coronal and (c) sagittal views of the delineated head of the ex vivo mouse. The green region in (a) and the arrows indicate the beams used for the dose calculations. It encompasses the fi ctitious tumor (red contour), which is partially in the
brain (light blue contour) and the spinal cord (dark blue contour). The elliptic green regions in (b-c) indicate the target region for the simulation. (d-e) show the 100 kVp dose map for DECT and SECT50, and (f-g) show the ratio between SECT and DECT dose maps for 100
and 225 kVp beams. Due to the similarities between SECT50 and SECT90, only the SECT50 case is shown here.
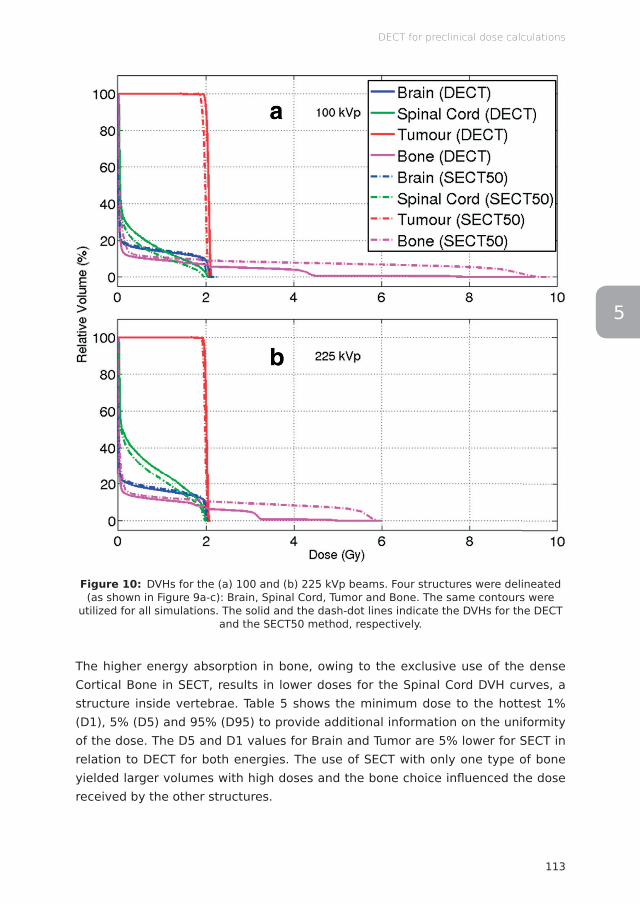
113
DECT for preclinical dose calculations
5
Figure 10: DVHs for the (a) 100 and (b) 225 kVp beams. Four structures were delineated (as shown in Figure 9a-c): Brain, Spinal Cord, Tumor and Bone. The same contours were
utilized for all simulations. The solid and the dash-dot lines indicate the DVHs for the DECT and the SECT50 method, respectively.
The higher energy absorption in bone, owing to the exclusive use of the dense Cortical Bone in SECT, results in lower doses for the Spinal Cord DVH curves, a structure inside vertebrae. Table 5 shows the minimum dose to the hottest 1% (D1), 5% (D5) and 95% (D95) to provide additional information on the uniformity of the dose. The D5 and D1 values for Brain and Tumor are 5% lower for SECT in relation to DECT for both energies. The use of SECT with only one type of bone yielded larger volumes with high doses and the bone choice infl uenced the dose received by the other structures.
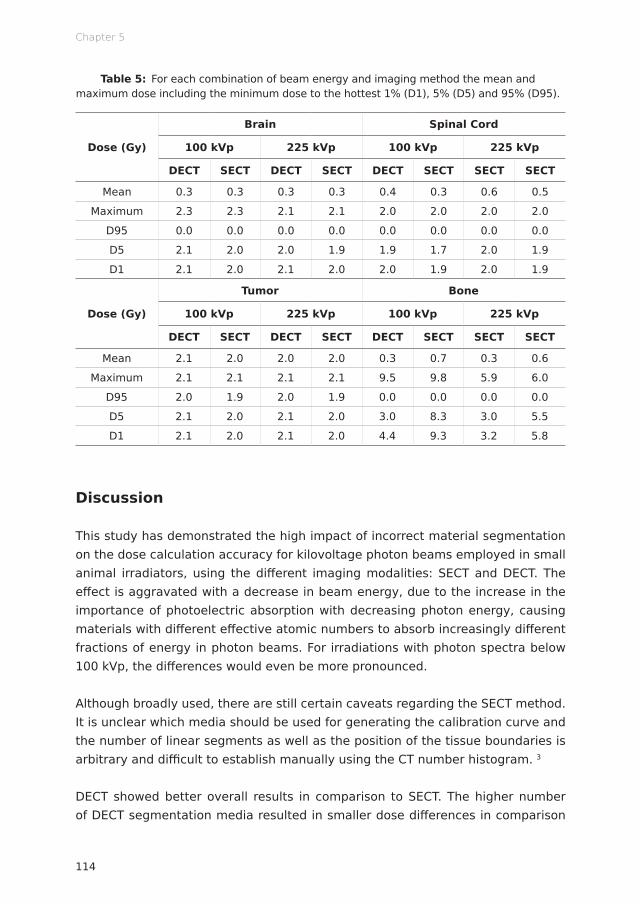
Chapter 5
114
Table 5: For each combination of beam energy and imaging method the mean and maximum dose including the minimum dose to the hottest 1% (D1), 5% (D5) and 95% (D95).
Dose (Gy)
Brain Spinal Cord
100 kVp 225 kVp 100 kVp 225 kVp
DECT SECT DECT SECT DECT SECT SECT SECT
Mean 0.3 0.3 0.3 0.3 0.4 0.3 0.6 0.5
Maximum 2.3 2.3 2.1 2.1 2.0 2.0 2.0 2.0
D95 0.0 0.0 0.0 0.0 0.0 0.0 0.0 0.0
D5 2.1 2.0 2.0 1.9 1.9 1.7 2.0 1.9
D1 2.1 2.0 2.1 2.0 2.0 1.9 2.0 1.9
Dose (Gy)
Tumor Bone
100 kVp 225 kVp 100 kVp 225 kVp
DECT SECT DECT SECT DECT SECT SECT SECT
Mean 2.1 2.0 2.0 2.0 0.3 0.7 0.3 0.6
Maximum 2.1 2.1 2.1 2.1 9.5 9.8 5.9 6.0
D95 2.0 1.9 2.0 1.9 0.0 0.0 0.0 0.0
D5 2.1 2.0 2.1 2.0 3.0 8.3 3.0 5.5
D1 2.1 2.0 2.1 2.0 4.4 9.3 3.2 5.8
Discussion
This study has demonstrated the high impact of incorrect material segmentation on the dose calculation accuracy for kilovoltage photon beams employed in small animal irradiators, using the different imaging modalities: SECT and DECT. The effect is aggravated with a decrease in beam energy, due to the increase in the importance of photoelectric absorption with decreasing photon energy, causing materials with different effective atomic numbers to absorb increasingly different fractions of energy in photon beams. For irradiations with photon spectra below 100 kVp, the differences would even be more pronounced.
Although broadly used, there are still certain caveats regarding the SECT method. It is unclear which media should be used for generating the calibration curve and the number of linear segments as well as the position of the tissue boundaries is arbitrary and difficult to establish manually using the CT number histogram. 3
DECT showed better overall results in comparison to SECT. The higher number of DECT segmentation media resulted in smaller dose differences in comparison
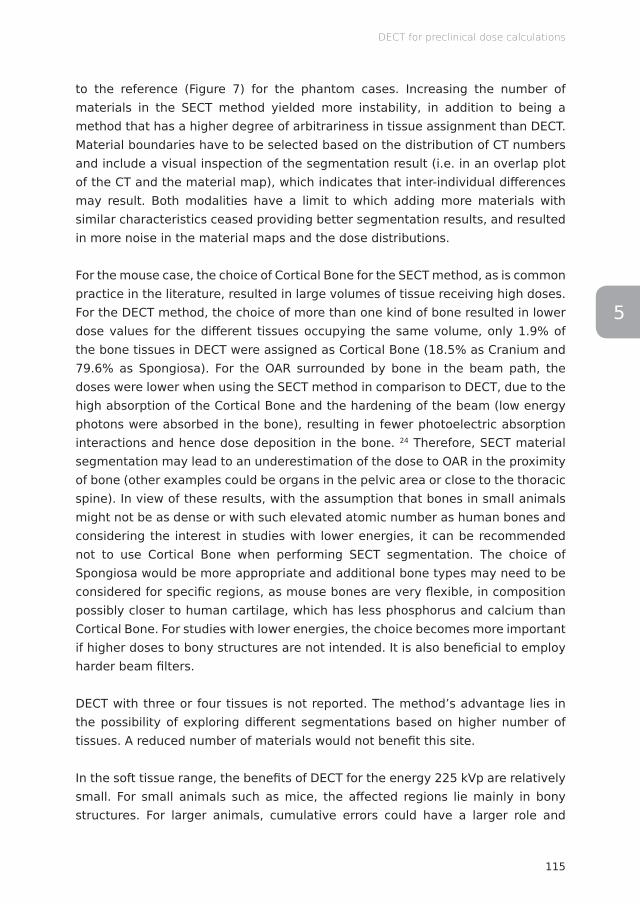
115
DECT for preclinical dose calculations
5
to the reference (Figure 7) for the phantom cases. Increasing the number of materials in the SECT method yielded more instability, in addition to being a method that has a higher degree of arbitrariness in tissue assignment than DECT. Material boundaries have to be selected based on the distribution of CT numbers and include a visual inspection of the segmentation result (i.e. in an overlap plot of the CT and the material map), which indicates that inter-individual differences may result. Both modalities have a limit to which adding more materials with similar characteristics ceased providing better segmentation results, and resulted in more noise in the material maps and the dose distributions.
For the mouse case, the choice of Cortical Bone for the SECT method, as is common practice in the literature, resulted in large volumes of tissue receiving high doses. For the DECT method, the choice of more than one kind of bone resulted in lower dose values for the different tissues occupying the same volume, only 1.9% of the bone tissues in DECT were assigned as Cortical Bone (18.5% as Cranium and 79.6% as Spongiosa). For the OAR surrounded by bone in the beam path, the doses were lower when using the SECT method in comparison to DECT, due to the high absorption of the Cortical Bone and the hardening of the beam (low energy photons were absorbed in the bone), resulting in fewer photoelectric absorption interactions and hence dose deposition in the bone. 24 Therefore, SECT material segmentation may lead to an underestimation of the dose to OAR in the proximity of bone (other examples could be organs in the pelvic area or close to the thoracic spine). In view of these results, with the assumption that bones in small animals might not be as dense or with such elevated atomic number as human bones and considering the interest in studies with lower energies, it can be recommended not to use Cortical Bone when performing SECT segmentation. The choice of Spongiosa would be more appropriate and additional bone types may need to be considered for specific regions, as mouse bones are very flexible, in composition possibly closer to human cartilage, which has less phosphorus and calcium than Cortical Bone. For studies with lower energies, the choice becomes more important if higher doses to bony structures are not intended. It is also beneficial to employ harder beam filters.
DECT with three or four tissues is not reported. The method’s advantage lies in the possibility of exploring different segmentations based on higher number of tissues. A reduced number of materials would not benefit this site.
In the soft tissue range, the benefits of DECT for the energy 225 kVp are relatively small. For small animals such as mice, the affected regions lie mainly in bony structures. For larger animals, cumulative errors could have a larger role and
Chapter 5
116
need further considerations. Improvements in tissue segmentation from DECT are needed for lower photon energies and proton beams in all tissues.
A source of uncertainty in this study is the presence of noise in the CT scans. In Figure 1b-c, artifacts can be seen in the bone insert, and the bulk of the phantom seems to have a texture instead of consisting of a uniform medium. The CT values of the entire region are irregular, 42 ± 62 and 16 ± 57 HU for 50 and 90 kVp scans. For DECT, the Zeff image is the most affected, with a noisy appearance and the bulk medium with a mean Zeff value of 8.0 ± 0.4 (ranging from 6.0 to 10.7), which encompasses many of the soft tissues used in the segmentation and makes it especially hard to distinguish between Water, Solid Water and Muscle, which also have densities close together. The large misassignment of materials on DECT8 and DECT9, using materials with similar characteristics (Zeff and ρe) can be partially attributed to image noise. The image noise and misassignment follow a similar pattern in Figure 6f,j. The CT projections were reconstructed with a simple FDK backprojection algorithm. The usage of an iterative reconstruction algorithm with beam hardening and artifact correction kernels could improve the effect of noise on the images and provide superior material segmentation when performing DECT. 25
The boundary regions of the phantom and the inserts presented the highest source of errors for DECT. This can be explained as a partial volume effect: as two contiguous materials partially fill a voxel, they are combined into voxels that do not correspond to the CT numbers of either of the materials. This will play a larger effect in phantoms with small air gaps than in animals. Another possible and complementary explanation is that the images should have a perfect overlap with the reference phantom, a small misregistration would provide substantial differences. This is a feature DECT is sensitive to, while it plays no role for SECT images. For small shifts between two scans, due to setup or animal movement, rigid image registration could be used if potential CT number errors from interpolations are minimal.
Dose calculations in human radiotherapy in the megavoltage photon energy range are not very sensitive to tissue compositions, however, in the kilovoltage range used in brachytherapy 6 and in preclinical studies mimicking human radiotherapy at the level of rodents it becomes a potential cause of uncertainties. 21 A final issue that deserves attention is that in the present study and, in general, the small animal radiobiology literature, specimens are segmented with human-like tissues. It is reasonable to assume that either knowing the actual composition or deriving a relationship between human and animal tissues should benefit the dose calculation accuracy and the absorbed dose for the photon energies used in this study.

117
DECT for preclinical dose calculations
5
Conclusion
The feasibility of dual energy CBCT imaging for kilovoltage dose calculations in preclinical studies was presented. Images obtained using well-separated x-ray spectra were acquired with an on-board imager and different segmentation schemes were tested. The DECT method enabled the employment of a higher number of materials increasing accuracy in dose calculations. In phantom studies, both SECT and DECT presented a limit to which adding materials resulted in more imaging noise in the material maps and the dose distributions. SECT performed best with three materials and DECT with seven for the phantom case. With lower beam energies, the effect of incorrect segmentation on the dose calculations was worse, due to the importance of the photoelectric effect for the kilovoltage energy range. DECT segmentation offers the distinct advantage of taking into consideration the effective atomic number of the media. For the ex vivo specimen, the dose calculations derived from the SECT method showed larger volumes with high doses. For kilovoltage energies, the use of DECT segmentation combined with the choice of a bone with low density and atomic number is recommended.
Acknowledgments
The authors would like to thank Blake Walters, Dr Mark Podesta, Dr Gabriel Fonseca and Relinde Lieverse for useful discussions.
Funding
AV acknowledges financial support from CAPES Scholarship and Science without Borders program from Brazil (BEX 12030/13-9).
Conflicts of interest
FV and SvH are the founders of SmART Scientific Solutions (Maastricht, Netherlands). In addition, FV and SvH declare that they have received research funding from Precision X-Ray (North Branford, Connecticut, USA) and have commercial interests with this company.
Chapter 5
118
References
1. Koontz BF, Verhaegen F, De Ruysscher D. Tumour and normal tissue radiobiology in mouse models: how close are mice to mini-humans? Br J Radiol 2016; 90: 20160441. doi: http://dx.doi.org/10.1259/bjr.20160441
2. Grau C, Defourny N, Malicki J, Dunscombe P, Borras JM, Coffey M, et al. Radiotherapy equipment and departments in the European countries: Final results from the ESTRO-HERO survey. Radiother Oncol 2014; 112: 155–164. doi: http://dx.doi.org/10.1016/j.radonc.2014.08.029
3. Verhaegen F, van Hoof S, Granton PV, Trani D. A review of treatment planning for precision image-guided photon beam pre-clinical animal radiation studies. Z Med Phys 2014; 24: 323–334. doi: http://dx.doi.org/10.1016/j.zemedi.2014.02.004
4. Verhaegen F, Granton P, Tryggestad E. Small animal radiotherapy research platforms. Phys Med Biol 2011; 56: R55–R83. doi: http://dx.doi.org/10.1088/0031-9155/56/12/R01
5. Bazalova M, Carrier JF, Beaulieu L, Verhaegen F. Dual-energy CT-based material extraction for tissue segmentation in Monte Carlo dose calculations. Phys Med Biol 2008; 53: 2439–2456. doi: http://dx.doi.org/10.1088/0031-9155/53/9/015
6. Landry G, Granton PV, Reniers B, Öllers MC, Beaulieu L, Wildberger JE, et al. Simulation study on potential accuracy gains from dual energy CT tissue segmentation for low-energy brachytherapy Monte Carlo dose calculations. Phys Med Biol 2011; 56: 6257–6278. doi: http://dx.doi.org/10.1088/0031-9155/56/19/007
7. Clarkson R, Lindsay PE, Ansell S, Wilson G, Jelveh S, Hill RP, et al. Characterization of image quality and image-guidance performance of a preclinical microirradiator: Characterization of a preclinical microirradiator. Med Phys 2011; 38: 845–856. doi: http://dx.doi.org/10.1118/1.3533947
8. Granton PV, Verhaegen F. On the use of an analytic source model for dose calculations in precision image-guided small animal radiotherapy. Phys Med Biol 2013; 58: 3377–3395. doi: http://dx.doi.org/10.1088/0031-9155/58/10/3377
9. Ma CM, Coffey CW, DeWerd LA, Liu C, Nath R, Seltzer SM, et al. AAPM protocol for 40–300 kV x-ray beam dosimetry in radiotherapy and radiobiology. Med Phys 2001; 28: 868–893. doi: http://dx.doi.org/10.1118/1.1374247
10. Feldkamp LA, Davis LC, Kress JW. Practical cone-beam algorithm. J Opt Soc Am A 1984; 1: 612. doi: http://dx.doi.org/10.1364/JOSAA.1.000612
11. Schyns LEJR, Almeida IP, van Hoof SJ, Descamps B, Vanhove C, Landry G, et al. Optimizing dual energy cone beam CT protocols for preclinical imaging and radiation research. Br J Radiol 2016; 90: 20160480. doi: http://dx.doi.org/10.1259/bjr.20160480
12. Saito M. Potential of dual-energy subtraction for converting CT numbers to electron density based on a single linear relationship: Conversion of energy-subtracted CT number to electron density. Med Phys 2012; 39: 2021–2030. doi: http://dx.doi.org/10.1118/1.3694111
119
DECT for preclinical dose calculations
5
13. Landry G, Seco J, Gaudreault M, Verhaegen F. Deriving effective atomic numbers from DECT based on a parameterization of the ratio of high and low linear attenuation coefficients. Phys Med Biol 2013; 58: 6851–6866. doi: http://dx.doi.org/10.1088/0031-9155/58/19/6851
14. White DR, Booz J, Griffith RV, Spokas JJ, Wilson IJ. ICRU Report 44: Tissue Substitutes in Radiation Dosimetry and Measurement. International Commission on Radiation Units and Measurements (ICRU) 1989; doi: http://dx.doi.org/10.1093/jicru/os23.1.Report44
15. van Hoof SJ, Granton PV, Verhaegen F. Development and validation of a treatment planning system for small animal radiotherapy: SmART-Plan. Radiother Oncol 2013; 109: 361–366. doi: http://dx.doi.org/10.1016/j.radonc.2013.10.003
16. Walters B, Kawrakow I, Rogers DWO. PIRS-794: DOSXYZnrc Users Manual. National Research Council Canada (NRC-CNRC) 2018. Available from: https://nrc-cnrc.github.io/EGSnrc/doc/pirs794-dosxyznrc.pdf
17. Kawrakow I, Mainegra-Hing E, Rogers DWO, Tessier F, Walters BRB. PIRS-701: The EGSnrc Code System: Monte Carlo Simulation of Electron and Photon Transport. National Research Council Canada (NRC-CNRC) 2018. Available from: https://nrc-cnrc.github.io/EGSnrc/doc/pirs701-egsnrc.pdf
18. Poludniowski GG, Evans PM. Calculation of x-ray spectra emerging from an x-ray tube. Part I. Electron penetration characteristics in x-ray targets. Med Phys 2007; 34: 2164–2174. doi: http://dx.doi.org/10.1118/1.2734725
19. Poludniowski G, Landry G, DeBlois F, Evans PM, Verhaegen F. SpekCalc: a program to calculate photon spectra from tungsten anode x-ray tubes. Phys Med Biol 2009; 54: N433–N438. doi: http://dx.doi.org/10.1088/0031-9155/54/19/N01
20. Chow JCL, Leung MKK, Lindsay PE, Jaffray DA. Dosimetric variation due to the photon beam energy in the small-animal irradiation: A Monte Carlo study. Med Phys 2010; 37: 5322–5329. doi: http://dx.doi.org/10.1118/1.3488979
21. Bazalova M, Graves EE. The importance of tissue segmentation for dose calculations for kilovoltage radiation therapy: Tissue segmentation for kilovoltage radiotherapy. Med Phys 2011; 38: 3039–3049. doi: http://dx.doi.org/10.1118/1.3589138
22. Granton PV, Dubois L, van Elmpt W, van Hoof SJ, Lieuwes NG, De Ruysscher D, et al. A Longitudinal Evaluation of Partial Lung Irradiation in Mice by Using a Dedicated Image-Guided Small Animal Irradiator. Int J Radiat Oncol Biol Phys 2014; 90: 696–704. doi: http://dx.doi.org/10.1016/j.ijrobp.2014.07.004
23. Balvert M, van Hoof SJ, Granton PV, Trani D, den Hertog D, Hoffmann AL, et al. A framework for inverse planning of beam-on times for 3D small animal radiotherapy using interactive multi-objective optimisation. Phys Med Biol 2015; 60: 5681–5698. doi: http://dx.doi.org/10.1088/0031-9155/60/14/5681
24. Chow JCL. Depth dose dependence of the mouse bone using kilovoltage photon beams: A Monte Carlo study for small-animal irradiation. Radiat Phys Chem 2010; 79: 567–574. doi: http://dx.doi.org/10.1016/j.radphyschem.2010.01.003

Chapter 5
120
25. Landry G, Gaudreault M, van Elmpt W, Wildberger JE, Verhaegen F. Improved dose calculation accuracy for low energy brachytherapy by optimizing dual energy CT imaging protocols for noise reduction using sinogram affirmed iterative reconstruction. Z Med Phys 2016; 26: 75–87. doi: http://dx.doi.org/10.1016/j.zemedi.2015.09.001

5


Isabel P AlmeidaLotte E J R Schyns
Michel C ÖllersWouter van Elmpt
Katia ParodiGuillaume LandryFrank Verhaegen
Published in Medical Physics (2016)http://dx.doi.org/10.1002/mp.12000
Dual energy CT quantitative imaging:a comparison study between twin-beam
and dual-source CT scanners
Chapter 1 2 3 4 5 6 7 8
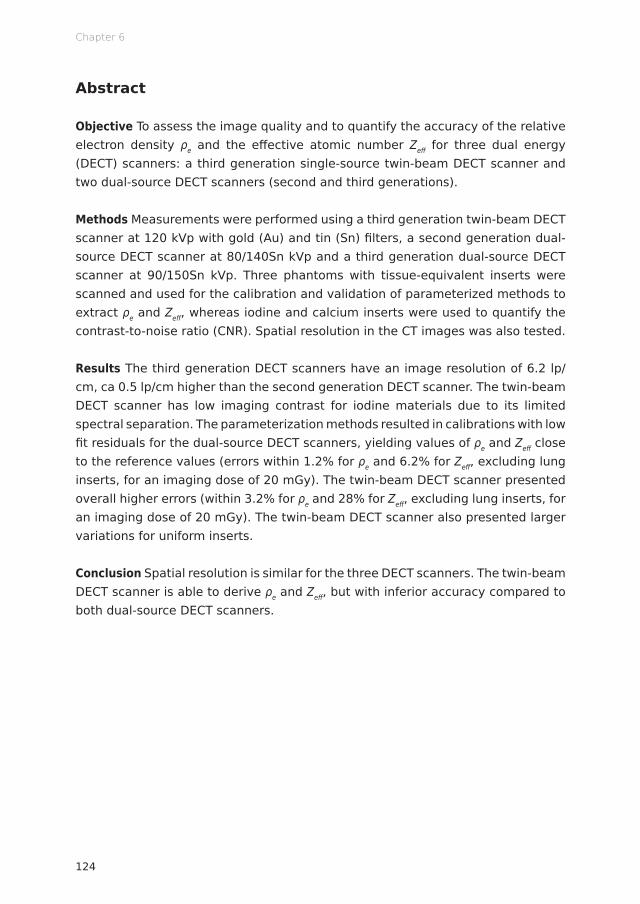
Chapter 6
124
Abstract
Objective To assess the image quality and to quantify the accuracy of the relative electron density ρe and the effective atomic number Zeff for three dual energy (DECT) scanners: a third generation single-source twin-beam DECT scanner and two dual-source DECT scanners (second and third generations).
Methods Measurements were performed using a third generation twin-beam DECT scanner at 120 kVp with gold (Au) and tin (Sn) filters, a second generation dual-source DECT scanner at 80/140Sn kVp and a third generation dual-source DECT scanner at 90/150Sn kVp. Three phantoms with tissue-equivalent inserts were scanned and used for the calibration and validation of parameterized methods to extract ρe and Zeff, whereas iodine and calcium inserts were used to quantify the contrast-to-noise ratio (CNR). Spatial resolution in the CT images was also tested.
Results The third generation DECT scanners have an image resolution of 6.2 lp/cm, ca 0.5 lp/cm higher than the second generation DECT scanner. The twin-beam DECT scanner has low imaging contrast for iodine materials due to its limited spectral separation. The parameterization methods resulted in calibrations with low fit residuals for the dual-source DECT scanners, yielding values of ρe and Zeff close to the reference values (errors within 1.2% for ρe and 6.2% for Zeff, excluding lung inserts, for an imaging dose of 20 mGy). The twin-beam DECT scanner presented overall higher errors (within 3.2% for ρe and 28% for Zeff, excluding lung inserts, for an imaging dose of 20 mGy). The twin-beam DECT scanner also presented larger variations for uniform inserts.
Conclusion Spatial resolution is similar for the three DECT scanners. The twin-beam DECT scanner is able to derive ρe and Zeff, but with inferior accuracy compared to both dual-source DECT scanners.
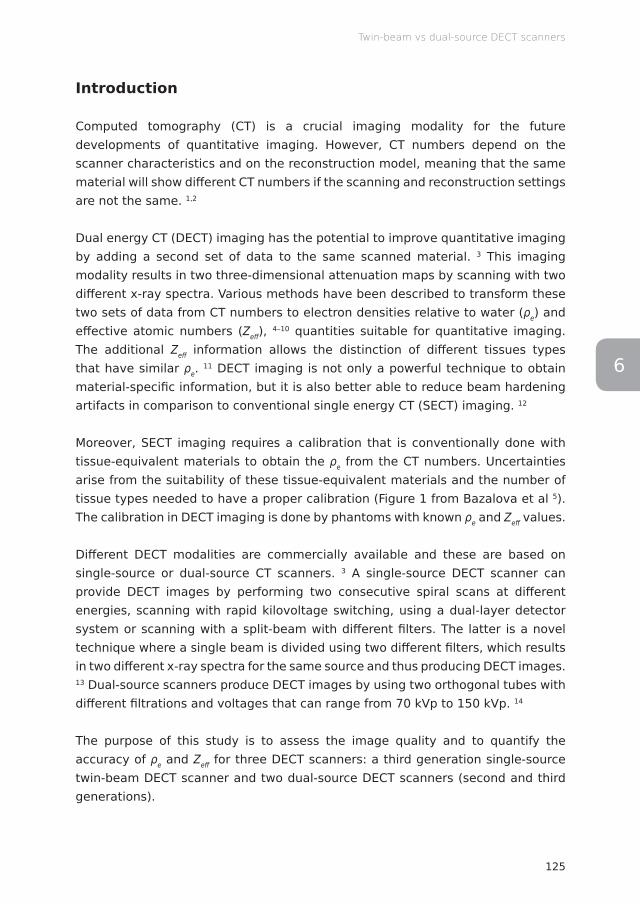
125
Twin-beam vs dual-source DECT scanners
6
Introduction
Computed tomography (CT) is a crucial imaging modality for the future developments of quantitative imaging. However, CT numbers depend on the scanner characteristics and on the reconstruction model, meaning that the same material will show different CT numbers if the scanning and reconstruction settings are not the same. 1,2
Dual energy CT (DECT) imaging has the potential to improve quantitative imaging by adding a second set of data to the same scanned material. 3 This imaging modality results in two three-dimensional attenuation maps by scanning with two different x-ray spectra. Various methods have been described to transform these two sets of data from CT numbers to electron densities relative to water (ρe) and effective atomic numbers (Zeff), 4–10 quantities suitable for quantitative imaging. The additional Zeff information allows the distinction of different tissues types that have similar ρe. 11 DECT imaging is not only a powerful technique to obtain material-specific information, but it is also better able to reduce beam hardening artifacts in comparison to conventional single energy CT (SECT) imaging. 12
Moreover, SECT imaging requires a calibration that is conventionally done with tissue-equivalent materials to obtain the ρe from the CT numbers. Uncertainties arise from the suitability of these tissue-equivalent materials and the number of tissue types needed to have a proper calibration (Figure 1 from Bazalova et al 5). The calibration in DECT imaging is done by phantoms with known ρe and Zeff values.
Different DECT modalities are commercially available and these are based on single-source or dual-source CT scanners. 3 A single-source DECT scanner can provide DECT images by performing two consecutive spiral scans at different energies, scanning with rapid kilovoltage switching, using a dual-layer detector system or scanning with a split-beam with different filters. The latter is a novel technique where a single beam is divided using two different filters, which results in two different x-ray spectra for the same source and thus producing DECT images. 13 Dual-source scanners produce DECT images by using two orthogonal tubes with different filtrations and voltages that can range from 70 kVp to 150 kVp. 14
The purpose of this study is to assess the image quality and to quantify the accuracy of ρe and Zeff for three DECT scanners: a third generation single-source twin-beam DECT scanner and two dual-source DECT scanners (second and third generations).
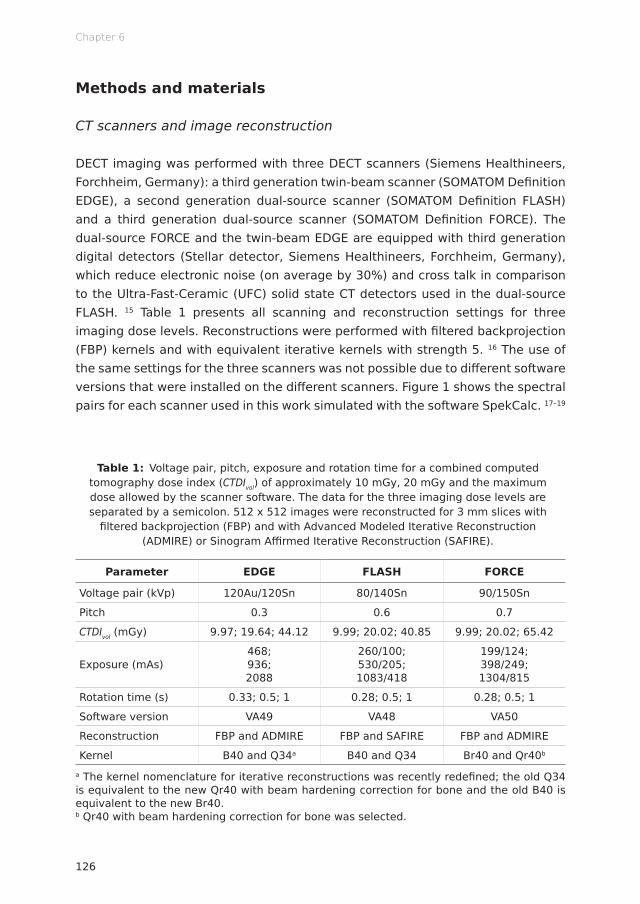
Chapter 6
126
Methods and materials
CT scanners and image reconstruction
DECT imaging was performed with three DECT scanners (Siemens Healthineers, Forchheim, Germany): a third generation twin-beam scanner (SOMATOM Definition EDGE), a second generation dual-source scanner (SOMATOM Definition FLASH) and a third generation dual-source scanner (SOMATOM Definition FORCE). The dual-source FORCE and the twin-beam EDGE are equipped with third generation digital detectors (Stellar detector, Siemens Healthineers, Forchheim, Germany), which reduce electronic noise (on average by 30%) and cross talk in comparison to the Ultra-Fast-Ceramic (UFC) solid state CT detectors used in the dual-source FLASH. 15 Table 1 presents all scanning and reconstruction settings for three imaging dose levels. Reconstructions were performed with filtered backprojection (FBP) kernels and with equivalent iterative kernels with strength 5. 16 The use of the same settings for the three scanners was not possible due to different software versions that were installed on the different scanners. Figure 1 shows the spectral pairs for each scanner used in this work simulated with the software SpekCalc. 17–19
Table 1: Voltage pair, pitch, exposure and rotation time for a combined computed tomography dose index (CTDIvol) of approximately 10 mGy, 20 mGy and the maximum dose allowed by the scanner software. The data for the three imaging dose levels are separated by a semicolon. 512 x 512 images were reconstructed for 3 mm slices with
filtered backprojection (FBP) and with Advanced Modeled Iterative Reconstruction (ADMIRE) or Sinogram Affirmed Iterative Reconstruction (SAFIRE).
Parameter EDGE FLASH FORCE
Voltage pair (kVp) 120Au/120Sn 80/140Sn 90/150Sn
Pitch 0.3 0.6 0.7
CTDIvol (mGy) 9.97; 19.64; 44.12 9.99; 20.02; 40.85 9.99; 20.02; 65.42
Exposure (mAs)468; 936; 2088
260/100; 530/205; 1083/418
199/124; 398/249; 1304/815
Rotation time (s) 0.33; 0.5; 1 0.28; 0.5; 1 0.28; 0.5; 1
Software version VA49 VA48 VA50
Reconstruction FBP and ADMIRE FBP and SAFIRE FBP and ADMIRE
Kernel B40 and Q34a B40 and Q34 Br40 and Qr40b
a The kernel nomenclature for iterative reconstructions was recently redefined; the old Q34 is equivalent to the new Qr40 with beam hardening correction for bone and the old B40 is equivalent to the new Br40.b Qr40 with beam hardening correction for bone was selected.

127
Twin-beam vs dual-source DECT scanners
6
Figure 1: Normalized x-ray spectra for the (a) EDGE, (b) FLASH and (c) FORCE DECT scanners. All high energy spectra have a tin (Sn) fi ltration (0.6 mm for the EDGE and
FORCE and 0.4 mm for the FLASH). The low energy spectrum for the EDGE has a gold (Au) fi lter of 0.05 mm.

Chapter 6
128
Phantoms
An RMI 467 phantom (Gammex, Middleton, Wisconsin, USA) was scanned with two diff erent insert confi gurations. First, the 16 tissue-equivalent inserts were confi gured as shown in Figure 2a, such that the bone tissues were spread out to minimize artifacts. A second confi guration followed using six iodine and six calcium inserts with diff erent concentrations. The remaining four holes were fi lled with solid water inserts. Another set of fi ve cylindrical inserts was scanned in two phantoms with diff erent sizes (Model 002H5 and Model 002HN, CIRS, Norfolk, Virginia, USA), but both made from identical water-equivalent material (Figure 2b). The inserts consist of tissue-equivalent material: lung (inhale), bone, muscle, adipose and plastic water (002ED and 002RW-S, CIRS, Norfolk, Virginia, USA). Table 2 presents the density ρ, ρe, and Zeff for the Gammex RMI 467 and the CIRS inserts (more detail can be found in Tables 1 and 2 of Landry et al 9). A Catphan 504 phantom (The Phantom Laboratory, Greenwich, New York, USA) consisting of several modules was also scanned with the same settings to test the image quality.
Figure 2: (a) Sketch of the Gammex RMI 467 phantom and its insert confi gurations for the tissue-equivalent inserts and for the iodine and calcium inserts. (b) Sketch of the CIRS
abdomen (top) and CIRS head (bottom) phantoms and their insert confi gurations.

129
Twin-beam vs dual-source DECT scanners
6
Table 2: Density (ρ), relative electron density (ρe) and effective atomic number (Zeff) for the inserts of the Gammex RMI 467 and the CIRS phantoms. ρe and Zeff were calculated
using the elemental compositions provided by the phantom manufacturers.
Phantom Insert name ρ (g/cm3) ρe Zeff
Gammex RMI 467
LN-300 lung 0.3 0.29 7.55
LN-450 lung 0.46 0.45 7.53
AP6 adipose 0.947 0.93 6.21
BR-12 breast 0.98 0.96 6.93
Water insert 1 1.00 7.48
CT solid water 1.022 0.99 7.74
BRN-SR2 brain 1.051 1.05 6.09
LV1 liver 1.096 1.06 7.74
IB inner bone 1.134 1.09 10.42
B200 bone mineral 1.152 1.10 10.42
CB2-30% CaCO3 1.331 1.28 10.90
CB2-50% CaCO3 1.559 1.47 12.54
SB3 cortical bone 1.822 1.69 13.64
CIRS
Lung 0.21 0.20 7.24
Adipose 0.967 0.96 6.44
Plastic water DT 1.039 1.00 7.55
Muscle 1.062 1.04 7.59
Bone 1.6 1.51 11.90
The EDGE has a minimum object width requirement of 10 cm in the craniocaudal direction, since the reconstruction is unreliable within 3 cm from the edges. This is due to the combination of the twin-beam design and the use of a flat object. On the one hand, due to penumbra effects a few detector rows close to the boundary of the filtered beams see a mixture of both Au and Sn spectra. On the other hand, the use of flat objects causes the attenuation to change drastically in the flat edges, which has an impact on the data processing and image quality. The Gammex RMI 467 phantom has a width of only 5 cm and its inserts have a length of 7 cm. Because of this, scans were made using two original 5 cm disks facing each other, thus assembling into a 10 cm wide phantom.
The Gammex RMI 467 scans with the tissue-equivalent inserts were used to calibrate each scanner for ρe and Zeff (following Saito 8 and Landry et al 9), whereas scans with the CIRS head and abdomen phantoms were used for validation. CT numbers in Hounsfield Units (HU) from the low and high energy images were
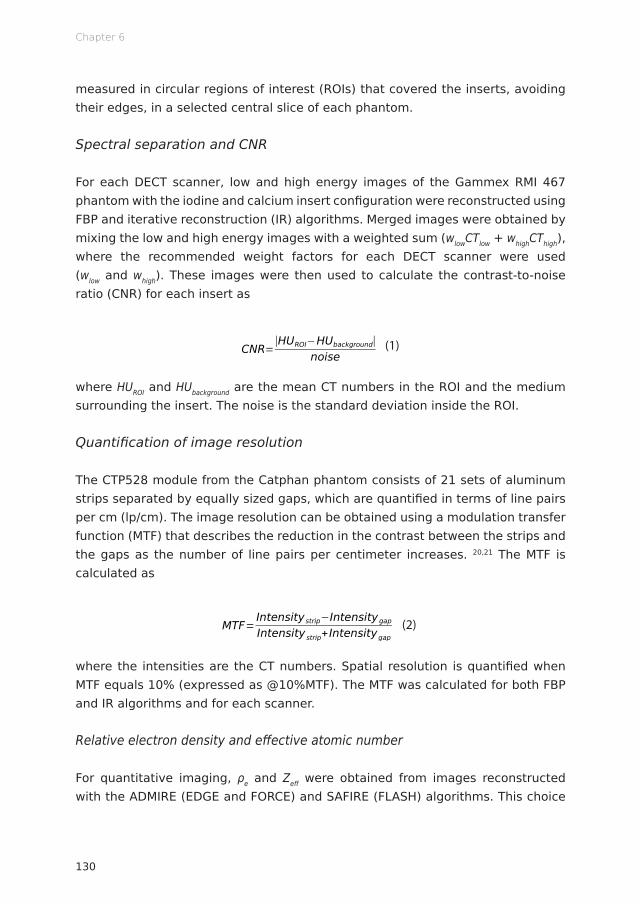
Chapter 6
130
measured in circular regions of interest (ROIs) that covered the inserts, avoiding their edges, in a selected central slice of each phantom.
Spectral separation and CNR
For each DECT scanner, low and high energy images of the Gammex RMI 467 phantom with the iodine and calcium insert configuration were reconstructed using FBP and iterative reconstruction (IR) algorithms. Merged images were obtained by mixing the low and high energy images with a weighted sum (wlowCTlow + whighCThigh), where the recommended weight factors for each DECT scanner were used (wlow and whigh). These images were then used to calculate the contrast-to-noise ratio (CNR) for each insert as
HU=1000⋅μ−μwater
μwater−μair
Zeff=n√∑i
ωi Zi
Ai
Zin /∑i
ωi Z i
Ai
μratio=μLowEnergy
μHighEnergy
μratio=μLowEnergy
μHighEnergy
=A+B⋅Zeff
n−1+C⋅Zeffm−1
D+E⋅Zeffn−1+F⋅Zeff
m−1
ρe=ρ∑i
ωi Zi
Ai
/ρe ,water
ΔHUHU=(1+α)⋅HUHighEnergy−α⋅HULowEnergy
ρe=a⋅(1+α)⋅HUHighEnergy−α⋅HULowEnergy
1000+b
ωi=ai⋅ρe+bi⋅Zeff+ci⋅ρeZeff+di
σtissue=√σmeasured2 −σnoise
2
σnoise=a⋅Db+c
CNR=Ī tissue−Ī background
√σtissue2 −σbackground
2
CNR=|HUROI−HUbackground|
noise
MTF (f )=π√24
⋅M(f )M0
MTF=Intensitystrip−Intensitygap
Intensitystrip+ Intensitygap
‖Rf−p‖2
argminf
‖Rf −p‖2
2RT (Rf−p)
ρ=1.073ρe−0.04
ΔHUD=(DDECT−DRef)/DRef⋅100%
(1)
where HUROI and HUbackground are the mean CT numbers in the ROI and the medium surrounding the insert. The noise is the standard deviation inside the ROI.
Quantification of image resolution
The CTP528 module from the Catphan phantom consists of 21 sets of aluminum strips separated by equally sized gaps, which are quantified in terms of line pairs per cm (lp/cm). The image resolution can be obtained using a modulation transfer function (MTF) that describes the reduction in the contrast between the strips and the gaps as the number of line pairs per centimeter increases. 20,21 The MTF is calculated as
HU=1000⋅μ−μwater
μwater−μair
Zeff=n√∑i
ωi Zi
Ai
Zin /∑i
ωi Z i
Ai
μratio=μLowEnergy
μHighEnergy
μratio=μLowEnergy
μHighEnergy
=A+B⋅Zeff
n−1+C⋅Zeffm−1
D+E⋅Zeffn−1+F⋅Zeff
m−1
ρe=ρ∑i
ωi Zi
Ai
/ρe ,water
ΔHUHU=(1+α)⋅HUHighEnergy−α⋅HULowEnergy
ρe=a⋅(1+α)⋅HUHighEnergy−α⋅HULowEnergy
1000+b
ωi=ai⋅ρe+bi⋅Zeff+ci⋅ρeZeff+di
σtissue=√σmeasured2 −σnoise
2
σnoise=a⋅Db+c
CNR=Ī tissue−Ī background
√σtissue2 −σbackground
2
CNR=|HUROI−HUbackground|
noise
MTF (f )=π√24
⋅M(f )M0
MTF=Intensitystrip−Intensitygap
Intensitystrip+ Intensitygap
‖Rf−p‖2
argminf
‖Rf −p‖2
2RT (Rf−p)
ρ=1.073ρe−0.04
ΔHUD=(DDECT−DRef)/DRef⋅100%
(2)
where the intensities are the CT numbers. Spatial resolution is quantified when MTF equals 10% (expressed as @10%MTF). The MTF was calculated for both FBP and IR algorithms and for each scanner.
Relative electron density and effective atomic number
For quantitative imaging, ρe and Zeff were obtained from images reconstructed with the ADMIRE (EDGE and FORCE) and SAFIRE (FLASH) algorithms. This choice
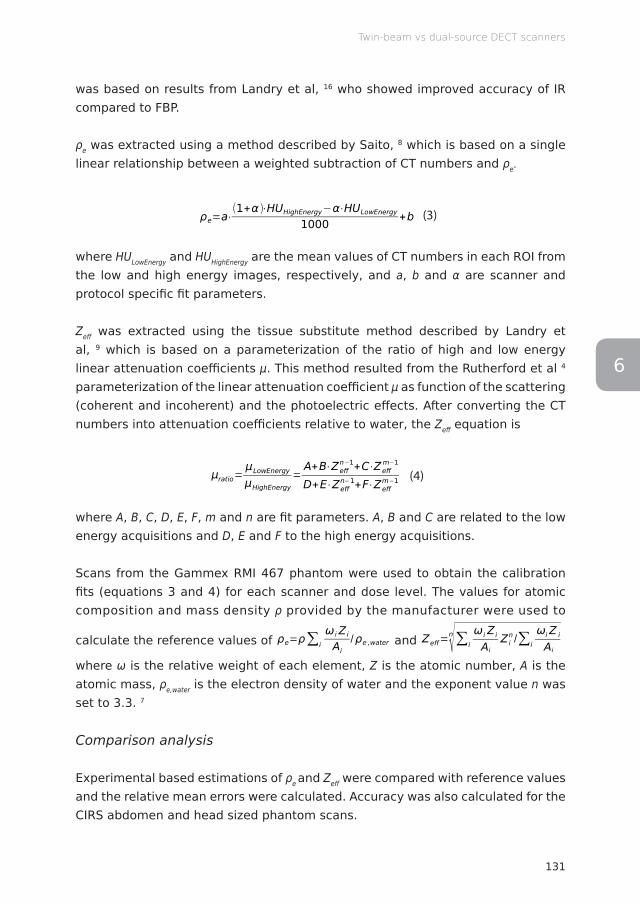
131
Twin-beam vs dual-source DECT scanners
6
was based on results from Landry et al, 16 who showed improved accuracy of IR compared to FBP.
ρe was extracted using a method described by Saito, 8 which is based on a single linear relationship between a weighted subtraction of CT numbers and ρe.
HU=1000⋅μ−μwater
μwater−μair
Zeff=n√∑i
ωi Zi
Ai
Zin /∑i
ωi Z i
Ai
μratio=μLowEnergy
μHighEnergy
μratio=μLowEnergy
μHighEnergy
=A+B⋅Zeff
n−1+C⋅Zeffm−1
D+E⋅Zeffn−1+F⋅Zeff
m−1
ρe=ρ∑i
ωi Zi
Ai
/ρe ,water
ΔHUHU=(1+α)⋅HUHighEnergy−α⋅HULowEnergy
ρe=a⋅(1+α)⋅HUHighEnergy−α⋅HULowEnergy
1000+b
ωi=ai⋅ρe+bi⋅Zeff+ci⋅ρeZeff+di
σtissue=√σmeasured2 −σnoise
2
σnoise=a⋅Db+c
CNR=Ī tissue−Ī background
√σtissue2 −σbackground
2
CNR=|HUROI−HUbackground|
noise
MTF (f )=π√24
⋅M(f )M0
MTF=Intensitystrip−Intensitygap
Intensitystrip+ Intensitygap
‖Rf−p‖2
argminf
‖Rf −p‖2
2RT (Rf−p)
ρ=1.073ρe−0.04
ΔHUD=(DDECT−DRef)/DRef⋅100%
(3)
where HULowEnergy and HUHighEnergy are the mean values of CT numbers in each ROI from the low and high energy images, respectively, and a, b and α are scanner and protocol specific fit parameters.
Zeff was extracted using the tissue substitute method described by Landry et al, 9 which is based on a parameterization of the ratio of high and low energy linear attenuation coefficients μ. This method resulted from the Rutherford et al 4 parameterization of the linear attenuation coefficient μ as function of the scattering (coherent and incoherent) and the photoelectric effects. After converting the CT numbers into attenuation coefficients relative to water, the Zeff equation is
HU=1000⋅μ−μwater
μwater−μair
Zeff=n√∑i
ωi Zi
Ai
Zin /∑i
ωi Z i
Ai
μratio=μLowEnergy
μHighEnergy
μratio=μLowEnergy
μHighEnergy
=A+B⋅Zeff
n−1+C⋅Zeffm−1
D+E⋅Zeffn−1+F⋅Zeff
m−1
ρe=ρ∑i
ωi Zi
Ai
/ρe ,water
ΔHUHU=(1+α)⋅HUHighEnergy−α⋅HULowEnergy
ρe=a⋅(1+α)⋅HUHighEnergy−α⋅HULowEnergy
1000+b
ωi=ai⋅ρe+bi⋅Zeff+ci⋅ρeZeff+di
σtissue=√σmeasured2 −σnoise
2
σnoise=a⋅Db+c
CNR=Ī tissue−Ī background
√σtissue2 −σbackground
2
CNR=|HUROI−HUbackground|
noise
MTF (f )=π√24
⋅M(f )M0
MTF=Intensitystrip−Intensitygap
Intensitystrip+ Intensitygap
‖Rf−p‖2
argminf
‖Rf −p‖2
2RT (Rf−p)
ρ=1.073ρe−0.04
ΔHUD=(DDECT−DRef)/DRef⋅100%
(4)
where A, B, C, D, E, F, m and n are fit parameters. A, B and C are related to the low energy acquisitions and D, E and F to the high energy acquisitions.
Scans from the Gammex RMI 467 phantom were used to obtain the calibration fits (equations 3 and 4) for each scanner and dose level. The values for atomic composition and mass density ρ provided by the manufacturer were used to
calculate the reference values of
HU=1000⋅μ−μwater
μwater−μair
Zeff=n√∑i
ωi Zi
Ai
Zin /∑i
ωi Z i
Ai
μratio=μLowEnergy
μHighEnergy
μratio=μLowEnergy
μHighEnergy
=A+B⋅Zeff
n−1+C⋅Zeffm−1
D+E⋅Zeffn−1+F⋅Zeff
m−1
ρe=ρ∑i
ωi Zi
Ai
/ρe ,water
ΔHUHU=(1+α)⋅HUHighEnergy−α⋅HULowEnergy
ρe=a⋅(1+α)⋅HUHighEnergy−α⋅HULowEnergy
1000+b
ωi=ai⋅ρe+bi⋅Zeff+ci⋅ρeZeff+di
σtissue=√σmeasured2 −σnoise
2
σnoise=a⋅Db+c
CNR=Ī tissue−Ī background
√σtissue2 −σbackground
2
CNR=|HUROI−HUbackground|
noise
MTF (f )=π√24
⋅M(f )M0
MTF=Intensitystrip−Intensitygap
Intensitystrip+ Intensitygap
‖Rf−p‖2
argminf
‖Rf −p‖2
2RT (Rf−p)
ρ=1.073ρe−0.04
ΔHUD=(DDECT−DRef)/DRef⋅100%
and
HU=1000⋅μ−μwater
μwater−μair
Zeff=n√∑i
ωi Zi
Ai
Zin /∑i
ωi Z i
Ai
μratio=μLowEnergy
μHighEnergy
μratio=μLowEnergy
μHighEnergy
=A+B⋅Zeff
n−1+C⋅Zeffm−1
D+E⋅Zeffn−1+F⋅Zeff
m−1
ρe=ρ∑i
ωi Zi
Ai
/ρe ,water
ΔHUHU=(1+α)⋅HUHighEnergy−α⋅HULowEnergy
ρe=a⋅(1+α)⋅HUHighEnergy−α⋅HULowEnergy
1000+b
ωi=ai⋅ρe+bi⋅Zeff+ci⋅ρeZeff+di
σtissue=√σmeasured2 −σnoise
2
σnoise=a⋅Db+c
CNR=Ī tissue−Ī background
√σtissue2 −σbackground
2
CNR=|HUROI−HUbackground|
noise
MTF (f )=π√24
⋅M(f )M0
MTF=Intensitystrip−Intensitygap
Intensitystrip+ Intensitygap
‖Rf−p‖2
argminf
‖Rf −p‖2
2RT (Rf−p)
ρ=1.073ρe−0.04
ΔHUD=(DDECT−DRef)/DRef⋅100%
where ω is the relative weight of each element, Z is the atomic number, A is the atomic mass, ρe,water is the electron density of water and the exponent value n was set to 3.3. 7
Comparison analysis
Experimental based estimations of ρe and Zeff were compared with reference values and the relative mean errors were calculated. Accuracy was also calculated for the CIRS abdomen and head sized phantom scans.
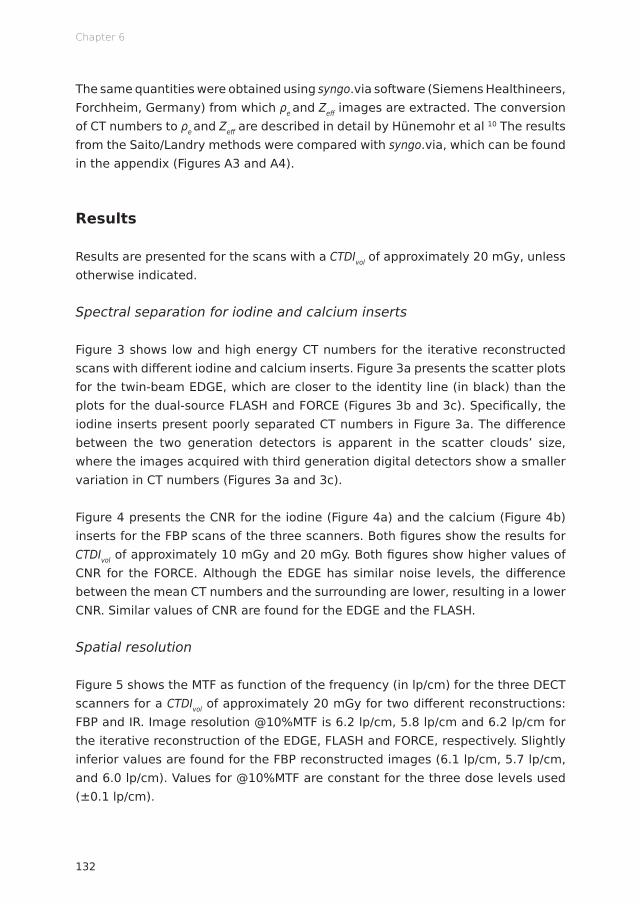
Chapter 6
132
The same quantities were obtained using syngo.via software (Siemens Healthineers, Forchheim, Germany) from which ρe and Zeff images are extracted. The conversion of CT numbers to ρe and Zeff are described in detail by Hünemohr et al 10 The results from the Saito/Landry methods were compared with syngo.via, which can be found in the appendix (Figures A3 and A4).
Results
Results are presented for the scans with a CTDIvol of approximately 20 mGy, unless otherwise indicated.
Spectral separation for iodine and calcium inserts
Figure 3 shows low and high energy CT numbers for the iterative reconstructed scans with different iodine and calcium inserts. Figure 3a presents the scatter plots for the twin-beam EDGE, which are closer to the identity line (in black) than the plots for the dual-source FLASH and FORCE (Figures 3b and 3c). Specifically, the iodine inserts present poorly separated CT numbers in Figure 3a. The difference between the two generation detectors is apparent in the scatter clouds’ size, where the images acquired with third generation digital detectors show a smaller variation in CT numbers (Figures 3a and 3c).
Figure 4 presents the CNR for the iodine (Figure 4a) and the calcium (Figure 4b) inserts for the FBP scans of the three scanners. Both figures show the results for CTDIvol of approximately 10 mGy and 20 mGy. Both figures show higher values of CNR for the FORCE. Although the EDGE has similar noise levels, the difference between the mean CT numbers and the surrounding are lower, resulting in a lower CNR. Similar values of CNR are found for the EDGE and the FLASH.
Spatial resolution
Figure 5 shows the MTF as function of the frequency (in lp/cm) for the three DECT scanners for a CTDIvol of approximately 20 mGy for two different reconstructions: FBP and IR. Image resolution @10%MTF is 6.2 lp/cm, 5.8 lp/cm and 6.2 lp/cm for the iterative reconstruction of the EDGE, FLASH and FORCE, respectively. Slightly inferior values are found for the FBP reconstructed images (6.1 lp/cm, 5.7 lp/cm, and 6.0 lp/cm). Values for @10%MTF are constant for the three dose levels used (±0.1 lp/cm).
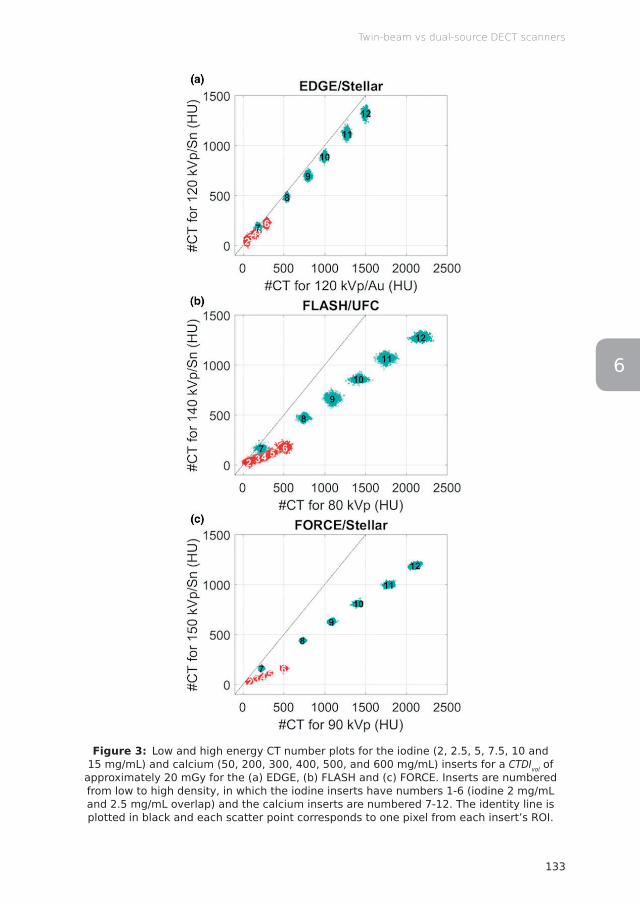
133
Twin-beam vs dual-source DECT scanners
6
Figure 3: Low and high energy CT number plots for the iodine (2, 2.5, 5, 7.5, 10 and 15 mg/mL) and calcium (50, 200, 300, 400, 500, and 600 mg/mL) inserts for a CTDIvol of
approximately 20 mGy for the (a) EDGE, (b) FLASH and (c) FORCE. Inserts are numbered from low to high density, in which the iodine inserts have numbers 1-6 (iodine 2 mg/mL and 2.5 mg/mL overlap) and the calcium inserts are numbered 7-12. The identity line is plotted in black and each scatter point corresponds to one pixel from each insert’s ROI.

Chapter 6
134
Figure 4: CNR for the (a) iodine and (b) calcium inserts for two dose levels (CTDIvol) of approximately 10 mGy (solid lines) and 20 mGy (dashed lines).
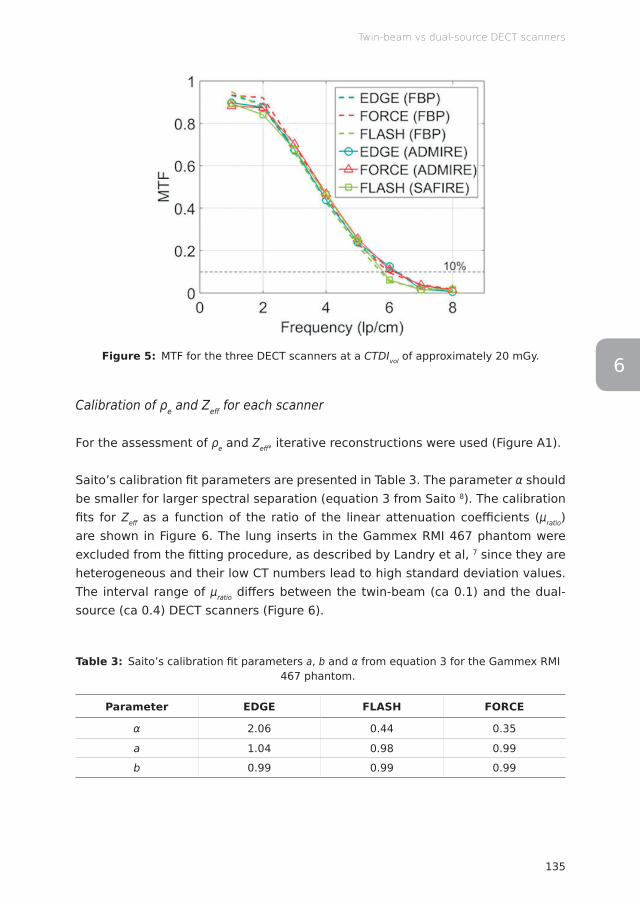
135
Twin-beam vs dual-source DECT scanners
6Figure 5: MTF for the three DECT scanners at a CTDIvol of approximately 20 mGy.
Calibration of ρe and Zeff for each scanner
For the assessment of ρe and Zeff , iterative reconstructions were used (Figure A1).
Saito’s calibration fi t parameters are presented in Table 3. The parameter α should be smaller for larger spectral separation (equation 3 from Saito 8). The calibration fi ts for Zeff as a function of the ratio of the linear attenuation coeffi cients (μratio) are shown in Figure 6. The lung inserts in the Gammex RMI 467 phantom were excluded from the fi tting procedure, as described by Landry et al, 7 since they are heterogeneous and their low CT numbers lead to high standard deviation values. The interval range of μratio diff ers between the twin-beam (ca 0.1) and the dual-source (ca 0.4) DECT scanners (Figure 6).
Table 3: Saito’s calibration fi t parameters a, b and α from equation 3 for the Gammex RMI 467 phantom.
Parameter EDGE FLASH FORCE
α 2.06 0.44 0.35
a 1.04 0.98 0.99
b 0.99 0.99 0.99
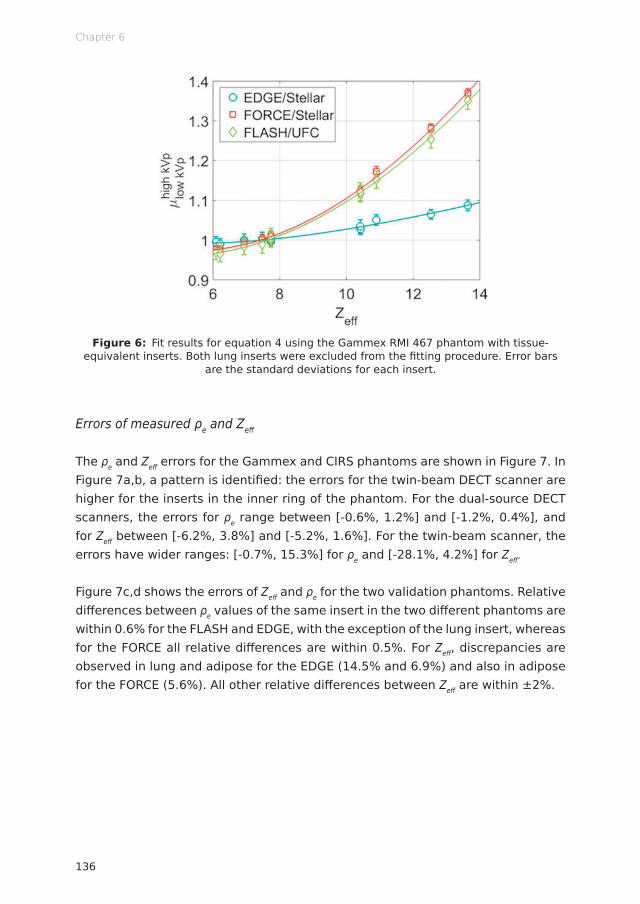
Chapter 6
136
Figure 6: Fit results for equation 4 using the Gammex RMI 467 phantom with tissue-equivalent inserts. Both lung inserts were excluded from the fi tting procedure. Error bars
are the standard deviations for each insert.
Errors of measured ρe and Zeff
The ρe and Zeff errors for the Gammex and CIRS phantoms are shown in Figure 7. In Figure 7a,b, a pattern is identifi ed: the errors for the twin-beam DECT scanner are higher for the inserts in the inner ring of the phantom. For the dual-source DECT scanners, the errors for ρe range between [-0.6%, 1.2%] and [-1.2%, 0.4%], and for Zeff between [-6.2%, 3.8%] and [-5.2%, 1.6%]. For the twin-beam scanner, the errors have wider ranges: [-0.7%, 15.3%] for ρe and [-28.1%, 4.2%] for Zeff .
Figure 7c,d shows the errors of Zeff and ρe for the two validation phantoms. Relative diff erences between ρe values of the same insert in the two diff erent phantoms are within 0.6% for the FLASH and EDGE, with the exception of the lung insert, whereas for the FORCE all relative diff erences are within 0.5%. For Zeff , discrepancies are observed in lung and adipose for the EDGE (14.5% and 6.9%) and also in adipose for the FORCE (5.6%). All other relative diff erences between Zeff are within ±2%.

137
Twin-beam vs dual-source DECT scanners
6
Figure 7: ρe and Zeff errors (%) of measured values with respect to the reference values of the (a,b) Gammex RMI 467 and (c,d) CIRS abdomen and head phantoms.
Material attribution feasibility
Tissue composition segmentation can be performed in the (ρe,Zeff ) space (detailed in section 2.5 from Landry et al 7), which uses the two-dimensional Mahalanobis distance to assign each voxel to its closest reference material. For this method to be feasible, a proper separation in the (ρe,Zeff ) space of the scatter plots for the diff erent calibration materials should exist. Figure 8 presents the scatter plots from the scans with the calibration phantom for the three scanners. The data discretization observed for low Zeff values (e.g. for the lung inserts) are a result of saving CT numbers as integers by the scanner software. In Figure 8a1, it is possible to observe in detail the cortical bone insert (insert number 8) for the EDGE scanner, which shows the spread of ρe (Δρe) and Zeff (ΔZeff ). Compared to the other two scanners, these ranges are wider for all inserts in the EDGE, which is especially noticeable for the bone tissues.
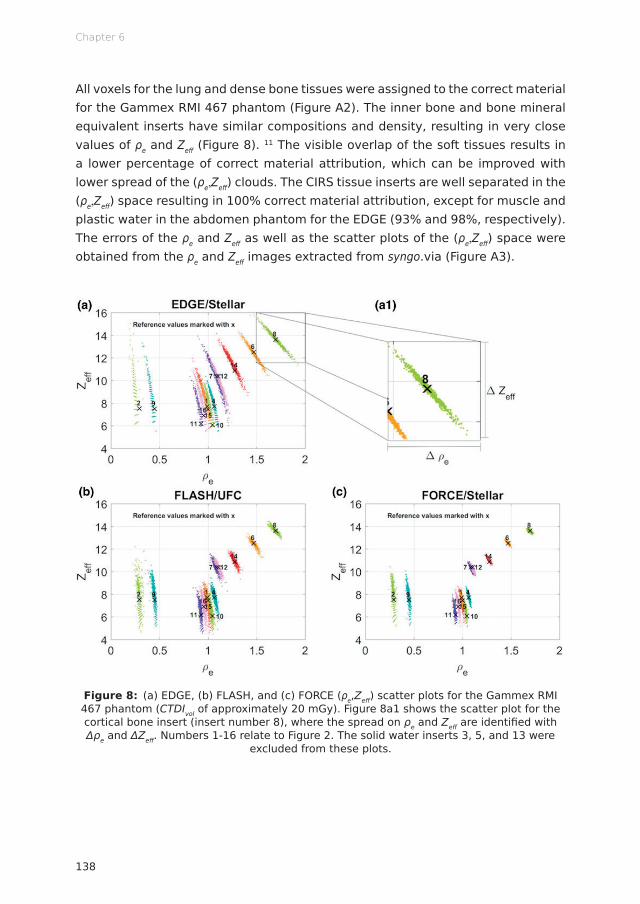
Chapter 6
138
All voxels for the lung and dense bone tissues were assigned to the correct material for the Gammex RMI 467 phantom (Figure A2). The inner bone and bone mineral equivalent inserts have similar compositions and density, resulting in very close values of ρe and Zeff (Figure 8). 11 The visible overlap of the soft tissues results in a lower percentage of correct material attribution, which can be improved with lower spread of the (ρe,Zeff ) clouds. The CIRS tissue inserts are well separated in the (ρe,Zeff ) space resulting in 100% correct material attribution, except for muscle and plastic water in the abdomen phantom for the EDGE (93% and 98%, respectively). The errors of the ρe and Zeff as well as the scatter plots of the (ρe,Zeff ) space were obtained from the ρe and Zeff images extracted from syngo.via (Figure A3).
Figure 8: (a) EDGE, (b) FLASH, and (c) FORCE (ρe,Zeff ) scatter plots for the Gammex RMI 467 phantom (CTDIvol of approximately 20 mGy). Figure 8a1 shows the scatter plot for the cortical bone insert (insert number 8), where the spread on ρe and Zeff are identifi ed with Δρe and ΔZeff . Numbers 1-16 relate to Figure 2. The solid water inserts 3, 5, and 13 were
excluded from these plots.
139
Twin-beam vs dual-source DECT scanners
6
Discussion
The novel technology presented in this paper, the split filter in the EDGE, has the advantage of using a single x-ray tube to acquire DECT scans, allowing for a possible upgrade on many clinical SECT scanners. In this work, a comparison of this new technique with the state-of-the-art dual-source DECT scanners was done to assess the performance of the twin-beam on quantitative imaging, knowing beforehand that the spectral separation of the twin-beam would not be as good as the one from the dual-source DECT scanners.
The EDGE has a width requirement of 10 cm in the craniocaudal direction, as explained previously. Although the scans with the calibration phantom were acquired using two Gammex RMI 467 disks, it is important to point out that using the syngo.via software, non-uniform ρe and Zeff images along the phantom’s profile were obtained for uniform inserts, whereas such non-uniformities were not seen in the CIRS phantoms, which have a width of 15 cm. Nevertheless, the central slice of the Gammex RMI 467 disk with the inserts presented the most uniformly reconstructed image and it was used to perform the calibration.
A consequence of the twin-beam energy spectra (Figure 1a) is the poor CT number separation seen in Figure 3a for the iodine and calcium inserts. The two dual-source scanners, with well-separated spectra, present a noticeable distinction in CT numbers between the low and high energy scans for the iodine and calcium scans. The FORCE with the third generation detectors and the smaller spectral overlap (of only 10.5% of the area overlapping) shows scatter plots further away from the identity line and with lower variations.
The FLASH and EDGE have similar CNR results for both iodine and calcium materials. On one hand, the FLASH has a good contrast due to its wider spectral separation, but higher noise levels due to the detector. On the other hand, the EDGE has low noise values, but also low contrast due to its narrower spectral separation. The FORCE has a CNR on average 1.5 times superior to the FLASH and 1.4 times superior to the EDGE.
In terms of image resolution, the results for the @10% MTF are similar for both the EDGE and the FORCE and slightly lower for the FLASH, since the MTF is mostly detector-related.
The calibration of ρe and Zeff was performed for the three scanners using the methods from Saito 8 and Landry et al 9 The EDGE presented less robust calibration
Chapter 6
140
curves with higher fit residuals. This can be explained again by the reduced spectral separation of the twin-beam, that resulted in a high α parameter for the ρe fit (Table 3) and a low range of the attenuation coefficients ratio for the Zeff fit (Figure 6a). These results have a direct implication on the extraction of the ρe and Zeff, which had overall higher differences to the reference values and spread out clouds in the (ρe,Zeff) scatter plots for this DECT scanner. The same or higher deviations were obtained from syngo.via’s images, which use a different method to calculate ρe and Zeff.
The ρe and Zeff errors for the calibration phantom are noticeably higher for the EDGE, especially for all inserts located in the inner ring of the Gammex RMI 467 phantom (inserts 9-16, Figure 7a,b). This can be related to the twin-beam requirement to reconstruct objects thicker than 10 cm. For this phantom, the FLASH and the FORCE presented lower errors for the tissue-equivalent inserts, specifically, errors for the soft tissues within 1.3% for ρe and 7% for Zeff and for the bone tissues within 0.5% for ρe and 1.9% for Zeff.
The validation was performed with a different set of tissue-equivalent inserts in two phantoms of different sizes, aiming to also assess the robustness of the calibration for a smaller phantom. Values of ρe for both phantoms have a relative difference within 0.6% for the three DECT scanners. Higher discrepancies are observed for Zeff, within 2% for bone, muscle and water and within 6% for adipose. From these results, it is possible to conclude that the calibration methods used for DECT are not phantom-size dependent, as long as beam hardening effects are corrected in the image reconstruction.
Images acquired with the twin-beam DECT modality resulted in widely spread ρe and Zeff values for the same material type (Figure 8), contrary to the results from the dual-source DECT scanners. The use of different IR algorithms and detector systems and the aberrant values found for the lung inserts are limitation from this study, but these do not change its overall conclusions.
Conclusion
The dual-source DECT scanners measure ρe and Zeff values closer to the reference values in comparison to the twin-beam DECT scanner, with a higher accuracy for the FORCE. A higher image resolution and CNR was also found for the FORCE compared to the other two DECT scanners.
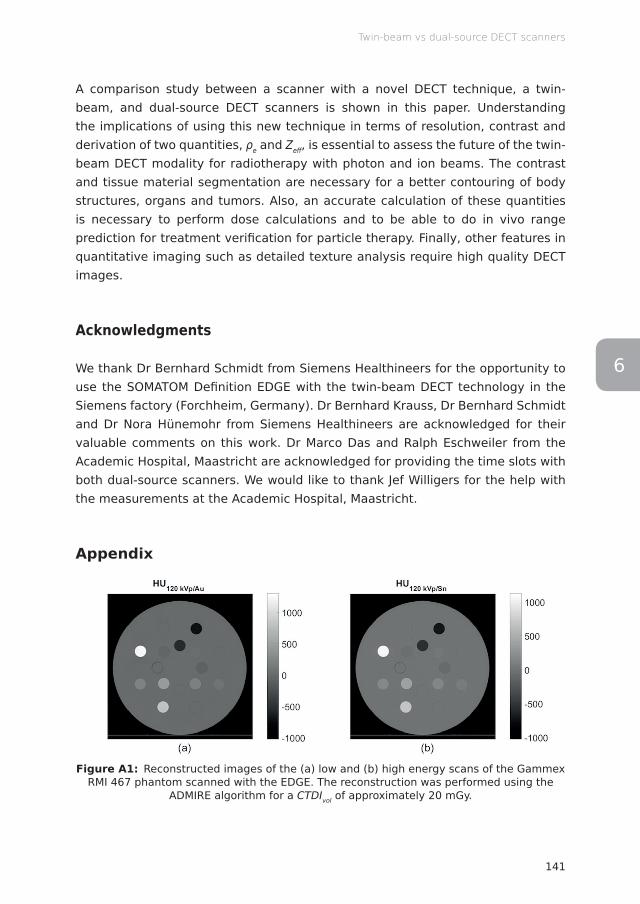
141
Twin-beam vs dual-source DECT scanners
6
A comparison study between a scanner with a novel DECT technique, a twin-beam, and dual-source DECT scanners is shown in this paper. Understanding the implications of using this new technique in terms of resolution, contrast and derivation of two quantities, ρe and Zeff , is essential to assess the future of the twin-beam DECT modality for radiotherapy with photon and ion beams. The contrast and tissue material segmentation are necessary for a better contouring of body structures, organs and tumors. Also, an accurate calculation of these quantities is necessary to perform dose calculations and to be able to do in vivo range prediction for treatment verifi cation for particle therapy. Finally, other features in quantitative imaging such as detailed texture analysis require high quality DECT images.
Acknowledgments
We thank Dr Bernhard Schmidt from Siemens Healthineers for the opportunity to use the SOMATOM Defi nition EDGE with the twin-beam DECT technology in the Siemens factory (Forchheim, Germany). Dr Bernhard Krauss, Dr Bernhard Schmidt and Dr Nora Hünemohr from Siemens Healthineers are acknowledged for their valuable comments on this work. Dr Marco Das and Ralph Eschweiler from the Academic Hospital, Maastricht are acknowledged for providing the time slots with both dual-source scanners. We would like to thank Jef Willigers for the help with the measurements at the Academic Hospital, Maastricht.
Appendix
Figure A1: Reconstructed images of the (a) low and (b) high energy scans of the Gammex RMI 467 phantom scanned with the EDGE. The reconstruction was performed using the
ADMIRE algorithm for a CTDIvol of approximately 20 mGy.

Chapter 6
142
Figure A2: Correctness of tissue attribution using the Mahalanobis distance for the Gammex RMI 467 phantom (excluding the solid water and liquid water inserts). Tissues are
ordered from low to high density.
Comparison with syngo.via
Comparison between the results for the methods used in this work (Saito/Landry methods) and syngo.via’s ρe and Zeff values presented overall higher errors using syngo.via’s methods for the EDGE and FLASH, whereas for the FORCE, both methods are more consistent for the majority of the inserts (Figure A3). Figure A4 shows the voxel spread for each insert in the (ρe,Zeff ) space. Although the scatter plots are narrower than the results from Figure 8, these are located further away from the reference values. Also, the conversion made by syngo.via from CT numbers to these quantities leads to a discretization of the scatter plots, which can cause the clear off set between the measured and the reference values, in particular, for the bone-equivalent inserts.
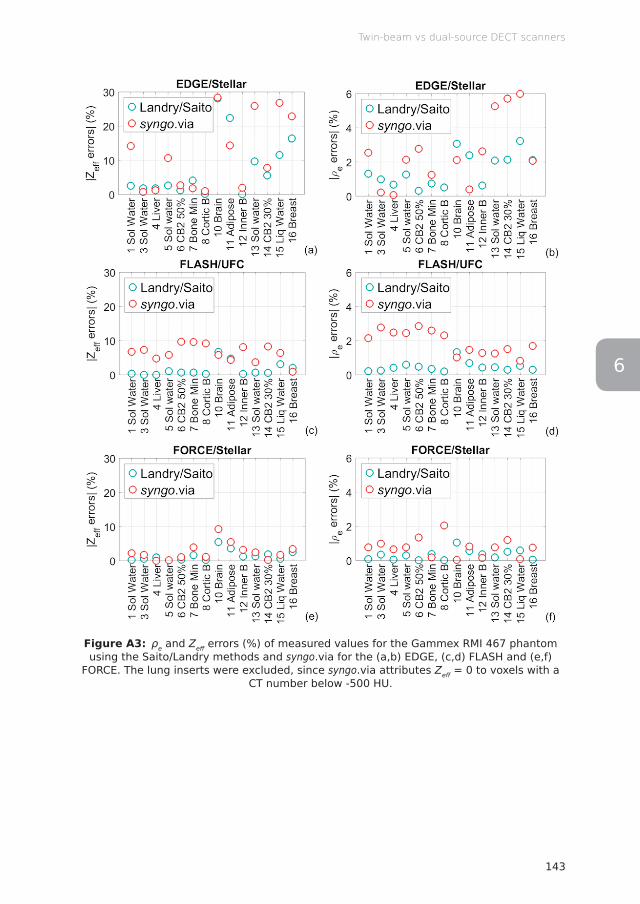
143
Twin-beam vs dual-source DECT scanners
6
Figure A3: ρe and Zeff errors (%) of measured values for the Gammex RMI 467 phantom using the Saito/Landry methods and syngo.via for the (a,b) EDGE, (c,d) FLASH and (e,f)
FORCE. The lung inserts were excluded, since syngo.via attributes Zeff = 0 to voxels with a CT number below -500 HU.
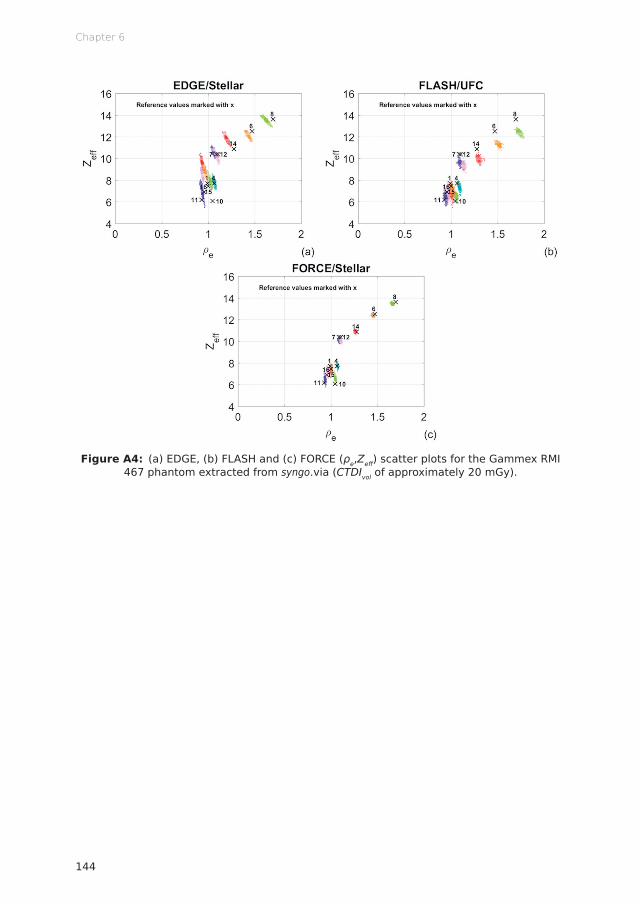
Chapter 6
144
Figure A4: (a) EDGE, (b) FLASH and (c) FORCE (ρe,Zeff ) scatter plots for the Gammex RMI 467 phantom extracted from syngo.via (CTDIvol of approximately 20 mGy).

145
Twin-beam vs dual-source DECT scanners
6
References
1. Fletcher JG, Leng S, Yu L, McCollough CH. Dealing with Uncertainty in CT Images. Radiology 2016; 279: 5–10. doi: http://dx.doi.org/10.1148/radiol.2016152771
2. Mileto A, Barina A, Marin D, Stinnett SS, Roy Choudhury K, Wilson JM, et al. Virtual Monochromatic Images from Dual-Energy Multidetector CT: Variance in CT Numbers from the Same Lesion between Single-Source Projection-based and Dual-Source Image-based Implementations. Radiology 2016; 279: 269–277. doi: http://dx.doi.org/10.1148/radiol.2015150919
3. van Elmpt W, Landry G, Das M, Verhaegen F. Dual energy CT in radiotherapy: Current applications and future outlook. Radiother Oncol 2016; 119: 137–144. doi: http://dx.doi.org/10.1016/j.radonc.2016.02.026
4. Rutherford RA, Pullan BR, Isherwood I. Measurement of effective atomic number and electron density using an EMI scanner. Neuroradiology 1976; 11: 15–21. doi: http://dx.doi.org/10.1007/BF00327253
5. Bazalova M, Carrier JF, Beaulieu L, Verhaegen F. Dual-energy CT-based material extraction for tissue segmentation in Monte Carlo dose calculations. Phys Med Biol 2008; 53: 2439–2456. doi: http://dx.doi.org/10.1088/0031-9155/53/9/015
6. Landry G, Reniers B, Granton PV, van Rooijen B, Beaulieu L, Wildberger JE, et al. Extracting atomic numbers and electron densities from a dual source dual energy CT scanner: Experiments and a simulation model. Radiother Oncol 2011; 100: 375–379. doi: http://dx.doi.org/10.1016/j.radonc.2011.08.029
7. Landry G, Granton PV, Reniers B, Öllers MC, Beaulieu L, Wildberger JE, et al. Simulation study on potential accuracy gains from dual energy CT tissue segmentation for low-energy brachytherapy Monte Carlo dose calculations. Phys Med Biol 2011; 56: 6257–6278. doi: http://dx.doi.org/10.1088/0031-9155/56/19/007
8. Saito M. Potential of dual-energy subtraction for converting CT numbers to electron density based on a single linear relationship: Conversion of energy-subtracted CT number to electron density. Med Phys 2012; 39: 2021–2030. doi: http://dx.doi.org/10.1118/1.3694111
9. Landry G, Seco J, Gaudreault M, Verhaegen F. Deriving effective atomic numbers from DECT based on a parameterization of the ratio of high and low linear attenuation coefficients. Phys Med Biol 2013; 58: 6851–6866. doi: http://dx.doi.org/10.1088/0031-9155/58/19/6851
10. Hünemohr N, Krauss B, Tremmel C, Ackermann B, Jäkel O, Greilich S. Experimental verification of ion stopping power prediction from dual energy CT data in tissue surrogates. Phys Med Biol 2013; 59: 83–96. doi: http://dx.doi.org/10.1088/0031-9155/59/1/83
11. Mahnken AH, Stanzel S, Heismann B. Spectral ρZ-Projection Method for Characterization of Body Fluids in Computed Tomography. Acad Radiol 2009; 16: 763–769. doi: http://

Chapter 6
146
dx.doi.org/10.1016/j.acra.2009.01.00212. Yu L, Leng S, McCollough CH. Dual-Energy CT–Based Monochromatic Imaging. AJR Am J
Roentgenol 2012; 199: S9–S15. doi: http://dx.doi.org/10.2214/AJR.12.912113. Euler A, Parakh A, Falkowski AL, Manneck S, Dashti D, Krauss B, et al. Initial Results
of a Single-Source Dual-Energy Computed Tomography Technique Using a Split-Filter: Assessment of Image Quality, Radiation Dose, and Accuracy of Dual-Energy Applications in an In Vitro and In Vivo Study. Invest Radiol 2016; 51: 491. doi: http://dx.doi.org/10.1097/RLI.0000000000000257
14. Flohr TG, Leng S, Yu L, Allmendinger T, Bruder H, Petersilka M, et al. Dual-source spiral CT with pitch up to 3.2 and 75 ms temporal resolution: Image reconstruction and assessment of image quality. Med Phys 2009; 36: 5641–5653. doi: http://dx.doi.org/10.1118/1.3259739
15. Christe A, Heverhagen J, Ozdoba C, Weisstanner C, Ulzheimer S, Ebner L. CT dose and image quality in the last three scanner generations. World J Radiol 2013; 5: 421. doi: http://dx.doi.org/10.4329/wjr.v5.i11.421
16. Landry G, Gaudreault M, van Elmpt W, Wildberger JE, Verhaegen F. Improved dose calculation accuracy for low energy brachytherapy by optimizing dual energy CT imaging protocols for noise reduction using sinogram affirmed iterative reconstruction. Z Med Phys 2016; 26: 75–87. doi: http://dx.doi.org/10.1016/j.zemedi.2015.09.001
17. Poludniowski GG, Evans PM. Calculation of x-ray spectra emerging from an x-ray tube. Part I. Electron penetration characteristics in x-ray targets. Med Phys 2007; 34: 2164–2174. doi: http://dx.doi.org/10.1118/1.2734725
18. Poludniowski GG. Calculation of x-ray spectra emerging from an x-ray tube. Part II. X-ray production and filtration in x-ray targets. Med Phys 2007; 34: 2175–2186. doi: http://dx.doi.org/10.1118/1.2734726
19. Poludniowski G, Landry G, DeBlois F, Evans PM, Verhaegen F. SpekCalc: a program to calculate photon spectra from tungsten anode x-ray tubes. Phys Med Biol 2009; 54: N433–N438. doi: http://dx.doi.org/10.1088/0031-9155/54/19/N01
20. Takenaga T, Katsuragawa S, Goto M, Hatemura M, Uchiyama Y, Shiraishi J. Modulation transfer function measurement of CT images by use of a circular edge method with a logistic curve-fitting technique. Radiol Phys Technol 2015; 8: 53–59. doi: http://dx.doi.org/10.1007/s12194-014-0286-x
21. Friedman SN, Fung GSK, Siewerdsen JH, Tsui BMW. A simple approach to measure computed tomography (CT) modulation transfer function (MTF) and noise-power spectrum (NPS) using the American College of Radiology (ACR) accreditation phantom. Med Phys 2013; 40: 051907. doi: http://dx.doi.org/10.1118/1.4800795

6

Lotte E J R SchynsBrent van der Heyden
Isabel P AlmeidaAna Vaniqui
Daniëlle B P EekersFrank Verhaegen
In preparation for submission (2019)
Human tissue compositions and densitiesrevisited after 60 years: an in vivo dual
energy CT study for radiotherapy
Chapter 1 2 3 4 5 6 7 8

Chapter 7
150
Abstract
Objective To reevaluate the approximately 60 year old reference data for human tissue compositions and densities using a dual energy CT (DECT) approach.
Methods DECT images of 26 abdominal cancer patients were used to extract several physical properties for different in vivo tissues. First, the effective atomic number Zeff and the relative electron density ρe were extracted for each voxel in the DECT images and compared to the well-established reference data which are derived from studies that are about 60 years old. Means and noise-corrected standard deviations were calculated for the extracted Zeff and ρe voxels. These values were used to calculate the spread in mass energy-absorption coefficients μen/ρ for the Palladium-103 photon emission spectrum. In the second part of this study, the influence of beam hardening as well as the influence of motion and image registration artifacts was investigated.
Results A large spread was found in Zeff and ρe voxels that belong to the same tissue. For Palladium-103 brachytherapy sources, the spread in tissue compositions and densities can result in μen/ρ differences ranging from -45.0% to +71.6% for soft tissues and from -72.7% to +24.7% for bone tissues within only a single standard deviation away from the mean tissue value. Therefore, it is unrealistic to represent an entire tissue by its mean value in dose calculations.
Conclusion Given the large differences found in this study, it is imperative that the spread in tissue compositions and densities is taken into account. DECT is an important first step to investigate this spread and to account for differences in tissue composition between individuals and within organs.

151
Human tissue compositions and densities
7
Introduction
In the field of radiotherapy, dose calculations are used to optimize the radiation dose to both the tumor and its surrounding healthy tissues. The gold standard for dose calculations is the Monte Carlo method, which involves simulating the transport of individual particles through the patient. Accurate dose calculations require correct modeling of both the radiation source and the patient. The modeling of the patient is often based on CT images. These images are used to generate a material map and density map of the patient geometry. The material map links each voxel to a material with a certain elemental composition. To obtain a material map, the voxels need to be segmented into different tissue types with a known elemental composition. This process is referred to as tissue segmentation. It has been shown that the accuracy of tissue segmentation increases when dual energy CT (DECT) images are used instead of the conventional single energy CT (SECT) images. 1–6
Both tissue composition and density are crucial factors in dose calculations. Tissue composition is particularly important for simulations of low energy photons used in brachytherapy, kilovoltage treatment/imaging beams and small animal radiotherapy. 7,8,3 For low energy photons, photoelectric absorption is the dominant interaction. The probability of photoelectric absorption depends strongly on the atomic number Z and thus, in the case of tissues, the elemental composition. For simulations of high energy photons used in megavoltage treatment/imaging beams, density is more important than tissue composition. For high energy photons, Compton scattering is the dominant interaction. The probability of Compton scattering depends on the number of electrons in a given volume (electron density), which is proportional to the mass density of the tissue. In the field of proton therapy, tissue composition is also a crucial factor, since it influences the mean excitation energy which is in turn used to calculate the proton stopping power ratio. Not only proton dose calculations, but also proton range verification techniques, such as positron emission tomography (PET) and prompt gamma imaging (PGI), require correct tissue compositions. 9–11
The well-established reference data for human tissue compositions and densities are listed in several reports by the International Commission on Radiation Units and Measurements (ICRU) and the International Commission on Radiological Protection (ICRP). 12–14 The origin of the reference data, which will be discussed later, can be traced back to multiple studies from as early as the 1950’s. The methods that were used in these studies were rather crude and often inconsistent between the different studies. The reference data have been compiled from many

Chapter 7
152
different sources and have been recycled and renormalized for many decades. This might lead to potential errors and inconsistencies. Moreover, the reference data are derived from ex vivo specimens. From a physical perspective, ex vivo tissue compositions and densities might be different from in vivo tissue compositions and densities, which are required when calculating a radiation dose in a patient. The factors mentioned above necessitate a reevaluation of the tissue compositions and densities in vivo by using a more modern approach.
In this study, DECT images of 26 abdominal cancer patients were used to extract several physical properties for different in vivo tissues. First, the effective atomic number Zeff and the relative electron density ρe were extracted for each voxel in the DECT images and compared to Zeff and ρe values that were calculated from the ICRU and ICRP reference data. Means and noise-corrected standard deviations were calculated for the extracted Zeff and ρe voxels. These values were used to calculate the spread in mass energy-absorption coefficients μen/ρ for the Palladium-103 photon emission spectrum. In the second part of this study, the influence of beam hardening as well as the influence of motion and image registration artifacts was investigated.
Methods and materials
Subjects
A total of 26 abdominal cancer patients who received external photon beam radiotherapy were included in this retrospective study, which was approved by MAASTRO Clinic’s internal review board (P0216). The 16 male and 10 female subjects had a mean (± 1 standard deviation) age of 66 (± 9) y.
Image acquisition
Both DECT and SECT images were acquired for all subjects using a SOMATOM Confidence RT Pro dual-spiral CT scanner (Siemens Healthineers, Forchheim, Germany). The DECT images (80 kVp and 140 kVp) were reconstructed using the I30f\5 algorithm and the SECT images (120 kVp) were reconstructed using the B30s or I30s\3 algorithms. B30s is a filtered backprojection reconstruction algorithm. I30s\3 and I30f\5 are Sinogram Affirmed Iterative Reconstruction (SAFIRE) reconstruction algorithms. The DECT and SECT images were both reconstructed into 1.0 x 1.0 x 3.0 mm3 voxels. The CARE Dose4D technique, which adapts the tube current to the patient’s size based on the topogram, was enabled to minimize the imaging dose (mean DECT imaging dose: 14.2 mGy).
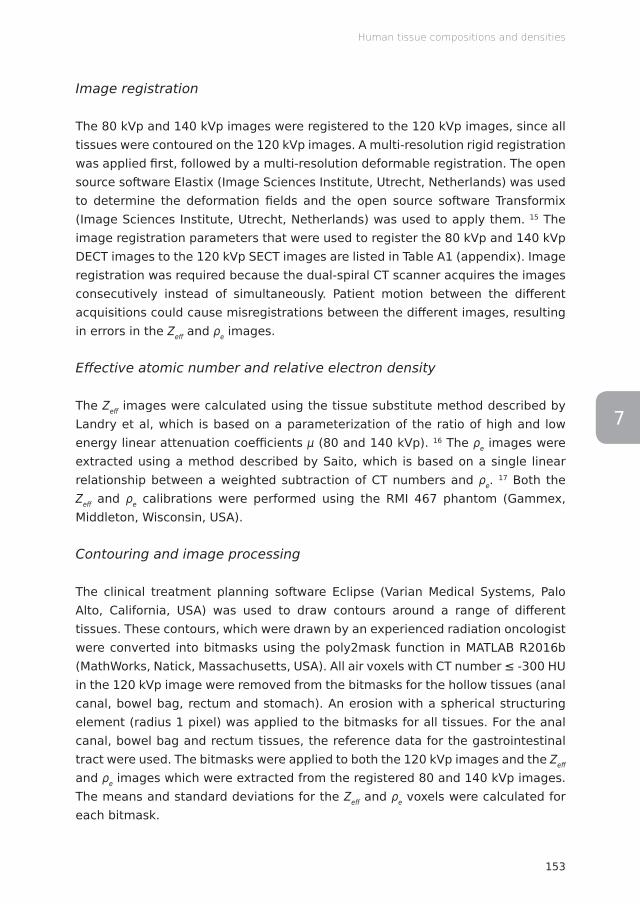
153
Human tissue compositions and densities
7
Image registration
The 80 kVp and 140 kVp images were registered to the 120 kVp images, since all tissues were contoured on the 120 kVp images. A multi-resolution rigid registration was applied first, followed by a multi-resolution deformable registration. The open source software Elastix (Image Sciences Institute, Utrecht, Netherlands) was used to determine the deformation fields and the open source software Transformix (Image Sciences Institute, Utrecht, Netherlands) was used to apply them. 15 The image registration parameters that were used to register the 80 kVp and 140 kVp DECT images to the 120 kVp SECT images are listed in Table A1 (appendix). Image registration was required because the dual-spiral CT scanner acquires the images consecutively instead of simultaneously. Patient motion between the different acquisitions could cause misregistrations between the different images, resulting in errors in the Zeff and ρe images.
Effective atomic number and relative electron density
The Zeff images were calculated using the tissue substitute method described by Landry et al, which is based on a parameterization of the ratio of high and low energy linear attenuation coefficients μ (80 and 140 kVp). 16 The ρe images were extracted using a method described by Saito, which is based on a single linear relationship between a weighted subtraction of CT numbers and ρe. 17 Both the Zeff and ρe calibrations were performed using the RMI 467 phantom (Gammex, Middleton, Wisconsin, USA).
Contouring and image processing
The clinical treatment planning software Eclipse (Varian Medical Systems, Palo Alto, California, USA) was used to draw contours around a range of different tissues. These contours, which were drawn by an experienced radiation oncologist were converted into bitmasks using the poly2mask function in MATLAB R2016b (MathWorks, Natick, Massachusetts, USA). All air voxels with CT number ≤ -300 HU in the 120 kVp image were removed from the bitmasks for the hollow tissues (anal canal, bowel bag, rectum and stomach). An erosion with a spherical structuring element (radius 1 pixel) was applied to the bitmasks for all tissues. For the anal canal, bowel bag and rectum tissues, the reference data for the gastrointestinal tract were used. The bitmasks were applied to both the 120 kVp images and the Zeff and ρe images which were extracted from the registered 80 and 140 kVp images. The means and standard deviations for the Zeff and ρe voxels were calculated for each bitmask.
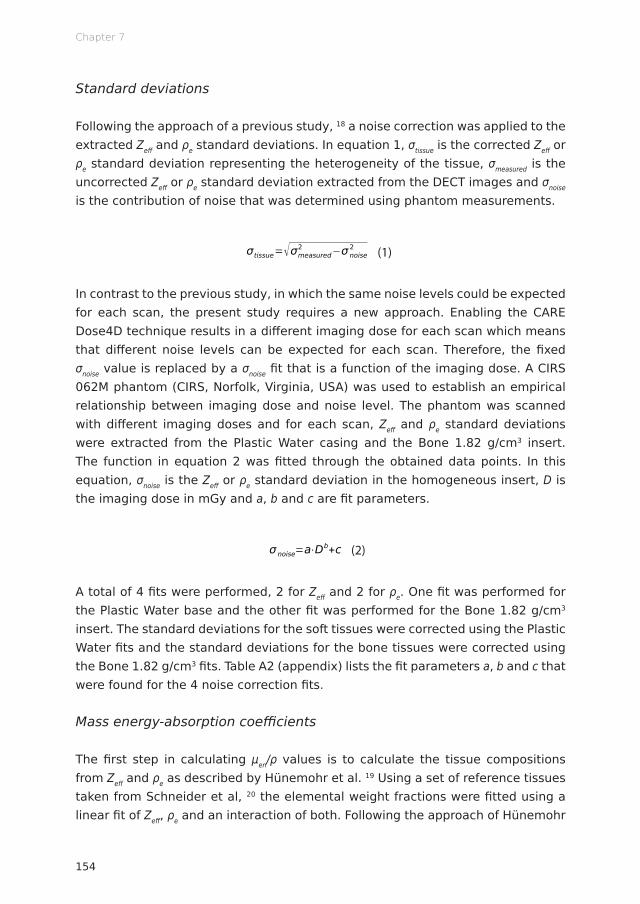
Chapter 7
154
Standard deviations
Following the approach of a previous study, 18 a noise correction was applied to the extracted Zeff and ρe standard deviations. In equation 1, σtissue is the corrected Zeff or ρe standard deviation representing the heterogeneity of the tissue, σmeasured is the uncorrected Zeff or ρe standard deviation extracted from the DECT images and σnoise is the contribution of noise that was determined using phantom measurements.
HU=1000⋅μ−μwater
μwater−μair
Zeff=n√∑i
ωi Zi
Ai
Zin /∑i
ωi Z i
Ai
μratio=μLowEnergy
μHighEnergy
μratio=μLowEnergy
μHighEnergy
=A+B⋅Zeff
n−1+C⋅Zeffm−1
D+E⋅Zeffn−1+F⋅Zeff
m−1
ρe=ρ∑i
ωi Zi
Ai
/ρe ,water
ΔHUHU=(1+α)⋅HUHighEnergy−α⋅HULowEnergy
ρe=a⋅(1+α)⋅HUHighEnergy−α⋅HULowEnergy
1000+b
ωi=ai⋅ρe+bi⋅Zeff+ci⋅ρeZeff+di
σtissue=√σmeasured2 −σnoise
2
σnoise=a⋅Db+c
CNR=Ī tissue−Ī background
√σtissue2 −σbackground
2
CNR=|HUROI−HUbackground|
noise
MTF (f )=π√24
⋅M(f )M0
MTF=Intensitystrip−Intensitygap
Intensitystrip+ Intensitygap
‖Rf−p‖2
argminf
‖Rf −p‖2
2RT (Rf−p)
ρ=1.073ρe−0.04
ΔHUD=(DDECT−DRef)/DRef⋅100%
(1)
In contrast to the previous study, in which the same noise levels could be expected for each scan, the present study requires a new approach. Enabling the CARE Dose4D technique results in a different imaging dose for each scan which means that different noise levels can be expected for each scan. Therefore, the fixed σnoise value is replaced by a σnoise fit that is a function of the imaging dose. A CIRS 062M phantom (CIRS, Norfolk, Virginia, USA) was used to establish an empirical relationship between imaging dose and noise level. The phantom was scanned with different imaging doses and for each scan, Zeff and ρe standard deviations were extracted from the Plastic Water casing and the Bone 1.82 g/cm3 insert. The function in equation 2 was fitted through the obtained data points. In this equation, σnoise is the Zeff or ρe standard deviation in the homogeneous insert, D is the imaging dose in mGy and a, b and c are fit parameters.
HU=1000⋅μ−μwater
μwater−μair
Zeff=n√∑i
ωi Zi
Ai
Zin /∑i
ωi Z i
Ai
μratio=μLowEnergy
μHighEnergy
μratio=μLowEnergy
μHighEnergy
=A+B⋅Zeff
n−1+C⋅Zeffm−1
D+E⋅Zeffn−1+F⋅Zeff
m−1
ρe=ρ∑i
ωi Zi
Ai
/ρe ,water
ΔHUHU=(1+α)⋅HUHighEnergy−α⋅HULowEnergy
ρe=a⋅(1+α)⋅HUHighEnergy−α⋅HULowEnergy
1000+b
ωi=ai⋅ρe+bi⋅Zeff+ci⋅ρeZeff+di
σtissue=√σmeasured2 −σnoise
2
σnoise=a⋅Db+c
CNR=Ī tissue−Ī background
√σtissue2 −σbackground
2
CNR=|HUROI−HUbackground|
noise
MTF (f )=π√24
⋅M(f )M0
MTF=Intensitystrip−Intensitygap
Intensitystrip+ Intensitygap
‖Rf−p‖2
argminf
‖Rf −p‖2
2RT (Rf−p)
ρ=1.073ρe−0.04
ΔHUD=(DDECT−DRef)/DRef⋅100%
(2)
A total of 4 fits were performed, 2 for Zeff and 2 for ρe. One fit was performed for the Plastic Water base and the other fit was performed for the Bone 1.82 g/cm3 insert. The standard deviations for the soft tissues were corrected using the Plastic Water fits and the standard deviations for the bone tissues were corrected using the Bone 1.82 g/cm3 fits. Table A2 (appendix) lists the fit parameters a, b and c that were found for the 4 noise correction fits.
Mass energy-absorption coefficients
The first step in calculating μen/ρ values is to calculate the tissue compositions from Zeff and ρe as described by Hünemohr et al. 19 Using a set of reference tissues taken from Schneider et al, 20 the elemental weight fractions were fitted using a linear fit of Zeff, ρe and an interaction of both. Following the approach of Hünemohr
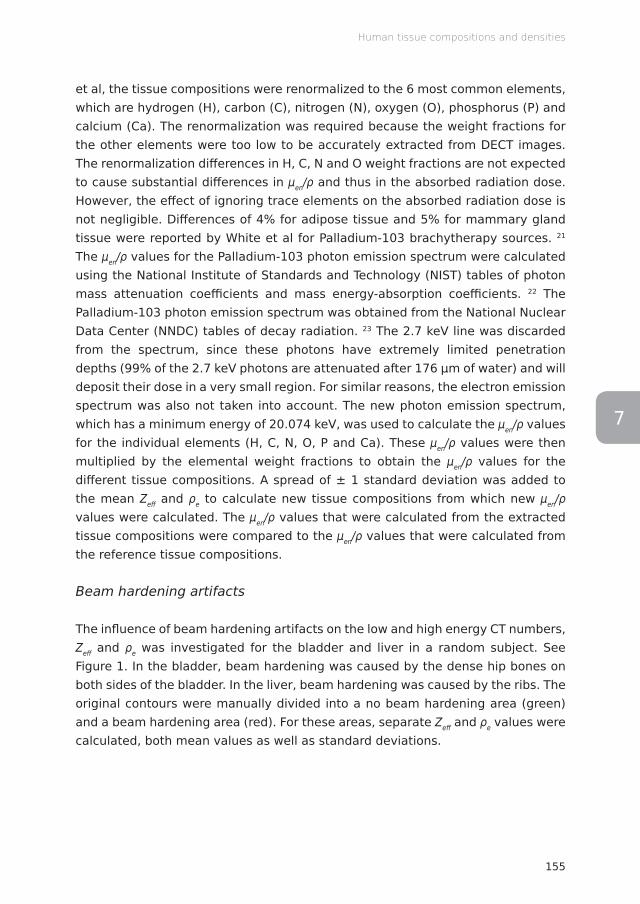
155
Human tissue compositions and densities
7
et al, the tissue compositions were renormalized to the 6 most common elements, which are hydrogen (H), carbon (C), nitrogen (N), oxygen (O), phosphorus (P) and calcium (Ca). The renormalization was required because the weight fractions for the other elements were too low to be accurately extracted from DECT images. The renormalization differences in H, C, N and O weight fractions are not expected to cause substantial differences in μen/ρ and thus in the absorbed radiation dose. However, the effect of ignoring trace elements on the absorbed radiation dose is not negligible. Differences of 4% for adipose tissue and 5% for mammary gland tissue were reported by White et al for Palladium-103 brachytherapy sources. 21 The μen/ρ values for the Palladium-103 photon emission spectrum were calculated using the National Institute of Standards and Technology (NIST) tables of photon mass attenuation coefficients and mass energy-absorption coefficients. 22 The Palladium-103 photon emission spectrum was obtained from the National Nuclear Data Center (NNDC) tables of decay radiation. 23 The 2.7 keV line was discarded from the spectrum, since these photons have extremely limited penetration depths (99% of the 2.7 keV photons are attenuated after 176 μm of water) and will deposit their dose in a very small region. For similar reasons, the electron emission spectrum was also not taken into account. The new photon emission spectrum, which has a minimum energy of 20.074 keV, was used to calculate the μen/ρ values for the individual elements (H, C, N, O, P and Ca). These μen/ρ values were then multiplied by the elemental weight fractions to obtain the μen/ρ values for the different tissue compositions. A spread of ± 1 standard deviation was added to the mean Zeff and ρe to calculate new tissue compositions from which new μen/ρ values were calculated. The μen/ρ values that were calculated from the extracted tissue compositions were compared to the μen/ρ values that were calculated from the reference tissue compositions.
Beam hardening artifacts
The influence of beam hardening artifacts on the low and high energy CT numbers, Zeff and ρe was investigated for the bladder and liver in a random subject. See Figure 1. In the bladder, beam hardening was caused by the dense hip bones on both sides of the bladder. In the liver, beam hardening was caused by the ribs. The original contours were manually divided into a no beam hardening area (green) and a beam hardening area (red). For these areas, separate Zeff and ρe values were calculated, both mean values as well as standard deviations.
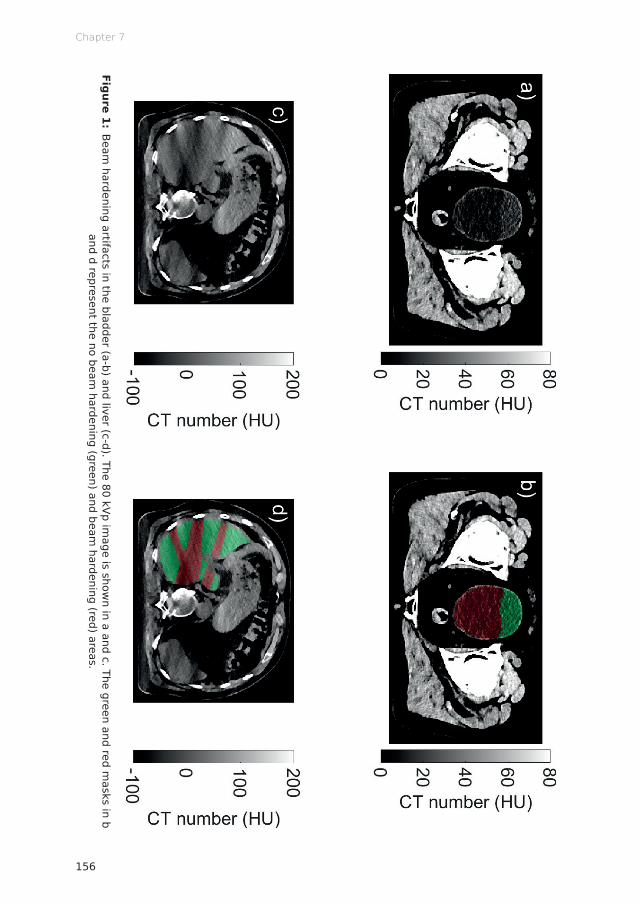
Chapter 7
156
Figure 1: Beam
hardening artifacts in the bladder (a-b) and liver (c-d). The 80 kVp image is show
n in a and c. The green and red masks in b
and d represent the no beam hardening (green) and beam
hardening (red) areas.

157
Human tissue compositions and densities
7
Motion and image registration artifacts
DECT images that are acquired using the dual-spiral technique can be subject to patient motion between the different acquisitions that could cause misregistrations between the different images, resulting in errors in the Zeff and ρe images. Image registration can correct these misregistrations, although not perfectly. The influence of an imperfect registration on Zeff and ρe, either due to motion or image registration artifacts, was investigated for the bladder and liver in a random subject. The registered high energy CT image was shifted 1, 2 and 3 voxels in the DICOM X, Y and Z directions. New Zeff and ρe images were calculated using the registered low energy CT image and the shifted registered high energy CT image. From the Zeff and ρe images, means and standard deviations were calculated for Zeff and ρe in the bladder and the liver.
Results
Dual energy CT scatter plots
Figure 2 shows DECT (ρe,Zeff) scatter plots for muscle, bone, kidney, liver and bladder tissues for 4 different subjects. Each point in this scatter plot represents a single voxel with a certain (ρe,Zeff) coordinate. The dashed lines represent the Zeff and ρe reference values and the intersection of the Zeff and ρe lines represent the reference point to which all voxels of the corresponding tissue are assigned in the case of a “perfect” tissue segmentation. The large size of the clouds in the scatter plots indicate that this theoretically perfect tissue segmentation is, in fact, far from perfect. Histograms of both the Zeff and ρe distributions are added to provide a better understanding of these distributions. The Zeff and ρe distributions are similar between different subjects, but a large spread can be observed within the different tissues.
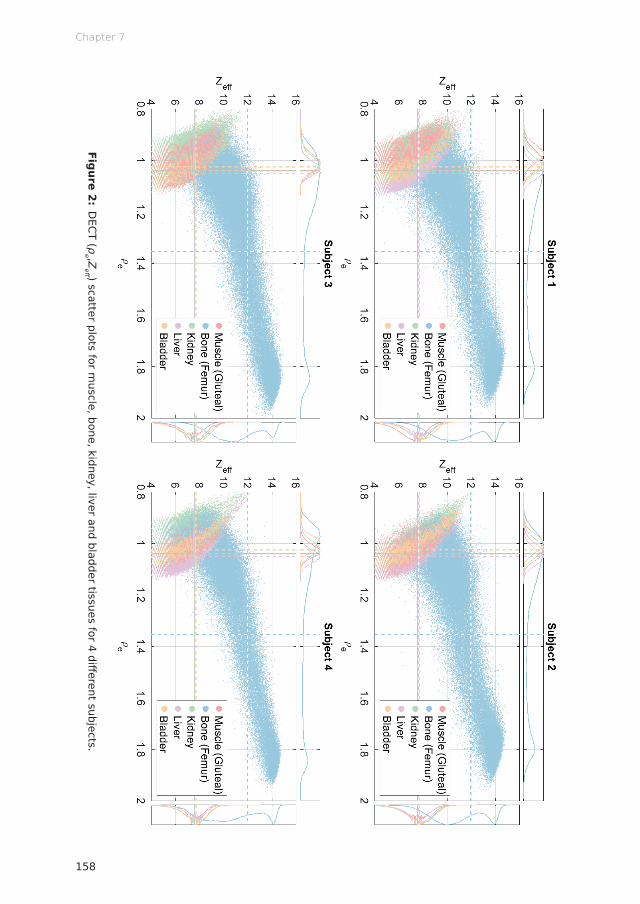
Chapter 7
158
Figure 2: DECT (ρ
e ,Zeff ) scatter plots for m
uscle, bone, kidney, liver and bladder tissues for 4 different subjects.

159
Human tissue compositions and densities
7
Effective atomic number and relative electron density
The distributions of Zeff and ρe voxels are shown in Figures 3 and 4, respectively. In these figures, the number of subjects used to calculate the Zeff and ρe values is presented between brackets next to the tissue labels. The corrected standard deviations are indicated by the black error bars and the uncorrected standard deviations are indicated by the grey error bars. On average, the mean Zeff difference equals 3.6%. When comparing the extracted Zeff to the reference Zeff and taking the spread within the tissues into account, errors ranging from -20.4% (bowel bag) to +22.2% (stomach) were found for the soft tissues. For the bone tissues, errors ranging from -29.1% (rib) to +7.2% (femur) were found. On average, the mean ρe difference equals 3.7%. When comparing the extracted ρe to the reference ρe and taking the spread within the tissues into account, errors ranging from -15.5% to +6.2% (both stomach) were found for the soft tissues. For the bone tissues, errors ranging from -28.1% (rib) to +18.6% (femur) were found.
Mass energy-absorption coefficients
Figure 5 shows the μen/ρ values for the Palladium-103 photon emission spectrum. The error bars indicate a spread of ± 1 std in Zeff and ρe. On average, the difference between the extracted μen/ρ and reference μen/ρ is 9.4% for soft tissues and 35.5% for bone tissues. Taking the spread within the tissues into account, errors ranging from -45.0% (bowel bag) to +71.6% (stomach) were found for the soft tissues. For the bone tissues, errors ranging from -72.7% (rib) to +24.7% (femur) were found. Considering that the error ranges apply to the ± 1 std interval, this implies that even larger errors are found for 32% of the voxels in the case of a normal distribution.
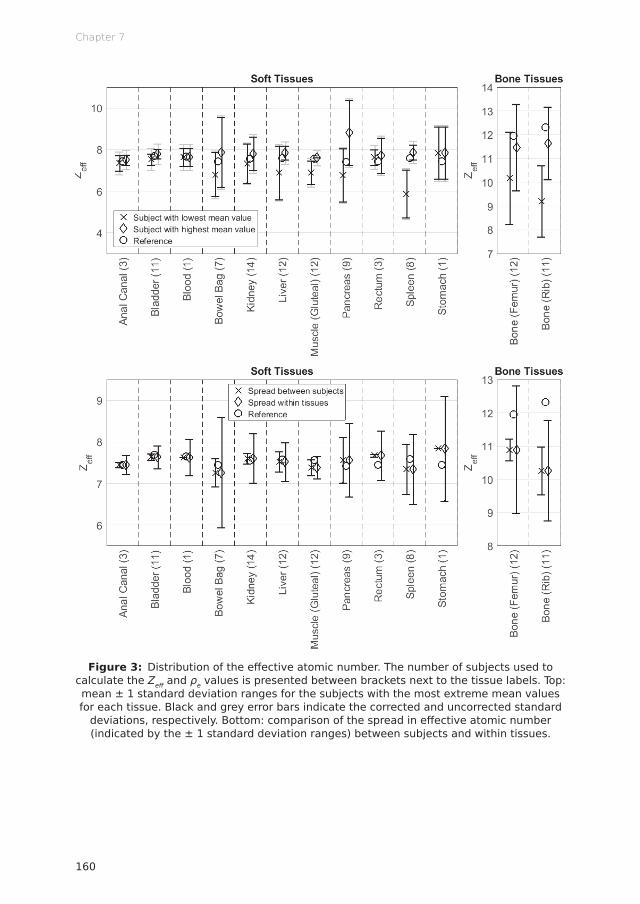
Chapter 7
160
Figure 3: Distribution of the effective atomic number. The number of subjects used to calculate the Zeff and ρe values is presented between brackets next to the tissue labels. Top: mean ± 1 standard deviation ranges for the subjects with the most extreme mean values for each tissue. Black and grey error bars indicate the corrected and uncorrected standard
deviations, respectively. Bottom: comparison of the spread in effective atomic number (indicated by the ± 1 standard deviation ranges) between subjects and within tissues.

161
Human tissue compositions and densities
7
Figure 4: Distribution of the relative electron density. The number of subjects used to calculate the Zeff and ρe values is presented between brackets next to the tissue labels. Top: mean ± 1 standard deviation ranges for the subjects with the most extreme mean values for each tissue. Black and grey error bars indicate the corrected and uncorrected standard
deviations, respectively. Bottom: comparison of the spread in relative electron density (indicated by the ± 1 standard deviation ranges) between subjects and within tissues.
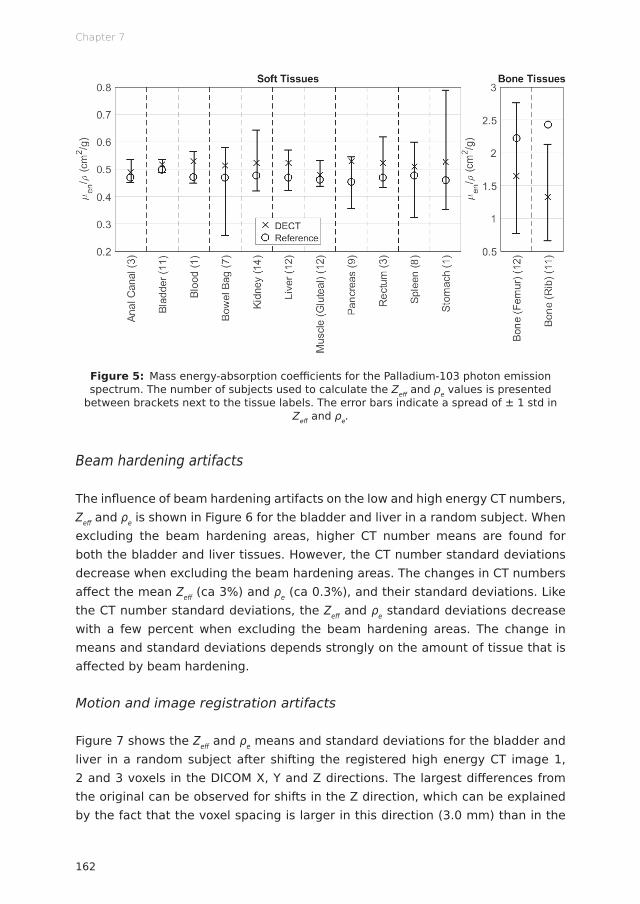
Chapter 7
162
Figure 5: Mass energy-absorption coefficients for the Palladium-103 photon emission spectrum. The number of subjects used to calculate the Zeff and ρe values is presented
between brackets next to the tissue labels. The error bars indicate a spread of ± 1 std in Zeff and ρe.
Beam hardening artifacts
The influence of beam hardening artifacts on the low and high energy CT numbers, Zeff and ρe is shown in Figure 6 for the bladder and liver in a random subject. When excluding the beam hardening areas, higher CT number means are found for both the bladder and liver tissues. However, the CT number standard deviations decrease when excluding the beam hardening areas. The changes in CT numbers affect the mean Zeff (ca 3%) and ρe (ca 0.3%), and their standard deviations. Like the CT number standard deviations, the Zeff and ρe standard deviations decrease with a few percent when excluding the beam hardening areas. The change in means and standard deviations depends strongly on the amount of tissue that is affected by beam hardening.
Motion and image registration artifacts
Figure 7 shows the Zeff and ρe means and standard deviations for the bladder and liver in a random subject after shifting the registered high energy CT image 1, 2 and 3 voxels in the DICOM X, Y and Z directions. The largest differences from the original can be observed for shifts in the Z direction, which can be explained by the fact that the voxel spacing is larger in this direction (3.0 mm) than in the
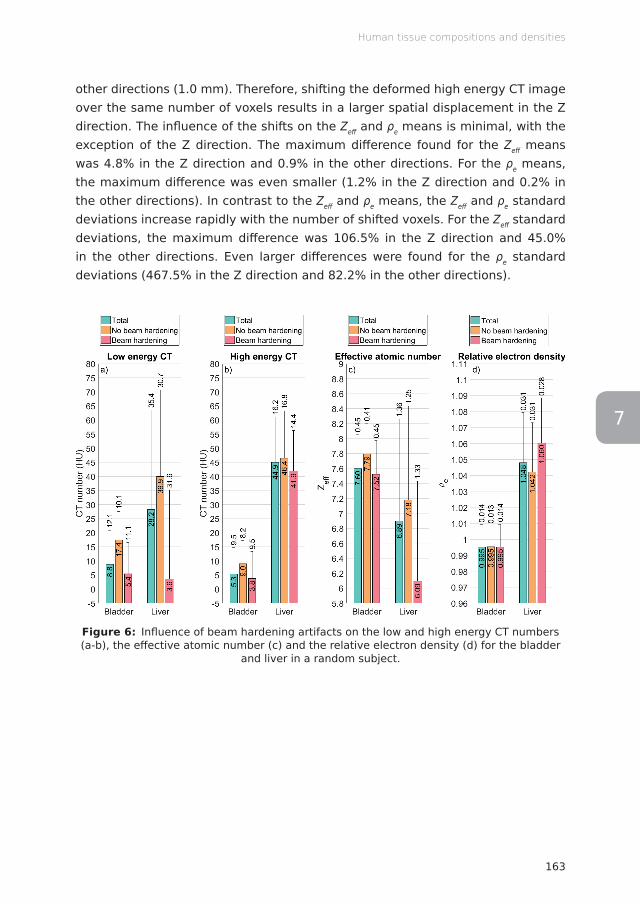
163
Human tissue compositions and densities
7
other directions (1.0 mm). Therefore, shifting the deformed high energy CT image over the same number of voxels results in a larger spatial displacement in the Z direction. The influence of the shifts on the Zeff and ρe means is minimal, with the exception of the Z direction. The maximum difference found for the Zeff means was 4.8% in the Z direction and 0.9% in the other directions. For the ρe means, the maximum difference was even smaller (1.2% in the Z direction and 0.2% in the other directions). In contrast to the Zeff and ρe means, the Zeff and ρe standard deviations increase rapidly with the number of shifted voxels. For the Zeff standard deviations, the maximum difference was 106.5% in the Z direction and 45.0% in the other directions. Even larger differences were found for the ρe standard deviations (467.5% in the Z direction and 82.2% in the other directions).
Figure 6: Influence of beam hardening artifacts on the low and high energy CT numbers (a-b), the effective atomic number (c) and the relative electron density (d) for the bladder
and liver in a random subject.

Chapter 7
164
Figure 7: Effective atomic number and relative electron density means and standard deviations for the bladder and liver in a random subject after shifting the registered high
energy CT image 1, 2 and 3 voxels in the DICOM X, Y and Z directions.
Discussion
Compared to a previous study on murine tissues, 18 a better agreement was found between the extracted and reference values. Given the fact that the reference values are largely based on human tissues (and not on murine tissues), this was expected. Additionally, the difference between the corrected and uncorrected standard deviations is substantially smaller in the present study than in the previous study. This can be partially explained by the fact that a filtered backprojection reconstruction algorithm was used in the previous study and an iterative reconstruction algorithm was used in the present study. 24,25 A similarity between the studies is that the spread within tissues is considerably larger than the spread of mean values between subjects. In contrast to the previous study on murine tissues, in which the extracted ρe was higher than the reference ρe for most tissues, the extracted ρe is now lower than the reference ρe for most tissues. The difference between the extracted μen/ρ and reference μen/ρ is larger compared to a previous study on murine tissues. 18 This can be explained by the fact that the mean energy of the Palladium-103 photon emission spectrum (18.9 keV; 20.7 keV after discarding the 2.7 keV line) is lower than the mean energy of
165
Human tissue compositions and densities
7
the typical kilovoltage treatment beam used in the previous study (86.1 keV). For lower energies, μen/ρ differs even more between different tissues.
The ICRU and ICRP reference tissue compositions are taken from publications from the 1980’s by Woodard and White, 26,27 who did not perform the original tissue analysis, but reassessed and updated data from ICRP publication 23, 28 which was compiled from many different sources that employed different experimental conditions. In some studies, fresh tissue samples were used. Other studies used tissue samples that were dehydrated, defatted or otherwise manipulated. Moreover, some of the tissue samples were not taken from humans but from a broad range of different animals. The weight fractions for the heavier elements were taken from emission spectrography studies performed at the University of Tennessee and the Oak Ridge National Laboratory in the 1950’s, which is 60 years ago. 29 The weight fractions for the lighter elements were recalculated from the weight fractions for water, lipid, protein, carbohydrate and ash contents. The weight fraction for these components were taken from studies from the 1950’s such as those performed by Forbes et al. 30 The origin of the reference tissue compositions is described recently in greater detail by Mann-Krzisnik et al. 7 Combining the weight fractions from different studies did not result in total weight fractions of 1. In fact, 23.5% of the compositions listed in ICRP publication 23 had mass discrepancies exceeding 5%. Even higher mass discrepancies, exceeding 20%, were found for 14.8% of the tissues. 31 The derived compositions were corrected to a total weight faction of 1 by allocating any missing mass to the major component or removing any exceeding mass from the major component. 26 Despite all of the above, the reference compositions are probably fairly accurate, on average, based on the Zeff values extracted in this study. This is unexpected in view of the methods used to obtain the reference compositions. Even though the average values are fairly accurate, it is unrealistic to represent an entire tissue by its mean value in dose calculations given the large spread found in this study.
The densities that are listed in the ICRU and ICRP reference data are also taken from the Woodard and White publications. 26,27 Like the tissue compositions, the densities are also not based on original data, but are recalculated from different components. However, these components and their densities were not mentioned. Only a book chapter by Fomon from 1966 was cited. 32 The components that were used in this chapter are water (0.994 g/cm3), fat (0.901 g/cm3), protein (1.340 g/cm3), bone mineral (2.982 g/cm3), non-osseous mineral (3.317 g/cm3) and residue (1.100 g/cm3). The densities were taken from a paper by Brožek et al from 1963. 33 The bone mineral, non-osseous mineral and residue densities were original research. The fat density was taken from a paper by Fidanza et al from
Chapter 7
166
1953, who determined the density of surgically removed human fat at different temperatures. 34 The origin of the water and protein densities are not mentioned by Brožek et al, aside from the short note that these values “were taken from the literature”. The density of water is well known and the used density of 0.994 g/cm3 is in agreement with more recent data. 35 The origin of the protein density remains a mystery. The densities of the components are all for a temperature of 36 °C, as stated by Brožek et al. This means that the ICRU and ICRP reference densities are applicable to in vivo tissues, yet the extracted ρe values were systematically lower than the reference ρe values. This difference could be caused by the fact that the densities were not determined directly, but recalculated from different components. Woodard and White also mention a difference of 2% between their recalculated densities and the densities listed in ICRP publication 23. 26 Another cause for the density difference could be the fact that the 36 °C densities for some of the components were obtained by interpolating densities at different temperatures. Based on the systematic difference between the mean extracted ρe and the reference ρe, it can be concluded that the ICRU and ICRP reference densities are probably not correct. The correctness of ρe is not as important as the correctness of Zeff, since it is common practice to assign densities based on the CT image and not based on the reference data, in contrast to the elemental compositions, which are usually assigned based on the reference data.
Temperature is an important factor that should be taken into account when determining densities, since both mass density and electron density are temperature dependent. Increasing the temperature of water from 20 °C to 36 °C at a constant pressure of 1 atm will decrease its mass density from 0.9982 to 0.9937 g/cm3 and its absolute electron density from 3.3368 · 1023 to 3.3217 · 1023 electrons/cm3. 35 In both cases, this is a decrease of 0.5%. The densities of other materials might change differently with increasing temperatures. Human fat, for example, has a volumetric thermal expansion coefficient of (9.2 ± 1.3) · 10-4 °C-1 in the range of 15 to 37 °C at a constant pressure of 1 atm, whereas the volumetric thermal expansion coefficient of water ranges between 1.5 · 10-4 and 3.7 · 10-4 °C-1 in the same temperature interval at the same pressure. 34,36 This implies that the density of human fat is even more sensitive to temperature changes than water. In conclusion, substantial density differences might be observed between ex vivo tissues (room temperature) and in vivo tissues (body temperature) when no temperature correction is applied.
Several methods have been proposed for extracting elemental compositions from DECT images. These methods are based on parameterization, 37,19 decomposition 38,39 or segmentation. 2,4 The segmentation approach is most commonly used
167
Human tissue compositions and densities
7
for dose calculations, but was not suitable for this study, since the voxels are segmented into different tissue types with fixed elemental compositions that are usually taken from the ICRU and ICRP reference data, instead of determining the elemental compositions from the CT images. Moreover, it would not be possible to assess the spread in tissue compositions using the segmentation approach. The large size of the clouds in the DECT scatter plots in Figure 2 indicate that this spread is substantial and that a theoretically perfect tissue segmentation in which all voxels of a certain tissue are assigned to its mean or reference value is, in fact, far from perfect. The decomposition approach is only feasible when the linear attenuation coefficients of the components are sufficiently different, which is not the case for the most common elements in the human body (H, C, N and O). For these reasons, a parameterization approach was used in this study, which is also not ideal because this approach depends on the reference data. Therefore, the extracted tissue compositions cannot be compared completely independently to the reference data. However, better methods to extract elemental compositions from CT images are not available at this time.
The influence of tissue compositions on the absorbed radiation dose was investigated by means of calculating the μen/ρ values for the Palladium-103 photon emission spectrum. This radioactive isotope has a very low energy photon emission spectrum which allows for an evaluation of the “worst case scenario”. μen/ρ differences ranging from -45.0% to +71.6% for soft tissues and from -72.7% to +24.7% for bone tissues within only a single standard deviation away from the mean tissue value can occur when using the reference tissue compositions in dose calculations instead of the full range of extracted tissue compositions. Landry et al reported that the difference in three different mean breast tissue compositions adds ± 10% dose variation for breast cancer patients treated with Palladium-103 brachytherapy sources. 40 They also established that Palladium-103 doses, when compared to Iodine-125 and Cesium-131 doses, are the most sensitive to variations in tissue compositions due to the very low energy of the Palladium-103 photon emission spectrum. Therefore, smaller differences are to be expected for other radioactive isotopes and especially for megavoltage treatment/imaging beams.
As stated in ICRU report 62, a dose difference as small as 5% may lead to real impairment or enhancement of tumor response, as well as to an alteration of the risk of morbidity. 41 This implies that the discrepancy between the planned and delivered radiation dose should never exceed 5%. The 5% value applies to the complete radiotherapy chain, including the image acquisition, dose calculation and beam delivery. All these separate parts have their own errors and uncertainties, leaving not much room for errors in tissue compositions. For most of the investigated

Chapter 7
168
tissues, the 5% value is already exceeded solely based on the natural spread in tissue composition. Given the large differences found in this study, it is imperative that the spread in tissue compositions and densities is taken into account. DECT is an important first step to investigate this spread and to account for differences in tissue composition between individuals and within organs.
Acknowledgments
The authors would like to thank Dr Mark Podesta and Dr Guillaume Landry for sharing their insight and experience.
Funding
AV acknowledges financial support from CAPES Scholarship and Science without Borders program from Brazil (BEX 12030/13-9).
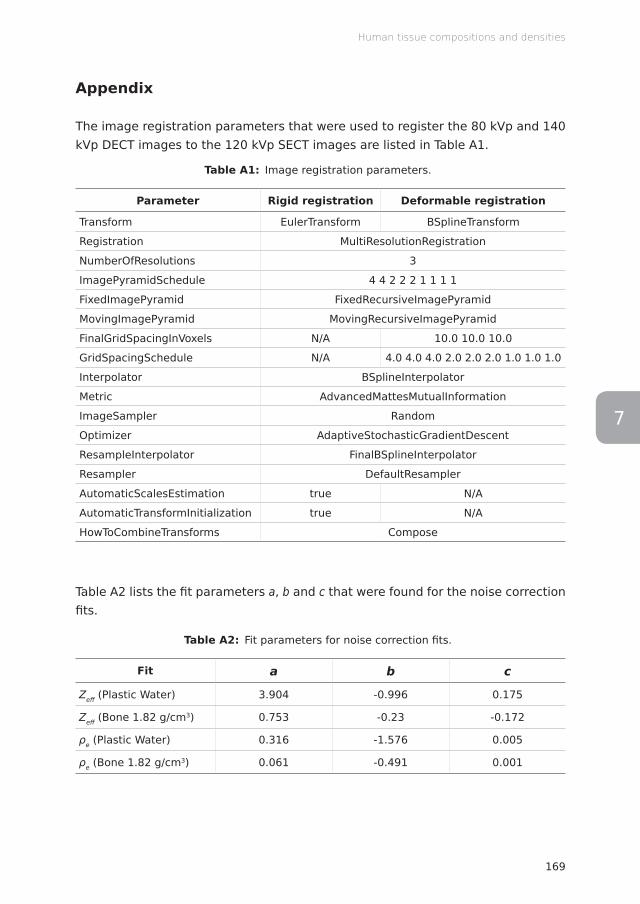
169
Human tissue compositions and densities
7
Appendix
The image registration parameters that were used to register the 80 kVp and 140 kVp DECT images to the 120 kVp SECT images are listed in Table A1.
Table A1: Image registration parameters.
Parameter Rigid registration Deformable registration
Transform EulerTransform BSplineTransform
Registration MultiResolutionRegistration
NumberOfResolutions 3
ImagePyramidSchedule 4 4 2 2 2 1 1 1 1
FixedImagePyramid FixedRecursiveImagePyramid
MovingImagePyramid MovingRecursiveImagePyramid
FinalGridSpacingInVoxels N/A 10.0 10.0 10.0
GridSpacingSchedule N/A 4.0 4.0 4.0 2.0 2.0 2.0 1.0 1.0 1.0
Interpolator BSplineInterpolator
Metric AdvancedMattesMutualInformation
ImageSampler Random
Optimizer AdaptiveStochasticGradientDescent
ResampleInterpolator FinalBSplineInterpolator
Resampler DefaultResampler
AutomaticScalesEstimation true N/A
AutomaticTransformInitialization true N/A
HowToCombineTransforms Compose
Table A2 lists the fit parameters a, b and c that were found for the noise correction fits.
Table A2: Fit parameters for noise correction fits.
Fit a b c
Zeff (Plastic Water) 3.904 -0.996 0.175
Zeff (Bone 1.82 g/cm3) 0.753 -0.23 -0.172
ρe (Plastic Water) 0.316 -1.576 0.005
ρe (Bone 1.82 g/cm3) 0.061 -0.491 0.001
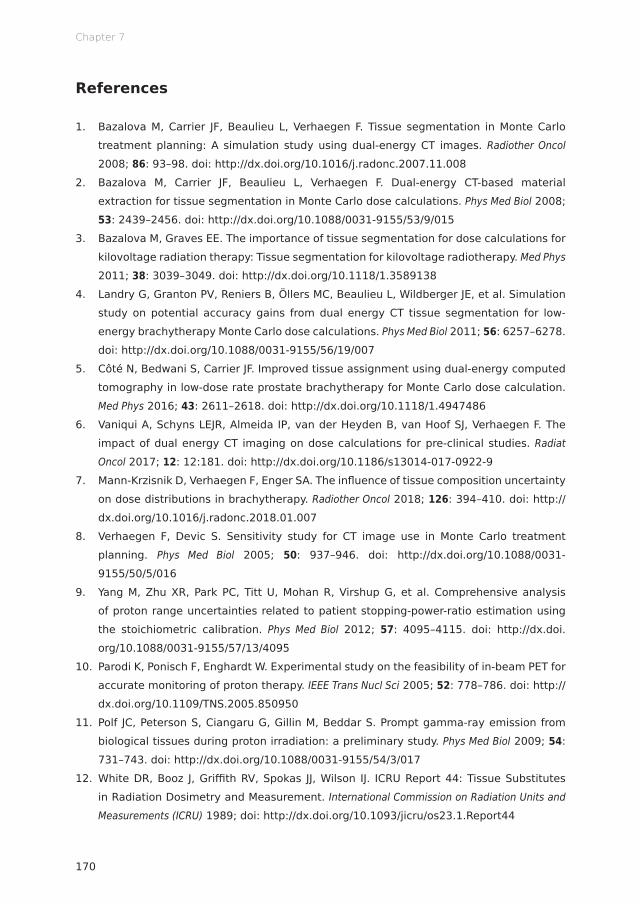
Chapter 7
170
References
1. Bazalova M, Carrier JF, Beaulieu L, Verhaegen F. Tissue segmentation in Monte Carlo treatment planning: A simulation study using dual-energy CT images. Radiother Oncol 2008; 86: 93–98. doi: http://dx.doi.org/10.1016/j.radonc.2007.11.008
2. Bazalova M, Carrier JF, Beaulieu L, Verhaegen F. Dual-energy CT-based material extraction for tissue segmentation in Monte Carlo dose calculations. Phys Med Biol 2008; 53: 2439–2456. doi: http://dx.doi.org/10.1088/0031-9155/53/9/015
3. Bazalova M, Graves EE. The importance of tissue segmentation for dose calculations for kilovoltage radiation therapy: Tissue segmentation for kilovoltage radiotherapy. Med Phys 2011; 38: 3039–3049. doi: http://dx.doi.org/10.1118/1.3589138
4. Landry G, Granton PV, Reniers B, Öllers MC, Beaulieu L, Wildberger JE, et al. Simulation study on potential accuracy gains from dual energy CT tissue segmentation for low-energy brachytherapy Monte Carlo dose calculations. Phys Med Biol 2011; 56: 6257–6278. doi: http://dx.doi.org/10.1088/0031-9155/56/19/007
5. Côté N, Bedwani S, Carrier JF. Improved tissue assignment using dual-energy computed tomography in low-dose rate prostate brachytherapy for Monte Carlo dose calculation. Med Phys 2016; 43: 2611–2618. doi: http://dx.doi.org/10.1118/1.4947486
6. Vaniqui A, Schyns LEJR, Almeida IP, van der Heyden B, van Hoof SJ, Verhaegen F. The impact of dual energy CT imaging on dose calculations for pre-clinical studies. Radiat Oncol 2017; 12: 12:181. doi: http://dx.doi.org/10.1186/s13014-017-0922-9
7. Mann-Krzisnik D, Verhaegen F, Enger SA. The influence of tissue composition uncertainty on dose distributions in brachytherapy. Radiother Oncol 2018; 126: 394–410. doi: http://dx.doi.org/10.1016/j.radonc.2018.01.007
8. Verhaegen F, Devic S. Sensitivity study for CT image use in Monte Carlo treatment planning. Phys Med Biol 2005; 50: 937–946. doi: http://dx.doi.org/10.1088/0031-9155/50/5/016
9. Yang M, Zhu XR, Park PC, Titt U, Mohan R, Virshup G, et al. Comprehensive analysis of proton range uncertainties related to patient stopping-power-ratio estimation using the stoichiometric calibration. Phys Med Biol 2012; 57: 4095–4115. doi: http://dx.doi.org/10.1088/0031-9155/57/13/4095
10. Parodi K, Ponisch F, Enghardt W. Experimental study on the feasibility of in-beam PET for accurate monitoring of proton therapy. IEEE Trans Nucl Sci 2005; 52: 778–786. doi: http://dx.doi.org/10.1109/TNS.2005.850950
11. Polf JC, Peterson S, Ciangaru G, Gillin M, Beddar S. Prompt gamma-ray emission from biological tissues during proton irradiation: a preliminary study. Phys Med Biol 2009; 54: 731–743. doi: http://dx.doi.org/10.1088/0031-9155/54/3/017
12. White DR, Booz J, Griffith RV, Spokas JJ, Wilson IJ. ICRU Report 44: Tissue Substitutes in Radiation Dosimetry and Measurement. International Commission on Radiation Units and Measurements (ICRU) 1989; doi: http://dx.doi.org/10.1093/jicru/os23.1.Report44
171
Human tissue compositions and densities
7
13. White DR, Griffith RV, Wilson IJ. ICRU Report 46: Photon, Electron, Proton, and Neutron Interaction Data for Body Tissues. International Commission on Radiation Units and Measurements (ICRU) 1992; doi: http://dx.doi.org/10.1093/jicru/os24.1.Report46
14. Valentin J. ICRP Publication 89: Basic Anatomical and Physiological Data for Use in Radiological Protection: Reference Values. International Commission on Radiological Protection (ICRP) 2002; doi: http://dx.doi.org/10.1016/S0146-6453(03)00002-2
15. Klein S, Staring M, Murphy K, Viergever MA, Pluim JPW. elastix: A Toolbox for Intensity-Based Medical Image Registration. IEEE Trans Med Imaging 2010; 29: 196–205. doi: http://dx.doi.org/10.1109/TMI.2009.2035616
16. Landry G, Seco J, Gaudreault M, Verhaegen F. Deriving effective atomic numbers from DECT based on a parameterization of the ratio of high and low linear attenuation coefficients. Phys Med Biol 2013; 58: 6851–6866. doi: http://dx.doi.org/10.1088/0031-9155/58/19/6851
17. Saito M. Potential of dual-energy subtraction for converting CT numbers to electron density based on a single linear relationship: Conversion of energy-subtracted CT number to electron density. Med Phys 2012; 39: 2021–2030. doi: http://dx.doi.org/10.1118/1.3694111
18. Schyns LEJR, Eekers DBP, van der Heyden B, Almeida IP, Vaniqui A, Verhaegen F. Murine vs human tissue compositions: implications of using human tissue compositions for photon energy absorption in mice. Br J Radiol 2018; 92: 20180454. doi: http://dx.doi.org/10.1259/bjr.20180454
19. Hünemohr N, Paganetti H, Greilich S, Jäkel O, Seco J. Tissue decomposition from dual energy CT data for MC based dose calculation in particle therapy. Med Phys 2014; 41: doi: http://dx.doi.org/10.1118/1.4875976
20. Schneider W, Bortfeld T, Schlegel W. Correlation between CT numbers and tissue parameters needed for Monte Carlo simulations of clinical dose distributions. Phys Med Biol 2000; 45: 459–478. doi: http://dx.doi.org/10.1088/0031-9155/45/2/314
21. White SA, Landry G, van Gils F, Verhaegen F, Reniers B. Influence of trace elements in human tissue in low-energy photon brachytherapy dosimetry. Phys Med Biol 2012; 57: 3585–3596. doi: http://dx.doi.org/10.1088/0031-9155/57/11/3585
22. Hubbell JH, Seltzer SM. Tables of X-Ray Mass Attenuation Coefficients and Mass Energy-Absorption Coefficients from 1 keV to 20 MeV for Elements Z = 1 to 92 and 48 Additional Substances of Dosimetric Interest. National Institute of Standards and Technology (NIST) 2004. Available from: https://www.nist.gov/pml/x-ray-mass-attenuation-coefficients
23. De Frenne D. Tables of Decay Radiation (Palladium-103). National Nuclear Data Center (NNDC) 2009. Available from: https://www.nndc.bnl.gov/chart/decaysearchdirect.jsp?nuc=103PD
Chapter 7
172
24. Landry G, Gaudreault M, van Elmpt W, Wildberger JE, Verhaegen F. Improved dose calculation accuracy for low energy brachytherapy by optimizing dual energy CT imaging protocols for noise reduction using sinogram affirmed iterative reconstruction. Z Med Phys 2016; 26: 75–87. doi: http://dx.doi.org/10.1016/j.zemedi.2015.09.001
25. Vaniqui A, Schyns LEJR, Almeida IP, van der Heyden B, Podesta M, Verhaegen F. The effect of different image reconstruction techniques on pre-clinical quantitative imaging and dual-energy CT. Br J Radiol 2018; 92: 20180447. doi: http://dx.doi.org/10.1259/bjr.20180447
26. Woodard HQ, White DR. The composition of body tissues. Br J Radiol 1986; 59: 1209–1218. doi: http://dx.doi.org/10.1259/0007-1285-59-708-1209
27. White DR, Woodard HQ, Hammond SM. Average soft-tissue and bone models for use in radiation dosimetry. Br J Radiol 1987; 60: 907–913. doi: http://dx.doi.org/10.1259/0007-1285-60-717-907
28. Snyder WS, Cook MJ, Nasset ES, Karhausen LR, Parry Howells G, Tipton IH. ICRP Publication 23: Report of the Task Group on Reference Man. International Commission on Radiological Protection (ICRP) 1975; doi: http://dx.doi.org/10.1016/0146-6453(80)90047-0
29. Tipton IH, Steiner RL, Foland WD, Mueller J, Stanley M. Spectrographic Analysis of the Tissues from Autopsies of Twenty-Four Instantaneous Deaths. Oak Ridge National Laboratory (ORNL) 1954.
30. Forbes RM, Mitchell HH, Cooper AR. Further Studies on the Gross Composition and Mineral Elements of the Adult Human Body. J Biol Chem 1956; 223: 969–975.
31. White DR, Fitzgerald M. Calculated Attenuation and Energy Absorption Coefficients for ICRP Reference Man (1975) Organs and Tissues. Health Phys 1977; 33: 73–81. doi: http://dx.doi.org/10.1097/00004032-197707000-00007
32. Fomon SJ. Body Composition of the Infant. Part I: The Male ‘Reference Infant’. Chapter in ‘Human Development’ edited by Frank Falkner. W.B. Saunders Company 1966.
33. Brožek J, Grande F, Anderson JT, Keys A. Densitometric Analysis of Body Composition: Revision of Some Quantitative Assumptions. Ann N Y Acad Sci 1963; 110: 113–140. doi: http://dx.doi.org/10.1111/j.1749-6632.1963.tb17079.x
34. Fidanza F, Keys A, Anderson JT. Density of Body Fat in Man and Other Mammals. J Appl Physiol 1953; 6: 252–256. doi: http://dx.doi.org/10.1152/jappl.1953.6.4.252
35. Lemmon EW, McLinden MO, Friend DG. Thermophysical Properties of Fluid Systems. National Institute of Standards and Technology (NIST) Available from: http://webbook.nist.gov/chemistry/fluid/
36. Ter Minassian L, Pruzan P, Soulard A. Thermodynamic properties of water under pressure up to 5 kbar and between 28 and 120 °C. Estimations in the supercooled region down to −40 °C. J Chem Phys 1981; 75: 3064–3072. doi: http://dx.doi.org/10.1063/1.442402
37. Landry G, Parodi K, Wildberger JE, Verhaegen F. Deriving concentrations of oxygen and carbon in human tissues using single- and dual-energy CT for ion therapy applications. Phys Med Biol 2013; 58: 5029–5048. doi: http://dx.doi.org/10.1088/0031-9155/58/15/5029

7
38. Liu X, Yu L, Primak AN, McCollough CH. Quantitative imaging of element composition and mass fraction using dual-energy CT: Three-material decomposition. Med Phys 2009; 36: 1602–1609. doi: http://dx.doi.org/10.1118/1.3097632
39. Lalonde A, Bouchard H. A general method to derive tissue parameters for Monte Carlo dose calculation with multi-energy CT. Phys Med Biol 2016; 61: 8044–8069. doi: http://dx.doi.org/10.1088/0031-9155/61/22/8044
40. Landry G, Reniers B, Murrer L, Lutgens L, Bloemen-Van Gurp E, Pignol JP, et al. Sensitivity of low energy brachytherapy Monte Carlo dose calculations to uncertainties in human tissue composition: Sensitivity of brachytherapy dose calculations to compositional uncertainties. Med Phys 2010; 37: 5188–5198. doi: http://dx.doi.org/10.1118/1.3477161
41. Landberg T, Chavaudra J, Dobbs J, Gerard JP, Hanks G, Horiot JC, et al. ICRU Report 62: Prescribing, Recording and Reporting Photon Beam Therapy. International Commission on Radiation Units and Measurements (ICRU) 1999; doi: http://dx.doi.org/10.1093/jicru/os32.1.Report62


Lotte E J R Schyns
General discussion and future perspectives
Chapter 1 2 3 4 5 6 7 8

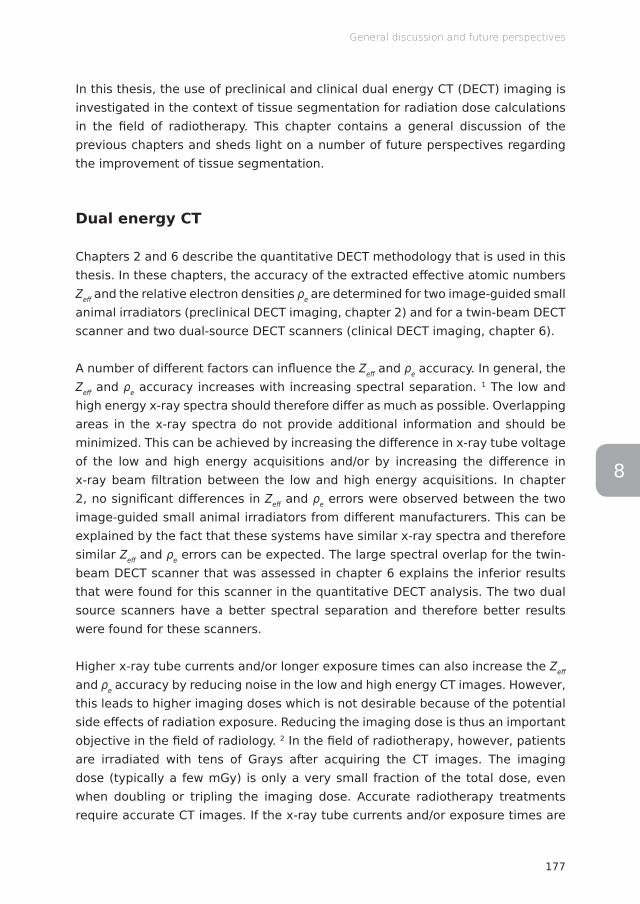
177
General discussion and future perspectives
8
In this thesis, the use of preclinical and clinical dual energy CT (DECT) imaging is investigated in the context of tissue segmentation for radiation dose calculations in the field of radiotherapy. This chapter contains a general discussion of the previous chapters and sheds light on a number of future perspectives regarding the improvement of tissue segmentation.
Dual energy CT
Chapters 2 and 6 describe the quantitative DECT methodology that is used in this thesis. In these chapters, the accuracy of the extracted effective atomic numbers Zeff and the relative electron densities ρe are determined for two image-guided small animal irradiators (preclinical DECT imaging, chapter 2) and for a twin-beam DECT scanner and two dual-source DECT scanners (clinical DECT imaging, chapter 6).
A number of different factors can influence the Zeff and ρe accuracy. In general, the Zeff and ρe accuracy increases with increasing spectral separation. 1 The low and high energy x-ray spectra should therefore differ as much as possible. Overlapping areas in the x-ray spectra do not provide additional information and should be minimized. This can be achieved by increasing the difference in x-ray tube voltage of the low and high energy acquisitions and/or by increasing the difference in x-ray beam filtration between the low and high energy acquisitions. In chapter 2, no significant differences in Zeff and ρe errors were observed between the two image-guided small animal irradiators from different manufacturers. This can be explained by the fact that these systems have similar x-ray spectra and therefore similar Zeff and ρe errors can be expected. The large spectral overlap for the twin-beam DECT scanner that was assessed in chapter 6 explains the inferior results that were found for this scanner in the quantitative DECT analysis. The two dual source scanners have a better spectral separation and therefore better results were found for these scanners.
Higher x-ray tube currents and/or longer exposure times can also increase the Zeff and ρe accuracy by reducing noise in the low and high energy CT images. However, this leads to higher imaging doses which is not desirable because of the potential side effects of radiation exposure. Reducing the imaging dose is thus an important objective in the field of radiology. 2 In the field of radiotherapy, however, patients are irradiated with tens of Grays after acquiring the CT images. The imaging dose (typically a few mGy) is only a very small fraction of the total dose, even when doubling or tripling the imaging dose. Accurate radiotherapy treatments require accurate CT images. If the x-ray tube currents and/or exposure times are
Chapter 8
178
too low, the organs at risk surrounding the tumor might even receive a higher radiation dose in the end due to dose calculation errors caused by the inferior CT image quality. However, an unrestricted increase in imaging dose without any concern for potential side effects is also not an option. Due to the success of cancer treatments, patients are already living for decades after the treatment. During this time, long-term side effects including secondary treatment-related cancers could develop. Animals are sacrificed as soon as the preclinical study is finished, meaning that long-term side effects are irrelevant and imaging doses can be higher. However, the imaging doses should always be as low as reasonably achievable to ensure the welfare of the animal and to avoid compromising the biological processes of interest. 3
All imaging artifacts that compromise the integrity of the extracted CT numbers have a negative effect (large or small) on the accuracy of the extracted Zeff and ρe values. These imaging artifacts can be divided into physics-based artifacts and patient-based artifacts. Beam hardening artifacts and scatter artifacts are examples of physics-based artifacts. The effects of beam hardening are more pronounced for low energy x-ray spectra, which means that a beam hardening correction is more relevant for preclinical DECT imaging than for clinical DECT imaging. Scatter is mainly a concern for cone beam CT (CBCT) imaging. Clinical CBCT images suffer more from scatter artifacts than preclinical CBCT images since there is more tissue in the beam that can cause the incident photons to scatter. For this reason, scatter corrections are more relevant for clinical dual energy CBCT imaging than for preclinical dual energy CBCT imaging. Motion artifacts and metal artifacts are examples of patient-based artifacts. In addition to the motion artifacts that can be present in single energy CT (SECT) images, the dual-spiral DECT modality allows for motion between the low and high energy acquisitions which results in a misregistration of the low and high energy CT images. Since Zeff and ρe are calculated in a voxelwise manner, a misregistration can lead to errors in Zeff and ρe. To minimize these errors, an additional image registration is required when analyzing dual-spiral DECT data. In general, CBCT images suffer more from motion artifacts than fan beam CT images due to the longer acquisition times in which the motion can occur. Metal artifacts are caused by the presence of metal objects in the x-ray beam, such as dental fillings, hip implants and pacemakers. The DECT technique allows for a better correction of metal artifacts than the SECT technique since metal objects can be better distinguished from bone tissues. Both metal objects and bone tissues have a high density, but metal objects have a much higher Zeff than bone tissues. Many different techniques have been proposed to correct artifacts in CT and/or CBCT images. 4–15 Correction techniques that improve the accuracy of the extracted low and high energy CT numbers
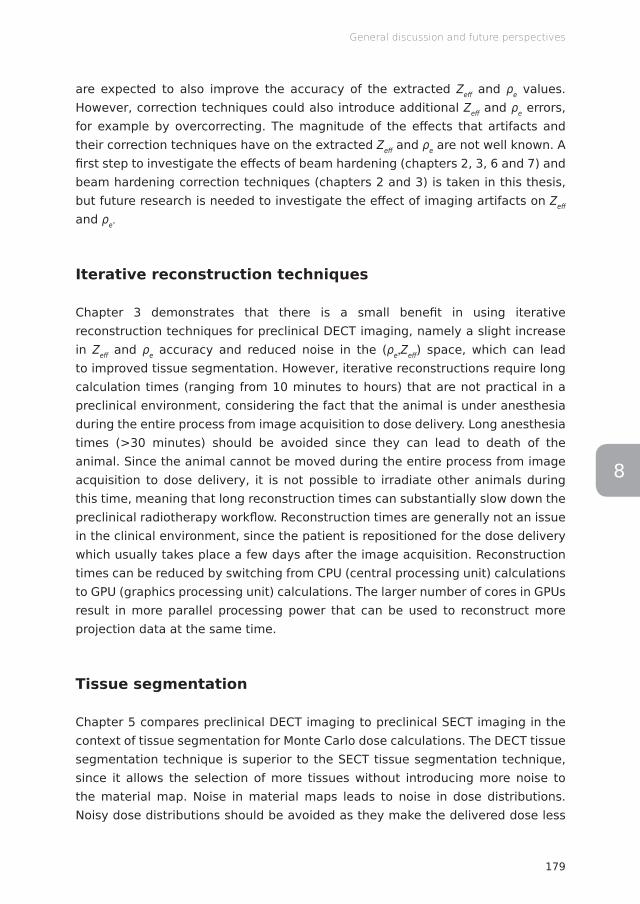
179
General discussion and future perspectives
8
are expected to also improve the accuracy of the extracted Zeff and ρe values. However, correction techniques could also introduce additional Zeff and ρe errors, for example by overcorrecting. The magnitude of the effects that artifacts and their correction techniques have on the extracted Zeff and ρe are not well known. A first step to investigate the effects of beam hardening (chapters 2, 3, 6 and 7) and beam hardening correction techniques (chapters 2 and 3) is taken in this thesis, but future research is needed to investigate the effect of imaging artifacts on Zeff and ρe.
Iterative reconstruction techniques
Chapter 3 demonstrates that there is a small benefit in using iterative reconstruction techniques for preclinical DECT imaging, namely a slight increase in Zeff and ρe accuracy and reduced noise in the (ρe,Zeff) space, which can lead to improved tissue segmentation. However, iterative reconstructions require long calculation times (ranging from 10 minutes to hours) that are not practical in a preclinical environment, considering the fact that the animal is under anesthesia during the entire process from image acquisition to dose delivery. Long anesthesia times (>30 minutes) should be avoided since they can lead to death of the animal. Since the animal cannot be moved during the entire process from image acquisition to dose delivery, it is not possible to irradiate other animals during this time, meaning that long reconstruction times can substantially slow down the preclinical radiotherapy workflow. Reconstruction times are generally not an issue in the clinical environment, since the patient is repositioned for the dose delivery which usually takes place a few days after the image acquisition. Reconstruction times can be reduced by switching from CPU (central processing unit) calculations to GPU (graphics processing unit) calculations. The larger number of cores in GPUs result in more parallel processing power that can be used to reconstruct more projection data at the same time.
Tissue segmentation
Chapter 5 compares preclinical DECT imaging to preclinical SECT imaging in the context of tissue segmentation for Monte Carlo dose calculations. The DECT tissue segmentation technique is superior to the SECT tissue segmentation technique, since it allows the selection of more tissues without introducing more noise to the material map. Noise in material maps leads to noise in dose distributions. Noisy dose distributions should be avoided as they make the delivered dose less
Chapter 8
180
certain and alter the shape of the dose volume histogram (DVH) and influence its parameters. DVH parameters are variables in the cost function that is used to optimize the radiotherapy treatment plan. Therefore, incorrect DVH parameters have a negative effect on the quality of the radiotherapy treatment plan. In the tissue segmentation process, a number is assigned to each voxel in the CT image, which results in the material map. Each number corresponds to a tissue (i.e. material) with fixed elemental compositions that are usually taken from the ICRU and ICRP reference data or, in the case of phantoms, the reference data provided by the phantom manufacturer. Increasing the number of tissues in the material map improves the dose calculation accuracy. However, both the SECT and DECT tissue segmentation techniques have a point at which adding more materials becomes counterproductive due to the amount of noise in the material map. The SECT tissue segmentation technique reaches this point sooner than the DECT tissue segmentation technique.
ICRU and ICRP reference data
Chapters 4 and 7 calculate mass energy-absorption coefficients μen/ρ from murine (chapter 4) and human (chapter 7) DECT images and compares these to μen/ρ values that are calculated from the ICRU and ICRP reference data. Although the extracted human Zeff values were closer to the reference Zeff values than the extracted murine Zeff values, the extracted murine μen/ρ values were closer to the reference μen/ρ values than the extracted human μen/ρ values. The smaller differences in the Zeff, but larger differences in μen/ρ for the human tissues can be explained by the fact that the Palladium-103 photon emission spectrum has a lower mean energy (18.9 keV; 20.7 keV after discarding the 2.7 keV line) than the 225 kVp photon spectrum (86.1 keV). Since photoelectric absorption is more dominant for lower photon energies, differences in elemental tissue compositions have a larger impact on μen/ρ and thus on the absorbed radiation dose when irradiating with lower photon energies.
Since the original tissue experiments from the 1950’s, spectroscopy techniques have greatly improved. 16 This provides the possibility to update and expand the human reference data and include animal reference data for preclinical studies. However, a complete overview would require extensive tissue catalogs for different sexes and ages, including different species and strains for preclinical studies, which is simply not feasible. Even if the spread between individuals could be taken into account using the tissue catalog approach, the spread within tissues would still not be accounted for. This is a problem, because the spread within
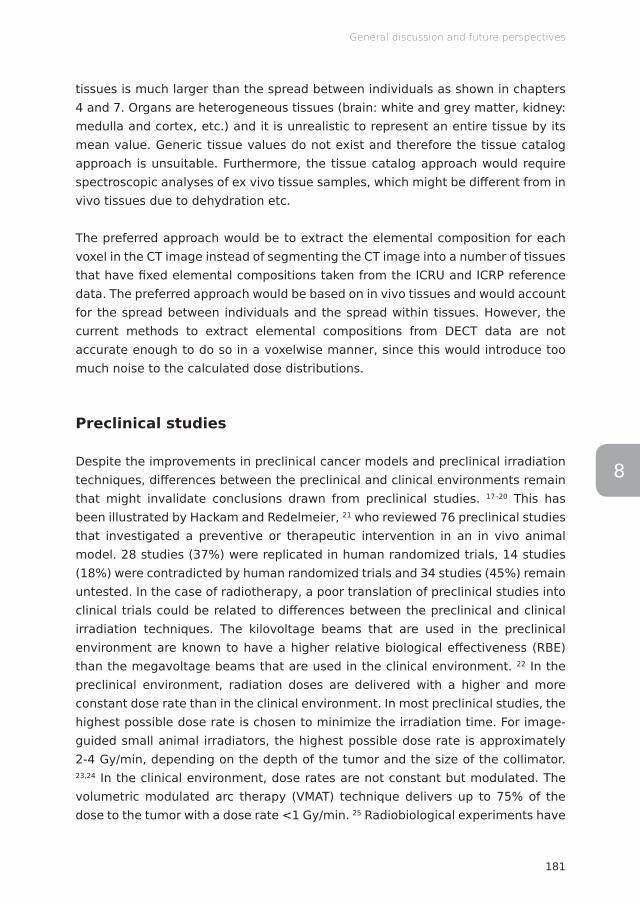
181
General discussion and future perspectives
8
tissues is much larger than the spread between individuals as shown in chapters 4 and 7. Organs are heterogeneous tissues (brain: white and grey matter, kidney: medulla and cortex, etc.) and it is unrealistic to represent an entire tissue by its mean value. Generic tissue values do not exist and therefore the tissue catalog approach is unsuitable. Furthermore, the tissue catalog approach would require spectroscopic analyses of ex vivo tissue samples, which might be different from in vivo tissues due to dehydration etc.
The preferred approach would be to extract the elemental composition for each voxel in the CT image instead of segmenting the CT image into a number of tissues that have fixed elemental compositions taken from the ICRU and ICRP reference data. The preferred approach would be based on in vivo tissues and would account for the spread between individuals and the spread within tissues. However, the current methods to extract elemental compositions from DECT data are not accurate enough to do so in a voxelwise manner, since this would introduce too much noise to the calculated dose distributions.
Preclinical studies
Despite the improvements in preclinical cancer models and preclinical irradiation techniques, differences between the preclinical and clinical environments remain that might invalidate conclusions drawn from preclinical studies. 17–20 This has been illustrated by Hackam and Redelmeier, 21 who reviewed 76 preclinical studies that investigated a preventive or therapeutic intervention in an in vivo animal model. 28 studies (37%) were replicated in human randomized trials, 14 studies (18%) were contradicted by human randomized trials and 34 studies (45%) remain untested. In the case of radiotherapy, a poor translation of preclinical studies into clinical trials could be related to differences between the preclinical and clinical irradiation techniques. The kilovoltage beams that are used in the preclinical environment are known to have a higher relative biological effectiveness (RBE) than the megavoltage beams that are used in the clinical environment. 22 In the preclinical environment, radiation doses are delivered with a higher and more constant dose rate than in the clinical environment. In most preclinical studies, the highest possible dose rate is chosen to minimize the irradiation time. For image-guided small animal irradiators, the highest possible dose rate is approximately 2-4 Gy/min, depending on the depth of the tumor and the size of the collimator. 23,24 In the clinical environment, dose rates are not constant but modulated. The volumetric modulated arc therapy (VMAT) technique delivers up to 75% of the dose to the tumor with a dose rate <1 Gy/min. 25 Radiobiological experiments have
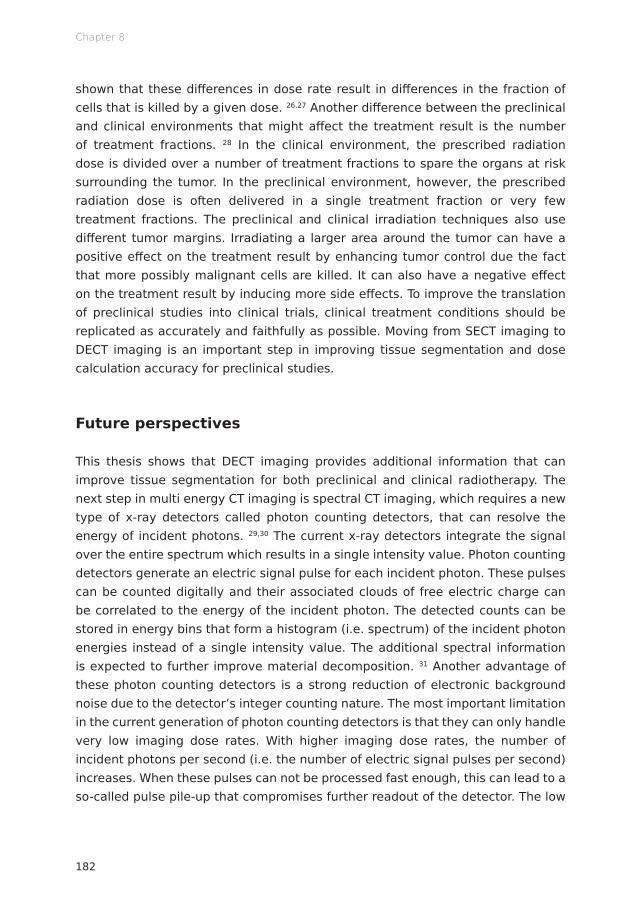
Chapter 8
182
shown that these differences in dose rate result in differences in the fraction of cells that is killed by a given dose. 26,27 Another difference between the preclinical and clinical environments that might affect the treatment result is the number of treatment fractions. 28 In the clinical environment, the prescribed radiation dose is divided over a number of treatment fractions to spare the organs at risk surrounding the tumor. In the preclinical environment, however, the prescribed radiation dose is often delivered in a single treatment fraction or very few treatment fractions. The preclinical and clinical irradiation techniques also use different tumor margins. Irradiating a larger area around the tumor can have a positive effect on the treatment result by enhancing tumor control due the fact that more possibly malignant cells are killed. It can also have a negative effect on the treatment result by inducing more side effects. To improve the translation of preclinical studies into clinical trials, clinical treatment conditions should be replicated as accurately and faithfully as possible. Moving from SECT imaging to DECT imaging is an important step in improving tissue segmentation and dose calculation accuracy for preclinical studies.
Future perspectives
This thesis shows that DECT imaging provides additional information that can improve tissue segmentation for both preclinical and clinical radiotherapy. The next step in multi energy CT imaging is spectral CT imaging, which requires a new type of x-ray detectors called photon counting detectors, that can resolve the energy of incident photons. 29,30 The current x-ray detectors integrate the signal over the entire spectrum which results in a single intensity value. Photon counting detectors generate an electric signal pulse for each incident photon. These pulses can be counted digitally and their associated clouds of free electric charge can be correlated to the energy of the incident photon. The detected counts can be stored in energy bins that form a histogram (i.e. spectrum) of the incident photon energies instead of a single intensity value. The additional spectral information is expected to further improve material decomposition. 31 Another advantage of these photon counting detectors is a strong reduction of electronic background noise due to the detector’s integer counting nature. The most important limitation in the current generation of photon counting detectors is that they can only handle very low imaging dose rates. With higher imaging dose rates, the number of incident photons per second (i.e. the number of electric signal pulses per second) increases. When these pulses can not be processed fast enough, this can lead to a so-called pulse pile-up that compromises further readout of the detector. The low
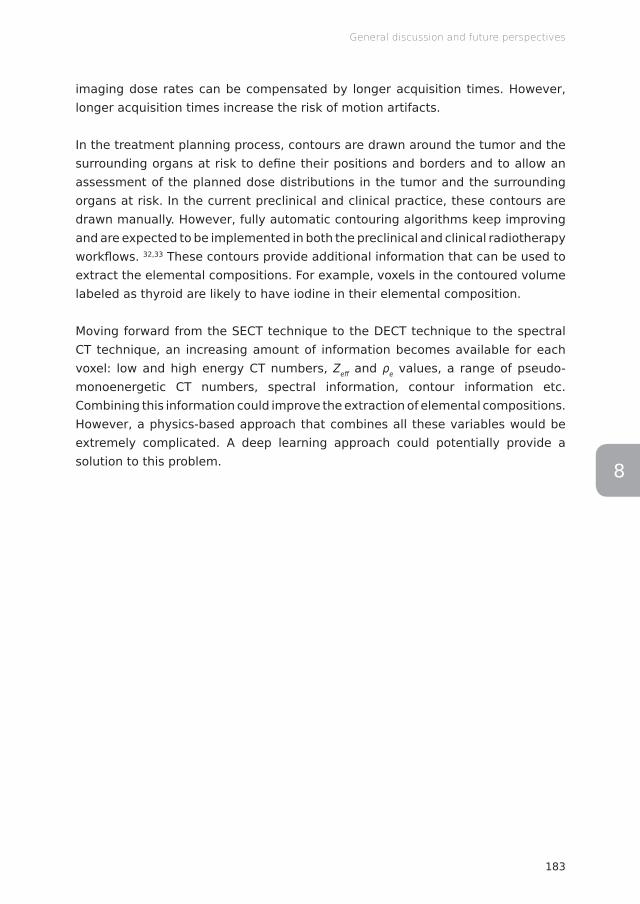
183
General discussion and future perspectives
8
imaging dose rates can be compensated by longer acquisition times. However, longer acquisition times increase the risk of motion artifacts.
In the treatment planning process, contours are drawn around the tumor and the surrounding organs at risk to define their positions and borders and to allow an assessment of the planned dose distributions in the tumor and the surrounding organs at risk. In the current preclinical and clinical practice, these contours are drawn manually. However, fully automatic contouring algorithms keep improving and are expected to be implemented in both the preclinical and clinical radiotherapy workflows. 32,33 These contours provide additional information that can be used to extract the elemental compositions. For example, voxels in the contoured volume labeled as thyroid are likely to have iodine in their elemental composition.
Moving forward from the SECT technique to the DECT technique to the spectral CT technique, an increasing amount of information becomes available for each voxel: low and high energy CT numbers, Zeff and ρe values, a range of pseudo-monoenergetic CT numbers, spectral information, contour information etc. Combining this information could improve the extraction of elemental compositions. However, a physics-based approach that combines all these variables would be extremely complicated. A deep learning approach could potentially provide a solution to this problem.
Chapter 8
184
References1. Krauss B, Grant KL, Schmidt BT, Flohr TG. The Importance of Spectral Separation:
An Assessment of Dual-Energy Spectral Separation for Quantitative Ability and Dose Efficiency. Invest Radiol 2015; 50: 114–118. doi: http://dx.doi.org/10.1097/RLI.0000000000000109
2. Ritman EL. Vision 20/20: Increased image resolution versus reduced radiation exposure. Med Phys 2008; 35: 2502–2512. doi: http://dx.doi.org/10.1118/1.2919112
3. Workman P, Aboagye EO, Balkwill F, Balmain A, Bruder G, Chaplin DJ, et al. Guidelines for the welfare and use of animals in cancer research. Br J Cancer 2010; 102: 1555–1577. doi: http://dx.doi.org/10.1038/sj.bjc.6605642
4. Herman GT. Correction for beam hardening in computed tomography. Phys Med Biol 1979; 24: 81–106. doi: http://dx.doi.org/10.1088/0031-9155/24/1/008
5. Hsieh J, Molthen RC, Dawson CA, Johnson RH. An iterative approach to the beam hardening correction in cone beam CT. Med Phys 2000; 27: 23–29. doi: http://dx.doi.org/10.1118/1.598853
6. Kachelrieß M, Sourbelle K, Kalender WA. Empirical cupping correction: A first-order raw data precorrection for cone-beam computed tomography. Med Phys 2006; 33: 1269–1274. doi: http://dx.doi.org/10.1118/1.2188076
7. Sonke JJ, Zijp L, Remeijer P, van Herk M. Respiratory correlated cone beam CT. Med Phys 2005; 32: 1176–1186. doi: http://dx.doi.org/10.1118/1.1869074
8. Berger M, Xia Y, Aichinger W, Mentl K, Unberath M, Aichert A, et al. Motion compensation for cone-beam CT using Fourier consistency conditions. Phys Med Biol 2017; 62: 7181–7215. doi: http://dx.doi.org/10.1088/1361-6560/aa8129
9. Kim S, Chang Y, Ra JB. Cardiac Motion Correction for Helical CT Scan With an Ordinary Pitch. IEEE Trans Med Imaging 2018; 37: 1587–1596. doi: http://dx.doi.org/10.1109/TMI.2018.2817594
10. Siewerdsen JH, Daly MJ, Bakhtiar B, Moseley DJ, Richard S, Keller H, et al. A simple, direct method for x-ray scatter estimation and correction in digital radiography and cone-beam CT: X-ray scatter correction. Med Phys 2005; 33: 187–197. doi: http://dx.doi.org/10.1118/1.2148916
11. Poludniowski G, Evans PM, Hansen VN, Webb S. An efficient Monte Carlo-based algorithm for scatter correction in keV cone-beam CT. Phys Med Biol 2009; 54: 3847–3864. doi: http://dx.doi.org/10.1088/0031-9155/54/12/016
12. Maier J, Eulig E, Vöth T, Knaup M, Kuntz J, Sawall S, et al. Real-time scatter estimation for medical CT using the deep scatter estimation: Method and robustness analysis with respect to different anatomies, dose levels, tube voltages, and data truncation. Med Phys 2019; 46: 238–249. doi: http://dx.doi.org/10.1002/mp.13274
13. Kalender WA, Hebel R, Ebersberger J. Reduction of CT artifacts caused by metallic implants. Radiology 1987; 164: 576–577. doi: http://dx.doi.org/10.1148/radiology.164.2.3602406
185
General discussion and future perspectives
8
14. Meyer E, Raupach R, Lell M, Schmidt B, Kachelrieß M. Normalized metal artifact reduction (NMAR) in computed tomography: Normalized metal artifact reduction (NMAR) in computed tomography. Med Phys 2010; 37: 5482–5493. doi: http://dx.doi.org/10.1118/1.3484090
15. Meyer E, Raupach R, Lell M, Schmidt B, Kachelrieß M. Frequency split metal artifact reduction (FSMAR) in computed tomography. Med Phys 2012; 39: 1904–1916. doi: http://dx.doi.org/10.1118/1.3691902
16. Molecular Spectroscopy - Experiment and Theory: From Molecules to Functional Materials. Springer Nature 2019; doi: http://dx.doi.org/10.1007/978-3-030-01355-4
17. Mak IWY, Evaniew N, Ghert M. Lost in translation: animal models and clinical trials in cancer treatment. Am J Transl Res 2014; 6: 114–118.
18. Gould SE, Junttila MR, de Sauvage FJ. Translational value of mouse models in oncology drug development. Nat Med 2015; 21: 431–439. doi: http://dx.doi.org/10.1038/nm.3853
19. Coleman CN, Higgins GS, Brown JM, Baumann M, Kirsch DG, Willers H, et al. Improving the Predictive Value of Preclinical Studies in Support of Radiotherapy Clinical Trials. Clin Cancer Res 2016; 22: 3138–3147. doi: http://dx.doi.org/10.1158/1078-0432.CCR-16-0069
20. Koontz BF, Verhaegen F, De Ruysscher D. Tumour and normal tissue radiobiology in mouse models: how close are mice to mini-humans? Br J Radiol 2016; 90: 20160441. doi: http://dx.doi.org/10.1259/bjr.20160441
21. Hackam DG, Redelmeier DA. Translation of Research Evidence From Animals to Humans. JAMA 2006; 296: 1727. doi: http://dx.doi.org/10.1001/jama.296.14.1731
22. Nikjoo H, Lindborg L. RBE of low energy electrons and photons. Phys Med Biol 2010; 55: R65–R109. doi: http://dx.doi.org/10.1088/0031-9155/55/10/R01
23. X-RAD SmART Technical Brochure. Precision X-Ray (North Branford, Connecticut, USA) Available from: https://www.accela.eu/files/products/133/x-rad-smart-technical-brochure.pdf
24. Lindsay PE, Granton PV, Gasparini A, Jelveh S, Clarkson R, van Hoof S, et al. Multi-institutional dosimetric and geometric commissioning of image-guided small animal irradiators. Med Phys 2014; 41: 031714. doi: http://dx.doi.org/10.1118/1.4866215
25. Podesta M, Popescu IA, Verhaegen F. Dose rate mapping of VMAT treatments. Phys Med Biol 2016; 61: 4048–4060. doi: http://dx.doi.org/10.1088/0031-9155/61/11/4048
26. Hall EJ. Radiation Dose-Rate: A Factor of Importance in Radiobiology and Radiotherapy. Br J Radiol 1972; 45: 81–97. doi: http://dx.doi.org/10.1259/0007-1285-45-530-81
27. Hall EJ, Brenner DJ. The dose-rate effect revisited: Radiobiological considerations of importance in radiotherapy. Int J Radiat Oncol Biol Phys 1991; 21: 1403–1414. doi: http://dx.doi.org/10.1016/0360-3016(91)90314-T
28. Kitakabu Y, Yuta S, Keisuke S, Koji O, Mitsuyuki A. Variations of the hypoxic fraction in the SCC VII tumors after single dose and during fractionated radiation therapy: Assessment without anesthesia or physical restraint of mice. Int J Radiat Oncol Biol Phys 1991; 20: 709–714. doi: http://dx.doi.org/10.1016/0360-3016(91)90013-T
Chapter 8
186
29. Taguchi K, Iwanczyk JS. Vision 20/20: Single photon counting x-ray detectors in medical imaging. Med Phys 2013; 40: 100901. doi: http://dx.doi.org/10.1118/1.4820371
30. Taguchi K. Energy-sensitive photon counting detector-based X-ray computed tomography. Radiol Phys Technol 2017; 10: 8–22. doi: http://dx.doi.org/10.1007/s12194-017-0390-9
31. Faby S, Kuchenbecker S, Sawall S, Simons D, Schlemmer HP, Lell M, et al. Performance of today’s dual energy CT and future multi energy CT in virtual non‐contrast imaging and in iodine quantification: A simulation study. Med Phys 2015; 42: 4349–4366. doi: http://dx.doi.org/10.1118/1.4922654
32. van der Heyden B, Podesta M, Eekers DBP, Vaniqui A, Almeida IP, Schyns LEJR, et al. Automatic multiatlas based organ at risk segmentation in mice. Br J Radiol 2018; 92: 20180364. doi: http://dx.doi.org/10.1259/bjr.20180364
33. Sharp G, Fritscher KD, Pekar V, Peroni M, Shusharina N, Veeraraghavan H, et al. Vision 20/20: Perspectives on automated image segmentation for radiotherapy. Med Phys 2014; 41: 050902. doi: http://dx.doi.org/10.1118/1.4871620

8


Summary


191
Summary
In this thesis, the use of preclinical and clinical dual energy CT imaging is investigated in the context of tissue segmentation for radiation dose calculations in the field of radiotherapy. The aim of radiotherapy is to kill tumor cells using ionizing radiation. During the radiotherapy treatment, a large amount of energy is deposited in the tumor. This causes DNA strands in the tumor cells to break and destroys the cells’ ability to divide and grow, which effectively kills the tumor. The energy deposition for certain kinds of radiation beams depends strongly on the atomic number Z of the elements in the tissue and therefore the elemental tissue compositions need to be taken into account when performing radiation dose calculations. Currently, the elemental tissue compositions in these dose calculations are taken from the reference data for human tissue compositions and mass densities, listed in several reports by the International Commission on Radiation Units and Measurements (ICRU) and the International Commission on Radiological Protection (ICRP). Instead of relying on the reference data, it would be preferable to extract information about the elemental composition of the tissues from CT images of the patient which are used in the treatment planning process. This information, in contrast to density information, cannot be obtained from conventional single energy CT (SECT) images. A new technique is required. When combining two CT images that are acquired with different x-ray spectra, it is possible to extract additional information from these images. This technique is called dual energy CT (DECT).
Chapter 1 is the introduction of this thesis, in which the importance of tissue segmentation and the role of DECT in the tissue segmentation process are discussed.
Chapters 2, 3, 4 and 5 focus on preclinical DECT imaging. The feasibility of quantitative DECT imaging for preclinical irradiators with an integrated cone beam CT (CBCT) system is described in chapter 2. To obtain the best results, optimizing the imaging protocols is required. Well-separated x-ray spectra and a sufficient dose level should be used to minimize errors and noise.
The effect of different image reconstruction techniques on quantitative DECT imaging is analyzed in chapter 3. Phantom images are reconstructed with different image reconstruction techniques and a quantitative DECT analysis is performed on these images to determine if there is any benefit in choosing an iterative reconstruction technique instead of the conventional backprojection reconstruction technique. In this chapter, it is concluded that iterative image reconstruction can be beneficial, but the benefit is small and calculation times may be unacceptable with current technology.
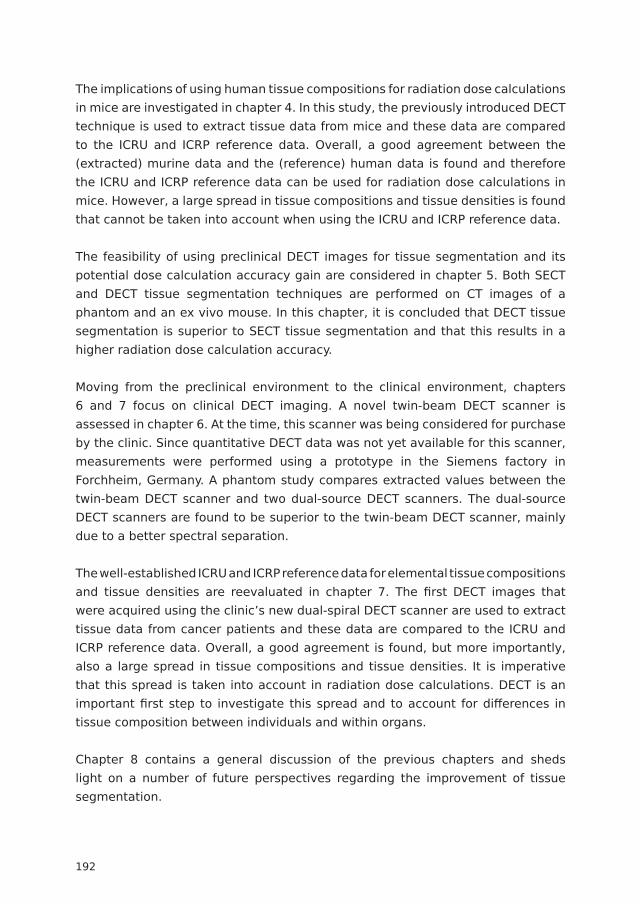
192
The implications of using human tissue compositions for radiation dose calculations in mice are investigated in chapter 4. In this study, the previously introduced DECT technique is used to extract tissue data from mice and these data are compared to the ICRU and ICRP reference data. Overall, a good agreement between the (extracted) murine data and the (reference) human data is found and therefore the ICRU and ICRP reference data can be used for radiation dose calculations in mice. However, a large spread in tissue compositions and tissue densities is found that cannot be taken into account when using the ICRU and ICRP reference data.
The feasibility of using preclinical DECT images for tissue segmentation and its potential dose calculation accuracy gain are considered in chapter 5. Both SECT and DECT tissue segmentation techniques are performed on CT images of a phantom and an ex vivo mouse. In this chapter, it is concluded that DECT tissue segmentation is superior to SECT tissue segmentation and that this results in a higher radiation dose calculation accuracy.
Moving from the preclinical environment to the clinical environment, chapters 6 and 7 focus on clinical DECT imaging. A novel twin-beam DECT scanner is assessed in chapter 6. At the time, this scanner was being considered for purchase by the clinic. Since quantitative DECT data was not yet available for this scanner, measurements were performed using a prototype in the Siemens factory in Forchheim, Germany. A phantom study compares extracted values between the twin-beam DECT scanner and two dual-source DECT scanners. The dual-source DECT scanners are found to be superior to the twin-beam DECT scanner, mainly due to a better spectral separation.
The well-established ICRU and ICRP reference data for elemental tissue compositions and tissue densities are reevaluated in chapter 7. The first DECT images that were acquired using the clinic’s new dual-spiral DECT scanner are used to extract tissue data from cancer patients and these data are compared to the ICRU and ICRP reference data. Overall, a good agreement is found, but more importantly, also a large spread in tissue compositions and tissue densities. It is imperative that this spread is taken into account in radiation dose calculations. DECT is an important first step to investigate this spread and to account for differences in tissue composition between individuals and within organs.
Chapter 8 contains a general discussion of the previous chapters and sheds light on a number of future perspectives regarding the improvement of tissue segmentation.


Samenvatting

197
Samenvatting
In deze thesis wordt het gebruik van preklinische en klinische dual energy CT beeldvorming onderzocht in de context van weefselsegmentatie voor stalingsdosisberekeningen in de radiotherapie. Het doel van radiotherapie is het uitschakelen van tumorcellen met behulp van ioniserende straling. Tijdens de radiotherapiebehandeling wordt een grote hoeveelheid energie in de tumor achtergelaten. Dit zorgt ervoor dat DNA strengen in de tumorcellen breken en dat deze cellen de mogelijkheid verliezen om te delen en te groeien, hetgeen de tumor op een effectieve manier uitschakelt. De energieafgifte voor bepaalde soorten stralingsbundels hangt sterk van het atoomgetal Z van de elementen in het weefsel en daarom dient rekening te worden gehouden met de elementaire weefselsamenstelling bij het uitvoeren van stralingsdosisberekeningen. Op dit moment worden de elementaire weefselsamenstellingen in deze dosisberekeningen overgenomen van de referentiedata voor weefselsamenstellingen en weefseldichtheden die staan genoteerd in verschillende rapporten van de International Commission on Radiation Units and Measurements (ICRU) en de International Commission on Radiological Protection (ICRP). In plaats van te vertrouwen op de referentiedata, zou het de voorkeur hebben om informatie over de elementaire weefselsamenstellingen te verkrijgen uit CT beelden van de patient die worden gebruikt bij het maken van het bestralingsplan. Deze informatie, in tegenstelling tot informatie over de dichtheid, kan niet worden verkregen uit conventionele single energy CT (SECT) beelden. Dit vereist een nieuwe techniek. Wanneer twee CT beelden die met verschillende Röntgenspectra zijn verkregen worden gecombineerd, is het mogelijk om meer informatie uit deze beelden te halen. Deze techniek wordt dual energy CT (DECT) genoemd.
Hoofdstuk 1 is de inleiding van deze thesis, waarin het belang van weefselsegmentatie en de rol van DECT in het weefselsegmentatieproces wordt besproken.
Hoofdstukken 2, 3, 4 en 5 concentreren zich op preklinische DECT beeldvorming. De haalbaarheid van kwantitatieve DECT beeldvorming voor preklinische bestralers met een geïntegreerd cone beam CT (CBCT) systeem wordt beschreven in hoofdstuk 2. Om de beste resultaten te verkrijgen is optimalisatie van de beeldvormingsprotocollen vereist. Een goede scheiding van de Röntgenspectra en een voldoende beeldvormingsdosis dienen te worden gebruikt om fouten en ruis te minimaliseren.
Het effect van verschillende beeldreconstructietechnieken op kwantitatieve DECT beeldvorming wordt geanalyseerd in hoofdstuk 3. Fantoombeelden worden gereconstrueerd met verschillende beeldreconstructietechnieken en een

198
kwantitatieve DECT analyse wordt uitgevoerd op deze beelden om te bepalen of er een voordeel is in het verkiezen van een iteratieve reconstructietechniek boven de conventionele gefilterde terugprojectie techniek. In dit hoofdstuk wordt geconcludeerd dat iteratieve beeldreconstructie voordelig kan zijn, maar het voordeel is klein en berekeningstijden kunnen mogelijk onacceptabel zijn met de huidige technologie.
De implicaties van het gebruik van humane weefselsamenstellingen voor stralingsdosisberekeningen in muizen worden onderzocht in hoofdstuk 4. In deze studie wordt de eerder geïntroduceerde DECT techniek gebruikt om weefseldata te verkrijgen van muizen en deze data worden vergeleken met de ICRU en ICRP referentiedata. Over het algemeen wordt er een goede overeenkomst tussen de (verkregen) muizen data en de (referentie) humane data geconstateerd en daarom kunnen de ICRU en ICRP referentiedata worden gebruikt voor stralingsdosisberekeningen in muizen. Echter, een grote spreiding in weefselsamenstellingen en weefseldichtheden wordt geconstateerd waar geen rekening mee kan worden gehouden wanneer de ICRU en ICRP referentiedata worden gebruikt.
De haalbaarheid van het gebruik van preklinische DECT beelden voor weefselsegmentatie en de mogelijke verbetering van de nauwkeurigheid van stralingsdosisberekeningen worden overwogen in hoofdstuk 5. Zowel SECT als DECT weefselsegmentatietechnieken worden uitgevoerd op CT beelden van een fantoom en een ex vivo muis. In dit hoofdstuk wordt geconcludeerd dat DECT weefselsegmentatie beter is dan SECT weefselsegmentatie en dat dit resulteert in een grotere nauwkeurigheid van stralingsdosisberekeningen.
Van de preklinische omgeving wordt overgegaan naar de klinische omgeving; hoofdstukken 6 en 7 concentreren zich op klinische DECT beeldvorming. Een nieuwe twin-beam DECT scanner wordt beoordeeld in hoofdstuk 6. Destijds overwoog de kliniek om deze scanner te kopen. Aangezien kwantitatieve DECT data nog niet beschikbaar waren voor deze scanner, zijn metingen uitgevoerd met een prototype in de Siemens fabriek in Forchheim, Duitsland. Een fantoomstudie vergelijkt de verkregen waarden van de twin-beam DECT scanner met die van twee dual-source DECT scanners. Er wordt geconstateerd dat de dual-source DECT scanners beter zijn dan de twin-beam DECT scanner, voornamelijk vanwege een betere spectrale scheiding.
De gevestigde ICRU en ICRP referentiedata voor elementaire weefselsamenstellingen en weefseldichtheden worden gereëvalueerd in hoofdstuk 7. De eerste DECT
199
Samenvatting
beelden die zijn verkregen met de klinieks nieuwe dual-spiral DECT scanner worden gebruikt om weefseldata te verkrijgen van kankerpatiënten en deze data worden vergeleken met de ICRU en ICRP referentiedata. Over het algemeen wordt er goede overeenkomst geconstateerd, maar van groter belang, ook een grote spreiding in weefselsamenstellingen en weefseldichteden. Het is noodzakelijk dat met deze spreiding rekening wordt gehouden in stralingsdosisberekeningen. DECT is een belangrijke eerste stap om deze spreiding te onderzoeken en om rekening te houden met verschillen in weefselsamenstellingen tussen individuen en binnen organen.
Hoofdstuk 8 bevat een algemene discussie van de voorafgaande hoofdstukken en werpt een blik op een aantal nieuwe mogelijkheden met betrekking tot de verbetering van weefselsegmentatie.

Valorisation addendum


203
Valorisation addendum
In this thesis, the use of preclinical and clinical dual energy CT (DECT) imaging is investigated in the context of tissue segmentation for radiation dose calculations in the field of radiotherapy. It is shown that DECT imaging is a useful tool for analyzing tissues and that DECT tissue segmentation can increase the accuracy of radiation dose calculations. This chapter discusses the clinical relevance of these findings and contains an implementation overview.
Clinical relevance
In the Netherlands, more than 100 thousand patients are diagnosed with cancer each year. 1 About 32% of these patients receive radiotherapy as (a part of) the primary treatment. 2 Like any other treatment, radiotherapy can cause side effects. General radiotherapy side effects are local skin problems, fatigue and secondary cancer development. In addition to these general side effects, irradiation of specific treatment sites can cause a number of other side effects. 3 Irradiation of the head and/or neck can cause a dry mouth, mouth and gum sores, difficulty swallowing, stiffness in the jaw, nausea, hair loss, lymphedema and tooth decay. Side effects of irradiating the chest are difficulty swallowing, shortness of breath, breast or nipple soreness, shoulder stiffness, pneumonitis and fibrosis. Irradiation of the stomach and/or abdomen can cause nausea, vomiting and diarrhea. Side effects of irradiating the pelvis are diarrhea, rectal bleeding, incontinence, bladder irritation, sexual problems and infertility. It is important to reduce these side effects to improve the quality of life after radiotherapy. A more precise irradiation can reduce radiotherapy side effects by sparing the healthy tissues surrounding the tumor. Improving the accuracy of radiation dose calculations is a crucial step in this process.
The patients that would benefit most from DECT tissue segmentation are the brachytherapy and proton therapy patients. Patients that are treated with megavoltage photon beams would benefit only slightly from DECT tissue segmentation due to the fact that the difference in energy deposition for tissues in megavoltage beams is negligible. Patients also benefit indirectly from preclinical DECT tissue segmentation since more precise preclinical irradiations can improve the quality of preclinical studies.
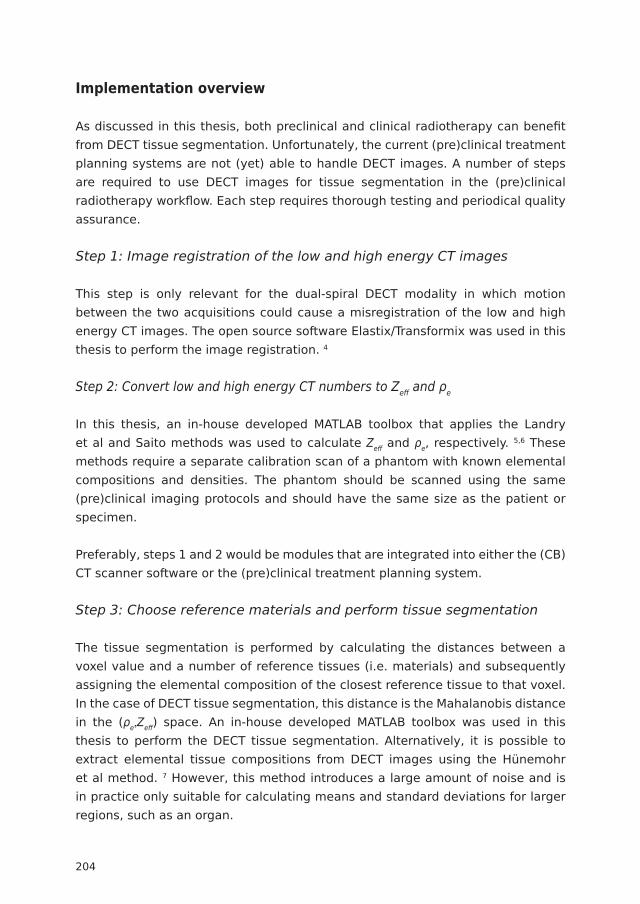
204
Implementation overview
As discussed in this thesis, both preclinical and clinical radiotherapy can benefit from DECT tissue segmentation. Unfortunately, the current (pre)clinical treatment planning systems are not (yet) able to handle DECT images. A number of steps are required to use DECT images for tissue segmentation in the (pre)clinical radiotherapy workflow. Each step requires thorough testing and periodical quality assurance.
Step 1: Image registration of the low and high energy CT images
This step is only relevant for the dual-spiral DECT modality in which motion between the two acquisitions could cause a misregistration of the low and high energy CT images. The open source software Elastix/Transformix was used in this thesis to perform the image registration. 4
Step 2: Convert low and high energy CT numbers to Zeff and ρe
In this thesis, an in-house developed MATLAB toolbox that applies the Landry et al and Saito methods was used to calculate Zeff and ρe, respectively. 5,6 These methods require a separate calibration scan of a phantom with known elemental compositions and densities. The phantom should be scanned using the same (pre)clinical imaging protocols and should have the same size as the patient or specimen.
Preferably, steps 1 and 2 would be modules that are integrated into either the (CB)CT scanner software or the (pre)clinical treatment planning system.
Step 3: Choose reference materials and perform tissue segmentation
The tissue segmentation is performed by calculating the distances between a voxel value and a number of reference tissues (i.e. materials) and subsequently assigning the elemental composition of the closest reference tissue to that voxel. In the case of DECT tissue segmentation, this distance is the Mahalanobis distance in the (ρe,Zeff) space. An in-house developed MATLAB toolbox was used in this thesis to perform the DECT tissue segmentation. Alternatively, it is possible to extract elemental tissue compositions from DECT images using the Hünemohr et al method. 7 However, this method introduces a large amount of noise and is in practice only suitable for calculating means and standard deviations for larger regions, such as an organ.

205
Valorisation addendum
Step 4: Perform dose calculations and optimize treatment plan
The dose calculation engine should be able to handle voxels with different elemental compositions. The Monte Carlo method is intrinsically capable of doing this. However, most superposition-convolution methods are not (or have limited capabilities). The radiotherapy treatment plan optimization requires no specific changes.
Preferably, steps 3 and 4 would be modules that are integrated into the (pre)clinical treatment planning system.
206
References
1. Incidentie kanker totaal. Nederlandse Kankerregistratie (NKR) 2019. Available from: https://www.cijfersoverkanker.nl/
2. Lybeert MLM, Louwman WJ, Poortmans PMP, Vulto JCM, Coebergh JWW. Trends in verwijzingen van patiënten voor radiotherapie na de initiële diagnose van kanker in Zuid-Nederland sinds 1988. Ned Tijdschr Oncol 2005; 2: 206–11.
3. Side Effects of Radiation Therapy. American Society of Clinical Oncology (ASCO) 2018. Available from: https://www.cancer.net/navigating-cancer-care/how-cancer-treated/radiation-therapy/side-effects-radiation-therapy
4. Klein S, Staring M, Murphy K, Viergever MA, Pluim JPW. elastix: A Toolbox for Intensity-Based Medical Image Registration. IEEE Trans Med Imaging 2010; 29: 196–205. doi: http://dx.doi.org/10.1109/TMI.2009.2035616
5. Landry G, Seco J, Gaudreault M, Verhaegen F. Deriving effective atomic numbers from DECT based on a parameterization of the ratio of high and low linear attenuation coefficients. Phys Med Biol 2013; 58: 6851–6866. doi: http://dx.doi.org/10.1088/0031-9155/58/19/6851
6. Saito M. Potential of dual-energy subtraction for converting CT numbers to electron density based on a single linear relationship: Conversion of energy-subtracted CT number to electron density. Med Phys 2012; 39: 2021–2030. doi: http://dx.doi.org/10.1118/1.3694111
7. Hünemohr N, Paganetti H, Greilich S, Jäkel O, Seco J. Tissue decomposition from dual energy CT data for MC based dose calculation in particle therapy. Med Phys 2014; 41: doi: http://dx.doi.org/10.1118/1.4875976


Curriculum vitae


211
Curriculum vitae
Lotte Elisabeth Josephine Regine Schyns Born on February 17th 1990 in Heerlen, the Netherlands
PhD Student in Medical Physics
May 2015 - October 2019 Maastricht University/MAASTRO Clinic Maastricht, the Netherlands
Master of Science in Biomedical Engineering
September 2013 - January 2016 Eindhoven University of Technology Eindhoven, the Netherlands
Pre-Master Program Biomedical Engineering
September 2012 - June 2013 Eindhoven University of Technology Eindhoven, the Netherlands
Bachelor of Medical Technology in Biometrics (cum laude)
September 2008 - June 2012 Zuyd University of Applied Sciences Heerlen, the Netherlands


List of publications

215
List of publications
Schyns LEJR, van der Heyden B, Almeida IP, Vaniqui A, Eekers DBP, Verhaegen F. Human tissue compositions and densities revisited after 60 years: an in vivo dual energy CT study for radiotherapy. In preparation for submission 2019
Sosa Iglesias V, van Hoof SJ, Vaniqui A, Schyns LEJR, Lieuwes N, Yaromina A, Spiegelberg L, Groot AJ, Verhaegen F, Theys J, Dubois L, Vooijs M. An orthotopic non-small cell lung cancer model for image-guided small animal radiotherapy platforms. Br J Radiol 2018; 92: 20180476.doi: http://dx.doi.org/10.1259/bjr.20180476
Schyns LEJR, Eekers DBP, van der Heyden B, Almeida IP, Vaniqui A, Verhaegen F. Murine vs human tissue compositions: implications of using human tissue compositions for photon energy absorption in mice. Br J Radiol 2018; 92: 20180454.doi: http://dx.doi.org/10.1259/bjr.20180454
Vaniqui A*, Schyns LEJR*, Almeida IP, van der Heyden B, Podesta M, Verhaegen F. The effect of different image reconstruction techniques on pre-clinical quantitative imaging and dual-energy CT. Br J Radiol 2018; 92: 20180447.doi: http://dx.doi.org/10.1259/bjr.20180447*Equal contributions
Almeida IP, Vaniqui A, Schyns LEJR, van der Heyden B, Cooley J, Zwart T, Langenegger A, Verhaegen F. Exploring the feasibility of a clinical proton beam with an adaptive aperture for pre-clinical research. Br J Radiol 2018; 92: 20180446.doi: http://dx.doi.org/10.1259/bjr.20180446
Konings GFJ, Saarinen N, Delvoux B, Kooreman L, Koskimies P, Krakstad C, Fasmer KE, Haldorsen IS, Zaffagnini A, Häkkinen MR, Auriola S, Dubois L, Lieuwes N, Verhaegen F, Schyns LEJR, Kruitwagen RFPM, ENITEC Consortium, Xanthoulea S, Romano A. Development of an Image-Guided Orthotopic Xenograft Mouse Model of Endometrial Cancer with Controllable Estrogen Exposure. Int J Mol Sci 2018; 19: 2547.doi: http://dx.doi.org/10.3390/ijms19092547
van der Heyden B, Podesta M, Eekers DBP, Vaniqui A, Almeida IP, Schyns LEJR, van Hoof SJ, Verhaegen F. Automatic multiatlas based organ at risk segmentation in mice. Br J Radiol 2018; 92: 20180364.doi: http://dx.doi.org/10.1259/bjr.20180364

216
Vaniqui A, van der Heyden B, Almeida IP, Schyns LEJR, van Hoof SJ, Verhaegen F. On the determination of planning target margins due to motion for mice lung tumours using a four-dimensional MOBY phantom. Br J Radiol 2018; 92: 20180445.doi: http://dx.doi.org/10.1259/bjr.20180445
van der Heyden B, Schyns LEJR, Podesta M, Vaniqui A, Almeida IP, Landry G, Verhaegen F. VOXSI: A voxelized single- and dual-energy CT scenario generator for quantitative imaging. PhiRO 2018; 6: 47–52.doi: http://dx.doi.org/10.1016/j.phro.2018.05.004
Almeida IP, Schyns LEJR, Vaniqui A, van der Heyden B, Dedes G, Resch AF, Kamp F, Zindler JD, Parodi K, Landry G, Verhaegen F. Monte Carlo proton dose calculations using a radiotherapy specific dual-energy CT scanner for tissue segmentation and range assessment. Monte Carlo proton dose calculations using a radiotherapy specific dual-energy CT scanner for tissue segmentation and range assessment. Phys Med Biol 2018; 63: 115008.doi: http://dx.doi.org/10.1088/1361-6560/aabb60
Vaniqui A, Schyns LEJR, Almeida IP, van der Heyden B, van Hoof SJ, Verhaegen F. The impact of dual energy CT imaging on dose calculations for pre-clinical studies. Radiat Oncol 2017; 12:doi: http://dx.doi.org/10.1186/s13014-017-0922-9
Wolfs CJA, Brás MG, Schyns LEJR, Nijsten SMJJG, van Elmpt W, Scheib SG, Baltes C, Podesta M, Verhaegen F. Detection of anatomical changes in lung cancer patients with 2D time-integrated, 2D time-resolved and 3D time-integrated portal dosimetry: a simulation study. Phys Med Biol 2017; 62: 6044–6061.doi: http://dx.doi.org/10.1088/1361-6560/aa7730
Trojanova E, Schyns LEJR, Dubois L, Jakubek J, Le Pape A, Sefc L, Sykora V, Turecek D, Uher J, Verhaegen F. Tissue sensitive imaging and tomography without contrast agents for small animals with Timepix based detectors. J Instrum 2017; 12: C01056.doi: http://dx.doi.org/10.1088/1748-0221/12/01/C01056
Almeida IP, Schyns LEJR, Öllers MC, van Elmpt W, Parodi K, Landry G, Verhaegen F. Dual-energy CT quantitative imaging: a comparison study between twin-beam and dual-source CT scanners. Med Phys 2017; 44: 171–179.doi: http://dx.doi.org/10.1002/mp.12000
217
List of publications
Schyns LEJR, Almeida IP, van Hoof SJ, Descamps B, Vanhove C, Landry G, Granton PV, Verhaegen F. Optimizing dual energy cone beam CT protocols for preclinical imaging and radiation research. Br J Radiol 2017; 90: 20160480.doi: http://dx.doi.org/10.1259/bjr.20160480
van der Heyden B, van Hoof SJ, Schyns LEJR, Verhaegen F. The influence of respiratory motion on dose delivery in a mouse lung tumour irradiation using the 4D MOBY phantom. Br J Radiol 2017; 90: 20160419.doi: http://dx.doi.org/10.1259/bjr.20160419
Schyns LEJR, Persoon LCGG, Podesta M, van Elmpt WJC, Verhaegen F. Time-resolved versus time-integrated portal dosimetry: the role of an object’s position with respect to the isocenter in volumetric modulated arc therapy. Phys Med Biol 2016; 61: 3969–3984.doi: http://dx.doi.org/10.1088/0031-9155/61/10/3969
Persoon LCGG, Podesta M, Hoffmann L, Sanizadeh A, Schyns LEJR, de Ruiter BM, Nijsten SMJJG, Muren LP, Troost EGC, Verhaegen F. Is integrated transit planar portal dosimetry able to detect geometric changes in lung cancer patients treated with volumetric modulated arc therapy? Acta Oncol 2015; 54: 1501–1507.doi: http://dx.doi.org/10.3109/0284186X.2015.1061213

Dual energy CT imaging for preclinical and clinical radiotherapy
Lotte E J R Schyns