
Ozone and UV Radiation over Southern South America: Climatology and Anomalies
Upload
independentCategory
view
1download
0
INTERNATIONAL JOURNAL OF CLIMATOLOGYInt. J. Climatol. 33: 2260–2273 (2013)Published online 22 October 2012 in Wiley Online Library(wileyonlinelibrary.com) DOI: 10.1002/joc.3602
Climatology of precipitation over the Iberian Central Systemmountain range
L. Duran,a,b,c* E. Sanchezd and C. Yaguee
a Dpto. Ciencias, Universidad Europea de Madrid, Madrid, Spainb InterMet Sistemas y Redes S.L.U., Madrid, Spain
c Dpto. Astrofısica y Ciencias de la Atmosfera, Universidad Complutense de Madrid, Madrid, Spaind Facultad de Ciencias Medioambientales, Universidad de Castilla la Mancha, Toledo, Spain
e Dpto. Geofısica y Meteorologıa, Universidad Complutense de Madrid, Madrid, Spain
ABSTRACT: An analysis of the observed precipitation for the last 22 years (1989–2010) over Sierra de Guadarrama(centre of Iberian Central System) has been performed. Since this area has received less attention compared with othermountain ranges in Europe and the rest of the world, an exhaustive compilation of literature on precipitation maincharacteristics on Central Iberia (SW Europe) has been done. The analysis, based on both rain gauges and reanalysis,is focused on the search of the atmospheric mechanisms and moisture sources that lead to precipitation. Also, emphasishas been made in the role played by orography conditioning, the complex spatial patterns observed in the region. Thiswork shows how it behaves as an orographic island that rises over an extensive plateau with a marked Atlantic forcingdespite the distance these masses have to travel inlands, with mostly of wet days due to advection of moisture fromthe ocean and small amount of rain due to local sources of humidity and convective precipitation. It also shows thegreat enhancement of precipitation caused by the range due to orographic precipitation and the big differences found atthe downwind and upwind side of the mountain leading to marked spatial patterns seasonal dependent, complex verticalgradients and high wind direction dependency. Finally, statistically significant mean conditions of variables related withorographic precipitation are given in order to be used as boundary conditions for orographic precipitation modellingexercises. This works gives a climatic framework for future precipitation assessments that could be conducted combiningmeasurements and such models.
KEY WORDS moisture advection; orographic precipitation; alpine climate; Iberian Central System; Sierra de Guadarrama
Received 3 January 2012; Revised 22 June 2012; Accepted 9 August 2012
1. Introduction
The description of precipitation is a complex and chal-lenging issue for meteorological scientists, due to itsirregular nature in space and time, and the diversityof atmospheric scales and processes involved on itsdescription. When the influence of the orography isincluded on the analysis of precipitation, the problembecomes even more complex. At the same time, pre-cipitation over complex terrain is clearly one of therelevant research areas pointed by the main projectsfocused on water cycle studies, such as GEWEX (GlobalEnergy and Water cycle Experiment) (Lawford et al .,2004). Complexity is both related to the observationaldescription and the modelling issues. Thus, Lawfordet al . (2007), for example, explicitly points to the ‘lackof understanding the orographic processes and the bestway to incorporate it into models’ when dealing with
* Correspondence to: L. Duran, Dpto. Astrofısica y Ciencias de laAtmosfera, Facultad de Ciencias Fısicas, Universidad Complutense deMadrid, Avd. Complutense s/n, Madrid 28040, Spain.E-mail: [email protected]; [email protected]
hydrometeorological sciences. While many aspects ofthe basic mechanisms responsible for orographic precip-itation have been understood, important issues remainunresolved (Roe, 2005). Mountainous environments havebeen described on the Agenda 21 document from UnitedNations Conference on Environment and Developmentas a major component of the global environment, beingunique areas of the detection of climatic change andthe assessment of climate-related impacts (Beniston,2003).
Several precipitation databases (such as Universityof Delaware (Matsuura and Willmott, 2009) or CPC(Merged Analysis of Precipitation) (Chen et al ., 2008)worldwide, among others), based on surface point obser-vations, are available. For multiple purposes, precipi-tation has been interpolated into gridded observationaldatabases, in order to be used for climate models val-idation, hydrology impact assessment, ecology studiesand others. Climate Research Unit Database (CRU) (Newet al ., 1999) is one of the most widely used. They anal-ysed with care what happens on mountainous areas andbeing cautious and more uncertain on mountainous areas,as they suffer from the complex terrain effect on spatial
2012 Royal Meteorological Society

CLIMATOLOGY OF PRECIPITATION OVER THE IBERIAN CENTRAL SYSTEM 2261
variability, together with the fact of having more scarceand less reliable observations. It is a well-known featurethat these databases suffer from undersampling at highelevations (Briggs and Cogley, 1996). A usual approachwhen dealing with spatial interpolation of rainfall and theeffects of complex terrain is the use of digital elevationmodels along with different statistical procedures, usuallymultivariate linear regression through different kriggingapproaches. The basic assumption here is a linear relationwith elevation of measured precipitation at the availablerain gauge stations (Daly et al ., 1994; Goovaerts, 2000;Kyriakidis et al ., 2001; Marquınez et al ., 2003; Guanet al ., 2005). In the last years, a large effort has beendone to develop an observational daily gridded databasefor the whole Europe (Haylock et al ., 2008), althoughit contains a very limited number of stations over theIberian Peninsula (IP). Herrera et al . (2012) has recentlycreated a high-density daily precipitation database overthe peninsular Spain.
It is interesting to notice that several specific numericalmodels have been developed in the past years to dealwith the physical description of how precipitation isaffected by the existence of a mountain (Smith andBarstad, 2004; Barstad and Smith, 2005; Barstad et al .,2007; Kirshbaum and Smith, 2008). Their idea is toanswer from a physical point of view to the question ofhow the mountains interact with the flow extracting itshumidity and leading to precipitation. Both temporal andspatial scales and their dependency on the environmentalconditions of the air masses are analysed on thosestudies. These orographic precipitation models give morerealistic results over very complex terrain but focus onsmall domains and do not take into account phenomenasuch as convective storms, which are responsible forconsiderable rain in certain parts of the globe. It isthen crucial to determine the main phenomena that isleading to precipitation in this area, before conductingany kind of modelling exercise. Regarding this, it wouldbe interesting to classify or separate the different typesof mechanisms that lead to the precipitation arounda mountainous environment: enhancement caused oversynoptical frontal structures, purely local orographicmodifications on the vertical air movements, or themesoscale thermal and dynamic effects of mountain sidesand valleys. Nevertheless, it has been shown the difficultyin establishing a clear and unambiguous classificationof these types of precipitation related to the orography(Little et al ., 2008).
Many rainfall analysis from rain gauges measured dataand observational campaigns have been carried on in thepast years over the main mountainous regions in WesternEurope: Frei and Schar (1998), or Bougeault et al . (2001)over the Alps, or Lopez-Moreno et al . (2008) for thePyrenees, or Romero et al . (1999) over MediterraneanSpain, including part of the Pyrenees. They conclude thatprecipitation over the IP presents a wide and complexrange of different features: from the Atlantic climate onthe northern and north-west region, with annual amountsup to 2500 mm year–1, to the Mediterranean area on the
east and south coast of the peninsula. At the south-eastcoast, there is even a region with semi-arid conditions,with less than 100 mm year–1. The inner part of the IPexhibit an interesting pattern in terms of precipitation,as it is divided by the Central System (CS) mountainrange. Both southern and northern plateaus present annualprecipitations around 500 mm, but mountains show morethan 1000 mm (Font-Tullot, 1983). Some studies haveanalysed precipitation climatic features from differentperspectives (Esteban-Parra et al ., 1998; Martın-Vide,2004), showing the large spread on the regimes shown inthe IP. Del Rıo et al . (2010) have studied observed trendson precipitation during the last half of the 20th century,showing a negative trend for most of the months andareas of the IP.
Many literature has been produced relating precipita-tion at IP and large-scale patterns; Zorita et al . (1992)showed how Iberian precipitation is connected with a‘high-index’ of the North Atlantic Sea Level Pressure(SLP), confirming that the dominant process responsi-ble for the variability of rainfall over the IP was theintensity of the westerly winds and the frequency ofstorms embedded in this flow. The North Atlantic Oscil-lation (NAO) pattern ended to be the main teleconnec-tion pattern in relation with precipitation (Rodriguez-Puebla et al ., 1998; Serrano et al ., 1999; Goodessand Jones, 2002; Rodrıguez-Fonseca and Serrano, 2002;Munoz-Dıaz and Rodrigo, 2004; Trigo et al ., 2004; Gal-lego et al ., 2005; Paredes et al ., 2006; Lopez-Bustinset al ., 2008; Lopez-Moreno et al ., 2011) showing spe-cific aspects related to particular seasons behaviour andthe interannual dependency. Zanchettin et al . (2008) alsorelates winter rainfalls to other variability patterns, suchas the (El Nino/Southern Oscillation) ENSO or the PacificDecadal Oscillation. Climate variability and its relation-ship with fauna in this specific area has been documented(Bosch et al ., 2007).
CS mountain range runs from south-west to north-eastright in the centre of the IP, with several peaks risingover 2200 m over an extensive plateau of 650 m on aver-age. The central part of this range is known as Sierrade Guadarrama . It is located around 500–600 km awayfrom the Atlantic coast. This mountainous region can beclimatologically defined as an Alpine climate immersedinto a Mediterranean continentalized climate (Garcıa-Romero et al ., 2010). Alpine climates are known to havesignificant amounts of solid precipitation, low tempera-tures with small diurnal temperature amplitude, accusedsynoptic forcing due to the high altitude and strong windslocally influenced by the generalized complex orogra-phy. This mountain range has some own features dueto be under the continental influence of the extensive andsurrounding Castillian plateau, which causes high con-trast in temperatures between summer and winter and lowprecipitation during summer. This continental behaviouris in some way softened by the remaining influence ofthe Atlantic Ocean and the Mediterranean Sea. TheseMediterranean and semi-arid mountain environmentsbehave as humidity islands (Lopez-Moreno et al ., 2008).
2012 Royal Meteorological Society Int. J. Climatol. 33: 2260–2273 (2013)

2262 L. DURAN et al.
Precipitation in the centre of the IP has been relatedto advection of moist air masses and storms comingfrom the Atlantic Ocean, which are dried in their wayfrom the north and west to the east and south, losinggradually their water content as they go through theorography (Font-Tullot, 1983). In spring, summer andfall, convective precipitation due to thermal instabilityis also responsible for some precipitation, but it is veryscarce and regionalized compared to total precipitation.
Not much is known about precipitation in CS interms of temporal and spatial variability. Hydrologicalrecords and other studies (Gavilan et al ., 1998) showhow precipitation is much higher in the higher lands, withisoyets following elevation contour lines (AEMET Atlas,2011). But the lack of long rain time series with enoughspatial coverage have made difficult to keep a reliableassessment of rain fields with enough resolution. Suchkind of knowledge would be very relevant as precipitationat these mountains is the only source of fresh water for theinhabitants, agriculture and industry that exist from manycenturies ago at both sides of the mountain range. This isespecially important in the case of the region of Madrid(capital of Spain), with a population in 2010 of morethan 6 million mostly concentrated in the metropolitanarea with a huge demand of fresh water fully satisfied bythe rivers born at this mountain range.
The drying effect of the mountain when comparingnorth and south sides can be seen, for example, interms of the length of the mean dry spells, as shownin Sanchez et al . (2011). There, using both observationsand regional climate models (RCM) is seen that dry spellstend to be shorter on the northern lee, and much longeron the southern part, on climatic scales. CS exhibits aclear gradient in terms of the length of consecutive dayswithout rain for the whole of the IP, which adds evenanother point of interest for a detailed description of itsprecipitation features.
Most of the previous works on precipitation in the IPusually do not include precipitation records from moun-tain sites (Rodriguez-Puebla et al ., 1998; Serrano et al .,1999; Andres et al ., 2000; Gonzalez-Rouco et al ., 2001;Martın-Vide, 2004). This is understandable due to thespecial behaviour of mountain precipitation and the lackof observations. Using these records would lead them toless representative conclusions and fragmentation of theobtained spatial patterns. Fernandez-Mills (1995), usingprincipal component analysis performed a regionalizationof the Spanish precipitation data into ten main clus-ters including, along with many other stations from allover the Peninsula, one mountain station located in CS(Navacerrada, 1894 m). One of the clusters found in theanalysis was the North-Western Coast of the Peninsula,which included surprisingly an isolated island in the mid-dle of the plateau, right where the station Navacerradawas located. The lack of more mountainous observationalstations prevents from probably a more extended clusterover the CS. A similar behaviour was found by Beranovaand Huth (2008), who identified five modes of variabil-ity in winter monthly precipitation from mean 500 hPa
geopotential height over the Euro-Atlantic sector usingstations all over Europe in order to perform a regional-ization at an European scale. They used 11 stations inthe IP, including Navacerrada station, which ended to beincluded in the central European cluster, very far awayfrom the immediate Iberian stations which were includedin the south-European cluster as expected. There are somestudies over other mountain regions of the IP, such asGarcıa-Marın et al . (2011), over Penibetica mountains(at southern coast of IP).
Modelled climatic features of precipitation over the IPhave been also described using Global Climate Models(GCMs) by many authors, such as Trigo and Palutikof(2001), or by the dynamical downscaling technique ofthe RCM, focused just over the IP (Arribas et al ., 2003;Herrera et al ., 2010; Sanchez et al ., 2011) or in theframe of an European analysis, begin the IP one of theregions as a whole (Jacob et al ., 2007). Due to theenhanced resolution of RCMs compared with GCMs,the precipitation over the mountain regions is clearlyimproved on the RCMs when compared with the griddedobservational databases. Lopez-Moreno et al . (2011)studied the relation of the winter NAO and the mountainareas, including the CS from a group of GCMs, both forobserved period and 21st future projections.
The objective of this work is to find simple but robustclimatic answers (based on data from the last 20 yearsof observations) to the following questions about theprecipitation at the Iberian Central System: what is themain source of humidity that leads to precipitation, localsources or the ocean? How important is convective (local)precipitation in relation to frontal (larger scales) andorographic precipitation? Is precipitation behaving in thesame way at the mountain range and at each of thetwo slopes? Which role is playing orography: orographicenhancement or rain shadowing? Are rain events spatiallyfragmented or not by the mountain range? How muchsolid precipitation is present? The answers to thesequestions will establish a good foundation for furtherresearch necessary for making a reliable assessment ofprecipitation at this region and will help in the designof new precipitation monitoring systems and appropriatemodelling techniques.
2. Data used
2.1. Observational data availability
There are just few precipitation series from differentlocations at this mountain range and most of them belongto short-duration-specific campaigns, or are still too shortto perform climatological analysis. Conducting meteo-rological measurements at high altitudes implies manydifficulties as sites are very remote, difficult to maintainand with limited power sources (Duran, 2003; Lo et al .,2011). The case is even more complicated when dealingwith precipitation, which comes in form of snow and hailduring many months of the year. Under these conditions,unheated automatic tipping bucket rain gauges, which
2012 Royal Meteorological Society Int. J. Climatol. 33: 2260–2273 (2013)

CLIMATOLOGY OF PRECIPITATION OVER THE IBERIAN CENTRAL SYSTEM 2263
39.65 40.65 41.65400
600
800
1000
1200
1400
1600
1800
2000(c)
Latitude (°)
Alti
tude
(m
)
A (1113 m)S (1005 m)
N (1894 m)
C (1004 m)
M (667 m)40km aprox
(a)
Longitude (°)
Latit
ude
(°)
−10 −8.7 −7.4 −6.1 −4.8 −3.5 −2.2 −0.9 0.4 1.7 335
36
37
38
39
40
41
42
43
44
45
500
1000
1500
2000
2500
3000 m (b)
Longitude (°)
Latit
ude
(°)
A
S
N
C
M
−6 −5.65−5.3−4.95−4.6−4.25−3.9−3.55−3.2−2.85−2.539
39.3
39.6
39.9
40.2
40.5
40.8
41.1
41.4
41.7
42
400
600
800
1000
1200
1400
1600
1800
2000
2200 m
Figure 1. Elevations of Iberian Peninsula (a) and Central System (b) with locations of rain observatories used in this study: Madrid (M),Colmenar Viejo (C), Navacerrada (N), Segovia (S) and Avila (A). An approximate cross section from a trajectory south to north passing close
to observatories is also shown (c).
might be appropriate for mostly of locations, are notvery reliable for these mountain applications (Sevruk,1996; Frei and Schar, 1998; Nystuen, 1999). However,manual measurement of precipitation is very useful,since daily maintenance and supervision of the site isdone during data collection (WMO, 2008). This easesdata validation, a crucial aspect for precipitation studiesat mountain sites. It also records the water equivalentof snow and hail, since it is melted for measurement.An obvious disadvantage is that manual measurement isvery hand work consuming, what leads to scarce samplepoints and small spatial coverage.
Fortunately, the Spanish Meteorological Agency(AEMET) have been running a mountain observa-tory (Navacerrada) located in the heart of Sierra deGuadarrama , since 1946. During this period, manualobservations of the main meteorological variables havebeen collected by the Agency staff following WorldMeteorological Organization (WMO) standards every6 h. There are some other observatories with historicalrecords and good measurement practises in Madrid (since1920), Colmenar Viejo (since 1978), Segovia (since1989) and Avila (since 1985). Only Navacerrada obser-vatory (N) can be considered a mountain observatory.Colmenar (C) and Segovia are located at the southernand northern side of the mountain range, and Avila (A)and Madrid (M) are located at the northern and southernplateau, at a considerable distance. Geographical locationof the observatories is shown in Figure 1.
Data is available for all the stations after 1989, so theperiod from 1989 to 2010 has been chosen for this study.Twenty-two years of daily data should be enough for aclimatic analysis of this kind.
2.2. ERA interim reanalysis
To describe and analyse the synoptic conditions andtheir relationship with precipitation at the five sites, theECMWF ERA interim Re-Analysis will be used, whichis the improved reanalysis in terms of data assimilation,improved physics, biases corrections and increased hor-izontal resolution compared with the classical ERA40database (Uppala et al ., 2008). This reanalysis is thesame time period as for the stations is chosen, with a 1.5◦
horizontal resolution. Surface variables are: 2 m air tem-perature and SLP; and 23 atmospheric levels from surfaceup to 200 hPa: U and V components of wind, geopoten-tial height, specific humidity. The domain of study forthe reanalysis is taken from 48◦N to 33◦N in latitude and15◦W to 1.5◦E in longitude.
3. Results
3.1. Main climatic characteristics
An Alexandersson homogeneity test (Alexandersson,1986) has been performed using Madrid (Retiro) obser-vatory as the reference station, since this observatory hasbeen shown to be homogeneous (Gonzalez-Rouco et al.,2001). Figure 2 shows the test statistic ‘T ’ obtained forthe rest of the observatories. As the critical value forrejecting the null hypothesis that the series are homoge-neous at a 5% confidence level for 22 samples is 7, thenit can be concluded that the series are homogeneous.
In Table I, the main annual statistics for the wholeperiod (1989–2010) are presented. As expected, the meanprecipitation is much higher over the mountainous station(N), with 1229 mm year−1, meanwhile, the rest of the
2012 Royal Meteorological Society Int. J. Climatol. 33: 2260–2273 (2013)

2264 L. DURAN et al.
1989 1990 1991 1992 1993 1994 1995 1996 1997 1998 1999 2000 2001 2002 2003 2004 2005 2006 2007 2008 2009 20100
1
2
3
4
5
6
7
Year
T
COLMENARNAVACERRADASEGOVIAAVILA
Figure 2. Values of T of an Alexandersson test for Colmenar, Navacerrada, Segovia and Avila using Madrid as reference station. The critical Tvalue for 5% confidence level and 22 samples is 7.
Table I. Annual basic statistics per observatory (1989–2010).
Madrid Colmenar Navacerrada Segovia Avila
Mean (mm) 427 567 1229 479 418Median (mm) 435 535 1160 451 401Standard deviation (mm) 96 158 301 102 108Maximum (mm) 573 859 2011 812 679Minimum (mm) 252 354 806 352 243Mean winter precipitation (DJF, %) 28 30 31 24 23Mean spring precipitation (MAM, %) 28 26 27 29 29Mean summer precipitation (JJA, %) 9 9 9 17 14Mean fall precipitation (SON, %) 35 34 33 30 33
observatories show values smaller than 600 mm year−1.Mountainous station also exhibits larger spread from yearto year (300 mm year−1), in comparison with the plateauobservatories (less than 150 mm year−1). Table I alsoshows the percentage for each of the seasons, with arounda 30% for spring, winter and autumn, meanwhile summeronly gives around 10% of the total annual amount. It isremarkable how Avila and Segovia show higher summervalues than the rest.
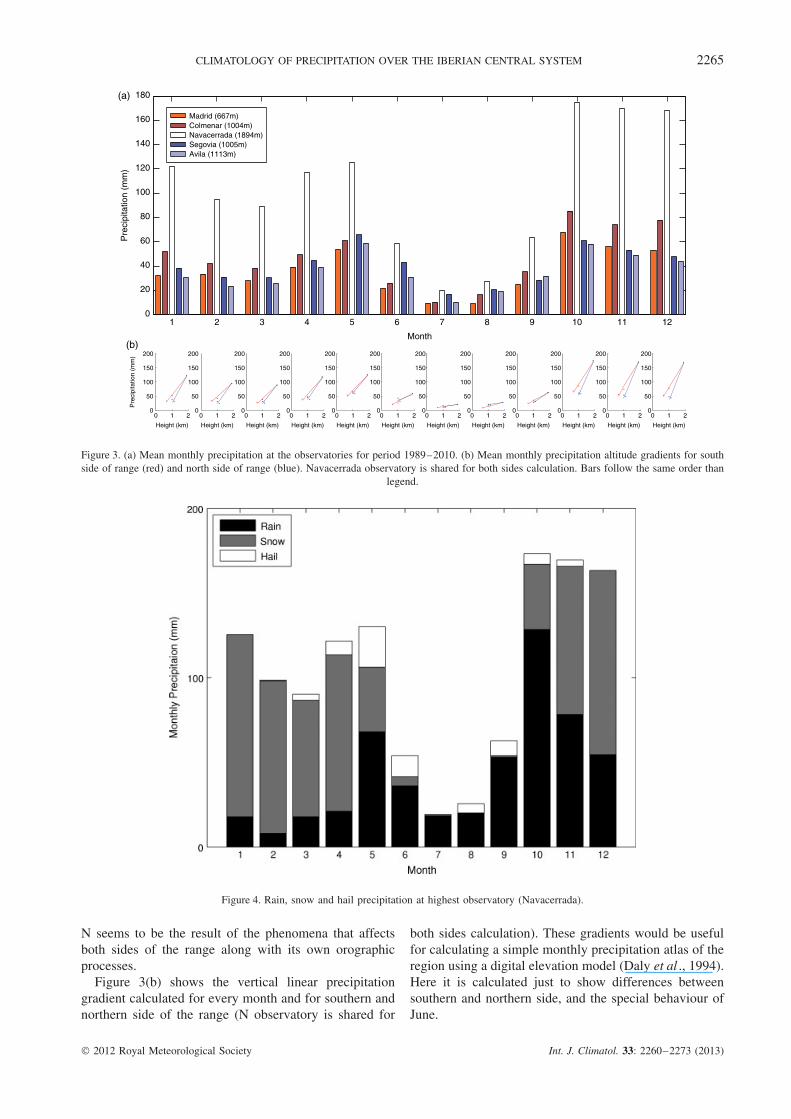
Figure 3(a) shows the climatic annual cycle of precip-itation at the five observatories, who all show bimodalpatterns with wet seasons in spring and fall plus winterand an accused minimum in summer. Precipitation at siteN is always considerable higher than the other stations, asexpected due to elevation, with an important percentageof solid precipitation (Figure 4). It is important to mentionhow precipitation shows a very marked decrease fromJune to September for all observatories. This behaviouris characteristic of the Mediterranean climates that dom-inate most of the IP. Here it is shown how CS alpineclimate seems also to be influenced by such annualprecipitation cycle, resulting in a larger decrease of
precipitation during summer than other Alpine-likeregions (Frei and Schar, 1998). This marked differencebetween summer and the rest of the year might be causedby the decrease of the advection of humidity from theocean due to synoptic disturbances. Along with this,orographically induced convective storms might be lessfrequent compared with other mountain chains, probablydue to the lack of local sources of humidity at the north-ern and southern plateau. It is also remarkable how thissummer minimum starts later in the northern side obser-vatories A and S, that show considerable precipitation inJune.
Maximum precipitation is found in spring in northernside and in fall in southern side. It is also shownhow precipitation during summer months is closer atall sites, which might indicate a possible decrease inthe role of orography in the production or enhancementof precipitation during this season, probably due to theconvective origin of precipitation during these months.Regarding N site, precipitation is always considerablyhigher than others, with a shorter summer droughtwhich extends only from July to August. Precipitation at
2012 Royal Meteorological Society Int. J. Climatol. 33: 2260–2273 (2013)
CLIMATOLOGY OF PRECIPITATION OVER THE IBERIAN CENTRAL SYSTEM 2265
1 2 3 4 5 6 7 8 9 10 11 120
20
40
60
80
100
120
140
160
180(a)
Month
Pre
cipi
tatio
n (m
m)
Madrid (667m)Colmenar (1004m)Navacerrada (1894m)Segovia (1005m)Avila (1113m)
0 1 20
50
100
150
200
0
50
100
150
200
0
50
100
150
200
0
50
100
150
200
0
50
100
150
200
0
50
100
150
200
0
50
100
150
200
0
50
100
150
200
0
50
100
150
200
0
50
100
150
200
0
50
100
150
200
0
50
100
150
200
Pre
cipi
tatio
n (m
m)
(b)
Height (km)
0 1 2
Height (km)
0 1 2
Height (km)
0 1 2
Height (km)
0 1 2
Height (km)
0 1 2
Height (km)
0 1 2
Height (km)
0 1 2
Height (km)
0 1 2
Height (km)
0 1 2
Height (km)
0 1 2
Height (km)
0 1 2
Height (km)
Figure 3. (a) Mean monthly precipitation at the observatories for period 1989–2010. (b) Mean monthly precipitation altitude gradients for southside of range (red) and north side of range (blue). Navacerrada observatory is shared for both sides calculation. Bars follow the same order than
legend.
Figure 4. Rain, snow and hail precipitation at highest observatory (Navacerrada).
N seems to be the result of the phenomena that affectsboth sides of the range along with its own orographicprocesses.
Figure 3(b) shows the vertical linear precipitationgradient calculated for every month and for southern andnorthern side of the range (N observatory is shared for
both sides calculation). These gradients would be usefulfor calculating a simple monthly precipitation atlas of theregion using a digital elevation model (Daly et al ., 1994).Here it is calculated just to show differences betweensouthern and northern side, and the special behaviour ofJune.
2012 Royal Meteorological Society Int. J. Climatol. 33: 2260–2273 (2013)
2266 L. DURAN et al.
1989 1990 1991 1992 1993 1994 1995 1996 1997 1998 1999 2000 2001 2002 2003 2004 2005 2006 2007 2008 2009 2010−2
−1
0
1
2
3
4
Year
Pre
cipi
tatio
n an
omal
ies
Madrid
Colmenar
Navacerrada
Segovia
Avila
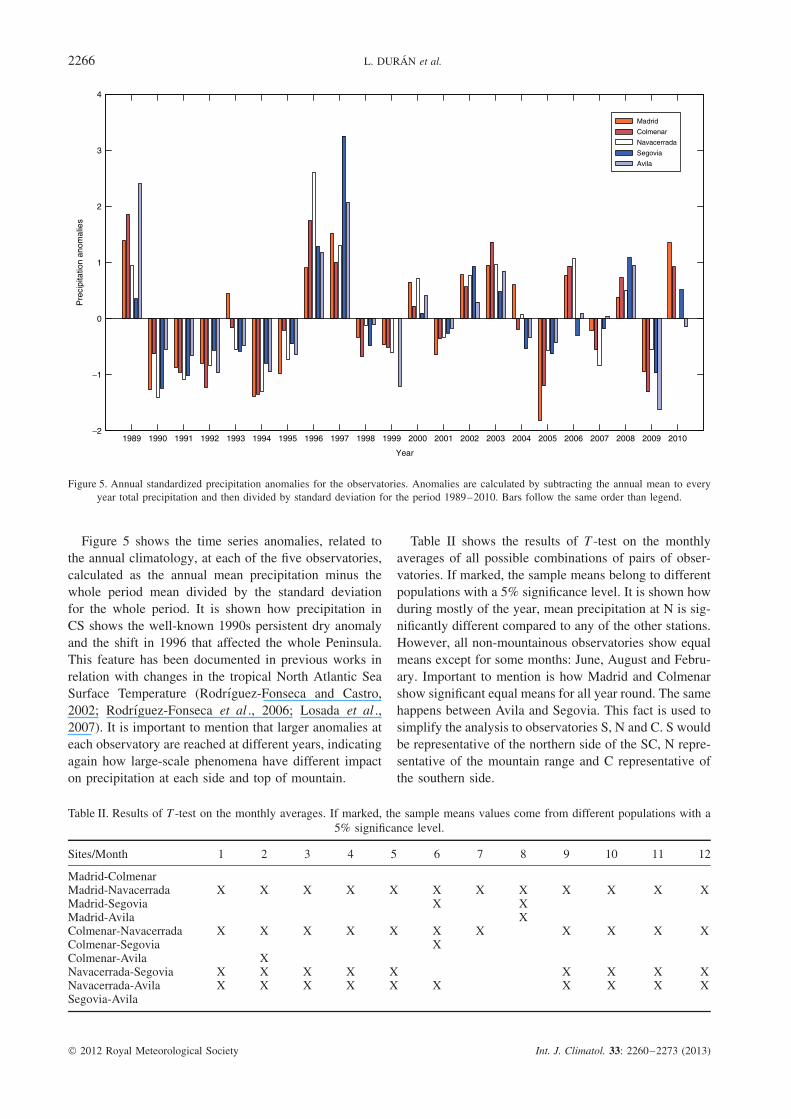
Figure 5. Annual standardized precipitation anomalies for the observatories. Anomalies are calculated by subtracting the annual mean to everyyear total precipitation and then divided by standard deviation for the period 1989–2010. Bars follow the same order than legend.
Figure 5 shows the time series anomalies, related tothe annual climatology, at each of the five observatories,calculated as the annual mean precipitation minus thewhole period mean divided by the standard deviationfor the whole period. It is shown how precipitation inCS shows the well-known 1990s persistent dry anomalyand the shift in 1996 that affected the whole Peninsula.This feature has been documented in previous works inrelation with changes in the tropical North Atlantic SeaSurface Temperature (Rodrıguez-Fonseca and Castro,2002; Rodrıguez-Fonseca et al ., 2006; Losada et al .,2007). It is important to mention that larger anomalies ateach observatory are reached at different years, indicatingagain how large-scale phenomena have different impacton precipitation at each side and top of mountain.
Table II shows the results of T -test on the monthlyaverages of all possible combinations of pairs of obser-vatories. If marked, the sample means belong to differentpopulations with a 5% significance level. It is shown howduring mostly of the year, mean precipitation at N is sig-nificantly different compared to any of the other stations.However, all non-mountainous observatories show equalmeans except for some months: June, August and Febru-ary. Important to mention is how Madrid and Colmenarshow significant equal means for all year round. The samehappens between Avila and Segovia. This fact is used tosimplify the analysis to observatories S, N and C. S wouldbe representative of the northern side of the SC, N repre-sentative of the mountain range and C representative ofthe southern side.
Table II. Results of T -test on the monthly averages. If marked, the sample means values come from different populations with a5% significance level.
Sites/Month 1 2 3 4 5 6 7 8 9 10 11 12
Madrid-ColmenarMadrid-Navacerrada X X X X X X X X X X X XMadrid-Segovia X XMadrid-Avila XColmenar-Navacerrada X X X X X X X X X X XColmenar-Segovia XColmenar-Avila XNavacerrada-Segovia X X X X X X X X XNavacerrada-Avila X X X X X X X X X XSegovia-Avila
2012 Royal Meteorological Society Int. J. Climatol. 33: 2260–2273 (2013)

CLIMATOLOGY OF PRECIPITATION OVER THE IBERIAN CENTRAL SYSTEM 2267
Table III. Definition of spatial precipitation classes according tothe observatories that record simultaneously daily precipitation.
Pattern Rain at S Rain at N Rain at C
SNC YES YES YESSNo YES YES NOoNC NO YES YESoNo NO YES NOSoo YES NO NOooC NO NO YESSoC YES NO YESooo NO NO NO
In such complex orography, density of stations wouldnot be enough to perform a spatial interpolation as doneby other authors (Daly et al ., 1994; Frei and Schar, 1998;Kyriakidis et al ., 2001; Marquınez et al ., 2003; Guan etal ., 2005). Nevertheless, in order to have an idea of thespatial extent of the rain episodes, eight different spatialprecipitation sizes are defined using precipitation from S,N and C; considering all the possible combinations ofwet and dry days at each observatory (wet day is definedas a day with a precipitation higher than 0.1 mm d−1).Classes are shown in Table III. Each of these classesrepresent the minimum known size of the rain event. Forexample, a day classified as ‘SNC’ would mean that rainwas observed that day at the three observatories: S, Nand C. Not much is known about the exact precipitationfield, but at least it is sure that daily rain field has aminimum size equal to the distance from S to C. Resultsusing this classification are shown in Figure 6 for eachseason. Around half of the days during winter, springand fall are wet days (rain at least at one of the threesites: all patterns but ‘ooo’) in CS . Of these wet days,only half of them, rain falls simultaneously at the threesites (SNC). The rest of wet days, rain falls at only twosites or one site. When rain falls at only two sites, thesesites are adjacent. Except in summer, with just 37% ofoccurrence, broad rain pattern (SNC) becomes the mostfrequent pattern being around 50% of all the wet days.The second most frequent pattern, except in summer, israin only at the top of the mountain and at northern sideof the range (‘SNo’), followed very closely in frequencyby rain only on the top of the mountain (‘oNo’), withan almost constant frequency all the year round. Northside and top pattern (‘SNo’) is more frequent than Southside and top pattern (‘oNC’). Considering that monthlyrain means (Figure 2) are higher during winter, halfspring and fall in the southern side, rain episodes areless frequent in the South side but with higher amounts.Rain at only one side of the range (‘Soo’ or ‘ooC’) is veryinfrequent, except in summer. These wet days, withoutrain on the top of the mountain, might be associated tolocal convective storms, that can be related to temperaturechanges associated to mountain conditions. Frequencyof rain at both sides of the mountain but with no rainon the top (‘SoC’), is almost negligible, confirming theconsistency of this simple classification. This patternclassification is also dependent on the direction of the
fronts that arrive to the CS, as it will be shown on nextparagraph.
3.2. Relationship between precipitation and humid airmasses reaching Sierra de Guadarrama
Precipitation is the result of a set of conditions in theatmosphere that lead the water vapour to condense andform droplets (clouds) that eventually reach the ground.Sometimes these conditions are reached in a very shorttime and space, like thermally induced storms, but inothers these conditions depend in the state of a very largeportion of the atmosphere with an origin of hundreds ofkilometers away from where precipitation takes place.These are known as the synoptic conditions.
Advection of humid air masses over continents is anessential source of precipitation at extra-tropical latitudes.One way to analyse advection of humid air massesconsists of studying the flux of water vapour in theatmosphere (Rasmuson, 1968; Trenberth and Guillemot,1998; Mariotti and Struglia, 2002). Specific humidityand wind velocity integrated from surface to 200 hPalevels have been used to calculate horizontal total columnwater vapour flux (hereafter TCWVF) using Equations(1) and (2).
Qu = 1
g
ps∫
pu
qudp (1)
Qv = 1
g
ps∫
pu
qvdp (2)
Q = Qui + Qv j (3)
where ps is surface pressure and pu is 200 hPa, q ismoisture, u and v are the horizontal wind componentsand thus Q is total column of water vapour flux.
Figure 7 shows the Pearson linear correlation coef-ficients between the monthly precipitation anomalies atthe three observatories and monthly TCWVF anomaliesfor each grid point in order to analyse the relationshipsbetween moisture advection and precipitation at the CS.Not significant correlations are neglected after applying aStudent’s t-test with 95% confidence level and monthlyanomalies of TCWVF at every grid point and precipita-tion anomalies at the observatories have been calculated.Anomalies are computed subtracting to the monthly valueat each particular year, the climatological monthly mean,dividing the result by the climatological standard devi-ation (These are known as standardized anomalies). Itis noticeable that the great correlation found betweenTCWVF values and precipitation anomalies at the threeobservatories for all year around except summer. Correla-tion maps for S show positive values during mostly of theyear, indicating that an anomalous higher flux of watervapour into IP is connected to an anomalous increase ofprecipitation. Maximum is located in the southern partof IP, this only indicates that the anomalies of TCWVFat that grid point are highly correlated with precipitation
2012 Royal Meteorological Society Int. J. Climatol. 33: 2260–2273 (2013)

2268 L. DURAN et al.
Figure 6. Spatial precipitation patterns frequencies (left) and spatial precipitation patterns frequencies for wet days (right).
Figure 7. Pearson correlation coefficient maps between monthly TCWVF anomalies at each grid point and monthly precipitation anomalies atnorthern side observatory (S), mountain top (N) and southern side observatory (C). Only significant correlations are shown.
2012 Royal Meteorological Society Int. J. Climatol. 33: 2260–2273 (2013)

CLIMATOLOGY OF PRECIPITATION OVER THE IBERIAN CENTRAL SYSTEM 2269
Figure 8. Box plot of relative humidity at 950 hPa and precipitation for all sites and seasons.
anomalies, what would be a good predictor, but does notgive any physical cause-effect connection. These anoma-lies might be associated with the main teleconnection pat-tern affecting IP, like NAO and others (Rodriguez-Pueblaet al ., 1998; Serrano et al ., 1999; Goodess and Jones,2002; Rodrıguez-Fonseca and Serrano, 2002; Munoz-Dıaz and Rodrigo, 2004; Trigo et al ., 2004; Gallego etal ., 2005). Southern observatory behaves slightly differ-ent. Here, correlation maps are shifted to the south andfirst a dipole pattern is shown in February, July and Octo-ber. These dipole patterns are formed when a band shapeflux is shifted to the south parallel to its initial trajectory,leaving northern part with a deficit in relation with cli-matology and an increase in the southern part. Mountainobservatory shares behaviour with S at the beginning ofsummer but does it with N for the end of summer. Itseems very interesting the high negative values foundin July. All these results confirms the important Atlanticforcing affecting CS. TCWVF seem to be reaching IPwith a great variety of shapes leading to a complex flowas a result of the daily synoptic configuration.
3.3. Average atmospheric conditions of the air massesthat lead to precipitation in CS
An added value of having the reanalysis data is thatit is possible to analyse the mean conditions of theadvected air masses before they reach the mountain rangeand before orographic precipitation processes dry theair. To understand the conditions of these masses thefollowing variables are analysed upwind the mountainrange: TCWVF, surface temperature, relative humidity at950 hPa and wind speed and sector. The level of 950 hPahas been chosen since it is the average pressure level ofthe plateau.
Figure 8 shows box plot diagrams for relative humid-ity at 950 hPa (the rest of plot diagrams are not shown).These box plots are a common tool useful to detectdifferent populations in a sample using null hypothesiscontrast from the median and the interquartile valuessince both parameters are robust towards the presenceof outliers. Two groups of data have been consideredper site and season: wet (W) and dry (D). Then, theextremes, the upper and lower hinges (quartiles), and themedian have been calculated and used for the box plot.On each box, the central mark is the median, the edgesof the box are the 25th (q1) and 75th (q3) percentiles,the whiskers extend to the most extreme data points notconsidered outliers, and outliers are plotted individually.Points are drawn as outliers if they are larger thanq3 + 1.5(q3 − q1) or smaller than q1 − 1.5(q3 − q1). Thevalue of 1.5 corresponds to approximately ± 2.7σ (beingσ the standard deviation) and 99.3 coverage if the dataare normally distributed. The plotted whisker extends tothe adjacent value, which is the most extreme data valuethat is not an outlier. The two medians, correspondingwet and dry day populations, are considered significantlydifferent at the 5% significance level if their intervals,defined by the notches, do not overlap. In that case, truemedians do differ with 95% confidence. Applying thenotches comparison graphically is like applying a t-testwith the upper and lower limits that fulfil the frequencydistribution for the significance level (McGill et al .,1978). Figure 8 shows box plot for relative humidity,where left box corresponds to wet days and right box todry days. From this figure seems easy to infer that the twopopulations (wet and dry events) are significantly differ-ent, since the notches do not overlap. Similar results areobtained for the rest of variables such relative humidityat low levels, surface temperature and wind (not shown).
2012 Royal Meteorological Society Int. J. Climatol. 33: 2260–2273 (2013)

2270 L. DURAN et al.
Table IV. Significant medians of ERA-interim variables closely related to orographic precipitation for wet (W) and dry (D) daysat the three observatories (Bold characters for wet days).
Season Site Kind Upwind TCWVF(kg m−1 s−1)
Upwind surfacetemperature (◦C)
Upwind relative humidityat 950 hPa (%)
Wind sector and speedat 850 hPa (m s−1)
Winter S W 165 6 86 W (6.16)D 69 5 76 N (1.1)
N W 152 6 84 W (4.9)D 60 5 75 N (1.26)
C W 165 6 86 SW (6.0)D 71 5 76 W(1.6)
Spring S W 141 11 71 W (4.15)D 78 12 55 SW (0.7)
N W 135 11 69 W (3.74)D 73 13 54 N (0.8)
C W 144 11 72 SW (4.14)D 80 13 56 NW (1.1)
Summer S W 143 21 49 SW (2.5)D 100 24 38 W (1.1)
N W 139 21 49 SW(2.3)D 100 24 38 W(1.2)
C W 142 21 49 SW(2.2)D 102 24 38 W(1.3)
Fall S W 199 12 76 W (5.7)D 95 15 59 NW (0.6)
N W 190 12 75 SW (5.0)D 87 15 58 N (0.66)
C W 206 13 77 SW (5.9)D 99 14 60 NW (1.16)
Table IV summarizes the results obtained for every siteand season. This table summarizes the mean conditionsof the main variables found in the air masses that reachCS and lead to precipitation (for wet days). As expected,precipitation at the CS seems to be very related withadvection of air masses transporting moisture from theAtlantic as seen in the significant different values ofTCWVF for wet and dry days. This points out orographicprecipitation as the main phenomena in CS precipitation.This is confirmed by the differences found in the relativehumidity of air advecting at 950 hPa for wet and dry days,specially during fall. Relative humidity is a very sensitivevariable for orographic precipitation models, speciallyfor low TCWVF (Barstad et al ., 2007). Relating winddirection, it is remarkable how mean sector for wet daysat site S is always W except in summer. On the otherhand, mean 850 hPa wind sector for wet days at C isalways SW. The simplicity of this classification schememakes robust the idea of precipitation at the CS beinghighly dependent on wind direction at medium levels ofthe troposphere.
To illustrate the directional dependency of precipitationat SC, Figure 9 shows rain-roses for the four seasons andthe three sites. Here, wind direction is divided in eightsectors containing three filled sectors representing accu-mulated precipitation at each observatory. These graphsare useful since they show the relationship between winddirection and total mean precipitation. Mostly of the pre-cipitation at the three observatories come from ‘sectorSW’, nevertheless ‘sector W’ is relevant for S while‘sector S’ is relevant for C. Taking into account the
orientation of the axis of SC (Figure 1(b)), a rain shadoweffect might be the cause of differences between differ-ent sides of the range. Again, it seems like site N sharesbehaviour of both sides and is less wind direction depen-dent. The mountain range would be drying the air massesthat travel from the Atlantic inland, sometimes these airmasses have a more west component giving precipitationat the windward side of the mountain, in this case thenorthern side, and the top of the range; and sometimeswith a more south component giving precipitation at thesouthern side and top.
These results reinforces the need of a combination oftools, modelling and high density measurements, if areliable assessment of precipitation is wanted for suchcomplex orography. Specific orographic precipitationmodels are very convenient in these cases since theyallow the use of higher spatial resolutions, considerationof more complex precipitation phenomena and longertime domains with many resolution (Barstad et al .,2008). These models are sensible to boundary conditionsand respond differently to changes in wind speed anddirection, relative humidity, surface temperature andother variables related with orographic precipitation.It has been shown here that ERA-Interim boundaryconditions could be acceptable for such purpose.
4. Conclusions
Even though numerous studies about precipitationregimes, climate variability, regionalization and other
2012 Royal Meteorological Society Int. J. Climatol. 33: 2260–2273 (2013)

CLIMATOLOGY OF PRECIPITATION OVER THE IBERIAN CENTRAL SYSTEM 2271
Figure 9. Rain-roses for the four seasons. Grey shaded sectors represent seasonally accumulated rain for 850 hPa wind coming from each sector.
climate analysis can be found focused in Western Europeand the IP for last decades, not much has been foundabout precipitation climatology in the CS mountainrange.
A basic climatic analysis has shown significant differ-ences between top, northern and southern regarding totalprecipitation, inter annual variability and time of sum-mer drought. Solid precipitation amounts at the top ofmountain are comparable with liquid precipitation duringwinter, spring and fall.
Despite the small distance among the three sites,only half of the rain episodes occur simultaneously atall of them, pointing out the complexity of the spatialdistribution of precipitation.
Total column water vapour flux calculated out ofERA Interim reanalysis has shown to be a reliablefield to understand the influence of synoptic forcings onprecipitation at the mountain range.
It has been shown how CS, although is located ata considerable distance inland and surrounded by twoextensive plateaus, is under the direct influence of thehumid air masses coming from the Atlantic Ocean. Its
presence generates the well-known drying effect of amountainous region, acting as a moisture sink of the airmasses that cross the IP. This results also indicate thesmall importance of local convective processes on thetotal precipitation.
It has been found that precipitation is stronglydirection-dependent. The relative position of the rangeaxis is crucial. This can be clearly seen as half of wetdays, precipitation can happen at one side of the rangeand top, or the other side, indicating fragmented spatialpatterns due to orography. This is also probably the rea-son of the summer drought shift found between northernand southern side.
Data from the observatories used here could be anexcellent foundation for building a reliable climaticassessment of precipitation in the CS. To have a betterpicture of precipitation at CS than those presented here, acombination of more observations and models is required.Due to the main precipitation phenomena found in thearea, specific orographic precipitation models seem to bethe most adequate, along with new measurements thatcould be able to account for all forms of precipitation.
2012 Royal Meteorological Society Int. J. Climatol. 33: 2260–2273 (2013)

2272 L. DURAN et al.
Acknowledgements
The authors would like to thank the European Centre forMedium-Range Weather Forecasts (ECMWF) for provid-ing the ERA-Interim Data and the Agencia Estatal deMeteorologıa (AEMET) for providing the observationaldata.
References
AEMET Spanish Meteorological Service. 2011. Iberian climate atlas.http://www.aemet.es/documentos/es/divulgacion/publicaciones/Atlas-climatologico/Atlas.pdf
Alexandersson H. 1986. A homogeneity test applied to precipitationdata. International Journal of Climatology 6: 661–675.
Andres M, Tomas C, de Pablo F. 2000. Spatial patterns of the daily non-convective rainfall in Castilla y Leon (Spain). International Journalof Climatology 20: 1207–1224.
Arribas A, Gallardo C, Gaertner M, Castro M. 2003. Sensitivity ofthe Iberian Peninsula to a land degradation. Climate Dynamics 20:477–489.
Barstad I, Smith RB. 2005. Evaluation of an orographic precipitationmodel. Journal of Hydrometeorology 6: 85–99.
Barstad I, Grabowski WW, Smolarkiewicz PK. 2007. Characteristicsof large-scale orographic precipitation: evaluation of linear model inidealized problems. Journal of Hydrology. 340: 78–90.
Barstad I, Sorteberg A, Flatøy F, Deque M. 2008. Precipitation,temperature and wind in Norway: dynamical downscaling of ERA40.Climate Dynamics 33(6): 769–776.
Beranova R, Huth R. 2008. Time variations of the effects of circulationvariability modes on European temperature and precipitation inwinter. International Journal of Climatology 28: 139–158.
Beniston M. 2003. Climatic change in mountain regions: a review ofpossible impacts. Climatic Change 59: 5–31.
Bosch J, Carrascal LM, Duran L, Walker S, Fisher MC. 2007. Climatechange and outbreaks of amphibian chytridiomycosis in a montanearea of Central Spain; is there a link? Proceedings of the RoyalSociety B: Biological Sciences 274: 253–260.
Bougeault P, Binder P, Buzzi A, Dirks R, Houze R, Kuettner J,Smith RB, Steinacker R, Volkert H. 2001. The MAP specialobserving period. Bulletin of the American Meterological Society 82:433–462.
Briggs PR, Cogley JG. 1996. Topographic bias in mesoscale precipi-tation networks. Journal of Climate 9: 205–218.
Chen M, Shi W, Xie P, Silva V, Kousky V, Higgins RW, JanowiakK. 2008. Assessing objective techniques for gauge-based analysesof global daily precipitation. Journal of Geophysical Research 113:D04110.
Daly C, Neilson RP, Phillips DL. 1994. A statistical-topographic modelfor mapping climatological precipitation over mountainous terrain.Journal of Applied Meteorology 33: 140–158.
Del Rıo S, Herrero L, Fraile R, Penas A. 2010. Spatial distribution ofrecent rainfall trends in Spain (1961–2006). International Journalof Climatology 31: 656–667.
Duran L. 2003. Description and preliminary results of a MeteorologicalNetwork for High Altitudes. EGS-AGU-EUG Joint Assembly.Geophysical Research Abstracts 5: 12466.
Esteban-Parra MJ, Rodrigo FS, Castro Dıez Y. 1998. Spatial andtemporal patterns of precipitation in Spain for the period 1880–1992.International Journal of Climatology 18: 1557–1574.
Fernandez-Mills G. 1995. Principal component analysis of precipita-tion and rainfall regionalization in Spain. Theoretical and AppliedClimatology 50: 169–183.
Font-Tullot I. 1983. Climatologıa de Espana y Portugal . InstitutoNacional de Meteorologıa: Madrid.
Frei C, Schar C. 1998. A precipitation climatology of the Alps fromhigh-resolution rain-gauge observations. International Journal ofClimatology 18: 873–900.
Gavilan R, Fernandez F, Blasi C. 1998. Climatic classification and ordi-nation of the Spanish Sistema Central; relationships with potentialvegetation. Plant Ecology 139: 1–11.
Gallego MC, Garcıa JA, Vaquero JM. 2005. The NAO signal in dailyrainfall series over the Iberian Peninsula. Climate Research 29:103–109.
Garcıa-Marın AP, Ayuso-Munoz JL, Taguas-Ruiz EV, Estevez J.2011. Regional analysis of the annual maximum daily rainfallin the province of Malaga (southern Spain) using the principalcomponent analysis. Water and Environment Journal 25:522–531.
Garcıa-Romero A, Munoz J, Andres N, Palacios D. 2010. Relationshipbetween climate change and vegetation distribution in the Mediter-ranean mountains: Manzanares Head valley, Sierra De Guadarrama(Central Spain). Climatic Change 100: 645–666.
Gonzalez-Rouco JF, Jimenez JL, Quesada V, Valero F. 2001. Qualitycontrol and homogeneity of precipitation data in the Southwest ofEurope. Journal of Climate 14: 964–978.
Goodess CM, Jones PD. 2002. Links between circulation and changesin the characteristics of Iberian rainfall. International Journal ofClimatology 22: 1593–1615.
Goovaerts P. 2000. Geostatistical approaches for incorporating eleva-tion into the spatial interpolation of rainfall. Journal of Hydrology228: 113–129.
Guan H, Wilson JL, Makhnin O. 2005. Geostatistical mapping ofmountain precipitation incorporating autosearched effects of ter-rain and climatic characteristics. Journal of Hydrometeorology 6:1018–1031.
Haylock MR, Hofstra N, Klein Tank AMG, Klok EJ, Jones PD, NewM. 2008. A European daily high-resolution gridded data set ofsurface temperature and precipitation for 1950–2006. Journal ofGeophysical Research 113: D20119.
Herrera S, Fita L, Fernandez J, Gutierrez JM. 2010. Evaluation ofthe mean and extreme precipitation regimes from the ENSEMBLESregional climate multimodel simulations over Spain. Journal ofGeophysical Research 115: D21117, DOI: 10.1029/2010JD013936
Herrera S, Gutierrez JM, Ancell R, Pons MR, Frıas MD, Fernandez J.2012. Development and analysis of a 50-year high-resolution dailygridded precipitation dataset over Spain (Spain02). InternationalJournal of Climatology 32: 74–85, DOI: 10.1002/joc.2256.
Jacob D, Barring L, Christensen OB, Christensen JH, de Castro M,Deque M, Giorgi F, Hagemann S, Hirschi M, Jones R, Kjellstrom E,Lenderink G, Rockel B, Sanchez E, Schar C, Seneviratne SI, SomotS, van Ulden A, van den Hurk B. 2007. An inter-comparison ofregional climate models for Europe: model performance in present-day climate. Climatic Change 81: 31–52.
Kirshbaum DJ, Smith RB. 2008. Temperature and moist-stabilityeffects on midlatitude orographic precipitation. Quarterly Journalof the Royal Meteorological Society 134: 1183–1199 Part A.
Kyriakidis PC, Kim J, Miller NL. 2001. Geostatistical mapping ofprecipitation from rain gauge data using atmospheric and terraincharacteristics. Journal of the Applied Meteorology 40: 1855–1877.
Lawford R, Stewart J, Roads H-J, Isemer M, Manton J, MarengoT, Yasunari S, Benedict TK, Williams S. 2004. Advancing Globaland continental-scale hydrometeorology. Contributions of GEWEXHydrometeorology Panel. Bulletin of the American MeterologicalSociety 85: 1917–1930, DOI: 10.1175/BAMS-85-12-1917
Lawford RG, Roads J, Lettenmaier DP, Arkin P. 2007. GEWEX con-tributions to large-scale hydrometeorology. Journal of Hydrometeo-rology 8: 629–641.
Little MA, Rodda HJE, McSharry PE. 2008. Bayesian objectiveclassification of extreme UK daily rainfall for flood risk applications.Hydrology and Earth System Sciences, Discussion. 5: 3033–3060.
Lo Y-H, Blanco JA, Seely B, Welham C, Kimmins JP. 2011.Generating reliable meteorological data in mountainous areas withscarce presence of weather records: the performance of MTCLIMin interior British Columbia, Canada. Environmental Modelling andSoftware 26(5): 644–657, DOI: 10.1016/j.envsoft.2010.11.005
Lopez-Bustins JA, Martın-Vide J, Sanchez-Lorenzo A. 2008. Iberiawinter rainfall trends based upon changes in teleconnection andcirculation patterns. Global and Planetary Change 63(2–3):171–176.
Lopez-Moreno JI, Beniston M, Garcıa-Ruiz JM. 2008. Environmentalchange and water management in the Pyrenees: facts and futureperspectives for Mediterranean mountains. Global and PlanetaryChange 61: 300–312.
Lopez-Moreno JL, Vicente Serrano SM, Moran-Tejeda E, Lorenzo-Lacruz J, Kenawy A, Beniston B. 2011. Effects of the North AtlanticOscillation (NAO) on combined temperature and precipitation wintermodes in the Mediterranean mountains: Observed relationships andprojections for the 21st century. Global and Planetary Change 77:62–76.
Losada T, Rodrıguez-Fonseca B, Garcia-Serrano J, Mechoso CR. 2007.Impacts of SST Anomalies on the North Atlantic Atmospheric
2012 Royal Meteorological Society Int. J. Climatol. 33: 2260–2273 (2013)

CLIMATOLOGY OF PRECIPITATION OVER THE IBERIAN CENTRAL SYSTEM 2273
Circulation: A case study for the Northern Winter 1995/96. ClimateDynamics 29: 807–819.
Mariotti A, Struglia MV. 2002. The hydrological cycle in the Mediter-ranean region and implications for the water budget of the Mediter-ranean sea. Journal of Climate 15: 1674–1690.
Marquınez J, Lastra J, Garcıa P. 2003. Estimation models for pre-cipitation in mountainous regions: the use of GIS and multivariateanalysis. Journal of Hydrology 270: 1–11.
Martın-Vide J. 2004. Spatial distribution of a daily precipitationconcentration index in peninsular Spain. International Journal ofClimatology 24: 959–971.
Matsuura K. and Willmott C. J. 2009 Terrestrial Air Temperature:1900–2008 Gridded Monthly Time Series . Center for ClimaticResearch, Dep. Of Geography, University of Delaware, Newark.http://climate.geog.udel.edu/∼climate/
McGill R, Tukey JW, Larsen WA. 1978. Variations of Boxplots. TheAmerican Statistician 32(1): 12–16.
Munoz-Dıaz D, Rodrigo FS. 2004. Impacts of the North AtlanticOscillation on the probability of dry and wet winters in Spain.Climate Research 27: 33–43.
New M, Hulme M, Jones PD. 1999. Representing twentieth cen-tury space-time climate variability, 1, Development of a 1961–90mean monthly terrestrial climatology. Journal of Climate 12:829–856.
Nystuen JA. 1999. Relative performance of automatic rain gaugesunder different rainfall conditions. Journal of Atmospheric andOceanic Technology 16: 1025–1043.
Paredes D, Trigo RM, Garcia-Herrera R, Trigo IF. 2006. Understandingprecipitation changes in Iberia in early spring: weather typingand storm-tracking approaches. Journal of Hydrometeorology 7(1):101–113.
Rasmuson EM. 1968. Atmospheric water vapor transport and the waterbalance of North America. Monthly Weather Review 96: 720–734.
Rodrıguez-Fonseca B, Castro M. 2002. On the connection betweenwinter anomalous precipitation in the Iberian Peninsula and Moroccoand the summer subtropical Atlantic SST. Geophysical ResearchLetters 29: 1863–1866.
Rodrıguez-Fonseca B, Serrano E. 2002. Winter 10-day coupled pat-terns between geopotential height and Iberian Peninsula rainfallusing the ECMWF precipitation reanalysis. Journal of Climate 15:1309–1321.
Rodrıguez-Fonseca B, Polo I, Serrano E, Castro M. 2006. Evaluation ofthe North Atlantic SST forcing on the European and northern Africanwinter climate. International Journal of Climatology 26: 179–191.
Rodriguez-Puebla C, Encinas AH, Nieto S, Garmendia J. 1998.Spatial and temporal patterns of annual precipitation variabilityover the Iberian Peninsula. International Journal of Climatology 18:299–316.
Roe GH. 2005. Orographic precipitation. Annual Review of Earth andPlanetary Sciences 33: 645–71.
Romero R, Ramis C, Guijarro JA, Sumner G. 1999. Daily rainfallaffinity areas in the Mediterranean Spain. International Journal ofClimatology 19: 557–578.
Smith RB, Barstad I. 2004. A linear theory of orographic precipitation.Journal of the Atmospheric Sciences 61(12): 1377–1391.
Sanchez E, Domınguez M, Romera R, de la Franca NL, Gaertner M,Gallardo C, Castro M. 2011. Regional modeling of dry spells over theIberian Peninsula for present climate and climate change conditions.Climatic Change 107: 625–634.
Serrano A, Garcıa JA, Mateos VL, Cancillo ML, Garrido J. 1999.Monthly modes of variation of precipitation over the IberianPeninsula. Journal of Climate 12: 2894–2919.
Sevruk B. 1996. Adjustment of tipping-bucket precipitation gaugemeasurements. Atmospheric Research 42(1–4): 237–246.
Trenberth KE, Guillemot CJ. 1998. Evaluation of the atmosphericmoisture and hydrological cycle in the NCEP/NCAR reanalyses.Climate Dynamics 14: 213–231.
Trigo RM, Palutikof JP. 2001. Precipitation scenarios over Iberia: acomparison between direct GCM output and different downscalingtechniques. Journal of Climate 14: 4422–4446.
Trigo RM, Pozo-Vazquez D, Osborn TJ, Castro-Dıez Y, Gamiz-FortisS, Esteban-Parra MJ. 2004. North Atlantic oscillation influence onprecipitation, river flow and water resources in the Iberian Peninsula.International Journal of Climatology 24: 925–944.
Uppala SM, Dee DP, Kobayashi S, Berrisford P, Simmons AJ.2008. Towards a climate data assimilation system: Status update ofERAInterim. ECMWF Newsletter 115: 12–18.
WMO World Meteorological Organization 2008. Guide to Meteoro-logical Instruments and Methods of Observation. WMO-No. 8. 7.Meteorological Organization, 978-92-63-100085.
Zanchettin D, Franks SW, Traverso P, Tomasino M. 2008. On ENSOimpacts on European wintertime rainfalls and their modulation by theNAO and the Pacific multi-decadal variability described through thePDO index. International Journal of Climatology 28(8): 995–1006.
Zorita E, Kharin V, von Storch H. 1992. The atmospheric circulationand sea surface temperature in the North Atlantic Area in winter:their interaction and relevance for Iberian precipitation. Journal ofClimate 5: 1097–1108.
2012 Royal Meteorological Society Int. J. Climatol. 33: 2260–2273 (2013)
Copyright © 2022 FDOKUMEN