Climate variability in the Aral Sea basin (Central Asia) during the late Holocene based on...
14
Climate variability in the Aral Sea basin (Central Asia) during the late Holocene based on vegetation changes Philippe Sorrel a, ⁎ , Speranta-Maria Popescu b , Stefan Klotz b,c , Jean-Pierre Suc b , Hedi Oberhänsli a a GeoForschungsZentrum Potsdam, Telegraphenberg, D-14473 Potsdam, Germany b Laboratoire PaléoEnvironnements et PaléobioSphère (UMR 5125 CNRS), Université Claude Bernard-Lyon 1, 27–43 boulevard du 11 Novembre, F-69622 Villeurbanne Cedex, France c Institut für Geowissenschaften, Universität Tübingen, Sigwartstrasse 10, D-72070 Tübingen, Germany Received 21 November 2006 Available online 25 January 2007 Abstract High-resolution pollen analyses (∼ 50 yr) from sediment cores retrieved at Chernyshov Bay in the NW Large Aral Sea record shifts in vegetational development from subdesertic to steppe vegetation in the Aral Sea basin during the late Holocene. Using pollen data to quantify climatic parameters, we reconstruct and date for the first time significant changes in moisture conditions in Central Asia during the past 2000 yr. Cold and arid conditions prevailed between ca. AD 0 and 400, AD 900 and 1150, and AD 1500 and 1650 with the extension of xeric vegetation dominated by steppe elements. These intervals are characterized by low winter and summer mean temperatures and low mean annual precipitation (P mm <250 mm/yr). Conversely, the most suitable climate conditions occurred between ca. AD 400 and 900, and AD 1150 and 1450, when steppe vegetation was enriched by plants requiring moister conditions (P mm ∼ 250–500 mm/yr) and some trees developed. Our results are fairly consistent with other late Holocene records from the eastern Mediterranean region and the Middle East, showing that regional rainfall in Central Asia is predominantly controlled by the eastern Mediterranean cyclonic system when the North Atlantic Oscillation (NAO) is in a negative phase. © 2006 University of Washington. All rights reserved. Keywords: Pollen analysis; Vegetation; Climate; Aral Sea; Late Holocene; Central Asia; Negative NAO Introduction Numerous biostratigraphic, geomorphological and archae- ological proxy data document that climate of Central Asian deserts and semi-deserts experienced many changes at various time scales through the Pleistocene and Holocene (e.g., Velichko, 1989; Tarasov et al., 1998a; Boomer et al., 2000; Boroffka et al., 2005, 2006). Climatic variations resulted in multiple shifts from hyper-arid to semi-arid deserts and even steppe vegetations with development of shrubs (Kremenetski and Tarasov, 1997; Kremenetski et al., 1997; Tarasov, 1992; Tarasov et al., 1997, 1998a). Whereas environmental and climate changes are well documented in southwestern Siberia and Kazakhstan during the Pleistocene and early Holocene (Kremenetski and Tarasov, 1997; Kremenetski et al., 1997; Tarasov et al., 1997), however, they are still scarce for the Aral Sea (e.g., Rubanov et al., 1987; Boomer et al., 2000). Using pollen and tree macrofossil records, Tarasov et al. (1998a) reconstructed vegetation biomes at ca. 6000 14 C yr BP and documented dry conditions similar to present-day ones around the Aral Sea. Distinct vegetation changes occurred in north- eastern Kazakhstan (Kremenetski and Tarasov, 1997). From two peatlands and two lakes sections, they document a milder climate between 6000 and 4500 14 C yr BP, followed by drier and more continental conditions during 4500–3600 14 C yr BP, and a “less continental” climate during 3300–2700 14 C yr BP. Recently, Esper et al. (2002) published a high-resolution climate record from the Karakorum and Tien-Shan Moun- tains based on tree-ring width, documenting prominent temperature changes for the last 1200 yr. They reported relatively warm conditions during AD 800–1000, AD 1300– Quaternary Research 67 (2007) 357 – 370 www.elsevier.com/locate/yqres ⁎ Corresponding author. Present address: Laboratoire « Morphodynamique continentale et côtière (M2C) » (UMR 6143 CNRS), Université de Caen Basse- Normandie, 24 rue des Tilleuls, F-14000 Caen, France. Fax: +33 231 565 757. E-mail address: [email protected] (P. Sorrel). 0033-5894/$ - see front matter © 2006 University of Washington. All rights reserved. doi:10.1016/j.yqres.2006.11.006
-
Upload
univ-lyon1 -
Category
Documents
-
view
1 -
download
0
Transcript of Climate variability in the Aral Sea basin (Central Asia) during the late Holocene based on...
(2007) 357–370www.elsevier.com/locate/yqres
Quaternary Research 67
Climate variability in the Aral Sea basin (Central Asia) during the lateHolocene based on vegetation changes
Philippe Sorrel a,⁎, Speranta-Maria Popescu b, Stefan Klotz b,c, Jean-Pierre Suc b, Hedi Oberhänsli a
a GeoForschungsZentrum Potsdam, Telegraphenberg, D-14473 Potsdam, Germanyb Laboratoire PaléoEnvironnements et PaléobioSphère (UMR 5125 CNRS), Université Claude Bernard-Lyon 1, 27–43 boulevard du 11 Novembre,
F-69622 Villeurbanne Cedex, Francec Institut für Geowissenschaften, Universität Tübingen, Sigwartstrasse 10, D-72070 Tübingen, Germany
Received 21 November 2006Available online 25 January 2007
Abstract
High-resolution pollen analyses (∼50 yr) from sediment cores retrieved at Chernyshov Bay in the NW Large Aral Sea record shifts invegetational development from subdesertic to steppe vegetation in the Aral Sea basin during the late Holocene. Using pollen data to quantifyclimatic parameters, we reconstruct and date for the first time significant changes in moisture conditions in Central Asia during the past 2000 yr.Cold and arid conditions prevailed between ca. AD 0 and 400, AD 900 and 1150, and AD 1500 and 1650 with the extension of xeric vegetationdominated by steppe elements. These intervals are characterized by low winter and summer mean temperatures and low mean annual precipitation(Pmm <250 mm/yr). Conversely, the most suitable climate conditions occurred between ca. AD 400 and 900, and AD 1150 and 1450, when steppevegetation was enriched by plants requiring moister conditions (Pmm ∼250–500 mm/yr) and some trees developed. Our results are fairlyconsistent with other late Holocene records from the eastern Mediterranean region and the Middle East, showing that regional rainfall in CentralAsia is predominantly controlled by the eastern Mediterranean cyclonic system when the North Atlantic Oscillation (NAO) is in a negative phase.© 2006 University of Washington. All rights reserved.
Keywords: Pollen analysis; Vegetation; Climate; Aral Sea; Late Holocene; Central Asia; Negative NAO
Introduction
Numerous biostratigraphic, geomorphological and archae-ological proxy data document that climate of Central Asiandeserts and semi-deserts experienced many changes at varioustime scales through the Pleistocene and Holocene (e.g.,Velichko, 1989; Tarasov et al., 1998a; Boomer et al., 2000;Boroffka et al., 2005, 2006). Climatic variations resulted inmultiple shifts from hyper-arid to semi-arid deserts and evensteppe vegetations with development of shrubs (Kremenetskiand Tarasov, 1997; Kremenetski et al., 1997; Tarasov, 1992;Tarasov et al., 1997, 1998a). Whereas environmental andclimate changes are well documented in southwestern Siberia
⁎ Corresponding author. Present address: Laboratoire « Morphodynamiquecontinentale et côtière (M2C) » (UMR 6143 CNRS), Université de Caen Basse-Normandie, 24 rue des Tilleuls, F-14000 Caen, France. Fax: +33 231 565 757.
E-mail address: [email protected] (P. Sorrel).
0033-5894/$ - see front matter © 2006 University of Washington. All rights reservdoi:10.1016/j.yqres.2006.11.006
and Kazakhstan during the Pleistocene and early Holocene(Kremenetski and Tarasov, 1997; Kremenetski et al., 1997;Tarasov et al., 1997), however, they are still scarce for the AralSea (e.g., Rubanov et al., 1987; Boomer et al., 2000). Usingpollen and tree macrofossil records, Tarasov et al. (1998a)reconstructed vegetation biomes at ca. 6000 14C yr BP anddocumented dry conditions similar to present-day ones aroundthe Aral Sea. Distinct vegetation changes occurred in north-eastern Kazakhstan (Kremenetski and Tarasov, 1997). From twopeatlands and two lakes sections, they document a milderclimate between 6000 and 4500 14C yr BP, followed by drier andmore continental conditions during 4500–3600 14C yr BP, and a“less continental” climate during 3300–2700 14C yr BP.Recently, Esper et al. (2002) published a high-resolutionclimate record from the Karakorum and Tien-Shan Moun-tains based on tree-ring width, documenting prominenttemperature changes for the last 1200 yr. They reportedrelatively warm conditions during AD 800–1000, AD 1300–
ed.
358 P. Sorrel et al. / Quaternary Research 67 (2007) 357–370
1450, and during the past century. In contrast, loweredtemperatures were inferred during AD 1000–1200 andduring the “Little Ice Age” (AD 1450–1900).
In the Aral Sea area, high-resolution climatic studies havebeen recently undertaken in the context of the projectCLIMAN (Nourgaliev et al., 2003; Sorrel et al., 2006). Inthis study, we present a new pollen record covering the last2000 yr with a time resolution of ca. 50 yr. Based onquantitative pollen analyses, we use pollen data to showsignificant changes in moisture conditions, temperature, andvegetation patterns in the Aral Sea basin. Our objective is toidentify climatically induced shifts in the terrestrial vegetationsurrounding the lake and to compare them to other recordsfrom the Middle East and Central Asia. These data are thencritically evaluated in order to initially assess late Holoceneclimatic changes in Central Asia.
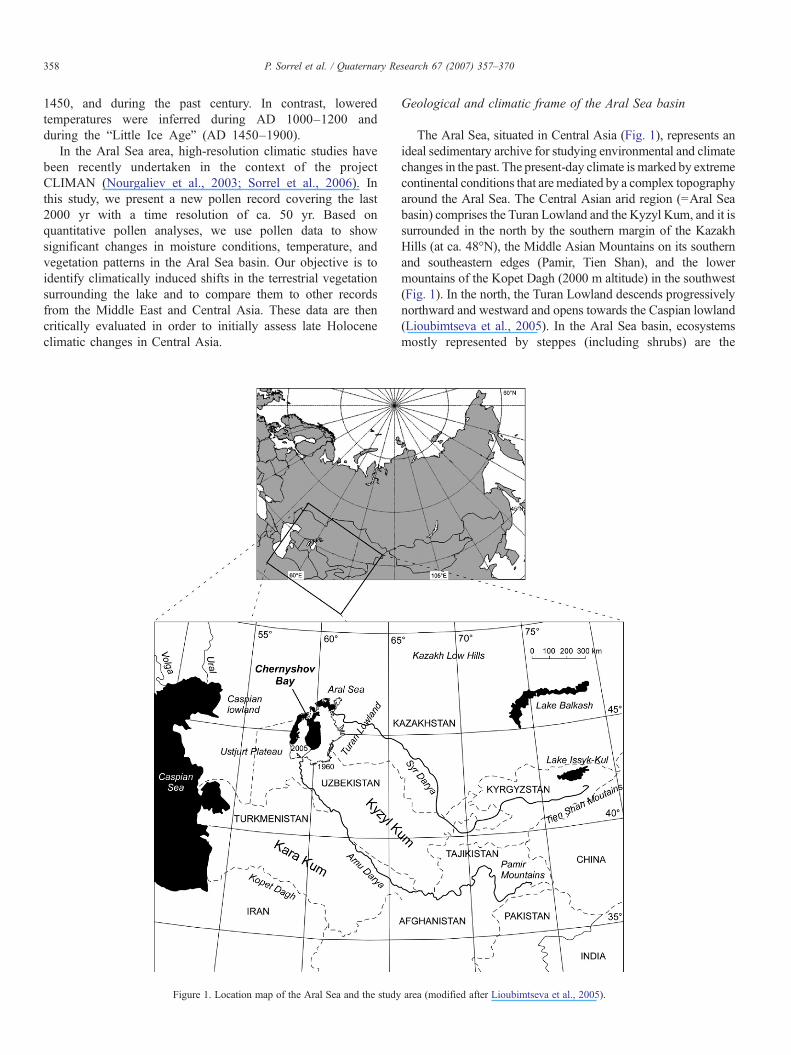
Figure 1. Location map of the Aral Sea and the study
Geological and climatic frame of the Aral Sea basin
The Aral Sea, situated in Central Asia (Fig. 1), represents anideal sedimentary archive for studying environmental and climatechanges in the past. The present-day climate is marked by extremecontinental conditions that are mediated by a complex topographyaround the Aral Sea. The Central Asian arid region (=Aral Seabasin) comprises the Turan Lowland and the Kyzyl Kum, and it issurrounded in the north by the southern margin of the KazakhHills (at ca. 48°N), the Middle Asian Mountains on its southernand southeastern edges (Pamir, Tien Shan), and the lowermountains of the Kopet Dagh (2000 m altitude) in the southwest(Fig. 1). In the north, the Turan Lowland descends progressivelynorthward and westward and opens towards the Caspian lowland(Lioubimtseva et al., 2005). In the Aral Sea basin, ecosystemsmostly represented by steppes (including shrubs) are the
area (modified after Lioubimtseva et al., 2005).

359P. Sorrel et al. / Quaternary Research 67 (2007) 357–370
prevailing landscapes. Some isolated trees (e.g., poplar, tamarisk,elm, oak), which are typical for riparian ecosystems, are restrictedto the banks of two major Central Asian rivers, the Syr Darya andthe Amu Darya. Winters, dominated by the Siberian HighPressure Cell (Zavialov, 2005), are cold. Severe frosts, with meantemperatures of −26 °C and absolute minimum of −40 °C arecommon (Lioubimtseva et al., 2005). In contrast, summers arehot, cloudless and dry. In autumn, a rapid cooling of the land tendsto stabilize the atmosphere, protracting the dry season. Therefore,rain is rare in the basin with maximum precipitation in winter andearly spring (Lioubimtseva, 2002; Nezlin et al., 2005), whereasalmost no rain occurs betweenMay and October (e.g., Létolle andMainguet, 1993; Zavialov, 2005). Overall, the characteristicnumber of rainy days is 30–45 per yr (Bortnik and Chistyaeva,1990), and precipitation over the Aral Sea tends to increasenorthwards (Zavialov, 2005).
Materials and methods
Site, sediments and chronology
During a field campaign in the summer 2002, piston coresCH1 (11.04 m) and CH2 (6.0 m) (45°58.528′N, 59°14.459′E;water depth 22 m) were retrieved with a Usinger piston corer(http://www.uwitec.at) about one km off the shoreline atChernyshov Bay (Fig. 1). We investigated the composite
Figure 2. Simplified lithological profile and age model for section CH2/1 based
sediment core CH2/1 (Cores CH1 and CH2), whose total lengthis 10.79 m. The correlation between Cores CH1 and CH2 wasperformed by matching laminations, using photographs,physical properties and XRF scanning data. Detailed lithologi-cal description of section CH2/1 is given in Sorrel et al. (2006).A simplified lithological profile and the age model for sectionCH2/1 are presented in Figure 2.
In section CH2/1, reliable dating for the upper 5 m wasobtained by correlation with the magnetic susceptibility recordfrom parallel cores 7, 8 and 9 retrieved ca. 50 m apart from thestudied cores (Nourgaliev et al., 2003). This correlation providesan age of 480±120 cal yr BP at 1.4 m depth and 655±65 cal yrBP at 4.48 m in section CH2/1 (Table 1). For the lower part ofsection CH2/1 [5.00–10.79 m], AMS radiocarbon ages weredetermined using the green alga Vaucheria sp. and CaCO3 frommollusc shells, which were successively picked from the washedsediment sample and carefully cleaned from adhering particles.Algae were stored in distilled water within a glass vessel. Foreach sample, AMS 14C dating was performed using between 0.2and 1.0 mg of pure extracted carbon. Extrapolation ofsedimentation rates below 8.3 m provides an age of ca. 200014C yr BP for the basement of section CH2/1. A samplinginterval of 30 to 40 cm was selected, which provides a timeresolution of ca. 50 yr. The top of the core (uppermost 40 cm) hasbeen dated as post-AD 1963, as based on a peak in 137Cs at0.46 m reflecting the bomb period (ca. AD 1963–1964) (Heim,
on AMS 14C dating (full dots). Open dot: peak in 137Cs [AD 1963–1964].
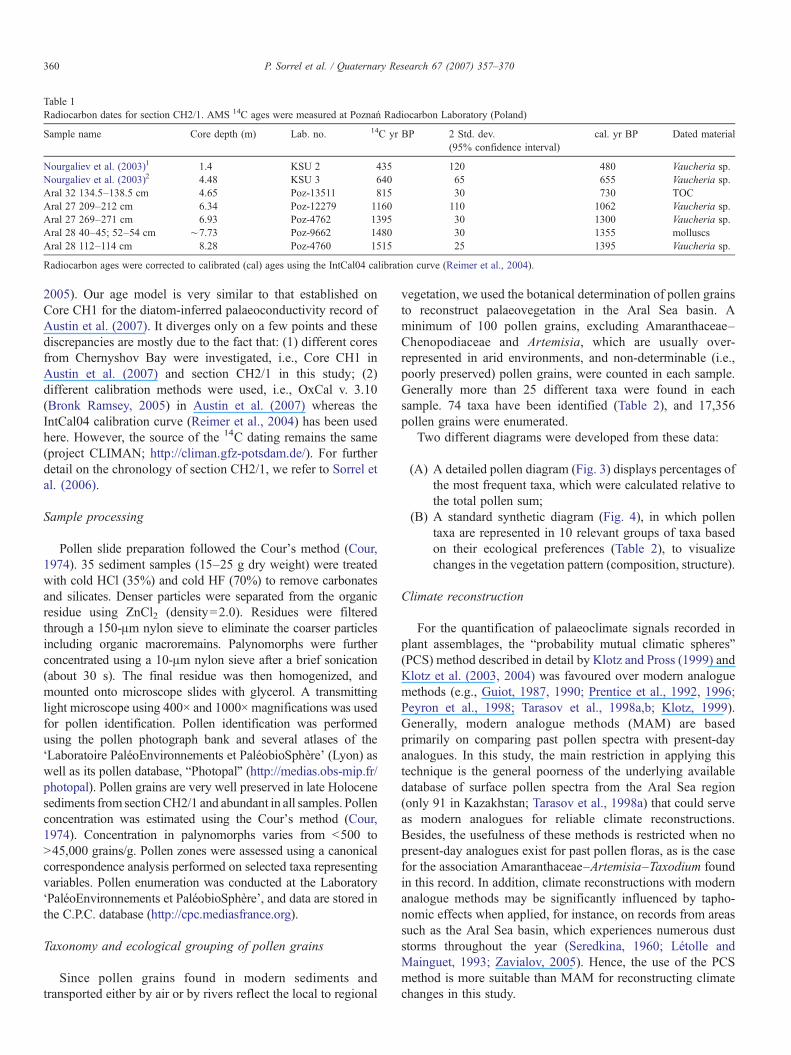
Table 1Radiocarbon dates for section CH2/1. AMS 14C ages were measured at Poznań Radiocarbon Laboratory (Poland)
Sample name Core depth (m) Lab. no. 14C yr BP 2 Std. dev.(95% confidence interval)
cal. yr BP Dated material
Nourgaliev et al. (2003)1 1.4 KSU 2 435 120 480 Vaucheria sp.Nourgaliev et al. (2003)2 4.48 KSU 3 640 65 655 Vaucheria sp.Aral 32 134.5–138.5 cm 4.65 Poz-13511 815 30 730 TOCAral 27 209–212 cm 6.34 Poz-12279 1160 110 1062 Vaucheria sp.Aral 27 269–271 cm 6.93 Poz-4762 1395 30 1300 Vaucheria sp.Aral 28 40–45; 52–54 cm ∼7.73 Poz-9662 1480 30 1355 molluscsAral 28 112–114 cm 8.28 Poz-4760 1515 25 1395 Vaucheria sp.
Radiocarbon ages were corrected to calibrated (cal) ages using the IntCal04 calibration curve (Reimer et al., 2004).
360 P. Sorrel et al. / Quaternary Research 67 (2007) 357–370
2005). Our age model is very similar to that established onCore CH1 for the diatom-inferred palaeoconductivity record ofAustin et al. (2007). It diverges only on a few points and thesediscrepancies are mostly due to the fact that: (1) different coresfrom Chernyshov Bay were investigated, i.e., Core CH1 inAustin et al. (2007) and section CH2/1 in this study; (2)different calibration methods were used, i.e., OxCal v. 3.10(Bronk Ramsey, 2005) in Austin et al. (2007) whereas theIntCal04 calibration curve (Reimer et al., 2004) has been usedhere. However, the source of the 14C dating remains the same(project CLIMAN; http://climan.gfz-potsdam.de/). For furtherdetail on the chronology of section CH2/1, we refer to Sorrel etal. (2006).
Sample processing
Pollen slide preparation followed the Cour's method (Cour,1974). 35 sediment samples (15–25 g dry weight) were treatedwith cold HCl (35%) and cold HF (70%) to remove carbonatesand silicates. Denser particles were separated from the organicresidue using ZnCl2 (density=2.0). Residues were filteredthrough a 150-μm nylon sieve to eliminate the coarser particlesincluding organic macroremains. Palynomorphs were furtherconcentrated using a 10-μm nylon sieve after a brief sonication(about 30 s). The final residue was then homogenized, andmounted onto microscope slides with glycerol. A transmittinglight microscope using 400× and 1000× magnifications was usedfor pollen identification. Pollen identification was performedusing the pollen photograph bank and several atlases of the‘Laboratoire PaléoEnvironnements et PaléobioSphère’ (Lyon) aswell as its pollen database, “Photopal” (http://medias.obs-mip.fr/photopal). Pollen grains are very well preserved in late Holocenesediments from sectionCH2/1 and abundant in all samples. Pollenconcentration was estimated using the Cour's method (Cour,1974). Concentration in palynomorphs varies from <500 to>45,000 grains/g. Pollen zones were assessed using a canonicalcorrespondence analysis performed on selected taxa representingvariables. Pollen enumeration was conducted at the Laboratory‘PaléoEnvironnements et PaléobioSphère’, and data are stored inthe C.P.C. database (http://cpc.mediasfrance.org).
Taxonomy and ecological grouping of pollen grains
Since pollen grains found in modern sediments andtransported either by air or by rivers reflect the local to regional
vegetation, we used the botanical determination of pollen grainsto reconstruct palaeovegetation in the Aral Sea basin. Aminimum of 100 pollen grains, excluding Amaranthaceae–Chenopodiaceae and Artemisia, which are usually over-represented in arid environments, and non-determinable (i.e.,poorly preserved) pollen grains, were counted in each sample.Generally more than 25 different taxa were found in eachsample. 74 taxa have been identified (Table 2), and 17,356pollen grains were enumerated.
Two different diagrams were developed from these data:
(A) A detailed pollen diagram (Fig. 3) displays percentages ofthe most frequent taxa, which were calculated relative tothe total pollen sum;
(B) A standard synthetic diagram (Fig. 4), in which pollentaxa are represented in 10 relevant groups of taxa basedon their ecological preferences (Table 2), to visualizechanges in the vegetation pattern (composition, structure).
Climate reconstruction
For the quantification of palaeoclimate signals recorded inplant assemblages, the “probability mutual climatic spheres”(PCS) method described in detail by Klotz and Pross (1999) andKlotz et al. (2003, 2004) was favoured over modern analoguemethods (e.g., Guiot, 1987, 1990; Prentice et al., 1992, 1996;Peyron et al., 1998; Tarasov et al., 1998a,b; Klotz, 1999).Generally, modern analogue methods (MAM) are basedprimarily on comparing past pollen spectra with present-dayanalogues. In this study, the main restriction in applying thistechnique is the general poorness of the underlying availabledatabase of surface pollen spectra from the Aral Sea region(only 91 in Kazakhstan; Tarasov et al., 1998a) that could serveas modern analogues for reliable climate reconstructions.Besides, the usefulness of these methods is restricted when nopresent-day analogues exist for past pollen floras, as is the casefor the association Amaranthaceae–Artemisia–Taxodium foundin this record. In addition, climate reconstructions with modernanalogue methods may be significantly influenced by tapho-nomic effects when applied, for instance, on records from areassuch as the Aral Sea basin, which experiences numerous duststorms throughout the year (Seredkina, 1960; Létolle andMainguet, 1993; Zavialov, 2005). Hence, the use of the PCSmethod is more suitable than MAM for reconstructing climatechanges in this study.
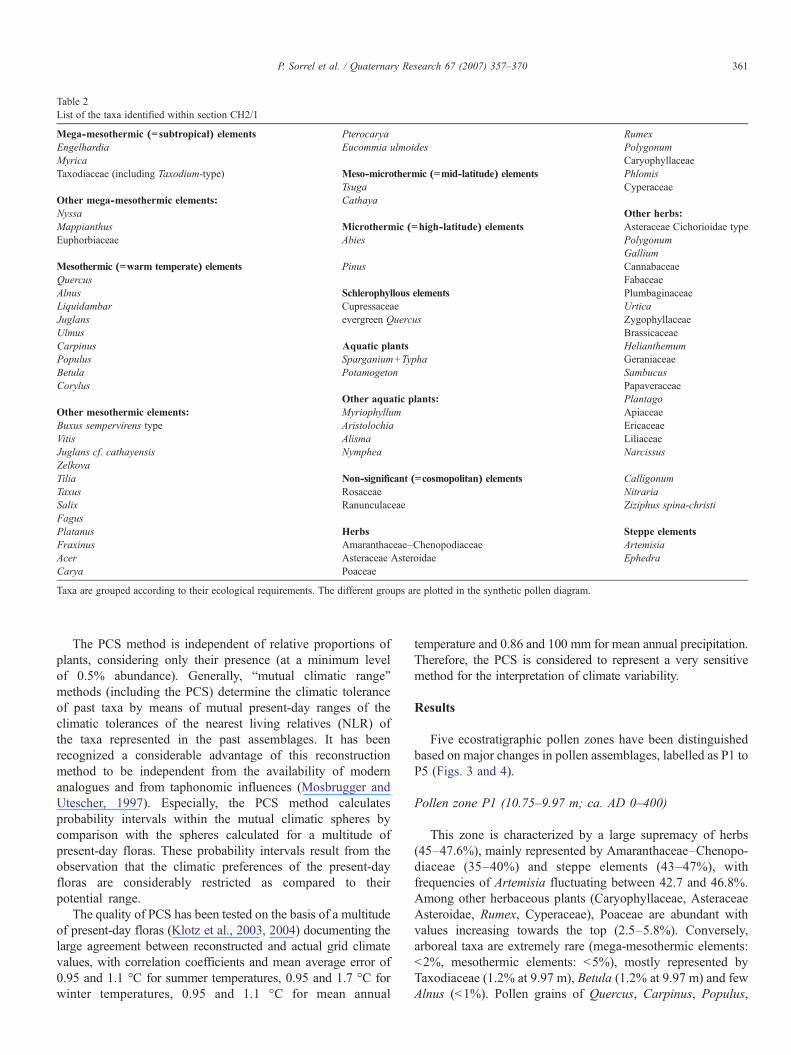
Table 2List of the taxa identified within section CH2/1
Mega-mesothermic (=subtropical) elements Pterocarya RumexEngelhardia Eucommia ulmoides PolygonumMyrica CaryophyllaceaeTaxodiaceae (including Taxodium-type) Meso-microthermic (=mid-latitude) elements Phlomis
Tsuga CyperaceaeOther mega-mesothermic elements: CathayaNyssa Other herbs:Mappianthus Microthermic (=high-latitude) elements Asteraceae Cichorioidae typeEuphorbiaceae Abies Polygonum
GalliumMesothermic (=warm temperate) elements Pinus CannabaceaeQuercus FabaceaeAlnus Schlerophyllous elements PlumbaginaceaeLiquidambar Cupressaceae UrticaJuglans evergreen Quercus ZygophyllaceaeUlmus BrassicaceaeCarpinus Aquatic plants HelianthemumPopulus Sparganium+Typha GeraniaceaeBetula Potamogeton SambucusCorylus Papaveraceae
Other aquatic plants: PlantagoOther mesothermic elements: Myriophyllum ApiaceaeBuxus sempervirens type Aristolochia EricaceaeVitis Alisma LiliaceaeJuglans cf. cathayensis Nymphea NarcissusZelkovaTilia Non-significant (=cosmopolitan) elements CalligonumTaxus Rosaceae NitrariaSalix Ranunculaceae Ziziphus spina-christiFagusPlatanus Herbs Steppe elementsFraxinus Amaranthaceae–Chenopodiaceae ArtemisiaAcer Asteraceae Asteroidae EphedraCarya Poaceae
Taxa are grouped according to their ecological requirements. The different groups are plotted in the synthetic pollen diagram.
361P. Sorrel et al. / Quaternary Research 67 (2007) 357–370
The PCS method is independent of relative proportions ofplants, considering only their presence (at a minimum levelof 0.5% abundance). Generally, “mutual climatic range”methods (including the PCS) determine the climatic toleranceof past taxa by means of mutual present-day ranges of theclimatic tolerances of the nearest living relatives (NLR) ofthe taxa represented in the past assemblages. It has beenrecognized a considerable advantage of this reconstructionmethod to be independent from the availability of modernanalogues and from taphonomic influences (Mosbrugger andUtescher, 1997). Especially, the PCS method calculatesprobability intervals within the mutual climatic spheres bycomparison with the spheres calculated for a multitude ofpresent-day floras. These probability intervals result from theobservation that the climatic preferences of the present-dayfloras are considerably restricted as compared to theirpotential range.
The quality of PCS has been tested on the basis of a multitudeof present-day floras (Klotz et al., 2003, 2004) documenting thelarge agreement between reconstructed and actual grid climatevalues, with correlation coefficients and mean average error of0.95 and 1.1 °C for summer temperatures, 0.95 and 1.7 °C forwinter temperatures, 0.95 and 1.1 °C for mean annual
temperature and 0.86 and 100 mm for mean annual precipitation.Therefore, the PCS is considered to represent a very sensitivemethod for the interpretation of climate variability.
Results
Five ecostratigraphic pollen zones have been distinguishedbased on major changes in pollen assemblages, labelled as P1 toP5 (Figs. 3 and 4).
Pollen zone P1 (10.75–9.97 m; ca. AD 0–400)
This zone is characterized by a large supremacy of herbs(45–47.6%), mainly represented by Amaranthaceae–Chenopo-diaceae (35–40%) and steppe elements (43–47%), withfrequencies of Artemisia fluctuating between 42.7 and 46.8%.Among other herbaceous plants (Caryophyllaceae, AsteraceaeAsteroidae, Rumex, Cyperaceae), Poaceae are abundant withvalues increasing towards the top (2.5–5.8%). Conversely,arboreal taxa are extremely rare (mega-mesothermic elements:<2%, mesothermic elements: <5%), mostly represented byTaxodiaceae (1.2% at 9.97 m), Betula (1.2% at 9.97 m) and fewAlnus (<1%). Pollen grains of Quercus, Carpinus, Populus,

Figure 3. Pollen detailed diagram for section CH2/1. Black-filled lines indicate percentage abundance and gray-filled lines give 10× exaggeration (i.e., per mill abundance). Pollen zones P1 to P5 are based on the presentstudy. For lithology, see Figure 2.
362P.
Sorrelet
al./Quaternary
Research
67(2007)
357–370

Figure 4. Pollen synthetic diagram for section CH2/1. Grouping was performed with regard to the ecology of the plants (see Table 2). Concentrations (per gram of drysediment) are relative to the total pollen sum. Each sample represents a 30- to 40-cm interval and is plotted by its mean depth (see text for details). The ratioAmaranthaceae–Chenopodiaceae/Poaceae is regarded as representing a semi-quantitative index of aridity. For lithology, see Figure 2.
363P. Sorrel et al. / Quaternary Research 67 (2007) 357–370
Corylus and Cupressaceae are also present at low percentages,with values never exceeding 1%. Pinus is found at lowabundances (<5%), as are pollen of Rosaceae and aquatic plants(>1%). Total pollen concentration is relatively high in thelowermost part of this zone (16,600 grains/g at 10.75 m) butdecrease upwards (<4000 grains/g at 9.97 m) (Fig. 4).
Pollen zone P2 (9.97–6.13 m; ca. AD 400–900)
This zone shows a conspicuous increase in percentages ofarboreal taxa characterized by higher abundances of mega-mesothermic (Taxodiaceae: 13.3% at 7.33 m) and mesothermic(6.8% at 7.33 m) elements. Among other warm-temperate trees,
Betula, Alnus and Corylus are most abundant (Figs. 3 and 4).Frequency of Cupressaceae also slightly increases (1.7% at7.33 m), while values of Pinus become more important (mean:6.2%; 11.7% at 6.53 m). This zone is also characterized by adrastic decrease in percentages of Amaranthaceae–Chenopo-diaceae (9–21%), and numbers of Poaceae also slightlydecrease. Relative abundances of Artemisia (steppe) remainstable at relative high levels, even showing higher values than inzone P1 (47–65%). Non-significant pollen grains are alsopresent in low values (<1.5%) and abundance of aquatic plantsslightly increases (0.6–3%). Total pollen concentration is lowerin this zone and fluctuates between 2000 and 10,500 grains/g(Fig. 4).

364 P. Sorrel et al. / Quaternary Research 67 (2007) 357–370
Pollen zone P3 (6.13–4.92 m; ca. AD 900–1150)
This zone is characterized by a general decrease in mega-mesothermic and mesothermic elements, with respective valuesof 2.8–9% and 1.5–3.4% (Fig. 4). In particular, abundances ofTaxodiaceae (mean: 3.1%) and Taxodium-type (0–1.6%) showpronounced lower values compared to the previous zone.Among the mesothermic elements, Alnus, Betula and to a lesserextent Quercus and Carpinus are the most represented taxa,with values rarely exceeding 1%. Though frequencies of herbs(Amaranthaceae–Chenopodiaceae, Asteraceae Asteroidae, Ru-mex, Phlomis, Cyperaceae) remain stable compared to zone P2(19.5–32%) with a slight decrease in Poaceae (1.5–3.6%),abundance of steppe elements conspicuously increases throughelevated frequency of Artemisia (56–72%). Percentages ofCupressaceae, non-significant elements and aquatic plants areagain relatively low (<2%), while Pinus frequency clearlydecreases (mean: 2.7%). Total pollen concentration increasestowards the top of this zone, with a maximum value of 40,000grains/g at 5.1 m (Fig. 4).
Pollen zone P4 (4.92–2.02 m; ca. AD 1150–1450)
Following the increase in steppe elements in zone P3, thiszone emphasizes a pronounced increase in percentages of treesand notably of mega-mesothermic elements with a maximum of28.3% at 3.58 m (Figs. 3 and 4). Noticeably, relativeabundances of Taxodiaceae fluctuate between 5% in thelowermost part of the zone (4.8 m) up to 21.7% at 3.85 m,while maximal values of Taxodium-type (12.2%) are recordedat 3.58 m. Pollen of Engelhardia and Myrica is also found butin low numbers (<1%), while rare specimens of Nyssa andMappianthus have been recorded as well. Mesothermicelements are common (3.5–9.8%) and mostly represented,among other warm-temperate taxa, by Carpinus (3.7% at3.18 m), Alnus (2.35% at 3.58 m), Quercus (1.4% at 3.18 m),Betula (1.15% at 3.85 m) and Corylus (1.5% at 3.85 m). Po-pulus (≤1%) and higher frequency of Liquidambar (<1%) alsooccur in this zone. Pinus becomes more abundant upwards,with a maximum of 24.3% at 2.42 m, while few pollen grains ofTsuga and Abies also have been found. Though frequency ofPoaceae noticeably increases (6.5% at 4.59 m. 6% at 3.18 m;5.6% at 2.82 m), as do values of Cyperaceae (0.2–2.8%),percentages of Artemisia conspicuously drop, with a minimumof 28.3% at 3.58 m and with values fluctuating around 40%throughout the zone. Abundances of Amaranthaceae–Cheno-podiaceae are relatively similar as in zones P2 and P3 (14.8–32%). Aquatic plants increase noticeably (4.7% at 3.58 m), asdoes Cupressaceae (1.9% at 4.59 m). Total pollen concentrationdecreases in this zone from 45,000 grains/g at 4.59 m to lessthan 500 at 2.42 m (Fig. 4).
Pollen zone P5 (2.02–0.00 m; ca. AD 1450–1980)
This zone is characterized by the transition to present-dayvegetation types, with an abrupt decrease in percentages ofmega-mesothermic elements (5.15–10.6%) and to a lesser
extent of warm temperate trees (1–4.8%), correlative with anincrease in herbs (23.8–33.6%) and steppe (45% to ca. 52% atthe top) frequencies (Figs. 3 and 4). Mega-mesothermicelements are mainly represented by Taxodiaceae (includingTaxodium-type) that nonetheless never exceed 10%, whileother taxa from this group become scarce. Among themesothermic elements, only abundance of Betula regularlyexceeds 1%, whereas Quercus, Alnus, Liquidambar, Populusand Corylus mostly run below 1%. Percentages of Cupressa-ceae slightly decrease (0.2–1.1%), as does Pinus from 10.8%at 1.66 m to 3% at the top. Tsuga, Abies and non-significantelements still occur, but at very low numbers (<1%). AlthoughAmaranthaceae–Chenopodiaceae yield a pronounced increasein this zone (16.7–27.7%), the frequency of Poaceae decreases(2–5.3%). Total pollen concentration is relatively low in thiszone (<500–5550 grains/g) (Fig. 4).
Vegetation patterns derived from the pollen record
Herbs, predominant in all samples (Fig. 4), are characterizedby an overwhelming presence of Artemisia that accounts for28–72% of the pollen sum, and pollen of Amaranthaceae–Chenopodiaceae (20–25%). Poaceae (mean: 3.5%) is alsocommon. Studies of pollen composition in aerosols indicate thatboth Artemisia and Amaranthaceae–Chenopodiaceae are highpollen producers (Van Campo et al., 1996; Cour et al., 1999),whereas Poaceae are rare in arid regions (Cour and Duzer, 1978;Van Campo et al., 1996). At present in Central Asia, Artemisiaand Amaranthaceae–Chenopodiaceae are characteristic ele-ments of steppe, semi-desert and desert environments (Tarasovet al., 1998a,b). Since Amaranthaceae–Chenopodiaceae arecommonly present under saline and desert conditions but can beeasily replaced, even during periods of minor elevation inprecipitation, a slight increase in abundance can be interpretedas an increase in salinity and/or aridification (El Moslimany,1990).
Pollen data suggest that open vegetation types with typicalsteppe elements (shrubs, herbs) were always predominant inthe Aral Sea basin during the last 2000 yr. This implies thatxeric conditions prevailed in the region, interrupted by periodsof slightly enhanced moisture as reflected by slightly increasedvalues of Poaceae. Based on the above ecological significanceof Amaranthaceae–Chenopodiaceae (indicative of dry condi-tions) and Poaceae, whose abundance generally increases withrain, we use the ratio Amaranthaceae–Chenopodiaceae/Poa-ceae as a semi-quantitative index of aridity (Fig. 4). In thisdiagram, high values of the ratio (>10) are consideredindicative of arid conditions that favour semi-desert-steppevegetation, whereas low values (<10) reflect periods of slightlyelevated moisture conditions and the development of few treesin a less arid steppe. This is concurrent with abundance ofaquatic plants and Cyperaceae, which reflect some extension inaquatic environment (Fig. 3). Therefore, correspondencebetween low ratio values, sedimentological data and changesin lake water levels (Sorrel et al., 2006) validate the use of theratio as a proxy for relative moisture availability in the AralSea basin.
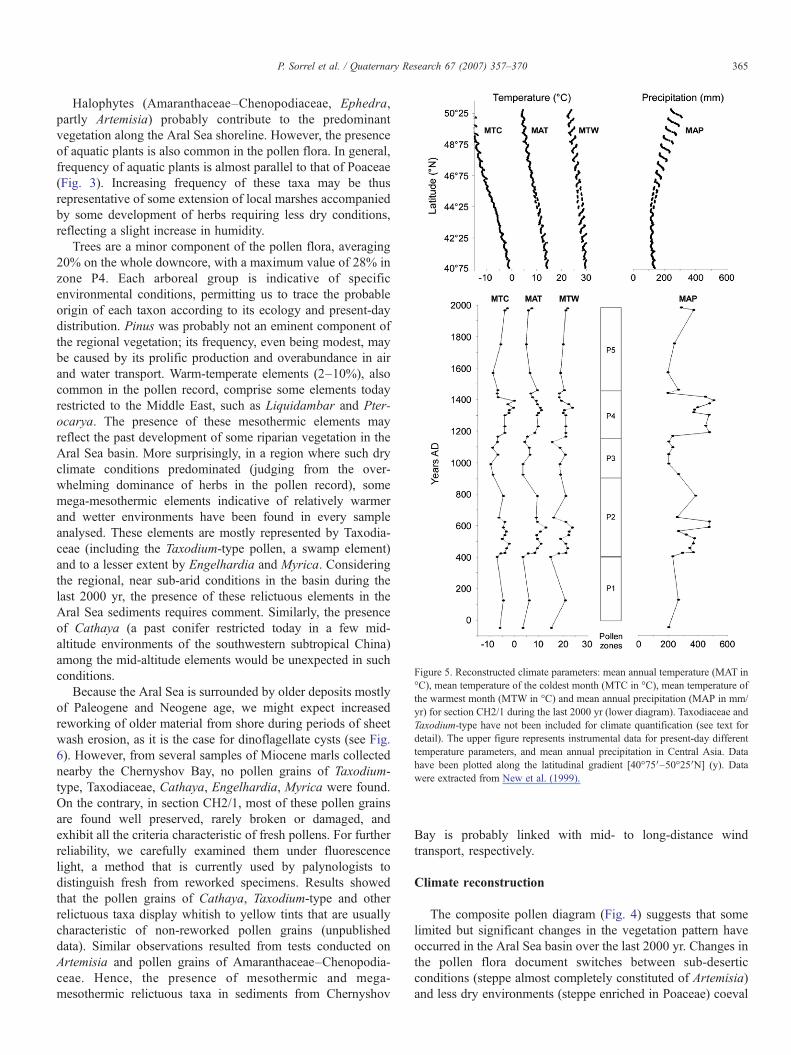
Figure 5. Reconstructed climate parameters: mean annual temperature (MAT in°C), mean temperature of the coldest month (MTC in °C), mean temperature ofthe warmest month (MTW in °C) and mean annual precipitation (MAP in mm/yr) for section CH2/1 during the last 2000 yr (lower diagram). Taxodiaceae andTaxodium-type have not been included for climate quantification (see text fordetail). The upper figure represents instrumental data for present-day differenttemperature parameters, and mean annual precipitation in Central Asia. Datahave been plotted along the latitudinal gradient [40°75′–50°25′N] (y). Datawere extracted from New et al. (1999).
365P. Sorrel et al. / Quaternary Research 67 (2007) 357–370
Halophytes (Amaranthaceae–Chenopodiaceae, Ephedra,partly Artemisia) probably contribute to the predominantvegetation along the Aral Sea shoreline. However, the presenceof aquatic plants is also common in the pollen flora. In general,frequency of aquatic plants is almost parallel to that of Poaceae(Fig. 3). Increasing frequency of these taxa may be thusrepresentative of some extension of local marshes accompaniedby some development of herbs requiring less dry conditions,reflecting a slight increase in humidity.
Trees are a minor component of the pollen flora, averaging20% on the whole downcore, with a maximum value of 28% inzone P4. Each arboreal group is indicative of specificenvironmental conditions, permitting us to trace the probableorigin of each taxon according to its ecology and present-daydistribution. Pinus was probably not an eminent component ofthe regional vegetation; its frequency, even being modest, maybe caused by its prolific production and overabundance in airand water transport. Warm-temperate elements (2–10%), alsocommon in the pollen record, comprise some elements todayrestricted to the Middle East, such as Liquidambar and Pter-ocarya. The presence of these mesothermic elements mayreflect the past development of some riparian vegetation in theAral Sea basin. More surprisingly, in a region where such dryclimate conditions predominated (judging from the over-whelming dominance of herbs in the pollen record), somemega-mesothermic elements indicative of relatively warmerand wetter environments have been found in every sampleanalysed. These elements are mostly represented by Taxodia-ceae (including the Taxodium-type pollen, a swamp element)and to a lesser extent by Engelhardia and Myrica. Consideringthe regional, near sub-arid conditions in the basin during thelast 2000 yr, the presence of these relictuous elements in theAral Sea sediments requires comment. Similarly, the presenceof Cathaya (a past conifer restricted today in a few mid-altitude environments of the southwestern subtropical China)among the mid-altitude elements would be unexpected in suchconditions.
Because the Aral Sea is surrounded by older deposits mostlyof Paleogene and Neogene age, we might expect increasedreworking of older material from shore during periods of sheetwash erosion, as it is the case for dinoflagellate cysts (see Fig.6). However, from several samples of Miocene marls collectednearby the Chernyshov Bay, no pollen grains of Taxodium-type, Taxodiaceae, Cathaya, Engelhardia, Myrica were found.On the contrary, in section CH2/1, most of these pollen grainsare found well preserved, rarely broken or damaged, andexhibit all the criteria characteristic of fresh pollens. For furtherreliability, we carefully examined them under fluorescencelight, a method that is currently used by palynologists todistinguish fresh from reworked specimens. Results showedthat the pollen grains of Cathaya, Taxodium-type and otherrelictuous taxa display whitish to yellow tints that are usuallycharacteristic of non-reworked pollen grains (unpublisheddata). Similar observations resulted from tests conducted onArtemisia and pollen grains of Amaranthaceae–Chenopodia-ceae. Hence, the presence of mesothermic and mega-mesothermic relictuous taxa in sediments from Chernyshov
Bay is probably linked with mid- to long-distance windtransport, respectively.
Climate reconstruction
The composite pollen diagram (Fig. 4) suggests that somelimited but significant changes in the vegetation pattern haveoccurred in the Aral Sea basin over the last 2000 yr. Changes inthe pollen flora document switches between sub-deserticconditions (steppe almost completely constituted of Artemisia)and less dry environments (steppe enriched in Poaceae) coeval
366 P. Sorrel et al. / Quaternary Research 67 (2007) 357–370
to the establishment of some riparian trees. Since the expansionof open vegetation and the development of trees are controlledby climate conditions, we used the pollen data to reconstructclimate variability in terms of different temperature parametersand mean annual precipitation during the last 2000 yr (Fig. 5).For the climate reconstruction, all taxa recorded in samples fromsection CH2/1 have been included with the exception ofTaxodiaceae. Indeed, Taxodium is naturally found today only invery restricted regions of southeast Asia, making the derivedclimatic sphere (e.g., coldest and warmest spheres of the speciesand their relationship) based on its geographical distributionvery approximate. This is in contrast to the climate spheres ofthe other azonal vegetation elements used in the reconstructionwhose present-day distributions are well known, and which aretherefore of higher resolution.
Because the source of some pollen grains may be distantfrom the central depression of the basin, this quantitativereconstruction of climatic parameters gives a regional wide-spread picture of the changes in moisture conditions ratherthan a local signal restricted to the Aral Sea and its nearestadjacent areas. To further constrain our climatic reconstruc-tion, we compared the reconstructed values to moderninstrumental data from Central Asia along the latitudinalgradient [40°75′–50°25′N] across the Aral Sea basin (Fig. 5).
Pollen zone P1 (10.75–9.97 m; ca. AD 0–400): basal aridinterval
High values of the ratio Amaranthaceae–Chenopodiaceae/Poaceae concurrently with high frequency of steppe elementArtemisia and Amaranthaceae–Chenopodiaceae indicate thatprevailing climate from ca. AD 0 to 400 was colder and morearid than today, with mean annual temperatures of 4–6 °C,temperatures of the coldest month averaging −6 °C and meanannual precipitation never exceeding 300 mm/yr. The generalfeature of such climatic conditions is supported by sedimento-logical data and precipitation of gypsum interbedded with fineclays in the lowermost part of this zone. The transition betweenpollen zones P1 and P2 is probably characterized by a very shortcoring gap.
Pollen zone P2 (9.97–6.13 m; ca. AD 400–900): increasinghumidity
Decreasing xeric conditions are inferred from low values ofthe ratio Amaranthaceae–Chenopodiaceae/Poaceae (<10)between ca. AD 400 and 900. Coevally, an increase in theabundance of warm-temperate elements and aquatic plantssuggests that the climate became moderately moister andpotentially warmer. Reconstructed climate conditions indeeddocument that mean annual precipitation fluctuated between270 and 475 mm/yr, whereas temperatures of the warmestmonth averaged 21 °C (coldest month: −5 °C) and mean annualtemperatures 9 °C. Increase in moisture conditions areconcurrent with the evidence of lake-level rise, inferred fromdinoflagellate cyst assemblages (Sorrel et al., 2006), and mayhave favoured the expansion of some riparian trees.
Pollen zone P3 (6.13–4.92 m; ca. AD 900–1150): strongaridification
This zone documents a return to strong arid conditions, asreflected by the progressive decrease in warm-temperate treesand the expansion of steppe elements Artemisia and Amar-anthaceae–Chenopodiaceae. This is concurrent with highvalues of the aridity index (>10) and declined rainfall (200–230 mm/yr). Climate reconstruction document lower tempera-tures during this interval (coldest month: −7° to −10 °C;warmest month: 15°–21 °C; mean annual temperature: 4°–6 °C). Further evidence for a long-term aridification is providedby a gypsum layer at 4.86 m (Fig. 4).
Pollen zone P4 (4.92–2.02 m; ca. AD 1150–1450): increasinghumidity
Increasing moisture conditions are inferred from a drop in theabundance of both steppe herbs and shrubs coincident withhigher percentages of Poaceae and trees. Based on the ratioAmaranthaceae–Chenopodiaceae/Poaceae (<10), prevailingclimate conditions were noticeably moister than at present.This is concurrent with enhanced precipitation (370–505 mm/yr). Reconstructed temperatures for this interval were higher(mean annual: 7°–11 °C; coldest month: −4 °C). Increasingmoisture conditions are consistent with rising lake levels andimportant freshwater discharges in the Aral Sea, as indicatedin the dinoflagellate cyst assemblages (Sorrel et al., 2006).Higher-water availability between ca. AD 1150 and 1450probably favoured the expansion of trees onshore, with apossible development of a riparian association comprisingwarm-temperate trees (Ulmus, Alnus, Populus, Corylus) andmaybe few mega-mesothermic elements (Taxodium-type, En-gelhardia). The last sample records the onset of more aridconditions resulting in lower precipitation rates (<200 mm/yr).
Pollen zone P5 (2.02–0.00 m; ca. AD 1450–1980): briefaridification followed by present-day climate conditions
A third arid interval is recorded during ca. AD 1450–1550,as reflected by increasing abundance of steppe element Arte-misia and slightly higher values of the ratio Amaranthaceae–Chenopodiaceae/Poaceae. This short phase is characterized bylow precipitation rates (200–270 mm/yr) but more contrastingtemperatures. Whereas both mean annual values (6°–9 °C) andtemperatures for the warmest month (18.9°–20.5 °C) suggestwarmer conditions in this interval, mean values for the coldestmonth decrease from −7 °C around AD 1450 to −9 °C at AD1550. This interpretation is confirmed by sedimentological data,with precipitation of gypsum crystals in clay sediments aroundAD 1500. Reconstructed climatic parameters from the pollencontent of surface sediments (AD 1550–1980) indicatecontrasting precipitation rates (240–370 m/yr) and a slightwarming trend (coldest month: −6° to −3 °C; warmest month:20°–22 °C; mean annual temperature: 7 °C). Observations ofpresent-day landscapes along the northern shore of the Aral Seacorroborate pollen evidence of enhanced aridity and higher
367P. Sorrel et al. / Quaternary Research 67 (2007) 357–370
temperatures in recent decades. The reconstructed climateparameters in the uppermost sample (i.e., AD 1980) are inaccordance with present-day instrumental data from CentralAsia (Fig. 5), where mean annual temperature and precipitationrespectively decrease/increase from 14 °C/110 mm at 40°75′Nto 4 °C/310 mm at 50°25′N, validating the ranges of valuesobtained in our climate quantification. However, whetherreconstructed temperature for the coldest month (−3 °C) fairlyoverlaps instrumental values (−1° to −16 °C), the estimatedvalue for the warmest month (22 °C) appears slightly lower thanthe instrumental ones (22°–30 °C). An explanation for thiscould be the rapid warming trend observed during the past20 yr, which is not documented in our pollen record.
Discussion and conclusions
Today, the climate in the deserts of Central Asia is mostlycontrolled by the shifts of the westerly cyclonic circulation anddepends on the position of the Siberian High during winter andspring (Zavialov, 2005). In addition, local precipitation occursduring winter and early spring when depressions, developingover the eastern Mediterranean, subsequently move along anortheast trajectory where they may replenish moisture over theCaspian Sea (Létolle and Mainguet, 1993; Roberts and Wright,
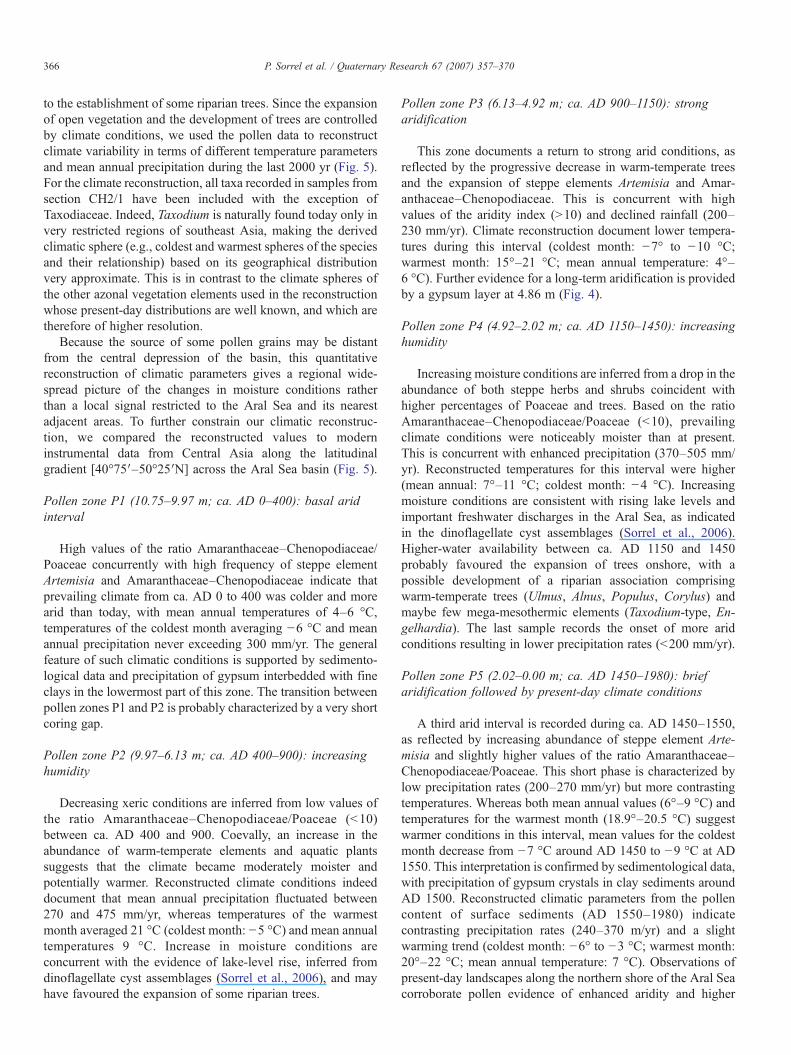
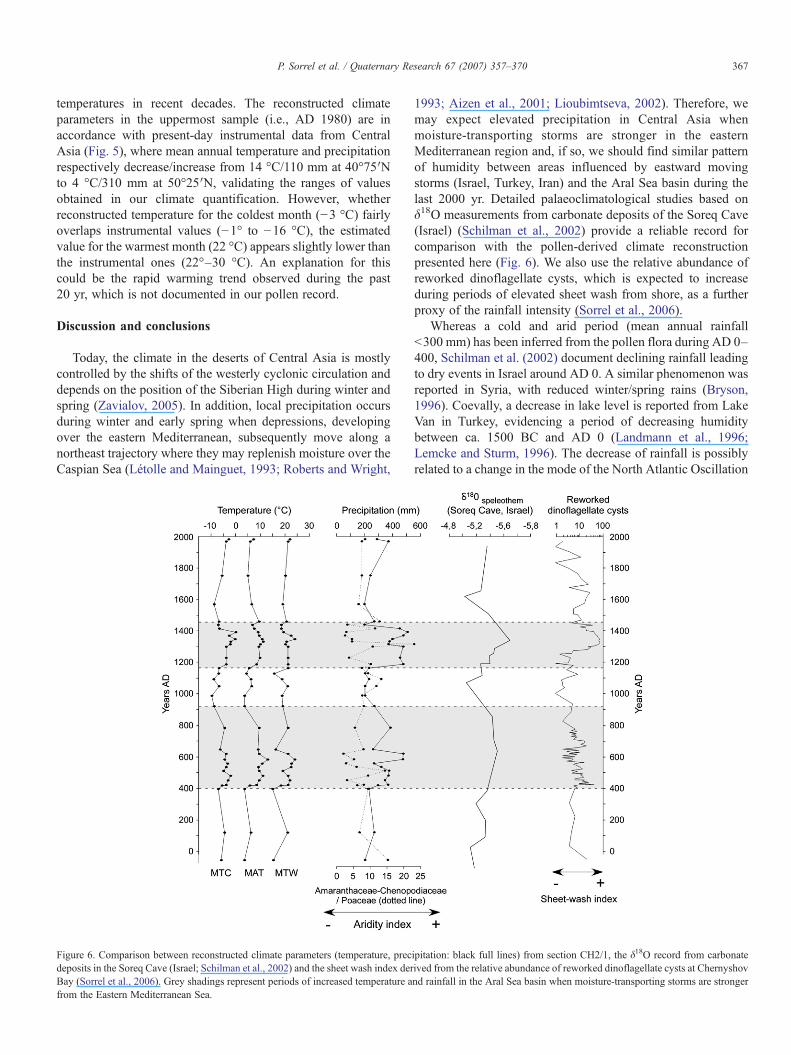
Figure 6. Comparison between reconstructed climate parameters (temperature, precdeposits in the Soreq Cave (Israel; Schilman et al., 2002) and the sheet wash index derBay (Sorrel et al., 2006). Grey shadings represent periods of increased temperature afrom the Eastern Mediterranean Sea.
1993; Aizen et al., 2001; Lioubimtseva, 2002). Therefore, wemay expect elevated precipitation in Central Asia whenmoisture-transporting storms are stronger in the easternMediterranean region and, if so, we should find similar patternof humidity between areas influenced by eastward movingstorms (Israel, Turkey, Iran) and the Aral Sea basin during thelast 2000 yr. Detailed palaeoclimatological studies based onδ18O measurements from carbonate deposits of the Soreq Cave(Israel) (Schilman et al., 2002) provide a reliable record forcomparison with the pollen-derived climate reconstructionpresented here (Fig. 6). We also use the relative abundance ofreworked dinoflagellate cysts, which is expected to increaseduring periods of elevated sheet wash from shore, as a furtherproxy of the rainfall intensity (Sorrel et al., 2006).
Whereas a cold and arid period (mean annual rainfall<300 mm) has been inferred from the pollen flora during AD 0–400, Schilman et al. (2002) document declining rainfall leadingto dry events in Israel around AD 0. A similar phenomenon wasreported in Syria, with reduced winter/spring rains (Bryson,1996). Coevally, a decrease in lake level is reported from LakeVan in Turkey, evidencing a period of decreasing humiditybetween ca. 1500 BC and AD 0 (Landmann et al., 1996;Lemcke and Sturm, 1996). The decrease of rainfall is possiblyrelated to a change in the mode of the North Atlantic Oscillation
ipitation: black full lines) from section CH2/1, the δ18O record from carbonateived from the relative abundance of reworked dinoflagellate cysts at Chernyshovnd rainfall in the Aral Sea basin when moisture-transporting storms are stronger
368 P. Sorrel et al. / Quaternary Research 67 (2007) 357–370
(NAO) that reduced cyclonic activity over the easternMediterranean, being high during a negative NAO mode(Hurrell, 1995; Hurrell et al., 2003). This is in accordance withAizen et al. (2001), who found that the NAO has a statisticallysignificant inverse relationship with moisture availability overmid-latitudes of continental Asia. Based on correlation analysesbetween atmospheric circulation patterns and regional precipi-tation, they reported that a negative (positive) difference in sea-level pressure anomalies between the Azores and the Iceland isfavourable (unfavourable) for precipitation development overthe middle plains of Asia.
Following this aridification, the time interval ca. AD 400–900 is characterized by some warmer and wetter climateconditions in the Aral Sea basin, which favoured thedevelopment of some arboreal vegetation in the less dry eda-phic areas. This is supported by a conspicuous decrease in theδ18O of carbonate deposits from the Soreq Cave (Schilman etal., 2002; Fig. 6), which infers elevated precipitation rates inIsrael during AD 400–900 linked to stronger storms over theeastern Mediterranean. Other evidences document a period ofmaximum precipitation around AD 700, as inferred fromland records including tree assemblages (Lipschitz et al.,1981), high-stand levels of the Dead Sea (Frumkin et al.,1991) and carbonate cave deposits in Israel (Bar-Matthews etal., 1998).
The period AD 900–1150 is characterized by a return tocolder and more arid conditions in the Aral Sea basinconcurrently with declining rainfall (<270 mm/yr) and lowmean annual temperatures, suggesting lowered moisturederived from the eastern Mediterranean in winter and earlyspring during a possible positive phase of the NAO. This is inaccordance with other palaeoenvironmental records from theeastern Mediterranean which document colder conditions andreduced precipitation between AD 850 and 1200 (Issar et al.,1991; Schilman et al., 2002).
After AD 1150, elevated moisture conditions during awarmer period are inferred with precipitation rates frequentlybeyond 400 mm/yr, although the associated change in thevegetation pattern was not registered in the C:N ratio (<10) oforganic isotopes from Chernyshov Bay (Austin, unpublisheddata). It coincides, however, with elevated sheet wash fromshore as reflected by higher abundance of reworked dino-flagellate cysts. A similar pattern to increasing humidity isinferred from lowered δ18O values in speleothems from theSoreq Cave between AD 1200 and 1500 (Fig. 6), suggestinghigher rainfall over the eastern Mediterranean region during theMedieval Warm Period. This event also corresponds to high-stand levels of the Dead Sea (Issar et al., 1991) and the Sea ofGalilee (Frumkin et al., 1991).
A brief aridification occurred again during AD 1450–1550.This short-term change towards colder/drier conditions prob-ably coincide with the Little Ice Age, whose signature has beenpreviously recorded in δ18O values from the foraminiferan G.ruber in the eastern Mediterranean Sea (Schilman et al., 2001)and in carbonate deposits from Israel (Bar-Matthews et al.,1998; Schilman et al., 2002). From AD 1550 onwards,increased temperatures document a progressive warming. For
the last 2000 yr, no human activity exerting control onvegetation change has been detected from the pollen record ofChernyshov Bay.
Despite a time-resolution of ca. 50 yr, the climate recons-truction provides compelling evidence that centennial-scaleevents are recorded during the last 2000 yr (Fig. 6). In the AralSea basin, climate conditions may fluctuate with a periodicity of∼400 yr, with intervals of relatively elevated moistureconditions alternating with more arid phases. Since our datamatch fairly well with the Soreq cave record from Israel(Schilman et al., 2002), we thus conclude that the precipitationpattern in the Aral Sea basin is directly linked to atmosphericchanges in the eastern Mediterranean region, modulatingmoisture distribution towards the Middle East and WesternCentral Asia. This link may document a teleconnection to theNAO during negative phases. Modelling of Holocene climaticscenarios would improve our understanding of atmosphere–biosphere interactions in this vast arid region and identifyimportant thresholds between climate changes and landscaperesponses.
Acknowledgments
The CLIMAN project was funded by INTAS (EuropeanUnion) (Project No. Aral 00-1030), the German ScienceFoundation (DFG Project 436 RUS 111/663-OB 86/4) andNATO CLG Ref. 980445. We are grateful for this support. Wewish to thank especially Dr. François Demory for excellentsupport in the field. The authors gratefully acknowledge Dr.Derek B. Booth and two anonymous reviewers for theirconstructive comments which have helped to improve themanuscript.
References
Aizen, E.M., Aizen, V.B., Melack, J.M., Nakamura, T., Ohta, T., 2001.Precipitation and atmospheric circulation patterns at mid-latitudes of Asia.International Journal of Climatology 21, 535–556.
Austin, P., Mackay, A., Palagushkina, O., Leng, M., 2007. A high-resolutiondiatom-inferred palaeoconductivity and sea-level record of the Aral Sea forthe last ca. 1600 years. Quaternary Research. Quaternary Research 67,383–393.
Bar-Matthews, M., Ayalon, A., Kaufmann, A., 1998. Middle to late Holocene(6500 years period) palaeoclimate in the eastern Mediterranean region fromstable isotopic composition of speleothems from Soreq Cave, Israel. In:Issar, A.S., Brown, N. (Eds.), Water, Environment and Society in Time ofClimate Change. Kluwer Academic Publishers, pp. 203–214.
Boomer, I., Aladin, N., Plotnikov, I., Whatley, R., 2000. The palaeolimnology ofthe Aral Sea: a review. Quaternary Science Reviews 19, 1259–1278.
Boroffka, N.G.O., Oberhänsli, H., Achatov, G.A., Aladin, N.V., Baipakov,K.M., Erzhanova, A., Hoernig, A., Krivonogov, S.K., Lobas, D.A.,Savel’eva, T.V., Wuennemann, B., 2005. Human settlements on thenorthern shores of Lake Aral and water level changes. Mitigation andAdaptation Strategies for Global Change 10, 71–85.
Boroffka, N.G.O., Oberhänsli, H., Sorrel, P., Demory, F., Reinhardt, C.,Wünnemann, B., Alimov, K., Baratov, S., Rakhimov, K., Saparov, N.,Shirinov, T., Krivonogov, S.K., 2006. Archaeology and climate: Settlementand lake level changes at the Aral Sea. Geoarchaeology 21 (7), 721–734.
Bortnik, V.N., Chistyaeva, S.P. (Eds.), 1990. Hydrometeorology and Hydro-chemistry of the USSR Seas. The Aral Sea, vol. VII. Gidrometeoizdat,Leningrad. 196 pp. (in Russian).

369P. Sorrel et al. / Quaternary Research 67 (2007) 357–370
Bronk Ramsey, C., 2005. OxCal version 3.10.Bryson, R.A., 1996. Proxy indications of Holocene winter rains in southwest
Asia compared with simulated rainfall. In: Dalfes, H.N., Kukla, G., Weiss,H. (Eds.), Third Millenium BC; Climate Change and Old World Collapse.NATO ASI Series I, vol. 49. Springer Verlag, pp. 465–473.
Cour, P., 1974. Nouvelles techniques de détection des flux et de retombéespolliniques: étude de la sédimentation des pollens et des spores à la surfacedu sol. Pollen et Spores 23 (2), 247–258.
Cour, P., Duzer, D., 1978. La signification climatique, édaphique etsédimentologique des rapports entre taxons en analyse pollinique. Annalesdes Mines de Belgique 7/8, 155–164.
Cour, P., Zheng, Z., Duzer, D., Calleja, M., Yao, Z., 1999. Vegetational andclimatic significance of modern pollen rain in northwestern Tibet. Review ofPalaeobotany and Palynology 104, 183–204.
El Moslimany, A.P., 1990. Ecological significance of common non-arborealpollen: examples from drylands of the Middle East. Review of Palaeobotanyand Palynology 76 (2–4), 343–350.
Esper, J., Schweingruber, F.H., Winiger, M., 2002. 1300 years of climatehistory for Western Central Asia inferred from tree-rings. Holocene 12,267–277.
Frumkin, A., Magaritz, M., Carmi, I., Zak, I., 1991. The Holocene climaticrecord of the salt caves of Mount Sedom, Israel. Holocene 1, 191–200.
Guiot, J., 1987. Late Quaternary climatic change in France estimated frommultivariate pollen time series. Quaternary Research 28, 100–118.
Guiot, J., 1990. Methodology of the last climatic cycle reconstruction in Francefrom pollen data. Palaeogeography, Palaeoclimatology, Palaeoecology 80,49–69.
Heim, C., 2005. Die Geochemische Zusammensetzung der Sedimente imAralsee und Sedimentationsprozesse während der letzten 100 Jahre.Diploma thesis, Alfred-Wegener-Institut Bremerhaven, 89 pp.
Hurrell, J., 1995. Decadal trends in the North Atlantic Oscillation—Regionaltemperatures and precipitation. Science 269, 676–679.
Hurrell, J., Kushnir, Y., Ottersen, G., Visbeck, M., 2003. An overview of theNorth Atlantic Oscillation. In: Hurrell, J., Kushnir, Y., Ottersen, G., Visbeck,M. (Eds.), The North Atlantic Oscillation: Climatic Significance andEnvironmental Impact. AGU, Washington, pp. 1–35.
Issar, A.S., Govrin, Y., Geyh, A.M., Wakshal, E., Wolf, M., 1991. Climatechanges during the Upper Holocene in Israel. Israelian Journal EarthSciences 40, 219–223.
Klotz, S., 1999. Neue Methoden der Klimarekonstruktion-angewendet aufquartäre Pollensequenzen der französischen Alpen. Tübinger Mikropaläon-tologische Mitteilungen 21, 169 pp.
Klotz, S., Pross, J., 1999. Pollen-based reconstructions in the EuropeanPleistocene: the modified indicator species approach as a tool forquantitative analysis. Acta Palaeobotanica, Supplementum 2, 481–486.
Klotz, S., Guiot, J., Mosbrugger, V., 2003. Continental European Eemian andearly Würmian climate evolution: comparing signals using differentquantitative reconstruction approaches based on pollen. Global andPlanetary Change 36, 277–294.
Klotz, S., Müller, U., Mosbrugger, V., de Beaulieu, J.L., Reille, M., 2004.Eemian to early Würmian climate dynamics: history and pattern of changesin Central Europe. Palaeogeography, Palaeoclimatology, Palaeoecology 211,107–126.
Kremenetski, C.-V., Tarasov, P.E., 1997. Postglacial development of Kazakhstanpine forests. Géographie Physique et Quaternaire 51 (3), 391–404.
Kremenetski, C.-V., Tarasov, P.E., Cherkinsky, A.E., 1997. The latestPleistocene in Southwestern Siberia and Kazakhstan. Quaternary Interna-tional 41/42, 125–134.
Landmann, G., Reimer, A., Lemcke, G., Kempe, S., 1996. Dating Late Glacialabrupt climate changes in the 14,570-yr long continuous varve record ofLake Van, Turkey. Palaeogeography, Palaeoclimatology, Palaeoecology122, 107–118.
Lemcke, G., Sturm, M., 1996. 18O and trace element measurements as proxyfor the reconstruction of climate changes at Lake Van (Turkey). In:Dalfes, H.N., Kukla, G., Weiss, H. (Eds.), Third Millenium BC; ClimateChange and Old World Collapse. NATO ASI Series I, vol. 49. SpringerVerlag, pp. 653–678.
Létolle, R., Mainguet, M., 1993. Aral. Springer Verlag, Paris, 358 pp.
Lioubimtseva, E., 2002. Arid environments. In: Shahgedanova, M. (Ed.),Physical Geography of Northern Eurasia. Oxford University Press, Oxford,571 pp.
Lioubimtseva, E., Cole, R., Adams, J.M., Kapustin, G., 2005. Impacts of climateand land-cover changes in arid lands of Central Asia. Journal of AridEnvironments 62, 285–308.
Lipschitz, N., Lev-Yadun, S., Waisel, Y., 1981. Dendroarchaeologicalinvestigations sin Israel (Asada). Israel Exploration Journal 31, 230–234.
Mosbrugger, V., Utescher, T., 1997. The coexistence approach—A method forquantitative reconstructions of Tertiary terrestrial palaeoclimate data usingplant fossils. Palaeogeography, Palaeoclimatology, Palaeoecology 134,61–86.
New, M., Hulme, M., Jones, P., 1999. Representing twentieth century space-timeclimate variability. I: development of a 1961–1990 mean monthly terrestrialclimatology. Journal of Climate 12, 829–856.
Nezlin, N.P., Kostianoy, A.G., Li, B.-L., 2005. Inter-annual variability andinteraction of remote-sensed vegetation index and atmospheric precipitationin the Aral Sea region. Journal of Arid Environments 62, 677–700.
Nourgaliev, D.K., Heller, F., Borisov, A.S., Hajdas, I., Bonani, G., Iassonov,P.G., Oberhänsli, H., 2003. Very high resolution paleosecular variationrecord for the last 1200 years from the Aral Sea. Geophysical ResearchLetters 30 (17), 4-1–4-4.
Peyron, O., Guiot, J., Cheddadi, R., Tarasov, P., Reille, M., de Beaulieu, J.L.,Bottema, S., Andreu, V., 1998. Climate reconstruction in Europe for18,000 yr B.P. from pollen data. Quaternary Research 49, 183–196.
Prentice, I.C., Cramer,W., Harrison, S.P., Leemans, R., Monserud, R.A., Solomon,A.M., 1992. A global biome model based on plant physiology and dominance,soil properties and climate. Journal of Biogeography 19, 117–134.
Prentice, I.C., Guiot, J., Huntley, B., Jolly, D., Cheddadi, R., 1996.Reconstructing biomes from palaeoecological data: a general method andits application to European pollen data at 0 and 6 ka. Climate Dynamics 12,185–194.
Reimer, P.J., Baillie, M.G.L., Bard, E., Bayliss, A., Beck, J.W., Bertrand, C.J.H.,Blackwell, P.G., Buck, C.E., Burr, G.S., Cutler, K.B., Damon, P.E.,Lawrence Edwards, R., Fairbanks, R.G., Friedrich, M., Guilderson, T.P.,Hogg, A.G., Hughen, K.A., Kromer, B., McCormac, G., Manning, S., BronkRamsey, C., Reimer, R.W., Remmele, S., Southon, J.R., Stuiver, M.,Talamo, S., Taylor, F.W., van der Plicht, J., Weiyhenmeyer, C.E., 2004.IntCal04 terrestrial radiocarbon age calibration, 0–26 cal. yr BP. Radio-carbon 46 (3), 1029–1058.
Roberts, N., Wright, H.E., 1993. Vegetational, lake-level, and climatic historyof the Near East and Southwest Asia. In: Wright, H.E. (Ed.), GlobalClimates since the Last Glacial Maximum. University of Minnesota Press,pp. 194–220.
Rubanov, I.V., Ischniyanov, D.P., Baskakova, M.A., 1987. Geology of the AralSea. Tashkent, 248 pp. (in Russian).
Schilman, B., Bar-Matthews, M., Almogi-Labin, A., Luz, B., 2001. Globalclimate instability reflected by Eastern Mediterranean marine records duringthe Late Holocene. Palaeogeography, Palaeoclimatology, Palaeoecology176, 157–176.
Schilman, B., Ayalon, A., Bar-Matthews, M., Kagan, E.J., Almogi-Labin, A.,2002. Sea–land palaeoclimate correlation in the Eastern Mediterraneanregion during the Late Holocene. Israel Journal of Earth Sciences 51,181–190.
Seredkina, E.A., 1960. Dust storms in Kazakhstan (Pyl’nie buri v Kazakhstane).Proceedings of KazNIGMI 15, 54–59 (in Russian).
Sorrel, P., Popescu, S.-M., Head, M.J., Suc, J.P., Klotz, S., Oberhänsli, H.,2006. Hydrographic development of the Aral Sea during the last2000 years based on a quantitative analysis of dinoflagellate cysts.Palaeogeography, Palaeoclimatology, Palaeoecology 234 (2–4), 304–327.
Tarasov, P.E., 1992. Holocene palaeogeography of the steppe zone of Northernand Central Kazakhstan. Thesis, Moscow University, 213 pp.
Tarasov, P.E., Jolly, D., Kaplan, J.O., 1997. A continuous Late Glacial andHolocene record of vegetation changes in Kazakhstan. Palaeogeography,Palaeoclimatology, Palaeoecology 136, 281–292.
Tarasov, P.E., Webb III, T., Andreev, A.A., Afanas'eva, N.B., Berezina, N.A.,Bezusko, L.G., Blyakharchuk, T.A., Bolikhovskaya, N.S., Cheddadi, R.,Chernavskaya, M.M., Chernova, G.M., Dorofeyuk, N.I., Dirksen, V.G.,

370 P. Sorrel et al. / Quaternary Research 67 (2007) 357–370
Elina, G.A., Filimonova, L.V., Glebov, F.Z., Guiot, J., Gunova, V.S.,Harrison, S.P., Jolly, D., Khomutova, V.I., Kvavadze, E.V., Osipova, I.M.,Panova, N.K., Prentice, I.C., Saarse, L., Sevastyanov, D.V., Volkova, V.S.,Zernitskaya, V.P., 1998a. Present-day and mid-Holocene biomes recon-structed from pollen and plant macropast data from the former Soviet Unionand Mongolia. Journal of Biogeography 25, 1029–1053.
Tarasov, P.E., Cheddadi, R., Guiot, J., Bottema, S., Peyron, O., Belmonte, J.,Ruiz-Sanchez, V., Saadi, F.A., Brewer, S., 1998b.Amethod to determinewarmand cool steppe biomes from pollen data; application to the Mediterranean andKazakhstan regions. Journal of Quaternary Sciences 13, 335–344.
Van Campo, E., Cour, P., Sixuan, H., 1996. Holocene environmental changes inBangong Co Basin (Western Tibet). Part 2: The pollen record. Palaeogeo-graphy, Palaeoclimatology, Palaeoecology 120, 49–63.
Velichko, A.A., 1989. The relationship of the climatic changes in the high andlow latitudes of the Earth during the Late Pleistocene and Holocene. In:Velichko, A.A., et al. (Ed.), Paleoclimates and Glaciation in the Pleistocene.Nauka Press, Moscow, pp. 5–19.
Zavialov, P.O., 2005. Physical oceanography of the dying Aral Sea. SpringerVerlag, published in association with Praxis Publishing, Chichester, UK,146 pp.