Cleaner Production Assessment at Kamadhenu Dairy
49
CLEANER PRODUCTION ASSESSMENT AT KAMADHENU DAIRY by Richa Humagain Food Technology Instruction Committee Institute of Science and Technology Tribhuvan University, Nepal 2009
-
Upload
khangminh22 -
Category
Documents
-
view
0 -
download
0
Transcript of Cleaner Production Assessment at Kamadhenu Dairy

CLEANER PRODUCTION ASSESSMENT AT KAMADHENU DAIRY
by
Richa Humagain
Food Technology Instruction Committee
Institute of Science and Technology
Tribhuvan University, Nepal
2009

Cleaner Production Assessment at Kamadhenu Dairy
A dissertation submitted to the Food Technology Instruction Committee
in Tribhuvan University in partial fulfillment of the requirements
for the degree of B.Tech in Food Technology
by
Richa Humagain
Food Technology Instruction Committee
Institute of Science and Technology
Tribhuvan University
Dharan, Hattisar, Nepal
January, 2010

iii
Tribhuvan University
Institute of Science and Technology
Food Technology Instruction Committee
Central Campus of Technology, Dharan
Approval Letter
This dissertation entitled “Cleaner Production Assessment at Kamadhenu Dairy” presented
by Richa Humagain has been accepted as the partial fulfillment of the requirement for the
B.Tech. in Food Technology.
Dissertation Committee
1. Head of Department
[Assoc. Prof. Geeta Bhattarai]
Chairperson, Food Technology Instruction Committee
2. External Examiner
[Prof……………………………]
3. Supervisor
(Assoc. Prof. Rishi Raj Gautam)
Date: …….. Dec, 2009

iv
Acknowledgement
This study has been accomplished with the encouragement, cooperation, guidance and
suggestions received from various esteemed organization and distinguished individuals and I am
extremely grateful to Central Campus of Technology, Hattishar, Dharan.
First of all, I deeply expressed high words of acknowledgement to my respected supervisor,
Asso. Prof. Rishi Raj Gautam for his valuable guidance, suggestion and constant encouragement
throughout the endeavor.
I would like to express my deep sense of gratitude and sincere thanks to Asso. Prof. Pashupati
Mishra, Assistant Dean and Campus Chief, Central Campus of Technology, Dharan, Mrs. Geeta
Bhattarai, Chairman, Food Technology Instruction Committee and Mr. Puspa Prasad Acharya,
Chairman, Quality Control Department, CCT, Dharan for providing necessary facilities during
the work.
My special thanks go to SEAM-N Project, Dharan for providing me laboratory support along
with Mr. Lal Mani Ojha, Project Manager and Mr. Prajwol Raut, Environmental Monitoring
Expert and Mrs. Sarita Poudel, Environmental Monitoring Expert, SEAM-N Project, Dharan for
providing valuable supports and field guidance. Similarly, I wish to acknowledge for help and
support I received from all staff of SEAM-N in providing necessary information during my field
works.
My special thanks goes to my dear friend Mr. Anup Khadka and to all my seniors, juniors and
my collogues for supporting me in formatting and editing my thesis work.
Above all, lastly I am greatly indebted to my family for their encouragement and support for
my study.

v
Content
Approval Letter .......................................................................................................................................... iii
1. Introduction ............................................................................................................................................. 1
1.1 Background ........................................................................................................................................ 1
1.2 Statement of problem ......................................................................................................................... 2
1.4 Rationale of the study ........................................................................................................................ 3
1.5 Limitation of the study ....................................................................................................................... 4
2. Literature review .................................................................................................................................... 5
2.1 Environment Pollution ....................................................................................................................... 5
2.2 Pollution control ................................................................................................................................ 5
2.3 Pollution prevention/Cleaner Production ........................................................................................... 6
2.4 Cleaner production in food industry .................................................................................................. 7
2.5 Industrial Wastewater ........................................................................................................................ 8
2.6 Wastewater Management ................................................................................................................... 9
2.7 Dairy waste ...................................................................................................................................... 10
2.8 Use of energy and water in dairy industry ....................................... Error! Bookmark not defined.
2.8.1 Water consumption in dairy .................................................................................................. 12
2.8.2 Energy consumption in dairy ................................................................................................ 13
2.9 Parameters in dairy waste water ...................................................................................................... 14
2.10 Quality control in dairy industry .................................................................................................... 17
2.11 Wastewater treatment .................................................................................................................... 18
4. Process review and observations ......................................................................................................... 20
5. Results and Discussions ........................................................................................................................ 27
6. Conclusions and recommendations ..................................................................................................... 31

vi
Abstracts

Part I
1. Introduction
1.1 Background
Cleaner Production is defined as the continuous application of an integrated preventive
environmental strategy applied to processes, products and services to increase overall
efficiency and reduce risks to human being and environment (UNEP, 1994).
Cleaner Production techniques include improved housekeeping practices, process
optimization, raw material substitution, new technology and new product design. Cleaner
Production is new thinking to improve production efficiency (Kunwar, 2003).
In the year 1999, His majesty’s Government of Nepal with the financial and technical
assistance of government of Denmark introduced the Environmental Sector Support
Program (ESPS) in Nepal with an objective of strengthening the management of brown
sector environment in the country. Cleaner production (CP) was one of the important
components in ESPS. ESPS started the first CP intervention in total 36 industries of HID in
2000 and the program continued up to 2005. Multinational companies like Nepal Bottlers,
Gorkha Breweries and Colgate Palmolive were also benefited with the CP program of
ESPS. Till to date CP intervention has been conducted in more than 140 industries. The
intervention has saved resources like raw material that amounts to over NRs 100 million,
NRs 80 million in energy and 3,130 tons in solid waste (Kunwar, 2003).
The government of Nepal has already released effluent standards for industrial sectors
requiring them to minimize pollution in their production processes including pashmina,
brick, stone crushing, dyeing and dairy industries. The set of rules aims at Cleaner
Production (CP) to bring down the level of pollution in these sectors which would increase
productivity, improve the quality of their goods, keep the environment clean and uplift
their public image through CP by minimizing solid waste, effluents, air pollution, accident
risks and occupational diseases (Kathmandu post, 2008).
Similarly, Government of Nepal and Government of Finland established a development
co-operation project "Strengthening of Environmental Administration and Management at
the Local Level in Nepal" called (SEAM-N) in autumn 2001 (SEAM-N Project-phase 1).
The overall objective of the Project is to improve environment with the enhancement of
environmentally sustainable rural, urban and industrial development and utilization of

2
natural resources. Implementation of CP (Cleaner Production) and OHS (Occupational
Health & Safety) at local industries in the project area is one of the three interlinked
component of the project. This project is conducting cleaner production assessment
programs in all kinds of industry regardless of its scale and size.
1.2 Statement of problem
Kamadhenu Dairy Development Cooperative private limited is a cooperative dairy industry
established in 2057 B.S. with a capital investment of Rs. 30,00,000. It is situated at
Hansposa-2 Tarahara, Sunsari. The factory involves 45 employees including 5 women. The
factory is operating on the basis of 365 working days in a year. It has one working shift of
8 hours a day. The factory has total installed capacity of 18,25,000 liter per year
pasteurized milk, yoghurt, butter, Ghee, khoa, paneer, etc. It has occupied a wide range of
market share of pasteurized milk and milk products in the major cities of eastern region
like Biratnagar, Duhabi, Dharan, Inaruwa, Itahari, Urlabari, etc
Like in many other food processing industries, the environmental issues associated with
dairy industries are high water consumption, generation of high-strength effluent streams,
and high energy consumption and the drainage of by products as waste. Since the
pollutants generated by the industry results losses in production, improvements in
production efficiency are recommended to reduce pollutant loads (World Bank, 1996). An
examination into milk processing shows the following focal points of milk (and hence fat)
losses: dripping pipelines and fittings; leaking plastic containers; spillage, overflowing
tanks and reservoirs; rinsing from tanks pipelines and plates; incomplete tank, lines, plate
drainage (residual losses); foam; thoughtless or willful dumping of milk products into the
drainage system. The first prerequisite of handling dairy waste is to keep it to a minimum
or, better yet, to prevent its occurrence (Hall and Trout, 1968). It is expected that Cleaner
Production assessment in the dairy industry will effectively reduce the pollution load and
increase productivity through reduced losses in the production.
1.3 Objective of the study
1.3.1 General objective
The general objective of this study is to find out the possibilities of CP in dairy industry
and the study also covers investigating, identifying and understanding the environmental

3
problems related to Kamadhenu dairy and identification of Cleaner Production
opportunities in the industry.
1.3.2 Specific objective
• To study the existing condition of production processes in kamadhenu dairy with the
details about different unit operations in the form of complete flow chart describing
clearly the types of wastes generating from each unit operation.
• To analyze the physical and chemical parameters of effluent generated from the
industry under consideration to obtain data regarding pollution load exerted by the
industry on the environment.
• To obtain data regarding different quality control parameters of milk in the
processing line especially in receiving, pasteurization and packaging.
• To suggest suitable CP options.
1.4 Rationale of the study
As we know the high volume of water consumption, waste water generation and solid
wastes generation are the main problems of industries, which carries the losses in the
production processes, control over these processes can prevent both the loss of valuable
products and pollution load on the environment. Therefore the proposed study will be
helpful for the industry to improve its process efficiency, reduce waste and develop an
environment friendly production.
Following outputs are expected from this study:
• Productivity improvement: The industry will be benefited through improved
productivity and reduced losses and will be able to follow the way of controlling its
processing using the techniques used in this study.
• Motivation to other industries: Other industries of similar scale industries will be
encouraged by the findings (results) from this study for CP assessment in those
industries.
• Create awareness on CP: This work will be the footsteps towards the CP
implementation in the industry under study.

4
1.5 Limitation of the study
Due to time constraint, the study will be limited only up to CP option generation and
feasibility study because no actual implementation and observation of results was possible
within such a short time frame.

Part II
2. Literature review
2.1 Environment Pollution
The world today is facing with three main problems viz. population growth, food scarcity
and environmental degradation. The last one is a serious problem in the developed and in
the developing countries too. Increased rate of industrialization and uncontrolled discharge
into the water and air, etc reflects towards environmental degradation in some sense.
(Malik et al. 2003)
HMG/N, 2000 describes pollution as that activity that significantly degrades, damage
the environment or harm the beneficial or useful purpose of the environment, by changing
the environment directly or indirectly, the interaction and interrelationship among the
components of natural, cultural and social system, economic and human activities and their
components. Simply, the adverse impact on the environment resulting from different
activities that affect different living and non-living components of the environment is said
to be an environmental pollution.
Industrial wastes contain various poisonous salts, alkalis, acids, odor, gases, heavy
metals, insecticides and pesticides. These polluted wastes are thrown into the canals,
streams or rivers where they deteriorate the quality of water making the water unfit for
irrigation purpose and for the use of animals. (Malik et al. 2003)
Energy and environmental pollution are the most discussed topics of the day. The
former, energy is in short supply and the latter, environmental pollution in abundance. It is,
therefore, the endeavor of mankind to efficiently use energy and reduce hazards of
pollution. To a little pensive mind, it appears that it is possible to recover energy from
some of the systems and in the process reduce pollution. (Tare, 1989)
2.2 Pollution control
When societies became aware of the effects of the environmental degradation caused by
human activity, the first strategy conceived was that of building filters to ensure that waste
from industries did not “leak” into the environment. However, analysis showed that better
strategies were required. The process of building filters only transferred pollutants from
one medium to another (e.g. from water to land). The process of building filters was also

6
not very economical. No savings accrued from this process (Erkman and Ramaswamy,
2001).
The traditional way to control emissions or discharges, as developed in the 1970s and
1980s, is with end-of-pipe solutions. In this case, governments impose very specific
requirements based on their knowledge of best available technologies. Small and medium-
sized industries have always had a hard time meeting end-of-pipe requirements (Bakken,
2001).
The development of new approaches to reduce the impact of industrial activity on the
environment is essential to sustainable development. “End-of-pipe” waste treatment
approaches have reduced gross pollution yet incremental waste loadings continue to
significantly stress natural systems. Issues such as global warming and the decline in
biodiversity are alarm bells ringing - as a species; we have to change our ways. We have to
find new approaches to sustain the economic and social systems dependant on ecological
health. (Robinson, 1999)
2.3 Pollution prevention/Cleaner Production
Pollution reduction or even prevention rather than control is gaining popularity over the
world since the last few decades. This approach is widely known as Cleaner Production,
which is the conceptual approach to reducing environmental impact of human activities
through a better use of resources, methods, technologies and above all, management of
processes and activities. There are several other terminologies used in different countries
such as waste minimization, green productivity, pollution prevention, eco-efficiency,
source reduction etc., which are the different names of cleaner production. What all these
have in common is an attempt to maintain the same level of output using less input (e.g.
water, energy, raw materials), thereby improving efficiency and reducing pollution.
(Adhikari, 2009)
The concept of Cleaner Production was introduced by UNEP in 1989 as a response to
the question of how industry could work toward sustainable development (UNEP, 1994).
The main goal of the Industrial Pollution Prevention/Cleaner Production component is to
show that significant financial savings and environmental improvements can be made by
relatively low cost and straightforward interventions. These consist of pollution prevention
through good housekeeping, waste minimization, process modification and technology
change. (SEAM, 1999)

7
Cleaner production is an excellent approach in developing countries where waste water
is typically discharged without any treatment at all. End of-pipe treatment is beyond the
financial capacity of many industries in the developing world (Taylor, 2005).
The plant-level working method for CP, or assessment, is often characterized as a
systematic planned procedure with the objective of identifying ways to reduce or eliminate
the generation of waste and emissions (Berkel, 1995).
It has shown that the CP concept has been successfully practiced in Nepalese industries
and the concept fits very well into the development efforts of Nepalese industries and the
industrial policy of HMG. Implementation of CP will improve the environment around the
industries as well (Pradhan, 2001).
2.4 Cleaner production in food industry
The food processing industry is very diverse. Major sectors include fruit and vegetables,
dairy, meats and fish, alcoholic and non-alcoholic beverages, oils, and packaged foods.
The most common environmental concerns in the industry are water consumption and
wastewater discharge, chemicals used in processing and cleaning, packaging reduction and
disposal, and food scraps and refuse. Energy efficiency and greenhouse gas emissions are
increasingly important issues as well. (Anon, 2002)
The effluents coming from textile, plastic, soap & chemical industry, brewery,
vegetable oil and ghee, biscuit and confectionary, straw and paper mill, tannery; pollution
prone industries; are expected to be highly alkaline, colored, high biochemical oxygen
demand (BOD), chemical oxygen demand (COD), temperature, dyes, bleaching agents,
high suspended solids, heavy metals and salts, high turbidity, heavy organic load, high
saponified soap, detergents etc. These all have contributed to the pollution of water and
adversely affect the environment and public health. Despite these the industries are still
operating in a conventional way with a little or no effort for pollution prevention or control
measures (ESPS 2001).
Wastes from the food processing industry are, to a certain extent, inevitable. When
these wastes, which are fairly wet and contains high carbon ratio, are left untreated, they
become a breeding ground for microorganisms. The material starts to decay and smell.
Wastes can give a dirty, untidy appearance to factory. (Elwan, Ahmed and Hamed, )

8
It is also not technically or economically feasible, at the last stage, to put a final control
on a series of major previous mistakes in the sequence of events. That is why food plants
which defy elementary housekeeping principles in-plant usually have major, costly,
unmanageable waste treatment problems at the end-of the-pipe. Therefore, the preferential
emphasis on process control must always be to throttle down all the sources of variance,
proportionately to their size and overall significance, as far to the left of the flow sheet as
possible (Green and Kramer, 1979).
2.5 Industrial Wastewater
Industrial wastewater generated from industrial operations includes process wastewater,
wastewater from utility operations, runoff from process and materials staging areas, and
miscellaneous activities including wastewater from laboratories, equipment maintenance
shops, etc. The pollutants in an industrial wastewater may include acids or bases (exhibited
as low or high pH), soluble organic chemicals causing depletion of dissolved oxygen,
suspended solids, nutrients (phosphorus, nitrogen), heavy metals (e.g. cadmium,
chromium, copper, lead, mercury, nickel, zinc), cyanide, toxic organic chemicals, oily
materials, and volatile materials. , as well as from thermal characteristics of the discharge
(e.g., elevated temperature). Transfer of pollutants to another phase, such as air, soil, or the
sub-surface, should be minimized through process and engineering controls (EHS, 2007).
In food processing, wastes can be broken down to direct and indirect wastes:
Direct waste: All wastes that can be accounted for, in dumpsters or bins and are
comprised of lost raw ingredients and semi-processed or fully processed product.
Direct wastes can be further broken down to:
• Intentional waste- any waste expected as part of the process, such as peeling and
pits from vegetable processing, whey from white cheese making, blood and bones
from meat processing, and waste water from different processes.
• Unintentional waste-waste resulting from poor operation, improper maintenance
and cleanup practices.
Indirect waste: Waste created as a result of direct waste discharged to the drain.
Indirect waste is comprised of sludge which is the solid waste produced from the
treatment of effluent wastewater. Sludge generation will depend on the type of food

9
processed, the amount lost into the drain and the type of wastewater treatment (SEAM,
1999).
2.6 Wastewater Management
Wastewater management includes water conservation, wastewater treatment, storm water
management, and wastewater and water quality monitoring. The term “waste-water” refers
to the water entering into the sewerage system in the form of water whose character has
been changed as a result of domestic or industrial use (particularly water which has been
polluted in some way) and rain water run-off from developed land. It also includes water
contaminated as a result of agricultural use and water issuing from dumps (GTZ, 1995).
The harmfulness of wastewater is determined by specific properties which (both
individually and together) can change the quality of a body of water. These include (GTZ,
1995):
• The content of the water in respect of particular substances (concentration),
• The pollutant quantity discharged into the water within a specific period (pollution
load),
• Certain properties and effects of the waste-water (e.g.O2 depletion).
Discharge of waste-waters into surface waters may impair the quality of the latter, i.e.,
it may cause contamination or lead to other adverse changes in water’s physical, chemical
and biological properties. Emission standards are used in monitoring waste water at the
discharge site; they are intended to preserve the water quality necessary for various forms
of use and to protect other aquatic organisms (GTZ, 1995).
Existing standards for the constituents of waste-water in Nepal apply to (HMG/N, 2003):
• Discharges into sewerage system with sewage treatment plant and/or
• Discharges into bodies of water and into sewerages systems without treatment
plant.
Emission standards essentially aim to ensure that waste-water is pretreated or the
pollution load reduced before waste-water is discharged into surface waters (HMG/N,
2003). Processors must manage 100% of their necessary inputs by minimizing their
wasteful outputs, keeping them concentrated and isolated prior to being reprocessed into
suitable condition for reuse within and beyond the plant, or for discharge under good

10
control with negligible harmful environmental consequences, or with some environmental
benefits (Green and Kramer, 1979).
2.7 Dairy wastes
As for many other food processing operations, the main environmental impacts associated
with all dairy processing activities are the high consumption of water, the discharge of
effluent with high organic loads and the consumption of energy (UNEP, 1995).
The wastes from milk processing plant consist principally of drainage and washing
from cans and equipment, with the occasional discharge of surplus buttermilk and whey
and of spoiled materials. Because of this, much can be done to reduce the volume and
concentration of the wastes by proper drainage of cans. (Imhoff and Fair, 1956)
In a manufacturing plant with no product losses from any area, the quantity of material
sold will be equal to the material delivered to the factory. However, in any manufacturing
process there are inherent losses. In market milk dairy, these will include packaging losses
due to overweight packs, material used for samples and all losses of liquid and semi-solids
associated with operation of the manufacturing, equipment, many of which are avoidable
(Carawan, 1979).
Dairy processing effluent contains predominantly milk and milk products which have
been lost from the process, as well as detergents and acidic and caustic cleaning agents.
Milk loss can be as high as 3–4%, with the main source of loss being residues which
remain on the internal surfaces of vessels and pipes, accidental spills during tanker
emptying and overflowing vessels (UNEP, 1995).
Due to the presence of milk solids (e.g. protein, fat, carbohydrates, and lactose),
untreated wastewater from dairy processing facilities may have a significant organic
content, biochemical oxygen demand (BOD), and chemical oxygen demand (COD).
(Environmental, Health and Safety (EHS) Guidelines General EHS Guidelines:
Introduction, IFC-international Finance Corporation, World Bank group april, 2007)
An excessive waste load means wasted product and lost income. More than 90 percent
of a plant’s total waste load comes from milk components that are lost and flow into floor
drains during processing. Lactose, proteins, and butterfat are the major components. The
wastewater also may contain cleaning agents, lubricants, and solids removed from

11
equipment and floor. Wastewater analysis is useful to indicate a plant’s processing
efficiency. MDairy Processing Methods to Reduce Water Use and Liquid Waste Load
F2071Department of Biological & Agricultural Engineering Kent D.Rausch Extension
Specialist, Food Engineering G. Morgan Powell Extension Natural Resource Engineer)
Whenever waste material from industry or from a municipality is introduced into the
receiving water stream, this material requires large amounts of oxygen to be decomposed:
the polluting material has a biochemical oxygen demand (B.O.D). If this B.O.D is high
enough it will use up oxygen which might otherwise be available to aquatic organisms.
The lowering of dissolved oxygen in streams, as a result of pollution, is one of the key
factors in the destruction of streams and rivers by polluting sources (Brittin et al., 1970).
Harper et al. (1971) found that 90% of the five day biochemical oxygen demand (BOD)
in dairy wastewaters could be attributed to milk products. The BOD concentration of dairy
wastewaters ranges from 750 mg/l to 4,200 mg/l (Harper, 1974). Over 96% of the BOD
load from fluid milk processing plants has been estimated to come from milk solids
(DPRA, 1975).
Fats, oil and greases (FOG) are important to dairies primarily because many
municipalities have sewer use ordinances which restrict FOG to 100 mg/l (WPCF, 1975).
Milk fat, which is biodegradable, is the main fat found in dairy wastewaters (EPA, 1974).
Harper et al. (1971) cautioned that when planning new dairy plants or remodeling
existing facilities, consideration should be given to the segregation of those sewers
expected to receive high BOD wastewaters. These wastewaters could be returned to a tank
for waste load equalization or subjected to pretreatment. These wastes included lubricants,
milk from filling areas, solid particles from cottage cheese operations, high temperature
short-time (HTST) discharge and cleaning-in-place (CIP) discharge.
The filling area is another area reviewed by Elliott (1973) for measures to conserve
water and prevent product wastes from going into the plant wastewater system. He
concluded that a plant recovery system was desirable to collect product from defective or
damaged cartons.
Essentially, cleaner production opportunities can arise in all of the factory operations.
Given the environmental impacts identified in the study, efficiency in energy use is
paramount in achieving cleaner production in the process. The other major factor in cleaner

12
production is the amount of wastewater disposed of as this contains milk solids and
chemical cleaners. Optimization of the cleaning processes to make them efficient with
respect to water and energy use is important. Minimizing of wastage and losses in the
filling and packaging steps will reduce the environmental impacts from these sources.
Reducing the waste of packaging materials during the filling processes would assist in
achieving cleaner production goals (Centre for Integrated Environmental Protection, http//
www.ens.gu.edu.au/ciep/dairyfarmers.pdf)
Measurement of losses
A waste minimization program in the dairy industry is governed by the loss monitoring
program. In the past, yields in the dairy industry have been calculated as:
Yield =
This was changed to incorporate the losses determined by the loss monitoring technique
which is given below:
Quantity of product packed = potential product in raw material - losses
Po = Pi - L
Direct measurement of losses, even with quite a low degree of accuracy, leads to an
order of magnitude increase in the degree of the estimation of the yield. Areas which must
be measured to determine losses are: wastewater, stack losses, product weights, product
composition and stock food. (J. W. Barnett, S. L. Robertson and J. M. Russell,
Environment Portfolio, New Zealand Dairy Research Institute, Private Bag 11 029,
Palmerston North)
2.8 Water consumption in dairy
In the dairy processing industry, water is used principally for cleaning equipment and work
areas to maintain hygienic conditions, and accounts for a large proportion of total water
use. Rates of water consumption can vary considerably depending on the scale of the plant,
the age and type of processing, whether batch or continuous processes are used and the
ease with which equipment can be cleaned, as well as operator practices. A typical range
for water consumption in reasonably efficient plants is 1.3–2.5 litres water/kg of milk

13
intake (UNEP, 1995). Plants with the least amount of water use per unit of product
processed have the least amount of pollutants per unit processed (Carawan, 1988).
The dairy industry reportedly takes in more water than it does milk (Renwick, 1975).
Each gallon of milk processed was said to require about 1.5 to 2.0 gal (gallons) of water
(Renwick, 1975). Hall and Trout (1968) reported dairy water use at 0.75 to 1 gal/lb of milk
Processed. As the water is used in the food plant, parts of the food product being processed
are deposited in the water, and this wastewater must be properly handled to prevent
pollution (Carawan, 1988).
Quality of water used in dairy processing is of great importance as it is one of the major
raw materials that directly come in contact with the milk. Bacteriological examination of
water is necessary for determining its fitness for use of human consumption, and for use in
industries such as food processing and dairy, photo film, etc. Water used for drinking, food
processing and dairying should be free from fecal or sewage contamination because micro-
organisms causing water-borne disease such as typhoid and parathyroid fevers, food
poisoning, gastroenteritis, cholera, dysentery and diarrhea are excreted in the feces of
individuals suffering from the disease (Kudesia and Kudesia, 1998).
Unit Water Use
This unit performance ratio would be calculated using the following formula, and reported
in units of liters of water per liter of Raw Milk, as follows:
Unit Water Use = Total m3 Water Used over 12 Month Period x 1,000 L/ m3
Total Litres Raw Milk Received Over Same 12 Months
This value is expected to be in the range of 1 to 3 Litres per Litre for fluid milk plants, and
upwards of 5 Litres per Litre for industrial milk plants. Water employed in products or
reconstitution is not to be included in total water use. (NDCC, 1997)
2.9 Energy consumption in dairy
Energy consumption depends on the age and scale of a plant, the level of automation and
the range of products being produced. Process which involve concentration and drying, for
example the production of milk powder, are very energy intensive, whereas market milk,
which requires only some heat treatment and packaging, requires considerably less energy.
A typical range for energy consumption in plants processing milk is 0.5–1.2 MJ/kg of milk

14
intake. [cleaner production assessment in dairyprocessing,UNEP)
http://www.unep.fr/shared/publications/pdf/2480-CpDairy.pdf]
Energy and water are important components contributing to the production cost. Water
conservation projects therefore environmental protection since depletion of natural
resources is considered an environmental hazard. (SEAM, 1999)
Industrial pollution by industries has been measured in terms of waste water volume,
biological oxygen demand (BOD), and total suspended solid (TSS) loads of the effluents.
(Anon, 1991)
2.10 Dairy wastewater quality parameters
2.10.1 Flow rate
The flow rate determines the extent of pollutant load on the receiving water bodies.
Greater is the volume of flow of effluent, lesser is the dilution effect in the river and more
is the pollution load. Some of the pollutants get biomagnified in the waters and get
accumulated in higher trophic levels, e.g., fish, crabs and other aquatic organisms. This
level of biomagnifications is considered important in water pollution studies and can be
studied through the proper knowledge of the flow rate (Trivedy and Goel, 1986).
2.10.2 pH
The pH of dairy effluent varies between 2 and 12 as a result of the use of acid and alkaline
detergents for plant cleaning both low and high pH values interfere with the activity of the
micro organisms that break down organic pollutants in the biological treatment stage of the
sewage treatment plant, transforming them into biological sludge (cell detritus). As a rule,
waste water with a pH of over 10 or below 6.5 must not be discharged to the sewage
system, as it is liable to corrode the pipes used detergents are therefore normally collected
in the mixing tank, often located close to the cleaning plant, and the pH is measured and
regulated to, say pH 7.0 before it is discharged to drain. (Dairy Processing Handbook.
Tetrapak)
Industrial processes and some municipal sewage can result in effluents which
drastically change the pH values of the receiving waters. Ordinarily living organisms have
a relatively narrow range of tolerance of pH changes. The majority of desirable living
organisms require water with a pH value somewhere between 6 and 8. It is true that some
organisms can live in waters having pH values outside that range. However, as a

15
generalization, it is safe to say that waters which support desirable aquatic life have a pH
values somewhere between 6 and 8. (Air and water pollution: proceedings of the summer
workshop, august 3-15, 1970.university of Colorado-Wesley E. Brittin, Ronald West,
Robert Williams)Book ko reference halne
2.10.3 TSS
One of the major pollutants in dairy plant discharges is suspended solid waste, such as
coagulated milk, particles of cheese curd, and in ice cream plants, pieces of fruits and nuts.
The measurement of this pollutant is called "total suspended solids," or TSS. These solids
discolor and cloud water. They impair photo-synthesis in aquatic plants. They can settle on
the bottom. When they contain organic matter - as dairy wastes do - the bottom deposits
become sludge beds that can further deplete the water's oxygen content. As the sludge
decomposes, it gives off gases that are toxic to aquatic life and cause odor problems.
(Carawan, Chambers and Zall, 1979)
2.10.4 Oil and grease
Oil and grease is defined as any material recovered as a substance soluble in the solvent.
Certain constituents measured by the oil and grease analysis may influence wastewater
treatment system. If present in excess amount, they may interfere with aerobic and
anaerobic biological processes and lead to decreased wastewater treatment efficiency.
When discharged in wastewater or treated effluent, they may cause surface films and
shoreline deposits leading to environmental degradation. (APHA, 1998)
Knowledge of the quantity of oil and grease present is helpful in proper design and
operation of wastewater treatment system and also may call attention to certain treatment
difficulty. (APHA, 1998)
2.10.5 Dissolved oxygen
Dissolved oxygen is one of the most important parameters in water quality assessment and
reflects the physical and biological processes prevailing in the waters. Its presence is
essential to maintain the higher forms of biological life in the water. The effects of a waste
discharge in a water body are largely determined by the oxygen balance of the system.
Oxygen can be rapidly removed from the waters by discharge of the oxygen demanding
wastes. Other inorganic reductants such as hydrogen Sulphide, ammonia, nitrites, ferrous
iron, and other oxidizable substances also tend to decrease dissolved oxygen in water. Low

16
oxygen in water can kill fish and other organisms present in water. Low oxygen
concentrations are generally associated with heavy contamination by organic matter. In
such conditions oxygen may sometimes totally disappears from the water (Trivedy and
Goel, 1986).
EPA has set the minimum stream D.O. at 5mg/L. it is important that wastewaters have
maximum D.O. levels when they are discharged and have a minimum of oxygen
demanding components (Trivedy and Goel, 1986).
2.10.6 Biochemical Oxygen Demand
Biochemical Oxygen Demand (BOD) is the amount of oxygen utilized by microorganisms
in stabilizing the organic matter. On an average basis, the demand for oxygen is
proportional to the amount of organic waste to be degraded aerobically. Hence, BOD
approximates the amount of oxidizable organic matter present in the solution. BOD value
can be used as a measure of waste strength. It is highly important to know the amount of
organic matter present in the waste treatment system and the quantity of oxygen required
for its stabilization. The BOD values are thus very useful in process design and loading
calculation as well as in measuring efficiency and operation of treatment plants. The BOD
test is also useful in stream pollution control management and in evaluating self-
purification capacities of streams, which in turn serves as a measure to assess the quantity
of wastes which can be safely assimilated by the stream (Trivedy and Goel, 1986).
The complete degradation of the organic matter may take as long as 20 days or more.
Simple organic compounds like glucose are almost completely oxidized in 5 days while
domestic sewage by only about 65%. Complex organic compounds might be oxidized only
up to 40% in this period. The 20 or more day’s period is of less significance in practice.
Therefore, the BOD test has been developed for 5 days at 20°C (APHA, 1998).
Types of microorganisms, pH, presence of toxins, some reduced mineral matter, and
nitrification process are the important factors influencing the BOD test. BOD in general
gives a qualitative index of the organic substances which are degraded quickly in a short
period of time (Trivedy and Goel, 1986; APHA, 1998). The BOD of an effluent is a useful
measure of wastage and efficiency of processing (Herschdoerfer, 1967).
Surveys show 1 pound of BOD5 in wastewater means at least 9 pounds of milk have
been lost. By knowing the BOD5 level in a waste stream, the amount of product flowing

17
down the drain can easily be estimated. (Dairy Processing Methods to Reduce Water Use
and Liquid Waste Load, Department of Biological & Agricultural Engineering Kent
D.Rausch Extension Specialist, Food Engineering G. Morgan Powell Extension Natural
Resource Engineer)
2.10.7 Chemical Oxygen Demand (COD)
Chemical oxygen demand is the oxygen required to oxidize organic substances in water by
a strong chemical oxidant. The determination of COD values is of great importance where
BOD values cannot be determined accurately due to the presence of toxins and other
unfavorable conditions for the growth of microorganisms (Trivedy and Goel, 1986).
The COD test continues to remain a very important parameter in management and
design of the treatment plants because of its rapidity in determination. For all practical
purposes its values are very close to the amount of chemically oxidizable carbonaceous
matter which may be quite useful in the control of treatment processes. COD values cannot
be corresponded with that of BOD values. In general, COD is more than BOD values for
most of the industrial wastes because of the fact that more compounds can be oxidized
chemically than by biologically. COD values are taken as basis for calculation of the
efficiency of the treatment plants and also figure in the standards for discharging
industrial/domestic effluents in various kinds of waters. For many types of wastes it is
possible to establish a relation between COD and BOD. For typical COD: BOD ratio
ranges from 1.47 to 1.65. If COD value is greater than 3, the waste is considered difficult
to biodegrade (Trivedy and Goel, 1986; APHA, 1998).
2.11 Quality control in dairy industry
United States Public Health Service defines pasteurization for milk and milk products as
the process of heating every particle of the product to 145°, and holding it continuously at
that temperature for at least 30 minutes; or to at least 161°F, and holding at that
temperature for at least 15 seconds. (Mitten, 1963) Pasteurization is usually done at
temperatures lower than 80-100°C [176°- 212°F]. (Anon, 2003) (Anon) 2003
Pasteurization- Heat treatment parameters. Available at:
http:/vency.com/webPASTEURIZATION.html [Accessed on 2/8/2008]
The HTST process for milk involves heating it to 72-75°C with a hold of 15-20 seconds
before it is cooled. (Dairy processing handbook, Tetrapak; Ahmad, 1997)

18
Intensive heat treatment of milk is desirable from the microbiological point of view. But
such treatment also involves a risk of adverse effects on the appearance, taste and
nutritional value of milk. Milk is very sensitive to intensive heat treatment which can cause
burnings on the heat exchange plates if the rate of heat transfer is too high. The
temperature difference between the product and the heating medium must therefore be kept
as small as possible in all parts of the heat exchanger (Ahmed, 1979).
According to Food Act 2026, Article 7, the specification for raw cow and buffalo milk is
stated below in table 2.1.
Table 2.1 Specification of raw cow and buffalo milk as per Food Act 2026
Composition Cow milk Buffalo milk
Fat%
SNF%
not less than 3.5%
not less than 7.5%
Fat% - not less than 5%
SNF% - not less than 8%
According to Model Weights and Measures ordinance (Anon, 1971), variation from the
declared net weight, measure, or count is permitted when caused by unavailable deviations
in weighing, or counting the contents of individual packages that occur in good packaging
practice. However, variations are not permitted to such extend that the average of the
quantities in the packages of a particular commodity, or a lot of the commodity, that is
kept, offered , or exposed for sale, or sold, is below the quantity stated. With regard to the
tolerance value in general, the tolerances are accepted as four percent (4%) per indicated
unit on under registration and two (2%) percent per indicated unit on over registration (Lin,
1981).
2.12 Wastewater treatment
Primary treatment of wastewater will be to remove most of the particulate material and
about 60% of the suspended solids. This will cause a drop of about 30% in the BOD.
Dissolved substances are not removed in primary treatment facilities. Primary treatment
involves simple processes such as screening and perhaps centrifugation. Secondary
treatment will address the total BOD issue. In this case, the suspended solids and BOD will
be reduced by about 85%. A minimum level of secondary treatment is required before
wastewater can be released into the natural water system.
19
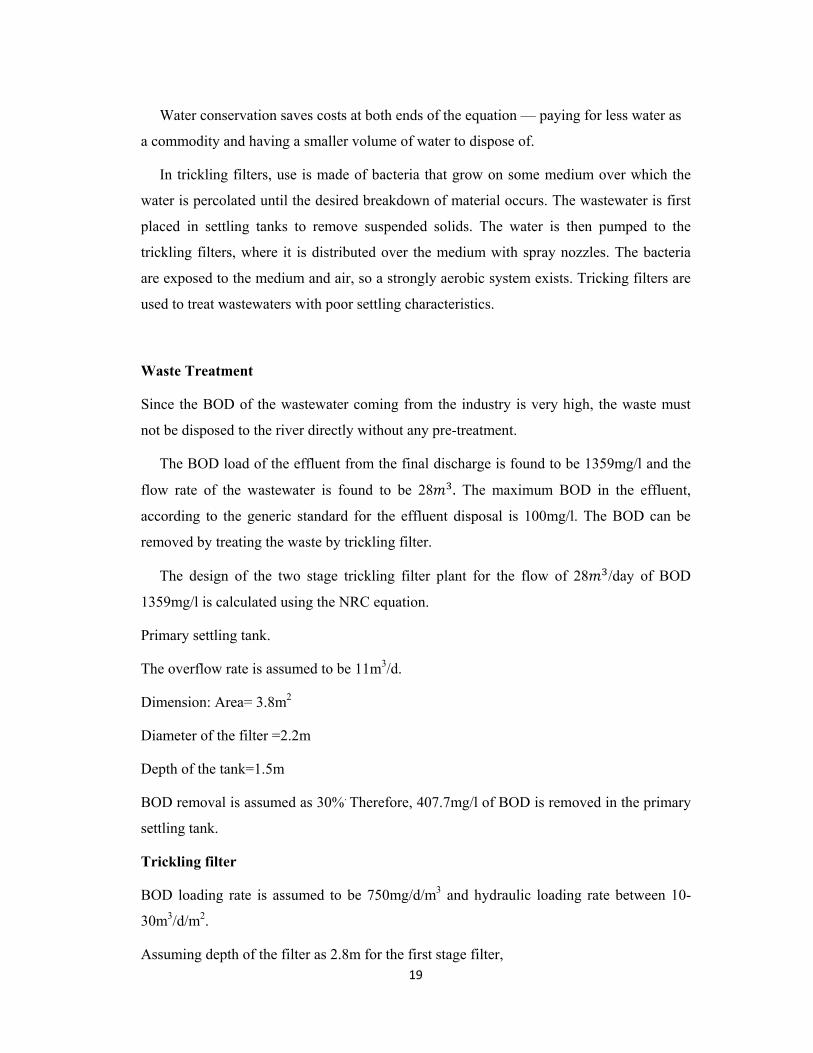
Water conservation saves costs at both ends of the equation — paying for less water as
a commodity and having a smaller volume of water to dispose of.
In trickling filters, use is made of bacteria that grow on some medium over which the
water is percolated until the desired breakdown of material occurs. The wastewater is first
placed in settling tanks to remove suspended solids. The water is then pumped to the
trickling filters, where it is distributed over the medium with spray nozzles. The bacteria
are exposed to the medium and air, so a strongly aerobic system exists. Tricking filters are
used to treat wastewaters with poor settling characteristics.
Waste Treatment
Since the BOD of the wastewater coming from the industry is very high, the waste must
not be disposed to the river directly without any pre-treatment.
The BOD load of the effluent from the final discharge is found to be 1359mg/l and the
flow rate of the wastewater is found to be 28 . The maximum BOD in the effluent,
according to the generic standard for the effluent disposal is 100mg/l. The BOD can be
removed by treating the waste by trickling filter.
The design of the two stage trickling filter plant for the flow of 28 /day of BOD
1359mg/l is calculated using the NRC equation.
Primary settling tank.
The overflow rate is assumed to be 11m3/d.
Dimension: Area= 3.8m2
Diameter of the filter =2.2m
Depth of the tank=1.5m
BOD removal is assumed as 30%. Therefore, 407.7mg/l of BOD is removed in the primary
settling tank.
Trickling filter
BOD loading rate is assumed to be 750mg/d/m3 and hydraulic loading rate between 10-
30m3/d/m2.
Assuming depth of the filter as 2.8m for the first stage filter,

20
Dimension: Volume of each filter= 17.8m3
Area of the first stage filter=6.35m2
Intermediate settling tank
Taking overflow rate as 14m3/d and depth of the tank as 2.1m,
Dimension: Area required=3m2
Diameter of the filter=2m
Final sedimentation tank
The over flow rate is assumed as 14m3/d and depth as 2.1m,
Dimension: Area required=2.5m2
Diameter of the filter=1.78m
The overall plant efficiency is calculated as 91% hence the estimated BOD of the final
effluent is 121mg/l, which is near the standard for the effluent disposal. Thus, after treating
in the trickling filter, the wastewater can be directly discharged in the river water.

Part III
3. Materials and Methods
3.1 Data collection procedure
Both primary and secondary data were used in the research. They were then processed and
analyzed using suitable statistical tools to get the results.
3.1.1 Primary data collection
The primary data and information required for the research were collected by direct
observation and analysis. The data for Fat% and SNF% of the raw milk from all the 25
milk collection centers were collected from the factory. Water consumption for each
section was determined by bucket and stopwatch method. The data for pasteurization was
obtained by monitoring the pasteurization temperature over a 30 day period, with 5
observations per day, in a random manner. The volume of the pasteurized milk in the
filling section was also recorded. The milk pouch samples were taken at random from both
the filling machines over a 20 day period, taking 10 samples per day from each machine at
frequent intervals. The defective packets from the filling operation were also calculated for
20 days.
3.1.2 Secondary data collection
The secondary data and information required for the study was collected by personal
communication from the dairy industry under study.
3.2 Sampling
The significance of analysis depends on large extent on the program. An ideal sample
should be one, which is both valid and truly representative of the water quality from which
it is collected and the sample should be small enough in volume to be transported
conveniently and handle in the laboratory.
As industrial samples are subjected to rapid change within a few minutes due to
breakdowns, spill over, floor washing etc. Hence it is necessary to collect individual
samples at uniform intervals, say 10 or 20 minutes. In fact the degree of variation in rate of
flow will determine the time interval for sampling (Kudesia and Kudesia, 1998). The
sampling program for the research work was performed as per guidelines given by APHA
(1998) and Trivedy and Goel (1986).

19
3.3 Sample collection
Samples for wastewater was collected from 5 different section of dairy processing viz; mik
receiving, crate washing, pasteurization, packaging and final outlet. The type of sampling
was purposive, random, grab sampling. Three samples from each sections were collected
in the sampling bottles, at equal time intervals, which were combined together to obtain a
representative composite sample. Prior to collection, these containers were thoroughly
cleaned with boiling water, 70% ethanol and then washed with acetone and dried well.
Separate BOD bottles were used for the collection of the wastewater sample for BOD
determination (Trivedy and Goel, 1986; APHA, 1998).
The record of each sample collected was defined with label and coded carefully. The
samples were coded as milk receiving section (75A), crate washing section (75B),
pasteurization section (75C), packaging section (81B) and final outlet (81A).
3.4 Sample handling and preservation
The collected samples were taken to SEAM-N-MMA laboratory, Biratnagar within 2 hour.
The samples were transported in refrigerated condition and protected from direct sunlight
and other contaminants. These samples were preserved under refrigeration in the
laboratory. Preservation techniques of the water and wastewater samples for chemical
analysis are given in Appendix VI.
3.5 Methods of analysis
The samples, thus collected, were analyzed for physical and chemical parameters at
SEAM-N-MMA environmental laboratory according to “Standard Methods for the
Examination of Water and Waste Water” (APHA, 1998) and “Chemical and Biological
Methods for Water Pollution Studies” (Trivedy and Goel, 1986). A summary of parameters
determined and methods followed is given in Table 3.2 and subsequent sections.
3.6 Data analysis
The data generated were compared with guideline values given by WHO, 1998 (Appendix
VII). In order to find out the contribution of each of the sections for the waste or pollution
load, the data of the wastewater quality parameters were analyzed using one way ANOVA-
with no blocking and with replication using Genstat Discovery Edition.

20
The primary data of the milk processing parameters like fat% and SNF% of the
incoming raw milk were presented by histogram. The defective % of the milk pouch was
presented by p-chart.
Table 3.1 Wastewater parameters determined and the method followed
Test parameters Analytical Methods
pH
Temperature
Conductivity
TSS
Oil and grease
BOD
COD
pH meter (0.01 unit sensitivity)
Mercury in glass thermometer (0.2°C sensitivity)
Conductivity meter
Gravimetric method (Trivedy and Goel, 1986)
Gravimetric method (Trivedy and Goel, 1986)
Azide Modification
Open reflux

Part IV
4. Process review and observations
4.1 Main Raw Materials
The main raw material used for the production of milk products is raw milk and Skim milk
powder where as auxiliary raw materials required are poly pouch, nitric acid, caustic soda,
detergents and water respectively.
4.2 Processing units
The existing number of processing units and their capacity is as follows:
Table 4.1 Milk processing units and their capacity
S.N. Particulars No. Capacity Remarks
1 Milk Receiving Weighing Scale 1 500 litre -
2 Pasteurizer 1 1800 lit/hr -
3 Milk Storage Tank 4 20,000 liter Each of 5000 l
4 Milk Packing Unit 2 1740 lit/hr Each of 900 and 840 l
5 Ghee Making Pan 1 50 lit/hr -
6 Cream Separator 1 27 lit/hr -
9 Hot water generator 1 5000 Kcal/hr Kerosene based
Source: Kamadhenu Dairy Development Cooperatives Ltd.

21
Process for Pasteurized milk is summarized in the following flow chart.
Raw Milk Reception Standardize milk
Filtration Pasteurization (75-78°C/15sec)
Chilling at 3°C Cooling to 7-8°C
Raw milk storage (at <5°C) Storage in Pasteurized Milk Tank
Pre heating 45-50°C Filling and sealing in Pouch
Cream Separation Storage at 3°C
Standardization Distribution
Market
Fig. 4.1 Process flow chart for milk pasteurization.
4.3 Process Description
A detailed process description including inputs, outputs and wastes is as follows:
4.3.1 Milk Processing
4.3.1.1 Raw Milk Collection
Raw milk is collected from 25 different milk co-operatives at the chilling centre. The
collected milk is chilled at 40C and stored in the chilling vat measuring its quality and
quantity.
Collected Raw Milk
Milk Waste milk
Collection

22
The overall view of the milk processing in Kamadhenu Dairy is presented below in fig.
2.1.
Raw Milk Receipt
Filtration
Storage
Standardization
Skim milk Cream
Pasteurization Ripening
Storage in Tank Churning
Pre heating 60oC Packaging in Pouch Washing (chilled water)
Butter
Heating 85oC Butter Milk
Cooling 42oC Heating110oC-120oC
Inoculation (2 % Culture) Clarification and Cooling
Incubation (42-45 oC) Filtration
Yoghurt Distribution Ghee
Market
Heating (in rotating pan)
Stirring with scrapper
Boiling for 1-1.5 hrs
Khoa
Fig. 4.2 An Overview of Milk Processing in Kamadhenu Dairy

4.3.1.2
The ch
factory
quality
The
analyz
conten
The
to 5.14
raw m
Freq
uenc
y
2 Milk Rec
hilled milk i
y. At the rec
y testing, fat
Milk
Chemicals
e samples o
zed for fat co
nt were plott
e true mean
4, at 95% co
milk was with
1
0
2
4
6
8
10
12
3.2
Fat
eiving
is loaded in
ceiving secti
t percentage
of the incom
ontent in the
ted in the his
of the fat%
onfidence lim
hin the range
2
21 3.59
t content
the milk tan
ion, quantity
and SNF pe
ming raw m
e factory by
stogram show
was found
mit. So we m
e as specified
1
9 3.97
of raw m
Quality
Rec
23
nker at the c
y and quality
ercentage is c
milk from t
volumetric G
wn below.
to lie within
may say that
d by Nepal S
3
4.35
Fat %
milk in K
y Testing
ceiving
hilling centr
y content of
checked.
Was
the entire 2
Gerber meth
n the range 4
the status of
Standard.
6
4.73
%
Kamadhen
re and then b
f milk is me
ste milk
Chem
5 collection
hod. Mean v
4.9±0.24 tha
f the fat% of
10
5.11
nu Dairy
brought to th
easured. In th
micals
n centre we
value of the f
at is from 4.6
f the incomin
2
5.49
y
he
he
ere
fat
66
ng

The sa
for SN
histog
The
to 8.3
incom
4.3.1.3
The ob
for sta
either
separa
Freq
uenc
y
amples of th
NF content b
gram shown b
e true mean
4, at 95% c
ming raw milk
3 Milk Stan
bjective of s
andard milk
cream is se
ation is based
Water/SM
1
0123456789
10
6.96
SN
he incoming
by Lactomet
below.
of the SNF%
confidence
k was within
ndardization
standardizati
and 5% fat
eparated from
d on fat cont
P
0
65 7.23
NF% of in
raw milk fr
ter test. Me
% was found
limit. So, w
n the range a
n
ion of milk
and 8% SNF
m milk or w
tents of milk
2
35 7.505
ncoming
Stand
24
rom the entir
an value of
d to lie withi
we may say
as specified b
is to meet w
F content for
water and SM
k.
3
5 7.775
SNF%
milk in k
dardization
re 25 collect
the SNF co
n the range
that the sta
by Nepal Sta
with standard
r whole milk
MP is added
9
8.045
%
kamadhe
tion centre w
ontent were
8.2±0.13 tha
atus of the
andard.
d i.e. 3% fat
k. During sta
d into it. Th
Cream, Sk
8
8.315
enu dairy
were analyze
plotted in th
at is from 8.0
SNF% of th
t and 8% SN
andardizatio
he addition
kim Milk
2
8.585
y
ed
he
06
he
NF
on,
or

4.3.1.4
After
of pas
In
the pr
the mi
From
throug
milk i
Raw M
The
five ob
data w
interva
Upper
line in
4 Pasteuriz
standardizat
teurization i
the pasteuriz
re-heating se
ilk is heated
heating sect
gh regenerat
s chilled up
Milk, Skim m
e data for m
bservations
was made ran
als. The dat
r specificatio
n the histogra
zation
tion process
is to kill all p
zation proce
ection of pas
d up to 600C
tion, it is pas
tion and pre
to 40C.
milk
milk pasteuriz
per day, at
nging from t
ta were pres
on limit for
am.
it is pasteur
pathogenic m
ess, first of a
steurizer. It
C. In the hea
ssed into hol
-heating sec
zation tempe
regular time
the lowest to
sented in th
pasteurizati
Pas
25
rized at 720C
micro-organi
all, the recei
is then pass
ating section
lding tanks w
ction, it is p
erature were
e interval. T
o the highest
he histogram
on temperat
steurization
C for 15 sec
isms present
ived milk is
sed to the re
n the milk is
where it is co
assed into c
e collected o
Then the freq
t value. The
m as shown
ture is 75°C
conds. The m
t in milk.
pre-heated
egeneration
s heated up
ooled for 15
chilling secti
Mi
over a 30-day
quency distr
data were p
in the figur
which is sh
main objectiv
at 40-450C
section whe
to 72.7-83°C
5 sec. and the
ion where th
ilk, Water
y period, wi
ribution of th
placed in cla
re below. Th
hown by US
ve
in
ere
C.
en
he
ith
he
ass
he
SL

26
From the figure it is clear that most of the data were above the upper specification limit
for pasteurization temperature. The loss of energy was calculated. Hence, it was found that
at 95% confidence limit, loss in energy amounts to 9.69 to 12.39 KW energy per/ day.
4.3.1.5 Milk Storage
In this stage the pasteurized milk is chilled below 40C in the chilling section of the
pasteurizer and then stored in storage tank. The storage tank is insulated so the milk
temperature is maintained constant.
Water Milk leakage
4.3.1.6 Milk Packing
The stored milk kept in storage tank is pumped into the filling section for packing. The
milk is packed into a 500 ml LDPE pouch. The packing is done by two packing machines.
Pasteurized milk Pasteurized Milk
Poly film Defective Poly Pouch
The milk packaging efficiency of the filling machines at Kamadhenu Dairy was also
studied. The histogram below represents the data regarding volume of pasteurized milk
taken during milk filling operation. The data were collected over a 10days period, with 20
observations, taking 10 samples from each machine. Variability in the volume of milk can
be observed. The histogram shows the shape of the distribution, its central tendency, and
the variation or scatter of the measurement. (Banks, 1989)
Milk Storage
Milk Packaging

The
of sign
any va
norma
The n
and th
Freq
uenc
y
0
0.02
0.04
0.06
0.08
0.1
0.12
0.14
4
e no. of milk
nificance. V
alue from 49
al variate we
number of m
he area cover
30
10
20
30
40
50
60
70
80
90
100
487.9
485
k packets w
Volume reco
94.5 to 505.5
ere calculated
Z= X
milk packets
red is shown
2
9 490.1 4
Volum
490
weighing betw
orded as bein
5 assuming
d from the fo
σXX − (at 5
weighing b
n in the figur
9
20
492.3 494.5
e of paste
495
27
ween 495 an
ng between
they are rec
ormula given
% level of s
etween 495
re below.
37
8
496.7 49
Volum
eurized m
500
nd 505ml we
495ml and
orded to the
n below,
ignificance)
and 505ml
86
24
98.9 501.1
e
milk pack
505
ere calculate
505ml can
e nearest ml.
was found
126
503.3 505
kets
510
ed at 5% lev
actually hav
. The standa
to be 88.63
61
5.5 507.7
515
vel
ve
ard
%
5

28
Similarly, the number of milk packets below 495ml was found to be 7.88%. The area
covered is given in the figure below.
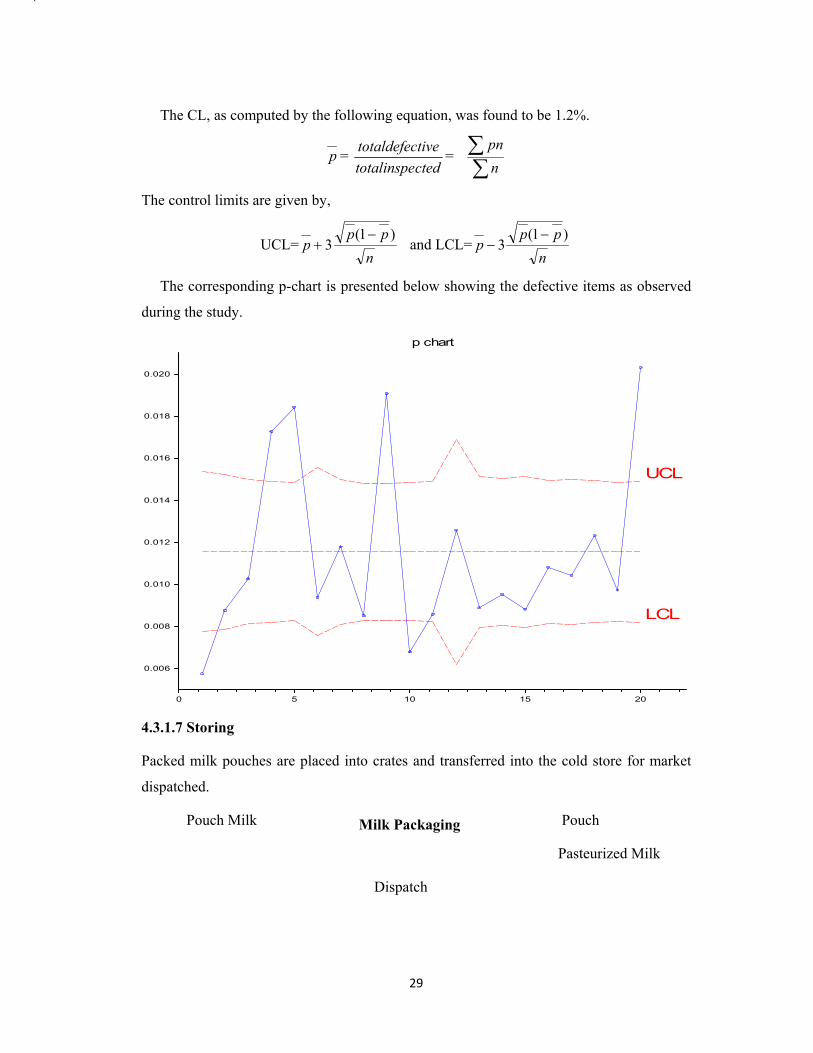
The table below presents the percentage defective in pasteurized milk package. The
values for the control limits for 20 days are shown in the last two columns of the table and
the p chart is shown in Figure….
Table 2. Percentage defective in milk packaging
SN No. of Pkg Inspected (n) No. of defective Pkg (Pn) P (%) UCL(%) LCL(%)1 7140 41 0.57 1.58 0.82 2 7540 66 0.88 1.57 0.83 3 8776 90 1.03 1.54 0.85 4 9100 157 1.72 1.53 0.86 5 9500 175 1.84 1.53 0.87 6 6400 60 0.94 1.6 0.8 7 8580 101 1.18 1.55 0.85 8 9640 82 0.85 1.53 0.87 9 9700 185 1.9 1.53 0.87 10 9592 65 0.67 1.53 0.87 11 9220 79 0.86 1.54 0.86 12 3580 45 1.26 1.74 0.66 13 8000 71 0.89 1.56 0.84 14 8400 80 0.95 1.55 0.85 15 7940 70 0.88 1.56 0.84 16 8880 96 1.08 1.54 0.86 17 8640 90 1.04 1.55 0.85 18 9020 111 1.23 1.54 0.86 19 9360 91 0.97 1.53 0.87 20 9160 186 2.03 1.54 0.86
00.020.040.060.080.1
0.120.14
485 490 495 500 505 510 515
29
The CL, as computed by the following equation, was found to be 1.2%.
p = ctedtotalinspetivetotaldefec =
∑∑
npn
The control limits are given by,
UCL=n
ppp
)1(3
−+ and LCL=
npp
p)1(
3−
−
The corresponding p-chart is presented below showing the defective items as observed
during the study.
4.3.1.7 Storing
Packed milk pouches are placed into crates and transferred into the cold store for market
dispatched.
Pouch Milk Pouch
Pasteurized Milk
Dispatch
Milk Packaging
LCL
UCL
0
0.020
0.016
0.012
0.008
0.014
0.006
20
0.010
15
0.018
105
p chart

30
4.3.2 Environmental Issues Related with Processes
The possible environmental issues related with milk processing are as follows.
4.3.2.1 Milk Receiving
The main form of waste generation in this process is wastewater and milk, Water is
consumed for rinsing the tankers, cleaning and sanitization of transfer vessels and storage
tanks. The effluent resulting from rinsing tankers and cleaning contain milk spilled over
the ground. This would contribute to the organic load of the effluent stream.
4.3.2.2 Pasteurization
The main environmental issue associated with this process is water consumed for rinsing
and cleaning of process equipments resulting in the generation of wastewater containing
milk, sludge and chemicals.
4.3.2.3 Milk storage
Milk spillage through leakages of piping and valves, spillage resulting in milk product lost
to the wastewater stream is responsible for high organic pollution load generation in
wastewater stream.
4.3.2.4 Packing
Milk loss due to voltage fluctuation in sealing of poly pouch is the major issue in terms of
organic pollution and solid waste generation. However, incorrectly filled milk poly
pouches are emptied and milk returned to the milk receiving section for reprocessing still
has contributed to the pollution load.
4.4 Nature of Waste Generation
The natures of waste generation from milk processing are as follows:
Waste Water- Waste Water containing milk product loss, milk and whey spillage,
chemicals used in CIP, crate washing and shop floor washing are the main sources of
waste water effluent coming out from the industry.
Solid Waste- Poly pouch rejected during the milk filling and sludge generation from
the cream separation, are the major source of solid waste.

Part V
5. Results and Discussions
5.1 Areas of Water Consumption
The ground water is a main source of water to be used in overall activity of milk
processing. The annual water consumption is 7182.03 m3. A section wise water use and
duration is given as below:
Table 5.1 Section wise water consumption record
S.N
.
Section Purpose Consumption Annual (m3)
Consumption Duration Lit/d
1. Milk reception
section
Cleaning 30 min 642.85 234.64
2. Crates/cans Cleaning 5 hr 4864.86 1775.67
3. Yoghurt making
section
Cleaning 30 min 720 262.8
7. Milk holding Tanks
(4 number)
CIP 20
min/tank
3000 x 2 2190
8. Pasteurizer CIP 1.5hr 2500 912.5
9. Packaging section CIP 30 min 920 336
9. Shop floor Cleaning 1.5 hrs/d 1928.57 703.92
10 Others Drinking, vehicle
washing and
Sanitation
Daily 2000 730
11. Ghee making
section
Cleaning - 100 36.5
Total 7182.03
Source: Kamadhenu Dairy Development Cooperatives Ltd.

28
5.2 Unit water use
The annual water consumption was found to be 7182.03 and the total amount of raw
milk received for the year 2065/66 was 1269294l.
The unit of liters of water per liter of raw milk is calculated as follows:
Unit water use =
X 1000 l/m3
Hence from the above formula the unit water use was found to be 5.65litre per liter of raw
milk.
5.3 Material Balance and cost of waste
The purpose of conducting material balance in the industry is to identify and quantify the
waste generation in the processes.
5.3.1 Material balance of the packaging section
Material and energy balances give a detailed account of all inputs and outputs, so that
problem areas can be identified and losses quantified. They will also clearly identify and
quantify previously unknown losses or emissions. (SEAM+CP) reference
The material balance about the packaging section of the dairy based on direct
observation and measurement is presented below.
Pasteurized milk (4578 Liter) Pouched milk (4450L)
Packaging material ( 27.543 kg) Packaging material (25.63kg)
Milk for reprocessing(120L)
(Loss)
Milk loss due to leakage 8 L
Packaging material loss 1.8 kg
MILK PACKAGING

29
5.4 Wastewater analysis
The data from waste water analysis of three different section of the dairy processing plant
are presented in the table below.
Table. Section wise dairy wastewater quality parameters
S.N. Parameters Section A Section B Section C
1 pH 7.9±0.01a 3.82±0.01b 6.73±0.02c
2 TSS (mg/L) 276±1 a 674±1 b 868±1 c
3 Oil and grease (mg/L) 108±1 a 1809±1 b 320±1 c
4 BOD (mg/L) 514±3 a 832±2 b 944±1 c
5 COD(mg/L) 936±2 a 2017±5 b 1892±2 c
The data in the above tables are in the form of (mean ± s. d.) and the figures with different
superscript are significantly different at 5% level of significance from each other otherwise
not.
From the above table it can be concluded that the effluent sample from each of the three
sections were found to be significantly different from each other at 5% level of
significance.
The detailed results and discussion about the water quality parameters is given in the
following paragraphs.
5.4.1 pH
The pH of the effluent coming from section B is not within the range as stated in the
generic standard for industrial effluent disposal given by HMG/N. The use of highly
concentrated nitric acid for cleaning purpose may be the cause of low pH in the wastewater
generated in that section.
5.4.2 TSS
The TSS of the samples of wastewater coming from all the three sections exceeds the
generic standard for effluent disposal given by HMG/N. Section c has the highest value of
864 mg/l. This shows that

30
5.4.3 Oil and grease
The value for oil and grease of the samples from all the three sections exceeds the generic
standard and it is maximum for the samples from section B that is from the pasteurization
unit. The high value of oil and grease may be due to the presence of milk residue during
HTST startup and shutdown or from
5.4.4 BOD
The BOD of all the samples exceeds the generic standard. The maximum BOD was from
section C. The high value of BOD from the packaging section may be due to spillage of
milk during filling operation, milk residue remaining in the overhead tank before cleaning
due to improper emptying of the tank.
5.4.5 COD
The value for COD of the samples from all the three sections exceeds the generic standard
and it is maximum for the samples from section B that is from the pasteurization unit. The
ratio of COD to BOD is less than three so it can be concluded that the waste is
biodegradable. So, biological methods can be applied to treat the waste.
Water Conservation Tips
• Think of water as a raw material with a cost.
• Set specific water conservation goals for your plant.
• Make water conservation a management priority.
• Install water meters and read the each shift.
• Train employees how to use water efficiently.
• Use automatic shut-off nozzles on all water hoses.
• Use high-pressure, low-volume cleaning systems.
• Avoid using water hoses as brooms.
• Reuse water where possible.
• Prevent spills of ingredients and of raw and finished product.
• Always clean up spills before washing.
• Establish a recognition and reward program for employees and teams who do an
outstanding job.

31
Part VI
6. Conclusions and recommendations
6.1 Conclusions

Appendix A. Quality parameters of the dairy effluent sample
SN. Parameters Units Methods Generic standard of effluent disposal Results
1 pH - pH metric 5.5-8.5
2 Temperature °C Electrometric Not exceed 40°C
3 Conductivity mS/cm APHA 2510 -
4 Total suspended solids mg/L APHA 2540D 150
5 Oil and Grease mg/L APHA 5520 10
6 Dissolved Oxygen mg/L APHA 4500 -
7 Biochemical Oxygen Demand mg/L APHA 5210 100
8 Chemical Oxygen Demand mg/L APHA 5220 250
9 Flow rate m3/Day Bucket and stopwatch method -

Appendix B Preservation techniques of the water sample for chemical analysis
Parameter Recommended sample vol. (ml)
Type of container
Preservation Allowable holding time
Acidity 100 P, G Refrigerate at – 4°C 24hr
Alkalinity 100 P, G Refrigerate at – 4°C 24hr
BOD 1000 P, G Refrigerate at – 4°C 6hr
COD 50 P, G H2SO4 to pH < 2 7 days
Chlorine, residual 500 P, G Analyze immediately –
Chloride 50 P, G Not required 7 days
Color 50 P, G Refrigerate at – 4°C 24hr
Cyanide 500 P, G Refrigerate at – 4°C; NaOH to pH 12
24 hr
Dissolved oxygen:
Probe 300 G Determine on site –
Winkler 300 G Fix on site 6hr
Hardness 100 P, G Refrigerate at – 4°C 7 days
Metals 200 P, G HNO3 to pH < 2 6 months
Ammonia 500 P, G Refrigerate at – 4°C;
H2SO4 to pH < 2
24 hr
Kjeldahl-N 500 P, G Refrigerate at – 4°C;
H2SO4 to pH < 2
7 days
Nitrate 100 P, G Refrigerate at – 4°C;
H2SO4 to pH < 2
24 hr
Nitrite 100 P, G Refrigerate at – 4°C 24 hr
Oil and grease 1000 G HCl to pH < 2 24 hr
Organic carbon 50 P, G Refrigerate at -4°C; 24 hr

33
H2SO4 to pH < 2
pH 100 P, G Determine on site –
Phenol 500 G Refrigerate at – 4°C 24 hr
Phosphate 50 P, G Refrigerate at – 4°C 24 hr
Specific conductance
100 P, G Refrigerate at – 4°C 24 hr
Solids (total, dissolved)
100 P, G Refrigerate at – 4°C 7 days
Sulfate 50 P, G Refrigerate at -4°C 7days
Sulfide 100 P, G Analyze immediately –
Temperature 1000 P, G Determine on site –
Turbidity 100 P, G Refrigerate at -4°C No holding
Radioactivity 1000 P, G Not required 24 hr
P – plastics; G – borosilicate glass
(Trivedy and Goel, 1986)

34