Ett 1500-talsvrak vid Risö. Fördjupat arkeologiskt kunskapsunderlag
Upload
khangminh22Category
view
1download
0
e .%~ t~.~ _ ~~.
.~ - ~.~a,,o.~p .
~~~~~~
°'iii,4 ~■~!9~,~
~~
CITY CAF ~RC)VID~N~E,
RH~?~~ I~~.aARICCOMPREHENSIVE ANNUAL FINANCIAL REPORT
Fiscal Year Ended June 30, 2015
___ _ _ _ i
-
~ 2
~ ~.' o '~
FINA~IC~ DEPAPTMFf~T of ~ ~~~25 Dorrance Street, ~ ~ ^-_
Providence, RI 02903 ~,~,~~~' ~~~

THIS PAGE If~TEfVTIO~IALLY LEFT BLA~II<

CITY OF PROVIDENCE RHODE ISLAND
YEAR ENDED JUNE 30, 2015
TABLE OF CONTENTS
INTRODUCTORY SECTION:
Exhibit Pa e s)
Letter of Transmittal .............................................................................................................. i — x
Organization Chart ................................................................................................................ xiList of City Officials ............................................................................................................... xiiGFOA Certificate of Achievement ......................................................................................... xiii
FINANCIAL SECTION:Report of Independent Auditors ............................................................................................ 1 - 2
Basic Financial Statements and Required Supplementary Information:Managements Discussion and Analysis ............................................................................... 3 - 11
Basic Financial Statements:Government-wide Financial Statements:Statement of Net Position ..................................................................................................... A-1 12Statement of Activities .......................................................................................................... A-2 13
Fund Financial Statements:Governmental Funds:Balance Sheet ....................................................................................................................... B-1 14Statement of Revenues, Expenditures, and Changes in Fund Balances ............................. B-2 15Reconciliation of the Statement of Revenues, Expenditures, and Changes in FundBalances of Governmental Funds (B-2) to the Statement of Activities (A-2) ....................... B-3 16
Proprietary Funds:Statement of Net Position ..................................................................................................... C-1 17Statement of Revenues, Expenses and Changes in Net Position ........................................ C-2 18Statement of Cash Flows ...................................................................................................... C-3 19 - 20
Fiduciary Funds:Statement of Fiduciary Net Position ...................................................................................... D-1 21Statement of Changes in Fiduciary Net Position .................................................................. D-2 22
Notes to Financial Statements ........................................................................................... 23 - 64
Required Supplementary Information:Budgetary Comparison Schedule for the General Fund ....................................................... E-1 65-69Budgetary Comparison Schedule for the School General Fund ........................................... E-2 70Notes to Required Supplementary Information ..................................................................... E-3 71Schedule of Funding Status ................................................................................... E-4 72Schedule of Changes in the Net Pension Liability and Related Ratios ............................ E-5 73Schedule of Contributions ...................................................................................... E-6 74Schedule of Investment Returns .............................................................................. E-7 75
Schedule of City of Providence School District Proportionate Shareof the Net Pension Liability .................................... E-8 76
Schedule of City of Providence School District Contributions .................. .................. E-9 77
(CONTINUED)

YEAR ENDED JUNE 30, 2015
TABLE OF CONTENTS
Exhibit Pa e s)
Other Supplementary Information:Non-major Governmental Funds:Combining Balance Sheet .................................................................................................... F-1 78Combining Statement of Revenues, Expenditures, and Changes in Fund Balances........... F-2 79
School Grant Funds:Combining Balance Sheet .................................................................................................... G-1 80Combining Statement of Revenues, Expenses and Changes in Fund Balances ................. G-2 81
Agency Funds:Statement of Changes in Assets and Liabilities -1 82
Capital assets schedules:Capital Assets Used in the Operation of Governmental Funds ........................................... J-1 83
ScheduleSTATISTICAL SECTION:Net Position by Component .................................................................................................. 1 84Changes in Net Position ........................................................................................................ 2 85-86Fund Balances, Governmental Funds .................................................................................. 3 87Changes in Fund Balances, Governmental Funds ............................................................... 4 88Tax Revenue by Source ........................................................................................................ 5 89Assessed Values and Estimated Actual Values of Taxable Property ................................... 6 90Principal Property Taxpayers ................................................................................................ 7 91Property Tax Levies and Collections ..................................................................................... 8 92Ratios of General Bonded Debt Outstanding ........................................................................ 9 93Direct Governmental Activities Debt ..................................................................................... 10 94Legal Debt Margin Information .............................................................................................. 11-12 95-96Pledged Revenue Coverage ................................................................................................. 13 97Demographic and Economic Statistics ................................................................................. 14 98
Principal Employers .............................................................................................................. 15 99Full-Time Equivalent Employees by Function ....................................................................... 16 100Operating Indicators by Function .......................................................................................... 17 101Capital Assets Statistical by Function ................................................................................... 18 102
(CONCLUDED)

CITY OF PROVIDENCEJorge O. Elorza, Mayor
Introductory Section
■ Letter of Transmittal■ Organizational Chart■ List of City Officials■ GFOA Certificate of Achievement

THIS PAGE INTEfVTIONALLY LEFT BLAfVI<

CITY OF PROVIDENCEJorge O. Elorza, MAyor
Ja11Ut11')~ ~, ~~~ ~
Providence City CoiutcilProvidence City I-tall25 Doi•rancc StreetProvid~;nce, Rhode Island 02903
Honorable Meitlbers,
Rhode Island state law cec~uij•es that all general purpose, local govet•nments publish a complete set ofaudited financial statements within six months of [he class cif each fiscal year. "Phis report fralfills thatrequirement fioi• the fiscal year (IaYL01 S) that ended June 30, 2015.
Manageme~~t assumes full responsibility for the completeness and reliability of the information containedin this i-cpo~rt, based upon a comprehensive fl•ameworl< of i~rternal controls established for this purpose.I~ecause the cast of internt~l controls should not exceed attiicipated benefits, the abj~ctive is to providereasc~n~~b(e, cat:her khan <ibsnlute, assurance that the ~i~aneial statements ire free cif any materialm issC~tements.
Accountants a~ld advisers from Marcum LI.~P (formerly Braver P.C.) hztve issued an u~tm~di~ed ("clea~~")opn~ian on tl~e City of Providence;, Rhode Island's financial statements for the year eliding June 30, 2015.A copy of their indepeitdeitl auditor's repot~t is located ~t the front of the financial section of the report.
Management's discussion and ai}alysis (MUcYcA} immediately follow t[~e independent auditor's report andprovide a narrative introduction, overview and analysis of the basic financial statements. The MDBr.A isintencJed to complement this letter of transmittal and should be read in conjunction with it.
Pro~te of tine Govei•nn~eut
The capital city of Providence was founded in 1636 and inc~rpoealed in 183 I , It occupies u total la~~d areaof 18. I square miles and an additional 1.9 square tulles of water; is loc~ited at the head of NarragansettBay an the Providence River, and is the major population, financial, educational, governmental, andindustrial center of Khade Island. Situated on the Boston-Washington [nterstate 95 corridor, withproximity to multi-billion dollar markets ar►d multi-million population centers, residents ancE businesseshave rc;ady access to all ii7t~jc~r fortes of U~arjsparfation, including AMT'RAIi, Pru~7idence &WorcesterRaitrc~ad, T.F. Green International Airpot-t, the Port of Providence and Intcrstates 95 and 195, Mu[ti-
~~FICE C7F T'W~ MAYOR
F'rovidei~ce City Hall ~ 25 Dorrance Street Providence, Rhode Island U2903
4Q1 421 24~i9 ph I X101 455 8823 fax
www.providenceri.com

}~j +'~~ ~{ Srl ,
i,
y-iet ~ry
9et,~f tµ~
CITY OF PROVIDENCEJorge O. Elorza, Mnyor
modal transpc~rtatiot~ has most recently been expanded with the opening of Interlinl., increasing c~mm~ateerail service can~iections with ttie Massacfnisetts F3ay "Transit Authority,
1'r~vidence i~as the larbest population of Rhode [slancl's 39 cities and towns with 178,036 residents (2U 10Census,) up 2.5 pei•ccnt fi•an 173,6] 8 iii 2000 (2400 Census), 'I'lle demogc•apliic prole for the city is tisfollows: Caucasians 49.$ percent; Hispanics 3$,1 percent; African Americans 16.Q percef7t; Asians 6.4per~cenl; and Native Atne►•icaus 1,4 percent,
T'he City leas aMayor-Council form of government; a Homy; Rule Chaeter was adopted in 1980 a~iclbecame fully effective on Januaiy 3, 1983. City government is responsible fc~r providing such services as:gc;ne~•al ~ovei•iu~7ent, community development, administrative services, public safely, sanitation, publicworks, planning and development, r~vorlcforce development, recreation, parks, and public education. TheCity adopts nn annual budget for tine General Fund, and separately for tf~e Providence Public Sch~c71Disi7•iet. "1'I~e legal level of control is by Department.
Facilig Struct~u~~il Deficit
IJpori taking of~rce in January 20l 5, Mayor Jc.~rge O. Elc~rla comi~~issianed a review of the City'sfina«ces. An analysis conducted by Pubtic Finance Management (PFM) included a baseline forecast andtill~[1GldI pt'O~~Ctlnri fOr ~i~e c~ty~ through fiscal year ~Q21.
"I'he baseline financial forecast shows an annul shortfall csf $] 1.5 million in Fiscal Year 2d 17. It grows to$13.5 million in FY2018 and reaches X17,2 million in FY2019, before slightly declining to $] 5.4 millionin ~~Y2020 as revaluations increase revenue, and then sta~~ts moving upward again —reaching $19.1million in FY2021. F,scalating pension and healthcare costs, the loss of tens ~f'millions in state aid andtittle fax rever7ue gi•o~~tli are amol3g the factors that drive tt7e City's pr~5jccted cle~icit aver the next fiveyears and beyond.
Assuming no policy adjustment, tlle. PFM report p~•ojeets total revenue at $~b3.3M in FY2017 and$477.2M iii 2021. Similarly, the report projects city expenditures to reach $49G.3M by 2021. Real estatetax collection, tangible tax collection, excise taY collection, State PII.,O"I' Revenues and School DebtConsteuotion Revenues are inciuc~ed as five key revenues souz•ces which, cambii7ed, represent 82.9% ofthe Cih~'s revenue in FY2017 and &3.2% fir projected revenue in rY2021.
Without intervention rind corrective action, the City faces a structural deficit in the range of'~11 million to$19 million annually resulting in a pntentia! cumulative deficit of X85 million by 2022.
Ot~ Iv7ay 21, 201 S, Mayor Elua•-ra said the follotiving of the PFM repac~t and its implications Per the City,"Tlae report is in, and it shows us that Providence still has a stcucttii•al deficit in the range of $ [ 1 to $19
C)FFIC~ OF THE MAYORProvidence city Hall ~ 25 Darrance Street Providence, Rhode Island 02903
401 4?1 2489 ~h ~ 4Q1 X55 8823 fax
www.prdvidenceri.com

CITY OF PROVIDENCEJorge O. Elorzt~, Mayor
million a year• ai d that gap will caiitinue to tivide~~ if we do not begin to i»lmediately address the problem.'~Ve need to fix the structural budget imbalances that stand in the way of lastittg fiscal strength instead ofjust kicking the can down the road a►~d letting the problem grow worse."
"I'he'Mayor added that 1~c is "committed to doing whatever it Yalces to provide 3 firm foundation far our'city" and that he is "coi~~cJet~t that Providence's stal<eholders are up to the challenge."FY201t I3ud~et
The budget for FY2016, the first passed under the F.,lorra Administration, begins to address the City'stmcler(yii~~; sfructurt~l deficit with an additional ~2 million in annual revenue from expanded parkingmeters and fees as ~~~ell as ~i $6.5 million deficit reduction through growth in the property values.
During Isis budget presentation to the City Council, Mayor Clc~rza discussed ho~v tfie City eras stillstruggling to fully recover in the wake of challenging financial times and emnhasizc:d a need far tt~ughdecisions and fiscal responsibly. "I~he budget for FYl6 was sighed into law on Thursday, June 1 1, 2Q15a~~d focuses on setting Providence on a arm path for the future.
The FY 1 h bud~ef Ite(d the line nn cotnmeraial real estate taxes end did not raise ~ropetty ~r cal' taxes,Casts were offset with a modest raise in fees for• building permits and business licenses as well as addedrevenue streams fi•om the expansion of parking meters throughout the city. The FYI G budget also placessi~niifcantly less o»us on one-lima revem►e sources.
FYIG budget takes a number of steps to promote and facilitate investment and business in the city,including creating a Liaison Business ~aeilitator position i~~ the City's Economic DeveIoptnent office toassist potential investors ar~d developers.
Mayor I~lorza also created a Cltief InnUvatioi~ OfFic~;r position to improve efficiency throughout cityde~7~t~tments, alla~ving them to better serve the public. It also incr~~~sed line items far snow remc~vaf by13%and street sweeping by ].0%.
The FY 16 budget included a 2% increase in revenue thr~ubh gro~~th of the tax lase, fl modest increase incertain permitting; fees (17rin~in~ the City in line with other municipalities iii Rhode Island) and severalitems of ne«~ tax revenue, including $SOO,000 from port equipment that wus not ~reviottsl}' on the taxrolls.
The f~Y 16 budget also fiilly budgets cha~iges tc~ account for the City's required deficit eedttctionpayments,
(7F~ICE QF THE MAYC7RProvidence City HMI) ~ 25 Dorrance Street Providence, Rhode Island 02943
401 421 24-89 ph ~ 401 455 8823 fax
www.providenceri.com

CITY OF PROVIDENCEJorge O. Elorza, Mayor
Developme►rt and Infrastj•ucture
FY2U 15 sa~~• a number of significlnt infrastruetural im~estments thrau~hout the City and alsa helped pavethe «gay for increased clevslopment doing forward.
TranspoR•t~ition Impj•c~vements —FY2Q15 saw significant investrnei~t in the C'ity's transportationinfrastructure. X40 million in road construction bonds saw marry roads throughout the cityreceived much needed p~vin~;. The City also finished its revitalization of Kennedy PIaz3, thecity's central modal and public transit hub. T13e City is also in tl7e process of finishing phase tl~rceof its cij•culator project, aimed at improvi~ig ~r;alkability and meeein~; 21st century t~•af~cdemands.
Parking Meters -- The City is in the process of converting all single and multi-space p~rkin~;meters to accept c~~edit cards, making them mare efficies7t and convenient. 'I`he City is alsoanticipating a modest increase i» ~~Zrking meter revenue fi~om tl~c addition of several hundcecjparking spaces in commercial areas tlu•ough~ut dle City.
Land of O~~po~'tllllit~' -- The land that vas freed up by the relocation of I-19S presents nonce-in-a-lifetime opportunity for• Providence R~ld Rhode Island to create the eco»omy of the futiu•e, TheElorza administration worked with state leadet•s, the City Council and the i-195 Commission todevelop a standardized tax stabilization agreement for the district that wilt provide prospectivedevelopers ~~rith a cle~i•er understanding of the i~icentives available to them when consiclei•ing a~iinveshnent on this land.
Cluster Developineut Study -- The City recently contracted a study to identify opport~u~ities toenhance economic development iii Providence acid better incite developme~~t.
I'or~t rxPansion --'This year, FravPc~rt secured a 14-acre parcel owned by the City v~~hieh it wil!lease from 2015 t~ 2()36 at 1 rate of $1~IO,Q00 per year. The expansion alli~weci ProvPart: toinct•ease capacity to accommodate a temporary structure that will house tivarkspace for fheconstruction of ne~v offshore tivi~id turbines. Mayor Elorza is also s~elciti~ apportu~~ities to e:~pandcommerce and better utilize the City's deep water chHnnel.
Improving Public Service thrau~h lnnav~tiou
Upon taking office, Mayor ~lorza sa~~ a necessity to invest in innovative and proactive. resoiu•ees toim}~rove ef~cieiicy and effectiveness of city government. Mayor I?larza has clearly mandated the need tobe more efficient with the resources that currently exist in the city to ensure that «~e are giving taxpayersthe mast fi~t~m the servires for ~~~hich they are ci.ircently paying.
OFFICE OF THE MAYORProvidence City Hall ; 25 L~orrance Street Providence, f~hode Island 02905
401 421 2 189 ph f 401 455 F3F323 fax
www.providenceri.com
iv

CITY 9~ Pf~OVIb~M110EJorge 6. Elorza, Mayor
Created a Department of Innovation -- Tarty in his tenure, Mayor Elorca established aDepartment of Innovation, which operates under the guidance of the City's €~1rst Chief InnovationUf~cer. Innovation is abort corist~~~tly improving tl~e way tt~e City operates and delivers serviceto the public. Tram LEAN prog~'atnming, la process improveme►tt and customer service relatedpractices, the Department of Innovation leads the city G~~orkforce in a commitment to eonsta»timprovement and works closely with the Mayor and his Administration to implement changes,
Mayor's Center far City Services (MCCS) -- Upon taking office Mayor F;loeza undertook aresfructui•in~; and refocusing of the Mayor's constituent service arm to provide ~i morestreamlined, responsive Fi11tJ CUStOIIl@t' SCl•vice oriented etiperience fc3r residents seeking assistanceCrow the City. Through innovative partnerships and systems the A9ayar's Center far City ServicesIS 1111pPoving the speed and effectiveness of city services. T'l~e City has implemented astate-of=the-art case managcil~ent system that allows departments t~ share and trac!< the status of requestsin real lime. Since Mayor Elorza tools olfce, the City Se►•vices office has closed appro~imateiy9,OQ0 uses, including a eliminatir7g a backlog of rnc~►•e than 3,000 cases inherited fi•orn t1~eprevious administeation, Residents are encouraged to call 421-CITY to speak directly with amember of the MCCS team.
Customer Seyvicc~ -- "['he City has partnered with ~1MIGA to pl•ovid$ customer• service tt•ain ing toMCCS staffers as well as other paints of contact througlzaut city government. The Cily has alsoadded tools to Delp the public interface with City Hall, including way~indi~fg signs throu~haut thebuilding, an information desk 'that is staffed by an MCGS representative by the first floorentrances to Cihf Hall and a Mobile MCCS van that allows the resources of the office Crave) tolocations througl~aut the city, providing the same high-quality resources available at City 1-iall.
Pa~~ks, Recreation and ~Iealti~y Communities
Gonsiclea•ing the positive effects c,f a healthy and active lifestyle, as well as the benefits readily availablefi•oni nt~tritioi~s food options for residents, Mayas• Elc~rza leas committed suUstantial resources to programswhich can have a direct impact.. The Department of Recreation, Providence Parks Department, Office ofHealthy Communities and numerous commtuiity partners work together to provide healthy oppa~~tunitiesfor eesidents of all ages and to make it easier for residents to make healthy lifestyle decisions,
expanded Suitimer Recreation -- Mayor Elorz~'s administration was pleased to offer anexpanded summer recreation program to city youth ~~hich began Monday, May 18, 201 S. Led byDirector of Rec~•eation Services l~fichacl Stephens, Parks and Recreation Superintendent WendyNilsson, and rtcreatiatis stafffi•an~ ac~•oss the city, the line-up included all previously offeredprograms but added nev+~ activities in addition to new age divisions.
OFFICE OF THE MAYORProvidence City t•iall ~ 25 Dorranc~ Street Providence, Rhode Island 02903
401 421 248 3 ph ~ X401 455 8823 fax
www.nrovidencerf.com

CfTY qF PROVIDENCEJorge O. Eforza, Mayor
Midnight Basketball -- For young adults, Mayor Elorza collaborated with community partners tore-establish a Summer Midnight Basketball League. The league consisted of 24 teams andutilized several recreational parks and facilities throughout the city from 9 p.m. to midnight. Withthe primary objective of prumotin~ camaraderie and athletic competition, tl~e leabue was asuccess, as all rasters were fitled.
Sif~niner Meals Pro~~•a~tt --With the assistance of Feder:~l, State, ~~nd local conuuunity partners,ziid the U.S. Dep~nrcment of A~riciilture (USDA), Providence ofi'fered f'rcc and nutritious meals tc~the children under the age of 18 through the Summer Food Sea~vice 1'ro~rRm. 'I'ttkiug intoconsideration the papul~ttion of students ~vlio depend on free or reduced meal options during theschool year, offering this program during the summer mouths ens~n•ed that youth ~vidi limitedaccess had an oppoirtunity eat a hcalkhy meal, '1`h~ program ..vas offered at 35 locations throughoutthe city.
Health equity Zone grant -- In April 2015, the I-healthy Communikies Office received a HealthEquity Zone (HL'Z) grant from the RI Department of Health. The long-term goal of this proposalis to impro~~e Providence residenks' health beh~~~iors and overall health status and to reduce therates of death and disability due to,tobacco use, obesity, clirraate change, end chronic disease.
Substance Abuse Prevention --The Healthy Communities Office worked to conduct a range ofeducational pragrlms to reduce youth use of alcohol, tobacco and other drugs. In September2015, we held a Prescription Drug'I'ake Bacic Day in paifiiership with the DEA in Providence,again having one of the most successful take back events throughout the stlte.
Access to TTealth Care -=I'l~e City reduced the number of children acid parents without healthinsurance through efforts to expand enrollment in Klte Care, the state's Medicaid/Cf-IIP programfear children and families. We held 37 enrollment events and supported efforts to help more than40,000 residents recertify and almost 1,000 residents sign up fc~r health care coverage in FY201 S.
Lots of FTope -- Expanding the City's hots of I lope ucb~n agriculture initiative in 2U 15, the Citycompleted the first-ever Lots of Hope urban greenhouse, which provides urban gardeners withseason extension technology and offers nearby scl~oals a space for farm-to-school activities.
Sustai~iability
]n July 2015, Mayor Elorza became ~ leader on cli,nate action by signing the Compact of Mayors,joininb what is now a coalition of over 400 cities worldwide committed to tracking and reducinggreenhouse gas emissions end prepari3lg for the impacts of climate cf~tinbe, The City's Office of
OFFICE dF THE MAYORProvidence City Mall ~ 25 Darrance Street Providence, Rhode Isl~rid 029Q3
401 421 2489 ph I 401 X55 8823 fax
www.providenceri.com
vi

CITY OF PROVIDENCEJorge O. Elorza, Mayor
Sustainability is updating the City's sustainability plan to include these new goals and report progress nnimplementation. The Cify is leading by e~:ample in a number of areas and is now increasing its capacity toengage residents and businesses in taking action that will improve our environment, save money, andbuild stronger communities.
LSD Streetlight Conversion -- Tlie City is under contract with tl~e P~u~tnership for Rhode IslandStreetlight Management (PR.ISM) to purchase and convert all 17,000 of the City's streetlights toI.,EDs. It is estimated that this will save the City approximately $3.5 rniUiou annually ondistribtrtion charges, energy costs, and maintenance. It will also result in higher quality lightingthroughout the city and reduce the City's municipal carbon footprint by 25 percent,
Municipal rnes•gy Efficieixey Projects -- Since 2010, the City leas completed lighting retrofits,gas conversions, and other energy efficiency acid conservation measures throughout City-awnedbuildings and schools. Electricity consumption has declined each year since 201 I and is 7%below 2011 levels. I3y converting oil to natural gas, municipal oil consumption has been reducedby over 80% since 2009. When taking weather into account, the City's overfill energyconsumption has declined by aver 6%. These conservation measw•es have resulted inconsiderable swings. Significant opportunities for ener~ry efficic;ncy projects still remain on City-owned properties. "I'he City re«isxins committed to its goal of reducing energy consum~~tion 30%by 2U3U, In the fall of 2015, the Ciiy released an RFQ to establish ~n energy partner to identifydeep ener~ry retrofit opportunities in 17 of its buildings, The goal of this work is to find savings of20 percent or ma•e, and to utilize new financing opportunities made available through the RhodeIsland Infrastructure Bank. The City plans to release a comprehensive municipal energy report inearly 2016.
Renewable rner~;y -- With a grant from Commerce RI, the City completed 1 solar feasibilitystudy in the: spring of 2016. It assessed twenty City-owned properties for bath the technical andfinancial viability for deploying solar photovoltaic panels. In the frill of 2015, the City released anREQ to identify a solar installer to move projects forward and eve are currently evaluatingproposals. By ittvescin~ in solar energy, the City is explo~•ing ways it can lock ii2 reduced energycosts, promote and support the renewable energy industry in Rhode Island, and reduce carbonemissions.
SustainPVD Initiative -- In July 2015, Mayor F~lorza launc[~ed SustaiilPVD, a community-videsustainability initiative to make Pc•ovidence a greeoei•, healthier, more livable city. It seeks toeducate, empower, and connect residents, businesses, institutions, and municipal governtne~it toachieve die goals set forCh by Sz~slai~~aGJe Provide»ce. The Mayer kicked off this initiative byjoining the Compact of Mayors, a global coalition of local leaders pledging to reduce and trackGHG einissioiis. The launch also coincided with an update of the Office of Sustainability's
OFFICE OF THE MAYORPravicience City Hall ~ 25 Dorrance Street ProvidencE, RPiode Island 02903
401 421 2489 ph ~ 401 X55 8823 fax
www.providenceri.com
vii

-.~. ''~
t ''y~.Y ~~,'cY
~. ~:~oi;.:c iy i•.
~PY,~JAC?~
CITY OF PRC}VIDENCEJorge O. Elorza, Mayar
websita tinder the new SustainPVD branding, a new SustainPVD e-newsletter, and SustainPVDsocial media channels (Faceboalc and 'I'~vitter).
SustainPVD Ambassadors -- Tn the spring of 2014, the City was awarded a grant to pilot aRecycling Ailibassadar Program. In August, SiistainPVll Aitzbassadors wet~e recruited and trainedin both energy efficiency and recyclitlg. Thcoughaut the fill, the energy ambflssadors supportedthe Find Your l~~t~r! residee~tixl energy conservation campaign by canvassing and attendingevents throughout the community. Tlie City is well over i~alfway to its goal of getting aver 3,000signups. T'he recycling aiYibassadors developed acommunity-based marketing strategy to improvet•ecycling rates in the Washington Park ~iei~hbo~~hoad. ~3ased ou o~rerwhelmii~~; positive feedbackfrom participants, the Office of Sustainability hopes to secure funding to continue the program inthe sp~~inb.
Providence Composts ~'rogram -- The Nrovidence Composts! program expanded this year toseven sites a~ld has diverted approximately 1 &tons of food scraps since 2013 through a networkof residential drop-off sites. The progeam is operated by Southside Community Land "crust with$20,(J00 from the City's recycling profit shacc funds.
'Textile RecyCllllf~ COIICl:t1011 PYtfgram -- The City continue its parhiership with Gc~odtivil]
Industries to collect used textiles for recycling and reuse at ten locaticans around the. city. Since itsinception 1 S months a~;~, the prc~~ram ha4 captured 24,860 pounds (12.43 tins} of ~rratei•ial thatwould have athe~•wise gone to the landfill. Each ton saves the City $32 from landfill fees andgenerates $100 that 1~elps find Providence's Parl<s &Recreation ~~rograms. The City also maycount the tonnage towflrd oui• slate tiv~sYe diversion foal,
Storm`vater Management Study -- Through funding from the RI Department of EnvironmentalManageme~~t, the City is leading phase [I of a starrr~~vater managcme~it utility district study. In2013, six municipalities at the head of the Narragansett Bay began exploring regional solutions toa wide mange of shared challenges including flooding, storm~~~ater pollution, ai d degradeddrai~iage infi~~skrueture. Phase 1 cif the study, completed in 2014, provided a planning love[~ssessmeait of the feasibility of a regional stocmwater utility district for ~nunioipalities, I'h~se IIwill defiize the titilily's scope and governance and provide detailf;cl guidance on the steps toimplement a regional stormwatc;r management district. At the c~nclt~sion of Phase II,mui3icipalities will detei`mine whether to proceed to Phase III, which would establish t}~em~inagei~~ent district.
~F'FICE OF THE MAYOF~Providence City Hall ( 25 Dorrance Street Pravid~nce, Rhnde Island 0293
401 4?_1 2489 ph ~ 4b1 455 ~i823 fax
www.providenceri.com
viii

yu,'sci .t ~t.t.t:,J • s
3:i5ii fit r~y~ ''~.0 !l.'L~ • ISl t 5~.~ .
i~~~ ~i ~'ti~ r
~'i.~.x i~i~L f. ~ 1
' ~iv:'r':~Ittf'
CITY OF PROVIDENCEJorge O. Elorza, Mayor
FY2U15 Deficit
T'he City was expecting to report a deficit ~f around $S,OQ0,000 fqr FY2015. upon taking office, theElorza Administration identified approximately $2U million in budget risk fa•the tisc~l yea►•, 'I'f~eAdmi~iislration took immediate actin to resolve more than $ I S million of thtit risk, yielding positivebud~etaty impact for both FY ] 5 and FY l6. Reacting to favorable n~arlcet conditions, the City refundedeligible binds resulting in $l2 million in savings ($8.2 million in f'Y15 and $4 million in F~Y1G). TheAdministration was ~inabl~ to immediately resolve $4.0 million in combined Public Safetycallf~acic(overtii7~e (Fire $3.6 million and Police $1.0 million, respectively} and excess snow removal costsof $696K. Further, there ti~~~s $6 million in one-time revenues budgeted that did not materialize. All c7fthese risks have been addressed in the PY l6 Budget.
T[ye City m~cie its ~arliesl 1 QO percent t~RC funding in the past ei~lit years for FY E ~, ~~~ith payments laidby August 1 S, 20l 5, incluciit~g post-June 30 accrued irrteresf of $33 ],953. The accelerated ef'fot~t saved theCity $7.3 n7illion in potent9al additional post-,tune 30 accrued interest.
We are planning to cajtinue our• commitment to fond tl7e $4.3 million deficit reduction from a prior fiscalyear in FY16 end FYl7 nn the cumulative deficit of $8.6 million, and sta~~ting with the budget for FY17,there will he an additional $1 million to fund tl~e 3~Y15 deficit c~i'approximat~ly $S,OO~,OQ~. We havepledged in our early reporting already this fiscal year that ~~ve are committed to paying against the deficit,which requires generating surpluses in at least these amounts.
We have made strident cfForts in increasing onr PY16 bad~;et to reflect an additional $5 million inmedical expendittn•es, given that the last 3 years rutming, medical expense has surpassed budgeted
amounts by $3.0 to $3.S million amnially.
The City is conducting an immediate. review of F'Y 16non-essential spending and vacant positions toascertain additional savings opportunities.
Debt Adn~inistratinr~
Outstanding government- and business-type activity bonds at June 30, 201 S totaled $531~,0C3,004. (Note
7 of this r~epo~~t represents fno~~e detailed information about the City's debt }3osition.} 'the City has thefollowing bend cati~~gs:
Maody's Investor Services-- I3aa]Standard and Poor's — BBBFitch — BHE~
Long-Term Financial Planning
OF~I~E C)F TI-•iE M1~Yc7~
Providence City Hall ~ 25 Dorrance Street providence, Rhode Island 02903
401 421 24 39 ph ( 401 455 8823 fax
www.providenceri.com
ix

CITY OF PRC3VIDENCEJorge O. Eloiza, Mayor
As part of tl~e annual budget process, the N finance anc! Planning Departments prese►~i a five-year Capitalt~xipravement Plan. This plan identifies costs and financing methods for those capital projects the City
expects tap fiend aver tihe next five years.
The 2013-2017 Fiscal Year Capital Improveme~~t Plan projects ~~eeds thE•ough FY2017. The planprovides foi• the needs of NZe general government and addresses issues such as infrastructure., major
equipment replacement, school facilities, public safety, recreation, anti public (ands and packs.
I~ui~ther, in recognition of the Cit}~'s continued structural deficit and the Administration's desire to offerstructural solutions, a ] 0 year Fiscal flan foe• the City has been commissioned. With a grant from the
Federal Gove~~nment and local philanthropic support, the /administration will deliver to the public a plan
by Ap~•il 4016 that will present options to get a fhe City to steucttu•a! surpluses by the end of~the plan.
Acknorvieclgment
The p~-eparati~n of this repo~~t could not have been accomplished ~a~ithout the dedication acid hard e~~aT•k of
the Finance, I'laiming & D~ve[opment, Policy and Comm~►nic~tions professionals who tivorlc far the Cityof Providence, I would like to express my appreciation and gratitude t~ all of the staff ►nembei~s wl~oassisted and contributed to its preparation, I also appreciate the assistance and dedication ot'the audit
team at Marcum I.,L,P.
Finally, ] woufci like to thank Mayor Jorge t~. I;lorza and the Prc~videnee City Cotaneil for their steady anti
responsible ste~varclship of all aspects of'City governrn~nt.
Respectfully submitted,
f,
Bt•ett P. SmileyChief Operating C)f~cer
OFFICE OF THE MAYOR
Pravid~nce City Hall 25 Dorrance Street Providence, Rhode Island U2903
401 421 2489 ph ~ 401 45~ 8823 fax
www.prQvidenceri.com

r~~ r~~4 + ;, ft~
:.~.
CITY OF PROVIDENCEJorge Q. Hlorza, Mayar
Executive Administration
Organizational Chart
Director ofEcoiwmic
Oovo;opment
Planning zrdDevelopmentQepartment
PEDPJtfice
_._......._..._....___.....t
ProvidenceRedevelopment
Agercy
Licenses andVital StatisticsUeoariment
Inspections andStandardsLlepartmenl
Art, Culture+Tourism
Departmert
WorkforceSolutions
Chief Opera6nyOfficer
FinanceDepartment
CityCenUoi:.er
.. Oitice _._.._ ...
TaxAssessorOffice
TaY.CollectorOffice
HumanResourcesDepartment
InformationTec~nolopYDepartment
Etecorderof Deetl5
~ItySo!Icitor
~.__.._.
~irecfor nOperations
F'UI}IIC VYOlkSDepartment
Parkspepartment
RecreaOonDopartment
Public PropertyDeparnnont
__......Purchasing _^.
j ~7epariment
N~afer SupplyBoard
Mayor
Chietof Staff
Deputy ~ DeFiuty r'olicyChief of Staf(1 ~ Chief at Staff 2 Director
Canvassers Community d~fike ofRelations Sustainability
_......_ ~~._.__ ~....~.Department
.... _......_~~.
yards and f~ff~ce of Gity HealthyComm(ssions c Servkes Communities
difwe
Senior Services GovemmertOffice Relailons
Advance Partnerships'team and
pevelopment
HumanRelations
Commission
......ProvidenceTalks
$ChGOi PJt7If Sa1CIySuC`rintardent Commissbner
Chief Gommunicalions Folit~Innovation Director Oe artment_Ct6ccr
....—. _...._........_. ~. _:_... _.p
~ ..~_Fire
Department
Prov~lenceEmeryencyManagement
Toleromm6epartment
XI

City OfficialsAs of June 30, 2015
MayorJorge O. Elorza
City Council
Ward 1 —Seth Yurdin Ward 6 —Michael J. Correia Ward 11 —Mary I{ay HarrisWard 2 —SamuelD. Zurier Ward 7 —John J. Igliozzi Ward 12 —Terrence M. HassettWard 3 —Kevin E. Jackson Ward 8 —Wilbur W. Jennings, Jr. Ward 13 —Brian PrincipeWard 4 —Nicholas A. Narducci, Jr. Ward 9 —Carmen Castillo Ward 14 —David A. SalvatoreWard 5 — Jo-Ann Ryan Ward 10 —Luis A. Aponte Ward I S —Sabina Matos
Department Directors
General Manager of Water Supply Richard A. CaruoloCommissioner of Public Safety Steven M. PareChief of Fire Department Clarence A. CunhaChief of Police Department Col. Hugh T. Clements, JrChief of Staff Tony SimonCity Clerk Lori L. HagenCity Controller J. Michael D'Antuono, CPACity Solicitor Jeffrey Dana, EsqCity Treasurer James J. Lombardi, IIIChief Operating Officer Brett P. SmileyDirector of Arts, Culture, and Tourism Lynne A. McCormackDirector of Emergency Management Michael BorgDirector of Finance Lawrence J. ManciniDirector of Information Technology James A. SilveriaDirector of Inspections and Standards Jeffrey L. Lyl<ins, RADirector of Public Property Alan R. SepeDirector of Personnel Sybil F. BaileyDirector of Planning and Development Bonnie Nickerson, AICPDirector of Public Works Russell P. KnightDirector of Telecommunications William B. TrinqueInternal Auditor Matthew M. Clarkin, JrRecorder of Deeds John A. Murphy, ActingRegish•ar of Vital Statistics Serena A. ConleySuperintendent of Parks and Recreation Wendy Nilsson
Superintendent of Schools Dr. Susan F. LusiTax Assessor David L. Quinn II
Tax Collector John A. MurphyTraffic Engineer William C. Bombard, P.E.
xii

Government ~~inance Officers Association
Certificate ofAchievementfor T,xce~l~~lcein Finan~i~.lReporting
Presented to
City of Providence
Rhode Island
For its Comprehensive Annual
~{ financial Il.~portfor the Fiscal Year Ended
June 30, 2014
~~~~ "~ ~~Executive Dirc;etor/CF,O

THIS PAGE INT~IVTIONALLY LEFT BLAIVI<

CITY OF PROVIDENCE
Financial Section
■ Repot~t of Independent Auditors■ Management's Discussion and Analysis■ Basic Financial Statements
■ Supplementary Information

THIS PAGE IN~rEIVTIO~IALLY LEFT BLA~I~<

~J~~~~ ~ ~ ~ ~~~ACCOUNTANTS ADVISORS
INDEPENDENT AUDITORS' REPORT
To the Honorable Mayor and Membersof the City Council
Providence, Rhode Island
Report on the Financial Statements
We have audited the accompanying financial statements of the governmental activities, the business-type activities, eachmajor fund, and the aggregate remaining fund information of the City of Providence, Rhode Island (the City), as of and forthe year• ended June 30, 2015, and the related notes to the financial statements which collectively comprise the City's basicfinancial statements as listed in the table of contents.
Management's Responsibility for the Financial Statements
Management is responsible for the preparation and fair presentation of these financial statements in accordance withaccounting principles generally accepted in the United States of America; this includes the design, implementation, andmaintenance of internal control relevant to the preparation and fair presentation of financial statements that are free frommaterial misstatement, whether due to fraud or error.
Auditors' Responsibility
Our responsibility is to express opinions on these financial statements based on our audit. We conducted our audit inaccordance with auditing standards generally accepted in the United States of America and the standards applicable tofinancial audits contained in Government Auditing Standards, issued by the Comptroller General of the United States. Thosestandards require that we plan and perform the audit to obtain reasonable assurance about whether the financial statementsare free from material misstatement.
An audit involves performing procedures to obtain audit evidence about the amounts and disclosures in the financialstatements. The procedures selected depend on the auditors' judgment, including the assessment of the risks of materialmisstatement of the financial statements, whether due to fraud or error. In making those risk assessments, the auditorconsiders internal control relevant to the entity's preparation and fair presentation of the financial statements in order todesign audit procedures that are appropriate in the circumstances, but not for the purpose of expressing an opinion on theeffectiveness of the entity's internal control. Accordingly, we express no such opinion. An audit also includes evaluating theappropriateness of accounting policies used and the reasonableness of significant accounting estimates made by management,as well as evaluating the overall presentation of the financial statements.
We believe that the audit evidence we have obtained is sufficient and appropriate to provide a basis for our audit opinions.
Opinio~rs
In our opinion, the financial statements referred to above present fairly, in all material respects, the respective financialposition of the governmental activities, the business-type activities, each major fund, and the aggregate remaining fundinformation of the City of Providence, Rhode Island, as of June 30, 2015, and the respective changes in financial position,and, where applicable, cash flows thereof for the year then ended in accordance with accounting principles generally acceptedin the United States of America.
0M/dRCUMGROUP
M E M B E R
Marcum uP 155 South Main Street Suite 100 Providence, Rhode Island 02903 Piione 401.457.6700 fax 401.457.6701 www.marcuinllp.c~wn

Cltmrge i~: Met/tod ofAccorrrrti~rg for Pensio~rs a~td Restateme~rt of Net Positio~r
As discussed in Note 1 to the financial statements, the City changed its method for accounting and financial reporting forpensions as a result of the adoption of Governmental Accounting Standards Board (GASB) Statement No. 68, Accountingand Financial Reporting for Pensio»s — an Amendment of GASB Statement No. 27 and GASB Statement No. 71, PensionTransition fof• Contributions Made Sa~bsegarent to the Measu~~ement Date. As discussed in Note 16 to the financialstatements, management had made a determination that the net position should be restated at July 1, 20 ] 4, and subsequent tothe original issuance of the financial statements management has revised the restatement to correct an overstatement of theNet Pension Liability. The beginning net position has been restated by $961,764,000 to reflect the City's Net PensionLiability as of July 1, 2014. Our opinion is not modified with respect to these matters.
Other Matters
Required Supplef~rentary brformatio~t
Accounting principles generally accepted in the United States of America requu•e that the Management's Discussion andAnalysis, budgetary comparison information, Schedules of Funding Progress, Funding Status, Changes in Net PensionLiability and Related Ratios, Contributions and Investment Returns on Pages 3—I l and pages 65-77, respectively, bepresented to supplement the basic financial statements. Such information, although not a part of the basic financialstatements, is required by the Governmental Accounting Standards Board, who considers it to be an essential part of financialreporting for placing the basic financial statements in an appropriate operational, economic, or historical context. We haveapplied certain limited procedures to the required supplementary information in accordance with auditing standards generallyaccepted in the United States of America, which consisted of inquiries of management about the methods of preparing theinformation and comparing the information for consistency with managements responses to our inquiries, the basic financialstatements, and other lrnowledge we obtained during our audit of the basic financial statements. We do not express anopinion or provide any assurance on the information because the limited procedures do not provide us with sufficientevidence to express an opinion or provide any assurance.
Ot/ter Infor»tatio~t
Our audit was conducted for the purpose of forming opinions on the financial statements that collectively comprise the City ofProvidence, Rhode Island's basic financial statements. The accompanying financial information listed as supplementalschedules in the table of contents are presented for purposes of additional analysis and are not a required part of the basicfinancial statements.
The combining fund financial statements and capital assets schedules are the responsibility of management and were derivedfrom and relate directly to the underlying accounting and other records used to prepare the financial statements. Theinformation has been subjected to the auditing procedures applied in the audit of the financial statements and certainadditional procedures, including comparing and reconciling such information directly to the underlying accounting and otherrecords used to prepare the financial statements or to the financial statements themselves, and other additional procedures inaccordance with auditing standards generally accepted in the United States of America, In our opinion, the information isfairly stated in all material respects in relation to the financial statements taken as a whole.
The introductory section and statistical sections have not been subjected to the auditing procedures applied in the audit of thebasic financial statements and, accordingly, we express no opinion on them.
Other Reporting Required by Gover~vnent Auditing Standards
In accordance with Government Auditing Standards, we have also issued our report dated January 6, 2016, on our considerationof the City's internal control over financial reporting and on our tests of its compliance with certain provisions of laws,regulations, contracts, grant agreements and other matters. The purpose of that report is to describe the scope of our testing ofinternal control over financial reporting and compliance and the results of that testing, and not to provide an opinion on theinternal control over financial reporting or on compliance. That report is an integral part of an audit performed in accordancewith Government Auditing Standards in considering the City of Providence, Rhode Island's internal control over financialreporting and compliance.
~,YI~Q~~C~~- L ~ P
Providence, RIJanuary 6, 2016 (except as to Note 16, which is as of May 23, 2016)

CITY OF PROVIDENCE, RHODE ISLAND
MANAGEMENT'S DISCUSSION AND ANALYSIS
JUNE 30, 2015
This Management's Discussion and Analysis of the City of Providence, Rhode Island's Basic FinancialStatements provides a narrative overview and analysis of the financial activities of the City for the fiscal yearended June 30, 2015.
Financial Highlights —Primary Government
Government —Wide Highlights
Net Positio~z —The liabilities of the City's governmental activities exceeded its assets for the fiscal year endingJune 30, 2015 by $1,084 million (presented as "total net position"). Of this amount, a negative of $1,304million was reported as "unrestricted". The net investment in capital assets was $219 million. The assets ofthe City's business-type activities exceed its liabilities by $246 million. Of this amount, $239 millionrepresents the City's business-type activities net investment in capital assets.
Clzange in Net Position —The City's total net position decreased by $4.4 million in fiscal year 2015. Netposition of governmental activities decreased by $21.0 million, while net position of business-type activitiesincreased by $16.6 million.
Fund Highlights
Governmental Funds — Ftmd Balances — As of June 30, 2015, the City's governmental funds reported acombined ending fund balance of $55 million, a $I6.0 million decrease from the prior year. Of the total fundbalance reported, a negative $13.4 million represents "unassigned fund balance".
Long-Term Obligations
The City's total long-term obligations related to its government activities had a net increase of $935 millionduring the current fiscal year•. This dramatic increase was mainly due to the implementation of GASBStatement No. 68, which requires total net pension liability to be included in the government-wide financialstatements. More information related to both GASB Statement No. 68 and the net pension liability can befound at Note 1 and Note 7 to the Financial Statements.
The total long-term obligations of the City's proprietary activities increased $67.7 million during the currentfiscal year•. The majority of the increase in long-term obligations is due to the implementation of GASB
Statement No. 68. More information related to this can be found at Note 1 and Note 7 to the financialstatements.
Overview of the Financial Statements
This discussion and analysis is intended to serve as an introduction to the City of Providence's basic financialstatements. The City's basic financials statements include three components: 1) government —wide financialstatements, 2) fund financial statements, and 3) notes to the financial statements. This report also containsadditional supplementary information (budget schedules) and other supplementary information (combiningfinancial statements). These components are described in this next section of this analysis.
Basic Financial Statements
The basic financial statements include two types of statements that present different views of the City'sfinancial information. These statements are the Government-Wide and the Fund Financial statements.These financial statements are accompanied by Notes to the financial Statements, which provide detailedinformation about financial statement items.

CITY OF PROVIDENCE, RHODE ISLANDMANAGEMENT'S DISCUSSION AND ANALYSIS
JUNE 30, 2015
Government-Wide Financial Statements
The government-wide financial statements provide a broad view of the city's operations in a manner similar toa business operating in the private sector. The statements provide short-term and long-term information aboutthe City's financial position, which assists in assessing the City's economic condition at the end of the fiscalyear. These are prepared using the flow of economic i•esout•ces measurement focus and the accrual basis ofaccounting. This basically means they follow methods that are similar to those used by most businesses. Theytake into account all revenues and expenses connected with the fiscal year even if cash involved has not beenreceived or paid. The government-wide financial statements include two statements:
■ The Statement of Net Position presents all of the governments assets and liabilities, with thedifference between the two reported as "net position." Over time, increases or decreases in the City'snet position may serve as a useful indicator of whether the financial position of the City is improvingor deteriorating.
The Statement of Activities presents information showing how the government's net position changedduring the fiscal year. All changes in net position are reported, as soon as, the underlying event givingrise to the change occurs, regardless of the timing of related cash flows. Thus, revenues and expensesare reported in this statement for some items that will not result in cash flows until future fiscalperiods (such as, uncollected tomes and earned, but unused vacation leave). This statement alsopresents a comparison between direct expenses and program revenues for• each function of the City.
Both of the above financial statements have separate sections for two different types of the City's programs oractivities. These activities are defined below:
Governmental Activities —The activities in this section are supported mostly by tax revenues andintergovernmental revenues (federal and state grants). Most services normally associated with Citygovernment fall into this category, including the executive, legislative and judicial, financialadministration, human resources, public safety, building inspections, public works, recreation, parks,schools, public property, planning, other general government, judgment and claims, retirement costs,debt service, and other employee benefits,
■ Business-Type Activities —These functions normally are intended to recover all or a significant portionof their costs through user fees and charges to external users of goods and services. The City'sbusiness-type activities include the operations of the Water Supply Board and The Providence PublicBuilding Authority. The City does not have any discretely presented component units.
Fund Financial Statements
A fund is a grouping of related accounts that is used to maintain control over resources that have beensegregated for specific activities or objectives. Like other local Governments, the City uses fund accounting toensure and demonstrate compliance with ftnance-regulated legal requirements.
The fund financial statements focus on individual parts of the City government, reporting the City's operationsin more detail than the government-wide statements. All of the funds of the City can be divided into threecategories. It is important to note that these fund categories use different accounting approaches and should beinterpreted differently. The three categories of funds are described below:
4

CITY OF PROVIDENCE, RHODE ISLANDMANAGEMENT'S DISCUSSION AND ANALYSIS
JUNE 30, 2015
Fund Financial Statements (continued)
1. Governmental Fund Financial Statements —Most of the basic services provided by the City arefinanced through governmental funds. Goverrunental funds are used to account for essentially thesame functions reported as governmental activities in the government-wide financial statements.However, unlike the government-wide financial statements, the governmental fund financialstatements focus on near-term inflows and outflows of spendable recourses. They also focus on thebalances of spendable resources available at the end of the fiscal year. Such information may beuseful in evaluating the government's near-term financing requirements. This approach is known asusing the flow of current financial t~esources measurement focus and the modified accrual basis ofaccounting. These statements provide a detailed, short-term view of the City's finances that assists indetermining whether there will be adequate financial resources available to meet the current needs ofthe City.
Because the focus of governmental funds is narrower than that of the government-wide financialstatements, it is useful to compare the information presented for governmental funds with similarinfof•mation presented for govet•nmental activities in the government-wide financial statements. Bydoing so, readers may better understand the long-te~•m impact of the governments near-term financingdecisions. Both the governmental fund balance sheet and fund statement of revenues, expendituresand changes in fund balances provide a reconciliation to facilitate this comparison betweengovernmental funds and the governmental activities. These reconciliations are presented on the pageimmediately following each governmental fund financial statement.
The City has four governmental funds considered to be major funds for financial statementpresentation. That is, each major fund is presented in a separate column in the governmental fundbalance sheet and governmental fund statement of revenues, expenditures, and changes in fundbalances. The City's four major governmental funds are comprised of the following: (1) the GeneralFund, (2) the School Fund, (3) the School Grant Fund, and (4) the Capital Projects Fund. Allnonmajor governmental funds are presented in single column. The basic governmental fund financialstatements can be found immediately following the government-wide statements.
2. Proprietary Fund Financial Statements —These funds are used to show activities that operate morelike those of commercial enterprises. Because these funds charge fees for services provided to outsidecustomers, including local governments, which are known as enterprise funds. Proprietary fundsprovide the same type of information as the government-wide financial statement, only in more detail.Like the government-wide financial statements, proprietary fund financial statements use the accrualbasis of accounting. There is no reconciliation needed between the government-wide financialstatements for business-type activities and proprietary fund financial statements. The City has twomajor enterprise funds: The Water Supply Board and the Providence Public Buildings Authority.Financial statements for the Providence Public Buildings Authority may be obtained from the City ofProvidence Finance Department.
The Internal Service Fund is maintained to account for the self-insured health claims and potentiallegal claims of the City.
The basic proprietary fund financial statements can be fo~md immediately following the governmentalfund financial statements.

CITY OF PROVIDENCE, RHODE ISLANDMANAGEMENT'S DISCUSSION AND ANALYSIS
JUNE 30, 2015
Fund Financial Statements (continued)
3. Fiduciary Fund Financial Statements —These funds are used to account for resources held for thebenefit of panties outside the City government. Fiduciary funds are not reflected in the government-wide financial statements because the resources of these funds are not available to support the City'sown programs. The accounting used for fiduciary funds is similar to that used for proprietary funds.They use the accrual basis of accounting.
The City's fiduciary funds are the Employee Retirement Fund, various Private-Purpose Trust Funds,and Agency Funds.
The fiduciary financial statements can be found immediately following the proprietary fund financialstatements.
Notes to the Financial Statements
The notes provide additional information that is essential to a full understanding of the data provided in thegovernment-wide and the fund basis financial statements. The notes to the financial statements can be foundimmediately following the fiduciary fund financial statements.
Required Supplementary Information
The basic financial statements are followed by a section of required supplementary information. This sectionincludes budgetary comparison schedules for the general and school funds —the only governmental funds forwhich legal budgets are adopted annually. In fiscal year 2015, there were no significant modifications to thebudgets originally adopted for each fund.
Other Supplementary Information
Combining Financial Statements and Schedules
Combining financial statements are presented for nonmajor governmental funds and combining schedules arepresented by individual grant within the school department. These are presented following the requiredsupplementary information. The total columns of these combining financial statements and schedules arepresented in the applicable fund financial statement.
D

CITY OF PROVIDENCE, RHODE ISLANDMANAGEMENT'S DISCUSSION AND ANALYSIS
JUNE 30, 2015
Government-Wide Financial Analysis
Net Position
As noted earlier, net position may serve as a useful indicator of the government's financial position over time.The City's combined net position (government and business-type activities) totaled to a deficit of $754 millionat the end of 2015, compared to the surplus of $125.9 million at the end of the prior year.
The largest portion of the City's net position, $458 million, reflect its investment in capital assets, like land,buildings, equipment, and infrastructure (roads, bridges, and other immovable assets) less any outstandingrelated debt used to acquire that asset. The City uses these capital assets to provide services to citizens;consequentially, these assets are not available for future spending. Although tha City's investments in itscapital assets is reported net of related debt, it should be noted that the resources needed to repay this debt mustbe provided from other sources, since the capital assets can not be used to liquidate these liabilities.
Current and other assets
Noncurrent assetsTotal Assets
Deferred Outflows of Resources
Current liabilities
Noncurrent liabilitiesTotal Liabilities
Deferred Inflows of Resources
Net Position:Net investment in capital assetsRestricted
UnrestrictedTotal Net Position
June 30, 2015
Governmental Business-typeActivities Activities Total
$ 236,775 $ 68,108 $ 304,883
June 30, 2014
Governmental Business-typeActivities Activities Total
$ 258,026 $ 60,725 $ 318,751
705,821 317,262 1,023,083 700,262 299,811 1,000,073942,596 385,370 1,327,966 958,288 360,536 1,318,824
36,158 363 - 36335,001 1,157
222,715 16,921 239,636 225,551 13,421 238,972
1,811,195 123,485 1,934,680 876,087 75,559 951,6462,033,910 140,406 2,174,316 1,101,638 88,980 1,190,618
28,140 - 2,709 2,70928,140 -
2]9,179 239,088 458,26742,322 42,322
(1,303,632) (35,289) (],338,921)$ (1,084,453) $ 246,121 $ (838,332)
199,002 225,544 424,54636,627 36,627
(341,989) 6,676 (335,313)$ (142,987) $ 268,847 $ 125,860
Restricted net position of $42.3 million primarily represents water restricted funds that are subject to externalrestrictions on how they may be used. Internally imposed designations of resources are not presented asrestricted net position.

CITY OF PROVIDENCE, RHODE ISLANDMANAGEMENT'S DISCUSSION AND ANALYSIS
JUNE 3 0, 2015
Changes in Net Position
The City's net position decreased by $21 million for governmental activities and increased by $16.6 millionfor business-type activities for a combined change in net position of $9.7 million. General fund revenuesincreased due to the success of increased tax collections and higher than budgeted departmental revenues,while expenditures for healthcare and pension costs came in higher than the budgeted amounts. Business-typeactivities increased due to large commitment to the replacement of infrastructure included in water• rates inFY2015. Approximately 47.5% of the City's total governmental revenues were generated from taxes andpayments in lieu of taxes, which is comparable to the prior year•. 35.52% resulted from grants andconh•ibutions, including Federal Aid, which is an increase over the prior year. There were slight decreases inboth, charges for various goods and services, which provided 12.2% of total revenues, while other revenuesand investment and rental income accounted for 4.7% of total revenues, respectively. The City's expensescover a range of services. The largest expenses were for school, public safety, retirement costs, and employeebenefits. Revenues from business-type activities in fiscal year 2015 exceeded expenses by $16.6 million. TheBusiness-type activities reported an increase in revenue of 3.8%, while expense decreased 2% from the prioryear.
June 30, 2015 June 30, 2014
Business- Business-
Governmental type Governmental type
Activities Activities Total Activities Activities Total
Revenues:
Program revenues:
Charges for service $ 93,444 $ 103,895 $ 197.,339 $ 97,506 $ 97,938 $ 195,444
Operating grants and contributions 282,583 282,583 260,964 260,964
Capital grants and contributions 1,098 1,098 3,304 3,304
General revenues:
Property taxes 363,712 363,712 358,243 358,243
Grants not restricted for a specific purpose 16,658 16,658 18,158 18,158
Miscellaneous 19,176 - 19,176 18,871 - 18,871
Unrestricted investment earnings 1 485 486 1 662 663
Total revenues 775,574 105,47$ 881,052 753,743 101,904 855,647
Expenses:
Executive, legislative and judicial 36,830 36,830 36,036 36,036
Finance 63,820 63,820 49,261 49,261
Public safety 180,430 180,430 169,742 169,742
Building inspection 4,496 4,496 4,381 4,381
Public works 26,959 26,959 23,965 23,965
Recreation 2,238 2,238 2,131 2,131
Public lands and parks 21,290 21,290 20,825 20,825
Education 422,730 15,152 437,882 402,539 15,418 417,987
Community development 17,981 17,981 18,901 ] 8,901
Interest on long-term debt 19,859 19,859 19,984 19,984
Economic development 17,076 17,076 19,322 19,322
Water 56,628 56,628 56,271 56,271
Total expenses 796,633 88,856 885,489 747,765 91,041 838,806
Change in net position (21,059) 16,622 (4,437) 5,978 10,863 16,841
Net position- beginning (as restated) (1,063,394) 229,499 (833,895) (148,965) 257,984 109,019
Netposition-ending $ (1,084,453) $ 246,121 $ (838,332) $ (142,987) $ 268,847 $ 125,860

CITY OF PROVIDENCE, RHODE ISLANDMANAGEMENT'S DISCUSSION AND ANALYSIS
JUNE 30, 2015
Business-Type Activities
The business-type activities increased the City's net position by $16.6 million. This resulted primarily from a$14.0 million increase in net position of the Water Supply Board. Additionally, there was an increase of netposition of $1.9 million by the Providence Public Building Authority, and an increase of $651 thousand fromthe school lunch program all contributing to the overall increase.
Financial Analysis of the City's Individual Funds
As noted earlier, the City uses fund accounting to ensure and demonstrate compliance with finance-relatedlegal requirements.
Governmental Funds
The focus of the City's governmental funds is to provide information on near-term inflows, outflows, andbalances of spendable resources. Such information is useful in assessing the City's financing requirements. Inparticular, unassigned fund balance may serve as a useful measure of a governments net resources availablefor spending at the end of the fiscal year.
The genera] fund is the chief operating fund of the City. At the end of the current fiscal year, unassigned fundbalance of the general fund was a negative $13.4 million, a decrease of $4.7 million from $8.7 million the prior•year. The decrease in fund balance is due to an overall increase in revenues collected of $2 million more thanprior fiscal year offset by overall increases in expenditures of $99 million, over the prior fiscal year. Otherfinancing sources amounted to $121 million which is consistent with the prior fiscal year. Increases in taxcollections as well as higher than budgeted departmental revenues, helped to offset decreases in other fundingsources, including fines and forfeitures and fedet~al and state funding for the current fiscal. year. While therevenues as a whole increased, the expenditures for the current fiscal year as previously stated also increasedover the prior year. These increases were in all areas of the expenditures covered by the general fund. As ameasure of the general funds' liquidity, it may be useful to compare both unassigned fund balance and totalfund balance.
School Grants-Fund Balance —The school grant fiends account for federal and state grants received andexpended by the school system. The fiscal year 2015 school grants fund balance is reported at $2.4 million,which is approximate to fiscal year 2014. The inclusion of all state aid in fiscal 2015 was included in theSchool's general fund and excluded from the school grants fund.
School Fund —The school fund ended the year with a $0 fund balance in accordance with City charterregulations. The expenditures were $361 million as compared to $349 million in the prior year. The inclusionof all state aid in fiscal 2015 was included in the School's general fund and excluded in the school grants fund.
Capital P~•ojects Fund-Fared Balance —The capital projects fund accounts for resources to be used for theacquisition or construction of capital assets for housing and community improvement activities in the City,other than those financed by proprietary funds. The fiscal year 2015 capital projects fund balance is $5.1million. The $10.5 million decrease from fiscal year 2014 is attributable most notably to capital outlays relatedto completion of the $40 Million Road Bond Paving Initiative.

CITY OF PROVIDENCE, RHODE ISLANDMANAGEMENT'S DISCUSSION AND ANALYSIS
JiJNE 30, 2015
Proprietary Funds
The City's proprietary funds provide the same type of information found in the government-wide financialstatements, but in more detail. As discussed in the business-type activities above, the City's proprietary netposition increased by $16.6 million as a result of operations in the individual enterprise funds. This increase isprimarily from a $140 million increase in net position of the Water Supply Board, an increase of net positionof $1.9 million by the Providence Public Building Authority, and a $651 thousand increase in the school lunchprogram for fiscal year 2015.
General Fund Budgetary Highlights
The general fund incurred an uncombined deficit in FY 2015 of $5.0 million. This will increase thecumulative uncombined general fund balance to a negative $21.8 million. The GASB 54 requirement forcombining funds shows a cumulative general fund balance as a negative $13.7 million. Total general fundrevenues and transfers for the fiscal year were $456 million and total general fund expenditut•es and transfersfor the fiscal year were $461 million.
Further details of favorable and unfavorable variances of revenue and expense items can be found in theRequired Supplementary Information on pages 65 to 71 of the fiscal year 2015 Comprehensive AnnualFinancial Report.
Capital Asset and Debt Administration
Capital Assets (Note 5 to the Basic Financial Statements)
Land
Land ImprovementsBuilding andImprovements
Machinery and Equipment
Infrastructure
Leased Assets
Construction in Progress
June 30, 2015
Governmental Business-typeActivities Activities Total
$ 46,767 $ 22,614 $ 69,381
18,682 18,682
]79,779 207,163 386,942
20,185 3,675 23,860
100,123 100,123
329,923 10,041 3 39, 964
29,044 55,087 84,131
$
705,821 $ 317,262 $ 1,023,083
June 30, 2014
Governmental Business-typeActivities Activities Total
$ 46,767 $ 21,958 $ 68,725
18,682 18,682
168,433 201,186 369,619
20,106 335 20,441
103,693 103,693
3 3 8, 73 4 10, 041 3 48, 7 7 5
22,529 47,609 70,138
700,262 $ 299,811 $ 1,000,073
The City's investment in capital assets for its governmental activities as of June 30, 2015 amounts to $1,132million, net of accumulated depreciation of $426 million, leaving a net book value of $706 million. Includedin the $1,132 million, is non-depreciable capital assets of $75.8 million, consisting of land and construction inprogress. This investment in capital assets included land, buildings, improvements, equipment, infrastructureand construction in progress. Infrastructure assets are items that are normally immovable and of value only tothe City, such as roads, bridges, streets and sidewalks, drainage systems, lighting systems, and similar items.
m

Debt Administration
General Obligation Bonds
Revenue Bonds
Tax Increment Obligations
Capital Notes Payable
Notes Payable
PPBA Debt
CITY OF PROVIDENCE, RHODE ISLANDMANAGEMENT'S DISCUSSION AND ANALYSIS
JUNE 30, 2015
June 30, 2015
Governmental Business-typeActivities Activities Total
92,261 $ 92,261
54,221 $ 78,174 132,395
2,725 2,725
33,473 33,473
2,382 2,382
June 30, 2014
Business-Governmental type
Activities Activities Total
99,501 $ 99,501
59,799 $ 74,269 134,068
6,170 6,170
30,506 30,506
2,474 2,474
306,682 306,682 333,343 333,343
$ 185,062 $ 384,856 $ 569,918 $ 198,450 $ 407,612 $ 606,062
The authority of the City to incur debt is governed by federal and state laws, which restrict the amounts andpurposes for which a municipality can incur debt.
General obligation bonds are backed by the full faith and credit of the City, including the City's power to levyadditional taxes to ensure repayment of the debt. Accordingly, all general obligation debt currentlyoutstanding was approved by a vote of the City Council.
The City's total outstanding notes and bonds decreased by $36.1 million during the cut~rent fiscal year. Thisdecrease was due in part between the City making all required debt payments and refunding of bonds duringthe current fiscal year.
The 2004 State legislative session authorized the City to issue variable rate debt and to participate in interestrate swaps. The City is developing policies that will set guidelines and procedures and define permittedinstruments. It will set participant requirements and limitations on exposure, as well as ongoing managementand reporting requirements.
The City of Providence maintains the following ratings from Wall Streets credit agencies for generalobligation debt: a Baal rating from Moody's Investors Service, a BBB t•ating from Standard and Poor• and aBBB rating from Fitch. The City of Providence continues to perform long-term strategic planning in a pro-active attempt to control costs: examples of these costs are health insurance, pension costs, education, salariesand benefits and debt service. The City has negotiated with all of its unions to increase employeecontributions for health insurance.
Additional information on the City's long-term debt obligations can be found in Notes 7 and 8 to the FinancialStatements.
Requests for Information
This financial report is designed to provide a general overview of the City of Providence's finances for all ofthe City of Providence's citizens, taxpayers, customers, and investors and creditors. This financial report seeksto demonstrate the City's accountability for the money it receives. Questions concerning any of theinformation provided in this report or requests for additional information should be addressed to: CiTy ofProvidence, Finance Department, Providence City Hall, 25 Dorrance Street, Providence, RI 02903.
11

THIS PAGE II~I+EIVTIO~IALLY LEFT BLANK

CITY OF PROVIDENCE
BASIC FINANCIAL STATEMENTS

THIS PAGE If~TEIVTIOIVALLY LEFT BLAIVI<

CITY OF PROVIDENCE
Statement of Net PositionJune 30, 2015 (in thousands)
ASSETS:Current Assets:Cash and cash equivalentsRestricted cash and cash equivalentsInvestmentsRestricted investmentsTaxes receivable (net of allowance)Intergovernmental receivableLoan receivable (net of allowance)Restricted receivablesOther receivableCharges for service receivable (net of allowance)Internal balancesOther assetsTotal currenf assets
Noncurrent assetsCapital assets, nondepreciableCapital assets, depreciable, netTotal noncurrent assets
TOTAL ASSETS
DEFERRED OUTFLOWS OF RESOURCESPension-related deferred outflows of resourcesTotal deferred outflows of resources
LIABILITIES:Current Liabilities:Warrants and accounts payablePayable to retirement planDue to other governmentsAccrued liabilitiesUnearned revenueAmounts payable with current restricted assetsLong term debt due within one yearTotal current liabilities
Noncurrent liabilities:Due in more than one yearTotal noncurrent liabilities
TOTAL LIABILITIES
DEFERRED INFLOWS OF RESOURCESPension related deferred inflow of resources
Total deferred inflows of resources
Net PositionNet investment in capital assetsRestricted for Water Qualify ProtectionRestricted for debt serviceUnrestricted
TOTAL NET POSITION
'After internal receivables and payables have been eliminated
A-1
Governmental Business-Type Totals*
Activities Activities
70,435 $ 23,425 $ 93,86033,354 33,354
25,697 7,943 33,6406,635 6,635
25,621 25,62149,197 1,414 50,61126,500 26,500
17 1720,561 20,561
9,835 9,83515,642 (15,642) -3,122 1,127 4,249
236,775 68,108 304,883
75,811 96,383 172,194630,010 220,879 850,889705,821 317,262 1,023, 083
942,596 385,370 1,327,966
35,001 1,157 36,15835,001 1,157 36,158
24,925 8,431 33,35655,632 55,632
187 18738,153 38,15318,474 18,474
3,861 3,86185,344 4,629 89,973
222, 715 16, 921 239, 636
1, 811,195 123,485 1, 934, 6801,811,195 123,485 1,934,680
2,033,910 140,406 2,174,316
28,140 28,14028,140 - 28,140
219,179 239,088 458,26736,145 36,1456,177 6,177
(1,303,632) (35,289) (1,338,921)$ (1,084,453) $ 246,121 $ (838,332)
SEE NOTES TO THE BASIC FINANCIAL STATEMENTS12

Functions/Programs
Primary government;Governmental activities:Executive, legislative, and judicial
Finance
Public SafetyBuilding
inspection
Public WorksRecreation
Public land and parksEducationCommunity developmentInterest on long-term debt
Total governmental activities
Business-type activities:PPBAWater Supply BoardNon-major School lunch program
Total business-type activities
Total primary government
A-2CITY OF PROVIDENCE, RHODE ISLAND
Statement of Acfivities
For the Year Ended June 30, 2015 (in thousands)
Program Revenues Net (Expense) Revenue and Changes in Net Position
Operating Grants Capital GrantsCharges for Governmental Business-type
Services and and
Activities Activities Total
Contributions Contributions
Expenses
$ 36,830 $ 191 $ - $ -63,820 60,636180,430 11,908 564,496 4,37626,959 3182,238 547 484
21,290 317422,730 15,151 275,25217,981 - 6,79119,859 -
796,633 93,444 282,583 -
$ (36,639) $ - $ (36,639)(3,184) (3,184)
(168,466) (168,466)(120) (120)
(26,641) (26,641)(1,207) (1, 207)
(20,973) (20,973)(132,327) (132,327)(11,190) (11,190)(19,859) (19,859)
(420,606) - (420,606)
17, 076 18,861 1, 785 1, 78556,628 69,231 1,098 13,701 13,70115,152 15, 803 651 651
88,856 103,895 1,098 16,137 16,137
$ 885,489 $ 197.339 $ 282,583 $ 1,098
General revenuesTaxes:
Property taxesPayments in lieu of taxes
Grants and contributions not restricted to specific programsInvestment income
Miscellaneous
Total general revenues
Change in net positionNet position-beginning, as restated
Net position-ending
SEE NOTES TO THE BASIC FINANCIAL STATEMENTS13
(420,606) 16,137 (404,469)
335,624 335,62428.088 28,08816,658 16,658
1 485 48619,176 19,176
399,547 485 400,032
(21,059) 16,622 (4,437)(1,063,394) 229,499 (833,895)
$ (1,084,453) $ 246,121 $ (838,332)
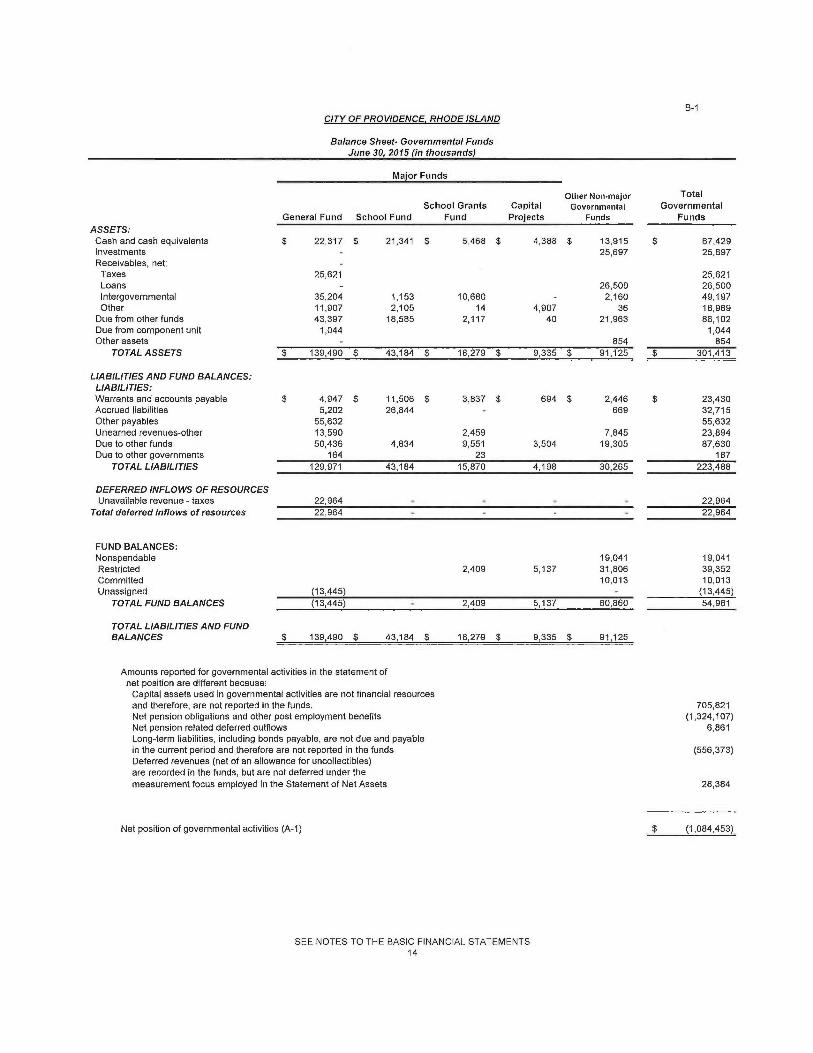
CITY OF PROVIDENCE, RHODE ISLAND
Balance Sheet- Governmental FundsJune 30, 2015 (in thousands)
B-1
Major Funds
Other Non-major TotalSchool Grants Capital Governmental Governmental
General Fund School Fund Fund Projects Funds FundsASSETS:Cash and cash equivalents $ 22,317 $ 21,341 $ 5,468 $ 4,388 $ 13,915 $ 67,429Investments - 25,697 25,697Receivables, net: -Taxes 25,621 25,621Loans - 26,500 26,500
Intergovernmental 35,204 1,153 10,680 - 2,160 49,197Other 11,907 2,105 14 4,907 36 18,969Due from other funds 43,397 18,585 2,117 40 21,963 86,102Due from component unit 1,044 1,044Other assets - 854 854
TOTAL ASSETS $ 139,490 $ 43,184 $ 18,279 $ 9,335 $ 91,125 $ 301,413
LIABILITIES AND FUND BALANCES:LIABILITIES:Warrants and accounts payable $ 4,947 $ 11,506 $ 3,837 $ 694 $ 2,446 $ 23,430Accrued liabilities 5,202 26,844 - 669 32,715Other payables 55,632 55,632
Unearned revenues-other 13,590 2,459 7,845 23,894Due to other funds 50,436 4,834 9,551 3,504 19,305 87,630Due to other governments 164 23 187
TOTAL LIABILITIES 129,971 43,184 15,870 4,198 30,265 223,488
DEFERRED INFLOWS OF RESOURCESUnavailable revenue -taxes 22,964 - - - - 22,964
Tofal deferred inflows of resources 22,964 - - - - 22,964
FUND BALANCES:Nonspendable 19,041 19,041
Restricted 2,409 5,137 31,806 39,352Committed 10,013 10,013Unassigned (13,445) - (13,445)
TOTAL FUND BALANCES (13,445) - 2,409 5,137 60,860 54,961
TOTAL LIABILITIES AND FUNDBALANCES $ 139,490 $ 43,184
$
18,279 $ 9,335 $ 91,125
Amounts reported for governmental activities in the statement ofnet position are different because:Capital assets used in governmental activities are not financial resourcesand therefore, are not feported in the funds.Net pension obligations and other post employment benefitsNet pension related deferred outFlowsLong-term liabilities, including bonds payable, are not due and payablein the current period and therefore are not reported in the fundsDeferred revenues (net of an allowance for uncollectibles)are recorded in the funds, but are not deferred under themeasurement focus employed in the Statement of Net Assets
Net position of governmental activities (A-1)
SEE NOTES TO THE BASIC FINANCIAL STATEMENTS14
705,821(1,324,17)
6,861
(556,373)
28,384
$ (1,084,453)

CITY OF PROVIDENCE, RHODE ISLAND
Statement of Revenues, Expenditures and Changes in Fund Balances-Governmental Funds
For the Year Ended June 30, 2015 (in thousands)
Major Funds
Other Non-majorSchool Grants Capital Governmental
General Fund School Fund Fund Projects Funds
Total
GovernmentalFunds
REVENUES:Taxes $ 334,103 $ - $ - $ - $ - $ 334,103
Departmental revenue 79,360 122 - 10,287 89,769
Federal and slate grants and reimbursements 33,708 220,079 44,135 415 17,954 316,291
Investment and rental income 540 - 1,303 1,843
Fines and forfeitures 4,559 - 4,559
Other 654 14,361 668 - 1,651 17,334
TOTAL REVENUES 452,924 234,562 44,803 415 31,195 763,899
EXPENDITURES:Current:Executive, legislative, and judicialFinancePublic safetyBuilding inspectionPublic worksRecreationPublic lands and parksOther departmentsGrantsEducationCommunity developmentNoncurrent:Capital outlaysDebt Service:PrincipalInterest and other costs
TOTAL EXPENDITURES
EXCESS (DEFICIENCI~ OF REVENUESOVER EXPENDITURES
12,512 842 13,354
47.741 - 47,741
158,796 8,422 167,218
4,239 4, 239
20,264 20,264
930 58 1,113 2,101
19,460 1,100 20,560
10,178 10,178
4,551 4,551
- 360,500 43,443 - 403,943- 13,430 13,430
- 17.579 1.297 18,876
38,189 2,292 40,481
19,570 - 807 20,377
336,430 360,500 43,443 17,637 29,303 787,313
116,494 (125,938) 1,360 (17,222) 1,892 (23,414)
OTHER FINANCING SOURCES (USES)
Capital lease proceeds 7,000 7,000
Refunding bonds issued 23,765 44,910 68,675
Payments to refunded bond escrow agent (24,658) (49,709) (74,367)
Premium on bond reoffering 1,125 4,936 6,061
Transfers in 3,542 126,220 1,322 - 293 131,377
Transfers out (125,041) (282) (2,645) (285) (3,124) (131,377)
TOTAL OTHER FINANCINGSOURCES (USES) (121,267) 125,938 (1,323) 6,715 (2,694) - 7,369
NET CHANGE IN FUND BALANCES
FUND BALANCES AT BEGINNING OF YEAR
FUND BALANCE AT END OF YEAR
(4,773) - 37 (10,507) (802) (16,045)
(8,672) - 2,372 15,644 61,662 71,006
$ (13445) 5 - $ 2,409 $ 5,137 $ 60,860 $ 54,961
SEE NOTES TO THE BASIC FINANCIAL STATEMENTS15
B-2
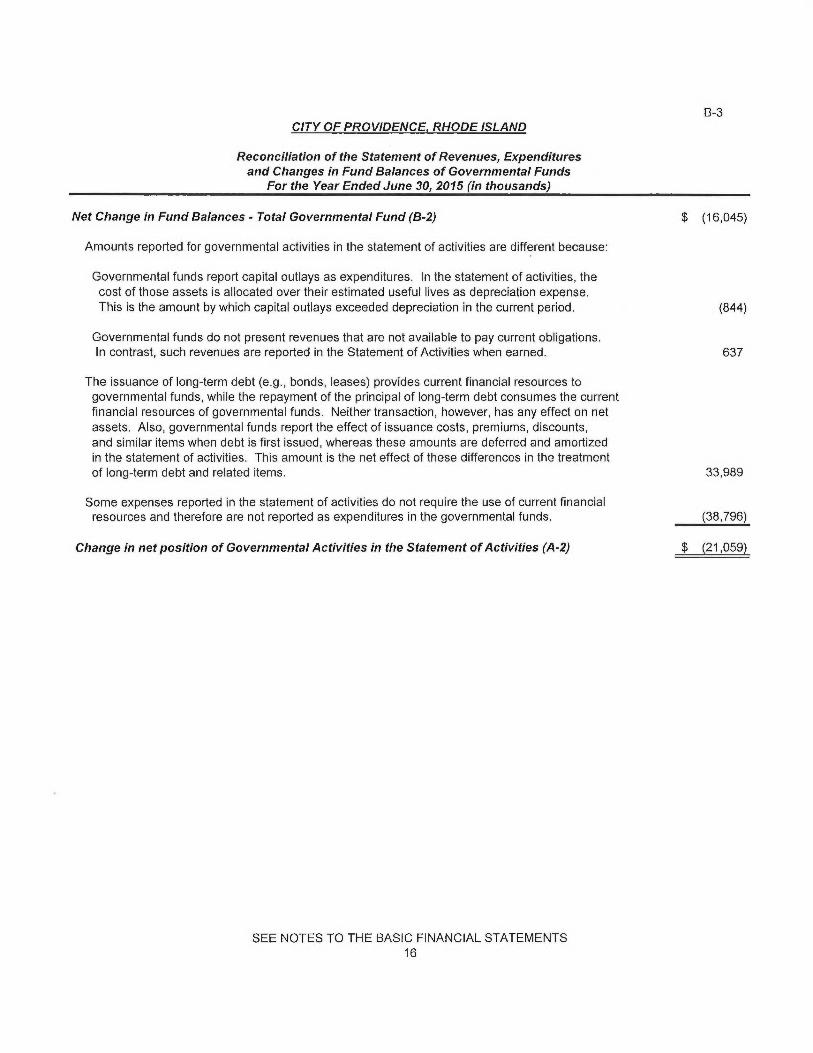
B-3CITY OF PROVIDENCE, RHODE ISLAND
Reconciliation of the Statement of Revenues, Expendituresand Changes in Fund Balances of Governmental Funds
For the Year Ended June 30, 2015 (in thousands)
Net Change in Fund Balances -Total Governmental Fund (B-2) $ (16,045)
Amounts reported for governmental activities in the statement of activities are different because:
Governmental funds report capital outlays as expenditures. In the statement of activities, thecost of those assets is allocated over their estimated useful lives as depreciation expense.This is the amount by which capital outlays exceeded depreciation in the current period. (844)
Governmental funds do not present revenues that are not available to pay current obligations.In contrast, such revenues are reported in the Statement of Activities when earned. 637
The issuance of long-term debt (e.g., bonds, leases) provides current financial resources togovernmental funds, while the repayment of the principal of long-term debt consumes the currentfinancial resources of governmental funds. Neither transaction, however, has any effect on netassets. Also, governmental funds report the effect of issuance costs, premiums, discounts,and similar items when debt is first issued, whereas these amounts are deferred and amortizedin the statement of activities. This amount is the net effect of these differences in the treatmentof long-term debt and related items. 33,989
Some expenses reported in the statement of activities do not require the use of current financialresources and therefore are not reported as expenditures in the governmental funds. (38,796)
Change in net position of Governmental Activities in the Statement of Activities (A-2) $ (21,059)
SEE NOTES TO THE BASIC FINANCIAL STATEMENTS16

ASSETS:Current assets:Cash and cash equivalentsRestricted cashInvestmentsRestricted investmentsReceivables, netRestricted receivablesReceivables- other governmentsDue from primary governmentDue from other fundsInventoriesOther assets
Total current assets
Noncurrent assets:Capital assets:
Land
Buildings and improvementsImprovements other than buildingsMachinery and equipmentConstruction in progress
Less accumulated depreciationTotal noncurrent assets
Total assets
C-1CITY OF PROVIDENCE, RHODE ISLAND
Statement of Net Position-Proprietary FundsJune 30, 2015 (in thousands)
GovernmentalBusiness-Type Activities-Enterprise Funds Activities
Water Supply Non-major
Internal ServiceBoard
PPB'4 School Lunch Totals Fund
Program
$ 4,797 $ 14,523 $ 4,105 $ 23,425 $ 3,00633, 354 33, 354
7, 943 7, 9436,635 6,6359,774 61 9,835 1,592
17 171,414 1,414
463,644 463,6441 1 29,260
827 827300 300 2,268
55,704 486,110 5,581 547,395 36,126
22,614 22,61484,680 84,680
311,431 311,43131, 586 31, 58673,769 73,769
524,080 524,080 -206, 818 206, S 18317,262 317,262 -
372,966 486,110 5,581 864,657 36,126
DEFERRED OUTFLOWS OF RESOURCESPension-related deferred outflows of resources 1,157 1,157
Total deferred outflows of resources 1,157 - - 1,157
LIABILITIESCurrent liabilities:Accounts payable and accrued liabilitiesClaims payableDue to other fundsDue to primary governmentOtherAmounts payable from restricted assetsCurrent portion of long-term debt andcapital leases, netTotal current liabilities
Noncurrent liabilities:Revenue bonds and PAP Loans, netNet pension liabilityNet OPEB obligation
Total noncurrent liabilities
3,615 2,148 2,668 8,431 1,4958,543
1, 394 251 1, 645 26, 0881,045 1,0452,772 2,772
3, 861 3, 861
4,629 22,133 26,76213,499 28,098 2,919 44,516 36,126
73,545 451,339 524,88443, 269 43, 2696,671 6,671
123,485 451,339 574,824
TOTAL LIABILITIES 136,984 479,437 2,919 619,340 36,126
DEFERRED INFLOWS OF RESOURCESNet deferred charges on debt refunding 353 353
Total De%rred Inflows of Resources - 353 - 353
NET POSITIONNet investment in capital assets 239,088 239,088Restricted for Water Quality Protection 36,145 36,145Restricted for debt service 6,177 6,177Unrestricted (38,094) 143 2,662 (35,289) -
TOTALNETPOSITION $ 237,139 $ 6,320 $ 2,662 $ 246,121 $ -
SEE NOTES TO THE BASIC FINANCIAL STATEMENTS17

CITY OF PROVIDENCE, RHODE ISLAND
Statement of Revenue, Expenses and Changes inNet Position-Proprietary Funds
For the Year Ended June 30, 2015 (in thousands)
OPERATING REVENUES:Charges for sales and servicesLease receiptsOther
Total operating revenues
OPERATING EXPENSES:Cost of sales and servicesHealth claimsAdministrationDepreciation
Total operating expenses
OPERATING INCOME (LOSS)
NON-OPERATING REVENUES (EXPENSES):
G2
Business-Type Activities-Enterprise FundsGovernmental
Activitieson-mayor
Water Supply School Lunch Internal ServiceBoard PPBA Program Totals Fund
$ 69,231 $ - $ 784 $ 70,015 $ 102,027- 17,621 17,621- 1,240 15,019 16,259 2,227
69,231 18,861 15,803 103,895 104,254
28,146 889 15,152 44,187
15,032 991 16,02311,313 - 11,31354,491 1,880 15,152 71,523
14,740 16,981 651 32,372
104,254
Investment income 325 160 485 -Interest expense (2,137) (15,196) (17,333)
Total non-operating expenses (1,812) (15,036) - (16,848) -
NET INCOME (LOSS) BEFORECONTRIBUTIONS 12,928 1,945 651 15,524 -
Capital grants and contributions 1,098 - 1,098
Change in net position 14,026 1,945 651 16,622 -
NET POSITION, BEGINNING, as restated 223,113 4,375 2,011 229,499 -
NET POSITION, ENDING $ 237,139 $ 6,320 $ 2,662 $ 246,121 $ -
SEE NOTES TO THE BASIC FINANCIAL STATEMENTS18
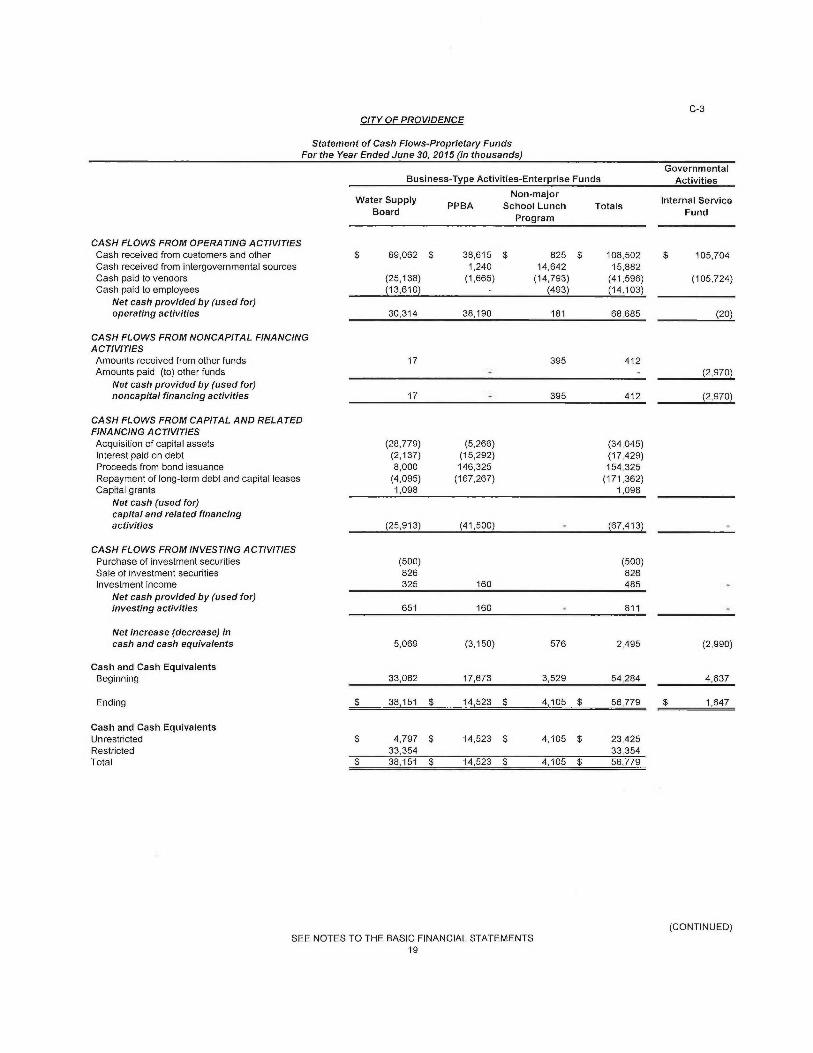
G3CITY OF PROVIDENCE
Statement of Cash Flows-Proprietary FundsFor the Year Ended June 30, 2015 (in thousands)
GovernmentalBusiness-Type Activities-Enterprise Funds Activities
Water Supply Non-major
Internal ServiceBoard PPBA School Lunch Totals
FundProgram
CASH FLOWS FROM OPERATING ACTIVITIESCash received from customers and otherCash received from intergovernmental sourcesCash paid to vendorsCash paid to employees
Net cash provided by (used fortoperating activities
CASH FLOWS FROM NONCAPITAL FINANCINGACTIVITIESAmounts received from other fundsAmounts paid (to) other funds
Net cash provided by (used fortnoncapifal financing activities
CASH FLOWS FROM CAPITAL AND RELATEDFINANCING ACTIVITIESAcquisition of capital assetsInterest paid on debtProceeds from bond issuanceRepayment of long-term debt and capital leasesCapital grants
Net cash (used for)capital and related financingactivities
CASH FLOWS FROM INVESTING ACTIVITIESPurchase of investment securitiesSale of investment securitiesInvestment income
Net cash provided by (used for)investing activities
Net increase (decrease) incash and cash equivalents
Cash and Cash EquivalentsBeginning
Ending
Cash and Cash EquivalentsUnrestricted
RestrictedTotal
$ 69,062 $
(25,138)(13,610)
38,615 $1,240
(1,665)-
825 $14,642
(14,793)(493)
108,502 $15,882
(41,596)(14,103)
105,704
(105,724)
30,314 38,190 181 68,685 (20)
17 395 412- - (2,970)
17 - 395 412 (2,970)
(28,779) (5,266) (34,045)(2,137) (15.292) (17.429)8, 000 146, 325 154, 325(4,095) (167,267) (171,362)1,098 1,098
(25,913) (41,500) - (67,413)
(500) (500)826 826325 160 485
651 160 - 811 -
5,069 (3,150) 576 2,495 (2,990)
33,082 17,673 3,529 54,284 4,637
$ 38,151 $ 14,523 $ 4,105 $ 56,779 $ 1,647
$ 4,797 $ 14,523 $ 4,105 $ 23,42533, 354 33, 354
$ 38,151 $ 14,523 $ 4,105 $ 56,779
(CONTINUED)
SEE NOTES TO THE BASIC FINANCIAL STATEMENTS19

Reconciliation of Operating Income (Loss) toNet Cash Provided by (Used in) OperatingActivitiesOperating income (loss)Adjustments to reconcile operating incometo net cash provided by (used in)operating activities:DepreciationChange in allowance for doubtful accountsPension expenseChanges is assets and liabilities:ReceivablesInventoriesOther assetsDue from other fundsAccounts payable and accrued expensesDue to other fundsUnearned revenue
Net cash provided by (used in)operating activities
G3
CITY OF PROVIDENCE. RHODE ISLAND
Statement of Cash Flows-Proprietary FundsFor the Year Ended June 30, 2015 (in thousands)
GovernmentalBusiness-Type Activities•Enterprise Funds Activities
Non major
Water Supply School Lunch
Board PPBA Program Totals Internal Service Fund
$ 14,740 $ 16,981 ~ 651 $ 32,372 $ -
11,313 11,313(270) (270)
755 755
370 20,942 (336) 20,97653 53
(269) (269)
4,305 267 (134) 4,438
(683) (683)
$ 30 314 $ 38,190 $ 181 $ 68,685
SEE NOTES TO THE BASIC FINANCIAL STATEMENTS20
2,465
(1,470)
(1,015)
$ (20)
(CONCLUDED)

CITY OF PROVIDENCE, RHODE ISLAND
Statement of Fiduciary Net Position-Fiduciary FundsJune 30, 2015 (in thousands)
ASSETSInvestments, at fair value:U.S. Government securitiesCorporate and foreign bondsCorporate equity securitiesMutual funds
Total investments
Cash and cash equivalents
Receivables:Loans receivableOther
Total receivables
Total assets
LIABILITIESAccounts payableDue to student groupsOther payables
Total liabilities
NET ASSETSHeld in Trust for Pension Benefitsand other purposes
D-1
Employee PrivateRetirement Purpose Trust
Plan Funds Agency Fund
$ 3,24347,342
215,646$ 1, 772
266,231 1,772
2,187 5 $ 1,519
26,72856,051 2
82,779 - 2
351,197 1,777 1,521
128 1666
2 855
130 1 $ 1,521
$ 351,067 $ 1,776
SEE NOTES TO THE BASIC FINANCIAL STATEMENTS21

CITY OF PROVIDENCE, RHODE ISLAND
Statement of Changes in Fiduciary Net Position-Fiduciary FundsFor the Year Ended June 30, 2015 (in thousands)
ADDITIONS:Contributions:EmployerEmployeesDonations
Total contributions
Investment EarningsNet appreciation in the fair value of investmentsInterestDividends
Total investment earnings
Total additions
DEDUCTIONS:BenefitsAdministrative expenses
Total deductions
Change in net assets
Net position -beginning
Net position -ending
D-2
EmployeeRetirement Private Purpose
Plan Trust Funds
$ 66,87511,955
$ 1978,830 19
10,437 1042,2893,134
15, 860 104
94,690 123
97,651 333,684
101,335 33
(6,645) 90
357,712 1,686
$ 351,067 $ 1,776
SEE NOTES TO THE BASIC FINANCIAL STATEMENTS22

CITY OF PROVIDENCE, RHODE ISLANDNotes to Financial Statements
June 30, 2015
1. SIGNIFICANTACCOUNTINGPOLICIES
Reporti~rg Entity
The City of Providence, Rhode Island (the "City") was incorporated in 1832. The City covers 18.5 square mileslocated in southeastern New England, at the head of the Nai-~•agansett Bay on the Atlantic sea coast. The City isapproximately 45 miles from Boston and approximately 3 1/2 hours from New York by automobile or rail.
The City operates under aMayor-Council form of government. A Home Rule Charter was adopted in November 1980and became fully effective on January 3, 1983. The Mayor is elected by the voters of the City to a four-yeas• term. CityCouncil members are also elected to four-year terms, which coincide with the term of the Mayor. Most departmentheads and other City officials are appointed by the Mayor.
The City complies with generally accepted accounting principles (GAAP), including all relevant GovernmentalAccounting Standards Board (GASB) pronouncements. The accounting and reporting framework and the moresignificant accounting policies are discussed in subsequent subsections of this Note.
All dollar values disclosed herein are in thousands (000 omitted).
In evaluating how to define the government fog• financial ~•eporting purposes, management has considered all potentialcomponent units, The decision to include a potential component unit in the reporting entity was made by applying thecriteria set forth in GASB Statement No. 61. Under GASB Statement No. 61, a legally separate entity is required tobe included as a component unit if it is fiscally dependent upon the primary government and there is a financialbenefit or burden relationship present. The primary government is financially accountable if it appoints the votingmajority of the organization's governing board and (1) it is able to impose its will on that organization or (2) there is apotential for the organization to provide specific financial benefits to, or impose specific financial burdens on, theprimary government. A potential component unit has a financial benefit or burden relationship with the primarygovernment if, for example, any one of the following conditions exists:
a. The primary government is legally entitled to or can otherwise access the organization's resources.
b. The primary government is legally obligated or has otherwise assumed the obligation to finance thedeficits of, or provide financial support to, the organization.
c. The primary government is obligated in some manner for the debt of the organization.
The c►•iterion has been considered and the blended component units discussed below are included in the City'sreporting entity because of the significance of its operational or financial relationships with the City.
h~divirhral Component Unif Disclosure
The component unit provides services entirely or almost entirely to the City or otherwise exclusively or almostexclusively benefits the City, even though they do not provide services directly to it. The component unit has beenreported as if it was part of the primary government through a method of inclusion known as blending. A descriptionof the component unit, criteria for inclusion and its relationship with the City is as follows:
Providence Public Buildings Authority
The Providence Public Buildings Autharity ("PPBA") was created by an act of the Rhode Island General Assemblyand was empowered by resolution of the Providence City Council on August 13, 1987, and by resolution of the PublicFinance Board, created under Section 42-10.11 of the General Laws of Rhode Island, on February 12, 1988.Membership is comprised of S members appointed by the Mayor and approved by the City Council. The PPBA ispresented as a blended enterprise fund.
23 (Continued)

CITY OF PROVIDENCE, RHODE ISLANDNotes fio Financial Statements
June 30, 2015
1. SIGNIFICANT ACCOUNTING POLICIES (Contintred)
Individual Co~nponeitt Unit Disclosure (Continried)
Providence Public Buildings Authority (Continued)
The purpose of the PPBA is to acquire, construct, maintain, renovate, repair and operate public facilities and publicequipment through the use of public financing for the City. These activities are structured as financing leases betweenthe PPBA and the City. The future payments to be received on these leases is presented as "Due from PrimaryGovernment" on the PPBA Statement of Net Position. These activities allow the PPBA to provide for the conduct ofthe executive, legislative and judicial functions of the government. The PPBA is obligated to pay the principal andinterest on any financing solely fi•om the rents, revenues and receipts derived under the lease agreements with the Cityor from receipts on the disposition of the assets being financed. The PPBA's administrative expenses are paid on anannual basis by the lessee in the form of additional rent.
Complete financial statements of the PPBA can be obtained tlu•ough the City of Providence Finance Department, CityHall, Providence, Rhode Island 02903.
The Providence Redevelopment Agency
The Providence Redevelopment Agency ("PRA") was formed on December 20, 1946 pursuant to R.I.G.L. 45-31 (theAct) by a duly enacted resolution of the City Council of the City. Under the Act, the PRA constitutes a bodycorporate and politic, exercising public and essential government functions, and having a distinct legal existence fromthe City. As such, the PRA has the authority to acquire, develop as a building site, administer, sell and lease property,has the power of eminent domain, and the power to issue bonds, notes and other evidence of indebtedness. The PRAdoes not have the power to levy taxes.
The PRA was created to eliminate and p►•event blighted and substandard areas and replace such areas throughredevelopment ofwell-planned, integrated stable, safe and healthful neighborhoods.
The Powers of the PRA are vested in eight members, including the Mayor of the City ex officio, five membersappointed by the Mayor of the City and two members who are also members of the City Council, appointed by theCity Council. All appointed members of the PRA must be resident electors of the City. The PRA is presented as ablended special revenue fund.
Rece~ttly Issc~erl Accounti~tg Standards
The City has implemented the following govermnental accounting standards during fiscal year ended June 30, 2015:
GASB Statement No. 68 —Accounting and Financial Reporting for Pensions — an amendment ofGASB Statement No. 27, effective for the Corporation's fiscal year ending June 30, 2015.
• GASB Statement No. 69 — Government Combinations and Disposals of GovernmentOperations, effective for the fiscal year ending June 30, 2015.
• GASB Statement No. 71 —Pension Transition for Contributions Made Subsequent to theMeasurement Date — an amendment of GASB Statement No. 68, effective for the fiscal yearending June 30, 2015.
24 (Continued)

CITY OF PROVIDENCE, RHODE ISLANDNotes to Financial Statements
Lune 30, 2015
1. SIGNIFICANT ACCOUNTING POLICES (Contrnuerl)
Recently Issued Accorinting Standards (Co~rtinsed)
The City will adopt the following new accounting pronouncements in future years:
• GASB Statement No. 72 —Fair Value Measurement and Application, effective fiscal year endingJune 30, 2016.
• GASB Statement No. 73 —Accounting and Financial Reporting for Pensions and Related Assets thatare not within the scope of GASB Statement No. 68. And amendments for certain provisions ofGASB Statements No. 67 and No. 68, effective for the City's fiscal year ending June 30, 2016.
• GASB Statement No. 74 —Financial Reporting for Postemployment Benefit Plans Other ThanPension Plans, effective for the fiscal year ending June 30, 2017.
• GASB Statement No. 75 —Accounting and Financial Reporting for Postemployment Benefits Other'Than Pensions, effective for fiscal year ending June 30, 2018.
• GASB Statement No. 76 —The Hierarchy of Generally Accepted Accounting Principles for Stateand Local Governments, effective for fiscal year ending June 30, 2016.
• GASB Statement No. 77 —Tax Abatement Disclosures, effective for the City's fiscal year endingJune 30, 2016.
The impact of these pronouncements on the City's financial statements has not been determined.
Governi~:eat-Wide Fu~rrl Financial Statements
The Statement of Net position and Statement of Activities display information about the reporting government as awhole. They include all funds of the reporting entity except for fiduciary funds. For the most part, the effect of inter-fund activity has been removed from these statements. The statements distinguish between governmental and business-type activities. Governmental activities generally are financed through taxes, intergovernmental revenues, and other non-exchange revenues. Business-type activities are financed in whole or in part by fees charged to external parties for goodsor services.
The statement of activities demonst~•ates the degree to which the direct expenses of a given function or segments areoffset by program revenues. Direct expenses are those that are clearly identifiable with a specific function or segment.Program revenues include 1) charges to customers or applicants who purchase, use, or directly benefit from goods,services or privileges provided by a given function or segment and 2) grants and contributions that are restricted tomeeting the operational or capital requirements of a particular function or segment. Taxes and other items not properlyincluded among program revenues are reported as general revenues.
Separate fund financial statements are provided for governmental funds, proprietary funds and fiduciary funds, eventhough the latter are excluded from the government-wide financial statements. Major individual governmental fundsand proprietary funds are reported as separate columns in the fund financial statements.
Mensrrrement Focus, Basis of Accounting, mrd Finmicirrl Statement Presentation
The government-wide financial statements, proprietary and fiduciary fund financial statements are reported using theeconomic resources measurement focus and the accrual basis of accounting. Agency funds are not involved in themeasurement of results of operations; therefore, measurement focus is not applicable to them. Revenues are recordedwhen earned and expenses are recorded when a liability is incurred, regardless of the timing of related cash flows.Property taxes are recognized as revenues in the year when levied for. Grants and similar items are recognized asrevenue as soon as all eligibility requirements imposed by the provider have been met.
25 (Continued)
CITY OF PROVIDENCE, RHODE ISLANDNotes to Financial Statements
June 30, 2015
1. SIGNIFICANT ACCOUNTING POLICIES (Conliiti[ed)
Measurement Focris, B
CITY OF PROVIDENCE, RHODE ISLANDNotes to Financial Statements
June 30, 2015
1. SIGNIFICANT ACCOUNTING POLICIES (Continued)
Measztref~ie~tt Focus, Basis of Accounting, and Financial Statement Presentation (Co~ttinued)
The City reports the following major governmental funds:
- The General Fzrnd is the City's primary operating fund. It accounts for all financial resources of the generalgovernment, except those required to be accounted for in another fund.
- The School Fa~nd accounts for operations of the Providence school system. Revenue is derived primarily from Stateand Federal Aid and transfers from the City.
- The School Grants Fund accounts for federal, state, and private grants received and expended by the school system
-The Capital Projects Fund accounts for resources to be used for the acquisition or construction of capital assets forthe housing and community improvement activities in the City.
The City reports the following major proprietary funds:
- The Water• Si~pp/y Boa~~d accounts for the activities of the Providence Water Supply Board.- The Providence Public Buildings Az~thoriry accounts for the activities related to acquisition, construction and leasingof capital assets to the City,
Additionally, the City reports the following fund types:
- The Pension Ti•ust Farad accounts for the activities of the City of Providence Employees Retirement System, whichaccumulates resources for pension benefit payments to qualified employees.- The Private-Panpose Tr•zrst Fz~nd is used to account for resources legally held in trust for the benefit of individuals,organizations or other governments.- The Agency Farad accounts for assets held by the City in a purely custodial capacity. Since agency funds arecustodial in nature (i.e, assets equal liabilities), they do not involve the measurement of results of operations.- The Internal Service Fzrnd is used by management to charge the costs of self-insurance and legal claims toindividual funds.
liiterfu~rd Receivables and Payables
Activity between funds that is representative of lending/borl•owing arrangements outstanding at the end of the fiscalyear are referred to as either "due to/from other• funds." Any residual balances outstanding between the governmentalactivities and business-type activities are reported in the government-wide financial statements as "internal balances."
Pe~rsion Plat Accounting
Employee Retirement PlanThe Employee Retirement Plan (Pension Trust Fund) is reported on the accrual basis of accounting. Employeecontributions are recognized in the period in which the contributions are due. Employer contributions to the plan arerecognized when due and the Gity has made a formal commitment to provide the contributions. Benefits and refundsare recognized when due and payable in accordance with the terms of each plan. Administrative costs are financedtlu•ough investment earnings.
Investments are reported at fair value. Short-term investments are reported at cost, which approximates fair value.Securities traded on a national or international exchange are valued at the last reported sales price at current exchangerates. Investments that do not have an established market are reported at estimated fair value, based on value ofunderlying assets.
27 (Continued)

CITY OF PROVIDENCE, RHODE ISLANDNotes to Financial Statements
June 30, 2015
1. SIGNIFICANT ACCOUNTING POLICIES (Continued)
Fundin PolicX
The City makes contributions at the discretion of management.
Accorr~rti~rg Estimates
The preparation of financial statements in conformity with accounting principles generally accepted in the UnitedStates of America requires management to make estimates and assumptions that affect the reported amounts of assetsand liabilities and disclosure of contingent assets and liabilities at the date of the financial statements and the reportedamounts of revenues, expenses and expenditures during the reporting period. Actual results could differ from thoseestimates.
Property foxes
The City's property tax is levied each year on July 1 based on the assessed property value, as of the prior December31, for all real property, tangible property, equipment and motor vehicles located in the City. Assessed values of realproperty were established by the City Assessor's office at 100% of appraised market value based on 2012 Statemandated statistical updated valuations less exemptions. Assessed values of tangible property and equipment andmotor vehicles are determined annually at 100% of market value, and a $1,000 exemption on motor vehicleassessments. Payments on the gross levy are due in equal quarterly installments in July, October, January, and April.Property taxes attach as an enforceable lien on property when levied.
Cnslt egi~iv~leitts
For purposes of the cash flow statement, the City considers certificates of deposits and highly liquid short-terminvestment funds with original maturities of three months or less, when purchased, to be cash equivalents, includingamounts reported as resh•icted.
brvesU~reirts
Investments and pooled fixed income investments are stated at fair value, based on quoted market prices.
lirve~rtories acrd prepnPd assets
Proprietary fund inventory is stated at the lower of weighted average cost or market using the first-in, fvst-outmethod. Inventory consists primarily of materials and supplies. Inventory is not maintained in governmental funds,but is recorded as an expenditure at the time of purchase.
Any payments to vendors that reflect costs applicable to future accounting periods are recorded as prepaid items inboth government-wide and fund financial statements.
Capitn/Assets
Capital assets, which include property, plant, equipment and infrastructure assets (e.g., roads, bridges, sidewalks, andsimilar items), are reported in the applicable governmental or business-type activities columns in the government-widefinancial statements and in the proprietary fund financial statements. Capital assets are defined by the government asall computer equipment and assets with an initial, individual cost of more than a range of $5,000 to $100,000 and anestimated useful life in excess of two years. Such assets are recorded at historical cost or estimated historical cost ifpurchased or constructed. Donated capital assets are recorded at estimated fair value at the date of donation.
28 (Continued)

1.
CITY OF PROVIDENCE, RHODE ISLANDNotes to Financial Statements
June 30, 2015
SIGNIFICANT ACCOUNTING POLICIES (Contrnrred)
Capital Assets (Co~itinrred)
The costs of normal maintenance and repairs that do not add to the value of the asset or materially extend asset livesare not capitalized. Improvements are capitalized and depreciated over the remaining useful lives of the related capitalasset, as applicable.
Capital assets of the governmental activities are depreciated using the straight-line method over the followingestimated useful lives:
Assets Yeai
Buildings........................................ . ............................ 45Building improvements ..... . ............................................. 20Public domain infrastructure ............................................. 45System infrash~ucture ...................................................... 30Vehicles...................................................................... 6Office equipment ........................................................... 7Computer equipment ...................................................... 5Machinery and equipment ................................................ 15
Capital assets are reported as expenditures and no depreciation expense is reported in the governmental fund financialstatements.
Property, plant and equipment of the business-type activities and proprietary funds are depreciated using the straight-line method over the following estimated useful lives:
Water SupplyBoard
Buildings, source of supply, str•uctui•es, andimprovements ................................. . ............................ 5 — 75 yearsImprovements other than burldings ...................................... 3 — 75 yearsMachinery and equipment ................................................ 3 — 50 years
Interest is capitalized on proprietary fund assets acquired with tax-exempt debt. The amount of interest capitalized iscalculated by offsetting interest expense incurred from the date of the borrowing until completion of the project withinterest earned on invested proceeds from project specific debt issued over the same period.
Self-brsura~rce
The City is self-insured in most areas of risk, subject to certain third-party "stop loss" coinsurance. Self-insured risksinclude general liability, property and casualty, workers' compensation, unemployment and employee healthinsurance claims. Claims incut~►•ed but not paid, including those which have not been reported, are accrued as long-term obligations in the government-wide and internal service fund financial statements. Obligations are paid out of theGeneral Fund and the Internal Service Funds.
Allowmrce for Collection Losses
The allowance for possible loan losses is maintained at a level believed adequate by management to absorb potentiallosses for outstanding loans. Management's determination of the adequacy of the allowance is based on an evaluationof the poi folio, past loan loss experience and current economic conditions.
29 (Continued)

CITY OF PROVIDENCE, RHODE ISLANDNotes to Financial Statements
June 30, 2015
SIGNIFICANT ACCOUNTING POLICIES (Corrtin~ied)
Allotivarrce for Collectio~i Losses (Coriti~rued)
All trade and property tax receivables for governmental and proprietary funds are reported net of an allowance foruncollectibles totaling $72,907 and $1,247 respectively. The majority of amounts relate to property taxes and waterusage. Amounts determined to be uncollectible are based on the type and age of the related receivable and the abilityof the debtor to pay.
Cotrrpe~asate~l Abse~ices
Under the terms of various contracts and policies, employees are granted vacation and sick leave based on length ofservice. The City's policy is to recognize the cost of vacation and sick leave in governmental funds when paid(matured). The liability for vacation and sick leave is recognized when earned in the government-wide and proprietaryfund financial statements. For governmental activities the general fund is used to satisfy this liability as it becomesdue, while each enterprise fund accounts for all its settlement of business-type liabilities for compensated absences.
Lorrg-teri~i Obligatio~rs
In the government-wide and proprietary fund financial statements, long-term debt and other long-te~~rn obligations arerepotrted as liabilities in the applicable statement of net position. Bond premiums and discounts, as well as issuancecosts, are deferred and amortized over the life of the bonds using the effective interest rate method. Bonds payable arereported net of the applicable bond premium or discount. Bond issuance costs are reported as deferred charges andamortized over• the term of the related debt.
In the fund financial statements, governmental fund types recognize bond proceeds, premiums and discounts, as wellas bond issuance costs, during the current period. The face amount of debt issued is reported as other financingsources. Premiums received on debt issuances are reported as other financing sources while discounts on debtissuances are reported as other financing uses. Issuance costs, whether or not withheld from the actual debt proceedsreceived, are reported as debt service expenditures. Payments of bond principal are recognized as expenditures as itcomes due.
Deferred Outflows/Iftflows of Resources
In addition to assets, the statement of net position and/or balance sheet can report deferred outflows of resources.Deferred outflow of resources represents a consumption of net position, that apply to a future period which will not berecognized as an outflow of resources (expense/expenditure) until that later date. At June 30, 2015 the City ofProvidence, Rhode Island reports deferred outflows related to pension in the government-wide statement of netposition. A deferred outflow of resources related to pension results from differences between expected and actualexperience, changes in assumptions or other inputs. These amounts are deferred and included in pension expense in asystematic and rational manner over a period equal to the average of the expected remaining service lives of allemployees that are provided with benefits tYu•ough the pension plan (active employees and inactive employees).
In addition to liabilities, the statement of net position and/or balance sheet can report deferred inflows of resources.Deferred inflows of resources represent the acquisition of net position that applies to a future period and which willnot be recognized as an inflow of resources (revenue) until a later date. At June 30, 2015 the City of Providence,Rhode Island had two items qualifying as a deferred inflow of resources. In the governmental funds balance sheet,unavailable tax revenue represents taxes receivables which are assessed on December 31, 2013 and prior and is notcollected within 60 days of June 30, 2015. Net unavailable tax revenue included in the fund financial statements was$22,964 at June 30, 2015. This amount is deferred and will be recognized as an inflow of resources in the years) inwhich the amounts become available. The City also reports a deferred inflow of resources related to pensions in thegovernment-wide statement of net position. A deferred inflow of resources related to pension results fi•om differencesbetween expected and actual experience, changes in assumptions or• other inputs. These amounts are deferred andinclude in pension expense in a systematic and rational manner over a period equal to the average of the expectedremaining service lives of all employees that are provided with benefits through the pension plan (active employeesand inactive employees).
3 0 (Continued)

I.
CITY OF PROVIDENCE, RHODE ISLANDNotes to Financial Statements
June 30, 2015
SIGNIFICANTACCOUNTING POLICIES (Co~rti~r~red)
Frnr~! Equity nerd Net Position
In the government-wide and proprietary fund financial statements, net position is classified in the followingcategories:
Net i~rvestynerrt iir capital assets -This category groups all capital assets, including infrastructure, into onecomponent of net position. Accumulated depreciation and the outstanding balances of debt that areattributable to the acquisition, construction or improvement of these assets reduce this category.
Restricted Net position -This category represents the net position of the City, which are restricted by outsideparties (creditors, grantors, contributors, or the laws or regulations of other governments) or enablinglegislation.
Unrestr[cted Net positio~r or Deficits -This category represents the net position of the City, which do notmeet the definition of "restricted" or "net investment in capital assets". Deficits require future funding.
Governmental fund equity is classified as fund balance. Fund balance is classified into one of the following fivecategories: non-spendable, resri•icted, committed, assigned, or unassigned. These categories are defined below.
(a) Non-spendable Fund Balance -includes amounts that cannot be spent because they are either (a) not inspendable form or (b) legally or contractually required to be maintained intact. "Not in spendable form"includes items that are not expected to be converted to cash.
(b) Restricted Fund Balance —includes amounts that are restricted to specific purposes. Fund balance isreported as restricted when constraints placed in the use of resources are either externally imposed bycreditors, grantors, contributors, or laws or regulations of other governments, or imposed by law throughconstitutional provisions or enabling legislation.
(c) Committed Fund Balance —includes amounts that can be used only for the specific purposes pursuant toconstraints imposed by formal action of the governments highest level of decision-making authority.Those corrunitted amounts cannot be used for any other purpose unless the government removes or changesthe specified use by taking the same type of action it employed to previously commit those amounts usuallythrough city ordinance. The City Council is the highest level of decision-making authority for the City ofProvidence and utilizes City Ordinances to vote on the City's budget and resolutions proposed by thevarious committees.
(d) Assigned Fund Balance —includes amounts that are constrained by the government's intent to be used forspecific purposes, but are neither restricted nor committed. The intent should be expressed by (a) thegoverning body itself or (b) a body (a budget or finance committee) or official to which the governing bodyhas delegated the authority to assign amounts to be used for specific purposes. The City of Providence doesnot currently have a spending policy regarding the order in which restricted, committed, assigned, andunassigned fund balances are spent when more than one amount is available for the expenditures incurred.Accordingly, by default, the City is following the policy prescribed by GASB Statement No. 54 whichspecifies that fund balance is reduced first by committed, then by assigned, then by unassigned whenexpenditures are incun~ed for purposes for which any unrestricted fund balance could be used.
(e) Unassigned Fund Balance — is the residual classification for the General Fund. This classificationrepresents fund balance that has not been assigned to other funds and that has not been restricted,committed, or assigned to specific purposes within the General Fund.
31 (Continued)

CITY OF PROVIDENCE, RHODE ISLANDNotes to Financial Statements
June 30, 2015
2. RECONCILIATION OF GOVERNMENTAL ACTIVITIES AND GOVERNRIENTAL FUND FINANCIALSTATEMENTS
The governmental fund balance sheet includes a reconciliation between fund balances —total governmental fundsand net position —governmental activities as reported in the government-wide statement of net position. One elementof that reconciliation explains that "long-term liabilities, including bonds payable, are not due and payable in thecurrent period and therefore are not reported in the funds." The details of this $556,373 difference are as follows:
Bonds and notes payable
Leases payable
Capital notes payable
Accrued interest payable
Bond premium
Compensated absences
Workers' compensation
Unspent PPBA bond proceeds
Claims and judgments
Net adjustment to reduce fund balance -total governmental funds
to arrive at net assets -governmental activities
$ (458,271)
(13,815)
(19,658)
(5,438)
(5,532)
(36,174)
(4,036)
12,954
(26,403)
$ (556,373)
The governmental fund statement of revenues, expenditures, and changes in fund balances includes reconciliation
between net changes in fund balances —total governmental funds and changes in net position of governmental
activities as reported in the government-wide statement of activities. One element of that reconciliation explains that"Governmental funds report capital outlays as expenditures; however, in the statement of activities, the cost of those
assets is allocated over their estimated useful lives and reported as depreciation expense." The details of this $844
difference is as follows:
Capital outlay -governmental funds $ 22,881
Depreciation e~ense (23,725)
Net adjustment to decrease net changes in fund balance -total
governmental funds to arrive at changes in net position of
governmental activities $ (844)
Another element of that reconciliation states that "the issuance of long-term debt (e.g., bonds, leases) provides currentfinancial resources to governmental funds, while the repayment of the principal of long-term debt consumes the
current financial resources of governmental funds. Neither transaction, however, has any effect on net position. Also,governmental funds report the effect of issuance costs, premiums, discounts, and similar items when debt is first
issued, whereas these amounts are deferred and amortized in the statement of activities." The details of this $33,989difference ai•e as follows:
32 (Continued)

2.
3.
CITY OF PROVIDENCE, RHODE ISLANDNotes to Financial Statements
June 30, 2015
RECONCILIATION OF GOVERNMENTAL ACTTI~ITIES AND GOVERNA~IENTAL FUND FINANCIALSTATEMENTS (Conti~ruetl)
Long-Term Liabilities issued o►• incurred:Bond, lease and note proceeds
Bond premium
Principal repayments:General obligation bonds
Capita 1 leasesCapital notesNotes payableNet adjustment to increase net changes in fund balances -total
governmental funds to arrive at changes in net position ofgovernmental activities
$ (222,000)(6,061)
257,9252,8481,18592
$ 33,989
Another element of that reconciliation states that "Some expenses reported in the statement of activities do not requirethe use of current financial resources and therefore are not reported as expenditures in governmental funds." Thedetails of this $38,796 difference are as follows:
Compensated absencesAccrued interest and other
Amortization of bond premiumClaims and judgments
Net pension liabilityOther post employment benefits
Net adjustment to decrease net changes in fund balance -totalgovernmental funds to arrive at changes in net positionof governmental activities
CASH, CASH EQUIVALENTSAND INVESTMENTS
Deposits
$ (904)(888)529811
(7,388)(30,956)
$ (38,796)
The City's custodial credit risk policy is in accordance with RI General Laws, Chapter 35-10.1, depository institutionsholding deposits of the State, its agencies or governmental subdivisions of the State, shall at a minimum, insure orpledge eligible collateral equal to 100% of time deposits with maturities greater than sixty days. Any of theseinstitutions which do not meet minimum capital standards prescribed by federal regulators will insure or pledgeeligible collateral equal to 100% of deposits, regardless of maturities.
litvest~nents
The City policy for pension investments is under the oversight of the Board of Investment Commissioners. The Boardcontracts with an investment advisory fu•m and approves any new investment vehicles presented by the consultant.The Board follows all applicable state statutes and Section 17-189 of the City Ordinance, which states, "The Board ofInvestment Commissioners is authorized and empowered to execute the disposition and investment of the funds whichare within its control in any securities and investments as would be acquired by prudent persons of discretion andintelligence in these matters, who are seeking a reasonable income and the preservation of their capital."
33 (Continued)

CITY OF PROVIDENCE, RHODE ISLANDNotes to Financial Statements
June 30, 2015
3. CASH, CASH EQiJIYALENTSAND INVESTMENTS (Coirti~tued)
Interest Rate Risk
The City does not have a formal investment policy for its pension funds that limits investment maturities as a meansof managing its exposure to fair value losses arising fiom increasing interest rates. The City's policy is to limit itsexposure to fair value losses arising from changes in interest rates by structuring the investment portfolio so thatsecurities matm•e to meet cash requirements for• ongoing operations, thereby avoiding the need to sell securities on theopen market prior to maturity, and investing operating funds primarily in shorter-term securities, money marketmutual funds, or similar investment pools.
Concentrations
The City's policy is to maintain a diversified portfolio to minimize the risk of loss resulting fi•om over concentrationof assets in a specific issuer.
Custodial Credit Risk
Deposits
This is the risk that, in the event of failure of a depository financial institution, a government will not be able torecover its deposits or will not be able to recover collateral securities that are in the possession of an outside party. Asof June 30, 2015 $46,207 of the city's bank balance of $158,855 was uninsured and uncollateralized. (Amounts do notinclude PPBA, as such amounts cannot be separated.)
Investments
This is the risk that in the event of the failure of the counterparty (e.g., broker-dealer) to a ri•ansaction, a governmentwill not be able to recover the value of its investment or collateral securities that are in the possession of another party.The City does not have a custodial credit risk policy.
34 (Continued)

CITY OF PROVIDENCE, RHODE ISLANDNotes to Financial Statements
June 30, 2015
3. CASH, CASH EQUIVALENTS AND INVESTMENTS (Coirti~rried)
Cash and investment balances held by banks and other financial institutions for the City
consist of the following at June 30, 2015:
Cash and Cash Equivalents
Deposits with financial institutions
PPBA deposits with financial institutions
Water Supply Board deposits with financial institutions
School Lunch Program deposits with financial institutions
Total cash and cash equivalents
Investments
Non-major Governmental Funds
Mutual Funds
Private Purpose Trust Funds
Mutual Funds
PPBA Investments
Guaranteed Investment Contracts
Water Supply Board
Equity Mutual Funds
Pension Tcust Funds
U.S. Government Securities
Corporate and Foreigi Bonds
Common and Preferred Stocks
Total investments
$ 74,146
14,523
38,151
4,105
130,925
25,697
25,697
1,772
7,943
7,943
6,635
3,243
47,342
215,646
266,231
308,278
Total cash, cash equivalents and investments $ 439,203
* These investments are uninsured and unregistered, with securities held by the counterparty, or by
its trust department or agent, in the City's name.
35 (Continued)

CITY OF PROVIDENCE, RHODE ISLANDNotes to Financial Statements
June 30, 2015
3. CASH, CASHEQUIVALENTSAND INVESTMENTS (Continr~ed)
Cash, cash equivalents, and investments are classified in the accompanying financial statement as follows:
Cash and Cash Equivalents
Statement of Net Position
Cash and cash equivalents $ 93,860
Restricted cash and cash equivalents 33,354
127,214
Fiduciary Funds
Cash and cash equivalents 3,711
3,711
Total cash and cash equivalents $ 130,925
Investments
Statement of Net Position
Investments $ 32,332
Restricted investments 7,943
40,275
Fiduciary Funds
Investments 266,231
Mutual funds 1,772
268,003
Total investments $ 308,278
Interest Rafe Risk
This is the risk that changes in market interest rates will adversely affect the fair value of an investment. Generally,
the longer• the maturity of an investment, the greater the sensitivity of its fau• value to changes in market interest rates.
Information about the exposure of the entity's debt type investments to this risk using the segmented time dish•ibution
model is as follows:
Type of Investment
Fair
Value
Investment Maturities (in Years)
Less Than 1-5 6-10 Over
1 Year Years Years 10 Years
U.S. Government Securities $ 3,243 $ $ 492 $ 2,751
Corporate and Foreign Bonds 47,342 481 2,115 14,530 $ 8,216
PPBA-Guaranteed Investment 7,943 272 7,671
TOTAL $ 58,528 $ 481 $ 24,879 $ 17,281 $ 15,887
36 (Continued)
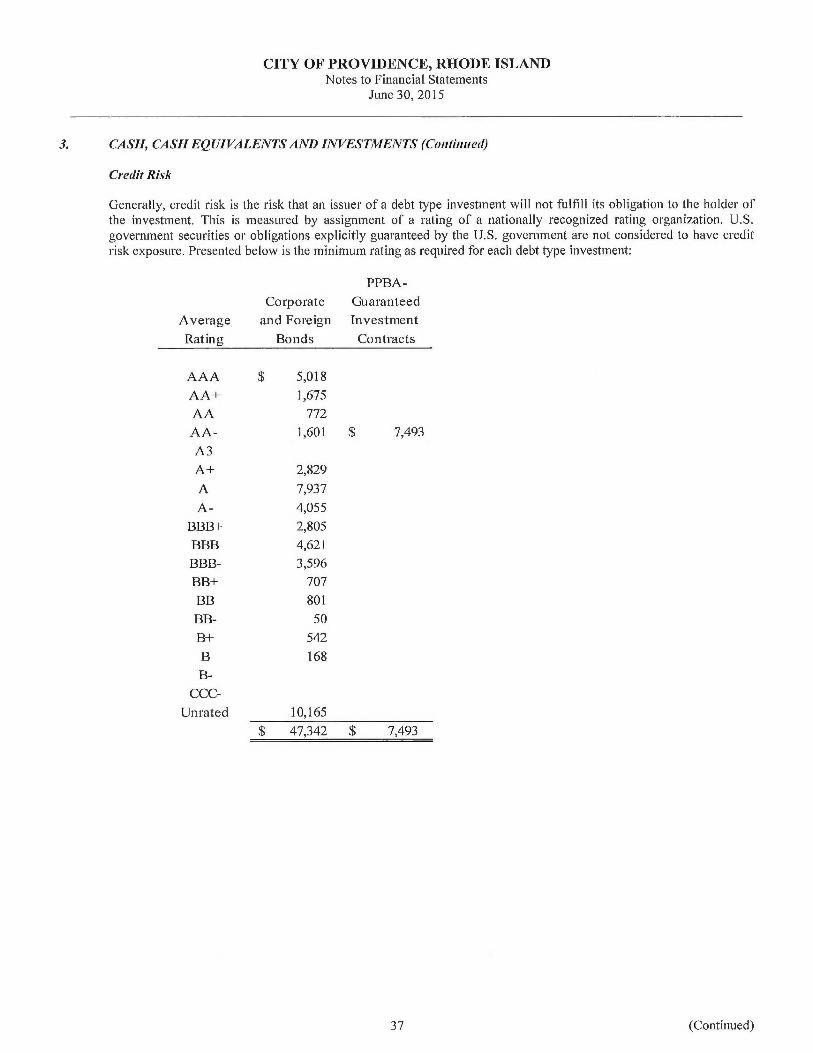
3.
CITY OF PROVIDENCE, RHODE ISLANDNotes to Financial Statements
June 30, 2015
CASH, CASH EQDIi~ALENTSAND INVESTMENTS (Contr~r~ied)
Credit Risk
Generally, credit risk is the risk that an issuer of a debt type investment will not fulfill its obligation to the holder ofthe investment. This is measured by assignment of a rating of a nationally recognized rating organization. U.S.government securities or obligations explicitly guaranteed by the U.S. government are not considered to have creditrisk exposure. Presented below is the minimum rating as required for each debt type investment:
PPBA-
Corporate Guaranteed
Average and Foreign Investment
Rating Bonds Contracts
AAA
AA+
AA
AA-
A3
A+
A
A-
BBB+
BBB
BBB-
BB+
BB
BB-
B+
B
B-
CCG
Unrated
5,018
1,675
772
1,601 $
2,829
7,937
4,055
2,805
4,621
3,596
707
801
50
542
168
7,493
10,165
$ 47,342 $ 7,493
37 (Continued)

CITY OF PROVIDENCE, RHODE ISLANDNotes to Financial Statements
June 30, 2015
4. INTERFUND RECEIVABLES, PAYABLESAND TRANSFERS
As of June 30, 2015, inter-fund receivables and payables that resulted from various inter-fund transactions were asfollows (in thousands):
Due from Due toOther Funds Other Funds
General Fund $ 43,397 $ 50,436School Fund 18,585 4,834School Grants 2,117 9,551Capital Projects 40 3,504Non-Major Governmental Funds 21,963 19,305Water Supply Board 1,394School Lunch Program 1 251Internal Service Fund 29,260 26,088
Total $ 115,363 $ 115,363
Amounts owed among funds result principally fi•om timing of payments to the City's general fund of $43.3 million,payments to the City's health insurance and legal claims fund of $29.2 million, and amounts owed to the school fundfor current year expenditures of $18.6 million. All of these amounts were paid subsequent to year-end. All otheramounts owed are expected to be paid within one year.
Inter-fund transfers during the year ended June 30, 2015 were as follows (in thousands):
Transfers from Transfers toOther Funds Other Funds
General Fund $ 3,542 $ 125,041School Fund ] 26,220 282School Grants 1,322 2,645Capital projects - 285Non-Major Governmental Funds 293 3,124
Total $ 131,377 $
131,377
The most significant transfer in fiscal year 2015 was the appropriated operating subsidy from the City's general fundto the school fund.
38 (Continued)
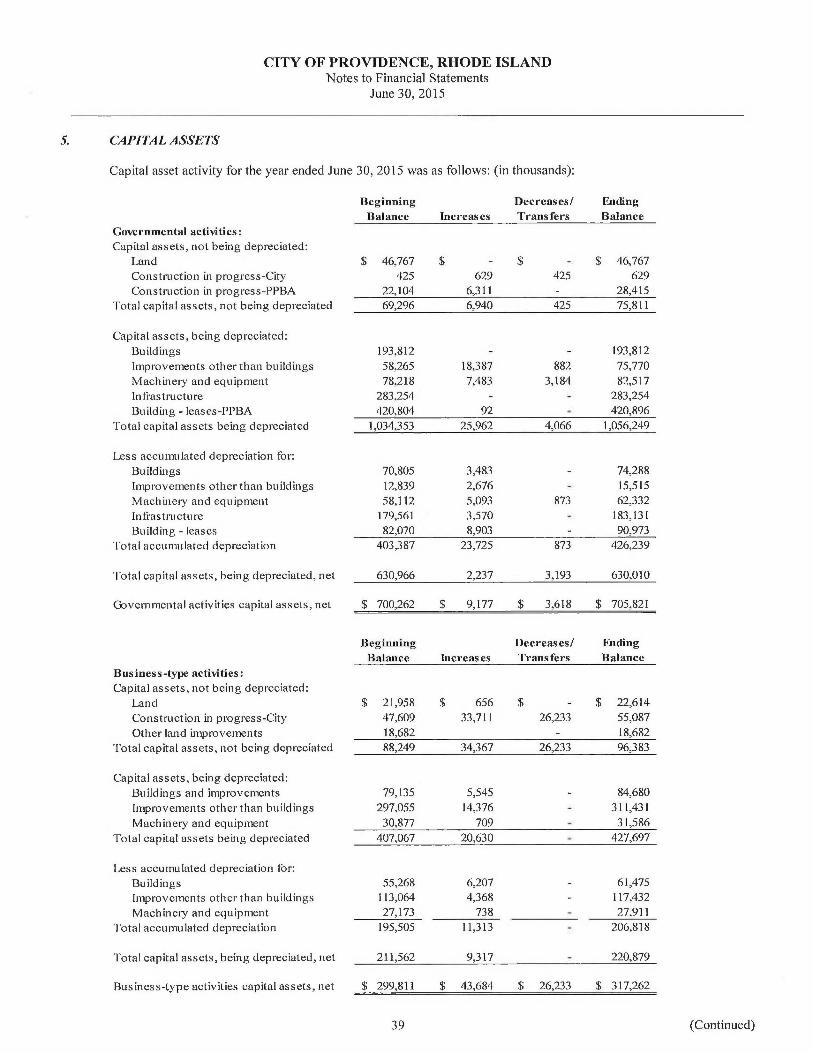
CITY OF PROVIDENCE, RHODE ISLANDNotes to Financial Statements
June 30, 2015
S. CAPITAL ASSETS
Capital asset activity for the year ended June 30, 2015 was as follows: (in thousands):
Beginning Decreases/ Ending
Balance Increases Transfers Balance
Governmental activities:
Capital assets, not being depreciated:
Land $ 46,767 $ - $ - $ 46,767
Construction in progress-City 425 629 425 629
Conshuction in progress-PPBA 22,104 6,311 - 28,415
Total capital assets, not being depreciated 69,296 6,940 x}25 75,811
Capital assets, being depreciated:
Buildings
Improvements other than buildings
Machinery and equipment
Infrastructure
Building -leases-PPBA
Total capital assets being depreciated
Less accumulated depreciation for:
Buildings
Improvements other than buildings
Machinery and equipment
Infi•ast~ucture
Building -leases
Total accumulated depreciation
Total capital assets, being depreciated, net
Governmental activities capital assets, net
193,812 - - 193,812
58,265 18,387 882 75,770
78,218 7,483 3,184 82,517
283,254 - - 283,254
420,804 92 - 420,896
1,034,353 25,962 4,066 1,056,249
70,805 3,483 - 74,288
12,839 2,676 - 15,515
58,112 5,093 873 62,332
179,561 3,570 - 183,131
82,070 8,903 - 90,973
403,387 23,725 873 426,239
630,966 2,237 3,.193 630,010
$ 700,262 $ 9,177 $ 3,618 $ 705,821
Beginning Decreases/ ceding
Balance Increases Transfers Balance
Business-type activities:
Capital assets, not being depreciated:
Land $ 21,958 $ 656 $ - $ 22,614
Construction in progress-City 47,609 33,711 26,233 55,087
Other land improvements 18,682 - 18,682
Total capital assets, not being depreciated 88,249 34,367 26,233 96,383
Capital assets, being depreciated:
Buildings and improvements 79,135 5,545 - 84,680
Improvements other than buildings 297,055 14,376 - 311,431
Machinery and equipment 30,877 709 - 31,586
Total capital assets being depreciated 407,067 20,630 - 427,697
Less accumulated depreciation for:
Buildings 55,268 6,207 - 61,475
Improvements other than buildings 1 ]3,064 4,368 - 117,432
Machinery and equipment 27,]73 738 - 27,911
Total accumulated depreciation 195,505 11,313 - 206,818
Total capital assets, being depreciated, net 211,562 9,317 - 220,879
Business-type activities capital assets, net $ 299,811 $ 43,684 $ 26,233 $ 317,262
39 (Continued)

S.
6.
CITY OF PROVIDENCE, RHODE ISLANDNotes to Financial Statements
June 30, 2015
CAPITAL ASSETS (Continued)
The leased assets reported in the table above represent assets, principally buildings and related improvements, leasedby the City from the Providence Public Building Authority. For the government-wide statements, the capital assetsand related PPBA debt is presented in the governmental activities column and the related transactions are eliminated.
Depreciation expense was charged to functions/programs of the primary government as follows:
Executive, legislative and judicial $ 10
Finance 73
Public safety 1,692
Public works 5,248
Recreation 7
Public lands and parks 1,651
Other departments 11,104
Education 3,940Total depreciation expense $ 23,725
UNEARNED REVENUE
Governmental funds report unearned revenue in connection with receivables for revenues that are not available toliquidate liabilities of the current period. Governmental funds and governmental activities report unearned revenue inconnection with resources that have been received, but not yet earned. At year-end, the various components ofunearned revenue reported in governmental funds and governmental activities were as follows:
General Fund:
Advance collections
Charges for services
ScJtool Grants Fufzd
OtlterNoft Major Governmental Funrls
Unearned
Revenue
$ 8,097
5.493~ 13,JyU
$ 2,459
$ 7,845
40 (Continued)

CITY OF PROVIDENCE, RHODE ISLANDNotes to Financial Statements
June 30, 2015
7. LONG-TERM OBLIGATIONS
Long-term liability activity for the year ended June 30, 201.5 was as follows:
Governmental activitiesBonds payable:
General obligation bonds
Revenue bonds
Special obligation tax increment
Total bonds payableNotes payableCapital leasesCapital notes
Total bonds and notes payable
Net bond premium
OtherLong-Term Liabilities:
(As restatedBeginning Ending Due Within
Balance Increases Decreases Balance One Year
$ 99,501 $ 23,765 $ 31,005 $ 9,261 $ 8,300
59,799 44,910 50,488 54,221 4,577
6,170 3,445 2,725 2,725
165,470 68,675 84,938 149,207 15,602
2,474 92 2,382 97
9,663 7,000 2,848 13,815 3,508
20,843 1,185 19,658 1,240
198,450 75,675 89,063 185,062 20,447
6,0G 1 529 165
Claims and judgments 39,639 657 38,982 38,982
Compensated absences 35,270 1,08b 182 36,174 3,617
Net pension liability 1,093,538 26,293 30,776 1,089,055 -
Otherpost employment liability 204,096 30,956 235,052 -
Total other long-term liabilities 1,372,543 58,335 31,615 1,399,263 42,599
PPBA Debt
Go~~ernmental activity
long-term liabilitiesbefore PPBA reclassification
Go~~ernment acti~~t~~
long-term liabilities
1,570,993 140,071 121,207 1,589,857 63,211
333,344 146,325 172,987 306,682 22,133
$ 1,904,337 $ 286,396 $ 294,194 $ 1,896,539 $ 85,341
Internal service funds predominantly serve the governmental funds. Accordingly, long-term liabilities for them areincluded as part of the above totals for governmental activities.
41 (Continued)

CITY OF PROVIDENCE, RHODE ISLANDNotes to Financial Statements
June 30, 2015
7. LONG-TERAl OBLIGATIONS (Co~rtinuerl)
Business-type acti`~ties:
Bonds payable:
Revenue bonds -water
PPBA -CITY
Total bonds
PPBA-net bond premium
PPBA -PAP notes*
Net pension liability
Otl~erpost employment liabflity
Business-type acti~~t~~
long-term liabilities
Less PPBA Eliminations
Business-type activity
long-term liabilities
Beginning Ending Due Within
Balance Increases Decreases Balance One Year
$ 74,269 $ 8,000 $ 4,095 $ 78,174 $ 4,629
333,344 $ 146,325 172,987 306,682 22,133
407,613 154,325 177,082 384,856 26,762
6,276 15,919 761 21,434 1,832
117,802 27,554 145,356
41,357 1,912 43,269
5,385 1,286 6,671
$ 578,433 $ 200,996 $ 177,843 601,586 28,544
(473,472) (23,965)
$ 128,114 $ 4,629
* -Amount represents internal notes between the City and the PPBA and is therefore eliminated on the entity-widestatements. The $166,790 difference between business type PPBA eliminations and governmental PPBA eliminations
consists of $145,366 of PAP loans between the City and PPBA and $21,434 of net bond premium.
The Water Supply Board long-term debt is general obligation debt of the City. However, because it is the intent of the
City to have the Board meet the debt service requirements of this debt, such amounts are recorded in the enterprise
funds of the City. Similarly, debt of the PPBA that will be met by the Water Supply Board has been recorded as the
Water Supply Board's debt.
42 (Continued)

CITY OF PROVIDENCE, RHODE ISLANDNotes to Financial Statements
June 30, 2015
7. LONG-TERM OBLIGATIONS (ColZtinued)
Debt service requirements for bonds and notes payable at June 30, ?015 were as follows:
Governmental Activities PPBA
Principal Interest Total Principal Interest Total
?016 $ 15,60? $ 6,587 $ 22,189
2017 13,080 6,062 19,142
?018 13,575 5,535 19,110
2019 13,]48 4,958 18,106
2020 12,066 4,374 16,440
2021-2025 42,731 15,513 58.44
2026-2030 30,895 5.]84 36,079
2031-2035 8,110 615 8,725
2036-2040 - -
2041-2045 -$ 149.207 $ 48,828 $ 198,035
$ ?x,133 $ 14,015 $ 36,148
~8,?~3 13,035 41?58
27,964 11,863 39,827
28 ~74 10,733 39,007
24,448 9,663 34,111
108,085 33,563 141.648
67,555 10,968 78,523
Total Government Entity-Wide
Principal Interest Total
$ 37,735 $ 20,602 $ 58,337
41303 19,097 60,400
41,539 17,398 58,937
41,4? 15,691 57.113
36,514 14,037 50,551
150,816 49,076 199,892
98,450 16,152 114,602
8,110 615 8,725
$ 306,682 $ 103,840 $ 410,522 $ 455,889 $ 152,668 $ 608,557
Business-Type Activities
ARRA Principal
Principal Forgiveness Interest Total
2016 $ 26,762 $ (389) $ 16.224 $ 42,597
2017 32,115 (204) 15,205 47,116
2018 31,942 (207) 13,950 45,685
2019 32,266 (211) 12,731 44,786
2020 29.563 (216) 11,570 40,917
2021-2025 128,205 (1,164) 41.305 168,346
2026-2030 91.899 (1,345) 15,472 106,026
2031-2035 12,104 (870) 1,737 12,971
2036-2040 0 0 0 -
2041-2045 - - - -
384,856 (4,606) 128,194 508,444
Less amount representing
the PPBA 306,682 - 103,840 410,522
$ 78,174 $ (4,606) $ 24,354 $ 97,922
Total interest expense paid on genera] loner term liabilities for the year ended June 30, 2015 was approximately $19,000.
43(Continued)
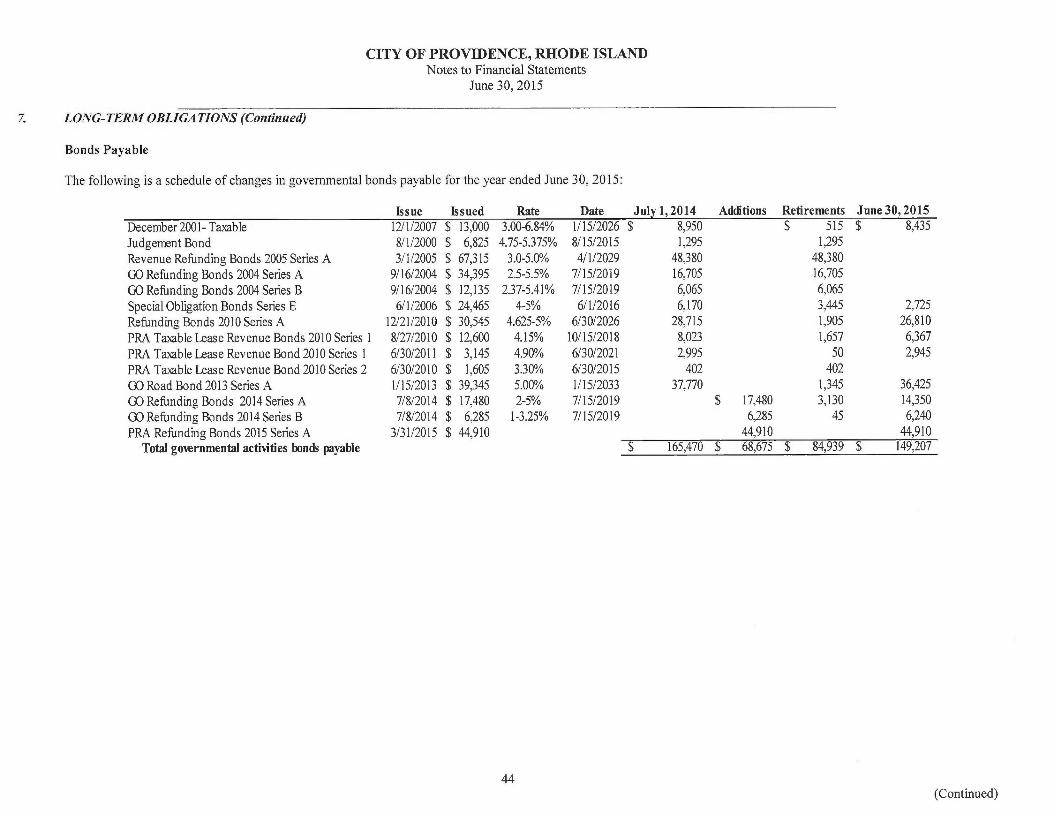
CITY OF PROVIDENCE, RHODE ISLANDNotes to Financial Statements
June 30, 2015
LONG-TERM OBLIGATIONS (Continued)
Bonds Payable
The following is a schedule of changes in governmental bonds payable for the year ended June 30, 2015:
Issue Issued Rate Date July 1, 2014 Additions Retirements June 30, 2015December2001-Taxable 12✓1/2007 $ 13,000 3.00-6.84% 1/15/2026 $ 8,950 $ 515 $ 8,435Judgement Bond 8/1/2000 $ 6,825 4.75-5375% 8/15/2015 1,295 1,295Revenue Refunding Bonds 2005 Series. A 3/1/2005 $ 67,315 3.0-5.0% 4/1/2029 48,380 48,380GO Refunding Bonds 2004 Series A 9/16/2004 $ 34,395 2.5-5.5% 7/15/2019 16,705 16,705
GO Refunding Bonds 2004 Series B 9/]6/2004 $ 12,135 237-5.41% 7/15/2019 6,065 6,065Special Obligation Bonds Series E 6/1/2006
$
24,465 4-5% 6/1/2016 6,170 3,445 2,725Refunding Bonds 2010 Series A 12/21/2010 $ 30,545 4.625-5% 6/30/2026 28,715 1,905 26,810
PRA Taxable Lease Revenue Bonds 2010 Series 1 8/27/2010$
12,600 4.15% 10/15/2018 8,023 1,657 6,367
PRA Taxable Lease Revenue Bond 2010 Series 1 6/30/2011$
3,145 4.90% 6/30/2021 2,995 50 2,945
PRA Taxable Lease Revenue Bond 2010 Series 2 6/30/2010 $ 1,605 3.30% 6/30/2015 402 402
GO Road Bond 2013 Series A 1/15/2013 $ 39,345 5.00% 1/15/2033 37,770 1,345 36,425
GO Refunding Bonds 2014 Series A 7/8/2014 $ 17,480 2-5% 7/15/2019$
17,480 3,130 14,350
GO Refunding Bonds 2014 Series B 7/8/2014 $ 6,285 1-3.25% 7/15/2019 6,285 45 6,240
PRA Refunding Bonds 2015 Series A 3/31/2015 $44,910 44,910 44,910Total governmental activities bonds payable 165,470 $ 68,675 $ 84,939 149,207
44(Continued)

CITY OF PROVIDENCE, RHODE ISLANDNotes to Financial Statements
June 30, 2015
LONG-TERM OBLIGATIONS (Co~ztinued)
Bonds Payable (continued)
The following is a schedule of changes in bond payable in business activities for the year ended June 30, 2015:
Revenue Bonds1998 Series A1999 Series A?001 Series A2006 Series A2007 Series A?007 Series B2007 Series C2009 Series A2009 Series A QSCB2010 Series 12011 Series A?010 Series A QSCB2010 Series B QSCB2013 Series A2015 Series A
Total business-type activities bonds payable
Capital Notes
Date of Amount Interest Maturity Balance Balance
Issue Issued Rate Date July 1, 2014 Addifions Retirements June 30, 2015$ 74,269 $ 8,000 $ 4,095 $ 78,174
5/1/1998 $ 28,270 3.85-5.10% 12/1/2018 1,230 220 1,010
7/1/1999 $ 39,750 4.10-5.5% 12/1/2019 1,385 200 1,185lrl/?001 $ 9,995 3.25-5.125% 12/1/2021 1,210 125 1,0859/]./2006 $ 60,000 4.0-5.0% 5/1/2027 45,955 43,360 2,595
11/7/2007 $ 75,000 3.75-5.5% 5/15/2028 61,245 56,390 4,855
]1/7/2007 $ 16,470 3.75-5.5% 5/15/2021 9,135 1,165 7,97012/20/2007 $ 75,000 3.5-5.0% 5/15/2028 60,845 56,270 4,5756/30/2009 $ 12,000 6.25% 6/30/2021 8,052 947 7,1.05
12/.10/2009 $ 22, 20 1.92% 6/ ] 5/2025 16,400 1,480 14,92011/15/?010 $ 19,500 4.25% 11/2018 11,732 2,415 9,3174/28/2011 $ 35,000 3.0-5.875% 6/15/2026 29,955 1,885 ?8,070
12/7/2010 $ 12,280 2.51% 5/15/2029 12,280 12,28012/7/2010 $ 9,665 2.51% 5/]5/2029 9,665 9,665
11/19/2013 $ 69,705 3.0-5.0% 5/14/2024 64,255 8,530 55,7253.0-5.0% 146,325 146,25
$ 407,613 154,325 $ 177,08? $ 384,856
The principal forgiveness would be funded through the American Recovery and Reinvestment Act of 2009 (ARRA) and could total $4,606. The following
are the changes in notes payable for the year ended June 30, 2015:
Date of Amount Interest Maturity Balance Balance
Issue Issued Rate Date July 1, 2014 Additions Retirement June 30, 2015
5/1/2003 $ 20,820 1.70 - 4.25% 2024 $ 13,985 $ 1,185 $ 12,800
5/ 1/2006 $ 6,858 534 - 5.56% 2036 6,858 - 6,858
$ 20,843 $ - $ 1,185 $ 19,658
45 (Continued)

CITY OF PROVIDENCE, RHODE ISLANDNotes to Financial Statements
June 30, 2015
7. LONG-TERM OBLIGATIONS (Contr~rued)
Notes Payable
At June 30, 2015, the City had notes outstanding relating to planning and development activities. These notes included$2,382 of Section 108 loans payable tluough 2032 with interest rates ranging fi•om .2% to 7.18%; $92 was paid in 20l 5.
PPBA Elinri~ratio~rs
The Providence Public Building Authority (PPBA) issues long-term bonds for the acquisition and construction of capitalassets. Upon acquisition or completion, these capital assets are leased to the City. Because the PPBA is included as ablended component unit in the accompanying statements, the capital assets and related debt are reported as part of thegovernmental activities and business-type activities columns in the government-wide statements as presented below. Therespective amounts in the PPBA statements have been eliminated in the business-type activities column in order toproperly reflect the debt and assets. The annual requirements to amortize the debt payable at June 30, 2015 are asfollows:
CityPrincipal Interest
2016 $ 22,133 $ 14,0152017 28,223 13,0352018 27,964 11,8632019 28,274 10,7332020 24,448 9,663
2021-2025 108,085 33,5632026-2030 67,555 10,968
$ 306,682 $ 103,840
The City and the Water Supply Board entered into lease agreements with the PPBA relating to various capital projects.In connection with these lease agreements, the PPBA issued revenue bonds that will be repaid by the Water Board withthe Water Quality Protection Charge. The City repays the PPBA as lease payments from general revenues. The PPBAdebt to be repaid by the proprietary funds has been shown as debt in those funds' financial statements. PPBA debt to berepaid by the City is presented as debt of the governmental activities in the government-wide statement of net position.
Debt Limit
Except as explained below, under Rhode Island law, the City may not, without special statutory authorization, incur anydebt which would increase its aggregate indebtedness not otherwise excepted by law to an amount greater than 3% of thetaxable property of the City. Deducted fi•om the computation of aggregate indebtedness is the amount of any borrowingin anticipation of taxes authorized by law and the amount of any borrowing in anticipation of taxes authorized by lawand the amount of any sinking funds maintained by the City. The current outstanding debt of the City subject to the 3%debt limit is $37.1 million and the current 3% debt limit of the City is $331.0 million based on taxable property as ofDecember 31, 2014, of approximately $11 billion, leaving a remaining borrowing capacity of approximately $294million.
The State of Rhode Island General Assembly (General Assembly) may, by special act permit the City to incurindebtedness outside the 3% debt limit. Bonds issued either within the 3%debt limit or by special legislation adopted bythe General Assembly authorizing the City to incur debt are subject to referendum by the electors of the City. On June30, 2015, the total outstanding debt of the City issued outside the 3% debt limit was $55.1 million, excluding waterbonds and sewer bonds which are deemed self-supporting.
46 (Continued)

CITY OF PROVIDENCE, RHODE ISLANDNotes to Financial Statements
June 30, 2015
7. LONG-TERM OBLIGATIONS (Contintret!)
Debt Li»tit (Co~rtint~erl)
In addition to debt authorized within the 3% debt limit and debt authorized by special act of the General Assembly,Rhode Island General Laws Section 45-12-11 authorizes the State Director of Administration, upon petition by amunicipality, to authorize such municipality to incur indebtedness in excess of the 3% debt limit whenever the Directorshall determine that the sums appropriated by the municipality or its funds available are insufficient to pay the necessaryexpenses of the municipality. The City has not requested the State Director of Administration to authorize indebtednessof the City under Section 45-12-11.
Bond A~rticipatio» Notes
The City had no bond anticipation transactions for the fiscal year ended June 30, 2015.
8. LEASE COMMITMENT
Property and equipment carried at approximately $98,000 with approximately $97,200 in accumulated depreciation, inthe governmental activities is acquired under capital lease arrangements.
The City is obligated under various capita] and operating leases to make the following aggregate annual lease payments
(in thousands): Operating lease expenditures approximated $2,030 for fiscal year ended June 30, 2015.
Operating Capital
2016 $ 2,030 $ 3,850
2017 2,030 3,892
2018 3,939
2019 1,481
2020 1,481
$ 4,060 14,643
L.es s :Interest 828
Present Value of minimum payments $ 13,815
9. RESTRICTED ASSETS AND RELATED LIABILITIES
The State of Rhode Island enacted the Public Drinking Water Protection Act of 1987 (the Act) that empowers suppliers
of public drinking water to levy a surcharge (the Water• Quality Protection Surcharge) of $0.01 per hundred gallons ofwater for all customers. The Act was amended numerous times and effective July I, 2002, the surcharge increased to$0.0292 per hundred gallons of water• for all customers. In addition to the increase, the Water Supply Board will retain36.1% of the surcharge in its Water• Quality Protection fund, remit 57% to the State Water Resources Board and retain
6.9% for general operations.
47 (Continued)
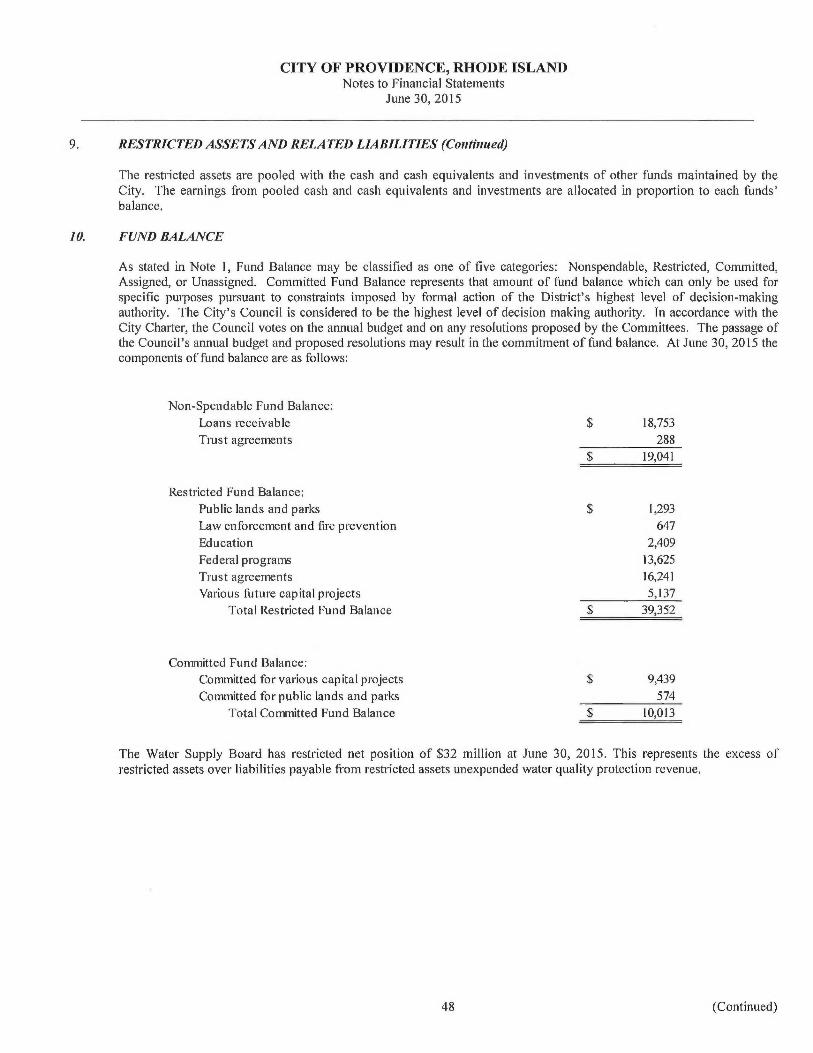
10.
CITY OF PROVIDENCE, RHODE ISLANDNotes to Financial Statements
June 30, 2015
RESTRICTED ASSETSAND RELATED LIABILITIES (Continued)
The restricted assets are pooled with the cash and cash equivalents and investments of other funds maintained by theCity. The earnings fi•om pooled cash and cash equivalents and investments are allocated in proportion to each funds'balance.
FUND BALANCE
As stated in Note 1, Fund Balance may be classified as one of five categories: Nonspendable, Rest~•icted, Committed,Assigned, or Unassigned. Committed Fund Balance represents that amount of fund balance which can only be used forspecific purposes pursuant to constraints imposed by formal action of the District's highest level of decision-makingauthority. The City's Council is considered to be the highest level of decision making authority. In accordance with theCity Charter, the Council votes on the annual budget and on any resolutions proposed by the Committees. The passage ofthe Council's annual budget and proposed resolutions may result in the commitment of fund balance. At June 30, 2015 thecomponents of fund balance ai•e as follows:
Non-Spendable Fund Balance:Loans receivableT~vst agreements
Restricted Fund Balance:Public lands and parksL.aw enforcement and fu•e prevention
EducationFederal programs
Trust agreementsVarious future capital projects
Total Restricted Fund Balance
Committed Fund Balance:Committed for various capital projects
Committed for public lands and parksTotal Committed Fund Balance
$ 18,753288
$ 19,041
$ 1,293647
2,40913,62516,2415,137
$ 39,352
9,439574
$ 10,013
The Water Supply Board has rest►•icted net position of $32 million at June 30, 2015. This represents the excess ofresr•icted assets over liabilities payable from restricted assets unexpended water quality protection revenue.
48 (Continued)

CITY OF PROVIDENCE, RHODE ISLANDNotes to Financial Statements
June 30, 2015
ll. DEFINED BENEFIT PENSION PLANS
The City has adopted GASB Statement No. 68 Accounting and Financial Reporting for' Pensions. These changesenhance the Plan's accounting and disclosure for the pension and expand the Required Supplemental Information (RSI)
data with new schedules. These were issued to improve the financial reporting by state and local government pensionplans. The following provides information required to be disclosed under GASB Statement No. 68.
The City contributes to two defined benefit pension plans -the Employees' Retu•ement System of the City of Providence(ERS), a single employer plan; and the Employees' Retirement System of the State of Rhode Island (the System), a cost-sharing multiple employer plan. The ERS is presented in the accompanying financial statements as a pension trust fund.A separate financial statement is not issued. The System is not included in the basic financial statements.
(a) Et~iployees' Retirement Syste~rt of the City of Providence (ERS)
Plnn Description
ERS is asingle-employer defined benefit pension plan that covers most management employees of the City, exceptschool teachers. The Plan provides retirement, disability and death benefits to plan members and their beneficiaries.
Cost-of-living adjustments (COLA) are provided to retirees and beneficiaries at varying percentages ranging from 0% to3%. Benefits are paid at varying amounts not to exceed 100% of final compensation for Class A (city) employees or
100% of final compensation for Class B at age 60 (police and fire). Final compensation is the average of the highestthree years of base compensation including longevity pay earned by a member during his total service as an employee.
ERS is governed by an Employee Retirement Board provided by the Providence Home Rule Charter. The ERS consists
of elected officials, management and employee representation and provides for establishing rules and regulations and is
responsible for the administration and operation of the city employee retirement system. The Board has the discretion
and authority to interpret the Plan and to determine the eligibility and benefits of Participants and beneficiaries pursuant
to the provisions of the Plan. On all such matters, the decision of a majority of the then members of the Board shall
govern and be binding upon the Employer, Participants, and beneficiaries.
Membership of the ERS plan consisted of the following at June 30, 2015, the date of the latest actuarial valuation:
Inactive plan members or beneficiaries currently receiving benefits 3,109
Inactive employees entitled to but not yet receiving benefits 428
Active employees 2,986
Total 6,523
The Plan's investment policy in regard to the allocation of invested assets is established and may be amended by the
City. It is the policy of the City to pursue an investment strategy that reduces risk through the prudent diversification of
the portfolio across a broad selection of distinct asset classes. The pension Plan's investment policy discourages the useof cash equivalents, except for liquidity purposes, and aims to refrain from dramatically shifting asset class allocations
over short time spans. The following was the asset allocation as of June 30, 2015:
Asset Class Target Allocation
Domestic equity 79%
Core fixed income 5%
High yield fixed income 13%
Short-term governmental money market 3%
Total 100%
49 (Continued)

CITY OF PROVIDENCE, RHODE ISLANDNotes to Financial Statements
June 30, 2015
11. DEFINED BENEFIT PENSION PLANS (Co~rti~:ued)
(a) Et~tployees' Retirement System of the City of Providence (ERS)
For the year ended June 30, 2015 the annual money-weighted rate of return on pension plan investments, net of pensionplan investment expenses, was 5.56 percent. The money-weighted rate of return expresses investment performance, netof investment expense, adjusted for• the changing amounts actually invested.
The total pension liability was determined by an actuarial valuation as of June 30, 2015, using the following actuarialassumptions, applied to all periods included in the measurement:
Inflation 3.5 percentSalary increases 3.5 peryear, before reflecting increases due to longevityInvestment rate of return 8.25 percent, net of pension plan investment e~ense, including inflation
The long-term expected rate of return on pension plan investments was determined using abuilding-block system inwhich best~stimate ranges of expected futw•e real rates of returns (expected returns, net of pension plan investmentexpense and inflation) are developed for each major asset class. These ranges are combined to produce long-termexpected rate of return by weighting the expected future real rates of return by the target asset allocation percentage andby adding expected inflation. Best estimates of arithmetic real rates of return for each major asset class included in thepension plan's target asset allocation as of June 30, 2015 are summarized in the following table:
Long-Term
Effected Real Rate
Asset Class of Return
Domestic equity 6.23%Core fixed income ].56%High yield fixed income 3.89%Short-term governmental money market 1.71%
Mortality rates were based on the RP-2014 Healthy Annuitant Mortality Table for Males or Females, as appropriate, withno assumed pre-retirement mortality or turnover.
50 (Continued)
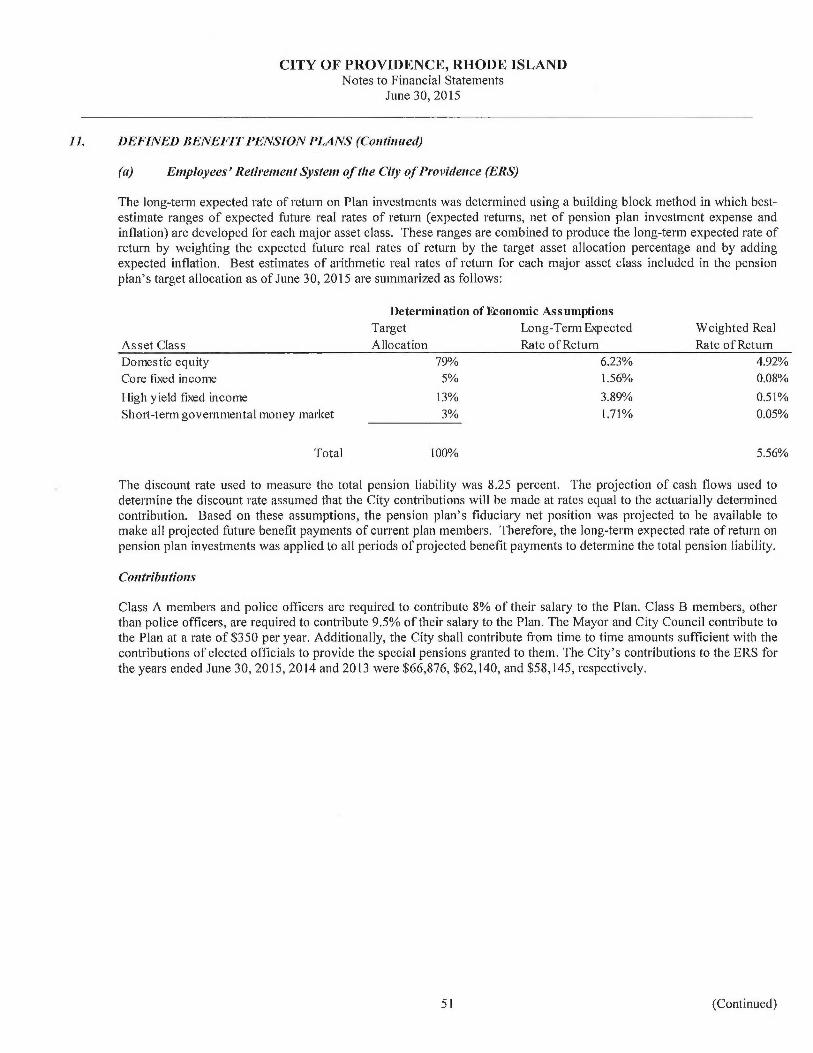
CITY OF PROVIDENCE, RHODE ISLANDNotes to Financial Statements
June 30, 2015
I1. DEFINED BENEFIT PENS70N PLANS (Contrnrred)
(a) Employees' Retire~ne~tt System of t/re City of Providence (ERS)
The long-term expected rate of return on Plan investments was determined using a building block method in which best-estimate ranges of expected future real rates of return (expected returns, net of pension plan investment expense andinflation) are developed for each major• asset class. These ranges are combined to produce the long-term expected rate ofreturn by weighting the expected future real rates of return by the target asset allocation percentage and by addingexpected inflation. Best estimates of arithmetic real rates of return for each major asset class included in the pensionplan's target allocation as of June 30, 2015 are summarized as follows:
Asset Class
Domestic equity
Core fined income
High yield fixed income
Shoat-term governmental money market
Total
Determination of Economic Assumptions
Target Long-Term Expected
Allocation Rate of Return
79%
5%
13%
3%
100%
6.23%
1.56%
3.89%
1.71
Weighted Real
Rate of Return
4.92%
0.08%
0.51%
0.05%
5.56%
The discount rate used to measure the total pension liability was 8.25 percent. The projection of cash flows used todetermine the discount rate assumed that the City contributions will be made at rates equal to the actuarially determinedcontribution. Based on these assumptions, the pension plan's fiduciary net position was projected to be available tomake all projected future benefit payments of current plan members. Therefore, the long-term expected rate of return onpension plan investments was applied to all periods of projected benefit payments to determine the total pension liability.
Contributions
Class A members and police officers are required to contribute 8% of their salary to the Plan. Class B members, otherthan police officers, are required to contribute 9.5% of their salary to the Plan. The Mayor and City Council contribute tothe Plan at a rate of $350 per year. Additionally, the City shall contribute from time to time amounts sufficient with thecontributions of elected officials to provide the special pensions granted to them. The City's contributions to the ERS forthe years ended June 30, 2015, 2014 and 2013 were $66,876, $62,140, and $58,145, respectively.
51 (Continued)

CITY OF PROVIDENCE, RHODE ISLANDNotes to Financial Statements
June 30, 2015
Il. DEFINED BENEFIT PENSION PLANS (Conti~tued)
(n) Employees' Retirei~re~r! System of the City of Providence (ERS) (Contr~rrred)
Investment Policy
The City policy for pension investments is under the oversight of the Board of Investment Commissioners. The Boardcontracts with an investment advisory firm and approves any new investment vehicles presented by the consultant. The
Board follows all applicable state statutes and Section 17-189 of the City Ordinance, which states, "The Board of
Investment Commissioners is authorized and empowered to execute the disposition and investment of the funds whichare within its control in any securities and investments as would be acquired by prudent persons of discretion andintelligence in these matters, who are seeking a reasonable income and the preservation of their capital."
Net Pe~rsion Liability
The net pension liability (asset) was measured as of June 30, 2015, and the total pension liability used to calculate the net
pension liability was determined by an actuarial valuation as of that date.
The components of the net pension liability of the Retirement System were as follows:
June 30, 2015 June 30, 2014
Total pension liability $ 1,251,850 $ 1,230,289
Plan fiduciary net position $ 351,068 $ 357,712
City's net pension liability $ 900,782 $ 872,577
Plan fiduciary net position
as a percentage ofthe total
pension liability 28.04% 29.0$%
52 (Continued)

Total Pension Plan Fiduciary Net Pension
Liability Net Position Liability
(a) (b) (A) - (b)1,230,289 357,712 872,577
17,783 - 17,783
98,938 - 98,938
1,650 - 1,650
841 - 841- 66,876 (66,876)
11,624 (] 1,624)
- 12,702 (12,702)
(97,651) (97,651) -
- (195) 195
CITY OF PROVIDENCE, RHODE ISLANDNotes to Financial Statements
June 30, 2015
ll. DEFINED BENEFIT PENSIONPLANS (Co~tti~irrerJ)
(a) Employees' Retiremeirt System of the Ciry of Providence (ERS) (Continued)
Increase (Decrease
Balance at 6/30/14
Changes for the year:
Service Cost
Interest
Differences between effected am
Changes in benefit terms
Changes in assumptionsContributions -employer
Contributions -employee
Net investment income
Benefit payments, includuig refu~
Administration expenses
Other changes
Net Changes 21,561 (6,644) 28,205
[3alance at G/30/I S 1,251,850 351,068 900,782
Additional information as ofthe latest actuarial valuation follows:
Valuation Date 1-Jul-14
Actuarial cost method~dividual entry age
method
Approximate level
Amortization cost method percent of payroll-
open
Remaining amortization period 26 years
Asset valuation method5-year smoothed
market value
Actuarial
assumptions:
Investment rate of return 8.25%
Inflation rate 3.5%
3.5% per year before
Projected salary increasesreflecting increases
due to longetivy
compensation
No COLA for new 8Cost of living adjustments
years, 3 /o thereafter
53 (Continued)

CITY OF PROVIDENCE, RHODE ISLANDNotes to Financial Statements
June 30, 2015
11. DEFINED BENEFIT PENSION PLANS (Co~ttirttterl)
(a) Employees' Retirement Systent of t/1e City of Providence (ERS) (Conti~tued)
Mortality rates for healthy retirees were based on RP-2000 Combined Healthy Mortality Table projected 21 years withScale AA from 2000 for• Class A employees and RP-2000 Combined Healthy Blue Collar Mortality Table projected 21years with Scale AA from 2000 for Class B employees. Disabled retiree mortality rates were based on RP-2000Combined Healthy Mortality Table set forward 3 years.
Discoarnt Rate: The discount rate used to measure the total pension liability was 8.25%. The projection of cash flowsused to determine the discount rate assumed plan member contributions will be made at the current contribution rate andthat the City of Providence's contributions will be made at the actuarially determined contribution rates. Based on thoseassumptions, the pension plan's fiduciary net position was projected to be available to make all projected future benefitpayments of cun~ent plan members. Therefore, the long-term expected ►•ate of return on pension plan investments wasapplied to all periods of projected benefit payments to determine the total pension liability.
Seusitiviry of t/tenet pension liability to changes iii tJte discount rate.
The following presents the net pension liability of the Retirement System, calculated using the discount rate of 8.25%, aswell as what the System's net pension liability would be if it were calculated using a discount rate that is 1-percentage-point lower (7.25%) or 1-percentage-point higher (9.25%) than the current rate:
1%Decrease Discount 1% Increase(7.25%) (8.25%) (9.25%)
Net pensionliablit~~ $ 1,031,998 $ 900,782 $ 789,874
Pension Expense and Deferred Outflows of Resources and Deferred Inflows of Resources Related to Pensions
For the year ended June 30, 2015, the City recognized pension expense of $80,279. At June 30, 2015, the City reporteddeferred outflows of resources and deferred inflows of resources related to pensions fi•om the following sources:
Differences between effected and actual experience
Changes ofassumption
Net difference between projected and actual earnings on
pension plan investments
Total
Deferred Outflo~rs Deferred Inflo~~sof Resources of Resources
$ 1,320
673
12,809$ 14,802
54 (Continued)

CITY OF PROVIDENCE, RHODE ISLANDNotes to Financial Statements
June 30, 2015
11. DEFINED BENEFIT PENSION PLANS (Coritintred)
(a) Employees' Retireme~rt System of N►e City of Provide~tce (ERS) (Co~ttiiu~ed)
Pension Expense and Deferred Outflows of Resources and Deferred Inflows of Resources Related to Pensions(Continued)
Amounts reported as defen•ed outflows of resources and deferred inflows of resources related to pensions will berecognized in pension expense as follows;
Year ended June 30:
2016 $ 3,7002017 3,700
2018 3,701
2019 3,701
Thereafter -
$ 14,802
Payable to the Plan
At June 30, 2015, the City reported a payable of $0 for the outstanding amount of contributions to the Plan required forthe year ended June 30, 2015.
(b) Employees Retirement Syste»~ of the State of Rhode Islaird
Effective July 1, 2012, the State administered retirement system which covers local teachers and certain municipalemployees was modified to include both defined benefit and defined conn•ibution plan components.
Plan Description
Certain employees of the City's School System participate in acost-sharing multiple-employer defined benefit pensionplan -the Employees' Retirement System plan -administered by the Employees' Retirement System of the State of RhodeIsland (System). Under acost-sharing plan, pension obligations for employees of all employers are pooled and plan assetsare available to pay the benefits of the employees of any participating employer providing pension benefits through theplan, regardless of the status of the employers' payment of its pension obligation to the plan. The plan provides retirementand disability benefits and death benefits to plan members and beneficiaries.
55 (Continued)

CITY OF PROVIDENCE, RHODE ISLANDNotes to Financial Statements
June 30, 2015
11. DEFINED BENEFIT PENSION PLANS (Co~rti~tued)
(b) Employees Retirerneirt System of the State of R/rode Island (Continued)
Plan Description
The System issues a publicly available financial report that includes financial statements and required supplementaryinformation for the plans. The report may be obtained at http://www.ersri.org.
Benefit provisions
The level of benefits provided to participants is established by Chapter 36-10 of the General Laws, which is subject to
amendment by the General Assembly. Member benefit provisions vary based on service credits accumulated at datesspecified in various amendments to the General Laws outlining minimum retirement age, benefit accrual rates andmaximum benefit provisions. In general, members accumulate service credits for each year of service subject to
maximum benefit accruals of 80% or 75%. For those hired after June 30, 2012, the benefit accrual rate is 1%per year
with a maximum benefit accrual of 40%. Members eligible to retire at September 30, 2009 may retire with 10 years of
service at age 60 or after 28 years of service at any age. The retirement eligibility age increases proportionately for other
members reflecting years of service and other factors until it aligns with the Social Security Normal Retirement Age,which applies to any member with less than 5 years of service as of July 1, 2012. Members are vested after 5 years of
service.
The plan provides for• survivor's benefits for service connected death and certain lump sum death benefits. Joint and
survivor benefit provision options are available to members.
Cost of living adjustments are provided but are cun'ently suspended until the collective plans covering state employees
and teachers reach a funded status of 80%. Until the plans reach an 80% funded status, interim cost of living adjustments
are provided at five-year intervals.
The plan also provides nonservice-connected disability benefits after five years of service and service-connected
disability benefits with no minimum service requnement.
Contributions
The funding policy, as set forth in the General Laws, Section 16-16-22, provides for actuarially determined periodic
contributions to the plan. For fiscal 2015, City's teachers were required to contribute 3.75% of their annual covered
salary. The City and the State are required to contribute at an actuarially determined rate, 40% of which is to be paid by
the state and the remaining 60% is to be paid by City; the rates were 22.60°/o and 20.68% of annual covered payroll for
the fiscal year ended June 30, 2015 for the State and City, respectively. The City contributed $21.4 million, $18.7 million
and $16.2 million for the fiscal years ended June 30, 2015, 2014 and 2013, respectively, equal to 100% of the requiredcontributions for each year.
56 (Continued)

CITY OF PROVIDENCE, RHODE ISLANDNotes to Financial Statements
June 30, 2015
II. DEFINED BENEFIT PENSION PLANS (Co~rtinued)
(b) Employees Retirement System of flee State of Rltode Island (Continued)
Pension Liabilities, Pension Expense, and Deferred Outflows of Resources and Deferred Inflows of Resources
At June 30, ZO15, the City's School Department reported a liability of $231,542 for its proportionate share of the netpension liability that reflected a reduction for contributions made by the state. The amount recognized by the City's
School Department as its proportionate share of the net pension liability, the related state support and the total portion of
the net pension liability that was associated with the Providence School Department were as follows:
Providence School Department proportionate share
ofthe net pension liability $ 231,542
State's proportionate share ofthe net pension
liability associated with the Providence School Department 158,779
Total net pension liability $ 390,321
The net pension liability was measured as of June 30, 2015, the measurement date, and the total pension liability used to
calculate the net pension liability was determined by an actuarial valuation as of June 30, 2013 rolled forward to June 30,
2014. The City's School District proportion of the net pension liability was based on a projection of the City's School
District long-term share of contributions to the pension plan relative to the projected contributions of all participating
employers and the state, actuarially determined. At June 30, 2014 the City's School District proportion was 9.51%.
Subsequent to June 30, 2014 (the measurement date), litigation challenging the various pension reform measures enacted
in previous years by the General Assembly (2009, 2010, and 2011) was settled. The final settlement approved by the
Court on July 8, 2015 also included enactment of the pension settlement provisions by the General Assembly.
The amended benefit provisions in the newly enacted legislation and settlement agreement have not been reflected in thedetermination of the net pension liability at June 30, 2014 (the measurement date). These amended benefit provisions are
summarized below:
• Employees with more than 20 years of service at July 1, 2012 will increase their employee contribution rate fi•om
3.75% to 11 % and participate solely in the defined benefit plan going forward —service credit accruals will
increase from 1 % to 2%per year.
• Employees with more than ] 0 but less than 20 years of service at July 1, 2012 will receive an increased employercontribution to the defined contribution plan.
• Retirees as of June 30, 2015 will receive two $500 stipends; the interim cost of living increases will occur at 4year rather 5 year intervals.
• Minor adjustments were made to the actuarial reduction for employees choosing to retire early.
These amendments are not considered to have a material effect on the net pension liability had they been retroactively
applied to the calculation of the total pension liability at June 30, 2013 rolled forward to June 30, 2014. An actuarialanalysis of the pension settlement provisions enacted by the General Assembly and approved by the Court indicated thatthe funded ratio at June 30, 2014 for teachers (determined on a funding basis) decreased fi•om 59.6% to $58.2%.
57 (Continued)

CITY OF PROVIDENCE, RHODE ISLANDNotes to Financial Statements
June 30, 2015
11. DEFINED BENEFIT PENSION PLANS (Continued)
(b) Employees Retirenreirt System of the State of R/rode Isla~id (Co~rtinrred)
Pension Liabilities, Pension Expense, and Deferred Outflows of Resources and Defer►•ed lnf7o~vs of Resources(Continued)
For the year ended June 30, 2015 the City's School District recognized gross pension expense of $27,133 and revenue of$11 million for suppo~~t provided by the State. At June 30, 2015 the City's School Department reported deferred outflowsof resources and deferred inflows of resources related to pensions from the following sources:
Defen•ed outflows of resources
Contributions subsequent to the measurement date:
Deferred inflows of resources
Changes of assumptions:
Net difference between projected and actual earnings
on pension plan investments:
Total:
$ 21,355
$ 8,201
19,938
$ 28,139
$21,355 reported as defen•ed outflows of resources related to pensions resulting fi•om the City's School Departmentconh~ibutions in fiscal year 2015 subsequent to the measurement date will be recognized as a reduction of the net pensionliability for the year ended June 30, 2016. Other amounts reported as deferred outflows of resources and deferred inflowsof resources related to pensions will be recognized in pension expense as follows:
Year ended June 30:
2015 $ 6,146
2016 6,146
2017 6, ] 46
2018 6,146
2019 1,161
thereafter 2,394
Total: $ 28,139
Actuarial Assumptions -the total pension liability was determined using the following actuarial assumptions, applied toall periods included in the measurement:
58 (Continued)

CITY OF PROVIDENCE, RHODE ISLANDNotes to Financial Statements
June 30, 2015
11. DEFINED BENEFIT PENSION PLANS (Corrtinrred)
(G) Employees Retirement System of Ire Stnte of Rhode Island (Contrirrrer!)
InflationSalary increasesInvestment rate of return
2.75%3.5% to 6.5%
7.50%
Mortality —male and female teachers: 97% and 92%, respectively of rates in a GRS table based on male and femaleteacher experience, projected with Scale AA from 2000.
The actuarial assumptions used in the June 30, 2013 valuation rolled forward to June 30, 2014 and the calculation of thetotal pension liability at June 30, 2014 were consistent with the results of an actuarial experience study performed as ofJune 30, 2013.
The long-term expected rate of return best-estimate on pension plan investments was determined by the actuary using abuilding-block method. The actuary started by calculating best-estimate future expected real rates of return (expectedreturns net of pension plan investment expense and inflation) for each major asset class, based on forward-lookingmedium-term (10 year) capital market return assumptions developed by eight investment consulting firms. The June 30,2014 expected arithmetic returns over the medium term by asset class as developed by the State InvestmentCommission's investment consultant, which are generally consistent with the averages utilized by the actuary, aresummarized in the following table:
Asset ClassTarget
Allocation
Medium-termexpected real rate
of returnGlobal Equity 38%0 6.05%Private Equity 7% 9.05%
Equity Hedge funds 8% 4.75%
Absolute return hedge 7% 2.95%
Real Return 14% 3.85%
Real Estate 8% 4.45%
Core Fined 15% 0.25%Cash 3% -0.50%
Total 100%
These return assumptions are then weighted by the target asset allocation percentage, factoring in correlation effects, todevelop the overall medium-term expected rate of return best-estimate on an arithmetic basis. To an•ive at the long-termexpected return estimate, the actuary adjusts the medium-term number to reflect the longer 30-year time frame required foractuarial calculations. This process produces the actuarial expected return, which is based on a 30-year horizon, and candiffer from the medium-term, 10-year-horizon return expectations.
Discount rate -the discount rate used to measure the total pension liability was 7.5 percent. The projection of cash flowsused to determine the discount rate assumed that contributions from plan members will be made at the current contributionrate and that conh•ibutions from the employers will be made at statutorily required rates, actuarially determined. Based onthose assumptions, the pension plan's fiduciary net position was projected to be available to make all projected futurebenefit payments of current plan members. Therefore, the long-term expected rate of return on pension plan investmentswas applied to all periods of projected benefit payments to determine the total pension liability.
59 (Continued)

CITY OF PROVIDENCE, RHODE ISLANDNotes to Financial Statements
June 30, 2015
Il. DEFINED BENEFIT PENSION PLANS (Co~rtinued)
(b) Employees Retirement Syste»t of the State of Rhode Island (Co~rtiirued)
Sensitivity of the net pension liability (asset) to changes in the discount rate -the following presents the net pensionliability (asset) calculated using the discount rate of 7.5 percent as well as what the net pension liability (asset) would beif it were calculated using a discount rate that is 1-percentage-point lower or 1-percentage-point higher than the currentrate.
1.00% Decrease Current Discount Rate 1,00 Increase
(6.50%) (7.5%) (8.5%)
289,978 231,542 171,908
Pension plan fiduciary net position -detailed information about the pension plan's fiduciary net position is available inthe separately issued ERSRI financial report.
Teac/rers Defr~red Co~rtribcrtioir Pensio~r Plmr
Plan Description
Employees participating in the defined benefit plan, as described above, also participate in a defined contribution planauthorized by General Law Chapter 36-10.3. The defined conri•ibution plan is established under IRS section 401(a) andis administered by TIAA-CREF. Employees may choose among various investment options available to planpa~~ticipants. Employees contribute 5% of their annual covered salary and employers contribute 1 % of annual coveredsalary. Employee contributions are immediately vested while employer contributions and any investment earningsthereon are vested after tlu•ee years of contributory service. Benefit terms and contributions required under the plan byboth the employee and employer are established by the General Laws, which are subject to amendment by the GeneralAssembly.
As previously indicated in the disclosure of recently-enacted pension legislation, the employer contribution for certainqualifying employees will increase slightly beginning in fiscal 2016.
Amounts in the defined contribution plan are available to participants in accordance with Internal Revenue Serviceguidelines for such plans.
The City's School District recognized pension expense of $721 for the fiscal year ended June 30, 2015.
The System issues a publicly available financial report that includes financial statements and required supplementaryinformation for plans administered by the system. The report may be obtained at http://www.ersri.org.
(c) Ot/ter City Pension Cosfs
The City is required to make contributions to the National Pension Plan of the Laborers' International Union of North
America, amulti-employer plan. The pension cost charged to the general fund for these purposes amounted to $4,2million for the year ended June 30, 2015.
60 (Continued)

CITY OF PROVIDENCE, RHODE ISLANDNotes to Financial Statements
June 30, 2015
12. POSTEMPLOYMENT BENEFITS
Plmt Description
The City's Post-Employment Medical Benefit Plan is asingle-employer defined benefit postretirement health insurance
program administered by the City. The City provides for a portion of the lifetime health care benefits to substantially all
retired employees and their spouses. Health care benefits were paid to 4,449 retired participants and spouses during the
fiscal year ended June 30, 2015 and are paid substantially on a pay as you go basis. Health care benefits are providedthrough the City's self-insured health insurance program covering both active and retired employees. The financial
activity of these programs is reported as an internal service fund. The Plan does not issue a separate financial report.
These benefits are provided for and amended under various provisions of Rhode Island General Law, City Ordinances
and the teams of collective bargaining agreements.
Fundi~rg Policy
The contribution requirements of plan members and the City are established and may be amended through provisions of
Rhode Island General Law, City Ordinances and through collective bargaining. The required contribution is based on
pay as you go financing requirements. For fiscal year 2015 the City contributed approximately $30,696 to the health
insurance program on behalf of retirees. Plan members contributed approximately $2,606 or 8.5% of the total
conh~ibuted. The plan can cover 100% of the costs of the benefit, however, retirees and their spouses are potentially
required to fund a portion of the Plan costs depending upon the class an employee has been assigned and their date of
hire. Current employee co-share for the retiree health insurance benefit requires a co-share of .O 1 of final average salary
with a maximum limit of $400.
Annrial OPEB Cost and Net OPEB Obligntioir
The City's annual other postemployment benefit (OPEB) cost (expense) is calculated based on the annual required
contribution of the employer (ARC), an amount actuarially determined in accordance with the provisions of GASB
Statement 45. The ARC represents a level of funding that, if paid on an ongoing basis, is projected to cover normal cost
each year and amortize any unfunded actuarial liabilities over a period not to exceed thirty years. The following table
shows the components of the City's annual OPEB cost for the year, the amount actually contributed to the plan, and
changes in the City's net OPEB obligation (amounts in thousands):
Annual conhibution
Interest on net OPEB obligation
Adjustment to annual c•equired contrbutions
Annual OPEB cost (expense)
Conhibutions made
Increase in net OPEB obligation
Net OPEB obligation - beginning of year
Net OPEB obligation -end of year
$ 62,189
8,379
(7,630)
62,938
30,696
32,242
209,481
$ 241,723
61 (Continued)

CITY OF PROVIDENCE, RHODE ISLANDNotes to Financial Statements
June 30, 2015
12. POSTEMPLOYMENT BENEFITS (Co~rtinued)
A~rnrra! OPEB Cost and Net OPEB Obligation (Conti~r~~ed)
The City's annual OPEB cost, the percentage of annual OPEB cost cont~•ibuted to the plan, and the net OPEB obligationfor 2015 and the two preceding years were as follows (dollar amounts in thousands):
Fiscal Percentage of Net
Year Annual AnnuaIOPEB OPEB
Ended OPEB Cost Cost Contributed Obligation
6/30/2015 $ 62,938 48.77% $ 241,723
6/30/2014 $ 65,830 45.00% $ 209,481
6/30/2013 $ 74,246 48.72% $ 173,271
Funding Status and Scherlri/e of Funding Progress
The unfunded actuarial accrued liability was determined using the level dollar thirty year open amortization basis.
Actuarial
Actuarial Accrued
Actuarial Value of Liability
Valuation Assets (AAL)
Unfunded
AAL Funded
(UAAL) Ratio
UAALas a
Percentage
Covered of Covered
Payroll Payroll
Date (a) (b) (b)-(a) (a)/(b) (c) [(b)-(a)]/(c)
7/1/2014 $ - $ 980,674 $ 980,974 0.00% $ 270,706 362.27%
7/1/2013 $ 1,032,887 $ 1,032,887 0.00% $ 267,341 386.36%
Actuarial valuations of an ongoing plan involve estimates of the value of reported amounts and assumptions about theprobability of occurrence of events far into the future. Examples include assumptions about future employment,mortality, and the healthcare cost trend. Amounts determined regarding the funded status of the plan and the annual
required conri•ibutions of the employer at•e subject to continual revision as actual results are compared with pastexpectations and new estimates are made about the future. The schedule of funding progress, presented as requiredsupplementary information following the notes to the financial statements, presents multiyear trend information aboutwhether the actuarial value of plan assets is increasing or decreasing over time relative to the actuarial accrued liabilitiesfor benefits.
Actuarial Methods n~rtl Assrr»:ptions
Projections of the benefits for financial reporting purposes are based on the substantive plan (the plan as understood bythe employer and the plan members) and include the types of benefits provided at the time of each valuation and thehistorical pattern of sharing of benefit costs between employer and plan members to that point. The actuarial methodsand assumptions used include techniques that are designed to reduce the effects of short-term volatility in actuarialaccrued liabilities and the actuarial value of assets, consistent with the long-term perspective of the calculations.
In the July 1, 2012 actuarial valuation, the projected unit credit method was used. The actuarial assumptions included a4.0%rate of return (net of administrative expenses), which is a blended rate of the expected long-term investment returnson plan assets and on the employer's own investments calculated based on the funded level of the plan at the valuationdate, and an annual healthcare cost trend rate of 9% initially, reduced by decrements to an ultimate rate of 5% after fiveyears. Both rates included a 3.5% inflation assumption (formerly 4.5%). The actuarial value of the assets wasdetermined using techniques that spread the effects of short-term volatility in the market value of investments over afive-year period. The UAAL is being amortized as a level percentage of projected payrolls on an open basis. Theremaining amortization period at July 1, 2012, was 30 years.
62 (Continued)
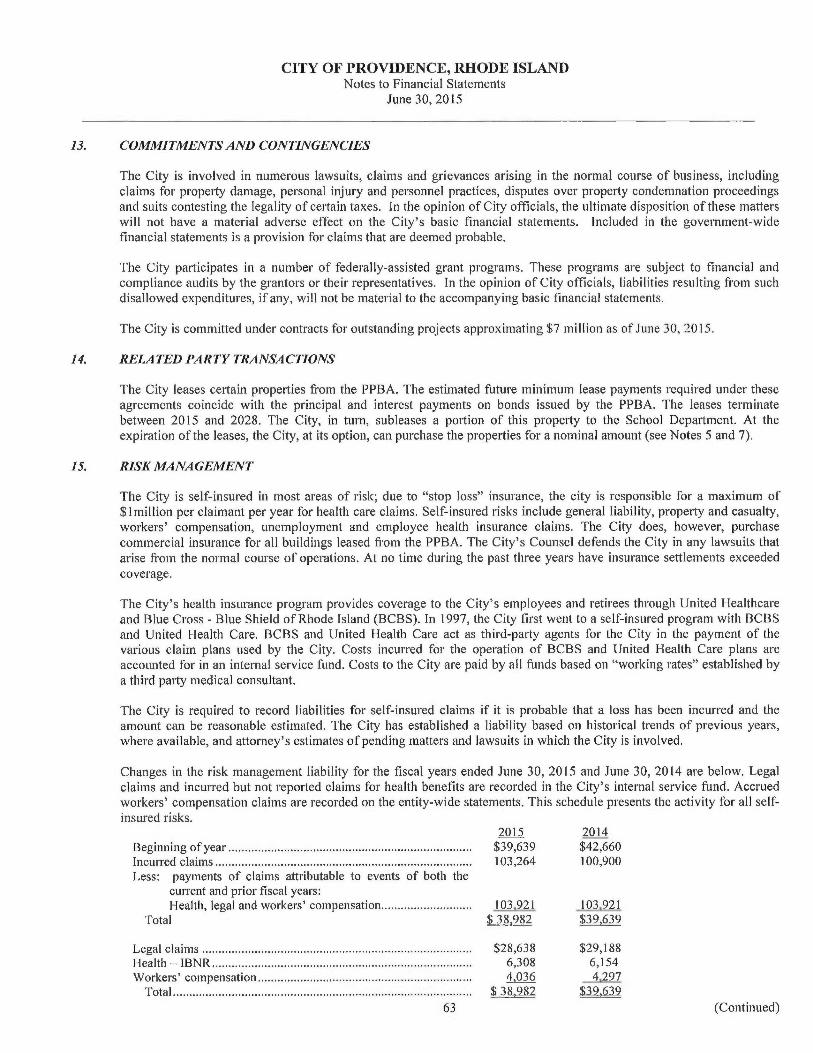
CITY OF PROVIDENCE, RHODE ISLANDNotes to Financial Statements
June 30, 2015
13. COMMITMENTS AND CONTINGENCIES
The City is involved in numerous lawsuits, claims and grievances arising in the normal course of business, includingclaims for property damage, personal injury and personnel practices, disputes over property condemnation proceedingsand suits contesting the legality of certain taxes. In the opinion of City officials, the ultimate disposition of these matterswill not have a material adverse effect on the City's basic financial statements. Included in the government-widefinancial statements is a provision for claims that are deemed probable.
The City participates in a number of federally-assisted grant programs. These programs are subject to financial andcompliance audits by the grantors or their representatives. In the opinion of City officials, liabilities resulting from suchdisallowed expenditures, if any, will not be material to the accompanying basic financial statements.
The City is committed under contracts for outstanding projects approximating $7 million as of June 30, 2015.
14. RELATED PARTY TRANSACTIONS
The City leases certain properties from the PPBA. The estimated future minimum lease payments required under theseagreements coincide with the principal and interest payments on bonds issued by the PPBA. The leases terminatebetween 2015 and 2028. The City, in turn, subleases a portion of this property to the School Department. At theexpiration of the leases, the City, at its option, can purchase the properties for a nominal amount (see Notes 5 and 7).
1 S. RISK MANAGEMENT
The City is self-insured in most areas of risk; due to "stop loss" insurance, the city is responsible for a maximum of$1 million per claimant per year for health care claims. Self-insured risks include general liability, property and casualty,workers' compensation, unemployment and employee health insurance claims. The City does, however, purchasecommercial insurance for all buildings leased fi•om the PPBA. The City's Counsel defends the City in any lawsuits thatarise from the normal course of operations. At no time during the past three years have insurance settlements exceededcoverage,
The City's health insurance program provides coverage to the City's employees and retirees through United Healthcareand Blue Cross -Blue Shield of Rhode Island (BCBS). In 1997, the City first went to aself-insured program with BCBSand United Health Care. BCBS and United Health Cate act as third-party agents for the City in the payment of thevarious claim plans used by the City. Costs incurred for the operation of BCBS and United Health Care plans areaccounted for in an internal service fund. Costs to the City are paid by all funds based on "working rates" established bya third party medical consultant.
The City is required to record liabilities for self-insured claims if it is probable that a loss has been incurred and theamount can be reasonable estimated. The City has established a liability based on historical trends of previous years,where available, and attorney's estimates of pending matters and lawsuits in which the City is involved.
Changes in the risk management liability for the fiscal years ended June 30, 2015 and June 30, 2014 are below. Legalclaims and incurred but not reported claims for health benefits are recorded in the City's internal service fund. Accruedworkers' compensation claims are recorded on the entity-wide statements. This schedule presents the activity for all self-insured risks.
2015 2014Beginning of year ........................................................................... $39,639 $42,660Incurred claims ............................................................................... 103,264 100,900Less: payments of claims attributable to events of both the
current and prior fiscal years:Health, legal and workers' compensation ............................ 103,921 103,921
Total 38 982 39 639
Legal claims ................................................................................... $28,638 $29,188Health
—
IBNR ................................................................................ 6,308 6,154Workers' compensation .................................................................. 4.036 4.297
Total............................................................................................ 38 982 39 39
63 (Continued)

16.
17.
CITY OF PROVIDENCE, RHODE ISLANDNotes to Financial Statements
June 30, 2015
RESTATEMENT OF NET PENSION LIABILITY
The net position of the Governmental and Business-type Activities have been restated as of June 30, 2014 to reflect the
implementation of GASB Statement No. 68 — Accoz~nti~~g and Financial Reporting for Pensions - an arnendntent of
GASB Statement No. 27 and GASB Statement No. 71 —Pension Transition for Contributions Made Szibsegtrent to the
Meas2n•enrent Date.
Subsequent to the original issuance of these financial statements, management discovered an error in the recording of the
City's Net Pension Liability as of June 30, 2014, originally presented as a restatement in accordance with professional
standards. The City's originally restated financial statements overstated the Net Pension Liability related to participation
in the Employees Retirement System of the State of Rhode Island covering certified teachers and certain other school
department employees. The liability was overstated due to the inclusion of the portion of the total Net Pension Liability
which is the responsibility of the State of Rhode Island, amounting to $154,399,000 and recorded in the governmental
activities.
The following table reflects the effect of implementation of GASB Statement No. 68, GASB Statement No. 71, and the
correction of error:
Governmental activities Ori_ Final
Net Position, June 30, 2014 as originally reported $ (142,987)
GASB 68 implementation (1,074,806)
Net Position, July 1, 2014 as restated $ (1,217,793)
Business-type activities
Net Position, June 30, 2014 as originally reported $ 268,847
GASB 68 implementation (41,357)
Co►•rection of liabilities 2,009
Net Position, July 1, 2014 as restated $ 229,499
SUBSEQUENT EVENT
As Restated
$ (142,987)
(920,407)$ (1,063,394)
$ 268,847
(41,357)2,009
$ 229,499
Subsequent to fiscal year 2015, the Providence Water Supply Board, an Enterprise fund of the City of
Providence entered into a finance agreement with the Rhode Island Infi•astructure Bank (formerly known as
Rhode Island Clean Water Finance Agency). The Bond issuance agreement is for $30,000,000 in Series 2015A
Bonds.
64 (Concluded)

THIS PAGE IIV~~EIVTIONALLY LEFT BLAIVI<

CITY OF PROVIDENCE
REQUIRED SUPPLEMENTARY INFORMATION

THIS PAGE II~`i-EfVTiOIVALLY LEFT BLANI<

E-1
CITY OF PROVIDENCE, RHODE ISLAND
Required Supplementary InformationGeneral Fund Revenues and Expenditures-Budgetary Basis
Budget and ActualFor the Year Ended June 30, 2015 (in thousands)
Budgeted AmountsVariance WithFinal Budget
Positive/Revenues and Transfers Original Final Actual (Negative►
Tax revenues:Property taxes $ 330,358 $ 330,358 $ 328,993 $ (1,365)Interest on overdue taxes 5,000 5,000 5,110 110
335,358 - 335,358 - 334,103 - (1,255)
Payments in lieu of taxes 26,227 26,227 28,088 1,861Tax stabilization plans 5,347 5,347 5,373 26State revenue 36,309 36,309 33,708 (2,601)Fines 6,400 - 6,400 4,559 (1,841)Investment interest - - 1 1Miscellaneous 2,500 2,500 654 (1,846)
76,783 - 76,783 - 72,383 - (4,400)
Executive, legislative, and judicialMayor's Office 75 75Law Department - - 5 5City clerk 8 8 10 2Probate court 158 158 146 (12)Housing court 25 25 32 7
191 - 191 - 268 - 77
Finance:City collector 684 684 583 (101)City controller - - 11 11City assessor - - 1 1
684 - 684 - 595 - (89)
Public safetyCommissioner of public safety 60 60 79 19Police department 1,113 1,113 398 (715)Fire department 923 923 646 (277)Communications 693 693 831 138Traffic engineering 3,168 3,168 2,443 (725)
5,957 - 5,957 - 4,397 - (1,560)
Building inspection department:Building inspection administration 4,261 4,261 4,376 115Zoning board of review 56 56 50 (6)Building board of review 10 10 6 (4)
4,327 - 4,327 - 4,432 - 105
(CONTINUED)
65

E-1CITY OF PROVIDENCE, RHODE ISLAND
Required Supplementary Information
General Fund Revenues and Expenditures-Budgetary Basis
Budget and Actual, ContinuedFor the Year Ended June 30, 2015 (in thousands)
Budgeted Amounts
Variance WithFinal Budget
Positive/Revenues and Transfers Original Final Actual ~Negativel
Public works:Environmental control 8 8 25 17
Highway 202 202 975 773
Sewer construction and maintenance 9 9 6 (3)
219 219 1.006 787
Public lands and parks:Recreation - - 66 66North Burial Ground 236 236 318 82
236 236 384 148
Other departments:Recorder of deeds 2,535 2,535 2,381 (154)
Vital statistics 314 314 345 31
Bureau of canvassers 69 69
Bureau of licenses 1,578 1,578 1,479 (99)
Emergency Management 150 150 139 (11)
WSB reimbursement 889 889 839 (50)
WSB medical reimbursement 375 375 - (375)
Room tax 1,820 1,820 1,764 (56)
Meals and beverage tax 4,918 4,918 4,928 10
Blue Cross reimbursement - - 6 6
Planning and urban development 2,028 2,028 58 (1,970)
Arts, Culture, Film &Tourism 126 126 127 1
Providence Place Mall 300 300 300 -
Voluntary payments in lieu of taxes 8,303 8,303 9,906 1,603
Human Service 323 323 - (323)
23,659 23,659 22,341 (1,318)
Public Properties 128 128 317 189
Transfers:
Transfer from rescue runs 4,400 4,400 4,596 196
Transfer from police/fire detail fund 1,700 1,700 2,037 337
Transfer from special revenue 2,378 2,378
Transfer from other non-major 31 31
Transfer from Road Bond Fund 125 125 285 160
Transfer from School Department - - 282 282
Transfers from North Burial Ground 350 350 282 (68)
Transfer from Other funds 4,000 4,000 284 (3,716)
10, 575 10, 575 10,175 (400 )
Total $ 458,117 $ 458,117 $ 450,401 $ (7,716)
(CONTINUED)
66

E-1CITY OF PROVIDtNCE, RHODE ISLAND
Required Supplementary InformationGeneral Fund Revenues and Expenditures-Budgetary Basis
Budget and Actual, ContinuedFor the Year Ended June 30, 2015 (in thousands)
Expenditures and Transfers
Budgeted Amounts
Original Final Actual
variance witnFinal Budget
Positive/(Negative)
Executive, legislative and judicial:Mayor's office $ 2,585 $ 2,585 $ 2,355 $ 230City Council 1,056 1,056 922 134
City sergeant 69 69 69 -City clerk 868 868 669 199Law department 4,301 4,301 5,861 (1,560)
Municipal court 1,843 1,843 1,494 349Probate court 444 444 429 15
Housing court 451 451 457 (6)Contingencies-Mayor 99 99 107 (8)
11,716 11,716 12,363 (647)
Finance:Finance Director 597 597 799 (202)
City controller 1,189 1,189 1,235 (46)Employees retirement office 394 394 416 (22)
Data processing 2,502 2,502 2,409 93
City collector 2,236 2,236 2,572 (336)
City assessor 1,780 1,780 1,709 71
Board of tax assessment review 14 14 15 (1)
Treasury department 505 505 496 9
Personnel 1,731 1,731 2,017 (286)
Heat, light and power 7,000 7,000 7,640 (640)
Debt service 66,906 66,906 57,527 9,379
Employee Death Benefit 200 200 134 66
Workers compensation 1,875 1,875 1,773 102
Unemployment compensation 226 226 137 89Elected officials pension contribution 131 131 - 131
87,286 87,286 78,879 8,407
Public safety:Commissioner of public safety 1,450 1,450 1,360 90
Police department 68,610 68,610 69,588 (978)
Fire department 70,177 70,177 72,526 (2,349)Communications department 8,591 8,591 8,873 (282)
Traffic Engineering 1,174 1,174 1,204 (30)150,002 150,002 153,551 (3,549)
(CONTINUED)67

E-1CITY OF PROVIDENCE, RHODE ISLAND
Required Supplementary InformationGeneral Fund Revenues and Expenditures-Budgetary Basis
Budget and Actual, ContinuedFor the Year Ended June 30, 2015 (in thousands)
Budgeted Amountsvariance witnFinal Budget
Positive/
Expenditures and Transfers Original Final Actual (Negative)
Building inspection department:Building inspection administrationStructures and zoning divisionPlumbing, drainage, and gas pipingdivision
Electrical installations divisionZoning board of reviewBuilding and housing board of reviewBuilding inspection code enforcementBuilding inspection prosecution
Public works:Public works administrationEngineering and sanitationEnvironmental controlHighwaySnow removalParking administrationSewer construction and maintenanceGarage maintenance and equipmentrepair
Recreation:Recreation seasonal
Public lands and parks:Grounds maintenance servicesForestry servicesZoological servicesPark environmental services (Greenhouse)Park programming (Roger Williams Park)Superintendent of parksNorth Burial Grounds
Other departments
1,599 1,599 1,495 1041,831 1,831 1,519 312
362 362 358 4339 339 353 (14)17 17 17 -14 14 9 5
- - 247 (247)219 219 241 (22)
4,381 4,381 4,239 142
750 750 775 (25)729 729 642 87
8,800 8,800 9,539 (739)4,038 4,038 4,582 (544)1,600 1,600 2,414 (814)451 451 699 (248)756 756 832 (76)
839 839 748 91
17,963 17,963 20,231 (2,268)
736 736 930 (194)
736 736 930 (194)
5,520 5,520 5,406 1141,132 1,132 981 1512,704 2,704 2,788 (84)521 521 532 (11)
1,480 1,480 1,298 1821, 059 1, 059 1,124 (65)696 696 652 44
13,112 13,112 12, 781 331
Recorder of deeds 484 484 469 15Vital statistics 308 308 301 7Board of canvassers 1,115 1,115 1,083 32Bureau of licenses 784 784 782 2
(CONTINUED)68

E-1CITY OF PROVIDENCE, RHODE ISLAND
Required Supplementary InformationGeneral Fund Revenues and Expenditures-Budgetary Basis
Budget and Actual, ContinuedFor the Year Ended June 30, 2015 (in thousands)
Expenditures and Transfers
Budgeted Amounts
Original Final Actual
variance witnFinal Budget
Positive/(Negative)
Other departments, Continued:Emergency Management 651 651 606 45Planning and urban development 5,236 5,236 4,102 1,134Administration to City Council 974 974 875 99Internal auditor 363 363 378 (15)Archives 282 282 281 1Human relations commission 78 78 73 5Department of human services 562 562 317 245Office of Arts, Culture, Film &Tourism 629 629 818 (189)Providence Housing Authority 10 10 7 3League of Cities 12 12 12 -Ceremonies 9 9 4 5P. E. R.A. 114 114 70 44
11,611 11,611 10,178 - 1,433
GrantsProvidence Public Library 3,824 3,824 3,545 279Providence plan commission 25 25 - 25Community centers 234 234 - 234
Crossroads 109 109 29 80
P.A.S.A 250 250 250 -Institute of Non-Violence 73 73 - 73
Grants (Transfer to Mary Sharpe) 25 25 - 25Grant Expenditure 500 500 727 (227)
5,040 5,040 4,551 489
Public properties 6,508 6,508 6,282 226
TransfersTransfers to School Department 124,897 124,897 124,897 -Transfer to Active Medical - - 2,414 (2,414)Transfer to Retiree Benefits 21,605 21,605 23,975 (2,370)Transfer to Public Safety Inspection 144 (144)
Deficit Reduction 3,260 3,260 - 3,260
149,762 149,762 151,430 (1,668)
Total $ 458,117 $ 458,117 $ 455,415 $ 2,702
(CONCLUDED)69

CITY OF PROVIDENCE, RHODE ISLAND
Required Supplementary Information
Schedule of Revenues and Expenditures-Budget and Actual-
School Fund
For the Year Ended June 30, 2015 (in thousands)
Budgeted Amounts
Revenues:
Federal and state revenueOther revenueTransfers from other fundsMaster lease proceeds
Totnl revenrres
Expenditures:
EducationTransfer to other funds
Tntn! expenses
Excess revenue over expenditures
E-2
Variance \VithG'inal Budget
PasiHveOriginal P'infll Actual (Neeative)
$ 214,897 $ 214,897$
214,897$ -
6,435 6,435 6,627 192
124,897 124,897 124,897 -
346,229 346,229 346,421 192
346,229 346,229 346,139 90
282 (282)
346,229 346,229 346,421 (192)
$
-
$
-
$
-
$
-
70

E-3CITY OF PROVIDENCE
NOTES TO REQUIRED SUPPLEMENTARY INFORMATIONJUNE 30, 2015
Schedules of Revenues and Expenditures -Budget and Actual —General and School Funds
The City employs the following procedures in establishing the General Fund budgetary data reflected in theaccompanying required supplementary information:
~ At least sixty days prior to July 1, the Mayor submits a proposed operating budget for the upcoming fiscalyear to the City Council. The operating budget includes proposed expenditures and the means of financingappropriations over expected revenues.
• The final budget is legally enacted tllrougll passage of an ordinance.
• The Mayor is authorized to make minor transfers of budgeted amounts between departments. Significantbudget revisions or transfers must be approved by the City Council.
The General and School funds are the only governmental funds that have legally adopted annual budgets. The "actualamounts" presented in the accompanying schedules are presented on a budgetary basis.
The budget for the School Fund is prepared annually and approved by the Providence School Board. The amount ofthe amival transfer from the General Fund is ultimately determined through the adoption of the General Fund budget.This appropriation does not lapse at year-end.
The difference between the amounts shown in the accompanying schedules and those shown in the basic financialstatements relate solely to reclassifications made between revenues and expendituc•es as presented below(inthousands):
General School
Fund Fund
Total budgetary revenues and transfers per schedule $ 450,401 $ 346,421
Reclassification of:
On-behalf payments paid directly by the State of
Rhode Island Teachers' Retirement System 14,361
Refunding bonds issued 23,765
Premiums on bond reoffering 1,125
Revenue from various other special revenue funds combined
with General Fund per GASB 54 requirements 6,065
Total revenues and transfers per
financial statements $ 481,356 $ 360,782
Total budgetary expenditures and transfers per schedule $ 455,415 $ 346,421
Reclassification of:
On-behalf payments paid directly by the State of
Rhode Island Teachers' Retirement System 14,361
Payments to refunded bond escrow agent 24,658
Bond issuance costs 232
Expenses and transfers of various other special reveune funds
combined with General Fund per GASB 54 requirements 5,824
Total expenditures and transfers per
financial statements $ 486,129 $ 360,782
71

E-4
CITY OF PROVIDENCEREQUIRED SUPPLEMENTARY INFORMATION —FUN-DING STATUS
JiJNE 30, 2015
Other Post-Tmployment Benefits
ActuarialActuarial Accrued
Actuarial Value of LiabilityValuation Assets (AAL)
UnfundedAAL Funded
(L7AAL) Ratio
UAALas aPercentage
Covered of CoveredPayroll Payroll
Date (a) (b) (b)-(a) (a)/(b) (c) [(b)-(a)]/(c)
7/1/2014 $ - $ 980,674 $ 980,974 0.00% $ 270,706 362.27%
7/1/2013 $ 1,032,887 $ 1,032,887 0.00% $ 267,341 386.36%
7/1/2012 $ - $ 1,190,552 $ 1,190,552 0.00% $ 260,546 456.95%
7/1/2011 $ - $ 1,149,115 $ 1,149,115 0.00% $ 266,731 430.81%
7/1/2010 $ 1,040 $ 1,212,615 $ 1,211,575 0.09% $ 267,593 452.77%
7/1/2009$
1,040 $ 1,498,491 $ 1,497,451 0.07%$
268,871 556.94%
7/1/2008 $ 1,035 $ 593,903 $ 592,868 O.17% $ 274,827 215.72%
72

E-5CITY OF PROVIDENCE
REQUIRED SUPPLEMENTARY INFORMATIONSCHEDULE OF CHANGES IN THE NET PENSION LIABILITY AND RELATED RATIOS
JUNE 30, 2015
20]5 2014
Total Pension Liability
Service cost $ 17,783 $ 18,844
Interest 98,938 96,007
Changes ofbenefit leans --
Differences between expected and actual expeience 1,650 --
Changes of assumptions 841 --
Benefit payments, including refitnds ofinembercontributions (97,651) (96,570)
Net Change in Total Pension Liability 21,561 18,281
Total Pension Liability -Beginning 1,230,289 1,212,008
Total Pension Liability- Ending (a) $ 1,251,850 $ 1,230,289
Plan Fyducia~y Net Position
Contributions -employer 66,876 $ 62,140
Contributions -member 11,624 10,873
Net Investment income 12,702 47,003
Benefit payments, including refunds of member contributions (97,651) (96,570)
Administrative expense (195) (1,519)
Not Change in Plan fiduciary Net Position (6,644) 21,927
Plan Fyduciary Net Position -Beginning 357,712 335,785
Plan Fiduciary Net Position -Ending (b) $ 351,068 $ 357,712
Net Pension Liability- Ending (a) - (b) $ 900,782 $ 872,577
Plan Fiduciary Net Position as a Percentage of the Total
Pension Liability 28.04% 29.08%
Covered Fanployee Payroll $ 142,504 $ 139,893
Net Pension Liability as a Percentage of
Covered-Fanployee Payroll 632.11% 623.75%
73

r~a~CITY OF PROVIDENCE
REQUIRED SUPPLEMENTARY INFORMATIONSCHEDULE OF CONTRIBUTIONS
June 30, 2015
Actuarially determined contribution
Contributions in relation to the actuarially
determined contribution
Contribution deficiency (excess)
Covered-employee payroll
Contributions as a percentage or
covered-employee payroll
Notes to Schedule:
Valuation date:
2015 2014
$ 66,876 $ 61,615
66,876 62,140
$ -- $ (525)
$ 142,504 $ 139,893
46.93% 44.42%
Actuarially determined conh•ibution rates are calculated as of July 1, two years prior to the end of the fiscal year in whichcontributions are ~•eported.
Methods and assumptions used to determine contribution rates:
Actuarial cost method: Entry age
Amortization method: Level dollar for the 1995 deferral liability and increasing 3.5%per year for theremaining unfunded liability.
Remaining amortization period: Market value of assets as reported by the City less unrecognized returns in each ofthe last five years plus the discounted contribution paid by the city in the followingyear, Unrecognized return is equal to the difference between the actual market returnand the expected market return and is recognized over afive-year period, furtheradjusted, if necessary, to be within 20% of the market value.
Inflation: 3.5%
Salary increases: 3.5%per year before reflecting increases due to longevity compensation.
Investment rate of return: 8.25%, net of pension plan investment and administrative expenses, includinginflation.
Cost of living adjustments: 10-year freeze as of January 1, 2013 and 3% thereafte►•.
Benefit changes: There have been no changes in benefit provisions since GASB 67/68 implementation
Assumption changes: The actuarial assumptions used to reflect the assumptions proposed in the ExperienceInvestigation for the Five Year Period Ending June 30, 2011 submitted to the Boardon April 2, 2012, with the following exception:
The retirement rate for Class B participants is l 00% at age 60.
74

E-7
CITY OF PROVIDENCEREQUIRED SUPPLEMENTARY INFORMATION
SCHEDULE OF INVESTMENT RETURNSJune 30, 2015
Annual money-weighted rate of retwn,
net of investment e~ense
2015 2014
17.50% 17.50%
75

E-8
CITY OT PROVIDENCE
REQUIRED SUPPLEMENTARY INFORMATION
SCHEDULE OF CITY Or PROVIDENCE SCHOOL DISTRICT PROPORTIONATE SHARE
OF THE NET PENSION LIABILITY
June 30, 2015
Employees' Retirement System
Employer's proportion of the net pension liability
Employer's proportionate share of the net pension liability
2015
9.51
$ 231,542
State's propoiKionate share of the net pension liability associated with theschool district 158,779Total $ 390,321
Employer's covered employee payroll $ 159,247
Employer's proportionate share of the net pension liability
as a percentage of its covered employee pay►•oll 145%
Plan fiduciary net position as a percentage of the total pension liability 61.40%
Notes:
/.) The amounts presented jor each frsca! year were determined as of 6/30 measui•enrent date prim to the frscal yens•-end.
2.) Sched:de is intended to shoi+~ infa•mntion for 10 J~ea~s -additional yea~•s will be displayed as they become available.
76

E-9
CITY OI' PROVIDENCE
REQUIRED SUPPLEMENTARY INFORMATION
SCHEDULE OF CITI' Oi' PROVID~NCES SCHOOL DISTRICT CONTRIBUTIONS
Employees' Retirement System
Actuarially determined contribution
2015
21,356
Contributions in relation to the actuarially determined contribution 21,356
Contribution deficiency (excess) $ -
Covered-employee payroll $ 159,252
Contributions as apercentage ofcovered- employee payroll 13.41
Notes:I.) Employers participating in the Sfafe Employee's Relirentent System are req:iired by RI General Lmvs,
Section 36-10-2, to conb•ib:rte an aclunrially determined contrib:dion rate each year.
2.) Sclred:rle is intended to show inforntatia~ for 10 years -additional years will be displayed as !lley
become available.
77

THIS PAGE II~1TEfVTIONALLY LEFT BLAfVI<

OTHER ~UPPLLMENTARl~ INFORMATION

Tf~IIS PAGE INTENTIONALLY LEFT BLAIVI<

V~ ! 1 ~1 ~~~ V ~~~~~~
NONMAJOR GOVERNMENTAL FUNDS
SPECIAL REVENUE FUNDS
Special revenue funds are used to account for specific revenues that arelegally restricted to expenditures for particular purposes.
Neighborhood Housing Fund — is used for Administrative and Program Expenses primarilyrelated to Housing Repair Loan Programs and Downpayment/Closing Assistance Programs.Also income related to Tax Stabilization Agreements.
Federal Funds Fund — is used to account for Administrative and Program Expenses andProgram Ir~c;ome primarily related to the following federally funded programs: CommunityDevelopment Block Grant, Emergency Shelter Grant and Housing Opportunities for Personswith Aids.
PEDC Fund - is used to account for Administrative and Program Expenses and ProgramIncome primarily related to loans and grants for business start-ups, expansion, and operatingcosts (industrial, Commercial and Operating Accounts).
PRA Fund — Is used to account for Administrative and Program Expenses and ProgramIncome primarily related to the sale, rent and upkeep of Providence Redevelopment Agencycontrolled land and buildings. Expenses related to implementation of redevelopment projects.
Other PB~D — is used to account for Good Faith Deposits —Deposits to secure vacant lots ofthe PRA until closing. There is also the Lead Fund which is primarily for expenses and incomerelated to federally funded programs that supply loans to homeowners for remediation work,income from federal grants and City Bond dollars.
Other Special Revenue Funds — is used to account for various smaller special revenue fundsused by the City.
Skating Rink — is used to account for the operations of the Skating Rink.
WDO — is used to account for proceeds received from the federal government for workforcedevelopment services.
Capital Proceeds Fund — is used to account for various smaller operations. It primarilyconsists of a Trust Fund that has spending stipulations for various City operations, andproceeds received for public safety and seizure.

THIS PAGE IRI~ENTIONALLY LEFT BLAf~I<

F-1
CITY OF PROVIDENCE, RHODE ISLAND
Combining Balance SheetNonmajor Governmental FundsJune 30, 2015 (in thousands)
er
Nonmajor
Neighborhood Other Special Capital Governmental
Housing Federal Funds PEDC PRA Other P 8 D Revenue Fund Skating Rink WDO Proceeds Fund Funds Totals
ASSETSCash and cash equivalents $ 1.618 $ 793 $ 1,880 $ 5,214 $ 277 $ 2,304 $ 136 $ 205 $ 618 $ 870 $ 13,915
Investments 5,891 172 3,354 16,280 25,697
Receivables, net:Loans 5,999 7,590 12,911 26,500
ntergovemmental 1,292 5 429 434 2,160
Other 36 36
Due from other funds 347 3,801 2,842 351 494 292 5 13,542 289 21,963
Other assets 854 854
Total assets $ 7.964 $ 13,476 $ 17,633 $ 12,315 $ 771 $ 3,233 $ 136 $ 644 $ 17,514 $ 17,439 $ 91,125
LIABILITIES AND FUND BALANCES
LIABILITIESWarrants and accounts payable $ 115 $ 946 $ 226 $ 253 $ 338 $ 380 $ - $ 188 $ 2,446
Accrued liabilities 181 452 36 669
Unearned revenue 145 7,590 12 98 7,845
Due to other funds 490 4,537 3,013 1,236 630 369 $ 50 '183 8,075 722 19,305
Totalliabilifies 931 13,073 3,251 1,941 630 605 50 599 8,075 910 30,265
FUND BALANCES (DEFICITS)Nonspendable 5,854 12,899 288 19,041
Restricted 1,179 403 1.483 10,374 141 1,854 86 45 16,241 31,806
Committed 574 9.439 10,013
Unassigned
Total fund balances (deficits) 7,033 403 14,382 10,374 141 2,428 86 45 9,439 16,529 60,860
Total liabilities and fund balances(deficits) $ 7,964 $ 13,476 $ 17,633 $ 12,315 $ 771 $ 3,233 $ 136 $ 644 $ 17,514 $ 17.439 $ 91,125
78

RevenuesDepartmentalIntergovernmentalInvestment and rental incomeOther
Total Revenues
ExpendituresCuneM:
Executive, legislative, and judicialFinancePublic safetyRecreationPublic lands and parksCommunity development
Debf servicePrincipalInterest and other costs
Capital outlayTotal expenditures
Exeess (deficiency) of revenueover expenditures
Other Flnancing Sources (Uses)Refunding bonds issuetlPayments to refunded bond escrow agentBond premiumTransfersinTransfers out
Total other financing sources (uses)
F-zCITY OF PROVIDENCE, RHODE ISLAND
Combining Statement of Revenues, Expenditures, and Changes in Fund BalanceNonmajor Governmental FundsJune 30, 2015 (in thousands)
OtherOther Capital Nonmajor
Neighborhood Federal Other Special Revenue Skating Proceeds Governmental
Housing Funds PEDC PRA P&D Fund Rink WDO Fund Funds Totals
S 8.919 $ 7B4 $ 584 $ - 5 10,287
S 6 S 6,336 $ 221 S 228 5,883 S 5,236 44 17,954
1 1 236 5 53 1,012 1,303
100 1 167 773 590 20 1,651
7 6 436 222 9 087 228 7 676 564 5 236 643 1 076 31,195
s~ ns sas
2,982 5,440 8.422554 559 1,113eaa 256 1,100
130 5,881 424 6,786 209 13,430
92 2.200 2,292
11 796 8071,256 41 1297
130 5,984 424 9,782 _ _ _ 209 _ _ _ _ 5 703 559 5440 1,072 29,303
(i23) 452 (202) (695) 19 1,973 25 (204) 643 4 1,892
44,910 44,910(49,709) (49.709)
4,936 4,936144 149 293
(2409) (284) (431) (3,124)137 (2265) (284) (282) (2,694)
Net change in fund balance (deficit) (123) 452 (202) (558) 19 (292) 25 (204) 359 (278) (602)
Fund Balance (d~ciS), beginning of year 7 156 (49) 14 584 10 932 122 2 720 61 249 9 060 16,807 61,662
Fund Balance (deficit), end of year $ 7 033 $ 403 S 14 382 $ 10,374 S 141 $ 2.428 S 86 $ 45 S 9 439 $ 16,529 $ 60,860
79

~~~'Y CIF P~C~O/IDENCE
NORIMAJOR GOVERNMENTAL FUNDS
PERMANENT TRUST FUNDS
Other Nonmajor governmental funds are used to account for permanenttrust funds.

THIS PAGE INTENTIONALLY LEFT BLAI~I<

G-1
CITY OF PROVIDEIV ~E. RHODE ISLAND
COMBINING BALANCE SHEETBY GRAINY ACCOUNT
JUNE 30, 2015 (in thousands)
Federal Direct Federal State Grants From IndErecY Sports
Grants Grants Grants Other Sources Costs Complex Totals
ASSETSCash and investments S 1,270 S 8 ~ 7,198 $ 2,171 $ 821 $ 5,468
Receivables, net:Othergovemments 8,728 1,715 237 10,680
Other 13 1 14
Due from other funds 213 193 13 7,474 3 224 2,117
Total assets $ 10,211 $ 8 $ 3.106 $ 2,434 ~ 2,296 3 224 ~ 18.279
LIABILITIES AND FUND BALANCES
LIABILITIESAccounts payable S 1,700 S 198 $ 1,939 $ 3,837
Unearned revenue 18 1,992 449 2,459
Due to other funds 8,209 S - 'f 3 6 $ 1.323 9,551
Due to other governments 15 8 23
Totalliabilifies 9,942 8 2,203 2,394 1,323 S - 15,870
FUND BALANCESRestricted: 269 903 40 973 224 2,409
Tofa! fund balances (defrciis) 269 903 40 973 224 2,409
Total liabilities and fund balance 5 10,211 $ 8 $ 3,106 $ 2.434 5 2,296 $ 224 $ 18,279
80

ClN OF PROVIDENCE. RHQDE ISLAND
COMBINING SCHEDULE OF REVENUES, EXPENDITURES AND CHANGES INFUND BALANCES BY GRANT FUND
JUNE 30, 2015 (in thousands)
REVENUES.Federal and state governmentsMiscellaneous
Tota! revenues
EXPENDITURES;Personnel servicesEmployee benefitsOther suppliesEquipmentMiscellaneous servicesOther servicesPupil transportationRepairsOffice suppliesEducation suppliesTe~Rbooks
Tofal expendifures
OTHER FINANCING SOURCES (USES)Transfer to other fundsTransfer from other funds
Tofal other financing sources (uses)
Net change in fund balances (deficit)
Fund balance, beginning of year
Fund balance, end of year
G-2
Federal Direct Federal State Grants From Indirect Sports
Grants Grants Grants Other Sources Costs Complex Totals
$ 41,562 $ 2,^22 451 $ 44,135$ 586 ~ 82 668
41,562 $ - 2,':22 1,037 S - 82 44,803
5,462 60 307 15,829
7,599 2 59 7,660
2,387 1,948 246 4,58111,703 84 44 11,831
515 233 53 801251 14 1 26G
0 41 41
2.290 8 97 2.395
8 B 14
25 2540,240 - 2.122 1,028 - 53 43,443
(1,322) (1,323) (2,645)1,322 1,322
(1,322) - (1) - (1,323)
_ .. 9 (Z) 29 37
269 9D3 31 974 195 2,372
~ 269 $ - ~ 903 ~ 40 $ 973 $ 224 5 2,409
81

CI~'l~ OF PF~C~VIDENC~
AGENCY FUfVDS
Agency funds are used to account for assets held by the government asan agent for others.

THIS PAGE INTENTIONALLY LEFT BLANI<

CITY OF PROVIDENCE, RHODE ISLAND
Statement of Changes in Assets and LiabilitiesFor the Year Ended June 30, 2015 (in thousands)
Balance BalanceJuly 1, June 30,2014 Additions Deletions 2015
AGENCY FUNDAssets
Cash and cash equivalents $ 1,281 $ 1,623 $ 1,385 $ 1,519Other receivables 14 12 2
Total Assets $ 1,295 $ 1,623 $ 1,397 $ 1,521
LiabilitiesOther payables $ 650 $ 205 $ - $ 855Due to student group 645 1,402 $ 1,381 666
Total Liabilities $ 1,295 $ 1,607 $ 1,381 $ 1,521
82

THIS PAGE INTE(~TIONALLY LEFT BLANI<

CI~'Y CAF P~OVIDE~VCE
CAf~ITAL ASSETS

THIS PAGE If~TEfVTIOIVALLY LEFT BLANI<

CITY OF PROVIDENCE, RHODE ISLAND
Capital Assets Used in the Operation of Governmental FundsFor the Yenr Ended June 30, 2015 (in thousands)
Governmental funds capital assets, net of relatedaccumulated depreciationLandImprovements other than buildingsBuildings and improvementsBuildings -leasesInfrastructureMachinery and equipmentConstruction in progress -CityConstruction in progress - PPBA
Investments in governmental funds capital assets:Assets put into service as of June 30, 2015
83
J-1
$ 46, 76760,255119,524329, 923100,12320,185
62928,415
$ 705,821
$ 705,821

THIS PAGE INTENTIO(~ALLY LEFT BLAf~K

CITY OF PRC3VIDE~V~E
~ rA r~~ r~ca ~ ~~c r~oN
This part of the City of Providence, Rhode Island's comprehensive annual financial reportpresents detailed information as a context for understanding what the information in thefinancial statements, note disclosures, and required supplementary information says aboutthe government's overall financial health.
Contents:
Financial Trends
These schedules contain trend information to help the reader understand how the government'sfinancial p~rfoi~mance and well-being have changed over time.
Revenue Capacity
These schedules contain information to help the reader assess the government's most significantlocal revenue source, the property tax.
Debt Capacity
These schedules present information to help the reader assess the affordability of the government'scurrent levels of outstanding debt and the governments ability to issue additional debt in the future.
Demographic and Economic Information
These schedules offer demographic and economic indicators to help the reader understand theenvironment within the government's financial activities take place.
Operating Informafion
These schedules contain service and infrastructure data to help the reader understand how theinformation in the government's financial report relates to the services the government provides andthe activities it performs.

PHIS PAGE IfVYENTIONALLY LEFT BLANI<

CITY OF PROVIDENCE, RHODE ISLAND
Schedule 1
Net Position By Component
Last Ten Fiscal Years
(accrual basis of accounting
Fiscal Year
2006 2007 2008 2009 2010 2011 2012 20]3 2014 2015
Governmental activities:
Net investment in capital asseu$
22,435 $ 51,350$
80,301$
]02,250 $ 122,820$
127,340$
122,997$
117,449$
199,002$
219,179
Unrestricted 11,285 765 (29,054) (63,215) (143,890) (233,086) (261,508) (263,762) (34],989) (1,303,632)
Total governmental activities
net assets $ 33,720 $ 52,1]5 $ 51,247 $ 39,035$
(21,070) $ (105,746)$
(138,511)$
(146,313) $ (142,987) $ (1,084,453)
Business-type activities:
Net investrnent in capital assets $ 157,507$
165,284$
143,479$
159,670$
179,800$
201,281 $ 213,758$
217,210$
225,544$
239,088
Restricted 17,515 19,470 54,745 44,280 31,037 18,809 20,943 35,112 36,627 42,322
Unrestricted 7,431 8,178 8,465 6,622 3,503 11,661 10,986 6,403 6,676 (35,289)
Total business-type activities
net assets $ 182,453 $ 192,932$
206,689$
210,572 $ 214,340$
231,751$
245,687$
258,725 $ 268,847 $ 246,121
Primary government
Net investment in capital asseu$
] 79,942 $ 216,634 $
223,780 $
261,920 $ 302,620 $
328,621 $
336,755 $ 334,659 $
424,546 $ 458,267
Restricted 17,515 19,470 54,745 44,280 31,037 18,809 20,943 35,112 36,627 42,322
Unrestricted 18,716 8,943 (20,589) (56,593) (140,387) (221,425) (250,522) (257,359) (335,3]3) (1,338,921)
Total primary government
net assets $ 216,173 $ 245,047 $
257,936 $ 249,607 $
193,270 $
126,005 $
107,176 $
112,412 $
125,860 S (838,332)
84

CITI' OT PROVIDENCE, RHODE ISLAND
Schedule 2
Changes In Net Position
Last Ten Fiscal Years
(accrual basis of accomrrinp~
(i~t lhotrsands)
Fiscal Year
2006 2007 2008 2009 2010 2011 2012 2013 2014 2015
Expenses:
Governmental activities:
Executive, legislative, and judicial $ 15,552 $ 22,761 $ 19,352 $ 32,624 $ 42,202 E 40,382 $ 51,677 $ 36,944 S 36,036 $ 36,830
Finance 32,655 106,740 119,373 111,908 59,345 58,740 57,819 58,462 49,261 63,820
Public safety 170,273 110,246 1 ] 1,183 106,243 182,787 178,374 157,676 170,854 169,742 180,430
Building inspection 5,455 2,495 2,717 2,946 4,806 4,636 4,126 4,264 4,381 4,496
Public works 30,275 21,992 18,384 17,079 23,030 28,451 25,754 15,752 23,965 26,959
Recreation 3,933 2,939 3,089 2,771 3,285 1,593 1,644 1,876 2,131 2,238
Public land and parks 23,992 17,535 17,249 5,523 21,069 24,572 19,437 21,941 20,825 21,290
Education 373,591 380,730 387,624 377,736 381,096 388,612 379,768 395,215 402,539 422,730
Community development 21,175 23,432 20,811 26,110 31,150 21,467 18,687 24,297 18,901 17,981
Interest on long-term debt 21,863 18,639 17,056 27,360 27,389 26,699 32,365 26,817 19,984 19,859
Total governmentalactiviticsexpenses 698,764 707,509 716,838 710,300 776,159 773,526 748,953 756,422 747,765 796,633
Business-type activities:
PPBA 9,314 11,790 14,900 17,222 17,696 18,949 19,992 19,396 19,322 ]7,076
Water Supply Board 43,661 46,105 47,610 50,381 52,303 47,483 50,461 52,553 56,271 56,628
Civic Center 2,241
Non-major School lunch program 12,044 12,194 12,836 13,908 14,422 15,448 15,152
Total business-type activities expenses 55,216 57,895 62,510 79,647 82,193 79,268 84,361 86,371 91,041 88,856
Total primary governmente~penses 753,980 765,404 779,348 789,947 858,352 852,794 833,314 842,793 838,806 885,489
Program revenue:
Governmental activities:
Charges for services:
Executive, legislative, and judicial 234 788 265 241 222 203 232 222 198 19l
Finance 24,526 34,717 18,779 16,928 42,926 51,412 63,264 68,955 67,590 60,636
Public safety 16,336 14,831 20,867 22,222 19,515 16,252 11,384 11,776 12,050 11,908
Building inspection 4,817 6,379 4,993 4,240 3,599 3,405 4,112 4,503 4,036 4,376
Public works 244 2,259 202 213 219 132 193 229 516 318
Recreation 90 418 361 416 231 226 206 211 196 547
Public land and parks 1,216 4,004 410 438 311 581 136 264 321 317
Education 2,802 1,526 I ,621 8,309 11,691 11,704 12,558 12,174 12,599 15,] 51
Community development 125 7,233 8,397 8,982 375 88 10 - - -
Oparating grants and contributions:
Executive, legislative, and judicial 142
Finance 683 61
Public safety 3,039 2,702 4,924 7,348 3,084 2,200 3,183 183 51 56
Public works 3,171
Recreation 599 703 743 329 349 296 261 442 395 484
Public land and parks - 4,679 4,714 177
Education 252,043 248,239 248,949 235,234 238,267 243,134 225,661 247,624 252,226 275,252
Community development 25,502 15,472 13,758 11,943 14,645 ] 5,856 12,518 13,005 8,292 6,791
Capital grants and contributions:
Finance
Education 15,199 15,039 13,908 15,872
Total governmental activities
program revenue: 350,768 359,051 342,891 332,892 335,434 345,489 333,718 359,588 358,470 376,027
(CONTINUED)
85

CITY OF PROVIDENCC, RHODE ISLAND
Schedule 2
Changes In Net Position, Continued
Last Ten Fiscal Years
(accrtra! basis of accorrr~ti~rp,1
Fiscal Year
2006 2007 2008 2009 2010 2011 2012 2013 2014 2015
Program revenue:
Business-type activities:
Charges for services:
PPBA 7,825 10,988 15,712 9,835 16,362 18,548 20,996 20,020 19,652 18,861
Water Supply Board 52,432 52,749 56,032 59,575 54,976 64,017 61,726 61,070 62,872 69,231
Civic Center 1,824 - - - - - - - - -
Non-majorSchool lunch program 12,040 12,446 12,986 14,548 15,124 15,414 15,803
Capital grants and contributions:
Water Supply Board 1,309 1,613 898 775 773 510 200 2,100 3,304 1,098
Total business-type activities
program revenues 63,390 65,350 72,642 82,225 84,557 96,061 97,470 98,314 101,242 104,993
Total primacy government program
revenues 414,158 424,401 415,533 415,117 419,991 441,550 '}31,188 457,902 459,712 481,020
Net (expense)revenue:
Govenunental activities (347,996) (348,458) (373,947) (377,408) (440,725) (428,037) (415,235) (396,534) (389,295) (420,606)
Business-type activities 8,174 7,455 10,132 2,578 2,364 16,793 13,109 11,943 10,201 16,137
Totalprimnry government net expense (339,822) (341,003) (363,815) (374,830) (438,361) (411,244) (402,126) (384,891) (379,094) (404,469)
General revenues and other changes in net position:
Governmental activities:
Property taxes 260,629 257,776 272,366 284,775 289,837 286,998 320,591 325,960 331,133 335,624
Payments in lieu of taxes 26,879 20,124 19,575 19,680 19,103 23,115 23,461 25,645 27,110 28,088
Grants and contributions not restricted to
specificpro6nams 49,546 51,967 42,787 38,048 40,070 25,619 21,473 ]9,246 18,158 16,658
Inveshnentincome 8,033 19,779 19,905 1,230 252 153 100 84 1 1
Gain (loss) on disposal 3,563 - 409
Miscellaneous 696 17,207 18,037 21,525 31,358 17,473 16,846 18,290 18,871 19,176
Transfers - (243) - -
Sale o£building and land 3,148 -
Total governmental activities 352,494 366,853 373,079 365,258 380,620 353,358 382,471 389,032 395,273 399,547
Business-type activities:
Inveshnent earnings 2,227 3,024 3,625 1,243 1,404 618 827 852 662 485
Transfers - - 243 - -
Special items:
Sale of building and land 9,204 -
Total business-type uctiviHes 11,431 3,024 3,625 1,243 1,404 618 827 1,095 662 485
Total primary government 363,925 369,877 376,704 366,501 382,024 353,976 383,298 390,127 395,935 400,032
Changes in nel position:
Governmental activities Q,498 18,395 (868) (12,150) (60,105) (74,679) (32,764) (7,802) 5,978 (21,059)
Business-type activities 19,605 10,479 13,757 3,821 3,768 17,111 13,936 13,038 10,863 16,622
Total primacy government $ 24,103 $ 28,874 $ 12,889 $ (8,329) $ (56,337) $ (57,268) $ (18,828) $ 5,236 $ 16,841 $ (4,437)
(CONCLUDED)
86

CITY OF PROVIDENCE, RHODE ISLAND
Schedule 3
Fund Balances, Governmental Funds
Last Ten Fiscal Years
(modified accrual basis of accounting
(in lhousandsJ
Fiscal Year
General Fund:
Designated for future uses $ 433$
550$ - $ - $
1,378 $ - $ - $ - $ - $ -
Unreserved/ Unassigned 19,251 21,614 22,361 17,361 ?,080 3,725 (11,399) (9,827) (8,672) (13,445)
Total General Fund $ 19,684$
22,164$ 22,361 $ 17,361
$
3,458 $ 3,725 $ (11,399) $ (9.827) $ (8,672) $ (13,445)
All Other Governmental Funds:
Nonspendable $ 16,428 $ 19,818 $ 19,932 $
18,770 $
19,041
Restricted 36,253 35,103 71,066 51,378 39,352
Committed 12,194 9,275 10,268 9,530 10,013
Unassigned 3,686 (262) (18)
Reserved $ 10,885 $ 1Q157 $ 11,729$
14,183 $ 15,882
Unreserved:
Designated for future uses 11,146 16,026 18,045 16,754
Special Revenue - - - - 9,311
Undesignated:
Capital Projects 23,541 14,513 7,394 9,807 7,08]
Special Revenue 95,918 76,976 57,678 42,400 20,041
Permanent Trust - 18,223 14,932 11,821 12,794
Total all other government
funds $ 141490$
135,895$
109,778$
94,965 $ 65,109 $
68,561 $
63,934 $
101,248 S 79,678 $ 68,406
87

CITY OF PROVIDENCE. RHODE ISLAND
SchcdWc 4Changes In Fund Balances. Govcnunrnial Funds
list Trn Fiscal Ymrs(modif+ed pcm~a! basis oJ'accounlingl
Fiscal Ycu
2006 2007 2008 2009 2010 2011 2012 2013 2014 2015
Revenues:Talcs S 285.966 S 281.422 S 273.956 S 283,63] S 290.358 S 290.704 S 314.355 S 324.058 S 330.4M19 $ 334,!03
Dcpufmrnul revenue 33.877 67.352 64.136 73.545 65.786 73A25 95.336 92.683 88.M2 89.769
Fcd~ral and lute ~anLt and~cimburscmrntt 345,627 338,863 334533 298.742 302,272 305,HI~i 281.120 306,195 306232 316291
Invcsvnrnt and renal income 21.305 19.779 21.201 16.254 19.742 1.829 1.451 3.297 4358 1.843
Finn and forfeitures 5.486 4,307 7,2~t1 7.461 7.663 8.133 7.341 6,030 G,U66 4.559
State Fiscal SWbiliration Funds 10.209 13.246 +{,406 I.-037 -
Oth~r 4.267 17,207 15,628 15,491 11,867 12.796 15.492 15.076 14,514 17334
Total m~enucs 696.528 728.930 716.695 705.336 710,934 699.717 720.535 747,339 749,661 763,899
E~pcndicures:Cuacnt:
Exxutivc. kgisiativc. and judicial 12.995 9.852 10161 ]1.f00 IA,239 12.695 15364 11,649 11.090 !3,353
Finance 124.814 106,674 112,142 103.361 43.437 39.526 ~9.6G1 50.743 44.540 47,741
Public safcry~ 108.136 103,111 109.197 103,795 166.254 165.909 151,655 153.492 161.866 163.213
Bwlding inspection 2.600 2.462 2.686 2.838 4.391 5.308 3,901 3,931 4.IH6 4.239
Poblic worts 13.919 13.A23 14,311 15.650 19.064 21.8W 26.179 18.963 18.852 20.264
Rarcalioo 2.939 2,909 2.992 2,656 2902 1.70 ].532 1.750 2,06M1 2101
Public lands and parts 16.211 23J18 14.8&M1 14.582 19.138 21.716 21.034 20.458 21. 15 20.860
Othv departments - 5,742 5.394 5,947 9,262 9.767 ]0.185 7.877 9.203 10,!78
Grants - 4,331 4.148 4.086 4.529 4.185 4.297 4,131 4.733 4.551
Education 366.910 377,793 385.721 380,577 383.636 378,572 362.649 382,618 388.489 403.953
Communin~da~clopmrnt 21.115 19.101 16.663 22.024 26,621 17,?82 1390 20,066 14.668 Ii.i30
Noncurrent:Capiul outlays 6179 19.627 14.520 7.903 2.856 10,782 2.587 4.638 23.341 22.881
Dcb~ srnicc principal paymcn~s I O,000 32,267 35.051 36,929 46.653 ~I.I58 139C6 42,84M1 45.161 40,481
Debt service intcrcs~ and other paymrnts 14.128 18.978 14,622 20,591 26,201 28JU6 32827 26.669 21.118 20.377
Tu[al cs~enditurcc 700,086 739,988 742.615 732.039 769.193 757.882 738.927 749,929 770,076 787,313
Excess of m~cnucc (under)c~penditures (3.358) Q1.058) Q5,920) (26J03) (58,259) (58.165) (18.192) (2.590) (20.315) (73.414)
Other financing sources (uses):Capiul !cases issued 9.135 7.547 - 6,952 14.500 - - 7.000
Capiui mtcs issued 9.081 - - - - -Bond proceeds 87.584 2.366 39,345 -
Rcfunding bonds issued 68.675
Pa}~nrnt m refunding bonds cscrmr agrn~ (28.213) (29.113) (29. 25) (73}6~
Premium on bond itsucd 778 - - - - - 2.125 - 6.061
Loan praccds 250
Proceeds Gom sale of real estate G,A40 - - - - -TfJI15~CI$ N 138.153 139A58 156,731 145.201 165J65 139.461 133.903 129.707 129,617 131,377
Transkrs out (138.270) Q39.358) (156,231) (135.201) (165.765) Q39.~61) Q33.9U3) (129.950) (129.61 (l31.37~
Proceeds on rcfwding bonds issued 28.675 29.910 -Total other financing source(uses) 25.758 7.943 6.952 14.500 58,159 2,366 4(.477 7369
SpcciIIl ItemsProceeds from sale 16.805
Nct change in fund Calancc S 39 005 E (3.115) S 25 9201 E (19.751) S !~3 7591 E (Gl S (16.026) S 38.887 S (20.4151 S 06,OII51
Debt service as a pttcafL~gc oLnonwpilalcspcndinucs 3.5% 7.1% 48% 7.9% 9.3% 9.4f 103% 93% 8.9% S.0%
88

CITY Or .PROVIDENCE, RH011E ISLAND
Schedule 5
1't~x Revenues by Saurce, Govei•iuuental Funds
Last Ten Fiscal Years
(modified accrual basis of ncrounlin~(zu~atrdrled)
(in thozrsands)
Tax Tangible ExciseYear Rea{ T_;state Ta:ces TnYes Total
2006 209,25 ] 28,154 17,768 255, l 73
2007 211,732 28,440 15,685 255,857
2QOS 22C,176 26,087 16,564 268,827
2Q09 231,186 30,080 1 G,963 X78,229
2010 234,687 34,262 ] 5,559 284,508
2011 234,519 34,032 1 G,221 284,772
2012 239,855 35,437 24,280 299,572
2013 238,593 35,185 25,939 309,717
2U l ~~ 251,201 39,006 26,599 3 ] b,80fi
2015 251,770 X5,652 32,025 329,447
Change20QG-201 S 20.3°/u 62.2% 80.x% 2~.1
Source; City records.
89

Cl"I'Y OF PROVIDENCE, RkIODE ISL~.ND
Schedule 6
Assessed Vafue and Estimated Actu~! Value of Taxable Property
Last Ten Fiscal Years
(in thousands)
(uraudrted)
Fiscal
Year
Rest
Property
Tan3ibie
Personal
Property
Motor
Vehicle F~cemptions
Tata[ Taxable
Assessed
Vx3ue
Percer„
Grow¢h
Total Direct
Tax Rate
Estimated
Actual
Taxable
Value
Assessed
Value at a
Percentage of
Actual Value
2006 9,496,709 636,126 241,061 (3,139,525) 734,371 -0.76°/a .5.36 8,818,102 32.04%
?007 9,651,377 b57,840 599,020 (3,593,E37} 7,3]4,600 l.il% .15.17 8,511,25 85.94%
2008 13,721,337 631,015 fi38.t07 {4,781,679) ]0,208,780 34.57% 36.fi2 10: 95,260 91.16%
.404 13,661,004 746,260 65&.076 (4,838,348} 10: 29,942 a21% 25.53 10,316,601 94.16%
2010 1,657,654 $30.2~.i 610,947 (4,$.i8.~9S) 1Or60,496 030% 28.87 I0,"s47,314 99.16°fo
2011 IG,35&,912 926,252 b16,722 (2,8>8,134) 9,043,752 -11.86% 35.37 9,120,353 99.16°/a
2612 1~,34b,045 850,314 644117 (2,960,325) 8,880,?.81 -1.81% 36.28 $,955,507 99.16°/u
2013 9,290, 16 969,783 701,408 (243,980 10,718, 32 ?0.70% 34.14 10,809,418 99.16%
2014 9,309.446 1,054,906 702,3]D (295.059} 10,772,103 O.SG% 34.62 10,891,457 98.41%
2015 4,487,244 ],137,126 720,527 (291,806) 11,053,Q91 2.61°10 X7.83 ] I,OSS,Z&6 97.47°l0
Source: City Records
Weighted Average Rate Calculation
Tot. R/E 9,487,244
Tar:gib3e 1.137,126
Excise 720,527
Tot. Assesment 11,344,897
%a of Assesment Tax Rate Toi.Direc[ Rate
Tot. Res. R'E 7,025,672 62% 33.10 ?q.50
Comm. R/E 2,461,72 22% 36.75 7.97
Tangible I,137,126 10% 5~.$4 5.~4
Excise 730,527 6% 50.Q0 3.81
nn 3-r as
~I7

CITY OF PROVIDENCE, RHODE ISLANB
Schedule 7
Principal Property Taxpayers
Current Year and Ten Years Ago
{unarsdztadJ
2415 2006
Percentage Percent~e
of Tot.l o£Totaf
Taxes City
Percentage Taxable Taxable
Taxable of1"ota! Assessed Assesszd
Taxpayer Assessed Value ~znk Taxes Taxpayer Value Rack Vaiue
Narragansett Electrsc Cornpeny $3~Q,607,658 1 4.56% l~arraga:isex Electric Ca 3179,765,078 I 2.47%
01vSN[ Rhode Island LLG $75,022,029 2 0.77% Fleet Certer Associates 596,Sid,ld4 2 132%
Motive Enterprises LLC 559,864,170 3 0.73°10 Capital Properties Inc 569,612,969 3 0.95%
Prospect Charter Czrc ~51,483,.i57 4 0.64°!o RI Hospital Trust NaJ Bank 539,989,985 ~ 0.55%
Westrrrinstcr Parhrers LLC X55.206.93& ~ O.Sb°io Biue Cross And B[ue Shield df Rhode Is 535,379,66! 5 0.49%
] Financial Holdings LLC $52w 14,670 6 0.53% Traclran Realty Corporation 534,276,371 6 0.47%
One Cituens Plaza Holdings LLC 5~4-1,731,064 7 0.47% Pro~~idence Gas Company 533,535,939 7 0•S6°/n
Textron Realty Corporation 544,200,558 8 0.46% Tfie Providence Iouma! Company S44,Q38,549 8 0.61
Regency Plana 543,781,400 9 0.45°!e I.aurtlmead Cooperative S31 X73 ~:r7 9 0,43%
Atlhena Providence Place $46,399,581 10 0.43% Providence Realty rtssociates LP S30,Gi3,]83 10 d.42%
CoxCom $?4,593,d00 1 I 4.40% Avalon Pmpertics Inc 53',,208,393 11 037°%
Blue Cross & B!ue Shield 532,532,307 1? 0.36% Edward E Zuker (trustee) 526,341,817 12 436°!0
Avalon Properties Inc $33,159,723 13 034% One Twenty One South Main Svte: Llc 521,945,671 t = 0.30%
10 Memorial Boulevard Qwner I.Lc $31,03 ],973 14 032°/a Alpine Realty Providence LLC 520,773,953 14 0.28%
Laureimead Cooperative £30,494,192 15 0.31% Home depot Usalnc %19,173,114 1 ~ 0?6%
High Rock Wesdninster St $3Q094,943 16 0.31°lo One Financial Cen:er Plaza LLC 518,48C,6IG 1 h 0.25%
ARC Hospitality Providence LLC 52 ,658,998 17 d30°!e Historic Hote3 Partners Of Prov Lp 518.436,330 1 ; 025%
PRi I LP $2325542 18 0.24'/o Jefferson, At Providence Placc Apartmerr Sl8,~t13,?S9 18 0.25%
One Financial Center Plaza LLC 521,124,275 19 0.22% Foundry Parcel FiBeen Associates Llc 518,253,532 19 0.25%
350 Westaninste: Sweet LLC ~i9,~65,960 20 0.2~% Elizabeth T Corson WostminstuTrust 517,1b5,~25 2U 0.2~%
'fora[ $ 1,097,421.039 12.59% $ _ 8d3,5S5,879 11.d0%
Source: City Records
total Levy for2015tax roll 5351,854?12.9"'
total levy for 2006 tax roll $25G.683,743.U4
91

CI'I'1' OF PROVT~ENC:E, RHODT ISLAND
Schedule 8
Prope►•ty Tax T,evies And CollectionsLast Ten ~ise~l Years
(rinaudilerl)
Collected Within theFiscal Year of the Lev,+ Total Collections to Date
Taxes Collections inriscal Year Levied far the Percentage Subsequent Percentage
Ended June 3D: Tax Year Amount of Levy Years Amouni of Levy
2006 259,979,819 243,165,192 93.53% 10,093,173 253,258,365 97,41%2007 261,951,088 246,952,069 94.27% 9,843,792 256,795,861 98.03%2008 275,$53,725 255,873,916 92.76°l0 13,202,033 269,076,949 97.54°'02009 287,281,144 269,559,M11 93.83°l0 11,3t44,OG9 280,903,310 97.78°/02010 294,18G,$E2 276,463,184 93.9$°/u 10,0$2,341 286,SQS,S25 97.4f)"/o2b 1 1 3Q7,014,942 ?77,131,464 90.27°/a 7,794,001 284,925,465 92.8 ]2012 324,4C0,4g7 299,707,12( 92.37% 9,955,783 309,662,909 95.44%2013 332,768119 31 O,S 10 342 93.:31 % 9,327,788 319,838,130 96,1 134~2014 340,814,523 317,730,599 93.23% 7,208,829 324,939,428 95.34%2015 345,156,GS8 321,248,525 93.07°/u - 321,24&,525 93.07%
Saw•ce: City Tax Gollecior Records
92

CITY OF PROVIDENCE, RHODE ISLAND
Schedule 9
Ratios of Net General Bonded Debt Outstanding by Type
Last Ten Fiscal Years
(unmidired)
(in thousands)
Governmental Activities Business-Type ActiviriesNet General
General Special Capital Total Percentage of Net Debt Obligation Bonds
Fiscal Obligation Revenue Obligation Tax PPBA Notes and Notes Net Bond Deferred Items Line of Revenue Capital Primazy Personal Per to Esfvnated
Yeaz Bonds Bonds Increment Debt Leases Payable Premium from Financing Credit Bonds Leases Government Income Capita Actual Value
2006 119,215 66,500 28,285 173,474 59,994 4,215 - (i,477) 385 18,070 3,865 470,526 ** 674 135%
2007 113,845 64,525 26,260 222,415 53,453 3,434 - (4,610) 300 11,879 2,950 498,451 °k 638 133
2008 105,075 62,445 23,755 361,011 4Q300 2,546 - (5,184) - 45,043 2,000 645,991 "' 1731 0.86%
2009 96,735 60,295 21,150 358,750 47,628 2,336 - (4,666) - 43,573 990 626,791 '" 542 0.80%
?010 88,260 58,080 18,435 360,663 52,286 798 - (4,184) - 55,299 - 629,637 "* 495 0.73%
2011 80,95 73,140 15,575 411,617 45,433 585 - (3,79?) - 53,010 - 676,503 "" 4526 0.67%
?012 73,815 68,860 12,585 388,487 39,554 ?,776 1,906 (3,284) - 52,489 - 637,188 '"* ** 0.61°
2013 105,661 65,934 9,450 363,919 35,127 2,777 1,758 (722) - 78,087 - 662,021 ** ** x•88%
20]4 99,501 59,799 6,170 333,344 30,506 2,474 6,276 (363) - 74,269 - 611,976 ** ** 0.83%
2015 92,261 54,221 2,725 306,682 33,473 2,38? 5,532 - 78,174 - 575,450 *f ++ p ~~o~
Note: Details regazding the Ciry's outstanding debt may be found in the notes to the basic financial statements
Amounts were included m general obligation bonds.
** Information not available.
93
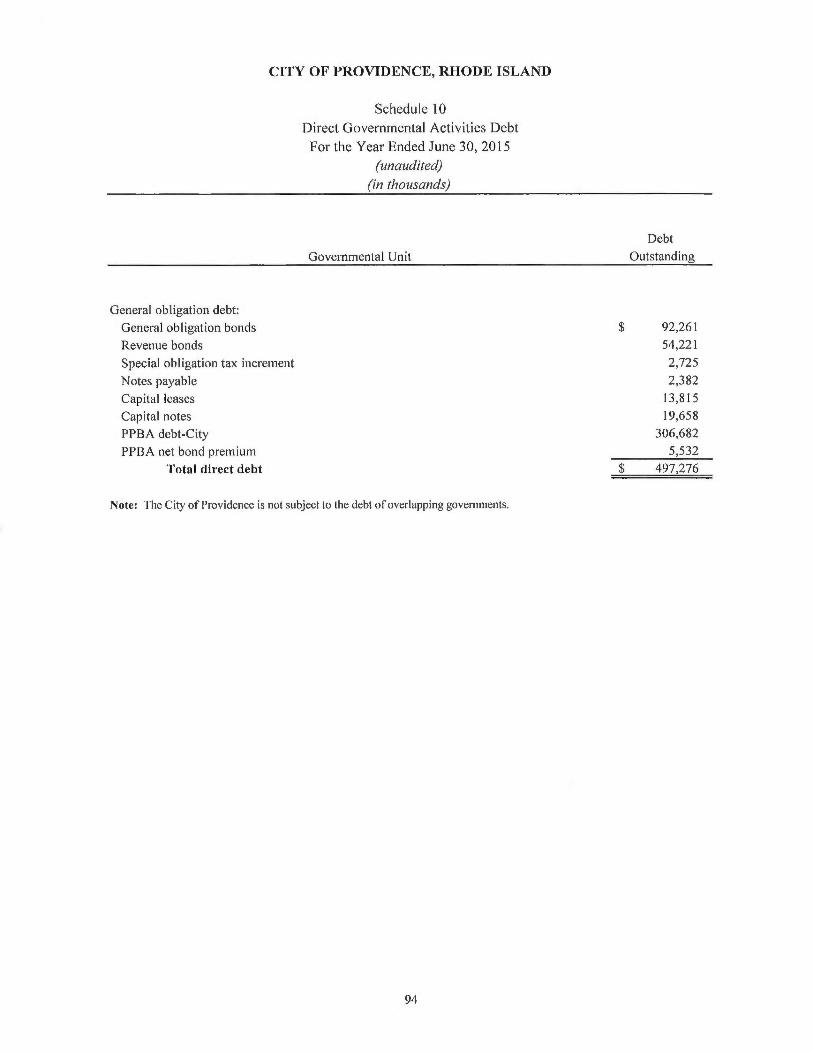
CITY OF PROVIDENCE, RHODE ISLAND
Schedule 10
Direct Governmental Activities Debt
For the Year Ended June 30, 2015
(zrnaudited)(in thousands)
Debt
Governmental Unit Outstanding
General obligation debt:
General obligation bonds
Revenue bonds
Special obligation tax increment
Notes payable
Capital leases
Capital notes
PPBA debt-City
PPBA net bond premium
Total direct debt
92,261
54,221
2,725
2,382
13,815
19,658
306,682
5,532
$ 497,276
Note: The City of Providence is not subject to the debt of overlapping governments.
94

CITY OF PROVIDENCE, RHODE ISLAND
Schedule 11
Legal Debt Margin Information
For the Year Ended June 30, 2015
(z~nazrdited)
(in thousands)
Legal Debt Margin Calculation foi~ Fiscal Year 2015
Taxable Property
Debt limit (3% of taxable property)
Debt applicable to limit:
General obligation bonds
Less: debt not subject to 3%limit
Total net debt applicable to limit
Legal debt margin
95
11,047,169
331,415
92,261
55, ] 70
37,091
$ 294,324

CITY OF PROVIDENCE, RHODE ISLAND
Schedule 12
Legal Debt Mazgin Information
Last Ten Fiscal Years and Current Year Computation
(unaudited)
(in thousands)
Fiscal Year
2006 2007 ?008 ?009 2010 2011 2012 2013 2014 201
Debt limit $ ?10.700 $ 219.400 $ 294,]63 $ 306,899 $ 309,438 $ 266,408 $ 273.279 $ 321,547 $ 323.251 $ 331,41
Tota] net debt applicable to limit ?3,400 19,400 16,247 13,078 9,914 6,750 4,340 41,235 39,065 37,090
Legal debt margin 187.300 200,000 277,916 ?93,821 299,524 259,658 268,939 280,312 284,186 294,325
Total net debt applicable to the limit
as a percentage of debt Iimit 12% 10% 6% 4% 3% 3% 2% 15% 14% 13%
Debt outstanding issuedoutside the 3%debt limitx $ 9,700 $ 93.400 ~ 88.828 ~ 83.67 $ 78,346 $ 74,185 $ 69,475 $ 6,950 S (i0.43~ $ ».170
* T'he State of Rhode Island General Assembly has, by Special Act, permitted the City to incur indebtedness outside the 3%debt limit. This amount excludes water and sewer
bonds that are deemed self-supporting.
96

CITY OF PROVIDENCE, RHODE ISLAND
Schedule 13
Pledged-Revenue Coverage
Last Ten Fiscal Years
(unaudited)
(in 1/~otrsands)
Water Supply Board
Utility Less Net
Fiscal Service Operating Available Debt Service
Year Charges Expenses Revenue Principal Interest Coverage
2006 52,432 42,446 9,986 509 183 14.43
2007 52,749 45,181 7,568 537 158 10.89
2008 56,032 46,410 9,622 S61 131 13.90
2009 59,575 48,796 10,779 590 102 15.58
2010 54,976 50,845 4,131 G18 71 6.00
2011 64,017 46,054 17,963 Gl 24 211.33
2012 61,726 49,212 12,514 115 41 80.22
2013 G1,070 50,305 10,765 na na na
2014 G2,872 54,394 8,478 na na na
2015 64,501 54,760 14,741 na na na
Civic Center Bonds
Net
Fiscal Operating Available Debt Service
Year Charges Expenses Revenues Principal Interest Coverage
2006 1,824 2,241 (417) •** - -
2007 - - - "'
2008 - - - "*
2009 - - - '#'
2010 - - - ~*; -
2011 - - - "* - -
2012 - - - '*' _ -
2013 - - - "' -
2014 - - - *"
2015 - - - "s
• Bond was filly refimded in 2005.
~`• Not Available.
**• Note: The Civic Center Aa[horit}~ was sold on December 5, 2005.
Redevelopment Revenue Bonds
Fiscal Debt Service
Year Collections Principal Interest Coverage
2006 - ' - -
2007 - * - -
2008 -
2009 - ' - -
2010 - ' - -
2011 - • - -
2012 - * -
2013 - • -
2014 - * - -
2015 - • -
Providence Public BuildingAuthority Revenue
Fiscal Debt Service
Year Collections Principal Interest Coverage
2006 7,825 10,516 8,713 0.41
2007 10,988 11,058 9,829 0.53
2008 15,712 27,874 13,124 038
2009 9,835 15,261 16,675 031
2010 16,362 20,407 16,715 0.44
2011 18,548 25,491 17,429 0.43
2012 20,966 23,130 19,607 0.49
2073 20,020 24,568 18,368 0.47
2014 19,652 25,663 17,486 0.46
2015 18,861 26,661 12,483 0.48
97

CITY OF PROVIl)F,NCC, RHODI: ISLAND
Schedule 1 ~
Dcmo~raphic and Economic Statistics
Last Ten i~iscal Years(zmauclited)
Fiscal
Year
t"snded Ycrsonnl Aer Capita Median School Unemployment(*)
June 30 Population'`* ]ncome Income**** Age*** Bnroliment** Rate
2006 17G,862 (1) (I) 3U.h 25, 190 6.9%
2007 176,862 (1) (1) 30.Q 24,394 6.1
2008 178, 00 (1) 26,867 Z8.1 2~k,A94 10.5%
2009 17~,~F00 (I) 26,8fi7 28.I 23,710 I3.1°/u
2010 178,400 (1) 26,867 2R.2 23,710 11.7%
2Q11 178,400 (l) 26,A67 28.2 23,500 10.9%
2012 178,042 (l) 20,735 28,5 23,520 12.9°/n
2013 t78,0~12 (1) 19>489 28.5 ?_3,$72 11.1%
2014 178,32 (1) 21,512 28,7 23,827 9,9%
2015 178,h32 (1) 21,512 28.7 23,765 7.1%
t~~ IJnavnilable
* Source: Rhode island Department of Libor and Training
** itI Depaitmenl ofEtlueation
*** Source: U.S. Bureau of the Census
*~`** Source U.S. Bureau aPEconomic Analysis
98

CITY Or PROVTDI;NCE, RHODI:ISI,AND
Schedule 15
Principal Employers
2013 and 2004
(zrnaredile~I)
2013• 2004
Pcrceutage of Percentage of'Total City Totai City
kmployer Employees Rank Employment Employccs Runk Fmploymeiit
Brown Uni~~crsity 4,600 1 4.30% 3,251 2 2.78%
Rhode Island Hospital 4,200 2 3.93% 6,063 1 5.19%
Life Span (Mgmt. Svcs. including Miriam Mgnri Svcs.) 1,990 3 1.86"10
Women &Infants Hospital 1,800 =1 1.6R"10 2,800 4 2.40°ro
Roger Williams T~tedical Center 1,470 5 1.38% 1,340 G 1,15°fo
The Miriam Flospital 1,263 6 1.18% 2,161 5 L85%
Bclo Corp/Providence Journal 870 7 0.8 I °/u 9b4 l 1 0.82°/n
Msrs 2000 RSO A 0.80%
Providence College 799 9 0.75%
AAA Southern Nc~v England 700 I O a.6G"/o
,lohnson &Wales tliiiversity 70U I l 0.66°/u 1,200 R 1.U3%
Hutler Hospital G99 12 O.6S°/a R00 16 0.68%
H, Carr &Sons Ina X00 13 0.47"/0
National Grid 450 Id 0.42% 1,304 10 l.l'L~u
Empluymen[ 2000 400 I S 0.37".0
Verirou Wireless ~I00 16 0,37%
Gilbune Building Co. 400 17 0.37%
Wa(-mart Stores 350 18 033°/a
de~vel Cuse Corp. 3a~ ~ ~ ~•2A°~a
iJordstrom Inc. 300 2U 0.28%
'' most recent infnnnntion available
Sources: Commerce RI, (f/k/a Rhnde Island Economic Development Corp.)
99

Pu~ctio.~sJP~:g,~g~lka~cutive, Legislative„ludicial and Pinrmcu:
City CouncilCity Council AdministrationInternal AuditorCity Scr~e~mlLity ClerkPersonnelrinAnCeComputer SorvicesI..egnlCOUCISRetirementDoard Tax. AssessmentCiq~'I'reasurcrCity CollectorCity Assessor
Recreation raid Public Land and Parks:Neighborhood Parks & Itecreatipn 5vsxecrcetfon'I.00ForestryParksGreenhousePublic Properly
Public ~afcry:Yalice Depnrimen!Commissioner's ORieeFirefighters' DepartmentCommunicationEmergency MgmtAiomeland Security
Public Works:AdministrationEngineeringEnvironmentfll ContrasHighway and Bridge MaintenanceSewer MaintenanceMiscellaneousC;arageParking AdministrationTroffic Engineering
Uuildins InspectionMiscellaneous:Recurdcd UaedsPlnnnin~ ~ DevelomentArts, Culture &TourismHuman RelotionaHuman ServicesPF.RAE3onrd ofCanvpssersAoa~d of l..icensesVital StatisticsCity Archivist
School DepartmentTotal
Som•re: City Records.
(:ITI' OF PROVIAE~T~T, RFiODI ISLAND
Schedule lbFull-Time f:quivnlent Employees Qy Functional Progrflm
Last'i'en Fiscal Years(~marrdited)
I~uli-Time Fquivale~t i mpinyees as oF.iwte 302015 2014 2013 2012 2011 2010 2009 2008 2007 200G
IS IS IS 1S IS 15 1S IS 15 IS10.5 11 11 II Il 11 - - -2 2 2 2 2 4 - - - -
9.5i4
I9
I9
I11
1I I
I1 I
iI I
l 1I t) 9
IG 1G 14 Id 12 12 13 13 12 12ix i~ 23 i~ 2a za zz zz 3o zs13 13 13 l.1 5 5 7 7 0 726 27 25 2l. 25 2~i 23 23 22 2223 2~ 23 24 24 24 23 23 23 23~J 4 q 5 5 5 S 5 S 54 4 S S 5 5 5 5 S 5S 5 5 6 7 6 G S 5 5IS 15 IS IS IS IS 13 I4 IR 1618 IR 18 IS 1G IS IS 17 Ib IA
57 57 SG f;U GI 44 4d Aq 44 '1721 21 20 20 20
31 31 "!I 31 31 31 31 31 31 3713 13 15 IS 15 Id Id 14 I4 1452 d9 51 49 51 X18 48 48 ~I9 45A 8 G 10 it II II II II 1t31 31 31 3Z 30 30 31 31 33 2d
S52 Sd4 529 562 59a 594 589 581 592 5928 9 9 9 y 8 8 8 7 7SU9 507 d38 433 4~0 467 489 a87 487 481G7 G9 69 73 7G 76 7G 76 78 785 5 5 G 6 6 - -
A R H R S R R 7 10 107 7 R 8 8 8 7 7 7 78 3 8 II 12 12 13 12 12 1249 50 50 52 SO 50 .56 50 Sp 4$9 9 9 (0 t2 12 12 10 IQ 9U U 3 3 1 I !20 117 d5 457 7 7 9 9 9 9 9 9 8
9 9 ~> R 13 13 13 13 12 1255 S7 42 55 60 60 49 X79 13 12
S 5 fi 7 7 7 - - - -4A d7 44 50 54 dfi - -~ 4 4 A 5 5 -1 I 1 ! 3 3 - - -8 7 7 3 2 4 -
2 3 3 - - - -]3 8 8 8 8 3 -Ii II 11 13 12 11d 5 I I 5 5 5 - - - -3 3 3 3 3 3 -
3 26b 3,2~I I 3,224 3 22b 7 23G ~ t S7 ~ 284 3,300 3 345 3,313
5,022 4,993 4,8$7 4,N45 5,023 _4,957, S,OR6 5,086 x,041 5,016
0(1

CITX OF PROVIDENCE, RHODE [BLAND
Schedule 17
Operating Indicators By Function/Program
Last Ten F fiscal Y: ars
(unaudited]
(in thvusandr)
Fiscal gear
r"i:ncuon/Pro~am 2015 20?4 2013 2012 2011 2010 2009 2008 ?007 2006
Police:CaILs for ser~•ice 122 ll 5 114 118 125 U9 I45 138 149 190
Fire:Total fire calls 40 42 4l 44 10 1 I ] 4 I3 ;4 13
Total rescue calls ~ - - - 31 3t 27 27 26 25
Building safety.Total banding permits 8 7 S 8 8 10 8 7 3,2] 0 8,250
Total value all permits 190,735 155,160 215,485 162,913 193.251 146,236 234, i 91 '~ 17,629 'IBD 251,400
Public service:Residential gazbage collected (tonT 70 70 71 73 74 77 79 R 1 TBD 64
Source: City Record;
~` Reporred as total~re and rescue
101

CITY OI" YROVIDENC~, RHODE 15LAlVD
Schedule 18
Capital Asset Statistics By Function/Prograiu
Last Ten fiscal Years
(tmauclited)
l~tinctioii/Program 2015 2U I ~! 2U 13 2012 2U I I ?01 U ?.009 700$ )..007 2006
Public Safety:
Fire, Fire Stations 15 15 l ~ (5 I S 15 I5 15 15 IS
Pire tn~cks 23 23 23 23 23 73 23 23 23 28
Public Works:
Hridges 27 27 27 ?7 27 27 27 27 27 53
Streets (Miles) 370 370 370 370 370 370 370 370 370 417
Manholes 20 20 20 20 20 20 2Q 20 20 20
Catch Aasins 12 12 12 12 l2 12 12 ] 2 l2 12
Drain vtlets 4 4 4 4 4 4 4 4 4
Parks R Recreation:
Acreage 1,300 1,300 1,300 1,300 1,3Q0 1,300 1,300 1,300 1,300
Parks 124 124 124 .124 124 l2a 124 124 124 lai
Colf Course 2 Z 2 2 2 z 2 ? Z ~
BaseUail/Softball Diamonds X10 40 40 4Q 40 40 dU AO 40
Greenhouse 6 6 6 6 6 6 G 6 6
SoccerlE'ootUall Fields 1 I I I I I 11 I t 11 I I 1 I t
Water Parks 9 9 9 9 9 9 9 9 9 3
Museum I 1 1 l I l I 1
Stivinzming pods 6 6 6 6 6 6 6 6 6 b
Recreation Centers 10 10 10 I 0 10 I 0 I 0 ! 0 10 12
Zoo I ! 1 1 I I I I 1
Community Centers
W titer;
Lakes 10 10 10 Id IQ 10 10 10 10 10
Wastewater:
Sanitary Sever Lines (miles) 300 30U 300 300 300 3U0 300 300 300 a I S
Source: City Records
102

THIS PAGE INTENTIONALLY LEFT BLAI~I<
Copyright © 2022 FDOKUMEN