Exosomal Telomerase Transcripts Contribute to CAF ...
30
Page 1/30 Exosomal Telomerase Transcripts Contribute to CAF Formation and Reprogram the MicroRNA Transcriptome Prole of the Recipient Cells Daniela Likonen The Felsenstein Medical Research Center Maria Pinchasi The Felsenstein Medical Research Center Einat Beery The Felsenstein Medical Research Center Roded Sharan School of Computer Science, Tel-Aviv University Asia Gervits School of Computer Science, Tel-Aviv University Lorenzo Signorini School of Computer Science, Tel-Aviv University Meir Lahav Sackler School of Medicine, Tel-Aviv University Pia Raanani Institute of Hematology, Davidoff Cancer Center, Rabin Medical Center Orit Uziel ( [email protected] ) The Felsenstein Medical Research Center Research Article Keywords: Human telomerase reverse transcriptase (hTERT), exosomes, microRNA, tumor microenvironment, cancer Posted Date: November 16th, 2021 DOI: https://doi.org/10.21203/rs.3.rs-1026385/v1 License: This work is licensed under a Creative Commons Attribution 4.0 International License. Read Full License
-
Upload
khangminh22 -
Category
Documents
-
view
4 -
download
0
Transcript of Exosomal Telomerase Transcripts Contribute to CAF ...

Page 1/30
Exosomal Telomerase Transcripts Contribute to CAFFormation and Reprogram the MicroRNATranscriptome Pro�le of the Recipient CellsDaniela Likonen
The Felsenstein Medical Research CenterMaria Pinchasi
The Felsenstein Medical Research CenterEinat Beery
The Felsenstein Medical Research CenterRoded Sharan
School of Computer Science, Tel-Aviv UniversityAsia Gervits
School of Computer Science, Tel-Aviv UniversityLorenzo Signorini
School of Computer Science, Tel-Aviv UniversityMeir Lahav
Sackler School of Medicine, Tel-Aviv UniversityPia Raanani
Institute of Hematology, Davidoff Cancer Center, Rabin Medical CenterOrit Uziel ( [email protected] )
The Felsenstein Medical Research Center
Research Article
Keywords: Human telomerase reverse transcriptase (hTERT), exosomes, microRNA, tumormicroenvironment, cancer
Posted Date: November 16th, 2021
DOI: https://doi.org/10.21203/rs.3.rs-1026385/v1
License: This work is licensed under a Creative Commons Attribution 4.0 International License. Read Full License

Page 2/30
AbstractIt is now well accepted that cancer cells change their microenvironment from normal to tumor-supportivestate to provide sustained tumor growth, metastasis and drug resistance. These processes are partiallycarried out by exosomes, nano-sized vesicles secreted from cells, shuttled from donor to recipient cellscontaining a cargo of nucleic acids, proteins and lipids. By transferring biologically active molecules,cancer-derived exosomes may educate microenvironmental cells to become tumor supportive. We haverecently shown that the transcript of human telomerase reverse transcriptase (hTERT), the hallmark ofcancer cells is packaged in cancer cells derived- exosomes. After the engulfment of the hTERT transcriptinto �broblasts, it is translated into a fully active enzyme. Telomerase activity in the recipient, otherwisetelomerase negative cells, provides them with a survival advantage. Here we show that exosomaltelomerase plays a role in modifying normal �broblasts into cancer associated �broblasts (CAFs) byupregulating aSMA and Vimentin, two CAF markers. We also show that telomerase activity changes thetranscriptome of microRNA in these �broblasts. By ectopically expressing microRNA 342, one of the topidenti�ed microRNAs we show that it may mediate the proliferative phenotype that these cells acquireupon taking-up exosomal hTERT, providing them with a survival advantage.
IntroductionThe importance of the microenvironment for the development, perpetuation and spreading of the tumormass has been extensively shown [1,2]. Secreted from most cell types, including cancer cells, exosomesare nanosized particles (30-150 in diameter) that mediate the cross talk between environmental andtumor cells. Exosomes carry a cargo of nucleic acids, proteins and lipids which re�ects the cellularcontent of their cells of origin. They travel in all body �uids and are taken up by cells in their vicinity. Bytransferring biologically active molecules to these recipient cells, cancer derived exosomes may educatemicroenvironmental cells to become tumor supportive cells, thus acting as intercellular communicators[3].
Telomerase, a reverse transcriptase which elongates telomeres, is a hallmark of cancer cells as it isexpressed in the vast majority of malignant cells and is repressed in most somatic cells. By preventingtelomeres' shortening, it provides cancer cells with endless replicative potential [4]. We have recentlyshown that exosomes derived from cancer cells contain the transcript of telomerase. When theseexosomes were taken up by �broblast, otherwise telomerase negative cells, the transcript was translatedinto a fully active enzyme, transforming these cells into telomerase positive cells, providing them with asurvival advantage [5]. Apart from telomere synthesis, telomerase possess other "extracurricular"activities, which are telomere length independent, for example, prevention of apoptosis [6]. Anotherexample is its involvement in microRNA upregulation [7]. The goal of the current study was to explorewhether some of the phenotypic changes carried out by exosome-derived telomerase activity in the�broblast cells were mediated by modulating these cells into cancer associated �broblasts (CAFs) and bythe upregulation of speci�c microRNAs in these cells.

Page 3/30
Materials And Methods
Cell lines, growth conditions and cell's transfectionThe following cell lines were used in the study: Acute T cell leukemia (Jurkat, kindly provided by Dr. GalitGranot, FMRC), primary human foreskin �broblast (pHFF, kindly provided by Dr. Selig from the IsraelInstitute of Technology); human foreskin �broblast (hFF). The hFF cell line was immortalized by theectopic expression of hTERT as previously described [8] and kindly provided by Dr. Selig from the IsraelInstitute of Technology.
Jurkat cell line was cultured inRPMI-1640 with 20% fetal bovine serum (FBS), containing 100 units/ml L-Glutamine and 1% streptomycin (BiologicalIndustries Beit Haemek, Israel).hFF andpHFF cells werecultured in Dulbecco's minimal essential medium (DMEM) with 20% FBS containing 100 units/ml L-Glutamine and 1% streptomycin (BiologicalIndustries). The cells were incubated at 37°C in 5% CO2. Forexosome isolation an exosome free media was prepared by ultracentrifugation of FBS at 100,000g for 16hours at 4°C (Optima™ XPN, Beckman coulter, USA).
For cell transfection,2.5pHFF cells/well were seeded in 6-well plate for 24hr and were subsequentlytransfected by using HiPerFect transfection reagent (Qiagen, Germany) according to the manufacturer’sinstructions. Brie�y, miRNA mimics was diluted (150 ng) in 100 µl of culture medium without serum for a�nal concentration of 5 nM. Then it was mixed with 12 µl of HiPerFect transfection reagent to allow theformation of transfection complexes in room temperature for 10 min. The resulting transfection solutionswere then added to each well containing 2.3 ml of culture medium. Cells were grown at 37oC for 72hbefore another transfection was performed as above.
Cells were transfected with the following miScript miRNAs:
hsa miR-342-3p miRNA (miR342 mimic)
miRNA Negative Control with a scrambled sequence.
miRNA Inhibitor
miRNA Inhibitors Negative Control
Isolation of exosomesExosomes were isolated by serial ultracentrifugation as previously described [9]. Brie�y, a total of 5xJurkat cells were grown in exosome depleted media for 3 days. Then, the cells debris was removed by 2consecutive centrifugations at 1,000 RCF 2,000 RCF each. Subsequently, the media was centrifuged at10,000 RCF for 30 min at 4°C and the supernatant collected and �ltered through 0.22 µm �lters (MerckMillipore, USA). The clari�ed medium was than centrifuged at 100,000 RCF at 4°C for 70 minutes(Beckman Coulter, CA, USA). The crude exosome-containing pellets were resuspended in 1 mL and asecond round of ultracentrifugation at 100,000 RCF at 4°C for 120 minutes was carried out. The resulting
Page 4/30
exosome pellet was resuspended in 200 µL of PBS and was referred to as the �rst pellet. A second pelletwas obtained after centrifuging the supernatant of the �rst pellet at 100,000 RCF at 4°C for 120 minutes.
Nanosized tracking analysis of Jurkat derived exosomesExosomes were quanti�ed by using the Nanosight tracking analysis, according to the manufacturer'sinstructions (Malvern Panalytical, Cambridge UK) and following published method [10]. The analysissettings were optimized and kept constant between samples.
BCA Protein quanti�cationExosomes were suspended in RIPA buffer and centrifuged for protein extraction. Total protein wasquanti�ed using Pierce BCA Protein Assay Kit (Thermo Scienti�c, MA, USA) in accordance with themanufacturer's instructions.
Exposure of �broblasts to Jurkat derived exosomes200μls of the resuspended exosomes were added to 3X10⁵ pHFF cells per well in a 6-well culture plate. 6hours later the �broblast cells were harvested and RNA was extracted for the measurement of hTERTexpression by q-PCR. Previous studies conducted in our laboratory have suggested that exosomesaffected the recipient cells in a dose and a time dependent manner. Therefore, we used these conditionsin all further experiments.
RNA isolationTotal RNA was extracted using the EZ-RNA II Isolation Kit reagent (Biological Industries Beit Haemek,Israel) according to manufacturer's instructions. Brie�y, cells were lysed with guanidine thiocyanatedetergent solution, followed by organic extraction and alcohol precipitation of the RNA. Quanti�cationand the purity of total RNA were assessed by using the NanoDrop1000®spectrophotometer (ThermoFisher Scienti�c, MA, USA).
RNA isolation from exosomes was performed by using Total Exosome RNA and Protein Isolation Kit(Invitrogen, CA, USA). Exosomes were lysed with denaturing solution and then precipitated by acid-phenol: chloroform solution followed by several washes and centrifugation steps. The supernatant wasthen placed on �lter cartridge tubes for further puri�cation using numerous washing solutions providedby the kit. RNA was eluted with PCR grade water.
cDNA formation

Page 5/30
Total RNA extracts from cells were reverse transcribed using the High-Capacity cDNA ReverseTranscription Kit (Applied Biosystem, CA, USA) according to the manufacturer's instructions. Brie�y,1,000ng of template RNA was added to 10μL reaction mixture containing dNTP's, random primers, RNaseinhibitor, reaction buffer and reverse transcriptase. The incubations steps included 10 min at 250cfollowed by 120 min at 370C and the reaction was terminated by a heating step at 850c for 5 min.
Q-real time PCR reactionReal-time-PCR was employed to estimate the levels of the hTERT mRNA in exosomes secreted from thegrowth media of Jurkat cells based on the Taqman methodology (Applied Biosystems, CA, USA) and forthe validation of the results of the microRNAs analysis. The expression of the HPRT-1 (Hypoxanthine-guanine-phosphoribosyltransferase-1) gene was used as the endogenous control. PCR reactions werecarried out using the Step One Plus detection system (Applied Biosystems, CA, USA). Taqman real timePCR reactions were performed with 50ng of cDNA, speci�c primers and Taqman gene expression mastermix (Applied Biosystems, CA, USA). The incubations steps included 2 min at 500C followed by 10 min at950C and 40 cycles of 15 seconds at 950C and 1 min at 600C.
PCR reactions were prepared with the following custom made Taqman �uorochrome labelled primers(Applied Biosystems, CA, USA).
hTERT primers: Forward: 5′-CGTCCAGACTCCGC TTCATC-3′
Reverse: 5′-GAGACGCTCGGCCCTCTT-3′;
HPRT-1 primers: Forward: 5-′TTATGGACA GGACTGAACGTCTTG-3′
Reverse: 5′-TGTAATCCAGCAGGTCAGCAAA-3′
Western blotThe expression of CAFs markers in exosomal exposed �broblast cells was assessed by Westernimmunoblot analysis. Proteins were extracted and quanti�ed using the Bradford assay (Bio-RadLaboratories, CA, USA). 25μg of proteins extracted from treated and untreated cells were subjected toPoly-Acrylamide Gel Electrophoresis and transferred to a nitrocellulose membrane. Membrane washybridized with antibodies against the different proteins: αSMA (1:500, Bio-Rad, California, USA);Vimentin (1:200, Santa Cruz Biotechnology, Texas, U.S.A.); and subsequently to �uorescent labeledsecondary antibodies. Visualization was done by the Odyssey analysis software (Odyssey IR imagingsystem; LI-COR).
ELISA assay
Page 6/30
The expression of IL-6 by exosome exposed �broblast cells was evaluated by ELISA assay. Culturesupernatants were collected centrifuged to pellet any detached cells and analyzed using a Human IL-6Quantikine ELISA Kit (R&D Systems Inc., MN, USA) according to the manufacturer's instructions. Culturesupernatants were diluted 150- 1000-fold for IL-6 measurements.
miRNA pro�lingmicroRNA expression levels were determined by using the Rosetta Genomics proprietary microarraysplatform containing 2167 microRNA probes and various control probes. RNA was extracted and labeled;samples were processed according to standard protocols. Data was stored in the Microarray Database.Statistical probability of signi�cance (adjusted p values, set at p < 0.05) and a fold change of >2 wereused to select the miRNAs that were signi�cantly differentially expressed between our samples. ThemiRBase website [12] was used to retrieve the mature sequences for each miR.
Validation of the results of the microRNA analysisq-PCR was performed to validate and quantify the expression of the results of the microRNA analysis(miR-342-3p, miR-125b-1, miR-128-3p and miR-92a-3p). Prior to RNA isolation as described above, pHFFcells were exposed to Jurkat cells derived exosomes for 6 h and the levels of microRNA were determinedby Q-PCR. pHFF cells without exosome exposure served as controls. Speci�c commercial primerssequences were used for the validation of each miRNAs (ABI,Foster City, CA, USA).
miRNA cDNA formationFor miRNA-speci�c cDNA formation we used 20ng total RNA from the RNA extraction samples. Taqman®small RNA Assay was used for miRNA reverse transcription reaction. 1-10 ng of total RNA sample wereused per 15 µl RT reaction. Taqman® MicroRNA probe was used as the Reverse Transcription primers.Each reaction included 7 µl master mix, 3 µl 5 X RT primers (miRNA speci�c primers) and 5 µl of RNAsample (1-10 ng).
miRNA Q-real time PCR reactionTaqman® Small RNA Assays kit was used for Real-time quantitative PCR according to the providedmanual (ABI,CA, USA), run and analyzed by the Step- One Q-PCR device(ABI).
miRNA speci�c primers were chosen for the following miRNAs: miR-342-3p, miR-125b-1, miR-128-3p andmiR-92a-3p. U3 was selected as a housekeeping gene to normalize the miRNA levels.

Page 7/30
The incubation steps included: 10 min at 95°C, followed by 40 cycles of 15 seconds at 950C and 60seconds at 60°C.
Proliferation assayCellular proliferation of pHFF cells was assessed by the Sulphorodamine B (SRB) assay. Posttransfection, cells/ml were cultured in 24-well plates for 72h. Cells were then �xated to the plate with 10%Tetrochloric Acid and incubated at 40C for 1h, then washed with dH2O. Subsequently, 1ml of SRB coloringagent (Sigma Aldrich Israel Ltd., Rehovot, Israel) was added to the wells which were incubated atroomtemperature for 30 mins and then washed with 1% acetic acid. After adding 10nM TRIS.HCl bufferabsorbance was measuredat 515nm by an ELISA microplate reader (Biotek InstrumentsInc., VT, USA).Experiments were performed in triplicates.
Cell cycle analysisThe cell cycle status was analyzed by �ow cytometry. Cells were processed by standard methods usingpropidium iodide staining of the DNA. Brie�y, after cells' transfection upon reaching 60% con�uence, thecells were trypsinized, resuspended in 5 ml cold PBS and centrifuged at 2,500 rpm for 5 mins at 4°C. Cellswere subsequently pelleted and �xed by adding 4.5 ml 70% cold ethanol dropwise to 0.5 cold PBS, withgentle mixing. The cells were then incubated for >2 h at -20°C. Cells were subsequently washed by PBSand centrifuged at 2,500 rpm for 5 minutes 4°C. Staining with propidium iodide (P4170, Sigma Aldrich)was conducted prior to �ow cytometry analysis. Cells were pelleted and resuspended in 0.5 ml PBScontaining 0.025 ml PI (50 μg/ml in PBS and 5μl of 100 mg/ml DNase-free RNase (Sigma, St Louis, MO).Cells were then incubated at 37°C for 15 minutes. Samples were analyzed on a Beckman-Coulter EpicsXL-MCL apparatus. The parameters were adjusted for the measurement of single cells using the forwardand side scatter plots.
Prediction of miRNA targetsTo determine potential mRNA targets for speci�c miRNAs we have used several publicly available targetprediction algorithms based on sequence complementarity between the miRNA and its potential mRNAtarget 3’ untranslated region (3’UTR).
TargetScan[11] was used to determine potential miR-342 targets involved in cell proliferation andcellcycle. In addition to TargetScan, a combination of bioinformatics tools for miRNA target prediction,includingmiRBase [12],miRanda [13], DIANAmt [14], miRDB [15], miRWalk [16] and PITA [17] were used.
Functional annotation and gene set enrichment analysis

Page 8/30
Several bioinformatic tools have been used for the biological interpretation and the analysis of pathwaysassociated with de�ned lists of genes. These included DIANA miRPath and DAVID. mirPath is a web-based computational tool developed to identify molecular pathways potentially altered by the expressionof single or multiple microRNAs. The software performs an enrichment analysis of multiple microRNAtarget genes comparing each set of microRNA targets to all known pathways. Pathways with p-value<0.05 providing statistically signi�cant values are selected [18]. mirPath was used to gain insight intoglobal molecular networks and canonical pathways speci�c to miR-342.
The Database for Annotation, Visualization and Integrated Discovery (DAVID) v6.7 bioinformaticalgorithm [19] was used for the functional annotation analysis of Gene Ontology (GO) terms associatedwith a given gene list of con�rmed mRNA targets within each miRNA cluster speci�c for miR-342. Weanalyzed the list of the most signi�cantly regulated genes using the ClueGO Cytoscape plugin [20]. GOfunctional categories with p-values under 0.05 were considered statistically signi�cant. To study theputative interactions between the four selected miRs and telomerase, we identi�ed proteins that areupstream to these miRs. These proteins were subjected to the Advanced Network Analysis Tool (ANAT)software, a tool for constructing and analyzing functional protein networks. ANAT provides access to up-to-date large-scale physical association of protein data, advanced algorithms for network reconstructionand several tools for exploring and evaluating the obtained network models. We used the network-basedanalysis inferring an anchored network (telomerase) that connects a given set of proteins (proteins thatregulate the four selected miRs expression) to designated anchor set of proteins [21].
Statistical analysisQuantitative data were expressed as means ± SD. Statistical signi�cance was determined by theStudent’s t-test. P-value < 0.05 was considered as statistically signi�cant.
Results
Jurkat cells derived exosomes are taken up by �broblastcellsTo harvest Jurkat cells derived exosomes we grew the cells in exosomes free media for 72h. Exosomeswere isolated using differential centrifugation. Two fractions were analyzed: the pellet of exosomes at theend of the ultracentrifugation process and the supernatant containing exosomes of the pellet. As shownin Fig. 1, nanosized tracking analysis (NTA) revealed that the second fraction contained more exosomespicked at the expected size (69nm). Protein analysis con�rmed the NTA results (Fig 1C). Therefore,throughout the study we have used the second exosomal fragment. These results veri�ed that Jurkatcells derived exosomes could be isolated. Subsequently, we exposed �broblast cells to the isolatedexosomes. Jurkat cells exosomes were labelled with FM 1-43 membrane �uorescent probe. The labeledexosomes were added to �broblast cells in a dose dependent manner while control cells were treated with

Page 9/30
PBS only. FACS analysis was performed 24 hours afterwards. As demonstrated in Fig. 2, the FM 1-43 dyelabeled �broblast cells population was increased from 0.15% to 0.7% when 1011 exosomes were appliedand to 45.19% when 1012 exosomes were used (Fig. 2C). Previous studies conducted in our laboratoryshowed that the optimal uptake time of these exosomes was 24h (not shown).
Jurkat cells derived exosomal hTERT partially induces theexpression of CAF related markersIn a previous study we showed that exposure of �broblast cells to exosomes derived from Jurkat cellsinduced about 3.5-fold expression of hTERT in the recipient's previously telomerase negative cells [5].These exosomes were previously isolated using a commercial kit. We repeated this experiment by usingexosomes that were isolated by serial centrifugations and as shown in Fig. 3A the cargo of theseexosomes contained the transcript of the hTERT gene. An increase of about 6.5-fold in the expression ofthe transcript of telomerase was detected 6 hours post exosomal exposure (Fig. 3B). As shown in ourprevious study, the hTERT transcript was translated into a fully active enzyme in the recipient's�broblasts, thus modifying their phenotype from telomerase negative into telomerase positive cells.
Cancer cells' exosomes induce the expression of cancer associated �broblasts (CAFs) in variousexperimental systems [22, 23]. To understand whether some of CAFs markers are upregulated in responseto telomerase activation, we exposed the �broblast cells to Jurkat derived exosomes with or without thetelomerase antagonist GRN163L. As demonstrated in Fig. 4A, exposed �broblast cells exhibited a slightinsigni�cant increase of 133% in αSMA levels after 24 hours. This elevation was not telomerasedependent as the inhibition of telomerase in the recipient �broblasts did not reduce the levels of αSMA.However, 48h after exosomal exposure, the increase in αSMA was decreased when telomerase wasinhibited, pointing to at least a partial dependency of the expression of αSMA in its activity.
A similar result was obtained when we analyzed the levels of vimentin. Twenty-four hours post exosomalexposure the levels of vimentin increased to 540% but were unchanged in response to the inhibition oftelomerase. Forty-eight hours post exosomal exposure the levels of vimentin increased by 344%. Theselevels decreased to 251% upon telomerase inhibition, again pointing to a partial dependency ontelomerase activity (Fig. 4B). To gain more insight into possible connection of these CAF markers andtelomerase, we employed the Advanced Network Annotation Tool (ANAT) software [15]. Based ondatabases of protein-protein interactions, ANAT connects a group of selected proteins (in our case- theidenti�ed CAF markers) to an "anchor" protein (human telomerase). The associations that are formed byANAT are all statistically signi�cant (compared to random input connections). This analysis identi�ed asingle pathway connecting telomerase and the CAF markers, Vimentin and αSMA, as follows: TERT- AKT-1- Vimentin- GABARAP-1- αSMA.
These associations actually describe a direct biological link between telomerase, Vimentin and αSMA.

Page 10/30
Fibroblast cells exposed to Jurkat cells derived exosomessecrete IL-6We next studied the effect of newly expressed telomerase in �broblast cells on in�ammation byassessing the expression of IL-6, as a key in�ammatory cytokine. Two different concentrations of puri�edJurkat cells derived exosomes were added to cells and equal volume of PBS was added to the controlplates. The media was collected after 24, 48 and 72 hours and subjected to human IL-6 immunoassay. Asdemonstrated in Fig. 5, when �broblast cells were treated with the lower exosome concentration, IL-6expression was 1.76-fold higher 24 hours post exosomal exposure compared to unexposed �broblastcells. The effect was partially due to newly expressed telomerase since treated cells with telomeraseinhibition exhibited a milder increase in IL-6 expression (1.37-fold higher then untreated �broblast cells).The effect was abolished 48 hours after exosomal exposure. When the exosome concentration washigher (4-fold) the expression of IL-6 increased by 2 fold after 24 hours compared to untreated�broblasts. By 48 hours, the effect was slightly diminished and IL-6 expression was 1.88-fold higher inexosome treated �broblast cells compared to untreated �broblast cells. In each time point the effect wastelomerase mediated to some degree since it was milder in treated �broblasts with telomerase inhibitioncompared to exosomal exposed cells (Fig. 5). After 72 hours of exposure, the lower exosomalconcentration did not affect the levels of IL-6 by the recipient cells, but the higher exosomal concentrationresulted in a similar level to that of the 48 hours effect (data not shown).
Jurkat cells derived exosomes modulate the microRNApro�le of pHFF cellsIn light of the study by Lassmann et al, describing the role of telomerase in microRNA upregulation [7], wesought to explore whether exosomal telomerase activity provides the recipient cells with a survivaladvantage, at least in part through the upregulation of speci�c microRNAs.
To test this hypothesis we exposed pHFF cells to Jurkat cells derived exosomes in the presence orabsence of telomerase template antagonist, GRN163L. We and others have previously shown ~ 80-90%inhibition of the activity of the enzyme in response to that inhibitor [24, 25]. We studied the pro�le ofmicroRNA under six conditions:
Jurkat cells cultured in exosome depleted media.
pHFFscells, naturally devoid of telomerase activity and hTERT expression.
pHFFs exposed to exosomes derived from Jurkat cells.
pHFFs exposed to exosomesderived from Jurkat cellswith inhibited telomerase activity. For thispurpose, pHFF cells were cultured in the presence of GRN163L before Jurkat cells derived exosomalexposure.

Page 11/30
human foreskin �broblasts (hFF) immortalized by the ectopic expression of hTERT- used as apositive control.
Exosomes isolated from Jurkat cells grown in exosome depleted media.
Next, we compared the microRNA pro�le of the cells under the above experimental setting.
The effect of Jurkat derived exosomes on microRNAexpression of �broblast cellsWhen comparing �broblasts with or without exosomes derived from Jurkat cells, the followingmicroRNAs were signi�cantly upregulated: hsa-miR-92a-3p, hsa-miR-128-3p, hsa-miR-342-3p, hsa-miR-125b-1-3p, (Supp. Fig. 1A, Table 1).
We validated the expression of each of these microRNAs separately by Q-RT-PCR. As shown in Fig. 6, theexpression of all four microRNAs was elevated upon exposure of �broblasts to Jurkat cells derivedexosomes.
The effect of telomerase inhibition on the expression ofmicroRNAs in �broblasts exposed to Jurkat cells derivedexosomesTo understand the putative contribution of exosomal hTERT to microRNA expression in the recipient�broblast cells, we compared the expression of microRNAs in �broblasts exposed to exosomes with orwithout telomerase activity. As shown in Supp. Fig. 1B, the expression of four microRNAs wassigni�cantly upregulated and the expression of two microRNAs was downregulated as a result of theinhibition of telomerase activity in the recipient cells. These include: hsa-miR-491-5p hsa-miR-665 hsa-miR-4730 hsa-miR-371b-5p that were upregulated and hsa-miR-30a-5p and hsa-miR-4284 whoseexpression decreased in response to Jurkat cells derived exosomes (Table 1).
Since miR- 342 was not upregulated as in cells that were exposed to Jurkat- derived exosomes upontelomerase inhibition and actually returned to base line levels and due to its known involvement inoncogenesis we selected it for the other parts of the study.
The effect of telomerase inhibition on the expression ofmicroRNAs in �broblastsTo gain more insight on microRNA expression resulting from exosomal telomerase we compared�broblasts that were exposed to exosomes and inhibition of telomerase versus naïve �broblasts. Theexpression of seven microRNAs was signi�cantly changed when cells were put under these conditions.

Page 12/30
The following microRNAs were upregulated: hsa-miR-181a-5p; hsa-miR-378a-3p, hsa-miR-4730 and hsa-miR-6132. Three microRNAs were downregulated in this setting: hsa-let-7e-5p, MID-20094 and hsa-miR-664b-3p (Supp. Fig. 1C, Table 1).
The effect of ectopic expression of telomerase on themicroRNA pro�le of �broblast cellsWe were able to compare the microRNA pro�le of �broblast cells that were transfected with a plasmidexpressing the catalytic subunit of telomerase, hTERT, expecting that this comparison will serve as apositive control. Supp. Fig. 1D shows the result of this analysis, pointing to other microRNAs thatchanged their expression in response to the overexpression of hTERT. These include two microRNAswhose expression was increased: hsa-miR-146a-5p and hsa-miR-490-5p. Three other microRNAs thatdecreased their expression are:hsa-miR-31-5p,MID-20524, hsa-miR-409-3p (Table 1).
Pro�le of MicroRNAs that were packaged from Jurkat cellsinto their exosomesWe compared the cellular microRNA content of Jurkat cells to their cognate exosome microRNAs (Supp.Fig. 1E). One hundred and twenty-two microRNAs were differentially expressed in the exosomescompared to the cells, 33 of these microRNAs levels were higher in the exosomes than in the cells,implying on a selective encapsulation of these miRs by exosomes. One of these higher expressed miRswas, miR-451a, implicated in several malignancies and proliferative processes [27]. This active packagingof microRNA molecules in exosomes may suggest the activity of a sorting mechanism which hasfunctional implications.
miR342 contributes to the proliferative rate and increasesthe S phase of the cell cycle of �broblastsTaken together, the results of the microRNA expression analysis under the various conditions point tomiR342 as a potential contributor to the survival advantage of exosomal exposed �broblasts. To study itsputative role in cell proliferation we overexpressed its open reading frame in �broblasts (miR mimic 342,Fig. 7A) and assessed its expression in a time and dose dependent manner. As a negative control to miRmimic342 we used a plasmid containing a scrambled oligonucleotide. In addition, we transfected the�broblast cells with an inhibitor of that miR and its negative control. Fibroblast cells with no plasmid(only transfection reagent) were used as another negative control. Thereafter, we measured theproliferation rate of the resulting �broblasts by using the SRB assay. A difference of approximately 1.5-fold of proliferation of pHFF cells containing ectopic miR-342 compared to that of the negative control

Page 13/30
was identi�ed. The ectopic expression of miR-342 increased �broblasts cell proliferation was comparedto cells in which the scrambled oligo was expressed (Fig. 7B).
To understand whether the increase in proliferation stems from change in the cell cycle of the exposedcells, we used the same experimental system and assessed the cell cycle status by �ow cytometry. Asshown in Fig. 7C,D, exosomal exposure resulted in G1/S transition in the exposed cells. The S phase ofthe cell cycle of cells exposed to miR342 was increased by two- fold compared to the control untreatedcells (Fig. 7C). Whereas ~13% of the cells transfected with miR342 were in the S phase of the cell cycle, inall other controls (including the negative control and the inhibitor related controls) about 6.3-7.4% of thecells were in the S phase (Fig. 7D). All in all, these results suggest that miR-342 can increase theproliferation rate of �broblasts cell, thus providing them with a survival advantage.
miR342 involvement in biological processes related tosurvivalTo gain more insightabout the biological signi�cance of miR342 we conducted several bioinformaticanalyses. First, we looked at its target genes using ClueGO Cytoscape plugin software. As shown in Table2, some of its target categories include regulation of viable cell number, cell proliferation and cell death.
To further understand potential miR-342 targets involved in cell proliferation and cell cycle, we usedseveral bioinformatic tools which identify putative miR binding sites based on the homology between the3'UTR sequence of genes and miR sequences. The analysis was done by using TargetScan [11], miRBase[12], DIANAmiRPath [18], miRDB [15] and miRWalk [16]. From the results of this analysis we selected sixgenes that may be biologically relevant to cell proliferation. These include: RAS1, NKAP and RGS4. Inaddition, genes that are involved in epigenetic regulation may also serve as targets for miR342. Theseinclude the following: KMT2A-a lysine (K)-speci�c methyltransferase 2A, HAT1-histone acetyltransferase1, and the TRMT2A-a tRNA methyltransferase 2 homolog A. These proteins are all histone methylationmodifying enzymes which mediate gene expression, genomic stability and mitosis [27, 28].
We have used the ANAT software here as well, to understand possible associations between the fourselected miRs and telomerase. Since ANAT is a protein- protein based network, we �rst identi�ed theprotein regulators of each miR and then applied ANAT using telomerase as the anchor and the regulatorsas end nodes. The regulators are depicted in Table 3. Fig. 8 depict the networks formed by ANAT. Theseresults point to different connectivity of telomerase and the protein regulators of the four miRs, re�ectinga possible differential biological importance of each miR in our setting.
Finally we performed Gene Ontology (GO) terms analysis to shed more light on the putative functions ofthe four upregulated miRs in this setting (Supplemental Table 1).miRNAs were analyzed with DAVIDfunctional Annotation tool to identify GO categories that are mostly represented in this subset.The resultsof this analysis demonstrated that the targets of the four miRs modulate the expression of genes that are

Page 14/30
implicated among other functions to mitotic cell cycle. Other gene products are related to protein, DNAand RNA metabolism.
Taken together, these analyses highlight both the putative biological connections between the miRs thatwere upregulated by exosomal telomerase and telomerase itself and the relevance of at least some ofthese miRs to proliferation processes.
DiscussionThe importance of the cancer microenvironment in cancer progression and aggressiveness is wellestablished. Tumor cells manipulate their microenvironment to support cancer by modulating stromalcells and the extra cellular matrix [29, 30]. The intercellular communication between cancer cells andstromal cells, especially the one mediated by cancer-associated �broblasts (CAFs) can be carried outamong others, by exosomes [31]. Telomerase activity has been detected in approximately 90% of tumorsamples of all types and is a central regulator of the hallmarks of cancer [32]. Telomerase importance incancer biology motivated us to study its putative role in the crucial interactions between cancer cells andtheir surrounding microenvironment. In a previous study we showed that the transcript of telomerase ispackaged in exosomes derived from cancer cell. This transcript is subsequently taken up by recipientcells, where it is translated into a fully active enzyme and its activity provides the cells with a survivaladvantage. In the current study we report two major biological processes that are regulated by exosomaltelomerase in exposed �broblasts: the upregulation of CAF associated markers and modulation of themicroRNA landscape of these cells.
The induction of CAF markersNumerous recent studies reported the transformation of �broblasts to CAFs after exposure to cancer cellsderived exosomes [33]. We examined the expression of two widely used CAFs markers in exosome treated�broblast cells: αSMA and Vimentin. αSMA is the most widely used CAFs and myo�broblasts marker [34].It is one of six different actin isoforms and was found to increase �broblast cells’ contractile ability. Wefound a slight telomerase dependency but an insigni�cant increase in αSMA levels in treated �broblastcells 48 hours post Jurkat cells derived exosomal exposure. The lack of statistical signi�cance may beattributed to the fact that the expression of that marker was assessed in the total �broblast populationand not in the sub-section of the cells that underwent CAFs transformation, or alternatively to the numberof exosomes used in our setting which could potentially be scaled up. Another explanation may beattributed to the dependency of αSMA levels on the expression levels of TGFβ in the cancer cells derivedexosomes to which the �broblast cells were exposed as recently reported [35]. It may well be that ourpuri�ed exosomes expressed a low level of TGFb.
Vimentin, a Type III intermediate �lament, is expressed in mesenchymal cells, the origin of �broblasts andconfers mechanical stability and contributes to cell motility [35, 36]. Exposure of the �broblast cells toJurkat cells derived exosomes elevated the levels of vimentin during 24 hours of exosomal exposure.

Page 15/30
This effect lasted by 48 hours and may be partially attributed to telomerase activity since cells withtelomerase inhibition exhibited a milder effect. We also observed additional bands of vimentin after 48hours of exosomal exposure that can arise from different isoforms of vimentin or posttranslationalmodi�cations [37, 38]. The connection found by ANAT strengthens the experimental results and point toanother extracurricular activity of telomerase.
IL-6 is a multifunctional cytokine that plays a central role in the regulation of in�ammatory processes andis a prototype of an angiogenic related cytokine [39, 40]. Many studies reported the secretion of IL-6 fromCAFs [41, 42] and its various tumor promoting downstream effects. In our setting, we found a clear trendof increase in IL-6 secretion levels from the exosomal exposed �broblasts. Again, the effect wastelomerase mediated to some degree since it was milder after inhibiting telomerase in the recipient�broblasts by GRN163L. This effect can be mediated by TERT in a non-canonical pathway as IL-6 hasbeen previously shown to be a direct target of telomerase activity [43].
Exosomal hTERT regulates the biogenesis of microRNA inrecipient �broblastsThe other part of our study describes the changes in miR expression in response to exosomal telomerasein these �broblast cells.
miRNAs have been the focus of many biological studies in general and in the �eld of cancer research inparticular as regulators of a large number of target genes, both as tumor suppressor or drivers. Given thefact that a single miRNA can target a large number of mRNA transcripts, aberrant expression of a set ofmiRNAs could have a signi�cant effect on the cellular function by affecting multiple signaling pathwaysin the cells. Moreover, miRNAs are key regulators of the tumor-promoting functions and it is becomingclearer that cancer-directed changes regulate these miRNA based networks.
The rational for this part of our study was based on a recent report showing that telomerase activity wasimplicated in regulating the biogenesis of microRNAs [7]. To study the putative effect of exosomaltelomerase on the expression of microRNAs in the recipient �broblasts we exposed �broblasts to Jurkatcells derived exosomes under the inhibition of telomerase activity in the recipient cells and analyzed theresulting microRNA landscape. We compared the expression of micrRNAs also to intact �broblasts, toJurkat cells and to �broblast cells expressing hTERT. Using that analysis we identi�ed four miRs thatwere signi�cantly overexpressed in �broblast cells exposed to exosomes containing hTERT compared tointact �broblasts: miR-342-3p, miR-125b-1, miR-128-3p and miR-92a. By Q-PCR we validated the results ofour analysis. These microRNAs were not expressed when telomerase activity was inhibited in therecipient cells and are involved in cancer related processes [44].
We also observed that the inhibition of hTERT was associated with dysregulation of miRNAs, which inturn could in�uence translation and function of over 600 gene targets.

Page 16/30
By comparing the expression of microRNAs in �broblasts which stably expressed hTERT to the intact�broblasts we identi�ed a different set of microRNAs, with miR-146a showing the highest expressionlevel in the presence of hTERT (20 fold). miR146 is implicated as a pleiotropic regulator of carcinogenesis[45]. The difference between the results of the two comparisons: that of exosomal hTERT versus that ofectopically expressed hTERT may stem from differences in the two experimental systems, for example,the expression levels of the gene.
Active packaging of miRs in exosomesInterestingly, microRNA expression pro�le analysis of exosomal microRNAs derived from Jurkat cellsidenti�ed some miRNAs that were expressed at higher levels in exosomes than in their parent cells,implying on an active packaging of molecules by exosomes and thus might have an important biologicalrole in some setting. However, the mechanisms for selective packaging and release of exosomalmicroRNAs are currently unknown and may be affected by the malignant transformation process itself.As an example, we identi�ed miR-451a, a regulator of tumor growth [46], which was highly expressed inJurkat cells derived exosomes versus the parental donor cells.
miR342In light of its higher expression and its biological role in carcinogenesis, miR-342 was chosen for thefollowing parts of our study. To understand whether this miR is involved in the phenotypic changesobtained by exosomal telomerase [5] we the chosen miR was overexpressed in �broblasts and we studiedthe putative effect on cell proliferation and cell cycle status. miR342 ectopic expression induced a 50%increase in cell proliferation which is re�ected by an increase of about two-fold in the S phase of the cellcycle of these cells suggesting that miR342 may act in the transition from G1 to S phase. These resultsare in accordance with the above-mentioned cancer related functions of that miR [47, 48]. Of note, thismiR was also expressed in the Jurkat cells but when analyzing the RNA cargo of their secreted exosomeswe detected only a small, non-statistically signi�cant amount of this miR. Since recipient cells in whichtelomerase was inhibited did not express miR342, we concluded that the activity of the enzyme is neededto activate the expression of miR342.
The results of our study may explain, at least in part, the survival effects provided by exosomaltelomerase to the �broblast recipient cells. Interestingly, the GO functions of the predicted target genes ofthe four miRs that were upregulated by exosomal telomerase, Toll Like Receptors (TLR) pathways, are inline with the increase in proliferation obtained in our setting (supplemental Table 1). The activation ofTLR is implicated in the development and perpetuation of tumor cells by various mechanisms includingthe secretion of various cytokines promoting proliferation. The �ndings of CAF associated markers inresponse to exosomal telomerase at the �rst part of the study, especially the secretion of IL-6, �ts wellwith the putative activation of TLR in inducing these cytokines secretion to promote tumor growth.

Page 17/30
When analyzing miR342 gene targets an enrichment of gene pathways related to proliferation wasobtained. These include NKAP, RGS4 and RASA1 pathways. RASA1 acts as a tumor suppressor [49];thereby its downregulation may promote cell proliferation through the RAS-RAF-MEK-ERK pathway [50-52]. Similarly, the downregulation of NKAP may lead to cellular proliferation via the NF-kappa-B signalingpathway. Other predicted target genes of miR342 were implicated in epigenetic regulation. These includeHAT1-histone acetyltransferase 1 and KMT2A-a lysine (K)-speci�c methyltransferase 2A, both involved inhistone methylation implicated in malignant transformation [53]. Other pathways related to the targets ofmiR342 include the TGF-beta, the NF-κB and the p38/MAPK and cytokine-cytokine receptor interactionpathways, all highly related to the proliferative effect obtained by miR342.
Telomerase non-canonical pathwaysIn addition to telomeres maintenance, telomerase also harbors other biological roles which are de�ned as"extracurricular". Acting via NFκB and Wnt/β-catenin pathways, these activities involve, among others,prevention of apoptosis, growth parameters and miRs biogenesis [54]. Here we show another side of theextracurricular activities of the enzyme, namely- the activation of miRs in exosome recipient cells. Theinterpretation of this result is supported by the analysis of ANAT, showing multiple connections betweenthe four miR targets that were upregulated by the shuttle of exosomal telomerase and the enzyme itself.
The main limitation of current study is its in vitro arti�cial setting. In order to clarify the implications ofour results, further study should measure exosome concentrations in cancer patients' sera and compare itto the exosome concentrations used in our study. Another difference between the in vitro and in vivosetting is the continuous nature of the process of secretion and uptake of exosomes in the human bodyversus a single dose exposure in vitro. Therefore, an in vivo study based on an animal model is needed.Clarifying these exosomal telomerase dependent microenvironmental relationships may be exploited inthe future for the development of new rationalized drugs against many types of cancer.
In summary, our study shows that hTERT exosomes alter the phenotype and the microRNA transcriptionpro�le of the recipient �broblasts. Speci�cally, two CAF related markers were upregulated, one cytokinewas secreted and four microRNAs including miR342. These changes may promote the exposed�broblasts to support cancer progression by providing them with a survival advantage through exosomaltelomerase.
References1. Quail DF,; Joyce JA. Microenvironmental regulation of tumor progression and metastasis. Nat Med.
2013 19, 1423-37. doi: 10.1038/nm.3394.
2. Whiteside TL. The tumor microenvironment and its role in promoting tumor growth. Oncogene. 2008,27, 5904-12. doi: 10.1038/onc.2008.271.

Page 18/30
3. Ramachandran S; Palanisamy V. Horizontal transfer of RNAs: exosomes as mediators of intercellularcommunication. Wiley Interdiscip Rev RNA. 2012 3, 286-93. doi: 10.1002/wrna.115.
4. Bryan TM; Cech TR. Telomerase and the maintenance of chromosome ends. Curr Opin Cell Biol.1999 11, 18-24. doi: 10.1016/S0955-0674(99)80043-X.
5. Gutkin A; Uziel O; Beery E; Nordenberg J; Pinchasi M; Goldvaser H; Henick S; Goldberg M; Lahav M.Tumor cells derived exosomes contain hTERT mRNA and transform nonmalignant �broblasts intotelomerase positive cells. Oncotarget. 2016 7, 59173-59188. doi: 10.18632/oncotarget.10384.
�. Jaiswal RK; Kumar P; Yadava PK. Telomerase and its extracurricular activities. Cell Mol Biol Lett.2013 18, 538-54. doi: 10.2478/s11658-013-0105-0.
7. Lassmann T; Maida Y; Tomaru Y; Yasukawa M; Ando Y; Kojima M; Kasim V; Simon C; Daub CO;Carninci P; Hayashizaki Y; Masutomi K. Telomerase reverse transcriptase regulates microRNAs. Int JMol Sci. 2015 16, 1192-208. doi: 10.3390/ijms16011192.
�. Hahn WC; Counter CM; Lundberg AS; Beijersbergen RL; Brooks MW; Weinberg RA. Creation of humantumour cells with de�ned genetic elements. Nature. 1999 400, 464-8. doi: 10.1038/22780.9.
9. Dragovic RA; Gardiner C; Brooks AS; Tannetta DS; Ferguson DJ; Hole P; Carr B; Redman CW; HarrisAL; Dobson PJ; Harrison P; Sargent IL. Sizing and phenotyping of cellular vesicles using NanoparticleTracking Analysis. Nanomedicine. 2011 7, 780-8. doi: 10.1016/j.nano.2011.04.003.
10. http:/www.targetscan.org
11. https://www.bmh.manchester.ac.uk/research/impact/mirbase/
12. http:/www.microrna.org
13. http://diana.cslab.ece.ntua.gr
14. http://mirdb.org
15. http://www.ma.uni-eidelberg.de/aps/zmf/mirwalk
1�. http://genie.weizmann.ac.il
17. http://www.microrna.gr/miRPathv2
1�. http://david.abcc.ncifcrf.gov/
19. Bindea G; Mlecnik B; Hackl H; Charoentong P; Tosolini M; Kirilovsky A; Fridman WH; Pagès F;Trajanoski Z; Galon J. ClueGO: a Cytoscape plug-in to decipher functionally grouped gene ontologyand pathway annotation networks. Bioinformatics. 2009 25, 1091-3. doi:10.1093/bioinformatics/btp101.
20. Yosef N; Zalckvar E; Rubinstein AD; Homilius M; Atias N; Vardi L; Berman I; Zur H; Kimchi A; Ruppin E;Sharan R. ANAT: a tool for constructing and analyzing functional protein networks. Sci Signal. 20114, pl1. doi: 10.1126/scisignal.2001935.
21. Ringuette Goulet C; Bernard G; Tremblay S; Chabaud S; Bolduc S; Pouliot F. Exosomes InduceFibroblast Differentiation into Cancer-Associated Fibroblasts through TGFβ Signaling. Mol CancerRes. 2018 16, 1196-1204. doi: 10.1158/1541-7786.MCR-17-0784.

Page 19/30
22. Gu J; Qian H; Shen L; Zhang X; Zhu W; Huang L; Yan Y; Mao F; Zhao C; Shi Y; Xu W. Gastric cancerexosomes trigger differentiation of umbilical cord derived mesenchymal stem cells to carcinoma-associated �broblasts through TGF-β/Smad pathway. PLoS One. 2012 7, e52465. doi:10.1371/journal.pone.0052465
23. Shammas MA; Koley H; Bertheau RC; Neri P; Fulciniti M; Tassone P; Blotta S; Protopopov A; MitsiadesC; Batchu RB; Anderson KC; Chin A; Gryaznov S; Munshi NC. Telomerase inhibitor GRN163L inhibitsmyeloma cell growth in vitro and in vivo. Leukemia. 2008 22, 1410-8. doi: 10.1038/leu.2008.81. Epub2008 May 1.
24. Uziel O; Beery E; Dronichev V; Samocha K; Gryaznov S; Weiss L; Slavin S; Kushnir M; Nordenberg Y;Rabinowitz C; Rinkevich B; Zehavi T; Lahav M. Telomere shortening sensitizes cancer cells toselected cytotoxic agents: in vitro and in vivo studies and putative mechanisms. PLoS One. 2010 5,e9132. doi: 10.1371/journal.pone.0009132.
25. Su Z; Ni L; Yu W; Yu Z; Chen D; Zhang E; Li Y; Wang Y; Li X; Yang S; Gui Y; Lai Y; Ye J. MicroRNA-451ais associated with cell proliferation, migration and apoptosis in renal cell carcinoma. Mol Med Rep.2015 11, 2248-54. doi: 10.3892/mmr.2014.2957.
2�. Del Rizzo PA; Trievel RC. Substrate and product speci�cities of SET domain methyltransferases.Epigenetics. 2011 6, 1059-67. doi: 10.4161/epi.6.9.16069. Epub 2011 Sep 1.
27. Audia JE; Campbell RM. Histone Modi�cations and Cancer. Cold Spring Harb Perspect Biol. 2016 8,a019521. doi: 10.1101/cshperspect.a019521.
2�. Bissell MJ; Hines WC. Why don't we get more cancer? A proposed role of the microenvironment inrestraining cancer progression. Nat Med. 2011 17, 320-9. doi: 10.1038/nm.2328.
29. Joyce JA; Pollard JW. Microenvironmental regulation of metastasis. Nat Rev Cancer. 2009 9, 239-52.doi: 10.1038/nrc2618. Epub 2008 Mar 12.
30. Kenny PA; Lee GY; Bissell MJ. Targeting the tumor microenvironment. Front Biosci. 2007 12, 3468-74.doi: 10.2741/2327.
31. Kim NW; Piatyszek MA; Prowse KR; Harley CB; West MD; Ho PL; Coviello GM; Wright WE; Weinrich SL;Shay JW. Speci�c association of human telomerase activity with immortal cells and cancer. Science.1994 266, 2011-5. doi: 10.1126/science.7605428.
32. Guo W; Gao Y; Li N; Shao F; Wang C; Wang P; Yang Z; Li R; He J. Exosomes: New players in cancer.Oncol Rep. 2017 38, 665-675. doi: 10.3892/or.2017.5714.
33. Shiga K; Hara M; Nagasaki T; Sato T; Takahashi H; Takeyama H. Cancer-Associated Fibroblasts:Their Characteristics and Their Roles in Tumor Growth. Cancers (Basel). 2015, 7 2443-58. doi:10.3390/cancers7040902.
34. Webber J; Steadman R; Mason MD; Tabi Z; Clayton A. Cancer exosomes trigger �broblast tomyo�broblast differentiation. Cancer Res. 2010 70, 9621-30. doi: 10.1158/0008-5472.CAN-10-1722.
35. Satelli A; Li S. Vimentin in cancer and its potential as a molecular target for cancer therapy. Cell MolLife Sci. 2011 68, 3033-46. doi: 10.1007/s00018-011-0735-1.

Page 20/30
3�. Eckes B; Dogic D; Colucci-Guyon E; Wang N; Maniotis A; Ingber D, Merckling A, Langa F, Aumailley M,Delouvée A, Koteliansky V, Babinet C, Krieg T. Impaired mechanical stability, migration and contractilecapacity in vimentin-de�cient �broblasts. J Cell Sci. 1998 111, 1897-907.
37. Van Steendam K; Tilleman K; De Ceuleneer M; De Keyser F; Elewaut D; Deforce D. Citrullinatedvimentin as an important antigen in immune complexes from synovial �uid of rheumatoid arthritispatients with antibodies against citrullinated proteins. Arthritis Res Ther. 2010, 12, R132. doi:10.1186/ar3070.
3�. Buchmaier BS; Bibi A; Müller GA; Dihazi GH; Eltoweissy M; Kruegel J; Dihazi H. Renal cells expressdifferent forms of vimentin: the independent expression alteration of these forms is important in cellresistance to osmotic stress and apoptosis. PLoS One. 2013 ,8 :e68301. doi:10.1371/journal.pone.0068301.
39. Ghosh A; Saginc G; Leow SC; Khattar E; Shin EM; Yan TD; Wong M; Zhang Z, Li G, Sung WK, Zhou J,Chng WJ, Li S, Liu E, Tergaonkar V. Telomerase directly regulates NF-κB-dependent transcription. NatCell Biol. 2012 14, 1270-81. doi: 10.1038/ncb2621.
40. Wei LH; Kuo ML; Chen CA; Chou CH; Lai KB; Lee CN; Hsieh CY. Interleukin-6 promotes cervical tumorgrowth by VEGF-dependent angiogenesis via a STAT3 pathway. Oncogene. 2003 22, 1517-27. doi:10.1038/sj.onc.1206226.
41. Wu X; Tao P; Zhou Q; Li J; Yu Z; Wang X; Li J; Li C; Yan M; Zhu Z; Liu B; Su L. IL-6 secreted by cancer-associated �broblasts promotes epithelial-mesenchymal transition and metastasis of gastric cancervia JAK2/STAT3 signaling pathway. Oncotarget. 2017 8, 20741-20750. doi:10.18632/oncotarget.15119.
42. Shintani Y; Fujiwara A; Kimura T; Kawamura T; Funaki S; Minami M; Okumura M. IL-6 Secreted fromCancer-Associated Fibroblasts Mediates Chemoresistance in NSCLC by Increasing Epithelial-Mesenchymal Transition Signaling. J Thorac Oncol. 2016 11, 1482-92. doi:10.1016/j.jtho.2016.05.025.
43. Trino S; Lamorte D; Caivano A; Laurenzana I; Tagliaferri D; Falco G; Del Vecchio L; Musto P; De LucaL. MicroRNAs as New Biomarkers for Diagnosis and Prognosis, and as Potential Therapeutic Targetsin Acute Myeloid Leukemia. Int J Mol Sci. 2018, 19, :460. doi: 10.3390/ijms19020460.
44. Min SK; Jung SY; Kang HK; Park SA; Lee JH; Kim MJ; Min BM. Functional diversity of miR-146a-5pand TRAF6 in normal and oral cancer cells. Int J Oncol. 2017 51, 1541-1552. doi:10.3892/ijo.2017.4124.
45. Bai H; Wu S. miR-451: A Novel Biomarker and Potential Therapeutic Target for Cancer. Onco TargetsTher. 2019 12, 11069-11082. doi: 10.2147/OTT.S230963.
4�. Tao K; Yang J; Guo Z; Hu Y; Sheng H; Gao H; Yu H. Prognostic value of miR-221-3p, miR-342-3p andmiR-491-5p expression in colon cancer. Am J Transl Res. 2014 6, 391-401.
47. He YJ; Wu JZ; Ji MH; Ma T; Qiao EQ; Ma R; Tang JH. miR-342 is associated with estrogen receptor-αexpression and response to tamoxifen in breast cancer. Exp Ther Med. 2013 5, 813-818. doi:10.3892/etm.2013.915.
Page 21/30
4�. Hu X; Stern HM; Ge L; O'Brien C; Haydu L; Honchell CD; Haverty PM; Peters BA; Wu TD; Amler LC;Chant J; Stokoe D; Lackner MR; Cavet G. Genetic alterations and oncogenic pathways associatedwith breast cancer subtypes. Mol Cancer Res. 2009 7, 511-22. doi: 10.1158/1541-7786.MCR-08-0107
49. Donovan S; Shannon KM; Bollag G. GTPase activating proteins: critical regulators of intracellularsignaling. Biochim Biophys Acta. 2002 1602, 23-45. doi: 10.1016/s0304-419x(01)00041-5.
50. Denhardt DT. Signal-transducing protein phosphorylation cascades mediated by Ras/Rho proteins inthe mammalian cell: the potential for multiplex signalling. Biochem J. 1996 318 ( Pt 3)(Pt 3):729-47.doi: 10.1042/bj3180729.
51. Downward J. Targeting RAS signalling pathways in cancer therapy. Nat Rev Cancer. 2003 3, 11-22.doi: 10.1038/nrc969.
52. Chen F;, Kan H;, Castranova V. "Methylation of Lysine 9 of Histone H3: Role of HeterochromatinModulation and Tumorigenesis". 2010. In Tollefsbol TO. Handbook of Epigenetics: The NewMolecular and Medical Genetics. Boston: Academic Press. pp. 149–157.
53. Ding D; Xi P; Zhou J; Wang M; Cong YS. Human telomerase reverse transcriptase regulates MMPexpression independently of telomerase activity via NF-κB-dependent transcription. FASEB J. 201327, 4375-83. doi: 10.1096/fj.13-230904.
TablesDue to technical limitations, tables are only available as a download in the Supplemental Files section.
Figures

Page 22/30
Figure 1
Quanti�cation of the Jurkat cells exosomes puri�cation. Jurkat cells exosomes were puri�ed from twofractions. The two fractions were quanti�ed using the Nano- Sight tracking analysis (NTA). Representedimages of the quanti�cation of the �rst fraction (using dilution factor 1:200) (A) and the quanti�cation ofthe second fraction (using dilution factor 1:6600) (B) are shown. (C) Quanti�cation of total proteinconcentration of the two fractions of puri�ed Jurkat cells exosomes. The graphs values represent meanconcentration ± S.E of three independent experiments. *indicates PV<0.001. D. Examples of singleexosomes images captured by EM.
Page 23/30
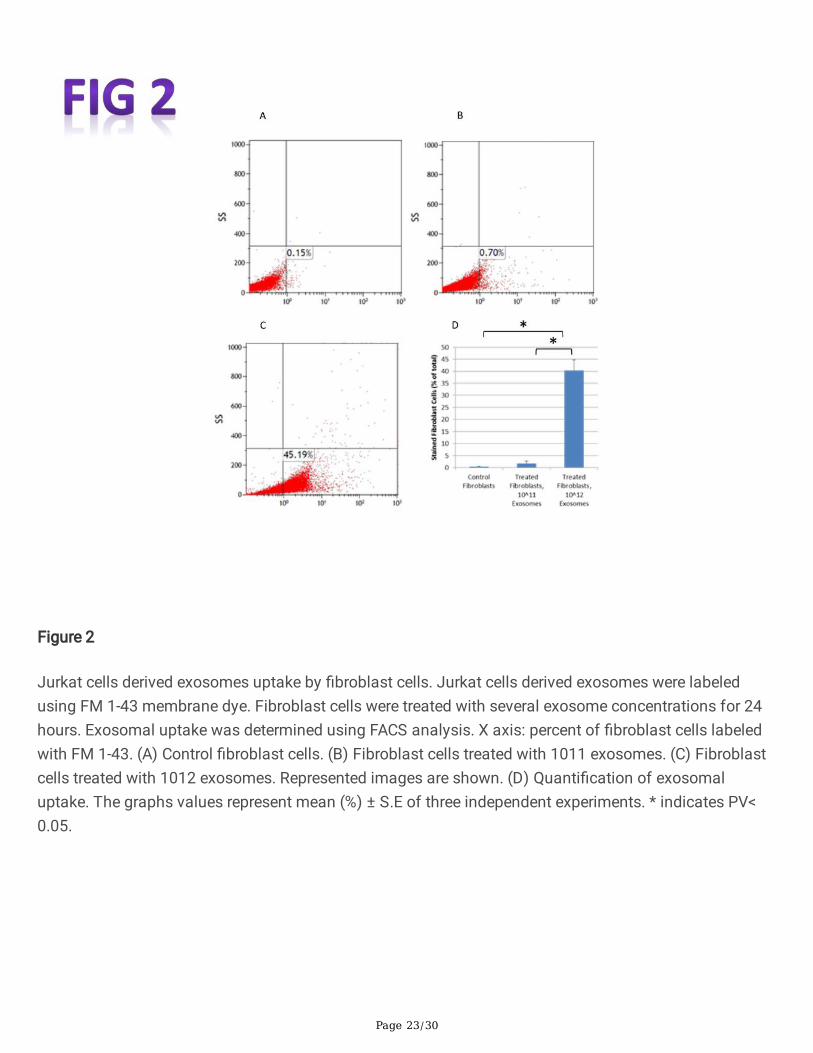
Figure 2
Jurkat cells derived exosomes uptake by �broblast cells. Jurkat cells derived exosomes were labeledusing FM 1-43 membrane dye. Fibroblast cells were treated with several exosome concentrations for 24hours. Exosomal uptake was determined using FACS analysis. X axis: percent of �broblast cells labeledwith FM 1-43. (A) Control �broblast cells. (B) Fibroblast cells treated with 1011 exosomes. (C) Fibroblastcells treated with 1012 exosomes. Represented images are shown. (D) Quanti�cation of exosomaluptake. The graphs values represent mean (%) ± S.E of three independent experiments. * indicates PV<0.05.

Page 24/30
Figure 3
hTERT expression in Jurkat cells exosomes and in subsequent �broblast cells. A. Exosomal RNA wasisolated from three different exosome isolations. hTERT and HPRT-1 as a control gene were ampli�ed byReal-Time PCR. The Y axis represents the normalized hTERT expression level in Jurkat cells exosomescompared to control �broblast cells exosomes. For calculation needs, a threshold of Ct 50 was used asthe "undetectable" hTERT expression in �broblast cells. The bars represent average hTERT expression ofeach sample ± S.E of three independent experiments. B. 3x10⁵ pHFF cells/ml cells were subjected toJurkat-derived exosomes for 6h. The cells were harvested and the expression of the hTERT mRNA wascarried out by quantitative real time PCR. Each column represents mean (%) ± S.E of three independentexperiments. Exosomes: cells exposed to Jurkat derived exosomes, control- cells exposed to PBS only.
Page 25/30
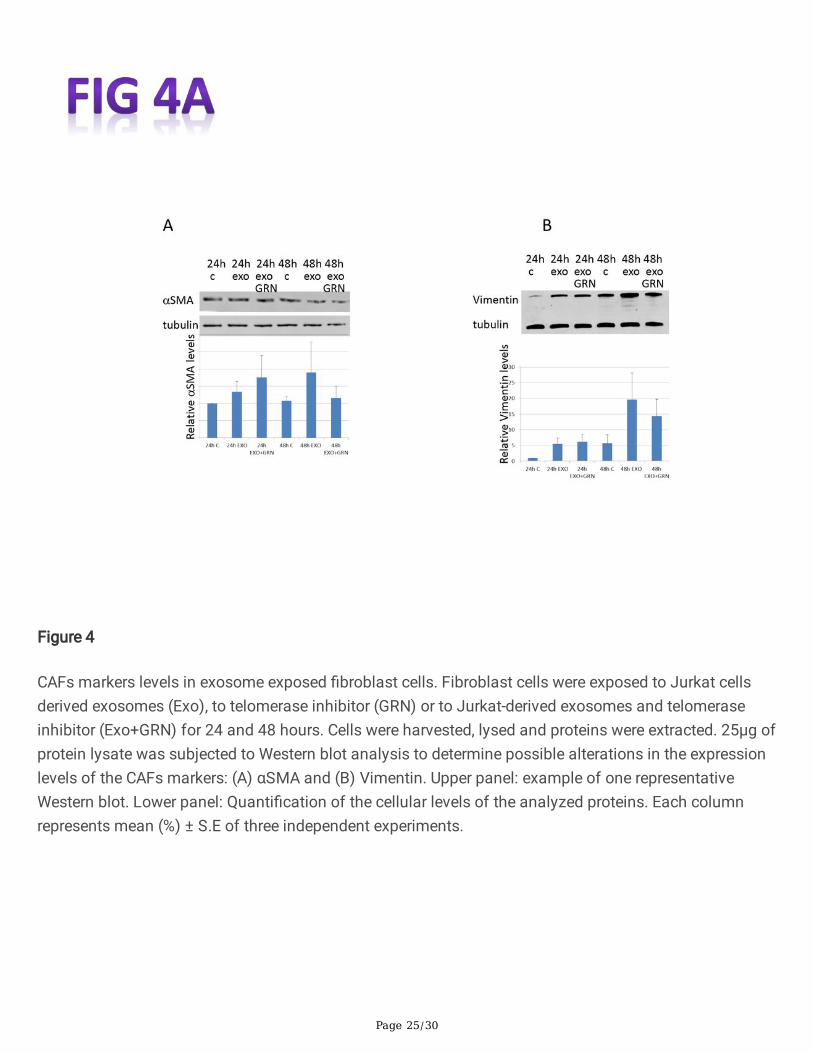
Figure 4
CAFs markers levels in exosome exposed �broblast cells. Fibroblast cells were exposed to Jurkat cellsderived exosomes (Exo), to telomerase inhibitor (GRN) or to Jurkat-derived exosomes and telomeraseinhibitor (Exo+GRN) for 24 and 48 hours. Cells were harvested, lysed and proteins were extracted. 25μg ofprotein lysate was subjected to Western blot analysis to determine possible alterations in the expressionlevels of the CAFs markers: (A) αSMA and (B) Vimentin. Upper panel: example of one representativeWestern blot. Lower panel: Quanti�cation of the cellular levels of the analyzed proteins. Each columnrepresents mean (%) ± S.E of three independent experiments.
Page 26/30
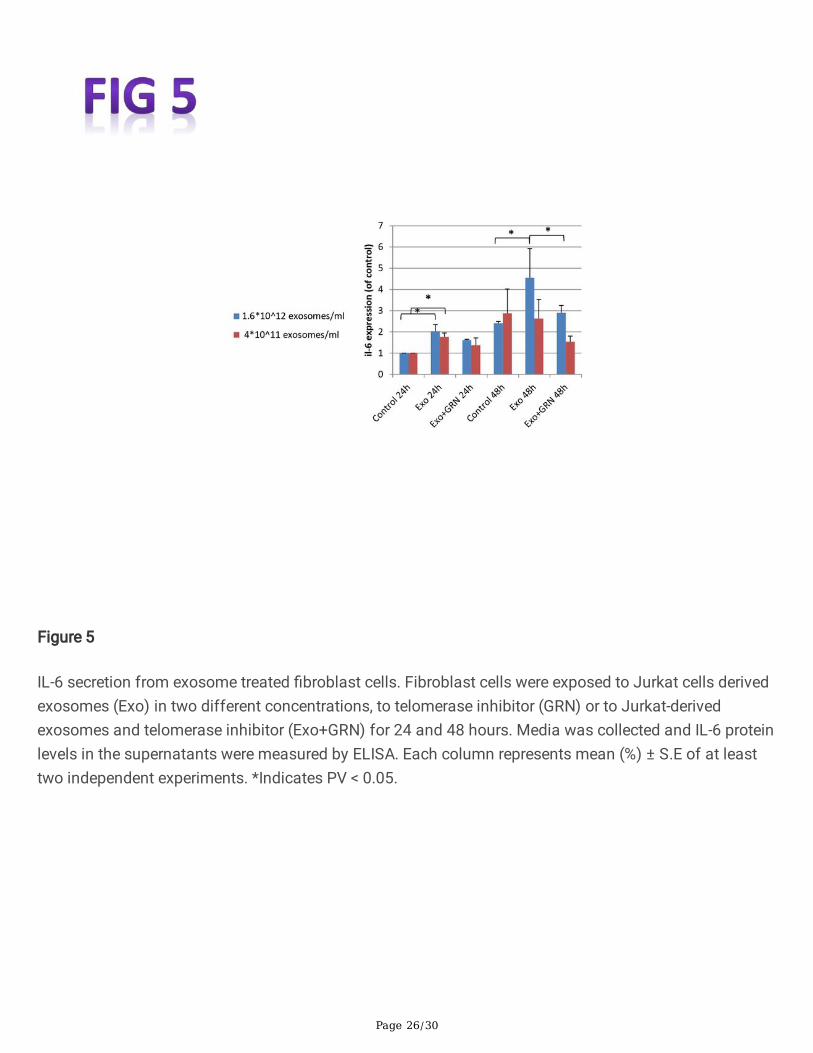
Figure 5
IL-6 secretion from exosome treated �broblast cells. Fibroblast cells were exposed to Jurkat cells derivedexosomes (Exo) in two different concentrations, to telomerase inhibitor (GRN) or to Jurkat-derivedexosomes and telomerase inhibitor (Exo+GRN) for 24 and 48 hours. Media was collected and IL-6 proteinlevels in the supernatants were measured by ELISA. Each column represents mean (%) ± S.E of at leasttwo independent experiments. *Indicates PV < 0.05.

Page 27/30
Figure 6
Analysis of relative microRNA expression after Jurkat derived exosomal exposure. A. Identi�cation ofmiRNAs which were differentially expressed in pHFF cells incubated with exosomes from Jurkat cells (y-axis) versus pHFF cells with no exosomal exposure (x-axis). Each blue cross represents a miRNA; Greycrosses are probes not tested in the analyses (e.g. control sequences or low expression). Each crosssigni�es the median expression of a probe in the two groups; Red circles: miRs with fold-change > 2,p<0.05 B. Q-Real-time PCR validation of the microarray data. Expression levels of miRNAs were measuredby quantitative RT-PCR (Q-RT-PCR) in a subset of 4 samples. Cycle threshold values for each miRNA werenormalized versus those of the housekeeping small RNA U3 gene. Q-RT-PCR showed that all four selectedmiRNAs display higher expression in the relevant samples after Jurkat cells derived exosomal exposure.Four miRNAs expression were correlated with the microarray results. Quantitative RT-PCR data arerepresented as the mean ± SD; n = 3. The statistical signi�cance was *p < 0.05 as measured using theStudent-t test. C. Correlation plot between miRNA expression in pHFFs incubated with exosomes +telomerase inhibitor GRN163 (y-axis) vs. pHFF incubated with exosomes only (x-axis). Upregulated miRswere enriched for G-rich miRs (technical bias), so additional �lters were used for this comparison. In black

Page 28/30
circled yellow: fold-change > 2, p-value < 0.05 and miRs that are not G-rich. D. Correlation plot betweenmiRNA expression in pHFFs incubated with exosomes + telomerase inhibitor GRN163 (y-axis) vs. pHFFalone (x-axis). Diagonal lines demarcate 1.5-fold difference levels in expression between the two groups;In blacked circled yellow: p<0.05 with the largest fold-change (fold-change > 5). Grey crosses are probesnot tested in analyses (e.g. control sequences or low expression). E. miRNA expression in pHFF cellstransfected with the hTERT gene (y-axis) vs pHFF wild type cells (x-axis). Bold red circles depict adifferential change of >2. F. miRNA expression in Jurkat cells (y-axis) vs Jurkat cells derived exosomes (x-axis). miRs that were signi�cantly differentially expressed are marked in Blue.
Figure 7
miR342 provides �broblasts cells with a survival advantage A. Transfection of pHFF cells with miR342.Left panel: Q-RT-PCR analysis of the relative expression levels of miR-342 after its mimic transfection.The standard Taqman MicroRNA Assays was followed to examine performance of RNU6B (snRNA)endogenous control candidates served as an internal reference. The data summarizes three experimentsand expressed as mean ± SD for three experiments. right Panel: Q- RT-PCR analysis of the relativeexpression levels of miR342 mimic in the pHFF cells after treatment with various concentrations of thatmiR-342 mimic (75 ng/μl, 150 ng/μl, 300 ng/μl) B. MiR-342 overexpression increases cellularproliferation. 96 hours after 150ng/μLmiR mimic 342 and its various controls transfection, we observed a

Page 29/30
statistically signi�cant increase in the growth of miR-342 overexpressing cells in comparison to cellstreated by negative control, untreated �broblast, or �broblast + reagent transfection (p<0.05) By using theSRC assay. The data summarizes three independent experiments and expressed as mean ± SD. C. Thecell cycle status of pHFF cells in reponse to the ectopic expression of miR342. The DNA content of thecells was measured by �ow cytometry. Cells were processed by standard methods using propidium iodidestaining of DNA. (I) pHFF cell-cycle pro�le of cells transfected with transfection reagent. (II) pHFF cell-cycle pro�le of cells transfected with negative control. (III) pHFF cell-cycle pro�le of cells transfected withmiR-342 mimic (IV) pHFF cell-cycle pro�le of cells transfected with miR-342 inhibitor (V) pHFF cell-cyclepro�le of cells transfected with inhibitor negative control (VI) pHFF cell-cycle pro�le of cells transfectedwith miR-342 mimic+ miR342 inhibitor. D. Quanti�cation of 7C. Graph displaying differences in cell cyclephases, as determined by FACS analysis, between normal and miR-342 expressing pHFF cells. The datasummarizes three independent experiments and expressed as mean ± SD.
Figure 8
ANAT output of four miRNA target proteins and telomerase. Pink circles represent proteins identi�ed byANAT. Brown circles are the targets of the miRs predicted by miRDB. The green circle refers to the anchor

Page 30/30
telomerase (hTERT). A. Interaction map showing the connections of telomerase (hTERT) and genestargeted by the miR-342. B. Interaction map showing the connections of telomerase (hTERT) and genestargeted by the miR-92-a. C. Interaction map showing the connections of telomerase (hTERT) and genestargeted by the miR-125-b. D. Interaction map showing the connections of telomerase (hTERT) and genestargeted by the miR-128.
Supplementary Files
This is a list of supplementary �les associated with this preprint. Click to download.
SuppTable1.docx
supp�gures.pdf
Tab1.jpg
Tab2.jpg
Tab3.jpg