Chromatin domain boundary element search tool for Drosophila
11
Chromatin domain boundary element search tool for Drosophila Arumugam Srinivasan and Rakesh K. Mishra* Centre for Cellular and Molecular Biology, Council for Scientific and Industrial Research (CSIR), Uppal Road, Hyderabad, 500007, India Received December 15, 2010; Revised January 6, 2012; Accepted January 10, 2012 ABSTRACT Chromatin domain boundary elements prevent in- appropriate interaction between distant or closely spaced regulatory elements and restrict enhancers and silencers to correct target promoters. In spite of having such a general role and expected frequent occurrence genome wide, there is no DNA sequence analysis based tool to identify boundary elements. Here, we report chromatin domain Boundary Element Search Tool (cdBEST), to identify boundary elements. cdBEST uses known recognition sequences of boundary interacting proteins and looks for ‘motif clusters’. Using cdBEST, we identified boundary sequences across 12 Drosophila species. Of the 4576 boundary seque- nces identified in Drosophila melanogaster genome, >170 sequences are repetitive in nature and have sequence homology to transposable elements. Analysis of such sequences across 12 Drosophila genomes showed that the occurrence of repetitive sequences in the context of boundaries is a common feature of drosophilids. We use a variety of genome organization criteria and also experimental test on a subset of the cdBEST boundaries in an enhancer-blocking assay and show that 80% of them indeed function as boundaries in vivo. These observations highlight the role of cdBEST in better understanding of chromatin domain boundaries in Drosophila and setting the stage for comparative analysis of boundaries across closely related species. INTRODUCTION Eukaryotic genomes contain a large number and variety of regulatory elements that control the cell type and context dependent expression patterns of genes. Much of the genome that does not code for proteins, contains these regulatory elements often in the close proximity of the target gene but frequently also at far away locations. Specific and appropriate interaction of regulatory elements governs the complex and regulated expression of genes. However, much of the mechanism involved in this process remains to be understood and, in particular, it is far from clear how the specificity of interactions among regulatory elements is achieved. It is known that given access by bringing together in transgenic context or by chromosomal rearrangements, enhancers as well as silen- cers can act on almost any promoter. It is also known that expression of a transgene construct in different independ- ent transgenic lines often depends on the site of insertion in the genome, a phenomenon referred to as position effect, due to the influence of local regulatory elements on the transgene. These observations suggest that in order to restrict infidel and distantly located elements to appropriate target promoters the genome is subdivided and highly organized by means of functionally independ- ent ‘chromatin domains’ (1). Critical to this chromatin domain model are chromatin domain boundary elements, the DNA sequences that define the borders of chromatin domains and capable of blocking enhancer-promoter interactions. Chromatin domain boundary elements were first identified in Drosophila melanogaster, as specialized chromatin struc- tures that border the two heat shock genes in 87A7 heat shock locus. The DNA sequences that are responsible for the bordering effect were named as scs and scs 0 (specialized chromatin structures), and they became the first molecu- larly defined boundary elements (2). Thereafter, several of boundary elements have been identified in D. melanogaster at various genomic locations, the notable ones are gypsy, Mcp, Fab-7 and Fab-8 (3–8). The gypsy boundary is part of naturally occurring gypsy retrotransposon and the Mcp, Fab-7 and Fab-8 boundary elements are present within the bithorax complex [BX-C] of Drosophila and are required for domain specific expression of Abd-B *To whom correspondence should be addressed. Tel: +91 40 27192658; Fax:+91 40 27160591; Email: [email protected] Published online 28 January 2012 Nucleic Acids Research, 2012, Vol. 40, No. 10 4385–4395 doi:10.1093/nar/gks045 ß The Author(s) 2012. Published by Oxford University Press. This is an Open Access article distributed under the terms of the Creative Commons Attribution Non-Commercial License (http://creativecommons.org/licenses/ by-nc/3.0), which permits unrestricted non-commercial use, distribution, and reproduction in any medium, provided the original work is properly cited.
Transcript of Chromatin domain boundary element search tool for Drosophila

Chromatin domain boundary element searchtool for DrosophilaArumugam Srinivasan and Rakesh K. Mishra*
Centre for Cellular and Molecular Biology, Council for Scientific and Industrial Research (CSIR),Uppal Road, Hyderabad, 500007, India
Received December 15, 2010; Revised January 6, 2012; Accepted January 10, 2012
ABSTRACT
Chromatin domain boundary elements prevent in-appropriate interaction between distant or closelyspaced regulatory elements and restrict enhancersand silencers to correct target promoters. In spite ofhaving such a general role and expected frequentoccurrence genome wide, there is no DNAsequence analysis based tool to identify boundaryelements. Here, we report chromatin domainBoundary Element Search Tool (cdBEST), toidentify boundary elements. cdBEST uses knownrecognition sequences of boundary interactingproteins and looks for ‘motif clusters’. UsingcdBEST, we identified boundary sequences across12 Drosophila species. Of the 4576 boundary seque-nces identified in Drosophila melanogaster genome,>170 sequences are repetitive in nature and havesequence homology to transposable elements.Analysis of such sequences across 12 Drosophilagenomes showed that the occurrence of repetitivesequences in the context of boundaries is acommon feature of drosophilids. We use a variety ofgenome organization criteria and also experimentaltest on a subset of the cdBEST boundaries in anenhancer-blocking assay and show that 80% ofthem indeed function as boundaries in vivo. Theseobservations highlight the role of cdBEST in betterunderstanding of chromatin domain boundaries inDrosophila and setting the stage for comparativeanalysis of boundaries across closely relatedspecies.
INTRODUCTION
Eukaryotic genomes contain a large number and varietyof regulatory elements that control the cell type and
context dependent expression patterns of genes. Much ofthe genome that does not code for proteins, contains theseregulatory elements often in the close proximity of thetarget gene but frequently also at far away locations.Specific and appropriate interaction of regulatoryelements governs the complex and regulated expressionof genes. However, much of the mechanism involved inthis process remains to be understood and, in particular, itis far from clear how the specificity of interactions amongregulatory elements is achieved. It is known that givenaccess by bringing together in transgenic context or bychromosomal rearrangements, enhancers as well as silen-cers can act on almost any promoter. It is also known thatexpression of a transgene construct in different independ-ent transgenic lines often depends on the site of insertionin the genome, a phenomenon referred to as positioneffect, due to the influence of local regulatory elementson the transgene. These observations suggest that inorder to restrict infidel and distantly located elements toappropriate target promoters the genome is subdividedand highly organized by means of functionally independ-ent ‘chromatin domains’ (1).Critical to this chromatin domain model are chromatin
domain boundary elements, the DNA sequences thatdefine the borders of chromatin domains and capable ofblocking enhancer-promoter interactions. Chromatindomain boundary elements were first identified inDrosophila melanogaster, as specialized chromatin struc-tures that border the two heat shock genes in 87A7 heatshock locus. The DNA sequences that are responsible forthe bordering effect were named as scs and scs0 (specializedchromatin structures), and they became the first molecu-larly defined boundary elements (2). Thereafter, several ofboundary elements have been identified in D. melanogasterat various genomic locations, the notable ones are gypsy,Mcp, Fab-7 and Fab-8 (3–8). The gypsy boundary is partof naturally occurring gypsy retrotransposon and theMcp, Fab-7 and Fab-8 boundary elements are presentwithin the bithorax complex [BX-C] of Drosophila andare required for domain specific expression of Abd-B
*To whom correspondence should be addressed. Tel: +91 40 27192658; Fax: +91 40 27160591; Email: [email protected]
Published online 28 January 2012 Nucleic Acids Research, 2012, Vol. 40, No. 10 4385–4395doi:10.1093/nar/gks045
� The Author(s) 2012. Published by Oxford University Press.This is an Open Access article distributed under the terms of the Creative Commons Attribution Non-Commercial License (http://creativecommons.org/licenses/by-nc/3.0), which permits unrestricted non-commercial use, distribution, and reproduction in any medium, provided the original work is properly cited.

gene. Apart from Drosophila, the boundary elements werealso identified in variety of organisms ranging from yeastto human (9–11).Experimental identification of boundary elements
in Drosophila involves the two main functional assays.First, the enhancer blocker assay where the reportergene is driven by a minimal promoter and a strongenhancer and when a boundary element is placedin-between the enhancer and promoter, the expressionlevel of reporter gene is eliminated or reduced (12). Thesecond assay is known as insulation from position effectwhere a reporter gene is flanked by boundary elementsthat to insulate from chromosomal position effects leadingto uniform levels of expression in independent transgeniclines (13). Though, these assays have been successfullyused for various boundary elements, they have an inherentdisadvantage of having to produce transgenic animal linesand as a result, these assays cannot be applied forgenome-wide screening.As analternative to testing in trans-genic flies, recently boundary elements have been assayed inDrosophila cells (14,15). More recently, a cell culture basedbarrier assay has been used where ability of a test DNA toprevent spread of repressive chromatin has been assayed(16). These testing methods also involve making ofconstructs and establishing cell lines, and, therefore, limittheir applicability at genome level analysis. Based on thefunctional assays used, boundary elements are alsoreferred as enhancer-blocking insulator or barrier element.Though it is accepted that boundary elements divide
the genome into domains, the mechanism by which theyestablish independent functional domains remains unclearand various models that have been proposed so far,suggest that they may use more than one mechanism(10,17). All the models agree that boundary elementsexert their function through interaction with variousDNA-binding proteins and associated factors. To date,in Drosophila six DNA-binding proteins are shown todirectly interact with boundary elements. These includeBEAF, Zw5, GAGA Factor (GAF), Su(Hw), dCTCFand recently identified Elba factor (18–27). A boundaryelement may require one or more of these DNA-bindingproteins to function as a boundary in vivo (21,26,27).Recent studies have reported the genome-wide binding
profiles of various boundary binding proteins usingChIP-on-chip approach (28–32). Although these bindingprofiles can precisely map the in vivo binding sites of indi-vidual proteins, it is not clear how far these individualprotein binding profiles can define functional boundariesin the genome since they define only the binding sites ofproteins rather than defining complete boundarysequence. The experimentally identified boundary sizevaries from 431 bp to �2.5 kb (Supplementary Table S1).Moreover, these proteins are also involved in othernuclear functions such as transcriptional activation orsilencing apart from their boundary function (28,33).In vivo binding site analysis of a boundary interactingfactor does not necessarily indicate an associatedboundary function.Here, we report a bioinformatics tool, chromatin
domain Boundary Element Search Tool (cdBEST) foridentification of potential boundary sequences in
Drosophila. Using cdBEST, we identified 93109 bound-aries across 12 Drosophila species. Our approach identified4576 boundaries for D. melanogaster, including severalrepetitive boundaries. We also analysed these boundariesfor their context in terms of flanking genes and experimen-tally tested 19 cdBEST boundaries in Drosophila S2 cellsfor enhancer-blocking activity and found that greatmajority of these cdBEST boundaries indeed function asboundaries in vivo.
MATERIALS AND METHODS
Sequence data
The known boundary sequences were retrieved fromNational Center for Biotechnology Information (NCBI)(http://www.ncbi.nlm.nih.gov/) by following the informa-tion provided in published literatures (SupplementaryTable S1). We used D. melanogaster genome releaseversion 5.2 of NCBI for boundary prediction. The follow-ing are the accession numbers for various chromosomalarms of D. melanogaster that were used in this study:NT_033777.2 (3R), NT_037436.3 (3L), NT_033778.3(2R), NT_033779.4 (2L), NC_004354.3 (X) andNC_004353.3 (4).
cdBEST
Calculation of motif frequencies and fold enrichmentvalues. To calculate genome level motif frequencies (fg),we searched for the occurrences of individual boundarymotifs (mi�mn) in the Drosophila genome and dividedthe total number of occurrences with genome size.Similarly a boundary level frequency (fb) was alsocalculated by considering boundary sequence alone foreach boundary motif (see Supplementary Table S2 fordetails). The ratio between genome level frequency andboundary level frequency for a given motif mi is definedas fold enrichment value (FEV) for that particular motif.
FEV of motif mi ðFEVmiÞ ¼ fbðmiÞ=fgðmiÞ
Boundary score. We calculated the boundary score bytaking the overall summation of motif occurrences(Omi�n) and their multiplication with FEV (FEVmi�n).
Boundary score ¼Xn
i¼1
ðOmi � FEVmiÞ
Implementation and availability of cdBEST. The cdBESTalgorithm is implemented in Perl as two variants, thecdBEST basic and advanced. The basic version is acommand line script requires Perl alone, can be used inLinux and Mac computers directly without any additionalrequirements. cdBEST_basic uses FASTA formattedsequence files for boundary search and produces textoutput files. The advanced version has a simple GUI(graphical user interface), where user can choose variousparameters for searching boundaries. In addition to textfiles, this version produces an image output showingboundaries and gene annotations together with the scale
4386 Nucleic Acids Research, 2012, Vol. 40, No. 10
for easy correlation. cdBEST_advanced requires Perl-Tkmodule for generating GUI and BioPerl modules (34) todraw image output files. In addition cdBEST searchresults can be uploaded to various genome browserssuch as FlyBase GBrowse and UCSC genome Browseras custom tracks to view along with any other feature.The cdBEST source file for different OS platforms witha readme file is available for download at http://www.ccmb.res.in/rakeshmishra/cdBEST.html.
Drosophila S2 cell based enhancer blocker assay
To make NPG vector (neomycin PE enhancer GFP) con-struct, we used pGreen H-Pelican vector as startingmaterial (35). We assembled the final NPG construct(Figure 4A) in three steps. (i) Vector backbone: byDraIII digestion, we removed white gene and religatedvector. (ii) Neomycin-hsp70 promoter: we assembled theneomycin gene (amplified from pEGFP) and hsp70promoter in pBluescript vector. Using ApaI/KpnIdouble digestion, this cassette was removed and clonedin vector backbone. (iii) PE enhancer: we amplified PEenhancer (twist gene’s Proximal Element enhancer) fromthe Drosophila genomic DNA using specific primerscarrying KpnI sites, and cloned in vector backbone (36).In the final NPG construct the test fragments can becloned in NotI and BamHI sites. We PCR amplifiedvarious test fragments (known boundaries and predictedboundary elements) and cloned in pGEM-T Easy vector.Using NotI sites that are present in pGEM-T Easy vector,we removed the inserts and cloned to NPG vector.
We cultured Drosophila S2 cells in Schneider’s InsectMedium (supplemented with 10% serum). We used onemicrogram of Qiagen column purified DNA to transfect1ml of cells (1� 106 cells/ml). Effectene transfectionreagent kit (Qiagen) was used for transfections. After36 h of transfection we added G418 to cells with thefinal concentration 1mg/ml. Once in every 4 days, wereplaced the old media with fresh media (containingG418). After 6 weeks of culturing, we assayed the cellsfor enhancer-blocking activity. Flow cytometry analyseswere done on MoFlo cell sorter using 0.5ml of cells and20 000 events were scored.
Polycomb and H3K27me3 data analysis
We downloaded the Polycomb and H3 me3K27ChIP-chip data from ArrayExpress database (accessioncode E-MEXP-535) (37). Using Perl scripts and FlyBasecoordinate converter, we converted release four coordin-ates to release five coordinates and extracted the data forregions of our interest and written the data in GFFformat. By using BioPerl modules we generated imagefiles in which gene information and predicted boundariesare plotted along with ChIP-chip data and manuallycounted the boundaries that lie very close to borders ofstrong PcG sites.
FlyAtlas gene expression profile comparison
We downloaded FlyAtlas data set containing the expres-sion data for 17 adult tissues, eight larval tissues and S2cell line (38). This data set has the expression profiles
for 18 880 probes which represents Drosophila 18 500 tran-scripts covering around 13 500 genes. As data is referencedbased on Probe Set IDs, we added gene names, start, stoppositions and FlyBase IDs to each probe by following anannotation file (Drosophila_2.na28.annot.csv). Using aPerl script and chromosome specific gene lists (preparedfrom release 5.2 GenBank files) we separated out the datafor each chromosome and wrote it as separate files. Thenwe mixed the predicted boundaries to this chromosomespecific data and sorted the data using start positions.Using another Perl script, we extracted the gene pairsthat flank predicted boundaries and compared theirexpression profiles. Here we called a gene pair as ‘differ-entially expressed’ if their expression change direction is innegative correlation (i.e. the change direction is ‘Up’verses ‘Down’ or ‘Down’ verses ‘Up’) for one or moretissues. In order to make sure that the ‘Up’ change direc-tion of a gene reflects its presence, we used Affymetrixcall Presence/Absence values. We considered AffymetrixPresence/Absence call value 0 or 1 as a mark for absence,value 3 or 4 as mark presence of transcripts.
RESULTS
cdBEST
The experimentally identified boundary elements inDrosophila share common functional properties; howeverthey do not posses any significant sequence similarity. Ingeneral, cis-regulatory elements are often enriched bysmall sequence motifs. Boundaries elements are no excep-tion to this phenomenon and they do have several suchmotifs that serve as interacting sites for boundary inter-acting proteins (Table 1). With the objective to identifynew boundary elements, we analysed the distributionof these motifs in the euchromatic portion of theD. melanogaster genome. The DNA motifs we analysedinclude BEAF (19), Zw5 (20), GAF (21), Su(Hw) (23,24),Elba (27), CTCF (31,32,39) and Fab-7 Motif (F7M)(Mishra,R.K., unpublished data). The distributionpattern shows that the smaller motifs, BEAF, Zw5 andGAF are more randomly distributed in the genome, butoccur as clusters in boundary regions (Table 1). The largermotifs like Su(Hw), CTCF are non-randomly distributedin the genome and highly enriched in the boundary regions.Based on motif clustering and enrichment, we divided
the boundaries into five types: Fab-7 type, Fab-8 type,SCS type, SCS0-BE28 type and gypsy type (Table 2).For each boundary type, we evaluated for criteria like,the total number of motifs, predominant motif(s) andthe average gap between motifs. Taking inputs fromthese analyses we built a boundary element search tool,cdBEST that looks for boundary type specific motifclusters under a defined set of constraints (Table 2). Weincluded a scoring method in this tool to eliminate falsepredictions. The boundary score for a given sequence iscalculated by the overall summation of motif occurrencesmultiplied by their respective FEV. In general FEV ofmotifs are calculated by comparing their occurrencefrequencies in positive verses background data sets(40–42). We used known boundary regions as positive
Nucleic Acids Research, 2012, Vol. 40, No. 10 4387

data set and Drosophila genome sequence as a backgrounddata. The calculated FEV (Table 1) are incorporatedin the tool to derive the boundary score. We setboundary type specific minimum required scores incdBEST (Table 2).To test the tool for its efficiency, we used set of known
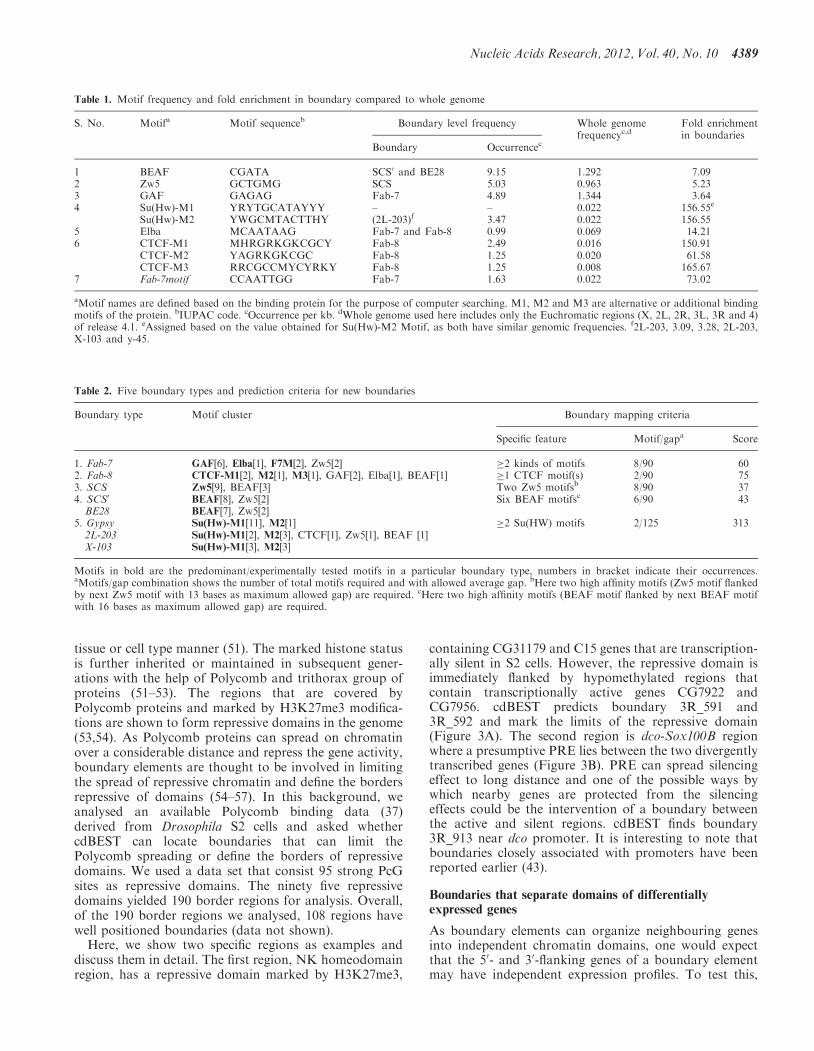
boundary sequences (Supplementary Table S1), cdBESTpicked up 10 of the 11 boundary sequences as hits withvarying scores (Supplementary Table S3). SF1 was theonly boundary that failed to a give hit because of itspoor motif content. The gypsy boundary achieved ahighest score of 1722.6, while the SCS boundaryreceived the lowest score 43.97. cdBEST did not yieldeven a single hit when regulatory element sequences suchas enhancers and polycomb response elements (PREs)were used as input (Supplementary Table S4) indicatingthe accuracy of the tool. A test run on a sequence regionthat covers Drosophila Bithorax complex (BX-C) identifies12 boundaries including previously known Mcp, Fab-6,Fab-7 and Fab-8 boundaries (Figure 1 andSupplementary File S1).
Whole genome analysis for boundaries inD. melanogaster
Drosophila melanogaster genome release 5.2 was used asinput for boundary search. Each chromosome was separ-ately analysed using 750 bp as set window size and 10 bpas window slide. Under these conditions, we retrieved4576 boundaries in the whole genome (Table 3 andSupplementary File S2). cdBEST correctly identified thereported boundaries, even-skipped, TER94, Abd-Bm andmyoglianin-eyeless (ME), which were not included in ourpositive data set (43–46). The average domain sizedeciphered by predicted boundaries varies from 19 to31 kb for various chromosome arms. Density of predictedboundary was greater on the X chromosome despitehaving a low gene density and moderate size.
Boundaries with repetitive occurrence are associatedwith transposable elements
To find multicopy or repetitive boundaries in theD. melanogaster genome, we carried out BLASTsequence alignments among the predicted boundarysequences. We used an identity of >90% over a stretchof 100-bp sequence to call repetitive boundaries in thegenome. Among the 4576 predicted boundaries, weretrieved 55 groups of repetitive boundaries containing239 individual elements. The number of boundarieswithin a group ranges from 2 to 39 (Table 4 andSupplementary Table S5). We also found the knowngypsy boundary in the list with two copies. This led tothe assumption that many of these multicopy boundariesmay be associated with transposable elements. To test this,we compared these repetitive boundary sequences withknown transposable element sequences from databases,FlyBase and Repbase (47,48). Of the 239 multicopyboundaries that are found in the D. melanogastergenome, 173 showed significant sequence similarity(>90% identity over 100-bp sequence) with transposableelements. Drosophila melanogaster has 96 known families
of transposable elements that covers the �5% of the eu-chromatic part of the genome (49,50). Out of 173boundaries of repetitive nature that are identified bycdBEST 110 boundaries maps to nine of these families(Table 4 and Supplementary Table S5), indicating thatonly a small subset of transposable elements haveboundary activity.
Application of cdBEST in other Drosophila species
Encouraged by the performance of cdBEST inD. melanogaster genome, we wanted to extent cdBESTprediction to 11 sequenced non-melanogaster species(50). Considering the evolutionary closeness of thesespecies we expected that the boundary elements to beconserved and cdBEST might be able to pickupboundaries across these species. First, we asked whethercdBEST can predict prominent boundaries, such as Fab-7and Fab-8 in these species. For this, we used region(s) thatcovers Bithorax complex to predict boundaries and foundhits that are orthologous to these two boundaries in allDrosophila species except grimshawi, where Fab-8 alonewas predicted (Supplementary Figure S1). As cdBESTcorrectly recognizes these two test boundaries in 10 outof the 11 species, we applied cdBEST for genome-wideboundary prediction. We downloaded the assembledgenome sequence of these 11 species from FlyBase(FB2011_05 Release) and screened for contigs that are>200 kb (47). Each genomic chromosome/contig/scaffoldwas subjected to boundary search and the total number ofboundaries was counted using an automated script.cdBEST identified 88533 boundaries for these 11non-melanogaster Drosophila species. The entire predic-tion data can be downloaded from our website (http://www.ccmb.res.in/rakeshmishra/cdBEST.html). Somespecies show very high number of boundaries whencompared to other species (Figure 2 and SupplementaryTable S6). Drosophila mojavensis has the highest numberof predicted boundaries (15781) among all 12 speciesin-spite of not having the largest genome size. We alsosearched for the occurrence of repetitive boundaries ineach of these species and extended the transposableelements verses repetitive boundaries comparison. In theend, we found large number of boundaries that areassociated with transposable elements across thesespecies (Supplementary Table S7). As shown in Figure 2,the percentage of repetitive boundaries closely follows therepeat contents of these 12 Drosophila genomes (50).D. ananassae and D. virilis are the only two species thatare having higher repeat boundary percentage than theiroverall repeat content. This may be because of speciesspecific repeat sequences with boundary potential arepresent in these species. The highest copy-numberboundary (2702 copies), is indeed a species specificrepeat sequence of D. ananassae.
Epigenomic context of boundaries identified by cdBEST
Boundary elements that mark the borders of repressivedomains. During the early embryonic development, theactive and inactive chromatin regions are marked byspecific post-translational histone modifications in a
4388 Nucleic Acids Research, 2012, Vol. 40, No. 10
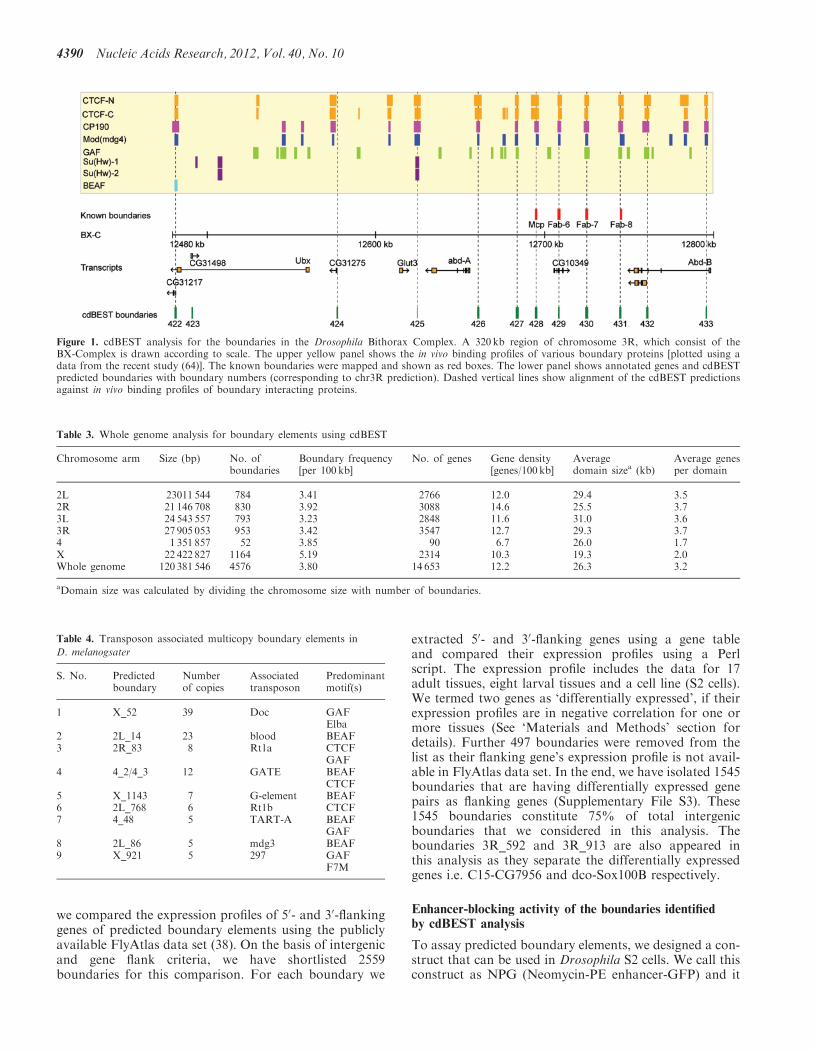
tissue or cell type manner (51). The marked histone statusis further inherited or maintained in subsequent gener-ations with the help of Polycomb and trithorax group ofproteins (51–53). The regions that are covered byPolycomb proteins and marked by H3K27me3 modifica-tions are shown to form repressive domains in the genome(53,54). As Polycomb proteins can spread on chromatinover a considerable distance and repress the gene activity,boundary elements are thought to be involved in limitingthe spread of repressive chromatin and define the bordersrepressive of domains (54–57). In this background, weanalysed an available Polycomb binding data (37)derived from Drosophila S2 cells and asked whethercdBEST can locate boundaries that can limit thePolycomb spreading or define the borders of repressivedomains. We used a data set that consist 95 strong PcGsites as repressive domains. The ninety five repressivedomains yielded 190 border regions for analysis. Overall,of the 190 border regions we analysed, 108 regions havewell positioned boundaries (data not shown).
Here, we show two specific regions as examples anddiscuss them in detail. The first region, NK homeodomainregion, has a repressive domain marked by H3K27me3,
containing CG31179 and C15 genes that are transcription-ally silent in S2 cells. However, the repressive domain isimmediately flanked by hypomethylated regions thatcontain transcriptionally active genes CG7922 andCG7956. cdBEST predicts boundary 3R_591 and3R_592 and mark the limits of the repressive domain(Figure 3A). The second region is dco-Sox100B regionwhere a presumptive PRE lies between the two divergentlytranscribed genes (Figure 3B). PRE can spread silencingeffect to long distance and one of the possible ways bywhich nearby genes are protected from the silencingeffects could be the intervention of a boundary betweenthe active and silent regions. cdBEST finds boundary3R_913 near dco promoter. It is interesting to note thatboundaries closely associated with promoters have beenreported earlier (43).
Boundaries that separate domains of differentiallyexpressed genes
As boundary elements can organize neighbouring genesinto independent chromatin domains, one would expectthat the 50- and 30-flanking genes of a boundary elementmay have independent expression profiles. To test this,
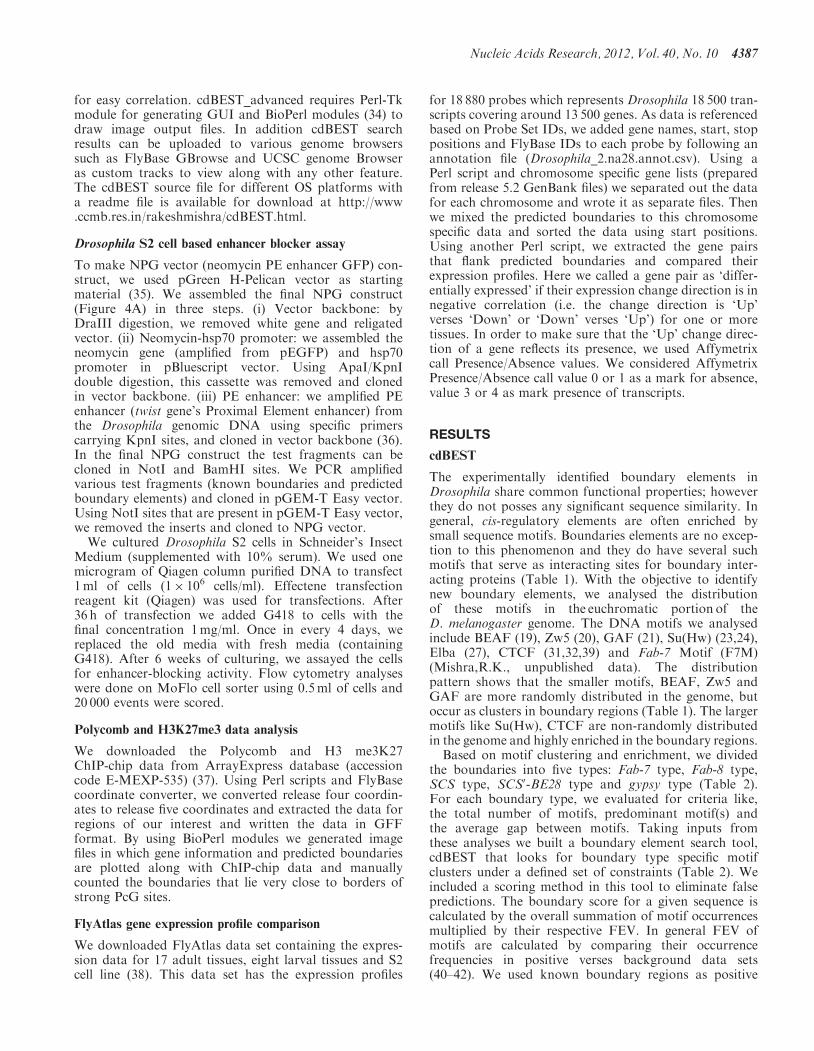
Table 1. Motif frequency and fold enrichment in boundary compared to whole genome
S. No. Motifa Motif sequenceb Boundary level frequency Whole genomefrequencyc,d
Fold enrichmentin boundaries
Boundary Occurrencec
1 BEAF CGATA SCS0 and BE28 9.15 1.292 7.092 Zw5 GCTGMG SCS 5.03 0.963 5.233 GAF GAGAG Fab-7 4.89 1.344 3.644 Su(Hw)-M1 YRYTGCATAYYY – – 0.022 156.55e
Su(Hw)-M2 YWGCMTACTTHY (2L-203)f 3.47 0.022 156.555 Elba MCAATAAG Fab-7 and Fab-8 0.99 0.069 14.216 CTCF-M1 MHRGRKGKCGCY Fab-8 2.49 0.016 150.91
CTCF-M2 YAGRKGKCGC Fab-8 1.25 0.020 61.58CTCF-M3 RRCGCCMYCYRKY Fab-8 1.25 0.008 165.67
7 Fab-7motif CCAATTGG Fab-7 1.63 0.022 73.02
aMotif names are defined based on the binding protein for the purpose of computer searching. M1, M2 and M3 are alternative or additional bindingmotifs of the protein. bIUPAC code. cOccurrence per kb. dWhole genome used here includes only the Euchromatic regions (X, 2L, 2R, 3L, 3R and 4)of release 4.1. eAssigned based on the value obtained for Su(Hw)-M2 Motif, as both have similar genomic frequencies. f2L-203, 3.09, 3.28, 2L-203,X-103 and y-45.
Table 2. Five boundary types and prediction criteria for new boundaries
Boundary type Motif cluster Boundary mapping criteria
Specific feature Motif/gapa Score
1. Fab-7 GAF[6], Elba[1], F7M[2], Zw5[2] �2 kinds of motifs 8/90 602. Fab-8 CTCF-M1[2], M2[1], M3[1], GAF[2], Elba[1], BEAF[1] �1 CTCF motif(s) 2/90 753. SCS Zw5[9], BEAF[3] Two Zw5 motifsb 8/90 374. SCS0 BEAF[8], Zw5[2] Six BEAF motifsc 6/90 43
BE28 BEAF[7], Zw5[2]5. Gypsy Su(Hw)-M1[11], M2[1] �2 Su(HW) motifs 2/125 313
2L-203 Su(Hw)-M1[2], M2[3], CTCF[1], Zw5[1], BEAF [1]X-103 Su(Hw)-M1[3], M2[3]
Motifs in bold are the predominant/experimentally tested motifs in a particular boundary type, numbers in bracket indicate their occurrences.aMotifs/gap combination shows the number of total motifs required and with allowed average gap. bHere two high affinity motifs (Zw5 motif flankedby next Zw5 motif with 13 bases as maximum allowed gap) are required. cHere two high affinity motifs (BEAF motif flanked by next BEAF motifwith 16 bases as maximum allowed gap) are required.
Nucleic Acids Research, 2012, Vol. 40, No. 10 4389
we compared the expression profiles of 50- and 30-flankinggenes of predicted boundary elements using the publiclyavailable FlyAtlas data set (38). On the basis of intergenicand gene flank criteria, we have shortlisted 2559boundaries for this comparison. For each boundary we
extracted 50- and 30-flanking genes using a gene tableand compared their expression profiles using a Perlscript. The expression profile includes the data for 17adult tissues, eight larval tissues and a cell line (S2 cells).We termed two genes as ‘differentially expressed’, if theirexpression profiles are in negative correlation for one ormore tissues (See ‘Materials and Methods’ section fordetails). Further 497 boundaries were removed from thelist as their flanking gene’s expression profile is not avail-able in FlyAtlas data set. In the end, we have isolated 1545boundaries that are having differentially expressed genepairs as flanking genes (Supplementary File S3). These1545 boundaries constitute 75% of total intergenicboundaries that we considered in this analysis. Theboundaries 3R_592 and 3R_913 are also appeared inthis analysis as they separate the differentially expressedgenes i.e. C15-CG7956 and dco-Sox100B respectively.
Enhancer-blocking activity of the boundaries identifiedby cdBEST analysis
To assay predicted boundary elements, we designed a con-struct that can be used in Drosophila S2 cells. We call thisconstruct as NPG (Neomycin-PE enhancer-GFP) and it
Figure 1. cdBEST analysis for the boundaries in the Drosophila Bithorax Complex. A 320 kb region of chromosome 3R, which consist of theBX-Complex is drawn according to scale. The upper yellow panel shows the in vivo binding profiles of various boundary proteins [plotted using adata from the recent study (64)]. The known boundaries were mapped and shown as red boxes. The lower panel shows annotated genes and cdBESTpredicted boundaries with boundary numbers (corresponding to chr3R prediction). Dashed vertical lines show alignment of the cdBEST predictionsagainst in vivo binding profiles of boundary interacting proteins.
Table 3. Whole genome analysis for boundary elements using cdBEST
Chromosome arm Size (bp) No. ofboundaries
Boundary frequency[per 100 kb]
No. of genes Gene density[genes/100 kb]
Averagedomain sizea (kb)
Average genesper domain
2L 23011 544 784 3.41 2766 12.0 29.4 3.52R 21 146 708 830 3.92 3088 14.6 25.5 3.73L 24 543 557 793 3.23 2848 11.6 31.0 3.63R 27 905 053 953 3.42 3547 12.7 29.3 3.74 1 351 857 52 3.85 90 6.7 26.0 1.7X 22 422 827 1164 5.19 2314 10.3 19.3 2.0Whole genome 120 381 546 4576 3.80 14 653 12.2 26.3 3.2
aDomain size was calculated by dividing the chromosome size with number of boundaries.
Table 4. Transposon associated multicopy boundary elements in
D. melanogsater
S. No. Predictedboundary
Numberof copies
Associatedtransposon
Predominantmotif(s)
1 X_52 39 Doc GAFElba
2 2L_14 23 blood BEAF3 2R_83 8 Rt1a CTCF
GAF4 4_2/4_3 12 GATE BEAF
CTCF5 X_1143 7 G-element BEAF6 2L_768 6 Rt1b CTCF7 4_48 5 TART-A BEAF
GAF8 2L_86 5 mdg3 BEAF9 X_921 5 297 GAF
F7M
4390 Nucleic Acids Research, 2012, Vol. 40, No. 10

has two reporters, neomycin gene for selection of theplasmid and GFP to assay the enhancer-blockingactivity (Figure 4A). We cloned two known boundaries(Fab-7 and Fab-8) and 19 predicted boundaries ofD. melanogaster (see Supplementary Table S8 for list ofprimes) in this construct and transfected them in S2 cells.We also included NG construct, a minimal version ofNPG that lacks PE enhancer. We selected for stable inte-grants by growing the transfected S2 cells in G418 con-taining culture medium for 6 weeks and assayed forenhancer blocker activity using Flow cytometry analysis.The result show that Fab-7 and Fab-8 function as strongenhancer blockers in this assay, as their percentage of cellsthat express GFP is comparable to NG (Figure 4B). Of thenineteen cdBEST boundaries that were assayed fifteenshowed enhancer-blocking activity (11 strong & 4moderate). In the remaining four, two elements that areclose to Abd-B promoter had higher GFP fluorescencethan NPG vector (Figure 4B). It is interesting to notethat one of the tested boundary, 4_29, is repetitive innature and it also showed strong enhancer-blockingactivity.
DISCUSSION
Chromatin domain boundaries are the key regulatoryelements that help in packaging the genome and regulatinggene expression as they are known to subdivide thegenome into independent functional domains (9,58–61).Mapping the boundary elements at the genome level,therefore, gives a global view of the structural and func-tional organization of the genome. Unlike coding or other
Figure 3. Predicted boundary elements mark the borders of Polycomb mediated repressed domains. The A and B parts are two representativeregions of chromosome 3R of Drosophila genome. Upper panels show the predicted boundaries and annotated gene transcripts with scale.Lower panels show the binding profiles (ChIP/input ratio) for H3K27me3, PC, PSC and E(Z) proteins obtained from previously publishedChIP-chip study (37).
Figure 2. Boundaries and their repetitive nature in 12 Drosophilaspecies. Four different data series, boundaries, repetitive boundaries,genome sizes and their repeat contents are plotted in logarithmicscale covering all 12 Drosophila species. Repetitive boundaries curveclosely follows the repeat contents of the genomes indicating a strongpositive correlation between them (i.e. genomes with higher repeatcontent are more likely to have higher number of repetitiveboundaries).
Nucleic Acids Research, 2012, Vol. 40, No. 10 4391

regulatory elements, boundaries do not have prominentsequence features that are common to all boundaries.Although a boundary can replace another boundary inthe endogenous locus and rescue the function, they lackany apparent primary sequence similarity (62). This, there-fore, rule out simple sequence comparison based searchfor such elements in the genome. Biochemical analysis ofseveral boundaries elements in Drosophila earlier have ledto the identification of small sequence motifs that are rec-ognition sites of the DNA-binding proteins involved in theboundary function. We noticed that all the boundariescontain a cluster of such motifs and several of them arecommon in subset of boundaries. Based on this motif clus-tering, here we describe a bioinformatics approach,cdBEST, to identify boundaries in D. melanogastergenome. We were also able to assign common sequencefeatures and derive boundary type specific criteria neededto predict various subclasses of boundaries that exist inDrosophila genome (30,63).We used several approaches to validate the cdBEST
predicted boundaries. Using an available genome-wideepigenetic profiling data of Polycomb group of proteins,we looked if a predicted boundary was seen between therepressive and active regions of the genome based on epi-genetic mark. Several predicted boundaries, indeed, werefound in such locations supporting that boundaries
subdivide genome into functional domains (Figure 3).In an independent approach, we also observed thataround 75% of the genes that flank predicted boundaryare differentially expressed in one or more tissues/celllines. This supports the anticipated role of the predictedboundaries in their genomic context. The strongestsupport for the relevance of the cdBEST predictedboundary elements comes from the direct demonstrationof their enhancer-blocking activity. We tested 19 predictedboundaries and found that 15 of them function asenhancer blockers in Drosophila S2 cells (Figure 4).These results allow us to conclude that the predictedboundaries are indeed functional elements in theDrosophila genome.
Several approaches have been used recently to addresschromatin domains and boundaries in Drosophila andhuman. One of these approaches is computationalsearch of motifs across the genome that are the sites ofinteraction for individual boundary interacting protein(24,40). This approach leaves other factors that mayco-occupy the boundary region while cdBEST uses‘motif cluster’ approach, where cluster of boundarymotifs is preferred over single motif. In addition,cdBEST includes all the known boundary motifs andcovers various boundary types that are present inDrosophila, which makes the search more comprehensive.
Figure 4. Predicted boundary elements function as enhancer blockers in Drosophila S2 cells. (A) The enhancer-blocking assay vector, NPG, showingthe neo resistance gene, the PE enhancer, the GFP reporter gene and the test DNA insertion site. If the test DNA blocks enhancer-promotercommunication, the stably transfected cells would have a lesser number of GFP positive cells. (B) Flow cytometry analysis was used to determinenumber of GFP positive cells. For each test DNA, percentage of GFP positive cells was calculated and plotted relative to NPG vector transfection.Filled black boxes indicate strong enhancer-blocking activity and half-filled ones indicate moderate activity and empty boxes show weak or noblocking activity.
4392 Nucleic Acids Research, 2012, Vol. 40, No. 10
cdBEST also has the flexibility of changing parametersand constraints and can be set to individual motifsearch too.
Another approach to identify boundaries at genomescale is by ChIP based in vivo occupancy of individualboundary proteins (64–66) which is experimental equiva-lent of the above discussed computation approach.A major difficulty in this approach is that majority of theboundary interacting proteins in Drosophila are alsoinvolved in other nuclear functions such as transcriptionalrepressor or activator and, therefore, each site detected forinteraction may not necessarily reflect boundary (65).Furthermore, ChIP experiments are often performedusing a single cell line, or mixed tissue such as embryowhich may not reflect the complexities involved in eachand every tissue and cell types (30). To investigate this,we compared our cdBEST boundaries with a publishedChIP data (64). As indicated in Figure 1, 11 out of the 12predicted boundaries that are present in BX-C had clearoverlapping ChIP signals. We find that �55% of thecdBEST boundaries have an overlapping ChIP signal forone or more boundary proteins. While this is a reasonableagreement, it is possible that at least some of the remaining45% cdBEST predicted boundaries may be tissue specificand may not be bound by proteins in cells where they arenot functional. Also, since cdBEST used sequence motifs ofadditional boundary proteins, for example, Zw5, Elba andF7M, and genome scale ChIP data is not available for theseproteins, cdBEST can still predict boundaries dependent onabove mentioned factors. We also noticed several instanceswhere a site identified as binding region for a boundaryprotein in vivo (for example, CP190) does not have the con-sensus DNA sequence motif on boundaries (64,67).Considering that boundaries can cluster together, somemay not have direct binding sites and may be recruitedthrough protein–protein interactions (67). Such boundariescan show up in ChIP based analyses but will be missed inrecognition motif based predictions. Since cdBEST usesexperimentally tested sites in the context of theirboundary function and the scoring system has beenoptimized keeping ‘true boundary motifs’ context in theconsideration, it has stringent predictive value. Inaddition, cdBEST has a clear advantage over ChIPapproach as it can be applied any other closely relatedgenomes.
The third genome scale boundary search approach hasbeen to look at the transition regions in profiling ofhistone modifications or chromatin proteins that definechromatin domains (68,69). This approach is novel andmost recent with the limitation that it is human specificand does not offer any tool which can be applied toother genomes (69). Although we have cdBEST forD. melanogaster, since it uses motif based approach itoffers a tool which can be optimized in many otherclosely related genomes as seen from our boundary searchresults in non-melanogaster drosophilids. A related studythat used genome scale profiling of more than 50 chro-matin proteins shows five principal chromatin types thatare present in Drosophila Kc-167 cells (68). In this study8428 chromatin domains have been identified with themedian size of 6.5 kb. Their data provides a fair idea of
chromatin domains that are present in Drosophila cells.We explored how frequently the transition regions ofthese chromatin domains coincided with the boundariesdefined by cdBEST. Of the 4576 cdBEST boundaries,21% (977) overlap within 2 kb sequence that was usedas the transition region, while the rest of the boundariesare found be located inside these domains. We took aclose look at the BX-Complex region that has a seriesof well identified and studied boundaries separating inde-pendent regulatory domains (11). While all the BX-Cboundaries were mapped by cdBEST and validated byenhancer-blocking assays (Figure 4B), in the ‘five princi-pal type chromatin’ study the entire BX-Complex ismarked as a single BLUE chromatin that correspondsto PcG chromatin. While this is in agreement with thechromatin state of Kc167 cell line, where BX-C genes arerepressed by PcG proteins, it does not reflect the dynamicand cell type specific redistribution of chromatin types.Since cdBEST uses the primary sequence alone as theinput, it extracts all possible boundaries that depend onthe motifs used even if they may not functionally exist ina particular cell type or state. Such an inclusive approachgives the global picture the genome organization.Any whole genome analysis is not complete, specially,
in higher eukaryotes, unless it takes into account therepetitive elements. Several lines of studies indicate roleof repetitive DNA in boundary function (16,70–72). IncdBEST based analysis, we also find several boundariesthat occur multiple times in the genome and majority ofthem turned out to be associated with transposableelements (Supplementary Table S5). Prior to thisanalysis, gypsy and Idefix were the only transposableelements in Drosophila known to have boundaryfunction and further experiments may identify manysuch elements and link these transposable elements toregulatory function. Boundary activity associated withrepetitive sequences is of special significance as itprovides means to regulate number of loci with fewerprotein factors in a coordinated manner (72).In conclusion, cdBEST is a reliable tool to detect
boundaries at whole genome scale in D. melanogasterand many other drosophilids. With the help of cdBEST,we can annotate a significant portion of the genome(�3%) as boundary elements. As majority of theboundary interacting proteins are conserved amonginsects (73,74), cdBEST can be easily adapted to otherinsect genomes to search boundary element sequencesand annotate their genomes for boundaries. With theincreasing number of species whose genome sequencesare being made available, for example, i5k project of5000 insects and other arthropods (75), tools likecdBEST will be helpful to analyse and understandfeatures of genome organization and function.
SUPPLEMENTARY DATA
Supplementary Data are available at NAR Online:Supplementary Tables 1–8, Supplementary Figure 1and Supplementary Files 1–3.
Nucleic Acids Research, 2012, Vol. 40, No. 10 4393

ACKNOWLEDGEMENTS
The authors thank Jyotsna Singh for her help in NPGassay vector preparation and G. Srinivas for help inFlow Cytometry data analysis.
FUNDING
RKM laboratory is supported by Council of Scientific andIndustrial Research (CSIR), India and research grantsfrom Department of Biotechnology (DBT) andDepartment of Science and Technology (DST) of theGovernment of India. Funding for open access charge:Centre for Cellular and Molecular Biology, Hyderabad,India.
Conflict of interest statement. None declared.
REFERENCES
1. Labrador,M. and Corces,V.G. (2002) Setting the boundaries ofchromatin domains and nuclear organization. Cell, 111, 151–154.
2. Udvardy,A., Maine,E. and Schedl,P. (1985) The 87A7chromomere. Identification of novel chromatin structures flankingthe heat shock locus that may define the boundaries of higherorder domains. J. Mol. Biol., 185, 341–358.
3. Gdula,D.A., Gerasimova,T.I. and Corces,V.G. (1996) Genetic andmolecular analysis of the gypsy chromatin insulator ofDrosophila. Proc. Natl Acad. Sci. USA, 93, 9378–9383.
4. Karch,F., Galloni,M., Sipos,L., Gausz,J., Gyurkovics,H. andSchedl,P. (1994) Mcp and Fab-7: molecular analysis of putativeboundaries of cis-regulatory domains in the bithorax complex ofDrosophila melanogaster. Nucleic Acids Res., 22, 3138–3146.
5. Hagstrom,K., Muller,M. and Schedl,P. (1996) Fab-7 functions asa chromatin domain boundary to ensure proper segmentspecification by the Drosophila bithorax complex. Genes Dev., 10,3202–3215.
6. Zhou,J., Barolo,S., Szymanski,P. and Levine,M. (1996) The Fab-7element of the bithorax complex attenuates enhancer-promoterinteractions in the Drosophila embryo. Genes Dev., 10,3195–3201.
7. Mihaly,J., Hogga,I., Gausz,J., Gyurkovics,H. and Karch,F. (1997)In situ dissection of the Fab-7 region of the bithorax complexinto a chromatin domain boundary and a Polycomb-responseelement. Development, 124, 1809–1820.
8. Barges,S., Mihaly,J., Galloni,M., Hagstrom,K., Muller,M.,Shanower,G., Schedl,P., Gyurkovics,H. and Karch,F. (2000) TheFab-8 boundary defines the distal limit of the bithorax complexiab-7 domain and insulates iab-7 from initiation elements and aPRE in the adjacent iab-8 domain. Development, 127, 779–790.
9. Bell,A.C., West,A.G. and Felsenfeld,G. (2001) Insulators andboundaries: versatile regulatory elements in the eukaryoticgenome. Science, 291, 447–450.
10. West,A.G., Gaszner,M. and Felsenfeld,G. (2002) Insulators: manyfunctions, many mechanisms. Genes Dev., 16, 271–288.
11. Mishra,R.K. and Karch,F. (1999) Boundaries that demarcatestructural and functional domains of chromatin J. Biosci., 24,377–399.
12. Kellum,R. and Schedl,P. (1992) A group of scs elements functionas domain boundaries in an enhancer-blocking assay.Mol. Cell. Biol., 12, 2424–2431.
13. Kellum,R. and Schedl,P. (1991) A position-effect assay forboundaries of higher order chromosomal domains. Cell, 64,941–950.
14. Ciavatta,D., Rogers,S. and Magnuson,T. (2007) DrosophilaCTCF is required for Fab-8 enhancer blocking activity in S2cells. J. Mol. Biol., 373, 233–239.
15. Li,M., Belozerov,V.E. and Cai,H.N. (2008) Analysis of chromatinboundary activity in Drosophila cells. BMC Mol. Biol., 9, 109.
16. Kim,J.H., Ebersole,T., Kouprina,N., Noskov,V.N., Ohzeki,J.,Masumoto,H., Mravinac,B., Sullivan,B.A., Pavlicek,A., Dovat,S.et al. (2009) Human gamma-satellite DNA maintains openchromatin structure and protects a transgene from epigeneticsilencing. Genome Res., 19, 533–544.
17. Valenzuela,L. and Kamakaka,R.T. (2006) Chromatin insulators.Annu. Rev. Genet., 40, 107–138.
18. Zhao,K., Hart,C.M. and Laemmli,U.K. (1995) Visualization ofchromosomal domains with boundary element-associated factorBEAF-32. Cell, 81, 879–889.
19. Cuvier,O., Hart,C.M. and Laemmli,U.K. (1998) Identification ofa class of chromatin boundary elements. Mol. Cell. Biol., 18,7478–7486.
20. Gaszner,M., Vazquez,J. and Schedl,P. (1999) The Zw5 protein, acomponent of the scs chromatin domain boundary, is able toblock enhancer-promoter interaction. Genes Dev., 13, 2098–2107.
21. Schweinsberg,S., Hagstrom,K., Gohl,D., Schedl,P., Kumar,R.P.,Mishra,R. and Karch,F. (2004) The enhancer-blocking activity ofthe Fab-7 boundary from the Drosophila bithorax complexrequires GAGA-factor-binding sites. Genetics, 168, 1371–1384.
22. Spana,C., Harrison,D.A. and Corces,V.G. (1988) The Drosophilamelanogaster suppressor of Hairy-wing protein binds to specificsequences of the gypsy retrotransposon. Genes Dev., 2, 1414–1423.
23. Parnell,T.J., Viering,M.M., Skjesol,A., Helou,C., Kuhn,E.J. andGeyer,P.K. (2003) An endogenous suppressor of hairy-winginsulator separates regulatory domains in Drosophila.Proc. Natl Acad. Sci. USA, 100, 13436–13441.
24. Ramos,E., Ghosh,D., Baxter,E. and Corces,V.G. (2006) Genomicorganization of gypsy chromatin insulators in Drosophilamelanogaster. Genetics, 172, 2337–2349.
25. Parnell,T.J., Kuhn,E.J., Gilmore,B.L., Helou,C., Wold,M.S. andGeyer,P.K. (2006) Identification of genomic sites that bind theDrosophila suppressor of Hairy-wing insulator protein.Mol. Cell. Biol., 26, 5983–5993.
26. Moon,H., Filippova,G., Loukinov,D., Pugacheva,E., Chen,Q.,Smith,S.T., Munhall,A., Grewe,B., Bartkuhn,M., Arnold,R. et al.(2005) CTCF is conserved from Drosophila to humans andconfers enhancer blocking of the Fab-8 insulator. EMBO Rep., 6,165–170.
27. Aoki,T., Schweinsberg,S., Manasson,J. and Schedl,P. (2008) Astage-specific factor confers Fab-7 boundary activity during earlyembryogenesis in Drosophila. Mol. Cell. Biol., 28, 1047–1060.
28. Jiang,N., Emberly,E., Cuvier,O. and Hart,C.M. (2009)Genome-wide mapping of boundary element-associated factor(BEAF) binding sites in Drosophila melanogaster links BEAF totranscription. Mol. Cell. Biol., 29, 3556–3568.
29. Emberly,E., Blattes,R., Schuettengruber,B., Hennion,M., Jiang,N.,Hart,C.M., Kas,E. and Cuvier,O. (2008) BEAF regulatescell-cycle genes through the controlled deposition of H3K9methylation marks into its conserved dual-core binding sites.PLoS Biol., 6, 2896–2910.
30. Bushey,A.M., Ramos,E. and Corces,V.G. (2009) Three subclassesof a Drosophila insulator show distinct and cell type-specificgenomic distributions. Genes Dev., 23, 1338–1350.
31. Holohan,E.E., Kwong,C., Adryan,B., Bartkuhn,M., Herold,M.,Renkawitz,R., Russell,S. and White,R. (2007) CTCF genomicbinding sites in Drosophila and the organisation of the bithoraxcomplex. PLoS Genet., 3, e112.
32. Smith,S.T., Wickramasinghe,P., Olson,A., Loukinov,D., Lin,L.,Deng,J., Xiong,Y., Rux,J., Sachidanandam,R., Sun,H. et al.(2009) Genome wide ChIP-chip analyses reveal important rolesfor CTCF in Drosophila genome organization. Dev. Biol., 328,518–528.
33. Chopra,V.S., Srinivasan,A., Kumar,R.P., Mishra,K., Basquin,D.,Docquier,M., Seum,C., Pauli,D. and Mishra,R.K. (2008)Transcriptional activation by GAGA factor is through its directinteraction with dmTAF3. Dev. Biol., 317, 660–670.
34. Stajich,J.E., Block,D., Boulez,K., Brenner,S.E., Chervitz,S.A.,Dagdigian,C., Fuellen,G., Gilbert,J.G., Korf,I., Lapp,H. et al.(2002) The Bioperl toolkit: Perl modules for the life sciences.Genome Res., 12, 1611–1618.
35. Barolo,S., Carver,L.A. and Posakony,J.W. (2000) GFP andbeta-galactosidase transformation vectors for promoter/enhanceranalysis in Drosophila. Biotechniques, 29, 726, 728, 730, 732.
4394 Nucleic Acids Research, 2012, Vol. 40, No. 10

36. Jiang,J., Kosman,D., Ip,Y.T. and Levine,M. (1991) The dorsalmorphogen gradient regulates the mesoderm determinant twist inearly Drosophila embryos. Genes Dev., 5, 1881–1891.
37. Schwartz,Y.B., Kahn,T.G., Nix,D.A., Li,X.Y., Bourgon,R.,Biggin,M. and Pirrotta,V. (2006) Genome-wide analysis ofPolycomb targets in Drosophila melanogaster. Nat. Genet., 38,700–705.
38. Chintapalli,V.R., Wang,J. and Dow,J.A. (2007) Using FlyAtlas toidentify better Drosophila melanogaster models of human disease.Nat. Genet., 39, 715–720.
39. Bartkuhn,M., Straub,T., Herold,M., Herrmann,M., Rathke,C.,Saumweber,H., Gilfillan,G.D., Becker,P.B. and Renkawitz,R.(2009) Active promoters and insulators are marked by thecentrosomal protein 190. EMBO J., 28, 877–888.
40. Xie,X., Mikkelsen,T.S., Gnirke,A., Lindblad-Toh,K., Kellis,M.and Lander,E.S. (2007) Systematic discovery of regulatory motifsin conserved regions of the human genome, including thousandsof CTCF insulator sites. Proc. Natl Acad. Sci. USA, 104,7145–7150.
41. Eden,E., Lipson,D., Yogev,S. and Yakhini,Z. (2007)Discovering motifs in ranked lists of DNA sequences.PLoS Comput. Biol., 3, e39.
42. Fiedler,T. and Rehmsmeier,M. (2006) jPREdictor: a versatile toolfor the prediction of cis-regulatory elements. Nucleic Acids Res.,34, W546–W550.
43. Ohtsuki,S. and Levine,M. (1998) GAGA mediates the enhancerblocking activity of the eve promoter in the Drosophila embryo.Genes Dev., 12, 3325–3330.
44. Fujioka,M., Wu,X. and Jaynes,J.B. (2009) A chromatin insulatormediates transgene homing and very long-rangeenhancer-promoter communication. Development, 136, 3077–3087.
45. Chopra,V.S., Cande,J., Hong,J.W. and Levine,M. (2009) StalledHox promoters as chromosomal boundaries. Genes Dev., 23,1505–1509.
46. Sultana,H., Verma,S. and Mishra,R.K. A BEAF dependentchromatin domain boundary separates myoglianin and eyelessgenes of Drosophila melanogaster. Nucleic Acids Res., 39,3543–3557.
47. McQuilton,P., St Pierre,S.E. and Thurmond,J. FlyBase 101 - thebasics of navigating FlyBase. Nucleic Acids Res, 40, D706–D714.
48. Jurka,J., Kapitonov,V.V., Pavlicek,A., Klonowski,P., Kohany,O.and Walichiewicz,J. (2005) Repbase Update, a database ofeukaryotic repetitive elements. Cytogenet. Genome Res., 110,462–467.
49. Kaminker,J.S., Bergman,C.M., Kronmiller,B., Carlson,J.,Svirskas,R., Patel,S., Frise,E., Wheeler,D.A., Lewis,S.E.,Rubin,G.M. et al. (2002) The transposable elements of theDrosophila melanogaster euchromatin: a genomics perspective.Genome Biol., 3, RESEARCH0084.
50. Clark,A.G., Eisen,M.B., Smith,D.R., Bergman,C.M., Oliver,B.,Markow,T.A., Kaufman,T.C., Kellis,M., Gelbart,W., Iyer,V.N.et al. (2007) Evolution of genes and genomes on the Drosophilaphylogeny. Nature, 450, 203–218.
51. Ringrose,L. and Paro,R. (2004) Epigenetic regulation of cellularmemory by the Polycomb and Trithorax group proteins.Annu. Rev. Genet., 38, 413–443.
52. Schwartz,Y.B. and Pirrotta,V. (2008) Polycomb complexes andepigenetic states. Curr. Opin. Cell Biol., 20, 266–273.
53. Papp,B. and Muller,J. (2006) Histone trimethylation and themaintenance of transcriptional ON and OFF states by trxG andPcG proteins. Genes Dev., 20, 2041–2054.
54. Kahn,T.G., Schwartz,Y.B., Dellino,G.I. and Pirrotta,V. (2006)Polycomb complexes and the propagation of the methylationmark at the Drosophila ubx gene. J. Biol. Chem., 281,29064–29075.
55. Sigrist,C.J. and Pirrotta,V. (1997) Chromatin insulator elementsblock the silencing of a target gene by the Drosophila polycombresponse element (PRE) but allow trans interactions betweenPREs on different chromosomes. Genetics, 147, 209–221.
56. van der Vlag,J., den Blaauwen,J.L., Sewalt,R.G., van Driel,R.and Otte,A.P. (2000) Transcriptional repression mediated bypolycomb group proteins and other chromatin-associatedrepressors is selectively blocked by insulators. J. Biol. Chem., 275,697–704.
57. Mendenhall,E.M. and Bernstein,B.E. (2008) Chromatin statemaps: new technologies, new insights. Curr. Opin. Genet. Dev, 18,109–115.
58. Bushey,A.M., Dorman,E.R. and Corces,V.G. (2008) Chromatininsulators: regulatory mechanisms and epigenetic inheritance.Mol. Cell, 32, 1–9.
59. Wallace,J.A. and Felsenfeld,G. (2007) We gather together:insulators and genome organization. Curr. Opin. Genet. Dev., 17,400–407.
60. Gaszner,M. and Felsenfeld,G. (2006) Insulators: exploitingtranscriptional and epigenetic mechanisms. Nat. Rev. Genet., 7,703–713.
61. Brasset,E. and Vaury,C. (2005) Insulators are fundamentalcomponents of the eukaryotic genomes. Heredity, 94, 571–576.
62. Iampietro,C., Cleard,F., Gyurkovics,H., Maeda,R.K. andKarch,F. (2008) Boundary swapping in the Drosophila Bithoraxcomplex. Development, 135, 3983–3987.
63. Gurudatta,B.V. and Corces,V.G. (2009) Chromatin insulators:lessons from the fly. Brief. Funct. Genomic. Proteomic., 8,276–282.
64. Negre,N., Brown,C.D., Shah,P.K., Kheradpour,P., Morrison,C.A.,Henikoff,J.G., Feng,X., Ahmad,K., Russell,S., White,R.A. et al.A comprehensive map of insulator elements for the Drosophilagenome. PLoS Genet., 6, e1000814.
65. Negre,N., Brown,C.D., Ma,L., Bristow,C.A., Miller,S.W.,Wagner,U., Kheradpour,P., Eaton,M.L., Loriaux,P., Sealfon,R.et al. A cis-regulatory map of the Drosophila genome. Nature,471, 527–531.
66. Martin,D., Pantoja,C., Fernandez Minan,A., Valdes-Quezada,C.,Molto,E., Matesanz,F., Bogdanovic,O., de la Calle-Mustienes,E.,Dominguez,O., Taher,L. et al. Genome-wide CTCF distributionin vertebrates defines equivalent sites that aid the identification ofdisease-associated genes. Nat. Struct. Mol. Biol., 18, 708–714.
67. Pai,C.Y., Lei,E.P., Ghosh,D. and Corces,V.G. (2004) Thecentrosomal protein CP190 is a component of the gypsychromatin insulator. Mol. Cell, 16, 737–748.
68. Filion,G.J., van Bemmel,J.G., Braunschweig,U., Talhout,W.,Kind,J., Ward,L.D., Brugman,W., de Castro,I.J.,Kerkhoven,R.M., Bussemaker,H.J. et al. Systematic proteinlocation mapping reveals five principal chromatin types inDrosophila cells. Cell, 143, 212–224.
69. Wang,J., Lunyak,V.V. and Jordan,I.K. Genome-wide predictionand analysis of human chromatin boundary elements. NucleicAcids Res, 40, 511–529.
70. Lunyak,V.V., Prefontaine,G.G., Nunez,E., Cramer,T., Ju,B.G.,Ohgi,K.A., Hutt,K., Roy,R., Garcia-Diaz,A., Zhu,X. et al. (2007)Developmentally regulated activation of a SINE B2 repeat as adomain boundary in organogenesis. Science, 317, 248–251.
71. Brasset,E., Bantignies,F., Court,F., Cheresiz,S., Conte,C. andVaury,C. (2007) Idefix insulator activity can be modulated bynearby regulatory elements. Nucleic Acids Res., 35, 2661–2670.
72. Kumar,R.P., Senthilkumar,R., Singh,V. and Mishra,R.K. (2010)Repeat performance: how do genome packaging and regulationdepend on simple sequence repeats? Bioessays, 32, 165–174.
73. Gray,C.E. and Coates,C.J. (2005) Cloning and characterization ofcDNAs encoding putative CTCFs in the mosquitoes, Aedesaegypti and Anopheles gambiae. BMC Mol. Biol., 6, 16.
74. Schoborg,T.A. and Labrador,M. (2009) The phylogeneticdistribution of non-CTCF insulator proteins is limited to insectsand reveals that BEAF-32 is Drosophila lineage specific.J. Mol. Evol, 70, 74–84.
75. Robinson,G.E., Hackett,K.J., Purcell-Miramontes,M., Brown,S.J.,Evans,J.D., Goldsmith,M.R., Lawson,D., Okamuro,J.,Robertson,H.M. and Schneider,D.J. Creating a buzz about insectgenomes. Science, 331, 1386.
Nucleic Acids Research, 2012, Vol. 40, No. 10 4395