Chromatin CKAP2, a new proliferation marker, as independent prognostic indicator in breast cancer
10
Chromatin CKAP2, a New Proliferation Marker, as Independent Prognostic Indicator in Breast Cancer Han-Seong Kim 1. , Jae-Soo Koh 2. , Yong-Bock Choi 3 , Jungsil Ro 3 , Hyun-Kyoung Kim 3 , Mi-Kyung Kim 3 , Byung-Ho Nam 3 , Kyung-Tae Kim 3 , Vishal Chandra 3 , Hye-Sil Seol 2 , Woo-Chul Noh 4 , Eun-Kyu Kim 4 , Joobae Park 5 , Chang-Dae Bae 5 *, Kyeong-Man Hong 3 * 1 Department of Pathology, Inje University Ilsan Paik Hospital, Ilsanseo-gu, Goyang, Korea, 2 Department of Pathology, Korea Cancer Center Hospital, Nowon-gu, Seoul, Korea, 3 Research Institute, National Cancer Center, Ilsandong-gu, Goyang, Korea, 4 Department of Surgery, Breast Cancer Center, Korea Cancer Center Hospital, Nowon- gu, Seoul, Korea, 5 Department of Molecular Cell Biology, Sungkyunkwan University School of Medicine, and Samsung Biomedical Research Institute, Suwon, Korea Abstract Background: The level of proliferation activity is a strong prognostic or predictive indicator in breast cancer, but its optimal measurement is still in debate, necessitating new proliferation markers. In the present study, the prognostic significance of the CKAP2-positive cell count (CPCC), a new proliferation marker, was evaluated, and the results were compared with those for the mitotic activity index (MAI). Methods: This study included 375 early-stage breast cancer samples collected from two institutions between 2000 and 2006. Immunohistochemical staining was performed using a CKAP2 monoclonal antibody. Cox proportional hazard regression models were fitted to determine the association between the CPCC and relapse-free survival (RFS) amongst three groups formed on the basis of the CPCC or MAI value: groups 2 and 3 showing the middle and highest values, respectively, and group 1 the lowest. Results: After adjustment for age, T stage, N stage, HER2 status, estrogen receptor status, progesterone receptor status, institution, and year of surgical resection, the CPCC was associated with a significantly worse RFS {hazard ratio [HR] = 4.10 (95% CI: 1.64–10.29) for group 2; HR = 4.35 (95% CI: 2.04–10.35) for group 3}. Moreover, its prognostic significance was similar to or higher than that based on the MAI {HR = 2.05 (95% CI: 0.94–4.65) for group 2; HR = 2.35 (95% CI: 1.09–5.10) for group 3}. In subgroup analyses, the CPCC showed a prognostic significance in the luminal A and triple-negative subgroups, but not in the HER2-positive subgroup. Conclusions: Chromatin CKAP2 is an independent prognostic marker for RFS in early-stage breast cancer, and could potentially replace the MAI in clinical evaluation of proliferation activity. Additionally, our study results suggest that the prognostic significance of proliferation activity differs among the various subgroups of breast cancer. Citation: Kim H-S, Koh J-S, Choi Y-B, Ro J, Kim H-K, et al. (2014) Chromatin CKAP2, a New Proliferation Marker, as Independent Prognostic Indicator in Breast Cancer. PLoS ONE 9(6): e98160. doi:10.1371/journal.pone.0098160 Editor: Syed A. Aziz, Health Canada and University of Ottawa, Canada Received January 20, 2014; Accepted April 29, 2014; Published June 2, 2014 Copyright: ß 2014 Kim et al. This is an open-access article distributed under the terms of the Creative Commons Attribution License, which permits unrestricted use, distribution, and reproduction in any medium, provided the original author and source are credited. Funding: This work was supported by a research grant to K.-M.H. from the National Cancer Center, Korea (1410050); by a grant to C.-D.B. from the Samsung Biomedical Research Institute, Korea (BB01022), and by a grant to J.R. from the National Research Foundation, Korea (1230950). The funders had no role in study design, data collection and analysis, decision to publish, or preparation of the manuscript. Competing Interests: The authors have declared that no competing interests exist. * E-mail: [email protected] (KMH); [email protected] (CDB) . These authors contributed equally to this work. Introduction Proliferation activity has been recognized as one of the most reliable breast cancer prognosticators [1,2,3]. Moreover, it has been identified as a reliable predictive marker for anti-cancer therapy, with higher proliferation activity correlating with stronger response to chemotherapy [4,5]. So, in addition to classical mitotic counting, a number of markers, including Ki-67, cyclin D, cyclin E, p27, p21, thymidine kinase, topoisomerase IIa, and phospho- histone H3, have been used to measure proliferation activity [6,7]. However, debate continues over which proliferation marker is the most reliable for clinical application. For example, whereas the mitotic activity index (MAI) has been the most reliable breast cancer prognosticator [1,2], the clinical application data on Ki-67 has been inconclusive [8,9]. On the contrary, as a predictive marker in breast cancer, Ki-67 has been the most widely evaluated, showing its clinical applicability, especially in triple- negative (TN) breast cancer [5,10,11]. Clearly, further prognostic and predictive evaluations of the currently available markers are necessary, and development of new proliferation markers, in turn, could facilitate the clinical application of proliferation activity to breast cancer. Cytoskeleton-associated protein 2 (CKAP2) [or tumor-associat- ed microtubule-associated protein/cytoskeleton-associated protein 2 (TMAP/CKAP2)] is a microtubule-associated protein that plays key roles in the regulation of microtubule assembly and PLOS ONE | www.plosone.org 1 June 2014 | Volume 9 | Issue 6 | e98160
-
Upload
kanpuruniversity -
Category
Documents
-
view
0 -
download
0
Transcript of Chromatin CKAP2, a new proliferation marker, as independent prognostic indicator in breast cancer
Chromatin CKAP2, a New Proliferation Marker, asIndependent Prognostic Indicator in Breast CancerHan-Seong Kim1., Jae-Soo Koh2., Yong-Bock Choi3, Jungsil Ro3, Hyun-Kyoung Kim3, Mi-Kyung Kim3,
Byung-Ho Nam3, Kyung-Tae Kim3, Vishal Chandra3, Hye-Sil Seol2, Woo-Chul Noh4, Eun-Kyu Kim4,
Joobae Park5, Chang-Dae Bae5*, Kyeong-Man Hong3*
1 Department of Pathology, Inje University Ilsan Paik Hospital, Ilsanseo-gu, Goyang, Korea, 2 Department of Pathology, Korea Cancer Center Hospital, Nowon-gu, Seoul,
Korea, 3 Research Institute, National Cancer Center, Ilsandong-gu, Goyang, Korea, 4 Department of Surgery, Breast Cancer Center, Korea Cancer Center Hospital, Nowon-
gu, Seoul, Korea, 5 Department of Molecular Cell Biology, Sungkyunkwan University School of Medicine, and Samsung Biomedical Research Institute, Suwon, Korea
Abstract
Background: The level of proliferation activity is a strong prognostic or predictive indicator in breast cancer, but its optimalmeasurement is still in debate, necessitating new proliferation markers. In the present study, the prognostic significance ofthe CKAP2-positive cell count (CPCC), a new proliferation marker, was evaluated, and the results were compared with thosefor the mitotic activity index (MAI).
Methods: This study included 375 early-stage breast cancer samples collected from two institutions between 2000 and2006. Immunohistochemical staining was performed using a CKAP2 monoclonal antibody. Cox proportional hazardregression models were fitted to determine the association between the CPCC and relapse-free survival (RFS) amongst threegroups formed on the basis of the CPCC or MAI value: groups 2 and 3 showing the middle and highest values, respectively,and group 1 the lowest.
Results: After adjustment for age, T stage, N stage, HER2 status, estrogen receptor status, progesterone receptor status,institution, and year of surgical resection, the CPCC was associated with a significantly worse RFS {hazard ratio [HR] = 4.10(95% CI: 1.64–10.29) for group 2; HR = 4.35 (95% CI: 2.04–10.35) for group 3}. Moreover, its prognostic significance wassimilar to or higher than that based on the MAI {HR = 2.05 (95% CI: 0.94–4.65) for group 2; HR = 2.35 (95% CI: 1.09–5.10) forgroup 3}. In subgroup analyses, the CPCC showed a prognostic significance in the luminal A and triple-negative subgroups,but not in the HER2-positive subgroup.
Conclusions: Chromatin CKAP2 is an independent prognostic marker for RFS in early-stage breast cancer, and couldpotentially replace the MAI in clinical evaluation of proliferation activity. Additionally, our study results suggest that theprognostic significance of proliferation activity differs among the various subgroups of breast cancer.
Citation: Kim H-S, Koh J-S, Choi Y-B, Ro J, Kim H-K, et al. (2014) Chromatin CKAP2, a New Proliferation Marker, as Independent Prognostic Indicator in BreastCancer. PLoS ONE 9(6): e98160. doi:10.1371/journal.pone.0098160
Editor: Syed A. Aziz, Health Canada and University of Ottawa, Canada
Received January 20, 2014; Accepted April 29, 2014; Published June 2, 2014
Copyright: � 2014 Kim et al. This is an open-access article distributed under the terms of the Creative Commons Attribution License, which permits unrestricteduse, distribution, and reproduction in any medium, provided the original author and source are credited.
Funding: This work was supported by a research grant to K.-M.H. from the National Cancer Center, Korea (1410050); by a grant to C.-D.B. from the SamsungBiomedical Research Institute, Korea (BB01022), and by a grant to J.R. from the National Research Foundation, Korea (1230950). The funders had no role in studydesign, data collection and analysis, decision to publish, or preparation of the manuscript.
Competing Interests: The authors have declared that no competing interests exist.
* E-mail: [email protected] (KMH); [email protected] (CDB)
. These authors contributed equally to this work.
Introduction
Proliferation activity has been recognized as one of the most
reliable breast cancer prognosticators [1,2,3]. Moreover, it has
been identified as a reliable predictive marker for anti-cancer
therapy, with higher proliferation activity correlating with stronger
response to chemotherapy [4,5]. So, in addition to classical mitotic
counting, a number of markers, including Ki-67, cyclin D, cyclin
E, p27, p21, thymidine kinase, topoisomerase IIa, and phospho-
histone H3, have been used to measure proliferation activity [6,7].
However, debate continues over which proliferation marker is the
most reliable for clinical application. For example, whereas the
mitotic activity index (MAI) has been the most reliable breast
cancer prognosticator [1,2], the clinical application data on Ki-67
has been inconclusive [8,9]. On the contrary, as a predictive
marker in breast cancer, Ki-67 has been the most widely
evaluated, showing its clinical applicability, especially in triple-
negative (TN) breast cancer [5,10,11]. Clearly, further prognostic
and predictive evaluations of the currently available markers are
necessary, and development of new proliferation markers, in turn,
could facilitate the clinical application of proliferation activity to
breast cancer.
Cytoskeleton-associated protein 2 (CKAP2) [or tumor-associat-
ed microtubule-associated protein/cytoskeleton-associated protein
2 (TMAP/CKAP2)] is a microtubule-associated protein that plays
key roles in the regulation of microtubule assembly and
PLOS ONE | www.plosone.org 1 June 2014 | Volume 9 | Issue 6 | e98160
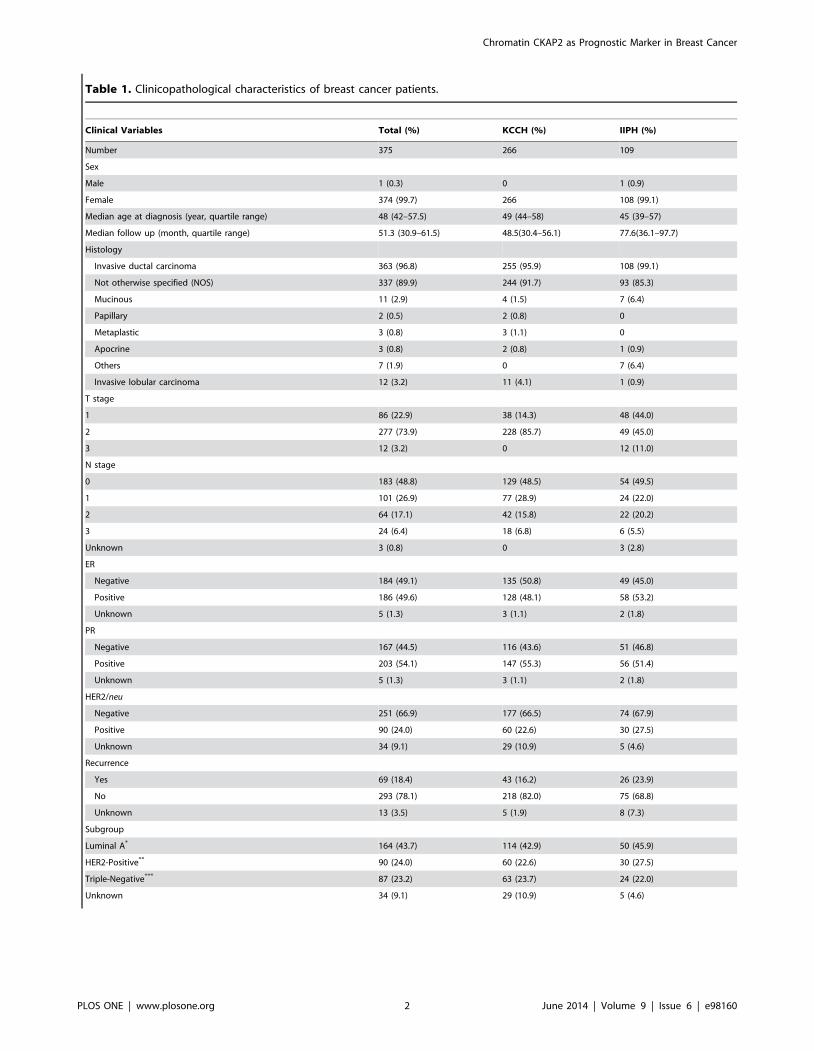
Table 1. Clinicopathological characteristics of breast cancer patients.
Clinical Variables Total (%) KCCH (%) IIPH (%)
Number 375 266 109
Sex
Male 1 (0.3) 0 1 (0.9)
Female 374 (99.7) 266 108 (99.1)
Median age at diagnosis (year, quartile range) 48 (42–57.5) 49 (44–58) 45 (39–57)
Median follow up (month, quartile range) 51.3 (30.9–61.5) 48.5(30.4–56.1) 77.6(36.1–97.7)
Histology
Invasive ductal carcinoma 363 (96.8) 255 (95.9) 108 (99.1)
Not otherwise specified (NOS) 337 (89.9) 244 (91.7) 93 (85.3)
Mucinous 11 (2.9) 4 (1.5) 7 (6.4)
Papillary 2 (0.5) 2 (0.8) 0
Metaplastic 3 (0.8) 3 (1.1) 0
Apocrine 3 (0.8) 2 (0.8) 1 (0.9)
Others 7 (1.9) 0 7 (6.4)
Invasive lobular carcinoma 12 (3.2) 11 (4.1) 1 (0.9)
T stage
1 86 (22.9) 38 (14.3) 48 (44.0)
2 277 (73.9) 228 (85.7) 49 (45.0)
3 12 (3.2) 0 12 (11.0)
N stage
0 183 (48.8) 129 (48.5) 54 (49.5)
1 101 (26.9) 77 (28.9) 24 (22.0)
2 64 (17.1) 42 (15.8) 22 (20.2)
3 24 (6.4) 18 (6.8) 6 (5.5)
Unknown 3 (0.8) 0 3 (2.8)
ER
Negative 184 (49.1) 135 (50.8) 49 (45.0)
Positive 186 (49.6) 128 (48.1) 58 (53.2)
Unknown 5 (1.3) 3 (1.1) 2 (1.8)
PR
Negative 167 (44.5) 116 (43.6) 51 (46.8)
Positive 203 (54.1) 147 (55.3) 56 (51.4)
Unknown 5 (1.3) 3 (1.1) 2 (1.8)
HER2/neu
Negative 251 (66.9) 177 (66.5) 74 (67.9)
Positive 90 (24.0) 60 (22.6) 30 (27.5)
Unknown 34 (9.1) 29 (10.9) 5 (4.6)
Recurrence
Yes 69 (18.4) 43 (16.2) 26 (23.9)
No 293 (78.1) 218 (82.0) 75 (68.8)
Unknown 13 (3.5) 5 (1.9) 8 (7.3)
Subgroup
Luminal A* 164 (43.7) 114 (42.9) 50 (45.9)
HER2-Positive** 90 (24.0) 60 (22.6) 30 (27.5)
Triple-Negative*** 87 (23.2) 63 (23.7) 24 (22.0)
Unknown 34 (9.1) 29 (10.9) 5 (4.6)
Chromatin CKAP2 as Prognostic Marker in Breast Cancer
PLOS ONE | www.plosone.org 2 June 2014 | Volume 9 | Issue 6 | e98160
disassembly, not to mention kinetochore and microtubule attach-
ment during mitosis and cytokinesis [12,13,14]. We previously
demonstrated both the localization of CKAP2 in the condensed
chromatin of mitotic cells and the close correlation of chromatin
CKAP2-positive cell count (CPCC) with the mitotic figure count
[14,15], indicating that chromatin CKAP2 is another proliferation
marker with specificity in the mitotic phase. However, its
prognostic significance has not been evaluated for any cancer.
Therefore, in the present study, the prognostic significance of
chromatin CKAP2 was evaluated in 375 early-stage breast cancer
cases, from two independent institutions, as based on the CPCC in
CKAP2 immunohistochemistry.
Materials and Methods
Breast cancer tissuesFormalin-fixed, paraffin-embedded breast cancer tissues repre-
senting a total of 375 invasive breast cancer cases, 266 from the
Korea Cancer Center Hospital (KCCH; 2005–2006) and 109
from Ilsan Inje Paik Hospital (IIPH; 2000–2003), were studied.
Access to and usage of clinical information and the relevant
archival tissues were approved by the Institutional Review Boards
of the National Cancer Center, the KCCH, and IIPH, which
waived the need for informed consent. The relevant clinical
characteristics are listed in Table 1. The estrogen receptor (ER)
and progesterone receptor (PR) positivity statuses, as based on
hospital records, were determined by Allred score, according to
which, intermediate or strong hormone receptor cases are counted
as positive. The human epidermal growth receptor 2 (HER2)
status also based on hospital records, was determined by IHC
staining: 3+ is counted as positive; 0 or 1+, negative. In cases with
2+ in IHC staining, FISH is performed, counting copy number 4
or more as positive.
Immunohistochemistry with monoclonal human CKAP2antibody
Immunohistochemical staining (IHC) was performed using the
Ultravision LP Detection System (Thermo Fisher Scientific Inc.,
Fremont, CA) as previously described using the same CKAP2
antibody [15]. Briefly, following deparaffinization of formalin-
Table 1. Cont.
Clinical Variables Total (%) KCCH (%) IIPH (%)
CPCC (quartile range) 23 (11–44) 26.5 (14–47.5) 14 (6–37)
MAI (quartile range) 10 (3–20) 11 (4–21.8) 6 (2–16)
*Luminal A subgroup: cases with hormone receptor (HR)-positive and HER2-negative status.**HER2-positive subgroup: cases with HER2-positive status with or without HR positivity.***Triple-negative subgroup (TN): HR-negative and HER2-negative status.IIPH = Ilsan Inje Paik Hospital; KCCH = Korean Cancer Center Hospital; ER = estrogen receptor; PR = progesterone receptor; HR = hormone receptor; HER2 = humanepidermal growth factor receptor 2; CPCC = chromatin CKAP2-positive cell count; MAI = mitotic activity index.doi:10.1371/journal.pone.0098160.t001
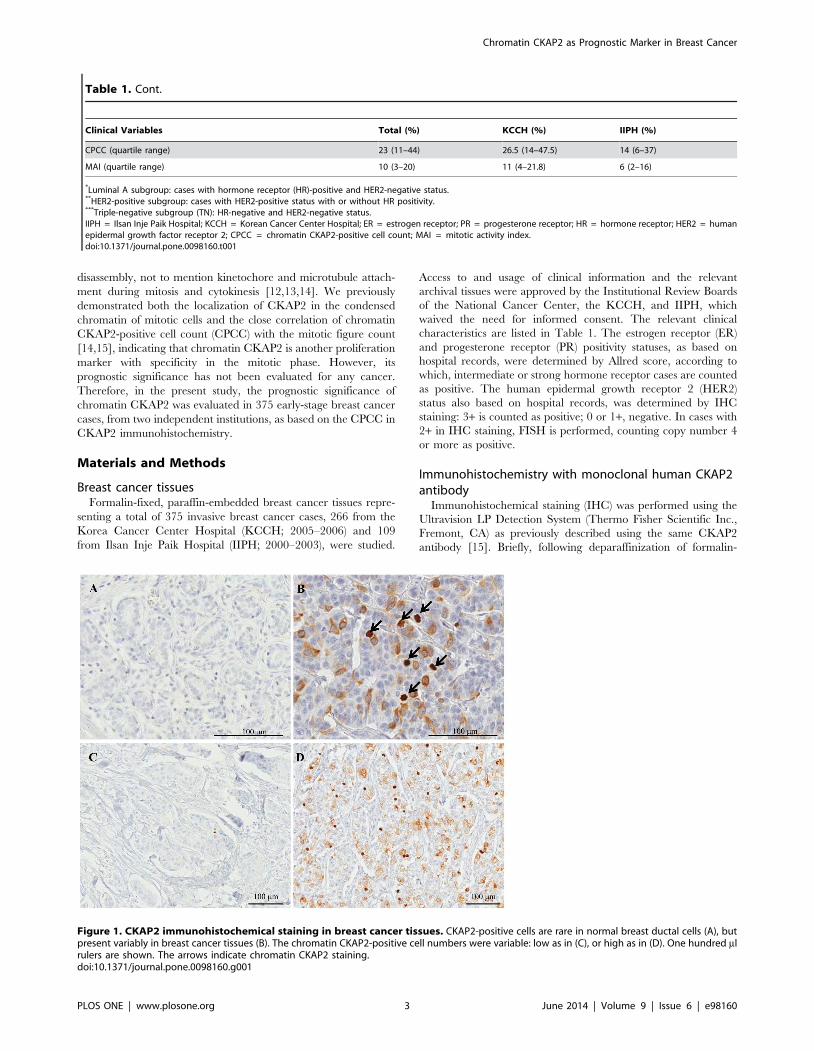
Figure 1. CKAP2 immunohistochemical staining in breast cancer tissues. CKAP2-positive cells are rare in normal breast ductal cells (A), butpresent variably in breast cancer tissues (B). The chromatin CKAP2-positive cell numbers were variable: low as in (C), or high as in (D). One hundred mlrulers are shown. The arrows indicate chromatin CKAP2 staining.doi:10.1371/journal.pone.0098160.g001
Chromatin CKAP2 as Prognostic Marker in Breast Cancer
PLOS ONE | www.plosone.org 3 June 2014 | Volume 9 | Issue 6 | e98160
fixed, paraffin-embedded breast cancer tissues, antigen was
retrieved in 10 mM citrate buffer, pH 6.0, containing 0.05%
Tween 20. After ethanol fixation, the tissues were sequentially
treated with 3% hydrogen peroxide and Ultra V block solution.
After 1 h room-temperature incubation with anti-CKAP2
antibody, the slides were washed in Tris-buffered saline including
Tween 20 (TBST), incubated with primary antibody enhancer for
10 min, and exposed to horseradish peroxidase-conjugated
secondary antibody for 15 min. After re-washing in TBST, the
tissue slides were incubated with diaminobenzidine chromogen
(Scytek Laboratories Inc, Logan, UT) and counter-stained with
Mayer’s hematoxylin (Dako Cytomation, Glostrup, Denmark).
Evaluation of chromatin CKAP2-positive cell count andMAI
The CPCC was determined by counting the total number of
CKAP2-positive cells per 10 consecutive high-power (4006) fields
in the area with the highest number of chromatin CKAP2-positive
cells. In the evaluation of the CKAP2-positive cells, strongly- to
moderately-stained chromatin-positive cells were included. The
inter-observer CPCC correlation was evaluated by two indepen-
dent observers for 100 cases among the KCCH tissues.
The MAI was determined as previously reported [16]. Briefly, it
was estimated on H&E-stained slides by summing the number of
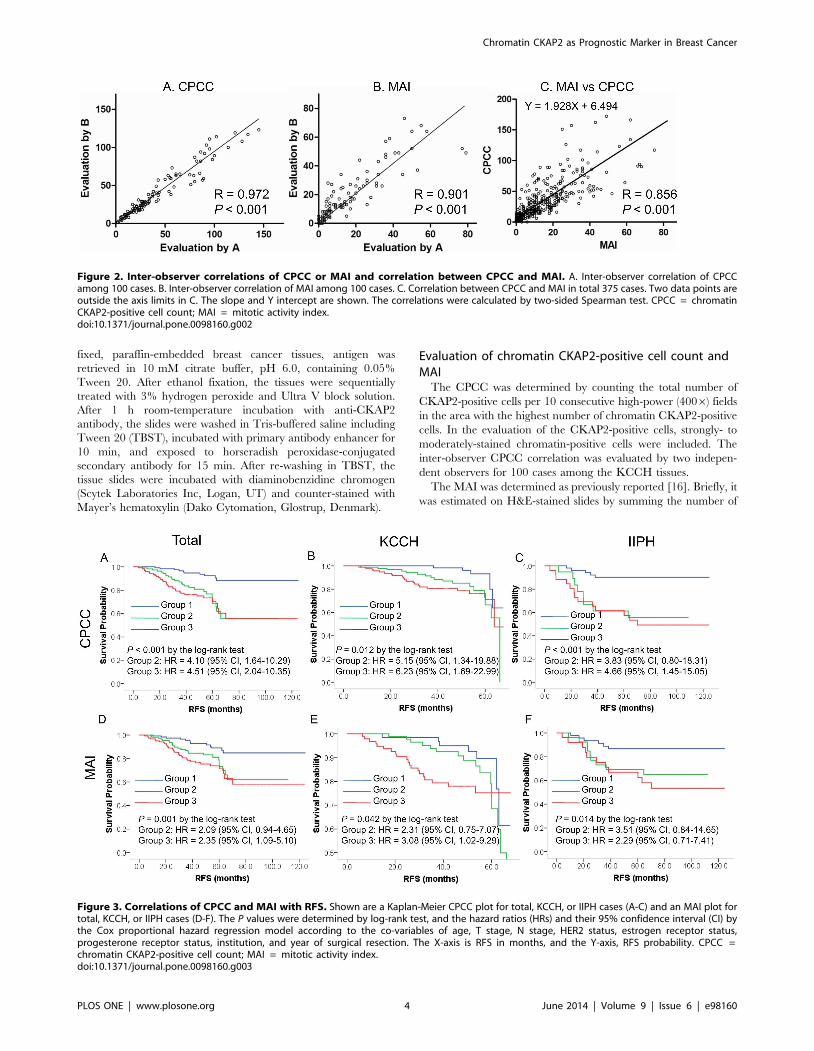
Figure 2. Inter-observer correlations of CPCC or MAI and correlation between CPCC and MAI. A. Inter-observer correlation of CPCCamong 100 cases. B. Inter-observer correlation of MAI among 100 cases. C. Correlation between CPCC and MAI in total 375 cases. Two data points areoutside the axis limits in C. The slope and Y intercept are shown. The correlations were calculated by two-sided Spearman test. CPCC = chromatinCKAP2-positive cell count; MAI = mitotic activity index.doi:10.1371/journal.pone.0098160.g002
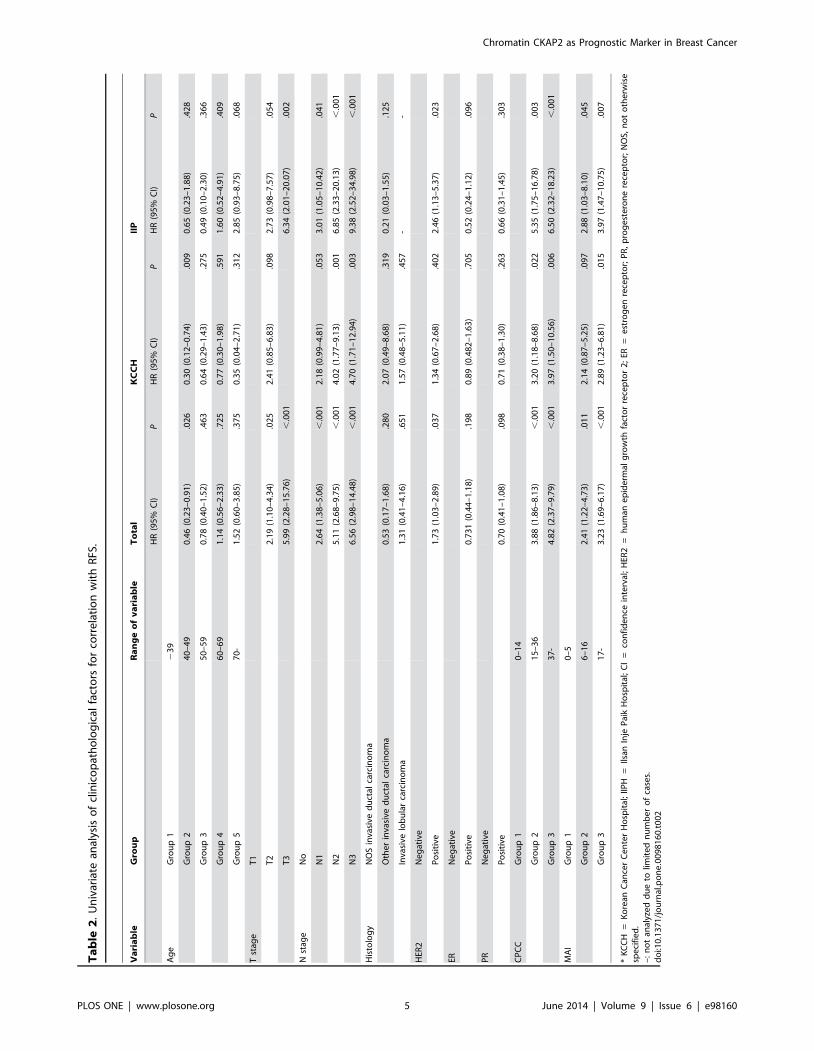
Figure 3. Correlations of CPCC and MAI with RFS. Shown are a Kaplan-Meier CPCC plot for total, KCCH, or IIPH cases (A-C) and an MAI plot fortotal, KCCH, or IIPH cases (D-F). The P values were determined by log-rank test, and the hazard ratios (HRs) and their 95% confidence interval (CI) bythe Cox proportional hazard regression model according to the co-variables of age, T stage, N stage, HER2 status, estrogen receptor status,progesterone receptor status, institution, and year of surgical resection. The X-axis is RFS in months, and the Y-axis, RFS probability. CPCC =chromatin CKAP2-positive cell count; MAI = mitotic activity index.doi:10.1371/journal.pone.0098160.g003
Chromatin CKAP2 as Prognostic Marker in Breast Cancer
PLOS ONE | www.plosone.org 4 June 2014 | Volume 9 | Issue 6 | e98160
Ta
ble
2.
Un
ivar
iate
anal
ysis
of
clin
ico
pat
ho
log
ical
fact
ors
for
corr
ela
tio
nw
ith
RFS
.
Va
ria
ble
Gro
up
Ra
ng
eo
fv
ari
ab
leT
ota
lK
CC
HII
P
HR
(95
%C
I)P
HR
(95
%C
I)P
HR
(95
%C
I)P
Ag
eG
rou
p1
23
9
Gro
up
24
0–
49
0.4
6(0
.23
–0
.91
).0
26
0.3
0(0
.12
–0
.74
).0
09
0.6
5(0
.23
–1
.88
).4
28
Gro
up
35
0–
59
0.7
8(0
.40
–1
.52
).4
63
0.6
4(0
.29
–1
.43
).2
75
0.4
9(0
.10
–2
.30
).3
66
Gro
up
46
0–
69
1.1
4(0
.56
–2
.33
).7
25
0.7
7(0
.30
–1
.98
).5
91
1.6
0(0
.52
–4
.91
).4
09
Gro
up
57
0-
1.5
2(0
.60
–3
.85
).3
75
0.3
5(0
.04
–2
.71
).3
12
2.8
5(0
.93
–8
.75
).0
68
Tst
age
T1
T2
2.1
9(1
.10
–4
.34
).0
25
2.4
1(0
.85
–6
.83
).0
98
2.7
3(0
.98
–7
.57
).0
54
T3
5.9
9(2
.28
–1
5.7
6)
,.0
01
6.3
4(2
.01
–2
0.0
7)
.00
2
Nst
age
No
N1
2.6
4(1
.38
–5
.06
),
.00
12
.18
(0.9
9–
4.8
1)
.05
33
.01
(1.0
5–
10
.42
).0
41
N2
5.1
1(2
.68
–9
.75
),
.00
14
.02
(1.7
7–
9.1
3)
.00
16
.85
(2.3
3–
20
.13
),
.00
1
N3
6.5
6(2
.98
–1
4.4
8)
,.0
01
4.7
0(1
.71
–1
2.9
4)
.00
39
.38
(2.5
2–
34
.98
),
.00
1
His
tolo
gy
NO
Sin
vasi
ved
uct
alca
rcin
om
a
Oth
er
inva
sive
du
ctal
carc
ino
ma
0.5
3(0
.17
–1
.68
).2
80
2.0
7(0
.49
–8
.68
).3
19
0.2
1(0
.03
–1
.55
).1
25
Inva
sive
lob
ula
rca
rcin
om
a1
.31
(0.4
1–
4.1
6)
.65
11
.57
(0.4
8–
5.1
1)
.45
7-
-
HER
2N
eg
ativ
e
Po
siti
ve1
.73
(1.0
3–
2.8
9)
.03
71
.34
(0.6
7–
2.6
8)
.40
22
.46
(1.1
3–
5.3
7)
.02
3
ERN
eg
ativ
e
Po
siti
ve0
.73
1(0
.44
–1
.18
).1
98
0.8
9(0
.48
2–
1.6
3)
.70
50
.52
(0.2
4–
1.1
2)
.09
6
PR
Ne
gat
ive
Po
siti
ve0
.70
(0.4
1–
1.0
8)
.09
80
.71
(0.3
8–
1.3
0)
.26
30
.66
(0.3
1–
1.4
5)
.30
3
CP
CC
Gro
up
10
–1
4
Gro
up
21
5–
36
3.8
8(1
.86
–8
.13
),
.00
13
.20
(1.1
8–
8.6
8)
.02
25
.35
(1.7
5–
16
.78
).0
03
Gro
up
33
7-
4.8
2(2
.37
–9
.79
),
.00
13
.97
(1.5
0–
10
.56
).0
06
6.5
0(2
.32
–1
8.2
3)
,.0
01
MA
IG
rou
p1
0–
5
Gro
up
26
–1
62
.41
(1.2
2–
4.7
3)
.01
12
.14
(0.8
7–
5.2
5)
.09
72
.88
(1.0
3–
8.1
0)
.04
5
Gro
up
31
7-
3.2
3(1
.69
–6
.17
),
.00
12
.89
(1.2
3–
6.8
1)
.01
53
.97
(1.4
7–
10
.75
).0
07
*K
CC
H=
Ko
rean
Can
cer
Ce
nte
rH
osp
ital
;IIP
H=
Ilsan
Inje
Pai
kH
osp
ital
;C
I=
con
fid
en
cein
terv
al;
HER
2=
hu
man
ep
ide
rmal
gro
wth
fact
or
rece
pto
r2
;ER
=e
stro
ge
nre
cep
tor;
PR
,p
rog
est
ero
ne
rece
pto
r;N
OS,
no
to
the
rwis
esp
eci
fie
d.
–:
no
tan
alyz
ed
du
eto
limit
ed
nu
mb
er
of
case
s.d
oi:1
0.1
37
1/j
ou
rnal
.po
ne
.00
98
16
0.t
00
2
Chromatin CKAP2 as Prognostic Marker in Breast Cancer
PLOS ONE | www.plosone.org 5 June 2014 | Volume 9 | Issue 6 | e98160
mitotic cells identified under 10 consecutive 4006 power fields.
The inter-observer MAI correlation was evaluated by two
independent observers for the same 100 cases as just noted for
the CPCC.
Statistical analysisA two-sided Spearman’s rank correlation test or Wilcoxon rank
sum test was applied to correlation analyses of the CPCC or MAI
with clinicopathological data, considering P values less than 0.05
as statistically significant. Both the inter-observer correlation of the
CPCC or MAI and the correlation between them were tested with
the two-sided Spearman correlation test.
To estimate the prognostic significance of chromatin CKAP2,
the total number of cases was equally divided into three groups
based on the CPCC values: group 1, #14 (N = 126); group 2, 15–
36 (N = 114); group 3, $37 (N = 122). The same classification was
performed based on the MAI values: group 1, #5 (N = 124); group
2, 6–16 (N = 116); group 3, $17 (N = 122).
In order to investigate the prognostic significance of the CPCC
or MAI in the breast cancer subgroups, all of the cases were
classified, based on the ER, PR, and HER2 statuses, into three
subgroups: 1) the luminal A subgroup showing hormone receptor
(HR)-positive and HER2-negative receptor status; 2) the HER2-
positive subgroup; 3) the triple-negative (TN) subgroup being
negative for all three receptors. Whereas the luminal B cases
showing both HR-positive and HER2-positive status were
included in the HER2-positive subgroup, the luminal B cases
showing HR-positive, HER2-negative, and high Ki-67 level were
included in luminal A subgroup, in the present study.
Relapse-free survival (RFS) was defined as the time from radical
surgical resection to diagnosis of relapse, or the last date of follow-
up. RFS estimates were calculated by the Kaplan-Meier method,
and differences were assessed by log-rank test. Additionally,
Kaplan-Meier survival graphs stratified by breast cancer subgroup
were generated. Multivariate analyses were carried out using
Cox’s proportional hazard regression model (hazard ratios with
their 95% CIs) after adjustment for age (10-year age groups), T
stage, N stage, HER2 status, estrogen receptor status, progesterone
receptor status, institution, and year of surgical resection. Linear
trends were calculated using the median value for each exposure
variable as a continuous variable. Multivariate analyses were
performed on the various breast cancer subgroups after adjust-
ment for age, T stage, N stage, institution, and year of surgical
resection. The statistical analyses were performed with GraphPad
Prism version 5 (GraphPad Software, Inc., San Diego, CA) or
SPSS version 18 (SPSS, Inc., Chicago, IL).
Results
Chromatin localizations of CKAP2 in breast cancer tissuesImmunohistochemical staining in normal breast tissues adjacent
to cancer cells revealed rare CKAP2 staining (Fig. 1A), but in
breast cancer tissues, CKAP2 was localized in the condensed
chromatin of the mitotic cells (Fig. 1B, arrows). Only moderately-
to strongly-stained chromatin CKAP2-positive cells were included
in the CPCC evaluation. The numbers of chromatin-stained
CKAP2-positive cells varied according to the breast cancer cases
(Figs. 1C-D).
The inter-observer correlations for both the CPCC (R = 0.972,
P,0.001) and the MAI (R = 0.901, P,0.001) were high, as shown
in Figs. 2A and 2B, respectively, suggesting that the evaluations
were quite reproducible. The correlation between the CPCC and
the MAI was also high (R = 0.856, P,0.001, Fig. 2C), suggesting
the CPCC’s utility as an index for proliferation activity in cancer.
Ta
ble
3.
Mu
ltiv
aria
tean
alys
iso
fC
PC
Co
rM
AI
for
corr
ela
tio
nw
ith
RFS
usi
ng
Co
xp
rop
ort
ion
alh
azar
dre
gre
ssio
nm
od
el
attw
oin
stit
uti
on
s.
Pa
ram
ete
rG
rou
pR
an
ge
of
va
ria
ble
To
tal
KC
CH
IIP
HR
(95
%C
I)P
HR
(95
%C
I)P
HR
(95
%C
I)P
CP
CC
Gro
up
10
–1
41
11
Gro
up
21
5–
36
4.1
0(1
.64
–1
0.2
9)
.00
35
.15
(1.3
4–
19
.8
8)
.01
73
.83
(0.8
0–
18
.31
).0
93
Gro
up
33
7-
4.5
1(2
.04
–1
0.3
5)
,.0
01
6.2
3(1
.69
–2
2.9
9)
.00
64
.66
(1.4
5–
15
.05
).0
10
.00
2{
.02
3{
.03
4{
MA
IG
rou
p1
0–
51
11
Gro
up
26
–1
62
.09
(0.9
4–
4.6
5)
.07
12
.31
(0.7
5–
7.0
7)
.14
43
.51
(0.8
4–
14
.65
).0
85
Gro
up
31
7-
2.3
5(1
.09
–5
.10
).0
30
3.0
8(1
.02
–9
.29
).0
46
2.2
9(0
.71
–7
.41
).1
67
.08
8{
.13
8{
.20
8{
Th
eco
-var
iab
les
of
age
atd
iag
no
sis
(gro
up
s1
–5
),T
stag
e(T
1,T
2o
rT
3),
Nst
age
(N0
,N1
,N2
or
N3
),H
ER2
stat
us
(ne
gat
ive
or
po
siti
ve),
ERst
atu
s(n
eg
ativ
eo
rp
osi
tive
),P
Rst
atu
s(n
eg
ativ
eo
rp
osi
tive
),in
stit
uti
on
(KC
CH
or
IIPH
),an
dye
aro
fsu
rgic
alre
sect
ion
(20
00
,2
00
1,
20
02
,2
00
3,
20
05
,o
r2
00
6)
we
reu
sed
inth
em
ult
ivar
iate
anal
ysis
,tr
eat
ing
eac
hco
-var
iab
leas
aca
teg
ori
cal
vari
able
.{ P
for
line
artr
en
d.
KC
CH
=K
ore
anC
ance
rC
en
ter
Ho
spit
al;
IIPH
=Ils
anIn
jeP
aik
Ho
spit
al;
CI
=co
nfi
de
nce
inte
rval
.d
oi:1
0.1
37
1/j
ou
rnal
.po
ne
.00
98
16
0.t
00
3
Chromatin CKAP2 as Prognostic Marker in Breast Cancer
PLOS ONE | www.plosone.org 6 June 2014 | Volume 9 | Issue 6 | e98160
The value of the CPCC was 1.928 times higher than that of the
MAI with the Y-intercept of 6.494.
Clinical characteristics of study populationThe clinical characteristics of the breast cancer patients are
listed in Table 1. As already noted, a total of 375 invasive breast
cancer cases, 266 from the KCCH and 109 from IIPH, were
analyzed. Whereas cases for the years 2000–2003 were randomly
selected at IIPH, T2 cases (85.7% of the total) were preferentially
selected at the KCCH. The T stage was higher at the KCCH, due
to the preferential T2 selection; the CPCC and MAI levels were
higher at the KCCH as well, a fact which might also be related to
preferential T2 selection.
Correlations between CPCC and clinicopathologicalfactors
The CPCC distribution was 0–296 (quartile range: 11–44), with
the median value of 23 (Fig. 2A and Table 1). An analysis of the
CPCC’s association with the clinicopathological factors revealed a
significant correlation with T stage (r= 0.219, P,0.001 by
Spearman correlation test), estrogen receptor status (Z = 27.25,
P,0.001 by Wilcoxon rank sum test), and progesterone receptor
status (Z = 26.57, P,0.001), but not with N stage (r= 0.08,
P = 0.113) or HER2 status (Z = 21.57, P = 0.116). Similarly, MAI
showed significant correlations with clinicopathological parame-
ters such as T stage (r= 0.166, P,0.001), estrogen receptor status
(Z = 26.394, P,0.001), and progesterone receptor status (Z = 2
3.891, P,0.001), but not with N stage (r= 0.019, P = 0.713) or
HER2 status (Z = 21.47, P = 0.143).
Prognostic significance of chromatin CKAP2 expressionAs for RFS, the CPCC showed a significant correlation by log-
rank test in the total cases (Fig 3A, P,0.001), the KCCH cases
(Fig. 3B, P = 0.012), and the IIPH cases (Fig. 3C, P,0.001).
Likewise, the MAI showed a significant correlation with RFS in
the total cases (Fig 3D, P = 0.001), the KCCH cases (Fig. 3E,
P = 0.042), and the IIPH cases (Fig. 3F, P = 0.014).
In univariate analyses, factors including age, T stage, N stage,
and HER2 status were significantly correlated with RFS (Table 2).
The CPCC and MAI showed a significant correlation with RFS
across the two institutions, but the significance was higher with the
CPCC than with the MAI in terms of hazard ratios (HRs) and P
values (Table 2).
In multivariate analyses using the Cox proportional hazard
regression model with co-variables including age, T stage, N stage,
HER2 status, ER status, PR status, institution, and year of surgical
resection, the CPCC showed significant correlations with worse
RFS in the total cases for groups 2 and 3, the KCCH cases for
groups 2 and 3, and the IIPH cases for group 3 (Table 3). In
multivariate analyses with the same co-variables as for the CPCC,
the MAI showed significant correlations with worse RFS in the
total cases and KCCH cases for group 3, but not in the IIPH cases.
The significance, once again, was higher with the CPCC than with
the MAI in terms of HRs and P values (Table 3)
Prognostic significance in breast cancer subgroupsAmong the breast cancer subgroups, RFS differed significantly
(P = 0.014, by log-rank test): the best was the luminal A subgroup,
and the worst, the HER2-positive subgroup.
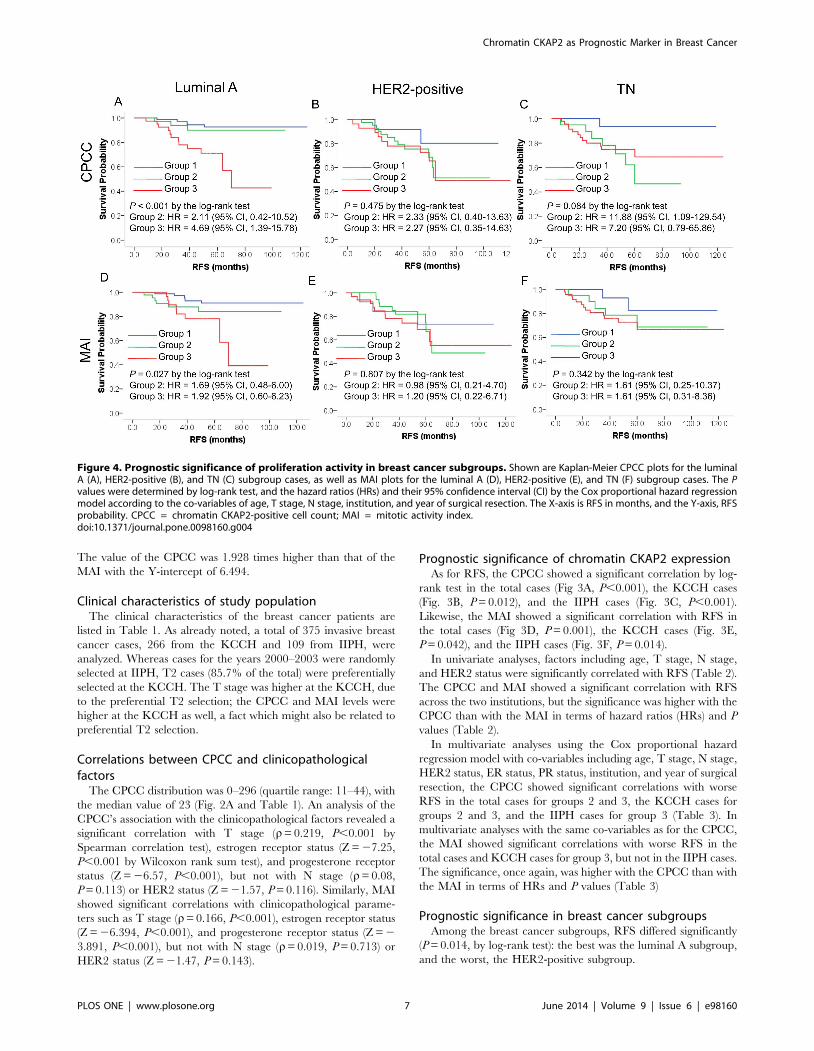
Figure 4. Prognostic significance of proliferation activity in breast cancer subgroups. Shown are Kaplan-Meier CPCC plots for the luminalA (A), HER2-positive (B), and TN (C) subgroup cases, as well as MAI plots for the luminal A (D), HER2-positive (E), and TN (F) subgroup cases. The Pvalues were determined by log-rank test, and the hazard ratios (HRs) and their 95% confidence interval (CI) by the Cox proportional hazard regressionmodel according to the co-variables of age, T stage, N stage, institution, and year of surgical resection. The X-axis is RFS in months, and the Y-axis, RFSprobability. CPCC = chromatin CKAP2-positive cell count; MAI = mitotic activity index.doi:10.1371/journal.pone.0098160.g004
Chromatin CKAP2 as Prognostic Marker in Breast Cancer
PLOS ONE | www.plosone.org 7 June 2014 | Volume 9 | Issue 6 | e98160
The CPCC and MAI showed significant correlations with RFS
in the luminal A subgroup, and the CPCC showed a marginal
correlation in the TN subgroup, by log-rank test (Fig. 4). In the
HER2-positive subgroup, however, neither the CPCC nor the
MAI showed any significant correlations with RFS (Fig. 4),
suggesting that proliferation activity has different prognostic roles
in the various breast cancer subgroups. In a Kaplan-Meier plot,
CPCC group 2 showed different patterns in the luminal A and TN
subgroups: in the luminal A subgroup, the RFS curve for group 2
was similar to that for group 1, but in the TN subgroup, it was
similar to that for group 3 (Fig. 4), suggesting that the CPCC-based
prognostic significance in group 2 differs between the luminal A
and TN subgroups.
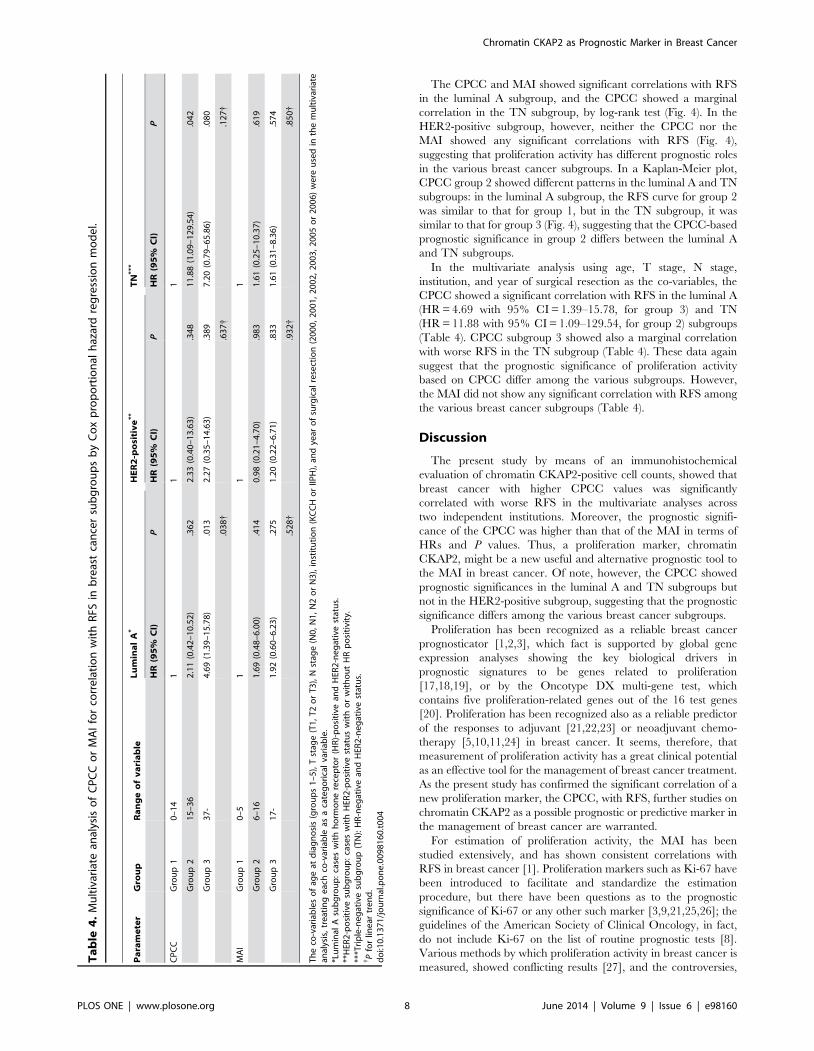
In the multivariate analysis using age, T stage, N stage,
institution, and year of surgical resection as the co-variables, the
CPCC showed a significant correlation with RFS in the luminal A
(HR = 4.69 with 95% CI = 1.39–15.78, for group 3) and TN
(HR = 11.88 with 95% CI = 1.09–129.54, for group 2) subgroups
(Table 4). CPCC subgroup 3 showed also a marginal correlation
with worse RFS in the TN subgroup (Table 4). These data again
suggest that the prognostic significance of proliferation activity
based on CPCC differ among the various subgroups. However,
the MAI did not show any significant correlation with RFS among
the various breast cancer subgroups (Table 4).
Discussion
The present study by means of an immunohistochemical
evaluation of chromatin CKAP2-positive cell counts, showed that
breast cancer with higher CPCC values was significantly
correlated with worse RFS in the multivariate analyses across
two independent institutions. Moreover, the prognostic signifi-
cance of the CPCC was higher than that of the MAI in terms of
HRs and P values. Thus, a proliferation marker, chromatin
CKAP2, might be a new useful and alternative prognostic tool to
the MAI in breast cancer. Of note, however, the CPCC showed
prognostic significances in the luminal A and TN subgroups but
not in the HER2-positive subgroup, suggesting that the prognostic
significance differs among the various breast cancer subgroups.
Proliferation has been recognized as a reliable breast cancer
prognosticator [1,2,3], which fact is supported by global gene
expression analyses showing the key biological drivers in
prognostic signatures to be genes related to proliferation
[17,18,19], or by the Oncotype DX multi-gene test, which
contains five proliferation-related genes out of the 16 test genes
[20]. Proliferation has been recognized also as a reliable predictor
of the responses to adjuvant [21,22,23] or neoadjuvant chemo-
therapy [5,10,11,24] in breast cancer. It seems, therefore, that
measurement of proliferation activity has a great clinical potential
as an effective tool for the management of breast cancer treatment.
As the present study has confirmed the significant correlation of a
new proliferation marker, the CPCC, with RFS, further studies on
chromatin CKAP2 as a possible prognostic or predictive marker in
the management of breast cancer are warranted.
For estimation of proliferation activity, the MAI has been
studied extensively, and has shown consistent correlations with
RFS in breast cancer [1]. Proliferation markers such as Ki-67 have
been introduced to facilitate and standardize the estimation
procedure, but there have been questions as to the prognostic
significance of Ki-67 or any other such marker [3,9,21,25,26]; the
guidelines of the American Society of Clinical Oncology, in fact,
do not include Ki-67 on the list of routine prognostic tests [8].
Various methods by which proliferation activity in breast cancer is
measured, showed conflicting results [27], and the controversies,
Ta
ble
4.
Mu
ltiv
aria
tean
alys
iso
fC
PC
Co
rM
AI
for
corr
ela
tio
nw
ith
RFS
inb
reas
tca
nce
rsu
bg
rou
ps
by
Co
xp
rop
ort
ion
alh
azar
dre
gre
ssio
nm
od
el.
Pa
ram
ete
rG
rou
pR
an
ge
of
va
ria
ble
Lu
min
al
A*
HE
R2
-po
siti
ve
**
TN
**
*
HR
(95
%C
I)P
HR
(95
%C
I)P
HR
(95
%C
I)P
CP
CC
Gro
up
10
–1
41
11
Gro
up
21
5–
36
2.1
1(0
.42
–1
0.5
2)
.36
22
.33
(0.4
0–
13
.63
).3
48
11
.88
(1.0
9–
12
9.5
4)
.04
2
Gro
up
33
7-
4.6
9(1
.39
–1
5.7
8)
.01
32
.27
(0.3
5–
14
.63
).3
89
7.2
0(0
.79
–6
5.8
6)
.08
0
.03
8{
.63
7{
.12
7{
MA
IG
rou
p1
0–
51
11
Gro
up
26
–1
61
.69
(0.4
8–
6.0
0)
.41
40
.98
(0.2
1–
4.7
0)
.98
31
.61
(0.2
5–
10
.37
).6
19
Gro
up
31
7-
1.9
2(0
.60
–6
.23
).2
75
1.2
0(0
.22
–6
.71
).8
33
1.6
1(0
.31
–8
.36
).5
74
.52
8{
.93
2{
.85
0{
Th
eco
-var
iab
les
of
age
atd
iag
no
sis
(gro
up
s1
–5
),T
stag
e(T
1,
T2
or
T3
),N
stag
e(N
0,
N1
,N
2o
rN
3),
inst
itu
tio
n(K
CC
Ho
rIIP
H),
and
year
of
surg
ical
rese
ctio
n(2
00
0,
20
01
,2
00
2,
20
03
,2
00
5o
r2
00
6)
we
reu
sed
inth
em
ult
ivar
iate
anal
ysis
,tr
eat
ing
eac
hco
-var
iab
leas
aca
teg
ori
cal
vari
able
.*L
um
inal
Asu
bg
rou
p:
case
sw
ith
ho
rmo
ne
rece
pto
r(H
R)-
po
siti
vean
dH
ER2
-ne
gat
ive
stat
us.
**H
ER2
-po
siti
vesu
bg
rou
p:
case
sw
ith
HER
2-p
osi
tive
stat
us
wit
ho
rw
ith
ou
tH
Rp
osi
tivi
ty.
***T
rip
le-n
eg
ativ
esu
bg
rou
p(T
N):
HR
-ne
gat
ive
and
HER
2-n
eg
ativ
est
atu
s.{ P
for
line
artr
en
d.
do
i:10
.13
71
/jo
urn
al.p
on
e.0
09
81
60
.t0
04
Chromatin CKAP2 as Prognostic Marker in Breast Cancer
PLOS ONE | www.plosone.org 8 June 2014 | Volume 9 | Issue 6 | e98160
might be related to the various phase-specificities of the
proliferation markers: for example, while Ki-67 is present in all
cell-cycle phases except G0, cyclin D and E show their activities
only in the G1/S transition [6]. Therefore, further validation of
the currently available proliferation markers, and development of
additional markers, is required. In the present study, chromatin
CKAP2, a new proliferation marker with its specificity in the
mitotic phase, showed consistent RFS-correlation results across
two institutions, with values higher than those for the MAI. As the
use of IHC markers offers great potential advantages in regard to
evaluation time and efficiency, CKAP2 immunohistochemistry
could facilitate the clinical application of proliferation activity to
breast cancer by providing a simple and effective MAI-alternative
measure. However, as an international assessment of Ki67 has
been convened [25], further study comparing chromatin CKAP2
with Ki-67 is warranted.
Although the prognostic significance of proliferation activity in
breast cancer seems evident, the prognostic significance as
measured by Ki-67 has been modest in breast cancer [8,26].
Nonetheless, because breast cancer has been classified into distinct
molecular subgroups based on receptor status [28,29], the
prognostic significances should be clarified in each subgroup,
since any of them might be disclosed as having a clinically
applicable potential. Recent retrospective studies suggest that
proliferation activity is an effective prognostic marker only in the
luminal A [21,30] or TN [31] subgroup. Our results, showing
prognostic significance in the luminal A and TN subgroups but not
in the HER2-positive subgroup, are consistent in that regard. Our
results additionally suggest that the prognostic significance of
CPCC for group 2 differs between the luminal A and TN
subgroups, though further independent validation is necessary.
Further subgroup validation analyses could identify the best
subgroup for clinical application of proliferation activity in breast
cancer.
In summary, the present study has shown that chromatin
CKAP2 is an effective independent prognostic marker for RFS in
early-stage breast cancer. Further investigation of chromatin
CKAP2’s clinical application to the management of breast cancer
treatment, therefore, is warranted. Additionally, our results
indicated that the prognostic significance of proliferation activity
differs among the various breast cancer subgroups, which fact
could potentially reveal the breast cancer subgroup wherein
proliferation activity is important for survival prediction.
Author Contributions
Conceived and designed the experiments: JR KTK JP CDB KMH. Wrote
the paper: HSK JSK JR KTK JP VC CDB KMH. Performed the
histopathological evaluation and reviewed the clinical data: HSK JSK.
Carried out and/or participated in the immunohistochemical staining:
YBC HKK HSS. Performed the statistical analyses: MKK BHN.
Reviewed the clinical data: HSS WCN EKK. Participated in study design
and coordination: CDB KMH. Read and approved the final manuscript:
HSK JSK YBC JR HKK MKK BHN KTK VC HSS WCN EKK JP
CDB KMH.
References
1. van Diest PJ, van der Wall E, Baak JP (2004) Prognostic value of proliferation in
invasive breast cancer: a review. J Clin Pathol 57: 675–681.
2. Baak JP, Gudlaugsson E, Skaland I, Guo LH, Klos J, et al. (2009) Proliferation is
the strongest prognosticator in node-negative breast cancer: significance, error
sources, alternatives and comparison with molecular prognostic markers. Breast
Cancer Res Treat 115: 241–254.
3. Yerushalmi R, Woods R, Ravdin PM, Hayes MM, Gelmon KA (2010) Ki67 in
breast cancer: prognostic and predictive potential. Lancet Oncol 11: 174–183.
4. Amadori D, Nanni O, Marangolo M, Pacini P, Ravaioli A, et al. (2000) Disease-
free survival advantage of adjuvant cyclophosphamide, methotrexate, and
fluorouracil in patients with node-negative, rapidly proliferating breast cancer: a
randomized multicenter study. J Clin Oncol 18: 3125–3134.
5. Keam B, Im SA, Lee KH, Han SW, Oh DY, et al. (2011) Ki-67 can be used for
further classification of triple negative breast cancer into two subtypes with
different response and prognosis. Breast Cancer Res 13: R22.
6. Colozza M, Azambuja E, Cardoso F, Sotiriou C, Larsimont D, et al. (2005)
Proliferative markers as prognostic and predictive tools in early breast cancer:
where are we now? Ann Oncol 16: 1723–1739.
7. Bossard C, Jarry A, Colombeix C, Bach-Ngohou K, Moreau A, et al. (2006)
Phosphohistone H3 labelling for histoprognostic grading of breast adenocarci-
nomas and computer-assisted determination of mitotic index. J Clin Pathol 59:
706–710.
8. Harris L, Fritsche H, Mennel R, Norton L, Ravdin P, et al. (2007) American
Society of Clinical Oncology 2007 update of recommendations for the use of
tumor markers in breast cancer. J Clin Oncol 25: 5287–5312.
9. Ferguson NL, Bell J, Heidel R, Lee S, Vanmeter S, et al. (2013) Prognostic value
of breast cancer subtypes, Ki-67 proliferation index, age, and pathologic tumor
characteristics on breast cancer survival in Caucasian women. Breast J 19: 22–
30.
10. Carey LA, Dees EC, Sawyer L, Gatti L, Moore DT, et al. (2007) The triple
negative paradox: primary tumor chemosensitivity of breast cancer subtypes.
Clin Cancer Res 13: 2329–2334.
11. Liedtke C, Mazouni C, Hess KR, Andre F, Tordai A, et al. (2008) Response to
neoadjuvant therapy and long-term survival in patients with triple-negative
breast cancer. J Clin Oncol 26: 1275–1281.
12. Jin Y, Murakumo Y, Ueno K, Hashimoto M, Watanabe T, et al. (2004)
Identification of a mouse cytoskeleton-associated protein, CKAP2, with
microtubule-stabilizing properties. Cancer Sci 95: 815–821.
13. Maouche-Chretien L, Deleu N, Badoual C, Fraissignes P, Berger R, et al. (1998)
Identification of a novel cDNA, encoding a cytoskeletal associated protein,
differentially expressed in diffuse large B cell lymphomas. Oncogene 17: 1245–
1251.
14. Hong KU, Choi YB, Lee JH, Kim HJ, Kwon HR, et al. (2008) Transient
phosphorylation of tumor associated microtubule associated protein (TMAP)/
cytoskeleton associated protein 2 (CKAP2) at Thr-596 during early phases of
mitosis. Exp Mol Med 40: 377–386.
15. Kim HS, Choi YB, Lee JH, Park SY, Kim HK, et al. (2012) Condensed
chromatin staining of CKAP2 as surrogate marker for mitotic figures. J CancerRes Clin Oncol 138: 95–102.
16. Baak JP, van Diest PJ, Voorhorst FJ, van der Wall E, Beex LV, et al. (2005)
Prospective multicenter validation of the independent prognostic value of themitotic activity index in lymph node-negative breast cancer patients younger
than 55 years. J Clin Oncol 23: 5993–6001.
17. Dai H, van’t Veer L, Lamb J, He YD, Mao M, et al. (2005) A cell proliferation
signature is a marker of extremely poor outcome in a subpopulation of breast
cancer patients. Cancer Res 65: 4059–4066.
18. Wirapati P, Sotiriou C, Kunkel S, Farmer P, Pradervand S, et al. (2008) Meta-
analysis of gene expression profiles in breast cancer: toward a unifiedunderstanding of breast cancer subtyping and prognosis signatures. Breast
Cancer Res 10: R65.
19. Whitfield ML, George LK, Grant GD, Perou CM (2006) Common markers ofproliferation. Nat Rev Cancer 6: 99–106.
20. Oakman C, Bessi S, Zafarana E, Galardi F, Biganzoli L, et al. (2009) Recentadvances in systemic therapy: new diagnostics and biological predictors of
outcome in early breast cancer. Breast Cancer Res 11: 205.
21. Nishimura R, Osako T, Okumura Y, Hayashi M, Toyozumi Y, et al. (2010) Ki-67 as a prognostic marker according to breast cancer subtype and a predictor of
recurrence time in primary breast cancer. Exp Ther Med 1: 747–754.
22. Penault-Llorca F, Andre F, Sagan C, Lacroix-Triki M, Denoux Y, et al. (2009)
Ki67 expression and docetaxel efficacy in patients with estrogen receptor-
positive breast cancer. J Clin Oncol 27: 2809–2815.
23. Hugh J, Hanson J, Cheang MC, Nielsen TO, Perou CM, et al. (2009) Breast
cancer subtypes and response to docetaxel in node-positive breast cancer: use ofan immunohistochemical definition in the BCIRG 001 trial. J Clin Oncol 27:
1168–1176.
24. Nishimura R, Osako T, Okumura Y, Hayashi M, Arima N (2009) Clinicalsignificance of Ki-67 in neoadjuvant chemotherapy for primary breast cancer as
a predictor for chemosensitivity and for prognosis. Breast Cancer 17: 269–275.
25. Dowsett M, Nielsen TO, A’Hern R, Bartlett J, Coombes RC, et al. (2011)
Assessment of Ki67 in breast cancer: recommendations from the International
Ki67 in Breast Cancer working group. J Natl Cancer Inst 103: 1656–1664.
26. Urruticoechea A, Smith IE, Dowsett M (2005) Proliferation marker Ki-67 in
early breast cancer. J Clin Oncol 23: 7212–7220.
27. Spyratos F, Ferrero-Pous M, Trassard M, Hacene K, Phillips E, et al. (2002)
Correlation between MIB-1 and other proliferation markers: clinical implica-
tions of the MIB-1 cutoff value. Cancer 94: 2151–2159.
28. Sorlie T, Perou CM, Tibshirani R, Aas T, Geisler S, et al. (2001) Gene
expression patterns of breast carcinomas distinguish tumor subclasses withclinical implications. Proc Natl Acad Sci U S A 98: 10869–10874.
Chromatin CKAP2 as Prognostic Marker in Breast Cancer
PLOS ONE | www.plosone.org 9 June 2014 | Volume 9 | Issue 6 | e98160

29. Vallejos CS, Gomez HL, Cruz WR, Pinto JA, Dyer RR, et al. (2010) Breast
cancer classification according to immunohistochemistry markers: subtypes and
association with clinicopathologic variables in a peruvian hospital database. Clin
Breast Cancer 10: 294–300.
30. Aleskandarany MA, Green AR, Benhasouna AA, Barros FF, Neal K, et al.
(2012) Prognostic value of proliferation assay in the luminal, HER2-positive, andtriple-negative biologic classes of breast cancer. Breast Cancer Res 14: R3.
31. Munzone E, Botteri E, Sciandivasci A, Curigliano G, Nole F, et al. (2012)
Prognostic value of Ki-67 labeling index in patients with node-negative, triple-negative breast cancer. Breast Cancer Res Treat 134: 277–282.
Chromatin CKAP2 as Prognostic Marker in Breast Cancer
PLOS ONE | www.plosone.org 10 June 2014 | Volume 9 | Issue 6 | e98160