Cholesterol Metabolism in Brain and Skin Fibroblasts from Sarda Breed Sheep With Scrapie-resistant...
24
1 Cholesterol metabolism in brain and skin fibroblasts from Sarda breed sheep with scrapie-resistant and scrapie-susceptible genotypes 1 Alessandra Pani, 2 Claudia Abete, 2 Claudia Norfo, 2 Claudia Mulas, 2 Marirosa Putzolu, 2 Sergio Laconi, 1 M. Dolores Cannas, 1 Cristina D. Orrù, 1 Paolo La Colla, 2 Sandra Dessì 1 General Microbiology and Virology and Microbial Biotechnologies Section, 2 Experimental Pathology Section, Department of Biomedical Sciences and Technology, University of Cagliari, Italy Abstract: Scrapie is a fatal spongiform encephalopathy of sheep, a transmissible form of prion disease caused by neuronal accumulation of the aberrantly conformed prion protein (PrPsc). Currently, no ante-mortem diagnostic tests are available to detect this untreatable disease in the pre- clinical stage, thus making difficult to control its spread. Recent evidence suggests that the production of PrPsc can be modulated by the levels of membrane cholesterol in neuronal cells. Since cholesterol levels in cell membranes depend on the cholesterol homeostasis in the whole organism, whole organism, we studied cholesterol metabolism in brain tissues, plasma and skin fibroblasts of Sarda breed sheep with scrapie-resistant (ARR/ARR) and scrapie-susceptible (ARQ/ARQ) prion protein genotypes, both not infected (ARQ/ARQ - ) and infected (ARQ/ARQ + ) with scrapie. We found that, the levels of cytoplasmic cholesterol esters (CE) in brains and skin fibroblasts from sheep with the ARQ/ARQ genotype were consistently higher than those from sheep with the ARR/ARR genotype. Conversely, the levels of free cholesterol (FC) were lower in ARQ/ARQ, as compared to ARR/ARR sheep, thus resulting in a sharp reduction of the FC/CE ratio. Moreover, both uninfected and infected ARQ/ARQ sheep showed abnormally low levels of high density lipoprotein-cholesterol (HDL-C) in their plasma, as compared to ARR/ARR sheep. These data other than adding new strength to the notion that altered levels of intracellular cholesterol may indicate the presence of a lipid metabolic state that predisposes to infection with, and accumulation of, PrPsc in the brain, discriminate for the first time between two distinct but related cellular pools of cholesterol, namely membrane FC on one hand and cytoplasmic CE on the other.
Transcript of Cholesterol Metabolism in Brain and Skin Fibroblasts from Sarda Breed Sheep With Scrapie-resistant...
1
Cholesterol metabolism in brain and skin fibroblasts from Sarda breed sheep
with scrapie-resistant and scrapie-susceptible genotypes
1Alessandra Pani,
2Claudia Abete,
2Claudia Norfo,
2Claudia Mulas,
2Marirosa Putzolu,
2Sergio Laconi,
1M. Dolores Cannas,
1Cristina D. Orrù,
1Paolo La Colla,
2Sandra Dessì
1General Microbiology and Virology and Microbial Biotechnologies Section,
2Experimental Pathology Section,
Department of Biomedical Sciences and Technology,
University of Cagliari, Italy
Abstract: Scrapie is a fatal spongiform encephalopathy of sheep, a transmissible form of prion
disease caused by neuronal accumulation of the aberrantly conformed prion protein (PrPsc).
Currently, no ante-mortem diagnostic tests are available to detect this untreatable disease in the pre-
clinical stage, thus making difficult to control its spread. Recent evidence suggests that the
production of PrPsc can be modulated by the levels of membrane cholesterol in neuronal cells.
Since cholesterol levels in cell membranes depend on the cholesterol homeostasis in the whole
organism, whole organism, we studied cholesterol metabolism in brain tissues, plasma and skin
fibroblasts of Sarda breed sheep with scrapie-resistant (ARR/ARR) and scrapie-susceptible
(ARQ/ARQ) prion protein genotypes, both not infected (ARQ/ARQ-) and infected (ARQ/ARQ
+)
with scrapie. We found that, the levels of cytoplasmic cholesterol esters (CE) in brains and skin
fibroblasts from sheep with the ARQ/ARQ genotype were consistently higher than those from
sheep with the ARR/ARR genotype. Conversely, the levels of free cholesterol (FC) were lower in
ARQ/ARQ, as compared to ARR/ARR sheep, thus resulting in a sharp reduction of the FC/CE
ratio.
Moreover, both uninfected and infected ARQ/ARQ sheep showed abnormally low levels of high
density lipoprotein-cholesterol (HDL-C) in their plasma, as compared to ARR/ARR sheep.
These data other than adding new strength to the notion that altered levels of intracellular
cholesterol may indicate the presence of a lipid metabolic state that predisposes to infection with,
and accumulation of, PrPsc in the brain, discriminate for the first time between two distinct but
related cellular pools of cholesterol, namely membrane FC on one hand and cytoplasmic CE on the
other.

2
Key words: Scrapie, Prion diseases, Cholesterol homeostasis, Cholesterol levels, Rafts
Correspondence to:
Sandra Dessì &Alessandra Pani
Università di Cagliari
Dipartimento di Scienze e Tecnologie Biomediche
Sezione di Patologia Sperimentale
Via Porcell 4 09124, Cagliari, Italy
T. n. 00390706758340
Fax n. 0039070662574
e-mail [email protected]
3
Introduction
Prion diseases are fatal neurodegenerative disorders for which no diagnostic tests “in vitam”, nor
treatments are currently available. Unlike any other neurodegenerative disease, prion diseases can
be inherited, transmitted or sporadic. However, in spite of their diverse origin, all these forms are
caused by the conversion of the normal prion protein (PrPc) into its pathologic, protease-resistant
counterpart (PrPsc)(1)
. The difference between PrPc and PrPsc is conformational: PrPc is
predominantly alpha helical and contains few beta-sheets, while PrPsc is mainly composed of beta-
sheets (2)
. Under normal conditions, the majority of PrPc is catabolized by cleavage at residues 110
and 111, and only a limited amount of it eventually switches to PrPsc (3)
. By contrast, in prion
diseases the conversion rate of PrPc to PrPsc is greatly enhanced (4)
leading to accumulation of
cytotoxic, protease-resistant PrPsc aggregates, the key event in the initiation of the
neuropathological manifestations of the disease(4)
. Interestingly, intracerebral injection of
exogenous PrPsc in mice induces the development of encephalopathy only in animals that express
the endogenous PrPc, but not in PrPc-null mice, indicating that expression of the endogenous PrPc
protein is an essential condition for the development of prion diseases (5)
.
PrPc is normally anchored to specialized cholesterol-rich domains of the plasma membrane, termed
lipid rafts or caveolae, through its glycophospatidyl inositol (GPI)-terminus (6)
. These membrane
domains are detergent-insoluble regions characterized by the presence of free cholesterol (FC),
saturated phospholipids and raft-resident proteins(7,8)
. Increasing evidence indicates that subtle
intracellular cholesterol changes affect the intracellular processing/trafficking, function and/or
activation of raft-resident proteins (9,10)
. Therefore, a role for cholesterol in the metabolism of PrPc
and its conversion to PrPSc has been proposed (11,12)
.
In normal tissues, with the exception of liver and adrenal glands, approximately 90% of the total
cellular cholesterol resides in membrane raft domains as FC, while only a minor amount
(approximately 1-10%) is found as cholesterol esters (CE) in a cytoplasmic storage form (13)
. Since
FC levels are critical to the maintenance of proper membrane fluidity, as well as to the function
and/or activation of raft-resident proteins, cells have developed a highly integrated set of
homeostatic mechanisms acting in concert to finely control intracellular cholesterol levels (14)
.
The FC found in cell membranes derives either from de novo synthesis in the endoplasmic
reticulum (ER), or from lysosomes following receptor-mediated uptake of low-density lipoproteins
(LDLs). Membrane FC, however, is in a dynamic state, moving back to the ER in response to
changing homeostatic conditions in the cell (15)
. In fact, if cholesterol in the rafts exceeds threshold
levels, its excess is promptly transferred to the ER, where it might elicit high-order responses from
4
the control proteins embedded (16)
. FC in the ER blocks the function of its cellular sensor, the
SREBP-cleavage-activating-protein (SCAP), which is needed for the proteolytic activation of the
sterol-regulatory-element-binding-protein-2 (SREBP-2), a transcriptional factor that promotes the
expression of genes involved in cholesterol synthesis [i.e. hydroxyl-methyl-glutaryl-coenzime A-
reductase (HMGCoA-R)] and uptake (i.e. LDL receptor) (15-18)
. FC in the ER can be either used in
the assembly of newly formed membrane rafts, and returned to the plasma membrane through
vesicular transport, or, if in excess, converted to CE by the acyl-cholesterol-acyl-transferase
(ACAT) and stored in the cytoplasm as neutral lipid droplets (19)
. Vice versa, when cell membranes
need FC, or when CE droplets exceed a critical threshold value, CE can be reconverted to FC by the
neutral-cholesterol-ester-hydrolase (nCEH) (20)
. FC can then be recycled to the membranes by
cholesterol binding protein, such as caveolin-1 (Cav-1) (7, 8)
, where i) it can be used to replenish raft
domains, or if in excess, ii) delivered to extracellular acceptors, namely high-density lipoproteins
(HDL), via the ATP-binding-cassette-sub-family A-member 1 (ABCA-1) transporter (21)
.
Recent evidence indicates that the metabolic fate of PrPc is dependent on its location in the plasma
membrane which, in turn, is affected by cholesterol levels in the rafts (22)
. On the other hand,
cholesterol levels in the rafts can be affected by various factors that may alter its intracellular
metabolism, including the levels of Cav-1 transporter (23)
. These findings led us and others(24,25)
to
hypothesize that cholesterol may have a pivotal role in the PrPc to PrPsc conversion and, therefore,
that alterations in intracellular cholesterol homeostasis may predispose to prion diseases.
Scrapie is the ovine counterpart of prion disorders, such as Creutzfeld-Jacobs in humans and BSE in
cows (26-29)
. Although the transmissible origin of sheep scrapie is well documented, there is also
evidence for a genetic susceptibility that depends on the particular polymorphisms of the prion
protein gene (PRNP) (26-29)
.
Many polymorphic codons have been described to date in the PrPc open-reading frame (30)
.
However, only substitutions at codons 136 (A→V), 154 (R→H) and 171 (Q→R o H) are associated
with susceptibility/resistance to the disease. These substitutions generate different alleles: VRQ,
ARQ, AHQ, ARH, ARR and 15 different genotypes. In general, VRQ and ARQ alleles are
associated with high susceptibility to scrapie, while the ARR allele is associated with resistance (30)
.
In the present study we compared the cholesterol metabolism of Sarda breed sheep carrying the
scrapie-resistant genotype (ARR/ARR) with that of animals carrying the scrapie-susceptible
(ARQ/ARQ) genotype, both without (ARQ/ARQ-) and with (ARQ/ARQ+) scrapie. The aim of the
present study was to establish a possible correlation between cellular and plasmatic cholesterol
homeostasis and genetic susceptibility to scrapie, in an attempt to identify a lipid metabolic state
that may influence genetic predisposition to prion diseases.
5
Materials and Methods
Brain samples: Brain samples collected from 3 adult sheep from the experimental farms of the
Istituto Zooprofilattico Sperimentale of Sardinia, Italy, were a generous gift by Dr. Ciriaco Ligios.
Two sheep carried the susceptible scrapie genotype ARQ/ARQ: 1 sheep was clinically affected by
natural scrapie while the other was healthy and negative for PrPSc
in the brain, by Western blot
analysis. The third sheep carried the resistant genotype ARR/ARR. All sheep were euthanized with
a barbiturate followed by 4 ml of embutramide and mebenzonico-iodide (Hoechst Roussel Vet),
brain samples were stored at –80°C immediately after collection and thawed just prior to use.
Skin biopsies and fibroblast isolation: Fresh skin biopsies (a generous gift by Dr. Ciriaco Ligios)
obtained from 14 sheep at the experimental farms of the Istituto Zooprofilattico Sperimentale of
Sardinia, Italy, were delivered to our laboratory in transport medium (Eurocollins). All animals
were raised in the same environmental conditions and were of the same age and sex in order to
reduce physiological differences of biochemical and molecular determinations. Ten biopsies were
from sheep with the susceptible genotype ARQ/ARQ: of these, 2 were scrapie-free, 1 had natural
scrapie, while 7 developed clinical disease following experimental inoculation of scrapie. All
biopsies were taken from scrapie-affected sheep at the terminal clinical stage of the disease. In
addition, skin biopsies from 4 scrapie-resistant ARR/ARR sheep which were experimentally
inoculated with PrPSc
and remained free of clinical signs were used as controls.
Tissues fragments from skin biopsies were plated into 6-well plates and allowed to adhere to the
bottom of the vessels. Then, after 2 hrs, they were covered with a few drops of Dulbecco’s modified
Eagle’s medium (D-MEM) (Gibco Lab NY, USA) supplemented with 10% fetal bovine serum
(FBS) (Sigma), 100 U/ml penicillin/streptomycin (Sigma), and fungizone (Life Technologies, Inc.)
and incubated at 37°C in a humidified incubator with 5% CO2. The following day, tissue fragments
were overlaid with culture medium, which was changed every two days. Five to six days later,
fibroblasts begun to proliferate from the fragment margins (“halo of cells”) and to form a
monolayer. After four weeks, fibroblasts were purified by repeated trypsinization (trypsin-EDTA)
and passaging to achieve an homogenous population of spindle cells. Purified fibroblasts were
washed twice with sterile PBS and centrifuged. 1x10⁶ cells were then seeded into 25 cm
2 culture
flask and grown to confluence. Then, cells were either used for “in vitro” experiments or
resuspended in cryopreservation medium at a density of 1x10⁷ cells/ml and stored in liquid
nitrogen. Analytical assays were carried out using fibroblast cultures between the second and fourth
passage. Cells were plated at a density of 5x10³ cell/cm
2 in 6-well plates and brought to
proliferative quiescence by incubation for 48 hrs in serum depleted (0.2% FCS) MEM 199. Then,
6
quiescent cells were stimulated to re-enter the cell cycle by the addition of 10% FCS and incubation
at 37 °C for the required time intervals.
Blood sampling: From the same group of sheep that provided skin biopsies, blood samples were
also obtained and used for determination of plasma total cholesterol (TC) and high-density
lipoprotein cholesterol (HDL-C) by an enzymatic method (Carlo Erba, Milan Italy).
Brain lipid extraction and cholesterol determination: Minced tissue samples were homogenized
and neutral lipids were extracted (31)
. FC and CE were separated by thin layer chromatography and
their respective levels were determined by the method of Bowman and Wolf (32)
using cholesterol
and cholesterol oleate as standards.
Neutral lipid staining: The neutral lipid content of cultured fibroblasts was determined as follows.
Cultures were washed three times with PBS and fixed by soaking in 10% formalin. Cells were then
treated with isopropyl alcohol (60%), washed, stained with oil red O (a stain specific for
intracellular neutral lipid droplets) and counterstained with Mayer’s hematoxylin. Stained cells were
examined by light microscopy and digital images were recorded. Red color intensity in single cells,
indicating neutral lipid-bound oil red O, was measured by the NIH Image 1.63 Analysis Software
program (Scion Image). Values were expressed as the mean colour intensity calculated on at least
30 single cells in 6 different microscopic fields.
3H-Thymidine incorporation: Cell proliferation rates were measured by
3H-thymidine
incorporation. Skin fibroblasts were cultured as described. Cells were labeled with 3H-thymidine
(2.5 µCi/ml) (Amersham, 5 mCi/mmole) during the last 6 hrs before sample collection and
harvested at the time points indicated. Cells were rinsed twice with ice-cold PBS, washed with 5%
cold TCA, repeatedly washed with water and then lysed with 1M NaOH at room temperature. The
amount of acid-insoluble radioactivity was determined in a Beckman β counter (Palo Alto, Ca)
using Ultima Gold as the scintillation fluid. Aliquots of cell lysates were processed for protein
content determination by the Lowry method (33).
Cell viability was assessed by the trypan blue
exclusion test.
Cholesterol esterification: Cholesterol esterification was evaluated by incubating fibroblast
monolayers for 6 hrs in medium containing 5 µCi/ml of [1-14
C] oleic acid (Dupont, NEN 55
mCi/mmol) bovine serum albumin (BSA) complex. After incubation, cells were washed with PBS,
to remove the bulk of radioactive precursor, and lipids were extracted with acetone. Lipid
subclasses were separated by thin layer chromatography (TLC) on kiesegel plates using a solvent
system containing n-heptane/isopropyl ether/formic acid (60:40:2 v/v/v). Cholesterol ester bands
were identified by comparison with reference standard run simultaneously side-by-side and
visualized under iodine vapors. To determine the amount of lipids incorporating [1-14
C] oleate-
7
cholesterol, bands were excised and added directly to counting vials containing 10 ml of Econofluor
(DuPont NEN) liquid scintillation fluid.
RT-PCR and Southern blotting: The expression levels of Cav-1 and PrPc mRNAs were evaluated
in brain homogenates and skin fibroblasts by reverse transcription polymerase chain reaction (RT-
PCR). mRNA levels for the housekeeping gene β-actin were used to normalize the amount of RNA
inputs in the RT-PCR. Total RNA was extracted from 106
cells using TRIZOL reagent (Invitrogen
Corporation). Equal amounts of total RNA (1 µg) were reverse transcribed into cDNA using the
random hexamer method and amplified by PCR in the presence of specific primers, according to the
instructions provided by the manufacturer (GeneAmp RNA PCR Kit, Perkin-Elmer Cetus).
PCR was performed using the following ovine-specific primers and conditions: for Cav-1 (258 bp)
forward: 5’- GATTAACAGTGGGTACGATA-3’, reverse: 5’-TATGTAGTCTTGCGTTATCC-3’;
94 °C for 30 sec, 59 °C for 30 sec and 72 °C for 45 sec, for 30 cycles. For PrPc, (341 bp.) forward:
5’-ATTGTCACCTAGCAGATAGA-3’, reverse: 5’-TTGTTCAGTAGCTCAAGTCT-3’; 94 °C for
30 sec, 58°C for 1 min, and 72 °C for 45 sec, for 30 cycles. For β-actin (217 bp) forward: 5’-
GATCATGTTTGAGACCTTC-3’, reverse: 5’-GAGGATCTTCATGAGGTAGT-3’; 96 °C for 30
sec, 60 °C for 59 sec, and 72 °C for 45 sec, for 20 cycles. Sub-saturation levels of cDNA templates,
needed to produce a dose-dependent amount of PCR product, were defined in initial experiments by
testing a range of template concentrations.
Amplicons were labeled during PCR with Digoxigenin-11-dUTP (DIG; Roche Applied Science),
immuno-detected with anti-digoxigenin antibodies conjugated to alkaline phosphatase (Roche
Applied Science) and visualized with the chemiluminescent substrate CSPD®. The intensity of the
autoradiographic bands was measured after exposure to X-ray film with the Kodak Digital Science
Band Scanner Image Analysis System containing HP ScanJet, ID Image Analysis Software.
The overall procedure was normalized by expressing the amount of PCR products for each target
mRNA relative to the amount of PCR products obtained for the housekeeping gene β-actin.
Western blots: Proteins were extracted from brain homogenates and fibroblast monolayers with the
RIPA buffer (0.05 mL per mg tissue or cell pellets from 106 fibroblasts). Protein concentration was
evaluated by the Bicinchoninic Acid Protein determination kit (Sigma). Aliquots of protein extracts
were separated by 10% SDS polyacrylamide gel electrophoresis and blotted onto nitrocellulose
membranes (Millipore, Bedford MA) Blots were subjected to immunoblotting with a 1:5000
dilution of the anti-ACAT-1 antibody (H-125, Santa Cruz Biotechnology, Santa Cruz, CA) and a
1:2000 dilution of the anti-Cav-1 antibody (7C8, Novus Biologicals, Littleton CO), as indicated by
the manufacturer. Blots were then reacted with the appropriate dilution of a HRP-conjugated
secondary antibody (1:6500 for ACAT-1 and 1: 1000 for Cav-1). Specific bands were detected after
8
addition of the chemiluminescent substrate (Amersham, Freiburg Germany), and analyzed by the
NIH Image 1.63 Analysis Software program (Scion Image).
Statistical analysis. Data represent mean values ± standard error (SE). Statistical comparisons were
performed with the Student t test. Significance was set at P < 0.05.
Results
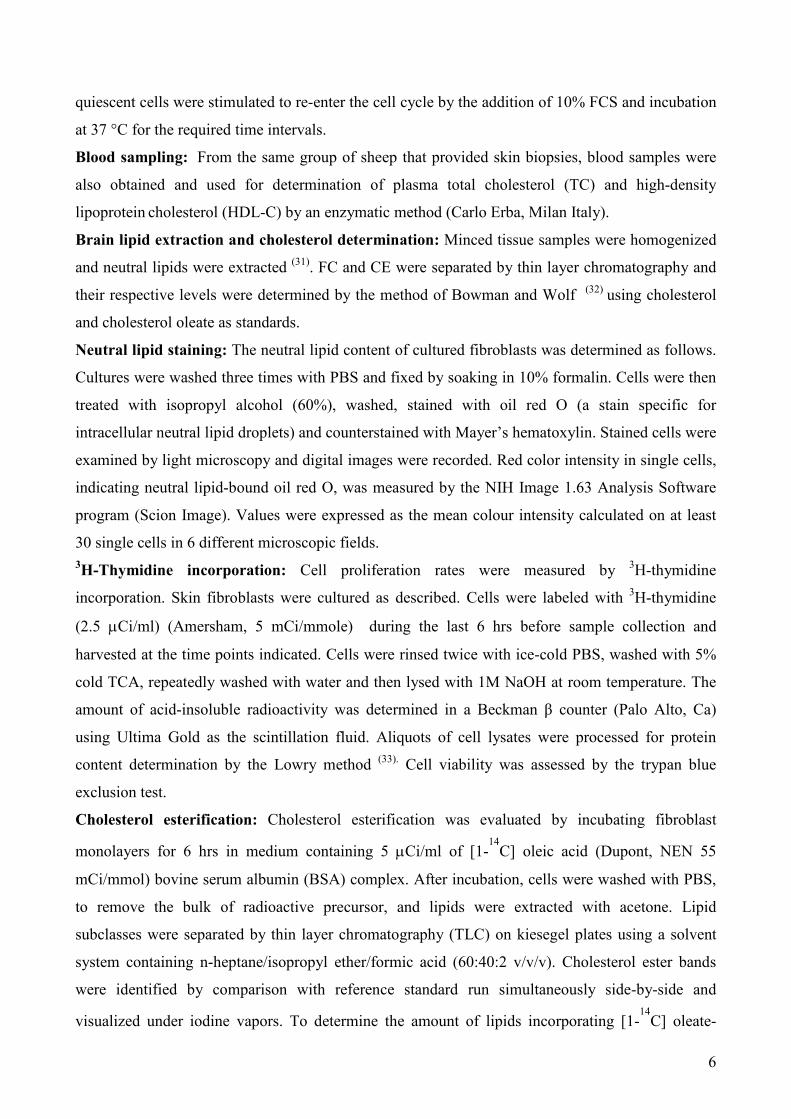
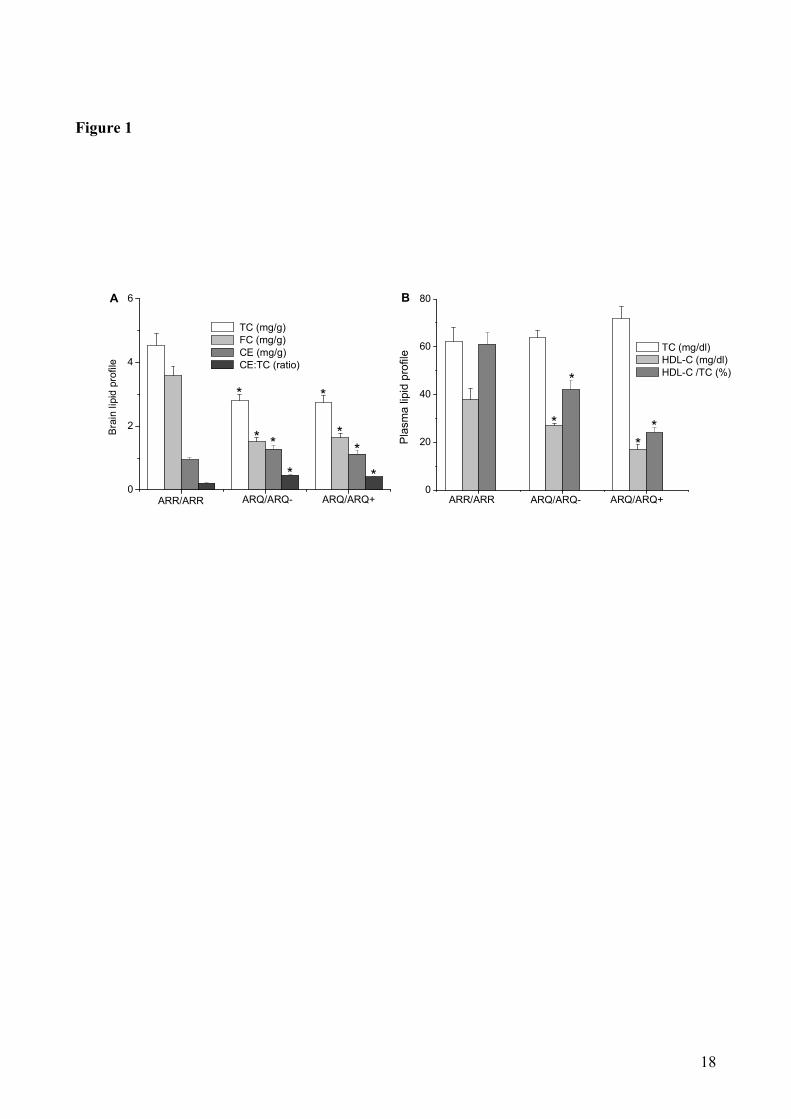
Cholesterol profiles in sheep brains and plasmas: We first determined cholesterol levels in the
brains from sheep carrying the scrapie-resistant genotype (ARR/ARR), or from animals carrying the
scrapie-susceptible genotype, either not infected (ARQ/ARQ-) or infected (ARQ/ARQ
+) with
scrapie (Fig. 1). Panel A shows that TC and FC levels were significantly higher (P<0.05) in brain
samples from the scrapie-resistant sheep as compared to scrapie-susceptible animals, irrespectively
to whether they were unaffected (ARQ/ARQ-) or affected (ARQ/ARQ
+) by scrapie. Conversely, CE
levels were 1.5-fold lower in ARR/ARR sheep, as compared to both ARQ/ARQ- and ARQ/ARQ
+
animals. The above differences in cholesterol levels are unequivocally evident by considering the
CE:TC ratio which, in brain samples from ARR/ARR sheep, is two-fold lower than in ARQ/ARQ
counterparts.
On the other hand, plasma TC levels turned out to be comparable in scrapie-resistant and scrapie-
susceptible sheep (P<0.05), whereas plasma HDL-C levels and, consequently, their percentage with
respect to TC, were found to progressively decrease in the following order: ARR/ARR >
ARQ/ARQ- > ARQ/ARQ
+. In summary, when compared to sheep with the ARR/ARR genotype,
ARQ/ARQ animals have, in their brains, lower absolute TC levels, lower FC and higher CE levels,
and, in their plasma, lower HDL-C levels.
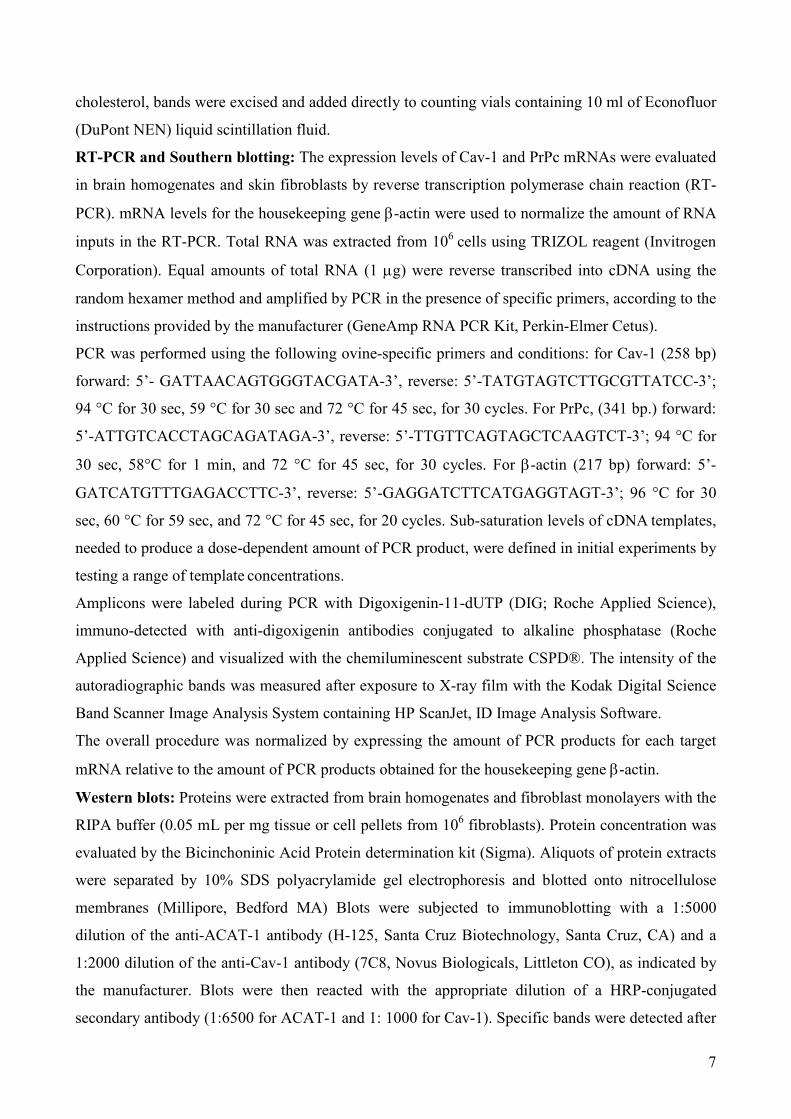
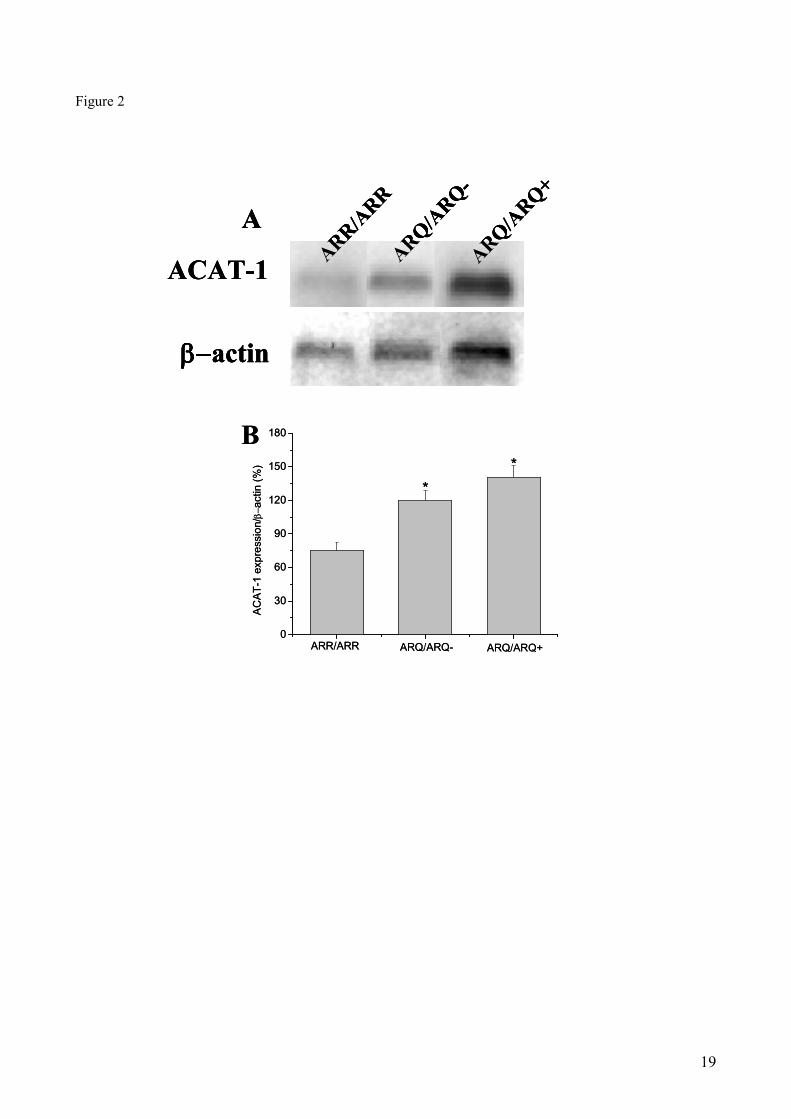
ACAT-1 protein levels in sheep brains: Due to the role of ACAT-1 in the conversion of FC to
EC, we investigated whether a correlation may exist between the different CE levels found in brains
of scrapie-resistant and scrapie-susceptible sheep (Fig. 1) and the expression levels of this enzyme.
Therefore, Western blot analysis of brain protein extracts of ARR/ARR, ARQ/ARQ- and
ARQ/ARQ+ sheep was carried out using the anti-ACAT-1
H-125 monoclonal antibody. As shown
in Fig. 2, lower expression levels of the ACAT-1 enzyme were indeed detected in ARR/ARR sheep,
as compared to ARQ/ARQ- and ARQ/ARQ
+ animals. In summary, when compared to sheep with
the ARR/ARR genotype, ARQ/ARQ- and ARQ/ARQ
+ sheep showed 1.7 and 2-fold higher levels of
ACAT-1, respectively.
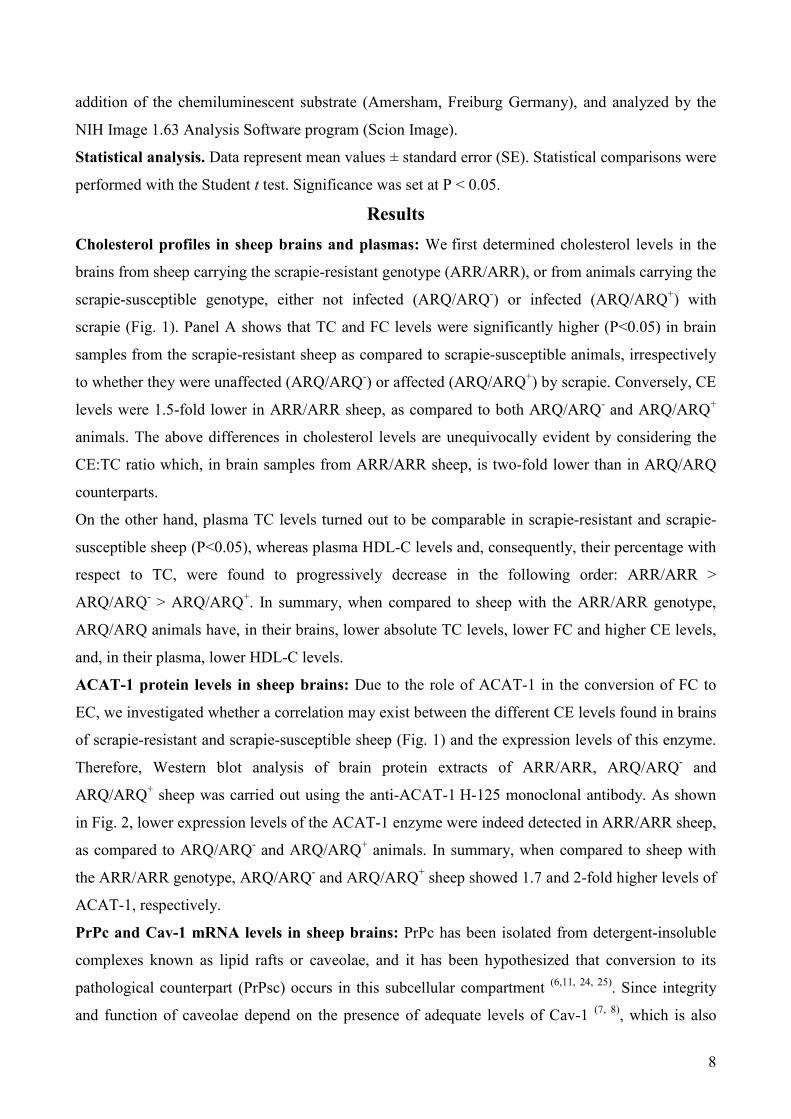
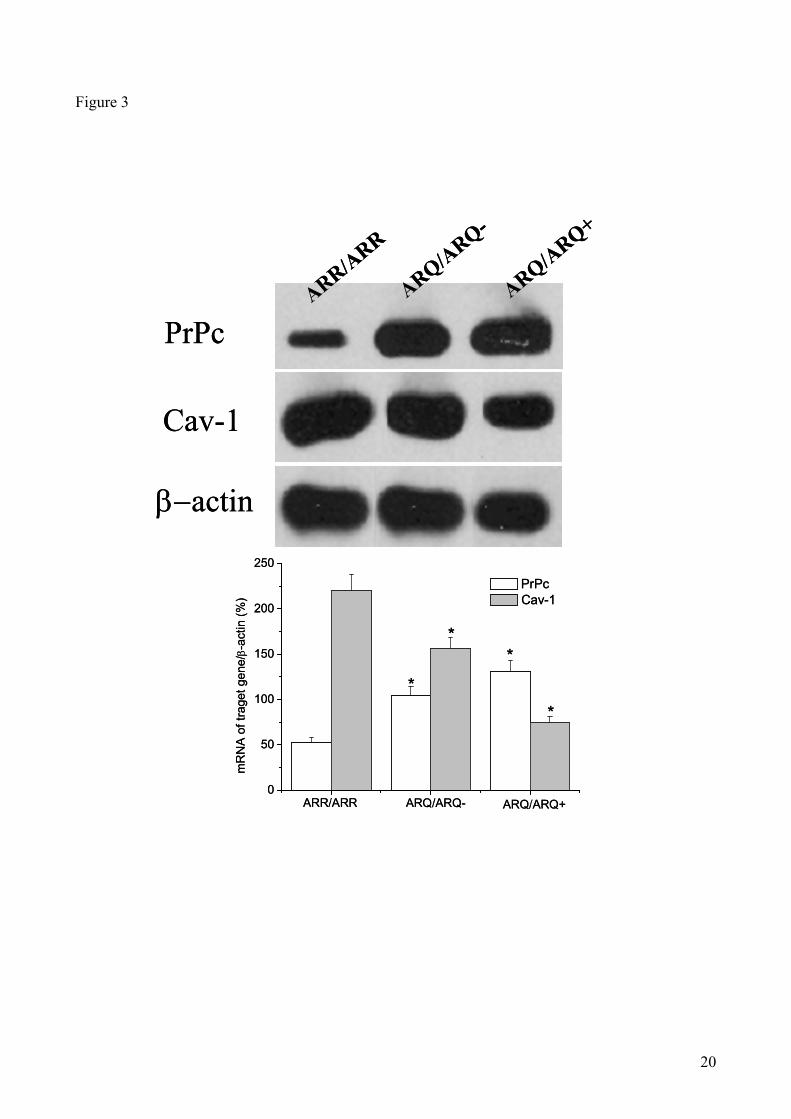
PrPc and Cav-1 mRNA levels in sheep brains: PrPc has been isolated from detergent-insoluble
complexes known as lipid rafts or caveolae, and it has been hypothesized that conversion to its
pathological counterpart (PrPsc) occurs in this subcellular compartment (6,11, 24, 25)
. Since integrity
and function of caveolae depend on the presence of adequate levels of Cav-1 (7, 8)
, which is also
9
involved in FC transport, we investigated a possible correlation between the levels of PrPc and Cav-
1 in brains of scrapie-susceptible and resistant sheep. ACAT-1 mRNA levels could not be studied
because the sequence of the sheep ACAT gene is not available.
As shown in Fig. 3, lower levels of PrPc mRNA, and higher levels of Cav-1 mRNA, were detected
in ARR/ARR sheep, as compared to ARQ/ARQ- and ARQ/ARQ
+ animals.
Altogheter our results support the conclusion that high brain CE levels (which may be considered
an index of altered cholesterol homeostasis), up-regulation of both ACAT-1 and PrPc and down-
regulation of Cav-1 gene expressions, coupled with low HDL-C in plasma, may represent a
distinctive metabolic profile of scrapie-susceptible animals.
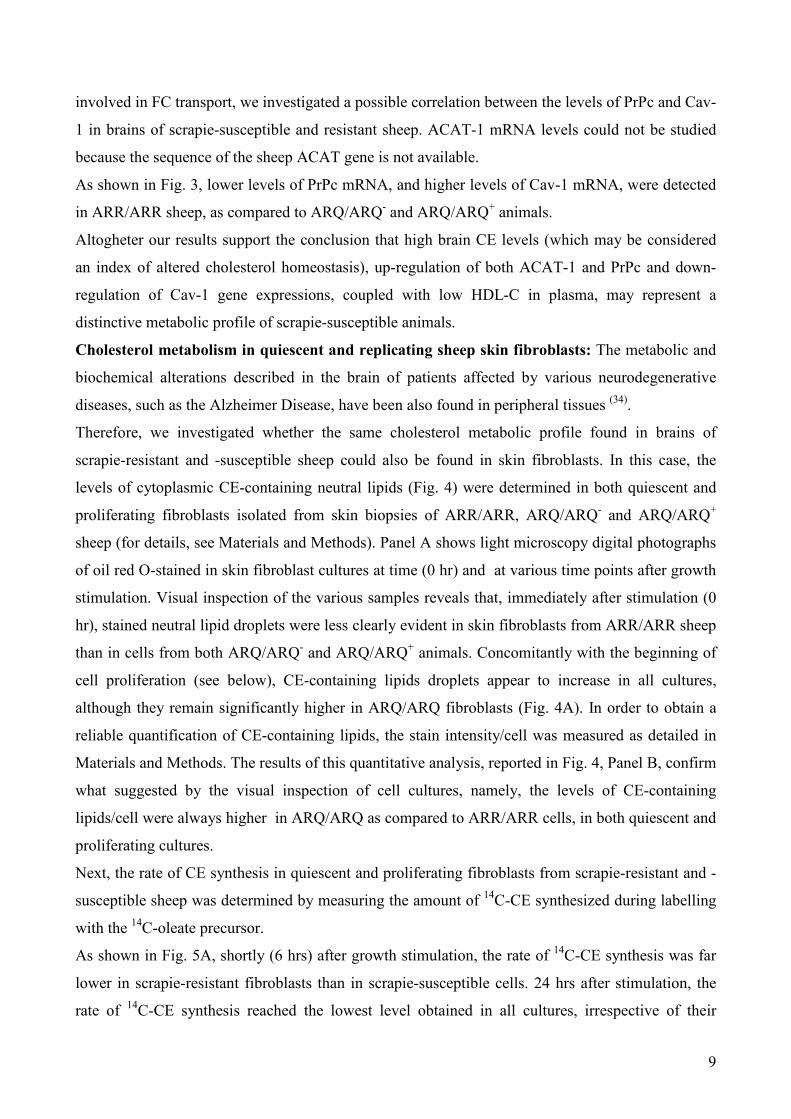
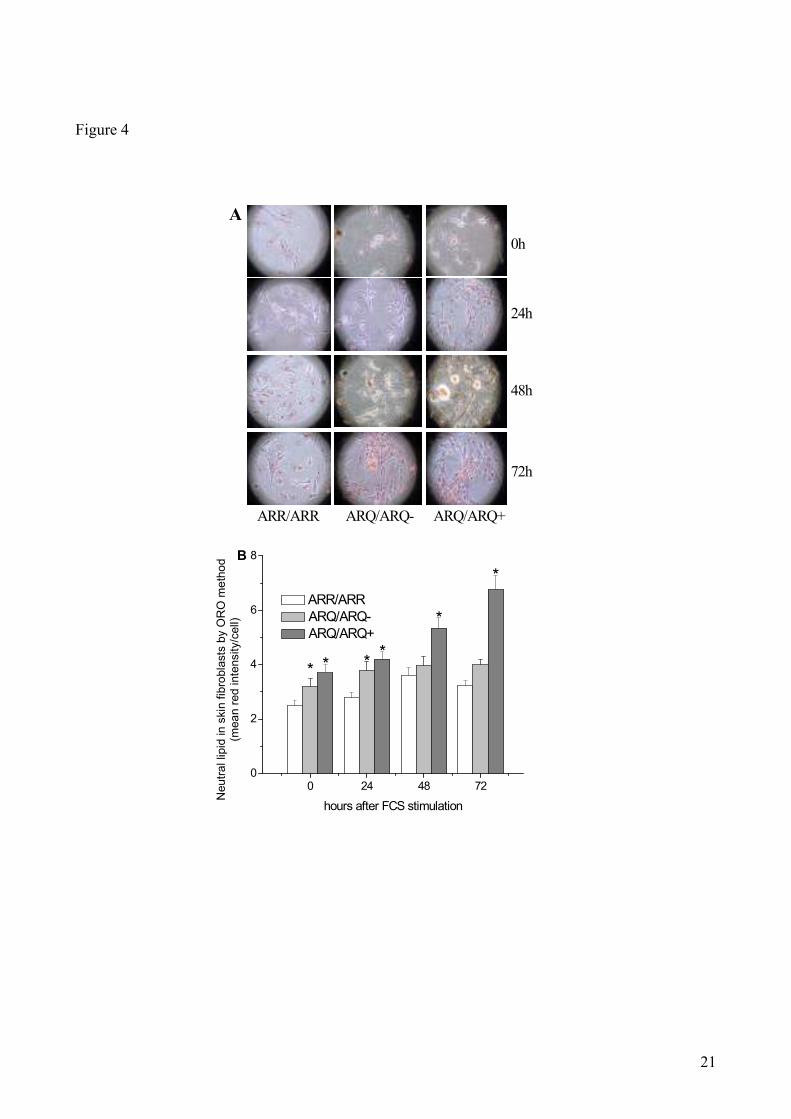
Cholesterol metabolism in quiescent and replicating sheep skin fibroblasts: The metabolic and
biochemical alterations described in the brain of patients affected by various neurodegenerative
diseases, such as the Alzheimer Disease, have been also found in peripheral tissues (34)
.
Therefore, we investigated whether the same cholesterol metabolic profile found in brains of
scrapie-resistant and -susceptible sheep could also be found in skin fibroblasts. In this case, the
levels of cytoplasmic CE-containing neutral lipids (Fig. 4) were determined in both quiescent and
proliferating fibroblasts isolated from skin biopsies of ARR/ARR, ARQ/ARQ- and ARQ/ARQ
+
sheep (for details, see Materials and Methods). Panel A shows light microscopy digital photographs
of oil red O-stained in skin fibroblast cultures at time (0 hr) and at various time points after growth
stimulation. Visual inspection of the various samples reveals that, immediately after stimulation (0
hr), stained neutral lipid droplets were less clearly evident in skin fibroblasts from ARR/ARR sheep
than in cells from both ARQ/ARQ- and ARQ/ARQ
+ animals. Concomitantly with the beginning of
cell proliferation (see below), CE-containing lipids droplets appear to increase in all cultures,
although they remain significantly higher in ARQ/ARQ fibroblasts (Fig. 4A). In order to obtain a
reliable quantification of CE-containing lipids, the stain intensity/cell was measured as detailed in
Materials and Methods. The results of this quantitative analysis, reported in Fig. 4, Panel B, confirm
what suggested by the visual inspection of cell cultures, namely, the levels of CE-containing
lipids/cell were always higher in ARQ/ARQ as compared to ARR/ARR cells, in both quiescent and
proliferating cultures.
Next, the rate of CE synthesis in quiescent and proliferating fibroblasts from scrapie-resistant and -
susceptible sheep was determined by measuring the amount of 14
C-CE synthesized during labelling
with the 14
C-oleate precursor.
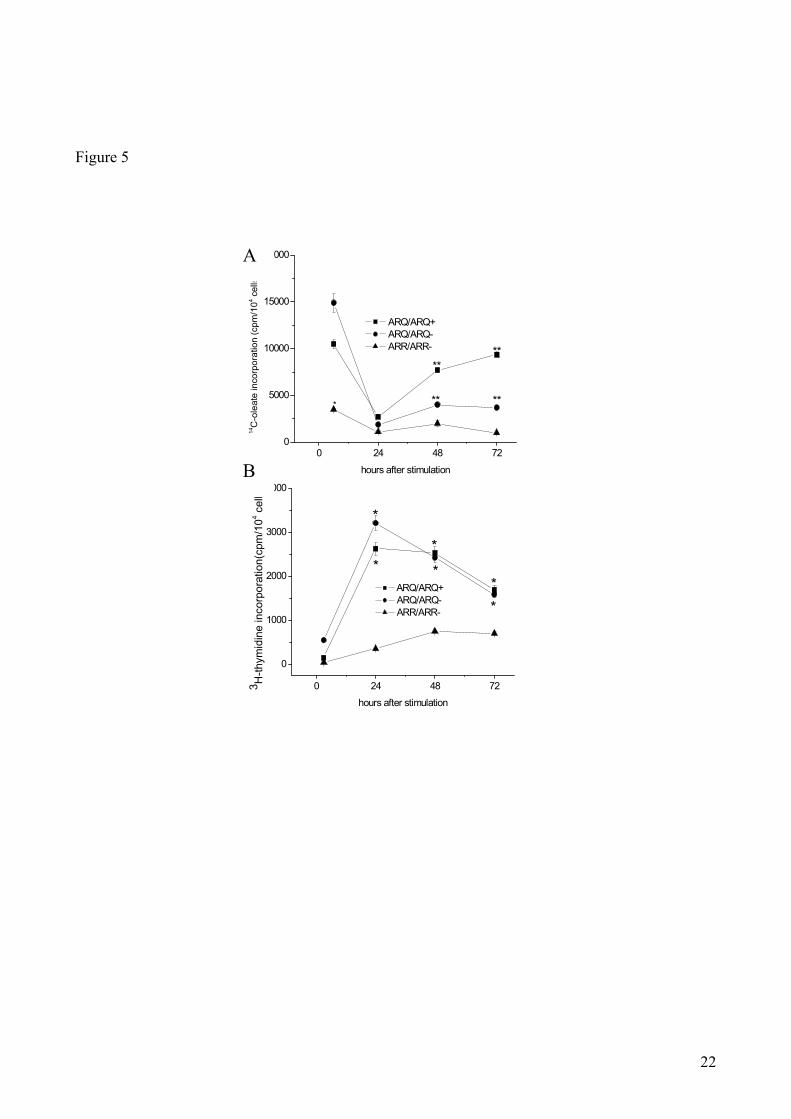
As shown in Fig. 5A, shortly (6 hrs) after growth stimulation, the rate of 14
C-CE synthesis was far
lower in scrapie-resistant fibroblasts than in scrapie-susceptible cells. 24 hrs after stimulation, the
rate of 14
C-CE synthesis reached the lowest level obtained in all cultures, irrespective of their
10
genotype. The rate of synthesis remained around those low levels for up to 72 hrs after stimulation
in ARR/ARR fibroblasts, while in ARQ/ARQ- fibroblasts it showed a modest increase (1.4-fold)
during the same time frame. 14
C-CE levels showed a more prominent increase (3-fold and 3.5-fold
at 48 and 72 hrs., respectively) in ARQ/ARQ+ fibroblasts.
As revealed by 3H-thymidine incorporation (Fig. 5B), shortly (6 hrs) after growth stimulation the
rate of DNA synthesis was, as expected, very low, irrespective of the fibroblast genotypes. At later
times after growth stimulation, the rate of 3H-thymidine incorporation showed a steady but modest
increase in ARR/ARR, reaching its peak (8-fold compared to time 6) at 48 hours. Conversely, the
rate of DNA synthesis rose sharply after stimulation in ARQ/ARQ fibroblasts, reaching its peak
(25-30-fold compared to time 6) at 24 hours and declining thereafter.
In conclusion, important differences were observed between ARR/ARR and ARQ/ARQ cultured
skin fibroblasts in the rates of CE and DNA synthesis. First of all, the metabolic pathway leading to
CE synthesis in quiescent fibroblasts was much more active in scrapie-susceptible than in scrapie-
resistant fibroblasts. Consistently with previous observations in other cell systems (35,36)
, increased
rates of cholesterol esterification were associated with increased growth rates, mainly in skin
fibroblasts from scrapie-susceptible sheep. These results indicate that skin fibroblasts from
ARQ/ARQ sheep display the same set of metabolic changes observed in brain tissue from the same
animals. Thus, cultured skin fibroblast may offer the advantage of allowing to avoid the frequent
artefacts due to rapid post-mortem alterations of brain tissue and, being easily accessible, they could
represent good candidates for the identification of new surrogate markers for ante-mortem diagnosis
of prion diseases.
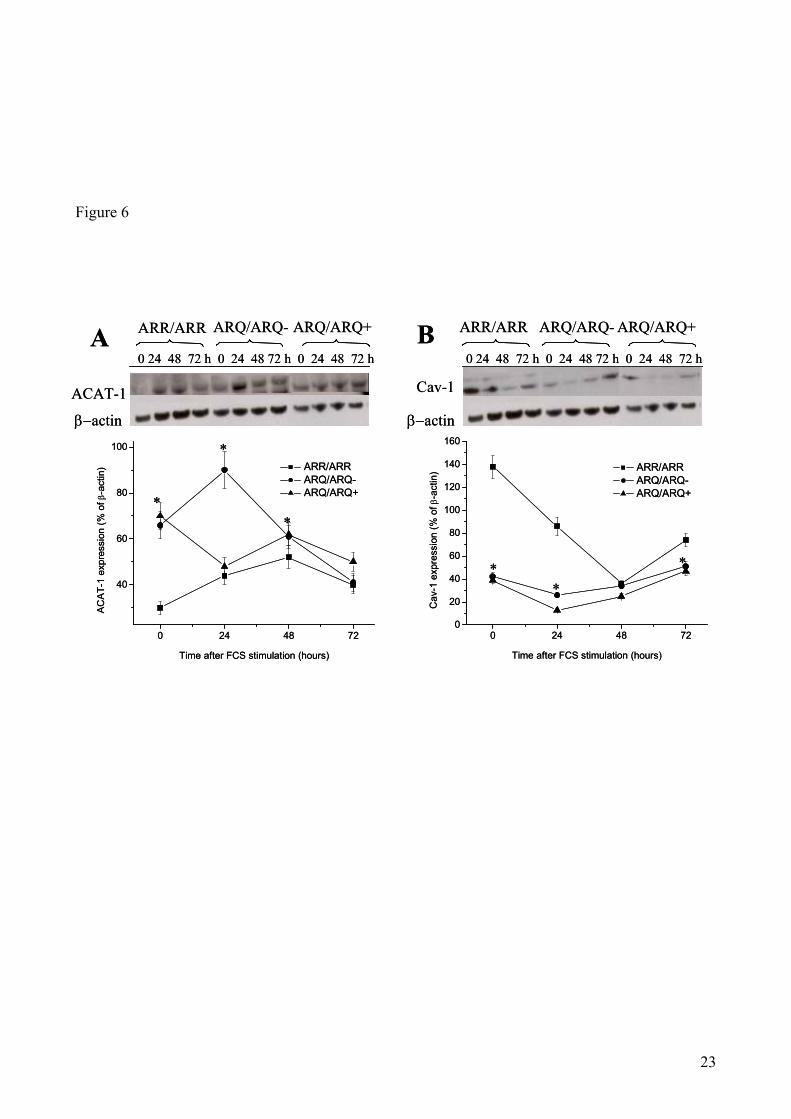
ACAT-1 and Cav-1 protein levels in quiescent and replicating sheep skin fibroblasts: Due to
the essential role of ACAT-1 and Cav-1 in cholesterol metabolism, it was interesting to investigate
whether expression patterns of the two proteins comparable to those found in sheep brains could
also be detected in skin fibroblasts.
The levels of ACAT-1 and Cav-1 proteins were determined in extracts of cultured skin fibroblasts
from scrapie-resistant and-susceptible sheep (Fig. 6). Western blot analysis confirmed that,
consistently with the results obtained in brains, ARR/ARR quiescent fibroblasts (time 0) contained
remarkably lower ACAT-1 levels than ARQ/ARQ quiescent fibroblasts (Panel A). With the sole
exception of ARQ/ARQ- fibroblasts at 24 hrs after FCS stimulation, the above difference in ACAT-
1 levels became less prominent as a consequence of cell proliferation. On the contrary, ARR/ARR
quiescent fibroblasts (time 0) contained remarkably higher Cav-1 levels than ARQ/ARQ quiescent
fibroblasts (Panel B). However, also in this case the above difference became less dramatic at 24 hrs
after FCS stimulation and was consistently reduced at 48 and 72 hrs.
11
In conclusion, consistently with the results obtained in sheep brains, when compared to scrapie-
resistant sheep, scrapie-susceptible animals show, also in fibroblasts, higher levels of ACAT-1
protein. Noteworthy, cultured ARQ/ARQ fibroblasts also show significantly lower amounts of Cav-
1 protein expression, particularly at 0 time and 72 hrs after growth stimulation.
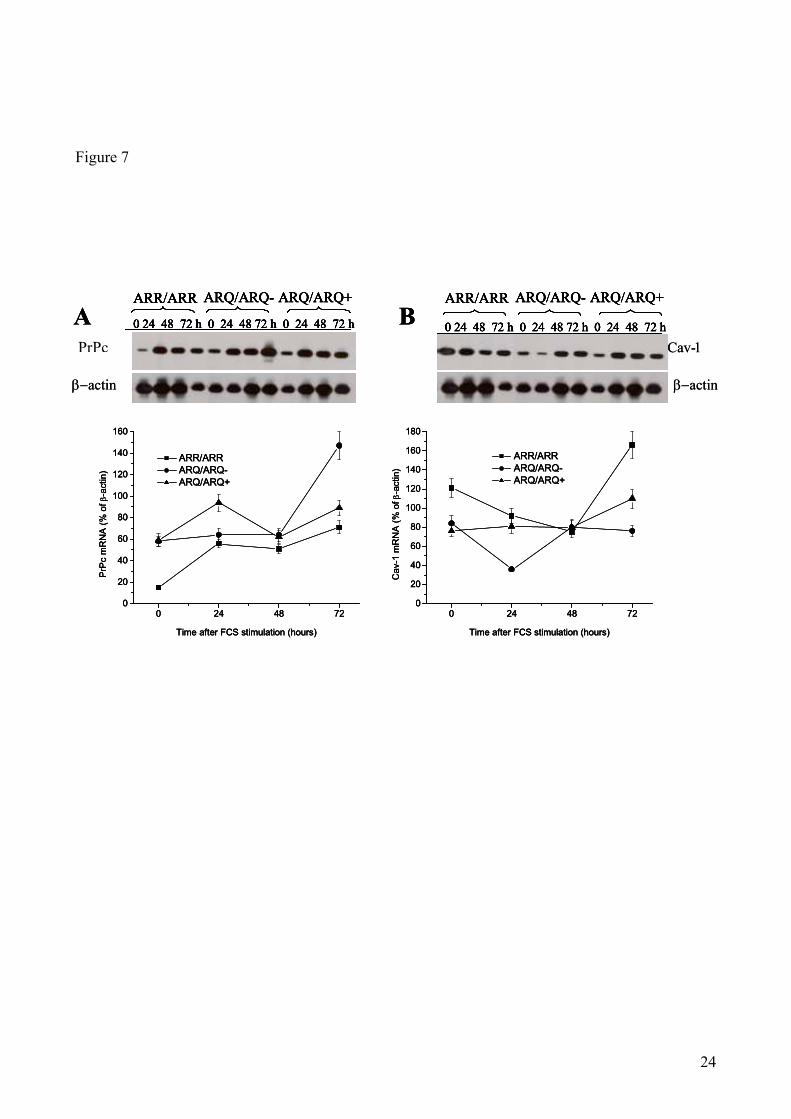
PrPc and Cav-1 mRNA levels in quiescent and replicating sheep skin fibroblasts: Finally, we
investigated whether PrPc and Cav-1 mRNA levels comparable to those found in sheep brains could
also be found in quiescent and proliferating fibroblasts from scrapie-susceptible and resistant sheep.
As a matter of fact, consistently with the results obtained in sheep brains, ARR/ARR fibroblasts
contained significantly lower basal (time 0) levels of PrPc mRNA, and higher basal levels of Cav-1
mRNA, as compared to ARQ/ARQ cells.
This trend was significant also 72 hrs after growth stimulation, whereas the differences in both
mRNA levels between scrapie-resistant and -susceptible sheep were less prominent or disappeared
at 24 and 48 hrs. In conclusion, consistently with the results obtained in sheep brains, higher levels
of PrPc mRNA, and lower levels of Cav-1 mRNA, were detected in scrapie-susceptible, as
compared to scrapie-resistant animals.
Discussion
PrPSc is known to represent the transmissible infectious agent in sheep scrapie, through its ability
to promote the structural conversion of the normal cellular prion protein PrPc, into a likeness of
itself. Although the existence of a genetic susceptibility for scrapie infection is well known28,32,
, it
is reasonable to hypothesize that particular metabolic states in target cells could modulate the
degree of susceptibility to prion infection and/or progression to overt disease. In this context, our
study on the role of alterations of intracellular cholesterol homeostasis on the pathogenesis of
scrapie in sheep, has revealed a positive correlation between an abnormal accumulation of
cholesterol esters and the genetic susceptibility to infection.
Of particular relevance, in our view, is the fact that these alterations are found not only in the brain
tissue but also in cultured skin fibroblasts from scrapie-susceptible sheep (ARQ/ARQ genotype). As
compared to brain tissue, we believe that this in vitro cell system may be amenable to the
development of “in vitam” diagnostic laboratory tests. Furthermore skin fibroblasts may help to
circumvent possible analytical artefacts due to post-mortem alterations in brain tissue. The
molecular mechanisms that cause the increased susceptibility to scrapie in sheep with the
ARQ/ARQ genotype are not entirely clear. On the basis of what is known on the familial forms of
prion diseases in humans, where mutations in the PRNP gene enhance the rate of spontaneous
conversion of PrPc to PrPsc, it is thought that the various polymorphic alleles of PrP may carry
inherently different tendency to acquire PrPsc conformation. Alternatively, however, these
12
polymorphisms could confer increased susceptibility to infection by PrPsc. Our finding that
expression of PrP mRNA is increased in sheep with susceptible genotype, may suggest an
alternative or complementary mechanism to genetic susceptibility. Indeed, as it has been. proposed
to explain prion disease development in PrPc over-expressing mice (37
) increased expression of
PrPc could lead to increased production of its altered form (PrPsc).
Recent evidence indicates that the metabolic fate of PrPc is dependent on its location at the plasma
membrane, which in turn is mediated by cholesterol levels in the rafts(11,12)
, suggesting that the rate
of PrPc to PrPsc conversion may be, at least partly, dependent on cholesterol homeostatic regulatory
mechanisms. In fact, rafts are essential for the proper folding of nascent PrPc protein and
cholesterol depletion in membranes promotes the conversion of PrPc to PrPsc(38)
. On the other hand,
replication of misfolded PrPc protein has been shown to interfere with raft composition, by
displacing raft proteins such as Cav-1, leading, among other things, to alterations of intracellular
cholesterol trafficking and intracellular cholesterol accumulation(23)
. We found that cholesterol ester
levels were systematically higher in brain tissue and skin fibroblasts of scrapie-susceptible sheep
(ARQ/ARQ genotype), as compared to those of the scrapie-resistant sheep (ARR/ARR genotype).
Accumulation of cholesterol esters was observed in cells from sheep with ARQ/ARQ genotype,
whether or not they were infected with scrapie, and was sustained by parallel alterations in the
expression level of genes and gene products involved in the pathways leading to intracellular
cholesterol trafficking and esterification. These data lead to suggest that genetic PrP polymorphisms
and alterations of cholesterol homeostasis may act in concert to create an environment favorable to
initiation and progression of prion disease.
Further studies are necessary to elucidate the mechanisms responsible for the alterations of
cholesterol homeostasis in sheep genetically susceptible to scrapie and to unveil possible cause-
effect relationships between PrP polymorphisms and these alterations. Similarly, additional work is
needed to reveal the potential implication of this association for prion disease susceptibility.
Nonetheless, the data reported in the present paper suggest that accumulation of cholesterol esters in
peripheral cells, together with the altered expression of some proteins implicated in intracellular
cholesterol homeostasis, might serve to identify a distinctive lipid metabolic profile associated with
increased susceptibility to the prion diseases.
Acknowledgements
The Authors thanks Dr. Ciriaco Ligios of Experimental Zooprophylactic Institute of Sassari (Italy)
for kindly providing tissue samples from Sarda breed sheep with ARR/ARR and ARQ/ARQ
genotypes.
13
References
1. Thackray, A.M.., L., Hopkins, and R. Buydoso, 2007. Proteinase K-sensitive disease-
associated ovine prion protein revealed by conformation-dependent immunoassay. Biochem.
J., 15: 475-483
2. Rymer, D.L. and T.A., Good, 2000. The role of prion peptide structure and aggregation in
toxicity and membrane binding. J. Neurochem., 75: 2536-2545.
3. Satoh, J. and Y. Takashi, 2005. Gene expression profile following stable expression of the
cellular prion protein. Cell. Mol. Neurob., 24: 793-814.
4. Sorgato, M.C., and A. Bertoli, 2006. Physiopathologic implications of the structural and
functional domains of the prion protein. It. J. Biochem., 55: 222-231.
5. Milhavet O., and S.Lehmann, 2001. Oxidative stress and the prion protein in transmissible
spongiform encephalopathies. Brain Res. Rev., 38: 328-339.
6. Loberto N., S., Prioni, A., Bettiga, V., Chigorno, A., Prinetti and S. Sonnino, 2005. The
membrane environment of endogenous cellular prion protein in primary rat cerebellar
neurons. J. Neurochem., 95: 771-783.
7. Kurzchalia, T.V. and R.G. Parton , 1999. Membrane microdomains and caveolae. Curr. Op.
Cell Biol., 11: 424-431.
8. Simons, K. and R. Ehehalt, 2002. Cholesterol, lipid raft and disease. J. Clin. Invest., 110,
597-603.
9. Diomede, L.. G., Forloni, O., Bugiani, F., Tagliavini, and M. Salmona,(2002. The prion protein
and cellular cholesterol homeostasis. Neurobio. Lipids 1: 8-14.
10. Luker, G.D., C.M., Pica, A.S., Kumar,, D.F., Covey, and D., Piwnica-Worms, 2000.Effects
of cholesterol and enantiomeric cholesterol on P-glycoprotein localization and function in
low-density membrane domains. Biochemistry; 39:7651 –7661.
11. Prado A.M., J.A., Silva, Ana C., Magalhaes, V.F., Prado, R., Linden, V.R., Martins, and
R.R. Brentani, 2004. PrPc on the road: trafficking of the cellular prion protein. J. Neuchem.,
88: 769-781.
12. Critchley, P., J., Kazlauskaite, R., Eason, and T.J. Pinheiro, 2004. Binding of prion protein
to lipid membranes. Biochem Biophys Res Commun., 313 :559-567.
14
13. Schmitz, G., and E. Orso, 2001. Intracellular Cholesterol and Phospholipid Trafficking:
Comparable Mechanisms in Macrophages and Neuronal Cells. Cell Mol. Life Sci., 26:1045-
1068
14. Maxfield, F.R., and I. Tabas, 2005. Role of cholesterol and lipid organization in disease.
Nature 438: 612-621
15. Simons, K., and E. Ikonen, 2000. How cell handle cholesterol. Science, 290: 1721-1726.
16. Feramisco, J.D, A., Radhakrishnamm, Y., Ikeda, J., Reitz, M.S. Brown, and J.L.,
Goldstein, 2005. Intramembrane aspartic acid in SCAP protein governs cholesterol induced
conformational change. Proc Natl Acad Sci USA, 102: 3242-3247.
17. Brown, M.S. and J.L. Goldstein, 1997. The SREBP pathway: regulation of cholesterol
metabolism by proteolysis of a membrane-bound transcription factor. Cell, 89:331-340.
18. Nohturfft A., R.A., Debose-Boyd, S., Scheek, J.L. Goldstein, and M.S. Brown, 1999. Sterol
regulate cycling of SREBP cleavage-activating protein (SCAP) between endoplasmic
reticulum and Golgi. Proc. Natl. Acad. Sci. USA, 96:11235-11240.
19. Binder, W.H., V., Barragan, and F.M. Menger. Domains and raft in lipid membrane.
Angewandte chemie-international edition, 42: 5802-5827.
20. Shimada A., T., Tamai, K., Oida, S., Takahashi, J., Suzuki, T., Nakai, and S., Miyabo,
1994. Increase in neutral cholesterol ester hydrolase activity produced by extralysosomal
hydrolysis of high-density lipoprotein cholesteryl esters in rat hepatoma cells (H-35).
Biochim Biophys. Acta , 1215: 126-132.
21. Oram, J.F., and A. M. Vaughan, 2000. ABCA1-mediated transport of cellular cholesterol
and phospholipids to HDL apolipoproteins. Curr. Opin. Lipid, 11:253-260.
22. Harris, D.A., 2003. Trafficking, turnover and membrane topology of PrP. Brit. Med. Bull.
66: 71-85.
23. Russelakis-Carneiro, M., C., Hetz, K., Maundrell, and C. Soto, 2004. Prion replication
alters the distribution of synaptophysin and caveolin 1 in neuronal lipid rafts. Am. J.
Pathol.165:1839-1848.
24. Sarnataro, D., V.,Campana, S.M., Paladino, M., Stornaiuolo, L., Nitsch, and C. Zurzolo.,
2004. PrPC Association with Lipid Rafts in the Early Secretory Pathway Stabilizes Its
cellular conformation. Mol Biol Cell. 15: 4031–4042.
25. Campana,V., D., Sarnataro, C., Fasano, P.,Casanova, S.,Paladino, and C., Zurzolo, 2006.
Detergent-resistant membrane domains but not the proteasome are involved in the
misfolding of a PrP mutant retained in the endoplasmic reticulum. J. Cell Sci., 119: 433-
442.
15
26. Collinge, J., 2001. Prion diseases of humans and animals: their causes and molecular basis.
Ann Rev Neurosci., 24: 519-550.
27. Edskes, H.K., and R.B., Wickner, 2004. Transmissible spongiform encephalopathies: prion
proof in progress. Nature., 430: 977-979.
28. Soto, C., and J. Castilla, 2004. The controversial protein-only hypothesis of prion
propagation. Nat. Med. 10: S63-67.
29. Wickner, R.B., H.K., Edskes, B.T., Roberts, U., Baxa, M.M., Pierce, E.D., Ross and A.
Brachmann, 2004. Prions: proteins as genes and infectious entities. Genes Dev. 18: 470-485.
30. Goldmann, W., M., Baylis, C., Chihota, E., Stevenson, and N., Hunter, 2005. Frequencies
of PrP gene haplotypes in British sheep flocks and the implications for breeding
programmes. J. Appl. Microbiol., 98: 1294-1302.
31. Folch, J., M., Lees, and G.H.S. Stanley, 1957. A simple method for the isolation and
purification of total lipids from animal tissues. J. Biol. Chem., 226: 497-509.
32. Bowman, R.E. and R.C. Wolf, 1962. A rapid and specific ultramicro method for total serum
cholesterol. Clin Chem. 8:302–309.
33. Lowry, O.H., N.J., Rosebrough, A.L., Farr, and R.J. Randall, 1951. Protein measurement
with the Folin phenol reagent. J Biol Chem 193: 265-275,
34. Gasparini L., M., Racchi, G., Binetti, M., Trabucchi, S.B., Solerte, D., Alkon, R.,
Etcheberrigaray, G., Gibson, J., Blass, R., Paoletti, and S. Govoni, 1998. Peripheral markers
in testing pathophysiological hypotheses and diagnosing Alzheimer's disease. Faseb J.,
12:17-34
35. Dessì, S., P. La Colla, A. Pani, 2007. Methods for the diagnosis of proliferative and/or
conformational diseases. PCT/IT2007/000110.
36. Anchisi, C., S. Dessì, P. La Colla, A. Pani, 2007. Prophylactic and/or therapeutic treatment
of proliferative and conformational diseases. PCT/IT2007/000109.
37. Hunter, N., Cairns D, Foster JD, Smith G, Goldmann W, Donnelly K, 1997. Is scrapie solely
a genetic disease? Nature 386:137.
38. Abid K., and C. Soto, 2006. The intriguing prion disorders. Cell. Mol. Life Sci., 63:2342-
2351
16
Legend to Figures
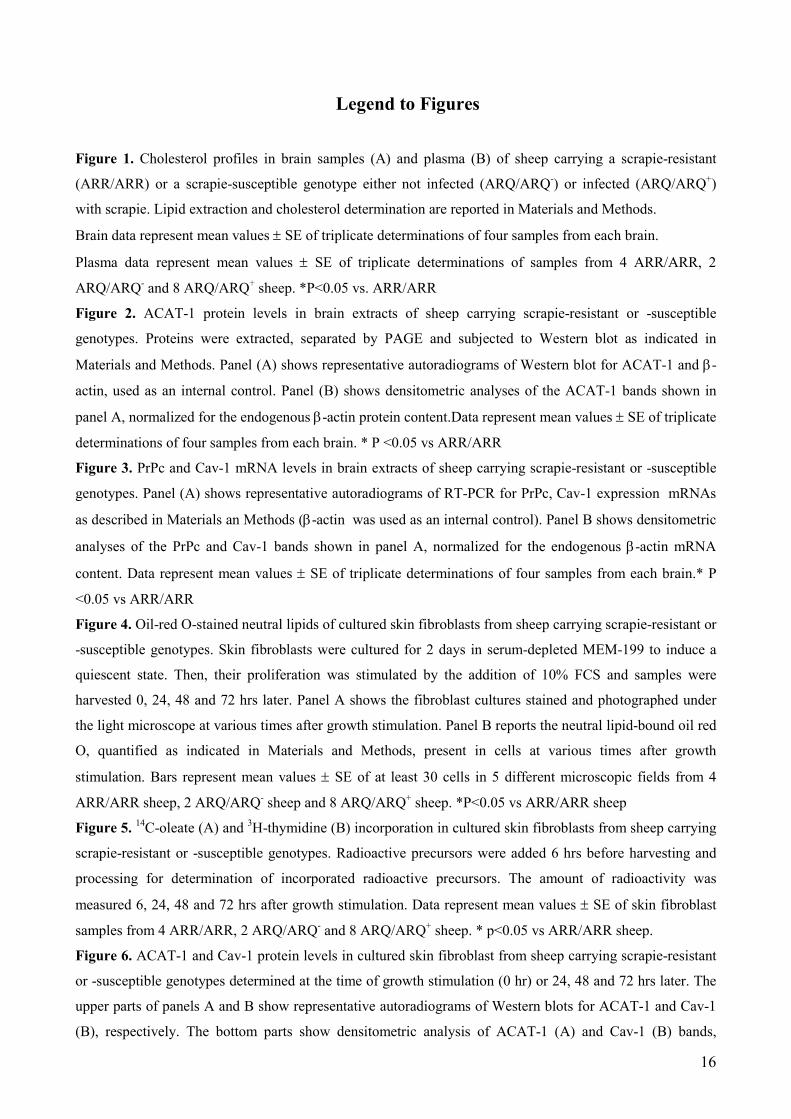
Figure 1. Cholesterol profiles in brain samples (A) and plasma (B) of sheep carrying a scrapie-resistant
(ARR/ARR) or a scrapie-susceptible genotype either not infected (ARQ/ARQ-) or infected (ARQ/ARQ
+)
with scrapie. Lipid extraction and cholesterol determination are reported in Materials and Methods.
Brain data represent mean values ± SE of triplicate determinations of four samples from each brain.
Plasma data represent mean values ± SE of triplicate determinations of samples from 4 ARR/ARR, 2
ARQ/ARQ- and 8 ARQ/ARQ
+ sheep. *P<0.05 vs. ARR/ARR
Figure 2. ACAT-1 protein levels in brain extracts of sheep carrying scrapie-resistant or -susceptible
genotypes. Proteins were extracted, separated by PAGE and subjected to Western blot as indicated in
Materials and Methods. Panel (A) shows representative autoradiograms of Western blot for ACAT-1 and β-
actin, used as an internal control. Panel (B) shows densitometric analyses of the ACAT-1 bands shown in
panel A, normalized for the endogenous β-actin protein content.Data represent mean values ± SE of triplicate
determinations of four samples from each brain. * P <0.05 vs ARR/ARR
Figure 3. PrPc and Cav-1 mRNA levels in brain extracts of sheep carrying scrapie-resistant or -susceptible
genotypes. Panel (A) shows representative autoradiograms of RT-PCR for PrPc, Cav-1 expression mRNAs
as described in Materials an Methods (β-actin was used as an internal control). Panel B shows densitometric
analyses of the PrPc and Cav-1 bands shown in panel A, normalized for the endogenous β-actin mRNA
content. Data represent mean values ± SE of triplicate determinations of four samples from each brain.* P
<0.05 vs ARR/ARR
Figure 4. Oil-red O-stained neutral lipids of cultured skin fibroblasts from sheep carrying scrapie-resistant or
-susceptible genotypes. Skin fibroblasts were cultured for 2 days in serum-depleted MEM-199 to induce a
quiescent state. Then, their proliferation was stimulated by the addition of 10% FCS and samples were
harvested 0, 24, 48 and 72 hrs later. Panel A shows the fibroblast cultures stained and photographed under
the light microscope at various times after growth stimulation. Panel B reports the neutral lipid-bound oil red
O, quantified as indicated in Materials and Methods, present in cells at various times after growth
stimulation. Bars represent mean values ± SE of at least 30 cells in 5 different microscopic fields from 4
ARR/ARR sheep, 2 ARQ/ARQ- sheep and 8 ARQ/ARQ
+ sheep. *P<0.05 vs ARR/ARR sheep
Figure 5. 14
C-oleate (A) and 3H-thymidine (B) incorporation in cultured skin fibroblasts from sheep carrying
scrapie-resistant or -susceptible genotypes. Radioactive precursors were added 6 hrs before harvesting and
processing for determination of incorporated radioactive precursors. The amount of radioactivity was
measured 6, 24, 48 and 72 hrs after growth stimulation. Data represent mean values ± SE of skin fibroblast
samples from 4 ARR/ARR, 2 ARQ/ARQ- and 8 ARQ/ARQ
+ sheep. * p<0.05 vs ARR/ARR sheep.
Figure 6. ACAT-1 and Cav-1 protein levels in cultured skin fibroblast from sheep carrying scrapie-resistant
or -susceptible genotypes determined at the time of growth stimulation (0 hr) or 24, 48 and 72 hrs later. The
upper parts of panels A and B show representative autoradiograms of Western blots for ACAT-1 and Cav-1
(B), respectively. The bottom parts show densitometric analysis of ACAT-1 (A) and Cav-1 (B) bands,
17
normalized for the endogenous β-actin protein content. Bars indicate mean values ± SE of skin fibroblast
samples from 4 ARR/ARR, 4 ARQ/ARQ- and 6 ARQ/ARQ+ sheep. * (p<0.05) vs ARR/ARR sheep.
Figure 7. PrPc and Cav-1 mRNA levels in cultured skin fibroblast from sheep carrying scrapie-resistant or -
susceptible genotypes determined at the time of growth stimulation (0 hr) or 24, 48 and 72 hrs later. The
upper parts of panels A and B shows representative autoradiograms of RT-PCR analysis for PrPc and Cav-1,
respectively. The bottom parts shows densitometric analysis of autoradiographic bands for PrPc (A) and
Cav-1 (B) mRNA, normalized for the β-actin mRNA contents. Bars indicate mean values ± SE of skin
fibroblast samples from 4 ARR/ARR, 2 ARQ/ARQ- and 8 ARQ/ARQ+ sheep. * p<0.05 vs ARR/ARR
sheep.
18
Figure 1
1 2 3
0
2
4
6
*
*
**
***B
rain
lip
id p
rofile
TC (mg/g)
FC (mg/g)
CE (mg/g)
CE:TC (ratio)
ARR/ARR ARQ/ARQ- ARQ/ARQ+
A
*
1 2 3
0
20
40
60
80
**
*
Pla
sm
a lip
id p
rofile
TC (mg/dl)
HDL-C (mg/dl)
HDL-C /TC (%)
ARR/ARR ARQ/ARQ- ARQ/ARQ+
B
*
19
Figure 2
AR
R/A
RR
AR
Q/A
RQ
-A
RQ
/AR
Q+
ACAT-1
ββββ−−−−actin
A
B
1 2 3
0
30
60
90
120
150
180
*
AC
AT
-1 e
xp
ressio
n/β−a
ctin (
%)
ARQ/ARQ+ARQ/ARQ-ARR/ARR
*
AR
R/A
RR
AR
Q/A
RQ
-A
RQ
/AR
Q+
ACAT-1
ββββ−−−−actin
A
AR
R/A
RR
AR
Q/A
RQ
-A
RQ
/AR
Q+
ACAT-1
ββββ−−−−actin
A
B
1 2 3
0
30
60
90
120
150
180
*
AC
AT
-1 e
xp
ressio
n/β−a
ctin (
%)
ARQ/ARQ+ARQ/ARQ-ARR/ARR
*
20
Figure 3
1 2 3
0
50
100
150
200
250
*
**
mR
NA
of
traget
gene/β
-actin (
%)
PrPc
Cav-1
ARQ/ARQ+ARQ/ARQ-ARR/ARR
*
AR
R/A
RR
AR
Q/A
RQ
-
AR
Q/A
RQ
+
Cav-1
β−actin
PrPc
1 2 3
0
50
100
150
200
250
*
**
mR
NA
of
traget
gene/β
-actin (
%)
PrPc
Cav-1
ARQ/ARQ+ARQ/ARQ-ARR/ARR
*
AR
R/A
RR
AR
Q/A
RQ
-
AR
Q/A
RQ
+
Cav-1
β−actin
PrPc
21
Figure 4
0h
48h
72h
24h
ARR/ARR ARQ/ARQ- ARQ/ARQ+
A
0 24 48 720
2
4
6
8
*
*
***
Neutr
al lip
id in
skin
fib
robla
sts
by O
RO
me
tho
d
(mea
n r
ed
inte
nsity/c
ell)
hours after FCS stimulation
ARR/ARR
ARQ/ARQ-
ARQ/ARQ+
*
B
22
Figure 5
0 24 48 720
5000
10000
15000
20000
****
**
**
14C
-ole
ate
in
co
rpo
ratio
n (
cp
m/1
04 c
ells
)
hours after stimulation
ARQ/ARQ+
ARQ/ARQ-
ARR/ARR-
B
*
0 24 48 72
0
1000
2000
3000
4000
*
**
*
*
3H
-thym
idin
e incorp
ora
tion(c
pm
/10
4 c
ells
)
hours after stimulation
ARQ/ARQ+
ARQ/ARQ-
ARR/ARR-
A
*
A
B
23
Figure 6
0 24 48 72
40
60
80
100
AC
AT
-1 e
xpre
ssio
n (
% o
f β-a
ctin)
Time after FCS stimulation (hours)
ARR/ARR
ARQ/ARQ-
ARQ/ARQ+
0 24 48 720
20
40
60
80
100
120
140
160C
av-1
expre
ssio
n (
% o
f β-a
ctin)
Time after FCS stimulation (hours)
ARR/ARR
ARQ/ARQ-
ARQ/ARQ+
ACAT-1
β−actin
Cav-1
β−actin
0 24 48 72 h 0 24 48 72 h 0 24 48 72 h
ARR/ARR ARQ/ARQ- ARQ/ARQ+ ARQ/ARQ- ARQ/ARQ+
0 24 48 72 h 0 24 48 72 h 0 24 48 72 h
ARR/ARRA B
∗
∗
∗
∗
∗
∗
24
Figure 7
0 24 48 720
20
40
60
80
100
120
140
160
PrP
c m
RN
A (
% o
f β-a
ctin)
Time after FCS stimulation (hours)
ARR/ARR
ARQ/ARQ-
ARQ/ARQ+
0 24 48 720
20
40
60
80
100
120
140
160
180
Cav-1
mR
NA
(%
of β-a
ctin)
Time after FCS stimulation (hours)
ARR/ARR
ARQ/ARQ-
ARQ/ARQ+
0 24 48 72 h 0 24 48 72 h 0 24 48 72 h
ARR/ARR ARQ/ARQ- ARQ/ARQ+
0 24 48 72 h 0 24 48 72 h 0 24 48 72 h
ARR/ARR ARQ/ARQ- ARQ/ARQ+
A BACAT-1
β−actin β−actin
Cav-1
0 24 48 720
20
40
60
80
100
120
140
160
PrP
c m
RN
A (
% o
f β-a
ctin)
Time after FCS stimulation (hours)
ARR/ARR
ARQ/ARQ-
ARQ/ARQ+
0 24 48 720
20
40
60
80
100
120
140
160
180
Cav-1
mR
NA
(%
of β-a
ctin)
Time after FCS stimulation (hours)
ARR/ARR
ARQ/ARQ-
ARQ/ARQ+
0 24 48 72 h 0 24 48 72 h 0 24 48 72 h
ARR/ARR ARQ/ARQ- ARQ/ARQ+
0 24 48 72 h 0 24 48 72 h 0 24 48 72 h
ARR/ARR ARQ/ARQ- ARQ/ARQ+
A B
0 24 48 720
20
40
60
80
100
120
140
160
PrP
c m
RN
A (
% o
f β-a
ctin)
Time after FCS stimulation (hours)
ARR/ARR
ARQ/ARQ-
ARQ/ARQ+
0 24 48 720
20
40
60
80
100
120
140
160
180
Cav-1
mR
NA
(%
of β-a
ctin)
Time after FCS stimulation (hours)
ARR/ARR
ARQ/ARQ-
ARQ/ARQ+
0 24 48 72 h 0 24 48 72 h 0 24 48 72 h
ARR/ARR ARQ/ARQ- ARQ/ARQ+
0 24 48 72 h 0 24 48 72 h 0 24 48 72 h
ARR/ARR ARQ/ARQ- ARQ/ARQ+
0 24 48 72 h 0 24 48 72 h 0 24 48 72 h
ARR/ARR ARQ/ARQ- ARQ/ARQ+
0 24 48 72 h 0 24 48 72 h 0 24 48 72 h
ARR/ARR ARQ/ARQ- ARQ/ARQ+
0 24 48 72 h 0 24 48 72 h 0 24 48 72 h
ARR/ARR ARQ/ARQ- ARQ/ARQ+
0 24 48 72 h 0 24 48 72 h 0 24 48 72 h
ARR/ARR ARQ/ARQ- ARQ/ARQ+
A BACAT-1
β−actin β−actin
Cav-1PrPc