China and Mexico in the Global Motor Industry - CORE
453
CHINA AND MEXICO IN THE GLOBAL MOTOR INDUSTRY: COMPETITION OR COMPLEMENTARITY? Pablo Wong-González A thesis submitted to the School of International Development, University of East Anglia, in partial fulfilment of the requirement for the degree of Doctor of Philosophy. April 2012
-
Upload
khangminh22 -
Category
Documents
-
view
2 -
download
0
Transcript of China and Mexico in the Global Motor Industry - CORE

CHINA AND MEXICO IN THE GLOBAL MOTOR INDUSTRY:
COMPETITION OR COMPLEMENTARITY?
Pablo Wong-González
A thesis submitted to the School of International Development, University of East
Anglia, in partial fulfilment of the requirement for the degree of Doctor of
Philosophy.
April 2012

ii
ACKNOWLEDGEMENTS
First of all, I would like to thank the Centro de Investigación en Alimentación y
Desarrollo, A.C. (CIAD), in its support of my research project at the University of
East Anglia in the United Kingdom. Also, to the Consejo Nacional de Ciencia y
Tecnología (CONACYT), for its sponsorship in the first stage of my postgraduate
studies in this country.
I would like to express my great gratitude to my supervisors, Professor Rhys O.
Jenkins and Dr. John T. Thoburn, for their enlightened comments, guidance,
critical observations, patience and support in finishing my thesis. Besides being an
invaluable source of knowledge, I appreciate their heart-warming manner.
I am also grateful to PROMEXICO, the Mexican Federal governmental agency
responsible for the promotion of trade and investment, for its institutional support
during my fieldwork, in particular in establishing the formal contacts with the
companies and executives selected for the interviews in Mexico, China and the
United States.
My gratitude to Professor Nigel Harris for having motivated me to embark on
doing research in my thesis topic. I appreciate his company during this long and
winding process of finishing my PhD, and for becoming a friend besides being a
source of intellectual inspiration. I would also like to thank Alfonso Mercado for
his pertinent comments, encouragement and friendship.
I am grateful to my friends and colleagues at UEA, Patricia, Perla Aurora,
Fabiola, Cath, Gabriel, Odra, Juancho, Alejandra, Belina, Josías, Arlette, Baruch,
Horacio, Citlalli, Rafael, Lucio, Patrick and Denis, for their friendship, support
and companionship during all this time in Norwich. Likewise, my great gratitude
to Bertha and Salvador for their worthwhile support, this being a fundamental
factor in accomplishing my goals in the U.K. To the “Undergrounds”, Karla,
Gabriel, Cristóbal and Francisco, thank you for having allowed me to share
moments of music. To those I could not mention, my deserved acknowledgment.

iii
I specially dedicate this thesis to my family, Patricia, Paulina and
Pablo Nigel, for moments lost.

iv
ABSTRACT
The emergence of China as a global economic player is one of the most
extraordinary events in world development over the last three decades. The
increasing Chinese presence in world markets has severely intensified the levels
and dimensions of competition, posing serious competitive threats in both
developing and developed countries. The thesis analyses the interactions and
impacts of China’s global expansion on Mexico’s motor industry, a capital
intensive sector with high-technology segments. In both China and Mexico this
industry is a key sector, considered high priority for these countries’ economic
and social development. Despite this, detailed and comprehensive studies of
China’s impacts on Mexico’s motor industry and their interactions were marginal
or non-existent.
Therefore, this study focused on competition in Mexico’s domestic market,
attraction of Foreign Direct Investment, competition in the U.S. market, as well as
investment and production networks within Mexico, and the role of both China
and Mexico in the motor industry’s global division of labour. A taxonomy of
impacts and channels of interaction in the bilateral relationship was applied.
Furthermore, this thesis proposes an alternative methodology for assessing the
‘competitive threat’ of China on the different product segments of Mexico’s motor
industry, in a more systematic and qualitative way.
The research findings showed that the interactions between Mexico and China in
the motor industry’s global competitive arena are much more complex than the
simple idea of “competitive threat” or “national competition”. It also involves
complementary forces, and a variety of functional interconnections through firms’
global production networks. Results also demonstrate the differentiated impacts
among the diverse product/segments of the industry. In addition, unlike other
domestic manufacturing sectors, Mexico’s motor industry has strengths,
especially in the export segment, that allow it to maintain its competitive position
in bilateral trade with China. Despite China’s increasing competitive power in the
global market, Mexico’s case shows that complementary factors with China could
be enhanced to find a win-win situation.

v
TABLE OF CONTENTS ACKNOWLEGEMENTS ii
ABSTRACT iv ABBREVIATIONS xiv
1. CHAPTER ONE 1 INTRODUCTION 1 1.1. China’s (Re) Emergence in the Global Economy 3
1.2. China as ‘Asian Driver of Global Change’ 9
1.3. The Competitiveness Obsession of Nations 11
1.4. The ‘China Syndrome’: Mexico’s Obsession 16
1.5. China’s Global Emergence and Mexico’s Motor Industry 22
1.6. Research Aims and Objectives 26
1.7. Outline of the Thesis 29
2. CHAPTER TWO 30 THEORETICAL/CONCEPTUAL FRAMEWORK 30 2.1. Globalisation, Competition and Trade 31
2.1.1. Competition and Firms 33 2.1.2. Competition and Nations 36
2.2. The Global Division of Labour 42
2.3. Global Production Networks and Global Value Chains 53
2.4. Conclusions 59
3. CHAPTER THREE 63 THE RESEARCH METHODOLOGY 63 3.1. Research Design 64
3.2. Research Sites: The Fieldwork 69
3.3. Research Methods: Data Collection and Sources 71
3.4. Data Reduction and Analysis Methods 76
3.5. Conclusions 97
4. CHAPTER FOUR 98 CHINA AND MEXICO IN THE GLOBAL MOTOR INDUSTRY 98 4.1. The Changing Motor Industry’s Global Division of Labour 101
4.2. China and Mexico in the Motor Industry’s Global
Development Ladder
107
4.3. Structure and Evolution of China’s Motor Industry 109
4.4. Structure and Evolution of Mexico’s Motor Industry 125
4.5. Conclusions 139

vi
5. CHAPTER FIVE 141 THE CHINA-MEXICO AUTO INTERACTION 1: INTERNATIONAL MARKET INTEGRATION AND GLOBAL INVESTMENT ATTRACTION
141 5.1. Evolution of Motor FDI in China and Mexico 146
5.1.1. China’s Motor FDI 146 5.1.2. Mexico’s Motor FDI 149 5.1.3. China’s and Mexico’s Comparative Evolution in Motor FDI 158
5.2. China and Mexico in the Global Capital Market: The Vision
of Automotive Actors
160
5.3. Auto Parts, Maquiladora Industry and China’s Competition 164
5.4. “Near-shoring” vs “Off-shoring”: Recent Trends in a Global
Competitive Market
171
5.5. Conclusions 174
6. CHAPTER SIX 179 THE CHINA-MEXICO INTERACTION 2: BILATERAL TRADE AND DOMESTIC MARKET COMPETITION
179
6.1. RCA and Specialisation of China and Mexico in World Motor
Trade
182
6.2. China-Mexico Total Bilateral Trade 187
6.3. China-Mexico Bilateral Motor Trade 191
6.3.1. Significance and Evolution of Bilateral Motor Trade 191 6.3.2. Structure and Composition of Bilateral Motor Trade 199
6.4. Trade Frictions: Counterfeiting, Dumping and Illegal
Imports
210
6.5. Conclusions 212
7. CHAPTER SEVEN 220 THE CHINA-MEXICO INTERACTION 3: COMPETITION IN THE U.S. MARKET
220
7.1. China and Mexico in U.S. Total Imports 226
7.2. Evolution and Composition of China’s and Mexico’s
Participation in U.S. Motor Imports
228
7.3. China’s Competitive Threat to Mexico in U.S. Motor Imports 238 7.4. Technological Complexity of China’s and Mexico’s Imports to
the U.S. Market
244
7.5. Conclusions 256
8. CHAPTER EIGHT 263 THE CHINA-MEXICO INTERACTION 4: CHINESE OPERATIONS IN MEXICO AND GLOBAL PRODUCTION NETWORKS
263
8.1. Modalities of Chinese Auto-Related Operations in Mexico 266
8.1.1. Joint Ventures 267 8.1.2. Wholly-Owned Manufacturing Operations 275

vii
8.1.3. Merger & Acquisitions 278 8.1.4. Licensing and Technological Associations 282 8.1.5. Marketing/Distribution Agreements/Representatives 286
8.2. Drivers and Motivations of Chinese Investment in Mexico 289
8.3. Problems and Limitations 296
8.4. Conclusions 303
9. CHAPTER NINE 309 CONCLUSIONS, FINDINGS AND IMPLICATIONS 309 9.1. Empirical Findings 314
9.2. Theoretical Implications and Paradoxes 332
9.3. Policy Implications 340
9.4. Recommendations for Further Research 344
9.5. Final Remarks 346
APPENDICES 347 REFERENCES 397

viii
LIST OF TABLES Table 1.1. Public Opinion about China’s Global Emergence and Impacts on Mexico
19
Table 3.1. Selected Methodologies for Classifying the Technological Intensity of Products/Exports with Special Reference to the Motor Industry
81
Table 3.2. Motor Industry “Cluster” by Technological Complexity Level in The Motor Value-Chain
85
Table 4.1. The Motor Industry in China and Mexico: A General Comparative View
100
Table 4.2. Geographical Distribution of Worldwide Motor Vehicle Production, 1950-2011 (Units)
102
Table 4.3. Geographical Distribution of Worldwide Motor Vehicle Production by Country Group, 1950-2011 (%)
104
Table 4.4. Major Changes in China’s Motor Industry Under the WTO Agreement
115
Table 4.5. Production, Sales and Exports in China’s Motor Industry, 1980- 2011 (Units)
122
Table 4.6. Top Brand Sales and Manufacturers in China’s Domestic Market, 2011
123
Table 4.7. Mexico’s Network of Free Trade Agreements (2012)
132
Table 4.8. Major Automakers and Plants in Mexico’s Passenger Vehicle Segment (2012)
134
Table 4.9. Major Automakers in Mexico’s Commercial Vehicle Segment (2012)
135
Table 4.10. Production, Sales and Exports in Mexico’s Motor Industry, 1980-2011 (Units)
137
Table 4.11. Production, Sales and Exports of Light-Vehicles by Automaker in Mexico’s Motor Industry, 2011 (Units)
138
Table 5.1. FDI in China’s Motor Industry (million dollars)
148
Table 5.2. FDI in Mexico’s Motor Industry (million dollars)
150

ix
Table 5.3. Major Automakers’ FDI Projects in Mexico’s Motor Industry, 2009-2011
152
Table 5.4. Major Auto Parts’ FDI Projects in Mexico’s Motor Industry, 2010-2011
156
Table 5.5. Employment by Sector in Mexico's Maquiladora Industry, 1990-2006 (Annual Average)
168
Table 5.6. Number of Plants by Sector in Mexico's Maquiladora Industry, 1990-2006 (Annual Average)
169
Table 5.7. Employment and Plants by Sector in Mexico's Maquiladora Industry, 1990-2006 (2000 = 100)
170
Table 6.1. Total World Motor Exports. Major Exporting Countries, 1992- 2010 (Million Dollars)
183
Table 6.2. World Motor-Vehicle Exports. Major Exporting Countries, 1992-2010 (Million Dollars)
185
Table 6.3. World Auto Parts Exports. Major Exporting Countries, 1992- 2010 (Million Dollars)
185
Table 6.4. China’s and Mexico’s Motor RCA Index in World Trade, 1992, 2001 and 2010
186
Table 6.5. Mexico’s Major Trade Partners, 1990-2011 (Million Dollars)
188
Table 6.6. China-Mexico Total Bilateral Trade, 1992-2010 (Million Dollars)
189
Table 6.7. China-Mexico Motor Trade in Total Bilateral Trade, 1992-2010 (Million Dollars) (China as Reporter Country)
192
Table 6.8. China-Mexico Motor Trade in Total Bilateral Trade, 1992-2010 (Million Dollars) (Mexico as Reporter Country)
193
Table 6.9. Major Export and Import Products in Trade with China, 2010 (Mexico as Reporter Country)
194
Table 6.10. China-Mexico Motor Trade Balance, 1992-2010 (Million Dollars)
195

x
Table 6.11. Ratio of Imports to Exports in Mexico’s Total Bilateral Trade and Bilateral Motor Trade with China (Mexico as Reporter Country)
197
Table 6.12. Mexico’s Major Motor Export and Imports Products in Trade with China, 2010 (Mexico as Reporter Country
200
Table 6.13. Mexico’s Motor Exports to China by Category of Technological Complexity in the Value Chain, 1992-2010 (Mexico as Reporter Country)
203
Table 6.14. Mexico’s Motor Imports from China by Category of Technological Complexity in the Value Chain, 1992-2010 (Mexico as Reporter Country)
204
Table 6.15. AAGR of China’s and Mexico’s Motor Bilateral Trade by Technological Complexity in the Value Chain, 1992-2010
209
Table 7.1. China and Mexico in the U.S. Total Imports, 1990-2010
227
Table 7.2. China’s and Mexico’s Participation in the U.S. Motor Imports, 1990-2010
230
Table 7.3. China’s and Mexico’s Participation in U.S. Motor-Vehicle Segment Imports, 1990-2010
233
Table 7.4. China’s and Mexico’s Participation in U.S. Auto Parts Segment Imports, 1990-2010
234
Table 7.5. RCA Index of China’s and Mexico’s Participation in the U.S. The U.S. Motor Imports by Segment, 1990-2010
236
Table 7.6. SICT: China’s Threat to Mexico in U.S. Motor Imports, 1990, 2001 and 2010
239
Table 7.7. DICT: China’s Threat to Mexico in U.S. Motor Imports, 1990- 2001 and 2001-2010
241
Table 7.8. China’s Competitive Threat to Mexico and Trade Interactions in U.S. Motor Imports, 1990-2001 and 2001-2010
243
Table 7.9. U.S. Motor Imports from China by Category of Technological Complexity, 1990-2010
247

xi
Table 7.10. U.S. Motor Imports from Mexico by Category of Technological Complexity, 1990-2010
248
Table 7.11. Specialisation Index of China’s Participation in U.S. Motor Import by Category of Technological Complexity, 1990-2010
251
Table 7.12. Specialisation Index of Mexico’s Participation in U.S. Motor Imports by Category of Technological Complexity, 1990-2010
252
Table 7.13. Main U.S. Motor Imports from China, 2010
253
Table 7.14. Main U.S. Motor Imports from Mexico, 2010
254
Table 7.15. Technological Complexity of Mexico’s Motor Exports Under ‘Direct’ Competitive Threat from China in the U.S. Market, 2010
255
Table 8.1. Mode of Entry and Product Segment of Chinese Firms’ Automotive-Related Operations in Mexico (2011-2012)
268
Table 8.2. Major Joint Ventures of Chinese Companies in Mexico’s Automotive-Related Industry
271
Table 8.3. Major Wholly-Owned Operations of Chinese Companies in Mexico’s Automotive-Related Industry
277
Table 8.4. Major Chinese Merger & Acquisitions of Auto Firms Operating in Mexico
281
Table 8.5. Major Technological Associations/Licensing of Chinese Motor Companies in Mexico
284
Table 8.6. Chinese Presence of Automotive-Related Companies Through Marketing/Distribution Agreements in Mexico
288
Table 8.7. Chinese Automotive Companies with Interest in Establishing Operations in Mexico
292
Table 8.8. Main Chinese Corporate Motives (Strategies) for Investing in Mexico’s Automotive-Related Operations, 2011-2012
294
Table 9.1. China-Mexico’s Major Interactions and Impacts in the Motor Industry
332

xii
LIST OF FIGURES Figure 2.1. Theoretical Framework: Major Interconnections Among Globalisation, Competition and Global Division of Labour
61
Figure 3.1. Position of ‘Social realism’ (Critical Realism) within the Range of Epistemological Stances
66
Figure 3.2. Research Sites: Fieldwork
70
Figure 3.3. Motor Industry Cluster
78
Figure 3.4. Technological Complexity of Motor-Vehicle Value Chain: A Typology and Mapping
84
Figure 3.5. Matrix of Competitive Interactions between China and Another Country in Export Markets
95
Figure 3.6. Matrix of Interaction Channels and Impacts
96
Figure 3.7. Research Design Process: A Schematic View
97
Figure 4.1. Geographical Distribution of Worldwide Motor-Vehicle Production by Country Group, 1950-2011 (%)
104
Figure 4.2. Worldwide Motor-Vehicle Production: Country Ranking 1980-2011
109
Figure 4.3. China’s Automotive Production Facilities: Global Automakers/ Joint Ventures
118
Figure 4.4. China’s Automotive Production Facilities: Domestic Automakers
119
Figure 4.5. Major Sino-Foreign Joint Ventures in the Motor Industry, 2012
121
Figure 4.6. Timeline of Policy Decrees in Mexico’s Motor Industry
131
Figure 4.7. Mexico’s Light-Vehicle Production Facilities, 2011
136
Figure 4.8. Mexico’s Commercial-Vehicle Production Facilities, 2011
136
Figure 5.1. Evolution of Auto FDI in China and Mexico, 2000-2009
158
Figure 5.2. Manufacturing-Outsourcing Cost Index. Composite Index 2010
173
Figure 6.1. Selected Motor Exporting Countries, 1990-2010
184

xiii
Figure 6.2. China-Mexico Total Bilateral Trade, 1992-2010 (million dollars) (China as Reporter)
190
Figure 6.3. Mexico-China Total Bilateral Trade, 1992-2010 (million dollars) (Mexico as Reporter)
190
Figure 6.4. China-Mexico Motor Bilateral Trade, 1992-2010 (million dollars) (China as Reporter Country)
196
Figure 6.5. China-Mexico Motor Bilateral Trade, 1992-2010 (million dollars) (Mexico as Reporter Country)
196
Figure 6.6. China’s Motor Exports to Mexico vs Mexico’s Motor Imports From China, 1990-1992
198
Figure 6.7. Mexico’s Motor Exports to China vs China’s Motor Imports From Mexico, 1990-1992
198
Figure 6.8. Mexico’s Motor Exports to China by Technological Complexity in the Value Chain, 1992-2010
205
Figure 6.9. Mexico’s Motor Imports from China by Technological Complexity in the Value Chain, 1992-2010
205
Figure 7.1. China’s and Mexico’s Participation in Total U.S. Imports, 1990-2010 (%)
228
Figure 7.2. China’s and Mexico’s Participation in U.S. Motor Imports, 1990-2010 (%)
231
Figure 7.3. China’s and Mexico’s Participation in the U.S. Motor-Vehicle Segment Imports, 1990-2010
235
Figure 7.4. China’s and Mexico’s Participation in the U.S. Auto Parts Segment Imports, 1990-2010
235
Figure 7.5. China’s and Mexico’s RCA Index in U.S. Total Motor Imports, 1990-2010
236
Figure 7.6. China’s and Mexico’s RCA Index in U.S. Motor-Vehicle Segment Imports, 1990-2010
237
Figure 7.7. China’s and Mexico’s RCA Index in U.S. Auto Parts Segment Imports, 1990-2010
237

xiv
ABBREVIATIONS
AMIA Asociación Mexicana de la Industria Automotriz
AAMA American Automobile Manufacturing Association
ACEA European Automobile Manufacturers Association
ANPACT Asociación Nacional de Productores de Autobuses, Camiones y
Tractocamiones
CATARC China Automotive Technology & Research Centre
CCPIT China Council for the Promotion of International Trade
CECHIMEX Centro de Estudios China-Mexico
CEPAL Comisión Económica para América Latina y el Caribe
CKD Completely Knocked Down
CNIMME Consejo Nacional de la Industria Maquiladora y Manufacturera
de Exportación
DRC Research Department of Industrial Economy
ECLAC Economic Commission for Latin America and the Caribbean
EIU Economist Intelligence Unit
EVI Electric Vehicles International
FAW First Automobile Works
FDI Foreign Direct Investment
FTA Free Trade Agreement
GDL Global Division of Labour
GDP Gross Domestic Product
GMC General Motors Corporation
GML Giant Motors Latinoamérica
GPN Global production Networks
GVC Global Value Chains
HS Harmonised Commodity Description and Coding System
IDB Inter-American Development Bank
IDL International Division of Labour
IDS Institute of Development Studies
INA Industria nacional de Autopartes
INEGI Instituto de Estadística, Geografía e Informática

xv
IMF International Monetary Fund
IRSC Institute for Regional Studies of the Californias
JV Joint Venture
M&A Merger and Acquisition
MAGIC Module to Analyse the Growth of International Commerce
MOFCOM Ministry of Commerce of People’s Republic of China
MVMA Motor Vehicle Manufacturers Association
NAFTA North American Free Trade Agreement
NDIL New International Division of Labour
OAAI Office of Aerospace and Automotive Industries
OECD Organisation for Economic Cooperation and Development
OEM Original Equipment Manufacturers
OICA International Organization of Motor Vehicle Manufacturers
PEF Poder Ejecutivo Federal
PRC People’s Republic of China
PROMEXICO Mexico’s Promotion Agency for Trade and Investment
RCA Revealed Comparative Advantage
SAE Society of Automotive Engineers of China
SAIC Shanghai Automotive Industry Corporation
SEZs Special Economic Zones
TNC Transnational Corporation
UNCOMTRADE United Nations Commodity Trade Statistics Database
UNCTAD United Nations Conference on Trade and Development
UNIDO United Nations Industrial Development Organization
USDOC United States Department of Commerce
USGAO United States General Accounting Office
USITC United States International Trade Commission
WCO World Customs Organisation
WTO World Trade Organisation
VW Volkswagen Corporation

1
1. CHAPTER ONE
INTRODUCTION
“When China wakes, it will shake the world” (Napoleon Bonaparte).1
“As the balance of world market and economic power shifts from West to
East, China will emerge as the key location in the battle for dominance of
the 21st century’s global auto industry” (Jullens, et al., 2012).
‘A spectre is haunting the world – the spectre of China’.2 The emergence of the
People’s Republic of China – hereafter referred to as China - as a global economic
player is one of the most extraordinary events in world development over the last
three decades. In a broader context, the rise of the Middle Kingdom and its impact
on a global scale has resulted in the term ‘The Chinese Century’ being used
(Shenkar, 2005). During this period, China’s economic growth has been
impressive, registering a Gross Domestic Product’ (GDP) annual average rate of
around 10%. It has become the world’s largest exporter and manufacturer of
goods, the biggest energy user, and one of the major recipients of Foreign Direct
Investment (FDI). China is now the world’s second biggest economy, displacing
Japan in 2010. The International Monetary Fund (IMF, 2012) estimates that by
2017 China will overtake the United States in terms of world GDP calculated at
Purchasing Power Parity, although its per capita income would still be much
smaller than the average in advanced economies. With 1.3 billion people, China is
the world’s most populated country, accounting for 20% of the globe’s total. Over
these last three decades, China’s two historic transformations, from a rural-
agricultural society to a urban-industrial one, and from a command economy to a
market-based one, have not only yielded impressive economic results but in the
social sphere these have also been remarkable (The World Bank, 2012).
According to the same source, the poverty rate fell from more than 65% to less
than 10%, lifting some 500 million people out of poverty.
1 Saying attributed to Napoleon Bonaparte in 1816-1817 after reading accounts of Lord McCartney’s trip to Beijing in the 1790s (Kristof and Wudunn, 1994). 2 Paraphrasing Marx and Engels (1975) in their Manifesto of the Communist Party.

2
The internal exceptional achievements of the Chinese economy, however, have
caused contradictory and polemic reactions externally. In particular, by becoming
the ‘factory of the world’, China has begun to be seen as a serious competitive
threat in both developing and developed countries. In fact, the increasing Chinese
presence in world markets, especially for certain manufactured goods, has
severely intensified the levels and dimensions of competition. This condition is
pointed out by Kaplinsky (2005) who states that, in the past, many low-income
countries were able to increase their exports at the expense of workers in the high-
income importing economies, but now, given the high inter-penetration of
markets, developing countries find themselves in increasing competition with
each other. An effect of this process – Kaplinsky argues -, is that the continued
growth in manufactured exports by an important number of low-income countries
is not viable under such circumstances. Thus, the ‘China Price’ is being felt in
both developed and developing markets. An additional tendency is that although
China competitive strengths started in labour-intensive and low-technology
products, by now they are increasingly competing in more technology- and skill-
intensive ones.
In the political arena, some consider that China’s global rise will pose a military
threat to the West, and undermine support for democracy and human rights around
the world (Peerenboom, 2007). In this sense, given the pre-conceived notion of
‘China Threat’, China is painted not only as unreformed Communist but as an
ugly Capitalist as well (Leung, 2005). As a consequence of these perceptions, a
collective ‘China Syndrome’ has induced fears about China’s increasing
competitiveness among a diversity of economic, social and political agents
(government officials, politicians, entrepreneurs, labour unions) in both
developing and developed economies (Lall and Albaladejo, 2004; Shenkar, 2005;
Fishman, 2005; Kaplinsky, 2005; Peerenboom, 2007). In many cases, different
forms of protectionism have been the answer, provoking trade disputes among
countries. Paradoxically, and simultaneously, amidst this conflictive scene
countries and firms have reinforced their trade ties, investments, and production
networks with China, taking advantage of low prices or production costs. Either
using China as source of imports, as an export destination or as a production base,

3
this process has contributed to the extension and deepening of the global division
of labour.
In a kind of Schumpeterian view of ‘creative destruction’ (Schumpeter, 1970),
China’s global emergence has revolutionised the worldwide competitive structure.
This extraordinary event has been highlighted by specialists on the topic. Within
this perspective, Chinese firms are starting to disrupt global competition by
implementing a strategy of cost innovation, thus breaking the established rules of
the game (Zeng and Williamson, 2007). Along the same lines, and related to the
rise of the ‘Asian Drivers’ framework, this process is visualised as ‘critical
disruption’ to the global economy and political order which is reshaping the
world’s current status, presaging a new ‘Global-Asia’ era (Kaplinsky and
Messner, 2008). Through its extraordinary achievements during the last three
decades, China has shown the world that not only ‘the South, but the East also
exists’.3
1.1. China’s (Re) Emergence in the Global Economy
From the early sixteenth century until the early nineteenth century, China
represented the world’s largest economy (Maddison, 2001; The World Bank,
2012). Chinese GDP in 1820 was nearly 30% higher than that of Western Europe
and its Western Offshoots combined (Maddison, 2001). Nevertheless, between the
1840s and 1940s, the Chinese economy collapsed. Per capita GDP in 1950 was
less than three quarters of the 1820 level and its total GDP was less than a twelfth
of that of Western Europe and the Western counterparts. The period of China
decline coincided with commercial penetration by foreign powers and the
Japanese attempt at conquest, but there were also internal forces which
contributed to China’s retrogression (ibid).
Maoist China: the Creation of the People’s Republic of China
After a long period of wars since the end of Qing dynasty in 1911, a new society
was created with the establishment of the People’s Republic of China (PRC) on
3 Paraphrasing Mario Benedetti’s (2000), “The South also exists”.

4
October 1, 1949. Under a Communist ideology and the leadership of Mao
Zedong, Chairman of the Party, the government sought to control all aspects of
social and economic activity (Guthrie, 2006; Baker, 2007). During the period of
Maoist China, several major stages can be identified (Thoburn, 2010a): a)
Agrarian reform (1948-1952); b) Agricultural collectivisation (1957); c) The
Great Leap Forward (1957-1958); d) The Great Famine (1960); and e) The
Cultural Revolution (1966-1976). Mao’s ruling period of almost thirty years
ended with his death in 1976. Until this time, under a poorly functioning
command system China’s economy was crippled, with a backward industrial
sector, inadequate allocation of resources, rigid and stultifying bureaucracy, and
isolation from the rest of the world (Guthrie, 2006; Baker, 2007).
Reform Period and ‘Open Doors’ Policy
In 1978 the process of economic reform in China got under way under the new
leader Deng Xiaoping. The new government recognised that access to world
markets and a freeing-up of domestic trade were necessary factors for
development. By commenting ‘it does not matter what the colour of the cat is, as
long as it catches mice’, Deng proposed a reform process of ‘groping for stones to
cross the river’ (Baker, 2007: 141-142). According to Nolan (2005), China’s
approach to the reform was deeply influenced by the disasters the country had
experienced since the middle of the nineteenth century, the massive famine after
the ‘Great Leap Forward’ and the acute suffering during the Cultural Revolution.
China’s style of reform process, away from the planned economy of the Maoist
period, contrasts sharply with the reform path of the former USSR, a ‘transition
orthodoxy’ policy (Nolan, 2005). It has been recognised that the success of the
economic reform path of the past three decades has derived from its particular
gradualist ‘nature’ (Nolan, 2005; Guthrie, 2006; Yueh, 2007). Instead of adopting
the ‘transition orthodoxy’ policy promoted by the World Bank, China followed an
experimental and evolutionary approach, under an authoritarian political system
(Nolan, 2005). Nevertheless, some analysts argue that despite this gradualist path
of China’s transition to a market economy, reforms have also been radical and
deep, given the following factors (Guthrie, 2006): a) the central government has

5
driven reforms forward through several key policies that have allowed China to
engage fully in the global economy; b) a policy of economic decentralisation has
been adopted giving incentives for local development to local officials and
creating competition among localities; and c) the government has reformed
industrial organisations without privatisation, but at the same time it has allowed a
private economy to emerge from below.
The central features of the development model after the reforms are the following
(Guthrie, 2006; Gao, 2006, cited by Gereffi, 2009): a) The reliance on the market
as the driving mechanism behind economic growth; b) The transformation of
incentives in agricultural activity; c) A policy of economic decentralisation, giving
incentives for regional development and creating competition among localities; d)
An aggressive strategy of FDI attraction; e) The opening of the domestic market
to the outside world; f) The facilitation of the development of a private economy;
g) The use of low-cost labour to participate in the global economy; h) The
beginning of a process that would address the economic burden that the social
security system posed for Chinese enterprises; and i) The valuation of economic
growth and upgrading, even at the expense of social stability.
At the same time that China was implementing the domestic reforms that
transformed the economy in the 1980s and 1990s, a deepening of the ‘open doors’
policy aimed at integration into the global economy was deployed. Among the
main actions was the construction of new institutions both domestically and
internationally, the development of new industrial policies, and the adoption of
aggressive trade and export strategies. Of particular significance was the creation
of ‘Special Economic Zones’ (SEZs) (i.e. Pudong, Shenzhen), which allowed
domestic and foreign firms to take advantage of specific tax incentives and other
types of policy goals in targeting particular kinds of investment in China (Guthrie,
2006).
Before 1978 China’s trade was driven by import needs and no FDI was allowed
between 1949 and 1978, except some from the ex-USSR (Thoburn, 2010a). The
economic reforms included access for foreign investment which had hitherto been
6
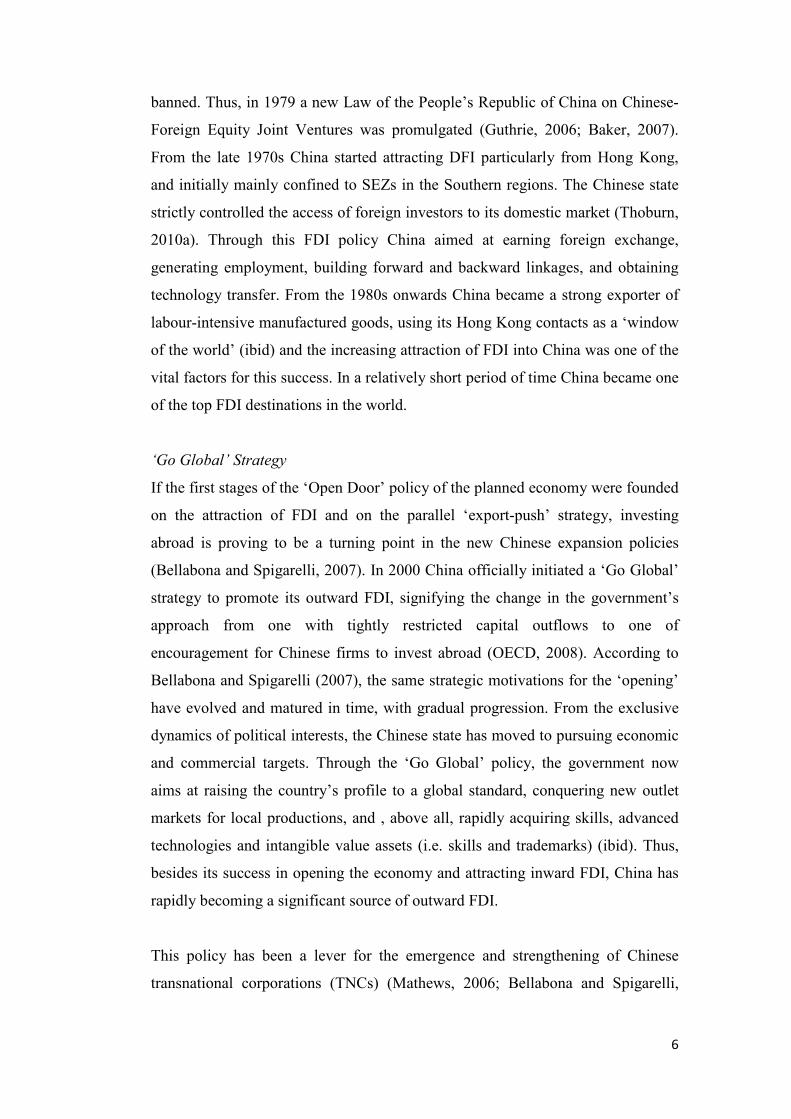
banned. Thus, in 1979 a new Law of the People’s Republic of China on Chinese-
Foreign Equity Joint Ventures was promulgated (Guthrie, 2006; Baker, 2007).
From the late 1970s China started attracting DFI particularly from Hong Kong,
and initially mainly confined to SEZs in the Southern regions. The Chinese state
strictly controlled the access of foreign investors to its domestic market (Thoburn,
2010a). Through this FDI policy China aimed at earning foreign exchange,
generating employment, building forward and backward linkages, and obtaining
technology transfer. From the 1980s onwards China became a strong exporter of
labour-intensive manufactured goods, using its Hong Kong contacts as a ‘window
of the world’ (ibid) and the increasing attraction of FDI into China was one of the
vital factors for this success. In a relatively short period of time China became one
of the top FDI destinations in the world.
‘Go Global’ Strategy
If the first stages of the ‘Open Door’ policy of the planned economy were founded
on the attraction of FDI and on the parallel ‘export-push’ strategy, investing
abroad is proving to be a turning point in the new Chinese expansion policies
(Bellabona and Spigarelli, 2007). In 2000 China officially initiated a ‘Go Global’
strategy to promote its outward FDI, signifying the change in the government’s
approach from one with tightly restricted capital outflows to one of
encouragement for Chinese firms to invest abroad (OECD, 2008). According to
Bellabona and Spigarelli (2007), the same strategic motivations for the ‘opening’
have evolved and matured in time, with gradual progression. From the exclusive
dynamics of political interests, the Chinese state has moved to pursuing economic
and commercial targets. Through the ‘Go Global’ policy, the government now
aims at raising the country’s profile to a global standard, conquering new outlet
markets for local productions, and , above all, rapidly acquiring skills, advanced
technologies and intangible value assets (i.e. skills and trademarks) (ibid). Thus,
besides its success in opening the economy and attracting inward FDI, China has
rapidly becoming a significant source of outward FDI.
This policy has been a lever for the emergence and strengthening of Chinese
transnational corporations (TNCs) (Mathews, 2006; Bellabona and Spigarelli,

7
2007; Pradhan, 2009; Williamson and Zeng, 2009). A change in the motives of
Chinese outward FDI during the last decade has been reported, diversifying from
the traditional market and natural resource-seeking modalities to strategic asset
acquisitions (through M&A), intended to enhance their technological and
innovative capability (Pradhan, 2009). Some of the high-profile Chinese TNCs are
Lenovo in the personal computer business, Huawei in the telecommunications
network equipment, and Geely, which recently acquired Volvo, in the motor
vehicle sector. These emerging TNCs, also called ‘Dragon Multinationals’, are
considered to be serious international players in the global economic scene
(Mathews, 2006). Their accelerated internationalisation and the strategic
organisational innovations’ characteristics are framed within the complex global
forces of economic integration. For some analysts, the continued emergence of
Chinese TNCs is expected to have a powerful, disruptive impact on the structure
of the global competitive arena (Williamson and Zeng, 2009).
China’s Accession to the World Trade Organisation
2001 marked another leap forward in the path of China’s integration into the
global economy, a historic milestone, as phrased by Nolan (2005). For trade and
economic analysts, China’s accession to the World Trade Organisation (WTO) in
December of that year represented an extraordinary event for diverse reasons. At
the time, China was the world’s sixth-largest economy, with a population of 1.3
billion, and reflecting a unique political and economic system consisting of a
hybridisation of planned economy and free-market principles (Cass, et al., 2003).
Likewise, the implications of China’s entry into the WTO for the world economy,
the international trading system, and the United States were enormous (Lardy,
2002). According to this author, China’s economy and international trade were so
vast that the expansion of economic output and trade resulting from its
membership was likely to notoriously affect the growth of global trade and thus
the pace of expansion of global output. This move was also considered a landmark
event for the following reasons (ibid): a) China’s membership committed it to
comply with the principles and rules of the international trading system; b)
China’s WTO commitments were a lever that its reform-oriented leadership could
use to complete the transition to a more market-oriented economy; and c) China’s

8
commitment to open markets to increased investments in telecommunications,
financial, and distribution services was genuinely revolutionary.
Although China achieved a great degree of openness to foreign trade in
manufactures prior to its accession to the WTO in 2001, the implications of its
membership for the world trading system and networks have been enormous
(Lardy, 2002). Besides the immense impacts within China such as the pressures
for economic reforms and industrial restructuring, WTO accession gave it a
further impulse in its international integration process and also increased its
competitive presence in several world market segments (Lardy, 2002; Bhattasali,
et al., 2004; Kaplinsky, 2005; Yueh, 2007). In fact, China’s accession to WTO
provoked deep concerns among both developing and developed countries. The
former feared increasing competition in their domestic and export markets as well
as in the attraction of FDI. The latter were worried about losing an important
number of unskilled jobs due to massive imports of cheap manufactured goods.
Although during the initial stages of participation in world markets China’s
competition was mainly in labour-intensive and low-technology products, over the
years the technological level of its products has steadily increased. China had
committed to compete in more technology-skill-intensive goods (Shafaeddin,
2004; Lall and Albaladejo, 2004). In this sense, some analysts have observed that
although low labour cost is certainly a major factor, it is not the only source of
China’s success. Other factors that are pointed out are: the strengthening of
manufacturing and processing capabilities, technological progress, improving
infrastructure, and suitable social and human environments (Lin, 2003; Lu, 2004;
Kaplinsky, 2005). In terms of innovation capability, more recently it has been
suggested that Chinese TNCs will fundamentally change the global competitive
game through a strategy of cost innovation (Zeng and Williamson, 2007). This
strategy consists of: a) Chinese companies are starting to offer customers high
technology at low cost; b) The emerging Chinese competitors are presenting
customers with an unmatched choice of products in what used to be considered
standardised, mass-market segments; and c) Chinese companies are using their
low costs to offer specialty products at dramatically lower prices, turning them
9
into volume business (ibid). This disruption of global competition, it is argued,
will initiate the transition to a new economic structure with changes in the
division of labour between regions, reorganisation of TNCs, and new alliances
among companies and countries over the next decade.
Unique Factors behind China’s Economic Success
In summary, the factors behind China’s economic success in its reforms are
considered unique. The key reforms included are: a) Pragmatic and effective
market-oriented reforms; b) Balancing growth with social and macroeconomic
stability; c) Decentralisation and interregional competition in attracting
investment, developing infrastructure, and improving the local business
environment; d) Domestic market integration by dismantling regional barriers to
the movement of goods, labour, and capital and the establishment of a single
national market; and e) Steady integration with the global economy (The World
Bank, 2012).
1.2. China as ‘Asian Driver of Global Change’
Globalisation has accelerated a number of vital transformations in several
dimensions of the contemporary world: economical, social, cultural, political,
technological, and territorial, among others. In recent years, two relevant trends
have been widely recognised (Schmitz, 2006): a) the global economy is
increasingly interconnected; and b) power is shifting from the West to the East, in
particular to China. These trends and their implications have led to the emergent
notion of ‘Asian Drivers’.
Succinctly, ‘Asian Drivers’ are the new dynamic and generally large Asian
economies, especially China and India, which are playing an increasingly
important role as global producers. They are likely to have a significant impact on
the global economy, derived not only from their size, but also from their
distinctive public and private actors (IDS Asian Drivers Team, 2006; Schmitz,
2006; Kaplinsky and Messner, 2008). Likewise, in terms of global governance,
the rise of China and India as drivers of global change is considered to be altering

10
the relationship between industrialised and developing countries causing
noteworthy impacts on this matter (Humphrey and Messner, 2006a). Given the
radical transformation this group of countries is likely to induce, its emergence is
seen as a critical ‘disruption’ to the global and political order, heralding a new
‘Global-Asia’ era (Kaplinsky and Messner, 2008).
The ‘Asian Drivers’ phenomenon has brought new issues for development and
policy processes (Kaplinsky and Messner, 2008). First, the depth and reach of
their impacts challenge both developed and developing countries. Second, the
variety of impacts presents threat and opportunities simultaneously, thus
provoking competitive and complementary, as well as direct and indirect, impacts.
Third, their successful experience provides new policy roles for other developing
countries, at variance with the traditional “Washington Consensus”.
Six major reasons are pointed out as to why the Asian Drivers are likely to pose
major challenges to developed and developing economies (Kaplinsky and
Messner, 2008): a) The huge size of their economies; b) These economies
markedly embody different combinations of state and capitalist development
compared with the industrialised world; c) They combine low incomes and low
wages with significant innovative potential; d) China and India are associated with
very different forms of regional integration; e) The economic rise of China and
India results in large-scale changes in important global governance arenas; and f)
The huge natural resource hunger and energy needs of China and India will, in the
future, serve to place the issue of sustainability squarely back on the agenda of
global politics and development policies.
A related notion to that of ‘Asian Drivers’ is the initiative of ‘Anchor Countries’,
which are defined as “developing countries whose size gives them the potential to
play important roles in regional and global governance, both positively and
negatively” (Humphrey and Messner, 2006b: 2). The ‘Anchor Countries’ are
considered to be significant partners for developing countries. This group of
countries, although heterogeneous, is mainly defined by the size of their economy,
population, territory and their political influence and participation in global

11
dialogue. Besides China and India in East and South Asia, the notion of “Anchor
Countries” also includes South Africa in Africa, Russia in Central Europe, and
Brazil and Mexico in Latin America, among others (ibid).4
Undoubtedly, at present China is the Asian Driver with major impacts on the
global economy. As pointed out above, the emergence of China as a global
economic player is seen as a factor that is changing the balance of world power
and leading to global restructuring. In this regard, Shenkar (2005: 1) emphasises,
“the impact of a rising China on the countries of the world – both developed and
developing – will be enormous, and so will be the need to develop strategies and
responses to meet the challenge”. However, following the sign of the present
process of globalisation, China represents, simultaneously, challenges and
opportunities. On one side, it is a major competitor for many countries in the
domestic and global markets and, on the other, from the demand side, it has
played a dynamic role as an engine of world economic growth. On this twofold
implication, Kaplinsky (2005) raises a highly suggestive point: while the
improvement in the global distribution of income arises mainly as a result of the
very rapid economic growth in China, it is also considered as a major cause for
squeezing the income of low-wage economy exporters of manufactures leading to
a declining terms of trade with the main consuming regions of the world.
1.3. The Competitiveness Obsession of Nations
After almost two decades of intense academic, business and political debate over
the ‘competitiveness’ of nations, the issue is still very much alive. One of the most
influential intellectual stances on the subject was formulated by Paul Krugman
(1994 and 1996), arguing that nations, unlike corporations, do not compete with
each other in the global marketplace. When taken to the public policy standpoint,
Krugman (1994: 44) goes further: “competitiveness is a meaningless word when
applied to national economies. And the obsession with competitiveness is both
4 Other related concepts are that of BRICs, integrated by Brazil, Russia, India and China. Likewise, the so-called BRICSAMs include South Africa and Mexico besides the BRICs (Agarwal, 2008). Very recently, an international consultancy firm “predicted” that Mexico is closer to become the next BRICs country (Global Auto Industry, 2012).

12
wrong and dangerous”. He warned that any nation’s obsession with
competitiveness could skew domestic policies and threaten the international
economic system, leading to a serious risk of trade conflicts. If on top of these
elements – following Henderson’s (2002) idea about research on economic
development given contemporary circumstances - the existence of an analytic
disjuncture of being state-centric in its assumptions and analyses is added to the
equation, then it could be argued that the ‘competitiveness obsession’ of nations
becomes not only wrong and dangerous, but perhaps fatal.
Almost immediately after the publication of Krugman’s work, it received rather
heated responses from prominent economists, academics and other professionals:
Lester C. Thurow, Clyde V. Prestowitz (Jr.), Rudolf Scharping, Stephen Cohen,
and Benn Steil (Foreign Affairs, 1994). The responses had a common ground: a)
competitiveness is an essential concern for nations; b) domestic economies must
compete successfully in the global economy in order to move to higher levels of
productivity and income; c) the level of prosperity of national economies depends
to a large extent on productivity and to a lesser extent on the international
competitiveness of their companies; d) one of the main problems is the static
approach adopted; among other arguments. Likewise, other authors argued that –
although often misused and mostly ill-defined - the concept of competitiveness
properly used is relevant for analysing and understanding the distribution of
wealth, both nationally and globally (Reinert, 1995). Moreover, Reinert pointed
out that, although under different titles, the term competitiveness addresses issues
which have been central in public policy for around 500 years.
More recently, the topic of national competitiveness has been tackled from the
perspective of policy decision-making and the construction of indices, ranking
international competitiveness as well as in assessing the competitive performance
of countries at international scale (Lall, 2001; Lall and Albaladejo, 2004). In
particular, Lall (2001) discusses two issues of Krugman’s arguments: first,
whether ‘national competitiveness’ has a valid economic definition; and, second,
– if it does, – whether competitiveness ‘strategy’ is justifiable. Lall (ibid)
concludes that as an economic issue, when market failures exist, free markets

13
cannot allocate resources optimally and countries can improve their position by
intervening to remedy these failures. Thus, the aim of a government’s
competitiveness strategy is to help countries to realise or build dynamic
comparative advantage. The author (ibid: 1504) adds that “selective strategies do
work under specific circumstances, and the rewards in terms of growth and
dynamic competitiveness are enormous”.
Regardless of the final conclusions of this apparently endless academic
controversy, governments all over the world are still obsessed with their national
competitiveness. As Harris (2003) underlines when discussing the agenda of the
nation-states and global economic integration, the old order fashioned economies
according to political geography, not according to global markets; and he adds
(ibid: 239), “trade remains, even if in a qualified fashion, an instrument of state
power and of the ancient rivalries”. Under globalisation, this author remarks, the
process is governed by the economics of global markets rather than by the politics
of national states. Paradoxically, this clinging to the idea of nations competing
with each other in the world market is kept in a moment when the actual origin
and the ‘nationality’ of products and capitals as well as the boundaries of firms are
becoming increasingly blurred and ‘fuzzy’ (Harris, 1983 and 2003; Ietto-Gillies,
2002; Dicken, 2003). In large part, this difficulty in identifying the nationality or
place of origin of goods and corporations is due to the increasing globalisation
process and the conformation of complex and specialised transboundary
production networks of interlinked firms.
Based on different experiences worldwide, there is no doubt that the emergence of
China as a major player/competitor in the global economy in the 1990s has been a
catalytic factor spurring on the competitive obsession of nations. Amazingly, fears
about China’s increasing competitiveness are manifested among governments, as
well as economic and social agents, in both developing and developed countries.
A clear example of this situation is the reaction in the United States, the world’s
largest economy and market. In fact, there have been a significant number of trade
disputes between the United States and China, ranging from implementation of
obligations that were made where China joined the WTO, China’s exchange rate

14
policy, lax trade law enforcement, and alleged subsidies to industrial producers
(Tang, 2009). Critics claim that China’s currency policy is a major cause of the
large U.S. trade imbalance with China and the loss of numerous U.S. jobs.
Nevertheless, while the Obama administration has pushed China to appreciate its
currency, it has also encouraged it to continue purchasing U.S. Treasury
securities, which totalled US$ 847 billion as of July 2010 (Morrison and Labonte,
2010). According to figures of the USDOC (2012), the bilateral U.S. trade deficit
with China rose to US$ 295.5 billion in 2011, 40% of the U.S. total. As a result,
administrators and Members of Congress are desperately aiming to achieve more
balance in U.S.-China trade relations.
Concerns about job losses in the U.S. economy have been manifested for years.
For example, a study prepared for the U.S.-China Economic and Security Review
Commission reported that between 1989 and 2003, the rise in the United States’
trade deficit with China caused the displacement of production that supported 1.5
million jobs. The number of jobs opportunities lost each year grew rapidly during
the 1990s, and accelerated after China entered the WTO in 2001 (Scott, 2005).
Very recently, in January 2012, the Alliance for American Manufacturing, which
includes manufacturers and United Steelworkers, claimed that about 1.6 million
U.S. jobs in the automotive parts industry were threatened by the ‘unfair,
predatory and protectionist’ trade practices of China in the auto parts sector. The
Alliance requested federal action to protect the recovery of the U.S. motor
industry (Alliance for American Manufacturing, 2012). In this sort of trade
disputes, the risk of protectionism is always present. As Jagdish Bhagwati (2009)
recently highlighted:
“To understand this paradox, consider that labour union lobbies and their
political friends have decided that the ideal defence against competition
from the poor countries is to raise their costs of production by forcing their
standards up, claiming that competition with countries with lower
standards is ‘unfair’. ‘Free but fair trade’ becomes an exercise in
insidious protectionism that few recognise as such”.

15
In summary, Krugman’s treatment of competitiveness raised some significant
elements for the discussion of national (and international) competitiveness,
provoking an intense wave of controversies on the issue. According to Krugman
(1994: 41), thinking and speaking in terms of competitiveness poses three real
dangers: a) it could result in the wasteful spending of government money on
enhancing national competitiveness; b) it could lead to protectionism and trade
wars; and c) it could result in bad public policy on a spectrum of important issues.
These arguments both augment and obscure the discussion on the national
economy’s productivity and trade performance in world markets. On the one
hand, Krugman’s claims warn about the dangers of becoming obsessive about
national competitiveness, in terms of justifying protectionist measures leading to
trade disputes, as well as about governments embarking in inefficient and
erroneous public policy. On the other hand, due to his idea of the meaningless of
the competitiveness concept when applied to national economies, these arguments
overshadow and underestimate its relevance in terms of defining a
competitiveness strategy within economic policy, aiming at strenghthening
dynamic comparative advantages.
In fact, a justification for nation states to be involved in competitiveness issues is
that the concept is bound up with the population’s quality of life (Planas and
Preston, 2010). In this regard, Aiginger (2006) underlines that the definition of
competitiveness as the ability of a country to create welfare not only contradicts
any attempt to focus primarily on low costs (price competitiveness), but also
sidelines definitions focusing on external balance and market share. In addition,
some authors (Hay, 2012: 464) have argued that Krugman’s treatment of
competitiveness “led him to fail to recognise, and inadvertently to reinforce, a
rather different and more virulent obsession of policy-makers – that with cost
competitiveness.” Hay (ibid) points out that policy-makers have long since ceased
viewing the competition between nations as analogous to that between
corporations, but they seem yet to realise the dangers of viewing the dynamics of
competition in all markets for goods and services as analogous to that for cheap
consumer goods.

16
1.4. The ‘China Syndrome’: Mexico’s Obsession
From December 2000 to the end of 2003, Mexico’s maquiladora5 industry lost
900 plants and 260,000 jobs, around a quarter and a fifth of the total, respectively.
This situation represented a major setback for Mexico since the maquiladora
industry is a key sector within the Mexican economy. At present, this activity
accounts for more than 50% of Mexico’s total exports and 30% of formal
manufacturing employment. It is, perhaps, the best example of the Mexican
economy in terms of globalisation and international integration. For particular
sectors, mostly based on labour-intensive operations, such as textiles, clothing,
footwear, home appliance, telephone equipment, and electronic segments, the
situation was critical.
As most of these jobs were lost to China through the relocation of plants or
market competition, the ‘China threat’ became Mexico’s obsession. Around 45%
of the assembly plants that migrated from Mexico were relocated to China
(Ornelas, 2007). As The Economist (2003: 49) pointed out at that time, “The
‘sucking sound’ of jobs going south that Ross Perot, an American presidential
candidate, feared would be consequence of NAFTA is now being heard from the
east by Mexicans”. By challenging head-on the maquiladora system’s
comparative advantage, China had begun eating Mexico’s lunch (Rosen, 2003).
5 The Maquiladora system was created in 1965 as part of the Border Industrialisation Programme (González-Aréchiga and Barajas, 1989). A maquiladora is a factory or assembly plant operated in Mexico under a preferential tariff scheme. Under the maquiladora programme, equipment, machinery, supplies and raw materials can be imported temporarily into Mexico duty-free; products are assembled and/or manufactured on the Mexican side and exported back to the Unites States for further processing and selling. Before NAFTA, maquiladoras were required to export all the production out of Mexico but after the starting operations of the free trade agreement, that condition was eliminated. In November 2006, the Mexican government (PEF, 2006) issued a decree combining the Maquiladora Programme with the PITEX Programme (Temporary Imports Programme to Produce Export Goods), an additional export promotion scheme created in 1990. The new export promotion scheme is called IMMEX (Manufacturing Industry, Maquiladora and Export Services Programme). Maquiladoras are also known as ‘in-bond’ or ‘twin’ plants. The concept originated from Spanish ‘maquiladora’, place where the miller’s fee is paid; and ‘maquila’, portion received by the miller in return for milling one’s grain (Houghton Mifflin Company, 2009).

17
Much of Mexico’s obsession had competition in third markets as a source,
particularly in the United States. The U.S. is a key market to Mexico since it
represents around 80% of its total export destination. In 2003, China displaced
Mexico as the second-largest supplier of goods to the U.S. market, behind
Canada. After a period of sustained growth due to the operation of NAFTA in
1994, U.S. imports from Mexico have observed a slump since 2001, surpassing
the value levels of 2000 only until 2004-2005. Conversely, U.S. imports from
China presented a dynamic growth, more than doubling the value from 2001 to
2005. In the case of Mexico, the underlying factors behind this tendency was a
combination of China’s increasing competition and the recession of the U.S.
economy since the end of 2000, which was exacerbated by the 9/11 factor.
Two events and changes linked to NAFTA operation and U.S. trade treaties
simultaneously enabled China to escape the recessive effects of the U.S. economy
(Sahling and Finley, 2004), and also eroded Mexico’s competitiveness: first,
China’s accession to the WTO in December 2001; and second, the activation of
NAFTA’s Article 303 on January 1, 2001. In the first event, the United States
lowered the duties levied on manufactured exports from China – in a similar way
to what had happened with other Central American countries in 2000 -, enhancing
the competitiveness of those exports within the Unites States. Before NAFTA,
China was the U.S.’s principal source of textiles and apparel products. After
NAFTA, Mexico obtained a special tariff treatment in these products, which
enabled Mexico to become the number one supplier in the American economy. In
the second event, when this NAFTA rule came into effect, it made maquiladora
operations more difficult, more costly and more uncertain in Mexico, since the
Article 303 outlawed tariff rebates for imports from non-NAFTA countries
(Gruben, 2004). As a result, firms importing from Asia for assembly in Mexico
and subsequent export to the United States – a traditional practice of special
relevance for the electronics industry, for example – found that, under the new
rule, operations were more expensive, and firms began relocating, or moving their
operations abroad. These are some of the factors why Mexico began losing
competitiveness in low-wage/low-skill operations against China and other Central
American countries.

18
The favourite explanation for China’s competitiveness in world markets is its
abundance of unskilled and cheap labour force. In 2002, China’s hourly
compensation costs6 were US$ 0.57, only 2.08% of those in the U.S. ($27.37) and
10.2% of Mexico’s ($5.59). Nevertheless, China has been steadily upgrading its
technology and skill-intensive of exported goods. Comparatively, labour costs in
China have been rising faster. By 2008, China’s hourly compensation costs
increased to US$ 1.36, against $ 6.47 in Mexico and $ 32.78 in the United States
(Banister and Cook, 2011).
The increasing presence of China in the international markets and the growing
fears about its ‘competitive threat’ provoked a number of reactions and opinions
among diverse governmental, businessman, politicians, and other social agents
both inside and outside Mexico. Most of the public opinions were defensive and
of a reactive character against China, although some expressed a more
conciliatory position by highlighting the potential benefits of entering into a phase
of cooperation with China (Table 1.1). During China’s first years of having joined
the WTO, most of the information regarding its negative impacts on Mexico came
from anecdotal and press reports. It was not until the middle of the 2000s when
more analytical studies on the subject were released. These studies showed
increasing competition from China in the domestic and U.S. markets, as well as in
the attraction of FDI, in particular in the textile/clothing and the electronics
manufacturing chains (Dussel Peters 2005a, 2005b, 2009 and 2010a).
Specifically, in the electronics industry Dussel Peters (2005a and 2009) reported
losses between 2001 and 2003 of more than 45,000 jobs, US$ 3.2 billion in
exports, and 514 million in FDI by companies that outsourced their activities to
China and/or outsourced their production lines to that country.
6 Compensation costs include: a) direct pay (all payments made directly to the worker, before payroll deductions of any kind); b) social insurance expenditures (employer payments to secure entitlement to social benefits for employees); and c) labour-related taxes (net of subsidies).

19
Table 1.1. Public Opinion about China’s Global Emergence
and Impacts on Mexico
“The ‘giant sucking sound’ Ross Perot used to talk about is back, only this time it is not Mexico sucking away American jobs. It is China sucking away Mexico’s jobs”. (William Greider, Journalist, The Nation, 31st December, 2001). “It is not clear whether or not China is actually competitive. Perhaps it is, but perhaps its current success is based on the fact that they do not respect a series of rules that other countries, such as Mexico, do respect.” (Mexico’s President Vicente Fox at the Asia Pacific Cooperation Summit, 22nd October, 2002, Presidencia de la República). “China is on the minds of every manager, politician, worker, housewife and youngster of this country. Mexico seldom has faced such a formidable rival that so clearly threatens our welfare.” (MEXICONOW Magazine’s Editor, Year 1, No. 2, January-February, 2003). “Mexico has nearly lost the battle on low-skilled, labour-intensive industries, where it simply cannot compete with China on labour costs and will likely continue losing market share”. (Merrill Lynch report, cited by Juan Forero, The New York Times, 3rd September, 2003). “China and Mexico are competing for the same markets. The question is not whether Mexico is losing the U.S. market, but rather how we can establish a strategic relationship with China to penetrate that market together”. (Speech of Luis Ernesto Derbez, Mexico’s Foreign Minister, at IDB Conference in Washington, D.C. IDBAmerica, October 2004). “The ubiquitous ‘Made in China’ stamp, found on everything from toys to textiles to statues of Our Lady of Guadalupe, has become the incarnation of the single greatest perceived threat to Mexico’s economic prosperity – and a symbol of the pitfalls of globalization”. (Farrel, D., A. Puron and J. Remes, Analysts, The McKinsey Quarterly, No. 1, 2005). “Our common destiny lies in the fact that they can be our manufacturing centre to export to the world, while we can be their platform to supply the American continental market”. (Simón Levy Dabbah, academician and current chairman of LatinAsia, reported by Global Automotive Industry, March 2006). “My message is that Americans and Mexican alike should not fear the economic rise of China. China presents an opportunity, not threat, to the NAFTA partners”. (Daniel Griswold, Director of the Centre for Trade Policy Studies at the Cato Institute, 15th November, 2006). “Protection won’t do any good. To protect is like taking an aspirin, it has instant effects, but it does not last long because we all are in the globalisation bandwagon”. (Yin Hengmin, People’s Republic of China Ambassador in Mexico, reported by El Sol de Mexico, 22nd February, 2008. “In a world where subpar growth and high rates of joblessness are likely to remain for some time, China is exporting large doses of unemployment to the rest of the world – not just to the United States bit also Europe, Latin America, India, Mexico, and South Africa”. (Fred Bergsten, Op-ed in Foreign Policy, Peterson Institute for International Economics, 14th April, 2010). Source: Own elaboration.

20
In the Latin American region, it seems that China’s ‘Angel’ face and ‘Helping
Hand’ (Santiso, 2007; Bláquez-Lidoy, Rodríguez and Santiso, 2007) did not reach
Mexico, since practically all the studies concluded that this country was the most
negatively affected by China’s competition, given the similarity of their export
structures. Because of this, Mexico emerged as the exception case or the
paradigmatic example (Blázquez-Lidoy, Rodríguez and Santiso, 2007; Paus,
2008; Gallagher and Porzecanski, 2008). According to Gallagher and Porzecanski
(2010), Mexico tops everyone’s list of nations under threat from China. Arguing
that China’s competitive threat has increased over time, these authors reported
that 83% of Mexican exports to the United States, and 99% of Mexico’s
manufacturing exports to the rest of the world were under threat from China by
2006. In 2004, the chairman of Mexico’s National Iron and Steel Industry
Chamber (CANACERO) declared that China did not represent any risk for the
domestic iron and steel industry (Infolatina, 2004). Interestingly, seven years later,
CANACERO denounced a process of de-industrialisation and job losses in the
sector mainly derived from increasing Chinese import penetration, and demanded
governmental protection (Mendes de Paula and Cervera, 2011). In 2003 China
not only displaced Mexico as the second largest supplier to the U.S. market; it
also became Mexico’s second trading partner due to increasing imports from the
former.
In general, amid similarities and differences, the China-Mexico relationship seems
to be a paradoxical one in many respects. Firstly, although China and Mexico
established trade contact in 1565 through the ‘China’s Nao’, there was a long
distancing period between them (Oropeza, 2010). Only until December 1899 did
both countries formalise diplomatic relationships. At the beginning of the
twentieth century, China and Mexico interrupted their relationship due to their
internal social and political movements. Mexico officially recognised the People’s
Republic of China in 1972 behind the United Nations Organisation (UNO).
Secondly, despite this political recognition, Mexico was the last of the 141
members of the WTO to sign a bilateral agreement with China to clear its
admission to the organisation in 2001. Likewise, up to the present, Mexico has not
granted China the status of market economy. Thirdly, China and Mexico started a

21
process of trade liberalisation and export-oriented strategies, following a period of
pursuing an import substitution model, almost at the same time. Nevertheless, the
results and implications for national development and industrial upgrading have
been substantially different, making it difficult for Mexico to compete with China
in world markets (Shafaeddin and Pizarro, 2007; Shafaeddin and Gallagher, 2008;
Gereffi, 2009; Gallagher and Porzecanski, 2010); whereas Mexico was the
‘champion of liberalisation’, China followed a ‘neo-developmental’ model
(Shafaeddin and Gallagher, 2008). Fourthly, for some observers, the collision
between Mexico and China was imminent, since the former, after NAFTA came
into operation in 1994, began pursuing an economic strategy that was more Asian
than Latin American. As a consequence, by transforming itself into a platform for
low-cost exports mainly to the U.S. market, Mexico became ‘the China of Latin
America’ (Johnson, 2002). Both counties are also considered ‘outliers’ in their
respective regions, Mexico in Latin America and China in East Asia, due to their
differentiated performance in relation to their neighbours’ (Lall, et al., 2004).
Nevertheless, it is noted that although both countries are dynamic exporters –
which makes them similar – they differ in behaviour and implications. Finally, as
a Mexican contribution to the Chinese transition, the new impetus to the SEZs
programme, one of China’s most successful strategies in its process of global
integration and competitiveness after the ‘open doors’ policy, was inspired by
Mexico’s maquiladora programme (Ley, 2010). After visiting Mexico’s border
towns in 1985, Jiang Zemin, at that time Shanghai’s Mayor, proposed the new
course of China’s SEZs (ibid). Years later, Jiang Zemin became the Communist
Party General Secretary and, subsequently, China’s President.
In conclusion, it could be argued that the conjunction and synchrony of cyclical
and structural factors – the U.S. economic recession, increasing competition from
China, the changing NAFTA and trade rules, and Mexico’s internal factors (lack
of reforms, increasing labour costs, lack of infrastructure, etc.) – led to Mexico’s
loss of competitiveness in the global market, especially in the United States, its
major export destination. The U.S. recession of 2000-2003, along with increased
Chinese competition, were the catalyst factors that made the structural
transformation of the Mexican economy in the light of increased international

22
competition clear: Mexico was no longer competitive in low-wage/labour
intensive production segments. Even further, the whole of Mexico’s
industrialisation and export-oriented model was put into question.
1.5. China’s Global Emergence and Mexico’s Motor Industry
If the present age is set to be called ‘The Chinese Century’, China’s motor
industry is certainly playing an outstanding role in it. China has become the
epicentre of the global motor industry, positioning itself as the world’s largest
motor vehicle producer and market since 2009. According to some analysts, 2009
is likely to be viewed as the year in which the baton of leadership in the global
auto industry passed from the Unites States to China (Perkowski, 2009). Recent
forecasts predict annual vehicles sales of 30 million in China by the end of this
decade; this would represent around 40% of the world’s total motor-vehicle sales
(Global Automotive Industry, 2012b). Practically every single global automaker
and parts producer has established production facilities in Chinese territory. China
is now becoming part of the global production networks of the major TNCs and
plays an important role in reshaping the industry’s global division of labour. In
addition, the Chinese motor industry has developed its own domestic firms and
brands, experiencing an increasing international presence. China’s government
has set a plan to triple the exports of vehicles and auto parts, reaching a value of
US$ 85 billion by 2015 (Haley, 2012).
2009 was a year of radical transformation of the global motor industry, marking
the end of an era. The 2008-2009 financial crisis, the ‘Great Recession’, severely
impacted the global motor industry (KPMG, 2008; UNCTAD, 2009; Sturgeon and
Van Biesebroeck, 2009; Haugh, et al., 2010). This event caused and accelerated
profound restructuring in the industry’s concentration of capital as well as in the
geography of production worldwide. Not only had the United States lost its
primacy as the world’s number one auto market to China but General Motors, one
of the U.S. economy’s icons and, - according to Peter Drucker (1972), the
company that had become the model for modern large–scale corporations across
the world -, was forced to file for bankruptcy only one year after having

23
commemorated its 100th anniversary. Paradoxically, it was China’s booming
motor market and the ties with Chinese auto partners that became Detroit’s
lifeline, helping the U.S. automakers to weather stagnant domestic sales caused by
the financial crisis.7 In November 2010, SAIC Motor Corporation, GM’s Chinese
partner, bought a US$ 500 million stake in GM’s initial public offering after the
bankruptcy (Automotive New Europe, 2010). Since 2010 China has become
GM’s biggest market worldwide, which has helped the U.S. company to recover
the crown as the world’s top-selling automaker in 2011. Toyota had dethroned
GM as the world’s biggest carmaker in 2008, a position the latter held for nearly
eighty years. For other U.S. firms, China’s motor industry also represented an
important way-out of the crisis. For Ford, for instance, China is playing an
increasingly significant role in its global strategy. In addition, in March 2010, the
Chinese firm Geely acquired Ford’s Volvo division in a US$ 1,800 million-
transaction, which helped the firm’s capitalisation.
For some observers, China’s growing participation in the global market means a
new round of predatory global competition in the auto industry (Becker, 2006). In
this view, China is seen as a ‘tsunami’, hitting motor vehicle markets around the
world (Baker, 2007) resulting in high unemployment in Central/Eastern Europe
and some Latin American countries, including Mexico (Lee and Anderson, 2006).
Other analysts have arrived at more cautious conclusions. Donnelly (2008), for
example, argues that it is obvious that China is well on its way to being an
extremely potent force in the global motor industry, but at present domestic
automakers are not yet adequately prepared to competitively penetrate the
developed countries’ markets. Before this happens, the author considers that the
Chinese auto industry needs to deal with serious technical and organizational
problems. Regarding the competitive pressures from the Chinese motor industry
on developing countries, Noble (2006) concluded that, up to present, the impact
has been modest and is unlikely to increase greatly in the short-to-medium term.
Interestingly, this author points out that the study of the motor industry suggests a
different and rather more bullish interpretation, particularly when it comes to
China. In his analysis, two important issues are highlighted. First, the trends in the
7 See the arguments of Fitz-Gerald (2009) in this regard.

24
car and auto parts sector present a startling contrast to developments in textiles
and electronics assembly, where Chinese firms have grabbed market share from
other developing countries and established a dominant position in the world
economy. The central argument is that industrial characteristics account for most
of the difference: the motor industry is far larger, and much of it is skilled-labour
and capital intensive. Second, the increasing concentration of China on compact
cars and commercial vehicles could significantly depress prices of those vehicles
in the developing countries to which they are initially being exported, with
consequences that are both positive (access to lower cost inputs for poor
households and small local businesses) and negative (heightened competition for
local firms, increasing congestion). The impact of even this mixed blessing,
however, is likely to be small.
This trend of China’s increasing participation in the world motor industry is
pushing global competition even further. Given the position and role played in the
global car industry, China’s ascendant phase is perceived in Mexico as a direct
threat not only in its domestic market, but in third markets, particularly in the
United States, as well as in the attraction of FDI. Despite the significance of the
motor industry in Mexico’s economy and the growing concern about China’s
competitive threat, up to now specific or comprehensive studies on the above
subjects have been non-existent or rather marginal. Most of the information has
been of anecdotal and press character. A few exceptions are a recent study by
Álvarez (2007) and Álvarez and García (2011), with an exploratory analysis of the
China-Mexico competition in the U.S. market; and the studies reported by Gachuz
(2009) and Dussel Peters (2012a), both analysing the prospects for China-Mexico
cooperation in this industry.
Nowadays, the existing studies on the subject are rather aggregated in sectoral and
geographical levels, with different time-frames and diverse analytical methods.
These characteristics have made it difficult to arrive at definitive conclusions. On
the one hand, some analysts argue that Mexico’s motor industry, in particular the
auto parts segment but also motor-vehicles, will become increasingly vulnerable
to Chinese competition in the short and medium terms. These arguments are based

25
on trends such as the increasing technological upgrading of Chinese automakers,
China’s great capacity for attracting FDI, its increasing internationalisation and
competition for efficiency-seeking FDI, which are affording Chinese firms great
potential to compete in global markets (Lall and Albaladejo, 2004; Dussel, 2005a,
2005b, 2012a and 2012b; Frischtak, 2004; Devlin, Estevadeordal and Rodríguez-
Clare, 2006; Phillips, 2007). On the other hand, in contrast to the above, another
group of analysts argue that auto parts have a strong competitive position, having
a solid foundation for a long-run presence in the region. The arguments are based
on the technological upgrading, best practice management skills, and constant
innovation and competition on the basis of product quality, which makes them
internationally competitive (Gerber and Carrillo, 2002); in addition, the
preferences of final assemblers are to maintain regional supply networks in order
to develop Just-in-Time relationships with their primary suppliers (Sargent and
Matthews, 2004, 2008a, 2008b and 2009). At a more general level, other analysts
consider that China represents a strategic opportunity for Mexico to diversify its
sources of FDI and technological upgrading in the automotive industry (Gachuz,
2009; Dussel Peters, 2012a).
Based on the aforementioned analysis, several pertinent factors justify a research
project on China’s global emergence and its implications for Mexico’s motor
industry:
a) Nowadays there is no specific, detailed and comprehensive study on the
motor industry’s complex interactions and impacts between China and
Mexico in a global perspective.
b) In both China and Mexico the motor sector represents a ‘key-pillar’
industry in their process of national economic development and
internationalisation strategies.
c) In comparative sectoral terms, the motor industry is substantively
different from others such as garments and electronics, in which Chinese
firms have established a dominant position at international level. Unlike

26
the latter, the former is a skilled-labour, capital intensive industry with
high technology segments, presenting – therefore - technical,
organisational and marketing specificities. In this sense, the motor industry
is at the frontier of China’s global competitive evolution.
d) Given the complexity, specificities and variability of processes and
effects of China’s global expansion and the ‘Asian Drivers’ phenomenon,
specialists have underlined the need for focusing on country and
sector/industry specific research (IDS Asian Drivers Team, 2006;
Kaplinsky, 2006; Jenkins, 2009; Lederman, Olarreaga and Perry,
2009).
e) On a more general level, historically the motor industry has played a
pivotal and revolutionary role in pioneering changes to the social
organisation, technologies and geographies of production (Hudson,
1994). Likewise, there is little systematic empirical work on the effects of
globalisation on the motor industry (Sturgeon and Florida, 2000).
1.6. Research Aims and Objectives
Based on the background analysis and the posing of the research problem, the
general objectives of the research project are as follows:
General Objective
• To understand the interactions, and assess the impacts, of China’s global
expansion on Mexico’s motor industry.
Particular Objectives
• To identify the different channels of interaction between China’s and
Mexico’s motor industries, especially in trade and investment flows and

27
patterns as well as other specific forms of connections linked to global
production networks.
• To analyse the impact of China’s emergence in the global market on
Mexico’s attraction of motor foreign direct investment.
• To perform an in-depth analysis of the structure and evolution of bilateral
trade in the motor industry, and undertake an evaluation of the impacts of
Chinese import penetration in Mexico’s domestic market.
• To carry out a detailed analysis of the competitive position of China’s
motor industry vis-à-vis Mexico in the U.S. market, assessing the degree
of the competitive threat and identifying the specific automotive
products/segments affected.
• To identify and provide a comprehensive account of the presence and
characteristics of Chinese motor industry-related operations in Mexico, in
particular those linked to China’s inward foreign direct investment,
technical-manufacturing and technological associations, as well as global
production networks.
• To provide some insights into the China-Mexico interaction in the
international motor industry within the broader globalisation process and
the changing division of labour.
Research Questions
The following general enquires are proposed to be answered:
• Does China represent a direct competitive threat to Mexico in the global
motor industry, a capital-intensive sector with high technology segments?
• Is it possible to simultaneously find competition and complementary
forces in the China-Mexico motor industry’s interaction?
International Market Integration and Global Investment Attraction
• To what extent is China competing with Mexico as a destination of global
motor investment?

28
• Is China substituting or diverting FDI flows from Mexico in the
automotive sector?
• If so, what production segments of the industry are most likely to be
affected?
China-Mexico Bilateral Trade and Domestic Market Competition
• What is the structure and evolution of the China-Mexico bilateral trade in
the motor industry?
• Does the bilateral trade present some type of specialisation or
complementary pattern between China and Mexico?
• Does the motor industry’s bilateral trade between China and Mexico
follow the same pattern as other manufactured sectors?
• What is the degree of competition and penetration in Mexico’s domestic
market of Chinese automotive products?
China-Mexico Competition in the U.S. Motor Market
• Is China a direct competitive threat to Mexico in the U.S. motor industry’s
market?
• What is the degree of China’s competitive threat in the U.S. market?
• In what particular products/segments of the motor value-chain does China
most strongly threaten Mexico?
• Do China and Mexico play a complementary role with particular
specialisations in the U.S. market?
Chinese Inward Foreign Investment and Global Production Networks
• How significant is China’s inward foreign investment in Mexico’s motor
industry at present?
• What are the main modes, drivers and motives of Chinese corporate
strategies in Mexico’s automotive industry?

29
• Are the Chinese automotive companies operating in Mexico displacing
domestic automotive firms?
China and Mexico in the Motor Industry’s Global Division of Labour
• Do China and Mexico currently play a specialised role in the global
division of labour?
1.7. Outline of the Thesis
The thesis is developed in nine chapters. The introductory section, Chapter One,
contextualises the research problem and presents the research justifications and
central objectives. Chapters Two and Three, respectively, set out the theoretical
framework and the research methodology. Chapter Four depicts the evolution and
recent trends in both China’s and Mexico’s motor industries and their positioning
in the sector’s global division of labour.
From Chapter Five to Chapter Eight, the core section of the research is set out,
presenting the empirical findings according to the different type of channel
interactions between China and Mexico in the motor industry. Chapter Five
presents the China-Mexico interaction in the context of international market
integration and global investment attraction. Chapter Six tackles the China-
Mexico bilateral trade relationship and domestic market competition. In Chapter
Seven, the third-markets interaction is addressed, focusing on China’s competitive
threat to Mexico in the U.S. motor market. Chapter Eight documents and analyses
the modalities and trends of automotive-related operations of Chinese firms in
Mexico, with special reference to FDI and the formation of global production
networks. Finally, in Chapter Nine the major findings and concluding remarks of
the research as a whole are presented. Some key implications for policy as well as
for further research are also depicted in this section.

30
2. CHAPTER TWO
THEORETICAL/CONCEPTUAL FRAMEWORK
“China’s rapid integration into the global economy...will initiate
transition to a new economic structure with changes in the division of
labour between regions, reorganisation of multinational firms, and new
alliances among companies (and countries) over the next decade.
All companies, workers, and governments have to find their new role if
they are to survive and prosper as the global map is redrawn” (Zeng and
Williamson, 2007: ix).
This chapter expounds the theoretical and conceptual framework and key
categories on which the study is based. An overview of recent and earlier
theoretical discussion regarding the globalisation process and its implications for
the nature of competition (among firms and countries), trade tendencies and the
changing global division of labour is depicted. Due to their significance in this
globalising context, in particular for emerging countries as new players in the
world economy, the topics of global production networks and global value chains
are also described and discussed.
Given the research topic and its dimensions, the study cannot be approached from
a single theoretical framework. In this sense, regarding the most appropriate
theoretical framework for understanding the “Asian Drivers” phenomenon, of
which China plays a central role, specialists underline that “….it is evident that
this will necessarily be interdisciplinary, multidisciplinary and contextual, for the
problems are too complex to be reduced to a single discipline, and the world is too
heterogeneous for a single theoretical framework” (IDS Asian Drivers Team,
2006: 8). In this research, emphasis will be given to the economic development
dimension of the process within a set of compatible theoretical categories.

31
As above sketched out, the research’s key conceptual categories are globalisation,
competition, cooperation, global division of labour, global production
networks/global value chains. The fundamentals rationale for using these
categories is as follows. First, The China-Mexico interaction has conventionally
been considered as a ‘competitive threat’ relationship or under a merely
‘competition’ framework. This leads to the need for discussing two important
approaches in the literature: a) Krugman’s (1994 and 1996) claim that countries
do not compete with each other the way corporations do, the ‘competitiveness
obsession of nations’; and b) the depiction about the increasing and
simultaneously appearance of competition and cooperation forms among firms
and nations under the ‘new economy’, process known as ‘co-opetition’ (Nalebuff
and Brandenburger, 1996). Second, the global division of labour is the broad
framework and dimension for a better understanding China’s re-emergence in the
world economy. Third, given the complex levels of technical, organisational,
policy intervention and manufacturing linkages in the motor industry worldwide,
the categories of global production networks and global value chains help to
explain these processes in a more comprehensive way.
2.1. Globalisation, Competition and Trade
Due to its transcendental impacts and transformations caused in the economy and
society, globalisation is, perhaps, the zeitgeist of the present age.8 Nevertheless,
there are not only different, but opposite views about the globalisation process.
The skeptics argue that globalisation is a myth relying on the accumulation of
isolated facts removed from context (Hirst and Thompson, 1999; Rugman, 2000).
Despite this anti-globalisation position, an almost generalised idea is the
following: it is the most transcendental force of change in restructuring the world
today (McGrew, 1992; Mittelman, 1995; Castells, 1996; Giddens, 2000; Ietto-
Gillies, 2002; Held and McGrew, 2003; Dicken, 2003).
8 Zeitgeist is originally a German expression that means “the spirit of the age”. It describes the intellectual and cultural climate of an era (Wikipedia: http://en.wikipedia.org/wiki/Zeistgeist).

32
Globalisation is a multidimensional process. Although the economic dimension of
this process has attracted more attention, it also comprises deep social, political,
technical, cultural, and institutional transformations. Spurred by technological
innovations, globalisation is considered a qualitative different stage in the
development of capitalism. Likewise, it is a complex, paradoxical and
heterogeneous phenomenon. As some analysts emphasise, globalisation is highly
uneven in its scope and highly differentiated in its consequences (McGrew, 1992);
and there is neither a single predetermined trajectory nor a fixed endpoint
(Dicken, 2003). McGrew (1992:3) sketches a comprehensive definition of
globalisation:
“Globalisation refers to the multiplicity of linkages and interconnections
between the states and societies which make up the modern world system. It
describes the process by which events, decisions, and activities in one part of
the world can come to have significant consequences for individuals and
communities in quite distant parts of the globe. Globalisation has two
distinct dimensions: scope (or stretching) and intensity (or deepening). On
the one hand, it defines a set of processes which embrace most of the globe
or which operate worldwide; the concept therefore has a spatial connotation.
Politics and other social activities are becoming stretched across the globe.
On the other hand it also implies the intensification in the levels of
interaction, interconnectedness or interdependence, between the states and
societies which constitute the world community. Accordingly, alongside the
stretching goes a deepening of global processes.”
In the economic dimension, globalisation means increasing international
integration of production and trade, creating new patterns of geographical
specialisation and global production networks (Castells, 1996; Harris, 1986; Ietto-
Gillies, 2002; Held and McGrew, 2003; Dicken, 2003; Kaplinsky, 2005). Taking
the competition issue, states and firms find themselves now in a new and more
complex scenario. Globalisation has induced the emergence of a new “competitive
era” (Petrella, 1996). As a consequence, the increasing and deepening process of
economic integration and interdependency is leading to the structural

33
transformation of firms and nations and the rivalry between states and the rivalry
between firms in the global arena has become far more intense (Stopford, et al.,
1991; Dunning, 2000).
Competition is the basis of growth under a capitalist market and as such, it is
continually pressing firms to restructure and relocate production; during slump
and stagnation these pressures upon particular sectors and firms become severe
(Harris, 1983). Despite the extraordinary growth of large transnational
corporations, which have led to the increasing centralisation of capital at global
scale, competition has not been reduced but increased by the advances of all forms
of organisation (Sayer and Walker, 1994). According to Dicken (2003: 200), two
features of competition in today’s world are: a) it is increasingly global in its
extent; and b) it is extremely volatile.
But, interestingly – and paradoxically -, this new scenario for firms and nations
also involves the opposite pole of competition: cooperation. This revolutionary
mindset has been called co-opetition (Nalebuff and Brandenburger, 1996). To
firms, this scenario has meant the creation of diverse forms of strategic alliances,
join-ventures, and other association arrangements. For nations, it meant the
establishment of economic unions, and free trade areas, among others.
2.1.1. Competition and Firms
Michael H. Best (1990) made the distinction between the “Old” and the “New
Competition”. According to Best, the “New Competition” is based upon different
production and organisational concepts led by business enterprises. The New
Competition is transcending the traditional Taylorist-Fordist legacy of mass
production, hierarchical, and rigid structure. To Best (1990: 251) “The old
competition is about Big Business, which means managerial hierarchy, scientific
management, and either vertical integration or ‘arm’s length’ market-oriented
supplier relations.”

34
Four dimensions distinguished the New Competition from the Old one (Ibid: 11):
a) organization of the firm; b) types of coordination across phases in the
production chain; c) organisation of the sector; and d) patterns of industrial policy.
A key feature in the New Competition is the need for strategic action within each
dimension.
In relation to the organisation of the firm, Best (1990) introduces the idea of the
Collective Entrepreneur. He argues that the entrepreneurial firm, as distinct from
the hierarchical firm of Chandler and Oliver Williamson, builds on the idea of
Schumpeterian competition. In this regard, one of the key features of the
entrepreneurial firm is its strategic orientation (Ibid: 11): a strategically oriented
firm chooses the terrain on which to compete; a hierarchical firm takes the terrain
as given. Thus, the entrepreneurial firm does not seek to maximise profits simply
by minimising costs but seeks strategic advantage on the basis of Schumpeterian
innovation in product, process or organisation. Another key feature is its
flexibility in the organisation of production. This is a fundamental condition to be
able to adjust a firm’s competitive strategy depending upon the strengths and
weakness of its competitors at any point in time. Also, the increasing volatility of
the business environment has led firms to a search for more flexible forms of
organisation (Buckley, 2000).
Regarding coordination in the production chain, Best (1990: 14-15) uses the
concept of Consultative Coordination. Under this structure, the organisation links
micro production units into large production chains. As a result, in the New
Competition inter-firm coordination transcends the traditional market dichotomy,
comprising consultative coordination or cooperation amongst mutually
interdependent companies each of which specialises in distinct phases of the same
production chain. On a larger scale, global value chains and global production
networks are developed.
In terms of sectoral coordination, the New Competition includes “a variety of
inter-firm practices and extra-firm agencies such as trade associations,
apprenticeship programmes, labour education facilities, joint marketing

35
arrangements, and regulatory commissions, each of which facilitates inter-firm
cooperation” (Ibid: 17). This leads to simultaneous forms of Competition and
Cooperation, providing common services and shaping complementary investment
strategies. According to Best, what distinguishes the New Competition from the
Old Competition is not an awareness of the paradox of competition – the market
imperfectness – but the institutional capacity to turn the paradox to advantage.
Finally, in relation to the patterns of industrial policy, Best (1990: 19) argues that
combining competition and cooperation amongst firms has wide implications for
public policy: “It suggests that the task of industrial (including antitrust) policy is
not to establish an ideal as defined by the neoclassical theory of perfect
competition but to administer the paradox: cooperation alone can ensure that
commitments are made to the long-term infrastructural development of a sector;
competition alone can ensure that business enterprises remain innovative and
responsive to new challenges and opportunities”.
An interesting issue raised by the New Competition approach is about the
relevance of the firm’s size. According to this view, it is misleading to define the
New Competition in terms of the size of the firm being necessary to understand
the distinctions between intra- and inter-firm relations. In this sense, the common
element to both large and small firms is networking.
On the one hand, the global corporation, as an organisational form, is a response
to the New Competition (Best, 1990). But – the author argues – the new set of
organisation imperatives limit what a division or wholly owned subsidiary can
competitively produce abroad. The resolution of these contradictory features (the
limits to expansion by direct production and ownership in other markets and the
strategic need to be in an insider position in each of these markets) is altering the
form of foreign investment. This has led to the development of global networking
in the form of international consortia, cross-licensing agreements, and joint-
ventures.

36
On the other hand, regarding small firms, Best (1990: 257) argues that the New
Competition has opened new possibilities for them to be internationally
competitive. This is particularly feasible when some conditions have competitive
force, such as design or product-led strategies, closeness to the customer,
consultative parent-supplier relations, and inter-firm networks which foster
enterprise specialisation.
2.1.2. Competition and Nations
From the perspective of nations, it is also recognised that globalisation has
changed the nature of competition (Boyer and Drache, 1996; Drache, 1996;
Petrella, 1996; Scott, 1998; Stopford et al., 1991; Vietor, 2007). Some of the
resulting key trends are the following: a) states are now competing more for the
means to create wealth within their territory than for power over more territory,
reflected in an increasing concern from governments towards national
competitiveness. Nations compete for the attraction of capital, technology and
access to new markets; b) the emergence of new forms of global competition
amongst firms also affects how states compete for wealth; c) in this competitive
environment, governments provide distinctive advantages to firms; d)
globalisation is eroding one of the basic foundations of the nation-state, the
national market, which is being replaced by a global market; e) the new global
order exposes more countries than ever to the global business, rendering its
‘sovereignty’ more fragile than ever; f) the emergence of a number of developing
countries as global competitors; g) the increasing globalisation of production and
trade has led to increasing integration of nations in both functional (de facto) and
formal (de jure) forms; and h) the changing geopolitics of production, competition
and regional interdependence is creating a new geography of economic and
political relationships, squeezing the nation-state between two forces:
supranational and local-regional. It is worth pointing out, however, that while
these tendencies and forces do not mean the “end of the nation-state” – as posed
by Kenichi Ohmae (1995), for example - they do have relevant impacts on its
structure and its role in the economy.

37
Some analysts argue that globalisation is levelling the playing field for
competition worldwide, allowing more people, firms and countries to participate
and interconnect in the global economy (Friedman, 2005). According to this
author, globalisation, levered by the technological revolution, is shrinking and
flattening the world.
In terms of the sources of national competitiveness, it has also been argued that
the globalisation process and the increasing mobility and transnationality of
companies’ operations have made inadequate the traditional trade theories of
comparative advantages (Ietto-Gillies, 2002; Venables, 1998; Drache, 1996). The
central arguments for this are: a) firms are less dependent than ever on the
endowment factors in their home nation; b) trade liberalisation and technical
progress are making activity increasingly mobile, enabling firms to split their
production between locations and making it easier for them to supply distant
consumers; and c) in a world dominated by transnational corporations, the
aggregate advantages of domestically based firms does not necessarily coincide
with the advantages of the nation-state.
Based upon the classical Ricardian theory of comparative advantage, and
assuming that countries differ in their factor endowments, the Heckscher-Ohlin
model (H-O) states that each country will export those goods whose production is
relatively intense in the country’s abundant factor and import those that are
intensive in the factors it lacks. Other basic assumptions of the model are no scale
economies, full access to technology, perfect competition, international factor
immobility, no artificial barriers to trade, etc. (Berry, et al., 1993; Lall, 1998).
According to this model, trade among countries would result in an increased
international specialisation of production.
To some analysts, the empirical evidence raises serious doubts that factor
endowments model, as expressed by the H-O theorem, is a sufficient explanation
for trade and consider it not only incomplete but also too static (Berry, et al.,
1993). Likewise, other tendencies, some of them associated to recent changes in
the world economy, pose additional questions to this model (Venables, 1998: 2):

38
a) a striking feature of the spread of industry to the developing world is its
geographical concentration; and b) the Heckscher-Ohlin theory is, unsurprisingly,
not good at explaining the location of industry across areas where factor
endowments are broadly similar (as much of Western Europe) or within which
factors of production are highly mobile (the USA).
Regarding the particular case of the manufacturing exports’ pattern by developing
countries, Lall (1998: 55) points out some weaknesses of the H-O explanatory
model: a) growing exports by developing countries of complex industrial
products; b) the enormous concentration of export activity in the developing
world, with a few countries dominating both simple and complex manufactured
exports; and c) large, often increasing differences in the ‘technology content’ of
exports. The model neglects critical factors such as learning, increasing returns,
externalities, linkages and cumulative effects. Lall concludes that emerging trade
and location patterns in the developing world are explained by market
imperfections and government policies to overcome them.
During the last two decades, alternative models such as the so-called ‘New Trade
Theory’ and ‘New Economic Geography’ (or Geographical Economics) have been
developed to explain trade and location. These models introduce new categories
such as scale economies, imperfect competition, transportation costs, and
agglomeration externalities, amongst others (Krugman, 1993 and 1996; Venables,
1998; Fujita, Krugman and Venables, 1999). The New Trade Theory gave
emphasis to develop formal mathematical models of trade in the presence of
increasing returns and imperfect competition. Paradoxically, this theory also gives
importance to historical factors. It is argued that a pattern of specialisation can be
established as a result of accident or some initial difference in countries’
resources, and then get locked in by the cumulative advantages that go with large
scale (Krugman, 1993).
When talking about forces affecting geographical concentration, Krugman (1998)
emphasises the existence of ‘centripetal’ forces – those promoting geographical
concentration – and ‘centrifugal’ forces –those leading geographical dispersion.

39
Linkages (market-size effects), thick labour markets and pure external economies
are ‘centripetal’ forces, while immobile factors, land rents and pure external
diseconomies are ‘centrifugal’ forces. In this model, cumulative causation and
spatial agglomeration are key elements. Thus, one of the major implications is that
the spread of industry will be geographically concentrated, tending to spread to
just a few countries at once.
An interesting conclusion is drawn from this theory regarding a nation’s cycle of
development. The model predicts that industrialisation will take the form of
sequential and rapid industrialisation by countries in turn, as industry spreads
from its initial location to new ones. Economic growth does not take the form of
smooth convergence of all countries in the world economy, but there are groups of
countries with different development levels. When considering multiple industries
that vary in their characteristics, Fujita, Krugman and Venables (1999) argue that
countries typically develop through the production of certain goods, then move
“upscale” as they cede those sectors to the nations that come after. This process of
international economic development has been called the ‘flying geese’ pattern
(Fujita, 2007). This conclusion is similar to the ‘stages’ approach to comparative
advantage developed by Balassa (1983) in the early 1980s. According to this
approach, the structure of exports changes with the accumulation of physical and
human capital moving up the ‘ladder of development’. With countries progressing
on the comparative advantage scale, their exports can supplant the exports of
countries that graduate to a higher level. Interestingly, Fujita (2007) has argued
that the ‘flying geese’ process of economic development in East Asia that started
in the early 1960s, since the mid-1990s East Asia’s economies as a whole started
being transferred from the previous monopolar system (dominated by Japan) to a
multi-cored system.
But Krugman’s theoretical propositions have not been immune to criticism. In
particular, some analysts consider that the New Economic Geography “is neither
new, nor is it geography” (Martin, 1999: 65). Others have criticised this approach
from the modelling foundations used to explain reality (Sayer, 2004). From the
perspective of the New Trade Theory, Ietto-Gillies (2002: 148-153) points out the

40
existence of tensions and contradictions in the new paradigm. Two examples of
these are: a) the main element of tension has to do with the contradiction between
theories that predict clusters and agglomeration and the reality of multinational
corporations that spread their activities wide; and b) some of the contradictions
and problems are due to the fact that a theory, which is basically rooted into
geography and space, is being fitted into a framework related to nations and
different regulatory regimes.
Ietto-Gillies (2002: 154-157) concludes that the real world seems to exhibit a
lower degree of agglomeration than the one predicted by the new trade theories.
This conclusion is based on transnational corporations’ advantages of operating
across different regulatory regimes and the ability to exploit the differences across
nation-states. This situation may affect the location structure of economic activity
as well as its agglomeration pattern. Finally, another conclusion is that “the forces
leading to multinationality cannot – or not fully – be assimilated into centripetal
and centrifugal forces and core-periphery because they favour the spread across
different regulatory regimes and thus different nations-states” (Ibid: 157).
Regarding Krugman’s (1994 and 1996) polemic proposition about the senseless
idea of the competitiveness of nations, Ietto-Gillies (Ibid) poses that, although she
does not agree with the notion that international trade is a zero-sum game for
nation-states, it is relevant to have a clear demarcation between competitive
advantages of companies and comparative advantages of nations. This argument is
based on the effects arising from the non coincidence between ownership and
territoriality of the internationalisation via transnational corporations (TNCs), as
compared to uninational corporations (UNCs). Thus – the author emphasises -, in
a world of UNCs the geographical scope of competitive and comparative
advantage coincide since companies’ competitive advantages are forged in the
same territorial context as the nations’ comparative advantage. On the other hand,
in a world of TNCs firms forge their competitive advantages on the basis of cross-
country activities, rather than just having activities in a single country. This leads
Ietto Gilles (2002: 180) to the conclusion that it has become increasingly more
problematic to analyse international trade on the basis of: (a) location bound and

41
static advantages; and (b) models that do not take account of the multi- and
transnationality of operations of companies.
In a kind of intermediate position, other observers agree with Krugman’s claim
that countries do not compete with each other the way corporations do and also
that, under certain circumstances, trade is a positive-sum game. Nevertheless, it is
considered that his general conclusions are “false and misleading” (Siebert, 2006:
137). Siebert’s main argument is Krugman’s neglect of the phenomenon of
international mobility of factors of production, in particular capital, technology
and highly-skilled labour. According to Siebert (2006), the increasing
international availability of these production factors influences the productivity of
the immobile domestic factors of production. As a consequence – he argues -, in
order to increase their factor endowment and rise their productivity of their
immobile domestic factors, countries compete internationally for the mobile
factors of production. This is in contrast to traditional trade theories where factor
endowments are treated as given and where their differences are only exploited.
Thus, for this author locational competition is an important concept to explain the
international division of labour. In essence, “it refers to the competitiveness of a
location in its capacity to attract within its borders mobile factors of production or
to hold on to them” (Siebert, 2006: 138). An important conclusion of this analyst
is that increased factor mobility reduces the government’s capacity to manoeuvre.
This poses relevant implications in terms of policy intervention’s effectiveness.
In a similar line of discussion, Lall and Weiss (2005) argue that given current
competitive global conditions (existence of scale economies, technological gaps,
externalities and agglomeration effects, endogenous technical change, immobile
factors domestically and mobile ones abroad, large firms with market power, etc.),
the “competitive threat” of nations exists. Specifically, they underline that (Ibid:
4) “there remain benefits from specialisation and trade remains a non-zero sum
game, but the realisation of the benefits depends on the ability to each economy
to create (or attract) competitive capabilities and to move into activities that offer
the best opportunities for growth, technological development and beneficial
spillovers”.
42
2.2. The Global Division of Labour
To some specialists, perhaps the most extraordinary and impressive feature of
modern economies compared to old is their remarkable division of labour (Sayer,
1995). In this regard, Sayer (Ibid: 55) stated that “capitalism has an advanced
division of labour in which specialization, fragmentation, interdependence and
internationalisation have been taken to unprecedented extremes”. Thus, the highly
complex kaleidoscopic structure emerged from the global division of labour
(Dicken, 2003) has corroborated the inadequacy of traditional concepts or
categories for analysing the contemporary world economic geography such as
core-semiperiphery-periphery, North-South, Industrialised-Semiindustrialised, etc.
(Mittelman, 1995; Castells, 1996; Hoeschele, 2002). For some analysts, the
increasing participation and integration of newly industrialising countries into the
global economy meant the ‘end of the Third World’ (Harris, 1986).
In the theoretical field, however, established approaches of economic
development and international trade have not been of much help in explaining or
anticipating recent global shift in the dispersal of manufacturing capacity from
developed to developing countries, for example (Schaeffer and Mack, 1997). As a
consequence, these theories are being questioned and revised, and new theories
are being constructed and proposed. Several analysts agree that the theoretical
perspective of the division of labour is a central concept in social and economic
thought, it provides an axis for analysing the complexity of contemporary
industrial economy, and it supplies a valuable tool for examining the geography of
capitalism as well as the opportunities and challenges of the globalisation process
(Sayer and Walker, 1994; Mittelman, 1994 and 1995; Garnsey, 1981).
Nevertheless, the division of labour is one of the most neglected categories in
contemporary political economy and social theory, being used rather as a
secondary analytical element (Sayer and Walker, 1994).
But, as in other theoretical fields, the category division of labour presents
problems of conceptualisation and ambiguity (Sayer, 1995), differences of
interpretations and its implications (Jenkins, 1984) as well as epistemological

43
discrepancies in the analysis (Garnsey, 1981). It is acknowledged that the concept
of division of labour has its origins in the work of Adam Smith at the end of the
eighteen century (Smith, 1976). By using the example of a pin-making factory,
Smith stated that division of labour, which arises from a propensity of human
nature to exchange, is the great cause of its increased powers. This process of task
specialisation, rather than having each individual worker perform all the steps
required for the manufacture of the product, meant enormous increases in
efficiency, productivity and health. The increasing productivity has the following
sources (Scott, 2006: 3): the simplification of tasks to be carried out, the
reductions in work set-up times, and the improvements in the capacity of
managers to supervise and control the pace of work. In addition, in a more long-
run perspective, the division of labour also helps to promote mechanisation and
automation of the production process (Ibid).
In its most basic conception, “division of labour refers to situations in which
individuals undertake different specialised type of work and hence become
dependent on one another” (Sayer, 1995: 44). Although there are a variety of
divisions of labour (between firms, between mental and manual workers, based on
gender or age, etc.), in terms of the purpose of this study it is important to identify
three of them, following the works of Massey (1984), Sayer (1995), Coffey
(1996), Morgan and Sayer (1998), and Scott (2006): technical, social, and spatial.
The technical division of labour involves the fragmentation and specialisation of
work tasks within the individual firm or unit of production; this division of labour
is planned and controlled by the owner. The social division of labour involves the
fragmentation and specialisation of work tasks between different firms; in a
general sense, it refers to the specialisation of functions performed by individuals
in society (factory worker, teacher, etc.). The spatial division of labour – in a
broad sense – implies the specialisation of production by geographic areas, and
manifests itself at various spatial scales. The spatial or territorial division of
labour may combine the technical and social divisions of labour. In this regard,
Morgan and Sayer (1998: 33) make two appreciations: a) the hierarchical spatial
division corresponds roughly to the technical division, where regions are
characterised by their different roles within corporate technical divisions; and b)
44
sectoral spatial division of labour corresponds to a situation in which regions are
distinguished primarily by their role in different parts of the social division of
labour.
Precisely, when the conception of the spatial division of labour at international
scale is applied, with its resulting national specialisation and trade patterns, the
notion of international division of labour arises. This has been particularly
associated with the work of David Ricardo. In the early nineteen century Ricardo
extended and gave a spatial connotation to Smith’s notion of division of labour
through the development of his classical theory of international trade based on the
countries’ comparative advantage. However, as the process of the world economy
evolved during the last two centuries, the theoretical foundations, the functional
characteristics, the geographical scope, and the developmental implications of the
classical theory of international trade, among other aspects, came under severe
examination. To a great extent, this circumstance has been induced by the
increasing process of worldwide international integration and the most recent
phenomenon of globalisation. As Sayer (1995: 55) observes, capitalism itself has
been responsible for accelerating, deepening and extending the division of labour
far beyond anything previously experienced.
Up to the present, by reviewing the different classifications regarding international
divisions of labour, a typology of four different international divisions of labour
can be depicted by using an historical perspective. Major contributions came from
Walton (1985), Henderson (1989), Coffey (1996), Mittelman (1995), Dicken
(2003), and Scott (2006). The typology is discussed in the following paragraphs.
Pre-Classical International Division of Labour
The first type is called Pre-Classical International Division of Labour (PCIDL).
This phase dates back to the early period of European colonisation. Colonial
regions were incorporated as new material suppliers and consumes for the
economies of industrialising European states. In particular, this division of labour
was characterised by the extraction of raw material and primary products (mainly
minerals and agricultural produce) from the “periphery” often by the forcible

45
application of labour (i.e. slavery). Besides being the centre of mercantile and
military control over the entire system, the “core” units themselves engaged in
primary and petty-commodity production, and traded largely with other “core”
units. According to Walton (1985: 3), in a primitive way, this international
division of labour – also called “Pre-Traditonal” - was geographical and
functional, down to the dismantling of rustic manufacture in the colonies and the
imposition of expensive finished goods from Europe.
Classical International Division of Labour
The second type, the Classical International Division of Labour (CIDL), which
characterised most of the nineteenth century and the first half of the twentieth
century, observed the expansion of industrial production in the “core” and of
asymmetric flows of manufactured and resource commodities between core and
periphery; the latter continued specialising in primary products. In this second
type, whose high point coincided with the phase of ‘classical’ imperialism, the
extraction of surplus from the periphery was largely via the sphere of circulation
(Henderson, 1989). From a political-economic perspective, the CIDL – also
labelled “Traditional International Division of Labour - and the consequent
pattern of exchange between core and periphery largely involved western
European and later, North American colonialist states and their current or former
colonies (Coffey, 1996). According to international trade theory, this CIDL and its
related trade flows, was the result of the respective ‘comparative advantage’ of the
nations involved (Ibid, 1996). Thus, the bulk of world trade in this phase was
shaped in substantive terms by the geographical distribution of Ricardian
endowments (Scott, 2006). This theory also emphasises the beneficial effects of
this specialisation pattern for the trading nations.
By the 1930s, this second type of international division of labour involved a
process of industrialisation within the periphery (the underdeveloped countries)
under the impulse of a national capitalist class, foreign enterprise or the
association of both (Walton, 1985). The logic of this was to capture and develop
the local market for manufactured goods and, later, to implement the strategy of
import substitution. In fact, the CIDL started to recede as colonialism crumbled

46
and a group of Third World countries politically more independent appeared in
the world arena after the Second World War (Scott, 2006). By then, a wave of
severe critiques of the theoretical foundations of the CIDL began to be displayed
by distinguished academics, specialists and policy-makers. Among these, Singer
and Prebisch stand out, arguing that the terms of international trade between
manufacturers and primary products were necessarily unequal as a consequence of
the contrasting effects of technical progress in the North (the rich countries) and
the South (the poor countries). The analysis and discussions assembled by these
personages evolved into an elaborate and politically militant theory of dependency
and unequal development (Ibid). According to Walton (1985), the CIDL was less
geographical and more functional than the previous one, with the advanced
countries still providing a large share of capital goods and competitively or
through joint ventures seeking for the consumer market of the periphery.
The New International Division of Labour
The third type, The New International Division of Labour (NIDL), emerged with
its characteristic features during the mid-1960s. This new phase in the
international division of labour is characterised by an increasing process of
internationalisation of productive capital. Foreign direct manufacturing
investment not only increases in the core economies themselves, but it also flew in
a significant scale from the core to the periphery. This trend of increasing
industrialisation of “Third World” countries in which export platforms to
developed countries were established, led to the emergence of the so-called
“Newly Industrialising Countries” (NICs), including Hong Kong, Taiwan,
Singapore, South Korea, and India in Asia, as well as Brazil and Mexico in Latin
America. Because of these evolving trends, this group of “advanced” Third World
countries was labelled the “semi-periphery” of the world economy. In addition,
the wave of export-led industrialisation in the periphery was associated with a
simultaneous closure of domestic manufacturing facilities in the core economies
(‘deindustrialisation’). In general terms, the NIDL advocates sought to explain the
shift of manufacturing from developed to developing countries with fragmentation
of production and the transfer of low-skill jobs, while the bulk of R&D activities
was retained at the core areas of capitalism (Mittelman, 1995). A relevant role in
47
this process was given to the transnational corporations through the expansion of
branch plants operations and international subcontracting activities. The
exploitation of cheap labour force in Third World countries – it was argued – was
one of the driving forces behind the strategies of transnational corporations.
Among the major exponents of the theory of the NIDL are the German scholars
Fröbel, Heinrichs, and Kreye (1981). In essence, by new international division of
labour, considered a qualitative new development in the world economy, they
meant the tendency which (Fröbel et al., 1981: 45): a) undermines the traditional
bisection of the world into a few industrialised countries on the one hand, and a
great majority of developing countries integrated into the world economy solely as
raw material producers on the other; and b) compels the increasing subdivision of
manufacturing process into a number of partial operations at different industrial
sites throughout the world. Other characteristics of the NIDL were: a) the export-
oriented industrialisation process in developing countries was not only highly
dependent on foreign companies but also extremely fragmented; b) the world
market factories were industrial enclaves with no connection to the local economy
except for their utilisation of extremely cheap labour and occasionally some local
inputs; c) the pool of labour force of this factories was basically unskilled; and d)
there was no technology transfer. From the perspective of the process of
valorisation and accumulation of capital, three preconditions were considered
decisive for this new development (Ibid: 34-35): a) the development of a world-
wide reservoir of potential labour-power; b) the development and refinement of
technology and job organisation made it possible to decompose complex
production processes into elementary units such that even unskilled labour could
be easily trained in quite a short period of time to carry out these rudimentary
operations; and c) the development of a technology (in transport and
communications) rendered industrial location and the management of production
itself largely independent of geographical distance. Finally, to this line of thought,
the perspectives and implications of the NIDL for development worldwide were
rather pessimistic. They conclude that the implications were structural
unemployment in developed countries, on the one hand, and continued and

48
deepening underdevelopment in Third World countries, on the other. Increasing
dependence and uneven development were foreseen.
In the same way as the NIDL theory attracted much attention among scholars and
was considered a better explanation of the phases of capitalist development at that
time, it was also the target of severe criticisms during the following years. Robin
Cohen (1988: 227) underlines three limitations and omissions in the NIDL
approach. First, conceptual problems, arguing that the variety of meanings
attaching to the phrase ‘division of labour’ makes it difficult to understand what
precise phenomena are under investigation. Second, historical gaps, maintaining
that NIDL theorists have ignored or misconceived the historical evolution and
successive phases of the international division of labour. And third, empirical
omissions, observing that NIDL theory tends to concentrate attention exclusively
on the growth of the manufacturing sector in the periphery at the expense of other
growth points in the global economy, which are better reflected by measuring
movements of labour, rather than movements of capital. Considering that
historical patterns established by prior international divisions of labour are so
much part of contemporary reality, Cohen asserts that the distinction between the
“new” and “old” international division of labour is not a very useful one. Based on
this clarification, he proposed to use the expression “the Changing International
Division of Labour”. 9
The NIDL thesis attracted great attention from the different Marxist perspectives:
the dependency school, world-systems analysis, and the internationalisation of
capital. In this regard, Jenkins (1984) made an excellent contribution by
discussing the divisions over the NIDL within the Marxist perspectives.
According to Jenkins (Ibid: 28-29), interpretations of the NIDL can be divided
into three broad groups: a) those which emphasise the sphere of exchange or
circulation; b) those which focus the sphere of production; and c) those which are
9 Based on the form of capital hegemonic in each phase of the changing international division of labour, Cohen (1988) identifies four sequential phases: the mercantile, industrial, imperial and transnational. He points out that while clear differences exist between each period in the form of labour deployed, there is also a sense of historical continuity rather than rupture.

49
based on an analysis of the circuits of capital in the internationalisation of capital.
Each of these interpretations has different implications for the NIDL.
The interpretation emphasising the sphere of circulation is represented by two
converging views: the one focusing on the changes in the world market for labour
and for production sites as the determining factor in bringing about the NIDL
(Neo-Smithian view); and the one arguing that the NIDL is a consequence of a
fall in the rate of profit in the developed countries which leads capital to relocate
to areas in which wages are lower and the working class weaker (Neo-Ricardian
view). Among the main implications of this approach, is that this NIDL merely
reinforces the Third World’s dependent integration into the world economy.
Simultaneously, it is argued that the NIDL has also negative consequences in the
core areas such as unemployment and crises. The implications of the production-
oriented approach are quite in contrast compared to the circulation-oriented
approach: the spread of capitalism is reducing the dependence of the Third World
on the developed countries; and that the NIDL represents not only a change in the
form of subordinate integration of the Third World into the world economy, but
rather a major change in substance. A central argument in Jenkins’ (1984: 40)
analysis is that neither an exchange-oriented approach nor an exclusive emphasis
on the productive side provides an adequate basis for a Marxist examination of the
NIDL. He suggests that Marx’s analysis of the internationalisation of capital and
its circuits represents a more theoretical foundation since it emphasises the unity
of production, distribution and exchange. A key implication for the NIDL from an
ontological and methodological point of views is posed by Jenkins (1984: 46):
“….there is no single emerging pattern which characterises the integration of
Third World countries into the international division of labour. It is possible to
identify different patterns both between and within branches and between and
within countries”.
No less severe turned out to be the limitations of the NIDL approach observed by
Henderson (1989), derived from a study of the semiconductor industry. By
associating the NIDL theory with the dependency paradigm, Henderson

50
underlined some key characteristics of it: un-dialectical, ahistoric, and fatalistic.10
It is un-dialectical because it assumed that all the key decisions were taken by the
owners of corporate capital in the ‘centre’, which looked inadequate; and it is
ahistoric and fatalistic, because it assumed that the early phases of the NIDL
would continue to be permanent and typical features of centre-periphery
relationships. In particular, Henderson (1989: 20-23) notices the following
limitations: a) the analysis suffers, like much neo-Marxist development theory,
from the fact that it posits a capital-logic approach to uneven development. As a
result, its work tends to replicate the theoretical error of devaluing the role of
nation-states, classes, and other social forces in the development trajectories of
particular countries; b) its implied notion of ‘determination’ since it appears to
operate with a mechanistic and discredited concept of the ‘superstructure-as-a-
reflection-of-the-base’ variety spun at the global level; c) its insufficient
sensitivity to the empirical specificities of ‘development’ (a tendency to
undervalue the impact and development of production facilities by particular
industrial branches or firms in specific territorial units; and d) by failing to focus
on the history of productive operations of particular firms and industrial branches
in particular locations, it misses the fact that rather than being one international
division of labour, a number of related spatial divisions of labour may be
emerging within certain industrial branches. By the end of the 1980s, Henderson
concluded that the historical details of the globalisation process posed serious
explanatory problems for the NIDL thesis. As the world economy has continued
to evolve – he added -, it was being rendered obsolete by history.
Despite the salient contributions of the NIDL theory for the understanding of
earlier phases of the internationalisation of capital, by the end of the 1980s and the
beginning of the 1990s, an increasing number of factors related to the changing
character and deepening of the globalisation process, announced a transformation
beyond the NIDL.
10 As pointed out by Peter Worsley in the foreword of Jeffrey Henderson’s book (1989).

51
Global Division of Labour
The fourth type, the Global Division of Labour (GDL), is the most recent
manifestation of the analysed phenomenon and is still much in flux. Although
there is no unique, consensual or refined definition of what constitutes the GDL, a
number of new trends lead to the conviction that the essence of the NIDL is been
superseded. For instance, according to Dicken (2003: 9) a new GDL implies “a
highly complex, kaleidoscopic structure involving the fragmentation of many
production processes and their geographical relocation on a global scale in ways
that slice through national boundaries”. This newer phase of the IDL’s emphasis
on the complexity and constantly changing functional and territorial patterns
seems to be some of the key features of the GDL. These characteristics are also
underlined by Castells (1996) by arguing the emergence of a global economy of
“variable geometry” which tends to dissolve the historical economic geography.
As he argued, the global economy is deeply asymmetric, but not in the simplistic
form of a centre, semi-periphery and periphery, or North and South. To Castells,
these trends are leading to new patterns of IDL. At the core of this transformation
is the emergence of the so-called informational or knowledge-based economy and
the network society. The global economy has the capacity to function as a single
unit in real time at universal scale (Ibid).
In fact, the ascendancy of the “new economy” is considered one of the most
relevant components driving forward new directions in the international division
of labour (Scott, 2006). Scott observes that an essential characteristic of this
emerging system is that it is made up of dense localised intra-cluster divisions of
labour embedded in widely extended inter-cluster interrelationships at global
scale. The outcome is an expanding mosaic of interrelated regional economies at
various levels of scale and development (Ibid: 43). This conclusion is supported
by other analysts of the changing IDL. Mittelman (1995: 274), for instance, argues
that “the GDL involves the restructuring among world regions including their
constituent units, notably states and export networks. This approach focuses on
the interpenetration of global processes, regional dynamics and local conditions”.
In his formulations, Mittelman notes major aspects of an integrated and yet

52
disintegrating world order, today marked by the persistence of the nation-state
system and a challenge from different types of non-state actors.
Some analysts consider the fourth phase of the IDL rather as an extension of the
third one (NIDL) and not as a clear break with it. This is the case of Coffey
(1996), for whom this new phase uses the terms “New NIDL” or “NEWER-IDL”.
Coffey (1996: 43) identifies four more recent processes that have begun to take on
increasing significance, overlaying but not necessarily displacing – he argues -,
the original dimensions of the NIDL: a) firms from developed countries have
increasingly begun to exploit the comparative advantages of less developed
countries without needing to resort to foreign direct investment (through
subcontracting activities, for example); b) an increasing share of the activities
relocated from the core to peripheral or semi-peripheral economies involves the
provision of services rather than the manufacturing of goods; c) some of the less
developed countries that were amongst the original destination for foreign direct
investment by core nations have developed to the point that their own firms have
begun to engage in outward foreign direct investment channelled towards
countries that are even less advanced; and d) an increasing level of outward
foreign direct investment by firms in advanced nations is destined for other core
economies. An interesting conclusion of Coffey is in relation to the role and
power of multinational companies. He points out that, in contrast to the past
where multinational corporations largely regulated the IDL, in the “NEWER-
IDL”, although it still playing a key role, the IDL is the outcome of complex
interactions between the competitive strategies of multinational companies and the
economic and trade policies of national governments.
Other increasingly distinctive characteristics of the GDL are the following: a) a
growing number of regions in developing countries not only carry out capital-
intensive and high-technology manufacturing operations, but they also perform
R&D activities; and b) emphasis have changed from the overwhelmingly role of
the transnational corporation during the NIDL phase, to the organisation in global
networks of production and global value chains amongst large companies and
small firms.

53
2.3 Global Production Networks and Global Value Chains
Global Production Networks and Global Value Chains can be considered
complementary conceptual and analytical categories to those of Competition,
Trade and International Division of Labour when analysing the roles of industries,
firms and nations in a dynamic and changing global economy. Based on the
analysis of recent trends in the international division of labour and industrial
organisation, networking seems to be amongst the key characteristics. The rise of
the ‘network society’ (Castells, 1996) and the emergence of the ‘virtual
corporation’ (Davidow and Malone, 1993) are a few examples of this trend. In
analytical terms, networks are considered the foundational unit of study for the
understanding of the global economy and the resulting new geographical patterns,
rather than individuals, companies or nation-states (Dicken, et. al., 2001; Dicken,
2003). A concise concept of network is “the processes connecting ‘actors ’or
‘agents’ (firms, states, individuals, social groups, etc.) into relational structures at
different organisational and geographical scales” (Dicken, 2003: 14).
The intensification of the processes of globalisation and competition have played
a relevant role in the conformation and increasing complexity of international
production networks (Sturgeon, 2001; Henderson, 2002; Ernst and Kim, 2002).
Two key categories relevant to this study arise from these tendencies: Global
Production Networks (GPN) and Global Value Chains (GVCs). It is worth noting
that there is a great diversity and overlapping definitions of the concepts of value
chains and production networks (Gereffi, et al., 2001; Henderson, et al., 2002;
Hess and Wai-Chung, 2006; Kaplinski and Morris, 2001), so only some of the
most relevant to the study will be reviewed here. Although both concepts have a
lot in common, Sturgeon (2001: 10) makes a very important distinction: “… a
chain maps the vertical sequence of events leading to the delivery, consumption
and maintenance of goods and services…while a network highlights the nature
and extent of the inter-firm relationships that bind sets of firms into larger
economic groups”.

54
According to some analysts, the GPN framework derives from a variety of
approaches linked to value chain analysis (Hess and Wai-Chung, 2006). Among
some of the most influential historical precursors are the value chain framework in
strategic management, the actor-network analysis, and the global
commodity/value chain framework. The latter approach, in particular the global
value chain developed since the mid-1990s, has a great deal of affinity and
complementary with the GPN.
According to their supporters, the GVC approach presents several virtues
contributing to a better understanding of the shape and trajectories of global
economic integration. Some of these virtues and advantages are the following: a)
from a general level, this approach shifts the focus from production alone to the
whole range of activities from design to marketing, tackling the governance issue
as well, which is, how chains are organised and managed (Gereffi, et al., 2001); b)
the possibility of transcending the limitations of relying only on macro-level
statistics such as trade and investment (Sturgeon, 2001). Here it is important to
analyse the role of personal and firm-to-firm relationships, smaller-scale studies of
national economies, as well as industry-level analysis of economic activity of
cross-border economic integration. In the same line of thoughts, Kaplinsky and
Morris (2001) underscore that the value chain approach represents both a heuristic
framework (descriptive construct for the generation of data) as well as an
analytical tool (explanatory-oriented structure). In particular these authors pose
the following advantages of the GVC approach: a) it overcomes a number of
important weaknesses of traditional sectoral analysis which tends to be static and
suffers from the weaknesses of its own bounded parameters; b)it is useful for new
producers – including poor producers and poor countries – who are trying to enter
global markets in a manner which would provide for sustainable income growth;
c) it is useful as an analytical tool in understanding the policy environment which
provides for the efficient allocation of resources within the domestic economy;
and d) its primary use as an analytical tool for understanding the way in which
firms and countries participate in the global economy.

55
In terms of GVC governance, which refers to the key actors in the chain that
determine the inter-firm division of labour and shape the capacities of participants
to upgrade their activities, two types of structures have been identified (Kaplinsky
and Morris, 2001; Gereffi, 2001): producer-driven chains and buyer-driven
chains. In the former, key producers in the chain, particularly large transnational
firms which command vital technology, have substantial control over the
backward and forward linkages, coordinating and taking responsibility for helping
the efficiency efforts of their suppliers and customers. This is characteristic of
capital and technology intensive industries, such as automobiles, aircraft,
semiconductors, etc. In the latter, large buyers with core competencies in branding
and marketing are the driving actors in setting up these value chains. They
increasingly organise, coordinate and control the production, designing and
marketing activities to target consumer markets in developed and developing
countries, and in the transition economies (UNIDO, 2004). These chains are
typical for labour-intensive industries and are highly relevant for developing
countries. Examples of these chains are textiles, garments, footwear, etc.
Recently, some developing countries, which traditionally tend to be only part of
labour-intensive, buyer-driven chains, have started moving to producer-driven
ones (Ibid). The leveraging channels to foreign partners in GVCs take a variety of
forms, ranging from traditional foreign direct investment, to newer forms such as
joint ventures, subcontracting, co-production, licensing agreements, and strategic
partnerships, amongst others. Finally, due to the major transformations in the
global economy linked to the technological revolution, and specifically to the
Internet, Gereffi (2001) identifies the emergence of a third form of governance
during the middle of the 1990s. Gereffi poses the idea that the Internet has the
potential to transform both buyer-driven and producer-driven GVCs.
As mentioned earlier, GVC approach is complemented by the GPN one. GPN
approach focuses on how a key company’s production network is organised, how
it is dispersed across firms and borders, and how technology is transferred among
network participants (UNIDO, 2004). The GPN exponents argue that this
approach – particularly those from the so-called ‘Manchester School’ (Hess and
Wai-Chung, 2006) - intends to overcome the limitations of both the GVC and

56
earlier GPN analysis (Henderson, et al., 2002; Henderson, 2002). According to
this line of thought, one of the major weaknesses of the ‘chain’ approach is its
conceptualisation of production and distribution processes as being essentially
vertical and linear. Conversely –they argue – such processes are highly complex
network structures in which there are intricate horizontal, diagonal and vertical
links. Thus, a more elaborated conceptual framework of GPNs is (Henderson, et.
al., 2002: 445-446):
“Production networks – the nexus of interconnected functions and
operations through which goods and services are produced, distributed and
consumed – have become both organisationally more complex and also
increasingly global in their geographic extent. Such networks not only
integrate firms (and parts of firms) into structures which blur traditional
organisational boundaries –through the development of diverse forms of
equity and non-equity relationships – but also integrate national economies
(or parts of such economies) in ways which have enormous implications for
their well-being. At the same time, the precise nature and articulation of
firm-centred production networks are deeply influenced by the concrete
socio-political contexts within which they are embedded. The process is
especially complex because while the latter are essentially territorially
specific (primarily, though not exclusively, at the level of the nation state)
the production networks themselves are not. They ‘cut through’ state
boundaries in highly differentiated ways, influenced in part by regulatory
and non-regulatory barriers and local socio-cultural conditions, to create
structures which are ‘discontinuously territorial’.”
Based on this proposition – and although accepting that the GPN does not
represent a totalising framework capable of comprehending the enormous
complexities of economic globalisation -, it is nevertheless considered a more
advanced analytical framework for understanding the changing international
distribution of production and consumption than previous approaches (Henderson,
et al., 2002; Henderson, 2002; Dicken, 2003). A distinctive feature of this
framework is its analytical disjuncture from former state-centred approaches

57
which tends to overplay macroeconomic rationales and the role of the nation-state
as the most important scene of economic and social development (Henderson,
2002; Robinson, 2004). Because of increasing fragmentation of production with
globalisation, the analytical framework needs to understand the dynamics of
uneven development in a multiple-scale view: transnationally, nationally and sub-
nationally. The reason behind the term ‘global’ in the concept of GPN obeys
precisely because the terms ‘international’ and ‘transnational’ derive from
essentially state-centric theories. In the same way, the use of ‘network’ rather than
‘chain’ reflects to the fact that the metaphor of chain gives the impression of an
essentially linear process of activities that ultimately result in a final commodity
rather than one in which the flows of materials, semi-finished products, design,
production, financial and marketing services are organised vertically, horizontally
and diagonally in complex and dynamic configurations. Finally, it is argued that
the preference of the term ‘production’ instead of ‘commodity’ derive from the
recognition that the latter does not capture adequately the post-fordist forms of
activity that characterise many of the industries today, on the one hand, and
because it places the analytical emphasis on the social processes involved in
producing goods and services and reproducing knowledge, capital and labour
power, on the other (Henderson, et al., 2002).
In methodological terms, the GPN approach directs attention to (Henderson, et al.,
2002: 447): a) the networks of firms involved in R&D, design, production and
marketing of a given product, and how these are organised globally and
regionally; b) the distribution of corporate power within those networks, and
changes therein; c) the significance of labour and the processes of value creation
and transfer; d) the institutions – particularly government agencies, but also in
some cases trade unions, employer associations and NGOs – that influence firm
strategy in the particular locations absorbed into the production chain; and e) the
implications of all these for technological upgrading, value-adding and capturing,
economic prosperity, etc. for the various firms and societies absorbed into the
networks. The GPN framework comprises three conceptual categories on which
its architecture is raised: Value (creation, enhancement and capture), Power
(corporate, collective and institutional) and Embeddedness (territorial and
58
network). Likewise, it includes four conceptual dimensions which give ‘energy’ to
the above categories: Firms, Sectors, Networks and Institutions. In synthesis, the
technique of mapping a GPN provides the possibility of visualising the economic
and social agents as well as highlighting the structural and spatial dimension of
networks, sectors, and the linkages between them. It also allows visualising the
GPN’s implications for development in different places within the GPNs’
territorial reach, and the main agents responsible for these implications
(Henderson, et al., 2002: 457).
From the perspective of the challenges facing the GPN approach, some analysts
argue there are several: ontological, epistemological, and methodological (Hess
and Wai-Chung, 2006). Regarding the ontological challenges, these are mainly
related to the integration of both the material and socio-cultural dimensions. The
epistemological challenges are linked to the fact that the GPN framework in
economic geography owes its theoretical foundations much more to economic
sociology and network analysis than to orthodox economics, as well as the
broadening of the GPN framework to incorporate varieties of capitalism into its
analytical orbit. For its part, the methodological challenge derives from the
underdeveloped of its methodological foundations. There is a lack of a systematic
set of methodological tools to operationalise the framework.
Finally, in terms of developing countries’ participation into the GPNs and GVCs
in a positive way, the perspectives seem to be of rather relative optimism,
compared to fatalistic views such as the NIDL, for example. For instance, some
recent studies concluded that being part of GVCs and GPNs can result in welfare
gains for producers and consumers; likewise, production globalisation through the
spreading of GVCs and GPNs stimulates industrial specialisation according to
dynamic comparative advantages (UNIDO, 2004). For their part, Ernst and Kim
(2002: 1428) conclude “that there is cause for cautious optimism: network
participation may provide new opportunities for effective knowledge diffusion to
local firms and industrial districts in developing countries, provided appropriate
policies and support institutions are in place that enable local suppliers to exploit
the opportunities and pressures that result from network participation.” Kaplinsky

59
and Morris (2001) arrive at similar conclusions. Recognising that the
manufacturing of components linked and coordinated on a global scale has opened
significant opportunities for developing countries and regions, they underline the
simultaneously heterogeneous and complex distributional pattern emerging from
the globalisation process, having both winners and losers. The authors emphasise
the need to manage the mode of insertion into the global economy.
2.4. Conclusions
In this chapter, the literature review relevant to the research topic is carried out. It
presents a broad theoretical framework that includes the major conceptual bases
and categories linked to the process of globalisation, competition, division of
labour, and networks in which countries and firms are embedded. While some are
more elaborated theoretical bodies, others might be defined better as a framework
than a theory; the latter is the case of globalisation. From another perspective,
some theories are categorised as macro-level approach since they tackle the world
or global system as a whole (i.e. international division of labour) while others are
more meso-level in scope (i.e. a firm’s production network).
It is worth underlining that for a more complete understanding of the evolution
and interactions between China and Mexico in the motor industry, a
comprehension of the roles these countries play in the broader sector’s global
division of labour and their specific insertion into global production networks and
chains is required. In particular, China’s global (re)emergence in the global
economy has to be seen as part of a deepening global division of labour’s process,
a new wave of integration of ‘transition’ economies during the last three decades,
which is generating a changing geography of production at a global scale. In this
broad and complex process, globalisation, and the derived forces driving the
world economy, has to be considered a conditioning and not a determining factor.
The literature review shows that there is no agreement on the globalisation
concept, origin, causes, effects, and reach. For the purpose of this study, an
ongoing debate is held on the role, future and bargaining power of the nation-
60
state, the influence, impact and reach of TNCs, as well as the prospects for
developing and emerging countries successfully engaging in high-value added
production networks and value chains. In this research, emphasis will be given to
the economic development dimension of globalisation, conceived as a complex
and paradoxical process. Of particular interest are those aspects related to trade,
FDI, and economic integration, including de jure integration, the elimination of
trade and investment barriers through formal agreements between or among
nations, as well as de facto integration, derived from functional linkages, intra or
inter-firm, through the operation of global production networks and global value
chains.
Despite that this study considers China and Mexico as units of analysis and their
interactions in the motor industry, a sectoral approach, a fundamental precept is to
go beyond the bilateral-type relationship and national economies on the one hand,
and to overcome the limitations of traditional static sectoral analysis, on the other.
The central idea is to adopt a broader analytical framework intending to
understand the modes in which countries and firms participate and interact in the
global economy and the changing division of labour. Under this view, relational
networks as the foundational unit of analysis and the dynamic linkages between
productive activities and firms provide a more comprehensive understanding of
the global economy (Dicken, et al., 2001; Kaplinsky and Morris, 2001).
In Figure 2.1, a synthesised sketch of the theoretical framework is presented. It
illustrates the dynamic and complex interconnections between major processes
and structures (globalisation, competition and global division of labour) and key
development actors (firms and nation-states). Along with this sort of horizontal
interconnections, there also are vertical and diagonal interrelationships and
networks. The basic foundation of this framework is that the increasingly complex
global division of labour, manifested in a variety of global production networks
and global value chains, is the outcome of a growing process of globalisation and
the exacerbation of competition which is now global in scope. Under this
scenario, firms are aggressively competing in the world market by enhancing their
competitive advantages; on the one hand, nation-states are developing strategies

61
by changing and enhancing dynamic comparative advantages to “compete”
globally through the attraction of mobile production factors (capital, etc.). In both
cases, firms and nation-states are developing networking structures: global
production networks and global value chains the former, and free trade areas, the
latter, for example. As nations become more specialised for global production, the
global economy becomes more integrated. With changing competitive advantages
of firms and comparative advantage of nations, there is a changing role of
countries and regions in the global division of labour. In a dialectic way, the
changing global division of labour and its increasing complexity produce strong
impacts on macro processes and structures as well as in the meso and micro-
entities.

62
In summary, for the purpose of this research, and based on the above discussion, it
could be said that while countries do not compete with each other in a strict sense
the way corporations do in the global market (‘market competition’), countries do
compete each other globally to attract mobile factors of production (‘locational
competition’) through investments in infrastructure, education and labour training,
incentives, and setting a favourable business climate, among other factors. In this
sense, it is possible to talk about the ‘competitiveness’ of firms and the
‘attractiveness’ of nations. In this context, countries (China and Mexico) are
considered as territorial production and export bases. In addition – following
Kaplinsky (2005) -, the world is experiencing a rapidly changing global
specialisation which in turn is forcing rapid adjustments inducing anxiety and
having significant distributional impacts. These trends have relevant implications
for global competition and the resulting international division of labour.
As an evolving process, the implications of the GDL are not yet fully understood.
For the purpose of this study, nevertheless, the following considerations are being
taken into account: a) IDL is a dynamic, constantly changing historical process; b)
IDL has no ‘deterministic’ or ‘fatalistic’ outcomes or patterns; and c) IDL is not
the outcome of unilateral strategies of the big transnational corporations or the
world’s powerful nations. It has emerged historically and largely unintentionally
out of a myriad of decisions made by governments and firms (Sayer and Morgan,
1987). As emphasised by Morgan and Sayer (1988: 264) regarding the NIDL
thesis, there is an “underestimation of the extent to which the international
division of labour is structured not only by corporate spatial divisions of labour of
multinationals but by competition between, and different patterns of specialisation
among, a large number of separate firms, many of which have significant degrees
of spatial monopoly in certain countries”.

63
3. CHAPTER THREE
THE RESEARCH METHODOLOGY
“China is now a part of us all” (Alvin & Heidi Toffler, 2006: 331).
“Noted economist Joseph Stiglitz once said that all economic theories
could be drawn from a car. And China is proving the truth of his
statement as the huge auto industry helps drive strong economic growth.”
(People’s Daily, 2003).
Although scientific research follows a formal sequential path during the phases of
planning, design and implementation, the whole process is not uni-directional and
mechanistic. Thus, in contemporary research the practice of a back-and-forth
movement among the different phases of the research process is recognised
(Blaikie, 2011; Bryman, 2012; Grix, 2010). Likewise, despite having a solid
planning phase, sometimes unforeseen events force to make changes and adjust
the research plan and design as the investigation proceeds. In this research project,
during 2008 two unforeseen events along the fieldwork phase obliged to make
temporal and functional adjustments. One was a process or deep reorganisation of
BANCOMEXT (Mexico’s External Trade Bank) within Mexico’s federal
administrative structure. BANCOMEXT, which after that process came to be
transformed into PROMEXICO (Trade and Investment Promotion Agency), was
the Mexican agency supporting the formal arrangements of interviews with key
actors of the motor sector in China and the United States. The second event was
the global financial crisis, which by the middle of 2008 was being widely felt, and
some auto companies were not totally open to discuss their views and future
perspectives. Fortunately, the core of the changes during this process was rather of
time-framing and logistics, and they did not essentially modify the research
problem and aims.
The academic reasons for undertaking research on this topic are related to the
aspiration of contributing to knowledge in this particular field as well as to public
64
decision-making process. Given the Chinese background of this thesis’ author,
personal motives are also involved. This chapter depicts the main elements of the
methodological framework and project’s research design. It provides information
on how the empirical implementation of the research is carried out, including
specific description of the methods, the data type and sources used, as well as data
reduction and analysis.
3.1. Research Design
A constant feature in the evolution of the field of Social Sciences is the seemingly
endlessly controversies over philosophical, theoretical and methodological issues
(Blaikie, 2003; Sayer 1992 and 2006). These controversies are particularly rough
around the theory of knowledge: epistemology. Accordingly, epistemology is
defined as the philosophical study of the nature, sources, and limits of knowledge
(Moser, Mulder and Trout, 1998: 4). Based on this premises, some analysts argue
that if the aim of social science is to provide knowledge, then epistemology
becomes unavoidable (Rosenberg, 1995). Given this rich and intense background
- as Blaikie (2003) suggests -, social inquiry has lost its innocence and social
researchers must now face up and deal with a range of divergent choices in
methods and research strategies. Although ontology is the starting point of all
research (Grix, 2010), epistemology plays a key role in the design of the research
process, becoming the cornerstone in it. Epistemology not only classifies the
different claims to knowledge but it also ranks them (Cameron, 2006).
Given the theoretical/conceptual framework and study nature, this research will
work within the assumptions of the ‘Depth Realist’ ontology and the ‘Neo-
realism’ epistemology. The main principles of the Depth realist ontology are
(Blaikie, 2011: 93): a) Reality consists of three domains ranging from what can be
observed (empirical domain), through what exists independently of the observer
(actual domain), to an underlying domain of structures and mechanisms that may
not be readily observed (real domain); b) Reality is stratified and has ontological
depth; and c) Unlike natural structures, social structures are less enduring and do

65
not exist independently of the activities they influence or social actors’
conceptions of what they are doing in these activities. The main principles of the
Neo-realism ontology are (Ibid: 94): a) Knowledge of the causes of observed
regularities is derived from the structures and/or mechanisms that produced them;
b) The discovery of these structures and/or mechanisms may necessitate the
postulation or selection of entities and process that go beyond surface
appearances; and c) This view of causation allows for the possibility that
competing or cancelling mechanisms may be operating when no event or change
is observed.
In terms of contemporary research paradigms, the versions of ‘Social Realism’,
also known as ‘Critical Realism’, are designed to replace both Positivism and
Critical Rationalism (Blaikie, 2011). The research paradigm/approach of social
realism is then coherent with the above ontological and epistemological
assumptions. Two additional factors favoured the adoption of Social Realism as
research paradigm. On the one hand, its affinity with political economy and
dialectical historical materialism approaches. On the other, social realism has been
already applied in several research projects in the areas of economic geography,
regional and urban development, development economics and industrial
restructuring, topics closely linked to the research interests (i.e. Morgan and
Sayer, 1988; Pratt, 1994; Fleetwood, 1999).
According to the analysis of the epistemological stance of the research, it bridges
from logical positivist economics to a kind of socially constructed institutionalist
political economy. In this sense, based on the ontological and epistemological
foundations of critical realism, it appears that this approach condenses elements of
the various stances in an intelligent way. Figure 3.1 shows the position of Social
Realism (Critical Realism) within the range of major epistemological stances. As
Sayer (2006: 2) claims, in the philosophy of natural science, realism offered a
third way between empiricism and positivism on the one hand, and the relativism
on conceptions of science as a cumulative foundationalist enterprise on the other.
The analysis of causation is highly relevant and is one of the most distinctive
features of realism. According to Sayer (2006 and 1992), objects are, or are part

66
of, structures. ‘Structure’ suggests a set of internally related elements whose
causal powers, when combined, are emergent from those of their constituents. In
that sense, causation is not understood on the model of regular successions of
events, and hence explanation need not depend on finding them, or searching for
putative social laws. Explanation, then, depends on identifying causal mechanisms
and how they work, and discovering if they have been activated and under what
conditions. Explaining why a certain mechanism exists involves discovering the
nature of the structure or object which possesses that mechanism of power. In
sum, when looking at causal factors, critical realism deals with the understanding
of necessity rather than regularities between distinct objects and events.
Two other major components of the epistemology’s trilogy –as presented by
Cameron (2006) -, are teleology and agency. In terms of teleology, the approach
of critical realism presents some claims regarding causality and prediction (Sayer,
2006; Sayer, 1992; Danermark et al., 2002): Firstly, critical realism rejects
determinisms and generalisations that intend to produce fixed and uniformed
outcomes. Secondly, the account of causal powers does not imply any
determinism; it is necessary to make sense of causation by abandoning
determinism that assumes that what happens in the world is wholly pre-
determined. Thirdly, because events are not pre-determined before they happen
but depend on contingent conditions, the future is open. Fourthly, in the ‘open
systems’ of the social world, the same causal power can produce different
Positivism Logical
Positivism
Social Object
Constructivism
Social
Institutional
Constructivism
Post-
Structuralism
Post-
Modernism
Figure 3.1. Position of ‘Social Realism’ (Critical Realism)
within the Range of Epistemological Stances
Social Realism
Source: Own elaboration.

67
outcomes, according to its spatio-temporal relations with other objects (the
context). Fifth, because of the open systems, the social sciences cannot make
predictions in the proper sense of the word; consequently, causal conditions must
be analysed as tendencies.
Regarding the relationship structure-agency, there is a big debate even within the
same line of critical realism. But in general terms, there is a stance in relation to
this conflictive issue. Paul A. Lewis (2002) underlines the following aspects: a)
critical realists seek to avoid the polar extremes of voluntarism and determinism.
Social structure and agency are held to be recursively related, so neither agency
nor structure can be reduced to the other; b) the structure-agency relationship must
be understood as an intrinsically historical or ‘tensed’ process in which social
structures and actors stand in temporal relations of priority and posterior towards
one another; c) all social activity takes place within the context provided by a set
of pre-existing social structures. The fact that social structure pre-exists and is
therefore ontologically irreducible to the current exercise of human agency
implies that it enjoys a certain degree of autonomy from the latter, exerting its
own, emerging causal influence on it (this is the hallmark of causal efficacy; d)
the ontological distinction between actors and social structure enables critical
realists to argue that the two may possess very different properties; e) social and
political events are generated by a complex causal nexus that involves both the
efficient causation of actors and the material causation of social structure; f) a
particular causal factor may on occasion dominate events. The existence of
otherwise of a dominant causal influence at a particular point in time can be
ascertained only ex posteriori through empirical research.
In terms of the whole research process, it seems to be a general agreement about
the need for having a clear connection and coherence between the ontological and
epistemological bases and the practical research work (Blaikie, 2003; Danermark
et al., 2002; Grix, 2004; Sayer, 1992). Interestingly, it is recognised among
analysts that critical realism is ontologically bold and epistemologically cautious
(Danermark et al., 2002: 204; Sayer, 2004: 1780; Lopez and Potter, 2001: 9). By
this conception it is meant critical realism’s ontology does not exclude any

68
method a priory, but the choice of method should be guided by the central
research aims. It is warned, however, that this practice must not follow simple
pragmatist methods, but coherence between the ontological conditions and the
identified necessary empirical procedures. In this sense, considering that method
is a practical matter, compared to positivism and interpretivism, critical realism
endorses or is compatible with a relatively wide range of research methods,
depending on the nature of the object of study and the purpose and expectations of
the enquiry (Sayer, 1992 and 2006). Thus, the methods must suit the object of
investigation as well as the purpose of it. In the midst of this dilemma, some
authors have proposed a new approach called “critical methodological pluralism”
(Danermark et al., 2002). This approach consists of a mix of methods but taking
into account the ontological and epistemological dimensions. It also put forward
the idea of overruling the methods dichotomies, as that of quantitative vs
qualitative or extensive vs intensive.
Literature on research methodology underlines that addressing complex problems,
such as those related to the ‘Asian Drivers’, requires heterodox mix of methods
(IDS Asian Drivers Team, 2006; Schmitz, 2006). This approach fits in with the
epistemological foundations of “critical methodological pluralism”, as mentioned
above. Based on these reflections, in terms the research strategies this project is
applying a combination of the inductive with the retroductive approaches. The
inductive strategy is mainly aimed at describing characteristics, nature and
network of regularities of socioeconomic processes. For its part, the retroductive
strategy is aimed at explaining the real underlying structure or mechanism(s) that
is/are responsible for producing the observed regularity, and identifying the
context in which this happens (Blaikie, 2011). Given the significant descriptive,
but limited scope of the inductive strategy, it can be complemented with the
explanatory and understanding role of the constructionist version of the
retroductive strategy (Ibid). In terms of data collection and sources, this study will
also use ‘mix methods’, combining and complementing quantitative and
qualitative data sources. Specialists in this topic have argued that the collection
of qualitative field data, when used in combination with macro-level statistics, can

69
lead to a more fine-grained understanding of global scale economic patterns and
trade (Sturgeon, 2001).
Finally, the unit of analysis is the complex China-Mexico interaction in the global
motor industry. Although is possible to separate the particular components of this
complex relationship (China, Mexico, and the motor industry), what is important
is the outcome of the interaction among the three elements. Linked to this
complex unit of analysis is the level of it. Given that the China-Mexico interaction
in the motor industry is framed in its global dimension, the scope of analysis is of
macro-level character, combining a sectoral approach (motor industry) and a
cross-national analysis (China and Mexico), including some comparative and
assessment elements. In this regard, it is recognised that industry-level analysis of
economic activity, especially one that uses a ‘value-chain’ approach, work well in
studies of cross-border economic integration, because it takes a significant but still
manageable slice of the global economy as its object of study (Sturgeon, 2001).
3.2. Research Sites: The Fieldwork
As pointed out above, the complex China-Mexico interaction in the global motor
industry represented the research’s core unit of analysis. Based on this, and
considering time and budgeting restrictions, the research’s fieldwork comprised
three main sites: China, Mexico and the United States (Figure 3.2). Taking
advantage of being at a British academic institution, additional research activity
was carried out in the United Kingdom.
Although the purpose of the fieldwork is to gather different kind of information
and data (primary, secondary and tertiary), the main aim in this case was to carry
out semi-structured interviews with the motor industry’s key actors. At the time of
the fieldwork, practically all the major global automakers and auto components
have production facilities in both China and Mexico, either as wholly-owned
operations, as in the latter, or under JVs, as in the former. The reason for including
the United States as research site is the significant presence and leading role that

70
U.S. motor companies (automakers and auto parts firms) play in both Mexico and
China. Decisions taken in Detroit have enormous implications for the operation
and evolution of the respective car industries in Mexico and China. In fact, the
motor industry has been considered a classic illustration of a ‘producer-driven’
global value chain in which large manufactures, generally TNCs, play the central
roles in coordinating production networks (Gereffi, 1999 and 2001; Kaplinsky and
Morris, 2001; UNCTAD, 2010a).
Within the selected countries, fieldwork was focused as follows: Mexico: a)
Mexico City and Hermosillo, Sonora; b) China: Shanghai; c) United States:
Detroit Metropolitan Area, and d) United Kingdom: London. In Mexico, auto
companies have their General Offices in the capital city, Mexico, D.F. and its
surrounding area. In China, Shanghai is one of the country’s major motor
‘clusters’ with presence of some of the major foreign and domestic automakers.
As is well known, Detroit represents the core of the U.S. motor industry, and
where the U.S. ‘Big Three’ have their global Head Offices. Hermosillo, in the
northern state of Sonora, functioned as the research headquarters. As Ford Motor
Company and a network of global suppliers are located there, this place was also
used for developing interviews and deepening in methodological issues.
Figure 3.2. Research Sites: Fieldwork
MEXICOCHINA
U.S.A.
Detroit
ShanghaiHermosillo
Mexico City
U. K. London
Source: Own elaboration.

71
The central activity in these places is to have interviews with key actors of the
motor sector in these countries: companies’ CEOs and executives; trade and sector
associations; government officials; industry analysts; and academicians, among
others. A description of this process will be performed in the following section.
3.3. Research Methods: Data Collection and Sources
A research design provides a framework for the collection and analysis of data
(Bryman, 2012). The choice of method of selection of data from its source is an
essential part of every research design. In recent years, social researchers have
become more eclectic in their choice of methods (Blaikie, 2011). In order to
answer different types of research questions, passing from description to
understanding and assessment, the project design contemplated the use of mix
methods in the research, quantitative and qualitative. In this sense, data used in the
analysis were of three types: primary, secondary and tertiary. Secondary data
basically consisted of ‘hard’ statistics; primary data was collected through the
method of ‘semi-structured interview’ to ‘key’ actors; and tertiary data was based
on social artefacts (documents, etc.). Secondary sources provided quantitative
information; primary sources basically produced qualitative information; and
tertiary, a combination of both. A succinct description of this type of data and
their sources is depicted in next paragraphs.
Primary Data
Primary data was basically obtained through semi-structured and focused
interviewing with ‘key’ actors of the motor industry in China, Mexico as well as
at global level. These selected ‘key’ or relevant actors were those with privileged
information and influence on the organisation’s decision-making process. Besides
corporative agents, among this group of relevant actors, governmental officials,
academics and consultancy agents were also included. Specialists on the subject
call this process ‘elite interviewing’ (Marshall, 1995). The semi-structured
interview is a research method that allows more flexibility in tackling a topic with
the interviewees (Bryman, 2012). By using this method the aim was to obtain

72
more qualitative, in-depth and detailed information on relevant issues. It was very
important to have information about past experiences, trends, as well as personal
views on how the different actors explain and understand events and patterns in
the motor industry in its implications for China and Mexico. The main topics
included in the ‘interview guide’ were current sectoral conditions, competitive
tendencies, location and investment decision’s logic, cooperation potential,
networks and associations, competitive forces, technological change and labour-
skill factors, sectoral regulation and policies, among others. Depending on the
interviewee specific position in the whole motor sector activity (firm executive,
governmental policy-making, etc.), the emphasis on the subjects was differently
treated.
In an initial phase, interviews in China (Shanghai) and the Unites States (Detroit)
were formally contacted through PROMEXICO’ Offices of Foreign
Representation. In Mexico, official and personal contacts were used to set up the
interviews. A total of 32 interviews were conducted in the selected sites: 19 in
Mexico, 7 in China, 5 in the USA and 1 in the U.K. (Appendix 3.1). In terms of
the interviewees’ specific activity area, the distribution was as follows: auto firms’
executives, 8; government officials, 8; industry association’s managers, 5;
academics and private sector analysts, 5; international development agencies and
business promoters, 3; consultants, 2; and labour unions’ representatives, 1. All
the interviews were carried out in the interviewees’ offices.
Secondary Data
The use of quantitative data in the construction of indexes and the examination of
statistical tendencies was another important tool for complementing the empirical
analysis. The quantitative information used through the different chapters can be
classified into three set of data sources, according to their significance in the
analysis: a) The United Nations Commodity Trade Statistics Database (UN
COMTRADE); b) The Module for the Analysis of Growth in International
Commerce (MAGIC) developed by ECLAC (The Economic Commission for
Latin America and the Caribbean); and c) Other Sources. Most of these data
sources and sets are of high quality in terms of their original source, geographical

73
coverage, standardisation, and updating process. In general the time-frame used in
the analysis was from 1990 to 2010, last date currently available.
The UN COMTRADE Database
This database is currently the largest depository of international trade data,
containing more than 1.7 billion data records for 45 years of information provided
for over 170 reporter countries. Data provides trade flows by commodities on
yearly bases, specifying the reporter and partner countries. Commodities are
reported under the Harmonised Commodity Description and Coding System (HS)
and the Standard International Trade Classification (SITC). The data received by
United Nations Statistics Division from the reporter countries are subsequently
transformed into a standard format with consistent coding and valuation using the
UN/OECD CoprA internal processing system.
This database was the a basic source of information for the analysis of trade flows
and patterns at international level as well as in the China-Mexico bilateral trade
relationship carried out in Chapter Six. It is worth mentioning that the UN
COMTRADE Database contains data up to 6-digit code level of the HS. The 6-
digit code was used in the analysis, which gives a significant level of
disaggregation of the automotive products when comparing specialisation
patterns, for example. This 6-digit code level was the base for the construction of
a “Motor Cluster”, integrated by 108 products. The main characteristics of this
‘motor cluster’ will be described in the next section.
The MAGIC Programme Database
This database was originally developed by the ECLAC subregional headquarters
in Mexico for post-trade analysis of the competitiveness of exports in the United
States’ market. MAGIC employs import data based on customs values provided
by the United States Department of Commerce (USDOC). The data are organised
according to the HS are aggregated from the 2- to 10-digit levels. The programme
contains annual data on U.S. imports and exports by product and country from
1990 to 2010. One of the advantages of the MAGIC programme is that

74
automatically performs a series of calculations to analyse the competitiveness of
products and countries within international trade.
This data base was a fundamental source for the analysis of trade trends,
specialisation patterns, and China’s competitive threat carried out in Chapter
Seven. The 6-digit level of the HS for the 108 products the ‘motor cluster’ was
used, in order to make it compatible with the CONTRADE data base.
Other Sources
Additional sources were used to cover information needed in the analysis of topics
related to GDP and FDI at international comparative level. In these cases, IMF
and UNCTAD, respectively, were the main data sources. In relation to specific
country-level macroeconomic indicators for Mexico and China, INEGI (Mexico’s
National Institute of Statistics, Geography and Informatics) and the Ministry of
Economy were the major sources for the former, and MOFCOM (China’s
Ministry of Foreign Commerce) for the latter.
Regarding specific motor industry’s data, at international comparative level the
basic sources were OICA (The International Organisation of Motor Vehicle
Manufacturers), WARDSAUTO and Automotive News. For individual countries,
AMIA, INA and ANPACT were consulted in Mexico’s case, and the China
Association of Automobile Manufacturers (CAAM) and China Automotive
Technology & Research Centre (CATARC), the Society of Automotive Engineers
of China, and FOURIN, in China’s case. Both data at international and national
levels of macroeconomic and motor industry indicators were mostly used in
analysis performed in Chapters Four, Five and Eight.
Tertiary Data
As is well known, tertiary data comprise a wide and heterogeneous set of sources.
Among these are reports and documents from governmental, private, social
organisations or academic institutions, as well as magazines, newspapers and
virtual outputs (Internet resources) (Blaikie, 2011; Bryman, 2012). In this
research, tertiary data was used as content and background analysis,

75
complementing both qualitative and quantitative information used in several
chapters. Most of the sources are specialised or closely related to the motor
industry and its diverse segments (motor vehicles, auto parts, etc.).
Given the limited nature of official data on automotive Chinese operations in
Mexico, tertiary sources represented an alternative to cover these shortcomings. In
particular, these sources were of great significance in Chapter Eight’s analysis.
Several reasons explain the limited scope of data on the Chinese motor industry’s
operations in Mexico: a) Chinese investment in automotive-related operations in
Mexico is a rather recent phenomenon and there is no systematic statistics
compilation on the subject; b) FDI data reported by the National Registration
Office for Foreign Investment (RNIE) tends to be of preliminary character since
the FDI movements reported by companies to this office present an important
backlog in relation to the dates they were actually developed (Secretaría de
Economía, 2011); c) Chinese automotive FDI’s figures are underestimated since a
large amount of these investments are carried out through other countries’ foreign
subsidiaries making it difficult to have an accurate registration (PROMÉXICO,
2010a); and d) in Mexico, updated statistics on production, sales, exports,
investment, auto companies and assembly plants are mainly provided by the
respective national association (AMIA, ANPACT, INA, etc.), considering only
the information of their formal members; most of the Chinese companies or joint
ventures operating in Mexico are not formally affiliated to these organisations yet.
In the case of Chinese sources, some caution is also suggested in using official
outward FDI figures (Davies, 2010; Sauvant et al, 2011).11 Given the above
shortcomings, an exhaustive daily-basis review of alternative automotive sources
was carried out in order to identify the trends.
11 In particular, Davies (2010: 2) underlines that both elements of overestimation and underestimation could be found. On the one hand, to the extent that outward FDI (OFDI) is used to inject funds into special purpose entities that then return money to China as inward FDI to take advantage of fiscal incentives, such as “round-tripping, the official total may be overestimated. On the other hand, official figures may also be underestimated. While most OFDI is from SOEs, a large and unknown proportion is from enterprises that are owned by non-state entities. While SOEs are constrained to go through the official approval process and so be recorded as making OFDI, non-state entities are more likely to evade approval. Where local OFDI approval is available, it may not always result in projects being included in national data.

76
3.4. Data Reduction and Analysis Methods
An essential part of the project’s research design was the selection or creation of
methods to be used to reduce and analyse data. These methods were used to
transform both qualitative and quantitative data into specific coding of categories
or variables, in order to organise and simplify their analysis. The most
representative methods used in this thesis, such as indexes construction, cluster-
framework analysis, typology classification, and interaction/impact
matrix/taxonomy, will be described below.
The Motor Industry ‘Cluster’
The motor industry represented a central element in the research’s unit of analysis.
In this sense, based on the research aims and questions, this analysis unit required
a conceptual and methodological definition. The motor industry is a highly
complex and diversified sector (Bhaskar, 1989; Maxton and Wormald, 2004;
Kaplinsky, 2005; Klier and Rubesntein; 2008; ACEA, 2010), being estimated that
around 15,000 auto parts are assembled to integrate a motor vehicle (Klier and
Rubesntein, 2008). The basic functional division of the motor industry is between
‘motor vehicles’ and ‘auto parts’ or ‘components’. Each of these aggregated
product-level can also be subdivided in other categories: motor vehicles in
automobiles and commercial vehicles; and auto parts in major and minor
components, and so on. Thus, in aiming to avoid the high aggregated level and
generalisation degree of most of the previous analyses, an extended motor
industry ‘cluster’ was especially constructed for this study. This wide-ranging
cluster structure will enhance the trade flows, specialisation patterns, and
competitive threat analysis.
The motor industry cluster was integrated by 108 automotive items, at 6-digit
code level, selected from the Harmonised Commodity Description and Coding
System (HS). The HS is an international standardised system developed by the
World Customs Organisation (WCO), which is arranged in 6-digit codes allowing

77
all participants countries to classify traded goods on a common basis.12 In this
sense, the 6-digit code level of the HS is the nomenclature adopted by the two
major databases used in this project, the UN COMTRADE and the MAGIC
Programme, allowing to work with homogeneous and standardised ‘products’.
Other sources, such as the Trade Map (UNCTAD-WTO), the Harmonised Tariff
Schedule of the United States (USITC), and the Office of Aerospace and
Automotive Industries (OAAI), were also consulted to crossing or complementing
information.
The designed motor industry cluster is an extended version in the sense that the
108 automotive items/products included were selected from different chapters of
the HS, and not only from chapter 87, which traditionally includes motor vehicles,
parts and accessories. Then, besides chapter 87, items from chapters 40, 68, 70,
73, 83, 84, 85, and 94 were incorporated (Appendix 3.2 and Figure 3.3). The
objective in the construction of this ‘cluster’ was to closely approximate the core
of the motor industry by excluding certain transport equipment-related items, such
as bicycles, motorbikes, railway, aircraft and vessels. Given that this motor
industry cluster is an ad hoc design for this study, its structure and classification is
not an ‘official’ one, and its value aggregation, for example, could differ from
these sources.
12 Beyond the 6-digit level, countries are free to introduce national distinctions for tariffs and many other purposes.

78
Technological Complexity Classification in Motor-Vehicle Value Chain: A
Typology
As underlined above, the motor industry is a highly complex and diversified
sector. Its technological complexity has been increasing over time since new
production systems and technical advances have been constantly incorporated into
the vehicle. A motor vehicle development, from design to production logistics,
takes up to 5 years. Engine design can take even longer. Their product cycle, or
the time that motor vehicles are kept in production, comprises up to 7 years
(ACEA, 2010). In particular, during the last few decades the complexity of motor
vehicles has reached unprecedented levels due to the development of flexible
electronics-based automation technologies, the introduction of complex
information processing in the product mix-model assembly, as well as the use of
new and lighter materials (Kaplinsky, 2005). Electronics is at the vehicle
technological frontier. The car is moving increasingly from being a mainly
mechanical engineering system to one based on electronics and electric power
(Maxton and Wormald, 2004). According to these authors, practically all
Figure 3.3. Motor Industry Cluster
Motor
Industry
Cluster
(108 Items)
Chapter 87.
Vehicles and
Parts
(39 Items)
Chapter 40.
Rubber and
Articles
(8 Items)
Chapter 68.
Stone, Plaster,
Asbestos
(1 Item)
Chapter 70.
Glass and
Glassware
(3 Items)Chapter 73.
Articles of
Iron and Steel
(4 Items)
Chapter 83.
Articles of
Iron and Steel
(2 Items)
Chapter 84.
Nuclear Reactors
and Machinery
(23 Items)
Chapter 85.
Electrical
Machinery and
Equipment
(27 Items)
Chapter 94.
Furniture,
Bedding and
Cushions
(1 Items
Source: Own elaboration.

79
subsystems are already under the command of electronic control units (ECUs),
consisting of sensors, logic circuits (hardware), control algorithms (software),
actuators and man-machine interfaces. As a result, the value of electronically
controlled systems in a vehicle has rapidly rising from 10% in 1990, 22% in 2000,
to 40% by 2010 (Ibid: 139).
The increasing technological complexity of the motor vehicles has been
considered as one of the underlying factors of the industry’s globalisation
(Kaplinsky, 2005). This is also related to the ‘fragmentation’ prospects of the
motor industry on a global scale. The intensity of fragmentation, conceptualised as
the relocation of processes or functions across countries,13 differs by industry,
depending on the following factors (Lall, Albaladejo and Zhang, 2004): a) The
technological ‘divisibility’ of the production process; b) The factor intensity of the
process; c) The technological complexity of each process; and c) The value-to-
weight ratio of the product. According to these analysts, compared to other
sectors, such as garments or electronics, in the motor industry fragmentation is
more constrained. The core of the argument is that while this industry has
individually separate and distinct processes, of which several are labour-intensive,
most require considerable local technological capabilities, components and
services to be undertaken efficiently and competitive. In addition, many
components are heavy, making their processing suitable for relocation in
proximate rather than in distant areas (Ibid). The above reflections on the
increasing technological complexity and diversity of the motor industry is highly
relevant for this research project, particularly in terms of the analysis of trade
tendencies and the assessment of the scope and degree of the competitive threat in
the sector.
This study intended to avoid aggregated analysis and over-generalisations by
developing detailed and specific research at product, sectoral and country levels.
Given the motor industry’s technological complexity and diversity, the literature
review on this subject revealed the inadequacy of current methodologies or
13 The process of ‘fragmentation’ has also been labelled ‘segmentation’, ‘production sharing’, ‘integrated production’, ‘outward processing’, and ‘vertical integration’ (Lall, Albaladejo and Zhang, 2004).

80
analytical schemes when aiming at having a more comprehensive and detailed
view and assessment of the industry, as posed in this research. As a whole, the
motor industry is classified as medium-high or medium technology sector. Table
3.1 presents some of the most representative and traditionally used methodologies
regarding the technological intensity classification of products or exports, with
special reference to the motor industry.
All these methodologies and functional classifications sketched in Table 3.1 are
very useful for some analytical purposes and have been applied in different
studies. Perhaps the methodology most commonly used in the literature related to
technological level or structure of manufactures is that developed by Sanjaya Lall
(2000). Nevertheless, as this classification was based on a 3-digit SITC level, the
data do not allowed capturing all aspects of technological upgrading, presenting
some limitations, as Lall noticed in his document (ibid: 340): a) This level of
aggregation puts together activities at different levels of technological complexity
under the same category; b) It does not distinguish quality differences within
given categories; c) It does not indicate the process involved in making a product
in different locations; and d) Export values do not show technological upgrading
over time within product categories.14 Even at the 4-digit SITC level of
disaggregation, several limitations arise, as in the case of measuring fragmentation
(Lall, Albaladejo and Zhang, 2004: 411): a) It is difficult to distinguish
meaningfully ‘final products’ from ‘parts and components’ by suing SITC
categories; b) SITC data combine parts and components of different products; c)
Many components are not included under the SITC labels for the final products
and come under different headings. For example, auto products do not include
components such as automotive electronics, batteries, tyres, plastics, paints, and
so on, which appear under separate headings; d) Trade data do not show different
stages of manufacture of a given product (under the same SITC heading) in
different countries; and e) Imports of parts and components may be used for other
purposes than fragmented production, such as domestic-oriented industries or by
firms outside integrated systems.
14 Although considering it useful, Gary Gereffi (2008) has also pointed out the limitations Lall’s (2000) methodology, arguing that the data is not sufficiently detailed for having a clear idea of the technology intensity involved in the processes by which products are made.

81
Table 3.1. Selected Methodologies for Classifying the Technological Intensity of
Products/Exports with Special Reference to the Motor Industry
Author/Source
Methodology/Functional Classification
UNCTAD (1996) Classification of exports into five broad categories considering the mix of different skill, technology, capital and scale requirements at the final product stage: 1) Primary commodities; 2) Labour-intensive and resource-based industries, 3) Low-to-medium level; 4) Medium-to-high level ((Motor Industry); and 5) High level.
OECD (1996) Four major levels of industrial R&R intensity: 1) High technology; 2) Medium-high technology (Motor Vehicles); 3) Medium-low technology; and 4) Low technology.
Lall (2000) Four major classifications for manufactured products: 1) Resource-based manufactures; 2) Low-technology manufactures; 3) Medium technology manufactures (Automotive Products); and 4) High technology manufactures. A 3-digit SITC level was used.
McAlinden and Andrea (2002)
Division into eleven major motor-vehicle component systems: 1) Engine; 2) Drivetrain; 3) Body structure; 4) Interior & exterior (trim); 5) Steering and suspension; 6) Fuel delivery; 7) Engine electrical; 8) Exhaust & emission; 9) Brakes, wheels & tires; 10) Climate/HVAC; and 11) Chassis electrical.
Maxton and Wormald (2004)
Division into five major motor-vehicle component systems: 1) Body; 2) Chassis; 3) Driveline; 4) Electrical power; and 5) Command, control and communication. Although these major subsystems are disaggregated into more detailed sets of functional areas, specific functions, and individual components, the technological level of each of these items is not specified.
Nag, Banerjee and Chatterjee (2007)
Division of 82 items at 6-digit level of the HS into seven Groups: 1) Rubber and Glass component; 2) Iron and Steel component; 3) Engines and its parts; 4) Auto-component I; 5) Auto-component II; 6) Auto-component III; and 7) Vehicles.
Klier and Rubenstein (2008)
Division into six major motor-vehicle component systems: 1) Powertrain; 2) Chassis; 3) Electronics; 4) Exterior; 5) Interior; and 6) Generic.
VanNieuwkuyk (2009)
Division into twelve major motor-vehicle component systems: 1) Powertrain, Drivetrain; 2) Electrical/Lighting; 3) Exterior/Exterior trim; 4) Fluid Handling; 5) Interior & Seating; 6) Materials & Carpet; 7) Wheels, Tires & Suspension; 8) Exhaust/Emissions; 9) Frame, Body and Doors; 10) Climate/HVAC; 11) Glass; and 12) Multimedia, Navigation & Display.
Murphy (2011) Division into sixteen major motor-vehicle component systems: 1) Engine; 2) Body & Structural; 3) Electronics & Electrical; 4) Interior; 5) Transmission; 6) Axles, Driveshafts & Components; 7) Climate Control & Engine Cooling; 8) Suspension; 9) Braking; 10) Steering; 11) Wheels & Tires; 12) Fuel system; 13) Passenger restraints; 14) Audio & Telematics; 15) Exhaust; and 16) Body glass.
Source: Own elaboration.

82
Regarding the specific functional classifications of the motor industry, most of
them have based their aggregation criteria on major motor-vehicle systems.
Although these classifications are useful in analysing trade patterns and
competition, and could give some clues on different skill and technological levels
content in each system and subsystems (Klier and Rubenstein, 2006 and 2008),
they do not explicitly present a disaggregated technological level by specific items
and subsystems. Thus, despite that the functional classification based on the
motor-vehicle systems has the advantage of including a wide variety of parts and
components, other than the chapter 87 of the HS, it suffers from some of the
shortcomings found in the methodologies discussed above, such as putting
together activities at different levels of technological complexity under the same
category, or not distinguishing quality differences within given categories, etc.
This thesis proposed an alternative methodology for assessing in a more
systematic, detailed and qualitative way, the ‘competitive threat’ of China on the
different product segments of Mexico’s motor industry as well as specialisation
patterns. Specialisation in the motor industry has increasingly become segment
specific, so a detailed data set for analysis in needed. This methodological tool
was also intended at combining the quantitative with the qualitative approach to
the competitive threat assessment. The methodological scheme was based on the
technological complexity level of products/segments within the motor industry’s
value chain. The proposed methodology used as reference previous studies on the
general approach to value chain analysis as well as specific applied value-chain
studies to the case of the motor industry and major auto systems (Booz-Allen &
Hamilton and INFOTEC, 1987; Kaplinsky and Morris, 2001; Veloso and Kumar,
2002; Humprey and Memedovick, 2003; Maxton and Wormald, 2004; Schmid
and Grosche, 2008; Klier and Rubenstein, 2008; UNCTAD, 2010a). The
methodology tried to overcome the limitations of previous studies by using more
detailed product categories of the HS, as suggested by Lall (2000). Based on the
concept of value-chain and the structure of major auto systems and subsystems,
the product classification relied on the available disaggregated code-level data (6
digits). In the process of classifying each of the 108 motor items within the
different categories and subcategories of technological complexity, the advice of

83
automotive specialists (one in international sourcing and the other in foreign
trade) consulted during the fieldwork phase, was taken into consideration. The
classification process involved focuded interviewing and several meetings with
the auto specialists during a six-month period, discussing and placing the 108
items into the different categories of high to low technological intensity. Although
there is always some degree of subjectivity in the categorisation process, this
typology is based on technical knowledge, representing a first exercise in the aim
of improving the methodological tools for analysing specialisation trade patterns
and competitive threat in the motor industry.
The methodology classifies the 108 products included in the motor industry
“cluster”, at 6-digit level of the Harmonised System (HS), into five Categories and
25 Subcategories of different technological complexity within the motor-vehicle
value chain. For its part, each subcategory also contains specific automotive
products.15 Ranging from high to low complexity level, the major categories are:
I. Finished Vehicles;
II. Major Components and Systems. Machining and Stamping;
III. Sophisticated Components and Subsystems. Specialised Technology;
IV. Parts & Components. Moderate and Universal Technology; and,
V. Accessories and Simple Parts.
This methodology also considers the fact that, within the category of “Finished
Vehicles”, a differentiated technological complexity exists. This is the case, for
instance, of the low end-smallest cars, such as sport & recreational,
microcars/bubble, and subcompacts, compared to compact, mid-size cars,
compact SUVs, luxury and full-size SUVs. Figure 3.4 displays the typology of
technological complexity in the motor-vehicle value chain, and Table 3.2 lists the
108 motor industry’s items according to the typology of categories of technology
complexity.
15 As far as possible, the typology’s product classification try to be consistent with the following hierarchy (Klier and Rubenstein, 2008: 18): a) Parts are typically small, individual pieces of metal, rubber, or plastic stamped out, cut, or molded into distinctive shapes, such as knobs and levers; b) Components are several parts put together into recognisable features, such as radios and seat covers; c) Modules are several components combined to make functional portions of a motor vehicle, such as instrument panels and seats; and d) Systems are groups of components that are linked by function into major units of motor vehicles, such as interiors and engines.

84
Figure 3.4. Technological Complexity in Motor-Vehicle Value Chain : A Typology and Mapping
I. Final Vehicle Assembly
II. Major Components and Systems . Machining and Stamping
Body Engine TransmissionElectric/
Electronic
Systems
Chassis with Engine
III. Sophisticated Components and Subsystems. Specialised Technology
Chassis Components:• Shock absorbers• Brake systems• Suspensions• Dashboards and pannels
Engine Components:
• Cooling pumps • Compressors• Carburettors• Pistons
Transmission and Drivetrain Components:
• Drive axles• Clutches • Steering wheels• Transmission shafts
Electronic and Safety Systems:
• Engine control devices• Sensors devices• Stereo apparatus• Heating/cooling systems• Safety airbags
IV. Parts and Components. Moderate and Universal Technology
• Chassis frames• Interior parts• Window frames• Springs• Bumpers
• Mirrors • Seats• Safety glass • Pneumatic tires• Rims
• Flywheels and pulleys• Gasket sets• Petrol filtres• Intake air filtres
• Iron-casting parts:o Smeltingo Forged
• Lighting signalling equipment• Windscreen wipes• Spark plugs• Ignition coils• Accumulators
V. Accessories and Simple Parts
• Brake linings and pads• Iron or steel articles; jacks.• Tubes, pipes and hoses of rubber• Gaskets, washers and seals
• Co-axial cables and conductors• Electric conductors• Electrical lamp-holders• Parts of electrical lighting
Source: Own elaboration
Sport &
Recrea-
tional
Microcar/
Bubble
Subcompact
/ City car
Compact &
Mid-size Car &
Compact SUV
Luxury, Sports,
Grand Tourer,
Mid & Full-size
SUV
Light
Trucks
Medium
& Heavy
Straight
Trucks
Passenger
Vans &
Buses
Road
Tractors
& Dump
Trucks
A B
A B C D E
A B C D
A B C DE
AB C
DE
FG
HI
Tech
no
logi
cal C
om
ple
xity
/ V
alu
e A
dd
ed
Le
vel
Low
Me
diu
m
Hig
h
Technological Complexity / Value Added Level
Low Medium High

85
Table 3.2. Motor Industry “Cluster” by Technological Complexity Level in the
Motor-Vehicle Value Chain
Product
Code
Product Description
I. Final Vehicle Assembly
I.A. Sport & Recreational
870310 Snowmobiles, golf cars and similar vehicles
I.B. Microcar/Bubble
870321 Automobiles w reciprocating piston engine displacing not more than 1000 cc
I.C. Compact/City Car
870322 Automobiles w reciprocating piston engine displacing >1000 cc to 1500 cc 870331 Automobiles with diesel engine displacing not more than 1500 cc
I.D. Compact, Mid-size Car & Compact SUV
870323 Automobiles w reciprocating piston engine displacing >1500 cc to 3000 cc 870332 Automobiles with diesel engine displacing more than 1500 cc to 2500 cc
I.E. Luxury, Sports, Grand Tourer, Mid&Full-size SUV
870324 Automobiles with reciprocating piston engine displacing >3000 cc 870333 Automobiles with diesel engine displacing more than 2500 cc 870390 Automobiles nes including gas turbine powered
I.F. Light Trucks
870421 Diesel powered trucks with a GVW not exceeding five tonnes 870431 Gas powered trucks with a GVW not exceeding five tonnes
I.G. Medium & Heavy Straight Trucks 870422 Diesel powered trucks w a GVW exc five tonnes but not exc twenty tonnes 870423 Diesel powered trucks with a GVW exceeding twenty tonnes 870432 Gas powered trucks with a GVW exceeding five tonnes 870490 Trucks nes
I.H. Passenger Vans & Buses
870210 Diesel powered buses with a seating capacity of nine persons 870290 Buses with a seating capacity of more than nine persons nes
I.I. Road Tractors & Dump Trucks
870120 Road tractors for semi-trailers 870410 Dump trucks designed for off-highway use
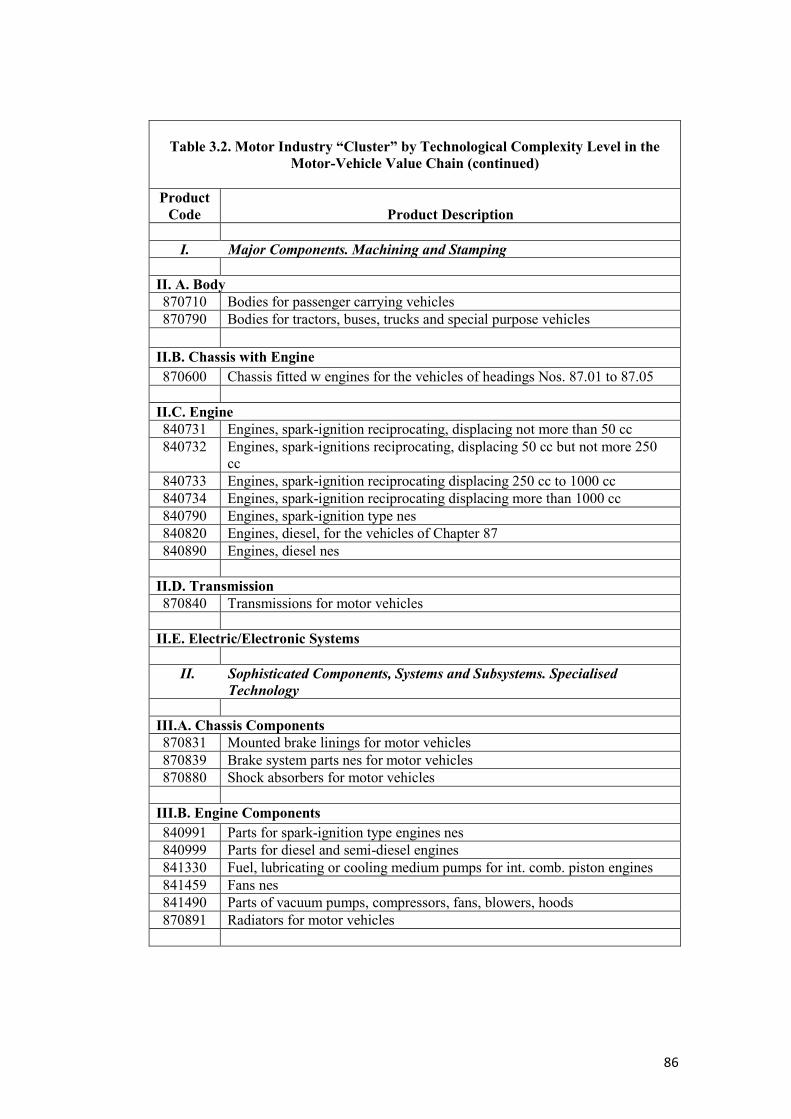
86
Table 3.2. Motor Industry “Cluster” by Technological Complexity Level in the
Motor-Vehicle Value Chain (continued)
Product
Code
Product Description
I. Major Components. Machining and Stamping
II. A. Body
870710 Bodies for passenger carrying vehicles 870790 Bodies for tractors, buses, trucks and special purpose vehicles
II.B. Chassis with Engine
870600 Chassis fitted w engines for the vehicles of headings Nos. 87.01 to 87.05
II.C. Engine
840731 Engines, spark-ignition reciprocating, displacing not more than 50 cc 840732 Engines, spark-ignitions reciprocating, displacing 50 cc but not more 250
cc 840733 Engines, spark-ignition reciprocating displacing 250 cc to 1000 cc 840734 Engines, spark-ignition reciprocating displacing more than 1000 cc 840790 Engines, spark-ignition type nes 840820 Engines, diesel, for the vehicles of Chapter 87 840890 Engines, diesel nes
II.D. Transmission
870840 Transmissions for motor vehicles
II.E. Electric/Electronic Systems
II. Sophisticated Components, Systems and Subsystems. Specialised
Technology
III.A. Chassis Components
870831 Mounted brake linings for motor vehicles 870839 Brake system parts nes for motor vehicles 870880 Shock absorbers for motor vehicles
III.B. Engine Components
840991 Parts for spark-ignition type engines nes 840999 Parts for diesel and semi-diesel engines 841330 Fuel, lubricating or cooling medium pumps for int. comb. piston engines 841459 Fans nes 841490 Parts of vacuum pumps, compressors, fans, blowers, hoods 870891 Radiators for motor vehicles

87
Table 3.2. Motor Industry “Cluster” by Technological Complexity Level in the
Motor-Vehicle Value Chain (continued)
Product
Code
Product Description
III.C. Transmission and Drive Train Components
848310 Transmission shafts (including camshafts and crankshafts) and cranks 870850 Drive axles with differential for motor vehicles 870860 Non-driving axles and parts for motors vehicles 870893 Clutches and parts for motor vehicles 870894 Steering wheels, steering columns and steering boxes for motor vehicles
III.D. Electronic and Safety Systems
841520 Automotive air conditioners
851180 Electrical ignition or starting equipment used for internal combustion engines; nesoi
852721 Radio reception apparatus for motor vehicles 852729 Radiobroadcast receivers for motor vehicles, not capable of operating
without outside power, nesoi 870895 Safety airbags with inflated system
I. Parts and Components. Moderate and Universal Technology
IV.A&B. Minor Body & Chassis Parts
401110 Pneumatic tire, new of rubber for motor cars, including station wagons and racing cars
401120 Pneumatic tires, new of rubber for buses or lorries 401310 Inner tubes, of rubber for motor cars, etc., buses or lorries 700711 Safety glass toughened (tempered) f vehicles, aircraft, spacecraft/vessel 700721 Safety glass laminated for vehicles, aircraft, spacecraft or vessels 700910 Rear-view mirrors for vehicles 732010 Springs, leaf and leaves therefor, iron or steel 732020 Springs, helical, iron or steel 732090 Springs, iron or steel, nes 830120 Locks of a kind used for motor vehicles of base metal 870810 Bumpers and parts for motor vehicles 870821 Safety seat belts for motors vehicles 870829 Parts and accessories of bodies nes for motor vehicles 870870 Wheels including parts and accessories for motor vehicles 940120 Seats of a kind used for motor vehicles
IV.C&D. Minor Engine and Transmission Parts
842123 Oil or petrol-filters for internal combustion engines 842131 Intake air filters for internal combustion engines 842199 Parts for filtering or purifying mchy & apparatus for liquids or gases, nes 848350 Flywheels and pulleys, including pulley blocks 848490 Gasket sets consisting of gaskets of different materials 870892 Mufflers and exhaust pipes for motor vehicles
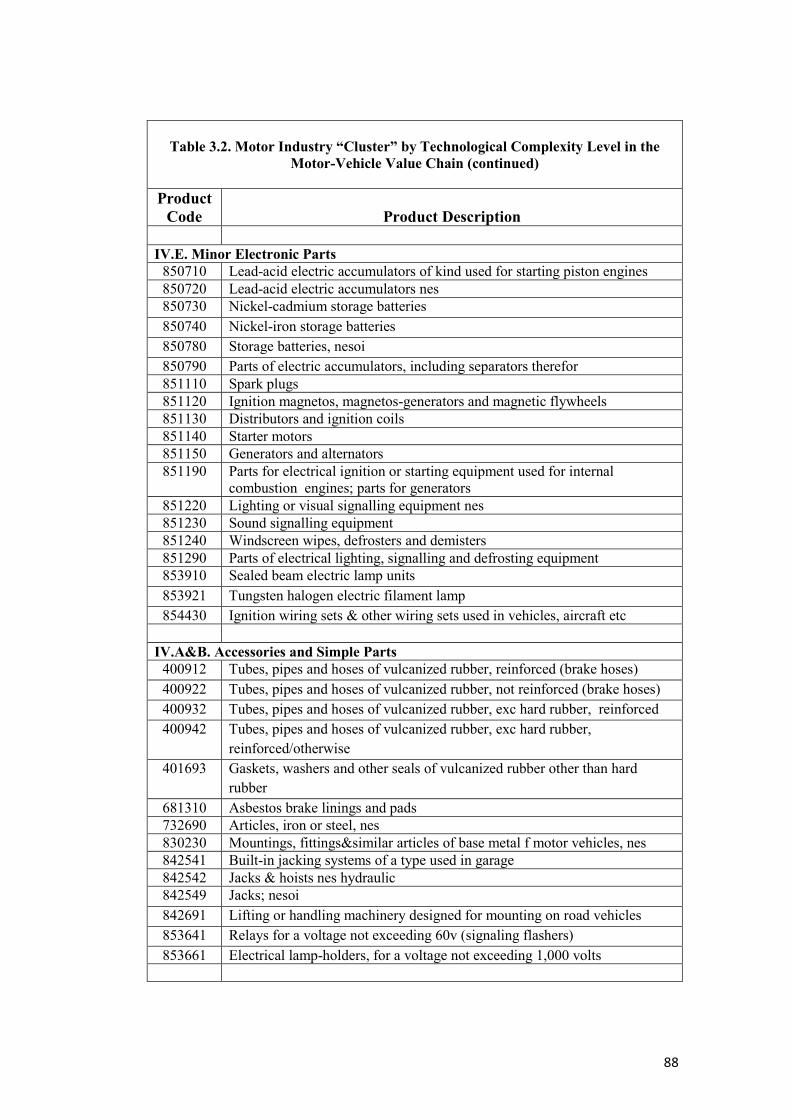
88
Table 3.2. Motor Industry “Cluster” by Technological Complexity Level in the
Motor-Vehicle Value Chain (continued)
Product
Code
Product Description
IV.E. Minor Electronic Parts
850710 Lead-acid electric accumulators of kind used for starting piston engines 850720 Lead-acid electric accumulators nes 850730 Nickel-cadmium storage batteries
850740 Nickel-iron storage batteries 850780 Storage batteries, nesoi 850790 Parts of electric accumulators, including separators therefor 851110 Spark plugs 851120 Ignition magnetos, magnetos-generators and magnetic flywheels 851130 Distributors and ignition coils 851140 Starter motors 851150 Generators and alternators 851190 Parts for electrical ignition or starting equipment used for internal
combustion engines; parts for generators 851220 Lighting or visual signalling equipment nes 851230 Sound signalling equipment 851240 Windscreen wipes, defrosters and demisters 851290 Parts of electrical lighting, signalling and defrosting equipment 853910 Sealed beam electric lamp units
853921 Tungsten halogen electric filament lamp 854430 Ignition wiring sets & other wiring sets used in vehicles, aircraft etc
IV.A&B. Accessories and Simple Parts
400912 Tubes, pipes and hoses of vulcanized rubber, reinforced (brake hoses)
400922 Tubes, pipes and hoses of vulcanized rubber, not reinforced (brake hoses) 400932 Tubes, pipes and hoses of vulcanized rubber, exc hard rubber, reinforced 400942 Tubes, pipes and hoses of vulcanized rubber, exc hard rubber,
reinforced/otherwise 401693 Gaskets, washers and other seals of vulcanized rubber other than hard
rubber
681310 Asbestos brake linings and pads 732690 Articles, iron or steel, nes 830230 Mountings, fittings&similar articles of base metal f motor vehicles, nes 842541 Built-in jacking systems of a type used in garage 842542 Jacks & hoists nes hydraulic 842549 Jacks; nesoi
842691 Lifting or handling machinery designed for mounting on road vehicles 853641 Relays for a voltage not exceeding 60v (signaling flashers)
853661 Electrical lamp-holders, for a voltage not exceeding 1,000 volts

89
Table 3.2. Motor Industry “Cluster” by Technological Complexity Level in the
Motor-Vehicle Value Chain (continued)
Product
Code
Product Description
854420 Co-axial cable and other co-axial electric conductors 854441 Electric conductors, for a voltage not exceed 80 V, fitted w connectors 854520 Carbon or graphite brushes 870899 Motor vehicle parts nes 871690 Trailer and other vehicle parts nes
Source: Own elaboration based on the Harmonised Commodity Description and Coding System (HS).
Quantitative Indexes
As part of the research methods used in the analysis, some basic indexes were
applied to quantitatively measure the expression or evolution of particular
categories or variables. Especially, the indexes were used to analyse competitive
threat tendencies and trade specialisation patterns. These are depicted below.
The Revealed Comparative Advantage Index
The Revealed Comparative Advantage Index (RCA) measure was based on the
traditional Balsassa’s Index (1965). The simplest formula is as follows:
����� =
��� ��
�� �
Where:
���,�� are values of country i’s and world exports of product j, respectively;
�� , � are values of total world trade in j and world total trade, respectively.

90
RCA indices use the trade pattern to identify the sectors in which an economy has
a comparative advantage, by comparing the country of interest’s trade profile with
the world average (ESCAP, 2010). The index measures a specific product’s share
in the country’s total exports relative to a share of this product in the world trade.
RCA > 1 implies that the country has comparative advantage in that product.16 In
theoretical models, comparative advantage is expressed in terms of relative prices
evaluated in the absence of trade; since these are not observed, in practice
comparative advantage is measured indirectly (Ibid). Thus, RCA index provides a
basis for assessing a country’s export potential (Mikic, 2005).17 Although RCA is
a measure of the relative cost of a particular product/industry compared to other
products produced in that country, whereas international competitiveness is in
relation to the same product produced in other countries, RCA is often used as
an approximation to international competitiveness, as applied in related analysis in
the literature (Shafaeddin, 2004; Jenkins, 2008; Gallagher, Moreno-Brid and
Porzecanski, 2008).
The RCA index has some limitations, however (Shafaeddin, 2004; ESCAP, 2010).
First, given that the index is affected by anything that distorts the trade pattern
(e.g. trade barriers), it does not show to what extent the gain in market share has
been due to comparative advantage and to what extent due to subsidiasing export,
dumping, etc. Second, it does not make clear whether a country also has
advantage in production of an item or only in assembly operation, as the data on
export show output rather than value added. Nevertheless, despite these
shortcomings, this index is still of significant use in tracing out national
competitive advantages (Shafaeddin, 2004; Mikic, 2005; Jenkins, 2008).
16 In his original article, Balassa (1965: 103) pointed out that “It is suggested that ‘revealed’ comparative advantage can be indicated by the trade performance of individual countries in regard to manufacturing products, in the sense that the commodity pattern of trade reflects relative costs as well as differences in non-prices factors. For one thing, comparative advantage would be expected to determine the structure of exports; for another, under the assumption of uniformity in tastes and a uniform incidence of duties in every industry within each industry, export-import ratios would reflect relative advantages.” 17 Other authors (Shafaeddin, 2004) have used this index as a measure of revealed competitive advantage.

91
Given the nature and bases of the RCA approach, in the literaure the index has
also been used for determining the degree of trade specialisation (Laurse, 1998;
Lall and Albaladejo, 2004; Lall and Weiss, 2005a; Mikic, 2005; Widgrén, 2005;
Gallagher, Moreno-Brid and Porzecanski, 2008; Hernández and Romero, 2009).
The Balassa measure of RCA is sometimes referred to as the Specialisation Index
by some authors, and the terms have been used interchangeably here. Besides
being applied in the literature, an important reason for equating the RCA index
with that of specialisation is the fact that the MAGIC Programme, the data source
for the U.S. motor imports from China and Mexico, precisely uses RCA as
substitutive measure of trade specialisation (Hernández and Romero, 2009). In
this way, the Specialisation index applied in the analysis of China and Mexico in
world trade in Chapter Six, using UN COMTRADE data, is comparable with the
Specialisation index in the U.S. market, calculated in Chapter Seven, and based
on the MAGIC database.
The RCA index was used in Chapter Six to calculate the degree of export
specialisation of both China and Mexico’s motor industries’ in world trade. In
Chapter Seven, the index had several uses, adapting the formula to include import
values based on U.S.-specific data rather than on global data.18 On the one hand, it
was applied to identify the products in which China and Mexico were competitive
in the U.S. motor market through the Static Index of Competitive Threat. On the
other, it was employed to estimate the RCA/Specialisation of China and Mexico’s
participation in the U.S. motor imports both at aggregated level and by category of
technological complexity of the different motor ‘cluster’ items, at 6-digit HS code.
The Static and Dynamic Indexes of Competitive Threat
In order to analyse the trends of China’s competitive threat to Mexico in the U.S.
motor market, two indexes were applied: the Static Index of Competitive Threat
(SICT) and the Dynamic Index of Competitive Threat (DICT). This methodology
was developed by Rhys Jenkins (2008), presenting several advantages over other
indices used in previous analysis regarding China’s competitive threat. This
18 Several studies have used import data to estimate RCA or specialisation. See, for example, Shafaeddin, 2004; Mikic, 2005; Hernández and Romero, 2009; and Gallagher and Porzecanski (2010).

92
author argues that most of export similarity indexes19 – and its related measures –
present serious limitations, making them potentially misleading indicators of the
severity of the competitive threat to different countries and of changes in
competition over time (Ibid).
The fundamental argument in Jenkins’s methodology is the following: “The
extent to which a country faces a competitive threat from China depends not on
the overall similarity of its export structure to that of China, but rather on the
proportion of its total exports accounted for by products in which China is
globally competitive…The higher the share of a country’s exports made up of
such products, the greater the extent of the threat from China” (2008: 1358).
Under this premise, the Index of Competitive Threat (ICT) is defined as follows:
ICT = 100 * ∑i ��
where i = 1,….m, which includes all products in which China is competitive.
�� = share of product i in total Mexican exports to U.S.
In calculating the Static Index of Competitive Threat (SICT), having a RCA > 1 is
used to identify those products in which China is competitive. From the
perspective of the present study, the SICT refers to the proportion of U.S.
automotive imports from Mexico in which China has a RCA > 1 in ths U.S.
market. This gives a static indicator of the extent to which Mexico’s exports (U.S.
imports from Mexico) are likely to be under threat from China, referred as the
SICT. The 6-digit level of the HS classification for 108 automotive products was
applied, using the MAGIC programme database, for the periods 1990-2001 and
2001-2010.
19 The Export Similarity Index (ESI) is designed to measure the degree of similarity between the export profiles of two economies. The more similar the export profiles are, the more likely that economies are competitors in global markets. High similarity indices may also indicate limited potential for inter-industry trade with a regional trading arrangement (ESCAP, 2010). The ESI is the sum over export categories of the smaller of the sectoral export shares (as a percentage) of each country under sudy.
93
The second approach, the Dynamic Index of Competitive Threat (DICT), identifies
those products in which China is competitive as all those in which U.S. motor
imports from China (China’s exports to the U.S.) are growing more rapidly than
U.S. total motor imports from the world. The DICT then refers to the share of
those products in U.S. imports of motor products from Mexico. This exercise is
somewhat similar to the ‘competitive threat’ technique developed by Lall and
Albaladejo (2004) and Lall and Weiss (2005a) described below. The indices also
distinguish between the competitive threat which a country faces from China and
vice versa (Jenkins, 2008). To calculate the DICT, the annual average growth rate
(AAGR) of the 108 motor product’s imports for the periods 1990-2001 and 2001-
2010 was considered. In correlation with the SITC analysis, these years cover the
periods before and after China’s entry into the WTO.20 The DICT include the
rates for total U.S. automotive imports from the world and U.S. auto imports from
China and Mexico.
The main advantages of the SICT and the DICT over the ESI and related
measures are the following (Jenkins, 2008: 1364-1365): a) they distinguish
between the threat that China poses to another country from the threat that the
other country poses to China, rather than conflating them into one measure; b)
they are not biased by differences in the value of exports from the two countries
concerned, or by differences in the commodity concentration of their exports; c)
since they measure the proportion of a country’s exports accounted for by
products in which China is internationally competitive, the meaning of a particular
value of the index is easy to understand, which is not the case with some of the
other indeices; d) they identify very clearly the key products in which a country
faces competition from China; and e) they are relatively economical in terms of
20 Of course, the periods established for the analysis can be decomposed into shorter number of years. Besides using 2001 as a turning point before and after China’s entry into the WTO in the whole period 1990-2010, the idea was to have a long-term perspective of the trends rather than a short-term one, in order to avoid conjunctural disruptions, such as the years 2000-2002 and 2008-2009, where global economic recession and financial crisis affected production and trade tendencies. Other similar studies have used periods of a decade or longer in the analysis. See, for instance, Lall and Albaladejo (2004), Lall and Weiss (2005a), and Mesquita-Moreira (2007).

94
data requirements and complexity of calculation once RCAs and changes in world
market shares for China have been obtained.
The ‘Competitive Threat’ Technique
In addition, in order to have a more specific image of China’s competitive threat
to Mexico in the U.S. motor market, the use of the SICT and the DICT was
complemented by the ‘competitive threat’ technique developed by Lall and
Albaladejo (2004) and Lall and Weiss (2005a). This technique has the merit of
providing some additional and more specific competitive interactions between
China and another country in export markets - Mexico in the U.S. market in this
case. Thus, instead of having only a single figure of percentage and value of
exports under threat from China, this technique identifies other categories, such as
‘direct’ and ‘partial’ threat, among others. This matrix of competitive threats and
interactions is presented in Figure 3.5.
Lall and Albaladejo (2004) and Lall and Weiss (2005) point out that there is no
accepted methodology for quantifying a “competitive threat” with trade data.
Based on the business literature, these authors (Ibid) used relative market shares
as common measure of competitive performance: there is a ‘competitive threat’ is
China gains export market share and the other country loses. The intensity of the
threat is given by the extent of the relative change. Given that the aim is to look at
the competitiveness in the U.S. market, as in the cases of the SICT and DICT, in
this exercise, the AAGR of U.S. imports from China and Mexico at 6-digit level
of the HS classification for 108 automotive products was calculated, using the
MAGIC programme database, for the periods 1990-2001 and 2001-2010.
It is worth mentioning that these authors (Ibid) caution on the difficulty of
inferring causal relationships from relative export and market share data to the
competitive impact of Chinese entry. As partial solution they suggest to examine
combinations of market share changes for China and its competitors to infer the
direction of the impact.21
21 Lall and Weiss (2005a) indicate that only detailed fieldwork can show direct causal relationships for the competitive impact of Chinese entry.

95
Figure 3.5. Matrix of Competitive Interactions between China and Another Country
in Export Markets
Chinese Export Market Shares
Other
Country’s
Export
Market
Shares
Rising Falling
Rising
A. No Threat: Both China and the other country have rising market shares and the latter in gaining more than China. B. Partial Threat: Both are gaining market share but China gaining faster than the other country.
C. Reverse Threat: No competitive threat from China. The threat is the reverse, from the other country to China.
Falling
D. Direct Threat: China gains market share and the other country loses; this may indicate causal connection unless the other country was losing market share in the absence of Chinese entry.
E. Mutual Withdrawal: Both parties lose shares in export markets to other competitors.
Source: Lall and Weiss (2005a).
Matrix of Interaction Channels and Competitive/Complementary Impacts
Given the research scope and objectives, some methodological tools derived from
the Asian Drivers’ impacts approach (Schmitz, 2006; Kaplinsky and Messner,
2008) was also applied in the research. Under this approach, a variety of potential
interactions and impacts is possible to expect of the economic and trade
relationships between countries (opportunities and threats/competition and

96
complement). This analytical framework provides qualitative and quantitative
information about potential China’s impacts on Mexico’s automotive industry in
several variables. Figure 3.6 displays the adapted matrix of potential interaction
channels and impacts between China and Mexico relationship in the motor
industry. Through this matrix, three types of interactions and impacts were
identified, each one having different implications and focus: a) Interaction
Channels, with emphasis in trade and FDI; b) Competitive and Complementary
Impacts; and c) Direct and Indirect Impacts. The thesis’ chapters in which these
interactions and impacts were mostly analysed are indicated in the matrix’s
quadrants.
Figure 3.6. Matrix of Interaction Channels and Impacts
Channels
Impact
Direct
Indirect
Trade
Competitive
Complementary
FDI
Competitive
Complementary
Source: Adapted from Schmitz (2006); and Kaplinsky and Messner (2008).
Chapter 6
Chapter 7
Chapter 8
Chapter 5
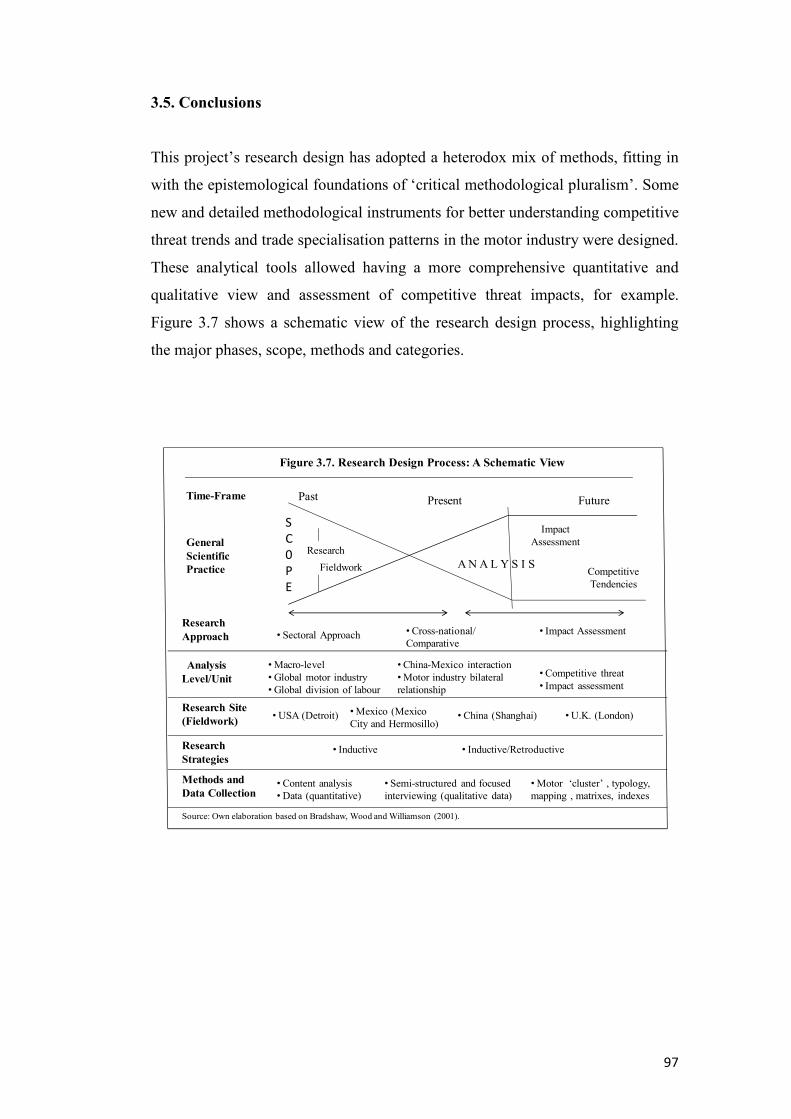
97
3.5. Conclusions
This project’s research design has adopted a heterodox mix of methods, fitting in
with the epistemological foundations of ‘critical methodological pluralism’. Some
new and detailed methodological instruments for better understanding competitive
threat trends and trade specialisation patterns in the motor industry were designed.
These analytical tools allowed having a more comprehensive quantitative and
qualitative view and assessment of competitive threat impacts, for example.
Figure 3.7 shows a schematic view of the research design process, highlighting
the major phases, scope, methods and categories.
Time-Frame Past Present Future
General
Scientific
Practice
S
C
0
P
E
Research
Fieldwork A N A L Y S I S
Impact Assessment
Competitive Tendencies
Research
Approach • Sectoral Approach • Cross-national/Comparative
• Impact Assessment
Analysis
Level/Unit
• Macro-level• Global motor industry• Global division of labour
• China-Mexico interaction• Motor industry bilateral relationship
• Competitive threat• Impact assessment
Research Site
(Fieldwork)• USA (Detroit) • China (Shanghai)• Mexico (Mexico
City and Hermosillo)• U.K. (London)
Research
Strategies• Inductive • Inductive/Retroductive
Methods and
Data Collection• Content analysis• Data (quantitative)
• Semi-structured and focused interviewing (qualitative data)
• Motor ‘cluster’ , typology, mapping , matrixes, indexes
Source: Own elaboration based on Bradshaw, Wood and Williamson (2001).
Figure 3.7. Research Design Process: A Schematic View

98
4. CHAPTER FOUR
CHINA AND MEXICO IN THE GLOBAL MOTOR INDUSTRY
“The world’s most populous nation will drive the globalization of the
industry into the next stage, vastly transforming today’s automotive
landscape” (Spitzer, 2005).22
“China doesn’t just want to learn how to make GM cars. It wants to be
GM and put GM out of business”. (Friedman, 2005: 422).
“Italy-born, Mexico-built, China-sold Fiat 500 epitomises auto
globalisation”. (Ciferri, 2011).
At the dawn of the 21st century the global motor industry is experiencing
fundamental changes, being in the midst of a deep restructuring process. At least,
two major forces are inducing this scenery. On the one hand is the advent of the
so-called ‘Second Automobile Revolution’ (Freyssenet, 2009) which is being
fuelled by the combination of a move towards alternative energies and driving
modes, and the emergence of global motor markets leaded by the BRICs.23 On the
other is the global financial crisis of 2008-2009, which severely hit the motor
industry worldwide. Simultaneously, the ‘epicentre’ of the global motor industry
was shifting from West to East, especially to China. In 2009, in the midst of the
worst economic crisis since the ‘Great Recession’ in the 1930s, China became the
world’s largest automotive producer and market.
As pointed out in the introductory chapter, China’s emergence in the global motor
industry was not only a matter of concern for developed economies, but for the
developing as well. Mexico, with an important motor industry, highly integrated
22 Richard D. Spitzer, Accenture’s global automotive managing partner (Accenture, 2005: 1). 23 Other authors have posed different views about the ‘stages’ or ‘revolutions’ in the motor industry’s evolution. Womack et al, (1990) put forward a revolutionary leap with the advent of ‘Lean Manufacturing’ replacing the ‘Fordist’ mass production system. In like manner, Maxton and Wormald (2004) postulate that the motor industry is at the edge of a ‘Fourth Revolution’, based on profound changes in the production function and in the whole system of relationships in the industry.

99
into global markets, was among them. Although Mexico and China share some
similarities in the development of their automotive industry, particularly in their
first stage when governments tried to establish a strong “national” industry by
applying protectionist measures and import substitution strategies, the path
followed by each country during the last three decades has been a rather divergent
one. Perhaps the convergence factor in the recent period is the increasing role
these countries are playing in the global automotive arena.
As in the case of their national development models, the motor industry in China
and Mexico also presents paradoxes. According to some analysts, “For a vision of
the fate Chinese policymakers hope to avoid, all one need do is look to Mexico”
(Thun, 2006: 217). Chinese policymakers tried to avoid the denationalization of
the motor industry, as happened in Mexico and other developing countries such as
Brazil and Thailand.
Nowadays, Mexico and China’s motor industries present very different economic,
technical and political environments. Also, they have contrasting conditions in
terms of industry structure, ownership of capital, destination of production/exports
and installed capacity. Table 4.1 shows a general comparative view of the motor
vehicle industry and the national economy in both countries.
The objective of this chapter is to present a general analysis of China and
Mexico’s position in the global motor industry, as well as their industries’
structure, evolution and main tendencies. As background, a succinct examination
of the changing geography and global division of labour in this industry will be
carried out.

100
Table 4.1. The Motor Industry in China and Mexico:
A General Comparative View
Concept
China
Mexico
The National Economy
Total population (2011)
1.34 billion 113.7 million
Area (Sq. Km)
9,596,961
1,964,375
Gross Domestic Product (GDP) (2011, US Dollars)
7,928.1 billion
1,154.8 billion
GDP per capita (2011, US dollars)
5,413.6
10,153.3
GDP (purchasing parity power-PPP) (2011, current international dollars)
11,299.9 billion
1,661.6 billion
GDP per capita at PPP (2011, current international dollars)
8,382.0
14,609.7
The Motor Industry Motor-vehicle production (2011, Units)
18,418,876
2,680,037
Motor-vehicle domestic sales (2011, Units)
18,510,000
909,026
Motor-vehicle exports (2011, Units)
849,000
2,143,883
Motor-vehicle exports as % of total production
4.6 %
80.0 %
Total export value of motor products (2010, US dollars)
62,780 million
67,905 million
Number of motor-vehicle manufacturers companies
1501
25
Number of auto parts companies
25,0002
1,100
1Only registered vehicle manufacturers. 2Of this total, only 10,000 companies are officially registered. Source: Own elaboration based on diverse sources.

101
4.1. The Changing Motor Industry’s Global Division of Labour
By the middle of the 1980s, an idea about the geographical redistribution of the
world motor industry and the resulting international division of labour began to
emerge: the new labour-saving automated technologies, flexible systems of
production, and “just-in-time” practices –among other trends-, would re-
concentrate motor production at the final markets of the developed countries
(Altshuler, et al., 1984; Jones and Womack, 1985; Estall, 1985; Schoenberger,
1987; and Sanderson, et. al. 1987). According to this approach, the new wave of
technological innovation had set the auto industry on a new path and in a different
direction of that predicted by the ‘dispersionist’ approaches, Vernon’s (1966)
‘product-life cycle’ and the static-NIDL’s thesis (Fröbel, Heinrichs and Kreye,
1980) among them. As a consequence, the future prospects for the participation of
developing countries in the car industry’s global division of labour were
considered only marginal. Even by the early 2000s, despite accepting that
globalisation has changed the worldwide geography of motr production, there was
a persistent conclusion that this industry remains overwhelmingly concentrated in
the developed countries (see, for instance, Sturgeon and Florida, 2000; and ILO,
2000).
Nevertheless, contrary to these analysts’ auguries, the trend towards the location
of manufacturing activities in this sector to developing countries continued to
ascend. For example, in 1950 the United States concentrated 76% of world motor
vehicle production; by the year 2011 this share had fallen below 11%. Even
though Japan captured a considerable proportion of this redistribution, at present
new producing countries concentrate around two thirds of total production, when
some decades ago this group of countries had not reached more than 5%.
Considering the ‘Pioneer Producing Countries’, more than 70% of auto
production worldwide is carried out outside their borders. It is worth noting that
besides the traditional NICs, during the second half of the 1990s a ‘second layer’
of new producing countries (the ‘Post-Wall Producing Countries’) emerged in the
worldwide scenario: China, Turkey, Thailand, Malaysia, Slovakia, and Czech
Republic (Tables 4.2 and 4.3; Figure 4.1).

102
Table 4.2. Geographical Distribution of Worldwide Motor Vehicle Production,
1950-2011 (Units)
Group/Country 1950 1960 1970 1980 Pioneer Producing Countries (PPCs) 9,968,690 14,182,526 19,988,536 19,515,596
Canada 387,726 397,739 1,159,504 1,323,999 France 357,552 1,369,210 2,750,086 3,378,433 Germany 306,034 2,055,127 3,842,247 3,878,553 Italy 127,847 644,633 1,854,252 1,611,856 United Kingdom 783,672 1,810,700 2,098,498 1,312,914 United States 8,000,859 7,905,117 8,283,949 8,009,841 Inter and Post-War Producing Countries
(IPWPCs)
572,607
1,521,126
7,518,715
14,542,513
Australia 126,721 326,250 473,790 364,109 Austria 2,169 12,658 7,191 15,261 Belgium 248 256 272,433 259,966 Czechoslovakia 31,424 73,684 169,920 233,112 Japan 31,597 481,551 5,289,157 11,042,884 Netherlands 19,339 79,219 112,881 Russia 362,895 494,994 916,118 2,199,200 Sweden 17,553 112,394 310,887 315,100 Post-War New Producing Countries (PWNPCs)
46,516 622,976 2,200,421 4,827,807
Argentina 89,338 219,599 288,917 Brazil 133,078 416,089 1,165,174 East Germany 9,200 76,000 181,000 214,000 India 14,688 51,126 82,766 113,326 Mexico 21,575 49,807 189,986 490,006 Poland 36,400 118,000 430,500 South Africa 113,097 297,573 404,766 South Korea 28,819 123,135 Spain 253 58,209 536,026 1,181,659 Taiwan 132,580 Yugoslavia 800 15,921 130,563 283,744 Post-Wall Producing Countries
(PWPCs)
000 21,000 137,700 418,339
China 15,400 70,000 222,288 Czech Republic Hungary 5,600 9,200 13,500 Indonesia Iran Malaysia Pakistan Philippines Portugal Romania 33,500 114,734 Slovak Republic Slovenia Thailand Turkey 25,000 67,817 Ukraine Vietnam Other Countries 4,631 140,712 ND ND
WORLD TOTAL 10,577,813 16,488,340 29,845,372 39,304,255

103
Table 4.2. Geographical Distribution of Worldwide Motor Vehicle Production,
1950-2005 (Units) (Continuation)
Group/Country 1990 2000 2011 Pioneer Producing Countries (PPCs) 24,135,914 27,860,063 21,649,007
Canada 1,920,565 2,961,636 2,134,893 France 3,768,993 3,348,361 2,294,889 Germany 4,976,552 5,198,000 6,311,318 Italy 2,120,850 1,738,315 790,348 United Kingdom 2,565,957 1,813,894 1,463,999 United States 9,782,997 12,799,857 8,653,560 Inter and Post-War Producing Countries
(IPWPCs)
17,119,560
13,436,481
11,587,894
Australia 384,095 347,122 224,193 Austria 20,006 141,026 152,505 Belgium 385,263 1,033,294 562,386 Czechoslovakia 242,000 Japan 13,486,796 10,140,796 8,398,654 Netherlands 151,132 267,319 73,151 Russia 2,040,000 1,205,581 1,988,036 Sweden 410,268 301,343 188,969 Post-War New Producing Countries (PWNPCs) 7,045,145 12,140,857 19,575,155
Argentina 99,639 339,632 828,771 Brazil 914,671 1,681,517 3,406,150 East Germany India 364,181 801,360 3,936,448 Mexico 820,558 1,935,527 2,680,037 Poland 365,000 504,972 837,132 South Africa 405,000 357,364 532,545 South Korea 1,321,630 3,114,998 4,657,094 Spain 2,053,350 3,032,874 2,353,682 Taiwan 382,000 372,613 343,296 Yugoslavia 319,116 Post-Wall Producing Countries (PWPCs) 879,767 5,099,230 27,222,384
China 509,242 2,069,069 18,418,876 Czech Republic 455,492 1,199,834 Hungary 8,525 137,398 202,800 Indonesia 292,710 837,948 Iran 277,985 1,648,505 Malaysia 282,830 540,050 Pakistan 31,500 163,060 Philippines 41,840 51,730 Portugal 26,000 246,724 192,242 Romania 94,000 78,165 335,232 Slovak Republic 181,783 639,763 Slovenia 122,949 174,119 Thailand 411,721 1,478,460 Turkey 242,000 430,947 1,189,131 Ukraine 31,255 104,654 Vietnam 6,862 45,980 Other Countries ND ND 29,728
WORLD TOTAL 49,180,386 58,536,631 80,064,168
Notes: South Africa’s data for 1990 is estimated; Romania’s and Portugal’s figures for 1990 correspond to 1991; Turkey’s figures for 1979 and 1990 correspond to 1971 and 1991, respectively. Source: Own elaboration based on MVMA, AAMA and OICA’s data.

104
Table 4.3. Geographical Distribution of Worldwide Motor Vehicle Production by
Country Group, 1950-2011 (%)
Group of Countries
1950
1960
1970
1980
1990
2000
2011
Pioneer Producing Countries (PPCs)
94.2
86.0
67.0
49.6
49.1
47.6
27.0
Inter and Post-War Producing Countries (IPWPCs)
5.4
9.2
25.2
37.0
34.8
23.0
14.5
Post-War New Producing Countries (PWNPCs)
0.4
3.8
7.4
12.3
14.3
20.7
24.4
Post-Wall Producing Countries (PWPCs)
0.9
0.4
1.1
1.8
8.7
34.0
Other Countries
0.1
0.1
WORLD TOTAL
100.0
100.0
100.0
100.0
100.0
100.0
100.0
Source: Own elaboration based on MVMA, AAMA and OICA’s data.
0
10
20
30
40
50
60
70
80
90
100
1950 1960 1970 1980 1990 2000 2011
%
Figure 4.1. Geographical Distribution of Worldwide Motor-
Vehicle Production by Country Group,
1950-2011 (%)
PPCs IPWPCs PWNPCs PWPCs
Own elaboration based on Table 4.3.

105
The changing geography of the motor-vehicle value chain has been driven by the
following developments (Kaplinsky, 2005: 146): a) Scale economies are growing,
particularly in knowledge - and design-intensive activities; b) Production
technologies and product design are becoming more complex; c) The sector is
now dominated by eleven mega-corporations, each with an extensive global reach;
d) Markets are growing most rapidly in low-income economies; and e) many low-
income and emerging economies have targeted the sector for industrial promotion.
Certainly, as Kaplisnky (Ibid) suggests, in the context of the factors driving the
globalisation of the motor industry, a number of centralising, centripetal and
centrifugal tendencies are simultaneously at work. In this regard, some analysts
argue that despite the fact that the industry has become more globally integrated,
it has rather developed a strong regional scale of integration (Sturgeon, Van
Biesebroeck and Gereffi, 2008; Sturgeon, et al., 2009). Nevertheless,
regionalisation of production and sales by TNCs might be also seen as part of
global strategies. The tendency towards the geographical dispersion of production
in the industry is increasing. Even in exports, emerging countries are gaining
position at global level, showing significant export potential (Peridy and Abedini,
2008). Based on UNCOMTRADE data (2012), Mexico, Korea, China, Spain,
Czech Republic, Poland and Thailand are among the largest automotive export-
countries, accounting for a quarter of the world’s total by 2010. In addition, the
recent financial crisis accelerated the trends towards greater significance of the
motor industry in emerging economies (Sturgeon and Van Biesebroeck, 2010).
Based on recent trends, it seems that there has been a process of widening and
deepening of the global division of labour in the automotive industry. The
globalisation process - seen as the increasing integration of production, trade and
capital at global scale – has pushed this phenomenon even further. It has been
recognised that the collapse of the ‘iron’ and ‘bamboo’ curtains at the beginning
of the 1990s brought the globalisation process to unpredictable levels,
incorporating the last frontiers of the global economy and representing one of the
most dramatic signs of the emergence of a new world order (Castells, 1996;
Harris, 2003; Becker, 2006).

106
The trends in the motor industry seem to contain most of the key characteristics of
the globalisation process: multidimensional, complex, dialectic and paradoxical.
For instance, at the same time that Detroit – known as ‘Motor City’ (Motown) – is
losing its position as assembly capital in North America, new automotive spaces
with the sobriquet of ‘Detroits’ are emerging around the world: ‘Detroit South’
(Mexico), ‘Detroit East’ (Central Europe), ‘Detroit North’ (Russia), and ‘Detroit
Far East’ (China). In this regard, in a recent article a business analyst declared that
“clearly, the old Detroit as Motor City is history” (Maynard, 2006). Paradoxically,
during the financial problems and slumps of the major U.S. carmakers (General
Motors and Ford) by the middle-2000s, both Detroit’s Mayor and Michigan’s
Governor turned to Japan – to Toyota and Honda in particular – seeking support
for attracting investment to regenerate job losses in the auto sector (Maynard,
2006; McElroy, 2005). During the 2008-2009 global financial crisis, China’s huge
and growing market as well as the Sino-US JVs seemed to have been the salvation
platform.
And yet, the pressures and turmoil in the car industry are increasing.
Overcapacity, growing costs, tougher competition in prices and new competitors
are inducing a constant restructuring of automakers and a changing relationship
with suppliers (Sturgeon and Florida, 2000; Humphrey and Memedovic, 2003;
Kaplinsky, 2005; Becker, 2006; Sturgeon, Van Biesebroeck and Gereffi, 2008).
For some companies and producing countries, a relatively new player in the global
competitive arena is causing a serious additional concern: China. For some
observers, China’s growing participation in the world market means a new round
of predatory global competition in the car industry (Becker, 2006). Paradoxically,
it is now a developing country, and not the traditional capitalist powers, the Unites
States, Germany or Japan, that is the source of this competition, and is perceived
as the symbol of the hidden risks of globalisation.
Although ‘division of labour’ suggests a collaborative and a stable distribution of
complementary work, it is not a passive phenomenon (Harris, 1983; Sayer, 1995;
Mittelman, 1994). Its dynamic character produces rivalries and tension amongst
the involved agents as a consequence of increased competition. Thus, the

107
changing global division of labour within the automotive industry has been a
source of competitive tensions amongst firms, workers and countries – the latter
considered ‘territorial production bases’ regardless of the national origin of firms
producing in such territories. As underlined in the introductory chapter, this trend
has led towards a kind of ‘competitiveness obsession’ of nations (Krugman,
1994). Thus, as presaged by Jonathan Mantle (1995) in ‘Car Wars’, despite the
fact that in the global market the individual firm and nation have been superseded
by interdependent interests and many-layered blocks of capital, the increasing
competition in the global automotive industry will lead to economic conflict
between nations in the 21st century.
4.2. China and Mexico in the Global Motor Industry’s Development Ladder
One of the key actors in the changing geography of the global motor industry is
China. With 1% of world’s total production in 1990, by 2011 the Middle
Kingdom accounted for 23%. Paradoxically, in the MIT’s 5-millionn dollar 5 year
study on the future of the automobile industry (Womack, Jones and Roos, 1990),
when discussing the prospects of worldwide diffusion of lean production
techniques as the means for achieving world-class manufacturing skills without
massive capital investments in developing countries, an interesting conclusion
was reached: China was the anomaly in East Asia. By 1990, the Chinese car
industry was considered to be focused inward, pursuing a combination of
extremely mass production in its two volume-production complexes in
Changchun and Hubai on the one hand, and inefficient low-quality craft
production in about a hundred additional vehicle-manufacturing spread around
China, on the other.24 According to the MIT project, this disastrous combination
gave China the distinction of having the world’s largest motor-vehicle industry in
terms of employment (more than 1.6 million workers) and one of the smallest in
terms of output (a projected 600,000 units in 1990) (Ibid: 268-269). The high
inefficiency and resulting significant diseconomies of scale in the large majority
24 The number of motor vehicle manufacturers in China rose from about 20 in the 1960s to 60 in the 1970s, and peaked at about 125 in the early 1990s (Harwit, 1995: 25; Harwit, 2001: 661).

108
of Chinese plants produced the most fragmented motor vehicle industry in the
world (Harwit, 1995; Thun, 2004).
Strikingly, if Japan was considered the worldwide car industry’s “shining star”
during the 1960s and 1970s, and so South Korea during the 1980s and 1990s due
to their spectacular growth, China followed a similar path from the middle of the
1990s to present. From 1990 to 2011, China’s automotive output grew at an
average annual rate of 64.4 per cent, while the world’s average was only 2.2 per
cent (Table 4.2). In that period of 21 years, China’s production increased more
than 35 times, passing from over half a million vehicles to more than 18.4 million.
As stated earlier, at present China ranks as the world’s number one motor vehicle
producer and market. Practically every single global automaker and parts producer
has established production facilities in Chinese territory. China is now becoming
part of the global production networks of the major TNCs and is playing a
relevant role in reshaping this industry’s global division of labour.
Thus, from the perspectives of both companies and nation-states intending to
develop their “national” automotive industries, this trend of increasing
participation of China in the world car market is pushing global competition even
further. Given the position and role played in the global car industry, Mexico is
perceiving China’s ascendant phase as a direct threat not only in its domestic
market, but in third markets – particularly in the Unites States -, as well as in the
attraction for foreign investment. China’s scaling in the worldwide ranking of
automotive production is shown in Figure 4.2. Ranking in 13th position in 1990,
China scaled to 8th in 2000, 4th in 2005, reaching the 1st place in 2009, position
kept to present. In Mexico’s case, although it appeared within the thirteen largest
automotive producers since 1980, ranking in the 11th place, its position has swung
from the 12th position in 1990 to 9th in 2000 and falling again at 11th in 2005.
Since then, Mexico has escalated several steps, reaching the 8th position
worldwide by 2011.
The recent global financial crisis had differentiated effects on China and Mexico.
While world auto production registered an annual negative growth of -3.7 and -

109
12.8% in 2008 and 2009, respectively, China grew at 5.2 and 48.3% during the
same years. For its part, Mexico performed relatively well in 2008 with a growth
of 4.6%, but in 2009 production drastically fell, registering -28.0% in relation to
the previous year. That year, the United States and Japan had an output drop of -
34.3 and -31.5, respectively.
Figure 4.2.Worldwide Motor-Vehicle Production: Country Ranking 1980-2011
Rank 1980 1990 2000 2005 2009 2011
1 Japan Japan USA USA China China
2 USA USA Japan Japan Japan USA
3 Germany Germany Germany Germany USA Japan
4 France France France China Germany Germany
5 USRR Italy Spain S. Korea S. Korea S. Korea
6 Italy Spain Canada France Brazil India
7 Canada Russia S. Korea Spain India Brazil
8 U. K. Canada China Canada Spain Mexico
9 Spain U. K. Mexico Brazil France Spain
10 Brazil S. Korea U. K. U. K. Mexico France
11 Mexico Brazil Italy Mexico Canada Canada
12 Poland Mexico Brazil India Iran Russia
13 S. Africa China Russia Russia U. K. Iran
Source: Own elaboration based on MVMA, AAMA, and OICA’s data.
4.3. Structure and Evolution of China’s Motor Industry
Background and Development Phases
After the triumph of Chairman Mao Zedong in 1949, the new government of the
PRC decided to develop a motor industry for the purposes of transporting rural
products and the military (Gallagher, 2006). In achieving this industrialization
goal, China relied heavily on its ally, the Soviet Union, for technical assistance.
As a result, the first motor-vehicle manufacturing plant was set up in 1953 in the
city of Changchun, under the name of First Auto Works (FAW). A few years
later, in 1958, Shanghai Automotive Assembly Plant – now Shanghai Automotive
Industry Corporation (SAIC) – started operations, producing the ‘Phoenix’
passenger car. Thus, the Soviet Union transferred the first motor industry
knowledge and hard technology to China (Ibid). But, these developments

110
suddenly stopped after the Sino-Soviet conflict and split in 1960. Since then, and
from the following two decades, China lacked the technological capabilities to
develop its car industry. During the ‘Great Leap Forward’ (1958-1960) and the
‘Third Front’ campaigns, the industry was atomised and dispersed (Harwit, 1995;
Gallagher, 2006). Production of passenger cars practically ended during the
‘Cultural Revolution’ (1966-1971) due to the lack of investment in the sector
(Gallagher, 2006). This stunted development was the state of China’s the motor
industry at the end of the 1970s.
From the perspective of market opening and the transition of development model
of the Chinese automotive industry, three stages have been identified (Song and
Yu, 2005: 171-172):
1) Self-sufficiency Stage (before the 1980s). In this stage, from the founding
of new China in 1949 to the 1980s, the technical and production
capabilities of local firms were developed by “reverse engineering”. Cars
were mainly produced by copying existing models as no ties existed
between Chinese and foreign enterprises whose products were imitated.
During this period, exchanges between domestic and foreign firms were
unidirectional and closed. The domestic car industry failed to overcome
the many technological bottlenecks, especially in core technologies.
2) Joint Venture Stage since the Beginning of the 1980s. As China adopted its
reform and opening up policy, its car industry entered a new development
phased by attempting to introduce advanced technologies. However,
developed countries, especially Japan, were not interested in China’s
efforts to introduce new technology. Therefore, from the beginning, the
government had to resort to high tariffs and non-tariff protection measures
and develop the industry by establishing joint ventures. The interactive
learning relationship was established on this basis and it, in turn, pushed
forward technological and product upgrading of local components and
parts producers. Nevertheless, the production capacity of the Chinese side
in the joint venture automakers did not improve a great deal, particularly in

111
the areas of product development, technological innovation and brand
marketing.
3) The Transformation of the Auto Industry after WTO Accession –
Dependent Development. Song and Yu (2005) argue that regardless of
whether or not domestic enterprises have the ability to compete with
multinationals within China, there will be a trend for market opening and
strategic adjustment of multinationals and domestic firms for a number of
years. First, domestic firms may have more competitive advantages.
Second, if they do not currently have any competitive advantages, these
firms have the potential to catch up with multinationals in the future.
When compared with Chinese firms, TNCs enjoy early-mover advantages
as reflected in their brands and models, technologies and management. In
terms of price, the reduction of tariffs and abolition of non-tariff measures
after China’s WTO accession have led to a sharp fall in the prices of
Chinese auto products.25 On the other hand, regarding technology, China
would lose the possibility of developing car models based on the local
market. From the perspective of the strategic adjustments of TNCs and
domestics enterprises after China’s WTO accession, changes in their
relative competitive edges and the fostering of their learning and adapting
to new circumstances, dependence of local enterprises on TNCs has
deepened.
Automotive Policy
Although with divergent perspectives on the final outcomes and policy reach,
analysts of China’s motor industry agree that the Chinese state has played a
central role, intervening heavily in the sector’s development process (Harwit,
1995 and 2001; Moore, 2002; Holweg, Luo and Oliver, 2005; Thun, 2006;
Gallagher, 2006; Chin, 2010).
25 Song and Yu (2005: 157) estimated that in 2004 auto price in China’s domestic market were about 1.25-3.45 times the price paid on world markets.

112
As a top government priority throughout the post-Mao era, the automotive
industry developed within a highly protectionist framework (Harwit, 1995 and
2001; Moore, 2002). But even though after Mao’s death in 1976 – year in which
the Cultural Revolution officially ended –, an accelerated degree of interaction
with foreign motor vehicle companies was evident, it was only after the mid-
1980s that central leaders recognised the need for acquiring advanced technology
and to rationalise the industry in order to overcome the inefficiency problems and
to reach international production standards (Harwit, 1995; Thun, 2006).
The preferred governmental mechanism for achieving this goal was the promotion
of cooperation with foreign manufacturers under the form of joint ventures
(Harwit, 1995; Holweg, Luo and Oliver, 2005; Thun, 2006). The establishment of
JVs with state-owned enterprises was a condition for foreign manufacturers to
enter to operate in China. Foreign participation had the limit of 50 percent
ownership. Local content requirements were also stipulated (40 per cent in the
first year of production, increasing to 60 and 80 per cent in the second and third
years, respectively). The Chinese also kept control of distribution networks for the
jointly-manufactured vehicles (Harwit, 1995 and 2001; Gao, 2002; Holweg, Luo
and Oliver, 2005). The first JV was established in 1983 between Beijing Jeep Co.
of Beijing Automotive Industry and American Motors, which was subsequently
taken over by Chrysler. The second one was established in 1985 between
Shanghai Volkswagen, involving Shanghai Automotive Industry Co. and
Volkswagen AG. Another joint venture was Guangzhou Peugeot, in 1985
(Harwit, 1995; Holweg, Luo and Oliver, 2005).
In 1994, under the Automotive Industry Development Policy, the automotive
industry was officially named a ‘Pillar Industry’ of the national economy. The
goal was to develop the sector as one of the internationally competitive ‘national
champions’ by 2010 (Moore, 2002; Holweg, Luo and Oliver, 2005). The main
policy objectives of the 1994 Automotive Policy were: open up domestic and
foreign markets; promotion of large scale production; concentration of the
industry eliminating small scale-dispersed operations; encouragement of
independent product development; encouragement of the establishment of R&D

113
activities, among others. In the consolidation objective, the Chinese government
targeted a so-called ‘Big Three, Mini Three’ (San Da, San Xiao – three big firms
and three smaller firms) structure and it intended to focus most of its own energies
and investment on those six companies (Gallagher, 2006).26 Despite these actions,
however, industry analysts concur about having mixing or disappointing results.
By early 2000s, JVs had satisfied domestic passenger car needs, but price and
quality problems have left the industry open to some challenges in a free market
post-WTO world (Harwit, 2001; Moore, 2002). Likewise, the industry’s
consolidation into a fewer big firms was not realized (Gallagher, 2006).
To adapt to changes in the Chinese motor industry to China’s economic boom
since the late 1990s, and to face the challenges emerging in the sector after
China’s joined the WTO in 2001, a new Automotive Industry Development Policy
was released in 2004 (Holweg, Luo and Oliver, 2005; Gallagher, 2006). The main
objectives of this new policy were: promotion of a harmonious development of
the automotive and associated industries; driving industrial structural adjustment;
enhancing economy of scale and concentration of the industry; encouragement of
self-reliant product development and local brand development; fostering the
development of local suppliers globally competitive; and become one of the major
global auto production countries and to export in big volume. Other relevant
aspects are: insisting on the principle of combining technology transfer and self-
reliant product development; encouraging the formation of big automotive groups
(with 15 per cent market share) or alliances; supporting the establishment of R&D
centres in automotive enterprises for improving independent product innovation
capabilities; Chinese shareholder in whole car assembly enterprises must be no
less than 50 per cent, but not applying to exportation-targeted projects. According
to Holweg, et al. (2005), the fundamental difference between the 2004 automotive
policy in relation to the 1994 one, is that the former offers encouragement and
strategic direction rather than regulation. In this sense, these authors point out
26 Since 1988 - somehow emulating the United States’ auto industry -, a scheme of ‘Big Three, Little Three’ had been proposed. According to this plan, China’s main vehicle manufacturers would be the FAW in Changchun, the Second Auto Works in Hubei, and the Shanghai vehicle factory, which by then had formed the JV with VW. The three minor players would be the JV companies of Beijing Jeep, Guangzhou Peugeot, and the Tianjin Automotive Corporation which had a licensing agreement with Japan’s Daihatsu Motor Company (Harwit, 1995: 36-37).

114
that this move “indicates a significant change in the role of the Chinese
government in economic matters, as the government is now committed to using
market forces to influence the industry’s future, rather than government-
prescriptive policies” (Holweg, et al., 2005: 16).
Given China’s aspiration in the global economy, avoiding its entrance into the
WTO was almost an impossible task. As Thun (2006: 5) underlines, “Accession to
the WTO represented not only a dramatic change in the formal rules of the game,
but also recognition on the part of (at least) some Chinese leaders that the very
nature of the game itself was changing”; and he adds (Ibid: 5-6), “Not joining the
WTO would both prevent China from fully participating in global production
networks – and the country clearly had a great deal to gain – and make it more
difficult for Chinese firms to develop the competitive ability that would allow
them to carve out high-value added pieces of such networks”. Thus, after China’s
entrance into the WTO, a number of steps to open up the market, including tariff
reductions and eliminating local content requirements were carried out. For
example, tariffs for passenger cars will fall to 26 per cent this year (2006),
whereas during the 1990s the range between 80-100 per cent; overall average will
be cut to 10 per cent by this year (Table 4.4).
China’s entry into the WTO brought about new challenges to the automotive
industry. TNCs and Chinese automakers have all made dramatic adjustments to
their development strategies (Harwitt, 2004; Song and Yu, 2005). In general
terms, the basic strategy of TNCs after China’s entry into the WTO has been to
invest or expand their investments in China, and continually bring out new
products, introduce whole series of products to the country, as well as lower car
prices. On the other hand, Chinese companies have all opted for the strategy of
entering into joint ventures or importing new models. Even if Chinese firms start
independent development and have their own brands, they are still ready to enter
into joint ventures with multinationals (Song and Yu, 2005). As a result, China’s
automotive industry began to grow at accelerated pace, both in terms of
production and marketing. The size of the market and the new conditions under

115
the WTO terms has meant an additional and powerful motive for foreign firms to
import cars and trucks made outside China (Holweg, et al., 2005; Harwitt, 2004).
Table 4.4. Major Changes in China’s Motor Industry Under the WTO Agreement
Key Issue
Before WTO After WTO
Import tariffs
200% in 1980s; 80-100% in 1990s on passenger cars; as low as 9% on some other vehicles.
Reduced to 25% for passenger cars by July 2006. Overall average cut to 10% by 2006.
Import quotas
Quotas vary by year on number and value of imported vehicles; 27,000 vehicle imports licenses issued in 1999.
Raised limit to $6 billion worth of imports on accession, 15% annual growth until elimination in 2005.
Local content requirements
40% in first year of production, increasing to 60%, 80% in second and third years, respectively. Various incentives to speed use of domestic parts suppliers.
Elimination of local content requirements on accession.
Import arrangements rights
Foreign enterprise cannot directly import vehicles.
Import rights granted within 3 years of accession.
Distribution, retail, after sales service
Cars manufacturers must use Chinese distribution to sell their vehicles (limited to wholesaling through joint ventures), and domestic firms to service them.
Distribution, sales and service rights for foreign firms phased in over three years.
Finance
Chinese consumers have difficulty financing vehicle purchase using domestic bank loans. Foreign, non-bank financial institutions prohibited for providing financing.
Non-bank foreign firms can provide unrestricted auto financing on accession.
Foreign Investment
Strict requirement for foreign companies to establish their operations as joint ventures with state-owned enterprises. Foreign equity could not exceed 50%.
Foreign companies can own no more than 50% of an enterprise, but not applying to exportation-targeted projects.
Source: Elaboration based on Harwit (2001: Table 4: 663), Gao (2002: Exhibit 3: 148), and Holweg, et al. (2005: Appendix B: 68).
The recent financial crisis also induced the implementation of new policy actions.
In particular, the 2009 Automotive Industry Revitalisation Plan, aimed at
stimulating the sector, included the following objectives (Stewart, et al, 2012): a)
Growth in the production and sales of autos with a goal of selling more than 10

116
million autos in 2009 and a achieving an average annual growth rate of 10% in
three years; b) Increasing auto consumption with a reasonable system of taxes and
fees, and creating an infrastructure to support electric autos; c) Optimising the
market demand structure, so that passenger cars of 1.5L or less account for 40%
or more of demand, with passenger cars of 1.0L or less account for 15% or more
of the market; heavy trucks will account for 25% of all trucks; d) Formation of
two or three large auto enterprises with production and sales exceeding 2 million
vehicles and four or five enterprises with production and sales volume exceeding
1 million vehicles. The number of enterprises accounting for 90 percent of market
share shall be reduced from 14 to 10 or less; e) Increasing the market share of
Chinese brand autos to 40 percent for passenger autos. Exports of Chinese brand
passenger cars shall account for 10 percent of the volume of automobiles
produced and sold; f) Increasing the production capacity for new-energy
automobiles to 500,000, including purely electric, chargeable hybrid electric, and
ordinary hybrid electric autos. The sales volume of such vehicles should account
for 5 percent of the total sales volume of passenger cars; g) Increasing research
and development in assembled vehicles so that main sedan products satisfy the
requirements of developed countries and so that the technical level of new-energy
autos reaches an advanced international level; h) Realising “technological
independence” in product areas such as key spare parts in the engine
transmissions, steering systems, braking systems, drivetrain systems, suspension
systems, and vehicle control systems and advancing the technological level of
new-energy vehicle parts so that they are globally competitive. As observed, the
Revitalisation Plan not only intended to help Chinese automakers to overcome the
economic slump, but also to enable them to leapfrog to the next stage of
technological development, focusing on ne-energy vehicles, and gain competitive
advantage in domestic and global markets.
More recently, in March 2011, the National People’s Congress approved the 12th
Five-Year Economic and Social Development Plan, the blueprint for China’s
economy from 2011 through 2015. In this plan, 7 new ‘strategic and emerging’
industries were identified (APCO, 2012): biotechnology, new energy, high-end
equipment manufacturing, energy conservation and environmental protection, new

117
materials, next-generation IT, and clean-energy vehicles. Thus, new-energy
vehicles, hybrid and electric, are part of these selected group of strategic sectors
towards the future. The 12th Five-Year Plan sets out two core sets of goals for the
Chinese motor industry (Stewart, 2012): a) To improve domestic automakers’
capability to produce entire vehicles in addition to parts, and it aims to develop an
independent indigenous capacity to produce key components; and b) The plan
places particular focus on new-energy vehicles, and it identifies the production of
such hybrid and electric vehicles as the key means by which China will be able to
develop the technology to leapfrog over its competitors and become a global
player in world auto market. Under this plan, other specific programmes for the
development of the new-energy vehicle policies have been implemented: The
‘863– Plan – Project for EVs (2011-2015) and the New Energy Vehicle Industry
Development Plan (2011-2010). China plans to invest more than US$ 18 billion
over the next 10 years to become the world’s leading producer of electric and
hybrid vehicles and their components.
Industry Structure and Recent Developments
The Chinese auto industry is comprised of between 130 and 150 vehicle
manufacturing companies (Ernst & Young, 2005; Russo, et al., 2009). Among
these, three types of producers can be identified (Holweg, et al., 2005): a) JVs
between local Chinese vehicle manufacturers and TNCs; b) five large domestic
groups that, either in addition to their JVs with foreign firms or independently,
manufacture and sell cars (Beijing Automotive Industry, Chongqing Changan
Automobile, Dongfeng Motor, China FAW Group, and SAIC Motor); and c) a
large base of small manufacturers which mainly produce economy vehicles for the
low-end market (Chery, Zhejiang Geely, Hafei, etc.). It is worth pointing out,
however, that despite these different types of producer groups, automakers do not
work in an independent way. Rather, a complex partnership structure and highly
complicated network relationships have developed among them. Figures 4.3 and
4.4 display the location of the major global automakers/JVs and domestic
automakers’ production facilities, respectively.
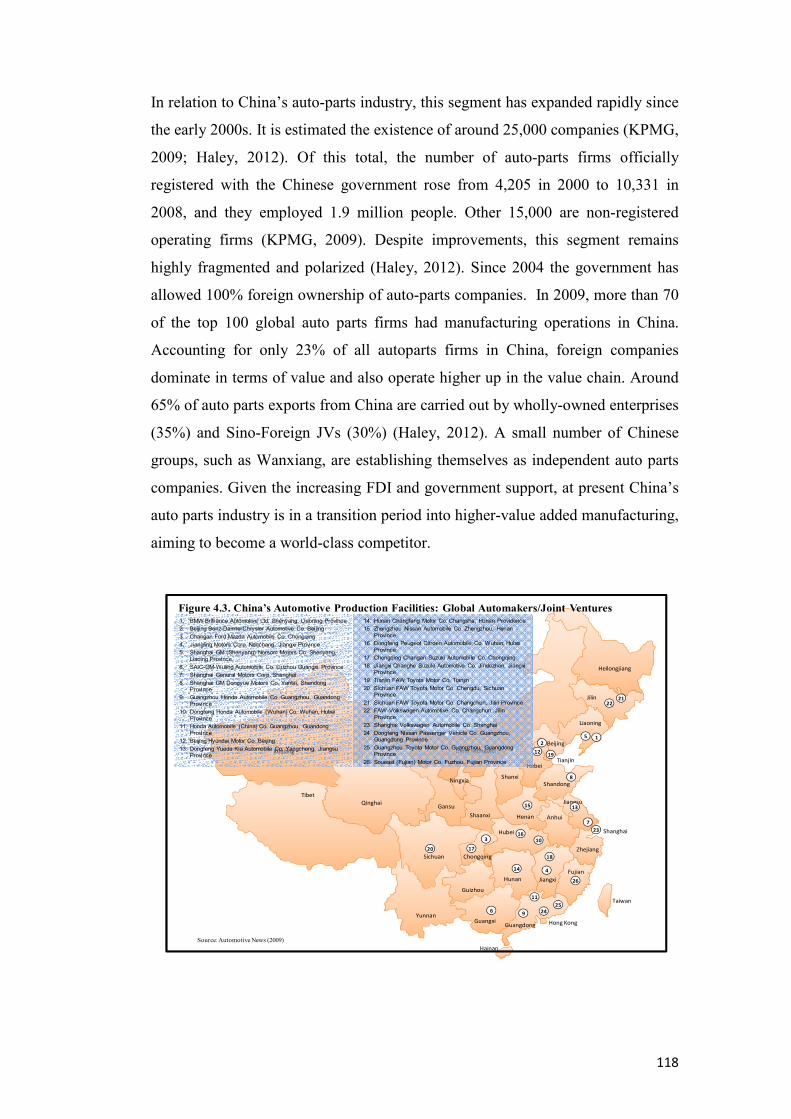
118
In relation to China’s auto-parts industry, this segment has expanded rapidly since
the early 2000s. It is estimated the existence of around 25,000 companies (KPMG,
2009; Haley, 2012). Of this total, the number of auto-parts firms officially
registered with the Chinese government rose from 4,205 in 2000 to 10,331 in
2008, and they employed 1.9 million people. Other 15,000 are non-registered
operating firms (KPMG, 2009). Despite improvements, this segment remains
highly fragmented and polarized (Haley, 2012). Since 2004 the government has
allowed 100% foreign ownership of auto-parts companies. In 2009, more than 70
of the top 100 global auto parts firms had manufacturing operations in China.
Accounting for only 23% of all autoparts firms in China, foreign companies
dominate in terms of value and also operate higher up in the value chain. Around
65% of auto parts exports from China are carried out by wholly-owned enterprises
(35%) and Sino-Foreign JVs (30%) (Haley, 2012). A small number of Chinese
groups, such as Wanxiang, are establishing themselves as independent auto parts
companies. Given the increasing FDI and government support, at present China’s
auto parts industry is in a transition period into higher-value added manufacturing,
aiming to become a world-class competitor.
Xinjiang
Tibet
Qinghai
Inner Mongolia
Gansu
Sichuan
YunnanGuangxi
Guangdong
Taiwan
Hainan
Hunan
Guizhou
Jiangxi
Fujian
Shaanxi
Ningxia
Hubei
Henan
Zhejiang
Anhui
Jiangsu
Shandong
Hebei
Shanxi
Hong Kong
Beijing
Liaoning
Jilin
Heilongjiang
Chongqing
Shanghai
Tianjin
69 24
25
11
26
414
18
103
7
16
17
23
15 13
8
15
2
1219
2122
20
1. BMW Brilliance Automotive Ltd. Shenyang, Liaoning Province
2. Beijing Benz-DaimlerChrysler Automotive Co. Beijing
3. Changan Ford Mazda Automobile Co. Chongqing
4. Jiangling Motors Corp. Nanchang, Jiangxi Province
5. Shanghai GM (Shenyang) Norsom Motors Co. Shenyang,
Liaoing Province
6. SAIC-GM-Wuling Automobile Co. Liuzhou Guangxi Province
7. Shanghai General Motors Corp. Shanghai
8. Shanghai GM Dongyue Motors Co. Yantai, Shandong Province
9. Guangzhou Honda Automobile Co. Guangzhou, Guandong
Province
10. Dongfeng Honda Automobile (Wuhan) Co. Wuhan, Hubei
Province
11. Honda Automobile (China) Co. Guangzhou, Guandong
Province
12. Beijing Hyundai Motor Co. Beijing
13. Dongfeng Yueda Kia Automobile Co. Yangcheng, Jiangsu Province
14. Hunan Changfeng Motor Co. Changsha, Hunan Providence
15. Zhengzhou Nissan Automobile Co. Zhengzhou, Henan
Province
16. Dongfeng Peugeot Citroen Automobile Co. Wuhan, Hubei
Province
17. Chongqing Changan Suzuki Automobile Co. Chongqing
18. Jiangxi Changhe Suzuki Automotive Co. Jindezhen, Jiangxi Province
19. Tianjin FAW Toyota Motor Co. Tianjin
20. Sichuan FAW Toyota Motor Co. Chengdu, Sichuan Province
21. Sichuan FAW Toyota Motor Co. Changchun, Jilin Province
22. FAW-Volkswagen Automotive Co. Changchun, Jilin
Province
23. Shanghai Volkswagen Automobile Co. Shanghai
24. Dongfeng Nissan Passenger Vehicle Co. Guangzhou, Guangdong Province
25. Guangzhou Toyota Motor Co. Guangzhou, Guangdong Province
26. Soueast (Fujian) Motor Co. Fuzhou, Fujian Province
Figure 4.3. China’s Automotive Production Facilities: Global Automakers/Joint Ventures
Source: Automotive News (2009)

119
China’s automotive industry has been highly dominated by the JV operations
between Chinese firms and TNCs. Among the most important ones are FAW-
Volkswagen Automotive Corporation, SAIC-General Motors, Guangzhou-Honda
Automobile Corporation, Beijing-Hyundai Motor Corporation, Dongfeng-Nissan
Corporation, Dongfeng-Peugeot Citroen Automobile Corporation, Tianjin FAW-
Toyota Motor Corporation, and Dongfeng Yueda-Kia Automobile Corporation.
The major Sino-Foreign JVs are presented in Figure 4.5. Although traditionally
Sino-Foreign JVs were dominated by China’s largest state-owned enterprises
(SOEs), very recently this pattern has started to change. Smaller and independent
Chinese automakers are also forming JVs with foreign partners. For example, in
May 2010 BYD and Daimler AG formed a US$ 95 million JV, BYD Daimler
New Technology, to design and manufacture electric vehicles (EVs) (Automotive
News Europe, 2012). In the same line of EVs, Great Wall Motors, one of China’s
major private companies, signed an agreement with CODA Automotive to jointly
design and build an economy-class EV that will be aimed at Chinese, U.S. and
European markets (China Economic Net, 2012a). Likewise, Chery Automobile
Xinjiang
Tibet
Qinghai
Inner Mongolia
Gansu
Sichuan
Yunnan
Guangxi
Guangdong
Taiwan
Hainan
Huanan
Guizhou
JiangxiFujian
Shaanxi
Ningxia
Hubei
Henan
Zhejiang
AnhuiJiangsu
Shandong
Hebei
Shanxi
Hong
Kong
Beijing
Liaoning
Jilin
Heilongjiang
Chongqing
Shanghai
Tianjin
13
8
3
17
5
121415
21
9
7
6
11
102
20
19
18
161
4
1. Dongfeng Liuzhou Motor Co. Liuzhou, Guangxi Province
2. Dongfeng Automobile Co.Xiangfan, Hubei Province
3. FAW Car Co. Changchun, Jilin Province
4. FAW Haima Automobile Co. Haikou, Hainan Province
5. Tianjin FAW Xiali Automobile Co. Tianjin
6. Chery Automobile Co. Wuhu, Anhui Province
7. Anhui Jianghuai Automobile Co. Hefei, Anhui Province
8. Shenyang Brilliance Jinbei Automotive Co. Shenyang,
Liaoning Province
9. BYD Auto Co. Xian, Shaanxi Province
10. Jiangxi Changhe Automobile Co. Jingdezhen, Jiangxi Province
11.Zhejiang Geely Automobile Group, Hangzhou, Zhejiang
Province
12.Great Wall Motor Co. Baoding, Hebei Province
13.Hafei Motor Co. Harbin, Heilongjiang Province
14.Hebei Zhongxing Automobile Co. Baoding, Hebei
Province
15.Rongcheng Huatai Automobile Co. Rongcheng, Shangdong Province
16. Jiangxi Jiangling Holding Co. Nanchang, Jiangxi
Province
17.Beijing Automobile Works Co. Beijing
18.Chongqing Changan Automobile Co. Chongqing
19.Chongqing Lifan Automobile Co. Chongqing
20.Hunan Jiang Nan Automobile Co. Xiangtan, Hunan Province
21.SAIC Motor Co. Shanghai
Figure 4.4. China’s Automotive Production Facilities: Domestic Automakers
Source: Automotive News (2009)

120
Co. finalised a JV agreement with Jaguar Land Rover (JLR), owned by India’s
Tata. The US$ 2.8 million JV will manufacture Jaguars, Land Rovers and new
JV-branded vehicles and engines, set up R&D facilities, and sell vehicles
produced by the JV (Automotive News, 2012a). This recent wave of Sino-Foreign
JVs marks not only the inclusion of small-independent and private Chinese
automakers in this sort of operations, but also a new type of linkages between
emerging-countries TNCs.
The dynamic changes in China’s motor industry, particularly after the 1990s, were
reflected in its economic indicators. The figures on investment, production and
sales are impressive. According to data from China Automobile Industry
Yearbook (CCPIT, 2007; DRC-SAE-VW Group China, 2010), total investment in
automotive-related activities27 jumped from 413.6 million renminbi (RMB) in
1980, to 4,129 million RMB in 1990, and 17,874.8 million RMB in 2000. In
2008, this amount reached 77,230 million RMB, around US$ 11,300 million.
During these years China also became the largest attractor of FDI in the motor
industry. As it will be analysed in Chapter 5, during the period 1983-1998 the
Chinese motor industry received US$ 20,366.0 million, 4,000 during 1998-2001,
and from 2001 to 2011, almost US$ 32,500 million.
Production and sales have grown exponentially. With 18.5 million motor-vehicles
produced and sold in 2011, China accounted for almost a quarter of the world’s
total in both categories.28 On the other hand, vehicle exports have not followed the
same pace of growth than production and sales. Although export volumes have
substantially increased from a very low base in the 1980s and 1990s, reaching
nearly 850,000 in 2011, this figure still very low in relation its potential,
representing less than 5% of total production (Table 4.5). It is clear that, up to
now, China’s domestic market is the main focus of automotive operations. As
discussed and analysed in more detail in chapters 5, 6 and 7, is in the auto parts
segments where China is rapidly gaining global competitive positioning.
27 It includes the segments of automobiles, refitted automobiles, motorbikes, vehicle engines and accessories. 28 Calculation based on figures from OICA and Ward’s.

121
In correlation with JVs dominance, global brands account for 70% of China’s
light-vehicles market, with Chinese brands reaching 30%. Conversely, in the
commercial-vehicle segment, Chinese brands dominate the market, concentrating
around 95% of domestic sales (Dunne, 2012). Based on 2011 figures for
passenger vehicles, VW is the top selling brand, with 13.6% of domestic market
share, followed by Toyota, Nissan and Hyundai, with 6.5%, 6.4% and 5.9%,
respectively. GM’s Buick and Chevrolet also have an important share of sales,
with nearly 10% between both brands (Table 4.6). Among the domestic brands,
Chery (4.3%), BYD (3.4%), Great Wall (2.8%) and JAC (1.7%) stand out.
A similar situation is observed in the production side, where the JVs are the top
manufactures of passenger vehicles, while Chinese firms dominate the
manufacturing of the commercial segment (Table 4.6). The largest JVs dominate
the production figures. Shanghai General and Motors and Shanghai Volkswagen
account for around a fifth of China’s total production of passenger vehicles. FAW
Figure 4.5. Major Sino-Foreign Joint Ventures in the Motor
Industry, 2012
SAIC
FAW
Dongfeng
Changan
Guangzhou AIC
Beijing AIC
Brilliance
Foton
Chery
Great Wall
BYD
Geely
Volkswagen
General Motors
Toyota
Ford
Daimler A G
PSA
Hyundai
Honda
Renault-Nissan
Fiat-Chrysler
Mazda
BMW
Suzuki
Kia
Zhongxing
Jianghuai
Jaguar Land RoverHafei
CODASource: Own elaboration.

122
Volkswagen is another significant manufacturer, with 8.3%. Of the domestic
firms, Chery, BYD, Geely Group, and Great Wall, as a whole participate with
15% of the market.
Table 4.5. Production, Sales and Exports in China’s Motor Industry,
1980-2011 (Units)
Year
Production
Sales
Exports
1980 140,950 n.a 726 1985 443,337 n.a. 1,659 1990 509,242 n.a. 4,431 1995 1,434,788 1,441,779 17,747 2000 2,069,069 2,091,305 27,136 2005 5,668,163 5,814,276 32,460 2006 7,566,233 7,076,817 89,935 2007 8,885,461 8,819,133 208,617 2008 9,233,290 9,330,366 245,917 2009 13,648,553 13,618,095 105,949 2010 18,264,667 18,061,936 544,900 2011 18,418,876 18,510,000 849,000
n.a.: Not available. Source: Own elaboration based on Ward’s (2001); OICA (2012); just-auto (2012); CCPIT, 2007; DRC-SAE-VW Group China, 2010
The counterpart of domestic sales for several of the small, independent and local
government-supported Chinese automakers is the export market. Some of these
are China’s most dynamic motor vehicle exporters, with a deliberate strategy of
internationalization. In the race to be globally competitive and to catch up faster
with technological capabilities, Chinese automakers have deployed a variety of
strategies. These go from hiring engineering service and design firms, buying
bankrupt companies, forming JVs with global suppliers, to acquiring luxury and
worldwide-recognized auto brands. In March 2010, for instance, Geely acquired
Volvo Corporation from Ford in a US$ 1,800 million-transaction.

123
Table 4.6. Top Brand Sales and Manufacturers in China’s Domestic Market,
2011
Rank
Brand Sales
Units
%
Manufacturers
Units
%
1 Volkswagen 1,777,623 13.6 Shanghai GM 1,207,445 9.8 2 Toyota 848,317 6.5 Shanghai VW 1,178,421 9.6 3 Nissan 835,217 6.4 FAW VW 1,017,802 8.3 4 Hyundai 770,705 5.9 Beijing Hyundai 743,888 6.1 5 Buick 645,829 4.9 Dongfeng Nissan 658,368 5.4 6 Chevrolet 618,244 4.7 Chery 629,386 5.1 7 Honda 593,212 4.5 FAW Toyota 528,270 4.3 8 Chery 556,235 4.3 BYD 449,425 3.7 9 Kia 459,938 3.5 Geely Group 435,476 3.5 10 BYD 448,484 3.4 Dongfeng Yueda
Kia 431,265 3.5
11 Great Wall 365,075 2.8 Changan Ford Mazda
419,520 3.4
12 Ford 323,285 2.5 Dongfeng PSA 405,935 3.3 13 Audi 305,920 2.3 GAC Honda 368,788 3.0 14 Suzuki 302,147 2.3 Great Wall Motor 365,952 3.0 15 FAW 273,520 2.1 GAC Toyota 272,526 2.2 16 BMW 234,241 1.8 Dongfeng Honda 253,854 2.1 17 Citroen 230,679 1.8 TAIC FAW Xiali 253,633 2.1 18 Mazda 225,433 1.7 FAW Car 239,141 1.9 19 Skoda 220,009 1.7 Changan Suzuki 219,889 1.8 20 JAC 217,201 1.7 Jianghuai Autom. 218,352 1.8
P-V Total 13,074,298 75.0 P-V Total 12,270,438 72.3
1 Wuling 1,209,006 24.5 SAIC-GM-Wuling 1,192,411 24.6 2 Changan 646,908 13.1 Changan Group 646,329 13.3 3 Dongfeng 575,531 11.7 Beiqi Foton 492,334 10.1 4 Foton 525,883 10.7 DFAC 353,719 7.3 5 Jinbei 305,340 6.2 Brilliance Jinbei 297,584 6.1 6 JAC 208,304 4.2 Dongfeng Yuan 234,731 4.8 7 FAW 137,992 2.8 Jianghuai Autom. 201,544 4.2 8 JMC 127,006 2.6 Jiangling Motors 178,238 3.7 9 Great Wall 121,736 2.5 Great Wall Motors 120,110 2.5 10 Hafei 117,933 2.4 Hafei Motors 115,772 2.4
C-V Total 4,928,749 25.0 C-V Total 4,853,206 27.7
P-V: Passenger Vehicles. C-V: Commercial Vehicles. Source: Elaboration based on LMC Automotive (2012).
124
In 2011 Chery exported 160,000 vehicles to more than 64 countries. In like
manner, Great Wall exported 83,000 units. The core of exports is destined to
developing countries (Southeast Asia, Middle East, North Africa, Eastern Europe,
and Latin America), competing in the low-end market segments. Great Wall has
established assembly facilities in Bulgaria, Egypt, Indonesia, Iran, Malaysia,
Philippines, Russia, Senegal, Venezuela and Vietnam. For its part, Chery has
located assembly operations in Argentina, Brazil, Egypt, Iran, Malaysia, Russia
and Ukraine, Uruguay, and Venezuela. Automotive specialists consider that due to
technical and organizational shortcomings, is going to take a few more years for
Chinese firms to substantially penetrate the developed-country markets (Donelly,
2008; Yang, 2012).
Among the factors ‘pushing’ Chinese domestic automakers to internationalise is
the increasing fierce domestic competition with a surge in the number of models
available in China and excess production capacity (Russo, et al., 2009b). This
process is causing a decrease in demand for some Chinese automakers’ brands,
squeezing domestic profit margins. An explanation for overcapacity among
domestic manufacturers is the fact that many Chinese provinces are trying to
develop their own automotive sectors. In order to do so, investment plans are
generally financed by state-owned banks regardless of commercial criteria (Ernst
& Young and EIU, 2005). Paradoxically, the central government has used foreign
firms to control local governments (Thun, 2004 and 2006), since the latter’s idea
of having their own car industry has caused inter-provincial rivalry and local
protectionism, leading to inefficiency problems for both domestic and foreign
joint ventures.
In fact, the sector’s excess capacity has been a source of concern among industry
executives and government official for some years. It is estimated that production
capacity in China will probably rise 15% in 2012 and 20% in 2013, outpacing the
expected 4% annual increase in demand (Automotive News, 2012b). In this
regard, aiming at limiting overcapacity and improving the strength of domestic
automakers, China’s National Development and Reform Commission (NDRC)
and the Ministry of Commerce formulated recently a policy guideline to restrict

125
foreign investment in automotive manufacturing. The new policy took effect on
January 30, 2012, replacing rules from 2007 (China Economic Net, 2012b).
China’s government will continue to encourage FDI in more fuel-efficient
vehicles, manufacturing of engines and other key components, as well as R&D in
key technologies. According to auto specialists, this new policy may have
important impacts on the flows of FDI since it might be more difficult for
automakers to get approval for new plants in the future, unless they have an
investment in new-energy vehicles (Automotive News, 2011a).
4.4. Structure and Evolution of Mexico’s Motor Industry
Background and Development Phases
Mexico’s automotive industry has undergone a radical transformation during the
last three decades. Since the beginning of the industry in the mid-1920s to 1980,
its structure and orientation was influenced by industrial policies following an
import substitution strategy (Bennett and Sharpe, 1985; CEPAL, 1992; Ramirez
de la O, 1998; Tuman, 2003). With the purpose of serving the domestic market –
particularly after the 1962 Automotive Decree -, a number of wholly-owned
transnational corporations started manufacturing activities competing in a closed
environment. Nevertheless, due to the 1982 economic crises, the Mexican
government was forced to change towards a more open and export promotion
policy. After liberalising the economy and establishing more flexible FDI rules,
Mexico was being increasingly integrated into the automotive global production
systems through new investments (CEPAL, 1992; Shaiken, 1994). The new
export plants combined high–tech production segments, highly skilled labour
force and flexible work norms. This trend about Mexico being a potential site for
high-tech and advanced production in the car industry attracted the attention of
some analysts who argued the changing nature of the current international division
of labour in this industry at that time (Shaiken, 1994). The signing of a North
American Free Trade Agreement (NAFTA) between Mexico, the United States
and Canada - which came into effect on 1 January 1994 - deepened Mexico’s
integration into the global motor industry, specially within the North American
market ad production base (Carrillo, 2004; Studer, 2004; Tuman, 2003; Ramirez

126
de la O, 1998). As a consequence of this process of Mexico’s integration into the
global automotive industry, the country’s sector has become more specialised for
the international markets.
The development phases of Mexico’s motor industry can be depicted as follows:29
1) The Emergence of the Industry and Assembly Stage (1908-1962). This phase
was characterised by the import of completely build vehicles (1908-1924) and
subsequently assembly activities with imported parts or complete knock down kits
(CKD) were developed through license agreements or by subsidiaries of foreign
companies (1925-1962). A new regulatory framework developed in 1924 imposed
steep tariffs on imported vehicles while cutting prevailing duties on parts imports,
as a first step toward implementing a policy of import substitution. This policy
induced automakers to invest in Mexico in order to avoid tariffs. The first
assembly plant in Mexico was set up by Ford Motor Company in 1925, being
followed by General Motors which initiated operation in 1935. A few years later,
in 1938, Chrysler entered the Mexican market through a license arrangement with
Fábricas Auto-Mex. Eventually, Chrysler acquired the Mexican company.
2) The Import Substitution Industrialisation (ISI) (1962-1969). Given the absence
of ‘backward’ linkages with local suppliers and the increasing deficit in the
sector’s balance of payments, in 1962 the government issued the first Automotive
Decree aiming at nationally integrating the structure of production. Under the
Decree regulations, 60% of all parts used in domestically produced vehicles were
required to come from Mexican suppliers. In addition, foreign investment in auto
parts operations was limited to 40%. The post-1962 structure of Mexico’s motor
industry reflected the dominance of U.S., Japanese and German automakers.
Nissan and VW started manufacturing operations in Mexico during the 1960s.
Vehicle production increased during this phase but, despite some advances, trade
imbalances persisted, and domestic component firms had problems to achieve
economies of scale, producing expensive and low-quality parts. Mexican-owned
29 The first five phases are mainly based on the works of Tuman’s (2003), and complemented with Bennett and Sharpe (1985), CEPAL (1992), and Moreno Brid (1996).

127
companies which had previously assembled cars through licenses agreements
were gradually displaced by foreign-owned subsidiaries.
3) The Exhausting of ISI (1970-1982). Government efforts during the decade of
the 1970s focused on imposing higher tariffs on imports, stronger domestic
content requirements, and export incentives. By 1972, all automakers were
required to balance automotive parts imports with exports. Nevertheless, the
initial move to export promotion was largely a failure since it was cheaper for
foreign firms to supply their home plants with components imported from other
developed countries. The 1977 Automotive Decree intended to promote exports
through strict regulation of balance-of-payments mechanisms. This time, the
international environment of the late 1970s, such as the impact of the 1974 oil
crisis and the penetration of Japanese imports into the U.S. market, induced
foreign automakers to consider Mexico as export platform, in particular of auto
parts and engines. During this period GM and Ford started investing in
maquiladora auto parts plants in northern Mexico. The effects of the 1977 Auto
Decree were diverse. On the one hand, in order to meet export requirements, the
major TNCs made substantial investments in engine and maquiladora plants. On
the other hand, the industry continued to experience a worsening trade deficit.
4) Restructuring and Export Promotion (1982-1993). Derived from the deep
economic crisis of the Mexican economy in 1982, the government was forced to
abandon the ISI model and initiated a process of liberalisation of the economy.
This policy change had very significant implications for the structure and
operation of the motor industry. In 1983 a new Automotive Decree was released,
having as major objectives the industry’s rationalisation and the strengthening of
the export-orientation. The new policy limited the number of models per company
and prohibited the production of 8-cylinder engines; also, the minimum domestic
content for each vehicle was raised to 60%, but each firm was allowed to
compensate for local content with higher ratio of exports to total production. After
this period of crisis, the composition of the finished vehicle sector changed. Firms
with weak financial position were forced out of the market (i.e. Renault and
VAM); the others entered a process of restructuring and modernisation. By the

128
mid-1980s, Ford, GM, Chrysler and VW had embarked in substantive investments
in technologically advanced and export-oriented car plants. In addition, by the
early 1990s the government also liberalised automotive trade, allowing importing
a greater number of different model from abroad. In summary, after an initial
period of adjustment, the industry experienced growth and recovery. Production
increased and the share of exports in relation to total production went from 11% to
more than 50% in the period 1983-1993.
5) NAFTA and Regional Integration (1994-2007). Mexico, the United States and
Canada formed the NAFTA in 1994, formalising a process of regional integration
and the creation of a free trade area. Under NAFTA, tariffs on goods traded in
North America were reduced, and domestic content rules as well as restrictions on
FDI were eliminated. As in the period after the 1982 economic crisis, NAFTA
and regional integration had important impacts on the motor industry’s structure
and operation (Tuman, 2003). First, trade liberalisation led to economic
restructuring, hitting inefficient-small and medium auto parts firms. In the
finished vehicle plants restructuring was also felt. Second, as duties had been
reduced on imports, automakers eliminated certain product lines in Mexico and
replaced them with vehicle imports from the United States or other countries.
Simultaneously to this process, Mexico’s motor industry received significant
amounts of FDI for the setting up of new car and engine plants, or increasing
installed capacity, mostly destined for export markets. New automakers initiated
operations in this period: Honda, Mercedes Benz and BMW. Third, motor vehicle
and auto parts production and exports have significantly grown. And, fourth,
NAFTA has resulted in a high level of integration in the North American motor
industry.
6) Post-NAFTA Phase: 2007–to Present. It could be argued that a new
development phase of Mexico’s motor industry began to emerge from the second
half of the 2000s. However, until now this new phase does not represent a radical
change from the previous one, but it does contain differentiated characteristics.
Some of these new characteristics are the following: a) New automotive players
are entering the Mexican market. Other European and Asian automakers are

129
setting up manufacturing operations. This is the case of Fiat, Audi, Mazda and
some Chinese firms (Foton and JAC Motors); b) Derived from the 2008-2009
financial crisis, Mexico is playing a key role as manufacturing centre of new-
efficient, technologically advanced, subcompact and medium-size cars; c) In the
auto parts segment new global players are also arriving to Mexico’s motor
industry, since new assembly operations are bringing their own supplier’s
network; d) There is a tendency for a diversification of the export markets,
especially towards some countries of Latin America, Europe and Asia; e)
Increasingly, the auto parts maquiladora industry is becoming of third and fourth
generation; and f) At small scale, but new ‘Mexican’ automakers are emerging.
On the one hand are the sport brands such as Mastretta and Vehizero; on the other,
commercial vehicle firms such as Giant Motors and Spartak, for example. What
attract attention in the case of the latter is that these new Mexican auto firms are
operating through technological association with Chinese counterparts. In this
sense, it seems that Chinese motor companies, through investment in assembly
plants, global maquiladoras and auto parts, as well as technological associations
are significantly shaping this new development phase of Mexico’s motor industry.
Automotive Policies and the Motor Industry’s Development
Given the significance of the motor industry in the Mexico’s national economic
development, the government has established specific programmes for its
promotion and consolidation. As reflected in the industry’s development phases,
formal implementation of these programmes has been carried out through
‘Automotive Decrees’ aimed at regulating the structure and evolution of Mexico’s
motor industry, the final assembly and the auto part segment (production, sales,
FDI, trade, etc.) (Moreno Brid, 1996). From 1962, the year that the first
automotive policy was issued, six Automotive Decrees have been released: 1962,
1972, 1977, 1983, 1989 and 2003. In 1995 some modification were carried out to
incorporate the NAFTA regulations. Likewise, in November 2009, the 2003
Decree was modified to accommodate to the new market situation after the
financial crisis, facilitating the registration or renovation as light vehicle producers
to auto firms (Presidencia de la República, 2009).

130
The central aim of the 1962 Auto Decree was to develop a ‘national’ motor
industry, strengthening local manufacturing capabilities through a process of
import substitution. By the end of the 1970s emphasis was placed on trade balance
and export promotion; by the 1980s a process of market liberalisation was
initiated. In the 1990s, with the signing of NAFTA, trade barriers in the sector
were gradually eliminated, marking the end of Mexico’s trade protectionist
policies in the motor industry (Moreno Brid, 1996; Mortimore and Vergara,
2004). Under the NAFTA framework, tariffs, domestic content rules and
restrictions on foreign investment were eliminated. Some of the main provisions
were as follows: a) Elimination of tariffs on all automotive goods by 2003; b)
New rules-of-origin and regional-content requirement of 62.5 percent for cars and
specific components and 60 percent for other parts, to be reduced by 2004 to 52.5
percent and 50 percent, respectively; c) In January 1994, Mexico’s import quota
on new automobiles - which limited a firm’s imports to 15 percent of its annual
production - was eliminated; d) Restrictions on foreign direct investment in the
Mexican automotive parts industry – which had previously limited foreign
ownership to 49 percent – where phased out in 1999; e) Treatment of Mexican-
produced vehicles as ‘domestic’ under the U.S. corporate average fuel economy
(CAFE).
In a zigzagging course, from 1962 to the early 1990s government policies were
moving from pursuing a ‘national’ industry to a globally (regionally) integrated
one. In rather inconsistent policy actions, along this timeline Auto Decrees
pursued the industry’s ‘integration’, ‘development’, ‘promotion’, ‘rationalisation’,
‘modernisation’, and ‘competitiveness’ (Figure 4.6).

131
During the mid-1990s, Mexico’s motor industry was viewed as one of the most
successful cases in industrial restructuring (Moreno Brid, 1996). Certainly,
government automotive policies played an important role, but they only explain
part of the equation. Rather, as Moreno Brid suggested (ibid: 30), the success in
establishing an internationally competitive motor industry is only partially
explained by automotive policies since “this development was not due entirely to
an imposition upon the transnational corporations by the Mexican government,
but the resulted from corporations’ interests, given the competitive context which
then prevailed worldwide, and the Big Three’s urgent need to respond to Japanese
competition”.
The increasing process of international integration has produced a more
specialised role of Mexico’s motor industry al global level, in particular in the
North American region. The changing automotive policy since the 1962 Decree
and the following three decades practically marked the end of a national dream:
the manufacture of a motor vehicle which in content and design is 100% Mexican,
the ‘Mex-Car’. As discussed above, during recent years, a kind of renaissance in
the design and manufacture of ‘Mexican’ brands is emerging. This time, this trend
1962 1972 1977 1983 1989 1995 2003
Integration
Development
Promotion
Rationalisation
Modernisation
NAFTAReforms
Competitiveness and Domestic
Market
Develop the
industry, improve
balance of payments
and acquire
technology
Strenghten the
participation of Mexican
capital
Generate foreign
currency, increase
vehicle and engine
production, and
strengthen national
integration
Rationalise assembly lines and models,
and standardise auto parts
Promote the industry’s
development to
consolidate advances and
expand its participation
in the international
economy
Incorporate the
resulting NAFTA
regulations
Investment promotion
Figure 4.6. Timeline of Policy Decrees in Mexico’s Motor Industry
Source: Own elaboration based on Mexico’s Ministry of Economy (2011).

132
is not the deliberated outcome of automotive policies, but the initiative of private
entrepreneurs.
Although not specifically designed for the motor industry, the policy of ‘Free
Trade Agreements’ (FTAs) has positively impacted this sector in attracting FDI.
Mexico has a network of 12 FTAs covering 44 countries (Table 4.7). According to
Mexico’s Ministry of Economy (2012a), this is a unique opportunity for
international commerce and investment because it gives strategic access to a
potential market of over one billion consumers which represents over 60% of the
world’s GDP.
Table 4.7. Mexico’s Network of Free Trade Agreements (2012)
Treaty
Country
In Force Since
NAFTA United States and Canada 1 January, 1994 FTA-G3 Colombia and Venezuela1 1 January, 1995
FTA Mexico-Costa Rica Costa Rica 1 January, 1995 FTA Mexico-Bolivia Bolivia 1 January, 1995 FTA Mexico-Nicaragua Nicaragua 1 July, 1998 FTA Mexico-Chile Chile 1 August, 1999 FTA-UEM (TLCUEM) European Union 1 July, 2000 FTA Mexico-Israel Israel 1 July, 2000 FTA Mexico-Northern Triangle
El Salvador, Guatemala and Honduras
14 March, 2000 with El Salvador and Guatemala. 1 June, 2001 with Honduras
FTA Mexico-AELC Iceland, Norway, Liechtenstein and Switzerland
1 July, 2001
FTA Mexico-Uruguay Uruguay 15 July, 2004 FTA-Unified Costa Rica, El Salvador,
Guatemala, Honduras y Nicaragua
Pending
EAA Mexico-Japan2 Japan 1 April, 2005 TIA Mexico-Peru3 Peru 30 January, 20124
1Since November 19, 2006, Venezuela does not participate. 2Economic Association Agreement. 3Trade Integration Agreement. 4Issued in the Federal Official Gazette (DOF). Source: Mexico’s Ministry of Economy (2012a); and Presidencia de la República (2012).

133
Structure and Recent Evolution
The position and significance of the motor industry’s value chain in Mexico’s
economy is unquestionable: it contributed with 20.3% of manufacturing GDP,
28.4% of manufacturing exports, 22% of FDI and around 15% of manufacturing
employment (BBVA, 2012; Romero, 2011). At present, most of the major global
automakers and auto parts firms have operations in Mexico. In 2011 Mexico
ranked in 8th place among the leading producing countries worldwide. Its
production capacity is supported on low operation costs, high productivity of
labour, supply chain and privileged geographical location, among other factors.
Mexico’s motor industry, both the finished-vehicle and auto parts segment, is
highly export-oriented. Exports account for more than 80% of total production.
The industry is comprised of 25 OEM firms producing light and commercial
vehicles and around 1,100 auto parts companies. OEM firms are overwhelmingly
dominated by foreign capital. In the auto parts segment, 70% of firms are of
foreign capital and 30%, national. Of total auto parts companies, 345 are Tier-1
and the rest are Tier-2, Tier-3 as well as input suppliers. Including distribution and
service centres, Mexico’s motor industry generates over a million jobs. The final-
vehicle assembly segment employs around 60,000 people and the auto parts,
550,000 (INA, 2010). Tables 4.8 and 4.9, and Figures 4.7 and 4.8, present the list
and location of the major companies and plants operating in Mexico’s passenger
and commercial-vehicle segments.30 The list also includes the new investment
projects announced or in which plants are under construction.
30 It is important noting that companies included in the lists are mainly those officially affiliated to the major motor vehicle associations in Mexico: AMIA for passenger-cars and ANPACT for commercial vehicles. As discussed in Chapter 8, this left out small or emerging companies, some Chinese operations among them.

134
Table 4.8. Major Automakers and Plants in Mexico’s Passenger Vehicle Segment
(2012)
Company
City
State
Start-up
Operations
Product/Brand
Chrysler
Saltillo Coahuila 1981 Ram trucks Saltillo Coahuila 1981 Engines Toluca Mexico 1968 Journey
Chrysler-Fiat Toluca Mexico 2011 FIAT 500 Toluca Mexico 2011 Freemont Saltillo Coahuila 2013 Ducato
Ford
Cuautitlán Mexico 1932 2010
Closed in 2007 for retooling Reopening with the ‘New
Fiesta’ Hermosillo Sonora 1986 Fusion, Millan, and MKZ,
including the hybrid versions.
Chihuahua Chihuahua 1983 Engines Irapuato Guanajuato 2010 Transmissions in JV with
Getrag
General Motors
Ramos Arizpe Coahuila 1979 SRX, Captiva, Monza, Sonic
Silao Guanajuato 1992 Escalade EXT, GM Sierra, Avalanche, Silverado
Toluca Mexico 1935 Engines San Luis Potosí San Luis Potosí 2007 Aveo
Toluca Mexico 2012 Engines
Honda El Salto Jalisco 1995 Accord (stop in 2007) 2007 CR-V
Mazda Salamanca Guanajuato 2013 Mazda 2, Mazda 3, and
engines
Nissan Aguascalientes Aguascalientes 1982 Sentra, Tilda HB, Versa Aguascalientes Aguascalientes Engines Cuautla Morelos 1966 Trucks, Frontier, Tsuru,
NV 200 Aguascalientes Aguascalientes 2013 Car base on platform B
Toyota Tecate Baja California 2004 Tacoma
Volkswagen Puebla Puebla 1964 New Beetle, Bora, Jetta,
Sportwagen and heavy trucks
Silao Guanajuato 2013 Engines
Volkswagen-Audi
Not determined Not determined 2016 Q5 SUV
Source: Own elaboration based on AMIA and other automotive sources.

135
Table 4.9. Major Automakers in Mexico’s Commercial Vehicle Segment (2012)
Company
City
State
Product
Daimler-Mercedes Benz Saltillo-Ramos
Arizpe Coahuila Tracto-tucks
García Nuevo León Buses Santiago
Tianguistengo Mexico Heavy trucks and
tracto-tucks
DINA Ciudad Sahagún Hidalgo Buses
Giant Motors Ciudad Sahagún Hidalgo Light trucks and buses
Hino Silao Guanajuato Light Trucks
Isuzu San Martin Tepetlixpan
Mexico Light Trucks
Kenworth Mexicali Baja California Tracto-trucks
Navistar-International Escobedo Nuevo León Tracto-tucks and
heavy-trucks
Scania El Marqués Querétaro Buses
Volvo Tultitlán Mexico Buses and heavy trucks
Volkswagen-MAN El Marqués Querétaro Buses, trucks
Source: Own elaboration based on ANPACT and other automotive sources.
Table 4.10 shows figures on production, sales and exports in Mexico’s motor
industry from 1980 to 2011. As observed, the export market drives production
trends. Exports reached a record level of 2.14 billion units in 2011. 80% of motor-
vehicle production is exported, in the same proportion to the United States. While
production also reached a record level of 2.7 million units, representing five times
that of 1980, sales have registered stagnation since the middle-2000s.

136
BAJA CALIFORNIA
Pick upsTecate
SONORA
CarsHermosillo
CHIHUAHUA
Gas and diesel engines
Chihuahua
COAHUILA
Ramos Arizpe Cars, engines
and transmissions
Light trucks
and engines
SAN LUIS POTOSÍSan Luis Potosí
Cars and
transmissions
JALISCO
El SaltoCars, engines and
motorcycles
AGUASCALIENTES
Aguascalientes Cars, engines and trans-axles
GUANAJUATO
Silao Cars, light trucks, engines and
transmissions
MORELOS
Cuernavaca Cars, light trucks
and engines
Cars
Cars
PUEBLA
Puebla Cars, light trucks and
engines
MEXICO
Toluca Light trucks, engines and foundry
Toluca Cars, engines and
transmissions
Cuautitlán Cars, light trucks and assembly precision
devices
Figure 4.7. Mexico’s Light-Vehicle Production Facilities, 2011
Irapuato Transmissions (joint-venture with Getreg)
Silao Light trucks
Ramos Arizpe
Toluca Cars
Silao Engines
Aguascalientes
Cuernavaca
Lerma Car blindage
Ocoyoacac Sport cars
CarsRamos Arizpe
Source: Various automotive sources
BAJA CALIFORNIA
Tracto-trucksMexicali
NUEVO LEON
García Buses
GUANAJUATO
Silao Light trucks
HIDALGO
Cd. Sahagún Light trucks
ESTADO DE MEXICOSantiago
TianguistengoHeavy Trucks
and tracto-trucks
TultitlánBuses and
heavy trucks
Source: Various automotive sources
Figure 4.8. Mexico’s Commercial Vehicle Production Facilities, 2011
COAHUILA
Ramo Arizpe Tracto-trucks
EscobedoTracto-trucks and
heavy trucks
QUERETAROQuerétaro
Buses
QuerétaroBuses and heavy
trucks
San Martín Tepetlixpan Light trucks
SAN LUIS POTOSI
San Luis Potosí Truck engines
Cd. Sahagún Light trucks
and buses
DURANGO
EnginesGómez Palacios

137
Despite Mexico’s car industry being hard hit by the financial global crisis, in 2010
the sector showed an outstanding recovery. In 2009 Mexico’s vehicle output
decreased nearly 30% in relation to 2008. The auto parts segment lost 125,000
jobs from January 2008 to December 2009 (INA, 2010). Nevertheless, in 2010
motor vehicle production registered a growth of 50%. Exports of vehicles and
auto parts also presented substantive increases. Production and exports are
expected to continue growing in the next years due to the sizeable investments
carried out by TNCs during the period 2010-2012, of around US$ 10 billion.
Production capacity is estimated to reach 4.5 million units by 2014 (El Semanario,
2012).
Table 4.10. Production, Sales and Exports in Mexico’s Motor Industry,
1980-2011 (Units)
Year
Production
Sales
Exports
1980 488,331 663,043 18,245 1985 457,029 389,825 58,423 1990 819,055 548,804 276,869 1995 934,717 188,591 781,082 2000 1,922,889 902,372 1,434,110 2005 1,684,238 1,162,158 1,186,346 2006 2,045,518 1,177,100 1,536,768 2007 2,095,245 1,144,305 1,613,313 2008 2,167,944 1,068,736 1,661,403 2009 1,561,052 777,385 1,223,333 2010 2,342,282 846,881 1,859,182 2011 2,680,037 909,026 2,143,879
Source: Own elaboration based on AMIA and INEGI.
Mexico is shifting from manufacturing low-end small cars to more technology
and value added vehicles, while importing small cars. At present a variety of
models are exclusively produced in Mexico by foreign automakers for the world
market: PT Cruiser (Daimler-Chrysler); Fusion, Zephyr and Milan (Ford);
Rendevouz (General Motors); Sentra and Tsuru (Nissan); New Beatle, Bora and

138
Jetta (Volkswagen). Likewise, global auto parts companies have developed
production networks in Mexico. Several of them, such as Delphi, Yazaki, Valeo,
Lear, Visteon and Siemens have established R&D centres in Mexican territory
(Carrillo, 2004).
Traditionally, Mexico’s motor industry has been dominated by the so-called U.S.
‘Big Three’, plus Nissan and Volkswagen. These five automakers account for
93% of total production and exports, and 75% of domestic sales (Table 4.11). The
other three, with less time in the Mexican market, have been steadily increasing
their share in these lines. Nowadays, Mexico is one of the most open and
competitive markets around the world. Models in the market jumped from 58 in
1995, 360 in 2006 to more than 500 in 2010 (Ornelas, 2006; INA, 2010).
According to AMIA, although Mexico exports around 80% of its annual
production, it also imports around 60% of total domestic sales, basically small-
compact cars.
Table 4.11. Production, Sales and Exports of Light-Vehicles by Automaker in
Mexico’s Motor Industry, 2011 (Units)
Company
Production
Sales
Exports
Chrysler 279,869 80,557 266,117
Fiat 58,903 2,965 56,979
Ford 462,462 86,586 449,925
General Motors 544,202 171,397 443,237
Honda 45,390 33,442 36,429
Nissan 607,087 223,465 411,660
Toyota 49,596 47,388 49,549
Volkswagen 510,041 127,795 429,987
Other -- 135,432 --
Total 2,557,550 909,026 2,143,883
Source: AMIA.

139
Finally, despite the advances and the positive prospects of Mexico’s motor
industry, it seems to be a general agreement among policymakers, analysts and
businessman that Mexico needs to improve some crucial areas in order to increase
the sector’s competitiveness in the whole value-chain (ATKEARNY, 2007;
Romero, 2011; Dussel Peters, 2012). These areas are mainly related to low levels
of investment in R&D, both public and private, limiting technological innovation;
structural deficiencies in the auto parts and motor vehicle industry inputs
production segment; concentration of export market in the U.S.; high
infrastructure costs; among other aspects.
4.5. Conclusions
During the past two decades, the world motor industry has experienced a number
of fundamental transformations, deepening the globalisation process. Along with
increasing technological complexity and organisational re-engineering, a
substantial change in the global geography of the industry is taking place. New
producing countries and growing markets in developing economies have been
integrated into the global production and distribution system. The recent global
financial crisis accelerated the trends towards greater significance of this industry
in emerging economies. It is possible to argue that the motor industry’s emerging
global division of labour is a qualitatively different one from that of the early
1990s.
Within this process of the motor industry’s deepening globalisation and changing
division of labour, both China and Mexico are playing an increasing significant
role. Both countries are key players in the strategies and global production
networks of the world’s larger automakers and suppliers. Nevertheless, their role
in the global division of labour presents a differentiated character. Nowadays,
China’s huge and dynamic domestic markets is the major driving force behind
foreign investment, while Mexico is being manly used as export platform,
especially for the North American market.

140
In terms of the motor industry’s evolution within the national economies, although
Mexico and China share some similarities in the development of the industry,
particularly in their first stage when governments tried to establish a strong
“national” industry by applying protectionist measures and import substitution
strategies, the path followed by each country during the last three decades has
been a rather divergent one. In China, governmental policies were more
‘pragmatic’ in pursuing the sector’s modernization, promoting JVs –with limits in
foreign ownership - to acquire advanced technology and rationalise the industry.
For its part, eventually Mexico liberalised the motor industry as a way of being
international competitive and attractive as investment location. Besides the size of
the industry and market, perhaps the major difference between China’s and
Mexico’s motor industries is the existence in the former of a very important
segment of domestic manufactures producing their own brands. Some of them are
trying to catch up with international standards, and have initiated a process of
transnationalisation of their operations.
China’s motor industry main advantages are their enormous and growing
domestic market, low production costs, and the tendency towards technological
innovation and value chain upgrading. Particularly, recent policy measures are
aimed at converting China as the world centre of new-energy vehicles. For its
part, Mexico’s advantage and strengths in the global automotive industry rely on
its outstanding geographical location, the relatively low operation costs, qualified
and skill labour force, logistics and service development. In addition, Mexico has
signed 12 FTAs with access to 44 countries which facilitate international trade.
The resulted combination of governmental policies and the strategies followed by
the major TNCs in the coming years will reshape China’s and Mexico’s roles in
the motor industry’s global division of labour.

141
5. CHAPTER FIVE
THE CHINA-MEXICO AUTO INTERACTION 1: INTERNATIONAL
MARKET INTEGRATION AND GLOBAL INVESTMENT ATTRACTION
“Automakers are moving as quickly as possible to countries with lower
labour costs. China in particular is a behemoth......Now that China
has lower costs than Mexico, the industry is moving east instead of
south.” (Øvreberg, 2005).
“China is not Mexico’s main competitor in attracting global automotive
investment flows. Rather, the southern U.S. states of Alabama, Indiana,
Mississippi, and Texas represent the major threat.”31
One of the major concerns in developing countries during the last decade has been
the issue of diversion or competition from China in the attraction of FDI. In these
countries it has been common to find government leaders, policymakers,
entrepreneurs and analysts claiming that China has negatively affected FDI flows
from TNCs into their economies. Although this topic has received less attention
compared to trade issues, several empirical studies have been elaborated to
analyse the “China effect” on Latin America’s FDI attraction. However, to date,
these studies have either produced contrasting results (Jenkins, 2009), or they
have not been statistically conclusive (Bittencourt et al., 2011), or they present
significant heterogeneity across Latin American subregions and countries
(Lederman, Olearraga and Perry, 2009). While some studies concluded the
existence of competitive effects, other found complementary impacts to
investment flows in Latin America. These contrasting conclusions have been
explained by Jenkins (2009: 52) by underlining that “these studies differ in terms
of methodology, time period, and countries covered and level of aggregation
making it difficult to compare their results.” Despite these contrasting, 31 Official from Mexican Ministry of Economy. Personal interview. Mexico City. 13th December, 2007.

142
inconclusive and heterogeneous results, a major - and almost unanimous -
conclusion derived from the analyses is that Mexico appears as Latin America’s
most adversely affected country by FDI competition and substitution effects,
especially after China’s accession into the WTO in 2001 (Dussel Peters, 2005a
and 2005b; Devlin, Estevadeordal and Rodríguez-Clare, 2006; García-Herrero and
Santabárbera, 2007; Jenkins and Dussel Peters, 2007; De la Cruz, Boncheva and
Ruiz-Porras, 2008; Hogenboom, 2008; Jenkins, Dussel Peters and Mosquita
Moreira, 2008; Gallagher and Porzecanski, 2008; Jenkins, 2009; Chantasasawat et
al., 2008 and 2010). At aggregated level, for example, through an econometric
analysis García-Herrero and Santabárbera (2007: 148) estimated that when
Chinese inward FDI increases by US$ 100 million, Mexican inward FDI is
reduced by 29 million. According to this study, among the fundamental factors
behind this situation is Mexico’s similar export structure to China’s as well as
direct competition for efficiency-seeking FDI, in which the former has been losing
competitiveness in world markets and global foreign investment attraction. This
trend induced analysts to highlight the multi-cited event of the maquiladora’s
‘massive’ migration from Mexico during the period 2000 to 2003-2004: ‘the giant
sucking sound from the East’ (Greider, 2001; The Economist, 2003). Based on
data from INEGI (2010), between December 2000 and December 2003 Mexico’s
maquiladora sector lost 900 plants and 260,000 jobs, around a quarter and a fifth
of the totals, respectively; in one year, from 2000 to 2001, maquiladora exports
decreased US$ 8.1 billion. In the same way, annual FDI inflows into the
maquiladora activity dropped by about one third, from US$ 3 billion in 2000 to 2
billion in 2003, falling to about the same level they had reached in 1998
(UNCTAD, 2004: 61).
Although not exclusively so, the relocation of FDI and plants from Mexico’s
maquiladora industry was largely attributed to fiercer competition from Asia,
especially from China32 (Rosen, 2003; Villarreal, 2003; Dussel Peters, 2005a;
32 Recognising the relevance of China’s competition in the maquiladora downturn during that period, several studies have underlined the incidence of other factors such as the recession in the U.S. economy, the appreciation of the peso, changes in Mexico’s tax regime for maquiladoras, the loss of certain tariff benefits as a result of the NAFTA, and the lack of internal macroeconomic reforms, among others (Gerber and Carrillo, 2002; USGAO, 2003; Quintin, 2004; Mollick and Wvalle-Vázquez, 2006).

143
Cornejo, 2005; Carrillo and Plascencia, 2007; Jenkins and Dussel Peters, 2007;
Sargent and Matthews, 2009). Estimations of the quantity of assembly plants
relocating to China range between a third and a half of the total number of lost
maquilas. A more complete examination of the geographical destination of 450
maquiladora plants for the period 2001-2003 reports that 44.4% went to China,
17.8% to other Asian countries, 15.6% returned to the United States, 13.3% went
to Central America and the Caribbean, and 8.9%, to Eastern Europe (Ornelas,
2007). According to some analysts, Chinese competition represents one of the
primary factors contributing to the first major contraction in the history of the
maquiladora program, since China took over the role of the global economy’s
premier location for export processing zones’ activity during the 1990s (Sargent
and Matthews, 2009).
Nevertheless, despite the consensus regarding the negative impacts on Mexico at
aggregated level derived from China’s increasing competition and FDI attraction,
there still some key gaps on the subject, such as the identification and assessment
of sectoral or regional impacts. A common assumption is the homogeneity of the
China effect across sectors, which is considered another challenge for the existing
literature (Cravino, Lederman and Olearraga, 2007a). One of the few studies
tackling FDI substitutability and complementarities within industries between
China and Latin America found out that although there is some weak evidence of
inflows of FDI into LAC’s manufacturing sector being substituted for FDI into
China’s manufacturing sectors, these effects were not statistically robust (Cravino,
Lederman and Olarreaga, 2007a, 2007b and 2009). More precisely, among the
major limitations found in most of the studies carried out so far are related to the
time period of the analyses, the geographical scale of data aggregation, and the
absence or marginal knowledge of the specificities of sectoral diversity which are
not identified at aggregated level. Based on this, further and deeper analysis on the
subject, especially on the impact on particular countries and sectors where FDI
diversion is most likely to occur, is suggested (Jenkins, 2009; Jenkins and Dussel
Peters, 2007; Jenkins, Dussel Peters and Mesquita Moreira, 2008).

144
In Mexico’s case, as in other Latin American countries, systematic academic
studies on specific bilateral sectoral impacts of China’s competition for FDI are
rather limited. As depicted above, most of the information came from anecdotal
and press evidence mainly linked to the maquiladora and relocation and job losses
during the 2000-2003 period. For particular industrial sectors, the situation was
critical for the textile, clothing, footwear, home appliance, telephone equipment,
and electronics segments, most of which are labour-intensive. For instance, the
relocation was reported of 85% of shoe manufacturers’ operations to China by
2003. In like manner, large corporations such as Sony, NEC, VTech, On
Semiconductor and makers of Kodak X-ray film have moved their factories. IBM
and Microsoft moved projects worth around US$1 billion to Asia (ECLAC,
2004a: 182). More recently, analytical academic research has been developed by
Dussel Peters (2005a, 2005b, 2009 and 2010a) on the implications for Mexico of
China’s emergence in the textile/clothing and the electronics global manufacturing
chains. In terms of economic effects, in the electronics industry Dussel Peters
(2005a and 2009) reported the loss of more than 45,000 jobs (21,217 direct and
23,880 indirect) between 2001 and 2003; US$ 3.2 billion in exports; and 514
million in FDI by companies that outsourced their activities and/or their
production lines to China.
Given the relevance of the motor industry for both China’s and Mexico’s
economies, the issue of actual and potential confrontation in the world capital
market has acquired great attention among governmental agents, entrepreneurs,
labour unions and analysts. These automotive agents’ fears about Chinese
competition are well founded. According to UNCTAD’s World Investment
Prospects Survey (2010b), for several years China has ranked at the top of the
most attractive economies for the location of FDI; and, as mentioned, in the
automotive sector China positioned as the world’s largest producer and market in
2009, becoming a highly dynamic industry. Nevertheless, up to now, no
comprehensive study on the China-Mexico competition for global motor FDI has
been found in the literature. At a general level, some auto analysts have tried to
extrapolate the implications for Mexico of this process. The argument is that given
automotive companies’ limited resources, they need to choose where to invest;

145
and, as they follow a global approach when planning their world-manufacturing
footprint, the growth of Asian markets looks extremely attractive. In this sense – it
is deduced - for every dollar invested in Asia there are, for example, possible 10 to
30 cents that are not invested in other emerging markets such as Mexico or South
America (Ornelas, 2006: 18).
Based on existing analyses on the subject, an interesting controversy and
inconclusive discussion on the implications for Mexico can be found. On the one
hand, some analysts argue that Mexico’s motor sector, in particular the auto parts
segment, will become increasingly vulnerable to Chinese competition in the near
and medium terms. These arguments are based on trends such as the increasing
technological upgrading of Chinese automakers, China’s great capacity for
attracting FDI and its encouragement for outward FDI, which is giving local firms
enormous potential to compete in global markets (Dussel Peters, 2005a, 2005b,
2010a and 2012b); likewise, although Mexico is seen at present to be relatively
solid in the automotive competitive arena, due to the increasing
internationalisation of Chinese firms and competition for efficiency-seeking FDI,
Mexico’s car industry may not be immune to such pressures (Devlin,
Estevadeordal and Rodríguez-Clare, 2006; Frischtak, 2004); the production of
simple auto parts, such as harnesses, could be relocated to China in the near
future, given the product’s size and life-cycle reduction which makes transport
costs relatively unimportant (Carrillo, 2007). On the other hand, in contrast to the
above, another group of analysts argue that auto parts hold a strong competitive
position, having a solid foundation for a long run presence in the region. The
arguments are based on the technological upgrading, best practice management
skills, and constant innovation and competition on the basis of product quality,
which makes them internationally competitive (Gerber and Carrillo, 2002); in
addition, the preferences of final assemblers to maintain regional supply networks
in order to develop Just-in-Time relationships with their primary suppliers
(Sargent and Matthews, 2004, 2008a, 2008b and 2009). At a more general level,
other analysts consider that China represents a strategic opportunity for Mexico to
diversify its sources of FDI in the motor industry (Gachuz, 2009; Dussel Peters,
2012a).

146
Against this background, the main objective of this chapter is to assess the impact
of China’s emergence on Mexico’s attraction of motor FDI. In this sense, the key
questions are: Is China substituting or diverting FDI flows from Mexico in this
sector? To what extent is China competing with Mexico as a destination of global
automotive investment? If so, which production segments are most likely to be
affected?. It is important to point out that deficiencies in reliable, updated and
standardised data on FDI flows, particularly at sectoral and bilateral levels,
represent a fundamental shortcoming for research in this area (Jenkins and Dussel
Peters, 2007; García-Herrero and Santabárbera, 2007; Dussel Peters, 2009).
Therefore, in order to overcome these limitations, diverse data sources will be
used and organised in an appropriate systematic mode. The analysis and
discussion will also rely significantly on information gathered through personal
interviews carried out with a variety of automotive actors in Mexico, China, the
United States, and the United Kingdom.
5.1. Evolution of Motor FDI in China and Mexico
5.1.1. China’s Motor FDI
China’s attraction of FDI during the last fifteen to twenty years has been
impressive. Within this process, the development of China’s motor industry
played a crucial role (Harwit, 1995; Thun, 2006; Gallagher, 2006; Chin, 2010). As
observed in previous chapters, China based the modernisation of its motor-vehicle
sector on the attraction of FDI through the consolidation of JVs between
automobile SOEs and leading auto TNCs. In fact, the automotive industry is one
of China’s industries in which FDI arrived earliest. Motor FDI formally entered
China in 1983, marked by the establishment of Beijing Jeep Automobile Co. LTD
(MOFCOM, 2002).
The arrival of motor FDI in China has been divided into three phases (Tang, 2009;
McKinsey Global Institute, 2003): the fisrt took place between the mid-1980s and
late 1990s, and was a period of limited foreign participation, where China’s
market was dominated by three foreign joint ventures —VW’s JV with SAIC, and
with FAW, in addition to PSA Peugeot Citroen’s JV with Dongfeng; from the late

147
1990s to 2001, the second phase was of growing foreign participation, when GM
and Honda entered the market; and in the third phase, after China’s accession to
the WTO in December 2001, other foreign automakers also entered the market.
During the first wave, from 1983 to 1998, China received US$ 20.4 billion of FDI
in the auto sector with 466 foreign-funded enterprises (MOFCOM, 2002). It was
not until the third wave, however, that FDI flows started to accelerate, attracted by
the large domestic market. From 2002 to 2009, in half the time than the first wave,
China obtained the same amount (US$ 19.2 billion). If the announced investments
for the period 2010-2011 are considered, in only a decade, China received more
than US$ 30 billion of FDI in the auto sector (Table 5.1). Based on the
information available, China’s auto industry captured between 3% and 10% of the
world’s total FDI in the motor industry during the period 2003-2011. In fact,
taking into consideration the total worldwide investments announcements (foreign
and domestic) by major automakers, some specialised sources have estimated that
China accounted for nearly half and two thirds of the auto industry’s global
investment in new production capacity during 2009 and 2010, respectively (Faria,
2011).33
Besides FDI in the OEM segment, after the recession of the first half of the
2000’s, and given producers’ increasing costs, China’s amounts of FDI in auto
components started soaring. Most of the global auto parts firms tried to set up
assembly facilities in China. Among this trend, for example, General Motors
shifted its worldwide electronics purchasing unit to Shanghai from the United
States to place it at the hub of China’s electronics industry (Sherefkin and La
Reau, 2006). The slowdown in FDI flows after 2005 has been explained as a
consequence of hyper-competition and overcapacity in China’s automotive
market, which led the major global automakers to diminishing investment and
paying more attention to adjustment and integration (MOFCOM, 2005).
Nevertheless, although auto FDI flows suffered the adverse effects in the short-
term, it kept a growing pace in the medium and long terms. As observed in table
5.1, the global financial crisis of mid-2007-2009, which severely hit the
33 Figures presented by Faria are substantially higher since they contain investment announcements both derived from FDI and domestic firm’s projects.

148
automotive activity of most countries and companies, China attracted a
substantive share of total worldwide auto FDI (4 to 5%). In fact, as already
pointed out, in 2009 China became the world’s largest automotive producer and
market. Regarding the proportion of auto FDI in China’s total inward FDI, after a
significant increase from the early years of 2000’s, reaching a peak in 2004 with
5.3%, during the second half of that decade this figure went down to levels of 2.0
to 2.5 a year.
Table 5.1. FDI in China’s Motor Industry
(million dollars)
Year/
Period
China’s Auto
FDI
World’s Total
Auto FDI
(WTAFDI)1
China’s
Auto FDI
as % of
WTAFDI
China’s Total
Inward FDI
(CTIFDI)
China’s
Auto FDI
as % of
CTIFDI 1983-1998 20,366.0 n.a
1998-2001 4,000.0 n.a
2000 634.92 n.a. 40,715.0 1.6
2001 872.32 n.a. 46,878.0 1.9
2002 1639.22 n.a. 52,746.0 3.1
2003 2,003.0 61,726.0 3.2 53,505.0 3.7
2004 3,200.0 53,511.0 6.0 60,630.0 5.3
2005 3,407.9 53,610.0 6.4 72,406.0 4.7
2006 2,141.0 50,388.0 4.2 72,715.0 2.9
2007 1,800.9 60,330.0 3.0 83,521.0 2.2
2008 2,667.1 65,515.0 4.0 108,312.0 2.5
2009 2,294.7 48,515.0 4.7 95,000.0 2.0
2010 5,439.13 61,763.0 8.8 105,735.0 5.1
2011 6,380.03 62,370.04 10.2 116,011.0 5.5
1 It includes automotive OEM and automotive components. 2 FDI contractual value. 3 Announced investments. 4 Own annualised estimation based on data from January-April 2011 period.
Source: Own elaboration based on MOFCOM (several years); UNCTAD (several years); McKinsey Global Institute, 2003; Faria (2010 and 2011); Carvalho et al. ( 2010) for 2004 China’s FDI; and diverse automotive sources.
Based on the information gathered related to investment announcements by the
major automakers operating in China, during 2010 and 2011 auto FDI flows

149
expanded dynamically. Expectations about China’s vehicle market reaching
annual sales of 40 million units by 2020, more than double 2011 figures, is
inducing assemblers to further increase production capacity (Sedgwick, 2011). For
instance, in its effort to become the world’s biggest automaker, Volkswagen and
its JVs are planning to invest US$ 19.0 billion through 2016; in the same way,
Nissan and Dongfeng announced an expansion plan of US$ 7.8 billion by 2015
(Automotive News China, 2011b and 2011c).
5.1.2. Mexico’s Motor FDI
In Mexico’s case, TNCs of the auto sector have dominated the industry from the
beginning (CEPAL, 1992; Durán, Dussel and Tanimura, 1997; Mortimore, 2000;
Tuman, 2003; Carrillo, 2004). Ford established assembly operations in the 1920s,
and GM and Chrysler during the 1930s. The U.S. “Big-Three” dominated the
market for several decades, with Nissan and VW joining them during the 1960s.
As in the 1970s and early 1980s, most of the previous auto FDI was made with
the aim of overcoming trade barriers. The operation of FDI in Mexico’s car
industry has been regulated through ‘Automotive Decrees’. From the first Auto
Decree in 1962 to present, government policies have been shifting from an active
interventionist and protectionist position towards a more export promotion and
liberalisation-oriented one. The export-oriented auto FDI wave began in the early
1980s, being strengthened during the 1990s after NAFTA came into effect in
1994. Throughout this period, the traditional automakers, as well as new-entrant
ones (Mercedes-Benz, BMW and Honda), carried out significant investments to
modernise production facilities and building new plants to integrate Mexico’s
motor industry on a North American regional basis. Along with this wave,
considerable FDI of global component firms also arrive. Therefore, from 1994 to
2001, Mexico received US$ 10.8 billion in FDI (Table 5.2).
With the exception of some maquiladoras of the auto parts segment,34 unlike auto
FDI previous to the 1980s, the new wave has been largely efficiency-seeking,
mainly intended to serve the U.S. market. The restructuring process after the U.S.
34 It has been reported that GM and Chrysler opened harness export- plants (maquiladoras) in the period 1978-1979 in Mexico (Carrillo and Hinojosa, 2001).

150
economic recession of 2000-2003 brought more investment to Mexico in order to
lower production costs. Thus, in the period 2002-2009 auto FDI attracted to the
country reached US$ 14.65 billion. In fifteen years, from 1994 to 2009, Mexico
received a total of US$ 25.5 billion.
Table 5.2. FDI in Mexico’s Motor Industry
(million dollars)
Year/
Period
Mexico’s
Auto FDI
World’s Total
Auto FDI
(WTAFDI)1
Mexico’s
Auto FDI
as % of
WTAFDI
Mexico’s Total
Inward FDI
(MTIFDI)
Mexico’s
Auto FDI
as % of
MTIFDI
1994 1,050.0 n.a.
1995 1,252.0 n.a
1996 767.0 n.a.
1997 1,281.0 n.a.
1998 603.0 n.a
1999 2,389.0 n.a.
2000 1,798.1 n.a. 18,110.0 9.9
2001 1,702.8 n.a 29,858.6 5.7
2002 1,335.3 n.a. 23,921.5 5.6
2003 1,385.4 61,726.0 2.2 18,538.3 7.5
2004 3,190.3 53,511.0 6.0 24,817.9 12.9
2005 2,297.4 53,610.0 4.3 24,275.8 9.5
2006 1,728.9 50,388.0 3.4 19,953.2 8.7
2007 2,021.2 60,330.0 3.4 30,514.3 6.6
2008 1,332.2 65,515.0 2.0 26,564.9 5.0
2009 1,361.1 48,515.0 2.8 15,829.2 8.6
2010 3,907.02 61,763.0 6.3 19,792.1 19.7
2011 7,746.02 62,370.04 12.4 19,513.03 39.7 1 It includes automotive OEM and automotive components. 2 Announced investments. 3 Own annualised estimation based on data from the period January-April 2011. 4 Banco de México’s estimation (Banco de México, 2011). Source: Own elaboration based on Mexico’s Secretaría de Economía (2011); UNCTAD (several years); Faria (2010 and 2011); BBVA (2012); and diverse automotive sources.
Nevertheless, despite the fact that Mexico’s motor industry being hard hit by the
global financial crisis in 2009, which increased competition and raised costs for
automakers, this seemed to have provoked a new and higher FDI wave into
Mexico’s auto industry. Between 2010 and 2011, nearly US$ 12 billion-

151
investment in expansion capacity and ‘green field’ plants, both from motor
vehicle assemblers and auto parts firms, were announced. ProMexico, Mexico’s
Trade and Investment Promotion Agency, estimated FDI of around US$ 4.5
billion in the motor industry in 2011 (Paredes, 2012). According to companies’
sources, these investments will materialise through 2012-2014. During this post-
crisis phase, new automakers are also entering the Mexican market (Fiat, Mazda
and Foton).35 Although significant, Mexico’s share of the world’s total auto FDI
has been lower than that of China, but the proportion of auto FDI in total inward
FDI is greater for the former. Mexico’s major motor projects of the period 2009-
2011 from both automakers and auto suppliers are outlined in Tables 5.3 and 5.4.
As a consequence of the financial crisis, production and domestic sales in
Mexico’s motor industry fell by 30% in 2009. Nevertheless, in the aftermath of
this great recession, Mexico emerged notably strengthened as production and
export base for the international markets. The changing demand preferences for
smaller and more fuel-efficient vehicles have located Mexico as one of the best
export platforms for global consumers. In the case of Nissan, with its new US$2
billion factory at Aguascalientes, the firm would nearly double its Mexican
production to 1.3 million vehicles per year, compared to 1.0 million in Japan
(AFP, 2011). Among the new models to be produced and exported from Mexico
are the Fiesta (Ford), Aveo and Sonic (GM), Fiat 500 and Ducato (Chrysler-Fiat),
New Beetle (VW), Micra and Versa (Nissan), and Mazda 2 (Mazda). Moreover,
the automakers’ announced plans will attract new auto parts companies to set up
factories in Mexico. In the same way, substantial amounts of investment have
been announced by the steel industry to supply the new auto manufacturing
operations, such as Nippon Steel & Ternium and Posco, with almost US$ 1 billion
altogether. From a production capacity of 1.3 million units of Mexico’s auto
industry in 1994, and 2.1 million in 2003, with the new investments projects
production is expected to reach 4.5 million vehicles by 2014.36
35 Announced investments for over US$ 1 billion from several Chinese automakers (FAW-Salinas Group, Geely, Changan and ZX Auto) have not been included since they are not confirmed or have been postponed. These cases are analysed in detail in Chapter 8. 36 Figures on production capacity were reported by McKinsey Global Institute (2003) and ECLAC (2004b), for 1994 and 2003, respectively. For 2014, estimation from Mexico’s Ministry of Economy reported by El Semanario ( 2012).

152
Table 5.3. Major Automakers’ FDI Projects in Mexico’s Motor Industry, 2009-2011
Company
Location
Project Characteristics
Start-up
Date
Chrysler (USA)
Saltillo, Coahuila
Assembly plant for the new generation of V6 Pentastar engines (‘Centenario’ Plant) to be used in the Dodge, Jeep and Ram vehicles. Investment of US$570 million and the generation of 900 jobs. Annual production capacity of 440,000 units.
2010
Saltillo, Coahuila
Plant expansion at Saltillo’s truck plant to manufacture the new Dodge Ram’s cabin chassis. Investment amount of US$370 million.
2010
Chrysler-FIAT
(USA-Italy)
Toluca, Estado de México
New production line for the manufacturing of the electric minicar FIAT 500 (“Cinquencento”), as part of the strategic alliance Chrysler-FIAT. The car will be exclusively produced at Chrysler’s plant at Toluca, with production capacity of 100,000 units a year. Investment of US$550 million generating 1,200 jobs. The car will be exported to the U.S.A. and South America.
2011
Toluca, Estado de México
Production of the Fiat Freemont, a new cross-utility vehicle. The car will be manufactured at Chrysler’s plant at Toluca along with the Fiat 500 and the Dodge Journey.
2011
Saltillo, Coahuila
Expansion at Chrysler’s facilities in Saltillo to assemble a Ram branded version of the Fiat Ducato commercial van. Annual production capacity will be 400,000 units a year, aimed towards the U.S. market. Investment of US$570 million and the generation of 500 jobs.
2013
Daimler- Mercedes
Benz (Germnay)
García, Nuevo León
A new production line expansion at the Bus Division plant. Investment of US$10 million.
2012
Saltillo, Coahuila
Truck plant expansion to manufacture the Sterling Cabins, including a painting area. US$37 million will be invested in the project, hiring 450 new employees.
2011
Saltillo, Coahuila
New assembly truck plant with an investment of 300 million dollars. In addition, suppliers will invest US$150 million. The plant will exclusively produce Freighliner Cascadia Class 8 to be sold in Mexico and exported to The U.S.A. and Canada.
2009
Foton
(China)
Coatzacoalcos, Veracruz
Investment of US$370,000 dollars in an assembly plant to produce agricultural tractors. By mid- 2010 Foton announced a plan for a new investment to build light trucks. Initial investment of 15 million dollars, increasing up to 250 million in further stages of production, reaching an annual capacity of 50,000 units
2009-2010

153
Table 5.3. Major Automakers’ FDI Projects in Mexico’s Motor Industry, 2009-2011 (continued)
Company
Location
Project Characteristics
Start-up
Date
Ford (USA)
Hermosillo, Sonora
Expansion investment (US$1,500 million) for the new generation of the mid-size car Fusion-Mondeo. Plant annual capacity will be increased to 500,000 units. 2,000 new jobs will be generated.
2011-2012
Cuautitlán, Estado de México
Plant retooling project to manufacture the ‘Fiesta’, a new generation of subcompact car. Investment of US$1,000 million adding 2,000 jobs. The car will be exported to North and South America.
2010
Chihuahua, Chihuahua
Diesel engine plant, the first industrial building adapted for these types of machines in all of Latin America. Investment of US$838 million; annual production capacity of 200,000 engines to be exported to U.S. and Great Britain. Generation of 1,100 jobs.
2010
Irapuato, Guanajuato
Assembly plant for the assembly of last generation transmissions (6DCT250) in JV with Getrag. Investment of US$500 million and the creation of 1,200 jobs.
2010
General Motors (USA)
Ramos Arizpe, Coahuila
US$500 million-investment to manufacture the new subcompact Chevrolet Sonic. The Sonic will replace the Chevy. The project plans to produce 70,000 units a year by 2013. 400 jobs will be created. Production is aimed at Mexican and Latin American markets.
2012-2013
Villa de Reyes, SLP
US$300 million-dollar investment to expand production platform and assemble the Aveo subcompact car. 1,850 jobs will be generated.
2012
Toluca, Estado de México
Investment of US$540 million in an engine plant to produce two low-emission models of 4-cylinder engines. 500 jobs will be created.
2011-2012
Ramos Arizpe, Coahuila
Investment of US$500 million to expand production facilities. 285 million for the production of an 8-cylinder efficient engine. 215 million for the manufacture of a new-generation vehicle. 400 jobs will be generated.
2011-2012
Villa de Reyes, SLP
New transmission-assembly plant for use in the U.S. Volt. Investment amount of US$300 million, generating 600 jobs. Yearly annual capacity of 300,000 units.
2009
Hino (Japan)
Silao, Guanajuato
A US$10 million-investment assembly plant to manufacture the Series 500 trucks (Rangers). Annual production capacity of 1,200 vehicles.
2009-2010

154
Table 5.3. Major Automakers’ FDI Projects in Mexico’s Motor Industry, 2009-2011 (continued)
Company
Location
Project Characteristics
Start-up
Date
Honda (Japan)
Celaya, Guanajuato
Assembly plant of a fuel-efficient subcompact vehicle with an annual capacity of 200,000 units. Investment of US$800 million and the generation of 3,200 jobs. Vehicles will be sold in the Mexican and North American markets.
2014
El Salto, Jalisco
Investment of US$200 million for plant retooling of the Honda CR-V. Annual capacity increased to 50,000 units adding 700 jobs.
2009
Hyundai (Korea)
Mexico’s central region
Light truck assembly plant with an initial investment of US$11 million. Production is intended to be exported to Latin America.
2012-2103
MAN
(Germany)
Querétaro US$10 million-dollar investment to transfer operations from Puebla to Querétaro as part of a strategy to integrate a new company. MAN purchased 100% of VW Trucks and Buses in 2009. The plant will produce 4,300 trucks and 260 hybrid buses a year.
2011
Mazda (Japan)
Salamanca, Guanajuato
Assembly plant in JV with Sumitomo Corp. with a yearly capacity of 140,000 cars. Manufacture of the small compact Mazda 2, the compact Mazda 3 and engines mainly to serve the South and Central America markets. Investment of US$500 million generating 3,000 jobs.
2013
Nissan (Japan)
Aguascalientes, Aguascalientes
Manufacturing complex to produce a car based on the platform B with an investment of US$2,000.0 million. The complex includes a supplier park. In the initial phase, the plant will have a manufacturing capacity of 175,000 vehicles a year and 3,000 jobs will be created. Production is expected to reach 400,000 units, destined to the U.S., Mexican and Latin American markets.
2013
Aguascalientes, Aguascalientes
Development of ‘UV’ Platform to produce three new low-cost subcompact models, including the March (Micra), Versa and a ‘multipurpose’. Total investment of US$1,050 million, including the supplier’s network. March’s annual production will be 60,000 units, reaching a combined volume of 300,000.
2011- 2013
Cuernavaca, Morelos and
Aguascalientes, Aguascalientes
US$328 million-dollar investment to produce new models. 160 million will be allocated to manufacture the Nissan NV200, ‘The Taxi of Tomorrow’, for New York City, and the rest to the production of the multipurpose vehicle based on the V platform at Aguascalientes.
2013
Mexicali, Baja California
Establishment of an automotive design centre. Investment of US$10 million dollars.
2010-2015

155
Table 5.3. Major Automakers’ FDI Projects in Mexico’s Motor Industry, 2009-2011 (continued)
Company
Location
Project Characteristics
Start-up
Date
NAVISTAR (USA)
Escobedo, Nuevo León
Investment of US$25 million to establish two new production lines for the ProStar truck model
2010
Polaris (USA)
Apodaca, Nuevo León
Assembly plant of ATVs and SUVs. Investment of US$60 million generating 500 jobs. The company relocated production from Wisconsin to Mexico.
2011-2012
Toyota (Japan)
Tijuana, Baja California
Announcement of the opening of a new production line as parts of its consolidation process at Baja California’s plant where the ‘Tacoma’ is assembled. Currently Toyota is analysing the possibility of investment in a second plant in Mexico.
2012
Volkswagen (Germany)
Silao, Guanajuato
Assembly of a new-generation gasoline engines whose main destination will be VW assembly plants in Puebla and Chattanooga, Tennessee, in the U.S. At a later stage, plans are to produce diesel engines. With an investment of US$550 million and the creation of 700 jobs, the plant will have an annual capacity of 330,000 engines.
2013
Puebla, Puebla
Production of the redesigned ‘New Beetle 2012 with an investment of US$400 million. Annual production capacity of 100,000 units and the creation of 2,000 jobs.
2011
Puebla, Puebla
New assembly line and a stamping area to manufacture the 2011 Jetta 6th Generation, the ‘Bicentenary’ edition. Investment of US$1,000 million, including the design and tooling used by suppliers. Annual capacity of 430,000 units. 90% of production is destined for exports markets.
2010
VW-Audi Central Mexico New assembly plant to manufacture the Q5 premium SUV for the global markets. The project considers a US$ 2.0 billion-investment, with an initial capacity of 150,000 units a year.
2016
Source: Own elaboration based on diverse automotive sources.

156
Table 5.4. Major Auto Parts’ FDI Projects in Mexico’s Motor Industry, 2010-2011
Company
Project Characteristics
Start-up
Date Airtemp Investment of US$23.5 million to produce auto components in
Puebla. Generation of 600 jobs. 2012
Alpha Corp. Alpha is set to spend US$40 million to build a new factory in the state of Jalisco to produce door handles.
2013
BorgWarner New production facility in Ramos Arizpe, Coahuila, to manufacture fuel-efficient turbochargers. 185 people will be employed.
2012
Bosch Investment of US$55 million to modernise machinery and tooling in Mexico’s 13 plants.
2011- 2012
CVG Investment of US$50 million by Commercial Vehicle Groups (CVG) in Saltillo, Coahuila. The plant produces pneumatic suspension seats and floor systems for the Freightliner truck. 510 jobs are expected to be created.
2011- 2012
Daido Metal Co.
Initial investment of US$30 million for the construction of a new manufacturing plant in the state of Jalisco for production of automobile bearings to supply Japanese and foreign vehicle manufacturers. 400 new jobs.
2012
Delphi New assembly plant by Delphi Packard in Durango to manufacture automotive harnesses. Investment of US$11 million expecting to hire 2,000 employees.
2012
Delphi Establishment of a new technical centre in Ramos Arizpe, Coahuila, to manufacture electrical components. Investment of US$20 million and the generation of 700 jobs.
Denso Corp. Building of a new plant in Silao, Guanajuato, investing US$57 million. The plant will manufacture heating, ventilation and air conditioning (HVAC) units. The firm expects to employ more than 400 people by 2015.
2013
Exedy Corp. Investment of US$20 million in the state of Aguascalientes. The new plant will produce clutch packs and torque convertors which are incorporated into automatic transmissions. 75 new jobs.
2012
Gemini-OKE JV between Gemini and OKE to produce auto parts for export markets. Investment of US$15 million and the creation of 150 jobs.
2011
Hitachi Chemical
Expansion of its plant at Monte Morelos, Nuevo León, to increase the production of disk brake pads to 10 million units per year. Investment of US$18.5 million and the creation of 100 jobs.
2011- 2102
Jatco Investment of US$200 million in Aguascalientes to renovate its production lines where Continuous Variable Transmissions (CVT) for autos with high ecological performance is manufactured.
2011
Johnson Controls
US$75 million-investment for the renovation of its motor vehicle’s battery recycling centre at Ciénega de Flores, Nuevio León.
2012
Kiriu Expansion of the production capacity by installing the second casting line at Lerma, Estado de México. Investment of US$37.5 million.
2010- 2011

157
Table 5.4. Major Auto Parts’ FDI Projects in Mexico’s Automotive Industry,
2010-2011 (continued)
Company
Project Characteristics
Start-up
Date
Linamar Corp.
Linamar invested US$120 million to expand production facilities in the production of components and systems used in the power train and transmissions. 800 jobs were generated.
2011
Magna Magna International is building a new state-of-the-art facility in San Luis Potosí to produce stamped and welded assemblies for various automakers. The company plans to invest more than US$100 million to build the plant expecting to employ 700 people at full capacity.
2012
Nippon Sheet Glass
Investment of US$15 million for the construction of a new plant to expand production capacity of automotive windshield in Mexicali, Baja California. 160 new jobs were expected to create.
2010- 2011
Nippon Steel and Ternium
Investment of US$405 million to produce high grade and high quality galvanised and galvan-nealed steel sheets for the auto industry. Annual output will be 400,000 metric tons.
2013
Pirelli New assembly plant located in Silao, Guanajuato, to manufacture high-performance tires for cars and light trucks with and investment of US$250 million. The plant will reach an annual capacity of 5 million units by 2015 and will generate 750 jobs. Production is destined for the Mexican, the U.S. and Canadian markets.
2012
Posco Posco (Pohang and Steel Company) will invest US$300 million in a second plant at Altamira, Tamaulipas, to produce high quality galvanised steel for the auto industry. 300 jobs will be created.
2013
RSB RSB Transmissions’ investment of US$20 million in Guanajuato. Generation of 500 jobs.
2011
Shaeffler Group
Expansion of its engine’s parts production facilities at Irapuato, Guanajuato. Investment of US$120 million in the next 5 years.
2012- 2015
Steel Technologies
Steel Technologies LLC, a JV between Mitsui and Nucor, will build a steel-processing plant to supply automakers. Investment of US$80 million.
2012
Thyssenkrupp Investment of US$28 million in Puebla to install a new auto parts production line.
2012
TI Automotive
New plant to produce blown-molded plastic fuel tank systems. Investment of US$30 million and creation of 200 jobs.
2011
TRW Investment of US$50 million to establish its third plant in Querétaro. The plant will produce ABS brake systems to supply Volkswagen Brazil. Creation of 400 new advanced manufacturing jobs.
2011- 2012
Yamashita Rubber
Establishment of a new manufacturing plant for suspension parts and plastics in Zacatecas. Investment of US$12.5 million and generation of 125 jobs.
2011
Yusa New plant in Zacatecas to produce suspension’s plastic parts to supply Honda. Investment of US$100 million.
2012
Source: Own elaboration based on diverse automotive sources.

158
5.1.3. China’s and Mexico’s Comparative Evolution in Motor FDI
When contrasting the evolution of auto FDI in China and Mexico for a
comparable period of time (2000-2009), it seems that – keeping the proportions -
both countries follow a similar path, closely linked to the world economic cycle
(Figure 5.1). As argued above, given Mexico’s integration into the North
American motor industry, Mexico’s auto FDI evolution is more closely connected
to the Unites States’ economic cycle than China’s. In Mexico’s case, a U.S.
economic stagnation provokes a declining in exports; but when the major
automakers, U.S. and non-U.S., decide to reorganise their global operations, a
new wave of investment takes place, as was the trend during the recessions of
20001-2003, 2005 and 2008-2009.37 Investment announcements in Mexico during
2009-2011 will mainly be reflected by 2013-2104.
37 During 2006, collectively GM and Ford planned to cut 60,000 jobs in the United States as part of their restructuring process (Maynard and Peters, 2006). By then, an operative loss of $2,496 dollars for each auto produced in the United States for GM was reported, while manufacturing a car in Mexico was only a quarter of the U.S. cost. Likewise, Ford reported an operative loss of $590 dollars for each car produced in the United States, but its Hermosillo plant in Mexico was ranked as the world’s number one in productivity (Cantera, 2006).
0.0
500.0
1000.0
1500.0
2000.0
2500.0
3000.0
3500.0
4000.0
2000 2001 2002 2003 2004 2005 2006 2007 2008 2009
Mil
lio
n D
oll
ars
Figure 5.1. Evolution of Motor FDI in China and Mexico,
2000-2009
China Mexico
Source: Own elaboration based on MOFCOM (several years) and Secretaría de Economía (2011).

159
A possible deduction resulting from the available comparable information is that
China’s dynamic development of its automotive industry and powerful magnet in
attracting FDI has not stopped, or negatively changed, the tendency of Mexico’s
inward FDI in the motor industry. Taking the period 2002-2009, exactly after
China entered the WTO and accelerated its global expansion, the annual average
of inward FDI in the auto sector was US$ 2.4 billion for China and US$ 1.8
billion for Mexico. Although China’s motor sector had an average value that was
much higher than Mexico’s, the latter registered an important increase in relation
to the period 1994-2000, when it obtained a value of US$ 1.5 billion, even with
the ‘NAFTA effect’.
In summary, it could be argued that during recent years, Mexico’s motor industry
has substantially increased its production capacity, escalated its position among
the top-ten worldwide producing and exporting countries, and has become the
number one supplier of automotive products in the U.S. market. Likewise, the
forecasts of auto specialists estimate that Mexico’s share of North American auto
production will increase to 19% over the next decade, from an average of 12%
from 2000 to 2009 (Black, 2010). Looking at these achievements from the
perspective of the China-Mexico interaction in the global automotive arena, a
major explanation for these trends might be the different entry motive of auto
TNCs in China and Mexico. Until recently, as reported by a comparative study,
auto FDI entry motives in China were 100% market-seeking, while in Mexico the
proportion was 70% efficiency-seeking and only 30% market-seeking (McKinsey
Global Institute, 2003). According to this source, among the major factors driving
the level of FDI in the auto sector in China are sector market potential, import and
FDI barriers. In Mexico’s case, location (proximity to the U.S. market combined
with a qualified and relatively low labour cost), macroeconomic conditions
associated to the growth in the U.S. economy, and governmental policies. In
particular, the signing of NAFTA and other FTAs entailed a reduction in tariffs
and local content requirements; also, the limit on FDI in auto components was
lifted. From a more broad perspective, it could be argued that these entire features
may also be associated to the different role China and Mexico play in the global
motor division of labour.

160
5.2. China and Mexico in the Global Capital Market: The Vision of
Automotive Actors
The trends mentioned above lead to the question of China-Mexico competition for
global auto FDI. Based on the interviews held with diverse automotive actors
during the fieldwork carried out for this research, this issue was considered to be
more complex than it appears, taking the view that it needs to be qualified given
the different facets it presents. An almost unanimous opinion was that China does
not compete with Mexico for auto FDI, at least not in a direct way, nor in the
short or medium terms. Likewise, a mixing situation of opportunities and threats
in the China-Mexico interaction was identified. As one automotive researcher38
pointed out: “Does China compete with Mexico? It depends where you stand
within the industry”. For instance, some aspects of major concern for different
agents are: a) Governments: economic development, job creation, national
industrial protection, etc.; b) Companies: trade, investment, competition, profits;
c) Congressmen: national security, military issues, constituency demands; d)
Labour unions: job security, increasing wages and improving working conditions.
Thus, depending on the role, business interests, or the people they represent, the
perception of China’s impacts differs.
According to the same interviewee, automakers have different strategies
depending on their business and market position. The announcement of Chrysler’s
intentions, for example, of importing small cars made by Chery from China to the
United States originated from the fact that it did not have a small vehicle for the
North American market at that time and needed to source it from Chery. So,
Chrysler is in a particular situation regarding the range of cars it can offer.39 By
contrast, Ford and GM are in a different position. Both have their own small car
produced in the North American region’s plants and do not have to import them
from a JV in China. These trends are shared by a TNC’s Senior Economist,40 who
corroborated that GM and Ford have no plans for importing cars to the U.S. from 38 Automotive Analysis Division, University of Michigan Transportation Research Institute (UMITRI). Personal interview. Ann Arbor (Detroit), Michigan, U.S.A. 27th August, 2008. 39 After the failure of the association with Chery, through its strategic alliance with Fiat in 2009, Chrysler is intending to widen the range of cars offered in the region. 40 Personal interview. Detroit, Michigan, U.S.A. 27th August, 2008.

161
China in the short and medium terms. And he added, “Chrysler is a different case.
Given its present situation, this automaker is functioning more as a distributor in
order to obtain profits”.
With regard to assessing if a firm is threatened by competitors, a thought
expressed a Mexican auto parts TNC’s executive operating in China41 was, “it
depends on the specific value-chain link where the company is located”. This
Mexican firm manufactures structural components for light and commercial
trucks: chassis structures, suspension structures, body structures, customised side
rails, heavy trucks frames, bus frames, and steel fuel tanks. According to this
executive, his firm considers it does not have competition in Mexico from
Chinese firms as the product is a component which is difficult to transport and to
export.
In the same line of corporate strategies, an automotive TNC’s Manager in charge
of emerging-market sourcing,42 elucidated a fundamental issue for a company’s
decision-making process in a global competitive environment. For this executive,
from the OEM’s perspective, a decision has to be made on: a) investment (‘green
field’ plants or expansion); or b) sourcing (imports). The decision depends on
several factors: foreign currency rate; size of domestic market; logistics/distance;
production costs, and so on.
Regarding investment decisions, the major factor in China now is the huge size of
the domestic market. For Mexico, domestic market is also important, but a more
relevant issue is to consider Mexico as an export base of motor vehicles. Because
of China’s market potential, and despite some undesirable regulations, foreign
automakers have decided to enter China through JVs. In the same auto executive’s
opinion, market size has given the Chinese government a strong negotiation factor
with TNCs. In this sense, particularly in terms of investment in new motor vehicle
capacity, he concluded that there is no competition between China and Mexico.
However, a decisive factor is what the market prospects are in both countries.
41 Personal interview. Shanghai, China. 12th May, 2008. 42 Personal interview. Dearborn (Detroit), Michigan, U.S.A. 28th August, 2008.

162
On the other hand, regarding components sourcing, the interviewee argued that
there is a direct competition between China and Mexico in particular segments,
since it is easier to outsource components than complete vehicles. In China, he
argued, overheads (indirect production costs) are competitive. For instance,
energy prices are low due to governmental subsidies, although labour costs
present an increasing tendency.
Another key issue in automaker’s decision-making process is the question of Off-
shoring vs Near-shoring. For U.S.-based companies, near-shoring includes the
United States and Mexico, and off-shoring refers to countries outside the region.
Finally, the Detroit-based executive pointed out that in small, simple auto
components, Honduras, Dominican Republic, and Costa Rica could become
Mexico’s competitors in the future due to governmental promotion and economic
incentives, among other factors. A related strategy linked to global location of
production and sourcing is that of regionalisation of the global division of labour.
Rather than competing on a global basis, original equipment suppliers, especially
Tier-1s, regionalise their operations to source the assembly plants. In interview, a
manager of a global Tier-1 supplier43 pointed out that his company has plants in
Mexico (Monterrey, N.L.) to supply North America, and also in China to supply
Chinese, and other Asian markets.
A Professor from Shanghai’s Fudan University44 raised two relevant points in the
discussion held with him. One was about the nature of competition, linking the
categories of countries and companies. He argued that “there is no direct
competition between Mexico and China in the automotive industry because the
former does not have a ‘Mexican’ car.” Mexico is mainly a production and export
base for international companies, and it does not produce its own brand-name
cars. In contrast, China’s motor industry is a different story, the interviewee
added, since there are an important number of domestic automakers producing
their own-branded vehicles. The second point was about China becoming an
export platform to world markets. In this regard, the interviewee considered that
43 Personal interview. Southfield (Detroit), Michigan, U.S.A. 25th August, 2008. 44 China Centre for Economic Studies, Fudan University. Personal interview. Shanghai, China. 16th May, 2008.

163
only in a period of ten years China would be exporting motor vehicles to the U.S.
and European markets in substantive quantities. For Chinese suppliers, it will take
20 years to be internationally competitive.
From the perspective of the actors from Mexico’s government who were
interviewed,45 an optimistic view prevailed in that China does not represent a
direct threat for Mexico’s motor industry, especially in the short and medium
terms.46 At most, they recognise that in the China-Mexico relationship there are
both threats and opportunities. A high-ranked Mexican official declared that in the
short-run, China was not Mexico’s competitor, neither in the domestic market nor
in the international level (third markets). He further asserted that “China is not
Mexico’s main competitor in attracting global automotive investment flows.
Rather, the southern U.S. states of Alabama, Indiana, Mississippi, and Texas
represent the major threat.”47 Nevertheless, the same government agent recognised
that if Mexico remains static, with no strategic actions (economic policy,
infrastructure improvement, R&D investment, etc.) in the medium term (ten
years) China might be a threat to Mexico.
An additional topic that emerged during the interviews, along with competition,
was complementarity/cooperation between the auto industry of China and
Mexico. In particular, governmental agents emphasised the beneficial impacts of
potential Chinese FDI and the creation of jobs through JVs in the auto industry.
The Ministry of Economy expected to have over $ 1 billion-dollar investment
from Chinese automakers during the period 2008-2011, for projects intended to
serve the domestic market and, subsequently, for export to Latin America and the
United States. The complementarity side of the China-Mexico auto interaction
was even highlighted by Mexican automakers that have recently started operations
with Chinese companies, through technological associations or licensing. This is
45 There was an opinion coincidence on this matter during the personal interviews among Mexico’s different government agencies’ personnel in Mexico City. This was the case of Mexico’s Ministry of Economy and ProMexico, the main governmental institutions for the country’s industrial and export promotion. 46 This view was also shared by independent economic analysts. Personal interview. Mexico City. 20th August, 2008. 47 Personal interview. Mexico City. 13th December 2007.

164
the case, for example, of Giant Motors Latinoamérica (GML) which signed a
technological association with FAW to assemble small and medium-size trucks.
An Executive Director48 of a Mexican automaker in technological association
with a Chinese firm pointed out that the arrival of Chinese automakers in
Mexico’s domestic market, or the development of technological associations with
Mexican companies, was increasing competition in the domestic market among
firms, especially in the small-car or light and medium commercial vehicle
segments.
5.3. Auto Parts, Maquiladora Industry and China’s Competition
Much of the discussion and concerns in Mexico about China’s competition was
highly related to the maquiladora industry’s downturn in the early 2000’s, the
“sucking sound from the East”.49 As underlined in the introduction to this chapter,
according to INEGI’s data, between December 2000 and December 2003
Mexico’s maquiladora sector lost 900 plants and 260,000 jobs, approximately a
total quarter and fifth, respectively. Despite the fact that the topic has attracted
great attention among governmental, entrepreneurial, academic and the media
circles, the most publicised information has been rather general, in particular for
the motor industry and its different production segments. In this regard, a more
sectoral-especific analysis would help to clarify and understand the trends – and
prospects – of China’s threat to Mexico’s automotive sector, and especially the
auto parts segment. It is necessary to find out how hard the sucking sound from
the East actually hit Mexico’s motor industry. Therefore, an examination of the
evolution of the auto parts maquiladoras in Mexico during the critical period of
the first decade of the 21st century is presented below.
The auto parts segment has been a lever for the development of the maquiladora
industry, especially since the late 1970s and early 1980s. Most of the foreign auto
48 Personal interview. Mexico, City. 20th June, 2011. 49 An interesting paradox in this case, which clearly shows the deepening of the globalization process as well as the lack of attachment to ‘national’ identity on the part of capital, is that, according to a new report, of the 350 maquilas that migrated from Mexico by 2002, 60% was Mexican-owned, and the large majority relocated to China (Marichal, 2002).

165
parts companies function within this programme. As mentioned in Chapter 4,
almost all the global auto parts companies operate in Mexico, having positioned
among the top-100 largest maquiladora employers. Lear Corporation, Yazaki,
Delphi, Denso, Takata, TRW, Bosch, and Johnson Controls are some examples.
Tables 5.5 to 5.7 show some basic figures on the number of plants and employees
in Mexico’s maquiladora industry by sector, from 1990 to 2006.50 As observed, in
1990 the automotive sector had 156 plants, behind the electric & electronics
accessories, garment & textiles, and furniture segments, with 9.1% of the total
number of plants. Nevertheless, it was the second largest maquiladora
employment generator with almost 105,000 employees, accounting for almost
one-fifth of the total. The auto segment was only exceeded by the electric &
electronics accessories segment which concentrated 25.7% of total maquiladora
employment. After a period of relatively slow growth from 1990 to 1995, during
the second half of the 1990s the auto parts segment registered a dynamic pace, and
expansion only stopped at the end of the 2000, as happened with the whole
maquiladora industry. Although several studies have underlined the joint
incidence of several factors such as the recession in the U.S. economy, the
appreciation of the peso, changes in Mexico’s tax regime for maquiladoras, the
loss of certain tariff benefits as a result of the NAFTA, and the lack of internal
macroeconomic reforms (Gerber and Carrillo, 2002; USGAO, 2003; Quintin,
2004; Mollick and Wvalle-Vázquez, 2006), China’s competition has received
much attention as major cause of the maquiladora downturn during that period.
The differentiated sectoral impact of the maquiladora crisis can be observed in
Table 5.7, where an index of the year 2000=100 is calculated. The hardest hit
sector in terms of loss of plants and employment were garments & textiles,
electric & electronics accessories, leather & shoes, and toys and sports articles.
50 On November 23, 2006, the Mexican government merged the Maquiladora and PITEX programmes into a new regime to promote exports. The new programme was named the Manufacturing Industry, Maquiladora and Export Services Program or IMMEX. Due to this reorganisation, specific data on the maquiladora industry is no longer published. Available data is up to December 2006. The full data set of maquiladora employment and plants for the period 1990-2006 is presented in Appendix 5.1.

166
Some of these sectors lost between 30% and 50% of the production
establishments and employment from the end of 2000 to 2003-2004. As reported
in several studies, these maquiladoras are mostly labour-intensive operations.
Among the less affected were machinery, automotive, and other manufactures
such as medical equipment, for instance. These activities represent segments with
relatively higher technology levels and more capital intensive. In fact, the auto
parts maquiladora sector lost less than 5% of its employment which was
recovered by 2003 and the number of plants was not affected. By 2006, the
automotive segment strengthened its position within the maquiladora industry,
operating 312 plants and becoming the largest employer with 22.6% of the total.
By looking at the maquiladora sectors that had not recovered the lost ground by
2005-2006 (garments & textiles, electric & electronics accessories, leather &
shoes, and toys and sports) it is clear that Mexico had lost competitiveness in the
labour intensive, low-productivity, maquiladora segments.
It is necessary to explore what factors explain the evolution of the auto parts
maquilas, which seem to have satisfactorily eluded the Chinese threat. Various
arguments have been put forward on this topic. One is related to the technological
level and managerial capabilities of maquiladora plants. Gerber and Carrillo
(2002) argue that 30-40% of auto parts firms are either within the so-called “third-
generation” maquilas which develop R&D and product design, or are at the
technology and management frontiers of their industry. Through this innovation
process, companies compete on the basis of product quality rather than on prices.
The authors warn that technological sophistication does not guarantee a
competitive firm, but being at the frontier of their industry and competing in the
international market, they are more likely to succeed in the long run. They
conclude that auto parts manufacturing have a solid foundation for a long run
presence in the region (Ibid).
Another explanation for the relatively successful evolution of the maquila auto
parts industry is posed by Sargent and Matthews (2004, 2008a, 2008b and 2009).
These authors recognise that the competitiveness of Mexico’s maquila auto parts
producers does not appear to be as threatened as the other major segments.

167
Although Sargent and Matthews (Ibid) recognise that a considerable number of
maquilas in the automotive sector have already made the transition into a higher
value-added model, a key elements of their argument are the locational and
proximity factors. In fact, they question, and consider open to debate, the
assumption that proximity-dependent maquilas utilise technology-intensive
production systems or that Mexico has an advantage over China in knowledge-
intensive, high-complexity Export Producing Zones’ segments (Ibid). Thus, one
of the major explanations for the competitive position of automotive maquilas is
that auto assemblers in North America continue to follow regional supply
strategies and require producers to supply intermediate goods on a Just-in-Time
basis. In a concise way, Sargent and Matthews (2004: 2016) state that “the
maquiladora option allows firms serving North American markets to supply final
assemblers on a just-in-time (JIT) basis, to respond rapidly to shifting consumer
demand, to provide customized rather than standardized products, and to
minimize transportation costs for hard-to-ship items”. Finally, these analysts
consider that recent events such as the revaluation of the Chinese currency,
increased transportation costs, and rising wage rates are all weakening China’s
comparative advantage; and this could provoke a new investment wave into
Mexico.

168
Table 5.5. Employment by Sector in Mexico's Maquiladora Industry, 1990-2006 (Annual Average)
Sector 1990 1995 2000 2001 2006
Number of Employees
Food 7,862 7,730 10,165 9,461 11,211
Garments& Textiles
42,464 99,476 282,755 268,033 169,490
Leather & Shoes 7,238 7,587 8,887 7,725 5,800
Furniture 24,224 35,807 60,897 59,904 58,504
Chemicals 6,565 12,754 26,571 23,997 36,502
Automotive 104,487 137,220 237,787 226,618 271,647
Machinery 5,018 6,799 14,180 15,714 20,413
Electric & Electronic Equipment
51,891 67,269 104,648 92,253 127,614
Electric & Electronic Accessories
114,610 167,164 337,471 297,914 261,139
Toys & Sports Articles 10,298 9,527 14,765 12,640 8,080
Other Manufactures 48,956 69,193 143,694 140,993 179,611
Services 22,824 27,738 49,412 43,691 52,124
Total 446,437 648,264 1,291,232 1,198,943 1,202,135
Percentages (%)
Sector 1990 1995 2000 2001 2006
Food 1.8 1.2 0.8 0.8 0.9
Garments& Textiles
9.5 15.3 21.9 22.4 14.1
Leather & Shoes 1.6 1.2 0.7 0.6 0.5
Furniture 5.4 5.5 4.7 5.0 4.9
Chemicals 1.5 2.0 2.1 2.0 3.0
Automotive 23.4 21.2 18.4 18.9 22.6
Machinery 1.1 1.0 1.1 1.3 1.7
Electric & Electronic Equipment
11.6 10.4 8.1 7.7 10.6
Electric & Electronic Accessories
25.7 25.8 26.1 24.8 21.7
Toys & Sports Articles 2.3 1.5 1.1 1.1 0.7
Other Manufactures 11.0 10.7 11.1 11.8 14.9
Services 5.1 4.3 3.8 3.6 4.3
Total 100.0 100.0 100.0 100.0 100.0
Source: Own elaboration with data from CNIMME and INEGI.

169
Table 5.6. Number of Plants by Sector in Mexico's Maquiladora Industry, 1990-2006 (Annual Average)
Sector 1990 1995 2000 2001 2006
Number of Plants
Food 45 58 81 79 42
Garments& Textiles
277 466 1,088 1,074 484
Leather & Shoes 47 58 62 59 25
Furniture 219 264 391 390 302
Chemicals 75 102 154 148 179
Automotive 156 166 246 267 312
Machinery 38 38 47 57 74
Electric & Electronic Equipment
102 118 159 167 170
Electric & Electronic Accessories
370 392 558 565 423
Toys & Sports Articles 32 42 60 56 34
Other Manufactures 264 325 508 530 454
Services 79 100 237 238 311
Total 1,703 2,130 3,590 3,630 2,810
Percentages (%)
Sector 1990 1995 2000 2001 2006
Food 2.6 2.7 2.3 2.2 1.5
Garments& Textiles
16.3 21.9 30.3 29.6 17.2
Leather & Shoes 2.7 2.7 1.7 1.6 0.9
Furniture 12.9 12.4 10.9 10.7 10.7
Chemicals 4.4 4.8 4.3 4.1 6.4
Automotive 9.1 7.8 6.9 7.3 11.1
Machinery 2.3 1.8 1.3 1.6 2.6
Electric & Electronic Equipment
6 5.6 4.4 4.6 6
Electric & Electronic Accessories
21.7 18.4 15.5 15.6 15.1
Toys & Sports Articles 1.9 2 1.7 1.5 1.2
Other Manufactures 15.5 15.3 14.1 14.6 16.1
Services 4.6 4.7 6.6 6.6 11.1
Total 100 100 100 100 100
Source: Own elaboration with data from CNIMME and INEGI.

170
Table 5.7. Employment and Plants by Sector in Mexico's Maquiladora Industry, 1990-2006 (2000 = 100)
Sector 1990 1995 2000 2001 2006
Number of Employees (2000 = 100)
Food 77.3 76.0 100.0 93.1 110.3
Garments& Textiles
15.0 35.2 100.0 94.8 59.9
Leather & Shoes 81.4 85.4 100.0 86.9 65.3
Furniture 39.8 58.8 100.0 98.4 96.1
Chemicals 24.7 48.0 100.0 90.3 137.4
Automotive 43.9 57.7 100.0 95.3 114.2
Machinery 35.4 47.9 100.0 110.8 144.0
Electric & Electronic Equipment
49.6 64.3 100.0 88.2 121.9
Electric & Electronic Accessories
34.0 49.5 100.0 88.3 77.4
Toys & Sports Articles 69.7 64.5 100.0 85.6 54.7
Other Manufactures 34.1 48.2 100.0 98.1 125.0
Services 46.2 56.1 100.0 88.4 105.5
Total 34.6 50.2 100.0 92.9 93.1
Number of Plants (2000 = 100)
Sector 1990 1995 2000 2001 2006
Food 55.6 71.6 100.0 97.5 51.9
Garments& Textiles
25.5 42.8 100.0 98.7 44.5
Leather & Shoes 75.8 93.5 100.0 95.2 40.3
Furniture 56.0 67.5 100.0 99.7 77.2
Chemicals 48.7 66.2 100.0 96.1 116.2
Automotive 63.4 67.5 100.0 108.5 126.8
Machinery 80.9 80.9 100.0 121.3 157.4
Electric & Electronic Equipment
64.2 74.2 100.0 105.0 106.9
Electric & Electronic Accessories
66.3 70.3 100.0 101.3 75.8
Toys & Sports Articles 53.3 70.0 100.0 93.3 56.7
Other Manufactures 52.0 64.0 100.0 104.3 89.4
Services 33.3 42.2 100.0 100.4 131.2
Total 47.4 59.3 100.0 101.1 78.3
Source: Own elaboration with data from CNIMME and INEGI.

171
5.4. “Near-shoring” versus “Off-shoring”: Recent Trends in a Global
Competitive Market
In recent years, a trend for locating or relocating primary production or
manufacturing closer to a centre of gravity of a company’s demand, known as
“near-shoring” seems to be replacing “off-shoring” practices (de Juan, León and
Lӧhner, 2008; Timberlake et al, 2009; Sirkin, Zinser and Hohner, 2011). The
“near-shoring” process, also labelled “reverse globalization”,51 is highly linked to
China’s changing business environment as well and recent transformations in the
global economy. Although it will vary from industry to industry, depending on the
labour content, transportation costs, China’s competitive strengths, and the
strategic needs of individual firms, a sizeable reallocation of global manufacturing
is expected over the next five years (Sirkin, Zinser and Hohner, 2011).
Interestingly, the actual and potential impacts of this process are of great
relevance for Mexico and its current and future economic, investment and trade
interactions with China.
Several specialized consultancy firms agree that China’s “low cost”
manufacturing cycle is coming to an end and that a combination of economic
forces is eroding its cost advantage as an export platform for the North American
market (de Juan, León and Lӧhner, 2008; Timberlake et al, 2009; Sirkin, Zinser
and Hohner, 2011; Roland Berger, 2011). Among the main factors impacting
China’s advantages are: a) increasing risk for foreign companies (economic
redevelopment; incentives shift); b) workforce becoming unstable (shrinking
workforce; reduced migration to cost; labour unrest and strikes; labour law
revisions); and c) losing cost advantage (rising wages; increasing inflation;
exports; rising production and transport costs) (Roland Berger, 2011). In labour
costs, for example, wage and benefits increase 15 to 20% a year (Sirkin, Zinser
and Hohner, 2011; Roland Berger, 2011),52 and hourly labour rates have jumped
from US$ 0.60 in 2002 to US$ 1.8 in 2009 (Roland Berger, 2011). In the
51 “Near-shoring” sometimes has been called “On-shoring” or “Re-Shoring”. 52 It is estimated that wage increases will slash China’s labour-cost advantage over low-cost states in the U.S., from 55% today to 39% in 2015, when adjusted for the higher productivity of U.S. workers (Sirkin, Zinser and Hohner, 2011: 3).

172
particular case of the China’s motor industry, some company managers have
reported increases in worker’s wages from 24,500 yuan (US$ 3,929) a year in
2003 to 49,000 yuan (US$ 7,858) in 2010. It is expected that manufacturing-
working wages will double by 2015 from the levels of 2009-2010 (Shirouzu,
2011). Another factor affecting China’s economic competitiveness has been the
escalation in oil prices, consequently increasing the cost of transport. Crude oil
soared from US$ 28 in 2003 to US$ 147 in 2008. As a result, the cost of shipping
a standard 40-foot container has more than tripled since the early 2000’s (Goel et
al., 2008).
According to an AlixPartners’ survey (2011a), the top reasons for “near-shoring”
are: a) lower freight costs; b) lower inventory or in-transit cost; c) improved speed
to market; d) time zone advantages for easier management coordination; and e)
improved cultural alignment. An almost unanimous conclusion of “near-shoring”
analysis is that Mexico emerges as the big winner in terms of supplying North
America (de Juan, León and Lӧhner, 2008; Fitz-Gerald, 2009; Sirkin, Zinser and
Hohner, 2011; AlixPartners, 2011a). When it comes to global manufacturing,
Mexico has been labelled “The New China” (Eyerdam, 2009; Fitz-Gerald, 2009)
or considered a privileged “sweet spot” in the globalisation landscape (de Juan,
León and Lӧhner, 2008). According to AlixPartners (2011a), Mexico has emerged
as the top choice among companies considering relocating their already off-shored
operations closer to North America. Mexico fulfils the attracting factors for near-
shoring, highlighting geographical proximity to the U.S. market, low
transportation costs, FTAs, favourable exchange rate, relatively low and stable
labour costs, and protection of intellectual property.53
In terms of costs, according to AlixPartners’ U.S. Manufacturing-Outsourcing
Cost Index, from 2007 to 2010 Mexico ranked as the low-cost country (LCC) for
the U.S. market (AlixPartners, 2011b). Since 2007, the competitive landscape for
outsourcing has been in favour of Mexico, some locations in Europe (Romania,
Russia), and several locations in Asia (Vietnam, India), other than China.
53 It is worth pointing out that, according to the survey results, although security risks are a clear concern among companies, relatively few have actually experienced supply chain disruption in Mexico and appear moderately optimistic about the future in this matter.

173
AlixPartners’ study (2011b) concluded that while Asian LCC will likely be more
impacted than Mexico, China may experience particular negative pressure on
landed costs due to wage inflation, exchange-rate pressures, and higher freight
rates.
One of Mexico’s major advantages over China is proximity to the U.S. market,
which not only save time and costs, but allows companies to practice JIT. Goods
shipped from Mexico can reach much of the United States in one or two days, as
opposed to bwtween nineteen and thirty-three days from China (de Juan, León and
Lӧhner, 2008). Another factor is the recent trend in labour costs. Since 2005 the
cost of manufacturing goods from Chin has risen by 40%; wages have increased
by 218% compared to 25% in Mexico (Global Auto Industry, 2011). Given the
rapid wage increases in China during the past five to six years, they are now
almost the same as the wage rates in Mexico. According to some sources, by 2010
Chinese workers were earning only two-thirds of what their Mexican counterparts
50
60
70
80
90
100
110
120
2005 2006 2007 2008 2009 2010
% o
f U
.S.
Co
st
Figure 5.2. Manufacturing-Outsourcing Cost Index
Composite Index 2010
China India Mexico Romania
Russia Vietnam U.S. (Baseline) Source: AlixPartners (2011b)

174
earned. It is estimated that by 2015, the fully loaded cost of hiring Chinese
workers will be 25% higher than the cost of using Mexican workers (Sirkin,
Zinser and Hohner, 2011). In the particular case of the motor industry, it has been
reported that by 2010, the rising wages in Chinese auto plants almost matched the
US$7 an hour all-in-cost, including benefits, of Mexican plants; if the US$1,200
to $2000 per-car cost to ship vehicles across the Pacific is added, the balance
plays in Mexico’s favour (Welch, 2010).54
In terms of the type of products most suitable for near-shoring from Mexico are
(de Juan, León and Lӧhner, 2008): a) products with significant logistics costs
(high volume-to weight or volume-to-value ratios); b) products that require
responsive supply chains; c) large bulky products with significant labour content;
and d) products that require significant managerial involvement. The motor
industry, both auto assembly and a large number of auto components, fit within
the above categories. In fact, during the last three to four years Mexico has
benefited from relocation processes of motor vehicle and components plants from
the U. S. and Canada.
5.5. Conclusions
This chapter aimed to assess the implications of China’s emergence on Mexico’s
attraction of motor FDI. Previous studies on this subject have not reached a
general agreement. Based on the analysis of limited data on total motor (vehicle
assembly and auto parts) FDI inflows for China and Mexico, as well as on the
opinion of diverse automotive agents, although not totally conclusive, it could be
argued that China does not compete for FDI with Mexico in the motor sector, at
least not in a direct-general way. A deduction resulting from the available
comparable information is that China’s dynamic development of its motor
industry and powerful magnet in attracting FDI has not stopped or significantly
changed the tendency of inward FDI in the Mexican motor industry. Obviously,
54 Even with the recent negotiations between automakers and labour unions in the USA, labour rates in Mexico looks highly attractive. At present, automakers in Mexico pay $4 to $5 an hour, whereas for the Detroit 3 is $28 an hour, for the so-called transplants, $15 to $20, and for Detroit’s new Tier-2 workers, $14 an hour (Chappell, 2012).

175
the size of China’s economy and domestic market is so large that makes difficult
to Mexico to avoid negative competitive or diverting effects in the motor
industry’s global FDI attraction. Based on the opinions gathered during the
personal interviews held with auto companies’ and industry associations’
executives, as well as governmental officials, it could be argued that, up to now,
only in certain component segments China is substituting FDI from Mexico,
presenting an increasing competition. This is particularly the case of the
electronics, and engine and chassis parts segments. At most, following García-
Herrero and Santabárbera (2007: 148), “the results should be read in terms of a
counterfactual: had Chinese inward FDI not been so strong, Mexico could have
attracted more FDI than it actually did”.
The analysis carried out in this chapter endorses some authors’ claims on the need
to develop further and deeper analysis on particular countries and sectors where
FDI diversion is most likely to occur, avoiding generalisations and the
homogeneity of the ‘China effect’ (Cravino, Lederman y Olearraga, 2007;
Jenkins, 2009; Jenkins and Dussel, 2007; Jenkins, Dussel Peters and Mesquita
Moreira, 2008). The issue is more complex than a simple-competitive relationship
between two countries, so it needs to be qualified. This qualification has to be
done from at least from two perspectives when analysing competition; first,
recognising the heterogeneity of the automotive sector’s production segments
regarding technical requirements, amount of capital, product size, etc., and the
specific value-chain link where the company is located; second,
identifying/understanding the stances held by different agents of the motor
industry (companies, governments, etc.). This qualification represents some sort
of technical division of labour and a social division of labour, respectively, within
the motor sector. Governments try to attract FDI and protect its domestic market,
while automotive firms compete against each other to capture a larger market
share, and conceiving the countries as territorial production and export bases
connected through global production networks. In this kind of country-sector
combination, the resulting set of interrelationships becomes quite complex.
176
When contrasting the evolution of auto FDI in China and Mexico for a
comparable period of time (2000-2009), it seems that both countries follow a
similar path, closely linked to the world economic cycle. In Mexico’s case, auto
FDI evolution is more closely connected to the Unites States’ economic cycle than
China. During the last years Mexico’s auto industry substantially increased its
production capacity; escalated positions among the top-ten worldwide producing
and exporting countries; became the number one supplier of automotive products
in the U.S. market; and increasing its share in the North American auto
production. Looking at these achievements from the perspective of the China-
Mexico interaction in the global automotive arena, a major explanation for these
trends might be the different entry motives of auto TNCs in China and Mexico:
auto FDI entry motive in China was 100% market-seeking, while in Mexico the
entry motive was mainly efficiency-seeking. From a broader perspective, these
entire features may also be associated to the different roles China and Mexico play
in the motor global division of labour. This will be depicted in more detail in
chapters 6 and 7 through the analysis of trade flows of autos and components and
other manufacturing interactions.
The results of this analysis, although limited and partial, contrast with the
generalised and almost unanimous conclusion in the literature that Mexico is Latin
America’s most adversely affected country by FDI competition and substitution.
Among the fundamental arguments is that behind this situation is Mexico’s
similar export structure to China’s as well as direct competition for efficiency-
seeking FDI, in which the former has been losing competitiveness in world
markets and global foreign investment attraction. The evidence in the case of the
motor sector does not seem to fit with this proposition.
Regarding the issue of competition and complementarity, the motor sector
presents a diversity of dimensions. In the same way as countries compete and
complement each other, so do the automakers in a kind of unity and struggle of
opposites. A case in point is the Sino-Foreign JVs. Besides quality and
environmental gaps as well as low prices, one of the main reasons why Sino-
Foreign JVs do not export much from China is because TNCs do not want to

177
compete with their own brands in their own countries. This situation is preventing
China to become an extensive export platform for the world markets. The nature
of competition also adopted different meaning depending on the social actor
involved. From the academic perspective, there is no direct competition between
Mexico and China in the motor industry because the former does not have a
‘Mexican’ car. Mexico is mainly a production and export base for international
companies, and it does not produce its own brand-name cars. From a
governmental point of view, “China is not Mexico’s main competitor in attracting
global automotive investment flows. Rather, the southern U.S. states of Alabama,
Indiana, Mississippi, and Texas represent the major threat”.55
Through investment decisions based on several factors such as foreign currency
rate; size of domestic market; logistics/distance; production costs and so on, auto
firms, especially the largest TNCs, shape the structure of the industry at global
scale. Through their decisions on the location of production and sourcing, these
companies can regionalise their technical division of labour, deciding on off-
shoring or near-shoring. From the study of China’s and Mexico’s motor industry,
two differentiated factors in automakers’ investment decisions stand out: location
for Mexico and domestic market size for China. Mexico’s experience shows that
geography still matters under globalisation. As for China’s, this bring out the issue
of the role of the State. Given China’s market potential, and despite some
undesirable regulations, foreign automakers have decided to enter China through
JVs. Market size has given the Chinese government a strong negotiation factor
with TNCs. In this sense, particularly in terms of investment in new motor vehicle
capacity, there is no competition between China and Mexico. However, the
market prospects in both countries are decisive issues.
Finally, this chapter’s findings also show the changing character of competitive
advantage of countries in a short period of time. With the economic recession of
2000-2003 and the migration of certain maquiladora segments, it became evident
that Mexico was no longer competitive in labour intensive operations. China was
55 Opinion of an official from Mexicos’ Ministry of Economy. Personal interview. Mexico City. 13th December, 2007.

178
the shelter for most of these production units, becoming the “world’s factory”.
Nevertheless, during the last few years, a combination of economic forces is fast
eroding China’s competitive advantage, moving to sector with higher technology
levels. On the other hand, recent trends towards practicing “near-shoring” in the
North American market, implying the abandonment of “off-shoring” from Asia, is
opening a new perspective for Mexico as a major player in this process, not only
for the relocation of investment and production capacity from North America, but
also in the economic and investment relationship with China. Under this trend, the
dual process of competition and complementarity between China and Mexico
arises again. By taking advantage of Mexico’s manufacturing base and location
respect to the North and South American markets, Chinese companies may locate
their production operations in Mexico to complement each other in exporting to
the United States.

179
6. CHAPTER SIX
THE CHINA-MEXICO AUTO INTERACTION 2: BILATERAL TRADE
AND DOMESTIC MARKET COMPETITION
“The arrival of cars manufactured in China is a watershed for the
Mexican automotive industry. Some see it with distrust and others want
to participate in it.” (Martínez, 2007).
“China’s auto parts maquiladora industry represents a sizeable threat to
Mexico, since it is estimated that it will reach a market penetration in half
the time than Japan’s.” (Suro-Rodríguez, 2003).56
Regarding the China-Latin America trade interaction and its impacts, two major
topics derived from the direct bilateral trade relationship have recently acquired
significance in the discussion: the implications of Latin America’s export boom to
China (China as export market) on the one hand, and China’s penetration in the
region’s domestic markets (China as import source), on the other. Within this the
discussion, it has been suggested that while the former topic has received some
attention in the literature, the latter has rather been marginalised. Given the
heterogeneity and differentiated pattern of the implications and impacts of the
growing trade relationship between Latin America and China, the limited country-
specific investigations which address these issues on a comprehensive way, as
well as the underestimation in most current studies of China’s impacts, there is,
however, agreement on the need of to carry out detailed specific reserach at the
product, sectoral, regional and country levels of China’s impacts on this subject
(Paus, 2008; Jenkins, 2009; Lederman, Olarreaga and Perry, 2009).
In the case of Mexico specifically, despite important advances, precise and
detailed studies on the impacts of China’s trade interaction on Mexico have been
limited. Early analyses focused on the China-Mexico relationship from an
historical and diplomatic perspective. On the other hand, more recent research has
56 Desc Automotriz’s Chairman. Reported by Anónimo (El Economista, 2003).

180
emphasised bilateral trade patterns and structure rather than the impacts on the
domestic economy. From the literature depicted above on the China-Latin
America trade relationship, a generalised conclusion is that Mexico represents a
“paradigmatic” example (Blázquez-Lidoy, Rodríguez and Santiso, 2007: 52) or an
“exception” case in all the studies (Paus, 2008: 5). According to Gallagher and
Porzecanski (2010: 8), Mexico tops everyone’s list of nations under direct threat
from China. While it is considered that export structure of most of Latin America
is more complementary than competitive with that of China, the similarity
between Mexico’s export structure and that of the Asian giant makes it a direct
competitor in world and domestic markets.57 In general, Mexico is the only
country in Latin America whose comparative advantage had been moving in the
same direction as China’s comparative advantage (Lederman, Olarreaga and
Perry, 2009). As a consequence, particularly after 2001, Mexico’s trade balance
with China has presented a growing deficit, of US$ 46.3 billion in 2011,
according to Mexican sources. Unlike most Latin American countries, Mexico has
not been able to take advantage of the region’s export boom to China. The China-
Mexico bilateral trade is mostly based on imports from China, which became
Mexico’s second largest trading partner in 2003. Whereas China’s share of
Mexico’s total exports is only 1.7%, the share of imports reaches 15%.
Studies of China’s impacts on Mexico’s domestic market and production structure
of specific sectors-products in Mexico have been even more limited. In the toy
industry, for example, the president of the Toy Industry Mexican Association
(AMIJ), have declared that Chinese imports with undervalued prices, along with
smuggling, piracy, and the economic crisis, have reported hit the industry badly.
The number of firms affiliated to the AMIJ has fallen from 320 in 1991 to 78 in
2011, a decrease of 75% (Patiño, 2011). It is estimated that between 35 and 65%
of this industry’s product is imported (Delgado, 2011). Recently, in a more
detailed study, the National Chamber of the Iron and Steel Industry
(CANACERO) reported that between 2007 and 2010 Mexico’s metallurgical
sector observed a drop of 6.1% in its production value and the loss of 135,000
jobs, mostly attributed to increased Chinese imports and competition (Mendes de
57 The China-Mexico competition in the U.S. market is the subject of analysis in Chapter 7.

181
Paula and Cervera, 2011). The study points out that metallurgics imports from
China went from representing 1.7% of Mexico’s production value in the sector in
2000 to 35.4% in 2010.58 Before this situation, the CANACERO has asked for
defensive measures, arguing a process of de-industrialisation in Mexico.
During the last few years, more comprehensive studies have been carried out, in
particular into the yarn-textile-garment and the electronics sectors (Dussel Peters,
2005a, 2005b, 2009 and 2010). Although not only attributed to Chinese
competition, Dussel Peters reported the loss of more than one third of
employment in the yarn-textile-garment commodity chain during the period 2000-
2005. Likewise, in the electronics sector (PC chain) China increased its share in
the Mexican market from 4.01% to 29.09% between 2000 and 2003. As a
consequence of China’s competition, Mexico’s electronics sector lost more than
45,000 (direct and indirect) jobs during the same period (Dussel Peters, 2005a,
2005b and 2009). According to analysts and other governmental and business
sources, if the illegal Chinese products introduced to Mexico were taken into
account, as well as their “triangulation” though U.S. ports, China’s final impact
could be worse (Dussel Peters, 2009; Jenkins, 2009). By the mid-2000s, Mexico’s
Ministry of Economy estimated that almost 60% of the apparel domestic market
was covered through illegal channels (smuggling, stolen goods and products with
tax evasion) (Arellano, 2006). In the toy industry, the AMIJ calculates that illegal
toy market in Mexico equals the US$ 2,000 million-value of the national formal
segment (Patiño, 2011). Likewise, at the end of 2011, the Chairman of Mexico’s
Employers Confederation (COPARMEX) declared that formal entrepreneurs lose
up to 40% in original equipment’ sales due to competition with piracy and
smuggling, especially regarding goods of Chinese origin (González, 2011).
Based on the examination of the literature, no special or detailed studies on the
China-Mexico bilateral trade relationship in the motor industry, or on the impacts
of China’s import penetration in this activity, have been performed. Against this
background, the main objective of this chapter is to analyse in detail the structure
58 Nevertheless, the study seems not having explicitly considered other relevant causes affecting the sector’s evolution, such as the economic crisis, for example.

182
and evolution of the China-Mexico bilateral trade in the motor industry. In
addition, an approximation to the impacts derived from China’s import
penetration in the sector will be addressed. Important questions to ask are: What is
the structure of the China-Mexico bilateral trade in the auto industry?; Is there
some type of specialisation pattern or complementarity between China and
Mexico?; Does China-Mexico bilateral trade in the motor industry follow the
same pattern than other manufactured sectors?; And, What is the degree of
Mexico’s domestic market competition of Chinese automotive products?
It is worth noting that, as in the case of FDI, there are important discrepancies
between Mexican and Chinese official statistics on bilateral trade, which pose
problems for making more “objective” analysis of the China-Mexico relationship.
Most of these statistical problems have been associated to differences in the
registration codes of the Harmonised System, the ‘triangulation’ flows of goods
into Mexico through the United States and Hong Kong, particularly the former, as
well as illegal imports (smuggling) (Dussel Peters, 2005c; Morales, 2009 and
2010). More specifically, among the major bilateral discrepancy sources are the
following (Morales, 2009): a) divergences between exports FOB and imports CIF;
b) differences in the registration times and dates between the exit of goods
(exports) and the arrival (imports); c) exports being registered according to the
destination country without determining if subsequently they are re-exported to a
third country; d) imports being registered according to their country of origin
without considering the precedence; e) human errors in the classification of goods
and/or registry of the trade flows’ value or volume; and f) illegal trade. Given
these discrepancies in the China-Mexico bilateral trade statistics, in this chapter,
the data analysed will be provided by the UN COMTRADE Database for both
China and Mexico, as reporter countries.
6.1. RCA and Specialisation of China and Mexico in World Motor Trade
As tendency, during the last two decades the world motor industry not only
presented a dynamic growth but also had an outstanding transformation in
structure and the geography production and trade. New producing and trading

183
countries appeared in the global scene; among them Mexico, since the 1980s, and
China, since the 1990s. In terms of trade, by 2010 Mexico ranked as the fourth-
largest exporter of automotive products, and China positioned itself in seventh
place. Together, these two countries account for almost 10% of total world motor
exports, while in the early 1990s they only registered over 3% (Table 6.1 and
Figure 6.1). Although by 2010 the traditional largest developed exporting
countries such as Germany, Japan and the USA were still the leaders, their share
of total motor exports has decreased. Besides Mexico and China, other emerging
countries have escalated in the export list, in particular Czech Republic, Poland
and Thailand.
Table 6.1. Total World Motor Exports. Major Exporting Countries, 1992-2010
(Million Dollars)
Country
1992
%
1995
%
2001
%
2005
%
2010
%
Germany 77,118 23.9 92,960 16.8 120,074 17.2 208,010 18.1 240,170 17.6
Japan 90,813 28.2 99,384 18.0 97,017 13.9 146,712 12.8 177,696 13.0
USA 50,651 15.7 67,796 12.2 83,856 12.0 110,141 9.6 126,362 9.3
Mexico 9,760 3.0 19,397 3.5 41,573 5.9 49,713 4.3 67,905 5.0
Korea 5,451 1.7 11,708 2.1 18,476 2.6 43,888 3.8 66,166 4.9
France n.a. 0.0 41,112 7.4 47,093 6.7 74,923 6.5 63,304 4.6
China 1,050 0.3 2,588 0.5 6,916 1.0 27,236 2.4 62,780 4.6
Canada 33,404 10.4 46,987 8.5 60,721 8.7 74,035 6.4 55,565 4.1
Spain 17,882 5.6 25,327 4.6 30,985 4.4 48,650 4.2 49,796 3.7
U. K. 17,3051 5.4 25,252 4.6 27,482 3.9 45,762 4.0 46,682 3.4
Belgium n.a. 0.0 n.a. 0.0 30,922 4.4 46,085 4.0 42,241 3.1
Italy n.a 0.0 23,585 4.3 23,678 3.4 37,967 3.3 40,392 3.0
Czech R. n.a. 0.0 2,365 0.4 8,070 1.2 19,587 1.7 31,666 2.3
Poland n.a. 0.0 1,562 0.3 5,978 0.9 18,891 1.6 29,796 2.2
Thailand 584 0.2 1,354 0.2 3,863 0.6 11,319 1.0 26,214 1.9
TOTAL 322,095 100.0 553,519 100.0 700,050 100.0 1,148,188 100.0 1,363,017 100.0 11991; n.a.: Not available. Source: Own elaboration based on UN COMTRADE Database.
In order to have a clearer image of China’s and Mexico’s participation in world
motor trade, and taking into consideration the product’s differentiated technical
specifications, exports can be divided into two broad categories: motor-vehicles
and auto parts.59 Under this classification, the ranking reallocation throws up
interesting results. In motor vehicle exports, by 2010 Mexico stands in fifth place 59 Of the 108 automotive items included in the “cluster” for this research, 19 correspond to “Motor-Vehicles” and 89 to “Auto Parts” (See Methodology in Chapter 3).

184
with an export value of US$ 67.9 billion, representing 5.5% of world’s total
(Table 6.2). On the other hand, compared to total motor exports, China loses
position accounting for less than 1%, although it increased the absolute value of
exports and registered a dynamic pace of growth, especially over the past decade.
When analyzing the auto parts export segment, a new arrangement in the country
ranking takes place: by 2010 China appears in fourth position and Mexico in
seventh. With less than 1% of the world’s total auto parts exports in 1992, in 2010
China concentrated 8.2%, with a value of US$ 56.4 billion. Mexico, on the other
hand, although losing world share during the last decade, it has kept its position in
the world ranking (Table 6.3). Besides China, in this segment of auto parts new
emerging countries are entering into the list of top-exporting countries,
particularly Czech Republic, Poland, Hungary and Thailand.
0.0
50.0
100.0
150.0
200.0
250.0
300.0
M
i
l
l
i
o
n
D
o
l
l
a
r
s
Figure 6.1. Selected Motor Exporting Countries,
1990-2010
Germany Japan USA Mexico
Korea France China Canada
Source: Own elaboration based on UN COMTRADE Database.

185
Table 6.2. World Motor-Vehicle Exports. Major Exporting Countries, 1992-2010
(Million Dollars)
Country 1992 % 1995 % 2001 % 2005 % 2010 %
Germany 49,251 26.6 57,926 20.0 76,574 20.4 124,809 20.8 142,446 21.1 Japan 59,739 32.3 52,108 18.0 59,067 15.7 89,148 14.9 103,634 15.3 USA 18,827 10.2 23,070 8.0 25,010 6.7 43,823 7.3 54,963 8.1 Canada 23,343 12.6 34,075 11.8 42,222 11.3 49,587 8.3 37,917 5.6 Mexico 3,966 2.1 9,382 3.2 21,929 5.8 21,639 3.6 36,981 5.5 Korea 2,831 1.5 8,304 2.9 13,213 3.5 29,206 4.9 34,977 5.2 Spain 11,899 6.4 16,968 5.9 19,930 5.3 293,948 4.9 31,210 4.6 U. K. 7,9021 4.3 12,236 4.2 13,269 3.5 26,769 4.5 29,081 4.3 Belgium n.a. n.a. 23,505 6.3 32,521 5.4 27,710 4.1 France n.a. 19,678 6.8 24,918 6.6 40,823 6.8 26,416 3.9 Czech R. 8381 0.4 923 0.3 3,092 0.8 6,741 1.1 13,125 1.9 Italy n.a. 10,376 3.6 9,187 2.4 11,826 2.0 13,034 1.9 Thailand 32 0.0 98 0.0 1,911 0.5 5,171 0.9 12,893 1.9 Poland n.a. 847 0.3 1,894 0.5 7,005 1.2 11,662 1.7 Turkey 127 0.1 433 0.1 1,678 0.4 7,698 1.3 10,467 1.5 Slovakia n.a. 95 0.0 1,773 0.5 3,847 0.6 9,368 1.4 Brazil 1,659 0.9 1,120 0.4 2,641 0.7 7,195 1.2 6,914 1.0 Argentina 284 0.2 674 0.2 1,539 0.4 2,039 0.3 6,595 1.0 China 64 0 146 0.1 153 0.0 1,866 0.3 6,425 0.9 India 172 0.1 272 0.1 164 0.0 1,337 0.2 5,536 0.8 TOTAL 184,939 100 289,498 100.0 375,095 100.0 598,610 100.0 676,393 100.0 1 1993; n.a.: Not available. Source: Own elaboration based on UN COMTRADE Database.
Table 6.3. World Auto Parts Exports. Major Exporting Countries, 1992-2010
(Million Dollars)
Country 1992 % 1995 % 2001 % 2005 % 2010 %
Germany 27,867 20.3 35,033 13.3 43,500 13.4 83,202 15.0 97,724 14.2
Japan 31,074 22.7 47,275 17.9 37,950 11.7 57,564 10.0 74,063 10.8
USA 31,824 23.2 44,726 16.9 58,846 18.1 66,318 12.1 71,339 10.4
China 986 0.7 2,442 0.9 6,763 2.1 25,370 4.6 56,355 8.2
France n.a. 0.0 21,434 8.1 22,175 6.8 34,101 6.2 36,888 5.4
Korea 2,621 1.9 3,404 1.3 5,263 1.6 14,682 2.7 31,189 4.5
Mexico 5,793 4.2 10,015 3.8 19,644 6.0 28,074 5.1 30,923 4.5
Italy n.a. 0.0 13,209 5.0 14,491 4.5 26,141 4.8 27,359 4.0
Spain 5,983 4.4 8,359 3.2 11,055 3.4 19,255 3.5 18,586 2.7
Czech R. n.a 0.0 1,443 0.5 4,978 1.5 12,846 2.3 18,542 2.7
Poland n.a. 0.0 715 0.3 4,084 1.3 11,887 2.2 18,135 2.6
Canada 10,061 7.3 12,912 4.9 18,499 5.7 24,448 4.4 17,649 2.6
U.K. 9,4031 6.9 13,016 4.9 14,213 4.4 18,993 3.5 17,601 2.6
Belgium n.a. 0.0 n.a. 0.0 7,417 2.3 13,564 2.5 14,531 2.1
Hungary 614 0.4 881 0.3 5,731 1.7 11,520 2.1 13,684 2.0
Thailand 552 0.4 1,256 0.5 1,952 0.6 6,148 1.1 13,321 1.9
TOTAL 137,155 100.0 264,022 100.0 324,956 100.0 549,578 100.0 686,624 100.0 11993. n. a.: Not available. Source: Own elaboration based on UN COMTRADE Database.

186
The tendencies shown above indicate that China and Mexico present a different
path in terms of their role in world motor exports. While for China auto parts
represents the bulk of total automotive exports (90%), for Mexico the motor-
vehicle segment is the most important one (55%). In terms of the RCA of China
and Mexico in world motor trade, the indices for the analysed years show a
manifest superiority of Mexico over China. By 2010, for instance, while Mexico
registered a substantive RCA in motor-vehicles and auto parts exports, with and
index of 2.762 and 2.275, respectively, China did not, reaching an index of 0.091
and 0.783, in the same order (Table 6.4). Some conclusions can be drawn from the
brief analysis on China’s and Mexico’s motor export trends. Firstly, both China
and Mexico are gaining position in worldwide automotive exports. Secondly,
although from a lower absolute base, China’s growth pace in automotive exports
is higher than Mexico’s. Thirdly, nowadays Mexico presents a much higher
degree of RCA at the aggregate level in world automotive exports (in both
vehicles and parts) than China’s. Finally, there is a differentiated specialisation
pattern: China in auto parts and Mexico in motor vehicles.
Table 6.4. China’s and Mexico’s Motor RCA Index in World Trade,
1992, 2001 and 2010
Country/
Export
Segment
Period (million dollars) RCA Index1
1992
%
2001
%
2010
%
1992
2001
2010
China Motor Vehicles 64 6.1 153 2.2 6,425 10.2 0.015 0.009 0.091 Auto Parts 986 93.9 6,763 97.8 56,355 89.8 0.312 0.478 0.783 Total Automotive Exports
1,050
100.0
6,916
100.0
62,780
100.0
0.142
0.227
0.440
Mexico Motor Vehicles 3,967 40.6 21,929 52.7 36,982 54.5 1.713 2.256 2.762 Auto Parts 5,793 59.4 19,644 47.3 30,923 45.5 3.372 2.333 2.275 Total Automotive Exports
9,760
100.0
41,573
100.0
67,905
100.0
2.419
2.291
2.517
1A country has revealed comparative advantage in a specific sector or segment when the Index value is > 1. Source: Own elaboration based on UN COMTRADE Database.

187
6.2. China-Mexico Total Bilateral Trade
Substantial economic interaction between China and Mexico began after the late
1990s and early 2000s. From the initial marginal trade relationship, in 2003 China
displaced Japan and became Mexico’s second largest trade partner, behind only
the United States (Table 6.5). In 1990 trade with China was less than 1 percent of
Mexico’s total, with a value of only US$ 24.8 million; in 2003 the Mexico-China
trade exceeded the US$ 10,000 and by 2011, the value reached US$ 58,213.2
million, accounting for 8.3% of Mexico’s worldwide trade.
Regarding China-Mexico bilateral trade, although the pace of growth was similar
during the different periods analysed (1992-2001 and 2001-2010), absolute
growth of trade value registered a strong boost after 2001, when China joined the
WTO (Table 6.6). As pointed out in the introductory section of this chapter,
important discrepancies in bilateral trade sources between China and Mexico
exist. According to Chinese sources, total bilateral trade with Mexico reached
US$ 24.7 billion in 2010. Of this value, 17.9 billion correspond to exports and 6.9
billion for imports. On the other hand, based on Mexican sources, total bilateral
trade with China reached US$ 49.8 billion, of which 4.2 billion correspond to
exports and 45.6 billion to imports. The major discrepancy is in China’s export
value in relation to Mexico’s import value, with a difference of 155% between
them. Despite the discrepancies in the trade value reported for both countries, a
similar AAGR between 26 and 28% for exports and between 21 and 28% for
imports are registered (Table 6.6).
Another characteristic of the China-Mexico bilateral relationship is the high
significance of imports from China in Mexico’s total trade. The increasing import
penetration of Chinese products has produced a huge trade imbalance for Mexico,
the largest deficit with a trading partner. Based on Chinese sources, in 2010 China
had a surplus of nearly US$ 11 billion while, according to Mexican sources,
Mexico had a trade deficit with China of US$ 41.4 billion (Figures 6.2 and 6.3).
That same year, the ratio of Mexican imports from China relative to Mexican
exports to China was 11:1. Despite this, it is worth pointing out that during recent

188
years, from 2008 to 2010, Mexican exports to China have doubled their value,
presenting AAGR three times higher than imports.60
Finally, this growing trade imbalance and domestic market penetration of Chinese
products have caused a tense environment in the China-Mexico bilateral
relationship. To some analysts, the situation could become worse in the short term
as a result of trade disputes within the WTO as well as other controversies such as
illegal Chinese imports (Dussel Peters, 2009).
Table 6.5. Mexico’s Major Trade Partners, 1990-2011
(Million Dollars)
Year USA Japan Canada China Total
1990 59,651.7 2,799.8 639.0 24.8 77,602.3
1991 69,283.1 3,513.6 1,358.1 205.0 91,541.1
1992 82,868.5 4,170.8 2,067.3 450.8 110,255.7
1993 88,145.5 4,615.2 2,774.0 431.2 117,198.6
1994 106,435.6 5,777.0 3,103.5 541.8 140,163.1
1995 119,018.5 4,973.3 3,439.3 736.4 151,993.6
1996 147,316.6 5,382.7 3,980.1 963.2 185,472.5
1997 174,933.2 5,349.9 4,272.9 1,389.5 220,045.0
1998 195,209.1 5,088.6 4,007.2 1,808.8 242,912.4
1999 223,899.3 6,029.4 6,292.6 2,095.3 278,336.6
2000 273,749.0 7,580.7 7,586.0 3,190.1 340,578.6
2001 250,213.2 9,532.0 7,502.5 4,412.1 327,176.2
2002 248,454.4 10,542.8 7,471.6 6,928.3 329,724.9
2003 249,654.0 8,767.6 7,162.3 10,375.0 335,312.3
2004 275,348.7 11,773.9 8,619.0 15,360.2 384,808.2
2005 302,110.2 14,547.8 10,403.8 18,831.9 436,052.5
2006 342,110.4 16,889.2 12,552.4 26,125.6 505,977.2
2007 363,973.6 18,280.0 14,469.7 31,687.8 555,277.5
2008 387,172.3 18,394.3 16,580.0 36,801.4 602,768.8
2009 297,312.3 13,011.7 15,678.9 34,744.6 464,005.2
2010 383,364.8 16,941.0 19,308.1 49,805.3 599,619.9
2011 449,068.4 18,747.4 20,333.0 58,213.2 700,424.1
Source: Own elaboration based on Mexico’s Ministry of Economy (2012b).
60In fact, based on Mexican sources in Table 6.13, for 2011 this ratio decreased to 8.75: 1.

189
Table 6.6. China-Mexico Total Bilateral Trade, 1992-2010
(Million Dollars)
Year
Chinas as Reporter Country Mexico as Reporter Country
Total
Trade
Exports Imports Balance Total
Trade
Exports Imports Balance
1992 271.7 157.7 114.0 43.8 449.5 47.2 402.3 -355.1
1993 280.5 155.7 124.8 30.9 456.8 2.4 454.5 -452.1
1994 295.3 201.5 93.9 107.6 599.7 100.4 499.4 -399.0
1995 389.6 195.1 194.5 0.6 557.1 37.0 520.1 -483.1
1996 518.3 221.1 297.2 -76.1 962.2 202.6 759.6 -557.1
1997 597.8 413.5 184.3 229.2 1,431.1 141.6 1,289.4 -1,147.8
1998 836.7 689.2 147.5 541.7 1,807.1 192.3 1,614.8 -1,422.6
1999 950.9 791.7 159.2 632.4 2,046.0 126.3 1,919.8 -1,793.5
2000 1,823.5 1,335.2 488.3 847.0 3,188.0 310.2 2,877.9 -2,567.7
2001 2,551.5 1,790.2 761.3 1,028.9 4,411.6 384.8 4,026.8 -3,642.0
2002 3,978.6 2,863.7 1,115.0 1,748.7 6,927.3 653.7 6,273.6 -5,619.9
2003 4,943.8 3,267.0 1,676.7 1,590.3 10,374.5 974.3 9,400.2 -8,425.9
2004 7,112.6 4,972.8 2,139.8 2,832.9 14,847.2 473.7 14,373.4 -13,899.7
2005 7,7763.0 5,537.7 2,225.3 3,312.4 18,831.9 1,135.6 17,696.3 -16,560.8
2006 11,430.7 8,823.6 2,607.1 6,216.5 26,126.4 1,688.1 24,438.3 -22,750.2
2007 14,983.0 11,717.7 3,265.3 8,452.3 31,638.7 1,895.0 29,743.7 -27,848.6
2008 17,556.7 13,866.5 3,690.3 10,176.2 36,735.1 2,044.8 34,690.3 -32,645.6
2009 16,180.9 12,299.0 3,881.9 8,417.1 34,736.8 2,207.8 32,529.0 -30,321.2
2010 24,747.8 17,872.7 6,875.2 10,997.5 49,803.4 4,195.9 45,607.5 -41,411.6
AAGR
1992-2010 26.8 28.3 24.1 28.1 26.6 28.3
1992-2001 30.8 27.5 20.9 25.7 23.4 25.9
2001-2010 25.5 25.9 24.6 27.4 27.0 27.5
Source: Own elaboration based on UN COMTRADE Database.
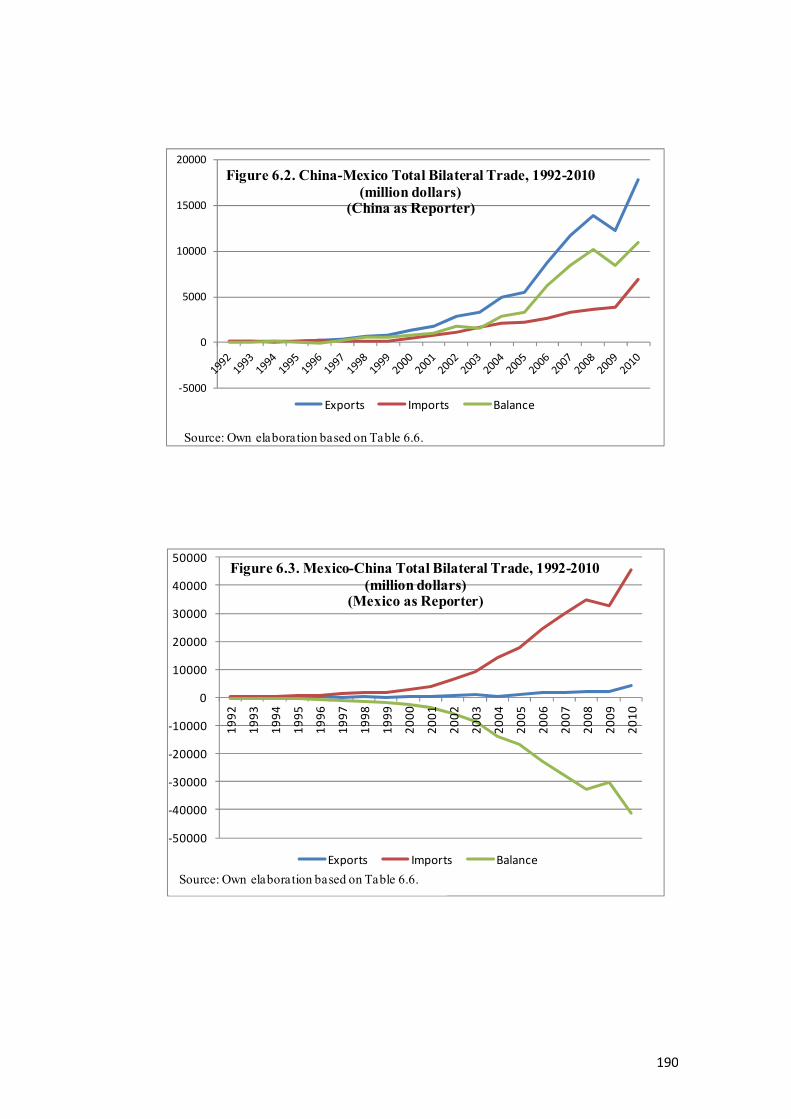
190
-5000
0
5000
10000
15000
20000
Figure 6.2. China-Mexico Total Bilateral Trade, 1992-2010
(million dollars)(China as Reporter)
Exports Imports Balance
Source: Own elaboration based on Table 6.6.
-50000
-40000
-30000
-20000
-10000
0
10000
20000
30000
40000
50000
19
92
19
93
19
94
19
95
19
96
19
97
19
98
19
99
20
00
20
01
20
02
20
03
20
04
20
05
20
06
20
07
20
08
20
09
20
10
Figure 6.3. Mexico-China Total Bilateral Trade, 1992-2010
(million dollars) (Mexico as Reporter)
Exports Imports Balance
Source: Own elaboration based on Table 6.6.

191
6.3. China-Mexico Bilateral Motor Trade
6.3.1. Significance and Evolution of Bilateral Motor Trade
It is pertinent to discuss the relevance of the motor industry in the China-Mexico
bilateral trade, and how the China-Mexico bilateral motor trade has evolved in
relation to the growth pace of total trade between the two nations. Tables 6.7 and
6.8 show, respectively, China’s and Mexico’s share of motor bilateral trade in
their total trade. As observed in the tables, motor trade plays and increasing
important role in total bilateral trade for both countries. Based on Chinsese official
figures (China as reporter country), from constituting less than 1% of China’s
total commercial transactions in the early 1990s, in 2010 automotive trade
represented 8% of total bilateral trade with Mexico with a value of nearly US$ 2.0
billion; motor exports were 6% and imports, a significant 13.1%. In terms of the
pace of growth, in all the periods analysed (1992-2010, 1992-2001 and 2001-
2010), China’s total auto trade with Mexico, as well as auto exports and imports,
registered AAGR twice as a much as the ones obtained in total bilateral trade; for
motor imports, the AARG were even higher.
Despite the fact that Mexico’s figures on motor bilateral trade with China seem to
have evolved erratically throughout the 1990s, it appears that these became
stabilised from the year 2000. According to Mexican official figures (Mexico as
reporter country), by 2010, Mexico’s motor trade with China represented around
6% of total bilateral trade, reaching a value of US$ 2.9 billion. In relative terms,
this figure is lower than China’s, but to Mexico auto exports represent almost 17%
of total exports. Despite that the value of Mexico’s automotive imports from
China is more than double that of China’s imports from Mexico, for the latter it
only represents 4.8% of total bilateral imports. In Mexico’s case, motor exports
have been more dynamic than the rest of bilateral trade. However, it is important
noting that during the recent period of 2001-2010, both auto exports and imports
registered higher AAGR than total bilateral trade. This trend was particularly
powerful during the last few years, overcoming the global financial crisis of 2008-
2009 by 2010.

192
Table 6.7. China-Mexico Motor Trade in Total Bilateral Trade, 1992-2010
(Million Dollars)
(China as Reporter Country)
Year
Total
Trade
(TT)
Motor
Trade
(MT)
%
MT/
TT
Total
Exports
(TE)
Motor
Exports
(ME)
%
ME/
TE
Total
Imports
(TI)
Motor
Imports
(MI)
%
MI/
TI
1992 271.7 0.7 0.3 157.7 0.7 0.4 114.0 0.0 0.0
1993 280.5 0.6 0.2 155.7 0.6 0.4 124.8 0.0 0.0
1994 295.3 0.8 0.3 201.5 0.7 0.3 93.9 0.1 0.1
1995 389.6 1.7 0.4 195.1 1.3 0.7 194.5 0.4 0.2
1996 518.3 5.6 1.1 221.1 5.4 2.4 297.2 0.2 0.1
1997 597.8 22.7 3.8 413.5 7.5 1.8 184.3 15.3 8.3
1998 836.7 37.4 4.5 689.2 12.5 1.8 147.5 24.9 16.9
1999 950.9 38.4 4.0 791.7 17.2 2.2 159.2 21.2 13.3
2000 1,823.5 58.9 3.2 1,335.2 32.0 2.4 488.3 26.9 5.5
2001 2,551.5 75.6 3.0 1,790.2 33.8 1.9 761.3 41.8 5.5
2002 3,978.6 130.0 3.3 2,863.7 62.4 2.2 1,115.0 67.7 6.1
2003 4,943.8 201.1 4.1 3,267.0 98.8 3.0 1,676.7 102.3 6.1
2004 7,112.6 315.4 4.4 4,972.8 184.1 3.7 2,139.8 131.3 6.1
2005 7,763.0 340.6 4.4 5,537.7 218.7 3.9 2,225.3 121.9 5.5
2006 11,430.7 706.1 6.2 8,823.6 435.0 4.9 2,607.1 271.2 10.4
2007 14,983.0 912.4 6.1 11,717.7 610.0 5.2 3,265.3 302.4 9.3
2008 17,556.7 1,061.6 6.0 13,866.5 772.2 5.6 3,690.3 289.4 7.8
2009 16,180.9 1,025.8 6.3 12,299.0 680.9 5.5 3,881.9 344.9 8.9
2010 24,747.8 1,971.1 8.0 17,872.7 1,073.9 6.0 6,875.2 897.2 13.1
AAGR
1992-2010 26.8 51.8 28.3 47.3 24.1 73.0
1992-2001 30.8 68.3 27.5 47.7 20.9 108.4
2001-2010 25.5 38.6 25.9 41.3 24.6 35.9
Source: Own elaboration based on UN COMTRADE Database.

193
Table 6.8. China-Mexico Motor Trade in Total Bilateral Trade, 1992-2010
(Million Dollars)
(Mexico as Reporter Country)
Year
Total
Trade
(TT)
Motor
Trade
(AT)
%
MT/
TT
Total
Exports
(TE)
Motor
Exports
(AE)
%
ME/
TE
Total
Imports
(TI)
Motor
Imports
(AI)
%
MI/
TI
1992 449.5 32.3 7.2 47.2 2.2 4.6 402.3 30.1 7.5
1993 456.8 31.5 6.9 2.4 0.0 1.4 454.5 31.5 6.9
1994 599.7 5.3 0.9 100.4 0.2 0.2 499.4 5.1 1.0
1995 557.1 11.3 2.0 37.0 0.4 1.1 520.1 10.9 2.1
1996 962.2 18.8 1.9 202.6 2.6 1.3 759.6 16.2 2.1
1997 1,431.1 61.8 4.3 141.6 20.2 14.3 1,289.4 41.5 3.2
1998 1,807.1 101.0 5.6 192.3 26.1 13.6 1,614.8 74.9 4.6
1999 2,046.0 84.8 4.1 126.3 2.3 1.8 1,919.8 82.5 4.3
2000 3,188.0 106.8 3.3 310.2 23.0 7.4 2,877.9 83.8 2.9
2001 4,411.6 142.3 3.2 384.8 30.7 8.0 4,026.8 111.6 2.8
2002 6,927.3 256.8 3.7 653.7 48.1 7.4 6,273.6 208.7 3.3
2003 10,374.5 379.6 3.7 974.3 95.4 9.8 9,400.2 284.1 3.0
2004 14,847.2 627.5 4.2 473.7 63.8 13.5 14,373.4 563.7 3.9
2005 18,831.9 923.3 4.9 1,135.6 93.3 8.2 1,7696.3 830.0 4.7
2006 26,126.4 1,442.8 5.5 1,688.1 251.8 14.9 24,438.3 1,191.0 4.9
2007 31,638.7 1,665.5 5.3 1,895.0 274.0 14.5 29,743.7 1,391.5 4.7
2008 36,735.1 1,877.3 5.1 2,044.8 234.6 11.5 34,690.3 1,642.7 4.7
2009 34,736.8 1,767.5 5.1 2,207.8 254.4 11.5 32,529.0 1,513.1 4.7
2010 49,803.4 2,875.2 5.8 4,195.9 703.6 16.8 45,607.5 2,171.6 4.8
AAGR
1992-2010 28.1 26.7 26.6 35.5 28.3 25.3
1992-2001 25.7 16.0 23.4 30.3 25.9 14.0
2001-2010 27.4 35.1 27.0 36.8 27.5 34.6
Source: Own elaboration based on UN COMTRADE Database.
In Mexico’s case, in terms of the position of automotive trade in relation to other
economic sectors in the bilateral relationship, by 2010 the more significant role is
in the export segment, ranking in third place with 16.8% of total exports to China
(Table 6.9), behind ores and mineral fuels. Although they have a lower share of
total imports, automotive products are located in fourth place, only behind
electronic equipment, nuclear reactors and electrical machinery, apparatus and
appliances. As observed in Table 6.9, Mexico’s bilateral trade with China is

194
highly concentrated in a few products. Based on 2010 figures, five items
concentrate 80% of total exports; and three accounts for 87% of total imports.
Only one, electrical and electronic equipment concentrates nearly 50% of total
imports from China that same year. An apparently paradox is that Mexico’s trade
structure presents great similarity to China’s, especially in manufacturing goods
(Dussel Peters, 2009).
Table 6.9. Major Export and Import Products in Trade with China, 2010
(Mexico as Reporter Country)
Commodity
Code
Product
Value
(US$ Million)
%
EXPORTS
26 Ores, slag and ash 1,028.1 24.5 27 Mineral fuels, oils, distillation products 724.3 17.3 871 Automotive products 703.6 16.8 74 Cooper and articles thereof 619.0 14.8 85 Electrical, electronic equipment 299.4 7.1 84 Nuclear reactors, boilers, machinery, etc. 197.8 4.7 29 Organic chemicals 180.3 4.3
TOTAL 4,195.9 100.0 IMPORTS
85 Electrical, electronic equipment 21,755.5 47.7 84 Nuclear reactors, boilers, machinery 10,675.5 23.4 77 Electrical machinery, apparatus and
appliances 7,309.2 16.0
871 Automotive products 2,171.6 4.8 90 Optical, photo, technical, medical 2,065.8 4.5 95 Toys, games and sport requisites 1,353.0 3.0 39 Plastics and articles thereof 1,023.4 2.2
TOTAL 45,607.5 100.0
1 The value of commodity code 87 includes the items classified under the “cluster” of 108 automotive products. It not includes items such as bicycles and motorbikes, but it may include some electrical and rubber items used in the automotive industry, for example. For this reason, the automotive segment as used here is different from the 87 commodity code. Source: Own elaboration based on UN CONTRADE Database.

195
As in the case of total bilateral trade, Mexico’s motor sector also presents a
negative trade balance with China (Table 6.10; Figures 6.4 and 6.5). Based on
Mexico as reporter country in UNCOMTRADE figures, in 2010 this sector’s trade
deficit was US$ 1.4 billion, although in relative terms the proportion seems to be
decreasing in recent years. In fact, whereas the ratio of imports to exports in
Mexico’s total bilateral trade with China was 30.3:1.0 in 2004, 17.0:1.0 in 2008
and 10.9:1.0 in 2010, the ratio for motor trade was 8.8:1.0, 7.0:1.0 and 3.1:1.0,
respectively (Table 6.11).
Table 6.10. China-Mexico Motor Trade Balance, 1992-2010
(Million Dollars)
China as Reporter Country Mexico as Reporter Country
Year Motor
Exports
Motor
Imports
Trade
Balance
Motor
Exports
Motor
Imports
Trade
Balance
1992 0.7 0.0 0.7 2.2 30.1 -27.9
1993 0.6 0.0 0.6 0.0 31.5 -31.4
1994 0.7 0.1 0.5 0.2 5.1 -4.9
1995 1.3 0.4 0.9 0.4 10.9 -10.5
1996 5.4 0.2 5.2 2.6 16.2 -13.6
1997 7.5 15.3 -7.8 20.2 41.5 -21.3
1998 12.5 24.9 -12.4 26.1 74.9 -48.8
1999 17.2 21.2 -4.0 2.3 82.5 -80.2
2000 32.0 26.9 5.1 23.0 83.8 -60.8
2001 33.8 41.8 -8.0 30.7 111.6 -80.9
2002 62.43 67.7 -5.3 48.1 208.7 -160.6
2003 98.8 102.3 -3.5 95.4 284.1 -188.7
2004 184.1 131.3 52.8 63.8 563.7 -499.9
2005 218.7 121.9 96.9 93.3 830.0 -736.7
2006 435.0 271.2 163.8 251.8 1,191.0 -939.3
2007 610.0 302.4 307.7 274.0 1,391.5 -1,117.5
2008 772.2 289.4 482.8 234.6 1,642.7 -1,408.2
2009 680.9 344.9 336.0 254.4 1,513.1 -1,258.7
2010 1,073.9 897.2 176.8 703.6 2,171.6 -1,468.0
Source: Own elaboration based on UN COMTRADE Database.

196
-200.00
0.00
200.00
400.00
600.00
800.00
1000.00
1200.00
19
92
19
93
19
94
19
95
19
96
19
97
19
98
19
99
20
00
20
01
20
02
20
03
20
04
20
05
20
06
20
07
20
08
20
09
20
10
M
i
l
l
i
o
n
D
o
l
l
a
r
s
Figure 6.4. China-Mexico Motor Bilateral Trade,
1992-2010(China as Reporter Country)
Auto Xs Auto Ms Trade Balance
Source: Own elaboration based on Table 6.10.
-2000.00
-1500.00
-1000.00
-500.00
0.00
500.00
1000.00
1500.00
2000.00
2500.00
3000.00
19
92
19
93
19
94
19
95
19
96
19
97
19
98
19
99
20
00
20
01
20
02
20
03
20
04
20
05
20
06
20
07
20
08
20
09
20
10
M
i
l
l
i
o
n
D
o
l
l
r
a
s
Figure 6.5. China-Mexico Motor Bilateral Trade, 1992-2010
(Mexico as Reporter Country)
Auto Xs Auto Ms Trade Balance
Source: Own elaboration based on Table 6.10.

197
Table 6.11. Ratio of Imports to Exports in Mexico’s Total Bilateral Trade
and Bilateral Motor Trade with China (Mexico as Reporter Country)
Year
Ratio of Imports to Exports
Total Bilateral
Trade
Motor
Trade
1992 8.5 13.8 1993 192.3 953.8 1994 5.0 27.6 1995 14.1 27.6 1996 3.7 6.2 1997 9.1 2.1 1998 8.4 2.9 1999 15.2 35.5 2000 9.3 3.6 2001 10.5 3.6 2002 9.6 4.3 2003 9.6 3.0 2004 30.3 8.8 2005 15.6 8.9 2006 14.5 4.7 2007 15.7 5.1 2008 17.0 7.0 2009 14.7 5.9 2010 10.9 3.1
Source: Own elaboration based on UN COMTRADE Database.
Another similarity with total bilateral trade is that the trade imbalance is smaller
according to Chinese sources. Again, the main discrepancies in automotive trade
figures arise in China’s exports to Mexico compared to Mexico’s imports from
China. The difference is around 100% (US$ 1 billion). Nevertheless, it is worth
noting that despite these discrepancies, both Chinese and Mexican sources report
the same increasing tendencies in export and import values (Figures 6.6 and 6.7).

198
0.0
500.0
1000.0
1500.0
2000.0
2500.0
19
92
19
93
19
94
19
95
19
96
19
97
19
98
19
99
20
00
20
01
20
02
20
03
20
04
20
05
20
06
20
07
20
08
20
09
20
10
M
i
l
l
i
o
n
D
o
l
l
a
r
a
s
Figure 6.6. China's Motor Exports to Mexico vs Mexico's
Motor Imports from China, 1992-2010
China Auto Xs Mexico Auto Ms
Source: Own elaboration based on Table 6.10.
0.00
100.00
200.00
300.00
400.00
500.00
600.00
700.00
800.00
900.00
1000.00
19
92
19
93
19
94
19
95
19
96
19
97
19
98
19
99
20
00
20
01
20
02
20
03
20
04
20
05
20
06
20
07
20
08
20
09
20
10
M
i
l
l
i
o
n
D
o
l
l
a
r
s
Figure 6.7. Mexico's Motor Exports to China vs China's
Motor Imports from Mexico, 1992-2010
Mexico Auto Xs China Auto MsSource: Own elaboration based on Table 6.10.

199
Finally, looking at the evolution of the bilateral trade between China and Mexico,
it can be argued that, unlike other sectors such as garments, toys and electronics,
in the automotive case the big trade boost started by the mid-2000s and not
immediately after China joined the WTO. This might be explained by the sectoral
differences, in particular the type of global value chains involved and their form
of governance, technological conditions, required scale economies, as well as
market and competition conditions, among other factors.
6.3.2. Structure and Composition of Bilateral Motor Trade
Based on the analysis of the sector’s evolution, motor trade plays an important
role in the bilateral trade of both China and Mexico, and has also registered a
dynamic pace of growth, especially during the last decade. This section discusses
the structure and product composition of the China-Mexico bilateral motor trade,
and whether there is some kind of specialisation pattern between the two
countries. As seen in the previous section, there are discrepancies in both Chinese
and Mexican sources, although similar increasing tendencies in export and import
values can be seen, and both countries’ sources present similar product
composition in their export and import structure of motor goods. Nevertheless, the
following analysis will mainly consider Mexico as reporter country.
Table 6.12 shows Mexico’s major export and import motor products in 2010. In
correlation with China, Mexico’s automotive exports are highly concentrated in
small number of items: nine products concentrate 96.2% of total exports to China.
As in China’s import structure, automobiles represent Mexico’s single largest
export product, accounting for around 80% of total motor exports. Besides motor
vehicles, other important items are electronic and safety systems (safety airbags
with inflated system); engine components (parts for spark-ignition type engines,
and parts for diesel and semi-diesel engines); parts for motor vehicle bodies;
general parts and accessories. In addition, in Mexico’s major export items appear
important component categories related to transmissions and drive train
components such as drive axles with differentials; steering wheels, steering
columns and steering boxes; and transmission shafts and cranks.

200
Table 6.12. Mexico’s Major Motor Export and Imports Products in Trade with
China, 2010 (Mexico as Reporter Country)
HS Code
Product Description
Value
(Million
Dollars)
%
of
Total
AAGR
2001-
2010
EXPORTS
870323 Automobiles w reciprocating piston engine displacing >1500 cc to 3000 cc
555.269 78.9 182.2
840991 Parts for spark-ignition type engines nes 27.476 3.9 4.4 870899 Motor vehicle parts nes 24.208 3.4 46.3 870895 Safety airbags with inflated system 16.673 2.4 87.8 870850 Drive axles with differential for motor vehicles 13.084 1.8 32.6 870829 Parts and accessories of bodies nes for motor
vehicles 12.961 1.8 15.4
840999 Parts for diesel and semi-diesel engines 12.935 1.8 79.6 870894 Steering wheels, steering columns and steering
boxes for motor vehicles 9.392 1.3 124.6
848310 Transmission shafts (including camshafts and crankshafts) and cranks
6.441 0.9 28.2
TOTAL 703.573 100.0 36.8
IMPORTS
732690 Articles, iron or steel, nes 218.627 10.1 27.0 401120 Pneumatic tyres, new of rubber for buses or
lorries 155.594 7.2 57.2
850780 Storage batteries, nesoi 139.816 6.4 42.9 401110 Pneumatic tyres, new of rubber for motor cars,
including station wagons and racing cars 135.357 6.2 43.8
870829 Parts and accessories of bodies nes for motor vehicles
99.612 4.6 61.6
841490 Parts of vacuum pumps, compressors, fans, blowers, hoods
92.019 4.2 50.6
870899 Motor vehicle parts nes 90.160 4.2 40.9 841459 Fans nes 81.562 3.8 23.8 854420 Co-axial cable and other electric conductors 76.306 3.5 41.4 853641 Relays for a voltage not exceeding 60v 66.806 3.1 39.5 851190 Parts for electrical ignition or starting
equipment used for internal combustion engines
54.628 2.5 55.2
870870 Wheels including parts and accessories 56.406 2.6 52.6 851290 Parts of electrical lighting, signalling and
defrosting equipment 54.821 2.5 52.2
870850 Drive axles with differential for motor vehicles 53.518 2.5 165.5 850720 Lead-acid electric accumulators nes 47.526 2.2 27.4 TOTAL 2,171.6 100.0 34.6
Source: Own elaboration based on UN COMTRADE Database.

201
Mexico’s motor imports from China are more diversified than exports. Except for
a few items, there is also a high correspondence between Mexico’s imports with
China’s exports. The most important import item in 2010 was iron and steel
articles with 10.1%; this is followed by pneumatic tyres for buses and automobiles
adding up to 13.4% between them. Electrical parts also take a considerable share
of imports, making nearly 10% among three items: co-axial cable and other
electric conductors; parts for electrical ignition or starting equipment used for
internal combustion engines; and parts for electrical lighting, signalling and
defrosting equipment. Other components are parts of vacuum pumps; storage
batteries; lead-acid electric accumulators; and accessories and general parts. In the
list also appear wheels, including parts and accessories, as well as drive axles with
differential. Finally, in terms of the pace of growth, while most of Mexico’s
imported items registered AAGR above the average, some of the exported ones
presented growth rates below the average, showing a loss of dynamism during the
period analysed.
Given the above trade structure and product composition, and in order to identify
the possible existence of a specialisation pattern in the China-Mexico motor
bilateral trade in a more systematic way, a specific methodology was designed for
this purpose. This scheme is also useful for assessing the qualitative side of a
“competitive threat”, as applied in Chapter 7, where the China-Mexico
competition in the U.S. market is evaluated. As described in the Methodological
Chapter, this particular methodology classifies the 108 products included in the
automotive “cluster”, at 6-digit level of the Harmonised System (HS), into five
categories and twenty-five subcategories with different technological complexity
within the automotive value chain. Ranging from high to low complexity level,
the major categories are:
I. Finished Vehicles;
II. Major Components and Systems. Machining and Stamping;
III. Sophisticated Parts and Subsystems. Specialised Technology;
IV. Parts & Components. Moderate and Universal Technology; and,
V. Accessories and Simple Parts.

202
This methodology also considers the fact that, within the category of “Finished
Vehicles”, a differentiated technological complexity exists. This is the case, for
instance, of the low end-smallest cars, such as sport & recreational,
microcars/bubble, and subcompacts, compared to compact, mid-size cars,
compact SUVs, luxury and full-size SUVs.
Tables 6.13 and 6.14 show the classification of Mexico’s motor exports and
imports in its bilateral trade with China, within the major categories of
technological complexity, for selected years of the analysed period.61 Despite the
fact that the bilateral automotive trade during the 1990s was irregular, as that data
discrepancies exist between the two countries, the results seem to be consistent. In
general, these results suggest a current trade pattern in which China is more
specialised in the lower-end categories of technology complexity of automotive
goods, and Mexico in the more sophisticated ones, particularly in finished
vehicles from the second half of the last decade (Figures.6.8 and 6.9).
As observed in Table 6.13, during the period analysed, the great majority of
Mexico’s exports to China have consisted of products classified in the high-
technology complexity categories. With the exceptions of some years, the
percentage of these categories in Mexico’s total motor exports to China have
ranged between 80 and 95%. Exports of finished vehicles to China have gained
relative importance during the last five years. From a marginal value of vehicle
exports by the late 1990s, in 2010 these items accounted around 80% of Mexico’s
total motor exports to China. That year, nearly 30,000 vehicles were exported to
China, an increase of 330% in relation to 2009. As a result, China became
Mexico’s sixth largest export destination of cars in 2010 (El Economista, 2011).
In the categories II and III, the largest share of exports corresponds to engine,
transmissions components, electronic, and safety systems. Mexico’s motor trade
flows to China are greatly linked to the major auto TNCs operating in both
countries. VW, for instance, besides exporting sedans, also sends parts and
components to be used in the ‘Jetta’ assembly plants in its Chinese JV operations.
61 The complete set of tables with data for China’s and Mexico’s export and imports of automotive products in their bilateral trade by Category and Subcategory is presented in Appendix 6.3.

203
Table 6.13. Mexico’s Motor Exports to China by Category of Technological
Complexity in the Value Chain, 1992-2010 (Mexico as Reporter Country)
Category
1992
1997
2001
2007
2010
Value (US$ Million)1
I. Finished Vehicles 0.0062 103.6 558.8
II. Major Components and Systems. Machining and Stamping
19.170 0.078 25.1 1.27
III. Sophisticated Parts and Subsystems. Specialised Technology
2.039 0.913 24.503 46.8 90.8
IV: Parts & Components. Moderate & Universal Technology
0.037 0.075 5.435 54.1 20.7
V. Accessories & Simple Parts 0.105 0.072 0.659 44.3 31.9
Grand Total 2.181 20.232 30.676 274.011 703.573
Percentage (%)1
I. Finished Vehicles 0.032 37.8 79.4
II. Major Components and Systems. Machining and Stamping
94.8 0.25 9.2 0.18
III. Sophisticated Parts and Subsystems. Specialised Technology
93.5 4.5 79.9 17.1 12.9
IV: Parts & Components. Moderate & Universal Technology
1.7 0.4 17.7 19.7 2.9
V. Accessories & Simple Parts 4.8 0.4 2.2 16.2 4.54
Grand Total 100.0 100.0 100.0 100.0 100.0
1Totals do not add up 100% due to rounding. 22000. Source: Own elaboration based on UN COMTRADE Database.

204
Table 6.14. Mexico’s Motor Imports from China by Category of Technological
Complexity in the Value Chain, 1992-2010 (Mexico as Reporter Country)
Category
1992
1997
2001
2007
2010
Value (US$ Million)1
I. Finished Vehicles 0.002 0.003 0.046 26.7 13.9
II. Major Components and Systems. Machining and Stamping
0.086 0.115 17.9 74.0
III. Sophisticated Parts and Subsystems. Specialised Technology
2.965 10.364 23.929 286.7 517.8
IV: Parts & Components. Moderate & Universal Technology
20.609 17.798 29.684 587.9 1,012.3
V. Accessories & Simple Parts 6.503 13.282 57.819 472.4 553.6
Grand Total 30.079 41.535 111.596 1,91.5 2,171.6
Percentage (%)1
I. Finished Vehicles 0.007 0.008 0.04 1.9 0.6
II. Major Components and Systems. Machining and Stamping
0.208 0.1 1.3 3.4
III. Sophisticated Parts and Subsystems. Specialised Technology
9.8 24.9 21.4 20.6 23.9
IV: Parts & Components. Moderate & Universal Technology
68.5 42.8 26.6 42.3 46.6
V. Accessories & Simple Parts 21.6 32.0 51.8 33.9 25.5
Grand Total 100.0 100.0 100.0 100.0 100.0
1Totals do not add up 100% due to rounding. Source: Own elaboration based on UN COMTRADE Database.

205
0
20
40
60
80
100
120
1992 1997 2001 2007 2010
%
Figure 6.8. Mexico's Motor Exports to China by
Technological Complexity in the Value Chain, 1992-2010
V. Accesories & Simple
Parts
IV. Parts& Components.
Moderate and Universal
Technology
III. Sphisticated Parts and
Subsystems. Specilalised
Technology
II. Major Components and
Systems. Machining &
Stamping
I. Finished Vehicles
Source: Own elaboration based
on Table 6.13.
0
20
40
60
80
100
1992 1997 2001 2007 2010
%
Figure 6.9. Mexico's Motor Imports from China by
Technological Complexity in the Value Chain, 1992-2010
V. Accesories & Simple
Parts
IV. Parts& Components.
Moderate and Universal
TechnologyIII. Sphisticated Parts and
Subsystems. Specilalised
TechnologyII. Major Components and
Systems. Machining &
StampingI. Finished Vehicles
Source: Own elaboration based
on Table 6.14.

206
On the other hand, the bulk of Mexico’s automotive imports from China have by
and large consisted in products for the aftermarket segment (replacement and
accessories), corresponding to the lowest segments of technology complexity
(categories IV and V). This feature of automotive imports from China was
corroborated by both Mexico’s governmental officials62 and automotive industry’s
executives63 during interviews. According to the interviewees, China was not
present in the original equipment segments or original products, having no
significant presence in Mexico’s assembly industry. These imports were mostly
characterised as being of very low quality and acquired by customers due to their
cheap prices. When imported, the use of Chinese parts have been problematic,
either because of quality or because adaptation work was needed. Both
automotive agents, however, concurred on the tendency of improved quality of
Chinese imported auto parts. This is the case, for instance, of the electronics
segment, in which China is becoming a strong competitor. During the interview,
Mexico’s automotive industry official mentioned that besides semiconductors,
Mexico imports electronic components and they are converted into auto parts. A
VW executive also agreed with these tendencies. He considered that despite the
fact that Mexico’s automakers and Tier-1 suppliers are still experiencing problems
with Chinese suppliers, qualitywise, logistic capacitywise, and communications,
the trend of buying more from China will accelerate in the coming years (Downer,
2007).
It is important to note that, as a tendency, China’s automotive exports to Mexico
are slowly but increasingly escalating the technological level of its products. For
instance, in 2010 the lower categories (IV and V) concentrated 70% of total
exports and nearly 30% of categories II and III, the latter more sophisticated and
technologically more complex, including items such as steering wheels, steering
columns and steering boxes, as well as transmissions. Furthermore, China quite
recently began exporting small quantities of motor vehicles to Mexico, focusing
on the lower-end segments (sport & recreational, micro, and subcompact cars, as
well as light and medium-size trucks in the commercial-vehicle segments).
62 Mexicican Ministry of Economy. Personal interview. Mexico City. 13th December, 2007. 63 Auto Parts National Industry (INA). Personal interview. Mexico City. 29th April, 2008.

207
However, up to now motor-vehicle import volumes are still marginal in relation to
Mexico’s total domestic market sales.
In this sense, it is possible to argue that during the last decade China seemed to
have developed a process of import substitution from Mexico of some simple
parts, accessories, as well as moderate technology components. These could be
the result of the quality and technological upgrading of Chinese domestic
suppliers, the increasing presence of global suppliers in China, or the import from
third countries within the Asian Region. Among the automotive goods in which
China’s imports from Mexico/Mexico’s exports to China have been losing ground
are several electrical-related items, simple accessories, brake system and engine
parts. The changing trend in the composition of the China-Mexico automotive
bilateral trade can be observed in Table 6.15, where the AAGR for each
technological complexity category is presented.
New trends have been recently changing the structure of China-Mexico motor
bilateral trade. As more widely analysed in Chapter 8, the presence of Chinese
automotive-related operations in Mexico has grown and acquired a variety of
forms. Thus, besides the traditional imports of automotive accessories under the
‘arms-length’ schemes, and the import of vehicles by distribution companies
(Bergé Group, Lifan, Zilent and Miles Electric Vehicles), in recent years the
development of wholly-owned operations (Foton and JAC Motors), maquiladora
plants (Minth, Dana-Wanxiang, Nexteer-PCM), technological associations (GML,
Spartak), and other potential manufacturing JVs, are diversifying the China-
Mexico automotive bilateral trade. This might be one of the major explanations of
the changing import pattern of automotive goods into Mexico from China. For
example, and although on a limited scale, during the initial stage of operations in
Mexico Chinese automakers are assembling vehicles by using a large ammount of
Chinese-made parts or by applying the CKD system. Likewise, in the case of the
Sino-Mexican technological associations, the Chinese partner is supplying key
components. An Executive Director64 of a Mexican truck company in
technological association with a Chinese partner indicated that engines, injection
64 Giant Motors Lationamérica. Personal interview. Mexico City. 20th June, 2011.

208
and electronic systems are received from China. At present, the company reaches
50% of domestic integration. Other low-scale Mexican assemblers of small and
medium size trucks, such as CBO Trucks and Cosmotrailer, maintain less formal
technological associations with Chinese suppliers and use an important volume of
imported components from China in their manufacturing operations.65
Another situation is the practice of importing motor vehicles from China to sell
them in Mexico’s domestic market under the commitment of investing in
assembly operations. Under the Mexican Automotive Decree of 2003, automakers
were allow import vehicles to the country, free of import duties, as long as they
have an investment, or the commitment to invest, at least US$ $100 million and
locally produced more than 50,000 cars a year (PEF, 2003). An example is the
import of cars by the Salinas Group in its JV with FAW. Before starting the
assembly operations in Mexico, they decided to sell cheap subcompacts Chinese
cars using Elektra’s retail chain in Mexico and Latin America. Under this scheme,
FAW-Salinas Group imported around 7,000 cars from the end of 2007, before
declaring the suspension of the JV by mid-2009, arguing economic difficulties
derived from the global financial crisis. The FAW-Salinas Group set a negative
precedent for the China-Mexico automotive bilateral relationships, since they did
not comply with the commitment and were involved in legal irregularities.66
65 Without specifying the type of companies or the type of auto parts, Lourdes Álvarez (2006: 110-111) reported that by seeking to lowering the cost of vehicles, some automakers in Mexico have started to include up to 30% of parts and components manufactured in China. Most probably this is the case of the low-scale truck assemblers mentioned above. 66 This case is widely analysed in Chapter 8.

209
Table 6.15. AAGR of China’s and Mexico’s Motor Bilateral Trade by Technological
Complexity in the Value Chain, 1992-2010
Country/Category
1992-2010
1992-2001
2001-2010
China as Reporter Country
China’s Motor Exports to Mexico 47.3 47.7 41.3
I. Finished Vehicles - - 89.7
II. Major Components. Machining and Stamping - - 107.8
III. Sophisticated Parts and Subsystems. Specialised Technology
46.7 35.7 52.7
IV: Parts & Components. Moderate & Universal Technology
55.2 59.2 44.8
V. Accessories & Simple Parts 39.2 46.7 27.8
China’s Motor Imports from Mexico 72.9 108.4 35.9
I. Finished Vehicles - - 74.1
II. Major Components. Machining and Stamping - - 52.6
III. Sophisticated Parts and Subsystems. Specialised Technology
63.4 135.8 20.4
IV: Parts & Components. Moderate & Universal Technology
68.3 133.9 15.0
V. Accessories & Simple Parts 47.1 65.6 25.8
Mexico as Reporter Country
Mexico’s Motor Exports to China 35.5 30.3 36.8
I. Finished Vehicles 112.61 37.82 182.13
II. Major Components. Machining and Stamping 31.54 26.25 32.2
III. Sophisticated Parts and Subsystems. Specialised Technology
22.1 28.2 14.0
IV: Parts & Components. Moderate & Universal Technology
39.5 64.7 14.3
V. Accessories & Simple Parts 35.1 20.2 47.4
Mexico’s Motor Imports from China 25.3 14.0 34.6
I. Finished Vehicles 59.3 33.2 76.8
II. Major Components. Machining and Stamping 70.56 41.77 90.8
III. Sophisticated Parts and Subsystems. Specialised Technology
31.2 23.2 36.0
IV: Parts & Components. Moderate & Universal Technology
22.7 3.7 42.3
V. Accessories & Simple Parts 26.4 24.4 25.3
11996-2010. 21996-2002. 32002-2010. 41994-2010. 51992-2001. 61993-2010. 71993-2001. Source: Own elaboration based on UN COMTRADE Database.

210
In contrast to China’s exports of vehicles to Mexico, Mexico’s exports to China
are focused on compact and medium-size cars, as well as mid and full size SUVs,
which are technologically more advanced and more expensive than the former.
Most probably, Mexico’s car exports to China will accelerate during the next few
years, as the former country is the exclusive manufacturing and export base of
specific models for global automakers. As indicated, a large part of automotive
exports from Mexico to China represent an intra-firm trade and forms part of the
auto TNCs’ strategies operating in both countries. Although Mexico has been an
important source for China’s automobile imports since the second half of the
2000s, especially for the sedan types, a number of new export plans from Mexico
by automakers are being developed. Besides the ‘Beetle’ and the ‘Jetta’ (VW), the
Dodge ‘Journey’ (Chrysler) and the Cadillac SRX (GM), are already exported,
Fiat projects to start exporting the Fiat 500 in 2012, and VW will also send the
new generations of the ‘Jetta’ and the ‘Beetle’ to the Chinese market. In both
cases, these new models are aimed at affluent Chinese buyers (Ciferri, 2011;
Szczesny, 2011).
6.4. Trade Frictions: Counterfeiting, Dumping and Illegal Imports
Chinese auto parts have been at the centre of controversies in world trade for
some time. Among the most common factors of conflict are counterfeiting,
dumping and illegal imports. In the case of counterfeit auto parts, for example,
specialists estimate that worldwide they generated US$ 45 billion in 2011, up
from 12 billion in 2008. Of the total, 83% of counterfeited auto parts came from
China (Haley, 2012: 29). According to this source, since 2001 the Chinese auto
parts industry has received about US$ 27 billion in subsidies, which has resulted
in unfair competition in world markets. Automotive-related counterfeiting is
considered a serious problem for companies and national economies, since it takes
jobs and money away from legitimate firms, jeopardise public safety, tarnishes
brand names, and increases costs related to warranty claims, investigations, legal
fees, and preventative measures (USDC, 2001). In general, Chinese counterfeiters
copy high-volume aftermarket parts. Among the typical counterfeit auto parts are

211
spark plugs, oil filters, brake pads, and steering parts; nevertheless, in recent years
more complex counterfeited parts such as air bags had also become common.
In Mexico, counterfeiting and illegal imports represent a grave problem. It has
been estimated that Mexico’s economy loses up to 12% of its GDP due to these
factors, the textile shoe and toy industries being the most affected (Machado,
2011). In the motor industry, the auto parts aftermarket segment has also been
negatively impacted by counterfeiting, “smuggling” and dumping practices. The
chairman of INA declared that in the aftermarket segment, the counterfeited auto
parts reached a value of around US$ 550 million in 2010 (Padilla, 2011). This
represented more than 4% of Mexico’s total formal replacement market, of US$
13,000 million that year. For Mexico’s formal sector organisations, this “black
market” embodies an “unfair trade” that is jeopardising the national industry. By
mid-2011, the president of ARIDRA (The National Association of
Representatives, Importers and Distributors of Automobile Spare Parts and
Accessories) indicated that counterfeiting in this auto segment amounted to
between 10 to 15% of the total market, most of this being of Chinese origin
(Rosagel, 2011). According to ARIDRA’s president, the market prices of
counterfeit Chinese auto parts are up to 40% lower than the originals, although
with less quality and durability. The most common counterfeited aftermarket parts
offered by auto spare stores are headlights, windshield wipers, electric systems,
storage batteries, brakes, suspensions and engine parts.
Another are of conflict in Mexico’s auto industry related to Chinese imports is the
pneumatic tyre market. Chinese penetration in Mexico’s domestic tyre market has
been very dynamic in the last few years. From a value of US$ 5.3 million in 2001,
Mexico’s tyre imports for cars and trucks from China had an extraordinary boost,
reaching US$ 291 million by 2010. In fact, together these two items (401110 and
401120 of the HS) represented the single-largest automotive product that year. In
2011, Mexico’s formal market sales of tyres were 26 million units, of which 14
million were imported. Of the imported slice, 40% (5.6 million) was of Chinese
origin (El Semanario, 2012b). As in the case of the aftermarket auto parts
segment, industrialists and distributors argue the existence of unfair trade from
Chinese imports due to dumping prices, lower than production costs, which are

212
supported by governmental subsidies (Torres, 2011). On average, prices of
Chinese-origin tyres are 40% cheaper than the domestic-produced ones, or those
legally imported from other countries. The chairman of the National Chamber of
the Rubber Industry (Cámara Nacional de la Industria Hulera-CNIH), Alejandro
Moreno, declared that the dumping of Asian tyre imports, especially from China,
are the main cause of the 50% fall in domestic production of commercial vehicle
tyres in 2010 (MBW, 2011). The Chamber’s executive indicated that the domestic
share of imported truck tyres went up from 18 to 38% that year. The elimination
of duties on Chinese truck tyres in 2009 by the Ministry of Economy, from 20 to
zero percent, was seen as a catalyst of this process. It is expected that the tyre
industry will be further affected since car tyre duties, which were lowered from 20
to 15% in 2009, were totally eliminated in 2010.
An additional source of trade friction is related to illegal imports of Chinese-
origin used tyres. The chairman of the National Association of Tyre Distributors
(Asociación Nacional de Distribuidores de Llantas y Plantas Renovadoras-
ANDELLAC) denounced the fact that 5 million used tyres are illegally imported
into Mexico.67 Of these, 60% come from the United States and the rest from China
(Excelsior, 2011). This tyre “black market” is considered highly negative for local
producers as well as for tyre renewal plants. The used tyre trade is part of the
“triangulation” problem, since it is well documented that substantial export of
used and waste tyres from China to Mexico is carried out through some U.S. west-
coast ports (IRSC, 2009).
6.5. Conclusions
China and Mexico have been increasingly integrated into the global economy: for
Mexico, this has been since the mid-1980s,68 by joining the GATT, and the 1990s,
signing the NAFTA; China’s entry into the WTO in 2001 accelerated its process
67 As in the case of the motor industry in general, it is interesting noting that Mexico’s domestic tire industry is dominated by foreign companies: Bridgestone (Japan), Continental (Germany), CooperTires and Goodyear (USA), Michelin (France), Pinelli (Italy), Hankook and Kumho (Korea), and Tornel (India). 68 Although Mexico started a process of integration into global production networks since the mid-1960s through the development of the maquiladora industry.
213
of internationalisation of its economy. One of the major reflections of this
trajectory for both countries has been the evolution and changing structure of
trade flows and patterns. In the case of the motor industry, nowadays China and
Mexico play significant roles in world trade: by 2010 Mexico ranked as the
fourth-largest exporter of automotive products and China positioned itself in
seventh place. However, up to now these worldwide roles presented a
differentiated specialisation pattern: China is specialised in auto parts exports
(90% of total), and Mexico in the motor-vehicle segment (55% of total). In term
of tendencies, it is important to point out that although Mexico presents a much
higher degree of specialization index than China in world automotive exports, the
latter, though from a lower absolute base, registered higher growth pace in
automotive exports than the former during the period 1992-2010.
In terms of the China-Mexico bilateral trade relationship, despite the fact that
sizeable economic interaction between China and Mexico did not begin until the
late 1990s and early 2000s, China became Mexico’s second largest trade partner
in 2003, displacing Japan and locating itself only behind the United States.
Although the pace of growth of bilateral trade was similar during the different
periods analysed (1992-2001 and 2001-2010), absolute growth of trade value
registered a strong boost after 2001, when China joined the WTO. A distinctive
characteristic of the China-Mexico bilateral relationship is the high significance of
imports from China in Mexico’s total trade. The increasing import penetration of
Chinese products has produced a huge trade imbalance for Mexico, the largest
deficit with a trading partner. Based on Chinese sources, in 2010 China had a
surplus of nearly US$ 11 billion while, according to Mexican sources, Mexico had
a trade deficit with China of US$ 41.4 billion. That year, the ratio of Mexican
imports from China relative to Mexican exports to China was 11:1. The growing
trade imbalance and domestic market penetration of Chinese products have caused
a tense environment in the China-Mexico bilateral relationship. As pointed out in
the analysis, the situation could become worse in the short term as a result of trade
disputes within the WTO due to dumping, as well as other controversies such as
illegal Chinese imports.

214
Motor trade represents a key sector in both China’s and Mexico’s foreign trade.
Nevertheless, in terms of trade flows and value in the international context, China
is more important to Mexico than the reverse. For Mexico, China ranks as its 6th
automotive partner in total exports (1.04%), and its 4th in total imports (5.23%).
On the other hand, for China, Mexico ranks in 14th place in total automotive
exports (1.71%),69 and 10th in total imports (1.22%). Although in relative terms
bilateral automotive trade seems to still be marginal for both countries in the
international context (less than 2% in China’s case), the absolute figures show a
substantial increase in the bilateral trade value over the last decade.
In this sense, it seems that, despite the international context automotive trade
between the two countries still being “marginal”, it has acquired more
significance within the total China-Mexico bilateral trade. For both countries,
automotive trade plays an increasing important role in total bilateral trade. For
China, total automotive trade represented 8% of total bilateral trade with Mexico
in 2010 (automotive exports were 6% and imports, a significant 13.1%). For
Mexico, motor trade with China represented around 6% of total bilateral trade
(17% of total exports and 4.8% of total imports). In terms of the pace of growth,
in all the periods analysed (1992-2010, 1992-2001 and 2001-2010), China’s total
auto trade with Mexico, as well as auto exports and imports, registered AAGR
twice as a high as the ones obtained in total bilateral trade; for automotive
imports, the AARG were even higher. In Mexico’s case, motor exports have been
more dynamic than the rest of bilateral trade. In terms of the position of
automotive trade in relation to other economic sectors in the bilateral relationship,
by 2010 the more salient role is in the export segment, ranking in third place with
16.8% of total exports to China; in total imports, automotive products are located
in fourth place.
Looking at the evolution of the bilateral trade between China and Mexico, it can
be argued that unlike other sectors such as garments, toys and electronics, in the
automotive case the big trade boost started by the mid-2000s and not immediately
69 It is interesting noting that if China homologises its export sources with the Mexican ones, then Mexico would be ranked in 6th place in 2010.

215
after China joined the WTO. This might be explained by the sectoral differences,
in particular the type of global value chains involved and their form of
governance, technological conditions, required scale economies, as well as market
conditions, among other factors. Likewise, this might reflect the fact that,
compared to the other sectors, especially those with lower capital intensity, the
Chinese motor industry gained international competitiveness at a later stage.
Nowadays, the China-Mexico bilateral motor trade looks much more complex
than the simple import of Chinese products displacing local production and
market, as is the case in some other Latin American countries or other sectors in
Mexico.
Another feature of the China-Mexico automotive bilateral relationship is related to
trade balance. As in the case of total bilateral trade, Mexico’s motor sector also
presents a negative trade balance with China. In 2010 this sector’s trade deficit
was US$ 1.4 billion. Nevertheless, in relative terms the deficit’s proportion seems
to have been decreasing in recent years. In fact, whereas the ratio of imports to
exports in Mexico’s total bilateral trade with China was 30.3:1.0 in 2004, 17.0:1.0
in 2008 and 10.9:1.0 in 2010, the ratio for motor trade was 8.8:1.0, 7.0:1.0 and
3.1:1.0, respectively. These trends suggests that, unlike other domestic
manufacturing sectors, Mexico’s motor industry possesses strengths, especially in
the export segment, that allow it to maintain competitive position in the bilateral
trade with China, despite the enormous power of the latter in the international
market. In this sense, it could be argued that Mexico’s motor industry is one of the
exceptions among the manufacturing sectors, taking advantage of Latin America’s
export boom to China.
In terms of the assessment on the specialisation pattern of China-Mexico motor
bilateral trade, the results suggest a current trade pattern in which China is more
specialised in the lower-end categories of technology complexity of automotive
goods, and Mexico in the more sophisticated ones, particularly in finished
vehicles from the second half of the last decade. In contrast to China’s exports of
micro and subcompact vehicles to Mexico, China’s imports from Mexico is
focused on compact and medium-size cars, as well as mid and full size SUVs,

216
which are technologically more advanced and more expensive than the former.
Most probably, Mexico’s car exports to China will accelerate during the next few
years, as the former country is the exclusive manufacturing and export base of
specific models for global automakers. A number of new export plans from
Mexico by automakers are being developed for the Chinese market. The great
majority of motor exports from Mexico to China represent an intra-firm trade and
forms part of the auto TNCs’ strategies operating in both countries. Nevertheless,
a key question is whether Mexico’s car export trend to China will maintain its
growth over the long-term or it only represents a short-term strategy of auto
TNCs. For the time being, despite the huge investment in China’s motor sector,
transnational automakers are unable to cope with the accelerated pace of growth
of the Chinese market. Under these circumstances, some auto firms have accepted
the payment of duties on product with relatively modest demand that might not
justify the cost of tooling up for production. As in the VW’s Beetle case, the
relatively low cost of manufacturing in Mexico helps compensate for the
additional shipping costs and duties (Szczesny, 2011). For the other automotive
segments, most of Mexico’s auto parts exports to China are OEM directed to the
assembly of new vehicles through the network of TNCs. VW, for example, has
sent parts and components for several years to be used in the assembly of the
‘Jetta’ models in its JVs with Chinese partners.
On the other hand, based on the different sources analysed, the large majority of
Mexico’s automotive imports from China consist of products for the aftermarket
segment (replacement and accessories). Most of this low-end automotive segment
is supplied by domestic Chinese firms. According to different agents of Mexico’s
motor industry, nowadays China does not have a relevant presence in the OEM
segments. Nevertheless, it is important noting that, as a tendency, China’s motor
exports to Mexico are slowly but increasingly escalating in terms of the
technological level of its products. This is especially the case of the electronics
segment, in which China is becoming a strong global competitor. Based on the
above-mentioned tendencies, it could be argued that the structure and pattern of
Chinese automotive imports into Mexico has changed over the past decade. This
trend might be mostly explained by three interrelated factors: a) the quality and

217
technological upgrading of domestic Chinese auto parts industry; b) the exports of
auto parts from China of global auto suppliers located in China; and c) the
increasing presence of Chinese automotive operations in Mexico (wholly-owned
operations, maquiladora plants, technological associations, JVs, etc.). Domestic
Chinese firms, through these diverse operation modes and linkages, are importing
into Mexico more technological upgraded auto parts and some key major
components. As a consequence, a diversified auto parts exports from China to
Mexico are likely to rise in the coming years.
Regarding this changing bilateral trade trends, during the last few years China
began exporting small quantities of motor vehicles to Mexico, focusing on the
lower-end segments (sport & recreational, micro, and subcompact cars, as well as
light and medium-size trucks in the commercial-vehicle segments). The bulk of
these vehicles are exported by domestic Chinese firms, some of them with
internationalisation strategies (FAW, Foton, Lifan, Geely, JAC Motors,
Dongfeng). However, up to now, motor-vehicle import volumes are still marginal
in relation to Mexico’s total domestic market sales. Considering the size of the
domestic market in Mexico, at present motor vehicle imports from China probably
represent less than one percent of total sales. Given their market strategy, Chinese
car are competing in the lower-end, low-price, segments. On the positive side,
Chinese auto firms are targeting middle and lower income population, which has
no access to credit from traditional financing institutions.
In this regard, another key question is whether Sino-Foreign JVs will start
exporting cars assembled in China to Mexico. In recent years, some foreign
automakers began exporting modest quantities of Chinese-built subcompacts
overseas, but exclusively to emerging and developing country’s markets. For
instance, Shanghai-GM is exporting its ‘New Sail’ car to Egypt, Chile, Peru,
Algeria and Iraq; Daimler is shipping sedans to the Middle East; Mercedes-Benz
to Colombia; and VW plans to export to Russia (Yang, 2012). Although a
potential FTA between China and Mexico could induce motor TNCs to export
Chinese-built cars to Mexico, up to now, unlike other Latin American countries,
and despite lower prices, in Mexico Chinese cars are not well positioned in the

218
domestic market.70 Besides the “negative image” of Chinese cars, the Mexican
automotive market is considered to be more sophisticated and demanding than
Chinese, Latin American, African and other emerging economies. Given these
trends, the likelihood is that it will take some time for Chinese-made cars to
obtain a substantial share of Mexico’s domestic market.
The perspective of the Mexican Automotive Industry Association (AMIA) was
not enthusiastic about the arrival of Chinese motor operations to Mexico.
Although AMIA’s agents did not conceive the Chinese automakers as direct
competition, they showed concerns about the car’s safety and environmental
standards, as well as the entry modes into the Mexican market. AMIA’s Deputy
Director of Economic Studies and Informatics71 stated that Chinese companies
and cars are very welcome in Mexico as long as their entry is equitable in relation
to requirements applied to other countries/companies (investment regulations,
safety, environmental standards, etc.). His view was that Chinese companies
currently operating in Mexico were fundamentally distributors, and they did not
carry out manufacturing activities.
Is it in Mexico’s aftermarket segment where Chinese imports have had a sizeable
domestic market penetration. Associated to this, several frictions related to
counterfeiting, “smuggling” and dumping practices have impacted the China-
Mexico bilateral trade relationship. All these factors are considered to have
negatively impacted Mexico’s domestic market, harming production, sales and
jobs. Representatives of diverse aftermarket associations have denounced the
negative impacts of the “black market” and “unfair trade” provoked by Chinese
imports. Industrialist and distributors are demanding that the Mexican government
takes defensive measures against Chinese imports, and tensions and frictions
derived from these trends may continue, and increase, in the next years. The
recent elimination of duties to Chinese imports of tyres in 2009 and 2010, together
with end of the Transition Measures on Compensatory Quotas for other sectors on
December 11, 2011, by which China will only pay 15% of customs duties as other 70 For instance, in Peru Chinese brands have captured 17% o the domestic market (Global Auto Industry, 2012c), 13.5% in Uruguay (Delgado, 2009), and 7% in Chile (Chrysler, 2011). 71 Personal interview. Mexico City. 20th August, 2008.

219
151 WTO’ member countries in the export of diverse products will most probably
increase the bilateral frictions. In addition, Mexico has still not recognised China’s
status as a market economy. In this regard, more deep and specific research is
needed to evaluate the impacts of Chinese domestic competition on Mexican
domestic producers of the auto sector and its diverse production and distribution
segments, and the solution to bilateral statistics discrepancies must be addressed.
Recently, new and challenging proposals have been put forward intending to
improve the China-Mexico bilateral relationship. Some have emphasised the need
for long-term vision in the bilateral relationship, as well as the promotion of
greater institutional measures, such as the strengthening of existing binational
institutions (Dussel Peters, 2009). Others have recommended the instrumentation
of a “Strategic Economic Association” that considers the elimination of custom
duties for those sectors in which the main trading products with higher weight in
the respective trade balance are included (Martínez, 2010). In addition, the signing
of a “Free Trade Agreement” has also been proposed by a business promoter.72
For this executive, who estimates that this FTA would take around ten years to
materialise, it is the only way to alleviate bilateral trade frictions, and a way to
obtain massive flows of Chinese FDI into Mexico. Very recently, Chen Yuming,
Economic Attaché to China´s Embassy in Mexico, declared that China is very
much interested in entering in a FTA with Mexico. Nevertheless, in order to
negotiate such an agreement, China demands equal treatment, and a prior
condition is that its market economy status be recognised by Mexico (Maquila
Portal, 2011). The short- and long-term solutions to the bilateral trade conflicts
between China and Mexico could benefit the motor industry in an important
degree. On the one hand, trade frictions (counterfeiting, smuggling and dumping)
could be reduced, and potential complementarities, that already exist, could be
enhanced.
72 Mexico-China Business Organisation. Personal interview. Mexico City. 21th August, 2008.

220
7. CHAPTER SEVEN
THE CHINA-MEXICO INTERACTION 3: COMPETITION IN THE U.S.
MARKET
“The ‘sucking sound’ of jobs going south that Ross Perot, an American
presidential candidate, feared would be the consequence of NAFTA is
now being heard from the east by Mexicans.” (The Economist, 2003: 49).
“Mexico, long the king of low-cost plants and exporter to the United
States of products from Ford trucks to Tommy Hilfiger shirts to I.B.M.
computers, is fast being supplanted by China and its hundreds of millions
of low-wage workers.” (Forero, 2003).
Unlike the issues of China’s impacts on Latin American domestic market
penetration and worldwide competition for FDI, the potential threat on the
region’s exports to third markets has received more attention by analysts. Given
the geographical and economic influence for the region, the impacts of China’s
competition in the U.S. market have been the focus of diverse studies. This has
been one of the major concerns for a large part of Latin America’s policy-makers
as well as its business community.
As with the issues of FDI and domestic competition presented in previous
chapters, the positions and views of China’s competition on Latin America’s
exports to third markets have changed over recent years. Early studies based on
data from the late 1990s and the beginning of the 2000s presented a more
‘optimistic’ views. Although some negative effects for some industries in some
countries were recognised in these perspectives, in general it was concluded that:
the competitive effects of China’s accession to the WTO on developing countries
were exaggerated in the literature (Shafaeddin, 2004); the direct threat to exports
to third country markets appeared small (Lall and Weiss, 2005a and 2007); there
was not substitutability of Latin America’s exports in third-country markets but
rather growth in Chinese exports to these markets, signaling demand
complementarities at the aggregate level (Lederman, Olarreaga and Perry, 2009);

221
there is no relevant trade competition between China and Latin America products
in the U.S. market (Blázquez-Lidoy, Rodríguez and Santiso, 2007).
Fundamentally, these conclusions and arguments were based on the differences in
export structures between China and Latin America, leading to a dissimilar trade
specialization pattern.
More recent studies, carried out under a broader development perspective, have
emphasised the increasing threat that China poses to Latin American exports to
third-country markets, including the United States (Mesquita-Moreira, 2004;
Dussel Peters, 2005a; Jenkins and Dussel Peters, 2007; Jenkins, Dussel Peters and
Mesquita-Moreira, 2008; Jenkins, 2009; Gallagher and Porzecanski, 2010;
Jenkins, 2010). According to Jenkins (2010), among the factors leading Latin
America to face increased competition from China over time are: a) the accession
of China to the WTO in December 2001 improved its access to developed country
markets; b) the ending of the Multi-fibre Arrangement quota system on 1 January
2005, which had regulated textile and clothing trade for over thirty years, also
allowed China to penetrate third-export markets; and c) low wages levels, massive
scale of production and increased productivity has led to falling prices and
increased competition over time for many of the goods exported by China. As
Gallagher and Porzecanski (2010) argue, the ‘dragon in the room’ that few are
talking about is that China is out-competing Latin American manufacturers in
world markets. These authors point out that 94% of Latin America’s
manufactured exports are threatened by China, representing 40% of all the
region’s exports (Ibid: 7-8). Finally, Jenkins’ (2010) notable synthesis of the
recent trends regarding Chinas’ threat to the region’s exports to third-country
markets: a) most Latin American countries have lost significant market share to
China since 2001; b) the trend has been for losses to increase over time; and c)
losses have been particularly severe in markets for manufactured goods.
In the midst of this debate, regardless of the period of analysis or the type of
methodology used, in practically all the studies one conclusion seemed to be
unanimous: Mexico was the country most negatively affected by China’s
competition in exports to third-country markets, particularly in the United States.

222
As pointed out by these studies, unlike most of the other Latin American
countries, Mexico and China have a similar export structure, and the former’s
comparative advantage has been moving in the same direction as the latter. As in
other areas of the China-Latin America trade and investment relationship, Mexico
emerged as the exception case or the paradigmatic example (Blázquez-Lidoy,
Rodríguez and Santiso, 2007; Paus, 2008; Gallagher and Porzecanski (2008).
For Mexico, the United States represents a key market. For decades, the
destination of over 80% of Mexico’s total exports has been the U.S. market.
However, since the beginning of the 2000s, Mexico’s maquiladora industry has
felt the ‘sucking sound from the east’. As underlined in previous chapters,
between December 2000 and December 2003, Mexico lost 900 plants and 260,000
jobs, around a quarter and a fifth, respectively, of the total number.
Approximately 45% of these plants were relocated to China (Ornelas, 2007). In
this restructuring process, China was challenging the maquiladora system’s
comparative advantage and, then, ‘eating Mexico’s lunch’ (Rosen, 2003). In fact,
in 2003 China displaced Mexico as the second-largest supplier of goods to the
U.S. market, behind Canada. Studies of the China-Mexico competition in the U.S.
market during that period reported that Mexico had lost market share in 47 out of
152 major U.S. categories, particularly in sectors such as apparel and textiles,
toys, electrical household appliances, telephone equipment and electrical
assemblies (USGAO, 2003). In the apparel sector, for example, some analysts
argued that Mexico was losing jobs to China even if manufacturers may not have
been shifting production to China, per se (Watkins, 2002). During the period
2000-2007, Mexico not only lost market share to China, but, among the top-five
suppliers to the U.S. it was the only one to have experienced negative growth of
imports; while other countries, such as Vietnam and Bangladesh had actually
increased market share in the face of Chinese competition (Thoburn, 2010b).
More comprehensive studies on the China-Mexico competition in the U.S. market
were carried out by the mid-2000s in the textile-garments and electronics sectors
(Dussel Peters, 2005a, 2005b, 2009 and 2010). According to Dussel Peters (2009),
during the period 2001-2006 China’s exports to the United States increased with

223
an AAGR of 23%, while Mexico registered only 8.7%, resulting in a share loss in
U.S. imports. In the yarn-textile-garment chain, China displaced Mexico – and
Central America – since 2001, becoming the United States’ major import source;
China’s share in U.S. imports of this chain increased from 12.1% in 2002 to
17.4% in 2004, while Mexico’s share declined (Ibid). Likewise, in the electronics
chain, China increased its share of total U.S. imports from 2.25% to 31.03% in
1990 and 2006, respectively; in the particular segment of personal computers,
China’s penetration in the U.S. market was even more impressive, increasing its
share from 0.02% in 1990 to 45.5% in 2006 (Dussel Peters, 2010). In other
products, such as television sets, although Mexico has kept an important
participation in the U.S. market, China increasingly threatened its market share
(Carrillo and Plascencia, 2007).
Another important feature of the China-Mexico competition in the U.S. market is
the time-frame: China’s threat has accelerated since 2001, when it joined the
WTO. Jenkins (2010) estimated that Mexico’s loss of total exports in the United
States to China was -1.1% in the period 1996-2001, increasing to -11.4% during
2001-2006. For Mexico’s manufactured exports the figures were -1.5% and -
13.6% in these periods, respectively. By applying an ‘export threat’ methodology
based on market share changes at 3-digit SITC level, Lall and Weiss (2005a,
2005b and 2007) estimated China’s potential threat (direct and indirect) of
11.15% of Mexico’s exports to the U.S. by 2002. Following Lall and Weiss’s
methodology, Gallagher and Porzecanski (2007) added to the analysis the post-
China WTO accession years, 2002-2004, and they calculated that 71% of
Mexico’s exports to the U.S. market were under threat (direct and indirect) by
China by 2004, only two years later. In a further study, Gallagher and Porzecanski
(2010) estimated that the percentage of Mexican exports to the United States
under threat from China had increased to 80.3% by 2006. In terms of exports to
the world, not only to the U.S. market, China’s challenge was even greater. These
authors found out that 99% of Mexico’s manufacturing exports to the world,
comprising 72% of total exports, were under threat from China by 2006 (Ibid).

224
Although with differences in study periods, methodologies, and trade digit-level
classifications, another salient feature of the China-Mexico competitive threat in
export markets is Mexico’s advantageous position in the motor industry. By and
large, in all the studies with some kind of sectoral-approach analysis, Mexico had
competitive strengths over China in this sector’s export markets (Watkins, 2002
and 2007; Lall and Weiss 2005a, 2005b and 2007; Dussel Peters, 2005a and 2009;
Arellano, 2006; Blázquez-Lidoy, Rodríguez and Santiso, 2007; Devlin,
Estevadeordal and Rodriguez-Clare, 2006; Gallagher and Porzecanski, 2007 and
2010; Gallagher, Moreno-Brid and Porzecanski, 2008). However, given the highly
differentiated composition of the motor industry, there are some caveats to
consider in the analysis and future trends. Some authors have argued that whereas
China’s competition in motor vehicles in the U.S. market is still low so far,
Mexico does face an increasing threat in the auto parts segment (Dussel Peters,
2005a and 2009; Jenkins and Dussel, 2007; Jenkins, Dussel and Mesquita-
Moreira, 2008). Even more, Dussel Peters (2005a) considers that China’s share in
the U.S. motor vehicle market will continue to rise, given the massive investments
carried out by foreign companies in that country. A similar situation was found in
the case of Mexico’s auto parts maquiladoras’ performance in the U.S. market, as
depicted in Chapter 5. According to this, auto parts maquiladoras do not appear to
be as threatened as the other major segments (Gerber and Carrillo, 2002; USGAO,
2003; Sargent and Matthews, 2008 and 2009). In the case of specific automotive
products, however, some analyst have argued that given China’s motor industry
dynamism, Mexico-made harnesses, which until recently represented 90% of the
U.S. market, could be produced in the Asian country in the near future (Carrillo
and Gomis, 2005a).73
Specific and detailed studies on the competition in the U.S. market between
China’s and Mexico’s motor industries are practically nonexistent. One exception
is the work carried out by Lourdes Álvarez (2007 and 2011), who used data from
1990 to 2008, although most of the analysis is based at 2-digit level of HS. In both
73 Nevertheless, in another study, one of these authors underlines that given the increasing technological content of harnesses production, as well as the required flexibility to adjust to a changing demand, the hypothesis of relocating low-added value processes such as this product to China, is not totally feasible in this case (Carrillo, 2008).

225
studies the conclusion was similar: China and Mexico participate with different
type of products in the U.S. market, and it is only in some components that China
represents a threat to Mexican producers. By using the export similarity index, the
author also found that similarity in exports of chapter 87 of the HS was still low
(Álvarez, 2011). On the other hand, linked to this increasingly competitive
environment, a changing strategy by firms of the auto sector located in Mexico
has been reported. Automotive firms have started to implement more skill labour
and advanced manufacturing operations in order to move up the technology
ladder, intending to pass from the stage of ‘assembled’ in Mexico to ‘created in’
and ‘coordinated’ from Mexico (Carrillo and Lara, 2003; Hunt, 2004; Carrillo and
Gomis, 2005b). In the meantime, throughout the past and present decade,
anecdotal information, press articles as well as businessman opinions still have a
strong idea about China’s increasing competitiveness and defiant threat to
Mexican firms in the U.S. automotive market (Ornelas, 2004; Hunt, 2004;
Anónimo, 2004; Revista T21, 2008; aregional, 2010; Morales, 2011).
The general objective of this chapter is to assess the competitive position of China
vis-à-vis Mexico in the U.S. motor industry’s market. The basic research
questions are: Is China a direct competitor and a real threat to Mexico in the U.S.
motor industry’s market? What is the degree of China’s competitive threat? If
there is a substantial confrontation in the U.S. market, in what particular
automotive segments/products of the motor value-chain does China most strongly
threaten Mexico? Are China and Mexico playing a complementary role, with
particular specialisations, in the U.S. market? In order to avoid generalisations, the
108 motor items at 6-digit level of the HS will be used in the analysis. Data is
based on the MAGIC programme developed by ECLAC. MAGIC employs U.S.
import data based on customs values provided by the USDC, which is compatible
with UN COMTRADE database. In the calculation of the RCA/Specialisation
index, U.S. imports figures instead of exports will be used. The qualitative
assessment of the ‘competitive threat’ will be done by applying a typology of
diverse categories of technological complexity within the automotive value chain,
methodology especially designed for this purpose (see the Methodology in
Chapter 3). The time frame of the analysis is 1990-2010.
226
7.1. China and Mexico in U.S. Total Imports
In 2003, two years after having joined the WTO, China not only became Mexico’s
second-largest trade partner but also, that year China displaced Mexico as the
second-largest importer country to the United States. Following an impressive
similar path to that at worldwide level, China rapidly became the number-one
import source to the U.S. market, relegating Canada to second place in 2007.
From a modest import value of US$ 15.2 billion in 1990, representing around 3%
of total U.S. imports, by 2010 China accounted for nearly one fifth (19.1%) of
total U.S. imports with a value of US$ 364.9 billion (Table 7.1 and Figure 7.1).
Mexico also increased its participation in total U.S. imports, jumping from 6.1%
to 12.0% in 1990 and 2010, respectively, with a corresponding increase in imports
value from US$ 30.2 to around 230.0 billion. China registered very dynamic
AAGR in its imports to the U.S. market during the analysed periods, around 2.5
times higher than the total U.S. average: 16.34% during 1990-2010, 17.22% in
1990-2001 and 13.56% in 2001-2010. Being among the most dynamic exporters
to the U.S. market, Mexico obtained its best performance during the period 1990-
2001 with an AAGR of 13.05%, reflecting the effects of the starting of NAFTA
operations in 1994. Although it grew at a slower pace during the 2001-2010
period, over the whole analysed period of 1990-2010, Mexico registered an
AAGR of 10.15%, almost double the U.S. average of total imports. In 2001
Mexico overtook Japan as the second-largest importer to the Unites States, which
it lost to China later on, in 2003.
During the two-decade period, China and Mexico’s gains in share of the U.S.
imports have been at the expense of some developed countries, in particular Japan
and Canada. Throughout the period 1990-2010, Japan’s import share fell from
18.1% to 6.3%. In 1990 this Asian country was ranked as the second largest U.S
import source; however, despite its substantial share loss, Japan is currently the
fourth most important import source to the U.S. Other countries that have lost
relative participation in the U.S. market are Germany, U.K., France, Italy, France,
Korea and Taiwan. On the other hand, emerging and transition countries such as

227
Ireland, Russia, India, Thailand and Malaysia have increased its participation in
the American market. In fact, although from a low value base, Russia and Ireland
presented higher or similar AAGR than China during the analysed period.
Table 7.1. China and Mexico in U.S. Total Imports, 1990-2010
País 1990 1995 2001 2003 2007 2010
Value (US$ Billions)
China 15.2 45.6 102.3 152.4 321.5 364.9
Canada 91.4 145.1 217.0 224.2 313.1 276.5
Mexico 30.2 61.7 131.4 138.1 210.8 229.7
Japan 89.6 123.6 126.6 118.0 145.5 120.3
Germany 28.1 36. 59.2 68.0 94.3 82.7
U.K. 20.3 26.9 41.4 42.7 56.9 49.7
Korea 18.5 24.2 35.2 37.0 47.6 48.9
France 13.1 17.2 30.3 29.2 41.6 38.5
Total Imports 495.1 743.5 1,142.0 1,259.3 1,953.5 1,912.0
Percentage (%)
China 3.1 6.1 9.0 12.1 16.5 19.1
Canada 18.5 19.5 19.0 17.8 16.0 14.5
Mexico 6.1 8.3 11.5 11.0 10.8 12.0
Japan 18.1 16.6 11.1 9.4 7.4 6.3
Germany 5.7 5.0 5.2 5.4 4.8 4.3
U.K. 4.1 3.6 3.6 3.4 2.9 2.6
Korea 3.7 3.3 3.1 2.9 2.4 2.6
France 2.7 2.3 2.7 2.3 2.1 2.0
Total Imports 100.0 100.0 100.0 100.0 100.0 100.0
AAGR
1990-2010 1990-2001 2001-2010
China 16.34 17.22 13.56
Canada 5.41 7.47 2.45
Mexico 10.15 13.05 5.74
Japan 1.41 2.92 -0.51
Germany 5.27 6.40 3.40
U.K. 4.36 6.12 1.85
Korea 4.73 5.51 3.34
France 5.27 7.22 2.44
Total Imports 6.65 7.21 5.29
Source: Own elaboration based on the MAGIC Programme.

228
Finally, an important difference between China and Mexico is the significance of
the U.S. market in their respective total world exports. For Mexico, the U.S. has
traditionally been its single most important export market, representing between
75 and 85% during the period 1990-2010 (U.N. COMTRADE, 2012). For China,
these figures range between 23 to a maximum of 40% in 2000. In both countries a
steady downward trend in their U.S. market share in relation to their total world
exports can be observed, particularly during the decade 2000-2010.
7.2. Evolution and Composition of China’s and Mexico’s Participation in U.S.
Motor Imports
Table 7.2 presents the major motor import-sourcing countries to the U.S. market
for the years 1990, 1995, 2001, 2005 and 2010. China and Mexico’s market
participation is highlighted. It also shows the AAGR of U.S. motor imports from
the selected countries as well as the world’s total motor imports for the periods
1990-2010, 1990-2001 and 2001-2010. As observed, nowadays Mexico’s position
in the U.S. motor market is overwhelmingly superior to China’s. Taking the 2010
figures, U.S. motor imports from Mexico are almost 4.5 times larger than those of
0.0
5.0
10.0
15.0
20.0
25.0
%
Figure 7.1. China's and Mexico's Participation in U.S. Total Imports,
1990-2010 (%)
China Canada Mexico Japan Germany
Source: Own elaboration based on the MAGIC Programme.

229
China (US$ 54,082 million vs $12,448). With 23.6% of total U.S. motor imports,
in 2010 Mexico was the number-one supplier, followed by Canada and Japan,
with 22.7% and 20.7%, respectively. Despite the gap with Mexico’s import value,
China accounts for 5.4% of total U.S. automotive imports, ranking in 5th place.
Although Japan and Canada dominated this segment in the U.S. market for several
decades, together accountting for between 65 and 70% of total U.S. imports
during the 1990s, in 2009 Mexico toppled Japan from the second place, and,
eventually, in 2010 displaced Canada from the top of the list (Figure 7.2). As
discussed in Chapter 5, this positive evolution might be associated with the effects
of NAFTA in the 1990s, and the wave of new export-oriented investments made
by the major auto TNCs in Mexico during the past decade, both in car assembly
and components, seeking to reduce production costs in the face of the economic
recession of 2000-2002 and the financial crisis of 2008-2009. These recession
years are reflected in lower AAGR of U.S. motor imports during the period 2001-
2010.
Beyond the absolute figures, what is interesting is the extraordinary rate of growth
registered by China’s imports to the United States in such a relatively short period
of time. Although this may be largely explained by the very low absolute value-
base registered in 1990, the growth after that year has been exceptional. In the
different periods from 1990 to 2010, China registered an AAGR of 6 to 8 times
higher than that of total United States’ imports: 23.8% in 1990-2010, 28.5% in
1990-2001, and 15.9% in 2001-2010. Only a small number of countries registered
AAGR similar to China during the analysed periods, although starting from a
much lower value-base than China. Among these countries are Slovakia, Austria
and South Africa. On the other hand, Mexico also observed significant levels of
growth, with AAGR 2.5 times higher than that of the U.S. import average and
above the other major exporters: 10.2%, 14.9% and 3.7% during the periods 1990-
2010, 1990, 2001 and 2001-2010, respectively.

230
Table 7.2. China’s and Mexico’s Participation in U.S. Motor Imports,
1990-2010
País 1990 1995 2001 2005 2010
Value (US$ Millions)
Mexico 7,081.2 17,287.4 37,513.8 41,543.8 54,082.2
Canada 29,758.3 44,810.9 57,554.9 70,272.8 51,933.5
Japan 32,763.2 40,022.9 47,181.9 55,326.8 47,514.8
Germany 8,401.6 9,646.5 19,298.0 28,041.3 24,743.8
China 140.4 881.5 2,848.6 7,987.4 12,447.6
Korea 1,771.3 2,317.2 7,498.9 11,581.7 11,431.0
U. K. 1,948.5 2,649.7 4,501.1 8,110.4 4,945.3
Total Imports 89,979.5 127,776.2 193,016.8 246,071.9 229,106.0
Percentage (%)
Mexico 7.9 13.5 19.4 16.9 23.6
Canada 33.1 35.1 29.8 28.6 22.7
Japan 36.4 31.3 24.4 22.5 20.7
Germany 9.3 7.5 10.0 11.4 10.8
China 0.2 0.7 1.5 3.2 5.4
Korea 2.0 1.8 3.9 4.7 5.0
U. K. 2.2 2.1 2.3 3.3 2.2
Total Imports 100.0 100.0 100.0 100.0 100.0
AAGR
1990-2010 1990-2001 2001-2010
Mexico 10.17 14.91 3.73
Canada 2.69 5.65 -1.02
Japan 1.79 3.09 0.07
Germany 5.28 7.18 2.52
China 23.81 28.51 15.89
Korea 9.29 12.78 4.31
U. K. 4.53 7.23 0.95
Total Imports 4.55 6.57 1.73
Source: Own elaboration based on the MAGIC Programme.

231
The acceleration in growth during the past two decades enabled China to jump
several places as U.S. automotive sourcing-country.74 Situated between 13th and
15th position in the early 1990s, China advanced to 7th in 2001 and 5th since 2008.
By 2008 China had surpassed other key U.S. auto supplier countries such as the
United Kingdom, Sweden, France, Brazil, Taiwan, Korea and Belgium. For its
part, during the same period Mexico reinforced its position as U.S. sourcing
country in motor trade, passing from being the third largest U.S. supplier in 1990
to the number one in 2010. The value of U.S. imports of automotive goods from
Mexico grew nearly 8 times from 1990 to 2010. The share gains in the U.S.
motor imports by Mexico, China and other emerging countries have been mainly
at the expenses of Japan and Canada, as well as other developed countries that
have lost dynamism such as Sweden, France, Belgium, Austria and Italy.
The increasing significance of China as U.S. automotive sourcing-country is even
more evident when a differentiation is made between imports of complete motor
vehicles (automobiles, buses, trucks and tractors), on the one hand, and auto parts,
74 Although U.S. motor imports fron China grew faster over the period 1990-2001 (28.51%) than 2001-2010 (15.89%), the rise of China as a U.S. automotive sourcing-country could be explained by the fact that during the last period (2001-2010), the difference between China’s rate of growth and the rest of competing countries widened even more (see Table 7.2).
0.0
5.0
10.0
15.0
20.0
25.0
30.0
35.0
40.0
45.0
%
Figure 7.2. China's and Mexico's Participation in U.S. Motor Imports,
1990-2010
Japan Canada Mexico Germany China Korea U. K.
Source: Own elaboration based on the MAGIC Programme.

232
on the other. It is clear that China’s major role as U.S. automotive supplier is in
the auto parts and components segment, since imports of motor vehicles are
minimal (Tables 7.3 and 7.4). Thus, considering only the auto parts segment, from
playing a marginal role during the 1990s, by the mid-2000s China had escalated to
4th place among the largest U.S. suppliers (Figures 7.3 and 7.4). This rank was
maintained by 2010, only behind Mexico, Japan and Canada, in that order. In
terms of value, after 2001, the year of China’s entry to the WTO, U.S. imports
from China grew at an accelerated pace.
From Mexico’s perspective, although below China’s growth pace, auto parts
imports grew at almost double the U.S. average during the period 1990-2010.
Mexico improved its ranking, overtaking Japan and Canada, becoming the leading
supplier of auto parts to the U.S. market in 2010. In this sense, both China and
Mexico are playing an increasing role in the U.S. motor sector’s supply chain. In
an opposite direction to China, Mexico is also acquiring significance as a supplier
of complete motor-vehicles to the United States (Table 7.3). Despite the AAGR,
China plays a marginal role as motor vehicle sourcing-country, with less than 1%
of total U.S. imports and a value of US$ 131.7 million. 99% of total U.S. motor
imports from China belong to the auto parts segment. For its part, Mexico stands
as the third-largest auto supplier, accounting for 21.3% and a value of US$
27,743.5 million in 2010.
This differentiated role and significance of the motor-vehicle and auto parts
segments between China and Mexico in the U.S. market is more clearly
demonstrated through the RCA index, which gives an indication of the
specialisation pattern of both countries in U.S. motor imports. Table 7.5 shows the
RCA for China and Mexico for the years 1990, 1995, 2001, 2005 and 2010, in
three categories/segments: a) total motor imports; b) motor-vehicle segment; and
c) auto parts segment. As observed, although China’s RCA value is increasing
through the period 1990-2010, in none of the categories this country reaches the
specialisation level of a minimum index of 1.0. As expected, the highest index
value for China is in the segment of auto parts, with 0.653.

233
Table 7.3. China’s and Mexico’s Participation in U.S. Motor-Vehicle Segment
Imports, 1990-2010
País 1990 1995 2001 2005 2010
Value (US$ Millions)
Canada 20,307.34 33,521.75 41,088.95 48,385.21 36,870.85
Japan 21,462.86 23,094.70 31,600.76 35,943.29 32,422.13
Mexico 2,394.36 7,623.83 21,301.35 18,444.06 27,743.45
Germany 5,884.84 6,648.85 15,052.74 20,496.53 17,508.75
Korea 1,125.62 1,655.67 6,344.92 8,770.13 6,551.24
U. K. 970.76 1,532.34 2,918.04 6,301.66 3,595.95
China 0.03 0.07 5.94 177.69 131.73
Total Imports 54,901.00 76,812.43 125,272.00 145,502.83 130,411.49
Percentage (%)
Canada 36.9890 43.6410 32.7998 33.2538 28.2727
Japan 39.0937 30.0664 25.2257 24.7028 24.8614
Mexico 4.3612 9.9253 17.0041 12.6761 21.2738
Germany 10.7190 8.6560 12.0160 14.0867 13.4258
Korea 2.0503 2.1555 5.0649 6.0275 5.0235
U. K. 1.7682 1.9949 2.3294 4.3310 2.7574
China 0.0001 0.0001 0.0047 0.1221 0.1010
Total Imports 100.0000 100.0000 100.0000 100.0000 100.0000
AAGR
1990-2010 1990-2001 2001-2010
Canada 2.88 6.05 -1.08
Japan 1.98 3.28 0.26
Mexico 12.37 19.98 2.68
Germany 5.33 8.14 1.52
Korea 8.75 15.50 0.32
U. K. 6.43 9.61 2.11
China 48.62 54.53 36.32
Total Imports 4.21 7.12 0.40
Source: Own elaboration based on the MAGIC Programme.

234
Table 7.4. China’s and Mexico’s Participation in U.S. Auto Parts Segment
Imports, 1990-2010
País 1990 1995 2001 2005 2010
Value (US$ Millions)
Mexico 4,686.8 9,663.6 16,212.4 23,099.8 26,338.8
Japan 11,300.3 16,928.2 15,581.1 19,383.5 15,092.7
Canada 9,451.0 11,289.1 16,466.0 21,887.6 15,062.6
China 140.3 881.4 2,842.6 7,809.7 12,315.9
Germany 2,516.8 2,997.7 4,245.2 7,544.7 7,235.0
Korea 645.7 661.6 1,154.0 2,811.6 4,879.8
Taiwan 893.5 1,142.1 1,528.9 2,303.2 2,431.81
Total Imports 35,078.5 50,963.8 67,744.8 100,569.1 98,694.5
Percentage (%)
Mexico 13.4 19.0 23.9 23.0 26.7
Japan 32.2 33.2 23.0 19.3 15.3
Canada 26.9 22.2 24.3 21.8 15.3
China 0.4 1.7 4.2 7.8 12.5
Germany 7.2 5.9 6.3 7.5 7.3
Korea 1.8 1.3 1.7 2.8 4.9
Taiwan 2.6 2.2 2.3 2.3 2.51
Total Imports 100.0 100.0 100.0 100.0 100.0
AAGR
1990-2010 1990-2001 2001-2010
Mexico 8.57 10.90 4.97
Japan 1.39 2.71 -0.32
Canada 2.24 4.74 -0.89
China 23.75 28.50 15.79
Germany 5.16 4.45 5.48
Korea 10.11 4.96 15.51
Taiwan 5.412 4.58 5.973
Total Imports 5.05 5.64 3.83 12008. 21990-2008. 32001-2008. Source: Own elaboration based on the MAGIC Programme.
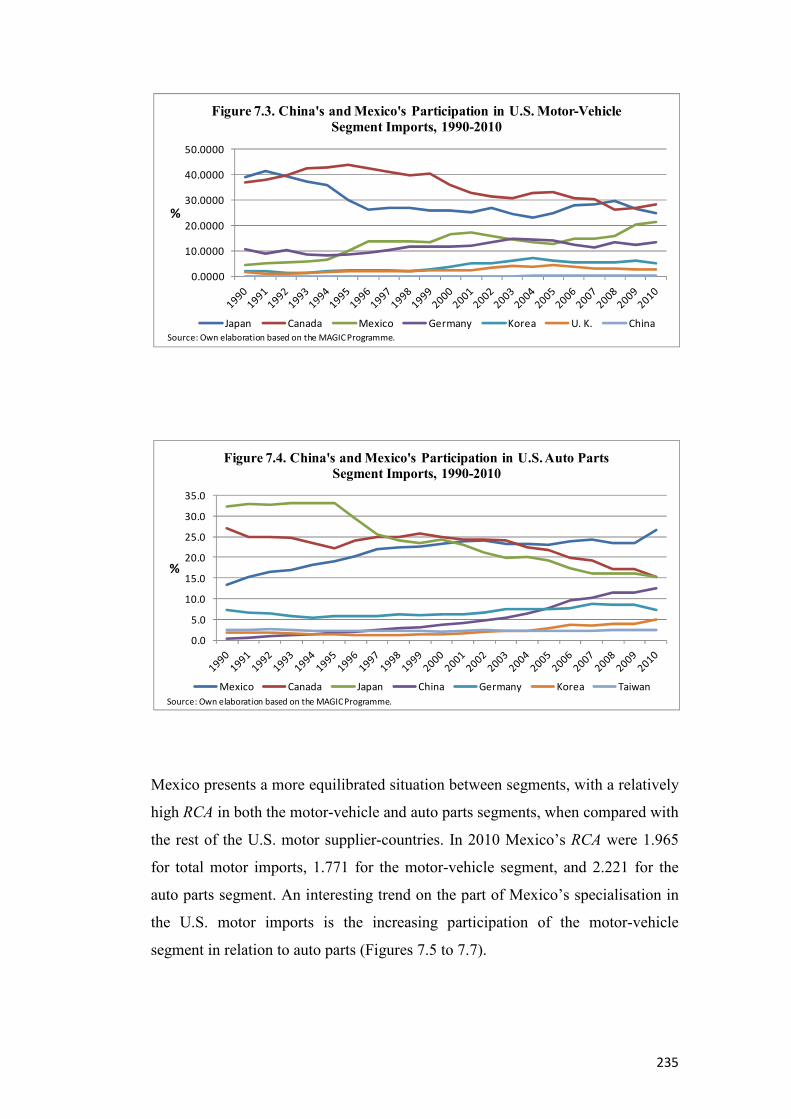
235
Mexico presents a more equilibrated situation between segments, with a relatively
high RCA in both the motor-vehicle and auto parts segments, when compared with
the rest of the U.S. motor supplier-countries. In 2010 Mexico’s RCA were 1.965
for total motor imports, 1.771 for the motor-vehicle segment, and 2.221 for the
auto parts segment. An interesting trend on the part of Mexico’s specialisation in
the U.S. motor imports is the increasing participation of the motor-vehicle
segment in relation to auto parts (Figures 7.5 to 7.7).
0.0000
10.0000
20.0000
30.0000
40.0000
50.0000
%
Figure 7.3. China's and Mexico's Participation in U.S. Motor-Vehicle Segment Imports, 1990-2010
Japan Canada Mexico Germany Korea U. K. China
Source: Own elaboration based on the MAGIC Programme.
0.0
5.0
10.0
15.0
20.0
25.0
30.0
35.0
%
Figure 7.4. China's and Mexico's Participation in U.S. Auto Parts
Segment Imports, 1990-2010
Mexico Canada Japan China Germany Korea Taiwan
Source: Own elaboration based on the MAGIC Programme.

236
Table 7.5. RCA Index1 of China’s and Mexico’s Participation in the U.S. Motor
Imports by Segment, 1990-2010
Country/Segment 1990 1995 2001 2005 2010
China
Total Motor imports 0.050 0.112 0.164 0.222 0.284
Motor Vehicles 0.000 0.000 0.000 0.008 0.005
Auto Parts 0.130 0.282 0.468 0.523 0.653
Mexico
Total Motor imports 1.291 1.630 1.688 1.657 1.965
Motor Vehicles 0.715 1.195 1.477 1.244 1.771
Auto Parts 2.192 2.284 2.079 2.254 2.221
1A country has RCA in a particular product/segment when the Index is > 1. Source: Own elaboration based on the MAGIC Programme.
0 0.5 1 1.5 2
1990
1995
2001
2005
2010
Figure 7.5. China's and Mexico's RCA Index in U.S. Total
Motor Imports, 1990-2010
Mexico
China
Source: Own elaboration based on the MAGIC Programme.
Specialisation Line
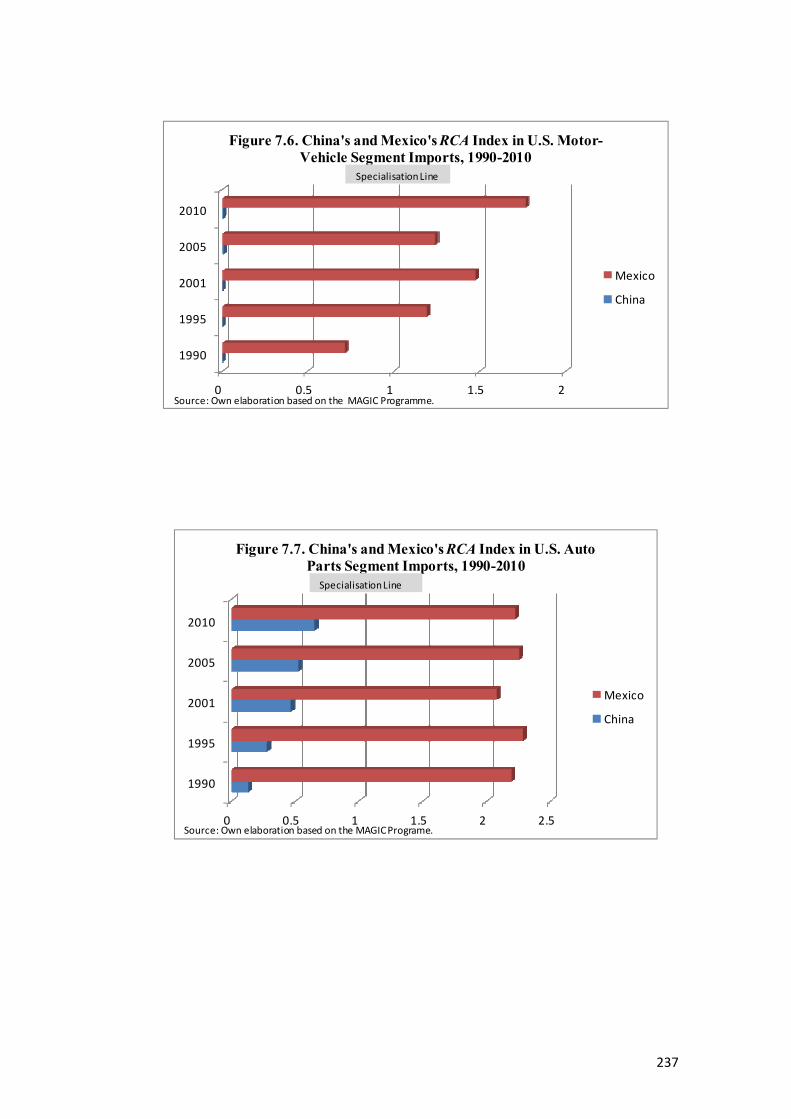
237
0 0.5 1 1.5 2
1990
1995
2001
2005
2010
Figure 7.6. China's and Mexico's RCA Index in U.S. Motor-
Vehicle Segment Imports, 1990-2010
Mexico
China
Specialisation Line
Source: Own elaboration based on the MAGIC Programme.
0 0.5 1 1.5 2 2.5
1990
1995
2001
2005
2010
Figure 7.7. China's and Mexico's RCA Index in U.S. Auto
Parts Segment Imports, 1990-2010
Mexico
China
Specialisation Line
Source: Own elaboration based on the MAGIC Programe.

238
7.3. China’s Competitive Threat to Mexico in U.S. Motor Imports
As depicted in the Methodology Chapter, China’s competitive threat to Mexico in
the U.S. auto market will be examined by applying two indices: the Static Index of
Competitive Threat (SICT) and the Dynamic Index of Competitive Threat (DICT).
This methodology was developed by Rhys Jenkins (2008), presenting several
advantages over other indices used in previous analysis. In addition, in order to
complement the previous indices, the ‘competitive threat’ technique developed by
Lall and Albaladejo (2004) and Lall and Weiss (2005a) will be applied. The aim
of using the latter technique is to identify some more specific competitive
interactions between China and Mexico in the U.S. motor import market. As the
perspective is to look at competitiveness in the U.S. market, the analysis is based
on U.S. import figures, rather than exports from China or Mexico. Again, a 6-digit
level of the HS classification for 108 automotive products will be applied, using
the MAGIC programme database. The period considered for the analysis is 1990-
2010.
The Static Index of Competitive Threat (SICT) is calculated for the years 1990,
2001 and 2010, covering a period pre- and post-China’s entry into the WTO. The
SICT’s results are presented in Table 7.6. As observed, although the number of
automotive items in which China had a RCA > 1 increased from 7 in 1990 to 23 in
2001 and 33 in 2010, the proportion of of Mexico’s exports value under threat in
the U.S. market was relatively low, and even presenting a decline towards the end
of the period: 0.8% in 1990, 8.5% in 2001 and 4.6% in 2010. In like manner,
Mexico has also increased the number of items with RCA > 1 during the analysed
period. In this sense, by 2010 65.8% of China’s exports value was under threat
from Mexico.
An interesting aspect is that there are relatively few items in which China and
Mexico coincide in having an RCA > 1: 3 in 1990 and 16 in 2001 from a total of
104 items, and 13 in 2010, from total of 108 items. This situation may suggest that
rather than competing, China and Mexico play a complementary role in supplying
the U.S. automotive market. Mexico’s RCA for the whole automotive sector in the

239
U.S. market is still substantially higher than China’s in 2010: 1.965 vs 0.284
(Table 7.5). Given its strength in this sector’s specialisation in the U.S. market, in
a large number of automotive items Mexico poses higher RCA indices. In a
preliminary way, and based on the SICT, it seems that up to now, Mexico is not
threatened by China in the U.S. auto market.
Table 7.6. SICT: China’s Threat to Mexico in U.S. Motor Imports,
1990, 2001 and 2010
Country/Concept 1990 2001 2010
China’s Threat to Mexico
Motor items with Chinese RCA > 1.0 7 23 33
% of Mexico’s exports value under threat from China
0.8 8.5 4.6
Value of exports under threat (US$ million) 58.6 3,189.8 2,489.6
Mexico’s Threat to China
Motor items with Mexican RCA > 1.0 34 57 63
% of China’s exports value under threat from Mexico
35.9 71.5 65.8
Value of exports under threat (US$ million) 50.4 2,036.1 8,196.4
Both China and Mexico with RCA > 1.0
Number of coincident items 3 16 13
Source: Own elaboration based on the MAGIC Programme.
To calculate the Dynamic Index of Competitive Threat (DICT), the AAGR of the
108 motor product’s imports for the periods 1990-2001 and 2001-2010 was
considered. In correlation with the SITC analysis, these years cover the periods

240
before and after China’s entry into the WTO. The DICT includes the rates for
total U.S. automotive imports from the world and U.S. auto imports from China
and Mexico. Six possible situations or trade trajectories can be identified when
looking at the resulting pattern of the AAGR of total (world) U.S. automotive
imports, imports from China and imports from Mexico: 1. China > Mexico >
World; 2. China > World > Mexico; 3. World > China > Mexico; 4. World >
Mexico > China; 5. Mexico > China > World; and 6. Mexico > World > China.
Given the different interactions, each of these situations represents a distinctive
competitive threat.
Following Jenkins’ methodology,75 interactions 1, 2 and 5 represent a
‘Competitive Threat’ (actual and potential) from China to Mexico in the U.S.
market. Conversely, interactions 1, 5 and 6 represent the ‘competitive threat’ that
China faces from Mexico. Unlike the SICT, under the DICT, which measures the
pace of growth of imports into the U.S. market, the ‘competitive threat’ from
China becomes more evident. According to this index, during the period 1990-
2001, 42.4% of Mexico’s motor imports into the U.S. were under threat from
China. In the period 2001-2010, almost a decade after China joined the WTO,
73.8% of Mexico’s imports into the U.S. were under competitive threat (Table
7.7). Accordingly, the number of items under competitive threat also increased,
jumping from 75 in the period 1990-2001, to 92 during 2001-2010. The number
of motor items under threat by 2010 represents 85% of the total’s considered.
Under the same index’s logic Mexico also poses a substantial competitive threat
to China. Nevertheless, the DICT points out a decreasing tendency in the
competitive threat from the pre- and post-China’s entry into the WTO’ periods.
From a figure of 86% during the period 1990-2001, China’s exports under threat
from Mexico fell to 52.9% in 2001-2010. The number of automotive items under
threat also fell from 73 to 53 between these periods, respectively. In summary,
when looking at the pace of growth, the DITC suggests an increasing competitive 75 The DICT identifies those products in which China is competitive as all those in which U.S. motor imports from China are growing more rapidly than U.S. total motor imports from the world. This is why in interaction 5, despite the fact that Mexico has higher RCA than China, the latter poses a potential competitive threat to Mexico, since its rate of growth is higher than U.S. imports from the world.

241
threat from China to Mexico’s motor exports to the U.S. market. However, it is
worth mentioning two caveats in this analysis. One is that the estimations of
China’s AAGR included all the automotive items, regardless of their value. An
important number of them registered a very low-base value during the 1990s. The
other is that despite this low-base value of many U.S. automotive items’ imports
from China, a large proportion of Mexico’s items had high AAGR, standing very
close to those of China’s.
Table 7.7. DICT: China’s Threat to Mexico in U.S. Motor Imports,
1990-2001 and 2001-2010
Country/Concept 1990-2001 2001-2010
China’s Threat to Mexico
Motor items with Chinese AAGR > USA
75
92
% of Mexico’s exports value under threat from China 42.4
73.8
Value of exports under threat (US$ million) 15,898.11
39,933.42
Mexico’s Threat to China
Motor items with Mexican AAGR > USA
73
53
% of China’s exports value under threat from Mexico 86.0
52.9
Value of exports under threat (US$ million) 2,449.81
6,582.72
12001. 22010. Source: Own elaboration based on the MAGIC Programme.
As mentioned above, in order to have a more specific image of China’s
competitive threat to Mexico in the U.S. motor market, the ‘competitive threat’
technique developed by Lall and Albaladejo (2004) and Lall and Weiss (2005a)
has been used to complement the previous analysis. In this exercise, some

242
additional and more specific competitive interactions between China and Mexico
in the U.S. market can be identified (Lall and Weiss, 2005a): a) Direct Threat:
China gains market share and Mexico loses; b) Partial Threat: both China and
Mexico are gaining market share but the former is gaining faster than the latter; c)
No Threat: both China and Mexico have rising market shares and the latter is
gaining more than the former; d) Reverse Threat: the threat is the reverse, China
loses market share and Mexico gains; and e) Mutual Withdrawal: both China and
Mexico lose shares in the U.S. market to other competitors. The number of
automotive items, the percentage of Mexico’s imports to the U.S. market and their
value under threat from China is calculated.
Table 7.8 displays the combination of outcomes according to the U.S. motor
imports’ share changes for China and Mexico for the period 1990-2001 and 2001-
2010. As put forward in the DICT, this exercise shows significant changes over
time in China’s competitive threat to Mexico. While in the period 1990-2001
China’s direct threat to Mexico only accounted for a minimal share of 1.1% of
Mexico’s imports into the U.S. market, during the 2001-2010 this figure increased
to 18.7%. The proportion of Mexico’s imports under partial threat also augmented
from 38.1% to more than 50% between these periods, respectively. In summary,
the share of Mexico’s motor imports under some type competitive threat (direct
and partial) increased from 39.2% during the period 1990-2001, to 70% in the
following decade. In concordance to this process, the share of items and value in
which Mexico had competitive strength also decreased during the analysed
periods. Thus, under the competitive interaction classified as ‘reverse threat’,
Mexico drastically reduced its share, passing from 57.4% to 22.7% between the
periods 1990-2001 and 2001-2010.

243
Table 7.8. China’s Competitive Threat to Mexico and Trade Interactions in U.S.
Motor Imports, 1990-2001 and 2001-2010
1990-2001
Competitive
Interaction
(AAGR)
Number
of
Items
Value of
Mexico’s Motor
Imports to the
USA, 2001
(US$ million)
% of
Mexico’s
Motor
Imports to
USA
Competitive
Threat
1. Ch > Mex > World 45 14,287.8 38.1 PARTIAL
2. Ch > World > Mex 16 426.2 1.1 DIRECT
3. World > Ch > Mex 6 0.1 0.00 MUTUAL
WITHDRAWAL 4. World > Mex > Ch 8 85.3 0.2
5. Mex > Ch > World 14 1,1983.8 3.2 NO THREAT
6. Mex > World > Ch 14 21,530.6 57.4 REVERSE
THREAT
Total 103 37,513.8 100.0
2001-2010
Competitive
Interaction
(AAGR)
Number
of
Items
Value of
Mexico’s Motor
Imports to the
USA, 2010
(US$ million)
% of
Mexico’s
Motor
Imports to
USA
Competitive
Threat
1. Ch > Mex > World 39 28,004.7 51.8 PARTIAL
2. Ch > World > Mex 44 10,111.5 18.7 DIRECT
3. World > Ch > Mex 2 0.004 0.00 MUTUAL
WITHDRAWAL 4. World > Mex > Ch 9 2,229.9 4.1
5. Mex > Ch > World 8 1,450.5 2.7 NO THREAT
6. Mex > World > Ch 6 12,285.6 22.7 REVERSE
THREAT
Total 108 54,082.24 100.0
Source: Own elaboration based on the MAGIC Programme.

244
7.4. Technological Complexity of China’s and Mexico’s Motor Imports to the
U.S. Market
Although the distinction between trade segments of complete motor vehicles and
auto parts is very helpful when analysing a potential competitive threat, the
number and diversity of parts and components that go into a vehicle (Bhaskar,
1980; Maxton and Worlmald, 2004; Klier and Rubenstein, 2008) require more
specification in the analysis within both the motor vehicles and auto parts
segments. For instance, a more detailed classification within the auto parts
segment is required for distinguishing between minor and major components,
their weight and size, as well as their technological content, among other
characteristics.
Based on the above clarification, the specific methodology designed for the
analysis of a more detailed and qualitative composition of the ‘competitive threat’
and trade interactions will be exercised in this section. This methodology is also
useful for identifying the existence of trade specialisation patterns in a more
systematic way (see the Methodological Chapter). As applied in Chapter 6, this
methodology classifies the 108 products included in the automotive “cluster”, at
6-digit level of the Harmonised System (HS), into five categories and 25
subcategories of different technological complexity within the automotive value
chain. Ranging from high to low complexity level, the major categories are:
I. Finished Vehicles;
II. Major Components and Systems. Machining and Stamping;
III. Sophisticated Parts and Subsystems. Specialised Technology;
IV. Parts & Components. Moderate and Universal Technology; and,
V. Accessories and Simple Parts.
This methodology also considers that within the category of “Finished Vehicles”,
a differentiated technological complexity exists. This is the case, for instance, of
the low end-smallest cars, such as sport & recreational, microcars/bubble, and
subcompacts, compared to compact, mid-size cars, compact SUVs, luxury and
full-size SUVs.

245
Tables 7.9 and 7.10, respectively, present the composition of U.S. motor imports
from China and Mexico by category of technological complexity. As observed, in
general during the analysed period China has concentrated between 65 and 75%
of its exports in categories IV (Parts & Components. Moderate and Universal
Technology) and V (Accessories and Simple Parts), the lowest in technological
content. In this sense, analysts of the U.S. automotive market have reported that
the rapid increase in auto parts imports from China into the United States since the
1990s was overwhelmingly in the aftermarket segment, rather than in that of
original equipment (Klier and Rubenstein, 2006 and 2008). As result, these
authors argue, producers of aftermarket parts face more pressure to minimise price
than to maximise quality (Ibid).
However, during the last decade, Chinese-made parts have been upgrading their
value added and technological development (Klier and Rubenstein, 2006; Haley,
2012). Likewise, during the fieldwork some interviewees declared that most of the
OE auto parts outsourced from China into the U.S. is carried out by global Tier-1
suppliers.76 This emerging trend can be corroborated by looking at the rising
proportion of Chinese imports to the U.S. market in category IV, and the
decreasing share in category V, shown in Table 7.9. In addition, foreign
automakers, in particular of U.S. origin, would increase the use of their captive
centres in China to supply their home bases directly. It has been reported that GM
and Ford announced that they would be purchasing more than US$ 10 billion and
7 billion worth of auto parts and accessories, respectively, from China by 2010
(Haley, 2012). In 2006, GM already decided to shift its worldwide electronics
purchasing unit to Shanghai from the U.S. to place it at the hub of China’s
electronics industry, aiming at outsourcing more components from the Asian
country (Sherefkin and LaReau, 2006).
76 U.S. automaker’s executive. Personal interview. Dearborn (Detroit), Michigan, USA. 28th August, 2008. Also, a motor analyst. Personal interview. Ann Arbor (Detroit), Michigan, USA. 27th August, 2008.

246
Conversely, by and large Mexico has concentrated between 60 and 75% of its
motor exports to the U.S. in the categories I (Finished Vehicles), II (Major
Components and Systems. Machining and Stamping) and III (Sophisticated Parts
and Subsystems. Specialised Technology), the more technologically complex
sectors. In fact, more than 50% of Mexico’s imports into the U.S. market in 2010
were motor vehicles, with a value on nearly US$ 28 billion. A large proportion of
Mexican-made parts and components are produced by foreign-owned
maquiladora plants, including the largest global Tier-1 firms, which provide OE
auto parts to assembly plants especially in the United Sates and Canada.
China’s and Mexico’s composition of motor imports to the U.S. are reflected in
their specialisation patterns (Tables 7.11 and 7.12). The specialisation indices
have been constructed by applying the RCA index. Although with lower levels of
specialisation, China presents increasing indices in the accessories & simple parts
category, as well as in the segments of minor electronic, minor engine &
transmission, and body & chassis parts. It also registers specialisation levels in the
segment of electronic & safety systems within the category of sophisticated parts
and subsystems. Most of these items are relatively labour-intensive and easy to
transport. During the last decade, China also reached specialisation levels in the
lower-end segment of sport & recreational cars, and got close to it in the
microcar/bubble segment.

247
Table 7.9. U.S. Motor Imports from China by Category of Technological
Complexity, 1990-2010
Category 1990 1995 2001 2005 2010
Value (US$ Million) I. Finished Vehicles 0.02 0.07 5.9 177.7 131.7
II. Major Component and Systems. Machining and Stamping
0.37
4.0
3.7
96.8
400.4
III. Sophisticated Parts and Subsystems. Specialised Technology
42.5
316.8
848.9
1,768.4
2,555.3
IV: Parts & Components. Moderate & Universal Technology
24.0
221.1
1,022.0
3,518.5
6,131.0
V. Accessories & Simple Parts
73.4 339.6 968.0 2,425.9 3,229.2
Total 140.4 881.5 2,848.6 7,987.3 12,447.6
Percentage (%) I. Finished Vehicles 0.01 0.008 0.2 2.2 1.1
II. Major Component and Systems. Machining and Stamping
0.27
0.45
0.13
1.2
3.2
III. Sophisticated Parts and Subsystems. Specialised Technology
30.3
35.9
29.8
22.1
20.5
IV: Parts & Components. Moderate & Universal Technology
17.1
25.1
35.9
44.1
49.3
V. Accessories & Simple Parts
52.3 38.5 34.0 30.4 25.9
Total 100.0 100.0 100.0 100.0 100.0
Source: Own elaboration based on the MAGIC programme database.

248
Table 7.10. U.S. Motor Imports from Mexico by Category of Technological
Complexity, 1990-2010
Category 1990 1995 2001 2005 2010
Value (US$ Million) I. Finished Vehicles 2,394.4 7,623.8 21,130.3 18,444.3 27,743.5
II. Major Component and Systems. Machining and Stamping
646.6
1,823.4
1,585.9
2,748.1
4,107.6
III. Sophisticated Parts and Subsystems. Specialised Technology
961.9
1,821.4
4,199.1
5,886.7
8,039.1
IV: Parts & Components. Moderate & Universal Technology
2,594.4
4,961.4
8,391.3
11,069.7
11,065.5
V. Accessories & Simple Parts
483.9 1,057.4 2,036.1 3,395.3 3,127.6
Total 7,081.2 17,287.4 37,513.8 41,544.0 54,082.2
Percentage (%) I. Finished Vehicles 33.8 44.1 56.8 44.4 51.3
II. Major Component and Systems. Machining and Stamping
9.1
10.5
4.2
6.6
7.6
III. Sophisticated Parts and Subsystems. Specialised Technology
13.6
10.5
11.2
14.2
14.9
IV: Parts & Components. Moderate & Universal Technology
36.6
28.7
22.4
26.6
20.5
V. Accessories & Simple Parts
6.8 6.1 5.4 8.2 5.8
Total 100.0 100.0 100.0 100.0 100.0
Source: Own elaboration based on the MAGIC programme database.

249
For its part, Mexico presents higher levels of specialisation in a variety of
automotive segments (Table 7.12). Nevertheless, its major strength is in the
category of motor vehicles, especially in the segments of compact, mid-size and
compact SUV; light trucks; medium & heavy straight trucks; as well as road
tractors.77 Likewise, Mexico also shows high levels of specialisation in the more
complex segments of components (II and III), and a decreasing tendency in the
indices of component IV. This is the case in particular of the segments linked to
electronics, such as the electronic & safety systems, and minor electronic parts.
This tendency might be the consequence of increasing Chinese penetration and
competition in the U.S. market in these particular auto segments.
Tables 13 and Table 14 show the list and value of China’s and Mexico’s major
import items to the U.S. The U.S. import share of each item is also calculated. In
accordance with each country’s specialisation pattern, China’s top export items
are concentrated in the categories IV and V of technological complexity: wheels,
motor vehicle and trailer parts in general, iron and steel articles, pneumatic tyres,
storage batteries, parts and accessories of bodies, as well as an important number
of items related to the electronic segments (radio reception apparatus, ignition
wiring sets, fans, parts for spark-ignition engines, lead-acid electric accumulators,
and co-axial cables). Some of these items comprise a substantial share of U.S.
motor imports. For example, Chinese wheels account for 42% of total U.S.
imports of this item; iron and steel articles, 34.5%; pneumatic tyres, 23%; storage
batteries, 49.3%; radio reception apparatus, 27.4%; fans, 29.4%; trailer parts,
68.2%; co-axial cable, 53.4%; lead-acid electric accumulators, 43.1%; and
hydraulic jacks & hoist, 82.8%.
Mexico’s export items are more diversified in terms of the technological content,
standing out the motor-vehicle participation in the export structure. For example,
only one product, automobiles with reciprocating piston engines displacing >
1,500 cc to 3000 cc (HS 870323), account for more than a fifth of total motor
imports into the U.S. market from Mexico. Gas and diesel powered trucks are also
77 It is worth mentioning that while the average value of a car exported from China is US$ 6,500, the average value of a light vehicle exported from Mexico is around US$ 20,000.

250
among the major export items. Other important items are transmissions, drive
axles, safety airbags, diesel engines, steering wheels, and radio reception
apparatus. In 2010, the market share in the U.S. of most of these top import items
was outstanding: gas powered trucks, 98.7%; road tractors, 98.2%; diesel powered
trucks, 98.1%; safety airbags, 81.3%; automobiles with diesel engine displacing
more than 1500 cc to 2500 cc, 76.3%; ignition wiring sets, 64%; automobiles with
reciprocating piston engines displacing > 1,500 cc to 3000 cc, 23.5%; among
others.
It is worth noting that of the list of China’s top 15-import items and Mexico’s top-
21 items, only 5 coincide: ignition wiring sets; parts for spark-ignition type
engines, radio reception apparatus; wheels; and motor vehicle parts. To an
important degree, this is an indication of the different specialisation pattern that
has prevailed up to now. The coinciding motor items face strong direct or partial
competition in the U.S. market. Thus, by using the results of the competitive
threat exercise carried out in the previous section, Table 15 presents a detailed
classification by category of technological complexity of the 44 items being under
‘direct threat’ (Table 7.8). As observed, 75% of the items and nearly 60% of the
value of items under ‘direct threat’ fall within the lower categories of
technological complexity (IV and V). Within these, the Moderate & Universal
Technology category is particularly significant, accounting for around 50% of
both number of items and value of Mexico’s exports to the U.S. market.
Pneumatic tyres, locks, accumulators, ignition coils, and lighting equipment are
among the major items in this category. When considering the value of exports,
the category of Sophisticated Parts and Specialised Technology also acquires
relevance, concentrating 18.3% of Mexico’s exports under ‘direct threat’.
Representative items of this category are radio reception apparatus, automotive air
conditioners, radiators, and steering wheels.

251
Table 7.11. Specialisation Index of China’s Participation in U.S. Motor Imports by
Category of Technological Complexity, 1990-2010
Category/Product
1990
1995
2001
2005
2010
I. Finished Vehicles 0.000 0.000 0.001 0.008 0.005
I.A. Sport & Recreational 0.000 0.000 0.114 1.139 1.062
I.B. Microcar/Bubble 0.000 0.000 0.035 0.735 0.850
I.C. Subcompact/City Car 0.000 0.000 0.000 0.000 0.000
I.D. Compact, Mid-size Cars and Compact SUV
0.000 0.000 0.000 0.000 0.000
I.E. Luxury, Sports, Grand Tourer, Mid & Full-size SUV
0.000 0.000 0.000 0.000 0.000
I.F. Light Trucks 0.000 0.000 0.000 0.000 0.000
I.G. Medium & Heavy Straight Trucks 0.000 0.000 0.000 0.000 0.000
I.H. Passenger Vans & Buses 0.000 0.000 0.000 0.000 0.040
I.I. Road Tractors & Dump Trucks 0.000 0.000 0.000 0.003 0.000
II. Major Component and Systems. Machining and Stamping
0.002 0.006 0.003 0.035 0.123
II.A. Body 0.002 0.003 0.001 0.001 0.079
II.B. Chassis with Engine 0.000 0.002 0.008 0.016 0.005
II.C. Engine 0.002 0.007 0.003 0.054 0.149
II.D. Transmission 0.000 0.003 0.003 0.003 0.087
III. Sophisticated Parts and Subsystems.
Specialised Technology 0.180 0.431 0.615 0.547 0.545
III.A. Chassis Components 0.046 0.386 0.743 0.642 0.324
III.B. Engine Components 0.084 0.242 0.496 0.368 0.574
III.C. Transmission & Drive Train Components
0.012 0.067 0.148 0.190 0.329
III.D. Electronic & Safety Systems 0.651 1.217 1.065 1.402 0.898
IV: Parts & Components. Moderate &
Universal Technology 0.069 0.206 0.457 0.659 0.809
IV.A&B. Minor Body & Chassis Parts 0.029 0.109 0.452 0.713 0.824
IV.C&D. Minor Engine & Transmission Parts
0.104 0.065 0.172 0.423 0.761
IV.E. Minor Electronic Parts 0.134 0.363 0.522 0.620 0.796
V. Accessories & Simple Parts 0.278 0.508 0.759 0.721 0.969
V.A&B. Accessories and Simple Parts 0.278 0.508 0.759 0.721 0.969
Total Motor Imports 0.050 0.112 0.164 0.222 0.284
Source: Own elaboration based on the MAGIC programme database.

252
Table 7.12. Specialisation Index of Mexico’s Participation in U.S. Motor Imports by
Category of Technological Complexity, 1990-2010
Category/Product
1990
1995
2001
2005
2010
I. Finished Vehicles 0.715 1.195 1.477 1.244 1.771
I.A. Sport & Recreational 0.001 0.000 0.000 0.001 0.494
I.B. Microcar/Bubble 0.000 0.000 0.000 0.000 1.960
I.C. Subcompact/City Car 0.001 0.000 0.000 0.000 0.015
I.D. Compact, Mid-size Cars and Compact SUV
1.195 1.917 1.452 1.631 1.870
I.E. Luxury, Sports, Grand Tourer, Mid & Full-size SUV
0.000 0.312 0.926 0.437 0.207
I.F. Light Trucks 0.504 2.378 3.876 4.313 8.212
I.G. Medium & Heavy Straight Trucks 0.001 0.171 2.141 2.500 5.912
I.H. Passenger Vans & Buses 0.000 0.561 0.691 0.005 0.659
I.I. Road Tractors & Dump Trucks 0.064 0.007 0.653 1.961 7.300
II. Major Component and Systems. Machining and Stamping
1.392 2.076 1.044 1.444 2.007
II.A. Body 0.171 0.338 0.486 0.859 1.662
II.B. Chassis with Engine 2.421 10.865 0.279 0.000 2.298
II.C. Engine 2.004 2.630 1.481 1.986 1.912
II.D. Transmission 0.057 0.027 0.232 0.464 2.187
III. Sophisticated Parts and Subsystems.
Specialised Technology 2.058 1.831 2.369 2.605 2.728
III.A. Chassis Components 0.471 0.617 0.989 1.867 1.639
III.B. Engine Components 1.126 1.061 1.633 2.307 2.471
III.C. Transmission & Drive Train Components
1.134 1.027 2.262 2.605 2.726
III.D. Electronic & Safety Systems 6.323 5.284 4.830 4.582 4.068
IV: Parts & Components. Moderate &
Universal Technology 3.801 3.417 2.923 2.967 2.321
IV.A&B. Minor Body & Chassis Parts 2.326 2.005 1.920 2.091 1.654
IV.C&D. Minor Engine & Transmission Parts
2.094 0.488 0.977 1.517 1.150
IV.E. Minor Electronic Parts 6.904 5.886 4.690 4.680 3.559
V. Accessories & Simple Parts 0.924 1.168 1.243 1.444 1.492
V.A&B. Accessories and Simple Parts 0.924 1.168 1.243 1.444 1.492
Total Motor Imports 1.291 1.630 1.688 1.657 1.965
Source: Own elaboration based on the MAGIC programme database.

253
Table 7.13. Main U.S. Motor Imports from China, 2010
HS
Code
Item
Total
Value
(US$
Million)
% of
Total
Motor
Imports
from
China
% of
Total
U.S.
Imports
of Item
870870 Wheels including parts and accessories for
motor vehicles
1,009.9 8.1 42.2
870899 Motor vehicle parts nes 1,001.2 8.0 9.9
732690 Articles, iron or steel, nes 821.9 6.6 34.5
401110 Pneumatic tyres, new of rubber for motor
cars, including station wagons and racing
cars
809.0 6.5 14.0
401120 Pneumatic tyres, new of rubber for buses
or lorries
723.4 5.8 23.0
850780 Storage batteries, nesoi 672.6 5.4 49.3
852721 Radio reception apparatus for motor
vehicles
629.7 5.1 27.4
870829 Parts and accessories of bodies nes for
motor vehicles
553.4 4.4 7.9
854430 Ignition wiring sets & other wiring sets
used in vehicles, aircraft etc
393.9 3.2 6.7
841459 Fans nes 310.4 2.5 29.4
840991 Parts for spark-ignition type engines nes 307.9 2.5 6.8
871690 Trailer and other vehicle parts nes 296.1 2.4 68.2
854420 Co-axial cable and other co-axial electric
conductors
294.2 2.4 53.4
850720 Lead-acid electric accumulators nes 284.0 2.3 43.1
842542 Jacks & hoists nes hydraulic 208.3 1.7 82.8
Source: Own elaboration based on the MAGIC programme database.

254
Table 7.14. Main U.S. Motor Imports from Mexico, 2010
HS
Code
Item
Total
Value
(US$
Million)
% of
Total
Motor
Imports
from
Mexico
% of
Total
U.S.
Imports
of Item
870323 Automobiles w reciprocating piston engine
displacing >1500 cc to 3000 cc 12,119.5 22.4 23.5
870431 Gas powered trucks with a GVW not exceeding five tonnes
7,306.8 13.5 98.7
854430 Ignition wiring sets & other wiring sets used in vehicles, aircraft etc
3,774.4 7.0 64.0
870120 Road tractors for semi-trailers 2,867.4 5.3 98.2
870829 Parts and accessories of bodies nes for motor vehicles
2,351.3 4.3
870899 Motor vehicle parts nes 2,036.9 3.8 20.2
870422 Diesel powered trucks w a GVW exc five tonnes but not exc twenty tonnes
1,860.9 3.4 73.6
870840 Transmissions for motor vehicles 1,695.7 3.1 26.8
840991 Parts for spark-ignition type engines nes 1,686.9 3.1 37.5
870324 Automobiles with reciprocating piston engine displacing >3000 cc
1,364.9 2.5 2.5
870895 Safety airbags with inflated system 1,294.7 2.4 81.3
840820 Engines, diesel, for the vehicles of Chapter 87
997.7 1.8 55.0
870421 Diesel powered trucks with a GVW not exceeding five tonnes
948.8 1.8 98.1
840734 Engines, spark-ignition reciprocating displacing more than 1000 cc
926.5 1.7 17.0
870894 Steering wheels, steering columns and steering boxes for motor vehicles
911.9 1.7 40.1
870850 Drive axles with differential for motor vehicles
872.8 1.6 43.2
870332 Automobiles with diesel engine displacing more than 1500 cc to 2500 cc
863.4 1.6 76.3
852721 Radio reception apparatus for motor vehicles
655.5 1.2 28.6
841330 Fuel, lubricating or cooling medium pumps for int. comb. piston engines
602.6 1.1 35.1
840999 Parts for diesel and semi-diesel engines 513.4 0.9 20.5
870870 Wheels including parts and accessories for motor vehicles
506.0 0.9 21.2
Source: Own elaboration based on the MAGIC programme database.

255
Table 7.15. Technological Complexity of Mexico’s Motor Exports Under ‘Direct’
Competitive Threat from China in the U.S. Market, 2010
Category/
HS Code
No. of
Items
under
Threat
% of
Items
under
Threat
Value of
Exports
under
Threat
% of
Value
under
Threat
Major Items
I. Finished Vehicles Items: 870324, 870410.
2
4.5
1,365.2
13.5
Piston-engine automobiles displacing > 3000 cc; dump trucks designed for off-highway use,
II. Major Components and Systems. Machining and Stamping Items: 840731, 840732, 840734, 840790.
4
9.1
934.8
9.2
Small engines, spark-ignition type.
III. Sophisticated Parts and Subsystems. Specialised Technology Items: 870891, 870894, 841520, 852721, 852729.
5
11.4
1,847.8
18.3
Radio reception apparatus; automotive air conditioners; radiators; steering wheels.
IV. Parts & Components. Moderate & Universal Technology Items: 401120, 401310, 700711, 700721, 732090, 830120, 870821, 940120, 842199, 850720, 850730, 850780, 850790, 851120, 851130, 851190, 851220, 851290, 853910, 853921, 854430.
21
47.7
5,474.5
54.1
Pneumatic tyres; inner tubes; safety glass; springs, iron or steel; locks; lead-acid electric accumulators; storage batteries; distributors and ignition coils; ignition wiring sets; lighting equipment.
V. Accessories & Simple Parts Items: 400912, 400922, 400942, 681310, 732690, 842541, 842542, 853641, 853661, 854441, 854520, 871690.
12
27.3
489.3
4.8
Tube brake hoses; asbestos brakes lining and pads; built-in jacking systems; signalling flashers; electric lamp holders.
Total 44 100.0 10,111.5 100.0
Source: Own elaboration based on the MAGIC programme database.

256
7.5 Conclusions
The United States is a key market for Mexico’s motor industry since the former
represents between 80 and 90% of its export destination. The evolution of China
and Mexico in U.S. motor imports indicates that both countries have increased
their participation in such a strategic market. Mexico has now positioned itself as
the single-largest source country of motor imports to the United States, overtaking
Canada and Japan. In like manner, China has rapidly climbed to situate itself
among the major importers to the U.S. market, ranking in 5th place, and
registering an accelerated pace of growth of its import value. Therefore, it is clear
that Mexico’s government officials, businessman and labour union members have
reasons to fear competition from China in the U.S. motor market, but the question
is whether these fears are well-founded. The answer is that they are, but the
characteristics and specificities of the competitive threat and market interaction
processes have to be qualified.
One of the categorical advantages of a sectoral and country-based study like the
present one is its proclivity to avoid generalisations in the analysis. As seen in the
literature review, most of the early studies on the China-Mexico competitive
threat were carried out by using 2 to 4-digit levels of the HS. Whereas these trade
classifications are useful for some purposes and economic activities, in the case of
the motor industry they are not good enough given the high diversity of its
structure and composition. In this study, a more disaggregated analysis was
performed by using a 6-digit level classification of the HS, integrating a ‘cluster’
of 108 motor products. In addition, the specific methodology, based on different
categories of technological complexity of the motor value chain, developed to
assess the qualitative character of the competitive threat, was very helpful in
obtaining a clearer view and specificities of the competitive interaction process.
Thus, although at an aggregate level Mexico’s motor industry was immune to
Chinese competition in the U.S. market, the application of a 6-dgit level analysis
gives a different and more qualified perspective. When considering the static view
in the analysis, based on each country’s RCA, the results suggest a

257
complementary structure of China’s and Mexico’s participation in the U.S. motor
market rather than direct competition. Nevertheless, although with regard to motor
vehicles there seems to be a clear specialisation pattern and division of labour in
which Mexico is specialised in compact, mid-size cars, SUVs, light and medium-
size trucks, as well as road tractors, and China has a marginal but incipient role in
the low-end motor vehicle segments such as sport & recreational vehicles, and
microcars, the competitive environment in auto parts is much more complex.
Despite the fact that Mexico is well positioned in some major components and
sophisticated parts, and China is more specialised in the production and export of
auto parts with universal technology and simple parts & accessories, in specific
auto parts products of different technological levels the competitive threat is rising
considerably.
The study carried out also corroborated the importance of the time-frame
considered in the analysis, as suggested by Gallagher and Porzecanski (2007) and
Jenkins (2010). By aiming at assessing changes over time in China’s competitive
threat to Mexico, a DICT was applied. Therefore, the 1990-2010 period was
divided into two phases: 1990-2001 and 2001-2010, the years before and after
China joined the WTO, respectively. By taking into account this time-frame, the
following conclusions arose: a) although Mexico increased its share of U.S. motor
imports, this grew at a slower rate than U.S. imports from China, and the relative
gap between growth rates was greater in the second period; and b) the trend in the
‘competitive threat’ from China is increasing at a fast pace over time.78 Thus,
whereas in the period 1990-2001 China’s direct threat to Mexico only accounted
for a minimal share of 1.1% of Mexico’s imports into the U.S. market, during
2001-2010 this figure increased to 18.7%. The proportion of Mexico’s imports
under partial threat also rose from 38.1% to more than 50% between these
78 As suggested by Lall and Albaladejo (2004) and Lall and Weiss (2005), in discussing the competitive impact of Chinese entry, it is difficult to infer causal relationships from relative export and market share data. In this sense, this analysis is based on the above authors’ assumption that a fall in Mexico’s share of exports is caused by a rise in China’s share. Nevertheless, given the dissaggretation level used in the thesis, some direct casual relationships of ‘compeitive threat’ from China were identified in some specific motor items, through the cross-checking of every single item’s tendencies for China and Mexico, as well as the qualified opinion of key actors during the interviews. This is the case, for example, of the electronics, and engine and chassis parts segments.

258
periods. Thus, the share of Mexico’s motor imports under some type of
competitive threat (direct and partial) increased from 39.2% during the period
1990-2001, to 70% in the following decade.
The qualitative analysis of technological complexity in the motor value chain
shows that China’s direct competitive threat is focused in the low-end (simple
parts and accessories) and some medium technology-level segments of auto parts.
In particular, China’s competitive threat in the U.S. market is increasing rapidly in
the electronic, engine and chassis parts segments. Most of these automotive items
are price-sensitive generic parts, relatively labour intensive and easy to transport.
However, although the rapid increase in auto parts’ imports from China into the
United States since the 1990s was overwhelmingly been in the aftermarket
segment, rather than in original equipment, during the last decade Chinese-made
parts has been upgrading their value added and technological development.
Moreover, competition in the U.S. market is likely to become fiercer since
Chinese-made auto parts, including original equipment, are expected to gain a
dramatically larger share of that market in the coming years (USDC, 2011; Haley,
2012). Among the factors identified for this to happen are: a) Expansion of
exports to overseas automakers, where foreign automakers’ captive centres in
China will supply their home bases directly. While other foreign auto firms
operating in China have links to auto-parts’ suppliers back home, U.S. auto
companies have cut their ties with suppliers in the U.S. or encouraged them to
manufacture in China; b) Expansion of exports to overseas Tier-1 suppliers. A
growing number of global Tier-1 suppliers have set up production facilities in
China and have started to export to the U.S. market; c) With increased foreign
investment and the gradual consolidation of domestic firms, auto parts
manufacturers in China are becoming more competitive. As Chinese automotive
firms are looking to enter new markets, top global suppliers are assisting them
with engineering, technical and managerial expertise; d) Companies are buying
factory equipment from leading international suppliers, as well as acquiring or
investing in suppliers located overseas, including in the U.S.; e) The Chinese
government is facilitating auto and auto parts manufacturers’ efforts in getting

259
loans from domestic banks to fund their exports. In addition, auto companies are
being helped to build overseas R&D centres and to acquire foreign peers to
improve their technology and product-development capabilities. With the recent
support measures, the NDRC, China’s Central Economic Planning Agency,
expected to see the export value of motor vehicles and auto parts made by
domestic firms grow 10% annually over the next years, and reach US$ 85 billion
by 2015 (Haley, 2010).
Nowadays, competition in the motor-vehicle segment in the U.S. market is clearer
and more stable. As mentioned previously, China and Mexico play a differentiated
specialisation role, being complementary rather than competitive. It seems that the
perspectives of change of this competitive environment in the U.S. market are not
feasible in the short and medium terms. For example, a Chinese academic79 stated
that, besides quality and environmental factors, and low prices, one of the main
reasons why Sino-Foreign JVs do not export much from China is because TNCs
do not want to compete with their own brands in their own countries. This
condition was supported by an international consultant in Shanghai,80 who
believes that foreign companies could manufacture vehicles for export from China
if production is 100% for export and having 100% foreign capital. Under the
current JVs in place, there is no incentive to export for reasons including the high
growth of the domestic market, and the difficulties in changing the quality of
vehicles with the supply chain they have at the moment. Both interviewees
considered that it would take between five to eight years for Chinese-made cars to
have a significant presence in the U.S. market.
The situation during the last few years has not changed radically. The great
majority of vehicle exports from China are from domestic-independent firms, such
as Great Wall, Chery and Geely, which account for more than 70% of China’s
total auto exports. Most of these cars are exported to developing countries’
markets in Africa, the Middle East, South East Asia and Latin America. The
exported cars, mostly small, low-end segments, have a unit price of less than
79 Fudan University. Personal interview. Shanghai, China. 16th May, 2008. 80 KPMG. Personal interview. Shanghai, China. 13th May, 2008.

260
$10,000 dollars (Tang, 2009). Plans to export more vehicles to developed-country
markets, such as the U.S. and the European Union, have been repeatedly delayed
due to low product quality, poor image and failure to fulfill safety and
environmental requirements. Recently, some Sino-Foreign JVs have started
exporting vehicles as well. During 2011, GM and Honda continued to send
Chinese-built subcompacts overseas; Daimler and BMW are exporting sedans,
while VW China plans to ship cars into two former Soviet republics.
Nevertheless, auto analysts consider that the volume of their exports from China
will remain small and their markets will be the developing countries (Yang,
2012). In the short and medium terms their main goal is to fill modest product
gaps in their overseas markets. This is the case of Honda which started sending its
Fit subcompact cars to Canada from China, it will stop doing so after its Mexican
assembly plant comes into operation in 2014 (Ibid).
The final outcome of the China-Mexico competitive process in the U.S. motor
market, particularly in the auto parts segments, is far from being clear. To a large
extent, the evolution of this complex trade and production interaction will depend
on the direction taken by opposing/alternative forces and tendencies currently in
operation. Some of the key ones are: a) Off-shoring vs near-shoring/globalisation
reversal; b) Relatively low labour costs in China vs logistics and cost of transport
(high cost of maintaining a trans-Pacific supply chain); and c) Location and
proximity dependence strategies vs increasing productivity and value added. It is
worth mentioning that in both China and Mexico the weight of global foreign
firms in manufacturing and export decisions will strongly define most of these
trends. Of course, governmental responses to these moves would condition the
particular outcomes. In addition, another important factor that could influence the
China-Mexico competitive environment in the U.S. market is the future decisions
of domestic Chinese motor companies about locating assembly operations in
Mexico, as announced during the last few years. If these projects materialise using
Mexico as an export platform, Chinese firms would be ‘helping’ Mexico to
‘compete’ with China in the U.S. market.81
81 Some Chinese auto parts and maquiladora firms are already exporting to the U.S. market, as discussed in Chapter 8.

261
Despite current advantages, some factors that can negatively affect China’s ability
to become a low-cost source of OE-auto parts for automakers worldwide are
(USDC, 2011): a) rising material, labour and energy costs in China; b) potential
currency, quality and logistics-related issues; and c) the increased cost
competitiveness of other global suppliers. On the other hand, Mexico has proved
to be most competitive in the U.S market in relation to China in products with the
following characteristics (Watkins, 2007): a) high ratio of weight to value; b)
quality (rather than price) intensive; c) inputs for industries that require just-in-
time delivery, customised production, or require frequent design changes; and d)
protection of intellectual property is important. Motor vehicles and large segments
of auto parts fit within these characteristics. Nevertheless, it is recognised that
Mexico needs to embark on economic and regulatory reforms as well as improve
the system of R&D to increase industrial competitiveness.82
An outstanding issue emerged with the implications of the China-Mexico
competitive process, particularly in the U.S. market. Beyond the simple fact of
losing market share to China, some analysts have argued that not only Chinese
competition will probably cause Mexico’s current export structure to change, but
also the export and industrialisation model is at risk (Blázques-Lidoy, Rodríguez
and Santiso, 2007; Mesquita Moreira, 2007; Dussel Peters, 2009; Gereffi, 2009;
Gallagher and Porzecanski, 2010). As result, the export-oriented model and the
role of the State in the whole Mexican development process has been put into
question. This debate raises crucial questions for policy.
Finally, considering the other aspects of the China-Mexico connections previously
analysed (competition for global FDI and competition in the domestic market), the
issue of increasing competition in the U.S. market represents a hot topic in the
China-Mexico economic and trade relationship, since a significant share of
Mexico’s FDI attraction and jobs creation depends on that competitive condition.
Furthermore, it is worth underlining that given the deepening of the globalisation
process, the issue of China-Mexico competition in the U.S. market is also a very 82 During the fieldwork, a common proposal among the interviewees in all the sectors (academic, governmental, business) was the need to increase investment in the R&D systems in order to become more competitive.

262
sensitive topic for the U.S. economy. The high degree of integration of the
Mexican, Chinese and U.S. economies makes it difficult to separate the
implications of the dynamic’s effects. For example, the increasing Chinese share
supplying maquiladora inputs into Mexico to be included in products for export to
the United States directly affects U.S. suppliers, and not necessarily Mexicans.
Thus, throughout the 1990s the vast majority of imported inputs to Mexico’s
maquiladora industry came from the United States. In 2000, 90% of these inputs
were from the U.S. and 9% were from Asia, with China contributing only with
1% (Cañas and Coronado, 2004). According to a Federal Reserve Bank of Dallas’
economist, China’s entry into the WTO changed dramatically the supply chain
(MEXICONOW, 2011). By 2011, only 55% of imported maquiladora inputs
come from the U.S. and the rest from Asia. China has taken significant advantage
of the maquiladora programme and they now supply roughly 10 to 15% of this
industry’s needs (Ibid). These trends are of great concern for businessman and
border development promoters in the U.S.-Mexico industrial areas, since in the
next 5 years a growth of about 50% is expected in Mexico’s motor exports into
the U.S. market (Ibid). Thus, the Mexico-China-USA interconnection seems to
have great national and local economic implications. As an Executive Director
and CEO of the Laredo development Foundation expressed (Adams, 2003: 36):
“The globalisation of products and markets is having a profound impact on all
sectors of the American economy. One driving force of this trend is the
relationship between Mexico and China on the U.S. economy. In every
community across the country some 40 percent of all finished products
(retail as well as industrial), sourced components, and assembly plants
have a direct or indirect link with Mexico and/or China. Thus, an
assessment of the two primary trading partners of the United States is key
to an understanding of present and future economic development trends at the
local, state and national level.”
263
8. CHAPTER EIGHT
THE CHINA-MEXICO AUTO INTERACTION 4: CHINESE
OPERATIONS IN MEXICO AND GLOBAL PRODUCTION NETWORKS
“The Chinese threat to Mexico’s automobile industry as a global source
of small vehicles and automotive parts is real and will materialise before
the end of the decade” (Ornelas, 2004: 23).
“There is no direct competition between Mexico and China in the
automotive industry because the former does not have a ‘Mexican’ car”
(Yin, 2008).83
Traditionally, in particular after China’s entry to the WTO in 2001, China’s
competitive threat to Mexico’s motor industry has been mostly associated with the
exponential import surge of manufactured products into the domestic market
(analysed in Chapter Six), as well as the increasing trade competition in the U.S.
market (Chapter Seven). Nevertheless, perhaps for being an even more recent
phenomenon, the China-Mexico interaction in Mexican territory linked to the
location of Chinese business operations through FDI, JVs or other forms of
technical-manufacturing integration in the auto sector, have attracted much less
attention from both economic and governmental agents as well as from the
academic-research agenda, if not neglected altogether.
Contrary to common knowledge and expectations, besides the existing trade
relationships and traditional “arms-length” market transactions between China and
Mexico, the presence of Chinese capital in automotive-related operations in
Mexico has materialised through a diversity of organisational forms. These entry
modes range from “Greenfield” investments, JVs, technological and marketing
associations to mergers and acquisitions (M&A), among others.
83 Prof. Yin Xingmin. Deputy Director, China Centre for Economic Studies, Fudan University. Personal interview. Shanghai, China. 16th May, 2008.

264
Since the end of 2005, several well-positioned Chinese automakers began
announcing substantial assembly plant investments in Mexico. Among the most
important are China FAW Group Corporation (FAW), Hebei Zhongxing
Automobile Co. Ltd. (ZX Auto), Geely Holding Group (Geely), Chongqing
Changan Automobile Co., Beiqi Foton Motor (Foton), and more recently,
Chongqing Lifan Automobile Co. (Lifan) and Anhui Jianghuai Automobile Co.
(JAC Motors). During the first quarter of 2008, Mexican governmental officials
declared that Chinese automakers would be investing approximately one thousand
million dollars in the following years (Revista T21, 2008b). Nevertheless, up to
now most of these relatively large investment plans have not came to fruition;
some have been cancelled, others postponed and only a few have started
operations or are under construction. From the companies’ perspectives, the
central explanation for this situation has been the severe financial and economic
crisis of mid-2007 to 2009 (Yang, 2009a and 2010; Fan, 2009; Ugarte and Islas,
2009).
The above-mentioned trends have provoked new lines of discussion about
Chinese FDI strategies. From a broader perspective, Jenkins and Dussel Peters
(2009) pose some key questions regarding the limited scope of China’s
investment flows in Latin America so far, as well as the future prospects in this
regard for the region. These authors try to identify the causal factors of this
situation by weighting the host countries’ policies – or the absence of them -, the
obstacles and the lack of a suitable investment environment, on the one hand, and
the home country’s behaviour with a “discriminatory” FDI strategy in favour of
securing a long-term supply of raw materials, on the other (ibid). These reflections
represent fundamental issues for analysing the current status and prospects of
Chinese FDI in Mexico’s auto industry.
Besides the issues raised by Jenkins and Dussel Peters (2009) and mentioned
above, both of macroeconomic character for host and home countries, in addition
to the global temporary circumstances of the economic crisis, other key factors
should be included in this debate. Especially, the understanding of Chinese
corporate strategies for overseas expansion derived from microeconomic

265
conditions (product/geographical diversification, scale economies, efficiency-
seeking, brand image, etc.) (Bellabona and Spigarelli, 2007; Lim, 2008). In
Mexico’s particular case and the potential investments plans of Chinese
automakers, some other questions remain open to debate linked to specific
microeconomic conditions of corporations, such as their technical and managerial
capabilities for establishing operations overseas and their global reach. Some of
these questions are the following: a) Have Chinese firms solved the whole
components’ supply chain for the manufacturing process in their Mexican plants
across the Pacific? b) To what extent are Chinese firms prepared in terms of the
facilities and structure to fulfil warranties, services and spare parts in their
Mexican operations? c) Do Chinese cars comply with the safety and
environmental norms stipulated in Mexico’ Auto Decree? d) If they plan to use
Mexico as export platform to the United States, are they prepared to fulfil the
required quality, safety and environmental norms in the short-run? e) To what
extent does the so-called hyper-competition in China’s domestic market obtain
priority over expanding operations in Mexico? and, f) Have Chinese automakers
found that Mexico’s domestic market has higher levels of competition and quality
standards than the markets of other developing counties in Africa, Asia and Latin
America?
The objective of this Chapter is to tackle the manifestation and characteristics of
the China-Mexico auto interaction in Mexico derived from the Chinese presence
in the domestic market, FDI flows and linkages to global production networks.
The identification of the scale and type of automotive-related operations of
Chinese firms is the starting point of the analysis (How significant is China’s
automotive investment at present in Mexico?). In doing so, a characterisation of
the modes of entry as well as of the motivation factors or investment strategies of
Chinese auto companies in Mexico will be carried out (What are the main modes
of entry, drivers and motives of Chinese corporate strategies in Mexico’s motor
industry?). In addition, an approximate assessment of the actual problems and
potential implications, and the resulting interaction networks of Chinese
operations on Mexico’s motor sector, will be elaborated (Are Chinese auto
companies operating in Mexico competing and displacing domestic automotive

266
firms?). As underlined in the Methodology section (Chapter 3), information and
official data on FDI and other forms of Chinese presence in Mexico’s automotive
sector is very limited. Given these shortcomings, an exhaustive daily-basis review
of alternative automotive sources was carried out in order to identify the trends.
8.1 Modalities of Chinese Auto-Related Operations in Mexico
In sharp contrast with trade trends between China and Mexico analysed in the
previous Chapter, China’s FDI in Mexico shows both a limited and unstable
character. According to the Mexican Ministry of Economy’s official figures,
during the period 1999-2010 China’s total accumulated FDI reached US$ 144.7
million (See Appendix 8.1). This amount corresponds to less than one percent of
Mexico’s total world inward FDI in that period. In a similar way to other figures,
some discrepancies arise when comparing Chinese OFDI sources with the
Mexican ones. China registers total accumulated FDI flows of US$ 200.63 million
by 2010, almost 40 per cent higher than Mexican sources.84
As indicated in the introductory segment of this Chapter, although still modest
and despite the fact that some of the automotive “flagship” projects have not
materialised, Chinese automotive-related operations in Mexico present an
increasing and diversifying modalities. Among the present and potential Chinese
auto operations in Mexico, it is possible to identify FDI equity and non-equity
participation, direct and indirect involvement, and arm’s-length and non arm’s-
length relationships, and so on. There are different ways of classifying the
modalities of FDI and TNCs’ organisational forms (UNCTAD, 1995 and 2009b;
UNIDO, 2006 and 2009). For this Chapter’s purpose, the analysis will be based
on the more common Chinese firms’ modes of entry into foreign markets, linked
to their process of internationalisation or outward economic expansion: a)
Manufacturing Joint Ventures; b) Wholly-Owned Operations; and c) Mergers and
Acquisitions (M&A). In addition, some specific entry modes and interaction, such
as Non-Equity, between Chinese companies and Mexican auto-related operations
84 An overview of Chinese FDI in Mexico is presented in Appendix 8.1.

267
will be examined.85 The analysis of the different modes of entry will help to
understand the motivation of Chinese corporations’ outward foreign investment in
Mexico’s market. Table 8.1 shows the different modes of entry and product
segments of identified Chinese companies with planned or operating projects.
8.1.1 Joint Ventures
Based on the number of identified actual or planned Chinese companies’
operations in automotive-related operations in Mexico so far, the “Joint Venture”
seems to be the favourite modality for companies intending to establish relatively
large assembly car and motorbikes projects. The most significant cases and their
basic characteristics are summarised in Table 8.2.
With regard to cars, since the middle of the 1990s diverse Chinese auto
companies, both large State-Owned Enterprises as well as small private ones, have
carried out a number of formal agreements with Mexican or other partners to
establish manufacturing operations in Mexico through manufacturing JVs. Taking
the available data, these joint ventures altogether would potentially generate more
than US$ 1 billion in investment, one million units in production capacity and
more than ten thousand jobs.
Analysing these Chinese car-assembly JVs as a whole, several common features
can be identified:
a) Manufacturing operations are focused on the small car, lower-end
market segments, especially compact and subcompacts. For instance,
FAW-Salinas Group intended to produce the compact cars Xiali and
Weizhi, while Changan’s brand small models were Benben mini, Zhixiang
and Yuexiang sedans.
85 UNCTAD (2010c and 2011) has reported the increasing relevance of non-equity modes of international production, becoming a significant feature of the emerging global division of labour. These non-equity modes include various types of international contract manufacturing, supplier and distribution relationships, services outsourcing, contract farming, franchising, licensing, management contracts and other types of contractual relationships through which TNCs coordinate activities in their global value chains and influence the management of host-country firms without owning an equity stake in those firms.

268
Table 8.1. Mode of Entry and Product Segment of Chinese Firms’ Automotive-
Related Operations in Mexico
(2011-2012)
Mode of
Entry
Product Segment
Cars
Commercial
Vehicles
Motorbikes
OEM
Parts
Others
Manufacturing Joint Ventures
•FAW-GSM1
•ZX Auto-FEMA2
•Geely-Bergé2
•Changan-Autopark2
•Lifan-Opeasa3
•Jincheng Ronda •Italika
Wholly Owned Manufacturing Operations
•Foton4
•JAC Motors4
•Dayun3
•Long •Dayun3
•Minth •Prime Wheel
•Foton (Tractors) •Krystal (limousines)
Mergers & Acquisitions
•Volvo-Geely •Saab-Spyker-Youngman-PangDa
•Delphi-Beijing West •DANA-Wanxiang •Moltech-Huayi •Nexteer-PCM •Inalfa-Hainachuan
Licensing/ Technological Associations
•GML-FAW •Spartak-Dongfeng •CBO •Cosmotrailer
Marketing/ Distribution Agreements
•Zilent •EVI •Miles •Bergé •Lifan
•Zilent •EVI •Miles •JAC Motors
•Zilent •Toromex-Autofin •Lifan
•LiuGong (construction and heavy machinery)
Notes: 1Cancelled/Postponed; 2Postponed; 3Planned; 4Planned/Under construction. Source: Own elaboration based on diverse automotive sources and personal interviews.

269
b) The ventures involve substantial amount of capital investment and
production capacity.
c) At this stage, Chinese firm’s competition strategy focused on low prices
as the main target customer was the entry-level buyer, from the working-
class population (Grupo Salinas-FAW, 2007; Grupo Elektra, 2007). Most
vehicles were priced between US $5,500 and $7,000, about 10 to 20 per
cent below the cheapest models on the market. In terms of supply, besides
competing among themselves, Chinese cars would compete with the low-
end models currently offered in the market. These include the Chevy and
Corsa (Chevrolet); Pointer (Volkswagen); Atos (Dodge); and Ikon and Ka
(Ford).
d) As new-entrant companies in the Mexican market, most Chinese JVs had
plans to start selling cars in Mexico before beginning local production, by
importing them from China. This move was possible under the commitment
to build manufacturing facilities in a period of three years. The Mexican
Automotive Decree of 2003 allows automakers to import vehicles to the
country, free of import duties, as long as they have an investment of at least
US$ $100 million and have produced more than 50,000 cars a year locally
(PEF, 2003). FAW-Salinas Group, for example, had sold around 5,500
imported cars from the end of January 2008 to mid-2009 (Salinas Group,
2009; Fan, 2009).
e) In their first phase of assembly operations, Chinese companies plan to use
a large proportion of parts and components imported from China. Most
plants would start with welding, painting and final assembly, but the idea is
to manufacture an increasing number of auto parts in Mexico, including
transmissions and engines.
f) With the exception of ZA Auto, the selected location sites for establishing
assembly operations of Chinese firms were around Mexico’s central region,

270
taking into consideration the geographical concentration of potential
domestic market.
g) Chinese automotive JVs in Mexico are central to their ambitious global
strategy and path towards internationalisation. Although the Mexican
domestic market is a relevant factor for Chinese firms’ decision to locate
manufacturing operations, under these JVs Mexico would also act as a
manufacturing base and an export springboard to the rest of Latin American
and, when the U.S. auto regulations are fulfilled, to North American markets
taking advantage of Mexico’s FTAs. Regarding the U.S. market, despite the
optimism of most Chinese firms, some executives of Mexico’s automotive
industry believe that only in approximately five to eight years’ time would
Chinese-made cars be exported to that market from Mexico, when safety
and environmental standards could be met.86
h) A common characteristic of these automotive JVs is that they have not
been able to materialise operations. While the main causes include the
unworkability of ZX Auto-CHAMCO’s venture had intra-partnership
disagreements, as well as CHAMCO’s failure to meet Mexico’s federal
requirements to begin operations, FAW-Salinas Group, Geely-Bergé, and
Changan-Autopark all blamed the global financial crisis of 2008-2009.
Although most of the JVs representatives declared that they have not
cancelled the projects, but “postponed” tehm (Yang, 2009a; Chow and
Yang, 2008; Gasgoo, 2009), there are serious doubts about the ventures’
feasibility. References from Chen Yuming, Head of the Trade and
Economic Council of China’s Embassy in Mexico, pointed out that most
auto Chinese investment projects were not cancelled but temporarily
“suspended”, due to the unfavourable economic conditions.87
86 Ministry of Economy’s official. Personal Interview. Mexico City. 13th December, 2007. 87 Gdem. Mexico-China Business Development. Mexico, D.F. Personal Communication. 3 February, 2010.

271
Table 8.2. Major Joint Ventures of Chinese Companies in Mexico’s Automotive-Related Industry
Company Project Description Investment
Partners
Plant
Location
Destination of
Production
Start-up Date
First Automobile Works (FAW)
JV agreement signed in late 2007 for the production of 100,000 units a year; depending on demand, it could increase to 250,000. Assembly of compact and subcompact cars. Investment of $US 150 million and 4,000 employees. Imports of FAW cars into Mexico through “Salinas Group” since December 2007.
Joint venture with Mexican “Salinas
Group”
Morelia (Zinapecuaro),
Michoacan
Mexico; Central and South
America; USA (in 8 years)
The plant was scheduled to start by 2010. In June 2009, FAW-SG announced the decision of postponing the project.
Hebei Zhongxing Automobile (ZX Auto)
Under ZX-Chamco agreement in 2006, the assembly of 300,000 pick-ups and SUVs, annually. Investment of 300 million and 3,000-4,000 jobs. Intention of importing ZX vehicles into the Mexican and US markets. In 2008 ZX cancelled the association with Chamco. By late 2009 and early 2010, ZX and the government of Baja California signed a deal to manufacture 200,000 vehicles. Planned investment of $100 to 400 million dollars, generating 2,000 jobs.
Originally a joint venture with Chamco, a US- based vehicle importer. Under the 2009-2010 deal, in partnership with Mexican FEMA Group.
Tijuana, Baja California
Mexico; USA, Central and
South America
Originally by 2009, under ZX-Chamco association. ZX cancelled this venture in 2008. The starting date of the new deal ZX-FEMA has not been specified.
Geely Automobile Holdings
In January 2008 Geely signed a memorandum of understanding to assembly 300,000 medium-sized cars a year (sedan or hatchback), including a supplier industrial park. The project envisages $US 500 million and 2,000 employees. By then, the Mexican factory would be the firm’s most expensive overseas facility and its first assembly plant outside of China with full manufacturing capabilities.
Association with Spaniard-Mexican partners (Bergé and Monterrey Groups).
Leon, Guanajuato
Mexico; USA; Central and
South America
Set to start operations by 2010. In March 2009 Geely announced that the Mexican project could cut down its size.

272
Table 8.2. Major Joint Ventures of Chinese Companies in Mexico’s Automotive-Related Industry (Continued)
Company Project Description Investment
Partners
Plant
Location
Destination of
Production
Start-up Date
Chongqing Changan Automobile Co. (CHANA)
In February 2009 Changan signed a cooperation framework agreement to establish an assembly plant with an initial annual capacity of 50,000 vehicles (compact and mid-sized cars). By mid-2009 Changan intended to hire Magna International to assemble cars for its planned joint venture.
Joint venture with Spanish-Mexican partner Autopark. Changan and Magna held talks to collaborate in the operation.
Central-Southern Region
Mexico, Central and South
America; and the United
States
The company planned to start sales operations during late 2009 or early 2010.
Chongqing Lifan Automobile Co.
At the end of 2010 Lifan Motors expressed the intention of setting up a small car-assembly plant in Mexico. The plant would produce 50,000 units a year with an initial investment of $100 million dollars. Lifan will contribute with the know-how and technology.
Opeasa is Lifan’s representative in Mexico, acting as leader in the project’ starting phase.
Feasibility studies in the
states of Guanajuato, Sonora and Chihuahua
Mexico, Latin America; and
eventually to the United States and Canada
Not specified
Italika Joint venture to produce 350,000 motorbikes a year, with an investment of $15 million dollars generating 500 direct jobs. It’s Mexico’s largest motorbike assembly plant. Salinas Group imported Loncin motorbikes since 2005.
Salinas Group and Loncin Group
Toluca, Estado de Mexico
Mexico and Latin America
The plant started operations in 2008
Jincheng Ronda
Joint venture constituted in 2007 with Jincheng Group to manufacture motorbikes, establishing the RONDAMEX brand. In 2008 an assembly plant starts up with an annual capacity of 60,000 units. The firm has around 50 sales points in Mexico.
Rondamex, Jincheng Group
San Francisco Papalotla, Tlaxcala
Mexico JV constituted in 2007. Plant started operations in 2008
Source: Own elaboration based on personal interviews and different automotive sources.

273
A totally different story from the vicissitudes of Chinese car-assembly has been
the experience of JVs regarding motorbikes. During the late 2000’s, two
motorbike assembly JVs between Chinese corporations and Mexican partners set
up successful operations: Italika and Jincheng Ronda.
In sharp contrast to Salinas Group’s other car-assembly JV with FAW, the
motorbike venture with Loncin has had an extraordinary success. During the first
quarter of 2011, the Elektra Group, Salinas Group’s marketing unit, reported
annual sales of 200,000 units, concentrating around 60% of Mexico’s motorcycle
national market. In six years of operation, Elektra has sold one million units of the
Italika brand (Web Report Italika, 2011). The company also markets the Italika
brand in other countries such as Guatemala, Honduras, Peru and Brazil. As in the
case of cars, Italika motorbikes are distributed through Elektra’s more than 2,000
retail stores in Mexico and in seven countries of Central and South America.
Recently, Italika announced the expansion of its motorcycles distribution network
through their marketing in Chedraui’s retail stores.
For its part, Jincheng Ronda, S. de C.V. is a JV constituted in 2007 by Mexican
Group Rondamex and the Chinese Jinchen Group. Jinchen Corporation is one of
China’s leading motorcycle manufactures, with export markets in more than 70
countries worldwide (Jinchen Corporation, 2011). Mexico’s JV established an
assembly plant in San Francisco Papalotla, Tlaxcala, in 2008, with an annual
capacity of 60,000 units of the Rondamex brand. At present, the firm has around
50 sales points throughout the Mexican territory.
Despite the differences in assembly capacity and the market destination of
production, Italika and Jinchen Ronda present some similarities in their
operations, and these can be summarised as follows:
a) Both have embarked in JVs with leading Chinese companies in the
motorcycle segment. The parent companies are also involved in motor
vehicle production operations (especially semi-trailers, construction
trucks, and mini-trucks).

274
b) As in the case of car assembly JVs, the main strategy of market
competition in motorbikes firms is low price, intending to attract low-
income population segments. Although considered of lower quality, Italika
and Rondamex motorbikes are between 20 to 30% cheaper than similar
Japanese brands. With this type of vehicle, the level of competition in the
Mexican market is substantially lower than with automobiles.
c) Both plants are located in Mexico’s central region, taking advantage of the
geographical concentration of potential domestic consumers.
d) Besides private use, these motorcycles have found a market niche in
micro and small enterprises, and other delivery businesses. Besides low
price, consumers try to reduce maintenance costs and increase fuel
efficiency.
e) Both JVs posses specialized service centres to customers, offering original
spare parts.
f) In addition, Italika and Rondamex also have and provide their own credit
system. Thus, low prices and accessible financing plans have produced a
highly positive base for market success.
In the case of motorbike assembly JVs, all these characteristics seem to be the key
factors for successful in the Mexican market. An interesting aspect of reflexion is
the future potential or real possibilities for these JVs to upgrade in the production
line to automobiles, such as the case of Honda during the mid-1990s, or China’s
Lifan. This last company has distributed its motorbikes in Mexico since 2009, and
it very recently announced its intention for establishing car-assembly operations in
this country through a JV.
An important effect of the starting operations of these motorbike JVs in Mexico
has been the strong fall in new motorbikes imports. Based on data from AMIA
(2011), from 2007 to 2010, Mexico’s motorbikes imports decreased 72.4%,
dropping from 432,772 to 119,456. As a counterpart, imports of motorbike
components registered an accelerated increase. Motorbike frames, for instance,
grew more than 600% in the same period, from 38,640 to 285,719. Nevertheless,
even though it could be assumed that this reduction in motorbike imports involved

275
China, this country remains as the number one import source: 78.4% in 2008,
65.6% in 2009, 68.8% in 2010, and 66.7% during the first semester of 2011.
8.1.2. Wholly-Owned Manufacturing Operations
Another modality of Chinese investment in Mexico’s motor industry is that of
wholly-owned manufacturing activities. Unlike car-assembly JVs, all these
companies have their assembly processes in operation working on a diversity of
production lines. Based on information available, firms under this type of
modality have made, or have committed, investments of US$ 300 million,
generating more than 2,200 jobs (Table 8.3).
Up to now, the most widely publicised of this type of operations is Foton Motor
Co. In Foton’s globalisation strategy, Mexico is considered as a strategic site for
overseas market expansion (Foton Motor Co, 2011). Foton has been a presence in
Mexico since 2007, marketing tractors and light trucks through Automotive
Trucks (AT), its exclusive sales agent. According to Foton sources in Mexico, the
plant currently is under construction (ibid). During 2009 the Chinese firm sold
1,500 vehicles, expecting to reach the 2,000 in sales by 2010. In a similar way
than car-assembly JVs, Foton market strategy in commercial vehicles is low price,
being considered 20% below competitors. Likewise, after selling in the domestic
market, Foton’s plan is to export to South America and the U.S. in further
operation stages. At present, the assembly of tractors is carried out by using the
KD system, with Foton importing all spare parts from China. The plan is to
implement the same KD system during the first stages of commercial vehicle
production. This practice is seen as a way of avoiding Mexico’s tariff of 50% on
imports of new complete vehicles, offering more competitive prices and
improving distribution and post-sales services (Zhou, 2009).
For its part, JAC Motors announced the establishment of a commercial truck
assembly plant in Culiacán, Sinaloa, northwestern Mexico, in 2012 (Torres,
2011b). The initial production plan considers 350 trucks a year using the SKD
system, in particular the drivetrain and diverse auto components. JAC Motors

276
distributed vehicles in Mexico since 2004. At present the company has only 2
dealer offices in the country expecting to open new ones in Mexico’s larger cities.
Among the modality of wholly-owned operations are the cases of two component-
supplier firms: Minth and Prime Wheel. Minth is located in the state of
Aguascalientes and produces exterior trims, decorative and body structural parts.
Besides Nissan, which is also located in Aguascalientes, Minth also functions as a
Tier-1 supplier for Fiat, Ford and Chrysler. For its part, Prime Wheel is a Chinese-
American firm specialised in the production of chromeplated aluminium wheels,
and is located in Mexicali, Baja California. With an initial investment of US$ 6
million it will generated around 1,000 jobs when starting operations in 2012. Its
main customers are Chrysler, Ford, GM and Mitsubishi, both in Mexico and the
USA.
Krystal Enterprises International (KEI) is a different kind operation as it is
specialised in the assembly of limousines and luxury vans. KEI is part of Krystal
Infinity, a U.S. company, and Winston Global Energy from China. KEI is the
largest assembler in its field in the United States and also dominates around 30%
of the world’s limousine markets; Winston Global Energy makes batteries for
electric vehicles, including the Lithium batteries. By mid-2011, the Chinese
partner injected more capital into the venture and announced the expansion of
operations by building a new plant (RVBusiness, 2011). KEI is taking advantage
of Mexico’s FTAs to export to the United States, Canada, Central and South
America, having recently included China as an export destination.
Finally, two motorbike firms fit in this entry mode category: Long and Dayun.
Interestingly, Dayun investment decision was motivated by the ending on
December 11th, 2011, of the Transition Measures agreed before the WTO between
Mexico and China. According to Dayun’s executives, upon eliminating the
transition measures, Mexico becomes highly attractive because when the
production plant is set up, all the spare parts imported from China into Mexico
will have a lower cost and there will be no impact on the price of the final
product.

277
Table 8.3. Major Wholly-Owned Operations of Chinese Companies in Mexico’s
Automotive-Related Industry
Company Project
Description
Plant
Location
Start-up
Date
Beiqi Foton Motor Co.
Investment of 370,000 dollars in an assembly plant producing agricultural tractors. Plant capacity is 6,000 units a year generating 45 direct jobs. By mid- 2010 Foton announced a plan for a new investment to build light trucks. Initial investment of 15 million dollars, increasing up to 250 million in further stages of production, reaching an annual capacity of 50,000 units. At final stages, vehicles would be exported to South America and the U.S.
Coatzacoalcos,
Veracruz
September
2009
Anhui
Jianghuai Automobile
Co. (JAC Motors)
JAC Motors announced the establishment of an assembly plant to start operations in 2012. Initial production plan of 350 commercial trucks a year using the SKD system. JAC Motors distributes vehicles in Mexico since 2004. At present the company has only 2 dealer offices in the country.
Culiacán, Sinaloa
2012
Minth México, S.A
Firm specialised in the production of exterior trims and body structural parts. Initial investment of 16 million dollars in Mach 2010, generating 110 jobs. In February 2011 Minth invested 18 million dollars in expanding operations, reaching a total staff of 500 employees. Minth is supplier to Nissan, Fiat, Ford and Chrysler.
Gigante de Arellano,
Aguascalientes
March 2010
Prime Wheel de México
Chinese-American firm specialised in the production of chromeplated aluminium wheels. With an initial investment of 6 million dollars it will generated around 1,000 jobs. Its main customers are Chrysler, Ford, GM and Mitsubishi, in Mexico and the USA.
Tijuana, Baja
California
2012
Krystal Enterprises
International
Initial investment of $40 million dollars, generating 300 jobs, to manufacture limousines and luxury vans. Current capacity of 1,000 units a year. Krystal Infinity investment (USA) was supported by Winston Global Energy (China). Exports to North, South America and China.
Mexicali, Baja
California
The plant
started operations
by mid-2009
Long, S.A
de C.V.
A medium-size firm dedicated to the assembly of bicycles and motorbikes. Annual production is 200,000 bicycles and 40,000 motorbikes, respectively, employing 420 persons. Vehicles are exported to the U.S. and Latin America.
Mexico,
City
1995
Dayun
This company is planning to invest 3 million dollars in a motorbike and truck assembly lines during the next 2 years. Dayun aims at producing 10,000 units the first year generating 500 jobs by 2012. Besides Mexico’s domestic market, the firm plans to export to North and South America.
Not specified
2012
Source: Own elaboration based on personal interviews and different automotive sources.

278
Despite the diversity of production lines of Chinese firms under wholly-owned
operations, most of them show, nonetheless, some points in common:
a) In general, wholly-owned operations involve relatively low investment
amounts and production capacity.
b) Setting-up assembly operations in Mexican territory allows firms to avoid
high tariff regulations.
c) Firms take advantage of Mexico’s FTAs, using Mexico asan export base to
USA and/or Latin America, and, recently, China.
d) As in the case of the large manufacturing JV operations, at least during the
initial production stage, assembly of vehicles under the wholly-owned
mode of entry is carried out through KD or SKD systems.
On the other hand, some differences can also been identified, in particular
between Minth, Prime Wheel and KEI in relation to the other companies:
a) Minth, Prime Wheel and KEI are operating under the maquiladora regime,
which gives them special fiscal treatment in trade transaction in the US
market.
b) As a consequence, for these three firms, Mexico forms part of a wide
North American production base.
8.1.3. Mergers & Acquisitions
An indirect way in which Chinese companies have used to gain a presence in
Mexico’s auto industry is through global M&A of foreign firms. At least six
Chinese M&A operations of companies with manufacturing activities in Mexico
have been identified: two in the automobile line (Volvo and Saab)88 and four in
the auto components (Dana, Delphi, Nexteeer and Inalfa) (Table 8.4). The total
88 At the time this chapter was being written, Chinese companies Pang Da and Yougnman were negotiating the acquisition of Saab from General Motors, which eventually failed.

279
transaction value of the whole M&A operations with global companies located in
Mexico during the period 2007-2011 exceeded US$ 2.5 billion.
On the automobile line, both Volvo and Saab already had presence in Mexico
trough their previous parent companies, Ford and General Motors respectively.
Geely, China’s largest private carmaker, bought the Volvo car subsidiary
operations of Ford in March 2010 in a transaction worth US$ 1,800 million. Up to
now, this is the biggest overseas takeover in Chinese auto industry. The deal
included Volvos’ product R&D, marketing, production and distribution in 2011
(Gasgoo, 2010). At present, Volvo has 24 distribution and services centres
throughout Mexican territory. According to AMIA information, Volvo car sales in
Mexico reached 1,300 units in 2010 and 900 during the first semester of 2011.
The other Chinese presence in Mexico through car brands M&A is Saab. After
months of negotiations, in October 2011 Swedish Automobile NB (SWAN)-
Spyker signed a memorandum of understanding with Chinese firms Zhejiang
Youngman Lotus Automobile Co. and PangDa Automobile Trade Co. to sell Saab
for 901 million Yuan, approximately US$140 million. In Mexico, the Saab brand
was introduced by General Motors in 2002. After Spyker took over Saab from
General Motors in January 2010, the Swedish firm started looking for a Mexican
partner to re-establish marketing, distribution and service operations. At present,
two more Saab’s auto links can be identified. One is an agreement with Global
Armor to armour-plate cars. The other is a contract to produce about 18,000
Saab’s 9-4X a year at GM’s assembly plant in Ramos Arizpe, Coahuila. At the
moment of the negotiations between NB (SWAN)-Spyker and their Chinese
counterparts, General Motors, which still owns preferential shares in Saab,
opposes the deal since it considers that could hurt GM’s competitive position.
Besides materialising M&A in luxury car brands, Chinese firms have been very
active in taking over world-class parts suppliers. Some of these supplier firms,
such as Dana, Delphi, Nexteer and Inalfa, have production facilities in Mexico.
Specific information of these transactions such as the seller company, production

280
segment, worldwide location operations, acquirer company, and value and date of
transaction is presented in Table 8.4.
Wanxiang Group acquired Dana’s coupled products unit. By 2007, Dana
employed about 2,130 people in the Unites States and Mexico with Dana’s
production facilities in Mexico located in San Luis Potosí. Beijing West Industries
bought Delphi’s suspension and brakes business. This unit comprises seven plants
employing 3,000 people in several countries. Pacific Century Motors, a JV
between Tempo International group and the municipality of Beijing, acquired
GM’s Nexteer steering components unit. Nexteer had around 6,200 employees
and 22 plants around the world; the deal also included 6 engineering and several
customer service centres. Of those facilities, three plants were located in Mexico:
Ciudad Juárez, Sabinas, and Querétaro. Lastly, Beijing Hainachuan Automotive
Parts bought Inalfa in May 2011. Inalfa Mexico’s plant is located in Irapuato, in
the state of Guanajuato in the central region.
The analysis of Chinese M&A of automotive firms, both car and auto parts, with
production facilities in Mexico show one point in common: a trend in the
globalization strategy of Chinese auto firms towards acquiring prestigious brand
names, and the rights to world-class technological processes, in order to move up
the value chain. For instance, although Volvo and Saab present financial
problems, they represent reputable brands in the luxury high-end car market
segments worldwide. In the same way, Dana, Delphi, Nexteer and Inalfa are
highly-positioned specialised auto parts firms at worldwide level. They hold
strategic locations in global markets, with advanced manufacturing and R&D
facilities, and function as Tier-1 suppliers of the largest global automotive
corporations. These companies form part of global production networks, using
Mexico as both production and export base for international markets, especially
for the North American region. This is one of the reasons why all these global
suppliers operate under Mexico’s maquiladora regime. In this sense, the role or
significance of these operations for Chinese companies goes beyond the limits of
Mexico’s domestic market, acquiring a more global or regional dimension.
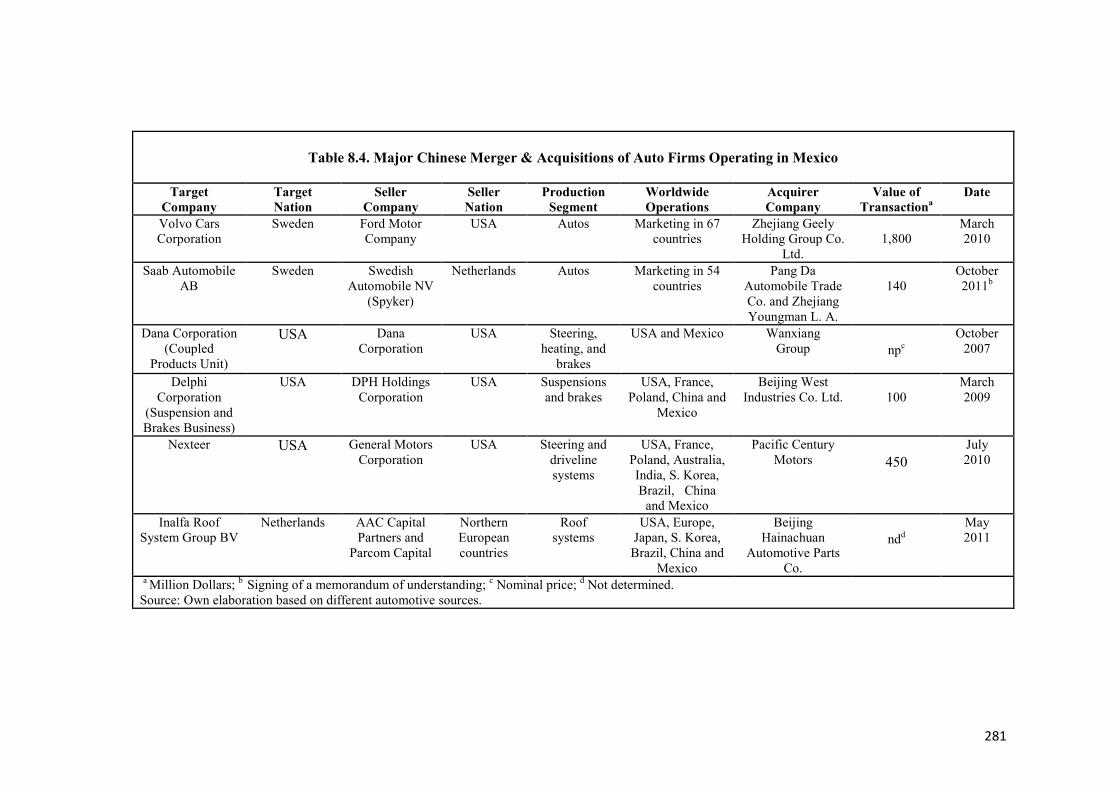
281
Table 8.4. Major Chinese Merger & Acquisitions of Auto Firms Operating in Mexico
Target
Company Target
Nation
Seller
Company
Seller
Nation
Production
Segment Worldwide
Operations
Acquirer
Company Value of
Transactiona
Date
Volvo Cars Corporation
Sweden Ford Motor Company
USA Autos Marketing in 67 countries
Zhejiang Geely Holding Group Co.
Ltd.
1,800
March 2010
Saab Automobile AB
Sweden Swedish Automobile NV
(Spyker)
Netherlands Autos Marketing in 54 countries
Pang Da Automobile Trade Co. and Zhejiang Youngman L. A.
140
October 2011b
Dana Corporation (Coupled
Products Unit)
USA Dana Corporation
USA Steering, heating, and
brakes
USA and Mexico Wanxiang Group
npc
October 2007
Delphi Corporation
(Suspension and Brakes Business)
USA DPH Holdings Corporation
USA Suspensions and brakes
USA, France, Poland, China and
Mexico
Beijing West Industries Co. Ltd.
100
March 2009
Nexteer USA General Motors Corporation
USA Steering and driveline systems
USA, France, Poland, Australia, India, S. Korea, Brazil, China
and Mexico
Pacific Century Motors
450
July 2010
Inalfa Roof System Group BV
Netherlands AAC Capital Partners and
Parcom Capital
Northern European countries
Roof systems
USA, Europe, Japan, S. Korea, Brazil, China and
Mexico
Beijing Hainachuan
Automotive Parts Co.
ndd
May 2011
a Million Dollars; b Signing of a memorandum of understanding; c Nominal price; d Not determined. Source: Own elaboration based on different automotive sources.

282
8.1.4. Licensing and Technological Associations
Technological Associations (TAs) or Licensing Agreements (LAs) is another
modality of Chinese involvement in Mexico’s motor industry. Although it is not
easy to clearly identify these types of operations, some automotive associations
are operating with characteristics that fit in this category. This is the situation of
Giant Motors Latinoamérica (GML), Spartak-Donfeng Motor Corporation
(DFM), CBO Trucks, and Cosmotrailer (Table 8.5).
The best example of this modality, with a relatively good level of operational
success, is GML. In 2007, this Mexican firm, headed by Bler Group, entered into
a fifteen-year association with FAW, consisting in technology transfer and auto
parts sourcing. GML obtained a license to manufacture light and heavy FAW
branded trucks (Maquila Portal, 2010).89 Starting with the manufacturing of mini,
light and semi-heavy trucks, over the years GML has widened its supply lines
with new models, such as utility mini vans, heavy trucks and buses. The recent
association of Bler Group with Carso Group has contribuited to this upgrading
process, giving more certitude and assurance to GML operations. The firm also
has plans to start exporting vehicles to some Central and South American
countries (See Appendix 8.2).
Regarding the Latin American markets, GML executives consider the firm is
more competitive there since, they argue, although these countries import Chinese
vehicles, GML’s are of higher quality. On the other hand, in relation to the
Mexican market, GML’s directives believe they have advantages and strengths
due to the learning and maturing process the firm has experienced. Given the
domestic market characteristics, they consider it takes at least three years of
learning to commercialise Chinese brands in Mexico.90 Nevertheless, although
GML receives total support from FAW in the technical and commercial areas,
89 According to automotive industry governmental officials, GML makes use of the benefits granted from Mexico’s Automotive PROSEC Programme (Sectoral Promotion Programme for the Automotive Industry) to import assembly material from China. Heavy and High Technology Industries, Mexico’s Ministry of Economy. Mexico City. Personal Interview. 28th April, 2008. 90 Giant Motors Latinoamérica (GML)-FAW Trucks. Mexico City. Personal Interview. 20 June, 2011.

283
GML executive pointed out that some problems have arisen in logistics,
operational and assembly activities. For instance, components’ shipments have
been delayed, materials management has not been successful, and there have been
incomplete deliveries of parts and components.
A sensitive issue came out during the interview with GML executives when
tackling the topic of “domestic integration” and the “nationality” of vehicles. It is
interesting that despite the fact that GML-FAW’s association is based on a
technological agreement and FAW is the major supplier of components, firm
directives do not conceive GML’s trucks as “Chinese”.91 The main arguments for
this opinion were that GML trucks possess 50% of domestic integration and that
engines, a major vehicle component, although assembled in China, are
manufactured by Cummins, as are injection and electronic systems. Based on
those aspects, they consider the GML vehicle to be a “global truck”.
Spartak is another Mexican company which embarked on a formal licensing
agreement with the Chinese partner DFM. Through this association, Spartak
assembles and distributes light truck brands of its Chinese associate. During the
first stages of operation, Spartak also had another Chinese firm, Yuejin Motor, as
a partner. Spartak focuses its market strategy on selling light load trucks to the
micro and small entrepreneur who seek to maximise resources by acquiring a low
cost vehicle, with low maintenance and excellent performance. According to the
company’s general manager, Spartak’s vehicles are quality units with a price
between 15 to 20 per cent cheaper than other brands. At present the units come
directly from China and are assembled at the Monterrey plant; they fulfil the
Mexican norms since vehicles use Euro III and Euro IV engines, as well as a 30
per cent of national integration of components (Transporte Informativo, 2009).
91 Ibid.
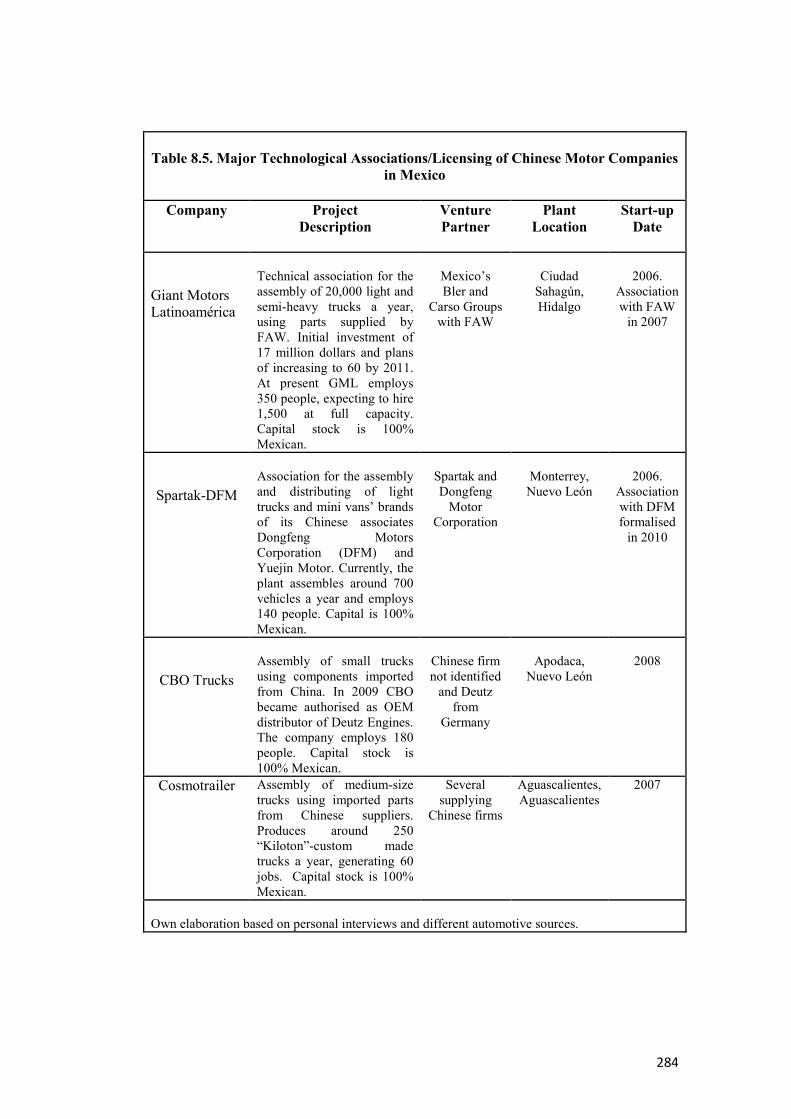
284
Table 8.5. Major Technological Associations/Licensing of Chinese Motor Companies
in Mexico
Company Project
Description
Venture
Partner
Plant
Location
Start-up
Date
Giant Motors Latinoamérica
Technical association for the assembly of 20,000 light and semi-heavy trucks a year, using parts supplied by FAW. Initial investment of 17 million dollars and plans of increasing to 60 by 2011. At present GML employs 350 people, expecting to hire 1,500 at full capacity. Capital stock is 100% Mexican.
Mexico’s Bler and
Carso Groups with FAW
Ciudad
Sahagún, Hidalgo
2006.
Association with FAW
in 2007
Spartak-DFM
Association for the assembly and distributing of light trucks and mini vans’ brands of its Chinese associates Dongfeng Motors Corporation (DFM) and Yuejin Motor. Currently, the plant assembles around 700 vehicles a year and employs 140 people. Capital is 100% Mexican.
Spartak and Dongfeng
Motor Corporation
Monterrey,
Nuevo León
2006.
Association with DFM formalised
in 2010
CBO Trucks
Assembly of small trucks using components imported from China. In 2009 CBO became authorised as OEM distributor of Deutz Engines. The company employs 180 people. Capital stock is 100% Mexican.
Chinese firm not identified
and Deutz from
Germany
Apodaca,
Nuevo León
2008
Cosmotrailer Assembly of medium-size trucks using imported parts from Chinese suppliers. Produces around 250 “Kiloton”-custom made trucks a year, generating 60 jobs. Capital stock is 100% Mexican.
Several supplying
Chinese firms
Aguascalientes, Aguascalientes
2007
Own elaboration based on personal interviews and different automotive sources.

285
Nevertheless, in August 2010 Spartak developed a new strategy. At present,
Spartak is a Dealer Master and DFM representative in Mexico, so its vehicles will
have the DFM acronym. As part of the image change, vehicles are sold in DFM’s
exclusive dealer agencies throughout the country, under new brand identification.
Therefore, Spartak-DFM Mexico will have now to fulfil the brand requirements at
world level (Hernández, 2010).
Two other Mexican firms, CBO Trucks and Cosmotrailer, assemble trucks under
technical associations with Chinese corporations, although these associations are
less formal than GML-FAW and Spartak-DFM. These are smaller companies, and
in both cases, they have Chinese firms as major components suppliers, importing
from cabins, engines, front and rear axis to other minor parts (CBO Motors,
2010). Similar to GML and Spartak, CBO and Cosmotrailer are also focused on
producing low cost vehicles with higher fuel efficiency levels.
This set of technological associatons presents a more homogeneous situation
among the involved firms, and these are:
a) All the associations are focused on the assembly and distribution of
commercial vehicles, especially trucks.
b) In all cases the capital stock was 100% Mexican.
c) Compared to the car assembly JVs, these are smaller companies, with low
capital investment amounts as well as in the scale of operations.
d) Like the car-assembly JVs, the business strategy of firms under
technological associations is also focussed on low price, low maintenance
costs and high efficiency levels.
e) Essentially, in the short and medium term all the firms are concentrated in
the domestic market; nevertheless, the relatively better-off are planning to
embark on export markets, or are already exporting in low volumes, such
as GML and CBO, in particular taking advantage of Mexico’s FTA.
f) Although production capacity and sales volumes are still low, the
operation of these TAs is increasing the level of competition in the low-
end segments of commercial vehicles. Mexican-Chinese TAs compete
with Japanese companies with similar production lines (Hino and Isuzu),

286
with one Mexican (DINA), with other Chinese brands (Foton, and JAC
Motors) as well as among themselves.
g) None of the TAs are formally affiliated to Mexican major trade
associations, ANPACT in this case, either because they have been rejected
after an evaluation and considered not to fulfil the regulatory requirements
yet, or because of their own decision, since they consider that that these
organisations have prejudices towards Chinese firms or Chinese-related
operations.
h) One important difference among the TAs is the licence to use the partner’s
brand name in the assembled vehicles, which would depend on the degree
of formalisation of the assocition, as well as on the financial capacity of
the Mexican partner.
8.1.5. Marketing/Distribution Agreements/Representatives
Marketing and Distribution agreements or Representative Offices are other ways
by which Chinese automotive-related firms have a presence in the Mexican
market. Most of the identified operations of this kind are very recent and
companies carry out low-volume businesses. To most firms, this modality
represents the initial phase for entering the Mexican market. Of the operations
under this modality analysed, three different groups can be identified: a) an
indirect way through Mexican or foreign – non-Chinese – companies with
marketing or distribution activities in Mexico. This is particularly the case of
companies in the line of electric vehicles (EVs) (Zilent, Miles and EVI); b)
Mexican or foreign firms marketing Chinese automotive-related products (Bergé
Group and Autofin); and c) Chinese companies operating through representative
offices or distribution agreements (Lifan, JAC Motors and LiuGong) (Table 8.6).
Marketing operations of EVs in Mexico are very interesting cases in terms of the
indirect involvement of Chinese auto companies, reflecting the complexity of
global production and distribution networks. Zilent Mexico, for example, is a
Mexican enterprise with a franchise to distribute EVs imported from China. Zilent
cars are assembled in China with Canadian technology. According to company

287
sources, although assembled in China, the electric systems are produced in the
United States and around 40% of the vehicle parts are manufactured in Mexico,
including the lithium battery (Alcántara, 2009). In addition, the Mexican firm has
a participation in the Chinese plant where the vehicles are assembled (Paredes,
2011). This sort of manufacturing and distribution associations in EVs is also
reflected in the cases of Miles and EVI. Miles Mexico imports the cars from
China, where they are assembled by Tianjin Qingyuan Electric Vehicle Company,
a FAW subsidiary; the vehicle is designed in the United States (California),
Miles’ headquarters location, where the drive train is also manufactured (Miles
Electric Vehicles, 2011). Likewise, EVI, a U.S. company also based in California,
developed the vehicle’s design; in 2008 EVI signed a strategic alliance with a
Chinese partner to manufacture the vehicles’ bodywork; and the assembly was
done in Toluca, Mexico (EVI, 2010). Given the potential market growth for
alternative fuel vehicles in California, in August 2009 EVI announced the
relocation of its factory and corporate headquarters back to that state. EVI
developed, tested and matured its technology in Mexico for several years (EVI,
2009) and by 2010, EVI still produced light-duty electric trucks in Mexico for the
Latin American markets.
In a short period of operation, EV companies have encountered a number of
obstacles in positioning themselves in Mexico’s automotive market. On the one
hand, EV distributors had to face the 2008-2009 financial crises. On the other
hand, despite their advantages in environmental terms, low operating costs, and
exemptions from the regular Mexican emissions inspections, among others, it has
been difficult to convince people to change to alternative energy vehicles
(Paredes, 2011). Under these adverse conditions, Zilent, for instance, decided to
make incursions into the electric motorbikes segment (Maquila Portal, 2010c).
The firm’s strategic move had two main explanatory factors: first, the motorbike
market had not been as badly hit by the economic crises as the new cars market;
and second, Mexico’s motorbike market is less complicated and less competitive
than thet for motor vehicles. It is worth noting that despite these problems and
obstacles, EV distributors maintain their idea of establishing manufacturing
facilities in Mexico in the short term.
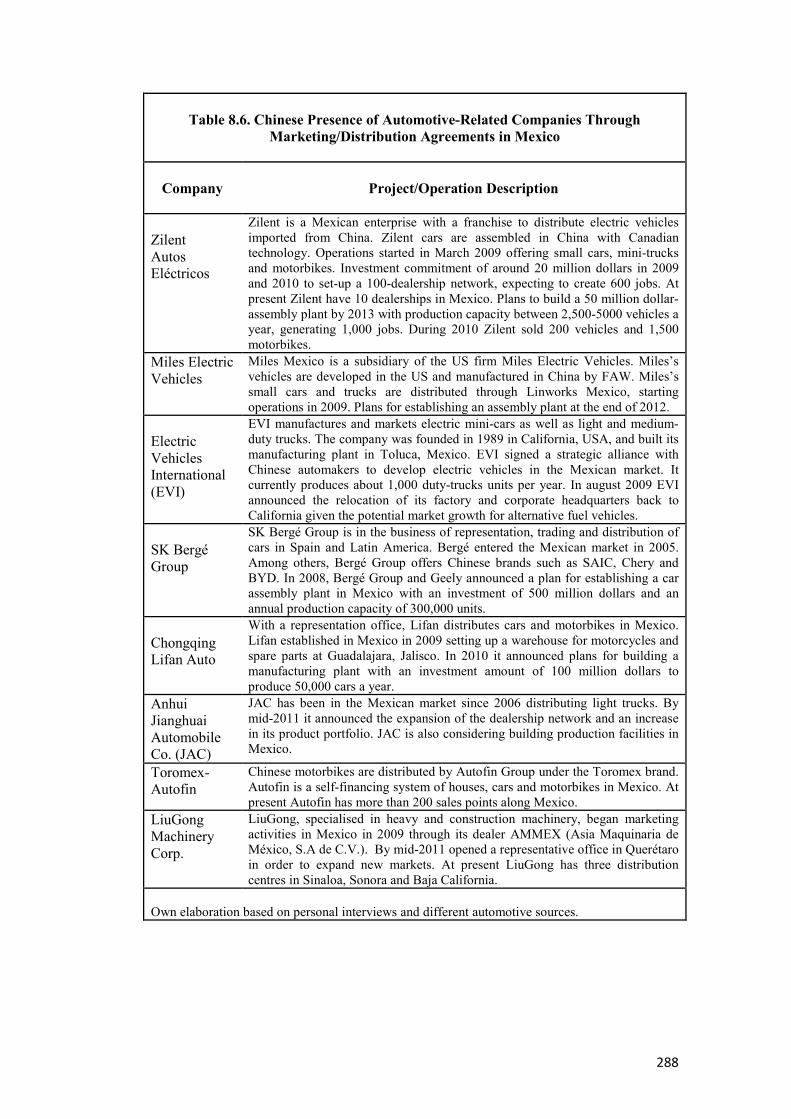
288
Table 8.6. Chinese Presence of Automotive-Related Companies Through
Marketing/Distribution Agreements in Mexico
Company
Project/Operation Description
Zilent Autos Eléctricos
Zilent is a Mexican enterprise with a franchise to distribute electric vehicles imported from China. Zilent cars are assembled in China with Canadian technology. Operations started in March 2009 offering small cars, mini-trucks and motorbikes. Investment commitment of around 20 million dollars in 2009 and 2010 to set-up a 100-dealership network, expecting to create 600 jobs. At present Zilent have 10 dealerships in Mexico. Plans to build a 50 million dollar-assembly plant by 2013 with production capacity between 2,500-5000 vehicles a year, generating 1,000 jobs. During 2010 Zilent sold 200 vehicles and 1,500 motorbikes.
Miles Electric Vehicles
Miles Mexico is a subsidiary of the US firm Miles Electric Vehicles. Miles’s vehicles are developed in the US and manufactured in China by FAW. Miles’s small cars and trucks are distributed through Linworks Mexico, starting operations in 2009. Plans for establishing an assembly plant at the end of 2012.
Electric Vehicles International (EVI)
EVI manufactures and markets electric mini-cars as well as light and medium-duty trucks. The company was founded in 1989 in California, USA, and built its manufacturing plant in Toluca, Mexico. EVI signed a strategic alliance with Chinese automakers to develop electric vehicles in the Mexican market. It currently produces about 1,000 duty-trucks units per year. In august 2009 EVI announced the relocation of its factory and corporate headquarters back to California given the potential market growth for alternative fuel vehicles.
SK Bergé Group
SK Bergé Group is in the business of representation, trading and distribution of cars in Spain and Latin America. Bergé entered the Mexican market in 2005. Among others, Bergé Group offers Chinese brands such as SAIC, Chery and BYD. In 2008, Bergé Group and Geely announced a plan for establishing a car assembly plant in Mexico with an investment of 500 million dollars and an annual production capacity of 300,000 units.
Chongqing Lifan Auto
With a representation office, Lifan distributes cars and motorbikes in Mexico. Lifan established in Mexico in 2009 setting up a warehouse for motorcycles and spare parts at Guadalajara, Jalisco. In 2010 it announced plans for building a manufacturing plant with an investment amount of 100 million dollars to produce 50,000 cars a year.
Anhui Jianghuai Automobile Co. (JAC)
JAC has been in the Mexican market since 2006 distributing light trucks. By mid-2011 it announced the expansion of the dealership network and an increase in its product portfolio. JAC is also considering building production facilities in Mexico.
Toromex-Autofin
Chinese motorbikes are distributed by Autofin Group under the Toromex brand. Autofin is a self-financing system of houses, cars and motorbikes in Mexico. At present Autofin has more than 200 sales points along Mexico.
LiuGong Machinery Corp.
LiuGong, specialised in heavy and construction machinery, began marketing activities in Mexico in 2009 through its dealer AMMEX (Asia Maquinaria de México, S.A de C.V.). By mid-2011 opened a representative office in Querétaro in order to expand new markets. At present LiuGong has three distribution centres in Sinaloa, Sonora and Baja California.
Own elaboration based on personal interviews and different automotive sources.

289
The second group represents the typical trading and marketing operations of non-
Chinese companies importing automotive products from China through the
establishment of distribution networks in Mexico. SKBergé, a Spanish-Chilean
Group with operations in Spain and Latin America, entered the Mexican market in
2005 representing different automotive brands, including China’s SAIC, Chery
and BYD (SKBergé, 2011). In 2008, Bergé Group and Geely announced a plan
for establishing a car assembly plant in Mexico with an investment of US$ 500
million and an annual production capacity of 300,000 units. As pointed out above,
the global financial crisis has been an obstacle to this and blamed for the delay in
initiliasing the plan.
The third group comprises Chinese companies operating in Mexico through
representative offices or distribution agreements (JAC Motors, Lifan and
LiuGong). JAC Motors has been in the Mexican market since 2006 distributing
light trucks; by mid-2011 it announced the expansion of the dealership network
and an increase in its product portfolio. Lifan has distributed cars and motorbikes
in Mexico since 2009, setting up a warehouse for motorcycles and spare parts at
Guadalajara, Jalisco. Very recently, both JAC Motors and Lifan expressed their
interest in building production facilities in Mexico (Lifan, 2010). These
companies’ market moves can be seen as a way of avoiding import tariffs from
China as well as catching with other Chinese automakers that have plans for
locating assembly operations in Mexico. Finally, LiuGong considers Mexico as a
key market in Latin America. The firm’s strategy in Mexico is to offer products
for an affordable price with state-of-the-art technology, and most of all, tailored to
customer needs (Maquila Portal, 2011b).
8.2. Drivers and Motivations of Chinese Investment in Mexico
As discussed in previous chapters, the factors driving companies to embark in a
process of internationalization are of diverse character. Among the major drivers,
classified in the literature as “push” and “pull” factors, are market and trade
conditions, costs of production, local business conditions and home government
policies for the former; and potential domestic/regional markets, low cost of

290
resources (natural resources, labour and infrastructure), as well as host
government’s policy framework, business facilitation activities and business
conditions (liberalisation and privatisation policies, trade and investment treaties)
for the latter (UNCTAD, 2006; Dunning, 2006). Likewise, some additional “pull”
factors for the OFDI of emerging economies have been identified: familiarity with
local business environment, geographical proximity, ethnic and cultural ties, and
strategic or political considerations (Aykut and Ratha, 2004). Although in general
the main drivers and motivations of Chinese automotive-related investment in
Mexico seem to fit within this traditional analytical framework, some peculiarities
can be highlighted, especially when contrasted within the Latin American context
and other developing countries.
Based on personal interviews held with governmental agents, automotive analysts,
and automotive industry associations’ representatives, the main factors for
Chinese auto corporations to invest in Mexico are linked to domestic market
potential, liberalisation and free trade agreements, geographical location to use the
country as an export platform, and a strategy to avoid import tariffs on new
vehicles. In addition, aiming at attracting Chinese capital into the motor sector,
Mexican authorities have promoted fiscal incentives, economic stability, low
inflation and interest rates, legal certainty, intellectual property protection and
access to a market of more than 1 billion consumers through Mexico’s twelve
FTAs covering firrt-four countries.
Chinese companies located, or with intentions to establish operations, in Mexico
have mentioned both “push” and “pull” driving factors. Among the major “push”
factors pointed out by both large (FAW, Changan) and small (Geely, Lifan) motor
vehicle firms is the hyper-competition - as Russo et al (2009) call it -, that Chinese
market is experiencing and the overcapacity associated to it. On the side of “pull”
factors, companies mention Mexico’s domestic market potential, import tariff
system, the network of FTAs, and strategic location to use Mexico as export
platform to the US and Latin American markets. In FAW’s case, in addition of the
pull factors of demand opportunities, push factors related to internal forces also
played a role in the decision to get involved in the Mexican JV. Some of these

291
forces are the increasing domestic competition with a surge in the number of
models available in China, and excess production capacity. This is causing a
decrease in demand for some Chinese automakers’ models, thus squeezing
domestic profit margins. For Geely executives, the firm needs to grow both its
China and export businesses to generate enough scale and profit for investments
in new products and capacity (Ying, 2008). On a minor scale, a group of Chinese
auto parts firms (Minth, Prime Wheel) acting as T1 suppliers to the largest global
automakers have explicitly alluded to becoming established in Mexico in order to
obtain a low-cost production base to export to the US and other markets.
In a research report and prospect analysis on the potentials of cooperation in the
automobile and auto parts sectors between China and Mexico, elaborated by
China Automotive Technology & Research Centre (CATARC, 2007), some main
attracting factors for investing in Mexico were identified: a) Taking advantage of
Mexico’s FTAs to develop U.S. and Latin American auto markets, avoiding tariff
and non-tariff barriers; b) Large market demand for China’s domestic independent
brands; c) Mexico’s excellent auto parts supply system. Based on a survey of 21
Chinese automakers regarding their interest in establishing operations in Mexico,
76.2% (16 firms) declared that they were very interested or highly interested
(Table 8.7). Although this high interest level reported by Chinese automakers has
not massively materialised, some of the surveyed firms are now operating in
Mexico (Foton, Lifan, JAC Motors), other still have investment plans (Geely,
ChangAn, ZX Auto), and one has suspended its operations indefinitely (FAW).
Literature on TNCs’ investment and international production suggests that push
and pull factors are not sufficient to explain the final choice of host locations;
therefore, an understanding of TNCs’ motives and strategies and context is
necessary (UNCTAD, 2006). In order to identify the main motives of Chinese
firms’ investment and operations in Mexico, a traditional analytical framework
from the perspective of corporate strategies is used (ECLAC, 2004b; UNCTAD,
2006; OECD, 2008; CEPAL, 2010): a) Natural-Resource-seeking strategy; b)
Market-seeking strategy; c) Efficiency-seeking strategy; d) Strategic/Created-asset
seeking; and e) Diversification-seeking strategies.

292
Table 8.7. Chinese Automotive Companies with Interest in Establishing Operations
in Mexico
Company
Interest
Index*
Attitude about Mexico’s Automotive
Market Hafei Automobile Group 2 Hafei regards Mexican automotive market
as important, and it is thinking about how to explore this market.
China FAW Group Corporation 2 Great interest. China Brilliance Auto Co.Ltd. 1 Baotou Beifang Benchi Heavy-Duty Truck Co., Ltd.
1
Tianjin FAW Xiali Automobile Co.Ltd.
2
Hebei Zhongxing Automobile Co., Ltd.
3 Zhongxing is preparing for setting up assembly line in Mexico.
Beiqi Foton Motor Co.Ltd. 2 Foton will explore Mexican automotive market in one or two years.
ChangAn Auto Co., Ltd. 3 Changan Auto Corporation gives great attention to Mexico’s auto market, but they are not familiar with the policy and regulation in Mexico.
SAIC Motor Corporation Limited 3 SAIC shows great interest in Mexico. Geely Holding Group 3 Geely will set up an agency in Mexico by
2007. Chery Auto Co.Ltd. 3 Chery will set up auto factory with DC in
near future. Anhui Jianghuai Automobile Group Co.Ltd.
1
Xiamen King Long United Automotive Industry Co.Ltd.
1
Xiamen Golden Dragon Van Co. Ltd 1 Nanjing Automobile (Group) Corporation
2 Mexican auto market is very important.
Great Wall motor Co., Ltd. 2 China National Heavy Duty Truck Group Corp.
2
Shanghai Maple Automobile Co.,Ltd.
2
Lifan Group Co.,Ltd. 2 Yutong Group Co., Ltd. 3 BYD Auto Co., Ltd. 2
*Interest Index: 1: Low; 2: Medium; 3: High. Source: CATARC (2007).
By using the different mode of entry analysed above, Table 8.8 shows the main
Chinese corporate motives for investing in auto-related operations in Mexico.

293
Given the nature of the motor sector, three main corporate strategies or motives
were identified: market-seeking, efficiency-seeking and strategic/created-asset
seeking. As can be observed, market-seeking is the favourite motive of the great
majority of Chinese companies in Mexico in all types of entry modes, with
exception of M&A. This strategy preference also seems to apply to all kind of
firms, regardless of their size, ownership pattern, or the particular product
segment. Some of the investments in production facilities, in particular through
manufacturing JVs, wholly-owned operations, and technological agreements, are
replacing previous Chinese operations under distribution centres or imports into
Mexico. This is the case, for example, of Italika and Jincheng-Ronda in
motorbikes and, more recently, Foton, Spartak-Dongfeng and JAC Motors in the
vehicle segment. It is worth pointing out that due to Mexico’ strategic
geographical location and its network of FTAs, the market-seeking strategy is
considered, in the medium term, to include domestic and regional markets, both to
the developed countries of North America and developing counties of Latin
America.
This market-seeking feature as the main motive for Chinese automotive-related
investment in Mexico is in total contrast with non-Chinese automotive
corporations’ investment profile (Ford, General Motors, Volkswagen, Nissan,
Chrysler, Honda, Toyota). Analyses of TNCs’ strategies in Latin America have
classified motor FDI in Mexico as efficiency-seeking (ECLAC, 1998 and 2004;
Mortimore 2000; Mortimore and Vergara, 2004). This contrasting strategy can be
explained by the current differences in the competitive advantages and
organizational capabilities of each group of automakers. The well-established
global auto TNCs use Mexico as an export platform as part of their regional or
global production networks, mainly acting as cost centres for higher-technology
activities. Besides taking advantage of Mexico’s qualified and relatively low
labour costs, TNCs have preferential export market access through the FTAs. For
their part, in the short run Chinese auto companies are mainly focused on gaining
a share of the domestic market in the lower-end segments, competing basically
with low prices.
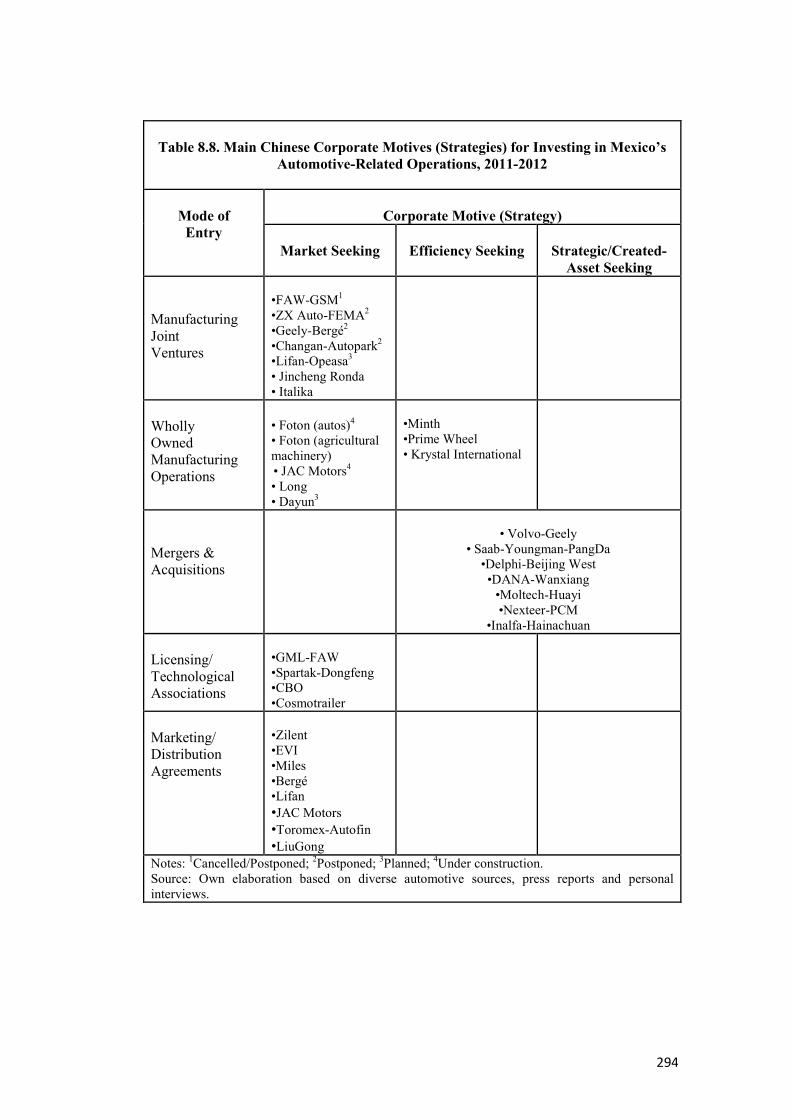
294
Table 8.8. Main Chinese Corporate Motives (Strategies) for Investing in Mexico’s
Automotive-Related Operations, 2011-2012
Mode of
Entry
Corporate Motive (Strategy)
Market Seeking
Efficiency Seeking
Strategic/Created-
Asset Seeking
Manufacturing Joint Ventures
•FAW-GSM1
•ZX Auto-FEMA2
•Geely-Bergé2
•Changan-Autopark2
•Lifan-Opeasa3
• Jincheng Ronda • Italika
Wholly Owned Manufacturing Operations
• Foton (autos)4
• Foton (agricultural machinery) • JAC Motors4
• Long • Dayun3
•Minth •Prime Wheel • Krystal International
Mergers & Acquisitions
• Volvo-Geely
• Saab-Youngman-PangDa •Delphi-Beijing West •DANA-Wanxiang
•Moltech-Huayi •Nexteer-PCM
•Inalfa-Hainachuan Licensing/ Technological Associations
•GML-FAW •Spartak-Dongfeng •CBO •Cosmotrailer
Marketing/ Distribution Agreements
•Zilent •EVI •Miles •Bergé •Lifan •JAC Motors •Toromex-Autofin •LiuGong
Notes: 1Cancelled/Postponed; 2Postponed; 3Planned; 4Under construction. Source: Own elaboration based on diverse automotive sources, press reports and personal interviews.

295
Despite the overwhelming market-seeking motives of Chinese auto investment in
Mexico, other type of corporate strategies, not “typical” of Chinese international
operations, can be identified: efficiency-seeking and strategic/created-asset
seeking (Table 8.8). The explanation for this trend is the conjunction of several
factors: the strategic location and Mexico’s role in the motor industry’s global
division of labour on the one hand, and the upgrading technological and
competitive capabilities of some Chinese automotive firms with
internationalisation strategies, as well as M&A from Chinese firms as a fast route
for gaining access to technology and internationally-recognised brands, on the
other. Up to now, three Chinese firms have efficiency-seeking as their main
investment motive in Mexico: two auto parts companies (Minth and Prime Wheel)
and a limousine and luxury van manufacturer (KEI). The most representative
firms of this strategy are Minth and Prime Wheel. Both are working under
Mexico’s maquiladora programme to take advantage of a special trade regime and
tax-free operations in order to obtain cost-efficiency and a competitive supply
base for global automakers. For these Chinese firms, an important motive for
internationalisation was to expand relationships with other successful TNCs, often
acting as suppliers to manufacturing OEMs, or as service providers (Sutherland,
2010). In the North American region, Minth has entered into the supplier system
of Nissan, Fiat, Ford and Chrysler; and Prime Wheel into the system of Chrysler,
Ford, GM and Mitsubishi.
Another way of entering the Mexican market by Chinese automotive corporations
has been the M&A of foreign firms with operations in Mexico, both automakers
and auto parts. As already pointed out, through this strategic/created-asset seeking
motive, Chinese companies have gained access to technology, R&D, and
internationally-recognised brands. The operations falling under this strategy in
Mexico are Volvo-Geely and Saab-Youngman for cars, and Dana-Wanxiang,
Delphi-Beijing West Industries, Nexteer-Pacific Century Motors and Inalfa-
Hainachuan, for auto parts. Given Mexico’s condition and position in the global
automotive industry, with these operations Chinese firms combine a
technological-asset seeking with an efficiency-seeking strategy.

296
8.3. Problems and Limitations
In terms of having a clear understanding of the present and future prospects of
Chinese investment through JVs in Mexico’s motor industry, particularly the large
JV-projects and wholly-owned manufacturing operations, it is worth making a
deeper analysis of the diverse causes provoking the failure or unfeasibility of
recent planned projects. Based on the revision of the different cases, as well as on
the opinions of the auto sector’s qualified agents (governmental, entrepreneurial,
consultancy) gathered through personal interviews, various types of causal factors
can be identified. These range from external forces, such as the recent global
financial crisis, to Mexico’s automotive policies, domestic market characteristics,
as well as internal factors of the firms involved, such as their technical, financial
and organisational capacity. These causes are set out below in a succinct way.
Mexico’s lack of a long term-strategic vision towards China
In a generalised way, analysts of the Mexico-China’s economic and trade
relationships coincide on the idea that Mexico, both at governmental and
entrepreneurship levels, lacks a strategic vision towards its relationship with
China, in particular for the medium and long terms (Dussel Peters, 2007 and
2009; Oropeza, 2007; Villalobos, 2007; Anguiano, 2010; Wu, 2010).92 From a
Mexican perspective, China is still seen as a threat and competitor rather than an
opportunity and partner. In this sense, Mexican economic policies and actions
towards China have been more reactive than proactive, jeopardising the binational
business environment.
Inadequacy of Mexico’s automotive policy and regulations
The recent experiences of new investment projects by Chinese automakers show
an inadequacy in Mexico’s automotive policy in a framework of multilateralism
and global markets. Whereas the present automotive Decree (PEF, 2003) is
appropriated in relation to the objectives of Mexico’s FTAs, in particular to
NAFTA, some analysts consider it poses high entry barriers to new players,
92 Formally, Mexico and China signed a “strategic association” agreement during the official visit to Mexico of Prime Minister Wen Jiabao in December 2003 (Anguiano, 2007; Wu, 2010), but it has not been put into practice.
297
especially for those firms coming from countries with which Mexico has not
signed a FTA, such as China and India (Dussel Peters, 2012). As stated above, the
2003 Automotive Decree states that newcomers into the Mexican market have to
fulfil the following requirements: i) invest a minimum of US$ 100 million; ii)
manufacture a minimum of 50,000 vehicles a year; iii) have their own brands; iv)
have the capacity of supplying to consumers the parts contained in the vehicle
manufactured in Mexico. This Decree also includes a clause that allows a three-
year transition period, under half-yearly official inspections, to fulfil the
requirements. Among the benefits of fulfilling the Decree is the fact that duty-free
imports of vehicles by automakers in a quantity similar to 10% of their yearly
vehicle production are allowed. In this way, automakers which are not officially
registered under the Automotive Decree, they are levied between 30 and 50% tax
rate for imported vehicle. Starting from January 2012, the import tariff for new
vehicles from countries which do not have a FTA with Mexico will fall to 20%
(Dussel Peters, 2012).
On top of that, based on the idea of avoiding an “unfair trade” from Chinese
automakers, Mexico’s major automotive producers and distributors associations
(AMIA and AMDA) proposed to the Ministry of Economy the updating of the
official norm for marketing new cars (NOM160SCFI), in order to force the new-
entrant automotive firms into the Mexican market to fulfil with a minimum safety
requirements (Cantera, 2009). Given the need for increasing the flows of FDI and
the Chinese firms’ complains about “protectionist” measures in the motor sector,
by early 2011 the Ministry of Economy received Presidential instructions to
facilitate the entrance of Chinese investment, as well as other Asian initiatives in
Mexico’s auto industry (Al Volante, 2011).
Internal structure and capability of Chinese firms to carry out international
operations
In addition to the factor of car cost, there are other technical and organisational
capabilities which automakers need to satisfy to enter the market. Among these
are an efficient system of international auto parts sourcing, quality aftersales
service, guarantees, aftermarket supply, marketing techniques, dealer networks,

298
management and technical specialists, and financing sources. In the case of FAW-
SG car JV, despite the Salinas Group-Elektra’s large international retail network
in Latin America, this association reflects most of these shortcomings in its
internal structure and capacity to deal with different parts and levels of the whole
car value chain. Owing to a variety of factors, FAW was not able to set up
production facilities to fulfil with Mexican auto regulations. From different
perspectives, automotive analysts93 and company executives94 consider the lack of
these technical and organisational capabilities as some of the major causes of
FAW-SG JV’s failure.95 It could be argued that other Chinese firms with
intentions of locating manufacturing production through JVs in Mexico are in a
similar position (ZX Auto, Geely, Changan, Lifan). Despite recent advances, it
seems that Chinese carmakers still display some of the fundamental weaknesses
and limitations (technical, operational and managerial) pointed out for automotive
specialists during the last few years (EIU, 2006; Russo, Tse and Tao, 2009).
Financial capacity and marketing knowledge of Chinese JV’s partners in the
Mexican market
Besides the technical and organisational capabilities of Chinese firms entering
into a JV in Mexico, equally important is the financial and marketing knowledge
of their JV partners in the Mexican market. The examples of CHAMCO with ZX
Auto and the Salinas Group with FAW are very illustrative in this regard. In both
cases, there are some elements suggesting that these companies not only lacked
knowledge of medium and long-term market conditions at both at national and
international levels, but neither did they have the capacity or the commitment to
fulfil with the compromises under the JV to establish manufacturing facilities
according to Mexico’s Auto Decree regulations. In addition, the evolution of these
events shows up some legal gaps in the normative of of operations.
93Automotive Analyst. University of Michigan Transportation Research Institute (UMITRI). Personal Interview. 27 August, 2008. Even before FAW-SG announced the “suspension” of operations in Mexico, the interviewee was skeptical about FAW’s international provisioning efficiency. 94 GML-FAW Trucks. Mexico City. Personal Interview. 20 June, 2011. 95 It is common to find newspaper’s articles and comments of FAW-SG’s customers complaining about problems with car services, parts supply and guarantees.

299
Undoubtedly, the most publicised Chinese investment in Mexico’s motor industry
of the last five years has been that of FAW and its Mexican partner, the Salinas
Group. Considered as a “flagship” project of Chinese FDI in Mexico, after a
period of uncertainties the venture did not materialise. This situation posed a
number of questions regarding the entry of new companies into the Mexican auto
market, since president Felipe Calderón had already laid the first stone at the site
in the state of Michoacán, central Mexico.
As a new-entrant company in the Mexican market, the FAW-SG’s JV was
importing cars from China under the commitment to build manufacturing facilities
in a period of three years. Nevertheless, by mid-2009 construction of the plant had
not yet started, even though the business plan was to start production in 2010. As
a consequence, The Mexican Ministry of Economy began looking at the legal
status of the Mexican-Chinese JV, analyzing a possible ban of its duty-free
imports from China.96 In the midst of this situation, in June 2009, GSM and FAW
announced the decision to postpone their plans for the Mexican joint plant.
According to company’ executives, the major cause for this was the deep
economic crisis and lower sales, which made it impossible for them to proceed
with the project in line with original schedule (Yang, 2009a; Marietta, 2009a);
however, the high costs of hauling parts and components from China to Mexico
also played a role (Yang, 2010). During the rest of 2009 and part of 2010, the
Salinas Group continued to import vehicles from FAW, along with other Chinese
brands such as Chery, for distribution through its retail chains. (See Appendix 8.3
for more details of the FAW-SG’ JV).
The characteristics of Mexico’s domestic market
A factor against Chinese car JVs in Mexico is the characteristics of the domestic
market. As pointed out above, the main competitive allure of Chinese cars is low
price, though they present disadvantages in quality, safety and other diverse
aftersales services. Up to now, exports and sales of Chinese cars are concentrated
in low-income countries of Africa, the Middle East, Eastern Europe, Latin
96 Some analysts consider that Mexico’s Ministry of Economy has joint-responsibility in this legal problem due to the delay in reviewing the compliance with current regulations according to the firm’s original business plan (Dussel Peters, 2012).

300
America, and Southeast Asia. According to the automotive analysts and company
executives interviewed, the Mexican automotive market is more sophisticated and
demanding than Chinese, Latin American, African and other emerging economies.
As a consequence, Chinese cars are not well-positioned in the domestic market.
Although some analysts see cheap Chinese cars as a transport alternative for low-
income people, as well as for displacing “junk-imported” cars, their demand has
not taken off as expected.
An automaker Commercial Executive Director,97 summarised the major problems
and shortcomings of Chinese cars in Mexico’s domestic market as being the
following:
a) As in the case of Japanese cars in the 1960s, in general, the reputation
and image of Chinese cars is rather negative;
b) The Mexican consumer is more demanding than the Chinese, most of
Latin Americans and those from other emerging countries;
c) There are high quantity of brands offered in Mexico and strong
competition by consolidated global automakers;
d) New Chinese brands are not known in Mexico;
e) The Mexican consumer does not like “tasting” the offered Chinese
option of “low price, high efficiency and acceptable quality”;
f) There are substantial differences in guaranties and services between
Chinese firms and other car companies.
The lack of capability for fulfilling the US quality and environmental standards
A possible additional factor for Chinese companies to delay automotive
investments in Mexico is the lack of technical and brand capabilities to fulfil the
required quality and environmental standards of the U.S. sophisticated automotive
market. Most of the Chinese auto investments in Mexico which has been
announced, plan to use the country as an export platform to the United States.
Because of this, some U.S. critics see Chinese automotive operations in Mexico as
a “Trojan Horse”. However, it seems that, despite improving the value chain and
the wave of M&A from Chinese companies, up to now these have not been able to
97 Mexico City. Personal Interview. 20 June, 2011.

301
catch up with the required U.S. standards. Neither Chery, nor FAW or Changan
have been able to export to the US market as they envisaged during recent years.
Given these trends, the U.S. market remains a distant target for Chinese
automakers (Yang, 2010). The estimated time span for Chinese cars to be
exported to the U.S. market is highly variable. For instance, during the personal
interviews, a Mexican governmental official estimated that it would take between
five and eight years for Chinese-made cars to be exported to the U.S. market from
Mexico, only when safety and environmental standards could be met. Likewise,
an academic from Fudan University at Shanghai considered that only in a period
of ten years China would be exporting motor vehicles to the USA and Europe.
Even among Chinese companies there is no agreement regarding a specific date
for entering the U.S. market. Thus, although Great Wall CEO Wang Fengying
recently declared that the company will enter the U.S. market by 2015
(Automotive News, 2011c), Yin Tongyao, president of Chery Automobile, said it
would take dozens of years (Dunne, 2011).
The impacts of the 2008-2009 global financial crisis
The common explanation for the postponement or suspension of most of the
announced Chinese JVs for car assembly in Mexico has been the severe financial
and economic crisis of 2008 and 2009. In Mexico, although the motor sector’s
production figures during 2008 presented a small increase of 4.6% in relation to
2007, these registered a severe drop of 28% by 2009. Motor vehicle production
passed from 2.2 million units to 1.6 million, from 2008 to 2009, falling back to
production levels of 2003.
By the end of 2008 the global financial crisis had severely hit the automotive
industry worldwide. Geely, for instance, had to reduce 2008’s export target by
more than 30%. As a consequence, the plan for building an assembly plant in
Mexico was to be re-evaluated (Chow and Yang, 2008). By March 2009 the
company announced that the Mexican project would cut down its size due to the
tough macroeconomic environment. Along the same lines, in June 2009 Salinas
Group and FAW announced the decision to postpone their plans for the Mexican

302
joint plant. According to company executives, the major cause for this was the
deep economic crisis which made it impossible for them to proceed with the
project in line with original schedule (Yang, 2009a and 2010; Marietta, 2009a;
Ugarte and Islas, 2009). Given this situation and the suspension of the marketing
operations, Grupo Elektra – the unit responsible for retailing FAW cars under the
Salinas Group -, reported a loss charge for approximately US$ 25 million during
the fourth quarter of 2009 (Besoain, 2010). With Mexico’s depressed market and
having a similar situation in Latin America and the United States, FAW-SG’s
other target markets, the JV saw no logic in continuing the assembly plant project
with a capacity of 50,000 units a year.
At the international level, as previously pointed out, the motor industry was one of
those most significantly affected by the recent global financial crisis (KPMG,
2008; UNCTAD, 2009b; Haugh, et al., 2010). Although China’s car industry was
not hit as hard as most of auto-producing countries, Chinese automakers had to
adjust their overseas strategies in order to adapt to sudden changes in the external
environment (DRC-SAE-VW Group China, 2010). According to a survey of
Chinese companies undertaken by the Asia Pacific Foundation of Canada and the
China Council for Promotion of International Trade (APFC and CCPIT, 2009),
more than three-quarters of respondents said the recession had impacted their
foreign investment plans; similarly, some 40% reported they have cut back their
planned investment offshore because of the slump.98 On the other hand, although
China’s outward FDI nearly doubled in 2008, going from US$ 24.8 billion in
2007 to 52.2 billion while global FDI fell by around 20%, more recent data
showed that, in 2009, China’s outward FDI registered a decline of around 8% in
relation 2008, reaching US$ 48,000 million (UNCTAD, 2010c).
The slow pace of Mexico’s car sales in relation to other Latin American markets
Another factor linked to the recent financial crisis that could have influenced
Chinese auto firms regarding delaying their investment plans is the slow pace of
98 Results were based on a sample of 1,104 Chinese firms which are members of the China Council for the Promotion of International Trade, have been involved in international business, and have annual revenue exceeding Rmb 1 million. The survey’s period was December, 2008 – February, 2009.

303
Mexico’s domestic car sales in relation to other Latin American markets. At
present, some of the largest Latin American markets register higher rates of new
car sales per capita than Mexico. For example, Argentina’s new car sales per
1,000 residents is 13.0, Chile’s is 11.6, and Brazil’s is 10.7, while in Mexico it is
4.3 (LATINtalk, 2011a). In fact, Brazil now represents the world’s fourth largest
automobile market, having sold 3.5 million vehicles in 2010. This situation,
combined with the low acceptance of Chinese cars from Mexican buyers and the
inability, up to now, of Chinese firms to export to the U.S. market due to quality
and environmental standards, are all relevant factors in the projects decision-
making process. In addition, in Mexico Chinese firms have to “compete” with the
so-called “chocolate” cars, the nickname for used cars imported from the United
States. AMIA’s chairman declared that from 2000 to 2010, five million used cars
were imported from abroad (Rosales, 2010). On average, this volume is around
500,000 vehicles a year, which represents more than half the current level of new
car sales in Mexico.
8.4. Conclusions
The general overview of China’s total FDI in Mexico confirms the limited scope
and the “pragmatism” followed by Chinese firms in Latin America. Taking into
account that official FDI data from both Mexican and Chinese sources is rather
incomplete and inaccurate, regarding Chinese investment in Mexico’s motor
industry, it could be concluded that, considering the size of the Mexican auto
sector, up to now this has been modest and limited. Without considering the
announced and planned operations, current Chinese investment in Mexico’s
automotive industry represents less than one per cent in terms of capital flows,
production capacity, sales and generated employment. On the other hand, this
chapter analysis reveals that despite the similarities found in general terms,
Chinese FDI in Mexico’s motor sector presents some interesting peculiarities
when compared to China’s FDI evolution in Latin America, as well as to the FDI
pattern in Mexico of other foreign automotive companies.

304
First of all, despite the fact that at this stage Chinese DFI in the auto industry is
still modest considering Mexico’s total inward FDI, compared to the other forms
of the China-Mexico interactions (trade flows and the U.S. market), through direct
and indirect modalities up to now Chinese capital is forging a kind of “silent”
market penetration. Contrary to expectations, the presence of Chinese capital in
automotive-related operations in Mexico has manifested itself through a diversity
of entry modes, including equity and non-equity forms: manufacturing JVs,
wholly-owned manufacturing operations, M&A, licensing and technological
associations, as well as marketing and distribution agreements. Although they
have not yet materialised, the preferred entry mode for the large car-assembly
investment projects in Mexico are JVs. Unlike Chinese FDI in other developing
countries, in the Mexican case this probably reflects their unfamiliarity with the
domestic market. Other reasons could be the aim of having access to deeper
knowledge of local customers, support networks, distribution and advertising; to
reduce perceived risks and costs associated with psychic distance; and, in general
avoiding an open exposure to political and business risks. Another difference in
the mode of entry between Chinese and other foreign-owned automakers is that
for the latter, wholly-owned operations is their exclusive mode. Decades ago,
some of the old-established auto TNCs also carried out a process of M&A of
Mexican firms.
Secondly, unlike the great majority of foreign carmakers operating in Mexico
which have efficiency-seeking as investment strategy, Chinese corporations seem
to have market-seeking strategy as the main determinant for investing in Mexico’s
motor industry. This Chinese FDI pattern is similar to the one observed in other
Latin American and developing markets around the world and can be mainly
explained by the differences in the competitive advantages they possess.
Nevertheless, the particularity of the Mexican case is that this market-seeking
strategy comprises a large regional area, intending to use Mexico, in the medium
term, as an export platform for two quantitative and qualitative contrasting
automotive markets: the U.S. and Latin America. Because of the geographical
proximity of the U.S. market, some Chinese auto operations use an efficiency-
seeking strategy, mostly associated to the entry modes of wholly-owned

305
manufacturing operations and M&A of foreign firms with export-oriented
production facilities in Mexico. In this sense, in the medium and long term,
thinking regionally in relation to an advanced and sophisticated automotive
market such as the U.S., Mexico is considered as an efficiency-seeking country
base. It could be argued that some Chinese corporations’ motives for investing in
Mexico are of mixed character (market-seeking and efficiency-seeking) and these
could become evolutionary over time.
Thirdly, as pointed out above, some modalities and corporate strategies of Chinese
motor operations in Mexico reveal their increasing internationalisation and
participation in complex global production networks. This is the case of the
wholly-owned manufacturing ventures operating under the maquiladora
programme as well as the firms under M&A, which all have efficiency-seeking as
their main investment motive in Mexico and are using it as a production and
export base for international markets, especially for the North American region.
For these firms, an important motive for internationalisation was to expand
relationships with other successful TNCs, often acting as suppliers to
manufacturing OEMs, or as service providers. For Chinese companies, the role
and significance of these operations go beyond the limit of Mexico’s domestic
market, acquiring a more global or regional dimension. This characteristic of
Chinese automotive firms in Mexico is another important difference with Chinese
FDI in the manufacturing sector in Latin America.
Fourthly, the Chinese presence in Mexico’s domestic market through FDI in the
auto sector shows an interesting face of the China-Mexico interaction:
competition with complementarity. Even more, given that Mexican capital-owned
firms are marginal in Mexico’s motor industry, practically no competition
between domestic and Chinese automakers is detected. Chinese automakers
running business in Mexico compete against other foreign companies and among
themselves in the lower-end car market segments. Paradoxically, rather than
competition, Chinese involvement through JVs, licensing and technological
associations, as well as some distribution agreements, is boosting and favouring
conditions that create a positive business atmosphere for Mexican firms to set up

306
automotive operations, in particular in the small and medium-size commercial
vehicle segments. Even in the OEM auto parts suppliers section, with exception of
some Chinese enterprises operating under the maquiladora regime, whoh also
compete with other foreign firms, up to now they constitute minor competition for
domestic OEM auto parts firms. Mexican firms have felt hard domestic
competition in the aftermarket segment, but this is mainly introduced through
imports, formally and informally.
Fifth, another interesting paradox of the China-Mexico automotive interaction
becomes evident when taking the analysing beyond “national” statistics by
complementing them with the complexity of global production networks derived
from TNCs’ activities. In line with some conclusions anticipated in Chapter
Seven, the exports to the U.S. markets of cars and auto parts from Chinese
companies located in Mexico would be officially registered as “Mexican” exports,
playing against – that is competing with - the statistics of China’s automotive
exports to the United States. A different issue is the fact that most of auto parts
exports from China to the United States are carried out by non-Chinese - foreign
companies, a large number is of U.S. capital – produced with a high proportion of
imported content. In the above situation, the obsessive discussion of nations
competing with each other seems to lose an important degree of objectivity.
Sixth, regarding motor vehicles, in a similar way to other developing country
markets, the competitive strategy of Chinese automakers in Mexico is based on
the low prices of the low-end, small-car segments. Current and planned Chinese
operations are following a pattern, from importing complete vehicles in a first
phase and then setting up assembly operations in Mexico, by mostly using SK or
CKD parts imported from China in a second phase. Some carmakers have
followed a path – as the Japanese did - of first entering and testing the Mexican
market with a less complex product and with a lower competition level, such as
motorbikes, before embarking in motor vehicle production. The transition from
phase one to phase two, which comprises assembling in Mexico, has provoked a
process of import substitution of finished products for intermediate parts and
components.

307
Seven, despite the increasing presence of Chinese automotive operations in
Mexico and their diversity of FDI modalities, the expected and announced
massive investment amounts, particularly the large car-assembly projects, have
not yet materialised. The causal factors and explanations for this condition are of
multi-dimensional character. Some are related to macro-national aspects derived
of Mexico as a host country for Chinese FDI, in particular the lack of a long term-
strategic vision towards China. Other factors are linked to the specific operation of
Mexico’s motor industry at sectoral level, such as the inadequacy of Mexico’s
automotive policy and regulations, the specific characteristics of Mexico’s
domestic market, and the current slow pace of Mexico’s car sales in relation to
other Latin American markets. Another set of factors is associated with the micro-
company environment and internal structure, organisation and relationship with
venture partners; among these the internal structure and capability of Chinese
firms to carry out international operations, the financial capacity and marketing
knowledge of Chinese JV partners in the Mexican market, as well as the lack of
capability for fulfilling the U.S.’ quality and environmental standards, all stand
out. Finally, other factors result from the international economic situation, such as
the impacts of the 2008-2009 global financial crisis. As depicted in the present
chapter, the materialisation of Chinese large automotive investment projects in the
short term will require a combination of actions from both the Mexican
government and Chinese companies’ JV partners, acting at the macro and micro
set of factors. The reactivation of the Mexican and U.S markets, as well as their
eventual acceptance of Chinese brands, would certainly play a relevant role for
present and future perspectives.
Eight, is not a question of whether Chinese companies will be major players in
Mexico’s motor industry, but of when. From a medium term perspective, the
conjunction of several favourable factors could make this trend feasible. On the
Mexican side, the country represents a strategic territory for Chinese automotive
companies, both automakers and auto parts, in the search for supplying the North
American and the Latin American markets at lower costs. Other pull factors are
the potential domestic market, the network of FTAs and the attributes of the
maquiladora programme, among others. In recent years, Mexico has become the

308
cheapest place in the world to manufacture products for the U.S. market. On the
Chinese side, auto companies will continue to be proactive in the global
competition and in the search for internationalisation. In addition, transportation
costs from China and local wages have been on the increase during recent years.
Hyper-competition in China’s domestic market represents a strong push factor for
independent Chinese automakers. In this process, the linkage with the U.S. market
again seems to be relevant. Besides producing in Mexico, if Chinese automakers
decide to locate manufacturing facilities in the United States – following the path
of Japanese and Korean companies - they could supply components from a low-
cost base in Mexico. Thus, by producing cars and auto parts in Mexico, Chinese
firms could obtain market and efficiency-seeking benefits and, simultaneously,
they could shorten their supply chain from China. This move would certainly
deepen and extend China’s role in the global motor divisions of labour.
Lastly, a full account of the impacts and risks of Chinese operations and FDI in
their diverse modalities on Mexico’s motor industry and economy in general is
well beyond the reach of this thesis. Further research on these crucial aspects in
Mexico is needed. The deep knowledge of the impacts and risks of Chinese
corporate activity on areas such as employment and incomes, capital formation,
technology transfer, labour skills and work conditions, structure of markets and
competition, the industrialisation model, and political and cultural issues, among
others, would be useful for the decision-making process in automotive policy.

309
9. CHAPTER NINE
CONCLUSIONS, FINDINGS AND IMPLICATIONS
“Wish that Mexico and China auto industry could achieve mutual benefit
and win-win situation in more extensive communication and
cooperation”. (Wang Xiaoming, n.d.).
“Mexico and China working together is good news to investors:
complementing interests is the key to a successful partnership” (Eduardo
J. Solís, 2005).
The present research project was aimed at analysing and understanding the
interactions and impacts of China’s global expansion on Mexico’s motor industry.
Based on this general objective, two central enquires were proposed:
• Does China represent a direct competitive threat to Mexico in the global
motor industry, a capital-intensive sector with high technology segments?
• Is it possible to simultaneously find competition and complementary
forces in the China-Mexico motor industry’s interaction?
In answering these questions this study has: a) identified the different channels of
interactions between China’s and Mexico’s motor industries; b) appraised the
impacts on Mexico’s attraction of motor FDI; c) analysed the structure and
evolution of the China-Mexico bilateral trade in the motor industry, as well as an
approximation to the impacts of China’s import penetration into Mexico’s
domestic market; d) assessed China’s competitive threat in the U.S. motor market;
and e) identified the manifestations and characteristics of the Chinese motor
industry’s-related operations in Mexico, in particular those linked to China’s FDI,
technical-manufacturing and technological associations, as well as global
production networks. In addition, some insights into broader aspects of the
globalisation process and the roles played by China and Mexico in the motor
industry’s changing international division of labour have been addressed.

310
Undoubtedly, the remarkable process of China’s global (re)emergence has been
one of the hottest topics within the literature on development issues during the
past two decades. China’s pace of economic growth has been outstanding in
recent history. On the worldwide political arena, due to China’s emergence as a
major player in the world economy the ‘China Syndrome’ has spurred the
‘competitive obsession of nations’ among both developed and developing
countries. If the rising of the Chinese economy and its impacts on a global scale
have led to the term ‘Chinese Century’ being used (Shenkar, 2005), the
development of its motor industry has played a key role in such a process. This
sector has been considered a ‘pillar’ industry for the country’s economic and
social development since 1994. From being a marginal producer in the early
1990s, since 2009 China has become the world’s largest motor vehicle producer
and market. It has also developed its own domestic firms and brands, with
increasing international presence. According to some analysts, 2009 is likely to be
viewed as the year in which the baton of leadership in the global auto industry
passed from the United States to China (Perkowsky, 2009). China not only
overcame the motor industry’s shining stars of the second half of the 20th century,
Japan and South Korea, in the pace of growth, but also imposed greater weight
and influence on the industry worldwide due its huge domestic market and capital
interconnections through JVs with global TNCs. China started to become the
world’s motor epicentre.
Although in the initial stage in the development of their national motor industries
China and Mexico had similar goals, over the years they have followed very
divergent trajectories. Within the emerging economies’ motor industries, different
configurations have been identified. China has been classified as ‘Protected
Autonomous Market’, intending to develop a locally-based industry; and Mexico,
the prototype of ‘Integrated Peripheral Markets’, tending to specialise in the
production of products in which they have comparative advantage on a regional
basis (Humprey, Lecler and Salerno, 2000). As it does in China, the motor
industry in Mexico represents a key sector due to its contribution to economic and
technological modernisation, the generation of output, jobs and exports, as well as
in FDI attraction. Mexico ranks among the world’s top-ten largest automotive

311
producer and exporter countries. Among its major strengths are product quality
and logistics for export markets. Unlike China, Mexico has not developed its own
‘Mex-car’. The Mexican government intends to transform Mexico into the ‘new
motor country’, the world’s best investment destination in the motor industry.
Given the high priority and significance of the motor industry for both China’s
and Mexico’s national economies, the increasing positioning of China in the
global auto industry became one of Mexico’s competitiveness obsessions. In
almost unanimous conclusion, all the studies regarding the impacts of China’s
economic threat on the Latin American countries, Mexico was considered to be
the most negatively affected in terms of domestic market competition, FDI
attraction, and competition in third-country markets, among other aspects. Taking
Latin America as a region, Mexico was seen as an ‘exception’ or ‘paradigmatic’
case. Nevertheless, the literature review revealed several gaps and limitations in
the knowledge of this subject. In the Latin American context, the studies first of
all presented contrasting, inconclusive and heterogeneous results in several topics.
Secondly, they used different methodologies, time-frame periods, and
geographical coverage. And, thirdly, the high sectoral aggregation level and the
assumption of homogeneity of the ‘China effect’ across sectors made it difficult to
compare results.
From the review of specific studies on the Mexican case, despite the salient role
that the motor industry plays in the China-Mexico bilateral trade and that
investment prospects in this sector are promising, similar gaps and limitations to
those at the Latin American level were found in the literature. Firstly, specific and
detailed studies of China’s impacts on Mexico’s motor industry in its diverse
areas (FDI, domestic market, and third-country markets competition) were
practically non-existent. Secondly, no comprehensive analyses of the modalities,
interactions, and impacts of Chinese automotive-related operations in Mexico
were identified. And thirdly, with scant exceptions, systematic academic studies
from a bilateral perspective and interaction between China and Mexico in the
motor industry were also non-existent.

312
Therefore, this thesis intended to contribute to filling some of the gaps and
limitations found in the literature regarding the impacts and interactions of
China’s global emergence on Mexico’s motor industry. Especially, in aiming to
avoid the high aggregated level and degree of generalisation of most of the
previous analyses, this study took the suggestion of carrying out detailed and
specific research at product, sectoral and country level on China’s impacts and
interactions (IDS Asian Drivers Team, 2006; Schmitz, 2006; Kaplinsky and
Messner, 2008; Paus, 2008; Jenkins, 2009; Lederman, Olarreaga and Perry, 2009).
A sectoral approach (motor industry) within the framework of the China-Mexico
relationships in the global economic arena was the basis of the empirical research.
Specifically, a taxonomy of impacts and channels of interaction in the China-
Mexico motor industry’s relationship was applied (Schmitz, 2006; Kaplinsky and
Messner, 2008). Furthermore, given that motor vehicles are highly complex and
diversified products, this thesis proposed an alternative methodology for assessing
in a more systematic and qualitative way the ‘competitive threat’ of China on the
different product segments of Mexico’s motor industry. The methodological
scheme was based on the technological complexity level of products/segments
within the motor industry’s value chain. An additional advantage of the ‘sectoral’
approach is that, besides being country- and product-specific, it allows the
identification of explicit functional and geographic interconnections between
firms as part of production networks and value chains. These sorts of
interconnections are not possible to identify and explore through a traditional
trade flows analysis.
It is worth to underlining the benefits of applying mixed methods research in the
project, in particular the use of qualitative analysis to supplement the quantitative
data. As in other topics, statistics on the motor industry were incomplete for some
of the variables (i.e. dissagregated data on FDI by different auto parts segments),
they were outdated in some cases, and they also presented wide divergencies
depending on the source (i.e. Chinese and Mexican data on FDI and bilateal trade
flows). The virtues of using qualitative analysis, which was fundamentally
developed through semi-structured and focused interviewing, were several. It was
a key tool in going beyond the basic purpose of describing, identifying and

313
analysing the phenomena, and reaching an understanding and the assessment of
impacts. In this way, qualitative analysis helped to answer a variety of research
questions.
In addition to filling some statistical gaps (i.e. Chinese motor investment and
operations in Mexico), through qualitative analysis, it was possible to obtain a
diversity of points of view, their meaning and interpretation of the process or the
phenomena in question, of the different actors involved in the motor industry. A
similar situation was registered for policy aims and its outcomes. Qualitative
methods allowed the research analysis to go beyond the surface of ‘cold statistics’
and getting more deeply into the phenomena (i.e. beyond bilateral trade statistics).
Thus, this type of analysis was extremely useful in identifying tendencies (i.e.
complementarity alongside competition), making connections between categories,
finding causal relationships (i.e. competitive threat in specific products and
market share), and detecting paradoxes (i.e. Chinese exports from Mexico to the
U.S. market ‘helping’ the former to compete, statistically, against China in that
market). Likewise, in methodological terms, qualitative analysis was a central
factor for designing typologies, and the construction and classification of
analytical categories (coding) (i.e. the typology and mapping of technological
complexity of the motor-vehicle value chain).
Regarding the use of qualitative methods, if the research were to be repeated,
much more emphasis ought to be given to interviewing subjects in two aspects: a)
to include a large number of Chinese automakers; and b) to include a large
number of Chinese and Mexican auto parts firms. The justification for this is that,
in the case of the Chinese automakers, in recent years they are displaying an
intense process of internationalisation, locating assembly and distribution
operations in different regions of the world, particularly in developing countries,
including Mexico. Some of these Chinese automakers are emerging as truly
transnational corporations (i.e. Geely, Great Wall, Foton), functioning both as a
source of global investment as well as adding competitive pressure to rival firms.

314
In the same line of discussion, if the research were to be repeated, in terms of the
theoretical/conceptual framework, the International Business (IB) literature ought
to be included (Buckley and Casson, 1976; Dunning, 1993 and 2000; Ramamurti
and Singh, 2009; Rugman, 2005 and 2010). Given the type of topic that the motor
industry represents – high degree of globalisation, and technologically and
organisationally complex - the IB literature is a suitable complement to trade
theories as well as GPNs and GVCs approaches. Over the years, the IB approach
has been shifting its core unit of analysis, passing from country level using
national statistics on trade and FDI, to the multinational enterprise and the
parent’s firm specific advantages. More recently, the multinational enterprise has
been analysed as a network and the subsidiary became a unit of analysis (Rugman,
et al., 2011). The IB school has been focusing the analysis on aspects such as
locational choice, modes and motives for FDI, marketing strategies, and
internationalisation processes, among others.
This concluding chapter presents, in an integrated and succinct way, the major
findings and implications derived from the research project as a whole. Section
9.1 shows the major empirical findings presented in Chapters Five, Six, Seven and
Eight. Section 9.2 outlines some key theoretical implications that emerged from
the discussion in the empirical chapters, and how they link and contrast with the
broader conceptual framework depicted in Chapter Two. The policy implications
derived from the analysis are presented in Section 9.3, where some general
guidelines are set down at both sectoral and macroeconomic levels. Section 9.4
suggests recommendations for further research and, finally, Section 9.5 gives the
closing remarks highlighting the research’s core conclusion.
9.1. Empirical Findings
This section provides a synthesis of the empirical findings from the study detailed
in Chapters Five, Six, Seven and Eight, linking up the main discussion topics and
arguments with key research questions.

315
Competition for Global Foreign Direct Investment in the Motor Industry
• Competition, global economic cycles and FDI attraction
Competition between China and Mexico for global FDI in the motor industry
exists, although not in a direct, straightforward way. Previous studies on this
matter have not reached at a general agreement. Based on the limited data on total
motor (vehicle assembly and auto parts) FDI, there is no clear evidence that
China’s increasing inflows of auto FDI are substituting those of Mexico. A
deduction resulting from the available comparable information is that China’s
dynamic development of its motor industry and powerful magnetism in attracting
FDI has not stopped, or significantly changed, the tendency of Mexico’s inward
FDI in the automotive industry. Obviously, the size of China’s economy and
domestic market is so large that it makes it difficult for Mexico to avoid negative
competitive or diverting effects in the motor industry’s attraction of global FDI.
Up to now, the evidence suggests that China is substituting FDI from Mexico in
specific auto parts segments, presenting an increasing global competition. At
most, following García-Herrero and Santabárbera (2007: 148), “the results should
be read in terms of a counterfactual: had Chinese inward FDI not been so strong,
Mexico could have attracted more FDI than it actually did”.
• The motor industry: a different pattern from other economic sectors
The findings referred to above in the specific case of the motor industry contrast
with the generalised, and almost unanimous, conclusion in the literature that
Mexico is Latin America that is most adversely affected by FDI competition and
substitution from China. Although Mexico has suffered fierce FDI competition in
more labour-intensive operation sectors, such as textiles & garments, toys, and
electronics, the evidence in the case of the motor industry does not seem to fit
with this proposition. One of the main differences between that of garments and
electronics, for example, and the motor industry, is that in the former, Chinese
FDI is efficiency seeking whereas in the latter it is market seeking. FDI diversion
is more likely where efficiency seeking FDI is involved.

316
• A specialised role in the motor industry’s global division of labour
From a broad perspective, the features and evolution of China and Mexico in the
motor industry’s global capital market might be associated to the different role
these countries play in the automotive global division of labour. From the study of
China’s and Mexico’s motor industry, two differentiated factors in automakers’
investment decisions stand out: location for Mexico and domestic market size for
China. Mexico’s experience shows that geography still matters under
globalisation. As for China, this brings out the issue of the role of the state. Given
China’s market potential, and despite some undesirable regulations, foreign
automakers have decided to enter China through JVs. Market size has given the
Chinese government a strong negotiation factor with TNCs. In this sense,
particularly in terms of investment in new motor vehicle capacity, there is no
competition between China and Mexico.
• Diverse perceptions on the nature of competition
Mexico is mainly a production and export base for international companies, and it
does not produce its own brand-name cars. From a governmental point of view,
China is not Mexico’s main competitor in attracting global automotive investment
flows. Rather, the southern U.S. states of Alabama, Indiana, Mississippi, and
Texas represent the major threat. The issue is more complex than a simple
competitive relationship between two countries, so it needs to be qualified. Based
on these findings, when analysing competition, this qualification has to be done at
least from two perspectives. First of all, recognising the heterogeneity of the
motor sector’s production segments regarding technical requirements, amount of
capital, product size, etc., and the specific value-chain link where the company is
located. Secondly, it is necessary to identify/understand the position held by
different agents of the motor industry held (companies, governments, etc.). This
qualification represents some sort of technical division of labour and a social
division of labour, respectively, within the automotive sector. Governments try to
attract FDI and protect its domestic market, while automotive firms compete
against each other to capture a larger market share, and they conceive of countries
as territorial production and export bases connected through global production
networks.

317
• The changing character of competitive advantages
The findings presented in this chapter also show the changing character of
competitive advantage of countries in a short period of time. With the economic
recession of 2000-2003 and the migration of certain maquiladora segments, it
became evident that Mexico was no longer competitive in labour intensive
operations. China was the shelter for most of these production units, becoming the
“world’s factory”. Nevertheless, during recent years, a combination of economic
forces is fast eroding China’s competitive advantage, moving to sectors with
higher technology levels. On the other hand, recent trends towards practicing
‘near-shoring’ in the North American market, implying the abandonment of ‘off-
shoring’ from Asia, is opening a new perspective for Mexico as a major player in
this process, not only for the relocation of investment and production capacity
from North America, but also in the economic and investment relationship with
China. Under this trend, the dual process of competition and complementarity
between China and Mexico arises again. By taking advantage of Mexico’s
manufacturing base and location respect to the North and South American
markets, Chinese companies may locate their production operations in Mexico to
complement each other in exporting to the United States.
Bilateral Trade and China’s Competition in Mexico’s Domestic Market
• Differentiated specialisation patterns in motor world trade flows
In the case of the motor industry, nowadays China and Mexico play significant
roles in world trade: by 2010 Mexico ranked as the fourth-largest exporter of
automotive products and China positioned itself in seventh place. However, these
worldwide roles present, up to now, a differentiated specialisation pattern: China
is specialised in auto parts exports (90% of total), and Mexico in the motor-
vehicle segment (55% of total).
• China is becoming an important trade partner producing increasing trade
imbalance
Despite the fact that sizeable economic interaction between China and Mexico did
not began until the late 1990s and early 2000s, China became Mexico’s second

318
largest trade partner in 2003, displacing Japan and locating itself only behind the
United States. Absolute growth of trade value registered a strong boost after 2001,
when China joined the WTO. A distinctive characteristic of the China-Mexico
bilateral relationship is the high significance of imports from China in Mexico’s
total trade. The increasing import penetration of Chinese products has produced a
huge trade imbalance for Mexico, creating the largest deficit with a trading
partner. Based on Mexican sources, in 2010 Mexico had a trade deficit with China
of US$ 41.4 billion. That year, the ratio of Mexican imports from China relative
to Mexican exports to China was 11:1. The growing trade imbalance and domestic
market penetration of Chinese products have caused a tense environment in the
bilateral relationship.
• Increasing significance of the motor sector in the China-Mexico bilateral
trade
For both countries automotive trade plays an increasing important role in total
bilateral trade. To China, total motor trade represented 8% of total bilateral trade
with Mexico in 2010 (automotive exports were 6% and imports, a significant
13.1%); to Mexico, motor trade with China represented around 6% of total
bilateral trade (17% of total exports and 4.8% of total imports). In Mexico’s case,
automotive exports have been more dynamic than the rest of bilateral trade.
• Motor industry: a different and more complex trajectory from other sectors
in the bilateral trade
Looking at the evolution of the bilateral trade between China and Mexico, unlike
other sectors such as garments, toys and electronics, in the motor case the big
trade boost started in the mid-2000s and not immediately after China joined the
WTO. This might be explained by the sectoral differences, in particular the type
of global value chains involved and their form of governance, technological
conditions, required scale economies, as well as market conditions, among other
factors. Likewise, this might reflect the fact that compared to the other sectors,
especially those with lower capital intensity, the Chinese motor industry gained
international competitiveness at a later stage. Unlike some other Latin American
countries or other sectors in Mexico, nowadays, the China-Mexico bilateral motor
319
trade looks much more complex than the simple import of Chinese products
displacing local production and market.
• Mexico’s motor industry maintains a competitive position in the bilateral
trade with China
As in the case of total bilateral trade, Mexico’s automotive sector also presents a
negative trade balance with China. In 2010 this sector’s trade deficit was US$ 1.4
billion. Nevertheless, in relative terms the proportion of deficit has decreased over
recent years. Unlike other domestic manufacturing sectors, Mexico’s motor
industry has strengths, especially in the export segment, that allow it to maintain a
competitive position in the bilateral trade with China.
• A specialisation pattern in the China-Mexico bilateral motor trade
The China-Mexico bilateral trade in the motor sector present a clear specialisation
pattern. China is more specialised in the lower-end categories of technology
complexity of automotive goods, and Mexico in the more sophisticated ones,
particularly in finished vehicles from the second half of the last decade. In
contrast to China’s limited exports of micro and subcompact vehicles to Mexico,
China’s imports from Mexico is focused on compact and medium-size cars, as
well as mid and full-size SUVs, which are technologically more advanced and
more expensive than the former. Mexico’s car exports to China will most
probably accelerate during the next few years, as Mexico is the exclusive
manufacturing and export base of specific models for global automakers. A
number of new export plans from Mexico by automakers are being developed for
the Chinese market. The great majority of automotive exports from Mexico to
China represent an intra-firm trade and forms part of the auto TNCs’ strategies
operating in both countries. Nevertheless, a key question is whether Mexico’s car
export trend to China will keep steady over the long-term, or if it only represents a
short-term strategy of auto TNCs. Regarding the other automotive segments,
most of Mexico’s auto parts exports to China are OEM directed to the assembly of
new vehicles through the network of TNCs. On the other hand, the large majority
of Mexico’s automotive imports from China consist in products for the
aftermarket segment (replacement and accessories). Most of this low-end

320
automotive segment is supplied by domestic Chinese firms. Nowadays, China has
no significant presence in the OEM segments.
• Chinese auto parts exports to Mexico are increasingly upgrading its
technological level
China’s automotive exports to Mexico are slowly but increasingly escalating the
technological level of its products. This is especially the case of the electronics
segment, in which China is becoming a strong global competitor. As a
consequence, the structure and pattern of Chinese automotive imports into Mexico
has changed over the past decade. This trend might be mostly explained by three
interrelated factors: a) the quality and technological upgrading of domestic
Chinese auto parts industry; b) the exports of auto parts from China of global auto
suppliers located in China; and c) the increasing presence of Chinese automotive
operations in Mexico (wholly-owned operations, maquiladora plants,
technological associations, JVs, etc.). Through these diverse operation modes and
linkages, domestic Chinese firms are importing into Mexico more technological
upgraded auto parts and some key major components. The tendency seems to be
that more diversified auto parts exports from China to Mexico are likely to rise in
the coming years.
• Marginal presence of Chinese cars in Mexico’s domestic market
In recent years, China began to export small quantities of motor vehicles to
Mexico, focusing on the lower-end segments. The bulk of these vehicles are
exported by domestic Chinese firms, some of them with internationalisation
strategies (FAW, Foton, Lifan, Geely, JAC Motors, Dongfeng). However, up to
now, motor-vehicle import volumes are still marginal in relation to Mexico’s total
domestic market sales. Another key question is whether Sino-Foreign JVs will
start exporting cars assembled in China to Mexico. Some foreign automakers have
began exporting modest quantities of Chinese-built subcompacts overseas, but
exclusively to emerging and developing country’s markets. Although a potential
FTA between China and Mexico could induce motor TNCs to export Chinese-
built cars to Mexico, up to now, unlike other Latin American countries, and
despite lower prices, in Mexico Chinese cars are not well positioned in the

321
domestic market. Besides the “negative image” of Chinese cars, the Mexican
automotive market is considered to be more sophisticated and demanding than
Chinese, Latin American, African and other emerging economies. Given these
trends, the likelihood is that it will take some time for Chinese-made cars to
obtain a substantial share of Mexico’s domestic market.
• Motor trade frictions: counterfeiting, “smuggling” and dumping practices
It is in Mexico’s aftermarket segment where Chinese imports have had a sizeable
domestic market penetration. Associated to this, several frictions related to
counterfeiting, “smuggling” and dumping practices have impacted the China-
Mexico bilateral trade relationship. All these factors are considered to have
negatively impacted Mexico’s domestic market, harming production, sales and
jobs.
Competition in the U.S. Motor Industry’s Market
• Fears in Mexico from China’s competition in the U.S. motor industry’s
market are well-founded
The United States is a key market for Mexico’s motor industry since the former
represents between 80 and 90% of its export destination. The evolution of China
and Mexico in U.S. motor imports indicates that both countries have increased
their participation in such a strategic market, but China is growing faster. Mexico
has strengthened and positioned itself as the single-largest source country of
motor imports to the United States, overtaking Canada and Japan. In like manner,
China has rapidly been climbing its position among the major importers to the
U.S. market, ranking in 5th place, and registering an accelerated pace of growth of
its import value. Therefore, fears in Mexico from China’s competition in the U.S.
motor market are well-founded. Nevertheless, the characteristics and specificities
of the competitive threat and market interaction processes have to be qualified.

322
• Mexico’s motor industry is not immune to China’s competition in the U.S.
market
Although, according to previous studies in Latin America, at an aggregate level
Mexico’s motor industry was immune to Chinese competition in the U.S. market,
the application of a 6-dgit level analysis gives a different and more qualified
perspective. When considering the static view in the analysis, based on each
country’s RCA, the results suggest a complementary structure of China’s and
Mexico’s participation in the U.S. motor import market rather than direct
competition. Nevertheless, although in motor vehicles there seems to be a clear
specialisation pattern and division of labour in which Mexico is specialised in the
middle and higher quality segments, and China has a marginal but incipient role in
the low-end motor vehicle segments, the competitive environment in auto parts is
much more complex. Although Mexico is well positioned in some major
components and sophisticated parts, and China is more specialised in the
production and export of auto parts with universal technology and simple parts &
accessories, with regard to specific auto parts products of different technological
levels, the competitive threat is rising considerably.
• The importance of including a time-frame perspective in the analysis
The finding in this section of the study corroborated the importance of including
in the analysis a time-frame, as suggested by Gallagher and Porzecanski (2007)
and Jenkins (2010). By aiming at assessing changes over time in China’s
competitive threat to Mexico, a Dynamic Index of Competitive Threat (DICT)
was applied. Therefore, the 1990-2010 period was divided into two phases: 1990-
2001 and 2001-2010, the years before and after China joined the WTO,
respectively. By taking into account this time-frame, the following conclusions
came out: a) although Mexico increased its share of U.S. motor imports, these
grew at a slower rate than U.S. imports from China, and the relative gap between
growth rates was greater in the second period; and b) the trend in the competitive
threat is increasing at a fast pace over time.

323
• China’s direct competitive threat is concentrated in the low-end auto parts
segments
The qualitative analysis of technological complexity in the motor value chain
showed that China’s direct competitive threat is focused in the low-end (simple
parts and accessories) and some medium technology-level segments of auto parts.
In particular, China’s competitive threat in the U.S. market is increasing rapidly in
the electronic, engine and chassis parts segments. Most of these automotive items
are price-sensitive generic parts, relatively labour intensive and easy to transport.
However, although the rapid increase in auto parts’ imports from China into the
United States since the 1990s was overwhelmingly in the aftermarket segment,
rather than original equipment, during the last decade Chinese-made parts has
been upgrading their value added and technological development.
• Competition from Chinese-made auto parts in the U.S. market is likely to
become fiercer
Competition in the U.S. market is likely to become fiercer since Chinese-made
auto parts exports, including original equipment, are expected to grow
dramatically over the following years. Among the factors identified that may this
this to happen are: a) expansion of exports to overseas automakers; b) expansion
of exports to overseas Tier-1 suppliers; c) with increased foreign investment and
the gradual consolidation of domestic firms, auto parts manufacturers in China are
becoming more competitive; d) companies are buying factory equipment from
leading international suppliers, as well as acquiring or investing in suppliers
located overseas, including in the United States; e) the Chinese government is
facilitating auto and auto parts manufacturers’ efforts in getting loans from
domestic banks to fund their exports. In addition, auto companies are being helped
to build overseas R&D centres and to acquire foreign peers to improve their
technology and product-development capabilities.
• Potential factors affecting China’s ability to become a worldwide low-cost
auto parts supplier
Despite China’s current advantages, some factors that can negatively affect its
ability to become a low-cost source of original equipment auto parts for

324
automakers worldwide are: a) rising material, labour and energy costs in China; b)
potential currency, quality and logistics-related issues; and c) the increased cost
competitiveness of other global suppliers. On the other hand, Mexico has proved
to be most competitive in the U.S market in relation to China in products with the
following characteristics: a) high ratio of weight to value; b) quality (rather than
price) intensive; c) inputs for industries that require just-in-time delivery,
customised production, or require frequent design changes; and d) the importance
of protecting intellectual property. Motor vehicles and large segments of auto
parts fit within these characteristics.
• A specialised role in the U.S. motor-vehicle market: Mexico is well
positioned in this segment
China and Mexico play differentiated specialisation roles, being complementary
rather than competitive. Besides quality and environmental gaps as well as low
prices, one of the main reasons why Sino-Foreign JVs do not export much from
China is because TNCs do not want to compete with their own brands in their
own countries. Under the current JVs there is no incentive to export for diverse
reasons: a) the high growth of domestic market; and b) difficulties to change the
quality of vehicles with the supplier chain they have at the moment. It is
considered that it would take between five and eight years for Chinese-made cars
to have a significant presence in the U.S. market. The great majority of vehicle
exports from China are from domestic-independent firms, which account for more
than 70% of China’s total auto exports, but most of these cars are exported to
developing countries’ markets in Africa, the Middle East, South East Asia and
Latin America. Plans to export more vehicles to developed-country markets, such
as the U.S. and the European Union, have been repeatedly delayed due to low
product quality, poor image and failure to fulfill safety and environmental
requirements. Recently, some Sino-Foreign JVs have started exporting vehicles as
well. Nevertheless, the volume of their exports from China will remain small and
their markets will be the developing countries. In the short and medium terms,
their main goal is to fill modest product gaps in their overseas markets.

325
• The final outcome of the China-Mexico competitive process in the U.S.
motor market is far from being clear
To a large degree, the evolution of this complex trade and production interaction
will depend on the direction taken by opposing/alternative forces and tendencies
currently in operation. Some of the key ones are: a) Off-shoring vs near-
shoring/globalisation reversal; b) Relatively low labour costs in China vs logistics
and cost of transport (high cost of maintaining a trans-Pacific supply chain); and
c) Location and proximity-dependency strategies vs increasing productivity and
value added.
• The China-Mexico competition in the U.S. market: a very sensitive topic
for the U.S. economy
A significant share of Mexico’s FDI attraction and jobs creation depends on that
competitive condition. Furthermore, given the deepening of the globalisation
process, the subject of China-Mexico competition in the U.S. market is a very
sensitive topic for the U.S. economy too. The high degree of integration of the
Mexican, Chinese and U.S. economies makes it difficult to separate the
implications of the dynamic’s effects. For example, the increasing Chinese share
supplying maquiladora inputs into Mexico to be included in products for export
to the United States directly affects U.S. suppliers, and not necessarily Mexicans.
China’s entry into the WTO has dramatically changed the supply chain. By 2011,
only 55% of imported maquiladora inputs come from the U.S. and the rest from
Asia. China has taken significant advantage of the maquiladora programme and
they now supply roughly 10 to 15% of this industry’s needs. Thus, the Mexico-
China-USA interconnection also seems to have great national and local economic
implications.
• China’s competition in the U.S. market has questioned Mexico’s export
and industrialisation model
Beyond the simple fact of losing market share before China, it seems that Chinese
competititon will not only probably cause Mexico’s current export structure to
change, but that the export and industrialisation model was at risk. As a result, the

326
export-oriented model and the role of the state in the whole Mexican development
process were put into question. This debate raises crucial questions for policy.
Chinese Foreign Direct Investment in Mexico and Global Production Networks
• China’s FDI ‘pragmatic’ approach in Mexico’s motor sector
Considering the size of the Mexican auto sector, up to now Chinese investment in
Mexico’s motor industry has been modest and limited. Without considering the
announced and planned operations, current Chinese investment in Mexico’s
automotive industry represents less than one per cent in terms of capital flows,
production capacity, sales and generated employment.
• Chinese capital is forging a “silent” market penetration in Mexico
Contrary to expectations, the presence of Chinese capital in automotive-related
operations in Mexico has manifested itself through a diversity of entry modes,
including equity and non-equity forms: manufacturing JVs, wholly-owned
manufacturing operations, M&A, licensing and technological associations, as well
as marketing and distribution agreements. Although they have not yet
materialised, the preferred entry mode for the large car-assembly investment
projects in Mexico are JVs. Another difference in the mode of entry between
Chinese and other foreign-owned automakers is that for the latter, wholly-owned
operations is their exclusive mode. Decades ago, some of the old-established auto
TNCs also carried out a process of M&A of Mexican firms.
• Market-seeking strategy: Chinese firms’ main determinant for investing in
Mexico’s motor industry.
Unlike the great majority of foreign carmakers operating in Mexico which have
efficiency-seeking as investment strategy, at present Chinese corporations seem to
have market-seeking strategy as the main determinant for investing in Mexico’s
motor industry. This Chinese FDI pattern is similar to the one observed in other
Latin American and developing markets around the world and can be mainly
explained by the differences in the competitive advantages they possess.

327
• The North American market: mixed and evolutionary character of Chinese
FDI motives
The particularity of the Mexican case is that this market-seeking strategy
comprises a large regional area, intending to use Mexico, in the medium term, as
export platform for two quantitative and qualitative contrasting automotive
markets: the U.S. and Latin America. Because of this geographical proximity to
the U.S. market, some Chinese operations in the auto parts segments are already
using an efficiency-seeking strategy, mostly associated to the entry modes of
wholly-owned manufacturing operations and M&A of foreign firms with export-
oriented production facilities in Mexico. In this sense, in the medium and long
term, thinking regionally in relation to an advanced and sophisticated automotive
market such as the U.S., Mexico could be considered by Chinese vehicle
assemblers as an efficiency-seeking country base.
• Chinese motor operations in Mexico and global production networks
Some modalities and corporate strategies of Chinese automotive operations in
Mexico reveal their increasing internationalisation and participation in complex
global production networks. This is the case of the wholly-owned manufacturing
ventures operating under the maquiladora programme as well as the firms under
M&A, all having efficiency-seeking as their main investment motive in Mexico
and using it as a production and export base for international markets, especially
for the North American region. For these firms, an important motive for
internationalisation was to expand relationships with other successful TNCs, often
acting as suppliers to manufacturing OEMs, or as service providers. For Chinese
companies, the role and significance of these operations go beyond the limit of
Mexico’s domestic market, acquiring a more global or regional dimension. This
characteristic of Chinese automotive firms in Mexico is another important
difference with Chinese FDI in the manufacturing sector in Latin America.
• Competition and complementary in China’s FDI in Mexico’s motor
industry
Chinese presence in Mexico’s domestic market through FDI in the auto sector
shows an interesting face of the China-Mexico interaction: competition with

328
complementarity. Furthermore, given that Mexican capital-owned firms are
marginal in Mexico’s motor industry, practically no competition between
domestic and Chinese automakers can be detected. Chinese automakers running
business in Mexico compete against other foreign companies, and among
themselves, in the lower-end car market segments. Paradoxically, rather than
competition, Chinese involvement through JVs, licensing and technological
associations, as well as some distribution agreements, is boosting and favouring
conditions that create a positive business atmosphere for Mexican firms to set up
automotive operations, in particular in the small- and medium-size commercial
vehicle segments.
• The competitive strategy of Chinese automakers in Mexico is based on
low prices of the low-end, small-car segments
In the motor vehicles segment, in a similar way to other developing country
markets, the competitive strategy of Chinese automakers in Mexico is based on
low prices of the low-end, small-car segments. Current and planned Chinese
operations follow a pattern; from importing complete vehicles in a first phase, and
then setting up assembly operations in Mexico by mostly using SK or CKD parts
imported from China in a second phase. Some carmakers have followed a path –
as did the Japanese - of first entering and testing the Mexican market with a less
complex product and with lower competition level, such as motorbikes, before
embarking in motor vehicle production.
• The expected and announced massive investment amounts have not
materialised yet
Despite the increasing presence of Chinese automotive operations in Mexico and
their diversity of FDI modalities, the expected and announced massive investment
amounts, particularly the large car-assembly projects, have not yet materialised.
The causal factors and explanations for this condition are of multi-dimensional
character. Some are related to macro-national aspects derived from Mexico being
a host country for Chinese FDI, in particular the lack of a long term-strategic
vision towards China. Other factors are linked to the specific operation of
Mexico’s motor industry at sectoral level, such as the inadequacy of Mexico’s

329
automotive policy and regulations, the specific characteristics of Mexico’s
domestic market, and the current slow pace of Mexico’s car sales in relation to
other Latin American markets. Another set of factors are associated with the
micro-company environment and internal structure, organisation and relationship
with venture partners. Finally, other factors are the result of the international
economic situation, such as the impacts of the 2008-2009 global financial crisis.
The materialisation of Chinese large automotive investment projects in the short
term will require a combination of actions from both the Mexican government and
Chinese companies with their JV partners, acting at the macro and micro set of
factors. The reactivation of the Mexican and U.S markets as well as their eventual
acceptance of Chinese brands, would certainly play a relevant role for present and
future perspectives.
• Chinese firms as major players in Mexico’s motor industry is not a
question of whether, but when
Having Chinese companies as major players in Mexico’s motor industry is not a
question of whether, but when. From a medium term perspective, the conjunction
of several favourable factors could make this trend feasible. On the Mexican side,
the country represents a strategic territory for Chinese motor companies, both
automakers and auto parts, in the search for supplying the North American and the
Latin American markets at lower costs. Other pull factors are the potential
domestic market, the network of FTAs and the attributes of the maquiladora
programme, among others. In recent years, Mexico has become the cheapest place
in the world to manufacture products for the U.S. market. On the Chinese side,
automotive companies will continue to be proactive in the global automotive
competition and the search for internationalisation. In addition, transportation
costs from China and local wages have been on the increase in recent years.
Hyper-competition in China’s domestic market represents a strong push factor for
independent Chinese automakers. In all this process, again, the linkage with the
U.S. market seems to be relevant. Besides producing in Mexico, if Chinese
automakers decide to locate manufacturing facilities in the United States –
following the path of Japanese and Korean companies - they could supply
components from a low-cost base in Mexico. Thus, producing cars and auto parts
330
in Mexico, Chinese firms could obtain market and efficiency-seeking benefits
and, simultaneously, they could shorten their supply chain from China. This
move, certainly, would deepen and extend China’s role in the global motor
division of labour.
Summary of Interactions Channels, Impacts and Competitive Threat Dimensions
The broader context of China and Mexico’s participation in the globalisation
process and the changing global division of labour in the motor industry can be
sketched as follows:
• The emerging global division of labour in the motor industry is a
qualitatively different one from that of the early 1990s. At present, a
growing number of “New/Emerging Producing Countries” in Southeast
Asia, Central Europe and Latin America are participating not only as
manufacturing and export locations of low-end cars or components, but
also as sites for more technology-advanced processes, including research
and development activities. Within this trend, both Mexico and China are
playing an increasing significant role.
• China and Mexico not only play a significant role in the motor industry’s
global division of labour but, in a relatively short period of time, their
respective motor sectors have become increasingly integrated in trade,
capital-investment and technical-manufacturing modalities.
• Mexico’s obsession with China’s competitiveness, seen as apparently
direct competition, represents a broader structural trend of the nations’
changing comparative advantage and an emerging global division of
labour in the motor industry in particular. More than a cyclical or
temporary condition, Mexico is losing comparative advantage in labour-
intensive segments of production. China is taking that position in the
international markets and, at the same time, it is rapidly upgrading its skill
and technology capabilities. As Kaplinsky (2005: 223) pointed out, “In a

331
world of rapidly changing global specialisation, and even more rapidly
changing technology, no country can hope to sustain income growth
without the capacity to change”.
• The analysis of the “encounter” and interaction implications between
Mexico and China in the motor sector’s global competitive arena are much
more complex than the simple idea of a straightforward “competitive
threat” or “national competition”. Besides competition, it involves
complementary forces too. In addition, it is necessary to take the analysis
beyond the phenomenon’s surface – the geographical representation of
competition between nations expressed in the statistics – and go to the
underlying causes of change and relations derived from the action of
automotive firms – both foreign and domestic - and the resulting global
production networks and value chains.
Table 9.1 summarises the China-Mexico major interactions and impacts in the
motor industry. Based on the framework for assessing the impact of Asian Drivers
on the developing world developed by Schmitz (2006) and Kaplinsky and
Messner (2008), the channels of interaction (Trade and FDI), complementary and
competitive impacts, as well as direct and indirect impacts are identified.

332
Table 9.1. China-Mexico’s Major Interactions and Impacts in the Motor Industry
Channels
Impact
Direct
Indirect
Trade
Complementary
• Imports of small-cheap cars and minor parts from China.
• Exports of medium-size cars and parts from Mexico to China
• Chinese firms plan to export cars to the U.S. and Latin American markets from Mexico
Competitive
• Imports of auto parts from China displaces domestic producers
• Arrival of Chinese brands in Mexico increases competition with other foreign firms in the lower-end market segments.
• Chinese and Mexican exporters of automotive products compete in the U.S. market in various segments
FDI
Complementary
• Chinese automakers investment in manufacturing plants in Mexico
• Chinese investment in auto parts and maquiladora operations in Mexico
• Chinese firms buy U.S. companies with manufacturing facilities in Mexico (M&A)
• Mexican auto parts firms buy global suppliers with manufacturing facilities in China
Competitive
• Mexican and transnational firms relocate production facilities from Mexico to China
• U.S. and other transnational firms substitute FDI flows to China from Mexico
Source: Own elaboration.
9.2. Theoretical Implications and Paradoxes
This section presents some theoretical implications of the major empirical
findings linked to the research questions. Some of the implications look a kind of
paradoxes when contrasting the theory or conceptual framework with real
processes. While some of the implications or findings might challenge existing
theories, others are consistent with previous theoretical debates. In any case, the
implications and paradoxes suggest the need for revisiting these theories and

333
categories and deepening research in order to further understand the whole China-
Mexico motor industry’s interaction experience, and other broader aspects of the
development process, at global level.
From Nation-State Centrism to Global Networks-Chains Approach
One of the advantages of adopting a sectoral-approach in the China-Mexico
interaction was the possibility of transcending a static view of conceiving the
involved countries competing against each other. This study’s findings show a
more complex set of relationships and ‘triangulations’ created by automotive
firms through the operation of global production networks and value chains
beyond the geopolitical boundaries of both China and Mexico. Although the use
of countries as central units of research is useful for some analytical purposes,
these findings endorse some authors’ claims on the need to go beyond a Nation-
State centrism approach to one of Networks approach to fully understand the
complexities of the global economy (Dicken, et al. 2001; Henderson, 2002;
Harris, 2003 and 2008; Robinson, 2004; Breslin, 2005). As Harris (2008) argued,
the political mystification of the emerging world economy in terms of competing
political/territorial interests rather than global non-territorial market, is an
increasingly severe obstacle to understanding the processes. Some of the posed
research problems are practical, since trade statistics are bilateral in nature, while
global production and trade flows are not (Breslin, 2005). To others, the Nation-
State centred approach poses important methodological and epistemological
problems for the analysis (Robinson, 2004).
This process has given rise to an interesting paradox in the China-Mexico motor
interaction, when analysed beyond “national” statistics and complemented with
the complexity of global production networks derived from TNCs activities. For
example, the exports to the U.S. markets of cars and auto parts from Chinese
companies located in Mexico would be officially registered as “Mexican” exports,
playing against – that is, competing with - the statistics of China’s automotive
exports to the United States. Likewise, around 65% of auto parts exports from
China to the United States are carried out by wholly foreign-owned enterprises
334
and Sino-Foreign JVs, produced with a high proportion of imported content
(Haley, 2012). In the same vein, it has been recognised that as a consequence of
China becoming more integrated into the global economy, it is also becoming
more difficult to identify the cars rolling off the Shanghai assembly lines as being
uniquely ‘Made in Shanghai’ or even ‘Made in China’ (Thun, 2004). Under the
above trends, the ‘nationality’ of the products is becoming increasingly blurred.
When “Big” is Beautiful
In the selection of the location of investments, auto firm’s decisions are based on
several factors; such as foreign exchange rate, size of domestic market,
logistics/distance, production costs, trade policies, among others. Based on the
present research findings, in China’s case the huge size and potential growth of its
domestic market present an overwhelming weight in firms’ decisions. Until
recently, auto FDI entry motive in China was 100% market-seeking. Despite the
virtues of smallness emphasised by Schumacher (1977) in “Small is Beautiful”,
China’s market size and potential have given the Chinese government a strong
bargaining power and lever in attracting TNCs’ investment and more advanced
technology. Thus, in spite of some undesirable regulations, foreign automakers
have decided to enter the China’s market through JVs. These findings share
similar positions as those identified in studies on China’s motor industry
development and modernization (Harwit, 2004; Liu and Dicken, 2006; Thun,
2006; Bungsche, 2007; Chin, 2010).
The above points of discussion pose at least two relevant theoretical implications:
a) the role and capacity of the state to carry out industrial policy and bargaining
with TNCs under globalization; and b) the feasibility for replication of the motor
industry’s ‘Chinese model’ for other developing countries. Regarding the first
implication, both Liu and Dicken’s (2006) and Chin’s (2010) studies challenge the
view that, under globalisation, states are essentially powerless to influence the
investment decisions of TNCs and use industrial policy to Channel FDI toward
national development benefit. Nevertheless, the same authors underline that states
can exert a material influence on TNCs only under the juncture of certain

335
conditions for specific sectors: particular factor endowments of individual
countries, and depending on world market conditions. To achieve this ‘obligated
embeddedness’ on the part of TNCs, the state not only has to have the theoretical
capacity to control access to assets within its territory, but also the power to
actually determine such a process (Liu and Dicken, 2006). In addition, the state’s
potential bargaining power has to ensure internal coherence in their bargaining
position (Chin, 2010). In relation to the second implication, there seems to be an
agreement that China’s experience in motor industry’ development is ‘unique’ and
will be difficult to emulate, since hardly any other countries would fully comply
with the requirements of the Chinese development model, the combination of
factor endowments, as well as the specific conditions in the world economy
(Bungsche, 2007; Chin, 2010).
Geography and Location Still Matter under Globalisation
In parallel to the radical proposition of the ‘End of the Nation-State’ (Ohmae,
1995), others have augured the ‘End of Geography’ (O’Brien, 1992) due to
increasing capital mobility, especially in the financial sector, and the extensive use
of information and communication technologies. This study’s findings contrast
with the above statements. In Mexico’s case, geographical contiguity has
remained a key factor in determining investment decisions by TNCs, in particular
for certain automotive product segments. The entry motives of auto TNCs in
Mexico have been fundamentally efficiency-seeking. In recent years, some trends
towards practicing “near-shoring” in the North American market, implying the
abandonment of “off-shoring” from Asia, is opening up a new perspective for
Mexico as a major player in this process, not only for the relocation of investment
and production capacity from North America, but also in the economic and
investment relationship with China. This location pattern is consistent with that
presented by other analysts who highlight the significance of geographical
proximity as a salient factor in some intra and transnational regional contexts
(Chen, 2005).

336
The discussion presented above poses some important theoretical implications,
especially in relation to changing role and nature of location factors and dynamic
competitive advantages of countries under the globalisation process. Certainly, the
increasing globalisation and virtualisation of the economy which is being
transformed from a ‘space of places’ into a ‘space of flows’ (Castells, 1996), have
undermined the traditional location factors. Nevertheless, Mexico’s case
illustrates that, under specific circumstances and a juncture of factors, geography
still matters under globalisation. As in the case of China’s market size and the
potential bargaining power, geographical proximity to the U.S. market per se is
not a sufficient condition for Mexico’s motor industry attractiveness. The
combination with a high productivity and relatively low cost of labour, logistics,
favourable trade policies, and automation improvements, on the one hand, and the
loss of competitiveness of competitors due to increasing wages and shipping
costs, on the other, enhance the geographic factor. In terms of geography as
location factor in the competition with China, probably the old saying attributed to
General Porfirio Díaz, “Poor Mexico, so far from God and so close to the United
States”, would change to “Fortunate Mexico, so far from China and so close to the
United States”.
What’s Good for China is Good for GM…but not Necessarily for the U.S.
In 1953, Charles Wilson, GM’s CEO at that time, told the US Congress, “What’s
good for GM is good for the United States” (Ayres, 1970). By then GM was the
icon of the U.S. economy and, in many respects, represented a microcosms of the
American State (ibid). ‘What’s was good for GM was good for the U.S.’ and vice
versa, reflected the coincidence of interests and the political and economical
symbiosis between the largest U.S. corporations and the American state. But, at
present, what is good for GM is not necessarily good for the United States – if it
ever was. One thing is clear by now, ‘What’s good for China is good for GM’.
GM’s ties with its Chinese partner SAIC was vital to overcome the bankruptcy
process. China is now GM’s largest market worldwide, selling more cars than in
the U.S., accounting for more thana quarter of its global sales. GM China plans to
double its annual sales to 5 million units by 2015.

337
In June 2009, when GM filed for bankruptcy, it announced plans to close or idle
fourteen plants in the U.S., eliminating more than 20,000 jobs. Simultaneously,
GM was strengthening its Chinese business through its JVs and sizeable
investments; it also relocated the headquarters of its international operations to
Shanghai. Faced with this situation, the United Auto Workers (UAW) and others
bodies such as the Steelworkers’ Union reacted, claiming protection from
President Obama. The unions argued that the bailing out of the U.S. motor
industry, a governmental investment of US$ 50 billion, was to save American jobs
and not to finance the outsourcing of jobs to other countries. In September 2009,
President Obama decided to place steep duties on tyre imports from China and, as
a response, the Chinese government announced an anti-dumping investigation into
exports of U.S. automotive products. This situation illustrates that the actions of
the U.S. and Chinese governments and those of the U.S. and Chinese motor
companies were moving in opposite direction. Although the described process is
more a paradox of globalisation, it does pose some theoretical implications on the
role of the state and the changing loyalty of TNCs to the Nation-State, as well as
emerging conflicting interests between both actors in a global economy.
The Emergence of ‘New Detroits’: Is the World Flat?
During the last decade, a number of new motor producing sites around the world
have flourished, receiving the sobriquet of ‘New Detroits’. In the ‘South’ is
Mexico: Saltillo, Toluca, Guanajuato; and Brazil: Sao Paulo. In ‘Central Europe’:
Poland, Hungary, Czech Republic, Romania and Slovakia. In the ‘East’ is China:
Shanghai, Changchun and Guangzhou; India: Pune and Chennai; Thailand.
Capital has also changed hands, passing from companies of the old empires to
those of the ex-colonies: Tata from India owns Jaguar and Land Rover; Chinese
SAIC owns Rover and MG; Proton from Malaysia owns Lotus; and the Chinese
Geely owns Volvo. The geography of automotive production has drastically
changed over the past several decades. By 2011, 73% of motor-vehicle production
was carried out outside the ‘Old Traditional Producing Countries’ (USA, United
Kingdom, Germany, France, Italy and Canada). To a lesser degree, auto exports
are also being spatially deconcentrated. Chinese auto firms are clear example of

338
the so-called ‘Dragon Multinationals’, considered new players in the 21st century
globalisation (Mathews, 2006).
Is the world flat? The central argument of a ‘flattened world’ is that technological
revolution was levelling the global economic playing field and enabling so many
more people than ever to collaborate a compete in real time with more other
people, on more different kinds of work from more different corner of the planet
than at any previous time in the history of the world (Friedman, 2005). In contrast
to this position, other analysts argue that globalisation is not flattering the world
economy but accentuating its unevenness. Furthermore, it is claimed that even
having equal access to a ubiquitous and flat technologies, ‘playing field’ does not
imply an equal outcome among the ‘players’ in terms of wealth creation,
prosperity and welfare (Christopherson, Garretsen and Martin, 2008). In the case
of the global motor industry, the playfield is not totally flat, but the industry has
shown itself to be increasingly mobile in a changing global division of labour.
Competition and Cooperation: Unity and Struggle of Opposites?
The findings on the motor industry’s China-Mexico interactions show a
paradoxical pattern involving both competition and complementary forces. These
findings are consistent with theoretical and methodological propositions of Best
(1990), Nalebuff and Branderburger (1996), Schmitz (2006), and Kaplinski and
Messner (2008), among others. ‘Co-opetition’, as Nalebuff and Branderburger
(1996) labelled, and networking, seem to be present in the interactions of the
involved nations and firms. Chinese motor products pose competitive threats to
Mexico in its domestic as well as in the U.S. market. However, at the same time
on an opposite pole, through wholly-owned investments, JVs and technological
associations, Chinese capital and technology are generating jobs and supporting
the creation of new profitably Mexican auto firms operating in the Mexican
market. The case of China’s motor industry is a clear example of this process. Its
development and modernisation was based on a strategy of JVs and strategic
associations with TNCs. On the other hand, along with these series of cooperation
arrangements, competition is found in many aspects of Chinese car industry: intra

339
and inter-company; inter-nations; inter-local governments; between central and
local governments; between domestic and foreign firms, and so on. The above
reflections and trends suggest that the study of the interactions among countries
and firms in a global economy from a single aspect or variable (trade, FDI, etc.)
will hardly comprehend the complexity of actual processes.
Will China Change the World and the Machine?
The path of China’s motor industry modernisation during the past two decades is
unquestionable. Its accelerated pace of growth has been impressive and
improvements in technological innovation are also evident. In a relatively short
period of time China became the world’s largest motor-vehicle market and
producer, becoming the epicentre of the motor industry worldwide. According to
industry analysts, the Chinese market has become the catalyst driving the
transformation of the business model and technological underpinnings of the
global auto industry (Russo et al., 2009a). Along a similar line of thought, China
is considered the first pull-model in the history of the motor industry that is very
likely to change the whole industry in a, so far, unprecedented way (Bungsche,
2007). As Zeng and Williamson (2007) have underlined, Chinese are disrupting
global competition through a new strategy of cost innovation. Conversely, other
analysts consider that Chinese firms are not changing the rules of the game or the
industry’s economics, but they are simply repeating the old formula for new
entrants: protect, invest, subsidise, and build scale through exports (Maxton,
2006).
With the adoption and practice of the ‘lean production’ based on the superior
productivity levels of Japanese automakers, especially after the second half of the
1970s, the industry replaced the ‘Fordist’ mass-production model, and the first
motor revolution emerged at the beginning of the 20th century. Thus, ‘the machine
had changed the world’ (Womack, Jones and Roos, 1990). At the beginning of the
21st century, a second motor revolution was claimed, but this time ‘the world had
changed the machine’, essentially by the emergence of the so-called BRICs
economies and the race towards alternative driving systems (Boyer and
340
Freyssenet, 2000; Freyssenet, 2009). Will China be capable to change the word
and the machine in the foreseeable future? As for the machine, the question is still
far for being answered; as for the world, up to now China’s (re) emergence seems
to have contributed significantly to its transformation process.
9.3. Policy Implications
With the motor industry being a central or ‘pillar’ sector in both China and
Mexico’s economic development, the research findings point some key issues
with significant policy implications. The development of the whole motor
industry chain in Mexico has enormous impacts on the generation of skilled jobs,
exports, FDI attraction, as well as technological upgrading. Given the production
structure, technological level, trade specialisation, and the role China and Mexico
are playing in the global motor industry, great potential for complementarity
between both countries’ industries seems to exist. As a matter of fact, unlike any
other manufacturing sector, nowadays the motor industry represents a crucial
factor for increasing economic and trade integration, the strengthening of their
bilateral relationship, and the establishment of a strategic partnership. Through a
battery of strategic policies, Mexico could aspire to strengthen its competitive
position vis-à-vis China on the one hand, and to enhance the potential benefits of
complementary and cooperation opportunities, on the other. Fortunately, the study
findings show that despite China’s increasing competitive threat, especially in the
U.S. market, in the motor industry interaction as a whole between the two
countries, complementary forces and structure dominate the relationship, creating
a favourable environment for cooperation.
It is worth underlining that a comprehensive policy framework for the
development of Mexico’s motor industry and its interaction with the Chinese
counterpart does require actions that transcend the sectoral view, integrating a
wider policy perspective. Likewise, the participation of all the industry
actors/stakeholders (federal government, state and local governments, automakers,
auto parts firms, industry associations, aftermarket distributors, labour unions,
universities and research centres, transport & logistics, etc.) is also necessary. In

341
Mexico’s case, the analysis highlights aspects such as the lack of pro-active
policies towards China, the vulnerabilities/weaknesses of the current industrial
model, the existence of regulatory gaps, the loss of competitiveness position in
some auto segments, and ‘lost opportunities’ in the motor industry’s interaction
with China. All these sensitive issues require a profound revision of strategy and
policy.
Of the different dimensions involving China’s emergence as a major player in the
global economy – ‘successful growth story, market, partner, and competitor’ – it
seems that Mexico still sees China predominantly as a threat and competitor. Both
at governmental and entrepreneurship levels, Mexico lacks a strategic vision
towards their relationship with China, an aspect which has been emphasised by
various authors (Dussel Peters, 2007b; 2009 and 2012b; Oropeza, 2007;
Villalobos, 2007; Anguiano, 2010; Wu, 2010). In this sense, Mexican economic
policies and actions towards China have been more reactive and protective than
proactive, putting at risk the binational business environment. There is an urgent
need for a proactive policy towards China, adopting a medium and long-term
perspective, as well as strengthening and deepening the bilateral institutions.
As the ‘Go Global’ policy and the process of internationalisation of Chinese
automakers continues, Mexico appears to be in a strategic location for the Chinese
expansion plans abroad. In particular, among the study findings is the feasibility
and intentions of Chinese automakers, not only to take advantage of Mexico’s
domestic market, but to use Mexico’s territory as an export base for Latin
American and U.S. markets. In this sense, in order to motivate Chinese auto
manufacturers to locate in Mexico – and to avoid negative experiences such as the
case of FAW-Salinas Group JV -, it is necessary to improve the automotive policy
and regulatory framework (the ‘Automotive Decree’). The aim is to establish the
necessary and fair conditions to attract Chinese investment to the sector.
In the case of the auto parts segment, there is also a great ground for collaboration.
Firstly, in both present operations and eventual setting-up of assembly activities
by Chinese automobile manufacturers, cooperation agreements and other sorts of

342
technological associations could be promoted between Chines automakers and
Mexican auto parts firms for these to participate in their supply chain and
sourcing. Secondly, given the quality and competitiveness of auto parts produced
in Mexico, government agencies and firms could negotiate the export of
increasing volumes of auto parts to the dynamic and enormous Chinese market.
Thirdly, there is a need for regulating quality and performance of imported
Chinese auto parts for the aftermarket segment, in order to take advantage of their
low cost and allow theis access to some population’s demand.
Another key aspect for policy implication is the debate on the prospects for
Mexican manufacturing activities’ competitiveness based on ‘proximity-
dependence’, as is the case of an important proportion of export-oriented auto
parts firms, instead of upgrading its technological level (Sargent and Matthews,
2004, 2008a, 2008b and 2009; Gallagher and Porzecanski, 2010). Geography and
location matters, but these factors need to be accompanied by other supporting
elements such as continuous technological upgrading.
An outstanding issue emerged regarding the implications of the China-Mexico
competitive process, particularly in the U.S. market. Beyond the simple fact of
losing market share in some auto segments to China, some analysts argued that
not only did Chinese competition exposed the competitive weakness of some
manufacturing sectors, but taht it also put into question the whole Mexican export
and industrialisation model. (Mesquita-Moreira, 2007; Dussel Peters, 2009;
Gereffi, 2009; Gallagher and Porzecanski, 2010). One of the arguments is that,
while both China and Mexico have pursued export-oriented development
strategies in the world economy, the results for national development and
industrial technological upgrading have been rather different. In this regard,
studies on the impacts of FDI in Latin America, and Mexico in particular, have
underlined that national policies did not channel FDI to priority development
activities and industrial upgrading (Jenkins, 1987; Mortimore, 2000 and 2004).
This has traditionally been the case of FDI in the motor industry. Given the
relatively complementary structures of the motor industries of China and Mexico,
particularly in the latter’s domestic market, through the potential collaborative

343
options in the motor industry between the two countries, Chinese FDI could be
used to serve sectoral and national development objectives, to achieve technology
transfer and to increase the domestic structure of the industry. Up to now, as the
research findings showed, although in an incipient way, through technological
associations Chinese FDI has propelled the operation and technological upgrading
of Mexican firms in the auto sector. Given the recent advances of China in the
development of alternative energies, such as electric vehicles, Mexico could take
advantage of it to update and establish a joint, long-term, programme on motor
‘green technologies’.
An area linked to technology transfer is R&D. In this issue of upgrading the
industry’s technological capabilities, universities and research centres play a
relevant role. Besides the ‘pure’ technical aspect, it is important to increase
investment in training the labour force and human resources qualification.
Collaboration agreements between universities and research centres of both
countries to carry out specific R&D programmes and projects on the motor
industry are another possibility in this line of action.
State and local governments could also take part in this collaborative strategy
between China and Mexico in the motor industry. For example, based on the
potential ‘green technology’ programme, local governments could design
collaborative projects to implement this strategy in the transport systems of
Mexico’s major urban areas. Likewise, State and local governments, along with
universities, research centres and industrial promoters could develop a strategy of
industrial clusters in selected motor regions, supported by the formation of
territorial innovation systems.
Logistics, transport and communications is another area of great interest linked to
the present and future development of Chinese automotive presence in Mexico.
The increasing operations of Chinese companies in Mexico has demanded more
port capacity in the country’s west coast. Most of the transport of automobiles and
auto parts trade between China and Mexico is done by sea, especially using the

344
ports of Lazaro Cárdenas and Manzanillo. This trend requires a medium and long-
term logistics and transport infrastructure plan.
Another area that needs attention to increase investment and trade between China
and Mexico is the obstacles posed by the different business cultures as well as the
language barrier. In practice, these obstacles have provoked cross-cultural
misunderstandings, which have often contributed to break potential associations
an investment projects. This issue is of interest to almost all type of stakeholder in
the motor industry: governments, academics, auto executives, trade associations
and workers, among others. No less significant is to embark on a bilateral project
to sort out the existing disparities in statistics between the two countries, not only
to carry out more ‘objective’ research and studies, but also to avoid trade disputes.
9.4. Recommendations for Further Research
This research aimed to give a comprehensive view of the China-Mexico
interactions in the global motor industry. As such, the scale and depth of the
potential knowledge of this phenomenon is extensive, complex and muti-
dimensional. Additional and more specific research is needed to fully understand
the evolution of the process, as well as for the assessment of impacts’ purposes.
In order to advance on this goal, the following future research lines are proposed:
• Modes and motives of Chinese FDI. Improved knowledge on the modes
and motives of Chinese automotive firms for investing in Mexico would
help to understand the logic, conditions and prospects of Chinese
operations in Mexico.
• Assessment of impacts, benefits and risks. A full account of the impacts
and knowledge of the benefits and risks of Chinese operations and FDI
in their diverse modalities on Mexico’s automotive industry and
economy in general is needed. Some specific crucial areas and topics
are: domestic market competition, technology transfer, employment and
income, capital formation, labour skills and work conditions, market

345
structure and competition, the industrialisation model, political and
cultural issues, and Chinese bargaining power, among others. In
addition, the solution to bilateral statistics discrepancies must be
addressed.
• Methodology for assessing the technological complexity level of the
motor industry value chain. It is necessary to continue improving and
fine-tuning the methodology for assessing the technological complexity
level of the motor industry value chain developed in this study. This
would help to better understand the implications for competitive threats
as well as complementary issues.
• Special ‘success’ and ‘failure’ case studies. The study of special cases in
the experiences of Chinese auto operations in Mexico would contribute
to deepen the understandinf of the specific factors behind the success or
failure of such ventures (policy and regulations; internal to firms’
organisation; the selection and capabilities of the business partner;
market conditions; etc.). The FAW-Salinas Group and the FAW-Giant
Motors Lationamérica are two cases with ‘failure’ and ‘success’
characteristics, respectively, of Chinese operations in Mexico’s motor
industry.
• Opportunity areas for collaboration and strategic alliances. On the
proactive line, a further research topic is the identification of
opportunity areas for collaboration and the establishment of strategic
alliances between companies of China and Mexico in both markets. The
research findings highlighted positive elements for complementary
potential.
• Regional Analysis of interactions. Besides the sectoral anlalysis of
interactions and impacts, it would be worth to undertake a regional
approach on those subjects within the Mexican territory.

346
Given the complexity and extensive nature of the topic, much of these research
lines would require a multi- and interdisciplina-ry approach to address the
research problems. The expected results would be useful for the decision-making
process in automotive policy as well as for comparative analysis with international
experiences of Chinese operations.
9.5. Final Remarks
The specific study of the impacts of China’s global expansion on Mexico’s motor
industry has contributed to a more comprehensive understanding of Chinese
presence and implications in the Latin and North American context. In particular,
this sectoral approach within the China-Mexico automotive sector assists in
avoiding the over-generalisation of findings at aggregated level of analysis of
most previous studies on the subject. The resulting China-Mexico interactions in
the motor industry are of complex nature, involving both competitive and
complementary forces, as well as differentiated impact levels and degrees among
the diverse product/segments of the industry.
China’s motor industry has certainly shown an increasingly ‘visible hand’ in its
global expansion, reshaping the industry and posing draconian competitive threats
in its path. Nevertheless, as Mexico’s case shows, complementary factors with
China could be enhanced to seek a win-win situation. In fact, though in an
incipient way, Chinese automotive operations are inducing the shaping of a new
development phase of Mexico’s motor industry. Mexico could take advantage of
China’s strengths to foster a more endogenous motor industry and diversify its
export markets. Likewise, China could use Mexico as a low-cost and efficient
export base for the Latin and North American markets, as well as for catching up
the opportunity of Chinese cars positioning as Mexico’s ‘Beetles’ (‘Vochos’) of
the 21st century.

347
APPENDICES
CHAPTER THREE
Appendix 3.1. Interviews Listing
Mexico
1. Jasso Torres, Humberto. General Director of Heavy and High Technology
Industries, Mexico’s Ministry of Economy. Personal Interview. Mexico
City. 13 December, 2007.
2. Huerta, Ernesto. Ford South America Operations, Labour and Safety, Ford
Motor Company. Personal Interview. Hermosillo, Sonora. 14 April, 2008.
3. Mosso Guadarrama, Emilio. Executive Director of the Automotive
Industry, Heavy and High Technology Industries, Mexico’s Ministry of
Economy. Personal Interview. Mexico City. 28 April, 2008.
4. Dussel Peters, Enrique. Coordinator of CECHIMEX (China-Mexico Study
Centre), UNAM (Mexico’s National Autonomous University). Personal
Interview. Mexico City. 29 April, 2008.
5. Morales Ochoa, Claudia. Section Manager, Industria Nacional de
Autopartes, A.C. (INA) (Auto Parts National Industry). Personal
Interview. Mexico City. 29 April, 2008.
6. Romero, Indira. Research Assistant, Deputy Director’s Office, Economic
Commission for Latin America and the Caribbean (ECLAC). Personal
Interview. Mexico City. 18 August, 2008
7. Hernández, Francisco. BARDAHL’ Director for Asia. Personal Interview.
Mexico City. 19 August, 2008.

348
8. Gómez Mireles, Jorge. Deputy Director of Economic Studies and
Informatics, Asociación Mexicana de la Industria Automotriz, A.C.
(AMIA) (Mexican Automotive Industry Association). Personal Interview.
Mexico City. 20 August, 2008.
9. Martínez, Alma. Economic Studies Department, BBVA-BANCOMER.
Personal Interview. Mexico City. 20 August, 2008.
10. Ling Chong, Juan José. Gdem. Mexico-China Business Development.
Personal Interview. Mexico City. 21 August, 2008.
11. Chen Yuming. Economic and Commercial Counselor, Embassy of the
People’s Republic of China in Mexico. Personal Interview. Mexico City.
21 August, 2008.
12. Cheng, Feng. Attaché, Embassy of the People’s Republic of China in
Mexico. Personal Interview. Mexico City. 21 August, 2008.
13. Romero Estrada, Juan Jesús. Executive Director of Automotive & IT
Industries, PROMEXICO. Personal Interview. Mexico City. 22 August,
2008.
14. Pliego Aguilar, Víctor. Deputy Director, Automotive Sector Investors’
Service, PROMEXICO. Personal Interview. Mexico City. 22 August,
2008.
15. Búrquez, Francisco. Director of COPRESON (Sonora’s Council for
Economic Development). Personal Interview. Hermosillo, Sonora. 17
March, 2009.
16. Santos Becerril, Mario. Director of CEDIAM-Sonora (Centre for the
Development of the Motor Industry in Mexico). Personal Interview.
Hermosillo, Sonora. Several meetings, January-March, 2009.

349
17. Sánchez Acosta, Alberto. International Business Consultancy. Personal
Interview. Hermosillo, Sonora. Several meetings, January-March, 2009.
18. Acosta, Oscar. SFT Purchasing, Sonora Forming Trade. Personal
Interview. Hermosillo, Sonora. Several meetings, January-March, 2009.
19. Adalid, Germán. Commercial Executive Director, Giant Motors
Latinoamérica – FAW Tucks. Personal Interview. Mexico City. 20 June,
2011.
China
20. Vieyra, Luis. Trade Commissioner of Mexico in Shanghai, PROMEXICO.
Personal Interview. Shanghai. 8 May, 2008.
21. Xu Bing Liang. Programme Administrator, SAE International (Society of
Automotive Engineers). China Automotive Technology & Research
Centre (CATARC). Personal Interview. Shanghai. 12 May, 2008.
22. Ni Shi Li. Project Engineer. China Automotive Technology & Research
Centre (CATARC). Personal Interview. Shanghai. 12 May, 2008.
23. Bichara Kabalen, Roberto. METALSA’s Globalisation Department.
Personal Interview. Shanghai. 13 May, 2008
24. Thomson, Andrew. Deputy Chief Operating Officer, Asia Pacific, KPMG.
Personal Interview. Shanghai. 13 May, 2008
25. Dorothy Chen. Marketing Department, Shanghai International Autocity
Development, Co. Ltd. (SIAD). Telephone and e-mail communication.
Shanghai. 13-24 May, 2008

350
26. Yin Xingmin. Deputy Director, China Centre for Economic Studies, Fudan
University. Personal Interview. Anting, Shanghai. 16 May, 2008.
The United States
27. González, Carlos. Account Manager, DENSO, Toyota Sales Department.
Personal Interview. Southfield, Michigan. 25 August, 2008
28. Ewing, Linda. Research Department, United Auto Workers (UAW).
Personal Interview. Detroit, Michigan. 26 August, 2008.
29. Belzowski, Bruce M. Associate Director, Assistant Research Scientist.
Automotive Analysis Division, University of Michigan Transportation
Research Institute (UMITRI). Personal Interview. Ann Arbor, Michigan.
27 August, 2008.
30. Delgado, Alejandro. Senior Economist, General Motor Corporation.
Renaissance Center. Personal Interview. Detroit, Michigan. 27 August,
2008.
31. Rubenstein, Daniel A. Purchasing Programme Manager, Emerging Market
Sourcing, Ford Motor Company. Personal Interview. Dearborn, Michigan.
28 August, 2008.
United Kingdom
32. Williamson, Peter J. Visiting Professor of International Management,
Judge Business School, University of Cambridge. Personal Interview.
London, England. 24 March, 2009.

351
Appendix 3.2. Motor Industry ‘Cluster’ by Chapter and Item of the HS
Classification
Motor Industry Cluster by Chapter and Item of the HS Classification
Product
Code
Product Description Chapter 40. Rubber and Articles
400912 Tubes, pipes and hoses of vulcanised rubber, reinforced (brake hoses) 400922 Tubes, pipes and hoses of vulcanised rubber, not reinforced (brake hoses)
400932 Tubes, pipes and hoses of vulcanised rubber, exc hard rubber, reinforced 400942 Tubes, pipes and hoses of vulcanised rubber, exc hard rubber,
reinforced/otherwise
401110 Pneumatic tyre, new of rubber for motor cars, including station wagons and racing cars
401120 Pneumatic tyres, new of rubber for buses or lorries 401310 Inner tubes, of rubber for motor cars, etc., buses or lorries 401693 Gaskets, washers and other seals of vulcanised rubber other than hard rubber
Chapter 68. Articles of Stone, Plaster, Cement, Asbestos, Micra or Similar Materials
681310 Asbestos brake linings and pads
Chapter 70. Glass and Glassware 700711 Safety glass toughened (tempered) f vehicles, aircraft, spacecraft/vessel 700721 Safety glass laminated for vehicles, aircraft, spacecraft or vessels 700910 Rear-view mirrors for vehicles
Chapter 73. Articles of Iron and Steel
732010 Springs, leaf and leaves therefor, iron or steel 732020 Springs, helical, iron or steel 732090 Springs, iron or steel, nes 732690 Articles, iron or steel, nes Chapter 83. Miscellaneous Articles of Base Metal
830120 Locks of a kind used for motor vehicles of base metal 830230 Mountings, fittings&similar articles of base metal f motor vehicles, nes
Chapter 84. Nuclear Reactors, Boilers, Machinery and Mechanical Appliances; Parts
840731 Engines, spark-ignition reciprocating, displacing not more than 50 cc 840732 Engines, spark-ignitions reciprocating, displacing 50 cc but not more 250 cc 840733 Engines, spark-ignition reciprocating displacing 250 cc to 1000 cc 840734 Engines, spark-ignition reciprocating displacing more than 1000 cc 840790 Engines, spark-ignition type nes 840820 Engines, diesel, for the vehicles of Chapter 87
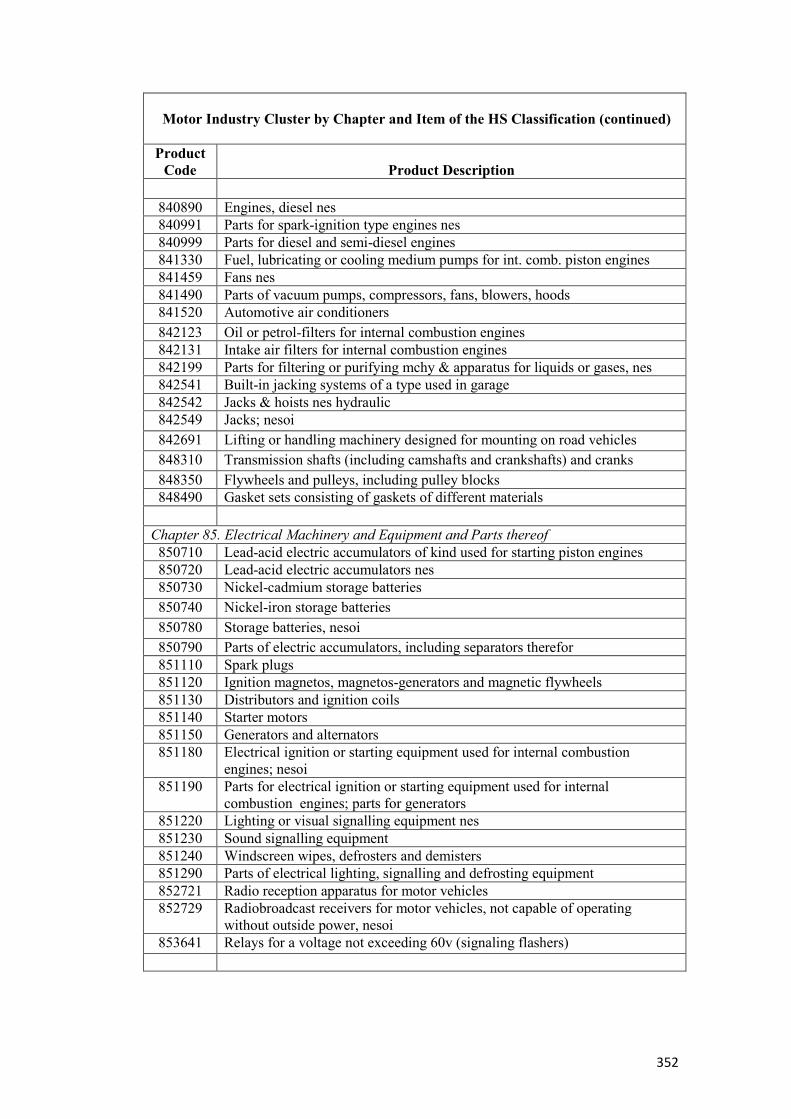
352
Motor Industry Cluster by Chapter and Item of the HS Classification (continued)
Product
Code
Product Description
840890 Engines, diesel nes 840991 Parts for spark-ignition type engines nes 840999 Parts for diesel and semi-diesel engines 841330 Fuel, lubricating or cooling medium pumps for int. comb. piston engines 841459 Fans nes 841490 Parts of vacuum pumps, compressors, fans, blowers, hoods 841520 Automotive air conditioners
842123 Oil or petrol-filters for internal combustion engines 842131 Intake air filters for internal combustion engines 842199 Parts for filtering or purifying mchy & apparatus for liquids or gases, nes 842541 Built-in jacking systems of a type used in garage 842542 Jacks & hoists nes hydraulic 842549 Jacks; nesoi
842691 Lifting or handling machinery designed for mounting on road vehicles 848310 Transmission shafts (including camshafts and crankshafts) and cranks
848350 Flywheels and pulleys, including pulley blocks 848490 Gasket sets consisting of gaskets of different materials
Chapter 85. Electrical Machinery and Equipment and Parts thereof
850710 Lead-acid electric accumulators of kind used for starting piston engines 850720 Lead-acid electric accumulators nes 850730 Nickel-cadmium storage batteries 850740 Nickel-iron storage batteries
850780 Storage batteries, nesoi 850790 Parts of electric accumulators, including separators therefor 851110 Spark plugs 851120 Ignition magnetos, magnetos-generators and magnetic flywheels 851130 Distributors and ignition coils 851140 Starter motors 851150 Generators and alternators 851180 Electrical ignition or starting equipment used for internal combustion
engines; nesoi 851190 Parts for electrical ignition or starting equipment used for internal
combustion engines; parts for generators 851220 Lighting or visual signalling equipment nes 851230 Sound signalling equipment 851240 Windscreen wipes, defrosters and demisters 851290 Parts of electrical lighting, signalling and defrosting equipment 852721 Radio reception apparatus for motor vehicles 852729 Radiobroadcast receivers for motor vehicles, not capable of operating
without outside power, nesoi 853641 Relays for a voltage not exceeding 60v (signaling flashers)

353
Motor Industry Cluster by Chapter and Item of the HS Classification (continued)
Product
Code
Product Description
853661 Electrical lamp-holders, for a voltage not exceeding 1,000 volts 853910 Sealed beam electric lamp units
853921 Tungsten halogen electric filament lamp 854420 Co-axial cable and other co-axial electric conductors 854430 Ignition wiring sets & other wiring sets used in vehicles, aircraft etc 854441 Electric conductors, for a voltage not exceed 80 V, fitted w connectors 854520 Carbon or graphite brushes
Chapter 87. Vehicles other than Railway or Tramway Rolling-Stock, and Parts and Access.
870120 Road tractors for semi-trailers 870210 Diesel powered buses with a seating capacity of nine persons 870290 Buses with a seating capacity of more than nine persons nes 870310 Snowmobiles, golf cars and similar vehicles 870321 Automobiles w reciprocating piston engine displacing not more than 1000 cc 870322 Automobiles w reciprocating piston engine displacing >1000 cc to 1500 cc 870323 Automobiles w reciprocating piston engine displacing >1500 cc to 3000 cc 870324 Automobiles with reciprocating piston engine displacing >3000 cc 870331 Automobiles with diesel engine displacing not more than 1500 cc 870332 Automobiles with diesel engine displacing more than 1500 cc to 2500 cc 870333 Automobiles with diesel engine displacing more than 2500 cc 870390 Automobiles nes including gas turbine powered 870410 Dump trucks designed for off-highway use 870421 Diesel powered trucks with a GVW not exceeding five tonnes 870422 Diesel powered trucks w a GVW exc five tonnes but not exc twenty tonnes 870423 Diesel powered trucks with a GVW exceeding twenty tonnes 870431 Gas powered trucks with a GVW not exceeding five tonnes 870432 Gas powered trucks with a GVW exceeding five tonnes 870490 Trucks nes 870600 Chassis fitted w engines for the vehicles of headings Nos. 87.01 to 87.05 870710 Bodies for passenger carrying vehicles 870790 Bodies for tractors, buses, trucks and special purpose vehicles 870810 Bumpers and parts for motor vehicles 870821 Safety seat belts for motors vehicles 870829 Parts and accessories of bodies nes for motor vehicles 870831 Mounted brake linings for motor vehicles 870839 Brake system parts nes for motor vehicles 870840 Transmissions for motor vehicles 870850 Drive axles with differential for motor vehicles 870860 Non-driving axles and parts for motors vehicles 870870 Wheels including parts and accessories for motor vehicles 870880 Shock absorbers for motor vehicles 870891 Radiators for motor vehicles 870892 Mufflers and exhaust pipes for motor vehicles
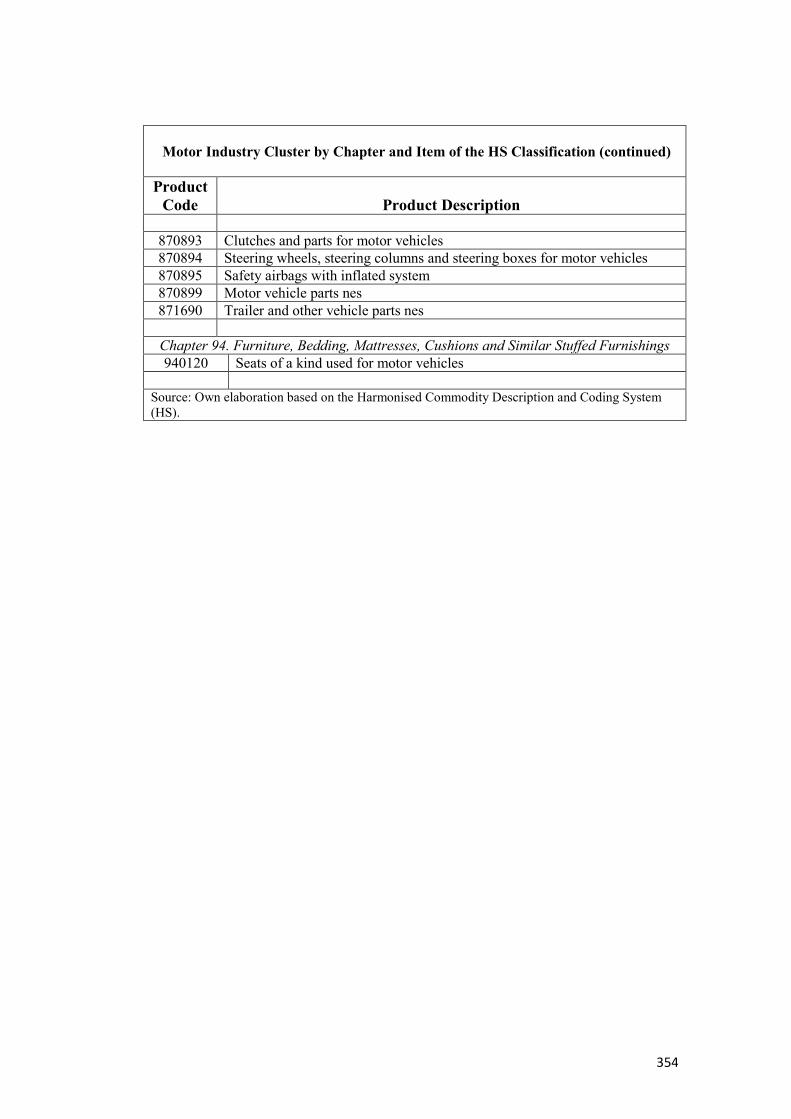
354
Motor Industry Cluster by Chapter and Item of the HS Classification (continued)
Product
Code
Product Description
870893 Clutches and parts for motor vehicles 870894 Steering wheels, steering columns and steering boxes for motor vehicles 870895 Safety airbags with inflated system 870899 Motor vehicle parts nes 871690 Trailer and other vehicle parts nes
Chapter 94. Furniture, Bedding, Mattresses, Cushions and Similar Stuffed Furnishings 940120 Seats of a kind used for motor vehicles
Source: Own elaboration based on the Harmonised Commodity Description and Coding System (HS).
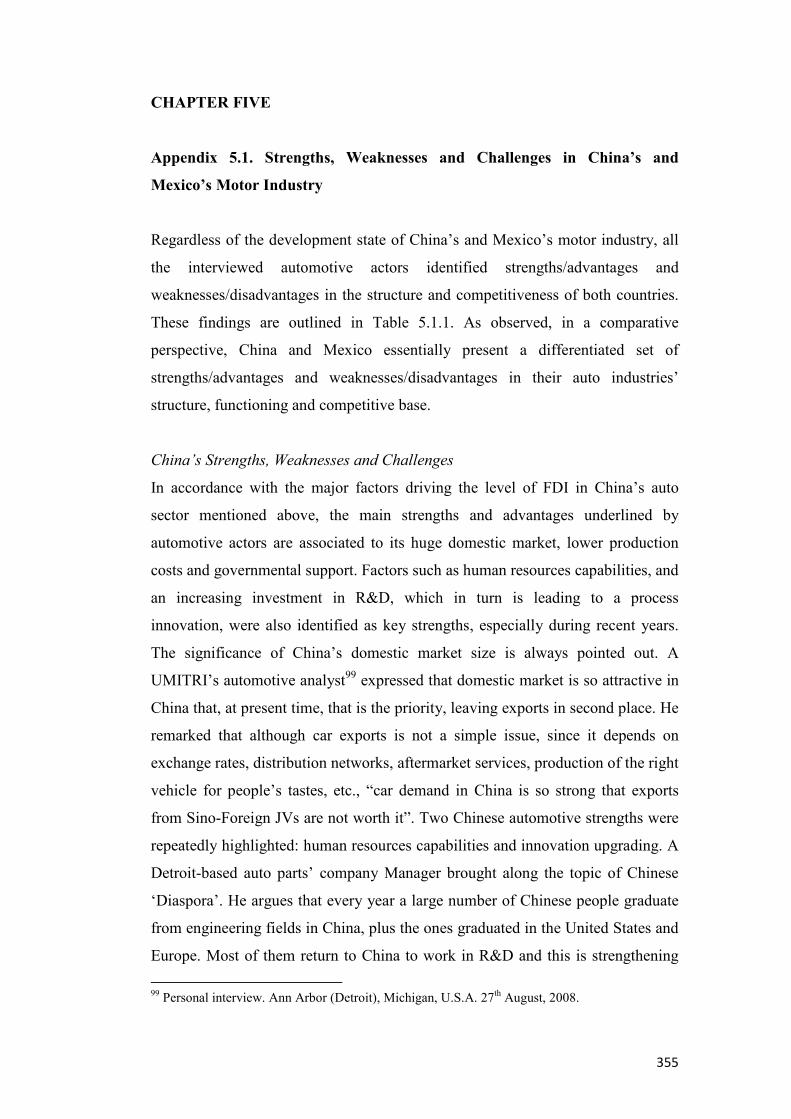
355
CHAPTER FIVE
Appendix 5.1. Strengths, Weaknesses and Challenges in China’s and
Mexico’s Motor Industry
Regardless of the development state of China’s and Mexico’s motor industry, all
the interviewed automotive actors identified strengths/advantages and
weaknesses/disadvantages in the structure and competitiveness of both countries.
These findings are outlined in Table 5.1.1. As observed, in a comparative
perspective, China and Mexico essentially present a differentiated set of
strengths/advantages and weaknesses/disadvantages in their auto industries’
structure, functioning and competitive base.
China’s Strengths, Weaknesses and Challenges
In accordance with the major factors driving the level of FDI in China’s auto
sector mentioned above, the main strengths and advantages underlined by
automotive actors are associated to its huge domestic market, lower production
costs and governmental support. Factors such as human resources capabilities, and
an increasing investment in R&D, which in turn is leading to a process
innovation, were also identified as key strengths, especially during recent years.
The significance of China’s domestic market size is always pointed out. A
UMITRI’s automotive analyst99 expressed that domestic market is so attractive in
China that, at present time, that is the priority, leaving exports in second place. He
remarked that although car exports is not a simple issue, since it depends on
exchange rates, distribution networks, aftermarket services, production of the right
vehicle for people’s tastes, etc., “car demand in China is so strong that exports
from Sino-Foreign JVs are not worth it”. Two Chinese automotive strengths were
repeatedly highlighted: human resources capabilities and innovation upgrading. A
Detroit-based auto parts’ company Manager brought along the topic of Chinese
‘Diaspora’. He argues that every year a large number of Chinese people graduate
from engineering fields in China, plus the ones graduated in the United States and
Europe. Most of them return to China to work in R&D and this is strengthening
99 Personal interview. Ann Arbor (Detroit), Michigan, U.S.A. 27th August, 2008.

356
the innovation process. In the same line, the existence of well educated and
inexperienced engineers is considered one of the relevant reasons for using China
as export platform for components, particularly in the electronics area. This is
seen as one of the main differences in both China and India, compared to Mexico.
At a more conceptual level, China’s development path or strategy was described
as being a kind of “disruptive innovation” and “disruptive competition”. To an
international consultant100, disruptive innovation means the creation of entirely
new markets and business models, appealing to customers who are unattractive to
the incumbents. Although disruptive innovation typically involves simple
adaptations of known technologies, entrants almost always beat incumbents at this
game because established companies lack the motivation to win. In the past, this
is what Japanese and Koreans implemented, he said. And the consultant added, “at
present, Chinese companies are catching up very fast in achieving this trend.
Obviously, technology gap exists (quality, etc.), but is a question of time”.
Finally, a Professor of International Management at Cambridge University101
argued that Chinese companies have applied a cost innovation strategy, which
gives them more flexibility in product change and putting down capital costs, and
that competition is in capital costs, product design, and production process. He
pointed out that within current business environment and competition, “it is not
what you know but how fast you can learn”. According to his view, the main
difference between Chinese and other companies are the following: a) they
learned to build a plant with less capital cost investment; b) they use more labour
force they have more flexibility; c) they are willing to use more local suppliers; d)
they are looking for marketing and distribution partners overseas; e) they have
more similarity with developing countries’ markets, especially in rural areas; and
f) they are willing to embark in new technologies (i.e. electric vehicles) because
they have less investment in the traditional areas.
Regarding weaknesses and disadvantages of China’s car industry, actor’s opinions
emphasised the poor quality, safety and brand image of cars, the existing
100 Personal interview. Shanghai, China. 13th May, 2008. 101 Personal interview. London, England. 24th March, 2009.

357
technological gap with major mature producing countries and companies, as well
as deficiencies in the supply chain. Various current aspects were also considered.
Some of them are related to China’s internal economy such as increasing labour
costs and inflation, as well as currency revaluation; others are associated to
external factors such as increasing oil prices affecting transport costs. Among the
discussed topics, the one on technology and innovation attracted much attention.
The diverse automotive actors agreed that despite Chinese domestic automakers
are rapidly increasing their technological and managerial capabilities, China still
presents a technological gap between foreign JVs and the domestic firms. This
view was shared by China’s motor industry’s executives102 who acknowledged
the need for Chinese firms to upgrade their technological capabilities and product
quality. That is the reason why they considered it would take around 8-10 years to
Chinese firms to export substantial volume of cars to the United States and
European markets. As known, Sino-Foreign JVs are seen by China’s government
as a way of upgrading the local companies. Nevertheless, an interviewee from the
academic area considered that despite some achievements, this has not worked out
for China and it would take longer to upgrade Chinese models. On the same line
of arguments, China’s car industry has been stereotyped as “copycat” country.103
102 Personal interview. Shanghai, China. 12th May, 2008. 103 Personal interview. Hermosillo, Sonora, Mexico. 14th April, 2008.

358
Table 5.1.1. Strengths and Weaknesses in China’s and Mexico’s Auto Industry
Strengths/Advantages
Weaknesses/ Disadvantages
China
• Very large domestic market • High car demand’s rate of growth
due to increasing income in important sectors of population
• Governmental support and active role with policies to ensure the functioning of the market
• Low cost of labour • Overheads (indirect production
costs) are competitive due to governmental subsidies.
• Increasing investment in technological innovation (R&D).
• Human resources capability • The existence of well educated,
but inexperienced engineers. • Access to I&D and technological
know-how through foreign JVs • A strategy of copying and
innovation
• Poor image of cars quality, safety and environmental standards
• Hugh technological time-gap in relation to mature producing countries
• Wide technological gap between Tier-1 and Tier-2 to Tier-4 suppliers
• Substantive differences in guaranties and services between Chinese firms and the rest of the car companies
• Increasing cost of labour force • Increasing oil prices • Increasing inflation levels and
currency revaluation • China is considered a “copycat” • Chinese government maintains a
high degree of interference in automotive industry’s investment and other related issues
Mexico
• Geographical location to use Mexico as export platform to North And South America
• Geographical proximity to the USA favours the practice of JIT systems and near-shoring
• World class labour productivity and competitive costs
• The network of Free Trade Agreements (FTAs)
• More efficient and more technological upgraded car industry
• More solid supply chain and a consolidated auto parts industry with high integration degree of Tier-1 and Tier-2 suppliers into the assembly industry
• Specialisation in high value-added cars and components to be exported with logistics advantage
• Better protection for intellectual property
• Support programmes for investment promotion
• Emphasis on FDI promotion of geographical closeness and low-cost production base
• Lack of a long-term vision planning • Heavy tax burden on entrepreneurs • Firms are not doing R&D
(designing vehicles) for the Mexican market
• Insufficient governmental support and lack of integral strategy in the industry’s R&D and innovation
• Relatively trade union problems in relation to China’s union control
• Increasing insecurity in certain places of the Mexican territory
Source: Own elaboration based on personal interviews to diverse automotive agents.

359
Another interesting issue of China’s auto industry came out in the interviews: the
basis of Chinese firms’ competition strategy and China’s domestic market
structure. A university Professor104 described China’s domestic competition as
follows: a) ccompanies compete with each other in the domestic market; b) brands
are similar than in any other country; c) there are no regulations in the market; and
d) automakers compete in low-unit price. The case of the Mexican auto parts
company intending to enter the Chinese market is an illustrative one. As explained
by one of its executives in China105, its firm was analysing to establish a plant in
China given the high growth of the domestic market. The other option in Asia was
India. The Mexican firm’s first question was, to have its own investment or to go
for a JV? To enter into an alliance with a Chinese company was a difficult
decision (or not profitable) since production costs in China are very low. Costs are
a third of those in North America. The Chinese firm would require the price set in
Chinese territory/market. The required products were of low quality, but they
fulfilled the requirements of China’s domestic market. This is the reason why an
auto parts company, besides supplying the domestic market, it would seek to
export in order to obtain or to make up for the profits missed out in China’s
domestic market. The terminal-assembly industry does not have this requirement
since the domestic market for vehicles is very dynamic. Nevertheless, the profit
margins have been reduced due to the price reductions. The interviewee
underlined that China’s automotive industry based its development, to a greater
degree, on lower prices. The preferential market of Chinese firms is the low-end
one, cheap cars, competing in low prices. This explains the reason Chinese
exports are fundamentally entering emerging markets such as Africa, South
America, the Middle East and Eastern Europe. In this regard, the Shanghai-based
international consultancy’s Manager106, stated that focusing only in low-value cars
is not sustainable in the longer term. Becoming competitive and scaling the value
ladder takes time. And he expressed, “Yes, Chinese automakers are going to get it.
But the real question is how long does it going to take”.
104 Personal interview. Shanghai, China. 16th May, 2008. 105 Personal interview. Shanghai, China. 12th May, 2008. 106 Personal interview. Shanghai, China. 13th May, 2008.

360
Mexico’s Strengths, Weaknesses and Challenges
Major strengths and advantages of Mexico’s auto industry in relation to China’s
were location factors, especially proximity to the U.S. market, existence of a
world class production base, a more consolidated supply chain and the network of
FTAs. Geographical proximity to the U.S. market was seen a key factor since it
favours the practice of ‘Just-in-Time’ (JIT) systems and near-shoring Also,
Mexico’s location was considered an ideal export platform, both to North and
South American markets. These factors were complemented by the existence of a
wide range of Mexico’s FTAs in the attraction of FDI in the auto sector. The
mentioned factors, it was argued, favours the location in Mexico of highly
customised products sensitive to transport costs and delivery times, bulky and
heavy products, as well as those requiring strong managerial management. In
addition, a world class labour productivity, competitive costs and a more solid
supply chain was highlighted by the interviewees. Another strength was Mexico’s
specialisation in high value-added cars and components to be exported with
logistics advantage. Mexico’s quality superiority in relation to China was tackled
in specific by an TNC’s executive107, mentioning that, at that time, Ford’s plant in
Chihuahua, Mexico, was Ford’s No. 1 worldwide in engine production quality.
Finally, and in particular when compared to China, the factor of better protection
for intellectual property was marked out.
On the side of weaknesses and disadvantages of Mexico’s car industry, most of
them were related to sectoral or macroeconomic policies affecting the industry. A
critique to automotive policy and FDI attraction was made for emphasising
geographical closeness and low-cost production base for FDI promotion,
paradoxically, two of the main strength factors. Others on the same line were the
lack of a long-term vision planning, heavy tax burden on entrepreneurs, increasing
insecurity in certain places of the Mexican territory, and insufficient governmental
support and lack of integral strategy in the industry’s R&D and innovation.
Weaknesses in relation to R&D was not only identified at government policy level
but was also mentioned for corporate strategies operating in Mexico: firms are not
doing R&D (designing vehicles) for the Mexican market. An automotive
107 Personal interview. Hermosillo, Sonora, Mexico. 14th April, 2008.

361
analyst108 elaborated more on this topic. He argued that the availability of
engineering and manufacturing talent in Mexico has been focused on the Tier-1
supply base and not to vehicle design and manufacturing because of: a) the lack of
domestic manufacturers; and b) foreign manufacturers design their vehicles
outside Mexico.
Regarding R&D strategies/policies, it depends on what specific chain the
country/company is located: design vehicles for local market, new engine
generation, or hybrid cars, etc. The academician holds the idea that from the
Mexican government and firms’ perspectives, if there are no “Mexican
Companies” or a ”Mexican Car”, there is no need for deepening R&D activities.
This totally changes the perspective on the industry and R&D. So, he argues,
Mexico is specialized in the production and exports of quality cars for the world
markets, especially for the USA.
To face the challenges and disadvantages of Mexico’s motor industry, a diversity
of proposals was made by the interviewees. Some specific actions to potentiate
Mexico’s geographical location and the JIT system in the North American region
were: a) infrastructure; b) energy supply; c) logistics; d) lower direct and indirect
production costs; e) flexibility of labour regulations; and f) foster R&D. An
unanimous opinion among automotive actors of the different sector was that one
of the major challenges for Mexico’s car industry is to increase investment in
R&D. Mexican governmental officials coincide that Mexico must move towards
design, development and research in the automotive industry. On the same line of
thoughts, analysts and international consultants have posed the suggestive
proposal for the Mexican government to take advantage of the new auto players,
the Chinese automakers, to update and go for new technologies in the hybrid and
electric vehicle segments, for example, where China is increasing its capabilities.
108 Personal interview. Ann Arbor (Detroit), Michigan, U.S.A. 27th August, 2008.

362
A more “aggressive” proposal was made by the Executive Director of a Mexico-
China business organisation,109 recommending a FTA between Mexico and China.
To the executive, who estimates that this FTA would take around ten years to
materialise, is the only way to obtain a massive flows of Chinese FDI into
Mexico.110 Finally, the future of Mexico’s automotive industry is still under
discussion. While some actors from the private sector considers that a major
difference between China and Mexico is that “in both China and Mexico know
where we came from, but in Mexico we do not know where we are heading to”,111
a governmental official expressed that facing the dilemma, in terms of Mexico’s
position in the global automotive industry, of being a lion’s tail or a mouse’s head,
“definitively, a lion’s tail”. 112
109 Personal interview. Mexico City. 21th August, 2008. 110 Very recently, Chen Yuming, Economic Attaché to China´s Embassy in Mexico, declared that China is very much interested in entering in a FTA with Mexico but there is reluctance in this country (Maquila Portal, 2011). 111 Personal interview. Southfield (Detroit), Michigan, U.S.A. 25th August, 2008. 112 Personal interview. Mexico City. 28th April, 2008

363
CHAPTER SIX
Appendix 6.1. China and Mexico in Worldwide Trade
As one of the signs of economic globalization, world trade has presented a
dynamic trend during the last decades. According to IMF sources113, during the
periods of 1990-2000 and 2000-2010, world trade growth was practically twice as
much as world output. World total exports in goods grew from US$ 3.4 trillion in
1990 to 6.4 trillion in 2000, and 15.1 trillion in 2010 (Table 6.1.1). Annual
average growth rate (AAGR) for world exports in goods was 7.4, 5.9 and 8.2% for
the periods 1990-2010, 1990-2000, and 2000-2010, respectively (Table 6.1.2).
Negative growth in world trade was observed in 2001 and, particularly, 2009,
reflecting the recent global financial crisis. World total imports in goods presented
a similar trend than world exports during the analysed period (Tables 6.1.3 and
6.1.4).
A relevant feature during the last two decades has been the changing geography of
world trade, reflecting the changing geography of world production. In 1990, the
seven largest developed economies (USA, Germany, Japan, France, Italy, UK,
and Canada) concentrated 53% of world exports and imports in goods; by 2010,
this share had fallen to 33.7 and 38.3%, respectively. Simultaneously, a number of
the so-called “Newly Industrialising Countries or “Emerging Economies” began
to scale up positions in trade flows: Korea, China, Spain, Singapore, Mexico,
India, Brazil and Russia, among others. This group of emerging economies
accounted only for 9.5% of world exports and 10.2% of world imports in 1990,
climbing up to around a quarter of world trade in both categories by 2010. As
observed in Tables 6.1.2 and 6.1.4, although from a low absolute base, the AAGR
in world exports and imports of this group of emerging countries was well above
the world´s total average.
Among these emerging economies, China played an outstanding role. As it is well
known, foreign trade is one of China’s major engines of economic growth.
113 IMF World Economic Outlook Database.

364
Nowadays, China is the world’s largest exporter and the second largest importer
of goods. In 1990 the Middle Kingdom exported US$ 62.1 billion accounting for
only 1.8% of world’s total exports; in 2000 its share increased to 3.9% with nearly
US$ 250.0 billion, reaching an impressive 1,578.3 billion by 2010, accounting for
10.5% of total exports. In 2007 China overtook the United States in second place,
and in 2009 it displaced Germany as the world’s number one exporter (Tables 6.1
to 6.4 and Figure 6.1). In Mexico’s case, it ranked in 13th place by 2010 with an
export value of nearly 300.0 billion dollars, accounting for 2.0% of the world’s
total. Although in absolute terms Mexico has been steadily increasing its exports,
the rate of growth has been at a slower pace than other emerging countries. This
trend was particularly evident during the decade of 2000-2010, feeling the effects
of the U.S. economic recessions of 2000-2002 and 2008-2009. China registered
the highest AAGR of exports in the two-decade period of 1990-2010 as well as in
2000-2010. On its part, Mexico presented the highest AAGR during the period
1990-2000, even above China. This export “boom” evolution of both China and
Mexico can be associated to processes of deepening international integration and
widening their global economy participation: in Mexico’s case, the starting of
operations of NAFTA in 1994; and in China’s case, its entry into the WTO in
2001.

365
Table 6.1.1. World Exports in Goods by Major Exporting Countries, 1990-2010
(Million Dollars)
Country
1990
%
1995
%
2000
%
2005
%
2010
% China 62,091 1.8 148,797 3.0 249,203 3.9 761,953 7.4 1,578,270 10.5
USA 393,592 11.7 584,743 11.9 781,918 12.3 907,158 8.8 1,277,580 8.5
Germany 410,135 12.1 523,909 10.7 550,222 8.7 977,970 9.5 1,271,352 8.4
Japan 287,648 8.5 443,259 9.0 479,227 7.5 594,986 5.8 769,839 5.1
France 216,606 6.4 284,914 5.8 298,765 4.7 443,619 4.3 514,124 3.4
Korea 65,016 1.9 125,058 2.5 172,267 2.7 284,419 2.8 466,384 3.1
Italy 170,499 5.0 234,020 4.8 239,934 3.8 372,962 3.6 447,465 3.0
Belgium 118,328 3.5 175,884 3.6 187,876 3.0 335,738 3.2 410,387 2.7
U.K. 185,326 5.5 242,036 4.9 281,754 4.4 371,381 3.6 410,176 2.7
Russia n.a. n.a. 78,217 1.6 103,093 1.6 241,473 2.3 397,668 2.6
Canada 127,634 3.8 192,204 3.9 276,641 4.4 359,411 3.5 386,011 2.6
Singapor
e
52,730 1.6 118,263 2.4 137,806 2.2 229,652 2.2 351,867 2.3
Mexico 40,711 1.2 79,542 1.6 166,367 2.6 213,891 2.1 298,138 2.0
Spain 55,524 1.6 91,041 1.9 113,348 1.8 191,021 1.8 246,274 1.6
India 17,970 0.5 30,628 0.6 42,378 0.7 99,618 1.0 222,794 1.5
Australia 39,760 1.2 53,115 1.1 63,878 1.0 105,833 1.0 212,364 1.4
Brazil 31,414 0.9 46,506 0.9 55,119 0.9 118,529 1.1 201,915 1.3
TOTAL 3,376,55
8
100.
0
4,908,48
6
100.
0
6,359,07
1
100.
0
10,337,94
2
100.
0
15,060,48
1
100.
0
n.a.: Not available. Source: Own elaboration based on United Nations Statistics Division (2011-2012).
Table 6.1.2. Growth of World Exports in Goods by Major Exporting Country, 1990-2010
(AAGR)
Country 1990-2010 1990-2000 2000-2010
China 16.66 13.47 18.27
USA 5.77 6.44 4.56
Germany 5.54 2.71 7.91
Japan 4.80 4.75 4.40
France 4.20 2.97 5.06
Korea, Rep. 9.84 9.26 9.48
Italy 4.70 3.15 5.83
Belgium 6.10 4.29 7.36
U.K. 3.86 3.88 3.47
Russia 12.551 10.48 13.06
Canada 5.41 7.29 3.07
Singapore 9.46 9.13 8.90
Mexico 9.95 13.65 5.45
Spain 7.35 6.70 7.31
India 12.74 8.11 16.29
Australia 8.31 4.40 11.54
Brazil 9.26 5.24 12.53
TOTAL 7.38 5.92 8.15 11992-2010. Source: Own elaboration based on United Nations Statistics Division (2011-2012).

366
Table 6.1.3. World Imports in Goods by Major Importing Countries, 1990-2010
(Million Dollars)
Country
1990
%
1995
%
2000
%
2005
%
2010
%
USA 516,987 14.8 770,852 15.6 1,259,300 19.3 1,735,060 16.4 1,968,760 13.1 China 53,345 1.5 129,113 2.6 225,024 3.4 660,206 6.2 1,396,200 9.3 Germany 346,179 9.9 464,366 9.4 495,450 7.6 780,514 7.4 1,068,054 7.1 Japan 235,424 6.7 335,990 6.8 379,491 5.8 514,988 4.9 692,434 4.6 France 234,465 6.7 281,497 5.7 310,831 4.8 490,611 4.6 603,700 4.0 U. K. 224,551 6.4 265,322 5.4 334,550 5.1 483,066 4.6 561,511 3.7 Italy 181,983 5.2 206,059 4.2 238,071 3.6 384,837 3.6 486,596 3.2 Korea 69,844 2.0 135,119 2.7 160,481 2.5 261,238 2.5 425,212 2.8 Belgium 120,325 3.4 159,716 3.2 176,992 2.7 319,798 3.0 390,578 2.6 Canada 120,242 3.4 163,954 3.3 238,811 3.7 323,365 3.1 390,527 2.6 India 23,583 0.7 34,710 0.7 51,563 0.8 142,865 1.4 329,065 2.2 Russia n. a. 46,709 1.0 33,880 0.5 98,708 0.9 229,655 1.5 Spain 87,559 2.5 113,316 2.3 152,901 2.3 287,610 2.7 315,548 2.1 Singapore 60,774 1.7 124,502 2.5 134,546 2.1 200,050 1.9 310,791 2.1 Mexico 41,594 1.2 72,453 1.5 174,500 2.7 221,414 2.1 301,482 2.0 Australia 42,024 1.2 61,283 1.2 71,537 1.1 125,283 1.2 201,640 1.3 Brazil 22,524 0.6 53,783 1.1 58,643 0.9 77,628 0.7 191,464 1.3 TOTAL 3,490,027 100.0 4,938,609 100.0 6,530,032 100.0 10,578,130 100.0 15,085,075 100.0
n. a.: Not available. Source: Own elaboration based on United Nations Statistics Division (2011-2012).
Table 6.1.4. Growth of World Imports in Goods by Major Importing Countries, 1990-2010
(AAGR)
Country 1990-2010 1990-2000 2000-2010
USA 6.57 8.43 4.15 China 16.82 13.98 18.05 Germany 5.41 3.31 7.23 Japan 5.27 4.44 5.62 France 4.61 2.60 6.22 U. K. 4.46 3.69 4.82 Italy 4.79 2.47 6.71 Korea, Rep. 8.98 7.86 9.26 Belgium 5.77 3.57 7.46 Canada 5.77 6.44 4.57 India 13.37 7.37 18.35 Russia 10.091 - 0.97 19.00 Spain 6.29 5.20 6.81 Singapore 8.08 5.86 7.91 Mexico 9.89 13.92 5.10 Australia 7.75 4.95 9.88 Brazil 10.73 9.09 11.36 TOTAL 7.22 5.86 7.91 11992-2010. Source: Own elaboration based on United Nations Statistics Division (2011-2012).

367
0.0
200.0
400.0
600.0
800.0
1000.0
1200.0
1400.0
1600.0
1800.0
B
i
l
l
i
o
n
D
o
l
l
a
r
s
Figure 6.1.1. World's Total Exports in Goods : Major Exporting Countries, 1990-
2010
China USA Germany Japan France Korea Italy Mexico
Source: Own elaboration baased on Table 6.1.1...
NAFTA takes effect
China joins the WTO

368
Appendix 6.2. Motor Trade in Total World Merchandise Trade
For decades, particularly since the second half of the twentieth century, the motor
industry has been a lever for world trade. As one of the industries with higher
levels of globalisation, its trade performance has accelerated during the last three
decades. As shown in Table 6.2.1, during the period 1992-2010 world total
automotive value of exports and imports represented between 8 and 13% of their
respective world merchandise trade. Motor trade value114 registered higher AAGR
than total world trade for the whole period of 1992-2010, which mainly reflected
its more dynamic evolution during the first period of 1992-2000. Given the recent
financial crisis’ severe negative effects on the motor industry (KPMG, 2008;
UNCTAD, 2009; Haugh, et al., 2010), combined with the recession of the early
2000s, its pace of growth slow down during the years from 2000 to 2010. From a
value of US$ 322.1 billion in 1992, automotive exports reached 710.4 billion in
2000 and a peak of 1,522.3 billion by 2008, just before the worsening of the
global financial crisis. World automotive imports followed a similar trend.
114 As specified in the Methodology Chapter, total world automotive trade value has been estimated by constructing a “cluster” of 108 automotive products, at 6-digit level of the Harmonised System.

369
Table 6.2.1. Motor Trade in Total World Merchandise Trade, 1990-2010
(Million Dollars)
Year World
Total Goods
Exports
(WTGE)
World
Total
Motor
Exports
(WTME)
%
WTME/
WTGE
World Total
Goods
Imports
(WTGI)
World
Total Motor
Imports
(WTMI)
%
WTMI/
WTGI
1992 3,688,163 322,095 8.7 3,797,788 285,435 7.5
1993 3,707,791 347,519 9.4 3,741,498 323,186 8.6
1994 4,110,245 458,685 11.2 4,141,912 439,184 10.6
1995 4,938,609 553,519 11.2 4,908,486 534,606 10.9
1996 5,101,371 588,176 11.5 5,170,132 572,923 11.1
1997 5,231,028 611,707 11.7 5,286,865 594,166 11.2
1998 5,165,329 650,159 12.6 5,242,845 643,422 12.3
1999 5,353,458 680,102 12.7 5,458,744 688,025 12.6
2000 6,359,071 710,486 11.2 6,530,032 717,114 11.0
2001 6,117,530 700,050 11.4 6,295,954 712,089 11.3
2002 6,403,212 771,147 12.0 6,526,644 777,647 11.9
2003 7,451,626 892,228 12.0 7,610,819 892,199 11.7
2004 9,062,403 1,052,639 11.6 9,292,103 1,049,379 11.3
2005 10,337,942 1,148,188 11.1 10,578,130 1,139,780 10.8
2006 11,952,279 1,268,616 10.6 12,153,464 1,259,220 10.4
2007 13,775,893 1,456,714 10.6 14,011,710 1,458,399 10.4
2008 15,945,609 1,522,347 9.5 16,184,733 1,512,195 9.3
2009 12,349,086 1,060,993 8.6 12,453,656 1,046,521 8.4
2010 15,060,481 1,369,017 9.1 15,085,075 1,330,776 8.8
AAGR
1992-2010 7.7 7.9 7.5 8.4
1992-2000 6.2 9.2 6.2 10.8
2000-2010 8.2 6.1 7.9 5.8
Source: Own elaboration based on United Nations Statistics Division (2011-2012) for world total merchandise trade; and UN COMTRADE Database for world total automotive trade.

370
Appendix 6.3. The Geography of China’s and Mexico’s Motor Trade Flows
In terms of the geography of motor trade flows, China and Mexico also present a
differentiated pattern. The resulting geographical trade patterns mostly derive
from the role and involvement in trade and production networks in their respective
regions of influence: East Asia for China and North America for Mexico. In
China’s case, the larger share of exports is destined to East and South East Asia as
well as the Middle East (Table 6.3.1 and Figure 6.3.1). Japan and Korea play a
key role, but also India, Iran, Russia, United Arab Emirates, Vietnam and
Malaysia.115 As most of these flows are linked to the global operations of
automakers and auto parts TNCs, some non-Asian countries appear as relevant
trading partners. This is especially the case of The United States and Germany. In
exports, for instance, the United States represents the number-one destination of
motor products. On the other hand, China’s motor imports are geographically
more concentrated. By 2010 nearly 80% of imports came from only four
countries, Japan, Germany, Korea and the USA, in that order (Table 6.3.2 and
Figure 6.3.2). These countries are the national origin of most of the auto TNCs
operating under JVs in China.
Compared to China, Mexico’s motor trade is highly concentrated in North
America, especially with the USA. Despite the relative tendency towards
diversification during the last decade, in 2010 the U.S. market concentrated more
than 80% of Mexico’s total exports (Table 6.3.3 and Figure 6.3.3). Although only
represented around 1% of Mexico’s auto trade by 2010, China has ranked in the
6th position as destination of exports. As in the case of China, to an important
degree motor trade flows in Mexico are defined by the major auto TNC’s global
strategies. This is reflected in the motor import figures, in which the USA, Japan
and Germany account for 75% of the total value (Table 6.3.4 and Figure 6.3.4). It
is worth noting, however, that in 2010 China appears as the fourth-largest import
motor source for Mexico, accounting for 5.2% of total.
115 In the statistics appears Hong Kong, both in exports and imports, which may indicate “triangulation” of trade to third countries.

371
Table 6.3.1. China: Geographical Destination of Motor Exports, 1992-2010
(Million Dollars)
Country 1992 % 2000 % 2010 %
USA 164.81 15.69 1,646.54 26.36 12,339.62 19.66 Japan 45.46 4.33 823.79 13.19 5,746.67 9.15 Hong Kong 410.72 39.11 815.16 13.05 3,646.97 5.81 Korea 8.42 0.80 16.54 2.65 3,207.38 5.11 Germany 32.97 3.14 311.04 4.98 2,203.22 3.51 India 0.00 0.00 17.84 0.29 1,750.74 2.79 Iran 0.89 0.09 42.75 0.68 1,478.55 2.36 U K 10.52 1.00 160.01 2.56 1,457.80 2.32 Russia 43.88 4.18 9.24 0.15 1,333.41 2.12 Australia 10.52 1.00 109.55 1.75 1,272.41 2.03 Brazil 2.36 0.23 38.91 0.62 1,258.76 2.01 U. Arab E. 29.43 2.80 118.90 1.90 1,180.78 1.88 Canada 5.91 0.56 85.42 1.37 1,116.15 1.78 Mexico 0.68 0.07 32.01 0.51 1,073.91 1.71 Vietnam 3.95 0.38 33.98 0.54 968.13 1.54 Malaysia 6.16 0.59 49.85 0.80 900.64 1.43 Other 273.52 26.04 1,940.00 28.58 21,844.88 34.80 TOTAL 1,050.20 100.00 6,245.51 100.00 62,780.01 100.00
Source: Own elaboration based on UN COMTRADE Database.
Table 6.3.2. China: Geographical Origin of Motor Imports, 1992-2010
(Million Dollars)
Country 1992 % 2000 % 2010 %
Japan 1,649.27 37.54 2,649.09 40.70 23,851.44 32.35 Germany 879.73 20.03 1,269.60 19.50 19,805.26 26.86 Korea 23.07 0.53 276.79 4.25 7,467.68 10.13 USA 447.88 10.20 419.91 6.45 6,081.04 8.25 Other Asia1 56.64 1.29 482.27 7.41 2,786.59 3.78 U K 51.47 1.17 149.25 2.29 2,760.98 3.74 Slovakia n. a 0.00 n. a 0.00 1,473.82 2.00 France 263.16 5.99 122.38 1.88 1,095.47 1.49 Hungary 1.14 0.03 19.56 0.30 1,093.16 1.48 Mexico 0.03 0.00 26.92 0.41 897.16 1.22 Sweden 10.47 0.24 116.66 1.79 516.50 0.70 Belgium 0.00 0.00 19.43 0.30 667.62 0.91 Austria 33.83 0.87 8.07 0.12 621.14 0.84 Canada 12.12 0.28 399.53 6.14 372.99 0.51 Brazil 2.46 0.06 16.64 0.26 123.79 0.17 Russia 454.17 10.34 6.23 0.10 60.45 0.01 Other 507.65 11.45 526.74 8.09 4,060.50 5.58 TOTAL 4,393.10 100.00 6,509.13 100.00 73,735.60 100.00 1It includes Hong Kong; n.a.: Not available. Source: Own elaboration based on UN COMTRADE Database.

372
Figure 6.3.1. China: Geographical Destination of Motor Exports (%),
1990, 2000 and 2010
Source: Own elaboration based on UNCOMTRADE.
Hong Kong
39%
USA
16%
Japan
4%
Russia
4% Singapore
3.4%Germany
3%
U. Arab E.
3%
Indonesia
1% Australia
1%
U K
1%
Mexico
0.07%
Other
24%
Other
28%
1992
USA
26%
Japan
13%
Hong Kong
13%
Germany
5%
Korea
3% U K
3%
Indonesia
2%
U. Arab E.
2%
Australia
1.8%
Singapore
1.7%
Canada
1.4%
France
1.4%
Mexico
0.51%
Other
26%
Other
33%
2000
USA
20%
Japan
9%
Hong Kong
6%
Korea
5%
Germany
3%
India
3%
Iran
2% U K
2%
Russia
2%
Australia
2%
Brazil
2%
U. Arab E.
2%
Canada
2%
Mexico
2%
Other
38%
Other
46%
2010

373
Figure 6.3.2. China: Geographical Origin of Motor Imports (%),
1990, 2000 and 2010
Source: Own elaboration based on UNCOMTRADE.
Japan
37.5%
Germany
20.0%
Russia
10.3%
USA
10.2%France
6.0% Other Asia
1.3%
U K
1.2%
Korea
0.6%
Mexico
0.01%
Other
12.9%
Other
14.7%
1992
Japan
40.7%
Germany
19.5%
Other Asia
7.4%
USA
6.5% Canada
6.1% Korea
4.3%
U K
2.3%
France
1.9%
Sweden
1.8%
Mexico
0.4%
Other
9.2%
Other
13.2%
2000
Japan
32.4%
Germany
26.9%
Korea
10.1%
USA
8.3%
Other Asia
3.8%U K
3.7%
Slovakia
2%
France
1.5%
Hungary
1.5%
Mexico
1.2%
Other
8.7%
Other
12.8%
2010

374
Table 6.3.3. Mexico: Geographical Destination of Automotive Exports, 1992-2010
(Million Dollars)
Country 1992 % 2000 % 2010 %
USA 8,233.9 84.37 38,734.4 90.56 55,222.8 81.32 Canada 607.7 6.23 1,981.7 4.63 3,131.1 4.61 Germany 256.5 2.63 987.3 2.31 2,530.3 3.73 Brazil 26.5 0.27 147.2 0.34 1,688.3 2.49 Argentina 8.7 0.09 12.9 0.03 985.1 1.45 China 2.2 0.02 23.0 0.05 703.6 1.04 Colombia 20.6 0.21 9.8 0.02 678.4 1.00 Chile 67.0 0.69 117.5 0.27 380.6 0.56 Japan 28.9 0.30 181.9 0.43 294.0 0.43 Peru 21.2 0.22 9.9 0.02 175.7 0.26 UK 3.2 0.03 59.8 0.14 161.9 0.24 Spain 22.0 0.23 34.9 0.08 68.1 0.10 Venezuela 49.9 0.51 37.1 0.09 58.4 0.09 India 0.1 0.00 8.1 0.02 61.3 0.09 Costa Rica 4.9 0.05 29.6 0.07 58.8 0.09 Guatemala 12.0 0.12 23.6 0.06 53.2 0.08 Other 394.5 4.04 375.1 0.88 1,653.2 2.43 TOTAL 9,759.8 100.00 42,773.7 100.00 67,904.7 100.00
Source: Own elaboration based on UN COMTRADE Database.
Table 6.3.4. Mexico: Geographical Origin of Automotive Imports, 1992-2010
(Million Dollars)
Country 1992 % 2000 % 2010 %
USA 3,864.08 77.88 22,753.60 76.50 23,756.53 57.16 Japan 233.05 4.70 1,440.40 4.84 4,183.69 10.07 Germany 162.50 3.28 2,129.64 7.16 3,250.39 7.82 China 30.08 0.61 83.78 0.28 2,171.60 5.23 Canada 24.41 0.49 1,182.00 3.97 1,940.81 4.67 Brazil 276.24 5.57 881.74 2.96 1,646.58 3.96 Korea 24.14 0.49 167.52 0.56 1,189.84 2.86 Spain 21.67 0.44 145.14 0.49 481.19 1.16 Argentina 5.50 0.11 50.83 0.17 370.91 0.89 UK 64.80 1.31 189.21 0.64 290.69 0.70 France 123.81 2.50 104.61 0.35 220.84 0.53 Thailand 0.03 0.00 9.52 0.03 180.36 0.43 Italy 78.59 1.58 50.91 0.17 170.93 0.41 Other 52.68 1.06 555.64 1.87 1,974.63 4.10 TOTAL 4,961.55 100.00 29,744.54 100.00 41,558.99 100.00
Source: Own elaboration based on UN COMTRADE Database.

375
Figure 6.3.3. Mexico: Geographical Destination of Motor Exports (%),
1990, 2000 and 2010
USA
84.4%
Canada
6.2%Germany
2.6%China
0.02%
Other
6.78%
Other
6.8%
1992
Source: Own elaboration based on UNCOMTRADE.

376
Figure 6.3.4. Mexico: Geographical Destination of Motor Imports (%),
1990, 2000 and 2010
Source: Own elaboration based on UNCOMTRADE.

377
Appendix 6.4. Data Sets – Chapter Six
Table 6.4.1. China’s Major Motor Export and Imports Products in Trade with
Mexico, 2010 (China as Reporter Country)
HS Code
Product Description
Value
(Million
Dollars)
%
of
Total
AAGR
2001-
2010
EXPORTS
401120 Pneumatic tyres, new of rubber for buses or lorries
128.455 12.0 49.9
401110 Pneumatic tire, new of rubber for motor cars, including station wagons and racing cars
111.098 10.3 51.5
870899 Motor vehicle parts nes 93.291 8.7 38.8
870894 Steering wheels, steering columns and steering boxes for motor vehicles
63.799 5.9 81.3
870840 Transmissions for motor vehicles 47.639 4.4 166.8
870870 Wheels including parts and accessories for motor vehicles
43.813 4.1 61.3
870829 Parts and accessories of bodies nes for motor vehicles
41.913 3.9 34.5
850780 Storage batteries, nesoi 35.993 3.4 127.0
851220 Lighting or visual signalling equipment nes 27.25 2.5 42.7
850720 Lead-acid electric accumulators nes 26.840 2.5 39.3
840991 Parts for spark-ignition type engines nes 21.987 2.0 49.7
840999 Parts for diesel and semi-diesel engines 21.876 2.0 69.7
841330 Fuel, lubricating or cooling medium pumps for int. comb. piston engines
21.617 2.0 98.3
870880 Shock absorbers for motor vehicles 20.450 1.9 121.3
851190 Parts for electrical ignition or starting equipment used for internal combustion engines, generator
20.439 1.9 52.8
TOTAL 1,073.9 100.0 41.3
IMPORTS
870323 Automobiles w reciprocating piston engine displacing >1500 cc to 3000 cc
660.0 73.6 74.1
840991 Parts for spark-ignition type engines nes 44.069 4.9 9.1
870895 Safety airbags with inflated system 43.843 4.9 12.71
870829 Parts and accessories of bodies nes for motor vehicles
18.644 2.1 51.7
870899 Motor vehicle parts nes 18.183 2.0 19.9
842199 Parts for filtering or purifying mchy & apparatus for liquids or gases, nes
16.640 1.9 54.4
870894 Steering wheels, steering columns and steering boxes for motor vehicles
11.829 1.3 36.7
870840 Transmissions for motor vehicles 8.118 0.9 60.9
TOTAL 897.2 100.0 35.9 12007-2010. Source: Own elaboration based on UN COMTRADE Database.

378
Table 6.4.2. China’s Automotive Exports to Mexico by Category of Technological
Complexity in the Value Chain, 1992-2010 (Million Dollars)1
(China as Reporter Country)
Category/Product
1992
1997
2001
2007
2010
I. Finished Vehicles 0.030 28.763 18.550
I.A. Sport & Recreational 0.001 8.137 6.502 I.B. Microcar/Bubble 0.008 7.484 0.222 I.C. Subcompact/City Car 5.773 0.156 I.D. Compact, Mid-size Car and Compact SUV
0.175 0.006
I.E. Luxry, Sports, Grand Tourer, Mid & Full-size SUV
0.075 0.301
I.F. Light Trucks 5.801 9.475 I.G. Medium & Heavy Straight Trucks
0.974 0.911
I.H. Passenger Vans & Buses 0.021 0.032 0.837 I.I. Road Tractors & Dump Trucks 0.310 0.137
II. Major Components and Systems. Machining and Stamping
0.023 0.037 10.685 56.058
II.A. Body 0.002 II.B. Chassis with Engine 0.606 0.185 II.C. Engine 0.023 0.034 9.071 8.231 II.D. Transmission 0.002 1.613 47.638
III. Sophisticated Parts and
Subsystems. Specialised Technology
0.175 1.112 3.724 80.1 256.3
III.A. Chassis Components 0.016 0.100 0.610 4.7 20.4 III.B. Engine Components 0.159 0.157 1.122 45.3 118.5 III.C. Transmission & Drive Train Components
0.078 0.253 15.4 102.9
III.D. Electronic & Safety Systems 0.777 1.7 14.6 14.4
IV: Parts & Components. Moderate
& Universal Technology
0.130 2.020 13.6 330.7 553.3
IV.A&B. Minor Body & Chassis Parts 0.120 1.414 7.4 156.7 345.9 IV.C&D. Minor Engine & Transmission Parts
0.002 0.015 0.108 12.1 28.5
IV.E. Minor Electronic Parts 0.007 0.590 6.1 161.9 178.9
V. Accessories & Simple Parts 0.354 4.332 16.364 159.8 189.6
V.A&B. Accessories and Simple Parts 0.354 4.332 16.364 159.8 189.6
Grand Total 0.684 7.465 33.787 610.0 1,073.9 1Totals do not add up 100% due to rounding. Source: Own elaboration based on UN COMTRADE Database.

379
Table 6.4.3. China’s Automotive Exports to Mexico by Category of Technological
Complexity in the Value Chain, 1992-2010 (%)1
(China as Reporter Country)
Category/Product
1992
1997
2001
2007
2010
I. Finished Vehicles 0.1 4.7 1.7
I.A. Sport & Recreational 0.003 1.333 0.605 I.B. Microcar/Bubble 0.03 1.220 0.021
I.C. Subcompact/City Car 0.940 0.015
I.D. Compact, Mid-size Car and Compact SUV
0.029 0.001
I.E. Luxry, Sports, Grand Tourer, Mid & Full-size SUV
0.012 0.030
I.F. Light Trucks 0.951 0.882
I.G. Medium & Heavy Straight Trucks 0.160 0.085 I.H. Passenger Vans & Buses 0.06 0.005 0.078
I.I. Road Tractors & Dump Trucks 0.051 0.013
II. Major Components and Systems. Machining and Stamping
3.5 0.1 1.8 5.2
II.A. Body II.B. Chassis with Engine 0.017
II.C. Engine 3.5 0.103 1.5 0.767
II.D. Transmission 0.008 0.3 4.436
III. Sophisticated Parts and
Subsystems. Specialised Technology
25.7 14.9 11.0 13.1 23.9
III.A. Chassis Components 2.4 1.3 1.8 0.8 1.9 III.B. Engine Components 23.3 2.1 3.3 7.4 11.0 III.C. Transmission & Drive Train Components
1.0 0.8 2.5 9.6
III.D. Electronic & Safety Systems 10.5 5.1 2.4 1.3
IV: Parts & Components. Moderate
& Universal Technology
19.0 27.1 40.3 54.2 51.5
IV.A&B. Minor Body & Chassis Parts 17.6 19.0 21.9 25.7 32.2 IV.C&D. Minor Engine & Transmission Parts
0.4 0.2 0.3 2.0 2.7
IV.E. Minor Electronic Parts 1.0 7.9 18.1 26.5 16.7
V. Accessories & Simple Parts 51.8 58.0 48.4 26.2 17.7
V.A&B. Accessories and Simple Parts 51.8 58.0 48.4 26.2 17.7
Grand Total 100.0 100.0 100.0 100.0 100.0 1Totals do not add up 100% due to rounding. Source: Own elaboration based on UN COMTRADE Database.

380
Table 6.4.4. China’s Automotive Imports from Mexico by Category of Technological
Complexity in the Value Chain, 1992-2010 (Million Dollars)1
(China as Reporter Country)
Category/Product
1992
1997
2001
2007
2010
I. Finished Vehicles 0.004 2.6 78.9 662.3
I.A. Sport & Recreational 0.334 I.B. Microcar/Bubble I.C. Subcompact/City Car 0.008 I.D. Compact, Mid-size Car and Compact SUV
0.004 2.6 78.9 660.040
I.E. Luxry, Sports, Grand Tourer, Mid & Full-size SUV
0.013 0.302
I.F. Light Trucks 1.544 I.G. Medium & Heavy Straight Trucks
0.052
I.H. Passenger Vans & Buses I.I. Road Tractors & Dump Trucks
II. Major Components and Systems. Machining and Stamping
14.0 0.132 28.7 9.1
II.A. Body 0.9 II.B. Chassis with Engine II.C. Engine 14.0 0.063 14.8 0.1 II.D. Transmission 0.069 13.9 8.1
III. Sophisticated Parts and
Subsystems. Specialised Technology 0.532 19.7 88.9 125.7
III.A. Chassis Components 0.5 2.2 2.0 III.B. Engine Components 0.435 18.6 46.9 52.6 III.C. Transmission & Drive Train Components
0.071 0.5 11.8 27.2
III.D. Electronic & Safety Systems 0.026 28.0 43.9
IV: Parts & Components. Moderate
& Universal Technology 0.003 0.690 15.7 29.7 63.7
IV.A&B. Minor Body & Chassis Parts
0.010 0.3 15.8 23.1
IV.C&D. Minor Engine & Transmission Parts
0.3 3.9 21.5
IV.E. Minor Electronic Parts 0.003 0.680 15.1 9.9 19.0
V. Accessories & Simple Parts 0.024 0.030 3.7 76.1 36.5
V.A&B. Accessories and Simple Parts 0.024 0.030 3.7 76.1 36.5
Grand Total 0.027 15.245 41.774 302.351 897.163 1Totals do not add up 100% due to rounding. Source: Own elaboration based on UN COMTRADE Database.

381
Table 6.4.5. China’s Automotive Imports from Mexico by Category of Technological
Complexity in the Value Chain, 1992-2010 (%)1
(China as Reporter Country)
Category/Product
1992
1997
2001
2007
2010
I. Finished Vehicles 0.03 6.2 26.1 73.8
I.A. Sport & Recreational I.B. Microcar/Bubble 0.037 I.C. Subcompact/City Car 0.02 I.D. Compact, Mid-size Car and Compact SUV
0.03 6.18 26.1 73.570
I.E. Luxry, Sports, Grand Tourer, Mid & Full-size SUV
0.004 0.034
I.F. Light Trucks 0.172 I.G. Medium & Heavy Straight Trucks
0.006
I.H. Passenger Vans & Buses I.I. Road Tractors & Dump Trucks
II. Major Components and Systems. Machining and Stamping
91.8 0.3 9.5 1.0
II.A. Body 0.1 II.B. Chassis with Engine II.C. Engine 91.8 0.1 4.9 0.001 II.D. Transmission 0.2 4.6 0.9
III. Sophisticated Parts and
Subsystems. Specialised Technology 3.5 47.1 29.4 14.0
III.A. Chassis Components 1.3 0.7 0.2 III.B. Engine Components 2.9 44.5 15.5 5.9 III.C. Transmission & Drive Train Components
0.5 1.2 3.9 3.0
III.D. Electronic & Safety Systems 0.2 9.3 4.9
IV: Parts & Components. Moderate
& Universal Technology 11.9 4.5 37.6 9.8 7.1
IV.A&B. Minor Body & Chassis Parts 0.1 0.7 5.2 2.6 IV.C&D. Minor Engine & Transmission Parts
0.6 1.3 2.4
IV.E. Minor Electronic Parts 11.9 4.5 36.3 3.3 2.1
V. Accessories & Simple Parts 88.1 0.2 8.8 25.2 4.1
V.A&B. Accessories and Simple Parts 88.1 8.8 25.2 4.1
Grand Total 100.0 100.0 100.0 100.0 100.0 1Totals do not add up 100% due to rounding. Source: Own elaboration based on UN COMTRADE Database.

382
Table 6.4.6. Mexico’s Automotive Exports to China by Category of Technological
Complexity in the Value Chain, 1992-2010 (Million Dollars)1
(Mexico as Reporter Country)
Category/Product
1992
1997
2001
2007
2010
I. Finished Vehicles 0.0062 103.6 558.8
I.A. Sport & Recreational I.B. Microcar/Bubble 0.212 I.C. Subcompact/City Car I.D. Compact, Mid-size Car and Compact SUV
0.0062 103.6 555.3
I.E. Luxry, Sports, Grand Tourer, Mid & Full-size SUV
3.3
I.F. Light Trucks I.G. Medium & Heavy Straight Trucks
I.H. Passenger Vans & Buses I.I. Road Tractors & Dump Trucks
II. Major Components and Systems. Machining and Stamping
19.170 0.078 25.1 1.27
II.A. Body 0.770 II.B. Chassis with Engine II.C. Engine 19.170 0.054 9.8 0.247 II.D. Transmission 0.024 15.3 0.241
III. Sophisticated Parts and
Subsystems. Specialised Technology 2.039 0.913 24.503 46.8 90.8
III.A. Chassis Components 0.092 4.260 4.201 2.461 III.B. Engine Components 2.019 0.525 19.706 35.4 40.919 III.C. Transmission & Drive Train Components
0.020 0.028 0.535 7.0 30.292
III.D. Electronic & Safety Systems 0.266 0.206 17.1
IV: Parts & Components. Moderate
& Universal Technology 0.037 0.075 5.435 54.1 20.7
IV.A&B. Minor Body & Chassis Parts
0.033 0.001 3.467 42.075 13.8
IV.C&D. Minor Engine & Transmission Parts
0.003 1.406 0.3
IV.E. Minor Electronic Parts 0.001 0.074 1.968 10.572 6.6
V. Accessories & Simple Parts 0.105 0.072 0.659 44.3 31.9
V.A&B. Accessories and Simple Parts 0.105 0.659 44.374 31.9
Grand Total 2.181 20.232 30.676 274.011 703.573 1Totals do not add up 100% due to rounding. 22000. Source: Own elaboration based on UN COMTRADE Database.
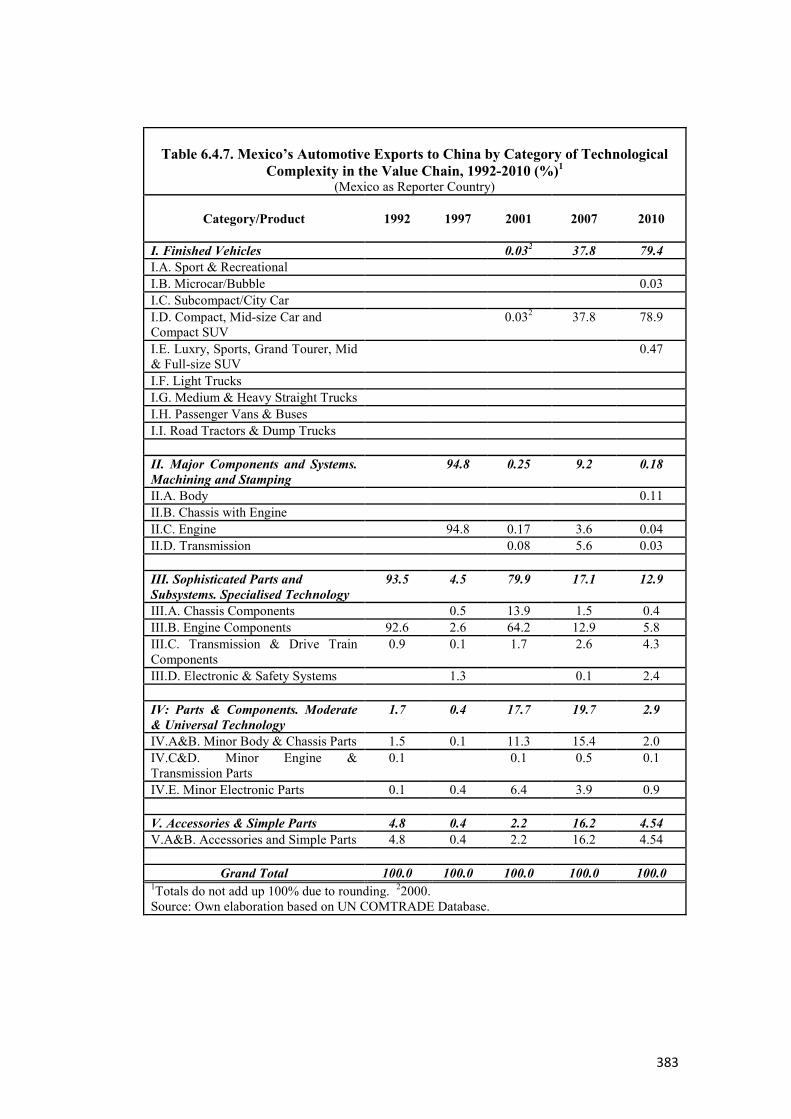
383
Table 6.4.7. Mexico’s Automotive Exports to China by Category of Technological
Complexity in the Value Chain, 1992-2010 (%)1
(Mexico as Reporter Country)
Category/Product
1992
1997
2001
2007
2010
I. Finished Vehicles 0.032 37.8 79.4
I.A. Sport & Recreational I.B. Microcar/Bubble 0.03 I.C. Subcompact/City Car I.D. Compact, Mid-size Car and Compact SUV
0.032 37.8 78.9
I.E. Luxry, Sports, Grand Tourer, Mid & Full-size SUV
0.47
I.F. Light Trucks I.G. Medium & Heavy Straight Trucks I.H. Passenger Vans & Buses I.I. Road Tractors & Dump Trucks
II. Major Components and Systems.
Machining and Stamping 94.8 0.25 9.2 0.18
II.A. Body 0.11 II.B. Chassis with Engine II.C. Engine 94.8 0.17 3.6 0.04 II.D. Transmission 0.08 5.6 0.03
III. Sophisticated Parts and
Subsystems. Specialised Technology 93.5 4.5 79.9 17.1 12.9
III.A. Chassis Components 0.5 13.9 1.5 0.4 III.B. Engine Components 92.6 2.6 64.2 12.9 5.8 III.C. Transmission & Drive Train Components
0.9 0.1 1.7 2.6 4.3
III.D. Electronic & Safety Systems 1.3 0.1 2.4
IV: Parts & Components. Moderate
& Universal Technology 1.7 0.4 17.7 19.7 2.9
IV.A&B. Minor Body & Chassis Parts 1.5 0.1 11.3 15.4 2.0 IV.C&D. Minor Engine & Transmission Parts
0.1 0.1 0.5 0.1
IV.E. Minor Electronic Parts 0.1 0.4 6.4 3.9 0.9
V. Accessories & Simple Parts 4.8 0.4 2.2 16.2 4.54
V.A&B. Accessories and Simple Parts 4.8 0.4 2.2 16.2 4.54
Grand Total 100.0 100.0 100.0 100.0 100.0 1Totals do not add up 100% due to rounding. 22000. Source: Own elaboration based on UN COMTRADE Database.

384
Table 6.4.8. Mexico’s Automotive Imports from China by Category of Technological
Complexity in the Value Chain, 1992-2010 (Million Dollars)1
(Mexico as Reporter Country)
Category/Product
1992
1997
2001
2007
2010
I. Finished Vehicles 0.002 0.003 0.046 26.7 13.9
I.A. Sport & Recreational 0.026 0.629 0.032 I.B. Microcar/Bubble 0.023 6.945 6.280 I.C. Subcompact/City Car 0.002 0.003 14.70 0.059 I.D. Compact, Mid-size Car and Compact SUV
0.246 0.009
I.E. Luxry, Sports, Grand Tourer, Mid & Full-size SUV
0.075 0.500
I.F. Light Trucks 0.006 2.603 4.830 I.G. Medium & Heavy Straight Trucks
1.243 1.593
I.H. Passenger Vans & Buses 0.064 0.439 I.I. Road Tractors & Dump Trucks 0.145 0.185
II. Major Components and Systems. Machining and Stamping
0.086 0.115 17.9 74.0
II.A. Body 0.1 0.4 II.B. Chassis with Engine 0.6 II.C. Engine 0.084 0.108 13.8 44.0 II.D. Transmission 0.002 0.007 4.0 29.0
III. Sophisticated Parts and
Subsystems. Specialised Technology 2.965 10.364 23.929 286.7 517.8
III.A. Chassis Components 0.604 0.266 1.973 44.0 41.7 III.B. Engine Components 1.604 5.064 12.641 156.2 290.9 III.C. Transmission & Drive Train Components
0.572 0.084 0.409 47.8 145.1
III.D. Electronic & Safety Systems 0.135 4.950 8.966 38.7 40.1
IV: Parts & Components. Moderate
& Universal Technology 20.609 17.798 29.684 587.9 1,012.3
IV.A&B. Minor Body & Chassis Parts
13.056 1.609 10.612 218.0 490.3
IV.C&D. Minor Engine & Transmission Parts
0.214 0.148 0.652 24.4 66.6
IV.E. Minor Electronic Parts 7.339 16.040 18.420 345.5 455.4
V. Accessories & Simple Parts 6.503 13.282 57.819 472.4 553.6
V.A&B. Accessories and Simple Parts 6.503 13.282 57.819 472.4 553.6
Grand Total 30.079 41.535 111.596 1,91.5 2,171.6 1Totals do not add up 100% due to rounding. Source: Own elaboration based on UN COMTRADE Database.

385
Table 6.4.9. Mexico’s Automotive Imports from China by Category of Technological
Complexity in the Value Chain, 1992-2010 (%)1
(Mexico as Reporter Country)
Category/Product
1992
1997
2001
2007
2010
I. Finished Vehicles 0.007 0.008 0.04 1.9 0.6
I.A. Sport & Recreational 0.02 0.04 0.001 I.B. Microcar/Bubble 0.01 0.50 0.289 I.C. Subcompact/City Car 0.007 0.008 1.05 0.003 I.D. Compact, Mid-size Car and Compact SUV
0.01 0.001
I.E. Luxry, Sports, Grand Tourer, Mid & Full-size SUV
0.005 0.023
I.F. Light Trucks 0.006 0.187 0.222 I.G. Medium & Heavy Straight Trucks 0.089 0.073 I.H. Passenger Vans & Buses 0.005 0.020 I.I. Road Tractors & Dump Trucks 0.01 0.009
II. Major Components and Systems.
Machining and Stamping 0.208 0.1 1.3 3.4
II.A. Body 0.01 0.02 II.B. Chassis with Engine 0.03 II.C. Engine 0.203 0.1 1.0 2.02 II.D. Transmission 0.005 0.007 0.29 1.34
III. Sophisticated Parts and Subsystems. Specialised Technology
9.8 24.9 21.4 20.6 23.9
III.A. Chassis Components 2.0 0.6 1.8 3.2 1.9 III.B. Engine Components 5.3 12.2 11.3 11.2 13.4 III.C. Transmission & Drive Train Components
1.9 0.2 0.3 3.4 6.7
III.D. Electronic & Safety Systems 0.6 11.9 8.0 2.8 1.8
IV: Parts & Components. Moderate
& Universal Technology 68.5 42.8 26.6 42.3 46.6
IV.A&B. Minor Body & Chassis Parts 43.4 3.9 9.5 15.7 22.5 IV.C&D. Minor Engine & Transmission Parts
0.7 0.3 0.6 1.8 3.1
IV.E. Minor Electronic Parts 24.4 38.6 16.5 24.8 21.0
V. Accessories & Simple Parts 21.6 32.0 51.8 33.9 25.5
V.A&B. Accessories and Simple Parts 21.6 32.0 51.8 33.9 25.5
Grand Total 100.0 100.0 100.0 100.0 100.0 1Totals do not add up 100% due to rounding. Source: Own elaboration based on UN COMTRADE Database.

386
CHAPTER EIGHT
Appendix 8.1. An Overview of China’s OFDI Flows into Mexico
In sharp contrast with trade trends between China and Mexico analysed in the
previous Chapter, China’s OFDI into Mexico shows both a limited and unstable
character. According to the Mexico’s Ministry of Economy official figures, during
the period 1999-2010 China’s total FDI reached 144.7 million dollars. This
amount corresponds to less than 1 percent of Mexico’s total world inward FDI in
that period (Table 8.1.1). In a similar way than other figures, some discrepancies
arise when comparing Chinese OFDI sources with the Mexican ones. China
registers a total amount of 200.63 million dollars by 2010, almost 40 per cent
higher than Mexican sources. Nevertheless, this figure looks insignificant when
compared to an estimated 317,210 million dollars of worldwide China’s OFDI
stock in 2010, representing, as well, less than 1 per cent. The number of registered
firms with Chinese participation in their share capital in Mexico was 611. The
overwhelming majority of Chinese investment has been directed to two sectors:
wholesale trade (43%) and manufacturing (32%).
Other sources of Chinese FDI in different Latin American countries present a
huge contrast with the above figures. For example, ECLAC’s Division of
Production, Productivity and Management (ECLAC, 2010), has estimated flows
of Chinese FDI into Mexico for 1,127 million dollars generating more than 6,000
jobs during the period 2003-2009.116 Most of this investment has been directed to
manufacturing sectors: automotive, OEM; office machinery and equipment
manufacturing; electro-domestic product manufacturing; communications,
training and research & development; industrial machinery, equipment, tools,
sales and distribution; metals, extraction and manufacturing; paper, printing and
packaging, manufacturing. On the same line, by the end of 2009 a market news
network reported that Mexico had been chosen by China as its main foreign
investment destination due to the advantage of the former as a manufacturing site
116 Another source reported a total of 400 million dollars of Chinese investment in Mexico by September 2008 (Wu, 2010: 33).

387
for exporting to the U.S. market (FINETIK, 2009). According to this source, by
then Mexico was the place with the highest number of investment projects of
Chinese companies outside China with about 109 development plans throughout
the Mexican territory. These recent trends indicate that official figures on Chinese
FDI in Mexico are underestimated or outdated.
Table 8.1.1. China’s Total Outward FDI into Mexico, 1999-2010
(million dollars)
Year
Mexican Sources
Chinese Sources
FDI Flows
from China
Total World
FDI into
Mexico
China’s FDI
Flows into
Mexico
China’s Total
World OFDI
Flows
1999 5.0 13, 873.5 97.0* 1,775
2000 10.7 18,160.5 19.8* 916
2001 2.4 29,807.9 0.2* 6,884
2002 -1.7 23,727.5 2.0* 2,518
2003 25.6 15,756.5 0.03 2,850
2004 12.0 24,501.0 27.10 5,500
2005 14.0 22,424.8 3.55 12,260
2006 20.2 20,103.1 -3.69 21,160
2007 8.6 29,083.7 17.16 26,510
2008 13.1 24,912.7 5.63 55,910
2009 28.5 14,462.5 0.82 56,530
2010 6.3 14,362.0 26.73 68,810
OFDI 144.7** 251,121.7** 200.63 317,210
*It refers to approved FDI outflows. **1999-2010. Source: Mexico: Secretaría de Economía (2011). China: MOFCOM (2009 and 2010), Statistical Bulletin of China’s Outward Foreign Direct Investment (China’s OFDI into Mexico, 2003-2010 period); UNCTAD (2003), for China’s OFDI into Mexico, 1999-2002 period; and UNCTAD (2001, 2003 and 2004) for China’s world total FDI flows, 1999-2002 period.

388
Table 8.1.2 shows a list and a brief description of major investment projects
carried out by Chinese companies in Mexico in recent years. In consistency with
ECLAC’s figures – and considering only the available information -, Chinese FDI
has surpassed the amount of 1,200 million dollars and created more than 8,000
jobs. Amongst the most important firms operating in Mexican territory are some
well-known transnational corporations such as Huawei Technologies and ZTE
Corporation (telecommunications sector); Lenovo (computer manufacturing
segment); Huaxi Group and Jinchuan Group (mining industry); Hutchison Port
Holding (port operation and storage); Golden Dragon Precise Cooper Pipe Co.
(cooper pipes manufacturing); Sinatex-China World Best Group (textile industry);
and Foton Motor (automotive industry). Besides serving Mexico’s domestic
market, most of the manufacturing-oriented firms intend to export their products
to the North American and South American countries.
The Mexican counterpart in FDI flows into China is much more modest. In a
similar way than Chinese FDI data in Mexico, there are no single or officially
accepted figures on FDI by Mexican firms in China. PROMEXICO (2010) has
reported an amount of 21.9 million dollars for the period 2006-2008.
Nevertheless, as in the case of Chinese investment in Mexico, this governmental
agency points out that most probably this amount is underestimated since several
Mexican companies, such as Seminis, MASECA and VITRO, are operating in
China thorough affiliates registered in third countries. For example, Seminis’
investment in China until 2004 was close to 400 million dollars, but for Chinese
statistics it is considered Korean capital, since the branch of the company in that
country was the one that performed the transaction (Ibid). Using data from the
years 2003 to 2007, ECLAC (2008) estimated a FDI of Mexican firms in China of
58.0 million dollars. A more complete portray of Mexican DFI in China was
presented by China’s Economic and Commercial Council in Mexico. According
to this source, up to the end of 2008 China had received 319.0 million dollars of
inward FDI from 116 Mexican companies (Chen, 2009). Given the enormous total
amount of FDI received by China during the last decade, by 2008 Mexican FDI
only represented a 0.01 per cent.

389
Table 8.1.2. Major Chinese Companies with FDI in Mexico
Company
Project Characteristics
Investment
Amount
(million
dollars)
Jobs
Generated
Huawei
Technologies
It was established in Mexico in the year 2000. At present it collaborates with the main operators in the telecommunications industry in Mexico, among them Alestra, América Móvil, Axtel-Avantel, Bestel, Iusacell, Maxcom, Telefónica and Telmex. The amount of the investment was 20 million dollars, and 220 jobs were generated.
20.0
300
Sinatex (China
Worldbest Group)
It established a textile products plant (mainly cotton thread) in Sonora in 2002. The amount of the investment was 96 million dollars. The firm entered in a restructuring process, transferring Mexico’s production plant to the Chinese company China Hengtian Group, Ltd., in May 2009.
96.0
2,800
ZTE
Corporation
It was established in Mexico in 2002, embarking on projects with the most important telecommunications operators at national level and in Central America. It has regional offices that function as sales offices, in Mexico City. The amount of the investment and the number of jobs generated are unknown.
n.a.
n.a.
Huaxi Group
It bought rights to operate copper mines in 2006. Said mines are located in the state of Sinaloa. Total investment was 25 million dollars. The number of jobs generated is not known.
25.0
n.a.
Lenovo
In 2008 it announced the establishment of a new plant to assemble computers and related equipment in Nuevo León. The plant started production early 2009 and it represented Lenovos’s largest manufacturing investment outside China. The new plant is able to produce 5 million units a year. Besides Monterrey, the firm also has facilities in Mexico City and Guadalajara.
40.0
1,000
Jinchuan Group
In 2008, this company acquired a copper deposit in Chihuahua from the Canadian company Tyler Resources. The amount of the investment was 214 million dollars.
214.0
n.a.
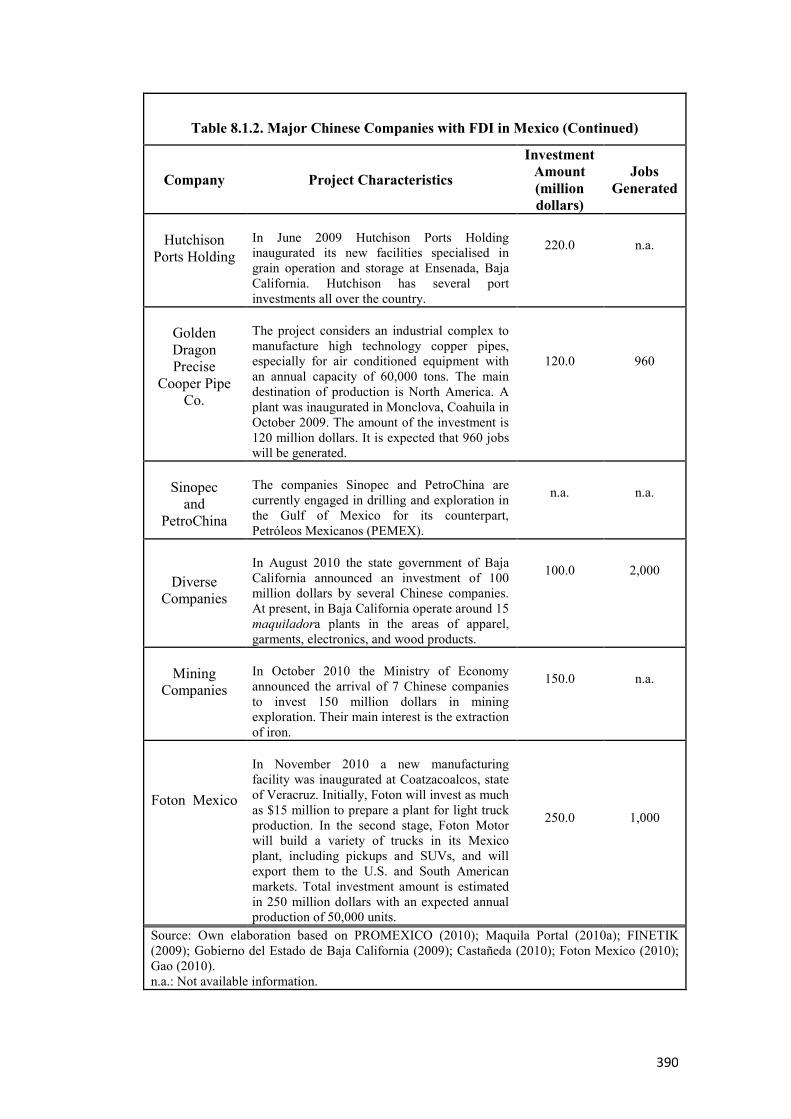
390
Table 8.1.2. Major Chinese Companies with FDI in Mexico (Continued)
Company
Project Characteristics
Investment
Amount
(million
dollars)
Jobs
Generated
Hutchison
Ports Holding
In June 2009 Hutchison Ports Holding inaugurated its new facilities specialised in grain operation and storage at Ensenada, Baja California. Hutchison has several port investments all over the country.
220.0
n.a.
Golden Dragon Precise
Cooper Pipe Co.
The project considers an industrial complex to manufacture high technology copper pipes, especially for air conditioned equipment with an annual capacity of 60,000 tons. The main destination of production is North America. A plant was inaugurated in Monclova, Coahuila in October 2009. The amount of the investment is 120 million dollars. It is expected that 960 jobs will be generated.
120.0
960
Sinopec
and PetroChina
The companies Sinopec and PetroChina are currently engaged in drilling and exploration in the Gulf of Mexico for its counterpart, Petróleos Mexicanos (PEMEX).
n.a.
n.a.
Diverse Companies
In August 2010 the state government of Baja California announced an investment of 100 million dollars by several Chinese companies. At present, in Baja California operate around 15 maquiladora plants in the areas of apparel, garments, electronics, and wood products.
100.0
2,000
Mining
Companies
In October 2010 the Ministry of Economy announced the arrival of 7 Chinese companies to invest 150 million dollars in mining exploration. Their main interest is the extraction of iron.
150.0
n.a.
Foton Mexico
In November 2010 a new manufacturing facility was inaugurated at Coatzacoalcos, state of Veracruz. Initially, Foton will invest as much as $15 million to prepare a plant for light truck production. In the second stage, Foton Motor will build a variety of trucks in its Mexico plant, including pickups and SUVs, and will export them to the U.S. and South American markets. Total investment amount is estimated in 250 million dollars with an expected annual production of 50,000 units.
250.0
1,000
Source: Own elaboration based on PROMEXICO (2010); Maquila Portal (2010a); FINETIK (2009); Gobierno del Estado de Baja California (2009); Castañeda (2010); Foton Mexico (2010); Gao (2010). n.a.: Not available information.

391
Especially since 2006, most of Mexico’s most prominent transnational firms have
opened operations in China. The major companies and investment sectors are the
following (PROMEXICO, 2010):
• Food industry, beverages and agribusiness: GRUMA, BIMBO,
MASECA, FEMSA, Seminis, Grupo Herdez, JUMEX, El Fogoncito;
• Construction materials industry: CEMEX, Interceramic;
• Auto Parts industry: Alfa Group-NEMAK, San Luis Rassini Corporación,
Katcon, Xignux;
• Metalic machinery and equipment for oil and energy industries: TAMSA,
Grupo Villacero;
• Other activities and services: Cydsa (chemicals, plastics and rubber
industry); Carso Group (diverse industrial and service activities); IDEAL
(project and infrastructure analysis); Televisa Group (broadcasting of
radio and television programmes).
392
Appendix 8.2. Giant Motors Lationamérica-FAW Technological Association
Another FAW connection in Mexico is a technological association with Giant
Motors Latinoamérica (GML), a Mexican company manufacturing commercial
vehicles. At the end of 2006 GML, owned by Bler Group, was formally
established and acquired an automobile assembly plant from DINA in Ciudad
Sahagún, state of Hidalgo. In 2007 GML entered into a 15-year association with
FAW, consisting in technology transfer and auto parts sourcing. GML got a
license to manufacture light and heavy FAW branded trucks.
With an initial investment of 17 million dollars to fit out the Ciudad Sahagún
plant, GML plans to develop a total investment of around 60 million dollars by
2011 in order to achieve full production capacity of 20,000 units a year. At full
capacity the firm expects to generate 1,500 direct jobs. GML started operations at
the end of 2007 manufacturing mini, light and semi-heavy trucks; in 2008 it
launched to the market its first heavy truck and by 2010 widens the supply lines
with the new utility mini vans and trucks. Major vehicle components come from
China but GML is trying to increase the percentage of Mexican-made parts; the
chassis is manufactured in Mexico and simple parts such as tires and wheels. At
present GML has 35 suppliers around Ciudad Sahagún and 75 at national.
In terms of marketing, GML’s executives have informed the sale of 2,350 units by
the end of 2010; the firm expects to increase production and sales by 40 per cent
during 2011. At present, GML-FAW holds 15 distribution agencies and service
centres throughout Mexico’s territory. Although in its original business
programme GML planned to export between 15 and 40 per cent of total
production by 2009, it rather focused on the domestic market. Nevertheless, the
Mexican firm expects to start exports shortly to countries of Central and South
America (Costa, Rica, Guatemala, Colombia, Uruguay and Brazil), in particular to
those whose Mexico has signed a FTA. Recently, GML announced a 50-50 per
cent association with Carso Group to manufacture new FAW passenger buses at
the Ciudad Sahagún plant. This will be their first incursion in the public transport
segment, especially school and tourist transportation.
393
According to GML management, the firm’s strategy of market positioning is
based on offering the best cost-benefit relation to customers, such as high fuel and
cost efficient vehicles. Depending on the size, and given the low product costs
derived from the component sourcing from its Chinese partner, GML vehicles are
between 20 and 25 per cent less expensive than their closest competitors. At
national level the firm has established strategic alliances with organisations such
as Grupo Financiero Inbursa, Intelisis, AMA (Mexican Automobile Association),
Condumex, Meusnier, Federal Mogul, and Gabriel de México.

394
Appendix 8.3. The FAW-Salinas Grouop Joint venture
China FAW Group Corporation, founded as the “First Automobile Works”, is the
birthplace of China’s automotive industry. This State-owned company is the
oldest and one of the largest motor vehicle manufacturers in the country. Over a
span of five decades, the FAW Group has evolved into one of the world’s largest
motor vehicle producers, reaching a total of 1.533 million units of sales in 2008.
According to Fortune, in 2010 FAW ranked 258rd among the Global 500 and 25rd
among the motor vehicle and parts sector. Along with Dongfeng Motor Co.
(formerly Second Automobile Works) and Shanghai Automotive Industry Corp.,
FAW is one of China’s original “Big Three”.
FAW entered the international market in 1984, exporting automobiles and vehicle
kits to over 70 countries. Supporting the company’s rapidly expanding
international sales network, FAW Group has established modern overseas
production facilities in Pakistan, South Africa, Tanzania, Ukraine, and Vietnam.
Likewise, FAW Group has embarked on Sino-foreign joint ventures and technical
licensing agreements with leading global automotive corporations both
automakers (Volkswagen, Toyota and Mazda) and auto parts suppliers (Arvin
Monitor, Eaton, Koyo, TRW and Valeo, among others). This Group has
established itself as a global OEM parts supplier of modules and components to
some of the world’s leading firms, including Ford, Hyundai, Toyota and
Volkswagen. At present, FAW Group has 28 wholly owned subsidiaries and
controlling interest in 18 partially owned subsidiaries. In addition, FAW Group
has established a state-of-the-art certified engineering development and test
centre, becoming China’s largest and most extensive automotive R&D facility.
As part of its transnational operations, at the end of 2007 FAW decided to enter
the Mexican market through a joint venture with the Mexican conglomerate, the
Salinas Group. FAW and the Salinas Group planned to build a $150 million
factory due to open in 2010 with a capacity of 100,000 units a year; it was
expected to employ 4,000 workers. The plant would be located in Zinapécuaro,
near the city of Morelia, the capital of the state of Michoacán. According to the

395
business plan, FAW would build the vehicles through its subsidiary Tianjin FAW
Xiali’s Automobile Division, assembling compact cars named Xiali and Weizhi.
On its part, the Salinas Group Motor (GSM) was constituted by two entities: a 100
per cent owned distribution company and a 70%/30% manufacturing joint venture
with FAW.
Before deciding to embark on a joint venture with FAW, the Salinas Group spent
around two years in discussions with several of the most successful Chinese
(Geely, Great Wall and Chery among others) and Indian automakers. In its first
phase, the project considered the supply of cars from China. In addition to the
assembly phase, further investments by Chinese and Mexican auto parts and
components suppliers were expected. The plant would start with welding, painting
and final assembly, but the idea was to manufacture transmissions and engines in
Mexico. It was expected that by 2010 vehicles would be produced in their new
platforms. On the other hand, company sources have informed that a further phase
in the joint venture would include the setting up of a technological R&D centre in
Mexico, aimed at designing vehicles focused on the target markets.
Under the agreement signed at the end of 2007, FAW cars would be sold in the
Mexican market and would also be exported to Central and South America.
Although FAW and the Salinas Group had declared that participation in the
United States was ruled out for the moment, it was believed that only in about 5-8
years time Chinese-made cars would be exported to that market from Mexico
when safety and environmental standards could be met. Sales started in Mexico at
the end of January 2008. Up to mid-2009, GSM and FAW had sold around 5,500
cars. FAW took advantage of the Salinas Group’s 1,700 Elektra-store network
covering most of the Latin American countries and its financing programmes
through Banco Azteca to market cars. Vehicles were priced between US $5,500
and $7,000, about 5 to 10 per cent below the cheapest models on the market. The
main target customer was the entry-level buyer, working-class population. In
terms of supply, although prices of Chinese cars are slightly cheaper, they will
compete with the low-end models currently offered in the market. These include

396
the Chevy and Corsa (Chevrolet); Pointer (Volkswagen); Atos (Dodge); and Ikon
and Ka (Ford).
As a new-entrant company in the Mexican market, GSM-FAW was importing
cars from China under the commitment to build manufacturing facilities in a
period of three years. The Mexican Automotive Decree of 2003 allows
automakers to import vehicles to the country, free of import duties, as long as they
have an investment of at least U.S. $100 million and locally produce more than
50,000 cars a year. Nevertheless, by mid-2009 construction of the plant had not
started yet, even if the business plan goal was to start production in 2010. As a
consequence, The Mexican Ministry of Economy began looking at the legal status
of the Mexican-Chinese joint venture analyzing a possible ban of its duty-free
imports from China. In the midst of this situation, in June 2009 GSM and FAW
announced the decision to postpone their plans for the Mexican joint plant.
According to companies’ executives, the major cause for this was the deep
economic crisis which made impossible to proceed with the project in line with
original schedule. During the rest of 2009 GSM continued to import vehicles from
FAW, along with other Chinese brands such as Chery, for distribution through its
retail chains.

397
REFERENCES AAMA (American Automobile Manufacturing Association). (Several editions).
World Motor Vehicle Data. American Automobile Manufacturers Association. Detroit.
Accenture (2005). China. An Automotive Industry on the Verge. Accenture.
Retrieved 7 May, 2006, from http://www.accenture.com. ACEA (European Automobile Manufacturers Association) (2010). The
Automobile Industry. Pocket Guide. ACEA Communications Department. Adams, J. (2003). “Mexico vs. China”. Economic Development Journal. Fall: 36-
45.
Agarwal, M. (2008). “The BRICSAM Countries and Changing World Economic Power: Scenarios to 2050”. CIGI Working Paper Series No. 39. October. The Centre for International Governance Innovation.
Aiginger, K. (2006). “Competitiveness: From a Dangerous Obsession to a
Welfare Creating Ability with Positive Externalities”. Journal of Industry, Competition and Trade, 6: 161-177.
Al Volante (2011). “Línea de gobierno: Aceptar inversions surcoreanas y chinas”.
Al Volante, 25 February. Retrieved 30 February, 2011, from (http://www.alvolante.info/nacionales/linea-de-gobierno-aceptar-inversiones-surcoreanas-y-chinas).
Alcántara, V. (2009). “Zilent saca provecho de la crisis”. CNNEXPANSIÓN. 19
August. Retrieved 25 October, from http://www.cnnexpansion.com/manufactura.
AlixPartners (2011a). Executives Perspectives on Near-Shoring. July.
AlixPartners. Retrieved 15 October, 2011, from http://www.alixpartners.com/en/WhatWeThink/Manufacturing/ExecutivePerspectivesonNearShoring.aspx.
AlixPartners (2011b). 2011 U.S. Manufacturing-Outsourcing Cost Index: Costs
and Complexity. December. AlixPartners. Retrieved 21 January, 2012, from http://www.alixpartners.com/en/WhatWeThink/Manufacturing/2011USManufacturingOutsourcingIndex.aspx.
Alliance for American Manufacturing (2012). “The Attack on the American Auto
Parts Industry. A Call for Action”. January. Retrieved 29 March, 2012, from http://www.americanmanufacturing.org/autopartsjobs/attack-american-auto-parts-industry-call-action.

398
Altshuler, A., et al. (1984). The Future of the Automobile. The Report of MIT`s International Automobile Program. London and Sydney. George Allen & Unwin Ltd.
Álvarez, L. (2007). “La industria automotriz china: posibilidades de competir con
la industria automotriz en México”. In: E. Dussel and Y. Trápaga (Eds.). China y México: Implicaciones de una Nueva Relación. México D.F. Nuestro Tiempo, Fundación Friedrich Ebert, ITESM, UNAM: 191-208.
Álvarez, L. and E. Sepúlveda (2006). “Reformas económicas, inversión extranjera
directa y cambios en la estructura de la industria automotriz china (1989-2004)”. Contaduría y Administración, No. 218, enero-abril: 87-113.
Álvarez, L. and F. García (2011). “China and Mexico: competition for the United
States automobile Market”. Conference Paper. 19th International Gerpisa Colloquium. Paris, 8-10 June: http://gerpisa.org.
AMIA (Asociación Mexicana de la Industria Automotriz). Automotive Industry
Mexican Association. Mexico City: http://www.amia.com.mx. AMIA (2011). “Motocicletas. Boletín de Prensa”. Asociación Mexicana de la
Industria Automotriz. 2 November. Retrieved 15 November, 2011, from(http://www.amia.com.mx/bpmotos.html.
Anguiano, E. (2010). “Perspectivas a largo plazo de la relación sino-mexicana”.
E. Dussel and Y. Trápaga (eds.). Hacia un diálogo entre México y China. Dos y tres décadas de cambios socioeconómicos. México, D.F. Friedrich-Ebert-Stiftung, China Institutes of Contemporary International Relations (CICIR), CECHIMEX-UNAM, Senado de la República: 429-443.
Anónimo (2003). “Presocupa a Desc industria de autopartes”. El Economista. 28
November. Retrieved 27 February, 2008, from http:// eleconomista.com.mx/node/113904.
Anónimo (2004). “Advierten industriales de la competitividad de China”. El
Economista. 14 July. Retrieved 12 March, 2008, from http://eleconomista.com.mx.
ANPACT (Asociación Nacional de Productores de Autobuses, Camiones y
Tractocamiones). National Association of Commercial Vehicles Manufacturers. Mexico City: http://www.anpact.com.mx.
APCO (2012). China’s 12th Five-Year Plan. Beijing, China. APCO Worldwide. APF (2011). “Nissan to build new factory in Mexico: report”. APF. 14 December.
Retrieved 15 December, 2011, from http://www.wweps.com/hostednews/afp/article/ALeqM5gbKeZDnOi5LqR11JG1Cu8Mk9vApA?docId=CNG.060300aa875f48b7c3965f7fb0a7ac0f.351.

399
APFC and CCPIT (2009). China Goes Global 2009. 2009 Survey of Outward Direct Investment Intentions of Chinese Companies. Vancouver-Beijing.
Aregional (2010). “China adelante en el Mercado automotriz”. Aregional.com.
Año 4, No. 44. Noviembre: 88-91. Arellano, R. (2006). “Implications of China’s Emergence in the Global Economy
for Latin America: the Case of Mexico”. Integration & Trade, Vol. 10, No. 24, June: 213-250.
ATKEARNY (2007). Estudio de Prospectiva tecnológica de la industria
automotriz en México. 11 Enero. México, D.F. INA, Secretaría de Economía.
Automotive News (2009). 2009 Guide to China’s Auto Market. April. Auburn
Hills, Michigan. JATO Dynamics. Automotive News (2011a). “China restricts foreign investment in auto
manufacturing”. Automotive News. 30 December. Retrieved 30 December, 2011, from http://www.autonews.com.
Automotive News (2011b). “SAIC among China carmakers keen to sell in U.S.,
regulator says”. Automotive News China. 25 April. Retrieved 26 April, 2011, from (http://www.autonewschina.com/en).
Automotive News China (2011a). “VW to invest 123B yuan in China for new
models, factories”. Automotive News China. 19 September. Retrieved 20 September, 2011, from http://www.autonewschina.com.
Automotive News China (2011b). “Nissan China reveals $7.8 billion expansion
plan”. Automotive News China. 26 July. Retrieved 27 July, 2011, from http://www.autonewschina.com.
Automotive News (2012a). “Jaguar and Land Rover seals 17.5 billion yuan
Chinese JV with Chery”. Automotive News. 21 March. Retrieved 22 March, 2012, from http://www.autonews.com.
Automotive News (2012b). “China’s auto sales growth trails U.S. for first time in
at least 14 years”. Automotive News. 13 January. Retrieved 14 January, 2012, from http://www.autonews.com.
Automotive News Europe (2010). “General Motors sells $500 million stake to
China SAIC”. Automotive News Europe. 19 November. Retrieved 20 November, 2012, from http://www.autonews.com/apps/pbcs.dll/article?AID=/20101119/ANE/101119781/1131&template=printart.

400
Automotive News Europe (2012). “Daimler-BYD to unveil EV sub-brand this month”. Automotive News Europe. 24 March. Retrieved 24 March, 2012, from http://edit.autonews.comapps/pbcs.dll/article.
Aykut, D. and D. Ratha (2003). Research Note: “South-South FDI flows: how big
are they?” Transnational Corporations, Vol. 13, No. 1, April: 149-176. Ayres, E. (1970). What’s Good for GM... Nashville/London. Aurora Publishers
Incorporated. Baker, K. (2007). Economic Tsunami: China’s Car Industry Will Sweep Away
Western Car Makers. Australia. Rosenberg Publishing. Balassa, B. (1965). “Trade Liberalisation and ‘Revealed’ Comparative
Advantage”. The Manchester School, Vol. XXXIII, No.2: 99-123. Balassa, B. (1983). The Newly Industrializing Countries in the World Economy.
New York. Pergamon Press. Banco de México (2011). “Encuestas sobre las expectativas de los especialistas en
economía del sector privado”. 3 October. Retrieved 20 September, 2011, from http://www.banxico.org.mx/informacion-para-la-prensa/comunicados/resultados-de-encuestas/expectativas-de-los-especialistas/index.html.
Banister, J. and G. Cook (2011). “China’s employment and compensation costs in
manufacturing through 2008”. Monthly Labor Review, March. Washington, D.C. Bureau of Labor Statistics. U.S. Department of Commerce.
Barbosa, A. (2008). “The Rising China and its Impacts on Latin America:
Strategic partnership or a New International Trap? VIII Reunión REDEALAP: http://www.iadb.org.intal/aplicaciones/uploads/ponencias/i_Foro_REDEALAP_2008_08_01_Barbosa.pdf.
BBVA (2012). “Industria automotriz: clave en el crecimiento de México”. BBVA
Research. Enero. Ciudad de México . Retrieved 25 January, 2011, from http://www.bbvaresearch.com/KETD/ketd/esp/index.jsp.
Becker, H. (2006). High Noon in the Automotive Industry. Germany. Spriger. Bellabona, P. and F. Spigarelli (2007). “Moving from Open Door to Go Global:
China goes on the world stage”. International Journal of Chinese Culture and Management, Vol. 1, No. 1: 93-107.
Benedetti, M. (2000). Antología Poética. México, D.F. ALFAGUARA.

401
Bennett, D. and K. Sharpe (1985). Transnational Corporations Versus the State. The Political Economy of the Mexican Auto Industry. Princeton, N.J. Princeton University Press.
Berger, R. (2011). “The End of China Cycle?”. Our view on manufacturing
footprint optimization. Detroit. Roland Berger Strategy Consultants. December. Retrieved 10 January, 2012, from http://www.rolandberger.com/media/publications/2012-01-03-rbsc-pub-The_end_of_the_China_cycle.html.
Berry, J.L. et al. (1993). The Global Economy. Resource Use, Locational Choice,
and International Trade. New Jersey. Prentice Hall. Besoain, A. (2010). “Termina ‘desvielado’ negocio de autos chinos de Elektra”.
Retail Latin America. 26 February. Retrieved 20 March, 2010, from http://retailchile.blogspot.com/2010/02/termina-desvielado-negocio-de-autos.html.
Best, M. H. (1990). The New Competition. Institutions of Industrial Restructuring.
Cambridge. Polity Press. Bhagwati, J. (2009). “Obama and trade: an alarm sounds”. Financial Times
FT.com. 8 January. Retrieved 10 January, 2009, from http://www.ft.com/cms/s/bfd9e546-dda5-11dd-930e-000077b07658,dwp_uui=73adc504-2ffa-11da-ba9f-00000e2511c8,print=yes.html.
Bhaskar. K. (1989). The Future of the World Motor Industry. London and New
York. Kogan Page Limited, Nichols Publishing Company. Bhattasali, D., Li, S. and Martin. W. (2004). “Impacts and Policy Implications of
WTO Accession for China”. In: D. Bhattasali, S. Li and W. Martin (Ed). China and the WTO. Accession, Policy, Reform, and Poverty Reduction Strategies. Washington D.C. The World Bank and Oxford University Press: 1-17.
Bittencourt, G. G. Carracelas, A. Doneschi, N. and Reig Lorenzi (2011). Efectos
de China sobre la captación de IED en América Latina. Departamento de Economía, Facultad de Ciencias Sociales, Universidad de la República. Montevideo, Uruguay. Retrieved 10 November, 2011, from (http://www.bcu.gub.uy/Comunicaciones/JornadasdeEconoma/t_doneschi_andrea_2011_.pdf).
Black, T. (2010). “More Car Jobs Shift to Mexico”. Bloomberg Businessweek. 24
June. Retrieved 6 July, 2010, from (http://wwwbusinessweek.com/print/magazine/content/10_27/b418501).
Blaikie, N. (2003). Approaches to Social Enquiry. Polity Press. Cambridge.

402
Blaikie, N. (2011). Designing Social Research. The Logic of Anticipation. 2nd Edition. Polity Press. Cambridge. Blázquez-Lidoy, J. J. Rodríguez and J. Santiso (2007). “Should Latin America
Fear China? In: J. Santiso (Ed.). The Visible Hand of China in Latin America. Organisation for Economic Cooperation and Development (OECD). Development Centre. Paris, France. OECD Publishing: 45-83.
Boyer, R. and D. Drache (1996). “Introduction”. In Robert Boyer and Daniel
Drache (Ed.). States Against Markets. London and New York. Routledge: 1-27.
Boyer, R. and M. Freyssenet (2000). “The World that Changed the Machine.
Synthesis of GERPISA Research Programs 1993-1999”. In: M. Freyssenet and Y. Lung (Dir.). Actes de GERPISA, 8-10 June. Paris, France.
Booz-Allen & Hamilton and INFOTEC (1987). Industria de Autopartes. México.
BANCOMEXT. Secretaría de Comercio y Fomento Industrial (SCFI). Bradshaw, M., L. Wood, and S. Williamson (2001). “Applying qualitative and
quantitative research: a social impact assessment of a fishery”. Applied Geography, 21: 69-85.
Breslin, S. (2005). “Power and production: rethinking China’s global economic
role”. Review of International Studies 31: 735-753. Bryman, A. (2012). Social Research Methods. 4th Edition. Oxford, New York.
Oxford University Press. Buckley, P. J. (2000). Multinational Firms, Cooperation and Competition in the
World Economy. London. McMillan Press Ltd. Buckley, P.J. and Casson, M.C. (1976). The Future of the Multinational
Enterprise. (1st edn). MacMillan. London. Bungsche, H. (2007). “Developing an Automobile Industry: China a Model for
Other Developing Countries?” 15th GERPISA International Colloquium. 20-22 June. Paris, France: http://gerpisa.org.
Cameron J. (2006). DSE 2006: Notes of Class. School of Development Studies.
Norwich. University of East Anglia (Mimeo). Cantera, S. (2006). “Compiten Ford y GM con bandera mexicana”. El Norte. 7
August. Retrieved 8 August, 2006, from http://www.elnorte.com/negocios/articulo/661101/default.asp?Param=7.
Cantera, S. (2009). “Frenarán con NOM autos chinos”. Reforma. 11 September.
Retrieved 12 January, 2010, from http://www.reforma.com/negocios/articulo/1033271/.
403
Cañas. J. And R. Coronado (2004). “U.S.-Mexico Trade: Are We Still Connected?” El Paso Business Frontier, Issue 3. Federal Reserve Bank of Dallas: 3-5.
Carrillo, J. (2004). “NAFTA: The Process of Regional Integration of Motor
Vehicle Production”. In: J. Carrillo, L. Yannick and R. van Tulder (eds) Cars, carriers of regionalism? New York. Palgrave McMillan in association with GERPISA, pp. 104-117.
Carrillo, J. (2007). “La industria maquiladora en México: evolución o
agotamiento?” Comercio Exterior, Vol. 57, No. 8, Agosto: 668-681.
Carrillo, J.and R. Hinojosa (2001). “Cableando el norte de México: La evolución de la industria maquiladora de arneses”. Región y Sociedad Vol. XIII, No. 21: 79-114.
Carrillo, J. and A. Lara (2003). “Maquiladoras en México y coordinación
centralizada: ¿Una nueva generación de empresas?”. Cuadernos del Cendes, Vol.20, No.54: 121-148.
Carrillo, J. and R. Gomis (2005a). “Integración Económica y Maquiladoras en
México: Evolución y Perspectivas frente al Reto de China”. In: R. Partida y J. Carrillo (Coords.). Integración Regional y Globalización: impactos económicos y sindicales. México. D.F. Centro Universitario de Ciencias Sociales y Humanidades (CUCSH), Fundación Friedrich Ebert, Centro Americano para la Solidaridad Sindical Internacional (AFL-CIO), Sindicato de Trabajadores Académicos de la Universidad de Guadalajara (STAUdG): 31-47.
Carrillo, J. and R. Gomis (2005b). “Generaciones de Maquiladoras: Un primer
acercamiento a su medición”. Frontera Norte. Vol. 17, No. 33. Enero-Junio: 25-51.
Carrillo, J. and I. Plascencia (2007). “La Industria de los Televisores y la
Competencia México-China por el Mercado Estadounidense”. In: E. Dussel and Y. Trápaga (Eds.). China y México: Implicaciones de una Nueva Relación. México D.F. Nuestro Tiempo, Fundación Friedrich Ebert, ITESM, UNAM: 209-232.
Carvalho, E. et al. (2010). “The Effects of the crisis on the auto assembler’s investment strategies in Brazil and China”. 18th International Gerpisa Colloquium. 9-11 June, 2010. Berlin. Retrieved 3 June, from http://gerpisa.org/en/node/752.
Cass, D. Z., B. Williams and G. Barker (2003). “China and the reshaping of the World Trade Organization”. In: D.Z. Cass, B. Williams and G. Barker (Ed). China and the World Trading System. Entering the New Millennium. Cambridge. Cambridge University Press: 1-15.
404
Castells, M. (1996). The Rise of the Network Society. The Information Age: Economy, Society and Culture, Vol. I. Cambridge and Oxford. Blackwell Publishers.
CATARC (2007). Research Report on Boosting the Strategic Cooperation
between Mexican and Chinese Auto & Auto Parts. China Automotive Technology & Research Center. Shanghai. China. June 8.
CBO Motors (2010). CBO Motors Website. Retrieved 20 December, 2010, from
http://www.cbomotors.com. CEPAL (Comisión Económica para América Latina y el Caribe) (1992).
Reestructuración y Desarrollo de la Industria Automotriz Mexicana en los Años Ochenta: Evolución y Perspectivas. Estudios e Informes de la CEPAL 83. Santiago de Chile. Comisión Económica para América Latina y el Caribe. Naciones Unidas.
CEPAL (Comisión Económica para América Latina y el Caribe) (2010). La
inversión extranjera directa en América Latina y el Caribe 2010. Santiago de Chile. Comisión Económica para América Latina y el Caribe. Naciones Unidas.
CCPIT (China Council for the Promotion of International Trade) (2007). Chinese
Business Guide (Auto Volume). October. China Council for the Promotion of International Trade. Economic Information Department.
Chantasasawat, B. et al. (2008). “Multinational enterprises in China, East Asia,
Latin America and Eastern Europe. Moving out or moving in?” Journal of Chinese Economic and Foreign Trade Studies, Vol. 1 No. 2: 122-135.
Chantasasawat et al. (2010). “FDI Flows to Latin America, East and Southeast
Asia, and China: Substitutes or Complements?” Review of Development Economics, 14(3): 533–546.
Chappell, L. (2012). “Why so many Mexican plants? Do the math”. Automotive
News. 6 February. Retrieved 6 February, 2012, from http://www.autonews.com/apps/pbcs.dll/article?AID=/20120206/OEM01/302069909/1126.
Chen, X. (2005). As Borders Bend. Transnational Spaces on the Pacific Rim.
Lanham. Rowman & Littlefield Publishers, Inc. Chin, T. (2010). China’s Automotive Modernization. The Party-State and
Multinational Corporations. London. Palgrave McMillan. China Economic Net (2012a). “Great Wall to develop electric car with U.S.
partner”. Auto--China Economic Net. 9 January. Retrieved 10 January, 2012, from http://en.ce.cn/Industries/Auto/201204/26/t20120426_23277109.shtml.

405
China Economic Net (2012b). “Foreign auto investment no longer ‘encouraged’”. Auto--China Economic Net. 26 April. Retrieved 20 April, 2011, from http://en.ce.cn/Industries/Auto/index_2.shtml.
Cho, D.S. and H.C. Moon (2002). From Adam Smith to Michael Porter. Evolution
of Competitiveness Theory. Asia-Pacific Business Series - Vol. 2. London. World Scientific Publishing.
Chow, N. and J. Yang (2008). “As exports fall, Geely suspends Mexico plant”.
Automotive News. 12 November. Retrieved 23 June, 2009, from (www.automotivenews.com).
Christopherson, S., H. Garretsen, and R. Martin (2008). “The world is not flat:
putting globalization in its place”. Cambridge Journal of Regions, Economy and Society 1: 343-349.
Chrysler, M. (2011). “Chinese Auto Makers Flex Muscles in Emerging Markets”.
WARDSAUTO.COM. 26 July. Retrieved 28 July, 2011, from http://www.wardauto.com.
Ciferri, L. (2011). “Italy born, Mexico-built, China-sold Fiat 500 epitomizes auto
globalization”. Automotive News Europe. 19 April. Retrieved 20 April, 2007, from http://www.autonews.com/apps/pbcs/dll/article.
CNIMME (Consejo Nacional de la Industria Maquiladora y Manufacturera de Exportación) (2011). “Memoria Estadística de la Industria Maquiladora y Manufacturera de Exportación”. México, D.F. Retrieved 15 January, 2011, from http://www.cnimme.index.org.mx/index.php?p=menuEstadisticas&title=Estadisticas.
Cohen, R. (1987). The New Helots. Migrants in the International Divison of Labour. England. Gower. Aldershot.
Coffey, W. J. (1996). “The ‘Newer’ International Division of Labour”. In P.W.
Daniels and W.F. Lever (Ed.). The Global Economy in Transition. Essex. Longman.
Cornejo, R. (2005). “México y la competitividad de China”. In: S. M. Cesarín and
C. Moneta (Comp.). China y América Latina. Nuevos Enfoques sobre Cooperación y Desarrollo. ¿Una Segunda Ruta de la Seda?. BID-INTAL. Buenos Aires: 235-268.
Cravino, J., D. Lederman and M. Olarreaga (2007a). “Substitution between
Foreign Capital in India, China, the Rest of the World and Latin America: Much Ado about Nothing?” Policy Research Working Paper 4361. September. The World Bank.

406
Cravino, J., D. Lederman and M. Olarreaga (2007b). “Foreign Direct Investment in Latin America during the Emergence of China and India: Stylized Facts” Policy Research Working Paper 4360. September. The World Bank.
Cravino, J., D. Lederman and M. Olarreaga (2009). “Foreign Direct Investment in
Latin America during the Emergence of China and India: Stylized Facts”. In: D. Lederman, D., M. Olarreaga, M. and G. Perry (Eds.). China’s and India’s Challenge to Latin America. Opportunity or Threat?. The International Bank for Reconstruction and Development / The World Bank. Washington, D.C.: 121-142.
Danermark, B. et al. (2002). Explaining Society. Critical realism in the social
sciences. London and New York. Routledge. Davidow, W. H. and M. S. Malone (1993). The Vitrual Corporation. Structuring
and Revitalizing the Corporation for the 21st Century. New York. Harper Business.
Davies, K. (2010). “FDI from China and its policy context”. Columbia FDI
Profiles, October 18. Vale Columbia Center on Sustainable International Investment. Columbia University.
De Juan, J., E. León and R. Lӧhner (2008). Mexico’s Evolving Sweet Spot in the Globalization Landscape. Boston, Massachusetts. The Boston Consulting Group.
De la Cruz, J.L., A. I. Boncheva and A. Ruiz-Porras (2008). “Competition
between Latin America and China for US Direct Investment”, Global Economy Journal, Volume 8, Issue 2: 1-11.
Delgado, R. (2009). “Orientales de frente”. La Diaria. 10 December. Retrieved 21
January, 2010, from http://ladiaria.com.uy/articulo/2009/12/orientales-de-frente.
Devlin, R., A. Estevadeordal and A. Rodríguez-Clare (Eds.) (2006). The
Emergence of China. Opportunities and Challenges for Latin America and the Caribbean. Inter-American Development Bank, David Rockefeller Center for Latin American Studies, Harvard University. Washington, D.C.
Dicken, P. (2003). Global Shift. Reshaping the Global Economic Map in the 21st
Century, Fourth Edition. London. Sage Publications Ltd. Dicken, P. et al. (2001). “Chains and networks, territories and sacales: towards a
relational framework for analysing the global economy”, Global Networks, 1, 2: 89-112.
Donnelly, T. (2008). “The Chinese Car Industry: Opportunity or Threat? 16th
GERPISA International Colloquium. 18 June. Turin, Italy. Retrieved 20 May, 2009, from http://gerpisa.org.

407
Downer, S. (2007). “VW Mexico feels heat of euro-dollar friction”. Automotive News. 9 August. Retrieved 15 August, 2007, from http://www.automotivenews.com.
DRC-SAE-VW Group China (2010). Blue Book of Automotive Industry. Annual Report on Automotive Industry in China (2010). Research Department of Industrial Economy, Society of Automotive Engineers of China, Volkswagen Group China.
Drache, D. (1996). “From Keynes to K-Mart. Competitiveness in a corporate
age”. In Robert Boyer and Daniel Drache (Ed.). States Against Markets. London and New York. Routledge: 29-61.
Drucker, P. (1972). Concept of the Corporation. New York and London. New
American Library. Dunne, M. (2011). “Chinese auto exports: Mortal threat or paper tiger?”
Automotive News China. 23 August. Retrieved 24 August, 2011, from (http://www.autonewschina.com/en).
Dunne, M. (2012). “China’s automakers will get Western technology through
their JV ‘baby brands’”. Automotive News. 3 April. Retrieved 4 April, 2012, from http://www.autonews.com.
Dunning, J. H. (2000). “Regions, Globalization and the Knowledge Economy:
The Issues Stated”. In: J.H. Dunning (Ed.). Regions, Globalization and the Knowledge Economy. Oxford. Oxford University Press: 7-41.
Dunning, J. H. (1993). Multinational Enterprises and the Global Economy. Great
Britain. Addisson-Wesley Publishing Company. Dunning, J. H. (2000). “The eclectic paradigm as an envelope for economic and
business theories of MNE activity”. International Business Review, 9: 163-190.
Dunning, J. H. (2006). “Towards a new paradigm of development: implications
for the determinants of international business”. Transnational Corporations, Vol. 15, No. 1, April: 173-227.
Dussel Peters, E. (2005a). Economic Opportunities and Challenges Posed by
China for Mexico and Central America. Studies 8. Bonn. Deutsches Institut für Entwicklungspolitik (DIE).
Dussel Peters, E. (2005b). “The implications of China’s entry into the WTO for
Mexico”. Global Issue Papers No. 24. November. Heinrich Böll Foundation. Berlin.

408
Dussel, E. (2005c). “El caso de las estadísticas comerciales entre China y México: para empezar a sobrellevar el desconocimiento bilateral”. Economía Informa, Núm. 335, julio-agosto: 50-61.
Dussel Peters (2007). “La relación económica y comercial entre China y México:
Propuestas para su profundización en el corto, mediano y largo plazo”. In: E. Dussel Peters (Comp.) (2007). Oportunidades en la relación económica y comercial entre China y México. México, D. F. CEPAL, SRE, CECHIMEX, Senado de la República. Naciones Unidas: 165-200
Dussel Peters, E. (2009). “The Mexican Case”. In: R. Jenkins and E. Dussel (Eds.). China and Latin America. Economic relations in the twenty-first century. Studies 49. Bonn, Mexiko City. Deutsches Institut für Entwicklungspolitik (DIE)-German Development Institute. In cooperation with Universidad Nacional Autónoma de México (UNAM)/Centro de Estudios China-México (CECHIMEX.: 279-393.
Dussel Peters, E. (2010a). “Mexico’s Economic Relationship with China: A Case
Study of the PC Industry in Jalisco, Mexico”. Cuadernos de Trabajo del CECHIMEX No. 1. Universidad Autónoma de México, Facultad de Economía, Centro de Estudios China-México. Ciudad de México.
Dussel Peters, E. (2011). “México: hacia una agenda estratégica en el corto,
mediano y largo plazo con China. Propuestas resultantes de las labores del Grupo de Trabajo México-China (2009-2010)”. Cuadernos de Trabajo del CECHIMEX, Número 1. Facultad de Economía, Centro de Estudios China-México, Universidad Nacional Autónoma de México.
Dussel Peters, E. (2012a). “The Auto Parts-Automotive Chain in Mexico and
China: Co-operation Potential?” The China Quarterly, 209, March: 82-110.
Dussel Peters, E. (2012b). “Políticas Chinas de Comercio Exterior e Inversión
Extranjera y sus Efectos”. In: G. Bittencourt (Coord.). El Impacto de China en América Latina: Comercio e Inversiones. Serie Redmercosur 20. Montevideo: 51-79
ECLAC (1998). Foreign Investment in Latin America and the Caribbean. 1998
Report. Economic Commission for Latin America and the Caribbean. United Nations. Santiago de Chile.
ECLAC (2004a). Latin America and the Caribbean in the World Economy 2002-
2003. Economic Commission for Latin America and the Caribbean, United Nations. Chile.
ECLAC (2004b). Foreign Investment in Latin America and the Caribbean 2003.
Economic Commission for Latin America and the Caribbean, United Nations. May. Chile.

409
EIU (2006). “Driven. Are China’s Car manufacturers ready to compete in the US and Europe? An Economist Intelligence Briefing Paper, sponsored by Roland Berger Strategy Consultants.
El Economista (2011). “México exporta 350% más en autos”. El Economista. 31
March. Retrieved 31 March, 2011, from http://eleconomista.com.mx/industrias/2011/03/31/mexico-exporta-350-mas-autos.
El Semanario (2012). “México producirá 4.5 millones de vehículos en 2014”. El
Semanario. 26 January. Retrieved 27 January, 2012, from http://elsemanario.com.mx/categorias/Autos/?id=7.
El Semanario (2012b). “Aumenta venta de llantas en 15% durante 2011”. El
Semanario. 12 January. Retrieved 14 January, 2012, from http://el semanario.com.mx.
Ernst, D. and L. Kim (2002). “Global production netwoks, knowledge diffusion,
and local capability formation”, Research Policy, 31: 1417-1429. Ernest & Young (2005). China’s automotive sector – at the crossroads. In
cooperation with the Economist Intelligence Unit. (www.ey.com). ESCAP (Economic and Social Commission for Asia and the Pacific) (2010).
Trade Statistics in Policymaking. A Handbook of Commonly Used Trade Indices and Indicators. Revised Edition. June. Bangkok, Thailand. United Nations.
Estall, R.C. (1985). “Stock control in manufacturing: the just-in-time system and
its locational implications”, Area, Vol. 17, Number 2. EVI (2009). “Electric truck manufacturer EVI moves to California”. Electric
Vehicles International Web page. Retrieved 24 January, 2011, from (www.evi-usa.com).
EVI (2010). “Cambio de Tecnología a los Vehículos”. Electric Vehicles
International Web page. Retrieved 24 January, 2011, from (www.evi-mex.com).
Excelsior (2011). “Llantas ilegales invaden México; cada año llegan 5 millones”.
Exceslior. 15 June. Retrieved 14 January, 2012, from http://excelsior.com.mx.
Eyerdam, R. (2009). “Mexico, the Other China”. Florida Shiper. Vol. 34, Issue 8.
23 February: 16-17. Fan, H. (2009). “FAW Exports 920 Xiali cars to Mexico”. China FAW Group
Corporation. 25 June. Retrieved 31 August, 2010, from http://www.faw.com/news.

410
Faria, A.J. (2010). Major Automotive Assembler Investment Announcements. Office of Automotive & Vehicle Research, Odette School of Business, University of Windsor, Ontario. 1 February.
Faria, A.J. (2011). Major Automotive Assembler Investment Announcements.
Office of Automotive & Vehicle Research, Odette School of Business, University of Windsor, Ontario. 31 January.
Fishman, T.C. (2005). China Inc. How the Rise of the Next Superpower
Challenges America and the World. New York. Scribner. Fitz-Gerald, K. (2009). “Is Mexico the “New” China?”. Money Morning. 13
November. Retrieved 10 December, 2009, from http://moneymorning.com/2009/11/13/mexico-leapfrogs-china. Fletwood, S. (Ed.) (1999). Critical Realism in Economics. Development and
debate. London and New York. Routledge. Foreign Affairs (1994), “The Fight over Competitiveness”. Responses. Foreign
Affairs, Volume 73, No. 4, July/August: 186-203. Forero, J. (2003). “As China Gallops, Mexico Sees Factory Jobs Slip Away”. The
New York Times. 3 September. Retrieved 20 May, 2007, from http://www.nytimes.com/2003/09/03/international/americas/03MEXI.html?pagewanted=all.
FOTON Mexico (2011). Foton Mexico Website. Retrieved 15 August, 2011, from
http://www.fotonmexico.com. Freyssenet, M. (2009). “Conclusion: The Second Automobile Revolution –
Promises and Uncertainties”. In: M. Freyssenet (Ed.). The Second Automobile Revolution. Trajectories of the World Carmakers in the 21st Century. London. Palgrave MacMillan, in association with GERPISA: 443-454.
Friedman, T. (2005). The World is Flat. The Globalized World in the Twenty-first
Century. London. Penguin Books. Frischtak, C. (2004). “Multinational Firms’ Responses to Integration of Latin
American Markets”. Business and Politics, Vol. 6, Issue 1, Article 5: 1-37. Fröbel, F., J. Heinrichs and O. Kreye (1981). The New International Division of
Labour. Structural unemployment in industrialised countries and industrialisation in developing countries. London. Cambridge University Press.
Fujita, M. (2007). “The development of Regional Integration in East Asia: From
the Viewpoint of Spatial Economics”. Review of Urban and Regional Development Studies, Vol. 19, No. 1: 2-20.

411
Fujita, M., P. Krugman and A. J.Venables (1999). The Spatial Economies: Cities, Regions and International Trade. Cambridge. The MIT Press.
Gachúz, J.C. (2009). “La Crisis Mundial en el Sector Automotriz, China: ¿Aliado
Estratégico de México?” Journal de Investigación de la Escuela de Graduados e Innovación. Septiembre. ITESM: 18-27.
Gallagher, K.S. (2006). China Shifts Gears. Automakers, Oil, Pollution, and
Development. Cambridge and London. The MIT Press. Gallagher, K. and R. Porzecanski (2007). “What a Difference a Few Years Makes:
China and the Competitiveness of Mexican Exports”. Oxford Development Studies, Vol. 35, No. 2, June: 219-223.
Gallagher, K. and R. Porzecanski (2008). “China Matters. China’s Economic
Impact in Latin America”. Latin American Research Review, Vol. 43, No. 1: 185-200.
Gallagher, K., J.C. Moreno-Brid, and R. Porzecanski (2008). “The Dynamism of
Mexican Exports: Lost in (Chinese) Translation”. World Development, Vol. 36, No. 8: 1365-1380.
Gallagher, K. and R. Porzecanski (2010). The Dragon in the Room. China & the
Future of Latin America Industrialization. Stanford, California. Stanford University Press.
Gao, Paul (2002). “A tune-up for China’s auto industry”, The McKinsey
Quarterly, Number 1: 144-155. García-Herrero, A. and D. Santabarbera (2007). “Does China Have an Impact on
Foreign Direct Investment to Latin America?” In: J. Santiso (Ed.). The Visible Hand of China in Latin America. Development Centre Studies. Paris, France. Organisation for Economic Cooperation and Development, OCDE Publishing: 133-150.
Garnsey, E. (1981). “The Rediscovery of the Division of Labour”. Theory and
Society Vol. 10, No. 3: 337-358. Gasgoo (2009). “Geely may downsize assembly project in Mexico”, Automotive
News. 6 March. Retrieved 23 May, 2009, from http://autonews.gasgoo.com.
Gasgoo (2010). “Geely denies high expenses for acquiring Volvo”. Automotive
News. 13 March. Retrieved 13 March, 2010, from http://autonews.gasgoo.com/AutoNews/Autobiz.
Gerber, J. and J. Carrillo (2002). “Are Tijuana’s and Mexicali’s Maquiladora
Plants Competitive?” Briefing Paper. July. San Diego Dialogue, University of California. San Diego.

412
Gereffi, G. (1999). “A Commodity Chains Framework for Analyzing Global Industries”. Institute of Developing Studies. Background Notes for the Workshop on Spreading the Gains from Globalisation. (www.ids.ac.uk/ids/global/conf/wkscf.html).
Gereffi, G. (2001). “Beyond the Producer-driven/Buyer-driven Dichotomy. The
Evolution of Global value Chains in the Internet Era”, IDS Bulletin Vol. 32, No. 3: 30-40.
Gereffi, G. (2009). “Development Models and Industrial Upgrading in China and
Mexico”. European Sociological Review, Vol. 25, Number 1: 37-51. Gereffi, G., J. Humprey, R. Kaplinsky and T.J. Sturgeon (2001). “Introduction:
Globalisation, Value Chains and Development”, IDS Bulletin Vol. 32, No. 3: 1-8.
Giddens, A. (2000). Runaway World. How Globalization is Reshaping our Lives.
New York. Routledge. Global Auto Industry (2011). “Renaissance for Mexican Manufacturing?”.
LATINtalk. November. Retrieved 14 December, 2011, from (http://www.globalautoindustry.com/article.php?id=7377&jaar=2011&maand=11&target=Latin).
Global Auto Industry (2012). “Mexican economy poised to rival BRICS”.
LATINtalk April. Retrieved 6 April, 2012, from http://www.globalautoindustry.com/article.php?id=8055&jaar=2012&maa nd=4&target=Latin. Global Auto Industry (2012b). “New Survey Predicts China Will Add 30 Million
New Cars Each Year”. CHINAtalk March. Retrieved 25 March, 2012, from http://www.globalautoindustry.com/article.php?id=7976&jaar=2012&ma=target=China.
Global Auto Industry (2012c). “South American Consumers Wooed by China’s
Low Cost Cars”. LATINtalk. February. Retrieved 29 February, 2012, from http://www.globalautoindustry.com/article.php?id=7851jaar=2012&maand=&target=Latin.
Goel, A., N. Moussavi and V. N. Srivatsan (2008). “Time to rethink offshoring”.
The McKinsey Quarterly. September. McKinset & Company: 1-5. González-Aréchiga. B. and R. Barajas (Comp.) (1989). Maquiladoras: Ajuste
Estructural y Desarrollo Regional. Tijuana, B.C. El Colegio de la Frontera Norte. Fundación Friedrich Ebert.

413
Greider, W. (2001). “ A New Giant Sucking Sound”. The Nation. 13 December. Retrieved 20 January, 2008, from (http://www.thenation.com/article/new-giant-sucking-sound).
Grix, J. (2010). The Foundations of Research. London. Palgrave McMillan. Gruben, W. (2004). “Have Mexico’s Maquiladoras Bottomed Out? Soutwest
Economy. Federal Reserve Bank of Dallas. January/February: 1-2. Grupo Electra (2007). “Grupo Elektra introduce la línea de autos FAW”,
Comunicado de Prensa, Noviembre 22. Retrieved 12 January, 2008, from (www.grupoelektra.com.mx).
Grupo Salinas-FAW (2007). “Grupo Salinas y FAW Group impulsan a la
industria automotriz mexicana”, Comunicado de Prensa, Noviembre 22. Retrieved 12 January, 2008, from (www.gruposalinas.com).
Guthrie, D. (2006). China and Globalization. The Social, Economic, and Political
Transfromation of Chinese Society. London and New York. Routledge Taylor & Francis Group.
Haley, U. (2012). Putting the Pedal to the Metal. Subsidies to China’s Auto-Parts
Industry from 2001- to 2011. EPI Briefing PaperNo. 316. January 31.
Harris, N. (2003). The Return of Cosmopolitan Capital. Globalization, the State & War. London and New York. I. B. Tauris.
Harris, N. (2008). “Speculations on the theme of Globalisation and the end of
national economic development”. Simposium Structural Change and Development Policies: Evaluation and New Avenues for the Construction of Sustainable and Viable Alternatives. Metropolitan Autonomous University (UAM), Xochimilco Campus. Mexico City. 19-22 May.
Harwit, E. (1995). China’s Automobile Industry. Policies, Problems and
Prospects. M.E. Sharpe. New York and London. Harwit, E. (2001). “The Impact of WTO Membership on the Automobile Industry
in China”. The China Quarterly: 655-670. Haugh, D., et al. (2010). “The Automobile Industry in a Beyond the Crisis”.
OECD Economics Department Working Papers, No. 745. OECD Publishing. Retrieved 22 February, 2011, from (doi: 10.1787/5kmmp8wg6cmq-en).
Hay, C. (2012). “The ‘dangerous obsession’ with cost competitiveness…and the
not so dangerous obsession with competitiveness”. Cambridge Journal of Economics, 36: 463-479.

414
Held, D. and A. McGrew (Ed.) (2003). The Global Transformations Reader. An Introduction to the Globalization Debate. Oxford. Polity Press.
Henderson, J. (1999). The Globalisation of High Technology Production. London
and New York. Routledge. Henderson, J. (2002). “Globalisation on the Ground: Global Production Networks,
Competition, Regulation and Economic Development”. Working Paper Series, Paper No. 38, Centre of Regulation and Competition, Institute for Development Policy and Management, University of Manchester, Manchester, United Kingdom.
Henderson, J., et al. (2002). “Global production networks and the analysis of
economic development”, Review of International Political Economy 9:3, August: 436-464.
Hernández, M. (2010). “DFM va por el mercado de Pick Up’s pequeñas”.Revista
Transporte y Turismo. 16 August. Retrieved 20 August, 2010, from http://www.tyt.com.mx.
Hernández, R. and I. Romero (2009). Módulo para Analizar el Crecimiento del
Comercio Internacional (MAGIC Plus). Serie Estudios y Perspectivas 107. Marzo. México, D.F. CEPAL, Naciones Unidas. Canadian International Development Agency.
Hess, M. and H. Wei-Chung (2006). “Guest editorial”, Environment and Planning
A, volume 38: 1193-1204. Hirst, P.Q. and G.F. Thompson (1999). Globalization in Question. The
International Economy and the Possibilities of Governance. Cambridge. Polity Press.
Hoeschele, W. (2002). “The Wealth of Nations and the Turn of the Millennium: A
Classification System Based on The International Division of Labour”. Economic Geography, 78 (2). April: 221-244.
Hogenboom, B. (2008). “Latin America and the rise of China: possibilities and
obstacles for development”. Paper for Conference “The Rise of China”, 7-8 March. The McCulloch Center for Global Initiatives, Mount Holyoke College. Retrieved 5 November, 2011, from http://www.mtholyoke.edu/global/docs/global/hogenboom_paper_march_2008.pdf.
Holweg, M., J. Luo and N. Oliver (2005). “The Past, Present and Future of China’s Automotive Industry: A Value Chain Perspective”. Working Paper. August. The Cambridge-MIT Institute, Centre for Competitiveness and Innovation. Cambridge.

415
Houghton Mifflin Company (2009). The American Heritage® Dictionary of the English Language, Fourth Edition. Retrieved 15 April, 2010, from http://www.thefreedictionary.com/maquiladora.
Hudson, Ray (1994). “New production concepts, new production geographies?
Reflections on changes in the automobile industry”. Transactions of the Institute of British Geographers, 19: 331-345.
Humprey, J., Y. Lecler, and M.S. Salerno (2000). “Introduction”. In: J. Humprey,
Y. Lecler, and M.S. Salerno (Eds.). Global Strategies and Local Realities. The Auto Industry in Emerging Markets. New York. MacMillan Press Ltd in association with GERPISA: 1-15.
Humprey, J. and O. Memedovic (2003). The Global Automotive Industry value
Chain: What Prospects for Upgrading by Developing Countries. Sectoral Studies Series. Vienna. United Nations Industrial Development Organisation.
Humprey, J. and D. Messner (2006a). “China and India as Emerging Global
Governance Actors: Challenges for Developing and Developed Countries”, IDS Bulletin Vol. 37, No. 1, January: 107-114.
Humprey, J. and D. Messner (2006b). “The Impact of the Asian and other Drivers
on Global Governance”, IDS Asian Drivers Programme (http://www.ids.ac.uk).
Hunt, H. (2004). “Shifting Gears. Mexico Fights for Position in Global Race”.
International Economy. Publication 1682. July. IDB (Inter-American Development Bank) (2010). Ten Years After the Take-off.
Taking Stock of China-Latin America and the Caribbean Economic Relations. October. Chengdu, China. Integration and Trade Sector. Inter-American Development Bank.
IDS Asian Drivers Team (2006). “The Impact of Asian Drivers on the Developing
World”, IDS Bulletin Vol. 37, No. 1, January: 3-11. Ietto-Gillies, G. (2002). Transnational Corporations. Fragmentation amidst
Integration. London and New York. Routledge. IMF (International Monetary Fund) (2012). World Economic Outlook Database.
IMF Web site: http://www.imf.org/external/pubs/ft/weo/2012/01/weodata/weoselgr.aspx.
INA (Industria Nacional de Autopartes) (2010). “Mexico’s Automotive Parts
Supplier Base. Importance and Current Trends. 19 August. Mexico, City. (Power Point Presentation).

416
INEGI (Several Issues). El Sector Automotriz en México. Serie Estadísticas Sectoriales. Instituto Nacional de Estadística y Geografía. Aguascalientes. México.
INEGI (2011). Banco de Información Económica. Instituto Nacional de
Estadística, Geografía e Informática. Retrieved 15 January, 2011, from http://dgcnesyp.inegi.org.mx/bdiesi/bdie.html.
Infolatina (2004). “CANACERO: China is not a threat to Mexico”. High Beam Research. 26 March. Retrieved 2 May, 2010, from http://www.highbeam.com.
IRSC (Institute for Regional Studies of the Californias) (2009). The Flow of Used
and Waste Tires in the California-Mexico Border Region. San Diego State University. Sacramento, California. California Integrated Waste Management Board.
Jenkins, R. (1984). “Divisions over the international division of labour”.
Capital&Class, Number 22, Spring: 28-57. Jenkins, R. (1987). Transnational Corporations and the Latin American
Automobile Industry. London. MacMillan. Jenkins, R. (2008). “Measuring the Competitive Threat from China for other
Southern Exporters”. The World Economy: 1351-1366. Jenkins, R. (2009). “The Latin American Case”. In: R. Jenkins and E. Dussel
(Eds.). China and Latin America. Economic relations in the twenty-first century. Studies 49. Bonn, Mexiko City. Deutsches Institut für Entwicklungspolitik (DIE)-German Development Institute. In cooperation with Universidad Nacional Autónoma de México (UNAM)/Centro de Estudios China-México (CECHIMEX): 21-63.
Jenkins, R. (2010). “China’s Global Growth and Latin American Exports”. In: A. U. Santos-Paulino and G. Wan (Eds.). The Rise of China and India. London. United Nations University, Institute for Development Economics Research (UNU-WIDER), Palgrave McMillan: 220-240.
Jenkins, R. and E. Dussel Peters (2007). “The Impact of China on Latin America
and the Caribbean”. IDS Working Paper 281, May. Institute of Development Studies, University of Sussex. Brighton.
Jenkins, R. and E. Dussel Peters (2009). “Introduction”. In: R. Jenkins and E.
Dussel Peters (Eds.). China and Latin America. Economic relations in the twenty-first century. Studies 49. Bonn, Mexiko City. Deutsches Institut für Entwicklungspolitik (DIE)-German Development Institute. In cooperation with Universidad Nacional Autónoma de México (UNAM)/Centro de Estudios China-México (CECHIMEX): 1-19.

417
Jenkins, R., E. Dussel and M. Mesquita Moreira (2008). “The Impact of China on Latin America and the Caribbean”. World Development, Vol. 36, No. 2: 235–253.
Jincheng Corporation (2011). Jincheng Corporation. Retrieved 11 March, 2011,
from http://en.jincheng.com. Johnson, Scott (2002). “Mexico’s China Obsession”. Newsweek, 4 November.
Retrieved 7 March, 2006, from http//www.keepmedia.com. Jones, Daniel T. and James P. Womack (1985). “Developing Countries and the
Future of the Automobile Industry”, World Development, Vol. 13, No. 3: 393-407.
Jullens, J., B. Russo and H. Xu (2012). The Circuitous Path to Electrification of
China’s Automotive Industry. Perspective. Greater China. Booz & Company Inc.
Just-auto (2012). “China Auto Industry”. Just-auto. Retrieved 2 April, 2012, from
http://www.just-auto.com. Kaplinsky, R. (2005). Globalization, Poverty and Inequality. Cambridge, United
Kingdom. Polity Press. Kaplinsky, R. (2006). “Introduction”, IDS Bulletin Vol. 37, No.1, January: 1. Kaplinsky, R. and M. Morris (2001). A Handbook for Value Chain Research.
Prepared for the IDRC. Kaplinsky, R. and D. Messner (2008). “Introduction: The Impact of Asian Drivers
on the Developing World”. World Development Vol. 36, No. 2: 197-209. Klier, T. and J. Rubenstein (2006). “Competition and trade in the U.S. auto parts
sector”. Chicago Fed Letter. Number 22. January. Essays on Issues. The Federal Reserve Bank of Chicago.
Klier, T. and J. Rubenstein (2008). Who Really made Your Car? Restructuring
and Geographic Change in the Auto Industry. Kalamazoo, Michigan. W.E. Upjohn Institute for Employment Research.
KPMG (2008). Momentum: KPMG’s Global Auto Executive Survey 2009.
Industry concerns and expectations 2009-20013. December. United Kingdom. KPMG International.
KPMG (2009). Momentum:China’s Automotive Components Sector Emerging
from the Crisis. July. China. KPMG International. Kristof, N. D. and S. Wudunn (1994). China Wakes. The Struggle for the Soul of a
Rising Power. London. Nicholas Brealey Publishing.

418
Krugman, P. (1993). Geography and Trade. Leuven and London. Leuven University Press and MIT Press.
Krugman, P. (1998). “What’s New About the New Economic Geography”.
Oxford Review of Economic Policy, Volume 14, No. 2: 7-17. Krugman, Paul (1994). “Competitiveness: A Dangerous Obsession”. Foreign
Affairs, Volume 73, No. 2, March/April: 28-44. Krugman, P. (1996). “Making Sense of the Competitiveness Debate”. Oxford
Review of Economic Policy, Volume 12, No. 3: 17-25. Lall, S. (1998). “Exports of Manufactures by Developing Countries: Emerging
Patterns of Trade and Location”. Oxford Revire of Economics, Vol. 14, No. 2: 54-73.
Lall, S. (2000). “The Technological Structure and Performance of Developing
Country manufactured Exports, 1985-98”. Oxford Development Studies, Vol. 28, No. 3: 337-369.
Lall, S. (2001). “Competitiveness Indices and Developing Countries: An
Economic Evaluation of the Global Competitiveness Report”. World Development, Volume 29, No. 9: 1501-1525.
Lall, S. and M. Albaladejo (2004) “China’s Competitiveness Performance: A
Threat to East Asian Manufactured Exports?”, World Development 32 (9): 1441-1466.
Lall, S., M. Albaladejo, and M. Mesquita Moreira (2004). “Latin American
Industrial Competitiveness and the Challenge of Globalization”. Occasional Paper-SITI-05. Inter-American Development Bank, Integration and Regional Programs Department. INTAL-ITD. Lall, S, M. Albaladejo, and J. Zhang (2004). “Mapping Fragmentation and
Automobiles in East Asia and Latin America”. Oxford Development Studies, Vol. 32, No. 3. September: 407-432.
Lall, S. and J. Weiss (2005a). “China’s Competitive Threat to Latin America: An
Analysis for 1990-2002”. Oxford Development Studies Vol. 33, No. 2. June: 163-194.
Lall, S. and J. Weiss (2005b). “China’s Competitive Threat to Latin America: An
Analysis for 1990-2002”. Working Paper No. 120. QEH Working papers Series. January.
Lall, S. and J. Weiss (2007). “China and Latin America: Trade Competition,
1990-2002”. In: J. Santiso (Ed.). The Visible Hand of China in Latin America. Organisation for Economic Cooperation and Development (OECD). Development Centre. Paris, France. OECD Publishing: 85-107.

419
Lardy, N. (2002). Integrating China into the Global Economy. Washington, D.C. The Brookings Institution.
LATINtalk (2011a). “Where Is Latin America Car Craziest? Think Southern
Cone”. GlobalAutoIndustry.com. November. Retrieved 5 November, 2011, from (http://www.globalautoindustry.com).
Laursen, K. (1998). “Revealed Comparative Advantage and the Alternatives as
Measures of International Specialisation”. DRUID Working Paper No. 98-30. December. Copenhage, Denmark. Danish Research Unit for Industrial Dynamics.
Lederman, D., M. Olarreaga, M. and G. Perry (2009). “Latin America’s Response
to China and India: Overview of Research Findings and Policy Implications”. In: D. Lederman, D., M. Olarreaga, M. and G. Perry (Eds.). China’s and India’s Challenge to Latin America. Opportunity or Threat?. The International Bank for Reconstruction and Development / The World Bank. Washington, D.C.: 3-35.
Lee, H. and B.A. Anderson (2006). Automobile Industry of China: past, present
and future. World Review of Entrepreneurship, Management and Sustainable Development . 12 (1/2): 144-160.
Leung, A. (2005). “Understanding the so-called ‘China Threat’”. 1 July.
Retrieved 5 February, 2010, from http://www.andrewleunginternationalconsultants.com.
Lewis, P. (2002). “Agency, Structure and Causality in Political Science: A
Comment on Sibeon”, Politics, Vol. 22 (1): 17-23. Ley, S. (2010). “La industria maquiladora Mexicana y las Zonas Económicas
Especiales de China. Dos caminos hacia un mismo objetivo”. In: E. Dussel and Y. Trápaga (Ed). Hacia un diálogo entre México y China. Dos y tres décadas de cambios socioeconómicos. México, D.F. Friedrich-Ebert-Stiftung, China Institute of Contemporary International Relations (CICIR), CECHIMEX-UNAM, Senado de la República: 95-99.
Lifan (2010). “LIFAN AUTO MEXICO”. Opeasa (Operadora del Este Asiático).
PDF Presentation. Retrieved 25 June, 2011, from lifan.opeasa.com/pdf/lifanmexico2010.pdf.
Lim, S. H. (2008). “How Chinese Foreign Direct Investment Can Achieve
Success in Korea: M&A Deals in the Automotive and Semiconductor Industries”. Issues and Studies 44, No. 3. September: 177-204.
Lin, C. (2003). “What Is China’s Comparative Advantage? The Chinese Economy,
Vol. 36, No. 2, March-April: 3-20.

420
Liu, W. and P. Dicken (2006). “Transnational corporations and “obligated embeddedness”: foreign direct investment in China’s automobile industry”. Environment and Planning A, Volume 38: 1229-1247.
LMC Automotive (2012). 2012 China Automotive Monthly Executive Summary.
January. Oxford and Detroit. LMC Automotive. Retrieved 17 February, 2012, from http://www.lmc-auto.com.
López, J. and Potter, G. (Eds.) (2001). After Postmodernism. An Introduction to
Critical Realism. London and New York. The Athlone Press. Lu, Z. (2004). “On the Comparative Advantage of Chinese Industries”. The
Chinese Economy, Vol. 37, No. 2, March-April: 6-15. Machado, O. (2011). “Economía pirata”. CNNEXPANSIÓN.com. 4 July.
Retrieved 5 July, 2011, from http://www.expansion.com/negocios. MacKinsey Global Institute (2003). New Horizons: Multinational Company
Investment in Developing Countries. San Francisco. MacKinsey&Compnay.
Maddison, A. (2001). The World Economy: A Millennial Perspective.
Development Centre of the Organisation for Economic Co-Operation and Development. Paris. OECD Publications.
MAGIC (Module to Analyse the Growth of International Commerce). Economic
Commission for Latina America and the Caribbean (ECLAC) of the United Nations: http://www.cepal.org/magic.
Mantle, J. (1995). Car Wars. The International Giants and the World they made.
London. McMillan. Maquila Portal (2010a). “Carso will produce buses in Mexico”. Weekly Bulletin
No. 462. Mexico Manufacturing Industry Information Cente. 19 March. Retrieved 20 March, 2010, from (http://www.maquilaportal.com).
Maquila Portal (2010b). “Electric motorcycles to be sold in Mexico”. Maquila
Portal. Mexico Manufacturing Industry Information Center. 4 January. Retrieved 18 May, 2010, from (http://www.maquilaportal.com).
Maquila Portal (2011a). “China proposes FTA to Mexico”. Maquila Portal.
Mexico Manufacturing Industry Information Center. 30 December. Retrieved 30 December, 2011, from http://www.maquilaportal.com.
Maquila Portal (2011b). “LiuGong coming to Mexico”. Maquila Portal. Mexico
Manufacturing Industry Information Center. 20 May. Retrieved 28 May, 2011, from (http://www.maquilaportal.com).

421
Marichal, C. (2002). “Maquiladoras mexicanas en China”. La Jornada Virtu@l. 18 May. Retrieved 9 November, 2010, from http://www.jornada.unam.mx/2002/05/18/023a1eco.php?origen=opinion.html.
Marietta, L. (2009). “Mexico: Chinese Company FAW Leaving”. Edmunds
INSIDE LINE. 15 October. Retrieved 30 October, 2009, from http://www.insideline.com.
Marshall, C. (1995). Designing Qualitative Research. Thousand Oaks. London.
Sage. Martin, R. (1999). “The ‘New geographical Turn’ in economics: a critical
survey”. Cambridge Journal of Economics, 23 (1): 65-91. Martínez, J.M. (2007). “Auto chinos ponen a temblar a industria”.
CNN.EXPANSIÓN.com. 4 December. Retrieved 10 December, 2007, from http://www.expansion.com/negocios/2007/12/04/autos-chinos.
Martínez, I. (2010). “Hacia un nuevo mecanismo que regule la relación comercial
entre México y China”. In: E. Dussel and Y. Trápaga (eds.). Hacia un diálogo entre México y China. Dos y tres décadas de cambios socioeconómicos. México, D.F. Friedrich-Ebert-Stiftung, China Institutes of Contemporary International Relations (CICIR), CECHIMEX-UNAM, Senado de la República: 473-490.
Marx, C. and F. Engels (1975). Manifesto of the Communist Party. Peking,
People’s Republic of China. Foreign Language Press. Massey, D. (1984). Spatial Divisions of Labour. Social Structures and the
Geography of Production. London. McMillan. Mathews, J.A. (2006). “Dragon multinationals: New players in 21st century
globalization”. Asia Pacific Journal of Management, 23: 5-27. Maxton, G.P. (2006). “Most firms see China as an opportunity. It is not. Worse, it
threatens to undermine the whole business”. The Insight Bureau, Issue No. 3, October.
Maxton, G. P. and J. Worlmald (2004). Time for a Model Change. Re-engineering
the Global Automotive Industry. United Kingdom. Cambridge University Press.
Maynard, M. (2006). “Detroit Grapples With a New Era: the Not-So-Big 3”. The
New York Times. May 11. Retrieved 12 May, 2006, from http://www.nytimes.com.

422
Maynard, M. And J. W. Peters (2006). “Decision Time in Detroit”. The New York Times. 9 June. Retrieved 9 June, 2006, from http://www.nytimes.com/2006/06/09auto.html.
MBW (Mexican Business Web) (2011). “Dumping de llantas asiáticas tira 50% la
producción del país”. MBW. Mexican Business Web. 3 March. Retrieved 3 March, 2011, from http://www.mexicanbusinessweb.com/noticias.
McAlinden, S. And D. J. Andrea (2002). Estimating the New Automotive Value
Chain. November. Center for Automotive Research. ALTRUM. McElroy, John (2005). “Michigan Needs Toyota”. Ward’s Auto World, July 1.
Retrieved 5 August, 2005, from http://www.keepmedia.com. McGrew, A. (1992). “Conceptualizing Global Politics”, in A. G. McGrew, P. G.
Lewis et al. Global Politics. Globalization and the Nation-State. Cambridge. Polity Press.
Mendes de Paula, G. and E. Cervera (2011). Desarrollo de la Cadena de Valor
Metalmecánica en México. Capítulo México. Cámara Nacional de la Industria del Hierro y del Acero (CANACERO). Julio. México.
Mesquita-Moreira, M. (2007). “Fear of China: Is There a Future for
Manufacturing in Latin America? World Development, Vol. 35, No. 3: 355-376.
Mexico’s Ministry of Economy (2012a). Acuerdos y Tratados Comerciales
Suscrtitos por México. Mexico. Retrieved 25 March, 2012, from http://www.economia.gob.mx/comunidad-negocios/comercio-exterior/tlc-acuerdos.
Mexico’s Ministry of Economy (2012b). Trade Statistics. Mexico. Retrieved 25
February, 2012, from http://www.economia.gob.mx/comunidad-negocios/comercio-exterior/informacion-estadistica-y-arancelaria#.
MEXICONOW (2011). “Fed economist sees growth for closely-tied U.S. and Mexico economies; China getting into maquila supply picture”. MEXICONOW Staff Interview. MEXICON0W, Year 9. Number 53, July-August: 64-66.
Mikic, M. (2005). “Commonly Used Trade Indicators: A Note”. Introduction to
Trade Research I: Trade Data and Statistics. ARTNeT Capacity Building Workshop on Trade Research, 22-25 March, 2005. UNESCAP. Retrieved 20 March, 2009, from http://www.unescap.org/tid/projects/artnetbk05.asp.
Miles Electric Vehicles (2011). “Plug into Miles Electric Vehicles”. Miles
Electric Vehicles Website. 7 June. Retrieved 10 June, 2011, from http://www.milesev.com/default.aspx?flash=off.
423
Mittleman, J. H. (1994). “The globalisation challenge: surviving at the margins”. Third World Quaterly. Vol. 15, No. 3: 427-443.
Mittleman, J. H. (1995). “Rethinking the international division of labour in the
context of globalisation”. Third World Quaterly. Vol. 16, No. 2 : 273-295. MOFCOM (2002). “The Survey of Foreign Investment in China’s Automobile
Industry of 2002”. Invest in China. Ministry of Commerce of People’s Republic of China. 17th November, 2002. Retrieved 29 October, 2010, from http://www.fdi.gov.cn/pub/FDI_EN/default.htm.
MOFCOM (2005). “The Survey of Foreign Investment in China’s Automobile
Industry of 2004”. Invest in China. Ministry of Commerce of People’s Republic of China. 1 July, 2005. Retrieved 20 November, 2010, from http://www.fdi.gov.cn/pub/FDI_EN/default.htm.
MOFCOM (2006). “The Survey of Foreign Investment in China’s Automobile
Industry of 2005”. Invest in China. Ministry of Commerce of People’s Republic of China. 28 April, 2006. Retrieved 20 November, 2010, from http://www.fdi.gov.cn/pub/FDI_EN/default.htm.
MOFCOM (2009). “The Survey of Foreign Investment in China’s Automobile
Industry of 2008”. Invest in China. Ministry of Commerce of People’s Republic of China. 15 December, 2009. Retrieved 20 November, 2010, from http://www.fdi.gov.cn/pub/FDI_EN/default.htm.
MOFCOM (2010). “The Survey of Foreign Investment in China’s Automobile
Industry of 2009”. Invest in China. Ministry of Commerce of People’s Republic of China. 28 October, 2010. Retrieved 20 November, 2010, from http://www.fdi.gov.cn/pub/FDI_EN/default.htm.
Mollick, A. And K. Wvalle-Vázquez (2006). “Chinese competition and its effects
on Mexican maquiladors”. Journal of Comparative Economics 34: 130-145.
Moore, T. G. (2002). China in the World Market. Chinese Industry and
International Sources of Reform in the Post-Mao Era. Cambridge. Cambridge University Press.
Morales, C. (2009). “Discrepancias estadísticas en el comercio bilateral México-
China”. Presentación Ciclo de Conferencias México-China 2009-I, CECHIMEX, UNAM, México, D.F.
Morales, C. (2010). “La relación comercial México-China en los últimos 25
años”. In: E. Dussel and Y. Trápaga (eds.). Hacia un diálogo entre México y China. Dos y tres décadas de cambios socioeconómicos. México, D.F. Friedrich-Ebert-Stiftung, China Institute of Contemporary International

424
Relations (CICIR), CECHIMEX-UNAM, Senado de la República: 339-355.
Morales, R. (2011). “China desafía a la industria mexicana de autopartes en EU”. El Economista. 12 April. Retrieved 14 April, 2011, from http://eleconomista.com.x.
Moreno Brid, J.C. (1996). “Mexico’s Auto Industry After NAFTA: A Successful
Experience in Restructuring? Kellogg Institute Working Paper No. 232, August. The Helen Kellogg Institute for International Studies.
Morgan, K. and A. Sayer (1988). Microcircuits of Capital. Sunrise Industry and
Uneven Development. Cambridge. Polity Press. Morrison, W. and M. Labonte (2010). “China’s Currency: An Analysis of the
Economic Issues”. CRS Report for Congress, RS21625. November 1. Congressional Research Service.
Mortimore (2000). “Corporate Strategies for FDI in the Context of Latin
America’s New Economic Model”. World Development, Vol. 28, No. 9: 1611-1626.
Mortimore, M. And S. Vergara (2004). “Targeting Winners: Can Foreign Direct
Investment Policy Help Developing Countries Industrialise? The European Journal of Development Research, Vol. 16, No. 3, Autum: 499-530.
Moser, P., H. Mulder and J.D. Trout (1998). The Theory of Knowledge. A
Thematic Introduction. New York and Oxford. Oxford University Press. Murphy. J. (2011). Who Makes the car - 2001. Major Component Systems,
Estimated Content Per Vehicle and Key Global Suppliers. Bank of America. Merrill Lynch.
MVMA (Motor Vehicle Manufacturers Association) (Several editions). World
Motor Vehicle Data. Motor Vehicle Manufacturers Association. Detroit. MVMA (Motor Vehicle Manufacturers Association). (Several editions). Motor
Vehicle Facts & Figures. Motor Vehicle Manufacturers Association. Detroit.
Nag, B., S. Banerjee and R. Chatterjee (2007). “Changing Features of the
Automobile Industry in Asia: Comparision of Production, Trade and Market Structure in Selected Countries”. ARTNeT Working Paper Series, No. 37, July. Asia-Pacific Research and Training Network on Trade.
Nalebuff, B. J. and A. M. Brandenburger (1996). Co-opetiion. London. Harper
Collins Business.

425
Noble, G.W. (2006). “The Emergence of the Chinese and Indian Automobile Industries and Implications for other Developing Countries”. May. Washington, D.C. World Bank. Retrieved 13 March, 2009, from http://www.google.com/url/Resources/Noble-Emergence_of_Ch_Ind_auto_ind--revMay2006.doc
Nolan, P. (2005). Transforming China. Globalization, Transition and
Development. London. Anthem Press. OAAI (Office of Aerospace and Automotive Industries). (2007). “Parts Product
Listings”. Revised 12.05.2007. Retrieved 10 January, 2009, from http://www.acronymgeek.com/OAAI/Office_of_Aerospace_and_Automotive_Industries.
O’Brien, R. (1992). Global Financial Integration: The End of Geography.
London. Royal Institute of International Affairs. Pinter Publishers. OECD (Organisation for Economic Cooperation and Development) (1996). The
Knowledge-Based Economy. Paris. OECD. OECD (2008). OECD Investment Policy Reviews: China 2008. Encouraging
Responsible Business Conduct. Organisation for Economic Cooperation and Development. OECD Publishing.
Ohmae, K. (1995). The End of the Nation State. The Rise of Regional Economies.
New York. The Free Press. OICA (International Organization of Motor Vehicle Manufacturers). (Several
years). International Organization of Motor Vehicle Manufacturers. Paris. (http://www.oica.net).
Ornelas, Sergio L. (2004). “Is China a Threat to Mexico’s Auto Industry?
MexicoNow. Number 10, Year 2, May-June: 10-24. Ornelas, S. (2006). “Mexico’s Auto Industry Revival”. MEXICONOW, Number
22, Year 4, May-June: 8-26. Ornelas, S (2007). “Mexico, Globalization & the Auto Industry”. Mexico´s Auto
Industry Conference. MEXICONOW. 21-23 March. Hermosillo, Sonora. (Power Point Presentation).
Oropeza, A. (2007). “China-México: un encuentro inesperado”. In: E. Dussel
Peters and Y. Trápaga Delfín (eds.). China y México: Implicaciones de una Nueva Relación. México D.F. Nuestro Tiempo, Fundación Friedrich Ebert, ITESM, UNAM: 153-189.
Oropeza, A. (2010). “La relación México-China: hacia una agenda de
coincidencias”. In: E. Dussel and Y. Trápaga (Ed). Hacia un diálogo entre México y China. Dos y tres décadas de cambios socioeconómicos. México,

426
D.F. Friedrich-Ebert-Stiftung, China Institute of Contemporary International Relations (CICIR), CECHIMEX-UNAM, Senado de la República: 445-472.
Øvreberg, A. (2005). “A standard for the road”. DNV Forum. Corporate
Magazine, No. 03. Det Norske Veritas. HØvik, Norway. DNV Corporate Communications: 8-9.
Padilla, G. (2011). “Estiman que mercado pirata de autopartes tenga valor de 550
mdd”. T21.com.mx. 7 April. Retrieved 8 April, 2011, from http://www.t21.com.mx/news/print.php?story_id=14060.
Patiño, D. (2011). “La Ruta del Juguete”. Revista T21, Año 13, Vol. 148,
Diciembre: 36-38. Paredes, M. (2011). “Empresarios ven complicada la venta de autos eléctricos en
México”. Excelsior. 3 January. Retrieved 4 january, 2011, from http://www.excelsior.com.mx/index.php?m=nota&buscado=1&id_nota=70634.
Paredes, M. (2012). “El país, en la carrera por atraer inversiones”. Excelsior. 24
January. Mexico. Retrieved 25 January, 2006, from http://www.excelsior.com.mx/index.php?m=nota&seccion=dinero&cat=13&id_nota=804680.
Paus, E. (2008). “The Chinese Development Rocket: Leaving Latin America in
the Dust?” Document presented at the 20th Congress of the Society for the Advancement of Socio-Economics, San José, Costa Rica. July 21-23.
Peerenboom, R. (2007). China Modernizes. Threat to the West or Model for the
Rest? Oxford, New York. Oxford University Press.
People’s Daily (2003). “China’s Auto Industry Holds Great Potential”. People’s Daily Online. 17 June. Retrieved 27 June, 2009, from http://english.peopledaily.com.cn/200306/17/eng20030617_118360.shtml.
Peridy, N. and J. Abedini (2008). “The Growing Influence of Emerging Countries
in the World Car Industry: An Estimation of Export Potentials in a World trade Model”. Global Economy Journal. Vol. 8, Issue 3.
Perkowski, J. (2009). “2009: The Year Global Autos Shifted to China”. Jack
Perkowski’s Blog. 30 April. Retrieved 4 December, 2009, from http://managingthedragon.com/?cat=6&paged2.
Petrella, R. (1996). “Globalization and Intenationalization. The dynamics of the
emerging world order”. In: R. Boyer and D. Drache (Ed). States Against Markets. The limits to globalization. London and New York. Routledge: 62-83.

427
Phillips, N. (2007). “Consequences of an Emerging China: Is Development Space Disappearing for Latin America and the Caribbean?” CIGI Working Paper No. 14. January. The Centre for International Governance Innovation.
Portal Automotriz (2009). “México busca inversiones de fabricantes chinos a
pesar de la crisis”. Portal Automotriz. Web Report ProMéxico. 23 April. Retrieved 23 April, 2009, from http://www.portalautomotriz.com.
Pradhan, J.P. (2009). “Emerging Multinationals from India and China: Origin,
Impetus and Growth”. MPRA Paper No. 18210. Munich Personal RePEc Archive.
Pratt, A. (1994). Uneven Re-Production. Industry, Space and Society. Oxford.
Pergamon. PEF (2003). “Decreto para el apoyo de la competitividad de la industria
automotriz terminal y el impulso al desarrollo del mercado interno de automóviles”. Diario Oficial de la Federación. 31 Diciembre. Secretaría de Economía, Poder Ejecutivo Federal. México, D.F.
PEF (Poder Ejecutivo Federal) (2006). “Decreto por el que se modifica el diverso para el fomento y operación de la industria maquiladora de exportación”. Diario Oficial de la Federación, Miércoles 1 de Noviembre. Secretaría de Economía. México D.F.
Planas, J. and J. Preston (2010). “A Dangerous Obsession? Rethinking National
Indices of Lifelong Learning and Competitiveness”. LLAKES Research Paper 11. Centre for Learning and Life Chances in Knowledge Economies and Societies (LLAKES). Institute of Education, University of London.
Presidencia de la República (2009). “Decreto que modifica el diverso para el
apoyo de la competitividad de la industria automotriz terminal y el impulso al desarrollo del mercado interno de automóviles”. Diario Oficial de la Federación. 30 de Noviembre, 2009. Poder Ejecutivo Federal.
Presidencia de la República (2012). “Decreto Promulgatorio del Acuerdo de
Integración Comercial entre los Estados Unidos Mexicanos y la República del Perú”. Diario Oficial de la Federación. 30 de Enero, 2012. Poder Ejecutivo Federal.
PROMEXICO (2010). “Síntesis de la Relación Comercial México-China”,
Unidad de Inteligencia de Negocios. 2 March. Retrieved 10 April, 2010, from (http://www.promexico.gob.mx).
PROMEXICO (2012). PROMEXICO Trade and Investment. Retrieved 30
January, 2012, from http://www.promexico.gob.mx Quintin, E. (2004). “Mexico´s Export Woes Not All China-Induced”. Southwest
Economy. November/December. Federal Reserve Bank of Dallas: 9-10.

428
Ramamurti, R. and Singh, J.V. (eds) (2009). Emerging Multinationals in Emerging Markets. Cambridge. Cambridge University Press.
Ramirez de O., R. (1998). “The Impact of NAFTA on the Auto Industry in
Mexico”, in Sideny Weintraub and Christopher Sands (eds.). The North American Auto Industry under NAFTA. Washington, D.C. The CSIS Press.
Reinert, E.S. (1995). “Competitiveness and its predecessors – a 500-year cross-
national perspective”. Structural Change and Economic Dynamics, 6: 23-42.
Revista T21 (2008a). “La industria automotriz de México peligra, pues más firmas
quieren asociarse con China”. Revista T21. 16 July. Retrieved 11 January, 2009, from http://www.t21.com.mx/revista/115/portada.php.
Revista T21 (2008b). “Invierten compañías automotrices chinas en México”.
Revista T21. 14 March. Retrieved 16 March, 2008, from http://www.t21.com.mx/revista.
Robinson, W. (2004). A Theory of Global Capitalism. Production, Class, and
State in a Transnational World. Baltimore and London. The John Hopkins University Press.
Romero, I. (2011). Impacto asimétrico de la crisis global sobre la industria
automotriz: Canadá y México comparados. Perspectivas para el futuro. Serie Estudios y Perspectivas No. 130. Octubre. México, D.F. Comisión Económica para América Latina y el Caribe. Naciones Unidas.
Rosagel, S. (2010). “Refaccionarias fomentan piratería”. CNNEXPANSION.com.
22 July. Retrieved 8 April, 2011, from http://cnnexpansion.com/manufactura/2010/07/22/refaccionarias-fomentan-pirateria-1.
Rosales, J. (2010). “Graves repercusiones en la industria automotriz por autos
chocolate”. Milenio.com, 26 May. Retrieved 29 November, 2010, from (http://www.milenio.com).
Rosen, D. (2003). “How China is Eating Mexico’s Lunch”. The International
Economy, Spring: 22-25. Rosenberg, A. (1995). Philosophy of Social Science. Second Edition. Oxford.
Westview Press. Ruiz, C., E. Dussel and T. Tanimura (1997). Changes in Industrial Organization
of the Mexican Automobile Industry by Economic Liberalization. Joint Research Program Series No. 120. Tokyo: Institute of Developing Economies.

429
Rugman, A.M. (2000). The End of Globalization. London. Random House Business Book.
Rugman, A.M. (2005). The Regional Multinationals. MNEs and “Global”
Strategic Management. Cambridge. Cambridge University Press. Rugman, A.M. (2010). “Reconciling internationalization theory and the eclectic
paradigm”. International Business Review, 18, 2: 1-12. Rugman, A.M., A. Verbeke, and Q.T.K. Nguyen (2011). “Fifty Years of
International Business Theory and Beyond”. Management International Review, 51: 755-786.
Russo, B., E. Tse and T. Ke (2009). “The Path to Globalization of China’s
Automotive Industry”. Booz & Company Inc. Greater China. Russo, B., et al. (2009a). The Eight Overarching China Automotive Trends that
are Revolutionazing the Auto Industry. Part 1. Greater China. Booz & Company Inc.
Russo, B., et al. (2009b). The Eight Overarching China Automotive Trends that
are Revolutionazing the Auto Industry. Part 2. Greater China. Booz & Company Inc.
RVBusiness (2011). “Editor’s Note”. RVBusiness. 8 March. Retrieved 20 April,
2011, from http://www.rvbusiness.com/tag/winston-chung. Sahling, L. and T. Finley (2004). “Is China’s Economic Success a Threat to
Mexico? ProLogis Research Bulletin. May: 1-12. Salinas Group (2009). “Grupo Salinas”. Automotive News World Congress.
Detroit. Power point presentation. January. Sanderson, W., G. Williams, T. Ballenger, y B.J. Berry (1987). “Impacts of
computer-aided manufacturing on offshore assembly and future manufacturing locations”, Regional Studies, Vol. 21, Number 2: 131-141.
Santiso, J. (2007). “China: A Helping Hand for Latin America? In: J. Santiso
(Ed.). The Visible Hand of China in Latin America. Organisation for Economic Cooperation and Development (OECD). Development Centre. Paris, France. OECD Publishing: 9-14.
Sargent, J. and L. Matthews (2004). “What Happens When Relative Costs
Increase in Export Processing Zones? Technology, Regional Production Networks, and Mexico’s Maquiladoras”. World Development Vol. 32, No.12: 2015–2030.

430
Sargent, J. and L. Matthews (2008a). “Capital Intensity, Technology Intensity, and Skill Development in Post China/WTO Maquiladoras”. World Development Vol. 36, No. 4: 541–559.
Sargent, J. and L. Matthews (2008b). “The Quality of Maquiladora Investment in
a Post China/WTO World: A Literature Review and Case Studies from Reynosa”. Latin American Business Review, Vol. 8(3): 24-53.
Sargent, J. and L. Matthews (2009). “China versus Mexico in the Global EPZ
Industry: Maquiladoras, FDI Quality, and Plant Mortality”. World Development, Vol. 37, No. 6: 1069-1082.
Sauvant, K., et al. (2011). Inward and Outward FDI Country Profiles, January.
Vale Columbia Center on Sustainable International Investment. Columbia University.
Sayer, A. (1992). Method in Social Science. A Realist Approach. Second Edition.
London and New York. Routdledge. Sayer, A. (1995). Radical Political Economy. A critique. Oxford and Cambridge.
Blackwell. Sayer, A. (2004). “Realisms through thick and thin”. Environment and Planning
A., volume 36: 1777-1789. Sayer, A. (2006). Realism and Social Science. London. Sage Publications. Sayer, A. and K. Morgan (1987). “High Technology Industry and the International
Division of Labour: The case of Electronics”. In: M. J. Breheny and R. McQuaid (Ed). The Development of High Technology Industries. An International Survey. London. Croom Helm: 10-35.
Sayer, A. and R. Walker (1994). The New Social Economy. Reworking the
Division of Labour. Cambridge and Oxfrod. Blackwell. Schoenberger, E. (1987). “Technological and organizational change in automobile
production: spatial implications”, Regional Studies, Vol. 21, Number 3: 199-214.
Schmid, S. and P. Grosche (2008). Managing the International Value Chain in the
Automotive Industry. Strategy, Structure and Culture. Bertelsmann Stiftung.
Schmitz, H. (2006). “Asian Drivers: Typologies and Questions”. IDS Bulletin,
Vol. 37, No. 1: 54-61. Schmitz, H. (2007). “The Rise of the East: what does it mean for Development
Studies?” IDS Bulletin, Vol. 38, No. 2: 51-58.

431
Scott, A. J. (2006). Geography and Economy. Three lectures. Oxford. Clarendon Press.
Scott, R. (2005). “U.S.-China Trade, 1989-2003. Impact on jobs and industries,
nationally and state by state”. EPI Working Paper No. 270. January. Economic Policy Institute.
Secretaría de Economía (2011). “Informe Estadístico sobre el Comportamiento de
la Inversión Extranjera Directa en México”. Comisión Nacional de Inversiones Extranjeras, Dirección General de Inversión Extranjera. http://www.economia.gob.mx.
Sedgwick, D. (2011). “China’s annual sales to double to 40 million units by 2020,
Beijing Auto chief predicts”. Automotive News China. 18 January. Retrieved 20 January, 2006, from http://www.autonewschina.com/en/printarticle.asp?id=6415.
Shaeffer, P. and R. S. Mack (1997). “The Conceptual Foundations of the New
International Division of Labour”. Journal of Planning Literature, Vol. 12, No. 1, August: 3-15.
Shafaeddin, M. (2004). “Is China’s accession to WTO threatening exports of
developing countries? China Economic Review 15: 109-144. Shafaeddin, M. and J. Pizarro (2007). “From Export Promotion to Import
Substitution: Comparative Experiences of China and Mexico”. MPRA Paper No. 6650. June. Munich Personal RePEc Archive.
Shafaeddin, M. and K. Gallagher (2008). “Policies for Industrial Learning in
China and Mexico: neo-developmental vs. Neo-liberal approaches”. MPRA Paper No. 11041. September. Munich Personal RePEc Archive.
Shaiken, H. (1994). “Advanced Manufacturing and Mexico: A New International
Division of Labour? Latin American Research Review, Vol. 29, No. 2: 39-71
Shenkar, O. (2005). The Chinese Century. The Rising Chinese Economy and Its
Impact on the Global Economy, the Balance of Power and Your Job. Upper Saddle River, N. J. Wharton School Publishing.
Sherefkin, R. and J. LaReau (2006). “GM picks China as global center for
electronics purchasing”. Automotive News, March 6. Retrieved 3 March, 2006, from (http://autonews.com/apps/pubcs.dll/article).
Shirouzu, N. (2011). “China’s foreign car makers feel pressures of rising wages”.
The Wall Street Journal. 30 September. Retrieved 30 September, 2011, from (http://www.theaustralian.com.au/business/world/rising-wages-squeeze-chinas-foreign-car-makers/story-e6frg90o-1226153539634).
432
Siebert, H. (2006). “Locational Competition: A Neglected Paradigm in the International Division of Labour”, World Economy, 29 (2), February: 137-159.
Sirkin, H., M. Zinzer and D. Hohner (2011). Made in America, Again. Why Manufacturing Will Return to the U.S. August. Boston, Massachusetts. The Boston Consulting Group.
SKBergé (2011). “Presencia internacional”. SKBergé Web page. Retrieved 5
February, 2011, from http://www.skberge.cl/frames/internacional.asp. Smith, A. (1976). An enquiry into the nature and causes of the wealth of nations.
Oxford. Clarendon Press. Solís, E. (2005). “Mexico-China: a partnership for a trade and investment”.
Expanding Trade and Investment Opportunities in Mexico. Mexico, D.F. 9 June. Secretaría de Economía.
Song, H. and C. Yu (2005). “Market Opening, Enterprise Learning and Industry
Transformation – A Case Study of China’s Car Industry”. In: China in a Globalizing World. New York and Geneva. United Nations Conference on Trade and Development. United Nations: 155-183.
Stewart, T. P. (2012). China’s Support Programs for Automobiles and Auto Parts
under the 12th Five-Year Plan. January. Washington, D.C.. Law Offices of Stewart and Stewart.
Stopford, J. M., S. Strange and J. Henley (1991). Rival States, Rival Firms.
Competition for world market shares. Cambridge University Press. Cambridge.
Studer, I. (2004). “The North American Auto Industry. Mapping the New North
American Reality”. IRPP Working Paper Series, No. 2004-09. Montreal, Quebec. Institute for Research on Public Policy.
Sturgeon, T. (2001). “How Do We Define Value Chains and Production
Networks? IDS Bulletin Vol. 32, No. 3: 9-18. Sturgeon, T. and R. Florida (2000). “Globalization and Jobs in the Automotive
Industry”. Final Report to the Alfred P. Sloan Foundation. March. A Study by Carnegie Mellon University and the Massachusetts Institute of Technology. MIT IPC Globalization Working Paper 01-003. MIT Industrial Performance Center.
Sturgeon, T., J. Van Biesebroeck, and G. Gereffi (2008). “Value chains, network
and clusters: reframing the global automotive industry”. Journal of Economic Geography 8: 297-321.
Sturgeon, T. and J.Van Biesebroeck (2009). “Crisis and Protection in the
Automotive Industry. A Global Value Chain Perspective”. Policy

433
Research Working paper Perspective 5060. September. International Trade Department. The World Bank.
Sturgeon, T. and J. Van Biesebroeck (2010). “Effects of the Crisis on the
Automotive Industry in Developing Countries”. Policy Research Working paper Perspective 5330. June. International Trade Department. The World Bank.
Sutherland, D. (2010). “An investigation of OFDI strategies in China’s private
businesses: ‘round-tripping’ or ‘onwardjourneying’?” Discussion Paper 65. August. China Policy Institute School of Contemporary Chinese Studies. The University of Nottingham.
Szczesny, J. (2011). “VW will export Beettles to China”. The Detroit Bureau. 26
August. Retrieved 29 August, 2011, from http://www.thedetroitbureau.com.
Tang, R. (2009). “The Rise of China’s Auto Industry and Its Impact on the U.S.
Motor Vehicle Industry”. CRS Report for Congress, 7-5700. Federal Publication Paper 688. November 16. ILR School. Cornell University.
The Economist (2003). “The sucking sound from the east”. The Economist. 26
July: 49-50. The World Bank (2012). China 2030. Building a Modern, Harmonious, and
Creative High-Income Society. Development Research Center of the State Council, the People’s Republic of China. Washington, D.C. International Bank for Reconstruction and Development.
Thun, E. (2004). “Going Local: Foreign Investment, Local Development and the
Chinese Auto Sector”. In: J. Carrillo, Y. Lung and R. van Tudler (Eds). Cars, Carriers of Regionalism? New York. Palgrave MacMillan in association with GERPISA: 233-246.
Thun, E. (2006). Changing Lanes in China. Foreign Direct Investment, Local
Governments, and Auto Sector Development. Cambridge. Cambridge University Press.
Thoburn, J. (2010a). “China: Comparative Economic Development in the Asia
Pacific”. Fall Q1 2010 Postgraduate, Lectures 13-14. Ritsumeikan Asia Pacific University.
Thoburn, J. (2010b). The Impact of World Recession on the Textile and Garment
Industries of Asia. Working paper 17/2009. Vienna. Research and Statistics Branch. United Nations Industrial Development Organization (UNIDO).
Timberlake, J. et al. (2009). China Still Manufacturing’s Shining Star?. Deloitte
Review Issue 5. Deloitte Development LLC.

434
Toffler, A. And H. Toffler (2006). Revolutionary Wealth. New York, London.
Currency-Doubleday. Torres, E. (2011). “Alegan productores competencia desleal en mercados de
neumáticos”. T21.com.mx. 4 December. Retrieved 5 December, 2011, from http://www.t21.com.mx/news/print.php?story.
Torres, E. (2011b). “Fabricante chino de camiones JAC se instala en Sinaloa”.
Revista T21. 17 July. Retrieved 17 July, 2011, from(http://www.t21.com.mx.news).
Transporte Informativo (2009). “Spartak traerá sorpresas al mercado mexicano
antes de finalizar el 2009”. TransporteInformativo.com. 18 August. Retrieved 19 August, 2009, from (http://www.transporteinformativo.com).
Tuman, J.P. (2003). Reshaping the North American Automobile Industry. London
and New York. Continuum. Ugarte, J. and D. F. Islas (2009). “Elektra aborta construcción de planta de autos
chinos”. El Semanario. 23 November. Retrieved 23 November, 2009, from http://www.elsemanario.com.mx/news.
UNCOMTRADE. United Nations Commodity Trade Statistics Database
http://www.comtrade.un.org. UNCTAD (1995). World Investment Report 1995.Transnational Corporations
and Competitiveness. United Nations Conference on Trade and Development. Division on Transnational Corporations and Investment. United Nations. New York and Geneva.
UNCTAD (2004). World Investment Report 2004. The Shift Towards Services.
United Nations Conference on Trade and Development, United Nations. New York and Geneva.
UNCTAD (2006). Trade and Development Report, 1996. Geneva. United
Nations. UNCTAD (2006b). World Investment Report 2006. FDI from Developing and
Transition Economies: Implications for Development. United Nations Conference on Trade and Development. Division on Transnational Corporations and Investment. United Nations. New York and Geneva.
UNCTAD (2008). World Investment Report 2008. Transnational Corporations
and the Infrastructure Challenge. United Nations Conference on Trade and Development. New York and Geneva.

435
UNCTAD (2009). Assessing the impact of the current financial and economic crisis on global FDI flows. Division on Investment and Enterprise. Geneva. United Nations.
UNCTAD (2009b). UNCTAD Training Manual for Statistics on FDI and the
Operations of TNCs. Volume I.FDI Flows and Stocks. United Nations Conference on Trade and Development. Division on Investment and Enterprise. United Nations. New York and Geneva.
UNCTAD (2010a). Integrating Developing Countries’ SMEs into Global Value
Chains. New York and Geneva. United Nations. UNCTAD (2010b). World Investment Prospects Survey 2010-2012. United
Nations Conference on Trade and Development, United Nations. New York and Geneva.
UNCTAD (2010c). World Investment Report 2010. Investing in a Low-Carbon
Economy. United Nations Conference on Trade and Development. United Nations. New York and Geneva.
UNCTAD (2011). World Investment Report 2011. Non-Equity Modes of
International Production and Development. United Nations Conference on Trade and Development. New York and Geneva.
UNCTAD/WTO (United Nations Conference on Trade and Development/World
Trade Organisation). (2009). TRADE MAP. International Trade Centre: http://www.trademap.org/stDataSources.aspx.
UNIDO (United Nations Industrial Development Organisation) (2004). Inserting
Local Industries into Global Value Chains and Global Production Network: Opportunities and Challenges for Upgrading With a focus on Asia. Working Papers. Vienna. United Nations Industrial Development Organisation.
UNIDO (2006). Alliances and joint ventures. Patterns of internationalization for
developing country enterprises. Part one. United Nations Industrial Development Organization. Vienna.
UNIDO (2009). FDI Policy Instruments: Advantages and Disadvantages.
Working Paper 01/2009. United Nations Industrial Development Organization. Research and Statistics Branch. Vienna.
United Nations Statistics Division (2010-2012). United Nations Commodity Trade
Statistics Database. COMTRADE. http://comtrade.un.org. USDOC (United States Department of Commerce) (2011). On the Road: U.S.
Automotive Parts Industry Annual Assessment. International Trade Administration. Office of Transportation and Machinery.

436
USDOC (United States Department of Commerce) (2012). “U.S. International Trade in Goods and Services. December 2011”. U.S. Census Bureau. U.S. Bureau of Economic Analysis. February 10. Washington, D.C.
USGAO (2003). Mexico’s Maquiladora Decline Affects U.S.- Mexico Border
Communities and Trade; Recovery Depends in Part on Mexico’s Actions. United States General Accounting Office. Report to Congressional Requesters. GAO 03-891 International Trade, July. Washington, D.C.
USITC (United States International Trade Commission) (2008). Hramonized
Tariff Schedule of the United States (2008) (Revision 2). Washington. D. C. USITC.
USITC (United States International Trade Commission) (2011). Hramonized
Tariff Schedule of the United States (2011) (Revision 1). USITC Publication 4201. Washington. D. C. USITC.
VanNieuwkuyk, M. (2009). Automotive News 2009 OEM Supplier Innovation
Study. J. D. Power and Associates. The McGraw-Hill Companies. Veloso, F. And R. Kumar (2002). “The Automotive Supply Chain: Global Trends
and Asian Perspectives”. ERD Working Paper Series No. 3. January. Economics and Research Department. Asian Development Bank.
Venables, A. J. (1998). “The Assessment: Trade and Location”. Oxford Review of
Economic Policy, Vol. 40, No. 2: 1-6. Vernon, R. (1966). “International Investment and International Trade in the
Product Cycle”, The Quarterly Journal of Economics, Vol. LXXX, No. 12, May: 190-207.
Vietor, R. (2007). How Countries Compete. Strategy, Structure, and Government
in the Global Economy. Boston, Massachussetts. Harvard Business School Press.
Villalobos, A. (2007). “La relación comercial de México con China”. In: E.
Dussel Peters (Comp.) (2007). Oportunidades en la relación económica y comercial entre China y México. México, D. F. CEPAL, SRE, CECHIMEX, Senado de la República. Naciones Unidas: 113-124.
Villarreal, R. (2003). “MÉXICO POST-NAFTA: Hacia una Estrategia de
Competitividad Sistémica para el Desarrollo”. Centro de Capital Intelectual y Competitividad (CECIC). Marzo. World Trade Center, Ciudad de México.
Walton, J. (1985). “The Third ‘New’ International Division of Labour”. John
Walton (Ed.). Capital and Labour in a Urbanized World. Sage Studies in International Sociology 31, London: 3-14.

437
Wang, X. (n.d.). “China’s Automobile Industrial Development and Opportunities”. Development Research Centre of the State Council (DRC). People’s Republic of China.
Ward’s (2011). World Motor Vehicle Data Book 2011. Southfield Michigan.
Ward’s Automotive Group. Watkins, R. (2002). “Mexico Versus China: Factors Affecting Export and
Investment Competition”. Industry Trade and Technology Review. USITC Publication 3534. United States International Trade Commission (USITC). July: 11-26.
Watkins, R. (2007). “The China Challenge to Manufacturing in Mexico”. Journal of the Flagstaff Institute, XXXI, No. 1, June: 44-70.
Williamson, P. and Zeng, M (2009). “Chinese multinationals: Emerging through
new global gateways”. In: R. Ramamurti and J.V. Singh (Ed). Emerging Multinationals in Emerging Markets. Cambridge. Cambridge University Press.
WCO (World Customs Organisation). Harmonised Commodity Description and
Coding System: http://www.wcoomd.org/home_wco_tpoics_hsoverviewboxes.htm.
Web Report Italika (2011). “Italika vende un millón de motocicletas en México;
alcanza 63% de participación de mercado”. Portal Automotriz. 22 March. Retrieved 23 March, 2011, from http://www.portalautomotriz.com/content/site/module/news/op/displaystory/story_id/40159/format/html/.
Welch, D (2010). “Labor unrest in China could be Mexico’s gain”. Bloomberg
Businessweek. 10 June. Retrieved 6 July, 2010, from (http://www.businessweek.com/autos/autobeat/archives/2010/06/labor_unrest_in_china_could_be_mexicos_gain.html).
Widgrén, M. (2005). “Revealed Comparative Advantage in the Internal Market”.
Keskusteluaiheita Discussion Paper No. 989. August. Helsinki, Finland. The Research Institute of the Finnish Economy (ETLA).
Womack, J., D.T. Jones, and D. Roos (1990). The Machine that Changed the
World. New York. Rawson Associates. Wu, H. (2010). “Treinta años de relaciones de China y México como socios
estratégicos: desarrollo económico y social”. E. Dussel and Y. Trápaga (eds.). Hacia un diálogo entre México y China. Dos y tres décadas de cambios socioeconómicos. México, D.F. Friedrich-Ebert-Stiftung, China Institutes of Contemporary International Relations (CICIR), CECHIMEX-UNAM, Senado de la República: 9-37.

438
Yang, J. (2009). “Chinese firm delays Mexico plant”. Automotive News. 6 July. Retrieved 7 July, 2009, from www.automotivenews.com.
Yang, J. (2010). “U.S. sales remain a distant dream for Chinese”. Automotive
News. 11 January. Retrieved 11 January, 2010, from http://automotivenews.com.
Yang, J. (2012). “Expect to see more foreign automakers export cars from China”.
Automotive News China. 3 February. Retrieved 3 February, 2012, from http://www.autonewschina.com/en/printarticle.asp?id=8179.
Ying, T. (2008). “Geely Plans Mexican Factory, U.S. Vehicle, Li Says”.
Bloomberg. 13 January. Retrieved 15 January, 2008, from (http://www.bloomberg.com).
Yueh, L. (2007). “The Rise of China”, Irish Studies in International Affairs, Vol.
18: 35-45. Zeng, M. And P. Williamson (2007). Dragons at your Door. How Chinese Cost
Innovation is Disrupting Global Competition. Boston, Massachusetts. Harvard Business School Press.
Zhou, Y. (2009). “Foton Delegation to Mexico Negotiated on the formation of
KD Factory”. FOTON MOTORS, Vol. 4. No. 4. 31 March.