Child nutrition and family size in the Philippines
16
Journal of Development Economics 23 (1986) 161-176. North-Holland CHILD NUTRITION AND FAMILY SIZE IN THE PHILIPPINES Susan HORTON* University of Toronto, Ont. M5S 1A1, Canada Received November 1984, final version received September 1985 This paper uses household data from the Philippines to examine jointly household decisions on family size and child quality, using nutritional status as a measure of quality. The results suggest that there are significant substitutions away from larger families and towards higher quality children with higher maternal and paternal education. Similar but less significant substitutions occur with higher maternal occupational status, and lower child mortality in the locality. However the paper finds only limited support for the idea that parents are concerned about average child quality, since the results show that there are strong birth order effects on nutritional status. 1. Introduction Studies of fertility have to explain one (at first sight) puzzling fact. Why do couples tend to have fewer children as their income increases, if it is assumed that children are not 'inferior goods' in the sense of consumer theory? A large number of models address this issue, one of which is the 'quantity- quality' theory of Becker and Lewis (1974) and Becker and Tomes (1976). The basic assumption of this theory is that households obtain utility both from the number of children that they have, and from the average 'quality' of the children, e.g., their level of education, health or nutrition. There is therefore a trade-off between quality and quantity of children: the more children the household desires, the higher the cost of increasing average quality. Conversely, the higher the average quality desired, the higher the cost of additional children. The present paper uses a version of this framework to estimate jointly the determinants of fertility and child nutrition in the Philippines, extending the *The author would like to thank the Bicol River Basin Development Program, USAID, and the Institute of Philippine Culture for permission to use the data. Helpful comments were received from John Ham, Morley Gunderson, Ake Blomquist, and two anonymous referees. Thanks to Tom Crawley, Margaret Sanderson and Kris Panday for excellent research assistance. The paper was written as part of the World Bank Living Standards Measurement Study, and an earlier version was presented at the Population Association of America 1984 meetings in Minneapolis. Additional work was enabled by a postdoctoral fellowship from the Social Sciences and Humanities Research Council of Canada. The author alone bears responsibility for any remaining errors or omissions. 0304-3878/86/$3.50 © 1986, Elsevier Science Publishers B.V. (North-Holland)
Transcript of Child nutrition and family size in the Philippines
Journal of Development Economics 23 (1986) 161-176. North-Holland
CHILD NUTRITION AND FAMILY SIZE IN THE PHILIPPINES
Susan HORTON*
University of Toronto, Ont. M5S 1A1, Canada
Received November 1984, final version received September 1985
This paper uses household data from the Philippines to examine jointly household decisions on family size and child quality, using nutritional status as a measure of quality. The results suggest that there are significant substitutions away from larger families and towards higher quality children with higher maternal and paternal education. Similar but less significant substitutions occur with higher maternal occupational status, and lower child mortality in the locality. However the paper finds only limited support for the idea that parents are concerned about average child quality, since the results show that there are strong birth order effects on nutritional status.
1. Introduction
Studies of fertility have to explain one (at first sight) puzzling fact. Why do couples tend to have fewer children as their income increases, if it is assumed that children are not 'inferior goods' in the sense of consumer theory? A large number of models address this issue, one of which is the 'quantity- quality' theory of Becker and Lewis (1974) and Becker and Tomes (1976). The basic assumption of this theory is that households obtain utility both from the number of children that they have, and from the average 'quality' of the children, e.g., their level of education, health or nutrition. There is therefore a trade-off between quality and quantity of children: the more children the household desires, the higher the cost of increasing average quality. Conversely, the higher the average quality desired, the higher the cost of additional children.
The present paper uses a version of this framework to estimate jointly the determinants of fertility and child nutrition in the Philippines, extending the
*The author would like to thank the Bicol River Basin Development Program, USAID, and the Institute of Philippine Culture for permission to use the data. Helpful comments were received from John Ham, Morley Gunderson, Ake Blomquist, and two anonymous referees. Thanks to Tom Crawley, Margaret Sanderson and Kris Panday for excellent research assistance. The paper was written as part of the World Bank Living Standards Measurement Study, and an earlier version was presented at the Population Association of America 1984 meetings in Minneapolis. Additional work was enabled by a postdoctoral fellowship from the Social Sciences and Humanities Research Council of Canada. The author alone bears responsibility for any remaining errors or omissions.
0304-3878/86/$3.50 © 1986, Elsevier Science Publishers B.V. (North-Holland)
162 S. Horton, Child nutrition and family size
previous literature which has concentrated on the joint fertility-education decision. The paper also examines some of the determinants of inequality within the household, in particular birth order.
Section 2 discusses the theory and previous literature, section 3 describes the data, section 4 presents the results, and section 5 contains the conclusions.
2. Model
The Becker-Lewis (1974) model suggests that the decisions on child quality and quantity are more closely related than those on any two commodities chosen at random, because of a special non-linearity in the budget constraint. In the model, the shadow price of child quality depends on the number of children a household has, and vice-versa. Formally, households maximize utility (U) which is a function of the number of children (n), average quality of the children (q), and other commodities (x). I.e.,
U = U ( n , q , x ) (1)
is maximized subject to a full income budget constraint of the form
I = n " H ~ + q " H q + n " q . H~q + X " I I x , (2)
where I is full income, H~ is the price of other commodities, H~ are costs which affect the quantity of children irrespective of their level of quality, Hq are costs which affect the quality of children but do not depend on the quantity, and Hnq are costs of children which depend both on quality and quantity. The shadow prices of child quality, child quantity, and other commodities can be derived from the first-order conditions, which are
MUn = 2(q" Hnq + H,),
MUq = 2(n" Hnq + Hq),
M U x = 2Hx,
where M U represent marginal utility and 2 is the Lagrange multiplier. Hence due to the nonlinearity, child quality and quantity decisions are
therefore related. However, it is not possible to test this directly, for example by the usual technique of estimating budget shares, since we do not observe either the shadow prices, or the total expenditure on children.
S. Horton, Child nutrition and family size 163
One possible approach is to use the household production framework and to assume that each commodity is produced with inputs of goods and with time of household members (in this case time of the children's mother and father). The full income term I can be rewritten as
I = V + Twww+ T=wm,
where V is unearned income, Tw and Tm are respectively the total time of the woman and man in the household, and Ww and Wm their corresponding wage rates. Utility maximization subject to the revised budget constraint and the production functions for the three commodities yield reduced form equations for the three commodities of the following form:
Z = f(Ww, Wm, Pn, Pq, Pnq, Px; If),
where Z stands for n, q or x, and Pi represents the price of goods inputs necessary for the ith commodity. These reduced form equations form the basis for estimation in what follows.
The model as such does not impose much structure on preferences or on the production functions for the commodities, and thus it is not easy to make predictions as to the expected signs on the price and income variables. However, if one is willing to assume that child quantity is the most time intensive of the commodities to produce, the model suggests that (com- pensated) increases in wages will tend to cause substitution away from larger families, and towards higher quality children. If it is also assumed that women's time is more important in the production of both child quality and child quantity, then the substitution response should be stronger with respect to the woman's rather than the man's wage. Also, if child quality and quantity are quite close substitutes as the budget equation implies, then a rise in the price of goods inputs to child quality is likely to decrease child quality and increase child quantity.
Other authors have imposed more structure on the above model. De Tray (1973) for example assumes that child quality and numbers produce a commodity called child services, C (via a constant returns to scale produc- tion function), and that utility is expressed as a function of child services, C, and other goods X. He then estimates reduced form equations using county data, using education as a measure of child quality.
Rosenzweig and Wolpin (1980) have explicitly tested the quality--quantity framework, using twins as a natural experiment to see whether unplanned additional fertility has the predicted effect on expenditure on child quality and on consumer durables.
There have also been a number of studies jointly estimating the decisions on fertility and child quality, without however explicitly using the quality-
164 S. Horton, Child nutrition and family size
quantity framework. These include Banskota and Evenson (1978) and Rosenzweig and Evenson (t977) who use education as the measure of child quality, and where female and child wages are the key variables of interest. There is also a study by Blau (1981) which obtains reduced form estimates of child nutrition and of fertility within a given time interval, in which sector of employment of the mother is the critical determinant.
There are additionally a large number of structural models which explain fertility and nutrition separately. The fertility literature is too large to survey here. Studies of nutrition include Battad (1978) for the Philippines, Martorell, Leslie and Moock (1982) and Moock and Leslie (1985) for Nepal, and Wolfe and Behrman (1983) for Nicaragua. The variables found significant include per capita income, mother's education, number of other small children in the household, length of breastfeeding, and the presence of specific items in the child's diet. Simultaneous equation studies by Knowles (1979) for Pakistan, Khan (1984) for Bangladesh, Anthony (1979) for Nepal, and Chernichovsky and Coate (1979) for the U.S., find the following additional variable significant: birth order, race (U.S.), mother's height, diet changes during pregnancy, and sex (Pakistan). The simultaneous studies also suggest that the effect of nutrition on health is much stronger than the reverse. Finally there are studies by public health practitioners and epidemiologists such as Kielmann et al. (1984) and Taylor et al. (1984), which find that birth order, number and sex of siblings, and age at weaning all affect nutritional status. However, these studies provide only partial guidance in the present case, since many of the variables included (such as birth spacing, number of children, and length of breastfeeding) are endogenous within the present framework.
It remains to specify the actual variables to be used in the present model, as well as to discuss some underlying assumptions of the model. The quantity variable used is total fertility, i.e., children ever born to the mother in the household. The quality variable used is the long-run nutritional status of children, averaged across all children in the household for whom information is available (z-score of height for age). Some estimates were also made for average current nutritional status (z-score of weight for height), but their explanatory power was minimal. Section 3 describes the variables in more detail and explains what a z-score is.
The model is estimated across all households, except that the quality equation could not be estimated for those with no children, since no quality measure is available for these. Since there were only two of these out of 1903 households, this is not likely to cause serious bias. Many of the households have not completed their fertility, and it may therefore be misleading to compare the average quality of children in a two-child family where the mother is 28, with a similar household where the mother is 58. For this reason mother's and father's age are included as independent variables, and it
S. Horton, Child nutrition and family size 165
is expected that these will have a positive coefficient in the fertility equation. 1 Parental age can however have additional effects on child quality and quantity, such as cohort and lifecycle effects.
Concerning the independent variables: wage variables for the mother were not readily available for the study. Only about one woman in 20 reported a market wage rate for the previous year, and imputation of wages was thus thought to be impractical. Instead, education and occupational status of the woman were used as an indicator of the wage. 2 (The mother was not necessarily currently practising what she regarded as her primary occupa- tion.) For comparability, the education level of the child's father was also included rather than his wage rate. Parental height variables were included to control for genetic factors.
Measures of unearned income are rather unreliable in household surveys in developing countries. It is assumed here that the long-run level of such incomes is likely to depend on ownership of physical assets. Thus a total asset measure was constructed which included the value of land, farm and fishing assets, business assets, and household assets owned. One would expect both child quality and child quantity to be positively related to the unearned income and hence to the asset variable, assuming that both are normal goods.
Various community level indicators were used as indicators of the price of goods inputs to the different commodities. Distance to the nearest family planning center was used as an indicator of one cost of regulating family size. Water supply and sanitation in the locality (barangay) were used as indicators of the cost of improving child nutritional status. Water supply and sanitation arguably have public good aspects in that households whose own water supply is good, but who live in a neighborhood with generally poor supply, are likely to remain subject to diseases associated with poor water supply.
Urban location was also included as a general measure of relative prices. It is usually expected that urban location would cause a substitution of child quality for child quantity. There is less opportunity for children to work and earn wages, and mothers are less able to combine child care and market work activities. The shadow price of child quality may also be lower in urban areas where schools and health centers are closer. Tastes may also change
1Earlier estimates were made for a sample of completed families only, but it was suggested by a referee that the selection of the subsample (based on mother's age, and the response 'no' to a question as to whether the mother desired more children) could be a source of bias.
2Mother's education and occupation might be argued to be endogenous, since women who intend to have larger families are less likely to invest in education and less likely to pursue a career. However, in the context of the present sample where few women have more than primary education, women's education can be taken as exogenous, and likely to have been determined by their parents.
166 S. Horton, Child nutrition and family size
depending on environment. In general, therefore, households in rural areas are expected to have larger families with lower average child quality. One possible opposing factor is that food prices may be lower in rural areas, thus improving nutritional status.
Finally, a mortality variable was included. If parents anticipate a higher level of mortality, they are likely to have larger families (to ensure an adequate number of surviving children). It would also be expected to reduce child quality investments, since mortality raises the cost of achieving a given number of surviving children of a given quality. (One possible opposing factor however is that parents may realise that improved child nutrition can up to a certain point reduce the risk of mortality.) The mortality variable constructed was the number of children who had died, divided by the number of children ever born, within the barangay. It was assumed that the distribution of women by marital duration was similar across barangays, and therefore adjusting the measure in the manner suggested by Trussell and Preston (1982) was not necessary.
One limitation of the model is that it is based on a household utility function, and does not deal with conflicts between husband and wife regarding children. In the Philippines households are mostly nuclear families, which removes the problems of dealing with extended or joint families with more than one set of parents. The analysis is restricted to households where both parents are still living. The reason for this is that death of a spouse could prevent a couple from attaining their desired number of children.
The model also assumes that parents care about the average quality of their children, whereas one alternative would be that they c a r e especially about the quality of a particular child or children. There is an interesting (infant) literature on allocation amongst siblings. Some studies [Griliches, (1979), Behrman, Pollak and Taubman (1982)] suggest that households try to even out the inequities in genetic endowment, rather than increase inequality. Other studies emphasize inequalities amongst siblings. For example Zajonc (1976) and Lindert (1977) suggest that middle children are disadvantaged relative to the youngest and oldest, because parents cannot allocate resources intertemporally perfectly, and the middle children grow up when there is more ,pressure on household resources, There is also a biological explanation as to why nutritional status of children should worsen as birth order increases. Childbearing (particularly as frequent as it is in the Philippines) takes a nutritional toll on the mother which is to the detriment of later children.
The present paper therefore contains some results on the effect of birth order, to examine the hypothesis that parents are concerned about average quality of children. These latter results use the individual child rather than the household as the unit of analysis.
S. Horton, Child nutrition and family size 167
3. Data
The data were collected as part of a multipurpose survey in the Bicol region of the Philippines. 1,903 households were surveyed in 1978. The following modules were included: a socioeconomic survey, health status measures collected by trained medical technologists (height, weight, arm circumference and hemaglobin data), a survey of infrastructure at the barangay level (the smallest administrative unit), and surveys administered to technical personnel (health workers, extension workers, etc.). The survey metholodgy is described in Popkin and Roco (1979).
The data are from 100 barangays in three provinces within the Bicol region. The region has one of the lowest per capita incomes of the 12 regions in the Philippines (in 1974 it was $172, 49% of the national average). The Bicol region has a low share of the country's manufacturing employment, has serious inequality of income, and is susceptible to damage by typhoons [Popkin and Roco (1979)]. About 70~ of the sample households live in rural areas, 14~ in towns (poblacions) and the remainder in three urban areas. The region has some problems of malnutrition. Ten percent of the sampled children below six were more than three standard deviations below the reference population median weight for age, 25~ were more than three standard deviations below in height for age, and 2~ in weight for height. These children correspond approximately to third degree malnutrition on the Gomez-Waterlow scale, and the 2~ with severe current malnutrition are of particular concern.
The dependent variables used are the number of children ever born reported by the mother, and the z-score for height for age, a measure of long-run nutritional status. The z-score method is recommended by the WHO (1979), and is calculated as follows. Children in the sample population are compared to those in the international standard population, i.e., U.S. children. Height of a child in the Philippine sample is expressed as a number of standard deviations above or below the U.S. median for a child of the same age, to obtain the z-score of height for age. This method is a little less convenient than the earlier technique of expressing the sample child as a percentage of the U.S. median, but is preferred for reasons explained in Martorell (1982). A rule of thumb for evaluating z-scores is that a score of less than - 3 indicates 'severe' malnutrition, a score of - 3 to less than - 2 indicates 'moderate' malnutrition, and a score of - 2 to less than - 1 indicates 'mild' malnutrition. For further details, see Horton (1984a).
The household equations use average z-scores for children less than 15 in t h e sample households, where the average is taken over all children for whom height and weight data were available. We assume that there is negligible bias introduced by excluding missing children. Most likely the missing children were absent at the time of survey, because of work or
168 S. Horton, Child nutrition and family size
school, and there is no apparent reason that this would cause bias as long as child's age is controlled for. The fact that the household average z-score is based on different numbers of children with z-scores present, may cause heteroscedasticity of residuals from OLS. Ideally GLS or weighted least squares could be used to correct for this.
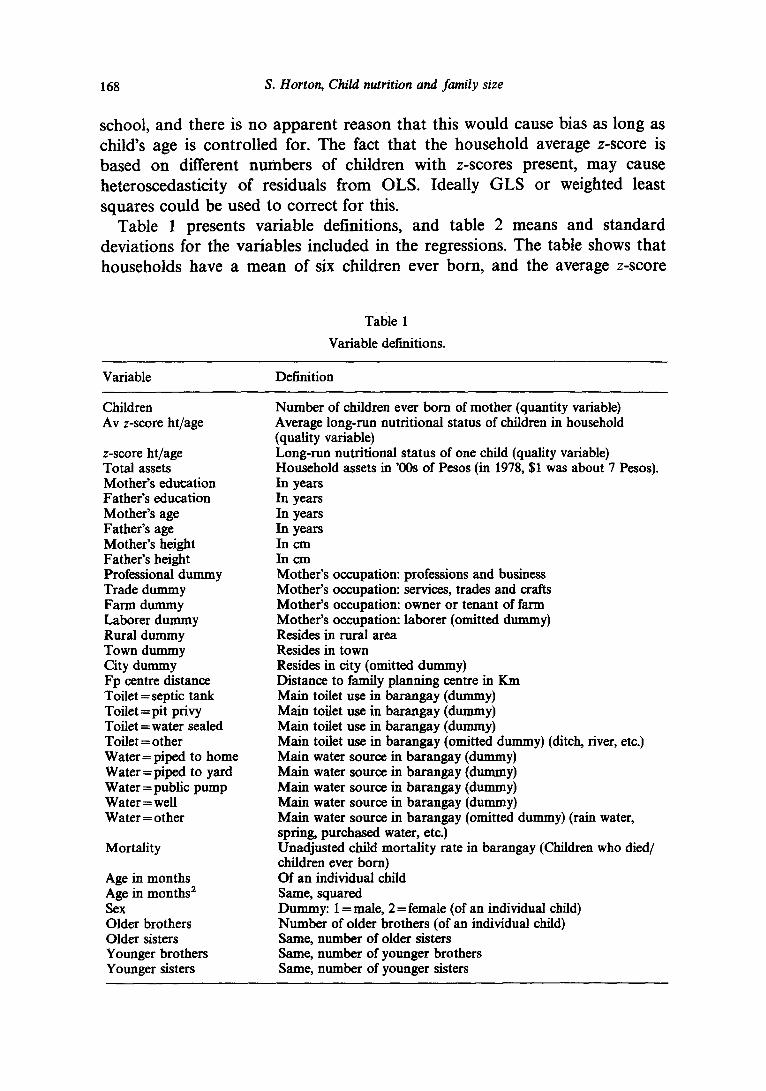
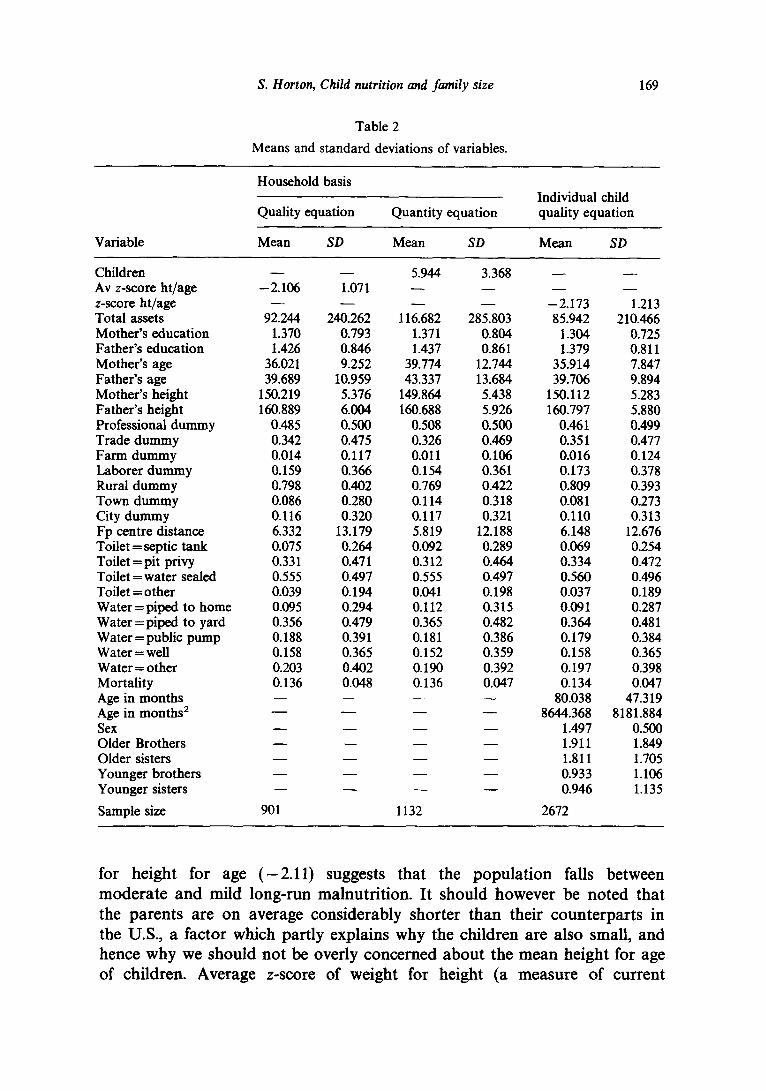
Table 1 presents variable definitions, and table 2 means and standard deviations for the variables included in the regressions. The table shows that households have a mean of six children ever born, and the average z-score
Table 1
Variable definitions.
Variable Definition
Children Av z-score ht/age
z-score ht/age Total assets Mother's education Father's education Mother's age Father's age Mother's height Father's height Professional dummy Trade dummy Farm dummy Laborer dummy Rural dummy Town dummy City dummy Fp centre distance Toilet = septic tank Toilet = pit privy Toilet = water sealed Toilet = other Water= piped to home Water= piped to yard Water = public pump Water = well Water = other
Mortality
Age in months Age in months 2 Sex Older brothers Older sisters Younger brothers Younger sisters
Number of children ever born of mother (quantity variable) Average long-run nutritional status of children in household (quality variable) Long-run nutritional status of one child (quality variable) Household assets in '00s of Pesos (in 1978, $1 was about 7 Pesos). In years In years In years In years In em In cm Mother's occupation: professions and business Mother's occupation: services, trades and crafts Mother's occupation: owner or tenant of farm Mother's occupation: laborer (omitted dummy) Resides in rural area Resides in town Resides in city (omitted dummy) Distance to family planning centre in Km Main toilet use in barangay (dummy) Main toilet use in barangay (dummy) Main toilet use in barangay (dummy) Main toilet use in barangay (omitted dummy) (ditch, river, etc.) Main water source in barangay (dummy) Main water source in barangay (dummy) Main water source in barangay (dummy) Main water source in barangay (dummy) Main water source in barangay (omitted dummy) (rain water, spring, purchased water, etc.) Unadjusted child mortality rate in barangay (Children who died/ children ever born) Of an individual child Same, squared Dummy: 1 =male, 2 =female (of an individual child) Number of older brothers (of an individual child) Same, number of older sisters Same, number of younger brothers Same, number of younger sisters
S. Horton, Child nutrition and family size 169
Table 2
Means and standard deviations of variables.
Household basis
Quality equation Quantity equation Individual child quality equation
Variable Mean SD Mean SD Mean SD
Children - - - - 5.944 3.368 - - Av z-score ht/age -2.106 1 .071 . . . . z-score ht/age . . . . . 2.173 1.213 Total assets 92.244 240.262 116.682 285.803 85.942 210.466 Mother's education 1.370 0.793 1.371 0.804 1.304 0.725 Father's education 1.426 0.846 1.437 0.861 1.379 0.811 Mother's age 36.021 9.252 39.774 12.744 35.914 7.847 Father's age 39.689 10.959 43.337 13.684 39.706 9.894 Mother's height 150.219 5.376 149.864 5.438 150.112 5.283 Father's height 160.889 6.004 160.688 5.926 160.797 5.880 Professional dummy 0.485 0.500 0.508 0.500 0.461 0.499 Trade dummy 0.342 0.475 0.326 0.469 0.351 0.477 Farm dummy 0.014 0.117 0.011 0.106 0.016 0.124 Laborer dummy 0.159 0.366 0.154 0.361 0.173 0.378 Rural dummy 0.798 0.402 0.769 0.422 0.809 0.393 Town dummy 0.086 0.280 0.114 0.318 0.081 0.273 City dummy 0.116 0.320 0.117 0.321 0.110 0.313 Fp centre distance 6.332 13.179 5.819 12.188 6.148 12.676 Toilet = septic tank 0.075 0.264 0.092 0.289 0.069 0.254 Toilet=pit privy 0.331 0.471 0.312 0.464 0.334 0A72 Toilet = water sealed 0.555 0.497 0.555 0.497 0.560 0.496 Toi le t=other 0.039 0.194 0.041 0.198 0.037 0.189 Water = piped to home 0.095 0.294 0.112 0.315 0.091 0.287 Water=piped to yard 0.356 0.479 0.365 0.482 0.364 0.481 Water=public pump 0.188 0.391 0.181 0.386 0.179 0.384 Water=well 0.158 0.365 0.152 0.359 0.158 0.365 Water=other 0.203 0.402 0.190 0.392 0.197 0.398 Mortality 0.136 0.048 0.136 0.047 0.134 0.047 Age in months . . . . 80.038 47.319 Age in months 2 . . . . . 8644.368 8181.884 Sex . . . . 1.497 0.500 Older Brothers . . . . 1.911 1.849 Older sisters . . . . 1.811 1.705 Younger brothers . . . . 0.933 1.106 Younger sisters . . . . 0.946 1.135
Sample size 901 1132 2672
for height for age ( -2 .11) suggests that the population falls between moderate and mild long-run malnutrition. It should however be noted that the parents are on average considerably shorter than their counterparts in the U.S., a factor which partly explains why the children are also small, and hence why we should not be overly concerned about the mean height for age of children. Average z-score of weight for height (a measure of current
170 S. Horton, Child nutrition and family size
nutritional status) is in the normal range [Horton (1984a)]. Children with low scores on this latter measure are of much greater concern.
4. Results
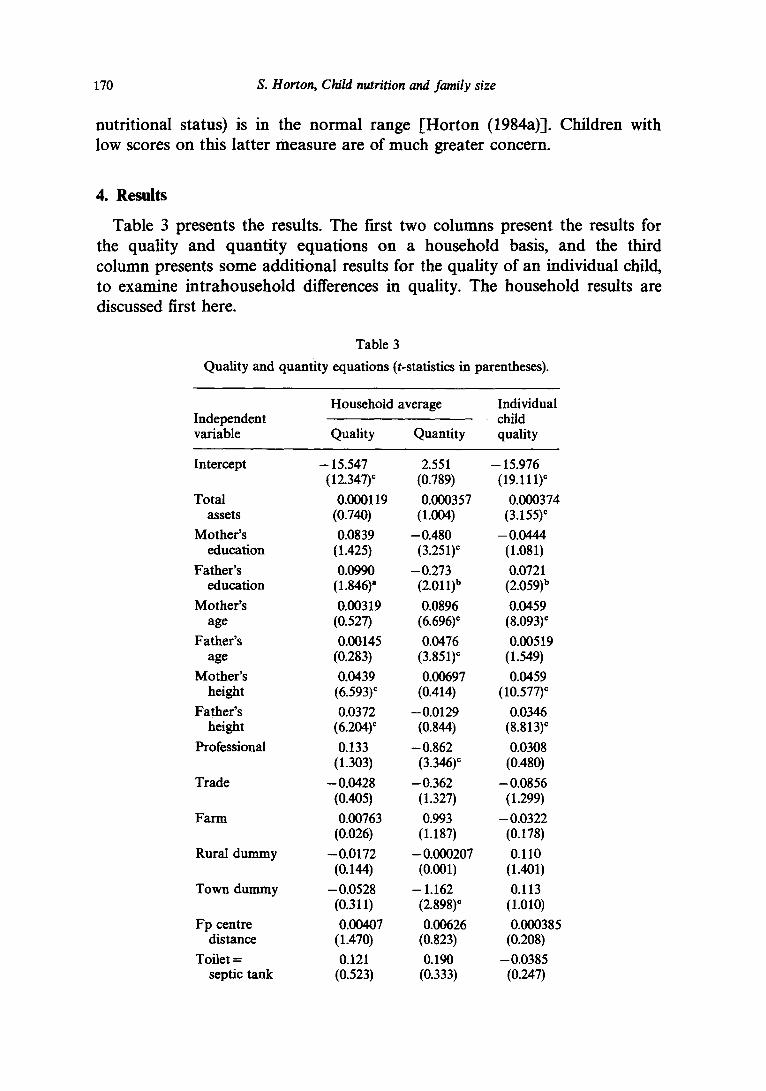
Table 3 presents the results. The first two columns present the results for the quality and quantity equations on a household basis, and the third column presents some additional results for the quality of an individual child, to examine intrahousehold differences in quality. The household results are discussed first here.
Table 3
Quality and quantity equations (t-statistics in parentheses).
Household average Individual Independent child variable Quality Quantity quality
Intercept -- 15.547 2.551 -- 15.976 (12.347) ¢ (0.789) (19.111) ¢
Total 0.000119 0.000357 0.000374 assets (0.740) (1.004) (3.155) ¢
Mother's 0.0839 -0.480 -0.~A,~ education (1,425) (3.251)¢ (1.081)
Father 's 0.0990 -0.273 0.0721 education (1.846)" (2.011) b (2.059) b
Mother's 0.00319 0.0896 0.0459 age (0.527) (6.696) ¢ (8.093) c
Father's 0.00145 0.0476 0.00519 age (0.283) (3.851) ¢ (1.549)
Mother's 0.0439 0.00697 0.0459 height (6.593) ¢ (0.414) (10.577) ¢
Father's 0.0372 -0.0129 0.0346 height (6.204) ¢ (0.844) (8.813) ¢
Professional 0.133 - 0.862 0.0308 (1.303) (3.346) ¢ (0.480)
Trade - 0.0428 - 0.362 - 0.0856 (0.405) (1.327) (1.299)
Farm 0.00763 0.993 - 0.0322 (0.026) (1.187) (0.178)
Rural dummy -0.0172 -0.000207 0.110 (0.144) (0.001) (1.401)
Town dummy -0.0528 - 1.162 0.113 (0.311) (2.898) ¢ (1.010)
Fp centre 0.00407 0.00626 0.000385 distance (1.470) (0.823) (0.208)
Toilet = 0.121 0.190 -0.0385 septic tank (0.523) (0.333) (0.247)
S. Hot(on, Child nutrition and family size 171
Table 3 (continued)
H o u s e h o l d average Individual Independen t child variable Qual i ty Quant i ty qual i ty
Toilet = 0.242 0.0221 0.0858 pit pr ivy (1.249) (0.045) (0.662)
Toilet = 0.234 -0 .00536 0.0697 water sealed (1.234) (0.011) (0.547)
Wa te r = piped 0.441 0.428 0.339 to h o m e (2.934) c (1.163) (3.377) ~
Wate r = piped 0.217 0.0293 0.182 to yard (2.083) b (0.108) (2.740) ~
W a t e r = p u b l i c 0.182 - 0 . 4 6 6 0.154 p u m p (1.631) (1.603) (2.141) b
Wate r = well 0.150 - 0 . 1 2 0 0.124 (1.219) (0.371) (1.580)
Mor ta l i ty - 0.227 3.485 - 0.139 (0.300) (1.808)" (0.281)
Age in m o n t h s - - - - - 0 . 0 0 7 6 1 (4.001) ¢
Age 2 in m o n t h s - - - - - 0 . 0 0 0 ( 0 7 8 6 (0.772)
Sex d u m m y ~ - - 0.0831 (1.921)"
Older - - - - - 0.0701 brothers (4.271) c
Older - - - - - 0 . 0 9 6 4 sisters (5.438) ~
Younge r - - - - - 0.0381 brothers (1.604)
Younger - - - - 0.0460 sisters (1.953) a
Adjusted R e 0.151 0.317 0.161
F statistic 8.300 c 24.500 ~ 19.276 ~
Degrees of f reedom 21,840 21,1063 28,2643
aSignificant at the 10% level on a one-tail test. bSigniticant at the 5% level on a one-tall test. cSignificant at the 1% level on a one-tail test.
172 S. Horton, Child nutrition and family size
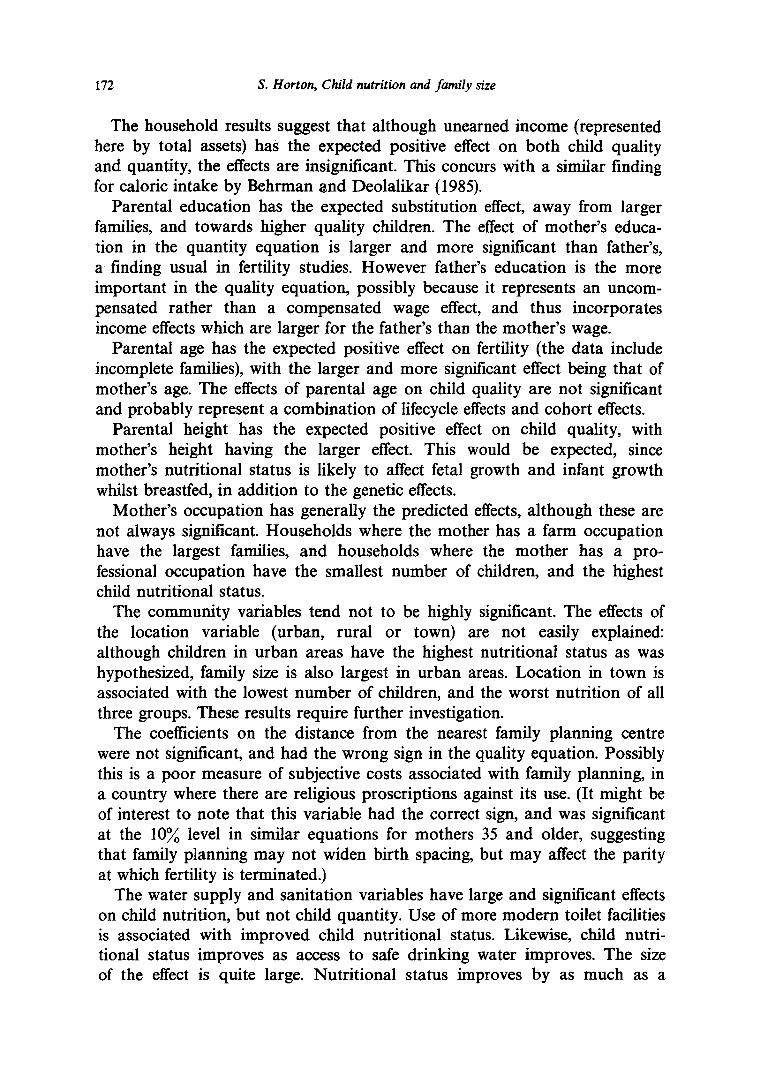
The household results suggest that although unearned income (represented here by total assets) has the expected positive effect on both child quality and quantity, the effects are insignificant. This concurs with a similar finding for caloric intake by Behrman and Deolalikar (1985).
Parental education has the expected substitution effect, away from larger families, and towards higher quality children. The effect of mother's educa- tion in the quantity equation is larger and more significant than father's, a finding usual in fertility studies. However father's education is the more important in the quality equation, possibly because it represents an uncom- pensated rather than a compensated wage effect, and thus incorporates income effects which are larger for the father's than the mother's wage.
Parental age has the expected positive effect on fertility (the data include incomplete families), with the larger and more significant effect being that of mother's age. The effects of parental age on child quality are not significant and probably represent a combination of lifecycle effects and cohort effects.
Parental height has the expected positive effect on child quality, with mother's height having the larger effect. This would be expected, since mother's nutritional status is likely to affect fetal growth and infant growth whilst breastfed, in addition to the genetic effects.
Mother's occupation has generally the predicted effects, although these are not always significant. Households where the mother has a farm occupation have the largest families, and households where the mother has a pro- fessional occupation have the smallest number of children, and the highest child nutritional status.
The community variables tend not to be highly significant. The effects of the location variable (urban, rural or town) are not easily explained: although children in urban areas have the highest nutritional status as was hypothesized, family size is also largest in urban areas. Location in town is associated with the lowest number of children, and the worst nutrition of all three groups. These results require further investigation.
The coefficients on the distance from the nearest family planning centre were not significant, and had the wrong sign in the quality equation. Possibly this is a poor measure of subjective costs associated with family planning, in a country where there are religious proscriptions against its use. (It might be of interest to note that this variable had the correct sign, and was significant at the 10% level in similar equations for mothers 35 and older, suggesting that family planning may not widen birth spacing, but may affect the parity at which fertility is terminated.)
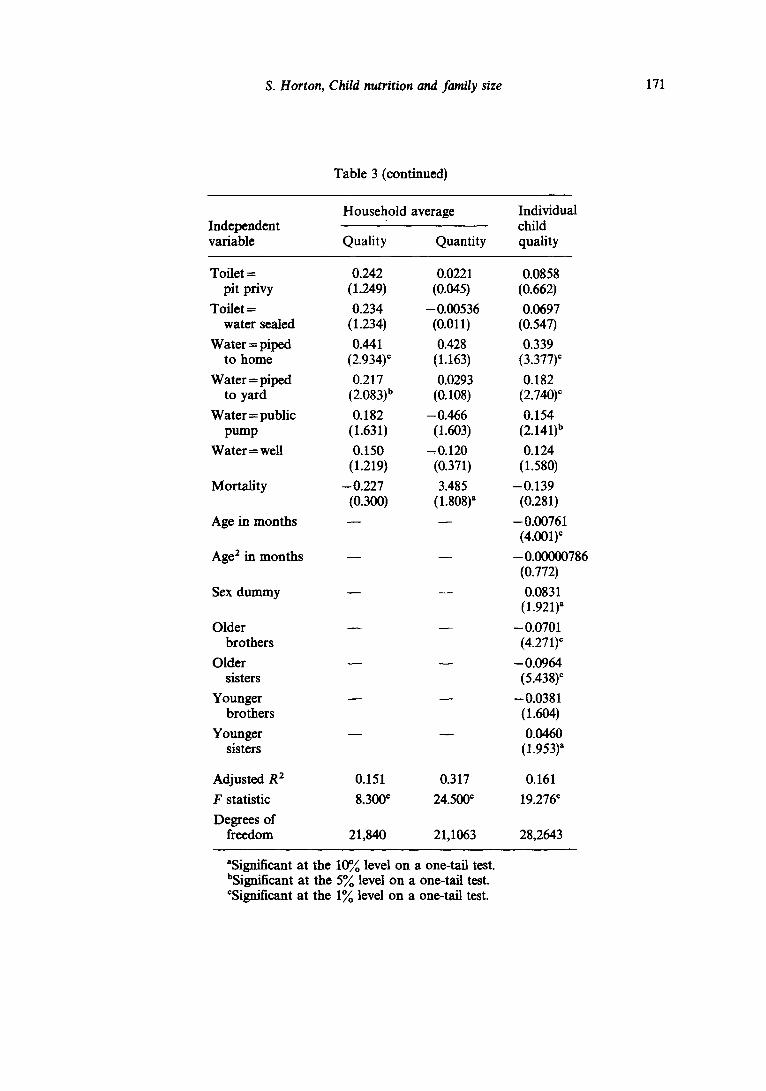
The water supply and sanitation variables have large and significant effects on child nutrition, but not child quantity. Use of more modern toilet facilities is associated with improved child nutritional status. Likewise, child nutri- tional status improves as access to safe drinking water improves. The size of the effect is quite large. Nutritional status improves by as much as a
S. Horton, Child nutrition and family size 173
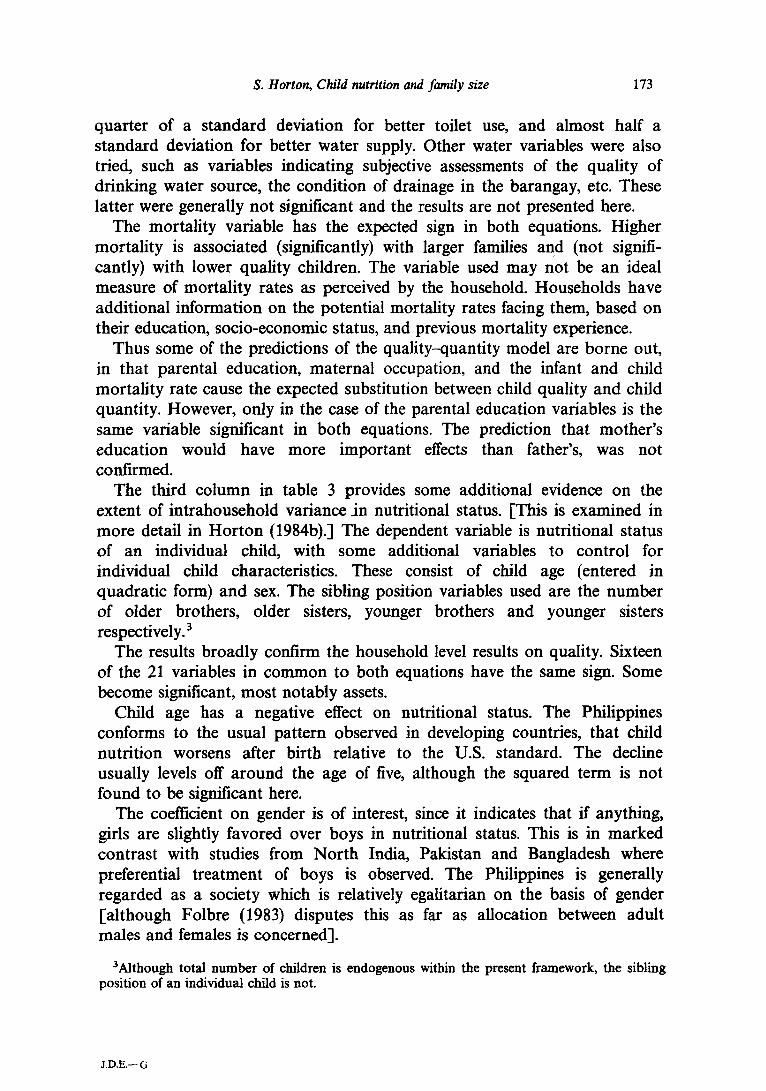
quarter of a standard deviation for better toilet use, and almost half a standard deviation for better water supply. Other water variables were also tried, such as variables indicating subjective assessments of the quality of drinking water source, the condition of drainage in the barangay, etc. These latter were generally not significant and the results are not presented here.
The mortality variable has the expected sign in both equations. Higher mortality is associated (significantly) with larger families and (not signifi- cantly) with lower quality children. The variable used may not be an ideal measure of mortality rates as perceived by the household. Households have additional information on the potential mortality rates facing them, based on their education, socio-economic status, and previous mortality experience.
Thus some of the predictions of the quality-quantity model are borne out, in that parental education, maternal occupation, and the infant and child mortality rate cause the expected substitution between child quality and child quantity. However, only in the case of the parental education variables is the same variable significant in both equations. The prediction that mother's education would have more important effects than father's, was not confirmed.
The third column in table 3 provides some additional evidence on the extent of intrahousehold variance in nutritional status. [This is examined in more detail in Horton (1984b).] The dependent variable is nutritional status of an individual child, with some additional variables to control for individual child characteristics. These consist of child age (entered in quadratic form) and sex. The sibling position variables used are the number of older brothers, older sisters, younger brothers and younger sisters respectively. 3
The results broadly confirm the household level results on quality. Sixteen of the 21 variables in common to both equations have the same sign. Some become significant, most notably assets.
Child age has a negative effect on nutritional status. The Philippines conforms to the usual pattern observed in developing countries, that child nutrition worsens after birth relative to the U.S. standard. The decline usually levels off around the age of five, although the squared term is not found to be significant here.
The coefficient on gender is of interest, since it indicates that if anything, girls are slightly favored over boys in nutritional status. This is in marked contrast with studies from North India, Pakistan and Bangladesh where preferential treatment of boys is observed. The Philippines is generally regarded as a society which is relatively egalitarian on the basis of gender Ialthough Folbre (1983) disputes this as far as allocation between adult males and females is concerned].
SAlthough total number of children is endogenous within the present framework, the sibling position of an individual child is not.
J.D.E.-- G
174 S. Horton, Child nutrition and family size
The coefficients on the sibling variables indicate that there exist rather marked effects of birth order, whereby older siblings have a significant negative effect on child nutritional status. The effects of younger siblings are less significant and the effects seem to be more mixed. Thus it seems that there are quite important intrahousehold differences in child quality, suffi- ciently large as to require some modification of a model which assumes that parents desire some average level of child quality.
5. Conclusions
The quality-quantity framework does seem to provide a useful basis to jointly examine fertility and child nutrition. Child quality and quantity do seem to be somewhat substitutable, possibly more so than another pair of goods chosen at random. However the quality-quantitY framework was not explicitly tested here.
The results on intrahousehold variation in child quality suggest that the framework might require some modification. Becker and Tomes (1976) have extended the quality--quantity model to deal with the intrahousehold alloca- tion of resources. Their model assumes that households try to even out allocation amongst siblings. Although some children may receive more education for efficiency reasons, this is counterbalanced by transfers to the other children in the form of bequests. This type of model may not be very appropriate in developing countries. Households do not seem to invest in quality of children according to the efficiency of such investments. Instead, their rather limited ability to even out resource availability over time leads to (possibly undesired) inequalities amongst their children.
As for policy implications, the study confirms that education, both of males and females, has beneficial effects on child nutrition, and is associated with decreased family size. Other measures with similar effects include improving female occupational opportunities, and reducing the overall level of child and infant mortality. Increases in assets interestingly do not however have strong direct effects on improving average child nutrition. However there may be an interaction effect between birth order and total assets worthy of further investigation. Water supply and sanitation variables can improve child quality. The study was not able to confirm the predicted effects of improved availability of family planning.
The results on individual children suggest that there are strong effects of birth order on child nutritional status. Thus if policy makers are concerned about individual children who are nutritionally at risk, then the intrahouse- hold allocation of resources is important. In particular, if high parity births can be prevented, this is likely to reduce the numbers of children most at risk. Another finding is that the Philippines, unlike South Asia, apparently does not exhibit bias in favor of male children.
S. Horton, Child nutrition and family size 175
The results suggest that further work on structural equations may be of interest, particularly to uncover the effects of urban versus rural location, and the effects of health, water supply and sanitation on nutrition. Further work on the intrahousehold variation in child nutrition may also prove interesting.
References
Anthony, C.R., 1979, Health, population and income: A theoretical and empirical investigation using survey data for rural Nepal, Unpublished Ph.D. dissertation (University of Pennsyl- vania, Philadelphia, PA).
Banskota, K. and R.E. Evenson, 1978, Fertility, schooling and home technology, The Philippines Economic Journal 17, 32-61.
Battad, J.R., 1978, Nutritional status of preschoolers, The Philippines Economic Journal 17, 154-157.
Becker, G.S. and H.G. Lewis, 1974, On the interaction between the quantity and quality of children, Journal of Political Economy 82, $279--$288.
Becker, G. and N. Tomes, 1976, Child endowments and the quantity and quality of children, Journal of Political Economy 84, $143-$162.
Behrman, J.R. and A.B. Deolalikar, 1985, How do food and producer prices affect nutrient intakes, health and labor force behavior for different family members in rural India?, Paper presented at Population Association of America annual meeting, Boston, March, Mimeo.
Behrman, J.R., R.A. Pollak and P. Taubman, 1982, Parental preferences and provision for progeny, Journal of Political Economy 90, 52-73.
Blau, D., 1981, Fertility, child nutrition and women's time allocation in developing countries, Presented at Population Association of America annual meeting, Washington DC, Mimeo.
Chernichovsky, D. and D. Coate, 1979, An economic analysis of the diet, growth, and health of young children in the United States, Working paper no. 416 (NBER, New York).
De Tray, D.N., 1973, Child quality and the demand for children, Journal of Political Economy 81, $70-$98.
Folbre, N., 1983, Household production in the Philippines: A non-neoclassical approach, Economic Development and Cultural Change 84, 302-330.
Griliches, Z., 1979, Sibling models and data in economics: Beginnings of a survey, Journal of Political Economy 87, $37-$64.
Horton, S., 1984a, Human development topic study, Living Standards Measurement Study (draft), Mimeo. (World Bank, Washington, DC).
Horton, S., 1984b, Birth order and child nutritional status: Evidence on the intrahousehold allocation of resources in the Philippines (draft), Mimeo.
Khan, Q., 1984, The impact of household endowment constraints on nutrition and labor supply: A simultaneous equation test of human capital divestment in rural Bangladesh, Journal of Development Economics 15, 313-328.
Kielmann, A.A. et al. 1984, Child and maternal health services in rural India: The Narangwal experiment, Vol. 1: Integrated mutrition and health care (Johns Hopkins University Press, Baltimore, MD).
Knowles, J.C., 1979, The determinants of mortality in a low income area of Karachi, Discussion paper no. 35 (Applied Economics Research Center, Karachi).
Lindert, P.H., 1977, Sibling position and achievement, Journal of Human Resources 12, 198-219. MartoreU, R., 1982, Nutrition and health status indicators: Suggestions for surveys of the
standard of living in developing countries, World Bank Living Standards Measurement Study, Working paper no. 13.
Martorell, R., J. Leslie and P.R. Moock, 1982, Characteristics and determinants of child nutritional status in Nepal, Discussion paper no. 82-15 (Population and Human Resources Division, World Bank, Washington, DC).
Moock, P.R. and J. Leslie, 1985, Childhood malnutrition and schooling in the Terai region of Nepal, Journal of Development Economics 19, no. 3.
Popkin, B.M., and S.S. Roco, Jr. with P. Bragais, Jr. and C.S. Callison, 1979, 1978 Bicol Multipurpose Survey, Vol. 1, Survey design and implementation (draft), Mimeo.

176 S. Horton, Child nutrition and family size
Rosenzweig M.R. and R. Evenson, 1977, Fertility, schooling and the economic contribution of children in rural India: An econometric analysis, Econometrica 45, 1065-1078.
Rosenzweig, M.R. and K.I. Wolpin, 1980, Testing the quantity-quality fertility model: The use of twins as a natural experiment, Econometrica 48, 227-240.
Taylor, C.E., R. Faruquee, R.S.S. Sarma, R. Parker and W. Reinke, 1984, Child and maternal health services in rural India: The Narangwal experiment, Vol. II, Integrated family planning and health care (Johns Hopkins University Press, Baltimore, MD).
Trussel, J. and S. Preston, 1982, Estimating the covariates of childhood mortality from retrospective reports of mothers, Health Policy and Education 3, 1-36.
WHO, 1979, Measurement of nutritional impact (WHO Document no. FAP/79.1, Geneva). Wolfe, B.L. and J.R. Behrman, 1983, Determinants of child mortality, health and nutrition in a
developing country, Journal of Development Economics 11, 163--194. Zajonc, R.B., 1976, Family configuration and intelligence, Science 192, 227-236.