Cheminformatics Approaches to Drug Discovery - CORE
156
Cheminformatics Approaches to Drug Discovery: From Knowledgebases to Toxicity Prediction and Promiscuity Assessment Inaugural-Dissertation to obtain the academic degree Doctor rerum naturalium (Dr. rer. nat.) submitted to the Department of Biology, Chemistry and Pharmacy of Freie Universität Berlin by VISHAL BABU SIRAMSHETTY from Hyderabad, India 2018
-
Upload
khangminh22 -
Category
Documents
-
view
0 -
download
0
Transcript of Cheminformatics Approaches to Drug Discovery - CORE
Cheminformatics Approaches to Drug Discovery:
From Knowledgebases to Toxicity Prediction and
Promiscuity Assessment
Inaugural-Dissertation�
to obtain the academic degree
Doctor rerum naturalium (Dr. rer. nat.)
submitted to the Department of Biology, Chemistry and Pharmacy
of Freie Universität Berlin
by
VISHAL BABU SIRAMSHETTY
from Hyderabad, India
2018

This research work was conducted from December 2014 to June 2018 under the supervision of
PD Dr. Robert Preissner at the Charité – Universitätsmedizin Berlin.
1. Reviewer: PD Dr. Robert Preissner (Charité – Universitätsmedizin Berlin)
2. Reviewer: Prof. Dr. Gerhard Wolber (Freie Universität Berlin)
Date of defense: 09.01.2019

Acknowledgements
I would like to take this opportunity to thank all those people who have accompanied me during the
last years and contributed in many ways to the completion of this dissertation.
Firstly, I would like to thank my supervisor PD Dr. Robert Preissner for his guidance, encouragement,
and support throughout my doctoral study. The last four years had a significant impact on my life. I
believe I evolved as a researcher as well as a social human being. I feel privileged to participate in
international conferences, meet some pioneers in the field and present my work. Dear Robert, I
sincerely thank you for providing the freedom to explore my interests and the trust you placed on me.
I would also like to thank Prof. Dr. Gerhard Wolber for being the co-referent of my thesis.
I extend my gratitude to all my colleagues of the Structural Bioinformatics Group at Charité for being
so kind and for providing a friendly and interactive working atmosphere. Many thanks to Malgorzata
Drwal, Priyanka Banerjee, Andreas Oliver Eckert, Björn Oliver Gohlke, and Janette Nickel-Seeber
for the highly productive and pleasant collaborations within the group. I would like to thank the
postdoctoral researchers Björn Oliver Gohlke, Mathias Dunkel, Andrean Goede, and Malgorzata
Drwal for being approachable for all my questions. Qiaofeng Chen, Prashanth Devarakonda and
Karolina Dawid, I am grateful that I could share my experience with you while supervising your
work which was also a learning experience for me. I wish you all the very best for your future
endeavors. My best wishes to the young colleagues Qiaofeng, Renata, and Vinoth for their doctoral
studies. I would also like to thank the Berlin-Brandenburg Research Platform BB3R for funding my
research work.
Finally, I am indebted to my family and friends for their encouragement and support during the last
years. Thank you, Mom (Manjula) and Dad (Narsimha Rao) for being the best parents. I would never
be able to complete this journey without you. Special thanks to my Sister (Soumya) for always
motivating me and proof-reading my drafts. Chandu (Samba), Sankalp, and Menorca, you have been
very supportive and motivated me throughout this journey. Thank you so much for being there during
the ups and downs and whenever I needed. My friends Srikanth, Mahender, Rajesh, Pradeep, Bhanu,
and Ravi receive a special mention as our conversations never failed to cheer me up whenever I was
low. Finally, I thank my fiancé Monica Theddu, whom I met during this journey, for her reliable and
invaluable support and motivation.
I

II
Abstract
Polypharmacology marked a paradigm shift in drug discovery from the traditional ‘one drug, one
target’ approach to a multi-target perspective, indicating that highly effective drugs favorably
modulate multiple biological targets. This ability of drugs to show activity towards many targets is
referred to as promiscuity, an essential phenomenon that may as well lead to undesired side-effects.
While activity at therapeutic targets provides desired biological response, toxicity often results from
non-specific modulation of off-targets. Safety, efficacy and pharmacokinetics have been the primary
concerns behind the failure of a majority of candidate drugs. Computer-based (in silico) models that
can predict the pharmacological and toxicological profiles complement the ongoing efforts to lower
the high attrition rates. High-confidence bioactivity data is a prerequisite for the development of
robust in silico models. Additionally, data quality has been a key concern when integrating data from
publicly-accessible bioactivity databases. A majority of the bioactivity data originates from high-
throughput screening campaigns and medicinal chemistry literature. However, large numbers of
screening hits are considered false-positives due to a number of reasons. In stark contrast, many
compounds do not demonstrate biological activity despite being tested in hundreds of assays.
This thesis work employs cheminformatics approaches to contribute to the aforementioned diverse,
yet highly related, aspects that are crucial in rationalizing and expediting drug discovery.
Knowledgebase resources of approved and withdrawn drugs were established and enriched with
information integrated from multiple databases. These resources are not only useful in small
molecule discovery and optimization, but also in the elucidation of mechanisms of action and off-
target effects. In silico models were developed to predict the effects of small molecules on nuclear
receptor and stress response pathways and human Ether-à-go-go-Related Gene encoded potassium
channel. Chemical similarity and machine-learning based methods were evaluated while highlighting
the challenges involved in the development of robust models using public domain bioactivity data.
Furthermore, the true promiscuity of the potentially frequent hitter compounds was identified and
their mechanisms of action were explored at the molecular level by investigating target-ligand
complexes. Finally, the chemical and biological spaces of the extensively tested, yet inactive,
compounds were investigated to reconfirm their potential to be promising candidates.
III

IV
Zusammenfassung
Die Polypharmakologie beschreibt einen Paradigmenwechsel von "einem Wirkstoff - ein
Zielmolekül" zu "einem Wirkstoff - viele Zielmoleküle" und zeigt zugleich auf, dass hochwirksame
Medikamente nur durch die Interaktion mit mehreren Zielmolekülen Ihre komplette Wirkung
entfalten können.
Hierbei ist die biologische Aktivität eines Medikamentes direkt mit deren Nebenwirkungen
assoziiert, was durch die Interaktion mit therapeutischen bzw. Off-Targets erklärt werden kann
(Promiskuität). Ein Ungleichgewicht dieser Wechselwirkungen resultiert oftmals in mangelnder
Wirksamkeit, Toxizität oder einer ungünstigen Pharmakokinetik, anhand dessen man das Scheitern
mehrerer potentieller Wirkstoffe in ihrer präklinischen und klinischen Entwicklungsphase aufzeigen
kann. Die frühzeitige Vorhersage des pharmakologischen und toxikologischen Profils durch
computergestützte Modelle (in-silico) anhand der chemischen Struktur kann helfen den Prozess der
Medikamentenentwicklung zu verbessern. Eine Voraussetzung für die erfolgreiche Vorhersage
stellen zuverlässige Bioaktivitätsdaten dar. Allerdings ist die Datenqualität oftmals ein zentrales
Problem bei der Datenintegration. Die Ursache hierfür ist die Verwendung von verschiedenen
Bioassays und „Readouts“, deren Daten zum Großteil aus primären und bestätigenden Bioassays
gewonnen werden. Während ein Großteil der Treffer aus primären Assays als falsch-positiv
eingestuft werden, zeigen einige Substanzen keine biologische Aktivität, obwohl sie in beiden Assay-
Typen ausgiebig getestet wurden (“extensively assayed compounds”).
In diese Arbeit wurden verschiedene chemoinformatische Methoden entwickelt und angewandt, um
die zuvor genannten Probleme zu thematisieren sowie Lösungsansätze aufzuzeigen und im Endeffekt
die Arzneimittelforschung zu beschleunigen. Hierfür wurden nicht redundante, Hand-validierte
Wissensdatenbanken für zugelassene und zurückgezogene Medikamente erstellt und mit
weiterführenden Informationen angereichert, um die Entdeckung und Optimierung kleiner
organischer Moleküle voran zu treiben. Ein entscheidendes Tool ist hierbei die Aufklärung derer
Wirkmechanismen sowie Off-Target-Interaktionen.
Für die weiterführende Charakterisierung von Nebenwirkungen, wurde ein Hauptaugenmerk auf
Nuklearrezeptoren, Pathways in welchen Stressrezeptoren involviert sind sowie den hERG-Kanal
gelegt und mit in-silico Modellen simuliert. Die Erstellung dieser Modelle wurden Mithilfe eines
V
integrativen Ansatzes aus “state-of-the-art” Algorithmen wie Ähnlichkeitsvergleiche und “Machine-
Learning” umgesetzt. Um ein hohes Maß an Vorhersagequalität zu gewährleisten, wurde bei der
Evaluierung der Datensätze explizit auf die Datenqualität und deren chemische Vielfalt geachtet.
Weiterführend wurden die in-silico-Modelle dahingehend erweitert, das Substrukturfilter genauer
betrachtet wurden, um richtige Wirkmechanismen von unspezifischen Bindungsverhalten (falsch-
positive Substanzen) zu unterscheiden. Abschließend wurden der chemische und biologische Raum
ausgiebig getesteter, jedoch inaktiver, kleiner organischer Moleküle (“extensively assayed
compounds”) untersucht und mit aktuell zugelassenen Medikamenten verglichen, um ihr Potenzial
als vielversprechende Kandidaten zu bestätigen.
VI
Table of Contents
Acknowledgments ............................................................................................................................ I
Abstract ......................................................................................................................................... III
Zusammenfassung ........................................................................................................................ V
Table of Contents
List of Own Publications ............................................................................................................. IX
Thesis Outline .............................................................................................................................. XI
Chapter 1 Introduction ................................................................................................................. 1
1.1 Cheminformatics - a Historical Background ............................................................................. 3
1.2 Cheminformatics Approaches to Drug Discovery ..................................................................... 5
1.3 Motivation and Aim of Thesis................................................................................................ 18
Chapter 2 Methodology................................................................................................................ 21
2.1 Publicly Accessible Resources for Chemogenomics Data ....................................................... 21
2.2 Integration of Chemogenomics Data for Knowledgebase Development and Modeling ............ 23
2.3 Construction of Knowledgebase Resources ............................................................................ 27
2.4 Development of In Silico Models for Toxicity Prediction ....................................................... 27
2.5 Other Cheminformatics Methods and Analyses ...................................................................... 39
Chapter 3 Knowledgebase Resources for In Silico Drug Discovery ......................................... 41
3.1 Construction of Databases of Approved and Withdrawn Drugs ............................................. 41
3.2 SuperDRUG2: A One Stop Resource for Approved/Marketed Drugs ..................................... 42
3.3 WITHDRAWN--A Resource for Withdrawn and Discontinued Drugs ................................... 50
3.4 Summary ............................................................................................................................... 59
Chapter 4 Development of In Silico Models for Toxicity Prediction ........................................ 61
4.1 Chemical Similarity and Machine-learning Methods for Predicting Toxicological Endpoints . 61
4.2 Molecular Similarity-based Predictions of the Tox21 Screening Outcome .............................. 62
4.3 Computational Methods for Prediction of In Vitro Effects of New Chemical Structures ......... 72
4.4 The Catch-22 of Predicting hERG Blockade Using Publicly Accessible Bioactivity Data ....... 84
4.5 Summary ............................................................................................................................... 95
VII
Chapter 5 Promiscuity and Mechanisms of Action of Frequent Hitter Compounds ............. 97
5.1 Application of PAINS Filters in HTS - Good or Bad? ............................................................ 97
5.2 Exploring Activity Profiles of PAINS and Their Structural Context in Target-Ligand
Complexes ................................................................................................................................. 98
5.3 Summary ............................................................................................................................. 111
Chapter 6 Exploring the True Promiscuity of Consistently Inactive Compounds ................ 113
6.1 Is ‘Dark Chemical Matter’ Really Dark? .............................................................................. 113
6.2 Drugs as Habitable Planets in the Space of Dark Chemical Matter ....................................... 114
6.3 Summary ............................................................................................................................. 121
Chapter 7 Discussion ................................................................................................................. 123
Chapter 8 Conclusions and Outlook ........................................................................................ 129
Bibliography ............................................................................................................................... 131
Appendix .................................................................................................................................... 151
A. List of Figures ...................................................................................................................... 151
B. List of Tables ........................................................................................................................ 152
C. List of Abbreviations ............................................................................................................ 153
D. Supplementary Data .............................................................................................................. 154
VIII

List of Own Publications
Peer-reviewed Publications
Publication 1
Siramshetty, V. B.; Chen, Q.; Devarakonda, P.; Preissner, R.
The Catch-22 of Predicting hERG Blockade Using Publicly Accessible Bioactivity Data.
Journal of Chemical Information and Modeling 58(6):1224-1233, 2018; 10.1021/acs.jcim.8b00150
Publication 2
Siramshetty, V. B.; Eckert, O. A.; Gohlke, B. O.; Goede, A.; Chen, Q.; Devarakonda, P.; Preissner,
S.; Preissner, R.
SuperDRUG2: A One Stop Resource for Approved/Marketed Drugs.
Nucleic Acids Research 46(D1):D1137-D1143, 2018; 10.1093/nar/gkx1088
Publication 3
Siramshetty, V. B.; Preissner, R.
Drugs as Habitable Planets in the Space of Dark Chemical Matter.
Drug Discovery Today 23(3):481-486, 2017; 10.1016/j.drudis.2017.07.003
Publication 4
Banerjee, P.; Siramshetty, V. B.; Drwal, M. N.; Preissner, R.
Computational Methods for Prediction of In Vitro Effects of New Chemical Structures.
Journal of cheminformatics 8:51, 2016; 10.1186/s13321-016-0162-2
Publication 5
Siramshetty, V. B.; Nickel, J.; Omieczynski, C.; Gohlke, B. O.; Drwal, M. N.; Preissner, R.
WITHDRAWN--A Resource for Withdrawn and Discontinued Drugs.
Nucleic Acids Research 44(D1):D1080-D1086, 2016; 10.1093/nar/gkv1192
Publication 6
Drwal, M.; Siramshetty, V. B.; Banerjee, P.; Goede, A.; Preissner, R.; Dunkel, M.
Molecular Similarity-based Predictions of the Tox21 Screening Outcome.
Frontiers in Environmental Science 3:54, 2015; 10.3389/fenvs.2015.00054
IX
Submitted Manuscripts
Siramshetty, V.B.; Preissner, R; Gohlke, B. O.
Exploring Activity Profiles of PAINS and Their Structural Context in Target-Ligand Complexes.
Journal of Chemical Information and Modeling (In Peer-Review)
(Revised Manuscript Submitted on June 15, 2018)
Other Publications
Siramshetty, V. B.; Chen, Q.; Preissner, R.
WITHDRAWN - A One-stop Source for Drug Withdrawals.
Pharmazeutische Medizin 20, 38-43, 2018
Posters and Talks
1. Fingerprint-based Matched Molecular Pair (FP-MMP) Analysis at 13th German Conference on
Chemoinformatics (November 2017), Mainz, Germany. (Poster)
2. Advancing the MMP Concept: A Fingerprint-based Matched Molecular Pair (FP-MMP)
Analysis of hERG Bioactivity Data at 6th RDKit User Group Meeting (September 2017), Berlin,
Germany. (Poster)
3. Predicting hERG/K+ Channel Inhibition: In Silico Modeling and Assessment on Published
Datasets at Gordon Research Conference and Seminar - Computer Aided Drug Design (July
2017), Mount Snow, United States. (Poster)
4. Compound Filters in High-throughput Screening: What Do Drugs Tell Us? at 21st EuroQSAR -
Where Molecular Simulations Meet Drug Discovery, (September 2016), Verona, Italy. (Poster)
5. Computational Methods for Prediction of In Vitro Activity of New Chemical Structures at
German Pharm-Tox Summit, (February-March 2016), Berlin, Germany. (Poster)
6. WITHDRAWN - a Resource for Withdrawn and Discontinued Drugs at Vienna Summer School
for Drug Design (September 2015), Vienna, Austria. (Poster)
7. Potential Drug Repositioning Opportunities for Ebola Virus Disease at 2nd Kazan Summer
School on Chemoinformatics (July 2015), Kazan, Russia. (Talk and Poster)
X
Thesis Outline
The thesis consists of eight individual chapters and is structured as follows.
Chapter 1 introduces the cheminformatics research discipline, provides an overview of the state-of-
the-art developments and current challenges in the field, and states the aims and objectives of the
thesis. Chapter 2 details the sources of data and describes the different computational methods
employed. The results of the thesis are presented in the Chapters 3, 4, 5 and 6.
Chapter 3 describes two publicly-accessible integrated databases that are potentially useful in
knowledge-driven in silico drug discovery. SuperDRUG2 is a database that serves as one-stop source
for approved drugs and the WITHDRAWN database is a comprehensive resource for withdrawn and
discontinued drugs. The databases provide a wide range of information on drugs and compound
collections from them were employed for further studies in this thesis.
Chapter 4 describes the three studies that reported in silico models based on chemical similarity and
machine-learning methods to predict toxicological outcomes of small molecules. The first two focus
on models developed to predict the potential of chemical structures to disrupt nuclear receptor and
stress response pathways that may lead to various toxicities. In the third study, binary classifiers were
developed to identify the small molecule inhibitors of human Ether-à-go-go-Related Gene (hERG)
encoded potassium channel. The performances achieved using different modeling methods and
chemical descriptors were compared and the challenges involved in the development of robust
models with broad applicability were discussed.
Chapter 5 investigates the activity profiles and the mechanisms of action of pan assay interference
compounds that are widely employed to detect frequent hitter compounds. The true promiscuity
trends of frequent hitters in different compound collections were established. Further, the structure-
level investigations confirmed their participation in molecular interactions responsible for binding to
target macromolecules.
Chapter 6 presents a retrospective outlook on the promiscuity and safety of the extensively tested
compounds (dark chemical matter), that have been inactive in multiple biological screens. Their
chemical space was compared with that of marketed drugs to forecast the prospects to identify
promising candidates.
Finally, Chapter 7 discusses the major findings of this research work in the light of the recent
developments in the field and Chapter 8 presents the overall conclusions and a general outlook.
XI

XII
Chapter 1
Introduction
The fundamental goal of drug discovery is to identify small molecules that are active against a
biological target of interest and alter its biological function. The research and development (R&D)
investments dramatically increased over the decades with a recent estimate of the collective annual
R&D expenditure by the big pharmaceutical companies summing up to $50 billion [1, 2]. However,
only a small proportion of the candidate drugs is approved and introduced to the market [3, 4]. The
overall productivity remains a huge concern despite the introduction of novel discovery technologies
such as genomics/proteomics, combinatorial chemistry, high-throughput screening (HTS), ligand
and structure-based drug design [5]. Temporal trends indicate that poor pharmacokinetics contributed
to a significantly lesser number of failures more recently as compared to the 1990s, while efficacy
and safety remain the major concerns behind the high overall attrition rates [6-8]. Earlier studies tried
to establish links between physicochemical properties and the likelihood of attritions due to poor
pharmacokinetic profile [9-11]. Later studies focused on the influence of these properties on
compound promiscuity and toxicity [12-15]. A recent analysis of the data from four major
pharmaceutical companies suggested that physicochemical properties can be linked to the failures
due to safety issues [16].
An understanding of the drug discovery and development pipeline (Figure 1.1) helps identify key
steps that could be influenced in order to improve the R&D productivity. A conventional drug
discovery pipeline begins with the identification of an appropriate biological target. Once the target
is validated, a range of experimental techniques is applied in the discovery and screening phase to
identify a promising lead compound. Then, medicinal chemistry and rational drug design methods
are employed to optimize the lead compound for efficacy, safety, and pharmacokinetics. The
optimized lead compounds are validated for biological activity in in vivo experiments. Finally, the
candidates are selected for testing in preclinical phases. Drug development includes the preclinical
and clinical phases of testing. While preclinical testing primarily focuses on pharmacokinetics and
safety of the drug, the clinical phases I, II and III evaluate pharmacokinetics, tolerability, safety,
efficacy, and dosage. After successful completion of Phase III, the regulatory authorities grant an
approval for the drug. Post to marketing, the long-term effects are evaluated based on reports from
1
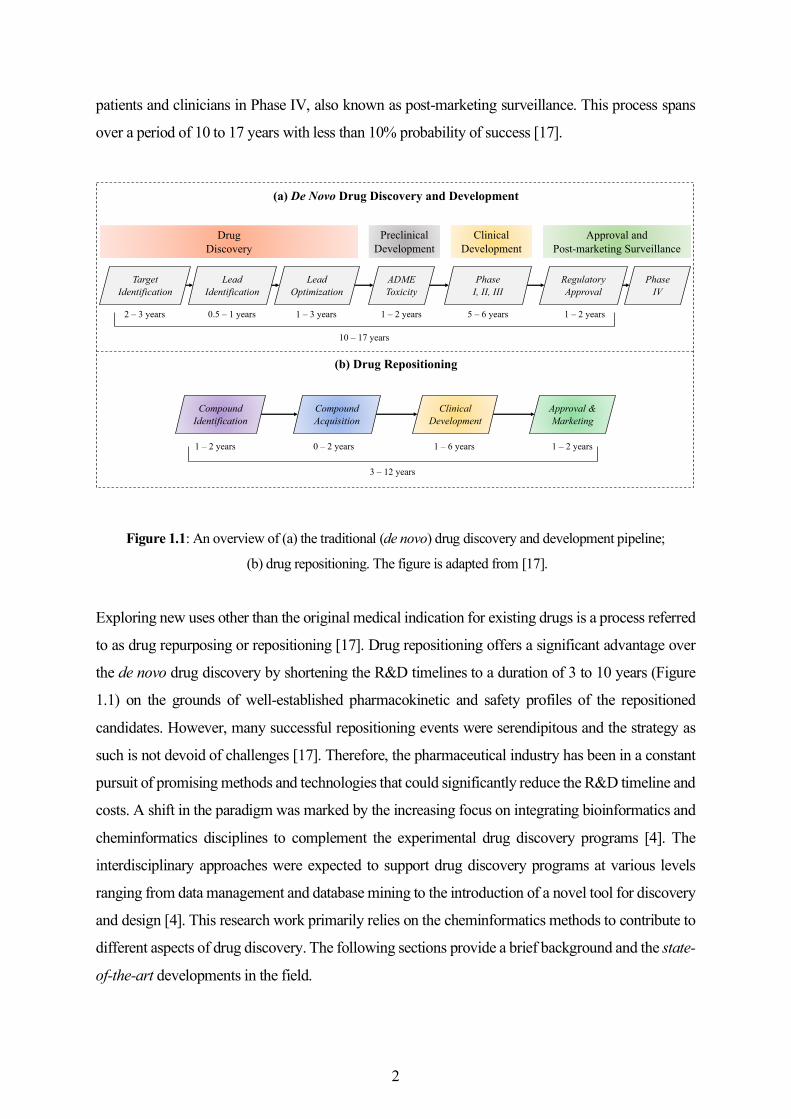
patients and clinicians in Phase IV, also known as post-marketing surveillance. This process spans
over a period of 10 to 17 years with less than 10% probability of success [17].
Figure 1.1: An overview of (a) the traditional (de novo) drug discovery and development pipeline;
(b) drug repositioning. The figure is adapted from [17].
Exploring new uses other than the original medical indication for existing drugs is a process referred
to as drug repurposing or repositioning [17]. Drug repositioning offers a significant advantage over
the de novo drug discovery by shortening the R&D timelines to a duration of 3 to 10 years (Figure
1.1) on the grounds of well-established pharmacokinetic and safety profiles of the repositioned
candidates. However, many successful repositioning events were serendipitous and the strategy as
such is not devoid of challenges [17]. Therefore, the pharmaceutical industry has been in a constant
pursuit of promising methods and technologies that could significantly reduce the R&D timeline and
costs. A shift in the paradigm was marked by the increasing focus on integrating bioinformatics and
cheminformatics disciplines to complement the experimental drug discovery programs [4]. The
interdisciplinary approaches were expected to support drug discovery programs at various levels
ranging from data management and database mining to the introduction of a novel tool for discovery
and design [4]. This research work primarily relies on the cheminformatics methods to contribute to
different aspects of drug discovery. The following sections provide a brief background and the state-
of-the-art developments in the field.
Target Identification
Lead Identification
Lead Optimization
ADMEToxicity
Phase I, II, III
Regulatory Approval
PhaseIV
2 – 3 years 0.5 – 1 years 1 – 3 years 1 – 2 years 5 – 6 years 1 – 2 years
10 – 17 years
Compound Identification
Compound Acquisition
ClinicalDevelopment
Approval &Marketing
1 – 2 years 0 – 2 years 1 – 6 years 1 – 2 years
3 – 12 years
(a) De Novo Drug Discovery and Development
(b) Drug Repositioning
DrugDiscovery
PreclinicalDevelopment
ClinicalDevelopment
Approval andPost-marketing Surveillance
2
1.1 Cheminformatics - a Historical Background
As defined by Frank Brown in 1998, “chemoinformatics is the mixing of those information resources
to transform data into information and information into knowledge for the intended purpose of
making better decisions faster in the area of drug lead identification and optimization” [18]. It can
be interpreted as the combination of various information resources required to optimize the properties
of a ligand to become a drug. While both terms chemoinformatics and cheminformatics have been in
use, the shorter variant cheminformatics gained much popularity with the recent establishment of the
Journal of Cheminformatics. The essential components of cheminformatics are those methods that
aid decision making in pharmaceutical research, methods that bridge the gap between computational
and experimental programs, the computational infrastructure to store, manage and analyze data
related to chemicals, and the approaches to investigate structure-activity and structure-property
relationships with an ultimate goal to identify or design better molecules [19].
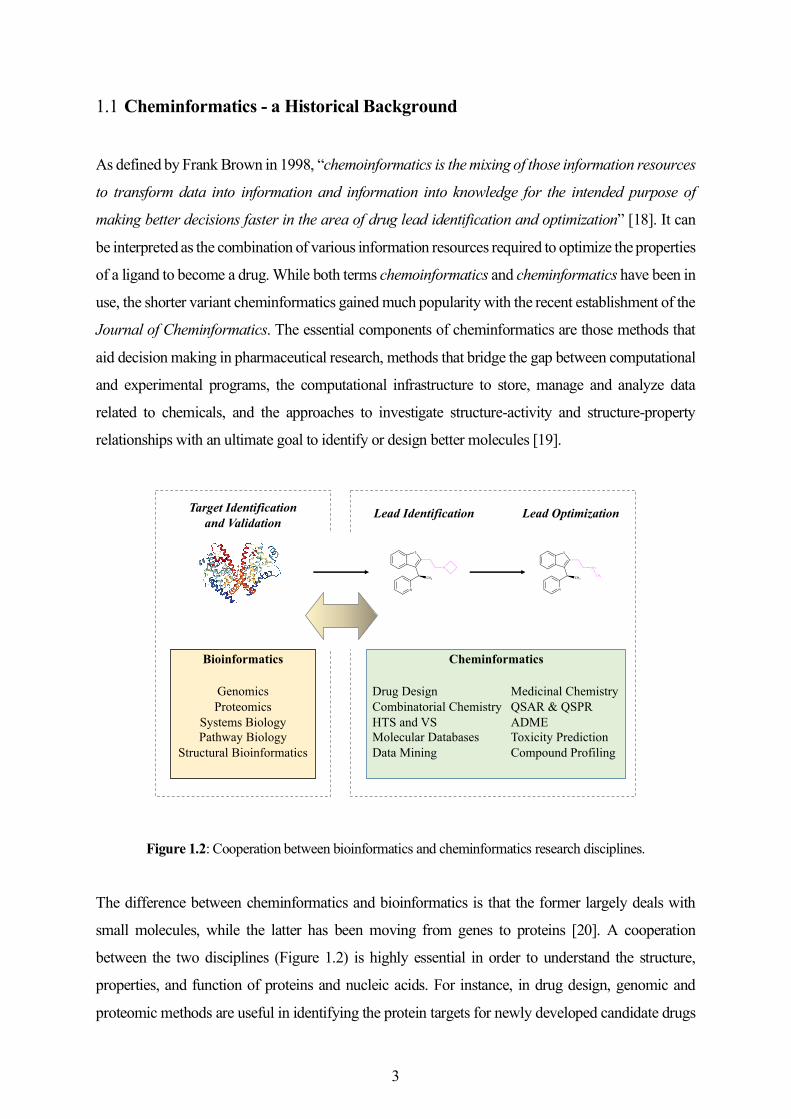
Figure 1.2: Cooperation between bioinformatics and cheminformatics research disciplines.
The difference between cheminformatics and bioinformatics is that the former largely deals with
small molecules, while the latter has been moving from genes to proteins [20]. A cooperation
between the two disciplines (Figure 1.2) is highly essential in order to understand the structure,
properties, and function of proteins and nucleic acids. For instance, in drug design, genomic and
proteomic methods are useful in identifying the protein targets for newly developed candidate drugs
Bioinformatics Cheminformatics
Target Identificationand Validation
Lead Identification Lead Optimization
GenomicsProteomics
Systems BiologyPathway Biology
Structural Bioinformatics
Drug DesignCombinatorial ChemistryHTS and VSMolecular DatabasesData Mining
Medicinal ChemistryQSAR & QSPRADMEToxicity PredictionCompound Profiling
3
while the cheminformatics methods are helpful in lead identification and lead optimization. Although
established as a relatively newer field, the early developments in cheminformatics date back to the
1960s. These efforts (listed in Table 1.1) have laid the foundations for many methods and algorithms
that are currently employed in modern drug discovery.
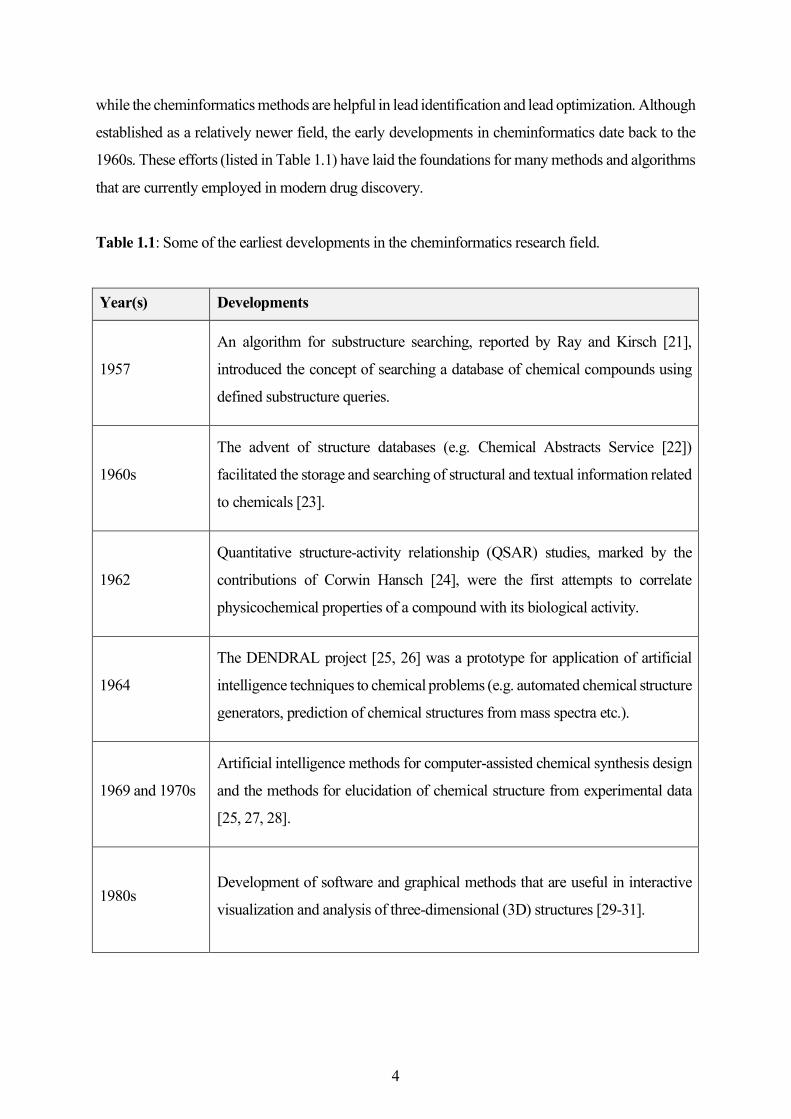
Table 1.1: Some of the earliest developments in the cheminformatics research field.
Year(s) Developments
1957
An algorithm for substructure searching, reported by Ray and Kirsch [21],
introduced the concept of searching a database of chemical compounds using
defined substructure queries.
1960s
The advent of structure databases (e.g. Chemical Abstracts Service [22])
facilitated the storage and searching of structural and textual information related
to chemicals [23].
1962
Quantitative structure-activity relationship (QSAR) studies, marked by the
contributions of Corwin Hansch [24], were the first attempts to correlate
physicochemical properties of a compound with its biological activity.
1964
The DENDRAL project [25, 26] was a prototype for application of artificial
intelligence techniques to chemical problems (e.g. automated chemical structure
generators, prediction of chemical structures from mass spectra etc.).
1969 and 1970s
Artificial intelligence methods for computer-assisted chemical synthesis design
and the methods for elucidation of chemical structure from experimental data
[25, 27, 28].
1980s Development of software and graphical methods that are useful in interactive
visualization and analysis of three-dimensional (3D) structures [29-31].
4
1.2 Cheminformatics Approaches to Drug Discovery
Although cheminformatics has been a long-established discipline, the recent gain in prominence
could be attributed majorly to the developments in areas such as HTS and combinatorial chemistry,
which produce vast amounts of structural and bioactivity data. Sophisticated informatics methods are
required to analyze this data. This section provides an overview of the cheminformatics approaches
harnessed by the pharmaceutical industry and academia while highlighting the state-of-the-art
developments that significantly impact various aspects of preclinical drug discovery. However, the
primary focus is on those aspects dealt with in this research work.
1.2.1 Data Explosion and Growth of Knowledgebase Resources
‘Big data’ currently influences several research disciplines, and chemistry is not an exception. While
there exists no general definition for big data in chemistry, it is often referred to databases that are
considerably larger, in several orders of magnitude, than those that are commonly used [32]. A
remarkable increase in the amount of publicly accessible compound and compound bioactivity data
has been witnessed in the last decade (Table 1.1) [33-35]. Introduction of high-throughput methods
[32, 34-36] and enhanced access to large data repositories facilitated by large-scale data mining
efforts (e.g. patents and literature) contributed the most to this data explosion [37-39]. Medicinal
chemistry, a conservative research discipline that responds slow to new trends, is also currently
entering the big data era [40]. For instance, polypharmacology and compound promiscuity are
aspects that are positively affected by the big data phenomenon.
The publicly accessible databases such as ChEMBL [41, 42], BindingDB [36] and PubChem [34]
emerged as large repositories of compound bioactivity data. ChEMBL and BindingDB contain
compound bioactivities extracted from medicinal chemistry literature while PubChem primarily
incorporates data from primary and confirmatory bioassays. The knowledge hidden in the patents
was uncovered by SureChEMBL database [38] which currently holds more than 18 million unique
chemical structures extracted from nearly 15 million chemical patents. The Protein Data Bank (PDB)
[43] and Cambridge Structural Database [44] are popular resources for experimentally determined
3D structures of biological macromolecules. On the other hand, commercial databases such as
Chemical Abstracts Service [45] and Reaxys [46] have been accumulating huge amounts of data
from publications and patents (see Table 1.2 for detailed statistics).
5
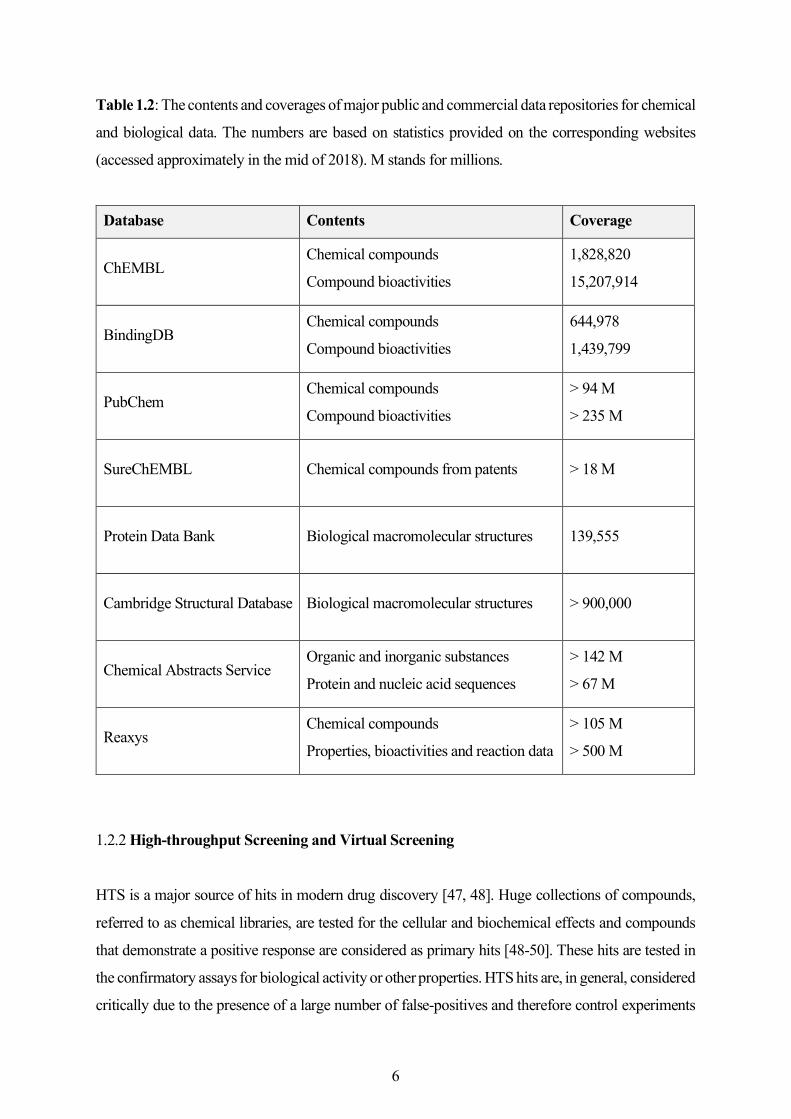
Table 1.2: The contents and coverages of major public and commercial data repositories for chemical
and biological data. The numbers are based on statistics provided on the corresponding websites
(accessed approximately in the mid of 2018). M stands for millions.
Database Contents Coverage
ChEMBL Chemical compounds
Compound bioactivities
1,828,820
15,207,914
BindingDB Chemical compounds
Compound bioactivities
644,978
1,439,799
PubChem Chemical compounds
Compound bioactivities
> 94 M
> 235 M
SureChEMBL Chemical compounds from patents > 18 M
Protein Data Bank Biological macromolecular structures 139,555
Cambridge Structural Database Biological macromolecular structures > 900,000
Chemical Abstracts Service Organic and inorganic substances
Protein and nucleic acid sequences
> 142 M
> 67 M
Reaxys Chemical compounds
Properties, bioactivities and reaction data
> 105 M
> 500 M
1.2.2 High-throughput Screening and Virtual Screening
HTS is a major source of hits in modern drug discovery [47, 48]. Huge collections of compounds,
referred to as chemical libraries, are tested for the cellular and biochemical effects and compounds
that demonstrate a positive response are considered as primary hits [48-50]. These hits are tested in
the confirmatory assays for biological activity or other properties. HTS hits are, in general, considered
critically due to the presence of a large number of false-positives and therefore control experiments
6
are conducted for validation. Major concerns associated with false-positives and incorrect assay
measurements include the purity and stability of compounds, compound concentrations that are lower
than the typical screening concentrations and non-specific reactivity of compounds [47, 51, 52].
Virtual screening (VS) is among those computational approaches developed to compensate for such
limitations. It was introduced as a cost- and time-efficient alternative to HTS as large libraries of
compounds can be screened to produce relatively higher hit rates [47, 49]. HTS and VS are generally
considered complementary screening methods and hence an integration of the two is believed to
reduce the number of compound hits that require further testing [51, 53].
Two different VS approaches include structure-based virtual screening [54] and ligand-based virtual
screening (LBVS) [55]. Structure-based methods rely on the 3D structure of a target to explore and
identify target-ligand interactions. Molecular docking is an example of structure-based virtual
screening which involved docking of a large number of database molecules into the 3D structure of
the target to predict hypothetical binding modes and scoring function based binding affinities [54,
56]. LBVS requires at least one compound with known activity towards a target in order to identify
new hits [55]. It enables identification of novel lead compounds that possess desirable biological
activity, even when the structure of a biological target is not known [57]. Identification of hits is
largely based on the renowned ‘similarity property principle’ which states that “similar molecules
should have similar biological properties (activity)”, as proposed by Johnson and Maggiora [58].
1.2.3 Similarity Searching
Similarity searching is a subdiscipline of VS and one of the widely applied ligand-based approaches
in drug discovery [59, 60]. Active compounds, either one or more, are employed as reference
compounds to screen a large database of compounds, which are ranked in the order of decreasing
similarity. Compounds ranked at the top are expected to exhibit similar biological activity as the
reference compounds. The essential components of similarity search are: (a) molecular
representations of compounds; (b) determination of chemical similarity; and (c) search strategy.
These aspects are discussed in the following subsections.
(a) Molecular representations
Chemical structure and molecular properties can be numerically encoded as molecular descriptors.
Molecular descriptors of varying complexity are currently available and capture different levels of
compound information [61, 62]. They are not only useful in the assessment of the structural diversity
7
of compound databases but also in the identification of potentially bioactive molecules in compound
libraries [61]. Molecular descriptors are in general grouped into three broad categories: one-
dimensional (1D), two-dimensional (2D) or 3D descriptors; based on the molecular representations
used to derive them [51]. 1D descriptors (e.g. atom count, molecular weight) are based on the
molecular formula. 2D descriptors are based on the 2D structure representations (e.g. molecular
graph, connection table). Topological descriptors and computed descriptors that approximate
molecular properties such as lipophilicity (e.g. logP) are examples of 2D descriptors. 3D descriptors
are determined from the 3D molecular conformations. Molecular surface, shape, and volume are
prominent examples of 3D descriptors.
Line notations such as SMILES, SMARTS, InChI, and InChIKey are among the popular
representations. SMILES (Simplified Molecular Input Line System) represent a molecule as a linear
string based on predefined rules and are a choice for efficient storage and retrieval of compounds
[63]. SMARTS (SMILES Arbitrary Target Specification) is a string representation and an extension
of SMILES to allow for variability in the represented chemical structure. SMARTS are often used in
substructure searching [64]. InChI (International Chemical Identifier) was established with an aim to
unify searches across multiple databases. An InChIKey is a hashed version of InChI and provides a
unique representation of a chemical structure commonly employed to index chemical structures [65].
InChI is made up of multiple layers of information on the chemical structure while InChIKey is a
fixed-length string of 27 characters generated using a cryptographic hash function [66].
Fingerprints are popular molecular descriptors that are either bit string or integer string
representations of molecules capturing the structural features and (or) physicochemical properties
[67]. In case of binary fingerprints, each bit encodes either the presence or absence of a specific
feature. If the feature is present in the molecule, then the bit is set to ’1’ or otherwise to ’0’. The non-
binary versions include count fingerprints, where an individual bit is replaced with an integer that
indicates the number of times a specific feature is present in the molecule. Hashed fingerprints are
the integer string representations derived by hashing the molecular features. Both 2D and 3D
structural features can be encoded in fingerprints depending on the type of representation chosen
[60]. Thus, different fingerprint types may vary in terms of the chemical information encoded and by
the means in which they are computed [67]. Substructure-based fingerprints, pharmacophore
fingerprints, and circular atom environment fingerprints are popular fingerprints types.
8
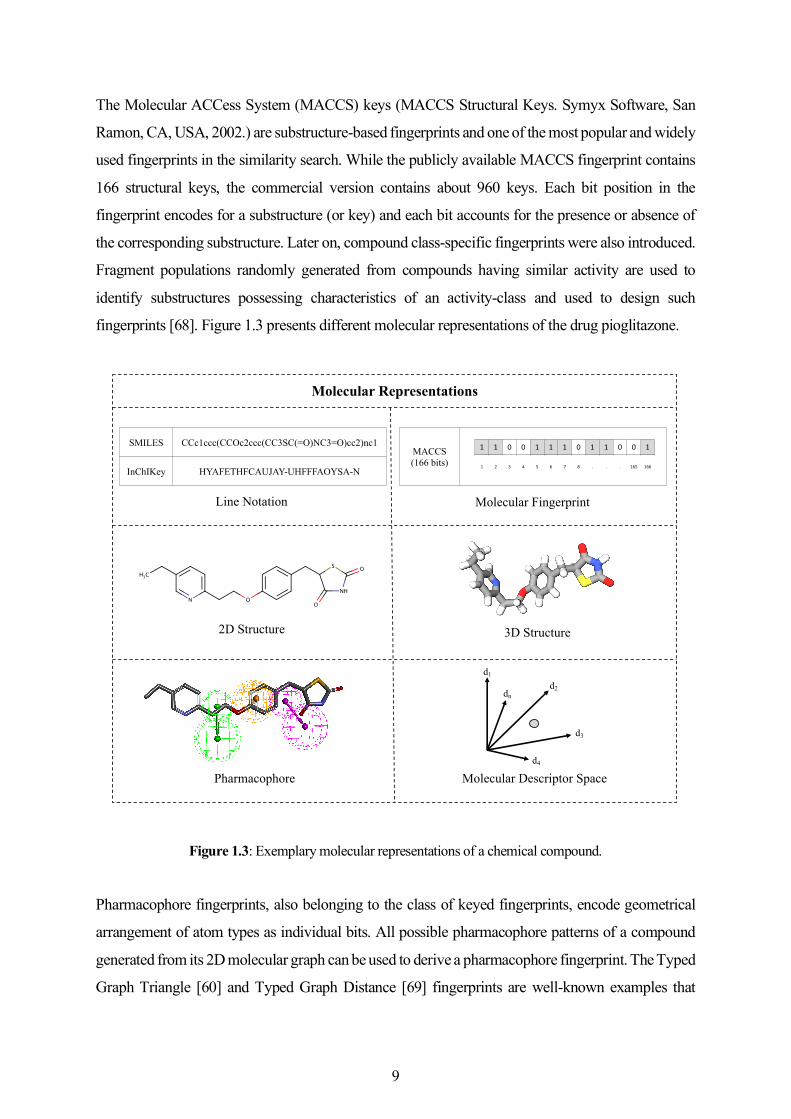
The Molecular ACCess System (MACCS) keys (MACCS Structural Keys. Symyx Software, San
Ramon, CA, USA, 2002.) are substructure-based fingerprints and one of the most popular and widely
used fingerprints in the similarity search. While the publicly available MACCS fingerprint contains
166 structural keys, the commercial version contains about 960 keys. Each bit position in the
fingerprint encodes for a substructure (or key) and each bit accounts for the presence or absence of
the corresponding substructure. Later on, compound class-specific fingerprints were also introduced.
Fragment populations randomly generated from compounds having similar activity are used to
identify substructures possessing characteristics of an activity-class and used to design such
fingerprints [68]. Figure 1.3 presents different molecular representations of the drug pioglitazone.
Figure 1.3: Exemplary molecular representations of a chemical compound.
Pharmacophore fingerprints, also belonging to the class of keyed fingerprints, encode geometrical
arrangement of atom types as individual bits. All possible pharmacophore patterns of a compound
generated from its 2D molecular graph can be used to derive a pharmacophore fingerprint. The Typed
Graph Triangle [60] and Typed Graph Distance [69] fingerprints are well-known examples that
SMILES CCc1ccc(CCOc2ccc(CC3SC(=O)NC3=O)cc2)nc1
InChIKey HYAFETHFCAUJAY-UHFFFAOYSA-N
Line Notation
2D Structure
MACCS(166 bits)
1 1 0 0 1 1 1 0 1 1 0 0 1
1 2 3 4 5 6 7 8 . . . 165 166
Molecular Fingerprint
Pharmacophore
3D Structure
d1
dnd2
d3
d4
Molecular Descriptor Space
Molecular Representations
9
consist of 420 and 1704 bits (or pharmacophore patterns), respectively. On the other hand,
combinatorial fingerprints fall into another category since they do not have a predefined length.
Extended-connectivity fingerprint (ECFP) [70] that encodes circular atom environments is a typical
example. Every non-hydrogen atom of the molecule is assigned an atom code that designates the
element type, mass, valence, charge and the total number of neighbor atoms it is connected to. Next,
local atom environments are generated around each atom depending on the bond depth (commonly
4). Each of these atom environments is hashed to an integer and a bit string of all these integers forms
an ECFP.
Although the amount of information encoded in 2D fingerprints is low in comparison to that available
from the 3D molecular representations, screening efforts based on 3D descriptors were found to
perform inferior to similarity searching with 2D fingerprints [71-73]. Furthermore, the 2D fingerprint
representations implicitly encode valuable information related to ligand-target interactions [74]. The
2D fingerprints, in general, are simpler and more robust as they do not require the generation of
multiple conformers, unlike 3D representations. Many studies have therefore employed only 2D
fingerprints [75] and owing to their superior screening performance in multiple studies [76, 77], the
ECFPs are one of the widely used fingerprints.
(b) Determination of chemical similarity
The similarity between two compounds can be calculated by comparing their molecular fingerprints.
A similarity measure that determines the overlap between two fingerprints is employed in order to
quantify the similarity. For binary fingerprints, the Tanimoto coefficient (Tc) is the most frequently
used similarity measure [59]. For a pair of fingerprints A and B, belonging to two molecules, Tc is
defined as:
!"($, &) = "* + , − "
where, a and b correspond to the number of the bits set to ‘1’ in fingerprints A and B, respectively,
and c represents the number of bits set to ‘1’ in both A and B. In simpler words, an intersection of the
fingerprint features is compared with a union of the features present in two fingerprints. The value of
Tc ranges from 0 to 1, where 0 indicates the least similarity and 1 indicates the maximum similarity
between the pair of molecules. Other similarity coefficients employed in similarity searching are the
Tversky coefficient [78], the Russel-Rao coefficient [79] and the Forbes coefficient [80].
10
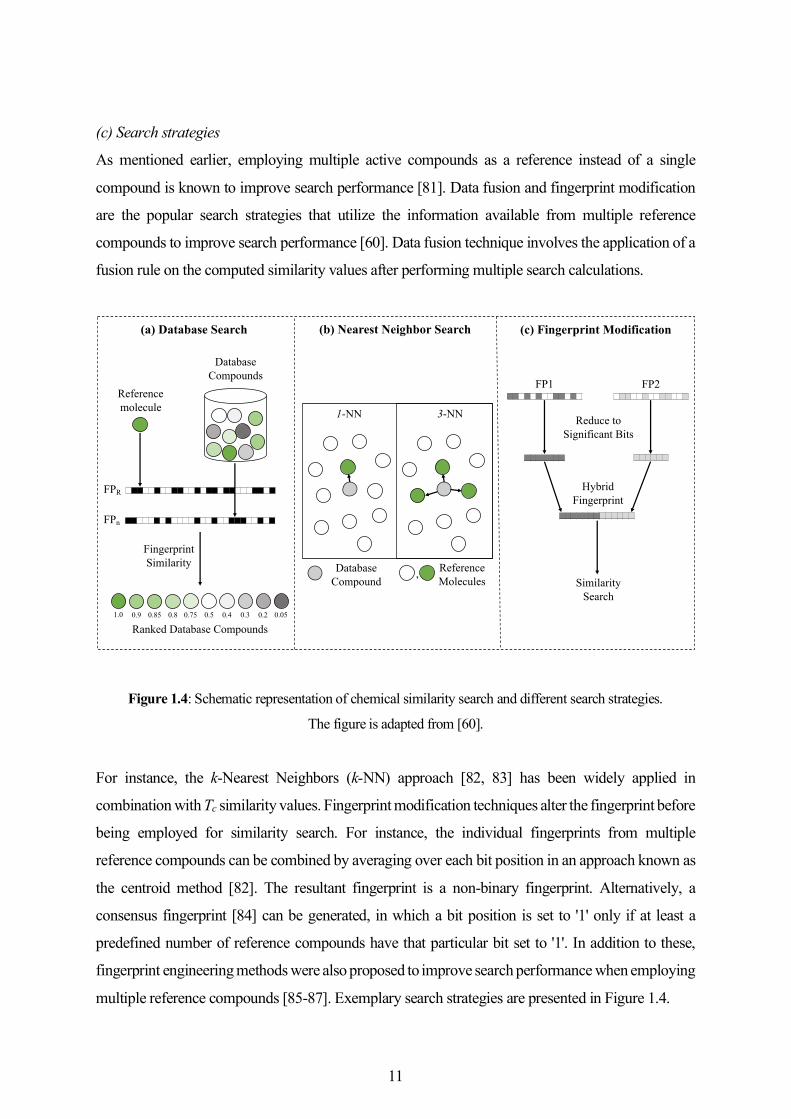
(c) Search strategies
As mentioned earlier, employing multiple active compounds as a reference instead of a single
compound is known to improve search performance [81]. Data fusion and fingerprint modification
are the popular search strategies that utilize the information available from multiple reference
compounds to improve search performance [60]. Data fusion technique involves the application of a
fusion rule on the computed similarity values after performing multiple search calculations.
Figure 1.4: Schematic representation of chemical similarity search and different search strategies.
The figure is adapted from [60].
For instance, the k-Nearest Neighbors (k-NN) approach [82, 83] has been widely applied in
combination with Tc similarity values. Fingerprint modification techniques alter the fingerprint before
being employed for similarity search. For instance, the individual fingerprints from multiple
reference compounds can be combined by averaging over each bit position in an approach known as
the centroid method [82]. The resultant fingerprint is a non-binary fingerprint. Alternatively, a
consensus fingerprint [84] can be generated, in which a bit position is set to '1' only if at least a
predefined number of reference compounds have that particular bit set to '1'. In addition to these,
fingerprint engineering methods were also proposed to improve search performance when employing
multiple reference compounds [85-87]. Exemplary search strategies are presented in Figure 1.4.
Referencemolecule
DatabaseCompounds
FPR
FPn
FingerprintSimilarity
Ranked Database Compounds1.0 0.850.9 0.8 0.75 0.5 0.4 0.3 0.2 0.05
, ReferenceMolecules
DatabaseCompound
1-NN 3-NN
FP1 FP2
Reduce toSignificant Bits
HybridFingerprint
SimilaritySearch
(a) Database Search (b) Nearest Neighbor Search (c) Fingerprint Modification
11
1.2.4 In Silico Methods for Prediction of Molecular Properties, Bioactivity and Toxicity
Computer-based (in silico) methods received great attention from both academia and for their ability
to limit and prioritize the candidates to be screened in experimental validations industry [88]. For
instance, virtual HTS was introduced to identify drug candidates from large chemical libraries as a
complementary approach to HTS [89]. The potential of in silico methods in the development of novel
therapeutics [90-92]) and discovery of hits that could not be identified with conventional HTS efforts
has been previously demonstrated [93]. Absorption, distribution, metabolism, and excretion
(ADME) properties and toxicity are crucial indicators of success in a drug discovery campaign.
While significant improvement has been observed with respect to the failures associated with
pharmacokinetics, safety concerns still remain a huge concern. This kept the interest open from both
academia and industry in their quest for promising in silico methods that can identify the toxic
liabilities of candidate drugs. There are a number of other reasons as to why toxicity prediction has
gained much importance in the recent times [94]. The notable reasons are:
1. the pressure to reduce the use of animals for experimental testing
2. legislation in the European Union and North America that encouraged and in some cases
mandated the use of computational techniques for toxicity prediction
3. developments in understanding the basic biology and chemistry that facilitate modeling of
complex toxicity endpoints
4. the potential to identify and test specific toxicity endpoints that could not be modeled in vivo or
in vitro
5. the ability to predict ADME and toxicological properties on virtual chemical structures, without
the need to carry out synthesis and experimental testing
6. the opportunities to explore and navigate the enormous chemical space and fill the data gaps
(a) QSAR Modeling
Amongst the various methods available to predict biological activities and properties, QSAR and
quantitative structure-property relationship (QSPR) methods receive a special mention. The
evolution of QSAR/QSPR methods can be explained in three phases: first, the introduction of
molecular descriptors that correlate with physicochemical properties and biological activity; second,
the development of statistical measures to evaluate the performance on external compounds that were
not involved in building model; and third, when applicability domain (the chemical space where
QSAR/QSPR models can be applied with acceptable accuracy) became the measure of the quality
12
[94]. Typically, QSAR models are specific to a single endpoint, either the activity of a chemical
towards a particular biological target (e.g. hERG channel blockade) or the likelihood to cause a
specific adverse/toxic effect (e.g. hepatotoxicity) [95-97]. In addition to the information about
compound structures, these models may include structural information about the target molecule if
available. When a model is developed on a chemical space comprising structural analogs, it leads to
what is called a local QSAR model which suffers from a poor applicability domain when tested on
new structural classes [98]. However, global models are preferred especially by regulatory agencies
in order to assess compounds belonging to diverse chemical classes [99, 100].
Despite the developments over the time, these models are still under active development within
regulatory bodies, limiting their use to flag compounds that are potentially toxic and gaining extra
information as opposed to decision making [101]. QSAR models to predict pharmaceutically relevant
endpoints such as QT prolongation, resulting from drug-induced inhibition of hERG channel, have
been used on a routine basis [102, 103]. Lead initiation and optimization are the stages where these
models are of high value, helping medicinal chemists understand the relationship between chemical
structure and the affinity towards hERG channel. Although many previous models contributed to a
broader understanding of the complex interactions of ligands with hERG channel, none of them
proved to have a global acceptance due to their limited applicability domains [96]. Similarly, multiple
models [104-106] have been developed to predict adverse events related to the peroxisome
proliferator-activated receptor family (a type of nuclear receptors known to be important in disease
areas such as cancer, diabetes, obesity etc.), [107] and toxic effects such as cardiac toxicity,
hepatotoxicity and reproductive toxicity [108]. Additionally, many models were recently reported to
predict the effects of chemical structures on the nuclear receptor and cellular stress response pathways
as a part of the Toxicology in the 21st Century (Tox21) Data Challenge [105].
(b) Machine Learning Approaches
Compound classification techniques represent another category of LBVS methods [51]. They
facilitate prediction of compound class labels (active versus inactive) based on the models derived
from training data and rank the test set (e.g. a database compounds) according to their probability to
be active against a target. Basic classification methods such as clustering and partitioning and
machine-learning (ML) approaches are gaining have gained popularity in LBVS. One of the first
applications of ML in drug discovery was substructure analysis performed on biological screening
data by Cramer et al [109]. Today, with the increasing availability of big data collections, ML is an
active area of research to develop novel tools for data mining [110, 111]. Currently, there exists a
13
broad spectrum of applicability for ML methods to aid in several steps of the drug discovery process:
protein structure and function prediction, identification and optimization of hit compounds,
prediction of biological activity, pharmacokinetics (ADME) and toxicity [112-115]).
In pharmaceutical R&D, particularly in the area of cheminformatics, several ML methods such as
naïve Bayes (NB) [116], k-NN [117], Random Forests (RF) [118] and Support Vector Machines
(SVM) [119] have been increasingly applied to datasets that are now transforming into the big data
[120-124]. These methods could be used for either binary or multi-class prediction problems or on
continuous data. While the initial focus, when the drug discovery datasets started out to be very small,
was on methods such as local QSAR or pharmacophore methods, more complex problems could be
handled with ML methods [125]. Most of these methods have been utilized in the development of
QSAR, classification and regression models for a long time. More recently, deep learning (DL)
methods have been highly successful across a wide range of applications such as self-driving cars,
computer vision, speech recognition and natural language processing, among others [126]. The
flexible architecture provided by neural networks [127], increased availability of big data and
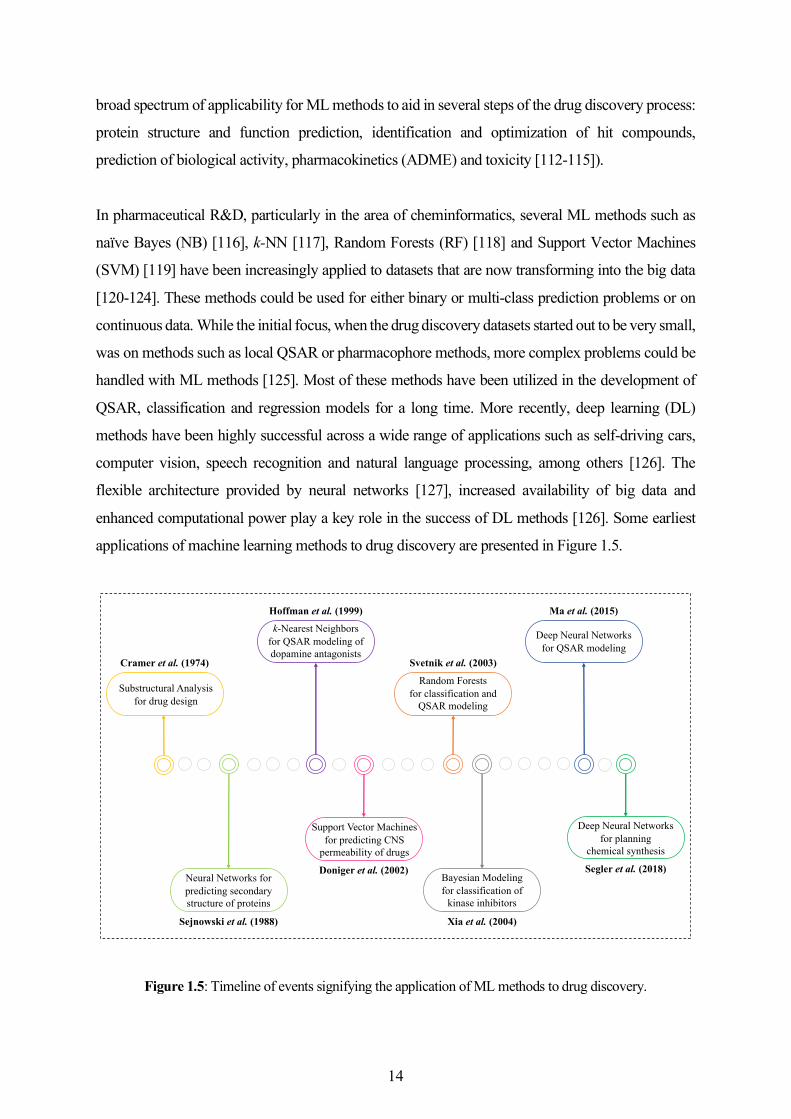
enhanced computational power play a key role in the success of DL methods [126]. Some earliest
applications of machine learning methods to drug discovery are presented in Figure 1.5.
Figure 1.5: Timeline of events signifying the application of ML methods to drug discovery.
Neural Networks for predicting secondary structure of proteins
Cramer et al. (1974)
Substructural Analysis for drug design
Sejnowski et al. (1988)
Hoffman et al. (1999)
k-Nearest Neighbors for QSAR modeling of dopamine antagonists
Doniger et al. (2002)
Support Vector Machines for predicting CNS
permeability of drugs
Svetnik et al. (2003)
Xia et al. (2004)
Ma et al. (2015)
Segler et al. (2018)
Random Forestsfor classification and
QSAR modeling
Bayesian Modelingfor classification of
kinase inhibitors
Deep Neural Networks for QSAR modeling
Deep Neural Networks for planning
chemical synthesis
14
Unlike similarity search, the development of classification models requires a training set containing
both active and inactive compounds. Although it is recommended to have as many compounds as
possible in the training set, in the practical scenario, the number varies depending on the complexity
of the system and data availability [128-130]. Compared to regression models that require explicit
biological activities (e.g. IC50 or Ki values) for training set compounds, classification models are
simple to construct, since it is easy to acquire such data from the literature [131].
Development of optimal prediction models for chemical applications is challenged by multiple
limitations. In the early stages of drug discovery, little knowledge about the biological target is
available and the experimental data is often available for small datasets of compounds with low
structural diversity. Prediction models developed using such data are prone to overfitting and have
limited generalization capabilities. Representation of chemical structures is also a challenge since not
all methods consider the flexibility of molecules and special features such as tautomers and
conformations. For instance, if the dataset contains stereoisomers (or other types of isomers) it must
be ensured that the molecular descriptors employed are sensitive to chirality [132]. LBVS methods,
including the ML methods, tend to rely on the assumption that similar molecules exhibit similar
properties. However, several highly similar compounds sometimes exhibit a large difference in
potency, referred to as ‘activity cliffs’ [133, 134]. Presence of a high number of activity cliffs in
training set has been implicated in the failure of QSAR models [132, 135]. In a nutshell, the predictive
power of an in silico model depends on the dataset characteristics (size of the dataset, structural
diversity, the presence of activity cliffs etc.) and the modeling procedure (data curation, descriptor
selection, validation, applicability domain etc.) [128, 136-138].
1.2.5 PAINS and Assay Artifacts
A successful HTS strategy involves judicious assessment of the screening results to identify
promising lead compounds and at the same time distinguish them from false-positive hits [139].
Without appropriate control experiments, more than 80% of the primary hits from HTS assays can
be considered false-positive hits, more commonly referred to as assay artifacts [140]. Regardless of
the observed potency, the screening results with artifacts are not useful to medicinal chemists because
the apparent activity is simply a consequence of chemical reactivity or other effects. The literature
describes a variety of mechanisms that include covalent protein reactivity [141], redox activity,
interference with assay detection technology [142-144], membrane disruption [145], decomposition
in buffers [146] and the formation of colloidal aggregates [147-149]. The different sources of false-
15
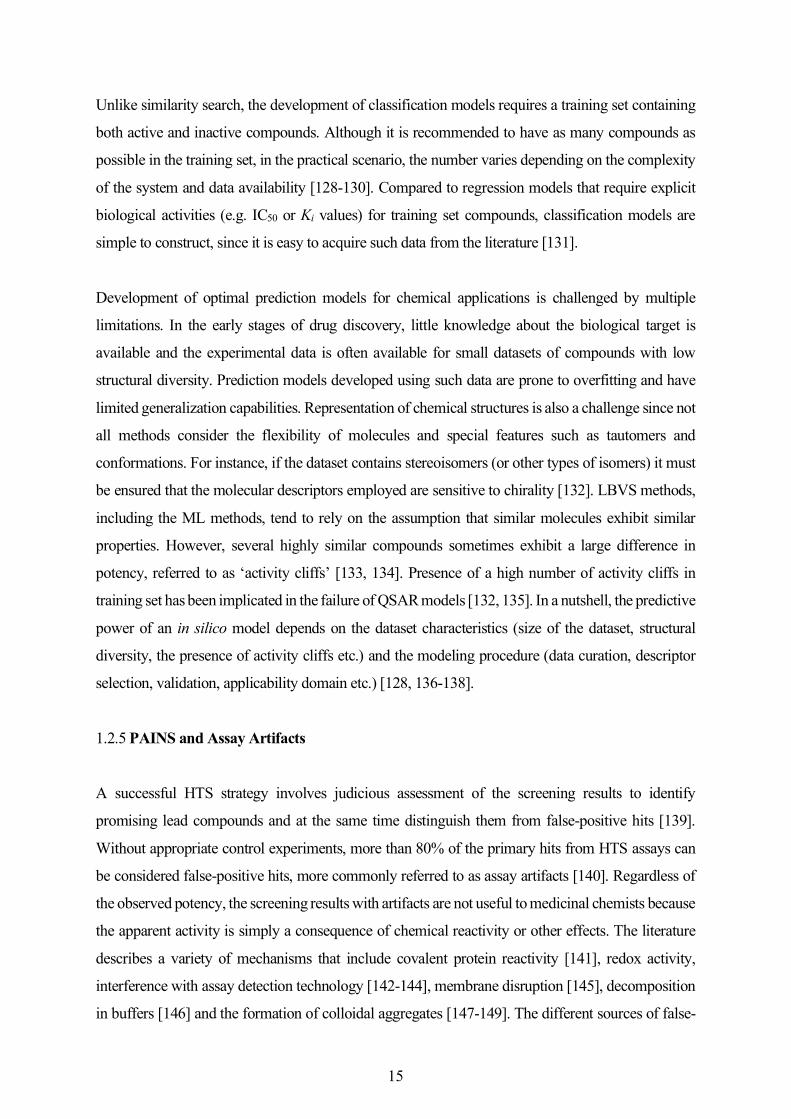
positive hits are summarized in Figure 1.6. Several approaches were introduced to improve the
quality of chemical libraries and to detect false-positive and nuisance compounds. Examples include
library enhancement approaches such as drug-likeness filters and structural/substructural alerts that
identify frequent hitters and potentially reactive compounds [150, 151]).
Figure 1.6: The fate of hits from HTS assays and different sources of false-positive hits.
In 2010, Baell and Holloway [52] tested a library of compounds in six AlphaScreen assays measuring
protein-protein interaction inhibition. Those compounds that were active in multiple assays and that
demonstrated interference with the bioactivity detection technology were termed as the Pan-Assay
INterference compoundS (PAINS). To ensure reproducibility, they derived about 480 structural
alerts called “PAINS alerts” which are nothing but the substructural features frequently found in
PAINS. The alerts were made publicly available for the community to flag suspicious compounds in
screening collections [52]. Eventually, PAINS alerts received great attention from the community
and were widely employed to deprioritize or discards any matching screening hits before
experimental validation [152]. Similarly, the candidates with PAINS were deprioritized for further
validation even after passing the experimental screens [153]. Web-based platforms [154, 155] that
facilitate detection of PAINS were developed and databases such as ChEMBL and ZINC [154]
started to flag compounds containing these filters. This prompted many follow-up studies [156-158].
Some have regarded PAINS as a model of compound promiscuity on grounds that a majority of
Hits(active compounds)
Non-covalent Modulators
Covalent Modulators
Test inOrthogonal
Assays
True Hits
TargetModulators
HitsNot Optimizable
False-Positive Hits
Optimized hits
Modulators ofAssay technology
Assay ReadoutModulators
Hits that interact specifically with target(e.g. metal chelation)
Non-specificTarget Modulators
Fluorescence,Singlet-oxygen quenchers etc.
Redox reactants,Protein denaturants
etc.
False-Positive Hits
False-Positive Hits
Hits that do not affect target function
Hits that affect target function via undesired mechanisms of action
16
highly promiscuous compounds contain these alerts [159]. A similar analysis suggested that many
compounds with PAINS did not show high assay promiscuity [160]. Furthermore, the applicability
domain of PAINS alerts was criticized to be limited owing to the proprietary nature of the compound
library they were derived from and the type of assay (only AlphaScreen assays) they were tested in
[160, 161]. Amidst these mixed reports [160, 162], it is unclear whether the application of these alerts
to discard hits at an early stage is a good idea.
1.2.6 Compound Promiscuity, Extensively Assayed Compounds, and Dark Chemical Matter
The shift in the drug discovery paradigm from 'one-drug, one-target' to 'one-drug, many-targets' is
marked by the emerging theme of polypharmacology [163, 164]. It is increasingly understood that
drugs elicit therapeutic effects by interacting with multiple targets and perturbing multiple pathways
[165]. Literature surveys indicate that drugs bind, on average, to two to seven biological targets [166].
While there are on one hand therapeutic areas such as oncology where activity at multiple targets is
essential to achieve a desired therapeutic effect, on the other hand, areas such as infectious diseases
require selective activity towards a target [165]. In this regard, compound promiscuity can be
understood as the ability of small molecules to interact with multiple biological targets [167, 168].
This behavior (‘good’ promiscuity) should not be confused with the non-specific or undesirable
effects (‘bad’ promiscuity) of aggregating compounds or PAINS in biological screens [159]. Taken
together, promiscuity forms the molecular basis for polypharmacology, which is desirable but may
as well lead to undesired side-effects due to specific interactions at some targets [164, 169].
Drug-target annotations [170], compound bioactivity data from medicinal chemistry literature [41,
171] and bioassay collections [172] are the major sources of data for estimation of promiscuity. More
recent estimates indicated that, on average, approved drugs and bioactive compounds bind to 5.9 and
1.5 targets, respectively [165]. However, data incompleteness (i.e. not all available compounds are
tested against all known targets) is an important factor to consider when attempting to generate
statistically meaningful promiscuity estimates [173, 174]. Thus, considering assay frequency
information, available from major repositories such as PubChem, provides a more meaningful
assessment [169]. In this context, investigation of the ‘extensively assayed compounds’ was expected
to push compound promiscuity analysis to a next level while addressing the issue of data
incompleteness [169]. To this end, Bajorath et al [169] recently compiled a data set of 437,257
compounds extensively tested in hundreds of primary and confirmatory assays. The average and
median degrees of promiscuity were 3.4 and 2.0, respectively (for primary assays) and 2.6 and 2.0,
17
respectively (for confirmatory assays) [169]. Surprisingly, these values were only slightly higher than
the previously detected promiscuity degree (1.5 targets) based on activity data from ChEMBL. These
findings confirm that bioactive compounds are only moderately promiscuous, in general, and less
promiscuous than drugs.
On the other end of the scale are those compounds that failed to demonstrate any activity despite
having been tested in hundreds of assays against multiple targets. Little light has been shed on these
seemingly biologically inert compounds as to how they are identified and treated while designing
screening libraries for HTS campaigns. A recent study by Wassermann et al [175] from Novartis
introduced the term dark chemical matter (DCM), referring to those compounds that have not shown
biological activity in at least 100 HTS assays. These compounds were analyzed in additional assays
to identify potent hits that showed antifungal activity. Owing to their ‘unique activity’ and ‘clean
safety’ profiles, DCM compounds were proposed as valuable starting points for lead optimization
efforts [175]. A similar study analyzed the screening collections of Boehringer Ingelheim and found
that only compounds tested in more than 125 assays showed deteriorating hit rates [176]. Therefore,
it is not certain whether an absolute criterion can be established to define DCM and whether
compounds identified as DCM in one screening campaign are also biologically inert in other
screening campaigns.
1.3 Motivation and Aim of Thesis
The shift to the ‘big data’ era presents both new opportunities as well as challenges that require careful
and efficient mining of the data. The data originating from the scientific literature may be associated
with significant levels of uncertainty due to various reasons [177-180]. The process of automated
data mining also has many limitations such as errors in extracting activity values, units, and chemical
names. Bioactivity data from public sources poses serious problems for a large-scale analysis since
most of the data is assay specific and is comparable only under certain conditions [178, 180]. Data
redundancy is another significant issue. Large amounts of redundant data were detected among the
contents of ChEMBL and PubChem databases [181]. This redundancy, not obvious to users, might
provide an unrealistic picture of the underlying compound and bioactivity data. This was previously
highlighted by comparing both public and commercial databases for the extent of overlap and
complementarity in compound and compound activity data [182, 183]. A more recent analysis
indicates that differences in the deposition dates and variability in chemical structure standardization
18
procedures are responsible for the discordance between major portals [184]. All these observations
suggest that the research community might benefit more from databases that serve as comprehensive
or one-stop resources that carefully integrate data from decentralized portals.
Comparison of the promiscuity trends of drugs and bioactive compounds revealed that highly
promiscuous drugs are often picked from the pool of bioactive compounds that are, in general,
moderately promiscuous. Thus, promiscuity, although essential in many cases, is one primary reason
behind the unwanted side effects that may lead to the failure of a candidate drug. In the light of a
steadily increasing number of new chemical entities introduced each year, early assessment of the
pharmacokinetic and safety (commonly referred as ADME/T) profiles is highly essential. In this
context, alongside in vitro and in vivo methods to assess toxicity, in silico approaches gained much
attention. Many consortia-based and crowd-sourced projects have been actualized with the
fundamental goal to replace or complement the in vitro and in vivo methods with in silico alternatives.
In the Tox21 program, more than 10000 chemicals were screened in quantitative HTS format for
interference in nuclear receptor and cellular stress response pathways. Through a data challenge,
model development was crowdsourced and several in silico models were assembled. A key
advantage is that gold-standard data from single standard assay format were employed in model
development. A large amount of such data is often unavailable at the publicly accessible bioactivity
databases for a majority of targets. For instance, the ChEMBL database provides more than 18000
bioactivity records for hERG, but they are collected from different sources and such data may not be
comparable under certain conditions, necessitating extensive curation efforts. On the other hand,
models based on smaller data sets have limited applicability domain. Thus, in silico models that are
based on high-confidence data sets, that best represent the chemical space tested for a particular
biological target, are much needed.
Much of the bioactivity data originates from primary assays. Presence of a large number of false-
positive hits in the screening output has been a predominant concern. Often, these false-positive hits
are frequent hitter compounds that exhibit unusually high promiscuity or those that are chemically
reactive towards the target via an unwanted mechanism of action. In this context, PAINS alerts were
introduced to identify frequent hitters. While a ‘black-box practice’ of deprioritizing or omitting
compounds contains PAINS has been increasingly noticed, recommendations were made as to not
completely omit PAINS liable compounds until unless confirmed in orthogonal assays. Thus,
exploring the activity profiles and mechanisms of action of PAINS might provide useful insights in
this regard. In contrast, screening libraries also comprise those compounds that do not demonstrate
19
any biological activity despite being tested in hundreds of assays. The fate of such compounds,
whether to be excluded from screening libraries in favor of less tested or untested compounds, is not
clearly understood so far. The recent literature on ‘dark chemical matter’ sheds light on these
compounds and highlights their potential to be promising candidates. However, the criteria for
inclusion of compounds in this category are questionable on the grounds that the dark chemical matter
shares their chemical space with marketed drugs. Therefore, it is worth investigating the true potential
of these compounds to possess ‘unique activity’ and ‘clean safety’ profiles.
The objective of this thesis is to utilize cheminformatics methods to address the challenges in the
aforementioned diverse, yet highly related, aspects of drug discovery that are crucial in improving
decision making. The primary aims of the thesis include:
1. Development of comprehensive knowledgebase resources that integrate data spanning multiple
chemogenomics resources that could be used for knowledge-driven drug discovery research.
2. Construction and validation of different in silico models that facilitate prediction of chemical
toxicity.
3. Investigation of the true promiscuity and mechanisms of action of the frequent hitter (i.e. PAINS)
and non-frequent hitter (i.e. DCM) compounds in biological screens.
20
Chapter 2
Methodology
Constant improvements in the availability and efficiency of computational tools and resources
complement the diverse range of cheminformatics methods employed in this thesis. The thesis work
started with the identification of publicly accessible resources for data on small molecules and
biological macromolecules. The data extracted from multiple resources were carefully curated and
integrated into two knowledgebase resources that serve as rich resources for further use in drug
discovery research. Next, in silico models were developed for predicting different toxicological
endpoints. This involved collection and curation of data, generation of molecular features, application
of chemical similarity and machine learning-based methods to develop binary classifiers, and finally
the usage of statistical methods to validate their performance. Furthermore, huge collections of HTS
data and the wealth of experimentally determined biological macromolecule structures were analyzed
for the promiscuous (frequent hitter) behavior of small molecules and the structural context of
PAINS. This section describes the different data sources and cheminformatic methods employed to
achieve the aforementioned tasks.
2.1 Publicly Accessible Resources for Chemogenomics Data
Much of the data needed to construct knowledgebase resources were extracted from the publicly
accessible repositories. These resources provide different kinds of data including drugs, drug targets,
small molecule structures, compound bioactivity data and target-ligand complexes. The resources
that are central to different studies of this thesis are DrugBank [185, 186], ChEMBL [41, 42], Tox21
browser [187], and Protein Data Bank [43]. Brief descriptions of these resources are provided in
Table 2.1. Additionally, some data sets were directly extracted from primary literature for use in this
thesis. While some comprise activity annotations against specific biological targets, some include
screening data from primary (HTS) and secondary (confirmatory dose-response assays) screens.
These data sets were primarily used for the development of in silico models that are able to predict
chemical toxicity and for the estimation and comparison of promiscuity trends.
21
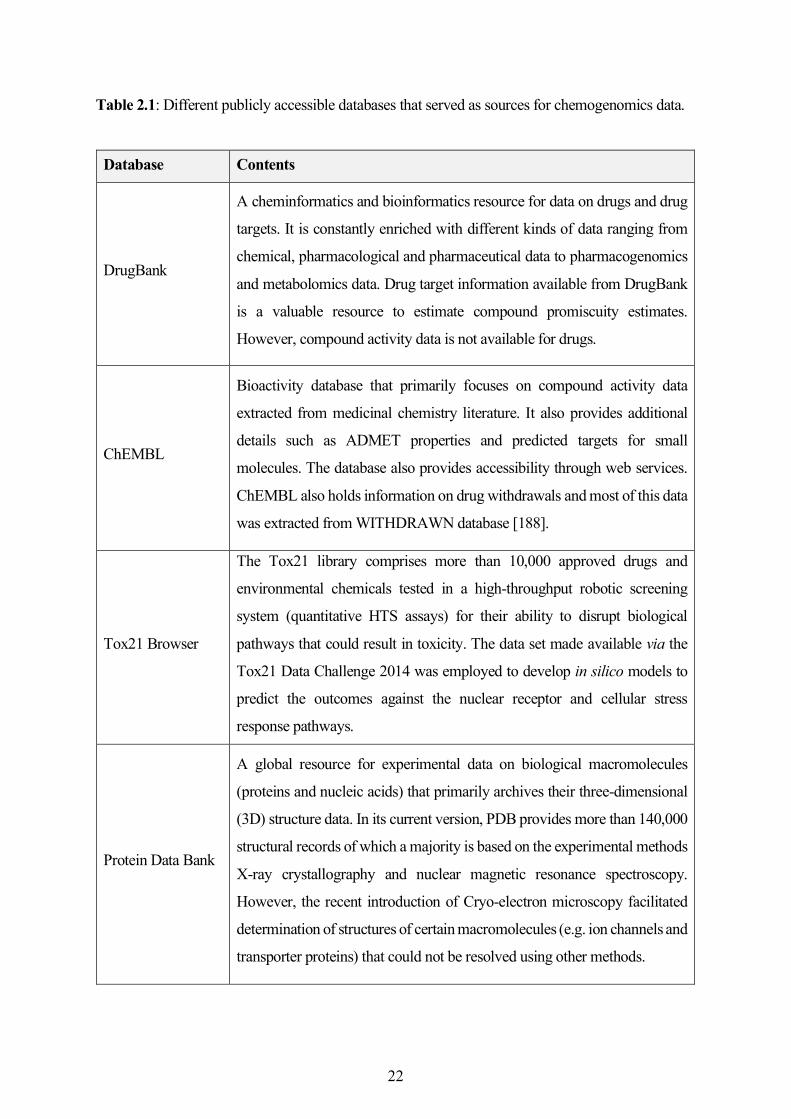
Table 2.1: Different publicly accessible databases that served as sources for chemogenomics data.
Database Contents
DrugBank
A cheminformatics and bioinformatics resource for data on drugs and drug
targets. It is constantly enriched with different kinds of data ranging from
chemical, pharmacological and pharmaceutical data to pharmacogenomics
and metabolomics data. Drug target information available from DrugBank
is a valuable resource to estimate compound promiscuity estimates.
However, compound activity data is not available for drugs.
ChEMBL
Bioactivity database that primarily focuses on compound activity data
extracted from medicinal chemistry literature. It also provides additional
details such as ADMET properties and predicted targets for small
molecules. The database also provides accessibility through web services.
ChEMBL also holds information on drug withdrawals and most of this data
was extracted from WITHDRAWN database [188].
Tox21 Browser
The Tox21 library comprises more than 10,000 approved drugs and
environmental chemicals tested in a high-throughput robotic screening
system (quantitative HTS assays) for their ability to disrupt biological
pathways that could result in toxicity. The data set made available via the
Tox21 Data Challenge 2014 was employed to develop in silico models to
predict the outcomes against the nuclear receptor and cellular stress
response pathways.
Protein Data Bank
A global resource for experimental data on biological macromolecules
(proteins and nucleic acids) that primarily archives their three-dimensional
(3D) structure data. In its current version, PDB provides more than 140,000
structural records of which a majority is based on the experimental methods
X-ray crystallography and nuclear magnetic resonance spectroscopy.
However, the recent introduction of Cryo-electron microscopy facilitated
determination of structures of certain macromolecules (e.g. ion channels and
transporter proteins) that could not be resolved using other methods.
22
2.2 Integration of Chemogenomics Data for Knowledgebase Development and
Modeling
The number of compounds and activity records available at major publicly-accessible portals such
as PubChem [172] and ChEMBL [41, 42] increased dramatically in the order of millions. With
limited or no access to commercial resources, much of the academic research relies on the data from
these resources. However, many studies reported inconsistencies and uncertainties with compound
structure representation and the heterogeneous compound activity data [136, 180, 189, 190]. The
choice of descriptors has a strong influence on the resulting QSAR models. Therefore, the erroneous
representation of chemical structures could hamper the performance of the models [136]. It was also
reported that the activity values of chemical compounds obtained from different laboratories
frequently disagree [138]. Thus, the establishment of appropriate search criteria to mine the wealth
of data and careful integration of data extracted from different resources are highly essential. To this
end, the recommendations [138, 191, 192] proposed in the literature were essentially practiced.
2.2.1 Integration of Compound Data
While many major resources provide compounds in standard file formats such as SDF (with 2D or
3D coordinates), some provide simpler representations such as SMILES. Depending on the software
and sometimes the version of the software used to generate them, minor discrepancies can be
expected. Therefore, the data obtained from different sources may contain duplicate entries. The
following steps were adapted consistently throughout this thesis to integrate compound data obtained
from different resources.
(a) Curation of Chemical Structures
This step involves standardization of the chemical structures in the data set. The curation protocol
typically starts with the removal of inconsistent chemical records such as inorganic compounds,
mixtures of compounds, counterions, and biologics. Next, the structures are validated by correcting
violations in valency of atoms, aromaticity, tautomers, and charges. Finally, the structure of the
compound is cleaned and a 3D representation is generated. Dealing with tautomers is challenging
since the ratio of different tautomers is subjective [193]. A number of software tools facilitate
performing these tasks. For instance, the JChem suite from ChemAxon [194] provides a standardizer
23
and the open-source cheminformatics toolkit RDKit [195] provides Structure Normalizer nodes in
KNIME [196]. More detailed guidelines are provided by Tropsha et al [138, 192]. In this thesis, the
curation of chemical structures was performed using the InstantJChem software from ChemAxon,
accessed with an academic license.
(b) Identification of Duplicates
It is often the case that the same compound is tested in different experiments and recorded multiple
times in a bioactivity database [192]. For instance, the same compound available from different
vendors might be tested in the same assay across multiple laboratories resulting in multiple activity
records identified by different internal identifiers [197]. This is also the case when collating drugs
from different resources that use different internal identifiers. Detecting the structurally identical
compounds is the first step in dealing with such data. Many methods and freely accessible tools are
available that identify duplicates based on different structural representations such as molecular
descriptors, chemical names, SMILES, database identifiers etc. [192, 198, 199]. In this thesis, hashed
InChI notation (commonly referred to as standard InChIKey) was employed owing to its wide
acceptance as a standard chemical structure identifier [66]. Compounds standardized in the previous
step are processed to generate InChIKey notations that are checked for duplicates via string matching.
2.2.2 Integration of Compound Bioactivity Data
Large-scale treatment of bioactivity data is a much difficult endeavor compared to the previous steps.
Pharmaceutical companies often the measure activity of a compound in duplicates or triplicates in
the same assay in order to assess the experimental variability of the assays using different statistical
metrics [178, 192]. Since such data is often not available for academic research, alternative
recommendations are needed that facilitate efficient mining of the bioactivity data in the public
domain. Identification of duplicate compound entries is the starting point when treating compound
bioactivity data. Therefore, the protocol starts with the two steps described before. The following
steps are followed in order to arrive at curated sets of bioactivity data.
(a) Search Criteria for High-confidence Bioactivity Data
It is acknowledged that large amounts of compound bioactivity data are heterogeneous and are
therefore associated with different experimental uncertainties and hence different levels of
24

confidence [191]. For instance, the target annotations of drugs from ChEMBL databases highly
varied with different data selection criteria [200]. Therefore, the data selection criteria influence the
conclusions drawn from such data. Practical recommendations were proposed by Bajorath et al to
select compound data sets with high confidence [191]. These criteria, outlined in Figure 2.1, have
been adapted for this thesis.
Figure 2.1: Compound selection criteria for generation of high-confidence bioactivity data. The criteria and
figure are adapted from [191].
(b) Detection of activity cliffs
The presence of pairs of compounds that share a high structural similarity and possess highly different
bioactivity values is considered as one of the challenges in the development of robust QSAR models
[132]. Such pairs of compounds are referred to as activity cliffs (Figure 2.2) [135, 201]. Different
similarity assessment strategies could be employed to identify activity cliffs. Matched molecular pair
(MMP) and fingerprint similarity-based approaches are commonly employed to detect activity cliffs
[201]. Identification and treatment of activity cliffs are recommended as one of the criteria before
initiation of a computational study [192]. Consideration of 3D structural differences might be subject
to the availability of the 3D structure of the target and the binding modes of at least one compound
High-confidencebioactivitydata
Treat compounds with multipleactivity values
Only records with relation type:“=”
Only records with standard unit:nanoMolar (nM)
Only records with activity type:IC50 or Ki
All records available in thebioactivity database
Only records with interactions againsthuman targets
Only records withassay confidence score = 9
Only records with assay type:binding/functional assay
DataConfidence
Data SetSize
25
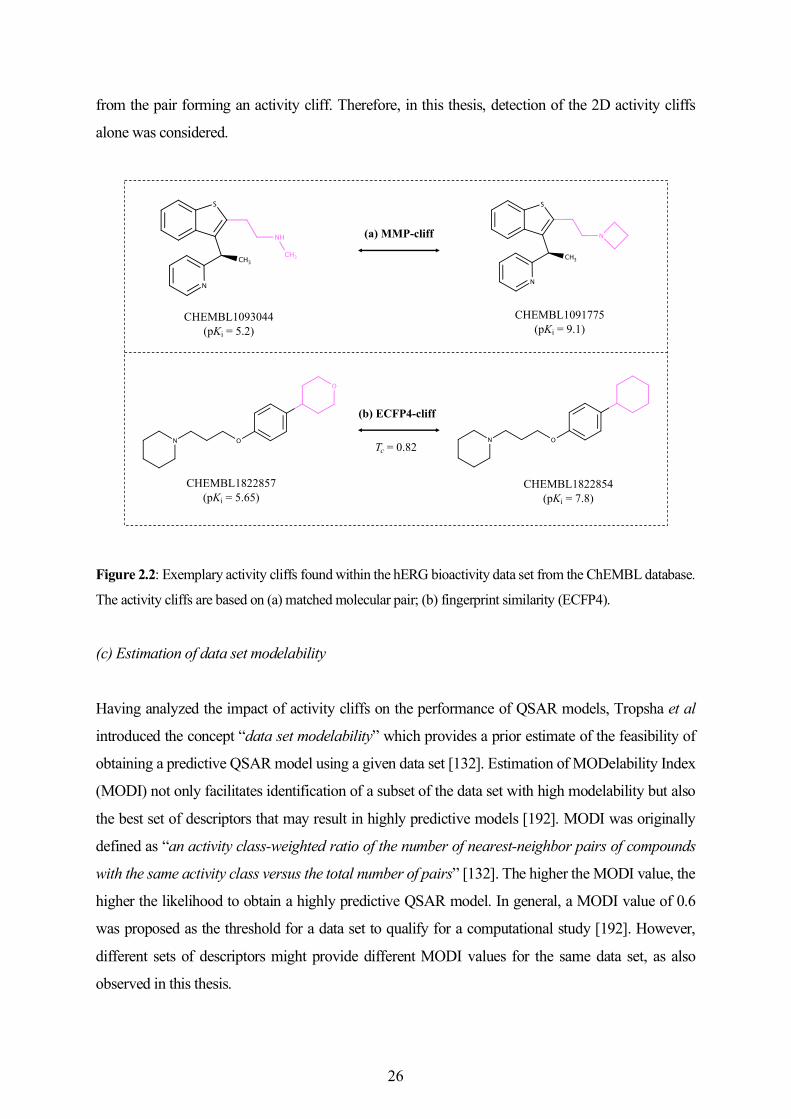
from the pair forming an activity cliff. Therefore, in this thesis, detection of the 2D activity cliffs
alone was considered.
Figure 2.2: Exemplary activity cliffs found within the hERG bioactivity data set from the ChEMBL database.
The activity cliffs are based on (a) matched molecular pair; (b) fingerprint similarity (ECFP4).
(c) Estimation of data set modelability
Having analyzed the impact of activity cliffs on the performance of QSAR models, Tropsha et al
introduced the concept “data set modelability” which provides a prior estimate of the feasibility of
obtaining a predictive QSAR model using a given data set [132]. Estimation of MODelability Index
(MODI) not only facilitates identification of a subset of the data set with high modelability but also
the best set of descriptors that may result in highly predictive models [192]. MODI was originally
defined as “an activity class-weighted ratio of the number of nearest-neighbor pairs of compounds
with the same activity class versus the total number of pairs” [132]. The higher the MODI value, the
higher the likelihood to obtain a highly predictive QSAR model. In general, a MODI value of 0.6
was proposed as the threshold for a data set to qualify for a computational study [192]. However,
different sets of descriptors might provide different MODI values for the same data set, as also
observed in this thesis.
(a) MMP-cliff
(b) ECFP4-cliff
CHEMBL1093044(pKi = 5.2)
CHEMBL1091775(pKi = 9.1)
CHEMBL1822857(pKi = 5.65)
CHEMBL1822854(pKi = 7.8)
Tc = 0.82
26
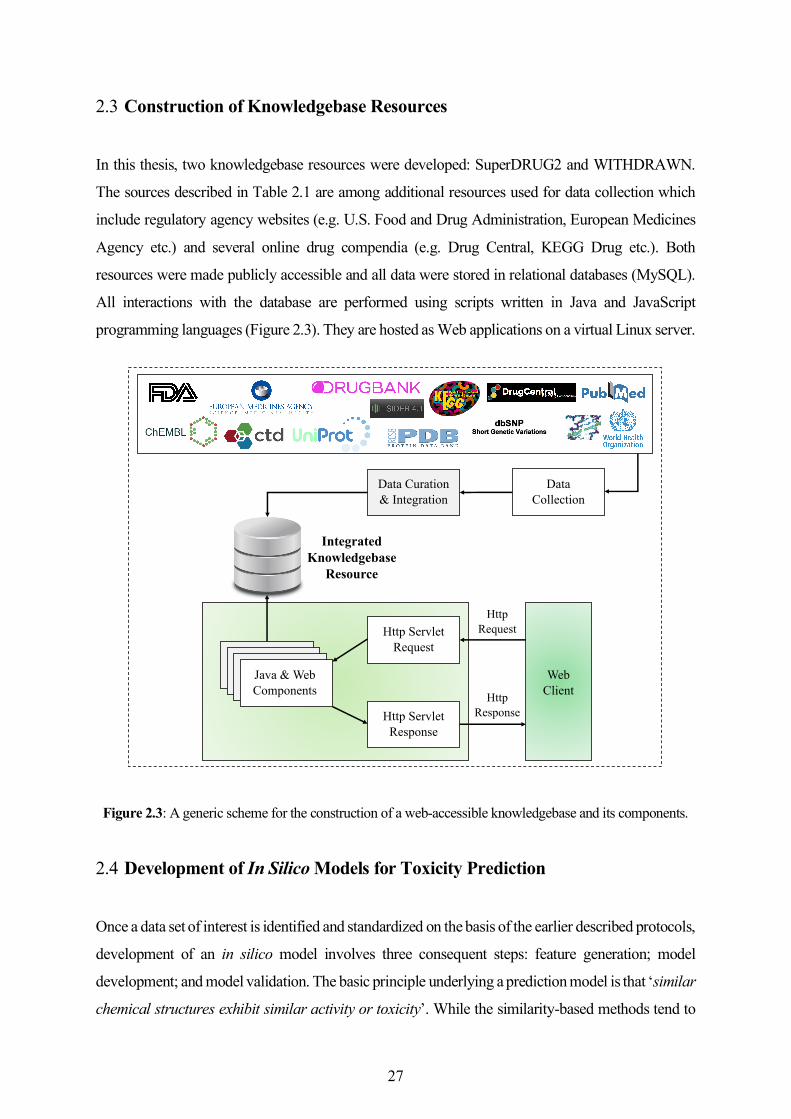
2.3 Construction of Knowledgebase Resources
In this thesis, two knowledgebase resources were developed: SuperDRUG2 and WITHDRAWN.
The sources described in Table 2.1 are among additional resources used for data collection which
include regulatory agency websites (e.g. U.S. Food and Drug Administration, European Medicines
Agency etc.) and several online drug compendia (e.g. Drug Central, KEGG Drug etc.). Both
resources were made publicly accessible and all data were stored in relational databases (MySQL).
All interactions with the database are performed using scripts written in Java and JavaScript
programming languages (Figure 2.3). They are hosted as Web applications on a virtual Linux server.
Figure 2.3: A generic scheme for the construction of a web-accessible knowledgebase and its components.
2.4 Development of In Silico Models for Toxicity Prediction
Once a data set of interest is identified and standardized on the basis of the earlier described protocols,
development of an in silico model involves three consequent steps: feature generation; model
development; and model validation. The basic principle underlying a prediction model is that ‘similar
chemical structures exhibit similar activity or toxicity’. While the similarity-based methods tend to
WebClient
Http ServletRequest
Http ServletResponse
Java & WebComponents
HttpRequest
HttpResponse
DataCollection
Data Curation& Integration
IntegratedKnowledgebaseResource
27
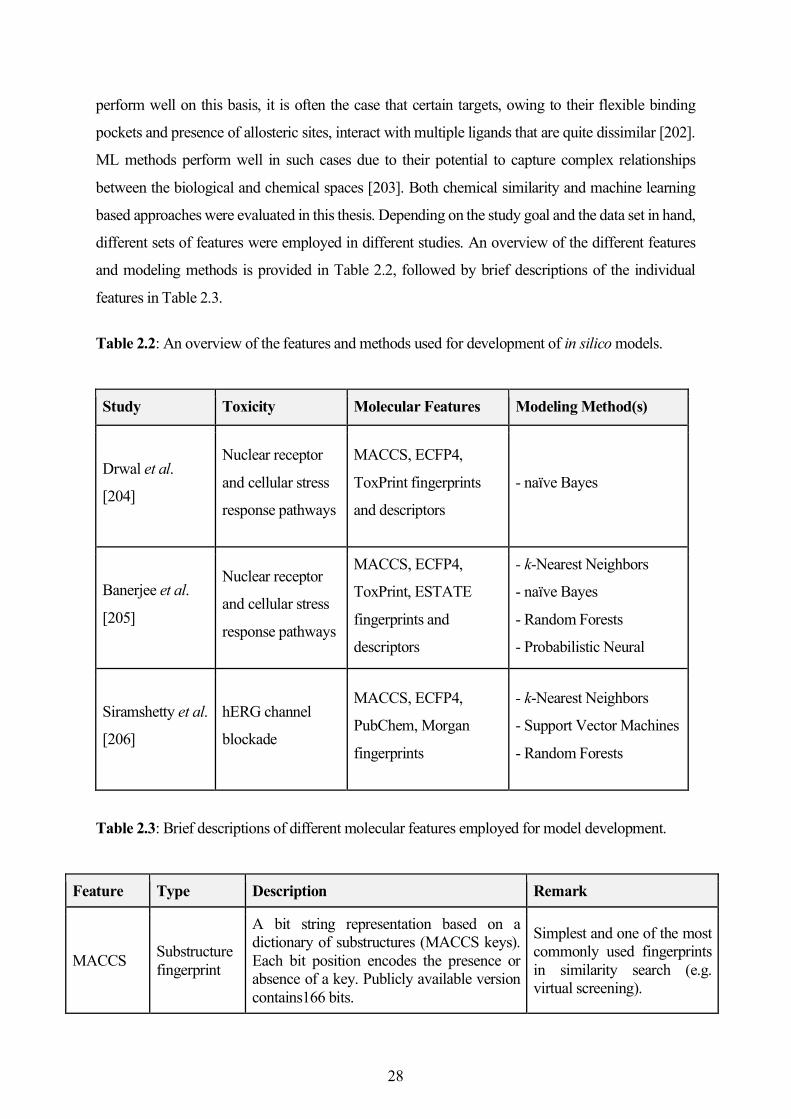
perform well on this basis, it is often the case that certain targets, owing to their flexible binding
pockets and presence of allosteric sites, interact with multiple ligands that are quite dissimilar [202].
ML methods perform well in such cases due to their potential to capture complex relationships
between the biological and chemical spaces [203]. Both chemical similarity and machine learning
based approaches were evaluated in this thesis. Depending on the study goal and the data set in hand,
different sets of features were employed in different studies. An overview of the different features
and modeling methods is provided in Table 2.2, followed by brief descriptions of the individual
features in Table 2.3.
Table 2.2: An overview of the features and methods used for development of in silico models.
Study Toxicity
Endpoint(s)
Molecular Features Modeling Method(s)
Drwal et al.
[204]
Nuclear receptor
and cellular stress
response pathways
MACCS, ECFP4,
ToxPrint fingerprints
and descriptors
- naïve Bayes
Banerjee et al.
[205]
Nuclear receptor
and cellular stress
response pathways
MACCS, ECFP4,
ToxPrint, ESTATE
fingerprints and
descriptors
- k-Nearest Neighbors
- naïve Bayes
- Random Forests
- Probabilistic Neural
Networks
Siramshetty et al.
[206]
hERG channel
blockade
MACCS, ECFP4,
PubChem, Morgan
fingerprints
- k-Nearest Neighbors
- Support Vector Machines
- Random Forests
Table 2.3: Brief descriptions of different molecular features employed for model development.
Feature Type Description Remark
MACCS Substructure fingerprint
A bit string representation based on a dictionary of substructures (MACCS keys). Each bit position encodes the presence or absence of a key. Publicly available version contains166 bits.
Simplest and one of the most commonly used fingerprints in similarity search (e.g. virtual screening).
28
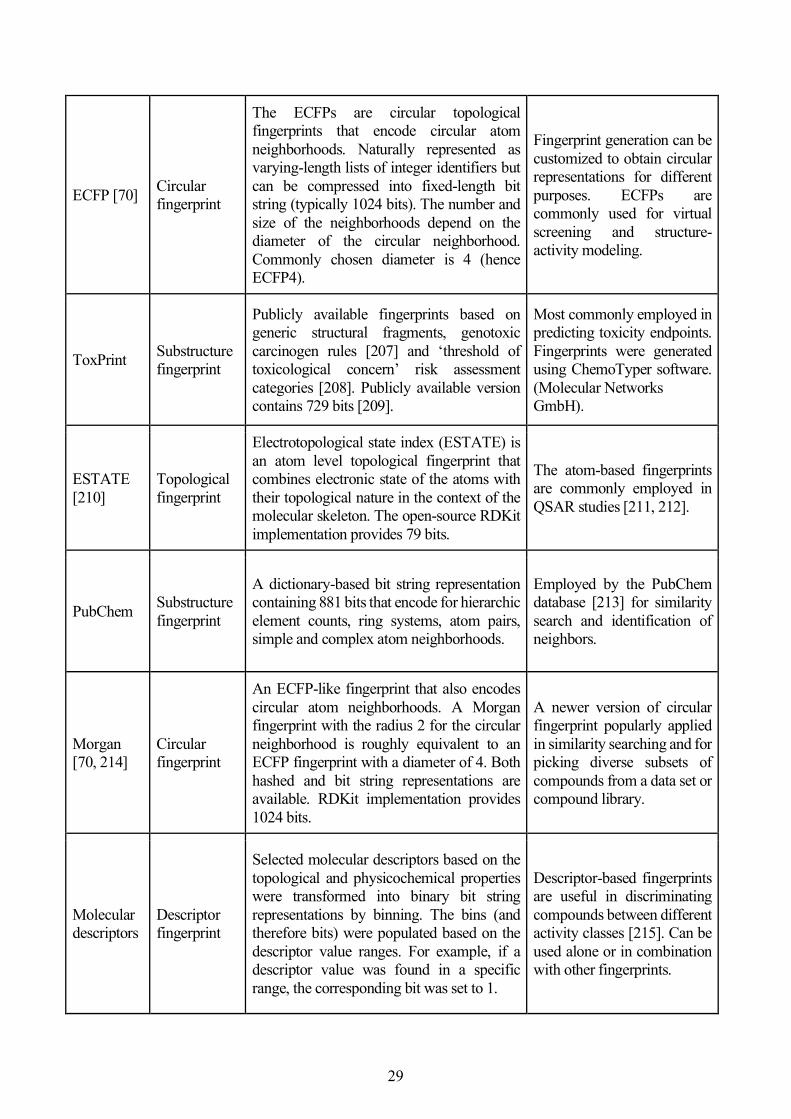
ECFP [70] Circular fingerprint
The ECFPs are circular topological fingerprints that encode circular atom neighborhoods. Naturally represented as varying-length lists of integer identifiers but can be compressed into fixed-length bit string (typically 1024 bits). The number and size of the neighborhoods depend on the diameter of the circular neighborhood. Commonly chosen diameter is 4 (hence ECFP4).
Fingerprint generation can be customized to obtain circular representations for different purposes. ECFPs are commonly used for virtual screening and structure-activity modeling.
ToxPrint Substructure fingerprint
Publicly available fingerprints based on generic structural fragments, genotoxic carcinogen rules [207] and ‘threshold of toxicological concern’ risk assessment categories [208]. Publicly available version contains 729 bits [209].
Most commonly employed in predicting toxicity endpoints. Fingerprints were generated using ChemoTyper software. (Molecular Networks GmbH).
ESTATE [210]
Topological fingerprint
Electrotopological state index (ESTATE) is an atom level topological fingerprint that combines electronic state of the atoms with their topological nature in the context of the molecular skeleton. The open-source RDKit implementation provides 79 bits.
The atom-based fingerprints are commonly employed in QSAR studies [211, 212].
PubChem Substructure fingerprint
A dictionary-based bit string representation containing 881 bits that encode for hierarchic element counts, ring systems, atom pairs, simple and complex atom neighborhoods.
Employed by the PubChem database [213] for similarity search and identification of neighbors.
Morgan [70, 214]
Circular fingerprint
An ECFP-like fingerprint that also encodes circular atom neighborhoods. A Morgan fingerprint with the radius 2 for the circular neighborhood is roughly equivalent to an ECFP fingerprint with a diameter of 4. Both hashed and bit string representations are available. RDKit implementation provides 1024 bits.
A newer version of circular fingerprint popularly applied in similarity searching and for picking diverse subsets of compounds from a data set or compound library.
Molecular descriptors
Descriptor fingerprint
Selected molecular descriptors based on the topological and physicochemical properties were transformed into binary bit string representations by binning. The bins (and therefore bits) were populated based on the descriptor value ranges. For example, if a descriptor value was found in a specific range, the corresponding bit was set to 1.
Descriptor-based fingerprints are useful in discriminating compounds between different activity classes [215]. Can be used alone or in combination with other fingerprints.
29
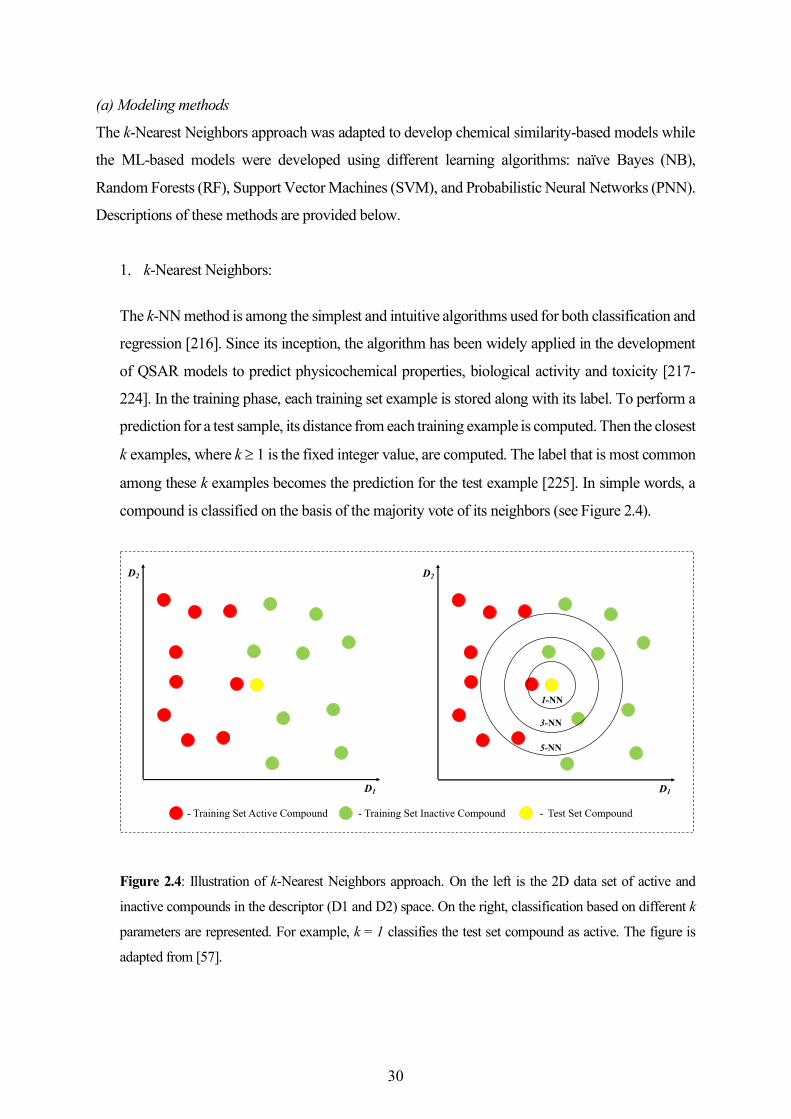
(a) Modeling methods
The k-Nearest Neighbors approach was adapted to develop chemical similarity-based models while
the ML-based models were developed using different learning algorithms: naïve Bayes (NB),
Random Forests (RF), Support Vector Machines (SVM), and Probabilistic Neural Networks (PNN).
Descriptions of these methods are provided below.
1. k-Nearest Neighbors:
The k-NN method is among the simplest and intuitive algorithms used for both classification and
regression [216]. Since its inception, the algorithm has been widely applied in the development
of QSAR models to predict physicochemical properties, biological activity and toxicity [217-
224]. In the training phase, each training set example is stored along with its label. To perform a
prediction for a test sample, its distance from each training example is computed. Then the closest
k examples, where k ³ 1 is the fixed integer value, are computed. The label that is most common
among these k examples becomes the prediction for the test example [225]. In simple words, a
compound is classified on the basis of the majority vote of its neighbors (see Figure 2.4).
Figure 2.4: Illustration of k-Nearest Neighbors approach. On the left is the 2D data set of active and
inactive compounds in the descriptor (D1 and D2) space. On the right, classification based on different k
parameters are represented. For example, k = 1 classifies the test set compound as active. The figure is
adapted from [57].
D1
D2
1-NN
3-NN
5-NN
D1
D2
Test Set Compound-Training Set Active Compound- Training Set Inactive Compound-
30
To train a k-NN classifier, the user should specify the value of k and determine the distance
function. For binary classification, to avoid the ties, it is recommended to choose a small odd
integer is used to avoid tied votes [57]. The k-NN method is popularly employed in combination
with Tanimoto similarity when molecular fingerprints as used as features [82, 83]. One of the
known disadvantages of k-NN is its time complexity required to predict new samples. Without
preselection of descriptors, k-NN cannot handle high dimensional data. Since only k neighbors
are chosen, the presence of wrongly classified training examples can lead to wrong predictions.
Although several implementations of k-NN are available in different toolkits and platforms like
KNIME, due to the difficulties in adapting it for the data set in hand and the voting scheme
chosen, a custom k-NN model was developed in this thesis.
2. Naïve Bayes:
Naïve Bayes is a probabilistic method of classification based on the Bayes theorem, which
describes the probability of an event that might have been based on prior knowledge of conditions
related to the event [226].
.($/&) = .(&/$).($).(&)
Here, the equation describes probability P for event A to be the outcome given the event B. If
previous knowledge about .(&/$),.($) and .(&) is available, probabilities can be derived
without specific knowledge about .($/&). In our context, it assumes the characteristics of
descriptors to contribute independently towards the probability that a particular data point (i.e. a
compound) belongs to a particular class. The classifier has been frequently used for predicting
biological activity and chemical toxicity [57, 227-229]. Due to its precise nature, the classifier
can be trained very efficiently using training data sets and a maximum likelihood for parameter
estimation. The main advantage of a Naïve Bayes classifier is its small size requirement of a
training data set for parameter estimation. Due to its ease of use, versatility and robustness,
Bayesian classifiers are increasingly employed in ligand-based virtual screening [230]. A major
limitation is that the modeling approach is unsuitable when there exist strong conditional
dependencies between the variables (or descriptors). However, utilizing multitarget Bayesian
classifiers (commonly referred to as Bayesian networks) has been associated with improved
classification accuracies [231]. Bayesian networks consider the dependencies between the
31
variables that are not accounted for by a naïve Bayes classifier. Furthermore, combining
fingerprints with descriptors has been a beneficial approach in Bayesian modeling [232]. Hence,
this classifier was successfully employed in one of the studies in this thesis for predicting the
nuclear receptor and stress response pathway interference.
3. Support Vector Machines:
SVMs are one of the most popular ML techniques used in the field of data mining in various
domains for real-world classification problems. Due to its high generalization capabilities and
ability to identify global and non-linear solutions, it became a very popular choice of technique
among the data mining researchers and scientists. Vapnik and colleagues [233] first introduced
the SVMs. These are supervised learning algorithms that facilitate both classification and
regression. In one of the earliest reported works, SVMs performed significantly better than other
ML-based methods in predicting the inhibitors of dihydrofolate reductase [234]. Since then,
SVMs have been successfully employed in drug discovery for binary activity or property
prediction [235-238], raking a database of compounds [239, 240] chemical toxicity prediction
[241, 242] and identification of novel active compounds [243] even in a scenario where no active
compounds are known for a target of interest [244].
The basic idea behind SVMs is to derive a separation rule for compounds belonging to two
different classes [245]. This is achieved by projecting the compounds into a high-dimensional
descriptor space and generating a hyperplane that distinguishes the compounds with different
class labels (Figure 2.5). While many such hyperplanes can be approximated, the SVM algorithm
chooses a hyperplane that maximizes the margin between the two classes, assuming that the
larger the margin, the lower the classification error. These hyperplanes are ‘support hyperplanes’
and the data points lying on them are referred to as ‘support vectors’. The projection of data points
is facilitated by a kernel function belonging to one of the four families of kernel functions: linear
kernel, polynomial kernel, sigmoid kernel and radial basis function kernel. Although polynomial
kernel functions are widely employed in combination with molecular descriptors and
fingerprints, simple linear kernel based SVMs have also been successfully applied in large-scale
QSAR studies [246]. Furthermore, a range of new kernel functions was introduced that compute
similarity by different means. For example, graph kernels assess the overall similarity between
labeled graphs, without the need to compute vector representations of the compounds [247]. The
Tanimoto kernel, based on the popular Tanimoto coefficient, compares different compound
32
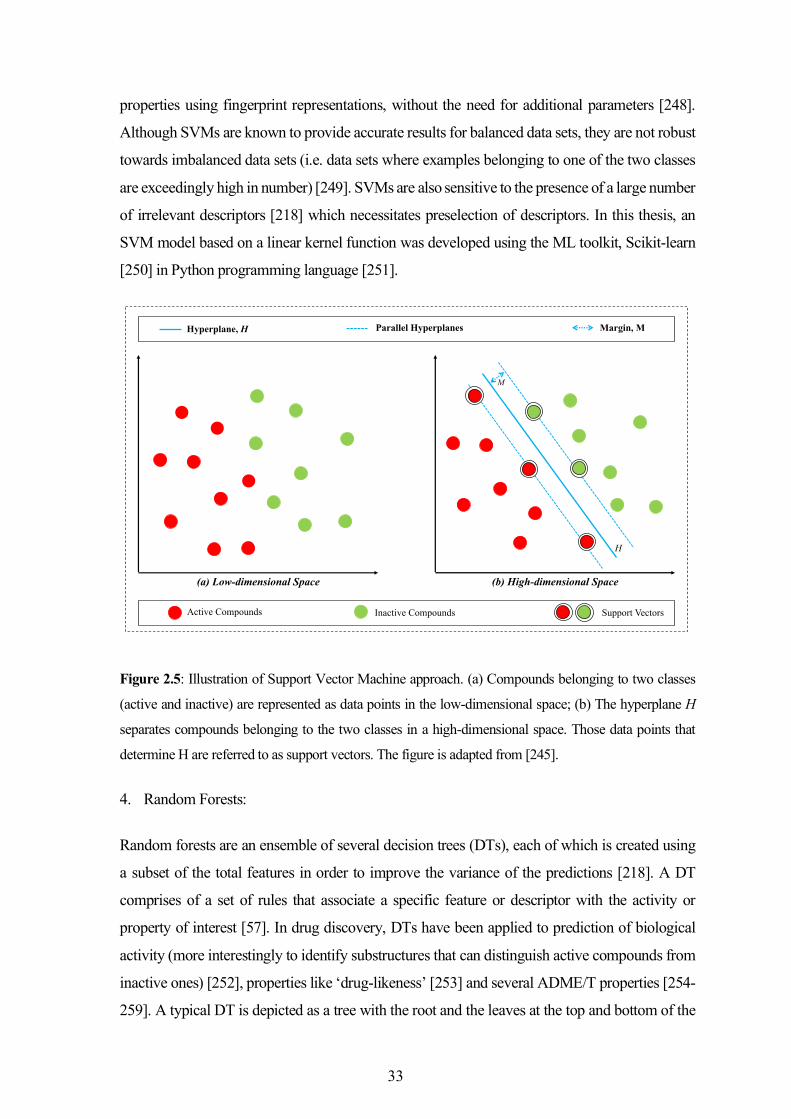
properties using fingerprint representations, without the need for additional parameters [248].
Although SVMs are known to provide accurate results for balanced data sets, they are not robust
towards imbalanced data sets (i.e. data sets where examples belonging to one of the two classes
are exceedingly high in number) [249]. SVMs are also sensitive to the presence of a large number
of irrelevant descriptors [218] which necessitates preselection of descriptors. In this thesis, an
SVM model based on a linear kernel function was developed using the ML toolkit, Scikit-learn
[250] in Python programming language [251].
Figure 2.5: Illustration of Support Vector Machine approach. (a) Compounds belonging to two classes
(active and inactive) are represented as data points in the low-dimensional space; (b) The hyperplane H
separates compounds belonging to the two classes in a high-dimensional space. Those data points that
determine H are referred to as support vectors. The figure is adapted from [245].
4. Random Forests:
Random forests are an ensemble of several decision trees (DTs), each of which is created using
a subset of the total features in order to improve the variance of the predictions [218]. A DT
comprises of a set of rules that associate a specific feature or descriptor with the activity or
property of interest [57]. In drug discovery, DTs have been applied to prediction of biological
activity (more interestingly to identify substructures that can distinguish active compounds from
inactive ones) [252], properties like ‘drug-likeness’ [253] and several ADME/T properties [254-
259]. A typical DT is depicted as a tree with the root and the leaves at the top and bottom of the
M
(b) High-dimensional Space
H
(a) Low-dimensional Space
Hyperplane, H Parallel Hyperplanes Margin, M
Active Compounds Inactive Compounds Support Vectors
33
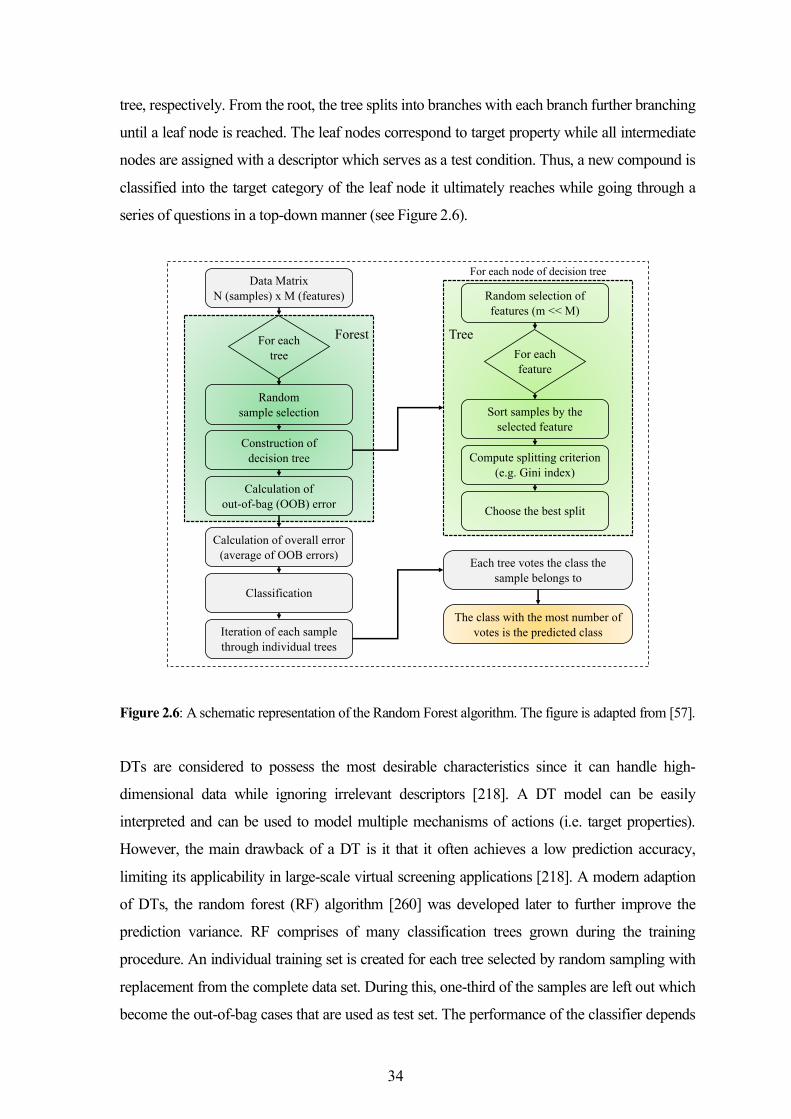
tree, respectively. From the root, the tree splits into branches with each branch further branching
until a leaf node is reached. The leaf nodes correspond to target property while all intermediate
nodes are assigned with a descriptor which serves as a test condition. Thus, a new compound is
classified into the target category of the leaf node it ultimately reaches while going through a
series of questions in a top-down manner (see Figure 2.6).
Figure 2.6: A schematic representation of the Random Forest algorithm. The figure is adapted from [57].
DTs are considered to possess the most desirable characteristics since it can handle high-
dimensional data while ignoring irrelevant descriptors [218]. A DT model can be easily
interpreted and can be used to model multiple mechanisms of actions (i.e. target properties).
However, the main drawback of a DT is it that it often achieves a low prediction accuracy,
limiting its applicability in large-scale virtual screening applications [218]. A modern adaption
of DTs, the random forest (RF) algorithm [260] was developed later to further improve the
prediction variance. RF comprises of many classification trees grown during the training
procedure. An individual training set is created for each tree selected by random sampling with
replacement from the complete data set. During this, one-third of the samples are left out which
become the out-of-bag cases that are used as test set. The performance of the classifier depends
Calculation of overall error (average of OOB errors)
Data MatrixN (samples) x M (features)
For eachtree
Randomsample selection
Construction of decision tree
Calculation ofout-of-bag (OOB) error
Classification
Iteration of each sample through individual trees
Random selection of features (m << M)
Sort samples by the selected feature
Compute splitting criterion (e.g. Gini index)
Choose the best split
For eachfeature
Each tree votes the class the sample belongs to
The class with the most number of votes is the predicted class
For each node of decision tree
Forest Tree
34
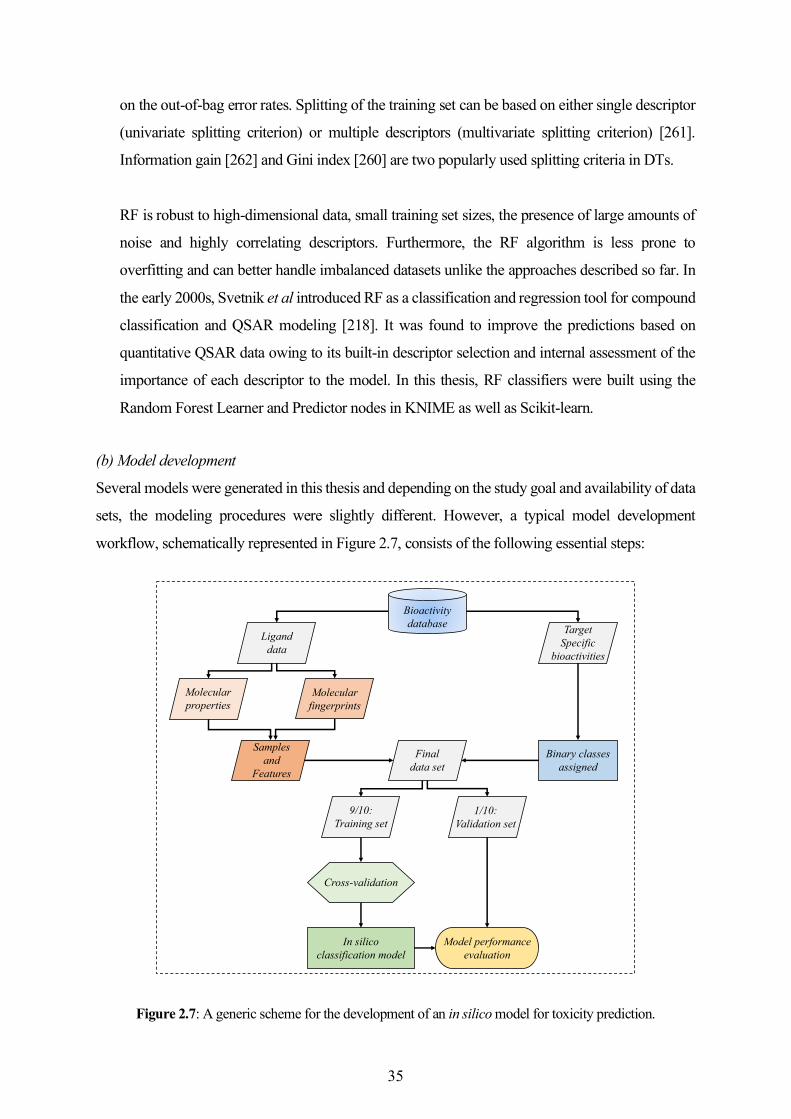
on the out-of-bag error rates. Splitting of the training set can be based on either single descriptor
(univariate splitting criterion) or multiple descriptors (multivariate splitting criterion) [261].
Information gain [262] and Gini index [260] are two popularly used splitting criteria in DTs.
RF is robust to high-dimensional data, small training set sizes, the presence of large amounts of
noise and highly correlating descriptors. Furthermore, the RF algorithm is less prone to
overfitting and can better handle imbalanced datasets unlike the approaches described so far. In
the early 2000s, Svetnik et al introduced RF as a classification and regression tool for compound
classification and QSAR modeling [218]. It was found to improve the predictions based on
quantitative QSAR data owing to its built-in descriptor selection and internal assessment of the
importance of each descriptor to the model. In this thesis, RF classifiers were built using the
Random Forest Learner and Predictor nodes in KNIME as well as Scikit-learn.
(b) Model development
Several models were generated in this thesis and depending on the study goal and availability of data
sets, the modeling procedures were slightly different. However, a typical model development
workflow, schematically represented in Figure 2.7, consists of the following essential steps:
Figure 2.7: A generic scheme for the development of an in silico model for toxicity prediction.
Bioactivitydatabase
Liganddata
TargetSpecific
bioactivities
Binary classesassigned
Finaldata set
Molecularproperties
Molecularfingerprints
Samplesand
Features
9/10:Training set
1/10:Validation set
Cross-validation
In silicoclassification model
Model performanceevaluation
35
1. Assembling training and test data sets:
Once a target or a toxicity endpoint of interest is identified, the first step involves assembling the
training and test data sets. The sources of data and the data preprocessing steps were already
discussed in earlier sections (2.1 and 2.2). In a typical classification task, activity values can be
ignored once the class labels are assigned. For binary classification, the class labels are usually
‘active’ (or toxic) and ‘inactive’ (or non-toxic), numerically indicated by ‘1’ and ‘0’, respectively.
A model is useful only when it is predictive and can be generalized to unknown data, which must
be thoroughly validated [263]. A traditional approach includes partitioning the data set into a
‘training set’ and a ‘test set’ [120]. The training set is employed for model building and the test
set serves for validation of the model. It is generally recommended to have a training set bigger
than the test set to allow sufficient learning on a larger chemical space. Most ML algorithms have
internal parameters that are optimized to produce the best possible model. For this purpose, a part
of the training set is left out as internal validation set which is used to find the parameters that
provide the best performance.
2. Cross-validation:
Cross-validation was introduced as an essential step to estimate the model parameters that
provide the best prediction performance [264-266]. An ideal scenario where there is sufficient
data available for training and validating the models rarely exists in life sciences research,
including QSAR [267]. Therefore, cross-validation is a common and effective approach to
identify optimal models. In an n-fold cross-validation task, the training set is divided into n
separate folds. In total, n separate models are generated, each time using a distinct set for testing
and all remaining sets for training. Thus each instance of the training set is predicted only once
[263]. In this way, feature selection is carried out independently for each of the n models.
Different cross-validation approaches have been reported so far, however a 5-fold or 10-fold
cross-validation is commonly employed [120]. Partitioning of data into training and test sets can
be performed either randomly or in a stratified fashion. While random partitioning, as the name
itself indicates, splits data randomly into training and test sets, stratified partitioning considers a
target variable (e.g. activity class) to make sure the instances are homogeneously assigned to the
training and test sets (e.g. same ratio of active to inactive compounds is maintained in the training
and test sets). Taken together, cross-validation ensures that more robust conclusions are drawn
while finding an optimal model.
36
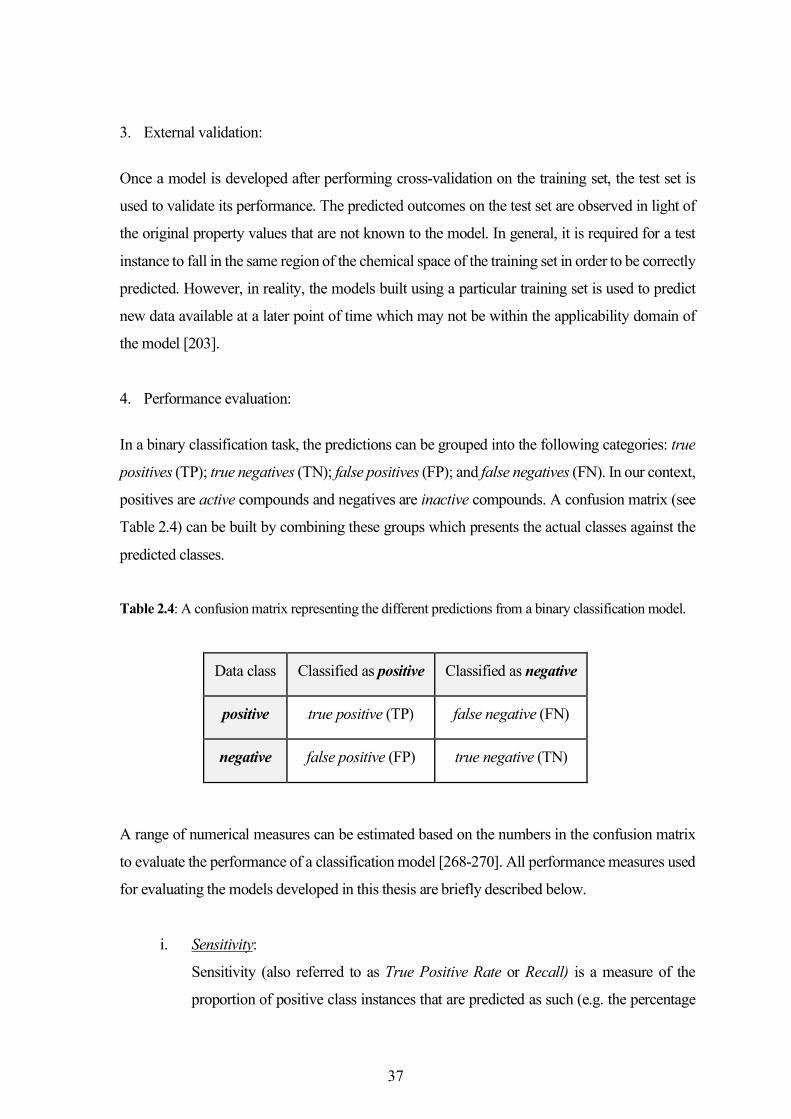
3. External validation:
Once a model is developed after performing cross-validation on the training set, the test set is
used to validate its performance. The predicted outcomes on the test set are observed in light of
the original property values that are not known to the model. In general, it is required for a test
instance to fall in the same region of the chemical space of the training set in order to be correctly
predicted. However, in reality, the models built using a particular training set is used to predict
new data available at a later point of time which may not be within the applicability domain of
the model [203].
4. Performance evaluation:
In a binary classification task, the predictions can be grouped into the following categories: true
positives (TP); true negatives (TN); false positives (FP); and false negatives (FN). In our context,
positives are active compounds and negatives are inactive compounds. A confusion matrix (see
Table 2.4) can be built by combining these groups which presents the actual classes against the
predicted classes.
Table 2.4: A confusion matrix representing the different predictions from a binary classification model.
Data class Classified as positive Classified as negative
positive true positive (TP) false negative (FN)
negative false positive (FP) true negative (TN)
A range of numerical measures can be estimated based on the numbers in the confusion matrix
to evaluate the performance of a classification model [268-270]. All performance measures used
for evaluating the models developed in this thesis are briefly described below.
i. Sensitivity:
Sensitivity (also referred to as True Positive Rate or Recall) is a measure of the
proportion of positive class instances that are predicted as such (e.g. the percentage
37
of active compounds in the test set that is actually predicted as active compounds).
In our context, it is the effectiveness of a classifier to detect active compounds. In
terms of the elements from the confusion matrix, Sensitivity can be denoted as:
01234546457 = !.(!. + 89)
ii. Specificity:
Specificity (also referred to as True Negative Rate) is a measure of the proportion of
negative class instances that predicted as such (e.g. the percentage of inactive
compounds in the test set that are actually predicted as inactive). In other words,
Specificity is a measure of the effectiveness of a classifier to identify inactive
compounds. It can be denoted in terms of the confusion matrix elements as follows:
0:1"4;4"457 = !9(!9 + 8.)
iii. Area under the ROC Curve:
The Receiver-Operating Characteristic (ROC) curve is created by plotting the true
positive rate (TPR) against the False Positive Rate, calculated as (1 - Specificity), at
different threshold settings. The area under the ROC curve (AUC) is a collective
measure of the performance of the classifier, which indicates whether on average a
true positive (i.e. an active compound) is ranked higher than false positives (i.e.
inactive compounds). AUC is a popularly employed measure for comparing the
classification performances of multiple ML models. An AUC value of 0.5 indicates
the performance of a random prediction model which is commonly used as a baseline
to decide if a classification model is useful. The following illustration of a ROC curve
(Figure 2.8) clearly represents the AUC.
38
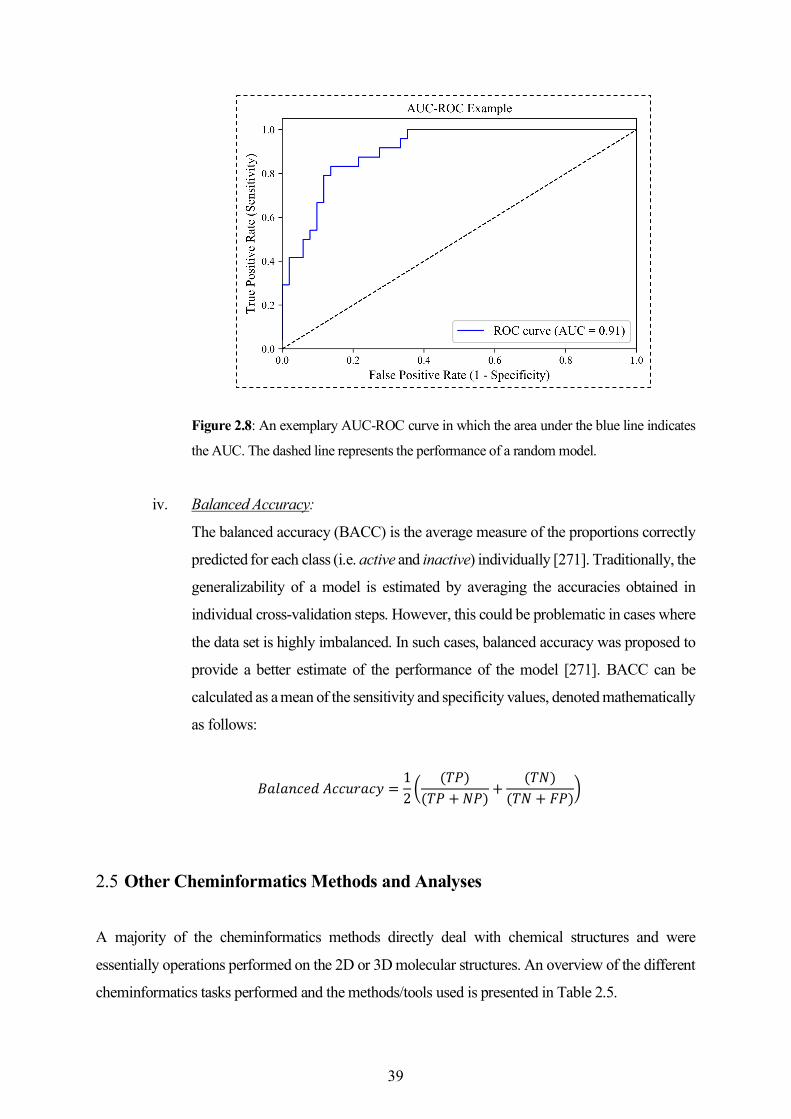
Figure 2.8: An exemplary AUC-ROC curve in which the area under the blue line indicates
the AUC. The dashed line represents the performance of a random model.
iv. Balanced Accuracy:
The balanced accuracy (BACC) is the average measure of the proportions correctly
predicted for each class (i.e. active and inactive) individually [271]. Traditionally, the
generalizability of a model is estimated by averaging the accuracies obtained in
individual cross-validation steps. However, this could be problematic in cases where
the data set is highly imbalanced. In such cases, balanced accuracy was proposed to
provide a better estimate of the performance of the model [271]. BACC can be
calculated as a mean of the sensitivity and specificity values, denoted mathematically
as follows:
&*<*2"1=$"">?*"7 = 12 B
(!.)(!. + 9.) +
(!9)(!9 + 8.)C
2.5 Other Cheminformatics Methods and Analyses
A majority of the cheminformatics methods directly deal with chemical structures and were
essentially operations performed on the 2D or 3D molecular structures. An overview of the different
cheminformatics tasks performed and the methods/tools used is presented in Table 2.5.
39
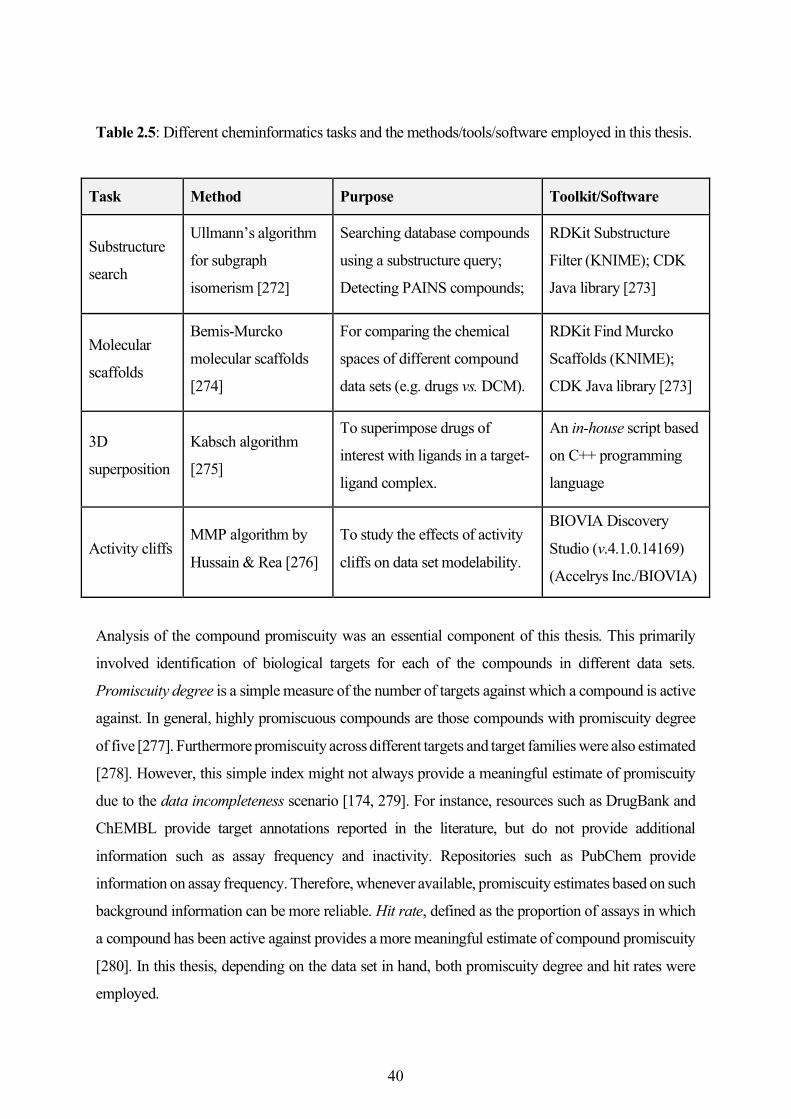
Table 2.5: Different cheminformatics tasks and the methods/tools/software employed in this thesis.
Task Method Purpose Toolkit/Software
Substructure
search
Ullmann’s algorithm
for subgraph
isomerism [272]
Searching database compounds
using a substructure query;
Detecting PAINS compounds;
RDKit Substructure
Filter (KNIME); CDK
Java library [273]
Molecular
scaffolds
Bemis-Murcko
molecular scaffolds
[274]
For comparing the chemical
spaces of different compound
data sets (e.g. drugs vs. DCM).
RDKit Find Murcko
Scaffolds (KNIME);
CDK Java library [273]
3D
superposition
Kabsch algorithm
[275]
To superimpose drugs of
interest with ligands in a target-
ligand complex.
An in-house script based
on C++ programming
language
Activity cliffs MMP algorithm by
Hussain & Rea [276]
To study the effects of activity
cliffs on data set modelability.
BIOVIA Discovery
Studio (v.4.1.0.14169)
(Accelrys Inc./BIOVIA)
Analysis of the compound promiscuity was an essential component of this thesis. This primarily
involved identification of biological targets for each of the compounds in different data sets.
Promiscuity degree is a simple measure of the number of targets against which a compound is active
against. In general, highly promiscuous compounds are those compounds with promiscuity degree
of five [277]. Furthermore promiscuity across different targets and target families were also estimated
[278]. However, this simple index might not always provide a meaningful estimate of promiscuity
due to the data incompleteness scenario [174, 279]. For instance, resources such as DrugBank and
ChEMBL provide target annotations reported in the literature, but do not provide additional
information such as assay frequency and inactivity. Repositories such as PubChem provide
information on assay frequency. Therefore, whenever available, promiscuity estimates based on such
background information can be more reliable. Hit rate, defined as the proportion of assays in which
a compound has been active against provides a more meaningful estimate of compound promiscuity
[280]. In this thesis, depending on the data set in hand, both promiscuity degree and hit rates were
employed.
40
Chapter 3
Knowledgebase Resources for In Silico Drug Discovery
3.1 Construction of Databases of Approved and Withdrawn Drugs
Understanding druglike molecules is an essential step in knowledge-based drug discovery. This
includes understanding key aspects such as physicochemical properties, pharmacological effects, and
toxicity profiles. Furthermore, knowledge of the structures and properties of both successful and
unsuccessful ligands is highly valuable in lead identification and lead optimization stages of a
cheminformatics-driven drug discovery pipeline. A limited number of resources provide
comprehensive information around these aspects that highlights the need to develop integrated
knowledgebases. The two articles in this section introduce SuperDRUG2 and WITHDRAWN as
knowledgebases of approved/marketed drugs and withdrawn drugs, respectively. Both resources
primarily focus on small molecule drugs that are annotated with a wide range of information,
particularly covering the aforementioned aspects. Both databases essentially provide 2D and 3D
structures of the drugs, their biological targets and toxic effects. A number of additional features that
facilitate navigation of the chemical and biological spaces of the two categories of drugs are described
in the original articles. Both resources can be accessed without any registration via the following
URLs:
SuperDRUG2 - http://cheminfo.charite.de/superdrug2
WITHDRAWN - http://cheminfo.charite.de/withdrawn
41
Original Research Article
3.2 SuperDRUG2: A One Stop Resource for Approved/Marketed Drugs
Siramshetty, V. B., Eckert, O. A., Gohlke, B. O., Goede, A., Chen, Q., Devarakonda, P., Preissner,
S. and Preissner, R.
Nucleic Acids Res. 2018 Jan 4;46(D1):D1137-D1143. https://doi.org/10.1093/nar/gkx1088
Author Contributions:
Implementation of website: Siramshetty, V. B. and Eckert, O. A.; Data collection and curation:
Siramshetty, V. B., Eckert, O. A., Gohlke, B. O., Goede, A., Chen, Q., Devarakonda, P., Preissner,
S; Writing of manuscript: Siramshetty, V. B.; Project coordination: Preissner, S. and Preissner, R.
42
Published online 11 November 2017 Nucleic Acids Research, 2018, Vol. 46, Database issue D1137–D1143doi: 10.1093/nar/gkx1088
SuperDRUG2: a one stop resource forapproved/marketed drugsVishal B. Siramshetty1,2,3, Oliver Andreas Eckert1,2, Bjorn-Oliver Gohlke4, Andrean Goede4,Qiaofeng Chen4,5, Prashanth Devarakonda4, Saskia Preissner4 and Robert Preissner1,2,3,4,*
1Structural Bioinformatics Group, Experimental and Clinical Research Center (ECRC), Charite – University MedicineBerlin, Berlin, Germany, 2German Cancer Consortium (DKTK), German Cancer Research Center (DKFZ),Heidelberg, Germany, 3BB3R – Berlin Brandenburg 3R Graduate School, Freie Universitaat Berlin, Berlin, Germany,4Structural Bioinformatics Group, Institute for Physiology, Charite – University Medicine Berlin, Berlin, Germany and5China Scholarship Council (CSC), China
Received September 15, 2017; Revised October 19, 2017; Editorial Decision October 20, 2017; Accepted October 22, 2017
ABSTRACT
Regular monitoring of drug regulatory agency websites and similar resources for information on newdrug approvals and changes to legal status of mar-keted drugs is impractical. It requires navigationthrough several resources to find complete infor-mation about a drug as none of the publicly ac-cessible drug databases provide all features essen-tial to complement in silico drug discovery. Here,we propose SuperDRUG2 (http://cheminfo.charite.de/superdrug2) as a comprehensive knowledge-baseof approved and marketed drugs. We provide thelargest collection of drugs (containing 4587 ac-tive pharmaceutical ingredients) which include smallmolecules, biological products and other drugs.The database is intended to serve as a one-stopresource providing data on: chemical structures,regulatory details, indications, drug targets, side-effects, physicochemical properties, pharmacokinet-ics and drug–drug interactions. We provide a 3D-superposition feature that facilitates estimation ofthe fit of a drug in the active site of a target witha known ligand bound to it. Apart from multipleother search options, we introduced pharmacokinet-ics simulation as a unique feature that allows users tovisualise the ‘plasma concentration versus time’ pro-file for a given dose of drug with few other adjustableparameters to simulate the kinetics in a healthy indi-vidual and poor or extensive metabolisers.
INTRODUCTION
Bioinformatics and cheminformatics are research fields inwhich huge amounts of data are being generated each day
at a rapid pace. This vast amount of data is distributedacross several online databases that are either publicly ac-cessible or often accessible only via subscription. This de-centralized distribution of data restrains linking of the cur-rent wealth of information with the enormous amount ofdata that has been accumulating over decades. We wit-nessed a significant progress in the last 10–15 years throughseveral remarkable contributions that attempted to bridgethis ‘information/informatics gap’. Comprehensive smallmolecule databases such as DrugBank (1), KEGG (2) andChEBI (3) have been established as expert curated re-sources. On the other hand, PubChem (4), ChEMBL (5)and Binding DB (6) serve as major resources for bioactiv-ity. Therapeutic Target Database (TTD) (7) and Compara-tive Toxicogenomics Database (CTD) (8) focus on knownor explored therapeutic targets of drugs and literature ref-erences that report chemical-gene/protein interactions. Arecent addition to the league of publicly accessible drugdatabases is DrugCentral (9) which serves as an onlinedrug compendium with a special focus on active pharma-ceutical ingredients that are approved by FDA and otherdrug regulatory agencies. Further, resources like ProteinData Bank (PDB) (10) and Cambridge Structural Database(CSD) (11) archive the experimentally determined threedimensional (3D) structures of biological macromoleculesand low molecular weight structures. Despite constant en-richment of data at each of these platforms, there has alwaysbeen a need for a resource that could connect several layersof information on drugs in the context of in silico research.Especially, no dedicated resources exist for 3D structuresof drugs, with rare exceptions such as e-Drug3D database(12). In this context, we previously came up with SuperDrugdatabase containing a total of 2396 experimentally deter-mined and computed 3D structures for active ingredientspresent in the WHO’s essential marketed drugs (13). Al-though some of the aforementioned resources focus on thepharmacological aspects of drugs to variable extents, none
*To whom correspondence should be addressed. Tel: +49 30 450528257; Email: [email protected]
C⃝ The Author(s) 2017. Published by Oxford University Press on behalf of Nucleic Acids Research.This is an Open Access article distributed under the terms of the Creative Commons Attribution License (http://creativecommons.org/licenses/by-nc/4.0/), whichpermits non-commercial re-use, distribution, and reproduction in any medium, provided the original work is properly cited. For commercial re-use, please [email protected]
43
D1138 Nucleic Acids Research, 2018, Vol. 46, Database issue
provide comprehensive pharmacokinetic data which facili-tates simulation of pharmacokinetics of approved drugs.
Here we present SuperDRUG2, an update of our previ-ous conformational drug database, currently containing in-formation for 4587 active pharmaceutical ingredients thatare present in pharmaceutical products. We aim to integratedata that is widely distributed across multiple resources andserve as a one-stop source. The database features multiplesearch options that facilitate two-dimensional (2D) and 3Dsimilarity calculation, identification of potential drug–druginteractions in complex drug regimens among several otherfeatures. A special focus of the database lies in simulation ofthe ‘plasma-concentration versus time’ curves using phar-macokinetic data extracted from various sources such asdrug labels and scientific literature. We introduce for the firsttime a 3D-superposition feature that superimposes drugs ofinterest with those ligands already known to bind with pro-tein targets in experimentally determined 3D structures.
MATERIALS AND METHODS
Approved and marketed drugs
Several online public resources including the most re-cent pharmaceutical product collections from the U.S.Food and Drug Administration (US FDA), the EuropeanMedicines Agency (EMA), Health Canada, the Korea’sFDA (KFDA), and China’s FDA (CFDA) were searchedfor active ingredients used in pharmaceutical products (seeSection 1 in supplementary information (S2) for detailed listof resources and methods). For convenience, we will use theterm ‘drug’ instead of ‘active ingredient’ which is widely ac-cepted by chemists and biologists in the field of drug dis-covery. Currently, the database comprises a total of 4587drugs grouped into two categories: small molecules (3,982drugs) and biological/other drugs (605 drugs). Both 2Dand 3D structures were standardized in ChemAxon soft-ware (https://www.chemaxon.com) for all small moleculesentries. The standardization procedure is detailed in one ofour former database papers (14). The 3D conformationswere also generated using the same software. The 2D de-pictions on the web site are generated using RDKit toolkit(http://www.rdkit.org) whereas the interactive 3D structurevisualisation is enabled via 3Dmol.js library (15).
Further, physicochemical properties and chemical struc-ture identifiers were generated using the RDKit nodes inKNIME (https://www.knime.com). In order to ensure con-nectivity with well-known drug databases, every drug en-try was annotated with links to external resources includ-ing the WHO’s index of ATC codes (https://www.whocc.no/atc ddd index). Drug labels were extensively text-mined forregulatory details (of approval), therapeutic indications andthe recommended doses. In addition, we also flagged someentries as withdrawn drugs. These drugs were previouslyknown to cause adverse effects and eventually withdrawn inone or more countries and sometimes world-wide (14), (16).It must be noted that sometimes only a particular pharma-ceutical product or a specific dose or dosage form of thedrug is withdrawn which does not necessarily indicate thatthe drug does not exist in any currently approved/marketedpharmaceutical products.
Drug targets
We extracted target information from DrugBank (v. 5) (1),TTD (7) and ChEMBL (v. 22) (5). Confirmed drug-targetinteractions were found at the first two resources whileChEMBL provides experimental activity data. Informationfrom ChEMBL was pre-processed using filter criteria sug-gested by Bajorath et al. (17) to retain only high confidenceactivity data (detailed procedure is described under Section2 of supplementary information (S2)). Overall, the databasecomprises >20 000 confirmed drug-target interactions cov-ering more than 2300 drugs interacting with 3000 distincttargets. In order to understand the interactions in the con-text of side-effects, we used a list of side-effect targets onthe Novartis Safety Panel proposed by Lounkine et al. (18)and annotated our drug-target relations into two categories:safety and non-safety. Identification of previously unde-tected targets for known drugs can provide valuable insightsand leads in drug repurposing endeavours. Our previouslypublished target prediction server, SuperPred (19) was usedto collect >17 000 drug-target interactions (more than 2500drugs). Further, protein structures and their co-crystallizedligands were extracted from PDB (10) and mapped to thetargets in our database, resulting in a total of 23 260 struc-tures that are used for 3D-superposition.
2D and 3D similarity
The 2D structures of small molecules are converted to MDLMACCS key based fingerprints to facilitate chemical sim-ilarity search. Tanimoto coefficient is used as the standard2D similarity metric. Additionally, we implemented the Ull-mann’s algorithm for subgraph isomerism using the opensource Chemistry Development toolkit (20) for substruc-ture similarity search. Up to 200 conformations per drugwere calculated in order to perform pairwise 3D structurecomparisons. Atoms were assigned by minimal distance andsuperimposed by using the Kabsch algorithm (21). In a co-ordinate system comprising normalized set of atoms, thecentre of masses of both conformers are calculated and su-perimposed. A root-mean-square-deviation (RMSD) scoreis derived for each comparison which signifies the extent ofsimilarity between the two structures. A detailed methodol-ogy on how 3D similarity is calculated can be found in ourprevious work (22).
Side effects
The current version of database includes >100 000 side ef-fect relations for nearly 950 approved drugs that not onlycover the adverse events recorded during the clinical tri-als prior to drug approval but also those identified duringthe post-marketing surveillance. The side effect data wascollected from SIDER resource (v. 4.1) (23). We also ex-tracted the frequency information for side effects for eachdrug and labelled the relations according to the SIDER fre-quency scale. A total of 4964 distinct side effects identifiedby MEDRA concept identifiers are currently linked fromour resource to the SIDER database.
44
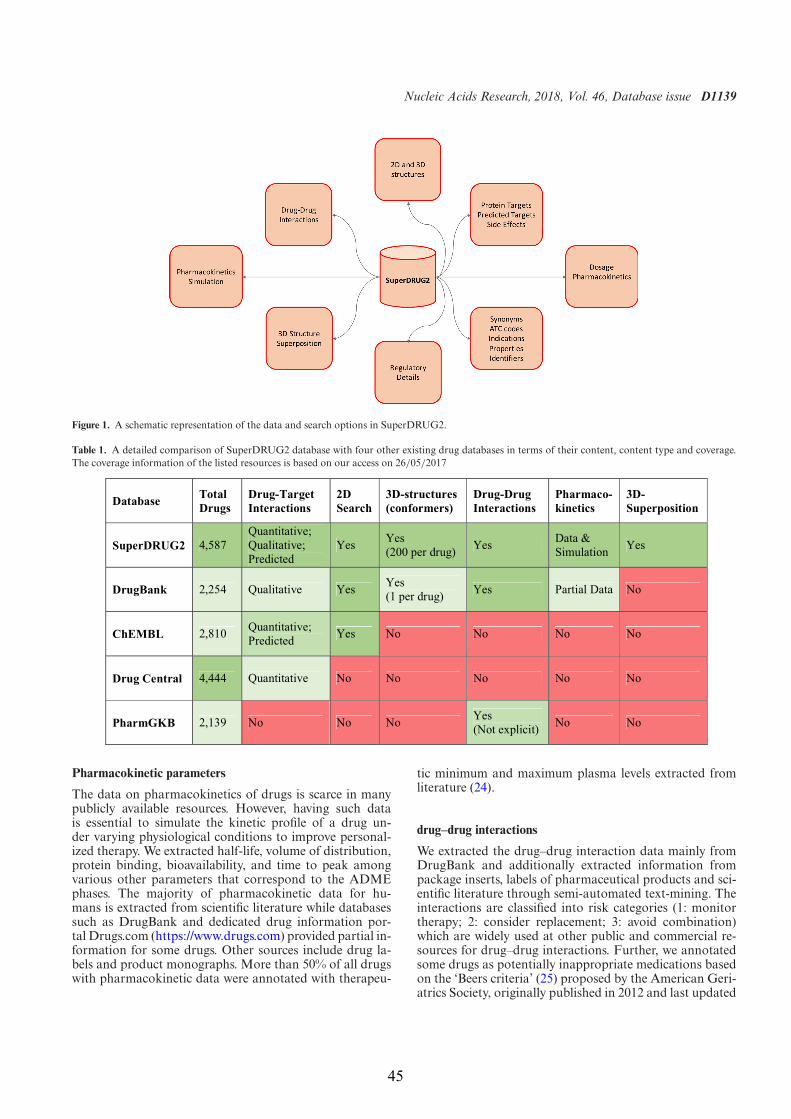
Nucleic Acids Research, 2018, Vol. 46, Database issue D1139
Figure 1. A schematic representation of the data and search options in SuperDRUG2.
Table 1. A detailed comparison of SuperDRUG2 database with four other existing drug databases in terms of their content, content type and coverage.The coverage information of the listed resources is based on our access on 26/05/2017
Pharmacokinetic parameters
The data on pharmacokinetics of drugs is scarce in manypublicly available resources. However, having such datais essential to simulate the kinetic profile of a drug un-der varying physiological conditions to improve personal-ized therapy. We extracted half-life, volume of distribution,protein binding, bioavailability, and time to peak amongvarious other parameters that correspond to the ADMEphases. The majority of pharmacokinetic data for hu-mans is extracted from scientific literature while databasessuch as DrugBank and dedicated drug information por-tal Drugs.com (https://www.drugs.com) provided partial in-formation for some drugs. Other sources include drug la-bels and product monographs. More than 50% of all drugswith pharmacokinetic data were annotated with therapeu-
tic minimum and maximum plasma levels extracted fromliterature (24).
drug–drug interactions
We extracted the drug–drug interaction data mainly fromDrugBank and additionally extracted information frompackage inserts, labels of pharmaceutical products and sci-entific literature through semi-automated text-mining. Theinteractions are classified into risk categories (1: monitortherapy; 2: consider replacement; 3: avoid combination)which are widely used at other public and commercial re-sources for drug–drug interactions. Further, we annotatedsome drugs as potentially inappropriate medications basedon the ‘Beers criteria’ (25) proposed by the American Geri-atrics Society, originally published in 2012 and last updated
45

D1140 Nucleic Acids Research, 2018, Vol. 46, Database issue
in 2015. The medications covered in this list are consideredto be associated with poor outcomes in older adults and arerecommended to be avoided for all individuals in this group,except those in palliative and hospital care. A German vari-ant of the Beers list, known as the ‘PRISCUS list’ (26) wasalso used to annotate drugs that are potentially unsuitablefor the elderly.
Web application, system requirements and data availability
All the data in SuperDRUG2 is stored in a relationalMySQL database and the web site is set up as Javaweb application on a virtual Linux (Ubuntu 14.04 LTS)server, accessible at http://cheminfo.charite.de/superdrug2.JavaScript is key to almost all search options we of-fer. Therefore, we strongly recommend using modern webbrowsers such as Safari, Google Chrome or Firefox (withJavaScript enabled). The contents of the database are madeavailable via customized download links on the web site.
DATABASE SEARCH OPTIONS
The integrated data in SuperDRUG2 can be accessedvia multiple interactive features described below and areschematically represented in Figure 1. A detailed compar-ison of the contents, coverage and the uniqueness of ourdatabase with existing drug databases is presented in Table1. Although the resources compared with are not necessar-ily exclusive drug databases, the details presented in Table 1are expected to justify the novelty of our database as a onestop-resource. A list of web links to the list of pharmaceu-tical products approved for use in several countries world-wide is provided in the supplementary information sheet S1.The national drug lists can also be accessed through a mapvisualization on the web site.
Drug search
A simple way to search for drug records is to use the ‘NameSearch’ option under the Drug Search page. In case an ex-act name or synonym match does not yield any result, thesearch query is used to look up the chemical structure atPubChem and five most similar drugs from the databaseare displayed and ranked by the similarity towards the in-put molecule. A molecule sketching tool provided in the‘Structure Search’ section facilitates structure-based search.Three different search types (exact match, similarity searchand substructure search) are provided. Users have the flex-ibility to choose a similarity threshold and the maximumnumber of results. A detailed drug record contains multi-ple sections that provide: basic details such as synonyms,indications, ATC codes and marketing status; 2D and 3Dmolecular structures; regulatory details; drug targets; side-effects, pharmacokinetic data; physicochemical properties,links to external databases via specific identifiers; and mar-keted drug products.
3D superposition
The feature of 3D superposition could be used in two ways.The first option is to look up for two small molecule drugs
Figure 2. 3D visualisation of the result of the superposition of nirapariband PDB ligand 1KS in the crystal structure (4KRS) of Tankyrase 1. Bothmolecules (niraparib: white colour; 1SX: red color) are well superposed inthe 1SX binding region of chain A.
using the name search fields. Once a user selects the drugs,a 3D superposition of the two structures is calculated andan interactive 3D visualisation of the superimposed struc-tures is displayed along with an RMSD score that indicatesthe structural similarity. The second option is to superim-pose a drug from the database with a ligand that is knownto bind to a protein in a PDB complex. To start using thefeature, the user has to first search for a protein target ofinterest. PDB structures associated with this target are dis-played along with the chain identifiers and ligands. Afterchoosing a combination of PDB structure and ligand, theuser is allowed to search for a small molecule drug of inter-est in the database. An interactive 3D visualisation of theoverlapped molecules is provided in the context of the bind-ing site of the ligand. This would be an interesting feature tounderstand the fit of the drug into the binding pocket of thetarget protein of interest. Figure 2 shows an exemplary 3Dsuperposition result in which niraparib, a well-known polyADP ribose polymerase (PARP) inhibitor is superimposedwith a small molecule inhibitor (PDB ligand ID: 1SX) in the3D structure of tankyrase 1 (PDB ID: 4KRS), an importantregulator of the Wnt/!-catenin signalling. Dual inhibitorsof PARP1/2 and tankyrase 1 are known to inhibit growthof DNA repair deficient tumours (27). Understanding therole of known PARP1/2 inhibitors such as niraparib andolaparib in the inhibition of tankyrase 1 could be useful inexploring opportunities to repurpose these drugs for othercancer types.
Pharmacokinetics simulation
To the best of our knowledge, SuperDRUG2 is the first aca-demic resource to provide simulation of pharmacokineticsof approved drugs as an easily accessible feature. The userscan simply search for a drug by its name to see if a simu-lation is available within our database. The concentrationvs. time curve for a recommended dose of the drug is dis-
46
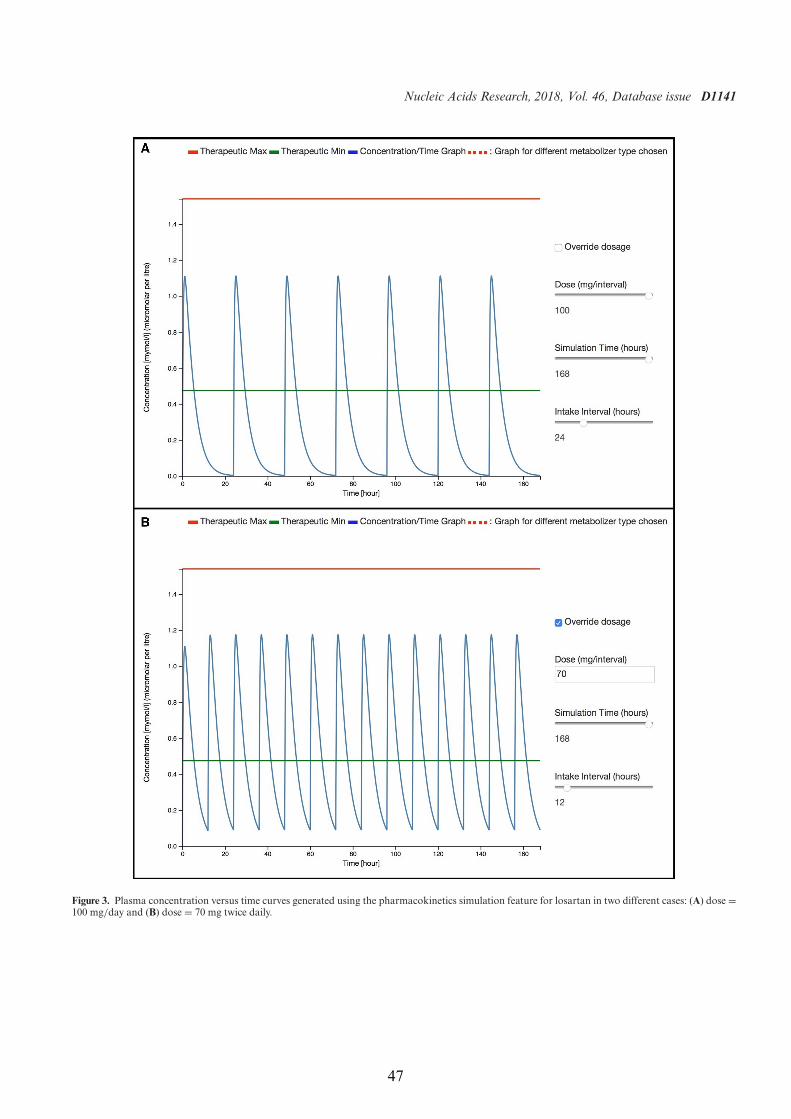
Nucleic Acids Research, 2018, Vol. 46, Database issue D1141
Figure 3. Plasma concentration versus time curves generated using the pharmacokinetics simulation feature for losartan in two different cases: (A) dose =100 mg/day and (B) dose = 70 mg twice daily.
47
D1142 Nucleic Acids Research, 2018, Vol. 46, Database issue
played, assuming that it is administered once per day. Atherapeutic window is displayed whenever the experimen-tally determined therapeutic minimum and maximum con-centrations are found. The users are provided with interac-tive sliders to adjust the dose, intake interval and the timeperiod of simulation. Furthermore, approximate changes indrug plasma levels for poor and ultra-rapid metaboliserscan be visualised relative to the plasma levels for a healthyadult. Optionally, users can provide a dose of interest toobserve changes in plasma level. A use case for dose adap-tation based on the pharmacokinetic simulation feature ispresented in the next section. It should be noted that thisfeature is not aimed at providing recommendations or al-ternatives to dosing schemes to healthcare practitioners inclinical practice but may provide hints for possible problemsand solutions. A brief description of the pharmacokineticmodel behind the simulation is provided under Section 4 ofsupplementary information (S2).
Drug–drug interactions
Our drug–drug interaction checker takes a list of medica-tions and provides a list of possible drug–drug interactionsassociated with the co-administration of these drugs. Theusers are alerted through a ‘traffic light signal’ adaptiondisplaying one three risk levels whenever a potential drug–drug interaction is found. In addition, to provide the con-text of metabolic effects on a drug combination, the usersare linked to our TRANSFORMER resource (28) whichprovides detailed report on the effects of a drug on metab-olizing enzymes. Further, in order to provide special rec-ommendations to the elderly patient group, we mark thosedrugs in the input list that are present in the PRISCUS andBeer’s list of potentially inappropriate medications. If a drugis known to be present in the PRICSUS list, all possible al-ternative drugs and dose levels are provided as recommen-dations.
USE CASE
The following use case illustrates the utility of pharmacoki-netics simulation feature of SuperDRUG2 to provide earlyrecommendations for dose adaption. We use the antihyper-tensive drug losartan as an example. The minimum andmaximum recommended doses per day are 25mg and 50mg,respectively. For hypertensive patients with left ventricularhypertrophy or type 2 diabetic nephropathy, a maximum of100mg per day is recommended. Losartan undergoes hep-atic metabolism via cytochrome enzymes 2C9 and 3A4 toform an active metabolite which is 10–40 times more potent.Previous studies indicate that decreased levels of losartanmetabolites are observed in carriers of CYP2C9*2 and/orCYP2C9*3 alleles (29) due to the lowered rate of oxida-tion of losartan (29) into its metabolite and a higher plasmaAUC losartan/AUC metabolite ratio (30).
In Figure 3A, one can see that the plasma levels of losar-tan even at a maximum dose for special indications of100 mg do not remain within the therapeutic window inorder to provide a longer duration of action. Therefore, atwice daily administration of 50–70 mg might improve thecoverage of the therapeutic window (see Figure 3B). Consis-
tently, a recent study also reported that twice daily admin-istration of the same daily dose of losartan is more effectivein comparison to once daily administration of a single dose(31). Additional use cases can be found in Section 5 of sup-plementary information (S2).
FUTURE DIRECTIONS
We will regularly update the database with new entries toensure excellent coverage and data quality standards. Espe-cially, the pharmacokinetic data needed for simulation ofplasma levels of drug will be further enriched to providesimulations for as many drugs as possible. We also plan toimprove the list of drugs that have side effects by adding in-formation from large collections such as the FDA’s adverseevent reporting system. Multiple other ways to browse thecontents of the database will be eventually added to improvethe user experience.
SUPPLEMENTARY DATA
Supplementary Data are available at NAR online.
FUNDING
Berlin-Brandenburg research platform BB3R, Federal Min-istry of Education and Research (BMBF), Germany[031A262C]; DKTK. Funding for open access charge:Charite - University Medicine Berlin.Conflict of interest statement. None declared.
REFERENCES1. Wishart,D.S., Knox,C., Guo,A.C., Shrivastava,S., Hassanali,M.,
Stothard,P., Chang,Z. and Woolsey,J. (2006) DrugBank: acomprehensive resource for in silico drug discovery and exploration.Nucleic Acids Res., 34, D668–D672.
2. Kanehisa,M., Goto,S., Sato,Y., Furumichi,M. and Tanabe,M. (2012)KEGG for integration and interpretation of large-scale moleculardata sets. Nucleic Acids Res., 40, D109–D114.
3. Hastings,J., Owen,G., Dekker,A., Ennis,M., Kale,N.,Muthukrishnan,V., Turner,S., Swainston,N., Mendes,P. andSteinbeck,C. (2016) ChEBI in 2016: Improved services and anexpanding collection of metabolites. Nucleic Acids Res., 44,D1214–D1219.
4. Kim,S., Thiessen,P.A., Bolton,E.E., Chen,J., Fu,G., Gindulyte,A.,Han,L., He,J., He,S., Shoemaker,B.A. et al. (2016) PubChemsubstance and compound databases. Nucleic Acids Res., 44,D1202–D1213.
5. Bento,A.P., Gaulton,A., Hersey,A., Bellis,L.J., Chambers,J.,Davies,M., Kruger,F.A., Light,Y., Mak,L., McGlinchey,S. et al.(2014) The ChEMBL bioactivity database: an update. Nucleic AcidsRes., 42, D1083–D1090.
6. Gilson,M.K., Liu,T., Baitaluk,M., Nicola,G., Hwang,L. andChong,J. (2016) BindingDB in 2015: A public database for medicinalchemistry, computational chemistry and systems pharmacology.Nucleic Acids Res., 44, D1045–D1053.
7. Zhu,F., Shi,Z., Qin,C., Tao,L., Liu,X., Xu,F., Zhang,L., Song,Y.,Liu,X., Zhang,J. et al. (2012) Therapeutic target database update2012: a resource for facilitating target-oriented drug discovery.Nucleic Acids Res., 40, D1128–D1136.
8. Davis,A.P., Grondin,C.J., Johnson,R.J., Sciaky,D., King,B.L.,McMorran,R., Wiegers,J., Wiegers,T.C. and Mattingly,C.J. (2017)The Comparative Toxicogenomics Database: update 2017. NucleicAcids Res., 45, D972–D978.
9. Ursu,O., Holmes,J., Knockel,J., Bologa,C.G., Yang,J.J., Mathias,S.L.,Nelson,S.J. and Oprea,T.I. (2017) DrugCentral: online drugcompendium. Nucleic Acids Res., 45, D932–D939.
48
Nucleic Acids Research, 2018, Vol. 46, Database issue D1143
10. Berman,H.M., Westbrook,J., Feng,Z., Gilliland,G., Bhat,T.N.,Weissig,H., Shindyalov,I.N. and Bourne,P.E. (2000) The Protein DataBank. Nucleic Acids Res., 28, 235–242.
11. Allen,F.H. (2002) The Cambridge Structural Database: a quarter of amillion crystal structures and rising. Acta Crystallogr. B., 58, 380–388.
12. Pihan,E., Colliandre,L., Guichou,J.F. and Douguet,D. (2012)e-Drug3D: 3D structure collections dedicated to drug repurposingand fragment-based drug design. Bioinformatics, 28, 1540–1541.
13. Goede,A., Dunkel,M., Mester,N., Frommel,C. and Preissner,R.(2005) SuperDrug: a conformational drug database. Bioinformatics,21, 1751–1753.
14. Siramshetty,V.B., Nickel,J., Omieczynski,C., Gohlke,B.O.,Drwal,M.N. and Preissner,R. (2016) WITHDRAWN–a resource forwithdrawn and discontinued drugs. Nucleic Acids Res., 44,D1080–D1086.
15. Rego,N. and Koes,D. (2015) 3Dmol.js: molecular visualization withWebGL. Bioinformatics, 31, 1322–1324.
16. Onakpoya,I.J., Heneghan,C.J. and Aronson,J.K. (2016)Post-marketing withdrawal of 462 medicinal products because ofadverse drug reactions: a systematic review of the world literature.BMC medicine, 14, 10.
17. Hu,Y. and Bajorath,J. (2014) Influence of search parameters andcriteria on compound selection, promiscuity, and pan assayinterference characteristics. J. Chem. Inf. Model., 54, 3056–3066.
18. Lounkine,E., Keiser,M.J., Whitebread,S., Mikhailov,D., Hamon,J.,Jenkins,J.L., Lavan,P., Weber,E., Doak,A.K., Cote,S. et al. (2012)Large-scale prediction and testing of drug activity on side-effecttargets. Nature, 486, 361–367.
19. Nickel,J., Gohlke,B.O., Erehman,J., Banerjee,P., Rong,W.W.,Goede,A., Dunkel,M. and Preissner,R. (2014) SuperPred: update ondrug classification and target prediction. Nucleic Acids Res., 42,W26–W31.
20. Steinbeck,C., Han,Y., Kuhn,S., Horlacher,O., Luttmann,E. andWillighagen,E. (2003) The Chemistry Development Kit (CDK): anopen-source Java library for Chemo- and Bioinformatics. J. Chem.Inf. Comput. Sci., 43, 493–500.
21. Kabsch,W. (1976) A solution for the best rotation to relate two sets ofvectors. Acta Cryst., A32, 922–923.
22. Gohlke,B.O., Overkamp,T., Richter,A., Richter,A., Daniel,P.T.,Gillissen,B. and Preissner,R. (2015) 2D and 3D similarity landscapeanalysis identifies PARP as a novel off-target for the drug Vatalanib.BMC Bioinformatics, 16, 308.
23. Kuhn,M., Letunic,I., Jensen,L.J. and Bork,P. (2016) The SIDERdatabase of drugs and side effects. Nucleic Acids Res., 44,D1075–D1079.
24. Schulz,M., Iwersen-Bergmann,S., Andresen,H. and Schmoldt,A.(2012) Therapeutic and toxic blood concentrations of nearly 1,000drugs and other xenobiotics. Crit. Care, 16, R136.
25. By the American Geriatrics Society 2015 Beers Criteria UpdateExpert Panel (2015) American Geriatrics Society 2015 updated beerscriteria for potentially inappropriate medication use in older adults. J.Am. Geriatr. Soc., 63, 2227–2246.
26. Holt,S., Schmiedl,S. and Thurmann,P.A. (2010) Potentiallyinappropriate medications in the elderly: the PRISCUS list. DeutschesArzteblatt Int., 107, 543–551.
27. McGonigle,S., Chen,Z., Wu,J., Chang,P., Kolber-Simonds,D.,Ackermann,K., Twine,N.C., Shie,J.L., Miu,J.T., Huang,K.C. et al.(2015) E7449: A dual inhibitor of PARP1/2 and tankyrase1/2inhibits growth of DNA repair deficient tumors and antagonizes Wntsignaling. Oncotarget, 6, 41307–41323.
28. Hoffmann,M.F., Preissner,S.C., Nickel,J., Dunkel,M., Preissner,R.and Preissner,S. (2014) The Transformer database: biotransformationof xenobiotics. Nucleic Acids Res., 42, D1113–D1117.
29. Yasar,U., Forslund-Bergengren,C., Tybring,G., Dorado,P.,Llerena,A., Sjoqvist,F., Eliasson,E. and Dahl,M.L. (2002)Pharmacokinetics of losartan and its metabolite E-3174 in relation tothe CYP2C9 genotype. Clin. Pharmacol. Ther., 71, 89–98.
30. Yasar,U., Tybring,G., Hidestrand,M., Oscarson,M.,Ingelman-Sundberg,M., Dahl,M.L. and Eliasson,E. (2001) Role ofCYP2C9 polymorphism in losartan oxidation. Drug Metab.Disposition, 29 , 1051–1056.
31. Szauder,I., Csajagi,E., Major,Z., Pavlik,G. and Ujhelyi,G. (2015)Treatment of hypertension: favourable effect of the twice-dailycompared to the once-daily (evening) administration of perindopriland losartan. Kidney Blood Pressure Res., 40, 374–385.
49
Original Research Article
3.3 WITHDRAWN--A Resource for Withdrawn and Discontinued Drugs
Siramshetty, V. B., Nickel, J., Omieczynski, C., Gohlke, B. O., Drwal, M. N. and Preissner, R.
Nucleic Acids Res. 2016 Jan 4;44(D1):D1080-6. https://doi.org/10.1093/nar/gkv1192.
Author Contributions:
Implementation of website: Siramshetty, V. B.; Collection and curation of data: Siramshetty, V. B.,
Nickel, J.; Omieczynski, C., Drwal, M. N. and Gohlke, B. O.; Writing of manuscript: mainly
Siramshetty, V. B., input from Drwal, M. N., Preissner, R., Nickel, J., Gohlke, B. O.; Project
coordination: Preissner, R. and Drwal, M. N.
50
D1080–D1086 Nucleic Acids Research, 2016, Vol. 44, Database issue Published online 8 November 2015doi: 10.1093/nar/gkv1192
WITHDRAWN––a resource for withdrawn anddiscontinued drugsVishal B. Siramshetty1 , Janette Nickel2,3, Christian Omieczynski2, Bjoern-Oliver Gohlke2,3,Malgorzata N. Drwal2,* and Robert Preissner2,3,4,*
1Structural Bioinformatics Group, ECRC Experimental and Clinical Research Center, Charite – University MedicineBerlin, 13125 Berlin, Germany, 2Structural Bioinformatics Group, Institute of Physiology, Charite – UniversityMedicine Berlin, 13125 Berlin, Germany, 3German Cancer Consortium (DKTK), German Cancer Research Center(DKFZ), 69120 Heidelberg, Germany and 4BB3R – Berlin Brandenburg 3R Graduate School, Freie Universitat Berlin,14195 Berlin, Germany
Received August 14, 2015; Accepted October 25, 2015
ABSTRACT
Post-marketing drug withdrawals can be associatedwith various events, ranging from safety issues suchas reported deaths or severe side-effects, to a mul-titude of non-safety problems including lack of effi-cacy, manufacturing, regulatory or business issues.During the last century, the majority of drugs vol-untarily withdrawn from the market or prohibited byregulatory agencies was reported to be related toadverse drug reactions. Understanding the under-lying mechanisms of toxicity is of utmost impor-tance for current and future drug discovery. Here,we present WITHDRAWN, a resource for withdrawnand discontinued drugs publicly accessible at http://cheminfo.charite.de/withdrawn. Today, the databasecomprises 578 withdrawn or discontinued drugs,their structures, important physico-chemical prop-erties, protein targets and relevant signaling path-ways. A special focus of the database lies on thedrugs withdrawn due to adverse reactions and toxiceffects. For approximately one half of the drugs in thedatabase, safety issues were identified as the mainreason for withdrawal. Withdrawal reasons were ex-tracted from the literature and manually classifiedinto toxicity types representing adverse effects ondifferent organs. A special feature of the database isthe presence of multiple search options which willallow systematic analyses of withdrawn drugs andtheir mechanisms of toxicity.
INTRODUCTION
Efficacy and safety are two decisive factors that affect theviability of a chemical entity while furthering in the drug
discovery pipeline. Consequently, the financial burden onpharmaceutical companies grows higher when the chemicalentities tend to fail in late stages of clinical trials (1). How-ever, a significant number of new chemical entities (NCEs)were recalled from the market post to their regulatory ap-proval due to various reasons ranging from inefficiency tosevere side-effects to financial and regulatory concerns. Ad-verse drug reactions (ADRs) not only account for marketwithdrawals but also for changes in labels or introduction ofnew black-box warnings for prescription drugs (2). ADRscan be interpreted either as primary effects elicited aftermodulation of the therapeutic (or primary) target or unin-tended effects due to interactions with off-targets. In few in-stances, the primary target is expressed in multiple organsand simultaneously targeted, leading to the therapeutic ef-fect in the target tissue and unwanted effects in other tissues.
A well-known class of drugs that cause adverse reactionsdue to their activity at primary target are antiarrhythmicdrugs, the benefits of which are, in few cases, hindered dueto aggravation of arrhythmia which is the indication be-ing treated (3). This effect is due to modulation of the al-pha subunit of a potassium ion channel (human Ether-a-go-go-related gene, hERG), which is primarily associatedwith regulation of cardiac action potentials (4). The hERGchannel is also a prominent off-target example whose un-intended modulation can cause severe side-effects. This hasultimately lead to market withdrawal of drugs inhibiting thehERG channel, a classical example being the withdrawal ofthe antihistaminic drug terfenadine due to severe arrhyth-mias and death (5).
Although there is much progress in elucidation and un-derstanding of the mechanisms leading to drug related toxiceffects, gaining clearer insights about these effects at cel-lular and biochemical level is much needed to appropri-ately adjust or reinvent the development strategies so as toovercome the attrition during clinical trial phases of drug
*To whom correspondence should be addressed. Tel: +4930450540755; Fax: +4930450540955; Email: [email protected] [email protected]
C⃝ The Author(s) 2015. Published by Oxford University Press on behalf of Nucleic Acids Research.This is an Open Access article distributed under the terms of the Creative Commons Attribution License (http://creativecommons.org/licenses/by-nc/4.0/), whichpermits non-commercial re-use, distribution, and reproduction in any medium, provided the original work is properly cited. For commercial re-use, please [email protected]
51

Nucleic Acids Research, 2016, Vol. 44, Database issue D1081
discovery and withdrawal after drug approval (6–8). Thistoxicological knowledge could be used to develop a panelof relevant in vitro assays that could mechanistically exam-ine the effects and profile the propensity of drugs to causeADRs (9). In contrast to the majority of ADR cases whichare relatively frequent and mostly dose-dependent, few side-effects are idiosyncratic drug reactions (IADRs), i.e. the ex-tremely rare drug reactions which occur unpredictably in apopulation. The target organs that are most commonly as-sociated with idiosyncratic events include liver, cardiovas-cular and central nervous systems (10–12). Hepatocellularand cholestatic drug-induced liver injury (DILI), liver fail-ure and hepatic necrosis are the common patterns of IADRsassociated with the liver. Limited knowledge exists to under-stand the underlying mechanisms of such IADRs. However,it is apparent that IADRs develop via complex mechanismswhich are subjective to both differential patient responsesand drug combination effects that result from simultane-ous triggering of multiple off-targets (13). Factors associ-ated with differential patient responses include genetic at-tributes like single nucleotide polymorphisms (SNPs) andmutations, and non-genetic attributes such as gender, ageand co-treatments (14). Drug-induced events are a result ofvarious effects ranging from direct activity on organs (e.g.on cardiovascular systems) to reactivity of active metabo-lites of drugs to interactions with biological transporters(15).
Over the decades, drug regulatory agencies, pharmaceu-tical companies and various clinical studies have reportedthe events of drug withdrawals due to side-effects (16–18). About 2.3 million adverse event reports were collectedagainst ∼6000 marketed drugs between 1969 and 2002 (19).Yet, only a small proportion (75 drugs; ∼1%) of these mar-keted drugs were withdrawn during this period. Anotherstudy reported that ∼95 drugs were documented to be with-drawn due to death as the primary reason between 1950 and2013 (17). However, not all of these drugs were withdrawnworld-wide. Most drugs were reported to be withdrawn inthe Unites States and European countries.
Several public resources contain information relevant todrug withdrawals (e.g. websites from regulatory agencies,World Health Organization’s consolidated list for with-drawn drugs and scientific literature). However, in manycases, the information is hidden in regulatory documentsand not easily accessible, impeding comprehensive analy-ses. Furthermore, there exists no single resource reporting acomplete list of drugs withdrawn due to safety concerns. Inorder to allow access to a variety of information related todrug withdrawals as well as shed light on the mechanismsof ADRs, we here present WITHDRAWN––a resource forwithdrawn and discontinued drugs. We collected a list ofmore than 500 drugs/drug products, which were withdrawnor discontinued in at least one country, and assembled in-formation regarding their molecular targets, pathways andtoxicities. For approximately half of the drugs, extensive lit-erature search revealed that toxic events are associated withthe withdrawal. Thus, WITHDRAWN can be seen as a plat-form to understand the mechanisms for severe ADRs dueto primary and off-target interactions of drugs, simultane-ous perturbation of complex biological pathways and ge-netic polymorphisms (SNPs). Furthermore, it provides mul-
tiple search options to systematically analyse molecules ofinterest by performing different types of molecular similar-ity search across the database’s drugs and can be a valuableresource for scientists in the drug development and toxicityprediction field.
MATERIALS AND METHODS
Withdrawn and discontinued drugs
A number of resources including the drug collections fromthe U.S. Food and Drug Administration (FDA; http://www.fda.gov/), the European Medicines Agency (EMA;http://www.ema.europa.eu/ema/), peer-reviewed literature(17), public databases such as DrugBank (20), e-Drug3D(21) and text-books (16) were searched in order to ex-tract information on drug withdrawals. Monoclonal an-tibodies and substance combinations were removed fromthe dataset. Currently, the database comprises two setsof drugs: withdrawn and discontinued. A total of 270drugs, that were identified to be withdrawn or recalled inat least one country/market due to safety issues are in-cluded in the former set while the latter consists of 308drugs that were suspended or discontinued in at least onemarket due to unclear reasons. The chemical structures ofthe withdrawn/discontinued drugs were standardized us-ing the JChem Suite (Instant JChem version 14.10.27.0,ChemAxon (http://www.chemaxon.com)). The standard-ization steps included aromatization of the structures, ad-dition of explicit hydrogens, removal of salts, and genera-tion of 3D structures. InChIKeys were calculated for thestandardized structures and used to join structures fromdifferent datasets and to remove duplicates. In addition toInChIKeys, the set was scanned for duplicates using chem-ical names, canonical smiles and external identifiers.
In many cases, the reason(s) for withdrawal and as-sociated toxicity was directly provided by the source.The reasons were manually extracted for the remainingdrugs by performing literature search. Furthermore, theyears of first approval, first and last withdrawal, and theyear of first reported death for all the withdrawn drugsand most of the discontinued drugs were extracted fromthe literature. Additionally, the Anatomical TherapeuticChemical (ATC) codes and external chemical identifierswere collected to link the drugs to the public databasesWHO ATC index (http://www.whocc.no/atc ddd index/),ChEMBL (22) and PubChem (23), respectively. Exter-nal identifiers were extracted using the PubChem Identi-fier Exchange Service (https://pubchem.ncbi.nlm.nih.gov/idexchange/idexchange.cgi) whereas the ATC codes werecollected by looking for drug names in the WHO ATC in-dex. For those drugs without an ATC code assigned bythe WHO, pseudo-ATC class names were assigned basedon their primary indication areas. The acute oral toxicityclass was calculated for each drug using the ProTox web-server (24). The toxicity classes (ranging from 1 to 6) arebased on the Globally Harmonized System of Classifica-tion and Labelling of Chemicals (GHS; https://www.osha.gov/dsg/hazcom/ghs.html) which classifies compounds us-ing their median lethal doses (LD50). Drugs that demon-strated very low structural similarity to the ProTox datasetwere assigned to the class 0.
52
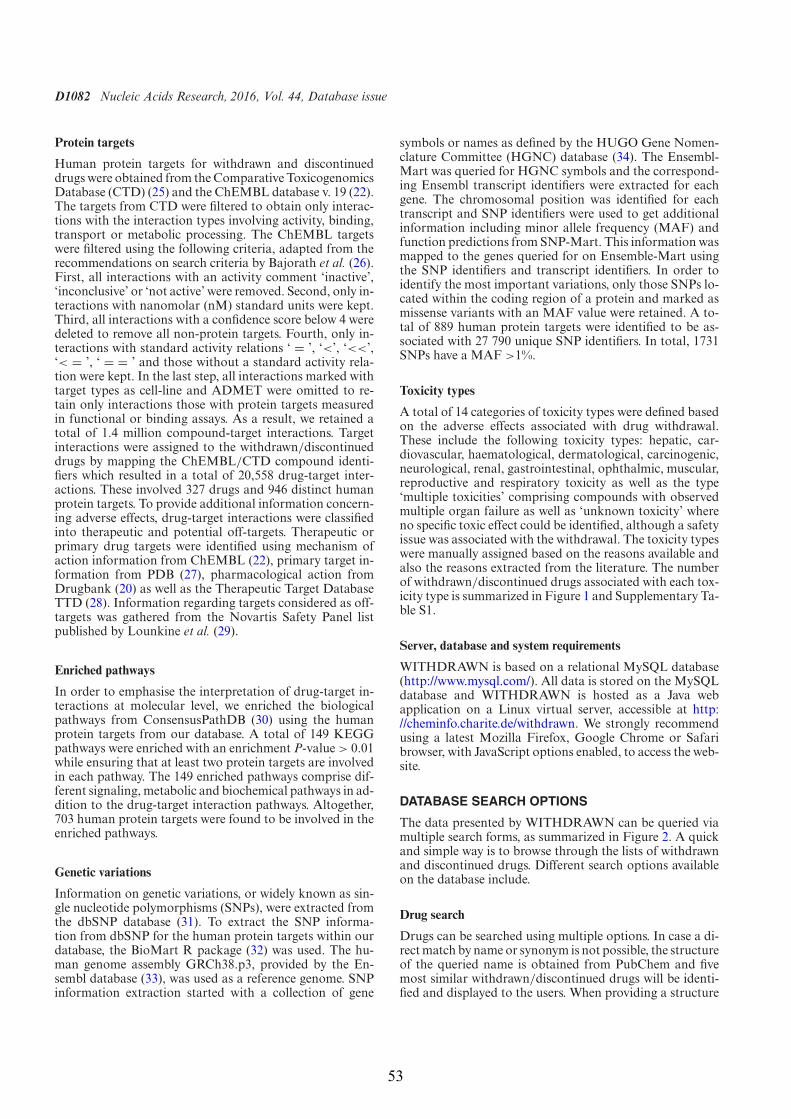
D1082 Nucleic Acids Research, 2016, Vol. 44, Database issue
Protein targets
Human protein targets for withdrawn and discontinueddrugs were obtained from the Comparative ToxicogenomicsDatabase (CTD) (25) and the ChEMBL database v. 19 (22).The targets from CTD were filtered to obtain only interac-tions with the interaction types involving activity, binding,transport or metabolic processing. The ChEMBL targetswere filtered using the following criteria, adapted from therecommendations on search criteria by Bajorath et al. (26).First, all interactions with an activity comment ‘inactive’,‘inconclusive’ or ‘not active’ were removed. Second, only in-teractions with nanomolar (nM) standard units were kept.Third, all interactions with a confidence score below 4 weredeleted to remove all non-protein targets. Fourth, only in-teractions with standard activity relations ‘ = ’, ‘<’, ‘<<’,‘< = ’, ‘ = = ’ and those without a standard activity rela-tion were kept. In the last step, all interactions marked withtarget types as cell-line and ADMET were omitted to re-tain only interactions those with protein targets measuredin functional or binding assays. As a result, we retained atotal of 1.4 million compound-target interactions. Targetinteractions were assigned to the withdrawn/discontinueddrugs by mapping the ChEMBL/CTD compound identi-fiers which resulted in a total of 20,558 drug-target inter-actions. These involved 327 drugs and 946 distinct humanprotein targets. To provide additional information concern-ing adverse effects, drug-target interactions were classifiedinto therapeutic and potential off-targets. Therapeutic orprimary drug targets were identified using mechanism ofaction information from ChEMBL (22), primary target in-formation from PDB (27), pharmacological action fromDrugbank (20) as well as the Therapeutic Target DatabaseTTD (28). Information regarding targets considered as off-targets was gathered from the Novartis Safety Panel listpublished by Lounkine et al. (29).
Enriched pathways
In order to emphasise the interpretation of drug-target in-teractions at molecular level, we enriched the biologicalpathways from ConsensusPathDB (30) using the humanprotein targets from our database. A total of 149 KEGGpathways were enriched with an enrichment P-value > 0.01while ensuring that at least two protein targets are involvedin each pathway. The 149 enriched pathways comprise dif-ferent signaling, metabolic and biochemical pathways in ad-dition to the drug-target interaction pathways. Altogether,703 human protein targets were found to be involved in theenriched pathways.
Genetic variations
Information on genetic variations, or widely known as sin-gle nucleotide polymorphisms (SNPs), were extracted fromthe dbSNP database (31). To extract the SNP informa-tion from dbSNP for the human protein targets within ourdatabase, the BioMart R package (32) was used. The hu-man genome assembly GRCh38.p3, provided by the En-sembl database (33), was used as a reference genome. SNPinformation extraction started with a collection of gene
symbols or names as defined by the HUGO Gene Nomen-clature Committee (HGNC) database (34). The Ensembl-Mart was queried for HGNC symbols and the correspond-ing Ensembl transcript identifiers were extracted for eachgene. The chromosomal position was identified for eachtranscript and SNP identifiers were used to get additionalinformation including minor allele frequency (MAF) andfunction predictions from SNP-Mart. This information wasmapped to the genes queried for on Ensemble-Mart usingthe SNP identifiers and transcript identifiers. In order toidentify the most important variations, only those SNPs lo-cated within the coding region of a protein and marked asmissense variants with an MAF value were retained. A to-tal of 889 human protein targets were identified to be as-sociated with 27 790 unique SNP identifiers. In total, 1731SNPs have a MAF >1%.
Toxicity types
A total of 14 categories of toxicity types were defined basedon the adverse effects associated with drug withdrawal.These include the following toxicity types: hepatic, car-diovascular, haematological, dermatological, carcinogenic,neurological, renal, gastrointestinal, ophthalmic, muscular,reproductive and respiratory toxicity as well as the type‘multiple toxicities’ comprising compounds with observedmultiple organ failure as well as ‘unknown toxicity’ whereno specific toxic effect could be identified, although a safetyissue was associated with the withdrawal. The toxicity typeswere manually assigned based on the reasons available andalso the reasons extracted from the literature. The numberof withdrawn/discontinued drugs associated with each tox-icity type is summarized in Figure 1 and Supplementary Ta-ble S1.
Server, database and system requirements
WITHDRAWN is based on a relational MySQL database(http://www.mysql.com/). All data is stored on the MySQLdatabase and WITHDRAWN is hosted as a Java webapplication on a Linux virtual server, accessible at http://cheminfo.charite.de/withdrawn. We strongly recommendusing a latest Mozilla Firefox, Google Chrome or Safaribrowser, with JavaScript options enabled, to access the web-site.
DATABASE SEARCH OPTIONS
The data presented by WITHDRAWN can be queried viamultiple search forms, as summarized in Figure 2. A quickand simple way is to browse through the lists of withdrawnand discontinued drugs. Different search options availableon the database include.
Drug search
Drugs can be searched using multiple options. In case a di-rect match by name or synonym is not possible, the structureof the queried name is obtained from PubChem and fivemost similar withdrawn/discontinued drugs will be identi-fied and displayed to the users. When providing a structure
53
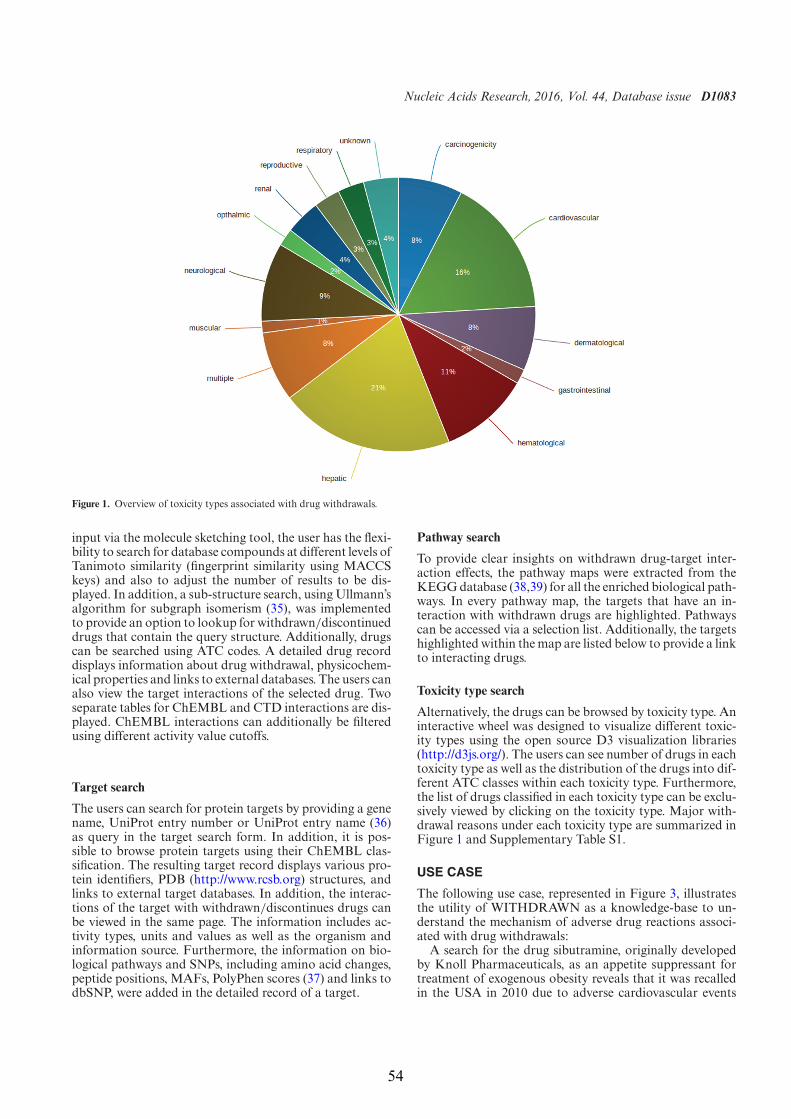
Nucleic Acids Research, 2016, Vol. 44, Database issue D1083
Figure 1. Overview of toxicity types associated with drug withdrawals.
input via the molecule sketching tool, the user has the flexi-bility to search for database compounds at different levels ofTanimoto similarity (fingerprint similarity using MACCSkeys) and also to adjust the number of results to be dis-played. In addition, a sub-structure search, using Ullmann’salgorithm for subgraph isomerism (35), was implementedto provide an option to lookup for withdrawn/discontinueddrugs that contain the query structure. Additionally, drugscan be searched using ATC codes. A detailed drug recorddisplays information about drug withdrawal, physicochem-ical properties and links to external databases. The users canalso view the target interactions of the selected drug. Twoseparate tables for ChEMBL and CTD interactions are dis-played. ChEMBL interactions can additionally be filteredusing different activity value cutoffs.
Target search
The users can search for protein targets by providing a genename, UniProt entry number or UniProt entry name (36)as query in the target search form. In addition, it is pos-sible to browse protein targets using their ChEMBL clas-sification. The resulting target record displays various pro-tein identifiers, PDB (http://www.rcsb.org) structures, andlinks to external target databases. In addition, the interac-tions of the target with withdrawn/discontinues drugs canbe viewed in the same page. The information includes ac-tivity types, units and values as well as the organism andinformation source. Furthermore, the information on bio-logical pathways and SNPs, including amino acid changes,peptide positions, MAFs, PolyPhen scores (37) and links todbSNP, were added in the detailed record of a target.
Pathway search
To provide clear insights on withdrawn drug-target inter-action effects, the pathway maps were extracted from theKEGG database (38,39) for all the enriched biological path-ways. In every pathway map, the targets that have an in-teraction with withdrawn drugs are highlighted. Pathwayscan be accessed via a selection list. Additionally, the targetshighlighted within the map are listed below to provide a linkto interacting drugs.
Toxicity type search
Alternatively, the drugs can be browsed by toxicity type. Aninteractive wheel was designed to visualize different toxic-ity types using the open source D3 visualization libraries(http://d3js.org/). The users can see number of drugs in eachtoxicity type as well as the distribution of the drugs into dif-ferent ATC classes within each toxicity type. Furthermore,the list of drugs classified in each toxicity type can be exclu-sively viewed by clicking on the toxicity type. Major with-drawal reasons under each toxicity type are summarized inFigure 1 and Supplementary Table S1.
USE CASE
The following use case, represented in Figure 3, illustratesthe utility of WITHDRAWN as a knowledge-base to un-derstand the mechanism of adverse drug reactions associ-ated with drug withdrawals:
A search for the drug sibutramine, originally developedby Knoll Pharmaceuticals, as an appetite suppressant fortreatment of exogenous obesity reveals that it was recalledin the USA in 2010 due to adverse cardiovascular events
54
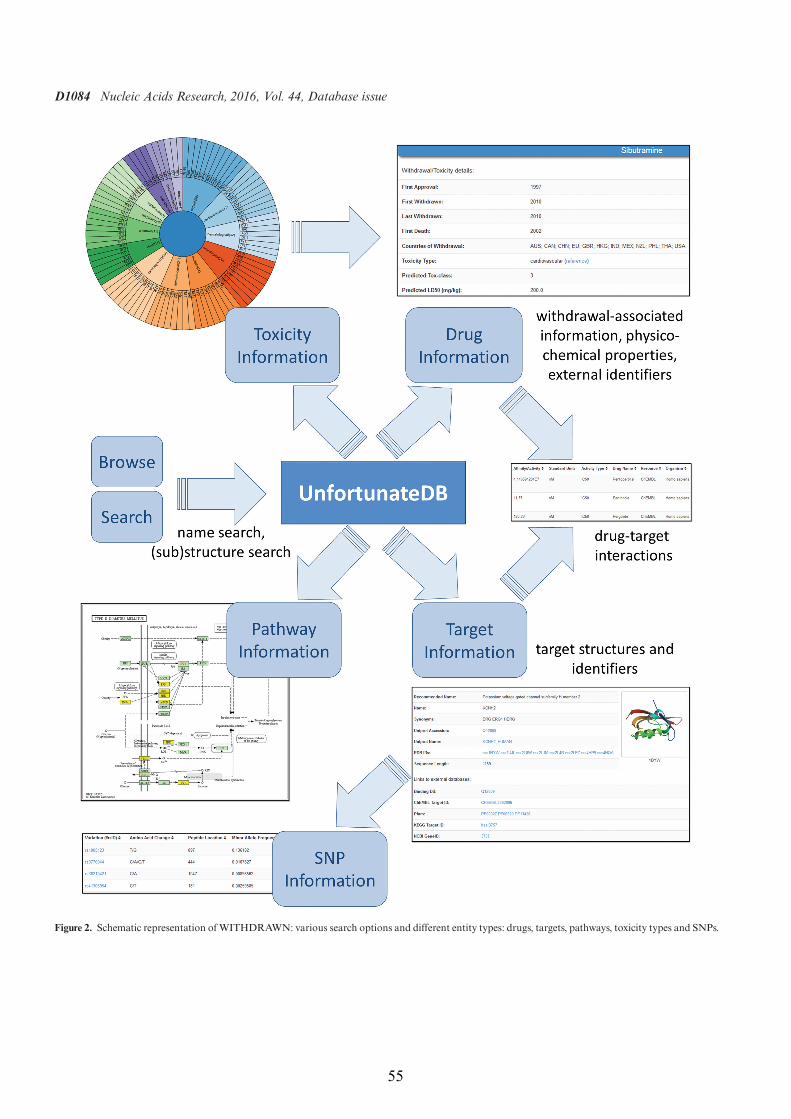
D1084 Nucleic Acids Research, 2016, Vol. 44, Database issue
Figure 2. Schematic representation of WITHDRAWN: various search options and different entity types: drugs, targets, pathways, toxicity types and SNPs.
55
Nucleic Acids Research, 2016, Vol. 44, Database issue D1085
Figure 3. Case study––use of WITHDRAWN in connecting links between drugs, targets and SNPs in toxicological context.
including myocardial infarctions and stroke (40). Sibu-tramine is a non-selective inhibitor that acts by inhibit-ing the reuptake of the three monoamine neurotransmit-ters: serotonin, dopamine and norepinephrine. By searchingfor sibutramine targets in WITHDRAWN, the drug recordshows additional drug-target interactions including the cy-tochromes CYP2B6, CYP2C19 and CYP2D6 as well asthe !2B-adrenergic receptor (ADRA2B) where sibutramineexhibits similar activity as at the primary targets. WITH-DRAWN shows four genetic variants for CYP2B6 witha MAF above 1% (rs3745274, rs3211371, rs8192709 andrs28399499). Indeed, it has been shown that CYP2B6 vari-ations, particularly rs3745274, may lead to a significant in-crease in the blood concentration of sibutramine and its ac-tive metabolites (41,42). As summarized by Zhang et al.(43), the increased drug concentration could result in anincreased off-target activity at ADRA2B which, throughan increased norepinephrine release, can lead to increasedblood pressure and adverse cardiovascular events. The ex-ample emphasizes the importance of considering extensivedrug-target and pharmacogenetics studies during drug de-velopment.
CONCLUSIONS
WITHDRAWN is a rich resource of withdrawn or discon-tinued drugs. Due to a relatively small number of drugswithdrawn per year (∼10), we will update the database an-nually to ensure good coverage and high standard. Thedatabase not only contains information related to drugwithdrawals and associated adverse drug reactions but also
drug-target interactions and genetic variations of the pro-tein targets. The drug-target interaction information ismapped to biological context by enriching the relevantpathways. The illustrated case study proves that, connectinglinks between drugs, targets and SNPs may explain the un-derlying mechanisms of toxicity. The knowledge presentedin the database can improve the insights of drug-target in-teractions in toxicological context and provide the rationalefor further off-target profiling and enhanced pharmacoge-netics studies in different populations.
SUPPLEMENTARY DATA
Supplementary Data are available at NAR Online.
ACKNOWLEDGEMENTS
The authors kindly acknowledge Jevgeni Erehman, Math-ias Dunkel and Herbert Schulz for their input and support.Author Contributions: Implementation of website: V.B.S.;curation of drug information: V.B.S., C.O., M.N.D., J.N.;curation of target information: J.N., V.B.S., M.N.D., C.O.;curation of pathway information: V.B.S.; curation of SNPinformation: B.O.G.; writing of manuscript: mainly V.B.S.,input from M.N.D., R.P., J.N., B.O.G.; project coordina-tion: R.P., M.N.D.
FUNDING
Berlin-Brandenburg research platform BB3R, Federal Min-istry of Education and Research (BMBF), Germany
56
D1086 Nucleic Acids Research, 2016, Vol. 44, Database issue
[031A262C] and the Immunotox project, Federal Min-istry of Education and Research (BMBF), Germany[031A268B]. Funding for open access charge: Berlin-Brandenburg research platform BB3R, Federal Ministry ofEducation and Research (BMBF), Germany [031A262C].Conflict of interest statement. None declared.
REFERENCES1. DiMasi,J.A., Hansen,R.W. and Grabowski,H.G. (2003) The price of
innovation: new estimates of drug development costs. J. Health Econ.,22, 151–185.
2. Lasser,K.E., Allen,P.D., Woolhandler,S.J., Himmelstein,D.U.,Wolfe,S.M. and Bor,D.H. (2002) Timing of new black box warningsand withdrawals for prescription medications. JAMA, 287 ,2215–2220.
3. Podrid,P.J. (1984) Can antiarrhythmic drugs cause arrhythmia? J.Clin. Pharmacol., 24, 313–319.
4. Heijman,J., Voigt,N., Carlsson,L.G. and Dobrev,D. (2014) Cardiacsafety assays. Curr. Opin. Pharmacol., 15, 16–21.
5. Roy,M., Dumaine,R. and Brown,A.M. (1996) HERG, a primaryhuman ventricular target of the nonsedating antihistamineterfenadine. Circulation, 94, 817–823.
6. Giacomini,K.M., Krauss,R.M., Roden,D.M., Eichelbaum,M.,Hayden,M.R. and Nakamura,Y. (2007) When good drugs go bad.Nature, 446, 975–977.
7. Arrowsmith,J. (2011) Trial watch: phase III and submission failures:2007–2010. Nat. Rev. Drug Discov., 10 , 87.
8. Arrowsmith,J. and Miller,P. (2013) Trial watch: phase II and phase IIIattrition rates 2011–2012. Nat. Rev. Drug Discov., 12, 569.
9. Thompson,R.A., Isin,E.M., Li,Y., Weaver,R., Weidolf,L., Wilson,I.,Claesson,A., Page,K., Dolgos,H. and Kenna,J.G. (2011) Riskassessment and mitigation strategies for reactive metabolites in drugdiscovery and development. Chem. Biol. Interact., 192, 65–71.
10. Patel,H., Bell,D., Molokhia,M., Srishanmuganathan,J., Patel,M.,Car,J. and Majeed,A. (2007) Trends in hospital admissions foradverse drug reactions in England: analysis of national hospitalepisode statistics 1998–2005. BMC Clin. Pharmacol., 7 , 9.
11. Edwards,I.R. and Aronson,J.K. (2000) Adverse drug reactions:definitions, diagnosis, and management. Lancet, 356, 1255–1259.
12. Hussaini,S.H. and Farrington,E.A. (2007) Idiosyncratic drug-inducedliver injury: an overview. Expert Opin. Drug Saf., 6, 673–684.
13. Ulrich,R.G. (2007) Idiosyncratic toxicity: a convergence of riskfactors. Annu. Rev. Med., 58, 17–34.
14. Lucena,M.I., Andrade,R.J., Kaplowitz,N., Garcia-Cortes,M.,Fernandez,M.C., Romero-Gomez,M., Bruguera,M., Hallal,H.,Robles-Diaz,M., Rodriguez-Gonzalez,J.F. et al. (2009) Phenotypiccharacterization of idiosyncratic drug-induced liver injury: theinfluence of age and sex. Hepatology, 49, 2001–2009.
15. Greer,M.L., Barber,J., Eakins,J. and Kenna,J.G. (2010) Cell basedapproaches for evaluation of drug-induced liver injury. Toxicology,268, 125–131.
16. Waller,P. (2004) Stephens’ Detection of New Adverse Drug Reactions.5th Edition ed. John Wiley & Sons, Ltd, Chichester, West Sussex,England.
17. Onakpoya,I.J., Heneghan,C.J. and Aronson,J.K. (2015) Delays in thepost-marketing withdrawal of drugs to which deaths have beenattributed: a systematic investigation and analysis. BMC Med., 13, 26.
18. Jefferys,D.B., Leakey,D., Lewis,J.A., Payne,S. and Rawlins,M.D.(1998) New active substances authorized in the United Kingdombetween 1972 and 1994. Br. J. Clin. Pharmacol., 45, 151–156.
19. Wysowski,D.K. and Swartz,L. (2005) Adverse drug event surveillanceand drug withdrawals in the United States, 1969–2002: theimportance of reporting suspected reactions. Arch. Intern. Med., 165,1363–1369.
20. Wishart,D.S., Knox,C., Guo,A.C., Cheng,D., Shrivastava,S., Tzur,D.,Gautam,B. and Hassanali,M. (2008) DrugBank: a knowledgebase fordrugs, drug actions and drug targets. Nucleic Acids Res., 36,D901–906.
21. Pihan,E., Colliandre,L., Guichou,J.F. and Douguet,D. (2012)e-Drug3D: 3D structure collections dedicated to drug repurposingand fragment-based drug design. Bioinformatics, 28, 1540–1541.
22. Bento,A.P., Gaulton,A., Hersey,A., Bellis,L.J., Chambers,J.,Davies,M., Kruger,F.A., Light,Y., Mak,L., McGlinchey,S. et al.(2014) The ChEMBL bioactivity database: an update. Nucleic AcidsRes., 42, D1083–1090.
23. Wang,Y., Xiao,J., Suzek,T.O., Zhang,J., Wang,J., Zhou,Z., Han,L.,Karapetyan,K., Dracheva,S., Shoemaker,B.A. et al. (2012)PubChem’s BioAssay Database. Nucleic Acids Res., 40 , D400–412.
24. Drwal,M.N., Banerjee,P., Dunkel,M., Wettig,M.R. and Preissner,R.(2014) ProTox: a web server for the in silico prediction of rodent oraltoxicity. Nucleic Acids Res., 42, W53–58.
25. Davis,A.P., Grondin,C.J., Lennon-Hopkins,K.,Saraceni-Richards,C., Sciaky,D., King,B.L., Wiegers,T.C. andMattingly,C.J. (2015) The Comparative Toxicogenomics Database’s10th year anniversary: update 2015. Nucleic Acids Res., 43, D914–920.
26. Hu,Y. and Bajorath,J. (2014) Influence of search parameters andcriteria on compound selection, promiscuity, and pan assayinterference characteristics. J. Chem. Inf. Model., 54, 3056–3066.
27. Rose,P.W., Prlic,A., Bi,C., Bluhm,W.F., Christie,C.H., Dutta,S.,Green,R.K., Goodsell,D.S., Westbrook,J.D., Woo,J. et al. (2015) TheRCSB Protein Data Bank: views of structural biology for basic andapplied research and education. Nucleic Acids Res., 43, D345–D356.
28. Qin,C., Zhang,C., Zhu,F., Xu,F., Chen,S.Y., Zhang,P., Li,Y.H.,Yang,S.Y., Wei,Y.Q., Tao,L. et al. (2014) Therapeutic target databaseupdate 2014: a resource for targeted therapeutics. Nucleic Acids Res.,42, D1118–D1123.
29. Lounkine,E., Keiser,M.J., Whitebread,S., Mikhailov,D., Hamon,J.,Jenkins,J.L., Lavan,P., Weber,E., Doak,A.K., Cote,S. et al. (2012)Large-scale prediction and testing of drug activity on side-effecttargets. Nature, 486, 361–367.
30. Kamburov,A., Stelzl,U., Lehrach,H. and Herwig,R. (2013) TheConsensusPathDB interaction database: 2013 update. Nucleic AcidsRes., 41, D793–D800.
31. Smigielski,E.M., Sirotkin,K., Ward,M. and Sherry,S.T. (2000)dbSNP: a database of single nucleotide polymorphisms. Nucleic AcidsRes., 28, 352–355.
32. Smedley,D., Haider,S., Durinck,S., Pandini,L., Provero,P., Allen,J.,Arnaiz,O., Awedh,M.H., Baldock,R., Barbiera,G. et al. (2015) TheBioMart community portal: an innovative alternative to large,centralized data repositories. Nucleic Acids Res., 43, W589–598.
33. Cunningham,F., Amode,M.R., Barrell,D., Beal,K., Billis,K.,Brent,S., Carvalho-Silva,D., Clapham,P., Coates,G., Fitzgerald,S.et al. (2015) Ensembl 2015. Nucleic Acids Res., 43, D662–669.
34. Gray,K.A., Yates,B., Seal,R.L., Wright,M.W. and Bruford,E.A.(2015) Genenames.org: the HGNC resources in 2015. Nucleic AcidsRes., 43, D1079–D1085.
35. Ullmann,J.R. (1976) Algorithm for Subgraph Isomorphism. J. ACM,23, 31–42.
36. Magrane,M. and Consortium,U. (2011) UniProt Knowledgebase: ahub of integrated protein data. Database (Oxford), bar009.
37. Adzhubei,I., Jordan,D.M. and Sunyaev,S.R. (2013) Predictingfunctional effect of human missense mutations using PolyPhen-2.Curr. Protoc. Hum. Genet., Chapter 7, Unit7 20.
38. Kanehisa,M., Goto,S., Sato,Y., Kawashima,M., Furumichi,M. andTanabe,M. (2014) Data, information, knowledge and principle: backto metabolism in KEGG. Nucleic Acids Res., 42, D199–D205.
39. Kanehisa,M. and Goto,S. (2000) KEGG: kyoto encyclopedia ofgenes and genomes. Nucleic Acids Res., 28, 27–30.
40. James,W.P., Caterson,I.D., Coutinho,W., Finer,N., Van Gaal,L.F.,Maggioni,A.P., Torp-Pedersen,C., Sharma,A.M., Shepherd,G.M.,Rode,R.A. et al. (2010) Effect of sibutramine on cardiovascularoutcomes in overweight and obese subjects. N. Engl. J. Med., 363,905–917.
41. Bae,S.K., Cao,S., Seo,K.A., Kim,H., Kim,M.J., Shon,J.H., Liu,K.H.,Zhou,H.H. and Shin,J.G. (2008) Cytochrome P450 2B6 catalyzes theformation of pharmacologically active sibutramine (N-{1-[1-(4-chlorophenyl)cyclobutyl]-3-methylbutyl}-N,N-dimethylamine)metabolites in human liver microsomes. Drug Metab. Dispos., 36,1679–1688.
42. Chung,J.Y., Jang,S.B., Lee,Y.J., Park,M.S. and Park,K. (2011) Effectof CYP2B6 genotype on the pharmacokinetics of sibutramine andactive metabolites in healthy subjects. J. Clin. Pharmacol., 51, 53–59.
43. Zhang,W., Roederer,M.W., Chen,W.Q., Fan,L. and Zhou,H.H. (2012)Pharmacogenetics of drugs withdrawn from the market.Pharmacogenomics, 13, 223–231.
57

58
3.4 Summary
Two knowledgebase resources that provide comprehensive information around approved and
withdrawn drugs were developed and made publicly accessible via the Web. Interactive features such
as 2D and 3D similarity search, substructure search, and 3D superposition were implemented to
explore the chemical space of drugs. An important feature of the two databases is cross-linking of the
drug entries to other major drug databases. Interesting use cases to exploit these knowledgebases
were provided in the original articles. For instance, the potential mechanism leading to adverse
cardiovascular effects of the withdrawn drug sibutramine could be retrospectively understood by
connecting links between drugs, targets and genetic variations. This use case highlights the need to
conduct extensive pharmacogenetic studies and investigate off-target effects during drug
development. Furthermore, off-target relations that are directly related to the reasons for withdrawal
are highly useful in predicting toxicity (in a read-across fashion) of newer ligands that are structurally
similar to these drugs. The integrated bioactivity data and drug-target relations can be employed in
the development of predictive QSAR models. In this regard, data have been made openly accessible
to the community to complement the ongoing research. For example, ChEMBL database (since
version 22) has been annotating entries as ‘withdrawn drugs’ on the basis of information extracted
from WITHDRAWN database. Regular updates have been performed using semi-automated data
collection and integration protocols.
The supporting information of these two articles can be obtained via the following URLs:
Siramshetty et al. - https://doi.org/10.1093/nar/gkx1088
Siramshetty et al. - https://doi.org/10.1093/nar/gkv1192
59

60
Chapter 4
Development of In Silico Models for Toxicity Prediction
4.1 Chemical Similarity and Machine-learning Methods for Predicting
Toxicological Endpoints
Combinatorial chemistry and HTS have led to a significant rise in the number of chemicals
synthesized and tested each year. Establishing the safety profiles of such a large number of
compounds using the conventional in vitro and in vivo tests is both costly and time-consuming. In
the light of the scientific reports that criticize the limited number of drug approvals per year and the
increase in the number of safety-related drug withdrawals, employing in silico models is associated
with many advantages. They are fast, cheap, and most importantly can be employed to predict the
outcomes even before a compound is synthesized. Government based agencies and several scientific
consortia have actualized large-scale projects to develop better tools for early assessment of chemical
toxicity. Many data challenges have been crowdsourced to aggregate best performing models from
the scientific community. The three articles reported in this chapter summarize the in silico models
developed during this thesis. While the first two articles focus on models that predict the potential of
chemicals to interfere with nuclear receptor and cellular stress response pathways, the third article
reports binary classification models to predict hERG channel blockade. The applicability of chemical
similarity-based methods and machine learning algorithms to develop in silico models were
discussed. Furthermore, differences in performances of models based on individual descriptors and
combinations of descriptors were reported. The models achieved very good performance when
validated on independent data sets and the constantly misclassified compounds were analyzed to
understand the reasons behind wrong predictions. Most importantly, the importance of data quality
was highlighted by developing multiple (hERG) models based on data sets of different levels of
confidence, composition, and chemical diversity.
61
Original Research Article
4.2 Molecular Similarity-based Predictions of the Tox21 Screening Outcome
Drwal, M. N., Siramshetty, V. B., Banerjee, P., Goede, A., Preissner, R. and Dunkel, M.
Front. Environ. Sci. 2015 July 30;3:54. https://doi.org/10.3389/fenvs.2015.00054.
Author Contributions:
Data preparation and analysis: Drwal, M. N., Siramshetty, V. B., Banerjee, P., Dunkel, M., Goede,
A.; Generation and validation of predictive models: Dunkel, M., Drwal, M. N., Siramshetty, V. B.,
Banerjee, P.; Calculation and selection of descriptors: Banerjee, P., Siramshetty, V. B., Dunkel, M.,
Drwal, M. N.; Writing of manuscript: Drwal, M. N.; Project coordination: Preissner, R., Dunkel, M.
and Drwal, M. N.
62
ORIGINAL RESEARCHpublished: 30 July 2015
doi: 10.3389/fenvs.2015.00054
Frontiers in Environmental Science | www.frontiersin.org July 2015 | Volume 3 | Article 54
Edited by:
Ruili Huang,
NIH National Center for Advancing
Translational Sciences, USA
Reviewed by:
Luis Gomez,
University of Las Palmas de Gran
Canaria, Spain
Ijaz Hussain,
Quaid-i-Azam University, Islamabad,
Pakistan
*Correspondence:
Mathias Dunkel,
Structural Bioinformatics Group,
Institute for Physiology, Charité –
University Medicine Berlin,
Lindenberger Weg 80,
13125 Berlin, Germany
Specialty section:
This article was submitted to
Environmental Informatics,
a section of the journal
Frontiers in Environmental Science
Received: 04 May 2015
Accepted: 14 July 2015
Published: 30 July 2015
Citation:
Drwal MN, Siramshetty VB, Banerjee
P, Goede A, Preissner R and Dunkel M
(2015) Molecular similarity-based
predictions of the Tox21 screening
outcome. Front. Environ. Sci. 3:54.
doi: 10.3389/fenvs.2015.00054
Molecular similarity-basedpredictions of the Tox21 screeningoutcomeMalgorzata N. Drwal 1, Vishal B. Siramshetty 1, Priyanka Banerjee 1, 2, Andrean Goede1,Robert Preissner 1, 3 and Mathias Dunkel 1*
1 Structural Bioinformatics Group, Institute for Physiology, Charité – University Medicine Berlin, Berlin, Germany, 2 Graduate
School of Computational Systems Biology, Humboldt-Universität zu Berlin, Berlin, Germany, 3 BB3R – Berlin Brandenburg 3R
Graduate School, Freie Universität Berlin, Berlin, Germany
To assess the toxicity of new chemicals and drugs, regulatory agencies require
in vivo testing for many toxic endpoints, resulting in millions of animal experiments
conducted each year. However, following the Replace, Reduce, Refine (3R) principle,
the development and optimization of alternative methods, in particular in silico methods,
has been put into focus in the recent years. It is generally acknowledged that the more
complex a toxic endpoint, the more difficult it is to model. Therefore, computational
toxicology is shifting from modeling general and complex endpoints to the investigation
and modeling of pathways of toxicity and the underlying molecular effects. The U.S.
Toxicology in the twenty-first century (Tox21) initiative has screened a large library
of compounds, including approximately 10K environmental chemicals and drugs, for
different mechanisms responsible for eliciting toxic effects, and made the results publicly
available. Through the Tox21 Data Challenge, the consortium has established a platform
for computational toxicologists to develop and validate their predictive models. Here,
we present a fast and successful method for the prediction of different outcomes of the
nuclear receptor and stress response pathway screening from the Tox21 Data Challenge
2014. The method is based on the combination of molecular similarity calculations and a
naïve Bayes machine learning algorithm and has been implemented as a KNIME pipeline.
Molecules are represented as binary vectors consisting of a concatenation of common
two-dimensional molecular fingerprint types with topological compound properties. The
predictionmethod has been optimized individually for eachmodeled target and evaluated
in a cross-validation as well as with the independent Tox21 validation set. Our results
show that the method can achieve good prediction accuracies and rank among the
top algorithms submitted to the prediction challenge, indicating its broad applicability in
toxicity prediction.
Keywords: molecular fingerprints, molecular similarity, machine learning, toxicity prediction, Tox21 Data
Challenge 2014
63
Drwal et al. Similarity-based Tox21 predictions
Introduction
The U.S. Toxicology in the twenty-first century (Tox21) initiativehas been established in 2008 with the vision to support thetransformation of toxicology into a predictive science (Krewskiet al., 2010). In order to achieve this goal, a large libraryof compounds, including approximately 10K environmentalchemicals and drugs, was screened for different mechanismsresponsible for eliciting toxic effects. Among the screens werehigh-throughput assays for two important pathways, the nuclearreceptor and the stress response pathway, which were the subjectof the Tox21 Data Challenge 2014.
Interactions of chemicals with nuclear receptors representa major health concern. In particular, binding of chemicalsto steroid receptors can cause the disruption of the normalendocrine function and have an adverse effect on development,reproduction and metabolic homeostasis (Huang et al., 2014).A famous example of an endocrine disrupting chemical isbisphenol A, a compound which has been widely used, e.g.in plastic bottles and metal cans, but has only recently beenassociated with impairments of neurobehavioral development(Weiss, 2012). Bisphenol A and its derivatives have beenshown to exhibit a promiscuous binding behavior involving,for instance, estrogen receptors (ER), androgen receptors (AR)and peroxisome proliferator-activated receptors (PPAR) of theγ subtype (Delfosse et al., 2014), all of which are subjectof the Tox21 screening. Another current focus of the Tox21screening is aromatase, an enzyme involved in the conversionof androgen to estrogen and therefore a target of endocrinedisrupting chemicals (Chen et al., 2014), as well as the arylhydrocarbon receptor (AhR), a nuclear receptor involved in themediation of tumorgenesis induced by dioxin (Murray et al.,2014). Similarly, mechanisms related to cellular stress also playa role in toxicological pathways. For example, recent studieshave shown that the impairment of mitochondrial functionis associated with drug-induced adverse effects on the liverand cardiovascular system (Nadanaciva and Will, 2011; Attene-Ramos et al., 2015).
To assess the risks of new chemical entities, in vivo animalstudies are required by regulatory agencies to evaluate varioustoxicological endpoints. However, in silico toxicology is gainingacceptance as an alternative method which can help to reducethe number of animal experiments performed. Computationalpredictions often rely on the observation or assumption thatsimilar molecules manifest a similar biological effect. Similarity-based methods have been successfully applied to solve variousresearch questions including predictions of targets (Campilloset al., 2008), therapeutic indications (Nickel et al., 2014) orside-effects (Lounkine et al., 2012). In particular, machinelearning approaches such as k-nearest neighbors, naïve Bayes
Abbreviations: 2D, two-dimensional; AhR, aryl hydrocarbon receptor; AR,androgen receptor; ARE, antioxidant response element; ATAD5, genotoxicityinduction; AUC, area under the curve; BAC, balanced accuracy; ER, estrogenreceptor 1; HSE, heat shock response; LBD, ligand binding domain; MMP,mitochondrial membrane potential; PPAR, peroxisome proliferator-activatedreceptor; ROC, receiver operating characteristic; Tox21, U.S. Toxicology in thetwenty-first century initiative.
models, support vector machines, random forests or ensemblesof different classification methods can use the similarity definedthe molecular structure and properties to make predictionsfor novel compounds. This concept has also been frequentlyand successfully applied to predictions of various toxicologicalendpoints (Drwal et al., 2014; Gadaleta et al., 2014; Li et al., 2014;Liu et al., 2015).
Here, we describe the development of a fast and successfulmethod for the prediction of different outcomes of the nuclearreceptor and stress response pathway screening from theTox21 Data Challenge 2014. The method is based on thecombination of a simple molecular similarity calculation witha naïve Bayes machine learning algorithm. Three different two-dimensional (2D) molecular representation methods as well astheir combination were compared and the prediction methodswere optimized individually for every target. The evaluationof each model showed that all models can achieve goodperformance and prediction accuracies as well as rank among thetop submissions among the Tox21 challenge participants.
Materials and Methods
OverviewAn overview of the workflow used in this study is givenin Figure 1. In the first step, all molecular structures werestandardized and the duplicates as well as compounds withambiguous activity values were removed. The training and testset provided by the Tox21 Data Challenge 2015 organizerswere merged and used in a 13-fold cross-validation to optimizeparameters for the classification algorithms. The optimizedmodels were then used to predict the activities of the evaluationset compounds. All steps are described in detail in the followingsections. For the majority of tasks, the open pipeline generationplatform KNIME v.2.10.0 (Knime.com AG) was used.
Data PreparationStandardizationAll molecular structures were downloaded from the Tox21 DataChallenge 2014 website (https://tripod.nih.gov/tox21/challenge/index.jsp) and their molecular structures were standardizedusing the Instant JChem software (version 6.2, Chemaxon)with the following settings: Water molecules were removed,molecules were aromatized, adjacent positive and negativecharges transformed into double/triple bonds, explicit hydrogenswere added and the 3D conformation was generated and cleaned.After the standardization, InChIKeys were calculated usingRDKit (http://www.rdkit.org) nodes in KNIME in order toidentify and remove duplicates. In case duplicate molecules werefound to have different activities (1 and 0) for a particular target,they were marked as ambiguous and removed from the trainingset of this target.
Additional DataFor each target, a search for additional known ligands wasperformed in the ChEMBL bioactivity database v.19 (Bento et al.,2014). A search was performed for the target name and EC50
or IC50 values in case of agonists or antagonists, respectively.
Frontiers in Environmental Science | www.frontiersin.org July 2015 | Volume 3 | Article 5464
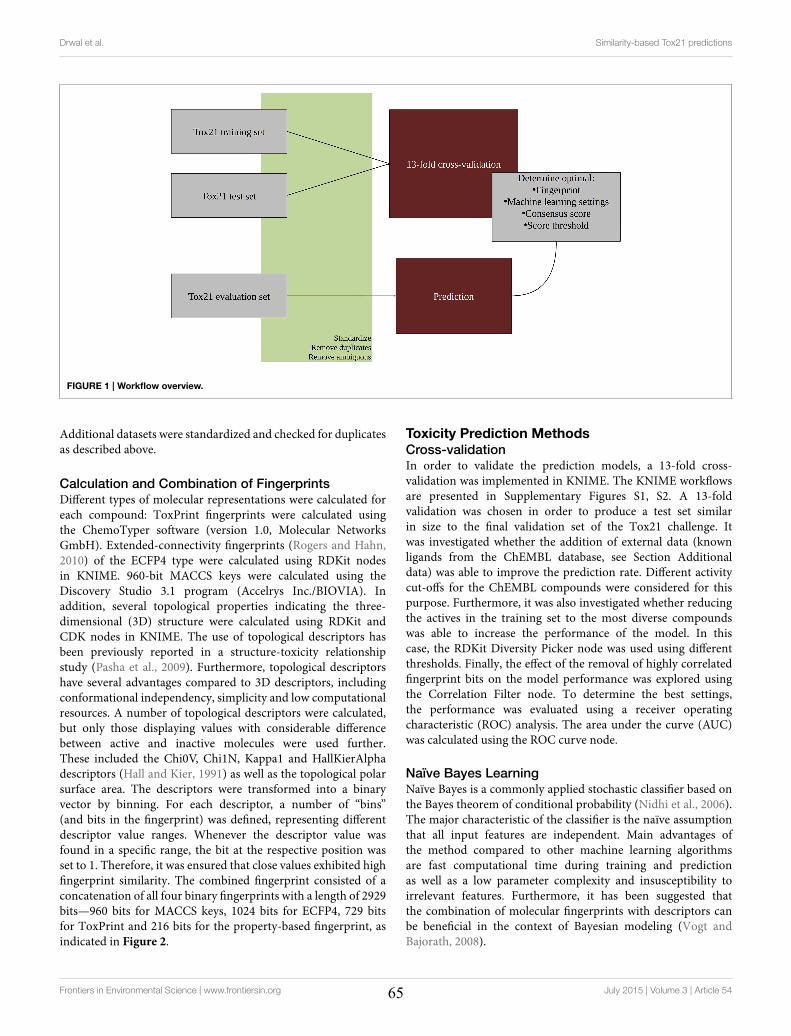
Drwal et al. Similarity-based Tox21 predictions
FIGURE 1 | Workflow overview.
Additional datasets were standardized and checked for duplicatesas described above.
Calculation and Combination of FingerprintsDifferent types of molecular representations were calculated foreach compound: ToxPrint fingerprints were calculated usingthe ChemoTyper software (version 1.0, Molecular NetworksGmbH). Extended-connectivity fingerprints (Rogers and Hahn,2010) of the ECFP4 type were calculated using RDKit nodesin KNIME. 960-bit MACCS keys were calculated using theDiscovery Studio 3.1 program (Accelrys Inc./BIOVIA). Inaddition, several topological properties indicating the three-dimensional (3D) structure were calculated using RDKit andCDK nodes in KNIME. The use of topological descriptors hasbeen previously reported in a structure-toxicity relationshipstudy (Pasha et al., 2009). Furthermore, topological descriptorshave several advantages compared to 3D descriptors, includingconformational independency, simplicity and low computationalresources. A number of topological descriptors were calculated,but only those displaying values with considerable differencebetween active and inactive molecules were used further.These included the Chi0V, Chi1N, Kappa1 and HallKierAlphadescriptors (Hall and Kier, 1991) as well as the topological polarsurface area. The descriptors were transformed into a binaryvector by binning. For each descriptor, a number of “bins”(and bits in the fingerprint) was defined, representing differentdescriptor value ranges. Whenever the descriptor value wasfound in a specific range, the bit at the respective position wasset to 1. Therefore, it was ensured that close values exhibited highfingerprint similarity. The combined fingerprint consisted of aconcatenation of all four binary fingerprints with a length of 2929bits—960 bits for MACCS keys, 1024 bits for ECFP4, 729 bitsfor ToxPrint and 216 bits for the property-based fingerprint, asindicated in Figure 2.
Toxicity Prediction MethodsCross-validationIn order to validate the prediction models, a 13-fold cross-validation was implemented in KNIME. The KNIME workflowsare presented in Supplementary Figures S1, S2. A 13-foldvalidation was chosen in order to produce a test set similarin size to the final validation set of the Tox21 challenge. Itwas investigated whether the addition of external data (knownligands from the ChEMBL database, see Section Additionaldata) was able to improve the prediction rate. Different activitycut-offs for the ChEMBL compounds were considered for thispurpose. Furthermore, it was also investigated whether reducingthe actives in the training set to the most diverse compoundswas able to increase the performance of the model. In thiscase, the RDKit Diversity Picker node was used using differentthresholds. Finally, the effect of the removal of highly correlatedfingerprint bits on the model performance was explored usingthe Correlation Filter node. To determine the best settings,the performance was evaluated using a receiver operatingcharacteristic (ROC) analysis. The area under the curve (AUC)was calculated using the ROC curve node.
Naïve Bayes LearningNaïve Bayes is a commonly applied stochastic classifier based onthe Bayes theorem of conditional probability (Nidhi et al., 2006).The major characteristic of the classifier is the naïve assumptionthat all input features are independent. Main advantages ofthe method compared to other machine learning algorithmsare fast computational time during training and predictionas well as a low parameter complexity and insusceptibility toirrelevant features. Furthermore, it has been suggested thatthe combination of molecular fingerprints with descriptors canbe beneficial in the context of Bayesian modeling (Vogt andBajorath, 2008).
Frontiers in Environmental Science | www.frontiersin.org July 2015 | Volume 3 | Article 5465
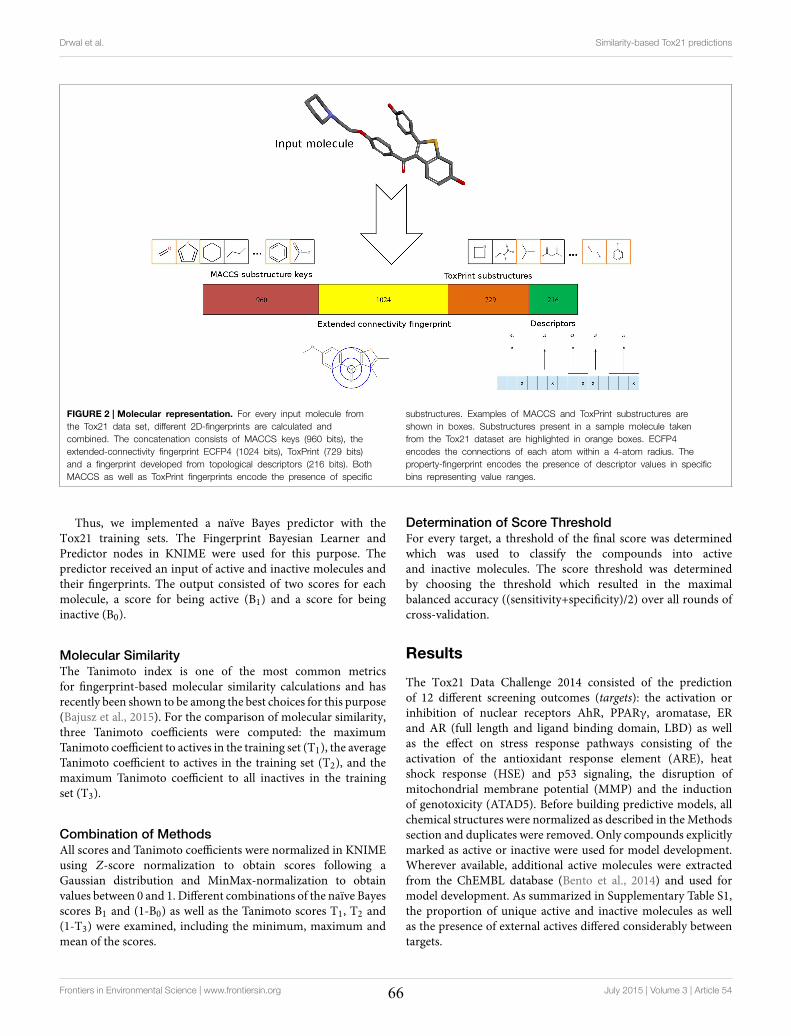
Drwal et al. Similarity-based Tox21 predictions
FIGURE 2 | Molecular representation. For every input molecule from
the Tox21 data set, different 2D-fingerprints are calculated and
combined. The concatenation consists of MACCS keys (960 bits), the
extended-connectivity fingerprint ECFP4 (1024 bits), ToxPrint (729 bits)
and a fingerprint developed from topological descriptors (216 bits). Both
MACCS as well as ToxPrint fingerprints encode the presence of specific
substructures. Examples of MACCS and ToxPrint substructures are
shown in boxes. Substructures present in a sample molecule taken
from the Tox21 dataset are highlighted in orange boxes. ECFP4
encodes the connections of each atom within a 4-atom radius. The
property-fingerprint encodes the presence of descriptor values in specific
bins representing value ranges.
Thus, we implemented a naïve Bayes predictor with theTox21 training sets. The Fingerprint Bayesian Learner andPredictor nodes in KNIME were used for this purpose. Thepredictor received an input of active and inactive molecules andtheir fingerprints. The output consisted of two scores for eachmolecule, a score for being active (B1) and a score for beinginactive (B0).
Molecular SimilarityThe Tanimoto index is one of the most common metricsfor fingerprint-based molecular similarity calculations and hasrecently been shown to be among the best choices for this purpose(Bajusz et al., 2015). For the comparison of molecular similarity,three Tanimoto coefficients were computed: the maximumTanimoto coefficient to actives in the training set (T1), the averageTanimoto coefficient to actives in the training set (T2), and themaximum Tanimoto coefficient to all inactives in the trainingset (T3).
Combination of MethodsAll scores and Tanimoto coefficients were normalized in KNIMEusing Z-score normalization to obtain scores following aGaussian distribution and MinMax-normalization to obtainvalues between 0 and 1. Different combinations of the naïve Bayesscores B1 and (1-B0) as well as the Tanimoto scores T1, T2 and(1-T3) were examined, including the minimum, maximum andmean of the scores.
Determination of Score ThresholdFor every target, a threshold of the final score was determinedwhich was used to classify the compounds into activeand inactive molecules. The score threshold was determinedby choosing the threshold which resulted in the maximalbalanced accuracy ((sensitivity+specificity)/2) over all rounds ofcross-validation.
Results
The Tox21 Data Challenge 2014 consisted of the predictionof 12 different screening outcomes (targets): the activation orinhibition of nuclear receptors AhR, PPARγ, aromatase, ERand AR (full length and ligand binding domain, LBD) as wellas the effect on stress response pathways consisting of theactivation of the antioxidant response element (ARE), heatshock response (HSE) and p53 signaling, the disruption ofmitochondrial membrane potential (MMP) and the inductionof genotoxicity (ATAD5). Before building predictive models, allchemical structures were normalized as described in theMethodssection and duplicates were removed. Only compounds explicitlymarked as active or inactive were used for model development.Wherever available, additional active molecules were extractedfrom the ChEMBL database (Bento et al., 2014) and used formodel development. As summarized in Supplementary Table S1,the proportion of unique active and inactive molecules as wellas the presence of external actives differed considerably betweentargets.
Frontiers in Environmental Science | www.frontiersin.org July 2015 | Volume 3 | Article 5466
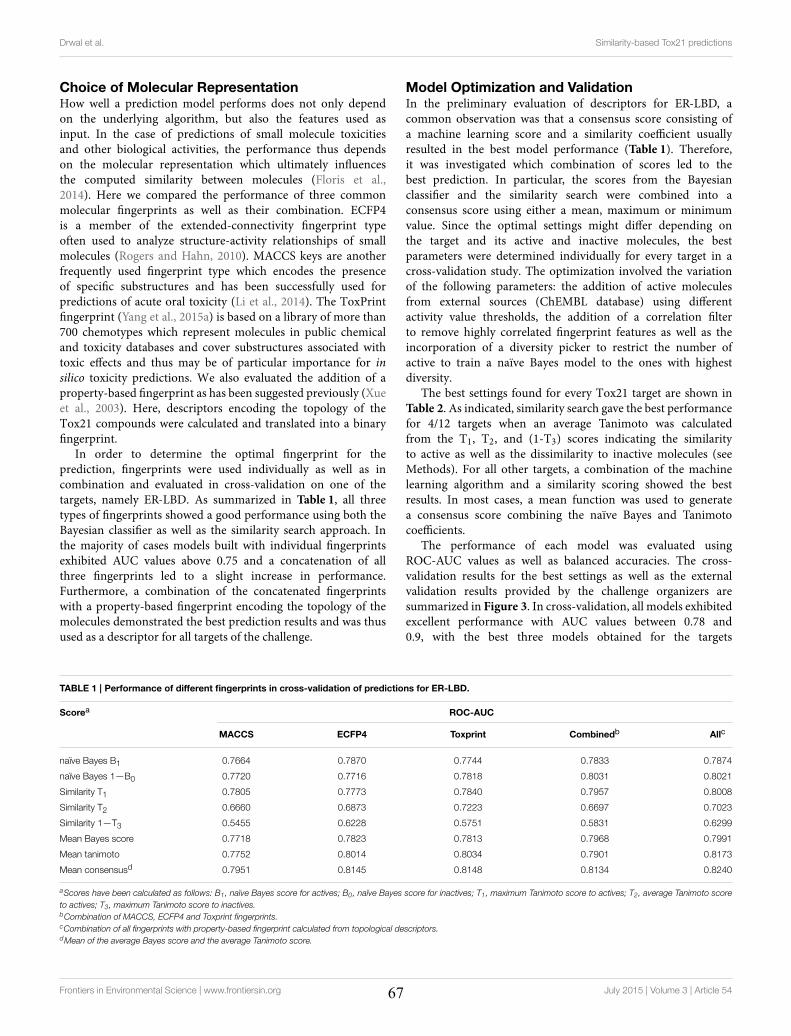
Drwal et al. Similarity-based Tox21 predictions
Choice of Molecular RepresentationHow well a prediction model performs does not only dependon the underlying algorithm, but also the features used asinput. In the case of predictions of small molecule toxicitiesand other biological activities, the performance thus dependson the molecular representation which ultimately influencesthe computed similarity between molecules (Floris et al.,2014). Here we compared the performance of three commonmolecular fingerprints as well as their combination. ECFP4is a member of the extended-connectivity fingerprint typeoften used to analyze structure-activity relationships of smallmolecules (Rogers and Hahn, 2010). MACCS keys are anotherfrequently used fingerprint type which encodes the presenceof specific substructures and has been successfully used forpredictions of acute oral toxicity (Li et al., 2014). The ToxPrintfingerprint (Yang et al., 2015a) is based on a library of more than700 chemotypes which represent molecules in public chemicaland toxicity databases and cover substructures associated withtoxic effects and thus may be of particular importance for insilico toxicity predictions. We also evaluated the addition of aproperty-based fingerprint as has been suggested previously (Xueet al., 2003). Here, descriptors encoding the topology of theTox21 compounds were calculated and translated into a binaryfingerprint.
In order to determine the optimal fingerprint for theprediction, fingerprints were used individually as well as incombination and evaluated in cross-validation on one of thetargets, namely ER-LBD. As summarized in Table 1, all threetypes of fingerprints showed a good performance using both theBayesian classifier as well as the similarity search approach. Inthe majority of cases models built with individual fingerprintsexhibited AUC values above 0.75 and a concatenation of allthree fingerprints led to a slight increase in performance.Furthermore, a combination of the concatenated fingerprintswith a property-based fingerprint encoding the topology of themolecules demonstrated the best prediction results and was thusused as a descriptor for all targets of the challenge.
Model Optimization and ValidationIn the preliminary evaluation of descriptors for ER-LBD, acommon observation was that a consensus score consisting ofa machine learning score and a similarity coefficient usuallyresulted in the best model performance (Table 1). Therefore,it was investigated which combination of scores led to thebest prediction. In particular, the scores from the Bayesianclassifier and the similarity search were combined into aconsensus score using either a mean, maximum or minimumvalue. Since the optimal settings might differ depending onthe target and its active and inactive molecules, the bestparameters were determined individually for every target in across-validation study. The optimization involved the variationof the following parameters: the addition of active moleculesfrom external sources (ChEMBL database) using differentactivity value thresholds, the addition of a correlation filterto remove highly correlated fingerprint features as well as theincorporation of a diversity picker to restrict the number ofactive to train a naïve Bayes model to the ones with highestdiversity.
The best settings found for every Tox21 target are shown inTable 2. As indicated, similarity search gave the best performancefor 4/12 targets when an average Tanimoto was calculatedfrom the T1, T2, and (1-T3) scores indicating the similarityto active as well as the dissimilarity to inactive molecules (seeMethods). For all other targets, a combination of the machinelearning algorithm and a similarity scoring showed the bestresults. In most cases, a mean function was used to generatea consensus score combining the naïve Bayes and Tanimotocoefficients.
The performance of each model was evaluated usingROC-AUC values as well as balanced accuracies. The cross-validation results for the best settings as well as the externalvalidation results provided by the challenge organizers aresummarized in Figure 3. In cross-validation, all models exhibitedexcellent performance with AUC values between 0.78 and0.9, with the best three models obtained for the targets
TABLE 1 | Performance of different fingerprints in cross-validation of predictions for ER-LBD.
Scorea ROC-AUC
MACCS ECFP4 Toxprint Combinedb Allc
naïve Bayes B1 0.7664 0.7870 0.7744 0.7833 0.7874
naïve Bayes 1—B0 0.7720 0.7716 0.7818 0.8031 0.8021
Similarity T1 0.7805 0.7773 0.7840 0.7957 0.8008
Similarity T2 0.6660 0.6873 0.7223 0.6697 0.7023
Similarity 1—T3 0.5455 0.6228 0.5751 0.5831 0.6299
Mean Bayes score 0.7718 0.7823 0.7813 0.7968 0.7991
Mean tanimoto 0.7752 0.8014 0.8034 0.7901 0.8173
Mean consensusd 0.7951 0.8145 0.8148 0.8134 0.8240
aScores have been calculated as follows: B1, naïve Bayes score for actives; B0, naïve Bayes score for inactives; T1, maximum Tanimoto score to actives; T2, average Tanimoto score
to actives; T3, maximum Tanimoto score to inactives.bCombination of MACCS, ECFP4 and Toxprint fingerprints.cCombination of all fingerprints with property-based fingerprint calculated from topological descriptors.dMean of the average Bayes score and the average Tanimoto score.
Frontiers in Environmental Science | www.frontiersin.org July 2015 | Volume 3 | Article 5467
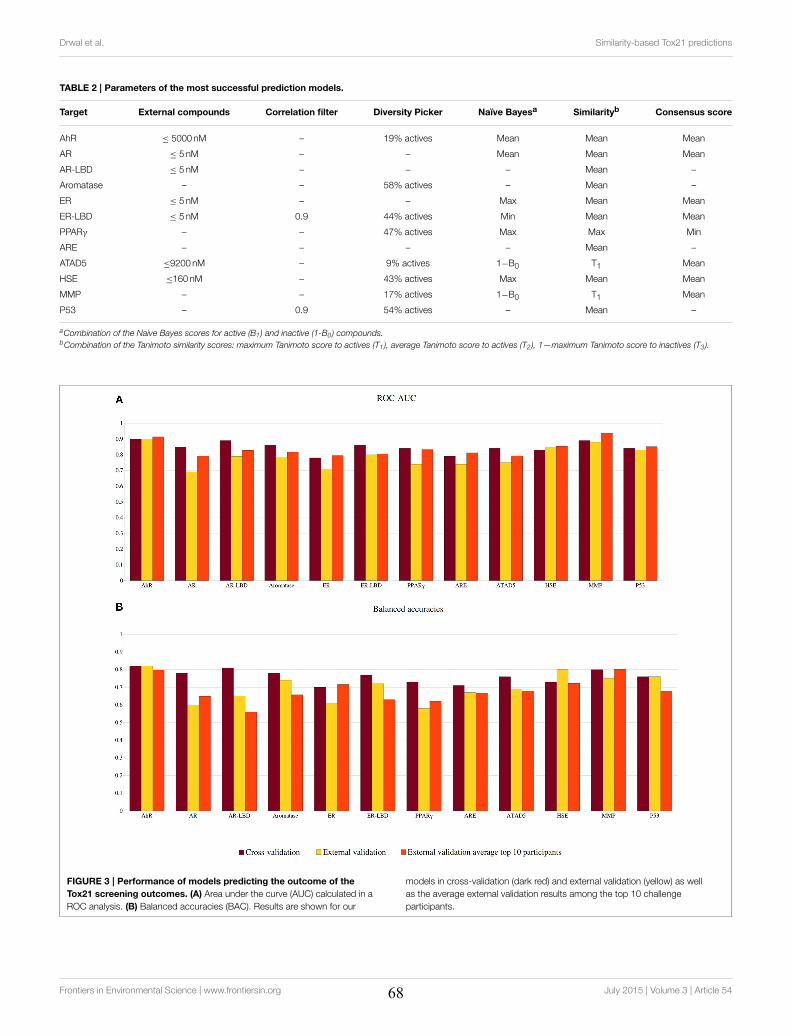
Drwal et al. Similarity-based Tox21 predictions
TABLE 2 | Parameters of the most successful prediction models.
Target External compounds Correlation filter Diversity Picker Naïve Bayesa Similarityb Consensus score
AhR ≤ 5000 nM – 19% actives Mean Mean Mean
AR ≤ 5 nM – – Mean Mean Mean
AR-LBD ≤ 5 nM – – – Mean –
Aromatase – – 58% actives – Mean –
ER ≤ 5 nM – – Max Mean Mean
ER-LBD ≤ 5 nM 0.9 44% actives Min Mean Mean
PPARγ – – 47% actives Max Max Min
ARE – – – – Mean –
ATAD5 ≤9200 nM – 9% actives 1−B0 T1 Mean
HSE ≤160 nM – 43% actives Max Mean Mean
MMP – – 17% actives 1−B0 T1 Mean
P53 – 0.9 54% actives – Mean –
aCombination of the Naive Bayes scores for active (B1) and inactive (1-B0) compounds.bCombination of the Tanimoto similarity scores: maximum Tanimoto score to actives (T1), average Tanimoto score to actives (T2), 1—maximum Tanimoto score to inactives (T3).
FIGURE 3 | Performance of models predicting the outcome of the
Tox21 screening outcomes. (A) Area under the curve (AUC) calculated in a
ROC analysis. (B) Balanced accuracies (BAC). Results are shown for our
models in cross-validation (dark red) and external validation (yellow) as well
as the average external validation results among the top 10 challenge
participants.
Frontiers in Environmental Science | www.frontiersin.org July 2015 | Volume 3 | Article 5468
Drwal et al. Similarity-based Tox21 predictions
AhR, AR-LBD, and MMP. For AhR, MMP, and p53, theresults of the external validation set showed a very similarperformance to the cross-validation, indicating good anduniversal models and scores. In the cross-validation, thebalanced accuracies of the individual models ranged between70 and 82% (see Figure 3). For several targets, including AhR,HSE, and p53, the balanced accuracy obtained in externalvalidation remained constant or increased in comparisonto the cross-validation results, illustrating broadly applicablemodels.
Comparison to Other Challenge ParticipantsAll models submitted to the challenge were evaluated by thechallenge organizers and ranked according to their AUC valuesfor the external validation set. The prediction values for the top 10participating teams are publicly available (https://tripod.nih.gov/tox21/challenge/leaderboard.jsp) and summarized in Figure 3,Supplementary Tables S2, S3. Taken together, 7 out of 12models we submitted were found in the top 10 leaderboard.While our models were not nominated as the sub-challengewinners, in many cases their AUC value was found very closeto the winning model. This was for instance observed for thetarget HSE, where the top 9 ranking models showed AUCvalues differing only by 0.02, suggesting that similarly goodmodels can be obtained with various approaches. As indicatedin Figure 3, our models for the targets AhR, ER-LBD and p53were also very close to the average AUC of the leading models.Although most leaderboard models showed AUC values within asmall range, large differences were observed for the predictionaccuracies (between 49 and 90%). Interestingly, four of ourmodels (targets: AR-LBD, ER-LBD, aromatase, and HSE) werethe determined to be the most accurate amongst all submissions(see Figure 3 and Supplementary Table S3). Four additionalmodels, developed for the targets AhR, ARE, ATAD5, and p53,displayed accuracies higher or equal to the average of the top 10submitted models.
Discussion
Here, we describe a successful machine learning methodfor the prediction of different outcomes of the nuclearreceptor and stress response pathway screening from theTox21 Data Challenge 2014. The key to our method is thecombination of different molecular fingerprints and descriptorsas well as the integration of two different algorithms, asimilarity-based approach and a naïve Bayes machine learningtechnique.
Combination of Features and AlgorithmsThe selection of features is a crucial and non-trivial partof development of predictive models. The features should beable to describe the differences between actives and inactivesin the training set and allow extrapolating to other, yetuntested compounds. Although several molecular fingerprints,such as extended-connectivity, substructure-based or path-basedfingerprints are standards in the chemoinformatics field andhave been successfully applied to prediction tasks, the results
are dependent on the data and none of the methods is ableto clearly outperform the others (Duan et al., 2010). Toavoid the choice of the wrong descriptor, the combination of(independent) fingerprints has been suggested (Duan et al., 2010)and several studies have successfully applied combinations ofpath- and substructure-based fingerprints (Drwal et al., 2014;Banerjee et al., 2015). As we report here, the combination ofdifferent fingerprint types has also been of advantage for theprediction of estrogen receptor ligands. An associated problem,however, is that a combined fingerprint is likely to containhighly correlated features. We have thus investigated the useof a correlation filter to remove fingerprint bits with highcorrelation, but the filter was able to increase the predictionperformance only for two targets. A more effective approachproved to be the use of a diverse subset of active molecules inthe training set, though the size of the diverse subset giving thebest results had to be optimized individually for every target.As the active molecules of the different Tox21 sub-challengesmight contain different important molecular characteristics,the use of extensive cross-validation to optimize the featureselection for every sub-challenge could further improve theprediction performance. Automated feature selection using deepneural networks, as suggested by one of the other teamsparticipating in the Tox21 challenge (Unterthiner et al., 2015),offers an alternative way to determine the most relevantfeatures in the input molecules which can be advantageous forlarge sets of molecules, but is obviously associated with largecomputational costs.
Combinations of multiple machine learning algorithms,also referred to as hybrid or ensemble learning, are a well-described approach and have been applied to solve diverseresearch questions (Yang et al., 2015b). It is usually assumedthat the use of multiple models can increase the predictionaccuracy as compared to the use of a single model and helpto manage high-dimensional and complex data sets. Similarlyto our approach, several other studies have proven thatmerging a naïve Bayes classifier with a similarity-based approachsuch as k-nearest neighbors can result in highly predictivemodels for various applications including the prediction ofmolecular targets (Ferdousy et al., 2013; Liu et al., 2013).Future investigations could focus on the evaluation of otherclassification methods (logistic regression, random forests, etc.)and larger model ensembles for the purposes of toxicityprediction.
Conclusions
Our models use a combination of molecular fingerprints andalgorithms and show consistently good performance for the 12outcomes of the Tox21 screen, four of the models being the mostaccurate amongst the challenge participants. We are planning tomake our models publicly available by incorporating them intoour toxicity prediction platform ProTox (http://tox.charite.de) inthe future.
The Tox21 Data Challenge 2014 has provided an excellentopportunity for academic and industrial groups to assessand directly compare the quality of their toxicity prediction
Frontiers in Environmental Science | www.frontiersin.org July 2015 | Volume 3 | Article 5469
Drwal et al. Similarity-based Tox21 predictions
methods. The results will be of great value to the scientificcommunity and can help to pave the way toward the useof more in silico toxicity models as decision-making tools toevaluate potential health hazards of environmental chemicalsand drugs.
Author Contributions
Data preparation and analysis: MND, VS, PB, MD, AG;Generation and validation of predictive models: MD, MND, VS,PB; Calculation and selection of descriptors: PB, VS, MD, MND;Writing of manuscript: MND; Project coordination: RP, MD,MND.
Acknowledgments
The authors kindly acknowledge the following funding sources:German Cancer Consortium (DKTK); Berlin-Brandenburgresearch platform BB3R (BMBF) [031A262C]; Immunotoxproject (BMBF) [031A268B]; research training group“Computational Systems Biology” [GRK1772].
Supplementary Material
The Supplementary Material for this article can be foundonline at: http://journal.frontiersin.org/article/10.3389/fenvs.2015.00054
References
Attene-Ramos, M. S., Huang, R., Michael, S., Witt, K. L., Richard, A., Tice, R.R., et al. (2015). Profiling of the Tox21 chemical collection for mitochondrialfunction to identify compounds that acutely decreasemitochondrial membranepotential. Environ. Health Perspect. 123, 49–56. doi: 10.1289/ehp.1408642
Bajusz, D., Rácz, A., and Héberger, K. (2015). Why is Tanimoto index anappropriate choice for fingerprint-based similarity calculations? J. Cheminform.7:20. doi: 10.1186/s13321-015-0069-3
Banerjee, P., Erehman, J., Gohlke, B. O., Wilhelm, T., Preissner, R., and Dunkel, M.(2015). Super Natural II–a database of natural products. Nucleic Acids Res. 43,D935–D939. doi: 10.1093/nar/gku886
Bento, A. P., Gaulton, A., Hersey, A., Bellis, L. J., Chambers, J., Davies, M., et al.(2014). The ChEMBL bioactivity database: an update. Nucleic Acids Res. 42,D1083–D1090. doi: 10.1093/nar/gkt1031
Campillos, M., Kuhn, M., Gavin, A. C., Jensen, L. J., and Bork, P. (2008). Drugtarget identification using side-effect similarity. Science 321, 263–266. doi:10.1126/science.1158140
Chen, S., Zhou, D., Hsin, L. Y., Kanaya, N., Wong, C., Yip, R., et al. (2014). AroERtri-screen is a biologically relevant assay for endocrine disrupting chemicalsmodulating the activity of aromatase and/or the estrogen receptor. Toxicol. Sci.139, 198–209. doi: 10.1093/toxsci/kfu023
Delfosse, V., Grimaldi, M., Le Maire, A., Bourguet, W., and Balaguer, P. (2014).Nuclear receptor profiling of bisphenol-A and its halogenated analogues.Vitam. Horm. 94, 229–251. doi: 10.1016/B978-0-12-800095-3.00009-2
Drwal, M. N., Banerjee, P., Dunkel, M., Wettig, M. R., and Preissner, R. (2014).ProTox: a web server for the in silico prediction of rodent oral toxicity. NucleicAcids Res. 42, W53–W58. doi: 10.1093/nar/gku401
Duan, J., Dixon, S. L., Lowrie, J. F., and Sherman, W. (2010). Analysis andcomparison of 2D fingerprints: insights into database screening performanceusing eight fingerprint methods. J. Mol. Graph. Model. 29, 157–170. doi:10.1016/j.jmgm.2010.05.008
Ferdousy, E. Z., Islam, M., and Matin, M. (2013). Combination of naive bayesclassifier and K-Nearest Neighbor (cNK) in the classification based predictivemodels. Comput. Inf. Sci. 6, 48. doi: 10.5539/cis.v6n3p48
Floris, M., Manganaro, A., Nicolotti, O., Medda, R., Mangiatordi, G. F., andBenfenati, E. (2014). A generalizable definition of chemical similarity forread-across. J. Cheminform. 6, 39. doi: 10.1186/s13321-014-0039-1
Gadaleta, D., Pizzo, F., Lombardo, A., Carotti, A., Escher, S. E., Nicolotti,O., et al. (2014). A k-NN algorithm for predicting the oral sub-chronic toxicity in the rat. ALTEX 31, 423–432. doi: 10.14573/altex.1405091s
Hall, L. H., and Kier, L. B. (1991). “The molecular connectivity chi indexesand kappa shape indexes in structure-property modeling,” in Reviews inComputational Chemistry, eds K. B. Lipkowitz and D. B. Boyd (Hoboken, NJ:John Wiley & Sons, Inc.), 367–422.
Huang, R., Sakamuru, S., Martin, M. T., Reif, D. M., Judson, R. S., Houck, K. A.,et al. (2014). Profiling of the Tox21 10K compound library for agonists and
antagonists of the estrogen receptor alpha signaling pathway. Sci. Rep. 4:5664.doi: 10.1038/srep05664
Krewski, D., Acosta, D. Jr., Andersen, M., Anderson, H., Bailar, J. C. 3rd,Boekelheide, K., et al. (2010). Toxicity testing in the 21st century: a visionand a strategy. J. Toxicol. Environ. Health B Crit. Rev. 13, 51–138. doi:10.1080/10937404.2010.483176
Li, X., Chen, L., Cheng, F., Wu, Z., Bian, H., Xu, C., et al. (2014). In silico predictionof chemical acute oral toxicity using multi-classification methods. J. Chem. Inf.Model. 54, 1061–1069. doi: 10.1021/ci5000467
Liu, J., Mansouri, K., Judson, R. S., Martin, M. T., Hong, H., Chen, M., et al.(2015). predicting hepatotoxicity using toxcast in vitro bioactivity and chemicalstructure. Chem. Res. Toxicol. 28, 738–751. doi: 10.1021/tx500501h
Liu, X., Vogt, I., Haque, T., and Campillos, M. (2013). HitPick: a web server for hitidentification and target prediction of chemical screenings. Bioinformatics 29,1910–1912. doi: 10.1093/bioinformatics/btt303
Lounkine, E., Keiser, M. J., Whitebread, S., Mikhailov, D., Hamon, J., Jenkins, J. L.,et al. (2012). Large-scale prediction and testing of drug activity on side-effecttargets. Nature 486, 361–367. doi: 10.1038/nature11159
Murray, I. A., Patterson, A. D., and Perdew, G. H. (2014). Aryl hydrocarbonreceptor ligands in cancer: friend and foe. Nat. Rev. Cancer 14, 801–814. doi:10.1038/nrc3846
Nadanaciva, S., and Will, Y. (2011). Investigating mitochondrial dysfunction toincrease drug safety in the pharmaceutical industry. Curr. Drug Targets 12,774–782. doi: 10.2174/138945011795528985
Nickel, J., Gohlke, B. O., Erehman, J., Banerjee, P., Rong, W. W., Goede, A., et al.(2014). SuperPred: update on drug classification and target prediction. NucleicAcids Res. 42, W26–W31. doi: 10.1093/nar/gku477
Nidhi, Glick, M., Davies, J. W., and Jenkins, J. L. (2006). Prediction of biologicaltargets for compounds using multiple-category Bayesian models trainedon chemogenomics databases. J. Chem. Inf. Model. 46, 1124–1133. doi:10.1021/ci060003g
Pasha, F. A., Neaz, M. M., Cho, S. J., Ansari, M., Mishra, S. K., and Tiwari, S.(2009). In silico quantitative structure-toxicity relationship study of aromaticnitro compounds. Chem. Biol. Drug Des. 73, 537–544. doi: 10.1111/j.1747-0285.2009.00799.x
Rogers, D., and Hahn, M. (2010). Extended-connectivity fingerprints. J. Chem. Inf.Model. 50, 742–754. doi: 10.1021/ci100050t
Unterthiner, T., Mayr, A., Klambauer, G., and Hochreiter, S. (2015). ToxicityPrediction Using Deep Learning. Machine Learning. Available onlineat:http://arxiv.org/abs/1503.01445
Vogt, M., and Bajorath, J. (2008). Bayesian screening for active compoundsin high-dimensional chemical spaces combining property descriptors andmolecular fingerprints. Chem. Biol. Drug Des. 71, 8–14. doi: 10.1111/j.1747-0285.2007.00602.x
Weiss, B. (2012). The intersection of neurotoxicology and endocrine disruption.Neurotoxicology 33, 1410–1419. doi: 10.1016/j.neuro.2012.05.014
Xue, L., Godden, J. W., Stahura, F. L., and Bajorath, J. (2003).Design and evaluation of a molecular fingerprint involving the
Frontiers in Environmental Science | www.frontiersin.org July 2015 | Volume 3 | Article 5470
Drwal et al. Similarity-based Tox21 predictions
transformation of property descriptor values into a binary classificationscheme. J. Chem. Inf. Comput. Sci. 43, 1151–1157. doi: 10.1021/ci030285+
Yang, C. H., Tarkhov, A., Marusczyk, J., Bienfait, B., Gasteiger, J., Kleinoeder,T., et al. (2015a). New publicly available chemical query language, csrml,to support chemotype representations for application to data miningand modeling. J. Chem. Inf. Model. 55, 510–528. doi: 10.1021/ci500667v
Yang, P., Yang, Y. H., Zhou, B. B., and Zomaya, A. Y. (2015b). A Reviewof Ensemble Methods in Bioinformatics. Curr. Bioinform. 5, 296–308. doi:10.2174/157489310794072508
Conflict of Interest Statement: The authors declare that the research wasconducted in the absence of any commercial or financial relationships that couldbe construed as a potential conflict of interest.
Copyright © 2015 Drwal, Siramshetty, Banerjee, Goede, Preissner and Dunkel. Thisis an open-access article distributed under the terms of the Creative CommonsAttribution License (CC BY). The use, distribution or reproduction in other forumsis permitted, provided the original author(s) or licensor are credited and that theoriginal publication in this journal is cited, in accordance with accepted academicpractice. No use, distribution or reproduction is permitted which does not complywith these terms.
Frontiers in Environmental Science | www.frontiersin.org July 2015 | Volume 3 | Article 5471
Original Research Article
4.3 Computational Methods for Prediction of In Vitro Effects of New Chemical
Structures
Banerjee, P.†, Siramshetty, V. B.†, Drwal, M. N. and Preissner, R.
J Cheminform. 2016 Sep 29;8:51. https://doi.org/10.1186/s13321-016-0162-2.
† Banerjee, P. and Siramshetty V. B. are the joint first authors of this work.
Author Contributions:
Conception of the study: Banerjee, P., Siramshetty, V. B., Drwal, M. N. and Preissner, R.; Design of
the study: Banerjee, P. and Siramshetty, V. B.; Machine-learning methods: Banerjee, P.; Similarity-
based methods: Siramshetty, V. B.; Writing of manuscript: Siramshetty, V. B. and Banerjee, P.;
Project coordination: Drwal, M. N. and Preissner, R.
72
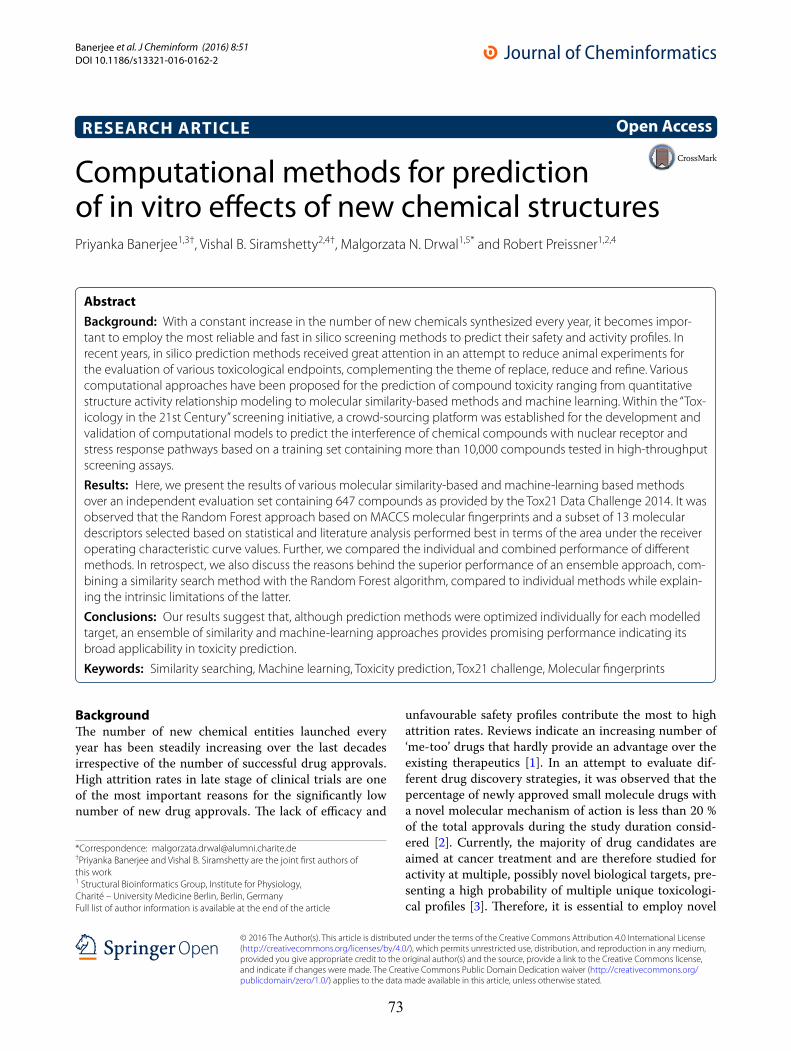
Banerjee et al. J Cheminform (2016) 8:51 DOI 10.1186/s13321-016-0162-2
RESEARCH ARTICLE
Computational methods for prediction of in vitro effects of new chemical structuresPriyanka Banerjee1,3†, Vishal B. Siramshetty2,4†, Malgorzata N. Drwal1,5* and Robert Preissner1,2,4
Abstract Background: With a constant increase in the number of new chemicals synthesized every year, it becomes impor-tant to employ the most reliable and fast in silico screening methods to predict their safety and activity profiles. In recent years, in silico prediction methods received great attention in an attempt to reduce animal experiments for the evaluation of various toxicological endpoints, complementing the theme of replace, reduce and refine. Various computational approaches have been proposed for the prediction of compound toxicity ranging from quantitative structure activity relationship modeling to molecular similarity-based methods and machine learning. Within the “Tox-icology in the 21st Century” screening initiative, a crowd-sourcing platform was established for the development and validation of computational models to predict the interference of chemical compounds with nuclear receptor and stress response pathways based on a training set containing more than 10,000 compounds tested in high-throughput screening assays.
Results: Here, we present the results of various molecular similarity-based and machine-learning based methods over an independent evaluation set containing 647 compounds as provided by the Tox21 Data Challenge 2014. It was observed that the Random Forest approach based on MACCS molecular fingerprints and a subset of 13 molecular descriptors selected based on statistical and literature analysis performed best in terms of the area under the receiver operating characteristic curve values. Further, we compared the individual and combined performance of different methods. In retrospect, we also discuss the reasons behind the superior performance of an ensemble approach, com-bining a similarity search method with the Random Forest algorithm, compared to individual methods while explain-ing the intrinsic limitations of the latter.
Conclusions: Our results suggest that, although prediction methods were optimized individually for each modelled target, an ensemble of similarity and machine-learning approaches provides promising performance indicating its broad applicability in toxicity prediction.
Keywords: Similarity searching, Machine learning, Toxicity prediction, Tox21 challenge, Molecular fingerprints
© 2016 The Author(s). This article is distributed under the terms of the Creative Commons Attribution 4.0 International License (http://creativecommons.org/licenses/by/4.0/), which permits unrestricted use, distribution, and reproduction in any medium, provided you give appropriate credit to the original author(s) and the source, provide a link to the Creative Commons license, and indicate if changes were made. The Creative Commons Public Domain Dedication waiver (http://creativecommons.org/publicdomain/zero/1.0/) applies to the data made available in this article, unless otherwise stated.
BackgroundThe number of new chemical entities launched every year has been steadily increasing over the last decades irrespective of the number of successful drug approvals. High attrition rates in late stage of clinical trials are one of the most important reasons for the significantly low number of new drug approvals. The lack of efficacy and
unfavourable safety profiles contribute the most to high attrition rates. Reviews indicate an increasing number of ‘me-too’ drugs that hardly provide an advantage over the existing therapeutics [1]. In an attempt to evaluate dif-ferent drug discovery strategies, it was observed that the percentage of newly approved small molecule drugs with a novel molecular mechanism of action is less than 20 % of the total approvals during the study duration consid-ered [2]. Currently, the majority of drug candidates are aimed at cancer treatment and are therefore studied for activity at multiple, possibly novel biological targets, pre-senting a high probability of multiple unique toxicologi-cal profiles [3]. Therefore, it is essential to employ novel
Open Access
*Correspondence: [email protected] †Priyanka Banerjee and Vishal B. Siramshetty are the joint first authors of this work1 Structural Bioinformatics Group, Institute for Physiology,Charité – University Medicine Berlin, Berlin, GermanyFull list of author information is available at the end of the article
73
Page 2 of 11Banerjee et al. J Cheminform (2016) 8:51
strategies that can predict the fate of the chemicals in early stages of development to overcome the failure rates and accelerate the development and approval of promis-ing candidates. Predictive toxicology, more commonly known as in silico toxicology, plays a key role in the opti-mization of hits by parallel investigation of safety and activity, thereby permitting a more efficient drug devel-opment process [4]. Along with in vitro assays, predictive toxicology received, in recent times, great attention as a method to evaluate various toxicological endpoints and reduce animal experiments, complementing the theme of replace, reduce and refine (3Rs) [5]. Additional factors that motivate the development of toxicological prediction methods include considerable progress with legislations in both the European Union and North America and the need for the reduction of costs involved in experimental testing of an increasing number of chemicals, as well as advances in the understanding of the biology and chem-istry of the active chemical compounds.
The early efforts for prediction of toxicity date back to the 1890s, as emphasized by the work of Richet [6], Meyer [7] and Overton [8] on the relationship between toxicity and solubility followed by their hypothesis that narcosis could be related to partitioning between water and oil phases. Since then, steady progress has been observed in predictive toxicology, highly complemented by advances in cheminformatics approaches such as quantitative structure–activity relationship (QSAR) modeling [9], physicochemical property and molecular descriptor based modeling [10, 11] and statistical meth-ods [12]. Later, a number of commercial and open-source expert systems have been developed for the prediction of pharmacokinetic parameters including TOPKAT® [13], ADMET Predictor™ [14], ADME-Tox Prediction [15], DEREK [16] and Toxicity Estimation Software Tools [17]. Machine learning methods have been widely used in the areas of bioactivity and ADMET (absorption, dis-tribution, metabolism, excretion and toxicity) properties prediction [18–23]. It has been demonstrated that mod-els built with machine learning methods which take into account high-dimensional descriptors are very successful and robust for external predictions [24, 25].
The US toxicology initiative, Toxicology in the 21st Century (Tox21), started in 2008, aims to develop fast and effective methods for large-scale assessment of toxicity in order to identify chemicals that could potentially tar-get various biological pathways within the human body and lead to toxicity [26]. The objectives of this initiative, after the initial screening, are to prioritize chemicals for further investigation of toxic effects and progres-sively build toxicity models as well as develop assays that measure responses of human pathways towards these chemicals. As a part of the screening initiative, a library
comprising more than 10,000 chemicals was screened in high-throughput assays against a panel of 12 different biological targets involved in two major groups of bio-chemical pathways: the nuclear receptor pathway and the stress response pathway. Further, during the Tox21 Data Challenge 2014 [27], the development of computational models which can predict the interference of these chem-icals in the two groups of pathways was crowd-sourced to researchers across the globe. Our previous work [28] illustrates the usefulness of a combination of chemical similarity and machine-learning approaches in predicting the activity of the Tox21 dataset with high accuracy for a majority of the targets considered in the challenge [29]. In this study, we present and discuss various computational methods, ranging from molecular similarity to different machine-learning approaches and their intrinsic limita-tions by comparing them with the best prediction models from our previous work [28] that ranked top among the submissions to the challenge. In order to keep the com-parison simple, we limit ourselves to a set of three tar-gets: aryl hydrocarbon receptor (AhR), estrogen nuclear receptor alpha ligand-binding domain (ER-LBD) and heat shock protein beta-1 (HSE). We also emphasize on the factors that can be attributed to a mixed performance of these models via illustration of example compounds.
ResultsWe compared the performance of four different algo-rithms as well as four different molecular fingerprints for the prediction of the AhR, ER-LBD and HSE assays for the Tox21 10 K compound library (for more details, see Additional file 1: Tables S1, S2). In particular, similarity-weighted k-nearest neighbors (kNN) approaches as well as three types of machine learning algorithms (Fig. 1) were investigated, as described in detail in the Methods section. In order to evaluate the performance of differ-ent fingerprints used as a hybrid fingerprint in our previ-ous work [28], we investigated MACCS [30], ECFP4 [31] and ToxPrint [32–34] fingerprints individually. While MACCS fingerprints are based on generic substructure keys, ToxPrint fingerprints encode generic substructures considering genotoxic carcinogen rules and structure-based thresholds relevant to toxicology. Extended con-nectivity fingerprints such as ECFP4 are based on the circular topology of molecules and have been designed for both similarity searching and structure–activity mod-eling. In addition, we chose to use ESTATE [35] finger-prints, to examine whether molecular fragments based on the electronic, topological and valence state indi-ces of atom types can help in prediction of toxic activ-ity. In addition to fingerprints alone, we also tested the concatenation of fingerprints with 13 selected molecular descriptors characterising the molecule’s topology and
74
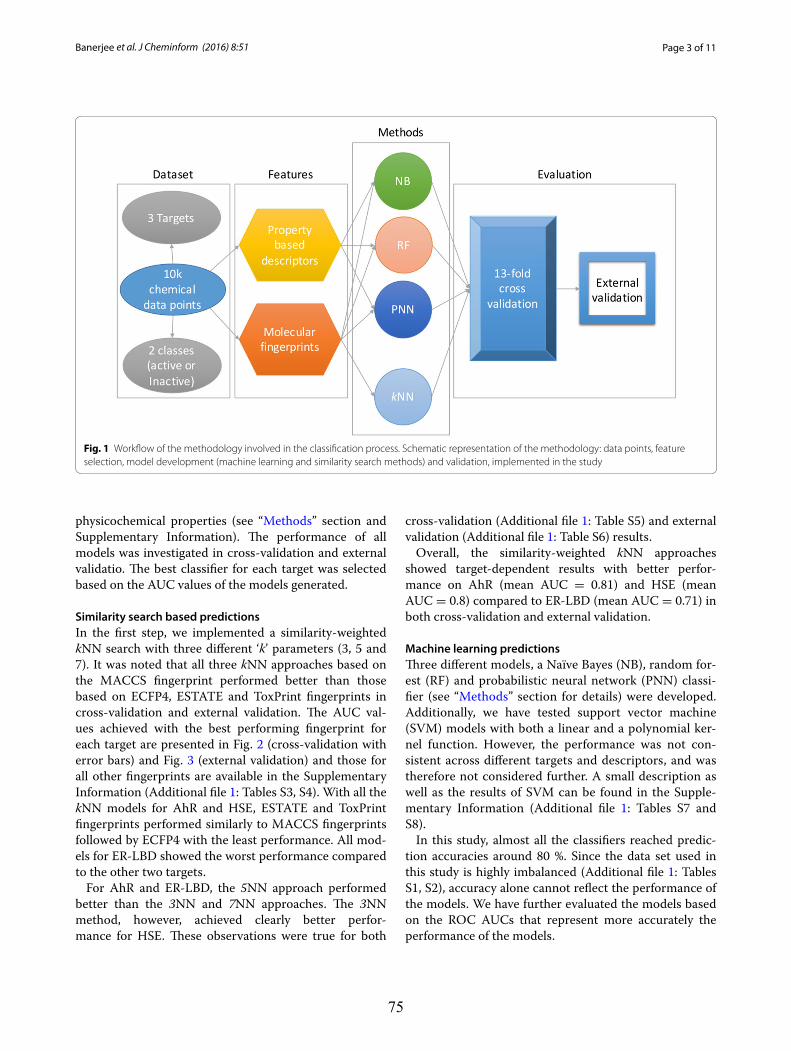
Page 3 of 11Banerjee et al. J Cheminform (2016) 8:51
physicochemical properties (see “Methods” section and Supplementary Information). The performance of all models was investigated in cross-validation and external validatio. The best classifier for each target was selected based on the AUC values of the models generated.
Similarity search based predictionsIn the first step, we implemented a similarity-weighted kNN search with three different ‘k’ parameters (3, 5 and 7). It was noted that all three kNN approaches based on the MACCS fingerprint performed better than those based on ECFP4, ESTATE and ToxPrint fingerprints in cross-validation and external validation. The AUC val-ues achieved with the best performing fingerprint for each target are presented in Fig. 2 (cross-validation with error bars) and Fig. 3 (external validation) and those for all other fingerprints are available in the Supplementary Information (Additional file 1: Tables S3, S4). With all the kNN models for AhR and HSE, ESTATE and ToxPrint fingerprints performed similarly to MACCS fingerprints followed by ECFP4 with the least performance. All mod-els for ER-LBD showed the worst performance compared to the other two targets.
For AhR and ER-LBD, the 5NN approach performed better than the 3NN and 7NN approaches. The 3NN method, however, achieved clearly better perfor-mance for HSE. These observations were true for both
cross-validation (Additional file 1: Table S5) and external validation (Additional file 1: Table S6) results.
Overall, the similarity-weighted kNN approaches showed target-dependent results with better perfor-mance on AhR (mean AUC = 0.81) and HSE (mean AUC = 0.8) compared to ER-LBD (mean AUC = 0.71) in both cross-validation and external validation.
Machine learning predictionsThree different models, a Naïve Bayes (NB), random for-est (RF) and probabilistic neural network (PNN) classi-fier (see “Methods” section for details) were developed. Additionally, we have tested support vector machine (SVM) models with both a linear and a polynomial ker-nel function. However, the performance was not con-sistent across different targets and descriptors, and was therefore not considered further. A small description as well as the results of SVM can be found in the Supple-mentary Information (Additional file 1: Tables S7 and S8).
In this study, almost all the classifiers reached predic-tion accuracies around 80 %. Since the data set used in this study is highly imbalanced (Additional file 1: Tables S1, S2), accuracy alone cannot reflect the performance of the models. We have further evaluated the models based on the ROC AUCs that represent more accurately the performance of the models.
Fig. 1 Workflow of the methodology involved in the classification process. Schematic representation of the methodology: data points, feature selection, model development (machine learning and similarity search methods) and validation, implemented in the study
75
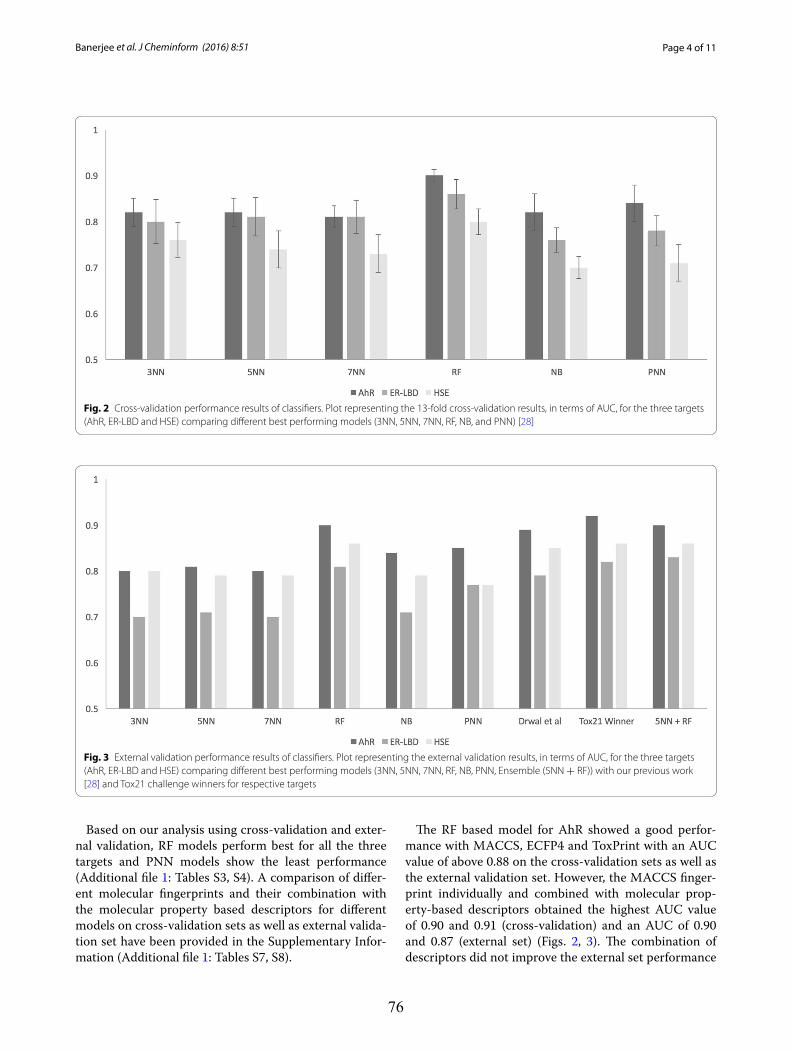
Page 4 of 11Banerjee et al. J Cheminform (2016) 8:51
Based on our analysis using cross-validation and exter-nal validation, RF models perform best for all the three targets and PNN models show the least performance (Additional file 1: Tables S3, S4). A comparison of differ-ent molecular fingerprints and their combination with the molecular property based descriptors for different models on cross-validation sets as well as external valida-tion set have been provided in the Supplementary Infor-mation (Additional file 1: Tables S7, S8).
The RF based model for AhR showed a good perfor-mance with MACCS, ECFP4 and ToxPrint with an AUC value of above 0.88 on the cross-validation sets as well as the external validation set. However, the MACCS finger-print individually and combined with molecular prop-erty-based descriptors obtained the highest AUC value of 0.90 and 0.91 (cross-validation) and an AUC of 0.90 and 0.87 (external set) (Figs. 2, 3). The combination of descriptors did not improve the external set performance
Fig. 2 Cross-validation performance results of classifiers. Plot representing the 13-fold cross-validation results, in terms of AUC, for the three targets (AhR, ER-LBD and HSE) comparing different best performing models (3NN, 5NN, 7NN, RF, NB, and PNN) [28]
Fig. 3 External validation performance results of classifiers. Plot representing the external validation results, in terms of AUC, for the three targets (AhR, ER-LBD and HSE) comparing different best performing models (3NN, 5NN, 7NN, RF, NB, PNN, Ensemble (5NN + RF)) with our previous work [28] and Tox21 challenge winners for respective targets
76
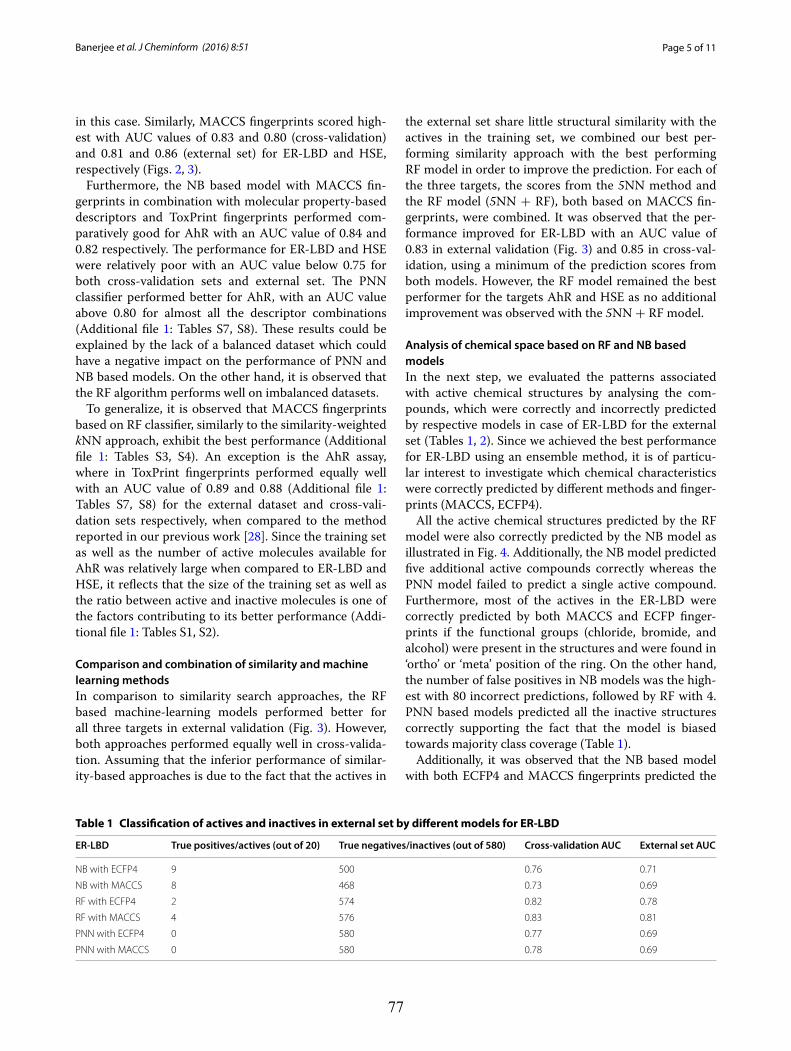
Page 5 of 11Banerjee et al. J Cheminform (2016) 8:51
in this case. Similarly, MACCS fingerprints scored high-est with AUC values of 0.83 and 0.80 (cross-validation) and 0.81 and 0.86 (external set) for ER-LBD and HSE, respectively (Figs. 2, 3).
Furthermore, the NB based model with MACCS fin-gerprints in combination with molecular property-based descriptors and ToxPrint fingerprints performed com-paratively good for AhR with an AUC value of 0.84 and 0.82 respectively. The performance for ER-LBD and HSE were relatively poor with an AUC value below 0.75 for both cross-validation sets and external set. The PNN classifier performed better for AhR, with an AUC value above 0.80 for almost all the descriptor combinations (Additional file 1: Tables S7, S8). These results could be explained by the lack of a balanced dataset which could have a negative impact on the performance of PNN and NB based models. On the other hand, it is observed that the RF algorithm performs well on imbalanced datasets.
To generalize, it is observed that MACCS fingerprints based on RF classifier, similarly to the similarity-weighted kNN approach, exhibit the best performance (Additional file 1: Tables S3, S4). An exception is the AhR assay, where in ToxPrint fingerprints performed equally well with an AUC value of 0.89 and 0.88 (Additional file 1: Tables S7, S8) for the external dataset and cross-vali-dation sets respectively, when compared to the method reported in our previous work [28]. Since the training set as well as the number of active molecules available for AhR was relatively large when compared to ER-LBD and HSE, it reflects that the size of the training set as well as the ratio between active and inactive molecules is one of the factors contributing to its better performance (Addi-tional file 1: Tables S1, S2).
Comparison and combination of similarity and machine learning methodsIn comparison to similarity search approaches, the RF based machine-learning models performed better for all three targets in external validation (Fig. 3). However, both approaches performed equally well in cross-valida-tion. Assuming that the inferior performance of similar-ity-based approaches is due to the fact that the actives in
the external set share little structural similarity with the actives in the training set, we combined our best per-forming similarity approach with the best performing RF model in order to improve the prediction. For each of the three targets, the scores from the 5NN method and the RF model (5NN + RF), both based on MACCS fin-gerprints, were combined. It was observed that the per-formance improved for ER-LBD with an AUC value of 0.83 in external validation (Fig. 3) and 0.85 in cross-val-idation, using a minimum of the prediction scores from both models. However, the RF model remained the best performer for the targets AhR and HSE as no additional improvement was observed with the 5NN + RF model.
Analysis of chemical space based on RF and NB based modelsIn the next step, we evaluated the patterns associated with active chemical structures by analysing the com-pounds, which were correctly and incorrectly predicted by respective models in case of ER-LBD for the external set (Tables 1, 2). Since we achieved the best performance for ER-LBD using an ensemble method, it is of particu-lar interest to investigate which chemical characteristics were correctly predicted by different methods and finger-prints (MACCS, ECFP4).
All the active chemical structures predicted by the RF model were also correctly predicted by the NB model as illustrated in Fig. 4. Additionally, the NB model predicted five additional active compounds correctly whereas the PNN model failed to predict a single active compound. Furthermore, most of the actives in the ER-LBD were correctly predicted by both MACCS and ECFP finger-prints if the functional groups (chloride, bromide, and alcohol) were present in the structures and were found in ‘ortho’ or ‘meta’ position of the ring. On the other hand, the number of false positives in NB models was the high-est with 80 incorrect predictions, followed by RF with 4. PNN based models predicted all the inactive structures correctly supporting the fact that the model is biased towards majority class coverage (Table 1).
Additionally, it was observed that the NB based model with both ECFP4 and MACCS fingerprints predicted the
Table 1 Classification of actives and inactives in external set by different models for ER-LBD
ER-LBD True positives/actives (out of 20) True negatives/inactives (out of 580) Cross-validation AUC External set AUC
NB with ECFP4 9 500 0.76 0.71
NB with MACCS 8 468 0.73 0.69
RF with ECFP4 2 574 0.82 0.78
RF with MACCS 4 576 0.83 0.81
PNN with ECFP4 0 580 0.77 0.69
PNN with MACCS 0 580 0.78 0.69
77
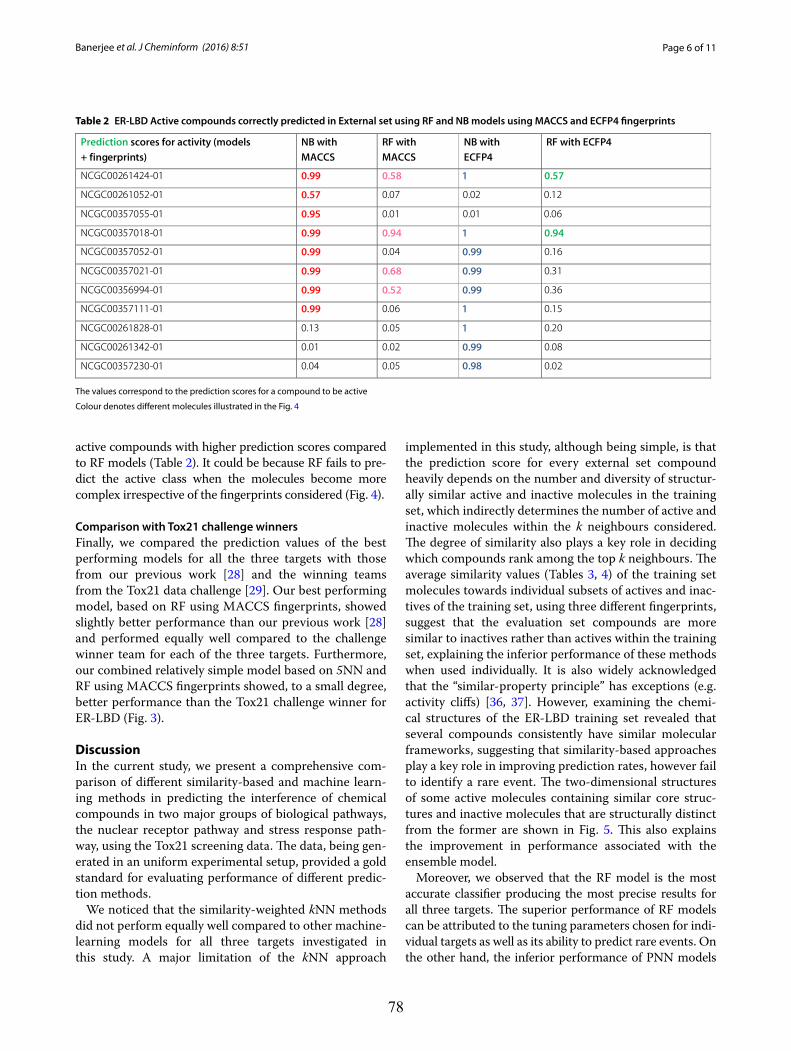
Page 6 of 11Banerjee et al. J Cheminform (2016) 8:51
active compounds with higher prediction scores compared to RF models (Table 2). It could be because RF fails to pre-dict the active class when the molecules become more complex irrespective of the fingerprints considered (Fig. 4).
Comparison with Tox21 challenge winnersFinally, we compared the prediction values of the best performing models for all the three targets with those from our previous work [28] and the winning teams from the Tox21 data challenge [29]. Our best performing model, based on RF using MACCS fingerprints, showed slightly better performance than our previous work [28] and performed equally well compared to the challenge winner team for each of the three targets. Furthermore, our combined relatively simple model based on 5NN and RF using MACCS fingerprints showed, to a small degree, better performance than the Tox21 challenge winner for ER-LBD (Fig. 3).
DiscussionIn the current study, we present a comprehensive com-parison of different similarity-based and machine learn-ing methods in predicting the interference of chemical compounds in two major groups of biological pathways, the nuclear receptor pathway and stress response path-way, using the Tox21 screening data. The data, being gen-erated in an uniform experimental setup, provided a gold standard for evaluating performance of different predic-tion methods.
We noticed that the similarity-weighted kNN methods did not perform equally well compared to other machine-learning models for all three targets investigated in this study. A major limitation of the kNN approach
implemented in this study, although being simple, is that the prediction score for every external set compound heavily depends on the number and diversity of structur-ally similar active and inactive molecules in the training set, which indirectly determines the number of active and inactive molecules within the k neighbours considered. The degree of similarity also plays a key role in deciding which compounds rank among the top k neighbours. The average similarity values (Tables 3, 4) of the training set molecules towards individual subsets of actives and inac-tives of the training set, using three different fingerprints, suggest that the evaluation set compounds are more similar to inactives rather than actives within the training set, explaining the inferior performance of these methods when used individually. It is also widely acknowledged that the “similar-property principle” has exceptions (e.g. activity cliffs) [36, 37]. However, examining the chemi-cal structures of the ER-LBD training set revealed that several compounds consistently have similar molecular frameworks, suggesting that similarity-based approaches play a key role in improving prediction rates, however fail to identify a rare event. The two-dimensional structures of some active molecules containing similar core struc-tures and inactive molecules that are structurally distinct from the former are shown in Fig. 5. This also explains the improvement in performance associated with the ensemble model.
Moreover, we observed that the RF model is the most accurate classifier producing the most precise results for all three targets. The superior performance of RF models can be attributed to the tuning parameters chosen for indi-vidual targets as well as its ability to predict rare events. On the other hand, the inferior performance of PNN models
Table 2 ER-LBD Active compounds correctly predicted in External set using RF and NB models using MACCS and ECFP4 fingerprints
Prediction scores for activity (models + fingerprints)
NB with MACCS
RF with MACCS
NB with ECFP4
RF with ECFP4
NCGC00261424-01 0.99 0.58 1 0.57
NCGC00261052-01 0.57
NCGC003 57 055-01 0.95
0.07 0.02 0.12
0.01 0.01 0.06
NCGC00357018-01 0.99 0.94 1 0.94
NCGC00357052-01 0.99 0.04 0.99 0.16
NCGC00357021-01 0.99 0.68 0.99 0.31
NCGC00356 994-01 0.99 0.52 0.99 0.36
NCGC00357111-01 0.99 0.06 1 0.15
NCGC0026 1828-01 0.13 0.05 1 0.20
NCGC0026 1342-01 0.01 0.02 0.99 0.08
NCGC00357230-01 0.04 0.05 0.98 0.02
The values correspond to the prediction scores for a compound to be active
Colour denotes different molecules illustrated in the Fig. 4
78
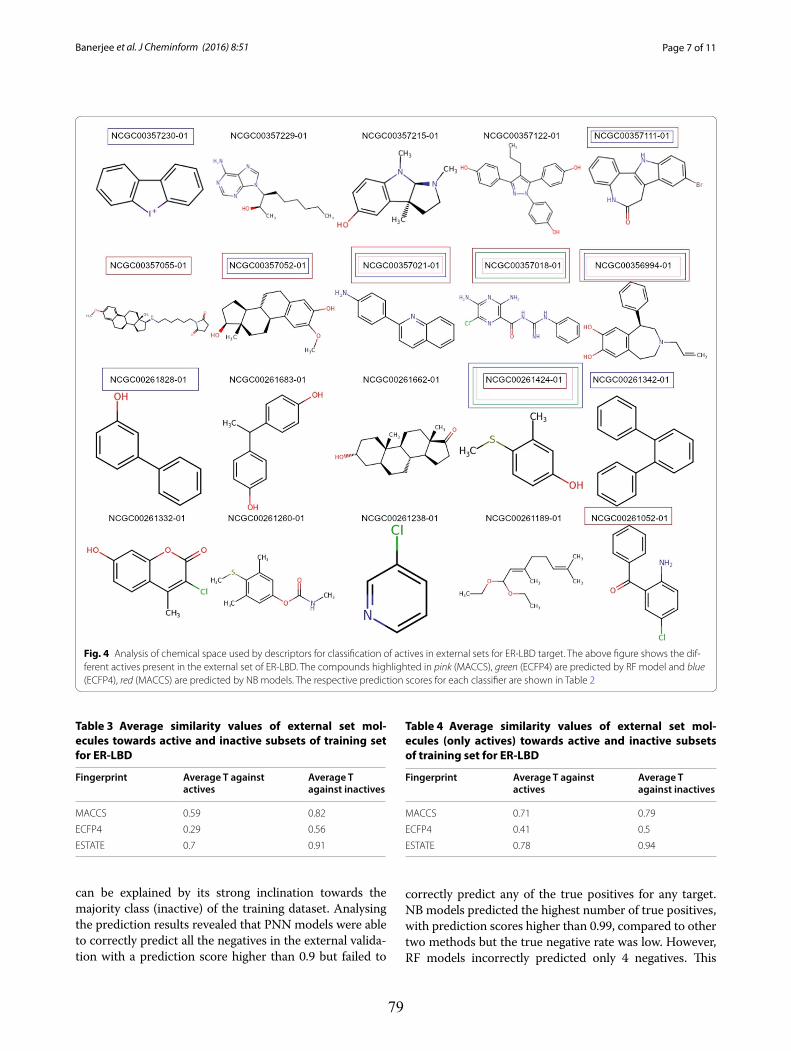
Page 7 of 11Banerjee et al. J Cheminform (2016) 8:51
can be explained by its strong inclination towards the majority class (inactive) of the training dataset. Analysing the prediction results revealed that PNN models were able to correctly predict all the negatives in the external valida-tion with a prediction score higher than 0.9 but failed to
correctly predict any of the true positives for any target. NB models predicted the highest number of true positives, with prediction scores higher than 0.99, compared to other two methods but the true negative rate was low. However, RF models incorrectly predicted only 4 negatives. This
Fig. 4 Analysis of chemical space used by descriptors for classification of actives in external sets for ER-LBD target. The above figure shows the dif-ferent actives present in the external set of ER-LBD. The compounds highlighted in pink (MACCS), green (ECFP4) are predicted by RF model and blue (ECFP4), red (MACCS) are predicted by NB models. The respective prediction scores for each classifier are shown in Table 2
Table 3 Average similarity values of external set mol-ecules towards active and inactive subsets of training set for ER-LBD
Fingerprint Average T against actives
Average T against inactives
MACCS 0.59 0.82
ECFP4 0.29 0.56
ESTATE 0.7 0.91
Table 4 Average similarity values of external set mol-ecules (only actives) towards active and inactive subsets of training set for ER-LBD
Fingerprint Average T against actives
Average T against inactives
MACCS 0.71 0.79
ECFP4 0.41 0.5
ESTATE 0.78 0.94
79
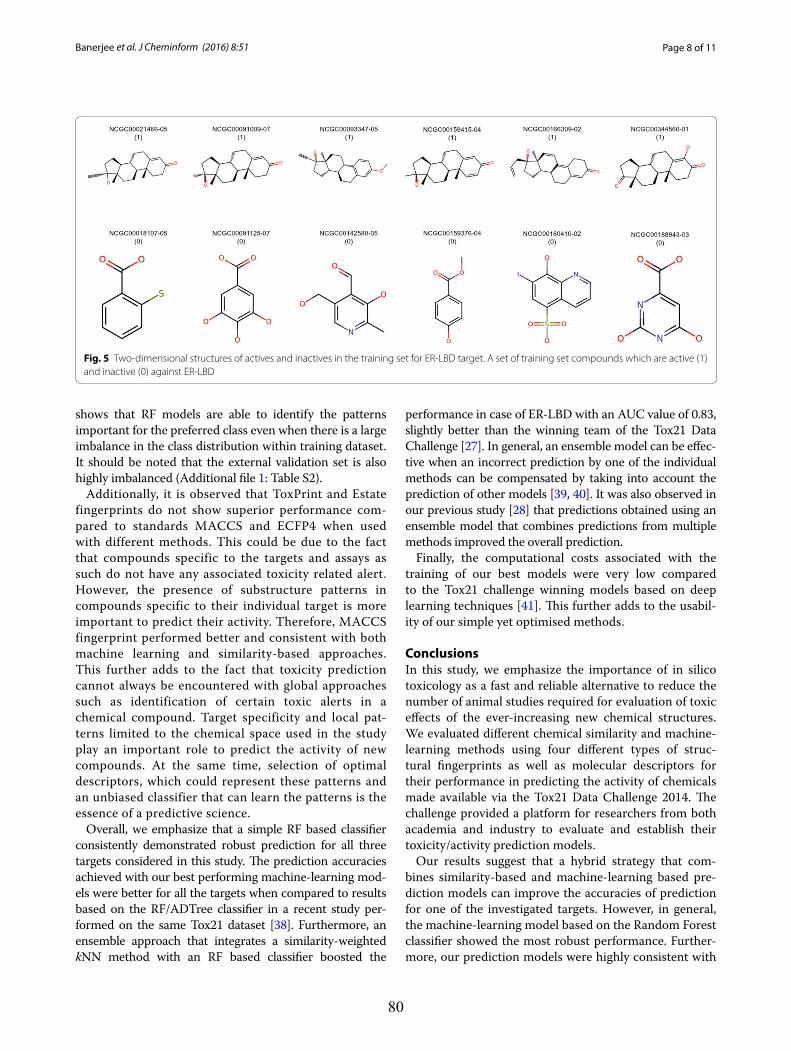
Page 8 of 11Banerjee et al. J Cheminform (2016) 8:51
shows that RF models are able to identify the patterns important for the preferred class even when there is a large imbalance in the class distribution within training dataset. It should be noted that the external validation set is also highly imbalanced (Additional file 1: Table S2).
Additionally, it is observed that ToxPrint and Estate fingerprints do not show superior performance com-pared to standards MACCS and ECFP4 when used with different methods. This could be due to the fact that compounds specific to the targets and assays as such do not have any associated toxicity related alert. However, the presence of substructure patterns in compounds specific to their individual target is more important to predict their activity. Therefore, MACCS fingerprint performed better and consistent with both machine learning and similarity-based approaches. This further adds to the fact that toxicity prediction cannot always be encountered with global approaches such as identification of certain toxic alerts in a chemical compound. Target specificity and local pat-terns limited to the chemical space used in the study play an important role to predict the activity of new compounds. At the same time, selection of optimal descriptors, which could represent these patterns and an unbiased classifier that can learn the patterns is the essence of a predictive science.
Overall, we emphasize that a simple RF based classifier consistently demonstrated robust prediction for all three targets considered in this study. The prediction accuracies achieved with our best performing machine-learning mod-els were better for all the targets when compared to results based on the RF/ADTree classifier in a recent study per-formed on the same Tox21 dataset [38]. Furthermore, an ensemble approach that integrates a similarity-weighted kNN method with an RF based classifier boosted the
performance in case of ER-LBD with an AUC value of 0.83, slightly better than the winning team of the Tox21 Data Challenge [27]. In general, an ensemble model can be effec-tive when an incorrect prediction by one of the individual methods can be compensated by taking into account the prediction of other models [39, 40]. It was also observed in our previous study [28] that predictions obtained using an ensemble model that combines predictions from multiple methods improved the overall prediction.
Finally, the computational costs associated with the training of our best models were very low compared to the Tox21 challenge winning models based on deep learning techniques [41]. This further adds to the usabil-ity of our simple yet optimised methods.
ConclusionsIn this study, we emphasize the importance of in silico toxicology as a fast and reliable alternative to reduce the number of animal studies required for evaluation of toxic effects of the ever-increasing new chemical structures. We evaluated different chemical similarity and machine-learning methods using four different types of struc-tural fingerprints as well as molecular descriptors for their performance in predicting the activity of chemicals made available via the Tox21 Data Challenge 2014. The challenge provided a platform for researchers from both academia and industry to evaluate and establish their toxicity/activity prediction models.
Our results suggest that a hybrid strategy that com-bines similarity-based and machine-learning based pre-diction models can improve the accuracies of prediction for one of the investigated targets. However, in general, the machine-learning model based on the Random Forest classifier showed the most robust performance. Further-more, our prediction models were highly consistent with
Fig. 5 Two-dimensional structures of actives and inactives in the training set for ER-LBD target. A set of training set compounds which are active (1) and inactive (0) against ER-LBD
80
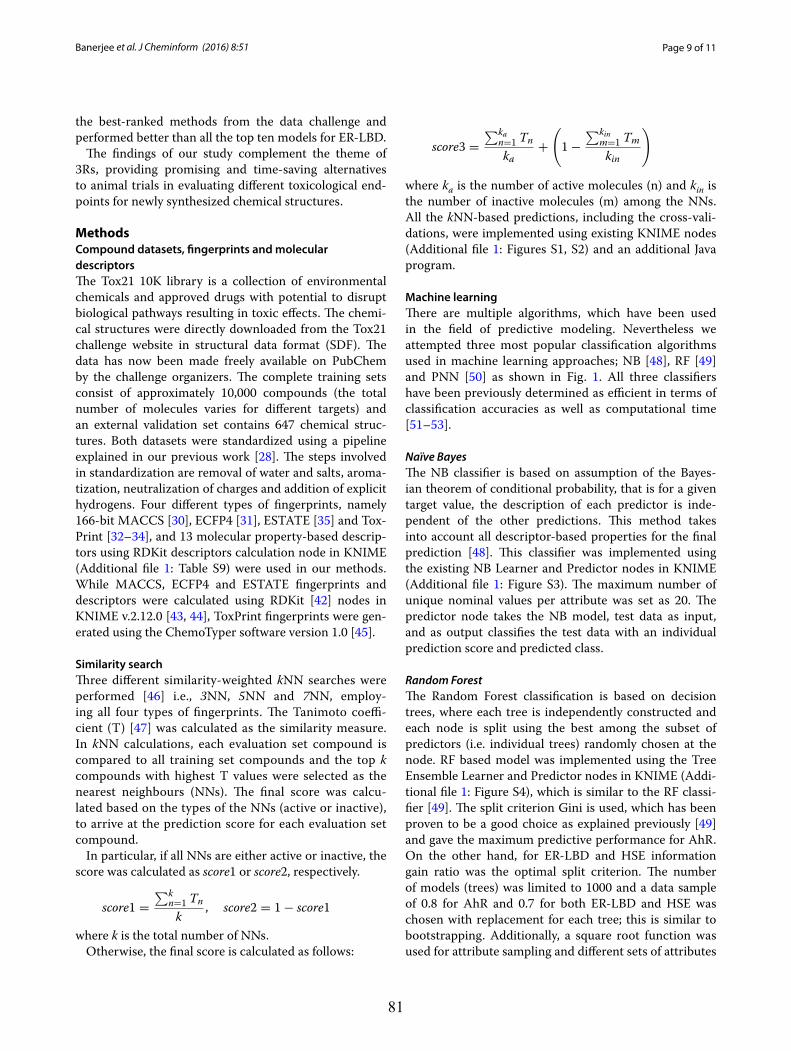
Page 9 of 11Banerjee et al. J Cheminform (2016) 8:51
the best-ranked methods from the data challenge and performed better than all the top ten models for ER-LBD.
The findings of our study complement the theme of 3Rs, providing promising and time-saving alternatives to animal trials in evaluating different toxicological end-points for newly synthesized chemical structures.
MethodsCompound datasets, fingerprints and molecular descriptorsThe Tox21 10K library is a collection of environmental chemicals and approved drugs with potential to disrupt biological pathways resulting in toxic effects. The chemi-cal structures were directly downloaded from the Tox21 challenge website in structural data format (SDF). The data has now been made freely available on PubChem by the challenge organizers. The complete training sets consist of approximately 10,000 compounds (the total number of molecules varies for different targets) and an external validation set contains 647 chemical struc-tures. Both datasets were standardized using a pipeline explained in our previous work [28]. The steps involved in standardization are removal of water and salts, aroma-tization, neutralization of charges and addition of explicit hydrogens. Four different types of fingerprints, namely 166-bit MACCS [30], ECFP4 [31], ESTATE [35] and Tox-Print [32–34], and 13 molecular property-based descrip-tors using RDKit descriptors calculation node in KNIME(Additional file 1: Table S9) were used in our methods.While MACCS, ECFP4 and ESTATE fingerprints anddescriptors were calculated using RDKit [42] nodes inKNIME v.2.12.0 [43, 44], ToxPrint fingerprints were gen-erated using the ChemoTyper software version 1.0 [45].
Similarity searchThree different similarity-weighted kNN searches were performed [46] i.e., 3NN, 5NN and 7NN, employ-ing all four types of fingerprints. The Tanimoto coeffi-cient (T) [47] was calculated as the similarity measure. In kNN calculations, each evaluation set compound is compared to all training set compounds and the top k compounds with highest T values were selected as the nearest neighbours (NNs). The final score was calcu-lated based on the types of the NNs (active or inactive), to arrive at the prediction score for each evaluation set compound.
In particular, if all NNs are either active or inactive, the score was calculated as score1 or score2, respectively.
where k is the total number of NNs.Otherwise, the final score is calculated as follows:
score1 =
!kn=1 Tn
k, score2 = 1 − score1
where ka is the number of active molecules (n) and kin is the number of inactive molecules (m) among the NNs. All the kNN-based predictions, including the cross-vali-dations, were implemented using existing KNIME nodes (Additional file 1: Figures S1, S2) and an additional Java program.
Machine learningThere are multiple algorithms, which have been used in the field of predictive modeling. Nevertheless we attempted three most popular classification algorithms used in machine learning approaches; NB [48], RF [49] and PNN [50] as shown in Fig. 1. All three classifiers have been previously determined as efficient in terms of classification accuracies as well as computational time [51–53].
Naïve BayesThe NB classifier is based on assumption of the Bayes-ian theorem of conditional probability, that is for a given target value, the description of each predictor is inde-pendent of the other predictions. This method takes into account all descriptor-based properties for the final prediction [48]. This classifier was implemented using the existing NB Learner and Predictor nodes in KNIME (Additional file 1: Figure S3). The maximum number of unique nominal values per attribute was set as 20. The predictor node takes the NB model, test data as input, and as output classifies the test data with an individual prediction score and predicted class.
Random ForestThe Random Forest classification is based on decision trees, where each tree is independently constructed and each node is split using the best among the subset of predictors (i.e. individual trees) randomly chosen at the node. RF based model was implemented using the Tree Ensemble Learner and Predictor nodes in KNIME (Addi-tional file 1: Figure S4), which is similar to the RF classi-fier [49]. The split criterion Gini is used, which has been proven to be a good choice as explained previously [49] and gave the maximum predictive performance for AhR. On the other hand, for ER-LBD and HSE information gain ratio was the optimal split criterion. The number of models (trees) was limited to 1000 and a data sample of 0.8 for AhR and 0.7 for both ER-LBD and HSE was chosen with replacement for each tree; this is similar to bootstrapping. Additionally, a square root function was used for attribute sampling and different sets of attributes
score3 =
!kan=1 Tn
ka+
"
1 −
!kinm=1 Tm
kin
#
81
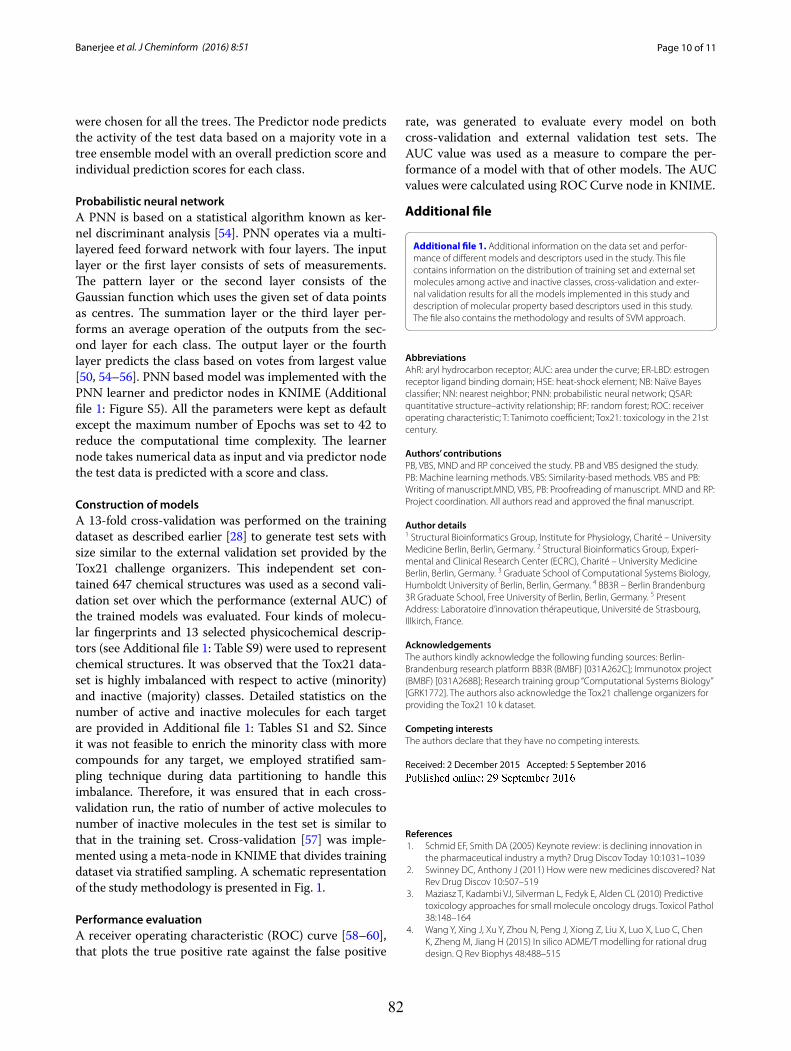
Page 10 of 11Banerjee et al. J Cheminform (2016) 8:51
were chosen for all the trees. The Predictor node predicts the activity of the test data based on a majority vote in a tree ensemble model with an overall prediction score and individual prediction scores for each class.
Probabilistic neural networkA PNN is based on a statistical algorithm known as ker-nel discriminant analysis [54]. PNN operates via a multi-layered feed forward network with four layers. The input layer or the first layer consists of sets of measurements. The pattern layer or the second layer consists of the Gaussian function which uses the given set of data points as centres. The summation layer or the third layer per-forms an average operation of the outputs from the sec-ond layer for each class. The output layer or the fourth layer predicts the class based on votes from largest value [50, 54–56]. PNN based model was implemented with the PNN learner and predictor nodes in KNIME (Additional file 1: Figure S5). All the parameters were kept as default except the maximum number of Epochs was set to 42 to reduce the computational time complexity. The learner node takes numerical data as input and via predictor node the test data is predicted with a score and class.
Construction of modelsA 13-fold cross-validation was performed on the training dataset as described earlier [28] to generate test sets with size similar to the external validation set provided by the Tox21 challenge organizers. This independent set con-tained 647 chemical structures was used as a second vali-dation set over which the performance (external AUC) of the trained models was evaluated. Four kinds of molecu-lar fingerprints and 13 selected physicochemical descrip-tors (see Additional file 1: Table S9) were used to represent chemical structures. It was observed that the Tox21 data-set is highly imbalanced with respect to active (minority) and inactive (majority) classes. Detailed statistics on the number of active and inactive molecules for each target are provided in Additional file 1: Tables S1 and S2. Since it was not feasible to enrich the minority class with more compounds for any target, we employed stratified sam-pling technique during data partitioning to handle this imbalance. Therefore, it was ensured that in each cross-validation run, the ratio of number of active molecules to number of inactive molecules in the test set is similar to that in the training set. Cross-validation [57] was imple-mented using a meta-node in KNIME that divides training dataset via stratified sampling. A schematic representation of the study methodology is presented in Fig. 1.
Performance evaluationA receiver operating characteristic (ROC) curve [58–60], that plots the true positive rate against the false positive
rate, was generated to evaluate every model on both cross-validation and external validation test sets. The AUC value was used as a measure to compare the per-formance of a model with that of other models. The AUC values were calculated using ROC Curve node in KNIME.
AbbreviationsAhR: aryl hydrocarbon receptor; AUC: area under the curve; ER-LBD: estrogen receptor ligand binding domain; HSE: heat-shock element; NB: Naїve Bayes classifier; NN: nearest neighbor; PNN: probabilistic neural network; QSAR: quantitative structure–activity relationship; RF: random forest; ROC: receiver operating characteristic; T: Tanimoto coefficient; Tox21: toxicology in the 21st century.
Authors’ contributionsPB, VBS, MND and RP conceived the study. PB and VBS designed the study. PB: Machine learning methods. VBS: Similarity-based methods. VBS and PB: Writing of manuscript.MND, VBS, PB: Proofreading of manuscript. MND and RP: Project coordination. All authors read and approved the final manuscript.
Author details1 Structural Bioinformatics Group, Institute for Physiology, Charité – University Medicine Berlin, Berlin, Germany. 2 Structural Bioinformatics Group, Experi-mental and Clinical Research Center (ECRC), Charité – University Medicine Berlin, Berlin, Germany. 3 Graduate School of Computational Systems Biology, Humboldt University of Berlin, Berlin, Germany. 4 BB3R – Berlin Brandenburg 3R Graduate School, Free University of Berlin, Berlin, Germany. 5 Present Address: Laboratoire d’innovation thérapeutique, Université de Strasbourg, Illkirch, France.
AcknowledgementsThe authors kindly acknowledge the following funding sources: Berlin-Brandenburg research platform BB3R (BMBF) [031A262C]; Immunotox project (BMBF) [031A268B]; Research training group “Computational Systems Biology” [GRK1772]. The authors also acknowledge the Tox21 challenge organizers for providing the Tox21 10 k dataset.
Competing interestsThe authors declare that they have no competing interests.
Received: 2 December 2015 Accepted: 5 September 2016
References 1. Schmid EF, Smith DA (2005) Keynote review: is declining innovation in
the pharmaceutical industry a myth? Drug Discov Today 10:1031–1039 2. Swinney DC, Anthony J (2011) How were new medicines discovered? Nat
Rev Drug Discov 10:507–519 3. Maziasz T, Kadambi VJ, Silverman L, Fedyk E, Alden CL (2010) Predictive
toxicology approaches for small molecule oncology drugs. Toxicol Pathol 38:148–164
4. Wang Y, Xing J, Xu Y, Zhou N, Peng J, Xiong Z, Liu X, Luo X, Luo C, Chen K, Zheng M, Jiang H (2015) In silico ADME/T modelling for rational drug design. Q Rev Biophys 48:488–515
Additional file
Additional file 1. Additional information on the data set and perfor-mance of different models and descriptors used in the study. This file contains information on the distribution of training set and external set molecules among active and inactive classes, cross-validation and exter-nal validation results for all the models implemented in this study and description of molecular property based descriptors used in this study. The file also contains the methodology and results of SVM approach.
82
Page 11 of 11Banerjee et al. J Cheminform (2016) 8:51
5. Vedani A, Smiesko M (2009) In silico toxicology in drug discovery—concepts based on three-dimensional models. Altern Lab Anim ATLA 37:477–496
6. Pliska V, Testa B, van de Waterbeemd H (eds) (1996) Lipophilicity in drug action and toxicology, vol 134. VCH Publishers, Weinheim, pp 49–71
7. Giuliano KA (1995) Aqueous two-phase partitioning. Physical chemistry and bioanalytical applications. FEBS Lett 98:98–102
8. Kubinyi H (1976) Quantitative structure–activity relationships. 2. A mixed approach, based on Hansch and free-Wilson analysis. J Med Chem 19:587–600
9. Hansch C, Hoekman D, Leo A, Zhang L, Li P (1995) The expanding role of quantitative structure–activity relationships (QSAR) in toxicology. Toxicol Lett 79:45–53
10. Todeschini R, Consonni V (2000) Handbook of molecular descriptors. New York 11:688
11. Sheppard S (2001) Handbook of property estimation methods for chemi-cals, environmental and health sciences, vol 30. Lewis Publishers/CRC Press LLC, Boca Raton, Florida
12. Livingstone DJ (1994) Computational techniques for the prediction of toxicity. Toxicol Vitro 8:873–877
13. TOPKAT (TOxicity Prediction by Komputer Assisted Technology). http://accelrys.com/
14. ADMET Predictor™ (Simulations Plus, Inc., USA). http://www.simulations-plus.com/
15. ADME-Tox Prediction (Advanced Chemistry Development, Inc., Canada). http://www.acdlabs.com/
16. DEREK (Lhasa Limited). http://www.lhasalimited.org/ 17. Toxicity Estimation Software Tools (U.S. Environmental Pro-
tection Agency). http://www2.epa.gov/chemical-research/toxicity-estimation-software-tool-test
18. Mitchell JBO (2014) Machine learning methods in chemoinformatics. Wiley Interdiscip Rev Comput Mol Sci 4:468–481
19. Hansen K (2012) Novel machine learning methods for computational chemistry. PhD thesis, Technical University of Berlin, Berlin. https://deposi-tonce.tu-berlin.de/bitstream/11303/3606/1/Dokument_30.pdf
20. Lavecchia A (2015) Machine-learning approaches in drug discovery: methods and applications. Drug Discov Today 20:318–331
21. Judson R, Elloumi F, Setzer RW, Li Z, Shah I (2008) A comparison of machine learning algorithms for chemical toxicity classification using a simulated multi-scale data model. BMC Bioinform 9:241
22. Kurczab R, Smusz S, Bojarski A (2011) Evaluation of different machine learning methods for ligand-based virtual screening. J Cheminform 3(Suppl 1):P41
23. Webb SJ, Hanser T, Howlin B, Krause P, Vessey JD (2014) Feature com-bination networks for the interpretation of statistical machine learning models: application to Ames mutagenicity. J Cheminform 6:8
24. Melville JL, Burke EK, Hirst JD (2009) Machine learning in virtual screening. Comb Chem High Throughput Screen 12:332–343
25. Varnek A, Baskin I (2012) Machine learning methods for property prediction in chemoinformatics: Quo Vadis? J Chem Inf Model 52:1413–1437
26. Krewski D, Acosta D, Andersen M, Anderson H, Bailar JC, Boekelheide K, Brent R, Charnley G, Cheung VG, Green S, Kelsey KT, Kerkvliet NI, Li AA, McCray L, Meyer O, Patterson RD, Pennie W, Scala RA, Solomon GM, Stephens M, Yager J, Zeise L (2010) Toxicity testing in the 21st century: a vision and a strategy. J Toxicol Environ Health B 13:51–138
27. Huang R, Xia M, Nguyen D, Zhao T, Sakamuru S (2016) Tox21 challenge to build predictive models of nuclear receptor and stress response path-ways as mediated by exposure to environmental chemicals and drugs. Front Environ Sci 3:1–9
28. Drwal MN, Siramshetty VB, Banerjee P, Goede A, Preissner R, Dunkel M (2015) Molecular similarity-based predictions of the Tox21 screening outcome. Front Environ Sci 3(July):1–9
29. Tox21 Data Challenge 2014. https://tripod.nih.gov/tox21/challenge/lead-erboard.jsp
30. MACCS Structural keys; Accelrys: San Diego, CA, 2011. http://accelrys.com/ 31. Rogers D, Hahn M (2010) Extended-connectivity fingerprints. J Chem Inf
Model 50:742–754 32. ToxPrint. https://toxprint.org/ 33. Ashby J, Tennant RW (1988) Chemical structure, Salmonella mutagenicity
and extent of carcinogenicity as indicators of genotoxic carcinogenesis
among 222 chemicals tested in rodents by the U.S. NCI/NTP. Mutat Res 204:17–115
34. Kroes R, Renwick AG, Cheeseman M, Kleiner J, Mangelsdorf I, Piersma A, Schilter B, Schlatter J, van Schothorst F, Vos JG, Würtzen G (2004) Euro-pean branch of the International Life Sciences Institute: structure-based thresholds of toxicological concern (TTC): guidance for application to substances present at low levels in the diet. Food Chem Toxicol 42:65–83
35. Hall LH, Kier LB (1995) Electrotopological state indices for atom types: a novel combination of electronic, topological, and valence state informa-tion. J Chem Inf Model 35:1039–1045
36. Johnson M, Basak S, Maggiora G (1988) A characterization of molecu-lar similarity methods for property prediction. Math Comput Model 11:630–634
37. Maggiora G, Vogt M, Stumpfe D, Bajorath J (2014) Molecular similarity in medicinal chemistry. J Med Chem 57:3186–3204
38. Stefaniak F (2015) Prediction of compounds activity in nuclear receptor signaling and stress pathway assays using machine learning algo-rithms and low-dimensional molecular descriptors. Front Environ Sci 3(December):1–7
39. Plewczynski D (2009) BRAINSTORMING: consensus learning in practice. Front Neuroinform 679:14
40. Liu J, Mansouri K, Judson RS, Martin MT, Hong H, Chen M, Xu X, Thomas RS, Shah I (2015) Predicting hepatotoxicity using ToxCast in vitro bioactiv-ity and chemical structure. Chem Res Toxicol 28:738–751
41. Mayr A, Klambauer G, Unterthiner T, Hochreiter S (2016) DeepTox: toxicity prediction using deep learning. Front Environ Sci 3:80
42. RDKit: Open-Source Cheminformatics Software. http://www.rdkit.org 43. Berthold MR, Cebron N, Dill F, Gabriel TR, Kötter T, Meinl T, Ohl P, Sieb C, Kil-
ian Thiel BW (2008) KNIME: the Konstanz information miner. Springer, Berlin 44. KNIME AG. https://www.knime.org/ 45. Molecular Networks GmbH. https://www.molecular-networks.com/ 46. Hert J, Willett P, Wilton DJ, Acklin P, Azzaoui K, Jacoby E, Schuffenhauer A
(2004) Comparison of fingerprint-based methods for virtual screening using multiple bioactive reference structures. J Chem Inf Comput Sci 44:1177–1185
47. Willett P (2003) Similarity-based approaches to virtual screening. Biochem Soc Trans 31(Pt 3):603–606
48. Schapire R, Machine learning algorithms for classification. http://www.cs.princeton.edu/~schapire/talks/picasso-minicourse.pdf. Accessed 1 Nov 2015
49. Breiman L (2001) Random Forests. Mach Learn 45:5–32 50. Specht DF (1990) Probabilistic neural networks. Neural Netw 3:109–118 51. Clark AM, Dole K, Coulon-Spektor A, McNutt A, Grass G, Freundlich JS,
Reynolds RC, Ekins S (2015) Open source Bayesian models. 1. Applica-tion to ADME/Tox and drug discovery datasets. J Chem Inf Model 55:1231–1245
52. Helma C, Cramer T, Kramer S, De Raedt L (2004) Data mining and machine learning techniques for the identification of mutagenicity inducing substructures and structure activity relationships of nonconge-neric compounds. J Chem Inf Comput Sci 44:1402–1411
53. Zhang C, Cheng F, Sun L, Zhuang S, Li W, Liu G, Lee PW, Tang Y (2015) In silico prediction of chemical toxicity on avian species using chemical category approaches. Chemosphere 122:280–287
54. Berthold MR, Diamond J (1998) Constructive training of probabilistic neural networks. Neurocomputing 19:167–183
55. Cheung V, Cannons K, An introduction to probabilistic neural networks. http://www.wi.hs-wismar.de/~cleve/vorl/projects/dm/ss13/PNN/Quellen/CheungCannons_AnIntroductiontoPNNs.pdf. Accessed 15 Nov 2015
56. The University of Reading Website: Probabilistic neural network (PNN), pp 1–9
57. Browne M (2000) Cross-validation methods. J Math Psychol 44:108–132 58. van Erkel AR, Pattynama PM (1998) Receiver operating characteristic
(ROC) analysis: basic principles and applications in radiology. Eur J Radiol 27:88–94
59. Pepe MS (2000) Receiver operating characteristic methodology. J Am Stat Assoc 95:308–311
60. Bewick V, Cheek L, Ball J (2004) Statistics review 13: receiver operating characteristic curves. Crit Care 8:508–512
83
Original Research Article
4.4 The Catch-22 of Predicting hERG Blockade Using Publicly Accessible
Bioactivity Data
Siramshetty, V. B., Chen, Q., Devarakonda, P. and Preissner, R.
J Chem Inf Model. 2018 Jun 25;58(6):1224-1233. https://doi.org/10.1021/acs.jcim.8b00150.
Author Contributions:
Conception of the study: Siramshetty, V. B. and Preissner, R.; Data preparation and model development: Siramshetty, V. B., Chen, Q., Devarakonda, P.; Writing of manuscript: Siramshetty, V.
B.; Project coordination: Preissner, R. and Siramshetty, V. B.
84
4.5 Summary
In silico models that are useful in predicting different toxicological outcomes were constructed solely
based on the knowledge of chemical structures. Chemical similarity based k-Nearest Neighbors
method and machine learning methods such as naïve Bayes, Support Vector Machines and Random
Forests were evaluated. The models developed to predict outcomes on 12 different targets belonging
to the panels of nuclear receptor and cellular stress response pathways were submitted to the Tox21
Data Challenge (2014). Although the models based on Deep Learning performed the best,
comparable and slightly better performances were achieved for some targets as reported in the two
articles. Together with the best performing Tox21 models, these assist in understanding the role of
chemicals in disrupting biological pathways that could result in toxicity. On the other hand, in silico
models for predicting hERG channel blockade were developed using by far the largest data set of
hERG bioactivities. The challenges involved in developing robust models using public domain
bioactivity data were highlighted. The models performed better than the previously reported QSAR
models that are developed on either smaller data sets that insufficiently span the chemical space of
hERG blockers or proprietary data. Data quality, activity threshold settings, training set composition
and structural diversity of hERG blockers were identified as crucial factors influencing the model
performance. Furthermore, consideration of additional data to improve the chemical space coverage
was shown to improve the model performance for Tox21 targets and hERG channel. All models
(including the data sets) were made publicly available to facilitate prediction of toxicological
outcomes and can be further developed to improve their reliability and interpretability.
The supporting information of these three articles can be obtained via the following URLs:
Drwal et al. - https://doi.org/10.3389/fenvs.2015.00054
Banerjee et al. - https://doi.org/10.1186/s13321-016-0162-2
Siramshetty et al. - https://doi.org/10.1021/acs.jcim.8b00150
95

96
Chapter 5
Promiscuity and Mechanisms of Action of Frequent Hitter
Compounds
5.1 PAINS Filters in HTS - Good or Bad?
As shown earlier, data quality plays a key role in the performance of in silico prediction models.
Major public databases such as PubChem and ChEMBL have been the primary sources of data which
provide activity data from primary/confirmatory assays and the medicinal chemistry literature,
respectively. HTS is typically the earliest step in which large compound libraries are tested against
multiple biological targets. These screening libraries are enhanced by applying substructure and
property filters to omit reactive or unsuitable compounds. However, it has been acknowledged that a
large number of hits originating from these screens may not be true hits due to non-specific effects
that include chemical reactivity and interference with assay signaling. Of the several approaches
proposed to limit such compounds in screening libraries, pan-assay interference compounds (PAINS)
have received great attention. Many chemotypes that showed non-specific effects in Alpha Screen
assays were identified and a list of PAINS rules was proposed to identify frequent hitter compounds.
However, multiple literature reports disregarded their generalization, primarily criticizing that the
source of these filters is a proprietary library of compounds tested only using a single assay detection
technology. The article in this chapter studied multiple compound data sets originating from different
sources for the presence of PAINS compounds. The promiscuity and activity profiles of PAINS
containing compounds (drugs, extensively tested compounds, and PDB ligands) were estimated to
validate if the frequent hitter detection model of PAINS can be generalized. Furthermore, the
mechanisms of action of PAINS containing ligands were explored at the molecular level by
automating the analysis of interactions in target-ligand complexes.
97
Manuscript In Peer-Review
5.2 Exploring Activity Profiles of PAINS and Their Structural Context in
Target-Ligand Complexes
Siramshetty, V.B., Preissner, R. and Gohlke, B. O.
J Chem Inf Model. In Peer-Review (Revised Manuscript Submitted: 15 June, 2018)
Author Contributions:
Conception of the study: Siramshetty, V. B., Gohlke, B. O. and Preissner, R.; Data preparation and
analysis: Siramshetty, V. B. and Gohlke, B. O.; Writing of manuscript: mainly Siramshetty, V. B.,
input from Gohlke, B. O.; Proofreading of manuscript: Gohlke, B. O. and Preissner, R.; Project
coordination: Gohlke, B. O. and Siramshetty, V. B.
98
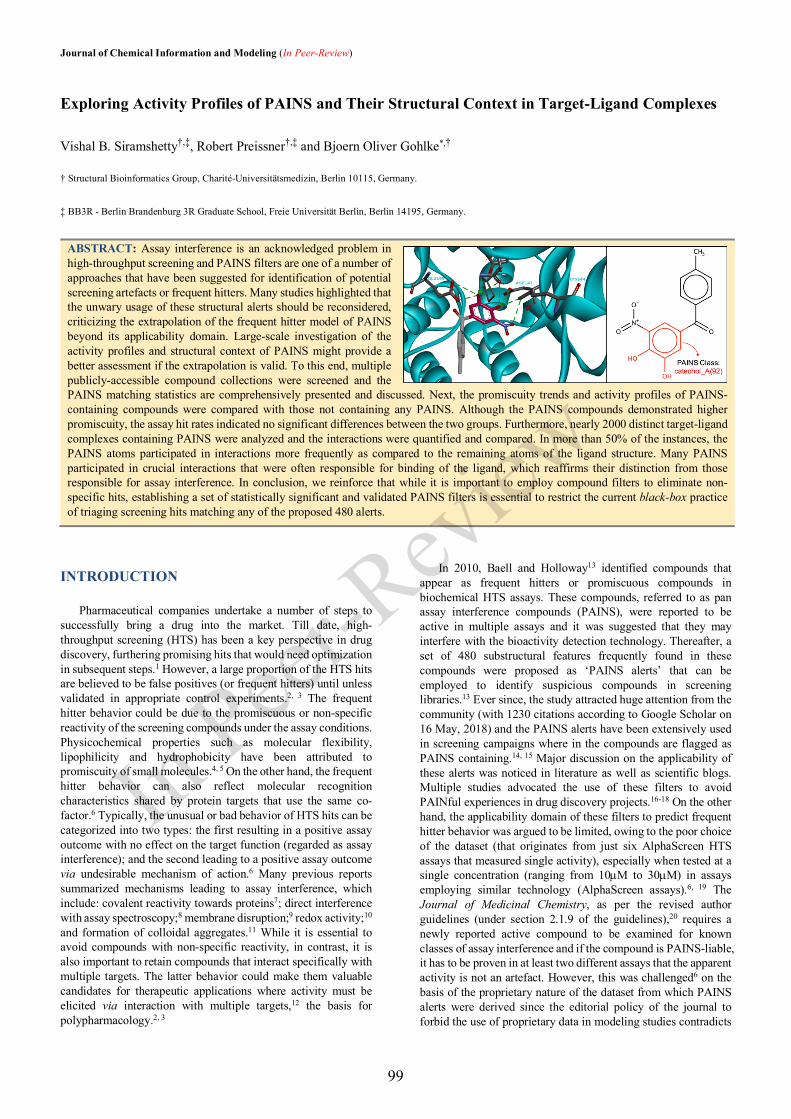
Journal of Chemical Information and Modeling (In Peer-Review)
Exploring Activity Profiles of PAINS and Their Structural Context in Target-Ligand Complexes
Vishal B. Siramshetty†,‡, Robert Preissner†,‡ and Bjoern Oliver Gohlke*,†
† Structural Bioinformatics Group, Charité-Universitätsmedizin, Berlin 10115, Germany.
‡ BB3R - Berlin Brandenburg 3R Graduate School, Freie Universität Berlin, Berlin 14195, Germany.
ABSTRACT: Assay interference is an acknowledged problem in high-throughput screening and PAINS filters are one of a number of approaches that have been suggested for identification of potential screening artefacts or frequent hitters. Many studies highlighted that the unwary usage of these structural alerts should be reconsidered, criticizing the extrapolation of the frequent hitter model of PAINS beyond its applicability domain. Large-scale investigation of the activity profiles and structural context of PAINS might provide a better assessment if the extrapolation is valid. To this end, multiple publicly-accessible compound collections were screened and the PAINS matching statistics are comprehensively presented and discussed. Next, the promiscuity trends and activity profiles of PAINS-containing compounds were compared with those not containing any PAINS. Although the PAINS compounds demonstrated higher promiscuity, the assay hit rates indicated no significant differences between the two groups. Furthermore, nearly 2000 distinct target-ligand complexes containing PAINS were analyzed and the interactions were quantified and compared. In more than 50% of the instances, the PAINS atoms participated in interactions more frequently as compared to the remaining atoms of the ligand structure. Many PAINS participated in crucial interactions that were often responsible for binding of the ligand, which reaffirms their distinction from those responsible for assay interference. In conclusion, we reinforce that while it is important to employ compound filters to eliminate non-specific hits, establishing a set of statistically significant and validated PAINS filters is essential to restrict the current black-box practice of triaging screening hits matching any of the proposed 480 alerts.
INTRODUCTION
Pharmaceutical companies undertake a number of steps to successfully bring a drug into the market. Till date, high-throughput screening (HTS) has been a key perspective in drug discovery, furthering promising hits that would need optimization in subsequent steps.1 However, a large proportion of the HTS hits are believed to be false positives (or frequent hitters) until unless validated in appropriate control experiments.2, 3 The frequent hitter behavior could be due to the promiscuous or non-specific reactivity of the screening compounds under the assay conditions. Physicochemical properties such as molecular flexibility, lipophilicity and hydrophobicity have been attributed to promiscuity of small molecules.4, 5 On the other hand, the frequent hitter behavior can also reflect molecular recognition characteristics shared by protein targets that use the same co-factor.6 Typically, the unusual or bad behavior of HTS hits can be categorized into two types: the first resulting in a positive assay outcome with no effect on the target function (regarded as assay interference); and the second leading to a positive assay outcome via undesirable mechanism of action.6 Many previous reports summarized mechanisms leading to assay interference, which include: covalent reactivity towards proteins7; direct interference with assay spectroscopy;8 membrane disruption;9 redox activity;10 and formation of colloidal aggregates.11 While it is essential to avoid compounds with non-specific reactivity, in contrast, it is also important to retain compounds that interact specifically with multiple targets. The latter behavior could make them valuable candidates for therapeutic applications where activity must be elicited via interaction with multiple targets,12 the basis for polypharmacology.2, 3
In 2010, Baell and Holloway13 identified compounds that
appear as frequent hitters or promiscuous compounds in biochemical HTS assays. These compounds, referred to as pan assay interference compounds (PAINS), were reported to be active in multiple assays and it was suggested that they may interfere with the bioactivity detection technology. Thereafter, a set of 480 substructural features frequently found in these compounds were proposed as ‘PAINS alerts’ that can be employed to identify suspicious compounds in screening libraries.13 Ever since, the study attracted huge attention from the community (with 1230 citations according to Google Scholar on 16 May, 2018) and the PAINS alerts have been extensively used in screening campaigns where in the compounds are flagged as PAINS containing.14, 15 Major discussion on the applicability of these alerts was noticed in literature as well as scientific blogs. Multiple studies advocated the use of these filters to avoid PAINful experiences in drug discovery projects.16-18 On the other hand, the applicability domain of these filters to predict frequent hitter behavior was argued to be limited, owing to the poor choice of the dataset (that originates from just six AlphaScreen HTS assays that measured single activity), especially when tested at a single concentration (ranging from 10µM to 30µM) in assays employing similar technology (AlphaScreen assays).6, 19 The Journal of Medicinal Chemistry, as per the revised author guidelines (under section 2.1.9 of the guidelines),20 requires a newly reported active compound to be examined for known classes of assay interference and if the compound is PAINS-liable, it has to be proven in at least two different assays that the apparent activity is not an artefact. However, this was challenged6 on the basis of the proprietary nature of the dataset from which PAINS alerts were derived since the editorial policy of the journal to forbid the use of proprietary data in modeling studies contradicts
In Peer
-Revi
ew
99
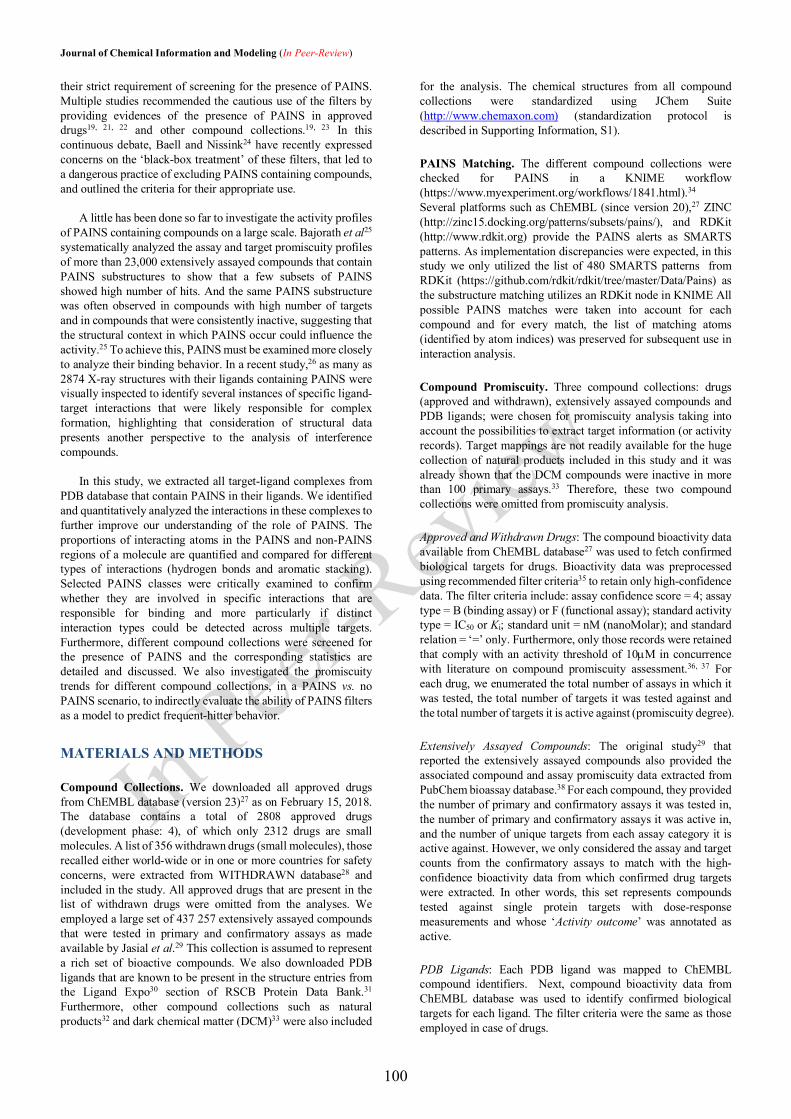
Journal of Chemical Information and Modeling (In Peer-Review) their strict requirement of screening for the presence of PAINS. Multiple studies recommended the cautious use of the filters by providing evidences of the presence of PAINS in approved drugs19, 21, 22 and other compound collections.19, 23 In this continuous debate, Baell and Nissink24 have recently expressed concerns on the ‘black-box treatment’ of these filters, that led to a dangerous practice of excluding PAINS containing compounds, and outlined the criteria for their appropriate use.
A little has been done so far to investigate the activity profiles
of PAINS containing compounds on a large scale. Bajorath et al25 systematically analyzed the assay and target promiscuity profiles of more than 23,000 extensively assayed compounds that contain PAINS substructures to show that a few subsets of PAINS showed high number of hits. And the same PAINS substructure was often observed in compounds with high number of targets and in compounds that were consistently inactive, suggesting that the structural context in which PAINS occur could influence the activity.25 To achieve this, PAINS must be examined more closely to analyze their binding behavior. In a recent study,26 as many as 2874 X-ray structures with their ligands containing PAINS were visually inspected to identify several instances of specific ligand-target interactions that were likely responsible for complex formation, highlighting that consideration of structural data presents another perspective to the analysis of interference compounds.
In this study, we extracted all target-ligand complexes from
PDB database that contain PAINS in their ligands. We identified and quantitatively analyzed the interactions in these complexes to further improve our understanding of the role of PAINS. The proportions of interacting atoms in the PAINS and non-PAINS regions of a molecule are quantified and compared for different types of interactions (hydrogen bonds and aromatic stacking). Selected PAINS classes were critically examined to confirm whether they are involved in specific interactions that are responsible for binding and more particularly if distinct interaction types could be detected across multiple targets. Furthermore, different compound collections were screened for the presence of PAINS and the corresponding statistics are detailed and discussed. We also investigated the promiscuity trends for different compound collections, in a PAINS vs. no PAINS scenario, to indirectly evaluate the ability of PAINS filters as a model to predict frequent-hitter behavior.
MATERIALS AND METHODS
Compound Collections. We downloaded all approved drugs from ChEMBL database (version 23)27 as on February 15, 2018. The database contains a total of 2808 approved drugs (development phase: 4), of which only 2312 drugs are small molecules. A list of 356 withdrawn drugs (small molecules), those recalled either world-wide or in one or more countries for safety concerns, were extracted from WITHDRAWN database28 and included in the study. All approved drugs that are present in the list of withdrawn drugs were omitted from the analyses. We employed a large set of 437 257 extensively assayed compounds that were tested in primary and confirmatory assays as made available by Jasial et al.29 This collection is assumed to represent a rich set of bioactive compounds. We also downloaded PDB ligands that are known to be present in the structure entries from the Ligand Expo30 section of RSCB Protein Data Bank.31 Furthermore, other compound collections such as natural products32 and dark chemical matter (DCM)33 were also included
for the analysis. The chemical structures from all compound collections were standardized using JChem Suite (http://www.chemaxon.com) (standardization protocol is described in Supporting Information, S1).
PAINS Matching. The different compound collections were checked for PAINS in a KNIME workflow (https://www.myexperiment.org/workflows/1841.html).34 Several platforms such as ChEMBL (since version 20),27 ZINC (http://zinc15.docking.org/patterns/subsets/pains/), and RDKit (http://www.rdkit.org) provide the PAINS alerts as SMARTS patterns. As implementation discrepancies were expected, in this study we only utilized the list of 480 SMARTS patterns from RDKit (https://github.com/rdkit/rdkit/tree/master/Data/Pains) as the substructure matching utilizes an RDKit node in KNIME All possible PAINS matches were taken into account for each compound and for every match, the list of matching atoms (identified by atom indices) was preserved for subsequent use in interaction analysis.
Compound Promiscuity. Three compound collections: drugs (approved and withdrawn), extensively assayed compounds and PDB ligands; were chosen for promiscuity analysis taking into account the possibilities to extract target information (or activity records). Target mappings are not readily available for the huge collection of natural products included in this study and it was already shown that the DCM compounds were inactive in more than 100 primary assays.33 Therefore, these two compound collections were omitted from promiscuity analysis.
Approved and Withdrawn Drugs: The compound bioactivity data available from ChEMBL database27 was used to fetch confirmed biological targets for drugs. Bioactivity data was preprocessed using recommended filter criteria35 to retain only high-confidence data. The filter criteria include: assay confidence score = 4; assay type = B (binding assay) or F (functional assay); standard activity type = IC50 or Ki; standard unit = nM (nanoMolar); and standard relation = ‘=’ only. Furthermore, only those records were retained that comply with an activity threshold of 10µM in concurrence with literature on compound promiscuity assessment.36, 37 For each drug, we enumerated the total number of assays in which it was tested, the total number of targets it was tested against and the total number of targets it is active against (promiscuity degree).
Extensively Assayed Compounds: The original study29 that reported the extensively assayed compounds also provided the associated compound and assay promiscuity data extracted from PubChem bioassay database.38 For each compound, they provided the number of primary and confirmatory assays it was tested in, the number of primary and confirmatory assays it was active in, and the number of unique targets from each assay category it is active against. However, we only considered the assay and target counts from the confirmatory assays to match with the high-confidence bioactivity data from which confirmed drug targets were extracted. In other words, this set represents compounds tested against single protein targets with dose-response measurements and whose ‘Activity outcome’ was annotated as active.
PDB Ligands: Each PDB ligand was mapped to ChEMBL compound identifiers. Next, compound bioactivity data from ChEMBL database was used to identify confirmed biological targets for each ligand. The filter criteria were the same as those employed in case of drugs.
In Peer
-Revi
ew
100
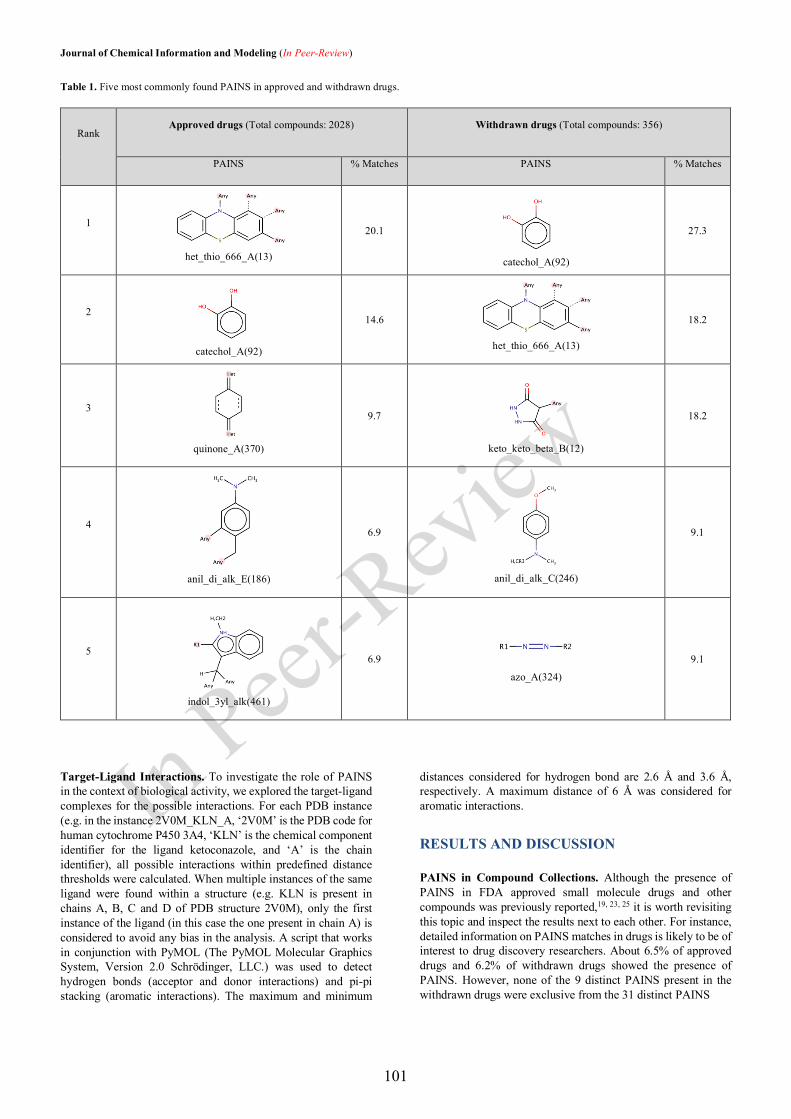
Journal of Chemical Information and Modeling (In Peer-Review) Table 1. Five most commonly found PAINS in approved and withdrawn drugs.
Rank Approved drugs (Total compounds: 2028) Withdrawn drugs (Total compounds: 356)
PAINS % Matches PAINS % Matches
1
het_thio_666_A(13)
20.1
catechol_A(92)
27.3
2
catechol_A(92)
14.6
het_thio_666_A(13)
18.2
3
quinone_A(370)
9.7
keto_keto_beta_B(12)
18.2
4
anil_di_alk_E(186)
6.9
anil_di_alk_C(246)
9.1
5
indol_3yl_alk(461)
6.9
azo_A(324)
9.1
Target-Ligand Interactions. To investigate the role of PAINS in the context of biological activity, we explored the target-ligand complexes for the possible interactions. For each PDB instance (e.g. in the instance 2V0M_KLN_A, ‘2V0M’ is the PDB code for human cytochrome P450 3A4, ‘KLN’ is the chemical component identifier for the ligand ketoconazole, and ‘A’ is the chain identifier), all possible interactions within predefined distance thresholds were calculated. When multiple instances of the same ligand were found within a structure (e.g. KLN is present in chains A, B, C and D of PDB structure 2V0M), only the first instance of the ligand (in this case the one present in chain A) is considered to avoid any bias in the analysis. A script that works in conjunction with PyMOL (The PyMOL Molecular Graphics System, Version 2.0 Schrödinger, LLC.) was used to detect hydrogen bonds (acceptor and donor interactions) and pi-pi stacking (aromatic interactions). The maximum and minimum
distances considered for hydrogen bond are 2.6 Å and 3.6 Å, respectively. A maximum distance of 6 Å was considered for aromatic interactions.
RESULTS AND DISCUSSION
PAINS in Compound Collections. Although the presence of PAINS in FDA approved small molecule drugs and other compounds was previously reported,19, 23, 25 it is worth revisiting this topic and inspect the results next to each other. For instance, detailed information on PAINS matches in drugs is likely to be of interest to drug discovery researchers. About 6.5% of approved drugs and 6.2% of withdrawn drugs showed the presence of PAINS. However, none of the 9 distinct PAINS present in the withdrawn drugs were exclusive from the 31 distinct PAINS
In Peer
-Revi
ew
101
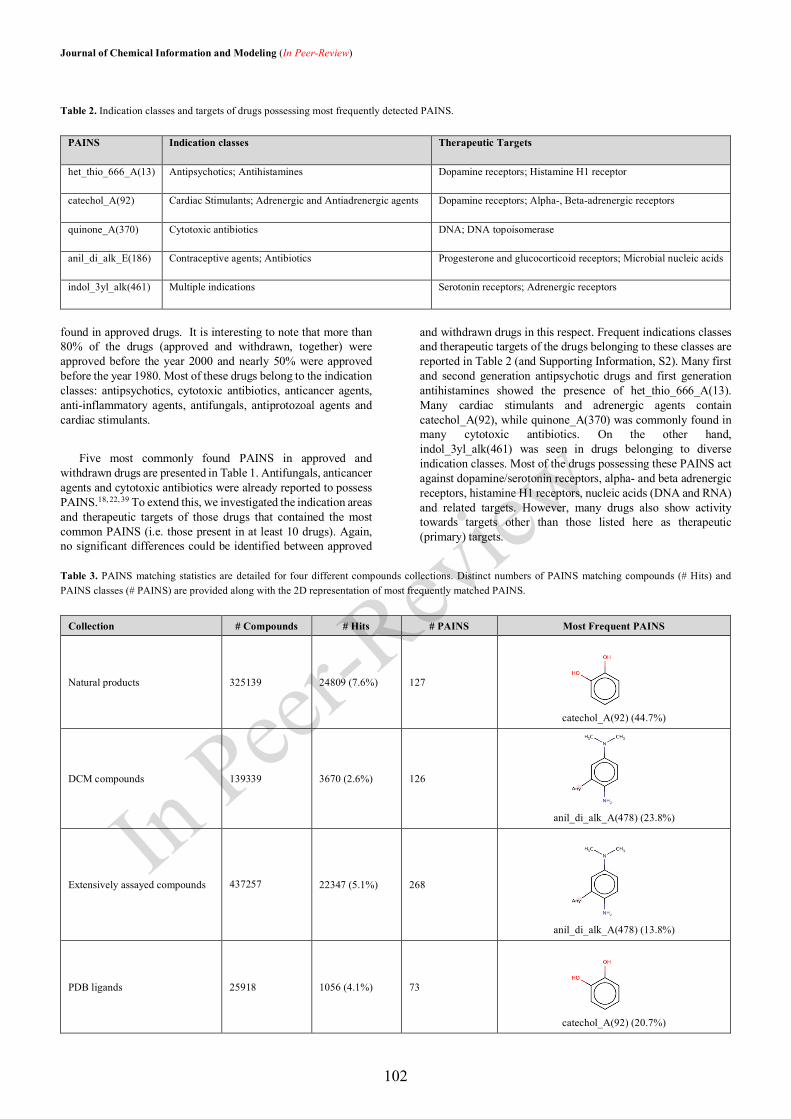
Journal of Chemical Information and Modeling (In Peer-Review)
Table 2. Indication classes and targets of drugs possessing most frequently detected PAINS.
PAINS Indication classes Therapeutic Targets
het_thio_666_A(13) Antipsychotics; Antihistamines Dopamine receptors; Histamine H1 receptor
catechol_A(92) Cardiac Stimulants; Adrenergic and Antiadrenergic agents Dopamine receptors; Alpha-, Beta-adrenergic receptors
quinone_A(370) Cytotoxic antibiotics DNA; DNA topoisomerase
anil_di_alk_E(186) Contraceptive agents; Antibiotics Progesterone and glucocorticoid receptors; Microbial nucleic acids
indol_3yl_alk(461) Multiple indications Serotonin receptors; Adrenergic receptors
found in approved drugs. It is interesting to note that more than 80% of the drugs (approved and withdrawn, together) were approved before the year 2000 and nearly 50% were approved before the year 1980. Most of these drugs belong to the indication classes: antipsychotics, cytotoxic antibiotics, anticancer agents, anti-inflammatory agents, antifungals, antiprotozoal agents and cardiac stimulants.
Five most commonly found PAINS in approved and withdrawn drugs are presented in Table 1. Antifungals, anticancer agents and cytotoxic antibiotics were already reported to possess PAINS.18, 22, 39 To extend this, we investigated the indication areas and therapeutic targets of those drugs that contained the most common PAINS (i.e. those present in at least 10 drugs). Again, no significant differences could be identified between approved
and withdrawn drugs in this respect. Frequent indications classes and therapeutic targets of the drugs belonging to these classes are reported in Table 2 (and Supporting Information, S2). Many first and second generation antipsychotic drugs and first generation antihistamines showed the presence of het_thio_666_A(13). Many cardiac stimulants and adrenergic agents contain catechol_A(92), while quinone_A(370) was commonly found in many cytotoxic antibiotics. On the other hand, indol_3yl_alk(461) was seen in drugs belonging to diverse indication classes. Most of the drugs possessing these PAINS act against dopamine/serotonin receptors, alpha- and beta adrenergic receptors, histamine H1 receptors, nucleic acids (DNA and RNA) and related targets. However, many drugs also show activity towards targets other than those listed here as therapeutic (primary) targets.
Table 3. PAINS matching statistics are detailed for four different compounds collections. Distinct numbers of PAINS matching compounds (# Hits) and PAINS classes (# PAINS) are provided along with the 2D representation of most frequently matched PAINS.
Collection # Compounds # Hits # PAINS Most Frequent PAINS
Natural products 325139 24809 (7.6%) 127
catechol_A(92) (44.7%)
DCM compounds 139339 3670 (2.6%) 126
anil_di_alk_A(478) (23.8%)
Extensively assayed compounds
437257 22347 (5.1%) 268
anil_di_alk_A(478) (13.8%)
PDB ligands 25918 1056 (4.1%) 73
catechol_A(92) (20.7%)
In Peer
-Revi
ew
102
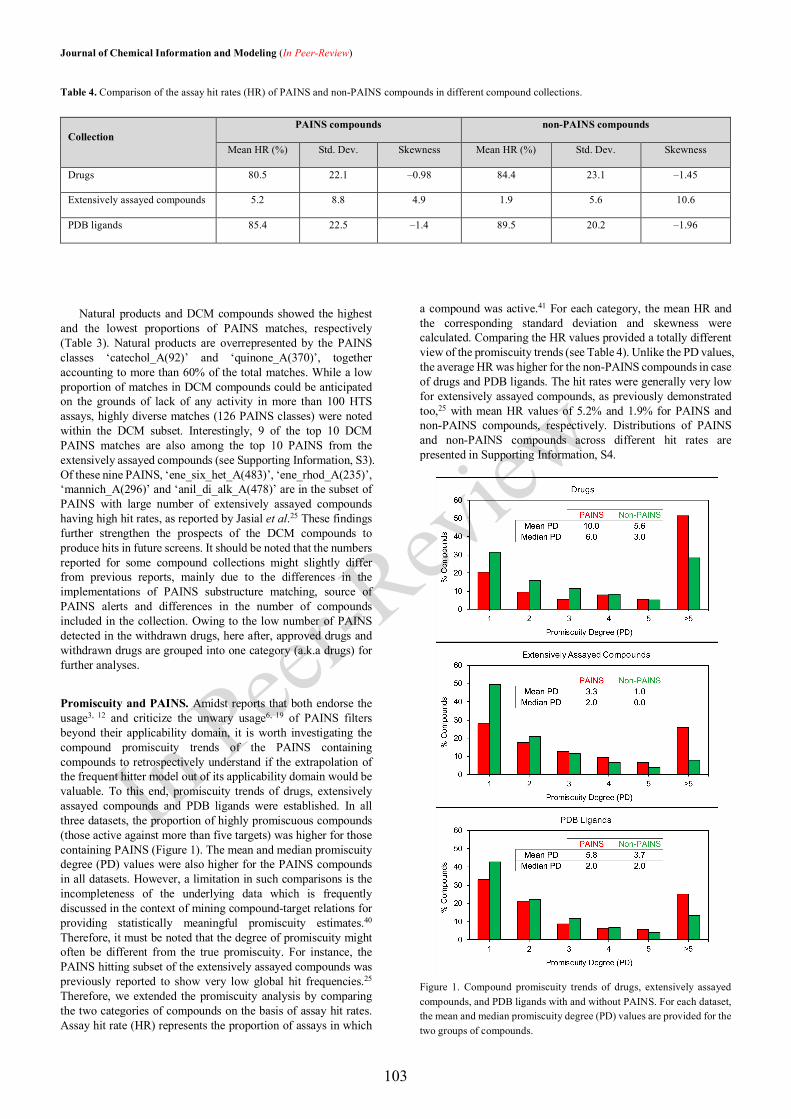
Journal of Chemical Information and Modeling (In Peer-Review) Table 4. Comparison of the assay hit rates (HR) of PAINS and non-PAINS compounds in different compound collections.
Collection PAINS compounds non-PAINS compounds
Mean HR (%) Std. Dev. Skewness Mean HR (%) Std. Dev. Skewness
Drugs 80.5 22.1 –0.98 84.4 23.1 –1.45
Extensively assayed compounds 5.2 8.8 4.9 1.9 5.6 10.6
PDB ligands 85.4 22.5 –1.4 89.5 20.2 –1.96
Natural products and DCM compounds showed the highest and the lowest proportions of PAINS matches, respectively (Table 3). Natural products are overrepresented by the PAINS classes ‘catechol_A(92)’ and ‘quinone_A(370)’, together accounting to more than 60% of the total matches. While a low proportion of matches in DCM compounds could be anticipated on the grounds of lack of any activity in more than 100 HTS assays, highly diverse matches (126 PAINS classes) were noted within the DCM subset. Interestingly, 9 of the top 10 DCM PAINS matches are also among the top 10 PAINS from the extensively assayed compounds (see Supporting Information, S3). Of these nine PAINS, ‘ene_six_het_A(483)’, ‘ene_rhod_A(235)’, ‘mannich_A(296)’ and ‘anil_di_alk_A(478)’ are in the subset of PAINS with large number of extensively assayed compounds having high hit rates, as reported by Jasial et al.25 These findings further strengthen the prospects of the DCM compounds to produce hits in future screens. It should be noted that the numbers reported for some compound collections might slightly differ from previous reports, mainly due to the differences in the implementations of PAINS substructure matching, source of PAINS alerts and differences in the number of compounds included in the collection. Owing to the low number of PAINS detected in the withdrawn drugs, here after, approved drugs and withdrawn drugs are grouped into one category (a.k.a drugs) for further analyses.
Promiscuity and PAINS. Amidst reports that both endorse the usage3, 12 and criticize the unwary usage6, 19 of PAINS filters beyond their applicability domain, it is worth investigating the compound promiscuity trends of the PAINS containing compounds to retrospectively understand if the extrapolation of the frequent hitter model out of its applicability domain would be valuable. To this end, promiscuity trends of drugs, extensively assayed compounds and PDB ligands were established. In all three datasets, the proportion of highly promiscuous compounds (those active against more than five targets) was higher for those containing PAINS (Figure 1). The mean and median promiscuity degree (PD) values were also higher for the PAINS compounds in all datasets. However, a limitation in such comparisons is the incompleteness of the underlying data which is frequently discussed in the context of mining compound-target relations for providing statistically meaningful promiscuity estimates.40 Therefore, it must be noted that the degree of promiscuity might often be different from the true promiscuity. For instance, the PAINS hitting subset of the extensively assayed compounds was previously reported to show very low global hit frequencies.25 Therefore, we extended the promiscuity analysis by comparing the two categories of compounds on the basis of assay hit rates. Assay hit rate (HR) represents the proportion of assays in which
a compound was active.41 For each category, the mean HR and the corresponding standard deviation and skewness were calculated. Comparing the HR values provided a totally different view of the promiscuity trends (see Table 4). Unlike the PD values, the average HR was higher for the non-PAINS compounds in case of drugs and PDB ligands. The hit rates were generally very low for extensively assayed compounds, as previously demonstrated too,25 with mean HR values of 5.2% and 1.9% for PAINS and non-PAINS compounds, respectively. Distributions of PAINS and non-PAINS compounds across different hit rates are presented in Supporting Information, S4.
Figure 1. Compound promiscuity trends of drugs, extensively assayed compounds, and PDB ligands with and without PAINS. For each dataset, the mean and median promiscuity degree (PD) values are provided for the two groups of compounds.
In Peer
-Revi
ew
103
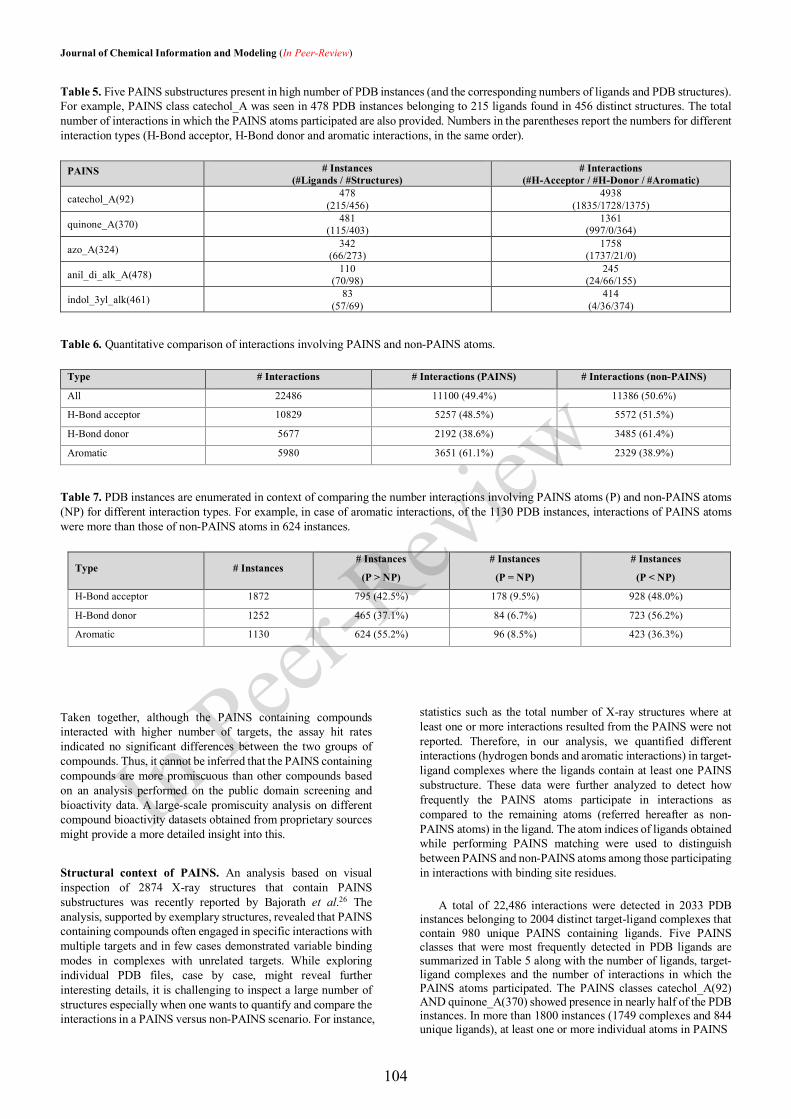
Journal of Chemical Information and Modeling (In Peer-Review) Table 5. Five PAINS substructures present in high number of PDB instances (and the corresponding numbers of ligands and PDB structures). For example, PAINS class catechol_A was seen in 478 PDB instances belonging to 215 ligands found in 456 distinct structures. The total number of interactions in which the PAINS atoms participated are also provided. Numbers in the parentheses report the numbers for different interaction types (H-Bond acceptor, H-Bond donor and aromatic interactions, in the same order).
PAINS # Instances (#Ligands / #Structures)
# Interactions (#H-Acceptor / #H-Donor / #Aromatic)
catechol_A(92) 478 (215/456)
4938 (1835/1728/1375)
quinone_A(370) 481 (115/403)
1361 (997/0/364)
azo_A(324) 342 (66/273)
1758 (1737/21/0)
anil_di_alk_A(478) 110 (70/98)
245 (24/66/155)
indol_3yl_alk(461) 83 (57/69)
414 (4/36/374)
Table 6. Quantitative comparison of interactions involving PAINS and non-PAINS atoms.
Type # Interactions # Interactions (PAINS) # Interactions (non-PAINS)
All 22486 11100 (49.4%) 11386 (50.6%)
H-Bond acceptor 10829 5257 (48.5%) 5572 (51.5%)
H-Bond donor 5677 2192 (38.6%) 3485 (61.4%)
Aromatic 5980 3651 (61.1%) 2329 (38.9%)
Table 7. PDB instances are enumerated in context of comparing the number interactions involving PAINS atoms (P) and non-PAINS atoms (NP) for different interaction types. For example, in case of aromatic interactions, of the 1130 PDB instances, interactions of PAINS atoms were more than those of non-PAINS atoms in 624 instances.
Type # Instances # Instances
(P > NP)
# Instances
(P = NP)
# Instances
(P < NP)
H-Bond acceptor 1872 795 (42.5%) 178 (9.5%) 928 (48.0%)
H-Bond donor 1252 465 (37.1%) 84 (6.7%) 723 (56.2%)
Aromatic 1130 624 (55.2%) 96 (8.5%) 423 (36.3%)
Taken together, although the PAINS containing compounds interacted with higher number of targets, the assay hit rates indicated no significant differences between the two groups of compounds. Thus, it cannot be inferred that the PAINS containing compounds are more promiscuous than other compounds based on an analysis performed on the public domain screening and bioactivity data. A large-scale promiscuity analysis on different compound bioactivity datasets obtained from proprietary sources might provide a more detailed insight into this.
Structural context of PAINS. An analysis based on visual inspection of 2874 X-ray structures that contain PAINS substructures was recently reported by Bajorath et al.26 The analysis, supported by exemplary structures, revealed that PAINS containing compounds often engaged in specific interactions with multiple targets and in few cases demonstrated variable binding modes in complexes with unrelated targets. While exploring individual PDB files, case by case, might reveal further interesting details, it is challenging to inspect a large number of structures especially when one wants to quantify and compare the interactions in a PAINS versus non-PAINS scenario. For instance,
statistics such as the total number of X-ray structures where at least one or more interactions resulted from the PAINS were not reported. Therefore, in our analysis, we quantified different interactions (hydrogen bonds and aromatic interactions) in target-ligand complexes where the ligands contain at least one PAINS substructure. These data were further analyzed to detect how frequently the PAINS atoms participate in interactions as compared to the remaining atoms (referred hereafter as non-PAINS atoms) in the ligand. The atom indices of ligands obtained while performing PAINS matching were used to distinguish between PAINS and non-PAINS atoms among those participating in interactions with binding site residues.
A total of 22,486 interactions were detected in 2033 PDB instances belonging to 2004 distinct target-ligand complexes that contain 980 unique PAINS containing ligands. Five PAINS classes that were most frequently detected in PDB ligands are summarized in Table 5 along with the number of ligands, target-ligand complexes and the number of interactions in which the PAINS atoms participated. The PAINS classes catechol_A(92) AND quinone_A(370) showed presence in nearly half of the PDB instances. In more than 1800 instances (1749 complexes and 844 unique ligands), at least one or more individual atoms in PAINS
In Peer
-Revi
ew
104
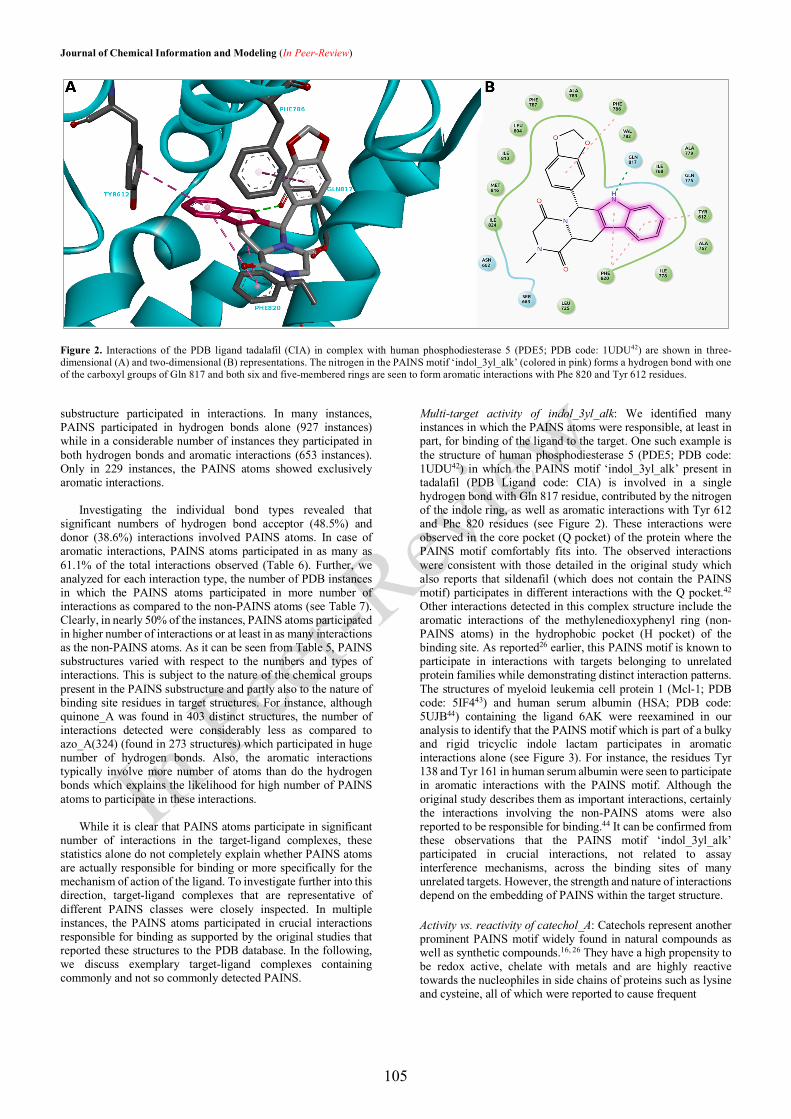
Journal of Chemical Information and Modeling (In Peer-Review)
Figure 2. Interactions of the PDB ligand tadalafil (CIA) in complex with human phosphodiesterase 5 (PDE5; PDB code: 1UDU42) are shown in three-dimensional (A) and two-dimensional (B) representations. The nitrogen in the PAINS motif ‘indol_3yl_alk’ (colored in pink) forms a hydrogen bond with one of the carboxyl groups of Gln 817 and both six and five-membered rings are seen to form aromatic interactions with Phe 820 and Tyr 612 residues. substructure participated in interactions. In many instances, PAINS participated in hydrogen bonds alone (927 instances) while in a considerable number of instances they participated in both hydrogen bonds and aromatic interactions (653 instances). Only in 229 instances, the PAINS atoms showed exclusively aromatic interactions.
Investigating the individual bond types revealed that
significant numbers of hydrogen bond acceptor (48.5%) and donor (38.6%) interactions involved PAINS atoms. In case of aromatic interactions, PAINS atoms participated in as many as 61.1% of the total interactions observed (Table 6). Further, we analyzed for each interaction type, the number of PDB instances in which the PAINS atoms participated in more number of interactions as compared to the non-PAINS atoms (see Table 7). Clearly, in nearly 50% of the instances, PAINS atoms participated in higher number of interactions or at least in as many interactions as the non-PAINS atoms. As it can be seen from Table 5, PAINS substructures varied with respect to the numbers and types of interactions. This is subject to the nature of the chemical groups present in the PAINS substructure and partly also to the nature of binding site residues in target structures. For instance, although quinone_A was found in 403 distinct structures, the number of interactions detected were considerably less as compared to azo_A(324) (found in 273 structures) which participated in huge number of hydrogen bonds. Also, the aromatic interactions typically involve more number of atoms than do the hydrogen bonds which explains the likelihood for high number of PAINS atoms to participate in these interactions.
While it is clear that PAINS atoms participate in significant
number of interactions in the target-ligand complexes, these statistics alone do not completely explain whether PAINS atoms are actually responsible for binding or more specifically for the mechanism of action of the ligand. To investigate further into this direction, target-ligand complexes that are representative of different PAINS classes were closely inspected. In multiple instances, the PAINS atoms participated in crucial interactions responsible for binding as supported by the original studies that reported these structures to the PDB database. In the following, we discuss exemplary target-ligand complexes containing commonly and not so commonly detected PAINS.
Multi-target activity of indol_3yl_alk: We identified many instances in which the PAINS atoms were responsible, at least in part, for binding of the ligand to the target. One such example is the structure of human phosphodiesterase 5 (PDE5; PDB code: 1UDU42) in which the PAINS motif ‘indol_3yl_alk’ present in tadalafil (PDB Ligand code: CIA) is involved in a single hydrogen bond with Gln 817 residue, contributed by the nitrogen of the indole ring, as well as aromatic interactions with Tyr 612 and Phe 820 residues (see Figure 2). These interactions were observed in the core pocket (Q pocket) of the protein where the PAINS motif comfortably fits into. The observed interactions were consistent with those detailed in the original study which also reports that sildenafil (which does not contain the PAINS motif) participates in different interactions with the Q pocket.42 Other interactions detected in this complex structure include the aromatic interactions of the methylenedioxyphenyl ring (non-PAINS atoms) in the hydrophobic pocket (H pocket) of the binding site. As reported26 earlier, this PAINS motif is known to participate in interactions with targets belonging to unrelated protein families while demonstrating distinct interaction patterns. The structures of myeloid leukemia cell protein 1 (Mcl-1; PDB code: 5IF443) and human serum albumin (HSA; PDB code: 5UJB44) containing the ligand 6AK were reexamined in our analysis to identify that the PAINS motif which is part of a bulky and rigid tricyclic indole lactam participates in aromatic interactions alone (see Figure 3). For instance, the residues Tyr 138 and Tyr 161 in human serum albumin were seen to participate in aromatic interactions with the PAINS motif. Although the original study describes them as important interactions, certainly the interactions involving the non-PAINS atoms were also reported to be responsible for binding.44 It can be confirmed from these observations that the PAINS motif ‘indol_3yl_alk’ participated in crucial interactions, not related to assay interference mechanisms, across the binding sites of many unrelated targets. However, the strength and nature of interactions depend on the embedding of PAINS within the target structure.
Activity vs. reactivity of catechol_A: Catechols represent another prominent PAINS motif widely found in natural compounds as well as synthetic compounds.16, 26 They have a high propensity to be redox active, chelate with metals and are highly reactive towards the nucleophiles in side chains of proteins such as lysine and cysteine, all of which were reported to cause frequent
In Peer
-Revi
ew
105
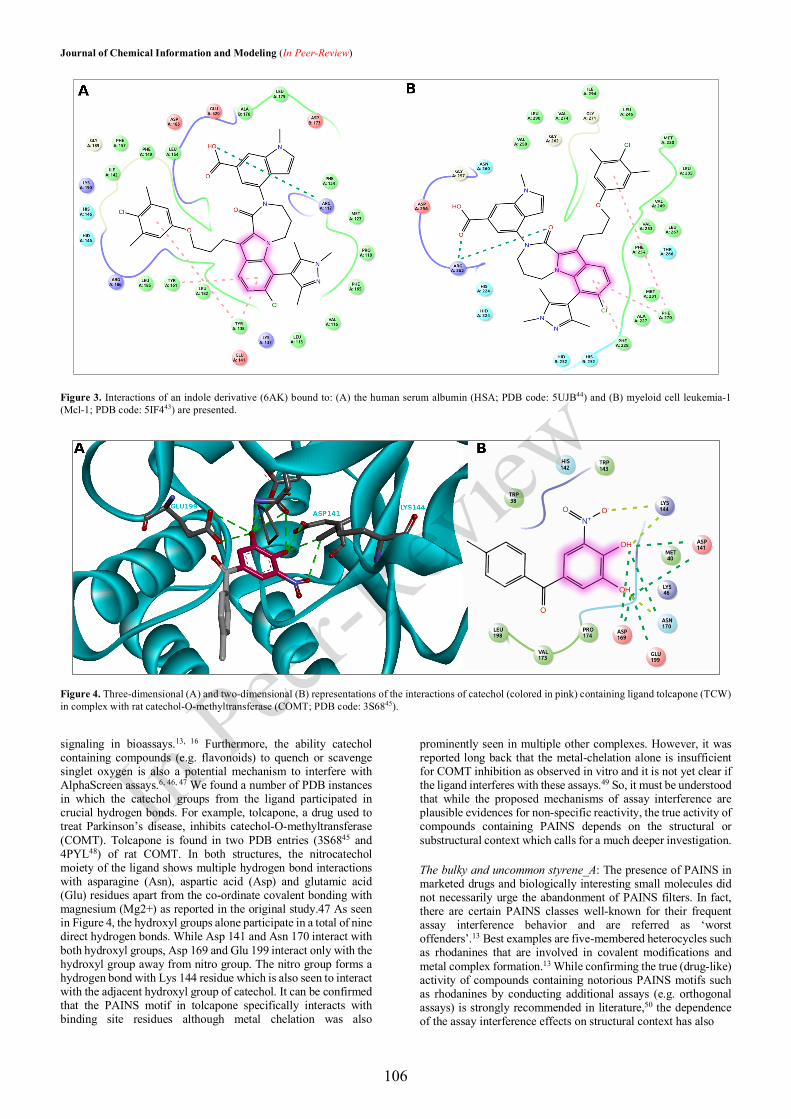
Journal of Chemical Information and Modeling (In Peer-Review)
Figure 3. Interactions of an indole derivative (6AK) bound to: (A) the human serum albumin (HSA; PDB code: 5UJB44) and (B) myeloid cell leukemia-1 (Mcl-1; PDB code: 5IF443) are presented.
Figure 4. Three-dimensional (A) and two-dimensional (B) representations of the interactions of catechol (colored in pink) containing ligand tolcapone (TCW) in complex with rat catechol-O-methyltransferase (COMT; PDB code: 3S6845). signaling in bioassays.13, 16 Furthermore, the ability catechol containing compounds (e.g. flavonoids) to quench or scavenge singlet oxygen is also a potential mechanism to interfere with AlphaScreen assays.6, 46, 47 We found a number of PDB instances in which the catechol groups from the ligand participated in crucial hydrogen bonds. For example, tolcapone, a drug used to treat Parkinson’s disease, inhibits catechol-O-methyltransferase (COMT). Tolcapone is found in two PDB entries (3S6845 and 4PYL48) of rat COMT. In both structures, the nitrocatechol moiety of the ligand shows multiple hydrogen bond interactions with asparagine (Asn), aspartic acid (Asp) and glutamic acid (Glu) residues apart from the co-ordinate covalent bonding with magnesium (Mg2+) as reported in the original study.47 As seen in Figure 4, the hydroxyl groups alone participate in a total of nine direct hydrogen bonds. While Asp 141 and Asn 170 interact with both hydroxyl groups, Asp 169 and Glu 199 interact only with the hydroxyl group away from nitro group. The nitro group forms a hydrogen bond with Lys 144 residue which is also seen to interact with the adjacent hydroxyl group of catechol. It can be confirmed that the PAINS motif in tolcapone specifically interacts with binding site residues although metal chelation was also
prominently seen in multiple other complexes. However, it was reported long back that the metal-chelation alone is insufficient for COMT inhibition as observed in vitro and it is not yet clear if the ligand interferes with these assays.49 So, it must be understood that while the proposed mechanisms of assay interference are plausible evidences for non-specific reactivity, the true activity of compounds containing PAINS depends on the structural or substructural context which calls for a much deeper investigation.
The bulky and uncommon styrene_A: The presence of PAINS in marketed drugs and biologically interesting small molecules did not necessarily urge the abandonment of PAINS filters. In fact, there are certain PAINS classes well-known for their frequent assay interference behavior and are referred as ‘worst offenders’.13 Best examples are five-membered heterocycles such as rhodanines that are involved in covalent modifications and metal complex formation.13 While confirming the true (drug-like) activity of compounds containing notorious PAINS motifs such as rhodanines by conducting additional assays (e.g. orthogonal assays) is strongly recommended in literature,50 the dependence of the assay interference effects on structural context has also
In Peer
-Revi
ew
106
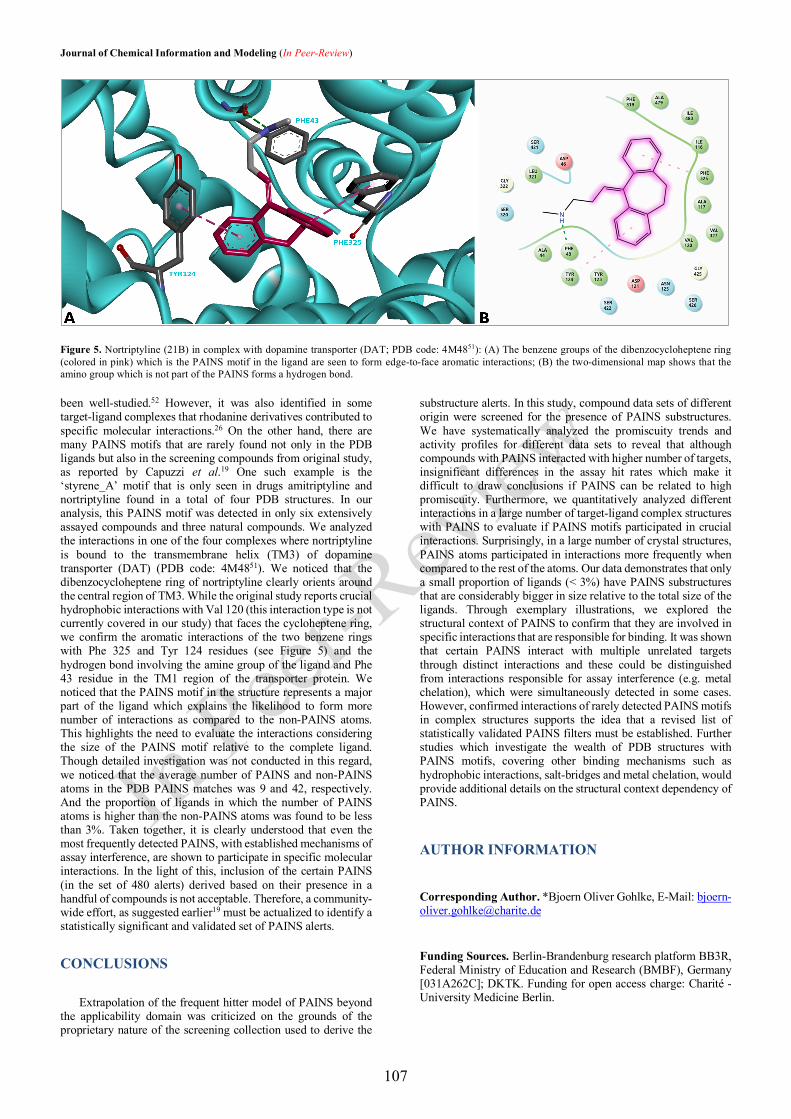
Journal of Chemical Information and Modeling (In Peer-Review)
Figure 5. Nortriptyline (21B) in complex with dopamine transporter (DAT; PDB code: 4M4851): (A) The benzene groups of the dibenzocycloheptene ring (colored in pink) which is the PAINS motif in the ligand are seen to form edge-to-face aromatic interactions; (B) the two-dimensional map shows that the amino group which is not part of the PAINS forms a hydrogen bond.
been well-studied.52 However, it was also identified in some target-ligand complexes that rhodanine derivatives contributed to specific molecular interactions.26 On the other hand, there are many PAINS motifs that are rarely found not only in the PDB ligands but also in the screening compounds from original study, as reported by Capuzzi et al.19 One such example is the ‘styrene_A’ motif that is only seen in drugs amitriptyline and nortriptyline found in a total of four PDB structures. In our analysis, this PAINS motif was detected in only six extensively assayed compounds and three natural compounds. We analyzed the interactions in one of the four complexes where nortriptyline is bound to the transmembrane helix (TM3) of dopamine transporter (DAT) (PDB code: 4M4851). We noticed that the dibenzocycloheptene ring of nortriptyline clearly orients around the central region of TM3. While the original study reports crucial hydrophobic interactions with Val 120 (this interaction type is not currently covered in our study) that faces the cycloheptene ring, we confirm the aromatic interactions of the two benzene rings with Phe 325 and Tyr 124 residues (see Figure 5) and the hydrogen bond involving the amine group of the ligand and Phe 43 residue in the TM1 region of the transporter protein. We noticed that the PAINS motif in the structure represents a major part of the ligand which explains the likelihood to form more number of interactions as compared to the non-PAINS atoms. This highlights the need to evaluate the interactions considering the size of the PAINS motif relative to the complete ligand. Though detailed investigation was not conducted in this regard, we noticed that the average number of PAINS and non-PAINS atoms in the PDB PAINS matches was 9 and 42, respectively. And the proportion of ligands in which the number of PAINS atoms is higher than the non-PAINS atoms was found to be less than 3%. Taken together, it is clearly understood that even the most frequently detected PAINS, with established mechanisms of assay interference, are shown to participate in specific molecular interactions. In the light of this, inclusion of the certain PAINS (in the set of 480 alerts) derived based on their presence in a handful of compounds is not acceptable. Therefore, a community-wide effort, as suggested earlier19 must be actualized to identify a statistically significant and validated set of PAINS alerts.
CONCLUSIONS
Extrapolation of the frequent hitter model of PAINS beyond the applicability domain was criticized on the grounds of the proprietary nature of the screening collection used to derive the
substructure alerts. In this study, compound data sets of different origin were screened for the presence of PAINS substructures. We have systematically analyzed the promiscuity trends and activity profiles for different data sets to reveal that although compounds with PAINS interacted with higher number of targets, insignificant differences in the assay hit rates which make it difficult to draw conclusions if PAINS can be related to high promiscuity. Furthermore, we quantitatively analyzed different interactions in a large number of target-ligand complex structures with PAINS to evaluate if PAINS motifs participated in crucial interactions. Surprisingly, in a large number of crystal structures, PAINS atoms participated in interactions more frequently when compared to the rest of the atoms. Our data demonstrates that only a small proportion of ligands (< 3%) have PAINS substructures that are considerably bigger in size relative to the total size of the ligands. Through exemplary illustrations, we explored the structural context of PAINS to confirm that they are involved in specific interactions that are responsible for binding. It was shown that certain PAINS interact with multiple unrelated targets through distinct interactions and these could be distinguished from interactions responsible for assay interference (e.g. metal chelation), which were simultaneously detected in some cases. However, confirmed interactions of rarely detected PAINS motifs in complex structures supports the idea that a revised list of statistically validated PAINS filters must be established. Further studies which investigate the wealth of PDB structures with PAINS motifs, covering other binding mechanisms such as hydrophobic interactions, salt-bridges and metal chelation, would provide additional details on the structural context dependency of PAINS.
AUTHOR INFORMATION
Corresponding Author. *Bjoern Oliver Gohlke, E-Mail: [email protected]
Funding Sources. Berlin-Brandenburg research platform BB3R, Federal Ministry of Education and Research (BMBF), Germany [031A262C]; DKTK. Funding for open access charge: Charité - University Medicine Berlin.
In Peer
-Revi
ew
107
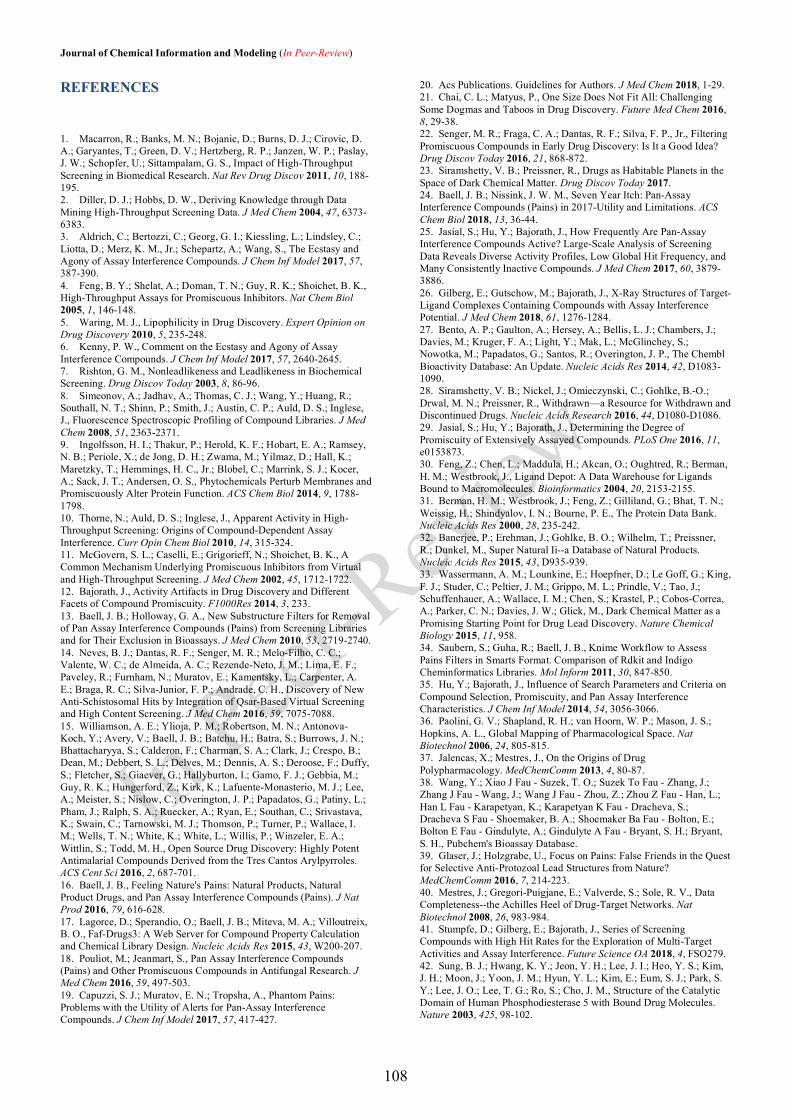
Journal of Chemical Information and Modeling (In Peer-Review) REFERENCES
1. Macarron, R.; Banks, M. N.; Bojanic, D.; Burns, D. J.; Cirovic, D. A.; Garyantes, T.; Green, D. V.; Hertzberg, R. P.; Janzen, W. P.; Paslay, J. W.; Schopfer, U.; Sittampalam, G. S., Impact of High-Throughput Screening in Biomedical Research. Nat Rev Drug Discov 2011, 10, 188-195. 2. Diller, D. J.; Hobbs, D. W., Deriving Knowledge through Data Mining High-Throughput Screening Data. J Med Chem 2004, 47, 6373-6383. 3. Aldrich, C.; Bertozzi, C.; Georg, G. I.; Kiessling, L.; Lindsley, C.; Liotta, D.; Merz, K. M., Jr.; Schepartz, A.; Wang, S., The Ecstasy and Agony of Assay Interference Compounds. J Chem Inf Model 2017, 57, 387-390. 4. Feng, B. Y.; Shelat, A.; Doman, T. N.; Guy, R. K.; Shoichet, B. K., High-Throughput Assays for Promiscuous Inhibitors. Nat Chem Biol 2005, 1, 146-148. 5. Waring, M. J., Lipophilicity in Drug Discovery. Expert Opinion on Drug Discovery 2010, 5, 235-248. 6. Kenny, P. W., Comment on the Ecstasy and Agony of Assay Interference Compounds. J Chem Inf Model 2017, 57, 2640-2645. 7. Rishton, G. M., Nonleadlikeness and Leadlikeness in Biochemical Screening. Drug Discov Today 2003, 8, 86-96. 8. Simeonov, A.; Jadhav, A.; Thomas, C. J.; Wang, Y.; Huang, R.; Southall, N. T.; Shinn, P.; Smith, J.; Austin, C. P.; Auld, D. S.; Inglese, J., Fluorescence Spectroscopic Profiling of Compound Libraries. J Med Chem 2008, 51, 2363-2371. 9. Ingolfsson, H. I.; Thakur, P.; Herold, K. F.; Hobart, E. A.; Ramsey, N. B.; Periole, X.; de Jong, D. H.; Zwama, M.; Yilmaz, D.; Hall, K.; Maretzky, T.; Hemmings, H. C., Jr.; Blobel, C.; Marrink, S. J.; Kocer, A.; Sack, J. T.; Andersen, O. S., Phytochemicals Perturb Membranes and Promiscuously Alter Protein Function. ACS Chem Biol 2014, 9, 1788-1798. 10. Thorne, N.; Auld, D. S.; Inglese, J., Apparent Activity in High-Throughput Screening: Origins of Compound-Dependent Assay Interference. Curr Opin Chem Biol 2010, 14, 315-324. 11. McGovern, S. L.; Caselli, E.; Grigorieff, N.; Shoichet, B. K., A Common Mechanism Underlying Promiscuous Inhibitors from Virtual and High-Throughput Screening. J Med Chem 2002, 45, 1712-1722. 12. Bajorath, J., Activity Artifacts in Drug Discovery and Different Facets of Compound Promiscuity. F1000Res 2014, 3, 233. 13. Baell, J. B.; Holloway, G. A., New Substructure Filters for Removal of Pan Assay Interference Compounds (Pains) from Screening Libraries and for Their Exclusion in Bioassays. J Med Chem 2010, 53, 2719-2740. 14. Neves, B. J.; Dantas, R. F.; Senger, M. R.; Melo-Filho, C. C.; Valente, W. C.; de Almeida, A. C.; Rezende-Neto, J. M.; Lima, E. F.; Paveley, R.; Furnham, N.; Muratov, E.; Kamentsky, L.; Carpenter, A. E.; Braga, R. C.; Silva-Junior, F. P.; Andrade, C. H., Discovery of New Anti-Schistosomal Hits by Integration of Qsar-Based Virtual Screening and High Content Screening. J Med Chem 2016, 59, 7075-7088. 15. Williamson, A. E.; Ylioja, P. M.; Robertson, M. N.; Antonova-Koch, Y.; Avery, V.; Baell, J. B.; Batchu, H.; Batra, S.; Burrows, J. N.; Bhattacharyya, S.; Calderon, F.; Charman, S. A.; Clark, J.; Crespo, B.; Dean, M.; Debbert, S. L.; Delves, M.; Dennis, A. S.; Deroose, F.; Duffy, S.; Fletcher, S.; Giaever, G.; Hallyburton, I.; Gamo, F. J.; Gebbia, M.; Guy, R. K.; Hungerford, Z.; Kirk, K.; Lafuente-Monasterio, M. J.; Lee, A.; Meister, S.; Nislow, C.; Overington, J. P.; Papadatos, G.; Patiny, L.; Pham, J.; Ralph, S. A.; Ruecker, A.; Ryan, E.; Southan, C.; Srivastava, K.; Swain, C.; Tarnowski, M. J.; Thomson, P.; Turner, P.; Wallace, I. M.; Wells, T. N.; White, K.; White, L.; Willis, P.; Winzeler, E. A.; Wittlin, S.; Todd, M. H., Open Source Drug Discovery: Highly Potent Antimalarial Compounds Derived from the Tres Cantos Arylpyrroles. ACS Cent Sci 2016, 2, 687-701. 16. Baell, J. B., Feeling Nature's Pains: Natural Products, Natural Product Drugs, and Pan Assay Interference Compounds (Pains). J Nat Prod 2016, 79, 616-628. 17. Lagorce, D.; Sperandio, O.; Baell, J. B.; Miteva, M. A.; Villoutreix, B. O., Faf-Drugs3: A Web Server for Compound Property Calculation and Chemical Library Design. Nucleic Acids Res 2015, 43, W200-207. 18. Pouliot, M.; Jeanmart, S., Pan Assay Interference Compounds (Pains) and Other Promiscuous Compounds in Antifungal Research. J Med Chem 2016, 59, 497-503. 19. Capuzzi, S. J.; Muratov, E. N.; Tropsha, A., Phantom Pains: Problems with the Utility of Alerts for Pan-Assay Interference Compounds. J Chem Inf Model 2017, 57, 417-427.
20. Acs Publications. Guidelines for Authors. J Med Chem 2018, 1-29. 21. Chai, C. L.; Matyus, P., One Size Does Not Fit All: Challenging Some Dogmas and Taboos in Drug Discovery. Future Med Chem 2016, 8, 29-38. 22. Senger, M. R.; Fraga, C. A.; Dantas, R. F.; Silva, F. P., Jr., Filtering Promiscuous Compounds in Early Drug Discovery: Is It a Good Idea? Drug Discov Today 2016, 21, 868-872. 23. Siramshetty, V. B.; Preissner, R., Drugs as Habitable Planets in the Space of Dark Chemical Matter. Drug Discov Today 2017. 24. Baell, J. B.; Nissink, J. W. M., Seven Year Itch: Pan-Assay Interference Compounds (Pains) in 2017-Utility and Limitations. ACS Chem Biol 2018, 13, 36-44. 25. Jasial, S.; Hu, Y.; Bajorath, J., How Frequently Are Pan-Assay Interference Compounds Active? Large-Scale Analysis of Screening Data Reveals Diverse Activity Profiles, Low Global Hit Frequency, and Many Consistently Inactive Compounds. J Med Chem 2017, 60, 3879-3886. 26. Gilberg, E.; Gutschow, M.; Bajorath, J., X-Ray Structures of Target-Ligand Complexes Containing Compounds with Assay Interference Potential. J Med Chem 2018, 61, 1276-1284. 27. Bento, A. P.; Gaulton, A.; Hersey, A.; Bellis, L. J.; Chambers, J.; Davies, M.; Kruger, F. A.; Light, Y.; Mak, L.; McGlinchey, S.; Nowotka, M.; Papadatos, G.; Santos, R.; Overington, J. P., The Chembl Bioactivity Database: An Update. Nucleic Acids Res 2014, 42, D1083-1090. 28. Siramshetty, V. B.; Nickel, J.; Omieczynski, C.; Gohlke, B.-O.; Drwal, M. N.; Preissner, R., Withdrawn—a Resource for Withdrawn and Discontinued Drugs. Nucleic Acids Research 2016, 44, D1080-D1086. 29. Jasial, S.; Hu, Y.; Bajorath, J., Determining the Degree of Promiscuity of Extensively Assayed Compounds. PLoS One 2016, 11, e0153873. 30. Feng, Z.; Chen, L.; Maddula, H.; Akcan, O.; Oughtred, R.; Berman, H. M.; Westbrook, J., Ligand Depot: A Data Warehouse for Ligands Bound to Macromolecules. Bioinformatics 2004, 20, 2153-2155. 31. Berman, H. M.; Westbrook, J.; Feng, Z.; Gilliland, G.; Bhat, T. N.; Weissig, H.; Shindyalov, I. N.; Bourne, P. E., The Protein Data Bank. Nucleic Acids Res 2000, 28, 235-242. 32. Banerjee, P.; Erehman, J.; Gohlke, B. O.; Wilhelm, T.; Preissner, R.; Dunkel, M., Super Natural Ii--a Database of Natural Products. Nucleic Acids Res 2015, 43, D935-939. 33. Wassermann, A. M.; Lounkine, E.; Hoepfner, D.; Le Goff, G.; King, F. J.; Studer, C.; Peltier, J. M.; Grippo, M. L.; Prindle, V.; Tao, J.; Schuffenhauer, A.; Wallace, I. M.; Chen, S.; Krastel, P.; Cobos-Correa, A.; Parker, C. N.; Davies, J. W.; Glick, M., Dark Chemical Matter as a Promising Starting Point for Drug Lead Discovery. Nature Chemical Biology 2015, 11, 958. 34. Saubern, S.; Guha, R.; Baell, J. B., Knime Workflow to Assess Pains Filters in Smarts Format. Comparison of Rdkit and Indigo Cheminformatics Libraries. Mol Inform 2011, 30, 847-850. 35. Hu, Y.; Bajorath, J., Influence of Search Parameters and Criteria on Compound Selection, Promiscuity, and Pan Assay Interference Characteristics. J Chem Inf Model 2014, 54, 3056-3066. 36. Paolini, G. V.; Shapland, R. H.; van Hoorn, W. P.; Mason, J. S.; Hopkins, A. L., Global Mapping of Pharmacological Space. Nat Biotechnol 2006, 24, 805-815. 37. Jalencas, X.; Mestres, J., On the Origins of Drug Polypharmacology. MedChemComm 2013, 4, 80-87. 38. Wang, Y.; Xiao J Fau - Suzek, T. O.; Suzek To Fau - Zhang, J.; Zhang J Fau - Wang, J.; Wang J Fau - Zhou, Z.; Zhou Z Fau - Han, L.; Han L Fau - Karapetyan, K.; Karapetyan K Fau - Dracheva, S.; Dracheva S Fau - Shoemaker, B. A.; Shoemaker Ba Fau - Bolton, E.; Bolton E Fau - Gindulyte, A.; Gindulyte A Fau - Bryant, S. H.; Bryant, S. H., Pubchem's Bioassay Database. 39. Glaser, J.; Holzgrabe, U., Focus on Pains: False Friends in the Quest for Selective Anti-Protozoal Lead Structures from Nature? MedChemComm 2016, 7, 214-223. 40. Mestres, J.; Gregori-Puigjane, E.; Valverde, S.; Sole, R. V., Data Completeness--the Achilles Heel of Drug-Target Networks. Nat Biotechnol 2008, 26, 983-984. 41. Stumpfe, D.; Gilberg, E.; Bajorath, J., Series of Screening Compounds with High Hit Rates for the Exploration of Multi-Target Activities and Assay Interference. Future Science OA 2018, 4, FSO279. 42. Sung, B. J.; Hwang, K. Y.; Jeon, Y. H.; Lee, J. I.; Heo, Y. S.; Kim, J. H.; Moon, J.; Yoon, J. M.; Hyun, Y. L.; Kim, E.; Eum, S. J.; Park, S. Y.; Lee, J. O.; Lee, T. G.; Ro, S.; Cho, J. M., Structure of the Catalytic Domain of Human Phosphodiesterase 5 with Bound Drug Molecules. Nature 2003, 425, 98-102.
In Peer
-Revi
ew
108
Journal of Chemical Information and Modeling (In Peer-Review) 43. Lee, T.; Bian, Z.; Zhao, B.; Hogdal, L. J.; Sensintaffar, J. L.; Goodwin, C. M.; Belmar, J.; Shaw, S.; Tarr, J. C.; Veerasamy, N.; Matulis, S. M.; Koss, B.; Fischer, M. A.; Arnold, A. L.; Camper, D. V.; Browning, C. F.; Rossanese, O. W.; Budhraja, A.; Opferman, J.; Boise, L. H.; Savona, M. R.; Letai, A.; Olejniczak, E. T.; Fesik, S. W., Discovery and Biological Characterization of Potent Myeloid Cell Leukemia-1 Inhibitors. FEBS Lett 2017, 591, 240-251. 44. Zhao, B.; Sensintaffar, J.; Bian, Z.; Belmar, J.; Lee, T.; Olejniczak, E. T.; Fesik, S. W., Structure of a Myeloid Cell Leukemia-1 (Mcl-1) Inhibitor Bound to Drug Site 3 of Human Serum Albumin. Bioorg Med Chem 2017, 25, 3087-3092. 45. Ellermann, M.; Lerner, C.; Burgy, G.; Ehler, A.; Bissantz, C.; Jakob-Roetne, R.; Paulini, R.; Allemann, O.; Tissot, H.; Grunstein, D.; Stihle, M.; Diederich, F.; Rudolph, M. G., Catechol-O-Methyltransferase in Complex with Substituted 3'-Deoxyribose Bisubstrate Inhibitors. Acta Crystallogr D Biol Crystallogr 2012, 68, 253-260. 46. Morales, J.; Günther, G.; Zanocco, A. L.; Lemp, E., Singlet Oxygen Reactions with Flavonoids. A Theoretical – Experimental Study. PLOS ONE 2012, 7, e40548. 47. Wilkinson, F.; Helman, W. P.; Ross, A. B., Rate Constants for the Decay and Reactions of the Lowest Electronically Excited Singlet State of Molecular Oxygen in Solution. An Expanded and Revised Compilation. Journal of Physical and Chemical Reference Data 1995, 24, 663-677. 48. Ehler, A.; Benz, J.; Schlatter, D.; Rudolph, M. G., Mapping the Conformational Space Accessible to Catechol-O-Methyltransferase. Acta Crystallogr D Biol Crystallogr 2014, 70, 2163-2174. 49. Ross, S. B.; Haljasmaa, O., Catechol-O-Methyl Transferase Inhibitors. In Vivo Inhibition in Mice. Acta Pharmacol Toxicol (Copenh) 1964, 21, 215-225. 50. Voss, M. E.; Carter, P. H.; Tebben, A. J.; Scherle, P. A.; Brown, G. D.; Thompson, L. A.; Xu, M.; Lo, Y. C.; Yang, G.; Liu, R. Q.; Strzemienski, P.; Everlof, J. G.; Trzaskos, J. M.; Decicco, C. P., Both 5-Arylidene-2-Thioxodihydropyrimidine-4,6(1h,5h)-Diones and 3-Thioxo-2,3-Dihydro-1h-Imidazo[1,5-a]Indol-1-Ones Are Light-Dependent Tumor Necrosis Factor-Alpha Antagonists. Bioorg Med Chem Lett 2003, 13, 533-538. 51. Penmatsa, A.; Wang, K. H.; Gouaux, E., X-Ray Structure of Dopamine Transporter Elucidates Antidepressant Mechanism. Nature 2013, 503, 85-90. 52. Mendgen, T.; Steuer, C.; Klein, C. D., Privileged Scaffolds or Promiscuous Binders: A Comparative Study on Rhodanines and Related Heterocycles in Medicinal Chemistry. J Med Chem 2012, 55, 743-753.
In Peer
-Revi
ew
109

110
5.3 Summary
PAINS were identified among several compound collections including approved drugs, withdrawn
drugs, bioactive compounds, extensively tested compounds and PDB ligands. Although the degree
of promiscuity of PAINS compounds was relatively higher as compared to the non-PAINS
compounds, the normalized promiscuity estimates revealed a contrasting viewpoint. PAINS
containing drugs and PDB ligands demonstrated, on average, lower hit rates as compared to the non-
PAINS subsets. Furthermore, a large-scale investigation of the mechanisms of action of PDB ligands
revealed that the PAINS atoms participated in a remarkable number of hydrogen bonds and aromatic
interactions. Exemplary target-ligand complexes were presented to emphasize that PAINS
contributed to crucial interactions that were responsible for binding to the target structures. It was
confirmed that the interactions were distinct from those responsible for assay interference, although
detected simultaneously in some structures. The findings of this study are in agreement with previous
reports that disregarded their generalization and proposed that the true behavior of PAINS depends
on the structural context. It was emphasized that a list of thoroughly validated PAINS filters must be
established to prevent the unwary practice of deprioritizing screening hits.
The supporting information of this article can be found in the Appendix, under section D.
111

112
Chapter 6
Exploring the True Promiscuity of Consistently Inactive
Compounds
6.1 Is ‘Dark Chemical Matter’ Really Dark?
The recent literature on polypharmacology and promiscuity confirms that many drugs are highly
promiscuous and the bioactive compounds are, on average, less promiscuous than drugs. On the
opposite end of the promiscuity scale lie those compounds that did not demonstrate any activity
despite having been extensively tested in primary assays. Such compounds were recently identified
in proprietary and public screening collections and those that were inactive in at least 100 assays were
termed as the dark chemical matter (DCM). The potential of certain chemotypes from the pool of
DCM compounds to demonstrate biological activity has been reported by researchers from Novartis.
Subsequently, Boehringer and GlaxoSmithKline analyzed their screening collections for the presence
of DCM compounds and reported their findings. The perspective article in this chapter focuses on
estimating the true potential of DCM to be promising candidates for drug discovery. The chemical
spaces of DCM compounds and drugs were compared at the structural, substructural (scaffolds) and
functional group levels. Furthermore, the promiscuity trends for those drugs that were structurally
identical to the consistently inactive compounds were established to study the potential of the latter
to behave similarly to drugs.
113
Perspective Article
6.2 Drugs as Habitable Planets in the Space of Dark Chemical Matter
Siramshetty, V. B. and Preissner, R.
Drug Discov Today. 2018 Mar;23(3):481-486. https://doi.org/10.1016/j.drudis.2017.07.003.
Author Contributions:
Conception of the study: Preissner, R. and Siramshetty, V. B.; Data preparation and analysis:
Siramshetty, V. B.; Writing of manuscript: Siramshetty, V. B.; Proofreading of the manuscript:
Preissner, R.
114
6.3 Summary
The DCM compounds were clearly found to share their chemical space with drugs. As many as 16%
of the current drugs and 3.5% of compounds from a large natural product library were structurally
identical to DCM compounds. Nearly 8% of the DCM compounds formed activity cliffs with drugs,
suggesting that minor structural modifications could render them as candidates worth investigating.
Although less promiscuous when compared to the current average promiscuity of drugs, many DCM-
like drugs interacted with at least five distinct protein targets. However, investigating the promiscuity
across different target families revealed that a majority of the drugs tends to be selective towards one
or two target families. It was concluded that the DCM compounds may not be biologically inert and
their clear similarities to drugs make them attractive candidates. On the same note, the criteria adopted
to flag compounds as dark chemical matter was questioned.
121

122
Chapter 7
Discussion
7.1 Drug Knowledgebases as Non-Redundant Data Sources
The process of drug discovery is complex and is associated with huge risks. Of the millions of
compounds screened in a drug discovery program, only a handful of compounds enter the phases of
clinical development. Most of them are withdrawn from the pipeline for reasons associated with
safety, efficacy, and pharmacokinetics. The primary question that arises is, “how to improve the
success rate?”. Systematic use of the knowledge on successful and unsuccessful ligands is one
approach that is central to the cheminformatics-driven efforts such as lead identification and lead
optimization [281]. A recent analysis of the clinical candidates that were reported in the Journal of
Medicinal Chemistry revealed that 43% of the small molecules were derived from previously known
compounds (i.e. known active compounds or compounds reported in the literature, patents or
previous drug discovery programs) [282]. The emergence of big data resulted in the rapid growth of
major databases [283]. However, data redundancy has been a key issue reported in this context [181].
Several open-access databases provide information on drugs but there are limited or no resources that
provide the complete spectrum of information relevant for drug discovery.
In this context, SuperDRUG2 [284] and WITHDRAWN [188] databases were developed as
integrated knowledgebase resources that focus on approved drugs and withdrawn drugs, respectively.
Both databases facilitate navigation of the chemical space of drugs via 2D or 3D similarity search.
Each drug entry is annotated with a variety of information including the chemical structures,
physicochemical properties, and biological activities. Most of the drug withdrawals due to safety
concerns were associated with side effects caused by interactions of drugs with one or more off-
targets that result in toxicity [285]. Therefore, it is essential to identify potential off-targets in humans
and try to avoid interactions with such targets in order to develop ‘safe’ drugs. In this regard, the
WITHDRAWN database serves as an excellent resource that could help establish links between the
off-targets of drugs and the adverse reactions that led to its recall. An example of this was shown in
the original article that presents the use case of sibutramine, an appetite suppressant drug withdrawn
from the market due to adverse cardiovascular outcomes [188, 286]. It was shown that specific
123
genetic variations in the metabolic targets (cytochromes) of the drug increase its concentration in
blood that leads to enhanced activity at the off-target alpha-2B adrenergic receptor which could have
led to cardiovascular events such as myocardial infarction and stroke [188]. Similarly, a number of
drugs were withdrawn due to hepatoxicity and cardiotoxicity [188, 287]. In the case of cardiotoxicity,
hERG channel has been a prominent off-target that lead to the withdrawal of several marketed drugs
[288]. WITHDRAWN helps users to search for drugs by toxicity type via an interactive search
feature. This is particularly useful to identify if the chemotypes belonging to a specific chemical class
are associated with a certain toxicity type. In drug discovery, such information is highly useful in
deriving the so-called ‘toxicophores’ or ‘structural alerts’ that are useful in flagging compounds that
are potentially toxic [289].
SuperDRUG2 was intended to be a one-stop resource that provides a wide range of information about
approved drugs. It contains the highest number of ‘active pharmaceutical ingredients’ that were ever
collected in a single database and links almost all small molecule entries with six other major
compound and compound activity repositories. The integrated and curated activity data serves as a
non-redundant source for bioactivity data on drugs. Regulatory information fetched from different
regulatory sources facilitates a temporal analysis of R&D innovation by pharmaceutical companies.
Furthermore, a 3D superposition feature allows users to evaluate the fit of a drug molecule in a target
of interest when a ligand is known to bind to a target already. This feature, exclusively available in
SuperDRUG2, can be very useful in structure-based studies and also in exploring additional
therapeutic areas for known drugs, i.e. drug repurposing. As stressed earlier, pharmacokinetics has
also been a major concern in the failure of many candidate drugs. Although much progress has been
witnessed in optimizing ADME properties using in silico models, estimating the blood plasma levels
of drugs would be a more useful estimate in the context of personalized medicine [290, 291]. In fact,
experimental plasma levels are not currently available for all marketed drugs and there are currently
only a few commercial software available that can provide simulations. SuperDRUG2 is the first
time open source platform that provides physiologically-based pharmacokinetics simulation as a
feature that provides an estimate of the plasma levels via the ‘plasma concentration versus time’
curves for many drugs, in a normal scenario as well as for poor and fast metabolizers. Taken together,
the two databases developed in this thesis are excellent resources for integrated information on
approved and withdrawn drugs with an increasing reception from the research community.
124
7.2 In Silico Models for Toxicity Prediction
Predicting the interactions of small molecules with biological targets by employing in silico methods
has been attractive for drug discovery not only to prioritize interesting candidates for further
development but also to identify potentially toxic compounds. Considerable changes in the legislation
across Europe and North America resulted in an increased acceptance of alternative methods for
toxicological assessment. For instance, the eTox project [292] integrated bio- and cheminformatics
approaches and developed alternative tools to model multiple toxicity endpoints [293]. Similarly, the
EU-ToxRisk project [294] was initiated with an aim to drive the paradigm shift in toxicity assessment
from animal testing to in vitro and in silico testing. Many 3R (reduce, refine, replace) initiatives (e.g.
the Berlin-Brandenburg Research Platform, BB3R [295]) began to focus on alternative methods to
achieve this paradigm shift. The Tox21 program is one such initiative from the United States. In this
context, three original research contributions were reported in this thesis.
The first two studies focused on developing models for detecting the Tox21 endpoints: nuclear
receptor and cellular stress response pathways, together accounting for a total of 12 targets [204, 205].
These models appeared in the top 10 Tox21 models [296] for seven out of the 12 targets and the
performances (AUC-ROC scores) were comparable to the average score of the top 10 models. Since
the training data was highly imbalanced, those models that achieved BACC scores closer to the AUC-
ROC values were considered optimal ones [105]. For eight out of the 12 targets, the external
validation BACC scores were found to be better than the average BACC value of the top 10 models
[204] indicating an optimal performance. Furthermore, four models (for the targets AhR, ARE,
ATAD5, and p53) achieved the highest accuracies compared to the remaining Tox21 models. While
all models in the first study were based on naïve Bayes method, chemical similarity and machine
learning based methods were evaluated in a follow-up study with a focus on only three targets (AhR,
ER-LBD, and HSE). A hybrid strategy that combined similarity and machine learning based
predictions achieved the highest performance, even compared to the top Tox21 models, for ER-LBD
[205]. Finally, models that aggregated predictions from individual models outperformed all models
for six out of the 12 targets [105] which highlights the importance of predictions from individual
models (i.e. wisdom of crowd). Altogether, it was demonstrated that simple open source
cheminformatics methods and descriptors could be employed to develop robust in silico models that
are comparable to those models based on complex modeling architectures (e.g. deep learning [297])
and descriptors from commercial software such as MOE (Chemical Computing Group Inc.,
125
Montreal, Canada), Dragon (Talete SRL, Milan, Italy) and ChemAxon (ChemAxon LLC.,
Cambridge, MA).
The third study reported binary classification models [206] for predicting the small molecule
inhibition of the hERG channel, a well-acknowledged off-target in the drug discovery pipeline.
Several drugs and promising clinical candidates were withdrawn due to their inhibitory potential
towards hERG, that may lead to the QT interval prolongation which can evolve into a fatal cardiac
arrhythmia [298]. Many previous studies proposed in silico models that were based on different data
sets, descriptors and modeling approaches [103]. Models produced from different datasets were
associated with significantly different prediction performances [299]. In the light of this, the potential
of chemical similarity and machine learning methods to contribute to robust models was assessed by
employing by far the biggest data set of hERG bioactivities. It was shown that the models were
superior in performance compared to the models reported in the literature that employed the same
data sets [299-302]. The RF models outperformed other models based on k-NN and SVM. They were
mostly robust to the choice of activity threshold to discriminate blockers and non-blockers in the
training set and the choice of molecular descriptors. This was understood to be due to the inbuilt
capabilities of the algorithm to handle high-dimensional data, highly correlating descriptors and
imbalanced data sets [57, 218]. The k-NN and SVM methods performed competitively with RF only
when a balanced training set was employed. Considering the huge sizes of the fingerprint descriptors,
the poor performance of the SVM based classifiers can be attributed to its inability to handle a large
number of irrelevant fingerprint bits. Although the k-NN classifiers provided better sensitivity and
BACC values than RF and SVM on imbalanced data sets, the overall performance remained low
with an additional limitation of higher computational times required for model construction. It was
also shown that the classifiers based on data sets with a relatively smaller number highly diverse
hERG blockers performed comparatively well, although the sensitivity values were relatively lower.
Furthermore, the influence and importance of data quality were demonstrated by developing
classifiers based on low-confidence training data that provided poor performance. Overall, the
challenges in developing robust models based on public domain bioactivity data were highlighted. A
recent assessment of different machine learning approaches in predicting hERG blockade reported
that the computationally expensive deep neural networks did not provide significant advantages over
the other methods [303], indicating that the models based on computationally inexpensive descriptors
and methods are still valuable.
126
7.3 Frequent and Non-frequent Hitters in High-throughput Screening
The presence of a large number of false-positive hits in HTS outputs has been a widely acknowledged
problem. Among the various approaches proposed to identify such compounds, PAINS filters
received a great attention in the literature which garnered as many as 1265 citations (according to
Google Scholar; 26 June 2018) [52]. The computational filters have been criticized for their limited
applicability domain and their inconsiderate use to deprioritize screening hits [160, 161].
Recommendations were proposed for the appropriate usage of these filters [304]. In this regard, the
true promiscuity of PAINS containing compounds was estimated by evaluating the activity profiles
of multiple compound collections and exploring the mechanisms of action of PAINS containing
ligands in binding to target biomolecules. In agreement with previous reports, many PAINS
containing compounds were found to be highly promiscuous [305]. However, the overall assay hit
rates were relatively lower of PAINS compounds in comparison to the non-PAINS compounds. This
trend, in contradiction with the promiscuity model of PAINS, remained the same for both drugs and
PDB ligands. Analyzing the interactions in target-ligand complexes revealed a significant number of
interactions involving the PAINS atoms, which in many instances were crucial for binding to the
target. This was computationally quantified for the first time, although a previous study reported that
PAINS participate in crucial interactions by manually inspecting several X-ray structures [306].
Through exemplary structures, the binding modes of PAINS containing compounds were reported.
Although the PAINS interactions were responsible for binding, other types of interactions (e.g. metal
chelation) that are possible mechanisms for assay interference were also noticed in some instances.
Therefore, the true behavior of PAINS depends on their structural embedding within the target
structures.
A category of compounds that possess a contrasting promiscuity profile compared to the frequent
hitters are those that did not demonstrate any biological activity although they have been screened in
multiple assays. These compounds have been undetected in the screening libraries for a very long
time until a milestone contribution from Novartis reported the ‘dark chemical matter’ from their in-
house compound collection and the PubChem bioassay collection [175]. The concept was well
acknowledged by the community as subsequent reports emerged from both academia [169] and
pharmaceutical industry [176, 307]. It was proposed that the DCM compounds possess ‘unique
activity’ and ‘clean safety’ profiles [175]. The last contribution of this thesis evaluated the true
potential of DCM compounds to be uniquely ‘active’ and ‘safe’ [308]. It was reported that these
127
biologically inert compounds clearly share their chemical space with drugs. This was confirmed by
identifying thousands of DCM compounds forming activity cliffs with drugs which suggests that
minor structural changes can render these compounds into attractive candidates that can be further
optimized for activity towards selective targets. Furthermore, analyzing the promiscuity degree of
DCM-like drugs revealed that many of them are highly promiscuous but are selective towards certain
target families. In this context, a recent study proposed target hypotheses for the DCM compounds
based on their structural analogues identified in a large pool of compounds with known bioactivities
[309]. A follow up of the original DCM study that analyzed screening collections from Merck
reported strategies to extract value out of the DCM compounds and also highlighted that a DCM
compound in screening collections of one institution might be biologically active in another
institution [310]. These cumulative findings highlight the potential of DCM compounds to show
biological activity in future screens, provided they are screened against different biological targets
and tested at screening concentrations higher than the typical HTS screening concentrations (1 µM
to 10 µM) [308, 311].
128
Chapter 8
Conclusions and Outlook
In the present work, different cheminformatics methods were utilized to establish knowledgebase
resources of small molecule drugs, develop in silico models for prediction of chemical toxicity and
analyze the activity and promiscuity profiles of the frequent and non-frequent hitter compounds. An
important aspect is that these knowledgebases contain integrated information extracted from multiple
data sources which make them one-stop resources for comprehensive information on drugs useful in
drug discovery research. The knowledge of chemical structures and properties of approved and
withdrawn drugs would be highly valuable for lead identification and lead optimization. For instance,
the core structures of toxic drugs from WITHDRAWN database can be used as templates to avoid
development of similar drugs with activity against the same off-targets. Similarly, the structure to
activity relationships of approved and withdrawn drugs can be compared to identify the chemical
classes or substructures relevant to specific toxicity types. The data and features provided by
SuperDRUG2 could be used in combination with other resources in the context of personalized
medicine. Furthermore, both resources provide non-redundant bioactivity data for drugs that were
employed in the further studies. The richly annotated regulatory information can be used to establish
temporal trends of drug approvals/withdrawals and investigate the innovation strategies, therapeutic
focuses and recall policies of pharmaceutical companies.
In the next step, computationally inexpensive in silico models were developed using chemical
similarity and machine learning based methods. It was shown that models based on simple
descriptors and modeling approaches provide robust performance in rapid detection of potentially
toxic compounds. Different data integration approaches and standardization protocols were utilized
to curate the bioactivity data needed to develop these robust models. These models were able to detect
the ability of small molecules known to inhibit different human targets that lead to adverse effects
such as cardiac toxicity, hepatotoxicity, and reproductive toxicity in the context of the 3Rs to reduce
animal usage for preclinical drug development. The models were on par with and sometimes
performed better than, those previously or contemporarily reported in the literature. The models made
available as open source workflows serve as readily available predictive tools and starting points for
further research. In addition to the ability to detect potentially toxic compounds, interpreting the
129
models could be highly valuable in the identification of structural features overrepresented in the
toxic compounds. These features could be further developed as generic structural alerts to flag the
entries of large compound databases for specific toxicity endpoints. Further, the models could be
used to detect potentially toxic compounds in the marketed drugs, which were not previously tested
against these off-targets. While computational methods are currently the popular choice for testing
of cosmetics, it might be much harder for them to ‘replace’ animal trials (for testing candidate drugs
for use in clinical purposes) in the next few years since such models have to be thoroughly validated
and no model may achieve an accuracy of 100%, given the constantly expanding chemical space.
Nevertheless, in silico alternatives have the potential to significantly ‘reduce’ animal testing.
The next two independent contributions established the promiscuity profiles of the nuisance
compounds (PAINS) and biologically inert compounds (dark chemical matter) found in HTS
collections. In the first study, the ability of PAINS compounds to participate in crucial interactions
that contribute to the binding to target macromolecules was demonstrated. These findings are relevant
for the development of statistically valid PAINS filters that possess wide applicability domain to
identify potential artifacts in screening libraries. This opens the door for further investigation of the
mechanism of action of PAINS considering additional interaction types such as salt bridges and metal
chelation by exploiting the wealth of structural data. Furthermore, it was acknowledged that many
confirmed nuisance compounds could not be detected in public and commercial screening collections
using the current set of PAINS filters. Therefore efforts can be extended to develop novel compound
filters and at the same time identify useless filters that are currently in use. Subsequently, the subsets
of compounds matching such validated compound filters can be employed for development of
computational models to predict the frequent hitter behavior arising from either true promiscuity or
assay interference. In the second study, the potential of dark matter compounds to be biologically
active was reconfirmed. These findings could guide the identification of interesting candidates that
possess selective activity towards pharmaceutically relevant targets. In this context, instead of waiting
for the consistently inactive compounds to be active in future screens, it would also be valuable to
adopt multiparametric screening methods such as high-content screening and biophysical approaches
for deorphanizing the dark chemical matter. By systematically searching for consistent structural
analogues in the space of drugs and bioactive compounds, potential targets can be identified for DCM
compounds. These hypotheses could be experimentally validated to identify novel lead compounds
with better safety profiles and essentially lower promiscuity. Furthermore, switching to target-
focused compound libraries might provide higher HTS hit rates as compared to using diverse
compound collections.
130
Bibliography
1. Munos B. Lessons from 60 years of pharmaceutical innovation. Nature reviews Drug discovery. 2009;8(12):959-68. Epub 2009/12/02. doi: 10.1038/nrd2961. PubMed PMID: 19949401. 2. Pammolli F, Magazzini L, Riccaboni M. The productivity crisis in pharmaceutical R&D. Nature reviews Drug discovery. 2011;10(6):428-38. Epub 2011/06/02. doi: 10.1038/nrd3405. PubMed PMID: 21629293. 3. Paul SM, Mytelka DS, Dunwiddie CT, Persinger CC, Munos BH, Lindborg SR, et al. How to improve R&D productivity: the pharmaceutical industry's grand challenge. Nature reviews Drug discovery. 2010;9(3):203-14. Epub 2010/02/20. doi: 10.1038/nrd3078. PubMed PMID: 20168317. 4. Bajorath J. Rational drug discovery revisited: interfacing experimental programs with bio- and chemo-informatics. Drug Discov Today. 2001;6(19):989-95. Epub 2001/09/29. PubMed PMID: 11576865. 5. Huang G, Lu Y, Lu C, Zheng M, Cai YD. Prediction of drug indications based on chemical interactions and chemical similarities. BioMed research international. 2015;2015:584546. Epub 2015/03/31. doi: 10.1155/2015/584546. PubMed PMID: 25821813; PubMed Central PMCID: PMCPMC4363546. 6. Bunnage ME. Getting pharmaceutical R&D back on target. Nature chemical biology. 2011;7(6):335-9. Epub 2011/05/19. doi: 10.1038/nchembio.581. PubMed PMID: 21587251. 7. Hay M, Thomas DW, Craighead JL, Economides C, Rosenthal J. Clinical development success rates for investigational drugs. Nature biotechnology. 2014;32(1):40-51. Epub 2014/01/11. doi: 10.1038/nbt.2786. PubMed PMID: 24406927. 8. Kola I, Landis J. Can the pharmaceutical industry reduce attrition rates? Nature reviews Drug discovery. 2004;3(8):711-5. Epub 2004/08/03. doi: 10.1038/nrd1470. PubMed PMID: 15286737. 9. Lipinski CA. Drug-like properties and the causes of poor solubility and poor permeability. Journal of pharmacological and toxicological methods. 2000;44(1):235-49. Epub 2001/03/29. PubMed PMID: 11274893. 10. Leeson PD, Springthorpe B. The influence of drug-like concepts on decision-making in medicinal chemistry. Nature reviews Drug discovery. 2007;6(11):881-90. Epub 2007/11/01. doi: 10.1038/nrd2445. PubMed PMID: 17971784. 11. Gleeson MP. Generation of a set of simple, interpretable ADMET rules of thumb. J Med Chem. 2008;51(4):817-34. Epub 2008/02/01. doi: 10.1021/jm701122q. PubMed PMID: 18232648. 12. Hughes JD, Blagg J, Price DA, Bailey S, Decrescenzo GA, Devraj RV, et al. Physiochemical drug properties associated with in vivo toxicological outcomes. Bioorganic & medicinal chemistry letters. 2008;18(17):4872-5. Epub 2008/08/12. doi: 10.1016/j.bmcl.2008.07.071. PubMed PMID: 18691886. 13. Peters JU, Schnider P, Mattei P, Kansy M. Pharmacological promiscuity: dependence on compound properties and target specificity in a set of recent Roche compounds. ChemMedChem. 2009;4(4):680-6. Epub 2009/03/07. doi: 10.1002/cmdc.200800411. PubMed PMID: 19266525. 14. Gleeson MP, Hersey A, Montanari D, Overington J. Probing the links between in vitro potency, ADMET and physicochemical parameters. Nature reviews Drug discovery. 2011;10(3):197-208. Epub 2011/03/02. doi: 10.1038/nrd3367. PubMed PMID: 21358739.
131
15. Luker T, Alcaraz L, Chohan KK, Blomberg N, Brown DS, Butlin RJ, et al. Strategies to improve in vivo toxicology outcomes for basic candidate drug molecules. Bioorganic & medicinal chemistry letters. 2011;21(19):5673-9. Epub 2011/08/20. doi: 10.1016/j.bmcl.2011.07.074. PubMed PMID: 21852131. 16. Waring MJ, Arrowsmith J, Leach AR, Leeson PD, Mandrell S, Owen RM, et al. An analysis of the attrition of drug candidates from four major pharmaceutical companies. Nature reviews Drug discovery. 2015;14(7):475-86. Epub 2015/06/20. doi: 10.1038/nrd4609. PubMed PMID: 26091267. 17. Ashburn TT, Thor KB. Drug repositioning: identifying and developing new uses for existing drugs. Nature reviews Drug discovery. 2004;3(8):673-83. Epub 2004/08/03. doi: 10.1038/nrd1468. PubMed PMID: 15286734. 18. Brown FK. Chapter 35 - Chemoinformatics: What is it and How does it Impact Drug Discovery. In: Bristol JA, editor. Annual Reports in Medicinal Chemistry. 33: Academic Press; 1998. p. 375-84. 19. Chemoinformatics. Bajorath J, editor: Humana Press; 2004. 20. Woody Nathaniel A. Chemoinformatics: a textbook, Johann Gasteiger and Thomas Engel (eds), Wiley-VCH, Weinheim, 2003, ISBN 3-527-30681-1. Journal of Chemometrics. 2004;18(6):314-5. doi: 10.1002/cem.871. 21. Ray LC, Kirsch RA. Finding Chemical Records by Digital Computers. Science. 1957;126(3278):814-9. 22. Chemical Abstracts Service. 23. Baker DB, Horiszny JW, Metanomski WV. History of Abstracting at Chemical Abstracts Service. Journal of Chemical Information and Modeling. 1980;20(4):193-201. 24. Hansch CORWIN, Maloney PEYTONP, Fujita TOSHIO, Robert M MUIR. Correlation of Biological Activity of Phenoxyacetic Acids with Hammett Substituent Constants and Partition Coefficients. Nature. 1962;194(4824):178-80. 25. Lindsay R. Applications of artificial intelligence for organic chemistry : the DENDRAL project: McGraw-Hill Book Co; 1980. 26. Lindsay RK, Buchanan BG, Feigenbaum EA, Lederberg J. DENDRAL: A case study of the first expert system for scientific hypothesis formation. Artificial Intelligence. 1993;61(2):209-61. doi: https://doi.org/10.1016/0004-3702(93)90068-M. 27. Wipke WT, Ouchi GI, Krishnan S. Simulation and evaluation of chemical synthesis—SECS: An application of artificial intelligence techniques. Artificial Intelligence. 1978;11(1-2):173-93. 28. Computer-Assisted Organic Synthesis. Wipke WT, Howe WJ, editors: AMERICAN CHEMICAL SOCIETY; 1977. 29. Humblet C, Marshall GR. Three-dimensional computer modeling as an aid to drug design. Drug Development Research. 1981;1(4):409-34. 30. Gund P, Andose JD, Rhodes JB, Smith GM. Three-dimensional molecular modeling and drug design. Science. 1980;208(4451):1425-31. Epub 1980/06/27. PubMed PMID: 6104357. 31. Langridge R, Ferrin TE, Kuntz ID, Connolly ML. Real-time color graphics in studies of molecular interactions. Science. 1981;211(4483):661-6. Epub 1981/02/13. PubMed PMID: 7455704. 32. Tetko IV, D ML, Williams AJ. The development of models to predict melting and pyrolysis point data associated with several hundred thousand compounds mined from PATENTS. Journal of cheminformatics. 2016;8:2. Epub 2016/01/26. doi: 10.1186/s13321-016-0113-y. PubMed PMID: 26807157; PubMed Central PMCID: PMCPMC4724158.
132
33. Chen B, Butte AJ. Leveraging big data to transform target selection and drug discovery. Clinical pharmacology and therapeutics. 2016;99(3):285-97. Epub 2015/12/15. doi: 10.1002/cpt.318. PubMed PMID: 26659699; PubMed Central PMCID: PMCPMC4785018. 34. Kim S, Thiessen PA, Bolton EE, Chen J, Fu G, Gindulyte A, et al. PubChem Substance and Compound databases. Nucleic acids research. 2016;44(D1):D1202-13. Epub 2015/09/25. doi: 10.1093/nar/gkv951. PubMed PMID: 26400175; PubMed Central PMCID: PMCPMC4702940. 35. Papadatos G, Gaulton A, Hersey A, Overington JP. Activity, assay and target data curation and quality in the ChEMBL database. Journal of computer-aided molecular design. 2015;29(9):885-96. Epub 2015/07/24. doi: 10.1007/s10822-015-9860-5. PubMed PMID: 26201396; PubMed Central PMCID: PMCPMC4607714. 36. Gilson MK, Liu T, Baitaluk M, Nicola G, Hwang L, Chong J. BindingDB in 2015: A public database for medicinal chemistry, computational chemistry and systems pharmacology. Nucleic acids research. 2016;44(D1):D1045-53. Epub 2015/10/21. doi: 10.1093/nar/gkv1072. PubMed PMID: 26481362; PubMed Central PMCID: PMCPMC4702793. 37. Schneider N, Lowe DM, Sayle RA, Tarselli MA, Landrum GA. Big Data from Pharmaceutical Patents: A Computational Analysis of Medicinal Chemists' Bread and Butter. J Med Chem. 2016;59(9):4385-402. Epub 2016/03/31. doi: 10.1021/acs.jmedchem.6b00153. PubMed PMID: 27028220. 38. Papadatos G, Davies M, Dedman N, Chambers J, Gaulton A, Siddle J, et al. SureChEMBL: a large-scale, chemically annotated patent document database. Nucleic acids research. 2016;44(D1):D1220-8. Epub 2015/11/20. doi: 10.1093/nar/gkv1253. PubMed PMID: 26582922; PubMed Central PMCID: PMCPMC4702887. 39. Muresan S, Petrov P, Southan C, Kjellberg MJ, Kogej T, Tyrchan C, et al. Making every SAR point count: the development of Chemistry Connect for the large-scale integration of structure and bioactivity data. Drug Discov Today. 2011;16(23-24):1019-30. Epub 2011/10/26. doi: 10.1016/j.drudis.2011.10.005. PubMed PMID: 22024215. 40. Hu Y, Bajorath J. Entering the 'big data' era in medicinal chemistry: molecular promiscuity analysis revisited. Future science OA. 2017;3(2):Fso179. Epub 2017/07/04. doi: 10.4155/fsoa-2017-0001. PubMed PMID: 28670471; PubMed Central PMCID: PMCPMC5481856. 41. Gaulton A, Bellis LJ, Bento AP, Chambers J, Davies M, Hersey A, et al. ChEMBL: a large-scale bioactivity database for drug discovery. Nucleic acids research. 2012;40(Database issue):D1100-7. Epub 2011/09/29. doi: 10.1093/nar/gkr777. PubMed PMID: 21948594; PubMed Central PMCID: PMCPMC3245175. 42. Nicola G, Liu T, Gilson MK. Public domain databases for medicinal chemistry. J Med Chem. 2012;55(16):6987-7002. Epub 2012/06/27. doi: 10.1021/jm300501t. PubMed PMID: 22731701; PubMed Central PMCID: PMCPMC3427776. 43. Berman HM, Westbrook J, Feng Z, Gilliland G, Bhat TN, Weissig H, et al. The Protein Data Bank. Nucleic acids research. 2000;28(1):235-42. Epub 1999/12/11. PubMed PMID: 10592235; PubMed Central PMCID: PMCPMC102472. 44. Groom CR, Bruno IJ, Lightfoot MP, Ward SC. The Cambridge Structural Database. Acta crystallographica Section B, Structural science, crystal engineering and materials. 2016;72(Pt 2):171-9. Epub 2016/04/07. doi: 10.1107/s2052520616003954. PubMed PMID: 27048719; PubMed Central PMCID: PMCPMC4822653. 45. Chemical Abstracts Service. CAS Content. 2018 [cited 2018 10 July]. Available from: https://www.cas.org/about/cas-content. 46. Elsevier. Reaxys Chemical Data 2018 [cited 2018 10 July]. Available from: https://www.elsevier.com/solutions/reaxys/how-reaxys-works/content.
133
47. Mestres J. Virtual screening: a real screening complement to high-throughput screening. Biochemical Society transactions. 2002;30(4):797-9. Epub 2002/08/28. doi: 10.1042/. PubMed PMID: 12196200. 48. Smith A. Screening for drug discovery: the leading question. Nature. 2002;418(6896):453-9. Epub 2002/07/26. doi: 10.1038/418453a. PubMed PMID: 12140563. 49. Shoichet BK. Virtual screening of chemical libraries. Nature. 2004;432(7019):862-5. Epub 2004/12/17. doi: 10.1038/nature03197. PubMed PMID: 15602552; PubMed Central PMCID: PMCPMC1360234. 50. Walters WP, Stahl MT, Murcko MA. Virtual screening—an overview. Drug Discovery Today. 1998;3(4):160-78. 51. Bajorath J. Integration of virtual and high-throughput screening. Nature reviews Drug discovery. 2002;1(11):882-94. Epub 2002/11/05. doi: 10.1038/nrd941. PubMed PMID: 12415248. 52. Baell JB, Holloway GA. New Substructure Filters for Removal of Pan Assay Interference Compounds (PAINS) from Screening Libraries and for Their Exclusion in Bioassays. Journal of Medicinal Chemistry. 2010;53(7):2719-40. 53. Stumpfe D, Bajorath J. Applied Virtual Screening: Strategies, Recommendations, and Caveats. Virtual Screening. 2011. doi: doi:10.1002/9783527633326.ch11 10.1002/9783527633326.ch11. 54. Lyne PD. Structure-based virtual screening: an overview. Drug Discov Today. 2002;7(20):1047-55. Epub 2003/01/28. PubMed PMID: 12546894. 55. Geppert H, Vogt M, Bajorath J. Current trends in ligand-based virtual screening: molecular representations, data mining methods, new application areas, and performance evaluation. J Chem Inf Model. 2010;50(2):205-16. Epub 2010/01/22. doi: 10.1021/ci900419k. PubMed PMID: 20088575. 56. Halperin I, Ma B, Wolfson H, Nussinov R. Principles of docking: An overview of search algorithms and a guide to scoring functions. Proteins. 2002;47(4):409-43. Epub 2002/05/10. doi: 10.1002/prot.10115. PubMed PMID: 12001221. 57. Lavecchia A. Machine-learning approaches in drug discovery: methods and applications. Drug Discovery Today. 2015;20(3):318-31. 58. Klopmand G. Concepts and applications of molecular similarity, by Mark A. Johnson and Gerald M. Maggiora, eds., John Wiley & Sons, New York, 1990, 393 pp. Price: 65.00. Journal of Computational Chemistry. 1992;13(4):539-40. 59. Willett P, Barnard JM, Downs GM. Chemical Similarity Searching. Journal of Chemical Information and Computer Sciences. 1998;38(6):983-96. 60. Stumpfe D, Bajorath J. Similarity searching. Wiley Interdisciplinary Reviews: Computational Molecular Science. 2011;1(2):260-82. 61. Todeschini R, Consonni V. Handbook of Molecular Descriptors: Wiley-VCH Verlag GmbH; 2000. 62. Molecular Descriptors for Chemoinformatics. Todeschini R, Consonni V, editors: Wiley-VCH Verlag GmbH & Co. KGaA; 2009. 63. Karthikeyan M, Bender A. Encoding and Decoding Graphical Chemical Structures as Two-Dimensional (PDF417) Barcodes. Journal of Chemical Information and Modeling. 2005;45(3):572-80. doi: 10.1021/ci049758i. 64. Guba W, Meyder A, Rarey M, Hert J. Torsion Library Reloaded: A New Version of Expert-Derived SMARTS Rules for Assessing Conformations of Small Molecules. Journal of Chemical Information and Modeling. 2016;56(1):1-5. doi: 10.1021/acs.jcim.5b00522. 65. Gregori-Puigjané E, Garriga-Sust R, Mestres J. Indexing molecules with chemical graph identifiers. Journal of Computational Chemistry. 2011;32(12):2638-46. doi: 10.1002/jcc.21843.
134
66. Heller S, McNaught A, Stein S, Tchekhovskoi D, Pletnev I. InChI - the worldwide chemical structure identifier standard. Journal of cheminformatics. 2013;5(1):7. Epub 2013/01/25. doi: 10.1186/1758-2946-5-7. PubMed PMID: 23343401; PubMed Central PMCID: PMCPMC3599061. 67. Heikamp K, Bajorat J. Fingerprint design and engineering strategies: rationalizing and improving similarity search performance. Future Med Chem. 2012;4(15):1945-59. Epub 2012/10/24. doi: 10.4155/fmc.12.126. PubMed PMID: 23088275. 68. Batista J, Bajorath J. Similarity Searching using Compound Class-Specific Combinations of Substructures Found in Randomly Generated Molecular Fragment Populations. ChemMedChem. 2008;3(1):67-73. 69. Carhart RE, Smith DH, Venkataraghavan R. Atom pairs as molecular features in structure-activity studies: definition and applications. Journal of Chemical Information and Modeling. 1985;25(2):64-73. 70. Rogers D, Hahn M. Extended-connectivity fingerprints. J Chem Inf Model. 2010;50(5):742-54. Epub 2010/04/30. doi: 10.1021/ci100050t. PubMed PMID: 20426451. 71. Venkatraman V, Perez-Nueno VI, Mavridis L, Ritchie DW. Comprehensive comparison of ligand-based virtual screening tools against the DUD data set reveals limitations of current 3D methods. J Chem Inf Model. 2010;50(12):2079-93. Epub 2010/11/26. doi: 10.1021/ci100263p. PubMed PMID: 21090728. 72. Brown RD, Martin YC. Use of Structure-Activity Data To Compare Structure-Based Clustering Methods and Descriptors for Use in Compound Selection. Journal of Chemical Information and Computer Sciences. 1996;36(3):572-84. 73. Hu G, Kuang G, Xiao W, Li W, Liu G, Tang Y. Performance evaluation of 2D fingerprint and 3D shape similarity methods in virtual screening. J Chem Inf Model. 2012;52(5):1103-13. Epub 2012/05/04. doi: 10.1021/ci300030u. PubMed PMID: 22551340. 74. Brown RD, Martin YC. The Information Content of 2D and 3D Structural Descriptors Relevant to Ligand-Receptor Binding. Journal of Chemical Information and Computer Sciences. 1997;37(1):1-9. 75. Geppert H, Bajorath J. Advances in 2D fingerprint similarity searching. Expert opinion on drug discovery. 2010;5(6):529-42. Epub 2010/06/01. doi: 10.1517/17460441.2010.486830. PubMed PMID: 22823165. 76. Vogt M, Stumpfe D, Geppert H, Bajorath J. Scaffold Hopping Using Two-Dimensional Fingerprints: True Potential, Black Magic, or a Hopeless Endeavor? Guidelines for Virtual Screening. Journal of Medicinal Chemistry. 2010;53(15):5707-15. 77. Gardiner EJ, Holliday JD, O'Dowd C, Willett P. Effectiveness of 2D fingerprints for scaffold hopping. Future Med Chem. 2011;3(4):405-14. Epub 2011/04/02. doi: 10.4155/fmc.11.4. PubMed PMID: 21452977. 78. Tversky A. Features of similarity. Psychological Review. 1977;84(4):327-52. 79. Russell PF, Rao TR. On Habitat and Association of Species of Anopheline Larvae in South-Eastern Madras. Journal of the Malaria Institute of India. 1940;3(1):153-78 pp. 80. Holliday JD, Salim N, Whittle M, Willett P. Analysis and display of the size dependence of chemical similarity coefficients. J Chem Inf Comput Sci. 2003;43(3):819-28. Epub 2003/05/28. doi: 10.1021/ci034001x. PubMed PMID: 12767139. 81. Willett P. Searching Techniques for Databases of Two- and Three-Dimensional Chemical Structures. Journal of Medicinal Chemistry. 2005;48(13):4183-99. 82. Schuffenhauer A, Floersheim P, Acklin P, Jacoby E. Similarity metrics for ligands reflecting the similarity of the target proteins. J Chem Inf Comput Sci. 2003;43(2):391-405. Epub 2003/03/26. doi: 10.1021/ci025569t. PubMed PMID: 12653501. 83. Hert J, Willett P, Wilton DJ, Acklin P, Azzaoui K, Jacoby E, et al. Comparison of fingerprint-based methods for virtual screening using multiple bioactive reference structures.
135
J Chem Inf Comput Sci. 2004;44(3):1177-85. Epub 2004/05/25. doi: 10.1021/ci034231b. PubMed PMID: 15154787. 84. Shemetulskis NE, Weininger D, Blankley CJ, Yang JJ, Humblet C. Stigmata: an algorithm to determine structural commonalities in diverse datasets. J Chem Inf Comput Sci. 1996;36(4):862-71. Epub 1996/07/01. PubMed PMID: 8768771. 85. Wang Y, Bajorath J. Bit silencing in fingerprints enables the derivation of compound class-directed similarity metrics. J Chem Inf Model. 2008;48(9):1754-9. Epub 2008/08/14. doi: 10.1021/ci8002045. PubMed PMID: 18698839. 86. Nisius B, Vogt M, Bajorath J. Development of a fingerprint reduction approach for Bayesian similarity searching based on Kullback-Leibler divergence analysis. J Chem Inf Model. 2009;49(6):1347-58. Epub 2009/06/02. doi: 10.1021/ci900087y. PubMed PMID: 19480403. 87. Nisius B, Bajorath J. Molecular fingerprint recombination: generating hybrid fingerprints for similarity searching from different fingerprint types. ChemMedChem. 2009;4(11):1859-63. Epub 2009/08/29. doi: 10.1002/cmdc.200900243. PubMed PMID: 19714705. 88. Terstappen GC, Reggiani A. In silico research in drug discovery. Trends in pharmacological sciences. 2001;22(1):23-6. Epub 2001/02/13. PubMed PMID: 11165668. 89. Subramaniam S, Mehrotra M, Gupta D. Virtual high throughput screening (vHTS)--a perspective. Bioinformation. 2008;3(1):14-7. Epub 2008/12/05. PubMed PMID: 19052660; PubMed Central PMCID: PMCPMC2586130. 90. Karthick V, Nagasundaram N, Doss CGP, Chakraborty C, Siva R, Lu A, et al. Virtual screening of the inhibitors targeting at the viral protein 40 of Ebola virus. Infectious Diseases of Poverty. 2016;5(1). 91. Clark AJ, Tiwary P, Borrelli K, Feng S, Miller EB, Abel R, et al. Prediction of Protein–Ligand Binding Poses via a Combination of Induced Fit Docking and Metadynamics Simulations. Journal of Chemical Theory and Computation. 2016;12(6):2990-8. 92. Tran N, Van T, Nguyen H, Le L. Identification of Novel Compounds against an R294K Substitution of Influenza A (H7N9) Virus Using Ensemble Based Drug Virtual Screening. International Journal of Medical Sciences. 2015;12(2):163-76. 93. Damm-Ganamet KL, Bembenek SD, Venable JW, Castro GG, Mangelschots L, Peeters DCG, et al. A Prospective Virtual Screening Study: Enriching Hit Rates and Designing Focus Libraries To Find Inhibitors of PI3K and PI3K. Journal of Medicinal Chemistry. 2016;59(9):4302-13. 94. Toropov AA, Toropova AP, Raska I, Jr., Leszczynska D, Leszczynski J. Comprehension of drug toxicity: software and databases. Computers in biology and medicine. 2014;45:20-5. Epub 2014/02/01. doi: 10.1016/j.compbiomed.2013.11.013. PubMed PMID: 24480159. 95. Benigni R, Netzeva TI, Benfenati E, Bossa C, Franke R, Helma C, et al. The expanding role of predictive toxicology: an update on the (Q)SAR models for mutagens and carcinogens. Journal of environmental science and health Part C, Environmental carcinogenesis & ecotoxicology reviews. 2007;25(1):53-97. Epub 2007/03/17. doi: 10.1080/10590500701201828. PubMed PMID: 17365342. 96. Muster W, Breidenbach A, Fischer H, Kirchner S, Muller L, Pahler A. Computational toxicology in drug development. Drug Discov Today. 2008;13(7-8):303-10. Epub 2008/04/15. doi: 10.1016/j.drudis.2007.12.007. PubMed PMID: 18405842. 97. Kruhlak NL, Contrera JF, Benz RD, Matthews EJ. Progress in QSAR toxicity screening of pharmaceutical impurities and other FDA regulated products. Advanced drug delivery reviews. 2007;59(1):43-55. Epub 2007/01/19. doi: 10.1016/j.addr.2006.10.008. PubMed PMID: 17229485.
136
98. Nigsch F, Macaluso NJ, Mitchell JB, Zmuidinavicius D. Computational toxicology: an overview of the sources of data and of modelling methods. Expert Opin Drug Metab Toxicol. 2009;5(1):1-14. Epub 2009/02/25. doi: 10.1517/17425250802660467. PubMed PMID: 19236225. 99. Yang C, Hasselgren CH, Boyer S, Arvidson K, Aveston S, Dierkes P, et al. Understanding genetic toxicity through data mining: the process of building knowledge by integrating multiple genetic toxicity databases. Toxicology mechanisms and methods. 2008;18(2-3):277-95. Epub 2008/01/01. doi: 10.1080/15376510701857502. PubMed PMID: 20020921. 100. Matthews EJ, Kruhlak NL, Benz RD, Contrera JF, Marchant CA, Yang C. Combined Use of MC4PC, MDL-QSAR, BioEpisteme, Leadscope PDM, and Derek for Windows Software to Achieve High-Performance, High-Confidence, Mode of Action-Based Predictions of Chemical Carcinogenesis in Rodents. Toxicology mechanisms and methods. 2008;18(2-3):189-206. Epub 2008/01/01. doi: 10.1080/15376510701857379. PubMed PMID: 20020914. 101. Benz RD. Toxicological and clinical computational analysis and the US FDA/CDER. Expert Opin Drug Metab Toxicol. 2007;3(1):109-24. Epub 2007/02/03. doi: 10.1517/17425255.3.1.109. PubMed PMID: 17269898. 102. Johnson DE, Rodgers AD. Computational toxicology: heading toward more relevance in drug discovery and development. Current opinion in drug discovery & development. 2006;9(1):29-37. Epub 2006/02/01. PubMed PMID: 16445115. 103. Braga RC, Alves VM, Silva MF, Muratov E, Fourches D, Tropsha A, et al. Tuning HERG out: antitarget QSAR models for drug development. Curr Top Med Chem. 2014;14(11):1399-415. Epub 2014/05/09. PubMed PMID: 24805060; PubMed Central PMCID: PMCPMC4593700. 104. Capuzzi SJ, Politi R, Isayev O, Farag S, Tropsha A. QSAR Modeling of Tox21 Challenge Stress Response and Nuclear Receptor Signaling Toxicity Assays. Frontiers in Environmental Science. 2016;4. 105. Huang R, Xia M, Nguyen D-T, Zhao T, Sakamuru S, Zhao J, et al. Tox21Challenge to Build Predictive Models of Nuclear Receptor and Stress Response Pathways as Mediated by Exposure to Environmental Chemicals and Drugs. Frontiers in Environmental Science. 2016;3. 106. Vedani A, Descloux AV, Spreafico M, Ernst B. Predicting the toxic potential of drugs and chemicals in silico: a model for the peroxisome proliferator-activated receptor gamma (PPAR gamma). Toxicology letters. 2007;173(1):17-23. Epub 2007/07/24. doi: 10.1016/j.toxlet.2007.06.011. PubMed PMID: 17643875. 107. Desvergne B, Wahli W. Peroxisome proliferator-activated receptors: nuclear control of metabolism. Endocrine reviews. 1999;20(5):649-88. Epub 1999/10/26. doi: 10.1210/edrv.20.5.0380. PubMed PMID: 10529898. 108. Peraza MA, Burdick AD, Marin HE, Gonzalez FJ, Peters JM. The toxicology of ligands for peroxisome proliferator-activated receptors (PPAR). Toxicological sciences : an official journal of the Society of Toxicology. 2006;90(2):269-95. Epub 2005/12/03. doi: 10.1093/toxsci/kfj062. PubMed PMID: 16322072. 109. Cramer RD, Redl G, Berkoff CE. Substructural analysis. Novel approach to the problem of drug design. Journal of Medicinal Chemistry. 1974;17(5):533-5. 110. Duda R. Pattern classification: Wiley; 2001. 111. Hand DJ. Principles of data mining: MIT Press; 2001. 112. Fox T, Kriegl J. Machine Learning Techniques for In Silico Modeling of Drug Metabolism. Current Topics in Medicinal Chemistry. 2006;6(15):1579-91. 113. Maltarollo VcG, Gertrudes JC, Oliveira PcR, Honorio KM. Applying machine learning techniques for ADME-Tox prediction: a review. Expert Opinion on Drug Metabolism & Toxicology. 2014;11(2):259-71.
137
114. Kell DB. Theodor Bucher Lecture. Metabolomics, modelling and machine learning in systems biology - towards an understanding of the languages of cells. Delivered on 3 July 2005 at the 30th FEBS Congress and the 9th IUBMB conference in Budapest. The FEBS journal. 2006;273(5):873-94. Epub 2006/02/16. doi: 10.1111/j.1742-4658.2006.05136.x. PubMed PMID: 16478464. 115. Goncalves V, Maria K, da Silv ABF. Applications of Artificial Neural Networks in Chemical Problems. Artificial Neural Networks - Architectures and Applications: InTech; 2013. 116. Hand DJ, Yu K. Idiots Bayes?Not So Stupid After All? International Statistical Review. 2001;69(3):385-98. 117. k-Nearest Neighbor Algorithm. Discovering Knowledge in Data. 2005. doi: doi:10.1002/0471687545.ch5 10.1002/0471687545.ch5. 118. Ho TK. The random subspace method for constructing decision forests. IEEE Transactions on Pattern Analysis and Machine Intelligence. 1998;20(8):832-44. 119. Cortes C, Vapnik V. Machine Learning. 1995;20(3):273-97. 120. Mitchell JB. Machine learning methods in chemoinformatics. Wiley interdisciplinary reviews Computational molecular science. 2014;4(5):468-81. Epub 2014/10/07. doi: 10.1002/wcms.1183. PubMed PMID: 25285160; PubMed Central PMCID: PMCPMC4180928. 121. Zhu H, Zhang J, Kim MT, Boison A, Sedykh A, Moran K. Big data in chemical toxicity research: the use of high-throughput screening assays to identify potential toxicants. Chemical research in toxicology. 2014;27(10):1643-51. Epub 2014/09/10. doi: 10.1021/tx500145h. PubMed PMID: 25195622; PubMed Central PMCID: PMCPMC4203392. 122. Clark AM, Ekins S. Open Source Bayesian Models. 2. Mining a "Big Dataset" To Create and Validate Models with ChEMBL. J Chem Inf Model. 2015;55(6):1246-60. Epub 2015/05/23. doi: 10.1021/acs.jcim.5b00144. PubMed PMID: 25995041. 123. Ekins S, Clark AM, Swamidass SJ, Litterman N, Williams AJ. Bigger data, collaborative tools and the future of predictive drug discovery. Journal of computer-aided molecular design. 2014;28(10):997-1008. Epub 2014/06/20. doi: 10.1007/s10822-014-9762-y. PubMed PMID: 24943138; PubMed Central PMCID: PMCPMC4198464. 124. Ekins S, Freundlich JS, Reynolds RC. Are bigger data sets better for machine learning? Fusing single-point and dual-event dose response data for Mycobacterium tuberculosis. J Chem Inf Model. 2014;54(7):2157-65. Epub 2014/06/27. doi: 10.1021/ci500264r. PubMed PMID: 24968215; PubMed Central PMCID: PMCPMC4951206. 125. Ekins S. The Next Era: Deep Learning in Pharmaceutical Research. Pharmaceutical research. 2016;33(11):2594-603. Epub 2016/09/08. doi: 10.1007/s11095-016-2029-7. PubMed PMID: 27599991; PubMed Central PMCID: PMCPMC5042864. 126. Chen H, Engkvist O, Wang Y, Olivecrona M, Blaschke T. The rise of deep learning in drug discovery. Drug Discovery Today. 2018;23(6):1241-50. 127. Salt DW, Yildiz N, Livingstone DJ, Tinsley CJ. The Use of Artificial Neural Networks in QSAR. Pesticide Science. 1992;36(2):161-70. 128. Tropsha A. Best Practices for QSAR Model Development, Validation, and Exploitation. Molecular Informatics. 2010;29(6-7):476-88. 129. Gramatica P. Principles of QSAR models validation: internal and external. QSAR & Combinatorial Science. 2007;26(5):694-701. 130. Gertrudes JC, Maltarollo VG, Silva RA, Oliveira PR, Honorio KM, da Silva AB. Machine learning techniques and drug design. Current medicinal chemistry. 2012;19(25):4289-97. Epub 2012/07/27. PubMed PMID: 22830342.
138
131. Lima AN, Philot EA, Trossini GH, Scott LP, Maltarollo VG, Honorio KM. Use of machine learning approaches for novel drug discovery. Expert opinion on drug discovery. 2016;11(3):225-39. Epub 2016/01/28. doi: 10.1517/17460441.2016.1146250. PubMed PMID: 26814169. 132. Golbraikh A, Muratov E, Fourches D, Tropsha A. Data set modelability by QSAR. J Chem Inf Model. 2014;54(1):1-4. Epub 2013/11/21. doi: 10.1021/ci400572x. PubMed PMID: 24251851; PubMed Central PMCID: PMCPMC3984298. 133. Stumpfe D, Bajorath J. Exploring activity cliffs in medicinal chemistry. J Med Chem. 2012;55(7):2932-42. Epub 2012/01/13. doi: 10.1021/jm201706b. PubMed PMID: 22236250. 134. Hu Y, Stumpfe D, Bajorath J. Advancing the activity cliff concept. F1000Research. 2013;2:199. Epub 2014/02/21. doi: 10.12688/f1000research.2-199.v1. PubMed PMID: 24555097; PubMed Central PMCID: PMCPMC3869489. 135. Maggiora GM. On outliers and activity cliffs--why QSAR often disappoints. J Chem Inf Model. 2006;46(4):1535. Epub 2006/07/25. doi: 10.1021/ci060117s. PubMed PMID: 16859285. 136. Young D, Martin T, Venkatapathy R, Harten P. Are the Chemical Structures in Your QSAR Correct? QSAR & Combinatorial Science. 2008;27(11-12):1337-45. 137. Fourches D, Tropsha A. Using Graph Indices for the Analysis and Comparison of Chemical Datasets. Mol Inform. 2013;32(9-10):827-42. Epub 2013/10/01. doi: 10.1002/minf.201300076. PubMed PMID: 27480235. 138. Fourches D, Muratov E, Tropsha A. Trust, but verify: on the importance of chemical structure curation in cheminformatics and QSAR modeling research. J Chem Inf Model. 2010;50(7):1189-204. Epub 2010/06/25. doi: 10.1021/ci100176x. PubMed PMID: 20572635; PubMed Central PMCID: PMCPMC2989419. 139. Rishton GM. Reactive compounds and in vitro false positives in HTS. Drug Discovery Today. 1997;2(9):382-4. 140. Aldrich C, Bertozzi C, Georg GI, Kiessling L, Lindsley C, Liotta D, et al. The Ecstasy and Agony of Assay Interference Compounds. ACS Central Science. 2017;3(3):143-7. 141. Rishton GM. Nonleadlikeness and leadlikeness in biochemical screening. Drug Discov Today. 2003;8(2):86-96. Epub 2003/02/05. PubMed PMID: 12565011. 142. Simeonov A, Jadhav A, Thomas CJ, Wang Y, Huang R, Southall NT, et al. Fluorescence Spectroscopic Profiling of Compound Libraries. Journal of Medicinal Chemistry. 2008;51(8):2363-71. 143. Thorne N, Auld DS, Inglese J. Apparent activity in high-throughput screening: origins of compound-dependent assay interference. Current opinion in chemical biology. 2010;14(3):315-24. Epub 2010/04/27. doi: 10.1016/j.cbpa.2010.03.020. PubMed PMID: 20417149; PubMed Central PMCID: PMCPMC2878863. 144. Lea WA, Simeonov A. Fluorescence polarization assays in small molecule screening. Expert opinion on drug discovery. 2011;6(1):17-32. Epub 2012/02/14. doi: 10.1517/17460441.2011.537322. PubMed PMID: 22328899; PubMed Central PMCID: PMCPMC3277431. 145. Ingolfsson HI, Thakur P, Herold KF, Hobart EA, Ramsey NB, Periole X, et al. Phytochemicals perturb membranes and promiscuously alter protein function. ACS chemical biology. 2014;9(8):1788-98. Epub 2014/06/06. doi: 10.1021/cb500086e. PubMed PMID: 24901212; PubMed Central PMCID: PMCPMC4136704. 146. Schneider C, Gordon ON, Edwards RL, Luis PB. Degradation of Curcumin: From Mechanism to Biological Implications. Journal of agricultural and food chemistry. 2015;63(35):7606-14. Epub 2015/03/31. doi: 10.1021/acs.jafc.5b00244. PubMed PMID: 25817068; PubMed Central PMCID: PMCPMC4752206.
139
147. McGovern SL, Caselli E, Grigorieff N, Shoichet BK. A common mechanism underlying promiscuous inhibitors from virtual and high-throughput screening. J Med Chem. 2002;45(8):1712-22. Epub 2002/04/05. PubMed PMID: 11931626. 148. Feng BY, Shelat A, Doman TN, Guy RK, Shoichet BK. High-throughput assays for promiscuous inhibitors. Nature chemical biology. 2005;1(3):146-8. Epub 2006/01/13. doi: 10.1038/nchembio718. PubMed PMID: 16408018. 149. Coan KE, Shoichet BK. Stoichiometry and physical chemistry of promiscuous aggregate-based inhibitors. Journal of the American Chemical Society. 2008;130(29):9606-12. Epub 2008/07/01. doi: 10.1021/ja802977h. PubMed PMID: 18588298; PubMed Central PMCID: PMCPMC2627561. 150. Lane SJ, Eggleston Ds Fau - Brinded KA, Brinded Ka Fau - Hollerton JC, Hollerton Jc Fau - Taylor NL, Taylor Nl Fau - Readshaw SA, Readshaw SA. Defining and maintaining a high quality screening collection: the GSK experience. (1359-6446 (Print)). 151. Hajduk Pj Fau - Galloway WRJD, Galloway Wr Fau - Spring DR, Spring DR. Drug discovery: A question of library design. (1476-4687 (Electronic)). 152. Neves BJ, Dantas RF, Senger MR, Melo-Filho CC, Valente WC, de Almeida AC, et al. Discovery of New Anti-Schistosomal Hits by Integration of QSAR-Based Virtual Screening and High Content Screening. J Med Chem. 2016;59(15):7075-88. Epub 2016/07/12. doi: 10.1021/acs.jmedchem.5b02038. PubMed PMID: 27396732; PubMed Central PMCID: PMCPMC5844225. 153. Williamson AE, Ylioja PM, Robertson MN, Antonova-Koch Y, Avery V, Baell JB, et al. Open Source Drug Discovery: Highly Potent Antimalarial Compounds Derived from the Tres Cantos Arylpyrroles. ACS Central Science. 2016;2(10):687-701. 154. Sterling T, Irwin JJ. ZINC 15 – Ligand Discovery for Everyone. Journal of Chemical Information and Modeling. 2015;55(11):2324-37. 155. Lagorce D, Sperandio O, Baell JB, Miteva MA, Villoutreix BO. FAF-Drugs3: a web server for compound property calculation and chemical library design. Nucleic acids research. 2015;43(W1):W200-7. Epub 2015/04/18. doi: 10.1093/nar/gkv353. PubMed PMID: 25883137; PubMed Central PMCID: PMCPMC4489254. 156. Mok NY, Maxe S, Brenk R. Locating sweet spots for screening hits and evaluating pan-assay interference filters from the performance analysis of two lead-like libraries. J Chem Inf Model. 2013;53(3):534-44. Epub 2013/03/05. doi: 10.1021/ci300382f. PubMed PMID: 23451880; PubMed Central PMCID: PMCPMC3739413. 157. Dahlin JL, Nissink JWM, Strasser JM, Francis S, Higgins L, Zhou H, et al. PAINS in the Assay: Chemical Mechanisms of Assay Interference and Promiscuous Enzymatic Inhibition Observed during a Sulfhydryl-Scavenging HTS. Journal of Medicinal Chemistry. 2015;58(5):2091-113. 158. Erlanson DA. Learning from PAINful lessons. Journal of Medicinal Chemistry. 2015;58(5):2088-90. 159. Gilberg E, Jasial S, Stumpfe D, Dimova D, Bajorath J. Highly Promiscuous Small Molecules from Biological Screening Assays Include Many Pan-Assay Interference Compounds but Also Candidates for Polypharmacology. Journal of Medicinal Chemistry. 2016;59(22):10285-90. 160. Capuzzi SJ, Muratov EN, Tropsha A. Phantom PAINS: Problems with the Utility of Alerts for Pan-Assay INterference CompoundS. J Chem Inf Model. 2017;57(3):417-27. Epub 2017/02/07. doi: 10.1021/acs.jcim.6b00465. PubMed PMID: 28165734; PubMed Central PMCID: PMCPMC5411023. 161. Kenny PW. Comment on The Ecstasy and Agony of Assay Interference Compounds. Journal of Chemical Information and Modeling. 2017;57(11):2640-5.
140
162. Senger MR, Fraga CA, Dantas RF, Silva FP, Jr. Filtering promiscuous compounds in early drug discovery: is it a good idea? Drug Discov Today. 2016;21(6):868-72. Epub 2016/02/18. doi: 10.1016/j.drudis.2016.02.004. PubMed PMID: 26880580. 163. Paolini GV, Shapland RH, van Hoorn WP, Mason JS, Hopkins AL. Global mapping of pharmacological space. Nature biotechnology. 2006;24(7):805-15. Epub 2006/07/15. doi: 10.1038/nbt1228. PubMed PMID: 16841068. 164. Boran AD, Iyengar R. Systems approaches to polypharmacology and drug discovery. Current opinion in drug discovery & development. 2010;13(3):297-309. Epub 2010/05/06. PubMed PMID: 20443163; PubMed Central PMCID: PMCPMC3068535. 165. Hu Y, Bajorath J. High-resolution view of compound promiscuity. F1000Research. 2013;2:144. Epub 2013/12/24. doi: 10.12688/f1000research.2-144.v2. PubMed PMID: 24358872; PubMed Central PMCID: PMCPMC3799544. 166. Jalencas X, Mestres J. On the origins of drug polypharmacology. Med Chem Commun. 2013;4(1):80-7. 167. Hu Y, Bajorath J. Compound promiscuity: what can we learn from current data? Drug Discov Today. 2013;18(13-14):644-50. Epub 2013/03/26. doi: 10.1016/j.drudis.2013.03.002. PubMed PMID: 23524195. 168. Lu JJ, Pan W, Hu YJ, Wang YT. Multi-target drugs: the trend of drug research and development. PloS one. 2012;7(6):e40262. Epub 2012/07/07. doi: 10.1371/journal.pone.0040262. PubMed PMID: 22768266; PubMed Central PMCID: PMCPMC3386979. 169. Jasial S, Hu Y, Bajorath J. Determining the Degree of Promiscuity of Extensively Assayed Compounds. PloS one. 2016;11(4):e0153873. Epub 2016/04/16. doi: 10.1371/journal.pone.0153873. PubMed PMID: 27082988; PubMed Central PMCID: PMCPMC4833426. 170. Law V, Knox C, Djoumbou Y, Jewison T, Guo AC, Liu Y, et al. DrugBank 4.0: shedding new light on drug metabolism. Nucleic acids research. 2014;42(Database issue):D1091-7. Epub 2013/11/10. doi: 10.1093/nar/gkt1068. PubMed PMID: 24203711; PubMed Central PMCID: PMCPMC3965102. 171. Bento AP, Gaulton A, Hersey A, Bellis LJ, Chambers J, Davies M, et al. The ChEMBL bioactivity database: an update. Nucleic acids research. 2014;42(Database issue):D1083-90. Epub 2013/11/12. doi: 10.1093/nar/gkt1031. PubMed PMID: 24214965; PubMed Central PMCID: PMCPMC3965067. 172. Wang Y, Xiao J, Suzek TO, Zhang J, Wang J, Zhou Z, et al. PubChem's BioAssay Database. Nucleic acids research. 2012;40(Database issue):D400-12. Epub 2011/12/06. doi: 10.1093/nar/gkr1132. PubMed PMID: 22140110; PubMed Central PMCID: PMCPMC3245056. 173. Hu Y, Bajorath J. Learning from 'big data': compounds and targets. Drug Discov Today. 2014;19(4):357-60. Epub 2014/02/25. doi: 10.1016/j.drudis.2014.02.004. PubMed PMID: 24561327. 174. Mestres J, Gregori-Puigjane E, Valverde S, Sole RV. Data completeness--the Achilles heel of drug-target networks. Nature biotechnology. 2008;26(9):983-4. Epub 2008/09/10. doi: 10.1038/nbt0908-983. PubMed PMID: 18779805. 175. Wassermann AM, Lounkine E, Hoepfner D, Le Goff G, King FJ, Studer C, et al. Dark chemical matter as a promising starting point for drug lead discovery. Nature chemical biology. 2015;11(12):958-66. Epub 2015/10/20. doi: 10.1038/nchembio.1936. PubMed PMID: 26479441. 176. Muegge I, Mukherjee P. Performance of Dark Chemical Matter in High Throughput Screening. J Med Chem. 2016;59(21):9806-13. Epub 2016/10/30. doi: 10.1021/acs.jmedchem.6b01038. PubMed PMID: 27762554.
141
177. Scior T, Medina-Franco JL, Do QT, Martinez-Mayorga K, Yunes Rojas JA, Bernard P. How to recognize and workaround pitfalls in QSAR studies: a critical review. Current medicinal chemistry. 2009;16(32):4297-313. Epub 2009/09/17. PubMed PMID: 19754417. 178. Kalliokoski T, Kramer C, Vulpetti A, Gedeck P. Comparability of mixed IC(5)(0) data - a statistical analysis. PloS one. 2013;8(4):e61007. Epub 2013/04/25. doi: 10.1371/journal.pone.0061007. PubMed PMID: 23613770; PubMed Central PMCID: PMCPMC3628986. 179. Tetko IV, Engkvist O, Koch U, Reymond JL, Chen H. BIGCHEM: Challenges and Opportunities for Big Data Analysis in Chemistry. Mol Inform. 2016;35(11-12):615-21. Epub 2016/07/29. doi: 10.1002/minf.201600073. PubMed PMID: 27464907; PubMed Central PMCID: PMCPMC5129546. 180. Kramer C, Kalliokoski T, Gedeck P, Vulpetti A. The Experimental Uncertainty of Heterogeneous Public Ki Data. Journal of Medicinal Chemistry. 2012;55(11):5165-73. 181. Yonchev D, Dimova D, Stumpfe D, Vogt M, Bajorath J. Redundancy in two major compound databases. Drug Discovery Today. 2018;23(6):1183-6. 182. Southan C, Sitzmann M, Muresan S. Comparing the Chemical Structure and Protein Content of ChEMBL, DrugBank, Human Metabolome Database and the Therapeutic Target Database. Mol Inform. 2013;32(11-12):881-97. Epub 2014/02/18. doi: 10.1002/minf.201300103. PubMed PMID: 24533037; PubMed Central PMCID: PMCPMC3916886. 183. Southan C, Varkonyi P, Muresan S. Quantitative assessment of the expanding complementarity between public and commercial databases of bioactive compounds. Journal of cheminformatics. 2009;1(1):10. Epub 2009/01/01. doi: 10.1186/1758-2946-1-10. PubMed PMID: 20298516; PubMed Central PMCID: PMCPMC3225862. 184. Southan C. Caveat Usor: Assessing Differences between Major Chemistry Databases. ChemMedChem. 2018;13(6):470-81. Epub 2018/02/17. doi: 10.1002/cmdc.201700724. PubMed PMID: 29451740; PubMed Central PMCID: PMCPMC5900829. 185. Wishart DS, Knox C, Guo AC, Shrivastava S, Hassanali M, Stothard P, et al. DrugBank: a comprehensive resource for in silico drug discovery and exploration. Nucleic acids research. 2006;34(Database issue):D668-72. Epub 2005/12/31. doi: 10.1093/nar/gkj067. PubMed PMID: 16381955; PubMed Central PMCID: PMCPMC1347430. 186. Wishart DS, Feunang YD, Guo AC, Lo EJ, Marcu A, Grant JR, et al. DrugBank 5.0: a major update to the DrugBank database for 2018. Nucleic acids research. 2018;46(D1):D1074-d82. Epub 2017/11/11. doi: 10.1093/nar/gkx1037. PubMed PMID: 29126136; PubMed Central PMCID: PMCPMC5753335. 187. Huang R, Xia M, Sakamuru S, Zhao J, Shahane SA, Attene-Ramos M, et al. Modelling the Tox21 10 K chemical profiles for in vivo toxicity prediction and mechanism characterization. Nature communications. 2016;7:10425. Epub 2016/01/27. doi: 10.1038/ncomms10425. PubMed PMID: 26811972; PubMed Central PMCID: PMCPMC4777217. 188. Siramshetty VB, Nickel J, Omieczynski C, Gohlke BO, Drwal MN, Preissner R. WITHDRAWN--a resource for withdrawn and discontinued drugs. Nucleic acids research. 2016;44(D1):D1080-6. Epub 2015/11/11. doi: 10.1093/nar/gkv1192. PubMed PMID: 26553801; PubMed Central PMCID: PMCPMC4702851. 189. Zhao L, Wang W, Sedykh A, Zhu H. Experimental Errors in QSAR Modeling Sets: What We Can Do and What We Cannot Do. ACS Omega. 2017;2(6):2805-12. 190. Oprea T. Chemoinformatics in drug discovery: Wiley-VCH; 2005. 191. Hu Y, Bajorath J. Influence of search parameters and criteria on compound selection, promiscuity, and pan assay interference characteristics. J Chem Inf Model. 2014;54(11):3056-66. Epub 2014/10/21. doi: 10.1021/ci5005509. PubMed PMID: 25329977.
142
192. Fourches D, Muratov E, Tropsha A. Trust, but Verify II: A Practical Guide to Chemogenomics Data Curation. J Chem Inf Model. 2016;56(7):1243-52. Epub 2016/06/10. doi: 10.1021/acs.jcim.6b00129. PubMed PMID: 27280890; PubMed Central PMCID: PMCPMC5657146. 193. Martin YC. Let's not forget tautomers. Journal of computer-aided molecular design. 2009;23(10):693-704. Epub 2009/10/21. doi: 10.1007/s10822-009-9303-2. PubMed PMID: 19842045; PubMed Central PMCID: PMCPMC2776169. 194. Instant JChem. (version 16.10.10, developed by ChemAxon), 2016. Available from: https://chemaxon.com. 195. RDKit. RDKit: Open-Source Cheminformatics Software. Available from: http://www.rdkit.org. 196. KNIME. KNIME Analytics Platform. Available from: https://www.knime.com. 197. Baurin N, Baker R, Richardson C, Chen I, Foloppe N, Potter A, et al. Drug-like Annotation and Duplicate Analysis of a 23-Supplier Chemical Database Totalling 2.7 Million Compounds. Journal of Chemical Information and Computer Sciences. 2004;44(2):643-51. 198. Varnek A, Fourches D, Horvath D, Klimchuk O, Gaudin C, Vayer P, et al. ISIDA - Platform for Virtual Screening Based on Fragment and Pharmacophoric Descriptors. Current Computer Aided-Drug Design. 2008;4(3):191-8. 199. Kuz'min VE, Artemenko AG, Muratov EN. Hierarchical QSAR technology based on the Simplex representation of molecular structure. Journal of computer-aided molecular design. 2008;22(6-7):403-21. Epub 2008/02/07. doi: 10.1007/s10822-008-9179-6. PubMed PMID: 18253701. 200. Hu Y, Bajorath J. Many structurally related drugs bind different targets whereas distinct drugs display significant target overlap. RSC Advances. 2012;2(8):3481-. 201. Hu Y, Maggiora GM, Bajorath J. Activity cliffs in PubChem confirmatory bioassays taking inactive compounds into account. Journal of computer-aided molecular design. 2013;27(2):115-24. Epub 2013/01/09. doi: 10.1007/s10822-012-9632-4. PubMed PMID: 23296990. 202. Allen CHG, Koutsoukas A, Cortés-Ciriano I, Murrell DS, Malliavin TE, Glen RC, et al. Improving the prediction of organism-level toxicity through integration of chemical, protein target and cytotoxicity qHTS data. Toxicology Research. 2016;5(3):883-94. 203. Varnek A, Baskin I. Machine Learning Methods for Property Prediction in Chemoinformatics: Quo Vadis? Journal of Chemical Information and Modeling. 2012;52(6):1413-37. 204. Drwal MN, Siramshetty VB, Banerjee P, Goede A, Preissner R, Dunkel M. Molecular similarity-based predictions of the Tox21 screening outcome. Frontiers in Environmental Science. 2015;3. 205. Banerjee P, Siramshetty VB, Drwal MN, Preissner R. Computational methods for prediction of in vitro effects of new chemical structures. Journal of cheminformatics. 2016;8:51. Epub 2017/03/21. doi: 10.1186/s13321-016-0162-2. PubMed PMID: 28316649; PubMed Central PMCID: PMCPMC5043617. 206. Siramshetty VB, Chen Q, Devarakonda P, Preissner R. The Catch-22 of Predicting hERG Blockade Using Publicly Accessible Bioactivity Data. Journal of Chemical Information and Modeling. 2018;58(6):1224-33. doi: 10.1021/acs.jcim.8b00150. 207. Ashby J, Tennant RW. Chemical structure, Salmonella mutagenicity and extent of carcinogenicity as indicators of genotoxic carcinogenesis among 222 chemicals tested in rodents by the U.S. NCI/NTP. Mutation research. 1988;204(1):17-115. Epub 1988/01/01. PubMed PMID: 3277047. 208. Kroes R, Renwick AG, Cheeseman M, Kleiner J, Mangelsdorf I, Piersma A, et al. Structure-based thresholds of toxicological concern (TTC): guidance for application to
143
substances present at low levels in the diet. Food and chemical toxicology : an international journal published for the British Industrial Biological Research Association. 2004;42(1):65-83. Epub 2003/11/25. PubMed PMID: 14630131. 209. ToxPrint. ToxPrint Chemptypes. 2013. Available from: https://toxprint.org. 210. Hall LH, Kier LB. Electrotopological State Indices for Atom Types: A Novel Combination of Electronic, Topological, and Valence State Information. Journal of Chemical Information and Modeling. 1995;35(6):1039-45. 211. Hall LH, Mohney B, Kier LB. The Electrotopological State: An Atom Index for QSAR. Quantitative Structure-Activity Relationships. 1991;10(1):43-51. 212. Testa B. Advances in drug research: Academic Press; 1992. 213. National Institutes of Health (NIH). The PubChem Project. 2018. Available from: https://pubchem.ncbi.nlm.nih.gov/. 214. Gobbi A, Poppinger D. Genetic optimization of combinatorial libraries. Biotechnology and bioengineering. 1998;61(1):47-54. Epub 1999/04/01. PubMed PMID: 10099495. 215. Eckert H, Bajorath J. Design and evaluation of a novel class-directed 2D fingerprint to search for structurally diverse active compounds. J Chem Inf Model. 2006;46(6):2515-26. Epub 2006/11/28. doi: 10.1021/ci600303b. PubMed PMID: 17125192. 216. Altman NS. An Introduction to Kernel and Nearest-Neighbor Nonparametric Regression. The American Statistician. 1992;46(3):175-85. 217. Kauffman GW, Jurs PC. QSAR and k-nearest neighbor classification analysis of selective cyclooxygenase-2 inhibitors using topologically-based numerical descriptors. J Chem Inf Comput Sci. 2001;41(6):1553-60. Epub 2001/12/26. PubMed PMID: 11749582. 218. Svetnik V, Liaw A, Tong C, Culberson JC, Sheridan RP, Feuston BP. Random forest: a classification and regression tool for compound classification and QSAR modeling. J Chem Inf Comput Sci. 2003;43(6):1947-58. Epub 2003/11/25. doi: 10.1021/ci034160g. PubMed PMID: 14632445. 219. Votano JR, Parham M, Hall LH, Kier LB, Oloff S, Tropsha A, et al. Three new consensus QSAR models for the prediction of Ames genotoxicity. Mutagenesis. 2004;19(5):365-77. Epub 2004/09/25. doi: 10.1093/mutage/geh043. PubMed PMID: 15388809. 220. Briem H, Gunther J. Classifying "kinase inhibitor-likeness" by using machine-learning methods. Chembiochem : a European journal of chemical biology. 2005;6(3):558-66. Epub 2005/02/08. doi: 10.1002/cbic.200400109. PubMed PMID: 15696507. 221. Honorio KM, da Silva AB. A study on the influence of molecular properties in the psychoactivity of cannabinoid compounds. Journal of molecular modeling. 2005;11(3):200-9. Epub 2005/05/04. doi: 10.1007/s00894-005-0243-z. PubMed PMID: 15868154. 222. Li H, Ung CY, Yap CW, Xue Y, Li ZR, Chen YZ. Prediction of estrogen receptor agonists and characterization of associated molecular descriptors by statistical learning methods. Journal of molecular graphics & modelling. 2006;25(3):313-23. Epub 2006/02/25. doi: 10.1016/j.jmgm.2006.01.007. PubMed PMID: 16497524. 223. Nigsch F, Bender A, van Buuren B, Tissen J, Nigsch E, Mitchell JB. Melting point prediction employing k-nearest neighbor algorithms and genetic parameter optimization. J Chem Inf Model. 2006;46(6):2412-22. Epub 2006/11/28. doi: 10.1021/ci060149f. PubMed PMID: 17125183. 224. Konovalov DA, Coomans D, Deconinck E, Heyden YV. Benchmarking of QSAR models for blood-brain barrier permeation. J Chem Inf Model. 2007;47(4):1648-56. Epub 2007/07/03. doi: 10.1021/ci700100f. PubMed PMID: 17602606. 225. Nene SA, Nayar SK. A simple algorithm for nearest neighbor search in high dimensions. IEEE Transactions on Pattern Analysis and Machine Intelligence. 1997;19(9):989-1003.
144
226. Jensen F. Bayesian networks and decision graphs: Springer; 2007. 227. von Korff M, Sander T. Toxicity-Indicating Structural Patterns. Journal of Chemical Information and Modeling. 2006;46(2):536-44. 228. Koutsoukas A, Lowe R, Kalantarmotamedi Y, Mussa HY, Klaffke W, Mitchell JB, et al. In silico target predictions: defining a benchmarking data set and comparison of performance of the multiclass Naive Bayes and Parzen-Rosenblatt window. J Chem Inf Model. 2013;53(8):1957-66. Epub 2013/07/09. doi: 10.1021/ci300435j. PubMed PMID: 23829430. 229. Nigsch F, Bender A, Jenkins JL, Mitchell JB. Ligand-target prediction using Winnow and naive Bayesian algorithms and the implications of overall performance statistics. J Chem Inf Model. 2008;48(12):2313-25. Epub 2008/12/06. doi: 10.1021/ci800079x. PubMed PMID: 19055411. 230. Watson P. Naive Bayes classification using 2D pharmacophore feature triplet vectors. J Chem Inf Model. 2008;48(1):166-78. Epub 2008/01/11. doi: 10.1021/ci7003253. PubMed PMID: 18183968. 231. Abdo A, Chen B, Mueller C, Salim N, Willett P. Ligand-Based Virtual Screening Using Bayesian Networks. Journal of Chemical Information and Modeling. 2010;50(6):1012-20. 232. Vogt M, Bajorath J. Bayesian screening for active compounds in high-dimensional chemical spaces combining property descriptors and molecular fingerprints. Chemical biology & drug design. 2008;71(1):8-14. Epub 2007/12/12. doi: 10.1111/j.1747-0285.2007.00602.x. PubMed PMID: 18069988. 233. Vapnik V. Statistical learning theory: Wiley; 1998. 234. Burbidge R, Trotter M, Buxton B, Holden S. Drug design by machine learning: support vector machines for pharmaceutical data analysis. Computers & chemistry. 2001;26(1):5-14. Epub 2002/01/05. PubMed PMID: 11765851. 235. Warmuth MK, Liao J, Ratsch G, Mathieson M, Putta S, Lemmen C. Active learning with support vector machines in the drug discovery process. J Chem Inf Comput Sci. 2003;43(2):667-73. Epub 2003/03/26. doi: 10.1021/ci025620t. PubMed PMID: 12653536. 236. Byvatov E, Fechner U, Sadowski J, Schneider G. Comparison of support vector machine and artificial neural network systems for drug/nondrug classification. J Chem Inf Comput Sci. 2003;43(6):1882-9. Epub 2003/11/25. doi: 10.1021/ci0341161. PubMed PMID: 14632437. 237. Zernov VV, Balakin KV, Ivaschenko AA, Savchuk NP, Pletnev IV. Drug discovery using support vector machines. The case studies of drug-likeness, agrochemical-likeness, and enzyme inhibition predictions. J Chem Inf Comput Sci. 2003;43(6):2048-56. Epub 2003/11/25. doi: 10.1021/ci0340916. PubMed PMID: 14632457. 238. Cheng T, Li Q, Wang Y, Bryant SH. Binary Classification of Aqueous Solubility Using Support Vector Machines with Reduction and Recombination Feature Selection. Journal of Chemical Information and Modeling. 2011;51(2):229-36. 239. Jorissen RN, Gilson MK. Virtual screening of molecular databases using a support vector machine. J Chem Inf Model. 2005;45(3):549-61. Epub 2005/06/01. doi: 10.1021/ci049641u. PubMed PMID: 15921445. 240. Geppert H, Horvath T, Gartner T, Wrobel S, Bajorath J. Support-vector-machine-based ranking significantly improves the effectiveness of similarity searching using 2D fingerprints and multiple reference compounds. J Chem Inf Model. 2008;48(4):742-6. Epub 2008/03/06. doi: 10.1021/ci700461s. PubMed PMID: 18318473. 241. Omer A, Singh P, Yadav NK, Singh RK. An overview of data mining algorithms in drug induced toxicity prediction. Mini reviews in medicinal chemistry. 2014;14(4):345-54. Epub 2014/02/21. PubMed PMID: 24552264. 242. Liu J, Mansouri K, Judson RS, Martin MT, Hong H, Chen M, et al. Predicting hepatotoxicity using ToxCast in vitro bioactivity and chemical structure. Chemical research in
145
toxicology. 2015;28(4):738-51. Epub 2015/02/24. doi: 10.1021/tx500501h. PubMed PMID: 25697799. 243. Wang F, Liu D, Wang H, Luo C, Zheng M, Liu H, et al. Computational screening for active compounds targeting protein sequences: methodology and experimental validation. J Chem Inf Model. 2011;51(11):2821-8. Epub 2011/10/01. doi: 10.1021/ci200264h. PubMed PMID: 21955088. 244. Geppert H, Humrich J, Stumpfe D, Gartner T, Bajorath J. Ligand prediction from protein sequence and small molecule information using support vector machines and fingerprint descriptors. J Chem Inf Model. 2009;49(4):767-79. Epub 2009/03/25. doi: 10.1021/ci900004a. PubMed PMID: 19309114. 245. Heikamp K, Bajorath J. Support vector machines for drug discovery. Expert opinion on drug discovery. 2014;9(1):93-104. Epub 2013/12/07. doi: 10.1517/17460441.2014.866943. PubMed PMID: 24304044. 246. Hinselmann G, Rosenbaum L, Jahn A, Fechner N, Ostermann C, Zell A. Large-scale learning of structure-activity relationships using a linear support vector machine and problem-specific metrics. J Chem Inf Model. 2011;51(2):203-13. Epub 2011/01/07. doi: 10.1021/ci100073w. PubMed PMID: 21207929. 247. Kashima H, Tsuda K, Inokuchi A. Marginalized kernels between labeled graphs. Proceedings of the Twentieth International Conference on International Conference on Machine Learning; Washington, DC, USA. 3041879: AAAI Press; 2003. p. 321-8. 248. Ralaivola L, Swamidass SJ, Saigo H, Baldi P. Graph kernels for chemical informatics. Neural networks : the official journal of the International Neural Network Society. 2005;18(8):1093-110. Epub 2005/09/15. doi: 10.1016/j.neunet.2005.07.009. PubMed PMID: 16157471. 249. Akbani R, Kwek S, Japkowicz N. Applying Support Vector Machines to Imbalanced Datasets. Machine Learning: ECML 2004: Springer Berlin Heidelberg; 2004. p. 39-50. 250. Pedregosa F, Ga, #235, Varoquaux l, Gramfort A, Michel V, et al. Scikit-learn: Machine Learning in Python. J Mach Learn Res. 2011;12:2825-30. 251. Python Software Foundation. Python Language Reference. Available from: https://www.python.org. 252. Klekota J, Roth FP. Chemical substructures that enrich for biological activity. Bioinformatics (Oxford, England). 2008;24(21):2518-25. Epub 2008/09/12. doi: 10.1093/bioinformatics/btn479. PubMed PMID: 18784118; PubMed Central PMCID: PMCPMC2732283. 253. Schneider N, Jäckels C, Andres C, Hutter MC. Gradual in Silico Filtering for Druglike Substances. Journal of Chemical Information and Modeling. 2008;48(3):613-28. 254. Hou T, Wang J, Li Y. ADME evaluation in drug discovery. 8. The prediction of human intestinal absorption by a support vector machine. J Chem Inf Model. 2007;47(6):2408-15. Epub 2007/10/13. doi: 10.1021/ci7002076. PubMed PMID: 17929911. 255. Deconinck E, Zhang MH, Coomans D, Vander Heyden Y. Classification tree models for the prediction of blood-brain barrier passage of drugs. J Chem Inf Model. 2006;46(3):1410-9. Epub 2006/05/23. doi: 10.1021/ci050518s. PubMed PMID: 16711761. 256. Gleeson MP, Waters NJ, Paine SW, Davis AM. In silico human and rat Vss quantitative structure-activity relationship models. J Med Chem. 2006;49(6):1953-63. Epub 2006/03/17. doi: 10.1021/jm0510070. PubMed PMID: 16539383. 257. Lamanna C, Bellini M, Padova A, Westerberg G, Maccari L. Straightforward recursive partitioning model for discarding insoluble compounds in the drug discovery process. J Med Chem. 2008;51(10):2891-7. Epub 2008/04/19. doi: 10.1021/jm701407x. PubMed PMID: 18419111.
146
258. de Cerqueira Lima P, Golbraikh A, Oloff S, Xiao Y, Tropsha A. Combinatorial QSAR modeling of P-glycoprotein substrates. J Chem Inf Model. 2006;46(3):1245-54. Epub 2006/05/23. doi: 10.1021/ci0504317. PubMed PMID: 16711744. 259. Mente SR, Lombardo F. A recursive-partitioning model for blood-brain barrier permeation. Journal of computer-aided molecular design. 2005;19(7):465-81. Epub 2005/12/07. doi: 10.1007/s10822-005-9001-7. PubMed PMID: 16331406. 260. Breiman L. Machine Learning. 2001;45(1):5-32. 261. Rokach L, Maimon O. Decision Trees. Data Mining and Knowledge Discovery Handbook: Springer-Verlag. p. 165-92. 262. Quinlan JR. Simplifying decision trees. International Journal of Man-Machine Studies. 1987;27(3):221-34. 263. Tropsha A, Gramatica P, Gombar VK. The Importance of Being Earnest: Validation is the Absolute Essential for Successful Application and Interpretation of QSPR Models. QSAR & Combinatorial Science. 2003;22(1):69-77. 264. Allen DM. The Relationship Between Variable Selection and Data Agumentation and a Method for Prediction. Technometrics. 1974;16(1):125-7. 265. Stone M. Cross-Validatory Choice and Assessment of Statistical Predictions. Journal of the Royal Statistical Society Series B (Methodological). 1974;36(2):111-47. 266. Geisser S. The Predictive Sample Reuse Method with Applications. Journal of the American Statistical Association. 1975;70(350):320-8. 267. Krstajic D, Buturovic LJ, Leahy DE, Thomas S. Cross-validation pitfalls when selecting and assessing regression and classification models. Journal of cheminformatics. 2014;6(1):10. Epub 2014/04/01. doi: 10.1186/1758-2946-6-10. PubMed PMID: 24678909; PubMed Central PMCID: PMCPMC3994246. 268. Baldi P, Brunak S, Chauvin Y, Andersen CA, Nielsen H. Assessing the accuracy of prediction algorithms for classification: an overview. Bioinformatics (Oxford, England). 2000;16(5):412-24. Epub 2000/06/28. PubMed PMID: 10871264. 269. Plewczynski D, Spieser SA, Koch U. Assessing different classification methods for virtual screening. J Chem Inf Model. 2006;46(3):1098-106. Epub 2006/05/23. doi: 10.1021/ci050519k. PubMed PMID: 16711730. 270. Sokolova M, Lapalme G. A systematic analysis of performance measures for classification tasks. Information Processing & Management. 2009;45(4):427-37. 271. Brodersen KH, Ong CS, Stephan KE, Buhmann JM, editors. The Balanced Accuracy and Its Posterior Distribution. 2010 20th International Conference on Pattern Recognition; 2010/08: IEEE. 272. Ullmann JR. An Algorithm for Subgraph Isomorphism. Journal of the ACM. 1976;23(1):31-42. 273. Steinbeck C, Han Y, Kuhn S, Horlacher O, Luttmann E, Willighagen E. The Chemistry Development Kit (CDK): an open-source Java library for Chemo- and Bioinformatics. J Chem Inf Comput Sci. 2003;43(2):493-500. Epub 2003/03/26. doi: 10.1021/ci025584y. PubMed PMID: 12653513; PubMed Central PMCID: PMCPMC4901983. 274. Bemis GW, Murcko MA. The properties of known drugs. 1. Molecular frameworks. J Med Chem. 1996;39(15):2887-93. Epub 1996/07/19. doi: 10.1021/jm9602928. PubMed PMID: 8709122. 275. Kabsch W. A solution for the best rotation to relate two sets of vectors. Acta Crystallographica Section A. 1976;32(5):922-3. 276. Hussain J, Rea C. Computationally efficient algorithm to identify matched molecular pairs (MMPs) in large data sets. J Chem Inf Model. 2010;50(3):339-48. Epub 2010/02/04. doi: 10.1021/ci900450m. PubMed PMID: 20121045.
147
277. Hu Y, Bajorath J. Analyzing compound activity records and promiscuity degrees in light of publication statistics. F1000Research. 2016;5. Epub 2016/06/28. doi: 10.12688/f1000research.8792.2. PubMed PMID: 27347396; PubMed Central PMCID: PMCPMC4916991. 278. Hu Y, Gupta-Ostermann D, Bajorath J. Exploring compound promiscuity patterns and multi-target activity spaces. Computational and structural biotechnology journal. 2014;9:e201401003. Epub 2014/04/02. doi: 10.5936/csbj.201401003. PubMed PMID: 24688751; PubMed Central PMCID: PMCPMC3962225. 279. Jacoby E. Chemogenomics: drug discovery's panacea? Molecular bioSystems. 2006;2(5):218-20. Epub 2006/08/02. doi: 10.1039/b603004c. PubMed PMID: 16880939. 280. Stumpfe D, Gilberg E, Bajorath J. Series of screening compounds with high hit rates for the exploration of multi-target activities and assay interference. Future science OA. 2018;4(3):Fso279. Epub 2018/03/24. doi: 10.4155/fsoa-2017-0137. PubMed PMID: 29568568; PubMed Central PMCID: PMCPMC5861374. 281. Ghose AK, Herbertz T, Salvino JM, Mallamo JP. Knowledge-based chemoinformatic approaches to drug discovery. Drug Discov Today. 2006;11(23-24):1107-14. Epub 2006/11/30. doi: 10.1016/j.drudis.2006.10.012. PubMed PMID: 17129830. 282. Brown DG, Boström J. Where do recent small molecule clinical development candidates come from? Journal of Medicinal Chemistry. 2018. 283. Hu Y, Bajorath J. Learning from `big data': compounds and targets. Drug Discovery Today. 2014;19(4):357-60. 284. Siramshetty VB, Eckert OA, Gohlke BO, Goede A, Chen Q, Devarakonda P, et al. SuperDRUG2: a one stop resource for approved/marketed drugs. Nucleic acids research. 2018;46(D1):D1137-d43. Epub 2017/11/16. doi: 10.1093/nar/gkx1088. PubMed PMID: 29140469; PubMed Central PMCID: PMCPMC5753395. 285. Barakat K. Modelling Off-target Interactions (I): Cardiotoxicity. Journal of Pharmaceutical Care & Health Systems. 2015;02(03). 286. James WP, Caterson ID, Coutinho W, Finer N, Van Gaal LF, Maggioni AP, et al. Effect of sibutramine on cardiovascular outcomes in overweight and obese subjects. The New England journal of medicine. 2010;363(10):905-17. Epub 2010/09/08. doi: 10.1056/NEJMoa1003114. PubMed PMID: 20818901. 287. Onakpoya IJ, Heneghan CJ, Aronson JK. Delays in the post-marketing withdrawal of drugs to which deaths have been attributed: a systematic investigation and analysis. BMC medicine. 2015;13:26. Epub 2015/02/06. doi: 10.1186/s12916-014-0262-7. PubMed PMID: 25651859; PubMed Central PMCID: PMCPMC4318389. 288. Aronov AM. Predictive in silico modeling for hERG channel blockers. Drug Discov Today. 2005;10(2):149-55. Epub 2005/02/19. doi: 10.1016/s1359-6446(04)03278-7. PubMed PMID: 15718164. 289. Sushko I, Salmina E, Potemkin VA, Poda G, Tetko IV. ToxAlerts: a Web server of structural alerts for toxic chemicals and compounds with potential adverse reactions. J Chem Inf Model. 2012;52(8):2310-6. Epub 2012/08/11. doi: 10.1021/ci300245q. PubMed PMID: 22876798; PubMed Central PMCID: PMCPMC3640409. 290. Rowland M, Peck C Fau - Tucker G, Tucker G. Physiologically-based pharmacokinetics in drug development and regulatory science. (1545-4304 (Electronic)). 291. Hartmanshenn C, Scherholz M, Androulakis IP. Physiologically-based pharmacokinetic models: approaches for enabling personalized medicine. (1573-8744 (Electronic)). 292. eTOX. The eTox Project. 2010. Available from: http://www.etoxproject.eu.
148
293. Sanz F, Pognan F, Steger-Hartmann T, Diaz C, Cases M, Pastor M, et al. Legacy data sharing to improve drug safety assessment: the eTOX project. Nature reviews Drug discovery. 2017;16(12):811-2. Epub 2017/10/14. doi: 10.1038/nrd.2017.177. PubMed PMID: 29026211. 294. EU-ToxRisk. EU-ToxRisk – An Integrated European ‘Flagship’ Programme Driving Mechanism-based Toxicity Testing and Risk Assessment for the 21st century. Available from: http://www.eu-toxrisk.eu. 295. BB3R. Berlin-Brandenburg research platform BB3R. Available from: https://www.bb3r.de/en/index.html. 296. National Center for Advancing Translational Sciences (NCATS). Tox21 Data Challenge 2014 Leaderboard. 2014. Available from: https://tripod.nih.gov/tox21/challenge/leaderboard.jsp. 297. Mayr A, Klambauer G, Unterthiner T, Hochreiter S. DeepTox: Toxicity Prediction using Deep Learning. Frontiers in Environmental Science. 2016;3. 298. Brown AM. Drugs, hERG and sudden death. Cell calcium. 2004;35(6):543-7. Epub 2004/04/28. doi: 10.1016/j.ceca.2004.01.008. PubMed PMID: 15110144. 299. Marchese0.25emRobinson RL, Glen RC, Mitchell JBO. Development and Comparison of hERG Blocker Classifiers: Assessment on Different Datasets Yields Markedly Different Results. Molecular Informatics. 2011;30(5):443-58. 300. Li Q, Jorgensen FS, Oprea T, Brunak S, Taboureau O. hERG classification model based on a combination of support vector machine method and GRIND descriptors. Mol Pharm. 2008;5(1):117-27. Epub 2008/01/17. doi: 10.1021/mp700124e. PubMed PMID: 18197627. 301. Sun H, Huang R, Xia M, Shahane S, Southall N, Wang Y. Prediction of hERG Liability - Using SVM Classification, Bootstrapping and Jackknifing. Mol Inform. 2017;36(4). Epub 2016/12/22. doi: 10.1002/minf.201600126. PubMed PMID: 28000393; PubMed Central PMCID: PMCPMC5382096. 302. Doddareddy MR, Klaasse EC, Shagufta, Ijzerman AP, Bender A. Prospective validation of a comprehensive in silico hERG model and its applications to commercial compound and drug databases. ChemMedChem. 2010;5(5):716-29. Epub 2010/03/30. doi: 10.1002/cmdc.201000024. PubMed PMID: 20349498. 303. Korotcov A, Tkachenko V, Russo DP, Ekins S. Comparison of Deep Learning With Multiple Machine Learning Methods and Metrics Using Diverse Drug Discovery Data Sets. Molecular Pharmaceutics. 2017;14(12):4462-75. 304. Baell JB, Nissink JWM. Seven Year Itch: Pan-Assay Interference Compounds (PAINS) in 2017-Utility and Limitations. ACS chemical biology. 2018;13(1):36-44. Epub 2017/12/05. doi: 10.1021/acschembio.7b00903. PubMed PMID: 29202222; PubMed Central PMCID: PMCPMC5778390. 305. Gilberg E, Stumpfe D, Bajorath J. Towards a systematic assessment of assay interference: Identification of extensively tested compounds with high assay promiscuity. F1000Research. 2017;6. Epub 2017/10/25. doi: 10.12688/f1000research.12370.2. PubMed PMID: 28928939; PubMed Central PMCID: PMCPMC5596351. 306. Gilberg E, Gütschow M, Bajorath J. X-ray Structures of Target–Ligand Complexes Containing Compounds with Assay Interference Potential. Journal of Medicinal Chemistry. 2018;61(3):1276-84. 307. Chakravorty SJ, Chan J, Greenwood MN, Popa-Burke I, Remlinger KS, Pickett SD, et al. Nuisance Compounds, PAINS Filters, and Dark Chemical Matter in the GSK HTS Collection. SLAS discovery : advancing life sciences R & D. 2018;23(6):532-45. Epub 2018/04/28. doi: 10.1177/2472555218768497. PubMed PMID: 29699447. 308. Siramshetty VB, Preissner R. Drugs as habitable planets in the space of dark chemical matter. Drug Discovery Today. 2018;23(3):481-6.
149

309. Jasial S, Bajorath J. Dark chemical matter in public screening assays and derivation of target hypotheses. MedChemComm. 2017;8(11):2100-4. 310. Wassermann AM, Tudor M, Glick M. Deorphanization strategies for dark chemical matter. Drug discovery today Technologies. 2017;23:69-74. Epub 2017/06/26. doi: 10.1016/j.ddtec.2016.11.004. PubMed PMID: 28647088. 311. Macarron R. Chemical libraries: How dark is HTS dark matter? Nature chemical biology. 2015;11(12):904-5. Epub 2015/10/20. doi: 10.1038/nchembio.1937. PubMed PMID: 26479440.
150
Appendix
A. List of Figures Figure 1.1 An overview of (a) the traditional (de novo) drug discovery and development pipeline; (b) drug
repositioning. The figure is adapted from [17]. ....................................................................................................... 2
Figure 1.2 Cooperation between bioinformatics and cheminformatics research disciplines. ............................. 3
Figure 1.3 Exemplary molecular representations of a chemical compound. ...................................................... 9
Figure 1.4 Schematic representation of chemical similarity search and different search strategies. The figure is
adapted from [60]. ................................................................................................................................................... 11
Figure 1.5 Timeline of events signifying the application of ML methods to drug discovery. .......................... 14
Figure 1.6 The fate of hits from HTS assays and different sources of false-positive hits. ................................ 16
Figure 2.1 Compound selection criteria for generation of high-confidence bioactivity data. The criteria and
figure are adapted from [191]. ................................................................................................................................ 25
Figure 2.2 Exemplary activity cliffs found within the hERG bioactivity data set from the ChEMBL database.
The activity cliffs are based on (a) matched molecular pair; (b) fingerprint similarity (ECFP4).
.................................................................................................................................................................................. 26
Figure 2.3 A generic scheme for the construction of a web-accessible knowledgebase and its components.
.................................................................................................................................................................................. 27
Figure 2.4 Illustration of k-Nearest Neighbors approach. On the left is the 2D data set of active and inactive
compounds in the descriptor (D1 and D2) space. On the right, classification based on different k parameters
are represented. For example, k = 1 classifies the test set compound as active. The figure is adapted from [57].
.................................................................................................................................................................................. 30
Figure 2.5 Illustration of Support Vector Machine approach. (a) Compounds belonging to two classes (active
and inactive) are represented as data points in the low-dimensional space; (b) The hyperplane H separates
compounds belonging to the two classes in a high-dimensional space. Those data points that determine H are
referred to as support vectors. The figure is adapted from [245]. ......................................................................... 33
Figure 2.6 A schematic representation of the Random Forest algorithm. The figure is adapted from [57]. .... 34
Figure 2.7 A generic scheme for the development of an in silico model for toxicity prediction. ..................... 35
Figure 2.8 An exemplary AUC-ROC curve in which the area under the blue line indicates the AUC. The
dashed line represents the performance of a random model. ................................................................................ 39
151
B. List of Tables Table 1.1 Some of the earliest developments in the cheminformatics research field. ......................................... 4
Table 1.2 The contents and coverages of major public and commercial data repositories for chemical and
biological data. The numbers are based on statistics provided on the corresponding websites (accessed
approximately in the mid of 2018). M stands for millions. .................................................................................... 6
Table 2.1 Different publicly accessible databases that served as sources for chemogenomics data. ............... 22
Table 2.2 An overview of the features and methods used for development of in silico models. ..................... 28
Table 2.3 Brief descriptions of different molecular features employed for model development. .................... 28
Table 2.4 A confusion matrix representing the different predictions from a binary classification model. ...... 37
Table 2.5 Different cheminformatics tasks and the methods/tools/software employed in this thesis. ............. 40
152
C. List of Abbreviations
1D One-dimensional
2D Two-dimensional
3D Three-dimensional
ADME Absorption, Distribution, Metabolism and Excretion
AUC-ROC Area Under the Receiver Operating Characteristic Curve
BACC Balanced Accuracy
DCM Dark Chemical Matter
DL Deep Learning
DT Decision Tree
ECFP Extended-Connectivity Fingerprint
FN False Negative
FP False Positive
hERG human Ether-à-go-go-Related Gene
HTS High-throughput Screening
k-NN k-Nearest Neighbors
LBVS Ligand-based Virtual Screening
MACCS Molecular Access System
ML Machine Learning
MODI Modelability Index
NB Naïve Bayes
PAINS Pan Assay Interference Compounds
PDB Protein Data Bank
PNN Probabilistic Neural Networks
QSAR Quantitative Structure-Activity Relationship
R&D Research and Development
RF Random Forest
SVM Support Vector Machine
Tc Tanimoto Coefficient
TN True Negative
Tox21 Toxicology in the 21st Century
TP True Positive
VS Virtual Screening
153
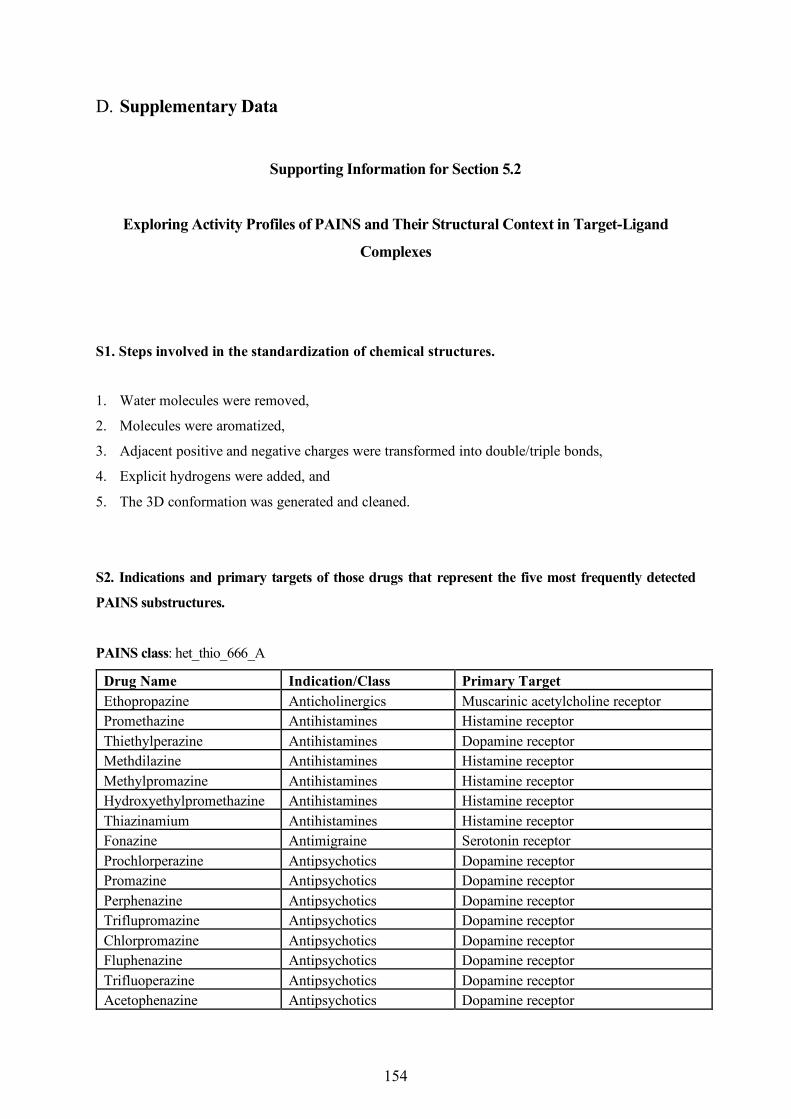
D. Supplementary Data
Supporting Information for Section 5.2
Exploring Activity Profiles of PAINS and Their Structural Context in Target-Ligand
Complexes
S1. Steps involved in the standardization of chemical structures.
1. Water molecules were removed,
2. Molecules were aromatized,
3. Adjacent positive and negative charges were transformed into double/triple bonds,
4. Explicit hydrogens were added, and
5. The 3D conformation was generated and cleaned.
S2. Indications and primary targets of those drugs that represent the five most frequently detected
PAINS substructures.
PAINS class: het_thio_666_A
Drug Name Indication/Class Primary Target Ethopropazine Anticholinergics Muscarinic acetylcholine receptor Promethazine Antihistamines Histamine receptor Thiethylperazine Antihistamines Dopamine receptor Methdilazine Antihistamines Histamine receptor Methylpromazine Antihistamines Histamine receptor Hydroxyethylpromethazine Antihistamines Histamine receptor Thiazinamium Antihistamines Histamine receptor Fonazine Antimigraine Serotonin receptor Prochlorperazine Antipsychotics Dopamine receptor Promazine Antipsychotics Dopamine receptor Perphenazine Antipsychotics Dopamine receptor Triflupromazine Antipsychotics Dopamine receptor Chlorpromazine Antipsychotics Dopamine receptor Fluphenazine Antipsychotics Dopamine receptor Trifluoperazine Antipsychotics Dopamine receptor Acetophenazine Antipsychotics Dopamine receptor
154
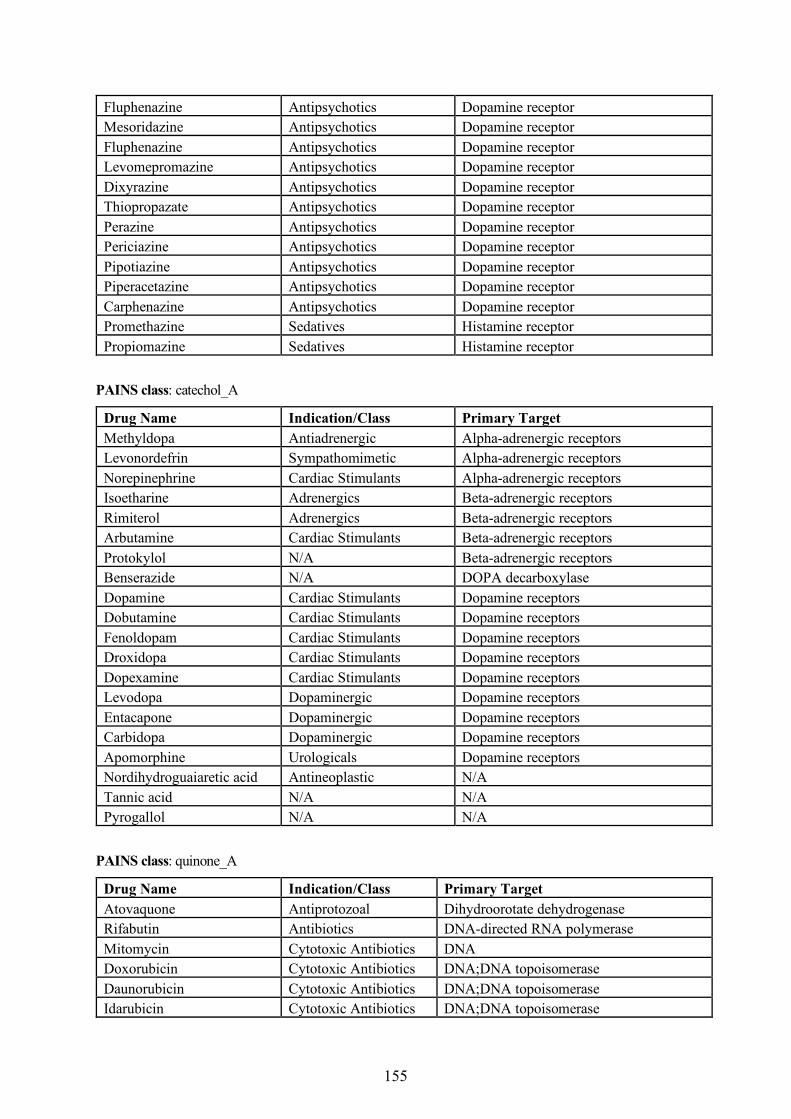
Fluphenazine Antipsychotics Dopamine receptor Mesoridazine Antipsychotics Dopamine receptor Fluphenazine Antipsychotics Dopamine receptor Levomepromazine Antipsychotics Dopamine receptor Dixyrazine Antipsychotics Dopamine receptor Thiopropazate Antipsychotics Dopamine receptor Perazine Antipsychotics Dopamine receptor Periciazine Antipsychotics Dopamine receptor Pipotiazine Antipsychotics Dopamine receptor Piperacetazine Antipsychotics Dopamine receptor Carphenazine Antipsychotics Dopamine receptor Promethazine Sedatives Histamine receptor Propiomazine Sedatives Histamine receptor
PAINS class: catechol_A
Drug Name Indication/Class Primary Target Methyldopa Antiadrenergic Alpha-adrenergic receptors Levonordefrin Sympathomimetic Alpha-adrenergic receptors Norepinephrine Cardiac Stimulants Alpha-adrenergic receptors Isoetharine Adrenergics Beta-adrenergic receptors Rimiterol Adrenergics Beta-adrenergic receptors Arbutamine Cardiac Stimulants Beta-adrenergic receptors Protokylol N/A Beta-adrenergic receptors Benserazide N/A DOPA decarboxylase Dopamine Cardiac Stimulants Dopamine receptors Dobutamine Cardiac Stimulants Dopamine receptors Fenoldopam Cardiac Stimulants Dopamine receptors Droxidopa Cardiac Stimulants Dopamine receptors Dopexamine Cardiac Stimulants Dopamine receptors Levodopa Dopaminergic Dopamine receptors Entacapone Dopaminergic Dopamine receptors Carbidopa Dopaminergic Dopamine receptors Apomorphine Urologicals Dopamine receptors Nordihydroguaiaretic acid Antineoplastic N/A Tannic acid N/A N/A Pyrogallol N/A N/A
PAINS class: quinone_A
Drug Name Indication/Class Primary Target Atovaquone Antiprotozoal Dihydroorotate dehydrogenase Rifabutin Antibiotics DNA-directed RNA polymerase Mitomycin Cytotoxic Antibiotics DNA Doxorubicin Cytotoxic Antibiotics DNA;DNA topoisomerase Daunorubicin Cytotoxic Antibiotics DNA;DNA topoisomerase Idarubicin Cytotoxic Antibiotics DNA;DNA topoisomerase
155
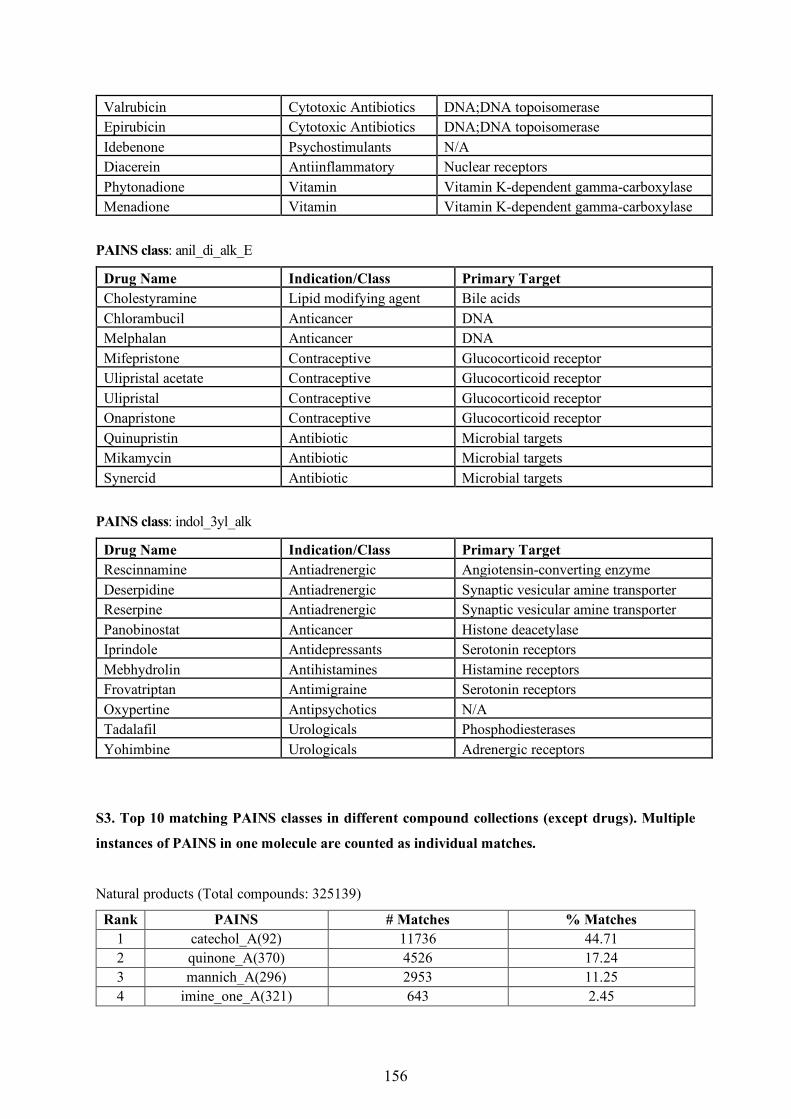
Valrubicin Cytotoxic Antibiotics DNA;DNA topoisomerase Epirubicin Cytotoxic Antibiotics DNA;DNA topoisomerase Idebenone Psychostimulants N/A Diacerein Antiinflammatory Nuclear receptors Phytonadione Vitamin Vitamin K-dependent gamma-carboxylase Menadione Vitamin Vitamin K-dependent gamma-carboxylase
PAINS class: anil_di_alk_E
Drug Name Indication/Class Primary Target Cholestyramine Lipid modifying agent Bile acids Chlorambucil Anticancer DNA Melphalan Anticancer DNA Mifepristone Contraceptive Glucocorticoid receptor Ulipristal acetate Contraceptive Glucocorticoid receptor Ulipristal Contraceptive Glucocorticoid receptor Onapristone Contraceptive Glucocorticoid receptor Quinupristin Antibiotic Microbial targets Mikamycin Antibiotic Microbial targets Synercid Antibiotic Microbial targets
PAINS class: indol_3yl_alk
Drug Name Indication/Class Primary Target Rescinnamine Antiadrenergic Angiotensin-converting enzyme Deserpidine Antiadrenergic Synaptic vesicular amine transporter Reserpine Antiadrenergic Synaptic vesicular amine transporter Panobinostat Anticancer Histone deacetylase Iprindole Antidepressants Serotonin receptors Mebhydrolin Antihistamines Histamine receptors Frovatriptan Antimigraine Serotonin receptors Oxypertine Antipsychotics N/A Tadalafil Urologicals Phosphodiesterases Yohimbine Urologicals Adrenergic receptors
S3. Top 10 matching PAINS classes in different compound collections (except drugs). Multiple
instances of PAINS in one molecule are counted as individual matches.
Natural products (Total compounds: 325139)
Rank PAINS # Matches % Matches 1
catechol_A(92) 11736 44.71 2 quinone_A(370) 4526 17.24 3 mannich_A(296) 2953 11.25 4 imine_one_A(321) 643 2.45
156
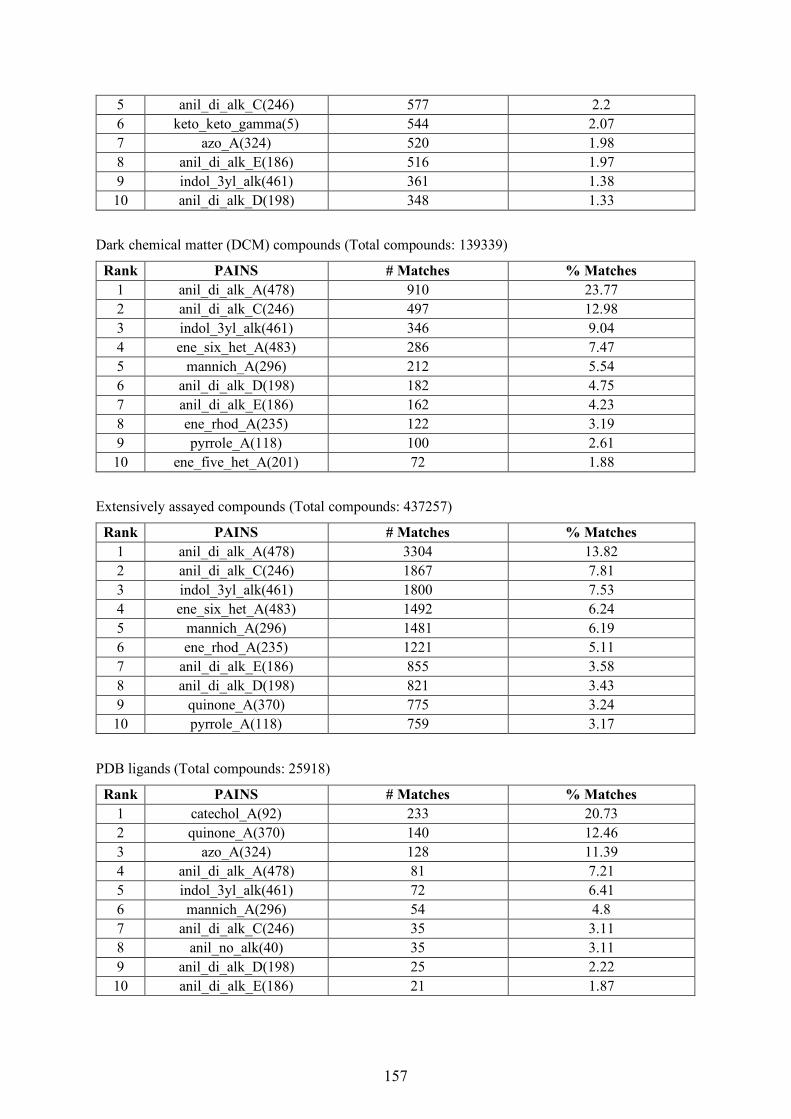
5 anil_di_alk_C(246) 577 2.2 6 keto_keto_gamma(5) 544 2.07 7 azo_A(324) 520 1.98 8 anil_di_alk_E(186) 516 1.97 9 indol_3yl_alk(461) 361 1.38 10 anil_di_alk_D(198) 348 1.33
Dark chemical matter (DCM) compounds (Total compounds: 139339)
Rank PAINS # Matches % Matches 1
anil_di_alk_A(478) 910 23.77 2 anil_di_alk_C(246) 497 12.98 3 indol_3yl_alk(461) 346 9.04 4 ene_six_het_A(483) 286 7.47 5 mannich_A(296) 212 5.54 6 anil_di_alk_D(198) 182 4.75 7 anil_di_alk_E(186) 162 4.23 8 ene_rhod_A(235) 122 3.19 9 pyrrole_A(118) 100 2.61 10 ene_five_het_A(201) 72 1.88
Extensively assayed compounds (Total compounds: 437257)
Rank PAINS # Matches % Matches 1
anil_di_alk_A(478) 3304 13.82 2 anil_di_alk_C(246) 1867 7.81 3 indol_3yl_alk(461) 1800 7.53 4 ene_six_het_A(483) 1492 6.24 5 mannich_A(296) 1481 6.19 6 ene_rhod_A(235) 1221 5.11 7 anil_di_alk_E(186) 855 3.58 8 anil_di_alk_D(198) 821 3.43 9 quinone_A(370) 775 3.24 10 pyrrole_A(118) 759 3.17
PDB ligands (Total compounds: 25918)
Rank PAINS # Matches % Matches 1
catechol_A(92) 233 20.73 2 quinone_A(370) 140 12.46 3 azo_A(324) 128 11.39 4 anil_di_alk_A(478) 81 7.21 5 indol_3yl_alk(461) 72 6.41 6 mannich_A(296) 54 4.8 7 anil_di_alk_C(246) 35 3.11 8 anil_no_alk(40) 35 3.11 9 anil_di_alk_D(198) 25 2.22 10 anil_di_alk_E(186) 21 1.87
157
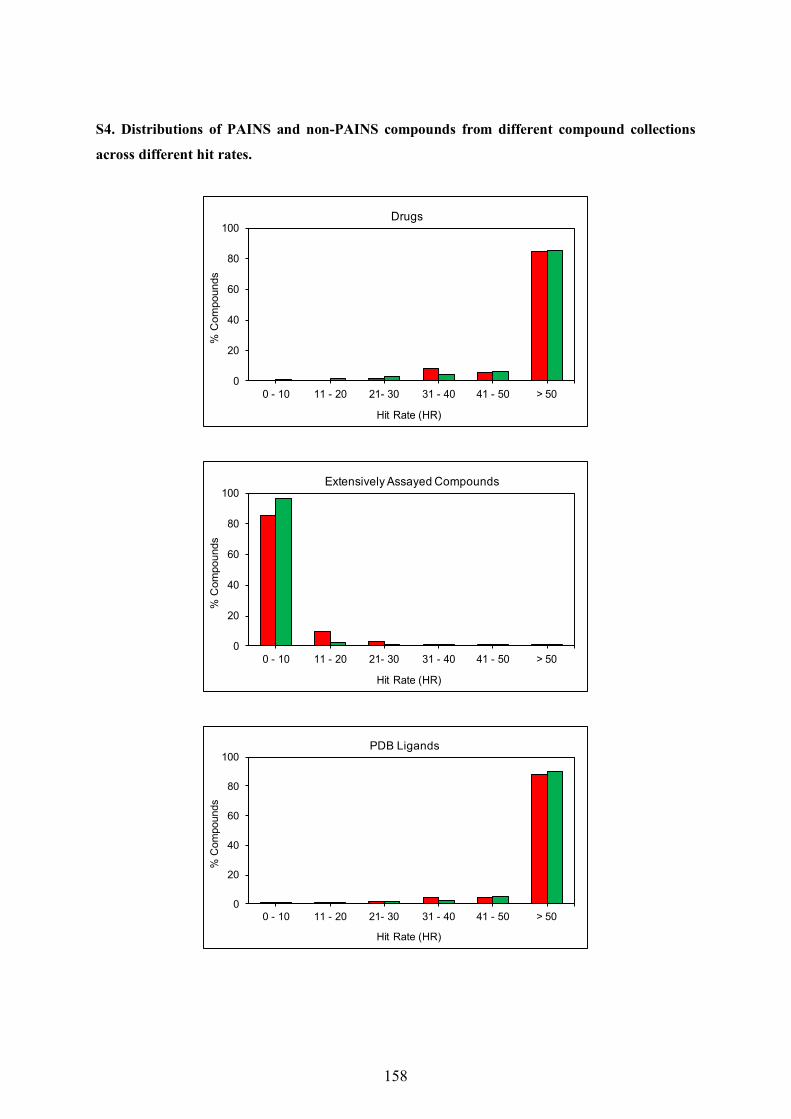
S4. Distributions of PAINS and non-PAINS compounds from different compound collections
across different hit rates.
0
20
40
60
80
100
0 - 10 11 - 20 21- 30 31 - 40 41 - 50 > 50
% C
ompo
unds
Hit Rate (HR)
Drugs
0
20
40
60
80
100
0 - 10 11 - 20 21- 30 31 - 40 41 - 50 > 50
% C
ompo
unds
Hit Rate (HR)
Extensively Assayed Compounds
0
20
40
60
80
100
0 - 10 11 - 20 21- 30 31 - 40 41 - 50 > 50
% C
ompo
unds
Hit Rate (HR)
PDB Ligands
158