Characterizing diffusion dynamics of a membrane protein associated with nanolipoproteins using...
11
Characterizing diffusion dynamics of a membrane protein associated with nanolipoproteins using fluorescence correlation spectroscopy Tingjuan Gao, 1 Craig D. Blanchette, 2 Wei He, 1 Feliza Bourguet, 2 Sonny Ly, 1 Federico Katzen, 3 Wieslaw A. Kudlicki, 3 Paul T. Henderson, 1 Ted A. Laurence, 2 Thomas Huser, 1 * and Matthew A. Coleman 1,2 * 1 NSF Center for Biophotonics Science and Technology, School of Medicine, University of California Davis, Sacramento, California 95817 2 Lawrence Livermore National Laboratory, Physics and Life Sciences, Livermore, California 94550 3 Life Technologies Corporation, Carlsbad, California 92008 Received 20 July 2010; Revised 29 November 2010; Accepted 1 December 2010 DOI: 10.1002/pro.577 Published online 17 December 2010 proteinscience.org Abstract: Nanolipoprotein particles (NLPs) represent a unique nanometer-sized scaffold for supporting membrane proteins (MP). Characterization of their dynamic shape and association with MP in solution remains a challenge. Here, we present a rapid method of analysis by fluorescence correlation spectroscopy (FCS) to characterize bacteriorhodopsin (bR), a membrane protein capable of forming a NLP complex. By selectively labeling individual components of NLPs during cell-free synthesis, FCS enabled us to measure specific NLP diffusion times and infer size information for different NLP species. The resulting bR-loaded NLPs were shown to be dynamically discoidal in solution with a mean diameter of 7.8 nm. The insertion rate of bR in the complex was ~55% based on a fit model incorporating two separate diffusion properties to best approximate the FCS data. More importantly, based on these data, we infer that membrane protein associated NLPs are thermodynamically constrained as discs in solution, while empty NLPs appear to be less constrained and dynamically spherical. Keywords: apolipoprotein; nanolipoprotein particles; nanodiscs; fluorescence correlation spectroscopy; dynamic light scattering; cell-free expression; co-expression Introduction The biochemical and structural characterization of individual transmembrane proteins remains a difficult task given the complex cellular environment containing a large number of other receptors and structural pro- teins in close proximity. Reconstitution of membrane proteins (MP) by addition of lipids during dialysis for detergent displacement allows sustaining the structure and activity of proteins after detergent-based Additional Supporting Information may be found in the online version of this article. Grant sponsors: The University of California Discovery Grant Program; The University of California and Life Technologies Corporation; Grant sponsor: The National Science Foundation, The Center for Biophotonics Science and Technology, The University of California, Davis; Grant number: PHY 0120999; Grant sponsor: The U.S. Department of Energy and Lawrence Livermore National Laboratory under Contract number DE-AC52-07NA27344, DE-AC52-07NA27244, with support from the DOE low dose biology program. *Correspondence to: Thomas Huser, NSF Center for Biophotonics Science and Technology, School of Medicine, University of California Davis, Sacramento, CA 95817. E-mail: [email protected] or Matthew A. Coleman, NSF Center for Biophotonics Science and Technology, School of Medicine, University of California Davis, Sacramento, CA 95817. E-mail: [email protected] or [email protected] Published by Wiley-Blackwell. V C 2010 The Protein Society PROTEIN SCIENCE 2011 VOL 20:437—447 437
-
Upload
independent -
Category
Documents
-
view
2 -
download
0
Transcript of Characterizing diffusion dynamics of a membrane protein associated with nanolipoproteins using...
Characterizing diffusion dynamics of amembrane protein associated withnanolipoproteins using fluorescencecorrelation spectroscopy
Tingjuan Gao,1 Craig D. Blanchette,2 Wei He,1 Feliza Bourguet,2 Sonny Ly,1
Federico Katzen,3 Wieslaw A. Kudlicki,3 Paul T. Henderson,1 Ted A. Laurence,2
Thomas Huser,1* and Matthew A. Coleman1,2*
1NSF Center for Biophotonics Science and Technology, School of Medicine, University of California Davis,
Sacramento, California 958172Lawrence Livermore National Laboratory, Physics and Life Sciences, Livermore, California 945503Life Technologies Corporation, Carlsbad, California 92008
Received 20 July 2010; Revised 29 November 2010; Accepted 1 December 2010
DOI: 10.1002/pro.577Published online 17 December 2010 proteinscience.org
Abstract: Nanolipoprotein particles (NLPs) represent a unique nanometer-sized scaffold for
supporting membrane proteins (MP). Characterization of their dynamic shape and association withMP in solution remains a challenge. Here, we present a rapid method of analysis by fluorescence
correlation spectroscopy (FCS) to characterize bacteriorhodopsin (bR), a membrane protein
capable of forming a NLP complex. By selectively labeling individual components of NLPs duringcell-free synthesis, FCS enabled us to measure specific NLP diffusion times and infer size
information for different NLP species. The resulting bR-loaded NLPs were shown to be dynamically
discoidal in solution with a mean diameter of 7.8 nm. The insertion rate of bR in the complex was~55% based on a fit model incorporating two separate diffusion properties to best approximate the
FCS data. More importantly, based on these data, we infer that membrane protein associated
NLPs are thermodynamically constrained as discs in solution, while empty NLPs appear to be lessconstrained and dynamically spherical.
Keywords: apolipoprotein; nanolipoprotein particles; nanodiscs; fluorescence correlationspectroscopy; dynamic light scattering; cell-free expression; co-expression
Introduction
The biochemical and structural characterization of individual transmembrane proteins remains a difficult
task given the complex cellular environment containing a large number of other receptors and structural pro-
teins in close proximity. Reconstitution of membrane proteins (MP) by addition of lipids during dialysis for
detergent displacement allows sustaining the structure and activity of proteins after detergent-based
Additional Supporting Information may be found in the online version of this article.
Grant sponsors: The University of California Discovery Grant Program; The University of California and Life Technologies Corporation;Grant sponsor: The National Science Foundation, The Center for Biophotonics Science and Technology, The University of California,Davis; Grant number: PHY 0120999; Grant sponsor: The U.S. Department of Energy and Lawrence Livermore National Laboratoryunder Contract number DE-AC52-07NA27344, DE-AC52-07NA27244, with support from the DOE low dose biology program.
*Correspondence to: Thomas Huser, NSF Center for Biophotonics Science and Technology, School of Medicine, University ofCalifornia Davis, Sacramento, CA 95817. E-mail: [email protected] or Matthew A. Coleman, NSF Center for BiophotonicsScience and Technology, School of Medicine, University of California Davis, Sacramento, CA 95817. E-mail: [email protected] [email protected]
Published by Wiley-Blackwell. VC 2010 The Protein Society PROTEIN SCIENCE 2011 VOL 20:437—447 437
purification.1–7 However, the purified protein is now
part of a proteoliposome containing multiple mole-
cules that are difficult to define or study due to mul-
tiple interactions.8 Also, proteoliposomes are typi-
cally not very soluble and thus cannot be
manipulated or analyzed by most traditional techni-
ques. These problems can be addressed by combining
novel spectroscopic techniques with nanolipoprotein
particles (NLPs) to isolate and solubilize MP.9–14
NLPs are soluble nanoparticles in an aqueous
environment and formed spontaneously when apoli-
poproteins and a population of phospholipids self-
assemble into bilayers of lipids circulated by an
apolipoprotein ‘‘belt’’.15–18 The bilayer closely mimics
the cell membrane,19 allowing MP to be functional
upon incorporation into NLPs.20–25 NLPs present
distinct advantages over currently used membrane
systems in terms of thermal stability,19,26 particle
size monodispersity and consistency.27,28 Although
NLP synthesis is now well-documented, and a few
studies have described their shape (the well-studied
discoidal model,29–31 the spherical model,32 and the
saddle model33), there remains a lack of comprehen-
sive solution-phase physical characterization meth-
ods for understanding the structure and dynamics of
an NLP with a functional protein incorporated.
A number of methods have been used to data to
characterize NLP-related complexes. Size-exclusion
chromatography (SEC) and native polyacrylamide
gel electrophoresis (PAGE) have been the predomi-
nant techniques used to provide purification capabil-
ities and approximation of NLP mass and polydis-
persity from bulk samples.21,27,33,34 Transmission
electron microscopy (TEM) and atomic force
microscopy (AFM) have also been used to examine
NLP shape features upon immobilization of NLPs
onto a surface.27,34–36 Compared with the techniques
described above, fluorescence correlation spectros-
copy (FCS) may emerge as a useful tool for probing
membrane protein interactions37 using NLPs that
are fully hydrated and freely diffusing in an aqueous
environment. When FCS is typically employed in
conjunction with confocal optical microscopy,38 fluo-
rescence intensity fluctuations due to diffusion,39–41
physical or chemical reactions, aggregation and
other factors are analyzed using a temporal autocor-
relation function as these species enter and exit
the excitation volume.42–46 When an appropriate
model42,44,47 is defined, FCS can be used to obtain
quantitative information such as diffusion coeffi-
cients, hydrodynamic radii, average concentrations,
kinetic chemical reaction rates, and singlet-triplet
state photochemical dynamics.47–50
In this study, we used cell-free protein expres-
sion for the rapid generation of fluorescently labelled
NLP complexes containing bacteriorhodopsin (bR)
and we characterized the dynamic structure and
association between NLPs and MP in solution using
FCS.
Results
bR-NLP Complex formation and purification
The cell-free protein expression and characterization
process is illustrated in Figure 1. Our approach21
rapidly produces a functional integral membrane
protein, bR (a seven transmembrane helical protein,
from Halobacterium salinarium) co-expressed with a
truncated apolipoprotein A-1 (D49A1) in the presence
of 1,2-ditetradecanoyl-sn-glycero-3-phosphocholine
(DMPC), as well as the cofactor all trans-retinal in a
cell-free expression mixture. The phospholipids were
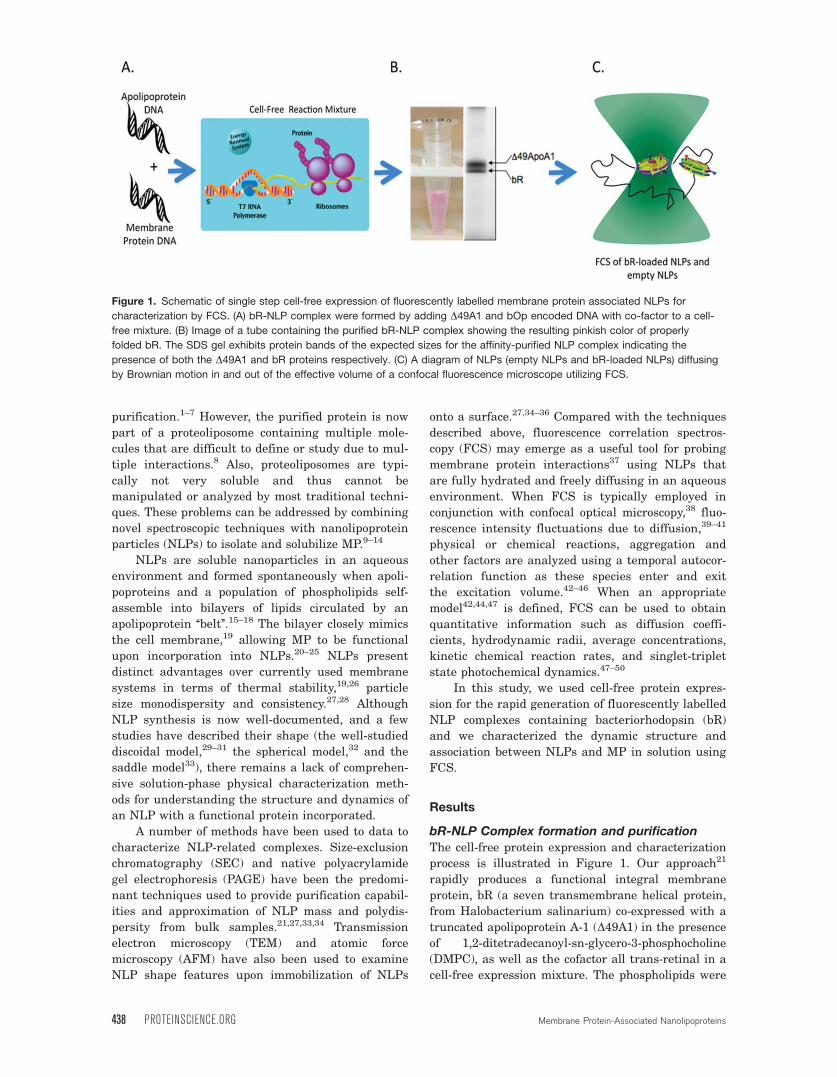
Figure 1. Schematic of single step cell-free expression of fluorescently labelled membrane protein associated NLPs for
characterization by FCS. (A) bR-NLP complex were formed by adding D49A1 and bOp encoded DNA with co-factor to a cell-
free mixture. (B) Image of a tube containing the purified bR-NLP complex showing the resulting pinkish color of properly
folded bR. The SDS gel exhibits protein bands of the expected sizes for the affinity-purified NLP complex indicating the
presence of both the D49A1 and bR proteins respectively. (C) A diagram of NLPs (empty NLPs and bR-loaded NLPs) diffusing
by Brownian motion in and out of the effective volume of a confocal fluorescence microscope utilizing FCS.
438 PROTEINSCIENCE.ORG Membrane Protein-Associated Nanolipoproteins
fluorescently labelled by Texas RedVR
1,2-dihexadeca-
noyl-sn-glycero-3-phosphoethanolamine triethylam-
monium salt (Texas RedVR
DHPE). The proteins were
labelled by BodipyVR
-FL (Promega) through adding
FluoroTectTM GreenLys into the reaction mixture for
in vitro translation.51 Since fluorescently labeled
lysine residues were incorporated into nascent pro-
teins during translation, only one Bodipy dye would
be labeled to one D49A1 or bR respectively at the
most, dependent on the labeling efficiency, which
was not disclosed from the BodipyVR
-FL provider.
Assembly of the soluble bR-NLP complex was
observed within 4 h after addition of plasmids to an
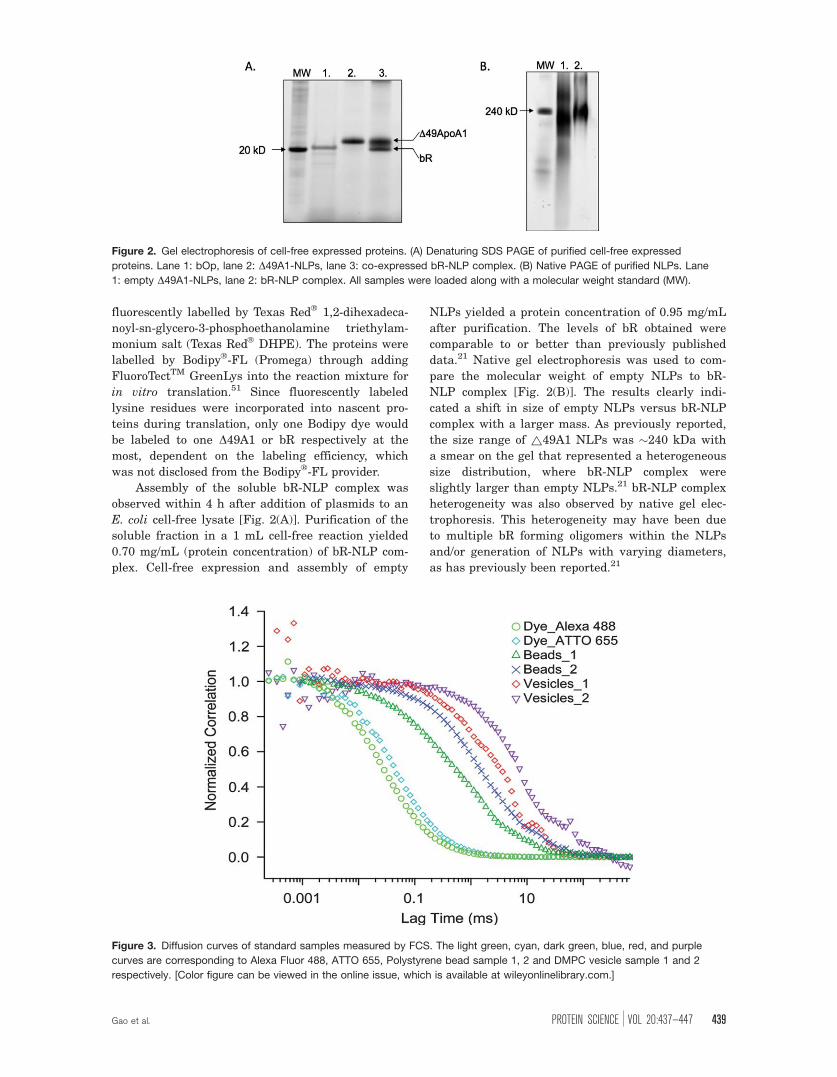
E. coli cell-free lysate [Fig. 2(A)]. Purification of the
soluble fraction in a 1 mL cell-free reaction yielded
0.70 mg/mL (protein concentration) of bR-NLP com-
plex. Cell-free expression and assembly of empty
NLPs yielded a protein concentration of 0.95 mg/mL
after purification. The levels of bR obtained were
comparable to or better than previously published
data.21 Native gel electrophoresis was used to com-
pare the molecular weight of empty NLPs to bR-
NLP complex [Fig. 2(B)]. The results clearly indi-
cated a shift in size of empty NLPs versus bR-NLP
complex with a larger mass. As previously reported,
the size range of ~49A1 NLPs was �240 kDa with
a smear on the gel that represented a heterogeneous
size distribution, where bR-NLP complex were
slightly larger than empty NLPs.21 bR-NLP complex
heterogeneity was also observed by native gel elec-
trophoresis. This heterogeneity may have been due
to multiple bR forming oligomers within the NLPs
and/or generation of NLPs with varying diameters,
as has previously been reported.21
Figure 2. Gel electrophoresis of cell-free expressed proteins. (A) Denaturing SDS PAGE of purified cell-free expressed
proteins. Lane 1: bOp, lane 2: D49A1-NLPs, lane 3: co-expressed bR-NLP complex. (B) Native PAGE of purified NLPs. Lane
1: empty D49A1-NLPs, lane 2: bR-NLP complex. All samples were loaded along with a molecular weight standard (MW).
Figure 3. Diffusion curves of standard samples measured by FCS. The light green, cyan, dark green, blue, red, and purple
curves are corresponding to Alexa Fluor 488, ATTO 655, Polystyrene bead sample 1, 2 and DMPC vesicle sample 1 and 2
respectively. [Color figure can be viewed in the online issue, which is available at wileyonlinelibrary.com.]
Gao et al. PROTEIN SCIENCE VOL 20:437—447 439
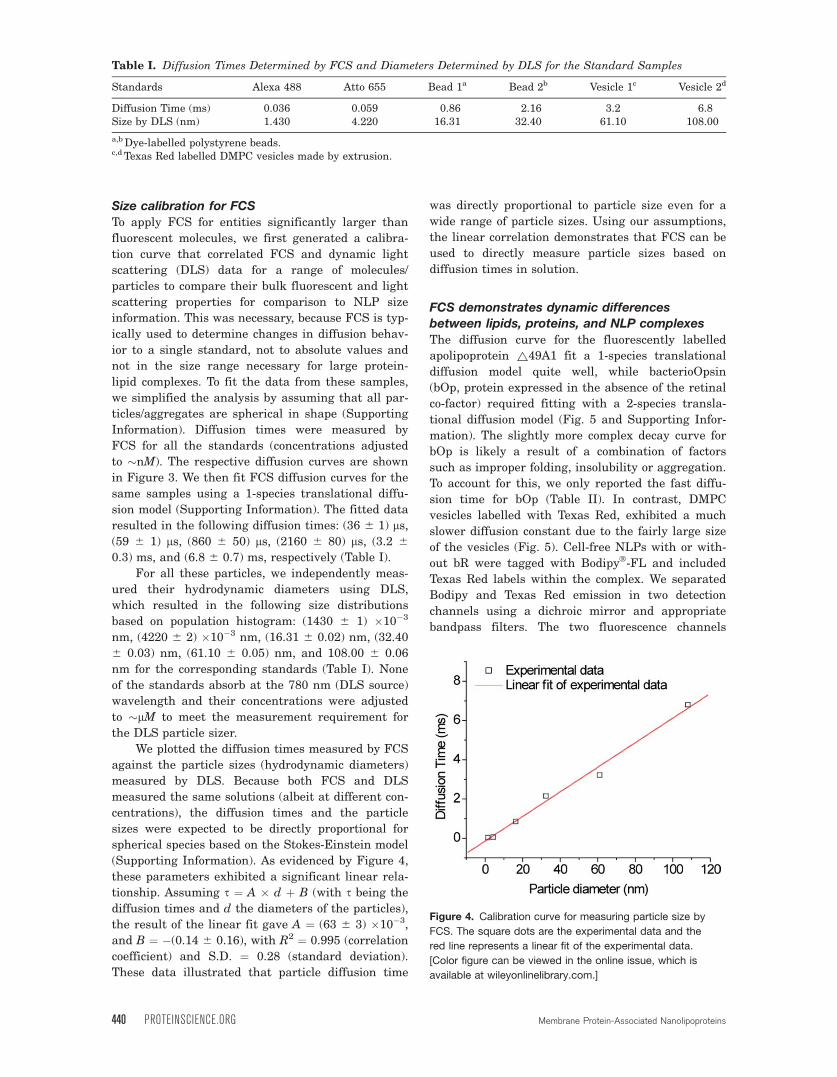
Size calibration for FCSTo apply FCS for entities significantly larger than
fluorescent molecules, we first generated a calibra-
tion curve that correlated FCS and dynamic light
scattering (DLS) data for a range of molecules/
particles to compare their bulk fluorescent and light
scattering properties for comparison to NLP size
information. This was necessary, because FCS is typ-
ically used to determine changes in diffusion behav-
ior to a single standard, not to absolute values and
not in the size range necessary for large protein-
lipid complexes. To fit the data from these samples,
we simplified the analysis by assuming that all par-
ticles/aggregates are spherical in shape (Supporting
Information). Diffusion times were measured by
FCS for all the standards (concentrations adjusted
to �nM). The respective diffusion curves are shown
in Figure 3. We then fit FCS diffusion curves for the
same samples using a 1-species translational diffu-
sion model (Supporting Information). The fitted data
resulted in the following diffusion times: (36 6 1) ls,(59 6 1) ls, (860 6 50) ls, (2160 6 80) ls, (3.2 6
0.3) ms, and (6.8 6 0.7) ms, respectively (Table I).
For all these particles, we independently meas-
ured their hydrodynamic diameters using DLS,
which resulted in the following size distributions
based on population histogram: (1430 6 1) �10�3
nm, (4220 6 2) �10�3 nm, (16.31 6 0.02) nm, (32.40
6 0.03) nm, (61.10 6 0.05) nm, and 108.00 6 0.06
nm for the corresponding standards (Table I). None
of the standards absorb at the 780 nm (DLS source)
wavelength and their concentrations were adjusted
to �lM to meet the measurement requirement for
the DLS particle sizer.
We plotted the diffusion times measured by FCS
against the particle sizes (hydrodynamic diameters)
measured by DLS. Because both FCS and DLS
measured the same solutions (albeit at different con-
centrations), the diffusion times and the particle
sizes were expected to be directly proportional for
spherical species based on the Stokes-Einstein model
(Supporting Information). As evidenced by Figure 4,
these parameters exhibited a significant linear rela-
tionship. Assuming s ¼ A � d þ B (with s being the
diffusion times and d the diameters of the particles),
the result of the linear fit gave A ¼ (63 6 3) �10�3,
and B ¼ �(0.14 6 0.16), with R2 ¼ 0.995 (correlation
coefficient) and S.D. ¼ 0.28 (standard deviation).
These data illustrated that particle diffusion time
was directly proportional to particle size even for a
wide range of particle sizes. Using our assumptions,
the linear correlation demonstrates that FCS can be
used to directly measure particle sizes based on
diffusion times in solution.
FCS demonstrates dynamic differences
between lipids, proteins, and NLP complexes
The diffusion curve for the fluorescently labelled
apolipoprotein ~49A1 fit a 1-species translational
diffusion model quite well, while bacterioOpsin
(bOp, protein expressed in the absence of the retinal
co-factor) required fitting with a 2-species transla-
tional diffusion model (Fig. 5 and Supporting Infor-
mation). The slightly more complex decay curve for
bOp is likely a result of a combination of factors
such as improper folding, insolubility or aggregation.
To account for this, we only reported the fast diffu-
sion time for bOp (Table II). In contrast, DMPC
vesicles labelled with Texas Red, exhibited a much
slower diffusion constant due to the fairly large size
of the vesicles (Fig. 5). Cell-free NLPs with or with-
out bR were tagged with BodipyVR
-FL and included
Texas Red labels within the complex. We separated
Bodipy and Texas Red emission in two detection
channels using a dichroic mirror and appropriate
bandpass filters. The two fluorescence channels
Table I. Diffusion Times Determined by FCS and Diameters Determined by DLS for the Standard Samples
Standards Alexa 488 Atto 655 Bead 1a Bead 2b Vesicle 1c Vesicle 2d
Diffusion Time (ms) 0.036 0.059 0.86 2.16 3.2 6.8Size by DLS (nm) 1.430 4.220 16.31 32.40 61.10 108.00
a,bDye-labelled polystyrene beads.c,d Texas Red labelled DMPC vesicles made by extrusion.
Figure 4. Calibration curve for measuring particle size by
FCS. The square dots are the experimental data and the
red line represents a linear fit of the experimental data.
[Color figure can be viewed in the online issue, which is
available at wileyonlinelibrary.com.]
440 PROTEINSCIENCE.ORG Membrane Protein-Associated Nanolipoproteins
were cross-correlated and normalized to the maxi-
mum correlation value. This is a standard FCS anal-
ysis procedure and the resulting correlation curve is
called a diffusion curve. Differences in fluorescence
intensities between empty NLPs and bR-NLP com-
plex do not affect this FCS analysis. As can be seen
in Figure 5, both empty and bR-NLP complex (iden-
tified by cross-correlating Bodipy and Texas Red)
diffused significantly faster than DMPC vesicles
alone. However, this diffusion time was also signifi-
cantly slower than D49A1, providing further
evidence for the complex formation.
Interestingly, the shape of the diffusion curve of
the bR-NLP complex was changed significantly
when compared to empty NLPs and exhibited two
plateaus (Fig. 5). These findings were very reproduc-
ible based on several repeat measurements (data not
shown). Such a decay curve can be best understood
with a two-species fit model. A potential explanation
is based on the assumption that bR-loaded NLPs not
only exhibit translational diffusion, but also a signif-
icant rotational diffusion, presumably due to their
more anisotropic shape. Rotational diffusion is typi-
cally orders of magnitudes faster than translational
diffusion and would give rise to a decay plateau on
the microsecond timescale. The second plateau at
slower diffusion times likely occurred due to a com-
bination of the average translational diffusion time
of both, empty NLPs and bR-loaded NLPs in the
samples. Accordingly, the bR-NLP curve was fitted
to a 2-species diffusion model including contribu-
tions for both fast and slow diffusion (Fig. 6). To
account for the contribution from empty NLPs in the
mixture, the translational diffusion time obtained
earlier for empty NLPs alone was used as a fixed
fitting parameter (Supporting Information). This fit
resulted in a fast (rotational) diffusion time of 5 lsand a translational diffusion time of (350 6 10) lsfor bR-loaded NLPs, which corresponded to a parti-
cle diameter of (7.8 6 2.8) nm and was just slightly
less than the diameter obtained for empty NLPs
(10.4 6 2.8 nm).
Table II. Diffusion Times of Proteins and NLPComplexes
Sample D49A1 bREmptyNLPs
bR-loadedNLPs
Diffusion Time (ms) 0.027 0.065 0.52 0.35Calculated
Diameter (nm)2.6 3.3 10.4 7.8
Figure 6. Normalized diffusion curve of bR-NLP complex.
A 2-species rotational and translational diffusion model was
used to fit the curve. After fixing 0.52 ms as the
translational diffusion time of species 2 (empty NLPs), we
found the translational diffusion time of species 1
(bR-loaded NLPs) to be 0.35 ms. [Color figure can be
viewed in the online issue, which is available at
wileyonlinelibrary.com.]
Figure 5. FCS diffusion curves of proteins and NLP complexes measured by FCS. The blue, green, yellow, purple, and red
curves correspond to D49A1, bOp, bR-NLP complex, empty NLPs, and DMPC vesicles in 1X PBS, respectively. [Color figure
can be viewed in the online issue, which is available at wileyonlinelibrary.com.]
Gao et al. PROTEIN SCIENCE VOL 20:437—447 441
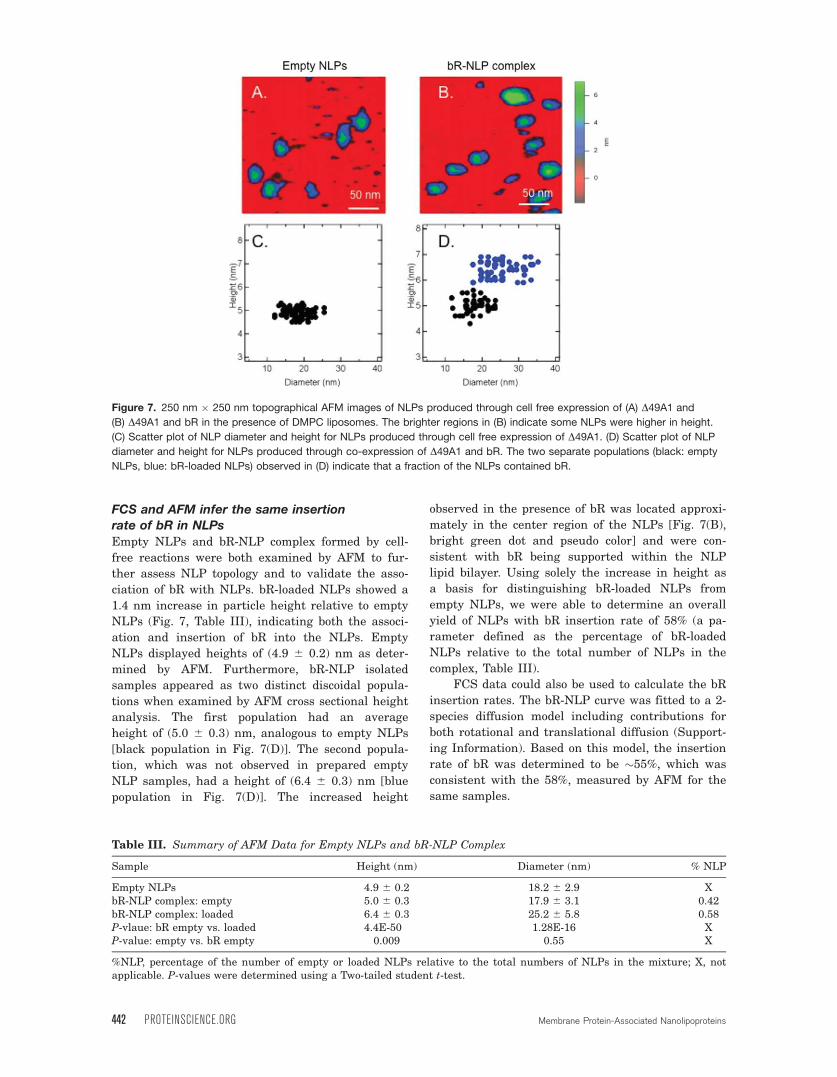
FCS and AFM infer the same insertionrate of bR in NLPs
Empty NLPs and bR-NLP complex formed by cell-
free reactions were both examined by AFM to fur-
ther assess NLP topology and to validate the asso-
ciation of bR with NLPs. bR-loaded NLPs showed a
1.4 nm increase in particle height relative to empty
NLPs (Fig. 7, Table III), indicating both the associ-
ation and insertion of bR into the NLPs. Empty
NLPs displayed heights of (4.9 6 0.2) nm as deter-
mined by AFM. Furthermore, bR-NLP isolated
samples appeared as two distinct discoidal popula-
tions when examined by AFM cross sectional height
analysis. The first population had an average
height of (5.0 6 0.3) nm, analogous to empty NLPs
[black population in Fig. 7(D)]. The second popula-
tion, which was not observed in prepared empty
NLP samples, had a height of (6.4 6 0.3) nm [blue
population in Fig. 7(D)]. The increased height
observed in the presence of bR was located approxi-
mately in the center region of the NLPs [Fig. 7(B),
bright green dot and pseudo color] and were con-
sistent with bR being supported within the NLP
lipid bilayer. Using solely the increase in height as
a basis for distinguishing bR-loaded NLPs from
empty NLPs, we were able to determine an overall
yield of NLPs with bR insertion rate of 58% (a pa-
rameter defined as the percentage of bR-loaded
NLPs relative to the total number of NLPs in the
complex, Table III).
FCS data could also be used to calculate the bR
insertion rates. The bR-NLP curve was fitted to a 2-
species diffusion model including contributions for
both rotational and translational diffusion (Support-
ing Information). Based on this model, the insertion
rate of bR was determined to be �55%, which was
consistent with the 58%, measured by AFM for the
same samples.
Figure 7. 250 nm � 250 nm topographical AFM images of NLPs produced through cell free expression of (A) D49A1 and
(B) D49A1 and bR in the presence of DMPC liposomes. The brighter regions in (B) indicate some NLPs were higher in height.
(C) Scatter plot of NLP diameter and height for NLPs produced through cell free expression of D49A1. (D) Scatter plot of NLPdiameter and height for NLPs produced through co-expression of D49A1 and bR. The two separate populations (black: empty
NLPs, blue: bR-loaded NLPs) observed in (D) indicate that a fraction of the NLPs contained bR.
Table III. Summary of AFM Data for Empty NLPs and bR-NLP Complex
Sample Height (nm) Diameter (nm) % NLP
Empty NLPs 4.9 6 0.2 18.2 6 2.9 XbR-NLP complex: empty 5.0 6 0.3 17.9 6 3.1 0.42bR-NLP complex: loaded 6.4 6 0.3 25.2 6 5.8 0.58P-vlaue: bR empty vs. loaded 4.4E-50 1.28E-16 XP-value: empty vs. bR empty 0.009 0.55 X
%NLP, percentage of the number of empty or loaded NLPs relative to the total numbers of NLPs in the mixture; X, notapplicable. P-values were determined using a Two-tailed student t-test.
442 PROTEINSCIENCE.ORG Membrane Protein-Associated Nanolipoproteins

DiscussionWe used NLPs as a complex model system to demon-
strate the versatility of FCS for obtaining dynamic
information regarding NLP complex formation when
a membrane protein is incorporated into the lipid
nanoparticle. Importantly, FCS was able to directly
compare and contrast the expressed NLP complexes
after cell-free self-assembly. This is the first study to
attempt to characterize fully hydrated, freely diffus-
ing membrane protein–NLP complexes using FCS.
The wealth of information that FCS provided, as
shown by our data, included particle diameter, diffu-
sion times, insertion rate, and demonstration of pro-
tein-lipid interactions. Thus the utility of FCS for
characterizing MP in native environments such as
presented by inserting the MP in to a NLP scaffold
should be considerable.
FCS studies may be contrasted directly with
other biophysical techniques such as SEC and PAGE
measurements. SEC and PAGE are the standard for
identifying complex size differences of proteins, but
are not very sensitive for observing extremely low
concentrations of molecules that can be measured by
FCS analysis. The techniques of TEM and AFM
require immobilization of molecules on a solid sur-
face, which might change the chemical or biological
environment of MP inserted in NLPs. FCS avoids
this complication by making measurements in solu-
tion phase. DLS is very simple and useful to charac-
terize particle size, but it requires a homogeneous
sample with monodispersed sizes, which means it
requires strict purification to provide accurate parti-
cle size information. FCS avoids these requirements
by utilizing cross-correlating measurements, which
allows us to isolate complexes even in heterogeneous
mixture.
By plotting normalized correlation versus lag
time, FCS generated diffusion curves and inferred
diffusion times for corresponding samples. Compared
with bR-NLP complex, the bump in the curve at lon-
ger diffusion times for empty NLPs (Fig. 5) indicates
that a larger size of them may be caused by some
degree of aggregation. Also the simple 1-species
translational diffusion model fits empty NLPs well
(Supporting Information). The scattered points in
the short lag time region represent the higher inac-
curacy with which fast diffusion times can be deter-
mined, but their importance is somewhat amplified
by the logarithmic scale of their overall contribution
to the FCS fit analysis. Significantly less scattering
along the y-axis was obtained for bR-NLP complex
and their curve exhibited a clear bump at a diffusion
time of �5 ls diffusion time (Fig. 5). These findings
can be best explained by including a fast (rotational)
diffusion term into the fit model for bR-NLP complex
describing a stable discoidal shape, while empty
NLPs may be more dynamic due to changes between
discoidal and spherical shapes faster than the time
resolution of our FCS set up, when solubilized and
freely diffusing in solution. This result obtained in
an aqueous environment is in disagreement to the
typically discoidal shape of empty NLPs observed,
for example, from our AFM results (Fig. 7) and pre-
viously reported TEM studies.35 If solubilized empty
NLPs were contained as stable discs in solution,
they should have equally presented a fast (rota-
tional) diffusion term as observed for bR-NLP com-
plex, and thus have significantly deviated from the
simple 1-species translational diffusion model. The
aggregation seen at longer diffusion times for
empty-NLPs would not be able to compensate for the
anisotropic property of individual empty NLPs ei-
ther, if they were truly stable discs in solution. How-
ever, the experimental data were not consistent with
these predictions and did not confirm a stable disc-
like structure for empty-NLPs present in solution.
To explain the diffusion behavior of bR-NLP
complex (a mixture of empty NLPs and bR-loaded
NLPs) we had to resort to a fit model that accounts
for a fast decay, likely due to rotational diffusion of
disc-like particles (diffusion time: 4.9 6 0.3 ls), as
well as additional terms describing two species with
different translational diffusions (diffusion times 520
6 70 ls, and 350 6 10 ls). It was impossible to fit
this diffusion curve with a simple 1-species transla-
tional diffusion model or a simple 2-species transla-
tional diffusion model. The adjusted 2-species trans-
lational and rotational diffusion model fit
particularly well, when we fixed one of the transla-
tional diffusion terms as determined for empty NLPs
(350 6 10 ls), while the second faster translational
diffusion term also included the rotational term for
bR-loaded NLPs. The faster translational diffusion
time assigned to bR-loaded NLPs indicates that their
average hydrodynamic diameter was about (2.6 6
0.8) nm smaller than that of empty NLPs. This ob-
servation, combined with the additional fast rota-
tional diffusion required to describe bR-loaded
NLPs, indicates that bR-loaded NLPs are not as
dynamic as empty NLPs in solution. The incorpora-
tion of the transmembrane protein to NLPs suggests
that the lipids form a planar bilayer and the NLPs
are more constrained as discoidal shape. This
resulted in a more homogeneous size distribution for
bR-loaded NLPs without the levels of aggregation as
was seen for empty NLPs.
As shown in Figure 7 and Table III, the inclu-
sion of the membrane protein leads to a larger
height and a larger hydrodynamic diameter when
measured by AFM (empty NLPs height/diameter:
4.9 nm/18.2 nm; bR-loaded NLPs height/diameter:
6.4 nm/25.2 nm). The discrepancy between AFM di-
ameter data and FCS diameter data (empty NLPs:
10.4 nm, bR-loaded NLPs: 7.8 nm) can be readily
explained since the solution-based model for FCS is
not accessible to AFM measurements because NLPs
Gao et al. PROTEIN SCIENCE VOL 20:437—447 443
have to be immobilized on a surface, and will either
collapse in the dry state or are compressed by the
AFM tip. Combining the height data measured by
AFM and the hydrodynamic diameter data meas-
ured by FCS (empty NLPs height/diameter: 4.9 nm/
10.4 nm; bR-loaded NLPs height/diameter: 6.4 nm/
7.8 nm), empty NLPs appear to be more disc-like
than bR-loaded NLPs, because of an overall larger
aspect ratio between the height and diameter. This,
however, is not consistent with the observation of a
fast (rotational) diffusion for bR-loaded NLPs in the
hydrated state, which demonstrates their anisotropic
property as discs but was not seen for empty-NLPs.
Based on our AFM and FCS data, bR-loaded NLPs
seem to retain their discoidal shape both, on a sur-
face, and in solution, as evidenced by the additional
fast diffusion component. Their translational diffu-
sion time is faster than that of empty NLPs, because
bR-loaded NLPs have a smaller hydrodynamic diam-
eter. Empty NLPs has a larger hydrodynamic diame-
ter while their shape/structure is more dynamic and
less constrained in solution.
Summary
We have provided evidence that empty, hydrated
NLPs adopt a different dynamic shape in solution,
while membrane protein associated NLPs are more
thermodynamically constrained as discs as illus-
trated by our FCS hydrodynamic measurements.
The disc-like nature of bR-loaded NLPs can be
inferred from both, a faster translational diffusion
rate when compared to empty NLPs, and the obser-
vation of a fast rotational diffusion. This result was
unexpected based on AFM height measurements,
but may be readily explained by hydration effects of
these nanoparticles. Importantly, bR-insertion rates
obtained by both FCS and AFM techniques were
found to be in excellent agreement, which further
confirms the validity of FCS findings. This also illus-
trates the usefulness of FCS for characterizing NLP
complex interactions.
In the future, since the kinetics of the NLP
formation and membrane protein insertion is of
great interest and FCS is capable of time-dependent
measurement of in situ solution reactions, we expect
FCS to observe insertion of different MP dynami-
cally and to study their functions and interactions
with ligands in a hydrated NLP system. We also
should be able to determine subpopulations of NLPs
more quantitatively and their effects on receptor-
ligand interactions by utilizing more methods, such
as emission anisotropy,48 fluorescence lifetime,52 and
accurate single particle size measurements.53,54
Materials and Methods
Delta49A1 and bOp sequence, which encodes bR,
were described previously.21 Preparative 1 mL reac-
tions were carried out using RTS 500 ProteoMaster
Kit (Roche). A total of 5 lg of delta49A1 encoding
plasmid DNA was added to the lysate mixture along
with added DMPC (Avanti Polar Lipids) vesicles to
form the empty NLPs. For membrane protein co-
expression, a total of 0.2 lg of delta49A1 plasmid
DNA and 1 lg of bOp plasmid DNA were added to
the cell-free mixture along with added DMPC
vesicles and all-trans retinal. Preparation of 20 mg/
mL DMPC stock solution was based on the instruc-
tions from Avanti Polar Lipids. The solution was
stored in 4�C refrigerator at least 4 h before use.
Small unilamellar vesicles of DMPC were prepared
by probe sonicating 20 mg/mL aqueous solution of
DMPC on ice for �15 min until optical clarity was
achieved. Texas Red labelled DMPC was prepared
by mixing 99.5% (molar concentration) DMPC and
0.5% Texas RedVR
DHPE (Invitrogen) to form a solu-
tion at a total lipid concentration 25 mg/mL. Two
minutes of centrifugation at 13,700 RCF was used to
remove any metal contamination from the sonication
probe tip. DMPC small unilamellar vesicles were
added to the cell-free reaction at a final concentra-
tion of 2 mg/mL. All trans-retinal (Sigma) solution
was prepared with 100% ethanol at a stock concen-
tration of 0.586 mM or 10 mM. The stock solution
was diluted with water to achieve a final working
concentration of 30 � 50 lM in cell-free reactions.
The proteins were labelled by BodipyVR
-FL through
adding 5 lL of FluoroTectTM GreenLys (Promega)
into the reaction mixture for in vitro translation.
After 4-h incubation at 30�C, the soluble fraction
was obtained by centrifuging the completed reac-
tions at 14,000g for 5 min.
Immobilized metal affinity chromatography was
used to isolate the proteins of interests from the cell-
free reaction mixture. The soluble fraction (�1 mL)
was mixed with 1 mL Ni-NTA Superflow resin (Qia-
gen) according to the manufacturer’s protocol using
native purification conditions with the following
modifications. For washing the column, 6 column
volumes of buffer, 10–50 mM imidazole in Phosphate
Buffered Saline (PBS) was used. A total of 6 mL of
elution buffer (400 mM imidazole in PBS) was used
to elute the bound protein from the column in 1 mL
aliquots. All of the elution fractions were combined,
concentrated and buffer exchanged into Tris Buf-
fered Saline (TBS) using a 100 K molecular weight
sieve filters (Vivascience) to achieve a final volume
of �200 lL. This material was used for further
characterization.
Five microliter aliquots of purified bOp, empty
NLPs, and bR-NLP complex were diluted with 2�sample loading buffer with reducing agents (Invitro-
gen), heat-denatured at 95�C for 10 min. Samples
were loaded onto 4–12% gradient precast NuPAGE
Bis-Tris gel (Invitrogen) along with the molecular
weight standard NovexSharp (Invitrogen) and run
444 PROTEINSCIENCE.ORG Membrane Protein-Associated Nanolipoproteins
using NuPAGE MES-SDS running buffer (Invitro-
gen). Samples were electrophoresed for 40 min at
250 V. Gels were imaged with a GE Typhoon 9410
using a 488 nm laser with a 520/40 nm band pass
filter. Equal amounts of purified empty NLP and
bR-NLP complex samples (<20 lg) were diluted with
2� native gel sample buffer (Invitrogen). The
samples were loaded onto 4–12% gradient precast
Tris-glycine gels (Invitrogen) along with the molecu-
lar weight standard NativeMark (Invitrogen). They
were run using Novex Tris-glycine Native Running
Buffer (Invitrogen). Samples were electrophoresed
for 2 h at 125 V. Gels were imaged with a GE
Typhoon 9410 using a 488 nm laser with a 520/40
nm band pass filter.
All FCS measurements were performed on a
MicroTime 200 single molecule fluorescence lifetime
measurement system (PicoQuant). A modified Olym-
pus 1X71, equipped with an Olympus UPlanAPO
NA 1.45 oil immersion objective, served as a base of
the microscope. As excitation source, a pulsed laser
diode with a repetition rate of 20 MHz was used.
For calibration standards, Alexa Fluor 488 (Invitro-
gen) emits at 520 nm; Atto 655 (Sigma-Aldrich)
emits at 684 nm; two polystyrene beads (Fluo-
rSpheresVR
, Life Technologies) emit at 514 nm; two
extruded Texas Red-DMPC lipid vesicle samples
emit at 613 nm. They were all excited with a 470
nm laser except Atto 655 (excited at a 640 nm laser)
and detected through bandpass filters. Proteins
labelled with BodipyVR
-FL dye were excited at 470
nm for analysis based on their 510 nm emission.
The beam was directed into the microscope by
reflecting it off a dichroic mirror (z467/638pc). The
focus point was placed 5 lm above the cover slip sur-
face, so the FCS measurements can be performed at
a defined distance to the cover slip surface. The fluo-
rescence emission was focused on a pinhole. The
pinhole size was set to 50 lm. After the pinhole, the
fluorescence light was divided via a 50/50 beam
splitter cube, passed an emission filter and focused
on two SPCM-AQR SPAD detectors (Perkin Elmer).
All measurements were performed using the Sym-
PhoTime Software (PicoQuant). Data analysis was
performed using IGOR Pro 6 and OriginPro 8.
The DLS measurements were performed on a
Nanotrac Particle Size Analyzer (Microtrac). The
AFM measurements were performed on Asylum
MFP-3D-CF AFM. Images were captured in tapping
mode with minimal contact force and scan rates of
1 Hz. Asylum software was used for cross-sectional
analysis to measure NLP height and diameter.
Height and diameter were measured from 182 empty
NLPs produced by cell-free expression. Height and
diameter were also measured for totally 440 NLPs
produced by cell-free co-expression, 185 were found
to be empty-NLPs and 255 were found to contain
bR. Two-tailed student T-tests were run to compare
both the height and diameter of the empty-NLP
population in bR-NLP complex compared to empty
NLPs only. A P-value of <0.01 was considered
significant.
References
1. Angrand M, Briolay A, Ronzon F, Roux B (1997) Deter-gent-mediated reconstitution of a glycosyl-phosphati-dylinositol-protein into liposomes. Eur J Biochem 250:168–176.
2. Banerjee P, Dasgupta A, Chromy BA, Dawson G (1993)Differential Solubilization of Membrane-Lipids byDetergents-Coenrichment of the Sheep Brain-Serotonin5-Ht(1a) Receptor with Phospholipids ContainingPredominantly Saturated Fatty-Acids. Arch BiochemBiophys 305:68–77.
3. Gohon Y, Popot JL (2003) Membrane protein-surfactant complexes. Curr Opin Colloid Interface Sci8:15–22.
4. Soskic V, Joksimovic J (1992) Solubilization of Dopa-mine D-1 Receptors with a Zwitterionic DetergentDchaps and Their Reconstitution. Int J Biochem 24:585–591.
5. Balen P, Kimura K, Sidhu A (1994) Specific Phospho-lipid Requirements for the Solubilization and Reconsti-tution of D-1 Dopamine-Receptors from StriatalMembranes. Biochemistry 33:1539–1544.
6. Devesa F, Chams V, Dinadayala P, Stella A, Ragas A,Auboiroux H, Stegmann T, Poquet Y (2002) Functionalreconstitution of the HIV receptors CCR5 and CD4 inliposomes. Eur J Biochem 269:5163–5174.
7. Gioannini TL, Fan LQ, Hyde L, Ofri D, Yao YH, HillerJM, Simon E (1993) Reconstitution of a PurifiedMu-Opioid Binding-Protein in Liposomes - Selective,High-Affinity, Gtp-Gamma-S-Sensitive Mu-OpioidAgonist Binding Is Restored. J Biochem Biophys ResCommun 194:901–908.
8. Otake K, Imura T, Sakai H, Abe M (2006) Preparationof liposomes using an improved supercritical reversephase evaporation method. Langmuir 22:2543–2550.
9. Bayburt TH, Grinkova LV, Denisov IG, Sligar SG(2004) Incorporation into nanobilayer structures andcontrol of the oligomerization state of the 7-TM proteinbacteriorhodopsin. Biophys J 86:252A–252A.
10. Bayburt TH, Grinkova YV, Sligar SG (2006) Assemblyof single bacteriorhodopsin trimers in bilayer nano-discs. Arch Biochem Biophys 450:215–222.
11. Bayburt TH, Sligar SG (2003) Self-assembly of singleintegral membrane proteins into soluble nanoscalephospholipid bilayers. Protein Sci 12:2476–2481.
12. Boldog T, Li MS, Hazelbauer GL (2007) Using nano-discs to create water-soluble transmembrane chemo-receptors inserted in lipid bilayers. Methods Enzymol423:317–335.
13. Cerione RA, Ross EM (1991) Reconstitution of Recep-tors and G-Proteins in Phospholipid-Vesicles. MethodsEnzymol 195:329–342.
14. Civjan NR, Bayburt TH, Schuler MA, Sligar SG (2003)Biotechniques 35:556–560.
15. Davidson WS, Thompson TB (2007) The structure ofapolipoprotein A-I in high density lipoproteins. J BiolChem 282:22249–22253.
16. Li Y, Kijac AZ, Sligar SG, Rienstra CM (2006) Struc-tural analysis of nanoscale self-assembled discoidallipid bilayers by solid-state NMR spectroscopy. BiophysJ 91:3819–3828.
Gao et al. PROTEIN SCIENCE VOL 20:437—447 445
17. Martin DDO, Budamagunta MS, Ryan RO, Voss JC,Oda MN (2006) Apolipoprotein A-I assumes a ‘‘loopedbelt’’ conformation on reconstituted high density lipo-protein. J Biol Chem 281:20418–20426.
18. Shih AY, Denisov IG, Phillips JC, Sligar SG, SchultenK (2005) Molecular Dynamics Simulations of DiscoidalBilayers Assembled from Truncated Human Lipopro-teins. Biophys J 88:548–556.
19. Shaw AW, McLean MA, Sligar SG (2004) Phospholipidphase transitions in homogeneous nanometer scalebilayer discs. FEBS Lett 556:260–264.
20. Bayburt TH, Leitz AJ, Xie G, Oprian DD, Sligar SG(2007) Transducin activation by nanoscale lipidbilayers containing one and two rhodopsins. J BiolChem 282:14875–14881.
21. Cappuccio JA, Blanchette CD, Sulchek TA, Arroyo ES,Kralj JM, Hinz AK, Kuhn EA, Chromy BA, SegelkeBW, Rothschild KJ, Fletcher JE, Katzen F, Peterson|TC, Kudlicki WA, Bench G, Hoeprich PD, Coleman MA(2008) Cell-free Co-expression of Functional MembraneProteins and Apolipoprotein, Forming SolubleNanolipoprotein Particles. Mol Cell Proteomics 7:2246–22253.
22. Leitz AJ, Bayburt TH, Barnakov AN, Springer BA,Sligar SG (2006) Functional reconstitution of b2-adre-nergic receptors utilizing self-assembling Nanodisctechnology. Biotechniques 40:601–612.
23. Whorton MR, Bokoch MP, Rasmussen SGF, Huang B,Zare RN, Kobilka B, Sunahara RK (2007) monomeric Gprotein-coupled receptor isolated in a high-density lipo-protein particle efficiently activates its G protein. ProcNatl Acad Sci USA 104:7682–7687.
24. Katzen F, Fletcher JE, Yang J, Kang D, Peterson TC,Cappuccio JA, Blanchette CD, Sulchek T, Chromy BA,Hoeprich PD, Coleman MA, Kudlicki W (2008) Inser-tion of membrane proteins into discoidal membranesusing a cell-free protein expression approach. J Pro-teome Res 7:3535–3542.
25. Katzen F, Chang G, Kudlicki W (2005) The past, pres-ent and future of cell-free protein synthesis. TrendsBiotechnol 23:150–156.
26. Denisov IG, McLean MA, Shaw AW, Grinkova YV, Sli-gar SG (2005) Thermotropic phase transition in solublenanoscale lipid bilayers. J Phys Chem B 109:15580–15588.
27. Chromy BA, Arroyo E, Blanchette CD, Bench G, BennerH, Cappuccio JA, Coleman MA, Henderson PT, HinzAK, Kuhn EA, Pesavento JB, Segelke BW, Sulchek TA,Tarasow T, Walsworth VL, Hoeprich PD (2007) Differentapolipoproteins impact nanolipoprotein particle forma-tion. J Am Chem Soc 129:14348–14354.
28. Denisov IG, Grinkova YV, Lazarides AA, Sligar SG(2004) Small-angle X-ray scattering study of monodis-perse lipid-protein nanodiscs as nanoscale fragments ofbiological membrane. Biophys J 86:252A–252A.
29. Bayburt TH, Grinkova YV, Sligar SG (2002) Self-as-sembly of discoidal phospholipid bilayer nanoparticleswith membrane scaffold proteins. Nano Lett 2:853–856.
30. Denisov IG, Grinkova YV, Lazarides AA, Sligar SG(2004) Directed self-assembly of monodisperse phospho-lipid bilayer nanodiscs with controlled size. J AmChem Soc 126:3477–3487.
31. Grinkova YV, Denisov IG, Bayburt TH, Sligar SG(2004) Structure and composition of self-assembled dis-coidal phospholipid bilayer nanoparticles formed withdifferent membrane scaffold proteins. Biophys J 86:252A–251A.
32. Silva RAGD, Huang R, Morris J, Fang J, GrachevaEO, Ren G, Kontush A, Jerome WG, Rye K, Davidson
WS (2008) Structure of apolipoprotein A-I in sphericalhigh density lipoproteins of different sizes. Proc NatlAcad Sci USA 105:12176–12181.
33. Miyazaki M, Nakano M, Fukuda M, Handa T (2009)Smaller Discoidal High-Density Lipoprotein ParticlesForm Saddle Surfaces, but Not Planar Bilayers. Bio-chemistry 487756–7763.
34. Blanchette CD, Cappuccio JA, Kuhn EA, Segelke BW,Benner WH, Chromy BA, Coleman MA, Bench G,Hoeprich PD, Sulchek TA (2009) Atomic force micros-copy differentiates discrete size distributions betweenmembrane protein containing and empty nanolipopro-tein particles. Biochim Biophys Acta 1788:724–731.
35. Bayburt TH, Sligar SG (2002) Single-molecule heightmeasurements on microsomal cytochrome P450 innanometer-scale phospholipid bilayer disks. Proc NatlAcad Sci USA 99:6725–6730.
36. Blanchette CD, Law R, Benner WH, Pesavento JB,Cappuccio JA, Walsworth V, Kuhn EA, Corzett M,Chromy BA, Segelke BW, Coleman MA, Bench G, Hoe-prich PD, Sulchek TA (2008) Quantifying size distribu-tions of nanolipoprotein particles with single-particleanalysis and molecular dynamic simulations. J LipidRes 49:1420–1430.
37. Sugiki T, Yoshiura C, Kofuku Y, Ueda T, Shimada I,Takahashi H (2009) High-throughput screening of opti-mal solution conditions for structural biological studiesby fluorescence correlation spectroscopy. Protein Sci 18:1115–1120.
38. Brinkmeier M, Dorre K, Riebeseel K, Rigler R (1997)Confocal spectroscopy in microstructures. BiophysChem 66:229–239.
39. Elson EL, Magde D (1974) Fluorescence Correlation(1974) Spectroscopy 1. Conceptual Basis and Theory.Biopolymers 13:1–27.
40. Magde D, Elson EL, Webb WW (1974) FluorescenceCorrelation Spectroscopy 2. Experimental Realization.Biopolymers 13:29–61.
41. Magde D, Webb WW, Elson EL (1978) FluorescenceCorrelation Spectroscopy 3. Uniform Translation andLaminar-Flow. Biopolymers 17:361–376.
42. Kask P, Piksarv P, Mets U, Pooga M, Lippmaa E (1987)Fluorescence Correlation Spectroscopy in the Nanosec-ond Time Range - Rotational Diffusion of Bovine Car-bonic Anhydrase-B. Eur Biophys J 14:257–261.
43. Kinjo M, Rigler R (1995) Ultrasensitive HybridizationAnalysis Using Fluorescence Correlation Spectroscopy.Nucleic Acids Res 23:1795–1799.
44. Tsay JM, Doose S, Weiss S (2006) Rotational and trans-lational diffusion of peptide-coated CdSe/CdS/ZnSnanorods studied by fluorescence correlation spectros-copy. J Am Chem Soc 128:1639–1647.
45. Wennmalm S, Edman L, Rigler R (1997) Conforma-tional fluctuations in single DNA molecules. Proc NatlAcad Sci USA 94:10641–10646.
46. Widengren J, Dapprich J, Rigler R (1997) Fast interac-tions between Rh6G and dGTP in water studied by flu-orescence correlation spectroscopy. Chem Phys 216:417–426.
47. Laurence TA, Braun G, Talley C, Schwartzberg A, Mos-kovits M, Reich N, Huser T (2009) Rapid, Solution-Based Characterization of Optimized SERS Nanopar-ticle Substrates. J Am Chem Soc 131:162–169.
48. Rauer B, Neumann E, Widengren J, Rigler R (1996)Fluorescence correlation spectrometry of the interac-tion kinetics of tetramethylrhodamin alpha-bungaro-toxin with Torpedo californica acetylcholine receptor.Biophys Chem 58:3–12.
446 PROTEINSCIENCE.ORG Membrane Protein-Associated Nanolipoproteins
49. Schwille P, Oehlenschlager F, Walter NG (1996) Quan-titative hybridization kinetics of DNA probes to RNAin solution followed by diffusional fluorescence correla-tion analysis. Biochemistry 35:10182–10193.
50. Widengren J, Mets U, Rigler R (1995) FluorescenceCorrelation Spectroscopy of Triplet-States in Solution-aTheoretical and Experimental-Study. J Phys Chem 99:13368–13379.
51. Sadanand G, Sergey M, Jerzy O, Kenneth R (1999)Ultrasensitive Fluorescence-Based Detection of NascentProteins in Gels. Anal Biochem 279:218–225.
52. Lukasiewicz S, Blasiak E, Faron-Gorecka A, Polit A,Tworzydlo M, Gorecki A, Wasylewski Z, Dziedzicka-
Wasylewska M (2007) Fluorescence studies of homooli-gomerization of adenosine A(2A) and serotonin 5-HT1Areceptors reveal the specificity of receptor interactionsin the plasma membrane. Pharmacol Rep 59:379–392.
53. Briddon SJ, Hill SJ (2007) Pharmacology under themicroscope: the use of fluorescence correlation spectros-copy to determine the properties of ligand–receptorcomplexes. Trends Pharmacol Sci 28:637–645.
54. Miller AE, Fischer AJ, Laurence T, Hollars CW,Saykally RJ, Lagarias JC, Huser T (2006) Single-mole-cule dynamics of phytochrome-bound fluorophoresprobed by fluorescence correlation spectroscopy. ProcNatl Acad Sci USA 103:11136–11141.
Gao et al. PROTEIN SCIENCE VOL 20:437—447 447