Characterization of the acidity of zeolite Beta by FTi.r. spectroscopy and t.p.d. of NH3
7
Characterization of the acidity of zeolite Beta by FTi.r. spectroscopy and t.p.d..of NH3 S.G. Hegde, R. Kumar, R.N. Bhat and P. Ratnasamy National Chemical Laboratory, Pune, India The acidity of zeolite Beta has been characterized by F'/i.r.spectroscopy and temperature-programmed desorption (t.p.d.) of NH3. Three types of hydroxyl groups, absorbing at 3740, 3602, and 3540 cm -~, have been identified and assigned to terminal/internal Si-OH, framework (OH), and hydrogen-bonded " (OH) groups, respectively. The influence of adsorption of NH3, D20, benzene, and pyridine on these hydroxyl groups has been evaluated. From a comparison of these results with those obtained with zeolites Y and ZSM-5, the following decreasing order for the acidic strength of the framework hydroxyls is derived: ZSM-5 > Beta > Y. Keywords: Zeolite Beta; acidity of zeolites; F'/q.r. spectroscopy; adsorption of NH~ INTRODUCTION Zeolite Beta is a wide-pore, high-silica, crystalline aluminosilicate, first synthesized by Wadlinger et al. 1 Its crystalline structure has been published. 2 In- formation on its void structure is available, s--4 It has a total pore volume 2 of around 0.2 ml g-l. It is proposed that the pore structure consists of channels of 12-membered rings interconnected by cages con- stituted by the intersections of the channels. 3'4 In view of its high-silica content, and wide, intercon- nected pores, the catalytic acidity of Beta zeolite has also been studied. 5-'7 One of its potential major applications is in the catalytic hydrodewaxing of petroleum oils, where it is able to lower the pour point of the oil 7 by isomerizing the normal paraffins contained therein (and which constitute the wax) to the branched isomers rather than cracking them to lighter paraffins as is done by'other zeolites such as ZSM-5 or erionite. Even though the mecha.nism of crystallization of Beta s as well as its shape-selective catalytic properties 9'1° are well documented, the same cannot be said about the nature of its surface acidity. Corma et al. 5 reported the i.r. spectra of tetraethyl- ammonium-Beta zeolite decomposed at various temperatures and identified hydroxyl groups absorb- ing at 3615 and 3680 cm -I, the intensity of the former being directly proportional to the number of framework aluminium ions. Perez-Pariente et al. s reported the framework vibration i.r. spectra of the as-synthesized sample and assigned the bands at 525 and 575 cm -~ as characteristic features of the Beta zeolites. Address reprint requests to Dr. Hegde at the National Chemical Laboratory, Pune, 411 008, India Received 4 May 1988 In the present study, t.p.d, of ammonia and FTi.r. spectroscopy have been jointly used to characterize the surface acidity of Beta zeolites with differing Si/AI ratios. The as-synthesised form (TEA-Beta), the ammonium form (NH4-Beta), the protonic form (H-Beta) containing varying amounts of adsorbed. NHs, and the pyridinium form (pyridine-Beta) have all been characterized by FTi.r. spectroscopy. In addition, the frequency shifts in the (OH) bands induced by adsorption of molecules like D20 and benzene, a weak base, have also been studied. The results lead to an integrated picture of the surface acidity of this zeolite. EXPERIMENTAL Materials The synthesis of Beta zeolite was carried out hydrothermally from the system (TEA)20--SiO2- AI2Os-Na20-H20 at 423 + 2 K. Samples A and B with the gel composition (molar basis) as follows were prepared by mixing appropriate quantities of silica (Sigma 400 type S-5005), sodium hydroxide (AR grade), sodium aluminate (43.8% A1203, 39% Na20, and 17.2% H20), 40% aqueous tetraethyl ammonium hydroxide (ALFA), and distilled water: sample A--60 SIO2:7.5 (TEA)20:AI2Os:3 Na20:900 H20, and sam- ple B--30 SIO2:3.75 (TEA)20:A1203:l.5 Na20:450 H20. Thegel obtained was stirred thoroughly before transferring it to stainless-steel autoclaves. The auto- claves were then kept in an oven maintained at 423 _+ 2 K. After completion of the crystallization (6-9 days), the autoclave was quenched in cold water. The solid material thus obtained was filtered, washed with deionized water, and dried at 393 K. The solids were ~) 1989 Butterworth Publishers ZEOLITES, 1989, Vol 9, May 231
-
Upload
independent -
Category
Documents
-
view
3 -
download
0
Transcript of Characterization of the acidity of zeolite Beta by FTi.r. spectroscopy and t.p.d. of NH3
Characterization of the acidity of zeolite Beta by FTi.r. spectroscopy and t.p.d..of NH3
S.G. Hegde, R. Kumar, R.N. Bhat and P. Ratnasamy Nat ional Chemical Laboratory, Pune , India
The acidity of zeolite Beta has been characterized by F'/i.r.spectroscopy and temperature-programmed desorption (t.p.d.) of NH3. Three types of hydroxyl groups, absorbing at 3740, 3602, and 3540 cm -~, have been identified and assigned to terminal/internal Si-OH, framework (OH), and hydrogen-bonded " (OH) groups, respectively. The influence of adsorption of NH3, D20, benzene, and pyridine on these hydroxyl groups has been evaluated. From a comparison of these results with those obtained with zeolites Y and ZSM-5, the following decreasing order for the acidic strength of the framework hydroxyls is derived: ZSM-5 > Beta > Y.
Keywords: Zeolite Beta; acidity of zeolites; F'/q.r. spectroscopy; adsorption of NH~
I N T R O D U C T I O N
Zeolite Beta is a wide-pore, high-silica, crystalline aluminosilicate, first synthesized by Wadlinger et al. 1 Its crystalline structure has been published. 2 In- formation on its void structure is available, s--4 It has a total pore volume 2 of around 0.2 ml g- l . It is proposed that the pore structure consists of channels of 12-membered rings interconnected by cages con- stituted by the intersections of the channels. 3'4 In view of its high-silica content, and wide, intercon- nected pores, the catalytic acidity of Beta zeolite has also been studied. 5-'7 One of its potential major applications is in the catalytic hydrodewaxing of petroleum oils, where it is able to lower the pour point of the oil 7 by isomerizing the normal paraffins contained therein (and which constitute the wax) to the branched isomers rather than cracking them to lighter paraffins as is done by'other zeolites such as ZSM-5 or erionite. Even though the mecha.nism of crystallization of Beta s as well as its shape-selective catalytic properties 9'1° are well documented, the same cannot be said about the nature of its surface acidity. Corma et al. 5 reported the i.r. spectra of tetraethyl- ammonium-Beta zeolite decomposed at various temperatures and identified hydroxyl groups absorb- ing at 3615 and 3680 cm -I , the intensity of the former being directly proportional to the number of framework aluminium ions. Perez-Pariente et al. s reported the framework vibration i.r. spectra of the as-synthesized sample and assigned the bands at 525 and 575 cm -~ as characteristic features of the Beta zeolites.
Address reprint requests to Dr. Hegde at the National Chemical Laboratory, Pune, 411 008, India Received 4 May 1988
In the present study, t.p.d, of ammonia and FTi.r. spectroscopy have been jointly used to characterize the surface acidity of Beta zeolites with differing Si/AI ratios. The as-synthesised form (TEA-Beta), the ammonium form (NH4-Beta), the protonic form (H-Beta) containing varying amounts of adsorbed. NHs, and the pyridinium form (pyridine-Beta) have all been characterized by FTi.r. spectroscopy. In addition, the frequency shifts in the (OH) bands induced by adsorption of molecules like D20 and benzene, a weak base, have also been studied. The results lead to an integrated picture of the surface acidity of this zeolite.
EXPERIMENTAL
Materials The synthesis of Beta zeolite was carried out
hydrothermally from the system (TEA)20--SiO2- AI2Os-Na20-H20 at 423 + 2 K. Samples A and B with the gel composition (molar basis) as follows were prepared by mixing appropriate quantities of silica (Sigma 400 type S-5005), sodium hydroxide (AR grade), sodium aluminate (43.8% A1203, 39% Na20, and 17.2% H20), 40% aqueous tetraethyl ammonium hydroxide (ALFA), and distilled water: sample A--60 SIO2:7.5 (TEA)20:AI2Os:3 Na20:900 H20, and sam- ple B--30 SIO2:3.75 (TEA)20:A1203:l.5 Na20:450 H20. Thege l obtained was stirred thoroughly before transferring it to stainless-steel autoclaves. The auto- claves were then kept in an oven maintained at 423 _+ 2 K. After completion of the crystallization (6-9 days), the autoclave was quenched in cold water. The solid material thus obtained was filtered, washed with deionized water, and dried at 393 K. The solids were
~) 1989 Butterworth Publishers ZEOLITES, 1989, Vol 9, May 231
Acidity of zeolite Beta: S.G. Hegde et al.
1 0
¢-
(b)
(a)
/.S 37 29 28
21 13 5
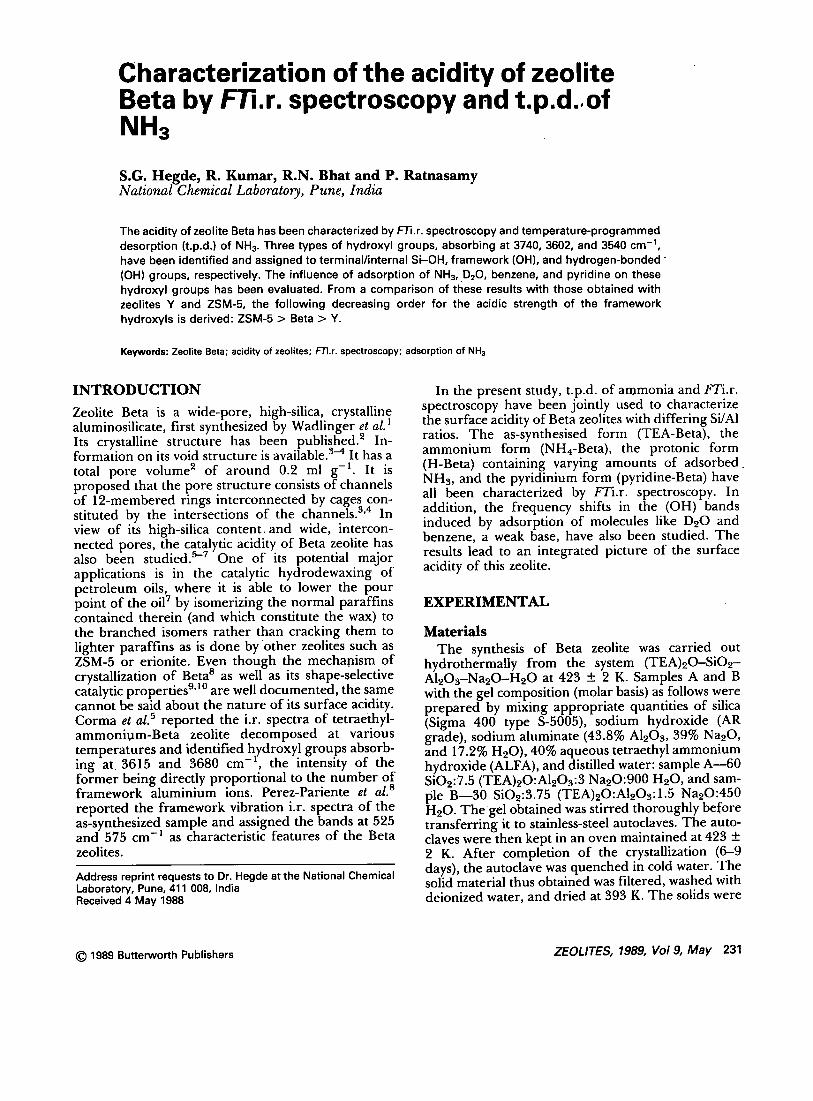
Figure 1 XRD patterns of as-synthesized zeolite Beta: (a) sample A; (b) sample B
further calcined in a flow of dry air at 723 K for 20 h to obtain the sodiumform. The molar cohaposition (anhydrous basis) of the two solid samples were Na-Beta-A: 44 SIO2:A1203:0.2 Na20; and Na-Beta-B: 28 SiO2:Al~Os:0.2 Na20. The chemical composition of the zeolites was analyzed by a combination of wet chemical, atomic absorption (Hitachi, Z-8000), and ICP (Jobin-JY-38 VHR) methods. The protonic forms (H-Beta-A and H-Beta-B) were prepared from the sodium form by ammonium exchange with NH4CI solution (5 N), until the Na content in the zeolite was less than 100 ppm, to obtain the ammo- nium form and then further by calcining the latter at 723 K for 20 h in flowing dry air.
Procedures The crystalline-phase identification and evaluation
of the synthesized products were performed by
employing X-ray diffraction (Philips, CuK0¢ radia- tion), scanning electron microscopy (Cambridge), thermal analysis (Netsch, Model STA 490), FTi.r. spectroscopy (Nicolet 60 SXB), conventional gra- vimetric adsorption, and t.p.d, of NH3. The charac- terization procedures (except FTi.r. spectroscopy) were similar to those described earlier. I~-~3 The FTi.r. spectra were recorded with the Spectra-Tech diffuse reflectance attachment. About 200 mg of the powder (200-250 mesh) was taken in the sample cup, which was placed inside the controlled ~nvironment chamber of the accessory. Ultrapure argon gas' was then passed (100 ml/min) over the sample, while the latter was being heated slowly (2 K/min) to the desired temperature and maintained at that temperature for 4 h before recording the spectrum. All spectra were recorded with the sample at room temperature. An average of 1000 scans were taken to obtain each spectrum.
RESULTS AND D I S C U S S I O N
XRD, SEM, and framework i.r. spectra The XRD patterns of samples A and B were found
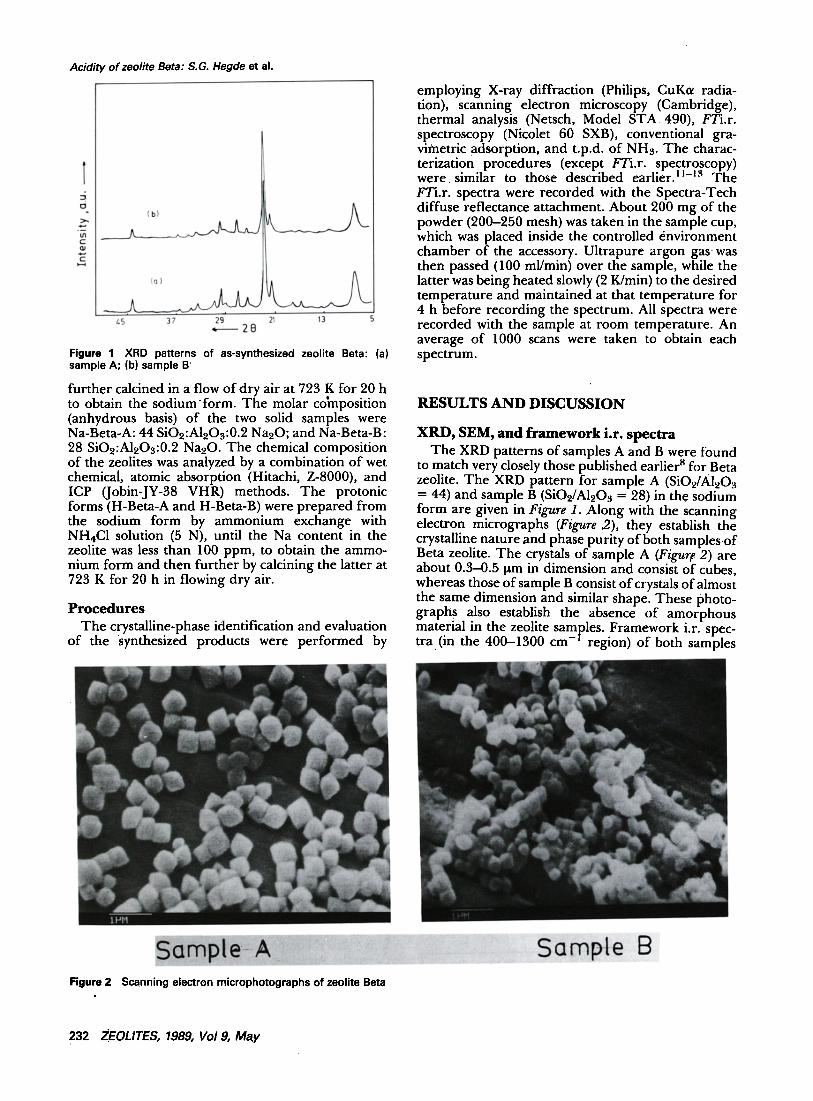
to match very closely those published earlier 8 for Beta zeolite. The XRD pattern for sample A (SiO,z/Al,zO:~ = 44) and sample B (SiO2/Al2Os = 28) in the sodium form are given in Figure 1. Along with the scanning electron micrographs (Figure 2), they establish the crystalline nature and phase purity of both samplesof Beta zeolite. The crystals of sample A (Figure 2) are about 0.3-0.5 I~m in dimension and consist of cubes, whereas those of sample B consist of crystals of almost the same dimension and similar shape. These photo- graphs also establish the absence of amorphous material in the zeolite samples. Framework i.r. spec- tra (in the 400-1300 cm- t r eg ion ) of both samples
Figure 2 Scanning electron microphotographs of zeolite Beta
B
232 ZEOLITES, 1989, Vo19, May

.o m
T.G."
- n d o ,
1.73 673 873 1073 1273
T , K .
Figure 3 T.g., d.t.g., and d.t.a, cuwes of as-synthesized zeolite Beta sample A; heating rate 10 K/min
were similar to those reported by Perez-Pariente et al. s
T h e r m a l a n a l y s i s The weight and energy changes during the thermal
decomposition of as-synthesized sample A are shown in Figure 3. The d.t.a./t.g, analysis of the samples was carried out in a flow of dry air (100 ml/min) at a heating rate of 10 K/min; 49.9 mg of the sample was used. Four distinct zones of exothermic weight loss are seen in the d.t.a./d.t.g, curves with peak maxima at 591,650, 723, and 900 K, respectively.
Perez-Pariente et al. s reported three exothermic weight losses at 493-623, 623-773, and 773-973 K, respectively, in the decomposition of a TEA-Beta zeolite. On the basis of assignments made earlier by Parker et al. 14 for the decomposition of TEA-ZSM-5, they assigned the first two exothermic losses to the removal of occluded T E A - O H and TEA + cations, respectively. The exothermic weight loss at 773-973 K was attributed to the oxidative decomposition of organic materials occluded in the zeolite. The results obtained in the present study are similar to those of Perez-Pariente et al. s except that in the region 623-773 K two distinct peaks at 650 and 723 K (rather than one at 700 K) are observed. The reasons
Table 1 Adsorption in Beta zeolites (T = 298 K, P/Po = 0.5)
Acidity of zeolite Beta: S.G. Hegde et al.
for this difference are not clear. Perhaps TEA + cations occluded in two different locations cause the observed peaks in the d.t.a, curve at 650 and 723 K. This is supported by the fact that the d.t.g., curve shows only a single, continuous, and broad maximum around 700 K even' though two maxima are s~en in the d.t.a, curve in this region (Figure 3). The total exothermic weight loss of 18.2% observed in "the present study compared to 15.2% reported by Perez- Pariente et al. s also indicates the higher TEA content m our sample.
A d s o r p t i o n The adsorption of probe molecules of various
kinetic diameter in the sodium forms of the two samples of Beta zeolites are shown in Table 1. The average pore volumes (assuming liquid .density) for the adsorbates for samples A and B are 0.23 and 0.26 + 0.03 ml/g, respectively. The results in Table I confirm the large-pore nature of the pores in Beta zeolite.
FTi .r . s p e c t r o s c o p y
T E A - and Na-Beta The difference FTi.r. spectra, obtained by subtract-
ing the spectra of the sodium form from that of the as-synthesized TEA-Beta zeolite, are shown in Figure 4a. For comparison, the spectra of the Na-Beta forms are given in Figure 4b. The spectra of Figure 4a were taken after heating the samples at 573 K in argon flow (i.e., without removal of the TEA cation), and those in Figure 4b, after oxidative decomposition in dry air (in situ) of the same samples at 723 K and ensuring the removal of the occluded organic mate- rial. The absorption bands in the region 2800-3000 cm-1 (appearing as negative peaks in the difference spectra, Figure 4a) are due to the asymmetric and symmetric C--H stretching vibrations. In both Figure 4a and b, three types of (OH) absorption bands can be distinguished: two sharp bands at 3740 and 3602 cm -1 and a third broad band with a maximum around 3540 cm - l . The bands at 3740 and 3540 cm- t are more intense for the sample with a higher silicon content (sample A), whereas the band at 3602 cm -1 is more intense for sample B with a higher AI content (Figure 4b).
Adsorbate
Kinetic A diameter
(A °) % adsorption
Sample
Pv ~ (ml g- l ) % adsorption Pv (mol g- l )
1. Water 2.65 19.9 0.20 21.3 0.21 2. n-Hexane 4.3 15.9 0.24 19.0 0.29 3. Cyclohexane 6.0 18.3 0.23 20.5 0.26 4. Ortho-xylene 6.8 22.7 0.26 21.8 0.25 5. Meta-xylene 7.0 20.0 0.23 25.0 0.29 6. 1,2,4-TMB b 7.5 17.1 0.20 24.0 0.28
a Pv -- pore volume bTMB = trimethylbenzene
ZEOLITES, 1989, Vol 9, May 233

Acidity of zeolite Beta: S.G. Hegde et al.
{ l .a) (L~ )
° ~
m m ~
37oo ' 3 , bo ~ 37~o 3~o
Figure 4 (a) F-fi.r. difference spectra (723-573 K) of as- synthesized zeolite Beta. (b) F'/i.r. spectra of zeolite Na-Beta, (curve a: sample A; curve b: sample B)
Very similar results, but in the ZSM-5 system, were observed by Woolery et al. 15 They distinguished three types of (OH) groups in ZSM-5 zeolites absorbing at 3740, 3610, and around 3500 cm -l and assigned them to free SiOH groups (both terminal and internal), Br6nsted acid sites associated with AI (bridging hydroxyl), and hydrogen-bonded SiOH groups, respectively. They also observed that the intensity of the bands at 3740 and 3500 cm -1 increased with the Si content of the zeolite, whereas that of the band at 3610 cm- 1 was proportional to the A1 content. The (OH) bands in Figure 4 are also assigned to similar species in Beta zeolite. There is, however, a significant difference between the results for ZSM-515 and for Beta (Figure 4): The band around 3500 cm -~ was absent in the spectra of NaZSM-5 zeolites and appeared only when the sodium ions were replaced by protons (see figure 2 of Ref. 15). In the case of Beta zeolite (Figure 4), the 3540 cm -l band is present even in Na-Beta. Its occurrence at a higher frequency [3540 instead of 3500 cm - l , indicative of a lower hydrogen-bonded character of these (OH)] is also consistent with the presence of a higher concentration of Na ions than in the samples, NH4- and H-Beta.
The sodium forms of the two samples of zeolites A and B (whose spectral characteristics were described above) were next converted into their respective ammonium forms by procedures described in the Experimental section. Figure 5 illustrates the changes in the FTi.r. spectra of sample B on NH~- decomposi- tion, in situ, at various temperatures. After decom- position at 423 K (curve a), apart from the bands at 3000-3400 cm-l due to N-H stretching vibrations, there is a sharp band at 3740 cm-~ (due to internal and terminal, SiOH) and broad bands around 3680 and 3540 cm -I On progressive decomposition at higher temperatures (curves a-c, Figure 5), the bands due to N-H vibrations disappear. After decomposi-
tion at 723 K (curve c), in addition to the bands at 3740, 3602, and 3540 cm- 1 observed above (Fkffure 4), a shoulder to the band at 3740 cm-I is seen at 3680 cm-I. It is difficuh to rule out the presence of this shoulder in the spectra of Figure 4. A similar peak at 3680 cm-l was observed in the spectra of ZSM-5 by Woolery et al.I'~ A decrease in the concentration of these hydroxyls accompanies the enhanced intensity of the bands at 3740 and 3602 cm-t on decomposi- tion at higher temperatures (compare curves a-c, Figure 5).
NHs adsorption on H-Beta The ammonium forms of Beta samples A and B
were converted to the protonic forms by procedures described above, to get H-Beta-A and H-Beta-B. Adsorption of NH3 on these samples was studied using FTi.r. spectroscopy and t.p.d, of NH:~. NH:, was adsorbed at room temperature on samples evacuated at 673 K and progressively desorbed at continuously increasing temperatures with simuhaneous monitor- ing of the desorbing gases using procedures de- scribed earlier.I l-=:~ The resuhs for t.p.d, of NH:~ are shown in Figure 6. The FTi.r. spectra (in the case of sample B) were recorded after desorption of NH:~ at 423,573,723, and 823 K and are illustrated in Figure 7 (curves a-d, respectively).
The features in Figure 6 are broadly similar to our earlier results on the t.p.d, of NH:~ from ZSM-5 zeolites. =6 The total amount of NH:~ adsorbed was found to be in excess of the number of AI atoms/g, indicating that part of the adsorbed NH:~ is physically adsorbed on sites like silanol groups. Only the last peak with the maximum in the 653-673 K region was found to correlate with the A1 content, acidity, and
o J~
C
/ j
Figure 5 Hydroxyl region FT~.r. spectra of zeolite NH4-Beta sample A; deammoniated at 423, 573, and 723 K, curves a, b, and c, respectively
234 ZEOLITES, 1989, Vol 9, May
o
m
c
373 473 573 673 773
b
¢1
I
873 T,K. •
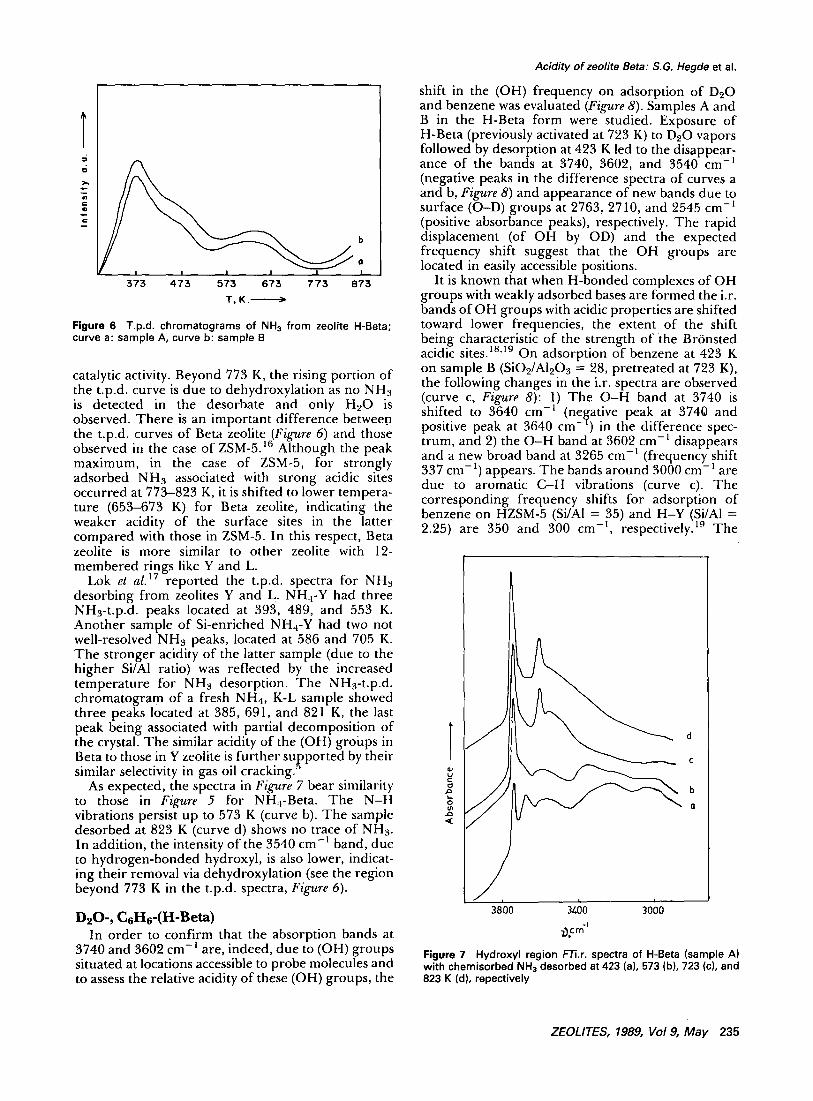
Figure 6 T.p.d. chromatograms of NHa from zeolite H-Beta; curve a: sample A, curve b: sample B
catalytic activity. Beyond 773 K, the rising portion of the t.p.d, curve is due to dehydroxylation as no NH,3 is detected in the desorbate and only H20 is observed. There is an important difference betwee.n the t.p.d, curves of Beta zeolite (Figure 6) and those observed in the case of ZSM-5.16 Although the peak maximum, in the case of ZSM-5, for strongly adsorbed NH~ associated with strong acidic sites occurred at 773-823 K, it is shifted to lower tempera- ture (653-673 K) for Beta zeolite, indicating the weaker acidity of the surface sites in the latter compared with those in ZSM-5. In this respect, Beta zeolite is more similar to other zeolite with 12- membered rings like Y and L.
Lok et al. iv reported the t.p.d, spectra for NH3 desorbing from zeolites Y and L. NH.I-Y had three NH~-t.p.d. peaks located at 393, 489, and 553 K. Another sample of Si-enriched NH4-Y had two not well-resolved NH~ peaks, located at 586 and 705 K. The stronger acidity of the latter sample (due to the higher Si/A1 ratio) was reflected by the increased temperature for NH3 desorption. The NH3-t.p.d. chromatogram of a fresh NH4, K-L sample showed three peaks located at 385, 691, and 821 K, the last peak being associated with partial decomposition of the crystal. The similar acidity of the (OH) groiaps in Beta to those in Y zeolite is further su.~ported by their similar selectivity in gas oil cracking.
As expected, the spectra in Figure 7 bear similarity to those in Figure 5 for NH4-Beta. The N - H vibrations persist up to 573 K (curve b). The sample desorbed at 823 K (curve d) shows no trace of NH~. In addition, the intensity of the 3540 cm -1 band, due to hydrogen-bonded hydroxyl, is also lower, indicat- ing their removal via dehydroxylation (see the region beyond 773 K in the t.p.d, spectra, Figure 6).
D20-, C6H6-(H-Beta) In order to confirm that the absorption bands at
3740 and 3602 cm-l are, indeed, due to (OH) groups situated at locations accessible to probe molecules and to assess the relative acidity of these (OH) groups, the
Acidity of zeofite Beta: S.Go Hegde et al.
shift in the (OH) frequency on adsorption of D~O and benzene was evaluated (Figure 8). Samples A and B in the H-Beta form were studied. Exposure of H-Beta (previously activated at 723 K) to DzO vapors followed by desorption at 423 K led to the disappear- ance of the bands at 3740, 3602, and 3540 cm -I (negative peaks in the difference spectra of curves a and b, Figure 8) and appearance of new bands due to surface (O-D) groups at 2763, 2710, and 2545 cm-l (positive absorbance peaks), respectively. The rapid displacement (of OH by OD) and the expected frequency shift suggest that the OH groups are located in easily accessible positions.
It is known that when H-bonded complexes of OH groups with weakly adsorbed bases are formed the i.r. bands of OH groups with acidic properties are shifted toward lower frequencies, the extent of the shift being characteristic of the strength of the Br6nsted acidic sites. 18"19 On adsorption of benzene at 423 K on sample B (SiO2/AI203 = 28, pretreated at 723 K), the following changes in the i.r. spectra are observed (curve c, Figure 8): 1) The O - H band at 3740 is shifted to 3640 cm -1 (negative peak at 3740 and positive peak at 3640 cm- ' ) in the difference spec- trum, and 2) the O - H band at 3602 cm-l disappears and a new broad band at 3265 cm-I (frequency shift 337 cm-l) appears. The bands around 3000 cm-1 are due to aromatic C -H vibrations (curve c). The corresponding frequency shifts for adsorption of benzene on HZSM-5 (Si/AI = 35) and H-Y (Si/AI = 2.25) are 350 and 300 cm -l , respectively. 19 The
d
C
g b
o a
3800 3400 3000 - I
~crn
Figure 7 Hydroxyl region F'/3.r. spectra of H-Beta (sample A) with chemisorbed NH3 desorbed at 423 (a), 573 (b), 723 (c), and 823 K (d), repectively
ZEOLITES, 1989, Vol 9, May 235
Acidity of zeolite Beta: S.G. Hegde et al.
strength of the Br6nsted acid sites in Beta zeolite is, hence, intermediate between that of HZSM-5 and H-Y.
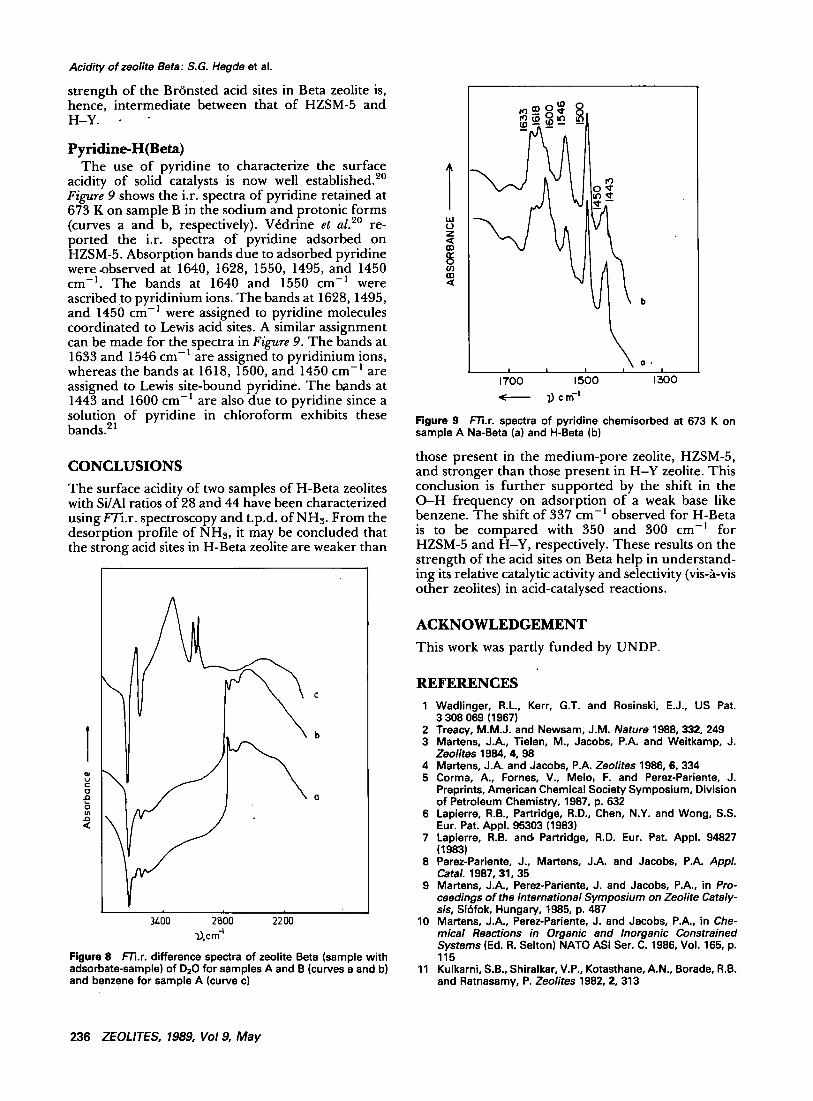
Pyridine-H(Beta) The use of pyridine to characterize the surface
acidity of solid catalysts is now well established. 2° Figure 9 shows the i.r. spectra of pyridine retained at 673 K on sample B in the sodium and protonic forms (curves a and b, respectively). V6drine et al. 2° re- ported the i.r. spectra of pyridine adsorbed on HZSM-5. Absorption bands due to adsorbed pyridine were ~bserved at 1640, 1628, 1550, 1495, and 1450 cm -I. The bands at 1640 and 1550 cm -1 were ascribed to pyridinium ions. The bands at 1628, 1495, and 1450 cm - l were assigned to pyridine molecules coordinated to Lewis acid sites. A similar assignment can be made for the spectra in Figure 9. The bands at 1633 and 1546 cm -1 are assigned to pyridinium ions, whereas the bands at 1618, 1500, and 1450 cm -1 are assigned to Lewis site-bound pyridine. The bands at 1443 and 1600 cm -I are also due to pyridine since a solution of pyridine in chloroform exhibits these bands. 21
CONCLUSIONS The surface acidity of two samples of H-Beta zeolites with Si/Al ratios of 28 and 44 have been characterized using FTi.r. spectroscopy and t.p.d, of NHa. From the desorption profile of NHs, it may be concluded that the strong acid sites in H-Beta zeolite are weaker than
o u t
. o
' 2Bbo 22b0 ~.cm-'
Figure 8 F'/3.r. difference spectra of zeolite Beta (sample with adsorbate-sample) of D20 for samples A and B (curves a and b) and benzene for sample A (curve c)
T t& l O Z
m
O9 II1 \
J I I I
1700 1500 < ~) cm -I
l "q
0 , I I
1300
Figure 9 F'/].r. spectra of pyridine chemisorbed at 673 K on sample A Na-Beta (a) and H-Beta (b)
those present in the medium-pore zeolite, HZSM-5, and stronger than those present in H-Y zeolite. This conclusion is further supported by the shift in the O - H frequency on adsorption of a weak base like benzene. The shift of 337 cm- i observed for H-Beta is to be compared with 350 and 300 cm -~ for HZSM-5 and H-Y, respectively. These results on the strength of the acid sites on Beta help in understand- ing its relative catalytic activity and selectivity (vis-a-vis other zeolites) in acid-catalysed reactions.
ACKNOWLEDGEMENT This work was partly funded by UNDP.
REFERENCES 1 Wadlinger, R.L, Kerr, G.T. and Rosinski, E.J., US Pat.
3 308 069 (1967) 2 Treacy, M.M.J. and Newsam, J.M. Nature 1988, 332, 249 3 Martens, J.A., Tielen, M., Jacobs, P.A. and Weitkamp, J.
Zeolites 1984, 4, 98 4 Martens, J.A. and Jacobs, P.A. Zeolites 1986, 6, 334 5 Corma, A., Fornes, V., Melo, F. and Perez-Pariente, J.
Preprints, American Chemical Society Symposium, Division of Petroleum Chemistry, 1987, p. 632
6 Lapierre, R.B., Partridge, R.D., Chen, N.Y. and Wong, S.S. Eur. Pat. Appl. 95303 (1983)
7 Lapierre, R.B. and Partridge, R.D. Eur. Pat. Appl. 94827 (1983)
8 Perez-Pariente, J., Martens, J.A. and Jacobs, P.A. AppL CataL 1987, 31, 35
9 Martens, J.A., Perez-Pariente, J. and Jacobs, P.A., in Pro- ceedings of the International Symposium on Zeolite Cataly- sis, Si6fok, Hungary, 1985, p. 487
10 Martens, J.A., Perez-Pariente, J. and Jacobs, P.A., in Che- mical Reactions in Organic and Inorganic Constrained Systems (Ed. R. Selton) NATO ASI Ser. C. 1986, Vol. 165, p. 115
11 Kulkarni, S.B., Shiralkar, V.P., Kotasthane, A.N., Borade, R.B. and Ratnasamy, P. Zeolites 1982, 2, 313
236 ZEOLITES, 1989, Vol 9, May

12 Ratnasamy, P., Babu, G.P., Chandwadkar, A.J. and Kulkarni, S.B. Zeolites 1986, 6, 98
13 Kotasthane, A.N., Shiralkar, V.P., Hegde, S.G. and Kulkarni, S.B° Zeolites 1986, 6, 253
14 Parker, L.M., Bibby, D°M. and Patterson, JoE. Zeolites 1984, 4, 168
15 Woolery, G.L., Alemany, L.B., Dessau, R.M. and Chester, A.W. Zeolites 1986, 6, 14
16 Babu, G.Po, Hegde, S.G., Kulkarni, S.B. and Ratnasamy, P. J. • CataL 1983, 81,471
17 Lok, B.M., Marcus, B.K. and Angell, C.L. Zeolites 1986, 6, 185
Acidity of zeolite Beta: S.G. Hegde et al.
18 Rouxhet, P.G. and Sempels, R.E. Jo Chem. Soc., Faraday Trans. 1 1971, 70, 2021
19 Kustov, L.M., Kazansky, V.B. and Ratnasamy, P. Zeolites 1987, 7, 79
20 Vddrine, J.C., Auroux, A., Bolis, V., Dejaifve, P.,.Naccache, C., Wierzchowski, P., Derouane, E.G., Nagy, J.B., Gilson, J., Van Hooff, J.H.C., Van den Berg, J.P. and Wolthuizen, J. J. CataL 1979, 59, 248
21 Little, L.H. Infrared Spectra of Adsorbed Species, Academic Press, London, 1966, p. 195
ZEOLITES, 1989, Vol 9, May 237