Microalgal lipids biochemistry and biotechnological perspectives
ORIGINAL PAPER
Characterization of Free and Bound Lipids among Four CornGenotypes as Affected by Drying and Storage Temperatures
Karamatollah Rezaei • Trust Beta • Carl J. Bern •
Pamela J. White
Received: 7 July 2011 / Revised: 9 December 2011 / Accepted: 2 January 2012 / Published online: 21 January 2012
� AOCS 2012
Abstract For whole grains, the most sensitive compo-
nents to the environmental changes are the lipids. In the
current study, the effects of drying temperature (27 and
93 �C) and storage temperature (4 and 27 �C) on the fatty
acid (FA) levels and lipid classes of endosperm lipids on
four selected corn genotypes were investigated during a
12-month storage period. Storage temperature indicated
greater impact on the FA composition than did the drying
temperature. The ratio of saturated to unsaturated fatty
acids, which was around 0.20–0.22 levels in the free lipid
(FL) fractions of all corn types studied here, did not change
significantly due to the drying and storage temperatures.
However, in the bound lipid (BL) fractions, it was changed
by a change in the drying and storage temperature in some
of the corn types. Some changes were also found in the
lipid classes within the FL and BL fractions of the studied
corn samples. No lysophosphatidylcholine (LPC) was
found in the FL fractions. In the BL fractions of two of the
corn samples, the level of free fatty acids (FFA) increased
more likely due to the deterioration of LPC. The results
of the current study indicated a possible migration of
triglycerides and FFA between the FL and BL fractions due
to drying and storage at higher temperatures.
Keywords Bound lipids � Corn � Drying � Endosperm �Free lipids � Post-harvest � Storage
Introduction
The food industry relies on a consistent supply of high-
quality grains to maintain product properties and to avoid
consequent changes in the processing parameters. To fulfill
this need, grain producers must follow certain post-harvest
drying and storage procedures so that grains can retain a
consistent and high level of quality. For whole grains, the
most sensitive components to the environmental changes
are the lipids. The impact of drying and storage conditions
on the lipid components of the grain can in turn influence
the processing properties of the grains, which may also
adversely impact the consumer acceptance of the end
products. In particular, the free lipids (FL) and the bound
lipids (BL) inside the grains can undergo certain changes
that influence the functionality and the sensory attributes of
the final products. For example, aging corn and sorghum
grains at 50 and 60 �C decreased the amounts of pericarp
removed from these grains, resulting in cooking losses [1].
In general, FL include those lipid components freely
available on the starch surfaces and can be easily removed
using simple extraction procedures such as Soxhlet and
maceration. The BL include lipids integrated in the starch
structure whose removal requires extra efforts to release
them from starch. FL are composed of triglycerides (TG),
glycolipids, phospholipids and free fatty acids (FFA) while
K. Rezaei (&)
Department of Food Science, Engineering and Technology,
University of Tehran, 31587-77871 Karaj, Iran
e-mail: [email protected]
T. Beta
Department of Food Science, University of Manitoba,
Winnipeg, MB R3T 2N2, Canada
C. J. Bern
Department of Agriculture and Biosystems Engineering,
Iowa State University, Ames, IA 50011, USA
P. J. White
Department of Food Science and Human Nutrition and Center
for Crops Utilization Research, Iowa State University,
Ames, IA 50011-1061, USA
123
J Am Oil Chem Soc (2012) 89:1201–1210
DOI 10.1007/s11746-012-2011-4
BL mainly include lysophospholipids and FFA integrated in
the starch structure [2]. The percentage of total lipids
extracted from samples may be different due to the drying
and storage temperatures and also due to the drying and
storage periods and also the extraction period. Despite the
obvious importance of the impact of the lipid changes on
the quality of corn, there are no reports in the literature that
quantify FL and BL in the endosperm of different corn
genotypes and provide their changes due to drying and
storage conditions. The corn mutants, waxy and high-
amylose, along with normal corn genotypes, are widely
used in the industry; thus, knowledge about the lipid
changes in these corn types during drying and storage is
needed to fully understand their possible impacts on the
processing of corn grains in food applications. Formation
of amylose–lipid inclusion complexes [3] and amylose–
lipid–protein component interactions have demonstrated to
contribute the endosperm functional properties [4, 5].
Chemical shifts of 13C NMR in lipid–amylose inclusion
complexes were different for different fatty acids (FA)
indicating different binding properties between amylose
and different FA [3]. Zhang and Hamaker [4] and Zhang
et al. [5] showed that water absorption and the relative
solubilities of sorghum starch were affected by the type of
FFA present. They also reported the formation of three-way
structures among starch, protein and FFA, and indicated
that FFA and starch contributions in these three-component
interactions were of the highest importance to starch func-
tionality. In a study on the corn starches from different
sources, Liu et al. [6] showed that the gelatinization
behaviors of corn starches were dependent on the ratio of
amylose/amylopectin as well as on their moisture and lipid
contents. Therefore, since the amylose content, type of FA
and their concentrations are different among different corn
types, the objective of this study was to determine the
impact of drying and storage temperatures and their com-
bined effects on the FA compositions as well as the lipid
classes of the FL and BL components of the endosperm
lipids in waxy, high-amylose and normal corn genotypes.
Materials and Methods
Corn Types and Treatments
The effects of drying temperature (27 and 93 �C) and
storage temperature (4 and 27 �C for 12 months) and also
combined effects of drying (at 93 �C) and storage (at 27 �C
for 12 months) were studied using two genetically paired
corn types, normal-1 (Pioneer 3335) and waxy (Pioneer
33A63). For comparison purposes, a second genetic pair,
normal-2 (B73 9 Oh43) and high-amylose (B73ae 9
Oh43ae), were also investigated for the combined effects of
drying at 93 �C and storage at 27 �C for 12 months. Nor-
mal-1 and waxy corn seeds, both from the same genetic
parents, were obtained from Pioneer Hi-Bred International
(Johnston, IA). Normal-2 and high-amylose corn seeds
were from the same genetic parents and were kindly pro-
vided by Dr. David Glover, formerly with Purdue Univer-
sity. All corn types were grown at the Iowa State University
Agricultural Experiment Station (Ames, IA) plots during
the same year and combine-harvested at about 21% mois-
ture level. All moistures are on a %wet basis. Control
samples were dried at 27 �C and maintained under refri-
gerated conditions for 12 months prior to the analysis.
According to the Megazyme amylose/amylopectin assay kit
[7], the amylose contents of these four corn genotypes were
20.4% for normal-1, 20.9% for normal-2, 1.9% for waxy
and 42.2% for high-amylose.
To study the drying effect, freshly harvested corn was
dried at two different temperatures selected from the
temperature conditions commonly used by corn producers.
The seeds from each corn type were divided into two parts.
One part was dried with natural air in screened-bottom
trays by circulating ambient air (about 27 �C) through the
chamber at a rate of 2.2 m3/min/Mg until corn moisture
was reduced to about 12%. Moisture loss was determined
by weighing the corn before and after drying. The second
part was dried by using an oven dryer. In this case, corn
was placed on screened-bottom trays to a depth of
approximately 5 cm and positioned in the chamber. Air
at 93 �C was forced through the chamber at a rate of
89 m3/min/Mg until corn moisture was reduced to about
10%. The higher flow rate for the latter was to allow the
rapid removal of moisture accumulated due to higher
temperature and to avoid torching the sample. The hot
grain was rapidly cooled by using forced ambient air at a
rate of 2.2 m3/min/Mg. The samples were maintained at
4 �C until analyzed for FL and BL about a year later.
To investigate the effect of storage temperature, part of
the corn samples dried at 93 �C and part of the normal-1
and waxy corn samples dried at 27 �C were stored (for
12 months) at 27 �C and the other half was stored (for
12 months) at 4 �C. The time of 12-month storage was
selected to correspond with the likely maximum time for
storage at a farm or other grain-storage facility. The con-
tainers were opened periodically and the grain was stirred
during storage to maintain aerobic conditions.
Germ Removal and Milling
Corn kernels were soaked in distilled water at 37 �C for
24 h prior to manual removal of the germ. The degermed
corn kernels were then partly dried overnight in an oven at
60–65 �C and milled into flour with a Retsch mill
(Brinkmann GmbH and Co. KG, Germany) equipped with
1202 J Am Oil Chem Soc (2012) 89:1201–1210
123
a 0.5 mm (pore size) sieve. Moisture levels of the milled
endosperm were measured in four replicates by using the
AACC Method 44-19 [8] and incorporated in the results.
Extraction of Free Lipids
In order to extract the FL fractions, flour samples (*1.50 g
each) were placed in polypropylene centrifuge tubes and
using the methods reported by Man and Cauberghe [9]
and Conforti, Harris and Rinehart [10] 15 mL of water-
saturated butanol (WSB) was added to each tube, shaken
for 10 min at 200 rpm and centrifuged for 1 min at
2,2609g by using a centrifuge model Centra CL2 (Inter-
national Equipment Company, Needham Heights, MA).
The supernatant was placed into a 250-mL round-bottom
collecting flask and the flour residue was re-extracted twice
more as just described, with the supernatant being added to
the collecting flask. Finally, using a 15 mL solution of
dichloromethane (DM):methanol (MH) (2:1, vol/vol), the
residue was quickly washed and transferred into a Maxi-
spinTM filter tube (Alltech Associates, Inc., Deerfield, IL)
made of polyvinylidene fluoride (PVDF) equipped with
membrane filters (with a pore size of 0.45 lm) for the
removal of the residue and centrifuged for 5 min (at
2,2609g). The supernatant was placed in a 250-mL round-
bottom collecting flask and the flour residue was
re-extracted twice more as just described with the super-
natant added again to the collecting flask. Finally, using
15 mL of a solution of DM:MH (2:1, vol/vol), the residue
was quickly rinsed and transferred into a Maxi-spinTM filter
tube made of PVDF equipped with membrane filters
(Alltech Associates Inc., Deerfield, IL) with a pore size of
0.45 lm for the removal of the residue and centrifuged for
5 min (at 2,2609g). The supernatant organic phase was
again added to the collecting flask. Methanol was used to
remove the interstitial WSB and non-polar lipids from the
residue [10]. All of the WSB and DM:MH (2:1, vol/vol)
phases collected in the 250-mL flask were rotary-evapo-
rated at reduced pressure (*5 mmHg) and 40 �C until
dried. The flasks were then washed and their contents were
quantitatively transferred into capped tubes by using
DM:MH (2:1). After homogenization and centrifugation to
precipitate any suspended flour, aliquots were taken for FA
and lipid-class analysis.
Extraction of Bound Lipids
To extract the BL, the residue from the extraction of the FL
was digested with Thermamyl (Novozymes North America
Inc., Franklinton, NC) at 85 �C for 90 min [11] followed
by extraction with DM:MH (2:1, vol/vol). To separate the
organic and water phases and to remove the digested flour,
Maxi-spinTM filter tubes (Alltech Associates Inc.) made of
PVDF equipped with membrane filters with a pore size of
0.45 lm were used (similar to the previous stage). The
digested materials along with the water suspending them
were transferred into Maxi-spinTM tubes with no mem-
brane filters while washing with 25 mL DM:MH (2:1, vol/
vol). The tubes were closed tightly and shaken vigorously
for a total of 3.0 min. The contents were transferred onto
the membrane filter inside a second Maxi-spinTM tube
(with filter) and centrifuged at 2,2609g for 3.0 min for
phase separation. About two-thirds of the solvent mixture
was recovered in the organic (lower) phase composed of
dichloromethane with some methanol and the rest stayed
with water phase. After separation, the organic phase was
dried by passing it through a silica filter loaded with 3.0 g
anhydrous sodium sulfate. To improve the lipid recovery,
extraction of flour residue was continued for a second and a
third time by using 12 mL dichloromethane alone at each
stage while the original water phase containing some
methanol was retained with the flours. The organic phases
from the second and the third extraction stages were dried,
as was the case with ‘‘Extraction of Free Lipids’’ for FL
extraction, and combined with the organic phase collected
in the first stage. After centrifugation for 3.0 min at
2,2609g to precipitate any suspended flour, the organic
phases were combined, fully homogenized and aliquots
were taken for FA and lipid-class analysis.
Fatty Acid Analysis of the Free and Bound Lipid
Extracts
To prepare the samples for FA analysis, the volume of each
extract was reduced under a gentle flow of nitrogen gas and
an aliquot was then converted into FA methyl esters
according to Method Ce 2-66 from American Oil Chem-
ists’ Society [12]. The semi-quantitative FA analyses of the
extracted FL and BL were performed using a gas chro-
matograph (GC) (Hewlett Packard series II model 5890)
equipped with an SP-2330 fused-silica column (15 m 9
0.25 mm 9 0.2 lm; Supelco, Bellefonte, PA), an auto-
sampler and a flame ionization detector (FID). Agilent
Chemstation software was used for the control of the
equipment and also for the data acquisition and data pro-
cessing. Oven temperature programming started from
40 �C and increased to 220 �C at 10 �C/min, where it was
held for 7.0 min. Both the injection port and the detector
were set at 230 �C. Duplicate injections were performed
for each sample. A mixture of external FA methyl ester
standards was used to identify the chromatographic peaks
and then the relative area counts of C16:0 (palmitic acid),
C18:0 (stearic acid), C18:1 (oleic acid), C18:2 (linoleic acid)
and C18:3 (linolenic acid) were reported as semi-quantita-
tive relative FA levels. The retention times for the FA
methyl esters of the above FA were obtained at 4.44, 5.51,
J Am Oil Chem Soc (2012) 89:1201–1210 1203
123
5.83, 6.38 and 7.09 min, respectively. Five major FA
(palmitic, stearic, oleic, linoleic and linolenic) account for
over 99% of the total FA found in corn oil [13, 14].
Therefore, in this study only these FA will be discussed.
Although the most accurate data for absolute FA methyl
ester composition are obtained by determining GC
response factors for each FA methyl ester and calculating
the amounts based on the size of the peak in relation to the
response, it is a common practice [15, 16] to report relative
area % of the key FA in vegetable oils, such as corn and
soybean oils, in this fashion. Total lipid concentrations of
the kernels (as ground flour) were measured by using the
AACC Method 30-25 [17].
Analysis of Lipid Classes
Changes in the lipid classes were monitored using an
HPLC system (HP 1100, Agilent Technologies, Santa
Clara, CA) equipped with a evaporative light scattering
detector operated at 65 �C and a gas (N2) flow rate of
1.78 L/min. Separation of the sample components was
performed on a Pholipidec LC column (25 cm 9 4.6 mm)
from Astec (Whippany, NJ). Sample injection was per-
formed using the autosampler assembled into the HPLC
system. Agilent Chemstation software was used for the
control of the equipment and also for the data acquisition
and data processing. A gradient elution programming
(Table 1) was used to elute the samples. Phosphatidyleth-
anolamine (PE), phosphatidylinositol (PI), lysophosphati-
dylcholine (LPC), lysophosphatidylethanolamine (LPE)
purchased from Sigma-Aldrich Co. (St. Louis, MO) and
also triolein (as a representative for semi-quantitative TG
analysis), dilinolein (as a representative for semi-quanti-
tative diglyceride analysis) and oleic acid (as a represen-
tative for semi-quantitative FFA) were used as external
standards to identify the peaks on the HPLC chromatogram
and also to estimate their quantities. Relative response
factors obtained in this study for the above compounds
were 18.6 for triolein, 20.0 for dilinolein, 27.2 for oleic
acid, 20.1 for PE, 15.9 for LPE, 5.6 for PI and 1.0 for LPC.
Statistical Analysis
In the current study, each variable was studied separately
and a completely randomized design was considered for
each treatment. The General Linear Model (GLM) proce-
dure of the Statistical Analysis System (SAS) release 8.2
(SAS Institute, Inc., Cary, NC) was used for data analysis.
All of the extractions were carried out on duplicate aliquots
of the flours. Means and least significant differences (LSD,
95% confidence level) were determined to evaluate the
differences in the FA compositions of FL and BL fractions
among the various treated corn types.
Results and Discussion
Characterization of the Free and Bound Lipids
from Different Corn Types After Drying at 27 �C
and Storage for 12 Months at 4 �C (Control Samples)
Regardless of drying and storage conditions, palmitic and
stearic acids were found at greater levels in the BL frac-
tions than in the FL fractions of all corn type (Tables 2, 3).
On the other hand, oleic, linoleic and linolenic acids were
at greater levels in the FL fractions than in the BL fractions
for each corn type. Genotypes may differ with respect to
the distribution of the FA between FL and BL, based on
their starch characteristics. For example, complexation and
dissociation behaviors of starch molecules depend partly
on the degree of polymerization of amylose and on the
branch chain lengths of amylopectin [2, 18, 19]. The ratios
of saturated to unsaturated (S/U) FA among the different
corn types of this study are also shown in Tables 2 and 3.
S/U ratios of 0.20–0.22 are found in the FL fractions of
control samples. On the other hand, such a ratio varies
within 0.31–0.85 levels in the BL fractions. This indicates
that the FL and BL among the different corn samples of
this study are unique in their S/U ratios, which can be used
for further processing purposes of grains depending on the
type of application they are considered for.
In the FL fractions, the percentages of palmitic and
stearic acids were not different among all corn types
(Tables 2, 3). However, oleic acid differed among all
types, with high-amylose being the greatest (26.0%),
Table 1 Gradient elution programming used in this study for the
separation of lipid classes on a Pholipidec LC column
(25 cm 9 4.6 mm)
Step Time A (%) B (%) C (%) D (%) Flow rate
(mL/min)
1 0 70 30 0 0 0.05
2 2 70 30 0 0 1.1
3 4 100 0 0 0 1.1
4 8 100 0 0 0 1.1
5 9 70 0 0 30 1.1
6 13 50 0 0 50 1.1
7 17 0 0 50 50 1.1
8 19 0 0 60 40 1.1
9 21 0 0 0 100 1.1
10 24 0 0 0 100 1.1
11 27 100 0 0 0 1.1
12 29 70 30 0 0 0.05
A chloroform, B hexane, C chloroform:methanol:water:ammonia
(50:48:1:1, vol/vol) and D methanol
1204 J Am Oil Chem Soc (2012) 89:1201–1210
123
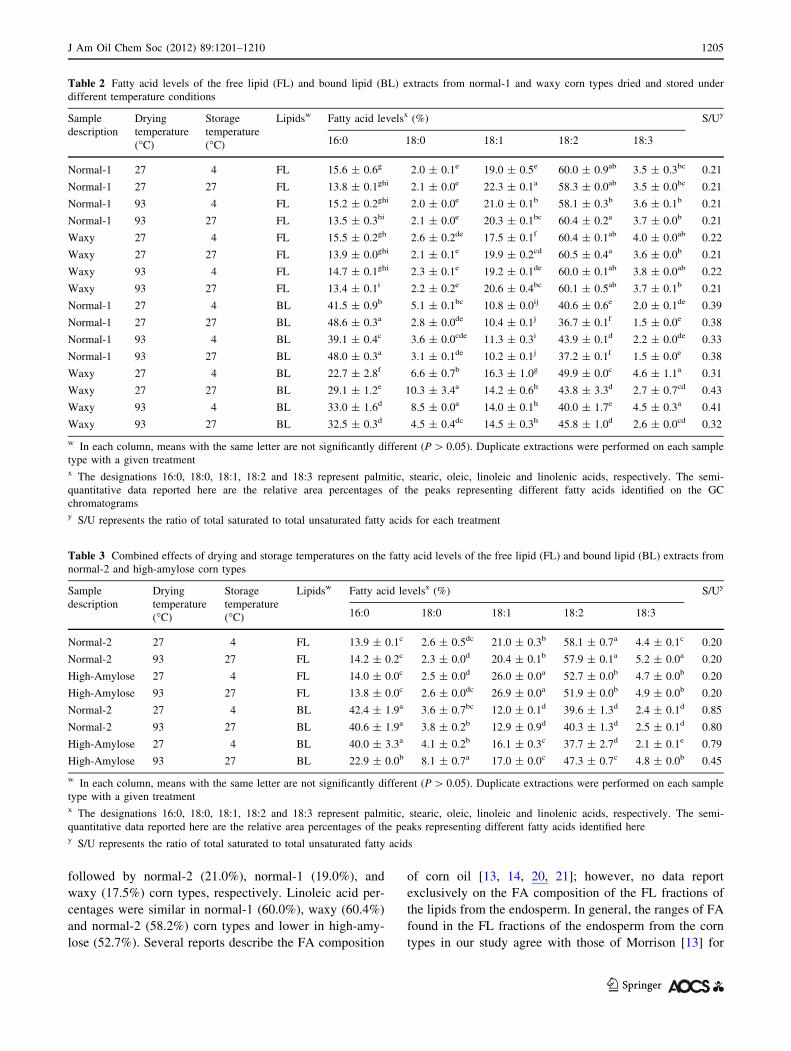
followed by normal-2 (21.0%), normal-1 (19.0%), and
waxy (17.5%) corn types, respectively. Linoleic acid per-
centages were similar in normal-1 (60.0%), waxy (60.4%)
and normal-2 (58.2%) corn types and lower in high-amy-
lose (52.7%). Several reports describe the FA composition
of corn oil [13, 14, 20, 21]; however, no data report
exclusively on the FA composition of the FL fractions of
the lipids from the endosperm. In general, the ranges of FA
found in the FL fractions of the endosperm from the corn
types in our study agree with those of Morrison [13] for
Table 2 Fatty acid levels of the free lipid (FL) and bound lipid (BL) extracts from normal-1 and waxy corn types dried and stored under
different temperature conditions
Sample
description
Drying
temperature
(�C)
Storage
temperature
(�C)
Lipidsw Fatty acid levelsx (%) S/Uy
16:0 18:0 18:1 18:2 18:3
Normal-1 27 4 FL 15.6 ± 0.6g 2.0 ± 0.1e 19.0 ± 0.5e 60.0 ± 0.9ab 3.5 ± 0.3bc 0.21
Normal-1 27 27 FL 13.8 ± 0.1ghi 2.1 ± 0.0e 22.3 ± 0.1a 58.3 ± 0.0ab 3.5 ± 0.0bc 0.21
Normal-1 93 4 FL 15.2 ± 0.2ghi 2.0 ± 0.0e 21.0 ± 0.1b 58.1 ± 0.3b 3.6 ± 0.1b 0.21
Normal-1 93 27 FL 13.5 ± 0.3hi 2.1 ± 0.0e 20.3 ± 0.1bc 60.4 ± 0.2a 3.7 ± 0.0b 0.21
Waxy 27 4 FL 15.5 ± 0.2gh 2.6 ± 0.2de 17.5 ± 0.1f 60.4 ± 0.1ab 4.0 ± 0.0ab 0.22
Waxy 27 27 FL 13.9 ± 0.0ghi 2.1 ± 0.1e 19.9 ± 0.2cd 60.5 ± 0.4a 3.6 ± 0.0b 0.21
Waxy 93 4 FL 14.7 ± 0.1ghi 2.3 ± 0.1e 19.2 ± 0.1de 60.0 ± 0.1ab 3.8 ± 0.0ab 0.22
Waxy 93 27 FL 13.4 ± 0.1i 2.2 ± 0.2e 20.6 ± 0.4bc 60.1 ± 0.5ab 3.7 ± 0.1b 0.21
Normal-1 27 4 BL 41.5 ± 0.9b 5.1 ± 0.1bc 10.8 ± 0.0ij 40.6 ± 0.6e 2.0 ± 0.1de 0.39
Normal-1 27 27 BL 48.6 ± 0.3a 2.8 ± 0.0de 10.4 ± 0.1j 36.7 ± 0.1f 1.5 ± 0.0e 0.38
Normal-1 93 4 BL 39.1 ± 0.4c 3.6 ± 0.0cde 11.3 ± 0.3i 43.9 ± 0.1d 2.2 ± 0.0de 0.33
Normal-1 93 27 BL 48.0 ± 0.3a 3.1 ± 0.1de 10.2 ± 0.1j 37.2 ± 0.1f 1.5 ± 0.0e 0.38
Waxy 27 4 BL 22.7 ± 2.8f 6.6 ± 0.7b 16.3 ± 1.0g 49.9 ± 0.0c 4.6 ± 1.1a 0.31
Waxy 27 27 BL 29.1 ± 1.2e 10.3 ± 3.4a 14.2 ± 0.6h 43.8 ± 3.3d 2.7 ± 0.7cd 0.43
Waxy 93 4 BL 33.0 ± 1.6d 8.5 ± 0.0a 14.0 ± 0.1h 40.0 ± 1.7e 4.5 ± 0.3a 0.41
Waxy 93 27 BL 32.5 ± 0.3d 4.5 ± 0.4dc 14.5 ± 0.3h 45.8 ± 1.0d 2.6 ± 0.0cd 0.32
w In each column, means with the same letter are not significantly different (P [ 0.05). Duplicate extractions were performed on each sample
type with a given treatmentx The designations 16:0, 18:0, 18:1, 18:2 and 18:3 represent palmitic, stearic, oleic, linoleic and linolenic acids, respectively. The semi-
quantitative data reported here are the relative area percentages of the peaks representing different fatty acids identified on the GC
chromatogramsy S/U represents the ratio of total saturated to total unsaturated fatty acids for each treatment
Table 3 Combined effects of drying and storage temperatures on the fatty acid levels of the free lipid (FL) and bound lipid (BL) extracts from
normal-2 and high-amylose corn types
Sample
description
Drying
temperature
(�C)
Storage
temperature
(�C)
Lipidsw Fatty acid levelsx (%) S/Uy
16:0 18:0 18:1 18:2 18:3
Normal-2 27 4 FL 13.9 ± 0.1c 2.6 ± 0.5dc 21.0 ± 0.3b 58.1 ± 0.7a 4.4 ± 0.1c 0.20
Normal-2 93 27 FL 14.2 ± 0.2c 2.3 ± 0.0d 20.4 ± 0.1b 57.9 ± 0.1a 5.2 ± 0.0a 0.20
High-Amylose 27 4 FL 14.0 ± 0.0c 2.5 ± 0.0d 26.0 ± 0.0a 52.7 ± 0.0b 4.7 ± 0.0b 0.20
High-Amylose 93 27 FL 13.8 ± 0.0c 2.6 ± 0.0dc 26.9 ± 0.0a 51.9 ± 0.0b 4.9 ± 0.0b 0.20
Normal-2 27 4 BL 42.4 ± 1.9a 3.6 ± 0.7bc 12.0 ± 0.1d 39.6 ± 1.3d 2.4 ± 0.1d 0.85
Normal-2 93 27 BL 40.6 ± 1.9a 3.8 ± 0.2b 12.9 ± 0.9d 40.3 ± 1.3d 2.5 ± 0.1d 0.80
High-Amylose 27 4 BL 40.0 ± 3.3a 4.1 ± 0.2b 16.1 ± 0.3c 37.7 ± 2.7d 2.1 ± 0.1e 0.79
High-Amylose 93 27 BL 22.9 ± 0.0b 8.1 ± 0.7a 17.0 ± 0.0c 47.3 ± 0.7c 4.8 ± 0.0b 0.45
w In each column, means with the same letter are not significantly different (P [ 0.05). Duplicate extractions were performed on each sample
type with a given treatmentx The designations 16:0, 18:0, 18:1, 18:2 and 18:3 represent palmitic, stearic, oleic, linoleic and linolenic acids, respectively. The semi-
quantitative data reported here are the relative area percentages of the peaks representing different fatty acids identified herey S/U represents the ratio of total saturated to total unsaturated fatty acids
J Am Oil Chem Soc (2012) 89:1201–1210 1205
123
combined amounts of FL and BL, except for the linolenic
acid, which was slightly greater in our study. According to
Morrison [13], total endosperm lipids were composed of
11–22% palmitic acid, 2–3% stearic acid, 17–39% oleic
acid, 34–63% linoleic acid and 1–3% linolenic acid.
A typical commercial corn oil coming from the germ,
rather than the endosperm studied here, would likely have
FA composition falling within this range, with a typical
composition being 11.6% palmitic acid, 1.8% stearic acid,
25.2% oleic acid, 59.7% linoleic acid and 0.8% linolenic
acid [14].
In the BL fractions of the control sample, waxy corn had
greater percentages of linoleic and linolenic acids and less
palmitic acid than did the other corn types, which showed
similar levels for these three FA (Tables 2, 3). Stearic acid
was less in normal-2 than in waxy corn. Oleic acid per-
centages occurred in the following order: waxy = high
amylose [ normal-2 [ normal-1. Kitahara et al. [22]
reported compositions of 31.6, 2.4, 14.5, 48.5 and 3.0% (w/w,
respectively) for palmitic, stearic, oleic, linoleic and lino-
lenic acids in the BL fraction of normal corn starch, where
other than linolenic acid the levels of FA are somewhat
different from those presented in Tables 2, 3. However,
mean values reported by White and Weber [14] of 37%
palmitic acid, 3% stearic acid, 11% oleic acid, 46% linoleic
acid and 3% linolenic acid in the BL fraction of non-waxy
corn starches are fairly close to the values obtained in this
study for both normal corn types dried at 27 �C. Also, for
the saturated FA, the complexation behavior of amylose
with FFA (in addition to other parameters) also depends on
the degree of polymerization and chain length of amylose
[19], which are also different for the various genotypes of a
given cereal [3] and for different levels of amylose con-
centration as was the case in the current study (20.4% for
normal-1, 20.9% for normal-2, 1.9% for waxy and 42.2%
for high-amylose). Starch granules may have different
sizes, shapes and structures, depending upon the botanical
origins, and amylose and amylopectin can vary in molec-
ular weight and structure accordingly [3]. Furthermore, the
complexation capacities of unsaturated FA (oleic, linoleic
and linolenic acids) with starch pastes differed from those
of saturated ones and within the saturated FA (caprylic,
lauric, myristic, palmitic and stearic acids) [19]. Also, for
the saturated FA, the complexation behavior was depen-
dent on the FA chain length: as the chain length increased,
the complexation started at a lower FA concentration [19].
Moreover, a higher degree of complexation was observed
with the unsaturated FA than with the saturated FA, and the
complexation level was increased with an increase in the
number of double bonds [4, 5, 19]. Degree of unsaturation
and the geometric configuration (cis or trans) of FFA also
can play an important role in the binding properties of FFA
to amylase [4, 5]. Therefore, the differences observed in
the FA levels of different corn genotypes as observed in
this study are reasonable. The triacylglycerol does not form
complexes with starch [19]. Total lipid concentrations
of the ground flours were measured at 3.1 ± 0.1% (w/w)
for normal-1 and normal-2, 3.4 ± 0.1% for waxy and
4.4 ± 0.1% for high-amylose corn types. The moisture
levels of the flours were within 7.5–9.0%.
Effect of Drying Temperature on the Fatty Acid Levels
of Free and Bound Lipids in Normal-1 and Waxy Corn
Types During a 12-Month Storage at 4 �C
In the FL fractions of both normal-1 and waxy corn types,
oleic acid was the only FA that was statistically different
when the corn was dried at 93 �C, rather than at 27 �C, and
stored for 12 months at 4 �C (Table 2). In the BL fraction
of normal-1 corn, only palmitic and linoleic acids differed
between the two drying temperatures. In the BL fraction of
waxy corn, the percentages of all FA, except for linolenic
acid, differed with a change in the drying temperature.
A decline of 12.2% in the combined amounts of oleic and
linoleic concentrations with drying at 93 �C might be
related to the sensitivity of unsaturated bonds in these FA
to the heat. A similar decline in linolenic acid concentra-
tion would have been expected, but that change did not
occur. Corresponding to these changes, an increase in the
combined percentages of palmitic and stearic acids
occurred with an increase in drying temperature. Such
changes were not observed in the FL. These findings are
consistent with the S/U ratios of FL and BL fractions
among all corn types studied here (Tables 2, 3). In the FL
fractions, the S/U ratio did not change by a change in the
drying conditions. But, in the BL fractions, distinct changes
in the S/U ratios are observed in the normal-1 and waxy
corn types as drying temperature is changed.
By analyzing many corn samples at different tempera-
tures, Lagrandeur et al. [23] demonstrated that both lipid
and carbohydrate metabolisms could occur in corn at tem-
peratures above 13 �C. After storage of corn for less than a
day, Black et al. [24] reported an increase in the percentage
of palmitic acid (from *12% at -25 �C to * over 40% at
160 �C) in the extracted oil. Total extractable amounts of oil
also dropped from *5.5% (w/w) to as low as 1.3% with
increased temperature suggesting increased binding of FA
at higher temperatures, and increased preferential binding
of oleic and linoleic acids resulting in an increase in the
relative percentage of palmitic acid in the extracted oil.
Tang and Copeland [19] showed that the complexation of
amylose and FFA was dependent on the type of FFA and
that for a given FFA a minimum concentration level was
required for the complexation to occur.
1206 J Am Oil Chem Soc (2012) 89:1201–1210
123
Effect of Storage Temperature on the Fatty Acid Levels
of Free and Bound Lipids in Normal-1 and Waxy Corn
Types
Compared with the samples stored at 4 �C, those stored at
27 �C resulted in increases in the oleic acid concentrations
of FL fractions (Table 2). In the BL fraction of normal-1,
there was an increase in palmitic acid and a decrease in
stearic and linoleic acids. The increase in the relative
percentage of palmitic acid accounted for a total relative
reduction of 7.1% in the remaining C18 FA (18:0, 18:1,
18:2 and 18:3). In the waxy corn, all the FA in the BL
fraction changed due to a change in the storage tempera-
ture. A decrease of 10.1% in the overall concentrations of
oleic, linoleic and linolenic acids, corresponding to a
10.1% increase in palmitic and stearic acids, might be
related to the greater sensitivities of these more-unsaturated
FA during the storage at higher temperatures. In the case of
waxy corn, a higher storage temperature resulted in a
decline in the percentage of linolenic acid in the BL below
that of the FL. In agreement with these results, Black et al.
[24] observed an increase in palmitic acid percentage
during storage of milled corn fractions. Christensen [25]
reported that with an increase in storage temperature, the
fat acidity value of corn also increased. Keitel [26, 27]
reported both oxidative and hydrolytic reactions in kernels
dried at 140–180 �C and stored for 6 months at 20 �C, with
oxidation mainly affected by atmospheric air and hydro-
lysis occurring in the fresh samples stored in an oxygen-
free atmosphere. The oxidation was more pronounced for
corn meal than for whole corn. Storage can cause the
liberation of FFA from the triacylglycerol backbones [4, 5].
In agreement with that, Tremazi and Saeed [28] reported
appreciable changes in the acid value, thiocyanogen value
and color of corn oil from the stored grain (for 1 year).
Lipid deterioration involves hydrolysis more than oxida-
tion [29]. Changes in the storage temperature in the current
study resulted in slight changes in the S/U ratios of the BL
fraction (Tables 2, 3). Black et al. [24] noted that oxidation
of unsaturated FA can also reduce the total extractable oil.
Vertucci [30] verified such deterioration with DSC ther-
mograms of corn stored for 22 years, where an increase in
the enthalpy of lipid transition was observed with an
increase in the storage time. He used seeds of similar
genetic background and assumed that the physical prop-
erties of seed lipids harvested in 1958 were the same as
those of the seeds harvested in 1980. Hydrolytic reactions
occurring during grain storage [26, 27, 29] lead to a
reduction in the total amount of FA left on the triacyl-
glycerol backbones. Also, since polyunsaturated FA dete-
riorate more rapidly with oxidation, new proportions in the
FA profiles would be expected (as was the case in the
current study).
Combined Effects of Drying and Storage Temperatures
on the Fatty Acid Levels of Free and Bound Lipids
in Corn Types
The combined effects of drying and storage temperatures
were studied using all four corn types, with comparisons
made between the corn dried at 27 �C and stored for
12 months at 4 �C and that dried at 93 �C and stored for
12 months at 27 �C (Tables 2, 3). Only minor, but some-
times significant, changes occurred in the FL fractions at
the higher drying and storage temperatures. Other than
linolenic acid, which increased slightly in normal-2
(Table 3), the only FA that changed due to a difference in
storage temperature was oleic acid in all corn types
(Tables 2, 3).
In the BL fraction, however, more substantial changes
occurred among the FA concentrations due to the combined
effects of drying and storage temperatures (Tables 2, 3).
Compared to corn dried at 27 �C and stored at 4 �C (i.e., the
control sample), nearly all the FA for normal-1, waxy and
high-amylose corn types dried at 93 �C and stored at 27 �C
were not only statistically different, but the differences were
large in many cases. In particular, sizable differences
occurred for waxy and high-amylose corn types. These
changes were similar to those for the normal-1 and waxy
corn types when they were dried at 27 �C and stored at
27 �C compared with drying at 27 �C and storage at 4 �C,
where, for example, linoleic and linolenic acids in the BL
generally decreased by substantial amounts. Due to such
increase in the drying and storage temperatures, palmitic
acid increased in the BL fractions of both normal-1 and
waxy corn types, but the levels of linoleic acid decreased in
both corn types. In waxy corn, increases in palmitic and
stearic acids corresponded well with the total decreases in
all unsaturated C18 FA. Also, contrary to what observed
with waxy corn, palmitic acid concentration decreased in
high-amylose while the concentrations of all other FA
increased. Combined effects of drying and storage tem-
peratures on the S/U ratio were mainly found in normal-2
and high-amylose corn types.
An additional comparison of the BL in normal-1 dried at
93 �C and stored at 27 �C with the BL from the corn dried
at 93 �C and stored at 4 �C showed many substantial
differences, such as an increase of 8.9% in palmitic acid
with corresponding decreases in oleic and linoleic acids
(Table 2). Fewer and smaller differences in FA levels
occurred for waxy corn due to a difference in storage
temperature, but some changes were significant. The final
comparison of normal-1 and waxy corns dried at 27 �C and
stored at 27 �C with the corns dried at 93 �C and stored at
27 �C revealed no differences for the normal-1 corn, and
differences only in palmitic and stearic acids for the waxy
corn. These data indicate that storage temperature had a
J Am Oil Chem Soc (2012) 89:1201–1210 1207
123
greater influence on the FA composition of the samples
than did differences in the drying temperature.
Changes in the Levels of Lipid Classes in the Free
Lipid and Bound Lipid Fractions
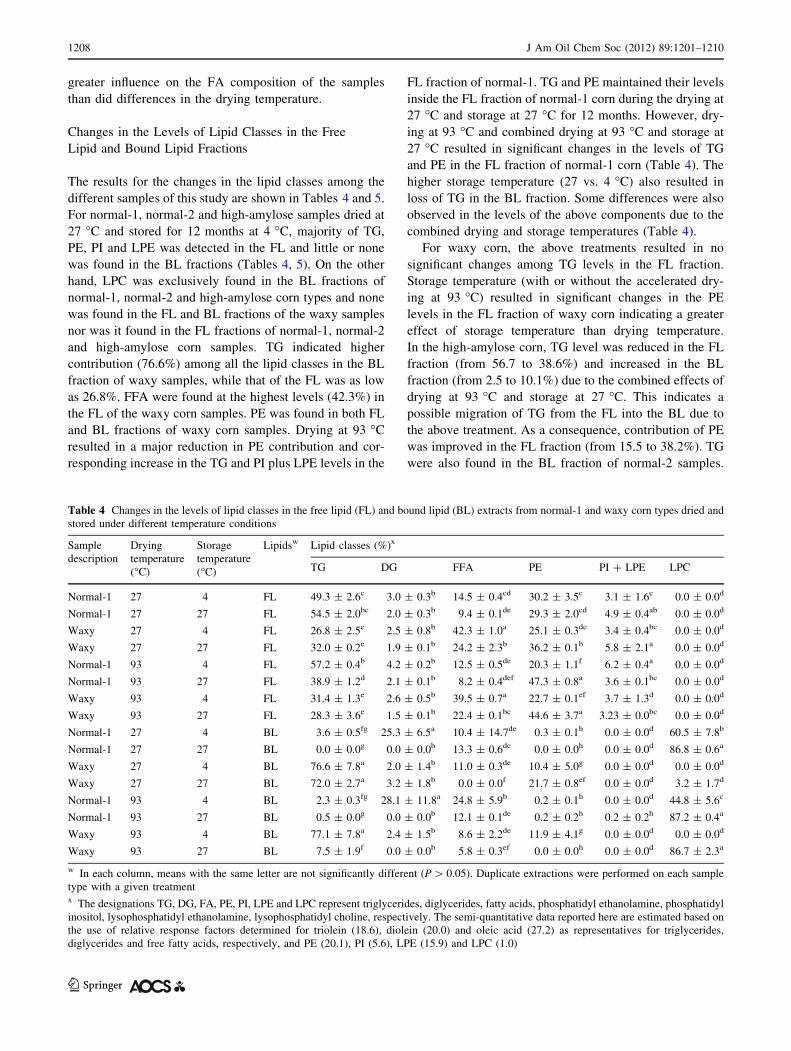
The results for the changes in the lipid classes among the
different samples of this study are shown in Tables 4 and 5.
For normal-1, normal-2 and high-amylose samples dried at
27 �C and stored for 12 months at 4 �C, majority of TG,
PE, PI and LPE was detected in the FL and little or none
was found in the BL fractions (Tables 4, 5). On the other
hand, LPC was exclusively found in the BL fractions of
normal-1, normal-2 and high-amylose corn types and none
was found in the FL and BL fractions of the waxy samples
nor was it found in the FL fractions of normal-1, normal-2
and high-amylose corn samples. TG indicated higher
contribution (76.6%) among all the lipid classes in the BL
fraction of waxy samples, while that of the FL was as low
as 26.8%. FFA were found at the highest levels (42.3%) in
the FL of the waxy corn samples. PE was found in both FL
and BL fractions of waxy corn samples. Drying at 93 �C
resulted in a major reduction in PE contribution and cor-
responding increase in the TG and PI plus LPE levels in the
FL fraction of normal-1. TG and PE maintained their levels
inside the FL fraction of normal-1 corn during the drying at
27 �C and storage at 27 �C for 12 months. However, dry-
ing at 93 �C and combined drying at 93 �C and storage at
27 �C resulted in significant changes in the levels of TG
and PE in the FL fraction of normal-1 corn (Table 4). The
higher storage temperature (27 vs. 4 �C) also resulted in
loss of TG in the BL fraction. Some differences were also
observed in the levels of the above components due to the
combined drying and storage temperatures (Table 4).
For waxy corn, the above treatments resulted in no
significant changes among TG levels in the FL fraction.
Storage temperature (with or without the accelerated dry-
ing at 93 �C) resulted in significant changes in the PE
levels in the FL fraction of waxy corn indicating a greater
effect of storage temperature than drying temperature.
In the high-amylose corn, TG level was reduced in the FL
fraction (from 56.7 to 38.6%) and increased in the BL
fraction (from 2.5 to 10.1%) due to the combined effects of
drying at 93 �C and storage at 27 �C. This indicates a
possible migration of TG from the FL into the BL due to
the above treatment. As a consequence, contribution of PE
was improved in the FL fraction (from 15.5 to 38.2%). TG
were also found in the BL fraction of normal-2 samples.
Table 4 Changes in the levels of lipid classes in the free lipid (FL) and bound lipid (BL) extracts from normal-1 and waxy corn types dried and
stored under different temperature conditions
Sample
description
Drying
temperature
(�C)
Storage
temperature
(�C)
Lipidsw Lipid classes (%)x
TG DG FFA PE PI ? LPE LPC
Normal-1 27 4 FL 49.3 ± 2.6c 3.0 ± 0.3b 14.5 ± 0.4cd 30.2 ± 3.5c 3.1 ± 1.6c 0.0 ± 0.0d
Normal-1 27 27 FL 54.5 ± 2.0bc 2.0 ± 0.3b 9.4 ± 0.1de 29.3 ± 2.0cd 4.9 ± 0.4ab 0.0 ± 0.0d
Waxy 27 4 FL 26.8 ± 2.5e 2.5 ± 0.8b 42.3 ± 1.0a 25.1 ± 0.3de 3.4 ± 0.4bc 0.0 ± 0.0d
Waxy 27 27 FL 32.0 ± 0.2e 1.9 ± 0.1b 24.2 ± 2.3b 36.2 ± 0.1b 5.8 ± 2.1a 0.0 ± 0.0d
Normal-1 93 4 FL 57.2 ± 0.4b 4.2 ± 0.2b 12.5 ± 0.5de 20.3 ± 1.1f 6.2 ± 0.4a 0.0 ± 0.0d
Normal-1 93 27 FL 38.9 ± 1.2d 2.1 ± 0.1b 8.2 ± 0.4def 47.3 ± 0.8a 3.6 ± 0.1bc 0.0 ± 0.0d
Waxy 93 4 FL 31.4 ± 1.3e 2.6 ± 0.5b 39.5 ± 0.7a 22.7 ± 0.1ef 3.7 ± 1.3d 0.0 ± 0.0d
Waxy 93 27 FL 28.3 ± 3.6e 1.5 ± 0.1b 22.4 ± 0.1bc 44.6 ± 3.7a 3.23 ± 0.0bc 0.0 ± 0.0d
Normal-1 27 4 BL 3.6 ± 0.5fg 25.3 ± 6.5a 10.4 ± 14.7de 0.3 ± 0.1h 0.0 ± 0.0d 60.5 ± 7.8b
Normal-1 27 27 BL 0.0 ± 0.0g 0.0 ± 0.0b 13.3 ± 0.6de 0.0 ± 0.0h 0.0 ± 0.0d 86.8 ± 0.6a
Waxy 27 4 BL 76.6 ± 7.8a 2.0 ± 1.4b 11.0 ± 0.3de 10.4 ± 5.0g 0.0 ± 0.0d 0.0 ± 0.0d
Waxy 27 27 BL 72.0 ± 2.7a 3.2 ± 1.8b 0.0 ± 0.0f 21.7 ± 0.8ef 0.0 ± 0.0d 3.2 ± 1.7d
Normal-1 93 4 BL 2.3 ± 0.3fg 28.1 ± 11.8a 24.8 ± 5.9b 0.2 ± 0.1h 0.0 ± 0.0d 44.8 ± 5.6c
Normal-1 93 27 BL 0.5 ± 0.0g 0.0 ± 0.0b 12.1 ± 0.1de 0.2 ± 0.2h 0.2 ± 0.2h 87.2 ± 0.4a
Waxy 93 4 BL 77.1 ± 7.8a 2.4 ± 1.5b 8.6 ± 2.2de 11.9 ± 4.1g 0.0 ± 0.0d 0.0 ± 0.0d
Waxy 93 27 BL 7.5 ± 1.9f 0.0 ± 0.0b 5.8 ± 0.3ef 0.0 ± 0.0h 0.0 ± 0.0d 86.7 ± 2.3a
w In each column, means with the same letter are not significantly different (P [ 0.05). Duplicate extractions were performed on each sample
type with a given treatmentx The designations TG, DG, FA, PE, PI, LPE and LPC represent triglycerides, diglycerides, fatty acids, phosphatidyl ethanolamine, phosphatidyl
inositol, lysophosphatidyl ethanolamine, lysophosphatidyl choline, respectively. The semi-quantitative data reported here are estimated based on
the use of relative response factors determined for triolein (18.6), diolein (20.0) and oleic acid (27.2) as representatives for triglycerides,
diglycerides and free fatty acids, respectively, and PE (20.1), PI (5.6), LPE (15.9) and LPC (1.0)
1208 J Am Oil Chem Soc (2012) 89:1201–1210
123
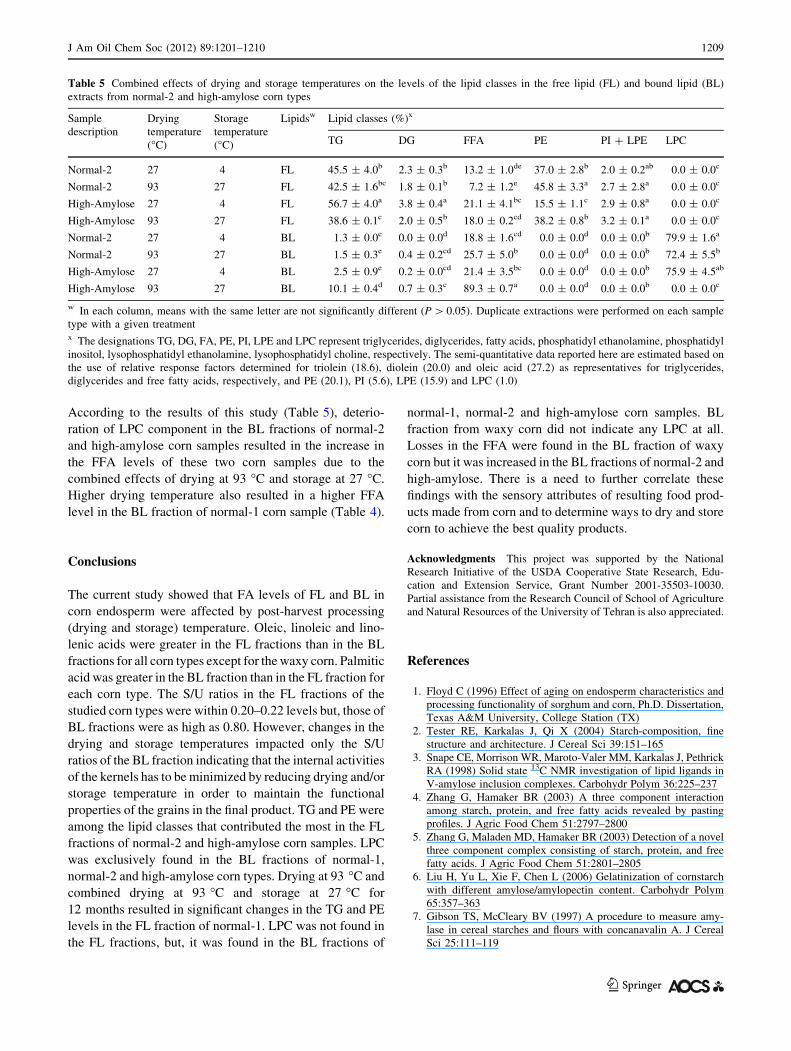
According to the results of this study (Table 5), deterio-
ration of LPC component in the BL fractions of normal-2
and high-amylose corn samples resulted in the increase in
the FFA levels of these two corn samples due to the
combined effects of drying at 93 �C and storage at 27 �C.
Higher drying temperature also resulted in a higher FFA
level in the BL fraction of normal-1 corn sample (Table 4).
Conclusions
The current study showed that FA levels of FL and BL in
corn endosperm were affected by post-harvest processing
(drying and storage) temperature. Oleic, linoleic and lino-
lenic acids were greater in the FL fractions than in the BL
fractions for all corn types except for the waxy corn. Palmitic
acid was greater in the BL fraction than in the FL fraction for
each corn type. The S/U ratios in the FL fractions of the
studied corn types were within 0.20–0.22 levels but, those of
BL fractions were as high as 0.80. However, changes in the
drying and storage temperatures impacted only the S/U
ratios of the BL fraction indicating that the internal activities
of the kernels has to be minimized by reducing drying and/or
storage temperature in order to maintain the functional
properties of the grains in the final product. TG and PE were
among the lipid classes that contributed the most in the FL
fractions of normal-2 and high-amylose corn samples. LPC
was exclusively found in the BL fractions of normal-1,
normal-2 and high-amylose corn types. Drying at 93 �C and
combined drying at 93 �C and storage at 27 �C for
12 months resulted in significant changes in the TG and PE
levels in the FL fraction of normal-1. LPC was not found in
the FL fractions, but, it was found in the BL fractions of
normal-1, normal-2 and high-amylose corn samples. BL
fraction from waxy corn did not indicate any LPC at all.
Losses in the FFA were found in the BL fraction of waxy
corn but it was increased in the BL fractions of normal-2 and
high-amylose. There is a need to further correlate these
findings with the sensory attributes of resulting food prod-
ucts made from corn and to determine ways to dry and store
corn to achieve the best quality products.
Acknowledgments This project was supported by the National
Research Initiative of the USDA Cooperative State Research, Edu-
cation and Extension Service, Grant Number 2001-35503-10030.
Partial assistance from the Research Council of School of Agriculture
and Natural Resources of the University of Tehran is also appreciated.
References
1. Floyd C (1996) Effect of aging on endosperm characteristics and
processing functionality of sorghum and corn, Ph.D. Dissertation,
Texas A&M University, College Station (TX)
2. Tester RE, Karkalas J, Qi X (2004) Starch-composition, fine
structure and architecture. J Cereal Sci 39:151–165
3. Snape CE, Morrison WR, Maroto-Valer MM, Karkalas J, Pethrick
RA (1998) Solid state 13C NMR investigation of lipid ligands in
V-amylose inclusion complexes. Carbohydr Polym 36:225–237
4. Zhang G, Hamaker BR (2003) A three component interaction
among starch, protein, and free fatty acids revealed by pasting
profiles. J Agric Food Chem 51:2797–2800
5. Zhang G, Maladen MD, Hamaker BR (2003) Detection of a novel
three component complex consisting of starch, protein, and free
fatty acids. J Agric Food Chem 51:2801–2805
6. Liu H, Yu L, Xie F, Chen L (2006) Gelatinization of cornstarch
with different amylose/amylopectin content. Carbohydr Polym
65:357–363
7. Gibson TS, McCleary BV (1997) A procedure to measure amy-
lase in cereal starches and flours with concanavalin A. J Cereal
Sci 25:111–119
Table 5 Combined effects of drying and storage temperatures on the levels of the lipid classes in the free lipid (FL) and bound lipid (BL)
extracts from normal-2 and high-amylose corn types
Sample
description
Drying
temperature
(�C)
Storage
temperature
(�C)
Lipidsw Lipid classes (%)x
TG DG FFA PE PI ? LPE LPC
Normal-2 27 4 FL 45.5 ± 4.0b 2.3 ± 0.3b 13.2 ± 1.0de 37.0 ± 2.8b 2.0 ± 0.2ab 0.0 ± 0.0c
Normal-2 93 27 FL 42.5 ± 1.6bc 1.8 ± 0.1b 7.2 ± 1.2e 45.8 ± 3.3a 2.7 ± 2.8a 0.0 ± 0.0c
High-Amylose 27 4 FL 56.7 ± 4.0a 3.8 ± 0.4a 21.1 ± 4.1bc 15.5 ± 1.1c 2.9 ± 0.8a 0.0 ± 0.0c
High-Amylose 93 27 FL 38.6 ± 0.1c 2.0 ± 0.5b 18.0 ± 0.2cd 38.2 ± 0.8b 3.2 ± 0.1a 0.0 ± 0.0c
Normal-2 27 4 BL 1.3 ± 0.0e 0.0 ± 0.0d 18.8 ± 1.6cd 0.0 ± 0.0d 0.0 ± 0.0b 79.9 ± 1.6a
Normal-2 93 27 BL 1.5 ± 0.3e 0.4 ± 0.2cd 25.7 ± 5.0b 0.0 ± 0.0d 0.0 ± 0.0b 72.4 ± 5.5b
High-Amylose 27 4 BL 2.5 ± 0.9e 0.2 ± 0.0cd 21.4 ± 3.5bc 0.0 ± 0.0d 0.0 ± 0.0b 75.9 ± 4.5ab
High-Amylose 93 27 BL 10.1 ± 0.4d 0.7 ± 0.3c 89.3 ± 0.7a 0.0 ± 0.0d 0.0 ± 0.0b 0.0 ± 0.0c
w In each column, means with the same letter are not significantly different (P [ 0.05). Duplicate extractions were performed on each sample
type with a given treatmentx The designations TG, DG, FA, PE, PI, LPE and LPC represent triglycerides, diglycerides, fatty acids, phosphatidyl ethanolamine, phosphatidyl
inositol, lysophosphatidyl ethanolamine, lysophosphatidyl choline, respectively. The semi-quantitative data reported here are estimated based on
the use of relative response factors determined for triolein (18.6), diolein (20.0) and oleic acid (27.2) as representatives for triglycerides,
diglycerides and free fatty acids, respectively, and PE (20.1), PI (5.6), LPE (15.9) and LPC (1.0)
J Am Oil Chem Soc (2012) 89:1201–1210 1209
123
8. AACC (1983) Approved methods of the American Association of
Cereal Chemists, Method 44-19, Library of Congress, 8th ed.
Salem
9. de Man W, Cauberghe N (1988) Changes of lipid composition in
maturing barley kernels. Phytochem 27:1639–1642
10. Conforti FD, Harris CH, Rinehart JT (1993) High performance
liquid chromatographic analysis of wheat flour lipids using an
evaporative light scattering detector. J Chromat A 645:83–88
11. Robinson JL, Weinert IA, Solms J (1983) The analysis of potato
starch and lipid in the presence of their inclusion complexes.
LWT—Food Sci Technol 16:235–238
12. AOCS (1997) Official methods and recommended practices of
the American Oil Chemists’ Society, Method Ce 2-66. American
Oil Chemists’ Society, Champaign (IL)
13. Morrison WR (1978) Cereal lipids. Adv Cereal Sci Technol
2:221–348
14. White PJ, Weber EJ (1997) Lipids of the kernel. In: White P,
Johnson L (eds) Paul St. corn: chemistry and technology, 2nd ed.
American Association of Cereal Chemists, Inc. 2003, MN. Taylor
& Francis Group, London. p. 233
15. Laureles LA, Rodriguez FM, Reano CE, Santos GA, Laurena AC,
Mendoza EMT (2002) Variability in fatty acid and triacylglycerol
composition of the oil of coconut (Cocos nucifera L.) hybrids and
their parentals. J Agric Food Chem 50:1581–1586
16. Lee D-S, Noh B-S, Bae S-U, Kim K (1998) Characterization of
fatty acids composition in vegetable oils by gas chromatography
and chemometrics. Anal Chim Acta 358:163–175
17. AACC (1995) Approved methods of the American Association of
Cereal Chemists, Method 30-25, 9th ed. Library of Congress,
Paul St
18. Fernandez-Moya V, Martinez-Force E, Garces R (2006) Lipid
characterization of a high-stearic sunflower mutant displaying a
seed stearic acid gradient. J Agric Food Chem 54:3612–3616
19. Tang MC, Copeland L (2007) Analysis of complexes between
lipids and wheat starch. Carbohydr Polym 67:80–85
20. Brooks RI, Csallany AS (1978) Effects of air, ozone, and nitrogen
dioxide exposure on the oxidation of corn and soybean lipids.
J Agric Food Chem 26:1203–1209
21. White PJ, Pollak LM (1995) Corn as food source in the United
States: Part II. Processes, products, composition, and nutritive
values. CFW 40:756–762
22. Kitahara K, Tanaka T, Suganuma T, Nagahama T (1997) Release
of bound lipids in cereal starches upon hydrolysis by glucoam-
ylase. Cereal Chem 74:1–6
23. Lagrandeur G, Tollier MT, Guilbot A (1968) Changes in con-
stituents of corn seed as a function of different storage or drying
conditions. Indus Aliment Agric 85:837–842
24. Black LT, Spyres GG, Brekke OL (1969) Effects of storage
condition on oil analysis of milled corn fractions by gas-liquid
chromatography. Cereal Chem 46:63–69
25. Christensen CM (1967) Some changes in No. 2 corn stored two
years at moisture contents of 14.5 and 15.2% and temperatures of
12 �C, 20 �C, and 25 �C. Cereal Chem 44:95–99
26. Keitel K (1978) Alteration of lipids and tocopherols of corn under
different conditions of preservation. Mehl und Brot 32:253–256
27. Keitel K (1978) Changes in lipids and fat soluble substances
under different conditions of preservation of shelled corn.
Detmold 91:135–141
28. Tremazi SA, Saeed MH (1965) Studies on the chemical com-
position and characteristics of stored maize oil and oil from
stored grains. Pak J Sci Res 17:140–144
29. Smidovnik A, Perdih A, Vitez L (1985) Stability of lipids in
maize flour during storage (II). Nova Proizvod 36:103–107
30. Vertucci CW (1992) A calorimetric study of the changes in
lipid during seed storage under dry conditions. Plant Physiol
99:310–316
1210 J Am Oil Chem Soc (2012) 89:1201–1210
123
Copyright © 2022 FDOKUMEN