دراسة تقابلية بين اللغة العربية والإندونيسية في الإسم الموصول

Characteristics of Single Spiral Tube Adsorber for Oxygen
Separation from Air
Zaid A. Abdel-Rahman*
Assist. Professor, Eng. College/Tikrit University/Iraq
Email : [email protected] Mobile: 07702542153
Abdulbasit H. Mhdi Assist. Lecturer, Eng. College/Tikrit University/Iraq
Ahmed J. Ali Assist. Professor, Eng. Faculty/Sohar University/Oman
ABSTRACT
Single long spiral tube column (25 mm diameter, and 4 m bed length) had
been constructed to study the separation of oxygen from air using commercial 13X
zeolite. The effect of adsorption pressure, and effluent flow rate on the system
breakthrough curves were studied. Single column with initial air pressurizing
simulates the work of 2-columns, 4-steps PSA process, whereas single column with
initial intermediate pure oxygen pressurizing simulates the work of 2-columns, 6-
steps PSA process with pressure equalization steps of the two columns. No
significant effect of pressure on the product oxygen purity is noticed when pressure
increased from 2 to 5 bar in both cases.
For initial air pressurizing case, the average maximum effluent oxygen
purity of 88% is obtained. The range of zeolite loading capacity is q=0.25-0.35
mole N2/kg zeolite, and only 40% of the range has been utilized before
breakthrough time. Whereas for initial oxygen pressurizing case, the maximum
oxygen purity of 95% is obtained. The range of zeolite loading capacity is q=0.39-
0.87 mole N2/kg zeolite, and 95% of the range has been utilized before
breakthrough time, which is agree well with the equilibrium data of
multicomponent Langmuir adsorption equation.
KEYWORDS : Spiral tube adsorber, breakthrough, Oxygen separation, PSA.
دراسة تصرف انبوب ا متزاز الملفوف المفرد لفصل ا وكسجين من الھواء
الخ�صة
لدراسة فصل ا�وكسجين من ) م 4ملم وطول 25قطر (صنيع عمود ملفوف طويل تم تودرس تاثير ضغط ا�متزاز ومعدل الجريان من . 13X الھواء باستخدام الزيو�يت التجاري
يحاكي العمود المفرد في حالة بدء الضغط بالھواء ، عملية ا�متزاز بتغير .خ,ل منحنى ا�ختراق، بينما يحاكي في حالة بدء الضغط با�وكسجين ، عملية ا�متزاز خطوات بعوارالضغط لعمودين
لم ي,حظ .بتغير الضغط لعمودين وست خطوات من ضمنھا خطوتي تساوي الضغط في العمودين .بار على نقاوة ا�وكسجين في الحالتين 5الى 2اي تاثير لضغط ا�متزاز من
وكان حدود %. 88ى نقاوة ل,وكسجين ھي كانت اقصفي حالة بدء الضغط بالھواء ، فقط يستفاد منھا قبل زمن % 40وان (q=0.25-0.35 mole N2/kg zeolite)سعة الزيو�يت
%. 95بينما في حالة بدء الضغط با�وكسجين ، كانت اقصى نقاوة ل,وكسجين ھي . ا�ختراقيستفاد منھا قبل % 95ان و (q=0.39-0.87 mole N2/kg zeolite)وكان حدود سعة الزيو�يت
.ل,متزاز في معادلة �نكمورزمن ا�ختراق، وھي متوافقة بصورة جيدة مع معلومات ا�تزان . ، فصل ا�وكسجين انبوب ا�متزاز الملفوف ، منحنى ا�ختراق :الدالة الكلمات
INTRODUCTION
Design of single fixed bed adsorption column often relies on the concept of
mass transfer zone (MTZ). Progress of the zone through the bed is shown in Fig. 1.
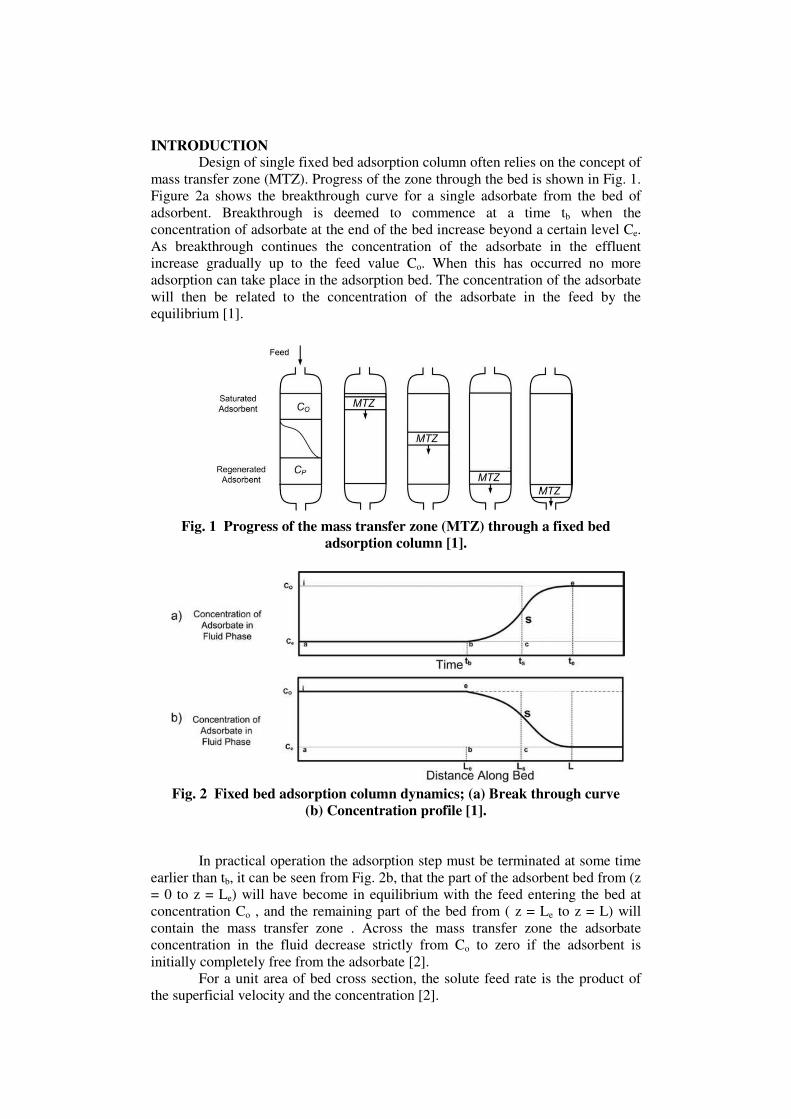
Figure 2a shows the breakthrough curve for a single adsorbate from the bed of
adsorbent. Breakthrough is deemed to commence at a time tb when the
concentration of adsorbate at the end of the bed increase beyond a certain level Ce.
As breakthrough continues the concentration of the adsorbate in the effluent
increase gradually up to the feed value Co. When this has occurred no more
adsorption can take place in the adsorption bed. The concentration of the adsorbate
will then be related to the concentration of the adsorbate in the feed by the
equilibrium [1].
Fig. 1 Progress of the mass transfer zone (MTZ) through a fixed bed
adsorption column [1].
Fig. 2 Fixed bed adsorption column dynamics; (a) Break through curve
(b) Concentration profile [1].
In practical operation the adsorption step must be terminated at some time
earlier than tb, it can be seen from Fig. 2b, that the part of the adsorbent bed from (z
= 0 to z = Le) will have become in equilibrium with the feed entering the bed at
concentration Co , and the remaining part of the bed from ( z = Le to z = L) will
contain the mass transfer zone . Across the mass transfer zone the adsorbate
concentration in the fluid decrease strictly from Co to zero if the adsorbent is
initially completely free from the adsorbate [2].
For a unit area of bed cross section, the solute feed rate is the product of
the superficial velocity and the concentration [2].
(1)
For an ideal breakthrough curve, all the solute fed in time ts is adsorbed
and the concentration on the solid has increased from the initial value qo to the
equilibrium or saturated value qsat. Thus
(2)
(3)
Where L and ρB are the length and bulk density of the bed, respectively. For fresh
adsorbent, qo= 0 , ts is ideal adsorption time for vertical breakthrough [2].
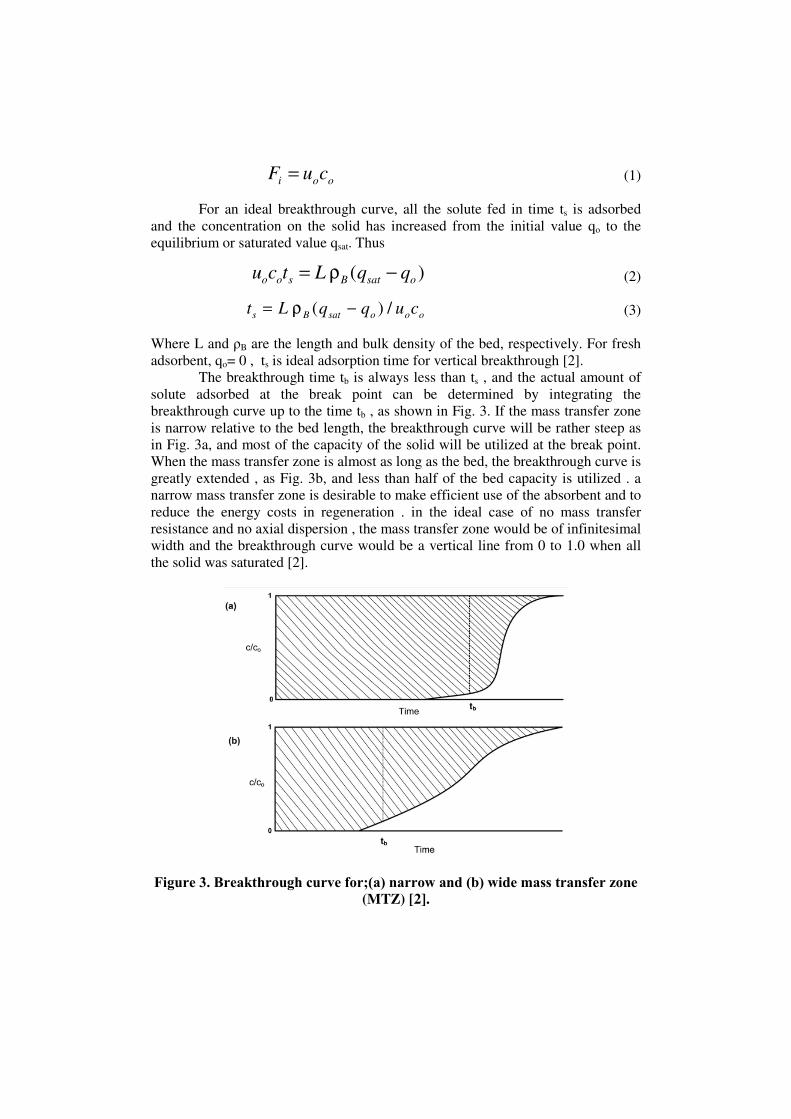
The breakthrough time tb is always less than ts , and the actual amount of
solute adsorbed at the break point can be determined by integrating the
breakthrough curve up to the time tb , as shown in Fig. 3. If the mass transfer zone
is narrow relative to the bed length, the breakthrough curve will be rather steep as
in Fig. 3a, and most of the capacity of the solid will be utilized at the break point.
When the mass transfer zone is almost as long as the bed, the breakthrough curve is
greatly extended , as Fig. 3b, and less than half of the bed capacity is utilized . a
narrow mass transfer zone is desirable to make efficient use of the absorbent and to
reduce the energy costs in regeneration . in the ideal case of no mass transfer
resistance and no axial dispersion , the mass transfer zone would be of infinitesimal
width and the breakthrough curve would be a vertical line from 0 to 1.0 when all
the solid was saturated [2].
Figure 3. Breakthrough curve for;(a) narrow and (b) wide mass transfer zone
(MTZ) [2].
ooi cuF =
)( osatBsoo qqLtcu −ρ =
ooosatBs cuqqLt /)( −ρ =
Single component Langmuir adsorption equilibrium equation for oxygen
separation from air is written as follows [3]:
(4)
Whereas the multi-component Langmuir adsorption equilibrium equation is
written as follows [3]:
(5)
Pressure swing adsorption (PSA) with dual columns is usually used for
oxygen separation from air [4].
In the present work, a single column with air initial pressurizing simulates
the work of 2-column, 4-steps PSA process, whereas a single column with initial
intermediate pure oxygen pressurizing simulates the work of 2-columns, 6-steps
PSA process with pressure equalization steps of the two columns.
The aim of the present work is to construct a small scale single long spiral
bed column, packed with commercial 13X zeolite, and to investigate the
characteristic of the single column, through the analysis of the breakthrough curves
at different adsorption pressures and effluent flowrates.
EXPERIMENTAL WORK
Figure 4 shows the experimental set-up of the single column
characteristics. The spiral column of Copper of 2.54 cm in diameter and 4 m in
length, with fittings and connections 12mm in diameter, pressure regulator ( 1 to 10
bar, max. temp. 120 oC, Norgren England), the solenoid valves of 6 mm size. A
rotameter is used for the effluent stream (1 to 8 l/min, Oxygen). Each column
contains 1300 g of zeloite 13X, the characteristic of the adsorbent is shown in
Table 1. Oxygen analyzer type is GOX 100 Greasing Electronic GmbH. Table 2
shows the operating conditions of the single column characteristics.
The experimental procedure was:
1. Preparation of the system shown in Fig. 3, using vacuum and O2 purging to
ensure the zeolite activity.
2. Adjust the air feed pressure by pressure regulator.
3. Adjust the system condition with or without initial pure O2 intermediate
pressure of the column to the desired value.
4. Open the air feed valve.
5. Open the output valve and adjust the flow rate product to the desired value,
using a gas rotameter and a regulating valve.
6. Recording the product purity (O2 %) measured by the analyzer with time.
7. Calculation of q according the following equation:
(6)
(7)
tywQq Oeff ∆−= ∑ )21.0()21/79)(4.22/( 2
tywQq OeffB ∆−= ∑ )21.0()21/79)(4.22/( 2
btt <
jj
ii
si
i
Pb
Pb
q
q
∑+=
1
ii
ii
si
i
Pb
Pb
q
q
+=
1
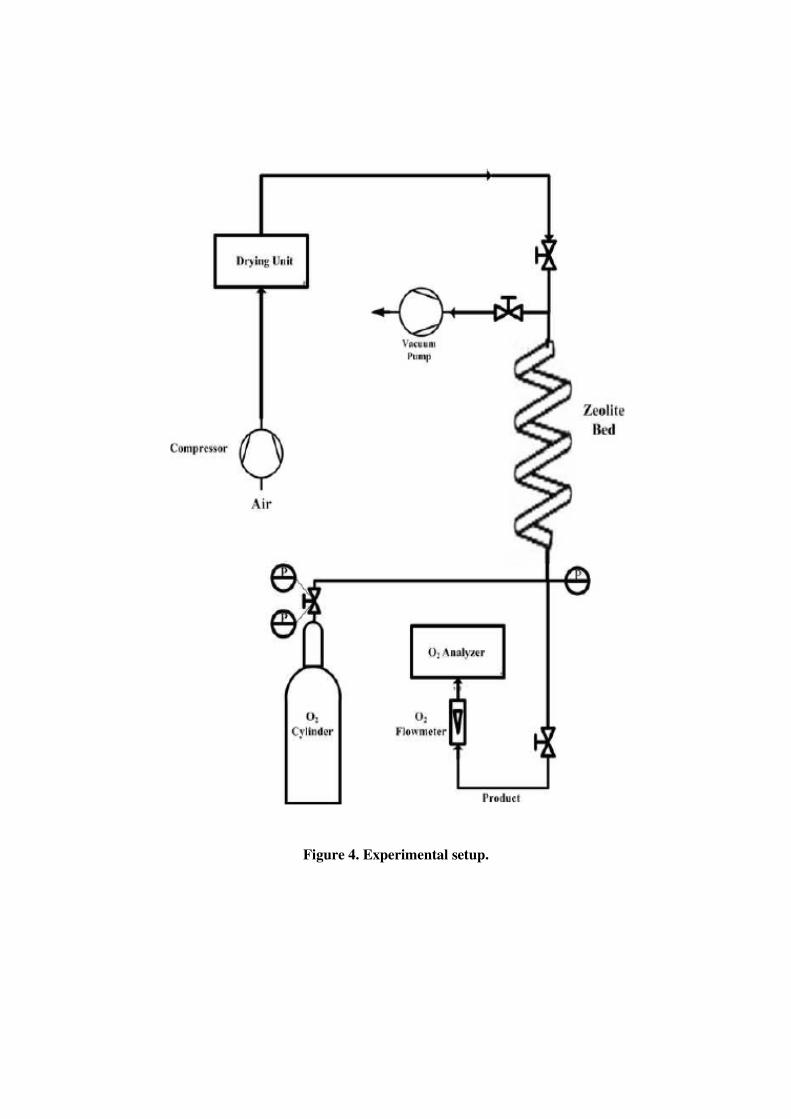
Figure 4. Experimental setup.

Table 1. Details of column and adsorbent.
Table 2. Experiments of of single column performance.
RESULTS AND DISCUSSION The experimental results for the single column characteristics are analyzed
using breakthrough curves.
Figure 5 represents breakthrough curve for air feed pressurizing, the purity
of oxygen produced by the single column as a function of time at different values
of pressure. The effluent flow rate from the column is 1 liter/min. The effluent
product oxygen purity is the range of about 87 % to 89 % up to about 60 seconds,
and after this point the effluent oxygen purity decreases, due to the penetration of
the bed by pressurized air feed. This point represents the breakthrough point of the
single bed with air pressurizing. The figure also shows the effect of pressure on the
maximum effluent oxygen purity before breakthrough point. The purity increases
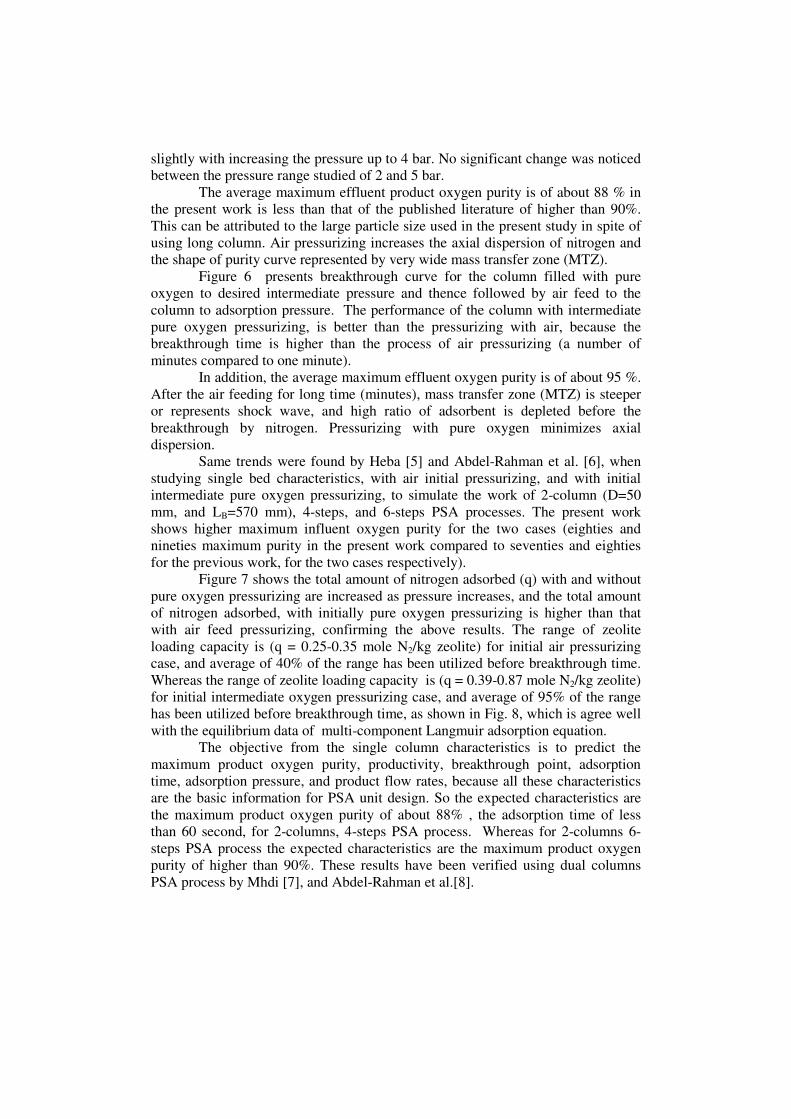
slightly with increasing the pressure up to 4 bar. No significant change was noticed
between the pressure range studied of 2 and 5 bar.
The average maximum effluent product oxygen purity is of about 88 % in
the present work is less than that of the published literature of higher than 90%.
This can be attributed to the large particle size used in the present study in spite of
using long column. Air pressurizing increases the axial dispersion of nitrogen and
the shape of purity curve represented by very wide mass transfer zone (MTZ).
Figure 6 presents breakthrough curve for the column filled with pure
oxygen to desired intermediate pressure and thence followed by air feed to the
column to adsorption pressure. The performance of the column with intermediate
pure oxygen pressurizing, is better than the pressurizing with air, because the
breakthrough time is higher than the process of air pressurizing (a number of
minutes compared to one minute).
In addition, the average maximum effluent oxygen purity is of about 95 %.
After the air feeding for long time (minutes), mass transfer zone (MTZ) is steeper
or represents shock wave, and high ratio of adsorbent is depleted before the
breakthrough by nitrogen. Pressurizing with pure oxygen minimizes axial
dispersion.
Same trends were found by Heba [5] and Abdel-Rahman et al. [6], when
studying single bed characteristics, with air initial pressurizing, and with initial
intermediate pure oxygen pressurizing, to simulate the work of 2-column (D=50
mm, and LB=570 mm), 4-steps, and 6-steps PSA processes. The present work
shows higher maximum influent oxygen purity for the two cases (eighties and
nineties maximum purity in the present work compared to seventies and eighties
for the previous work, for the two cases respectively).
Figure 7 shows the total amount of nitrogen adsorbed (q) with and without
pure oxygen pressurizing are increased as pressure increases, and the total amount
of nitrogen adsorbed, with initially pure oxygen pressurizing is higher than that
with air feed pressurizing, confirming the above results. The range of zeolite
loading capacity is (q = 0.25-0.35 mole N2/kg zeolite) for initial air pressurizing
case, and average of 40% of the range has been utilized before breakthrough time.
Whereas the range of zeolite loading capacity is (q = 0.39-0.87 mole N2/kg zeolite)
for initial intermediate oxygen pressurizing case, and average of 95% of the range
has been utilized before breakthrough time, as shown in Fig. 8, which is agree well
with the equilibrium data of multi-component Langmuir adsorption equation.
The objective from the single column characteristics is to predict the
maximum product oxygen purity, productivity, breakthrough point, adsorption
time, adsorption pressure, and product flow rates, because all these characteristics
are the basic information for PSA unit design. So the expected characteristics are
the maximum product oxygen purity of about 88% , the adsorption time of less
than 60 second, for 2-columns, 4-steps PSA process. Whereas for 2-columns 6-
steps PSA process the expected characteristics are the maximum product oxygen
purity of higher than 90%. These results have been verified using dual columns
PSA process by Mhdi [7], and Abdel-Rahman et al.[8].
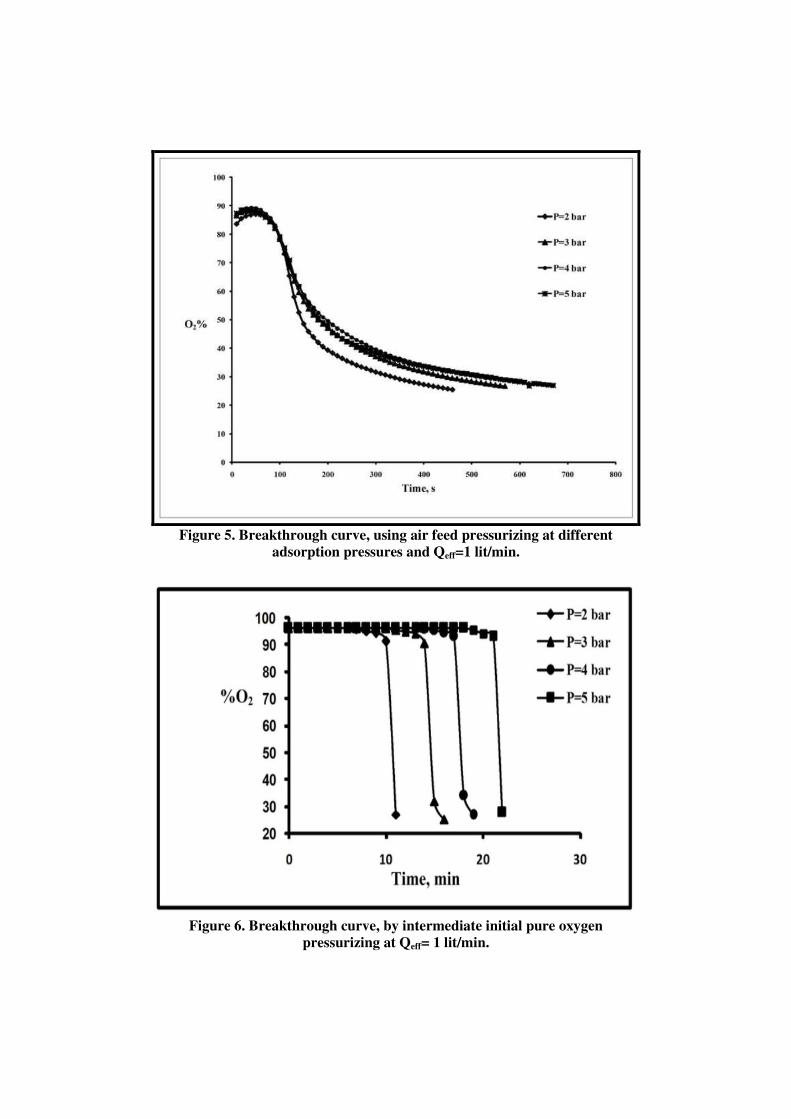
Figure 5. Breakthrough curve, using air feed pressurizing at different
adsorption pressures and Qeff=1 lit/min.
Figure 6. Breakthrough curve, by intermediate initial pure oxygen
pressurizing at Qeff= 1 lit/min.
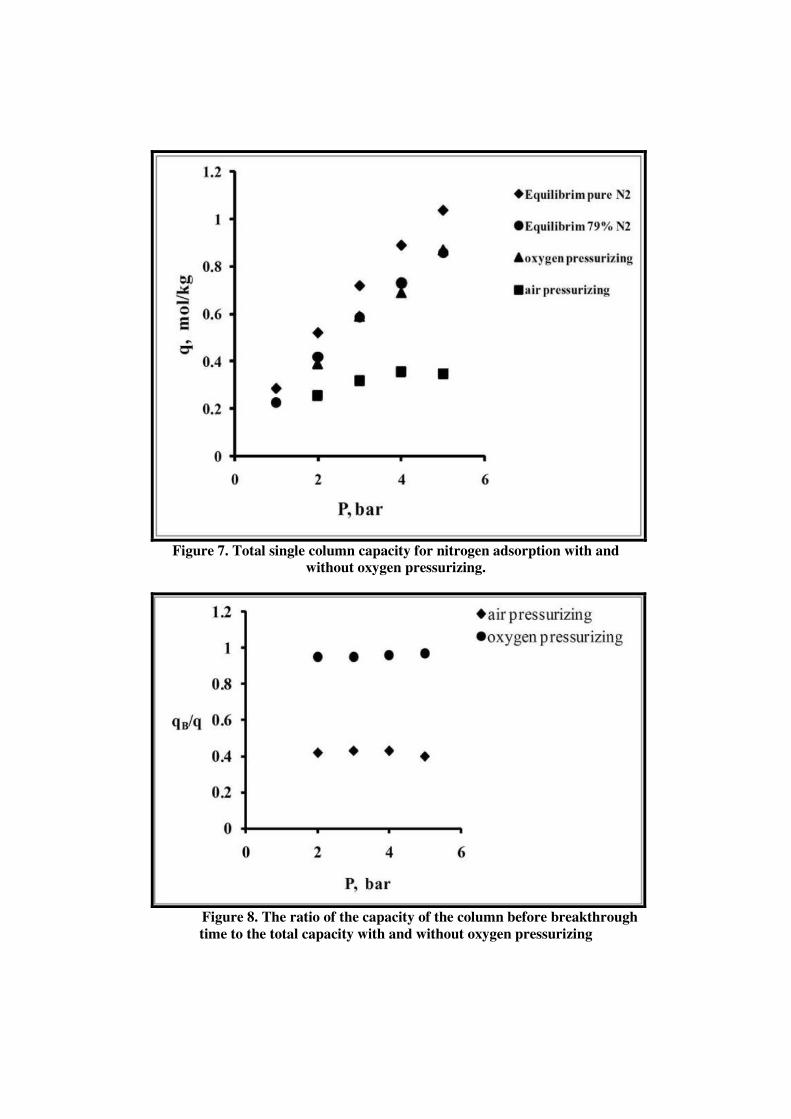
Figure 7. Total single column capacity for nitrogen adsorption with and
without oxygen pressurizing.
Figure 8. The ratio of the capacity of the column before breakthrough
time to the total capacity with and without oxygen pressurizing
CONCLUSIONS 1. No significant effect of pressure on the product oxygen purity is noticed when
pressure increased from 2 to 5 bar
2. The average maximum oxygen purity of 88% is obtained for initial air
pressurizing case, and 95% is obtained for initial intermediate pure oxygen
pressurizing case.
3. The range of zeolite loading capacity (q) is 0.25-0.35 mole N2/kg zeolite for
initial air pressurizing case, and average of 40% of the range has been utilized
before breakthrough time.
4. The range of zeolite loading capacity (q) is 0.39-0.87 mole N2/kg zeolite for
initial intermediate oxygen pressurizing case, and average of 95% of the range
has been utilized before breakthrough time, which is agree well with the
equilibrium data of multi-component Langmuir adsorption equation.
REFERENCES [1] Crittenden, B. and Thomas, W.J., Adsorption Technology & Design,
Butterworth-Heinemann, Oxford, 1998.
[2] McCabe W.L. Smith J.C. and Harriot P., Unit Operations of Chemical
Engineering. McGraw Hill, 6th Edition, 1993.
[3] Ruthven, D. M.; Farooq, S.; Knaebel, K. S., Pressure Swing Adsorption. VCH
Publishers,New York, 1994.
[4] Santos J. C., Portugal A. F., Magailaes F. D., and Mendes A, Optimization of
Medical PSA Units for Oxygen Production. Ind. ,Eng., Chem., Res. 45, 1085,
2006.
[5] Auob, H.S., A Study of Oxygen Separation from Air by Pressure Swing
Adsorption (PSA), M.Sc. thesis, Tikrit University, 2010.
[6] Abdel-Rahman, Z. A., Ali, A. J., Auob, H.S., A Study of Oxygen Separation
from Air by Pressure Swing Adsorption (PSA). Nahrain Univ. Conf., 1-2
December 2010.
[7] Mhdi, A.H., Two Spiral Tubes Pressure Swing Adsorption (PSA) For Oxygen
Separation From Air. M.SC. thesis, Tikrit University, 2011.
[8] Abdel-Rahman, Z.A., Mhdi, A.H., and Ali, A.J., Two Spiral Tubes Pressure
Swing Adsorption for Oxygen Separation from air, 1st National Conf. for
Engineering Sciences, 7-8 November 2012.
NOMENCLATURE
b Langmuir isotherm constant, bar-1
C solute concentration, mol/l
Co solute feed concentration, mol/l
Ce low solute concentration, mol/l
Cp solute product concentration, mol/l
D column diameter
dp zeolite diameter, mm
Fi feed flow of component (i), mole/s
LB bed length, m
Le bed length, m
P adsorption high pressure ,bar
Pi pressure of component (i), bar

Qeff effluent flow rate, l/min
q adsorbent capacity, mol/kg
qi adsorbent capacity of component (i),
mol/kg
qs maximum adsorbent capacity of
Langmuir isotherm, mol/kg
qsat saturated adsorbent capacity, mol/kg
qo initial adsorbent capacity, mol/kg
qB adsorbent capacity before breakthrough
time, mol/kg
t time, s
tb breakthrough time, s
ts ideal adsorption time or saturation time, s
uo interstitial velocity during adsorption
step, m/s
w adsorbent weight, kg
yi mole fraction of component (i)
z axial co-ordinate,or distance traveled
by the front, m
Greek Symbols
ρB bulk density, kg/m3
ρB particle density, kg/m3
ε bed porosity
Copyright © 2022 FDOKUMEN