Characteristics of cometary dust tracks in Stardust aerogel and laboratory calibrations
18
Meteoritics & Planetary Science 43, Nr 1/2, 23–40 (2008) Abstract available online at http://meteoritics.org AUTHOR’S PROOF 23 © The Meteoritical Society, 2008. Printed in USA. Characteristics of cometary dust tracks in Stardust aerogel and laboratory calibrations M. J. BURCHELL 1* , S. A. J. FAIREY 1 , P. WOZNIAKIEWICZ 2 , D. E. BROWNLEE 3 , F. HÖRZ 4 , A. T. KEARSLEY 2 , T. H. SEE 5 , P. TSOU 6 , A. WESTPHAL 7 , S. F. GREEN 8 , J. M. TRIGO-RODRÍGUEZ 9 , and G. DOMINGÚEZ 10 1 Centre for Astrophysics and Planetary Sciences, University of Kent, Canterbury, Kent CT2 7NH, UK 2 Department of Mineralogy, The Natural History Museum, London SW7 5BD, UK 3 Department of Astronomy, University of Washington, Seattle, Washington 98195, USA 4 ARES, NASA Johnson Space Center, Houston, Texas 77058, USA 5 ESCG, NASA Johnson Space Center, Houston, Texas 77058, USA 6 Jet Propulsion Laboratory, California Institute of Technology, Pasadena, California 91109–8099, USA 7 Department of Physics, University of California at Berkeley, Berkeley, California 94720 8 Planetary and Space Science Research Institute, Open University, Milton Keynes MK7 6AA, UK 9 Institute of Space Sciences (CSIC), Campus UAB, Facultat de Ciencies, Torr C-5, parells, 2a planta, 08913 Bellaterra, Spain and Institut d’Estudies Espacials de Catalunya (IEEC), Ed. Nexus, Gran Capita, 2-4, 08034 Barcelona, Spain 10 Department of Chemistry and Biochemistry, University of California San Diego, La Jolla, California 92093–0356, USA * Corresponding author. E-mail: [email protected] (Received 11 December 2006; revision accepted 21 July 2007) Abstract–The cometary tray of the NASA Stardust spacecraft’s aerogel collector was examined to study the dust captured during the 2004 flyby of comet 81P/Wild 2. An optical scan of the entire collector surface revealed 256 impact features in the aerogel (width >100 μm). Twenty aerogel blocks (out of a total of 132) were removed from the collector tray for a higher resolution optical scan and 186 tracks were observed (track length >50 μm and width >8 μm). The impact features were classified into three types based on their morphology. Laboratory calibrations were conducted that reproduced all three types. This work suggests that the cometary dust consisted of some cohesive, relatively strong particles as well as particles with a more friable or low cohesion matrix containing smaller strong grains. The calibrations also permitted a particle size distribution to be estimated for the cometary dust. We estimate that approximately 1200 particles bigger than 1 μm struck the aerogel. The cumulative size distribution of the captured particles was obtained and compared with observations made by active dust detectors during the encounter. At large sizes (>20 μm) all measures of the dust are compatible, but at micrometer scales and smaller discrepancies exist between the various measurement systems that may reflect structure in the dust flux (streams, clusters etc.) along with some possible instrument effects. INTRODUCTION The use of silica aerogel (originally developed as a low- density material by Kistler [1931], with ultra-low densities available in recent decades), as an ultra-low-density transparent solid to capture relatively intact samples of projectiles impacting at speeds in excess of a few km s −1 was demonstrated in the laboratory (Tsou et al. 1988); a recent review of subsequent developments is given by Burchell et al. (2006). In brief, silica aerogel is a solid foam, essentially a dried SiO 2 gel with an open network of pores. The low densities obtainable today for aerogel (which range from just over 1 to approximately 500 kg m −3 ), are the consequence of this pore space inside an otherwise solid material. Projectiles travelling at hypervelocity speed (of the order of km s −1 ) normally undergo severe damage on impact with a solid (nonporous) target of density much greater than aerogel. Typically during such impacts, the front of the projectile slows but is then crushed by the rear of the projectile (which has not yet slowed) and the target material cannot initially move away from the impact point to respond to the impact, thus generating a shock wave. The result is that extremely high densities and shock pressures are generated in both the projectile and target materials. During adiabatic release from
-
Upload
independent -
Category
Documents
-
view
3 -
download
0
Transcript of Characteristics of cometary dust tracks in Stardust aerogel and laboratory calibrations

Meteoritics & Planetary Science 43, Nr 1/2, 23–40 (2008)Abstract available online at http://meteoritics.org
AUTHOR’S PROOF
23 © The Meteoritical Society, 2008. Printed in USA.
Characteristics of cometary dust tracks in Stardust aerogeland laboratory calibrations
M. J. BURCHELL1*, S. A. J. FAIREY1, P. WOZNIAKIEWICZ2, D. E. BROWNLEE3, F. HÖRZ4, A. T. KEARSLEY2, T. H. SEE5, P. TSOU6, A. WESTPHAL7, S. F. GREEN8, J. M. TRIGO-RODRÍGUEZ9, and G. DOMINGÚEZ10
1Centre for Astrophysics and Planetary Sciences, University of Kent, Canterbury, Kent CT2 7NH, UK2Department of Mineralogy, The Natural History Museum, London SW7 5BD, UK
3Department of Astronomy, University of Washington, Seattle, Washington 98195, USA 4ARES, NASA Johnson Space Center, Houston, Texas 77058, USA 5ESCG, NASA Johnson Space Center, Houston, Texas 77058, USA
6Jet Propulsion Laboratory, California Institute of Technology, Pasadena, California 91109–8099, USA7Department of Physics, University of California at Berkeley, Berkeley, California 94720
8Planetary and Space Science Research Institute, Open University, Milton Keynes MK7 6AA, UK 9Institute of Space Sciences (CSIC), Campus UAB, Facultat de Ciencies, Torr C-5, parells, 2a planta, 08913 Bellaterra,
Spain and Institut d’Estudies Espacials de Catalunya (IEEC), Ed. Nexus, Gran Capita, 2-4, 08034 Barcelona, Spain10Department of Chemistry and Biochemistry, University of California San Diego, La Jolla, California 92093–0356, USA
*Corresponding author. E-mail: [email protected]
(Received 11 December 2006; revision accepted 21 July 2007)
Abstract–The cometary tray of the NASA Stardust spacecraft’s aerogel collector was examined tostudy the dust captured during the 2004 flyby of comet 81P/Wild 2. An optical scan of the entirecollector surface revealed 256 impact features in the aerogel (width >100 μm). Twenty aerogel blocks(out of a total of 132) were removed from the collector tray for a higher resolution optical scan and186 tracks were observed (track length >50 μm and width >8 μm). The impact features were classifiedinto three types based on their morphology. Laboratory calibrations were conducted that reproducedall three types. This work suggests that the cometary dust consisted of some cohesive, relativelystrong particles as well as particles with a more friable or low cohesion matrix containing smallerstrong grains. The calibrations also permitted a particle size distribution to be estimated for thecometary dust. We estimate that approximately 1200 particles bigger than 1 μm struck the aerogel.The cumulative size distribution of the captured particles was obtained and compared withobservations made by active dust detectors during the encounter. At large sizes (>20 μm) all measuresof the dust are compatible, but at micrometer scales and smaller discrepancies exist between thevarious measurement systems that may reflect structure in the dust flux (streams, clusters etc.) alongwith some possible instrument effects.
INTRODUCTION
The use of silica aerogel (originally developed as a low-density material by Kistler [1931], with ultra-low densitiesavailable in recent decades), as an ultra-low-densitytransparent solid to capture relatively intact samples ofprojectiles impacting at speeds in excess of a few km s−1 wasdemonstrated in the laboratory (Tsou et al. 1988); a recentreview of subsequent developments is given by Burchell et al.(2006). In brief, silica aerogel is a solid foam, essentially adried SiO2 gel with an open network of pores. The lowdensities obtainable today for aerogel (which range from just
over 1 to approximately 500 kg m−3), are the consequence ofthis pore space inside an otherwise solid material. Projectilestravelling at hypervelocity speed (of the order of km s−1)normally undergo severe damage on impact with a solid(nonporous) target of density much greater than aerogel.Typically during such impacts, the front of the projectileslows but is then crushed by the rear of the projectile (whichhas not yet slowed) and the target material cannot initiallymove away from the impact point to respond to the impact,thus generating a shock wave. The result is that extremelyhigh densities and shock pressures are generated in both theprojectile and target materials. During adiabatic release from

24 M. J. Burchell et al.
this shocked state (which can involve pressures of tens oreven hundreds of GPa), heating of the materials occurs. Mostof the projectile is then vaporized, and only a few percent ofit can be subsequently found at the impact site, usually in theform of a melt lining part of the crater that forms in the target.
In aerogel, however, the impact process is different and ismore of a “penetration” event than a cratering one. The peakpressures generated on collision with such a low-densitymedium are insufficient to melt typical silicate-impactors,sometimes even insufficient to cause projectilefragmentation. Such projectiles tunnel into the aerogel, losingspeed as a continual process (see Anderson and Ahrens[1994] for a general model for capture of hypervelocityparticles in mesoporous foams and Domínguez et al. [2004]for a recent model of capture specific to aerogel). At some6 km s−1, the projectile may penetrate a factor of 100–200deeper into aerogel compared to crater depth in solids such asrock or metal, producing a long, readily visible penetrationtrack with a captured and typically unmelted particle at theend. During capture, there is some heating of the aerogel thatcan melt and form a molten wrap around the particle; some ofthe projectile surface is heated and shed as an ablativeprocess. Depending on the nature of the impactor, a relativelyintact particle can be found at the end of a track in the aerogelafterward. How much of the particle is captured depends onimpact speed, aerogel density, and projectile structure andcomposition, but at 5–6 km s−1, as much as 60, 70, or even100% of relatively competent particles some tens ofmicrometers across can be captured (see Burchell et al. 2006).Alternatively, the impact process can so severely disrupt theparticle that it effectively breaks apart into a large number offragments lining the wall of a wide cavity in the aerogel. Andsome inhomogeneous particles give a combination of thesetwo capture possibilities, resulting in tracks that are a mixtureof the large, broad cavity plus discrete subsidiary tracksemerging from it. This is discussed in more detail later.
Given that silica aerogel is highly transparent, and thatthe particle fragments (large or small) are easily observableand readily extractable for detailed characterization withstate-of-the-art analytical instruments, aerogel became thecollector medium of choice for retrieving cosmic dust, i.e.,dust in space that is travelling at speeds of km s−1 relative tothe observer. Several space missions have deployed aerogeldust collectors in low-Earth orbit (reviewed in Burchell et al.2006).
The NASA Stardust mission to comet 81P/Wild 2deployed an aerogel dust collector (Brownlee et al. 2003) as itflew past the comet at 1.86 AU from the Sun, with a relativeencounter speed of 6.1 km s−1 (Brownlee et al. 2004; Tsouet al. 2004). At this heliocentric distance, the comet wasactively ejecting dust and gas. The speed of the dust grains(with respect to the comet) was low compared to the fly-byspeed of the spacecraft so the impact on the aerogel was at aconstant encounter speed of 6.1 km s−1 and normal incidence.The Dust Flux Monitor Instrument (DFMI), an active impactsensor on the spacecraft’s leading edge, indicated that duringthe encounter dust grains were indeed striking the spacecraft,and it predicted a flux for the entire aerogel collector of2800 ± 500 cometary grains larger than 15 μm in diameter(Tuzzolino et al. 2004), although an impact ionization detector(sensitive to smaller particles) indicated a much lower flux(Kissel et al. 2004).
The successful return of the Stardust aerogel collector toEarth in January 2006 provided access to the cometarymaterial captured in the aerogel. The first reports (Brownleeet al. 2006; Hörz et al. 2006; and other papers in the sameissue of Science) have already provided a wealth of detailfrom the preliminary examination (PE) post-flight analysiseffort. In this paper, we provide an in-depth analysis of thecharacteristics of the tracks observed in the Stardust cometaryaerogel, combined with a description of experimental impactsthat simulated the Stardust environment, thus providinginsights and “calibrations” for the Stardust observations.
LABORATORY CALIBRATION
Laboratory Impacts with Glass Beads
The calibration of track size as a function of impactor sizeor mass is greatly aided by the fact that the encounter speed ofStardust was a constant 6.1 km s−1 at normal incidence to thecollector surface. The experiments employed the same soda-lime glass beads that were used to calibrate the crater size inStardust aluminum foils (Kearsley et al. 2006). These glassbeads were supplied by Whitehouse Scientific Ltd.; their
Table 1. Properties of glass beads used in calibration work. Impact speeds are accurate to better than 1%.Nominal diameter ±σ (μm)
Measured diameter ±σ(μm)a
Impact speed(km s−1)
11.58 ± 0.19 9.8 ± 2.2 6.0735.0 ± 0.8 34.7 ± 1.0 5.9963.8 ± 0.8 64.1 ± 2.8 5.82
aSee Kearsley et al. (2006).
Fig. 1. Schematic of typical carrot-shaped track observed inlaboratory impacts of glass beads in aerogel. Key dimensions arelabeled. EHD = entrance hole diameter. Note that the width at trackend is not always the same as the mean diameter of the capturedparticle. Impact direction was from left.

Characteristics of cometary dust tracks in Stardust aerogel and laboratory calibrations 25
characteristics are given in Table 1. In Kearsley et al. (2006),particle sizes were measured independently of the supplier’snominal values and good agreement was found. Using theUniversity of Kent two-stage light-gas gun (Burchell et al.1999a), samples beads in three size ranges were fired intoStardust-grade aerogel manufactured as part of the samebatches used in the Stardust cometary aerogel collector. Thisaerogel did not have a uniform density; instead it varied acrossthe 3 cm thickness of the blocks, from 5 kg m−3 at the frontface to 50 kg m−3 at the rear face (Tsou et al. 2003). The impactspeeds were measured for each shot to better than 1% and aregiven in Table 1. Tracks were observed with the classic carrotshape, i.e., the entrance hole widening quickly to a maximumtrack width just below the surface and then tapering with(nonparallel) straight-line sides to a near point where theparticle was captured (see schematic in Fig. 1). Note that themaximum track width is not at the entrance hole, but occurs atsome small depth below it.
For each size of projectile, several tracks were measuredunder the microscope. The various parameters measured aredefined as follows: track length is the straight line distancefrom center of the entrance hole in the surface plane of theaerogel to the center of the captured particle. The entrance holediameter is the average of several measurements; the holes arenot necessarily circular, so two orthogonal diameters aretaken and averaged; any narrow fractures in the surface planethat emanate from the main hole are ignored. The maximumtrack width is measured transverse to the main track axis (i.e.,track length) at its widest point and the depth of this positionbelow the original aerogel surface is also recorded. Thecaptured particle may not be spherical; accordingly, twoorthogonal diameters are taken and averaged. The averagevalues for the measurements of each quantity are given inTable 2. The uncertainty given on each average value is the1σ value of the distribution in each case. On average, themaximum track width occurred 13% of the total track lengthbelow the entrance hole (although there is a large scatter onthis). The data for track length (L), entrance hole diameter(EHD) and greatest width (W) are plotted versus originalparticle diameter (OPD) in Fig. 2 (various fits are shown andare described as follows). In Fig. 2a, it is found that:
L = −(1287 ± 669) + (296 ± 19) × OPD (1)
where units are in μm. This can be re-arranged to obtain:
OPD = [L + (1287 ± 669)]/(296 ± 19) (2)
where all units are μm. If the fit is forced to pass through the
origin, then we obtain L = (271 ± 10) × OPD (dashed line inthe figure), which is very similar to the original fit.
The data for EHDs are shown in Fig. 2b, along with threefits. The first fit is a linear fit, which gives:
EHD = (14 ± 46) + (5.0 ± 1.4) × OPD (3)
Again units are μm and the results can be rearranged as:
OPD = [EHD − (14 ± 46)]/(5.0 ± 1.4) (4)
If the linear fit is constrained to pass through the origin, weobtain EHD = (5.3 ± 0.6) × OPD, shown as a dashed line in thefigure and very similar to the original linear fit. The third fitconsidered in Fig. 2b is a polynomial fit. As can be seen in thefigure, although in the size range used it tracks the data pointsthemselves, this fit does not approach the origin at smallvalues of OPD, a nonphysical result for small-sized particles.This is typical of fits to any of the calibration data, where alinear fit is always found to describe the data well. With thiscaveat about failing for small particles, the fit yields:
EHD = (60 ± 71) + 1.38 × OPD + 0.057 × OPD2 (5)
(units are μm). This can be solved as a quadratic to give theoriginal particle diameter for a particular value of entrancehole diameter (EHD).
OPD = {−1.38 ± √[1.904 − 0.228 × (60 − EHD)]}/0.114 (6)
In Fig. 2c, the greatest track width data are shown and areagain fitted twice. Both fits are linear. The first (solid line)only uses the three data points and gives:
W = −(36 ± 50) + (13.3 ± 2.3) × OPD (7)
units are in μm. Rearranging gives:
OPD = [(36 ± 50) + W]/(13.3 ± 2.3) (8)
The intercept on this fit is a finite value but is within 1σ ofzero. Accordingly, we refit (dashed line), requiring the linearfit to pass through the origin, and obtain:
W = (12.1 ± 0.5) × OPD (9)
which rearranged yields:
OPD = W/(12.1 ± 0.5) (10)
where units are μm. As well as the directly measured quantities, it was also
possible to estimate the volume of each track. This was done byapproximating the track shape as a series of congruent frustra. Afrustum is a symmetrical truncated cone, as shown in Fig. 3a.
Table 2. Average track dimensions measured in the aerogel.Nominal diameter ±σ(μm)
Number of tracks
Track length(μm)
Entrance hole diameter (μm)
Maximum width(μm)
Depth of maximum width(μm)
Captured particle diameter (μm)
Track volume (mm3)
11.58 ± 0.19 6 2131 ± 529 84 ± 35 114 ± 33 238 ± 130 15 ± 2 0.010 ± 0.00735.0 ± 0.8 5 9309 ± 1755 178 ± 22 467 ± 73 2026 ± 769 34.8 ± 1.8 0.643 ± 0.23563.8 ± 0.8 5 17,598 ± 837 379 ± 76 750 ± 144 1108 ± 331 66.0 ± 2.4 3.10 ± 1.32

26 M. J. Burchell et al.
Two such shapes can be combined to approximate a carrot trackshape (Fig. 3b). The key measurements of a frustum were allavailable from the track measurements. These were then used toobtain the volume (V) of the three-dimensional track. On selectedtracks, volume measurements were made by slicing the track into20 or 40 individual cells and finding the volume of each.Agreement in the results with the two-frustrum method wasat the level of 10–15%, indicating reasonable robustness in themethod. The average results for volume are given in Table 2 andplotted versus impact kinetic energy (KE) in Fig. 4. The KEswere obtained for each sample using the nominal particle size andthe mean mass combined with the speed of each shot. Thisyields energies of 3.5 × 10⁻⁵ J, 9.1 × 10⁻⁴ J and 6.02 × 10⁻³ J,respectively, for the 11.58, 35, and 63.8 μm diameter samples.The fit to Fig. 4 gives:
V = −(0.011 ± 0.009) + (600 ± 170) × KE (11)
where units are mm3 for volume and J for KE. Rearrangingthis gives:
KE = {V + (0.011 ± 0.009)}/(600 ± 170) (12)
where again units are mm3 for volume and J for KE. Thissuggests 1.7 mJ of energy are needed to excavate each cubicmm of aerogel, with an accuracy of about 28%. That theintercept is only just over 1σ away from zero, suggests thisrelation also holds for smaller tracks than those measured here.
In general, there is a degree of surprise about these results.For example, it has previously been shown (e.g., Hörz et al. 1998;Burchell et al. 2006) that for impacts at equal speed by similarlysized particles, track length increases as aerogel densitydecreases. Here, impacts of different sized projectiles into densitygradient aerogel have produced a simple dependence of, forexample, track length on particle size. Detailed modelling isunderway to evaluate the origin of these dependences and todetermine the actual density gradient in the top 10 mm ofStardust aerogel tiles. It should also be noted that with only threedata points in each calibration data set here, although linear fitsare shown to be good descriptions of the data, any fine non-lineardependencies are not discernible rather than completelyexcluded.
Using these results, it is possible to measure track length,entrance hole diameter, or greatest track width and obtain anestimate of the diameter of the original impacting particle onthe Stardust collector. In the case of track volume thecalibration gives an impact energy (based on the volume ofaerogel excavated). For the known impact speed of Stardust,a particle mass can then be found. If a density is assumed theparticle diameter can then be obtained.
The above relationships were obtained for soda-limeglass beads (density 2.4 g cm−3) impacting the aerogel.Whether these can then be directly applied to other types ofparticles requires consideration. In the case of entrance holediameters, it is reasonable to assume that the criticalparameter is particle diameter. For example, Burchell et al.
Fig. 2. Calibration shots in aerogel. a) Average track length versusoriginal particle diameter. b) Average entrance hole diameterversus original particle diameter. c) Average greatest track widthversus original particle diameter. Parameterizations of the fitcurves are given in the figure (and explained in the main text asEquations 1, 3, 5, and 7) along with r, the regression coefficient ofthe fit.

Characteristics of cometary dust tracks in Stardust aerogel and laboratory calibrations 27
(1999b) have shown that particles of olivine, soda glass, andiron 100 microns in diameter all leave similarly sizedentrance holes in aerogel. This seems reasonable if weconsider the analogy as penetration of a very thin sheet; athypervelocities the hole punched in thin films gives a goodmeasure of particle cross-sectional area (Hörz et al. 1994).If taken further, this analogy may suggest that similarly tothe thin film, the continuous aerogel medium does notexhibit a major flow field around the surface entrance hole.Track length should not, however, be taken as a goodindicator of particle size, as this may well depend onadditional properties of the particle (e.g., density, which willaffect impact energy or melting point that will affect themass loss during penetration). Greatest track width is alsonot an ideal parameter, although it is accurate for trackssimilar in shape to those obtained in the calibration; in theStardust aerogel other track morphologies are also seen.Track volume may be a good indicator of impact kineticenergy, as the data suggest a constant excavation energy permm3 of aerogel for the soda-lime glass impactors used in thepresent experiments. This assumes no extra source of energy(i.e., from chemical decomposition of the projectile duringcapture). This will be returned to later when applied to realdata from Stardust.
Laboratory Impacts with a Variety of Minerals and Basalt
As well as glass beads, impacts on Stardust cometarygrade aerogels were obtained in the laboratory with four typesof natural materials. These were to simulate impacts from atypical range of materials possibly representative of thoselikely to be found at a comet. Details of the materials are givenin Table 3. The olivine and basalt grains produced carrot tracksin the aerogel similar to Fig. 1, these are called type A. The
pyrrhotite grains produced type B tracks, i.e., tracks with aslightly broader initial cavity which then tapered down to acarrot track. This has the appearance of a champagne flutewine glass without the base (i.e., only a bowl and a stemregion). This is shown in Fig. 5a. The lizardite grains,however, produced type C tracks with a broad cavity and noindividual tracks emerging from it (Fig. 5b); the walls of thesecavities were lined with fine fragments of particles, some ofwhich had penetrated slightly into the aerogel beyond the edgeof the cavity. Several such broad cavity tracks were seen in theaerogel from the lizardite impacts. A typical cavity is shown atcentimeter-size scale in Fig. 5b; we also observed similarimpact features at millimeter-scale. This behavior is thus notsize-dependent. However, in the lizardite shot, there were alsosome impacts that gave type B tracks with discrete fragments(of lizardite) at the end of the stylus. The size distribution ofthese trapped grains (and the associated large scatter in tracklength) did not reflect the size of the initial particles,suggesting they may have broken up during launch beforeimpacting the aerogel.
There are thus three types of tracks observed in theseshots and the morphological classification used is that whichwas also used in Hörz et al. 2006. Type A (soda-lime glass,basalt, olivine) is the classic carrot-shaped aerogel track,which initially broadens to a maximum width below the initialimpact point, then has (nonparallel) near-straight lined wallsthat come to a point (with the trapped particle nearby). Type B(pyrrhotite and some lizardite) are also relatively slendertracks, but have a broader initial cavity than the glassprojectiles and curved walls, which taper to a thinner stemfrom which emerges a carrot-shaped track, terminating near acaptured particle. Type C tracks (some lizardite particles)have only a broad cavity and no stem emerging from it, withno large discrete fragments of the initial particle beneath thecavity; instead multiple small fragments line the cavity.
Fig. 3. a) Top and side views of a frustum shape. b) Side view of twofrustums, which approximate the carrot track shape shown in Fig. 1.
Fig. 4. The estimated average track volume versus impact kineticenergy is shown for the calibration shots in aerogel. Theparameterization of the fit curve (Equation 11; see main text) is givenon the figure along with r, the regression coefficient of the fit.

28 M. J. Burchell et al.
There has been previous experimental work which hasproduced aerogel tracks of various shapes. Hörz et al. (1998)observed impacts in aerogel (density 20 kg m−3) in thelaboratory at speeds up to 6 km s−1. As well as carrot-shapedtracks from glass beads, they also observed types B and Ctracks from impacts of compressed dry cocoa powder (madefrom micron-sized grains). Type B tracks were obtained bymixing aluminum or glass spheres (50 μm) with the cocoapower, and type C tracks by pure cocoa powder projectiles.When examined afterward, the cocoa powder was found toline the wall of the cavities. Their conclusion was that low-cohesion projectiles leave bulbous, type C cavities, butcohesive projectiles produce carrot-shaped type A tracks.Mixtures of the two types of material inside oneinhomogeneous particle would produce a track type that wasa cross between these two extremes, i.e., a type B track. Thereis thus good agreement with the types of tracks found in themineral shots here in Stardust grade aerogels and the work ofHörz et al. (1998). One difference is that the bulbous cavitiesin the lizardite shots here may arise from a high volatilecontent of the projectile (lizardite is typically 14% water bymass) whereas in Hörz et al. (1998), it was due to lowcohesive strength of a fine-grained matrix. At potentiallyhigher, albeit unknown, impact speeds, Hörz et al. (2000) alsoobserved similar track morphologies in aerogel exposed onthe Mir Space Station. Separately, Kitazawa et al. (1999)proposed a scheme for track categorization. For impacts at >4km s−1, they found three track types (similar to those here)from impacts into aerogel of density 30 kg m−3. There is thusgood agreement between three separate sets of experimentsindicating that three major types of tracks are obtained fromimpacts in aerogel. In the remainder of this work, we use thenames types A, B, or C to label each type. The transitionbetween types (and variation inside types) is totallygradational.
Although three types of tracks are found, the entranceholes appear similar (a typical entrance hole is shown in Fig. 6).Thus the entrance hole does not differentiate between tracktype. Although the mineral grains were not monodispersive,
the range of entrance hole sizes in each shot is compatiblewith that expected from the known particle size range and thecalibration for soda-lime glass (Fig. 2b; Equations 3 and 5).This indicates that entrance hole diameter is probably themost suitable parameter to use for determining particle sizefrom impacts in aerogel of unknown particles. However, dueto the highly transparent nature of aerogel and some intrinsicsurface roughness, it can be difficult to focus on the surfaceface of an aerogel block and obtain a well-resolved image ofan entrance hole, especially at small track sizes.
STARDUST COMETARY TRAY TRACKS
Level 2 Scan
The returned Stardust aerogel samples were examined ina dedicated Class 100 clean room at the NASA CuratorialFacilities in Houston, Texas. The cometary aerogel traycontained 132 cells of aerogel, 130 of which were rectangularwith slightly rounded corners (surface of nearly 4 cm × 2 cm),but two were trapezoid-shaped, with a width of 2 cm and
Table 3. Mineral and basalt shots into Stardust-grade aerogel in the laboratory. Impact speeds are accurate to better than 1%.
Projectile Source
Impact speed(km s−1)
Grain size (μm)a
Basalt Natural History Museum (London). USGS sample NKT–1G
6.09 1–several hundred μm
Pyrrhotite Natural History Museum (London) BM.2005,M317
5.85 <125
Lizardite Natural History Museum (London). Confirmed by X-ray diffraction.
5.94 >53
Olivine LLNL, San Carlos olivine 5.85 <45aThis was at launch; some minerals may break apart into a smaller size range
during the shock of launch.
Fig. 5. Tracks made by impact of: (a) pyrrhotite grains in aerogel at5.85 km s−1; the largest track just extends off the bottom of the imageso the captured grain is not visible. b) Lizardite grain in aerogel at5.94 km s−1; the incident grain has broken up/disaggregated intomany fine fragments which are too small to be visible at this scale butline the walls of the cavity in the aerogel. In both cases the impactdirection was from the top.
Characteristics of cometary dust tracks in Stardust aerogel and laboratory calibrations 29
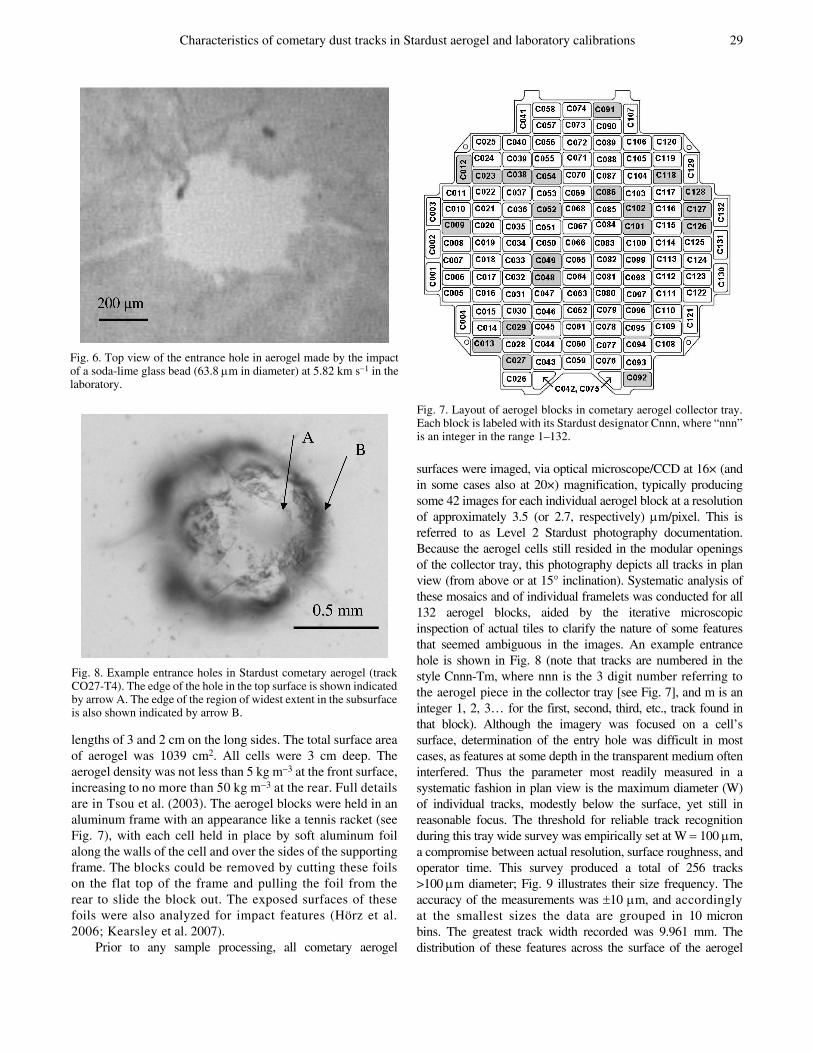
lengths of 3 and 2 cm on the long sides. The total surface areaof aerogel was 1039 cm2. All cells were 3 cm deep. Theaerogel density was not less than 5 kg m−3 at the front surface,increasing to no more than 50 kg m−3 at the rear. Full detailsare in Tsou et al. (2003). The aerogel blocks were held in analuminum frame with an appearance like a tennis racket (seeFig. 7), with each cell held in place by soft aluminum foilalong the walls of the cell and over the sides of the supportingframe. The blocks could be removed by cutting these foilson the flat top of the frame and pulling the foil from therear to slide the block out. The exposed surfaces of thesefoils were also analyzed for impact features (Hörz et al.2006; Kearsley et al. 2007).
Prior to any sample processing, all cometary aerogel
surfaces were imaged, via optical microscope/CCD at 16× (andin some cases also at 20×) magnification, typically producingsome 42 images for each individual aerogel block at a resolutionof approximately 3.5 (or 2.7, respectively) μm/pixel. This isreferred to as Level 2 Stardust photography documentation.Because the aerogel cells still resided in the modular openingsof the collector tray, this photography depicts all tracks in planview (from above or at 15° inclination). Systematic analysis ofthese mosaics and of individual framelets was conducted for all132 aerogel blocks, aided by the iterative microscopicinspection of actual tiles to clarify the nature of some featuresthat seemed ambiguous in the images. An example entrancehole is shown in Fig. 8 (note that tracks are numbered in thestyle Cnnn-Tm, where nnn is the 3 digit number referring tothe aerogel piece in the collector tray [see Fig. 7], and m is aninteger 1, 2, 3… for the first, second, third, etc., track found inthat block). Although the imagery was focused on a cell’ssurface, determination of the entry hole was difficult in mostcases, as features at some depth in the transparent medium ofteninterfered. Thus the parameter most readily measured in asystematic fashion in plan view is the maximum diameter (W)of individual tracks, modestly below the surface, yet still inreasonable focus. The threshold for reliable track recognitionduring this tray wide survey was empirically set at W = 100 μm,a compromise between actual resolution, surface roughness, andoperator time. This survey produced a total of 256 tracks>100 μm diameter; Fig. 9 illustrates their size frequency. Theaccuracy of the measurements was ±10 μm, and accordinglyat the smallest sizes the data are grouped in 10 micronbins. The greatest track width recorded was 9.961 mm. Thedistribution of these features across the surface of the aerogel
Fig. 6. Top view of the entrance hole in aerogel made by the impactof a soda-lime glass bead (63.8 μm in diameter) at 5.82 km s−1 in thelaboratory.
Fig. 8. Example entrance holes in Stardust cometary aerogel (trackCO27-T4). The edge of the hole in the top surface is shown indicatedby arrow A. The edge of the region of widest extent in the subsurfaceis also shown indicated by arrow B.
Fig. 7. Layout of aerogel blocks in cometary aerogel collector tray.Each block is labeled with its Stardust designator Cnnn, where “nnn”is an integer in the range 1–132.

30 M. J. Burchell et al.
collector is shown in Fig. 10. Given 132 aerogel blocks and 256features, approximately two per block are expected for arandom distribution.
To generate a preliminary impact flux for the wholecometary aerogel collector, a calibration has to be applied.The relation of Equation 8 is used to provide estimates ofprojectile diameter DP (note that for greatest widths ofdiameter, >100 μm, there is little difference between use ofEquations 8 or 10). The resulting cumulative particle size wasgiven in Hörz et al. (2006) and is shown in Fig. 11. Asexpected, the distribution cuts off at about 10 μm in DP andextends up to almost 1 mm. Ignoring the largest few particles(where small statistics may cause fluctuations), a fit to thedata from 10 to 200 μm gives:
Cumulative size distribution per m2 = 47100 Dp−1.22 ± 0.06(13)
At larger sizes, the slope in the cumulative flux increasessomewhat, but as stated, this may be due to the statistics ofsmall numbers of events. The lack of a roll-off in the flux atsmaller sizes indicates a fairly complete degree of scanning.Based on this flux, we find that 180 particles greater than15 μm in diameter struck the aerogel.
However, some caution is required in fully acceptingthis estimate of the flux. The calibration used was obtainedfrom the experimental type A tracks. However, as will beseen below, the data here are a mixture of track types. Asalready stated, it is not certain if maximum track width for agiven value of DP is independent of track type. Type Btracks are wider than type A by perhaps a factor of 2 (basedon rough estimates made from the calibration shots oflizardite). So a fraction of tracks in the cumulative flux inFig. 11 may have had their DP overestimated by a similarfactor. Since type A tracks dominate at small track lengths,the true slope in Fig. 11 is probably slightly steeper than thatin Equation 13.
Level 3 Scan
After the whole tray survey, 20 cometary cells of aerogelwere initially removed from the tray and their analysis isgiven here (shown as shaded blocks in Fig. 7 and listed inTable 4) (Note that additional cells have been removedsubsequently either for analysis or long-term curatorialstorage). The removed cells were then imaged side-on, whereeach tile was rotated some 15° to permit viewing of theexposed surface from below, which substantially improved
Fig. 9. Size frequency of features seen on Level 2 scan. In addition,there are four features greater than 4 mm in size.
Fig. 11. Cumulative particle size distribution for the cometaryaerogel collector based on an optical (Level 2) scan of the wholeaerogel surface while it was still in the collector tray (before anyindividual aerogel cells were removed from analysis). The fit curveshown is described in the text (Equation 13).
Fig. 10. Distribution of Level 2 features across the aerogel collector.Feature diameter is represented by symbol size: • is 100–500 μm, • is500–1000 μm, • is 1000–5000 μm, and • is 5000–10,000 μm.

Characteristics of cometary dust tracks in Stardust aerogel and laboratory calibrations 31
(compared to perfectly orthogonal views) the recognition ofvery small tracks. This so-called Level 3 Stardustphotography documentation was conducted at magnificationsof up to 16×, 25×, 32×, 50×, 63×, or even 100×, with aresolution of 3.4, 2.2, 1.7, 1.1, 0.88 or 0.55 μm per pixel,respectively, modestly higher than Level 2. Also, each tilewas photographed in discrete depth intervals, progressing in2.5 mm steps from the front to the rear side, resulting in 8“slices,” each slice consisting of some 64 images. Thepurpose of this photography was to produce a permanentrecord of the size and X/Y location of the track population ina given tile. Additionally, most of the large tracks werephotographed individually, with an optimally adjusted focalplane. The extracted blocks represented some 15% of the totalaerogel in the cometary tray, which was sufficient to providea high-resolution survey of tracks in the collector. The rest ofthe tray is currently being preserved by NASA as a resourcefor future analysis.
A total of 206 possible track-like features were initiallynoted in the Level 3 images. One feature was excluded as ithad impacted on the edge of the supporting aluminum frameand the resulting debris had spread into the aerogel; 19features were discarded because they were somewhatambiguous and not verified by a second observer. This gave aset of 186 tracks in the 20 aerogel blocks. Due to their smallsize and faint images, nine of these tracks could only havetheir dimensions measured to worse than 20% accuracy. Theremaining 177 tracks were measured to higher accuracy, withthe largest measured to better than 1%. The minimum tracklength was 55 μm and the smallest maximum track widthmeasured was 6 μm.
The tracks were visually categorized into type using the186 track data set. Examples are shown in Fig. 12 (type A),Fig. 13 (type B), and Fig. 14 (type C). In Fig. 12b, the capturedparticle at the end of a type A track is shown. In Fig. 13, verythin tracks can be seen emerging almost radially (with a slightdownward tilt) from the main cavity. Fine grains of particulatematerial line the main cavity and are seen along these fiber-like tracks and the stylus, as well as there being a terminalparticle at the end of the stylus. Many of these fragments aremicron scale and suitable for analysis by a variety oftechniques. Thus a single type B track may contain manyidentifiable particle fragments suitable for compositionalstudies. There is a very fine division between types B and C,several tracks listed as B are close to type C, possessing onlyvery short styli emerging beneath the main cavity.
Averaged over all sizes, 65% of tracks were type A, 33%type B, and 2% type C. However, this was found to be size-dependent. A breakdown of the percentage of types A and Bversus track length is given in Fig. 15 and given numerically
in Table 5. For small track lengths (<100 μm), all tracks aregiven as type A. There is a problem here as the resolution isstarting to become comparable to track width, and althoughthe tracks do not appear to have a transition region along theirlength (which would indicate a type B track if it were seen),higher resolution imaging is required to determine if this isindeed the case. For tracks greater than 500 μm in length,50% are A’s and 50% B’s. In the track length ranging from100 to 500 μm, there is a gradual transition from one regimeto the other. At larger track lengths (>1500 μm), the smallstatistics prevent meaningful comparison. The four type Ctracks were spread over all lengths in proportion to where thebulk of the tracks occurred, indicating no favored size scale.
In some impacts of type A, the incident particle appears
Cometary aerogel trays used in this work
C009, C012, C013, C023, C027, C029, C038, C048, C049, C052, C054, C086, C091, C092, C101, C102, C118, C126, C127, C128
Fig. 12. Examples of type A impacts from Stardust cometary aerogeltray (Level 3 images). a) Typical track (C038-T7). b) Capturedterminal particle (bottom) at end of track (from C086-T2). In bothcases, the impact direction was from the top.

32 M. J. Burchell et al.
to have split during capture, and resulted in more than oneterminal track (or “stylus”) per impact. This is also true fortype B tracks, where several styli can be seen emergingbeneath the main cavity (and are clearly distinct in size fromthe radial-hair-like features seen in Fig. 13). The distributionof how many styli are found in each track type is shown inFig. 16. There is a clear difference between track types. TypeA tracks are dominated by single terminal particles (86%).Type B tracks have one terminal particle just under 50% ofthe time, two in one-third of occurrences and 21% of type Btracks have three or more terminal particles. This suggests adifferent nature to the particles causing types A and B tracks.Type A particles are stronger materials, well-consolidatedinto usually a single grain. Type B particles are weaker in
some fashion, either more loosely bound or more volatile-rich, and are more readily disrupted into fragments duringcapture.
Each track was then individually measured. The keymeasurements were total track length (L) from entrance hole tothe deepest penetrating discrete fragment (or bottom of cavityfor type C tracks), entrance hole diameter (EHD), andmaximum track width (W). In addition, for types B and Ctracks, the main cavity was divided into several contiguousfrustra and the necessary heights and widths obtained. For alltracks, if more than 1 stylus was observed, each was measuredseparately (and treated as being similar to a carrot-shaped track,i.e., it had a base diameter and length that served to define a coneshape for the stylus). From the set of measurements made foreach track, an estimate of track volume (V) was then obtained,treating each track as a set of frustums or cones as required(similar to the treatment of the calibration data).
The distribution of maximum track widths versus lengthsis shown in Fig. 17. The track lengths ranged from 50 to10,000 μm. Track widths ranged from 4 to 2000 μm. A strongcorrelation was observed between track width and length(indicated by the near-diagonal trend in the data in Fig. 17).The data displayed in Fig. 17 have been grouped by tracktype. A division between the types is possible (with a fewexceptions close to the boundaries). The division betweentypes A and B is given by:
W = 0.065 × L1.1 (14)
and between types B and C by:
W = 0.20 × L1.1 (15)
As noted above, at short track lengths (L < 100 μm), onlytype A tracks are observed. It is possible that for the shortesttracks, the imaging resolution is insufficient to clearly
Fig. 13. Example of a type B impact (C054-T3) from the Stardustcometary aerogel tray (Level 3 images). Impact direction was from thetop.
Fig. 15. The percent of tracks that are type A, defined as 100 ×ΣA/Σ(A + B) versus track length (bin width 100 μm). For thelongest tracks, the quantization of 0, 66, or 100% at long tracklengths is due to small numbers of tracks per bin.
Fig. 14. Example of a type C track (C052-T6) from the Stardustcometary aerogel tray (Level 3 images). Impact direction was fromthe top.

Characteristics of cometary dust tracks in Stardust aerogel and laboratory calibrations 33
distinguish between types A and B. The tracks appear at currentresolution as “fat” cylinders with only some slight taperingtoward their terminus. They are thus apparently not type B, butare, however, relatively broader than the type A track seen atlarger scales. This assignment should thus be used cautiouslyand will be the subject of future work at higher resolutions.
The ratio W/L is informative for tracks, as it indicateshow relatively thin or fat a track is. W/L is shown versus tracklength in Fig. 18. The lines shown in Fig. 18 divide the dateinto distinct regions. At low track lengths (<100 μm, shownby a vertical solid line) only type A tracks are seen (as notedearlier). The main population of types A and B tracks aremostly separated by a horizontal line shown at W/L = 0.11,while the main population of type B and C tracks areseparated by a horizontal line shown at W/L = 0.35. Ignoringthe region L < 100 μm, track type A thus has W/L < 0.11, typeB has 0.11 ≤ W/L < 0.35, and type C has W/L 0.35. Sometype B tracks do intrude into the region defined for type C.Renewed examination of these shows that the terminal trackin these type B tracks is visible, but is typically very short andnarrow (in some images similar short tracks are seen radiatingnear laterally from higher up the main cavity), indicating thepresence of a very small fragment of the original particle.
In Fig. 19 the track volumes are shown versus tracklength for all tracks. Figure 19a shows type A tracks, and thedata were fitted to yield:
V = 0.043 × L(2.47 ± 0.08) (16)
where L is in μm and V in μm3. The behavior of the datafor L < 100 μm seems to differ somewhat for that at largertrack lengths. Accordingly, this data was excluded fromthe fit and a new relation obtained for type A tracks(L > 100 μm) of:
V = 0.012 × L(2.66 ± 0.09) (17)
As might be expected, the power in Equation 17 hasincreased slightly compared to Equation 16. Both fits areshown on the plot (all data solid line, L > 100 μm as adashed line). In Fig. 19b, the data are given for type Btracks and these yield a fit:
V = 0.0072 × L(3.01 ± 0.10) (18)
where again L is in μm and V in μm3. In Fig. 19c, all data areshown combined into one plot. Ignoring the region forL < 100 μm (boundary marked by a vertical line), we find thatthe boundary between type A and B tracks is given by:
V = 0.003 × L3 (19)
and between types B and C by:
V = 0.05 × L3 (20)
In most cases, attempts to directly measure the size of thecaptured particles from the Level 3 images failed as the particleswere at or below the limits of resolving and measuring such tinygrains in the images. More detailed images of the capturedparticles were made for a few tracks as part of thecompositional analysis studies, which are reported elsewherein this volume.
The measured values for track volume were thencombined with the calibration data (Equation 12) to obtainestimates of the pre-impact particle diameters in each track.The assumption made was that all particles had a density of2400 kg m−3. The results are shown versus track length inFig. 20. The projectile sizes ranged from 0.4 to 100 micron.The cumulative size plot is shown in Fig. 22. At small sizes(<1 μm) the cumulative size distribution flattens off,indicating a loss in scanning efficiency rather than a lack ofsmaller particles. At large particle diameters, the data aresusceptible to the statistics of small numbers and thecumulative curve shows a sudden change in slope. Finally, thetotal size distribution of Fig. 21 was fit over the range 1–100 μm, yielding:
Cumulative size distribution per m2 = 11900 Dp−0.76 ± 0.01 (21)
Table 5. Track categories versus track length (some percents do not sum to 100 due to rounding errors).
Track length range % type A % type B % type C
All 65 33 2<100 μm 100 0 0100–500 μm 70 27 3500–1000 μm 49 49 3>1000 μm 51 49 0
≥ Fig. 16. Frequency of the number of terminal tracks (“styli”) for (a)type A tracks and (b) type B tracks.

34 M. J. Burchell et al.
From Equation 21, the number of particles bigger than1 μm in diameter striking the Stardust aerogel tray ispredicted to be approximately 1200, and the number ofparticles larger than 15 micron diameter is predicted to be 158particles. This latter value is compatible with that predictedby the Level 2 scan of the entire tray, which predicted 180particles greater than 15 μm in diameter. And as shown inHörz et al. (2006), the size distribution (ignoring clustering,which is discussed in the next section and can lead tosignificant variations in flux on small surface areas) iscompatible with the average size distribution obtained fromthe craters on the aluminum foils at that size scale. This ishowever, substantially less than the 2800 ± 500 particlesgreater than 15 μm predicted by the DFMI during the flyby in2004 (Tuzzolino et al. 2004).
DISCUSSION
Calibration and Classification of Stardust Aerogel Tracks
The calibration is based on two data sets. The firstconcerns measured track parameters (length, volume, etc.)obtained from mono-dispersive glass beads fired intoStardust-grade aerogels in the laboratory. The second usespolydispersive grains of various materials, again fired atStardust-grade aerogels in the laboratory. In both cases, thedata sets are revealing and provide the necessary insights intocapture in the Stardust aerogels. However, both could befurther extended. The present limitation is operational andrelated to the lack of more Stardust-grade aerogel. Thissituation may be improved in the near future when theoriginal Stardust aerogel manufacturing procedure may berepeated to provide more aerogel for calibration purposes. Itwill then be possible to conduct calibrations with mono-
dispersive particles of a range of densities as has been donefor the cratering in Stardust foils (Kearsley et al. 2007).Similarly, fine details of the capture mechanism and how itchanges the nature of the impactor (e.g., processing oforganics during capture) can be studied in more depth.
The data herein concerning tracks in the Stardustaerogel from the cometary collector side were obtainedduring the PE period up until August 2006. They thusrepresent a first look at the aerogel. Work is ongoing, andmore data will be available later as more blocks areremoved for analysis. However, the current data sets arelarge enough to show the main trends in the analysis,although in some cases (e.g., the type C tracks) there arestill low statistics that, if improved, may reveal more. Ingeneral, it is unlikely that many more large tracks will befound. However, with greater statistics and particularlyhigher resolution images for the very short tracks, the trackmorphological classification can almost certainly beimproved and the nature of the tracks at the smallest scalesclarified further. One major point to note, however, is thatthe data refer only to the cometary collector tray. Theinterstellar collector tray still awaits an equivalent analysiswhen the first imaging of the tray is complete by theStardust@home analysis effort.
One notable feature of the observed tracks is theirdistribution across the collector as observed in the Level 3scan of extracted aerogel cells shown in Fig. 22. Theobserved number counts per cell are not compatible with arandom distribution. This effect is strongly correlated withfeature size (i.e., particle size). For larger particles, thedistribution is nearly compatible with a random distribution,but for the smallest particles this is not the case. This isdiscussed in detail in a separate paper (Westphal et al.2008).
Fig. 17. Stardust cometary aerogel track widths versus lengths(Level 3 scan). Track types are as indicated. See main text for detailsof the boundary lines superimposed on the data.
Fig. 18. Ratio of track width/length versus track length. Track typesare as shown. See the text for details of the boundary linessuperimposed on the data.

Characteristics of cometary dust tracks in Stardust aerogel and laboratory calibrations 35
Cumulative Size Distribution and Flux
The cumulative size distribution obtained from the datareported in depth in this paper can be compared to thatobtained by analysis of the cratering in the aluminum foils inStardust and the flux measured during the cometary encounterby electronic instruments read out in real time. All methodscan yield a size distribution, but the active instruments(DFMI) also provide timing information reflecting on thespatial distribution of the dust near the comet. In the followingdiscussion, all data have been converted to particle sizesassuming a density of 2.4 g cm3. While this may be areasonable assumption for the density of individual grains,particles with high porosity may have a significantly lowerbulk density.
In summary, there are two cumulative size distributionscalculated from the features in the aerogel (see above andTable 6). The first is based on the Level 2 scan of surfacefeatures of the whole collector tray and the second is based onthe higher resolution Level 3 scan of tracks (side view) in theaerogel blocks (15% of the total) removed during the PEperiod. The two thus use different data sets: the former iscomplete at large sizes (impactors nearly up to a millimeter insize) but loses sensitivity at intermediate sizes (10 μmimpactor size), while the latter is never complete per se, but issensitive to smaller impact features, extending the impactorsize range down to 0.5 μm. The Level 2 and 3 data sets areshown on the same axes in Fig. 23. A fit to the combined Level2 and 3 results was made over the size range 1 to 200 μm inprojectile size, and gave (dotted line on Fig. 23):
Cumulative size distribution per m2 = 14100 Dp−0.86 ± 0.01 (22)
It can be seen in Fig. 23 that at small sizes theaerogel data rolls off and is probably incomplete due to
Fig. 19. Track volume (V) versus track length (L) for tracksmeasured in the Stardust cometary aerogel. a) Type A tracks. b)Type B. c) All data. The fit curves shown in (a) and (b) areEquations 16, 17, 18 as described in the text. The boundarylines shown in (c) are Equations 19 and 20 as described in thetext.
Fig. 20. Estimated particle size versus track length for tracksmeasured in the Stardust cometary aerogel. Particle size wasobtained from Equation 12 in the text.

36 M. J. Burchell et al.
limited resolution. At large sizes, a single fit no longerdescribes all the data (with the data falling below the fitresult).
These results can be compared to those previouslyreported by the Stardust PE team. In Hörz et al. (2006), Fig. 4shows the cumulative size distribution data. The fit that wasgiven in that paper was based on the craters measured in thealuminum foils carried by Stardust. Using the calibration inKearsley et al. (2006), the crater widths (rim crest to rimcrest) were converted to impactor diameter. This calibrationused impacts of soda-lime glass beads onto Stardust-gradefoils (similar in nature to those used here for the aerogel, withdiameters in the size range 10–84 μm). Two sets of Stardustcraters were used in obtaining the impactor size distribution.The first was called “large” craters (>10 μm in diameter) andrepresent the tray-wide sum of such craters on all foils, akin tothe Level 2 track observations. The second category wassmall craters (<5 μm in diameter), which were obtained fromhigher resolution SEM scans of selected sub-areas of the foilsthat were harvested and allocated during PE. Afterapplication of the calibration (i.e., assuming the impactorswere spheres of density 2.4 g cm−3), the small craterscorrespond to impactors sized 20 nm to 1 μm (and thus aresmaller than the projectiles used in the calibration) and thelarge craters to impactors sized 4 to 100 μm (roughlycovering the calibration projectile size range). A single fit tothe combined crater data over the impactor size range 0.05 to100 μm yielded:
Cumulative size distribution per m2 = 125800 Dp−1.72 ± 0.05 (23)
The crater data are shown in Fig. 23 (the fit is the solidline). Above a particle diameter of 10 μm, the aerogel trackand foil crater data overlap substantially. However, below thissize there is a divergence that increases as particle sizedecreases.
In Hörz et al. (2006), the aerogel data that was usedagrees at large particle sizes with that presented here, butdiffers below 10 μm. In the Level 3 scan data here, all theextracted blocks have been used to obtain the cumulative sizedistribution. However, in Hörz et al. (2006), only two blockswere used, namely blocks C012 and C023. As can be seenfrom Fig. 22, these are the only two blocks with large numbersof tracks and the latter were dominated by small tracks andhence small particles. As was shown in Hörz et al. (2006) (andreproduced here on Fig. 23) the flux based on just these blocksis fully compatible with that from the foil crater data down toparticle sizes of 1 or 2 μm. Below this, the aerogel data rollsoff, indicating the limits of resolution have been reached. Thereason why the track data from aerogel blocks C012 and C023differs from that given by the Level 3 analysis based here onmore blocks, is that the former appear to contain a cluster ofimpacts that has occurred on a spatial scale of centimetersacross the collector; this is the only such cluster in the largersample. Given that this cluster is dominated by smallparticles, the cumulative size distribution is accordinglyinfluenced at small sizes in the two analyses by the relativeareas considered. As described in detail by Westphal et al.(2008), this clustering is poorly understood at present.
Fig. 21. Cumulative particle size distribution based on a highresolution optical (Level 3) scan of the 20 aerogel blocks extractedfrom the Stardust cometary dust collector tray. The fit curve shownis described (Equation 21) in the main text.
Fig. 22. Spatial distribution of tracks in Level 3 scan of extractedaerogel cells. Extracted cells are shown shaded; the number in thosecells is the observed number of tracks. Note that the large numbers oftracks in cells 12 and 23 are predominantly very short tracks.

Characteristics of cometary dust tracks in Stardust aerogel and laboratory calibrations 37
The results obtained during the post-flight analysis fromthe aerogel and foils can be compared to those obtainedduring the cometary encounter by the real-time DFMI(Tuzzolino et al. 2003). The data obtained by DFMI duringthe encounter were analyzed in Tuzzolino et al. (2004) and inmore detail in Green et al. 2004. Two points emerged. First,the slope of the cumulative size distribution varied as thespacecraft passed closer to the comet (within 3700 km,referred to as the inner coma) and then travelled further away(outer coma). Second, above particle sizes of approximately100 μm, an excess of particles was reported, which was notincluded in any fits. For comparison to the data here, theDFMI data were converted from particle mass (m) to particlesize (r) (with density 2400 kg m−3) and are shown plotted onFig. 23 along with all the other data sets. A fit to the DFMIdata from 1 < r < 100 μm yielded:
Cumulative size distribution per m2 = 1622000 Dp−2.55 ± 0.15 (24)
(with regression coefficient −0.9785). As expected, the power−2.55 is equal to the power of the equivalent mass distribution(−0.85) reported by Tuzzolino et al. (2004) and Green et al.(2004). In Fig. 23 above 10 μm in particle size, DFMI, craters,and aerogel tracks all yield similar results. The discrepanciesbetween the data sets only emerge significantly at smallerparticle sizes, with extreme divergence between DFMI andthe other data sets showing up at 1 μm. In the DFMI data, theresults for the smallest size particles were obtained from themost sensitive impact detector which had a surface area of20 cm2.
When comparing the size distribution measured duringencounter and those measured after the return, the largedifference in the power of the cumulative size distributions(Table 6) can be seen to lie in two effects. First, the fits in thefoil and aerogel analyses include data for impactors greaterthan order 100 μm in size. In the fits to the DFMI encounterdata (Tuzzolino et al. 2004; Green et al. 2004), this part of thesize distribution was excluded as it was considered to be due
to an excess of large grains (similar to that reported by theGiotto encounter with comet Halley, e.g., McDonnell et al.[1991] and also partly as it was of low statisticalsignificance at 7 impacts). If the data at large sizes (r > 100 μm)were included, the data point at the smallest sizes is then notcompatible with the fit of a single power law. Accordingly, ifwe remove the data point at the smallest size but include thoseat the largest sizes, we obtain:
Cumulative size distribution per m2 = 182000 Dp−1.74 ± 0.15 (25)
(with regression coefficient of −0.9787). There are thustwo equally statistically valid fits (Equations 24 and 25), butwith different slopes, depending on which end of the sizerange is excluded. Based on comparison with the other datahere, it is the DFMI datum at smallest sizes that appearsanomalous, as even allowing for clustering events, the otherdetectors do not reproduce such a high flux at small sizes andthe DFMI data at this size are spread over a time periodincompatible with a single cluster impact. In Green et al.(2004), the DFMI data were divided into time windows(corresponding to different stages of the encounter with thecomet). The power of the size distribution was found to varygreatly depending on the time interval chosen, ranging from−0.9 to −2.25 near closest encounter, rising to −3.39 some600+ s after the encounter, when a burst of counts wasdetected. It should also be noted that the other activeinstrument during encounter, Cometary and Interstellar DustAnalyzer (CIDA; with a very small active area) was designedto produce time-of-flight mass spectra from impacts of smallparticles (size >0.1 μm), and it observed a flux significantlysmaller than that predicted by the other methods extrapolatedto such scales (Kissel et al. 2004); the single cumulativedatum at approximately 1 μm projectile size of CIDA (seeFig. 23) falls below most of the post-flight crater and trackanalysis by approximately a factor of 2–10.
Table 6. Fits to cumulative size distribution, of the formy = axb, with x in μm.
Data set
Impactor size range (μm) a b
Aerogel Level 2, Equation 13
10–2000 47,100 −1.22 ± 0.06
Aerogel Level 3, Equation 21
1–100 11,900 −0.76 ± 0.01
Aerogel (all), Equation 22
1–200 14,100 −0.86 ± 0.01
Foil craters, Equation 23; Hörz et al. 2006
0.05–100 125,800 −1.72 ± 0.05
DFMI, Tuzzolino et al. 2004; Equation 24
1–200 1,622,000 −2.55 ± 0.15
DFMI (excluding small sizes and including large sizes), Equation 25
5–600 182,000 −1.74 ± 0.05 Fig. 23. Cumulative particle size distribution based from all data sets:aerogel Levels 2 and 3 scans (data presented herein), aerogel cells 12and 23 (Hörz et al. 2006), craters in foils (Hörz et al. 2006), and theDFMI (Tuzzolino et al. 2004). The parameterizations of the fitcurves shown are given in Table 6.

38 M. J. Burchell et al.
Taken together, the various DFMI, foil, and aerogel datasets indicate that there was significant temporal variation inthe particle flux and size distribution during encounter(DFMI) and that there were significant inhomogeneities in thespatial distribution of the cumulative particle flux measuredupon sample return (foil craters and aerogel tracks),particularly at smaller sizes, e.g., 1 μm scale and below.Obtaining a single flux or cumulative size distribution is thusdifficult, as it depends on the time period considered, theparticle size range used, and/or the location on the spacecraftof the detector. However, an appropriate cumulative sizedistribution can be obtained if a set of constraints is applied:
1. Use the combined flux from the encounter and ignoreany temporal variations.
2. Include the particle size range up to largest sizes (mmscale), i.e., do not treat large grains as an excess. Thevarious data sets here that satisfy these constraintsproduce a cumulative size distribution that is compatibleacross all the individual data sets for sizes >10 μm and isbest described by Equation 13.
3. For sizes below 10 μm, discrete clusters of particles areobserved and how many are included in the data set andnormalized to what collecting area can greatly influencethe reported cumulative size distribution. The range of slopes shown in Fig. 23 at small sizes
reflects variation in these parameters acting differently in thevarious data sets. The three fits shown in Fig. 23 illustratethis. A small number of clusters (potentially one) normalizedto a large collection area yields a distribution with a shallowslope (Equation 22). Data with a few clusters and a moderatearea yields an intermediate slope (which is well-representedby the extrapolation of Equation 13 to smaller sizes), whileuse of several clusters in a normalizing area restricted to thecluster regions increases the slope to that of Equation 23 orgreater (e.g., Equation 24). However, it should be noted thatat the smallest sizes measured by DFMI, the flux was notcompatible with the other measurements, either in absolutenumber or in the time distribution of the signals (which areincompatible with coincident hits inside a cluster).
These results can be compared to the cumulative sizedistributions from previous cometary encounters. Thepower of the size distribution from 1P/Halley was given asapproximately −3.0 (McDonnell et al. 1991) or −(2.6 ± 0.2)(Fulle et al. 2000), although this was found to depend on bothparticle size and distance from the nucleus. By contrast, thedust-grain size distribution measured during encounter at26P/Grigg-Skjellerup had a slope of −0.93 (McDonnell et al.1993). Ground-based observations of cometary dust massdistributions have also been made. For example, based onobservations of comet Hale-Bopp combined with modellingand simulations, it is predicted that the small particledistribution in the size range 0.1 to 20 μm had a size-distribution slope of −3 (Levasseur-Regourd et al. 2007). Thetime-resolved Stardust data suggest considerable spatial and
temporal variation in the size distribution of freshly liberateddust from a single comet, while the cumulative Wild 2observations seem to suggest differences from comet tocomet.
CONCLUSIONS
The Stardust mission successfully returned cometarydust grains captured in aerogel after being freshly emittedfrom comet 81P/Wild 2. Analysis of the tracks in the aerogelhas permitted an estimate of the total cometary particle fluxintercepted by the dust collector. The tracks in the aerogeldivide into several categories depending on the variablecomposition and structure of the particles. There are solidgrains that remain mostly intact during capture, and morefriable grains with either a less cohesive structure or asubstantial volatile content. The latter may also containsmaller grains of well-consolidated materials.
Laboratory impacts into aerogel have providedcalibrations that were used to obtain Stardust cometaryparticle cumulative size distributions and provided samples asreferences for composition analysis teams. Study of 15% ofthe aerogel yielded 177 well-identified tracks over 50 μm inlength, which, extrapolated to the whole cometary tray,suggests that some 1180 tracks of this length or above arecontained in the aerogel blocks. This is a rich harvest ofcometary materials awaiting detailed analysis.
The cumulative size distribution and flux obtained forWild 2 shows non-uniform features in both short time andspatial regimes. For particle sizes greater than 10 μm all themeasurement methods used by Stardust produced similarresults. However, at smaller sizes, measurement of theparticle size (or mass) distribution by different methodsproduced significantly different results that are not readilyexplained at this time; they may relate to the differingdetection thresholds of the diverse methods or to spatial andtemporal heterogeneities of the coma dust at the scale ofindividual detector surfaces, e.g., stream effects in the comaand localized point sources (some of which may be close tothe spacecraft, i.e., break-up of larger particles after emissionfrom the comet nucleus, as discussed by Westphal et al.2008).
Acknowledgments–We thank NASA for supporting thePreliminary Examination period for the Stardust missionfrom project funds as well as through the StardustParticipating Scientist Program. The able support of thecuratorial staff, including J. Warren, R. Bastien, andK. Messenger at the Johnson Space Center is gratefullyacknowledged. Constructive reviews by T. J. Ahrens andJ.-C. Liou were greatly appreciated. PPARC provided supportfor participation by groups in the United Kingdom. TheNatural History Museum provided additional funds to assistin analysis.
Characteristics of cometary dust tracks in Stardust aerogel and laboratory calibrations 39
Editorial Handling—Dr. Christian Koeberl
REFERENCES
Anderson W. W. and Ahrens T. J. 1994. Physics of interplanetarydust capture via impact into organic polymer foams. Journal ofGeophysical Research 99:2063–2071.
Brownlee D. E., Tsou P., Anderson J. D., Hanner M. S., NewburnR. L., Sekanina Z., Clark B. C., Hörz F., Zolensky M. E.,Kissel J., McDonnell J. A. M., Sandford S. A., and TuzzolinoA. J. 2003. Stardust: Comet and interstellar dust sample returnmission. Journal of Geophysical Research 108, doi:10.1029/2003JE002087.
Brownlee D. E., Hörz F., Newburn R. L., Zolensky M., DuxburyT. C., Sandford S., Sekanina Z., Tsou P., Hanner M. S., ClarkB. C., Green S. F., and Kissel J. 2004 Surface of young Jupiterfamily comet 81P/Wild 2: View from the Stardust spacecraft.Science 304:1764–1769.
Brownlee D., Tsou P., Aléon J., Alexander C. M. O’D., Araki T.,Bajt S., Baratta G. A., Bastien R., Bland P., Bleuet P., Borg J.,Bradley J. P., Brearley A., Brenker F., Brennan S., Bridges J. C.,Browning N., Brucato J. R., Brucato H., Bullock E., BurchellM. J., Busemann H., Butterworth A., Chaussidon M.,Cheuvront A., Chi M., Cintala M. J, Clark B. C., Clemett S. J.,Cody G., Colangeli L., Cooper G., Cordier P. G., Daghlian, C.,Dai Z., D'Hendecourt L., Djouadi Z., Dominguez G.,Duxbury T., Dworkin J. P., Ebel D., Economou T. E., FaireyS. A. J., Fallon S., Ferrini G., Ferroir T. Fleckenstein H., Floss C.,Flynn G., Franchi I. A., Fries M., Gainsforth Z., Gallien J.-P.,Genge M., Gilles M. K., Gillet P., Gilmour J., Glavin D. P.,Gounelle M., Grady M. M., Graham G. A., Grant P. G., GreenS. F., Grossemy F., Grossman L., Grossman J., Guan Y.,Hagiya K., Harvey R., Heck P., Herzog G. F., Hoppe P., Hörz F.,Huth J., Hutcheon I. D., Ishii H., Ito M., Jacob D., Jacobsen C.,Jacobsen S., Joswiak D., Kearsley A. T., Keller L., Khodja H.,Kilcoyne A. L. D., Kissel J., Krot A., Langenhorst F.,Lanzirotti A., Le L., Leshin L., Leitner J., Lemelle L., Leroux H.,Liu M.-C., Luening K., Lyon I., MacPherson G., Marcus M. A.,Marhas K., Matrajt G., Meibom A., Mennella V., Messenger K.,Mikouchi T., Mostefaoui S., Nakamura T., Nakano T.,Newville M., Nittler L. R., Ohnishi I., Ohsumi K., Okudaira K.,Papanastassiou D. A., Palma R., Palumbo M. O., Pepin R. E.,Perkins D., Perronnet M., Pianetta P., Rao W., Rietmeijer F.,Robert F., Rost D., Rotundi A., Ryan R., Sandford S. A.,Schwandt C. S., See,T. H., Schlutter D., Sheffield-Parker J. A.,Simionovici S., Sitnitsky S. I., Snead C. J., Spencer M. K.,Stadermann F. J., Steele A., Stephan T., Stroud R., Susini J.,Sutton S. R., Taheri M., Taylor S., Teslich N., Tomeoka K.,Tomioka N., Toppani A., Trigo-Rodríguez J. M., Troadec D.,Tsuchiyama A., Tuzolino A. J., Tyliszczak T., Uesugi K.,Velbel M., Vellenga J., Vicenzi E., Vincze L., Warren J.,Weber I., Weisberg M., Westphal A. J., Wirick S., Wooden D.,Wopenka B., Wozniakiewicz P. A., Wright I., Yabuta H.,Yano H., Young E. D., Zare R. N., Zega T., Ziegler K.,Zimmerman L., Zinner E., and Zolensky M. 2006. Comet Wild 2under a microscope. Science 314:1711–1716.
Burchell M. J., Cole M. J., McDonnell J. A. M., and Zarnecki J. C.1999a. Hypervelocity impact studies using the 2 MV Van deGraaff accelerator and two-stage light-gas gun of the Universityof Kent at Canterbury. Measurement Science Technology 10:41–50.
Burchell M. J., Thomson R., and Yano H. 1999b. Capture ofhypervelocity particles in aerogel: In ground laboratory and lowEarth orbit. Planetary and Space Science 47:189–204.
Burchell M. J., Graham G., and Kearsley A. 2006. Cosmic dustcollection in aerogel. Annual Reviews of Earth and PlanetaryScience 34:385–418.
Domínguez G., Westphal A. J., Jones S. M., and Phillips M. L. F.2004. Energy loss and impact cratering in aerogels: Theory andexperiment. Icarus 172:613–624.
Fulle M., Levasseur-Regourd A. C., McBride N., and Hadamcik N.2000. In situ dust measurements from within the coma of 1P/Halley: First-order approximation with a dynamical dust model.The Astronomical Journal 119:1968–1977.
Green S. F., McDonnell J. A. M., McBride N., ColwellM. T. S. H., Tuzzolino A. J., Economou T. E., Tsou P., ClarkB. C., and Brownlee D. E. 2004. The dust mass distribution ofcomet 81P/Wild 2. Journal of Geophysical Research 109:1–12.
Hörz F., Cintala M., Bernhard R. P., and See T. H. 1994.Dimensionally scaled penetration experiments—Aluminumtargets and glass projectiles 50 μm to 3.2 mm in diameter.International Journal of Impact Engineering 15:257–280.
Hörz F., Cintala M. J., Zolensky M. E., Bernhard R. B., DavidsonW. E., Haynes G., See T. H., Tsou P., and Brownlee D. E. 1998.Capture of hypervelocity particles with low-density aerogel.NASA TM-98-201792. 58 p.
Hörz F., Zolensky M. E., Bernard R. P., See T. H., and Warren J. L.2000. Impact features and projectile residues in aerogel exposedon Mir. Icarus 147:559–579.
Hörz F., Bastien, R., Borg J., Bradley J. P., Bridges J. C., BrownleeD. E., Burchell M. J., Cintala M. J, Dai Z. R., Djouadi Z.,Dominguez G., Economou T. E., Fairey S. A. J., Floss C., FranchiI. A., Graham G. A., Green S. F., Heck H., Hoppe P., Huth J.,Ishii H., Kearsley A. T., Kissel J., Leitner J., Leroux H.,Marhas M., Messenger K., Schwandt C. S., See T. H., Snead S.,Stadermann F. J., Stephan T., Stroud R., Teslich N., Trigo-Rodríguez J. M., Tuzzolino A. J., Troadec D., Tsou P., Warren J.,Westphal A., Wozniakiewicz P. J., Wright I., and Zinner E. 2006.Impact features on Stardust: Implications for comet 81P/Wild 2dust. Science 314:1716–1719.
Kearsley A. T., Burchell M. J., Hörz F., Cole M. J., and SchwandtC. S. 2006. Laboratory simulations of impacts upon aluminumfoils of the Stardust spacecraft: Calibration of dust particlesize from comet Wild 2. Meteoritics & Planetary Science 41:167–180.
Kearsley A. T., Graham G. A., Burchell M. J., Cole M. J., Dai Z.,Teslich N., Chater R. J., Wozniakiewicz, Spratt J., and JonesG. 2007. Analytical scanning and transmission electronmicroscopy of laboratory impacts on Stardust aluminum foils:Interpreting impact crater morphology and the composition ofimpact residues. Meteoritics & Planetary Science 42:191–210.
Kissel J., Krueger F. R., Silén J., and Clark B. C. 2004. The cometaryand interstellar dust analyzer at comet 81P/Wild 2. Science 304:1774–1776.
Kistler S. S. 1931. Coherent expanded aerogels and jellies. Nature127:741.
Kitazawa Y., Fujiwara A., Kadono T., Imagawa K., Okada Y., andUematsu K. 1999. Hypervelocity impact experiments on aerogeldust collector. Journal of Geophysical Research 104:22,035–22,052.
Levasseur-Regourd A. C., Mukai T., Lasue J., and Okada Y. 2007.Physical properties of cometary and interplanetary dust.Planetary and Space Science 55:1010–1020.
McDonnell J. A. M., Lamy P. L., and Pankiewicz G. S. 1991. InComets in the post-Halley era, vol. 2, edited by Newburn R. L.,Neugebauer M., and Rahe J. Norwell, Massachusetts: KluwerAcademic. pp. 1043–1073.

40 M. J. Burchell et al.
McDonnell J. A. M., McBride N., Beard R., Bussoletti E.,Colangeli L., Eberhardt P., Firth J. G., Grard R., Green S. F., andGreenberg J. M. 1993. Dust particle impacts during the Giottoencounter with comet Grigg-Skjellerup. Nature 362:732–734.
Tsou P., Brownlee D. E., Laurance M. R., Hrubesh L., and AlbeeA. L. 1988. Intact capture of hypervelocity micrometeoroidanalogs. 19th Lunar and Planetary Science Conference.pp. 1205–1206.
Tsou P., Brownlee D. E., Sandford S. A., Hörz F., and ZolenskyM. E. 2003. Wild 2 and interstellar sample collection and Earthreturn. Journal of Geophysical Research 108:1–21.
Tsou P., Brownlee D. E., Anderson J. D., Bhaskaran S., CheuvrontA. R., Clark B. C., Duxbury T., Economou T., Green S. F., HannerM. S., Hörz F., Kissel J., McDonnell J. A. M., Newburn R. L.,Ryan R. E., Sandford S. A., Sekanina Z., Tuzzolino A. J., VellingaJ. M., and Zolensky M. E. 2004. Stardust encounters comet 81P/Wild 2. Journal of Geophysical Research 109:1–8.
Tuzzolino A. J., Economou T. E., McKibbon R. B., Simpson J. A.,
McDonnell J. A. M., Burchell M. J., Vaughan B. A. M., Tsou P.,Hanner M. S., Clark B. C., and Brownlee D. E. 2003. Dust FluxMonitor Instrument for the Stardust mission to comet Wild 2.Journal of Geophysical Research 108:1–24.
Tuzzolino A. J., Economou T. E., Clark B. C., Tsou P., Brownlee D. E.,Green S. F., McDonnell J. A. M., McBride N., and ColwellM. T. S. H. 2004. Dust measurements in the coma of comet 81P/Wild 2 by the Dust Flux Monitor Instrument. Science 304:1776–1780.
Westphal A. J., Bastien R. K., Borg J., Bridges J., Brownlee D. E.,Burchell M. J., Cheng A. F., Clark B. C., Djouadi Z., Floss C.,Franchi I., Gainsforth Z., Graham G., Green S. F., Heck P. R.,Hor’anyi M., Hoppe P., Hörz F., Huth J., Kearsley A., Leroux H.,Marhas K., Nakamura-Messenger K., Sandford S. A., See T. H.,Stadermann F., Tsitrin S., Tsou P., Warren J. L., WozniakiewiczP. J., and Zolensky M. E. 2008. Discovery of non-random spatialdistribution of impacts in the Stardust cometary collector.Meteoritics and Planetary Science 43. This issue.


![The Effective Temperature Scale of FGK Stars. II. T eff : Color : [Fe/H] Calibrations](https://static.fdokumen.com/doc/165x107/632500fa85efe380f30679bb/the-effective-temperature-scale-of-fgk-stars-ii-t-eff-color-feh-calibrations.jpg)