Assessment and control of organic and other contaminants associated with the Stardust sample return...
45
Assessment and control of organic and other contaminants associated with the Stardust sample return from comet 81P ⁄ Wild 2 Scott A. SANDFORD 1* , Sasˇa BAJT 2 , Simon J. CLEMETT 3 , George D. CODY 4 , George COOPER 5 , Bradley T. DEGREGORIO 6 , Vanessa de VERA 7 , Jason P. DWORKIN 8 , Jamie E. ELSILA 8 , George J. FLYNN 9 , Daniel P. GLAVIN 8 , Antonio LANZIROTTI 10 , Thomas LIMERO 7 , Mildred P. MARTIN 8,11 , Christopher J. SNEAD 12 , Maegan K. SPENCER 13 , Thomas STEPHAN 14 , Andrew WESTPHAL 15 , Sue WIRICK 16 , Richard N. ZARE 17 , and Michael E. ZOLENSKY 18 1 NASA-Ames Research Center, Astrophysics Branch, Mail Stop 245-6, Moffett Field, California 94035–1000, USA 2 Institute of Geophysics and Planetary Physics, Lawrence Livermore National Laboratory, Livermore, California 94550, USA #Present address: DESY Deutsches Elektronen-Synchrotron, Notkestraße 85, 22607 Hamburg, Germany 3 ERC, Inc. ⁄ NASA-Johnson Space Center, Houston, Texas 77058, USA 4 Geophysical Laboratory, Carnegie Institution of Washington, Washington, D.C. 20015, USA 5 NASA-Ames Research Center, Astrobiology Branch, Mail Stop 239-4, Moffett Field, California 94035–1000, USA 6 Naval Research Lab., Code 6366, 4555 Overlook Ave. SW, Washington, D.C. 20375–5320, USA 7 Wyle Integrated Science and Engineering, Houston, Texas 77058, USA 8 Goddard Center for Astrobiology, NASA-Goddard Space Flight Center, Greenbelt, Maryland 20771, USA 9 Physics Department, SUNY Plattsburgh, 101 Broad Street, Plattsburgh, New York 12901, USA 10 CARS, University of Chicago, Chicago, Illinois 60637, USA 11 The Catholic University of America, Washington, D.C. 20064, USA 12 Department of Earth and Space Sciences, UCLA, California 90095–1567, USA 13 Department of Chemistry, Stanford University, Stanford, California 94305–5080, USA Present address: Sawtooth Labs, Inc., Redwood City, California 94063, USA 14 Department of the Geophysical Sciences, The University of Chicago, 5734 South Ellis Avenue, Chicago, Illinois 60637, USA 15 Space Sciences Laboratory, University of California at Berkeley, Berkeley, California 94720, USA 16 Physics and Astronomy Department, SUNY at Stony Brook, Stony Brook, New York 11794–3800, USA 17 Department of Chemistry, Stanford University, Stanford, California 94305–5080, USA 18 1KT, NASA-Johnson Space Center, Houston, Texas 77058, USA * Corresponding author. E-mail: [email protected] (Received 28 September 2009; revision accepted 12 December 2009) Abstract–Numerous potential sources of organic contaminants could have greatly complicated the interpretation of the organic portions of the samples returned from comet 81P ⁄ Wild 2 by the Stardust spacecraft. Measures were taken to control and assess potential organic (and other) contaminants during the design, construction, and flight of the spacecraft, and during and after recovery of the sample return capsule. Studies of controls and the returned samples suggest that many of these potential sources did not contribute any significant material to the collectors. In particular, contamination from soils at the recovery site and materials associated with the ablation of the heatshield do not appear to be significant problems. The largest source of concern is associated with the C present in the original aerogel. The relative abundance of this carbon can vary between aerogel tiles and even within individual tiles. This C was fortunately not distributed among a complex mixture of organics, but was instead largely present in a few simple forms (mostly as Si-CH 3 groups). In most cases, the signature of returned cometary organics can be readily distinguished from contaminants through their different compositions, nonterrestrial isotopic ratios, and ⁄ or association with other cometary materials. However, some conversion of the carbon indigenous to the flight aerogel appears to have happened during particle impact, and some open issues remain regarding how this C may be processed into new forms during the hypervelocity impact collection of the comet dust. Ó The Meteoritical Society, 2010. 406 Meteoritics & Planetary Science 45, Nr 3, 406–433 (2010) doi: 10.1111/j.1945-5100.2010.01031.x
Transcript of Assessment and control of organic and other contaminants associated with the Stardust sample return...
Assessment and control of organic and other contaminants
associated with the Stardust sample return from comet 81P ⁄Wild 2
Scott A. SANDFORD1*, Sasa BAJT2, Simon J. CLEMETT3, George D. CODY4, George COOPER5,Bradley T. DEGREGORIO6, Vanessa de VERA7, Jason P. DWORKIN8, Jamie E. ELSILA8,George J. FLYNN9, Daniel P. GLAVIN8, Antonio LANZIROTTI10, Thomas LIMERO7,
Mildred P. MARTIN8,11, Christopher J. SNEAD12, Maegan K. SPENCER13, Thomas STEPHAN14,Andrew WESTPHAL15, Sue WIRICK16, Richard N. ZARE17, and Michael E. ZOLENSKY18
1NASA-Ames Research Center, Astrophysics Branch, Mail Stop 245-6, Moffett Field, California 94035–1000, USA2Institute of Geophysics and Planetary Physics, Lawrence Livermore National Laboratory, Livermore, California 94550, USA
#Present address: DESY Deutsches Elektronen-Synchrotron, Notkestraße 85, 22607 Hamburg, Germany3ERC, Inc. ⁄NASA-Johnson Space Center, Houston, Texas 77058, USA
4Geophysical Laboratory, Carnegie Institution of Washington, Washington, D.C. 20015, USA5NASA-Ames Research Center, Astrobiology Branch, Mail Stop 239-4, Moffett Field, California 94035–1000, USA
6Naval Research Lab., Code 6366, 4555 Overlook Ave. SW, Washington, D.C. 20375–5320, USA7Wyle Integrated Science and Engineering, Houston, Texas 77058, USA
8Goddard Center for Astrobiology, NASA-Goddard Space Flight Center, Greenbelt, Maryland 20771, USA9Physics Department, SUNY Plattsburgh, 101 Broad Street, Plattsburgh, New York 12901, USA
10CARS, University of Chicago, Chicago, Illinois 60637, USA11The Catholic University of America, Washington, D.C. 20064, USA
12Department of Earth and Space Sciences, UCLA, California 90095–1567, USA13Department of Chemistry, Stanford University, Stanford, California 94305–5080, USA
Present address: Sawtooth Labs, Inc., Redwood City, California 94063, USA14Department of the Geophysical Sciences, The University of Chicago, 5734 South Ellis Avenue, Chicago, Illinois 60637, USA
15Space Sciences Laboratory, University of California at Berkeley, Berkeley, California 94720, USA16Physics and Astronomy Department, SUNY at Stony Brook, Stony Brook, New York 11794–3800, USA
17Department of Chemistry, Stanford University, Stanford, California 94305–5080, USA181KT, NASA-Johnson Space Center, Houston, Texas 77058, USA
*Corresponding author. E-mail: [email protected]
(Received 28 September 2009; revision accepted 12 December 2009)
Abstract–Numerous potential sources of organic contaminants could have greatly complicatedthe interpretation of the organic portions of the samples returned from comet 81P ⁄Wild 2 bythe Stardust spacecraft. Measures were taken to control and assess potential organic (andother) contaminants during the design, construction, and flight of the spacecraft, and duringand after recovery of the sample return capsule. Studies of controls and the returned samplessuggest that many of these potential sources did not contribute any significant material to thecollectors. In particular, contamination from soils at the recovery site and materials associatedwith the ablation of the heatshield do not appear to be significant problems. The largestsource of concern is associated with the C present in the original aerogel. The relativeabundance of this carbon can vary between aerogel tiles and even within individual tiles. ThisC was fortunately not distributed among a complex mixture of organics, but was insteadlargely present in a few simple forms (mostly as Si-CH3 groups). In most cases, the signatureof returned cometary organics can be readily distinguished from contaminants through theirdifferent compositions, nonterrestrial isotopic ratios, and ⁄or association with other cometarymaterials. However, some conversion of the carbon indigenous to the flight aerogel appears tohave happened during particle impact, and some open issues remain regarding how this C maybe processed into new forms during the hypervelocity impact collection of the comet dust.
� The Meteoritical Society, 2010.406
Meteoritics & Planetary Science 45, Nr 3, 406–433 (2010)
doi: 10.1111/j.1945-5100.2010.01031.x

INTRODUCTION
One of the scientific goals of the Stardust cometsample return mission was to establish whethercometary dust contained complex organic materials, andif so, to establish the abundance, chemical, and isotopicnature of the organic phase(s) (Brownlee et al. 2003;Tsou et al. 2003). Such information would provide keyinsights into the formation and evolution of the comet,and the nature of the organic material can potentiallybe used to place constraints on the environments andchemical processes by which the organics were originallymade and subsequently evolved (e.g., Cronin et al. 1988;Bernstein et al. 1999; Sandford et al. 2000, 2001;Pizzarello et al. 2006). Characterization of any organicphases also allows an additional means by which thereturned cometary materials can be compared to thoseseen in other extraterrestrial materials, particularly inmeteorites and interplanetary dust particles (IDPs), andto the various organic materials detected in interstellarspace.
In addition, it has been suggested that comets andtheir dust may have played an important role indelivering complex organic materials to early planetarysurfaces and that these materials may have played keyroles in the formation of life on Earth (e.g., Oro 1961;Oro et al. 1980; Chyba and Sagan 1992; Huebner andBoice 1992; Chyba and McDonald 1995). Insofar asour planetary system formed by universal processes, abetter understanding of the delivery of organicmaterials to planets in our solar system by cometarydust also provides some assessment of the role suchmaterials might play in other forming planetarysystems.
The study of organic materials in extraterrestrialsamples is fraught with difficulty, however. We live ona planet that is rich with life, and organic compoundsare everywhere around us. Thus, organic analysis ofextraterrestrial samples must deal with the potential forthe presence of contaminants that may be mistakenlyidentified as having an extraterrestrial origin. In thecase of the samples returned from comet 81P ⁄Wild 2,this problem is exacerbated by the extremely smallsizes of the returned samples (typically nanograms orless) and their intimate association with aerogelcollector material, which contained some indigenouscarbon.
In the paper that follows, we describe the results ofa study made by members of the Stardust organicspreliminary examination team (PET) to characterize thepopulations of potential Stardust contaminants andassess the nature of any organic contaminants foundwithin the Stardust sampling system.
EXPERIMENTAL TECHNIQUES
During the course of the organics preliminaryexamination (PE), and the preparations leading up to it,the Organics PET made use of a wide variety of analyticaltechniques (see supporting online material [SOM] formore details). These techniques included Fourier infrared(IR) microspectroscopy, nuclear magnetic resonance(NMR) spectroscopy, luminescence imaging, liquidchromatography with UV fluorescence detection andtime-of-flight mass spectrometry (LC-FD ⁄TOF-MS),time-of-flight secondary ion mass spectrometry (TOF-SIMS), X-ray absorption near-edge spectroscopy(XANES), X-ray diffraction, and microprobe laser-desorption laser-ionization mass spectrometry (lL2MS).Details of these techniques and the equipment andprocedures used for these analyses are summarized in thepaper’s SOM.
PREFLIGHT, FLIGHT, AND POSTFLIGHT
CONTROLS
It was recognized from the very beginnings of theStardust mission that special care was needed tominimize the potential exposure of the Stardust samplecollection system to outside organics. Members of thescience team (SS and MZ) worked with the contractorthat built the spacecraft, Lockheed-Martin, during thedesign and construction phase of the mission to dowhat could be done within the resources available tomaintain as clean a sampling environment as possible.Of course, it was not possible to make and maintain acompletely contamination-free spacecraft and samplingsystem, and a parallel effort was also made to assessany possible contaminants that might ultimately bepresent in the sampling system. This effort involved theinventory and collection of samples of spacecraftconstruction materials that could potentiallycontaminate the collectors. ‘‘Witness coupons’’ werealso used during construction, test, and flight that couldbe examined to assess any accumulated contaminants.During recovery of the sample return capsule (SRC) inUtah, samples were also obtained from potentialcontamination reservoirs, including local soil and airsamples, portions of the thermal protection system, andthe contents of the sample canister’s air filter. Finally,considerable efforts were made to characterize theintrinsic organic contents of the aerogel tiles in whichthe cometary samples were collected, since thesematerials are in intimate contact with the majority ofthe returned samples.
Much of the discussion that follows involves studiesof these various control samples. It should be noted
Stardust contamination assessment 407

that, during the duration of the mission, samples of allthese materials have been archived by the StardustCurator at Johson Space Center (JSC) and, just as arethe Wild 2 samples collected by Stardust, thesematerials are available for investigators to request forscientific purposes.
In the text that follows we will sequentially discuss(i) the organics associated with the Stardust aerogelcollector medium, (ii) potential contaminants that couldhave been acquired from the Stardust spacecraft duringflight, and (iii) potential contaminants from flight, re-entry, and recovery of the SRC. We then end with adiscussion of relevant ‘‘lessons learned’’ from the flightof the Stardust mission.
ORGANICS ASSOCIATED WITH THE AEROGEL
COLLECTOR MEDIUM
As noted earlier, one of the largest concerns withregard to organic contamination of the Wild 2 samplesis associated with the presence of carbon in the originalaerogel collector tiles. Aerogel tiles used in the Stardustcollector tray were produced from tetraethyl-ortho-silicate (TEOS) using the basic process developed byTillotson and colleagues (see Tillotson and Hrubesh1992). However, these processes were modified in orderto produce tiles with density gradients (Tsou et al. 2003;Jones 2007). The aerogel manufacturing processinvolved the use of TEOS, ethanol, water, nitric acid,ammonium hydroxide, and acetonitrile. In addition, asilicone based mold release was sprayed into the aerogeltile molds to prevent aerogel from adhering to themolds. After wet gel precursors were placed into themolds and allowed to form wet gels, samples were driedby high temperature supercritical solvent extraction.Finally, the cells were all baked at 350 �C to furtherremove volatiles and carbon. The final aerogel densitygradients were measured using the Gladstone method,i.e., by measuring the deflection of a laser beam as ittraversed the corner of an aerogel block to determinethe index of refraction, which was then correlated todensity (Jones 2007).
Aerogel tiles were made in batches from a singleaerogel percursor and individual cells were selected fromthese batches for installation in the Stardust collectortrays. Cells from 10 different batches were placed in thecometary collector tray and cells from 19 differentbatches were placed in the interstellar collector tray.Unused cells were collected by the Stardust Curator atJSC and samples of these preflight aerogel tiles areavailable for request for study.
Ideally, the aerogel manufacture process wouldproduce aerogel that consists solely of Si and O.However, infrared measurements of early Stardust
aerogel prototypes showed the original aerogel tocontain significant amounts of aliphatic -CH3 and-CH2- groups (S. A. Sandford, unpublished results). Itwas determined that this carbon was not soluble butwas instead largely bonded into the aerogel networkand that its abundance could be greatly decreased byheating. Stardust cells were heated to 350 �C for severalhours to minimize this organic contamination. Higherheatings were not used since they removed relativelylittle additional carbon and could result in changes ofthe structure and transparency of the aerogel.
Since it was known that the flown aerogel collectortiles contained some intrinsic carbon, a number ofdifferent analytical techniques were used prior to returnof the Wild 2 samples and during the PE period toaddress the state, abundance, and distribution of thecarbon originally in the tiles. Additional work was alsodone to examine how this carbon can be altered duringthe course of hypervelocity impact by an incomingparticle. The results of these efforts are described in thefollowing sections.
The State of the Carbon in the Original Stardust Aerogel
Collector Tiles
The nature of the original carbon in variousStardust aerogel tiles was examined using IR, NMR,luminescence imaging, LC-FD ⁄TOF-MS, XANES, andlL2MS analytical techniques. These studies includeresults obtained both from flown aerogel tiles and frommaterials taken from archival aerogel tiles taken fromthe same production batches as those flown.
Infrared SpectroscopyCarbon originally in the aerogel can be detected in
infrared (IR) transmission spectra, where absorptionfeatures in the 3050–2800 ⁄ cm (3.28–3.57 lm) rangecharacteristic of C-H stretching vibrations of aliphatic-CH2- and -CH3 groups are seen. Infrared spectrademonstrated that heating of the aerogel after itsproduction greatly decreased the abundance of, but didnot fully eliminate, this material.
Numerous IR measurements were made from bothStardust flight aerogel and archival samples of unflowntiles taken from the same production batches to assessthe chemical nature and distribution of this indigenouscarbon in the Stardust flight aerogel tiles. For example,the results of analyses of two keystones extracted fromStardust cometary aerogel cell C2115 are shown inFigs. 1 and 2. The keystones were made using thestandard techniques of Westphal et al. (2004) and wereeach approximately 200 to 300 lm thick. The keystoneseach contained the separate comet particle tracksC2115,22,20 and C2115,23,21. Both tracks showed a
408 S. A. Sandford et al.

fairly typical ‘‘ginseng’’ shape, and had comparablelengths of approximately 900 lm (see Bajt et al. 2009for an image of track C2115,22,20). IR spectra forcontamination measurements were made approximately500 lm from each track through a square aperture10 lm on a side.
The infrared spectra of these keystones aregenerally typical of Stardust aerogels and show astrong, broad Si-O stretching absorption feature near
1000 cm)1 (10 lm) characteristic of amorphous silicates(Fig. 1). In addition, aliphatic C-H stretchingabsorption features due to aliphatic -CH3 and -CH2-groups are seen between 3000 and 2850 cm)1 (3.3–3.5 lm), C=O stretching features are seen near1700 cm)1 (5.88 lm), and ‘‘structural O-H’’ bands areseen near 3700 cm)1 (Fig. 1). Spectra typically show abroad band spanning the 3600–3200 cm)1 range due toH2O adsorbed onto aerogel surfaces.
While the IR spectra of all Stardust aerogels showsimilar spectra, several issues can make it difficult toassess the full extent of aerogel contamination in the IRspectra of Stardust samples. These include variations inthe amount and state of the contaminant between andwithin individual tiles and the presence, around sometracks, of cometary organics that were dispersed intothe surrounding aerogel during impact collection (seeSandford et al. 2006; Bajt et al. 2009).
An example of variations between different piecesof aerogel can be seen in Fig. 2, which shows thealiphatic C-H features measured from the C2115,22,20and C2115,23,21 keystones. These features showdistinctly different profiles. In addition, the intensity ofthe -CH3 feature varied by a factor of 2 to 3 from pointto point in each keystone, a variation larger thanexpected due to likely thickness or density variations ofthe aerogel in the keystones. However, quantitativedetermination of the -CH3 abundance was not possiblebecause the Si-O absorption, which is a direct measureof the aerogel mass in the analysis beam, was saturated,making it impossible to determine the -CH3 ⁄Si-O ratio.
The point-to-point variation in the IR spectra ofthe organic contamination in the Stardust aerogel canmake quantitative background subtraction, and thus theprecise determination of the infrared spectra ofcometary organics, difficult. Despite these variations,the -CH3 absorption was always significantly strongerthan the -CH2- absorption in the Stardust flight aerogelsamples we analyzed. Additionally, the aliphaticcomponent of collected Wild 2 organics has high-CH2- ⁄ -CH3 ratios (see Keller et al. 2006; Sandfordet al. 2006; Rotundi et al. 2008; Bajt et al. 2009), whichallows for IR spectral detection of cometary organicmatter despite the residual aerogel carbon. Nonetheless,it is clear that comet organic matter whose spectrum isdominated by aliphatic CH3 groups would be extremelydifficult to positively identify, and that considerable caremust be taken in the interpretation of the IR spectra ofStardust samples.
Nuclear Magnetic ResonanceSamples of aerogel tiles from several of the flight
aerogel batches were analyzed using 1H, 13C, and29Si solid state NMR. One sample was taken from tile
Fig. 1. Infrared spectrum of an approximately 10 lm · 10 lmspot on C2115,23,21, a keystone extracted from the C2115Stardust aerogel flight cell. The strong Si-O, C=O, aliphatic-CH2- and -CH3, structural –OH, and adsorbed H2Oabsorption features were seen at all the spots examined andtheir presence is typical of Stardust flight aerogels.
Fig. 2. Infrared spectra in the C-H stretching region takenapproximately 560 lm away from the centers of tracksC2115,22,20 (dashed line) and C2115,23,21 (solid line) in theirrespective keystones.
Stardust contamination assessment 409

E232-1A, which came from a batch noted to exhibithigh luminescence under UV light (see discussion ofaerogel luminescence in the next section), while anotherwas taken from tile E235-3C, which came from a batchthat showed low luminescence. Details of the NMRanalytical methods used can be found in the paper’sSOM.
29Si Solid State NMR—Prior to discussing theNMR results, it is worth considering the synthesischemistry behind the aerogel. The standard precursormolecules for the synthesis of aerogel includetetramethyl and ⁄or tetraethyl orthosilicate.Condensation polymerization of these is typicallyperformed in predominantly polar, aprotic solvents withsome water added as an initiator. The degree to whichthe polymerization is complete, i.e., the extent to whichall oxygen atoms are bonded to two silicon atoms, isreadily determined via 29Si NMR. This can be easilyobserved in the NMR spectrum of condensed silicic acid(Fig. 3), wherein a peak at approximately )113 ppmcorresponds to the fully polymerized silica (Q4, i.e.,silica tetrahedra with four bridging oxygens, Si-O-Si).Weaker peaks due to partially polymerized silicatetrahedral species having one and two nonbridgingoxygen species are also seen (Q3, approximately)104 ppm, and Q2, approximately )95 ppm,respectively). In the case of the two aerogel samples(E235-5C and E232-1A), the 29Si NMR spectra aredominated by the Q4 species, although there exists apronounced shoulder at the characteristic frequency forQ3 species and a hint of a shoulder at the characteristicfrequency for Q2 species (Fig. 3). Fitting of thesespectra with Gaussian line shapes indicates thatapproximately 27% and approximately 21% of thesilica tetrahedra are Q3, in E232-1A and E235-3C,respectively, with the remainder being predominantlyQ4.
In the case of condensed silicic acid, all non-bridging oxygens are expected to be terminated by aproton (H+). However, in the case of the aerogelsamples, the nonbridging oxygens may be terminated byun-reacted methoxy or ethoxy groups. If all Q3 specieswere so terminated, this would yield a very largeorganic carbon background, e.g., the atomic C ⁄Si ratiocould be on the order of 0.4 for these aerogels. As weshall see later, the actual C ⁄Si is much lower than this,suggesting that many of the aerogel Q3 species in theseaerogels may actually be terminated with protons.Furthermore, it has been shown that in aerogel, Si-O·radical defects are present and are a source ofphotoluminescence (Nishikawa et al. 1996), a propertythat Stardust aerogel tiles show to a variable degree (seenext section). Indeed, as noted earlier, the fact that thelow luminescence E235-3C aerogel has a lower
abundance of Q3 sites than the high luminescence E232-1A gel may support the idea that the luminescence isdue to such defects. One wrinkle to this scenario,however, is that 29Si in close proximity to Si-O· radicalswill be unobservable due to the excessive linebroadening associated with electron–nucleus dipolarinteractions. However, the presence of abundantradicals can result in the need for excessive NMR probe
Fig. 3. 29Si NMR spectra (from top to bottom) of condensed,solid, silicic acid, aerogel samples E235-3C and E232-1A,a solution of Synlube 1000 (a silicone release agent), andpolymethylsilicone grease. The silicic acid solid state NMRspectrum reveals the presence of three different silicateelectronic environments Q4, Q3, and Q2, corresponding to 0, 1,and 2 nonbridging oxygen groups, respectively. The aerogelsamples exhibit a predominance of Q4 but with a pronouncedshoulder corresponding to approximately 20–30% Q3. In thecase of the low luminescence aerogel sample, E235-3C, aminor peak at approximately )15 ppm indicates the presenceof some silicone moieties.
410 S. A. Sandford et al.

retuning during measurement, something we did notneed to do. We therefore conclude that most of the Q3
species in the aerogel samples are likely terminated withprotons.
Finally, there is the issue of whether the Synlube1000 used as a release agent to coat the aerogel moldsurfaces to aid removal of the aerogel blocks hascontributed any detectible organic matter to theaerogels that might be ultimately confused withcometary organics. In Fig. 3, a 29Si spectrum of Synlube1000 is presented along with a sample of poly[dimethylsilicone] grease. The valence of silicon in silicone is 2+,as opposed to 4+ for silicon in silicate. The reductionin surrounding oxygen atoms in silicone results in alarge shift of characteristic resonant frequencies todistinctly higher frequencies than that of silicates, i.e., tochemical shifts of approximately )25 ppm. In Fig. 3,both Synlube 1000 and a sample of poly[dimethylsilicone] grease exhibit sharp resonances atapproximately )25 ppm. Interestingly, there is clearly asmall spectral feature at approximately )15 ppm in the29Si NMR spectrum of the E235-3C aerogel in thefrequency range expected for silicone. While it ispossible that this peak could reveal the presence ofSynlube 1000 contamination, it appears more likely thatthese silicone moieties were actually created duringaerogel synthesis. This conclusion is supported by thefact that a 10 ppm difference in frequency is quite large(in fact, too large to be ascribed to differences betweenSynlube 1000 methyl silicone moieties in a ‘‘neat’’environment as opposed to coating aerogel).Furthermore, the peak width appears too great for asimple compound; the line width of the peak at)15 ppm is more typical of amorphous solids.
The intensity of the )15 ppm (methyl silicone) peakis approximately 6% of the total 29Si NMR signal,which could imply a C ⁄Si ratio of between 0.12 and0.06 independent of what the presence of unreactedmethoxy and ethoxy groups might add. It should benoted, however, that no attempt was made to assess theT1 relaxation behavior of 29Si in these aerogels, and it iscertainly possible that 29Si in the silicone moieties wouldrelax much faster than the silicates due to the proximityto the fluctuating magnetic fields derived from theprotons on the rotating methyl groups. Thus, if therewere any longitudinal saturation occurring, the outcomewould be an enhanced sensitivity for the methyl siliconegroups. As we shall see based on the otherspectroscopy, the relative abundance of methyl-siliconedetected via 29Si NMR appears to be about right.
13C Solid State NMR—The presence of siliconemethyl, methoxy, and ⁄or ethoxy groups in aerogel canbe verified directly with 13C solid state NMR. Figure 4presents CPMAS 13C NMR spectra of the aerogel
samples E235-3C and E232-1A. In both cases the mostintense peak occurs at very low frequencies, )3 ppm,with a shoulder at )7 ppm, consistent with anassignment to methyl groups in silicone moieties. Inaddition, there are a small number of peaks that mostlikely correspond to silicate bound methoxy and ethoxygroups spanning the frequency range fromapproximately 17 ppm up to 60 ppm (Fig. 4). Thesepeaks make it clear that there is organic carbonassociated with the aerogel, and that overall the carbonchemistry is quite simple and is dominated by methylgroups.
It should be noted that the carbon signal for bothaerogel samples is very weak. In order to place someconstraints on actual carbon abundance in theseaerogels, we can compare the signal strength per massof sample with that of an NMR standard, e.g.,hexamethylbenzene (HMB). Assuming similar crosspolarization dynamics apply for both the HMB and theaerogel, the aerogels E232-1A and E235-3C carry 0.3and 1.0 lm ⁄mg carbon, respectively, yielding C ⁄Si ratiosof 0.02 and 0.06, respectively. These estimates constitutelower limits, i.e., if any difference in CP dynamics exists
Fig. 4. 1H-13C cross polarization solid state NMR spectra ofaerogel samples from tiles E235-3C (low luminescence) andE232-1A (high luminescence). The presence of carboncorresponding to silicate bound ethoxide and methoxide, alongwith a more abundant methyl silicone moiety atapproximately )3 and )7 ppm, is clearly revealed.
Stardust contamination assessment 411

between HMB and the aerogel samples this would leadto an increase in the C ⁄Si ratios inferred for theaerogels. Thus, whereas the 13C NMR does directlyreveal the presence of organic carbon intrinsic to theaerogel, it also reveals that this carbon is both simple inits chemistry and relatively low in abundance.
1H Solid State NMR—An additional perspectiveon the organic carbon intrinsic to the Stardust aerogelscan be obtained via 1H solid state NMR, whichprovides a complementary (with 13C and 29Si) view oftheir molecular structure. Figure 5 presents the solidstate 1H NMR spectra of the two aerogel samples and asample of condensed silicic acid. Condensed silicic acidproduces a relatively sharp peak nearly centered on topof a broader peak—the former corresponds to Si-OHgroups, the latter to structural H2O, i.e., to nonliquidwater that is strongly associated with the silicic acid
solid through hydrogen bonding. In the case of bothaerogels, the intense peak at 2 ppm is assigned to Si-OHgroups. Note that the frequency shift of this peakrelative to that observed in condensed silicic acid (atapproximately 4 ppm) is not unusual in the case of 1HNMR. The exposed (‘‘external’’ to the molecular unit)nature of protons (relative to 13C or 29Si) to theenvironment results in frequency shifts due to evenminor differences in local structure that perturb theelectron current density surrounding the protons.Similar to condensed silicic acid, both aerogels exhibit abroad spectral feature that likely is closely associatedH2O. Again, the shifts in frequency of both the Si-OHand H2O between condensed silicic acid and aerogelslikely reflect differences in density and mean O-H···Odistances.
As is expected on the basis of the CPMAS 13CNMR spectra, the aerogel samples also exhibit 1HNMR features consistent with the presence of organiccarbon, e.g., protons on ethoxy, methoxy, and methylsilicone moieties (Fig. 5). The fact that the lessluminescent aerogel (E235-3C) exhibits greater intensityfor methyl silicone moieties than the more luminescentaerogel (E232-1A) is consistent with the 13C and 29Sispectral data. The 1H data provides a link betweensilica species (e.g., Si-OH) and organics (e.g., CH3) thatallows us to derive an independent estimate of C ⁄Si.Fitting the respective aerogel spectra in Fig. 5 withGaussian band profiles and taking into considerationthe relative proportion of Q3 and Q4 groups determinedfrom 29Si NMR (Fig. 3) reveals C ⁄Si atomic ratios of0.04 and 0.12, for samples E232-1A and E235-3C,respectively. These values are higher than those derivedfrom 13C NMR, but recall that the 13C NMR derivedestimates constitute a lower limit, and both the 13CNMR data and combined 1H with 29Si data resultsconclude that sample E232-3C has more associatedcarbon.
In summary, the NMR analyses indicate that thereis organic carbon in Stardust aerogels with variableC ⁄Si ratios that are sometimes perhaps as high as 0.12.The presence of this carbon is likely an inevitableoutcome of the synthesis; it is unreasonable to assumethat 100% condensation of the orthosilicate precursorscould actually occur. On the positive side, the NMRdata reveal that this organic carbon is dominated by afew very simple functional groups, i.e., the carbon has avery simple chemistry. During particle capture, aerogelthat is heated up will likely largely lose these organicfunctional groups through the formation of highlyvolatile species, e.g., methanol, ethylene, ethanol, etc. Itis highly unlikely that these simple organic moietieswould undergo extensive condensation reactions to formcomplex organic solid particles of the types described in
Fig. 5. 1H solid state NMR spectra of silicic acid (top) andaerogel samples E232-1A (middle) and E235-3C (bottom). Inaddition to Si-OH and structural (nonliquid) water thatcontributes to the very broad peak spanning the entirefrequency range, the aerogel samples reveal sharp peaks thatindicate the presence of hydrogen in silicate ethoxide andmethoxide functional groups, as well as silicone methylgroups.
412 S. A. Sandford et al.

the Stardust preliminary analyses like those reported inSandford et al. (2006) and Cody et al. (2008). Forexample, one would expect such condensates to coatother materials rather than exist in discrete subgrainswithin larger particles. (However, as we discuss later, itis clear that a minor fraction of this carbon can beconverted into dispersed, small polycyclic aromatichydrocarbons.)
Placing a constraint on the concentration of carbonrelative to silica in aerogel is also useful in establishinglimits to the contribution of aerogel carbon to observedStardust particles. Compression and, in some cases,melting of aerogel certainly occurred during particlecapture, and organic-rich particles are often closelyassociated with compressed aerogel (cf. Cody et al.2008). Based on these NMR data, the background C ⁄Si(or C ⁄O for that matter) does not exceed 0.12 (or 0.06in the case of C ⁄O) in Stardust aerogels. In the case ofmicrometer size organic particles extracted from aerogelcoupons that were flown on the Stardust spacecraft,C ⁄Si and C ⁄O’s are on the order of 1.7 and 0.6,respectively (Cody et al. 2008). This significantenrichment in carbon is difficult to explain any otherway than to conclude that the additional carbon iscometary.
LuminescenceDuring the PE period it was noted that aerogel
keystones removed from individual Stardust flightaerogel tiles showed varying degrees of visibleluminescence when exposed to UV light. This was firstnoticed on an aerogel keystone that contained a trackthat had been examined by beam analysis techniques.
Several zones of luminescence were noted. Portions ofthe keystone that represented the space exposed surfaceof the aerogel tile showed the most luminescence, butincreased luminescence was also seen in portions of theaerogel that had been exposed to beam analysis (Fig. 6).The presence of this luminescence raised the concernthat it might be due to exposure of the surface to anorganic contaminant with conjugated bonds and ⁄or dueto radiation exposure changing some of the residualcarbon originally in the flight aerogel into morecomplex, luminescent forms.
Measurements from several keystones (bothpreviously irradiated and unirradiated) using afluorescent ⁄ luminescent microscope at UC Berkeley thatcould measure emission yield as a function of excitationwavelength failed to yield conclusive results. Differentsamples, and different locations in the same sample,showed essentially the same luminescence spectrum andthe same energy dependence of excitation, independentof irradiation history. The biggest difference was thatpreviously irradiated samples showed a higher overallemission intensity. These measurements were notsuggestive of any particular organic compound(s) beingthe source of the luminescence.
To understand whether this luminescence was amore global issue on the collectors, UV illuminationwas then used to examine the entire collector trays atJSC. Luminescence images of the cometary collectortray were obtained using a 254 nm excitation sourceheld at a distance of about 30 cm from the front (i.e.,comet exposed) surface of the tray. A digital camerawas position about 5 cm above the UV source and at adistance of about 35 cm from collector. The camera had
Fig. 6. Photomicrograph of Track 2 in a keystone from cometary tile C009 (left) compared with an image of the same field ofview in luminescence under UV illumination (right). Note that the brightest luminescence is associated with the leftmost surfaceof the aerogel, which was the surface that was exposed to space.
Stardust contamination assessment 413

a zoom lens that was adjusted so that an individualimage would cover approximately 1 ⁄4 of the collectorsurface. Under these conditions the imaged area had arelatively uniform UV flux. These images were thencombined into composite images of the entire tray.Each image uses the green channel as a crudespectrometer, so that the intensity variations representthe luminescence emission principally in the 500–540 nmrange. Each image was then processed by a de-specklingalgorithm to remove CCD hot spots, corrected for lensbarrel distortion, and made into a montage using anautocorrelation routine. The resultant composite imageis shown in Fig. 7.
It is clear from these images that the luminescenceis not uniformly or smoothly spread across the collectortray, but instead differs from tile to tile. This stronglysuggests that the source of the luminescence is not acontaminant to which the entire tray has been exposed.A plot of the individual tile ‘‘bulk’’ luminescenceintensities is shown in Fig. 8 (this information can befound in tabular form in Table S1 in the SOM). Whilethe plot shows a smooth variation in intensities,comparison of the individual tile luminescenceintensities with a map of the flight aerogel batchplacement of the tiles in the tray demonstrated that theluminescence correlates strongly with production batchnumber. A subjective analysis of the relationship of cellluminescence with aerogel batch number in which eachtile is categorized (by eye) as having low, low-medium,
medium, medium-high, and high luminescent intensity issummarized in Table 1. It is clear that the intensity ofthe luminescence is batch-related, although there are afew cells that fall off the trends (see below).
Batches 227 and 232 are responsible for all thebrightest cells but one. These batches contributedrelatively few tiles to the tray. The tiles from these twobatches are C075 (trapezoidal cell), C028, C035, C044,C085. Tile C044 (from Batch 232) was not examinedbecause it had already been removed for other PETanalysis. Batch 236 shows uniformly moderateluminescence (tiles C009 and C115, pulled for PET
Fig. 7. Photograph of the tile luminescence in the cometarytray. Dark rectangles represent locations where tiles hadalready been removed for PE analysis. It is clear from theseimages that the luminescence is not uniformly or smoothlyspread across the collector tray.
Fig. 8. A histogram plot of the rough individual tile ‘‘bulk’’luminescence intensities in the aerogel tiles shown in Fig. 7.While these tiles show a smooth range of intensities, they arenot random. There is a strong correlation with aerogelmanufacturing batch number. Ten tiles are not shown in theplot; these include eight rectangular tiles that had already beenpulled from the collector tray when the luminescencemeasurements were made (C009, C027, C038, C044, C054,C086, C092, and C126), and two smaller, triangular tiles nearthe edge of the collector (C042 and C075).
414 S. A. Sandford et al.

analyses prior to the luminescence mapping, were in thisbatch). Batches 234 and 235 show generally lowluminescence, but some tiles exhibit moderateluminescence. Thus, Tiles C027, C054, C086, and C092pulled for PET analyses prior to measurement probablyhave low luminescence, but it could be a little higher.Batches 237, 239, and 246 consistently show very littleluminescence, with the exception of tile C045, which islisted as being from Batch 237 and yet shows very highluminescence (the highest of all the tiles). Given theuniformity of the other cells from this batch, thissuggests that tile C045 may be mislabeled. Samplesfrom cells C038, C052, and C126, which were pulled forPET analyses prior to measurement, probably did notproduce high luminescence.
The fact that adjacent cells can show greatlydifferent luminescence intensities indicates that thesource is not organics or other luminescent materials(cometary or contaminant) added after tray assembly.NMR measurements made on preflight aerogel samples(see previous section) from both a low and a highluminescence batch suggest the luminescence may bedue to Q3 defect sites, which are known to be apotential source of photo-luminescence (Nishikawaet al. 1996). The density of these sites correlates in aqualitative sense with luminescent intensity of thebatches in the samples examined so far. The number ofsuch sites might be expected to increase in aerogelexposed to ionizing radiation that could break bondsand generate new Q3 defect sites, perhaps explaining thebehavior seen in Fig. 6.
We used IR and LC-FD ⁄TOF-MS measurements totest for any correlations between the intensity of theluminescence and the nature and abundance of organicmaterials detected in the aerogel tiles. IR absorptionspectra taken from tiles falling in different luminescence
categories suggest that the abundance of some chemicalfunctional groups correlate with luminescence intensity.In particular, tiles with high luminescence appear tohave both considerably more structural –OH (asindicated by the bands near 3745 and 980 cm)1; 2.67and 10.2 lm) and considerably less aliphatic carbon (asindicated by the band at 2970 cm)1; 3.37 lm) (Fig. 9).The structural –OH is presumably associated withlocations within the aerogel in which the Si-O lattice isnot completely connected and a dangling bond has beenterminated with a hydrogen atom. Thus, the IR dataare consistent with the NMR data—the luminescencedoes not correlate with the abundance of carbon in theaerogel, but seems to be more correlated with unlinkedO atoms in the structure. LC-FD ⁄TOF-MSmeasurements of aerogel cells from different preflightaerogel batches showed no correlation between totalabundance of amines in the preflight aerogel and theintensity of the luminescence.
Overall, observations made to date suggest theluminescence in Stardust aerogel tiles is largely due todefects within the Si-O lattice. More intenseluminescence at aerogel surfaces could be due toinduced defects caused by solar particle irradiation.Increased luminescence induced by beam analysistechniques could also be due to production of such
Table 1. Number of cells versus intensity ofluminescence.
Batch LowLow-med Medium
Med-high High
Unknowncellsa
227 – – – – 1232 – – – – 3 044234 14 6 1 – – 027, 054,
086, 092235 17 9 5 – –236 – 10 15 – – 009, 115
237 24 3 – – 1 038, 052239 11 1 – – – 126246 1 – – – –aSome cells could not be placed in the table because they had
already been removed for PET analysis and were no longer
available for examination for whole tile luminescence.
Fig. 9. Infrared absorption spectra collected from samples ofaerogel tiles E235-3E (low to medium luminescence), E236-6C(low-medium to medium luminescence), and E232-1A (highluminescence). The high luminescence aerogel produces both astronger structural –OH band near 3745 and 980 cm)1 and aweaker aliphatic CH band near 2970 cm)1. The spectra haveall been normalized to the unsaturated aerogel peak near800 cm)1 peak, so variations in the strengths of the –OH andaliphatic bands are not due to difference in aerogel thickness.
Stardust contamination assessment 415

defects. This would also explain why the luminescencespectral properties of the ‘‘original’’ surface- andvolume-induced luminescence look very similar.However, the origin of variable production of Si-Odefects in different aerogel batches remains unclear.Nevertheless, the lack of correlation between theintensity of the luminescence and the nature andabundance of organic materials detected in the aerogeltiles using a variety of analytical techniques, suggeststhat organics are not primarily responsible.
LC-FD ⁄ TOF-MS Measurement of Soluble Amines inStardust Aerogels
The LC-FD ⁄TOF-MS analyses of soluble amineswere made on preflight aerogel tiles E243-13C andE243-10F. Tile E243-13C was a preflight baked aerogelsample that had been stored under vacuum since shortlyafter its creation. Tile E243-10F was an unbakedaerogel sample stored in air. The results of these studies
were previously reported in Glavin et al. (2008) and weonly provide a brief summary of that work here. Thechromatogram of Tile E243-13C shows only tiny peaksclose in area to those found in the procedural blank.Trace levels of amino acids and amines were identifiedin these samples, including l-aspartic and l-glutamicacids, l-serine, glycine, b-alanine (BALA), c-amino-n-butyric acid (GABA), l-alanine, e-amino-n-caproic acid(EACA), ethanolamine (MEA), methylamine (MA), andethylamine (EA). Total concentrations ranging from0.04 to 3.4 nmol per gram of aerogel were found (seeTable 2 of Glavin et al. 2008). No free amino acids oramines were detected in the unhydrolyzed water extractof E243-13C.
Preflight aerogel sample E243-10F had not beenbaked out nor stored under vacuum. It showed asimilar abundance and distribution of aminecompounds compared to E243-13C, with the exceptionthat it contained much higher concentrations
Table 2. Summary of the total amine concentrations in the HCl hydrolyzed hot-water extracts of the Stardustcontamination control samples analyzed during the preliminary examination perioda.
Amine detected
SRC SLA
backshell
(E51049)
SRC PICA
heatshield
(E51043)
SRC filter
(5208,1,5,1,2)
UTTR mud
(M4762,3)
Kapton tape
(Whipple test)
Synlube
1000
(mold release)
Nylon
bag
(JSC curation)
d-Aspartic acid 112 ± 18 27 ± 3 <0.1 9 ± 3 3 ± 2 <0.1 <0.1
l-Aspartic acid 193 ± 3 60 ± 3 <0.1 18 ± 4 11 ± 2 <0.1 <0.1
d-Glutamic acid 102 ± 8 14 ± 1 <0.1 3 ± 1 3 ± 1 <0.1 <0.1
l-Glutamic acid 335 ± 16 61 ± 2 <0.1 26 ± 2 25 ± 8 <0.1 <0.1
d-Serine 39 ± 22 6 ± 1 <0.1 4 ± 1 9 ± 5 <0.1 <0.1
l-Serine 108 ± 2 144 ± 17 1 ± 1 13 ± 1 46 ± 24 1 ± 1 <0.3
Glycine 770 ± 109 189 ± 36 6 ± 3 45 ± 7 120 ± 16 <0.1 3 ± 1
b-Alanine (BALA) 43 ± 1 8 ± 3 1 ± 1 4 ± 1 3 ± 1 1 ± 1 3 ± 2
c-Amino-n-butyric acid
(GABA)
127 ± 10 8 ± 1 1 ± 1 2 ± 1 8 ± 1 <0.1 2 ± 1
d-Alanine 112 ± 24 12 ± 3 <0.3 4 ± 1 4 ± 1 <0.1 <0.5
l-Alanine 310 ± 36 91 ± 13 1 ± 1 25 ± 2 13 ± 3 <0.1 1 ± 1
d,l-b-Amino-n-butyric
acid
<0.3 <0.1 <0.1 <0.1 <0.1 <0.1 <0.1
a-Aminoisobutyric
acid (AIB)
<0.2 <0.1 <0.1 <0.1 <0.1 <0.1 <0.1
d,l-a-Amino-n-butyric
acidb<0.1 <0.1 <0.1 <0.1 <0.1 <0.1 <0.1
d,l-Isovaline <0.3 <0.5 <0.1 <0.1 <0.1 <0.1 <0.1
e-Amino-n-caproic acid
(EACA)c3,316 ± 161 3,077 ± 172 4 ± 1 2 ± 1 16 ± 1 <0.1 176,000 ±17,000
d-Valine <0.5 <0.1 <0.1 <0.5 <0.2 <0.1 <0.1
l-Valine 133 ± 115 24 ± 21 <0.1 13 ± 4 11 ± 2 <0.1 <0.1
Methylamine (MA) 436 ± 60 4 ± 3 <0.3 <0.1 11 ± 1 1 ± 1 <0.1
Ethylamine (EA) 101 ± 6 <0.1 <0.1 <0.1 3 ± 1 3 ± 1 <0.1
Ethanolamine (MEA) 74 ± 22 8 ± 5 10 ± 1 <0.1 204 ± 60 38 ± 5 <0.1aThe amine concentrations are reported as 10)9 mol per gram (nmol ⁄ g) on a bulk sample basis. The uncertainties (·x) are based on
the standard deviation of the average value of between two and four separate measurements (N) with a standard error, ·x = · x ·
(N)1))1 ⁄ 2. Upper limits are shown for amines that were not detected above procedural blank background levels.bEnantiomers could not be separated under the chromatographic conditions.cMajor component of Nylon-6; also known as 6-aminohexanoic acid.
416 S. A. Sandford et al.

(approximately 8–10·) of the amino acids GABA andEACA compared to the baked aerogel. EACA,[(NH2(CH2)5COOH)], is a monomer of the Nylon-6polymer and has previously been shown to be a goodindicator of the extent of Nylon-6 contamination ofAntarctic meteorite samples during collection andstorage (Glavin et al. 2006). Subsequent isotopicanalysis of EACA extracted from aluminum foils thatbacked the aerogel cells on the Stardust collector wasperformed to determine its origin. The carbon isotopicratio of the EACA was measured via gaschromatography coupled with mass spectrometry andisotope ratio mass spectrometry (GC-MS ⁄ IRMS) andcompared with the carbon isotopic ratio of a piece of astorage bag used by JSC, measured by elementalanalysis-isotope ratio mass spectrometry (EA-IRMS).The isotope ratios matched within experimental error(d13C ⁄ 12C = )25 ± 2& for Stardust foils,d13C ⁄ 12C = )26.8 ± 0.2& for JSC bag), implying thatthe EACA observed in the Stardust samples originatedfrom the Nylon-containing bags used during curation atJSC.
e-Amino-n-caproic acid was detected in E243-13Cat much lower concentrations than in E243-10F, whichis not surprising since E243-13C was stored inside aglass tube and was not directly exposed to Nylon-6prior to analysis. No d-amino acids were detected ineither preflight aerogel sample above the 0.1 nmol ⁄glevel. In addition, only trace quantities of MA and EA(0.5 to 4 nmol ⁄g) were identified in the preflightaerogels. The ratio of MA to EA in the preflightaerogels (MA ⁄EA approximately 7) was distinct from aratio of approximately 1 found in the cometary exposedaerogel samples (Sandford et al. 2006; Glavin et al.2008). Ethanolamine (MEA) was detected in both of theStardust preflight aerogel extracts at a similarconcentration. We believe that the source of the MEAcontamination is most likely the mold release lubricant(Synlube 1000) used during the Stardust aerogelmanufacturing process (MEA was by far the mostabundant amine compound, approximately 40 nmol pergram, detected in an acid-hydrolyzed, hot water extractof Synlube 1000).
L2MS Measurement of PAHs in Stardust AerogelsA series of Stardust aerogel flight spare samples
were analyzed using lL2MS. These included 11 withlayered density, six with gradient density, and 21 withmostly uniform density silica. About 16 mm2 of eachflight spare was obtained for analysis, with each samplebeing representative of the uppermost layer (i.e., leastdense) of the installed Stardust aerogel tiles. This upperlayer captured the majority of comet 81P ⁄Wild 2particles. Details of the sample preparation procedure
can be found in the SOM. lL2MS analysis of aromaticcompounds in these samples showed most samplescontained no measurable contamination by polycyclicaromatic hydrocarbons (PAHs). Ten of the samples,however, did exhibit distinctive, low-intensity envelopesof low-mass aromatic compounds (Spencer and Zare2006; Spencer 2008). All samples that displayed thesecontaminants showed comparable and consistentpatterns of m ⁄ z peaks in the lL2MS mass spectra. Thismass pattern included an envelope of peaks with majorpeaks at 135, 149, and 179 amu, which are likely 1-ring,nitrogen-containing aromatic compounds, as well as anextended series of alkylated phenanthrene. Thisenvelope of peaks was not detected during anysubsequent Stardust aerogel analyses, including in theStardust witness coupon (see below), and was thusassigned to laboratory contamination of these nonflightaerogels incurred during storage since its synthesis in1999. A second, distinctive envelope of peaks was alsodetected, including major peaks at 135, 179, 223, and267 amu. This envelope of peaks was also seenconsistently in returned Stardust aerogel samples andthese masses should always be viewed with suspicionbefore assigning them to cometary PAHs.
STXM ⁄ XANESNine picokeystones of nontrack aerogel were cut
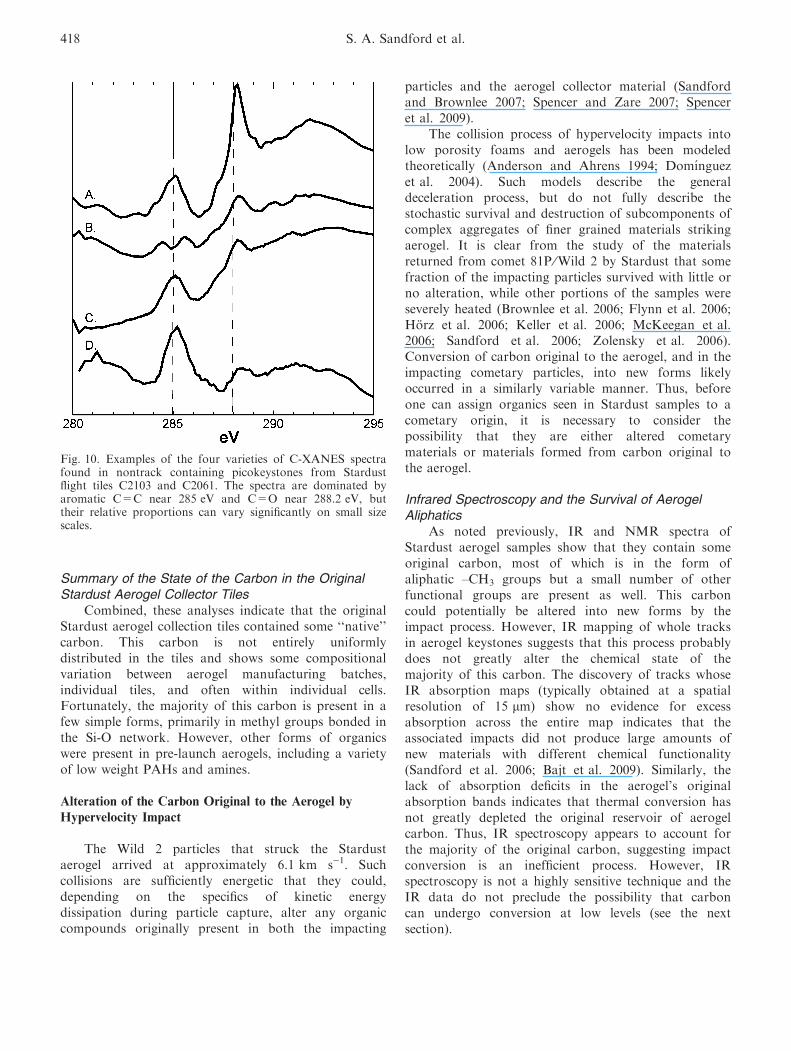
from comet tray tiles and examined using both scanningtransmission X-ray microscopy (STXM) and the IRmicroscope located at the National Synchrotron LightSource (NSLS). Seven of the picokeystones were cutfrom tile C2103, one picokeystone from the top (cometside) of the tile and the other six from the bottom sideof the tile and two picokeystones were cut from tileC2061, both from the top of the tile. Details about thepreparation and measurement of these samples can befound in the SOM. The carbon XANES spectragenerally show similar features, although their relativestrengths can differ substantially (Fig. 10). All thespectra contain absorption in the 285 eV regioncharacteristic of aromatic carbon, most likely due toC=C in a ring. The breadth of this peak suggests thatthere generally is absorption from more than onematerial in this region, and in the case of trace B, thepresence of two peaks shows that at least two distinctpopulations are present. The spectra also showabsorption peaks at 288.2 eV, an energy generallyassigned to C=O groups. No evidence of carbonateshas been seen in these aerogel samples. Thus, the C-XANES spectra detect functional groups consistent withthose seen in the aerogel using other techniques.However, these data demonstrate that the relativeproportions of these groups can differ not only betweentiles, but also within tiles on very small spatial scales.
Stardust contamination assessment 417
Summary of the State of the Carbon in the OriginalStardust Aerogel Collector Tiles
Combined, these analyses indicate that the originalStardust aerogel collection tiles contained some ‘‘native’’carbon. This carbon is not entirely uniformlydistributed in the tiles and shows some compositionalvariation between aerogel manufacturing batches,individual tiles, and often within individual cells.Fortunately, the majority of this carbon is present in afew simple forms, primarily in methyl groups bonded inthe Si-O network. However, other forms of organicswere present in pre-launch aerogels, including a varietyof low weight PAHs and amines.
Alteration of the Carbon Original to the Aerogel by
Hypervelocity Impact
The Wild 2 particles that struck the Stardustaerogel arrived at approximately 6.1 km s)1. Suchcollisions are sufficiently energetic that they could,depending on the specifics of kinetic energydissipation during particle capture, alter any organiccompounds originally present in both the impacting
particles and the aerogel collector material (Sandfordand Brownlee 2007; Spencer and Zare 2007; Spenceret al. 2009).
The collision process of hypervelocity impacts intolow porosity foams and aerogels has been modeledtheoretically (Anderson and Ahrens 1994; Domınguezet al. 2004). Such models describe the generaldeceleration process, but do not fully describe thestochastic survival and destruction of subcomponents ofcomplex aggregates of finer grained materials strikingaerogel. It is clear from the study of the materialsreturned from comet 81P ⁄Wild 2 by Stardust that somefraction of the impacting particles survived with little orno alteration, while other portions of the samples wereseverely heated (Brownlee et al. 2006; Flynn et al. 2006;Horz et al. 2006; Keller et al. 2006; McKeegan et al.2006; Sandford et al. 2006; Zolensky et al. 2006).Conversion of carbon original to the aerogel, and in theimpacting cometary particles, into new forms likelyoccurred in a similarly variable manner. Thus, beforeone can assign organics seen in Stardust samples to acometary origin, it is necessary to consider thepossibility that they are either altered cometarymaterials or materials formed from carbon original tothe aerogel.
Infrared Spectroscopy and the Survival of AerogelAliphatics
As noted previously, IR and NMR spectra ofStardust aerogel samples show that they contain someoriginal carbon, most of which is in the form ofaliphatic –CH3 groups but a small number of otherfunctional groups are present as well. This carboncould potentially be altered into new forms by theimpact process. However, IR mapping of whole tracksin aerogel keystones suggests that this process probablydoes not greatly alter the chemical state of themajority of this carbon. The discovery of tracks whoseIR absorption maps (typically obtained at a spatialresolution of 15 lm) show no evidence for excessabsorption across the entire map indicates that theassociated impacts did not produce large amounts ofnew materials with different chemical functionality(Sandford et al. 2006; Bajt et al. 2009). Similarly, thelack of absorption deficits in the aerogel’s originalabsorption bands indicates that thermal conversion hasnot greatly depleted the original reservoir of aerogelcarbon. Thus, IR spectroscopy appears to account forthe majority of the original carbon, suggesting impactconversion is an inefficient process. However, IRspectroscopy is not a highly sensitive technique and theIR data do not preclude the possibility that carboncan undergo conversion at low levels (see the nextsection).
Fig. 10. Examples of the four varieties of C-XANES spectrafound in nontrack containing picokeystones from Stardustflight tiles C2103 and C2061. The spectra are dominated byaromatic C=C near 285 eV and C=O near 288.2 eV, buttheir relative proportions can vary significantly on small sizescales.
418 S. A. Sandford et al.

The Production of Small PAHs during HypervelocityImpact
The lL2MS technique was used in a separate studyto assess the influence of hypervelocity impact oncarbon contaminants in Stardust aerogel. Cometparticle capture was mimicked in the laboratory usingtwo methods, both of which utilized Stardust-typeaerogel (i.e., flight spare or witness coupon aerogel) asthe capture medium. The two methods were (i)hypervelocity impact of a micrometer-size borosilicateglass bead and (ii) impact simulation utilizing laserpulsed heating. Both of these studies revealed theproduction of a consistent, low-mass envelope ofaromatic compounds (Spencer and Zare 2007; Spencer2008; Spencer et al. 2008, 2009). Detected massesranged from 78 to 206 amu (tentatively assigned tobenzene and phenanthrene + 2CH2, respectively), withthe most intense peak at 128 amu (naphthalene). Thisenvelope was not detected during lL2MS contaminationcontrol studies of the Stardust aerogel and witnesscoupon, as discussed elsewhere in this paper. Anidentical envelope of aromatic compounds was detectedusing lL2MS along the dissected impact track of aWild 2 particle in aerogel (Sandford et al. 2006). Basedon these results, lightweight PAHs in samples should beviewed with suspicion as they contain a significantcontribution from artifacts of the collection process, asoriginally suspected during the preliminary examinationperiod (Sandford et al. 2006; Sandford and Brownlee2007; Spencer and Zare 2007).
Summary of Impact Alteration EffectsInfrared absorption difference-maps of individual
tracks suggest that impacting Stardust particles do notconvert the majority of the original carbon in theaerogel tiles into new chemical forms that remain inthe aerogel. However, L2MS studies demonstrate thatat least a small amount of the original aliphaticcarbon in the aerogel is converted into aromaticmaterials in the form of lightweight PAHs. Thus,while most of the original aerogel carbon appears tobe unaffected by the impact process, the issue of thepossible presence of impact converted organics mustbe considered on a case-by-case basis wheneverspecific organics are being sought in Stardust aerogelsamples.
POTENTIAL CONTAMINANTS FROM THE
STARDUST SPACECRAFT DURING FLIGHT
There are a number of potential ways in whichcontaminants may have found their way into the SRCduring flight. These include materials outgassed fromnearby spacecraft components, propellant byproducts,
and secondary materials from dust impacts on otherparts of the spacecraft, particularly the Whipple shieldsand solar panels.
Whipple Shield and Spacecraft Materials
Cometary particles impacted on the aerogel tiles inthe collector tray perpendicular to their forwardsurfaces. Thus, any tracks seen with obliqueorientations must be either due to strikes by randominterplanetary dust particles or to secondary materialsfrom impacts on other parts of the spacecraft. Obliquetracks have, in fact, been found in the flight aerogeltiles, most of which fall in nonrandom spatialdistributions on the cometary collector (Westphal et al.2008). The materials in these tracks could includecomponents from both the original impactor and fromthe spacecraft.
The source of these tracks is not entirely clear, butthe preponderance of evidence points toward at leastone grazing impact on the central Whipple shield of thespacecraft as the origin of clustered low-angle obliquetracks. In these tracks, the most likely contaminantwould be the Mylar thermal protection material thatwrapped the edge of the Whipple shields. A secondpopulation of high-angle oblique tracks unambiguouslyoriginate from a noncometary impact on the spacecraftbus just forward of the collector. The exact location ofthis strike on the spacecraft bus is not known, butpossible contaminants include materials used for thesides of the spacecraft bus. We have used XANES toexamine archived samples of these materials, whichconsist of a honeycomb network of aluminum foilcapped by a carbon composite board attached with anadhesive glue. Small pieces of the carbon compositeboard and the glue were embedded in sulfur,ultramicrotomed to a thickness of 100 nm and theircarbon XANES spectra were obtained. The carboncomposite board consists of highly ordered graphiteembedded in an epoxy matrix. Minor absorption in thegraphite spectrum at 288.2 eV suggests the graphite maybe slightly oxidized (Fig. 11). The carbon XANESspectra of the foil glue and the epoxy matrix indicatethat both compounds are identical and differencesbetween the carbon spectra are due to crystalorientation effects since the beam at the X1 beamline islinearly polarized. Materials in the high obliquity trackshaving these spectra should be suspected of being non-cometary contaminants.
In summary, it is clear that the cometary collectortray was struck by a limited number of secondaryparticles resulting from impacts on other parts of thespacecraft. Materials in these oblique tracks should beviewed with considerable caution before interpreting
Stardust contamination assessment 419

their significance as possible cometary materials.Fortunately, the most likely contaminants, Mylar wrapon the Whipple shields and carbon composites from thebody of the spacecraft, have distinctive C-XANESspectra that make them relatively easy to recognize. Atpresent, there is no evidence that this process hasintroduced contamination outside the domain of theoblique tracks themselves.
Results of Witness Coupon Studies
It is possible that contaminants could have beenintroduced to the Stardust sampling trays directly fromthe spacecraft during its nearly 7 year flight. This is ofspecial concern for the aerogel collectors since aerogel,with its very large surface area to mass ratio, is anexcellent ‘‘sponge’’ for adsorbing contaminants. To
assess the extent of on-flight contamination, several‘‘witness coupons’’ were enclosed in the Stardust SRC(Tsou et al. 2003). These coupons included 1 cmdiameter disks of aluminum and sapphire, and one‘‘interstellar’’ aerogel tile (2 cm wide · 4 cm long · 1 cmdeep). These coupons were located on the arm thatdeployed the aerogel collector array and were placedlow enough that they resided in the shadow of the mainWhipple shield. Thus, these coupons were exposed tothe same flight environment as the aerogel collectors forthe entire mission, but were never directly exposed tothe cometary influx. Samples of the aerogel witnesscoupon (sample WCARMI1CPN) were examined byseveral Organics PE Team members. The aluminum andsapphire disks have yet to be examined in detail, butshowed no visible signs of adhering materials or stains.(It should be noted that none of the exposed surfaces inthe Stardust sample return canister showed any signs ofthe ‘‘brown stain’’ seen on many of the surfaces of theGenesis return capsule [Hittle et al. 2006].)
LC-FD ⁄ TOF-MS and Soluble AminesTwo samples of the Stardust aerogel witness tile
WCARMI1CPN (Pieces 8 and 9, 0.2 mg) were analyzedseparately for amines by LC-FD ⁄TOF-MS. Bothsamples of the witness tile contained the amino acids l-serine, glycine, b-alanine (BALA), c-amino-n-butyricacid (GABA), e-amino-n-caproic acid (EACA), and theamine ethanolamine (MEA) at levels that exceededthose found in the procedural blank. With the exceptionof EACA, the concentration of these amine compoundsranged from 4 to approximately 50 nmol per gram ofaerogel (Glavin et al. 2008). The high concentration ofpredominantly bound EACA (approximately9600 nmol ⁄g) in the witness tile is most likely due tocontamination of the aerogel with Nylon-6 polymerfrom the sample storage vial cap (Glavin et al. 2008). Itshould be emphasized that the EACA contaminant didnot interfere with LC-FD ⁄TOF-MS detection andidentification of other amine compounds in any of theStardust flight aerogel extracts. Ethanolamine (MEA)was detected in all of the Stardust preflight and flightaerogel extracts at similar relative abundances (Glavinet al. 2008). The source of MEA contamination isbelieved to be the Synlube 1000 mold release lubricantused during the Stardust aerogel manufacturing process(Table 2). Kapton tape also releases MEA, butsignificant abundances of l-serine and l-glutamic acidshould have also been observed. We did not detect anyd-amino acids, methylamine (MA), or ethylamine (EA)in the witness tile aerogel above the 0.2 to 8 nmol pergram level. These detection limits are approximatelytwo orders of magnitude higher than those for thepreflight aerogel samples and directly reflect the small
Fig. 11. Carbon XANES spectra of the glue and carboncomposite board components used to make the sides of theStardust spacecraft. The inset shows how these materials wereused to surface an aluminum honeycomb structure (pennyprovided for scale).
420 S. A. Sandford et al.

quantity of witness tile aerogel allocated for the PETstudy. In summary, the Stardust flight aerogel witnesstile contains a variety of different amine contaminantsthat could originate from the aerogel manufacturingprocess, inflight spacecraft outgassing, and ⁄or postflightstorage and handling of the aerogel. However, theoverall cleanliness of the witness coupon for thesecompounds suggests that inflight outgassing was not adominant effect.
Laser-Desorption Laser-Ionization Mass SpectrometryNo aromatic compound contaminants were
detected with lL2MS when analyzing a depth profileof the Stardust witness coupon tile at normaloperating parameters. At higher powers, whichapproximately simulated hypervelocity particle impact,a low-mass envelope of aromatic compounds wasdetected, as discussed earlier. These were likely (i)generated from carbon contaminants during laser pulseheating of aerogel or (ii) released from the aerogelmatrix upon high-power laser desorption (Spencer andZare 2007; Spencer 2008; Spencer et al. 2008). Toeliminate the contribution from these components, all81P ⁄Wild 2 particle analyses were performed using alow-power desorption laser (approximately 2.5 ·106 W cm)2).
Time-of-Flight Secondary Ion Mass SpectrometryThe aerogel witness coupon material analyzed with
TOF-SIMS showed a PAH spectrum similar to thatobserved in a dissected aerogel keystone containing anactual cometary particle track (Stephan et al. 2008).However, compared to the witness coupon, PAHconcentrations are up to a factor of six higher inaerogel associated with the track (Stephan et al. 2008).Furthermore, this factor of six may be regarded as alower limit since the Ar+ sputter cleaning (see SOM)that was performed on the track sample (but not onthe witness coupon material) to diminish surfacecontamination should also have diminished the PAHsin the sample associated with the track.
IR SpectroscopyInfrared transmission spectra were measured from a
small piece of aerogel taken from the aerogel witnesscoupon. The background spectrum was collected thesame way as for the keystones with particle tracks, i.e.,by obtaining the spectrum of an ‘‘air blank’’ using thesame optical setup as for the sample. Individual spectrafrom 4000 to 650 cm)1 were collected at about 100 lmintervals from seven different points on this piece. Eachspectrum consisted of 1024 co-added scans and wascollected with 4 cm)1 spectral resolution. Spectra ofsamples thin enough to avoid band saturation showed
the witness coupon was very homogenous—there wasno detectible variation over a 500 lm area. Only a peakat 2970 cm)1, a weak peak at 2910 cm)1, and an evenweaker one at 2880 cm)1, corresponding to asymmetricand symmetric stretching vibrations of –CH3 weredetected in the C-H stretching region. Unlike many ofthe exposed cometary aerogels, the spectra do notcontain a broad –OH peak at approximately 3300 cm)1
or peak associated with C=O at approximately1700 cm)1.
SummaryAnalyses of the aerogel witness coupon, i.e., aerogel
that was exposed to all environmental conditions as thecollector aerogel except the comet shows similarities tocollector aerogel, although the levels of contaminants,when detected, are generally lower and somecomponents (for example, the carrier of the 1700 cm)1
IR C=O feature) are dramatically less abundant. Thissuggests that contamination associated with theoperational environment of the spacecraft during flightwas not a main source of contaminants associated withthe samples.
POTENTIAL CONTAMINANTS FROM FLIGHT,
RE-ENTRY, AND RECOVERY OF THE SAMPLE
RETURN CAPSULE
Inspection of the Stardust SRC after its re-entry andrecovery on January 2, 2006, indicated that it had notsuffered any identifiable loss of structural integrity.Nevertheless, potential contamination must beconsidered since the SRC was not designed to behermetically sealed during or after Earth return.Consequently, pressure equalization between the interiorand exterior of the capsule during atmospheric re-entryprovides a potential entry route into the sample canisterfor ablation products from the capsule’s thermalprotection system (i.e., the heatshield and backshell).
Due to the high velocity (12.8 km s)1) associated withthe hyperbolic return trajectory of the SRC, itexperienced a significant heat flux during re-entry(approximately 1100W cm)2), with temperatures at thestagnation point at the nose of the heatshield peaking atapproximately 2700 �C. To protect the interior of thecapsule during re-entry, the SRC’s thermal protectionsystem (TPS) used a phenolic impregnated carbonablator (PICA) for the heatshield and a super lightablator (SLA 561-V) for the backshell. An ablativeheatshield functions by pushing the hot shock layer of gasformed during re-entry away from the heatshield’s outersurface through a process known as ‘‘blowing.’’ Blowingoccurs by the charring and pyrolysis of the outer layers ofthe heatshield which creates gas phase decomposition
Stardust contamination assessment 421

products that then block the convective and catalytic heatflux from the underlying layers of the heatshield.Unfortunately, these same gas phase pyrolysis productsalso constitute a potential organic contamination threat.
In addition to potential contamination by debrissucked into the SRC during re-entry and re-pressurization, the nonhermetic seal of the SRC alsoallowed for the possibility of entry of atmosphericcontaminants during the subsequent descent of the SRCby parachute, and soil and water samples picked upwhen the SRC contacted the ground.
The chief defense against the accumulation of all ofthese forms of potential contamination was a designthat required materials entering the SRC to first pass anumber of barriers before they could enter the samplecanister. These barriers included backshell vents coveredby meshes and a multilayer, high efficiency particulateair (HEPA) filter on the sample canister itself (Brownleeet al. 2003; Tsou et al. 2003).
In order to assess the extent to which thesecontaminants may have found their way into the samplecanister, Organics PET members studied samples ofmaterials from the SRC’s heatshield and backshellmaterials (both preflight and postrecovery samples), thecontents of the sample canister filter, gas samples takenduring the recovery process, and samples of soils takenfrom the recovery site.
Heatshield and Backshell Material
As mentioned above, two different materials wereused for the thermal protection system on the StardustSRC. Phenolic Impregnated Carbon Ablator (PICA)was used for the forward heatshield and Super LightAblator (SLA-561) was used for the backshell. ThePICA consisted of a substrate of C fibers, 14–16 lm indiameter, known as Fiberform (Fiber Materials, Inc.,Biddeford, ME) that was partially impregnated with thephenolic resin Durite (Bordon Packaging and IndustrialProducts). The SLA used for the SRC backshell consistsof a highly filled elastomeric silicone material containingcork as a filler ingredient. A third material, SiliconImpregnated Reuseable Carbon Ablator (SIRCA) wasconsidered for use on the SRC, but not ultimately used.
Carbon XANES MeasurementsCarbon XANES spectral results from a preflight
SLA sample show well defined absorption peaks at285 eV, 285.35 eV, 286.6 eV, 287.4 eV, and 288.4 eV,with possible peaks at 284.4 eV and 284.6 eV suggestinga complex carbon bonding environment. XANESspectral results from a preflight PICA sample show ahighly ordered graphitic material, but with additionalpeaks at 286.6 eV, 288.5 eV, and a possible peak at
289.8 eV, indicating the presence of a phenolic ormethylphenolic functional group associated with thegraphite. For comparison, the carbon XANES spectrumfrom a SIRCA sample (not ultimately used on Stardust)was nearly identical to the carbon XANES spectrumfrom the SLA sample but with a slight difference in the290 eV region (Fig. 12).
Infrared MeasurementsMid-IR spectra (4000–650 cm)1) were collected
from grain-sized samples of the SRC postflightheatshield and backshell materials using the FTIRALS beamline. The grains were placed directly on KBrwindows and measured in transmission mode withoutany further sample preparation. Since the SLA usedfor the SRC backshell consists of a highly filledelastomeric silicone material containing cork as onefiller ingredient, it is perhaps not surprising that itsoverall spectrum has many similarities of other silicon-
Fig. 12. Carbon XANES spectra taken from preflight samplesof the three materials considered for use in the thermalprotection system on the Stardust SRC. The forwardheatshield was made from PICA and the backshell was madefrom SLA-561. SIRCA was not ultimately used in theStardust SRC.
422 S. A. Sandford et al.

containing organics like silicone oil (Fig. 13). IRspectra of backshell (SLA) grain (E51049) showstrong aliphatic C-H stretching mode bands in the3000–2800 cm)1 region, as well as aromatic C-Hstretching mode bands at 3072 and 3054 cm)1
(Fig. 13). The dominant C-H stretching feature in thissample does not fall at the location of the -CH2-absorption near 2933 cm)1 that is prominent inStardust aerogel tracks observed to contain excessorganics (Sandford et al. 2006; Bajt et al. 2009).
The infrared spectrum of a sample taken from thenose of the forward (PICA) heatshield (E51043) wasfound to be featureless and is consistent with graphite, ametal, or perhaps metal oxide. The sample lookedmetallic and crystalline under the optical microscopeand showed a dendritic structure.
LC-FD ⁄ TOF-MS MeasurementsThe LC-FD ⁄TOF-MS analysis was used to examine
samples of the Stardust heatshield paint edge (E51047;8.5 mg), heatshield nose (E51043; 0.6 mg), heatshieldedge (E51044; 0.2 mg), and backshell (E51049; 0.1 mg).The Stardust heatshield and backshell samples analyzedin this study contained a variety of amino acids andamines including d- and l-aspartic and glutamic acids,d- and l-serine, d- and l-alanine, BALA, GABA,EACA, l-valine, MA, EA, and MEA with total amineconcentrations ranging from 930 to 8300 nmol per gramof sample (Table 2). EACA was the most abundantamine in these Stardust samples accounting for 50 to85% of the total amine concentration. Its most likelysource is Nylon-6 contamination from the samplestorage containers. The fact that most of these
compounds were not detected in the Stardust flightaerogel witness tile (see below) suggests that theStardust flight aerogel samples were not extensivelycontaminated with terrestrial amino acids and aminesduring the Stardust SRC re-entry and landing phases.
Ultra-L2MS MeasurementsSamples for investigation by ultra-L2MS were taken
shortly after SRC recovery from three differentlocations on the heatshield and three different locationson the backshell, as indicated in Fig. 14. Acquisitionand preparation of these samples are described in moredetail in the SOM. For each sample, 50 single-shotspectra were acquired and summed to give therepresentative mass spectra presented in Figs. 15a and15b. A difference is readily apparent in both theabundance and distribution of organic species observedbetween the heatshield samples and those from thebackshell. For the heatshield samples, the leading outerconical edge of the heatshield (#51044) showed thegreatest profusion of organic species and showed apronounced enrichment of relatively volatile low-masshydrocarbons, unlike the samples from the trailing edge(#51047) or stagnation point at the nose (#51043),Particularly prominent is naphthalene (C10H8; 128 amu)and its Cn-alkylated homologues (i.e., C10H9-[CH2]nH;142, 156, 170, . . . amu), as well as several oxygenatedaromatics that are either conspicuously absent orpresent in greatly diminished abundance in the other
Fig. 13. The 4000–650 cm)1 (2.5–15.4 lm) IR spectra ofbackshell SLA sample E51049 (solid line) compared with theOmnic� library database spectrum of silicone oil (dashedline). The similarities in the spectra are consistent with thepresence of Si-bearing organics in both materials.
Fig. 14. Samples were taken from six different locations onthe heatshield and backshell for investigation by ultra-L2MS.These include 51043 (heatshield—stagnation point at thenose—PICA), 51044 (heatshield—leading edge of outerrim—PICA), 51047 (heatshield—trailing edge of outerrim—PICA), 51046 (backshell—upper lip with honeycombsupport exposed—SLA), 51050 (backshell—outer conicalrim—SLA), and 51049 (backshell—RTV sealed penetration onthe outer conical rim—SLA).
Stardust contamination assessment 423

Fig. 15. Mass spectra taken from samples from SRC locations on the a) heatshield and b) backshell as noted in Fig. 14. Speciesdetected include 1–4 ring aromatic species, their Cn-alkylated homologues, oxygenated aromatics, and low mass phenolicaromatics. The abundance and distribution of these organic species varies significantly between samples, but the distributions donot match those of aromatic species found within aerogel impact tracks in the Stardust collector (see text).
424 S. A. Sandford et al.

heatshield samples. These include phenol (C6H5OH;94 amu) and most likely a dimethoxybenzene isomer(HOCH2C6H4CH2OH; 138 amu) and its Cn-alkylatedhomologues. It seems likely these oxygenated aromaticsrepresent monomer fragments produced from thepyrolysis of the phenolic resin in the heatshield. Thehigher mass peaks observed at 240, 254, and 268 amulikely represent the products of gas-phase free radicalrecombination reactions. For example the 254 amu peakis consistent with the recombination of naphthylradicals (i.e., C10H7 + C10H7 fi C10H7)C10H7). Theremaining spectra from the trailing edge (#51047) orstagnation point at the nose (#51043) are self-similarand are dominated by the three and four ring aromaticsphenanthrene (C14H10; 178 amu) and pyrene (C16H10;202 amu) (and associated isomers) along with their Cn-alkylated homologues. The relative lack of oxygenatedaromatics may represent a sampling artifact or beindicative of a different thermal environment.
In contrast to the heatshield samples, the threebackshell samples all show mass spectra that aredominated by low mass phenolic aromatics that overlay amuch weaker distribution of two, three, and four ringfused aromatic species. The concentration of the organicspecies varies considerably between samples, being mostabundant in the upper lip of the SLA (#51046) and leastabundant around the outer conical rim of the SLA(#51050). It is unclear whether the greater abundance ofoxygenated aromatics in these samples is a consequenceof the lower heat flux experience by the backshell(approximately 250 W cm)2) or due to the re-depositionof gas phase species initially liberated from PICAheatshield.
Fortunately, the peak heating during the ablativephase of atmospheric entry happens at high altitudeswhere pressure equilization results in the intake ofvery little total air into the SRC. Nonetheless, ablationof the heatshield and backshell during re-entry likelyproduced volatile aromatic species that could havepenetrated into the SRC during pressure equalization.However, even in a worst case scenario this could notaccount for the range and diversity of organic speciesobserved, for example, by ultra-L2MS along aerogelimpact tracks. In particular, there is no evidence in theheatshield and backshell mass spectra for the oddmass aromatic species that have been previouslyobserved and interpreted as evidence for aromaticnitrile species being present in collected cometary dustgrains (see Clemett et al. 2010). In this context it isworth noting that while the emission spectra of theplasma formed in the shock front generated by theSRC during re-entry was dominated by CN and N2
+
species, we find no evidence for the generation of
N-containing aromatics on either the heatshield or thebackshell.
In summary, the heatshield and backshell, and theirsolid ablation products, have an organic character. Thenature of these materials differs significantly from theorganics seen in the cometary collector and, to date,there have been no indications that materials associatedwith the heatshield and backshell and their ablativere-entry into Earth’s atmosphere found their way intothe sample canister within the SRC.
Sample Canister Filter Contents
The LC-FD ⁄TOF-MS analysis was also used toexamine samples taken from the interior of the SRCfilter (5208,1,5,1,2). Less than a total of 25 nmol pergram of soluble amines were found in acid hydrolyzedhot water extracts of the filters (Table 2). This suggeststhat the filter was not called on to remove anysignificant amount of these materials from the air whenthe SRC re-pressurized during re-entry. MEA, glycine,and EACA were the most abundant primary aminesdetected.
Gas Samples Taken during and after SRC Recovery
Several gas samples were taken during and after therecovery of the SRC from its UTTR landing site onJanuary 15, 2006. This was done in an attempt to assessthe nature of any gases that may have outgassed fromthe SRC’s thermal protection system and been exposedto the sample canister’s inlet filter. Four 1 L samples ofair were taken shortly after the SRC Recovery Teamarrived at the landing site using pre-evacuated andcleaned Grab Sample Canisters (GSC). By this time theSRC had had sufficient time during its parachutedescent and subsequent time on the ground before beinglocated to cool to ambient temperatures. One samplewas taken from within 1 cm of the front surface of theheatshield and another was taken at the location of oneof the two backshell air inlet vents shortly after the firstRecovery Team member arrived at the SRC. A secondpair of samples was taken after the remainder of theRecovery Team arrived about 20 min later. After theSRC had been transported back to the temporarycleanroom at the UTTR Avery Complex, threeadditional 1 L samples were taken—two from near theheatshield and one from near one of the SRC backshellvents. These samples were delivered to the IS09001:2000certified Toxicology Laboratory at NASA’s JohnsonSpace Center for analysis on January 18, 2006. Inaddition, tests were made of the dry N2 gas being usedto purge the cabinet in which the Stardust samples are
Stardust contamination assessment 425
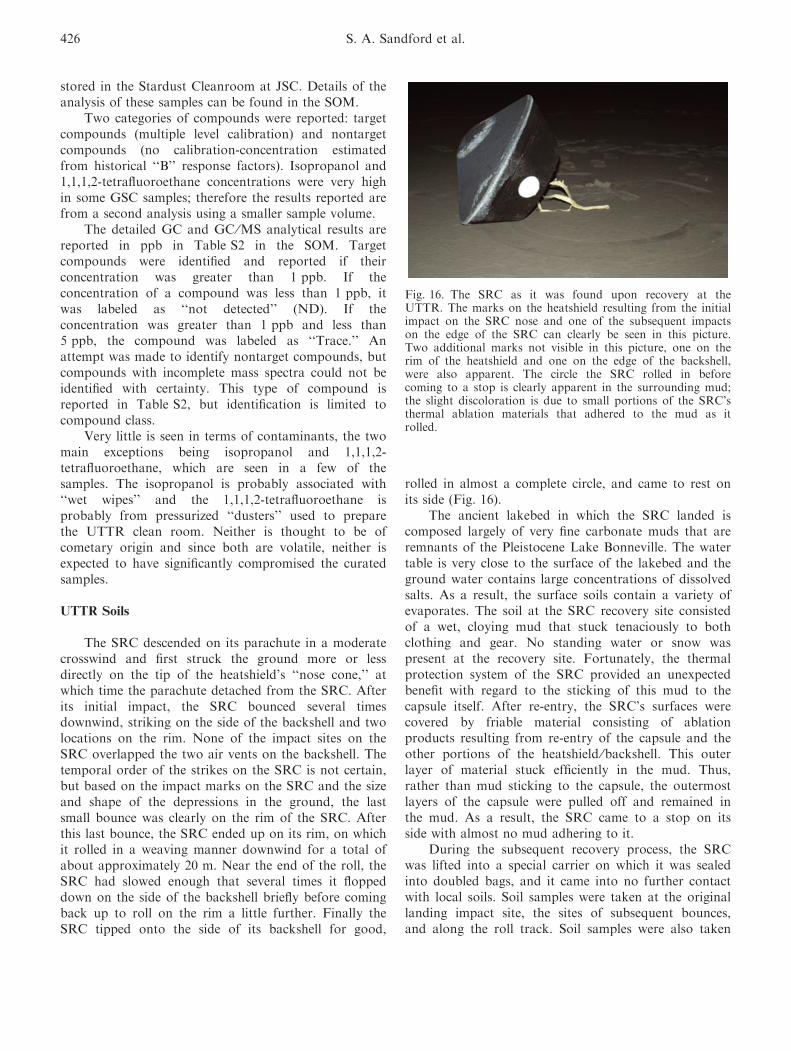
stored in the Stardust Cleanroom at JSC. Details of theanalysis of these samples can be found in the SOM.
Two categories of compounds were reported: targetcompounds (multiple level calibration) and nontargetcompounds (no calibration-concentration estimatedfrom historical ‘‘B’’ response factors). Isopropanol and1,1,1,2-tetrafluoroethane concentrations were very highin some GSC samples; therefore the results reported arefrom a second analysis using a smaller sample volume.
The detailed GC and GC ⁄MS analytical results arereported in ppb in Table S2 in the SOM. Targetcompounds were identified and reported if theirconcentration was greater than 1 ppb. If theconcentration of a compound was less than 1 ppb, itwas labeled as ‘‘not detected’’ (ND). If theconcentration was greater than 1 ppb and less than5 ppb, the compound was labeled as ‘‘Trace.’’ Anattempt was made to identify nontarget compounds, butcompounds with incomplete mass spectra could not beidentified with certainty. This type of compound isreported in Table S2, but identification is limited tocompound class.
Very little is seen in terms of contaminants, the twomain exceptions being isopropanol and 1,1,1,2-tetrafluoroethane, which are seen in a few of thesamples. The isopropanol is probably associated with‘‘wet wipes’’ and the 1,1,1,2-tetrafluoroethane isprobably from pressurized ‘‘dusters’’ used to preparethe UTTR clean room. Neither is thought to be ofcometary origin and since both are volatile, neither isexpected to have significantly compromised the curatedsamples.
UTTR Soils
The SRC descended on its parachute in a moderatecrosswind and first struck the ground more or lessdirectly on the tip of the heatshield’s ‘‘nose cone,’’ atwhich time the parachute detached from the SRC. Afterits initial impact, the SRC bounced several timesdownwind, striking on the side of the backshell and twolocations on the rim. None of the impact sites on theSRC overlapped the two air vents on the backshell. Thetemporal order of the strikes on the SRC is not certain,but based on the impact marks on the SRC and the sizeand shape of the depressions in the ground, the lastsmall bounce was clearly on the rim of the SRC. Afterthis last bounce, the SRC ended up on its rim, on whichit rolled in a weaving manner downwind for a total ofabout approximately 20 m. Near the end of the roll, theSRC had slowed enough that several times it floppeddown on the side of the backshell briefly before comingback up to roll on the rim a little further. Finally theSRC tipped onto the side of its backshell for good,
rolled in almost a complete circle, and came to rest onits side (Fig. 16).
The ancient lakebed in which the SRC landed iscomposed largely of very fine carbonate muds that areremnants of the Pleistocene Lake Bonneville. The watertable is very close to the surface of the lakebed and theground water contains large concentrations of dissolvedsalts. As a result, the surface soils contain a variety ofevaporates. The soil at the SRC recovery site consistedof a wet, cloying mud that stuck tenaciously to bothclothing and gear. No standing water or snow waspresent at the recovery site. Fortunately, the thermalprotection system of the SRC provided an unexpectedbenefit with regard to the sticking of this mud to thecapsule itself. After re-entry, the SRC’s surfaces werecovered by friable material consisting of ablationproducts resulting from re-entry of the capsule and theother portions of the heatshield ⁄backshell. This outerlayer of material stuck efficiently in the mud. Thus,rather than mud sticking to the capsule, the outermostlayers of the capsule were pulled off and remained inthe mud. As a result, the SRC came to a stop on itsside with almost no mud adhering to it.
During the subsequent recovery process, the SRCwas lifted into a special carrier on which it was sealedinto doubled bags, and it came into no further contactwith local soils. Soil samples were taken at the originallanding impact site, the sites of subsequent bounces,and along the roll track. Soil samples were also taken
Fig. 16. The SRC as it was found upon recovery at theUTTR. The marks on the heatshield resulting from the initialimpact on the SRC nose and one of the subsequent impactson the edge of the SRC can clearly be seen in this picture.Two additional marks not visible in this picture, one on therim of the heatshield and one on the edge of the backshell,were also apparent. The circle the SRC rolled in beforecoming to a stop is clearly apparent in the surrounding mud;the slight discoloration is due to small portions of the SRC’sthermal ablation materials that adhered to the mud as itrolled.
426 S. A. Sandford et al.

from directly under the SRC (after it was removed) andfrom several nearby locations the SRC had not comeinto contact with. These samples were later examined bymembers of the Organics PE Team using a variety ofanalytical techniques.
STXM ⁄ XANESSTXM ⁄XANES spectra were collected in the energy
range from 280–310 eV on soil samples M4762,5,M4762,6, and M5213,3. These are soil samples collectedfrom impact pits made in the lakebed mud during theSRC’s landing. All these samples contained bits ofheatshield that could be easily identified visually. Detailsof the preparation of these samples for analysis can befound in the SOM.
Figure 17 shows plots of the different carbonXANES spectra obtained from soil sample 5213,3 butare representative of all of the soil samples. Panels (a),(b), (d), and (g) contain spectra of organic matter fromthe soil. The soil samples also contained carbonates
(Figs. 17c, 17e, and 17f), potassium (Figs. 17c and 17h),and several different types of organic carbon. The 2pp* bond energy of carbonates occurs at 290.2 eV (Stohr1992) and the potassium L2,3 edge absorption peakenergies occur at 297.2 eV and 299.6 eV (Guan et al.2005). Some of the carbon XANES spectra in Fig. 17are similar to those from soil samples reported bySolomon et al. (2007), Courdouan et al. (2007), andLehmann et al. (2008). We see humic acid substancessimilar to those they report, although the humicmaterials in the UTTR soils are spatially closelyassociated with both the carbonate and potassium(Figs. 17c, 17e, 17f, and 17h). Figure 17g is a typicalspectrum one obtains from bacteria (Wirick et al.2004), and the spectra in Figs. 17a and 17b are similarto standard spectra of lipid biomolecules. The spectrumin Fig. 17d is similar to that of polyethylene.Disordered graphite (Smith and Lobo 2006) was foundin some samples (Fig. 17i). The disordered graphite islikely from heatshield material that was altered upon
Fig. 17. Carbon XANES spectra of representative grains from UTTR soil sample M5213,3. Panels (a), (b), (c), and (d) containspectra of organic matter from the soil. Panels c), e), f), and h) show organic features, a carbonate absorption peak at 290.2eV,and potassium absorption peaks at 297.2 and 299.6 eV. Panel i) shows the presence of disordered graphite and is likely fromablated materials shed from the SRC heatshield or backshell.
Stardust contamination assessment 427

re-entry and that stuck in the mud when the SRCimpacted the ground (compare to the PICA spectrumin Fig. 12).
The C-XANES data from other soil samples(4762,5 and 5213,3) similarly showed the presence of thecarbonates calcite, dolomite, aragonite, and alsographite. Again, the graphite is likely associated withheatshield material.
Carbonate-containing sub-micrometer sized particleshave been identified in tracks in the Stardust aerogel(Mikouchi et al. 2007; Wirick et al. 2007; Flynn et al.2008), so the presence of carbonates in soil samplesfrom the landing site raises the concern that thecarbonates in the aerogel could be soil contamination.However, a comparison of the C-XANES spectra fromthe landing site soil samples to C-XANES spectra fromcarbonate-containing Stardust samples showed noassociated organic matter contamination in the Stardustsamples from the landing site soils analyzed. Wetherefore conclude that it is unlikely that thesecarbonates are due to soil from the landing site gettinginto the SRC. However, any carbonate materialsdiscovered in the Stardust collection should beconsidered suspect until possible soil contamination canbe reasonably ruled out.
LC-FD ⁄ TOF-MS and Soluble AminesCompared to the SRC heatshield and backshell, the
UTTR mud sample analyzed in this study (M4761,2;109 mg wet weight) contained a much lower abundanceof amino acids and amines with a total concentration of140 nmol per gram (Table 2). In contrast to theheatshield and backshell samples, MA and EA were notdetected in the UTTR mud sample above the 0.1 nmolper gram level. The presence of several d-amino acids inthe soils, including d-aspartic and glutamic acids, d-serine, and d-alanine, that were not detected in theStardust flight aerogel witness tile provides additionalevidence that the Stardust flight aerogel samples werenot extensively contaminated with terrestrial aminoacids and amines during the Stardust SRC landingphase.
Microprobe Laser-Desorption Laser-Ionization MassSpectrometry
Microprobe laser-desorption laser-ionization massspectrometry analysis of soil from the Stardust SRClanding site revealed no significant presence of PAHs(Spencer and Zare 2006).
Gas Chromatography–Mass SpectrometryWater-soluble polar nonvolatile organic compounds
were identified in the soils by GC-MS. The mostabundant were amino acids. The major amino acids
were glycine (approximately 61 ppb), d-alanine(approximately 22 ppb), l-alanine (approximately54 ppb), dl-glutamic (approximately 77 ppb), dl-aspartic, serine, and valine (abundances are qualitative).Ion chromatography (IC) was used to detect thenonvolatile anions formate (13 ppm), acetate (1 ppm),chloride (32ppt) and 72 ppt (sample # M4761,3), andsulfate (32 ppm).
Summary of Potential Contaminants from Flight,Re-Entry, and Recovery of the SRC
The accumulation of local soils (mud) from therecovery site was a major issue of concern for theStardust Science Team prior to recovery of the SRC.Fortunately, integrity of the SRC during landing, therelative inability of the mud at the recovery site tostick to the SRC, and the fact that none of thebouncing impacts occurred at the locations of the twobackshell vents greatly decreased the magnitude ofthis concern. At present, analyses made using anumber of analytical techniques show no indicationsthat soils from the recovery site infiltrated the samplecanister or in any way contaminated the returnedsamples.
CONTAMINATION CONTROL AND ASSESSMENT
FOR SAMPLE RETURN MISSIONS—STARDUST
LESSONS LEARNED
The small nature of the samples returned by theStardust spacecraft made it critical that careful attentionbe paid to the issues of contamination control andassessment. Indeed, sample return missions in generalmust pay closer attention to these issues than othertypes of spacecraft missions. To its credit, the StardustTeam recognized this point from the very beginning andcarried out a number of activities designed to addressthis issue (of which this paper is one result). However,the Stardust mission was a very cost-constrainedmission and the team had to address issues that hadnever been thoroughly dealt with before. Reflection onthe Stardust effort therefore provides some important‘‘lessons learned’’ about contamination control andassessment, both for approaches that worked well andfor approaches that could be improved. Here, we list afew key points:
1. Efforts need to be made both for contaminationcontrol, i.e., to minimize contamination, andcontamination assessment. No matter how goodcontamination control is, there will be somecontamination, and it is critical to characterize thenature of the contaminants so they can bedistinguished from returned samples. Members ofthe Stardust Team did their best to carry out such
428 S. A. Sandford et al.

efforts on a tight schedule and with limitedbudget, but ideally these activities would be fullyintegrated into a sample return mission’s budgetand schedule.
2. Contamination control and assessment requirescooperative efforts be made that involve thespacecraft manufacturers, the spacecraft operators,the mission’s Science Team, and the NASACuratorial Office. Each of these groups shouldidentify an individual or individuals responsiblefor organizing contamination control andassessment activities, and these individuals need towork closely together across organizationalboundaries. Stardust benefited immensely fromScience Team members who were willing to devoteconsiderable time and effort to this work,including one Science Team member who was alsoon the NASA Curatorial staff (coauthor MZ).
3. Oddly enough, one important issue that everybodyon the mission needs to address early is to agreeon what is meant by the word ‘‘clean’’ and howthis definition will translate into operationalactivities. It is surprising how this simple word canmean very different things to different people. Forexample, a spacecraft engineer may see ‘‘clean’’ asan issue of eliminating surface particulates of acertain size and clean something by wiping it witha solvent soaked wipe, while an organic chemistmay flinch in horror at the uniform organicresidue left behind when the solvent evaporates.Note that the agreed on definition of ‘‘clean’’ maywell differ from mission to mission, depending onthe nature of the expected sample and how it willbe analyzed.
4. During construction of the spacecraft andsampling system, it is critical to document whatcomponents ⁄materials are used. Where possible,samples of these materials should be collected andarchived for ultimate storage by the NASACuratorial Office at the time of manufacture. TheStardust Team did some of this, but there werestill a number of cases where ‘‘standards’’ ofconstruction components were not availableduring preliminary examination and could not beacquired 7+ years after the actual assembly of thespacecraft.
5. It is important to use ‘‘witness coupons’’ to trackthe introduction of contaminates during themanufacture, flight, and recovery of thespacecraft, and during the subsequent removal ofthe samples from the SRC. These coupons need tobe removed and examined quickly so thatproblems associated with unexpected orproblematic contaminants can be dealt with
rapidly (again, these activities should be explicitlyfunded and scheduled within the mission).
6. Witness coupons need to be designed so that theycan easily be divided and distributed to multipleanalysts. The Stardust witness coupons consistedof single aluminum or sapphire plates, and a singleaerogel tile. It proved to be very difficult toexamine these coupons by multiple analytictechniques.
7. Sample return spacecraft should carry a significantnumber of relevant witness coupons. Stardustcarried only one small tile of flown, butunexposed, aerogel. This material was a criticalstandard that many investigators needed forcomparison against aerogel tiles that were exposedto the comet. This material represents the all-important ‘‘blank’’ or ‘‘control’’ sample that iscritical to the interpretation of many studies of theactual cometary samples. This is particularlyimportant for studies of organics. It would havebeen very helpful to have more of this kind ofmaterial available for Stardust.
8. It is not always clear what materials will workbest for contamination control and assessment anddifferent materials can result in different analyticalconstraints. Thus, where possible, it is generallydesirable to use more than one type of witnesscoupon.
9. Plans must be made in advance so the NASACuratorial Office is prepared to store anddistribute not only the returned samples, but alsothe associated contamination control andassessment materials (witness coupons, samples ofspacecraft materials, etc.).
10. Last, but not least, missions that desire to usesilica aerogel as a collector medium should devoteadditional development effort to the production ofthe cleanest possible aerogel. The inclusion ofstray particulates and the presence of structuralcarbon within the aerogel significantly complicatethe analysis of collected samples. The furtherdevelopment of other types of aerogel (forexample, carbon and tantalum aerogels) wouldalso be very useful.
CONCLUSIONS
Numerous sources of potential organiccontaminants could have greatly complicated theinterpretation of the organic (and inorganic) portions ofthe samples returned from comet 81P ⁄Wild 2 by theStardust spacecraft. Studies of controls and the returnedsamples suggest that most of these potential sources didnot contribute any significant material to the collectors.
Stardust contamination assessment 429

In particular, contamination from soils at the recoverysite and materials associated with the ablation of theheatshield do not appear to be significant problems. Inaddition, contamination accumulated from thespacecraft environment during flight also does notappear to be a significant problem. The lack of thesematerials is a testament to the efforts made by theStardust Team to minimize and control contaminationwhenever and wherever possible before, during, andafter the flight.
The largest source of concern is associated with thecarbon present in the original aerogel. This carbon wasfortunately not distributed among a complex mixture oforganics, but was instead largely present in a few simpleforms (mostly as –CH3 groups). However, there doesappear to be some variations in this carbon componentbetween and within individual aerogel tiles. In addition,while the initial carbon is dominated by just a fewforms, some conversion of this original material intonew organic forms appears to happen during particleimpact. This issue is particularly problematic forlightweight PAHs. However, in most cases the organicsresulting from the impact process do not appear tooverwhelm the signature of the returned cometaryorganics, which can generally be recognized throughtheir different compositions, association with othercometary materials (e.g., minerals), or the presence ofisotopically anomalous H and N.
In a few cases, specific molecules appear as commoncontaminants associated with processing, shipment, orstorage of the samples. For example, EACA,[(NH2(CH2)5COOH)], a monomer of the Nylon-6polymer, is seen in many samples and is likely due toNylon-6 contamination during storage and shipping.
Overall, these results indicate that contaminationissues do not, and will not, preclude the investigation ofcometary organics in the samples. Nonetheless, as withany studies of the organics in extraterrestrial materials,extreme caution should continue to be taken to assessthe potential impact of organic contaminants whenstudying any Stardust samples.
Acknowledgments–—The efforts reported in this paperspanned more than ten years of the Stardust projectand benefited from the support of numerous individualsand funding sources. The authors are grateful to all themany people associated with the Stardust project whoassisted with the design and implementation of thespacecraft’s contamination control and assessmentactivities. The authors also gratefully acknowledge keyfinancial support from the following sources: the NASAOrigins of Solar System Program, the NASAAstrobiology Institute and the Goddard Center forAstrobiology, the NASA Sample Return Instruments
and Data Analysis Program, the W. M. Keck SolidState NMR Facility at the Geophysical Laboratory, theU.S. Department of Energy by the Lawrence LivermoreNational Laboratory under Contract No. W-7405-ENG-48, the Advanced Light Source, LawrenceBerkeley National Laboratory, which is supported bythe Director, Office of Science, Office of Basic EnergySciences, Materials Sciences Division, of the U.S.Department of Energy under Contract No. DE-AC03-76F00098, and the Deutsche Forschungsgemeinschaft(STE 576 ⁄17-2). The authors are grateful to Dr. J. Borgand an anonymous reviewer for their helpful commentson the original version of this paper, and to Dr. D.Brownlee for efficient handling of the paper’ssubmission.
Editorial Handling—Dr. Donald Brownlee
REFERENCES
Anderson W. W. and Ahrens T. J. 1994. Physics ofinterplanetary dust capture via impact into organicpolymer foams. Journal Geophysical Research 99:2063–2071.
Bajt S., Sandford S. A., Flynn G. J., Matrajt G., Snead C. J.,Westphal A. J., and Bradley J. P. 2009. Infraredspectroscopy of Wild 2 particle hypervelocity tracks inStardust aerogel: Evidence for the presence of volatileorganics in cometary dust. Meteoritics & Planetary Science44:471–484.
Bernstein M. P., Sandford S. A., Allamandola L. J., Gillette J.S., Clemett S. J., and Zare R. N. 1999. Ultravioletirradiation of polycyclic aromatic hydrocarbons (PAHs) inices: Production of alcohols, quinones, and ethers. Science283:1135–1138.
Brownlee D. E., Tsou P., Anderson J. D., Hanner M. S.,Newburn R. L., Sekanina Z., Clark B. C., Horz F.,Zolensky M. E., Kissel J., McDonnell J. A. M., SandfordS. A., and Tuzzolino A. J. 2003. Stardust: Comet andinterstellar dust sample return mission. Journal ofGeophysical Research 108:#E10 8111, pp. 1-1–1-15.
Brownlee D., Tsou P., Aleon J., Alexander C. M. O’D., ArakiT., Bajt S., Baratta G. A., Bastien R., Bland P., Bleuet P.,Borg J., Bradley J. P., Brearley A., Brenker F., BrennanS., Bridges J. C., Browning N. D., Brucato J. R., BullockE., Burchell M., Busemann H., Butterworth A.,Chaussidon M., Cheuvront A., Chi M., Cintala M. J.,Clark B. C., Clemett S. J., Cody G., Colangeli L., CooperG., Cordier P., Daghlian C., Dai Z., d’Hendecourt L.,Djouadi Z., Dominguez G., Duxbury T., Dworkin J. P.,Ebel D. S., Economou T. E., Fakra S., Fairey S. A. J.,Fallon S., Ferrini G., Ferroir T., Fleckenstein H., FlossC., Flynn G., Franchi I. A., Fries M., Gainsforth Z.,Gallien J.-P., Genge M., Gilles M. K., Gillet P., GilmourJ., Glavin D. P., Gounelle M., Grady M. M., Graham G.A., Grant P. G., Green S. F., Grossemy F., Grossman L.,Grossman J. N., Guan Y., Hagiya K., Harvey R., HeckP., Herzog G. F., Hoppe P., Horz F., Huth J., HutcheonI. D., Ignatyev K., Ishii H., Ito M., Jacob D., JacobsenC., Jacobsen S., Jones S., Joswiak D., Jurewicz A.,Kearsley A., Keller L. P., Khodja H., Kilcoyne A. L. D.,
430 S. A. Sandford et al.

Kissel J., Krot A., Langenhorst F., Lanzirotti A., Le L.,Leshin L. A., Leitner J., Lemelle L., Leroux H., Liu M.-C., Luening K., Lyon I., MacPherson G., Marcus M. A.,Marhas K., Marty B., Matrajt G., McKeegan K., MeibomA., Mennella V., Messenger K., Messenger S., MikouchiT., Mostefaoui S., Nakamura T., Nakano T., Newville M.,Nittler L. R., Ohnishi I., Ohsumi K., Okudaira K.,Papanastassiou D. A., Palma R., Palumbo M. E., PepinR. O., Perkins D., Perronnet M., Pianetta P., Rao W.,Rietmeijer F. J. M., Robert F., Rost D., Rotundi A.,Ryan R., Sandford S. A., Schwandt C. S., See T. H.,Schlutter D., Sheffield-Parker J., Simionovici A., Simon S.,Sitnitsky I., Snead C., Spencer M. K., Stadermann F. J.,Steele A., Stephan T., Stroud R., Susini J., Sutton S. R.,Suzuki Y., Taheri M., Taylor S., Teslich N., Tomeoka K.,Tomioka N., Toppani A., Trigo-Rodrıguez J. M., TroadecD., Tsuchiyama A., Tuzzolino A. J., Tyliszczak T., UesugiK., Velbel M., Vellenga J., Vicenzi E., Vincze L., WarrenJ., Weber I., Weisberg M., Westphal A. J., Wirick S.,Wooden D., Wopenka B., Wozniakiewicz P., Wright I.,Yabuta H., Yano H., Young E. D., Zare R. N., Zega T.,Ziegler K., Zimmerman L., Zinner E., and Zolensky M.2006. Comet 81P ⁄Wild 2 under a microscope. Science314:1711–1716.
Chyba C. F. and McDonald G. D. 1995. The origin of life inthe solar system: Current issues. Annual Review of Earthand Planetary Sciences 23:215–249.
Chyba C. F. and Sagan C. 1992. Endogenous production,exogenous delivery and impact-shock synthesis of organicmolecules: An inventory for the origin of life. Nature355:125–132.
Clemett S. J., Spencer M. K., Sandford S. A., Nakamura-Messenger K., Horz F., McKay D. S., and Zare R. N.2010. Complex aromatic hydrocarbons in Stardust samplescollected from comet 81P ⁄Wild 2. Meteoritics & PlanetaryScience 45(5). In press.
Cody G. D., Ade H., Alexander C. M. O’D., Araki T.,Butterworth A., Fleckenstein H., Flynn G., Gilles M. K.,Jacobsen C., Kilcoyne A. L. D., Messenger K., SandfordS. A., Tyliszczak T., Westphal A. J., Wirick S., andYabuta H. 2008. Quantitative organic and light-elementanalysis of comet 81P ⁄Wild 2 particles using C-, N-, andO- l-XANES. Meteoritics & Planetary Science 43:353–365.
Courdouan A., Christl I., Meylan S., Wersin P., andKretzschmar R. 2007. Characterization of dissolvedorganic matter in anoxic rock extracts and in situ porewater of the Opalinus Clay. Applied Geology 22:2926–2939.
Cronin J. R., Pizzarello S., and Cruikshank D. P. 1988.Organic matter in carbonaceous chondrites, planetarysatellites, asteroids, and comets. In Meteorites and theearly solar system, edited by Kerridge J. F. and MatthewsM. S. Tucson, AZ: The University of Arizona Press. pp.819–857.
Dominguez G., Westphal A. J., Jones S. M., and Phillips M.L. F. 2004. Energy loss and impact cratering in aerogels:Theory and experiment. Icarus 172:613–624.
Flynn G. J., Bleuet P., Borg J., Bradley J. P., Brenker F. E.,Brennan S., Bridges J., Brownlee D. E., Bullock E. S.,Burghammer M., Clark B. C., Dai Z. R., Daghlian C. P.,Djouadi Z., Fakra S., Ferroir T., Floss C., Franchi I. A.,Gainsforth Z., Gallien J.-P., Gillet P., Grant P. G.,Graham G. A., Green S. F., Grossemy F., Heck P. R.,Herzog G. F., Hoppe P., Horz F., Huth J., Ignatyev K.,Ishii H. A., Janssens K., Joswiak D., Kearsley A. T.,
Khodja H., Lanzirotti A., Leitner J., Lemelle L., LerouxH., Luening K., MacPherson G. J., Marhas K. K.,Marcus M. A., Matrajt G., Nakamura T., Nakamura-Messenger K., Nakano T., Newville M., PapanastassiouD. A., Pianetta P., Rao W., Riekel C., Rietmeijer F. J. M.,Rost D., Schwandt C. S., See T. H., Sheffield-Parker J.,Simionovici A., Sitnitsky I., Snead C. J., Stadermann F. J.,Stephan T., Stroud R. M., Susini J., Suzuki Y., Sutton S.R., Taylor S., Teslich N., Troadec D., Tsou P.,Tsuchiyama A., Uesugi K., Vekemans B., Vicenzi E. P.,Vincze L., Westphal A. J., Wozniakiewicz P., Zinner E.,and Zolensky M. E. 2006. Elemental compositions ofcomet 81P ⁄Wild 2 samples collected by Stardust. Science314:1731–1735.
Flynn G. J., Leroux H., Tomeoka K., Tomioka N., OhnishiI., Mikouchi T., Wirick S., Keller L. P., Jacobsen C., andSandford S. A. 2008. Carbonate in comets: A comparisonof comets 1P ⁄Halley, 9P ⁄Temple 1, and 81P ⁄Wild 2(abstract #1979). 39th Lunar and Planetary ScienceConference. CD-ROM.
Glavin D. P., Dworkin J. P., Aubrey A., Botta O., Doty III J.H., Martins Z., and Bada J. L. 2006. Amino acid analysesof Antarctic CM2 meteorites using liquid chromatography-time of flight-mass spectrometry. Meteoritics & PlanetaryScience 41:889–902.
Glavin D. P., Dworkin J. P., and Sandford S. A. 2008.Detection of cometary amines in samples returned byStardust. Meteoritics & Planetary Science 43:399–413.
Guan L., Suenaga K., Shi Z., Gu Z., and Iijima S. 2005.Direct imaging of the alkali metal site in K-dopedfullerence peapods. Physical Review Letters 94:045502.
Hittle J. D., Calaway M. J., Allton J. H., Warren J. L.,Schwarz C. M., and Stansbery E. K. 2006. Genesisspacecraft science canister preliminary inspection andcleaning (abstract #1411). 37th Lunar and PlanetaryScience Conference. CD-ROM.
Horz F., Bastien R., Borg J., Bradley J. P., Bridges J. C.,Brownlee D. E., Burchell M. J., Chi M., Cintala M. J., DaiZ. R., Djouadi Z., Dominguez G., Economou T. W.,Fairey S. A. J., Floss C., Franchi I. A., Graham G. A.,Green S. F., Heck P., Hoppe P., Huth J., Ishii H., KearsleyA. T., Kissel J., Leitner J., Leroux H., Marhas K.,Messenger K., Schwandt C. S., See T. H., Snead C.,Stadermann F. J., Stephan T., Stroud R., Teslich N., Trigo-Rodrıguez J. M., Tuzzolino A. J., Troadec D., Tsou P.,Warren J., Westphal A., Wozniakiewicz P., Wright I., andZinner E. 2006. Impact features on Stardust: Implicationsfor comet 81P ⁄Wild 2 dust. Science 314:1716–1719.
Huebner W. F. and Boice D. C. 1992. Comets as a possiblesource of prebiotic molecules. Origins of Life and Evolutionof the Biosphere 21:299–315.
Jones S. 2007. A method for producing gradient densityaerogel. Journal of Sol-Gel Science and Technology 44:255–258.
Keller L. P., Bajt S., Baratta G. A., Borg J., Bradley J. P.,Brownlee D. E., Busemann H., Brucato J. R., Burchell M.,Colangeli L., d’Hendecourt L., Djouadi Z., Ferrini G.,Flynn G., Franchi I. A., Fries M., Grady M. M., GrahamG. A., Grossemy F., Kearsley A., Matrajt G., Nakamura-Messenger K., Mennella V., Nittler L., Palumbo M. E.,Stadermann F. J., Tsou P., Rotundi A., Sandford S. A.,Snead C., Steele A., Wooden D., and Zolensky M. 2006.Infrared spectroscopy of comet 81P ⁄Wild 2 samplesreturned by Stardust. Science 314:1728–1731.
Stardust contamination assessment 431

Lehmann J., Solomon D., Kinyangi J., Dathe L., Wirick S.,and Jacobsen J. 2008. Spatial complexity of soil organicmatter forms at nanometer scales. Nature Geosciences1:238–242.
McKeegan K. D., Aleon J., Bradley J., Brownlee D.,Busemann H., Butterworth A., Chaussidon M., Fallon S.,Floss C., Gilmour J., Gounelle M., Graham G., Guan Y.,Heck P. R., Hoppe P., Hutcheon I. D., Huth J., Ishii H.,Ito M., Jacobsen S. B., Kearsley A., Leshin L. A., Liu M.-C., Lyon I., Marhas K., Marty B., Matrajt G., MeibomA., Messenger S., Mostefaoui S., Mukhopadhyay S.,Nakamura-Messenger K., Nittler L., Palma R., Pepin R.O., Papanastassiou D. A., Robert F., Schlutter D., SneadC. J., Stadermann F. J., Stroud R., Tsou P., Westphal A.,Young E. D., Ziegler K., Zimmermann L., and Zinner E.2006. Isotopic compositions of cometary matter returnedby Stardust. Science 314:1724–1728.
Mikouchi T., Tachikawa O., Hagiya K., Ohsumi K., SuzukiY., Uesugi K., Takeuchi A., and Zolensky M. E. 2007.Mineralogy and crystallography of comet 81P ⁄Wild 2particles (abstract #1946). 38th Lunar and PlanetaryScience Conference. CD-ROM.
Nishikawa H., Watanabe E., Ito D., Sakurai Y., NagasawaK., and Ohki Y. 1996. Visible photoluminescence from Siclusters in gamma-irradiated amorphous SiO2. Journal ofApplied Physics 80:3513–3517.
Oro J. 1961. Comets and the formation of biochemicalcompounds on the primitive Earth. Nature 190:389–390.
Oro J., Holzer G., and Lazcano-Araujo A. 1980. Thecontribution of cometary volatiles to the primitive Earth.In Life sciences and space research. Vol. 18.—Proceedingsof the Open Meeting of the Working Group on SpaceBiology, Bangalore, India, May 29–June 9, 1979. (A80-50051 22-51) Oxford and Elmsford, NY: Pergamon Press.pp. 67–82.
Pizzarello S., Cooper G. W., and Flynn G. J. 2006. Thenature and distribution of the organic material incarbonaceous chondrites and interplanetary dust particles.In Meteorites and the early solar system II, edited byLauretta D. S. and McSween H. Y., Jr. Tucson, AZ: TheUniversity of Arizona Press. pp. 625–651.
Rotundi A., Baratta G. A., Borg J., Brucato J. R., BusemannH., Colangeli L., d’Hendecourt L., Djouadi Z., Ferrini G.,Franchi I. A., Fries M., Grossemy F., Keller L. P.,Mennella V., Nakamura K., Nittler L. R., Palumbo M. E.,Sandford S. A., Steele A., and Wopenka B. 2008.Combined micro-Raman, micro-infrared, and fieldemission scanning electron microscope analyses of comet81P ⁄Wild 2 particles collected by Stardust. Meteoritics &Planetary Science 43:367–397.
Sandford S. A. and Brownlee D. E. 2007. Response tocomment on ‘‘Organics captured from comet 81P ⁄Wild 2by the Stardust spacecraft.’’ Science 317:1682.
Sandford S. A., Bernstein M. P., Allamandola L. J., Gillette J.S., and Zare R. N. 2000. Deuterium enrichment of PAHsby photochemically induced exchange with deuterium-richcosmic ices. The Astrophysical Journal 538:691–697.
Sandford S. A., Bernstein M. P., and Dworkin J. P. 2001.Assessment of the interstellar processes leading todeuterium enrichment in meteoritic organics. Meteoritics &Planetary Science 36:1117–1133.
Sandford S. A., Aleon J., Alexander C. M. O’D., Araki T.,Bajt S., Baratta G. A., Borg J., Bradley J. P., Brownlee D.E., Brucato J. R., Burchell M. J., Busemann H.,
Butterworth A., Clemett S. J., Cody G., Colangeli L.,Cooper G., d’Hendecourt L., Djouadi Z., Dworkin J. P.,Ferrini G., Fleckenstein H., Flynn G. J., Franchi I. A.,Fries M., Gilles M. K., Glavin D. P., Gounelle M.,Grossemy F., Jacobsen C., Keller L. P., Kilcoyne A. L.D., Leitner J., Matrajt G., Meibom A., Mennella V.,Mostefaoui S., Nittler L. R., Palumbo M. E.,Papanastassiou D. A., Robert F., Rotundi A., Snead C. J.,Spencer M. K., Stadermann F. J., Steele A., Stephan T.,Tsou P., Tyliszczak T., Westphal A. J., Wirick S.,Wopenka B., Yabuta H., Zare R. N., and Zolensky M. E.2006. Organics captured from comet 81P ⁄Wild 2 by theStardust spacecraft. Science 314:1720–1724.
Smith M. A. and Lobo R. F. 2006. The local and surfacestructure of ordered mesoporous carbons from nitrogensorption, NEXAFS and synchrotron radiation studies.Microporous and Mesoporous Materials 92:81–93.
Solomon D., Lehmann J., Kinyangi J., Amelung W., Lobe I.,Pell A., Riha S., Ngoze S., and Verchot L. 2007. Long-term impacts of anthropogenic perturbations on dynamicsand speciation of organic carbon in tropical forest andsubtropical grassland ecosystems. Global Change Biology14:27–47.
Spencer M. K. 2008. Laser mass spectrometric detection ofterrestrial and extraterrestrial polycyclic aromatichydrocarbons. Ph.D. thesis, Stanford University, Stanford,California, USA.
Spencer M. K. and Zare R. N. 2006. lmL2MS analysis ofstandards in preparation for the return of NASA Stardust(abstract #1432). 37th Lunar and Planetary ScienceConference. CD-ROM.
Spencer M. K. and Zare R. N. 2007. Comment on ‘‘Organicscaptured from comet 81P ⁄Wild 2 by the Stardustspacecraft.’’ Science 317:1680.
Spencer M. K., Hammond M. R., and Zare R. N. 2008. Lasermass spectrometric detection of extraterrestrial aromaticmolecules: Mini-review and examination of pulsed heatingeffects. Proceedings of the National Academy of Sciences105:18,096–18,101.
Spencer M. K., Clemett S. J., Sandford S. A., McKay D.S., and Zare R. N. 2009. Organic compound alterationduring hypervelocity collection of carbonaceousmaterials in aerogel. Meteoritics & Planetary Science44:15–24.
Stephan T., Rost D., Vicenzi E. P., Bullock E. S.,MacPherson G. J., Westphal A. J., Snead C. J., Flynn G.J., Sandford S. A., and Zolensky M. E. 2008. TOF-SIMSanalysis of cometary matter in Stardust aerogel tracks.Meteoritics & Planetary Science 43:233–246.
Stohr J. 1992. NEXAFS spectroscopy. Springer Series inSurface Sciences, vol. 25. New York, NY: Springer-Verlag.
Tillotson T. M. and Hrubesh L. W. 1992. Transparentultralow-density silica aerogels prepared by a two-stepsol-gel process. Journal of Non-Crystalline Solids 145:44–50.
Tsou P., Brownlee D. E., Sandford S. A., Horz F., andZolensky M. E. 2003. Wild 2 and interstellar samplecollection and Earth return. Journal of GeophysicalResearch 108, #E10, 8113: pp. 3-1 to 3-21.
Westphal A. J., Snead C., Butterworth A., Graham G. A.,Bradley J. P., Bajt S., Grant P. G., Bench G., Brennan S.,and Pianetta P. 2004. Aerogel keystones: Extraction ofcomplete hypervelocity impact events from aerogelcollectors. Meteoritics & Planetary Science 39:1375–1386.
432 S. A. Sandford et al.
Westphal A. J., Bastien R. K., Borg J., Bridges J., BrownleeD. E., Burchell M. J., Cheng A. F., Clark B. C., DjouadiZ., Floss C., Franchi I., Gainsforth Z., Graham G.,Green S. F., Heck P. R., Horanyi M., Hoppe P., Horz F.P., Huth J., Kearsley A., Leroux H., Marhas K.,Nakamura-Messenger K., Sandford S. A., See T. H.,Stadermann F. J., Teslich N. E., Tsitrin S., Warren J. L.,Wozniakiewicz P. J., and Zolensky M. E. 2008. Discoveryof non-random spatial distribution of impacts in theStardust cometary collector. Meteoritics & PlanetaryScience 43:415–429.
Wirick S., Flynn G. J., Keller L., and Jacobsen C. 2004.Evidence for terrestrial organic contamination of theTagish Lake meteorite (abstract #1532). 35th Lunar andPlanetary Science Conference. CD-ROM.
Wirick S., Leroux H., Tomeoka K., Zolensky M. E., Flynn G.J., Tyliszczak T., Butterworth A., Tomioka N., Ohnishi I.,Nakamura-Messenger K., Sandford S., Keller L., andJacobsen C. 2007. Carbonates found in Stardust aerogeltracks (abstract #1534). 38th Lunar and Planetary ScienceConference. CD-ROM.
Zolensky M. E., Zega T. J., Yano H., Wirick S., Westphal A. J.,Weisberg M. K., Weber I., Warren J. L., Velbel M. A.,Tsuchiyama A., Tsou P., Toppani A., Tomioka N.,Tomeoka K., Teslich N., Taheri M., Susini J., Stroud R.,Stephan T., Stadermann F. J., Snead C. J., Simon S. B.,Simionovici A., See T. H., Robert F., Rietmeijer F. J. M.,Rao W., Perronnet M. C., Papanastassiou D. A., Okudaira
K., Ohsumi K., Ohnishi I., Nakamura-Messenger K.,Nakamura T., Mostefaoui S., Mikouchi T., Meibom A.,Matrajt G., Marcus M. A., Leroux H., Lemelle L., Le L.,Lanzirotti A., Langenhorst F., Krot A. N., Keller L. P.,Kearsley A. T., Joswiak D., Jacob D., Ishii H., Harvey R.,Hagiya K., Grossman L., Grossman J. N., Graham G. A.,Gounelle M., Gillet P., Genge M. J., Flynn G., Ferroir T.,Fallon S., Ebel D. S., Dai Z. R., Cordier P., Clark B., ChiM., Butterworth A. L., Brownlee D. E., Bridges J. C.,Brennan S., Brearley A., Bradley J. P., Bleuet P., Bland P.A., and Bastien R. 2006. Mineralogy and petrology ofcomet 81P ⁄Wild 2 nucleus samples. Science 314:1735–1739.
SUPPORTING INFORMATION
Additional supporting information may be found inthe online version of this article:
Table S1. Comet tray aerogel tiles, batches, andrelative luminescence intensities.
Table S2. Analytical results of Stardust air samples.Please note: Wiley-Blackwell are not responsible for
the content or functionality of any supporting materialssupplied by the authors. Any queries (other thanmissing material) should be directed to thecorresponding author for the article.
Stardust contamination assessment 433

1
Assessment and control of organic and other contaminants
associated with the Stardust sample return from Comet 81P/Wild 2
Scott A. SANDFORD,1,* Saša BAJT,
2 Simon J. CLEMETT,
3 George D. CODY,
4
George COOPER,5 Bradley T. DEGREGORIO,
6 Vanessa DE VERA,
7 Jason P.
DWORKIN,8 Jamie E. ELSILA,
8 George J. FLYNN,
9 Daniel P. GLAVIN,
8
Antonio LANZIROTTI,10
Thomas LIMERO,7 Mildred P. MARTIN,
8,11
Christopher J. SNEAD,12
Maegan K. SPENCER,13
Thomas STEPHAN,14
Andrew
WESTPHAL,15
Sue WIRICK,16
Richard N. ZARE,17
and Michael E.
ZOLENSKY18
1 NASA-Ames Research Center, Astrophysics Branch, Mail Stop 245-6, Moffett Field, CA
94035-1000 USA 2 Institute of Geophysics and Planetary Physics, Lawrence Livermore National Laboratory,
Livermore, CA 94550 USA (now at DESY Deutsches Elektronen-Synchrotron, Notkestraße
85, 22607 Hamburg, Germany) 3
ERC, Inc. / NASA Johnson Space Center, Houston, Texas 77058 USA 4
Geophysical Laboratory, Carnegie Institution of Washington, Washington DC, 20015 USA 5 NASA-Ames Research Center, Astrobiology Branch, Mail Stop 239-4, Moffett Field, CA
94035-1000 USA 6 Naval Research Lab., Code 6366, 4555 Overlook Ave. SW, Washington DC, 20375-5320 USA
7 Wyle Integrated Science and Engineering, Houston, Texas 77058 USA
8 Goddard Center for Astrobiology, NASA-Goddard Space Flight Center, Greenbelt, MD 20771
USA 9 Physics Dept., SUNY Plattsburgh, 101 Broad Street, Plattsburgh, NY 12901 USA
10 CARS, University of Chicago, Chicago, IL, 60637 USA
11 The Catholic University of America, Washington, DC. 20064 USA
12 Department of Earth and Space Sciences, UCLA, CA 90095-1567 USA
13 Department of Chemistry, Stanford University, Stanford, California 94305-5080 USA (now
at Sawtooth Labs, Inc., Redwood City, CA 94063 USA) 14
The University of Chicago, Department of the Geophysical Sciences, 5734 South Ellis
Avenue, Chicago, IL 60637, USA 15
Space Sciences Laboratory, University of California at Berkeley, Berkeley, CA 94720 16
Physics and Astronomy Dept., SUNY at Stony Brook, Stony Brook, NY 11794-3800 USA 17
Department of Chemistry, Stanford University, Stanford, California 94305-5080 18
1KT, NASA-Johnson Space Center, Houston, Texas 77058 USAJ.

2
SUPPORTING ONLINE MATERIALS – ANALYTICAL TECHNIQUES,
PROCEDURES, AND EQUIPMENT
Infrared Spectroscopy of Aerogel
Infrared results presented in this paper were obtained using synchrotron based Fourier
transform infrared (FTIR) microscopes located at the National Synchrotron Light Source (NSLS)
at Brookhaven National Laboratory (Upton, NY) and the Advanced Light Source (ALS) at
Lawrence Berkeley National Laboratory (Berkeley, CA). These synchrotron sources provide
bright IR beams that enable imaging with diffraction limited beam spots. Both systems consist
of a source of infrared light (the synchrotron), an interferometer, a microscope equipped with an
infrared detector, and a data recording and analysis system.
The ALS beamline 1.4.3 is equipped with a ThermoNicolet Magna 760 FTIR bench and a
SpectraTech Nic-Plan IR microscope (Holman and Martin 2006). The FTIR bench used a KBr
beamsplitter and the transmitted light was collected with a Mercury Cadmium Telluride (MCT-
A) detector between 4000 and 650 cm-1
(2.5-15.4 µm) with 4 cm-1
spectral resolution. Spectra
were normalized to the spectrum of the beam through the air and typical collection times on
keystone samples were between 6 and 60 seconds per position. Aerogel keystones were held
with silicon microforks attached to substrate holders that fit into the microscope slide holder,
thereby allowing the sample to be moved under the microscope with sub-micrometer precision
utilizing a software stage control while the synchrotron beam remained fixed. Hence, the maps
obtained at the ALS were collected as raster scan where the whole spectrum was recorded for
each individual point in the map. Optical and infrared beams were aligned prior to each session
and after each synchrotron beam refill, which typically occurs every 8 hours, in order to have a
perfect match between optical and infrared images.
The NSLS beamline U10 is built on a bending magnet port of the accelerator’s VUV ring

3
(Carr et al. 1999). The beamline delivers a diffraction-limited beam optimized for IR
microscopy/microspectroscopy. NSLS measurements reported in this paper were made using a
Nicolet Continuum FTIR spectro-microscope, equipped with a fixed Ge/KBr beamsplitter, two
Schwarzschild all-reflecting objectives (15X and 32X), automated X-Y scanning stage for
spectroscopic mapping with 1 µm step resolution, and two MCT detectors covering the spectral
range from 4000 to 450 cm-1
(2.5-22.2 µm). The analyses were made by obtaining an air
background, then measuring the absorption of the keystone containing the particle track, using
analysis spots having sizes ranging from 10 µm x 10 µm to 20 µm x 20 µm.
Nuclear Magnetic Resonance (NMR) of Aerogel
All the Nuclear Magnetic Resonance (NMR) experiments reported here were performed at
the W. M. Keck Solid State NMR Facility at the Geophysical Laboratory on a Varian-
Chemagnetics Infinity spectrometer with a 7.05 Tesla static field provided by an Oxford wide
bore superconducting magnet. Two large samples of aerogel were acquired from the same stock
that was flown on the Stardust spacecraft; specifically these are E232-1A (a highly luminescent
sample under UV) and E235-3C (a low luminescence sample). In addition to the aerogel, a
sample of the release agent, Synlube 1000, and a polymethylsilcone grease were also analyzed.
In order to thoroughly assess the chemistry of the aerogel, 1H,
13C, and
29Si NMR
experiments were performed. Line narrowing was achieved with rapid magic angle sample
spinning, necessitating that the aerogel samples be compacted prior to loading in the sample
rotors. The specific acquisition parameters for each experiment are as follows. Single pulse 29
Si
NMR was performed with excitation pulse widths (at a frequency of 59 MHz) of 30°, a recycle
delay of 10s, the MAS frequency ( r/2π) was 5 kHz. High power 1H decoupling ( 1/2π = 75
kHz) was employed during signal acquisition. The number of acquisitions was 10,000 per

4
sample. Carbon, 13
C, NMR was performed using 1H-
13C cross polarization (75 MHz and 300
MHz, for carbon and hydrogen, respectively), with a 1H 90° pulse width of 4 µs, a contact time
of 12 ms, a recycle delay of 1s and an MAS frequency ( r/2π) of 12 kHz. The number of
acquisitions was 78,000 per sample. A linear amplitude ramp was employed on the carbon
channel during cross polarization to compensate for the Hartmann-Hahn frequency modulation
effects derived from relatively fast MAS. Single pulse 1H NMR was performed using a 90° pulse
width and a recycle delay of 2s; the DEPTH multipulse routine was employed to suppress
hydrogen background signal. The number of acquisitions was 32,000 per sample. The frequency
reference standard for 1H,
13C, and
29Si NMR spectra are the resonant frequencies of the
respective nuclei in tetramethyl silane (TMS), defined as being equal to 0 ppm in all cases.
Luminescence Measurements
Luminescence images of the cometary collector tray were obtained using a 254 nm excitation
source held at a distance of about 30 cm from the front (i.e., comet exposed) surface of the tray. A
digital camera was position about 5 cm above the UV source and at a distance of about 35 cm from
collector. The camera had a zoom lens that was adjusted so that an individual image would cover
approximately 1/4 of the collector surface. Under these conditions the imaged area had a relatively
uniform UV flux. These images were then combined into composite images of the entire tray.
Each image uses the green channel as a crude spectrometer, so that the intensity variations
represent the luminescence emission principally in the 500-540 nm range. Each image was then
processed by a de-speckling algorithm to remove CCD hot spots, corrected for lens barrel
distortion, and made into a montage using an autocorrelation routine. Table S1 summarizes the
individual tiles examined with the intensity of their observed luminescence.
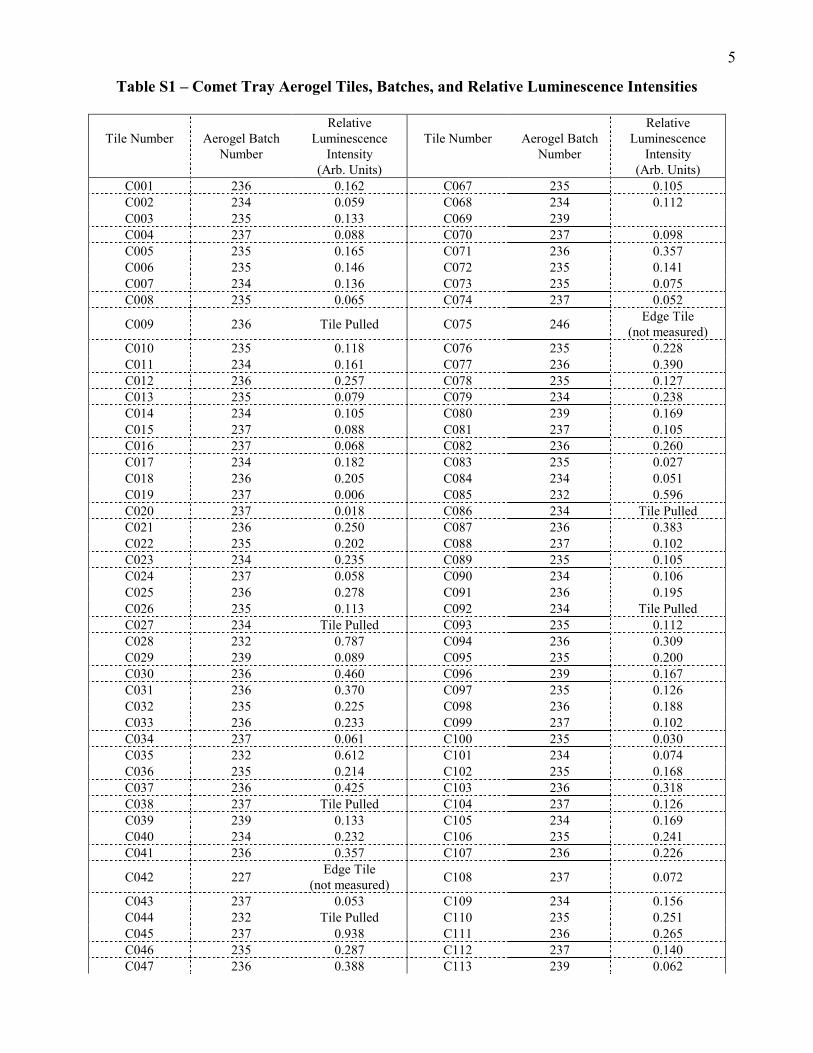
5
Table S1 – Comet Tray Aerogel Tiles, Batches, and Relative Luminescence Intensities
Tile Number
Aerogel Batch
Number
Relative
Luminescence
Intensity
(Arb. Units)
Tile Number
Aerogel Batch
Number
Relative
Luminescence
Intensity
(Arb. Units)
C001 236 0.162 C067 235 0.105
C002 234 0.059 C068 234 0.112
C003 235 0.133 C069 239
C004 237 0.088 C070 237 0.098
C005 235 0.165 C071 236 0.357
C006 235 0.146 C072 235 0.141
C007 234 0.136 C073 235 0.075
C008 235 0.065 C074 237 0.052
C009 236 Tile Pulled C075 246 Edge Tile
(not measured)
C010 235 0.118 C076 235 0.228
C011 234 0.161 C077 236 0.390
C012 236 0.257 C078 235 0.127
C013 235 0.079 C079 234 0.238
C014 234 0.105 C080 239 0.169
C015 237 0.088 C081 237 0.105
C016 237 0.068 C082 236 0.260
C017 234 0.182 C083 235 0.027
C018 236 0.205 C084 234 0.051
C019 237 0.006 C085 232 0.596
C020 237 0.018 C086 234 Tile Pulled
C021 236 0.250 C087 236 0.383
C022 235 0.202 C088 237 0.102
C023 234 0.235 C089 235 0.105
C024 237 0.058 C090 234 0.106
C025 236 0.278 C091 236 0.195
C026 235 0.113 C092 234 Tile Pulled
C027 234 Tile Pulled C093 235 0.112
C028 232 0.787 C094 236 0.309
C029 239 0.089 C095 235 0.200
C030 236 0.460 C096 239 0.167
C031 236 0.370 C097 235 0.126
C032 235 0.225 C098 236 0.188
C033 236 0.233 C099 237 0.102
C034 237 0.061 C100 235 0.030
C035 232 0.612 C101 234 0.074
C036 235 0.214 C102 235 0.168
C037 236 0.425 C103 236 0.318
C038 237 Tile Pulled C104 237 0.126
C039 239 0.133 C105 234 0.169
C040 234 0.232 C106 235 0.241
C041 236 0.357 C107 236 0.226
C042 227 Edge Tile
(not measured) C108 237 0.072
C043 237 0.053 C109 234 0.156
C044 232 Tile Pulled C110 235 0.251
C045 237 0.938 C111 236 0.265
C046 235 0.287 C112 237 0.140
C047 236 0.388 C113 239 0.062

6
C048 237 0.068 C114 235 0.071
C049 234 0.095 C116 237 0.052
C050 236 0.211 C117 235 0.074
C051 239 0.008 C118 235 0.138
C053 236 0.496 C119 237 0.143
C054 234 Tile Pulled C120 239 0.105
C055 239 0.208 C121 235 0.303
C056 237 0.233 C122 237 0.030
C057 236 0.306 C123 239 0.073
C058 234 0.171 C124 237 0.059
C059 239 0.060 C125 237 0.033
C060 237 0.357 C126 239 Tile Pulled
C061 236 0.426 C127 234 0.033
C062 235 0.272 C128 234 0.067
C063 234 0.106 C129 235 0.165
C064 239 0.089 C130 234 0.105
C065 237 0.048 C131 237 0.046
C066 237 0.044 C132 234 0.031
LC-FD/TOF-MS
Prior to analysis, all of the samples examined using liquid chromatography with UV
fluorescence detection and time of flight mass spectrometry (LC-FD/TOF-MS) were carried
through a hot-water extraction and acid-hydrolysis procedure designed to investigate amino acids
and amines in both the free and bound state. Details on the extraction procedure and analytical
technique can be found in Glavin et al. (2008).
GC-MS/IRMS and EA-IRMS
Isotopic measurements of EACA were performed on samples previously extracted and
hydrolyzed for LC-FD/ToF-MS analysis. Details of the isotopic analytical procedure can be found
in Elsila et al. (2009).
µL2MS and ultra-L
2MS
The underlying concept of L2MS and ultra-L
2MS, namely that of two-step laser mass
spectrometry, is described in detail in Clemett and Zare (1996). A detailed description of the

7
application of L2MS toward the analysis of contamination controls for the NASA Stardust
mission can be found in Spencer (2008) and the use of ultra-L2MS on Stardust samples is
discussed in more detail in Clemett et al. (2009).
Samples of the heatshield and backshell examined by ultra-L2MS (Figure 14, main paper)
were acquired by using a sable brush to gently remove loose or flaking material from the selected
region, which were then immediately transferred to a clean sample vial and sealed. Each sample
consisted of one or more black-to-grey fines that were typically up to several hundred microns
along their longest dimension. One of the fines from each sample vial was dry-picked with a
cleaned stainless steel needle and attached to small squares of Au foil using the thermal setting
polymer CrystalBond. Once all six samples had been mounted on the Au foil, the foil itself was
attached to a stainless steel sample platter using double-sided C tape and inserted into the ultra-
L2MS system.
STXM/XANES of soils, heatshield, backshell, Whipple Shield, and aerogel – STXM was used to
analyze soil samples M4672,6, M4762,5, and M5213,3 as well as the various components of the
SRC thermal protection system, the Whipple shield, and aerogel picokeystones. The techniques
and equipment used for these measurements is described in detail elsewhere (Jacobsen et al. 1996;
Cody et al. 2008).
The STXM studies of aerogel were done on picokeystones taken from flight aerogel tiles (see
main text). The picokeystones were triangular in shape, ~0.5mm on a side, ~70 µm thick, and
were sandwiched between two 3 mm, ~100 nm thick square silicon nitride windows for XANES
analysis. It was only possible to collect data from the outer ~30 µm edges of these picokeystones
where the aerogel was thin enough for X-rays to fully penetrate. The comet aerogel was stored in a
nitrogen environment except during the time it took to cut the picokeystones in a clean room. The

8
samples were shipped overnight to the NSLS and are kept in a nitrogen purging cabinet until the
samples were analyzed. During the STXM measurement, the aerogel was kept in a helium-purged
environment.
Soils samples were initially stored in polyethylene bags and later transferred to clean, glass
tubes and dried. To prepare the samples for STXM analysis, a 1mm size piece of a soil sample
was crushed in between two clean glass slides. Large pieces of soil were taped off of one of the
glass slides and 100 µl of Sigma water number 270733 was dropped onto the material still left on
the slide. A copper TEM grid backed with silicon monoxide was touched to the surface of this
droplet and left to dry. This method selected micrometer to submicrometer size pieces that were
thin enough for X-ray transmission measurements.
TOF-SIMS
A TOF-SIMS IV instrument from ION-TOF GmbH was used to study inorganic and organic
compositions of particle fragments extracted from aerogel (Stephan et al. 2008a), of particle track
material exposed to the very surface of dissected aerogel keystones (Stephan et al. 2008b), as
well as of cometary residues associated with impact craters on aluminum foil (Leitner et al.
2008). For comparison, also an aerogel witness coupon was analyzed.
Prior to TOF-SIMS measurements, all analyzed samples except for the witness coupon were
cleaned by Ar+ ion sputtering, although sputtering usually destroys organic molecules by
fragmentation. However, cleaning was required because all sample surfaces showed an
omnipresent, mainly organic contamination layer preventing any SIMS analysis of the Wild 2
material. For the analyses, an intermittent Ga+ primary ion beam with a pulse length of 1.5 ns and
a beam diameter of ~300 nm was used. With a repetition rate of 10 kHz, the analyzed sample
regions were raster-scanned for typically 12 hours either with 1282 pixels or 256
2 pixels. Both
9
polarities, positive as well as negative secondary ions, were analyzed in two consecutive
measurements. Further details on the TOF-SIMS technique in general are given by Stephan
(2001). TOF-SIMS of organics, especially of PAHs is described by Stephan et al. (2003).
The analysis of the witness coupon was performed without prior Ar+ sputtering to ensure
that no contamination was removed from the control sample and no large molecules were
fragmented. Therefore, the amount of organic compounds observed on the control sample
represents only an upper limit for the contamination expected to be found after sputtering on
aerogel exposed to the comet. Any surplus in the latter samples can be attributed to the comet.
Gas Sampling and Analysis
Gas samples were taken during and after recovery of the SRC. Preparations of 10 1-liter
Grab Sample Canisters (GSC) and subsequent sample analyses were performed in the
IS09001:2000 certified Toxicology Laboratory at NASA’s Johnson Space Center. The
procedures and analyses in this section were performed in accordance with the stated IS09001
work instructions (WI). These work instructions are either modified versions of Environmental
Protection Agency (EPA) air analysis protocols or they are custom methods written to maintain
the spirit of the EPA quality assurance program when no EPA protocol was available.
Key steps in the preparation of 10 grab sample containers (GSCs) for Stardust were
certifying them leak-free and clean (TOX-003: Cleaning Sample Canisters). GSCs were verified
leak-free by a two-part test that checks the integrity of the valve, first with pressure in the GSC
and then with the GSC at vacuum. The cleanliness of each GSC was confirmed by filling it with
humidified zero air (certified) and analyzing an aliquot from the GSC by an automated inlet
system/gas chromatograph/mass spectrometer (AIS/GC/MS). The GSC was certified clean when
no volatile organic compounds were detected above the instrument quantitation limit (5 ppbv).
10
Final preparation steps included evacuating the certified GSCs to 10-5
Torr and packing them for
delivery to the Stardust landing site in Utah.
GSCs filled during the SRC recovery process were returned to JSC where the pressure of
each GSC was measured upon receipt into NASA’s JSC Toxicology Laboratory. Pressures were
also measured at each subsequent step of the analytical process. The pressure profile verified the
GSC sample integrity throughout its processing in the Toxicology Laboratory.
Each GSC was analyzed by several methods to accommodate measurement of a wide range
of compounds. First, carbon monoxide and carbon dioxide analyses were performed on a
GC/thermal conductivity detector (TOX-004: Analysis of carbon monoxide, methane, ethylene,
carbon dioxide, and hydrogen in spacecraft air using grab sample containers). Next, a GC-flame
ionization detector was used to quantitate compounds that are frequently detected at high levels
(> 1.0 ppm) in GSCs, such as methanol, ethanol, isopropanol, 2-butanone, and acetone.
The last analysis of the GSC, by AIS/GC/MS, identified and quantified the volatile organic
compounds in the air sample (WI: Measurement of volatile organic compounds in spacecraft air
using grab sample containers). Prior to the analysis of the Stardust samples, the instrument
stability was verified by adherence to EPA criteria for all ions of a bromofluorobenzene tune,
zero air runs, initial calibration, and daily calibration verification. The AIS/GC/MS was
calibrated between 40 and 300 ppb using TO-14 non-polar and TO-15 polar compounds at five
levels to generate the initial relative response factors (RRF). The RRFs from the daily calibration
verification (mid-range concentration standard) were used for sample calculations.
The volatile organics analysis began by cryogenically pre-concentrating an aliquot of the
GSC sample through a series of multi-bed traps in the AIS. The two-fold purpose of this process
is to remove water and CO2, and to focus the organics into a narrow band before desorption onto
the GC and introduction into the mass spectrometer. Compounds in a GSC sample were

11
identified by their characteristic GC retention time and mass spectra. Compound concentrations
were derived by an internal standard calculation method that used fluorobenzene (internal
standard) and the daily calibration RRF.
The detailed results of the analyses are listed in Table S2.

12
Table S2 - Analytical Results of Stardust Air Samples
CHEMICAL CONTAMINANT
CONCENTRATION (ppb)
AA03938 Landing Site Heatshield SIS S/N 25228
Stardust ID#7
AA03939 Landing Site Heatshield SIS S/N 22385
Stardust ID#8
AA03940 Landing Site
Backshell Vent
SIS S/N 25223
Stardust ID#3
AA03941 Landing Site
Backshell Vent
SIS S/N 25220
Stardust ID#4
AA03942 Clean Room Heatshield SIS S/N 25378
Stardust ID#1
AA03943 Clean Room Heatshield SIS S/N 23681
Stardust ID#5
AA03945 Clean Room Interior of
SRC SIS S/N 21259
Stardust ID#6
AA03947 N2 Purge
from Building 31
SIS S/N 21260
Stardust ID#10
TARGET COMPOUNDS (TO-14/POLAR)*** FREON12 ND ND ND ND ND ND ND ND
CHLOROMETHANE ND ND TRACE ND TRACE ND ND ND
FREON114 ND ND ND ND ND ND ND ND
METHANOL TRACE ND 36 12 83 19 19 ND
ACETALDEHYDE 6.7 7.5 17 16 22 12 5.7 TRACE
VINYLCHLORIDE ND ND ND ND ND ND ND ND
BROMOMETHANE ND ND ND ND ND ND ND ND
ETHANOL ND ND 6.5 TRACE 23 17 13 ND
CHLOROETHANE ND ND ND ND ND ND ND ND
ACETONITRILE ND ND TRACE ND TRACE TRACE ND ND
PROPENAL ND ND 4.4 ND 6.8 2.8 ND ND
ACETONE TRACE TRACE TRACE TRACE 15 10 9.3 ND
PROPANAL ND ND TRACE TRACE TRACE TRACE TRACE ND
ISOPROPANOL ND TRACE 16 TRACE 5100 5800 4800 ND
FREON11 ND ND ND ND ND ND ND ND
FURAN ND ND ND ND ND ND ND ND
ACRYLONITRILE ND ND ND ND ND ND ND ND
PENTANE ND ND ND ND TRACE TRACE TRACE ND
2-METHYL-2-PROPANOL ND ND ND ND ND ND ND ND
METHYLACETATE ND ND ND ND ND ND ND ND
1,1-DICHLOROETHENE ND ND ND ND ND ND ND ND
DICHLOROMETHANE ND ND ND ND ND ND ND ND
3-CHLOROPROPENE ND ND ND ND ND ND ND ND
FREON113 ND ND ND ND ND ND ND ND
N-PROPANOL ND ND ND ND TRACE TRACE ND ND
1,1-DICHLOROETHANE ND ND ND ND ND ND ND ND
BUTANAL ND ND ND TRACE TRACE ND ND ND
2-BUTANONE ND ND ND ND TRACE TRACE ND ND
CIS-1,2-DICHLOROETHENE ND ND ND ND ND ND ND ND

13
2-METHYLFURAN ND ND ND ND ND ND ND ND
ETHYLACETATE ND ND ND ND TRACE ND ND ND
HEXANE ND ND ND ND TRACE ND ND ND
CHLOROFORM ND ND ND ND ND ND ND ND
2-BUTENAL ND ND ND ND ND ND ND ND
1,2-DICHLOROETHANE ND ND ND ND ND ND ND ND
1,1,1-TRICHLOROETHANE ND ND ND ND ND ND ND ND
N-BUTANOL ND ND ND ND ND ND ND ND
BENZENE ND ND TRACE ND 6.7 TRACE TRACE ND
CARBONTETRACHLORIDE ND ND ND ND ND ND ND ND
2-PENTANONE ND ND ND ND ND ND ND ND
2-METHYLHEXANE ND ND ND ND ND ND ND ND
2,3-DIMETHYLPENTANE ND ND ND ND ND ND ND ND
PENTANAL ND ND ND ND ND ND ND ND
3-METHYLHEXANE ND ND ND ND TRACE ND ND ND
1,2-DICHLOROPROPANE ND ND ND ND ND ND ND ND
1,4-DIOXANE ND ND ND ND ND ND ND ND
TRICHLOROETHENE ND ND ND ND ND ND ND ND
2,5-DIMETHYLFURAN ND ND ND ND ND ND ND ND
N-HEPTANE ND ND ND ND TRACE ND ND ND
4-METHYL2-PENTANONE ND ND ND ND ND ND ND ND
CIS-1,3-DICHLOROPROPENE ND ND ND ND ND ND ND ND
2-PENTENAL ND ND ND ND ND ND ND ND
TRANS-1,3-DICHLOROPROPENE ND ND ND ND ND ND ND ND
1,1,2-TRICHLOROETHANE ND ND ND ND ND ND ND ND
TOLUENE ND ND ND ND 17 TRACE TRACE ND
HEXANAL ND ND ND ND TRACE ND ND ND
MESITYLOXIDE ND ND ND ND ND ND ND ND
1,2-DIBROMOETHANE ND ND ND ND ND ND ND ND
BUTYLACETATE ND ND ND ND ND ND ND ND
TETRACHLOROETHENE ND ND ND ND ND ND ND ND
CHLOROBENZENE ND ND ND ND ND ND ND ND
ETHYLBENZENE ND ND ND ND ND ND ND ND
M/P-XYLENES ND ND ND ND TRACE TRACE TRACE ND
2-HEPTANONE ND ND ND ND ND ND ND ND
CYCLOHEXANONE ND ND ND ND ND ND ND ND
HEPTANAL ND ND ND ND ND ND ND ND
STYRENE ND ND ND ND ND ND ND ND
1,1,2,2-TETRACHLOROETHANE ND ND ND ND ND ND ND ND
O-XYLENE ND ND ND ND ND ND ND ND
1,3,5-TRIMETHYLBENZENE ND ND ND ND ND ND ND ND
1,2,4-TRIMETHYLBENZENE ND ND ND ND ND ND ND ND
1,3-DICHLOROBENZENE ND ND ND ND ND ND ND ND
1,4-DICHLOROBENZENE ND ND ND ND ND ND ND ND

14
1,2-DICHLOROBENZENE ND ND ND ND ND ND ND ND
1,2,4-TRICHLOROBENZENE ND ND ND ND ND ND ND ND
HEXACHLORO-1,3-BUTADIENE ND ND ND ND ND ND ND ND
NON-TARGET COMPOUNDS
OCTAMETHYLCYCLOTETRASILOXANE TRACE TRACE TRACE TRACE 8.5 TRACE TRACE TRACE
1,1,1,2-TETRAFLUOROETHANE ND ND 19 ND 4300 2100 1900 ND
TRIMETHYLSILANOL ND ND 5.5 TRACE 17 7.7 TRACE ND
HEXAMETHYLCYCLOTRISILOXANE TRACE 13 7.6 TRACE 32 26 8.8 TRACE
GC TARGET COMPOUNDS
CARBON MONOXIDE < LOD < LOD < LOD < LOD < LOD
CARBON DIOXIDE 294000 312000 643000 649000 < LOD
METHANOL < LOD < LOD 139 < LOD < LOD
ETHANOL < LOD < LOD < LOD < LOD < LOD
ACETONE < LOD < LOD < LOD < LOD < LOD
TOTAL CONCENTRATION 17 28 128 48 9664 8017 6773 7.5
OTHER COMPOUNDS IDENTIFIED IN SAMPLES
CARBONYL SULFIDE F F F F F F F ND
C4 ALKANE ND ND F ND F F F ND
C5 ALKANE ND ND ND ND F F F ND
C5 DIENE ND ND ND ND F F F ND
C6 ALKANE ND ND F ND F ND F ND
C7 ALKENE ND ND F ND F ND ND ND
C7 ALKANES ND ND F ND F F F ND
C8 ALKANES ND ND ND ND F ND F ND
ISOPROPANOL concentrations are from the GC data.
1,1,1,2-TETRAFLUOROETHANE concentrations are from dilution analysis.
ND: Compound not detected or the concentration was <1ppb.
TRACE: Amount detected is sufficient for compound identification and the concentration was >1ppb and <5ppb.
F: Found. Other compounds were identified in samples, but were not quantified.
***Measurements are calibrated by multi-point initial calibration and verified by mid-point continuing calibration.
NOTE: < LOD = less than limit of detection or detection limit; Instrument Detection Limit (D.L.). Estimated as 3.14 X SD of continuing
calibration standard in ppm.
15
NOTE: LOD for CO = 500 ppb
NOTE: LOD for CO2 = 220000 ppb

16
GCMS of Soil Samples
A Finnigan ion trap GC-MS interfaced to a Finnigan GCQ mass spectrometer was used for
analysis of soils obtained at the SRC landing site. The MS detector conditions were:
temperature, 200oC; damper gas, helium; transfer line, 200
oC; electron voltage 70 eV. Two
Chrompack Chirasil Dex-CB columns (25m x 0.25 um each, Varian Corp.) in series were used
for GC separations. The GC injector temperature was constant at 200oC and He flow rate at 30
cm3/min. The following set of GC conditions was found to be optimum for the ISP-TFA/PFP
derivatives: initial oven temperature, 45oC, 3
oC/min to 70
oC, hold 30 min, 3
oC/min to 200
oC.
Sample extraction and GC-MS preparation procedures are similar to those used previously
(Cooper and Cronin 1995).
SUPPORTING ONLINE MATERIALS REFERENCES
Carr G. L., Merlo O., Munsli M., Springer S., and Ho S. C. 1999. Characterization of the new
NSLS infrared microspectroscopy beamline U10B. In Accelerator-based sources of infrared
and spectroscopic applications, SPIE Proc. 3775:22-29.
Clemett S. J. and Zare R. N. 1996. Microprobe Two-Step Laser Mass Spectrometry as an
Analytical Tool for Meteoritic Samples. In Molecules in Astrophysics: Probes & Processes,
ed. van Dishoeck E. F., Univ. of Leiden:Netherlands, pp. 305.
Clemett S. J., Spencer M. K., Sandford S. A., Nakamura-Messenger K., Hörz F., McKay D. S.,
and Zare R. N. 2009. Complex aromatic hydrocarbons in Stardust samples collected from the
Comet 81P/Wild-2. Meteoritics and Planetary Science, in press.
Cody G., D., Ade H., Alexander C. M. O’D., Araki T., Butterworth A., Fleckenstein H., Flynn
G., Gilles M. K., Jacobsen C., Kilcoyne A. L. D., Messenger K., Sandford S. A., Tyliszczak
T., Westphal A. J., Wirick S., and Yabuta H. 2008. Quantitative organic and light-element
analysis of Comet 81P/Wild 2 particles using C-, N-, and O- µ-XANES. Meteoritics and
Planetary Science 43:353-365.
Cooper, G. W., and Cronin, J. R. 1995. Linear and cyclic aliphatic carboxamides of the
Murchison meteorite: Hydrolyzable derivatives of amino acids and other carboxylic acids.
Geochimica et Cosmochimica Acta 59:1003-1015.

17
Elsila J. E., Glavin D. P., and Dworkin J. P. 2009. Cometary glycine detected in samples
returned by Stardust. Meteoritics and Planetary Science 44:1323-1330.
Glavin D. P., Dworkin J. P., and Sandford S. A. 2008. Detection of cometary amines in samples
returned by Stardust. Meteoritics & Planetary Science 43:399–413.
Holman H. -Y., and Martin M. C. 2006. Synchrotron radiation infrared spectromicroscopy: A
non-invasive chemical probe for monitoring biogeochemical processes. Advances in
Agronomy 90:79-127.
Jacobsen C., Chapman H. N., Fu J., Kalinovsky A., Kirz J., Maser J., Osanna A., Spector S.,
Tennant D., Wang S., Wirick S., and Zhang X. 1996. Biological microscopy and soft X-ray
optics at Stony Brook. Journal of Electron Spectroscopy and Related Phenomena 80:337-
341.
Leitner J., Stephan T., Kearsley A. T., Hörz F., Flynn G. J. and Sandford S. A. 2008. TOF-SIMS
analysis of crater residues from Wild 2 cometary particles on Stardust aluminum foil.
Meteoritics & Planetary Science 43:161–185.
Spencer, M. K. 2008. Laser mass spectrometric detection of terrestrial and extraterrestrial
polycyclic aromatic hydrocarbons. Ph.D. Thesis, Stanford University, Stanford, CA, USA,
June 15, 2008.
Stephan T. 2001. TOF-SIMS in cosmochemistry. Planetary and Space Science 49:859–906.
Stephan T., Jessberger E. K., Heiss C. H. and Rost D. 2003. TOF-SIMS analysis of polycyclic
aromatic hydrocarbons in Allan Hills 84001. Meteoritics & Planetary Science 38:109–116.
Stephan T., Flynn G. J., Sandford S. A. and Zolensky M. E. 2008a. TOF-SIMS analysis of
cometary particles extracted from Stardust aerogel. Meteoritics & Planetary Science 43:285–
298.
Stephan T., Rost D., Vicenzi E. P., Bullock E. S., MacPherson G. J., Westphal A. J., Snead C. J.,
Flynn G. J., Sandford S. A. and Zolensky M. E. 2008b. TOF-SIMS analysis of cometary
matter in Stardust aerogel tracks. Meteoritics & Planetary Science 43:233–246.
All in-text references underlined in blue are linked to publications on ResearchGate, letting you access and read them immediately.