Comparative evaluation of the toxicity and genotoxicity of cadmium in amphibian larvae (Xenopus...
14
Comparative Evaluation of the Toxicity and Genotoxicity of Cadmium in Amphibian Larvae (Xenopus laevis and Pleurodeles waltl) Using the Comet Assay and the Micronucleus Test F. Mouchet, 1 L. Gauthier, 1 M. Baudrimont, 2 P. Gonzalez, 2 C. Mailhes, 3 V. Ferrier, 4 A. Devaux 5,6 1 Laboratoire d’Ecologie des Hydrosyste ` mes LEH, Universite ´ Paul Sabatier, UMR CNRS UPS 5177, 29 Rue Jeanne Marvig, 31055 Toulouse, France 2 Laboratoire d’Ecophysiologie et Ecotoxicologie des Syste ` mes Aquatiques LEESA, UMR CNRS 5805, Universite ´ Bordeaux 1, Place du Dr B. Peyneau, 33120 Arcachon, France 3 IRIT–ENSEEIHT-Te ´ SA, 2 rue Camichel, BP 7122, F-31071 Toulouse cedex7, France 4 Centre de Biologie du De ´ veloppement CBD, Universite ´ Paul Sabatier, UMR CNRS UPS 5547, 118 route de Narbonne, 31062 Toulouse, France 5 Laboratoire des Sciences de l’Environnement LSE, Ecole Nationale des Travaux Publics de l’Etat, 69518 Vaulx-en-Velin, France 6 INRA, De ´ partement d’Hydrobiologie et Faune Sauvage, Campus de Beaulieu, 35042 Rennes cedex, France Received 4 December 2006; accepted 5 February 2007 ABSTRACT: The toxic and genotoxic potential of Cadmium (CdCl 2 ) were evaluated by the micronucleus test (MNT) and comet assay (CA) using amphibian larvae (Xenopus laevis and Pleurodeles waltl). Acute toxicity results showed that Cd is toxic to Xenopus larvae exposed from 2 to 50 mg/L and to Pleurodeles from 5 to 50 mg/L, depending on the nature of the water (reconstituted water containing mineral salts or mineral water MW (Volvic 1 )). The MNT results obtained in MW showed that Cd (2 mg/L) is genotoxic to Xenopus, whereas it was not genotoxic to Pleurodeles at all concentrations tested. The CA established that the genotoxicity of Cd to Xenopus and Pleurodeles larvae depends on the concentration, the expo- sure times, and the comet parameters (Tail DNA, ETM, OTM, and TL). The CA and MNT results were compared for their ability to detect genotoxic effects, considering the concentrations of Cd applied and the exposure time. The CA showed Cd to be genotoxic from the first day of exposure. In amphibians, the CA appears to be a sensitive and suitable method for detecting genotoxicity such as that caused by Cd. # 2007 Wiley Periodicals, Inc. Environ Toxicol 22: 422–435, 2007. Keywords: cadmium; amphibian; Xenopus laevis; Pleurodeles waltl; acute toxicity; genotoxicity; comet assay; micronucleus test INTRODUCTION Increased environmental pollution can be attributed to a va- riety of factors resulting from current industrial and agricul- tural technologies, together with changes in our way of life. In addition, the nature of the pollution itself has become more diverse. Metallic pollution receives widespread atten- tion because of increasing amounts of metal being released into the environment due to the development of industrial societies. This is an area of increasing concern in industrial- ized countries. Regardless of their origin, metals tend to find their way into the aquatic compartment and can exhibit toxic and genotoxic activity in fresh water. Cadmium is used in metal plating, metallurgical alloy- ing, mining, ceramics and pigments and in other industrial Correspondence to: F. Mouchet; e-mail: florence.mouchet@wanadoo. fr Published online in Wiley InterScience (www.interscience.wiley.com). DOI 10.1002/tox.20267 C 2007 Wiley Periodicals, Inc. 422
-
Upload
independent -
Category
Documents
-
view
0 -
download
0
Transcript of Comparative evaluation of the toxicity and genotoxicity of cadmium in amphibian larvae (Xenopus...

Comparative Evaluation of the Toxicity andGenotoxicity of Cadmium in Amphibian Larvae(Xenopus laevis and Pleurodeles waltl) Using theComet Assay and the Micronucleus Test
F. Mouchet,1 L. Gauthier,1 M. Baudrimont,2 P. Gonzalez,2 C. Mailhes,3
V. Ferrier,4 A. Devaux5,6
1Laboratoire d’Ecologie des Hydrosystemes LEH, Universite Paul Sabatier, UMR CNRS UPS5177, 29 Rue Jeanne Marvig, 31055 Toulouse, France
2Laboratoire d’Ecophysiologie et Ecotoxicologie des Systemes Aquatiques LEESA, UMRCNRS 5805, Universite Bordeaux 1, Place du Dr B. Peyneau, 33120 Arcachon, France
3IRIT–ENSEEIHT-TeSA, 2 rue Camichel, BP 7122, F-31071 Toulouse cedex7, France
4Centre de Biologie du Developpement CBD, Universite Paul Sabatier, UMR CNRS UPS 5547,118 route de Narbonne, 31062 Toulouse, France
5Laboratoire des Sciences de l’Environnement LSE, Ecole Nationale des Travaux Publics del’Etat, 69518 Vaulx-en-Velin, France
6INRA, Departement d’Hydrobiologie et Faune Sauvage, Campus de Beaulieu, 35042 Rennescedex, France
Received 4 December 2006; accepted 5 February 2007
ABSTRACT: The toxic and genotoxic potential of Cadmium (CdCl2) were evaluated by the micronucleustest (MNT) and comet assay (CA) using amphibian larvae (Xenopus laevis and Pleurodeles waltl). Acutetoxicity results showed that Cd is toxic to Xenopus larvae exposed from 2 to 50 mg/L and to Pleurodelesfrom 5 to 50 mg/L, depending on the nature of the water (reconstituted water containing mineral salts ormineral water MW (Volvic1)). The MNT results obtained in MW showed that Cd (2 mg/L) is genotoxic toXenopus, whereas it was not genotoxic to Pleurodeles at all concentrations tested. The CA establishedthat the genotoxicity of Cd to Xenopus and Pleurodeles larvae depends on the concentration, the expo-sure times, and the comet parameters (Tail DNA, ETM, OTM, and TL). The CA and MNT results werecompared for their ability to detect genotoxic effects, considering the concentrations of Cd applied andthe exposure time. The CA showed Cd to be genotoxic from the first day of exposure. In amphibians, theCA appears to be a sensitive and suitable method for detecting genotoxicity such as that caused by Cd.# 2007 Wiley Periodicals, Inc. Environ Toxicol 22: 422–435, 2007.
Keywords: cadmium; amphibian; Xenopus laevis; Pleurodeles waltl; acute toxicity; genotoxicity; cometassay; micronucleus test
INTRODUCTION
Increased environmental pollution can be attributed to a va-
riety of factors resulting from current industrial and agricul-
tural technologies, together with changes in our way of life.
In addition, the nature of the pollution itself has become
more diverse. Metallic pollution receives widespread atten-
tion because of increasing amounts of metal being released
into the environment due to the development of industrial
societies. This is an area of increasing concern in industrial-
ized countries. Regardless of their origin, metals tend to
find their way into the aquatic compartment and can exhibit
toxic and genotoxic activity in fresh water.
Cadmium is used in metal plating, metallurgical alloy-
ing, mining, ceramics and pigments and in other industrial
Correspondence to: F. Mouchet; e-mail: florence.mouchet@wanadoo.
fr
Published online in Wiley InterScience (www.interscience.wiley.com).
DOI 10.1002/tox.20267
�C 2007 Wiley Periodicals, Inc.
422

techniques such as the production of chemical stabilizers
(Martins et al., 2004) as well as in agriculture as a by-prod-
uct (Coles et al., 1995). It is expected to be persistent in
ecosystems and toxic to a wide variety of organisms. It has
no biological role and is not an essential metal. It exerts a
large number of adverse effects on ecosystems and human
and animal health (IPCS, 1992). Among them, genotoxic
activities may durably affect the aquatic ecosystems and
cadmium’s presence in water can also have repercussions
on nonaquatic species, via food chains, or simply as a result
the water being used for drinking.
A number of tests have been developed, using either
plants or aquatic animals (see the reviews of Jaylet and
Zoll, 1990; Godet et al., 1993), which can potentially serve
to assess the genotoxic potency of pollutants in water
samples. The assays can be carried out with intact animals,
taking into account uptake and elimination, internal trans-
port, and metabolism. An example is the use of amphibians,
which have proved to be valuable bioindicators and a sensi-
tive model for environmental studies (Jaylet et al., 1986;
Krauter et al., 1987; Zoll et al., 1990; Gauthier, 1996;
Ferrier et al., 1998; AFNOR, 2000; Djomo et al., 2000;
Mouchet et al., 2005a, 2006a). Larvae can be reared, not
only in containers filled with unconcentrated water samples
(laboratory conditions) but also in running water from
various sources (e.g., factory effluents, surface water, river
waters). In the present investigation, the amphibians
Xenopus laevis (anuran) and Pleurodeles waltl (urodele)
were used because of their ecotoxicological relevance
which has already been well established in a large array of
studies on biomarkers such as induction of biotransforma-
tion enzyme activities (Bekaert et al., 2002; Gauthier et al.,
2004), micronucleus (Ferrier et al., 1998) or DNA adduct
formation (Bekaert et al., 2002), comet induction following
DNA damage (Mouchet et al., 2005a,b, 2006b), or terato-
genic malformations (Chenon et al., 2002; Prati et al.,
2002; Bonfanti et al., 2004). Moreover, even though the
toxic effects of Cd on aquatic organisms have been well
documented, notably in amphibians (Perez-Coll et al.,
1999; Flament et al., 2003; Mounaji et al., 2003; James
et al., 2004), less or no data on genotoxic effects are, to our
knowledge, available for amphibians.
Among the numerous biomarkers of genotoxicity (DNA
adducts, DNA strand breaks, chromosomal aberrations,
sister chromatid-exchange, micronuclei, etc.) used to evalu-
ate the genetic damage resulting from exposure to environ-
mental pollutants, the present test for Cd was carried out
with two different endpoints: micronucleus (micronucleus
test, MNT) and primary DNA damage induction (Comet
assay, CA) in two amphibian models (Xenopus laevis and
Pleurodeles waltl larvae). The sensitivity of the two tests
was compared.
The MNT detects the induction of micronuclei, which
are the consequence of chromosome fragmentation and/or
malfunction of the mitotic apparatus: thus, clastogenic
compounds and spindle poisons both lead to an increase in
the number of micronucleated cells. In aquatic vertebrates,
the MNT has been carried out in different fish species (Das
and Nanda, 1986; Metcalfe, 1988; Carrasco et al., 1990).
Amphibians have also proved to be valuable biological
models for the study of micronucleus induction in erythro-
cytes (Jaylet et al., 1986; Krauter et al., 1987; Jaylet and
Zoll, 1990; Zoll et al., 1990; Gauthier, 1996; Ferrier et al.,
1998; AFNOR, 2000; Djomo et al., 2000; Bekaert et al.,
2002). The sensitivity and reliability of the MNT to detect
chromosomic/genomic mutations makes it a good method
to analyze the potential cytogenetic damage caused by pure
substances (Grinfeld et al., 1986; Jaylet et al., 1986;
Fernandez and Jaylet, 1987; Fernandez et al., 1989, 1993;
Gauthier, 1996; Mouchet et al., 2005a).
The Comet assay (CA), as first described by Ostling and
Johanson (1984), and further developed by Singh et al.
(1988) and Olive et al., (1990) is a sensitive method widely
used for detecting DNA damage in individual cells (double-
and single-strand breaks, alkali-labile sites, excision repair
sites and crosslinks), induced by a variety of genotoxic
agents such as industrial chemicals, biocides, agrochemi-
cals, and pharmaceuticals (for general review articles see
McKelvey et al., 1993; Fairbairn et al., 1995; Anderson and
Plewa, 1998; Rojas et al., 1999; Speit and Hartmann, 1999;
Tice et al., 2000; Hartmann et al., 2003). Numerous studies
have demonstrated its capacity to detect low levels of DNA
damage, its requirement for few cells, its low cost, and its
speed of execution and analysis for assessing the genotoxic-
ity of chemicals toward fish (Belpaeme et al., 1998; Devaux
et al., 1998; Mitchelmore and Chipman, 1998; Flammarion
et al., 2002; Winter et al., 2004), mussels (Nacci et al.,
1996; Pavlica et al., 2001) and amphibians (Ralph et al.,
1996; Clements et al., 1997; Ralph and Petras, 1998a,b;
Mouchet et al., 2005a,b, 2006a,b,c).
MATERIALS AND METHODS
Amphibian (Xenopus and Pleurodeles)Maintenance and Breeding
Sexually mature Xenopus and Pleurodeles were provided
by the Developmental Biology Department of Paul Sabatier
University (Toulouse, France). The Xenopus males were
injected with 400 IU of human chorionic gonadotropin
(HCG) and the females with 700 IU of HCG to induce
spawning. No hormonal induction was needed for Pleuro-deles because of the natural laying period. The amphibian
males and females were then placed together in normal tap
water filtered through active charcoal at 22 6 2 8C. Twelve
hours later for Xenopus, the pair was separated and viable
eggs were maintained in an aquarium also containing nor-
mal tap water filtered through active charcoal at 20–22 8C,
until they reached a development stage appropriate for
423TOXICITY AND GENOTOXICITY OF CADMIUM IN AMPHIBIAN LARVAE
Environmental Toxicology DOI 10.1002/tox

experimentation (usually 3 weeks). For Pleurodeles, a few
days after, viable eggs were maintained in a bowl contain-
ing 5–6 L of normal tap water filtered through active char-
coal at 18 8C until the swimming stage. They were then
transferred to an aquarium containing the same type of
water at 20 6 1 8C until they reached a development stage
appropriate for experimentation (about 6 weeks after lay-
ing). The Xenopus larvae were fed every day on dehydrated
aquarium fish food. The young Pleurodeles larvae were
also fed every day on freshly hatched artemia (Artemiaspec.), then, the food was switched to thawed Chironomuslarvae. Each day, one third of the water was renewed before
feeding.
Exposure Conditions
The experimental exposure conditions, basically the same
for the MNT and CA, are described in the French Standard
AFNOR NF T90-325 (AFNOR, 2000). AFNOR is the
French National Organization for quality regulations. The
water to which the amphibian models were exposed was
either reconstituted water (RW, normal tap water filtered
through active charcoal, to which were added nutritive salts
[294 mg/L CaCl2 � 2H2O, 123.25 mg/L MgSO4 � 7H2O,
64.75 mg/L NaHCO3, 5.75 mg/L KCl]), or mineral water
(MW: 9.9 mg/L Ca2þ, 6.1 mg/L Mg2þ, 9.4 mg/L Naþ,
5.7 mg/L Kþ, 8.4 mg/L Cl�, 6.3 mg/L NO3�, 6.9 mg/L
SO42�, 65.3 mg/L HCO3
2�, 30.0 mg/L Si, pH 7, Volvic1,
Danone, France) at 22 6 0.5 8C for Xenopus and at 20 6
1 8C for Pleurodeles. Exposure began on larvae at stage
50 of the Xenopus development table (Nieuwkoop and
Faber, 1956) characterized by the hind limb bud longer
than broad, constricted at the base. For Pleurodeles, expo-
sure began at stage 53 of the development table (Galien and
Durocher, 1957) when the hind limbs present four well-
formed digits with an outline of the fifth. The larvae were
taken from the same hatch to reduce inter-animal variabi-
lity. They were exposed in groups of 20 (100 mL/larvae)
in 5-L glass flasks containing either a control medium—
negative and positive control—or a test medium (different
concentrations of Cd). The negative control was either RW
or MW. Positive controls were systematically performed in
each experiment to check both the responsiveness of the
amphibian larvae and the correct operation of the experi-
ment. The positive control for the MNT was benzo[a]pyr-
ene (B[a]P, [50-32-8]; purity, �96.0%; Sigma France) at
0.125 mg/L (AFNOR, 2000). For the CA, the positive con-
trol was methyl methanesulfonate (MMS, [66-27-3]; purity,
�99%; Sigma France) at 1.56 mg/L (Mouchet et al.,
2005a). B[a]P was dissolved in dimethylsulphoxide
(DMSO [67-68-5], Sigma France) at a final concentration
of 0.05%—previously shown to be nongenotoxic and non-
toxic on Xenopus, (data not published)—before being
added to the water. The concentrations of Cd as CdCl2were 0.25, 0.5, 1, 2, 10, 50 mg/L. Amphibian larvae were
submitted to a 12 h light and 12 h dark cycle. Xenopus were
fed every day on dehydrated aquarium fish food and
Pleurodeles on thawed Chironomus larvae. The flasks were
partially immersed in water baths to maintain their temper-
ature at 22 6 0.5 8C for Xenopus and 20 6 1 8C for Pleuro-deles. The media in control and exposed flasks were
renewed daily.
Acute Toxicity
Acute toxicity to the larvae exposed to Cd in RW and MW
was examined for 12 days by visual inspection: death and
no growth (severe toxicity) and abnormal behavior, reduced
size, diminished food intake (weak toxicity). Recording the
toxicity data daily in treated larvae in MW ensured that
genotoxicity tests were performed under conditions that
were not acutely toxic.
Genotoxicity Assays
Genotoxicity was only assayed in MW. At the end of expo-
sure, i.e., 12 days for the MNT and 1, 2, 4, 8, and 12 days
for the CA, a blood sample was obtained from each anaes-
thetized larva by cardiac puncture with heparinized micro-
pipettes (20% solution at 5000 IU/mL). For a given test
(MNT or CA), larvae coming from the same group of
exposure were used. Genotoxicity was assessed up to the
concentrations at which signs of acute toxicity began to
appear in the exposed larvae.
Micronucleus Test
The MNT was carried out according to the Standard
AFNOR NF T90-325 procedure (AFNOR, 2000). At the
end of the 12 days of exposure, a single smear of blood was
prepared from each animal (n ¼ 15). After fixing in metha-
nol and staining with hematoxylin, the smears were
screened under the microscope (oil immersion lens, 1500�).
The number of erythrocytes that contained one micronu-
cleus or more was determined in a total sample of 1000
erythrocytes per larva. Slides were blind scored by only one
individual.
For each group of animals, the results (number of micro-
nucleated erythrocytes per thousand, MNE %) obtained for
the individual larvae were arranged in increasing order of
magnitude. The medians and quartiles were then calculated.
The statistical method used to compare the medians was
based on the recommendations of Mc Gill et al. (1978) and
consisted of determining the theoretical medians of samples
of size n (where n � 7) and their 95% confidence limits
expressed by M 6 1.57 � IQR/Hn, where M is the median
and IQR is the inter-quartile range (upper quartile–lower
quartile). Under these conditions, the difference between
the theoretical medians of the test groups and the
424 MOUCHET ET AL.
Environmental Toxicology DOI 10.1002/tox

theoretical median of the negative control group is signifi-
cant to within 95% certainty if there is no overlap.
Comet Assay
The CA was performed under alkaline conditions, accord-
ing to the procedure described by Singh et al. (1988) and
subsequently adapted to Xenopus laevis (Mouchet et al.,
2005a) and Pleurodeles waltl larvae (Mouchet et al.,
2006b). After cardiac puncture, erythrocyte viability was
routinely determined using the Trypan blue exclusion test,
and samples showing <90% viability were discarded
(Collins, 2002). Sixty-five microliters of diluted blood in
low-melting-point agarose (LMA, 1% in phosphate buf-
fered saline PBS) were spread on precoated slides (normal
melting agarose NMA, 0.8% in PBS) and covered with a
coverslip (22*50). After cooling on ice and removing the
coverslip, a third layer (90 �l of LMA 1% in PBS) was then
added and allowed to solidify on ice. The slides were
immersed in freshly prepared ice-cold lysing solution
(4 8C, 2.5M NaCl, 0.1 M Na2 EDTA, 0.01 M Tris, 1% Tri-
ton X-100, 10% DMSO, adjusted to pH 10 with NaOH) and
left for 1 h. Lysis and subsequent steps were performed in
the dark under dim red light. The slides were then trans-
ferred to a horizontal electrophoresis tank containing
freshly prepared alkaline buffer (0.3 M NaOH, 1 mM
Na2EDTA, pH >13) for 20 min at 48C in order to allow the
DNA to unwind. Electrophoresis was carried out in the
same buffer at 4 8C for 20 min in Xenopus and 30 min in
Pleurodeles (electric field of 20 V and 300 mA). The slides
were washed twice in a neutralization buffer (0.4 M
Tris-HCl, pH 7.5) for 5 min, and finally dehydrated in abso-
lute ethanol for 5 min. Slide analysis was performed using
a confocal microscope (LSM 410 inverted laser scanning
microscope, Zeiss) at 40� magnification, after staining the
slides with 0.05 mM ethidium bromide solution.
Quantitative assessment of DNA damage in erythrocyte
nuclei was performed using the Komet 4.1 image analysis
software (Kinetic Imaging Ltd), by measuring four parame-
ters: extent tail moment (ETM, defined as the tail length
weighted by the percentage of tail DNA), olive tail moment
(OTM, product of the amount of DNA in the tail and the
mean distance of migration in the tail, Olive et al., 1990),
Tail DNA (percentage of DNA in the tail), and tail length
(TL, length of the tail, distance between the head and the
last DNA fragment). Slides were blind scored by only one
individual. Thirty randomly selected cells were analysed on
each slide. Comet images were randomly captured from the
centre of the slide, at a constant depth in the gel, avoiding
the edges of the slide and overlapping figures. Comets with
completely fragmented DNA (hedgehog-like figures with
no apparent head) that could not be measured by the image
analysis system were not of course taken into account. Data
from two slides per animal and two animals for each
concentration (120 measurements per concentration tested)
were analysed using the nonparametric Kolmogorov–
Smirnov test (Mouchet et al., 2005a,b, 2006a,b). The
following evolution coefficient was proposed in order to
establish the time-course of DNA damage between two
successive exposure times at a given concentration i of Cd
(Mouchet et al., 2006b):
ECCA ¼ ½½fmðconcentration i; time 2Þ � mðconcentration
i; time 1Þg � fmðneg.control, time 2Þ� mðneg.control, time 1Þg�=fmðconcentration i;
time 1Þ � mðneg.control, time 1Þg� � 100 ð1Þ
where m(concentration i, time 2), m(concentration i, time1),
and m(neg.control, time 2), m(neg.control, time 1) represent
the mean values of the parameter computed for a given con-
centration i of Cd, and the corresponding negative control,
at the two exposure times considered.
RESULTS
Acute Toxicity
Xenopus Laevis
Cd was found to be severely toxic to Xenopus larvae
exposed from 2 to 50 mg/L of Cd in MW (Table I). 100%
TABLE I. Results of the acute toxicity to Xenopus and Pleurodeles larvae exposed to cadmium (mg/L) in mineralwater and reconstituted water for 12 days
Concentration (mg/L) 0 0.25 0.5 1 2 5 10 50
XenopusMW � � � � þ (until day 4) þþ (40% in 6 days) þþ (100% in 3 days) þþ (100% in 1 day)
RW � � � � � þ (from day 8) þþ (60% in 6 days) þþ (100% in 3 days)
PleurodelesMW � � � � � þ (from day 2) þþ (100% in day 1) þþ (100% in day 1)
RW � � � � � � þþ (50% in 6 days) þþ (100% in 4 days)
%, percentage of deaths (n ¼ 20 larvae); �, no toxicity to larvae; þ, weak toxicity; þþ, severe toxicity.
425TOXICITY AND GENOTOXICITY OF CADMIUM IN AMPHIBIAN LARVAE
Environmental Toxicology DOI 10.1002/tox

lethality was obtained for 10 and 50 mg/L on days 1 and 3,
respectively. 40% lethality was also recorded at 5 mg/L of
Cd in MW on day 6. Cd appeared weakly toxic to Xenopus
larvae exposed to 2 mg/L until day 4. No signs of acute
toxicity were observed for Xenopus tadpoles exposed to
lower Cd-concentrations in MW (0.25, 0.5, and 1 mg/L).
TABLE II. Results of the Xenopus and Pleurodeles micronucleus assay
Concentration (mg/L) NC PC 0.25 0.5 1 2
XenopusLower quartile 1 9 1 2 3 5.5
Median 2 12 1 2 4 7
Confidence limit (1.19–2.81) (10.32–13.68) (0.59–1.41) (2–2) (2.58–5.42) (5.99–8.01)
Upper quartile 3 13 2 2 6.5 8
Results þ � � � þNumber of animals 15 15 15 15 15 15
PleurodelesLower quartile 21.5 78.5 9 7 13 12
Median 23 85 9 9.5 15 18
Confidence limit (21.99–24.01) (80.54–89.46) (6.91–11.09) (7.51–11.87) (12.16–17.84) (15.58–20.42)
Upper quartile 24 89.5 13 11 20 24
Results þ � � � �Number of animals 15 15 15 15 15 15
Frequencies of micronucleated erythrocytes per 1000 cells in larvae exposed to cadmium (mg/L) for 12 days in mineral water. Genotoxicity is expressed
as the values of the medians (number of micronucleated erythrocytes per thousand) and their 95 % confidence limits. NC, negative control; PC, positive
control; �, nongenotoxic concentration compared to the negative control group (Mac Gill et al., 1978); þ, genotoxic concentration compared to the
negative control group (Mac Gill et al., 1978).
TABLE III. Results of the Xenopus comet assay: mean Tail DNA, ETM, OTM and TL values in larvae exposedfrom 1 to 12 days to cadmium in mineral water
Exposure time (days) Parameter NC
Concentrations of Cadmium (mg/L)
0.25 0.5 1 PCMMS
1 Tail DNA 3.11 6 0.81 3.51 6 0.79* 6.92 6 1.97* 4.44 6 0.75* 17.54 6 2.66*
ETM 0.72 6 0.27 1.44 6 0.43* 3.37 6 1.03* 1.69 6 0.47* 10.75 6 2.38*
OTM 0.74 6 0.22 0.93 6 0.22* 1.98 6 0.44* 1.15 6 0.22* 6.14 6 0.92*
TL 17.9 6 2.3 29.62 6 2.83* 33.76 6 3.85* 29.38 6 2.53* 56.65 6 5.58*
2 Tail DNA 2.73 6 0.57 2.88 6 0.49 10.91 6 1.79* 5.06 6 1.24* 18.31 6 2.78*
ETM 0.69 6 0.16 0.87 6 0.2 6.33 6 1.37* 2.03 6 0.76* 10.28 6 2.16*
OTM 0.67 6 0.15 0.7 6 0.12 3.64 6 0.61* 1.35 6 0.4* 6.49 6 1*
TL 22.55 6 2.08 24.35 6 2.34* 44.68 6 3.98* 25.99 6 2.75* 51.18 6 5.51*
4 Tail DNA 1.89 6 0.43 3.58 6 1.44* 2.31 6 0.44 2.25 6 0.43 18.1 6 3.57*
ETM 0.48 6 0.15 1.33 6 0.63* 0.76 6 0.21 0.83 6 0.25 11.01 6 2.63*
OTM 0.43 6 0.1 0.87 6 0.28* 0.59 6 0.12 0.59 6 0.13 5.4 6 0.82*
TL 19.5 6 2.63 25.76 6 2.74* 22.95 6 2.81* 22.66 6 3.09* 55.33 6 4.47*
8 Tail DNA 1.78 6 0.47 1.61 6 0.25** 2.1 6 0.4* 3.46 6 0.65* 11.76 6 1.44*
ETM 0.42 6 0.15 0.41 6 0.1 0.55 6 0.16 1.02 6 0.25* 6.03 6 1.08*
OTM 0.38 6 0.09 0.36 6 0.06 0.51 6 0.1 0.87 6 0.18* 4.01 6 0.49*
TL 18 6 2.91 22.47 6 2.59* 19.23 6 2.30 22.23 6 2.17* 48.43 6 4.27*
12 Tail DNA 3.13 6 2.23 2.9 6 0.54 1.68 6 0.41** 1.7 6 0.32** 12.46 6 1.62*
ETM 0.87 6 0.79 1.04 6 0.28* 0.38 6 0.16** 0.36 6 0.1** 5.5 6 0.94*
OTM 0.53 6 0.29 0.75 6 0.14* 0.39 6 0.13** 0.37 6 0.07** 4.19 6 0.57*
TL 21.53 6 3.51 27.31 6 2.52* 17.91 6 1.84** 16.07 6 2.01** 41.05 6 3.34*
This table presents the calculated mean values of Tail DNA (%DNA in the tail), ETM (extent tail moment), OTM (olive tail moment) and TL (tail length)
followed by their 95% confidence limits. The notation ‘‘*’’ indicates an increase of DNA damage, relative to the negative control, confirmed by a
Kolmogorov-Smirnov test (p ¼ 0.05). ‘‘**’’ indicates a decrease of DNA damage, relative to the negative control, confirmed by a Kolmogorov-Smirnov
test (p ¼ 0.05). NC, negative control group; PCMMS, positive control group (MMS to 1.56 mg/L).
426 MOUCHET ET AL.
Environmental Toxicology DOI 10.1002/tox

In RW, Cd was acutely toxic to Xenopus larvae from 5
to 50 mg/L of Cd (Table I). 100% and 60% lethality were
obtained for 50 and 10 mg/L, respectively, in 3 and 6 days,
respectively. Cd appeared weakly toxic to Xenopus larvae
exposed to 5 mg/L from the day 8. Cd was not toxic to
Xenopus tadpoles exposed to lower Cd-concentrations in
RW (0.25, 0.5, 1, and 2 mg/L).
Pleurodeles Waltl
In the same way, Cd was acutely toxic to Pleurodeles at
10 and 50 mg/L of Cd in MW (Table I). 100% lethality was
observed at both these concentrations on day 1. Cd
appeared weakly toxic to Pleurodeles larvae exposed to
5 mg/L from the day 2. No signs of acute toxicity were
observed for Pleurodeles tadpoles exposed to lower
Cd-concentrations in MW (0.25, 0.5, 1, and 2 mg/L).
In RW, Cd was severely toxic to Pleurodeles at 10 and
50 mg/L (Table I). 50% and 100% lethality were observed
at both these concentrations in 6 and 4 days, respectively.
Cd was not toxic to Pleurodeles tadpoles exposed to lower
Cd-concentrations in RW (0.25, 0.5, 1, 2, and 5 mg/L).
Micronucleus Test
The median value of micronucleated erythrocytes per thou-
sand (MNE %) was 2 6 0.81 (Table II) and 23 6 1.01
(Table II) for the negative control in the Xenopus and
Pleurodeles MNT, respectively. The positive control
showed a significantly higher MNE % compared to the
negative one in both MNT: 12 6 1.68 (Table II) and 85 6
4.46 (Table II) for Xenopus and Pleurodeles MNT,
respectively.
Xenopus Laevis
Results of the Xenopus MNT showed that 2 mg/L of Cd
induced a significant genotoxic response (Table II). Indeed,
the result is significant at a median value of 8 for a 95%
confidence limit. The lowest Cd-concentrations (0.25, 0.5,
and 1 mg/L) were nongenotoxic to Xenopus larvae. Never-
theless, a dose-response relationship was apparent between
the four Cd-concentrations.
Pleurodeles Waltl
Results of the Pleurodeles MNT showed no genotoxi-
city irrespective of the Cd-concentration: 0.25, 0.5, 1, and
2 mg/L (Table II). Moreover, no clear dose-response rela-
tionship was apparent.
Comet Assay
Results of PCMMS showed a significant genotoxic effect of
MMS as positive control, compared with negative control,
for both CA using Xenopus and Pleurodeles, at all exposure
times (1, 2, 4, 8, and 12 days).
Xenopus Laevis
The results of the Xenopus CA (Table III) showed a geno-
toxic effect of Cd after one day of exposure, for all Cd con-
centrations (0.25, 0.5, and 1 mg/L), whatever the parameter.
After 2 days of exposure, the results showed a genotoxic
effect of Cd for all concentrations, irrespective of the pa-
rameter except for Tail DNA, ETM, and OTM at 0.25 mg/
L. In the same way, Cd was genotoxic after 4 days of expo-
sure, whatever the concentration and the parameters, except
for 0.5 and 1 mg/L using Tail DNA, ETM, and OTM. After
8 days of exposure, Cd induced genotoxic effects at 1 mg/
L, whatever the parameter, and at 0.5 and 0.25 mg/L using
Tail DNA and TL, respectively. In contrast, 0.2 mg/L of Cd
induced a significant decrease in DNA damage using Tail
DNA. In the same way, after 12 days of exposure, 0.5 and
1 mg/L of Cd induced a significant decrease in DNA dam-
age, irrespective of the parameter, whereas 0.25 mg/L
TABLE IV. Results of the Xenopus comet assay: doseeffect relationships in larvae exposed for 1 to 12 days tocadmium in mineral water
Exposure
time (days) Parameter
Cadmium concentration (mg/L)
0.25 vs 0.5 0.5 vs 1
1 Tail DNA * **
ETM * **
OTM * **
TL * **
2 Tail DNA * **
ETM * **
OTM * **
TL * **
4 Tail DNA � �ETM � �OTM � �TL ** �
8 Tail DNA * *
ETM * *
OTM * *
TL ** *
12 Tail DNA ** �ETM ** �OTM ** �TL ** **
The notation ‘‘*’’ indicates a positive significant dose-effect relationship,
confirmed by a Kolmogorov-Smirnov test (p ¼ 0.05). ‘‘**’’ indicates a
negative significant dose-effect relationship, confirmed by a Kolmogorov-
Smirnov test (p ¼ 0.05). ‘‘�’’ indicates a nonsignificant dose-effect rela-
tionship. ‘‘vs,’’ a given concentration is compared versus another one,
based on the calculated mean values of Tail DNA (%DNA in the tail),
ETM (extent tail moment), OTM (olive tail moment), and TL (tail length).
427TOXICITY AND GENOTOXICITY OF CADMIUM IN AMPHIBIAN LARVAE
Environmental Toxicology DOI 10.1002/tox

induced a significant increase in DNA damage, whatever
the parameter, except for tail DNA.
A positive significant dose-effect relationship was
observed with 0.25 and 0.5 mg/L of Cd (Table IV) after 1,
2, and 8 days of exposure, (except for TL after 8 days),
whereas a negative significant dose-effect relationship was
observed with the same concentrations after 4 days and 8
days using TL parameter and after 12 days, whatever the
parameter. With 0.5 and 1 mg/L, a negative significant
dose-effect relationship was noted after 1 and 2 days
of exposure, whatever the parameter and after 12 days
of exposure using TL parameter. A positive significant
dose-effect relationship was noted after 8 days of expo-
sure, irrespective of the parameter. For the other times and
parameters, no significant dose-effect relationship was
recorded.
The evolution coefficients (Table V) showed that levels
of DNA damage increased or decreased according to the
exposure time for a given concentration, including for the
negative control. The overall change for the negative con-
trol between days 1 and 12 indicated a significant increase
in the values of the ETM and TL parameters after Cd expo-
sure, unlike OTM (significant decrease). For Cd-exposure,
the overall change in DNA damage between days 1 and 12
indicated a significant decrease in the values of all the
parameters at 0.5 and 1 mg/L of Cd, unlike at 0.25 mg/L.
Pleurodeles Waltl
Results of the Pleurodeles CA (Table VI) showed a geno-
toxic effect of Cd after 1 and 12 days, at all concentrations
(0.5, 1, and 2 mg/L), whatever the parameter. After 2 days
of exposure, Cd induced significant DNA damage at 2 mg/
L only, whatever the parameter, whereas no significant
DNA damage was observed at 0.5 and 1 mg/L of Cd, what-
ever the parameter, except for 1 mg/L using TL (significant
decrease of DNA damages). After 4 days of exposure, Cd
induced significant DNA damage, at all concentrations and
all parameters, except for 1 mg/L and 2 mg/L with TL (sig-
nificant decrease in DNA damage). After 8 days, Cd
induced genotoxic effects only at 1 mg/L using the OTM
parameter.
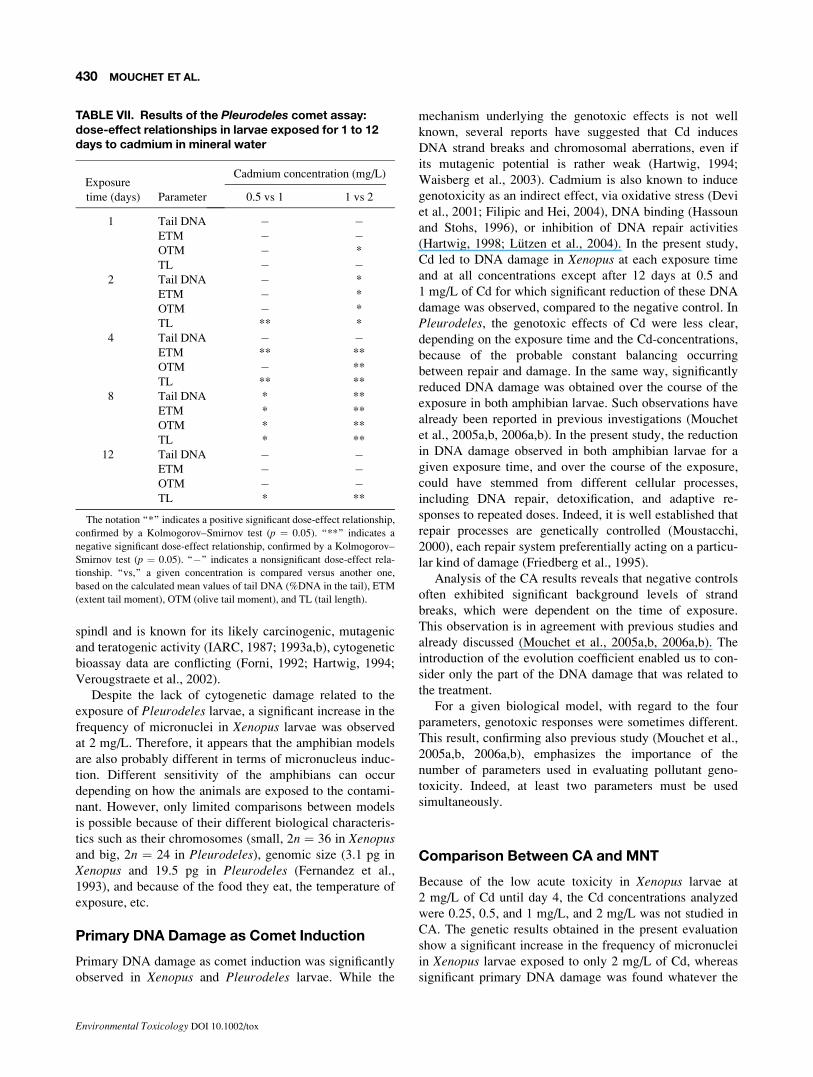
A positive significant dose-effect relationship (Table VII)
was obtained for 0.5 versus 1 mg/L after 8 days of exposure
only, whatever the parameter and after 12 days of exposure
using only the TL parameter. With these concentrations, a
significant negative dose-effect relationship was obtained
after 2 days using parameter TL and after 4 days using
parameters ETM and TL. When considering 1 mg/L versus
2 mg/L, a positive significant dose-effect relationship was
obtained only after 1 day using OTM and after 2 days what-
ever the parameter. In contrast, a significant negative dose-
effect relationship was obtained after 4 and 8 days,
TABLE V. Results of the Xenopus comet assay: evolution coefficients (ECCA) of tail DNA, ETM, OTM, and TLin larvae exposed for 1 to 12 days to cadmium in mineral water
Exposure time (days) Parameter NC
Cadmium concentration (mg/L)
0.25 0.5 1
1–2 Tail DNA �12.15 �64.38 þ114.96* þ75.34*
ETM �5.24 �74.82* þ112.97* þ38.98*
OTM �10.25 �83.19 þ140.85* þ68.90*
TL þ25.97* �84.63* þ39.52* �70.00*
2–4 Tail DNA �30.80* þ1093.33* �94.86* �84.80*
ETM �29.67* þ365.19 �95.11* �74.33*
OTM �36.01* þ1282.29 �94.64* �76.38*
TL �13.53* þ247.69 �84.41* �8.23*
4–8 Tail DNA �5.90* �109.99* �23.95 þ374.71*
ETM �13.38 �101.02* �51.10 þ75.76*
OTM �10.57 �104.01* �16.37 þ200.10*
TL �7.69 �28.63* �64.25* þ33.77*
8–12 Tail DNA þ76.63* þ36.44* �553.61* �185.26*
ETM þ107.61* �2136.89* �458.70* �184.29*
OTM þ38.73* �1333.80* �206.63* �132.77*
TL þ19.63 þ29.29* �393.92* �229.39*
1–12 Tail DNA þ0.48 �157.95 �138.13* �207.87*
ETM þ19.82* �75.71 �118.28* �152.85*
OTM �28.75* þ15.06 �111.52* �139.24*
TL þ20.30* �50.71 �122.86* �147.64*
These evolution coefficients are calculated as described in Eq. 1. Therefore, a positive value corresponds to increased DNA damage (and vice versa)
between two successive exposure times. ‘‘*’’ indicates that the evolution of DNA damage between two successive exposure times is significant (Kolmo-
gorov–Smirnov test, p ¼ 0.05). Tail DNA, %DNA in the tail; ETM, extent tail moment; OTM, olive tail moment; TL, tail length.
428 MOUCHET ET AL.
Environmental Toxicology DOI 10.1002/tox

whatever the parameter and after 12 days using TL parame-
ter only.
Evolution coefficients (Table VIII) showed that levels of
DNA damage increased or decreased according to the
exposure time for a given concentration, including for the
negative control. The overall change for the negative con-
trol between days 1 and 12 indicated that the level of DNA
damage remained unchanged, whatever the parameter. The
overall change in DNA damage between days 1 and 12 of
Cd-exposure indicated a significant decrease in the values
of all the parameters except for ETM, OTM, and TL at
1 mg/L (significant increase).
DISCUSSION
Acute Toxicity
Cd was acutely toxic to the amphibian larvae depending on
the concentrations and the nature of the exposure water.
Toxic concentrations of Cd in MW ranged from 2 mg/L in
Xenopus and 5 mg/L in Pleurodeles, to 50 mg/L for the two
species. They seemed to be higher for amphibian larvae
exposed in RW than in MW; indeed, the toxic concentra-
tions ranged from 5 mg/L to 50 mg/L in Xenopus, and from
10 mg/L to 50 mg/L in Pleurodeles. In the present investi-
gation, the Ca2þ concentration was about 700 times higher
in RW than in MW. Consequently, the greater ion concen-
trations in RW may limit the sensitivity of larvae by inhibi-
ting the toxic potential of Cd. In fact, the toxicity of certain
metals, in relation with their bioavailability, is strongly
correlated to their chemical speciation (Chapman and
McCrady, 1977; Spokes et al., 1996). In particular, interac-
tions between bivalent metal and aqueous calcium ion is
especially now well known such as mimetic action and
competition between metal ions and calcium (Wood, 1983;
Part et al., 1985; Wicklund and Runn, 1988; Freda, 1991;
Playle et al., 1993a,b; Playle, 1998; Richards et al., 1999;
Meinelt et al., 2001; Perceval et al., 2002). Xenopus larvae
seemed to be more sensitive than Pleurodeles to the acute
toxicity of Cd in both kinds of water (MW and RW). Their
different sensitivities may be partly linked to the mech-
anisms of Cd uptake at the gills via the Ca2þ-transport
pathway (Wood, 2001) competitively inhibiting the high-
affinity Ca2þ-ATPase in Pleurodeles, which have large
external gills in contact with the exposure medium.
Micronucleus Induction
Cd appeared to be nongenotoxic in Pleurodeles and geno-
toxic at the highest concentration in Xenopus. Although
cadmium is suspected to have an effect on the mitotic
TABLE VI. Results of the Pleurodeles comet assay: mean tail DNA, ETM, OTM and TL values in larvae exposed for 1to 12 days to cadmium in mineral water
Exposure time (days) Parameter NC
Concentrations of cadmium (mg/L)
0.5 1 2 PCMMS
1 Tail DNA 0.49 6 0.12 0.98 6 0.25* 0.89 6 0.23* 0.91 6 0.17* 5.03 6 0.88*
ETM 0.06 6 0.03 0.2 6 0.08* 0.13 6 0.05* 0.14 6 0.04* 2.23 6 0.51*
OTM 0.15 6 0.04 0.27 6 0.07* 0.23 6 0.06* 0.27 6 0.05* 2.18 6 0.37*
TL 10.25 6 2.95 12.26 6 1.86* 10.85 6 1.58* 12.03 6 1.61* 40.45 6 3.82*
2 Tail DNA 0.74 6 0.16 0.95 6 0.25 0.8 6 0.17 1.03 6 0.22* 5.21 6 0.84*
ETM 0.13 6 0.04 0.16 6 0.05 0.11 6 0.04 0.21 6 0.06* 2.73 6 0.59*
OTM 0.22 6 0.05 0.28 6 0.08 0.22 6 0.05 0.31 6 0.06* 2.26 6 0.36*
TL 13.77 6 2.45 13.2 6 1.79 11.28 6 1.95** 16.17 6 2.6* 47.27 6 3.35*
4 Tail DNA 0.68 6 0.17 1.11 6 0.22* 1.22 6 0.28* 1.05 6 0.26* 7.66 6 1.55*
ETM 0.13 6 0.05 0.28 6 0.08* 0.23 6 0.07* 0.15 6 0.05* 4.29 6 1.15*
OTM 0.19 6 0.04 0.36 6 0.07* 0.35 6 0.08* 0.27 6 0.07* 3.68 6 0.71*
TL 16.48 6 2.8 19.77 6 2.71* 14.38 6 1.65 11.63 6 1.28** 48.4 6 4.72*
8 Tail DNA 0.82 6 0.17 0.73 6 0.12 0.95 6 0.14 0.78 6 0.13 10.38 6 2.37*
ETM 0.13 6 0.05 0.1 6 0.02 0.16 6 0.03 0.13 6 0.04 8.41 6 2.67*
OTM 0.22 6 0.04 0.2 6 0.03 0.27 6 0.04* 0.22 6 0.03 5.33 6 1.32*
TL 12.92 6 1.77 12.43 6 1.31 14.6 6 1.52 12.51 6 1.45 63.95 6 5.95*
12 Tail DNA 0.5 6 0.14 0.9 6 0.18* 0.87 6 0.22* 0.75 6 0.13* 10.26 6 1.54*
ETM 0.06 6 0.02 0.14 6 0.04* 0.16 6 0.06* 0.1 6 0.03* 7.57 6 1.58*
OTM 0.14 6 0.04 0.25 6 0.05* 0.26 6 0.07* 0.2 6 0.03* 5.35 6 0.87*
TL 9.78 6 1.84 11.41 6 1.37* 12.91 6 1.58* 10.9 6 1.14* 67.03 6 4.52*
This table presents the calculated mean values of tail DNA (%DNA in the tail), ETM (extent tail moment), OTM (olive tail moment), and TL (tail length)
followed by their 95% confidence limits. The notation ‘‘*’’ indicates an increase of DNA damage, relative to the negative control, confirmed by a Kolmo-
gorov–Smirnov test (p ¼ 0.05). The notation ‘‘**’’ indicates a decrease of DNA damage, relative to the negative control, confirmed by a Kolmogorov–
Smirnov test (p ¼ 0.05). NC, negative control group; PCMMS, positive control group (MMS to 1.56 mg/L).
429TOXICITY AND GENOTOXICITY OF CADMIUM IN AMPHIBIAN LARVAE
Environmental Toxicology DOI 10.1002/tox
spindl and is known for its likely carcinogenic, mutagenic
and teratogenic activity (IARC, 1987; 1993a,b), cytogenetic
bioassay data are conflicting (Forni, 1992; Hartwig, 1994;
Verougstraete et al., 2002).
Despite the lack of cytogenetic damage related to the
exposure of Pleurodeles larvae, a significant increase in the
frequency of micronuclei in Xenopus larvae was observed
at 2 mg/L. Therefore, it appears that the amphibian models
are also probably different in terms of micronucleus induc-
tion. Different sensitivity of the amphibians can occur
depending on how the animals are exposed to the contami-
nant. However, only limited comparisons between models
is possible because of their different biological characteris-
tics such as their chromosomes (small, 2n ¼ 36 in Xenopusand big, 2n ¼ 24 in Pleurodeles), genomic size (3.1 pg in
Xenopus and 19.5 pg in Pleurodeles (Fernandez et al.,
1993), and because of the food they eat, the temperature of
exposure, etc.
Primary DNA Damage as Comet Induction
Primary DNA damage as comet induction was significantly
observed in Xenopus and Pleurodeles larvae. While the
mechanism underlying the genotoxic effects is not well
known, several reports have suggested that Cd induces
DNA strand breaks and chromosomal aberrations, even if
its mutagenic potential is rather weak (Hartwig, 1994;
Waisberg et al., 2003). Cadmium is also known to induce
genotoxicity as an indirect effect, via oxidative stress (Devi
et al., 2001; Filipic and Hei, 2004), DNA binding (Hassoun
and Stohs, 1996), or inhibition of DNA repair activities
(Hartwig, 1998; Lutzen et al., 2004). In the present study,
Cd led to DNA damage in Xenopus at each exposure time
and at all concentrations except after 12 days at 0.5 and
1 mg/L of Cd for which significant reduction of these DNA
damage was observed, compared to the negative control. In
Pleurodeles, the genotoxic effects of Cd were less clear,
depending on the exposure time and the Cd-concentrations,
because of the probable constant balancing occurring
between repair and damage. In the same way, significantly
reduced DNA damage was obtained over the course of the
exposure in both amphibian larvae. Such observations have
already been reported in previous investigations (Mouchet
et al., 2005a,b, 2006a,b). In the present study, the reduction
in DNA damage observed in both amphibian larvae for a
given exposure time, and over the course of the exposure,
could have stemmed from different cellular processes,
including DNA repair, detoxification, and adaptive re-
sponses to repeated doses. Indeed, it is well established that
repair processes are genetically controlled (Moustacchi,
2000), each repair system preferentially acting on a particu-
lar kind of damage (Friedberg et al., 1995).
Analysis of the CA results reveals that negative controls
often exhibited significant background levels of strand
breaks, which were dependent on the time of exposure.
This observation is in agreement with previous studies and
already discussed (Mouchet et al., 2005a,b, 2006a,b). The
introduction of the evolution coefficient enabled us to con-
sider only the part of the DNA damage that was related to
the treatment.
For a given biological model, with regard to the four
parameters, genotoxic responses were sometimes different.
This result, confirming also previous study (Mouchet et al.,
2005a,b, 2006a,b), emphasizes the importance of the
number of parameters used in evaluating pollutant geno-
toxicity. Indeed, at least two parameters must be used
simultaneously.
Comparison Between CA and MNT
Because of the low acute toxicity in Xenopus larvae at
2 mg/L of Cd until day 4, the Cd concentrations analyzed
were 0.25, 0.5, and 1 mg/L, and 2 mg/L was not studied in
CA. The genetic results obtained in the present evaluation
show a significant increase in the frequency of micronuclei
in Xenopus larvae exposed to only 2 mg/L of Cd, whereas
significant primary DNA damage was found whatever the
TABLE VII. Results of the Pleurodeles comet assay:dose-effect relationships in larvae exposed for 1 to 12days to cadmium in mineral water
Exposure
time (days) Parameter
Cadmium concentration (mg/L)
0.5 vs 1 1 vs 2
1 Tail DNA � �ETM � �OTM � *
TL � �2 Tail DNA � *
ETM � *
OTM � *
TL ** *
4 Tail DNA � �ETM ** **
OTM � **
TL ** **
8 Tail DNA * **
ETM * **
OTM * **
TL * **
12 Tail DNA � �ETM � �OTM � �TL * **
The notation ‘‘*’’ indicates a positive significant dose-effect relationship,
confirmed by a Kolmogorov–Smirnov test (p ¼ 0.05). ‘‘**’’ indicates a
negative significant dose-effect relationship, confirmed by a Kolmogorov–
Smirnov test (p ¼ 0.05). ‘‘�’’ indicates a nonsignificant dose-effect rela-
tionship. ‘‘vs,’’ a given concentration is compared versus another one,
based on the calculated mean values of tail DNA (%DNA in the tail), ETM
(extent tail moment), OTM (olive tail moment), and TL (tail length).
430 MOUCHET ET AL.
Environmental Toxicology DOI 10.1002/tox

exposure time and the Cd-concentration (except for 0.5 and
1 mg/L after 12 days of exposure), depending on the param-
eter studied. Moreover, even though Cd did not lead to the
induction of any micronuclei in Pleurodeles at any concen-
tration, it did induce significant primary DNA damage
depending on the concentration and the parameter studied.
This finding may first suggest a lack of clastogenic and/or
aneugenic effects in larvae related to the Cd concentrations
studied. Indeed, genetic endpoints are different. The in vivoMNT in amphibians (AFNOR, 2000) detects chromosomal
and/or genomic mutations (chromosomal damage and/or
alteration of mitotic spindles), whereas alkaline CA detects
primary DNA damage, expressed as single- and double-
strand breaks, alkali-labile sites that are expressed as sin-
gle-strand breaks and single-strand breaks associated with
incomplete repaired excision (sites present at the time of
cell lysis). Cd exposure led to significant DNA damage
measured through CA and not through MNT in Xenopusand Pleurodeles after 12 days of exposure at the same con-
centrations. This result suggests that Cd-concentrations
which induce primary DNA lesions cannot give rise to fixed
mutations, assuming that single-strand breaks do not neces-
sarily induce chromosomic damage resulting in micronu-
cleus formation. These results may also emphasize the
repair capacity of these organisms. Indeed, primary DNA
lesions induced by Cd-concentrations which did not lead to
the formation of micronuclei (0.25, 0.5, and 1 mg/L in
Xenopus and 0.5, 1, and 2 mg/L in Pleurodeles) were
repaired by the induction of genetic mechanisms, since they
did not persist after one mitotic cycle. However, with 2 mg/
L, Cd saturation of these repair systems may be reached in
Xenopus. So, it is not surprising that concentrations of gen-
otoxicant can induce single-strand breaks, as revealed by
the CA, without necessarily inducing micronucleus forma-
tion because of repair mechanisms, as already observed in a
previous study on captan exposure (Mouchet et al., 2006b).
Moreover, Xenopus larvae are known to establish an effec-
tive detoxification mechanism, from the first day of expo-
sure, theoretically capable of ‘‘minimizing’’ the toxic
effects of cadmium via production of metallothioneins
(MTs) (Mouchet et al., 2006c). MTs may, at least in part,
contribute to limiting micronucleus formation due to direct
Cd effects. In this previous study, Cd was shown to induce
micronuclei at relatively low concentrations (2, 10, and 30
�g Cd/L) in Xenopus larvae in the same exposure condi-
tions (AFNOR, 2000); MT induction was probably insuffi-
cient to inhibit the clastogenic effects of cadmium at
relatively low concentrations and inhibit finally the micro-
nucleus induction. In contrast, the present results suggest
that the genotoxic mechanism of Cd action depends on the
Cd concentration, the capacity of detoxification processes,
and also on other pathways for exerting deleterious effects
TABLE VIII. Results of the Pleurodeles comet assay: evolution coefficients (ECCA) of tail DNA, ETM, OTM, and TL inlarvae exposed for 1 to 12 days to cadmium in mineral water
Exposure time (days) Parameter NC
Cadmium concentration (mg/L)
0.5 1 2
1–2 Tail DNA þ50.76* �57.40 �85.10 �31.18
ETM þ78.86* �68.71 �110.41 þ34.05*
OTM þ52.92* �53.40 �101.95 �26.31
TL þ34.30* �128* �513.88 þ35.21*
2–4 Tail DNA �7.25 þ103.71* þ794.59* �84.80
ETM þ10.95 þ265.27* �1460.91* �75.95
OTM �12.53 þ172.13* �8819.04* �76.38
TL þ19.73* �680.88* �15.43* �302.43*
4–8 Tail DNA þ20* �121.37* �76.93 þ23.94*
ETM þ4.67 �121.12* �75.92 �104.94
OTM þ14.16* �114.74* �66.15 þ200.10*
TL �21.63* �114.68* �64.25 �91.59
8–12 Tail DNA �38.91* �531.21 þ200.13* �676.55
ETM �54.34* �331.6 þ309.12* �3750
OTM �35.03* �556.35 þ131.38* �132.77
TL �24.25* �436.20* þ85.64* �373.46
1–12 Tail DNA þ2.62 �20.02* �7.72* �41.64*
ETM �5.15 �44.07* þ39.64* �41.79*
OTM þ0.17 �14.65* þ32.74* �139.23*
TL �4.55 �19.08* þ420.83* �37.08*
These evolution coefficients are calculated as described in Eq 1. Therefore, a positive value corresponds to increased DNA damage (and vice versa)
between two successive exposure times. ‘‘*’’ indicates that the evolution of DNA damage between two successive exposure times is significant (Kolmo-
gorov–Smirnov test, p ¼ 0.05); tail DNA, %DNA in the tail; ETM, extent tail moment; OTM, olive tail moment; TL, tail length.
431TOXICITY AND GENOTOXICITY OF CADMIUM IN AMPHIBIAN LARVAE
Environmental Toxicology DOI 10.1002/tox

on DNA. In the previous study, gene expression levels have
also been investigated by quantitative real-time RT-PCR in
liver and in the remaining tissues of larvae exposed to rela-
tively low concentrations. For instance, genes participating
in some other Cd-detoxification mechanisms to inhibit
micronucleus induction, such as the tap gene (belonging to
the ABC transporter family), have been found to be not
expressed. Genes involved in DNA repair, such as the
growth-arrest-DNA-damage (gadd), the mutL and the
rad51 genes, were found to be down-regulated at 30 �g Cd/
L, and up-regulated at 10 �gCd/L, suggesting that the DNA
damage generated by Cd can be repaired when exposure
concentrations are low, whereas Cd seems to inhibit DNA
repair mechanisms at higher concentrations. Genes encod-
ing for antioxidant enzymes like sodMt and coxI were
induced in larvae, indicating that Cd contamination gener-
ated oxidative stress in certain cells, depending on the
tissues analysed.
In the present study, the CA applied to amphibian larvae
for assessing genotoxicity of Cd seems to be a more sensi-
tive method than the normalized MNT (AFNOR, 2000)
since genotoxic Cd-effects were preferentially established
though CA. Genotoxic responses to Cd can be measured
from the first day of exposure with the CA, in comparison
with the 12-day exposure required by the MNT in the stand-
ardized procedure (AFNOR, 2000). Taking these results
into account and because of their different endpoints and
response times, both tests carried out on amphibian larvae
could be proposed in a complementary manner in a battery
test system.
The studied concentrations in CA and MNT from
250 �g Cd/L to 2 mg Cd/L are higher than mean concentra-
tions measured in natural contaminated waters. Environ-
mental Cd-concentrations such as 2, 10, and 30 �g Cd/L
(Mouchet et al., 2006c) are relevant for evaluating the
Cd-stress in ‘‘chronic conditions’’. In the same way, higher
Cd-concentrations can be considered relevant for evaluat-
ing this stress in ‘‘acute conditions’’ since important conta-
minated sediment and sludge stocks are accumulated in
contaminated sites and would represent additional and
potential Cd sources due to remobilization by floods, vio-
lent storms, dredging, or road and urban development.
CONCLUSION
Summing up, Cd could induce adverse effects in aquatic
species. In amphibians, lethal concentrations of Cd may
cause the immediate death of animals, while sublethal con-
centrations may increase the genotoxic potential of Cd and
influence vulnerability (predation, fertilization, behavior,
etc.). In amphibians, contaminants are of major concern
because many populations are declining dramatically and
the death of entire populations occurs increasingly fre-
quently, in some cases due to anthropogenic changes in the
environment. One of the key functions of such biomarkers
(micronucleus and comets) is to provide an ‘‘early warn-
ing’’ signal of significant biological effects (changes at the
genetic/molecular level) with suborganismic (molecular,
biochemical, and physiological) responses preceding those
occurring at higher levels of biological organization such as
cellular, tissue, organ, whole-body levels, and in line at
population level. Biomarkers are also well suited as rapid
and effective screening assays to assess ‘‘hot spots’’ of con-
tamination. In this way, the use of the MNT and CA may
provide an important tool for the prediction of the potential
long-term effects in amphibians in the environment.
Nevertheless, no increase in cytogenetic damage was
found when evaluated by the MNT in Pleurodeles larvae,
but an increase was found with 2 mg/L of Cd in Xenopustadpoles. Moreover, genotoxic responses were observed in
the form of primary DNA damage in both species. Consid-
ering that (i) the induction of DNA damage measured by
the two bioassays stems from different mechanisms, and
(ii) their different response-times, the CA could be carried
out as a relevant complementary method to assess the geno-
toxicity of both pure substances and complex contaminated
matrices, in biomonitoring studies using amphibian larvae.
We are especially grateful to Marie Charveron and
Caroline Baudouin from Pierre Fabre Laboratories in
Toulouse for the use of the Komet software. We are also
very indebted to Peter Winterton for reviewing the English
version of the manuscript.
REFERENCES
AFNOR. 2000. Association francaise de normalisation, NF T90-
325. Qualite de l’eau—Evaluation de la genotoxicite au moyen
de larves d’amphibiens (Xenopus laevis, Pleurodeles waltl).France: AFNOR. 17 p.
Anderson D, Plewa MJ. 1998. The international comet assay
workshop. Mutagenesis 13:67–73.
Bekaert C, Ferrier V, Marty J, Pfohl-Leszkowicz A, Bispo A,
Jourdain MJ, Jauzein M, Lambolez-Michel L, Billard H. 2002.
Evaluation of toxic and genotoxic potential of stabilized indus-
trial waste and contaminated soils. Waste Manage 22:241–247.
Belpaeme K, Cooreman K, Kirsch-Volders M. 1998. Development
and validation of the in vivo alkaline comet assay for detecting
genomic damage in marine flatfish. Mutat Res 415:167–184.
Bonfanti P, Colombo A, Orsi F, Nizzetto I, Andrioletti M,
Bacchetta R, Mantecca P, Fascio U, Vailati G, Vismara C.
2004. Comparative teratogenicity of Chlorpyrifos and Malathion
on Xenopus laevis development. Aquat Toxicol 70:189–200.
Carrasco KR, Tilbury KL, Myers MS. 1990. Assessment of the
piscine micronucleus test as an in situ biological indicator of
chemical contaminants effects. Can J Fish Aquat Sci 47:2123–
2136.
Chapman GA, McCrady JK. 1977. Copper toxicity: A question of
form. In: Tubbs RA, editor. Recent Advances in Fish Toxicol-
ogy. Corvallis, Oregon: Department of Fisheries and Wildlife,
Oregon State University. pp 132–151.
432 MOUCHET ET AL.
Environmental Toxicology DOI 10.1002/tox

Chenon P, Gauthier L, Loubieres L, Severac A, Delpoux M. 2002.
Evaluation of the genotoxic and teratogenetic potential of a
municipal sludge and sludge amended soil using the amphibian
Xenopus laevis and the tobacco: Nicotiana tabacum L. var.xan-thi Dulieu. Sci Total Environ 301:139–150.
Clements C, Ralph S, Petras M. 1997. Genotoxicity of select
herbicides in Rana catesbeiana tadpoles using the alkaline
single-cell gel DNA electrophoresis (Comet) assay. Environ
Mol Mutagen 29:277–288.
Coles JA, Farley SR, Pipe RK. 1995. Alterations of the immune
response of the common marine mussel Mytilus edulis resulting
from exposure to cadmium. Dis Aquat Organ 22:59–65.
Collins AR. 2002. The comet assay. Principles, applications, and
limitations. Methods Mol Biol 203:163–177.
Das RK, Nanda NK. 1986. Induction of micronuclei in peripheral
erythrocytes of fish Heteropneustes fossilis by mitomycin C and
paper mill effluent. Mutat Res 75:65–71.
Devaux A, Flammarion P, Bernardon V, Garric J, Monod G.
1998. Monitoring of the chemical pollution of the river Rhone
through measurements of DNA damage and cytochrome P
4501A induction in chub (Leuciscus cephalus). Mar Environ
Res 46:257–262.
Devi KD, Banu BS, Mahboob M, Jamil K, Grover P. 2001. In vivogenotoxic effect of cadmium chloride in mice leucocytes using
comet assay. Teratog Carcinog Mutagen 21:325–333.
Djomo JE, Ferrier V, Bekaert C. 2000. Amphibian micronucleus
test in vivo (Jaylet test) to evaluate the genotoxicity of petro-
chemical waste waters. Bull Environ Contam Toxicol 65:168–
174.
Fairbairn DW, Olive PL, O’Neill KL. 1995. The comet assay: A
comprehensive review. Mutat Res 339:37–59.
Fernandez M, Jaylet A. 1987. An antioxidant protects against the
clastogenic effects of benzo(a)pyrene in the newt in vivo. Muta-
genesis 2:293–296.
Fernandez M, Gauthier L, Jaylet A. 1989. Use of newt for in vivogenotoxicity testing of water: Results on 19 compounds
evaluated by the micronucleus test. Mutagenesis 4:17–26.
Fernandez M, L’Haridon J, Gauthier L, Zoll-Moreux C. 1993.
Amphibian micronucleus test(s): A simple and reliable method
for evaluation of in vivo genotoxic effects of fresh water
pollutants and radiations. Initial assessment. Mutat Res 292:
83–99.
Ferrier V, Gauthier L, Zoll-Moreux C, L’Haridon J. 1998. Geno-
toxicity tests in amphibians—A review. Microscale testing in
aquatic toxicology: advances, techniques and practice. Environ
Toxicol 35:507–519.
Filipic M, Hei TK. 2004. Mutagenicity of cadmium in mammalian
cells: Implication of oxidative DNA damage. Mutat Res 546(1/
2):81–91.
Flament S, Kuntz S, Chesnel A, Grillier-Vuissoz, Tankozic C,
Penrad-Mobayed M, Auque, G, Shirali P, Schroeder H,
Chardard D. 2003. Effect of cadmium on gonadogenesis and
metamorphosis in Pleurodeles waltl (urodele amphibian). Aquat
Toxicol 64:143–153.
Flammarion P, Devaux A, Nehls S, Migeon B, Noury P, Garric J.
2002. Multibiomarker responses in fish from the Moselle River
(France). Ecotoxicol Environ Saf 51:145–153.
Forni A. 1992. Chromosomal effects of cadmium exposure in
humans. IARC Sci Publ 118:377–383.
Freda J. 1991. The effects of aluminium and other metals on
amphibians. Environ Pollut 71:305–328.
Friedberg G, Errol C, Walker C, Siede W. 1995. DNA Repair and
Mutagenesis. Washington, DC: American Society for Microbi-
ology Press. 698 p.
Galien L, Durocher M. 1957. Tables de developpement chez
Pleurodeles waltl. Bull Biol Fr Belg 91:97–117.
Gauthier L. 1996. The amphibian micronucleus test, a model for
in vivo monitoring of genotoxic aquatic pollution. Alytes Int J
Batrachol 14:53–84.
Gauthier L, Tardy E, Mouchet F, Marty J. 2004. Biomonitoring of
the genotoxic potential (micronucleus assay) and detoxifying
activity (EROD induction) in the river Dadou-France, using the
amphibian Xenopus laevis. Sci Total Environ 323:47–61.
Godet F, Vasseur P, Babut M. 1993. Essais de genotoxicite in vivoet in vitro applicables a l’environnement hydrique. Revue des
Sciences de l’Eau 6:285–314.
Grinfeld S, Jaylet A, Siboulet R, Deparis P, Chouroulinkov I.
1986. Micronuclei in red blood cells of the newt Pleurodeleswaltl after treatment with benzo(a)pyrene: Dependence on dose,
length of exposure, postreatment time, and uptake of the drug.
Environ Mutagen 8:41–51.
Hartmann A, Agurell E, Beevers C, Brendler-Schwaab S,
Burlinson B, Clay P, Collins A, Smith A, Speit G, Thybaud V,
Tice RR. 2003. Recommendations for conducting the in vivoalkaline comet assay. Mutagenesis 18:45–51.
Hartwig A. 1994. Role of DNA repair inhibition in lead- and
cadmium-induced genotoxicity: A review. Environ Health
Perspect 3:45–50.
Hartwig A. 1998. Carcinogenicity of metals compounds: Possible
role of DNA repair inhibition. Toxicol Lett 102, 103:235–239.
Hassoun EA, Stohs SJ. 1996. Cadmium-induced production of
superoxide anion and nitric oxide, DNA single strands breaks
and lactate dehydrogenase leakage in J774A.1. Cell Cult
Toxicol 112:219–226.
IARC. 1987. Overall evaluations of carcinogenicity: An updating
of IARC Monographs. Lyon: IARC. Monographs on the evalua-
tion of carcinogenic risks to humans and their supplements,
Lists of evaluations, Vol. 1–42, Supplement No. 7. 440 p.
IARC. 1993a. Monographs on the evaluation of carcinogenic risks
to humans: Beryllium, cadmium, mercury, and exposures in the
glass manufacturing industry, Vol. 58. pp 41–117.
IARC. 1993b. Monographs on the evaluation of carcinogenic risks
to humans: Beryllium, cadmium, mercury, and exposures in the
glass manufacturing industry, Vol. 58. 119–237.
IPCS. 1992. Cadmium. Environ Health Criteria 134:97–195.
James SM, Little EE, Semlitsch RD. 2004. The effect of soil
composition and hydration on the bioavailability and toxicity
of cadmium to hibernating juvenile American toads (Bufoamericanus). Environ Pollut 132:523–532.
Jaylet A, Zoll C. 1990. Tests for detection of genotoxins in
freshwater. Aquat Sci 2:151–166.
Jaylet A, Deparis P, Ferrier V, Grinfeld S, Siboulet R. 1986. A
new micronucleus test using peripheral blood erythrocytes of
433TOXICITY AND GENOTOXICITY OF CADMIUM IN AMPHIBIAN LARVAE
Environmental Toxicology DOI 10.1002/tox

the newt Pleurodeles waltl to detect mutagen in fresh water
pollution. Mutat Res 164:245–257.
Krauter PW, Anderson SL, Harisson FL. 1987. Radiation-induced
micronuclei in peripheral erythrocytes of Rana catesbeiana: An
aquatic animal model for in vivo genotoxicity studies. Environ
Mol Mutagen 10:285–291.
Lutzen A, Liberti SE, Rasmussen LJ. 2004. Cadmium inhibits
human DNA mismatch repair in vivo. Biochem Biophys Res
Commun 321:21–25.
Martins RJE, Pardo R, Boeventura RAR. 2004. Cadmium (II) and
zinc (II) adsoprtion by the aquatic moss Fontinalis antipyretica:
Effect of temperature, pH and water hardness. Water Res
38:693–699.
McGill R, Tuckey J, Larsen W. 1978. Variations of box plots. Am
Stat 32:12–16.
McKelvey VJ, Green MHL, Schmezer BL, Pool-Zobel BL, De
Meo MP, Collins A. 1993. The single cell gel electrophoresis
assay (comet assay): A European review. Mutat Res 288:47–63.
Meinelt T, Playle RC, Pietrock M, Burnison BK, Wienke A,
Steiberg EW. 2001. Interactions of cadmium toxocity in
embryos and larvae of zebrafish (Danio rerio) with calcium and
humic substances. Aquat Toxicol 54:205–215.
Metcalfe CD. 1988. Induction of micronuclei and nuclear
abnormalities in the erythrocytes of mudminnows (Umbra limi)and brown bullheads (Ictalurus nebulosus). Bull Environ
Contam Toxicol 40:489–495.
Mitchelmore CL, Chipman JK. 1998. DNA strand breakage in
aquatic organisms and the potential values of the comet assay in
environmental monitoring. Mutat Res 339:135–147.
Mouchet F, Gauthier L, Mailhes C, Ferrier V, Devaux A. 2005a.
Comparative study of the comet assay and the micronucleus test
in amphibian larvae (Xenopus laevis) using benzo(a)pyrene,
ethyl methanesulfonate, and methyl methanesulfonate: Estab-
lishment of a positive control in the amphibian comet assay.
Environ Toxicol 20:74–84.
Mouchet F, Mailhes C, Gauthier L, Ferrier V, Jourdain MJ,
Devaux A. 2005b. Biomonotoring of the genotoxic potential of
draining water from dredged sediments, using the comet and
micronucleus tests on amphibian (Xenopus laevis) and bacterial
assays (Mutatox and Ames tests). J Toxicol Environ Health A
68:811–832.
Mouchet F, Gauthier L, Mailhes C, Ferrier V, Jourdain MJ,
Triffault G, Devaux A. 2006a. Biomonitoring of the genotoxic
potential of aqueous extracts of soils and bottom ash resulting
from municipal solid waste incineration, using the comet and
micronucleus tests on amphibian (Xenopus laevis) larvae and
bacterial assays (Mutatox and Ames tests). Sci Total Environ
355:232–246.
Mouchet F, Gauthier L, Mailhes C, Ferrier V, Devaux A. 2006b.
Comparative evaluation of the genotoxicity of captan in amphib-
ian larvae (Xenopus laevis and Pleurodeles waltl) using the comet
assay and the micronucleus test. Environ Toxicol 21:264–277.
Mouchet F, Baudrimont M, Gonzalez P, Cuenot Y, Bourdineaud
JP, Boudou A, Gauthier L. 2006c. Genotoxic and stress induc-
tive potential of cadmium in Xenopus laevis larvae. Aquat Toxi-
col 78:157–166.
Mounaji K, Vlassi M, Erraiss NE, Wegnez M, Serrano A, Soukri A.
2003. In vitro effect of metal ions on the activity of two am-
phibian glyceraldehydes-3-phosphate deshydrogenases: Potential
metal binding sites. Comp Biochem Pysiol B 135:241–254.
Moustacchi E. 2000. DNA damage and repair: Consequences on
dose-responses. Mutat Res 464:35–40.
Nacci DE, Cayula S, Jackim E. 1996. Detection of DNA damage
in individual cells from marine organisms using the single cell
gel assay. Aquat Toxicol 35:197–210.
Nieuwkoop PD, Faber J. 1956. Normal Tables of Xenopus laevis(Daudin). Amsterdam: North-Holland.
Olive PL, Banath JP, Durand RE. 1990. Heterogeneity in radia-
tion-induced DNA damage and repair in tumor and normal cells
measured using the ‘comet’ assay. Radiat Res 122:86–94.
Ostling O, Johanson KJ. 1984. Microelectrophoretic study of radi-
ation induced DNA damages in individual mammalian cells.
Biochem Biophys Res Commun 123:291–298.
Part P, Svanberg O, Kiessling A. 1985. The availability of cad-
mium to perfused rainbow trout gills in different water qualities.
Water Res 19:427–434.
Pavlica M, Klobucar GIV, Mojas N, Erben R, Papes D. 2001.
Detection of DNA damage in haemocytes of zebra mussel using
comet assay. Mutat Res 490:209–214.
Perceval O, Pinel-Alloul B, Methot G, Couillard Y, Giguere A,
Campbell PG, Hare L. 2002. Cadmium accumulation and me-
tallothionein synthesis in freshwater bivalves (Pyganodongrandis): Relative influence of the metal exposure gradient
versus limnological variability. Environ Pollut 118:5–17.
Perez-Coll CS, Herkowits J, Fridman O, Daniel P, D’Eramo JL.
1999. Metallothionein induction and cadmium uptake in Buffoarenarum embryos following an acclimation protocol. Environ
Pollut 106:443–448.
Playle RC. 1998. Modelling metal interactions at fish gills. Sci
Total Environ 219:147–163.
Playle RC, Dixon DG, Burnison K. 1993a. Copper and cadmium
binding to fish gills: Modifications by dissolved organic carbon
and synthetic ligands. Can J Fish Aquat Sci 50:2667–2677.
Playle RC, Dixon DG, Burnison K. 1993b. Copper and cadmium
binding to fish gills: Estimates of metal-gill stability constants
and modelling of metal accumulation. Can J Fish Aquat Sci
50:2678–2687.
Prati M, Gornati R, Boracchi P, Biganzoli E, Fortaner S, Pietra R,
Sabbioni E, Bernardini G. 2002. A comparative study of the
toxicity of mercury dichloride and methylmercury, assayed by
the Frog Embryo Teratogenesis Assay—Xenopus (FETAX).
Altern Lab Anim 30:23–32.
Ralph S, Petras M. 1998a. Caged amphibian tadpoles and in situ gen-
otoxicity monitoring of aquatic environments with the alkaline sin-
gle cell gel electrophoresis (comet) assay. Mutat Res 413:235–250.
Ralph S, Petras M. 1998b. Comparison of sensitivity to methyl
methanesulphonate among tadpole development stages using
the alkaline single-cell gel electrophoresis (comet) assay. Envi-
ron Mol Mutagen 31:374–382.
Ralph S, Petras M, Pandrangi R, Vrzoc M. 1996. Alkaline single
cell gel (comet) assay and genotoxicity monitoring using two
species of tadpoles. Environ Mol Mutagen 28:112–120.
Richards JG, Burnison BK, Playle RC. 1999. Natural and com-
mercial dissolved organic matter protects against the physiolog-
ical effects of a combined cadmium and copper exposure in
434 MOUCHET ET AL.
Environmental Toxicology DOI 10.1002/tox

rainbow trout (Oncorhynchus mykiss). Can J Fish Aquat Sci
56:407–418.
Rojas E, Lopez MC, Valverde M. 1999. Single cell gel electropho-
resis assay: Methodology and applications. J Chromatogr B
Biomed Appl 722:225–254.
Singh NP, McCoy MT, Tice RR, Schneider EL. 1988. A simple
technique for quantitation of low levels of DNA damage in indi-
vidual cells. Exp Cell Res 175:184–191.
Speit G, Hartmann A. 1999. The comet assay (single-cell gel
test)—A sensitive genotoxicity test for the detection of DNA
damage and repair. In: Henderson DS, editor. Methods in Mo-
lecular Biology, Vol. 113: DNA Repair Protocols: Eucaryotic
Systems. Towa, NJ: Humana Press. pp 203–212.
Spokes LL, Campos MLAM, Jickells TD. 1996. The role of
organin matter in controlling copper speciation in precipitation.
Atmos Environ 30:3959–3966.
Tice RR, Agurell E, Anderson D, Burlinson B, Hartmann A,
Kobayashi H, Miyamae Y, Rojas E, Ryn JC, Sasaki YF. 2000.
Single cell gel/comet assay: Guidelines for in vitro and in vivogenetic toxicology testing. Environ Mol Mutagen 35:206–221.
Verougstraete V, Lison D, Hotz P. 2002. A systematic review of
cytogenetic studies conducted in human populations exposed to
cadmium compounds. Mutat Res 1:15–43.
Waisberg M, Joseph P, Hale B, Beyersmann D. 2003. Molecular
and cellular mechanisms of cadmium carcinogenesis. Toxicol-
ogy 192(2/3):95–117.
Wicklund A, Runn P. 1988. Calcium effects on cadmium uptake,
redistribution, and elimination in minnows, Phoxinus phoxinus,acclimated to different calcium concentrations. Aquat Toxicol
13:109–122.
Winter MJ, Day N, Hayes RA, Taylor EW, Butler PJ, Chipman
JK. 2004. DNA strand breaks and adducts determined in feral
and caged chub (Leuciscus cephalus) exposed to rivers exhibit-
ing variable water quality around Birmingham, UK. Mutat Res
552:163–175.
Wood AM. 1983. Available copper ligands and the apparent bio-
availability of copper to natural phytoplankton assemblages. Sci
Total Environ 28:51–64.
Wood CM. 2001. Toxic responses of the gill. In: Schlenk DW,
Benson WH, editors. Target Organ Toxicity in Marine and
Freshwater Teleosts, Vol. 1: Organs. Washington, DC: Taylor
and Francis. pp 1–89.
Zoll C, Ferrier V, Gauthier L. 1990. Use of aquatic animals for
monitoring genotoxicity in unconcentrated water samples. In:
Kappas A, editor. Mechanisms of Environmental Mutagenesis-
Carcinogenesis. New York: Plenum. pp 233–244.
435TOXICITY AND GENOTOXICITY OF CADMIUM IN AMPHIBIAN LARVAE
Environmental Toxicology DOI 10.1002/tox