Chapter 7 Health & Human Services - DC Office of Planning
46
• Indices 2013 • District of Columbia • 179 Health & Human Services 180 Department of Human Services 180 Clients in Human Services Programs 180 Office on Aging 182 Mission 182 Background 182 Community Supports and Services 182 Changing Demographics of an Aging Population 182 New Programs and Initiatives 183 Funding and Resources 183 Agency Challenges 183 Accomplishments and Goals 184 Office of Disability Rights 184 Mission 184 Programs and Services 184 Disabilty Services 185 Developmental Disabilities Administration 185 Rehabilitation Services Administration 185 Child and Family Services Agency 186 Mission and Functions 186 Strategic Agenda 186 Demand for Service 187 Demographics of Children and Youth in Foster Care 187 Exits from Foster Care 187 Department of Health 188 About the DC Department of Health 188 Administrations 188 Community Health Administration 189 HIV/AIDS, Hepatitis, STD, & TB Administration 193 Health Regulation and Licensing Administration 198 Health Emergency Preparedness and Response Administration 200 Center for Policy, Planning, & Evaluation 202 Chapter 7 Department of Mental Health 215 Transition to Department of Behavioral Health 215 Consumers in Department of Mental Health Programs 215 Mental Health Services and Supports 216 Access HelpLine 216 Crisis Emergency Services 216 Housing Services 217 Homeless Services 218 Mental Health Services Division 218 School Mental Health Program 218 Saint Elizabeths Hospital 219 Health Care Finance 221 About 221 Medicaid 221 Long Term Care 221 Administrations 222 Office of Health Care Ombudsman and Bill Of Rights 223 Initiatives 224 Health & Human Services
-
Upload
khangminh22 -
Category
Documents
-
view
4 -
download
0
Transcript of Chapter 7 Health & Human Services - DC Office of Planning

• Indices 2013 • District of Columbia • 179
Health & Human Services . . . . . . . . . . . . . . . . . . . . . . . . . . . . . . . . 180Department of Human Services . . . . . . . . . . . . . . . . . . . . . . . . . . . . 180
Clients in Human Services Programs . . . . . . . . . . . . . . . . . . . . . . 180Office on Aging . . . . . . . . . . . . . . . . . . . . . . . . . . . . . . . . . . . . . . . . . 182
Mission . . . . . . . . . . . . . . . . . . . . . . . . . . . . . . . . . . . . . . . . . . . . . 182Background . . . . . . . . . . . . . . . . . . . . . . . . . . . . . . . . . . . . . . . . . . 182Community Supports and Services . . . . . . . . . . . . . . . . . . . . . . . . 182Changing Demographics of an Aging Population . . . . . . . . . . . . . 182New Programs and Initiatives . . . . . . . . . . . . . . . . . . . . . . . . . . . . 183Funding and Resources . . . . . . . . . . . . . . . . . . . . . . . . . . . . . . . . . 183Agency Challenges . . . . . . . . . . . . . . . . . . . . . . . . . . . . . . . . . . . . 183Accomplishments and Goals . . . . . . . . . . . . . . . . . . . . . . . . . . . . . 184
Office of Disability Rights . . . . . . . . . . . . . . . . . . . . . . . . . . . . . . . . 184Mission . . . . . . . . . . . . . . . . . . . . . . . . . . . . . . . . . . . . . . . . . . . . . 184Programs and Services . . . . . . . . . . . . . . . . . . . . . . . . . . . . . . . . . . 184
Disabilty Services . . . . . . . . . . . . . . . . . . . . . . . . . . . . . . . . . . . . . . . 185Developmental Disabilities Administration . . . . . . . . . . . . . . . . . 185Rehabilitation Services Administration . . . . . . . . . . . . . . . . . . . . . 185
Child and Family Services Agency . . . . . . . . . . . . . . . . . . . . . . . . . . 186Mission and Functions . . . . . . . . . . . . . . . . . . . . . . . . . . . . . . . . . . 186Strategic Agenda . . . . . . . . . . . . . . . . . . . . . . . . . . . . . . . . . . . . . . 186Demand for Service . . . . . . . . . . . . . . . . . . . . . . . . . . . . . . . . . . . . 187Demographics of Children and Youth in Foster Care . . . . . . . . . . 187Exits from Foster Care . . . . . . . . . . . . . . . . . . . . . . . . . . . . . . . . . . 187
Department of Health . . . . . . . . . . . . . . . . . . . . . . . . . . . . . . . . . . . . 188About the DC Department of Health . . . . . . . . . . . . . . . . . . . . . . 188Administrations . . . . . . . . . . . . . . . . . . . . . . . . . . . . . . . . . . . . . . . 188Community Health Administration . . . . . . . . . . . . . . . . . . . . . . . . 189HIV/AIDS, Hepatitis, STD, & TB Administration . . . . . . . . . . . . 193Health Regulation and Licensing Administration . . . . . . . . . . . . . 198Health Emergency Preparedness and Response Administration . . 200Center for Policy, Planning, & Evaluation . . . . . . . . . . . . . . . . . . 202
Chapter 7
Department of Mental Health . . . . . . . . . . . . . . . . . . . . . . . . . . . . . . 215Transition to Department of Behavioral Health . . . . . . . . . . . . . . . 215Consumers in Department of Mental Health Programs . . . . . . . . . 215Mental Health Services and Supports . . . . . . . . . . . . . . . . . . . . . . 216Access HelpLine . . . . . . . . . . . . . . . . . . . . . . . . . . . . . . . . . . . . . . 216Crisis Emergency Services . . . . . . . . . . . . . . . . . . . . . . . . . . . . . . 216Housing Services . . . . . . . . . . . . . . . . . . . . . . . . . . . . . . . . . . . . . . 217Homeless Services . . . . . . . . . . . . . . . . . . . . . . . . . . . . . . . . . . . . . 218Mental Health Services Division . . . . . . . . . . . . . . . . . . . . . . . . . . 218School Mental Health Program . . . . . . . . . . . . . . . . . . . . . . . . . . . 218Saint Elizabeths Hospital . . . . . . . . . . . . . . . . . . . . . . . . . . . . . . . . 219
Health Care Finance . . . . . . . . . . . . . . . . . . . . . . . . . . . . . . . . . . . . . 221About . . . . . . . . . . . . . . . . . . . . . . . . . . . . . . . . . . . . . . . . . . . . . . . 221Medicaid . . . . . . . . . . . . . . . . . . . . . . . . . . . . . . . . . . . . . . . . . . . . 221Long Term Care . . . . . . . . . . . . . . . . . . . . . . . . . . . . . . . . . . . . . . 221Administrations . . . . . . . . . . . . . . . . . . . . . . . . . . . . . . . . . . . . . . . 222Office of Health Care Ombudsman and Bill Of Rights . . . . . . . . . 223Initiatives . . . . . . . . . . . . . . . . . . . . . . . . . . . . . . . . . . . . . . . . . . . . 224
Health & Human Services

• District of Columbia • Indices 2013 •180
HealtH & Human ServiceS
Department of Human ServiceSThe mission of the District of Columbia Department of Human Services (DHS), in collaboration with the com-munity, is to assist low-income individuals and families to maximize their potential for economic security and self-sufficiency.
Clients in Human Services ProgramsOver 220,000 District residents receive one or more ser-vices administered by the District’s human services safety net . Recipients of these services include participants in income support programs, such as Temporary Assistance for Needy Families (TANF, formerly Aid to Families with
Dependent Children), Supplemental Nutritional Assis-tance Program (SNAP, formerly Food Stamps), and Inter-im Disability Assistance (IDA). Medicaid continues to be the largest program with an enrollment of nearly 170,000 individuals .
A comparison of participants over the fourteen-year pe-riod shows that the number of Medicaid recipients in-creased by 34 percent, SNAP recipients increased by 41 percent, and TANF recipients have fluctuated, but have shown needed increase in recent years (Table 7.1).
Temporary Assistance for Needy Families (TANF)In 1996, Congress enacted the Personal Responsibility and Work Opportunity Reconciliation Act (PRWORA),
P.L. 104-193, which eliminated the Emergency Assis-tance Program and the Aid to Families with Dependent Children (AFDC) program, shifting from an open-end-ed entitlement to a cash assistance program limited to 60-months in a lifetime. The TANF program is designed to assist individuals to become self-sufficient by requiring them to work or participate in certain work activities in or-der to receive benefits. Support services and employment related services are provided to enable the individual to seek, obtain and maintain employment. After a number of years of declining caseloads, the number of TANF cases has seen a significant increase since 2008 (Table 7.2). In response to the increasing demands, and the challenges facing TANF families, DHS has dramatically redesigned the TANF program.
Table 7.1. Number of Participants by Program (Monthly average) by Fiscal Year
1999 2000 2001 2002 2003 2004 2005 2006 2007 2008 2009 2010 2011 2012Medicaid* 119,712 125,680 129,638 130,663 133,913 137,832 144,026 144,413 140,486 140,600 133,905 160,562 162,262 168,359SNAP (formerly Food Stamps) 84,386 79,536 72,776 73,069 79,887 86,817 87,215 86,872 85,011 86,957 99,203 113,629 128682 135,506
TANF 51,535 46,764 43,702 43,600 43,137 44,985 43,576 39,859 37,613 37,272 36,677 42,760 43,113 44,528General Assistance for Children 571 546 548 555 525 512 463 411 384 360 334 329 285 306
Interim Disability Assistance n/a n/a n/a 420 787 1,012 1,510 1973 2140 3481 2697 1591 1085 662DC Healthcare Alliance** n/a n/a n/a n/a n/a n/a n/a n/a 44,513 48,095 52,082 48,082 23,705 20,543*DHS provides Eligibility only; benefits administered by Department of Health Care Finance (DHCF)**DHS initiated DC Healthcare Alliance services in FY07Source: Department of Human Services
Table 7.2. Temporary Assistance for Needy Families (TANF), Monthly Average by Fiscal Year
1999 2000 2001 2002 2003 2004 2005 2006 2007 2008 2009 2010 2011 2012Recipients 51,535 46,764 43,702 43,600 43,137 44,985 43,576 39,859 37,613 37,272 39,588 40,554 43,113 44,528Children 37,481 34,271 32,056 32,050 32,638 33,501 32,780 30,379 28,768 28,078 29,549 30,073 31,174 31,515Cases 19,062 17,312 16,210 16,390 16,804 17,329 17,066 16,012 15,171 14,892 16,085 16,654 17,382 17,699Avg. Mthly Payment by Case $351 $346 $340 $335 $335 $335 $331 $334 $352 $374 $373 $369 $358 $344Family Size 2 .7 2 .7 2 .7 2 .7 2 .6 2 .6 2 .6 2 .49 2 .48 2 .5 2 .5 2 .4 2 .5 2 .5Total TANF Payments (in millions) $80 .30 $71 .80 $67 .20 $66 .80 $67 .50 $69 .60 $67 .70 $64 .11 $64 .14 $67 .00 $72 .00 $73 .00 74 .7 73 .0
Source: Department of Human Services

• Indices 2013 • District of Columbia • 181
SNAP/Food StampsThe Food Stamp program is designed to provide supple-mental nutrition assistance to individuals and families in need. Since 2007, the number of households receiving Food Stamp benefits has increased dramatically (Table 7.3). This has been the result of both the economic down-turn, as well as expanded eligibility guidelines in the Dis-trict .
Permanent Supportive HousingIn 2008, the District of Columbia adopted the Housing First Initiative, a revolutionary, yet tested, approach for
addressing and bringing an end to chronic homelessness in the District of Columbia. As a result, DHS created the Permanent Supportive Housing (PSH) Program, which serves individuals, families and veterans. The PSH pro-grams transformed the delivery of homeless services from an approach that simply meets the survival needs of in-dividuals with blankets and shelter, to one that provides a subsidized housing unit paired with tightly linked sup-portive services .
Shelter ServicesIn addition to the Permanent Supportive Housing pro-grams, the District provides shelter and transitional hous-ing programs for individuals and families experiencing homelessness (Table 7.5). Hypothermia, low barrier and temporary shelters provide 12-24 hour daily shelter with access to supportive services. Transitional shelter aims to facilitate the movement of homeless individuals and fam-ilies to permanent housing within a reasonable amount of time (usually 24 months) .
Adult Protective ServicesAdult Protective Services (APS) investigates reports al-leging abuse, neglect and exploitation of elderly, disabled and other vulnerable adults and intervenes to protect those adults who are at risk .
Strong FamiliesThe Strong Families program aims to strengthen individu-als and family units, foster healthy development, and help address the issues that create ongoing challenges by pro-viding client needs assessments, case plan development, social work interventions and referral and coordination of services (Table 7.7).
Table 7.3. SNAP (Formerly Food Stamps), Monthly Average by Fiscal Year
2003 2004 2005 2006 2007 2008 2009 2010 2011 2012Recipients 79,887 86,817 87,215 86,872 85,011 86,957 99,203 113,629 128,682 135,506Cases 37,910 41,977 43,273 44,058 44,028 46,132 54,299 63,720 73,438 77,717Source: Department of Human Services
Table 7.4. Permanent Supportive Housing by Fiscal Year
2008 2009 2010 2011 2012Individuals Housed 362 190 38 60 26
Families Housed n/a 74 165 242 113
Total number of households 362 380 286 302 139
Source: Department of Human Services
Table 7.5. Shelter by Fiscal Year
2008 2009 2010 2011 2012Shelter*Individuals 11,631 persons 11,442 persons 10,427 persons 8,608 persons 9,289 persons
Families 1,371 persons (433 families)
1,451 persons (464 families)
1,802 persons (564 families)
1,762 persons (579 families)
2,627 persons (791 families)
Transitional HousingIndividuals 738 persons 702 persons 697 persons 1,252 persons 1,080 persons
Families 918 persons (281 families)
1,008 persons (304 families)
1,035 (310 fam-ilies)
1,662 persons (512 families)
1,588 persons (475 families)
*Includes hypothermia, seasonal and overflow bedsSource: Department of Human Services
Table 7.6. Adult Protective Services by Fiscal Year
2008 2009 2010 2011 2012Total number of cases 957 874 856 861 956
Source: Department of Human Services
Table 7.7. Strong Families by Fiscal Year
2008 2009 2010 2011 2012Families Served 969 1,161 1,423 2,076 1,621
Source: Department of Human Services

• District of Columbia • Indices 2013 •182
office on aging
MissionThe mission of the District of Columbia Office on Ag-ing (DCOA) is to advocate, plan, implement, and monitor programs in health, education, employment, and social services which promote longevity, independence, dignity and choice for our senior citizens .
BackgroundThe District of Columbia Office on Aging was created by DC Law 1-24 in 1975 as the State and Area Agency on Aging. The agency is responsible for the development, implementation, and administration of a comprehensive and coordinated social services system which consists of over 30 programs (funded by federal and local dollars) for residents 60 years of age and older, persons living with disabilities and caregivers. The agency carries out its mis-sion by funding its Senior Service Network comprised of 27 community-based nonprofit organizations that provide a full range of core home and community-based support-ive services, namely:
y Adult Day Care y Emergency Shelter y Caregiver Support y Congregate Meals y Home Delivered Meals y Elder Abuse Prevention y Comprehensive Assessment y Health Insurance Counseling y Long-Term Care Case Management y Respite Care y Legal Support y Transportation y Recreation & Socialization y Health Promotion & Wellness y Short and Long-Term Counseling y Nutrition Education & Counseling y In-Home Care/Supportive Services
DCOA also offers information, assistance and referrals, employment and training programs, options counseling, nursing home transition and hospital discharge planning services through its Aging and Disability Resource Cen-ter (ADRC) for seniors, persons living with disabilities, and caregivers. In addition, DCOA owns two nursing facilities, the Washington Center for Aging Services and
Unique Residential Care Facility, that are privately oper-ated and managed by Stoddard Baptist Home Foundation and Vital Management Team.
Another component of the Office on Aging is the District of Columbia’s Commission on Aging. This advisory board is comprised of 15 members appointed by the Mayor with the advice and consent of DC City Council and advocates on behalf of District seniors to ensure their concerns and needs are being met by DCOA and the District Govern-ment as a whole .
Community Supports and ServicesFrom 2008 through 2012, more than 48,600 of the 103,483 seniors living in the District have received one or more core services funded by the DC Office on Aging. The top five most utilized services in 2012 were short and long-term counseling, home and congregate meals, trans-portation, long-term care case management, and health promotion and wellness (Figure 7 .1) .
Changing Demographics of an Aging PopulationThe District of Columbia has a growing population of 632,323 residents. From 2010 to 2012, the Census report-ed that the District’s population increased by 17,000 per-sons. The population that is 60 years of age and older is
now 103,483, sixteen percent of the total population, with 11,003 persons 80 years of age. Overall, this is an increase of 1,696 older persons (1.5 percent increase) from the pre-vious year .
Since 2006 (first year of the baby boomers turning 60), the population 60 years of age and older has increased by 1.6 percent each year. This trend is expected to continue over the next 15 years .
If current city demographic trends continue, the senior population will see the greatest growth from both ends of the age continuum; youngest seniors (60-69 years of age and older) and oldest seniors (85 years of age and older) . It is projected by 2015, 110,000 persons (almost 17 per-
Figure 7.1. Number of Persons Receiving Core Services
Source: Office on Aging Customer Services Tracking and Reporting System, 2013

• Indices 2013 • District of Columbia • 183
cent of the population) could be at least 60 years of age and older; this represents 1 out of every 7 residents in the District (Figure 7 .2) .
As the number of multicultural older adults with low-in-come increases, along with the surge in multiple chronic healthcare needs, DCOA is committed to expanding home and community-based programs. The agency also has a keen interest in the baby boomer population in helping them to stay active, remain healthy and live in the com-munity for as long as possible.
New Programs and InitiativesIn FY 2011 and FY 2012, DCOA implemented the follow-ing new programs and services:
y ADRC launched a public awareness campaign en-titled “Know Your Options Decide Your Future” to promote the importance of long-term care planning among DC residents. The campaign included adver-tisements on Metrobus, rail, and direct mail of more than 80,000 planning guides.
y The ADRC developed a user-friendly respite care database that is readily available on the DCOA’s website and in print format to restore and strength-en caregivers’ ability to continue providing care for their loved ones. The database assists in locating
short-term relief to families and primary caregivers of children, persons living with disabilities and old-er adults by linking families to the online database of respite care providers .
y The ADRC conducted new Diabetes Self-Man-agement Program (DSMP) workshops in senior housing buildings and senior wellness centers to promote healthy aging among residents. As a result, ADRC recruited and trained 18 Master Trainers for the DSMP and exceeded its goal of 52 workshops, with a total of 123 workshops .
y The ADRC formed the DC Healthy Aging Coalition (DCHAC), which is comprised of key leaders from organizations throughout the city with an interest in health promotion and/or aging. DCHAC’s vision is that the District of Columbia will create and sus-tain programs, policies and environments to foster healthy aging and the health, well-being and inde-pendence of its citizens. The Coalition is a compo-nent of the Diabetes Self-Management Program in terms of the sustainability of the program and the promotion of a healthy living lifestyle beyond the grant period .
y The DCOA hosted the Mayor’s First Annual Senior Symposium . It was a platform for our customers to express concerns and barriers while problem solve alongside government officials, health and human service providers and advocates . It was also an ed-ucational offering for participants to learn about issues such as the HIV/AIDS epidemic, Gay, Lesbi-ans, Bisexual and Transgender (GLBT) issues, rec-reation and socialization, caregiver support, options counseling, and long-term care planning.
y The DC Long-Term Care Ombudsman Program succeeded in expanding the scope of its program . The program now includes monitoring the quality of care delivered in individual homes for residents receiving long-term care services through the DC Medicaid Elderly and Persons with Disabilities (EPD) Waiver. In addition, funding was secured for the program in the amount of $300,000 to carry out this new mandate .
y DCOA created the agency’s first Ambassador Pro-gram. The goal of the program is to train volun-teers as community representatives to educate and empower residents, particularly seniors, about the DCOA programs and services. As a result, there are currently 114 trained DCOA ambassadors through-out the city to educate seniors about our services.
Although DCOA has added new programs to its portfolio,
seniors have also benefited from resources offered by oth-er District agencies (DC Housing Authority, Metropolitan Police, DC Public Library, Department of Housing and Community Development, DC Fire and Emergency Ser-vices, Department of Human Services, Office of Tax and Revenue, Department of Parks and Recreation, Depart-ment of Motor Vehicles and the University of the District of Columbia).
Funding and ResourcesIn FY 2010, the spending for services to seniors under DCOA amounted to $27.7 million, which was comprised of $17.3 million in District funds, $2.6 million in In-tra-District funds, and $7.8 million in federal funds. FY 2011, the spending for services to seniors under DCOA amounted to $26.0 million, comprised of $16.6 million in District funds, $1.9 million in Intra-District funds, and $7.5 million in federal funds. By 2012, spending for ser-vices amounted to $26.4, which included $17.2 million in District funds, $1.8 million in Intra-District funds and $7 .4 million in federal funds (Figure 7 .3) .
Agency ChallengesThe federal cuts in spending due to sequestration pose a great risk to the District’s economic and fiscal outlook, and could negatively impact funding for DCOA programs and services. In addition, there is a growing need for basic necessities of life such as food, healthcare, transportation and affordable housing for seniors, persons living with
Figure 7.2. Persons 60 Years and Older by Actual and Projected Counts
Sources: Metropolitan Washington Council of Government Popu-lation Forecasts for Traffic Analysis Round 8.2, 35 Year Population forecasts at the traffic analysis zone (TAZ) level for the District of Columbia. Interim State Projections of Population for Five Year Age Groups and Selected Age Group: July 1, 2004 to 2030. US Census Bureau, Population Division, Interim State Population Pro-jections, 2005
Figure 7.3. DCOA Spending by Funding Source 2010-2012
Source: Office on Aging Budget, 2013

• District of Columbia • Indices 2013 •184
disabilities and caregivers in the District of Columbia.
A very significant change in the senior population is rap-idly approaching and will have a considerable impact on the ability of local and federal government agencies to provide services. In the District of Columbia, there is ex-pected to be a sharper contrast between younger seniors, primarily baby boomers, who will have more education, more income in their work lives and larger pensions in their retirement as compared with older seniors (85+) who typically have less education and less income . Based on projected population growth, it is possible to have an entirely different set of needs identified for DCOA’s cus-tomers in the next two decades as the number of baby boomers increases the pool of seniors, persons living with disabilities, and caregivers.
Accomplishments and GoalsIn FY 2011 and FY 2012, DCOA’s accomplishments in-cluded:
y The consolidation of the DCOA Headquarters and ADRC was the biggest accomplishment of the year. DCOA services needed to be centralized and this objective was realized. In addition, the agency saved an estimated $112,398 annually in rent pay-ment for the ADRC location.
y DCOA worked with the Department of Real Estate Services (DRES) to transition the District’s nursing home management contracts to long-term ground leases for the Washington Center for Aging Services and the JB Johnson Nursing Facility. For twenty years, the contracts presented a huge liability for the city and currently the facilities generate $2 million dollars of revenue annually and millions in savings from renovations and repairs .
y The Office on Aging administered the Senior Needs Assessment to better understand the needs of seniors in the District. This assessment helped the agency to recognize the needs of older adults, the current service delivery model and the gaps between the existing and necessary services. The results of the assessment shaped the development of Mayor Vin-cent Gray’s New Community Living 5-Year Stra-tegic Plan, providing a comprehensive framework for the agency to address various issues impacting the city seniors, persons living with disabilities, and their caregivers. The plan defines an overarching purpose and goals that will guide future work .
y The Office on Aging submitted and gained approval
from the U.S. Administration on Aging for a new State Plan on Aging for Fiscal Years 2013-2015. The Plan outlines five goals and accompanying strategies to address the city’s vision for moderniz-ing the delivery of aging services .
DCOA strategic goals mirror those established by the U.S. Administration on Aging in its Strategic Action Plan for 2007-2013. The shared goals are listed below:
y Make it easier for older adults to access an integrat-ed array of health, social supports and long-term care options .
y Promote home and community-based support ser-vices for older adults and caregivers .
y Empower older people to stay active and healthy through Older Americans Act services and the new prevention benefits under Medicare.
y Ensure the rights of older people and prevent their abuse, neglect and exploitation.
y Maintain effective and responsive management .
Through these goals, objectives, strategies and out-comes, DCOA and its Senior Service Network are mov-ing towards a truly integrated system and is committed to meeting the new and existing demands of the senior population, including baby boomers, and keeping them in the communities that they know and love with the proper supports for as long as possible.
office of DiSability rigHtS
MissionThe mission of the Office of Disability Rights (ODR) is to ensure that every program, service, benefit, and activity operated or funded by the District of Columbia is fully accessible to, and usable by, people with disabilities.
Programs and ServicesODR is responsible for oversight of the District’s obliga-tions under the Americans with Disabilities Act (ADA) as well as other federal and local disability rights laws.
ODR provides technical assistance, training, informal dispute resolution, policy guidance, and expertise on dis-ability rights issues to District agencies and the disability community .
ODR coordinates the ADA compliance efforts of all Dis-
trict agencies to ensure that the District is responsive to the needs of consumers, residents and employees with disabilities.
y Informal resolution of discrimination complaints y Support District Government agencies to ensure
ADA compliance y Centralized Sign Language Interpretation Program y Braille Translation Services y Olmstead (community integration) planning y Policy and budget recommendations to enhance
District Government accessibility y Training and technical assistance for District agen-
cies, consumer and residents y Support the DC Commission on Persons with Dis-
abilities. Mayoral appointed body that advises the Mayor on issues of relevance to the disability com-munity
y Other Local and Federal Civil Rights Laws; Fair Housing Act, Section 508 and more
The ADA is a civil rights law that protects people with different types of disabilities from discrimination in all aspects of social life. Title II of the ADA requires that all programs offered through the District of Columbia must be accessible to and usable by people with disabilities.
The ADA protects individuals with various kinds of dis-abilities. To be protected, a person must have a physical or mental impairment that substantially limits a major life activity. The person must also be qualified to participate in the job, program, or activity at issue.
The most notable rights under the ADA are… y No Exclusion y Communications Access y Programmatic Access y Architectural Access y Employment
To request training or file a disability rights complaint go to http://odr .dc .gov/ or call 202-724-5055 .

• Indices 2013 • District of Columbia • 185
DiSabilty ServiceSThe mission of the Department on Disability Services (DDS) is to provide innovative high quality services that enable people with disabilities to lead meaningful and productive lives as vital members of their families, schools, workplaces and communities in every neighbor-
hood in the District of Columbia. DDS is composed of two Administrations that oversee and coordinate services for people with disabilities through a network of private and non-profit providers.
Developmental Disabilities Administration The Developmental Disabilities Administration (DDA) ensures that people with intellectual and developmental disabilities receive the services and supports they need to lead self-determined and valued lives in the community . These services include needs assessment and evaluation, care coordination, transportation planning, community living services, quality assurance reviews, medical con-sultation and training, health monitoring and employment assistance . Recent initiatives aim to ensure the success-ful transition of Home and Community based Services (HCBS) waiver eligible persons with developmental dis-abilities, to community based settings. The data provided demonstrate the move from more restrictive living situa-tions such as intermediate care facilities to less restrictive settings . (Figures 7 .4 and 7 .5)
Rehabilitation Services AdministrationThe Rehabilitation Services Administration (RSA) focus-es on employment and independent living related services,
ensuring people with disabilities achieve a greater quality of life by obtaining and sustaining employment consis-tent with their capability and informed choice, economic self-sufficiency and independence within their communi-ties. RSA achieves this through offering an array of in-dividualized services which include but are not limited to the following: counseling and guidance, employment and placement services, post-secondary education, voca-tional training, mental and physical restoration, assistive technology services, follow-up and inclusive business en-terprises and supports for the DC Center for Independent Living. Recent initiatives include increasing the number of persons with disabilities who receive the supports nec-essary to obtain and maintain living wage employment in integrated settings as well as expanding the opportunities available for youth with disabilities by ensuring that they have Individualized Plans for Employment in place prior to graduation . (Figures 7 .6 and 7 .7)
Figure 7.7. Average Hourly Wage for Individuals who achieve Competitive Employment through RSA
Source: Department on Disability Services
Figure 7.6. Individuals in Supported Employment
Source: Department on Disability Services
Figure 7.4. Developmental Disabilities Administra-tion Facility Mix
Source: Department on Disability Services
Figure 7.5. Age and Sex of Individuals who Received DDA Services
Source: Department on Disability Services

• District of Columbia • Indices 2013 •186
cHilD anD family ServiceS agency
Mission and FunctionsIn the District of Columbia, the Child and Family Services Agency (CFSA) is the public child welfare agency with the legal authority and responsibility to protect child vic-tims, and those at risk, of abuse and neglect. Like public child welfare agencies across the nation, CFSA protects children through four core functions .
Take and Investigate ReportsCFSA Child Protective Services (CPS) is the gateway to the local public child protection system. CPS takes reports of known or suspected abuse and neglect of youngsters up to age 18 in the District 24 hours a day 365 days a year at 202-671-SAFE. When a report indicates a child has allegedly suffered abuse or neglect as defined in law at the hands of parents, guardians, or others acting in a parental capacity, CPS gets involved. (The Metropolitan Police Department investigates allegations of child abuse/neglect in the schools .)
Allegations of serious physical or sexual abuse get a full-blown investigation to determine whether they are true and if so, to identify the maltreated. However, the major-ity of reports are about child neglect. In instances where the risk to children is low, CFSA responds with a non-ad-versarial assessment that identifies family needs. When families agree to accept help, we connect them with oth-er public or community-based services, safely diverting them from entering the child welfare system .
Strengthen FamiliesChild welfare is unique in that serving our primary cli-ents—children—means helping their parents or caretakers . When CFSA identifies child victims of abuse or neglect, trained social workers from CFSA or private agencies un-der contract to CFSA step in to keep children safe by work-ing with their families . We connect families to services that will help them overcome long-standing difficulties that endanger their children. About 60% of our cases involve social workers monitoring the safety and wellbeing of chil-dren in their homes. People interested in becoming foster or adoptive parents should call 202-671-LOVE .
Provide Safe, Temporary Homes for ChildrenWhen a child’s home presents too much danger, CFSA has
the authority to remove him/her to a safe setting . We must then gain agreement with our decision from the Family Court of the Superior Court of the District of Columbia. Our first choice is to keep families together by identify-ing a relative who will take the child and providing any support the relative needs. CFSA also recruits, trains, and licenses foster parents and also licenses, monitors, and maintains contracts with group homes (and other safe places) for children .
Children develop best within the bonds of a family. For that reason, removal of children from home is temporary. The goal is to help parents resolve crises and overcome difficulties so children can go home safely. However, when parents are unwilling or unable to protect their chil-dren, CFSA and Family Court must seek other permanent homes for them .
Ensure Children Have Permanent HomesEveryone needs a family. CFSA recruits and trains people willing to adopt . Most local youngsters hoping to leave the child welfare system for an adoptive home are age 10 or older. Some want to be adopted with their brothers and sisters. People who adopt children from the public system are eligible for financial and other support. Legal guard-ianship is an alternative to adoption for relatives (or oth-ers) who want to provide a permanent home for children without legally terminating parental rights .
In addition to these standard child welfare functions, Dis-trict child welfare has some distinguishing features .
y Both state-level and local child welfare functions are within CFSA.
y District child welfare is partially privatized, with private agencies under contract to CFSA managing about 60% of the caseload.
y Federal Court oversight continues as a result of the LaShawn lawsuit filed in 1989, with Children’s Rights as plaintiff .
y Long-standing local statutes allow youth to remain in the system to age 21, if necessary (in contrast to age 18 in most states) .
y More than half (52%) of the current foster care pop-ulation is composed of youth age 13 or older .
y As with all social services agencies in the city, CFSA faces challenges associated with one of the highest percentages of children living in poverty—approximately 30% compared to 22% nationally.
Strategic AgendaWhile the District has diligently reformed child welfare for more than a decade, recent events have dramatical-ly accelerated progress. Under new leadership in 2012, CFSA and the local child-serving community developed and rallied around a strategic agenda known as the Four Pillars. It is a bold offensive to improve outcomes for children, youth, and families involved with District child welfare . Each pillar represents an area ripe for improve-ment and features a values-based foundation, set of ev-idence-based strategies, and series of specific outcome targets .
y Narrow the Front Door: Children have the opportunity to grow up with their families . We remove children from their families only when necessary to keep them safe .
y Temporary Safe Haven: Foster care is temporary. We start planning for a safe exit back to a permanent home from the moment a child enters care .
y Well Being: Every child is entitled to a nurturing environment that supports healthy growth and de-velopment, good physical and mental health, and academic achievement. Although the government can never be the optimal “parent,” we take good care of children while they are in the system .
y Exit to Permanence: Every child and youth leaves foster care as quickly as possible for a safe, well-sup-

• Indices 2013 • District of Columbia • 187
ported family environment or life-long connection . Older youth have the skills for successful adulthood .
A scorecard that tracks quarterly progress in achieving specific outcomes under the Four Pillars agenda is on the CFSA website at http://cfsa .dc .gov/ .
Demand for ServiceChild and youth victims and those at risk, of abuse and neglect come to CFSA attention via calls to the District’s 24-hour hotline at 202-671-SAFE. Under District law, nu-merous child-serving professionals designated as “man-dated reporters” must call whenever they know or sus-pect that a child or youth age 18 or younger is suffering maltreatment . Calls also come to the hotline from family
members, neighbors, and other concerned citizens.
Over the last three years, calls to the hotline increased (Figure 7.8). One reason is that District law requires schools to report chronic truancy of children ages 5 to 13 to CFSA. As schools ramp up their compliance with
this law, CFSA is receiving a rising volume of reports of educational neglect. At the same time, the total number of children and youth CFSA serves continued the steady decline that has been underway for a decade (Table 7.8). This reflects a national trend.
Table 7.8. Key Indicators of Demand for Services
Fiscal YearNew Investigations of Child Abuse/Neglect
Substantiations of Child Abuse/Neglect
Children Entering Foster Care
Total Children Served (Point in time: Last day of fiscal year)
FY2010 6,203 1,678 802 4,301FY2011 6,653 1,498 604 3,753FY2012 7,303 1,355 509 3,632Source: DC Child and Family Services Agency
Figure 7.12. Age of DC Children/Youth in Foster Care
Source: DC Child and Family Services Agency
Figure 7.10. Home Ward of DC Children/Youth in Foster Care
Source: DC Child and Family Services Agency
Figure 7.11. Gender of DC Children/Youth in Foster Care
Source: DC Child and Family Services Agency
Figure 7.8. Hotline Calls
Source: DC Child and Family Services Agency
Figure 7.9. DC Child Welfare Population Trend
Source: DC Child and Family Services Agency

• District of Columbia • Indices 2013 •188
Child Welfare Population TrendCFSA monitors children at home with their families (in-home cases) as well as children in foster care (out-of-home cases). In FY12, the number of in-home cases surpassed out-of-home (Figure 7.9). This is an early indication of success in pursuing the agency strategic agenda to “nar-row the front door” safely. Whenever possible, children should grow up with their families. CFSA removes them only when they truly cannot be safe at home.
Demographics of Children and Youth in Foster CareThe majority of District children and youth entering foster care come from Wards 7 and 8 (Figure 7.10). The foster care population is about evenly divided between males and females (Figure 7.11), and more than half the case-load is composed of youth age 13 or older (Figure 7 .12) .
Exits from Foster CareFor many years, exits from foster care have exceeded en-tries. In FY12, 508 children and youth came into care and 767 left, for a ratio of 1:1.5. The outcome CFSA strives to achieve for every child or youth in care is an exit to a safe, nurturing, permanent home as quickly as possible. This can mean returning to parents (reunification), gaining a legal guardian (often a relative), or becoming part of new forever family via adoption (Figure 7 .13) .
Department of HealtH
About the DC Department of Health The Mission of the Department of Health is to promote and protect the health, safety and quality of life of resi-dents, visitors and those doing business in the District of Columbia. Our responsibilities include identifying health risks; educating the public; preventing and controlling diseases, injuries and exposure to environmental hazards; promoting effective community collaborations; and opti-mizing equitable access to community resources.
The Department of Health is organized into six administra-tions and offices indicated in the organization structure below.
Administrations y The Addiction Prevention and Recovery Adminis-
tration (APRA) promotes access to substance abuse prevention, treatment and recovery support services. Prevention services include preventing the onset of alcohol, tobacco, and other drug use by children and youth, reducing the progression of risk and increas-ing protective factors that increase the likelihood of healthy, drug-free youth and their families. Treat-ment services include assessment and referrals for appropriate levels of care and maintenance of a com-prehensive continuum of substance abuse treatment
services including outpatient, intensive outpatient, residential, detoxification and stabilization, and med-ication assisted therapy . Recovery support services include wrap-around services such as mentoring services, education skills building and job readiness training, to ensure a full continuum of care. APRA ensures the quality of these services through its reg-ulation and certification authority as the Single State Authority for substance abuse treatment services.
y The Center for Policy, Planning, and Evaluation (CPPE) Administration’s mission is to assess health issues, risks and outcomes through data collection, surveillance, analysis, research and evaluation; per-form state health planning functions; and to assist programs in the design of strategies, interventions and policies to prevent or reduce disease, injury and disability in the District of Columbia. Services in-clude birth and death certificates; Certificate of Need; Behavioral Risk Factor Surveillance (BRFSS) data; Occupational injuries, illnesses, and death statistics.
y The mission of the Community Health Administra-tion (CHA) is to improve health outcomes for tar-geted populations by promoting coordination within the health care system, by enhancing access to pre-vention, medical care and support services, and by fostering public participation in the design and im-plementation of programs for District of Columbia women, infants, children (including children with special health care needs) and other family members. The mission is also to provide chronic and communi-
Figure 7.13. Exits to Positive Permanence of DC Children/Youth in Foster Care
Source: DC Child and Family Services Agency

• Indices 2013 • District of Columbia • 189
cable disease prevention and control services, com-munity-based forums and grants, expert medical ad-vice, health assessment reports, and pharmaceutical procurement and distribution, disease investigations and disease control services to District residents, workers and visitors so that their health status is im-proved .
y The Health Emergency Preparedness and Response Administration (HEPRA) provides accurate and timely information about the prevention and control of biological threats to the residents of the District of Columbia. HEPRA is responsible for the prepared-ness of the city, which includes Bioterrorism resourc-es, children and disease, Homeland Security Adviso-ry Systems; resources for health care, for example, disaster preparedness providers and biological and chemical agents; and emerging infectious diseases like pandemic influenza.
y The HIV/AIDS, Hepatitis, STD and TB Adminis-tration (HAHSTA) is the core District government agency to prevent HIV/AIDS, STDs, Tuberculosis
and Hepatitis, reduce transmission of the diseases and provide care and treatment to persons with the diseases. HAHSTA partners with health and commu-nity-based organizations to offer testing and coun-seling, prevention education and intervention, free condoms, medical support, free medication and in-surance, housing, nutrition, personal care, emergen-cy services, and direct services at its STD and TB Clinics and more for residents of the District and the metropolitan region. HAHSTA administers the Dis-trict’s budget for HIV/AIDS, STD, Tuberculosis, and Hepatitis programs, provides grants to service pro-viders, monitors programs, and tracks the incidence of HIV, AIDS, STDs, Tuberculosis and Hepatitis in the District of Columbia.
y The mission of the Health Regulation and Licensing Administration (HRLA) is to administer all District and Federal laws and regulations governing the li-censing, certification and registration of Health Pro-fessionals, Health Care Facilities, Food, Drug, Ra-diation and Community Hygiene Services. HRLA
enforces all District and federal laws and regulations which govern licensure and regulations which pro-tect the health, safety and environment District res-idents. Programs include: the Office of Compliance and Quality Assurance; Office of Health Professional Licensing Boards: Division of Medical Boards, Di-vision of Nursing Boards, Division of Allied Health Board, Division of Pharmacy Boards; The Office of Health Care Facilities; Office of Food, Drug, Radia-tion and Community Hygiene: Division of Food, Di-vision of Drug, Division of Radiation, The Division of Community Hygiene and The Branch of Animal Disease Control .
Community Health Administration
Children’s National Medical Center School Health Nursing ProgramChildren’s School Services, Health Suite Visits, School Year (SY) 2010 – 2011
Table 7.9. Children’s School Services, Utilization data for all nursing suites, broken down by school, SY 2010-2011, Total–All Schools
Sep-10 Oct-10 Nov-10 Dec-10 Jan-11 Feb-11 Mar-11 Apr-11 May-11 Jun-11Summer
2011YTD Total
Student Encounters DCPS 27,145 14,048 17,837 11,063 15,189 16,588 23,117 14,434 22,123 10,796 9,437 181,777Student Encounters PCS 6,321 4,529 6,009 3,603 5,330 6,178 8,334 5,697 7,150 2,781 2,264 58,196Total Student Encounters 33,466 18,577 23,846 14,666 20,519 22,766 31,451 20,131 29,273 13,577 11,701 239,973Source: DC Department of Health, Community Health Administration
Table 7.10. Public School Enrollment by Ward SY 2010-2011
Sep-10 Oct-10 Nov-10 Dec-10 Jan-11 Feb-11 Mar-11 Apr-11 May-11 Jun-11Summer
2011YTD Total
Ward 1 2,990 1,844 2,179 1,323 1,666 1,869 2,238 1,431 2,301 1,083 1,135 20,059Ward 2 2,324 785 1,124 712 960 1,094 1,391 904 1,257 687 438 11,676Ward 3 3,524 1,668 1,907 1,303 1,921 1,928 2,619 1,688 2,577 1,471 663 21,269Ward 4 3,630 1,969 2,646 1,640 2,208 2,347 3,306 2,030 3,218 1,638 1,211 25,843Ward 5 4,929 2,726 3,240 2,024 2,601 2,842 4,106 2,515 3,712 1,889 1,427 32,011Ward 6 2,904 1,614 1,808 1,126 1,581 1,753 2,373 1,487 2,036 1,128 1,532 19,342Ward 7 2,362 1,243 1,753 1,175 1,566 1,868 2,797 1,766 2,879 1,188 1,454 20,051Ward 8 4,482 2,199 3,180 1,760 2,686 2,887 4,287 2,613 4,143 1,712 1,577 31,526Elementary Schools 3,314 2,741 3,428 1,888 2,865 3,110 4,067 2,606 3,532 1,714 1,072 30,337Secondary Schools 3,007 1,788 2,581 1,715 2,465 3,068 4,267 3,091 3,618 1,067 1,192 27,859Source: DC Department of Health, Community Health Administration

• District of Columbia • Indices 2013 •190
The Children’s School Health Nursing Program is respon-sible for the collection and submission of student health related data and statistics on a monthly and annual basis. This annual report has been compiled inclusive of infor-mation collected under the management and supervision of the Children’s School Services leadership team. In FY10, Health Masters, a school-based electronic health records (EHR) system was implemented in DC public and
public charter schools that participate in the DOH School Nursing Program .
School nurses promote a healthy school environment and provide for the physical and emotional safety of the school community . School nurses are trained to assist stu-dents with asthma or other allergies. DC Public Schools collaborate with the Department of Health/Community
Health Administration and Children’s National Medical Center to ensure that each DCPS school has nursing cov-erage during the school year and during the summer if
Table 7.11. Type of Services broken down by School Year Period (School Year 2010-2011)
Nurse Services Sept 10 Oct 10 Nov 10 Dec 10 TotalCatheterization 187 129 139 95 550Diabetes Care 662 519 541 352 2,074Gastrostomy: Tube Feeding 104 62 48 45 259Medication Administration (Doses) 1,378 1,384 1,754 1,301 5,817
Ostomy Care 127 91 117 97 432Tracheostomy: Suctioning 26 14 36 14 90Total 2,484 2,199 2,635 1,904 9,222Source: DC Department of Health, Community Health Administration
Table 7.13. Number of Health Education Sessions Attendees broken down by School Year Period (School Year 2010-2011)
Subject/Topic Sep-10 Oct-10 Nov-10 Dec-10 Jan-11 Feb-11 Mar-11 Apr-11 May-11 Jun-11 TotalAbuse Prevention 643 294 1,199 960 792 1,508 1,284 694 967 1,079 9,420Asthma/Respiratory 1 0 27 0 28 1 255 42 176 6 536Career Choices 170 0 142 0 30 0 85 0 47 15 489Dental Care 103 163 231 497 981 1,198 1,272 87 1,850 641 7,023Health Maintenance 215 109 432 281 587 571 676 177 1,958 109 5,115HIV / STD Education/Family Planning 463 95 513 1,157 574 1,321 492 154 370 24 5,163Human Anatomy 0 82 105 252 15 70 0 98 106 0 728Human Growth and Development 3 123 100 263 509 103 207 147 735 155 2,345Hygiene 897 523 560 292 937 919 446 434 597 75 5,680Nutrition 623 385 729 189 676 570 546 856 351 158 5,083Personal Choices/Decision Making 134 0 138 57 187 30 0 42 0 91 679Pre/Post Natal Care 15 75 44 9 0 104 37 17 12 15 328Safety 168 441 118 180 70 413 212 94 426 250 2,372Substance Abuse Prevention Education (SAPE) 0 172 101 76 300 701 620 908 1,295 654 4,827
Total - All Education Session Attendees 3,435 2,462 4,439 4,213 5,686 7,509 6,132 3,750 8,890 3,272 49,788Source: DC Department of Health, Community Health Administration
Table 7.12. FY2011 Nursing Services by Type
Nursing Services TotalsCatheterization 16,308Diabetes Care 60,809Gastrostomy: Tube Feeding 3,280Medication Administration (Doses) 5,037Ostomy Care 1,954Tracheostomy: Suctioning 31,478Total 134,226*Note: Children’s School Services (CSS) data collection method changed over the last two school years due to both DCPS and char-ter school nurses are now using the electronic health record (Health Office). Last SY 2010-2011 CSS utilized 2 data systems and data from both were merged into one report. As such, CSS was limited to the field data fields that could be reported because the two systems were not congruent.
Source: DC Department of Health, Community Health Administration

• Indices 2013 • District of Columbia • 191
DCPS summer school is in operation at the school site . (Tables 7.9-13)
Immunization ServicesThe Immunization Program is located in the Department of Health’s Community Health Administration (CHA). The Immunization Program was established to prevent and control vaccine-preventable diseases among District residents. The Immunization Program provides free im-munization services to all medically uninsured and un-der-insured residents of the District. The mission of the program is to reduce and eliminate morbidity and mor-tality due to vaccine-preventable diseases in the District of Columbia. The goal of the program is to improve and maintain high immunization levels in children and adults, with particular emphasis on children less than two years of age .
Vaccines also provide great cost benefits by decreasing the economic impact associated with vaccine-preventable diseases, such as costs related to doctor’s visits, hospital-izations, parent’s loss of time from work and premature deaths. Since 1979, the District of Columbia has required children attending school and daycare to be fully immu-nized . Vaccination rates for children 19-35 months old
have increased dramatically since 2003 (Table 7.14).
WIC, Special Supplemental Nutrition Program for Women, Infants and ChildrenWIC provides nutrition education and counseling, breast-feeding promotion and support, medical and social ser-vices referrals, and nutritious food. WIC food packages are designed to meet the nutritional needs of pregnant women, breastfeeding mothers, infants, and young chil-dren . WIC is a gateway to health care and social services . WIC promotes physical activities and plays an important role in achieving the national goals of improving mater-nal and child health, reducing infant mortality, ending childhood hunger by 2015, improving breastfeeding rates, reducing child abuse, and reducing obesity and chronic diseases .
To qualify for WIC, applicants must meet residential, categorical, income, and nutrition risk eligibility require-ments to qualify for the program. Requirements include:
y Women to be pregnant or breastfeeding, a new mother, an infant, or a child up to age 5;
y Live in the District of Columbia (US Citizenship is not required);
y Have a nutritional or medical risk (determined by a
health professional); and y Fall within 185% of the Federal poverty guideline,
or participate in Medicaid, DC Healthy Families, School Lunch Program, Temporary Assistance for Needy Families (TANF), or the Supplemental Nu-trition Assistance program (SNAP).
A number of studies have found that WIC participation during pregnancy is associated with improved birth out-comes and reductions in maternal and newborn health care costs after birth. In contrast to the large body of lit-erature examining the effects of WIC participation during pregnancy, fewer studies have focused on the effects of WIC participation on children . By far the most common birth outcome examined in the literature is newborn birth weight, and most studies find a significant effect of prena-tal WIC participation on birth weight.
The mission of the Special Supplemental Nutrition Pro-gram for Women, Infants and Children (WIC), which is funded and administered by the United States Department of Agriculture, is to improve the lifelong health and nutri-tion of pregnant women, new mothers (breastfeeding and non-breastfeeding), infants and children up to age 5 who are at nutritional risk by providing individualized nutri-tion education, breastfeeding promotion and support, tai-
Table 7.14. Immunization Compliance Levels in DC Using the Immunization Registry: Includes Routine, Catch-up, and Exemptions
Licensed Child Development Centers Head Start Centers Public Schools
Non-Public Schools (Assessments start at the Beginning of the SY August through June)
Private Charter Parochial2003 63.11% 59.35% 84.44% 79.58% 74.68% 55.81%2004 67.33% 66.66% 90.88% 79.50% 84.76% 59.81%2005 69.60% 74.78% 95.05% 84.10% 90.94% 74.70%2006 71.73% 83.03% 96.32% 83.71% 91.32% 78.68%2007 74.27% 81.42% 97.32% 85.04% 94.47% 78.67%2008 93.03% 97.15% 97.94% 88.62% 96.25% 78.25%2009 91.02% 91.75% 98.21% 88.77% 95.55% 79.74%2010 90.84% (Dec 2010) 90.71% (June 2010) 89.97% 67.43% 83.11% 50.03%2011 91.97% (Dec 2011) 89.06% (6/30/2011) 92.85% (6/30/2011) 79.39% (6/30/2011) 89.36% (6/30/2011) 67.14% (6/30/2011)2012 91.64% (Dec. 2012) 91.09% (6/27/2012) 92.91% (6/28/2012) 80.65% (6/27/2012) 87.25% (6/28/2012) 73.23% (6/27/2012) *1997-2008: Preschool - 4 DTP, 3 Polio, 1 MMR, 3 Hib, 3 Hep B, 1 Varicella; School-Age - 5 DTaP, 4 Polio, 2 MMR, 3 Hep B, 2 Varicella, 1 10-year Td2009-2012: Preschool - 4 DTP, 3 Polio, 1 MMR, 3 Hib, 3 Hep B, 1 Varicella, 4 Pneumococcal Conjugate, 2 Hepatitis A.; School-Age - 5 DTaP, 4 Polio, 2 MMR, 3 Hep B, 2 Varicella, 1 Tdap, 1 Meningococcal, and HPV for girls entering the 6th grade
Source: DC Department of Health, Community Health Administration, Bureau of Child, Adolescent & School Health

• District of Columbia • Indices 2013 •192
lored nutrient-rich supplemental food packages that sup-ply adequate levels of nutrients essential to prenatal and infant health, proper growth and development, and social service referrals and immunization screening for children less than two years of age . Comprehensive revisions to the WIC food packages, including adding fresh produce, were implemented by October 1, 2009.
Research shows that participation in the WIC program saves from $1 .77 to $3 .13 in health care costs for every infant within the first 60 days after birth and is responsible for the following improved health outcomes: improved birth outcomes, improved diet and diet-related outcomes, improved feeding practices, improved cognitive devel-opment, improved rates of childhood immunization due to having a regular source of medical care and improved preconception nutrition for women .
DC WIC served approximately 19,029 customers month-ly at 20 clinics and four mobile unit sites in 2012 (Table 7 .15) .
Supplemental Nutrition Assistance Program-Education (SNAP-Ed)The mission of the Supplemental Nutrition Assistance Program: Nutrition Education and Obesity Prevention Grant Program (SNAP-Ed) is to provide nutrition educa-tion to residents of the District of Columbia that will help them make healthy food choices that are consistent with the Dietary Guidelines for Americans and My Pyramid and My Plate. The program is funded and administered by the United States Department of Agriculture.
Services
SNAP-Ed provides services where at least 50% of popu-lations have gross incomes at or below 185% of poverty. Our services include interactive nutrition education class-es, food/cooking demonstrations, and information booths at health fairs and farmers’ markets. Our nutrition educa-tion topics include:
y Understanding the My Pyramid/My Plate y Benefits of Physical Activity y Obesity Prevention and Reduction y Reading and Understanding Food Labels y Meal planning and budgeting
SNAP-Ed Partners
Our DC partners include DC Public Schools, Public Char-tered Schools, Day Care Centers, Senior Centers, Cove-nant House, Recreation Centers, churches and many other community outreach programs. They organize and pro-mote SNAP-Ed activities within the community.
DC SNAP-Ed data collection started in 2004. The Uni-versity of District of Columbia (UDC) and later, Capital Area Food Bank (CAFB) became sub-contractors. Tables 7.16-19 include both direct and indirect (e.g. health fairs) contacts .
SNAP-Ed Participants - Each individual counts as one participant, regardless of the number of times he or she has participated in direct education activities .
A “SNAP-Ed contact” is defined as an interaction in which a SNAP-Ed participant participates in a direct edu-cation activity. Each SNAP-Ed participant may have one or more SNAP-Ed contacts.
Table 7.15. Average Monthly Enrollment of Women, Infants and ChildrenYear Women Infants Children Total2003 4,820 4,178 9,775 18,7732004 5,146 4,210 9,910 19,2662005 5,279 4,285 9,795 19,3592006 4,789 4,789 7,998 17,5762007 4,845 5,310 7,034 17,1892008 5,128 5,645 7,728 18,5012009 5,157 5,657 8,782 19,5962010 4,868 5,505 8,852 19,2252011 4,719 5,404 8,949 19,0722012 4,835 5,398 8,796 19,029Source: DC Department of Health, Community Health Administration
Table 7.16. Number of SNAP-Ed Contacts
Year Agency Total Monthly Average
2004 DOH 4,480 3732005 DOH+UDC 11,1132 9,2612006 DOH+UDC 136,570 11,3812007 DOH+UDC+CAFB 127,855 10,6552008 DOH+UDC+CAFB 161,952 13,496Source: DC Department of Health, Community Health Administration
Table 7.17. Number of SNAP-Ed Unduplicated partic-ipants
Year Agency Total Monthly Average
2009 DOH+UDC+CAFB 15,276 1,273Source: DC Department of Health, Community Health Administration
Table 7.18. Education and Administrative Reporting System (EARS) in FY 2010, Average Monthly number of SNAP-Ed participants (direct education)
Year
Less than 5 Years
5-17 Years
Grades K-12
18-59 Years
60 Years
or More
All Ages Com-bined
2010 292 478 1,032 525 2,3272011 205 481 899 555 21402012 2,614 228 145 224 3,211Source: DC Department of Health, Community Health Administration
Table 7.19. Education and Administrative Reporting System (EARS) in FY 2010, Average Monthly number of SNAP-Ed contacts (direct education)
Year
Less than 5 Years
5-17 Years
Grades K-12
18-59 Years
60 Years
or More
All Ages Com-bined
2010 3,337 4,297 11,380 4,642 23,6562011 2,458 3,423 9,745 4,846 20,4722012 27,964 912 145 400 29,421Source: DC Department of Health, Community Health Administration

• Indices 2013 • District of Columbia • 193
HIV/AIDS, Hepatitis, STD, & TB AdministrationMissionThe HIV/AIDS, Hepatitis, STD, and TB Administration (HAHSTA) within the District Department of Health holds primary responsibility for monitoring the occur-rence of the infections/diseases referenced in the name of the agency, as well as responsibility for the coordination and implementation of related evidence-based prevention and treatment strategies .
Guided by multiple national and local strategic, program planning, and policy documents, the primary goals for HAHSTA focus on:
y Reducing the number of new HIV, Hepatitis, STD, and TB infections in the District;
y Increasing access to care and treatment services; y Reducing health disparities and health inequities;
and y Achieving a more coordinated response to address
local needs .
The multifaceted approach implemented by HAHSTA to achieve the stated goals incorporates activities directed
toward increasing the efficacy within target populations to engage in preventive health behaviors, as well as in accessing needed testing, care, treatment, and ancillary support services. HAHSTA partners with a diverse range of clinical providers and community-based organizations throughout the District of Columbia metropolitan region to ensure that all segments of the population are reached through the programs and services funded by HAHSTA initiatives .
More information concerning the mission and goals for the HIV/AIDS, Hepatitis, STD, and TB Administration is outlined in the recent report, Ending the Epidemic: The District of Columbia HIV/AIDS Implementation Plan, available at http://doh .dc .gov/service/hivaids .
Organizational StructureAs represented by the red boxes in Figure 7.14, HAHS-TA is comprised of the following five programmatic and service divisions: STD &TB Control; Prevention and Intervention Services; Care, Housing, and Support Ser-vices; Partnerships, Capacity Building, and Community Outreach; and Strategic Information. The alignment of these Divisions under one administration is designed to promote integrated surveillance, programmatic, and pol-
icy activities across disease areas, maximizing the effec-tive coordination and utilization of resources in address-ing HIV, STD, Hepatitis, and TB related syndemics within the District .
Overview of HAHSTA Programs & ActivitiesAs the administrative body providing oversight for the District’s budget supporting HIV/AIDS, Hepatitis, STD, and TB related activities, HAHSTA manages a diverse portfolio of prevention, treatment, and care programs pri-marily implemented through strategic partnerships with community-based providers and organizations. Designed to address population needs identified through epidemi-ologic analysis, specialized studies and evaluations, and community input, funded programs include social market-ing; condom distribution; testing and counseling services; subsidized medical and prescription services; emergency care; housing; and other ancillary support services . In addition, HAHSTA also provides direct services through agency run clinics supporting STD screening and treat-ment and TB control. While some activities are disease specific, considerable effort has been directed toward integrating prevention and treatment strategies to better reflect the syndemic nature of the infections targeted by HAHSTA supported programs and services.
Social Marketing & Condom DistributionAs a primary prevention strategy, HAHSTA has directed substantial resources towards increasing awareness con-cerning effective methods for preventing HIV and other sexually transmitted infections, and promoting the accept-ability and accessibility of effective preventive measures. Social marketing campaigns such as “DC Takes on HIV”, “Join the Rubber Revolution”, and “DC’s Doin’ It” are based on multi-media approaches incorporating tradition-al advertising (e.g., print, radio, and television), social media (e.g., internet-based advertising, Facebook, and Twitter), and consumer/provider focused educational ma-terials (e.g., brochures, posters, and palm cards). Through this mix of marketing, communication, and educational mediums, HAHSTA is able to maximize the reach of HIV and STD prevention messaging within the general pop-ulation, as well as target sub-populations such as gay or bisexual men, older adults, and youth. Such campaigns also maximize population reach through the utilization of non-traditional advertising venues (e.g., bars, laundro-mats, and check cashing facilities), and through the devel-
Figure 7.14. HAHSTA Organizational Diagram
Source: HAHSTA

• District of Columbia • Indices 2013 •194
opment of materials in multiple languages .
While some of the social marketing campaigns support-ed by HAHSTA direct attention toward testing and treat-ment, the promotion of condom utilization is a common focus among the campaigns previously mentioned . Com-plimenting efforts to promote the use of male condoms, the HAHSTA social marketing campaign “DC’s Doin’ It” represents the first campaign ever developed and im-plemented to educate and promote use of the FC2 female condom .
In order to ensure that individuals have access to effec-tive methods for preventing HIV and STD infections, The Condom Distribution Program within HAHSTA supplies latex and non-latex male condoms, water-based lubricant, FC2 female condoms, and latex dental dams to over 530 community partners in the District for distribution at no costs to individuals. Additionally, individuals can order condoms directly from HAHSTA at no cost through the Department of Health website. The demand and distri-bution of condoms through this program has grown sub-stantially in recent years in part due to the expansion in the number of community partners, as well as increased outreach through social marketing campaigns .
Table 7.20. HAHSTA Condom Distribution Program, District of Columbia Fiscal Year 2009-2012
2009 2010 2011 2012Total Number of Condoms Distributed
3,219,446 3,955,940 5,186,340 5,747,000
Source: Partnerships, Capacity Building, and Community Outreach Division, HAHSTA
HIV Counseling, Testing, & ReferralIn order to increase the proportion of the population aware of their HIV status, HAHSTA has directed efforts towards expanding the provision of HIV testing in both clinical and non-clinical settings through educational, program-matic, and policy initiatives. Early diagnosis is not only important for optimizing health outcomes among infected individuals, but is also an essential component in disrupt-ing transmission .
The number of publicly supported HIV test conduct-ed in the District increased nearly 50% between fiscal
years 2009 and 2012 (Table 7.21). During this time peri-od, HAHSTA not only provided direct funding to multi-ple organizations to provide HIV counseling and testing services, but also distributed oral rapid HIV test kits to an expansive network of clinical and community-based providers in order to promote routine HIV testing. This network included multiple non-traditional testing sites in-cluding the District Department of Motor Vehicles and the District Department of Human Services . Supplementing this effort to expand accessibility to HIV testing services, HAHSTA also manages the “Ask for the Test” and the “We Offer the Test” campaigns designed to increase the demand for testing among consumers and the provision of testing services among providers .
Another cornerstone of the effort to increase the number of individuals receiving HIV testing services is the pro-motion of routine, opt-out HIV testing as a standard of care within clinical facilities through academic detailing and efforts to improve the sustainability of services by supporting the establishment of the needed mechanisms and structure for third party reimbursement of HIV testing services .
Table 7.21. HAHSTA Funded HIV Testing, District of Columbia Fiscal Year 2009-2012
2009 2010 2011 2012Total HIV Tests Com-pleted
92,748 110,358 122,356 138,317
Source: Prevention and Intervention Services Division, HAHSTA
Ryan White HIV/AIDS ProgramThe Care, Housing, and Support Services Division (CHSSD) within HAHSTA serves as the grantee for Ryan White Part A, Part B and HOPWA services in the eligi-ble metropolitan area (EMA). Programs within CHSSD include:
y Part A (Grants to Eligible Metropolitan Areas and Transitional Grant Areas) provides emer-gency assistance to Eligible Metropolitan Areas (EMAs) and Transitional Grant Areas (TGAs) that are most severely affected by the HIV/AIDS epi-demic. Part A funds are used for persons living with HIV/AIDS (PLWHA) who are uninsured, underin-sured, or underserved to ensure access to core med-ical and support health services that enhance access
to care; maintain clients in care, particularly prima-ry care services; and ensure continuity of care .
y Part B (Grants to States and Territories) provides a base grant to supplement core medical and sup-port services, the AIDS Drug Assistance Program (ADAP) award, ADAP supplemental grants, and grants to States for Emerging Communities .
y Minority AIDS Initiative (MAI) (Grants for dis-proportionally impacted communities) grants are provided to address the HIV/AIDS care needs of minority communities . In the DC metropolitan re-gion, MAI funds are provided to the grantees under Parts A and B to DC, MD, and VA. The District also receives MAI funds through Part D.
y AIDS Drug Assistance Program (ADAP) in the District provides access to HIV related medications for low-income individuals with infected with HIV who have limited or no coverage from private insur-ance or Medicaid .
y Housing Opportunities for Persons with AIDS (HOPWA) funding provides housing assistance and related supportive services. HOPWA funds are used for a wide range of housing, social services, pro-gram planning, and development costs.
CHSSD is committed to ensuring that all clients across the EMA are provided equal, accessible, and quality HIV medical, treatment, housing, and health-related services. Sub-grantee performance is systematically measured and monitored to assess the extent to which service providers achieve key health outcomes for HIV-positive patients, and used to make data-driven decisions to enhance ser-vices provided to HIV-infected individuals. Sub-grantee performance data are collected through several reports, including the Ryan White Services Report (RSR) and Quality Management Report .
The RSR contains client-level data that include informa-tion on demographic status, HIV clinical information, and core medical and support services delivered with Ryan White funds. The RSR data presented provide a demo-graphic profile of those utilizing Ryan White services in the District, including current age, gender, race, and risk factor/mode of transmission . Ryan White services are de-pendent on eligibility; therefore, it should not be expected that everyone living with HIV/AIDS in DC would be eli-gible for and/or receiving Ryan White services.
The number of clients utilizing Ryan White services var-ies year to year and is expected to continue to change due

• Indices 2013 • District of Columbia • 195
to Medicaid expansion and the implementation of the Af-fordable Care Act. Persons between 45-64 years of age ac-count for the most (54 percent) of those receiving services . Adolescents and young adults (ages 13–24) account for 6
percent of those receiving services (Table 7.22). The age distribution of those receiving services is similar to those living with HIV/AIDS in the District. Males comprise the majority of those utilizing Ryan White funded ser-
vices, accounting for 62% percent of all services in 2012. Transgender persons make up 3 percent of those receiv-ing services (Table 7.23). Blacks (includes African-born) account for 70 percent of those receiving services in the District (Table 7.24). Table 7.25 shows that heterosexual contact in the primary mode of transmission among those receiving Ryan White services, accounting for 22 percent of the service population. Additionally, MSM account for 17 percent of the service population .
The Quality Report is comprised of a portfolio of national-ly endorsed indicators. The measures are used to evaluate key aspects of care and support services that are optimally linked to better health outcomes. Data are used to doc-
Table 7.22. Age Breakdown for CARE Act Clients, 2010-2012
2010 2011 2012Age group Number % Number % Number %<2 22 0.3% 34 0.3% 86 0.9% 2 to 12 205 2.5% 292 2.4% 83 0.8%13 - 24 833 10.2% 1287 10.5% 576 5.9%25 - 44 3136 38.6% 4317 35.3% 3,459 35.3%45 - 64 3666 45.1% 5871 48.1% 5,277 53.8%65 & > 258 3.2% 412 3.4% 326 3.3%Unknown 10 0.1% 35 0.3% - 0.0%Total 8130 100% 12215 100% 9,807 100.0%Source: Ryan White Services Report
Table 7.23. Gender Breakdown for CARE Act Clients, 2010-2012
2010 2011 2012Number % Number % Number %
Male 5,086 63% 7,469 61% 6,042 62%Female 2,854 35% 4,496 37% 3,418 35%Transgender 142 2% 170 1% 339 3%Unknown/Unreported 48 1% 80 1% 8 0%
Source: Ryan White Services Report
Table 7.24. Race* Breakdown for CARE Act Clients, 2010-2012
2010 2011 2012Number % Number % Number %
White 907 11% 990 8% 620 6%Black 6949 85% 9871 81% 7077 70%Asian 34 0% 73 1% 1183 12%Nat Hawaiian / PI 23 0% 25 0% 274 3%American Indian / Alaska Native 38 0% 47 0% 226 2%
Unknown 179 2% 1209 10% 708 7%*Multiple races can be reported on the same individual.Source: Ryan White Services Report
Figure 7.15. Medical Visits*
*Percentage of clients with HIV infection who had two or more medical visits in an HIV care setting in the measurement year.
Source: Quality Management / DC Collaborative Data Reports
Figure 7.16. Viral Load Suppression*
*Percentage of patients, regardless of age, with a diagnosis of HIV/AIDS with viral load below limits of quantification (<200 copies/mL) at last test during the measurement year.
Source: Quality Management / DC Collaborative Data Reports

• District of Columbia • Indices 2013 •196
ument areas of strength, identify areas for improvement and help guide, shape, and enhance the delivery and qual-ity of care. The performance indicators include: medical visits, as a measure of linkage and retention to care, and viral load suppression, which is the ultimate goal of treat-ment. Additional indicators vital to measuring progress on quality improvement projects and adherence to U.S. Pub-lic Health Service Guidelines include PCP Prophylaxis prescription rates and Syphilis screening rates .
CHSSD is dedicated to building capacity to provide the highest level of care to all persons living with HIV in the District of Columbia. Quality Improvement projects
undertaken include an RPR Screening Project to test and treat for syphilis co-infection in HIV positive patients, and improving PCP Prophylaxis prescription rates in those with low CD4 T-cell counts infected with HIV.
Needle Exchange ProgramThe District Needle Exchange Program (NEX) targets reductions in the risks of HIV, hepatitis, and other infec-tions among injection drug users by reducing the circu-lation of contaminated syringes and drug paraphernalia . Implemented as an integrated service program model, the NEX program also provides access to a full range
of complimentary services such as HIV counseling and testing, HIV medical care linkages, hepatitis education and screening, HIV care and treatment, primary medical care services, residential and outpatient substance abuse treatment programs, methadone programs, mental health services, wound care services, overdose prevention, STD screening, and other social services. HAHSTA supported NEX programs offer a combination of fixed location and mobile outreach efforts. HAHSTA currently funds three needle exchange programs. Of the three programs, two provide mobile intervention services throughout Wards 1, 2, 4, 5, 6, 7, and 8 in the District. The remaining program operates as a stationary site in Ward 2 .
As indicated in Table 7.26, the number of used syringes collected through the NEX program has increased sub-stantially in recent years. Additionally, approximately 1,312 individuals were linked to HIV counseling, testing, and referral services during fiscal year 2012 through the District needle exchange program and 274 individuals were linked to substance abuse treatment services during the same time period .
Table 7.26. HAHSTA Needle Exchange Program, Dis-trict of Columbia Fiscal Year 2009-2012
2009 2010 2011 2012Number of Used Syring-es Collected from IDUs
279,707 302,997 341,879 549,464
Source: Prevention and Intervention Services Division, HAHSTA
Youth School-Based STD Screening ProgramThe District directs multiple efforts to support young peo-ple in developing awareness, skills, and behaviors that lead to a reduction in the risks for STDs and HIV through-out their lifetime. Activities to achieve this goal include: mainstreaming of STD/HIV information into youth ac-tivities; training all school nurses working in DC Public Schools (DCPS) to integrate routine STD and HIV pre-vention and screening; education for in-school and out-of-school youth to build skills that allow them to reduce their risks of infection; and expanding youth outreach and STD/HIV testing and treatment services.
The school-based STD health education and screening program is one of the strategies implemented by HAH-
Table 7.25. Risk Factor* Breakdown for CARE Act Clients, 2010-2012
2010 2011 2012Number % Number % Number %
MSM 667 8% 1,330 11% 1503 17%IDU 238 3% 390 3% 465 5%Hemophilia/Coag dis 6 0% 1 0% 17 0%Hetero contact 1,175 14% 2,111 17% 1936 22%Receipt of bld/bld prod 7 0% 22 0% 30 0%Perinatal 19 0% 297 2% 200 2%Other 49 1% 192 2% 437 5%Unknown/unreported 5,970 73% 7,781 64% 4169 48%Total 8,131 100% 12,124 100% 8,757 100%*Multiple factors can be reported on the same individual.Source: Ryan White Services Report
Figure 7.18. PCP Prophylaxis*
*Percentage of clients with HIV infection and a CD4 T-cell count below 200 cells/mm who were prescribed PCP prophylaxis.
Source: Quality Management / DC Collaborative Data Reports
Figure 7.17. Syphilis Screening*
*Percentage of adult clients with HIV infection who had a test for syphilis performed within the measurement.
Source: Quality Management / DC Collaborative Data Reports

• Indices 2013 • District of Columbia • 197
STA in conjunction with DCPS to enhance the accessi-bility of age-appropriate sexual health information and services for youth in the District. HAHSTA maintains a successful partnership with twenty-five DCPS and select public charter schools to provide voluntary school-based STD screening during the school year. HAHSTA also has a partnership with youth-serving community based organizations to offer STD screening at their locations and in outreach activities . In order to ensure appropri-ate follow-up after screening, HAHSTA utilizes routine text message reminders to alert students of the need to call in for test results; and for those infected, text mes-sage reminders are also used to encourage partner testing and re-screening . Infected students are offered multiple options for treatment and follow-up including in-school services; the HAHSTA-managed Southeast STD Clinic; or their personal medical provider with close follow-up by a Disease Intervention Specialist (DIS) .
During fiscal year 2012, 8,487 youth participated in the school-based STD health education and screening pro-gram. Of those students, 5,870 (69.2%) provided a urine specimen for STD testing (Table 7.27). Three hundred youth tested positive for chlamydia and/or gonorrhea, rep-resenting 5.1% of those screened. Approximately 91% of the students identified with an STD received appropriate treatment and counseling following testing .
Table 7.27. HAHSTA School-Based STD Screening Program, District of Columbia Fiscal Year 2009-2012
2009 2010 2011 2012Number of Youths, 15 to 19 years, Screened for STDs Through Outreach Pro-grams
5,265 4,319 4,274 5,870
Source: Prevention and Intervention Services Division, HAHSTA
Clinic-Based STD Services
The Southeast (SE) STD Clinic is the only publicly funded STD clinic in the District. Operating five days per week, the SE STD Clinic provides STD and HIV screening, physical exams, laboratory testing, treatment, follow-up, disease intervention counseling, and referral services. In addition, clinic staff participates in multiple educational
and screening outreach activities targeting high risk popu-lations and geographic areas within the District .
Over 95% of those testing positive for an STD at the SE STD Clinic receive appropriate treatment and follow-up services. For those testing positive for HIV, appropriate mechanisms are in place to ensure linkage to medical care .
Table 7.28. Southeast STD Clinic, District of Colum-bia Fiscal Year 2011, 2012
2011 2012Number of Individual Clients Receiving Services 8,473 9,332
Number of Positive Diagnoses:Chlamydia 1,401 1,089Gonorrhea 755 644Syphilis* 51 27HIV* 29 43
*New Diagnoses OnlySource: STD & TB Control Division, HAHSTA
Tuberculosis Control ProgramThrough the Tuberculosis (TB) Control Program, HAHS-TA provides the following prevention and control services for District residents:
y Screening, diagnosis, treatment, case management, and follow up of persons infected with or suspected of having TB;
y Contact investigations, including the evaluation and treatment of close contacts of TB cases;
y Screening and medical evaluation of individuals at high risk for TB infection and disease;
y Medical consultations, educational activities, and technical assistance for health care providers and others with an interest in TB prevention and control;
y Participation in TB Treatment Control Trials and Epidemiologic Studies sponsored by CDC;
y Training of nursing, medical and post-doctoral stu-dents and fellows in TB management; and
y Participation in national trainings such as grand round webinars on TB and contact investigation courses .
Health care providers and laboratories are required to report suspected cases of TB in District residents to the District Department of Health. All incoming reports are reviewed by TB Control Program staff. Reports with spu-
tum smears showing acid-fast bacilli on microscopic ex-amination are assigned immediately, as suspected cases of TB, and an investigation is initiated prior to diagnostic confirmation.
Table 7.29. TB Control Program, District of Colum-bia Fiscal Year 2011-2012
2011 2012Number of individuals receiv-ing one or more clinic services* 5,700 4,379
Number of Preliminary Investi-gations Concerning Suspected TB Cases
118 26
Identification & Investigation of Confirmed TB Cases 53 37
Number of TB Contact Inves-tigations 700 567
*Clinic services include tuberculin skin test, chest x-ray, medical evaluation and/or follow-up, and the dispens-ing of medicationSource: STD & TB Control Division, HAHSTA
Epidemiology of HIV/AIDS, Hepatitis, STDs, and TB in the DistrictKey points from available 2011 HIV/AIDS, hepatitis, STD, and TB surveillance data include:
y 15,056 residents of the District of Columbia or 2.4% of the population are living with HIV. An estimated prevalence of 2.4% exceeds the World Health Orga-nization definition of 1% as a generalized epidemic.
y Blacks, Hispanics, and whites with HIV exceed 1% of their respective populations, with blacks dispro-portionately impacted at 3.7%.
y Men who have sex with men (MSM) and heterosex-ual contact are the two leading transmission modes reported among newly diagnosed and identified HIV cases .
y The number of newly diagnosed HIV cases in the District decreased to 718 cases in 2011, a decline of 46% from 1,333 cases in 2007.
y There was an 80% decrease in the number of newly diagnosed HIV cases where reported mode of trans-mission was injection drug use. In 2007, prior to the scale up of DC‘s needle exchange program there were 149 cases compared to 30 in 2011 .
y The number of reports of newly diagnosed AIDS

• District of Columbia • Indices 2013 •198
cases decreased 47% from 682 in 2007 to 363 in 2011 .
y The number of deaths among persons with HIV de-creased by 41% from 425 in 2007 to 251 in 2011.
y There were reports of 6,584 new cases of chlamyd-ia, 2,572 new cases of gonorrhea, and 165 new cases of primary and secondary syphilis reported in 2011 .
y There were reports of 2,924 cases of hepatitis B and 13,520 cases of hepatitis C diagnosed between 2007 and 2011 .
y 55 new cases of TB were reported in 2011.
A detailed review of HIV/AIDS, hepatitis, STD, and TB trends and patterns within the District is provided in the Annual Epidemiology & Surveillance Report produced by HAHSTA, available at http://doh .dc .gov/service/hivaids .
Health Regulation and Licensing AdministrationMission StatementThe mission of the Health Regulation and Licensing Ad-ministration (HRLA) is to administer all District and Fed-eral laws and regulations governing the licensing, certi-fication and registration of Health Professionals, Health Care Facilities, Food, Drug, Radiation, and Community Hygiene Services. HRLA enforces all District and federal laws and regulations which govern licensure and regula-tions which protect the health, safety, and environment of District residents .
Program ActivitiesOffice of Compliance and Quality Assurance: The Office has regulatory oversight to ensure the health, safety, and welfare of our most vulnerable population within commu-nity residential facilities and nursing homes. The Office also investigates complaints against health professionals and issues summary suspension notices and subpoenas. The Office aggressively investigates and provides timely and thorough investigations of incidents (self-reported by individual facilities) and complaints (from the public or family) that are triaged through the Office.
Office of Health Professional Licensing Boards: The ob-jectives for the Office are to license and regulate health care professionals across 18 Boards and 35 licensee cate-gories. The Office issues approximately 6,000 new licens-
Table 7.25. Risk Factor* Breakdown for CARE Act Clients, 2010-2012
Board License Type FY2009 FY2010 FY2011 FY2012 FY2013*
Medicine
Medicine & Surgery 9,072 9,697 9,489 1,041 10,413Osteopathy & Surgery 144 180 177 216 219Physician Assistants 461 550 549 639 668
Anesthesiologist Assistants 19 23 24 31 34Acupuncturists 153 171 156 174 176
Naturopathic Physicians 16 24 23 28 32Surgical Assistants 30 55 58 62 62
Chiropractors 78 88 84 96 96Chiropractors – Ancillary
Procedures 43 59 56 66 67
Nursing
Registered Nurse 20,400 19,861 22,365 24,370 19,553Licensed Practical Nurse 3,113 3,842 4,163 3,334 3,405Certified Nurse Midwives 92 82 93 89 89Clinical Nurse Specialists 48 46 49 47 48
Nurse Practitioners 936 935 1,057 1,043 1,100Nurse Staffing Agencies 118 139 196 151 157
Registered Nurse Anesthesi-ologist 156 138 155 152 152
Trained Medication Employee 480 566 848 920 999
AudiologyAudiology 14 60 78 94 100
Speech Language Pathology 59 285 396 506 550Dance Ther-apy Dance Therapist 3 2 3 2 3
Dentistry
Dentists 1,360 1,342 1,546 1,266 1,303Dental Hygienists 555 538 635 499 513Local Anesthesia 3 5 19 16 21
Nitrous Oxide 0 0 1 1 1Local Anesthesia and Nitrous
Oxide 8 28 31 17 18
Dietetics and Nutrition
Dieticians 448 408 451 379 402Nutritionists 70 72 72 55 55
Marriage & Family Ther-apy
Licensed Marriage and Family Therapist 117 136 131 141 139
Massage Ther-apist Massage Therapist 702 863 713 859 844

• Indices 2013 • District of Columbia • 199
es and renews biennially 61,000 licensed professionals in the District. The Office also provides administrative support to the Boards for meetings, disciplinary hearings, including investigation, legal and staff support.
y Division of Medical Boards: The Division of Med-ical Boards is the entity responsible for the licensing and regulatory oversight of medicine and surgery, chiropractors, ancillary procedures, osteopathy and surgery, physicians’ assistants, acupuncturists, an-esthesiologist assistants, naturopathic physicians, surgical assistants, postgraduate physicians, and polysomnographers .
y Division of Nursing Boards: The Division of Nurs-ing Boards is the entity responsible for the licens-ing and regulatory oversight of registered nurses, licensed practical nurses, certified nurse midwives, clinical nurse specialists, nurse practitioners, nurs-ing staffing agencies, nurse anesthetists, and trained medication employees .
y Division of Allied and Behavioral Health Board: The Division of Allied and Behavioral Health Board is the entity responsible for the licensing and regula-tory oversight of addiction counselors, audiologist, dance therapists, dental hygienists, dentists, dieti-cians, licensed professional counselors, licensed marriage counselors, family therapist, nutritionists, occupational therapists, occupational therapist as-sistants, optometrists, physical therapists, physical therapist assistants, podiatrists, psychologists, rec-reational therapists, respiratory care practitioners, speech language pathologist, social workers, nurs-ing home administrators and psychology associates .
y Division of Veterinary Medical Boards: The Divi-sion of Veterinary Medical Boards is the entity re-sponsible for the licensing and regulatory oversight of Veterinarians in the District of Columbia.
y Division of Pharmacy Boards: The Division of Pharmacy Boards is the entity responsible for the licensing and regulatory oversight of pharmacists, pharmacists with the authority to immunize, phar-macy interns, controlled substances registrations for practitioners, and pharmaceutical detailer registra-tions .
The Office of Health Care FacilitiesThe Division of Health Care Facilities is the entity re-sponsible for the inspection and certification of ambula-tory surgical centers, certified home health agencies, end stage rental disease facilities, hospice care, hospitals, hos-
Table 7.25 conti. Risk Factor* Breakdown for CARE Act Clients, 2010-2012Board License Type FY2009 FY2010 FY2011 FY2012 FY2013*
Naturopathy Naturopaths 788 No longer registering
No longer registering
No longer registering N/A
Occupational Therapist
Occupational Therapist 477 562 611 533 578Occupational Therapist As-
sistants 16 25 44 27 33
OptometryOptometrists 231 217 250 202 214
DPA 144 151 170 164 176TPA 159 155 171 168 180
Pharmaceuti-cal Control
Controlled Substance 5,983 6,713 6,597 7,456 7,671Controlled Substance – NP 578 591 695 708 749Controlled Substance – PA 143 206 218 278 297
Physical Therapy
Physical Therapists 877 989 691 816 1,024Physical Therapists Assistants 23 37 36 55 58
Podiatry Podiatrists 156 147 168 132 132
Professional Counseling
Licensed Professional Coun-selors 1,014 836 929 1,032 1,044
Addiction Counselors 501 505 112 109
Pharmacy
Pharmacists 1,512 1,679 1,591 1,747 1,790Pharmacists Interns 19 22 29 50 51Pharma Detailers 1921 1625 1845 1173 1261
Vaccine and Immunization Authority 32 154 223 296 326
PsychologyPsychologists 1,207 1,211 1,307 1,156 1,171
Supervised Practice Psychol-ogist 1 1 1 2 2
Recreation Therapy Recreational Therapists 63 46 50 45 50
Veterinary Vet Examiners 198 200 223 224 230
Social Work
Graduate Social Workers 1,124 1,309 1,428 1,280 1,337Ind . Clinical Soc . Workers 2,697 2,919 3,006 2,836 2,905Independent Soc . Workers 88 88 88 78 79
Social Work Associates 130 152 153 113 114Nursing Home Administra-tion
Nursing Home Administration 69 71 72 51 53
*Year to Date 6-10-2013Source: DC Department of Health, Health Regulation and Licensing Administration

• District of Columbia • Indices 2013 •200
pital organ transplant, clinical laboratories, certificate of waivers, communicable disease labs, tissue banks, hospi-tals labs, nursing homes, outpatient physical therapy or speech pathology services, portable x-ray suppliers, DC detention center, DC youth services, and maternity cen-ters .
The Division of Intermediate Care is the entity respon-sible for the inspection and certification of intermediate care facilities for persons with intellectual disabilities (IFC/ID), community residence facilities for persons with intellectual disabilities (CRF/ID), assisted living resi-dences, child placing agencies, home care agencies, and community residence facilities .
Office of Food, Drug, Radiation, and Community HygieneDivision of Food: The Division of Food Safety and Hy-giene Inspection Services regulates food services that are provided in bakeries, delicatessens, food products, gro-cery stores, restaurants, caterers, marine, wholesalers, hotels, and vendors. The Division has the authority to in-spect barbershops, beauty spas, massage establishments, and swimming pools .
Division of Drug: The Division of Drug Control is the en-tity that regulates local pharmacies, controlled substances, non-resident pharmacies, out of state controlled substanc-es, out of state manufacturers, distributors/wholesalers, substance abuse facilities, researchers, hearing aid regis-trations, and medical marijuana.
Division of Radiation: The Division of Radiation Control is the entity that regulates dental x-ray equipment, medi-cal x-ray equipment, health physicists, suppliers, and an-alytical x-ray tubes.
The Division of Community Hygiene: The Branch of Ro-dent Control within the Division of Community Hygiene is the entity responsible for providing public outreach and education, surveys and inspections, abatement, enforce-ment, and cooperation with private organizations to pro-tect human health and the environment .
The Branch of Animal Disease Control: The Branch of An-imal Disease Control is the entity responsible for the pre-vention and spread of communicable diseases transmitted from animals to humans through timely investigations,
referrals, follow-up on cases, licensing, and enforcement and provides field inspection services throughout the Dis-trict. The branch is also responsible for monitoring DC Animal Shelter.
Health Emergency Preparedness and Response AdministrationThe Health Emergency Preparedness and Response Ad-ministration (HEPRA) is responsible for protecting the public health and safety of the residents and visitors in the District of Columbia through public health emergen-cy preparation and response, disease surveillance and in-vestigation, regulatory oversight of Emergency Medical Services (including service providers, associated educa-tional institutions, EMS agencies and their operations), and analysis of the health threat to First Responders and District residents. HEPRA and its partners are prepared to respond to city-wide medical and public health emer-gencies, such as those resulting from terrorist attacks or natural disasters .
There are a number of critical functions and activities per-formed by HEPRA:
y Bioterrorism and Response y Community Resilience y Emergency Medical Services y Medical Planning y Pharmaceutical Procurement and Distribution y Special Operations y Strategic National Stockpile
Bioterrorism and Response Bioterrorism and Response conducts surveillance of bi-ological agents which can be used in the deliberate re-lease of viruses, bacteria, or other germs (agents) used to cause illness or death in people, animals, or plants. These agents are typically found in nature, but altering the nat-ural composition increases their ability to cause disease, makes them resistant to current medicines, or increases their ability to be spread into the environment.
Community Resilience Community Resilience is defined as the ability of com-munities to make it through and bounce back from nat-ural and manmade disasters by assessing, strengthening and leveraging community connections, resources and
relationships (e.g. neighbor to neighbor, organization to organization, and administration to administration). Re-silient DC is a collaborative effort between government agencies, community based organizations and community members to build resilience in the District. Since January 2013, DOH/HEPRA has laid the groundwork for Resilient DC in collaboration with RAND Corporation. Accom-plishments to-date include:
y Commissioning the Resilient DC Advisory Com-mittee with leaders from the Mayor’s office, busi-ness leaders, health care providers, etc.
y Facilitating a half-day Resilient DC Communi-ty Forum with a welcome from the Office of the Deputy Mayor for Health and Human Services that highlighted the connection between community re-silience and community health
y Engaging approximately100 government and community based stakeholders from the business, media, cultural/faith, healthcare, housing, mental health, and senior services sectors
y Conducting focus groups with residents from all 8 Wards to get input on community resilience and preparedness strategies
y Organizing a community leaders roundtable to identify best practices in messaging resilience to the community
The next steps for Resilient DC include organizing a Steering Committee and sector based workgroups, devel-op and implement a strategic plan, and creating a commu-nications plan .
Emergency Medical Services The Emergency Medical Services (EMS) Division is the regulatory oversight authority for all EMS activities in the District of Columbia. This authority was placed in the De-partment of Health with the passage of “The EMA Act of 2008.” The Division provides leadership to a comprehen-sive emergency care system of cooperative partnerships, certifies all emergency medical service providers, desig-nates trauma centers and establishes and maintains the District-wide trauma system. In addition, the EMS Divi-sion may exercise its authority to deny, suspend or revoke the certification of an emergency medical service agency or provider who fails to meet set standards .
Certified Ambulances
The EMS Division inspected and certified a total of 189 ambulances in the District of Columbia in 2012. There

• Indices 2013 • District of Columbia • 201
were 152 ambulances certified for Basic Life Support (BLS) level care, while the remaining 37 ambulances were certified at the Advanced Life Support (ALS) care level .
EMS Response Services
There are 12 EMS response agencies certified in the Dis-trict of Columbia, categorized as:
y 9-1-1 Public Service Providers1 . DC Fire & Emergency Medical Services De-
partment y College Based Emergency Ambulance Services
2 . GERMS (Georgetown Emergency Response Medical Service)
3 . EMeRG (Emergency Medical Response Group at George Washington University)
y Hospital-Based Service Providers4 . Children’s Medical Transport Services (Ground
ambulance)5 . STAT MedEvac (Air ambulance service for
Children’s National Medical Center)6 . MedSTAR Transport Services (Ground and Air
ambulances for MedSTAR Washington Hospital Center
y Commercial Ambulance Service Providers7 . All American Ambulance (AAA)8 . American Medical Response (AMR)9 . Butler Medical Transport10 . LifeStar Response11 . Team Critical Care (TCC)
y Special Events Service Providers12 . Special Events Medical Services
EMS Education
EMS Educational InstitutionsThe EMS education institutions within the District of Columbia provide high-quality educational programs for EMS providers. These institutions are required to follow the guidelines of the National Educational Standards for EMS certification as published by the National Highway Transportation Safety Administration (NHTSA). They also are required to meet the District standards for edu-cational institutions, as well as the requirements of the National Registry of Emergency Medical Technicians (NREMT). There are currently seven certified EMS Edu-cational Institutions in the District of Columbia who meet these standards:
y DC Fire & EMS Department y East Coast EMS Higher Development Academy y Georgetown University y George Washington University Emergency Health
Services Program y National Institute for Emergency Medical Services y Washington Hospital Center EMS Education y Westlink Career Institute
Updates in EMS Education RequirementsThe National Education Standards have replaced the older National Standard Curriculum (NSC). All EMS providers who were certified under the older NSC will be required to attend a transition course in order to maintain their NREMT certification. The District is following the transi-tion timetable as published by the NREMT.
Emergency Medical Technician (EMT) Certification CoursesIn the District there were a total of 13 EMT certification courses conducted during 2012. A total of 380 students enrolled and 296 students completed the course require-ments (Figure 7 .19) . 287 students passed the psychomotor exam, 217 students passed both the cognitive and psycho-motor exam, obtaining NREMT certification, becoming eligible for District certification.
EMS Certification
District of Columbia Certified Providers
The District of Columbia has a dedicated group of EMS providers who administer pre-hospital healthcare services
on a daily basis. In 2009, the District raised its certifica-tion standards by requiring all EMS providers to obtain NREMT certification for both initial certification and cer-tification renewal. Today, all DC certified EMS providers have obtained their NREMT certification.
In 2012, the District had 2,498 certified EMS Providers (Figure 7.20), which included: (Table 7.31)
Table 7.31. District of Columbia Certified EMS Pro-viders, 2012Certified Providers Number PercentEmergency Medical Techni-cians (EMT’s) 1,992 80%
Advanced EMT 2 0%EMT-Intermediates 74 3%Paramedics 430 17%Source: 2012 EMS Annual Report, Health Emergency Preparedness and Emergency Response Administration, DC Department of Health
Medical Planning Medical Planning partners with the DC Homeland Secu-rity and Emergency Management Agency (HSEMA) to assist special event organizers in the development of a health and safety plan . DOH in conjunction with DC HSE-MA requires that all event coordinators submit a Health,
Figure 7.19. 2012 EMT Student Enrollment
Source: 2012 EMS Annual Report, Health Emergency Prepared-ness and Emergency Response Administration, DC Department of Health
Figure 7.20. District of Columbia Certified EMS Providers
Source: 2012 EMS Annual Report, Health Emergency Prepared-ness and Emergency Response Administration, DC Department of Health

• District of Columbia • Indices 2013 •202
Medical and Safety Plan that is reviewed and approved by DOH before the event can begin. The DC Special Event Health and Safety Plan application includes a description of the event, location, date and hours of operation, medi-cal provisions, types of medical aid to be offered, as well as the deployment of any aid stations or ambulances.
In 2012, DOH/HEPRA participated in three (3) disaster (incident response) and preparedness (planning) events in collaboration with DC HSEMA. In 2013, from January to May, there have been a total of four (4) events which currently represents a 25% increase above the total num-ber of events in 2012. An increase in the total number of events in 2013 is expected with six (6) months remaining in the calendar year .
2012 Events: y Derecheo (Incident Response) – June 2012 y July 4th Celebration (Planning/Response Coordina-
tion) – July 2012 y Hurricane Sandy (Incident Response) October 2012
2013 Events (January – May): y 57th Presidential Inauguration (Planning/Response
Coordination) – January 2013 y Presidential State of the Union Address (Planning/
Response Coordination) – February 2013 y Snow Storm (Incident Response) – March 2013 y H7N9 Influenza (Intelligence Sharing) – May 2013
In 2012, HEPRA coordinated with HSEMA on three events. As of May 2013, the two agencies have coordinat-ed on four events .
Pharmaceutical Procurement and Distribution Pharmaceutical Procurement and Distribution maintains a timely and efficient drug delivery rate of greater that 99%, and assures that the Department of Health contin-ues to maintain access to drug discount programs that will allow as many District residents as possible, access to life saving medications . It also provides clinical support formulary management and quality assurance monitoring sufficient to address the needs of all programs supported by Pharmaceutical Services, in addition to maintaining a state of the art inventory control system capable of sup-porting DOH needs and also supporting the Strategic Na-tional Stockpile (SNS) in the event of an emergency .
Special Operations Special Operations monitors Special Events in the District of Columbia in conjunction with the DC Homeland Secu-rity and Emergency Management Agency and represents the Department of Health on the Mayor’s Special Event Task Group. Special Operations supports the review, de-velopment, and implementation of health and safety plans for over 135 special events each year in the District of Columbia. Special Operations is involved in the planning of large scale special events in which the Department of Health plays a more active role to include personnel from the Medical Reserve Corps and the Department of Health in staffing aid stations and providing medical care.
Strategic National Stockpile The Strategic National Stockpile (SNS) Program is an essential response component of the Centers for Disease Control (CDC) larger Bioterrorism Preparedness and Response Initiative. The SNS program ensures the avail-ability and rapid deployment of life-saving pharmaceu-ticals, antidotes, other medical supplies, and equipment necessary to counter the effects of nerve agents, biological pathogens, and chemical agents. The SNS program stands ready for immediate deployment in the event of a terrorist attack using a biological toxin or chemical agent directed against a civilian population in the District of Columbia.
Center for Policy, Planning, & EvaluationMissionThe mission of the Center for Policy, Planning, & Evalua-tion is to assess health issues, risks and outcomes through data collection, surveillance, analysis, research and eval-uation; perform state health planning functions; and to as-sist programs in the design of strategies, interventions and policies to prevent or reduce disease, injury and disability in the District of Columbia.
Data Management and Analysis DivisionCensus of Fatal Occupational Injuries, District of Colum-bia Workplace Fatalities, 2010
Background of the Program The Census of Fatal Occupational Injuries (CFOI), part of the BLS Occupational Safety and Health Statistics
(OSHS) program, compiles a count of all fatal work in-juries occurring in the U.S. during the calendar year. The CFOI program uses diverse state, federal, and independent data sources to identify, verify, and describe fatal work in-juries. This assures counts are as complete and accurate as possible. Beginning with 2009 data, the CFOI program began classifying industry using the 2007 version of the North American Industry Classification System (NAICS 2007). Industry data from 2003 to 2008 were classified using the NAICS 2002. NAICS 2007 includes revisions across several sectors. The most significant revisions are in the information sector, particularly within telecommu-nications .
Fatal work injuries totaled 16 in 2010 for the District of Columbia, according to the District of Columbia Depart-ment of Health’s Census of Fatal Occupational Injuries (CFOI), in cooperation with the U.S. Department of La-bor, Bureau of Labor Statistics (BLS). The 2010 count of workplace fatalities increased five over the year and was three more than the highest total since 2006 (Figure 7 .21) . Assaults and violent acts were the leading cause of on-the-job fatalities during 2010 in the District, with 7 deaths or 44 percent. The service providing industry accounted for 56 percent of the total workplace fatalities in the Dis-trict of Columbia.
Key Characteristics of Fatal Work Injuries in 2010 in the District of Columbia:
y Men (15) accounted for almost all of the work-relat-
Figure 7.21. Fatal Occupational Injuries in the Dis-trict of Columbia, 2006-2010
Source: DC Department of Health, Center for Policy, Planning, and Evaluation, Occupational Safety and Health Statistics Program and the U.S. Department of Labor, Bureau of Labor Statistics

• Indices 2013 • District of Columbia • 203
ed fatalities in the District. Assaults and violent acts were the leading cause .
y Six of the seven fatalities caused by assaults and vi-olent acts were shootings .
y Workers aged 35-54 years comprised of 10 fatalities in the District, representing 63 percent of work-re-lated fatalities in 2010; three of the five fatal work-place injuries in the 35-44 age group occurred in falls and three of the five fatal workplace injuries in the 45-54 age group occurred in assaults and violent acts .
y Eleven of the workers who died on-the-job in the District worked for wages and salaries .
y Thirty-eight percent of the workers who died on-the-job were Black, non-Hispanic.
y Five self-employed workers died in 2010. Assaults and violent acts accounted for all of these .
Survey of Occupational Injuries and Illnesses
Characteristics for Injuries and Illnesses Requiring Days Away From Work In Private IndustryThe Washington, DC Survey of Occupational Injuries and Illnesses was conducted by the DC Department of Health in cooperation with the U.S. Department of Labor, Bureau of Labor Statistics. Beginning with 2009 data, the Occu-pational Safety Health Statistics program began classify-ing industry using the 2007 version of the North American Industry Classification System (NAICS 2007). Industry data from 2003 to 2008 were classified using the NAICS 2002. NAICS 2007 includes revisions across several sec-tors. The most significant revisions are in the information sector, particularly within telecommunications.
The District of Columbia’s Annual Survey of Occupa-tional Injuries and Illnesses for 2010 showed that there were 2,980 work-related injury and illness cases report-ed in the private industry that required days away from work . Sprains and strains accounted for approximately 33 percent of these cases and was the leading type of injury or illness . Service occupations had the most injury and illness days away from work cases and made up 1,510 or 51 percent of the cases; followed by professional and related occupations with 430 or 14 percent of the cases (Figure 7 .22) .
Case Characteristic Highlights y The leading nature of the work-related injury or
illness cases involving days away from work was sprains and strains (990 cases); other significant causes were soreness and pain (390), bruises and contusions (370) cases and cuts and lacerations (250 cases) .
y The part of the body that was most frequently af-fected by injuries and illnesses was the trunk (850), which includes the back and shoulder, which ac-counted for 29 percent of all days away from work cases. Lower extremities, including the knee, ankle, foot and toe, accounted for 26 percent while upper extremities, including arm, wrist, hand, and finger, accounted for 23 percent of all days away from work cases .
y Floor and ground surfaces accounted for 28 percent of all sources of injury and illness cases .
y Cases involving contact with an object or equipment accounted for 740, the majority of these were cases involving being struck by an object which account-ed for 490 cases. The next largest event categories involved cases with falls on the same level and overexertion which accounted for 580 cases each .
Demographic Highlights y Fifty-four percent of the occupational injuries and
illnesses that resulted in days away from work in-volved women (1,620 cases).
y Workers in the age range of 45-54 years accounted for 27 percent or 810 cases .
y Forty-seven percent of the occupational injuries and illnesses that resulted in days away from work in-volved Black or African American workers (1,400).
y Employees with a length of service with their em-ployer from one to five years or more accounted for 2,330 of the injuries and illnesses.
y Of the injuries and illnesses with days away from
work that reported the time of incident, the hours from 8:01 AM to 12:00 PM accounted for 890 in-cidents .
y Of the injuries and illnesses with days away from work that reported hours on the job before the event occurred, employees on the job for two to four hours made up 700 cases .
y Tuesday (600 cases) and Thursday (540 cases) were the days of the week when most of the injuries and illnesses involving days away from work occurred .
Research Evaluation and Measurement DivisionBehavioral Risk Factor Surveillance System (BRFSS)
The Behavioral Risk Factor Surveillance System (BRFSS) is the largest health-risk behavior database in the world and provides the only nationwide health-risk data in the country. All 50 US states, the District of Columbia, and three territories carry out this ongoing telephone survey, sponsored by the Centers for Disease Control and Preven-tion (CDC), independently.
Traditionally the BRFSS has been a landline telephone health survey since 1984 . During the 2011 survey peri-od, two new changes in methodology and data collec-tion were made to increase the integrity and validity of the BRFSS and to ensure the data represented the current population. These changes were 1) including cell phones and 2) adopting an advanced weighting method . With these new implementations, the BRFSS has been able to collect data that better represents the current health status of the nation’s population.
Figure 7.22. Injury and Illness Cases Involving Days Away from Work by Selected Occupational Group and Industry Sector
Source: DC Department of Health, Center for Policy, Planning, and Evaluation, Occupational Safety and Health Statistics Program and the U.S. Department of Labor, Bureau of Labor Statistics

• District of Columbia • Indices 2013 •204
Table 7.32. Having Health Care Coverage“Do you have any kind of health care coverage, including health insurance, prepaid plans such as HMOs or government plans such as Medicare or Indian Health Services?”
# Yes NoTotal 4,545 92 .3 7 .7
Sex Male 1,737 90 .3 9 .7
Female 2,808 93 .9 6 .1
Age
18 To 24 129 90 .3 *25 To 34 457 91 .9 8 .135 To 44 629 92 .8 7 .245 To 54 781 90 .0 10 .055 To 64 1,115 92 .3 7 .765 Or Older 1,434 96 .5 3 .5
Rac
e/Et
h-ni
city
Caucasian/White 1,995 96 .6 3 .4African American/Black 2,023 89 .4 10 .6Other 247 89 .4 10 .6Hispanic 183 90 .7 *
Educ
atio
n Less than high school 291 88 .1 11 .9High school graduate 773 90 .0 10 .0Some college or tech sch 710 88 .5 11 .5College graduate 2,753 96 .3 3 .7
Inco
me
Less than $15,000 486 90 .1 9 .9$15,000-$24,999 489 84 .3 15 .7$25,000-$34,999 283 87 .3 12 .7$35,000-$49,999 371 92 .8 *$50,000-$74,999 484 92 .1 *$75,000 or more 1,872 97 .4 *
War
d
Ward 1 327 93 .3 6 .7Ward 2 362 96 .2 3 .8Ward 3 722 94 .0 6 .0Ward 4 594 90 .2 9 .8Ward 5 468 87 .4 12 .6Ward 6 496 91 .7 8 .3Ward 7 464 97 .0 3 .0Ward 8 375 93 .2 6 .8
*Suppressed if cell size is less than 50Source: DC Department of Health, Center for Policy, Planning, and Evaluation, District of Columbia Behavioral Risk Factor Surveillance System (BRFSS), 2011
Table 7.33. Multiple Health Care Providers
“Do you have one person you think of as your personal doctor or health care provider?”# Yes, only one More than one No
Total 454 73 .0 7 .7 19 .3
Sex Male 170 66 .8 6 .6 26 .6
Female 280 78 .4 8 .7 12 .9
Age
18 To 24 129 64 .6 6 .1 29 .325 To 34 456 59 .5 8 .2 32 .335 To 44 629 75 .0 6 .9 18 .145 To 54 781 82 .4 5 .4 12 .255 To 64 111 81 .5 7 .5 11 .065 Or Older 143 80 .9 12 .2 6 .8
Rac
e/Et
h-ni
city
Caucasian/White 199 71 .3 9 .0 19 .7African American/Black 202 76 .3 6 .7 17 .0Other 245 64 .0 7 .8 28 .3Hispanic 184 66 .8 8 .0 25 .2
Educ
atio
n Less than high school 292 75 .1 6 .9 18 .0High school graduate 777 74 .5 5 .9 19 .6Some college or technical school 708 74 .3 8 .0 17 .7College graduate 275 71 .1 8 .7 20 .2
Inco
me
Less than $15,000 487 72 .3 6 .5 21 .1$15,000-$24,999 493 70 .2 7 .5 22 .2$25,000-$34,999 282 81 .1 5 .1 13 .8$35,000-$49,999 371 71 .8 7 .0 21 .3$50,000-$74,999 483 71 .0 8 .2 20 .8$75,000 or more 187 75 .2 7 .8 17 .0
War
d
Ward 1 327 74 .9 7 .9 17 .1Ward 2 361 75 .1 11 .3 13 .7Ward 3 722 74 .7 7 .2 18 .1Ward 4 594 80 .6 5 .2 14 .2Ward 5 469 71 .7 9 .2 19 .0Ward 6 495 74 .5 9 .0 16 .6Ward 7 463 82 .7 7 .6 9 .7Ward 8 377 74 .8 5 .3 19 .8
Source: DC Department of Health, Center for Policy, Planning, and Evaluation, District of Columbia Behavioral Risk Factor Surveillance System (BRFSS), 2011

• Indices 2013 • District of Columbia • 205
Access to Health CareHealthy People 2020 Objectives
y Goal Not Met: Increase the proportion of persons with medical insurance to 100%, the District of Co-lumbia 92.3%.
An estimated 50 million adults aged 18-64 years had no health insurance at some point during the past 12 months . Individuals who do not have health care coverage do not receive many of the necessary screenings in a timely man-ner that would to detect many chronic diseases such as cancer at its early stages .
District residents were asked if they have any kind of health care coverage, including health insurance, prepaid plans such as Health Maintenance Organizations (HMO), or government plans such as Medicare. Overall, 92.3% of District residents have health care coverage (Table 7.32). District residents were asked if they had one person they thought of as their personal doctor or health care provid-er (Table 7.33). Overall, 73% of District residents have only one personal doctor or health care provider . District residents were asked how long it has been since they last visited a doctor for a routine check-up (Table 7.34). Over-all, 74.6% of residents had a routine checkup within the past year .
Table 7.34. Time Since Last Check-up“About how long has it been since you last visited a doctor for a routine checkup?” A routine checkup is a general physical exam, not an exam for a specific injury, illness or condition.
#Within past
yearWithin past
2 yearsWithin past
5 years5 or more years ago Never
Total 4,535 74 .6 13 .4 7 .3 4 .3 0 .5
Sex Male 1,730 69 .1 14 .9 9 .1 6 .3 0 .6
Female 2,805 79 .3 12 .1 5 .7 2 .5 0 .4
Age
18 To 24 128 74 .6 16 .7 6 .7 2 .025 To 34 454 66 .0 16 .0 11 .0 6 .4 0 .635 To 44 625 67 .7 14 .4 10 .2 7 .3 0 .445 To 54 778 75 .1 14 .0 6 .7 3 .4 0 .855 To 64 1,115 81 .0 11 .2 3 .8 3 .0 1 .065 Or Older 1,435 89 .0 6 .8 2 .5 1 .6 0 .2
Rac
e/Et
h-ni
city
Caucasian/White 1,988 65 .9 17 .4 9 .4 6 .9 0 .4African American/Black 2,024 82 .7 9 .0 6 .0 1 .9 0 .4Other 246 65 .1 16 .9 9 .0 7 .0 2 .0Hispanic 182 72 .5 19 .4 4 .2 3 .6 0 .3
Educ
atio
n Less than high school 290 83 .2 10 .1 4 .2 1 .0 1 .5High school graduate 775 83 .3 10 .7 3 .6 2 .0 0 .4Some college or tech sch 708 75 .9 11 .2 7 .7 5 .1 0 .1College graduate 2,743 67 .4 16 .7 9 .7 5 .9 0 .4
Inco
me
Less than $15,000 483 82 .2 7 .9 6 .9 2 .3 0 .7$15,000-$24,999 490 78 .1 12 .7 6 .6 2 .5 0 .1$25,000-$34,999 280 76 .0 11 .4 10 .3 1 .1 1 .2$35,000-$49,999 371 75 .6 11 .0 7 .4 6 .0$50,000-$74,999 484 72 .3 16 .5 5 .0 5 .8 0 .4$75,000 or more 1,865 68 .9 16 .5 8 .4 5 .8 0 .3
War
d
Ward 1 324 70 .1 14 .3 12 .7 3 .0 *Ward 2 362 68 .0 18 .3 7 .8 6 .0 *Ward 3 721 70 .1 16 .3 7 .2 6 .4 *Ward 4 591 75 .3 14 .2 7 .3 2 .9 0 .3Ward 5 469 75 .8 11 .3 8 .1 3 .6 1 .3Ward 6 493 71 .1 13 .1 7 .7 7 .2 0 .8Ward 7 462 87 .7 7 .9 2 .2 2 .3 *Ward 8 374 86 .0 7 .4 6 .1 .5 *
*Suppressed if cell size is less than 50Source: DC Dept of Health, Center for Policy, Planning, & Evaluation, DC Behavioral Risk Factor Surveillance System (BRFSS), 2011

• District of Columbia • Indices 2013 •206
Alcohol ConsumptionHealthy People 2020 Objectives
y Goal Not Met: Reduce the proportion of persons engaging in binge drinking during the past 30 days - adults aged 18 years or older to 24.4%; the District of Columbia rate is 25%.
The detrimental effect of alcohol use is a global problem resulting in millions of deaths, including hundreds of thousands of young lives lost. The widely used and le-gal substance is not only a contributing factor in many diseases, but also contributes to a variety of social prob-lems . Its negative impact has spread throughout many communities. Excessive alcohol use, including underage drinking and binge drinking, can lead to increased risk of health problems such as injuries, violence, liver diseases, and cancer. Despite all these problems, the harmful use of alcohol remains a low priority in many health and public policies .
District residents were asked a variety of questions about their alcohol intake during the past 30 days. This included whether or not they had at least one drink of any alcoholic beverage, how many days per week or per month they drank, how many alcoholic drinks they drank in a day on average, how many times they binge drank, and finally, the highest number of alcoholic drinks they consumed on any occasion (Table 7.35). Overall, 25% of District resi-dents were binge drinkers (5 or more drinks on an occa-sion for men or 4 or more drinks on an occasion for wom-en). Heavy drinking is defined as drinking two or more drinks per day for men and one or more drinks per day for women (Table 7.36). Overall, 9.6% of District residents were heavy drinkers .
Table 7.35. Binge Drinking
(Five or more drinks on an occasion for men or 4 or more drinks on an occasion for women)
# No YesTotal 258 75 .0 25 .0
Sex Male 162 68 .7 31 .3
Female 258 80 .5 19 .5
Age
18 To 24 116 59 .9 40 .125 To 34 418 57 .2 42 .835 To 44 590 74 .3 25 .745 To 54 728 81 .8 18 .255 To 64 103 89 .7 10 .365 Or Older 132 94 .6 5 .4
Rac
e/Et
h-ni
city
Caucasian/White 190 67 .1 32 .9African American/Black 183 82 .1 17 .9Other 225 80 .2 19 .8Hispanic 170 66 .7 33 .3
Educ
atio
n Less than high school 258 83 .5 16 .5High school graduate 680 80 .2 19 .8Some college or tech sch 642 76 .2 23 .8College graduate 261 69 .8 30 .2
Inco
me
Less than $15,000 427 84 .1 15 .9$15,000-$24,999 449 80 .8 19 .2$25,000-$34,999 257 76 .4 23 .6$35,000-$49,999 349 70 .7 29 .3$50,000-$74,999 452 67 .3 32 .7$75,000 or more 178 70 .2 29 .8
War
d
Ward 1 306 65 .4 34 .6Ward 2 341 70 .4 29 .6Ward 3 681 73 .7 26 .3Ward 4 564 79 .0 21 .0Ward 5 440 80 .8 19 .2Ward 6 463 72 .8 27 .2Ward 7 409 82 .7 17 .3Ward 8 328 83 .2 16 .8
Source: DC Department of Health, Center for Policy, Planning, and Evaluation, District of Columbia Behavioral Risk Factor Surveillance System (BRFSS), 2011
Table 7.36. Heavy Alcohol ConsumptionHeavy drinking results are from responses to: One drink is equivalent to a 12 ounce beer, a 5 ounce glass of wine, or a drink with one shot of liquor. Heavy drinking is defined as drinking two or more drinks per day for men and one or more drinks per day for women.
# No Yes
Total 4,216 90 .4 9 .6
Sex Male 1,627 91 .8 8 .2
Female 2,589 89 .2 10 .8
Age
18 To 24 116 86 .9 13 .1
25 To 34 420 86 .2 13 .8
35 To 44 589 92 .1 7 .9
45 To 54 727 92 .5 7 .5
55 To 64 1,036 91 .8 8 .2
65 Or Older 1,328 94 .4 5 .6
Rac
e/Et
h-ni
city
Caucasian/White 1,904 87 .5 12 .5
African American/Black 1,834 93 .1 6 .9
Other 224 89 .0 11 .0
Hispanic 172 90 .2 *
Educ
atio
n Less than high school 260 91 .4 *
High school graduate 679 92 .4 7 .6
Some college or tech sch 645 90 .9 9 .1
College graduate 2,618 89 .1 10 .9
Inco
me
Less than $15,000 432 93 .0 7 .0
$15,000-$24,999 446 92 .6 7 .4
$25,000-$34,999 254 93 .8 *
$35,000-$49,999 350 88 .6 11 .4
$50,000-$74,999 455 86 .5 13 .5
$75,000 or more 1,786 88 .1 11 .9
War
d
Ward 1 305 87 .8 12 .2
Ward 2 340 88 .5 11 .5
Ward 3 684 90 .0 10 .0
Ward 4 564 91 .4 8 .6
Ward 5 439 95 .4 4 .6
Ward 6 462 89 .2 10 .8
Ward 7 411 90 .7 9 .3
Ward 8 330 92 .8 7 .2
*Suppressed if cell size is less than 50Source: DC Department of Health, Center for Policy, Planning, and Evaluation, District of Columbia Behavioral Risk Factor Surveillance System (BRFSS), 2011
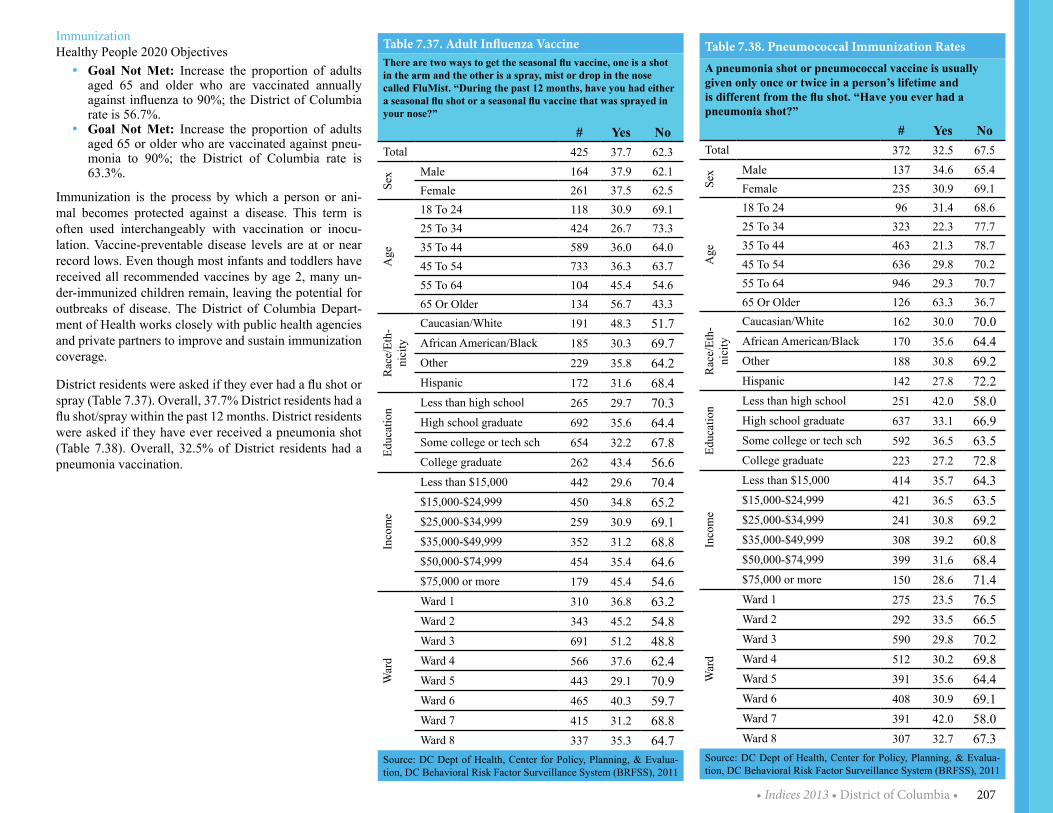
• Indices 2013 • District of Columbia • 207
ImmunizationHealthy People 2020 Objectives
y Goal Not Met: Increase the proportion of adults aged 65 and older who are vaccinated annually against influenza to 90%; the District of Columbia rate is 56.7%.
y Goal Not Met: Increase the proportion of adults aged 65 or older who are vaccinated against pneu-monia to 90%; the District of Columbia rate is 63.3%.
Immunization is the process by which a person or ani-mal becomes protected against a disease. This term is often used interchangeably with vaccination or inocu-lation. Vaccine-preventable disease levels are at or near record lows . Even though most infants and toddlers have received all recommended vaccines by age 2, many un-der-immunized children remain, leaving the potential for outbreaks of disease. The District of Columbia Depart-ment of Health works closely with public health agencies and private partners to improve and sustain immunization coverage .
District residents were asked if they ever had a flu shot or spray (Table 7.37). Overall, 37.7% District residents had a flu shot/spray within the past 12 months. District residents were asked if they have ever received a pneumonia shot (Table 7.38). Overall, 32.5% of District residents had a pneumonia vaccination .
Table 7.37. Adult Influenza VaccineThere are two ways to get the seasonal flu vaccine, one is a shot in the arm and the other is a spray, mist or drop in the nose called FluMist. “During the past 12 months, have you had either a seasonal flu shot or a seasonal flu vaccine that was sprayed in your nose?”
# Yes NoTotal 425 37 .7 62 .3
Sex Male 164 37 .9 62 .1
Female 261 37 .5 62 .5
Age
18 To 24 118 30 .9 69 .125 To 34 424 26 .7 73 .335 To 44 589 36 .0 64 .045 To 54 733 36 .3 63 .755 To 64 104 45 .4 54 .665 Or Older 134 56 .7 43 .3
Rac
e/Et
h-ni
city
Caucasian/White 191 48 .3 51 .7African American/Black 185 30 .3 69 .7Other 229 35 .8 64 .2Hispanic 172 31 .6 68 .4
Educ
atio
n Less than high school 265 29 .7 70 .3High school graduate 692 35 .6 64 .4Some college or tech sch 654 32 .2 67 .8College graduate 262 43 .4 56 .6
Inco
me
Less than $15,000 442 29 .6 70 .4$15,000-$24,999 450 34 .8 65 .2$25,000-$34,999 259 30 .9 69 .1$35,000-$49,999 352 31 .2 68 .8$50,000-$74,999 454 35 .4 64 .6$75,000 or more 179 45 .4 54 .6
War
d
Ward 1 310 36 .8 63 .2Ward 2 343 45 .2 54 .8Ward 3 691 51 .2 48 .8Ward 4 566 37 .6 62 .4Ward 5 443 29 .1 70 .9Ward 6 465 40 .3 59 .7Ward 7 415 31 .2 68 .8Ward 8 337 35 .3 64 .7
Source: DC Dept of Health, Center for Policy, Planning, & Evalua-tion, DC Behavioral Risk Factor Surveillance System (BRFSS), 2011
Table 7.38. Pneumococcal Immunization RatesA pneumonia shot or pneumococcal vaccine is usually given only once or twice in a person’s lifetime and is different from the flu shot. “Have you ever had a pneumonia shot?”
# Yes NoTotal 372 32 .5 67 .5
Sex Male 137 34 .6 65 .4
Female 235 30 .9 69 .1
Age
18 To 24 96 31 .4 68 .625 To 34 323 22 .3 77 .735 To 44 463 21 .3 78 .745 To 54 636 29 .8 70 .255 To 64 946 29 .3 70 .765 Or Older 126 63 .3 36 .7
Rac
e/Et
h-ni
city
Caucasian/White 162 30 .0 70 .0African American/Black 170 35 .6 64 .4Other 188 30 .8 69 .2Hispanic 142 27 .8 72 .2
Educ
atio
n Less than high school 251 42 .0 58 .0High school graduate 637 33 .1 66 .9Some college or tech sch 592 36 .5 63 .5College graduate 223 27 .2 72 .8
Inco
me
Less than $15,000 414 35 .7 64 .3$15,000-$24,999 421 36 .5 63 .5$25,000-$34,999 241 30 .8 69 .2$35,000-$49,999 308 39 .2 60 .8$50,000-$74,999 399 31 .6 68 .4$75,000 or more 150 28 .6 71 .4
War
d
Ward 1 275 23 .5 76 .5Ward 2 292 33 .5 66 .5Ward 3 590 29 .8 70 .2Ward 4 512 30 .2 69 .8Ward 5 391 35 .6 64 .4Ward 6 408 30 .9 69 .1Ward 7 391 42 .0 58 .0Ward 8 307 32 .7 67 .3
Source: DC Dept of Health, Center for Policy, Planning, & Evalua-tion, DC Behavioral Risk Factor Surveillance System (BRFSS), 2011

• District of Columbia • Indices 2013 •208
Overweight/ObesityHealthy People 2020 Objectives
y Goal Met: Reduce the proportion of adults who are obese to 30.5%; the District of Columbia rate is 23.8%.
y Goal Met: Increase the proportion of adults who are at a healthy weight to 33.9%; the District of Co-lumbia rate is 45.4%.
According to the 2011 BRFSS, District adults ranked 47th in obesity which is among the lowest in the nation. It is important to note that while the District of Columbia com-pared to national rates rank low in obesity, some of the District’s wards rank higher than the national rate. More than one-third of U.S. adults (35.7%) are obese.
BMI is calculated from a person’s weight and height (Table 7.39) and provides a reasonable indicator of body fatness and weight categories that may lead to health problems. District residents were asked about their height and weight to calculate their BMI (Table 7.40). Overall, 23.7% of District residents were obese.
Table 7.40. BMI
Calculated variable based on Body Mass Index (BMI). BMI is a function of respondent’s reported height and weight. “Overweight” is equal to a BMI of 25 to 29 and “Obese” is equal to a BMI of 30 or higher.
#Under-weight
Normal Weight Overweight Obese
Total 4,368 1 .7 45 .4 29 .1 23 .7
Sex Male 1,716 * 45 .6 34 .9 18 .6
Female 2,652 2 .5 45 .2 23 .9 28 .4
Age
18 To 24 123 * 65 .7 22 .3 *25 To 34 437 * 53 .0 24 .7 20 .835 To 44 599 * 43 .3 33 .4 22 .045 To 54 759 * 36 .2 28 .0 34 .855 To 64 1,064 * 35 .1 33 .2 30 .665 Or Older 1,386 2 .4 36 .7 34 .6 26 .3
Rac
e/Et
h-ni
city
Caucasian/White 1,938 1 .9 58 .5 28 .9 10 .7African American/Black 1,953 * 33 .2 28 .9 36 .7Other 232 * 54 .5 27 .6 16 .0Hispanic 167 * 51 .3 31 .6 13 .3
Educ
atio
n Less than high school 269 * 32 .4 25 .1 39 .7High school graduate 750 * 35 .7 29 .5 33 .0Some college or technical school 673 * 39 .0 28 .4 31 .0College graduate 2,665 1 .6 56 .2 30 .4 11 .9
Inco
me
Less than $15,000 464 * 31 .6 25 .1 41 .6$15,000-$24,999 472 * 34 .3 29 .1 35 .3$25,000-$34,999 277 * 40 .1 28 .9 30 .0$35,000-$49,999 355 * 43 .5 25 .6 27 .6$50,000-$74,999 475 * 46 .5 31 .4 20 .3$75,000 or more 1,820 * 53 .5 32 .9 12 .7
War
d
Ward 1 319 * 47 .8 31 .7 18 .9Ward 2 352 * 61 .6 26 .9 11 .1Ward 3 697 * 58 .9 26 .6 12 .9Ward 4 568 * 45 .6 29 .1 23 .2Ward 5 451 * 30 .1 32 .0 36 .8Ward 6 480 * 43 .8 33 .6 20 .6Ward 7 440 * 32 .3 28 .2 39 .2Ward 8 361 * 32 .9 22 .0 42 .0
*Suppressed if cell size is less than 50Source: DC Dept of Health, Center for Policy, Planning, & Evaluation, DC Behavioral Risk Factor Surveillance System (BRFSS), 2011
Table 7.39. Body Mass Index
BMI between 25 and 29.9 is considered overweight and BMI of 30 or higher is considered obese.
HeightWeight Range BMI Considered
5’9”
124 lbs or less Below 18 .5 Underweight
125 lbs to 168 lbs 18 .5 to 24 .9 Healthy
weight169 lbs to
202 lbs 25 .0 to 29 .9 Overweight
203 lbs or more 30 or higher Obese
Source: DC Dept of Health, Center for Policy, Planning, & Evalua-tion, DC Behavioral Risk Factor Surveillance System (BRFSS), 2011

• Indices 2013 • District of Columbia • 209
Physical Activity/ExerciseHealthy People 2020 Objectives
y Goal Met: Reduce the proportion of adults who en-gage in no leisure-time physical activity to 32.6%; the District of Columbia rate is 19.8%.
Regular physical activity is essential to good health, es-pecially for individuals who are trying to lose weight or to maintain a healthy weight . Physical activity reduces risks of cardiovascular disease and diabetes beyond that produced by weight reduction alone. Physical activity can reduce high blood pressure, risk for type 2 diabetes, heart attack, stroke, and symptoms of anxiety, depression and several forms of cancer . Physical activity can also reduce arthritis pain associated with disability and reduce risk for osteoporosis and falls .
District residents were asked if during the past month, other than their job, if they participated in any physical ac-tivities or exercise such as running, calisthenics, golf, gar-dening or walking for exercise . Respondents who report-ed doing enough physical activity to meet the 300-minute (or vigorous equivalent) aerobic recommendation were classified as “Highly active”; respondents who reported doing 150-300 minutes (or vigorous equivalent) of phys-ical activity as “Active”; respondents who reported doing insufficient physical activity (11-149 minutes) as “Insuf-ficiently active”; and respondents who reported doing no physical activity as “Inactive” (Table 7.41).
Table 7.41. Exercise/Physical Activity
Physical Activity Categories
#Highly Active Active
Insufficient-ly Active Inactive
Total 415 34 .4 23 .0 20 .5 22 .1
Sex Male 161 37 .5 21 .9 21 .2 19 .5
Female 253 31 .6 24 .1 19 .9 24 .4
Age
18 To 24 115 45 .4 24 .6 19 .2 10 .825 To 34 427 30 .9 25 .8 25 .9 17 .435 To 44 592 31 .1 26 .3 22 .9 19 .745 To 54 733 32 .4 22 .1 20 .6 25 .055 To 64 992 33 .0 19 .7 18 .7 28 .565 Or Older 129 37 .2 17 .4 11 .9 33 .4
Rac
e/Et
h-ni
city
Caucasian/White 189 39 .0 31 .2 19 .8 10 .1African American/Black 179 31 .3 17 .1 19 .7 31 .9Other 226 38 .5 18 .7 21 .2 21 .7Hispanic 171 24 .8 20 .9 28 .8 25 .5
Educ
atio
n Less than high school 249 30 .1 15 .4 15 .1 39 .4High school graduate 681 33 .5 12 .9 21 .2 32 .5Some college or technical school 627 32 .4 23 .4 19 .6 24 .6College graduate 258 36 .9 29 .1 22 .1 11 .9
Inco
me
Less than $15,000 423 26 .4 18 .5 18 .8 36 .4$15,000-$24,999 446 30 .3 18 .1 16 .9 34 .6$25,000-$34,999 261 30 .9 20 .9 25 .8 22 .4$35,000-$49,999 341 33 .1 21 .2 19 .1 26 .6$50,000-$74,999 443 36 .6 26 .5 17 .7 19 .1$75,000 or more 177 38 .0 29 .1 21 .3 11 .5
War
d
Ward 1 298 30 .4 20 .8 31 .0 17 .8Ward 2 337 41 .6 28 .7 19 .5 10 .2Ward 3 674 41 .8 27 .9 18 .2 12 .1Ward 4 551 33 .2 22 .1 19 .1 25 .7Ward 5 431 33 .7 21 .2 19 .5 25 .7Ward 6 459 31 .2 27 .2 23 .0 18 .5Ward 7 404 30 .0 20 .1 17 .4 32 .6Ward 8 330 30 .1 14 .0 15 .9 40 .0
Source: DC Dept of Health, Center for Policy, Planning, & Evaluation, DC Behavioral Risk Factor Surveillance System (BRFSS), 2011

• District of Columbia • Indices 2013 •210
DiabetesHealthy People 2020 Objectives
y Goal Not Met: Increase the proportion of persons with diabetes who receive formal diabetes education to 62.5%; the District of Columbia rate is 52.9%.
y Goal Met: Increase the proportion of adults with diabetes who have a glycosylated hemoglobin mea-surement (A1C) at least once a year to 71.1%; the District of Columbia rate is 84.3%.
y Goal Met: Increase the proportion of persons with diabetes who have an annual dilated eye exam-ination to 58.7%; the District of Columbia rate is 81.9%.
y Goal Met: Increase the proportion of adults with di-abetes who have at least an annual foot examination to 74.8%; the District of Columbia rate is 76.9%.
In the District of Columbia, diabetes is the sixth leading cause of death and the seventh leading cause of hospi-tal admissions. Diabetes is the seventh leading cause of death in the United States. As of 2010, 25.8 million peo-ple—8.3% of the U.S. population—have diabetes; 1.9 million new cases of diabetes were diagnosed in people aged 20 years or older in 2010 .
Diabetes is a disease in which blood glucose levels are above normal. Most of the food individuals eat is turned into glucose, or sugar, for our bodies to use for energy. The pancreas, an organ that lies near the stomach, makes a hormone called insulin to help glucose get into the cells of our bodies. When someone has diabetes, your body either does not make enough insulin or cannot use its own insu-lin as well as it should. Diabetes can cause serious health complications including heart disease, blindness, kidney failure, and lower-extremity amputations.
District residents were asked if they have ever been told by a doctor, nurse or other health professional that they have diabetes (Table 7.42). Overall, 9.1% of District resi-dents have diabetes.
State Health Planning and Development AgencyState Health Planning and Development Agency is re-sponsible for the administration of Health Systems Plan which serves as a guide for the development of health care services by both the public and private sectors; adminis-tration, operation, and enforcement of the Certificate of Need program; collection and analysis of health data; and the monitoring of health facilities for compliance with the
Table 7.42. Prevalence of Diabetes
“Has a doctor, nurse or other health professional ever told you that you have diabetes?”
# Yes
Yes, but female told only during
pregnancy No
No, pre-diabetes or borderline
diabetesTotal 4,551 9 .1 0 .7 89 .0 1 .2
Sex Male 1,739 9 .3 - 89 .6 1 .1
Female 2,812 9 .0 * 88 .5 1 .3
Age
18 To 24 129 - * 96 .9 2 .225 To 34 456 2 .7 * 95 .8 0 .935 To 44 628 5 .3 * 93 .8 0 .145 To 54 782 10 .5 * 87 .9 0 .855 To 64 1,116 17 .6 * 80 .8 1 .565 Or Older 1,440 22 .6 * 74 .5 2 .2
Rac
e/Et
h-ni
city
Caucasian/White 1,997 2 .8 * 96 .4 0 .4African American/Black 2,030 15 .0 * 83 .2 1 .2Other 244 8 .6 * 86 .4 4 .7Hispanic 184 5 .4 * 89 .8 2 .6
Educ
atio
n Less than high school 292 19 .2 * 77 .7 2 .9High school graduate 777 13 .4 * 85 .1 1 .1Some college or technical school 710 9 .7 * 88 .2 0 .8College graduate 2,754 4 .0 0 .6 94 .5 0 .9
Inco
me
Less than $15,000 485 15 .4 * 82 .5 1 .1$15,000-$24,999 492 15 .5 * 81 .1 2 .1$25,000-$34,999 282 11 .3 * 86 .6 2 .0$35,000-$49,999 371 10 .2 * 87 .0 2 .7$50,000-$74,999 485 7 .1 * 90 .6 2 .0$75,000 or more 1,873 3 .3 * 95 .8 0 .4
War
d
Ward 1 326 4 .8 * 92 .4 2 .5Ward 2 362 4 .0 * 95 .5 0 .4Ward 3 721 4 .4 * 94 .0 1 .3Ward 4 594 9 .6 * 87 .7 0 .4Ward 5 469 12 .6 * 85 .9 1 .4Ward 6 495 8 .4 * 90 .2 0 .7Ward 7 463 13 .5 * 83 .0 3 .3Ward 8 377 20 .4 * 78 .6 0 .5
*Suppressed if cell size is less than 50; - Zero responseSource: DC Dept of Health, Center for Policy, Planning, & Evaluation, DC Behavioral Risk Factor Surveillance System (BRFSS), 2011

• Indices 2013 • District of Columbia • 211
requirements that govern the provision of uncompensated care to needy residents .
Certificate of Need Process
As a means of ensuring the availability of high quality, accessible and affordable health care services, the District has a Certificate of Need program (CON). Certificate of Need is essentially a mechanism that requires both public and private providers of health services to receive approv-
al for capital improvements, equipment purchases or the establishment of new health services. District law (DC Official Code 44-401) requires that health care providers obtain a certificate of need when entering into an obliga-tion for any new health care service, capital projects with a budget of $2.5 million or more, major medical equipment costing $1.5 million or more for facilities and $250,000 or more for physician’s offices. Table 7.43 shows the CON applications by category.
Vital Records Division Vital Records Division is responsible for collecting, pre-serving and administering the District’s system of birth and death records .
Vital Statistics: Births
In 2011, there were 9,289 births in the District. This figure represents a 24.0 percent increase in births from 2002 and a 1.5 percent increase compared with 2010. The general fertility rate, a measure of fertility based on the number of women of child-bearing, increased from 54.8 in 2005 to 61 .4 in 2008 and started a declining trend from 2009 with a fertility rate of 59.7. In 2011, births to women young-er than 20 years of age accounted for 9 .8 percent of all births, compared to 10.6 percent of all births in 2010. The proportion of births to single mothers decreased from 54.7 percent in 2010 to 53.4 percent in 2011. The percent of infants weighing less than 2,500 grams increased from 10.2 percent in 2010 to 10.5 percent in 2011. The infant mortality rate in 2011 was 7.4 per 1,000 live births, which was a historic low in the District of Columbia. This rate represents a 7.5 percent decrease from 2010 (Table 7.44).
Births by Race/Ethnicity
The number of births over this 10-year period showed an increasing trend. Births increased by 24 percent between
Table 7.43. Certificate of Need Applications By Category: 2003-2012
Calendar Year ApplicationsFacilities and
ServicesReplacement
and RenovationMajor Medical
EquipmentChange of Own-
ership2003 20 15 2 32004 20 14 3 32005 18 14 3 12006 25 19 3 1 22007 29 19 2 3 52008 17 10 3 2 22009 25 21 3 0 12010 24 18 3 1 22011 43 26 6 7 42012 39 30 5 2 2Source: DC Department of Health, Center for Policy, Planning and Evaluation, State Health Planning & Development Agency
Table 7.44. Annual Live Births and Infant Deaths by Calendar Year
2002 2003 2004 2005 2006 2007 2008 2009 2010 2011*Live Births Total** 7,494 7,616 7,937 7,940 8,522 8,870 9,134 9,008 9,156 9,289 Married Women 3,261 3,523 3,495 3,492 3,613 3,679 3,846 3,950 4,093 4,290 Single Women 4,233 4,093 4,442 4,448 4,908 5,190 5,278 4,995 5,008 4,963General Fertility Rate 52 .1 53 .1 55 .2 54 .8 58 .3 60 .0 61 .4 59 .7 56 .4 55 .9Percent of births to Women Under 20 Years 12 .8 11 .4 11 .2 11 .0 12 .0 12 .1 12 .2 11 .7 10 .6 9 .8
Percent of Low Birth weight Infants 11 .6 11 .0 11 .1 11 .2 11 .6 11 .1 10 .5 10 .3 10 .2 10 .5
Infant Deaths 86 78 94 108 96 116 100 89 73 69Infant Death Rate Per 1,000 Live Births 11 .5 10 .2 11 .8 13 .6 11 .3 13 .1 10 .9 9 .9 8 .0 7 .4
*Preliminary data.** Numbers may not add up Total due to missing or unreported information.Source: DC Department of Health, Center for Policy, Planning, and Evaluation, Data Management and Analysis Division

• District of Columbia • Indices 2013 •212
2002-2011. During this same period, the proportion of births to black mothers declined by 12.7 percent. Since 2002, the proportion of births to white mothers showed a steady upward trend . Births to white mothers increased by 27 percent from 24.1 percent in 2002 to 30.6 percent in 2011. The proportion of births to Hispanic mothers also showed an increasing trend . Births to Hispanic mothers increased by 9.8 percent from 13.3 percent in 2002 to 14.6 in 2011. The number of birth to Asian & Pacific Islanders also increased during the reporting period (Table 7.45).
Births to women with post-secondary education (i.e., some college or higher) increased by 29.8 percent from 40.9 percent in 2002 to 53.1 percent in 2011 and births among women with primary & secondary education de-clined 9.2 percent during the same period. Preterm birth was highest with 13.4 percent in 2005 and 2006 but the lowest in 2010 (10 .4 percent) .
Births by Ward
As shown in Table 7.46, from 2002-2011, except the years 2005 and 2006, Ward 8 had the largest number of births. From 2005-2011, Ward 4 had the second highest number of births. Ward 2 had the fewest number of births followed by Ward 3 from 2002-2011.
Vital Statistics: Termination of Pregnancies
Abortions performed in the District are reported to the DOH on a voluntary basis by hospitals and free-standing clinics. The DOH does not receive reports on abortions performed in private physician’s offices. Abortions per-formed on District residents in other states are included in the reporting on a voluntary basis. During the past seven
years, the number of reported abortions averaged 1,861 per year. The number of reported abortions for District residents increased by 1.7 percent between 2010 and 2011, while the abortion rate decreased by less than 1 per-cent. Of the 1,941 abortions reported in 2011, 12.1 percent were performed on women under the age of 20. Almost 60 percent of the procedures were performed on women
Table 7.45. Annual Live Births by Race/Ethnicity, Education of Mother, and Pre-Term Birth by Calendar Year
2002 2003 2004 2005 2006 2007 2008 2009 2010 2011*All Races Total** 7,494 7,616 7,937 7,940 8,522 8,870 9,134 9,008 9,156 9,289
Black 4,532 4,566 4,684 4,575 4,848 4,926 5,031 4,847 4,940 4,903 White 1,808 1,925 2,115 2,171 2,312 2,370 2,494 2,655 2,638 2,843 Asian & Pacific Islander 193 225 225 165 182 215 220 298 365 420 Other 925 881 881 1,009 1,164 1,330 1,361 904 622 612
Hispanic Origin*** Hispanic 1,000 975 1,028 1,132 1,344 1,487 1,527 1,498 1,351 1,358 Non-Hispanic 6,494 6,641 6,909 6,806 7,175 7,383 7,596 7,305 7,721 7,828
Education of Mother (Percent) Primary & Secondary 50 .1 49 .8 48 .0 47 .8 48 .2 50 .0 50 .0 46 .3 46 .5 45 .5 Post-Secondary 40 .9 43 .9 44 .0 43 .0 42 .9 42 .8 45 .6 51 .2 51 .8 53 .1
Percent of Pre-Term Birth < 37 Weeks Gestational Age 12 .4 12 .5 12 .5 13 .4 13 .4 12 .2 12 .2 11 .0 10 .4 11 .0
*Preliminary data. ** Numbers may not add up Total due to missing or unreported information. ***Persons of Hispanic origin may be of any race.Source: DC Department of Health, Center for Policy, Planning, and Evaluation, Data Management and Analysis Division
Table 7.46. Annual Live Births by Ward, District of Columbia 2002-2011 Calendar Year
2002 2003 2004 2005 2006 2007 2008 2009 2010 2011*All Wards Total** 7,494 7,616 7,937 7,940 8,522 8,870 9,134 9,008 9,156 9,289
Ward 1 1,126 1,053 1,141 1,123 1,262 1,243 1,306 1,227 1,219 1,174 Ward 2 757 759 763 799 846 634 682 693 691 601 Ward 3 921 956 1,013 936 913 796 786 765 801 842 Ward 4 1,001 1,034 1,088 1,196 1,316 1,460 1,467 1,441 1,324 1,423 Ward 5 787 791 854 839 898 1,041 1,085 1,099 1,067 1,089 Ward 6 850 834 946 949 991 939 998 1,067 1,118 1,245 Ward 7 822 932 898 945 1,015 1,210 1,222 1,162 1,218 1,218 Ward 8 1,221 1,252 1,231 1,150 1,249 1,545 1,583 1,521 1,635 1,667 *Preliminary data. ** Numbers may not add up Total due to missing or unreported information.Source: DC Department of Health, Center for Policy, Planning, and Evaluation, Data Management and Analysis Division

• Indices 2013 • District of Columbia • 213
in their twenties, while 26.4 percent were performed on women in their thirties and 2 .6 percent on women in 40 years and older. The rate of abortion in 2011 was 11.7 per 1,000 live women between the ages of 15 and 44 (Ta-ble 7.47). In 1988, Congress prohibited the District gov-ernment from paying for abortions with federal or local funds, except in cases to save the life of the mother.
Vital Statistics: Deaths
In 2011, there were 4,582 District resident deaths re-corded (Table 7.48). Total District resident deaths have decreased in each of the past five years. In 2011, deaths decreased by 11.3 percent from 2007. When examined by race and gender, the trends show a 12.1 percent decrease among black and other non-white males in contrast to a decrease of 18.5 percent among white males. For black and other non-white females, total deaths decreased 6.0 percent compared with a decrease of 20 .2 percent among white females .
The number of deaths among black and other non-white females in 2011 was disproportionate to their numbers in the population. This group accounted for 41.6 percent of all deaths of residents, yet accounted for only 32.9 percent of the District’s population.
Vital Statistics: Leading Causes of Death
The leading cause of death in the District of Columbia and in the nation in 2011 was heart disease . In the Dis-trict, the age-adjusted death rate from heart disease de-creased by 16.1 percent from 2007 to 2011, with a con-sistent downward trend beginning in 2008. Nationally, the age-adjusted death has decreased by 9 percent during the same five-year period. The second highest cause of
death is cancer, which has decreased by 8.7 percent in the District between 2007 and 2011. As of 2011 in the District, Cerebrovascular Diseases (which leads to stroke) and Accidents were the third and fourth causes of death, while they were ranked 4th and 5th in the United States, respectively. From 2007 to 2011, the rate of deaths due to Accidents decreased by 19 percent in the District, which made the District’s deaths due to Accidents lower than na-tional levels. Deaths due to HIV/AIDS in the District have
Table 7.47. Number and Rate* of Abortions Reported Performed on District Residents by Calendar Year
2005 2006 2007 2008 2009 2010 2011Maternal Age # Rate # Rate # Rate # Rate # Rate # Rate # RateUnder 15 years** 27 1 .7 9 0 .6 8 0 .6 7 0 .5 14 1 .0 19 1 .5 10 0 .815-19 years 444 21 .9 204 9 .9 178 8 .4 208 9 .8 240 11 .1 275 13 .1 232 11 .320-24 years 830 30 .5 504 18 .0 464 16 .2 414 14 .2 594 21 .9 593 16 .8 612 1825-29 years 679 22 .7 498 16 .6 447 14 .7 385 12 .2 483 15 .0 507 13 .5 519 13 .130-34 years 407 16 .3 269 10 .9 282 11 .3 221 8 .9 288 10 .7 302 10 .6 345 11 .235-39 years 219 9 .9 158 7 .1 160 7 .2 118 5 .4 137 5 .9 163 7 .6 168 7 .740 years and older*** 80 3 .9 51 2 .5 47 2 .3 50 2 .5 50 2 .5 49 2 .6 50 2 .6Not Reported 0 - 4 - 1 - 0 - 0 - 1 - 5 -Total**** 2,686 18 .5 1,697 11 .6 1,587 10 .7 1,403 9 .4 1,806 12 .0 1,909 11 .8 1,941 11 .7*These are the rates per thousand women aged 15-44 years, using the Bureau of the Census July 2005-2009 population estimates and 2010 census. Rates are calculated by dividing the number of abortions by the number of women in the age class being considered and multiplying by 1,000. **For “under 15 years,” rate computed by relating the number of events to women under 15 years to women aged 10-14 years.***For “40 years and older,” rate computed by relating the number of events to women aged 40 years and over to women aged 40-44 years. ****For the total, rate computed by relating the number of events to women of all ages to women aged 15-44 years.
Source: DC Department of Health, Center for Policy, Planning, and Evaluation, Data Management and Analysis Division
Table 7.48. Deaths by Race and Gender in the District of Columbia by Calendar Year
2007 2008 2009 2009 % 2010 2010 % 2011* 2011* %Black & Other Non-White races
Male 1,979 2,037 1,967 40 .8 1,777 38 .1 1,739 38 .0Female 2,030 2,028 1,868 38 .8 1,877 40 .2 1,908 41 .6Subtotal 4,009 4,065 3,835 79 .6 3,654 78 .2 3,647 79 .6
WhiteMale 599 573 520 10 .8 495 10 .6 488 10 .7Female 560 486 462 9 .6 521 11 .2 447 9 .8Subtotal 1,159 1,059 982 20 .4 1,016 21 .8 935 20 .4
Total 5,168 5,124 4,817 100.0 4,670 100.0 4,582 100.0*Preliminary data.Source: DC Dept of Health, Center for Policy, Planning, & Evaluation, Data Mgmt & Analysis Division. U.S. Census Bureau, Population Division.

• District of Columbia • Indices 2013 •214
been steadily declining from 2007; a decrease of 54.7 percent between 2007 and 2011. During this five-year period, the death rate due to homicide (assault) has also decreased by 38.9 percent in the District; however, the District’s homicide (assault) death rate is still much higher than the national rate of 5.2. The District’s mortality rates for six of the 10 leading causes of death were higher than the national rates: heart disease, cancer, di-abetes, homicide/assault, HIV/AIDS, and septicemia. Cerebrovascular diseases (which leads to stroke), accidents, chronic lower respiratory diseases, Alzheimer’s disease, and influenza/pneumonia death rates in the District were lower than in the nation.
Chronic disease, including heart disease, cerebrovascular diseases (stroke), cancer, and diabetes, account for 56.4 percent of all deaths in the District in 2011. If HIV/AIDS is included as a chronic disease, then these five causes of death account for 58.4 percent in 2011 .
Deaths by Ward
As shown in Table 7.51, from 2007-2011, Ward 5 had the highest crude death rate among all wards, except in year 2008 when Ward 4 had the highest rate. Ward 4 had the second highest death rate in 2007 and 2009, while Ward 7 had the second highest death rate in 2010 and 2011. Ward 2 had the lowest crude death rate followed by Ward 1 from 2009-2011. Crude death rates in all wards have decreased in the last 5 years, except in Wards 7 and 8, which increased by 5.8 and 4.4 percent, respectively.
Table 7.49. Leading Causes of Death in The District of Columbia Age-Adjusted Rate Per 100,000 Population
DC Rank* Cause of Death 2007 2008 2009 2010
Prelim-inary 2011
% Change 2007-2011
1 Heart Disease 228 .6 232 .6 231 .4 221 .4 191 .9 -16 .12 Malignant Neo-
plasms (Cancer) 197 .0 192 .4 190 .2 177 .1 179 .8 -8 .7
3 Cerebrovascular Diseases 33 .2 35 .0 34 .3 32 .4 34 .1 2 .7
4 Accidents 33 .1 28 .8 35 .1 34 .9 26 .8 -19 .05 Chronic Lower Re-
spiratory Diseases 21 .1 22 .4 24 .2 25 .5 25 .5 20 .9
6 Diabetes 25 .6 27 .6 23 .0 24 .9 25 .7 0 .47 Alzheimer’s Disease 19 .1 19 .1 16 .0 18 .7 19 .7 3 .18 Homicide/Assault 25 .2 28 .8 20 .5 17 .1 15 .4 -38 .99 Influenza and Pneu-
monia 19 .1 19 .0 13 .0 13 .6 15 .4 -19 .4
10 HIV/AIDS 31 .8 27 .6 23 .6 20 .4 14 .4 -54 .710 Septicemia 21 .3 23 .2 15 .0 15 .3 16 .1 -24 .4*Rank based on number of District of Columbia resident deaths in 2011.Source: DC Department of Health, Center for Policy, Planning, and Evaluation, Data Management and Analysis Division
Table 7.50. Leading Causes of Death in The United States Age-Adjusted Rate Per 100,000 Population
U.S. Rank* Cause of Death 2007 2008 2009 2010
Prelim-inary 2011
% Change 2007-2011
1 Heart Disease 190 .9 186 .5 180 .1 179 .1 173 .7 -9 .02 Malignant Neoplasms
(Cancer) 178 .4 175 .3 173 .2 172 .8 168 .6 -5 .5
3 Chronic Lower Respi-ratory Diseases 40 .8 44 .0 42 .3 42 .2 42 .7 4 .7
4 Cerebrovascular Diseases 42 .2 40 .7 38 .9 39 .1 37 .9 -10 .2
5 Accidents 40 .0 38 .8 37 .3 38 .0 38 .0 -5 .06 Alzheimer’s Disease 22 .7 24 .4 23 .5 25 .1 24 .6 8 .47 Diabetes 22 .5 21 .8 20 .9 20 .8 21 .5 -4 .48 Influenza and Pneu-
monia 16 .2 16 .9 16 .2 15 .1 15 .7 -3 .1
9 Nephritis, Nephrotic Syndrome and Ne-phrosis
14 .5 14 .8 14 .9 15 .3 13 .4 -7 .6
10 Intentional Self-Harm (Suicide) 11 .3 11 .6 11 .8 12 .1 12 .0 6 .2
*Rank based on number of deaths in the United States in 2011.Source: U.S. Department of Health and Human Services, Center for Disease Control and Prevention, Na-tional Center for Health Statistics .
Table 7.51. Crude Death Rates by Ward, District of Columbia, 2007-2011 Calendar Year
2007 2008 2009 2010Prelimi-
nary 2011% Change 2007-2011
City-wide Mortality Rate 887 .6 866 .7 803 .3 776 .1 761 .5 -14 .2
Ward 1 572 .5 594 .4 547 .8 506 .6 429 .2 -25 .0Ward 2 744 .4 701 .9 403 .1 326 .6 331 .6 -55 .5Ward 3 739 .8 679 .2 568 .4 596 .2 537 .9 -27 .3Ward 4 1,126.0 1,148.8 1,035.6 966 .0 960 .8 -14 .7Ward 5 1,241.2 1,114.9 1,358.5 1,182.9 1,139.9 -8 .2Ward 6 849 .5 811 .8 645 .8 694 .5 664 .5 -21 .8Ward 7 1,035.8 1,078.0 1,023.7 1,068.0 1,096.1 5 .8Ward 8 828 .9 793 .8 842 .9 898 .0 865 .5 4 .4Source: DC Department of Health, Center for Policy, Planning, and Evaluation, Data Management and Analysis Division

• Indices 2013 • District of Columbia • 215
Department of mental HealtHThe mission of the Department of Mental Health (DMH) is to support prevention, resiliency and recovery for Dis-trict residents in need of public mental health services. To fulfill its mission DMH develops, supports and oversees a comprehensive, community-based, consumer driven, culturally competent, quality mental health system that is responsive and accessible to children, youth, adults, and their families . DMH contracts with a network of commu-nity-based, private providers and also provides direct ser-vices through the Comprehensive Psychiatric Emergency Program, Mental Health Services Division, School-Based Mental Health Program, and Saint Elizabeths Hospital.
Transition to Dept of Behavioral HealthEffective October 1, 2013, the Department of Mental Health will merge with the Addiction Prevention and Recovery Administration in the Department of Health to integrate treatment and services for residents with men-tal health and substance use disorders. Mayor Vincent C. Gray formed the new Department of Behavioral Health to improve the health and well-being of residents who receive mental health and substance use treatment and supports . Research shows that integrated treatment pro-duces better outcomes for individuals with co-occurring mental and substance use disorders. Without integrated treatment, one or both disorders may not be addressed properly. The overall vision of an integrated system is to effectively serve individuals with co-occurring disorders whether they are seeking help for substance use disorders or mental health conditions . It is estimated that annually about 22,000 adults and children receive mental health treatment while APRA serves about 12,000 residents. Over the next year, the new Department will merge sepa-rate clinical services and develop an infrastructure within the mental health and substance use systems to support in-tegrated service delivery . Residents who only seek mental health treatment or only substance use treatment will con-tinue to be served by the new Department.
Consumers in Department of Mental Health ProgramsTables 7.52-54 provide a profile of people receiving men-
Table 7.52. Number of Individuals Receiving Services in FY 2010
Age Sex Black White HispanicMore than one race identified Other Total
Under17 Female 1,478 5 50 0 20 1,553Male 2121 10 103 0 29 2,263Unknown 0 0 1 0 0 1Total 3,599 15 154 0 49 3,817
18-64 Female 6,791 373 293 5 341 7,803Male 6,472 447 261 3 566 7,749Unknown 51 20 9 0 23 103Total 13,314 840 563 8 930 15,655
65+ Female 296 52 12 0 62 422Male 222 45 11 0 69 347Unknown 4 2 0 0 1 7Total 522 99 23 0 132 776
Total 17,435 954 740 8 1,111 20,248Source: Department of Mental Health Uniform Reporting System Data submitted to the U.S. Department of Health and Human Services, Sub-stance Abuse and Mental Health Services Administration
Table 7.53. Number of Individuals Receiving Services in FY 2011
Age Sex Black White HispanicMore than one race identified Other Total
Under17 Female 1,733 5 67 0 27 1,832Male 2,377 6 92 0 28 2,503Unknown 0 0 0 0 0 0Total 4,110 11 159 0 55 4,335
18-64 Female 7,322 425 316 6 353 8,422Male 7,227 493 310 5 552 8,587Unknown 7 8 1 1 5 22Total 14,556 926 627 12 910 17,031
65+ Female 282 60 17 0 64 423Male 214 54 12 0 67 347Unknown 1 0 0 0 0 1Total 497 114 29 0 131 771
Total 19,163 1051 815 12 1,096 22,137Source: Department of Mental Health Uniform Reporting System Data submitted to the U.S. Department of Health and Human Services, Sub-stance Abuse and Mental Health Services Administration

• District of Columbia • Indices 2013 •216
tal health services by age, gender, and race for the peri-od FY10, FY11, and FY12. The total number of persons served is 20,248; 22,137 and 24,052, respectively for the three fiscal years for an average of 22,146 served annual-ly. These individuals received services from DMH either through its government operated mental health programs or through community based mental health providers. The majority of people who receive services are eligible for Supplemental Security Income, Medicaid or are unin-sured .
Mental Health Services and SupportsDMH offers specialty services for adults and children/
youth that include evidence-based and promising practic-es. These services include: assertive community treatment (ACT) for adults; and multi-systemic therapy (MST) and functional family therapy (FFT), and high fidelity wrap-around (HFW) for children/youth . HFW is considered a promising practice, not an evidence-based practice. Table 7.55 shows the number of adults and children/youth who received these services in FY10-FY12 .
Access HelpLine DMH operates a 24/7 Access HelpLine (1-888-793-4357) for emergency psychiatric care and to enroll for ongoing mental health services. In April 2011, the Access Help-Line (AHL) was granted full certification as a Suicide Lifeline Network provider for the District of Columbia by the American Association of Suicidology. AHL provides Suicide Lifeline Network callers with 24-hour suicide prevention via telephone access. The activities include: 1) responding to callers who access the Suicide Lifeline Network; 2) providing suicide intervention; and 3) dis-patching mobile crisis services when necessary.
In response to the increasing number of suicides at tran-sit stations, during the latter part of FY11 in partnership
with the Washington Metropolitan Area Transit Authority (WMATA), AHL began operating the WMATA Life Line. Also, in FY12 DMH began providing suicide prevention training to WMATA staff. Table 7.56 shows calls made to the AHL administrative, crisis and suicide lines.
Crisis Emergency ServicesDMH is responsible for providing emergency assistance to adults and children experiencing a psychiatric or emo-tional crisis. The Comprehensive Psychiatric Emergency Program (CPEP) is a 24-hour/7-day a week operation that provides immediate psychiatric evaluation, treatment and stabilization, and eight (8) extended observation beds if necessary for adults. There were 10,073 total admissions to CPEP during FY10-FY12, as shown in Table 7.57. This data represents total encounters not unduplicated counts .
During this 3-year period, a little more than half (55.4% or 4784) of admitted consumers were males, and the largest ethnic group (86.8% or 7498) was Black/African Ameri-can (which includes individuals of African descent). The average age for consumers was 43 years for females, 42 years for males, and 38 years for transgendered individ-uals. The demographic profile of the adults who received emergency psychiatric services in FY10-FY12 is shown in Table 7.58.
Table 7.54. Number of Individuals Receiving Services in FY 2012
Age Sex Black White HispanicMore than one race identified Other Total
Under17 Female 1,714 4 45 0 36 1,799Male 2,358 7 67 0 83 2,515Unknown 1 1 0 0 1 3Total 4,073 12 112 0 120 4,317
18-64 Female 7,845 415 295 4 671 9,230Male 7,996 465 278 6 839 9,584Unknown 25 18 1 4 7 55Total 15,866 898 574 14 1517 18,869
65+ Female 306 61 14 0 82 463Male 242 55 15 1 84 397Unknown 5 0 0 0 1 6Total 553 116 29 1 167 866
Total 20,492 1,026 715 15 1,804 24,052Source: Department of Mental Health Uniform Reporting System Data submitted to the U.S. Department of Health and Human Services, Sub-stance Abuse and Mental Health Services Administration
Table 7.55. Adults and Children/Youth Receiving Evi-denced-Based and Promising Practices
Services PopulationFY
2010FY
2011FY
2012ACT Adults 1020 1125 1300MST Children/Youth 122 129 120FFT Children/Youth N/A 82 224HFW Children/Youth 171 211 282Source: Department of Mental Health
Table 7.56. Access HelpLine Administrative, Crisis and Suicide Lines
FY 2010 FY 2011 FY 2012Administrative Line
Inbound Calls 24,353 45,149 20,800Outbound Calls 32,825 34,052 34,169Total Admin. Line Calls 57,178 79,201 54,969
Crisis LineInbound Calls Only 25,491 30,495 38,322
Suicide Life LineInbound Calls Only 122 479 1,718
WMATA Life LineInbound Calls Only N/A N/A 75
Total Other Calls 25,613 30,974 40,115Source: Department of Mental Health

• Indices 2013 • District of Columbia • 217
CPEP also oversees mobile crisis teams that provide crisis intervention services for adults who are unable or unwill-ing to come to the facility. During FY10-FY12, the teams provided 7,200 face-to-face and phone engagements to 3,717 unique individuals as shown in Table 7.59.
In addition to on-site crisis stabilization, the mobile crisis services teams perform assessment for voluntary and in-voluntary hospitalizations and linkages to other services including ongoing mental health care and substance abuse detoxification and treatment. The mobile crisis services teams also provide follow-up care for consumers admitted to CPEP who are in need of further assistance (e.g., trans-port to their residence or to a core services agency intake appointment after discharge) . Consumers in crisis may experience one or more mental health issues. The crisis teams reported that of the 3,306 crisis response episodes, 2,086 (63.1%) involved a consumer with mental illness who was decompensating; 1,062 (32.1%) were suicidal; 481(14.5%) were homicidal; 232 (7%) were using/abus-ing substances; 224 (6.8%) had self-neglect behaviors; 153(4.6%) also had medical issues; and 28 (0.8%) were hoarders .
With regard to child and youth crisis services, DMH con-tracts with the Children and Adolescent Mobile Psychiat-ric Service known as ChAMPS, to provide rapid on the scene response to children facing an emotional or mental health crisis. This mobile crisis service team stabilizes the child, helps families manage the crisis, and in the case of foster parents, seeks to avoid placement disruption. Table 7.60 shows ChAMPS deployments during FY 10-FY12. In FY10, data for deployable calls was tracked beginning with the second through the fourth quarters.
Housing ServicesTo increase the supply of quality, affordable housing available to people with mental illness, DMH operates a rental housing subsidy program. In addition, to support community integration and recovery, DMH supports com-munity residential facilities and supportive independent living . DMH has developed meaningful partnerships with the DC Housing Authority and Department of Housing and Community Development .
DMH awarded 133 new housing subsidies in FY12, which supported reaching the goal of 1,496 housing subsidies by the end of the fiscal year. Also, during FY12 DMH con-tracted with The Technical Assistance Partnership, Inc. to develop a housing strategic plan that was finalized in Sep-tember 2012. This process involved evaluating DMH’s current system of supported housing to identify strategies to ensure a continuum of community-based housing and
Table 7.57. Number of Adults Receiving Emergency Psychiatric Services
Oct Nov Dec Jan Feb Mar Apr May Jun Jul Aug Sep TotalFY10 341 337 332 333 288 326 276 330 321 357 380 322 3,941FY11 305 305 304 319 318 382 352 350 314 313 331 328 3,921FY12 340 332 318 294 315 365 339 312 340 331 334 305 3,925Total 986 974 954 946 921 1,073 967 992 975 1,001 1,045 955 10,073Source: Department of Mental Health
Table 7.58. Demographic Profile of Adults Receiving Emergency Psychiatric Services by Race/Ethnicity
GenderAmerican
Indian
Asian/ Pacific
Islander
Black/ African
AmericanCaucasian/
White Hispanic Other Total
Female 3 25 3,356 345 84 9 3,822 (44.2%)
Male 2 39 4,110 436 174 23 4,784 (55.4%)
Transgender 0 0 32 1 3 0 36 (0.4%)
Total 5 (0.06%) 64 (0.7%) 7,498 (86.8%) 782 (9%) 261 (3%) 32 (0.4%) 8,642
(100%)Source: Department of Mental Health
Table 7.59. Mobile Crisis Service Engagements
Response Types FY10 FY11 FY12 Total
Crisis Response – Face to Face 1,161 1,019 1,084 3,264
(45.3%)
Crisis Response – Phone Only 15 8 19 42
(0.6%)
Outreach – Face to Face 528 501 344 1,373
(19.1%)
Outreach – Phone Only 628 522 251 1,401
(19.5%)
Transportation Assistance - CPEP Discharge
421 342 357 1,120 (15.5%)
Total 2,753 (38.2%)
2,392 (33.2%)
2,055 (28.5%)
7,200 (100%)
Source: Department of Mental Health
Table 7.60. Children and Adolescent Mobile Psychiat-ric Service Calls and DeploymentsActivity FY2010 FY2011 FY2012
Total Calls 1,015 979 1,276Total Deployable Calls 498 545 708
Total Deployments 581 482 644Unduplicated Chil-dren Served 414 324 882
Source: ChAMPS Program Anchor Mental Health Catholic Charities of Washington DC

• District of Columbia • Indices 2013 •218
support services that meet consumer needs, are built on best practices, consistent with DMH priority population needs, and cost-effective. The planning process included stakeholders, DMH staff, and other partners. The result of this work is the 5-year Supportive Housing Strategic Plan FY 2012- FY2017, which establishes guiding strategies for DMH’s future activity in permanent supportive hous-ing and specific actions to be implemented.
Supportive Housing Programs include services and sup-ports to help individuals obtain and maintain appropriate housing. Table 7.61 shows the number of people who par-ticipated in the housing programs in FY10-FY12 .
Homeless ServicesThe Homeless Outreach Program provides a wide variety of services for consumers with mental illness, providers and community members, and individuals initially identi-fied as homeless. The primary services include: outreach and crisis services to individuals through regular visits to shelters; on the streets and in homes in the District; and coordination with other outreach program’s social work-ers and community members to provide assessments, re-ferrals, traveler’s assistance, brief intervention services, and referrals to overnight shelter services .
During FY10-FY12, the Homeless Outreach Program served 3,847 consumers. Of these, 3,497 (91%) were known homeless individuals; and the majority (2,891 or 75.1%) were single-adults (Table 7.62).
Also, during the reporting period consumers received a total of 9,824 face-to-face engagements with an average of three per consumer. The main services provided during these engagements included: 9,692 (98.7%) rapport build-ing encounters; 2,012 (20.8%) assessments; 214 (2.2%) admissions to CPEP or a community hospital for psychi-atric care; 36 (0.4%) admissions to an emergency room for health issues; and 217 (2.2%) encounters to assist with an existing or new core service agency linkage .
Mental Health Services DivisionThe Mental Health Services Division provides specialized mental health services that are not otherwise readily avail-able within the DMH service system or the private sector. The programs and services include: 1) a same day urgent care clinic; 2) multicultural services; 3) intellectual/de-velopmental disability and deaf /hard of hearing services; and 4) pharmacy services .
The Same Day Urgent Care Clinic services are intend-ed to intervene to prevent relapse or full-blown crisis by alleviating presenting problems. Promotion of emotional health is enhanced beyond the services typically provided by a community clinic that serves individuals with major mental illnesses. This is achieved as follows: 1) adult and child consumers may walk-in unscheduled and be evalu-ated the same day; 2) same day access to a psychiatrist; 3)
psychotherapy services are available on a scheduled basis through the Residents’ Clinic; and 4) on-site pharmacy that serves individuals without insurance, all walk-in con-sumers who see a psychiatrist can also have their prescrip-tions filled that day. The number of consumers served by the Same Day Urgent Care Clinic in FY10-FY12 (Table 7 .63) .
Table 7.63. Unduplicated Consumers Served by Same Day Urgent Care ClinicPopulation FY2010 FY2011 FY2012
Adults 2,080 2,825 3,083Children/Youth 402 488 489Totals 2,482 3,313 3,572Source: Mental Health Services Division
School Mental Health ProgramThe School Mental Health Program promotes social and emotional development and addresses psychosocial and mental health problems that become barriers to learning by providing prevention, early intervention, and treatment services to youth, families, teachers and school staff. Ser-vices are individualized to the needs of the school and may include screening, behavioral and emotional assess-ments, school-wide or classroom based interventions, psychoeducational groups, consultation with parents and teachers, crisis intervention, as well as individual, family and group treatment. The number of DC Public and Pub-lic Charter Schools that received services by school year include: 52 in SY 2009-2010; 59 in SY 2010-2011; and 53
Table 7.61. Consumers Participating in Housing Pro-gramsHousing Program FY2010 FY2011 FY2012
Home First 766 756 830Supported Indepen-dent Living (SIL) 476 551 551
Local Rent Subsidy (LRSP) 43 80 93
Federal Vouchers (set asides) 368 368 368
Contract Community Residential Facilities (CRFs)
256 220 220
Independent Com-munity Residential Facilities (ICRFs)
472 472 472
Total 2,379 2,447 2,534Source: Department of Mental Health
Table 7.62. Unduplicated Consumers Served by Homeless Status
Homeless Status Consumer Type FY10 FY11 FY12 Total
HomelessSingle-Adult 1141 909 841 2891 (75.1%)Family-Adult 109 111 110 330 (8.6%)Family-Child 56 111 109 276 (7.2%)
Not HomelessSingle-Adult 109 88 67 264 (6.9%)Family-Adult 43 9 4 56 (1.5%)Family-Child 2 0 1 3 (0.1%)
Unknown Single-Adult 9 13 5 27 (0.7%)Totals 1,469 1,241 1,137 3,847 (100%)Source: Department of Mental Health

• Indices 2013 • District of Columbia • 219
in SY 2011-2012 .
Table 7.64 shows the number of participants receiving various services during the three school years. Table 7.65 shows the number of participants in prevention and early
intervention activities during the same period. The de-crease in service utilization across years was likely due to the reduction in the number of full-time employees across the two academic years (i.e., loss of six contract positions and four vacancies during the 2011-2012 School Year) .
Saint Elizabeths HospitalSaint Elizabeths Hospital (SEH) provides inpatient care for adults with serious and persistent mental illnesses, including those who have been civilly and forensically committed . Founded in 1855 at the urging of Dorothea Dix, Saint Elizabeths was the first large-scale, federally run mental health and psychiatric care facility in the Unit-ed States. It was transferred to the District of Columbia in 1987. Working with community based mental health providers, Saint Elizabeths focuses on maximizing the po-tential for recovery so that people with mental illness will be able to integrate into the larger community with the appropriate level of support necessary for successful rein-tegration. In May 2010, a state-of-the-art, 448,190 square foot (10.3 acres) facility opened that features a number of strategies to lessen the building’s environmental impact, including the use of natural light, bio-retention areas, and a 28,000 square foot green roof that is likely the largest on any mental health facility in the country .
For the past several years, SEH saw a consistent and significant census reduction as a result of decreased ad-missions and concerted efforts to appropriately discharge
individuals in care to the community. As a result, dis-charges have exceeded admissions. In FY06, there were 846 admissions and 872 discharges, 71 admissions and 73 discharges per month on average . FY12 data show admis-sions (400 in total or 33 per month) and discharges (411 in total or 34 per month) represent only 47% of the FY06 level. The number of discharges has exceeded the num-ber of admissions every year since FY09, contributing to the steady reduction of census. The number of individuals served by the Hospital has continued to decline for the 4th consecutive year, falling 32% from September 2008 to September 2012. During September 2012, on average, a total of 273 individuals were in care per day, which is a 6% reduction from September 2011, when SEH served 290 individuals on a given day .
A majority of admissions at SEH were either transfers from another psychiatric unit of a community hospital or pre-trial defendants admitted by court order (Table 7.68). The forensic admissions include those who were adjudi-cated to be not guilty by reason of insanity (NGBRI) and have been residing in the community but are re-admitted to the Hospital .
In the past few years, individuals admitted as pre-trial defendants increased while those admitted for emergen-cy or with a civil commitment legal status significantly declined . SEH had a total of 237 admissions with a civil legal status in FY10 but only 171 and 173 civil admissions in FY11 and FY12, respectively, whereas pre-trial admis-sions increased from 184 in FY10 to 228 in FY11 and
Table 7.64. Treatment Services Provided by School Mental Health Program Clinicians
SY 2009-2010
SY 2010-2011
SY 2011-2012
Referrals 1,715 1,538 1,453Referrals Seen within the same month of referral
1,255 1,179 1,088
Students on Clinical Caseload 737 665 609
Individual Therapy Sessions 9,405 8,699 8,209
Family Therapy Sessions 539 629 544
Group Therapy Sessions 409 353 171
Source: Dept of Mental Health, School Mental Health Program
Table 7.65. Prevention and Early Intervention Ser-vices Provided by School Mental Health Program Cli-nicians
SY 2009-2010
SY 2010-2011
SY 2011-2012
Prevention Sessions 1,868 1,792 1,098Walk-ins 4,474 4,072 3,917Conflict Resolution Sessions 1,906 15,50 1,428
Classroom Observa-tions 2,233 2,284 1,875
Parent Consultations 2,385 2,249 2,202Teacher Consultations 5,077 4,703 4,814Other Staff Consulta-tions 4,640 4,320 5,064
Referrals Made for Out-side MH Services 152 131 132
Presentations, Work-shops, and Conferences 206 217 194
Source: Dept of Mental Health, School Mental Health Program
Figure 7.23. Monthly Average Admissions vs. Dis-charges (FY06-FY12)
Source: PRISM and Trend Analysis published by Office of Statis-tics and Reporting, Saint Elizabeths Hospital, Department of Men-tal Health
Figure 7.24. Trend of Daily Census (FY06-FY12)
Source: PRISM and Trend Analysis published by Office of Statis-tics and Reporting, Saint Elizabeths Hospital, Department of Men-tal Health

• District of Columbia • Indices 2013 •220
declined a little bit to 204 in FY12.
As of September 30, 2012, a total of 105 or 38% of the 279 total individuals in care were those adjudicated to be
not guilty by reason of insanity (NGBRI) and 64 or 23% were those court-ordered for inpatient pre-trial examina-tion .
Table 7.66. Monthly Admissions (Civil vs. Forensic)
Oct Nov Dec Jan Feb Mar Apr May Jun Jul Aug Sep Total
FY10
Civil 17 20 34 20 16 17 20 13 14 25 21 20 237Forensic 19 14 13 13 18 17 21 21 18 22 11 11 205Total 36 34 47 33 34 34 41 34 32 47 39 31 442
FY11
Civil 13 17 16 11 12 19 16 18 8 11 14 16 171Forensic 21 15 19 22 17 17 22 19 17 23 31 29 252Total 34 32 35 33 29 36 38 37 25 34 45 45 423
FY12
Civil 19 9 19 13 18 14 13 13 12 16 12 15 173Forensic 19 22 19 16 17 23 16 22 22 18 14 19 227Total 38 31 38 29 35 37 29 35 34 34 26 34 400
Source: PRISM and Trend Analysis published by Office of Statistics and Reporting, Saint Elizabeths Hospital, Department of Mental Health
Table 7.67. Legal Status (9/30/10, 9/30/11, 9/30/12)
Legal Status 9/30/10 9/30/11 9/30/12
Civ
il
Committed Inpatient 35 31 24Committed Outpatient 31 28 21Emergency 36 15 22Voluntary 43 41 43Non Protesting 1 0 0Civil Sub-total 146 (47%) 115 (40%) 110 (39%)
Fore
nsic
Pr
e-tri
al DC Examination 52 61 59DC Mentally Incompetent 5 3 5Forensic Pre-trial Sub-total 57 (18%) 64 (22%) 64 (23%)
Fore
nsic
Pos
t-tria
l
Dual (NGBRI/Criminal Convict .) 1 1 1
NGBRI - DC 91 94 92NGBRI - US 10 12 9NGBRI - USVI 2 1 1Sexual Psychopath (Miller Act) 4 3 2
Forensic Post-trial Sub-total 108 (35%) 111 (38%) 105 (38%)Grand Totals 311 290 279Source: PRISM and Trend Analysis published by Office of Statistics and Reporting, Saint Elizabeths Hospital, Department of Mental Health
Table 7.68. Admission by Source, FY 2010-FY 2012
FY 2010 FY 2011 FY 2012Admission Source # % # % # %CPEP 67 15% 18 4% 22 6%Community Hospital - Medical Unit 19 4% 6 1% 2 1%
Community Hospital - Psychiatric Unit 151 34% 149 35% 149 37%
Court/Law Enforcement 189 43% 226 53% 204 51%Transfer from Foren-sic Outpatient (CL) to Inpatient
10 2% 16 4% 15 4%
Other or Not Identified* 6 1% 8 2% 8 2%Total 442 100% 423 100% 400 100%*This includes those whose admission source information is missing, unverifiable or categorized in inactive values in Avatar.Source: PRISM and Trend Analysis published by Office of Statistics and Reporting, Saint Elizabeths Hospital, Department of Mental Health

• Indices 2013 • District of Columbia • 221
HealtH care finance
AboutThe mission of Department of Health Care Finance (DHCF) is to improve health outcomes by providing ac-cess to comprehensive, cost-effective and quality health-care services for residents of the District of Columbia. DHCF provides health care coverage for nearly one third (or more than 230,000) of District residents, including low-income children, adults, the elderly and persons with disabilities. DHCF is the District of Columbia’s state Medicaid agency. In addition to the Medicaid program, DHCF also administers insurance programs for immi-grant children, the State Child Health Insurance Program (CHIP), and the DC Healthcare Alliance program, which is a locally funded insurance program for eligible, unin-sured District residents. Historically, the District of Co-lumbia has been a leader in health care coverage and in recent years only 6.2% of District residents reported be-ing uninsured, which is among the lowest rates nationally. Health Insurance Coverage in the District of Columbia is estimated from the 2009 DC Health Insurance Survey .
The District of Columbia has made considerable progress toward implementation of the Patient Protection and Af-fordable Care Act (ACA), including two recent eligibili-ty expansions: (1) Effective July 1, 2010, eligibility was extended to childless adult citizens and legal residents up to 133% of the federal poverty limit (FPL); and (2) effec-tive December 1, 2010, eligibility was extended to cov-
er childless adult citizens and legal residents from above 133% to 200% of the FPL. As an early expansion state, the District of Columbia added over 44,000 childless adults to the Medicaid program in 2010 .
Section 2 of the District of Columbia Medicaid State Plan, which addresses eligibility, is currently under revision to incorporate all of the changes to Medicaid eligibility that are required by the ACA, including the implementation of Modified Adjusted Gross Income (MAGI) eligibility rules (to be effective October 1, 2013). DHCF is also currently working with the DC Health Benefit Exchange Authority and the Department of Human Services to launch a new eligibility website that will make it easier for individuals and families to apply for and maintain Medicaid benefits or purchase insurance on the Exchange .
MedicaidMedicaid is a health insurance program that pays for medical services for low-income and disabled people. For those eligible for full services, Medicaid reimburses their doctors, hospitals and pharmacies that are enrolled as DC Medicaid providers. The Medicaid benefit package, which offers federally mandated services, includes doctor vis-its; hospitalization; eye care; dental services and related treatment; dialysis services; durable medical equipment;
emergency ambulance services; hospice services; labora-tory services; radiology; medical supplies; mental health services; nurse practitioner services; home and communi-ty based services; and other services as approved by the Centers for Medicare and Medicaid Services (CMS) in the State Plan .
The State Children’s Health Insurance Program (CHIP), is a Medicaid program for the children of parents whose incomes are too high for Medicaid, but still too low to pay for their children’s health insurance. The program covers doctor’s visits, vision, dental care, prescription medica-tion, hospitalization and more. Those who may be eligible include children; adolescents under the age of 19 who live alone; parents and guardians of children; and pregnant women. The program provides health insurance cover-age for working families who: (1) live in the District of Columbia; (2) do not have health insurance; and (3) earn income up to 200 percent of the Federal Poverty Level (FPL), or up to 300 percent of the FPL (when covering children only) .
Beginning July 2013, health insurance will be offered through one of the three managed care plans for the Medicaid Managed Care and Alliance programs: Thrive Health Plan, AmeriHealth Mercy Family of Cos., and MedStar Family Choice .
Long Term Care Spending in the Medicaid program is organized across two major types of care: (1) primary and acute care ser-vices ($1.2 billion); and (2) long term care ($688.7 mil-lion). On the primary and acute care side, essentially 80 percent of all payments are made to the District’s man-aged care plans (53 percent) or directly to the hospitals for inpatient care provided to beneficiaries who are not en-rolled in managed care (27 percent) . Medicaid funding for long-term care is allocated to providers who deliver ser-vices in either institutions or through community-based State Plan and waiver programs. The purpose of the waiv-er programs is to allow individuals who would normally require institutionalization due to their mental or physical disabilities to receive care in the community. The District of Columbia has two community based waiver programs: the DD waiver for qualifying individuals with develop-mental disabilities and the EPD waiver for qualifying in-dividuals who are elderly or have physical disabilities. An
Table 7.69. Medicaid & Alliance Enrollment, Monthly AveragesServices FY11 FY12 FY13 Total Fee-For-Service 65,066 67,047 67,196Total Medicaid Man-aged Care 143,817 151,072 154,897
Alliance Managed Care 24,304 19,357 15,653
Total DHCF Monthly Average 233,188 237,505 238,400
*FY13 is from April 3, 2013 Enrollment Report, Only includes October 2012 and November 2012.Source: Department of Health Care Finance, Medical Care Advi-sory Committee (MCAC), Rolling Monthly Enrollment Reports
Table 7.70. DC Medicaid Income Requirements
House-hold Size
2013 Feder-al Poverty Guidelines
300% FPL (Children
Only)200% FPL (Families)
1 $11,490.00 $ 34,470.00 $22,980.002 $15,510.00 $ 46,530.00 $31,020.003 $19,530.00 $ 58,590.00 $39,060.004 $23,550.00 $ 70,650.00 $47,100.005 $27,570.00 $ 82,710.00 $55,140.006 $31,590.00 $ 94,770.00 $63,180.007 $35,610.00 $106,830.00 $71,220.008 $39,630.00 $118,890.00 $79,260.00For families/households with more than 8 persons, add $4,020 for each additional person.Source: Annual Update of the HHS Poverty Guidelines Published in the Federal Register 1/24/13 https://www.federalregister.gov/articles/2013/01/24

• District of Columbia • Indices 2013 •222
important caveat to the use of community-based care is the federal requirement that the cost of these services, in the aggregate, must be less expensive than institutional care. Tables 7.71-72, taken from DHCF’s FY 2014 Bud-get Briefing, present details on the scope and cost of the District’s long-term care programs. As shown, while the waiver programs have high average per-participant cost, they are considerably less expensive than their institution-al counterparts .
The Mayor has budgeted $338 million for FY 2014 to cover the inpatient hospital cost of Medicaid beneficiaries who are not in managed care – the so called fee-for-ser-vice population. There is a “high cost” group of Medicaid beneficiaries who comprise about 11 percent of the fee-for-service population . Compared to their “lower cost” counterparts, beneficiaries in this group are nearly five times more likely to visit an emergency room; are admit-ted for inpatient care at five times the rate of the “low
cost” group; have hospital stays that are twice as long; average 10 more prescriptions, and are more likely to suf-fer from multiple chronic conditions . DHCF expects this population to exert continued upward pressure on inpa-tient hospital costs in FY 2014 .
State Plan Personal Care ProgramOver the next two years, DHCF will pay special attention to the services provided through DHCF’s State Plan Op-tion Personal Care program. The projected growth of over 80 percent from the FY 2013 to the FY 2014 budgets (Ta-ble 7.72). A large portion of this amount, however, can be attributed to an agency policy change which now requires that the first eight hours of personal care for individuals in the Elderly and Persons with Disabilities (EPD) waiver be charged to the State Plan Option program .
AdministrationsThe Health Care Delivery Management Administration (HCDMA) ensures that quality services and practices per-vade all activities that affect the delivery of health care to beneficiaries served by the District’s Medicaid, CHIP and Alliance programs. HCDMA accomplishes this through informed benefit design; use of prospective, concurrent and retrospective utilization management; ongoing pro-gram evaluation; and the application of continuous quali-ty measurement and improvement practices in furnishing preventive, acute, and chronic/long-term care services to children and adults through DHCF’s managed care con-tractors and institutional and ambulatory fee-for-service providers .
The Health Care Policy and Research Administration (HCRPRA) has responsibility for maintaining the Medic-aid and CHIP State Plan which governs eligibility, scope of benefits, and reimbursement policies for the District’s Medicaid and CHIP programs; developing policy for the administration of the Alliance and other health care pro-grams for publicly funded enrollees that are administered or monitored by DCHF based on sound analysis of local and national healthcare and reimbursement policies and strategies; and ensuring coordination and consistency among healthcare and reimbursement policies developed by the various Administrations within DCHF. The admin-istration is also responsible for designing and conducting research and evaluations of health care programs .
Table 7.71. Overall And Per Recipient Cost For Waiver, Personal Care And Institutional LTC Programs, FY2012
Program ServiceTotal Number of
Recipients Total Cost for ServicesAverage Cost Per
RecipientDD Waiver* 1,591 $148,853,889 $93,560ICF/DD 395 $69,778,061 $176,653EPD Waiver 3,679 $84,544,759 $22,980State Plan Personal Care 8,736 $162,448,495 $18,595Nursing Facilities 3,724 $216,988,015 $58,268*DD Waiver costs do not include DDS local funds for the waiver.Source: Department of Health Care Finance
Table 7.72. Budget Request For Select Medicaid Mandatory Services
Provider Type FY 2013 Budget FY 2014 Budget % GrowthManaged Care $701 .5 $851 .9 21.44%Inpatient Hospital* $349 .9 $338 .8 -3.17%Nursing Facilities $251 .2 $274 .3 9.20%EPD Waiver $123 .6 $51 .8 -58.09%ICF/DD $78 .8 $96 .9 22.97%DD Waiver $156 .9 $180 .3 14.91%Personal Care $100 .7 $182 .3 81.03%*FY 2013 budget includes funding for emergency hospital care for Alliance beneficiaries. In FY 2014, the cost for this service is shown as a separate line.Source: Department of Health Care Finance
Figure 7.25. Number Of Medicaid Recipients Using Personal Care Benefits
Source: Department of Health Care Finance

• Indices 2013 • District of Columbia • 223
The Health Care Operations Administration (HCOA) is responsible for the administration of programs that per-tain to the payment of claims; management of the fiscal agent contract; management of the administrative con-tracts; management of the Medicaid Management Infor-mation Systems (MMIS); and provider enrollment and requirements. The office provides management of the Non-Emergency Transportation contract, the Pharmacy Benefits Manager, the Quality Improvement Organization contract, and the MMIS Fiscal Intermediary contract as well as additional administrative contracts .
The Health Care Reform and Innovation Administra-tion (HCRIA) is responsible for identifying, validating and disseminating information about new care models and payment approaches to serve Medicaid beneficiaries while seeking to enhance the quality of health and health care and reducing cost through improvement. This office creates and tests new models in clinical care, integrated care and community health, and creates and tests innova-
tive payment and service delivery models, building col-laborative learning networks to facilitate the collection and analysis of innovation, as well as the implementation of effective practices, and developing necessary technol-ogy to support these activities; including HIT and HIE.
The Long Term Care Administration (LTCA) is respon-sible for developing, implementing and overseeing pro-gramming for elders and for persons with physical and de-velopmental disabilities. Through program development and day-to-day operations, the LTCA also ensures access to needed cost-effective, high quality extended and long-term care services for Medicaid beneficiaries residing in home and community-based or institutional settings
Office of Health Care Ombudsman and Bill Of RightsThe Health Care Ombudsman and Bill of Rights (OHCO-
BR) is an independent office located in the Department of Health Care Finance (DHCF), Health Care Delivery Management Administration. The OHCOBR operates in-dependently of all other government and non-government entities, and is a neutral body dedicated to advocating on behalf of the District’s uninsured and underinsured resi-dents, and insurance consumers. The Office maintains its independence by having no direct involvement, participa-tion, investment, interest or ownership in a health care fa-cility, health care service, health benefits plan or provider of a health benefits plan.
The OHCOBR provides varied assistance with respect to matters pertaining to the health care of individuals covered by insurance licensed in the District, as well as uninsured and underinsured District residents. At times, to assist consumers in the resolution of their health care issues, the OHCOBR collaborates with other DC agencies and organizations in the remediation of consumer disputes in an effort to ensure a timely and efficient resolution.
Figure 7.26. OHCOBR Contacts by Ward, FY11 and FY12
Data captured between October 1, 2010 through September 30, 2011 and October 1, 2011 through September 30, 2012
Source: Health Care Ombudsman and Bill of Rights
Figure 7.27. OHCOBR Contacts by Insurance Type, FY11 and FY12
Data captured between October 1, 2010 through September 30, 2011 and October 1, 2011 through September 30, 2012
Source: Health Care Ombudsman and Bill of Rights
Figure 7.28. Categories of Issues Encountered by Consumers, FY11 and FY12
Data captured between October 1, 2010 through September 30, 2011 and October 1, 2011 through September 30, 2012.
Source: Health Care Ombudsman and Bill of Rights

• District of Columbia • Indices 2013 •224
The OHCOBR provides a considerable amount of direct assistance with Medicaid/CHIP and a limited amount to Medicare cases . While the OHCOBR mostly refers Medi-care cases to the GW/HICP, OHCOBR is still involved in resolving matters for dual eligible beneficiaries (Medicare and Medicaid) where more than half of its contacts are derived .
OHCOBR Fiscal Year 2012 ActivitiesDuring Fiscal Year 2012, the OHCOBR has tracked all communications, or contacts, received (Figures 7.26-28). The OHCOBR classified all contacts as “cases” which the Office investigated and strived to bring closure. The OHCOBR staff recorded all contacts in a standardized Health Care Ombudsman In-Take Tracking Log that has specific categories for classifying different cases. These findings summarize data from the In-Take Tracking Log for the Fiscal Year 2012 (October 1, 2011 through Sep-tember 30, 2012). During Fiscal Year 2012, the OHCOBR received a total of 4,472 contacts by individuals (consum-ers), of which 308 individuals were repeat callers. The category of issue “Other Issues” refers to anomalous and generic complaints such as auto repairs; banking issues; burial assistance; death certificates; duplicate QMB ID cards; food stamps; fraud-Medicaid/Medicare; housing assistance; legal services; name/address change; names misspelled on QMB ID cards; non-receipt-QMB cards; replacement of Medicaid/Medicare/MCO/QMB ID cards; and responses to Department of Health Care Finance’s (DHCF) correspondence mailed to DC Medicaid benefi-ciaries regarding issues that affected their coverage; etc .
InitiativesDHCF spends more than $2.5 billion every year to pro-vide health insurance to lower-income District residents . DHCF’s programs are critical to the health of District res-idents, because research has proven that people without health insurance are: sicker than people who have health insurance; get poorer quality health care when they do re-ceive it; and have worse health outcomes even when they receive health care. In response, DHCF efforts are guided by four major priorities established at the beginning of
Mayor Gray’s Administration: (1) Improve patient out-comes; (2) Strengthen DHCF’s program integrity opera-tions; (3) Resolve Medicaid billing issues with our part-ner agencies; and (4) Successfully implement health care reform. Several key initiatives are outlined in Table 7.73.
Table 7.73. DHCF Initiatives
Initiative Description Goal of Project
Improve Patient Outcomes, Reform MCO Program
Build a program using health plans with innovative solutions to improv-ing health outcomes for program beneficiaries, while mitigating the impact of those factors which have created growing cost pressures in the program .
Establish a managed care program that focuses on greater care coordi-nation, improved services to chil-dren, and documented improvements in patient outcomes
Implement Health Care Reform, Develop New Medicaid Eligibility System for Health Care Reform
Work with an IT vendor to develop and implement a new eligibility, enrollment, integrated case man-agement system, and HBX for the District of Columbia.
Provide seamless access to District health insurance options and other services to meet the requirements of the Affordable Care Act
Enhance Program Integrity, Reform Medicaid Long-Term Care System
Develop an improved system of long term care with a single “front door” for program entry, conflict-free, comprehensive, and automated assessments of patient need, and alignment of eligibility criteria with assessments, and improved program monitoring and oversight .
Eliminate fragmentation in the long-term care system, reduce inappropri-ate growth, and strengthen program oversight
Redesign The Hospital Outpatient Payment System
Develop a plan to shift hospitals to the ICD-10-CM system used to clas-sify and code all diagnoses . Update the grouper used to calculate in-pa-tient payment rates, and modernize the hospital outpatient payment methodology .
Modernize the outpatient payment methodology to establish diagnosis specific rather than flat rate pay-ments for patient care
Source: Department of Health Care Finance