Chapter 7 Examination on Renewable Energy Utilization
215
Final Report Chapter 7 Republic of El Salvador 7 - 1 March 2012 The Project for Master Plan for the Development of Renewable Energy (JICA) Chapter 7 Examination on Renewable Energy Utilization 7.1 Preparation of Wind Power Potential Map all over the Country Nationwide wind power potential map of El Salvador will be prepared to identify the potential area in this study. Wind potential map indicates distribution of wind potential over large regions at certain height above ground level. The potential is simulated based on GIS data and global meteorological model. Data is corrected by surface wind data which being monitored in the assessment areas. Accordance with the following scope of works, selected organization will produce the nationwide wind potential map of El Salvador. 7.1.1 Specifications of Wind Power Potential Map The study team of Japan International Cooperation Agency (JICA) is executing “The Project for Master Plan for the Development of Renewable Energy in the Republic of El Salvador”. The nationwide wind potential map will be prepared in the study. This specification shall be applied to the procurement of the wind potential map in El Salvador. The main use of the map is to identify wind potential area in the country. In the study, following scope of works is prepared for the tender. 7.1.1.1 Scope of Work A. Output materials The materials for wind power potential map shall be prepared in the following format. Output: Nationwide Wind Potential Map of El Salvador Data Set, Handbook Format: DVD (wind potential map (ArcGIS ver.9.3 (.gdb file), pdf), data set, instruction): 10 copies Printed Map (A1: 594 mm x 841 mm, color, 1:400,000): 15 copies (5 for each height) Language: Spanish (Map, Instruction)
-
Upload
khangminh22 -
Category
Documents
-
view
2 -
download
0
Transcript of Chapter 7 Examination on Renewable Energy Utilization

Final Report Chapter 7
Republic of El Salvador 7 - 1 March 2012 The Project for Master Plan for the Development of Renewable Energy (JICA)
Chapter 7 Examination on Renewable Energy Utilization
7.1 Preparation of Wind Power Potential Map all over the Country Nationwide wind power potential map of El Salvador will be prepared to identify the potential area in this study. Wind potential map indicates distribution of wind potential over large regions at certain height above ground level. The potential is simulated based on GIS data and global meteorological model. Data is corrected by surface wind data which being monitored in the assessment areas. Accordance with the following scope of works, selected organization will produce the nationwide wind potential map of El Salvador.
7.1.1 Specifications of Wind Power Potential Map The study team of Japan International Cooperation Agency (JICA) is executing “The Project for Master Plan for the Development of Renewable Energy in the Republic of El Salvador”. The nationwide wind potential map will be prepared in the study. This specification shall be applied to the procurement of the wind potential map in El Salvador. The main use of the map is to identify wind potential area in the country. In the study, following scope of works is prepared for the tender.
7.1.1.1 Scope of Work A. Output materials
The materials for wind power potential map shall be prepared in the following format.
Output:
Nationwide Wind Potential Map of El Salvador
Data Set, Handbook
Format:
DVD (wind potential map (ArcGIS ver.9.3 (.gdb file), pdf), data set, instruction): 10 copies
Printed Map (A1: 594 mm x 841 mm, color, 1:400,000):
15 copies (5 for each height)
Language: Spanish (Map, Instruction)

Final Report Chapter 7
Republic of El Salvador 7 - 2 March 2012 The Project for Master Plan for the Development of Renewable Energy (JICA)
B. Contents of the materials
Wind Potential Map: El Salvador (nationwide)
Resolution: 500 meters mesh
Height: 30 m, 50 m and 80 m above ground level
Classification of Wind Potential:
7 classes (Wind potentials are separated by colors) 0~200, 200~300, 300~400, 400~500, 500~600, 600~800, >800
Data Set: Selected Wind Potential Site (12 sites) Wind speed (m/s) /Wind density (W/m2) Wind Direction (wind rose 16 direction) Weibull parameter (k, c)
Instruction: Process of wind map preparation Instruction for use of contents in DVD
C. Input Data
Global Meteorological Model (by contractor in Japan)
Analysis Software (by contractor in Japan)
Surface Data (by the JICA Study Team)
GIS Data (by the JICA Study Team)
After the simulation, GIS data shall be removed or disposed by the responsibility of contractor.
7.1.1.2 Appointed date of delivery A. Instruction (Spanish)
The Constructor has to submit the draft of the instruction to JICA study team on 31st December 2011.
B. Other products
The contractor has to complete the works and submit all of products by 16th January 2012 to JICA study team. JICA study team has to check the contents promptly, after receiving the products.
7.1.1.3 Schedule Work schedule of preparation of the wind potential map is shown in the table below.

Final Report Chapter 7
Republic of El Salvador 7 - 3 March 2012 The Project for Master Plan for the Development of Renewable Energy (JICA)
Table 7.1.1 Schedule of Works Item 2011
October
November
December
2012
January
1. Tender and Contract Negotiation.
2.Schedule Planning, Preparation
3.Review of Data, Pre-processing
4.Simulation of Wind Potential
5.Confirmation, Statistical work
6.Mapping, Data processing
7. Confirmation of Accuracy
8.Instruction Manual
Comment from counterpart organization in El Salvador
3 15
Output
Wind Potential Map
Instruction Manual Draft Final (Source: JICA Study Team)
7.1.2 Preparation of Wind Power Potential Map 7.1.2.1 Procedure The wind potential map and the data set were prepared in the following procedures.
a. As a result of analysis on the meteorological data and influence such as the El Nino phenomenon, meteorological data in 2008 was chosen as suitable annual data for calculation.
b. Meteorological data by the global model, topography data and land-use data were collected and arranged in an available form. Those data are necessary for following calculation.
c. Annual wind characteristics (500 m mesh) of target year (2008) were calculated by a numerical value simulation model.
d. Based on a calculation result, the statistics conversion from wind speed level to wind power energy, and annual average wind speed, accumulated value and relative frequency of wind speed was carried out.
e. Annual average wind power potential map (30 m, 50 m and 80 m above ground level) were prepared.
f. Based on the wind potential maps, considering with natural and social condition area, high potential area (10 sites) were selected. In the selected sites, various data were maintained as a wind characteristics database and recorded in DVD with a designated format.
g. The handbook for the wind map was made. In addition to preparation and operation procedures, analysis results are explained.

Final Report Chapter 7
Republic of El Salvador 7 - 4 March 2012 The Project for Master Plan for the Development of Renewable Energy (JICA)
7.1.2.2 Weather Simulation Model for Evaluation of Wind Potential A. Weather Research and Forecasting Model (WRF Model)
On the basis of WRF Model, annual wind power potential was simulated in this study. WRF model was developed under the cooperative work between U.S. Centers for Environmental Prediction (NECP) and American Center for Atmospheric Research (NCAR). The model is used all over the world as regional weather model. One-year weather simulation of 2008 which is targeted year for the simulation was carried out using this model. The situation of the wind of 8,784 hours in a year was calculated in 5km mesh every day for every one hour.
Global Final Analysis (FNL), objective analysis data of NECP, was used for the simulation of initial value and boundary value for weather simulation by WRF. FNL is re-analyzed global weather data by NCEP. NFL includes value of distributed meteorological data in three-dimension which are calculated based on monitored meteorological data such as ground surface data and upper air observation, and satellite data. The following figure shows sample of FNL data on wind and temperature distribution. Data of terrain and land-use are included in WRF Model which prepared by United States Geological Survey (USGS).
(Source: Japan Weather Association) Figure 7.1.1 Sample of FNL Data (Wind and Temperature)
Monitoring period for the simulation is one year, from January to December 2008. The calculation area is categorized into 2 areas. In the wide area (area 1), it was calculated each 15 km horizontal mesh. In the neighboring area of El Salvador (area 2) , it was calculated each 5 km horizontal mesh.

Final Report Chapter 7
Republic of El Salvador 7 - 5 March 2012 The Project for Master Plan for the Development of Renewable Energy (JICA)
Table 7.1.2 Area for calculation (WRF Model) Area1 Area2
Horizontal Mesh 15 km 5 km No. of Mesh 60×52 75×51
Calculation Area
(Source: Japan Weather Association)
B. MASCON Model
On the basis of the results of calculation on wind speed in each 5 km horizontal mesh by WRF Model, wind potential data which cover nationwide of the country area by 500 m horizontal mesh is calculated. MASCON model is a model to correct wind velocity to satisfy law of conservation of mass using topography data (an altitude level). This calculation can examine detailed topography effect by relatively little time. And, initial value to input into the calculation was prepared based on the result of WRF by interpolating weight points of the distance. DEM of resolution approximately 500 m which prepared by digital data of SRTM was used for the topography altitude level.

Final Report Chapter 7
Republic of El Salvador 7 - 6 March 2012 The Project for Master Plan for the Development of Renewable Energy (JICA)
Table 7.1.3 Calculation Area (MASCON MODEL) MASCON MODEL Calculation Area Horizontal Mesh Around 500 m No. of Horizontal
Mesh 625×367
No. of Vertical
Mesh 15 (layer)
End points of the
area
Longitude: West:90.497685, East:87.608796 Latitude: North:14.696759, South:13.002315
Calculation Area
and altitude
(Source: Japan Weather Association)
7.1.2.3 Wind Power Potential Map The height of wind potential maps which prepared in the studies are 30 m, 50 m and 80 m above ground level. According to NREL, the area where wind power energy density becomes over 320 (W/m2) at 30 meters above ground level, and over 400 (W/m2) at 50 m above ground level is suitable for wind power development. The table below shows an evaluation standard of the wind power energy density and wind speed.

Final Report Chapter 7
Republic of El Salvador 7 - 7 March 2012 The Project for Master Plan for the Development of Renewable Energy (JICA)
Table 7.1.4 Standard definitions of wind power class
Class Resource
potential
Wind speed (m/s)
(30 m height)
Wind power density
(W/m2 )
(30 m height)
Wind speed (m/s)
(50 m height)
Wind Power density
(W/m2)
(50 m height)
1 Poor 0.0 - 5.1 0 - 1 60 0 – 5.6 0 – 200
2 Marginal 5.1 – 5.9 1 60 – 240 5.6 – 6.4 200 – 300
3 Considerable 5.9 – 6.5 240 – 320 6.4 – 7.0 300 – 400
4 Good 6.5 – 7.0 320 – 400 7.0 - 7.5 400 – 500
5 - 7.0 – 7.4 400 – 480 7.5 – 8.0 500 – 600
6 - 7.4 – 8.2 480 – 640 8.0 – 8.8 600 – 800
7 - 8.2 – 11.0 640 – 1,600 8.8 – 11.9 800 – 2,000 (Source: NREL)
Nationwide wind potential maps of El Salvador are as shown below.
(Source: Japan Weather Association)
Figure 7.1.2 Wind Potential Map of El Salvador (30m above ground level)

Final Report Chapter 7
Republic of El Salvador 7 - 8 March 2012 The Project for Master Plan for the Development of Renewable Energy (JICA)
(Source: Japan Weather Association)
Figure 7.1.3 Wind Potential Map of El Salvador (50m above ground level)
(Source: Japan Weather Association)
Figure 7.1.4 Wind Potential Map of El Salvador (80m above ground level)

Final Report Chapter 7
Republic of El Salvador 7 - 9 March 2012 The Project for Master Plan for the Development of Renewable Energy (JICA)
7.1.3 Analysis Results 7.1.3.1 Wind Power Potential As a result of wind potential analysis in El Salvador, it was recognized that wind potential was large in the following areas.
- A southwest mountainous area (area from a ridgeline in the south side)
- A northwest mountainous area (around ridgeline)
- A northeast mountainous area (around ridgeline to border)
In addition, the distribution of wind potential in the site mentioned above is almost similar at each altitude. However, the potential becomes larger with the increase of altitude. The area with over 800 W/m2 is large at 80 meters above ground level,.
The result of wind potential map at 50 meters above ground level is similar to that of which prepared by SWERA. In this map, wind potential at the south side of southwest mountainous area appears clearly.
7.1.3.2 Wind Power Potential Sites In the study, suitable sites for wind power development were identified from the wind potential map. On the basis of the map, a database was prepared. For the selection of wind potential area, the area where wind potential greater than 700 W/m2 at 50 m above ground level are selected. As a result, 12 areas shown in the figure below were selected. Largest potential in the area was selected as a representative data of the area.

Final Report Chapter 7
Republic of El Salvador 7 - 10 March 2012 The Project for Master Plan for the Development of Renewable Energy (JICA)
(Source: Japan Weather Association)
Figure 7.1.5 Wind Potential Sites
Wind speed and potentials at 30m, 50m and 80m above ground level are shown in Table 7.1.5. Similarly, each Weibull distribution parameter (c,k) is shown in the table 7.1.6.
Table 7.1.5 Data of wind potential sites (wind speed, wind potential)
point(area) latitude longitude altitude
annual mean wind
speed(m/s)
annual wind
potential(W/m2)
deg deg m 30 m 50 m 80 m 30 m 50 m 80 m
1 13.6181 -89.3773 956 6.50 7.32 7.66 574.0 843.8 1010.2
2 13.7569 -89.9653 224 5.15 5.94 6.62 401.6 703.4 1036.7
3 13.8403 -89.8079 1796 8.20 8.52 8.69 1072.2 1231.2 1348.9
4 13.8727 -89.6875 1925 6.61 7.42 7.94 485.1 707.0 899.1
5 13.8449 -89.6273 2096 8.19 8.48 8.55 1100.8 1237.1 1281.8
6 14.1134 -89.7245 1318 8.22 8.87 9.33 806.0 1013.6 1193.8
7 14.4236 -89.3773 2214 8.61 8.95 9.08 1183.2 1363.3 1460.1
8 14.2477 -89.0069 1266 7.26 7.81 7.96 1029.6 1287.6 1402.6
9 14.1458 -88.9144 1447 5.82 6.26 6.44 589.5 749.0 849.5
10 14.1273 -88.8773 1178 5.96 6.30 6.47 591.6 708.8 794.9
11 14.1181 -88.8773 1101 5.94 6.30 6.46 576.9 700.9 782.6
12 13.8727 -87.7986 1001 6.75 7.56 7.98 636.4 911.5 1103.1 (Source: Japan Weather Association)

Final Report Chapter 7
Republic of El Salvador 7 - 11 March 2012 The Project for Master Plan for the Development of Renewable Energy (JICA)
Table 7.1.6 Data of wind potential sites (Weibull parameter (c, k)) point
(area)
Weibull parameter c Weibull parameter k
30 m 50 m 80 m 30 m 50 m 80 m
1 7.05 7.91 8.20 1.33 1.30 1.25
2 5.46 6.13 6.70 1.16 1.07 1.00
3 8.72 9.06 9.26 1.36 1.33 1.29
4 7.12 7.90 8.39 1.49 1.45 1.43
5 8.80 9.02 9.13 1.27 1.29 1.28
6 9.05 9.73 10.22 1.69 1.68 1.66
7 9.03 9.39 9.56 1.37 1.32 1.29
8 7.33 7.90 8.01 1.10 1.07 1.04
9 5.89 6.30 6.45 1.10 1.07 1.04
10 6.20 6.54 6.69 1.15 1.13 1.10
11 6.21 6.60 6.71 1.16 1.14 1.11
12 7.09 7.92 8.33 1.34 1.31 1.26 (Source: Japan Weather Association)
7.1.3.3 Comparison to Monitoring Data
The annual average wind speed is calculated based on wind speed of every hour and day in each mesh area. In addition, annual average wind speed and wind potential are almost corresponding if there are no large differences on the frequency distribution. In addition, in area of existing weather stations, which compared actual value with calculated value is shown below. It is considered that the calculated values are almost corresponding with the actual values of 2008.
Table 7.1.7 Monitored data and calculated data
Code Weather station
Annual average wind speed (m/s) (2008)
Calculated wind speed (m/s)
H = 10 m H = 10m H = 30m
4 Ilopango 4.6 3.5 4.6
31 La Union 2.9 3.4 4.5
32 San Miguel 2.0 2.4 2.7
(Source: Japan Weather Association)

Final Report Chapter 7
Republic of El Salvador 7 - 12 March 2012 The Project for Master Plan for the Development of Renewable Energy (JICA)
7.1.4 Recommendation In the study, a nationwide wind potential map for El Salvador was prepared. As a result, wind potential area in El Salvador became clear. The followings are recommendations for further actions:
A. The installation of the wind monitoring system:
It is necessary to install wind monitoring tower to monitor wind characteristics in the wind potential sites.
B. Wind characteristics data analysis:
It is necessary to analyze the data which monitored, and to select suitable area for introduction of wind generation system.
C. Establishment of observation and analysis system:
It is necessary to establish a system for installation of monitoring tower, data collection, analysis and evaluation to carry out wind monitoring.

Final Report Chapter 7
Republic of El Salvador 7 - 13 March 2012 The Project for Master Plan for the Development of Renewable Energy (JICA)
7.2 Preparation of Guidelines for the Promotion of Small Hydropower System The guidelines for the promotion of small hydropower (SHP) with a capacity of less than 20 MW were prepared through discussion and collaboration between CNE and the JICA Study Team. The guidelines were prepared only in Spanish, separate from the main report. The guidelines include 1) necessary procedures for the development of small hydropower system, 2) plan formulation and evaluation of the project, 3) Operation and Maintenance (O&M), 4) environmental impact monitoring and 5) recommendations and attachments (Format of Concession Procedure of SIGET, MARN)
7.2.1 Outline of the Guidelines to be Prepared The purposes of the guidelines for the promotion of small hydropower in El Salvador are as follows:
A. To increase installed capacity of renewable energy, especially of small hydropower in the future, and to reduce fossil fuels and CO2 emissions.
B. To serve as reference for deciding the overall development plan and prioritization of renewable energy in El Salvador by the government.
C. To breach the barrier in the introduction of small hydropower development, various complex procedures will be introduced in an easy manner to facilitate works by developers.
D. To serve as guidance to the developer for processing necessary procedures in obtaining environmental permit from MARN or development permit from SIGET, etc.,.
E. To evaluate the preliminary study of the possibility of the plan for the developers, simplified process of technical, economical, financial and environmental evaluation for the primary stage for small hydropower planning will be introduced.
F. To introduce operation and maintenance methods including a list of necessary spare parts, etc.
The guidelines include the following items:
a. Introduction
b. Necessary Procedure for Development of SHP
c. Plan Formulation & Evaluation of SHP Project
d. O&M of SHP Project
e. Environmental Impact Monitoring
f. Recommendations
g. Attachments (Format of Concession Procedure of SIGET, MARN)

Final Report Chapter 7
Republic of El Salvador 7 - 14 March 2012 The Project for Master Plan for the Development of Renewable Energy (JICA)
7.2.2 Development Target for Small Hydropower The government of El Salvador has no official development target for the development of small hydropower systems. According to CNE demand forecast and expansion plan, “Plan Indicativo de la Expansión de la Generación de El Salvador 2012 - 2026” (CNE, 2011), 20 MW is assumed as the development target for the installation of small hydro up to 2026, as shown in Table 7.2.1.
Table 7.2.1 Power Expansion Plans by CNE
Año ProyectoPotencia (MW)
2011 Expansión Ingenio El Ángel 15
2012 Contrato Xacbal 30
2013 Expansión Ingenio La Cabaña 15
2015Hidroeléctrica Chaparral
Optimización Geotérmica Ahuachapán. 665
2016
Expansión hidroeléctrica 5 de Noviembre Geotérmica Berlín, Unidad 6
Ciclo Combinado Gas Natural ‐aCiclo combinado Gas Natural –b
805
250107
2017Central Geotérmica ChinamecaGeotérmica Berlín, Unidad 5
Ciclo Combinado Gas Natural – b
4726
143
2019 Motores de media velocidad, gas natural 100
2020 Motores de media velocidad, gas natural 100
2021 Motores de media velocidad, gas natural 100
2023 Ciclo combinado Gas Natural – c 250
2026 Ciclo combinado Gas Natural – d 250
Año ProyectoPotencia (MW)
2011 Expansión Ingenio El Ángel 15
2012 Contrato Xacbal 30
2013 Expansión Ingenio La Cabaña 15
2015Hidroeléctrica Chaparral
Optimización Geotérmica Ahuachapán.
Fotovoltaico ‐ a
665
5
2016
Expansión hidroeléctrica 5 de Noviembre Geotérmica Berlín, Unidad 6
Ciclo Combinado Gas Natural ‐aCiclo combinado Gas Natural ‐ bPequeña Central Hidroeléctrica ‐ a
805
25025010
2017
Central Geotérmica ChinamecaGeotérmica Berlín, Unidad 5
Pequeña Central Hidroeléctrica ‐ bFotovoltaico ‐ bParque Eólico
Térmico Solar Concentrado
4726
10342
50
2018 Fotovoltaico ‐ c 10
2021 Motores de media velocidad, gas natural 100
2022Ciclo combinado Gas Natural ‐ c
Cimarrón250261
Source: “Plan Indicativo de la Expansión de la Generación de El Salvador 2012 - 2026” , CNE, 2011.
The target for the development of the installed capacity on small hydropower in the guideline is set at 20 MW up to 2027.
7.2.3 Guidelines for the Promotion of Small Hydropower 7.2.3.1 Basic Considerations of Technical Aspects Basic considerations of technical aspects for the guidelines for the promotion of small hydropower are shown in Figure 7.2.1. To estimate the investment cost of a small hydropower project at an early stage, rough cost estimation method was introduced based on Japanese hydropower guidelines shown in Table 7.2.2. Also, to estimate the design discharge for the small hydropower project at a planned site, Dimensionless Flow Duration Curve (FDC) for each area (Department-wise) using available hydrological data, will be attached in the guideline as shown in Figure 7.2.2 and Table 7.2.3.

Final Report Chapter 7
Republic of El Salvador 7 - 15 March 2012 The Project for Master Plan for the Development of Renewable Energy (JICA)
A) General Electric Law
B) EIA (MARN) C) SIGET Concession
B) Japanese Guidelines for SHP, etc.
Monthly Q by SNET Monthly R by SNET
A) Japanese Guidelines for SHP, etc. B) Review of Pre-F/S of SHP in El Salvador.
A) Japanese Guidelines for SHP, etc. B) Review of Pre-F/S of SHP in El Salvador.
A) BCIE-ARECA-kfw_"Guide line for development of RenewableEnergy in El Salvador" by BCIE/ARECA was received fromInternet.Collection & Review
of Existing Information
Draft Contents
Making of Materials for Guideline
Formulation of Guideline for SHP
Collection & Review of Regulation or Law, MARN/SIGET
Hydrological Data
Estimation of Area‐wise Dimensionless Flow Duration Curve (FDC)
Rough Cost EstimateMethod
Rough Economic & Financial Evaluation
Necessary Procedure for Development of PCH
EIAGuidelines, River Maintenance Flow
Examples of O&MRecomendation
(Source: JICA Study Team) Figure 7.2.1 Flow of Guideline Formulation and Related Technical Aspects
Table 7.2.2 Rough Formulas for Estimating Construction Cost of SHP
Items Formula Power House Cost [x1000 US$] = 0.084 * (P[kw])^0.830 / 80
Intake Weir Qmax = Q / Plant Factor (H: Height of Weir [m])2 * (L:Length of Weir [m]) = Qmax * 198 Concrete Volume [m3] = 11.8 * (H2 * L)^0.781 Cost [mil.US$] = 0.21 * (Concrete Volume)^0.866 / 80
Intake [Q < 4.4 m3/s] Inner Diameter [m] = 1.8 m [Q >= 4.4 m3/s] Inner Diameter [m] = 1.036 * Q^0.375 Cost [x1000 US$] = 19.7 * (Inner Diameter * Q)^0.506 / 80
Settling Basin Cost [x1000 US$] = 18.2 * Q^0.830 /80 Open Canal √(Width * Height) = 1.09 * Q^0.379
Unit Cost [x1000 US$/m] = 122 * (√(Width * Height))^1.19 / 80
Penstock Pipe Inner Diameter [m] = 0.888 * Q^0.370 Unit Cost [x1000 US$/m] = 357 * (Inner Diameter)^1.14 /80
Outlet Chanel Cost [mil.US$] = 9.54 * (Radius of Chanel) * Q ^0.432 / 80 ※Radius of Outlet Chanel is decided by Penstock Pipe
Mechanical Works Cost [mil.US$] = 0.0595 * Q * He^2/3 * (number of turbine)^1/2 ^1.49 /80
Electrical Facilities Cost [mil.US$] = 12.8 * ( P[kW] / √He)^0.648 / 80
(Source: New Energy Foundation (NEF), Japan, “Medium and Small Hydroelectric Guidebook”)

Final Report Chapter 7
Republic of El Salvador 7 - 16 March 2012 The Project for Master Plan for the Development of Renewable Energy (JICA)
0
1
2
3
4
5
6
7
0% 10% 20% 30% 40% 50% 60% 70% 80% 90% 100%
Spe
cific
Dis
char
ge [m
3 /s/1
00km
2 ]
Percent of Days Exceeded (%)
Dimensionless Flow Duration Curve (Depertment Ahuachapán)
1. Ahuachapán - Zone: W (PAZ, Rio PAZ)
2. Ahuachapán - Zone: N (PAMPE, Rio PAZ)
0
1
2
3
4
5
6
7
0% 10% 20% 30% 40% 50% 60% 70% 80% 90% 100%
Spe
cific
Dis
char
ge [m
3 /s/1
00km
2 ]
Percent of Days Exceeded (%)
Dimensionless Flow Duration Curve (Depertment Sonsonate)
3. Sonsonate - Zone: SW (SAN PEDRO, Rio SAN PEDRO)
4. Sonsonate - Zone: SW (GDE. DE SONSONATE, Rio GDE. DE SONSONATE)
5. Sonsonate-Zone: S (BANDERA, Rio BANDERA)
0
1
2
3
4
5
6
7
0% 10% 20% 30% 40% 50% 60% 70% 80% 90% 100%
Spe
cific
Dis
char
ge [m
3 /s/1
00km
2 ]
Percent of Days Exceeded (%)
Dimensionless Flow Duration Curve (Depertment Santa Ana)
7. Santa Ana - Zone: S (GUAJOYO, Rio LEMPA)
8. Santa Ana - Zone: N (ANGUE, Rio LEMPA)
9. Santa Ana - Zone: SE (GUAJOYO, Rio LEMPA)
0
1
2
3
4
5
6
7
0% 10% 20% 30% 40% 50% 60% 70% 80% 90% 100%
Spe
cific
Dis
char
ge [m
3 /s/1
00km
2 ]
Percent of Days Exceeded (%)
Dimensionless Flow Duration Curve (Depertment La Libertad)
10. La Libertad - Zone: N(U/S) (AGUA CALIENTE, Rio LEMPA)
11. La Libertad - Zone: N(U/S) (SUCIO, Rio LEMPA)
12. La Libertad - Zone: N (SUQUIAPA, Rio LEMPA)
13. La Libertad - Zone: N (SUQUIAPA, Rio LEMPA)
14. La Libertad - Zone: NE(D/S) (SUCIO, Rio LEMPA)
0
1
2
3
4
5
6
7
0% 10% 20% 30% 40% 50% 60% 70% 80% 90% 100%
Spe
cific
Dis
char
ge [m
3 /s/1
00km
2 ]
Percent of Days Exceeded (%)
Dimensionless Flow Duration Curve (Estimated) (Depertment San Vicente)
SanV-1. San Vicente - Zone: All (Etimated by Amates / Montecristo)
0
1
2
3
4
5
6
7
0% 10% 20% 30% 40% 50% 60% 70% 80% 90% 100%
Spe
cific
Dis
char
ge [m
3 /s/1
00km
2 ]
Percent of Days Exceeded (%)
Dimensionless Flow Duration Curve(Depertment La Paz)
20. La Paz - Zone: M (JIBOA, Rio JIBOA)
21. La Paz - Zone: ME (JALPONGA, Rio JALPONGA)
0
1
2
3
4
5
6
7
0% 10% 20% 30% 40% 50% 60% 70% 80% 90% 100%
Spe
cific
Dis
char
ge [m
3 /s/1
00km
2 ]
Percent of Days Exceeded (%)
Dimensionless Flow Duration Curve(Depertment Usultán)
22. Usultán - Zone: SE (GRANDE DE SAN MIGUEL, Rio GRANDE DE SAN MIGUEL)
0
1
2
3
4
5
6
7
0% 10% 20% 30% 40% 50% 60% 70% 80% 90% 100%
Spe
cific
Dis
char
ge [m
3 /s/1
00km
2 ]
Percent of Days Exceeded (%)
Dimensionless Flow Duration Curve(Depertment San Miguel)
23. San Miguel - Zone: SW (GRANDE DE SAN MIGUEL, Rio GRANDE DE SAN MIGUEL)
24. San Miguel - Zone: SE (GRANDE DE SAN MIGUEL, Rio GRANDE DE SAN MIGUEL)
25. San Miguel - Zone: M (GRANDE DE SAN MIGUEL, Rio GRANDE DE SAN MIGUEL)
(Source: SNET (Prepared by JICA Study Team))
Figure 7.2.2 Dimensionless FDC by Department (1/2)

Final Report Chapter 7
Republic of El Salvador 7 - 17 March 2012 The Project for Master Plan for the Development of Renewable Energy (JICA)
0
1
2
3
4
5
6
7
0% 10% 20% 30% 40% 50% 60% 70% 80% 90% 100%
Spe
cific
Dis
char
ge [m
3 /s/1
00km
2 ]
Percent of Days Exceeded (%)
Dimensionless Flow Duration Curve (Depertment San Salvador)
15. San Salvador - Zone: N (SUCIO, Rio LEMPA)
16. San Salvador - Zone: N (ACELHUATE, Rio LEMPA)
0
1
2
3
4
5
6
7
0% 10% 20% 30% 40% 50% 60% 70% 80% 90% 100%
Spe
cific
Dis
char
ge [m
3 /s/1
00km
2 ]
Percent of Days Exceeded (%)
Dimensionless Flow Duration Curve (Estimated) (Depertment Cuscatlán)
Cus-1. Cuscatlán - Zone: All (Etimated by using Guazapa)
0
1
2
3
4
5
6
7
0% 10% 20% 30% 40% 50% 60% 70% 80% 90% 100%
Spe
cific
Dis
char
ge [m
3 /s/1
00km
2 ]
Percent of Days Exceeded (%)
Dimensionless Flow Duration Curve (Depertment Chalatenango)
17. Chalatenango - Zone: NW (LEMPA, Rio LEMPA)
18. Chalatenango - Zone: SE (TAMULASCO, Rio LEMPA)
19. Chalatenango - Zone: SE (SUMPUL, Rio LEMPA)
0
1
2
3
4
5
6
7
0% 10% 20% 30% 40% 50% 60% 70% 80% 90% 100%
Spe
cific
Dis
char
ge [m
3 /s/1
00km
2 ]
Percent of Days Exceeded (%)
Dimensionless Flow Duration Curve (Estimated) (Depertment Cabañas)
Cab-1. Cabañas - Zone: SW (Etimated by using Guazapa)
Cab-2. Cabañas - Zone: NE (Etimated by using La Sierpe)
0
1
2
3
4
5
6
7
0% 10% 20% 30% 40% 50% 60% 70% 80% 90% 100%
Spe
cific
Dis
char
ge [m
3 /s/1
00km
2 ]
Percent of Days Exceeded (%)
Dimensionless Flow Duration Curve(Depertment Morazán)
26. Morazán - Zone: M (TOROLA, Rio LEMPA)
0
1
2
3
4
5
6
7
0% 10% 20% 30% 40% 50% 60% 70% 80% 90% 100%
Spe
cific
Dis
char
ge [m
3 /s/1
00km
2 ]
Percent of Days Exceeded (%)
Dimensionless Flow Duration Curve(Depertment La Unión)
27. La Unión - Zone: NE (EL SAUCE, Rio GOASCORAN)
(Source: SNET (Prepared by JICA Study Team)) Figure 7.2.2 Dimensionless FDC by Department (2/2)

Final Report Chapter 7
Republic of El Salvador 7 - 18 March 2012 The Project for Master Plan for the Development of Renewable Energy (JICA)
Table 7.2.3 Specific Flow Duration by Department
Average Specific Discharge [m3/s/100km2] by Duration of Percent of Days Exceeded by Each DepartmentNo. No. 1 2 3 4 5 6 7 8 9 10 11 12 13 14 15 16Department Departmento Ahuachapán Ahuachapán Sonsonate Sonsonate Sonsonate Sonsonate Santa Ana Santa Ana Santa Ana La Libertad La Libertad La Libertad La Libertad La Libertad San Salvador San SalvadorZone Zona W N SW SW S M S N SE N(U/S) N(U/S) N N NE(D/S) N NBasin Cuenca PAZ PAZ SAN PEDRO GDE. DE
SONSONATBANDERA BANDERA LEMPA LEMPA LEMPA LEMPA LEMPA LEMPA LEMPA LEMPA LEMPA LEMPA
River Río PAZ PAMPE SAN PEDRO GDE. DESONSONAT
BANDERA CENIZA GUAJOYO ANGUE GUAJOYO AGUACALIENTE
SUCIO SUQUIAPA SUQUIAPA SUCIO SUCIO ACELHUATE
Station Estacion LAHACHADURA
SANLORENZO
LA ATALAYA SENSUNAPAN
SANTABEATRIZ
CONACASTE HERRADO
SINGUIL LOSPUENTES
SANFRANCISCO
SANANDRES /E.N.A.
SANANDRES
LAS PAVAS TACACHICO EL JOCOTE DESEMBOCADURA
GUAZAPA
Latitude Latitud 13º51'34.3" 14º02' 13º37´ 13º36´ 13º36´ 13º40´ 14º07´ 14º20´ 14º02´ 13º49´ 13º48' 14º02´ 13º59´ 13º55' 14º02´ 13º53´Longitude Longitud 90º05'17.1" 89º47' 89º50´ 89º50´ 89º44´ 89º44´ 89º36´ 89º33´ 89º30' 89º24´ 89º24' 89º18´ 89º20´ 89º18' 89º16´ 89º12´El. [m] Elevacion 30.16 507.53 3.20 1.77 24.03 148.87 615.37 427.21 393.88 445.02 440.85 264.57 288.24 321.70 245.06 320.84C.A. [km2] Area drenaje 1,991.0 351.2 102.2 219.0 422.0 167.7 114.5 587.4 199.7 112.6 379.2 435.0 308.0 724.0 843.0 366.0Obs.Period Apr.62-Oct.85,
Jun.93- Feb.60-Feb.85Sep.68-Jun.88,Feb.90- Jun.59-Oct.82 Jul.60-Jun.87
Feb.70-Sep.80,Jan.90-Oct.98 Jun.69-Oct.85 May.59-Nov.85 Apr.61-Nov.86
Aug.65-Aug.91,Dec.81- Apr.59 -
Oct.68-Sep.82,Mar.90- Nov.60-Jul.87 Feb.67-Abr.87 Apr.60-Aug.74 67-68, 74-84
Duration Days of Year Specific.Discharge [m3/s/100km2][%] Dias5% 18 3.750 2.548 7.221 6.708 6.872 4.609 5.790 6.027 5.533 2.718 3.966 5.402 4.104 3.649 5.302 4.344
10% 37 2.819 2.178 6.155 5.315 4.600 3.667 3.764 4.270 3.766 2.371 3.201 3.979 3.474 3.006 4.377 3.50315% 55 2.294 1.765 5.039 4.493 3.725 3.381 2.594 2.785 2.954 2.034 2.661 3.333 3.029 2.728 3.760 3.07420% 73 1.906 1.538 4.511 4.009 3.270 2.856 2.201 2.215 2.399 1.865 2.402 2.651 2.721 2.355 3.149 2.81425% 91 1.654 1.256 4.090 3.658 2.628 2.600 1.782 1.820 2.033 1.696 2.136 2.237 2.471 2.131 2.881 2.37730% 110 1.411 1.108 3.346 3.329 2.201 2.338 1.371 1.129 1.612 1.572 1.912 1.887 2.107 1.830 2.159 2.16735% 128 1.173 1.039 2.994 3.132 1.855 2.212 1.144 0.735 1.172 1.501 1.582 1.699 1.906 1.532 1.732 1.83940% 146 0.962 0.945 2.691 2.763 1.618 2.010 0.969 0.557 0.936 1.430 1.253 1.372 1.724 1.378 1.476 1.71645% 164 0.869 0.897 2.427 2.466 1.436 1.860 0.751 0.446 0.771 1.385 1.076 1.184 1.571 1.231 1.357 1.56650% 183 0.760 0.863 2.035 2.091 1.055 1.550 0.524 0.274 0.561 1.561 0.912 1.078 1.460 1.097 1.251 1.41055% 201 0.708 0.812 1.888 1.516 0.727 1.389 0.419 0.201 0.421 1.510 0.730 0.959 1.299 0.999 1.157 1.30160% 219 0.648 0.777 1.693 1.324 0.547 1.091 0.341 0.169 0.366 1.279 0.620 0.917 1.195 0.907 0.940 1.11765% 237 0.601 0.752 1.614 1.100 0.467 0.877 0.306 0.145 0.290 1.226 0.554 0.851 1.123 0.840 0.870 1.03070% 256 0.569 0.735 1.536 0.877 0.396 0.674 0.253 0.111 0.245 1.190 0.501 0.814 1.078 0.786 0.794 0.95175% 274 0.544 0.706 1.409 0.790 0.294 0.501 0.218 0.089 0.200 1.296 0.464 0.768 1.039 0.738 0.719 0.89180% 292 0.523 0.678 1.321 0.658 0.218 0.441 0.183 0.063 0.165 1.245 0.419 0.749 0.994 0.696 0.673 0.84285% 310 0.499 0.658 1.204 0.584 0.175 0.376 0.157 0.039 0.130 1.194 0.382 0.713 0.951 0.649 0.600 0.79890% 329 0.469 0.638 1.076 0.516 0.126 0.328 0.140 0.026 0.105 1.153 0.353 0.694 0.922 0.610 0.530 0.73895% 347 0.432 0.592 0.920 0.402 0.092 0.286 0.114 0.012 0.075 1.122 0.309 0.655 0.860 0.543 0.414 0.689100% 365 0.245 0.376 0.538 0.096 0.055 0.149 0.087 0.002 0.050 0.949 0.166 0.554 0.656 0.383 0.249 0.541
Source: JICA Study Team. Prepared by using Mean Monthly Discharge Data at each Hydrological Stations by SNET.
No. No. Cus-1 17 18 19 Cab-1 Cab-2 SanV-1 20 21 22 23 24 25 26 27Department Departmento Cuscatlán Chalatenango Chalatenango Chalatenango Cabañas Cabañas San Vicente La Paz La Paz Usultán San Miguel San Miguel San Miguel Morazán La UniónZone Zona All NW SE SE SW NE All M ME SE SW SE M M NEBasin Cuenca Etimated LEMPA LEMPA LEMPA Etimated Etimated Etimated JIBOA JALPONGA GRANDE DE
SANMIGUEL
GRANDE DESANMIGUEL
GRANDE DESANMIGUEL
GRANDE DESANMIGUEL
LEMPA GOASCORAN
River Río Etimated LEMPA TAMULASCO SUMPUL Etimated Etimated Etimated JIBOA JALPONGA GRANDE DESANMIGUEL
GRANDE DESANMIGUEL
GRANDE DESANMIGUEL
GRANDE DESANMIGUEL
TOROLA EL SAUCE
Station Estacion Etimated byusingGuazapa
CITALA LA SIERPE LASFLORES
Etimated byusingGuazapa
Etimated byusing LaSierpe
Etimated byAmates /Montecristo
AMATES /MONTECRISTO
LA CEIBA LASCONCHAS
VADOMARIN
MOSCOSO VILLERIAS OSICALA EL SAUCE
Latitude Latitud 14º22.1' 14º01.7´ 14º02.7' 13º30.5´ 13º31´ 13º17' 13º18´ 13º27.7' 13º31´ 13º50' 13º40'Longitude Longitud 89º12.9' 88º56.5´ 88º48.5' 88º59.5´ 88º57´ 88º25' 88º17´ 88º09.2' 88º11´ 88º09' 87º48'El. [m] Elevacion 701.63 344.18 174.33 68.21 98.34 7.47 19.78 76.02 87.43 277.40 71.79C.A. [km2] Area drenaje 914.0 74.0 980.5 426.0 58.0 2,238.0 1,900.0 1,074.0 910.0 908.0 319.5Obs.Period
N.D.May.72-Oct.82,Jul.90-
May.74-Sep.85,Dec.93- N.D. N.D. N.D.
Jun.59-Mar.77,Sep.77-Aug.86,Jan.93-
Jul.65-Sep.85 Jul.63-Jan.82May.59-Apr.81,Jun.93-99, Apr.2006-
May.64-Apr.8170-79, 95-96,2002-
Duration Days of Year Specific.Discharge [m3/s/100km2][%] Dias5% 18 4.344 7.911 9.108 8.129 4.344 9.108 3.993 3.993 9.052 5.943 5.069 6.620 6.407 13.326 9.718
10% 37 3.503 6.277 7.135 6.578 3.503 7.135 3.005 3.005 7.052 4.245 4.026 5.253 4.545 10.570 6.72015% 55 3.074 5.098 5.743 5.119 3.074 5.743 2.451 2.451 4.966 3.677 3.051 4.113 3.434 8.283 5.20520% 73 2.814 4.269 4.973 4.875 2.814 4.973 2.073 2.073 4.086 2.493 2.411 3.268 2.911 6.601 4.08525% 91 2.377 3.488 3.635 3.685 2.377 3.635 1.734 1.734 3.017 2.158 1.975 2.628 2.440 4.792 2.83630% 110 2.167 2.751 2.811 3.299 2.167 2.811 1.580 1.580 2.328 1.810 1.512 2.058 1.960 3.513 1.82835% 128 1.839 1.895 2.041 2.707 1.839 2.041 1.310 1.310 1.983 1.538 1.137 1.547 1.396 2.694 1.38040% 146 1.716 1.327 1.311 1.642 1.716 1.311 1.167 1.167 1.466 1.270 0.944 1.287 1.182 2.026 1.05245% 164 1.566 1.111 1.014 1.260 1.566 1.014 0.974 0.974 1.069 1.028 0.770 1.039 1.038 1.432 0.70150% 183 1.410 0.859 0.716 0.886 1.410 0.716 0.878 0.878 0.845 0.835 0.684 0.846 0.864 1.211 0.50455% 201 1.301 0.602 0.486 0.705 1.301 0.486 0.782 0.782 0.724 0.758 0.593 0.743 0.725 0.954 0.37660% 219 1.117 0.532 0.392 0.565 1.117 0.392 0.655 0.655 0.569 0.693 0.503 0.638 0.562 0.787 0.31065% 237 1.030 0.486 0.338 0.452 1.030 0.338 0.566 0.566 0.483 0.603 0.453 0.540 0.443 0.677 0.19470% 256 0.951 0.430 0.270 0.367 0.951 0.270 0.467 0.467 0.448 0.536 0.395 0.443 0.347 0.533 0.14775% 274 0.891 0.350 0.243 0.300 0.891 0.243 0.399 0.399 0.362 0.432 0.363 0.372 0.274 0.400 0.12280% 292 0.842 0.302 0.203 0.267 0.842 0.203 0.354 0.354 0.310 0.405 0.327 0.296 0.242 0.307 0.08585% 310 0.798 0.247 0.176 0.230 0.798 0.176 0.315 0.315 0.310 0.368 0.297 0.256 0.216 0.249 0.07890% 329 0.738 0.218 0.162 0.191 0.738 0.162 0.282 0.282 0.259 0.321 0.248 0.219 0.189 0.206 0.06995% 347 0.689 0.174 0.135 0.168 0.689 0.135 0.245 0.245 0.224 0.285 0.223 0.189 0.157 0.164 0.056100% 365 0.541 0.101 0.081 0.122 0.541 0.081 0.117 0.117 0.121 0.229 0.160 0.116 0.113 0.100 0.034
Source: JICA Study Team. Prepared by using Mean Monthly Discharge Data at each Hydrological Stations by SNET. (Source: JICA Study Team. (Mean Monthly Discharge Data by SNET))

Final Report Chapter 7
Republic of El Salvador 7 - 19 March 2012 The Project for Master Plan for the Development of Renewable Energy (JICA)
For estimation of design flow for the planned small hydropower, it is possible to calculate the discharge [m3/s] easily if the catchment area [km2] at the proposed intake site is known. This is done by using the specific flow duration discharge [m3/s/km2] at each zone (Department-wise) from Table 7.2.3, and applying the following formula:
Q = A * Qsp
Q : Discharge at Proposed Intake Site [m3/s]
A : Catchment Area at Proposed Intake Site [km2]
Qsp : Specific Discharge at Planned Zone (Department) [m3/s/100km2]
Location map of hydrological stations by SNET is shown in Figure 7.2.3. The list of hydrological stations and the observed period are shown in Table 7.2.4. As shown in Figure 7.2.3 and Table 7.2.4, works in most stations were interrupted from 1985 to 1992 due to the Civil War. After the Civil War, some stations continued their operations. The locations of hydrological stations are partially distributed. The hydrological stations are insufficient in the eastern part of Ahuachapán Department, southern part of La Libertad Department, southern part of San Salvador Department, north-west part of Chalatenango Department, northern part of San Miguel Department, and all areas of Morazán Department and La Unión Department. Especially, there are no hydrological stations in the Departments of Cuscatlán, Cabañas and San Vicente.
For the planning of small hydropower or water resources projects, long-term discharge observation data at a nearest station is required. Thus, it is required to build the nationwide hydrological and meteorological observation systems as soon as possible.

Final Report Chapter 7
Republic of El Salvador 7 - 20 March 2012 The Project for Master Plan for the Development of Renewable Energy (JICA)
Hydrological Station (Operating)Hydrological Station (not operating)
1. La Hachadura(Río Paz)
2. San Lorenzo(Río Pampe)
3. La Atalaya(Río San Pedro)
4. Sensunapan(Río Grande
de Sonsonate)
5. Santa Beatriz (Río Bandera)
6. Conacaste Herrado(Río Ceniza)
7. Singuil (Río Guajoyo)
8. Los Puentes (Río Angue)
9. San Francisco (Río Guajoyo)
10. San Andres / E.N.A. (Río Agua Caliente)
11. San Andres (Río Sucio)
12. Las Pavas (Río Suquiapa)
13. Tacachico(Río Suquiapa)
14. El Jocote(Río Sucio)
15. Desembocadura (Río Sucio)
16. Guazapa(Río Acelhuate)
17. Citala (Río Lempa)
18. La Sierpe (Río Tamulasco)
19. Las Flores(Río Sumpul)
20. Amates / Montecristo (Río Jiboa)
21. La Ceiba (Río Jalponga)22. Las Conchas (Río Grande de San Miguel)
23. Vado Marin (Río Grande de San Miguel)
24. Moscoso (Río Grande de San Miguel)
25. Villerias (Río Grande de San Miguel)
26. Osicala(Río Torola)
27. El Sauce(Río El Sauce)
28. Paso del Oso(Río Lempa)
29.Colima(Río Lempa)
30. San Marcos(Río Lempa)
(Source: Prepared by JICA Study Team based on the mean monthly discharge data of SNET)
Figure 7.2.3 Location Map of Hydrological Stations by SNET

Final Report Chapter 7
Republic of El Salvador 7 - 21 March 2012 The Project for Master Plan for the Development of Renewable Energy (JICA)
Table 7.2.4 Hydrological Stations and the Observation Period by SNET No. Department Basin River Station Latitude Longitude El. [m] C.A. [km2] Obs. Period Year / Año
Departmento Cuenca Río Estacion Latitud Longitud Elevacion Areadrenaje
Período deObservación
’59 ’60 ’61 ’62 ’63 ’64 ’65 ’66 ’67 ’68 ’69 ’70 ’71 ’72 ’73 ’74 ’75 ’76 ’77 ’78 ’79 ’80 ’81 ’82 ’83 ’84 ’85 ’86 ’87 ’88 ’89 ’90 ’91 ’92 ’93 ’94 ’95 ’96 ’97 ’98 ’99 ’00 ’01 ’02 ’03 ’04 ’05 ’06 ’07 ’08 ’09 ’10 ’11
1 Ahuachapán Paz Paz La Hachadura 13º51'34.3" 90º05'17.1" 30.16 1,991.0Apr.62-Oct.85,Jun.93-
2 Ahuachapán Paz Pampe San Lorenzo 14º02' 89º47' 507.53 351.2 Feb.60-Feb.85
3 Sonsonate San Pedro San Pedro La Atalaya 13º37´ 89º50´ 3.20 102.2Sep.68-Jun.88,Feb.90-
4 SonsonateGrande deSonsonate
Grande deSonsonate Sensunapan 13º36´ 89º50´ 1.77 219.0 Jun.59-Oct.82
5 Sonsonate Bandera Bandera Santa Beatriz 13º36´ 89º44´ 24.03 422.0 Jul.60-Jun.87
6 Sonsonate Bandera CenizaConacasteHerrado 13º40´ 89º44´ 148.87 167.7
Feb.70-Sep.80,Jan.90-Oct.98
7 Santa Ana Lempa Guajoyo Singuil 14º07´ 89º36´ 615.37 114.5 Jun.69-Oct.85
8 Santa Ana Lempa Angue Los Puentes 14º20´ 89º33´ 427.21 587.4 May.59-Nov.85
9 Santa Ana Lempa Guajoyo San Francisco 14º02´ 89º30' 393.88 199.7 Apr.61-Nov.86
10 La Libertad Lempa Agua CalienteSan Andres /E.N.A. 13º49´ 89º24´ 445.02 112.6
Aug.65-Aug.91,Dec.81-
11 La Libertad Lempa Sucio San Andres 13º48' 89º24' 440.85 379.2 Apr.59 -
12 La Libertad Lempa Suquiapa Las Pavas 14º02´ 89º18´ 264.57 435.0Oct.68-Sep.82,Mar.90-
13 La Libertad Lempa Suquiapa Tacachico 13º59´ 89º20´ 288.24 308.0Nov.60-Jul.87,Sep.02-
14 La Libertad Lempa Sucio El Jocote 13º55' 89º18' 321.70 724.0Feb.67-Abr.87,Aug.92-
15 San Salvador Lempa Sucio Desembocadura 14º02´ 89º16´ 245.06 843.0 Apr.60-Aug.74
16 San Salvador Lempa Acelhuate Guazapa 13º53´ 89º12´ 320.84 366.0 67-68, 74-84
17 Chalatenango Lempa Lempa Citala 14º22.1' 89º12.9' 701.63 914.0May.72-Oct.82,Jul.90-
18 Chalatenango Lempa Tamulasco La Sierpe 14º01.7´ 88º56.5´ 344.18 74.0May.74-Sep.85,Dec.93-
19 Chalatenango Lempa Sumpul Las Flores 14º02.7' 88º48.5' 174.33 980.5Sep.72-Apr.79,May.03-Apr.08
20 La Paz Jiboa Jiboa Amates /Montecristo
13º30.5´ 88º59.5´ 68.21 426.0Jun.59-Mar.77,Sep.77-Aug.86,Jan.93-
21 La Paz Jalponga Jalponga La Ceiba 13º31´ 88º57´ 98.34 58.0 Jul.65-Sep.85
22 UsultánGrande deSan Miguel
Grande deSan Miguel Las Conchas 13º17' 88º25' 7.47 2,238.0 Jul.63-Jan.82
23 San MiguelGrande deSan Miguel
Grande deSan Miguel Vado Marin 13º18´ 88º17´ 19.78 1,900.0
May.59-Apr.81,Jun.93-99, Apr.2006-
24 San MiguelGrande deSan Miguel
Grande deSan Miguel Moscoso 13º27.7' 88º09.2' 76.02 1,074.0 May.64-Apr.81
25 San MiguelGrande deSan Miguel
Grande deSan Miguel Villerias 13º31´ 88º11´ 87.43 910.0
70-79, 95-96,2002-
26 Morazán Lempa Torola Osicala 13º50' 88º09' 277.40 908.0Jan.62-Apr.80,May.02-
27 La Unión Goascoran El Sauce El Sauce 13º40' 87º48' 71.79 319.5Nov.70-Feb.82,May.03-Nov.06
28Santa Ana /
Chalatenango Lempa Lempa Paso del Oso 14º05.5´ 89º25´ 294.60 4,531.4Feb.71-Oct.83,Mar.90-
29 Cuscatlan Lempa Lempa Colima 14º04´ 89º08´ 218.58 7,342.9 May.61-Oct.76
30Usultán / San
Vicente Lempa Lempa San Marcos 13º26´ 88º42´ 4.88 18,176.3 Dec.59-Oct.82
Source: SNET.Note: : Data available completely, : Data available partially.

Final Report Chapter 7
Republic of El Salvador 7 - 22 March 2012 The Project for Master Plan for the Development of Renewable Energy (JICA)
Long-term mean annual discharge at principal hydrological stations is shown in Figure 7.2.4. There is no remarkable trend of fluctuation of long-term mean annual discharge at each station; however, it seems that there is a decrease in trend of the mean annual discharge at La Hachadura station in Río Paz.
0
10
20
30
40
50
60
1960 1965 1970 1975 1980 1985 1990 1995 2000 2005 2010
Mea
n A
nnua
l Dis
char
ge [m
3 /s]
Year
La Hachadura (Río Paz)
5-year moving average discharge at La Hachadura (Río Paz)San Andres (Río Sucio)
Tacahico (Río Suquiapa)
El Jocote (Río Sucio)
La Sierpe (Río Tamulasco)
(Source: Prepared by JICA Study Team based on the mean monthly discharge data of SNET)
Figure 7.2.4 Long-tern Mean Annual Discharge at Principal Hydrological Stations
In the planning of run-off river-type small hydropower without reservoir, achieving a stable water flow throughout the whole year and rich water flow in the dry season is preferred. Thus, the curve “Line-(a)” in Figure 7.2.5 is suitable for small hydropower.
0
10
20
30
40
50
60
70
80
0% 10% 20% 30% 40% 50% 60% 70% 80% 90% 100%
Disc
harg
e [m
3 /s]
Percent of Days Exceeded (%)
Line-(a)
Line-(b)
(Source: JICA Study Team)
Figure 7.2.5 Desirable Type of FDC for Small Hydropower
Good
Not Good

Final Report Chapter 7
Republic of El Salvador 7 - 23 March 2012 The Project for Master Plan for the Development of Renewable Energy (JICA)
7.2.3.2 Procedure Related to Regulatory Aspects To breach the barrier in the introduction of small hydropower development, various complex procedures will be introduced in an easy manner to facilitate related works by the developers. Necessary procedures on regulatory aspects in the guidelines for the promotion of small hydropower are listed below:
A. Summary of General Electricity Law
B. Summary of Environmental Law & Environmental Protected Area / Zone
C. Procedure to MARN / EIA (how to get permit from MARN, description of regulations & flowchart, Water Right)
D. Procedure to SIGET (how to get Permit from SIGET, description of regulations & flowchart)
E. Summary of Law of Renewable Energy Incentives
F. Procedure to get Land Use Permit (for CNR, Municipals, etc.)
G. Procedure to connect Grid Line (SIGET / UT, connection cost, EIA for grid line)
H. Procedure to get CDM Credit
I. Other necessary procedures (if necessary)
7.2.3.3 Contents of Guidelines Contents of the guidelines were discussed and agreed between CNE and the JICA Study Team during the first field survey period in October 2011. The agreed contents of the guidelines are shown below:
Guidelines for the Development of Small Hydro Power (SHP) in El Salvador
Table of Contents
1. Introduction
1.1 Purpose of this Guideline
1.2 Electricity Market in El Salvador
1.3 Why PCH is needed?
1.4 What is Small Hydro Power (SHP)? & Potential Estimation (P=9.8*H*Q*η)
2. Necessary Procedure for the Development of SHP
2.1 Summary of General Electricity Law
2.2 Summary of Environmental Law & Environmental Protected Area / Zone
2.3 Procedure to MARN / EIA
2.4 Procedure to SIGET
2.5 Summary of Law of Renewable Energy Incentives
2.6 Procedure to get Land Use Permit
Final Report Chapter 7
Republic of El Salvador 7 - 24 March 2012 The Project for Master Plan for the Development of Renewable Energy (JICA)
2.7 Procedure to connect Grid Line
2.8 Procedure to get CDM Credit
3. Key Points of Plan Formulation & Evaluation of SHP Project
3.1 Work Flow of Development of SHP Project
3.2 Pre-Feasibility Study
3.2.1 Topographic Survey
3.2.2 Hydrological Study (Estimation of Discharge by using Dimensionless Specific Flow Duration Curve at nearby hydrological station)
3.2.3 Determination of River Maintenance Flow (Caudal Ecologico)
3.2.4 Determination of Design Discharge and Optimum Install Capacity
3.2.5 Rough Cost Estimation
3.2.6 Estimation of Annual Energy Production
3.2.7 Economic & Financial Analysis (include price of sell energy to market, IRR=TIR, NPV=VAN, B/C, etc.)
3.2.8 Environmental Impact Assessment (EIA)
4. Operation & Maintenance (O&M) of SHP Project
4.1 Operation
4.2 Maintenance
4.3 Environmental Impact Monitoring
5. Recommendations
5.1 Hydrological Observation (items, include Equipments)
5.2 Environmental Monitoring (items, include Equipments)
Attachments
1. Format of Concession Procedure of SIGET
2. Format of Procedure of MARN (EIA)
3. Contact address & telephone of major organization (CNE, MARN, SIGET, MAG, SNET, etc.)

Final Report Chapter 7
Republic of El Salvador 7 - 25 March 2012 The Project for Master Plan for the Development of Renewable Energy (JICA)
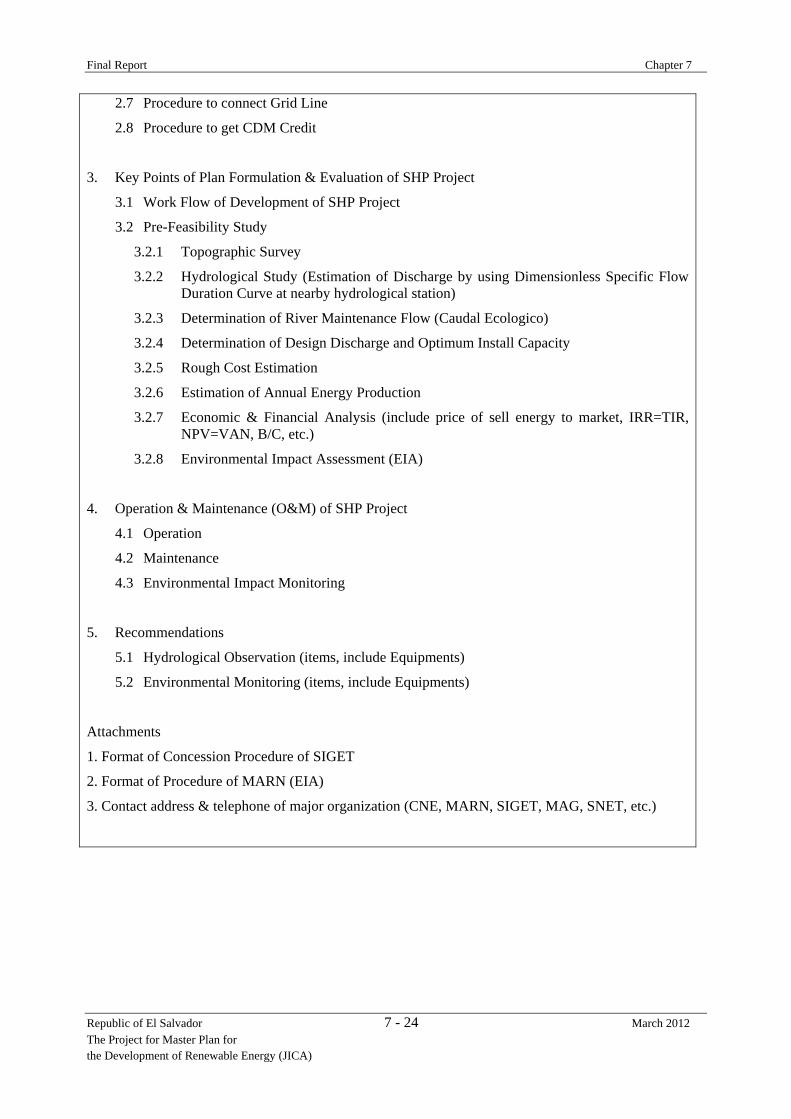
7.3 Examination of Rooftop-Type Solar PV in Urban Areas Solar PV is expected to be a power source, which steadily supplies electricity to the existing grid, not only for private consumption but also for public use. Therefore, review and examination of technical aspects such as specifications and required infrastructure for connecting solar PV to the grid are conducted. Concept of roadmap for dissemination of rooftop solar PV is subsequently explained.
Figure 7.3.1 shows the concept of a rooftop solar PV system.
(Source: NEDO)
Figure 7.3.1 Concept of Rooftop Solar PV System 7.3.1 Current Status and Future Prospects 7.3.1.1 Potential Power output from solar PV is calculated by the following expression.
Ep = H × K × P
Ep:Estimated Power Output (kWh/day)
H:Averaged Solar Irradiation (inclined 15 deg.)( kWh/m2/day)
K: Total System Loss
P:Solar PV System Capacity (kWp)
K = k1 × k2 × k3 × k4 × k5 k1: Variation of annual average solar irradiation correction factor: 0.97
k2: Aged deterioration correction factor of PV array: 0.95
k3: Load matching correction factor of PV array: 0.94
k4: Circuit correction factor of PV array: 0.97
k5: Power conditioner efficiency: 0.90

Final Report Chapter 7
Republic of El Salvador 7 - 26 March 2012 The Project for Master Plan for the Development of Renewable Energy (JICA)
Solar irradiation is as high as 5.3 kWh/m2/day in terms of annual horizontal average in El Salvador, especially around San Salvador Metropolitan Area. Therefore, rooftop solar PV can be one of the best options for power supply in this urban area. Table 7.3.1 and Figure 7.3.2 show the monthly solar irradiation, which is monitored at CEL and estimated power output form 2kW rooftop solar PV system.
Table 7.3.1 Estimated Monthly Power Output in San Salvador Metropolitan (2kW)
Month days
Irradiation
angle 15
(kWh/m2-day)
Ambient
Temp.
()
2 kWp
Power Output
(kWh/day)
Monthly
Output
(kWh/Mo)
Jan 31 6.80 25.4 10.3 319
Feb 28 6.10 26.0 9.2 258
Mar 31 6.80 26.3 10.3 319
Apr 30 5.50 26.8 8.3 250
May 31 5.00 26.1 7.56 234
Jun 30 4.80 25.6 7.3 218
Jul 31 5.80 26.0 8.8 272
Aug 31 6.50 25.9 9.8 305
Sep 30 5.80 25.2 8.8 263
Oct 31 6.10 25.2 9.2 286
Nov 30 5.90 25.5 8.9 268
Dec 31 6.20 25.4 9.4 291
Average 365 5.94 25.8 9.0 273 (Source: JICA Study Team)
0
50
100
150
200
250
300
350
Jan Feb Mar Apr May Jun Jul Aug Sep Oct Nov DecMon
thly
Pow
er O
utpu
t (kW
h)
Month
(Source: JICA Study Team) Figure 7.3.2 Estimated Monthly Power Output in San Salvador Metropolitan (2 kW)

Final Report Chapter 7
Republic of El Salvador 7 - 27 March 2012 The Project for Master Plan for the Development of Renewable Energy (JICA)
7.3.1.2 Estimated Price and Installed solar PV system The potential of solar irradiation is high in El Salvador; however, the initial cost of rooftop solar PV is still expensive for individual users as compared to the current power tariff. The current range of prices for a rooftop solar PV system with 2kW capacity were studied in San Salvador as shown below.
Solar PV system (2kW): US$8,500.00 - US$10,050.00 (plus VAT)
(Source: DelSol Energy and Tecnosolar companies, Feb. 2012. Prices includes 2kW PV modules, 2kW, AC120V,
inverter, mounting structure, electrical accessories, labor, etc.)
Table 7.3.2 shows a list of grid-connected PV systems in El Salvador. There are two systems, which are installed at households. Most of them are installed at government buildings and schools or universities. The largest PV system, 91 kW, is installed at the U.S. base camp. In addition to this, there is a 9 kW solar PV also installed in the camp. There are few companies in El Salvador who are engaged in the solar PV business.
Table 7.3.2 Grid-Connected Solar PV system in El Salvador Application Location Capacity
(kW) Recreational House Lago Coatepeque, Sta Ana 1.63Germany School San Salvador 20.00Santo Domingo Ecological Farm Sto Tomás, San Salvador 2.48Administrative Offices, CEL San Salvador 24.57Administrative Offices, FUNDE San Salvador 2.17Administrative Offices, SEESA San Salvador 2.17Private home Sn José Villanueva, La Libertad 2.02Universidad Nacional San Salvador 2.20Superstore, San Carlos Sn Rafael Cedros 6.00Universidad Politécnica San Salvador 0.70U.S. base camp La Paz 91.0 + 9.0
(Source: JICA Study Team)
7.3.2 Cost Trend of Solar PV Rooftop solar PV will be disseminated through market-driven approach; therefore, its price has to be competitive with the power tariff. Cost trend of solar PV in past and expected future cost trend are given in the following sub-section.
7.3.2.1 Cost Trend in the Past The costs of PV have been falling consistently over the last three decades, exhibiting a learning rate of 19.3%. Such trends can be expected to continue, given the scope for performance and cost improvements delivered by development efforts, as well as significant benefits from scaling up manufacturing processes. Figure 7.3.3 shows the cost digression of solar PV module.

Final Report Chapter 7
Republic of El Salvador 7 - 28 March 2012 The Project for Master Plan for the Development of Renewable Energy (JICA)
(Source: Renewable Energy Markets and Prospects By Technology, IEA)
Figure 7.3.3 Cost Digression of Solar PV Modules (1976‐2010)
In accordance with the IEC report, the current spot market prices for solar modules range between US$1.80/Wp and US$2.27/Wp for crystalline modules, and between US$ 1.37/Wp and US$ 1.65/Wp for thin film modules. It is noted however that prices vary significantly among markets. The total system costs in June 2011 range between US$ 3,300/kWp and US$ 5,800/kWp for rooftop systems. Note that these costs are decreasing quickly and may well be out of date at the time of publication of this report. The resulting generation costs depend on the cost of capital and insulation. Taking the above system costs, levelized costs of electricity will range between US$0.14/kWh and US$0.69/kWh for rooftop systems.
7.3.2.2 Expected Future Cost Trend of Solar PV Table 7.3.3 shows the roadmap of technology development on solar PV systems, which is prepared by the New Energy and Industrial Technology Development Organization (NEDO), Japan. The target of the roadmap is to decrease the power generation cost by improving the module conversion efficiency and production capability. Meanwhile, Figure 7.3.4 shows the solar PV road map prepared by IEA. Both organizations analyzed the reduction of energy production cost of solar PV system. NEDO assumes the energy production to become US$ 0.18/kWh in 2017 while IEA assumes the cost to be US$ 0.105/kWh in 2020.

Final Report Chapter 7
Republic of El Salvador 7 - 29 March 2012 The Project for Master Plan for the Development of Renewable Energy (JICA)
Table 7.3.3 Solar PV Technology Roadmap (NEDO) Target 2010 or later 2017 2025 2050
Power generation cost
Equivalent to
household
electricity tariff
(US$0.29/kWh)
Equivalent to
commercial
electricity tariff
(US$0.18/kWh)
Equivalent to
general power
source
(US$0.09/kWh)
Equivalent to
general power
source
(US$ 0.09/kWh)
Module conversion
efficiency
(lab. level)
Commercial: 16%
(Lab: 20%)
Commercial: 20%
(Lab: 25%)
Commercial: 25%
(Lab: 30%)
Ultra-high
performance:
40% and over
Production
(GW/ year)
for
Japan
0.5 to 1 GW 2 to 3 GW 6 to 12 GW 25 to 35 GW
for
Overseas
to 1GW to 3GW 30 to 35 GW to 300GW
Major applications
Single-family
houses,
public facilities
Single/multi-family
houses, public
facilities, offices,
etc.
Single/multi-family
houses, public
facilities, consumer
use, charging EV,
etc.
Consumer use,
industries,
transport,
agriculture,
stand-alone, etc. (Source: JICA Study Team)
(Source: IEA)
Figure 7.3.4 Solar PV Roadmap (IEA)

Final Report Chapter 7
Republic of El Salvador 7 - 30 March 2012 The Project for Master Plan for the Development of Renewable Energy (JICA)
Rooftop solar PV will be disseminated through market-driven approach; therefore, its price has to be competitive with the power tariff. The power production cost of a PV system is still higher than that of current power tariff in El Salvador. The availability of the rooftop solar PV system for the general public will increase while the price decreases. Once the price becomes affordable, it will be disseminated widely as in the case for mobile phones. Therefore, it is necessary to prepare human resources in the field of renewable energy.
For solar PV industry, improvement of economic efficiency and reduction of generation cost is the most significant issue in expanding the usage of solar PV system. To address this, it is necessary to develop high-performance and low-cost production technologies for PV modules and system components. Moreover, it is also necessary to simplify installation works and extend the lifetime of solar PV systems. The following table shows the target generation cost of solar PV industry in Japan.
Table 7.3.4 Target Power Generation Cost of Japanese PV Industry
Target Year 2017 2025 2050
Generation Cost (Yen/kWh)
14 7 <7
Generation Cost (US$/kWh)
0.18 0.09 <0.09
(Source: JICA Study Team)
In Japan, around 700,000 rooftop solar PV systems have been installed by the end of 2011, which is the largest number in the world. Most of the rooftop systems, over 90 %, are installed at private households with governmental subsidy and FIT. The number of systems serves around 0.55% of the national population in Japan. In El Salvador, the ratio could be estimated lower value due to lack of governmental subsidy and FIT. Base on the estimated ratio rooftop system and population, 0.005% from year 2012 to 2016, 0.01% from year 2017 to 2021, 0.1% from year 2022 to 2026, plan is prepared as shown the table below:
Table 7.3.5 Master Plan of Solar PV (Rooftop)
Capacity (MW) Power Output (GWh/year)
2012 to 2016 0.09*1 0.15
2017 to 2021 0.18*2 0.31
2022 to 2026 1.8*3 3.05
*1: 2012 to 2016: 6,200,000 x 15% x 0.005% x 2kW= 93 kW *2: 2017 to 2021: 6,200,000 x 15% x 0.01% x 2kW= 186 kW *3: 2022 to 2026: 6,200,000 x 15% x 0.1% x 2kW= 1860 kW This 15% is the proportion of urban households with electricity in El Salvador (Source: JICA Study Team)

Final Report Chapter 7
Republic of El Salvador 7 - 31 March 2012 The Project for Master Plan for the Development of Renewable Energy (JICA)
7.3.3 Issues and Countermeasures on Technical Aspects The generation electricity from solar PV is not stable and fluctuates depending on the weather condition. Issues and the countermeasures are examined from the viewpoint of electricity quality and installation.
7.3.3.1 Issues and Countermeasures of Electricity Quality A. Over / Under Voltage
Surplus electricity will flow back to the grid when the power generated by solar PV becomes larger than the consumed energy at the demand side. In this case, electric current flow reverses direction, and the voltage rises as it goes to the end. As PV penetration increases on a grid with a small capacity, the voltage could exceed the upper limit. This issue is called overvoltage. It is possible to control the line voltage to some extent by reducing the sending voltage from the transformer. However, this may cause undervoltage of neighboring lines. Overvoltage and undervoltage could have a negative impact on both the supply-side devices and demand-side equipment.
There are power conditioners for PV systems, which are designed to control voltage rise so as not to exceed the limit. Overvoltage can be completely prevented using this technology. However, a disadvantage is that the PV power output is dumped to control the voltage, leading to lower efficiency of the PV system. Therefore, it is necessary to confirm total capacity of solar PV system which already connected with grid. Accordance with necessity, grid capacity have to be increased as a countermeasures.
B. Harmonics
The inverter converts DC to AC through a semiconductor switching circuit; however, the AC wave obtained from the devices will not be a perfect sinusoidal wave.
The latest inverter models generate little harmonics. The applied scheme is called Pulse Width Modulation (PWM). In PWM, the voltage is controlled by changing the interval and width of the pulse so that the average value of the voltage becomes equal to the desired fundamental waveform.
Therefore, issue on harmonics is a solved in technical aspect, but replace to the latest inverter with PWM is necessary for the solar PV facilities equipped with old-model inverter.
C. Unintended Islanding
Unintended islanding is an electrical phenomenon in which PV systems within a certain network continue to supply power to the load even after the network is disconnected. PV systems are designed to detect the abnormal power quality for immediate disconnection from the network. However, if the power generated from the PV systems and that consumed in the load are identical by chance, the PV systems might not be able to detect the unintended islanding and will continue to supply power.
It is necessary to consider about unintended islanding operation although there is little impact from unintended islanding since the possibility of unintended islanding operation is quite low.

Final Report Chapter 7
Republic of El Salvador 7 - 32 March 2012 The Project for Master Plan for the Development of Renewable Energy (JICA)
7.3.3.2 Issues and Countermeasures of the Installation In order to begin planning a grid-connected solar PV system, a site survey is essential. This enables an assessment of the basic conditions for the PV system.
Table 7.3.6 Checklist for Rooftop Solar PV
1 Customer's requirements with regard to module type, system concept and method of installation
2 Desired PV power or the desired power output from PV system 3 Usable roof, open space 4 Orientation and angle of inclination 5 Roof shape, roof structure, roof substructure and type of roofing 6 Data on shading
7 Installation sites for PV combiner / junction boxes, isolating facility and inverter
8 Meter cupboard and space for extra meters 9 Cable length, wiring routes and routing method
10 Access, particularly when equipment is required for installing PV array (crane, scaffolding, etc.)
(Source: Planning & Installing Photovoltaic System)
A. Strength Examination of Building Structure
For the installation of rooftop solar PV system, shapes of roofs are not so significant; however direction of its slope, angle and type of household structure are considered as more important. Therefore, it is easier to install a rooftop solar PV system on new buildings being constructed. The total weight of the module and supporting structure of a 2 kW rooftop system is around 220 kg. Installers have to examine the structure prior to installing solar PV on old houses.
Current conditions of buildings have been randomly studied at 132 schools in San Salvador Department. As a result, around 66.7% of school buildings were constructed in the 1980’s and the prior years. The following figure shows the percentage distribution of buildings according to their year of construction.
(Source: JICA Study Team)
Figure 7.3.5 Percentage of School Buildings by Year of Construction

Final Report Chapter 7
Republic of El Salvador 7 - 33 March 2012 The Project for Master Plan for the Development of Renewable Energy (JICA)
As mentioned above, there are a lot of old buildings. About the building targeted for the installation of rooftop solar PV, maintenance of the standard on strength evaluation of building structure, development of organization or persons who carrying out the evaluation are necessary.
B. Shading
Ideally, solar PV should be installed at a location without any shade. However, rooftop grid-connected systems are usually installed even where some shading exists. It is necessary to confirm the situation of shading which described in the table below to avoid the effect of shading.
Table 7.3.7 Classification of Shading Type of shading Description
Temporary shading
Typical temporary shading includes factors such as leaves, bird
droppings and other type of soiling. A tilt angle of greater than 12o is
usually sufficient to achieve self-cleaning of leaves and soils on the
array.
Shading resulting from location
Shading from the location covers all shading around the solar PV.
Shading of building and trees are included. Growth of trees and
vegetation must be taken in account.
Shading resulting from building
Shading resulting from the building involves direct shadows. Attention
should be paid to chimney, antennae, lighting conductors, satellite
dishes, etc.
Self-shading
Self-shading may be caused by the row of PV modules in front. The
space requirement and shading loses can be minimized through
optimizing distance between rows or tilt angle.
Direct-shading
Direct shading can cause high losses of energy. The closer the
shadow-casting object, the darker the shadow will be since module is hit
by core shadow. The core shadow cast by a near object reduces the
energy incident to the cells by approximately 60 to 80 %. (Source: Planning & Installing Photovoltaic System)
C. Confirmation with Customer
It is important to establish whether the building is suitable for installing a solar PV system. A thorough initial investigation avoids planning errors and miscalculations in the related quotation, which will be prepared. The installation work for the PV array, installation site, wiring routes, actual laying of cables and expanding or modifying the meter cupboard can be better estimated and agreed in consultation with the customer. Furthermore, it is important to know the budget of the customer for the installation of solar PV system since it will have an influence in deciding the size of the system.
7.3.4 Predicted Issues for Future Introduction The installation capacity of solar PV system, stimulated by supportive policies in a relatively small

Final Report Chapter 7
Republic of El Salvador 7 - 34 March 2012 The Project for Master Plan for the Development of Renewable Energy (JICA)
number of countries, has been rapid and accompanied by impressive reductions in prices. Solar PV system is now cost competitive in some isolated systems. If productive capacity of solar PV system continues to grow, it can be expected to become competitive with retail power prices and eventually with wholesale prices in an increasing number of markets, over the next ten to 20 years. This change will open up the possibilities for deploying the technology in a much wider range of countries. Currently, solar PV applications are not cost competitive. If markets are to grow, economic incentives need to be in place. Experience shows that feed-in tariff (FIT) schemes are effective policy tools; however, care should also be taken in the detailed design of the policy so as to avoid runaway markets, when costs reduce more rapidly than policy makers have anticipated.
This potential trend should be seen as a problem stimulated by success, which could be constantly difficult. By taking advantage of the accumulated policy learning, it should be possible to design policies that effectively stimulate capacity and generation in a predictable way while constraining policy costs to an affordable level. Policies need to be able to react rapidly to changing circumstances.
7.3.4.1 Issues and Countermeasures on Institutional Aspects A. FIT
The concept of FIT is simple. It permits the interconnection of renewable energies with the existing grid and specifies the price paid. Two approaches have emerged for determining the price per kWh. One is bidding or the tendering system, and the second uses a fixed price.
B. Tradable Green Certificates (TGC)
Certificate systems are based on the idea of separating the actual power and its “greenness”. The power is sold on the normal market. In addition, renewable generators can sell a certificate that represents a certain amount of renewable electricity that they generated.
C. Renewable Energy Portfolio Standard (RPS)
An RPS ensures that a minimum amount of renewable energy is included in the portfolio of electricity resources.
D. Loan Softening and Guarantees
Similarly, loan softening programs and loan guarantees, or reassuring of guarantees given by the local governments, can reduce the costs of private lending and thus, improve the project economics.
E. Tendering Schemes
Under a tendering scheme, a regulatory authority announces that it intends to install a certain capacity of a given technology or a suite of technologies. Project developers will then apply to build the project and name their price they are willing to accept for developing the project. Tenders commonly contain specific requirements (e.g. shares of local manufacturing, details of technological specifications, maximum price per unit of energy). The bidder with the lowest offer is selected and can go ahead with the project. Usually, parties sign a long-term contract (power purchasing agreement). Tenders combine two enablers to overcome the economic barriers. They can establish a guaranteed demand, and they ensure, at least in theory, that revenues recover costs for investment.

Final Report Chapter 7
Republic of El Salvador 7 - 35 March 2012 The Project for Master Plan for the Development of Renewable Energy (JICA)
7.3.4.2 Human Resource Development Further time is needed to develop human resources before the power production cost of solar PV comes to be able to compete with the cost of existing power generation system. Therefore, in anticipation of price erosion and the dissemination of solar PV system, it is necessary to develop human resources in the field of renewable energy in preliminary stage.
In El Salvador, there are some universities which include renewable technologies in their curriculum. Table 7.3.8 shows the current condition of renewable energy courses in those universities. In El Salvador, human resources on renewable technologies are limited both in lecturers and students.
Table 7.3.8 Current Situation of Universities
No. University
Number of Students Who
Graduated with Degree on Renewable Energies
(including Masters Degree)
No. of Lecturers on Renewables
Subjects on Renewable Energies
Studies and Projects in Execution 2011.
Electrical Mechanical
1
Universidad Centro
Americana "Josè Simeòn
Cañas" (UCA)
20/year 1 2 Renewable Energies
1-Woody biomass as an alternative energy source. 2-Wind monitoring at the campus.
2
Universidad de El
Salvador (UES)
3/year 4 -
1-Photovoltaic Systems. 2-Generation Systems. 3-Energy Efficiency.
1-Laboratory of photovoltaic applications. 2-Solar-tracking systems in two axes. 3-Measurement of photovoltaic generation potential of the roofs of the campus. 4-Application to computer centers Island battery inverter and inverter to the grid.
3 Universidad
"Don Bosco " (UDB)
11/year 1 1
1-Alternative energy sources. 2-Solar Technologies. 3-Engineering and Environment.
1-Design of an Electronic device for matching and selecting receptor`s surface for solar concentrate collectors. 2-Design and construction of a solar iron mechanism for demo.
(Source: JICA Study Team)
In Universidad de El Salvador, there is a cooperative training program entitled “Masters Degree on Environment and Renewable Energies”. The objective of the program is to develop the capacity of lecturers teaching renewable energy in the university. This program is being carried out with the cooperation of “Universidad de Leon Nicaragua” and financed by “Universidad Complutense of Madrid”. The program started in April 2011 and continues up to March 2012.
In the program, students are engineers from institutions and companies such as CNE, CEL, LaGeo and

Final Report Chapter 7
Republic of El Salvador 7 - 36 March 2012 The Project for Master Plan for the Development of Renewable Energy (JICA)
NGOs. Trainers are about 8 teachers with Master from Nicaragua, Spain and the UES. The subjects and schedule of lectures are shown below:
Subject:
Wind, Solar PV, Solar Thermal, Energy Efficiency, Fuel Cells, Solar Resources, Biomass, Environmental Legislation, Small Hydro, Geothermal, Tidal, Bio-Climatic Architecture, Carbon Credit.
Schedule: Lessons: 5:30 PM to 8:30 PM from Monday to Friday Experiments: Saturday, From 8:00 AM to 5:00 PM / Sunday, From 8:00 AM to 2:00PM
Table 7.3.9 shows the current situation of solar PV companies in El Salvador in 2011. The numbers of companies are limited in El Salvador. Moreover, each company has only a few technicians involved in renewable energy technologies.
Table 7.3.9 Current Situation of Private PV Business (November 2011)
No. Photo Voltaic Company Established Year
Number of Technicians on
Renewables
Installed Capacity Sold
(kW)
Represented Manufacturer of PV modules
1 Company A 1992 5 400 KYOCERA,
SOLARWORLD, ISOFOTON
2 Company B 1998 6 10,000 KYOCERA, SUNTECH, EVERGREEN, SHARP
3 Company C 1984 5 N/A KYOCERA, SIEMENS, FOTOWATT, SOLARA,
UNISOLAR (Source: JICA study team)
Capacity building is required as part of technical assistance for both private and public sectors in order to disseminate solar PV system. Any technical support program should attempt at maximizing the involvement of local institutions to foster technology and policy learning. The governments and utilities in El Salvador should be involved to allow them to gain experiences in renewable energy projects and policies.
In addition, structures for local private sectors such as local companies and banks should be established to enable them to gather experience in financing and operation of renewable energy projects.
Technical assistance and capacity building should focus on:
Development, resource assessment and feasibility studies
Construction, operation and maintenance
Grid integration of renewable energy
Financing and risk mitigation strategies for local financiers
Policy design for policy makers: e.g. feed-in tariff design

Final Report Chapter 7
Republic of El Salvador 7 - 37 March 2012 The Project for Master Plan for the Development of Renewable Energy (JICA)
Price and rate setting
Policy review and transitional decreasing of financial support over time
Transfer of renewable energy technologies matches the need in El Salvador. In addition, it is required to reduce CO2 emissions in the country. It is necessary to create sustainable paths for the development of renewable technology. To enable technology transfer on a larger scale, incentives are vital for technology developers to achieve cooperation and share technology.
7.3.4.3 Accumulation of Operative Experiences and Data For dissemination of solar PV system, it is necessary to accumulate data and experiences on site survey, installation, management, operation and maintenance. Therefore, implementation of pilot project is important. Objectives and expected output from the pilot test are as shown below.
To accumulate installation experience
To accumulate O&M experiences
To demonstrate the benefits of solar PV technology to local people
To raise awareness on environmental and energy issues
A pilot project related to rooftop solar PV systems with a capacity of 540 kW has been prepared by CEL. That project will be implemented between 2012 and 2016.
7.3.5 Roadmap for Introduction Current issues and countermeasures on rooftop solar PV can be summarized as shown in below.
Grid connected solar PV is not disseminated yet although the solar irradiation potential is high in El Salvador. (There are 11 grid connected solar PV system including 2 rooftop system at households)
Currently, it is difficult to purchase rooftop solar PV for majority in the nation because the initial investment cost of is high.
In addition, rooftop solar PV will be purchased by individual users, not like other large scale power generation systems. Therefore, if there is no benefit for individual users, it is difficult to disseminate through market driven approach.
The costs of solar PV have been falling consistently over the last three decades and such trends can be expected to continue. It is estimated the cost becomes lower level as same as current national power tariff by 2020.
If the cost becomes same level to current power tariff, it is necessary for users to have awareness on environmental and energy issues for the dissemination of solar PV. In addition, economical benefit is necessary for users.

Final Report Chapter 7
Republic of El Salvador 7 - 38 March 2012 The Project for Master Plan for the Development of Renewable Energy (JICA)
The issues on grid connect solar PV is solved technically. It does not become the problem if equipped with latest equipments. The problem in the installation varies according to individual cases. It is necessary to have the person who we understand and evaluate the system.
It can be considered preparation stage for the dissemination of rooftop solar PV system in future is by 2020. Therefore, it is necessary to conduct following preparation.
Human resource development
It is necessary to improve educational opportunities on solar PV engineers in university and so on.
It is necessary to accumulate solar irradiation data in main cities.
It is necessary to conduct technical training to empower private sector.
It is necessary to accumulate experiences and data through implementation of pilot test.
Institutional arrangement
It is necessary to prepare guideline, standard and regulation for introduction of rooftop solar PV system
It is necessary to prepare regulation such as FIT and RPS.
It is necessary to prepare subsidy for introduction of rooftop solar PV.
Figure 7.3.6 shows the road map for introduction of solar PV and other renewable technologies.

Final Report Chapter 7
Republic of El Salvador 7 - 39 March 2012 The Project for Master Plan for the Development of Renewable Energy (JICA)
(Source: JICA study team)
Figure 7.3.6 Roadmap for Introduction of Solar PV

Final Report Chapter 8
Republic of El Salvador 8 - 1 March 2012 The Project for Master Plan for the Development of Renewable Energy (JICA)
Chapter 8 Approaches for Examination of the Possibility of Renewable Energy Introduction
Based on the results of studies and examinations conducted, examinations will be made on the possibility of renewable energy introduction in El Salvador. Such examinations will be made on three aspects namely, “Technical,” “Economic and Financial,” and “Environmental.”
8.1 Technical Aspects From the result of studies and examination, maturity of technologies and plans for each renewable resource in El Salvador can be categorized as shown in Figure 8.1.1. The figure shows the master plan period of 15 years in the horizontal axis, and the maturity of technologies and planning in the vertical axis. Depending on the maturity of the technologies and planning, four categories were set: (1) ready for development, (2) five-year preparation period required for development, (3) ten-year preparation period required for development, and (4) more preparation period required for development.
Further, based on the review of available information, each technology of renewable energy was positioned in the same chart to show the status of the renewable energy in El Salvador. Small hydropower and geothermal technologies are classified as high maturity while roof-top type solar PV and other biogas are classified as low maturity.
Considering the maturity of technologies as shown in Figure 8.1.1, examinations will be made on the possibilities of introducing renewable energy in El Salvador.
Master Plan Period2012 to 2026
2012-2016o --------------------o --------------------o --------------------o --------------------
2017-2021o --------------------o --------------------o --------------------o --------------------
2022-2026o --------------------o --------------------o --------------------o --------------------
Ready for Development
Preparation Period- Data Collection- Examination - Study
2017-2021o --------------------o --------------------o --------------------o --------------------
2022-2026o --------------------o --------------------o --------------------o --------------------
5 year Preparation for Development
Preparation Period- Data Collection- Examination - Study
2022-2026o --------------------o --------------------o --------------------o --------------------
10 year Preparation for Development
Need More Preparation for Development
Preparation Period- Data Collection- Examination - Study
Small Hydropower
Geothermal
Biomass(Bagasse)
Biogas (Landfill)
Solar PV(MW-class)
Wind
Biogas (Animal Waste)
Solar Thermal
Mat
urity
of T
echn
olog
ies
and
Plan
ning
Hig
hLo
w
Solar PV(Roof-top
Type)
Biogas (Others)
Biomass (Gasificatoin)
Status of Technologiesin El Salvador
(Source: JICA Study Team) Figure 8.1.1 Relationships among Maturity on Technologies and Planning, Method of Planning,
and Status of Renewable Energy Sources in El Salvador

Final Report Chapter 8
Republic of El Salvador 8 - 2 March 2012 The Project for Master Plan for the Development of Renewable Energy (JICA)
Methods for examination of each renewable energy source are described hereunder. The results of the examinations are presented in Chapter 10 of this report.”
8.1.1 Small Hydropower There are many studies on small hydropower compared with other energy sources. For small hydropower development, examination on introduced amount will be made after the review of available materials. The steps for the examination on small hydropower development are as illustrated in Figure 8.1.2. Furthermore, aggregate development costs will be developed from the results of review, which will serve as basis for the preparation of schedules for development. The development schedule will be prepared for every five years between 2012 and 2026.
Simple Reviews on Technical Part
Estimate of Aggregate Costs and Economic Indicators
Examinations on Possible Amount of
Introduction
Collection of Information on
Existing Potential
Examinations on new development
locations
(Source: JICA Study Team) Figure 8.1.2 Flow of Technical Examination on Small Hydropower Development
8.1.2 Wind Power High potential areas will be selected using the wind potential maps to be prepared during the course of the study.
In addition, existing plans prepared by power companies will be reviewed to formulate the action plans toward the introduction of wind power. Such action plans and programs include current technical issues and required further studies and examinations. The steps of the technical examination on wind power development are as illustrated in Figure 8.1.3.
Preparation of Wind Potential Map
Selection of Promising Potential
Sites
Formulation of Master Plan
Current TechnicalIssues and Items for
Examination
Action Plans towardIntroduction
Review of Existing Development Plan
(Source: JICA Study Team) Figure 8.1.3 Flow of Technical Examination on Wind Power Development
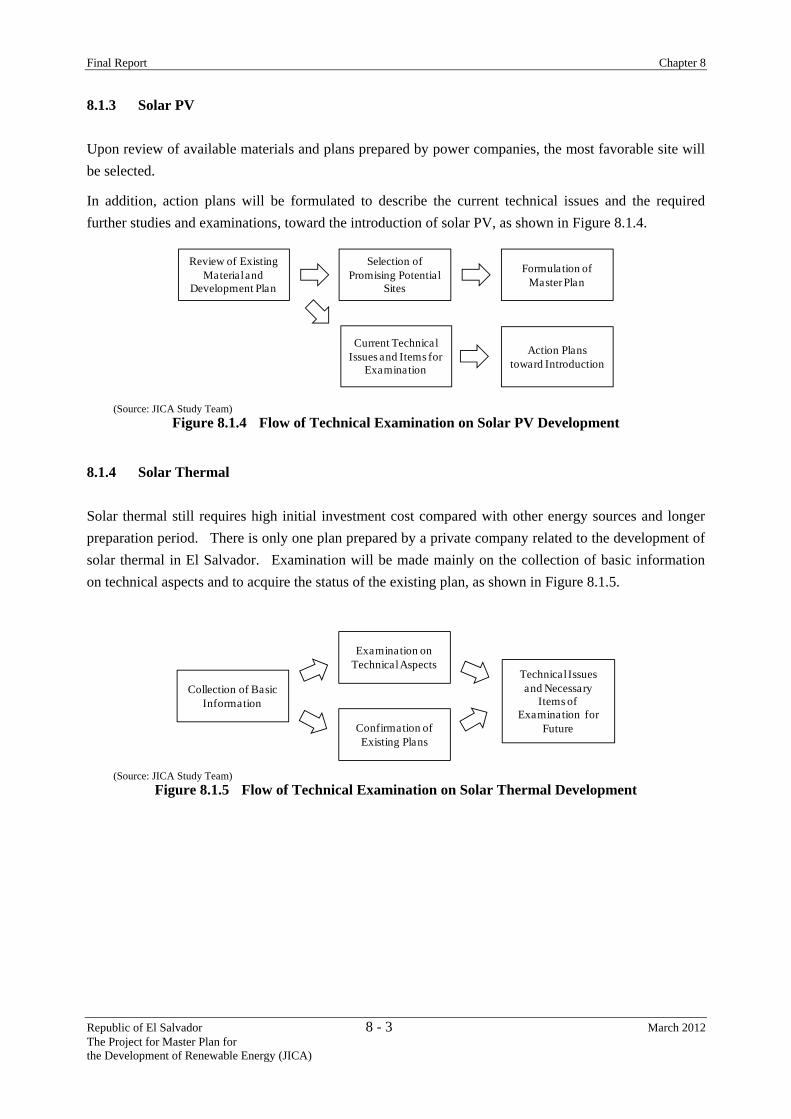
Final Report Chapter 8
Republic of El Salvador 8 - 3 March 2012 The Project for Master Plan for the Development of Renewable Energy (JICA)
8.1.3 Solar PV Upon review of available materials and plans prepared by power companies, the most favorable site will be selected.
In addition, action plans will be formulated to describe the current technical issues and the required further studies and examinations, toward the introduction of solar PV, as shown in Figure 8.1.4.
Review of Existing Material and
Development Plan
Selection of Promising Potential
Sites
Current Technical Issues and Items for
Examination
Formulation of Master Plan
Action Plans toward Introduction
(Source: JICA Study Team) Figure 8.1.4 Flow of Technical Examination on Solar PV Development
8.1.4 Solar Thermal Solar thermal still requires high initial investment cost compared with other energy sources and longer preparation period. There is only one plan prepared by a private company related to the development of solar thermal in El Salvador. Examination will be made mainly on the collection of basic information on technical aspects and to acquire the status of the existing plan, as shown in Figure 8.1.5.
Collection of Basic Information
Technical Issues and Necessary
Items of Examination for
Future
Examination on Technical Aspects
Confirmation of Existing Plans
(Source: JICA Study Team)
Figure 8.1.5 Flow of Technical Examination on Solar Thermal Development

Final Report Chapter 8
Republic of El Salvador 8 - 4 March 2012 The Project for Master Plan for the Development of Renewable Energy (JICA)
8.1.5 Geothermal Through the review of available materials and interviews with related organizations, a development plan toward 2017 will be formulated. Subsequently, additional studies will be required to identify the introduced potential. Therefore, a plan after 2017 will only indicate the total remaining potential to be developed as guiding figures.
既存計画のレ
ビュー
Examinations on Possible Amount of
Introduction
Collection of Basic Information
Examination on Possibilities for
Future Development
Formulation of Master Plan
Review of Existing Development Plan
(Source: JICA Study Team) Figure 8.1.6 Flow of Technical Examination on Geothermal Development
8.1.6 Biomass Upon review of existing materials, the most favorable biomass resources of bagasse from sugar factories were identified. Coffee and rice husks, which are also possible sources, though not significant, are to be examined for future introduction of biomass.
For power generation using bagasse from sugar factories, examination on introduced amount will be made by reviewing the existing plans.
On the other hand, development potential of coffee and rice husks will be examined by applying the annual production by region using the data from coffee factories and rice mills.
In addition, possibilities of biomass power generation will be examined by indicating the technical issues and required items for further examinations. The steps for this examination are as shown in Figure 8.1.6.
Review of Existing Development Plan
Examinations on Possible Amount of
Introduction
Estimate of Development
Potentia l
Examination on Possibilities for
Future Technical Issues
(Other Biomass))
(Sugarcane)
Formulation of Master Plan
Necessary Items of Examination for
Future
(Source: JICA Study Team) Figure 8.1.7 Flow of Technical Examination on Biomass Development

Final Report Chapter 8
Republic of El Salvador 8 - 5 March 2012 The Project for Master Plan for the Development of Renewable Energy (JICA)
8.1.7 Biogas Upon review of available materials and after conducting site visits to related organizations, it was found that only one location is currently operating biogas power generation through landfill. By reviewing landfill biogas operations, examination will be made on future introduction of biogas. For other biogas options, basic information will be collected as there are no existing power generations using other technologies. In addition, technical issues and further examination required will be arranged toward the introduction of biogas in the future. Actual experiences on introduction in other countries will be indicated, if available.
Review of Existing Development Plan
Examination on Introduction Plan
for Future
Collection of Basic Information
Presentation of Issues on Technical
Aspect
(Other Type Biogas)
(Landfill Type Biogas)
Presentation ofNecessary Items for
Examination toward Introduction
(Source: JICA Study Team)
Figure 8.1.8 Flow of Technical Examination on Biogas Development
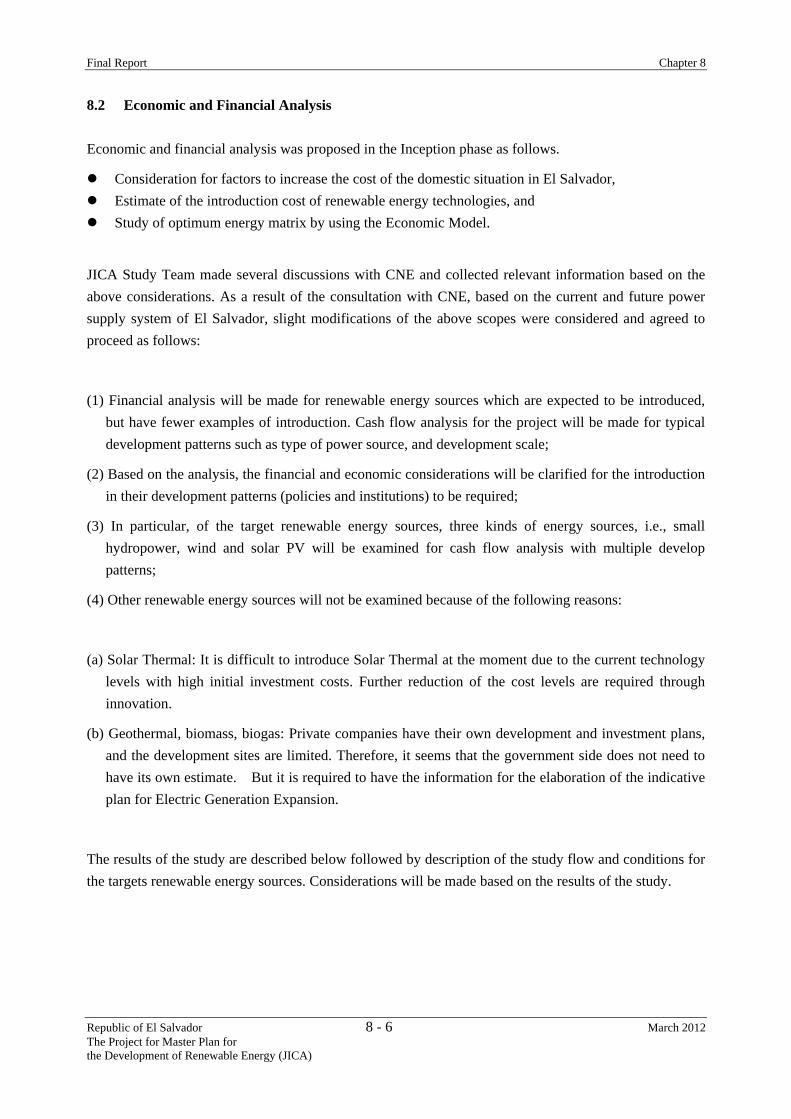
Final Report Chapter 8
Republic of El Salvador 8 - 6 March 2012 The Project for Master Plan for the Development of Renewable Energy (JICA)
8.2 Economic and Financial Analysis Economic and financial analysis was proposed in the Inception phase as follows.
Consideration for factors to increase the cost of the domestic situation in El Salvador, Estimate of the introduction cost of renewable energy technologies, and Study of optimum energy matrix by using the Economic Model.
JICA Study Team made several discussions with CNE and collected relevant information based on the above considerations. As a result of the consultation with CNE, based on the current and future power supply system of El Salvador, slight modifications of the above scopes were considered and agreed to proceed as follows:
(1) Financial analysis will be made for renewable energy sources which are expected to be introduced, but have fewer examples of introduction. Cash flow analysis for the project will be made for typical development patterns such as type of power source, and development scale;
(2) Based on the analysis, the financial and economic considerations will be clarified for the introduction in their development patterns (policies and institutions) to be required;
(3) In particular, of the target renewable energy sources, three kinds of energy sources, i.e., small hydropower, wind and solar PV will be examined for cash flow analysis with multiple develop patterns;
(4) Other renewable energy sources will not be examined because of the following reasons:
(a) Solar Thermal: It is difficult to introduce Solar Thermal at the moment due to the current technology levels with high initial investment costs. Further reduction of the cost levels are required through innovation.
(b) Geothermal, biomass, biogas: Private companies have their own development and investment plans, and the development sites are limited. Therefore, it seems that the government side does not need to have its own estimate. But it is required to have the information for the elaboration of the indicative plan for Electric Generation Expansion.
The results of the study are described below followed by description of the study flow and conditions for the targets renewable energy sources. Considerations will be made based on the results of the study.

Final Report Chapter 8
Republic of El Salvador 8 - 7 March 2012 The Project for Master Plan for the Development of Renewable Energy (JICA)
8.2.1 Study Flow Studies were carried out on three types of energy, i.e., small hydro, wind and solar PV based on the study flow mentioned below.
Analysis of Preconditions
Development of Cost Estimate
Income and Expense Analysis
Evaluation of Project Viability
(Source: JICA Study Team)
Figure 8.2.1 Study Flow of Economic and Financial Analysis
The possibility for the introduction of renewable energy (feasibility) will be examined for each case based on general financial indicators, such as financial internal rate of return (FIRR).
8.2.2 Purpose of Analysis The plant factors or energy generation efficiencies varies among the different types of renewable energy source. Therefore, examinations will be made for expected typical development patterns (i.e., development scale and plant factor, change of development year in terms of cost reduction by research and development, exclusion of grid connection cost, etc.) to find out the possibility of development of renewable energy sources in the master plan. 8.2.3 Preconditions of Analysis 8.2.3.1 Energy Promotion Policy For promoting the introduction of renewable energy in Europe and Japan, the introduction policy is in accordance with the RPS, feed-in tariff (FIT), and subsidy provision to developers. However, in El Salvador, renewable energy promotion depends only on the law on tax incentives for electricity generation based on renewable energies that was enacted in December 2007 (Act Order 462). The said law seeks to promote the introduction of renewable energy. The legislation on renewable energy promotion applies an incentive of tax exemption for five to ten years for energy development with capacities of a certain scale (up to 20 MW, refer to 3.4.3 of Chapter 3). Within this legal framework, whether renewable energy is accelerated or not, the commercial viability of the development or commercialization of renewable energy will be identified by analyzing. 8.2.3.2 Preconditions of Analysis For the examination of wind and solar PV (grid connected), development size is set at 20 MW, the maximum size that can be benefitted from the above mentioned tax incentive. As for small hydropower, in which a few have already been developed, many development potential sites with less than 1MW scale are indicated in Chapter 4. The development potential of small hydropower with capacities from100 kW to 5 MW is to be analyzed for their feasibilities. . There are two electricity markets in El Salvador, namely, wholesale market and retail market. According to the Reglamento de Operacion del Sistema de

Final Report Chapter 8
Republic of El Salvador 8 - 8 March 2012 The Project for Master Plan for the Development of Renewable Energy (JICA)
Transmision y del Mercad Mayorista Basado en Costos de Production (SIGET, July 2011), generation capacity of more than 5 MW can sell energy to the wholesale market. While, generation capacity of less than 5 MW can sell energy to the retail market. Thus, this analysis is targeted on the retail market in terms of development scale.
Table 8.2.1 Development Scale by Energy Development Study by Energy Project Scale
Small hydropower 100 kW – 5 MW Wind power 20 MW
PV (grid connected) 20 MW Source: JICA Study Team
8.2.3.3 Profitability Index Profitability index in development projects is determined by the net present value (NPV), FIRR, and benefit-cost ratio (B/C). The evaluation criteria are mentioned below. These indicators are commonly used in the energy industry and electricity companies in El Salvador.
Table 8.2.2 Profitability Index Profitability Index Evaluation Criteria NPV with 10% discount rate More than 0 FIRR More than 12% B/C More than 1.5 Source: JICA Study Team
8.2.3.4 Preconditions of Cash Flow for Project Development Gathering information about conditions in El Salvador and trends in the global development of renewable energy, cash flow for the development project are prepared based on the following preconditions

Final Report Chapter 8
Republic of El Salvador 8 - 9 March 2012 The Project for Master Plan for the Development of Renewable Energy (JICA)
Table 8.2.3 Precondition for Profitability Estimates Item Precondition
1. Construction Period Small Hydropower Wind Energy Solar PV (Grid Connected)
Construction period set up as follows: A small hydropower project takes more than three years, including feasibility study (F/S), etc.. It is assumed that it takes two years for analysis. The IEA report suggested that it takes about two years for a wind energy project. It is expected to take about two years for analysis. The IEA report suggested that it takes one or two years for a solar PV (grid connected) project. It is also expected take about two years for analysis.
2. Loan Conditions (1) Capital Procurement (2) Loan Period (3) Interest Rate
Loan conditions for project development are applied according to the terms of the country. Borrow 70% of the capital cost from the bank. Equal repayment of loan amount within ten years 8% annually
3. Project Evaluation Period and Depreciation
20 years. The evaluation period may be set from 30 to 50 years for small hydropower projects, and up to 20 years for wind and solar energy projects. Depreciation period is 20 years for small hydropower and 15 years for wind and solar PV. Straight line method is adopted respectively
4. Corporate Tax 25% of the annual income before tax deduction 5. Tax Exemption -Ten years tax exemption for capacity of less than 10 MW
-Five years tax exemption for capacity of 10-20 MW. 6. Annual Inflation It is recognized that electricity prices are expected to rise with the inflation
rate due to bidding conditions. Referring to the rate predicted by the IMF and other international organizations, a 4% per annum is applied in this analysis.
(Source: JICA Study Team)
8.2.3.5 Assumption of the Project Income The annual project income is to be calculated using the electricity sale unit price (US$/MWh) and the annual energy production revenue.
(1)Unit Price
The electricity sale price was set to US$140/MWh in the first year with reference to current pricing, and the transaction price has been announced by SIGET. It was considered that the sale price has changed significantly from US$87.91/MWh to US$162.90/MWh in 2010, and from US$143.53/MWh to US$186.68/MWh in 2011 (refer to Figure 8.2.2). Therefore, mean value of US$140/MWh is applied.

Final Report Chapter 8
Republic of El Salvador 8 - 10 March 2012 The Project for Master Plan for the Development of Renewable Energy (JICA)
(Source: September 2011 UT Variation Diagram)
Figure 8.2.2 Price Changes in 2010 and 2011 (2)Annual Energy Generation and Electricity Sales
The annual energy generation is verified depending on the plant factor and energy generation efficiency. Since the annual energy production largely affects the operational income, such can be set based on the plant factor (Base Case), which is set as shown below. Also, several development scenarios in the case study sets the plant factor based on the results of the Base Case, which considers the impact on project profitability.
Table 8.2.4 Plant Factor by Energy Type of Energy Operation Factor (Energy Generation Efficiency)
Small Hydro Plant factor is estimated at about 50% according to the plant factor of a small
hydropower project with energy of less than 20 MW, hydroelectric energy
generation of 675 GWh and capacity of 158 MW in Chapter 4. On the other hand,
some projects have been at about 60% in energy generation according to statistics of
SIGET. In the Base Case for this analysis, 50% is applied, while 40% and 60% are
applied for other case studies depending on the conditions.
Wind Energy Plant factor of wind power is basically dependent on wind speed indicators.
Therefore economic viability of the project differs largely by the wind speed. The
plant factor of the Metapan Project (42 MW) is currently estimated at 34.4%. The
plant factor for the Base Case analysis is assumed at 25% by referring to material
provided by NEDO.
Solar PV (Grid
Connection)
Solar energy generation efficiency is largely affected by photovoltaic systems (grid
connected) and natural conditions at the development sites (particularly solar
radiation). The average energy generation efficiency is estimated at 12% in Japan.
Solar radiation in El Salvador is high at 1.5 to 1.6 times of the average in Tokyo.
The energy generation efficiency of 18% is applied for the Base Case. (Source: JICA Study Team)
8.2.3.6 Development Cost Estimate (1)Development Costs
The development costs of small hydropower projects consist of the grid transmission and distribution costs in addition to the generation project cost since grid connection costs shall be borne by the generator or developer according to current regulations. Grid connection costs for renewable energy (wind power

Final Report Chapter 8
Republic of El Salvador 8 - 11 March 2012 The Project for Master Plan for the Development of Renewable Energy (JICA)
and grid-connected solar PV) are already included in the development cost. The development costs by type of energy were set, as shown below.
Table 8.2.5 Development Costs by Type of Energy Type of Energy Development Cost Small Hydropower
Although small hydropower potential projects less than 20 MW are listed in Chapter 4, the analysis for small hydropower projects will be made for 5 MW to 100 kW as case study. Development costs including construction costs were set as follows, referring to the development costs estimated in F/S reports on small hydropower projects by CECSA and other companies. For projects that cannot identify the development site, a small hydropower project cost was considered for the grid connection cost at a distance of about 3 km from the site.
Installed Capacity 5 MW ~ 1.0 MW 1.0 MW ~ 100 kW
Capital Cost (US$000/MW) 2,500 3,000 Interconnection Cost (US$000/km) 50
Wind Power Referring to the IEA and GWEC reports, the wind power development costs per kW are as shown in the following table. In case there are several different estimates by development scenario in these reports, the mean values (costs) are adopted. Development costs in 2030 are expected to be reduced by approximately 20% or more of the development costs in 2010.
Year 2010 2015 2020 2025 2030
IEA (US$/kW) 1,725 - 1,420
GWEC (US$/kW) 1,890 1,730 1,590
JICA Study Team (US$/kW) 1,800 1,700 1,600 1,600 1,500
Notes: 1) IEA price at 2008 was applied for 2010 2) IEA: International Energy Agency 3) GWEC: Global Wind Energy Council
Solar PV (Grid Connected)
Referring to the reports of EPIA and IEA, the cost per kW of PV (grid connected) projects are as shown in the following table. In case there are several different estimates by development scenario in these reports, the mean values (costs) are adopted. Development costs in 2030 are expected to be reduced by approximately one-third of development costs in 2010. Development costs in 2020 are expected to be about less than half of the costs in 2010.
Year 2010 2015 2020 2025 2030IEA (US$/kW) 4,060 1,830 1,220EPIA (US$/kW) 3,600 1,380 1,060JICA Study Team (US$/kW) 3,800 2,700 1,600 1,300 1,100
Notes: 1) IEA price at 2008 was applied for 2010 2) IEA: International Energy Agency 3) EPIA: European Photovoltaic Industry Association
(Source: JICA Study Team)

Final Report Chapter 8
Republic of El Salvador 8 - 12 March 2012 The Project for Master Plan for the Development of Renewable Energy (JICA)
(2)O&M Costs
O&M costs for small hydropower, wind power and solar PV power are shown as follows. The O&M costs will reflect the annual inflation.
Table 8.2.6 O&M Costs Type of Energy O&M Costs
Small
Hydropower
Annual O&M costs consist of routine cost and special cost for urgent repair. Routine cost is
assumed at 5% of the annual energy sales and special cost is assumed at US$0.35/MWh for a
small hydropower project. These costs include direct costs such as personnel costs and other
expenses related to repair and maintenance of the plants, and indirect costs such as local taxes
imposed by the department at the power plant site and surcharges of SIGET, etc.
Wind Power As shown in the IEA report (IEA Annual Report 2010), the O&M costs of wind power on land are
US$12~32/MWh. Mean value of US$22/MWh is adopted in this analysis.
Solar PV (Grid
Connected)
As shown in the IEA report (IEA Annual Report 2010), O&M costs of solar PV (grid connected)
are US$4/MWh. US$4/MWh is adopted in this analysis. (Source: JICA Study Team)
8.2.3.7 Preconditions for Typical Development Case Income and expenditure simulation will be conducted considering the following factors that affect the profitability of the project:
Project Scale: Project profitability is greatly affected by the scale of the development costs and O&M costs.
Capacity Factor: Project income will be increased/reduced by operation factor which would be increased/reduced by the ratio set up in the base case.
Development Year: The development year is to be postponed because development costs will reduce the current cost through research and development, especially in case of wind power and solar PV.
Site Development Conditions: For the cost of small hydropower development, the development project costs are significantly affected by the access condition to the site and the distance from the potential site to the grid connection point. The cost of grid connection accounts for a large portion of development cost.
Income and expenditure simulation for energy project is conducted based on the conditions shown as follows.

Final Report Chapter 8
Republic of El Salvador 8 - 13 March 2012 The Project for Master Plan for the Development of Renewable Energy (JICA)
Table 8.2.7 Preconditions for Income and Expenditure Simulation Case Study by Type of Energy
Project Scale Preconditions for Simulation
Small Hydropower
Case H0 5 MW Created a cash flow based on the preconditions mentioned above under the Base Case (H0) simulation.
Case H1 4 MW Changed development cost due to change of the development scale from Case H0 above.
Case H2 3 MW Changed development cost due to change of the development scale from Case H0 above.
Case H3 2 MW Changed development cost due to change of the development scale from Case H0 above.
Case H4 1 MW Changed development cost due to change of the development scale from Case H0 above.
Case H5 0.7MW Changed development unit cost due to change of the development scale from the cost of Base Case above.
Case H6 0.5MW Changed development cost due to change of the development scale from Case H5 above.
Case H7 0.3 MW Changed development cost due to change of the development scale from Case H5 above.
Case H8 0.2 MW Changed development cost due to change of the development scale from Case H5 above..
Case H9 0.2 MW Changed capacity factor with 40% from Case H8 above.
Case H10 0.1 MW Changed development cost due to change of the development scale from Case H5 above.
Case H11 0.1 MW Changed capacity factor with 60% from Case H10 above.
Wind Power
Case W0 20 MW Created a cash flow based on the preconditions mentioned above under the Base Case (W0) simulation.
Case W1 20 MW Changed development costs in 2015 prices and the operation factor is 25%.
Case W2 20 MW Changed the operation factor to 34% similar to the Metapan Project.
Case W3 20 MW Changed development costs in 2020 prices and the operation factor is 34%.
Solar PV
Case S0 20 MW Created a cash flow based on the preconditions mentioned above under the Base Case (S0) simulation.
Case S1 20 MW Changed development costs in 2015 prices from Base Case above.
Case S2 20 MW Development costs same as Case S1 in 2015 prices and changed energy generation efficiency (25%) from Base above.
Case S3 20 MW Changed development cost in 2020 prices and generation efficiency (25%) from Base Case above.
(Source: JICA Study Team)
8.2.4 Evaluation of Project Profitability 8.2.4.1 Cash Flow by Case The following Figures show the results of cash flows prepared in accordance with the preconditions shown above. In addition, these cash flow statements are shown in Appendix -E.
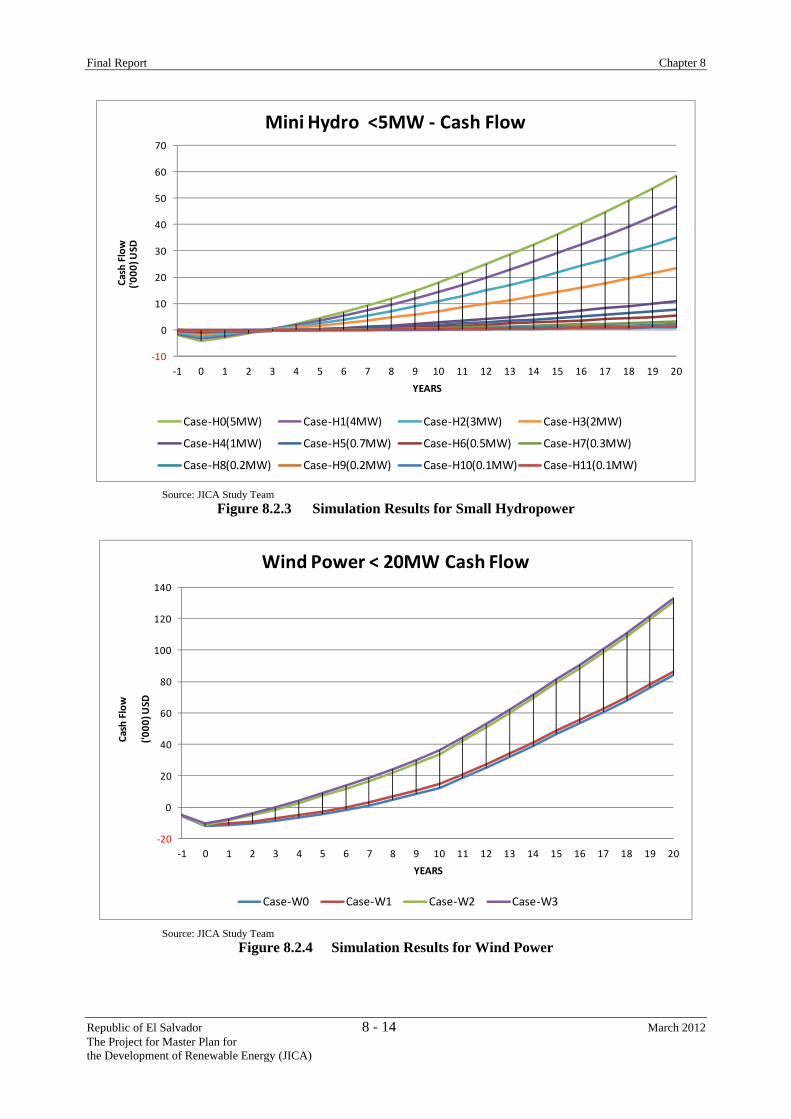
Final Report Chapter 8
Republic of El Salvador 8 - 14 March 2012 The Project for Master Plan for the Development of Renewable Energy (JICA)
‐10
0
10
20
30
40
50
60
70
‐1 0 1 2 3 4 5 6 7 8 9 10 11 12 13 14 15 16 17 18 19 20
Cash Flow
('000
) USD
YEARS
Mini Hydro <5MW ‐ Cash Flow
Case‐H0(5MW) Case‐H1(4MW) Case‐H2(3MW) Case‐H3(2MW)
Case‐H4(1MW) Case‐H5(0.7MW) Case‐H6(0.5MW) Case‐H7(0.3MW)
Case‐H8(0.2MW) Case‐H9(0.2MW) Case‐H10(0.1MW) Case‐H11(0.1MW)
Source: JICA Study Team Figure 8.2.3 Simulation Results for Small Hydropower
‐20
0
20
40
60
80
100
120
140
‐1 0 1 2 3 4 5 6 7 8 9 10 11 12 13 14 15 16 17 18 19 20
Cash Flow
('000
) USD
YEARS
Wind Power < 20MW Cash Flow
Case‐W0 Case‐W1 Case‐W2 Case‐W3
Source: JICA Study Team Figure 8.2.4 Simulation Results for Wind Power

Final Report Chapter 8
Republic of El Salvador 8 - 15 March 2012 The Project for Master Plan for the Development of Renewable Energy (JICA)
‐60
‐40
‐20
0
20
40
60
80
100
120
‐1 0 1 2 3 4 5 6 7 8 9 10 11 12 13 14 15 16 17 18 19 20
Cash Flow
('000
) USD
YEARS
PV Power < 20MW ‐ Cash Flow
Case‐S0 Case‐S1 Case‐S2 Case‐S3
Source: JICA Study Team Figure 8.2.5 Simulation Results for Solar PV (Grid Connected)
The above typical analysis is carried out by the assumption of electricity sales price at the $ 140/MWh. In El Salvador, sales price is determined by competitive bidding. Therefore unit price of $ 100/MWh in the option case is also carried out by sensitivity analysis in terms of price competitiveness.
All calculated outputs and evaluation results by cash flow are shown as follows. In addition, the evaluation was made using the following three categories based on the (B/C) of the financial indicator in the typical development pattern (electricity sales price $ 140/MWh):
• "A" means viable project, no need for special incentives. (B/C>1.5) • "B" means viable project subject to site development conditions, high capacity factor to be
installed at potential site or grid connection cost will be borne by third party. (B/C 1.0~1.5) • "C" means difficult to develop the project without financial support or subsidy. (B/C<1.0)
An analysis was done taking as reference the energy sales price at $140 per MWh, however, an analysis was done taking as reference the energy sales price at $100 per MWh to obtain a price sensitization analysis and to achieve this way a better picture of their behavior.
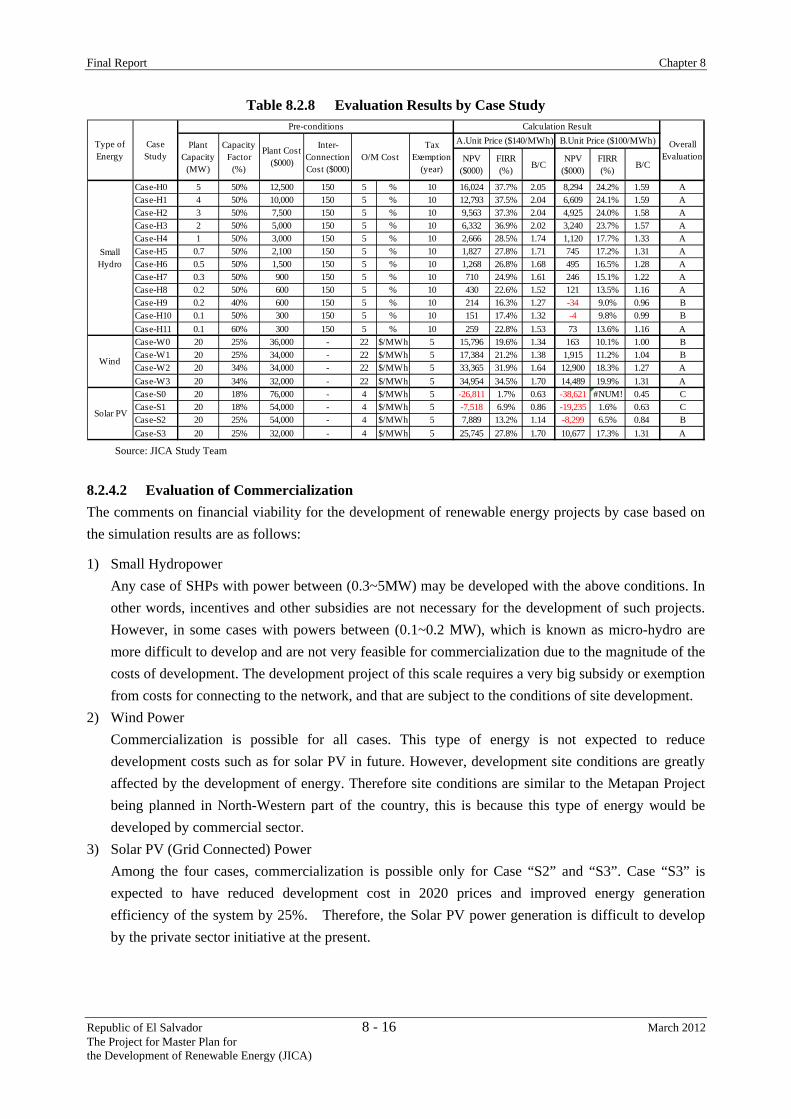
Final Report Chapter 8
Republic of El Salvador 8 - 16 March 2012 The Project for Master Plan for the Development of Renewable Energy (JICA)
Table 8.2.8 Evaluation Results by Case Study
NPV($000)
FIRR(%) B/C
NPV($000)
FIRR(%) B/C
Case-H0 5 50% 12,500 150 5 % 10 16,024 37.7% 2.05 8,294 24.2% 1.59 ACase-H1 4 50% 10,000 150 5 % 10 12,793 37.5% 2.04 6,609 24.1% 1.59 ACase-H2 3 50% 7,500 150 5 % 10 9,563 37.3% 2.04 4,925 24.0% 1.58 ACase-H3 2 50% 5,000 150 5 % 10 6,332 36.9% 2.02 3,240 23.7% 1.57 ACase-H4 1 50% 3,000 150 5 % 10 2,666 28.5% 1.74 1,120 17.7% 1.33 ACase-H5 0.7 50% 2,100 150 5 % 10 1,827 27.8% 1.71 745 17.2% 1.31 ACase-H6 0.5 50% 1,500 150 5 % 10 1,268 26.8% 1.68 495 16.5% 1.28 ACase-H7 0.3 50% 900 150 5 % 10 710 24.9% 1.61 246 15.1% 1.22 ACase-H8 0.2 50% 600 150 5 % 10 430 22.6% 1.52 121 13.5% 1.16 ACase-H9 0.2 40% 600 150 5 % 10 214 16.3% 1.27 -34 9.0% 0.96 BCase-H10 0.1 50% 300 150 5 % 10 151 17.4% 1.32 -4 9.8% 0.99 BCase-H11 0.1 60% 300 150 5 % 10 259 22.8% 1.53 73 13.6% 1.16 ACase-W0 20 25% 36,000 - 22 $/MWh 5 15,796 19.6% 1.34 163 10.1% 1.00 BCase-W1 20 25% 34,000 - 22 $/MWh 5 17,384 21.2% 1.38 1,915 11.2% 1.04 BCase-W2 20 34% 34,000 - 22 $/MWh 5 33,365 31.9% 1.64 12,900 18.3% 1.27 ACase-W3 20 34% 32,000 - 22 $/MWh 5 34,954 34.5% 1.70 14,489 19.9% 1.31 ACase-S0 20 18% 76,000 - 4 $/MWh 5 -26,811 1.7% 0.63 -38,621 #NUM! 0.45 CCase-S1 20 18% 54,000 - 4 $/MWh 5 -7,518 6.9% 0.86 -19,235 1.6% 0.63 CCase-S2 20 25% 54,000 - 4 $/MWh 5 7,889 13.2% 1.14 -8,299 6.5% 0.84 BCase-S3 20 25% 32,000 - 4 $/MWh 5 25,745 27.8% 1.70 10,677 17.3% 1.31 A
B.Unit Price ($100/MWh)PlantCapacity
(MW)
CapacityFactor
(%)
Plant Cost($000)
Inter-ConnectionCost ($000)
TaxExemption
(year)
OverallEvaluation
Type ofEnergy
CaseStudy
Wind
SmallHydro
Solar PV
Pre-conditions
O/M Cost
Calculation ResultA.Unit Price ($140/MWh)
Source: JICA Study Team
8.2.4.2 Evaluation of Commercialization The comments on financial viability for the development of renewable energy projects by case based on the simulation results are as follows:
1) Small Hydropower Any case of SHPs with power between (0.3~5MW) may be developed with the above conditions. In other words, incentives and other subsidies are not necessary for the development of such projects. However, in some cases with powers between (0.1~0.2 MW), which is known as micro-hydro are more difficult to develop and are not very feasible for commercialization due to the magnitude of the costs of development. The development project of this scale requires a very big subsidy or exemption from costs for connecting to the network, and that are subject to the conditions of site development.
2) Wind Power Commercialization is possible for all cases. This type of energy is not expected to reduce development costs such as for solar PV in future. However, development site conditions are greatly affected by the development of energy. Therefore site conditions are similar to the Metapan Project being planned in North-Western part of the country, this is because this type of energy would be developed by commercial sector.
3) Solar PV (Grid Connected) Power Among the four cases, commercialization is possible only for Case “S2” and “S3”. Case “S3” is expected to have reduced development cost in 2020 prices and improved energy generation efficiency of the system by 25%. Therefore, the Solar PV power generation is difficult to develop by the private sector initiative at the present.

Final Report Chapter 8
Republic of El Salvador 8 - 17 March 2012 The Project for Master Plan for the Development of Renewable Energy (JICA)
8.2.5 Factors for Increasing the Cost In developing the above energy sources, it is necessary to consider the following factors that increase the cost in El Salvador:
1) Natural Disaster Prevention Large-scale natural disasters such as hurricanes, earthquakes and volcanic eruptions have occasionally happened in El Salvador. Site selection for renewable energy development should need to consider such factors. In some cases, it is assumed that the costs for development become higher because of the need to install countermeasures against natural disasters.
2) Fostering of Maintenance Technology for New Power Systems Small hydropower projects have been developed in El Salvador before; however, wind power and solar power systems will be newly introduced as power generation systems. The procurement for these new generation systems will be from abroad and performed while receiving technical assistance from suppliers such as installation works. It is necessary to train personnel on construction technology and proper maintenance for the new systems. These factors are expected to affect the development costs and maintenance costs for fostering technicians while obtaining technical guidance from a foreign manufacturer.
3) Spare parts procurement system It is necessary to implement periodical inspection and replace consumables and parts according to the plans of routine inspection to avoid disrupt the operation failed due to power systems. To achieve this condition, it is necessary to develop the necessary parts procurement to be quickly and regularly procured for maintenance of power system through the local agencies in the country. This system could increase maintenance costs, but the constant operation of the power generation system is required for introduction of this procurement system.
4) The funding conditions
The power sector development in El Salvador has been led by the private sector. Private company can be procured necessary funding to develop a new project from public financial institutions including BCIE (Banco Centroamericano de Intecración Económica) in addition to the commercial banks. However, the annual interest rate is not less than 8%, which is considerably more expensive when compared to interest rates from foreign soft loans. This interest rate is one of the factors increasing cost burden. Need to consider creating a mechanism to procure soft loans from abroad.

Final Report Chapter 8
Republic of El Salvador 8 - 18 March 2012 The Project for Master Plan for the Development of Renewable Energy (JICA)
8.3 Environmental Aspects During the planning or design of a project, it is very important to take into account the various environmental and social factors, which are vital for the project’s sustainability and viability. This chapter focuses on the environmental aspects such as protected areas, obstacles, and unforeseen impacts, as well as those subjects considered as priorities, which should be taken into account while implementing renewable energies. The final objective is to include all socio-environmental considerations while executing the projects.
8.3.1 Identifying barriers for the promotion of Renewable Energies The Study Team has conducted various research and interviews with different agencies regarding renewable energy, taking into consideration the environmental and social aspects, as well as the current experiences and conditions of the projects existing in El Salvador. Based on this, the Study Team has identified the following obstacles which must be breached in order to promote the mentioned projects:
(1) Political Barriers • Lack of a basic framework and a master plan for the development of renewable energy. • Lack of incentive laws, which would promote renewable energies in relation to national
socio-environmental measures. • Lack of an environmental permit from the Ministry of the Environment and Natural Resources
(MARN), for each renewable energy.
As a direct result of these obstacles, it is very difficult for any related institutions and even private sectors, to have the tools defined in order to implement power generation projects using renewable energy sources.
(2) Institutional Barriers • Lack of MARN experts on renewable energy. • Lack of a shared information system between the institutions involved with the environment,
particularly regarding the environmental impacts and damages caused by renewable energy projects, as well as the progress made during the implementation of said assignment.
(3) Barriers to Project Implementation • Expensive environmental studies, particularly of the environmental impact assessment (EIA),
which prevent companies from risking their investments in this type of research. • Poor distribution of land possession, mainly due to inadequate land planning and zoning, and
lack of a socio-environmental perspective. • Complex procedures (or red tape) in acquiring environmental and social permits. In many cases,
the projects destined for rural areas do not proceed due to these processes. • Lack of human resources specifically trained for environmental and social permits approval,
particularly smaller companies and non-profit organizations.

Final Report Chapter 8
Republic of El Salvador 8 - 19 March 2012 The Project for Master Plan for the Development of Renewable Energy (JICA)
As a result of these obstacles, it is increasingly difficult for the private sector involved with renewable energy to smoothly execute related projects while taking into consideration the various socio-environmental aspects.
8.3.2 Expected Impacts on the Socio-Environment due to the Implementation of Renewable Energies (Scoping)
Based on the strategic analysis conducted in this Study, the following tables 8.3.1 to 8.3.6 show scoping and impacts that are expected to affect the socio-environment as a result of the development of renewable energy in El Salvador:

Final Report Chapter 8
Republic of El Salvador 8 - 20 March 2012 The Project for Master Plan for the Development of Renewable Energy (JICA)
Table 8.3.1 Scoping for Renewable Energy Projects <Small Hydropower (SHP)>
Components
Evaluation
Expected Impacts Construction Stage
Operation
Stage1 Population Resettlement B- C [Construction Stage]
- Possible resettlement of some families residing in the immediate vicinity of the project
[Operation Stage] - A follow-up plan must be implemented.
2 Local Economy and Livelihoods
B+ B+ [Construction Stage] - Possibility of generating direct (construction labor) and
indirect employment (sellers, restaurants, etc. within the vicinity of the construction site).
[Operation Stage] - Reactivation of the industrial sector is expected as a result of
energy cost reduction. 3 Land Use and Use of
Local Resources D D - Non-significant negative impacts are foreseen.
4 Social Capital and Local Organizations
D D - No significant negative impacts are foreseen, rather, possible benefits are expected for local residents.
5 Existing Infrastructure and Public Services
D B+ [Operation Stage] - It is expected that electricity services in the neighboring areas
of the project will be stabilized. 6 Ethnic Minorities and
Indigenous Population D D - No significant negative impact is foreseen
7 Unbalanced Distribution
of Benefits and Damages
by the Project
D D - No significant impact is foreseen. Possible benefits to local residents.
8 Local Conflict caused by Common Interests
C C - No local conflict is expected; however, a public poll will be conducted to become aware of the opinion of the people.
9 Cultural Heritage C D [Construction Stage] - An inspection of the project site will be conducted by the
Culture Secretariat 10 Right of Water Use B- B- - Right of water use permits will be requested. 11 Infectious Diseases like
HIV/AIDS D D - Small or no impact at all is expected.
12 Working Conditions D D - Small or no impact at all is expected. 13 Topography and
Geography B- D [Construction Stage]
- Generation of negative impact to the topography and geography of the site is expected from engineering works.
14 Underground Water D D - No negative impacts are expected to affect the groundwater 15 Soil Erosion B- D [Construction Stage]
- Possible effects on the soil because of erosion originating from earthworks through stripping.
16 Hydrology C C - Negative impacts to the water resources are expected. 17 Flora and Fauna /
Biodiversity B- B- [Construction Stage and Operation Stage]
- It is possible to affect the area´s flora, fauna and biodiversity.
18 Climate D D - Non-significant negative impact is expected.

Final Report Chapter 8
Republic of El Salvador 8 - 21 March 2012 The Project for Master Plan for the Development of Renewable Energy (JICA)
Components
Evaluation
Expected Impacts Construction Stage
Operation
Stage19 Landscape B- B- [Construction Stage]
- There is a possibility of affecting the landscape of the area due to earthworks, road works, etc.
[Operation Stage] - There is a possibility of affecting the landscape of the area
due to the height of the wind towers. 20 Protected Natural Areas C C - Protected natural areas must be identified. 21 Control of Waste Disposal
Sites D D - Very little negative impact is expected since the planned
waste disposal site will be the one expressly authorized by the corresponding agency.
22 Global Warming D D - Little or none expected impact 23 Air Pollution D D - No significant chemical gases are expected to pollute the air. 24 Water Pollution D D - No significant chemical liquids are expected to pollute the
water. 25 Soil Pollution D D - No significant chemical liquids are expected to pollute the
soil. 26 Solid Waste D D - No significant amounts of solid waste. 27 Noise and Vibrations B- B- [Construction Stage]
- Noise and vibrations will be generated due to the operation of heavy machinery and different construction activities.
[Operation Stage] - Noise generated from small activities.
28 Land Subsidence D D - No impact is expected 29 Offensive Odors D D - No impact is expected 30 Traffic Accidents B- D [Construction Stage]
Accidents are expected to some degree from ongoing and incoming vehicular traffic caused by the project and neighboring residents.
A: Significant impact expected B: Moderate impact expected C: There is no information, more research required D: None or little impact expected +: Positive -: Negative (Source: JICA Study Team)

Final Report Chapter 8
Republic of El Salvador 8 - 22 March 2012 The Project for Master Plan for the Development of Renewable Energy (JICA)
Table 8.3.2 Scoping for Renewable Energy Projects <WIND>
Components
Evaluation
Expected Impact Construction Stage
Operation
Stage1 Population Resettlement B- C [Construction Stage]
- Possible resettlement of a few families which reside in the immediate vicinity of the site.
[Operation Stage] - Follow-up plan must be implemented.
2 Local Economy and Livelihood
B+ B+ [Construction Stage] - Possible generation of direct (construction labor) and indirect
employment (sellers, restaurants, etc. from the neighboring vicinities).
[Operation Stage] - Reactivation of the industrial sector is expected as a result of
energy cost reduction. 3 Land Use and Use of
Local Resources B- D [Construction Stage]
- Agricultural and livestock areas will be affected. Part of the vegetation will be cut (mainly bushes).
4 Social Capital and Local Organizations
D D - No significant negative impacts are expected; furthermore, there may be some positive benefits to the local residents.
5 Existing Infrastructure and Public Services
D B+ [Operation Stage] - It is expected that electricity services in the neighboring areas
of the project will be stabilized. 6 Ethnic Minorities and
Indigenous Communities C C - Existing indigenous communities must be identified within
the facility. 7 Unbalanced Distribution
of Benefits and Damages
by the Project
D D - No significant damages are expected. Possible benefits to local residents .
8 Local Conflict caused by Common Interests
C C - No local conflicts are expected; however, a public poll will be conducted to know the opinion of the community.
9 Cultural Heritage C D [Construction Stage] - Project´s inspection will be conducted by the Culture
Secretariat. 10 Right of Water Use D D - No expected impact to water sources. 11 Infectious Diseases like
HIV/AIDS D D - No expected impact.
12 Working Conditions D D - No expected impact. 13 Topography and
Geography B- D [Construction Stage]
- Negative impacts to the topography and geography of the site (cut and fill works) are to be expected.
14 Groundwater D D - No negative impacts to groundwater are expected. 15 Soil Erosion B- D [Construction Stage]
- Possible effects on the soil because of erosion originating from earthworks through stripping.
16 Hydrology D D - No negative impacts are expected on the local hydrology. 17 Flora and Fauna /
Biodiversity B- B- [Construction Stage y Operation Stage]
- It is possible that fauna and biodiversity will be affected, specifically the bird species.
18 Climate D D - No negative impacts on the climate are expected.

Final Report Chapter 8
Republic of El Salvador 8 - 23 March 2012 The Project for Master Plan for the Development of Renewable Energy (JICA)
Components
Evaluation
Expected Impact Construction Stage
Operation
Stage19 Landscape B- B- [Construction Stage]
- There is a possibility of negatively affecting the landscape of the area due to earthworks, road works, etc.
[Operation Stage] - There is a possibility of negatively affecting the landscape of
the area due to the height of the wind towers. 20 Protected Natural Areas C C - Protected natural areas must be identified. 21 Control of Waste disposal
Sites D D - No impact is expected due to solid waste.
22 Global Warming D D - No impact to the atmosphere is expected. 23 Air Pollution D D - No negative impact on air quality is expected. 24 Water Pollution D D - No negative impact on water quality is expected. 25 Soil Pollution D D - No negative impact on soil is expected. 26 Solid Waste D D - No negative impact due to solid waste generation is
expected. 27 Noise and Vibrations B- B- [Construction Stage]
- Noise and vibrations are generated due to the operation of heavy machinery and construction works.
[Operation Stage] - Noise generated due to tower operation. - Microwaves emission due to tower operation.
28 Land Subsidence D D - No impact is expected 29 Offensive Odors D D - No impact is expected 30 Traffic Accidents B- D [Construction Stage]
Accidents are expected to some degree from ongoing and incoming vehicular traffic caused by the project and neighboring residents.
A: Significant impact expected B: Moderate impact expected C: There is no information, more research required D: None or little impact expected +: Positive -: Negative (Source: JICA Study Team)

Final Report Chapter 8
Republic of El Salvador 8 - 24 March 2012 The Project for Master Plan for the Development of Renewable Energy (JICA)
Table 8.3.3 Scoping for Renewable Energy Projects <SOLAR PV POWER>
Components
Evaluation
Expected Impacts Construction Stage
Operation
Stage1 Population Resettlement D D - No negative impact is expected. 2 Local Economy and
Livelihood B+ B+ [Construction Stage]
- Possible generation of direct (construction labor) and indirect employment (sellers, restaurants, etc. from the neighboring vicinities).
[Operation Stage] - Reactivation of the industrial sector is expected as a result of
energy cost reduction. 3 Land Use and Use of
Local Resources D D - No negative impact is expected
4 Social Capital and Local Organizations
D D - No negative impact is expected.
5 Existing Infrastructure and Public Services
D B+ [Operation Stage] - It is expected that electricity services in the neighboring areas
of the project will be stabilized specially those for public facilities such as schools and medical clinics.
6 Ethnic Minorities and Indigenous Communities
D D - No negative impact is expected.
7 Unbalanced Distribution
of Benefits and Damages
by the Project
D D - No negative impact is expected.
8 Local Conflict caused by Common Interests
C C - No local conflict is expected; however, a public poll will be conducted to determine the opinion of the community.
9 Cultural Heritage C D [Construction Stage] - Project site inspection will be conducted by the Culture
Secretariat. 10 Right of Water Use D D - No negative impact is expected. 11 Infectious Diseases like
HIV/AIDS D D - No negative impact is expected.
12 Working Conditions D D - No negative impact is expected. 13 Topography and
Geography D D - No negative impact is expected.
14 Groundwater D D - No negative impact to underground water is expected. 15 Soil Erosion D D - No negative impact is expected. 16 Hydrology D D - No negative impact is expected. 17 Flora and Fauna /
Biodiversity D D - No negative impact is expected.
18 Climate D D - No negative impact is expected. 19 Landscape C C [Construction Stage and Operation]
- Possible negative impact on the landscape due to the size of the solar panels.
20 Protected Natural Areas D D - No negative impact is expected. 21 Control of Waste Disposal
Sites D D - No negative impact is expected.
22 Global Warming D D - No negative impact is expected. 23 Air Pollution D D - No negative impact to the atmosphere is expected. 24 Water Pollution D D - No negative impact to water is expected. 25 Soil Pollution D D - No negative impact to soil is expected. 26 Solid Waste D D - No negative impact due to solid waste is expected. 27 Noise and Vibrations D D - No negative impact is expected.

Final Report Chapter 8
Republic of El Salvador 8 - 25 March 2012 The Project for Master Plan for the Development of Renewable Energy (JICA)
Components
Evaluation
Expected Impacts Construction Stage
Operation
Stage28 Land Subsidence D D - No negative impact is expected. 29 Offensive Odors D D - No negative impact is expected. 30 Traffic Accidents D D - No negative impact is expected.
A: Significant impact expected B: Moderate impact expected C: There is no information, more research required D: None or little impact expected +: Positive -: Negative (Source: JICA Study Team)

Final Report Chapter 8
Republic of El Salvador 8 - 26 March 2012 The Project for Master Plan for the Development of Renewable Energy (JICA)
Table 8.3.4 Scoping for Renewable Energy Projects <SOLAR THERMAL>
Components
Evaluation
Expected Impacts Construction Stage
Operation
Stage1 Population Resettlement D D - No negative impact is expected. 2 Local Economy and
Livelihood B+ B+ Construction Stage]
- Possible generation of direct (construction labor) and indirect employment (sellers, restaurants, etc. from the neighboring vicinities).
[Operation Stage] - Reactivation of the industrial sector is expected as a result of
energy cost reduction. 3 Land use and Use of
Local Resources D D - No negative impact is expected.
4 Social Capital and Local Organizations
D D - No negative impact is expected.
5 Existing Infrastructure and Public Services
D B+ [Operation Stage] - It is expected that electricity services in the neighboring areas
of the project will be stabilized specially those for public facilities such as schools and medical clinics, etc.
6 Ethnic Minorities and Indigenous Communities
D D - No negative impact is expected.
7 Unbalanced Distribution
of Benefits and Damages
by the Project
D D - No negative impact is expected.
8 Local Conflict caused by Common Interests
C C - No local conflict is expected; however, a public poll will be conducted to know the opinion of the community.
9 Cultural Heritage C D [Construction Stage] - Project site inspection will be conducted by the Culture
Secretariat. 10 Right of Water Use D D - No negative impact is expected. 11 Infectious Diseases like
HIV/AIDS D D - No negative impact is expected.
12 Working Conditions D D - No negative impact is expected. 13 Topography and
Geography D D - No negative impact is expected.
14 Groundwater D D - No negative impact is expected. 15 Soil Erosion D D - No negative impact is expected. 16 Hydrology D D - No negative impact is expected. 17 Flora and Fauna /
Biodiversity D D - No significant negative impact is expected.
18 Climate D D - No significant negative impact is expected. 19 Landscape C C [Construction Stage and Operation]
- Some negative impact on the landscape due to the size of the solar panels is expected.
20 Protected Natural Areas C C - Protected natural areas must be identified. 21 Control of Waste Disposal
Sites D D - No significant negative impact is expected.
22 Global Warming D D - No negative impacts to the atmosphere are expected. 23 Air Pollution D D - No impact regarding pollution due to air emissions is
expected. 24 Water Pollution D D - No negative impacts to water are expected.

Final Report Chapter 8
Republic of El Salvador 8 - 27 March 2012 The Project for Master Plan for the Development of Renewable Energy (JICA)
Components
Evaluation
Expected Impacts Construction Stage
Operation
Stage25 Soil Pollution D D - No pollution due to contamination and spills on soil is
expected. 26 Solid Waste D D - No solid waste is expected from the construction works. 27 Noise and Vibrations D D - No negative impact is expected. 28 Land Subsidence D D - No negative impact is expected. 29 Offensive Odors D D - No negative impact is expected. 30 Traffic Accidents D D - No negative impact is expected.
A: Significant impact expected B: Moderate impact expected C: There is no information, more research required D: None or little impact expected +: Positive -: Negative (Source: JICA Study Team)

Final Report Chapter 8
Republic of El Salvador 8 - 28 March 2012 The Project for Master Plan for the Development of Renewable Energy (JICA)
Table 8.3.5 Scoping for Renewable Energy Projects <GEOTHERMAL>
Components
Evaluation
Expected Impacts Construction Stage
Operation
Stage1 Population Resettlement B- C [Construction Stage]
- Possible resettlement of some families residing in the immediate vicinity.
[Operation Stage] - Monitoring plan must be implemented.
2 Local Economy and Livelihood
B+ B+ [Construction Stage y Operation Stage] - Possible generation of direct (construction labor) and indirect
employment (sellers, restaurants, etc. from the neighboring vicinities).
[Operation Stage] - Reactivation of the industrial sector is expected as a result of
energy cost reduction. 3 Land Use and Use of
Local Resources B- D [Construction Stage]
- The agricultural and livestock areas will be affected. Parts of the vegetation mainly bushes will be affected.
[Operation Stage] - No significant negative impact is expected or none at all.
4 Social Capital and Local Organizations
D D - No significant negative impact is expected. Rather, there are possible benefits for the locals.
5 Existing Infrastructure and Public Services
D B+ [Operation Stage] - It is expected that electricity services in the neighboring areas
of the project will be stabilized, especially within access roads.
6 Ethnic Minorities and Indigenous Communities
C C - Indigenous communities within the facilities must be identified.
7 Unbalanced Distribution
of Benefits and Damages
by the Project
D D - No significant damage is expected. Rather, there are possible benefits for the locals.
8 Local Conflict caused by Common Interests
C C - No local conflict is expected; however, a public poll will be conducted to determine the opinion of the community.
9 Cultural Heritage C D [Construction Stage] - Project site inspection will be conducted by the Culture
Secretariat. 10 Right of Water Use B- C [Construction Stage]
- Right of water use permits will be requested, not only during the construction Stage, but also during the well drilling stage.
11 Infectious Diseases like HIV/AIDS
D D - Few or no impact is expected.
12 Working Conditions D D - Few or no impact is expected. 13 Topography and
Geography B- D [Construction Stage]
- The generation of negative impacts due to cut and fill works are expected.
14 Groundwater D D - No negative impact on groundwater is expected due to drilling, construction Works or even operation processes.
15 Soil Erosion B- D [Construction Stage] - Possible effects on soil due to erosion as a result of the
changes in the land where drilling platforms and plant facilities will be installed.

Final Report Chapter 8
Republic of El Salvador 8 - 29 March 2012 The Project for Master Plan for the Development of Renewable Energy (JICA)
Components
Evaluation
Expected Impacts Construction Stage
Operation
Stage16 Hydrology D D - Few or no significant effects are expected on the water
resources. 17 Flora and Fauna /
Biodiversity B- B- [Construction Stage y Operation Stage]
- It is possible that flora, fauna and biodiversity of the area will be affected.
18 Climate D D - Few or no significant negative impacts are expected. 19 Landscape B- B- [Construction Stage]
- Possible negative impact to the landscape of the area due to plant construction.
[Operation Stage] - During the operation stage, vapor emissions into the
atmosphere will be observed. 20 Protected Natural Areas C C - Protected natural areas must be identified. 21 Control of Waste Disposal
Sites D D - Few negative impacts are expected. Effort will be made to
use the sites designated by the competent authorities. 22 Global Warming D D - Few or no impacts are expected. 23 Air Pollution B- D [Construction Stage and Operation]
- Possible deterioration of air quality due to gas emissions by the worksite machineries (CO2 y H2S) and suspended dust particles from the construction itself.
24 Water Pollution B- D [Construction Stage] - Possible contamination of water due to pollution and oil
spills from the construction site. 25 Soil Pollution B- B- [Construction Stage and Operation Stage]
- Possible soil pollution due to geothermal water spills and pollutants.
26 Solid Waste B- D [Construction Stage] - Solid waste will be generated from the works.
27 Noise and Vibration B- B- [Construction Stage] - Noise and vibration caused by machineries for construction,
as well as traffic due to heavy vehicles. [Operation Stage] - Noise generation from road operation.
28 Land Subsidence B- B- - Possible land subsidence due to the extraction of thermal water.
29 Offensive Odors B- B- [Construction Stage] - Offensive odors from gas emissions caused by construction
machineries and well drilling. [Operation Stage] - Permanent offensive odors due to H2S emissions within the
central community. 30 Traffic Accidents B- D [Construction Stage]
- Possibility of traffic accidents within the site´s vicinity, mainly due to vehicular movements within the project caused by internal activities.
A: Significant impact expected B: Moderate impact expected C: There is no information, more research required D: None or little impact expected +: Positive -: Negative (Source: JICA Study Team)

Final Report Chapter 8
Republic of El Salvador 8 - 30 March 2012 The Project for Master Plan for the Development of Renewable Energy (JICA)
Table 8.3.6 Scoping for Renewable Energy Projects <BIOMASS>
Components
Evaluation
Expected Impact Construction Stage
Operation
Stage1 Population Resettlement B- C [Construction Stage]
- Possible resettlement of some families residing in the vicinity.
[Operation Stage] - Follow-up plan must be implemented.
2 Local Economy and Livelihood
B+ B+ [Construction Stage y Operation Stage] - Possible generation of direct (construction labor) and indirect
employment (sellers, restaurants, etc. from the neighboring vicinities).
[Operation Stage] - Reactivation of the industrial sector is expected as a result of
energy cost reduction. 3 Land Use and Use of
Local Resources D D - No significant negative impact is expected.
4 Social Capital and Local Organizations
D D - No significant negative impact is expected.
5 Existing Infrastructure and Public Services
D B+ [Operation Stage] - It is expected that electricity services in the neighboring areas
of the Project will be stabilized 6 Ethnic Minorities and
Indigenous Community D D - No negative effects are expected on the indigenous
communities. 7 Unbalanced Distribution
of Benefits and Damages
by the Project
D D - No major changes are expected at the site in terms of damages or benefits caused by the project. Plant has been proposed to be located in a small area.
8 Local Conflict caused by Common Interests
C C - No conflicts from the local residents are expected; however, a public poll will be conducted to confirm the opinions of the communities involved.
9 Cultural Heritage C D [Construction Stage] - Project site inspection will be conducted by the Culture
Secretariat. 10 Right of Water Use C C - Right of water use should be identified and controlled. 11 Infectious Diseases like
HIV/AIDS D D - No impacts due to HIV are expected
12 Working Conditions D D - Working conditions should not be affected. 13 Topography and
Geography B- D [Construction Stage]
- Some negative impact, albeit insignificant, is expected on the topography and geography where the construction works are conducted.
14 Groundwater D D - No significant negative impact to groundwater is expected, 15 Soil Erosion B- D [Construction Stage]
- Damages resulting from soil erosion will be sustained as a result of the earth removal activities, etc.
16 Hydrology D D - No impacts are expected to the water resources within the area where the central source will be installed.
17 Flora and Fauna / Biodiversity
D D - No significant negative impacts to these components.
18 Climate D D - Few or no expected impacts. 19 Landscape D D - Few or no expected impacts. 20 Protected Natural Areas C C - Protected natural areas must be identified.

Final Report Chapter 8
Republic of El Salvador 8 - 31 March 2012 The Project for Master Plan for the Development of Renewable Energy (JICA)
Components
Evaluation
Expected Impact Construction Stage
Operation
Stage21 Control of Waste Disposal
Sites D D - Few negative impacts are expected, since the waste disposal
site specifically authorized by the competent authorities will be used.
22 Global Warming D B- [Operation Stage] - Possible negative impact due to methane gas emissions.
23 Air Pollution B- B- [Construction Stage and Operation] - Air pollution due to gas emissions caused by the use of
machineries within the site and suspended dust particles from all ongoing activities.
24 Water Pollution B- B- [Construction Stage and Operation] - There is a possibility that drinking water quality will
deteriorate due to oil and fuel spills from the machineries used.
25 Soil Pollution B- B- [Construction Stage and Operation] - Possible deterioration of soil quality caused by oil and fuel
spills from machineries. 26 Solid Waste B- B- [Construction Stage and Operation]
- Solid waste is expected from construction works as well as from the operation itself.
27 Noise and Vibration B- B- [Construction Stage] - General noise and vibrations caused by the operation of
construction machineries, and the eventual heavy vehicle traffic.
[Operation Stage] - Noise caused by the overall operation of the central plant.
28 Land Subsidence D D - No impact expected. 29 Offensive Odors B- B- [Construction Stage]
- Offensive odors caused by the emissions from combustion of gasses from the machineries as well as the creation of solid waste.
[Operation Stage] - Offensive odors due to gas emissions caused by the
combustion from plant operation. 30 Traffic accidents D- D [Construction Stage]
- No traffic accidents are expected within the site. A: Significant impact expected B: Moderate impact expected C: There is no information, more research required D: None or little impact expected +: Positive -: Negative (Source: JICA Study Team)

Final Report Chapter 8
Republic of El Salvador 8 - 32 March 2012 The Project for Master Plan for the Development of Renewable Energy (JICA)
8.3.3 Priorities for Renewable Energies within the Framework of Environmental and Social Considerations As a result of the analysis of the existing obstacles and barriers in implementing renewable energy projects, as well as the EIA discussed above, the following priorities are recommended to promote the development of renewable energies in El Salvador:
(1) Priorities for Policies - Energy policies in El Salvador must take into account the environmental and social framework. - The General Electricity Law must be harmonized with various laws pertaining to the sector. - Create a standard on power network interconnection of distributed resources, such as small
hydroelectric power stations and photovoltaic solar energy. - It is urgent to amend the Environmental Act and harmonize it with related laws. (2) Priorities for Institutions - It is essential to highly prioritize the issuance of guidelines for government institutions in order to
establish a general pattern regarding renewable energies and their eventual implementation. - Within the framework of the Environmental Act, Articles 6, 7, 8 and 9 must be observed,
particularly regarding the System of National Environmental Management (SINAMA). An environmental unit must be created within SIGET or the CNE. Once the said unit is established, it must create the terms of reference (ToR) for renewable energy projects as a valuable input for the MARN, who will then need to endorse the said ToR. The objective of such procedures would be to optimize government resources and speed up the authorization processes for the ToR from projects regarding renewable energy sources.
- The government should be a part of the process of strengthening related knowledge by providing training for the personnel from involved government institutions in matters pertaining to renewable energies and the environment.
- Support exchange of information towards the transfer of technologies from the renewable energy resources, aiming to enrich the abilities of technicians to develop these projects.
- The government should make the most of the existing human resource of the country, specifically the professionals specializing in disciplines pertaining to renewable energy sources.
- Agreements with universities focused on projects regarding renewable energy sources, both at scientific and implementation levels.
- The government should support the provision of information regarding renewable energy resources, and should also provide guidelines for institutions involved with this subject. This is intended to enable its personnel to handle the information without discretion and within the framework of the Right to Information Act.
(3) Priorities for Project Implementation Financial Priorities: Implement an adequate safeguarding system that will provide security to the investment in the renewable energy development sector; lower the high percentages on investments and increase economic incentives; and achieve reasonable rates, which would benefit the general population.

Final Report Chapter 9
Republic of El Salvador 9 - 1 March 2012 The Project for Master Plan for the Development of Renewable Energy (JICA)
Chapter 9 Proposals for Promoting Renewable Energy use 9.1 Proposals for the development of Renewable Energy use Based on the results of investigations and studies, some proposals are defined concerning the course that could take in the future renewable energy policy and the development of each energy source. The proposals discussed the different energy sources, which have been categorized in the following respects: (1) technical, (2) economic and financial (3) environmental like it is referred in Table 9.1.
Table 9.1.1 Recommendations on Future Directions of Development of Renewable Energy based on the Study Results
Technical Aspect
Economic and Financial
Aspect Environmental Aspect
General
1. Each of the sources of energy (small hydropower, wind, solar PV, solar thermal, geothermal, biomass and biogas) differs from each other by their level of difficulty of exploitation. Therefore, it is necessary to perform proper preparation and studies to promote the introduction of renewable energy sources taking into consideration the level of maturity of each technology.
1. Interest rate of commercial bank is high as 8%, which is one of the barriers for preparation of development funds. As renewable energy development requires relatively high initial investment costs, it is necessary to consider establishment of low interest rate financing systems especially for renewable energy development.
1. Preparation of simplified procedures for obtaining environmental permit for renewable energy development that has less environmental impacts.
2. Clarification of the status of renewable energy development in the protected natural areas.
Small Hydropower
1. Confirmation of more accurate head (m) and discharge (m3/sec) through site visits to the promising sites.
2. Preparation and maintenance of hydrological observation network and accumulation of hydrological data in a long term point of view.
1. For 100 kW to 200 kW class small hydropower, subsidy will be required to cover grid connection fee or to cover about one third of the construction cost to make the project viable.
2. For 0.3 MW to 5 MW class small hydropower, the project can be possibly developed without any subsidy.
1. Establishment of guidelines for river maintenance flow.
2. It is necessary to elaborate procedures and formats for environmental permit application especially for small hydropower.

Final Report Chapter 9
Republic of El Salvador 9 - 2 March 2012 The Project for Master Plan for the Development of Renewable Energy (JICA)
Technical Aspect
Economic and Financial
Aspect Environmental Aspect
Wind Power 1. Wind observation is required at promising sites which are identified by wind potential map.
2. Detailed assessment of wind power potential through Pre F/S or F/S.
3. Training of technical expert who can lead development and maintenance of wind power projects.
1. Under the current tax incentive measures that can be applied to projects up to 20 MW, development costs should be less than 1,700 US$/kW and plant factors should be more than 35% to make the project viable.
2. Monitoring of world-wide trends for technology development and cost levels are recommended.
1. It is necessary to elaborate procedures and formats for environmental permit application especially for wind power.
Solar PV 1. Solar radiation potential is relatively high, for example in San Salvador.
2. Need for pilot projects development to overcome technical barriers.
3. Training of technical expert who can lead development and maintenance of solar PV projects.
1. Under the current tax incentive measures that can be applied to projects up to 20 MW, development costs should be less than 1,600 US$/kW and plant factors should be more than 25% to make the project viable.
2. Monitoring of world-wide trends for technology development and cost levels are recommended.
1. It is necessary to elaborate procedures and formats for environmental permit application especially for solar PV.
Solar Thermal
1. Currently, high initial investment cost is a barrier for introduction. Monitoring of the latest world-wide trends for technology development and cost levels are necessary to decide the time for investment.
1. Standard size for solar thermal development ranges from 30 to 50 MW which is out of ranges for tax incentives application. To promote introduction, modification and enhancement of incentive schemes will be required.
1. It is necessary to elaborate procedures and formats for environmental permit application especially for solar thermal.
Geothermal 1. By 2017, it is important to develop geothermal power based on the development schedule prepared by LaGeo to reinforce base load for electricity.
2. Timely studies and investigations will be required to formulate development plans after 2017.
1. Considerations for public funds for new geothermal resources investigations to reduce financial burden and risks of private developers are required.
1. Simplification of environmental permit application procedures and expedition of required time.

Final Report Chapter 9
Republic of El Salvador 9 - 3 March 2012 The Project for Master Plan for the Development of Renewable Energy (JICA)
Technical Aspect
Economic and Financial
Aspect Environmental Aspect
Biomass 1. Expansion of installed capacity for power generation using bagasse.
2. Examination of potential for other biomass resources by region.
1. Collection of cost information on biomass resources utilization.
1. It is necessary to elaborate procedures and formats for environmental permit application especially for biomass.
Biogas 1. F/S for new and extension projects for landfill biogas.
2. Accumulation of know-how and data will be required for other type of biogas technologies such as animal waste or waste water, through implementation of pilot projects that use biogas (e.g. cattle waste or sewage)
1. Collection of cost information on biogas resources utilization.
1. It is necessary to elaborate procedures and formats for environmental permit application especially for biogas.
(Source: JICA Study Team)
9.2 Governmental support and incentives for developers of power projects that use renewable resource As was also examined in section 9.1, the following items can be considered as support schemes by the government or incentive schemes for power companies:
(1) Necessity of low interest rate financing systems to improve cash flow of renewable energy development projects. For example, establishment of “Renewable Energy Development Funds.”
(2) Enhancement of target power development for the current tax incentive (by Decree 462). Enhancement from 30 to 50 MW class solar thermal or biomass power generation.
(3) Preparation of hydrological observation networks led by the government organizations.
(4) Observation of solar radiations or wind potential led by the government organizations.
(5) For wind, solar PV and solar thermal, training of technical expert is urgently required in an effective manner through coordination of government organizations, universities and public/private companies to be ready for actual introduction in the future.

Final Report Chapter 10
Republic of El Salvador 10-1 March 2012 The Project for Master Plan for the Development of Renewable Energy (JICA)
Chapter 10 Renewable Energy Master Plan 10.1 Definition of Master Plan Based on the studies and examinations made so far, descriptions are given on the Renewable Energy Master Plan. Master Plan was prepared for seven renewable energy sources for 15 year period from 2012 to 2026 as an Indicative Development Plan. Of the renewable energy sources there are energy sources that require further preparation periods prior to introduction. For such energy sources, references are provided for required items for examinations toward introduction.
10.1.1 Target Energy Sources for Master Plan Formulation
The following seven energy sources are considered for formulation of the master plan:
- Small Hydropower
- Wind Power
- Solar PV
- Solar Thermal
- Geothermal
- Biomass
- Biogas
As was examined in Chapter 8, there are energy sources that requires further examinations or pilot projects prior to introduction because the technologies or conditions of the market is still premature for introduction. For such energy sources, information was provided on: (1) current technical issues to be examined toward introduction; (2) action plans toward introduction and (3) introduction of examples of installation as references.
10.2 Indicative Development Plan As was presented in Chapter 2, El Salvador applies an electricity supply system through transactions in an electricity market. State owned and private power generation companies play important roles in the electricity supply activities. Therefore, future development plans are very closely related with investment plans for those power generation companies.
In other countries that apply liberalized electricity market (Colombia in Latin America, for example), the government organization in charge of power sector policy preparation normally prepares an Indicative Development Plan for the next 15 years or so and announce the plan.
In this master plan, the same manner will be applied to prepare an Indicative Development Plan for the

Final Report Chapter 10
Republic of El Salvador 10-2 March 2012 The Project for Master Plan for the Development of Renewable Energy (JICA)
next 15 years (2012 to 2026).
An Indicative Development Plan should be updated in the certain time of the year by reflecting the investment plans or expansion plans prepared by state owned or private companies. For such update works, the latest information from state owned or private companies are prerequisite. To obtain such information, periodical information exchange occasions should be organized by the government organization in charge of power sector policy preparation. By using such occasions, confirmation on development directions and progress is recommended to formulate indicative development plans.
In this master plan study, renewable energy parts of the Indicative Development Plan for the next 15 years from 2012 to 2026 are presented. As the electricity supply system applies market mechanism, no prioritization were made for individual energy sources, but to present expected capacity of introduction by dividing the 15 year period from 2012 to 2026 into three, i.e., Phase 1 (2012 to 2016), Phase 2 (2017 to 2021) and Phase 3 (2022 to 2026).
An Indicative Development Plan is as shown in Table 10.1.1.
Table 10.2.1 Indicative Development Plan (2012 to 2026)
Type of Energy
Phase
Existing Phase 1 (2012 to
2016)
Phase 2 (2017 to
2021)
Phase 3 (2022 to
2026)
Phase 1 to 3 Total
Small Hydropower (up to 20 MW)
35 MW 103.9 MW 33.5 MW 25.3 MW 162.7 MW
Wind Power - 10 MW 20 MW 30 MW 60MW
Solar PV 0.5 MW 18 MW 21 MW 51 MW 90 MW
Solar Thermal - 60 MW 80 MW 60 MW 200 MW
Geothermal 204.4 MW 5~9 MW 55~80 MW - 60~89 MW
Biomass 109.5 MW 45 MW - - 45 MW
Biogas 6.3 MW 10 MW - 25 MW 35 MW
(Source: JICA Study Team)

Final Report Chapter 10
Republic of El Salvador 10-3 March 2012 The Project for Master Plan for the Development of Renewable Energy (JICA)
0
50
100
150
200
250
300
Phase 3(2022~2026)
Phase 2(2017~2021)
Phase 1(2012~2016)
Existing
(Source: JICA Study Team)
Figure 10.1.1 Ratio of Energy Sources by Type in the Master Plan
For the above Indicative Development Plan, the followings are the remarks:
1) For small hydropower, Phase 1 projects were selected from: Under construction/concession projects, rehabilitation projects, projects with completed feasibility study or basic design or pre-feasibility study, with B/C (with bank loan) of more than 1.0. Phases 2 and 3 projects were selected considering economic viability and attractive size of the projects to private developers. Those projects with equal to or more than 250 kW in installed capacity, and with B/C equal to or large than 1.0, were selected.
2) For wind power, CEL has a plan to install total capacity of 72 MW. However, in reality, there is no actual installation schedule so far and the candidate locations for construction are limited. The figures in the indicative development plan are assumed figures that were confirmed through consultation with CNE.
3) For solar PV, CEL only has a plan to install about 18 MW. It was assumed that the plan to be implemented by 2016. For the development plan after 2016, the figures in the indicative development plan are assumed figures that were confirmed through consultation with CNE. Solar PV systems to be personally installed are not considered in the development plan.
4) For solar thermal, LaGeo and INE have development plans. LaGeo has a plan to implement by 2016. The indicative development plan was prepared from information derived from both companies to estimate future possibilities.

Final Report Chapter 10
Republic of El Salvador 10-4 March 2012 The Project for Master Plan for the Development of Renewable Energy (JICA)
5) For geothermal, LaGeo (in charge of development) has a development plan up to 2017 only. Additional studies will be required for formulating further plans after 2017. On the other hand, another 60 to 90 MW will be expected to be developed by estimating in view of developable potential.
6) For biogas, the figures in the indicative development plan are assumed figures based on the existing development plans of Nejapa landfill biogas plant, i.e., short term expansion plan up to 10 MW and long term expansion plan up to 25 MW.
Detailed technical examinations in preparing the Indicative Development Plan are described in the next section.
10.3 Master Plan for Each Renewable Energy Source
Based on the technical and planning maturity of relevant energy sources, master plan was formulated for the following seven renewable energy sources:
- Small Hydropower (up to 20 MW)
- Wind Power
- Solar PV
- Solar Thermal
- Geothermal
- Biomass
- Biogas
Detailed descriptions for each energy sources are given hereunder:
10.3.1 Small Hydropower Master plan for small hydropower was prepared in accordance with the workflow presented in Section 8.1.1 of Chapter 8. Based on information about the existing potential sites and the newly identified potential sites through desk studies, simple technical reviews was conducted through analysis of previous studies and verification of the newly found potential sites for small hydro, through the study of topographic maps, hydrologic analysis, cost estimate by formulas of Japanese guidelines, current unit cost in El Salvador and financial analysis. The size of the capacity is determined by optimizing the difference between benefit and cost (B-C). The master plan for development of small hydropower in

Final Report Chapter 10
Republic of El Salvador 10-5 March 2012 The Project for Master Plan for the Development of Renewable Energy (JICA)
three phases is considered for each five year from 2012 to 2027.
Scheduled development programs and the number of development sites for each phase are as presented in Table 10.3.1.1.
Table 10.3.1.1 Summary of Master Plan for Small Hydropower Development
(Source: JICA Study Team)
For formulation of master plan, the following criteria are adopted:
Phase-I (2012-2017) : Under construction/concession projects, rehabilitation projects, projects with completed feasibility study or basic design or pre-feasibility study, with B/C (with bank loan) of more than 1.0 The potential sites in the environmentally protected areas (SANP) are excluded.
Phase-II (2017-2022) : 50% of the potential sites with B/C (with bank loan) of more than 1.0 and with potential capacity of more than 250 kW. The potential sites in the environmentally protected areas (SANP) are excluded.
Phase-III (2022-2027) : The remaining 50% of the potential sites with B/C (with bank loan) of more than 1.0 and potential capacity of more than 250 kW. The potential sites in the environmentally protected areas (SANP) are excluded.
Total of 123 sites (59 in Phase-I, 32 in Phase-II and 32 in Phase-III) are selected for the master plan The total capacity is estimated at 162.7MW (103.9 MW in Phase-I, 33.5 MW in Phase-II and 25.3MW in Phase-III). Total annual energy is estimated at 671.4 Wh/year (436.1 GWh/year in Phase-I, 146.1 GWh/year in Phase-II and 89.2 GWh/year in Phase-III). The total investment cost will be US$483.4 million.
Details of master plan formulation are described hereunder. 10.3.1.1 Workflow of Master Plan Formulation for Small Hydropower Projects Study of nationwide potential of small hydropower was conducted in CEL-UCA 1989 Study. In 2002, some information such as investment costs and economic values were updated for several of potential sites of the CEL-UCA 1989 Study by UNDP/GEF-MARN (Transénergie, F. Lozano/J. Cottin). However, UNDP/GEF-MARN did not update all the potential sites of CEL-UCA 1989 Study. Therefore, some of the above potential information are already outdated and need updating.
On the other hand, Pre-F/S or F/S was conducted for each hydropower project site, but nationwide study of
Base del Inversionista(con préstamo del Banco)
Investment Base (with BankTIR
FIRR(Average)
VANNPV
(Average)
B/C(Average)
(%) (x1,000US$)
Phase-I (2012-2017) Under Const.,with B/D, F/S & Pre-F/S 59 103.9 436,100 48% 305,100 2,937 27.7% 4,500 1.58
Phase-II (2017-2022) B/C >=1, P>=0.25 (MW), 50% of Potential 32 33.5 146,100 50% 92,500 2,761 29.3% 3,500 1.72
Phase-III (2022-2027) B/C >=1, P>=0.25 (MW), 50% of Potential 32 25.3 89,200 40% 85,800 3,391 17.6% 1,400 1.33
TOTAL 123 162.7 671,400 47% 483,400 2,972 24.7% 3,248 1.52
FasePhase
CondicionesConditions
Nomberof
Projects
PotenciaPotential
(MW)
EnergíaEnergy
(MWh/Año)
PlantFactor
Inversión TotalInvestment Cost
(x 1,000 US$)
Costo/kW(US$)

Final Report Chapter 10
Republic of El Salvador 10-6 March 2012 The Project for Master Plan for the Development of Renewable Energy (JICA)
potential small hydropower projects has not been updated. Therefore, updating of this comprehensive study of potential small hydropower projects is required.
To select viable sites among the identified potential sites mentioned above, technical, economical, financial and environmental feasibility were evaluated and updated.
Basic approach in the master plan formulation for the development of small hydropower with capacities less than 20 MW for 2012-2027 is described below.
A. Review and updating of potential installed capacity [MW] and average annual energy production [MWh/year] for each potential site by using results of previous studies, 1/50,000 scale topographic maps and recent hydrological data, etc.
B. Review and updating of investment cost [US$], benefit [US$] and financial values such as FIRR (TIR), NPV (VPN) and B/C for each potential site by using results of previous studies and recent economic values
C. Locating potential sites using 1/50,000 scale topographic maps D. Estimation of the possible potential installed capacity [MW], average annual energy production
[MWh/year], financial viability indicators such as FIRR (TIR), NPV (VPN) and B/C for each potential site by using results of previous studies and recent economic values, for each new potential site by using 1/50,000 scale topographic maps, recent hydrological data, and recent economic values
E. Project prioritization based on project status, such as study stage (potential survey, Pre-F/S, F/S, final design, under concession, etc.) and financial viability indicators (B/C)
F. Environmental impacts and viability evaluation
The workflow of master plan formulation for small hydropower development is shown in Figure 10.3.1.1.
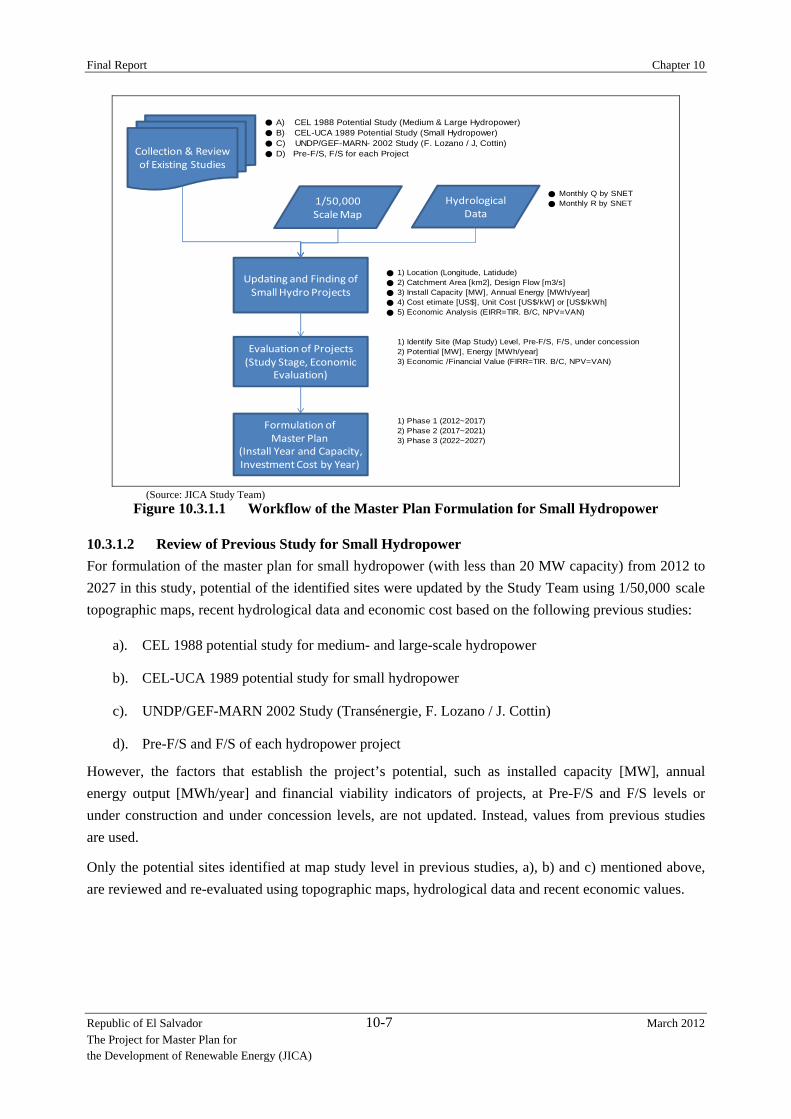
Final Report Chapter 10
Republic of El Salvador 10-7 March 2012 The Project for Master Plan for the Development of Renewable Energy (JICA)
A) CEL 1988 Potential Study (Medium & Large Hydropower) B) CEL-UCA 1989 Potential Study (Small Hydropower) C) UNDP/GEF-MARN- 2002 Study (F. Lozano / J, Cottin) D) Pre-F/S, F/S for each Project
Monthly Q by SNET Monthly R by SNET
1) Location (Longitude, Latidude) 2) Catchment Area [km2], Design Flow [m3/s] 3) Install Capacity [MW], Annual Energy [MWh/year] 4) Cost etimate [US$], Unit Cost [US$/kW] or [US$/kWh] 5) Economic Analysis (EIRR=TIR. B/C, NPV=VAN)
1) Identify Site (Map Study) Level, Pre-F/S, F/S, under concession2) Potential [MW], Energy [MWh/year]3) Economic /Financial Value (FIRR=TIR. B/C, NPV=VAN)
1) Phase 1 (2012~2017)2) Phase 2 (2017~2021)3) Phase 3 (2022~2027)
Collection & Review of Existing Studies
Updating and Finding of Small Hydro Projects
Evaluation of Projects(Study Stage, Economic
Evaluation)
Formulation of Master Plan
(Install Year and Capacity, Investment Cost by Year)
Hydrological Data
1/50,000 Scale Map
(Source: JICA Study Team)
Figure 10.3.1.1 Workflow of the Master Plan Formulation for Small Hydropower 10.3.1.2 Review of Previous Study for Small Hydropower For formulation of the master plan for small hydropower (with less than 20 MW capacity) from 2012 to 2027 in this study, potential of the identified sites were updated by the Study Team using 1/50,000 scale topographic maps, recent hydrological data and economic cost based on the following previous studies:
a). CEL 1988 potential study for medium- and large-scale hydropower
b). CEL-UCA 1989 potential study for small hydropower
c). UNDP/GEF-MARN 2002 Study (Transénergie, F. Lozano / J. Cottin)
d). Pre-F/S and F/S of each hydropower project
However, the factors that establish the project’s potential, such as installed capacity [MW], annual energy output [MWh/year] and financial viability indicators of projects, at Pre-F/S and F/S levels or under construction and under concession levels, are not updated. Instead, values from previous studies are used.
Only the potential sites identified at map study level in previous studies, a), b) and c) mentioned above, are reviewed and re-evaluated using topographic maps, hydrological data and recent economic values.

Final Report Chapter 10
Republic of El Salvador 10-8 March 2012 The Project for Master Plan for the Development of Renewable Energy (JICA)
10.3.1.3 Findings and Evaluation of New Potential Sites Amongst the proposed potential sites in previous studies, such as the CEL-UCA 1989 Study, only the economically viable potential sites are presented in the final report. Most sites proposed in the CEL-UCA 1989 Study were identified through map studies and field investigations. In the JICA master plan study, new potential sites were also identified and evaluated using 1/50,000 scale topographic maps, hydrological data and recent economic cost data by the JICA Study Team. The project’s potential indicators, such as installed capacity [MW], annual energy output [MWh/year] and financial parameters are also evaluated using recent values.
10.3.1.4 Technical Evaluation of Potential Sites For the evaluation and selection of small hydropower potential sites for the master plan study, technical evaluation was conducted. In the review of the proposed sites in existing studies, and in the search for new potential sites; map studies, hydrological study and financial evaluation were made for each potential site.
A. Map Study
i) Gross Head
Topographic maps of 1:50,000 scale were used in the measurement and verification of gross head [m] on each potential site. New potential sites for small hydropower are also proposed by the JICA Study Team.
ii) Proposed Intake and Powerhouse Sites
Proposed intake and powerhouse sites in previous studies were reviewed and proposal for new intake and powerhouse sites were also prepared using the topographic maps.
iii) Length of Canal and Penstock
The length of the canal was measured following the contour lines until the proposed headtank site. The length of the penstock was measured between the proposed headtank and powerhouse site taking into account the slope. Example of a map study is shown in Figure 10.3.1.2.

Final Report Chapter 10
Republic of El Salvador 10-9 March 2012 The Project for Master Plan for the Development of Renewable Energy (JICA)
(Source: INGENDEHSA S.A DE C.V)
Figure 10.3.1.2 Example of a Map Study for a Small Hydropower Layout
B. Hydrological Study
Daily mean discharge at proposed intake site for each potential site is estimated by using available daily mean discharge data at nearby hydrological station and monthly mean rainfall data at nearby rainfall stations as shown in Figure 10.3.1.3 and by the following equation:
Qd Qs A RA R
Where,
Qd: Estimated daily discharge at proposed intake site [m3/s]
Qs: Observed daily mean discharge at nearby hydrological station [m3/s]
Ad: Catchment area at proposed intake site [km2]
As: Catchment area at nearby hydrological station [km2]
Rd: Monthly mean basin rainfall at proposed intake site [mm/month]
Rs: Monthly mean basin rainfall at nearby hydrological station [mm/month]
Monthly mean rainfall at proposed sites and hydrological stations are estimated using available rainfall data by SNET and Thiessen’s Polygons.
After estimation of daily mean discharge at proposed intake sites, the flow duration curves of the daily discharge of available periods were created.

Final Report Chapter 10
Republic of El Salvador 10-10 March 2012 The Project for Master Plan for the Development of Renewable Energy (JICA)
Q(g)
Q(d1)
Presa‐1
Estación de medición de Caudales
Área de la Cuenca de medición de Caudales CA(g)
Área de la Cuenca de Presa‐1 CA(d1)
Presa‐2
Área de la Cuenca de Presa‐2 CA(d2)
Q(d2)
Q(d1) = Q(g) X ( CA(d1)*R(d1) )/ (CA(g)*R(g) )Q(d2) = Q(g) X ( CA(d2)*R(d2) )/ (CA(g)*R(g) )
precipitación de la Cuencade Presa‐1 R(d1)
precipitación de la Cuencamedición de Caudales R(g)
precipitación de la Cuencade Presa‐2 R(d2)
(Source: JICA Study Team)
Figure 10.3.1.3 Estimation of Discharge at Proposed Intake Site
C. Design Discharge
The design discharge for each potential site was determined from the results of the optimization study where site selection is based on the maximum benefit-cost value (B-C or NPV). The discharge is evaluated from 10% to 95% at 5% intervals of the flow duration curves for each proposed intake site. As this is a master plan level study, the river maintenance flow was not considered. River maintenance flow is normally examined at the Pre-F/S or F/S stages.
D. Power Output
The power output is estimated for each design discharge and head, using the following equations:
gtc
lge
ec
HHHHQP
γγγ
γ
*
81.9
=
−=×××=
where, P : Power output [kW]
Q : Design Discharge [m3/s]
Hn : Gross Head [m] (Intake water level [El. m] - Tailrace water level [El. m])
He : Effective Head [m]
Hl : Head loss [m]
γc : Combined Efficiency
γt : Turbine Efficiency
γg : Generator Efficiency
The head loss Hl is estimated as follows:
Hl=(1/5000)*L1 + (1/200)*L2 + (1/5000)*L3
where, L1 : Length of headrace channel[m]
L2 : Length of penstock [m]

Final Report Chapter 10
Republic of El Salvador 10-11 March 2012 The Project for Master Plan for the Development of Renewable Energy (JICA)
L3 : Length of tailrace [m]
Note: this formula only can be used when we working Francis Turbine
The combined efficiency γc by turbine type is as shown in Figure 10.3.1.4.
(Source: “Guide Manual for Development Aid Program and Studies of Hydro Electric Power Projects”: New Energy Foundation, Japan 1996)
Figure 10.3.1.4 Combined Efficiency by Turbine Type
The type of turbine is selected for each design flow and effective head as shown in Table 10.3.1.2, but for simplified estimation, refer to Figure 10.3.1.5.
Table 10.3.1.2 Selection of Turbine Type Type of Turbine Head (m) Discharge (m3/s)
Cross-Flow H<80 m Q<1.0 m3/s
Pelton H>75 m Q<2.0 m3/s
Francis H>30 m Q>0.3 m3/s (Source: JICA Study Team)
y = ‐0.5682x3 + 0.4356x2 + 0.4871x + 0.52
y = 0.3687x3 ‐ 1.0755x2 + 1.0103x + 0.567
y = 0.5749x3 ‐ 1.6021x2 + 1.4692x + 0.4542
y = 0.7054x3 ‐ 1.7861x2 + 1.493x + 0.4894
60%
65%
70%
75%
80%
85%
90%
95%
100%
20% 30% 40% 50% 60% 70% 80% 90% 100%
Combined Efficiency(%
)
Q/Qmax (%)
FrancisPeltonKaplanBulb

Final Report Chapter 10
Republic of El Salvador 10-12 March 2012 The Project for Master Plan for the Development of Renewable Energy (JICA)
(Source: Nippon Koei Co., Ltd.)
Figure 10.3.1.5 Turbine Selection Diagram
E. Energy
The average annual energy generation for each design discharge case is estimated using the flow duration curves described as follows:
Flow below Qmax (design discharge) is divided into blocks partitioned by 5% steps as shown in Figure 10.3.1.6, which shows design discharge at 30% of year (Q30%) schematic as example.
Volume of inflow for each block area A <a> through A <o> is obtained.
Energy generation of each block is calculated. In this case (Qd = Q30%), the combined efficiency of the equipment is obtained from the ratio of the mean flow to the maximum plant discharge of each block by using Figure 10.3.1.4 above.
Ea = P30% * 24*365*30% ; P30% = 9.8*Q30%*η30% * He
Eb = (P30% + P35%)/2 * 24*365*5% ; P35% = 9.8*Q35%*η35% * He
Ec = (P35% + P40%)/2 * 24*365*5% ; P40% = 9.8*Q40%*η40% * He
Ec = (P40% + P45%)/2 * 24*365*5% ; P45% = 9.8*Q45%*η45% * He
(same as above for the 45% to 90% of flow duration)
En = (P90% + P95%)/2 * 24*365*5% ; P95% = 9.8*Q95%*η95% * He
Eo = (P95% + P100%)/2 * 24*365*5% ; P100% = 9.8*Q100%*η100% * He
Annual energy generation, E [kWh/year] = Ea + Eb+ Ec + Ed + ...... + Em + En + Eo

Final Repor
Republic of The Project the Develop
10.3.1.5
A. Con
Example hydraulic estimated results onand Studi
The unit c
Aver(Li) o
HeadcondOTK
C
rt
f El Salvador for Master Plan
pment of Renew
(Sour
Cost Estim
struction Co
of a cost eand electroby using the
n existing hyes of Hydro-
costs in civil
rage height oof intake wei
Li = (
drace channeduction pipesK Flowtite, C
Cost of Condu
Z= (L
where
0.
0.
1.
1.
2.
2.
3.
Flow
(m
3/s)
n for wable Energy (J
rce: JICA Study TFigure 10.3
mate of Pote
ost Estimate
estimate is s-mechanicale equations i
ydropower sta-Electric Pow
works were
of intake weiir was calcul
Qmax * 198
el assumes th for each sizolombian co
uction Pipe [
Lt*Dr)/(26.72
e:
Z:
Lt:
Dr:
.0
.5
.0
.5
.0
.5
.0
0% 10%
A<
JICA)
Team) 3.1.6 Cal
ential Sites
e
shown in Tal equipmentin Tables S.2ations in Jap
wer Projects:
based on cu
ir (Hd) was lated using th
8)/(Hd2/7)
hat the canalze are estimaompany).
[US$]:
243+0.0068*
Cost of
Length
Diamete
20% 30%
<a> b
10-13
culation of E
able S.1 of for each po
2 and S.3 of pan (Source: New Energy
urrent 2011 p
assumed at he following
l is construcated by the fo
*Ln (Lt )- 3.1
Conduction
of Conductio
er of Conduc
40% 50%% of Du
c d e f
Energy (Qd=
Appendix-Sotential site Appendix-SGuide Manu
y Foundation
rices in El S
2.0 m for al equation:
cted using coollowing equ
1711*Ln (Dr
Pipe [US$]
on Pipe [m]
ction Pipe [m
60% 70% 8uration
g h i j
=Q30% case)
S. The costand design
S, which werual for Deven, Japan 199
alvador.
ll potential s
onduction pipuation and F
r))
mm]
80% 90%10
k l m n o
ts of civil wn discharge re taken fromelopment Aid6).
sites. The c
pe. The unigure 10.3.1
00%
o
Chapter 10
March 2012
works and case were
m the study d Program
crest width
nit costs of .7 (source:

Final Report Chapter 10
Republic of El Salvador 10-14 March 2012 The Project for Master Plan for the Development of Renewable Energy (JICA)
(Source: INGENDEHSA S.A DE C.V)
Figure 10.3.1.7 Cost of Conduction GRP Pipe
Unit cost of electro-mechanical equipment (turbine and generator) was estimated using the following equation and Figure 10.3.1.8. (source: VOLK Wasserkraft WKV, German company)
Cost of Electro-mechanical Equipment [US$ Million] = 0.7452 * P[MW]^0.8546
(Source: INGENDEHSA S.A DE C.V)
Figure 10.3.1.8 Cost of Electro-mechanical Equipment
The assumed length of transmission line (distribution) was 3.0 km for all potential sites. The unit cost of the distribution line used in the estimate was US$50,000/km.
The assumed length of access road was 2.0 km for all potential sites. The unit cost of access road used was US$200,000/km for more than 500 kW and US$100,000/km for less than 500 kW.

Final Report Chapter 10
Republic of El Salvador 10-15 March 2012 The Project for Master Plan for the Development of Renewable Energy (JICA)
B. Total Construction Cost
The estimated total construction cost is shown in Table S.4 of Appendix-S. This is based on the following assumptions:
preparatory works (assumed 5% of civil works cost)
environmental mitigation costs (assumed 1% of civil works cost)
miscellaneous works of civil works (assumed 25% of civil works cost)
administration & engineering fee (assumed 3% of direct cost)
contingency (assumed 1% of direct cost)
10.3.1.6 Financial Evaluation of Potential Sites
A. General
The financial evaluation of small hydropower potential sites was carried out using the Net Present Value (NPV), Financial Internal Rate of Return (FIRR), and Benefit-Cost ratio (B/C). The project financial analysis “without” and “with” bank loan cases were carried out on the evaluation of the base case scenario of the project and on the more accurate financing cases using bank loan.
The IRR is expressed by the following equation:
1 10
Where:
Ct : Cost [US$]
Bt : Benefit [US$]
t : Year
n : Life of the project (=50 years)
i : Discount rate (if Cost=Benefit => i=Internal Rate of Return; IRR)
Net present value (NPV) is estimated as follows:
1
The B/C is estimated as follows:
∑ 1
∑ 1

Final Report Chapter 10
Republic of El Salvador 10-16 March 2012 The Project for Master Plan for the Development of Renewable Energy (JICA)
Generation cost is estimated as follows:
Generation cost [US$/kWh] = (Construction cost per kWh) * α
Construction cost per kWh [US$/kWh] = C US$A W
α = CRF + Fo = 0.082+0.05 = 0.132
= 0.082
where,
α: Annual cost factor
CRF: Capital recovery factor
i: Interest rate (assumed at i = 8%)
y: Service life (years) (assumed hydropower: 50 years)
Fo: O&M cost factor (assumed at 5%)
B. Condition of Project Financial Evaluation (without bank loan case)
The following assumptions were used in the project financial analysis of the ‘without bank loan’ case:
Percentage of investors’ contribution: 100% (in this case, bank loan is not considered)
Discount rate: 10%
Construction period: 2 years (assumed)
For the sale price of energy, this is based on the authorized average price of energy for distribution companies from 2008 to 2011, with a value of US$146.70/MWh (www.siget.gob.sv) and with 5.5% discount from the dealer, which is equivalent to US$140/MWh with an annual increase of 4% calculated on the basis of price changes for the period mentioned above.
Operation and maintenance cost: 5% of total gross income and US$0.35/MWh for major maintenance
Administrative expenses are assumed as follows:
P>=1MW 1MW> P
>=500kW
500kW> P
>=200kWP<200kW
Unit Cost
(US$/month)
Engineer 1 1 0 0 US$1,800
Operator 2 2 1 1 US$500
Security guard 2 1 1 0 US$400
Accountant 1 1 0 0 US$500
Annual increase in operation and maintenance costs and administration expenses: 5% (estimates based on average annual inflation in El Salvador)

Final Report Chapter 10
Republic of El Salvador 10-17 March 2012 The Project for Master Plan for the Development of Renewable Energy (JICA)
Annual insurance payment equivalent to US$1.5 per 1,000 (= US$0.0015) of investment cost and variable according to depreciable assets.
Tax of municipality: US$0.216 per 1,000 of investment cost.
Annuity to SIGET: US$0.51/MWh
Registration Tax (CNR): US$11.43 per US$100,000 of investment cost (maximum US$11,430)
Income tax: 25% from the 11 years of operation.
Example of result of project financial evaluation “without” bank loan case is shown in Table S.5 of Appendix-S.
C. Condition of Financial Evaluation (with bank loan case)
The following additional assumptions were used for financial analysis of the ‘with bank loan’ case. The assumption and calculation are the same with those applied in Chapter 8, Section 8.2.
Percentage financed by banking institutions: 70%
Percentage of investors’ contribution: 30%
Bank interest rate: 8.00%
Funding period: 12 years (10 years plus 2 years of grace payment).
Example of project financial evaluation results for the ’with bank loan’ case is shown in Table S.6 of Appendix-S.
10.3.1.7 Optimization of Design Discharge for Potential Sites Design discharge was selected based on the optimum B-C value (or NPV) resulting from the project financial analysis of the ’with bank loan’ case, as shown in Figure 10.3.1.9.
(Source: JICA Study Team)
Figure 10.3.1.9 Optimization of Design Discharge (Example)
0
2,000
4,000
6,000
8,000
10,000
12,000
14,000
0% 10% 20% 30% 40% 50% 60% 70% 80% 90% 100%
B-C
(NPV
) [U
S$]
% of Flow Duration
Optimum

Final Report Chapter 10
Republic of El Salvador 10-18 March 2012 The Project for Master Plan for the Development of Renewable Energy (JICA)
10.3.1.8 Potential Sites for Small Hydropower Plants The evaluated small hydropower potential sites (< 20 MW) in El Salvador are shown in Table S.7 to S.8 of Appendix-S and Figure 10.3.1.10. There are 209 sites in total that were identified. The total capacity is estimated at 180.8MW and the estimated mean annual energy is 756 GWh. Most of the potential sites are located in the western region, especially in the Department Ahuachapán, Sonsonate and La Paz.
(Source: JICA Study Team). (Base map by SNET/MARN)
Figure 10.3.1.10 Location Map of Hydropower Potential Sites
There are 20 potential sites located in environmentally protected areas (Sistema Area Natural Protegida: “SANP”) as shown in Figure 10.3.1.11, especially in Department Ahuachapán. According to MARN, private projects are not allowed in SANP. However, a government project is allowed to construct in SANP if necessary permits from MARN are obtained.
Hydropower Potential Site (>20MW)Hydropower Potential Site (<20MW)Existing Hydropower
Hydrological StationHydrological Station

Final Report Chapter 10
Republic of El Salvador 10-19 March 2012 The Project for Master Plan for the Development of Renewable Energy (JICA)
(Source: JICA Study Team). (Base map by SWERA, 2005)
Figure 10.3.1.11 Small Hydropower Potential Sites (<20 MW) and Environmentally Protected Area (SANP)
10.3.1.9 Master Plan for Small Hydropower The list of small hydropower potential sites and the corresponding financial evaluation results are shown in Table S.8 of Appendix-S. In this list, if some information such as annual energy [MWh/year], cost [US$], or financial indicators (FIRR, NPV, B/C) from previous studies/projects (under construction/concession, rehabilitation projects, F/S, B/D, Pre-F/S) are not available, these values were estimated using the following assumptions:
Annual energy was estimated using capacity [MW] and assumed plant factor of 50%.
Cost estimate is based on the assumed unit cost of US$3,000/kW.
Calculation of FIRR, NPV and B/C is based on the method mentioned in Section 10.3.1.6.
The evaluation resulted to a total of 152 potential sites with B/C (with bank loan case) of more than 1.0, as shown in Table 10.3.1.3. The total capacity is 171.8 MW and the annual energy is 712.6 GWh.
Table 10.3.1.3 Summary of Small Hydropower Potential Sites with B/C >= 1.0
Number of Projects
Potential Capacity
[MW]
Annual Energy
[GWh/year]
Investment Cost
[US$ Million]
Average Cost/kW
[US$/kW]
TOTAL 152 171.8 712.6 528.5 3,077
(Source: JICA Study Team)
Hydropower Potential Site (<=20MW)

Final Report Chapter 10
Republic of El Salvador 10-20 March 2012 The Project for Master Plan for the Development of Renewable Energy (JICA)
The master plan for small hydropower development for each 5-year phase between 2012 and 2027, the following criteria shown in Table 10.3.1.4 are adopted.
Phase-I (2012-2017) : Under construction/concession projects, rehabilitation projects, and projects with completed feasibility study or basic design or pre-feasibility study and with B/C (with bank loan) of more than 1.0. The potential sites in the environmentally protected areas (SANP) are excluded.
Phase-II (2017-2022) : 50% of the potential sites with B/C (with bank loan) of more than 1.0 and potential capacity of more than 250 kW .The potential sites in the environmentally protected areas (SANP) are excluded.
Phase-III (2022-2027) : The remaining 50% of the potential sites with B/C (with bank loan) of more than 1.0 and potential capacity of more than 250 kW. The potential sites in the environmentally protected areas (SANP) are excluded.
Table 10.3.1.4 Criteria for Selection for Master Plan of Small Hydropower
Phase Year B/C (with bank loan)
Potential Capacity
[kW]
Environmentally Protected Area
(SANP)
% of Potential
Sites
I 2012-2017
All projects under const./concession, with F/S or B/D or Pre-F/S and projects with B/C > 1.0 from previous study results (*1)
all sizes (*1) Excluded -
II 2017-2022 B/C > 1.0 > 250 kW Excluded 50% III 2022-2027 B/C > 1.0 > 250 kW Excluded 50%
Note *1): The projects include isolated rural electrification projects by NGO SABES. (Source: JICA Study Team)
The selection criteria for projects under Phase-II and Phase-III(i.e., installed capacity of more than 250 kW and B/C of more than 1.0), are based on its economical and financial viability, development priority to meet the increasing national electricity demand, and its attractiveness in terms of size to private investors.
The formulated master plan for each phase is summarized in Table 10.3.1.5. The location map of selected potential sites for each phase is shown in Figure 10.3.1.12. The characteristics of selected sites on the master plan for the development of small hydropower are shown in Table 10.3.1.6.
Table 10.3.1.5 Summary of Master Plan for Small Hydropower Development
(Source: JICA Study Team)
A total 123 sites (59 in Phase-I, 32 in Phase-II and 32 in Phase-III) are selected for the master plan of
Base del Inversionista(con préstamo del Banco)
Investment Base (with BankTIR
FIRR(Average)
VANNPV
(Average)
B/C(Average)
(%) (x1,000US$)
Phase-I (2012-2017) Under Const.,with B/D, F/S & Pre-F/S 59 103.9 436,100 48% 305,100 2,937 27.7% 4,500 1.58
Phase-II (2017-2022) B/C >=1, P>=0.25 (MW), 50% of Potential 32 33.5 146,100 50% 92,500 2,761 29.3% 3,500 1.72
Phase-III (2022-2027) B/C >=1, P>=0.25 (MW), 50% of Potential 32 25.3 89,200 40% 85,800 3,391 17.6% 1,400 1.33
TOTAL 123 162.7 671,400 47% 483,400 2,972 24.7% 3,248 1.52
FasePhase
CondicionesConditions
Nomberof
Projects
PotenciaPotential
(MW)
EnergíaEnergy
(MWh/Año)
PlantFactor
Inversión TotalInvestment Cost
(x 1,000 US$)
Costo/kW(US$)

Final Report Chapter 10
Republic of El Salvador 10-21 March 2012 The Project for Master Plan for the Development of Renewable Energy (JICA)
small hydropower development for the duration between 2012 and 2027. The total capacity is estimated at 162.7 MW (103.9 MW in Phase-I, 33.5 MW in Phase-II and 25.3 MW in Phase-III will be proposed for installation). Total annual energy is estimated at 671.4 GWh (436.1 GWh/year in Phase-I, 146.1 GWh/year in Phase-II and 89.2 GWh/year in Phase-III will be generated additionally). The estimated investment cost is US$483.4 Million in total.
(Source: JICA Study Team) (Base map by SNET/MARN)
Figure 10.3.1.12 Location Map of Selected Small Hydropower Potential Sites for Master Plan 2012-2027
Figure 10.3.1.13 shows the correlation between the B-C value (or NPV) and the potential capacity [MW] of selected small hydropower potential sites for the three phases. The projects under Phase-I and II have wide range of B-C values. The relationship between B-C and potential capacity [MW] of Phase-I and Phase-II projects seems linear. The B-C of Phase-III projects are, in general, smaller than the Phase-II projects.
Hydropower Potential Site (>20MW)
Hydropower Potential Site (<20MW, Phase-I)"
Hydropower Potential Site (<20MW, Phase-II)
Hydropower Potential Site (<20MW, Phase-III)
Existing Hydropower
Hydrological Station

Final Report Chapter 10
Republic of El Salvador 10-22 March 2012 The Project for Master Plan for the Development of Renewable Energy (JICA)
(Source: JICA Study Team) Figure 10.3.1.13 Relationship between B-C and Potential Capacity of Selected
Small Hydropower Potential Sites by Phase
0.0
0.5
1.0
1.5
2.0
2.5
3.0
3.5
4.0
4.5
5.0
0 2,000 4,000 6,000 8,000 10,000 12,000 14,000
Pote
ntia
l [M
W]
B-C (NPV) [US$]
Phase-I (2012-2017)
Phase-II (2017-2022)
Phase-III (2022-2027)

Final Report Chapter 10
Republic of El Salvador 10-23 March 2012 The Project for Master Plan for the Development of Renewable Energy (JICA)
Table 10.3.1.6 Selected Small Hydropower Potential Sites for Master Plan (1/2)
Note: Italicized numbers are estimated values n.d.: no data (Source: JICA Study Team)
Nombre de Proyecto Río Departamento Latitud Longitud Etapa del Proyecto Potencia EnergíaFactor de
planta Inversión Total Costo/kWGeneración
de costos
Base del Proyecto(sin préstamo del Banco)
Project Base (without Bank Loan)
Base del Inversionista(con préstamo del Banco)
Investment Base (with Bank Loan)
Fasedel
proyecto
Project Name River Department Latitude Longitude Project Stage Potential Energy PlantFactor
InvestmentCost Cost/kW Generation
CostTIR
FIRRVANNPV B/C TIR
FIRRVANNPV B/C Project
Phase
(N) (W) (MW) (MWh/Año) (x 1,000 US$) (US$/kW) (US$/kWh) (%) (x1,000 US$) (%) (x1,000 US$)
1 El Calambre Río El Calambre Morazán 13.9928 88.0804 Construcción 0.058 311 61% 146 2,512 0.062? 16.5% 82 1.17 ? 39.4% 207? 1.83? 12 Mirazalco Río Gran.d.e de Sonsonate Sonsonate 13.8414 89.7456 Construcción 3.370 14,762? ? 50% 9,969 2,958 0.089? ? 19.6% ? 8,830 1.67? ? 29.3% 9,475? 1.76? 13 Gualpuca Río Gualpuca Morazán 13.8333 88.2333 Financiamiento 1.000 6,155 70% 1,475 1,475 0.032? 26.0% 614 1.70 ? 90.5% 5,893? 2.94? 14 Ilopango Aguacayo lago de Ilopanago La Paz 13.6311 89.0334 Financiamiento 17.000 74,460? ? 50% 51,000? 3,000? 0.090? ? 19.7% ? 45,746 1.70? ? 29.5% 49,047? 1.80? 15 San Luis IV Rio Suquiapa La Libertad 13.9942 89.4828 Bid Process 1.500 6,570? ? 50% 5,250? 3,500? 0.105? ? 16.3% ? 2,953 1.43? ? 22.4% 3,293? 1.50? 16 Sumpul Río Sumpul Chalatenango 13.8300 89.7300 De Registro SIGET 16.200 64,043 45% 48,600? 3,000? 0.100? ? 17.9% ? 35,075 1.58? ? 25.8% 38,221? 1.67? 17 Sucio, Los Tetuntes Río Sucio La Libertad 13.8822 89.2594 De Registro SIGET 6.600 28,908? ? 50% 19,800? 3,000? 0.090? ? 19.5% ? 17,481 1.69? ? 29.2% 18,762? 1.78? 18 La Joya Río Acahuapa San Vicente 13.6248 88.7383 De Registro SIGET 3.000 13,140? ? 50% 9,000? 3,000? 0.090? ? 19.2% ? 7,696 1.65? ? 28.6% 8,279? 1.74? 19 San Francisco Rio Tapuchina Sonsonate 13.8482 89.7285 De Registro SIGET 1.000 4,380? ? 50% 3,000? 3,000? 0.090? ? 18.2% ? 2,261 1.53? ? 26.4% 2,455? 1.61? 110 La Colmena (El Volcán) Río El Volcán/Rio Sn Juan San Miguel 13.7339 88.2375 De Registro SIGET 0.097 450 53% 290 2,986 0.085? 15.3% 124 1.10 ? 28.0% 259? 1.63? 111 Quebrada la Cueva / San Jose Quebrada la cueva / San Jose Morazán 13.7855 88.2146 De Registro SIGET 0.065 455 80% 294 4,527 0.085? 13.2% 88 1.10 ? 28.0% 262? 1.63? 112 Santa Rosa (El Riachuelo) Río Riachuelo San Miguel 13.8518 88.2707 De Registro SIGET 0.038 260 78% 180 4,737 0.091? 11.8% 30 1.00 ? 22.7% 116? 1.43? 113 Atehuecillas (Rehabilitation) Ahuachapán 13.9228 89.8811 Rehabilitación 0.630 2,759? ? 50% 1,890? 3,000? 0.090? ? 17.6% ? 1,300 1.46? ? 25.0% 1,422? 1.53? 114 San Esteban Río San Esteban San Miguel 13.5196 88.1829 Rehabilitación 0.751 3,287 50% 4,858 6,472 0.195? ? 8.3% ? -689 0.88? ? 8.6% ? -374 0.93? 115 Cucumacayan (Reconversion) Río Grande de Sonsonate Sonsonate 13.7500 89.7167 Reconversion 2.300 17,895 89% 2,225 967 0.016? 42.0% 261 1.76 ? 164.1% 19,707? 4.25? 116 Acahuapa (Rehabilitation) San Vicente 13.6583 88.8157 Rehabilitación 0.120 526? ? 50% 360? 3,000? 0.090? ? 18.2% ? 270 1.53? ? 26.4% 294? 1.60? 117 Sapuyo (Rehabilitation) La Paz 13.4941 88.8667 Rehabilitación 0.060 263? ? 50% 180? 3,000? 0.090? ? 16.6% ? 107 1.38? ? 23.1% 119? 1.44? 118 Chorreron Jiboa n.d. La Paz Factibilidad 2.000 8,760? ? 50% 6,000? 3,000? 0.090? ? 19.0% ? 4,979 1.62? ? 28.1% 5,367? 1.70? 119 La Montañita Morazan 13.8167 88.2167 Factibilidad 0.900 3,942? ? 50% 2,700? 3,000? 0.090? ? 18.2% ? 2,034 1.53? ? 26.4% 2,208? 1.61? 120 El Sapo Río Sapo Morazán 13.9216 88.1056 Factibilidad 0.060 263? ? 50% 180? 3,000? 0.090? 31.0% 11,010 3.32 ? 23.1% 119? 1.44? 121 San Luis III Rio Suquiapa Santa Ana 13.9942 89.4828 Factibilidad 0.600 2,628? ? 50% 1,800? 3,000? 0.090? ? 17.4% ? 1,218 1.45? ? 24.8% 1,335? 1.52? 122 Sonzacate (Nahuizalco II) Río Sensunapán Sonsonate 13.7567 89.7153 Factibilidad 3.839 16,816 50% 9,450 2,461 0.074? 22.3% 9,758 2.18 ? 37.2% 12,427? 2.00? 123 Potrerillos Quebrada Las Lajas Morazán 13.8084 88.2417 Factibilidad 0.320 2,600 93% 976 3,049 0.049? 18.4% 257 1.50 ? 59.1% 2,292? 2.52? 124 Guanijiquil - Poza Hon.d.a Río Sapo Morazán 13.8500 88.1500 Factibilidad 0.131 510 44% 345 2,637 0.089? 14.7% 140 1.43 ? 26.7% 287? 1.61? 125 La Cabaña Río Gran.d.e de San Miguel Usulután 13.3019 88.2885 Factibilidad 0.980 4,300 50% 2,600 2,653 0.080? 11.4% 181 1.40 ? 31.4% 2,731? 1.75? 126 La Loma Río Osicala Morazán 13.8167 88.1333 Factibilidad 0.055 398 83% 270 4,905 0.089? 16.0% 136 1.15 ? 25.7% 212? 1.56? 127 El Progreso Río Aruate Morazán 13.8797 88.2216 Factibilidad 0.033 280 97% 200 6,061 0.094? 11.8% 34 1.00 ? 22.2% 124? 1.42? 128 Araute Río Araute Morazán 13.8751 88.2245 Factibilidad 0.033 284 98% 99? 3,000? 0.046? ? 30.6% ? 206 1.98? ? 54.9% 212? 2.05? 129 Cumaro Río Cumaro n.d. 13.9167 88.1333 Factibilidad 0.040 175? ? 50% 120? 3,000? 0.090? ? 15.0% ? 53 1.26? ? 19.9% 61? 1.30? 130 El Naranjito Río El Naranjito Ahuachapán 13.7050 89.9333 Factibilidad 0.031 146 54% 97 3,124 0.087? 10.3% 2 0.85 ? 18.9% 44? 1.26? 131 Quezalapa Río Quezalapa Cuscatlán/Cabañas 13.8833 88.9667 Diseños Básicos 1.050 2,628 29% 3,150? 3,000? 0.158? ? 9.9% ? -26 0.99? ? 11.1% 178? 1.05? 132 Tihuapa 1 Río Tihuapa San Salvador/La Paz 13.5883 89.1383 Diseños Básicos 1.315 3,870 34% 3,945? 3,000? 0.134? ? 12.3% ? 794 1.16? ? 15.1% 1,049? 1.22? 133 Tihuapa 2 Río Tihuapa San Salvador/La Paz 13.5500 89.1333 Diseños Básicos 0.900 2,580 33% 2,700? 3,000? 0.138? ? 11.6% ? 359 1.10? ? 13.8% 534? 1.16? 134 San Simón 1 Río San Simón Usulután 13.5619 88.5176 Diseños Básicos 0.900 2,040 26% 2,700? 3,000? 0.174? ? 8.6% ? -304 0.91? ? 9.1% 130?- 0.96? 135 San Simón 2 Río San Simón Usulután 13.5699 88.5362 Diseños Básicos 0.915 2,484 31% 2,745? 3,000? 0.146? ? 10.9% ? 201 1.06? ? 12.6% 379? 1.11? 136 San Simón 3 Río San Simón Usulután 13.5833 88.5667 Diseños Básicos 0.870 2,570 34% 2,610? 3,000? 0.134? ? 11.9% ? 427 1.12? ? 14.3% 596? 1.18? 137 Titihuapa 3 Río Titihuapa Cabañas/San Vicente 13.6067 88.6500 Diseños Básicos 2.100 6,802 37% 6,300? 3,000? 0.122? ? 14.2% ? 2,305 1.29? ? 18.4% 2,713? 1.36? 138 Titihuapa 5 Río Titihuapa Cabañas/San Vicente 13.7667 88.6000 Diseños Básicos 1.410 5,673 46% 4,230? 3,000? 0.098? ? 17.2% ? 2,757 1.48? ? 24.3% 3,031? 1.56? 139 Cuyuapa Río Cuyuapa Sonsonate 13.7500 88.8000 Diseños Básicos 1.020 2,840 32% 3,060? 3,000? 0.142? ? 11.2% ? 315 1.08? ? 13.2% 513? 1.13? 140 Suquiapa Río Suquiapa Santa Ana 13.9833 89.4333 Diseños Básicos 3.530 13,630 44% 10,590? 3,000? 0.102? ? 17.2% ? 6,886 1.51? ? 24.2% 7,571? 1.59? 141 Gr. Chalatenango Río Gr. Chalatenango Chalatenango 14.7167 89.0833 Diseños Básicos 1.630 3,680 26% 4,890? 3,000? 0.175? ? 9.3% ? -279 0.95? ? 10.1% 37? 1.01? 142 Sucio 3 Río Sucio La Libertad/San Salvador 13.9833 89.2833 Diseños Básicos 2.025 11,149 63% 6,075? 3,000? 0.072? ? 23.5% ? 7,849 1.91? ? 38.1% 8,242? 2.01? 143 Polorós La Unión 13.8050 89.8083 Diseños Básicos 2.025 5,250 30% 6,075? 3,000? 0.152? ? 11.2% ? 597 1.08? ? 13.1% 991? 1.14? 144 Huiza 2 Río Huiza La Libertad/San Salvador 13.5500 89.2333 Diseños Básicos 2.100 6,009 33% 6,300? 3,000? 0.138? ? 12.4% ? 1,330 1.17? ? 15.3% 1,738? 1.24? 1
45 Santo Domingo (Presa 1 & 2 &3) Río Tepechapa/ Río Cacahuata/ QuebradaEl Camote Sonsonate 13.7497 89.7838 Pre Factibilidad 1.540 7,885 58% 2,958 2,881 0.087? 23.4% 3,969 2.29 ? 35.9% 5,579? 1.92? 1
46 Chacala Los Apantes (Presa 1 & 2) Río Chacala / Río Los Apantes Ahuachapán 13.8037 89.8484 Pre Factibilidad 1.500 8,126 62% 4,498 3,124 0.094? 22.0% 3,492 2.14 ? 36.8% 5,825? 1.95? 147 Santa Rita Río Jiboa La Páz 13.6143 88.9630 Pre Factibilidad 8.357 36,603 50% 21,220 2,539 0.076? 21.7% 20,688 2.11 ? 36.3% 27,052? 2.00? 148 Milingo (Reconversion) Río Acelhuate San Salvador 13.7443 89.1619 Pre Factibilidad 0.800 3,504? ? 50% 2,225 2,781 0.084? 42.0% 261 1.76 ? 28.8% 2,061? 1.66? 149 Copinula I Río Copinula Ahuachapán 13.7864 89.8444 Pre Factibilidad 0.603 2,641 50% 2,155 3,573 0.107? 14.1% 653 1.35 ? 19.6% 1,059? 1.37? 150 San José Loma Río Jiboa La Páz 13.5411 88.9845 Pre Factibilidad 1.901 8,327 50% 7,797 4,101 0.123? 13.1% 1,804 1.26 ? 18.3% 3,354? 1.37? 151 Cara Sucia (Presa 1 & 2) Río Mistepe / Río Maishtapula Ahuachapán 13.8286 89.9814 Pre Factibilidad 0.584 2,559 50% 2,560 4,382 0.132? 11.1% 201 1.09 ? 14.6% 624? 1.19? 52 San Pedro II Río San Pedro Ahuachapán 13.7603 89.8080 Pre Factibilidad 0.397 1,739 50% 1,641 4,134 0.124? 11.0% 117 1.08 ? 18.1% 685? 1.35? 153 Copinula II Río Copinula Ahuachapán 13.7482 89.8388 Pre Factibilidad 0.487 2,132 50% 2,266 4,655 0.140? 10.0% -7 1.00 ? 15.5% 653? 1.25? 154 Qbda El Naranjito al Naranjo Ahuachapán 13.7050 89.9333 Pre Factibilidad 0.080 350? ? 50% 240? 3,000? 0.090? ? 17.4% ? 162 1.45? ? 24.7% 177? 1.52? 155 Qbda El Singual, al Cuyapo Morazan 13.8333 88.2333 Pre Factibilidad 0.058 254? ? 50% 174? 3,000? 0.090? ? 16.5% ? 102 1.37? ? 22.9% 113? 1.43? 156 Venecia Prusia n.d. n.d. Pre Factibilidad 1.200 5,256? ? 50% 3,600? 3,000? 0.090? ? 18.5% 2,804? 1.56? ? 27.0% 3,037? 1.64? 157 Las Pilonas Río Huiza San Salvador 13.5762 89.2177 Pre Factibilidad 1.100 2,961 31% 3,268 2,971 0.145? 9.9% -17 0.99 ? 12.8% 489? 1.12? 158 Copinula Río Copinula Ahuachapán 13.7862 89.8445 Pre Factibilidad 0.241 1,055 50% 1,371 5,691 0.171 5.2% -400 0.67 ? 10.9% 67? 1.04? 159 Santa Emilia I n.d. n.d. Pre Factibilidad 0.500 2,190? ? 50% 1,500? 3,000? 0.090? ? 17.0% 946? 1.41? ? 23.8% 1,044? 1.47? 160 Santa Emilia II n.d. n.d. Pre Factibilidad 0.500 2,190? ? 50% 1,500? 3,000? 0.090? ? 17.0% 946? 1.41? ? 23.8% 1,044? 1.47? 161 Torola Río Torola San Miguel 13.8501 88.4663 Inventory 4.321 18,667 49% 4,710 1,090 0.033 26.0% 1,530 1.78 ? 89.7% 18,607? 3.20? 262 Copinula III Río Copinula Ahuachapán 13.7721 89.8431 Inventory 0.463 3,187 79% 1,636 3,533 0.068 24.9% 2,364 2.02 41.4% 2,470 2.11 263 La Calzadora I Quebrada La Calzadora Usulután 13.5667 88.5000 Inventory 0.432 2,300 61% 1,308 3,028 0.075 22.6% 1,564 1.85 36.0% 1,648 1.94 264 Los Hervideros I Río Los Hervideros Ahuachapán 13.9550 89.9534 Inventory 0.993 5,457 63% 2,934 2,954 0.071 23.2% 3,688 1.85 37.3% 3,878 1.93 265 Los Hervideros II (Presa 1 & 2) Río El Molino / Río Nejapa Ahuachapán 13.9484 89.9264 Inventory 0.435 3,136 82% 1,902 4,372 0.080 21.5% 2,064 1.80 33.6% 2,187 1.89 266 Malancola Río Jiboa La Páz 13.5695 88.9850 Inventory 4.175 17,688 48% 10,926 2,617 0.081 21.3% 11,575 1.79 33.0% 12,282 1.88 267 Gran.d.e de San Miguel, Sn Juan Rio Gran.d.e de San Miguel Usulután 13.2947 88.3068 Inventory 4.500 19,710 50% 13,500? 3,000? 0.132 ? 19.4% 11,773? 1.67? ? 29.0% 12,647? 1.76? 268 Gn.d.e de San Miguel, San José Rio Gran.d.e de San Miguel Usulután 13.2947 88.3068 Inventory 3.200 14,016 50% 9,600? 3,000? 0.132 ? 19.3% 8,240? 1.65? ? 28.7% 8,861? 1.74? 269 Chilama I (Presa 1 & 2) Río Chilama / Río Siguapate La Libertad 13.6212 89.3309 Inventory 2.623 7,840 34% 5,197 1,981 0.087 19.5% 4,562 1.64 29.1% 4,898 1.73 2
No.

Final Report Chapter 10
Republic of El Salvador 10-24 March 2012 The Project for Master Plan for the Development of Renewable Energy (JICA)
Table 10.3.1.6 Selected Small Hydropower Potential Sites for Master Plan (2/2)
Note: Italicized numbers are estimated values. n.d.: no data (Source: JICA Study Team)
Nombre de Proyecto Río Departamento Latitud Longitud Etapa del Proyecto Potencia Energía Factor deplanta Inversión Total Costo/kW Generación
de costos
Base del Proyecto(sin préstamo del Banco)
Project Base (without Bank Loan)
Base del Inversionista(con préstamo del Banco)
Investment Base (with Bank Loan)
Fasedel
proyecto
Project Name River Department Latitude Longitude Project Stage Potential Energy PlantFactor
InvestmentCost Cost/kW Generation
CostTIR
FIRRVANNPV B/C TIR
FIRRVANNPV B/C Project
Phase
(N) (W) (MW) (MWh/Año) (x 1,000 US$) (US$/kW) (US$/kWh) (%) (x1,000 US$) (%) (x1,000 US$)
71 La Calzadora II Quebrada La Calzadora Usulután 13.5347 88.5294 Inventory 0.457 2,434 61% 1,677 3,670 0.091 19.0% 1,401 1.63 28.2% 1,509 1.72 272 EL Jabio Rio Gran.d.e de Sonsonate Sonsonate 13.7532 88.2887 Inventory 2.000 8,760 50% 6,000? 3,000? 0.132 ? 19.0% 4,979? 1.62? ? 28.1% 5,367? 1.70? 273 El Rosario II Río El Rosario Ahuachapán 13.7754 89.8729 Inventory 0.498 2,606 60% 1,848 3,711 0.093 18.6% 1,460 1.60 27.2% 1,580 1.69 274 San Sebastián Río Tihuapa La Páz 13.5544 89.1366 Inventory 0.480 2,317 55% 1,656 3,449 0.094 18.4% 1,276 1.59 26.8% 1,383 1.67 275 Chilama II Río Chilama La Libertad 13.5929 89.3300 Inventory 0.457 2,343 59% 1,695 3,708 0.095 18.2% 1,273 1.57 26.4% 1,383 1.66 276 El Molino I Río El Molino Ahuachapán 13.9325 89.8960 Inventory 0.260 1,876 82% 1,345 5,175 0.094 18.2% 1,010 1.57 26.4% 1,097 1.65 278 El Refugio Río Las Lajas La Libertad 13.5569 89.2385 Inventory 0.465 2,243 55% 1,649 3,545 0.097 17.9% 1,191 1.55 25.8% 1,298 1.64 279 Los Toles Río Los Toles Ahuachapán 13.9715 89.9386 Inventory 0.428 2,035 54% 1,503 3,511 0.097 17.8% 1,065 1.54 25.5% 1,163 1.62 280 El Peñon Río Gran.d.e de San Vicente La Libertad 13.5855 89.3947 Inventory 0.486 2,212 52% 1,645 3,384 0.098 17.7% 1,157 1.54 25.4% 1,263 1.62 281 Guayapa V Río Guayapa Ahuachapán 13.9476 89.9636 Inventory 0.486 2,310 54% 1,741 3,582 0.099 17.5% 1,192 1.53 25.0% 1,304 1.61 283 El Charrerón El Chorrerón La Libertad 13.6178 89.3460 Inventory 0.418 1,903 52% 1,476 3,531 0.102 16.9% 927 1.48 23.8% 1,023 1.56 284 Santa Lucía Río Tamanique La Libertad 13.5962 89.4202 Inventory 0.966 3,609 43% 2,541 2,630 0.093 17.6% 1,766 1.49 25.2% 1,931 1.56 285 El Rosario I Río El Rosario Ahuachapán 13.7531 89.8731 Inventory 0.423 2,155 58% 1,800 4,255 0.110 15.9% 949 1.42 21.7% 1,065 1.49 287 Asesesco (Presa 1 & 2) Río Asesesco / Río Viejo Cabañas 13.8793 88.9226 Inventory 0.435 2,105 55% 1,767 4,061 0.111 15.8% 917 1.41 21.5% 1,032 1.49 288 Miramundo Qda. Miramun.d.o Chalatenango 14.3268 89.1353 Inventory 0.480 1,877 45% 1,567 3,265 0.110 15.8% 814 1.41 21.5% 916 1.48 289 Tilapa II Río Gran.d.e de Chalatenango Chalatenango 14.2237 89.0976 Inventory 1.925 6,402 38% 5,234 2,719 0.108 15.9% 2,762 1.40 21.7% 3,100 1.48 290 El Faro (Presa 1 & 2) Río Los Leones / Río La Máquina La Libertad 13.5990 89.3561 Inventory 0.426 1,750 47% 1,476 3,465 0.111 15.6% 739 1.39 21.1% 834 1.47 291 Santa María Río Tihuapa La Páz 13.5893 89.1307 Inventory 0.874 3,264 43% 2,494 2,854 0.101 16.2% 1,384 1.40 22.2% 1,545 1.46 293 San Pedro I Río San Pedro Ahuachapán 13.7386 89.8057 Inventory 0.344 1,944 65% 1,685 4,899 0.114 15.3% 791 1.37 20.5% 900 1.45 295 El Caoba Río El Naranjo Ahuachapán 13.7948 89.9263 Inventory 0.451 2,156 55% 1,898 4,209 0.116 15.1% 863 1.36 20.2% 986 1.44 296 El Rosario IV Río El Rosario Ahuachapán 13.8103 89.8788 Inventory 0.313 1,496 55% 1,290 4,122 0.114 15.2% 592 1.36 20.2% 675 1.43 298 Tizapa II Río Tempisque Cuscatlán 13.7917 88.9461 Inventory 0.418 1,907 52% 1,701 4,069 0.118 14.9% 732 1.34 19.7% 842 1.42 299 San Isidro Río Sensipa La Libertad 13.6160 89.4840 Inventory 0.477 1,782 43% 1,600 3,354 0.118 14.7% 669 1.33 19.4% 772 1.41 3101 Loma de San Juan Río Huiza San Salvador 13.5449 89.2304 Inventory 0.954 3,837 46% 3,278 3,436 0.113 14.8% 1,391 1.32 19.5% 1,603 1.39 3103 Los Pozos Río Los Pozos Chalatenango 14.3289 89.1455 Inventory 0.827 2,791 39% 2,276 2,752 0.107 14.9% 996 1.31 19.8% 1,143 1.38 3104 Los Pueblos II Río de Los Pueblos Cabañas 13.8643 88.6869 Inventory 1.247 4,627 42% 4,075 3,267 0.116 14.5% 1,610 1.30 18.9% 1,873 1.37 3105 El Jícaro (Presa 1 & 2) Río Chuluma/Grand. de San Vicente La Libertad 13.5933 89.4021 Inventory 0.496 1,851 43% 1,736 3,500 0.124 14.1% 632 1.29 18.3% 744 1.36 3106 Guarumo Río Guarumo Cabañas 13.7670 88.8046 Inventory 0.897 3,647 46% 3,192 3,559 0.115 14.4% 1,233 1.29 18.8% 1,440 1.36 3107 Guascoran Rio el Sauce La Unión 13.6446 87.7524 Inventory 12.500 38,000 35% 38,000? 3,040? 0.132 ? 13.7% 12,482? 1.28? ? 17.6% 14,942? 1.35? 3111 Agua Fría Río Agua Fría Cabañas 13.8100 88.8215 Inventory 0.974 3,960 46% 3,678 3,776 0.122 13.7% 1,187 1.25 17.5% 1,425 1.31 3112 Chilama III Río Chilama La Libertad 13.5367 89.3142 Inventory 0.934 3,756 46% 3,491 3,738 0.122 13.6% 1,101 1.24 17.3% 1,327 1.31 3113 Tehuechode Río Chichicalapa San Salvador 13.5926 89.1514 Inventory 0.339 1,267 43% 1,243 3,667 0.129 13.2% 352 1.23 16.7% 433 1.29 3114 Tizapa IV Río Ajuluco Cuscatlán 13.7649 88.9248 Inventory 0.265 1,284 55% 1,268 4,786 0.130 13.2% 351 1.22 16.6% 433 1.29 3115 Quezalate Río Quezalate La Libertad 13.5989 89.2288 Inventory 0.495 1,651 38% 1,679 3,391 0.134 13.0% 437 1.21 16.2% 546 1.28 3116 El Anonal Río El Zonte La Libertad 13.5565 89.4540 Inventory 0.481 1,794 43% 1,835 3,815 0.135 13.0% 474 1.21 16.2% 593 1.28 3117 Mizata I Río Mizata La Libertad 13.5786 89.5516 Inventory 0.421 1,727 47% 1,776 4,217 0.135 12.9% 445 1.21 16.0% 560 1.27 3118 Los Pueblos I Río de Los Pueblos Cabañas 13.8726 88.7215 Inventory 0.412 2,081 58% 2,176 5,281 0.138 12.8% 524 1.20 15.9% 665 1.27 3119 El Cutal Río Teostrife Chalatenango 14.2258 89.0690 Inventory 0.445 1,618 42% 1,675 3,764 0.136 12.8% 401 1.20 15.8% 509 1.26 3121 El Silencio Río Comalapa La Páz 13.5940 89.1084 Inventory 0.287 1,178 47% 1,201 4,184 0.134 12.7% 281 1.19 15.7% 358 1.25 3122 Concepción Los Planes Río Comalapa La Páz 13.5674 89.0916 Inventory 0.450 1,680 43% 1,766 3,924 0.138 12.6% 396 1.18 15.5% 510 1.25 3124 El Escalón Río Aquiquisquillo La Libertad 13.5564 89.2489 Inventory 0.420 1,567 43% 1,641 3,908 0.138 12.6% 367 1.18 15.5% 474 1.25 3125 Cuitapán Río Cuitapán San Salvador 13.5969 89.1825 Inventory 0.422 1,575 43% 1,659 3,930 0.139 12.5% 362 1.18 15.4% 469 1.24 3126 Río Ceniza (Presa 1 & 2) Río Ceniza Sonsonate 13.7712 89.7030 Inventory 0.330 1,780 62% 1,898 5,751 0.140 12.4% 401 1.17 15.3% 524 1.24 3127 Papaleguayo (Presa 1 & 2) Río Papaleguayo/ Río El Patashte San Salvador 13.5649 89.1588 Inventory 0.278 1,143 47% 1,198 4,308 0.138 12.3% 241 1.16 15.1% 318 1.23 3131 San Benito (Presa 1 & 2) Río Huiza / Río Texis La Libertad 13.5925 89.4340 Inventory 0.483 1,613 38% 1,807 3,742 0.148 11.8% 276 1.13 14.1% 393 1.19 3132 Tecomate Río Cuitapan San Salvador 13.5794 89.1882 Inventory 0.421 1,572 43% 1,758 4,176 0.147 11.8% 269 1.13 14.1% 383 1.19 3133 Tilapa III Río Gran.d.e de Chalatenango Chalatenango 14.2371 89.1150 Inventory 0.480 1,619 39% 1,817 3,785 0.148 11.8% 276 1.13 14.1% 393 1.19 3135 Ayacachapa III Río Ayacachapa Sonsonate 13.6506 89.5371 Inventory 0.312 1,166 43% 1,275 4,088 0.144 11.8% 199 1.13 14.2% 282 1.19 3136 Ayacachapa II Río Ayacachapa Sonsonate 13.9282 89.5561 Inventory 0.448 1,495 38% 1,674 3,737 0.148 11.7% 250 1.12 14.1% 358 1.19 3138 Tilapa I Río Gran.d.e de Chalatenango Chalatenango 14.2154 89.0780 Inventory 1.025 3,680 41% 3,954 3,858 0.142 11.6% 552 1.11 13.9% 808 1.17 3139 Apancoyo II Río Apancoyo Sonsonate 13.6516 89.5709 Inventory 0.416 1,388 38% 1,589 3,819 0.151 11.4% 193 1.10 13.5% 296 1.16 3144 Mizata II Río Mizata La Libertad 13.6137 89.5317 Inventory 0.270 1,109 47% 1,288 4,771 0.153 11.1% 118 1.08 13.0% 202 1.14 3149 Talquezalar Río Talquezalar Chalatenango 14.2894 89.1316 Inventory 0.421 1,238 34% 1,501 3,565 0.160 10.7% 88 1.05 12.3% 185 1.11 3150 El Cedro Río Pepetapa La Páz 13.5974 89.0623 Inventory 0.336 1,119 38% 1,348 4,012 0.159 10.7% 78 1.05 12.3% 165 1.11 3156 San Ignacio Río San Ignacio Chalatenango 14.3288 89.1968 Inventory 0.441 1,269 33% 1,636 3,711 0.170 10.0% 5 1.00 11.3% 111 1.06 3
Totales 180.759 756,000 48% 586,000 3,242 0.105 123 Phase-I 59
Phase-II 32Phase-III 32
No.

Final Report Chapter 10
Republic of El Salvador 10-25 March 2012 The Project for Master Plan for the Development of Renewable Energy (JICA)
10.3.1.10 Recommendations for Realization of the Master Plan
A. Site Reconnaissance and Detailed Study for Next Step
The level of precision of some parameters used in preparing the Master Plan, such as flow rate or the cost estimation, is not the one obtained in a field research or a feasibility study. The study used limited hydrological data and the 1/50,000 scale map to estimate necessary figures. For the realization of the master plan, the following field surveys and detailed studies are required. When a site is classified as worthy of further detailed study, it is important to conduct a site reconnaissance along the proposed waterway route and alternative routes of a development site. Using 1:50,000 or 1:100,000 scale topographic maps, the differences between the topographic map and the actual topography, the geological conditions, existing facilities, and road conditions are to be verified in the site reconnaissance for each structure site. The results are inputted back to the study in preparation of the development plan. The following features should be carefully examined during the site reconnaissance.
Topography: Topographic maps of 1:50,000 - 1:100,000 scale used in the reconnaissance study are of less reliable accuracy. The intake site topography and headrace route must be confirmed at the site as those features shown in the map may differ from the actual situation. Longitudinal and cross-sectional profiles of the penstock route are drawn based on the topographic map and an approximate location is confirmed at the site.
Geology: The geological features at the intake site, and upstream and downstream of the site are surveyed. The condition of the foundation rock is confirmed from the outcrop of bedrock to determine its suitability as an intake weir site. The geology of the proposed headrace or penstock route and powerhouse site is checked from outcrops, vegetation, and landslide or slope failure.
River flow: Flow at the intake site should be measured by using current meter or float.
Riverbed deposit: Riverbed deposit is checked and the result is used to estimate future sedimentation behind the intake weir.
Access road conditions to each site: As the availability of an existing road that will serve as access to the site during construction has significant effect on the project construction cost and construction schedule, existing navigable roads are checked on the site with the aid of a topographic map.
Construction materials: For a concrete weir, the method of supplying concrete and locating a quarry site for aggregates are investigated at the site.
Transmission line: The route of transmission or distribution lines that will transmit the electric power generated at the planned powerhouse is confirmed.
Environmental survey: It is necessary to investigate the area for environmental restriction zones such as environmentally protected areas, natural parks, wildlife reserves, reserve forest, cultural assets, and houses, farms and existing water utility facilities, especially in the areas affected by the power plant. Water use for irrigation or drinking, fishery, etc., should be investigated during the site reconnaissance.

Final Report Chapter 10
Republic of El Salvador 10-26 March 2012 The Project for Master Plan for the Development of Renewable Energy (JICA)
The plan is reviewed based on the data acquired from the site reconnaissance, and a final plan for site reconnaissance stage should be prepared. As a result of the review, if the development plan is judged to go for the next step of the study, pre-feasibility study and feasibility study should be conducted, and an investigation schedule should be prepared prior to the study.
In case there is no runoff gauging station at the intake site or in the adjacent areas, it is essential to install one and start runoff recording immediately.
B. Government Support in the Study, Design and/or Investment
To meet the objectives of the Master Plan it is required to facilitate the support of the government of El Salvador in various stages of the project development. Some aspects to consider are related to the land acquisition for the development of the projects, the feasibility studies and final design. Further, the government’s support is required to simplify the process of obtaining the required permits. The approval of the environmental permit should comply with the time periods established by law. It is estimated that if the 60 days (demanded by the art. 24 of the Environment Act) passed and if there is no environmental resolution, the project related to the use of renewable resources should be automatically approved. Within the requirements of obtaining the Environmental Permit, there are commitments from the developer of the project for social development and local communities that are adjacent to the project site, these agreements should be notarized in the presence of a lawyer, and registered in the FISDL. As part of the process of free competition and the implementation of existing regulatory frameworks for renewable energy, it is recommended to promote training and disclosure mechanisms relating to the topics and to be oriented to the developers of small hydro.
C. Nationwide Hydrological Observation System
Location map of hydrological stations by SNET is shown in Figure 10.3.1.14. Most of the observation stations were stopped from 1985 to 1992 during the period of the civil war. After the civil war, some of the stations resumed operations. The locations of hydrological stations are distributed partially. The number of hydrological stations is insufficient in the following areas:
Department Ahuachapán: eastern part Department La Libertad: southern part Department San Salvador: southern part Department Chalatenango: northwest part Department San Miguel: northern part Department Morazán: all area Department La Unión: all area Department Cuscatlán: all area Department Cabañas: all area Department San Vicente: all area
Noteworthy, is the absence of hydrological stations in the departments of Cuscatlán, Cabañas and San Vicente.

Final Report Chapter 10
Republic of El Salvador 10-27 March 2012 The Project for Master Plan for the Development of Renewable Energy (JICA)
(Source: Prepared by JICA Study Team based on the mean monthly discharge data of SNET)
Figure 10.3.1.14 Location Map of Hydrological Stations by SNET
Hydrological data is basic and essential information for the country, not only for hydropower development planning, but also for water resources such as irrigation, water supply, flood and/or draught control, or environmental protection and monitoring.
The long-term discharge observation data at the nearest station is required for planning of small hydropower projects. Thus, it is required to immediately build a nationwide network of hydrological and meteorological observation systems. The automatic telemeter hydrological observation system is suitable for monitoring of river flow.
D. Determination of River Maintenance Flow
In this master plan study, river maintenance flow was not considered in estimating the design discharge, power output [kW] and energy [kWh/year].
In El Salvador, most of the major hydropower plants are requested to release water, as a minimum, 10% of daily discharge for small hydropower, from intake weir site to downstream, as “river maintenance flow” for environmental and social purposes.
Study on the state of river utilization
As hydropower plants use river water, river utilization, such as for drinking, irrigation and industrial water supply, fisheries, and inland transport activities must be investigated during project planning.
Hydrological Station (Operating)Hydrological Station (not operating)
1. La Hachadura(Río Paz)
2. San Lorenzo(Río Pampe)
3. La Atalaya(Río San Pedro)
4. Sensunapan(Río Grande
de Sonsonate)
5. Santa Beatriz (Río Bandera)
6. Conacaste Herrado(Río Ceniza)
7. Singuil (Río Guajoyo)
8. Los Puentes (Río Angue)
9. San Francisco (Río Guajoyo)
10. San Andres / E.N.A. (Río Agua Caliente)
11. San Andres (Río Sucio)
12. Las Pavas (Río Suquiapa)
13. Tacachico(Río Suquiapa)
14. El Jocote(Río Sucio)
15. Desembocadura (Río Sucio)
16. Guazapa(Río Acelhuate)
17. Citala (Río Lempa)
18. La Sierpe (Río Tamulasco)
19. Las Flores(Río Sumpul)
20. Amates / Montecristo (Río Jiboa)
21. La Ceiba (Río Jalponga)22. Las Conchas (Río Grande de San Miguel)
23. Vado Marin (Río Grande de San Miguel)
24. Moscoso (Río Grande de San Miguel)
25. Villerias (Río Grande de San Miguel)
26. Osicala(Río Torola)
27. El Sauce(Río El Sauce)
28. Paso del Oso(Río Lempa)
29.Colima(Río Lempa)
30. San Marcos(Río Lempa)

Final Report Chapter 10
Republic of El Salvador 10-28 March 2012 The Project for Master Plan for the Development of Renewable Energy (JICA)
The construction of the intake weir may sometimes result to inundation of houses and farmland, and consequently, the construction of a power facility decreases the river flow between the intake and tailrace sites. Therefore, water utilization facility in the project area should be carefully studied using available topographic maps and field investigation.
If there is water use between proposed intake site and powerhouse, the required discharge volume of water for utilization must be released downstream from the intake weir.
River Maintenance Flow (Caudal Ecologico)
River maintenance flow should be considered for cases where the length of the waterway of the proposed hydropower is long (more 1 km). The following items are recommended to satisfy the required minimum river maintenance flow for river ecology:
10% of daily discharge
10% of annual average discharge throughout the year
0.1~0.3 m3/s/100 km2 (Japanese Guidelines for Hydropower)
Minimum discharge throughout the year
Necessary discharge for fishes, fauna and flora, landscape and river ecology
The acceptable and rationalized rate of river maintenance flow is as required and established by MARN.

Final Report Chapter 10
Republic of El Salvador 10-29 March 2012 The Project for Master Plan for the Development of Renewable Energy (JICA)
10.3.2 Wind Energy In this chapter, the permissible capacities of wind and solar energy in El Salvador are estimated. And also, procedures for wind monitoring and key issues on the construction of wind turbines are explained. Moreover, the technical aspects of operation and maintenance are explained. General implementation schedule of wind power projects and the project application processes in El Salvador are studied. As an example of wind power development in Central America, the current situation of wind power projects in Costa-Rica is studied.
10.3.2.1 Selection of Potential Sites In the study, a nationwide wind potential map is prepared and several wind potential sites are identified on the map. The wind potential map and potential sites are explained in Chapter 7.
10.3.2.2 Allowable Capacity for Introduction to the Grid The power output from wind turbine and solar PV system comes with large fluctuations of the power output depending on meteorological conditions. Because there is fluctuation of the daily load on the demand-side, it is necessary to adjust the power output depending on the current consumption of electricity to ensure stable supply of power. Therefore, it is necessary to conduct a review of the maximum allowable capacity for grid interconnection. However, in El Salvador, it is difficult to carry out simulation of the power network for analysis of the power grid that is interconnected with the wind and solar PV systems.
In the study, the allowable capacity of the wind power for grid interconnection was examined using an algebraic method of Tohoku Electric Power. In addition, the high penetration ratio of wind power to the interconnected power grid in European countries was taken into account. In the calculation, it is assumed that the maximum allowable capacity for grid interconnection can include both the wind and solar PV. This was considered because the fluctuation of power output from wind is larger than that of solar PV. Short-term fluctuations in the power output from wind and solar PV, such as those with 20-minute intervals, are very difficult to predict. On the basis of accumulated data from Tohoku Electric Power operations, the fluctuation in the power demand and the power output from wind turbine is estimated as shown below.
・Power demand fluctuation rate: 1.13% of national demand
・Wind power output fluctuation rate: 23% of wind capacity
・Lowest monthly peak demand: 864 MW (March 2010)
・Wind capacity (assumption): 60 MW

Final Report Chapter 10
Republic of El Salvador 10-30 March 2012 The Project for Master Plan for the Development of Renewable Energy (JICA)
Maximum allowable capacity for grid interconnection is examined by using an algebraic equation to the data mentioned above.
• Demand fluctuation =864 MW × 1.13% = 9.7 MW
• Output fluctuation =60 MW × 23% = 13.8 MW
The following shows the total fluctuation of demand and wind power output. The fluctuation becomes larger with any increase in wind power output.
Total Fluctuation Demand fluctuation + Output fluctuation = 16.9 MW
The maximum value to satisfy the lower equation is the allowable wind output fluctuation.
Load Frequency Control Permissible error Demand fluctuation Allowable wind output fluctuation
16.9 MW Allowable wind output fluctuation
Assuming the grid interconnection of wind and solar PV as 60 MW of the 864 MW total installed capacity of the national power grid (maximum demand, January 2010 at 14:30H), the total fluctuation and allowable wind power output fluctuation values are almost the same. Therefore, the maximum allowable capacity of wind and solar power can be estimated at 60 MW in El Salvador. This value is approximately 7% of the assumed national power demand.
Therefore, it is desirable that the concentrated large-scale wind farm or solar PV systems be introduced progressively. In addition, when concentrated large-scale wind or solar PV systems are interconnected to the national grid in the future, it is necessary to re-examine the maximum allowable output capacity of wind and solar PV based on the result of the operating conditions of the actual installed power generation system.
The penetration ratio of wind power generation is high in European countries. The ratio in Denmark is around 21.9%, that of Spain is 16% and Germany is 9.4%. As for high penetration ratio in those countries, this is because wind power fluctuations can easily be absorbed by European countries that are bound together by a common power network. In Central America, wind power, with a total capacity of 62.8 MW, was introduced in Costa Rica, and the penetration ratio is approximately 4.2%. The maximum allowable capacity for grid interconnection will increase with the improvement of the smoothing technology for power output, such as battery storage.

Final Report Chapter 10
Republic of El Salvador 10-31 March 2012 The Project for Master Plan for the Development of Renewable Energy (JICA)
Depending on the improvement of the future power demand and the selection of the technologies to be introduced, maximum allowable capacity may increase.
As for renewable energies, such as wind or solar PV power, power fluctuations easily happen depending on meteorological conditions. Therefore, implementation of technology to limit power fluctuations is necessary. A large-sized accumulator for charging power and smoothing the power output is required to mitigate the power fluctuations. However, the price of the accumulator is still expensive and thus, difficult to install in all wind power generators due to its high cost.
10.3.2.3 Consideration on Technical Aspects A. Preparation Schedule
In El Salvador, grid connected wind turbines have not been installed yet. Therefore, it is necessary to prepare an action plan for the future implementation of wind power projects. In this Chapter, the planning process for wind power development is explained. The implementation planning for wind power generation varies depending on the purpose and business-scale.
In El Salvador, two types of application are being considered. The first case being considered is to sell all the generated power while the other case is to consume the generated power at a certain facility and sell any excess to power distribution companies such as CAESS, AES-CLESSA, EEO, DEUSEM, DELSUR, EDESAL, B&D and Abruzzo. It is a requirement for wind power developers to discuss this with the power distribution companies in El Salvador. Adjustment of technical issues on grid connected system and the selling price of generated power will also be discussed. Wind power project is one of the most economically feasible technologies amongst all renewable energy sources.
Submission of applications to concerned organizations is necessary before the implementation of the project. Since there are no wind projects implemented in El Salvador yet, there are no examples that can be used as a reference for project implementation. Therefore, the following procedures are suggested by the Ministry of Environment and Renewable Resources (MARN). The process of wind power development is similar to that of small hydro. However, since there is no previous experience on environmental impact assessment of wind power in El Salvador, it is difficult to predict the duration of the preparation schedule for application.
APPLICATION PROCEDURE
Step 1: The applicant surveys and identifies a project that utilizes renewable resources to generate electricity in a certain place.
Step 2: The applicant prepares the pre-feasibility study.
Step 3: Once the pre-feasibility study is conducted, the applicant receives environmental and technical forms from the Ministry of Environment and Renewable Resources (MARN). Then, it is filled-out and submitted to MARN together with all the required attachments.

Final Report Chapter 10
Republic of El Salvador 10-32 March 2012 The Project for Master Plan for the Development of Renewable Energy (JICA)
Step 4: As MARN receives both the environmental and technical forms and all the required attachments, the next procedure is to qualify the project by category: a) “b1”, there is no need for an Environmental Impact Assessment (EIA) but compliance to certain conditions is required. b) “b2”, the project needs EIA and therefore Terms of Reference (TOR) are provided.
Step 4a: If the project has been classified by MARN as "b1", proceed directly to step 13.
Step 4b: If the project has been classified by MARN as “b2", then proceed to step 5.
Step 5: It is considered appropriate to inform the power distribution company about the project.
Step 6: The MARN will appoint an environmental inspector to study the proposed project site. The inspector verifies current conditions and collects necessary details for the TOR.
Step 7: After the inspection, the MARN will provide TOR to the applicant.
Step 8: Based on the TOR, the applicant will now prepare the EIA.
Step 9: The applicant submits the EIA to MARN.
Step 10: The applicant will need to revise the EIA if there are comments from MARN. It is necessary to revise the EIA until it is approved.
Step 11: Once the EIA is approved, MARN will issue the approval documents and inform the applicant of the necessity for an environmental bond.
Step 12: The applicant submits the environmental bond to the MARN.
Step 13: The applicant conducts the feasibility study for all the required technical issues.
Step 14: A copy of the feasibility study will be submitted to the local Electric Power distribution company.
Step 15: The local Electric Power distribution company reviews and evaluates the technical aspects of national grid interconnection.
Step 15a: If necessary, the applicant should correct the electrical issues in the feasibility study and submit it to the utility company for approval.
Step 15b: If there are no further remarks or recommendations, the electric power company issues technical approval.
Step 16: The applicant submits the feasibility study approved by the power distribution company to SIGET.
Step 17: SIGET reviews the feasibility study and issues approval of the document.
Step 18: The Ministry of Finance receives the feasibility study approved by SIGET and grants tax exemption for the project.
Step 19: After all of the preparatory works are complete, the project can then begin construction.

Final Report Chapter 10
Republic of El Salvador 10-33 March 2012 The Project for Master Plan for the Development of Renewable Energy (JICA)
The following figure shows the preparation process for wind power projects. The same procedure can be applied for Biomass, Solar PV and Solar Thermal projects.
(Source: JICA Study Team)
Figure 10.3.2.1 Work Flow for Preparation of Wind Power Projects
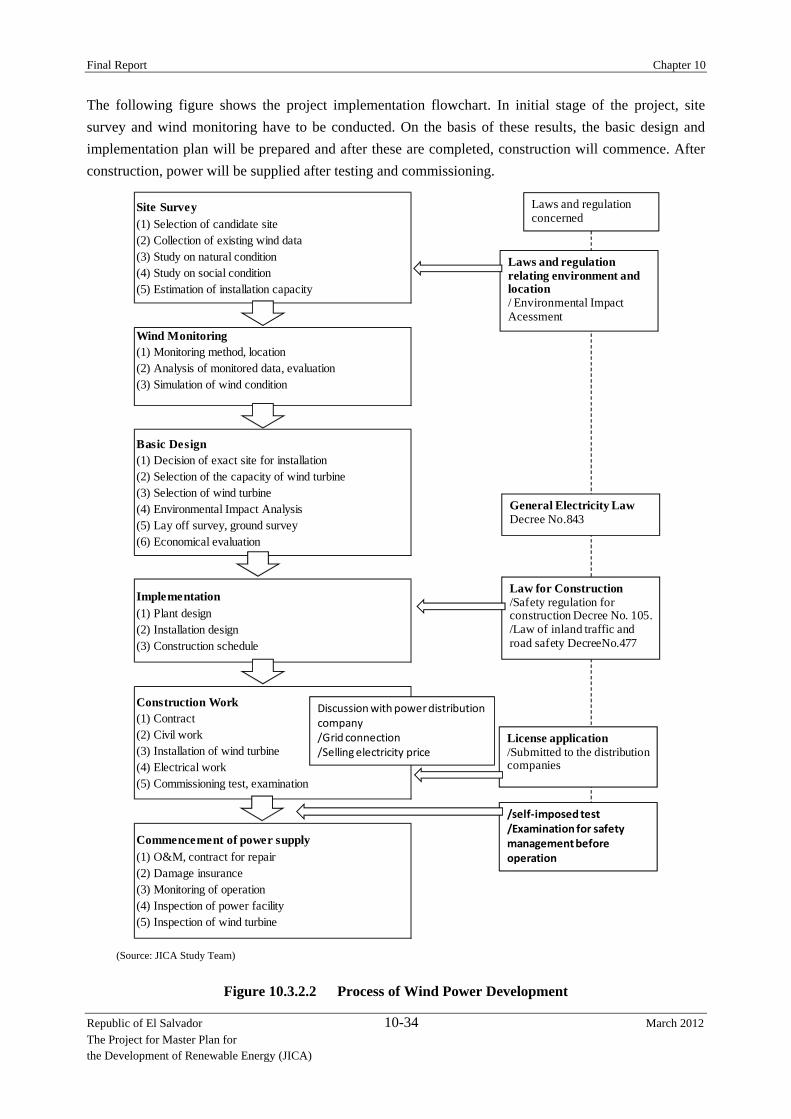
Final Report Chapter 10
Republic of El Salvador 10-34 March 2012 The Project for Master Plan for the Development of Renewable Energy (JICA)
The following figure shows the project implementation flowchart. In initial stage of the project, site survey and wind monitoring have to be conducted. On the basis of these results, the basic design and implementation plan will be prepared and after these are completed, construction will commence. After construction, power will be supplied after testing and commissioning.
(Source: JICA Study Team)
Figure 10.3.2.2 Process of Wind Power Development
Site Survey(1) Selection of candidate site(2) Collection of existing wind data(3) Study on natural condition(4) Study on social condition(5) Estimation of installation capacity
Wind Monitoring(1) Monitoring method, location(2) Analysis of monitored data, evaluation(3) Simulation of wind condition
Basic Design(1) Decision of exact site for installation(2) Selection of the capacity of wind turbine(3) Selection of wind turbine(4) Environmental Impact Analysis(5) Lay off survey, ground survey(6) Economical evaluation
Implementation(1) Plant design(2) Installation design(3) Construction schedule
Construction Work(1) Contract(2) Civil work(3) Installation of wind turbine(4) Electrical work(5) Commissioning test, examination
Commencement of power supply(1) O&M, contract for repair(2) Damage insurance(3) Monitoring of operation(4) Inspection of power facility(5) Inspection of wind turbine
Laws and regulationconcerned
Laws and regulationrelating environment and location/ Environmental Impact Acessment
Discussion with power distribution company/Grid connection/Selling electricity price
General Electricity LawDecree No.843
License application/Submitted to the distributioncompanies
Law for Construction/Safety regulation for construction Decree No. 105./Law of inland traffic and road safety DecreeNo.477
/self‐imposed test/Examination for safety management before operation

Final Report Chapter 10
Republic of El Salvador 10-35 March 2012 The Project for Master Plan for the Development of Renewable Energy (JICA)
B. Wind Potential Evaluation
a. Measurement Plan
The main objective of wind monitoring is to identify potential wind development areas that also possess other desirable qualities of a wind energy development site. In El Salvador, nationwide wind potential map is already prepared. Therefore, it is easy to identify good wind potential areas for wind monitoring. There are three steps in the wind monitoring works:
Identification of potential wind development areas;
Inspection and ranking of candidate sites; and
Selection of actual tower location(s) within the candidate sites.
For the wind development plan, it is necessary to prepare measurement methodologies for wind monitoring. The following features should be specified in the preparation.
・ Measurement parameters
・ Equipment type, quality, and cost
・ Number and location of monitoring stations
・ Sensor measurement heights
・ Minimum measurement accuracy, duration, and data recovery
・ Data sampling and recording intervals
・ Data storage format
・ Data handling and processing procedures
・ Quality control measures
・ Format of data reports
b. Examination of Wind Power Potential
Wind analysis will be conducted to evaluate the wind characteristics based on the results of wind monitoring at candidate sites. On the basis of the results, power outputs from wind turbines are estimated. Consequently, installed capacity for the project will be decided.
b1. Monitoring Duration
The minimum monitoring duration should be one year, but two or more years will produce more reliable results. One year is usually sufficient to determine the diurnal and seasonal variability of the wind.

Final Report Chapter 10
Republic of El Salvador 10-36 March 2012 The Project for Master Plan for the Development of Renewable Energy (JICA)
Inter-annual variability of the wind can also be estimated by comparing the data monitored at long-term reference stations such as airport and meteorological stations. The data recovery for all measured parameters should be at least 90% over the program’s duration, with any data gaps kept to a minimum at less than a week.
b2. Wind Monitoring
In general, wind monitoring stations for wind power development are installed for a limited period only. Permission for the wind monitoring stations should be acquired from the land owner. The following table shows the basic parameters which should be examined in the evaluation.
Table 10.3.2.1 Basic Parameters
Measured Parameters Recorded Values
Wind Speed (m/s) Average Standard Deviation Maximum/Minimum
Wind Direction (degrees) Average Standard Deviation Maximum Gust Direction
Temperature (°C) Average Maximum/Minimum
Barometric Pressure (hPa) Average Maximum/Minimum
Solar Radiation (W/m2) Average Maximum/Minimum (Source: NREL Wind Resource Assessment Handbook)
Wind Speed
Wind speed data is the most important indicator of a site’s wind energy resource. Multiple measurement heights are encouraged for determining a site’s wind shear characteristics, conducting turbine performance simulations at several turbine hub heights, and for backup.
Wind Energy
The amount of energy in wind is a function of its speed and mass. At higher wind speed, more energy is available. Wind energy is the rate at which energy is available, or the rate at which energy passes through an area per unit time. The following formula shows the power that can be generated from wind.
P12
ρAV
P: wind power (W)
ρ: Air density (kg/m3)
A: Swept area (m2)
V: Wind velocity (m/s)
Wind Direction
Wind direction frequency information is important in identifying preferred terrain shapes and orientations and in optimizing the layout of wind turbines in a wind farm. Prevailing wind directions

Final Report Chapter 10
Republic of El Salvador 10-37 March 2012 The Project for Master Plan for the Development of Renewable Energy (JICA)
have to be defined.
Temperature
In most locations the average near ground level ambient temperature (at 2 to 3 m) falls within 1°C of the average at hub height.
Vertical Wind Speed
Wind speed and power varies with the height above ground level. However, it is difficult to measure wind speed at the exact hub height especially at 80 meters. Therefore, it is necessary to measure wind speed at different heights to estimate that of the higher levels. Therefore, wind speed has to be monitored in at least two different heights.
The following equation illustrates how to use the power law method where V0 is the wind speed at the original height, V is the wind speed at the new height, H0 is the original height, H is the new height and α is the wind shear exponent.
VH
HV
V0: Wind speed at original height
V: Wind speed at new height
Ho: Original height
H: New height
α: Wind shear exponent

Final Report Chapter 10
Republic of El Salvador 10-38 March 2012 The Project for Master Plan for the Development of Renewable Energy (JICA)
Table 10.3.2.2 Wind Shear Exponent Terrain Wind Shear Exponent
α
Coastal areas
Cut grass
Short-grass prairies
Crops, tall-grass prairies
Scattered trees and hedges
Trees, hedges, a few building
Suburbs
Woodlands
0.11
0.14
0.16
0.19
0.24
0.29
0.31
0.43
(Source: Wind Power)
If wind speeds are monitored at different heights, it is possible to calculate the wind shear exponent using the following equation:
αIn V
V
In HH
Barometric Pressure
Barometric pressure is used together with air temperature to determine air density. However, it is difficult to measure accurately in windy environments because of the dynamic pressures induced when wind flows across an instrument enclosure. An indoor or office environment is the preferred location for a pressure sensor. Therefore, most resource assessment does not measure barometric pressure but instead use data taken by SNET stations that is then adjusted for elevation.
b3. Monitoring Height
Typical wind monitoring heights for both wind speed and direction are 40 m, 25 m, and 10 m. However, hub height goes higher with increased wind turbine capacity. In general, the typical hub height of a 1 MW wind turbine is about 60 meters, and that of 2 MW class is around 70 to 80 meters. Therefore, it is necessary to monitor wind speeds as close to the hub height as possible.
Ambient temperature, barometric pressure and solar radiation are monitored 2 to 3 meters above ground level.

Final Report Chapter 10
Republic of El Salvador 10-39 March 2012 The Project for Master Plan for the Development of Renewable Energy (JICA)
b4. Placement of wind monitoring tower
Two important guidelines should be followed when choosing the location for the monitoring tower:
• Place the tower as far away as possible from local obstructions to the wind
• Select a location that is representative of the majority of the site.
Siting a tower near obstructions such as trees or buildings can adversely affect the analysis of the site's wind characteristics. The presence of these features can alter the perceived magnitude of the site's overall wind resource, wind shear, and turbulence levels. As a rule, if sensors are near an obstruction, they should be located at a horizontal distance no closer than 10 times the height of the obstruction in the prevailing wind direction.
c. Evaluation
c1. Monitoring
The following table shows the list to be evaluated based on the results of wind monitoring. For each evaluation item, the purpose and procedures for wind monitoring are stated.

Final Report Chapter 10
Republic of El Salvador 10-40 March 2012 The Project for Master Plan for the Development of Renewable Energy (JICA)
Table 10.3.2.3 List of Wind Power Data forEvaluation
(Source: Guidebook for Wind Power Introduction / NEDO)
c2. Evaluation of Monitored Data
Suitable wind characteristics for wind power development are high average wind speed, steady wind direction and small intensity of turbulence.
Average Wind Speed
The sites where annual average wind speeds exceed 6 m/s at 30 m above ground level are acceptable for wind power development.
Average Wind Speed m/s =Sum of all hourly averaged value withinthe monitoring period m/s
Number of monitored data
Items Term Purpose Procedure
Average Wind Speed (m/s) AnnualMonthly
Evaluation of wind speed Average Wind Speed =Sum of all hourly averagedvalue in of monitoring term / No. of data
Wind Speed FrequencyDistribution(%)
Annual Evaluate characteristic of wind speed by windspeed frequency distribution
A wind speed class is established every 1m/s andcalculates the relative frequency of each class
Wind Direction FrequencyDistribution (%) Annual Clarify prevailing wind direction
All wind direction is divided into 16 direction andaccumulate in mean wind direction
Directional Wind Speed(m/s)
Annual Clarify prevailing wind direction to considersit ing of wind turbines
An arithmetic average based on hour mean windspeed is calculated every direction
Wind Speed DirectionalFrequency Distribution (%)
Annual Clarify prevailing wind direction to considersit ing of wind turbines
Relative frequency of each wind speed class (1m/sstep) is calculated every azimuth
Diurnal Wind Speed(m/s)
DiurnalAnnual
T ime variability of wind speed is evaluatedfor operational plan of the wind turbines
The average hourly wind speed of each month iscalculated and clarifies the transaction by chart
Turbulence intensity AnnualFluctuation properties of the wind speed andthe direction with large wind speedfluctuation is clarified
It is calculated for the wind speed for all azimuthdirection and each direction.Intensity of turbulence =standard deviation of windspeed / mean wind speed
Vertical Wind Speed AnnualPower index to predict wind speed at certainheight is calculated and clarified verticaldistribution of the wind speed
Each monitoring height and the wind speed aresubstituted for following formula and calculate it bya least squaresV/V1 =(Z/Z1)1/n
Utilization Factor AnnualOperational conditions of the wind turbineare clarified
It accumulates from the high wind speed side inwind speed relative frequency and calculatescumulative relative frequency.Utilization Factor = Cumulative relative frequencyhigher than cut-in wind speed - Cumulative relativefrequency higher than cut-out wind speed
Power Availability(Annual Power Output)(kWh/m2/year)
AnnualMonthly
Amount of power output that can be acquiredfrom wind power generation is evaluated
It is accumulated in annual power output at everywind speed based on power curve of wind turbineand wind speed relative frequency.
Capacity Factor AnnualMonthly
Possibility of the introduction of the windpower generation is evaluated
Capacity factor = power output / (reted poweroutput x operational hours)
Win
d Co
nditi
onW
ind
Ener
gy

Final Report Chapter 10
Republic of El Salvador 10-41 March 2012 The Project for Master Plan for the Development of Renewable Energy (JICA)
Relative frequency of wind direction
If the relative frequency of annual wind direction is more than 60% in the wind axis, the wind direction can be considered as stable. (Wind axis is defined as the direction of the prevailing wind and the two immediate directions on both sides, and the symmetric directions of these three directions. In total, 6 azimuths out of the 16 azimuth angles are designated as the wind axis. The following figure shows an example of wind-axis (SSW, SW, WSW and ENE, NE, NNE) marked by the red line.)
Figure 10.3.2.3 Wind-axis
Turbulence intensity
The intensity of turbulence is greatly affected by the topographic features. Therefore, it is difficult to standardize. It is generally within the range of approximately 0.1-0.3 depending on the topographic features. Candidate locations can be reviewed if the turbulence intensity is larger than that of the IEC standard or it is necessary to consult with manufacturers for the selection of appropriate wind turbines.
Intensity of turbulence standard deviation of wind speed m/s
mean wind speed m/s
c3. Evaluation of Output Energy
Wind Energy Density
Annual wind energy density has to be more than 240 W/m at 30 meters above ground level.
Wind Energy Density W/m12
ρ ∑ VT
ρ: Air Density (W/m3)
V: Hourly average wind speed (m/s)
T0: Hours in the period

Final Report Chapter 10
Republic of El Salvador 10-42 March 2012 The Project for Master Plan for the Development of Renewable Energy (JICA)
Wind energy Density is wind energy which available in unit area (m2). Wind density can be calculated using the gas law as a function of change in temperature and pressure as shown in the following equation. For example, air density at standard temperature of 15 0C at sea level is 1.225 kg/m3
ρP
RT
P: Air pressure (N/m2)
R: Gas Content (287.04 J/kgK)
T: Temperature in Kelvin
Capacity Factor of Wind Turbine
Annual capacity factor has to be more than 20%.
Annual Capacity Factor % Annual Power Output kWh
Rated Power Output kW 8760 hr100
Utilization factor should be around 90 to 95% to account for repair system failures. Correction factor is 95% for flat land, 90% for complex terrain.
Annual Power Output (kWh) = Annual Power Output ×Utilization Factor ×Correction Factor
Operation rate expresses rate of system operation for power generation by hour. With the value that divided the total operation hours of wind turbine by annual hours, it is calculated by accumulation of relative frequency of wind speed from cut-in to cut-out wind speed. When a wind characteristics curve (cumulative relative frequency) is available, it is calculated by the following expressions.
Operation Rate (%) = Cumulative relative frequency higher than cut-in wind speed
― Cumulative relative frequency higher than cut-out wind speed
Power output correction factor has to be 95% in flat regions and 90% in complex terrains.

Final Report Chapter 10
Republic of El Salvador 10-43 March 2012 The Project for Master Plan for the Development of Renewable Energy (JICA)
C. Basic Design
a. Determination of Exact Site for Installation a1. Wind Potential
In El Salvador, the wind potential map is available. Therefore, it is easy to identify the wind potential area by using the map. The preparation process for the wind potential map is written in Chapter 7.
a2. Natural Environment
Wind condition is heavily dependent on surrounding terrain and circumstances. It is therefore necessary to study the local climatic features. Wind energy development should be located so as to optimize the aesthetic qualities of the surrounding landscape and those of the wind energy development itself.
b. Consideration of Natural and Social Conditions It is necessary to consider the wind characteristics of the surrounding areas of the installation site to achieve maximum effect from the introduction of wind power generation. As for the location of the wind power turbines and power plant, these can be in mountain ranges, plains, coastal areas and sometimes parks or urban districts, and so on. In addition, it is necessary to consider other natural conditions that may damage the facilities and structures such as, lightning or damage from salt water. It is also necessary to consider the condition of the access road for bringing in materials or heavy machines during construction and the availability of potable water and electric power supply that will be needed during construction. In addition, compliance to local regulations, securing official licenses and permits to comply with land use policies (prohibited area; timber, farm land, urban district, park), is required. It is necessary to examine the environmental impacts such as noise, vibration, electromagnetic interference, landscape and the impact to the local ecosystem. In the technical aspect, considerations for meteorological conditions (i.e. hurricane, turbulent flow and lightning) of the site where installation is planned are important. During these past few years, there were few cases of problems with regards to landscape and ecosystem issues (the bird strike of particularly rare raptors). Therefore, consideration must be given to the concerns of local inhabitants and organizations. The summarized installation requirements that should be considered in the installation of the wind turbines are shown in the next table.

Final Report Chapter 10
Republic of El Salvador 10-44 March 2012 The Project for Master Plan for the Development of Renewable Energy (JICA)
Table 10.3.2.4 List of Items to Consider in Advance
Items Issues to consider N
atur
al C
ondi
tion
Wind Condition (speed /direction)
A site where the annual average wind speed exceeds 5 to 6 m/s at 30 meters above ground level is suitable for wind power projects. Additional consideration is necessary for areas with high incidence of hurricanes.
Wind Flow
It is necessary to conduct additional studies at sites where turbulent flow caused by complex terrain is strong. For the installation of several wind turbines, it is necessary to consider the wake effects of wind and interference between the wind turbines caused by their placement.
Lightning Lightning produces a large energy surge during discharge. It is necessary to consider suitable countermeasures at areas with frequent lightning occurrence.
Damage from salt water
It is necessary to take measures for mitigation of damage from salt water on structures near in coastal areas.
Dust (Blowing sand)
It is necessary to be take measures to mitigate damage from dust or wind-blown sand in coastal areas.
Geology, Slope It is necessary to consider the ground gradient and other topographic features.
Soci
al C
ondi
tion
Prohibited territory
It is necessary to consider prohibited territories, such as natural parks and the nature conservation areas.
Land use It is necessary to consider the current land-use policy at candidate site
Transmission / Distribution line, Transformer
It is necessary to consider the location of transmission lines, distribution lines and transformers.
Road, Bridge, Port
It is necessary to consider the road conditions, such as road width and curvature for transportation of materials, wind turbines and equipment. It is necessary to pay special attention to the material (space and weight) restrictions of the bridge and the harbor.
Noise It is necessary to pay attention to the distance from the nearest households.
Electromagnetic radiation
It is necessary to pay attention to the distance and direction to important radio aids so as to minimize interference.
Bioecology It is necessary to consider the effect on animals and plants in nature.
Landscape It is necessary to pay attention on its influence on the landscape. (Source: JICA Study Team)
C. Selection of Wind Turbine
Plans for the placement of the wind turbines based on the estimated most suitable installed capacity will be established through the following procedures:
Estimation of power output
Total power output from wind turbines will be assumed based on the available project implementation budget and other considerations such as distance, capacity and main load of the power transmission and

Final Report Chapter 10
Republic of El Salvador 10-45 March 2012 The Project for Master Plan for the Development of Renewable Energy (JICA)
distribution grid.
On the basis of the power output curve which will be provided by the manufacturers, power output of the wind turbine is estimated. The manufacturers estimate the power output of their turbine under the standard condition of hub-height wind speed, Rayleigh distribution, air density at sea level and 15 0C.
When wind speed is stronger than the cut-in wind speed, the wind turbine starts generating power. Power output of wind turbine is controlled by pitch or stall when wind speeds reach the rated value. Rotor is stopped to prevent damage and to stop power generation when wind speeds are too strong. The following figure shows the typical wind turbine power output with steady wind speed. Cut-in, cut-out and rated output speed depends on the performance of the wind turbines. In general, the following wind speed values are applied:
Cut-in wind speed : 3~4 m/s
Rated wind speed: 12~16 m/s (dependent on the performance of wind turbine)
Cut-out wind speed: 24~25 m/s
(Source: UK wind power program)
Figure 10.3.2.4 Power Curve of Typical Wind Turbine
The following table shows the power output from a typical wind turbine. Average power output from wind turbines is calculated using the power curve by multiplying the power output with wind probability at each wind speed. The following equation shows annual power output at wind speed Vi (m/s).
Annual Power Output kWh = P i f i 8760 h
P i : Power output (kW) at Vi (m/s) f i : wind probability (%) at Vi (m/s)

Final Report Chapter 10
Republic of El Salvador 10-46 March 2012 The Project for Master Plan for the Development of Renewable Energy (JICA)
Table 10.3.2.5 Estimation of Power Output V
(m/s) Power
Curve (kW) Wind
Probability (f) Net kW
0 0 0.885% 0.00 1 0 6.803% 0.00 2 0 12.238% 0.00 3 18 15.383% 2.77 4 55 16.015% 8.81 5 102 14.564% 14.86 6 157 11.847% 18.60 7 255 8.730% 22.26 8 367 5.872% 21.55 9 487 3.622% 17.64
10 595 2.056% 12.23 11 677 1.077% 7.29 12 735 0.521% 3.83 13 779 0.233% 1.82 14 797 0.097% 0.77 15 801 0.037% 0.30 16 788 0.013% 0.10 17 769 0.004% 0.03 18 749 0.001% 0.01 19 733 0.000% 0.00 20 717 0.000% 0.00 21 705 0.000% 0.00 22 701 0.000% 0.00 23 700 0.000% 0.00 24 702 0.000% 0.00 25 0 0.000% 0.00 100.00% 132.87
(Source: JICA Study Team)
D. Implementation Plan a. Construction Area In areas where the introduction of wind power generation is planned, the field selected based on the natural and social conditions is recommended as the site where construction of the wind power generation facility is possible. In the case of installation of a single wind turbine, the field with the most suitable wind characteristics should be selected in the available area. Occupancy dimensions where wind turbine is assembled on ground and installed are shown below.

Final Report Chapter 10
Republic of El Salvador 10-47 March 2012 The Project for Master Plan for the Development of Renewable Energy (JICA)
(Source: Guidebook for Wind Power Introduction: NEDO)
Figure 10.3.2.5 Required Occupancy Dimensions during Construction
500 kW :Class A=50 m×50 m
1,000 kW Class: A=65 m×65 m
2,000 kW Class: A=85 m×85 m
On the other hand, it is necessary to consider the prevailing wind direction at the installation site in deciding the layout if multiple wind turbines will be installed. The disturbed area of wind characteristics formed leeward of the wind turbine is called the wake area. If another wind turbine is installed in the wake area, the amount of power output from that wind turbine decreases greatly. The wake area is confirmed by experimentation and actual measurement. It is approximately 3 times the rotor (D)diameter perpendicular to the wind direction, and it is approximately 10 times in the leeward direction. Therefore, construction should be avoided in these wake areas where multiple wind turbines are installed.
In the area where the general direction of the wind is clearly defined, the wind power generation facility is designed with a rectangular layout of 10D 3D. In the area where the general direction of the wind is not clearly defined, the wind power generation facility is designed in a triangular layout of 10D10D x 10D. A concrete layout example is shown in the figure below.
A
A

Final Report Chapter 10
Republic of El Salvador 10-48 March 2012 The Project for Master Plan for the Development of Renewable Energy (JICA)
(Source: Guidebook for Wind Power Introduction: NEDO) Figure 10.3.2.6 Layout of Multiple Wind Turbines
b. Heavy-Duty Vehicle
It is necessary to complete the installation of wind turbines without problems during the implementation period. In this period, construction of foundations, assembly of equipment, installation of towers, wiring and site preparation have to be completed. Therefore, it is necessary to establish a construction plan and work schedule for safety purposes. It is necessary to consider the following issues: For the construction of wind turbine, a trailer for transportation of materials and a crane truck for tower installation will be required. It is necessary to investigate road conditions such as the width of the road, slope, curve, weight limit of bridge and so on, to determine if the site will be accessible for these types of heavy-duty vehicles. Truck crane and crawler crane will be used for the installation of the wind turbines. However, a 2000 kW class wind turbine can be installed by a truck crane if the nacelle can be divided into several parts and if the length of the tower is shorter. For installing multiple wind turbines, assembly and disassembly of crawler crane for every wind turbine takes much time. It will be more economical and faster to move the crawler crane to next location instead of taking it apart and assembling it again. In this case, it will be necessary to widen the existing road for transporting the crane. Therefore, calculating any additional costs will be necessary. The land use restrictions for the installation works will also have to be confirmed at the same time. The following table shows the summarized information of heavy-duty vehicles needed for wind turbine installation.

Final Report Chapter 10
Republic of El Salvador 10-49 March 2012 The Project for Master Plan for the Development of Renewable Energy (JICA)
Table 10.3.2.6 Heavy-Duty Vehicle for Wind Installation Item unit 600kW 1,000kW 2,000kW
Specification
of Wind
Turbine
Weight of Nacelle ton 35 45 65
Diameter of rotor m 45 - 50 60 80
Length of blade m 22 - 25 30 40
Weight of tower ton 40 - 80 80 - 120 150 - 250
Length of tower m 35 - 50 50 - 70 60 - 100
Heavy Duty
Vehicle
Transportation (blade) pole trailer pole trailer pole trailer
Transportation
(nacelle) low-floor trailer low-floor trailer low-floor trailer
Installation
Sub Crane
50t
Sub hydraulic Crane
100t
Sub hydraulic Crane
120t
Main Crane
200t
Main hydraulic
Crane 550t
Crawler Crane
650t (Source: Guidebook for Wind Power Introduction: NEDO)
E. Implementation Schedule
Enough space of leveled land area is required for assembling the blades, tower construction and the main jib assembly of the truck crane. After construction of foundations for the wind power generation facility is completed, it will be necessary to conduct schedule adjustment with other work schedules. Depending on the model of wind turbine, there is a method to attach each piece of blade to the nacelle directly without assembling the blade on the ground. In addition, there is a method of construction involving the use of special lifts instead of the large-scale crane truck. In this case, the land area prepared for construction work becomes smaller. As for the installation work of the switchboard and cubicle, electrical works and other related works may be carried out during the same period. Therefore, schedule adjustment is necessary for each work starting from the planning phase of the works. For conveyance and lifting of heavy materials, it is necessary to be careful about loading and hoisting loads. In addition, it is necessary to be careful about changes in the wind speed while the crane is operating. Construction work under hazardous conditions is never allowed. It is necessary to take preventive measures against unauthorized persons entering the construction zone except for persons concerned with the project. In addition, it is necessary to pay attention to the technical specifications of the works.
The construction period takes approximately around three months for a wind turbine from commencement of civil engineering work to the end of the trial run. The work schedule is a standard term so that the schedule varies with the capacity of wind turbine and the process of installation. For the installation of large-scale wind farms, e.g. 10 turbines of 2,000 kW class, the usual construction period required will be more than 12 months. However, in this case, construction period varies with construction conditions greatly.

Final Report Chapter 10
Republic of El Salvador 10-50 March 2012 The Project for Master Plan for the Development of Renewable Energy (JICA)
Table 10.3.2.7 Implementation Schedule
(Source: Guidebook for Wind Power Introduction: NEDO)
F. Operation and Maintenance a. Operation & Maintenance Maintenance inspection is essential in maintaining the high operating rate of the wind turbine generator. For O&M, daily monitoring of operations, periodic and regular maintenance and modification, and the repair of equipment are required. Monitoring of operation with daily inspection contributes to the detection of problems early. Objectives of maintenance and repair are to operate the facility safely under stable conditions. It is necessary to maintain the high operational rate of wind turbines, so rehabilitation works will have to be conducted promptly after the maintenance works. Generally, maintenance means periodic inspection. And maintenance service means investigation and rehabilitation works on parts that are close to failure and problems that occur irregularly. The contractual agreement for the operations and maintenance should be reviewed. The O&M cost is one of the important factors when selecting the model to evaluate economical efficiency. In anycontract agreement, it is necessary to consider the highly specialized nature of the works. It is recommended to carry out negotiations with the manufacturer or a specialized O&M company in consideration of the items which are shown in the following table.
NGroundbreaking Receive electricity Hand over
Road and Land Construction
Construction of Basement
Maintains the area of thegenerating plant
Wireing for interconnection
Installation of switchboard andthe cubicle
Wiring and Grounding Works
Assembly and Installation ofTower
Assembly and Installation ofnacell and rotor
Installation and the wiring of thecontrol unit
4 Monitoring device Installation of monitoring devices
Examination by Manufacture(adjustment)
Self-imposed test
Testing Operation
3
Wind Turbine(includingtransportation)
5 Comissioning Test
Milestone1 Civil Works
2 Electrical Works
Schdule of Wind Turbine Construction 1st Month 2nd Month 3rd Month 4th Month

Final Report Chapter 10
Republic of El Salvador 10-51 March 2012 The Project for Master Plan for the Development of Renewable Energy (JICA)
Table 10.3.2.8 Operation and Maintenance List Items to be Considered
Contract for
monitoring of
operation
1) Monitoring items, contents, issues and frequencies have to be clarified.
2) Qualifications and conditions to be monitored have to be clarified.
3) Duty of the monitor, working condition and monitoring area has to be clarified.
4) Selection between monitoring methods, such as remote or direct monitoring.
5) Framework corresponding to emergency cases has to be made clear. The cases in which a
monitoring personnel communicates are made clear.
6) Periodic reports for the owner: term (week, month, year), item, reporting method and
disclosed data are confirmed.
Contract for
maintenance
(Periodic
Inspection)
1) Facility for maintenance (wind turbine, electrical equipment, others), contents,
maintenance period, cost, necessity of assistance, traveling expenses and transportation are
decided.
2) Work fulfillment condition is clarified.
3) Maintenance contractual guarantee conditions for the inspection part.
4) Confirmation of road accessibility for equipment and service engineer. And assignment
of road responsibility is clarified.
5) Dissolution and renewal conditions of the contract are clarified.
6) If the maintenance contractor is different from the equipment supplier, term charge out,
guarantee conditions, warranty area and condition and availability of a spare item are
clarified.
7) Availability and delivery of consumable supplies.
8) Target term is made clear.
Contract for
maintenance
(irregular
inspection )
1) Target range of the service (a product, work, and conveyance), contents, time of service,
cost, necessity of assistance, contents of warranties is clarified.
2) Setting of the repair duration considering re-arrangement of heavy machinery when
non-conformity occurs due to large-sized equipment, transportation and procurement of
parts.
3) Service procedure (from whom, until when, who, what) .
4) Confirmation of road accessibility for equipment and service engineer. And assignment
of road responsibility is clarified.
Contract for
repair
(modification,
repair)
1) Modification, purpose of the repair, effect, term and costs are clarified.
2) Modification, coverage for the repair result, term and substance are clarified.
3) Necessity of securing access road for heavy-duty machines for modification and repair
are clarified. Assignment of the work responsibility is clarified.
4) If enforcement of modification and repair is different from an equipment supplier,
necessary items such as the coverage of the equipment supplier and the modification of
conditions are made clear.
5) If enforcement of modification and repair is different from an equipment supplier,

Final Report Chapter 10
Republic of El Salvador 10-52 March 2012 The Project for Master Plan for the Development of Renewable Energy (JICA)
condition and range of disclosed information from owner company are clarified.
Spare parts
1) Consumables, spare parts, replacement period and price are clarified.
2) Supplemental spare parts stocked by operating company, aged consumables, new model.
3) Necessity of exchange of spare parts. The defrayal of costs is made clear.
Tools and
fixture
1) The scope of supply, cost and compensation by the operating company have to be
clarified.
2) The scope of supply, cost and compensation by the company in charge of O&M have to
be clarified.
3) Necessity of special fixture, availability, cost, operation is clarified.
Right of access Monitoring operations by owner company, maintenance, right-of-access to wind turbine is
disclosed to the service company.
Training
1) Training of owner company by the equipment supplier: contents, term and limitation of
operation are clarified.
2) Training for the engineer of the owner company for primary correspondence: contents
and the defrayal of costs are clarified.
3) Training of operation monitoring company by owner company: term and limitation
operation are clarified.
4) The training of the maintenance company by owner company: contents and operating
range are clarified.
5) Training of the service firm by owner company: contents and operating range are made
clarified.
Restriction of
debt
1) If supplier conducts modification or exchange of equipment without the agreement of the
proprietor: responsibility and charge-out of the supplier for non-conformity which accrued
are clarified.
2) If proprietor modifies it without the agreement of the supplier: responsibility and
charge-out of the system owner for non-conformity which accrued are clarified.
3) Dissolution of maintenance service, manifestation of reclamation contents.
(Source: Guidebook for Wind Power Introduction: NEDO)
The wind turbine generator has many mechanical parts, and periodic inspections such as refilling of the lubricating oil or the exchange of consumable supplies are required.
The company-in-charge of O&M and the owner company commits to a maintenance agreement together for the purpose of improving the operating efficiency in carrying out mechanical and electrical inspections. The periodic inspections vary according to the manufacturer, but quarterly inspections are recommended by most manufacturers. The inspection costs for a 2000 kW capacity wind turbine is around US$50,000.00 per year. Visual inspection will be conducted for the cables, blades and tower booms. Lubricating oil refilling, terminal strapping, bolt dip, and braking system will also be inspected. It is necessary to change the oil for braking valve unit, gear box, oil hydraulic brakes regularly.

Final Report Chapter 10
Republic of El Salvador 10-53 March 2012 The Project for Master Plan for the Development of Renewable Energy (JICA)
Table 10.3.2.9 Periodic Inspection Item Contents of Inspection
Visual Inspection
(4 times/year)
All parts are checked in appearance (discoloration, nasty smell, extraordinary
noise, modification, fissuring).
Inspection for rusted or corroded parts.
Rainwater encroachment.
Inspection of each department’s fluorescent light fittings.
Inspection of Oil
(2 times/year)
Changing canned grease for each bearing part.
Grease refilling of each bearing part and revolving superstructure of nacelle.
Confirmation of oil quantity in gear box of the yaw control system.
Pitch gear box oil quantity of the oil hydraulic brake unit will be checked.
Inspection on
Mechanical Parts
(1 time/year)
Tightening of the tower foundation bolt, abnormality can be determined from
the basement surface.
Tightening of the bolts of the blades.
Securing of the bolts in the tower foundation except the blade.
Changing the oil of the yaw gear box.
Changing the oil of the pitch gear box.
Changing the oil of the oil hydraulic brake unit.
Inspection on
Electrical Parts
(1 time / year)
Inspection and adjustment of each sensor switch of wind turbine.
Connection of the main circuit is confirmed.
Each parameter of the wind turbine is confirmed.
Performance testing of all parts.
Testing of protective system.
(Source: Guidebook for Wind Power Introduction: NEDO)
G. Experience of Other Countries in Central America (Costa Rica)
In Central America, wind power development has been implemented in Costa Rica. Around 63 MW of wind turbine capacity is currently operating in the country.
Installation of a wind farm with a total capacity of 12.8 MW was completed at Los Santos, San José in September 2011. During the preparation stage, transportation from port to candidate sites of the wind

Final Report Chapter 10
Republic of El Salvador 10-54 March 2012 The Project for Master Plan for the Development of Renewable Energy (JICA)
farm was confirmed. In the installation process, the foundation of the wind turbine was constructed by Costa Rican companies. And for installation, a crane truck with a 275-ton capacity was used. In total, GAMESA’s (Spanish company) 15 wind turbines with a capacity of 850 kW each are installed. The tower has a height of 44.55 m with a 52 m rotor diameter.
The project cost is shown in the table below. In Costa Rica, kW cost of wind power project is US$1,975/kW.
Table 10.3.2.10 Table of Wind Farm in Costa Rica
(Source: JICA Study Team, based on the expansion plan of ICE Costa Rica)
10.3.2.4. Master Plan A master plan of wind power development from 2012 to 2026 is required in this study. However, this is only the plan by CEL. Thus, the following development plan was compiled for implementation from 2012 to 2016 based on information from CNE. On the other hand, the CEL plan only points out the possibility of further wind development plan.
Wind power development plan of CEL will be revised continuously. Therefore, wind power development plan will have to be revised for several years. CNE has to coordinate with CEL and other institutions to update the Master Plan.
10.3.2.5 Recommendations to institute the Master Plan 1. Installation of monitoring systems for the most important parameters presented in this study. It is recommend to monitor wind potential at the potential sites which are shown in Figure 7.1.5 and Table 7.1.5
2. Strengthen the ability of experts or institutions for data collection, analysis and evaluation of wind monitoring.
3. There are technical regulations on protection of electrical works. However, it is necessary to define the regulation on unintentional operation for wind turbines.
4. It is necessary to consider regulations on wind power capacity for grid interconnection to avoid increase of fluctuation.
5. It is necessary to transfer the technology on O&M skills, wind monitoring and simulation of grid
No. PROJECT NAME LOCATION POTENTIAL (MW) INVESTMENT (US$)
1 GUANACASTE 1ST STAGE GUANACASTE PROVINCE 25
2 GUANACASTE 2nd STAGE GUANACASTE PROVINCE 25
3 VALLE CENTRAL Los Santos, San José 12.8 $36,000,000.00
62.8 $124,000,000.00TOTAL
$88,000,000.00

Final Report Chapter 10
Republic of El Salvador 10-55 March 2012 The Project for Master Plan for the Development of Renewable Energy (JICA)
connection as a part of human development in El Salvador.
6. It is necessary to clarify to wind development sites not only based on wind potential but also surrounding condition for grid interconnection such as distance to distribution lines, access roads and households.
Table 10.3.2.11 Master Plan of Wind Development
Year Capacity (MW)
Power Production (MWh/year)
2012 to 2016 10 21.9
2017 to 2021 20 43.8
2022 to 2026 30 65.7
(Source: JICA Study Team)

Final Report Chapter 10
Republic of El Salvador 10-56 March 2012 The Project for Master Plan for the Development of Renewable Energy (JICA)
10.3.3 Solar PV Power In this Chapter, key issues on construction, technical aspects of operation and maintenance are explained. System structure, site surveys, equipment plans and sample implementation schedule for MW-class solar photovoltaic(PV) systems and O&M work items are explained. There is an existing solar PV system with 100 kW of installed capacity in El Salvador, and the installation project cost is used as a reference in this report. For the Master Plan, review of installation schedule every five-year duration is recommended. As for the rooftop solar PV, details are explained in Chapter 7.
10.3.3.1 Selection of Potential Sites Nationwide solar potential map which was prepared by SWERA is explained in Chapter 4. This map shows the high solar irradiation in the country, especially at the central region of El Salvador.
10.3.3.2 Allowable Capacity for Introduction to the Grid The allowable capacity for wind and solar energy sources is explained in Section 10.3.2.2. The power output from solar PV comes with large fluctuations of power output depending on meteorological conditions. In the study, allowable capacity of the wind and solar power for grid interconnection was examined using the algebraic method of Tohoku Electric Power. The result shows a 60-MW maximum allowable capacity for the grid-interconnected solar PV and wind systems. This value is approximately 7% of the lowest national monthly maximum power demand in 2010. Depending on the improvement of the future power demand and the selection of the technologies to be introduced, maximum allowable capacity may increase. It is necessary to re-examine the maximum allowable capacity of wind and solar energy when concentrated large-scale wind or solar PV systems are interconnected with the national grid in the future.
10.3.3.3 Consideration on Technical Aspects A. Preparation
The preparatory works for solar PV systems follows the same methodology mentioned in Section 10.3.2.2. Work flow for the preparation of solar PV projects is the same as that for wind power projects as shown in Figure 10.3.3.1.
Figure 10.3.3.1 shows the flowchart of the project implementation. During the initial stages of the project, concept plan and basic design of solar PV installation will be considered. On the basis of these results, the basic design and implementation plan will be prepared. The solar PV system will then be constructed based on the prepared plans, before commissioning tests are conducted. After completion of the project implementation process, power will be supplied to the grid.

Final Report Chapter 10
Republic of El Salvador 10-57 March 2012 The Project for Master Plan for the Development of Renewable Energy (JICA)
(Source: JICA Study Team)
Figure 10.3.3.1 Process of Solar PV Power Development
Draft Planning & Preparation(1) Purpose of installation(2) Location, installed capacity, system component
Site Survey(1) Available space for installation(2) Ambient condition (ground, weather, etc.)(3) Grid connection, etc.
Basic Plan(1) Condition of installation, location, direction, tilt angle(2) Estimation of power output(3) System, component(4) Work schedule, budget(5) Relating regulation
Detailed Design(1) Detailed design, single line diagram, technical drawing,(2) Selection of PCS, protection,(3) Preparation of construction work(4) Observe laws and regulations
Construction Work(1) Installation power supply line for temporal(2) Civil work, electrical work(3) Main system equipments <order of materials>(4) Construction of basement, supporting structure(5) Installation of PV module, connection box(6) Wiring work,(7) Installation of equipments for interconnection
Establishment of O&M Structure(1) O&M, contract for repair(2) Training engineers and technician for O&M
Commencement of power supply(3) Monitoring of operation(4) Inspection of power facility(5) Inspection of solar PV facility
Laws and regulationrelating environment and location/ Environmental Impact Acessment
Discussion with power distribution company/Grid connection/Selling electricity price
License application/Submitted to the distributioncompanies
Law for Construction/Safety regulation for construction Decree No. 105./Law of inland traffic and
/self-imposed test/Examination for safety management before operation
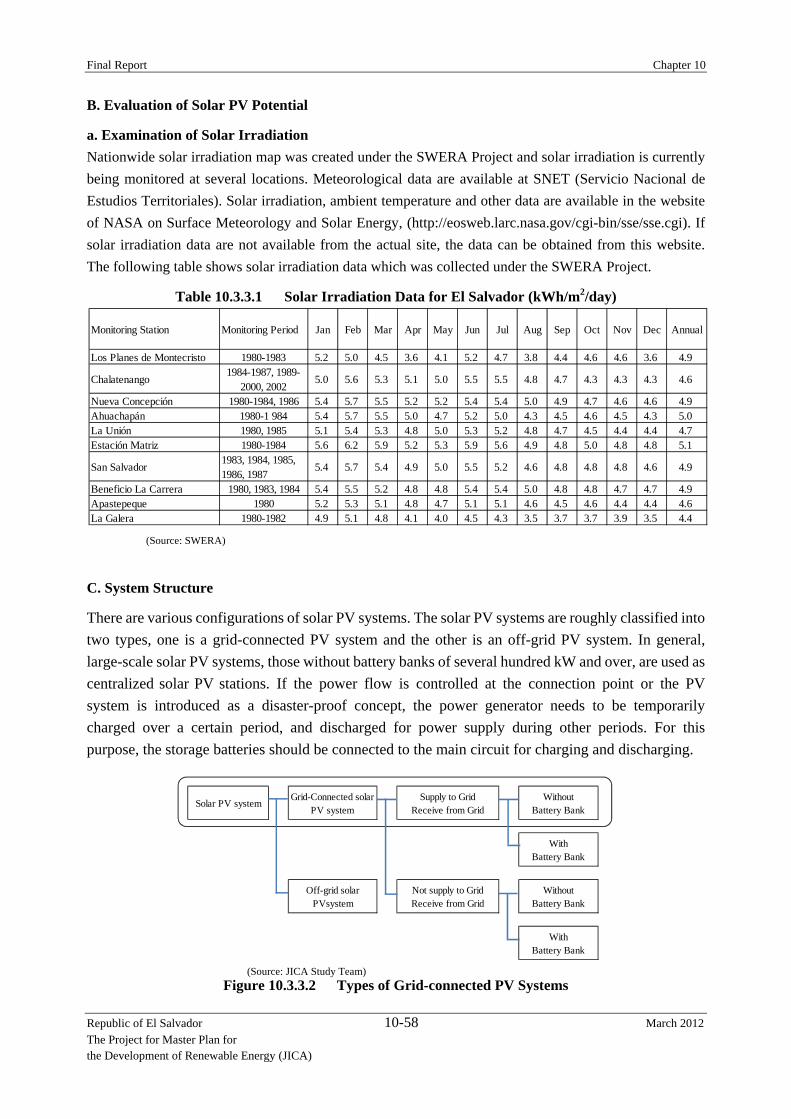
Final Report Chapter 10
Republic of El Salvador 10-58 March 2012 The Project for Master Plan for the Development of Renewable Energy (JICA)
B. Evaluation of Solar PV Potential
a. Examination of Solar Irradiation Nationwide solar irradiation map was created under the SWERA Project and solar irradiation is currently being monitored at several locations. Meteorological data are available at SNET (Servicio Nacional de Estudios Territoriales). Solar irradiation, ambient temperature and other data are available in the website of NASA on Surface Meteorology and Solar Energy, (http://eosweb.larc.nasa.gov/cgi-bin/sse/sse.cgi). If solar irradiation data are not available from the actual site, the data can be obtained from this website. The following table shows solar irradiation data which was collected under the SWERA Project.
Table 10.3.3.1 Solar Irradiation Data for El Salvador (kWh/m2/day)
(Source: SWERA)
C. System Structure
There are various configurations of solar PV systems. The solar PV systems are roughly classified into two types, one is a grid-connected PV system and the other is an off-grid PV system. In general, large-scale solar PV systems, those without battery banks of several hundred kW and over, are used as centralized solar PV stations. If the power flow is controlled at the connection point or the PV system is introduced as a disaster-proof concept, the power generator needs to be temporarily charged over a certain period, and discharged for power supply during other periods. For this purpose, the storage batteries should be connected to the main circuit for charging and discharging.
(Source: JICA Study Team)
Figure 10.3.3.2 Types of Grid-connected PV Systems
Monitoring Station Monitoring Period Jan Feb Mar Apr May Jun Jul Aug Sep Oct Nov Dec Annual
Los Planes de Montecristo 1980-1983 5.2 5.0 4.5 3.6 4.1 5.2 4.7 3.8 4.4 4.6 4.6 3.6 4.9
Chalatenango1984-1987, 1989-
2000, 20025.0 5.6 5.3 5.1 5.0 5.5 5.5 4.8 4.7 4.3 4.3 4.3 4.6
Nueva Concepción 1980-1984, 1986 5.4 5.7 5.5 5.2 5.2 5.4 5.4 5.0 4.9 4.7 4.6 4.6 4.9Ahuachapán 1980-1 984 5.4 5.7 5.5 5.0 4.7 5.2 5.0 4.3 4.5 4.6 4.5 4.3 5.0La Unión 1980, 1985 5.1 5.4 5.3 4.8 5.0 5.3 5.2 4.8 4.7 4.5 4.4 4.4 4.7Estación Matriz 1980-1984 5.6 6.2 5.9 5.2 5.3 5.9 5.6 4.9 4.8 5.0 4.8 4.8 5.1
San Salvador1983, 1984, 1985,1986, 1987
5.4 5.7 5.4 4.9 5.0 5.5 5.2 4.6 4.8 4.8 4.8 4.6 4.9
Beneficio La Carrera 1980, 1983, 1984 5.4 5.5 5.2 4.8 4.8 5.4 5.4 5.0 4.8 4.8 4.7 4.7 4.9Apastepeque 1980 5.2 5.3 5.1 4.8 4.7 5.1 5.1 4.6 4.5 4.6 4.4 4.4 4.6La Galera 1980-1982 4.9 5.1 4.8 4.1 4.0 4.5 4.3 3.5 3.7 3.7 3.9 3.5 4.4
Solar PV systemGrid-Connected solar
PV systemSupply to Grid
Receive from GridWithout
Battery Bank
WithBattery Bank
Off-grid solarPVsystem
Not supply to GridReceive from Grid
WithoutBattery Bank
WithBattery Bank

Final Report Chapter 10
Republic of El Salvador 10-59 March 2012 The Project for Master Plan for the Development of Renewable Energy (JICA)
In a basic solar PV system, the PV module generates DC power, then passing through junction boxes DC power is collected at the collection box, before supplying power to the PCS. The PCS converts the collected low voltage DC power to AC power. For large solar PV systems, a transformer converts the high voltage AC power, before supplying electricity to grid.
(Source: JICA Study Team)
Figure 10.3.3.3 Example of a Grid-connected Solar PV System In general, voltages of power output from most PCSs are as low as 210 V or 420 V. For solar PV systems with large capacities, it is necessary to consider the location of PCS (Power Conditioning System) to reduce power losses. There are two types of layout for PCS, one is the distributed system and the other is the concentrated system. The following figure shows sample solar PV systems with 1.0 MW total capacity. In many centralized solar PV systems, PCS with a 250-kW capacity is applied for cost effectiveness and availability of various types. For the layout of distributed PCS system, a transformer is installed at the center of the PCSs or on locations that facilitate maintenance services. As for a concentrated PCS system, a transformer is installed beside a PCS to reduce the distance of AC distribution line. It is possible to improve efficiency if manufacturers produce units which consist of both a PCS and a transformer.
(Source: Guidelines for the Introduction of Large-scale Solar PV Systems: NEDO)
Figure 10.3.3.4 Layout of Distributed PCS System
Low Voltage DC
Low Voltage AC
Transformer 1000kW High Voltage AC

Final Report Chapter 10
Republic of El Salvador 10-60 March 2012 The Project for Master Plan for the Development of Renewable Energy (JICA)
(Source: Guidelines for the Introduction of Large-scale Solar PV Systems: NEDO)
Figure 10.3.3.5 Layout of Concentrated PCS System
Most large-scale grid-connected solar PV systems are built as power stations that are operated by electric power companies or independent power producers (IPP). The system basically consists of multiple sets of PV arrays, junction boxes, collection boxes, and PCSs. In some cases, the system is equipped with storage batteries to reduce the impact of grid connection on the commercial power system (changes in the voltage and frequency), and a remote monitoring and controlling system is installed in the operator’s control center to improve the efficiency of operation and maintenance.
D. Site survey
a. Problems of shading
It is necessary to confirm shading from neighboring buildings, trees, mountains, chimneys, electric or telephone poles, steel towers and signboards during the site survey. The power output from solar PV decreases when there is shadow on the PV modules. The phenomenon called the ‘thermoelectric effect’ is possible by partial shading. Therefore, it is an important basic requirement to install solar PV modules in a location where there is no shadow from surrounding structures. At the site survey, it is necessary to consider that there can be possible changes in the surrounding situation, which can be the growth of a tree or the construction of a new building. And also, it is necessary to consider the possibility of shading by leaves, dust and volcanic ashes, bird droppings or oily smoke.
b. Others (corrosive effects of salt, lightning, etc.)
It is necessary to investigate corrosive damages from salt in coastal areas. Data on salt concentration levels will be essential in designing the metal parts of the systems, such as the supporting structures of the solar PV system.
Lightning is categorized by either indirect and/or direct lightning strikes. If the solar PV system is in an exposed location, suitable lightning conductors must be used. Surge arresters on the DC side in the generator junction box are recommended. Over voltage protection on the AC side is also generally recommended.
It is important to study the maximum wind speed at the project site for the design of the solar PV system’s support structures. It is also necessary to investigate the damage caused by hurricanes in the
Low Voltage DC
High Voltage AC Transformer 1000kW Low Voltage AC

Final Report Chapter 10
Republic of El Salvador 10-61 March 2012 The Project for Master Plan for the Development of Renewable Energy (JICA)
past. The following table shows instantaneous maximum wind speed in El Salvador. The design of support structures for solar PV systems has to consider the wind speed indicated in the table below.
Table 10.3.3.2 Instantaneous Maximum Wind Speed
Municipality Year Maximum Wind
Speed (m/s)
OZATLAN 1938 19.4
BERLIN 1969 16.7
SAN PEDRO NONUALCO 1969 16.7
SANTIAGO DE MARIA 1969 16.7
TECAPAN 1969 16.7
JUAYUA 1970 19.4
AHUACHAPAN 1979 19.4
SANTA ANA 1979 19.4
CALIFORNIA 2002 16.7
APANECA 2006 21.1
COLON 2006 21.1
NAHUIZALCO 2006 21.1
NUEVA SAN SALVADOR 2006 21.1
SAN IGNACIO 2006 22.2
SAN SALVADOR 2006 21.1
(Source: JICA Study Team)
In case of on-ground installation, it is necessary to investigate the existing ground conditions, such as the soil bearing capacity and drainage, to avoid submergence of the site with rainwater.
c. Necessary Area for Installation
Installed capacity of a solar PV system is determined by the available area and the project budget. In general, depending on the system design, the required dimensional area is assumed at around 10 to 15 m2 per kW. In addition, it is necessary to evaluate the required space for the installation of transformers, power conditioners and other equipment.
d. Load Power consumption pattern on the demand side is not a relevant factor in determining the capacity of the grid-connected solar PV system. When power output from solar PV is lower than the demand from consumers, the necessary electricity will be complementally supplied from the grid. In contrast, when the power output from solar PV is larger than the demand, the surplus electricity will be supplied to the grid. In addition, it is necessary to examine the impact on and the countermeasures for the solar PV system when there are equipment or structures generating noise in the load facilities. It is necessary to understand these types and characteristics of the load facilities.
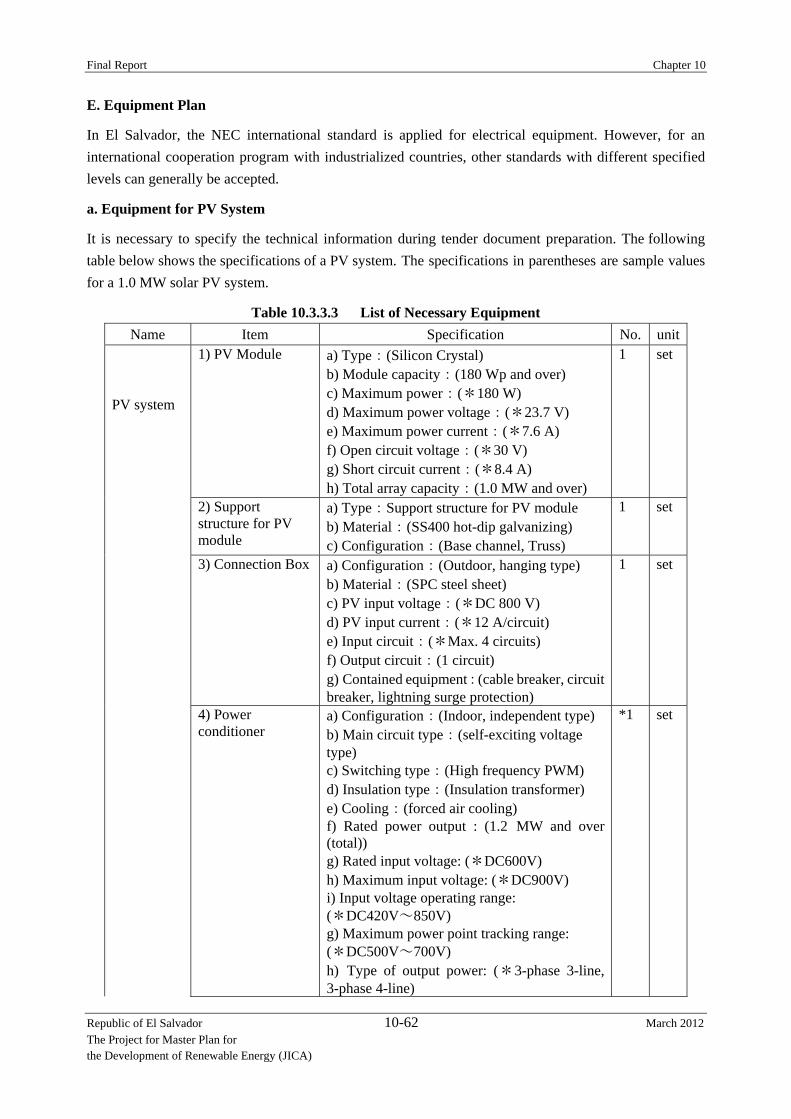
Final Report Chapter 10
Republic of El Salvador 10-62 March 2012 The Project for Master Plan for the Development of Renewable Energy (JICA)
E. Equipment Plan
In El Salvador, the NEC international standard is applied for electrical equipment. However, for an international cooperation program with industrialized countries, other standards with different specified levels can generally be accepted.
a. Equipment for PV System
It is necessary to specify the technical information during tender document preparation. The following table below shows the specifications of a PV system. The specifications in parentheses are sample values for a 1.0 MW solar PV system.
Table 10.3.3.3 List of Necessary Equipment Name Item Specification No. unit
PV system
1) PV Module a) Type:(Silicon Crystal) b) Module capacity:(180 Wp and over) c) Maximum power:(*180 W) d) Maximum power voltage:(*23.7 V) e) Maximum power current:(*7.6 A) f) Open circuit voltage:(*30 V) g) Short circuit current:(*8.4 A) h) Total array capacity:(1.0 MW and over)
1 set
2) Support structure for PV module
a) Type:Support structure for PV module b) Material:(SS400 hot-dip galvanizing) c) Configuration:(Base channel, Truss)
1 set
3) Connection Box a) Configuration:(Outdoor, hanging type) b) Material:(SPC steel sheet) c) PV input voltage:(*DC 800 V) d) PV input current:(*12 A/circuit) e) Input circuit:(*Max. 4 circuits) f) Output circuit:(1 circuit) g) Contained equipment:(cable breaker, circuit breaker, lightning surge protection)
1 set
4) Power conditioner
a) Configuration:(Indoor, independent type) b) Main circuit type:(self-exciting voltage type) c) Switching type:(High frequency PWM) d) Insulation type:(Insulation transformer) e) Cooling:(forced air cooling) f) Rated power output : (1.2 MW and over (total)) g) Rated input voltage: (*DC600V) h) Maximum input voltage: (*DC900V) i) Input voltage operating range: (*DC420V~850V) g) Maximum power point tracking range: (*DC500V~700V) h) Type of output power: (*3-phase 3-line, 3-phase 4-line)
*1 set

Final Report Chapter 10
Republic of El Salvador 10-63 March 2012 The Project for Master Plan for the Development of Renewable Energy (JICA)
g) Rated output voltage: (*AC400V or 230V) h) AC output current distortion factor: (total harmonic distortion 5% and under, each harmonic distortion 3% and under) i) Power control type:(Maximum power point tracking) j) Efficiency:(*90% and over) k) Function:(Automatic voltage adjustment, in-out current regulation, output regulation, soft start) l) Grid-connection protection function: (UVR, OVR, UFR, OFR, islanding operation prevention (passive, active detection, prevent power supply after recovery) m) Communication:(condition・accident・monitoring signal(RS485))
5) Outdoor transformer
1) Rated power output:(1000 kVA and over in total) 2) Primary /secondary voltage:(13.2 kV, 23 kV, 46 kV/230V, 400V), 3 phases 4 lines,60 Hz 3) Particular specification Outdoor, Oil self-cooling type, Wiring:Δ-Y, neutral ground, Total load capacity tap ±2.5%, ±5%
1 set
6) Load distribution board
1) Configuration:(indoor-hanging or autonomous) 2) Material:(SPHC steel sheet) 3) In-out circuit: (input : 1 circuit, output:*10circuits) Contained equipment:(Molded case circuit breaker (MCCB))
1 set
7) Monitoring display
1) Configuration:(outdoor-hanging or self-standing) 2) Material:(SPHC steel sheet) 3) Display data:(power output/day(kWh), instantaneous power potential(kW), irradiation (kWh/m2)) 4) Size:(*W800×L600×H60)
1 set
8) Data management and monitoring system
1) Pyranometer: (ISO9060, Second Class 6~8mV/(kW/m2)) 2) Thermometer:(resistance temperature sensor Pt100Ω, 4 lines type,-50oC~+100oC) 3) Data logger a) Configuration:(Outdoor hanging type) b) Material:(SPHC steel sheet) c) Input signal:(irradiation (0 to 10 mV),Thermometer(Pt100Ω)) d) Output signal:(4~20mA) e) Power source:(AC120V, Battery & Charger
1 set

Final Report Chapter 10
Republic of El Salvador 10-64 March 2012 The Project for Master Plan for the Development of Renewable Energy (JICA)
(DC48V)) f) Contained equipment:(Pyranometer converter T/D, thermometer T/D, power T/D, potential T/D(selling, buying electricity) 4) Monitoring equipment (indoor) a) Data monitoring: (monitoring cycle:6 seconds, collected data:irradiation, temperature, power output) b) Equipment:(PC, signal converter, UPS) c) Software:(display of instantaneous value, figure, form, condition of PC, accident, others)
9) Control House 1) *Size:(W2,400×L7,200×H2,460) 2) Accessory:(door, light, air conditioner, dial thermometer(with contact point)) 3) Contained equipments:(Power conditioner, load distribution board, Monitoring board )
1 set
Construction materials
1) Cable 2) Grounding, etc.
1) Cable : (22 kV-CV-60sqmm-1core, 600V-CV500, 5.5, 2sqmm, 600V-CVVS-2.0sqmm) 2)Others: (Grounding terminal, PE piping materials)
1 Set
*: reference value, applied manufacturer standards
(Source: JICA Study Team)
b. Basic Design of PV System Component
The basic design of PV system component is as shown below.
PV module (Array)
A photovoltaic array is a linked collection of photovoltaic modules. The total capacity and type of PV module should be decided.
Mounting structure for PV module / Connection box
The construction cost of mounting structure for the PV module and connection box with wiring works represents 20% of the total cost.
The structure should withstand a wind speed of 30 m/s. Layout of PV array is designed for effective solar irradiation in a limited area. The area angle of PV module is around 15 degrees in El Salvador. The PV modules have to be installed at a higher vantage point to avoid shadows on the modules. The maximum height of PV modules is set at 3 meters above ground level. It is necessary to take into account 6 meters of free space between PV arrays to avoid shadows.
The base of the support structure depends on the combination of PV modules. For six-180 Wp, which is around 1.0 kWp, the module supports a vertical load of about 160 kg. Therefore, concrete foundation is necessary to support the PV array.
Connection box consists of breakers for the distribution line, input circuit switch, output circuit switch, backflow prevention diode and lightning protection. Connection box is used for interconnection of PV

Final Report Chapter 10
Republic of El Salvador 10-65 March 2012 The Project for Master Plan for the Development of Renewable Energy (JICA)
arrays and for disconnection of circuit during maintenance and repair. It is necessary to install reverse flow diode, lightning protector and surge protection device on each direct current circuit.
Power Conditioner(protection device of grid-connected operation)
Power conditioners convert direct current (DC) from PV array to alternating current (AC), and it consists of an inverter and other devices for grid-connected operation.
The functions of the power conditioner are for regulation and protection of the PV system, power converter and grid connection. The main functions are as shown below. In grid-connected PV systems, reverse flow to the grid is possible but islanding operation is not affordable.
Accuracy of output voltage (isolated operation) :AC 400V ± 10%
Accuracy of output frequency (isolated operation) :+/- 0.2Hz
Accuracy of output frequency (grid-connected operation) :+/-1Hz (Adjustable range)
Distortion factor of AC voltage (isolated operation) :Total 5% and below
Distortion factor of AC current (isolated operation)
:Total current 5% and below (rated output)
:Each harmonic 3% and below (rated output)
Power factor (grid-connected operation) : 0.85 and over
(except for emergency cases, such as to prevent voltage rises)
Total Efficiency :90% and over
Output voltage unbalanced ratio (isolated operation) :10% and below
Grid-connected operation and protection
: Voltage /frequency monitoring
: Maximum power point tracking function
: Islanding operation prevent function
: Automatic voltage regulate function
: DC output protection function (insulating transformer)
: DC ground detector
:UVR, OVR, UFR, OFR, islanding operation prevention (passive, active detection shall prevent power supply after recovery)
Outdoor Transformer
Outdoor transformer converts AC power output voltage from power conditioner to high voltage for grid connection.

Final Report Chapter 10
Republic of El Salvador 10-66 March 2012 The Project for Master Plan for the Development of Renewable Energy (JICA)
The transformer shall be selected based on “SIGET standard No.65-E-2010”. The codes for transformers with 1000 kVA are shown below.
TT021- 3phase, 1000 kVA, 23 kV
TT022- 3phase, 1000 kVA, 13.2 kV
TT023- 3phase, 1000 kVA, 46 kV
Main specifications are as shown below:
Type:Outdoor Oil-Filled Transformer
Rated power output:1000 kVA and over
Primary voltage/Secondary voltage:13.2 kV, 23 kV, 46 kV/230 V, 400 V, 3 phases 4 wires, 60 Hz
Particular specification: Outdoor, Oil self-cooling type, Wiring:Δ-Y, neutral ground
Load Distribution Board
Load distribution board will receive electricity for PV system operations. The power will be utilized by air conditioner, light, data logger, monitoring display and so on. The total capacity will be about 5 to 10 kW. Load distribution board is made from steel sheets and there are indicator lights for power. Circuit breakers (MCCB) shall be equipped for each load.
Display monitor
A display monitor for solar PV has an important role as a visual aid. The display monitoring panel shall display the following information. The contractor might also suggest additional information.
Power output/day (kWh/day)
Instantaneous power potential (kW)
Solar irradiation (kWh/m2)
CO2 emission reduction (kg-C)
Management and monitoring system of operational data
Operational data management and monitoring system will be installed in a control room to verify PV system performance.
Solar irradiation and outdoor ambient temperature
Pyranometer:ISO9060/2nd Class, input signal: irradiation (0~10 mV)
Ambient thermometer:Pt100Ω

Final Report Chapter 10
Republic of El Salvador 10-67 March 2012 The Project for Master Plan for the Development of Renewable Energy (JICA)
c. Monitoring data
Operational data
The following data which includes data suggested by manufacturers will be logged.
PV output voltage (V) PV output current (A) Inverter output voltage (V) Inverter output current (A) Inverter output potential (kW) Inverter power output (kWh) Inverter operational condition Grid connection condition
Failure information
Grid connection failure (grid connection protection function) Inverter failure Protection function in inverter Trip breaker for load distribution wiring
Data logging system
Generated power, consumed power from distribution lines, and the CO2 emission reduction will be calculated and recorded in a computer with date (day, month, year) and time.
Table 10.3.3.4 PV System Signal List
No. Name of Signal Type of Signal Qty Output/
Input
1 Power Conditioner “ON” Digital 1 Output
2 Power Conditioner “OFF” Digital 1 Output
3 Protection Relay “Normal”(UV, OV, UF, OF, Isolation) Digital 1 Output
4 Protection Relay “Abnormal”(UV, OV, UF, OF, Isolation) Digital 1 Output
5 Representative Power Conditioner “Alarm” Digital 1 Output
6 PC Input Current (DC) Digital 1 Output
7 PC Input Voltage (DC) Digital 1 Output
8 PC Input Power (kW) Digital 1 Output
9 PC Output Current (AC) Digital 1 Output
10 PC Output Voltage (AC) Digital 1 Output
11 PV System Temperature Digital 1 Output
12 PV System Irradiation Digital 1 Output
13 Temperature High Alarm in Control House Digital 1 Output (Note: Above-mentioned signals will be monitored for each power conditioner.) (Source: JICA Study Team)

Final Report Chapter 10
Republic of El Salvador 10-68 March 2012 The Project for Master Plan for the Development of Renewable Energy (JICA)
Control space
If indoor-type power conditioner is selected, it has to be installed in a room or a house. Others, such as load distribution board, management and monitoring system for operations will be installed in a control room in the building or house. Air conditioner, temperature alarm, lighting and spare power conditioner are equipped in the control space.
E. Operation and Maintenance
Currently, grid-connected solar PV systems are not widely used in El Salvador. To secure smooth operation, it is necessary to address issues on technical information, documents and human resources on PV systems as shown below.
Lack of technical engineers who can work on O&M and repair.
Lack of manuals for the training of O&M engineers.
An appropriate O&M system is necessary to secure sustainability of the project outcome. Therefore, the owner company has to confirm activities by refererring to O&M reports submitted daily and periodically by maintenance staff members. In addition, it is necessary to collect data on power generation and the amount of CO2 emission reduction for analysis. Those data will be summarized by SIGET.
It is necessary to transfer the appropriate O&M skills for sustainable use of solar PV system. It is desirable to conduct repair or replacement of faulty parts of the PV system locally. Therefore, in addition to O&M techniques, troubleshooting techniques have to be transferred.
The following table shows items for daily inspection by the technical staff of the solar PV operating company. Basically, it is not important to conduct complicated daily O&M on PV system since it operates automatically. However, daily inspection is important to identify faulty parts early. It is also important to obtain higher power output as much as possible. In addition, the damages caused by the theft of system components and malicious mischief can be prevented through frequent inspection. In the project area, power distribution lines have to be maintained regularly by the technical staff of the system operating company. It is important to transfer the maintenance procedures of the PV system from manufacturers during installation work.

Final Report Chapter 10
Republic of El Salvador 10-69 March 2012 The Project for Master Plan for the Development of Renewable Energy (JICA)
Table 10.3.3.5 Daily Inspection
Visual Inspection
PV Array
dirt and cracks on module surfaces
corrosion and rust on the mounting structure
damage on outside cables
Connection Box corrosion and rust on the box
damage on outside cables
Power Conditioner
corrosion and rust on external surfaces
damage on outside cables
abnormal noise and sound during operation
clogging of filter at ventilator exhaust
environmental conditions in the surrounding area(humidity, temperature)
Grounding damage on outside cables
Power Generation check operational conditions by checking the display meters and indicators
Surrounding Condition fence damage, growth of vegetation, bird's nest etc. (Source: JICA Study Team)
The table below shows the list of periodic inspections which will be conducted every 2 months. The detailed items for regular inspection will be instructed by the manufacturers of the installed equipment. Regular service procedures will be transferred to technical staff.

Final Report Chapter 10
Republic of El Salvador 10-70 March 2012 The Project for Master Plan for the Development of Renewable Energy (JICA)
Table 10.3.3.6 Regular Service
Visual Inspection Measurement
PV array
dirt and cracks on module surfaces Insulating resistance
corrosion and rust on the mounting structure
damage on outside cables Open circuit voltage damage on grounding cable, tightness of grounding
connection
Connection Box
corrosion and rust on the box
Insulating resistance damage on outside cables
damage on grounding cable, tightness of grounding connection
Power Conditioner
corrosion and rust on external surfaces Check function
damage on outside cables
abnormal noise and sound during operation
Insulating resistance clogging of filter at ventilator exhaust
environmental conditions in the surrounding area(humidity, temperature) damage on grounding cable, tightness of grounding connection
Grounding damage on outside cables Grounding resistance (Source: JICA Study Team)
It is necessary to confirm the accuracy of the data which were monitored at the PV system. It is also necessary to store the data properly. When it is difficult to settle problems locally, such as repair of malfunctioning parts, operating institution will need support from the manufacturers. Except for the management procedure, monitoring of power generating conditions and the calculation of CO2 emission reduction quantities will be transferred. The table below shows the list of main operational and data management tasks.
Table 10.3.3.7 Operational and Data Management Functions Tasks
Operational Management
confirmation of operational condition
educational framework for O&M technician
coordination with manufacturers, when necessary
Data Management monitoring of power generating condition
compiling data on CO2 emission reduction (Source: JICA Study Team)

Final Report Chapter 10
Republic of El Salvador 10-71 March 2012 The Project for Master Plan for the Development of Renewable Energy (JICA)
F. General Project Schedule
For the on-ground installation of solar PV, it is necessary to coordinate the land acquisition schedule in advance. Therefore, it is important to conduct site surveys to collect and confirm the information beforehand. The system’s construction period varies according to the type and capacity of the solar PV system. In the case of Japan, it was necessary to consider around 6 months of construction period for the installation of a 1.0-MW solar PV. The period is from commencement of construction to commissioning of operation. This construction period is extended longer, in conformity with the increase in capacity of the solar PV system. It is desirable to avoid construction works during the rainy season as it is normally assumed that the duration of works is prolonged once stormy weather conditions start. Therefore, before construction of the solar PV system, it is necessary to examine the schedule for design and procurement of equipment, discussion with distribution companies connected to the grid, and consultation of relevant laws and regulations during the planning stage. The following table shows sample project schedule for solar PV system installation in El Salvador:
Table 10.3.3.8 Sample of Work Schedule
(Source: JICA Study Team)
G. Project Cost
In Japan, the average unit price of solar PV, with capacities greater than 100 kW, is more than US$9,100 per kW. The price varies according to installation location, type and capacity of the system. In case of on-ground installation, expenses such as land acquisition costs have to be included in the cost of the PV system. As for running cost after the installation works, O&M cost and insurance expenses will be examined.
Bid notification
Acceptance of question &answer
Paticipation of bid Meeting
Evaluation of bidding
Contract with constructor
Design & Manufacturing ofsolar PVConstruction of bacement,Supporting structure,
Manufacuring of equipments
Transportation・customs
Civil Work
Installation
Comissioning & transfer
15
Months8 9 11 12 13 14101 2 3 4 5 6 7
Works out of the country Works in the country Work on site

Final Report Chapter 10
Republic of El Salvador 10-72 March 2012 The Project for Master Plan for the Development of Renewable Energy (JICA)
There is a solar PV system with a 100-kW capacity at a U.S. Base in El Salvador. The project cost is shown below. The comparison of the average unit prices of Japan and El Salvador showed that the price for the El Salvador project is lower.
Price of a 100-kW solar PV system
Installation: US$690,000 (US$6,900/kW)
O&M: US$1,000/year (4 visits per year)
10.3.3.4 Master Plan A master plan for solar PV systems for 2012 until 2026 is required in this study. However, as for the centralized solar PV system, there is only one plan by CEL. Thus, the following development plan was compiled for implementation during the period from 2012 to 2026 based on the information from CNE.
Solar PV development plan of CEL will be revised continuously. Therefore, solar PV development plans will have to be revised for several years.
Table 10.3.3.9 Master Plan of Solar PV (on-ground)
On ground Rooftop (Project base)
Year Capacity
(MW)
Power Production
(GWh/year)
Capacity
(MW)
Power Output
(GWh/year)
2012 to 2016 17 27.9 1 1.6
2017 to 2021 20 32.8 1 1.6
2022 to 2026 50 80.0 1 1.6 (Source: CNE)

Final Report Chapter 10
Republic of El Salvador 10-73 March 2012 The Project for Master Plan for the Development of Renewable Energy (JICA)
10.3.4 Solar Thermal In El Salvador, the average solar radiation is as high as 5 kWh/m2 per day. In this chapter, the current state of solar thermal energy in El Salvador is explained. Moreover, solar radiation data obtained from LaGeo and Inversiones Energéticas S.A. de C.V. (INE) are examined. In order to realize the implementation of solar thermal projects, there are some difficulties to overcome. Therefore, measures to overcome these difficulties are considered in this chapter. Furthermore, for the introduction of the CSP system, necessary recommendations are mentioned.
10.3.4.1 Potential of Solar Thermal Solar irradiation is an energy source for solar thermal systems. In a spatial area, solar irradiation is found to be 1353 W/m2, and thus called as the solar constant. Before solar irradiation reaches the surface of the earth, it is attenuated by absorption, reflection, and irradiation depending on the conditions in each location and its value will always be lower than the solar constant. Solar thermal technology is based on the fact that solar light is energy in the form of electromagnetic radiation emitted in different wavelengths which range from ultraviolet, visible and/or infrared wave lengths. For low temperatures (up to 95 °C), flat plate or vacuum tube collectors are used mainly for water heating. For intermediate temperatures (up to 350 °C), CSP system is used. There are different configurations of CSP, such as parabolic trough, solar tower, parabolic dish, and Fresnel. The aim of the CSP is to concentrate high density of energy to the receiver from the focal point of the concentrator. The concentrator is made up of a reflectance surface of high efficiency. In general, reflectance factor is 95% or higher for new and clean conditions. The receiver surface exhibits the following characteristics at operating temperature: high absorptance in visible wavelengths and low emittance in infrared wavelengths. Insolation levels in El Salvador is high. In terms of energy, the average number of peak-sunshine hours is 5 hr/day. For systems without solar concentrators, such as flat plate collectors, all the energies are taken into account. For solar concentrator systems, only direct radiation is used. In this case, the potential energy available is around 70%, or 3.5 peak-sunshine hrs/m2. Thus, it is possible to say that the national average of direct normal irradiation (DNI) is at ~3.5 kWh/m2 per day. However, it is necessary to monitor solar irradiation at particular places where construction of CSP system is planned. According to the data monitored by LaGeo, the average DNI in Berlin is as high as 5.0 kWh/m2 per day. In addition, based on the data monitored by INE, the average daily DNI in Miravalle (Acajutla) is 5.4 kWh/m2 and in San Fernando (San Vicente) is 5.3 kWh/m2.
For example, the capacity of a collector aperture is calculated below.
Reflection efficiency: 80%
Total efficiency of receiver and heat transfer: 80%
DNI (Berlin): 5.0 kWh/m2
Energy per m2=5.0×0.8×0.8 = 3.2 kWh-th/m2 per day. (kWh-th: Unit of thermal output in kWh)
As for a solar collector with 48 m2 of effective aperture, the estimated potential thermal energy it can

Final Report Chapter 10
Republic of El Salvador 10-74 March 2012 The Project for Master Plan for the Development of Renewable Energy (JICA)
receive is shown below.
3.2 kWh-th/m2/day ×48 m2 = 153.6 kWh-th /day
Average power output can be calculated based on the effective aperture of solar collector and the number of peak-sunshine hours. Power output from the above-mentioned collector with 6 peak-sunshine hours is calculated as shown below.
153.6 kWh-th/day ÷ 6 hrs = 25.6 kWth
Power output from unit area is computed as follows:
25.6 kWh ÷ 48 m2 = 0.533 kWth/m2
This figure must be adjusted according to the technical specifications of a collector system and the environmental conditions in a given location.
For example, in case of two sets of generators, which have similar performance capabilities to the Ahuachapán geothermal power plant, the resulting operational conditions are as follows.
Input steam flow: 144 kg/s
Inlet pressure: 4.6 Bar (a)
Inlet temperature: 154 °C
Input power, thermal: 396.5 MWth (MWth: Unit of thermal power in MW)
Output power, electrical: 60 MWe (MWe: Unit of electrical power in MW)
Efficiency, thermal to electrical: 15 %
Power to mass rate: 2.4 (kg/s)/MWe
Considering 15% efficiency and 60 MW of power output, the computed total area of the collector system’s effective aperture is as follows:
396.5 MWth/(0.533 kWth/m2/1,000) = 743,902 m2
In general, the area of land occupied by the aperture is estimated between 50 to 70% of the total plant area. Considering the area for construction and operation of the CSP system, the necessary land area is roughly 1.0 km2 as calculated below.
743,902 ÷70% = 1,062,717 m2
The thermal power obtained from a solar collector field can be converted into electric power by means of a thermodynamic cycle. The solar energy converted into heat must be transported by a transport fluid, such as heat transfer fluid or molten sodium. The heat transfer, through heat exchangers, to the working fluid, usually water, produces steam that drives a turbo generator to generate power. For some types of CSP, water is used as the working fluid which is directly converted into steam at the focal point of the concentrator. In this case, special treatment is required for energy storage. In general, storage of

Final Report Chapter 10
Republic of El Salvador 10-75 March 2012 The Project for Master Plan for the Development of Renewable Energy (JICA)
thermal energy is necessary to extend operational hours of CSP. It is important to consider that solar irradiation only occurs during the day, and some kind of storage must be considered in order to offer certain degree of continuity in the power output.
From a technical point of view, it is possible to construct a CSP system completely by using solar concentrators which are supplied by several international companies. Taking into account the abundant solar irradiation in El Salvador, and the developed solar thermal technology in the international market, the project has great potential for implementation. On the other hand, it is also important to consider the possibility of local manufacture of solar collectors to reduce cost. Therefore, to fully realize local manufacture of solar collectors, technical transfer of the solar thermal power plant technology is important.
10.3.4.2 Current Status and Future Prospects A. Existing Plan in El Salvador
At present, there are three institutions working on solar thermal technology that utilizes different approaches, LaGeo, INE, and Universidad Don Bosco.
a. LaGeo
LaGeo started in 2007 a development program for the local solar thermal technology. Four modules of parabolic trough solar concentrators is designed and constructed by LaGeo. Polished stainless steel reflectors with reflective efficiency of 60%, was used in the program. As for the concentrator, a carbon steel pipe with selective coating was used. The total aperture area of the parabolic concentrators is 160 m2 (four modules having 4-m width and 10-m length). The system heats the thermal oil and recirculates it at a rate of 1.5 kg/s until the temperature in the storage tank increases to 225°C. The capacity of the storage tank is 1.132 m3. Heat is transferred to the separated hot water from the first flasher. This process is part of the function of a heat exchanger to generate steam by solar energy. The obtained power in this process is around 183.8 kWth. Unit capacity of this system is calculated as follows:
183 kWth / 160 m2 = 1.144 kWth / m2
Currently, the new prototype collectors with cavity-type receiver are being designed and will be constructed for research and development objectives. A plastic metalized film with a reflectance factor of 95% will be used as the prototype. All the systems will be installed in the northern geothermal field of Berlin. Installed capacity is planned as 30 MWe. There are five alternatives for the installation of solar thermal plant as shown in the table below.

Final Report Chapter 10
Republic of El Salvador 10-76 March 2012 The Project for Master Plan for the Development of Renewable Energy (JICA)
Table 10.3.4.1 Options of Installation for Solar Thermal Plant Project (LaGeo) Options 1 2 3 4 5
Description Geo-solar thermal hybrid Solar thermal Solar thermal Solar thermal Solar thermal
Location Northern
geothermal field Berlin
Northern geothermal field
Berlin San Miguel San Miguel San Miguel
DNI (kWh/m2 per year) 1800 1800 1860 1860 1860
MWe 30 30 30 30 30
Plant type Direct steam generation
Direct steam generation
Direct steam generation
HTF technology, Therminol VP1
HTF technology, Therminol VP1
Energy storage No No No No Yes
Water input Geothermal De-mineralized water
De-mineralized water N/A N/A
Turbine operating pressure and temperature
35 Bar (a), 130 °C
28 Bar (a), 230 °C
28 Bar (a), 230 °C
100 Bar (a), 370 °C
100 Bar (a), 370 °C
Solar field aperture (m2) 171,070 171,070 171,070 171,070 342,140
Concentrator type Eurotrough - 100 Eurotrough - 100 Eurotrough - 100 Eurotrough - 100 Eurotrough - 100
Concentrator quantity 312 312 312 312 624
Concentrator origin Spain Spain Spain Spain Spain
Receiver type Schott - Germany
Schott - Germany
Schott - Germany
Schott - Germany
Schott - Germany
Total area (ha) 61 61 61 61 114
Solar field area (ha) 53 53 53 53 106
Capacity factor (%) 20.4 17.9 18.8 16.1 30.9
Total yearly energy production (GWh) 53.7 47.1 49.5 42.2 81.1
Yearly energy per unit area of solar field (GWh/ha per year)
1.01 0.89 0.93 0.8 0.77
Initial investment (Million US $) 111 111 111 115 185
(Source: LaGeo)
Mainly, there are two objectives on the Research and Development Program.
Confirm possibility of local construction of solar collectors to reduce construction cost of solar
thermal power plant.
One of the purposes of LaGeo is that engineers understand the solar thermal technology. Obtain
technical knowledge for business.

Final Report Chapter 10
Republic of El Salvador 10-77 March 2012 The Project for Master Plan for the Development of Renewable Energy (JICA)
b. INE
In the case of INE, the pre-feasibility, technical, financial and legal studies for the installation of a solar thermal plant have already been carried out. The collected data from INE is as shown below..
Western Zone: Sonsonate, Cantón Miravalle.
Central Zone: San Vicente, Tecoluca, Cantón San Fernando.
Eastern Zone: (No data).Selected site had poor solar irradiation.
The monitoring data was collected from September 2010 to August 2011. The average daily direct normal irradiation (DNI) data are as shown in the table below.
Table 10.3.4.2 Monitored DNI (INE) Miravalle
(kWh/m2 per day) San Fernando
(kWh/m2 per day) September 2010 3 2.9 October 5.1 5.4 November 6.6 6.4 December 7.7 7.5 January 2011 7 7 February 7.3 7.3 March 6.9 6.5 April 4 3.1 May 4.7 4 June 3.4 3.1 July 3.8 n/a August n/a n/a Average DNI 5.41 5.32
(Source: INE)
Currently, INE is waiting for the final report of the pre-feasibility study from Solar Millenium AG (Spanish Company) to establish the size and characteristics of the plant to be installed. However, INE is considering installation of solar thermal plants with 50 MWe including storage of thermal energy by molten salt battery. The capability of the thermal storage has to be around 8 hours. Parabolic trough type of CPS system is considered for application on a plant having dimensions of 5.11 m width and 75/100/150 m length collectors, with the usage of heat transfer fluid. The operating temperature will be between 293 °C and 393 °C.
Implementation schedule is estimated at around three and a half years, i.e., one year for the feasibility study and bid process, and 2.5 years for the installation of the plant.
c. Universidad Don Bosco
El Salvador is a country with an abundance of natural energy resources such as hydro, geothermal and solar. In addition, there are no fossil fuel resources in the country. Based on the reasons above, the School of Electrical Engineering presented to the President of Universidad Don Bosco a proposal for

Final Report Chapter 10
Republic of El Salvador 10-78 March 2012 The Project for Master Plan for the Development of Renewable Energy (JICA)
research and development of solar thermal technology and its installation by year 2000. The Fondo para la Iniciativa de las Américas, El Salvador (FIAES) provided the financial support for the research and development. The general objectives of the project were to develop solar thermal technology and to locally accumulate knowledge and expertise on the said technology. The specific objectives were to design and construct a prototype CSP which is capable of generating electricity for the lighting of 14 rural households, and driving a corn mill, a water pump and an oven for bakery.
To be able to accomplish the established objectives, it was decided to design a circular concentrator collector and a steam generator or boiler placed at the focal point of the concentrator. The fluid chosen as the thermal transport media and as driver of thermodynamic cycle was water. Based on the demand thermal and electrical loads from users, the system should have a capacity of 30 kWth.
The main parts of the system for construction are as follows:
Collector concentrator
The concentrator has 1,824 mirrors mounted on a flat circular structure and each is calibrated to assure reflection to the focal point of the receiver. Diameter of the collector is 10 m.
Boiler
During normal operation, the boiler temperature reached 250 °C, and the steam output at 193 °C with pressure of 8.379 kPa.
Solar tracking system
Two-axis system: One axis is adjusted with azimuth and the other for height over the horizon.
Steam reservoir
Typical conditions of steam are 175 psi (g) and 193°C as indicated by the instruments mounted on the reservoir. Steam trap and safety valve was adjusted at 8.379 kPa.
Pumping system
The condensate is pumped to the boiler at a rate of around 60 L/hr.
Steam engine
The steam drives a two-cylinder engine of 3 HP nominal power at 600 rpm. It is coupled to a belt speed multiplier to drive the alternator and rectifier.
Alternator
The capacity of the power generator is 1.0 kW with DC 12 V. Generated electricity is charged in the battery bank.
Thermodynamic control system
The thermodynamic cycle is controlled by a microcontroller. It operates the inlet valve of the steam engine, the current level of field circuit of alternator, and the lubricating system.
Final Report Chapter 10
Republic of El Salvador 10-79 March 2012 The Project for Master Plan for the Development of Renewable Energy (JICA)
Inverter
The capacity of the inverter is 1.0 kW, and can convert DC 12 V to AC 120 V, 60 Hz.
Application loads
This system supplies both the electrical and thermal outputs. The expected electrical load was for the lighting of 14 rural households, a total of 300 W for 4 hours a day, from 5:00 to 9:00 p.m. There was also a direct thermal load that can supply an oven for bakery during sunny days. The maximum temperature in the oven was 150 °C. It was also expected to operate a small water pump.
B. Barriers to overcome.
There are several hindrances in the further dissemination of solar thermal technology as explained in this section.
a. Knowledge on solar thermal technology
Initiatives to raise awareness are important for the future development of solar thermal technology. It is important for people to understand the potential and benefits of CSP technology and its other applications. It is important to be informed of the functions of other CSP systems, such as its operations in the USA, Spain, etc. Furthermore, it is necessary to extensively introduce information about solar thermal technology due to the high solar potential in El Salvador.
b. High initial investment costs
Initial investment cost on solar thermal plant is high due to the following two reasons: 1) high initial installation cost, especially of the solar collector; and, 2) the technology is still under development and commercially, not so widely used yet.
There have been efforts to develop cost-effective solar collectors in El Salvador. For example, Universidad Don Bosco has conducted research and development works to accumulate technical knowledge and experience in the design and construction of solar collectors in the country. In addition, LaGeo has carried out two kinds of research and development works, which are as follows: 1) local manufacturing of the solar thermal collectors; and, 2) possible methodologies to lower the installation cost in case there is a need to procurement components from overseas suppliers. A sample of a specification details and the cost of the solar thermal power plant is as shown in the table below.

Final Report Chapter 10
Republic of El Salvador 10-80 March 2012 The Project for Master Plan for the Development of Renewable Energy (JICA)
Table 10.3.4.3 Specification of solar collector (Eurotrough-100)
Collector width (m) 5.76
Total length of each collector (m) 98.7
Quantity of modules per collector 8
External diameter of receiver pipes (m) 0.07
Internal diameter of receiver pipes (m) 0.065
Net aperture area per collector (m2) 548.3
Internal roughness of receiver: 20 μm
Nominal reflectivity of mirrors, r 0.93
Transmissivity of glass envelope of receiver, τ 0.95
Absorptance of selective surface of receiver, α 0.95
Interception factor for optical and installation errors, γ1 0.90
Peak optical rendering: r x τ x α x γ1 x γ2 0.755
Net cost for a Euro trough-100, (Cost at factory) US$183,000.00 (Source: Universidad Don Bosco )
General cost information is shown as follows.
Unit cost: US$334/m2
(Effective area of collector, at the factory in Europe)
Operational conditions:
Operating temperature: 300 oC
Solar direct irradiation: 900 W/m2
Output:
Solar thermal efficiency: 66.7%
Cost per unit thermal power: US$555/kWth
Thermal power per m2: 0.601 kWth/m2
If it is possible to manufacture the collectors in El Salvador, the cost is lower than those bought from Europe. Moreover, it is not necessary to estimate transportation cost from distant countries.
In Mexico, a project of booster configuration solar thermal plant is being prepared. The details are shown below.
Project title: Solar Thermal Project Agua Prieta II
Collector field thermal power: 31 MWth

Final Report Chapter 10
Republic of El Salvador 10-81 March 2012 The Project for Master Plan for the Development of Renewable Energy (JICA)
Collector field size: 120,000 m2
Collector field cost: US$43,518,000.00
Unit cost: US$362.65/m2
Cost per kWth : US$1,403.81/kWth
c. Lack of trained engineers
There is limited number of engineers or researchers who are working on solar thermal technology. Educational institutions should carry out human resource development training for the design, implementation, operation and maintenance of solar thermal plants. It is necessary to establish proper educational policies for the training activities. Currently, there is a master’s degree in renewable energy management and solar thermal pilot plant design in Universidad Don Bosco.
d. Intermittent power output
Solar irradiation is available only during daytime. However, there are countermeasures to compensate the intermittent of power output, such as the following:
Include storage system of thermal energy with capacity consistent with the project objectives and the
costs involved.
There is a complementary relation between seasonal power outputs of solar thermal and hydro power
plants.
e. Minimum warranted power for wholesale contract
Minimum power output from solar thermal plants is unpredictable due to the varying weather condition. Solar irradiation is an intermittent source of energy, which as expected, translates to power output of solar thermal plant that is also intermittent. For this reason, at present, the power output from these plants is fed into a distribution grid. Power producers who are interested in trading at the wholesale market have to guarantee a minimum power output. However, this is difficult in the case of solar thermal power stations. In order to address this problem, it is necessary to involve the technical and legal sectors of El Salvador for this kind of plant to be eligible for the wholesale market.
B. Recommendations
Recommendations for the introduction of solar thermal power plant are as follows:
Pre-feasibility and feasibility studies for the inclusion of solar thermal plants.
Coordination with universities to develop training programs on solar thermal technologies for
engineers and technicians, with international technical assistance must be included.
Revision of legal and technical regulations and standards.

Final Report Chapter 10
Republic of El Salvador 10-82 March 2012 The Project for Master Plan for the Development of Renewable Energy (JICA)
Provide incentives for the creation of solar thermal enterprises in particular, and renewable energy in
general.
Development of local technologies that enable production of solar thermal collectors.
Create favorable conditions for the export of some components used in solar thermal production.
Promote international cooperation between the government and manufacturers of solar thermal
technologies.
To study the possibility of solar thermal-geothermal, hybrid generation system introduction.

Final Report Chapter 10
Republic of El Salvador 10-83 March 2012 The Project for Master Plan for the Development of Renewable Energy (JICA)
10.3.4.3 Examination of Technical Aspects A. General
Currently, solar thermal technology is not yet commercially or industrially available in El Salvador, but there is an incipient and growing interest in the universities, professional organizations, governmental institutions, and all those involved with energy, to explore new alternative sources of energy. Solar thermal technology is available from international suppliers, especially manufacturers from Spain, Germany and the USA.
Solar thermal technology has been in development for several decades, starting significantly in 1969 with the construction of a high temperature furnace in Odeillo, France. In 1986, one of the largest solar thermal plants was built in Kramer Junction, Mojave Desert. In decades of 80s and 90s, continued developments in the USA led to “solar one” and “solar two” central receiver thermal power plants. In the first decade of the 21st century, the USA, Spain and Germany have achieved great advances in the technology. At present, the technology for the installation of large solar thermal plants for generating electricity is already available.
It is possible to import many collector types such as the following: parabolic and Fresnel for linear, and heliostats for central receiver plants. Even if the initial cost is high, this can still be reduced by developing local technology for the manufacture of collectors, opening the possibility of its commercial competitiveness in the future. Aside from the collector and energy storage, the rest of the technologies are basically similar to the traditional thermal technology. However, a complete system must be considered to ensure compatibility among all its parts when implementing the project. Manufacturers usually conduct business under this concept.
B. Cost Information
In general, the initial investment cost of solar thermal is still high. LaGeo has estimated the gross cost for a project without thermal storage at US$3,700/kWe and US$6,167/kWe for those with thermal storage. In Mexico, the cost, only for the solar field is US$1,404/kWe. This is based on the proposal to the GEF for “Hybrid Solar Thermal Powerplant Project Agua Prieta II”. According to INE, unit cost for a 50 MWe plant is US$5,000 to 6,000 /kWe and the unit cost for solar thermal with storage is US$ 6,000/kWe.”
Thus, the cost of the entire solar thermal plant is estimated to be around US$300 Million. As for Universidad Don Bosco, the total cost for “Research and Development of Solar Thermal Technology” program, which included research, development, design, materials, labor and administration was US$207,930. The implementation of this project took three years. It is not necessary to compare the cost per kWe to other systems as it was not developed as prototype for commercial use. It was intended to accumulate necessary technical information and expertise for the design of solar concentrator collectors.

Final Report Chapter 10
Republic of El Salvador 10-84 March 2012 The Project for Master Plan for the Development of Renewable Energy (JICA)
10.3.3.4 Master Plan A master plan for solar thermal power generation from 2012 to 2026 is required in this Study. However, as for solar thermal systems, there is only the plan by LaGeo and INE. Thus, the following development plan will be compiled from 2012 to 2026 based on the information from both organizations.
Solar thermal development plans of LaGeo and INE will be revised continuously. Therefore, solar thermal development plans will be revised in the succeeding years.
Table 10.3.4.4 Solar Thermal Master Plan
Year Capacity (MWe)
Power Production (GWh/yr)
2012 to 2016 60 158*
2017 to 2021 80 210*
2022 to 2026 60 158* * : System with thermal energy storage. (Plant Factor: 30 %).
(Source: JICA Study Team, According to information given by INE and LaGeo in meeting with CNE, JST, INE and LaGeo).

Final Report Chapter 10
Republic of El Salvador 10-85 March 2012 The Project for Master Plan for the Development of Renewable Energy (JICA)
10.3.5 Geothermal Based on collected basic information described in Chapter 4, and based on method of examination described in Chapter 8, examination was made for introduction of geothermal energy sources.
Estimate of introducible amount of geothermal was presented through review of the existing plans. Possibilities of development after 2017 were estimated from the existing potential information. Further, a standard development schedule and development costs were described based on the interview results from LaGeo.
A. Development Plan up to 2017
Currently, LaGeo is the only entity engaged in geothermal power development in El Salvador. Their development plan for increasing their geothermal power generation is described in section 4.6.3. Table 10.3.5.1 is a list of their new development plan which have specific development schedule.
Table 10.3.5.1 Plan of New Development, Expansion and Modification by LaGeo Location
Plan
Addition
(MW) Feasibility
Timing (year)
Possible Delay
Ahuachapán Modification of Unit-2 5-9 A 2015 No Berlín Expansion by Unit-5 25-30 A 2017 No
Chinameca New Development 30-50 B 2017 Up to 2 years
- Total (by 2017) 60-89 - - - (Feasibility) A: Proven (Definite), B: Probable (Source: LaGeo)
As seen in this table, LaGeo has a plan of increasing their geothermal power generation by 60 to 89 MW by 2017 or later.
B. Development Plan after 2017
Currently, LaGeo does not have any certain plan of new power development after 2017. Thus, possibility of further geothermal power development in future is estimated in 4.6.4. Based on the result, the maximum level of total geothermal power generation in El Salvador is estimated to be 300 MW to 400 MW at the moment. This value must be revised periodically as studies in other existing zones of the country progress.
Like other underground natural resources, understanding of the geothermal resources advances in line with the advance of geothermal exploration and development. Then, possibility of the power development level changes along with the improvement of the understanding. Therefore, all the plans and estimates related to geothermal power development should be revised in line with the advance of

Final Report Chapter 10
Republic of El Salvador 10-86 March 2012 The Project for Master Plan for the Development of Renewable Energy (JICA)
geothermal exploration and development in El Salvador.
C. A Generalized Development Schedule and Cost
A generalized development schedule and cost estimate of a new 30 MW-class geothermal power development by LaGeo is shown in Table 10.3.5.2. As seen in this table, this project requires approximately eight years including permission procedures, with a total cost of US$150 to 200 million.
Table 10.3.5.2 Generalized Development Schedule and Cost of a 30 MW-Class Geothermal Power Development by LaGeo in El Salvador
(Source: LaGeo)
In case of new geothermal development in the future, the development will possibly be executed referring to the aforementioned schedules and costs.
Item Specification year 1 year 2 year 3 year 4 year 5 year 6 year 7 year 8 number unitrange of price
($1,000)(*)remarks
1. Permission/Concession
Concession acquisition Sum of 1.2. Surface Exploration Geology/Geochemistry Geophysics Conceptual model for drilling target consideration Sum of 2. 1,0003. Well Drilling Civil engineering Drilling pads
Roads Exploration wells 2- 4 X 2000m (6-1/4") 10,000-14,000 Feasibility Wells 4 X 2000m (8-1/2") 28,000-34,000 Production wells 5 X 2000m (8-1/2") 35,000-40,000 Reinjection wells 3 X 1500m (8-1/2") 20,000-25,000
Sum of 3. 93,000-113,0004. Discharge test Single-well discharge Short term 0 by LaGeo Multi-well discharge Long term (more than 6 months) 0 by LaGeo
Sum of 4. 05. Resource Assessment Reservoir assessment by LaGeo Economic assessment by LaGeo
Sum of 5. 06. Environmental Impact Assessment Background monitoring Exploration well MARN Permission EIA for feasibility EIA for development Sum of 6. 200
Sum of 1. ~ 6. 94,200-114,2007. Power plant construction Planning and basic design Steam facilities 30000 kW 10,000-14,000 Power plant 30000 kW 45,000-60,000
Transmission line 3,000-5,000 Commissioning
(*) Costs reference: Paul Quinlivan, S.K.M., Auckland, N.Z., WGC2010, Practical Finnancing of Geothermal Projects. Developments & operating Costs. Total 152,200-193,200(Information Source/Date) LaGeo/Oct. 10, 2011

Final Report Chapter 10
Republic of El Salvador 10-87 March 2012 The Project for Master Plan for the Development of Renewable Energy (JICA)
10.3.6 Biomass The necessity of introducing small-scale biomass power generation system is determined from the results of the study on biomass resources in El Salvador. In this Chapter, as small-scale biomass generation systems, biomass gasification systems and micro-binary generators which operate by utilizing biomass resources and solar heat are explained.
10.3.6.1 Biomass Gasification A. General Gasification is a thermo-chemical process that converts solid biomass to combustible producer gas. Gasification technology has a long history. Research on the production of gas from wood was conducted in the 18th century. In 1881, an engine was tested to run using producer gas. This technology was most widely used during World War II. The war caused severe shortage of oil products. About a million gasifiers were used in running cars, trains and ships and in generating electricity in Europe. About 100,000 gasification vehicles were used in Japan and Russia. After the war, oil products became cheap and readily available and thus, gasification was forgotten. The technology was reconsidered during the oil shock in 1973. For the last couple of decades, biomass energy utilization has been recognized as one of the most important countermeasures against global warning. Development and utilization of biomass gasification technology has been progressing rapidly.
Biomass is recognized as one of the major potential sources for energy production. Biomass resources include forestry residues, energy crops, food manufacturing waste, coconut shell, bagasse from sugarcane processes and food processing residues have all been used for energy generation. Biomass gasification is the incomplete combustion of biomass resulting in the production of combustible gases consisting of Carbon monoxide (CO), Hydrogen (H2) and traces of Methane (CH4). This combustible gas is called producer gas. There are two major methods (direct combustion and gasification) to generate electricity from solid biomass. Direct combustion is the most common way of converting biomass to energy. For generating electricity, a biomass-fired boiler converts the heat of combustion into steam, this steam then drives the turbine-generator to produce electricity. This system is a proven technology and has been introduced to many agricultural processing factories around the world. The system is suitable for relatively large-scale use (e.g. > 1.0 MW), such as those using bagasse for power generation in a sugarcane factory in El Salvador. However, it is not appropriate for small-scale industries, such as the coffee and rice industries in El Salvador.
Gasification is a thermo-chemical process that converts biomass into a combustible gas called producer gas which contains about 80% of the energy originally present in the biomass. The producer gas is sent through a cooling and purifying unit before feeding into the engine to generate electricity. The system is commercially available from 4 kW to several MW. They are commonly used for rural electrification and thermal application in some countries and small-scale biomass gasification is thought of as a proven technology. This small system can be a more suitable technology for coffee and rice processing factories.
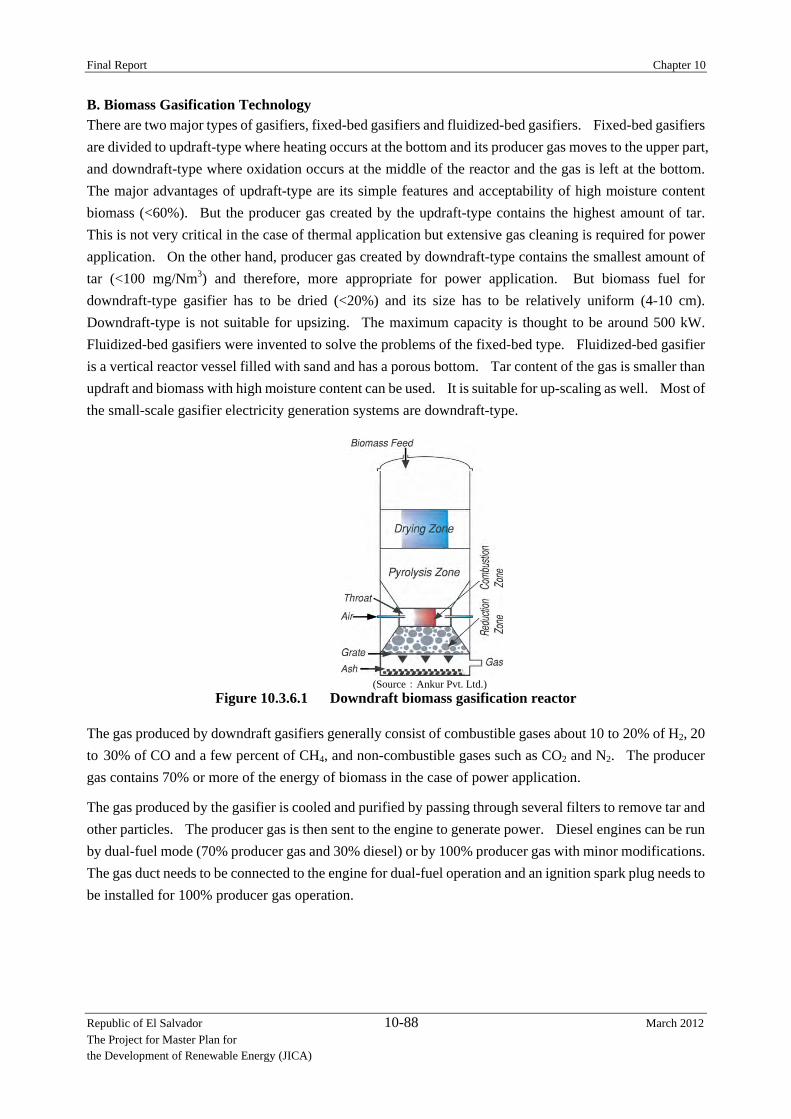
Final Report Chapter 10
Republic of El Salvador 10-88 March 2012 The Project for Master Plan for the Development of Renewable Energy (JICA)
B. Biomass Gasification Technology There are two major types of gasifiers, fixed-bed gasifiers and fluidized-bed gasifiers. Fixed-bed gasifiers are divided to updraft-type where heating occurs at the bottom and its producer gas moves to the upper part, and downdraft-type where oxidation occurs at the middle of the reactor and the gas is left at the bottom. The major advantages of updraft-type are its simple features and acceptability of high moisture content biomass (<60%). But the producer gas created by the updraft-type contains the highest amount of tar. This is not very critical in the case of thermal application but extensive gas cleaning is required for power application. On the other hand, producer gas created by downdraft-type contains the smallest amount of tar (<100 mg/Nm3) and therefore, more appropriate for power application. But biomass fuel for downdraft-type gasifier has to be dried (<20%) and its size has to be relatively uniform (4-10 cm). Downdraft-type is not suitable for upsizing. The maximum capacity is thought to be around 500 kW. Fluidized-bed gasifiers were invented to solve the problems of the fixed-bed type. Fluidized-bed gasifier is a vertical reactor vessel filled with sand and has a porous bottom. Tar content of the gas is smaller than updraft and biomass with high moisture content can be used. It is suitable for up-scaling as well. Most of the small-scale gasifier electricity generation systems are downdraft-type.
(Source:Ankur Pvt. Ltd.)
Figure 10.3.6.1 Downdraft biomass gasification reactor
The gas produced by downdraft gasifiers generally consist of combustible gases about 10 to 20% of H2, 20 to 30% of CO and a few percent of CH4, and non-combustible gases such as CO2 and N2. The producer gas contains 70% or more of the energy of biomass in the case of power application.
The gas produced by the gasifier is cooled and purified by passing through several filters to remove tar and other particles. The producer gas is then sent to the engine to generate power. Diesel engines can be run by dual-fuel mode (70% producer gas and 30% diesel) or by 100% producer gas with minor modifications. The gas duct needs to be connected to the engine for dual-fuel operation and an ignition spark plug needs to be installed for 100% producer gas operation.
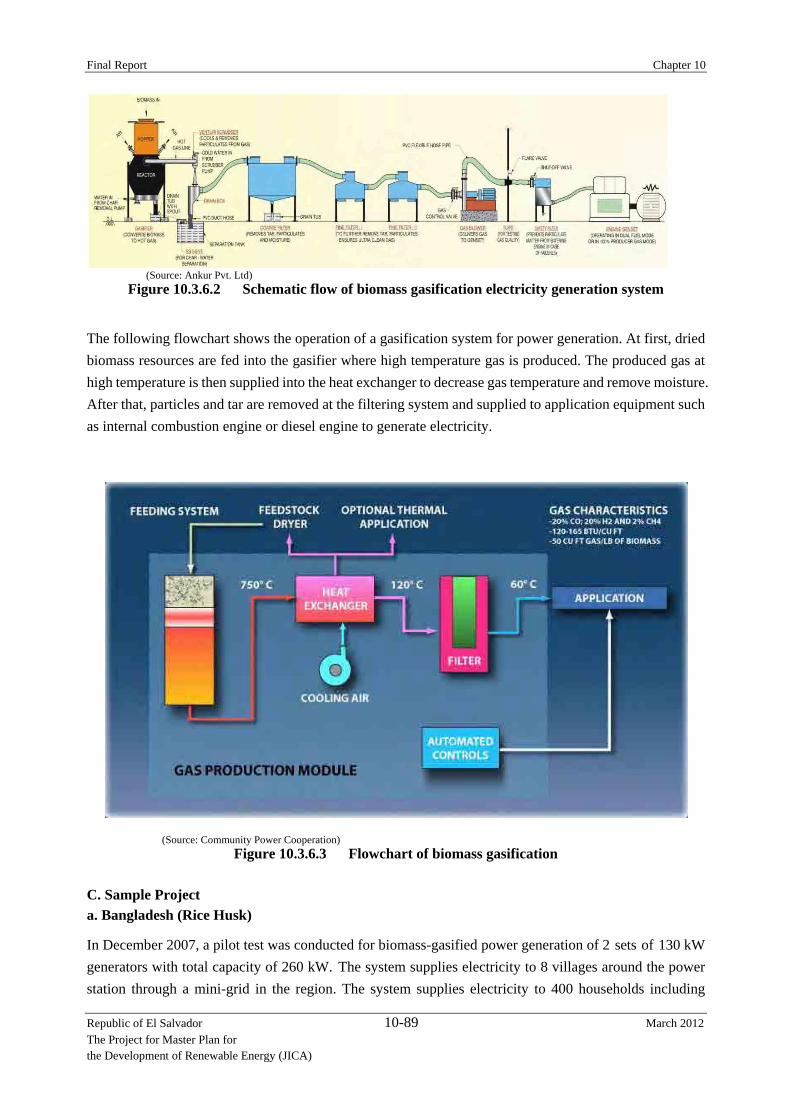
Final Report Chapter 10
Republic of El Salvador 10-89 March 2012 The Project for Master Plan for the Development of Renewable Energy (JICA)
(Source: Ankur Pvt. Ltd)
Figure 10.3.6.2 Schematic flow of biomass gasification electricity generation system
The following flowchart shows the operation of a gasification system for power generation. At first, dried biomass resources are fed into the gasifier where high temperature gas is produced. The produced gas at high temperature is then supplied into the heat exchanger to decrease gas temperature and remove moisture. After that, particles and tar are removed at the filtering system and supplied to application equipment such as internal combustion engine or diesel engine to generate electricity.
(Source: Community Power Cooperation) Figure 10.3.6.3 Flowchart of biomass gasification
C. Sample Project a. Bangladesh (Rice Husk)
In December 2007, a pilot test was conducted for biomass-gasified power generation of 2 sets of 130 kW generators with total capacity of 260 kW. The system supplies electricity to 8 villages around the power station through a mini-grid in the region. The system supplies electricity to 400 households including

Final Report Chapter 10
Republic of El Salvador 10-90 March 2012 The Project for Master Plan for the Development of Renewable Energy (JICA)
telecom facility, shops and so on. Rice husks are being used as the biomass fuel for gasification. Dream Power Ltd was established as a private power supply company for the project. There are 15 employees including 3 technicians who trained in an Indian company which manufactures gasification systems. Electricity is being supplied for 5 hours and 30 minutes every day, from 18:00 H to 23:30 H. Except during operational hours, power demand is too small to supply electricity as a private business. The total capacity of the power plant is 260 kW. However, only one set of gasification system is being operated as the power demand is too small at 60 kW compared with the estimated demand. Power meters are installed at contacted households and power tariffs are collected at metered rates. The connection fee to the mini-grid is US$1.3 and the unit price of power is US$0.065/kWh. In the financial aspect, it is not easy to manage the power supply company because the average total power tariff from users is only around US$780 per month. With this income, the company still has to pay for fuel and maintenance cost. The power demand was overestimated and is one of the reasons for the current difficulties in management. In addition, users are also trying to reduce power consumption by using effective compact fluorescent light.
1. Operational power output :40 kWe 2. Rice husk consumption :3 bags /hour, 50kg/hour 3. Price of rice husk :US$0.26-0.52/bag (seasonal change) 4. Fuel consumption rate :1.25 kg/kWh 5. Unit price of biomass fuel :US$0.02/kWh (US$0.26/bag)
US$0.026/kWh (US$0.52/bag) (1 BDT=0.013US$)
Figure 10.3.6.4 Biomass gasified generation plant

Final Report Chapter 10
Republic of El Salvador 10-91 March 2012 The Project for Master Plan for the Development of Renewable Energy (JICA)
b. Sample Project: USA (Woody Biomass, etc.) Community Power Cooperation (CPC) was established in 1995. The company was initially involved in providing modern energy services to off-grid communities in developing countries. In 1999, CPC was selected by DOE as part of the Phase I Project to develop a 12.5-kW prototype system called the “BioMax” to provide power to a remote community in the Philippines using coconut shells as the feedstock. CPC was then given the Phase II contract in 2000 to incorporate numerous technological advances, increase the capacity to 15 kW, and deploy several systems as part of a Product Validation program. The company has since expanded its product lineup to include 25, 50 and 75 kW systems; combined heat and power systems; thermal systems; containerized systems; mobile systems; and systems that can make synthetic diesel fuel. The summarized technical information of the “BioMax” is shown below.
Table 10.3.6.1 Summarized information of BioMax series Performance Category 63 Nm3/hr 125 Nm3/hr 175 Nm3/hr
Maximum electrical output (kWe) - 100%
electrical 25 50 75
Maximum thermal output (MJ/hr) - 100% heat 317 633 950
Biomass conversion rate (dry kg/hr) 22 44 66
Gasifier Type Downdraft Downdraft Downdraft
Maximum Temperature (C°) 900 to 1000 1650 - 1830 1650 - 1830
Gas Temperature Out of Gasifier (C°) 650 - 700 650 - 700 650 - 700
Engine Types
Spark ignition or
Compression
ignition
Spark ignition or
Compression
ignition
Spark ignition or
Compression
ignition
(Source: CPC)
(Source: CPC)
Figure 10.3.6.5 BioMax 25

Final Report Chapter 10
Republic of El Salvador 10-92 March 2012 The Project for Master Plan for the Development of Renewable Energy (JICA)
D. System Cost Biomass gasification systems are already widely distributed in India, therefore system cost is lower compared to that of other countries. The following shows the typical system cost of a biomass gasification system in India.
India (ANKUR)
Typical prices are between US$900 to 2000/kWe
USA (CPC)
Typical prices are between $4,500 and $7,000/kWe. 10.3.6.2 Microbinary Generation System In a binary-cycle power generation system, binary fluid with a low boiling point such as butane or pentane hydrocarbon is pumped at high pressure through the heat exchanger. After that, the fluid is vaporized at the heat exchanger and then directed through a turbine for electricity generation. “Microbinary” is developed as small-scale binary power generation system by KOBELCO. Microbinary is commercialized as the world's first half-sealed screw turbine. It can be operated using hot water with low temperatures between 700C to 950C. Therefore, the binary generation system can be applied to many types of renewable energy sources, such as geothermal, biomass and solar thermal. In addition, it can also use waste heat from industries.
A. Main Characteristic
High-performance power generation is available because of the adjustability of the technologies, such as screw turbine and synchronous generator, to the temperature fluctuations of the heat source.
B. Simple and small-binary power generation systems
Installation of multiple modules of 70 kW is possible. It is possible to design based on surrounding circumstances. In a microbinary generation set, the inverter, converter and controller are assembled.
4 kW US$Basic 1.7 3,400Add: transport, taxes, duties 0.3 600Site specific civil works 0.4 800Misc. & Contingencies 0.3 600Total 2.7 5,400
40 kW US$Basic 15 30,640Add: transport, taxes, duties 0.5 1,000Site specific civil works 1.5 3,000Misc. & Contingencies 2 4,000Total 19 38,640

Final Report Chapter 10
Republic of El Salvador 10-93 March 2012 The Project for Master Plan for the Development of Renewable Energy (JICA)
Therefore, it is easy to install on-site.
C. Specifications
The following table shows the technical specifications of the microbinary generation system. The binary generation system can be operated using hot water at low temperatures between 700C to 950C. Other necessary equipment, such as inverters and converters, are packaged with the generation system.
Table 10.3.6.2 Microbinary Generation Systems Specifications Type MB-70H
Maximum Power Output at Generator 70 kW
Maximum Power Output at Generator 60 kW
Generator Synchronized Generator
Rated rotational speed 5500 rpm
Binary gas HFC245fa
Designed Pressure 0.97 MPa
Temperature of heating source 70 to 95 0C
Turbine Screw Turbine
Inverter, Converter in the unit
Controller in the unit
Size 2250 mm x 2600 mm x 2250 mm
Weight 6500 kg (Source: KOBELCO)
The following figure shows KOBELCO (MB-70H). The system can be operated using geothermal, solar and biomass sources of energy.
(Source: KOBELCO)
Figure 10.3.6.6 KOBELCO Microbinary (MB-70H)

Final Report Chapter 10
Republic of El Salvador 10-94 March 2012 The Project for Master Plan for the Development of Renewable Energy (JICA)
(Source: KOBELCO)
Figure 10.3.6.7 Microbinary using Solar and Biomass D. System Cost
The following shows only the cost of the microbinary equipment and its installation. The installation cost may vary depending on the usage purpose.
Microbinary (MB-70H): US$312,500 (Equipment only)
US$500,000(Including installation)
Power GenerationSolar
Biomass
Heat

Final Report Chapter 10
Republic of El Salvador 10-95 March 2012 The Project for Master Plan for the Development of Renewable Energy (JICA)
10.3.6.3 Consideration for the introduction of biomass technology Biomass potential in El Salvador has been studied and the results are summarized below. A. Summary of the study a. Sugar cane: There are 3 factories with 4 bagasse power plants in the country. The total capacity is
109.5 MW by the end of December 2011. There are development plans for a generation system with additional 45 MW total capacity.
b. Coffee: Currently, coffee husks are being used as fuel for the boiler in some factories. Estimated capacity for power generation using coffee husks is small at 0.6 MW for the country. At present coffee husks is not available for generating electricity because it is totally used in generating steam in the coffee factory.
c. Rice: Estimated capacity for power generation using rice husks is small at 0.95 MW for the country.
d. Introduction of the technology
Small-scale power generation systems are introduced because biomass resources are limited and widely distributed in the country.
B. Consideration for future development
a. Updating of biomass data
It is necessary to update the information on biomass resources in the country. The information has to be made available to interested people or institutions.
b. Cooperative framework
Since biomass resources, such as coffee or rice husks, are limited for processing at a factory, regional cooperative framework consisting of several factories has to be considered.
c. Human resource development
There is a possibility to introduce the use of small-scale biomass power generation systems in small biomass potential sites. Some small-scale biomass power generation systems, such as biomass gasification can be manufactured in the country. As such, it is important to transfer those kinds of technologies locally.

Final Report Chapter 10
Republic of El Salvador 10-96 March 2012 The Project for Master Plan for the Development of Renewable Energy (JICA)
10.3.7 Biogas The necessity of introduction of small-scale biogas power generation system is found in the results of a study on biogas resources in El Salvador. In this chapter, a successful biogas project by Grameen Shakti, an NGO in Bangladesh, is discussed. As for data on costs, this is based on the result of a study by UCA on biogas. Information on wastewater treatment plants are collected from Administración Nacional de Acueductos y Alcantarillados (ANDA). The Biogas Project, which is conducted in Chile by GIZ, is explained in this chapter. The required technologies for future development are explained as recommendation. Information on waste power generation system is discussed.
10.3.7.1 Animal Waste A. General
Biogas is the gaseous product of anaerobic digestion of organic matter. It is typically made up of 60-70% methane (CH4), 30-40% carbon dioxide (CO2), 1-5% hydrogen (H2), up to 0.2% nitrogen (N2) and a few impurities including hydrogen sulfide (H2S). Under ideal conditions, concentration of CH4 can increase up to 80%. However, this is more commonly around 60% with approximately 40% of CO2. When CO2 concentration in the biogas exceeds 40%, deterioration of combustion rate and misfires occur and the engine could not run normally.
The typical components of biogas, landfill gas and natural gas are indicated in Table 10.3.7.1. The main difference in the composition between biogas and natural gas is on the carbon dioxide content. Carbon dioxide is one of the main components of biogas, while natural gas contains very low amounts of CO2. In addition, natural gas also contains higher levels of hydrocarbons other than methane. These differences result to lower energy content of biogas per unit volume compared to natural gas. Typical lower heating value of biogas is as low as 6.5 kWh/Nm3 compared to that of natural gas (Danish) which is 11.0 kWh/N-m3.
Table 10.3.7.1 Typical Components of Biogas
Biogas Landfill
gas
Natural gas
(Danish)*
Natural gas
(Dutch)
Methane (CH4) (vol-%) 60–70 35–65 89 81
Other hydrocarbons (vol-%) 0 0 9.4 35
Hydrogen (H2) (vol-%) 0 0-3 0 –
Carbon dioxide (CO2) (vol-%) 30–40 15–50 0.67 1
Nitrogen (N2) (vol-%) ~0.2 5–40 0.28 14
Oxygen (O2) (vol-%) 0 0-5 0 0
Hydrogen sulfide (H2S) (ppm) 0–4000 0–100 2.9 –
Ammonia (NH3) (ppm) ~100 ~5 0 –
Lower heating value (kWh/Nm3) 6.5 4.4 11.0 8.8 (Source: Biogas Upgrading Technologies – Developments and Innovations, IEA)

Final Report Chapter 10
Republic of El Salvador 10-97 March 2012 The Project for Master Plan for the Development of Renewable Energy (JICA)
B. Biogas Technology
a. Bio- digester
The bio-digester is a physical structure that is more commonly known as the biogas plant. Since various chemical and microbiological reactions take place in the bio-digester, it is also known as bio-reactor or anaerobic reactor. The main function of this structure is to provide anaerobic conditions inside its chamber, which should be air/water-tight. This can be made using various construction materials and in different shapes and sizes. Construction of this structure comprises major part of the investment cost. Some of the commonly used designs of small-scale bio-digesters are discussed below.
Fixed-Dome Digester
Fixed-dome Chinese model biogas plant consists of an underground brick masonry compartment with a dome on the top for gas storage. In this design, the fermentation chamber and the gas holder are combined as one unit. The lifespan of fixed-dome type plant extends from 20 to 50 years. Figure 10.3.7.1 below shows typical construction of fixed-dome digester.
(Source: Consolidated Management Services, Nepal)
Figure 10.3.7.1 Fixed-Dome Digester
Floating Drum Digester
In this design, the digester chamber is made of brick masonry in cement mortar. A mild steel drum is placed on top of the digester to collect the biogas produced from the digester. Thus, there are two separate structures for gas production and collection. With the introduction of the fixed-dome Chinese model plant, the floating drum plants became obsolete because of its comparatively high investment and maintenance cost along with other design weaknesses. The figure below shows the typical construction layout of a fixed-dome digester.

Final Report Chapter 10
Republic of El Salvador 10-98 March 2012 The Project for Master Plan for the Development of Renewable Energy (JICA)
(Source: Consolidated Management Services, Nepal)
Figure 10.3.7.2 Floating Drum Digester
b. Biogas Generator
The utilization of biogas in internal combustion engines (gas engines) is a long-established and extremely reliable technology. Thousands of engines are operated on sewage works, landfill sites and biogas installations. The engine sizes range from several kW on small farms up to several MW on large-scale landfill sites. A diesel engine can be rebuilt into a spark-ignited gas engine or a dual-fuel engine where approximately 8-10% diesel is injected for ignition. Both types of engines are often used. Latest designs show electricity conversion efficiencies of up to 41%.
c. Operation
For the operation of biogas plant, pH and temperature are useful indicators.
pH value :
The optimum biogas production is achieved when the pH value of input mixture in the digester is between 6 and 7. The pH in a biogas digester is also a function of the retention time. In the initial period of fermentation, as large amounts of organic acids are produced by acid-forming bacteria, the pH inside the digester can decrease to below 5. This inhibits or even stops the digestion or fermentation process. When the methane production level is stabilized, the pH range remains buffered between 7.2 and 8.2.

Final Report Chapter 10
Republic of El Salvador 10-99 March 2012 The Project for Master Plan for the Development of Renewable Energy (JICA)
Temperature:
The methanogens are inactive in extreme high and low temperatures. The optimum temperature is 35 °C. When the ambient temperature goes down to 10 oC, gas production virtually stops. Satisfactory gas production takes place in the mesophilic range, between 25 to 30 °C. Proper insulation of the digester helps in increasing gas production during cold season.
C. Sample Project
a. Grameen Shakti Project in Bangladesh Biogas for cooking In Bangladesh, around 7,000 biogas facilities are introduced in the rural area by Grameen Shakti, a world-famous NGO. Actual operational situations of 12 biogas systems were studied in the JICA study. Out of 12, there are 7 users of 2.4-m3 biogas facilities, 3 users of 2.0-m3 digesters and one user each of 3.2-m3 and 4.8-m3 digesters. Slurry discharged from biogas digesters is being used in agriculture as organic fertilizer. In addition, dried slurry with moisture content of ~15% is prepared by users and the solid form of the slurry is being sold at US¢4 per kg. In the study, 11 out of 12 households responded that they use the slurry for agricultural purposes which reduced their expenditures on fertilizers. Table 8-10 shows price list of biogas in the project. The subsidy from the government of around US$130/unit is not included in the price.
Table 10.3.7.2 Price List of Biogas: Grameen Shakti Capacity
(m3) No. of
Users Construction
Cost* Minimum
down Payment
Monthly Repayment
1 2.0 5-6 US$207 US$52 US$7.5
2 3.0 7-8 US$254 US$64 US$9.3
3 4.0 10-12 US$313 US$78 US$11.4
4 5.0 15-16 US$365 US$ 91 US$13.4
5 6.0 18-20 US$417 US$104 US$15.1
(Source: JICA Study Team)
Biogas for power generation
Power generation systems are being introduced slowly by private institutions. Grameen Shakti has introduced 20 biogas systems for power generation. There are two biogas power generation facilities with 5-kW capacity each at the dairy farm in the local community. The source of biogas is the cow dung produced from the dairy farm. There are two

Final Report Chapter 10
Republic of El Salvador 10-100 March 2012 The Project for Master Plan for the Development of Renewable Energy (JICA)
biogas digesters in the farm. The following shows the amount of biogas production and the input to the digesters. Demand of electricity is mainly for lighting, fan and water pump in the dairy farm.
Digester No. 1 Output : 850 ft3/day Input : 600 kg cow dung/day + 600 L water/day
Digester No. 2 Output : 2100 ft3/day Input : 1500 kg cow dung/day + 1500 L water/day
In this plant, gas engine made in China is being used for power generation and the price is ~US$765. Before using the gas engine, Chinese-made small diesel generator was used and operated by dual-fuel, biogas and diesel. Instead of a diesel generator, the gas engine is being used for the new project because of the possibility to operate using 100% of produced gas. Venturi tube for air and gas mixers and filters to remove sulfur-hydrogen and moisture are manufactured in the country. Small enterprises are selling these equipment with biogas digesters.
D. System Cost
Universidad Centro Americana (UCA) has conducted research on the economic analysis of biogas systems in El Salvador. The bio-digester was installed at Miravalle, in El Porvenir Municipality, Santa Ana Department. The following assumptions are taken into account in the analysis:
The initial investment was made in early 2010 (January 2010). Project life cycle is 20 years. No replacement of equipment. Discount rate is 7.3%. Loans for the initial investment have 0% interest. Projected income and expenses are in constant prices. Straight-line depreciation.
The construction and equipment costs of the bio-digester and power generation system are shown in Table 10.3.7.3. These construction costs have been provided by the actual bio-digester manufacturer.

Final Report Chapter 10
Republic of El Salvador 10-101 March 2012 The Project for Master Plan for the Development of Renewable Energy (JICA)
Table 10.3.7.3 Initial Construction Cost at Miravalle
CIVIL WORKS: CONSTRUCTION
Design --
Mixed pool perimeter fence --
Channels --
Machine room --
Improvement (plaster, hermetically
sealed) --
Labor --
Others --
SUB-TOTAL US$26,668.33
MACHINE ROOM: EQUIPMENT
Purchase of generator (15 kW) US$10,000.00
Expenditure on imports US$1,500.00
Others US$1,490.33
SUB-TOTAL US$12,990.33
Accessories
Gas meters US$57.00
Piping network US$20.00
Pumps and filters (2 units) US$1,200.00
Metering equipment US$30.00
Installation of other accessories US$10.00
SUB-TOTAL US$1,317.00
O&M TOOLS
Operation tools US$10.00
Maintenance tools US$10.00
SUB TOTAL US$20.00
Lower administrative expenses US$5.00
SUB-TOTAL US$5.00
TOTAL US$41,000.66 (Source: Aprovechamiento Energético del Biogás En El Salvador, UCA)
The estimated cost of monthly operation of biogas digester is shown in Table 10.3.7.4. Staff salaries are not included because the operators-in-charge are also employees of the Miravalle Farm who are already paid for their work at the farm. Water consumption is also excluded in the estimate as water from the tap will not be used for the operation of the bio-digester, instead, recycled water will be used.

Final Report Chapter 10
Republic of El Salvador 10-102 March 2012 The Project for Master Plan for the Development of Renewable Energy (JICA)
Table 10.3.7.4 Monthly Operational Cost Operation staff Not included
Water consumption/month Not included
Purchase of miscellaneous supplies (gloves, masks) US$15.00
Monthly analysis US$25.00
Lower administrative expenses US$5.00
TOTAL US$45.00 (Source: Aprovechamiento Energético del Biogás En El Salvador, UCA)
The estimated maintenance costs are presented in the following table.
Table 10.3.7.5 Monthly Maintenance Cost
Operation staff Not included
Purchase of spare parts (for the plant) US$5.00
Maintenance of measurement equipment (preventive) US$5.00
Maintenance of generator (preventive) US$10.00
Maintenance of pump (preventive) US$10.00
General maintenance of the plant (preventive and corrective) US$5.00
Maintenance of other facilities and equipment US$5.00
Emergency fund for corrective maintenance US$10.00
Lower administrative expenses US$5.00
TOTAL US$55.00 (Source: Aprovechamiento Energético del Biogás En El Salvador, UCA)
10.3.7.2 Wastewater A. General
According to ANDA, there are 66 water treatment facilities which are managed by governmental organization and other external organizations. Currently, the available information on water treatment plants is only for the estimation of biogas production. In this chapter, the typical workflow on a water treatment facility is explained. And the project, “Potential de Biogas: Identification and Classification Type of Available Biomass for Biogas Generation” which was carried out by GIZ in Chile in 2007 is explained as a sample. The required technologies for future development are explained as recommendation.
B. Biogas Production by Water Treatment Plant a. Water Treatment Plant Technology The objective of the wastewater treatment plant is to remove solids, reduce organic matter and pollutants, and restore oxygen. Mainly, there are two methods of wastewater treatment, namely, aerobic and anaerobic treatment. The first type of wastewater treatment is with oxygen, and the other treatment is without oxygen (anaerobic reactors).

Final Report Chapter 10
Republic of El Salvador 10-103 March 2012 The Project for Master Plan for the Development of Renewable Energy (JICA)
A pre-treatment must be done to remove all the solids such as plastic, metals and inorganic matter. Reducing the organic matter is a natural process where bacteria and microorganisms consume organic matter from the wastewater. In the final process, more oxygen is introduced and this supports aquatic life in the water resource. The following figure shows the work processes in a wastewater treatment plant.
(Source: JICA Study Team)
Figure 10.3.7.3 Conventional Wastewater Treatment Plant b. Operation Wastewater treatment process of conventional facility is described below.
Physical treatment After wastewater is introduced into the wastewater treatment plant, sludge, grease and sand are removed before the preliminary treatment. All the solid particles are removed in this process.
Sediment tank In sediment tanks, solid particles settle at the bottom of the tank. These solid particles, which are called sludge, can be used after anaerobic treatment.
Biofilters The solid particles in wastewater can be removed by passing the water through filters. Bacteria and micro-organisms are used in the filter to reduce the amount of organic materials. Also, activated sludge can be used for the aerobic treatment.
Anaerobic reactors Wastewater treatment plants can use anaerobic reactors to produce biogas. However, this is not a common technology on all wastewater treatment plants. The most common technology for producing biogas is the anaerobic reactor or the UASB reactor.

Final Report Chapter 10
Republic of El Salvador 10-104 March 2012 The Project for Master Plan for the Development of Renewable Energy (JICA)
Purification Basically, if water after treatment process is for consumption by humans, the water has to include purification in the process.
Discharge Water will be discharged after the treatment process. Treated water can be used for other purposes such as irrigation, human consumption and discharge to water resources.
C. Sample Project a. Potential of Biogas in Chile Engines used Internal combustion engines were used in the project. In general, capacities of engines using biogas range from few kW to around 20 MW. The efficiency of these engines can be between 70 to 80%. The efficiency of power generation varies between 30 and 40%. The recovery of exhaust heat is dependent on the performance of the heat exchanger installed at the engine cooling system. Two cooling systems are attached to these engines. The range of operational temperature for first cooling system is ~85 to 99°C and that of the other cooling system is around 40 to 70 °C. The cooling system lowers the temperature of engine, oil, and compressed air at the entrance of the system. In this project, around 30% of the engine’s energy consumption is supplied by produced biogas. Heat recovery from exhaust pipe is an additional process. The temperature reaches ~350 to 550 °C at the exhaust pipe. The exhaust heat represents roughly 23 to 35% of energy produced by the biogas engine. The table below shows performance of an internal combustion engine which is operated using biogas.
Table 10.3.7.6 Regular Performance of a CAT 352 Engine
Performance Efficiency (%)
Electric 30.0
Thermic (gases) 20.7
Thermic (cooler) 19.3 (Source: Identificacion y clasificacion de biomasa, en Chile, GTZ)
Biomass analyses for electricity The project, “Potential de Biogas: Identification and Classification of Types of Available Biomass for Biogas Generation in Chile” was carried out by GIZ in 2007.
In the study, identification and classification of different types of biomass for power generation which are available in Chile were carried out. The following table shows the variations between different types of biomass available in Chile. The amount of each waste is indicative of the potential biogas production for each biomass type evaluated.

Final Report Chapter 10
Republic of El Salvador 10-105 March 2012 The Project for Master Plan for the Development of Renewable Energy (JICA)
Table 10.3.7.7 Amount of Biogas Production
Biomass Waste Unit Biogas Production
Anaerobic treatment 169.370 Ton DBO/year 480 m3/ton DQO
Sludge* 249.762 Ton Organic M/year 550 m3/ton Organic M.
Beer factory* 12.546 Ton Organic M/year 700 m3/ton Organic M.
*dry waste Organic M: Organic Material / DQO: Demanda Quimica de Oxígeno (Chemical Oxygen Demand) DBO: Demanda Biológica de Oxígeno (Biological Oxygen Demand) (Source: Identificacion y clasificacion de biomasa, en Chile, GIZ)
The table below shows available power output and capacity based on the available amount of biogas production.
Table 10.3.7.8 Available Power Output and Capacity
Biomass Total electric power Electric power capacity installed
Min. available (MWh/year)
Max. available (MWh/year) Min. available MW Max. available
MW Anaerobic treatment 19.396 38.793 20 33
Sludge* 161.271 258.033 20 33 Beer factory* 16.762 19.905 2 3
*dry waste (Source: Identificacion y clasificacion de biomasa, en Chile, GTZ)
D. System Cost
GIZ has conducted research on economic analysis of biogas systems in Chile. The study was conducted at beer breweries which produce biogas from solid waste. The biogas production system used in the beer brewery was anaerobic digestion. The following table shows the amount of solid waste, volume of produced biogas, capacity and number of generators.
Table 10.3.7.9 Summarized Information of Biogas System in Beer Breweries in Chile
Beer brewery Amount of solid waste (ton/year)
Volume of biogas production (km3/year)
Size of the generator MW
Number of generators
1 50,000 122,880 4 2
2 20,000 45,056 2 1 (Source: Identificacion y clasificacion de biomasa, en Chile, GIZ)
The result of the study shows that the power plant has capability to generate 122,880 cubic kilometers of biogas in a year.
The following table shows the total cost of the project for a cogeneration of 4 MW for solid waste generated by the beer breweries. All the solid waste (sludge) underwent anaerobic treatment after its

Final Report Chapter 10
Republic of El Salvador 10-106 March 2012 The Project for Master Plan for the Development of Renewable Energy (JICA)
discharge from the wastewater treatment facility.
Table 10.3.7.10 Investments Costs of Cogeneration Plant (4 MW) in Beer Breweries Cost Unit Value
Specific investments cost
- Grid connection US$ 10,000
Engine cost US$ 1,379.048
Digester cost and plant US$ 5,464.161
Others (buildings) US$ 342,160
Heat grid (connection cost) US$ 20,000
Investment cost US$ 7,215.369
Planning cost/permits: 10% of the
investment costs
US$ 721.537
Total US$ 7,936.907 (Source: Identificacion y clasificacion de biomasa, en Chile, GIZ)
E. Future Requirements The production of biogas from water treatment plants can be estimated based on accumulated data and information. The following shows the list of processes essential in the analysis of the biogas production potential from wastewater.
Information update: The data of water treatment facility has to be updated. And the data has to be made available to engineers who estimate output production of biogas resources.
Water treatment plant input: The volume of organic materials in water has to be measured at each plant. It is necessary to calculate the expected biogas production based on the analysis of the anaerobically treated-water at each wastewater treatment plant. Also, BOD level has to be examined for estimation purposes as the BOD levels provide an indicative value of the amount of organic matter in water.
Sludge production measurement: The produced agglomerated residue after water treatment process is called sludge. This sludge can undergo treatment using anaerobic reactors to produce biogas. The sludge productions have to be studied to find out the potential for biogas production. Also, analysis of the different sludge types can be conducted to establish estimation procedures of biogas production rates.
Capacity of the plant: The total number of water treatment plants managed by ANDA is 66. However, the capacities of most facilities are as low as <1.0 m3. In most water treatment facilities, there are no anaerobic reactors or UASB reactors that can be used to produce biogas.

Final Report Chapter 10
Republic of El Salvador 10-107 March 2012 The Project for Master Plan for the Development of Renewable Energy (JICA)
10.3.7.3 Waste Power Generation A. General Waste power generation system produces steam by elevating temperature and pressure with the heat from incinerated solid waste. Then, electricity is generated from the steam turbine. The exhaust heat of the generator can be used effectively as energy source for air-conditioner and water heater in the neighboring areas of the plant. The waste power generation requires large amount of solid waste. However, it is possible to introduce waste power generation systems in small communities if some communities work together. Also, cooperation from residents is important in the introduction of waste power generation facilities into their community. Some features of waste generation are as follows:
Waste power generation contributes solution to both problems of garbage disposal and energy.
Discharge of dioxin is controlled by incineration at high temperature.
Potential to supply heat in the neighboring areas.
Classification of waste is important in effectively using waste as an energy source. For example, classification of plastic, paper and wood is necessary. However, in El Salvador, laws that promote utilization of recycled resources based on the 3R concept (Reuse, Recycle, Reduce) are not yet in place. Recently, discharge of dioxins caused by the combustion of waste and the lack of ash disposal facilities contribute to the problem. However, technology development to control discharge of dioxins by incineration at high temperatures has been carried out recently.
B. Sample Project
Joint study for power generation projects and efficient utilization of industrial wastes in Vietnam was carried out by NEDO and IEA in 2009. In the study, conceptual design of an industrial waste power generation project was prepared. The following shows the summary of the results of the study:
a. Specifications
Incineration capacity: 75 tons/day (ave. calorie content: 16,000 kJ/kg)
Type of incinerator: Rotary kiln stoker (fluidized-bed furnace is also possible)
Generation capacity: 1.2 MW (transmission end base)
Operation: 24 hrs/day ×330 days/yr = 7,920 hrs/yr
Power production rate: 1.2 MW×0.90×24 hrs/day ÷75 ton/day = 345.6 kWh/ton
b. Estimated Project Cost and Energy Efficiency
Total project cost: approximately US$21 million
Energy efficiency: 8.7%
Power generation cost: approximately US$0.26/kWh
O &M costs: approximately US$416,000/yr

Final Report Chapter 10
Republic of El Salvador 10-108 March 2012 The Project for Master Plan for the Development of Renewable Energy (JICA)
c. Preliminary Schedule
The following preliminary schedule was suggested by the NEDO study team for the project in Vietnam.
Table 10.7.3.11 Preliminary Schedule
(Source: Joint Study for a Power Generation Project and Efficient Utilization in Vietnam Hanoi Area, NEDO)
The following figure shows the concept of waste power generation system:
Figure 10.3.7.4 Waste Power Plant (Source: Joint Study for a Power Generation Project and Efficient Utilization in Vietnam Hanoi Area, NEDO)

Final Report Chapter 10
Republic of El Salvador 10-109 March 2012 The Project for Master Plan for the Development of Renewable Energy (JICA)
10.3.7.4 Consideration for Introduction of Biogas Technology Biogas potentials in El Salvador have been studied and the results are summarized below.
A. Summary of the Study a. Landfill: There is a landfill biogas power generation system in Nejapa with an
installed capacity of 6.3 MW. There is potential to increase capacity to 10 MW at present, and 25 MW in the future. Total capacity for development is around 7.9 MW excluding Nejapa.
b. Animal Waste: Estimated capacity for power generation using cattle waste is around 84 MW in total. Estimated power generation capacity from pig waste is roughly 2.4 MW, and from poultry is estimated at around 96 MW.
c. Industrial Waste: There are some industries using industrial waste for biogas production such as coffee factory and beer factory. Current condition of using biogas from these industrial waste sources was studied.
d. Wastewater: There are 66 water treatment plants managed by ANDA. The possibility of biogas production from wastewater treatment is examined.
e. Introduction of technology
Small-scale power generation systems are introduced because biogas resources are limited and distributed throughout the country. In the report, small-scale biogas digester, biogas from wastewater and waste power generation are explained.
B. Consideration for Future Development
a. Updating of biogas data
It is necessary to update the information on biogas resources in the country. The information has to be made available to interested individuals or institutions.
b. Cooperative framework
It is necessary to cooperate with institutions, such as ANDA, for biogas production from wastewater. Also, it is necessary to provide available technical information to private institutions.
c. Human resource development
There is possibility to introduce small-scale biogas power generation system in places such as cattle, pig and poultry farms. Small-scale biogas digesters are already introduced in El Salvador. The configuration of the biogas system is simple; therefore, it can be manufactured in the country. It is important to transfer the technology for design, construction and operation of biogas power generation system.

Final Report Appendix-A
Republic of El Salvador March 2012 The Project for Master Plan for the Development of Renewable Energy (JICA)
Appendix - A
Evaluation of Distributed Generation Capacity

Final Report Appendix-A
Republic of El Salvador A - 1 March 2012 The Project for Master Plan for the Development of Renewable Energy (JICA)
Appendix A – Evaluation of Distributed Generation Capacity In the case of El Salvador, the interconnection of distributed generators in the primary distribution networks will be performed at the voltage levels of 23 kV (urban and rural) and 13.2 kV (rural area). The following table shows the maximum capacities of distribution facilities. The maximum capacity of feeders in 23 kV is higher than 13.2 kV due to the higher voltage level has greater carrying capacity. Usually the urban area has a higher load density compared to rural areas (greater number of users per area), that is, urban feeders are smaller in length and can serve a greater number of users, and thus they have a greater feeder capacity.
Table A.1 Maximum capacity of distribution facilities in El Salvador
# Voltage
Level Area
Number
Feeders per
Substation
Trunk
Feeder
Length (km)
Maximum
Capacity per
Feeder
(MVA)
Total
Capacity per
Substation
(MVA)
1 23 kV Urban 5 8 12 60
2 23 kV Rural 4 15 8 32
3 13.2 kV Rural 4 15 5 20
(Source: Information of several distribution companies in El Salvador in December 2011)
An approximate evaluation can be performed to check the feeder and maximum capacities for each voltage level. This evaluation can be performed using the connection of distributed generation unit in a typical feeder using the specifications obtained in El Salvador. The following figure shows the considerations for the approximate evaluation of distribution feeders.
# Description Value
1 Trunk feeder conductor 336,4 MCM 26/7 ACSR
2 Geometric configuration of the conductors
Dab = 0.7 m Dbc = 1.2 m Dac = 1.9 m
3 Characteristics of demand for the triangular area of
uniform density
Power factor = 0.95% minimum = 25%
% peak = 80%
4 Characteristics of distributed generation
Power factor = 0.90Connection at 75% of the total length
Line - Configuration 3φ Model of feeder and distributed generator connection
(Source: JICA Study Team) Figure A.1 Considerations for approximate evaluation of distribution feeders
The criteria for determining the maximum capacity of distributed generation that can be connected to the feeder in the worst condition of demand (in this case of minimum demand) was defined according to their performance in terms of: i) maintaining low voltage drop at node “m” and ii) prevent the increase in total electrical losses feeder.
lg
IdgG
DG

Final Report Appendix-A
Republic of El Salvador A - 2 March 2012 The Project for Master Plan for the Development of Renewable Energy (JICA)
Table A.2 Maximum capacity of distributed generation in El Salvador
# Voltage
Level Area
Total
Capacity per
Substation
(MVA)
Maximum
Capacity per
Feeder (MVA)
Maximum
Capacity of
Distributed
Generation
(MVA)
1 23 kV Urban 60 12 4.8
2 23 kV Rural 32 8 3.0
3 13.2 kV Rural 20 5 2.1
(Source: JICA Study Team)
The above results show the dependence of the maximum capacity of a distributed generator connected in a typical feeder respect to the voltage level and type of area (urban or rural). For the typical feeder in El Salvador, it can be defined a general maximum capacity of approximately 5 MVA. This value is recommended considering that it might be used the IEEE technical standard 1547-2003 (IEEE Standard for Interconnecting Distributed Resources with Electric Power Systems), which covers the connection of distributed generators with a capacity less than 10 MVA.

Final Report Appendix-B
Republic of El Salvador March 2012 The Project for Master Plan for the Development of Renewable Energy (JICA)
Appendix - B
Procedure of Electrical Loss Calculation for Distributed Generators

Final Report Appendix-B
Republic of El Salvador B - 1 March 2012 The Project for Master Plan for the Development of Renewable Energy (JICA)
Appendix-B Procedure of Electrical Loss Calculation for Distributed Generators To establish the technical benefits that can bring a small generator connected to distribution networks, a general procedure is proposed. This procedure may be performed for two cases:
Case I: Generator connected to the same distribution system of the end-user. Case II: Generator connected to a different distribution of the end user.
The general procedure for calculating electrical losses follows the next steps:
(1) Demarcate the areas of power loss analysis for distribution systems where the generator and the end user areas are connected.
Case I Case II
For case I, it is demarcated only the distribution system A. For the case II, it is demarcated the distribution systems A and B related to the nodes of the generator and end user, respectively.
(2) Perform a power flow simulation using the electrical network consisting of all distribution systems without the generator connected to node k. All nodes connected to the transmission are considered with control bus voltage. The electrical losses are calculated as follows:
a. Case I: ∑∑Ω∈
≠Ω∈
−++=AA i
ic
kii
igAAlossA PPPPP ,,)0(2)0(1)0(
where: PlossA(0) Electrical loss of distribution system A without generator connected
to node k (MW) PA1(0) Injected power from transmission network to distribution system A,
through to link A1, without generator connected to node k (MW) PA2(0) Injected power from transmission network to distribution system A,
through to link A2, without generator connected to node k (MW) ΩA Set of nodes relative to the distribution system A
Generator
End User
Connection to Transmission –
Link A1
Distribution
PA1 PA2
k
Connection to Transmission –
Link A2
i
Generator
PA1
PA2
k
End User
PB1
PBA1PAB1
Connection to Transmission –
Link A1 Connection to Transmission –
Link A2
Connection to Transmission –
Link B1 Distribution i
Distribution j

Final Report Appendix-B
Republic of El Salvador B - 2 March 2012 The Project for Master Plan for the Development of Renewable Energy (JICA)
Pg,i Power of generator connected to node i (MW), where node i is any node that belongs to the distribution system A
Pc,i Power of load connected to node i (MW)
b. Case II: )0(1,,)0(2)0(1)0( BAi
ic
kii
igAAlossA PPPPPPAA
+−++= ∑∑Ω∈
≠Ω∈
)0(1,,)0(1)0( ABj
jcj
jgBlossB PPPPPBB
+−+= ∑∑Ω∈Ω∈
where: PlossB(0) Electrical loss of distribution system B without generator connected
to node k (MW) PB1(0) Injected power from transmission network to distribution system B,
through to link B1, without generator connected to node k (MW) PBA1(0) Injected power from distribution system B to distribution system A,
through to link BA1, without generator connected to node k (MW) PAB1(0) Injected power from distribution system A to distribution system B,
through to link AB1, without generator connected to node k (MW) ΩB Set of nodes relative to the distribution system B Pg,j Power of generator connected to node j (MW), where node j is any
node that belongs to the distribution system B Pc,j Power of load connected to node j (MW)
(3) Perform a power flow simulation using the electrical network consisting of distribution systems with the generator connected to node k. All nodes connected to the transmission are considered with control bus voltage. The electrical losses are calculated as follows:
a. Case I: ∑∑Ω∈Ω∈
−++=AA i
ici
igAAlossA PPPPP ,,)1(2)1(1)1(
where: PlossA(1) Electrical loss of distribution system A with generator connected to
node k (MW) PA1(1) Injected power from transmission network to distribution system A,
through to link A1, with generator connected to node k (MW) PA2(1) Injected power from transmission network to distribution system A,
through to link A2, with generator connected to node k (MW)
b. Case II: )1(1,,)1(2)1(1)1( BAi
ici
igAAlossA PPPPPPAA
+−++= ∑∑Ω∈Ω∈
)1(1,,)1(1)1( ABj
jcj
jgBlossB PPPPPBB
+−+= ∑∑Ω∈Ω∈
where: PlossB(1) Electrical loss of distribution system B with generator connected to

Final Report Appendix-B
Republic of El Salvador B - 3 March 2012 The Project for Master Plan for the Development of Renewable Energy (JICA)
node k (MW) PB1(1) Injected power from transmission network to distribution system B,
through to link B1, with generator connected to node k (MW) PBA1(1) Injected power from distribution system B to distribution system A,
through to link BA1, with generator connected to node k (MW) PAB1(1) Injected power from distribution system A to distribution system B,
through to link AB1, with generator connected to node k (MW) (4) The variation of the electrical losses can be calculated as follows:
a. Case I: )()(Δ 10 −= lossAlossAlossA PPP
b. Case II: )()(Δ 10 −= lossAlossAlossA PPP , )()(Δ 10 −= lossBlossBlossB PPP
The results of the variation of the electrical losses can be interpreted as follows:
ΔPlossA > 0 ⇒ Electrical losses decrease in the distribution system A due to the connection to the generator at node k.
ΔPlossA < 0 ⇒ Electrical losses increase in the distribution system A due to the connection to the generator at node k.
In case it is required only the variation of the electrical losses, it can be simplified the steps (2) through (4) as follows:
(2) Perform a power flow simulation as seen in step (2) above, without generator connected at node k. Save the following information:
a. Case I: PA1(0), PA2(0). b. Case II: PA1(0), PA2(0), PB1(0), PAB1(0), PBA1(0).
(3) Perform a power flow simulation as seen in step (3) above, with generator connected at node k. Save the following information:
a. Case I: PA1(1), PA2(1). b. Case II: PA1(1), PA2(1), PB1(1), PAB1(1), PBA1(1).
(4) The variation of the electrical losses can be calculated as follows:
a. Case I: kgAAAAlossA PPPPPP ,)()()()(Δ −−−+= 12110201
b. Case II: kgBAAABAAAlossA PPPPPPPP ,)()()()()()(Δ −−−−++= 111211010201
kgABBABBlossB PPPPPP ,)()()()(Δ −−−+= 11110101
where: Pg,k Injected power of generator connected to node k (MW)

Final Report Appendix-E
Republic of El Salvador March 2012 The Project for Master Plan for the Development of Renewable Energy (JICA)
Appendix - E
Economic & Financial Analysis

Final Report Appendix-E
Republic of El Salvador E - 1 March 2012 The Project for Master Plan for the Development of Renewable Energy (JICA)
Case-H0(5MW) Cash Flow for Small Hydropower -5 MW (Case-H0)
Plant Cap(MW)
CapacityFactor (%)
EscalationRate
PlantCost
($000)
Inter-ConnectionCost ($000)
O/MCost
% ofLoan
Bank Loan($000)
Repayment Period
(year)
LoanInterestRate p.a
TaxExemption
(year)
CorporateTax
5 50% 4% 12,500 150 5% 70% 8,855 10 8% 10 25%NPV ($000) 16,024FIRR 37.7%B/C 2.05
PowerPlant
Inter-Connection
Cost
PrincipalRepayment Interest
0 0 1,875 1,875 1,875 -1,875 0 -1,875 -1,8750 0 1,875 45 1,920 354 2,274 -2,274 0 -2,274 -4,1491 140 21,900 3,066 153 153 886 708 1,747 1,319 0 1,319 -2,830 6332 145.6 21,900 3,189 159 159 886 638 1,682 1,506 0 1,506 -1,324 6333 151.4 21,900 3,316 166 166 886 567 1,618 1,698 0 1,698 374 6334 157.5 21,900 3,449 172 172 886 496 1,554 1,895 0 1,895 2,269 6335 163.8 21,900 3,587 179 179 886 425 1,490 2,097 0 2,097 4,366 6336 170.3 21,900 3,730 187 187 886 354 1,426 2,304 0 2,304 6,670 6337 177.1 21,900 3,879 194 194 886 283 1,363 2,517 0 2,517 9,187 6338 184.2 21,900 4,035 202 202 886 213 1,300 2,735 0 2,735 11,921 6339 191.6 21,900 4,196 210 210 886 142 1,237 2,959 0 2,959 14,880 633
10 199.3 21,900 4,364 218 218 886 71 1,175 3,189 0 3,189 18,070 63311 207.2 21,900 4,538 227 227 227 4,312 920 3,392 21,462 63312 215.5 21,900 4,720 236 236 236 4,484 963 3,521 24,983 63313 224.1 21,900 4,909 245 245 245 4,663 1,008 3,656 28,638 63314 233.1 21,900 5,105 255 255 255 4,850 1,054 3,796 32,434 63315 242.4 21,900 5,309 265 265 265 5,044 1,103 3,941 36,375 63316 252.1 21,900 5,522 276 276 276 5,246 1,153 4,092 40,467 63317 262.2 21,900 5,743 287 287 287 5,455 1,206 4,250 44,717 63318 272.7 21,900 5,972 299 299 299 5,674 1,260 4,413 49,130 63319 283.6 21,900 6,211 311 311 311 5,901 1,317 4,584 53,714 63320 295.0 21,900 6,460 323 323 323 6,137 1,376 4,761 58,474 633
Total 438,000 91,300 3,750 45 4,565 8,360 8,855 4,250 21,465 69,834 11,360 58,474 58,474Source: JICA Study Team 31,324 15,301 NPV= 16,024
(g) Loan ($000) (h) TotalCost(f+g)
($000)
(i) Profitbefor Tax
(c-h)($000)
(j)CorporateTax (25%)
(k) NetIncome (i-j) ($000)
(l)Accumulated
Income($000)
Depreciation($000)
f) SubTotalCost(d+e)
Year(a) Unit
Price($/MWh)
(b)Generation
(MWh)
(c)Operation
Income($000)
d) Capital Cost ($000)e) O/M
Cost($000)
Case-H2(3MW) Cash Flow for Small Hydropower -3 MW (Case-H2)
Plant Cap(MW)
CapacityFactor (%)
EscalationRate
PlantCost
($000)
Inter-ConnectionCost ($000)
O/MCost
% ofLoan
Bank Loan($000)
Repayment Period
(year)
LoanInterestRate p.a
TaxExemption
(year)
CorporateTax
3 50% 4% 7,500 150 5% 70% 5,355 10 8% 10 25%NPV ($000) 9,563FIRR 37.3%B/C 2.04
PowerPlant
Inter-Connection
Cost
PrincipalRepayment
Interest
0 0 1,125 1,125 1,125 -1,125 0 -1,125 -1,1250 0 1,125 45 1,170 214 1,384 -1,384 0 -1,384 -2,5091 140 13,140 1,840 92 92 536 428 1,056 784 0 784 -1,725 3832 145.6 13,140 1,913 96 96 536 386 1,017 896 0 896 -829 3833 151.4 13,140 1,990 99 99 536 343 978 1,012 0 1,012 183 3834 157.5 13,140 2,069 103 103 536 300 939 1,130 0 1,130 1,313 3835 163.8 13,140 2,152 108 108 536 257 900 1,252 0 1,252 2,565 3836 170.3 13,140 2,238 112 112 536 214 862 1,377 0 1,377 3,942 3837 177.1 13,140 2,328 116 116 536 171 823 1,504 0 1,504 5,446 3838 184.2 13,140 2,421 121 121 536 129 785 1,636 0 1,636 7,082 3839 191.6 13,140 2,518 126 126 536 86 747 1,771 0 1,771 8,853 383
10 199.3 13,140 2,618 131 131 536 43 709 1,909 0 1,909 10,762 38311 207.2 13,140 2,723 136 136 136 2,587 551 2,036 12,798 38312 215.5 13,140 2,832 142 142 142 2,690 577 2,113 14,911 38313 224.1 13,140 2,945 147 147 147 2,798 604 2,194 17,105 38314 233.1 13,140 3,063 153 153 153 2,910 632 2,278 19,383 38315 242.4 13,140 3,186 159 159 159 3,026 661 2,365 21,748 38316 252.1 13,140 3,313 166 166 166 3,147 691 2,456 24,205 38317 262.2 13,140 3,446 172 172 172 3,273 723 2,551 26,755 38318 272.7 13,140 3,583 179 179 179 3,404 755 2,649 29,404 38319 283.6 13,140 3,727 186 186 186 3,540 789 2,751 32,155 38320 295.0 13,140 3,876 194 194 194 3,682 825 2,857 35,012 383
Total 262,800 54,780 2,250 45 2,739 5,034 5,355 2,570 12,959 41,820 6,808 35,012 35,012Source: JICA Study Team 18,795 9,232 NPV= 9,563
Year(a) Unit
Price($/MWh)
(b)Generation
(MWh)
(c)Operation
Income($000)
d) Capital Cost ($000) (g) Loan ($000) (h) TotalCost(f+g)
($000)
(i) Profitbefor Tax
(c-h)($000)
(j)CorporateTax (25%)
(k) NetIncome (i-j) ($000)
Depreciation($000)
e) O/MCost
($000)
f) SubTotalCost(d+e)
(l)Accumulated
Income($000)

Final Report Appendix-E
Republic of El Salvador E - 2 March 2012 The Project for Master Plan for the Development of Renewable Energy (JICA)
Case-H1(4MW) Cash Flow for Small Hydropower -4 MW (Case-H1)
Plant Cap(MW)
CapacityFactor (%)
EscalationRate
PlantCost
($000)
Inter-ConnectionCost ($000)
O/MCost
% ofLoan
Bank Loan($000)
Repayment Period
(year)
LoanInterestRate p.a
TaxExemption
(year)
CorporateTax
4 50% 4% 10,000 150 5% 70% 7,105 10 8% 10 25%NPV ($000) 12,793FIRR 37.5%B/C 2.04
PowerPlant
Inter-Connection
Cost
PrincipalRepayment Interest
0 0 1,500 1,500 1,500 -1,500 0 -1,500 -1,5000 0 1,500 45 1,545 284 1,829 -1,829 0 -1,829 -3,3291 140 17,520 2,453 123 123 711 568 1,402 1,051 0 1,051 -2,278 5082 145.6 17,520 2,551 128 128 711 512 1,350 1,201 0 1,201 -1,077 5083 151.4 17,520 2,653 133 133 711 455 1,298 1,355 0 1,355 278 5084 157.5 17,520 2,759 138 138 711 398 1,246 1,513 0 1,513 1,791 5085 163.8 17,520 2,869 143 143 711 341 1,195 1,674 0 1,674 3,466 5086 170.3 17,520 2,984 149 149 711 284 1,144 1,840 0 1,840 5,306 5087 177.1 17,520 3,104 155 155 711 227 1,093 2,011 0 2,011 7,316 5088 184.2 17,520 3,228 161 161 711 171 1,042 2,185 0 2,185 9,502 5089 191.6 17,520 3,357 168 168 711 114 992 2,365 0 2,365 11,867 508
10 199.3 17,520 3,491 175 175 711 57 942 2,549 0 2,549 14,416 50811 207.2 17,520 3,631 182 182 182 3,449 735 2,714 17,130 50812 215.5 17,520 3,776 189 189 189 3,587 770 2,817 19,947 50813 224.1 17,520 3,927 196 196 196 3,731 806 2,925 22,872 50814 233.1 17,520 4,084 204 204 204 3,880 843 3,037 25,908 50815 242.4 17,520 4,247 212 212 212 4,035 882 3,153 29,062 50816 252.1 17,520 4,417 221 221 221 4,196 922 3,274 32,336 50817 262.2 17,520 4,594 230 230 230 4,364 964 3,400 35,736 50818 272.7 17,520 4,778 239 239 239 4,539 1,008 3,531 39,267 50819 283.6 17,520 4,969 248 248 248 4,720 1,053 3,667 42,934 50820 295.0 17,520 5,168 258 258 258 4,909 1,100 3,809 46,743 508
Total 350,400 73,040 3,000 45 3,652 6,697 7,105 3,410 17,212 55,827 9,084 46,743 46,743Source: JICA Study Team 25,060 12,266 NPV= 12,793
f) SubTotalCost(d+e)
(j)CorporateTax (25%)
(l)Accumulated
Income($000)
(i) Profitbefor Tax
(c-h)($000)
Year(a) Unit
Price($/MWh)
(b)Generation
(MWh)
(c)Operation
Income($000)
e) O/MCost
($000)
d) Capital Cost ($000) (g) Loan ($000) (h) TotalCost(f+g)
($000)
(k) NetIncome (i-j) ($000)
Depreciation($000)
Case-H3(2MW) Cash Flow for Small Hydropower -2 MW (Case-H3)
Plant Cap(MW)
CapacityFactor (%)
EscalationRate
PlantCost
($000)
Inter-ConnectionCost ($000)
O/MCost
% ofLoan
Bank Loan($000)
Repayment Period
(year)
LoanInterestRate p.a
TaxExemption
(year)
CorporateTax
2 50% 4% 5,000 150 5% 70% 3,605 10 8% 10 25%NPV ($000) 6,332FIRR 36.9%B/C 2.02
PowerPlant
Inter-Connection
Cost
PrincipalRepayment Interest
0 0 750 750 750 -750 0 -750 -7500 0 750 45 795 144 939 -939 0 -939 -1,6891 140 8,760 1,226 61 61 361 288 710 516 0 516 -1,173 2582 145.6 8,760 1,275 64 64 361 260 684 592 0 592 -581 2583 151.4 8,760 1,326 66 66 361 231 658 669 0 669 88 2584 157.5 8,760 1,380 69 69 361 202 631 748 0 748 836 2585 163.8 8,760 1,435 72 72 361 173 605 829 0 829 1,665 2586 170.3 8,760 1,492 75 75 361 144 579 913 0 913 2,578 2587 177.1 8,760 1,552 78 78 361 115 553 998 0 998 3,576 2588 184.2 8,760 1,614 81 81 361 87 528 1,086 0 1,086 4,662 2589 191.6 8,760 1,678 84 84 361 58 502 1,176 0 1,176 5,839 258
10 199.3 8,760 1,746 87 87 361 29 477 1,269 0 1,269 7,108 25811 207.2 8,760 1,815 91 91 91 1,725 367 1,358 8,466 25812 215.5 8,760 1,888 94 94 94 1,794 384 1,410 9,875 25813 224.1 8,760 1,964 98 98 98 1,865 402 1,463 11,338 25814 233.1 8,760 2,042 102 102 102 1,940 421 1,519 12,858 25815 242.4 8,760 2,124 106 106 106 2,018 440 1,578 14,435 25816 252.1 8,760 2,209 110 110 110 2,098 460 1,638 16,073 25817 262.2 8,760 2,297 115 115 115 2,182 481 1,701 17,774 25818 272.7 8,760 2,389 119 119 119 2,269 503 1,766 19,541 25819 283.6 8,760 2,484 124 124 124 2,360 526 1,835 21,375 25820 295.0 8,760 2,584 129 129 129 2,455 549 1,905 23,281 258
Total 175,200 36,520 1,500 45 1,826 3,371 3,605 1,730 8,706 27,813 4,533 23,281 23,281Source: JICA Study Team 12,530 6,197 NPV= 6,332
e) O/MCost
($000)
f) SubTotalCost(d+e)
(g) Loan ($000) (h) TotalCost(f+g)
($000)
(i) Profitbefor Tax
(c-h)($000)
(j)CorporateTax (25%)
(k) NetIncome (i-j) ($000)
(l)Accumulated
Income($000)
Year(a) Unit
Price($/MWh)
(b)Generation
(MWh)
(c)Operation
Income($000)
d) Capital Cost ($000)Depreciation
($000)

Final Report Appendix-E
Republic of El Salvador E - 3 March 2012 The Project for Master Plan for the Development of Renewable Energy (JICA)
Case-H4(1MW) Cash Flow for Small Hydropower -1MW (Case-H4)
Plant Cap(MW)
CapacityFactor (%)
EscalationRate
PlantCost
($000)
Inter-ConnectionCost ($000)
O/MCost
% ofLoan
Bank Loan($000)
Repayment Period
(year)
LoanInterestRate p.a
TaxExemption
(year)
CorporateTax
1 50% 4% 3,000 150 5% 70% 2,205 10 8% 10 25%NPV ($000) 2,666FIRR 28.5%B/C 1.74
PowerPlant
Inter-Connection
Cost
PrincipalRepayment Interest
0 0 450 450 450 -450 0 -450 -4500 0 450 45 495 88 583 -583 0 -583 -1,0331 140 4,380 613 31 31 221 176 428 186 0 186 -848 1582 145.6 4,380 638 32 32 221 159 411 227 0 227 -621 1583 151.4 4,380 663 33 33 221 141 395 268 0 268 -353 1584 157.5 4,380 690 34 34 221 123 378 311 0 311 -41 1585 163.8 4,380 717 36 36 221 106 362 355 0 355 314 1586 170.3 4,380 746 37 37 221 88 346 400 0 400 714 1587 177.1 4,380 776 39 39 221 71 330 446 0 446 1,160 1588 184.2 4,380 807 40 40 221 53 314 493 0 493 1,653 1589 191.6 4,380 839 42 42 221 35 298 541 0 541 2,195 158
10 199.3 4,380 873 44 44 221 18 282 591 0 591 2,786 15811 207.2 4,380 908 45 45 45 862 176 686 3,472 15812 215.5 4,380 944 47 47 47 897 185 712 4,184 15813 224.1 4,380 982 49 49 49 933 194 739 4,923 15814 233.1 4,380 1,021 51 51 51 970 203 767 5,689 15815 242.4 4,380 1,062 53 53 53 1,009 213 796 6,485 15816 252.1 4,380 1,104 55 55 55 1,049 223 826 7,312 15817 262.2 4,380 1,149 57 57 57 1,091 233 858 8,169 15818 272.7 4,380 1,194 60 60 60 1,135 244 890 9,060 15819 283.6 4,380 1,242 62 62 62 1,180 256 924 9,984 15820 295.0 4,380 1,292 65 65 65 1,227 267 960 10,944 158
Total 87,600 18,260 900 45 913 1,858 2,205 1,058 5,121 13,139 2,194 10,944 10,944Source: JICA Study Team 6,265 3,599 NPV= 2,666
Year(a) Unit
Price($/MWh)
(b)Generation
(MWh)
(c)Operation
Income($000)
d) Capital Cost ($000)e) O/M
Cost($000)
f) SubTotalCost(d+e)
(g) Loan ($000) (h) TotalCost(f+g)
($000)
(i) Profitbefor Tax
(c-h)($000)
(j)CorporateTax (25%)
(k) NetIncome (i-j) ($000)
(l)Accumulated
Income($000)
Depreciation($000)
Case-H5(0.7MW) Cash Flow for Small Hydropower -0.7 MW (Case-H5)
Plant Cap(MW)
CapacityFactor (%)
EscalationRate
PlantCost
($000)
Inter-ConnectionCost ($000)
O/MCost
% ofLoan
Bank Loan($000)
Repayment Period
(year)
LoanInterestRate p.a
TaxExemption
(year)
CorporateTax
0.7 50% 4% 2,100 150 5% 70% 1,575 10 8% 10 25%NPV ($000) 1,827FIRR 27.8%B/C 1.71
PowerPlant
Inter-Connection
Cost
PrincipalRepayment Interest
0 0 315 315 315 -315 0 -315 -3150 0 315 45 360 63 423 -423 0 -423 -7381 140 3,066 429 21 21 158 126 305 124 0 124 -614 1132 145.6 3,066 446 22 22 158 113 293 153 0 153 -461 1133 151.4 3,066 464 23 23 158 101 282 183 0 183 -278 1134 157.5 3,066 483 24 24 158 88 270 213 0 213 -65 1135 163.8 3,066 502 25 25 158 76 258 244 0 244 179 1136 170.3 3,066 522 26 26 158 63 247 276 0 276 455 1137 177.1 3,066 543 27 27 158 50 235 308 0 308 763 1138 184.2 3,066 565 28 28 158 38 224 341 0 341 1,104 1139 191.6 3,066 587 29 29 158 25 212 375 0 375 1,480 113
10 199.3 3,066 611 31 31 158 13 201 410 0 410 1,890 11311 207.2 3,066 635 32 32 32 604 123 481 2,371 11312 215.5 3,066 661 33 33 33 628 129 499 2,870 11313 224.1 3,066 687 34 34 34 653 135 518 3,387 11314 233.1 3,066 715 36 36 36 679 142 537 3,925 11315 242.4 3,066 743 37 37 37 706 148 558 4,482 11316 252.1 3,066 773 39 39 39 734 155 579 5,061 11317 262.2 3,066 804 40 40 40 764 163 601 5,662 11318 272.7 3,066 836 42 42 42 794 170 624 6,286 11319 283.6 3,066 870 43 43 43 826 178 648 6,934 11320 295.0 3,066 904 45 45 45 859 187 672 7,606 113
Total 61,320 12,782 630 45 639 1,314 1,575 756 3,645 9,137 1,531 7,606 7,606Source: JICA Study Team 4,385 2,558 NPV= 1,827
Year(a) Unit
Price($/MWh)
(b)Generation
(MWh)
(c)Operation
Income($000)
d) Capital Cost ($000)e) O/M
Cost($000)
f) SubTotalCost(d+e)
(g) Loan ($000) (h) TotalCost(f+g)
($000)
(i) Profitbefor Tax
(c-h)($000)
(j)CorporateTax (25%)
(k) NetIncome (i-j) ($000)
(l)Accumulated
Income($000)
Depreciation($000)

Final Report Appendix-E
Republic of El Salvador E - 4 March 2012 The Project for Master Plan for the Development of Renewable Energy (JICA)
Case-H6(0.5MW) Cash Flow for Small Hydropower - 0.5 MW (Case-H6)
Plant Cap(MW)
CapacityFactor (%)
EscalationRate
PlantCost
($000)
Inter-ConnectionCost ($000)
O/MCost
% ofLoan
Bank Loan($000)
Repayment Period
(year)
LoanInterestRate p.a
TaxExemption
(year)
CorporateTax
0.5 50% 4% 1,500 150 5% 70% 1,155 10 8% 10 25%NPV ($000) 1,268FIRR 26.8%B/C 1.68
PowerPlant
Inter-Connection
Cost
PrincipalRepayment
Interest
0 0 225 225 225 -225 0 -225 -2250 0 225 45 270 46 316 -316 0 -316 -5411 140 2,190 307 15 15 116 92 223 83 0 83 -458 832 145.6 2,190 319 16 16 116 83 215 104 0 104 -354 833 151.4 2,190 332 17 17 116 74 206 126 0 126 -228 834 157.5 2,190 345 17 17 116 65 197 147 0 147 -80 835 163.8 2,190 359 18 18 116 55 189 170 0 170 89 836 170.3 2,190 373 19 19 116 46 180 193 0 193 282 837 177.1 2,190 388 19 19 116 37 172 216 0 216 498 838 184.2 2,190 403 20 20 116 28 163 240 0 240 738 839 191.6 2,190 420 21 21 116 18 155 265 0 265 1,003 83
10 199.3 2,190 436 22 22 116 9 147 290 0 290 1,293 8311 207.2 2,190 454 23 23 23 431 87 344 1,637 8312 215.5 2,190 472 24 24 24 448 91 357 1,994 8313 224.1 2,190 491 25 25 25 466 96 370 2,364 8314 233.1 2,190 511 26 26 26 485 101 384 2,748 8315 242.4 2,190 531 27 27 27 504 105 399 3,147 8316 252.1 2,190 552 28 28 28 525 111 414 3,561 8317 262.2 2,190 574 29 29 29 546 116 430 3,991 8318 272.7 2,190 597 30 30 30 567 121 446 4,437 8319 283.6 2,190 621 31 31 31 590 127 463 4,900 8320 295.0 2,190 646 32 32 32 614 133 481 5,381 83
Total 43,800 9,130 450 45 456 951 1,155 554 2,661 6,469 1,088 5,381 5,381Source: JICA Study Team 3,132 1,864 NPV= 1,268
Year(a) Unit
Price($/MWh)
(b)Generation
(MWh)
(c)Operation
Income($000)
d) Capital Cost ($000)e) O/M
Cost($000)
f) SubTotalCost(d+e)
(g) Loan ($000) (h) TotalCost(f+g)
($000)
(i) Profitbefor Tax
(c-h)($000)
(j)CorporateTax (25%)
(k) NetIncome (i-j) ($000)
(l)Accumulated
Income($000)
Depreciation($000)
Case-H7(0.3MW) Cash Flow for Small Hydropower -0.3 MW (Case-H7)
Plant Cap(MW)
CapacityFactor (%)
EscalationRate
PlantCost
($000)
Inter-ConnectionCost ($000)
O/MCost
% ofLoan
Bank Loan($000)
Repayment Period
(year)
LoanInterestRate p.a
TaxExemption
(year)
CorporateTax
0.3 50% 4% 900 150 5% 70% 735 10 8% 10 25%NPV ($000) 710FIRR 24.9%B/C 1.61
PowerPlant
Inter-Connection
Cost
PrincipalRepayment Interest
0 0 135 135 135 -135 0 -135 -1350 0 135 45 180 29 209 -209 0 -209 -3441 140 1,314 184 9 9 74 59 141 42 0 42 -302 532 145.6 1,314 191 10 10 74 53 136 55 0 55 -247 533 151.4 1,314 199 10 10 74 47 130 68 0 68 -178 534 157.5 1,314 207 10 10 74 41 125 82 0 82 -96 535 163.8 1,314 215 11 11 74 35 120 96 0 96 -1 536 170.3 1,314 224 11 11 74 29 114 110 0 110 109 537 177.1 1,314 233 12 12 74 24 109 124 0 124 233 538 184.2 1,314 242 12 12 74 18 103 139 0 139 372 539 191.6 1,314 252 13 13 74 12 98 154 0 154 526 53
10 199.3 1,314 262 13 13 74 6 92 169 0 169 695 5311 207.2 1,314 272 14 14 14 259 52 207 903 5312 215.5 1,314 283 14 14 14 269 54 215 1,117 5313 224.1 1,314 295 15 15 15 280 57 223 1,340 5314 233.1 1,314 306 15 15 15 291 60 231 1,572 5315 242.4 1,314 319 16 16 16 303 63 240 1,812 5316 252.1 1,314 331 17 17 17 315 66 249 2,061 5317 262.2 1,314 345 17 17 17 327 69 259 2,320 5318 272.7 1,314 358 18 18 18 340 72 268 2,588 5319 283.6 1,314 373 19 19 19 354 75 279 2,867 5320 295.0 1,314 388 19 19 19 368 79 289 3,156 53
Total 26,280 5,478 270 45 274 589 735 353 1,677 3,801 645 3,156 3,156Source: JICA Study Team 1,879 1,170 NPV= 710
Year(a) Unit
Price($/MWh)
(b)Generation
(MWh)
(c)Operation
Income($000)
d) Capital Cost ($000) e) O/MCost
($000)
f) SubTotalCost(d+e)
(g) Loan ($000) (h) TotalCost(f+g)
($000)
(i) Profitbefor Tax
(c-h)($000)
(j)CorporateTax (25%)
(k) NetIncome (i-j) ($000)
(l)Accumulated
Income($000)
Depreciation($000)
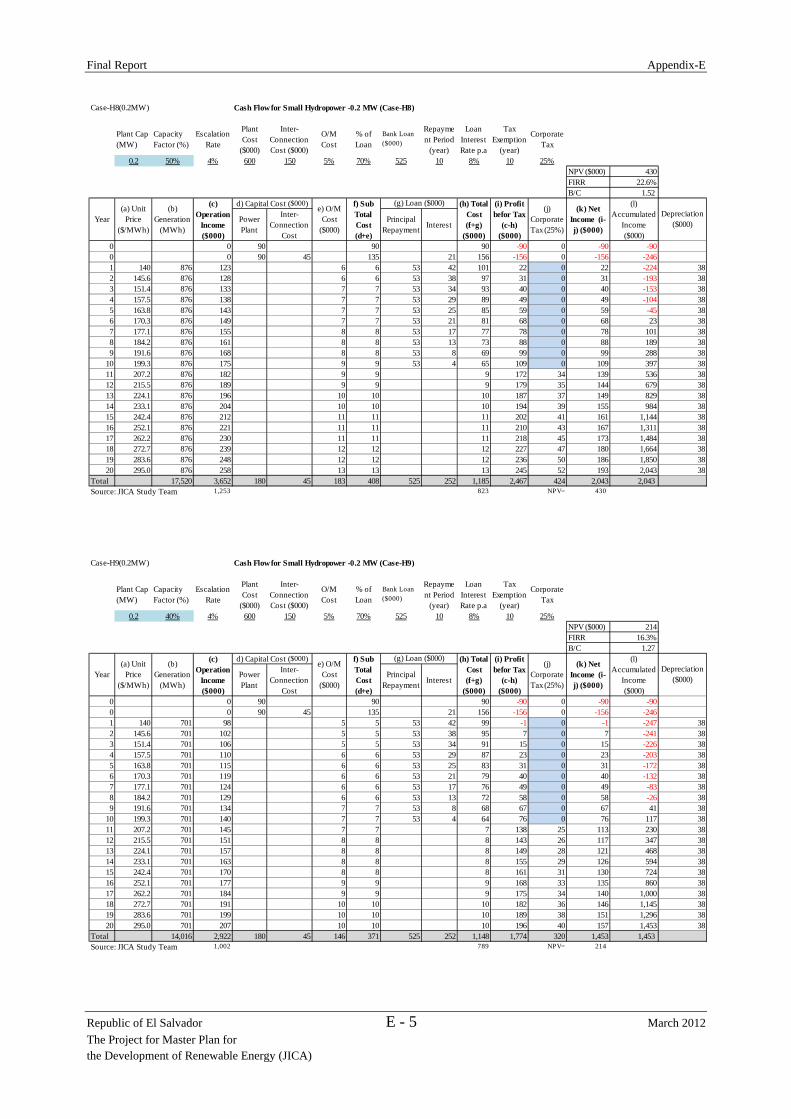
Final Report Appendix-E
Republic of El Salvador E - 5 March 2012 The Project for Master Plan for the Development of Renewable Energy (JICA)
Case-H8(0.2MW) Cash Flow for Small Hydropower -0.2 MW (Case-H8)
Plant Cap(MW)
CapacityFactor (%)
EscalationRate
PlantCost
($000)
Inter-ConnectionCost ($000)
O/MCost
% ofLoan
Bank Loan($000)
Repayment Period
(year)
LoanInterestRate p.a
TaxExemption
(year)
CorporateTax
0.2 50% 4% 600 150 5% 70% 525 10 8% 10 25%NPV ($000) 430FIRR 22.6%B/C 1.52
PowerPlant
Inter-Connection
Cost
PrincipalRepayment Interest
0 0 90 90 90 -90 0 -90 -900 0 90 45 135 21 156 -156 0 -156 -2461 140 876 123 6 6 53 42 101 22 0 22 -224 382 145.6 876 128 6 6 53 38 97 31 0 31 -193 383 151.4 876 133 7 7 53 34 93 40 0 40 -153 384 157.5 876 138 7 7 53 29 89 49 0 49 -104 385 163.8 876 143 7 7 53 25 85 59 0 59 -45 386 170.3 876 149 7 7 53 21 81 68 0 68 23 387 177.1 876 155 8 8 53 17 77 78 0 78 101 388 184.2 876 161 8 8 53 13 73 88 0 88 189 389 191.6 876 168 8 8 53 8 69 99 0 99 288 38
10 199.3 876 175 9 9 53 4 65 109 0 109 397 3811 207.2 876 182 9 9 9 172 34 139 536 3812 215.5 876 189 9 9 9 179 35 144 679 3813 224.1 876 196 10 10 10 187 37 149 829 3814 233.1 876 204 10 10 10 194 39 155 984 3815 242.4 876 212 11 11 11 202 41 161 1,144 3816 252.1 876 221 11 11 11 210 43 167 1,311 3817 262.2 876 230 11 11 11 218 45 173 1,484 3818 272.7 876 239 12 12 12 227 47 180 1,664 3819 283.6 876 248 12 12 12 236 50 186 1,850 3820 295.0 876 258 13 13 13 245 52 193 2,043 38
Total 17,520 3,652 180 45 183 408 525 252 1,185 2,467 424 2,043 2,043Source: JICA Study Team 1,253 823 NPV= 430
Year(a) Unit
Price($/MWh)
(b)Generation
(MWh)
(c)Operation
Income($000)
d) Capital Cost ($000) e) O/MCost
($000)
f) SubTotalCost(d+e)
(g) Loan ($000) (h) TotalCost(f+g)
($000)
(i) Profitbefor Tax
(c-h)($000)
(j)CorporateTax (25%)
(k) NetIncome (i-j) ($000)
(l)Accumulated
Income($000)
Depreciation($000)
Case-H9(0.2MW) Cash Flow for Small Hydropower -0.2 MW (Case-H9)
Plant Cap(MW)
CapacityFactor (%)
EscalationRate
PlantCost
($000)
Inter-ConnectionCost ($000)
O/MCost
% ofLoan
Bank Loan($000)
Repayment Period
(year)
LoanInterestRate p.a
TaxExemption
(year)
CorporateTax
0.2 40% 4% 600 150 5% 70% 525 10 8% 10 25%NPV ($000) 214FIRR 16.3%B/C 1.27
PowerPlant
Inter-Connection
Cost
PrincipalRepayment Interest
0 0 90 90 90 -90 0 -90 -900 0 90 45 135 21 156 -156 0 -156 -2461 140 701 98 5 5 53 42 99 -1 0 -1 -247 382 145.6 701 102 5 5 53 38 95 7 0 7 -241 383 151.4 701 106 5 5 53 34 91 15 0 15 -226 384 157.5 701 110 6 6 53 29 87 23 0 23 -203 385 163.8 701 115 6 6 53 25 83 31 0 31 -172 386 170.3 701 119 6 6 53 21 79 40 0 40 -132 387 177.1 701 124 6 6 53 17 76 49 0 49 -83 388 184.2 701 129 6 6 53 13 72 58 0 58 -26 389 191.6 701 134 7 7 53 8 68 67 0 67 41 38
10 199.3 701 140 7 7 53 4 64 76 0 76 117 3811 207.2 701 145 7 7 7 138 25 113 230 3812 215.5 701 151 8 8 8 143 26 117 347 3813 224.1 701 157 8 8 8 149 28 121 468 3814 233.1 701 163 8 8 8 155 29 126 594 3815 242.4 701 170 8 8 8 161 31 130 724 3816 252.1 701 177 9 9 9 168 33 135 860 3817 262.2 701 184 9 9 9 175 34 140 1,000 3818 272.7 701 191 10 10 10 182 36 146 1,145 3819 283.6 701 199 10 10 10 189 38 151 1,296 3820 295.0 701 207 10 10 10 196 40 157 1,453 38
Total 14,016 2,922 180 45 146 371 525 252 1,148 1,774 320 1,453 1,453Source: JICA Study Team 1,002 789 NPV= 214
Year(a) Unit
Price($/MWh)
(b)Generation
(MWh)
(c)Operation
Income($000)
d) Capital Cost ($000) e) O/MCost
($000)
f) SubTotalCost(d+e)
(g) Loan ($000) (h) TotalCost(f+g)
($000)
(i) Profitbefor Tax
(c-h)($000)
(j)CorporateTax (25%)
(k) NetIncome (i-j) ($000)
(l)Accumulated
Income($000)
Depreciation($000)

Final Report Appendix-E
Republic of El Salvador E - 6 March 2012 The Project for Master Plan for the Development of Renewable Energy (JICA)
Case-H10(0.1MW) Cash Flow for Small Hydropower -0.1 MW (Case-H10)
Plant Cap(MW)
CapacityFactor (%)
EscalationRate
PlantCost
($000)
Inter-ConnectionCost ($000)
O/MCost
% ofLoan
Bank Loan($000)
Repayment Period
(year)
LoanInterestRate p.a
TaxExemption
(year)
CorporateTax
0.1 50% 4% 300 150 5% 70% 315 10 8% 10 25%NPV ($000) 151FIRR 17.4%B/C 1.32
PowerPlant
Inter-Connection
Cost
PrincipalRepayment Interest
0 0 45 45 45 -45 0 -45 -450 0 45 45 90 13 103 -103 0 -103 -1481 140 438 61 3 3 32 25 60 2 0 2 -146 232 145.6 438 64 3 3 32 23 57 6 0 6 -140 233 151.4 438 66 3 3 32 20 55 11 0 11 -128 234 157.5 438 69 3 3 32 18 53 16 0 16 -112 235 163.8 438 72 4 4 32 15 50 22 0 22 -90 236 170.3 438 75 4 4 32 13 48 27 0 27 -64 237 177.1 438 78 4 4 32 10 45 32 0 32 -31 238 184.2 438 81 4 4 32 8 43 38 0 38 6 239 191.6 438 84 4 4 32 5 41 43 0 43 49 23
10 199.3 438 87 4 4 32 3 38 49 0 49 98 2311 207.2 438 91 5 5 5 86 16 70 169 2312 215.5 438 94 5 5 5 90 17 73 241 2313 224.1 438 98 5 5 5 93 18 76 317 2314 233.1 438 102 5 5 5 97 19 78 395 2315 242.4 438 106 5 5 5 101 20 81 477 2316 252.1 438 110 6 6 6 105 21 84 561 2317 262.2 438 115 6 6 6 109 22 87 648 2318 272.7 438 119 6 6 6 113 23 91 739 2319 283.6 438 124 6 6 6 118 24 94 833 2320 295.0 438 129 6 6 6 123 25 98 931 23
Total 8,760 1,826 90 45 91 226 315 151 692 1,133 203 931 931Source: JICA Study Team 626 476 NPV= 151
Year(a) Unit
Price($/MWh)
(b)Generation
(MWh)
(c)Operation
Income($000)
d) Capital Cost ($000) e) O/MCost
($000)
f) SubTotalCost(d+e)
(g) Loan ($000) (h) TotalCost(f+g)
($000)
(i) Profitbefor Tax
(c-h)($000)
(j)CorporateTax (25%)
(k) NetIncome (i-j) ($000)
(l)Accumulated
Income($000)
Depreciation($000)
Case-H11(0.1MW) Cash Flow for Small Hydropower -0.1 MW (Case-H11)
Plant Cap(MW)
CapacityFactor (%)
EscalationRate
PlantCost
($000)
Inter-ConnectionCost ($000)
O/MCost
% ofLoan
Bank Loan($000)
Repayment Period
(year)
LoanInterestRate p.a
TaxExemption
(year)
CorporateTax Subsidy
0.1 60% 4% 300 150 5% 70% 315 10 8% 10 25%NPV ($000) 259FIRR 22.8%B/C 1.53
PowerPlant
Inter-Connection
Cost
PrincipalRepayment Interest
0 0 45 45 45 -45 0 -45 -450 0 45 45 90 13 103 -103 0 -103 -1481 140 526 74 4 4 32 25 60 13 0 13 -134 232 145.6 526 77 4 4 32 23 58 19 0 19 -116 233 151.4 526 80 4 4 32 20 56 24 0 24 -92 234 157.5 526 83 4 4 32 18 53 29 0 29 -62 235 163.8 526 86 4 4 32 15 51 35 0 35 -27 236 170.3 526 90 4 4 32 13 49 41 0 41 14 237 177.1 526 93 5 5 32 10 46 47 0 47 61 238 184.2 526 97 5 5 32 8 44 53 0 53 113 239 191.6 526 101 5 5 32 5 42 59 0 59 173 23
10 199.3 526 105 5 5 32 3 39 65 0 65 238 2311 207.2 526 109 5 5 5 103 20 83 321 2312 215.5 526 113 6 6 6 108 21 86 408 2313 224.1 526 118 6 6 6 112 22 90 497 2314 233.1 526 123 6 6 6 116 23 93 590 2315 242.4 526 127 6 6 6 121 25 96 687 2316 252.1 526 133 7 7 7 126 26 100 787 2317 262.2 526 138 7 7 7 131 27 104 890 2318 272.7 526 143 7 7 7 136 28 108 998 2319 283.6 526 149 7 7 7 142 30 112 1,110 2320 295.0 526 155 8 8 8 147 31 116 1,226 23
Total 10,512 2,191 90 45 110 245 315 151 711 1,480 254 1,226 1,226Source: JICA Study Team 752 493 NPV= 259
Year(a) Unit
Price($/MWh)
(b)Generation
(MWh)
(c)Operation
Income($000)
d) Capital Cost ($000) e) O/MCost
($000)
(l)Accumulated
Income($000)
f) SubTotalCost(d+e)
(g) Loan ($000) (h) TotalCost(f+g)
($000)
(i) Profitbefor Tax
(c-h)($000)
(j)CorporateTax (25%)
(k) NetIncome (i-j) ($000)
Depreciation($000)

Final Report Appendix-E
Republic of El Salvador E - 7 March 2012 The Project for Master Plan for the Development of Renewable Energy (JICA)
Case-W0 Cash Flow for Wind Power-20MW (Case-W0)
1,800
Plant Cap(MW)
CapacityFactor (%)
EscalationRate
PlantCost
($000)
Inter-ConnectionCost ($000)
O/MCost
($)/MWh
% ofLoan
Bank Loan($000)
Repayment Period
(year)
LoanInterestRate p.a
TaxExemption
(year)
CorporateTax
20 25% 4% 36,000 22 70% 25,200 10 8% 5 25%NPV ($000) 15,796FIRR 19.6%B/C 1.34
PowerPlant
Inter-Connection
Cost
PrincipalRepayment Interest
0 0 5,400 5,400 5,400 -5,400 0 -5,400 -5,4000 0 5,400 0 5,400 1,008 6,408 -6,408 0 -6,408 -11,8081 140 43,800 6,132 964 964 2,520 2,016 5,500 632 0 632 -11,176 2,4002 145.6 43,800 6,377 1,002 1,002 2,520 1,814 5,337 1,041 0 1,041 -10,135 2,4003 151.4 43,800 6,632 1,042 1,042 2,520 1,613 5,175 1,457 0 1,457 -8,678 2,4004 157.5 43,800 6,898 1,084 1,084 2,520 1,411 5,015 1,883 0 1,883 -6,795 2,4005 163.8 43,800 7,174 1,127 1,127 2,520 1,210 4,857 2,317 0 2,317 -4,478 2,4006 170.3 43,800 7,461 1,172 1,172 2,520 1,008 4,700 2,760 90 2,670 -1,808 2,4007 177.1 43,800 7,759 1,219 1,219 2,520 806 4,546 3,213 203 3,010 1,202 2,4008 184.2 43,800 8,069 1,268 1,268 2,520 605 4,393 3,676 319 3,357 4,559 2,4009 191.6 43,800 8,392 1,319 1,319 2,520 403 4,242 4,150 438 3,713 8,272 2,400
10 199.3 43,800 8,728 1,372 1,372 2,520 202 4,093 4,635 559 4,076 12,348 2,40011 207.2 43,800 9,077 1,426 1,426 1,426 7,650 1,313 6,338 18,686 2,40012 215.5 43,800 9,440 1,483 1,483 1,483 7,957 1,389 6,567 25,253 2,40013 224.1 43,800 9,818 1,543 1,543 1,543 8,275 1,469 6,806 32,059 2,40014 233.1 43,800 10,210 1,604 1,604 1,604 8,606 1,551 7,054 39,113 2,40015 242.4 43,800 10,619 1,669 1,669 1,669 8,950 1,637 7,312 46,426 2,40016 252.1 43,800 11,043 1,735 1,735 1,735 9,308 2,327 6,981 53,40717 262.2 43,800 11,485 1,805 1,805 1,805 9,680 2,420 7,260 60,66718 272.7 43,800 11,945 1,877 1,877 1,877 10,068 2,517 7,551 68,21819 283.6 43,800 12,422 1,952 1,952 1,952 10,470 2,618 7,853 76,07020 295.0 43,800 12,919 2,030 2,030 2,030 10,889 2,722 8,167 84,237
Total 876,000 182,599 10,800 0 28,694 39,494 25,200 12,096 76,790 105,809 21,572 84,237 84,237Source: JICA Study Team 62,649 46,853 NPV= 15,796
Year(a) Unit
Price($/MWh)
(b)Generation
(MWh)
(c)Operation
Income($000)
d) Capital Cost ($000)e) O/M
Cost($000)
f) SubTotalCost(d+e)
(g) Loan ($000) (h) TotalCost(f+g)
($000)
(i) Profitbefor Tax
(c-h)($000)
(j)CorporateTax (25%)
(k) NetIncome (i-j) ($000)
(l)Accumulated
Income($000)
Depreciation($000)
Case-W1 Cash Flow for Wind Power-20MW (Case-W1)1,700
Plant Cap(MW)
CapacityFactor (%)
EscalationRate
PlantCost
($000)
Inter-ConnectionCost ($000)
O/MCost
($)/MWh
% ofLoan
Bank Loan($000)
Repayment Period
(year)
LoanInterestRate p.a
TaxExemption
(year)
CorporateTax
20 25% 4% 34,000 22 70% 23,800 10 8% 5 25%NPV ($000) 17,384FIRR 21.2%B/C 1.38
PowerPlant
Inter-Connection
Cost
PrincipalRepayment Interest
0 0 5,100 5,100 5,100 -5,100 0 -5,100 -5,1000 0 5,100 0 5,100 952 6,052 -6,052 0 -6,052 -11,1521 140 43,800 6,132 964 964 2,380 1,904 5,248 884 0 884 -10,268 2,2672 145.6 43,800 6,377 1,002 1,002 2,380 1,714 5,096 1,282 0 1,282 -8,986 2,2673 151.4 43,800 6,632 1,042 1,042 2,380 1,523 4,945 1,687 0 1,687 -7,299 2,2674 157.5 43,800 6,898 1,084 1,084 2,380 1,333 4,797 2,101 0 2,101 -5,198 2,2675 163.8 43,800 7,174 1,127 1,127 2,380 1,142 4,650 2,524 0 2,524 -2,674 2,2676 170.3 43,800 7,461 1,172 1,172 2,380 952 4,504 2,956 172 2,784 109 2,2677 177.1 43,800 7,759 1,219 1,219 2,380 762 4,361 3,398 283 3,115 3,225 2,2678 184.2 43,800 8,069 1,268 1,268 2,380 571 4,219 3,850 396 3,454 6,679 2,2679 191.6 43,800 8,392 1,319 1,319 2,380 381 4,080 4,313 511 3,801 10,480 2,267
10 199.3 43,800 8,728 1,372 1,372 2,380 190 3,942 4,786 630 4,156 14,636 2,26711 207.2 43,800 9,077 1,426 1,426 1,426 7,650 1,346 6,305 20,941 2,26712 215.5 43,800 9,440 1,483 1,483 1,483 7,957 1,422 6,534 27,475 2,26713 224.1 43,800 9,818 1,543 1,543 1,543 8,275 1,502 6,773 34,247 2,26714 233.1 43,800 10,210 1,604 1,604 1,604 8,606 1,585 7,021 41,268 2,26715 242.4 43,800 10,619 1,669 1,669 1,669 8,950 1,671 7,279 48,548 2,26716 252.1 43,800 11,043 1,735 1,735 1,735 9,308 2,327 6,981 55,52917 262.2 43,800 11,485 1,805 1,805 1,805 9,680 2,420 7,260 62,78918 272.7 43,800 11,945 1,877 1,877 1,877 10,068 2,517 7,551 70,33919 283.6 43,800 12,422 1,952 1,952 1,952 10,470 2,618 7,853 78,19220 295.0 43,800 12,919 2,030 2,030 2,030 10,889 2,722 8,167 86,359
Total 876,000 182,599 10,200 0 28,694 38,894 23,800 11,424 74,118 108,481 22,122 86,359 86,359Source: JICA Study Team 62,649 45,264 NPV= 17,384
Year(a) Unit
Price($/MWh)
(b)Generation
(MWh)
(c)Operation
Income($000)
d) Capital Cost ($000)e) O/M
Cost($000)
f) SubTotalCost(d+e)
(g) Loan ($000) (h) TotalCost(f+g)
($000)
(i) Profitbefor Tax
(c-h)($000)
(j)CorporateTax (25%)
(k) NetIncome (i-j) ($000)
(l)Accumulated
Income($000)
Depreciation($000)
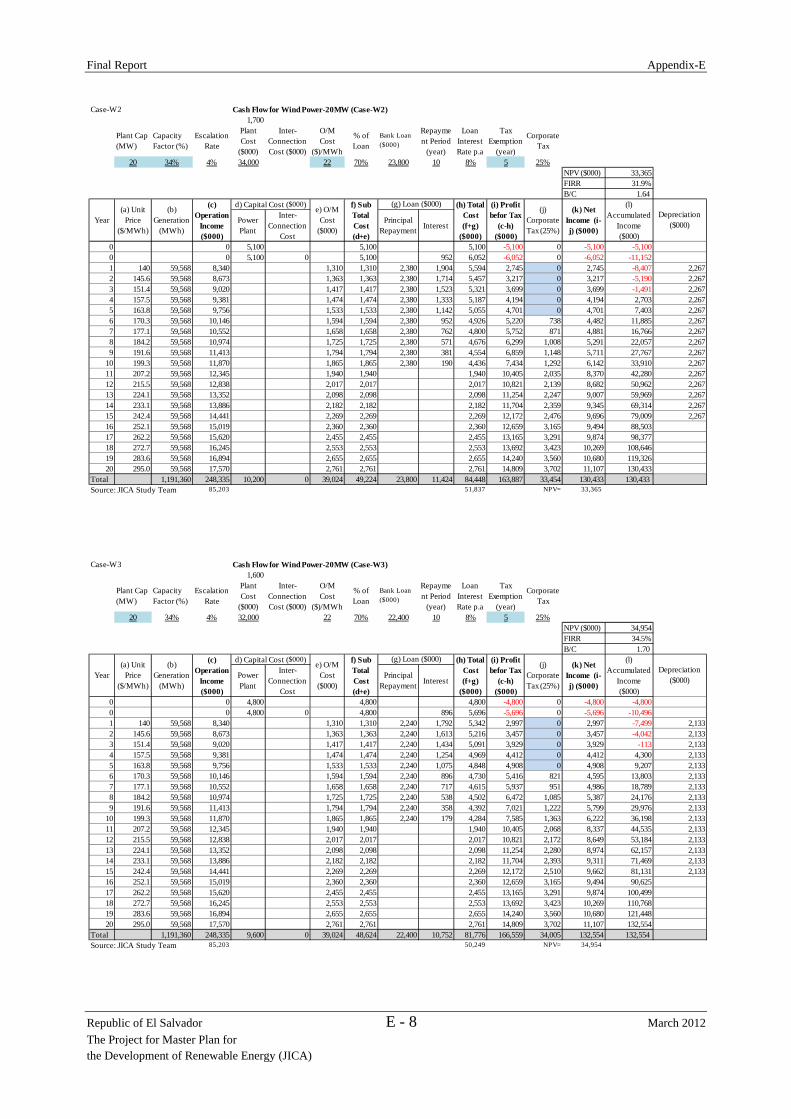
Final Report Appendix-E
Republic of El Salvador E - 8 March 2012 The Project for Master Plan for the Development of Renewable Energy (JICA)
Case-W2 Cash Flow for Wind Power-20MW (Case-W2)1,700
Plant Cap(MW)
CapacityFactor (%)
EscalationRate
PlantCost
($000)
Inter-ConnectionCost ($000)
O/MCost
($)/MWh
% ofLoan
Bank Loan($000)
Repayment Period
(year)
LoanInterestRate p.a
TaxExemption
(year)
CorporateTax
20 34% 4% 34,000 22 70% 23,800 10 8% 5 25%NPV ($000) 33,365FIRR 31.9%B/C 1.64
PowerPlant
Inter-Connection
Cost
PrincipalRepayment Interest
0 0 5,100 5,100 5,100 -5,100 0 -5,100 -5,1000 0 5,100 0 5,100 952 6,052 -6,052 0 -6,052 -11,1521 140 59,568 8,340 1,310 1,310 2,380 1,904 5,594 2,745 0 2,745 -8,407 2,2672 145.6 59,568 8,673 1,363 1,363 2,380 1,714 5,457 3,217 0 3,217 -5,190 2,2673 151.4 59,568 9,020 1,417 1,417 2,380 1,523 5,321 3,699 0 3,699 -1,491 2,2674 157.5 59,568 9,381 1,474 1,474 2,380 1,333 5,187 4,194 0 4,194 2,703 2,2675 163.8 59,568 9,756 1,533 1,533 2,380 1,142 5,055 4,701 0 4,701 7,403 2,2676 170.3 59,568 10,146 1,594 1,594 2,380 952 4,926 5,220 738 4,482 11,885 2,2677 177.1 59,568 10,552 1,658 1,658 2,380 762 4,800 5,752 871 4,881 16,766 2,2678 184.2 59,568 10,974 1,725 1,725 2,380 571 4,676 6,299 1,008 5,291 22,057 2,2679 191.6 59,568 11,413 1,794 1,794 2,380 381 4,554 6,859 1,148 5,711 27,767 2,267
10 199.3 59,568 11,870 1,865 1,865 2,380 190 4,436 7,434 1,292 6,142 33,910 2,26711 207.2 59,568 12,345 1,940 1,940 1,940 10,405 2,035 8,370 42,280 2,26712 215.5 59,568 12,838 2,017 2,017 2,017 10,821 2,139 8,682 50,962 2,26713 224.1 59,568 13,352 2,098 2,098 2,098 11,254 2,247 9,007 59,969 2,26714 233.1 59,568 13,886 2,182 2,182 2,182 11,704 2,359 9,345 69,314 2,26715 242.4 59,568 14,441 2,269 2,269 2,269 12,172 2,476 9,696 79,009 2,26716 252.1 59,568 15,019 2,360 2,360 2,360 12,659 3,165 9,494 88,50317 262.2 59,568 15,620 2,455 2,455 2,455 13,165 3,291 9,874 98,37718 272.7 59,568 16,245 2,553 2,553 2,553 13,692 3,423 10,269 108,64619 283.6 59,568 16,894 2,655 2,655 2,655 14,240 3,560 10,680 119,32620 295.0 59,568 17,570 2,761 2,761 2,761 14,809 3,702 11,107 130,433
Total 1,191,360 248,335 10,200 0 39,024 49,224 23,800 11,424 84,448 163,887 33,454 130,433 130,433Source: JICA Study Team 85,203 51,837 NPV= 33,365
Year(a) Unit
Price($/MWh)
(b)Generation
(MWh)
(c)Operation
Income($000)
d) Capital Cost ($000) e) O/MCost
($000)
f) SubTotalCost(d+e)
(g) Loan ($000) (h) TotalCost(f+g)
($000)
(i) Profitbefor Tax
(c-h)($000)
(j)CorporateTax (25%)
(k) NetIncome (i-j) ($000)
(l)Accumulated
Income($000)
Depreciation($000)
Case-W3 Cash Flow for Wind Power-20MW (Case-W3)1,600
Plant Cap(MW)
CapacityFactor (%)
EscalationRate
PlantCost
($000)
Inter-ConnectionCost ($000)
O/MCost
($)/MWh
% ofLoan
Bank Loan($000)
Repayment Period
(year)
LoanInterestRate p.a
TaxExemption
(year)
CorporateTax
20 34% 4% 32,000 22 70% 22,400 10 8% 5 25%NPV ($000) 34,954FIRR 34.5%B/C 1.70
PowerPlant
Inter-Connection
Cost
PrincipalRepayment Interest
0 0 4,800 4,800 4,800 -4,800 0 -4,800 -4,8000 0 4,800 0 4,800 896 5,696 -5,696 0 -5,696 -10,4961 140 59,568 8,340 1,310 1,310 2,240 1,792 5,342 2,997 0 2,997 -7,499 2,1332 145.6 59,568 8,673 1,363 1,363 2,240 1,613 5,216 3,457 0 3,457 -4,042 2,1333 151.4 59,568 9,020 1,417 1,417 2,240 1,434 5,091 3,929 0 3,929 -113 2,1334 157.5 59,568 9,381 1,474 1,474 2,240 1,254 4,969 4,412 0 4,412 4,300 2,1335 163.8 59,568 9,756 1,533 1,533 2,240 1,075 4,848 4,908 0 4,908 9,207 2,1336 170.3 59,568 10,146 1,594 1,594 2,240 896 4,730 5,416 821 4,595 13,803 2,1337 177.1 59,568 10,552 1,658 1,658 2,240 717 4,615 5,937 951 4,986 18,789 2,1338 184.2 59,568 10,974 1,725 1,725 2,240 538 4,502 6,472 1,085 5,387 24,176 2,1339 191.6 59,568 11,413 1,794 1,794 2,240 358 4,392 7,021 1,222 5,799 29,976 2,133
10 199.3 59,568 11,870 1,865 1,865 2,240 179 4,284 7,585 1,363 6,222 36,198 2,13311 207.2 59,568 12,345 1,940 1,940 1,940 10,405 2,068 8,337 44,535 2,13312 215.5 59,568 12,838 2,017 2,017 2,017 10,821 2,172 8,649 53,184 2,13313 224.1 59,568 13,352 2,098 2,098 2,098 11,254 2,280 8,974 62,157 2,13314 233.1 59,568 13,886 2,182 2,182 2,182 11,704 2,393 9,311 71,469 2,13315 242.4 59,568 14,441 2,269 2,269 2,269 12,172 2,510 9,662 81,131 2,13316 252.1 59,568 15,019 2,360 2,360 2,360 12,659 3,165 9,494 90,62517 262.2 59,568 15,620 2,455 2,455 2,455 13,165 3,291 9,874 100,49918 272.7 59,568 16,245 2,553 2,553 2,553 13,692 3,423 10,269 110,76819 283.6 59,568 16,894 2,655 2,655 2,655 14,240 3,560 10,680 121,44820 295.0 59,568 17,570 2,761 2,761 2,761 14,809 3,702 11,107 132,554
Total 1,191,360 248,335 9,600 0 39,024 48,624 22,400 10,752 81,776 166,559 34,005 132,554 132,554Source: JICA Study Team 85,203 50,249 NPV= 34,954
Year(a) Unit
Price($/MWh)
(b)Generation
(MWh)
(c)Operation
Income($000)
d) Capital Cost ($000) e) O/MCost
($000)
f) SubTotalCost(d+e)
(g) Loan ($000) (h) TotalCost(f+g)
($000)
(i) Profitbefor Tax
(c-h)($000)
(j)CorporateTax (25%)
(k) NetIncome (i-j) ($000)
(l)Accumulated
Income($000)
Depreciation($000)

Final Report Appendix-E
Republic of El Salvador E - 9 March 2012 The Project for Master Plan for the Development of Renewable Energy (JICA)
Case-S0 Cash Flow for PV Power-20MW (Case-S0)
3,800
Plant Cap(MW)
CapacityFactor (%)
EscalationRate
PlantCost
($000)
Inter-ConnectionCost ($000)
O/MCost
($)/MWh
% ofLoan
Bank Loan($000)
Repayment Period
(year)
LoanInterestRate p.a
TaxExemption
(year)
CorporateTax
20 18% 4% 76,000 4 70% 53,200 10 8% 5 25%NPV ($000) -26,811FIRR 1.7%B/C 0.63
PowerPlant
Inter-Connection
Cost
PrincipalRepayment Interest
0 0 11,400 11,400 11,400 -11,400 0 -11,400 -11,4000 0 11,400 0 11,400 2,128 13,528 -13,528 0 -13,528 -24,9281 140 31,536 4,415 126 126 5,320 4,256 9,702 -5,287 0 -5,287 -30,215 5,0672 145.6 31,536 4,592 131 131 5,320 3,830 9,282 -4,690 0 -4,690 -34,905 5,0673 151.4 31,536 4,775 136 136 5,320 3,405 8,861 -4,086 0 -4,086 -38,991 5,0674 157.5 31,536 4,966 142 142 5,320 2,979 8,441 -3,475 0 -3,475 -42,466 5,0675 163.8 31,536 5,165 148 148 5,320 2,554 8,021 -2,856 0 -2,856 -45,322 5,0676 170.3 31,536 5,372 153 153 5,320 2,128 7,601 -2,230 0 -2,230 -47,552 5,0677 177.1 31,536 5,586 160 160 5,320 1,702 7,182 -1,596 0 -1,596 -49,147 5,0678 184.2 31,536 5,810 166 166 5,320 1,277 6,763 -953 0 -953 -50,100 5,0679 191.6 31,536 6,042 173 173 5,320 851 6,344 -302 0 -302 -50,402 5,067
10 199.3 31,536 6,284 180 180 5,320 426 5,925 359 0 359 -50,043 5,06711 207.2 31,536 6,535 187 187 187 6,349 320 6,028 -44,015 5,06712 215.5 31,536 6,797 194 194 194 6,603 384 6,219 -37,796 5,06713 224.1 31,536 7,069 202 202 202 6,867 450 6,417 -31,380 5,06714 233.1 31,536 7,351 210 210 210 7,141 519 6,623 -24,757 5,06715 242.4 31,536 7,645 218 218 218 7,427 590 6,837 -17,920 5,06716 252.1 31,536 7,951 227 227 227 7,724 1,931 5,793 -12,12717 262.2 31,536 8,269 236 236 236 8,033 2,008 6,025 -6,10218 272.7 31,536 8,600 246 246 246 8,354 2,089 6,266 16319 283.6 31,536 8,944 256 256 256 8,689 2,172 6,516 6,68020 295.0 31,536 9,302 266 266 266 9,036 2,259 6,777 13,457
Total 630,720 131,471 22,800 0 3,756 26,556 53,200 25,536 105,292 26,179 12,722 13,457 13,457Source: JICA Study Team 45,107 71,919 NPV= -26,811
(k) NetIncome (i-j) ($000)
Year(a) Unit
Price($/MWh)
(b)Generation
(MWh)
(c)Operation
Income($000)
d) Capital Cost ($000)e) O/M
Cost($000)
f) SubTotalCost(d+e)
(g) Loan ($000) (h) TotalCost(f+g)
($000)
(i) Profitbefor Tax
(c-h)($000)
(j)CorporateTax (25%)
(l)Accumulated
Income($000)
Depreciation($000)
Case-S1 Cash Flow for PV Power-20MW (Case-S1)2,700
Plant Cap(MW)
CapacityFactor (%)
EscalationRate
PlantCost
($000)
Inter-ConnectionCost ($000)
O/MCost
($)/MWh
% ofLoan
Bank Loan($000)
Repayment Period
(year)
LoanInterestRate p.a
TaxExemption
(year)
CorporateTax
20 18% 4% 54,000 4 70% 37,800 10 8% 5 25%NPV ($000) -7,518FIRR 6.9%B/C 0.86
PowerPlant
Inter-Connection
Cost
PrincipalRepayment Interest
0 0 8,100 8,100 8,100 -8,100 0 -8,100 -8,1000 0 8,100 0 8,100 1,512 9,612 -9,612 0 -9,612 -17,7121 140 31,536 4,415 126 126 3,780 3,024 6,930 -2,515 0 -2,515 -20,227 3,6002 145.6 31,536 4,592 131 131 3,780 2,722 6,633 -2,041 0 -2,041 -22,268 3,6003 151.4 31,536 4,775 136 136 3,780 2,419 6,336 -1,560 0 -1,560 -23,829 3,6004 157.5 31,536 4,966 142 142 3,780 2,117 6,039 -1,072 0 -1,072 -24,901 3,6005 163.8 31,536 5,165 148 148 3,780 1,814 5,742 -577 0 -577 -25,478 3,6006 170.3 31,536 5,372 153 153 3,780 1,512 5,445 -74 0 -74 -25,552 3,6007 177.1 31,536 5,586 160 160 3,780 1,210 5,149 437 0 437 -25,115 3,6008 184.2 31,536 5,810 166 166 3,780 907 4,853 957 0 957 -24,158 3,6009 191.6 31,536 6,042 173 173 3,780 605 4,557 1,485 0 1,485 -22,673 3,600
10 199.3 31,536 6,284 180 180 3,780 302 4,262 2,022 0 2,022 -20,651 3,60011 207.2 31,536 6,535 187 187 187 6,349 687 5,661 -14,990 3,60012 215.5 31,536 6,797 194 194 194 6,603 751 5,852 -9,138 3,60013 224.1 31,536 7,069 202 202 202 6,867 817 6,050 -3,088 3,60014 233.1 31,536 7,351 210 210 210 7,141 885 6,256 3,168 3,60015 242.4 31,536 7,645 218 218 218 7,427 957 6,470 9,639 3,60016 252.1 31,536 7,951 227 227 227 7,724 1,931 5,793 15,43217 262.2 31,536 8,269 236 236 236 8,033 2,008 6,025 21,45618 272.7 31,536 8,600 246 246 246 8,354 2,089 6,266 27,72219 283.6 31,536 8,944 256 256 256 8,689 2,172 6,516 34,23920 295.0 31,536 9,302 266 266 266 9,036 2,259 6,777 41,016
Total 630,720 131,471 16,200 0 3,756 19,956 37,800 18,144 75,900 55,571 14,556 41,016 41,016Source: JICA Study Team 45,107 52,625 NPV= -7,518
f) SubTotalCost(d+e)
(l)Accumulated
Income($000)
Year(a) Unit
Price($/MWh)
(b)Generation
(MWh)
(c)Operation
Income($000)
d) Capital Cost ($000)e) O/M
Cost($000)
(g) Loan ($000) (h) TotalCost(f+g)
($000)
(i) Profitbefor Tax
(c-h)($000)
(j)CorporateTax (25%)
(k) NetIncome (i-j) ($000)
Depreciation($000)
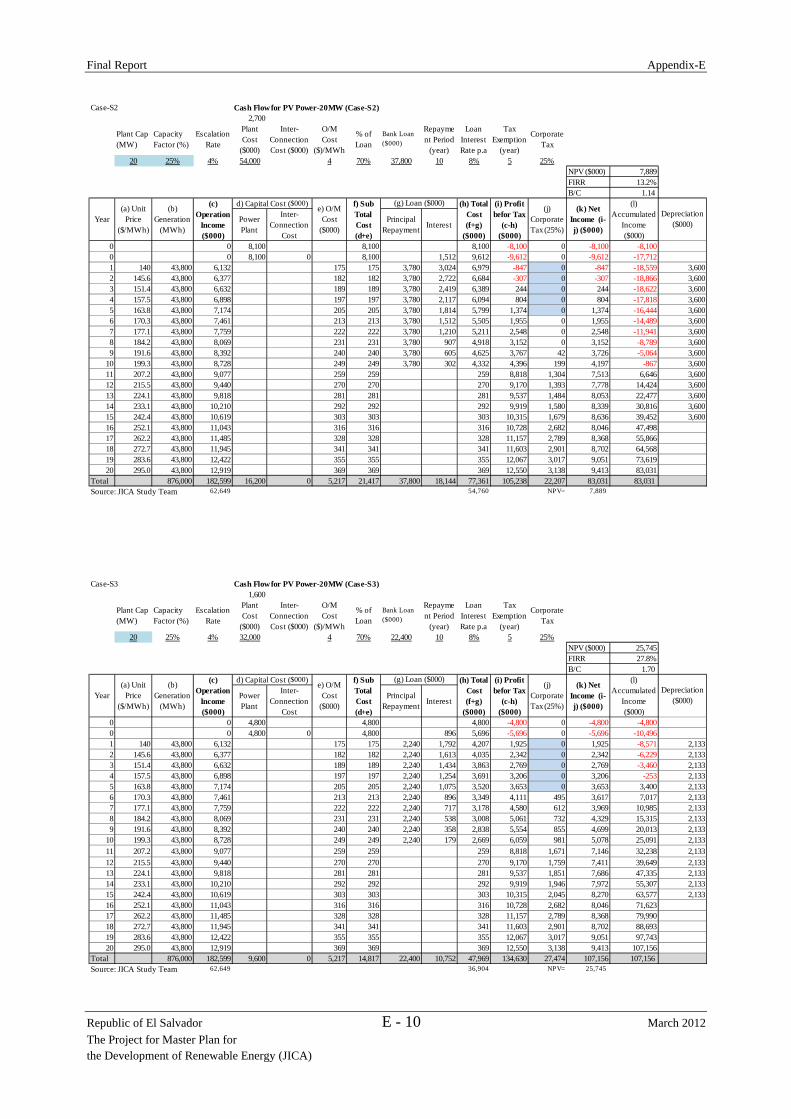
Final Report Appendix-E
Republic of El Salvador E - 10 March 2012 The Project for Master Plan for the Development of Renewable Energy (JICA)
Case-S2 Cash Flow for PV Power-20MW (Case-S2)2,700
Plant Cap(MW)
CapacityFactor (%)
EscalationRate
PlantCost
($000)
Inter-ConnectionCost ($000)
O/MCost
($)/MWh
% ofLoan
Bank Loan($000)
Repayment Period
(year)
LoanInterestRate p.a
TaxExemption
(year)
CorporateTax
20 25% 4% 54,000 4 70% 37,800 10 8% 5 25%NPV ($000) 7,889FIRR 13.2%B/C 1.14
PowerPlant
Inter-Connection
Cost
PrincipalRepayment Interest
0 0 8,100 8,100 8,100 -8,100 0 -8,100 -8,1000 0 8,100 0 8,100 1,512 9,612 -9,612 0 -9,612 -17,7121 140 43,800 6,132 175 175 3,780 3,024 6,979 -847 0 -847 -18,559 3,6002 145.6 43,800 6,377 182 182 3,780 2,722 6,684 -307 0 -307 -18,866 3,6003 151.4 43,800 6,632 189 189 3,780 2,419 6,389 244 0 244 -18,622 3,6004 157.5 43,800 6,898 197 197 3,780 2,117 6,094 804 0 804 -17,818 3,6005 163.8 43,800 7,174 205 205 3,780 1,814 5,799 1,374 0 1,374 -16,444 3,6006 170.3 43,800 7,461 213 213 3,780 1,512 5,505 1,955 0 1,955 -14,489 3,6007 177.1 43,800 7,759 222 222 3,780 1,210 5,211 2,548 0 2,548 -11,941 3,6008 184.2 43,800 8,069 231 231 3,780 907 4,918 3,152 0 3,152 -8,789 3,6009 191.6 43,800 8,392 240 240 3,780 605 4,625 3,767 42 3,726 -5,064 3,600
10 199.3 43,800 8,728 249 249 3,780 302 4,332 4,396 199 4,197 -867 3,60011 207.2 43,800 9,077 259 259 259 8,818 1,304 7,513 6,646 3,60012 215.5 43,800 9,440 270 270 270 9,170 1,393 7,778 14,424 3,60013 224.1 43,800 9,818 281 281 281 9,537 1,484 8,053 22,477 3,60014 233.1 43,800 10,210 292 292 292 9,919 1,580 8,339 30,816 3,60015 242.4 43,800 10,619 303 303 303 10,315 1,679 8,636 39,452 3,60016 252.1 43,800 11,043 316 316 316 10,728 2,682 8,046 47,49817 262.2 43,800 11,485 328 328 328 11,157 2,789 8,368 55,86618 272.7 43,800 11,945 341 341 341 11,603 2,901 8,702 64,56819 283.6 43,800 12,422 355 355 355 12,067 3,017 9,051 73,61920 295.0 43,800 12,919 369 369 369 12,550 3,138 9,413 83,031
Total 876,000 182,599 16,200 0 5,217 21,417 37,800 18,144 77,361 105,238 22,207 83,031 83,031Source: JICA Study Team 62,649 54,760 NPV= 7,889
(g) Loan ($000)
Year(a) Unit
Price($/MWh)
(b)Generation
(MWh)
(c)Operation
Income($000)
d) Capital Cost ($000) e) O/MCost
($000)
f) SubTotalCost(d+e)
Depreciation($000)
(h) TotalCost(f+g)
($000)
(i) Profitbefor Tax
(c-h)($000)
(j)CorporateTax (25%)
(k) NetIncome (i-j) ($000)
(l)Accumulated
Income($000)
Case-S3 Cash Flow for PV Power-20MW (Case-S3)1,600
Plant Cap(MW)
CapacityFactor (%)
EscalationRate
PlantCost
($000)
Inter-ConnectionCost ($000)
O/MCost
($)/MWh
% ofLoan
Bank Loan($000)
Repayment Period
(year)
LoanInterestRate p.a
TaxExemption
(year)
CorporateTax
20 25% 4% 32,000 4 70% 22,400 10 8% 5 25%NPV ($000) 25,745FIRR 27.8%B/C 1.70
PowerPlant
Inter-Connection
Cost
PrincipalRepayment Interest
0 0 4,800 4,800 4,800 -4,800 0 -4,800 -4,8000 0 4,800 0 4,800 896 5,696 -5,696 0 -5,696 -10,4961 140 43,800 6,132 175 175 2,240 1,792 4,207 1,925 0 1,925 -8,571 2,1332 145.6 43,800 6,377 182 182 2,240 1,613 4,035 2,342 0 2,342 -6,229 2,1333 151.4 43,800 6,632 189 189 2,240 1,434 3,863 2,769 0 2,769 -3,460 2,1334 157.5 43,800 6,898 197 197 2,240 1,254 3,691 3,206 0 3,206 -253 2,1335 163.8 43,800 7,174 205 205 2,240 1,075 3,520 3,653 0 3,653 3,400 2,1336 170.3 43,800 7,461 213 213 2,240 896 3,349 4,111 495 3,617 7,017 2,1337 177.1 43,800 7,759 222 222 2,240 717 3,178 4,580 612 3,969 10,985 2,1338 184.2 43,800 8,069 231 231 2,240 538 3,008 5,061 732 4,329 15,315 2,1339 191.6 43,800 8,392 240 240 2,240 358 2,838 5,554 855 4,699 20,013 2,133
10 199.3 43,800 8,728 249 249 2,240 179 2,669 6,059 981 5,078 25,091 2,13311 207.2 43,800 9,077 259 259 259 8,818 1,671 7,146 32,238 2,13312 215.5 43,800 9,440 270 270 270 9,170 1,759 7,411 39,649 2,13313 224.1 43,800 9,818 281 281 281 9,537 1,851 7,686 47,335 2,13314 233.1 43,800 10,210 292 292 292 9,919 1,946 7,972 55,307 2,13315 242.4 43,800 10,619 303 303 303 10,315 2,045 8,270 63,577 2,13316 252.1 43,800 11,043 316 316 316 10,728 2,682 8,046 71,62317 262.2 43,800 11,485 328 328 328 11,157 2,789 8,368 79,99018 272.7 43,800 11,945 341 341 341 11,603 2,901 8,702 88,69319 283.6 43,800 12,422 355 355 355 12,067 3,017 9,051 97,74320 295.0 43,800 12,919 369 369 369 12,550 3,138 9,413 107,156
Total 876,000 182,599 9,600 0 5,217 14,817 22,400 10,752 47,969 134,630 27,474 107,156 107,156Source: JICA Study Team 62,649 36,904 NPV= 25,745
(l)Accumulated
Income($000)
f) SubTotalCost(d+e)
(g) Loan ($000) (h) TotalCost(f+g)
($000)
(i) Profitbefor Tax
(c-h)($000)
(j)CorporateTax (25%)
(k) NetIncome (i-j) ($000)
Year(a) Unit
Price($/MWh)
(b)Generation
(MWh)
(c)Operation
Income($000)
d) Capital Cost ($000) e) O/MCost
($000)
Depreciation($000)

Final Report Appendix-S
Republic of El Salvador March 2012 The Project for Master Plan for the Development of Renewable Energy (JICA)
Appendix - S
Small Hydropower

Final Report Appendix-S
Republic of El Salvador S - 1 March 2012 The Project for Master Plan for the Development of Renewable Energy (JICA)
Table S.1 Condition of Cost Estimation (Example)
(Source: JICA Study Team)
Catchment Area A km2 424.0Firm Discharge Qfm m3/s 1.20 Q90% of flow duration curve
Design Intake Discharge Qd m3/s 8.79 Parameter
Maximum plant discharge Qmax m3/s 8.79 Qd = Qmax
Intake Water Level IWL m from Topo. Map
Tail Water Level TWL m from Topo. Map
Gross Head Hg m 57 Hg=IWL - TWL
Length of headrace channel L1 m 2,600 from Topo. Map
Length of penstock L2 m 290 from Topo. Map
Length of tailrace channel L3 m 10 (assumed)
Factor of head loss for headrace a - 0.0002 1/1,000 for tunnel, 1/5.000 for open channel
Factor of head loss for penstock b - 0.0050 assumed 1/200
Factor of head loss for tailrace c - 0.0002 1/1,000 for tunnel, 1/5.000 for open channel
Other head loss Dh m 0.00 (assumed)
Total head loss Hl m 1.97 Hl = a*L1 + b*L2 + c*L3 + DL
Effective Head He m 55.43 He = Hg - Hl
Combined Efficiency of Maximum Output η - 87.5% h = ht * hg
Maximum Output Pmax kW 4,175 P=9.8*Qd*He*hr*ht
Combined Efficiency of Firm Output ηφ - 59% h = ht * hg
Firm Output Pf kW 385 Q90%
Number of Turbine Unit n nos 2 IF( Pmax>=1000, 2, 1 )
Transmission Line km 3.00 (assumed)
Access Road (Gravel Paved, W=4m) km 2.00 (assumed)

Final Report Appendix-S
Republic of El Salvador S - 2 March 2012 The Project for Master Plan for the Development of Renewable Energy (JICA)
Table S.2 Cost Estimation of Civil Works (Example) (1/2)
(Source: JICA Study Team)
Civil Works and Material Cost Unit Q'ty Unit Price (US$) Notes Amount(US$)
Preliminary / General and Day work L.S. - 10.0% % of Civil Work Cost 972,000Intake Weir 260,800
Maximum plant discharge Qmax m3/s 8.8Weir/Dam Height Hd m 2.0 assumed
* Crest Width Li m 62.2 US$/m3 Li = Qmax * 198 / Hd^2 / 7
Catchment Area A km2 424.0 from Topo.Map
Region coefficient for Flood a - 17.0 a=17~84
Design Flood Qf m3/s 1,490 assumed, Qf =(a*A^(A^(-0.05)-1) )*A
Excavation Volume (Rock) Ve m3 2,100 US$/m3 3.39 Ve=8.69*(Hd*L)^1.14 7,200Temp.Coffer Dam Vol. Vsd m3 400 US$/m3 16.3 Vsd= Li*Hd *3m 6,600Concrete Volume Vc m3 700 US$/m3 247.4 Vc=16.1*(Hd^2*L)^0.695 173,200(Weight of Cement) Wc ton 290 Wc=Vc * 8.3bag * 50kg/bag (Class:A)
(Weight of Fixation Wire) Ww ton 5.8 Ww=Wc*2%
(Weight of Sand) Ws ton 739 Ws=Vc* 0.48m3 *2200kg/m3 (Class:A)
(Weight of Gravel/Stones) Wa ton 1,232 Wa=Vc* 0.8m3 *2200kg/m3 (Class:A)
Weight of Reinforcement Bar Wr ton 6.0 US$/ton 2,260 Wr=0.0274*Vc^0.830 13,600Others L.S. - 30% of above costs 60,200
Intake 179,300Design Intake Discharge Qd m3/s 8.79Design Intake Velocity V m/s 1.40 assumed
Diameter of Intake Di m 2.39 Di=SQRT( 4*Ac / (pi *V) )
Excavation Volume Ve m3 820 US$/m3 3.93 Ve=171*(R*Q)^0.666, R=D/2 3,300Concrete Volume Vc m3 440 US$/m3 236.4 Vc=147*(R*Q)^0.470 104,100(Weight of Cement) Wc ton 150.0 Wc=Vc * 6.8bag * 50kg/bag (Class:B)
(Weight of Fixation Wire) Ww ton 3.00 Ww=Wc*2%
(Weight of Sand) Ws ton 523 Ws=Vc* 0.54m3 *2200kg/m3 (Class:B)
(Weight of Gravel/Stones) Wa ton 794 Wa=Vc* 0.82m3 *2200kg/m3 (Class:B)
Weight of Reinforcement Bar Wr ton 15.9 US$/ton 2,260 Wr=0.0145*Vc^1.15 36,000Others L.S. - 25% of above costs 35,900
Settling Basin (Sandtrap) 535,400Maximum plant discharge Qmax m3/s 8.79Excavation Volume Ve m3 5,300 US$/m3 3.93 Ve=515*Qmax 1.07 20,900
* Concrete Volume Vc m3 1,300 US$/m3 236.40 Vc=169*(Qd)^0.936 307,400(Weight of Cement) Wc ton 215.0 Wc=Vc * 3.3bag * 50kg/bag (stone masonry 1:4)
(Weight of Fixation Wire) Ww ton 4.30 Ww=Wc*2%
(Weight of Sand) Ws ton 1,420 Ws=Vc* 0.496m3 *2200kg/m3 (stone masonry 1:4)
(Weight of Gravel/Stones) Wa ton 3,430 Wa=Vc* 1.2m3 *2200kg/m3 (stone masonry 1:4)
Weight of Reinforcement Bar Wr ton 52.1 US$/ton 2,260 Wr=0.120*Vc^0.847 117,800Others L.S. - 20% of above costs 89,300
Headrace Channel 1,339,200Length of Headrace Canal Lc m 2,600 from Topo.Map
Headrace Flow Velocity vc m/s 2.5 (Open Channel or Pipe Channel =2 ~ 3 m/s)
Water Area (Cross Section ) Ac m2 3.52 Qmax / vc
Thickness of concrete wall tc m 0.00 assumed
* Pipe Diameter (if Piped channel) Dc mm 1,338 (if piped canal) Dc=SQRT( 4*Ac / (pi *vc) )
* Pipe Wight (if Pipe channel) Wp ton 80.00 - - Wp [kg]=(0.0227x + 0.022) * L
Excavation Volume Ve m3 59,790 US$/m3 3.93 Ve=6.22*(Ac)^1.04*Lc 235,000Concrete Volume Vc m3 0 US$/m3 236.40 Vc=H*tc*2+(B+2*tc)*tc*Lc 0(Weight of Cement) Wc ton 0 Wc=Vc * 3.3bag * 50kg/bag (stone masonry 1:4)
(Weight of Fixation Wire) Ww ton 0.00 Ww=Wc*2%
(Weight of Sand) Ws ton 0 Ws=Vc* 0.496m3 *2200kg/m3 (stone masonry 1:4)
(Weight of Gravel/Stones) Wa ton 0 Wa=Vc* 1.2m3 *2200kg/m3 (stone masonry 1:4)
Weight of Reinforcement Bar Wr ton 0 US$/ton 2,260 Wr=0.577* (Vc/L)^0.888*Lc 0* Pipe Material Cost m 2,600 US$/m 338.85 [US$/m]=0.0916*Dp + 0.0233 881,000
Others L.S. - 20% of above costs 223,200

Final Report Appendix-S
Republic of El Salvador S - 3 March 2012 The Project for Master Plan for the Development of Renewable Energy (JICA)
Table S.2 Cost Estimation of Civil Works (Example) (2/2)
(Source: JICA Study Team)
Unit Q'ty Unit Price (US$) Notes Amount(US$)
Head Tank 477,000Excavation Volume Ve m3 3,680 US$/m3 3.93 Ve=808*Qmax 0.697 14,500
* Concrete Volume Vcf m3 930 US$/m3 236.40 Vc=197*Qmax 0.716 219,900(Weight of Cement) Wc ton 317 Wc=Vc * 6.8bag * 50kg/bag (Class:B)
(Weight of Fixation Wire) Ww ton 6.34 Ww=Wc*2%
(Weight of Sand) Ws ton 1,105 Ws=Vc* 0.54m3 *2200kg/m3 (Class:B)
(Weight of Gravel/Stones) Wa ton 1,680 Wa=Vc* 0.82m3 *2200kg/m3 (Class:B)
Weight of Reinforcement Bar Wr ton 47.0 US$/ton 2,260 Wr=0.051*Vc 106,300Others L.S. - 40% of above costs 136,300
Penstock 644,000Penstock Design Flow Velocity Vp m 3.0 - - (ave. Vp=2 ~ 4 m/s)
Inner Diameter of Pestock Pipe Dp m 1.90 - - Dp=(4*Qd/ (pi*Vt))^(1/2)
Penstock Roughness np mm 0.01 assumed
Effective Head He m 55.43 from waterway profile
Thickness of Steel Pipe Tp mm 6 - - Tp=0.0362*Hg*Dp+2
Length of Penstock Pipe Lp m 290.0 - - from Topo.Map
Excavation Volume Ve m3 7,500 US$/m3 3.93 Ve=10.9*Dp^1.33*Lp 29,500Concrete Volume Vc m3 1,830 US$/m3 236.40 Vc=2.14*Dp^1.68*Lp 432,600(Weight of Cement) Wc ton 620 Wc=Vc * 6.8bag * 50kg/bag (Class:B)
(Weight of Fixation Wire) Ww ton 12.40 Ww=Wc*2%
(Weight of Sand) Ws ton 1,860 Ws=Vc* 0.46m3 *2200kg/m3 (Class:B)
(Weight of Gravel/Stones) Wa ton 3,300 Wa=Vc* 0.82m3 *2200kg/m3 (Class:B)
Weight of Reinforcement Bar Wr ton 33.0 US$/ton 2,260 Wr=0.018*Vc 74,600Others L.S. - 20% of above costs 107,300
Spillway 231,500Inner Diameter of Spillway Pipe Ds m 0.85 - Ds=Dp * 50%
Length of Spillway Ls m 290.0 - (assumed Installed parallel with penstock)
Excavation Volume Ve m3 2,160 US$/m3 3.93 Ve=9.87 * Ds^1.69 * Ls 8,500Concrete Volume Vc m3 610 US$/m3 236.40 Vc=2.78 * Ds^1.70 * Ls 144,300(Weight of Cement) Wc ton 101.0 Wc=Vc * 3.3bag * 50kg/bag (stone masonry 1:4)
(Weight of Fixation Wire) Ww ton 2.02 Ww=Wc*2%
(Weight of Sand) Ws ton 666 Ws=Vc* 0.496m3 *2200kg/m3 (stone masonry 1:4)
(Weight of Gravel/Stones) Wa ton 1,611 Wa=Vc* 1.2m3 *2200kg/m3 (stone masonry 1:4)
Weight of Reinforcement Bar Wr ton 17.7 US$/ton 2,260 Wr=0.029* Vc 40,100Others L.S. - 20% of above costs 38,600
Power House 913,300Number of unit n nos 2 unit -Excavation Volume Ve m3 4,300 US$/m3 3.93 Ve=97.8*Q*He^(2/3)*n^(1/2)^0.727 16,900Concrete Volume Vc m3 1,700 US$/m3 236.40 Vc=28.1*Q*He^(2/3)*n^(1/2)^0.795 401,900(Weight of Cement) Wc ton 281 Wc=Vc * 3.3bag * 50kg/bag (stone masonry 1:4)
(Weight of Fixation Wire) Ww ton 5.62 Ww=Wc*2%
(Weight of Sand) Ws ton 1,860 Ws=Vc* 0.496m3 *2200kg/m3 (stone masonry 1:4)
(Weight of Gravel/Stones) Wa ton 4,490 Wa=Vc* 1.2m3 *2200kg/m3 (stone masonry 1:4)
Weight of Reinforcement Bar Wr ton 114 US$/ton 2,260 Wr=0.046*Vc^1.05 257,700Others L.S. - 35% of above costs 236,800
Tailrace 78,500Waterway radius R m 1.10 assumed
Excavation Volume Ve m3 1,200 US$/m3 3.93 Ve=395 * (R*Q)^0.479 4,700Concrete Volume Vc m3 191 US$/m3 236.40 Vc=40.4 * (R*Q)^0.684 45,200(Weight of Cement) Wc ton 31.5 Wc=Vc * 3.3bag * 50kg/bag (stone masonry 1:4)
(Weight of Fixation Wire) Ww ton 0.63 Ww=Wc*2%
(Weight of Sand) Ws ton 208 Ws=Vc* 0.496m3 *2200kg/m3 (stone masonry 1:4)
(Weight of Gravel/Stones) Wa ton 504 Wa=Vc* 1.2m3 *2200kg/m3 (stone masonry 1:4)
Weight of Reinforcement Bar Wr ton 6.8 US$/ton 2,260 Wr=0.278* Vc^0.61 15,500Others L.S. - 20% of above costs 13,100
Access Pass/ Road Construction 400,000Access Road (Gravel Paved, W=4m) km 2.0 US$/km 200,000 from Topo.Map 400,000
Sub Total 6,031,000

Final Report Appendix-S
Republic of El Salvador S - 4 March 2012 The Project for Master Plan for the Development of Renewable Energy (JICA)
Table S.3 Cost Estimation of Hydraulic and Electro-Mechanical Equipments (Example)
(Source: JICA Study Team)
Hydraulic Equipment & Material Cost Unit Q'ty Unit Price (US$) Notes Amount(US$)
Intake Weir 50,600Weight of Gate Wg ton 23.0 US$/ton 2,200 Wg=0.145*Qf^0.692 50,600
Intake 107,400Weight of Gate Wg ton 44.5 US$/ton 2,200 Wg=12.7*(R*Q)^0.533, R=Di/2 97,900Weight of Screen Ws ton 2.8 US$/ton 3,390 Ws=0.701*(R*Q)^0.582, R=Di/2 9,500
Settling Basin (Sandtrap) 24,400Weight of Gate Wg ton 3.5 US$/ton 2,200 Wg=0.910*Qmax 0.613 7,700Weight of Screen Ws ton 4.9 US$/ton 3,390 Ws=0.879*Qmax 0.785 16,700
Penstock 318,700Wight of Pipe Wp ton 94.0 US$/ton 3,390 Wp [ton]=7.85*pi*Dp*Tp/1000*1.15*L 318,700
Outlet Gate 0Weight of Gate Wo ton - US$/ton 2,200 Wg=0.910*Qmax 0.613 -
Others 100,000L.S. - 20% 100,000
Sub Total 601,100
Electro-Mechanical Equipment Unit Q'ty Unit Price (US$) Notes Amount(US$)
Electro-Mechanical Equipment (Turbine & Gen kW 4,175 US$/kW 600 Cost [mil.US$] = 0.7452 * P []mW] ^0.8546 2,505,000Mechanical Transmission kW 4,175 US$/kW - included in Turbine & Generator Cost 0Generator kW 4,175 US$/kW - included in Turbine & Generator Cost 0Controller nos. 2 US$/set 24,000 Cost = 23867 * (Turbine nos.) 48,000Switch Board Cubicle kW 4,175 US$/kW 39.28 included in Turbin Cost 164,000Mandatory Spare Parts kW 4,175 US$/kW 39.28 Cost = 15.484*P + 3589 164,000Miscellanies kW 4,175 US$/kW 16.29 Cost = 4.3077*P + 1355.1 68,000Erection, Test, Commissioning and Training kW 4,175 US$/kW 55.81 Cost = 51.824*P + 16269 233,000
Sub Total 3,182,000
Transmission Line Unit Q'ty Unit Price (US$) Notes Amount(US$)
Transmission Line km 3.00 US$/km 50,000 13.2 kV or 46 kV of distribution line (less 5 MW) 150,000Sub Total 150,000

Final Report Appendix-S
Republic of El Salvador S - 5 March 2012 The Project for Master Plan for the Development of Renewable Energy (JICA)
Table S.4 Estimated Total Construction Cost (Example)
(Source: JICA Study Team)
DescriptionEstimated
CostUS$
Note
l. Preparatory work(1) Access Road 400,000(2) Camp & Facilities 291,200 5.0% * (3 Civil work)Sub total 691,200
2. Environmental Mitigation Cost 58,200 1.0% * (3 Civil work)
3. Civil Works(1) Intake Weir 260,800(2) Intake 179,300(3) Settling Basin 535,400(4) Headrace 1,339,200(5) Head tank 477,000(6) Penstock 644,000(7) Spillway 231,500(8) Powerhouse 913,300(9) Tailrace channel -(10) Tailrace 78,500(11) Miscellaneous Works 1,164,800 25.0% * ((1)~(10))Sub total 5,824,000
4. Hydraulic Equipment(1) Gate & Screen 282,400(2) Penstock 318,700Sub total 601,000
5. Electro-mechanical Equipment 3,182,000
6. Transmission Line 150,000
Direct Cost 10,506,400 1+2+3+4+5+6
7. Administration & Engineering fee 315,000 3.0% * Direct Cost
8. Contingency 105,000 1.0% * Direct Cost
Total 10,926,400

Final Report Appendix-S
Republic of El Salvador S - 6 March 2012 The Project for Master Plan for the Development of Renewable Energy (JICA)
Table S.5 Example of Financial Analysis (Without Bank Loan)
(Source: JICA Study Team)
Plant Cap(MW)
Energy(MWh/yr)
OperationFactor (%)
EscalationRate
Plant Cost($000)
O/M Cost Insualance DiscountRate
Salaries ofoperators
Person(s) Unit Cost(US$/month)
4.175 17,688 48% 4% 10,926 5% 1.50 10% Engineer 1 $1,800/month Operator 2 $500/month
Security guard 2 $400/monthResident mana 1 $500/month
Benefit
Year Unit Price Generation OperationIncome
Capital Cost($000)
O/M Cost($000)
InsuaranceSeguros($000)
DepreciationSub TotalCost (d~g)
($000)Gross Profit
Salaries ofoperators,engineers,
securities, ect.
Tax of Alcaldia SIGETAnnuity
CommercialRegistration
(CNR)
($/MWh) (MWh/year) (x1000 US$) (x1000 US$) (x1000 US$) (x1000 US$) (x1000 US$) (x1000 US$) (x1000 US$) (x1000 US$) (x1000 US$) (x1000 US$) (x1000 US$)
a (4%) b c=a*b de=c*5%+b*0.3
5
f=PlantCost*1.5/1000(98% per year)
g=PlantCost/50
h=sum(d~e) i=c-hj=(1800+2*500+2*400+500)*12*
(105%)
k=0.00216*plantcost
l=b*0.51 m=Plant
Cost/100,000*11.43
0 0.0 -5,4630 0.0 -5,4631 140.00 17,688.0 2,476.3 130.0 16.4 218.5 364.9 2,111.4 49.2 23.6 9.0 1.249 2 145.60 17,688.0 2,575.4 135.0 16.1 218.5 369.5 2,205.8 51.2 23.6 9.0 1.249 3 151.42 17,688.0 2,678.4 140.1 15.7 218.5 374.4 2,304.0 53.2 23.6 9.0 1.249 4 157.48 17,688.0 2,785.5 145.5 15.4 218.5 379.4 2,406.1 55.3 23.6 9.0 1.249 5 163.78 17,688.0 2,896.9 151.0 15.1 218.5 384.7 2,512.3 57.6 23.6 9.0 1.249 6 170.33 17,688.0 3,012.8 156.8 14.8 218.5 390.2 2,622.6 59.9 23.6 9.0 1.249 7 177.14 17,688.0 3,133.3 162.9 14.5 218.5 395.9 2,737.4 62.3 23.6 9.0 1.249 8 184.23 17,688.0 3,258.7 169.1 14.2 218.5 401.9 2,856.8 64.7 23.6 9.0 1.249 9 191.60 17,688.0 3,389.0 175.6 13.9 218.5 408.1 2,980.9 67.3 23.6 9.0 1.249 10 199.26 17,688.0 3,524.6 182.4 13.7 218.5 414.6 3,110.0 70.0 23.6 9.0 1.249 11 207.23 17,688.0 3,665.6 189.5 13.4 218.5 421.4 3,244.2 72.8 23.6 9.0 1.249 12 215.52 17,688.0 3,812.2 196.8 13.1 218.5 428.5 3,383.7 75.7 23.6 9.0 1.249 13 224.14 17,688.0 3,964.7 204.4 12.9 218.5 435.8 3,528.8 78.8 23.6 9.0 1.249 14 233.11 17,688.0 4,123.2 212.4 12.6 218.5 443.5 3,679.8 81.9 23.6 9.0 1.249 15 242.43 17,688.0 4,288.2 220.6 12.4 218.5 451.5 3,836.7 85.2 23.6 9.0 1.249 16 252.13 17,688.0 4,459.7 229.2 12.1 218.5 459.8 3,999.9 88.6 23.6 9.0 1.249 17 262.22 17,688.0 4,638.1 238.1 11.9 218.5 468.5 4,169.6 92.2 23.6 9.0 1.249 18 272.71 17,688.0 4,823.6 247.4 11.6 218.5 477.5 4,346.1 95.8 23.6 9.0 1.249 19 283.61 17,688.0 5,016.6 257.0 11.4 218.5 486.9 4,529.6 99.7 23.6 9.0 1.249 20 294.96 17,688.0 5,217.2 267.1 11.2 218.5 496.7 4,720.5 103.7 23.6 9.0 1.249
Total 353,759.5 73,739.9 -10,926.4 3,810.8 272.4 8,453.8 24.978
NPV ($000) 11,575FIRR (TIR) 21.3%B/C 1.79B - C ($000) 11,575
YearTotal
Operationcost
Total CostOperation
Benefit InterestBenefit before
taxes Income TaxesNet income
withoutdepresiation
Cash Flowresidual
valuePrincipal
Repayment Net IncomeAccumulated
Income($000)
Total Benefit Total Cost
(x1000US$)
(x1000 US$) (x1000 US$) (x1000 US$) (x1000 US$) (x1000 US$) (x1000 US$) (x1000 US$) (x1000 US$) (x1000 US$) (x1000 US$) (x1000 US$) (x1000 US$) (x1000US$)
n=j+k+l+m o=h+n p=i - nq=0 (no loan
case)r=p - q
s=r*25% (after12 year)
t=p-s u=g+tv=Plant
Cost/50*30w=0 (no loan
case)x=u+v-w y
0 -5,463.2 -5,463 0.0 5,463.20 -5,463.2 -10,926 0.0 5,463.21 83.1 448.0 2,028.3 0 2,028.3 0.0 2,028.3 2,246.8 0.0 2,246.8 -8,680 2,476.3 229.52 85.0 454.6 2,120.8 0 2,120.8 0.0 2,120.8 2,339.3 0.0 2,339.3 -6,340 2,575.4 236.13 87.1 461.5 2,216.9 0 2,216.9 0.0 2,216.9 2,435.4 0.0 2,435.4 -3,905 2,678.4 242.94 89.2 468.6 2,316.9 0 2,316.9 0.0 2,316.9 2,535.4 0.0 2,535.4 -1,369 2,785.5 250.15 91.4 476.1 2,420.8 0 2,420.8 0.0 2,420.8 2,639.4 0.0 2,639.4 1,270 2,896.9 257.66 93.7 483.9 2,528.9 0 2,528.9 0.0 2,528.9 2,747.4 0.0 2,747.4 4,017 3,012.8 265.47 96.1 492.0 2,641.3 0 2,641.3 0.0 2,641.3 2,859.8 0.0 2,859.8 6,877 3,133.3 273.58 98.6 500.5 2,758.2 0 2,758.2 0.0 2,758.2 2,976.7 0.0 2,976.7 9,854 3,258.7 282.09 101.2 509.3 2,879.7 0 2,879.7 0.0 2,879.7 3,098.2 0.0 3,098.2 12,952 3,389.0 290.810 103.9 518.5 3,006.1 0 3,006.1 0.0 3,006.1 3,224.6 0.0 3,224.6 16,177 3,524.6 300.011 106.7 528.1 3,137.5 0 3,137.5 784.4 2,353.1 2,571.6 0.0 2,571.6 18,748 3,665.6 1,093.912 109.6 538.1 3,274.1 3,274.1 818.5 2,455.6 2,674.1 0.0 2,674.1 21,422 3,812.2 1,138.113 112.6 548.5 3,416.2 3,416.2 854.1 2,562.2 2,780.7 0.0 2,780.7 24,203 3,964.7 1,184.014 115.8 559.3 3,564.0 3,564.0 891.0 2,673.0 2,891.5 0.0 2,891.5 27,095 4,123.2 1,231.715 119.1 570.5 3,717.6 3,717.6 929.4 2,788.2 3,006.8 0.0 3,006.8 30,101 4,288.2 1,281.416 122.5 582.3 3,877.4 3,877.4 969.4 2,908.1 3,126.6 0.0 3,126.6 33,228 4,459.7 1,333.117 126.0 594.5 4,043.6 4,043.6 1,010.9 3,032.7 3,251.2 0.0 3,251.2 36,479 4,638.1 1,386.918 129.7 607.2 4,216.4 4,216.4 1,054.1 3,162.3 3,380.8 0.0 3,380.8 39,860 4,823.6 1,442.819 133.5 620.5 4,396.1 4,396.1 1,099.0 3,297.1 3,515.6 0.0 3,515.6 43,376 5,016.6 1,501.020 137.5 634.3 4,583.0 4,583.0 1,145.7 3,437.2 3,655.7 6,555.8 0.0 10,211.6 53,587 11,773.1 1,561.5
Total 2,142.5 10,596.3 0.0 10,522.5 49,918 PV (Benefit) PV (Cost)Source: JICA Study Team NPV= 11,574.8 26,185.7 14,610.9

Final Report Appendix-S
Republic of El Salvador S - 7 March 2012 The Project for Master Plan for the Development of Renewable Energy (JICA)
Table S.6 Example of Financial Analysis (With Bank Loan)
(Source: JICA Study Team)
Plant Cap(MW)
Energy(MWh/yr)
OperationFactor (%)
EscalationRate
Plant Cost($000)
Inter-ConnectionCost ($000)
O/M Cost % of LoanBank Loan($000)
RepaymentPeriod(year)
Loan InterestRate p.a
Tax Exemption(year)
CorporateTax
DiscountRate
4.18 17,688 48% 4% 10,926 0 5% 70% 7,648 10 8% 10 25% 10%Included Plant Cost
Salaries ofoperators
Person(s) Unit Cost(US$/month)
Engineer 1 $1,800/monthOperator 2 $500/monthSecurity gua 2 $400/monthResident ma 1 $500/month
Benefit
Year Unit Price GenerationOperation
Income
CapitalCost($000)
O/M Cost($000)
InsuaranceSeguros($000)
Depreciation
Sub TotalCost (d~g)
($000)
GrossProfit
Salaries ofoperators,engineers,securitys,
ect.
Tax of AlcaldiaSIGET
Annuity
CommercialRegistration
(CNR)
($/MWh) (MWh/year)
(x1000US$)
(x1000US$)
(x1000 US$) (x1000US$)
(x1000US$)
(x1000 US$) (x1000US$)
(x1000 US$) (x1000 US$) (x1000US$)
(x1000 US$)
a (4%) b c=a*b de=c*5%+b*0.
35
f=PlantCost*1.05/1
000 (98%per year)
g=PlantCost/50
h=sum(d~e) i=c-hj=(1800+2*500+2*400+500)*12* (105%)
k=0.00216*d l=b*0.51 m=Plant
Cost/100,000*11.43
0 0.0 -1,6390 0.0 -1,6391 140.00 17,688.0 2,476.3 130.0 0.5 218.5 349.1 2,127.2 49.2 23.6 9.0 1.249 2 145.60 17,688.0 2,575.4 135.0 0.5 218.5 354.0 2,221.3 51.2 23.6 9.0 1.249 3 151.42 17,688.0 2,678.4 140.1 0.5 218.5 359.2 2,319.2 53.2 23.6 9.0 1.249 4 157.48 17,688.0 2,785.5 145.5 0.5 218.5 364.5 2,421.0 55.3 23.6 9.0 1.249 5 163.78 17,688.0 2,896.9 151.0 0.5 218.5 370.1 2,526.9 57.6 23.6 9.0 1.249 6 170.33 17,688.0 3,012.8 156.8 0.5 218.5 375.9 2,637.0 59.9 23.6 9.0 1.249 7 177.14 17,688.0 3,133.3 162.9 0.5 218.5 381.9 2,751.5 62.3 23.6 9.0 1.249 8 184.23 17,688.0 3,258.7 169.1 0.5 218.5 388.1 2,870.5 64.7 23.6 9.0 1.249 9 191.60 17,688.0 3,389.0 175.6 0.5 218.5 394.6 2,994.4 67.3 23.6 9.0 1.249 10 199.26 17,688.0 3,524.6 182.4 0.5 218.5 401.4 3,123.2 70.0 23.6 9.0 1.249 11 207.23 17,688.0 3,665.6 189.5 0.4 218.5 408.4 3,257.1 72.8 23.6 9.0 1.249 12 215.52 17,688.0 3,812.2 196.8 0.4 218.5 415.8 3,396.4 75.7 23.6 9.0 1.249 13 224.14 17,688.0 3,964.7 204.4 0.4 218.5 423.4 3,541.3 78.8 23.6 9.0 1.249 14 233.11 17,688.0 4,123.2 212.4 0.4 218.5 431.3 3,691.9 81.9 23.6 9.0 1.249 15 242.43 17,688.0 4,288.2 220.6 0.4 218.5 439.5 3,848.6 85.2 23.6 9.0 1.249 16 252.13 17,688.0 4,459.7 229.2 0.4 218.5 448.1 4,011.6 88.6 23.6 9.0 1.249 17 262.22 17,688.0 4,638.1 238.1 0.4 218.5 457.0 4,181.1 92.2 23.6 9.0 1.249 18 272.71 17,688.0 4,823.6 247.4 0.4 218.5 466.3 4,357.3 95.8 23.6 9.0 1.249 19 283.61 17,688.0 5,016.6 257.0 0.4 218.5 475.9 4,540.6 99.7 23.6 9.0 1.249 20 294.96 17,688.0 5,217.2 267.1 0.4 218.5 486.0 4,731.3 103.7 23.6 9.0 1.249
Total 353,759.5 73,739.9 -3,277.9 3,810.8 9.1 8,190.5 24.978
NPV ($000) 12,282FIRR 33.0%B/C 1.88B - C ($000) 12,282
YearTotal
Operationcost
Total Cost OperationBenefit
Interest Benefitbefore taxes
IncomeTaxes
Net incomewithout
depresiation
Cash Flow residualvalue
PrincipalRepayment
Net IncomeAccumulated Income
($000)Total Benefit Total Cost
(x1000US$)
(x1000 US$) (x1000US$)
(x1000US$)
(x1000 US$) (x1000US$)
(x1000US$)
(x1000 US$) (x1000US$)
(x1000 US$) (x1000 US$) (x1000US$)
(x1000 US$) (x1000 US$)
n=j+k+l+m o=h+n p=i - n q r=p - qs=r*25%(after 12
year)t=p-s u=g+t
v=PlantCost/50*30
w=0 (no loancase)
x=u+v-w y
0 -1,639.0 -1,639 0.0 1,639.00 306 -305.9 0.0 -305.9 -305.9 -1,944.9 -3,584 0.0 1,944.91 83.1 432.2 2,044.2 612 1,432.3 0.0 1,432.3 1,650.8 764.8 886.0 -2,698 2,476.3 1,590.42 85.0 439.1 2,136.3 551 1,585.6 0.0 1,585.6 1,804.1 764.8 1,039.3 -1,659 2,575.4 1,536.13 87.1 446.2 2,232.1 490 1,742.6 0.0 1,742.6 1,961.2 764.8 1,196.3 -462 2,678.4 1,482.14 89.2 453.7 2,331.8 428 1,903.5 0.0 1,903.5 2,122.0 764.8 1,357.2 895 2,785.5 1,428.45 91.4 461.5 2,435.4 367 2,068.3 0.0 2,068.3 2,286.8 764.8 1,522.0 2,417 2,896.9 1,374.96 93.7 469.6 2,543.2 306 2,237.3 0.0 2,237.3 2,455.8 764.8 1,691.0 4,108 3,012.8 1,321.87 96.1 478.0 2,655.3 245 2,410.6 0.0 2,410.6 2,629.1 764.8 1,864.3 5,972 3,133.3 1,269.18 98.6 486.7 2,771.9 184 2,588.4 0.0 2,588.4 2,806.9 764.8 2,042.0 8,014 3,258.7 1,216.69 101.2 495.8 2,893.2 122 2,770.8 0.0 2,770.8 2,989.3 764.8 2,224.5 10,239 3,389.0 1,164.510 103.9 505.3 3,019.3 61 2,958.1 0.0 2,958.1 3,176.6 764.8 2,411.8 12,650 3,524.6 1,112.811 106.7 515.1 3,150.4 0 3,150.4 787.6 2,362.8 2,581.3 0.0 2,581.3 15,232 3,665.6 1,084.212 109.6 525.4 3,286.8 3,286.8 821.7 2,465.1 2,683.6 0.0 2,683.6 17,915 3,812.2 1,128.513 112.6 536.0 3,428.6 3,428.6 857.2 2,571.5 2,790.0 0.0 2,790.0 20,705 3,964.7 1,174.714 115.8 547.1 3,576.2 3,576.2 894.0 2,682.1 2,900.6 0.0 2,900.6 23,606 4,123.2 1,222.615 119.1 558.6 3,729.6 3,729.6 932.4 2,797.2 3,015.7 0.0 3,015.7 26,622 4,288.2 1,272.516 122.5 570.6 3,889.1 3,889.1 972.3 2,916.8 3,135.4 0.0 3,135.4 29,757 4,459.7 1,324.317 126.0 583.0 4,055.1 4,055.1 1,013.8 3,041.3 3,259.8 0.0 3,259.8 33,017 4,638.1 1,378.318 129.7 596.0 4,227.6 4,227.6 1,056.9 3,170.7 3,389.2 0.0 3,389.2 36,406 4,823.6 1,434.419 133.5 609.5 4,407.1 4,407.1 1,101.8 3,305.3 3,523.8 0.0 3,523.8 39,930 5,016.6 1,492.720 137.5 623.5 4,593.7 4,593.7 1,148.4 3,445.3 3,663.8 6,555.8 0.0 10,219.7 50,150 11,773.1 1,553.4
Total 2,142.5 10,332.9 7,648.5 -1,087.3 -2,641 PV (Benefit) PV (Cost)Source: JICA Study Team NPV= 12,282.1 26,185.7 13,903.6

Final Report Appendix-S
Republic of El Salvador S - 8 March 2012 The Project for Master Plan for the Development of Renewable Energy (JICA)
Table S.7 List of Small Hydropower Potential Sites (1/4)
(Source: JICA Study Team)
Nom
bre
de P
roye
cto
Río
Depa
rtam
ento
Lat
itud
Lon
gitu
dEt
apa
del P
roye
cto
Fuen
te O
rigin
alA
ctua
lizad
o po
rÁ
rea
deD
rena
jeC
auda
lDi
seño
Caid
abr
uta
Long
itud
de la
Cana
l
Long
itud
de tu
bería
de p
resi
ón
Area
Natu
ral
Pro
tegi
daP
oten
cia
Ene
rgía
Proj
ect N
ame
Riv
erDe
partm
ent
Lat
itude
Lon
gitu
deP
roje
ct S
tage
Ori
gina
l Sou
rce
Upda
ted
byCa
tchm
ent
Are
aDe
sign
Disc
harg
eG
ross
Hea
dLe
ngth
of
Cana
lLe
ngth
of
Pest
ock
Natu
ral
Prot
ect
Area
Pot
entia
l E
nerg
y
(N)
(W)
(km
²)(m
³/s)
(m)
(m)
(m)
(SAN
P)
(MW
) (M
Wh/
Año)
1E
l Cal
ambr
eR
ío E
l Cal
ambr
eM
oraz
án13
.992
8
88
.080
4
C
onst
rucc
ión
AEA
ON
G S
ABE
S6.
410.
422
72.3
n.d.
n.d.
0.05
831
1
2M
iraza
lco
Río
Gra
n.d.
e de
Son
sona
teS
onso
nate
13.8
414
89.7
456
Con
stru
cció
nG
IZ 2
011
Hyd
ro W
est
219.
001.
706
238.
0n.
d.n.
d.3.
370
14,7
62?
3G
ualp
uca
Río
Gua
lpuc
aM
oraz
án13
.833
3
88
.233
3
Fi
nanc
iam
ient
oAE
AO
NG
SAB
ES
3.39
0.39
242
3.0
n.d.
n.d.
1.00
06,
155
4Ilo
pang
o Ag
uaca
yo
lago
de
Ilopa
nago
La
Paz
13.6
311
89.0
334
Fina
ncia
mie
nto
ING
EN
DE
HS
AIN
GE
ND
EH
SA
n.d.
9.00
0n.
d.n.
d.n.
d.17
.000
74,4
60?
5S
an L
uis
IVR
io S
uqui
apa
La L
iber
tad
13.9
942
89.4
828
Bid
Pro
cess
CE
CS
AIN
GE
ND
EH
SA
n.d.
n.d.
n.d.
n.d.
n.d.
1.50
06,
570
?
6S
umpu
lR
ío S
umpu
lC
hala
tena
ngo
13.8
300
89.7
300
De
Reg
istro
SIG
ET
ING
EN
DE
HS
AIN
GE
ND
EH
SA
966.
4364
.720
62.0
3,00
01,
000
16.2
0064
,043
7
Suc
io, L
os T
etun
tes
Río
Suc
ioLa
Lib
erta
d13
.882
2
89
.259
4
D
e R
egis
tro S
IGE
Tn.
d.n.
d.n.
d.n.
d.n.
d.6.
600
28,9
08?
8La
Joy
aR
ío A
cahu
apa
San
Vic
ente
13.6
248
88.7
383
De
Reg
istro
SIG
ET
AEA
ON
G S
ABE
Sn.
d.n.
d.n.
d.n.
d.n.
d.3.
000
13,1
40?
9S
an F
ranc
isco
Rio
Tap
uchi
naS
onso
nate
13.8
482
89.7
285
De
Reg
istro
SIG
ET
n.d.
n.d.
n.d.
n.d.
n.d.
1.00
04,
380
?
10La
Col
men
a (E
l Vol
cán)
Río
El V
olcá
n/R
io S
n Ju
anS
an M
igue
l13
.733
9
88
.237
5
D
e R
egis
tro S
IGE
TO
NG
SAB
ES
ON
G S
ABE
S2.
050.
238
59.1
n.d.
n.d.
0.09
745
0
11Q
uebr
ada
la C
ueva
/ S
an J
ose
Que
brad
a la
cue
va /
San
Jos
eM
oraz
án13
.785
5
88
.214
6
D
e R
egis
tro S
IGE
TG
IZ 2
011
De
Reg
istro
SIG
ET
n.d.
n.d.
n.d.
n.d.
n.d.
0.06
545
5
12S
anta
Ros
a (E
l Ria
chue
lo)
Río
Ria
chue
loS
an M
igue
l13
.851
8
88
.270
7
D
e R
egis
tro S
IGE
TAE
AO
NG
SAB
ES
24.6
01.
854
12.4
n.d.
n.d.
0.03
826
0
13At
ehue
cilla
s (R
ehab
ilitat
ion)
Ahua
chap
án13
.922
8
89
.881
1
R
ehab
ilitac
ión
AEA
CE
CS
An.
d.n.
d.n.
d.n.
d.n.
d.0.
630
2,75
9?
14
San
Est
eban
Río
San
Est
eban
San
Mig
uel
13.5
196
88.1
829
Reh
abilit
ació
nC
EL-
UC
A 19
89C
EC
SA
44.9
01.
222
74.0
n.d.
n.d.
0.75
13,
287
15C
ucum
acay
an (R
econ
vers
ion)
Río
Gra
nde
de S
onso
nate
S
onso
nate
13
.750
0
89
.716
7
R
econ
vers
ion
AEA
CE
CS
An.
d.n.
d.n.
d.n.
d.n.
d.2.
300
17,8
95
16Ac
ahua
pa (R
ehab
ilitat
ion)
San
Vic
ente
13.6
583
88.8
157
Reh
abilit
ació
nC
EC
SA
n.d.
n.d.
n.d.
n.d.
n.d.
0.12
052
6?
17S
apuy
o (R
ehab
ilitat
ion)
La P
az13
.494
1
88
.866
7
R
ehab
ilitac
ión
CE
CS
An.
d.n.
d.n.
d.n.
d.n.
d.0.
060
263
?
18
Cho
rrer
on J
iboa
n.d.
La P
azFa
ctib
ilidad
CE
CS
An.
d.n.
d.n.
d.n.
d.n.
d.n.
d.2.
000
8,76
0?
19
La M
onta
ñita
Mor
azan
13.8
167
88.2
167
Fact
ibilid
adO
NG
SAB
ES
,200
8n.
d.n.
d.n.
d.n.
d.n.
d.0.
900
3,94
2?
20
El S
apo
Río
Sap
oM
oraz
án13
.921
6
88
.105
6
Fa
ctib
ilidad
Ing.
Alfa
roIN
GE
ND
EH
SA
53.5
44.
046
95.3
n.d.
n.d.
0.06
026
3?
21S
an L
uis
IIIR
io S
uqui
apa
San
ta A
na
13.9
942
89.4
828
Fact
ibilid
adC
EC
SA
ING
EN
DE
HS
An.
d.n.
d.n.
d.n.
d.n.
d.0.
600
2,62
8?
22
Son
zaca
te (N
ahui
zalc
o II)
Río
Sen
suna
pán
Son
sona
te13
.756
7
89
.715
3
Fa
ctib
ilidad
GIZ
201
1S
ensu
napá
n S
.A. d
e C
76.2
34.
205
110.
0n.
d.n.
d.3.
839
16,8
16
23P
otre
rillo
sQ
uebr
ada
Las
Laja
sM
oraz
án13
.808
4
88
.241
7
Fa
ctib
ilidad
AEA
ON
G S
ABE
S5.
3131
0.9
n.d.
n.d.
0.32
02,
600
24G
uani
jiqui
l - P
oza
Hon
.d.a
Río
Sap
oM
oraz
án13
.850
0
88
.150
0
Fa
ctib
ilidad
AEA
ON
G S
ABE
S13
7.58
9.83
62.
7n.
d.n.
d.0.
131
510
25
La C
abañ
aR
ío G
ran.
d.e
de S
an M
igue
lU
sulu
tán
13.3
019
88.2
885
Fact
ibilid
adAE
AO
NG
SAB
ES
1,90
0.00
53.4
923.
7n.
d.n.
d.0.
980
4,30
0
26
La L
oma
Río
Osi
cala
Mor
azán
13.8
167
88.1
333
Fact
ibilid
adAE
AO
NG
SAB
ES
11.3
60.
790
84.4
n.d.
n.d.
0.05
539
8
27E
l Pro
gres
oR
ío A
ruat
eM
oraz
án13
.879
7
88
.221
6
Fa
ctib
ilidad
AEA
ON
G S
ABE
S63
.89
5.04
68.
3n.
d.n.
d.0.
033
280
28
Arau
teR
ío A
raut
eM
oraz
án13
.875
1
88
.224
5
Fa
ctib
ilidad
ING
EN
DH
ES
AIN
GE
ND
HE
SA,
200
5n.
d.n.
d.n.
d.n.
d.n.
d.0.
033
284
29
Cum
aro
Río
Cum
aro
n.d.
13.9
167
88.1
333
Fact
ibilid
adO
NG
SAB
ES
, 200
8n.
d.n.
d.n.
d.n.
d.n.
d.0.
040
175
?
30
El N
aran
jito
Río
El N
aran
jito
Ahua
chap
án13
.705
0
89
.933
3
Fa
ctib
ilidad
AEA
ON
G S
ABE
S1.
400.
112
38.5
n.d.
n.d.
0.03
114
6
31Q
ueza
lapa
Río
Que
zala
paC
usca
tlán/
Cab
añas
13.8
833
88.9
667
Dis
eños
Bás
icos
CE
L-AC
CIO
NA
CE
L-AC
CIO
NA,
201
1n.
d.n.
d.n.
d.n.
d.n.
d.1.
050
2,62
8
32
Tihu
apa
1R
ío T
ihua
paS
an S
alva
dor/L
a P
az13
.588
3
89
.138
3
D
iseñ
os B
ásic
osC
EL-
ACC
ION
AC
EL-
ACC
ION
A, 2
011
n.d.
n.d.
n.d.
n.d.
n.d.
1.31
53,
870
33Ti
huap
a 2
Río
Tih
uapa
San
Sal
vado
r/La
Paz
13.5
500
89.1
333
Dis
eños
Bás
icos
CE
L-AC
CIO
NA
CE
L-AC
CIO
NA,
201
1n.
d.n.
d.n.
d.n.
d.n.
d.0.
900
2,58
0
34
San
Sim
ón 1
Río
San
Sim
ónU
sulu
tán
13.5
619
88.5
176
Dis
eños
Bás
icos
CE
L-AC
CIO
NA
CE
L-AC
CIO
NA,
201
1n.
d.n.
d.n.
d.n.
d.n.
d.0.
900
2,04
0
35
San
Sim
ón 2
Río
San
Sim
ónU
sulu
tán
13.5
699
88.5
362
Dis
eños
Bás
icos
CE
L-AC
CIO
NA
CE
L-AC
CIO
NA,
201
1n.
d.n.
d.n.
d.n.
d.n.
d.0.
915
2,48
4
36
San
Sim
ón 3
Río
San
Sim
ónU
sulu
tán
13.5
833
88.5
667
Dis
eños
Bás
icos
CE
L-AC
CIO
NA
CE
L-AC
CIO
NA,
201
1n.
d.n.
d.n.
d.n.
d.n.
d.0.
870
2,57
0
37
Titih
uapa
3R
ío T
itihu
apa
Cab
añas
/San
Vic
ente
13.6
067
88.6
500
Dis
eños
Bás
icos
CE
L-AC
CIO
NA
CE
L-AC
CIO
NA,
201
1n.
d.n.
d.n.
d.n.
d.n.
d.2.
100
6,80
2
38
Titih
uapa
5R
ío T
itihu
apa
Cab
añas
/San
Vic
ente
13.7
667
88.6
000
Dis
eños
Bás
icos
CE
L-AC
CIO
NA
CE
L-AC
CIO
NA,
201
1n.
d.n.
d.n.
d.n.
d.n.
d.1.
410
5,67
3
39
Cuy
uapa
Río
Cuy
uapa
Son
sona
te
13.7
500
88.8
000
Dis
eños
Bás
icos
CE
L-AC
CIO
NA
CE
L-AC
CIO
NA,
201
1n.
d.n.
d.n.
d.n.
d.n.
d.1.
020
2,84
0
40
Suq
uiap
aR
ío S
uqui
apa
San
ta A
na
13.9
833
89.4
333
Dis
eños
Bás
icos
CE
L-AC
CIO
NA
CE
L-AC
CIO
NA,
201
1n.
d.n.
d.n.
d.n.
d.n.
d.3.
530
13,6
30
41G
r. C
hala
tena
ngo
Río
Gr.
Cha
late
nang
oC
hala
tena
ngo
14.7
167
89.0
833
Dis
eños
Bás
icos
CE
L-AC
CIO
NA
CE
L-AC
CIO
NA,
201
1n.
d.n.
d.n.
d.n.
d.n.
d.1.
630
3,68
0
42
Suc
io 3
Río
Suc
ioLa
Lib
erta
d/S
an S
alva
do13
.983
3
89
.283
3
D
iseñ
os B
ásic
osC
EL-
ACC
ION
AC
EL-
ACC
ION
A, 2
011
n.d.
n.d.
n.d.
n.d.
n.d.
2.02
511
,149
43
Pol
orós
La U
nión
13
.805
0
89
.808
3
D
iseñ
os B
ásic
osC
EL-
ACC
ION
AC
EL-
ACC
ION
A, 2
011
n.d.
n.d.
n.d.
n.d.
n.d.
2.02
55,
250
44H
uiza
2R
ío H
uiza
La
Lib
erta
d/S
an S
alva
do13
.550
0
89
.233
3
D
iseñ
os B
ásic
osC
EL-
ACC
ION
AC
EL-
ACC
ION
A, 2
011
n.d.
n.d.
n.d.
n.d.
n.d.
2.10
06,
009
45S
anto
Dom
ingo
(Pre
sa 1
& 2
&3)
Río
Tep
echa
pa/ R
ío C
acah
uata
/S
onso
nate
13.7
497
89.7
838
Pre
Fac
tibilid
adC
EL-
UC
A 19
89IN
GE
ND
EH
SA
29.1
21.
280
145.
03,
230
1,09
01.
540
7,88
5
46
Cha
cala
Los
Apa
ntes
(Pre
sa 1
& 2
)R
ío C
haca
la /
Río
Los
Apa
ntes
Ahua
chap
án13
.803
7
89
.848
4
P
re F
actib
ilidad
ING
EN
DE
HS
AIN
GE
ND
EH
SA
19.0
40.
838
207.
03,
660
1,14
01.
500
8,12
6
47
San
ta R
itaR
ío J
iboa
La P
áz13
.614
3
88
.963
0
P
re F
actib
ilidad
CE
L-U
CA
1989
ING
EN
DE
HS
A37
4.97
7.40
313
6.0
4,00
077
08.
357
36,6
03
48M
ilingo
(Rec
onve
rsio
n)R
ío A
celh
uate
S
an S
alva
dor
13.7
443
89.1
619
Pre
Fac
tibilid
adAE
AC
EC
SA
n.d.
n.d.
n.d.
n.d.
n.d.
0.80
03,
504
?
49C
opin
ula
IR
ío C
opin
ula
Ahua
chap
án13
.786
4
89
.844
4
P
re F
actib
ilidad
ING
EN
DE
HS
AIN
GE
ND
EH
SA
27.8
91.
211
60.0
2,26
527
00.
603
2,64
1
50
San
Jos
é Lo
ma
Río
Jib
oaLa
Páz
13.5
411
88.9
845
Pre
Fac
tibilid
adC
EL-
UC
A 19
89IN
GE
ND
EH
SA
429.
698.
483
27.0
2,07
614
51.
901
8,32
7
51
Car
a S
ucia
(Pre
sa 1
& 2
)R
ío M
iste
pe /
Río
Mai
shta
pula
Ahua
chap
án13
.828
6
89
.981
4
P
re F
actib
ilidad
ING
EN
DE
HS
AIN
GE
ND
EH
SA
16.2
10.
704
100.
04,
328
860
SAN
P0.
584
2,55
9
52
San
Ped
ro II
Río
San
Ped
roAh
uach
apán
13.7
603
89.8
080
Pre
Fac
tibilid
adIN
GE
ND
EH
SA
ING
EN
DE
HS
A13
.77
0.59
880
.02,
048
450
0.39
71,
739
53C
opin
ula
IIR
ío C
opin
ula
Ahua
chap
án13
.748
2
89
.838
8
P
re F
actib
ilidad
ING
EN
DE
HS
AIN
GE
ND
EH
SA
33.7
51.
466
40.0
n.d.
n.d.
0.48
72,
132
54Q
bda
El N
aran
jito
al N
aran
joAh
uach
apán
13.7
050
89.9
333
Pre
Fac
tibilid
adO
NG
SAB
ES
n.d.
n.d.
n.d.
n.d.
n.d.
0.08
035
0?
55Q
bda
El S
ingu
al, a
l Cuy
apo
Mor
azan
13.8
333
88.2
333
Pre
Fac
tibilid
adO
NG
SAB
ES
n.d.
n.d.
n.d.
n.d.
n.d.
0.05
825
4?
56Ve
neci
a P
rusi
a n.
d.n.
d.P
re F
actib
ilidad
AEA
Com
pani
a E
lect
rica
Me
n.d.
n.d.
n.d.
n.d.
n.d.
1.20
05,
256
?
57La
s P
ilona
sR
ío H
uiza
San
Sal
vado
r13
.576
2
89
.217
7
P
re F
actib
ilidad
ING
EN
DE
HS
AIN
GE
ND
EH
SA
34.6
31.
031
79.0
n.d.
n.d.
1.10
02,
961
No.

Final Report Appendix-S
Republic of El Salvador S - 9 March 2012 The Project for Master Plan for the Development of Renewable Energy (JICA)
Table S.7 List of Small Hydropower Potential Sites (2/4)
(Source: JICA Study Team)
Nom
bre
de P
roye
cto
Río
Dep
arta
men
to L
atitu
d L
ongi
tud
Etap
a de
l Pro
yect
oFu
ente
Ori
gina
lA
ctua
lizad
o po
rÁr
ea d
eDr
enaj
eC
auda
lD
iseñ
oC
aida
brut
a
Long
itud
de la
Cana
l
Long
itud
de tu
berí
ade
pre
sión
Are
aN
atur
alP
rote
gida
Pote
ncia
Ene
rgía
Pro
ject
Nam
eR
iver
Dep
artm
ent
Lat
itude
Lon
gitu
deP
roje
ct S
tage
Ori
gina
l Sou
rce
Upd
ated
by
Cat
chm
ent
Are
aD
esig
nD
isch
arge
Gro
ssHe
adLe
ngth
of
Cana
lLe
ngth
of
Pes
tock
Nat
ural
Pro
tect
Are
aPo
tent
ial
Ene
rgy
(N)
(W)
(km
²)(m
³/s)
(m)
(m)
(m)
(SA
NP)
(MW
) (M
Wh/
Año)
58C
opin
ula
Río
Cop
inul
aAh
uach
apán
13.7
862
89.8
445
Pre
Fact
ibilid
adIN
GEN
DE
HSA
ING
END
EHS
A28
.18
0.50
957
.0n.
d.n.
d.0.
241
1,05
5
59
San
ta E
milia
In.
d.n.
d.P
re F
actib
ilidad
AEA
http
://ap
pext
.sic
a.in
t/n.
d.n.
d.n.
d.n.
d.n.
d.0.
500
2,19
0?
60
Sant
a E
milia
IIn.
d.n.
d.Pr
e Fa
ctib
ilidad
AEA
http
://ap
pext
.sic
a.in
t/n.
d.n.
d.n.
d.n.
d.n.
d.0.
500
2,19
0?
61
Toro
laR
ío T
orol
aS
an M
igue
l13
.850
1
88
.466
3
In
vent
ory
CE
L-U
CA
1990
CE
L-U
CA,
199
0.P
ag.4
4n.
d.n.
d.n.
d.n.
d.n.
d.4.
321
18,6
67
62C
opin
ula
IIIR
ío C
opin
ula
Ahua
chap
án13
.772
1
89
.843
1
In
vent
ory
ING
EN
DE
HS
AJI
CA
Stu
dy T
eam
29.2
70.
692
80.0
1,10
027
00.
463
3,18
7
63
La C
alza
dora
IQ
uebr
ada
La C
alza
dora
Usu
lutá
n13
.566
7
88
.500
0
In
vent
ory
CE
L-U
CA
1989
JIC
A S
tudy
Tea
m6.
970.
136
378.
13,
000
1,00
00.
432
2,30
0
64
Los
Her
vide
ros
IR
ío L
os H
ervi
dero
sAh
uach
apán
13.9
550
89.9
534
Inve
ntor
y C
EL-
UC
A 19
89JI
CA
Stu
dy T
eam
95.9
41.
475
80.0
2,28
013
00.
993
5,45
7
65
Los
Her
vide
ros
II (P
resa
1 &
2)
Río
El M
olin
o / R
ío N
ejap
aAh
uach
apán
13.9
484
89.9
264
Inve
ntor
y IN
GE
ND
EH
SA
JIC
A S
tudy
Tea
m84
.48
0.86
860
.03,
824
145
0.43
53,
136
66M
alan
cola
Río
Jib
oaLa
Páz
13.5
695
88.9
850
Inve
ntor
y C
EL-
UC
A 19
89JI
CA
Stu
dy T
eam
423.
988.
789
57.4
2,60
029
04.
175
17,6
88
67G
ran.
d.e
de S
an M
igue
l, S
n Ju
anR
io G
ran.
d.e
de S
an M
igue
lU
sulu
tán
13.2
947
88.3
068
Inve
ntor
y C
EL-
UC
A 19
89Tr
ansé
nerg
ia, P
NU
D/G
n.d.
n.d.
n.d.
n.d.
n.d.
4.50
019
,710
68
Gn.
d.e
de S
an M
igue
l, S
an J
osé
Rio
Gra
n.d.
e de
San
Mig
uel
Usu
lutá
n13
.294
7
88
.306
8
In
vent
ory
CE
L-U
CA
1989
Tran
séne
rgia
, PN
UD/G
n.d.
n.d.
n.d.
n.d.
n.d.
3.20
014
,016
69
Chi
lam
a I (
Pre
sa 1
& 2
)R
ío C
hila
ma
/ Río
Sig
uapa
teLa
Lib
erta
d13
.621
2
89
.330
9
In
vent
ory
CE
L-U
CA
1989
JIC
A S
tudy
Tea
m37
.62
1.73
018
0.0
2,46
436
02.
623
7,84
0
70
Gua
yapa
IIR
ío G
uaya
paAh
uach
apán
13.8
221
89.9
345
Inve
ntor
y IN
GE
ND
EH
SA
JIC
A S
tudy
Tea
m12
.58
0.49
512
0.0
3,01
532
5S
ANP
0.49
72,
599
71La
Cal
zado
ra II
Que
brad
a La
Cal
zado
raU
sulu
tán
13.5
347
88.5
294
Inve
ntor
y C
EL-
UC
A 19
89JI
CA
Stu
dy T
eam
12.9
00.
252
218.
73,
000
1,00
00.
457
2,43
4
72
EL
Jabi
oR
io G
ran.
d.e
de S
onso
nate
Son
sona
te13
.753
2
88
.288
7
In
vent
ory
CE
CS
AC
EC
SA
n.d.
n.d.
n.d.
n.d.
n.d.
2.00
08,
760
73E
l Ros
ario
IIR
ío E
l Ros
ario
Ahua
chap
án13
.775
4
89
.872
9
In
vent
ory
CE
L-U
CA
1989
JIC
A S
tudy
Tea
m19
.02
0.74
780
.02,
265
270
0.49
82,
606
74S
an S
ebas
tián
Río
Tih
uapa
La P
áz13
.554
4
89
.136
6
In
vent
ory
ING
EN
DE
HS
AJI
CA
Stu
dy T
eam
37.4
20.
715
80.0
1,00
021
00.
480
2,31
7
75
Chi
lam
a II
Río
Chi
lam
aLa
Lib
erta
d13
.592
9
89
.330
0
In
vent
ory
CE
L-U
CA
1989
JIC
A S
tudy
Tea
m42
.13
0.68
280
.02,
604
175
0.45
72,
343
76El
Mol
ino
IR
ío E
l Mol
ino
Ahua
chap
án13
.932
5
89
.896
0
In
vent
ory
ING
EN
DE
HS
AJI
CA
Stu
dy T
eam
50.3
80.
517
60.0
2,27
215
00.
260
1,87
6
77
Gua
yapa
IR
ío G
uaya
paAh
uach
apán
13.7
955
89.9
466
Inve
ntor
y IN
GE
ND
EH
SA
JIC
A S
tudy
Tea
m17
.13
0.67
380
.02,
630
230
SAN
P0.
450
2,35
3
78
El R
efug
ioR
ío L
as L
ajas
La L
iber
tad
13.5
569
89.2
385
Inve
ntor
y IN
GE
ND
EH
SA
JIC
A S
tudy
Tea
m29
.06
0.55
510
0.0
1,36
432
00.
465
2,24
3
79
Los
Tole
sR
ío L
os T
oles
Ahua
chap
án13
.971
5
89
.938
6
In
vent
ory
ING
EN
DE
HS
AJI
CA
Stu
dy T
eam
22.8
00.
424
120.
01,
713
275
0.42
82,
035
80E
l Peñ
onR
ío G
ran.
d.e
de S
an V
icen
teLa
Lib
erta
d13
.585
5
89
.394
7
In
vent
ory
ING
EN
DE
HS
AJI
CA
Stu
dy T
eam
21.9
10.
482
120.
01,
366
300
0.48
62,
212
81G
uaya
pa V
Río
Gua
yapa
Ahua
chap
án13
.947
6
89
.963
6
In
vent
ory
ING
EN
DE
HS
AJI
CA
Stu
dy T
eam
31.2
60.
581
100.
02,
518
280
0.48
62,
310
82R
ío F
río /
Agua
Cal
ient
eR
ío F
río /
Río
Agu
a C
alie
nte
Ahua
chap
án14
.038
7
89
.839
7
In
vent
ory
ING
EN
DE
HS
AJI
CA
Stu
dy T
eam
205.
442.
109
60.0
1,85
01,
330
SAN
P0.
958
6,90
6
83
El C
harre
rón
El C
horre
rón
La L
iber
tad
13.6
178
89.3
460
Inve
ntor
y C
EL-
UC
A 19
89JI
CA
Stu
dy T
eam
12.6
00.
277
180.
02,
057
515
0.41
81,
903
84S
anta
Luc
íaR
ío T
aman
ique
La L
iber
tad
13.5
962
89.4
202
Inve
ntor
y IN
GE
ND
EH
SA
JIC
A S
tudy
Tea
m12
.58
0.41
128
0.0
957
885
0.96
63,
609
85E
l Ros
ario
IR
ío E
l Ros
ario
Ahua
chap
án13
.753
1
89
.873
1
In
vent
ory
CE
L-U
CA
1989
JIC
A S
tudy
Tea
m21
.56
0.84
760
.02,
484
230
0.42
32,
155
86M
aish
tapu
laR
ío M
aish
tapu
laAh
uach
apán
13.8
444
89.9
520
Inve
ntor
y IN
GE
ND
EH
SA
JIC
A S
tudy
Tea
m5.
290.
239
160.
01,
754
500
SAN
P0.
320
1,52
8
87
Ases
esco
(Pre
sa 1
& 2
)R
ío A
sese
sco
/ Río
Vie
joC
abañ
as13
.879
3
88
.922
6
In
vent
ory
ING
EN
DE
HS
AJI
CA
Stu
dy T
eam
14.8
60.
864
60.0
2,71
514
50.
435
2,10
5
88
Mira
mun
doQ
da. M
iram
un.d
.oC
hala
tena
ngo
14.3
268
89.1
353
Inve
ntor
y IN
GE
ND
EH
SA
JIC
A S
tudy
Tea
m4.
530.
287
200.
063
173
50.
480
1,87
7
89
Tila
pa II
Río
Gra
n.d.
e de
Cha
late
nang
oC
hala
tena
ngo
14.2
237
89.0
976
Inv e
ntor
y C
EL-
UC
A 19
89JI
CA
Stu
dy T
eam
31.7
12.
867
80.0
2,48
623
01.
925
6,40
2
90
El F
aro
(Pre
sa 1
& 2
)R
ío L
os L
eone
s / R
ío L
a M
áqui
naLa
Lib
erta
d13
.599
0
89
.356
1
In
vent
ory
ING
EN
DE
HS
AJI
CA
Stu
dy T
eam
8.44
0.23
122
0.0
2,63
262
00.
426
1,75
0
91
San
ta M
aría
Río
Tih
uapa
La P
áz13
.589
3
89
.130
7
In
vent
ory
ING
EN
DE
HS
AJI
CA
Stu
dy T
eam
19.8
50.
649
160.
03,
049
290
0.87
43,
264
92El
Mol
ino
IIR
ío E
l Mol
ino
Ahua
chap
án13
.906
0
89
.834
5
In
vent
ory
ING
EN
DE
HS
AJI
CA
Stu
dy T
eam
24.5
80.
272
100.
02,
221
820
0.22
11,
523
93S
an P
edro
IR
ío S
an P
edro
Ahua
chap
án13
.738
6
89
.805
7
In
vent
ory
ING
EN
DE
HS
AJI
CA
Stu
dy T
eam
20.8
30.
697
60.0
1,52
041
00.
344
1,94
4
94
Ashu
quem
a I
Río
Ash
uque
ma
Ahua
chap
án13
.942
0
89
.972
0
In
vent
ory
ING
EN
DE
HS
AJI
CA
Stu
dy T
eam
28.0
50.
288
80.0
2,43
150
50.
189
1,36
1
95
El C
aoba
Río
El N
aran
joAh
uach
apán
13.7
948
89.9
263
Inve
ntor
y IN
GE
ND
EH
SA
JIC
A S
tudy
Tea
m12
.16
0.54
810
0.0
2,35
261
00.
451
2,15
6
96
El R
osar
io IV
Río
El R
osar
ioAh
uach
apán
13.8
103
89.8
788
Inve
ntor
y C
EL-
UC
A 19
89JI
CA
Stu
dy T
eam
8.24
0.37
210
0.0
1,84
919
50.
313
1,49
6
97
Sun
zacu
apa
IIIR
ío S
unza
cuap
aAh
uach
apán
13.7
681
89.8
283
Inve
ntor
y IN
GE
ND
EH
SA
JIC
A S
tudy
Tea
m8.
130.
272
80.0
356
150
0.18
41,
060
98Ti
zapa
IIR
ío T
empi
sque
Cus
catlá
n13
.791
7
88
.946
1
In
vent
ory
ING
EN
DE
HS
AJI
CA
Stu
dy T
eam
12.8
60.
833
60.0
1,81
222
00.
418
1,90
7
99
San
Isid
roR
ío S
ensi
paLa
Lib
erta
d13
.616
0
89
.484
0
In
vent
ory
ING
EN
DE
HS
AJI
CA
Stu
dy T
eam
9.64
0.31
518
0.0
2,20
539
00.
477
1,78
2
10
0C
auta
Río
Cau
taAh
uach
apán
13.8
035
89.8
641
Inve
ntor
y IN
GE
ND
EH
SA
JIC
A S
tudy
Tea
m8.
930.
141
160.
01,
406
245
0.19
197
1
101
Lom
a de
San
Jua
nR
ío H
uiza
San
Sal
vado
r13
.544
9
89
.230
4
In
vent
ory
CE
L-U
CA
1989
JIC
A S
tudy
Tea
m69
.44
1.90
060
.01,
628
215
0.95
43,
837
102
San
Juan
Bue
navi
sta
Río
Aqu
iqui
squi
lloLa
Lib
erta
d13
.538
2
89
.247
9
In
vent
ory
ING
EN
DE
HS
AJI
CA
Stu
dy T
eam
17.3
40.
683
160.
01,
768
390
SAN
P0.
918
3,06
3
10
3Lo
s P
ozos
Río
Los
Poz
osC
hala
tena
ngo
14.3
289
89.1
455
Inve
ntor
y IN
GE
ND
EH
SA
JIC
A S
tudy
Tea
m7.
750.
700
140.
01,
085
260
0.82
72,
791
104
Los
Pue
blos
IIR
ío d
e Lo
s P
uebl
osC
abañ
as13
.864
3
88
.686
9
In
vent
ory
ING
EN
DE
HS
AJI
CA
Stu
dy T
eam
24.1
01.
881
80.0
2,84
834
51.
247
4,62
7
10
5E
l Jíc
aro
(Pre
sa 1
& 2
)R
ío C
hulu
ma/
Gra
nd. d
e S
an V
icen
teLa
Lib
erta
d13
.593
3
89
.402
1
In
vent
ory
ING
EN
DE
HS
AJI
CA
Stu
dy T
eam
18.0
60.
591
100.
02,
726
225
0.49
61,
851
106
Gua
rum
oR
ío G
uaru
mo
Cab
añas
13.7
670
88.8
046
Inve
ntor
y IN
GE
ND
EH
SA
JIC
A S
tudy
Tea
m19
.81
2.66
140
.01,
122
900.
897
3,64
7
10
7G
uasc
oran
Rio
el S
auce
La U
nión
13
.644
6
87
.752
4
In
vent
ory
CE
L-U
CA
1989
Tran
séne
rgia
, PN
UD
/Gn.
d.n.
d.n.
d.n.
d.n.
d.12
.500
38,0
00
108
El D
iam
ante
IIR
ío E
l Dia
man
teAh
uach
apán
13.7
672
89.9
006
Inve
ntor
y IN
GE
ND
EH
SA
JIC
A S
tudy
Tea
m8.
830.
267
100.
02,
076
725
0.21
81,
333
109
Río
Nej
apa
IR
ío N
ejap
aAh
uach
apán
13.9
336
89.9
175
Inve
ntor
y C
EL-
UC
A 19
89JI
CA
Stu
dy T
eam
27.7
90.
263
60.0
1,78
118
50.
132
1,00
0
11
0As
uchí
oR
ío A
such
íoLa
Lib
erta
d13
.561
8
89
.313
5
In
vent
ory
ING
EN
DE
HS
AJI
CA
Stu
dy T
eam
13.5
00.
369
140.
01,
985
730
SAN
P0.
428
1,75
6
11
1Ag
ua F
ríaR
ío A
gua
Fría
Cab
añas
13.8
100
88.8
215
Inve
ntor
y C
EL-
UC
A 19
89JI
CA
Stu
dy T
eam
14.7
91.
987
60.0
1,75
049
00.
974
3,96
0
11
2C
hila
ma
IIIR
ío C
hila
ma
La L
iber
tad
13.5
367
89.3
142
Inve
ntor
y IN
GE
ND
EH
SA
JIC
A S
tudy
Tea
m68
.32
1.86
960
.02,
709
235
0.93
43,
756
113
Tehu
echo
deR
ío C
hich
ical
apa
San
Sal
vado
r13
.592
6
89
.151
4
In
vent
ory
ING
EN
DE
HS
AJI
CA
Stu
dy T
eam
7.72
0.25
216
0.0
2,63
831
50.
339
1,26
7
11
4Ti
zapa
IVR
ío A
julu
coC
usca
tlán
13.7
649
88.9
248
Inve
ntor
y IN
GE
ND
EH
SA
JIC
A S
tudy
Tea
m9.
010.
524
60.0
1,32
515
00.
265
1,28
4
11
5Q
ueza
late
Río
Que
zala
teLa
Lib
erta
d13
.598
9
89
.228
8
In
vent
ory
ING
EN
DE
HS
AJI
CA
Stu
dy T
eam
18.7
30.
737
80.0
1,14
420
50.
495
1,65
1
11
6E
l Ano
nal
Río
El Z
onte
La L
iber
tad
13.5
565
89.4
540
Inve
ntor
y IN
GE
ND
EH
SA
JIC
A S
tudy
Tea
m22
.00
0.72
080
.02,
697
240
0.48
11,
794
117
Miz
ata
IR
ío M
izat
aLa
Lib
erta
d13
.578
6
89
.551
6
In
vent
ory
CE
L-U
CA
1989
JIC
A S
tudy
Tea
m23
.28
0.63
780
.02,
397
405
0.42
11,
727
118
Los
Pue
blos
IR
ío d
e Lo
s P
uebl
osC
abañ
as13
.872
6
88
.721
5
In
vent
ory
ING
EN
DE
HS
AJI
CA
Stu
dy T
eam
35.1
61.
273
40.0
2,07
835
50.
412
2,08
1
11
9E
l Cut
alR
ío T
eost
rife
Cha
late
nang
o14
.225
8
89
.069
0
In
vent
ory
ING
EN
DE
HS
AJI
CA
Stu
dy T
eam
8.68
0.66
880
.01,
796
290
0.44
51,
618
No.

Final Report Appendix-S
Republic of El Salvador S - 10 March 2012 The Project for Master Plan for the Development of Renewable Energy (JICA)
Table S.7 List of Small Hydropower Potential Sites (3/4)
(Source: JICA Study Team)
Nom
bre
de P
roye
cto
Río
Dep
arta
men
to L
atitu
d L
ongi
tud
Etap
a de
l Pro
yect
oFu
ente
Ori
gina
lA
ctua
lizad
o po
rÁ
rea
deD
rena
jeC
auda
lD
iseñ
oC
aida
brut
a
Long
itud
de la
Can
al
Long
itud
de tu
berí
ade
pre
sión
Are
aN
atur
alP
rote
gida
Pot
enci
a E
nerg
ía
Pro
ject
Nam
eR
iver
Dep
artm
ent
Lat
itude
Lon
gitu
deP
roje
ct S
tage
Ori
gina
l Sou
rce
Upd
ated
by
Cat
chm
ent
Are
aD
esig
nD
isch
arge
Gro
ssH
ead
Leng
th o
fC
anal
Leng
th o
fP
esto
ck
Nat
ural
Pro
tect
Are
aP
oten
tial
Ene
rgy
(N)
(W)
(km
²)(m
³/s)
(m)
(m)
(m)
(SA
NP
)(M
W)
(MW
h/Añ
o)12
0Te
pech
apa
Río
Tep
echa
paC
usca
tlán
13.7
884
88.9
756
Inve
ntor
y IN
GEN
DE
HS
AJI
CA
Stud
y Te
am14
.03
0.69
040
.01,
216
105
0.23
21,
224
121
El S
ilenc
ioR
ío C
omal
apa
La P
áz13
.594
0
89
.108
4
In
vent
ory
ING
END
EH
SA
JIC
A St
udy
Team
9.62
0.26
313
0.0
2,58
033
00.
287
1,17
8
12
2C
once
pció
n Lo
s P
lane
sR
ío C
omal
apa
La P
áz13
.567
4
89
.091
6
In
vent
ory
ING
END
EH
SA
JIC
A St
udy
Team
18.4
80.
604
90.0
1,54
046
50.
450
1,68
0
12
3E
l Ros
ario
VR
ío E
l Ros
ario
Ahua
chap
án13
.818
2
89
.883
0
In
vent
ory
ING
END
EH
SA
JIC
A St
udy
Team
6.89
0.27
180
.01,
391
195
0.18
295
1
124
El E
scal
ónR
ío A
quiq
uisq
uillo
La L
iber
tad
13.5
564
89.2
489
Inve
ntor
y IN
GEN
DE
HS
AJI
CA
Stud
y Te
am15
.37
0.50
310
0.0
1,82
836
50.
420
1,56
7
12
5C
uita
pán
Río
Cui
tapá
nS
an S
alva
dor
13.5
969
89.1
825
Inve
ntor
y IN
GEN
DE
HS
AJI
CA
Stud
y Te
am12
.93
0.42
312
0.0
2,55
450
50.
422
1,57
5
12
6R
ío C
eniz
a (P
resa
1 &
2)
Río
Cen
iza
Son
sona
te13
.771
2
89
.703
0
In
vent
ory
ING
END
EH
SA
JIC
A St
udy
Team
31.6
40.
688
60.0
1,55
673
50.
330
1,78
0
12
7P
apal
egua
yo (P
resa
1 &
2)
Río
Pap
aleg
uayo
/ Río
El P
atas
hte
San
Sal
vado
r13
.564
9
89
.158
8
In
vent
ory
ING
END
EH
SA
JIC
A St
udy
Team
8.66
0.23
714
0.0
3,79
927
50.
278
1,14
3
12
8G
uaya
pa V
IR
ío G
uaya
paAh
uach
apán
13.8
328
89.9
305
Inve
ntor
y IN
GEN
DE
HS
AJI
CA
Stud
y Te
am6.
660.
262
80.0
1,14
427
0S
ANP
0.17
591
5
129
Cau
ta II
Río
Cau
taAh
uach
apán
13.7
754
89.8
604
Inve
ntor
y IN
GEN
DE
HS
AJI
CA
Stud
y Te
am13
.60
0.45
560
.02,
192
485
0.22
31,
259
130
Gua
yapa
IIR
ío G
uaya
paAh
uach
apán
13.9
284
89.9
511
Inve
ntor
y IN
GEN
DE
HS
AJI
CA
Stud
y Te
am25
.85
0.26
560
.03,
015
325
0.13
194
7
131
San
Ben
ito (P
resa
1 &
2)
Río
Hui
za /
Río
Tex
isLa
Lib
erta
d13
.592
5
89
.434
0
In
vent
ory
ING
END
EH
SA
JIC
A St
udy
Team
14.7
50.
581
100.
02,
611
375
0.48
31,
613
132
Teco
mat
eR
ío C
uita
pan
San
Sal
vado
r13
.579
4
89
.188
2
In
vent
ory
ING
END
EH
SA
JIC
A St
udy
Team
19.4
60.
636
80.0
2,44
737
50.
421
1,57
2
13
3Ti
lapa
III
Río
Gra
n.d.
e de
Cha
late
nang
oC
hala
tena
ngo
14.2
371
89.1
150
Inve
ntor
y IN
GEN
DE
HS
AJI
CA
Stud
y Te
am6.
390.
578
100.
02,
066
465
0.48
01,
619
134
San
Raf
ael (
Pre
sa 1
& 2
)R
ío L
os T
rozo
s / R
ío M
atat
apa
La L
iber
tad
13.6
417
89.4
770
Inve
ntor
y IN
GEN
DE
HS
AJI
CA
Stud
y Te
am5.
070.
139
200.
02,
370
690
0.23
295
5
135
Ayac
acha
pa II
IR
ío A
yaca
chap
aS
onso
nate
13.6
506
89.5
371
Inve
ntor
y IN
GEN
DE
HS
AJI
CA
Stud
y Te
am11
.34
0.37
110
0.0
1,54
019
50.
312
1,16
6
13
6Ay
acac
hapa
IIR
ío A
yaca
chap
aS
onso
nate
13.9
282
89.5
561
Inve
ntor
y IN
GEN
DE
HS
AJI
CA
Stud
y Te
am16
.97
0.66
880
.02,
618
175
0.44
81,
495
137
Sun
zacu
apa
IR
ío S
unza
cuap
aAh
uach
apán
13.7
237
89.8
238
Inve
ntor
y IN
GEN
DE
HS
AJI
CA
Stud
y Te
am20
.08
0.60
640
.01,
923
325
0.19
71,
183
138
Tila
pa I
Río
Gra
n.d.
e de
Cha
late
nang
oC
hala
tena
ngo
14.2
154
89.0
780
Inve
ntor
y IN
GEN
DE
HS
AJI
CA
Stud
y Te
am40
.32
3.10
140
.01,
330
230
1.02
53,
680
139
Apan
coyo
IIR
ío A
panc
oyo
Son
sona
te13
.651
6
89
.570
9
In
vent
ory
ING
END
EH
SA
JIC
A St
udy
Team
12.6
10.
496
100.
02,
310
250
0.41
61,
388
140
Tiza
pa II
IR
ío C
amal
ote
Cus
catlá
n13
.790
2
88
.936
3
In
vent
ory
CE
L-U
CA
1989
JIC
A St
udy
Team
2.87
0.23
510
0.0
592
140
0.19
880
0
141
Río
Nej
apa
IIR
ío N
ejap
aAh
uach
apán
13.9
203
89.8
979
Inve
ntor
y C
EL-
UC
A 19
89JI
CA
Stud
y Te
am25
.14
0.25
860
.01,
813
560
0.12
690
7
142
El R
osar
io II
IR
ío E
l Ros
ario
Ahua
chap
án13
.788
0
89
.875
0
In
vent
ory
ING
END
EH
SA
JIC
A St
udy
Team
14.9
30.
586
40.0
621
190
0.19
599
4
143
Gua
yapa
IV (P
resa
1 &
2)
Río
Gua
yapa
/ Q
da. L
os C
horr
osAh
uach
apán
13.8
455
89.9
282
Inve
ntor
y IN
GEN
DE
HS
AJI
CA
Stud
y Te
am3.
920.
176
100.
076
915
0S
ANP
0.14
971
3
144
Miz
ata
IIR
ío M
izat
aLa
Lib
erta
d13
.613
7
89
.531
7
In
vent
ory
ING
END
EH
SA
JIC
A St
udy
Team
14.7
60.
404
80.0
2,10
622
50.
270
1,10
9
14
5S
unza
cuap
a II
Río
Sun
zacu
apa
Ahua
chap
án13
.741
4
89
.819
8
In
vent
ory
ING
END
EH
SA
JIC
A St
udy
Team
17.6
10.
589
40.0
1,74
927
50.
193
1,09
0
14
6E
l Tab
lón
Que
brad
a E
l Agu
acat
eLa
Lib
erta
d13
.563
3
89
.374
6
In
vent
ory
ING
END
EH
SA
JIC
A St
udy
Team
4.37
0.14
316
0.0
1,87
914
00.
194
723
14
7E
l Dia
man
te I
Río
El D
iam
ante
Ahua
chap
án13
.731
0
89
.904
5
In
vent
ory
ING
END
EH
SA
JIC
A St
udy
Team
18.1
30.
713
40.0
2,41
721
00.
235
1,19
6
14
8E
l Ros
ario
VI
Río
El R
osar
ioAh
uach
apán
13.8
262
89.8
863
Inve
ntor
y C
EL-
UC
A 19
89JI
CA
Stud
y Te
am5.
460.
246
80.0
940
240
SAN
P0.
165
789
14
9Ta
lque
zala
rR
ío T
alqu
ezal
arC
hala
tena
ngo
14.2
894
89.1
316
Inve
ntor
y IN
GEN
DE
HS
AJI
CA
Stud
y Te
am4.
300.
502
100.
083
226
50.
421
1,23
8
15
0E
l Ced
roR
ío P
epet
apa
La P
áz13
.597
4
89
.062
3
In
vent
ory
ING
END
EH
SA
JIC
A St
udy
Team
6.82
0.26
915
0.0
2,70
059
00.
336
1,11
9
15
1G
uaya
pa II
I (P
resa
1 &
2)
Río
Gua
yapa
Ahua
chap
án13
.900
6
89
.913
5
In
vent
ory
ING
END
EH
SA
JIC
A St
udy
Team
16.6
50.
144
80.0
2,71
470
50.
093
733
15
2M
izat
a III
Río
Miz
ata
La L
iber
tad
13.6
247
89.5
190
Inve
ntor
y C
EL-
UC
A 19
89JI
CA
Stud
y Te
am9.
360.
256
100.
01,
963
240
0.21
588
3
153
Ayac
acha
pa I
Río
Aya
cach
apa
Son
sona
te13
.593
8
89
.570
8
In
vent
ory
ING
END
EH
SA
JIC
A St
udy
Team
34.0
80.
651
40.0
1,72
710
50.
218
1,03
6
15
4C
omiz
apa
Río
Com
izap
aC
usca
tlán
13.8
587
88.9
861
Inve
ntor
y IN
GEN
DE
HS
AJI
CA
Stud
y Te
am2.
520.
180
100.
089
815
50.
152
673
15
5La
s M
esas
Río
El N
ajan
jito
Ahua
chap
án13
.790
6
89
.911
1
In
vent
ory
ING
END
EH
SA
JIC
A St
udy
Team
1.45
0.04
822
0.0
1,49
449
50.
089
513
15
6S
an Ig
naci
oR
ío S
an Ig
naci
oC
hala
tena
ngo
14.3
288
89.1
968
Inve
ntor
y IN
GEN
DE
HS
AJI
CA
Stud
y Te
am7.
500.
875
60.0
1,02
319
00.
441
1,26
9
15
7As
huqu
ema
IIR
ío A
shuq
uem
aAh
uach
apán
13.9
226
89.9
544
Inve
ntor
y IN
GEN
DE
HS
AJI
CA
Stud
y Te
am22
.53
0.25
060
.01,
391
730
0.12
082
2
158
El M
ataz
ano
Río
El S
hilo
La L
iber
tad
13.6
098
89.5
025
Inve
ntor
y IN
GEN
DE
HS
AJI
CA
Stud
y Te
am3.
120.
102
200.
01,
948
140
0.17
364
8
159
Sib
eria
Río
El Z
onte
La L
iber
tad
13.5
738
89.4
538
Inve
ntor
y IN
GEN
DE
HS
AJI
CA
Stud
y Te
am17
.41
0.47
660
.01,
625
180
0.24
096
5
160
Joya
Ver
deR
ío T
aqui
lloLa
Lib
erta
d13
.536
7
89
.489
9
In
vent
ory
ING
END
EH
SA
JIC
A St
udy
Team
6.48
0.17
812
0.0
2,20
735
00.
178
731
16
1Ag
uach
apío
III
Río
Agu
acha
pío
Ahua
chap
án13
.798
6
89
.959
3
In
vent
ory
ING
END
EH
SA
JIC
A St
udy
Team
3.36
0.13
310
0.0
1,98
619
0S
ANP
0.11
258
3
162
Apan
coyo
IIIR
ío A
panc
oyo
Son
sona
te13
.663
1
89
.547
9
In
vent
ory
ING
END
EH
SA
JIC
A St
udy
Team
5.65
0.15
512
0.0
1,45
721
00.
156
641
16
3Ta
zulá
Río
Taz
ulá
Son
sona
te13
.668
2
89
.581
8
In
vent
ory
ING
END
EH
SA
JIC
A St
udy
Team
7.62
0.20
910
0.0
1,77
025
00.
175
719
16
4M
etal
ío I
Río
Met
alío
Ahua
chap
án13
.715
7
89
.858
1
In
vent
ory
CE
L-U
CA
1989
JIC
A St
udy
Team
7.39
0.13
860
.03,
015
325
0.06
851
7
165
Agua
chap
ío II
Río
Agu
acha
pío
Ahua
chap
án13
.785
0
89
.973
3
P
re F
actib
ilidad
ING
END
EH
SA
ING
END
EHS
A5.
220.
226
60.0
n.d.
n.d.
0.11
349
3
166
El I
zcan
al IV
Río
Izca
nal
Ahua
chap
án13
.816
0
89
.961
2
In
vent
ory
ING
END
EH
SA
JIC
A St
udy
Team
2.89
0.08
811
0.0
1,98
339
50.
080
487
16
7Lo
s Au
sole
sR
ío L
os A
usol
esAh
uach
apán
13.9
332
89.8
165
Inve
ntor
y IN
GEN
DE
HS
AJI
CA
Stud
y Te
am13
.33
0.13
760
.02,
022
345
0.06
849
0
168
Gua
yapa
IVR
ío G
uaya
paAh
uach
apán
13.8
750
89.9
183
Inve
ntor
y IN
GEN
DE
HS
AJI
CA
Stud
y Te
am5.
020.
052
140.
01,
022
840
0.06
043
0
169
Miz
ata
IVR
ío M
izat
aLa
Lib
erta
d13
.634
8
89
.506
3
In
vent
ory
ING
END
EH
SA
JIC
A St
udy
Team
7.08
0.23
110
0.0
848
560
0.19
171
5
170
El I
zcan
al II
IR
ío Iz
cana
lAh
uach
apán
13.8
001
89.9
746
Inve
ntor
y IN
GEN
DE
HS
AJI
CA
Stud
y Te
am5.
530.
131
60.0
1,76
628
5S
ANP
0.06
544
4
171
Que
brad
a Ho
n.d.
aQ
uebr
ada
Hon
.d.a
Cha
late
nang
o14
.232
3
89
.239
3
In
vent
ory
JIC
A St
udy
Team
3.74
0.26
680
.01,
541
330
0.17
764
9
172
Tihu
icha
IR
ío T
ihui
cha
Ahua
chap
án13
.739
7
89
.890
6
In
vent
ory
ING
END
EH
SA
JIC
A St
udy
Team
4.05
0.10
980
.075
775
50.
071
459
17
3R
ío N
ejap
a III
Río
Nej
apa
Ahua
chap
án13
.880
8
89
.888
0
In
vent
ory
CE
L-U
CA
1989
JIC
A St
udy
Team
10.9
40.
121
60.0
1,78
034
00.
060
412
17
4E
l Izc
anal
IR
ío Iz
cana
lAh
uach
apán
13.7
782
89.9
959
Inve
ntor
y IN
GEN
DE
HS
AJI
CA
Stud
y Te
am11
.14
0.18
040
.092
249
50.
058
462
17
5La
Sol
edad
IR
ío S
an F
rans
cisc
o La
Sol
edad
Ahua
chap
án13
.836
1
90
.016
1
In
vent
ory
ING
END
EH
SA
JIC
A St
udy
Team
10.2
30.
121
70.0
1,87
437
00.
070
415
17
6E
l Sau
ce (P
resa
1 &
2)
Río
El C
arriz
o/ R
ío d
e C
upa
La L
iber
tad
13.5
444
89.5
244
Inve
ntor
y IN
GEN
DE
HS
AJI
CA
Stud
y Te
am16
.25
0.26
360
.02,
382
645
0.12
764
1
177
La S
oled
ad II
Río
San
Fra
nsci
sco
La S
oled
adAh
uach
apán
13.8
511
90.0
023
Inve
ntor
y IN
GEN
DE
HS
AJI
CA
Stud
y Te
am7.
070.
084
100.
02,
074
620
SAN
P0.
069
416
17
8M
etal
ío II
Río
Met
alío
Ahua
chap
án13
.753
1
89
.852
6
In
vent
ory
CE
L-U
CA
1989
JIC
A St
udy
Team
2.74
0.10
880
.01,
252
220
0.07
237
8
179
Texi
spul
coR
ío T
exis
pulc
oAh
uach
apán
13.7
594
89.8
017
Inve
ntor
y C
EL-
UC
A 19
89JI
CA
Stud
y Te
am4.
170.
126
60.0
1,88
028
50.
063
378
No.

Final Report Appendix-S
Republic of El Salvador S - 11 March 2012 The Project for Master Plan for the Development of Renewable Energy (JICA)
Table S.7 List of Small Hydropower Potential Sites (4/4)
(Source: JICA Study Team)
Nom
bre
de P
roye
cto
Río
Depa
rtam
ento
Lat
itud
Lon
gitu
dEt
apa
del P
roye
cto
Fuen
te O
rigi
nal
Act
ualiz
ado
por
Áre
a de
Dre
naje
Cau
dal
Dis
eño
Caid
abr
uta
Long
itud
de la
Cana
l
Long
itud
de tu
berí
ade
pre
sión
Are
aN
atur
alP
rote
gida
Pot
enci
a E
nerg
ía
Proj
ect N
ame
Rive
rDe
part
men
t L
atitu
de L
ongi
tude
Pro
ject
Sta
geO
rigi
nal S
ourc
eU
pdat
ed b
yCa
tchm
ent
Area
Des
ign
Dis
char
geG
ross
Hea
dLe
ngth
of
Cana
lLe
ngth
of
Pest
ock
Nat
ural
Pro
tect
Are
aP
oten
tial
Ene
rgy
(N)
(W)
(km
²)(m
³/s)
(m)
(m)
(m)
(SA
NP)
(MW
) (M
Wh/
Año)
180
Ashu
quem
a III
(Pre
sa 1
& 2
)R
ío A
shuq
uem
a / R
ío Is
hcan
elo
Ahua
chap
án13
.886
5
89
.940
6
In
vent
ory
ING
END
EHS
AJIC
A S
tudy
Tea
m6.
410.
099
80.0
891
335
0.06
636
2
181
Río
Chi
quito
Río
Chi
quito
Cab
añas
13.7
794
88.8
428
Inve
ntor
y C
EL-
UC
A 19
89JIC
A S
tudy
Tea
m6.
020.
147
40.0
899
720
0.04
638
4
182
Cas
a de
Pie
dra
Río
Cas
a de
Pie
dra
San
Sal
vado
r13
.627
7
89
.217
4
In
vent
ory
ING
END
EHS
AJIC
A S
tudy
Tea
m4.
140.
091
100.
03,
179
170
0.07
634
7
183
Tiza
pa V
Río
Pas
o Ho
n.d.
oC
usca
tlán
13.7
607
88.9
009
Inve
ntor
y C
EL-
UC
A 19
89JIC
A S
tudy
Tea
m1.
610.
104
80.0
1,89
725
00.
070
327
18
4Lo
s M
ilagr
osR
ío S
an A
nton
ioSo
nson
ate
13.7
511
89.7
414
Inve
ntor
y IN
GE
NDE
HSA
JICA
Stu
dy T
eam
3.92
0.13
160
.070
645
00.
065
328
18
5El
Que
quei
shqu
e II
Río
El Q
uequ
eish
que
Ahua
chap
án13
.868
3
89
.995
5
In
vent
ory
ING
END
EHS
AJIC
A S
tudy
Tea
m4.
230.
081
100.
01,
430
240
0.06
830
9
186
El Iz
cana
l II
Río
Izca
nal
Ahua
chap
án13
.792
4
89
.987
6
In
vent
ory
ING
END
EHS
AJIC
A S
tudy
Tea
m8.
500.
144
40.0
3,58
049
5S
ANP
0.04
535
5
187
La S
oled
ad IV
(Pre
sa 1
& 2
)R
ío S
an F
rans
cisc
o La
Sol
edad
Ahua
chap
án13
.868
1
89
.972
2
In
vent
ory
ING
END
EHS
AJIC
A S
tudy
Tea
m1.
770.
042
200.
098
633
5S
ANP
0.07
027
4
188
Tiza
pa I
Río
El R
osar
ioC
usca
tlán
13.8
001
88.9
611
Inve
ntor
y C
EL-
UC
A 19
89JIC
A S
tudy
Tea
m2.
100.
136
60.0
1,63
922
50.
068
311
18
9Te
lesc
alig
üeR
ío T
eles
calig
üeSo
nson
ate
13.6
287
89.5
878
Inve
ntor
y IN
GE
NDE
HSA
JICA
Stu
dy T
eam
3.09
0.08
510
0.0
1,52
218
50.
071
292
19
0Lo
s In
fiern
illos
Qda
. Los
Infie
rnillo
sC
hala
tena
ngo
14.2
763
89.0
697
Inve
ntor
y IN
GE
NDE
HSA
JICA
Stu
dy T
eam
0.97
0.05
116
0.0
1,32
068
50.
067
279
19
1La
Sol
edad
III
Río
San
Fra
nsci
sco
La S
oled
adAh
uach
apán
13.8
559
89.9
837
Inve
ntor
y C
EL-
UC
A 19
89JIC
A S
tudy
Tea
m4.
430.
053
100.
02,
864
230
SAN
P0.
044
266
19
2El
Que
quei
shqu
e I
Río
El Q
uequ
eish
que
Ahua
chap
án13
.855
0
90
.009
5
In
vent
ory
ING
END
EHS
AJIC
A S
tudy
Tea
m7.
250.
120
60.0
791
325
0.06
028
9
193
Ayac
acha
pa IV
(Pre
sa 1
& 2
)R
ío E
stas
uche
/ R
ío C
acag
uayo
Sons
onat
e13
.613
3
89
.553
3
In
vent
ory
ING
END
EHS
AJIC
A S
tudy
Tea
m6.
650.
127
60.0
1,84
328
50.
063
300
19
4Su
nzap
úa I
Río
Sun
zapú
aSo
nson
ate
13.6
085
89.5
990
Inve
ntor
y IN
GE
NDE
HSA
JICA
Stu
dy T
eam
3.73
0.10
280
.01,
658
250
0.06
827
9
195
Oju
shic
o I
Río
Oju
shic
oSo
nson
ate
13.6
013
89.5
935
Inve
ntor
y IN
GE
NDE
HSA
JICA
Stu
dy T
eam
5.40
0.11
960
.02,
495
155
0.06
026
7
196
Sihu
apila
pa I
Río
Sih
uapi
lapa
Sons
onat
e13
.564
8
89
.578
0
In
vent
ory
ING
END
EHS
AJIC
A S
tudy
Tea
m3.
290.
053
100.
01,
633
550
0.04
422
5
197
Oj u
shic
o II
Río
Oju
shic
oSo
nson
ate
13.6
159
89.5
744
Inve
ntor
y IN
GE
NDE
HSA
JICA
Stu
dy T
eam
1.27
0.05
016
0.0
2,46
927
00.
067
224
19
8Ag
uach
apío
IR
ío A
guac
hapí
oAh
uach
apán
13.8
213
89.9
448
Inve
ntor
y IN
GE
NDE
HSA
JICA
Stu
dy T
eam
0.53
0.02
420
0.0
892
490
SAN
P0.
040
192
19
9Ap
anco
yo I
(Pre
sa 1
& 2
)R
ío A
panc
oyo
/ Río
Tel
esca
ligüe
Sons
onat
e13
.634
7
89
.590
4
In
vent
ory
ING
END
EHS
AJIC
A S
tudy
Tea
m20
.42
0.11
240
.01,
056
800
0.03
423
2
200
Cha
gala
pa I
Río
Cha
gala
paAh
uach
apán
13.8
606
90.0
259
Inve
ntor
y IN
GE
NDE
HSA
JICA
Stu
dy T
eam
3.87
0.04
680
.02,
237
390
0.03
018
1
201
Cui
lapa
Río
Cui
lapa
Ahua
chap
án13
.766
9
89
.950
7
In
vent
ory
ING
END
EHS
AJIC
A S
tudy
Tea
m1.
910.
051
80.0
2,50
51,
490
0.03
120
3
202
Sunz
apúa
IIR
ío S
unza
púa
Sons
onat
e13
.619
3
89
.586
5
In
vent
ory
CE
L-U
CA
1989
JICA
Stu
dy T
eam
1.96
0.04
310
0.0
1,46
225
50.
036
165
20
3C
haga
lapa
IIR
ío C
haga
lapa
Ahua
chap
án13
.870
1
90
.005
8
In
vent
ory
ING
END
EHS
AJIC
A S
tudy
Tea
m1.
770.
042
120.
01,
871
530
0.04
216
4
204
Río
Frío
Río
Frío
Sons
onat
e13
.742
5
89
.748
6
In
vent
ory
ING
END
EHS
AJIC
A S
tudy
Tea
m1.
160.
047
80.0
1,32
029
00.
031
143
20
5Ti
anm
ica
Río
Tia
nmic
aAh
uach
apán
13.8
783
90.0
395
Inve
ntor
y IN
GE
NDE
HSA
JICA
Stu
dy T
eam
2.27
0.04
380
.01,
588
350
0.02
913
1
206
Tihu
icha
IIR
ío T
ihui
cha
Ahua
chap
án13
.753
1
89
.891
0
In
vent
ory
CE
L-U
CA
1989
JICA
Stu
dy T
eam
0.28
0.00
610
0.0
900
485
0.00
536
20
7Hu
isco
yol
Río
Hui
scoy
olAh
uach
apán
13.8
573
90.0
152
Inve
ntor
y IN
GE
NDE
HSA
JICA
Stu
dy T
eam
0.32
0.00
610
0.0
1,71
248
00.
005
25
208
Sihu
apila
pa II
Qda
. El T
ambo
rSo
nson
ate
13.5
758
89.5
634
Inve
ntor
y IN
GE
NDE
HSA
JICA
Stu
dy T
eam
0.58
0.00
510
0.0
1,78
721
50.
004
25
209
Que
brad
a S
eca
Que
brad
a S
eca
Sons
onat
e13
.580
6
89
.604
5
In
vent
ory
ING
END
EHS
AJIC
A S
tudy
Tea
m0.
770.
004
80.0
1,58
944
50.
003
20
Tota
les
20
180.
759
756,
000
No
te: I
talic
num
ber w
as e
stim
ated
val
ues.
N
.d.:
No
dat.
Max
.=17
.000
74,4
60
Min
.=0.
003
20
No.

Final Report Appendix-S
Republic of El Salvador S - 12 March 2012 The Project for Master Plan for the Development of Renewable Energy (JICA)
Table S.8 Financial Values of Small Hydropower Potential Sites (1/2)
(Source: JICA Study Team)
Nombre de Proyecto Etapa del ProyectoArea
NaturalProtegida
Potencia Energía Factor deplanta
InversiónTotal
Costo/kW Generaciónde costos
Base del Proyecto(sin préstamo del Banco)
Project Base (without Bank Loan)
Base del Inversionista(con préstamo del Banco)
Investment Base (with Bank Loan)
Fasedel
proyecto
Project Name Project StageNaturalProtectArea
Potential Energy PlantFactor
InvestmentCost Cost/kW Generation
CostTIR
FIRRVANNPV B/C TIR
FIRRVANNPV B/C Project
Phase
(SANP) (MW) (MWh/Año) (x 1,000 US$) (US$/kW) (US$/kWh) (%) (x1,000 US$) (%) (x1,000 US$)
1 El Calambre Construcción 0.058 311 61% 146 2,512 0.062? 16.5% 82 1.17 ? 39.4% 207? 1.83? 12 Mirazalco Construcción 3.370 14,762? ? 50% 9,969 2,958 0.089? ? 19.6% ? 8,830 1.67? ? 29.3% 9,475? 1.76? 13 Gualpuca Financiamiento 1.000 6,155 70% 1,475 1,475 0.032? 26.0% 614 1.70 ? 90.5% 5,893? 2.94? 14 Ilopango Aguacayo Financiamiento 17.000 74,460? ? 50% 51,000? 3,000? 0.090? ? 19.7% ? 45,746 1.70? ? 29.5% 49,047? 1.80? 15 San Luis IV Bid Process 1.500 6,570? ? 50% 5,250? 3,500? 0.105? ? 16.3% ? 2,953 1.43? ? 22.4% 3,293? 1.50? 16 Sumpul De Registro SIGET 16.200 64,043 45% 48,600? 3,000? 0.100? ? 17.9% ? 35,075 1.58? ? 25.8% 38,221? 1.67? 17 Sucio, Los Tetuntes De Registro SIGET 6.600 28,908? ? 50% 19,800? 3,000? 0.090? ? 19.5% ? 17,481 1.69? ? 29.2% 18,762? 1.78? 18 La Joya De Registro SIGET 3.000 13,140? ? 50% 9,000? 3,000? 0.090? ? 19.2% ? 7,696 1.65? ? 28.6% 8,279? 1.74? 19 San Francisco De Registro SIGET 1.000 4,380? ? 50% 3,000? 3,000? 0.090? ? 18.2% ? 2,261 1.53? ? 26.4% 2,455? 1.61? 110 La Colmena (El Volcán) De Registro SIGET 0.097 450 53% 290 2,986 0.085? 15.3% 124 1.10 ? 28.0% 259? 1.63? 111 Quebrada la Cueva / San Jose De Registro SIGET 0.065 455 80% 294 4,527 0.085? 13.2% 88 1.10 ? 28.0% 262? 1.63? 112 Santa Rosa (El Riachuelo) De Registro SIGET 0.038 260 78% 180 4,737 0.091? 11.8% 30 1.00 ? 22.7% 116? 1.43? 113 Atehuecillas (Rehabilitation) Rehabilitación 0.630 2,759? ? 50% 1,890? 3,000? 0.090? ? 17.6% ? 1,300 1.46? ? 25.0% 1,422? 1.53? 114 San Esteban Rehabilitación 0.751 3,287 50% 4,858 6,472 0.195? ? 8.3% ? -689 0.88? ? 8.6% ? -374 0.93? 115 Cucumacayan (Reconversion) Reconversion 2.300 17,895 89% 2,225 967 0.016? 42.0% 261 1.76 ? 164.1% 19,707? 4.25? 116 Acahuapa (Rehabilitation) Rehabilitación 0.120 526? ? 50% 360? 3,000? 0.090? ? 18.2% ? 270 1.53? ? 26.4% 294? 1.60? 117 Sapuyo (Rehabilitation) Rehabilitación 0.060 263? ? 50% 180? 3,000? 0.090? ? 16.6% ? 107 1.38? ? 23.1% 119? 1.44? 118 Chorreron Jiboa Factibilidad 2.000 8,760? ? 50% 6,000? 3,000? 0.090? ? 19.0% ? 4,979 1.62? ? 28.1% 5,367? 1.70? 119 La Montañita Factibilidad 0.900 3,942? ? 50% 2,700? 3,000? 0.090? ? 18.2% ? 2,034 1.53? ? 26.4% 2,208? 1.61? 120 El Sapo Factibilidad 0.060 263? ? 50% 180? 3,000? 0.090? 31.0% 11,010 3.32 ? 23.1% 119? 1.44? 121 San Luis III Factibilidad 0.600 2,628? ? 50% 1,800? 3,000? 0.090? ? 17.4% ? 1,218 1.45? ? 24.8% 1,335? 1.52? 122 Sonzacate (Nahuizalco II) Factibilidad 3.839 16,816 50% 9,450 2,461 0.074? 22.3% 9,758 2.18 ? 37.2% 12,427? 2.00? 123 Potrerillos Factibilidad 0.320 2,600 93% 976 3,049 0.049? 18.4% 257 1.50 ? 59.1% 2,292? 2.52? 124 Guanijiquil - Poza Hon.d.a Factibilidad 0.131 510 44% 345 2,637 0.089? 14.7% 140 1.43 ? 26.7% 287? 1.61? 125 La Cabaña Factibilidad 0.980 4,300 50% 2,600 2,653 0.080? 11.4% 181 1.40 ? 31.4% 2,731? 1.75? 126 La Loma Factibilidad 0.055 398 83% 270 4,905 0.089? 16.0% 136 1.15 ? 25.7% 212? 1.56? 127 El Progreso Factibilidad 0.033 280 97% 200 6,061 0.094? 11.8% 34 1.00 ? 22.2% 124? 1.42? 128 Araute Factibilidad 0.033 284 98% 99? 3,000? 0.046? ? 30.6% ? 206 1.98? ? 54.9% 212? 2.05? 129 Cumaro Factibilidad 0.040 175? ? 50% 120? 3,000? 0.090? ? 15.0% ? 53 1.26? ? 19.9% 61? 1.30? 130 El Naranjito Factibilidad 0.031 146 54% 97 3,124 0.087? 10.3% 2 0.85 ? 18.9% 44? 1.26? 131 Quezalapa Diseños Básicos 1.050 2,628 29% 3,150? 3,000? 0.158? ? 9.9% ? -26 0.99? ? 11.1% 178? 1.05? 132 Tihuapa 1 Diseños Básicos 1.315 3,870 34% 3,945? 3,000? 0.134? ? 12.3% ? 794 1.16? ? 15.1% 1,049? 1.22? 133 Tihuapa 2 Diseños Básicos 0.900 2,580 33% 2,700? 3,000? 0.138? ? 11.6% ? 359 1.10? ? 13.8% 534? 1.16? 134 San Simón 1 Diseños Básicos 0.900 2,040 26% 2,700? 3,000? 0.174? ? 8.6% ? -304 0.91? ? 9.1% 130?- 0.96? 135 San Simón 2 Diseños Básicos 0.915 2,484 31% 2,745? 3,000? 0.146? ? 10.9% ? 201 1.06? ? 12.6% 379? 1.11? 136 San Simón 3 Diseños Básicos 0.870 2,570 34% 2,610? 3,000? 0.134? ? 11.9% ? 427 1.12? ? 14.3% 596? 1.18? 137 Titihuapa 3 Diseños Básicos 2.100 6,802 37% 6,300? 3,000? 0.122? ? 14.2% ? 2,305 1.29? ? 18.4% 2,713? 1.36? 138 Titihuapa 5 Diseños Básicos 1.410 5,673 46% 4,230? 3,000? 0.098? ? 17.2% ? 2,757 1.48? ? 24.3% 3,031? 1.56? 139 Cuyuapa Diseños Básicos 1.020 2,840 32% 3,060? 3,000? 0.142? ? 11.2% ? 315 1.08? ? 13.2% 513? 1.13? 140 Suquiapa Diseños Básicos 3.530 13,630 44% 10,590? 3,000? 0.102? ? 17.2% ? 6,886 1.51? ? 24.2% 7,571? 1.59? 141 Gr. Chalatenango Diseños Básicos 1.630 3,680 26% 4,890? 3,000? 0.175? ? 9.3% ? -279 0.95? ? 10.1% 37? 1.01? 142 Sucio 3 Diseños Básicos 2.025 11,149 63% 6,075? 3,000? 0.072? ? 23.5% ? 7,849 1.91? ? 38.1% 8,242? 2.01? 143 Polorós Diseños Básicos 2.025 5,250 30% 6,075? 3,000? 0.152? ? 11.2% ? 597 1.08? ? 13.1% 991? 1.14? 144 Huiza 2 Diseños Básicos 2.100 6,009 33% 6,300? 3,000? 0.138? ? 12.4% ? 1,330 1.17? ? 15.3% 1,738? 1.24? 1
45 Santo Domingo (Presa 1 & 2 &3) Pre Factibilidad 1.540 7,885 58% 2,958 2,881 0.087? 23.4% 3,969 2.29 ? 35.9% 5,579? 1.92? 1
46 Chacala Los Apantes (Presa 1 & 2) Pre Factibilidad 1.500 8,126 62% 4,498 3,124 0.094? 22.0% 3,492 2.14 ? 36.8% 5,825? 1.95? 147 Santa Rita Pre Factibilidad 8.357 36,603 50% 21,220 2,539 0.076? 21.7% 20,688 2.11 ? 36.3% 27,052? 2.00? 148 Milingo (Reconversion) Pre Factibilidad 0.800 3,504? ? 50% 2,225 2,781 0.084? 42.0% 261 1.76 ? 28.8% 2,061? 1.66? 149 Copinula I Pre Factibilidad 0.603 2,641 50% 2,155 3,573 0.107? 14.1% 653 1.35 ? 19.6% 1,059? 1.37? 150 San José Loma Pre Factibilidad 1.901 8,327 50% 7,797 4,101 0.123? 13.1% 1,804 1.26 ? 18.3% 3,354? 1.37? 151 Cara Sucia (Presa 1 & 2) Pre Factibilidad SANP 0.584 2,559 50% 2,560 4,382 0.132? 11.1% 201 1.09 ? 14.6% 624? 1.19? 52 San Pedro II Pre Factibilidad 0.397 1,739 50% 1,641 4,134 0.124? 11.0% 117 1.08 ? 18.1% 685? 1.35? 153 Copinula II Pre Factibilidad 0.487 2,132 50% 2,266 4,655 0.140? 10.0% -7 1.00 ? 15.5% 653? 1.25? 154 Qbda El Naranjito al Naranjo Pre Factibilidad 0.080 350? ? 50% 240? 3,000? 0.090? ? 17.4% ? 162 1.45? ? 24.7% 177? 1.52? 155 Qbda El Singual, al Cuyapo Pre Factibilidad 0.058 254? ? 50% 174? 3,000? 0.090? ? 16.5% ? 102 1.37? ? 22.9% 113? 1.43? 156 Venecia Prusia Pre Factibilidad 1.200 5,256? ? 50% 3,600? 3,000? 0.090? ? 18.5% 2,804? 1.56? ? 27.0% 3,037? 1.64? 157 Las Pilonas Pre Factibilidad 1.100 2,961 31% 3,268 2,971 0.145? 9.9% -17 0.99 ? 12.8% 489? 1.12? 158 Copinula Pre Factibilidad 0.241 1,055 50% 1,371 5,691 0.171 5.2% -400 0.67 ? 10.9% 67? 1.04? 159 Santa Emilia I Pre Factibilidad 0.500 2,190? ? 50% 1,500? 3,000? 0.090? ? 17.0% 946? 1.41? ? 23.8% 1,044? 1.47? 160 Santa Emilia II Pre Factibilidad 0.500 2,190? ? 50% 1,500? 3,000? 0.090? ? 17.0% 946? 1.41? ? 23.8% 1,044? 1.47? 161 Torola Inventory 4.321 18,667 49% 4,710 1,090 0.033 26.0% 1,530 1.78 ? 89.7% 18,607? 3.20? 262 Copinula III Inventory 0.463 3,187 79% 1,636 3,533 0.068 24.9% 2,364 2.02 41.4% 2,470 2.11 263 La Calzadora I Inventory 0.432 2,300 61% 1,308 3,028 0.075 22.6% 1,564 1.85 36.0% 1,648 1.94 264 Los Hervideros I Inventory 0.993 5,457 63% 2,934 2,954 0.071 23.2% 3,688 1.85 37.3% 3,878 1.93 265 Los Hervideros II (Presa 1 & 2) Inventory 0.435 3,136 82% 1,902 4,372 0.080 21.5% 2,064 1.80 33.6% 2,187 1.89 266 Malancola Inventory 4.175 17,688 48% 10,926 2,617 0.081 21.3% 11,575 1.79 33.0% 12,282 1.88 267 Gran.d.e de San Miguel, Sn Juan Inventory 4.500 19,710 50% 13,500? 3,000? 0.132 ? 19.4% 11,773? 1.67? ? 29.0% 12,647? 1.76? 268 Gn.d.e de San Miguel, San José Inventory 3.200 14,016 50% 9,600? 3,000? 0.132 ? 19.3% 8,240? 1.65? ? 28.7% 8,861? 1.74? 269 Chilama I (Presa 1 & 2) Inventory 2.623 7,840 34% 5,197 1,981 0.087 19.5% 4,562 1.64 29.1% 4,898 1.73 270 Guayapa II Inventory SANP 0.497 2,599 60% 1,791 3,604 0.091 19.1% 1,502 1.64 28.3% 1,618 1.72 71 La Calzadora II Inventory 0.457 2,434 61% 1,677 3,670 0.091 19.0% 1,401 1.63 28.2% 1,509 1.72 272 EL Jabio Inventory 2.000 8,760 50% 6,000? 3,000? 0.132 ? 19.0% 4,979? 1.62? ? 28.1% 5,367? 1.70? 273 El Rosario II Inventory 0.498 2,606 60% 1,848 3,711 0.093 18.6% 1,460 1.60 27.2% 1,580 1.69 274 San Sebastián Inventory 0.480 2,317 55% 1,656 3,449 0.094 18.4% 1,276 1.59 26.8% 1,383 1.67 275 Chilama II Inventory 0.457 2,343 59% 1,695 3,708 0.095 18.2% 1,273 1.57 26.4% 1,383 1.66 276 El Molino I Inventory 0.260 1,876 82% 1,345 5,175 0.094 18.2% 1,010 1.57 26.4% 1,097 1.65 277 Guayapa I Inventory SANP 0.450 2,353 60% 1,723 3,830 0.096 18.0% 1,260 1.56 26.0% 1,372 1.64 78 El Refugio Inventory 0.465 2,243 55% 1,649 3,545 0.097 17.9% 1,191 1.55 25.8% 1,298 1.64 279 Los Toles Inventory 0.428 2,035 54% 1,503 3,511 0.097 17.8% 1,065 1.54 25.5% 1,163 1.62 280 El Peñon Inventory 0.486 2,212 52% 1,645 3,384 0.098 17.7% 1,157 1.54 25.4% 1,263 1.62 281 Guayapa V Inventory 0.486 2,310 54% 1,741 3,582 0.099 17.5% 1,192 1.53 25.0% 1,304 1.61 282 Río Frío / Agua Caliente Inventory SANP 0.958 6,906 82% 5,109 5,333 0.097 17.6% 3,535 1.52 25.1% 3,866 1.60 83 El Charrerón Inventory 0.418 1,903 52% 1,476 3,531 0.102 16.9% 927 1.48 23.8% 1,023 1.56 284 Santa Lucía Inventory 0.966 3,609 43% 2,541 2,630 0.093 17.6% 1,766 1.49 25.2% 1,931 1.56 285 El Rosario I Inventory 0.423 2,155 58% 1,800 4,255 0.110 15.9% 949 1.42 21.7% 1,065 1.49 286 Maishtapula Inventory SANP 0.320 1,528 55% 1,243 3,883 0.107 16.0% 674 1.42 22.0% 754 1.49 87 Asesesco (Presa 1 & 2) Inventory 0.435 2,105 55% 1,767 4,061 0.111 15.8% 917 1.41 21.5% 1,032 1.49 288 Miramundo Inventory 0.480 1,877 45% 1,567 3,265 0.110 15.8% 814 1.41 21.5% 916 1.48 289 Tilapa II Inventory 1.925 6,402 38% 5,234 2,719 0.108 15.9% 2,762 1.40 21.7% 3,100 1.48 290 El Faro (Presa 1 & 2) Inventory 0.426 1,750 47% 1,476 3,465 0.111 15.6% 739 1.39 21.1% 834 1.47 291 Santa María Inventory 0.874 3,264 43% 2,494 2,854 0.101 16.2% 1,384 1.40 22.2% 1,545 1.46 292 El Molino II Inventory 0.221 1,523 79% 1,284 5,809 0.111 15.5% 631 1.38 20.9% 714 1.46 93 San Pedro I Inventory 0.344 1,944 65% 1,685 4,899 0.114 15.3% 791 1.37 20.5% 900 1.45 294 Ashuquema I Inventory 0.189 1,361 82% 1,207 6,386 0.117 15.1% 545 1.36 20.1% 623 1.44 95 El Caoba Inventory 0.451 2,156 55% 1,898 4,209 0.116 15.1% 863 1.36 20.2% 986 1.44 296 El Rosario IV Inventory 0.313 1,496 55% 1,290 4,122 0.114 15.2% 592 1.36 20.2% 675 1.43 297 Sunzacuapa III Inventory 0.184 1,060 66% 941 5,116 0.117 14.9% 411 1.35 19.8% 472 1.42 98 Tizapa II Inventory 0.418 1,907 52% 1,701 4,069 0.118 14.9% 732 1.34 19.7% 842 1.42 299 San Isidro Inventory 0.477 1,782 43% 1,600 3,354 0.118 14.7% 669 1.33 19.4% 772 1.41 3100 Cauta Inventory 0.191 971 58% 871 4,559 0.118 14.7% 364 1.33 19.4% 420 1.40 101 Loma de San Juan Inventory 0.954 3,837 46% 3,278 3,436 0.113 14.8% 1,391 1.32 19.5% 1,603 1.39 3102 San Juan Buenavista Inventory SANP 0.918 3,063 38% 2,521 2,746 0.108 15.0% 1,112 1.32 19.9% 1,275 1.39 103 Los Pozos Inventory 0.827 2,791 39% 2,276 2,752 0.107 14.9% 996 1.31 19.8% 1,143 1.38 3104 Los Pueblos II Inventory 1.247 4,627 42% 4,075 3,267 0.116 14.5% 1,610 1.30 18.9% 1,873 1.37 3105 El Jícaro (Presa 1 & 2) Inventory 0.496 1,851 43% 1,736 3,500 0.124 14.1% 632 1.29 18.3% 744 1.36 3106 Guarumo Inventory 0.897 3,647 46% 3,192 3,559 0.115 14.4% 1,233 1.29 18.8% 1,440 1.36 3107 Guascoran Inventory 12.500 38,000 35% 38,000? 3,040? 0.132 ? 13.7% 12,482? 1.28? ? 17.6% 14,942? 1.35? 3108 El Diamante II Inventory 0.218 1,333 70% 1,238 5,678 0.122 14.0% 439 1.28 18.1% 519 1.35 109 Río Nejapa I Inventory 0.132 1,000 86% 963 7,296 0.127 13.8% 317 1.27 17.6% 380 1.34
No.

Final Report Appendix-S
Republic of El Salvador S - 13 March 2012 The Project for Master Plan for the Development of Renewable Energy (JICA)
Table S.8 Financial Values of Small Hydropower Potential Sites (2/2)
(Source: JICA Study Team)
Nombre de Proyecto Etapa del ProyectoArea
NaturalProtegida
Potencia Energía Factor deplanta
InversiónTotal Costo/kW Generación
de costos
Base del Proyecto(sin préstamo del Banco)
Project Base (without Bank Loan)
Base del Inversionista(con préstamo del Banco)
Investment Base (with Bank Loan)
Fasedel
proyecto
Project Name Project StageNaturalProtectArea
Potential EnergyPlant
FactorInvestment
Cost Cost/kWGeneration
CostTIR
FIRRVANNPV B/C
TIRFIRR
VANNPV B/C
ProjectPhase
(SANP) (MW) (MWh/Año) (x 1,000 US$) (US$/kW) (US$/kWh) (%) (x1,000 US$) (%) (x1,000 US$)
110 Asuchío Inventory SANP 0.428 1,756 47% 1,725 4,031 0.129 13.5% 525 1.25 17.1% 637 1.32 111 Agua Fría Inventory 0.974 3,960 46% 3,678 3,776 0.122 13.7% 1,187 1.25 17.5% 1,425 1.31 3112 Chilama III Inventory 0.934 3,756 46% 3,491 3,738 0.122 13.6% 1,101 1.24 17.3% 1,327 1.31 3113 Tehuechode Inventory 0.339 1,267 43% 1,243 3,667 0.129 13.2% 352 1.23 16.7% 433 1.29 3114 Tizapa IV Inventory 0.265 1,284 55% 1,268 4,786 0.130 13.2% 351 1.22 16.6% 433 1.29 3115 Quezalate Inventory 0.495 1,651 38% 1,679 3,391 0.134 13.0% 437 1.21 16.2% 546 1.28 3116 El Anonal Inventory 0.481 1,794 43% 1,835 3,815 0.135 13.0% 474 1.21 16.2% 593 1.28 3117 Mizata I Inventory 0.421 1,727 47% 1,776 4,217 0.135 12.9% 445 1.21 16.0% 560 1.27 3118 Los Pueblos I Inventory 0.412 2,081 58% 2,176 5,281 0.138 12.8% 524 1.20 15.9% 665 1.27 3119 El Cutal Inventory 0.445 1,618 42% 1,675 3,764 0.136 12.8% 401 1.20 15.8% 509 1.26 3120 Tepechapa Inventory 0.232 1,224 60% 1,245 5,366 0.134 12.8% 298 1.19 15.8% 379 1.26 121 El Silencio Inventory 0.287 1,178 47% 1,201 4,184 0.134 12.7% 281 1.19 15.7% 358 1.25 3122 Concepción Los Planes Inventory 0.450 1,680 43% 1,766 3,924 0.138 12.6% 396 1.18 15.5% 510 1.25 3123 El Rosario V Inventory 0.182 951 60% 1,001 5,502 0.139 12.6% 224 1.18 15.5% 289 1.25 124 El Escalón Inventory 0.420 1,567 43% 1,641 3,908 0.138 12.6% 367 1.18 15.5% 474 1.25 3125 Cuitapán Inventory 0.422 1,575 43% 1,659 3,930 0.139 12.5% 362 1.18 15.4% 469 1.24 3126 Río Ceniza (Presa 1 & 2) Inventory 0.330 1,780 62% 1,898 5,751 0.140 12.4% 401 1.17 15.3% 524 1.24 3127 Papaleguayo (Presa 1 & 2) Inventory 0.278 1,143 47% 1,198 4,308 0.138 12.3% 241 1.16 15.1% 318 1.23 3128 Guayapa VI Inventory SANP 0.175 915 60% 995 5,687 0.143 12.2% 185 1.15 14.8% 249 1.22 129 Cauta II Inventory 0.223 1,259 64% 1,377 6,175 0.144 11.9% 223 1.13 14.3% 312 1.20 130 Guayapa II Inventory 0.131 947 83% 1,061 8,096 0.148 11.8% 165 1.13 14.2% 234 1.19 131 San Benito (Presa 1 & 2) Inventory 0.483 1,613 38% 1,807 3,742 0.148 11.8% 276 1.13 14.1% 393 1.19 3132 Tecomate Inventory 0.421 1,572 43% 1,758 4,176 0.147 11.8% 269 1.13 14.1% 383 1.19 3133 Tilapa III Inventory 0.480 1,619 39% 1,817 3,785 0.148 11.8% 276 1.13 14.1% 393 1.19 3134 San Rafael (Presa 1 & 2) Inventory 0.232 955 47% 1,022 4,406 0.141 11.9% 165 1.13 14.3% 231 1.19 135 Ayacachapa III Inventory 0.312 1,166 43% 1,275 4,088 0.144 11.8% 199 1.13 14.2% 282 1.19 3136 Ayacachapa II Inventory 0.448 1,495 38% 1,674 3,737 0.148 11.7% 250 1.12 14.1% 358 1.19 3137 Sunzacuapa I Inventory 0.197 1,183 69% 1,377 6,987 0.153 11.5% 176 1.11 13.6% 265 1.17 138 Tilapa I Inventory 1.025 3,680 41% 3,954 3,858 0.142 11.6% 552 1.11 13.9% 808 1.17 3139 Apancoyo II Inventory 0.416 1,388 38% 1,589 3,819 0.151 11.4% 193 1.10 13.5% 296 1.16 3140 Tizapa III Inventory 0.198 800 46% 927 4,682 0.153 11.3% 104 1.09 13.4% 164 1.16 141 Río Nejapa II Inventory 0.126 907 82% 1,062 8,425 0.154 11.3% 116 1.09 13.3% 185 1.15 142 El Rosario III Inventory 0.195 994 58% 1,179 6,048 0.156 11.2% 118 1.08 13.1% 194 1.15 143 Guayapa IV (Presa 1 & 2) Inventory SANP 0.149 713 55% 836 5,609 0.154 11.1% 78 1.08 13.0% 132 1.14 144 Mizata II Inventory 0.270 1,109 47% 1,288 4,771 0.153 11.1% 118 1.08 13.0% 202 1.14 3145 Sunzacuapa II Inventory 0.193 1,090 64% 1,322 6,848 0.160 11.0% 110 1.07 12.8% 196 1.13 146 El Tablón Inventory 0.194 723 43% 870 4,484 0.158 10.8% 60 1.06 12.5% 116 1.12 147 El Diamante I Inventory 0.235 1,196 58% 1,436 6,109 0.158 10.8% 94 1.05 12.5% 187 1.11 148 El Rosario VI Inventory SANP 0.165 789 55% 960 5,819 0.160 10.8% 61 1.05 12.4% 123 1.11 149 Talquezalar Inventory 0.421 1,238 34% 1,501 3,565 0.160 10.7% 88 1.05 12.3% 185 1.11 3150 El Cedro Inventory 0.336 1,119 38% 1,348 4,012 0.159 10.7% 78 1.05 12.3% 165 1.11 3151 Guayapa III (Presa 1 & 2) Inventory 0.093 733 90% 899 9,663 0.161 10.6% 47 1.04 12.2% 105 1.10 152 Mizata III Inventory 0.215 883 47% 1,055 4,907 0.157 10.5% 47 1.04 12.1% 116 1.09 153 Ayacachapa I Inventory 0.218 1,036 54% 1,266 5,806 0.161 10.4% 48 1.03 11.9% 130 1.09 154 Comizapa Inventory 0.152 673 51% 845 5,559 0.165 10.3% 21 1.02 11.7% 76 1.08 155 Las Mesas Inventory 0.089 513 66% 633 7,109 0.163 10.2% 12 1.02 11.6% 53 1.07 156 San Ignacio Inventory 0.441 1,269 33% 1,636 3,711 0.170 10.0% 5 1.00 11.3% 111 1.06 3157 Ashuquema II Inventory 0.120 822 78% 1,080 9,003 0.173 9.9% -5 1.00 11.1% 65 1.05 158 El Matazano Inventory 0.173 648 43% 840 4,856 0.171 9.9% -6 0.99 11.1% 48 1.05 159 Siberia Inventory 0.240 965 46% 1,237 5,153 0.169 9.9% -13 0.99 11.0% 67 1.05 160 Joya Verde Inventory 0.178 731 47% 984 5,525 0.177 9.6% -31 0.97 10.6% 32 1.03 161 Aguachapío III Inventory SANP 0.112 583 59% 791 7,065 0.179 9.4% -42 0.96 10.2% 9 1.01 162 Apancoyo III Inventory 0.156 641 47% 879 5,635 0.181 9.3% -49 0.95 10.2% 8 1.01 163 Tazulá Inventory 0.175 719 47% 997 5,697 0.183 9.3% -57 0.95 10.1% 7 1.01 164 Metalío I Inventory 0.068 517 87% 731 10,743 0.186 8.9% -70 0.92 9.4% -22 0.97 165 Aguachapío II Pre Factibilidad 0.113 493 50% 697 6,192 0.186 -3.3% -418 0.31 ? 9.4% ? -24 0.97? 166 El Izcanal IV Inventory 0.080 487 70% 693 8,663 0.187 8.7% -72 0.91 9.3% -28 0.96 167 Los Ausoles Inventory 0.068 490 82% 709 10,429 0.191 8.6% -83 0.90 9.0% -37 0.95 168 Guayapa IV Inventory 0.060 430 82% 615 10,247 0.189 8.5% -74 0.90 9.0% -34 0.95 169 Mizata IV Inventory 0.191 715 43% 1,079 5,648 0.199 8.5% -136 0.89 8.9% -66 0.94 170 El Izcanal III Inventory SANP 0.065 444 78% 683 10,511 0.203 7.9% -117 0.86 8.0% -73 0.90 171 Quebrada Hon.d.a Inventory 0.177 649 42% 1,034 5,842 0.210 7.9% -177 0.85 8.0% -110 0.90 172 Tihuicha I Inventory 0.071 459 74% 721 10,152 0.207 7.8% -132 0.84 7.8% -86 0.89 173 Río Nejapa III Inventory 0.060 412 78% 677 11,288 0.217 7.3% -151 0.81 7.1% -107 0.86 174 El Izcanal I Inventory 0.058 462 91% 771 13,288 0.220 7.2% -173 0.81 7.1% -123 0.85 175 La Soledad I Inventory 0.070 415 68% 699 9,981 0.222 7.1% -166 0.80 6.8% -121 0.84 176 El Sauce (Presa 1 & 2) Inventory 0.127 641 58% 1,118 8,806 0.230 7.1% -262 0.79 6.9% -190 0.84 177 La Soledad II Inventory SANP 0.069 416 69% 721 10,448 0.228 6.8% -185 0.78 6.5% -139 0.83 178 Metalío II Inventory 0.072 378 60% 651 9,042 0.227 6.8% -170 0.78 6.4% -128 0.82 179 Texispulco Inventory 0.063 378 68% 669 10,611 0.233 6.6% -185 0.76 6.1% -142 0.81 180 Ashuquema III (Presa 1 & 2) Inventory 0.066 362 63% 651 9,870 0.237 6.4% -190 0.75 5.9% -148 0.79 181 Río Chiquito Inventory 0.046 384 95% 718 15,609 0.246 6.1% -222 0.73 5.5% -175 0.78 182 Casa de Piedra Inventory 0.076 347 52% 683 8,989 0.260 5.7% -237 0.70 4.9% -193 0.74 183 Tizapa V Inventory 0.070 327 53% 664 9,480 0.267 5.4% -243 0.68 4.5% -200 0.72 184 Los Milagros Inventory 0.065 328 58% 680 10,454 0.273 5.2% -257 0.67 4.3% -213 0.71 185 El Quequeishque II Inventory 0.068 309 52% 642 9,444 0.274 5.2% -247 0.67 4.2% -205 0.71 186 El Izcanal II Inventory SANP 0.045 355 90% 758 16,842 0.281 5.1% -293 0.66 4.2% -244 0.70 187 La Soledad IV (Presa 1 & 2) Inventory SANP 0.070 274 45% 584 8,340 0.280 4.8% -237 0.65 3.8% -199 0.69 188 Tizapa I Inventory 0.068 311 52% 671 9,869 0.284 4.9% -270 0.65 3.9% -226 0.69 189 Telescaligüe Inventory 0.071 292 47% 635 8,949 0.287 4.8% -261 0.64 3.7% -220 0.68 190 Los Infiernillos Inventory 0.067 279 48% 614 9,161 0.290 4.6% -259 0.63 3.5% -219 0.67 191 La Soledad III Inventory SANP 0.044 266 69% 584 13,277 0.289 4.6% -248 0.63 3.5% -210 0.67 192 El Quequeishque I Inventory 0.060 289 55% 645 10,743 0.294 4.6% -274 0.63 3.5% -232 0.67 193 Ayacachapa IV (Presa 1 & 2) Inventory 0.063 300 54% 674 10,690 0.296 4.6% -286 0.63 3.5% -242 0.67 194 Sunzapúa I Inventory 0.068 279 47% 656 9,647 0.310 4.2% -295 0.60 3.0% -253 0.64 195 Ojushico I Inventory 0.060 267 51% 661 11,023 0.326 3.9% -315 0.58 2.6% -272 0.62 196 Sihuapilapa I Inventory 0.044 225 58% 587 13,339 0.343 3.4% -300 0.55 2.0% -262 0.59 197 Ojushico II Inventory 0.067 224 38% 601 8,967 0.354 3.2% -315 0.54 1.7% -276 0.57 198 Aguachapío I Inventory SANP 0.040 192 55% 552 13,795 0.378 2.7% -310 0.51 1.1% -274 0.54 199 Apancoyo I (Presa 1 & 2) Inventory 0.034 232 78% 712 20,929 0.405 2.6% -403 0.49 1.0% -357 0.52 200 Chagalapa I Inventory 0.030 181 69% 562 18,733 0.409 2.2% -333 0.48 - -296 0.51 201 Cuilapa Inventory 0.031 203 75% 639 20,623 0.415 2.3% -375 0.48 0.6% -333 0.51 202 Sunzapúa II Inventory 0.036 165 52% 548 15,231 0.437 1.8% -340 0.45 - -304 0.48 203 Chagalapa II Inventory 0.042 164 44% 581 13,843 0.468 1.5% -371 0.43 - -334 0.46 204 Río Frío Inventory 0.031 143 53% 539 17,394 0.497 1.1% -359 0.41 - -324 0.43 205 Tianmica Inventory 0.029 131 52% 542 18,690 0.543 0.7% -376 0.38 - -341 0.40 206 Tihuicha II Inventory 0.005 36 82% 439 87,880 1.612 - -402 0.18 - -380 0.19 207 Huiscoyol Inventory 0.005 25 58% 445 88,900 2.305 - -420 0.15 - -399 0.15 208 Sihuapilapa II Inventory 0.004 25 71% 442 110,575 2.334 - -418 0.15 - -397 0.15 209 Quebrada Seca Inventory 0.003 20 78% 440 146,533 2.844 - -421 0.13 - -401 0.14
Totales 20 180.759 756,000 48% 586,000 3,242 0.105 123 Note: Italic number was estimated values. N.d.: No dat. Max.= 17.000 74,460 51,000 Phase-I 59
Min.= 0.003 20 96.85 Phase-II 31*Note: (Generation Cost) = (Intestment Cost) / (Annual Enrgy) * (Annual Cost Factor) Phase-II 33
No.
Phase I Phase-II
Phase-III


![Transmission Distribution and Utilization [15EE52T]](https://static.fdokumen.com/doc/165x107/6328d58109048e4b7c061729/transmission-distribution-and-utilization-15ee52t.jpg)