Chapter 4. Project Planning Techniques - CiteSeerX
21
Chapter 4. Project Planning Techniques Santtu Asp and Juha Nummelin In this chapter, we consider still another view of a management of IS projects. Here, the system is a set of activities or tasks that must be performed to complete a project. What flows in this system is work according to a plan, with a measurement scale that is based on time. We will also consider resources necessary to complete an activity. The objective in this kind of system description is typically to model the overall project according to the time and resources necessary to complete it, and consider how modifications to the activities affect the overall project. 4.1 Project Planning Basics Why do we plan? For the reason, that we try to identify what/when is to be done. How to justify the requirement. Determine the budget needed. Provide basis for performance measurement. A project is a human activity that is a one-time effort, is finite (in time), has an objective and requires resources. Example of Projects: - You want to build a shed, with assistance from friends and family members who have specific skills such as welding and concreting. - NASA decided to bring a man on the moon. - Your company decided to create a web oriented marketing system. Planning is to be done (normally) in two phases of which phase 1 is preliminary planning and phase 2 is detailed planning. 4.1.1 Preliminary planning The preliminary planning sets the determination of what is to be accomplished, when it is to be finished and what is the budget for the project. The result of the preliminary planning is the Scope Document, which provides answers to the previous questions and it must state: 1. Goals in user and management terms
-
Upload
khangminh22 -
Category
Documents
-
view
1 -
download
0
Transcript of Chapter 4. Project Planning Techniques - CiteSeerX
Chapter 4. Project Planning Techniques
Santtu Asp and Juha Nummelin
In this chapter, we consider still another view of a management of IS projects. Here,
the system is a set of activities or tasks that must be performed to complete a project.
What flows in this system is work according to a plan, with a measurement scale that
is based on time. We will also consider resources necessary to complete an activity.
The objective in this kind of system description is typically to model the overall
project according to the time and resources necessary to complete it, and consider
how modifications to the activities affect the overall project.
4.1 Project Planning Basics
Why do we plan? For the reason, that we try to identify what/when is to be done. How
to justify the requirement. Determine the budget needed. Provide basis for
performance measurement. A project is a human activity that is a one-time effort, is
finite (in time), has an objective and requires resources.
Example of Projects:
- You want to build a shed, with assistance from friends and family members who
have specific skills such as welding and concreting.
- NASA decided to bring a man on the moon.
- Your company decided to create a web oriented marketing system.
Planning is to be done (normally) in two phases of which phase 1 is preliminary
planning and phase 2 is detailed planning.
4.1.1 Preliminary planning
The preliminary planning sets the determination of what is to be accomplished, when
it is to be finished and what is the budget for the project. The result of the preliminary
planning is the Scope Document, which provides answers to the previous questions
and it must state:
1. Goals in user and management terms

2. Goals in specific and measurable terms
3. Goals that are realistic and attainable
4. Impact of project success or failure
4.1.2 Detailed planning
The detailed plan is not an end product. It consists of several documents indicating
1. What should be done (tasks)
2. When it needs to be done (time and duration)
3. What it takes to get it done (resources and cost)
After detailed planning we know the tasks that should be done. When they are to be
done. The duration of the tasks and all human and other resources that are needed for
the project as well as the cost for all the part and the total cost for the whole project.
4.1.3 What is the planning process?
You have to do 11 different phases:
1. Break project into phases and tasks
2. Determine the duration of each task
3. Assign phases and tasks to a schedule with date/time and relationships
4. Assign milestones to mark completion of phases, major tasks and the project
5. Determine the skills for each task
6. Determine other resources for each task
7. Establish (human and non-human) resource availability
8. Assign resources to tasks
9. Identify and resolve any resource conflicts
10. Evaluate and refine the schedule
11. Compile a report about the plan
As defined above a Project is a set of activities, which ends with specific
accomplishment and which has non-routine tasks and distinct start/finish dates and is
resource constraints (time/money/people/equipment)
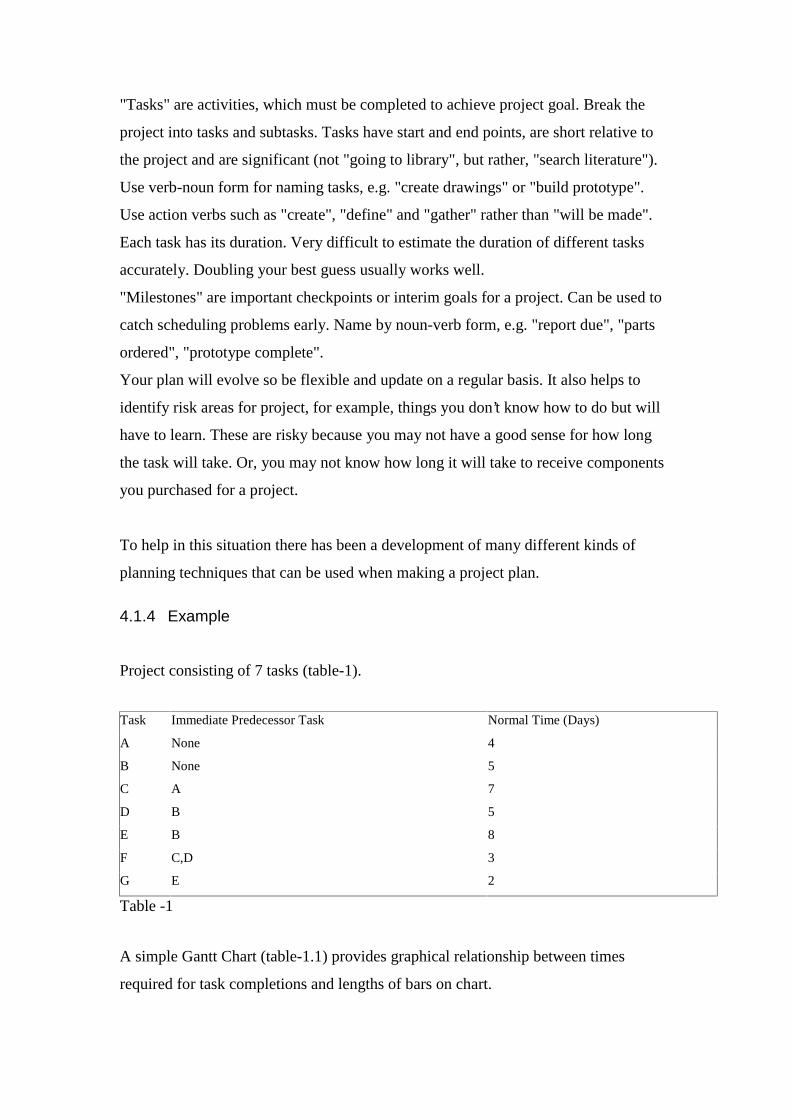
"Tasks" are activities, which must be completed to achieve project goal. Break the
project into tasks and subtasks. Tasks have start and end points, are short relative to
the project and are significant (not "going to library", but rather, "search literature").
Use verb-noun form for naming tasks, e.g. "create drawings" or "build prototype".
Use action verbs such as "create", "define" and "gather" rather than "will be made".
Each task has its duration. Very difficult to estimate the duration of different tasks
accurately. Doubling your best guess usually works well.
"Milestones" are important checkpoints or interim goals for a project. Can be used to
catch scheduling problems early. Name by noun-verb form, e.g. "report due", "parts
ordered", "prototype complete".
Your plan will evolve so be flexible and update on a regular basis. It also helps to
identify risk areas for project, for example, things you don’t know how to do but will
have to learn. These are risky because you may not have a good sense for how long
the task will take. Or, you may not know how long it will take to receive components
you purchased for a project.
To help in this situation there has been a development of many different kinds of
planning techniques that can be used when making a project plan.
4.1.4 Example
Project consisting of 7 tasks (table-1).
Task Immediate Predecessor Task Normal Time (Days)
A None 4
B None 5
C A 7
D B 5
E B 8
F C,D 3
G E 2
Table -1
A simple Gantt Chart (table-1.1) provides graphical relationship between times
required for task completions and lengths of bars on chart.

Table -1.1
4.2 Some techniques to do Project planning
4.2.1 Work breakdown structures.
A work breakdown structure (WBS) is a hierarchic decomposition or breakdown of a
project or major activity insto successive levels, in which each level is a finer
breakdown of the preceding one. In final form a WBS is very similar in structure and
layout to a document outline. Each item at a specific level of a WBS is numbered
consecutively (e.g., 10, 10, 30, 40, 50). Each item at the next level is numbered within
the number of its parent item (e.g., 10.1, 10.2, 10.3, 10.4).
A work breakdown statement (WBS) is a categorized list of tasks with an estimate of
resources required to complete the task. An example (Table 1) WBS appears below.
WBS
#
Task
Description
Est
Person
-Hrs
Who Resources
5 Profile motor power
5.1 Design test stand 20 SE, JM Pro/E
5.2 Build test stand 15 SE, JM Frame & brake parts
5.3 Test 3 motors 3 SE, JM Stroboscope

5.4 Plot torque vs. speed 2 JM Excel
Table 1: WBS example
4.2.2 Program Evaluation and Review Technique (PERT).
Program evaluation and review technique (PERT) charts depict task, duration, and
dependency information. Each chart starts with an initiation node from which the first
task, or tasks, originates. If multiple tasks begin at the same time, they are all started
from the node or branch, or fork out from the starting point. Each task is represented
by a line, which states its name or other identifier, its duration, the number of people
assigned to it, and in some cases the initials of the personnel assigned. The other end
of the task line is terminated by another node, which identifies the start of another
task, or the beginning of any slack time, that is, waiting time between tasks.
A PERT chart is a project management tool used to schedule, organize, and
coordinate tasks within a project. PERT is a methodology developed by the U.S. Navy
in the 1950s to manage the Polaris submarine missile program. A similar
methodology, the Critical Path Method (CPM), which was developed, for project
management in the private sector at about the same time, has become synonymous
with PERT, so that the technique is known by any variation on the names: PERT,
CPM, or PERT/CPM. An example, figure 1 PERT chart.

Project Evaluation and Review Technique (or PERT) is designed for research and
development type projects when activity completion times are uncertain.
4.2.3 Critical Path Method
Critical Path Method (CPM) type project planning networks are characterized by
estimates of normal time for task completions. CPM is appropriate when activity
times can be accurately predicted [such as construction or maintenance work].
Charts are similar to PERT charts and are sometimes known as PERT/CPM. In a
CPM chart, the critical path is indicated. A critical path consists that set of dependent
tasks (each dependent on the preceding one) which together take the longest time to
complete. Although it is not normally done, a CPM chart can define multiple, equally
critical paths. Tasks, which fall on the critical path, should be noted in some way, so
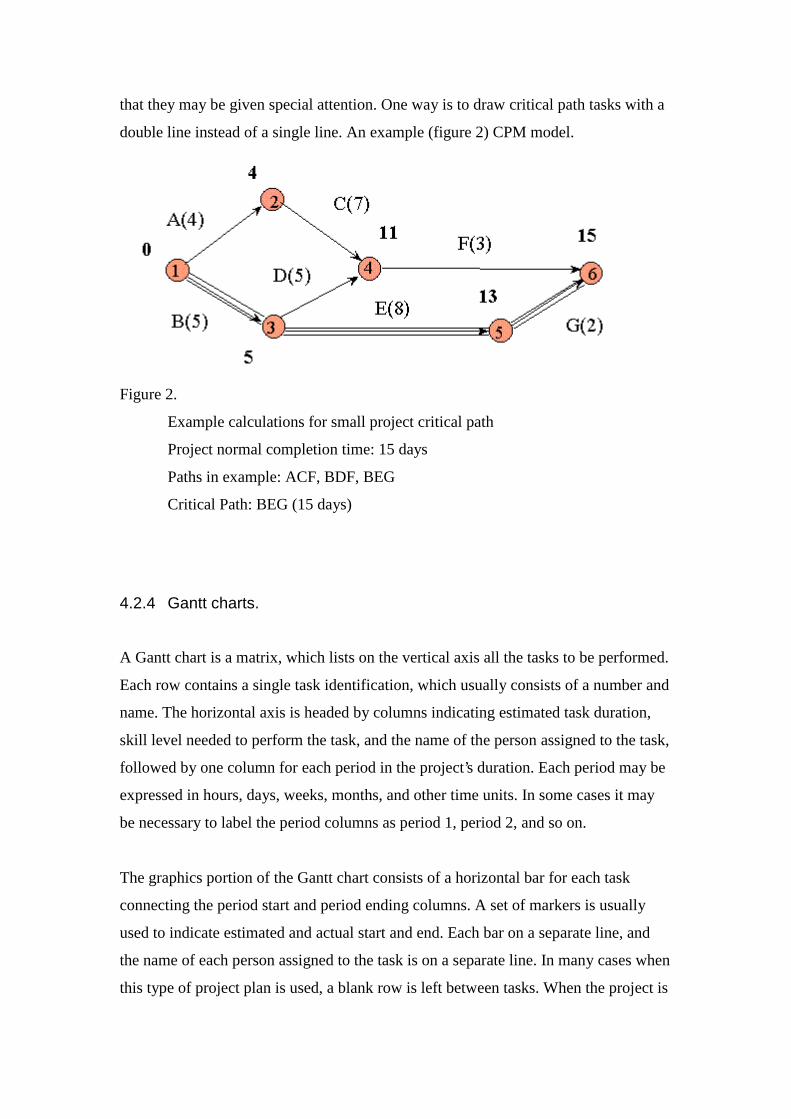
that they may be given special attention. One way is to draw critical path tasks with a
double line instead of a single line. An example (figure 2) CPM model.
Figure 2.
Example calculations for small project critical path
Project normal completion time: 15 days
Paths in example: ACF, BDF, BEG
Critical Path: BEG (15 days)
4.2.4 Gantt charts.
A Gantt chart is a matrix, which lists on the vertical axis all the tasks to be performed.
Each row contains a single task identification, which usually consists of a number and
name. The horizontal axis is headed by columns indicating estimated task duration,
skill level needed to perform the task, and the name of the person assigned to the task,
followed by one column for each period in the project’s duration. Each period may be
expressed in hours, days, weeks, months, and other time units. In some cases it may
be necessary to label the period columns as period 1, period 2, and so on.
The graphics portion of the Gantt chart consists of a horizontal bar for each task
connecting the period start and period ending columns. A set of markers is usually
used to indicate estimated and actual start and end. Each bar on a separate line, and
the name of each person assigned to the task is on a separate line. In many cases when
this type of project plan is used, a blank row is left between tasks. When the project is

under way, this row is used to indicate progress, indicated by a second bar, which
starts in the period column when the task is actually started and continues until the
task is actually completed. Comparison between estimated start and end and actual
start and end should indicate project status on a task-by-task basis.
Variants of this method include a lower chart, which shows personnel allocations on a
person-by-person basis. For this section the vertical axis contains the number of
people assigned to the project, and the columns indicating task duration are left blank,
as is the column indicating person assigned. The graphics consists of the same bar
notation as in the upper chart indicates that the person is working on a task. The value
of this lower chart is evident when it shows slack time for the project personnel, that
is, times when they are not actually working on any project. An example (Figure-3)
Gantt Chart.
Figure-3
Gantt chart is showed with more specific definitions and many examples in chapter
GANTT CHART in more details.
4.3 GANTT CHART in more details
A Gantt chart is a horizontal bar chart developed as a production control tool in 1917
by Henry L. Gantt, an American engineer and social scientist. Frequently used in

project management, a Gantt chart provides a graphical illustration of a schedule that
helps to plan, coordinate, and track specific tasks in a project. Gantt charts may be
simple versions created on graph paper or more complicated, automated versions
created using project management applications such as Microsoft Project or Excel.
Purpose of a Gantt chart is to present a project schedule that shows the relationship of
activities over time. Gantt charts are a Project planning tool that can be used to
represent the timing of tasks required to complete a project. Because Gantt charts are
simple to understand and easy to construct, they are used by most project managers
for all but the most complex projects.
The Gantt Chart is a scheduling tool that shows how project activities overlap.
Included in the display of the schedule are milestones, which are the key events or
milestones that are expected to occur during the life of the project.
4.3.1 Why to use Gantt chart?
Time Line Charts (Gantt Charts) are convenient means of representing graphically
schedules, appointments and events. Such charts help members of an organization to
plan activities better. Information about WHAT is happening WHEN is happening
WHERE is happening and WHO will be present is valuable to concerned people in the
organization. However well planned, changes do take place. Changes to plans and
new additions should be disseminated immediately.
It is good because:
1) Plots activities as bars on a time scale.
2) It indicates of different:
• activities
• responsibilities
• estimated or planned activities’ start and completion (target) dates
• actual start and completion dates
3) It aids in:
• scheduling activities
• coordinating activities
• evaluating progress
• reallocating resources in case of problems

Major Advantage:
Provide an easily understandable overview of a project for those without any technical
background. Gantt charts are relatively easy to create and maintain.
Disadvantage:
Does not show a task interrelationship.
4.3.2 To elaborate on these points
A Gantt chart is useful for tracking and reporting progress, as well as for graphically
displaying a schedule. Gantt charts are often used to report progress because they
represent an easily understood picture of project status. Gantt charts, however, are not
an ideal tool for project control. One problem with Gantt charts is that they do not
indicate activity dependencies.
A big strength of Gantt charts is that anyone (management, users, etc.) can look at the
chart and get a clear picture of the work needed to be done as well as the current
status. However, even though the author implies the opposite, they don’t indicate
dependencies or interrelationships between tasks. That means that just because one
task ends right before another begins, you can’t make the assumption that the first task
must be completed before the second begins. That could just be the way it’s currently
scheduled.
4.3.3 What are Gantt charts?
Gantt charts are bar graphs that help plan and monitor project development or
resource allocation on a horizontal time scale (Figure -4).
Figure -4. Simple Gantt Chart

Typically, Gantt charts indicate the exact duration of specific tasks, but they can also
be used to indicate the relationship between tasks, planned and actual completion
dates, cost of each task, the person or persons responsible for each task, and the
milestones in a project’s development (Figure- 5).
Figure -5. Gantt Chart with more info about tasks.
Gantt charts are also used by supervisors and team leaders, to schedule team members
for various time dependent tasks such as visiting client companies for a sales
organization or guard duty for the military. They can also show the activity load of
departments or machines (Figure - 6).
Figure -6. Example of the many ways of using Gantt Chart
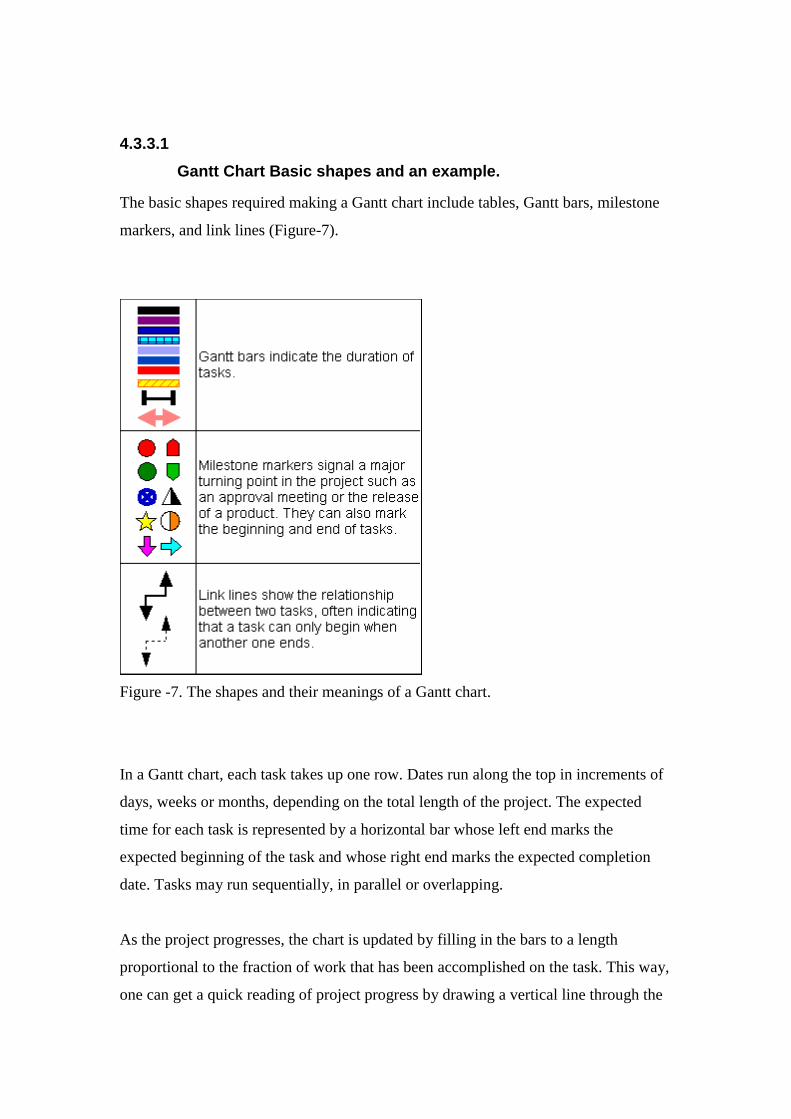
4.3.3.1
Gantt Chart Basic shapes and an example.
The basic shapes required making a Gantt chart include tables, Gantt bars, milestone
markers, and link lines (Figure-7).
Figure -7. The shapes and their meanings of a Gantt chart.
In a Gantt chart, each task takes up one row. Dates run along the top in increments of
days, weeks or months, depending on the total length of the project. The expected
time for each task is represented by a horizontal bar whose left end marks the
expected beginning of the task and whose right end marks the expected completion
date. Tasks may run sequentially, in parallel or overlapping.
As the project progresses, the chart is updated by filling in the bars to a length
proportional to the fraction of work that has been accomplished on the task. This way,
one can get a quick reading of project progress by drawing a vertical line through the

chart at the current date. Completed tasks lie to the left of the line and are completely
filled in. Current tasks crosses the line and are behind schedule if their filled-in
section is to the left of the line and ahead of schedule if the filled-in section stops to
the right of the line. Future tasks lie completely to the right of the line.
In constructing a Gantt chart, keep the tasks to a manageable number (no more than
15 or 20) so that the chart fits on a single page. More complex projects may require
subordinate charts, which detail the timing of all the subtasks, which make up one of
the main tasks. For team projects, it often helps to have an additional column
containing numbers or initials which identify who on the team is responsible for the
task.
Often the project has important events, which you would like to appear on the project
timeline, but which are not tasks. For example, you may wish to highlight when a
prototype is complete or the date of a design review. You enter these on a Gantt chart
as "milestone" events and mark them with a special symbol, often an upside-down
triangle, (Figure-8).
Figure - 8. Project development schedule shown with Gantt Chart.
A Gantt chart is constructed with a horizontal axis, which represents the total time
span of the project and is broken down into increments (for example, days, weeks, or
months). Second axis is the vertical axis, which represents the tasks that make up the

project (for example, if the project is outfitting your computer with new software. The
major tasks involved might be; conduct research, choose software, installing
software). Horizontal bars of varying lengths represent the sequences, timing, and
time span for each task. Using the same example, you would put "conduct research" at
the top of the vertical axis and draw a bar on the graph that represents the amount of
time you expect to spend on the research. Then enter the other tasks below the first
one and representative bars at the points in time when you expect to undertake them.
The bar spans may overlap, as, for example, you may conduct research and choose
software during the same time span. As the project progresses, secondary bars,
arrowheads, or darkened bars may be added to indicate completed tasks, or the
portions of tasks that have been completed. A vertical line is used to represent the
report date.
Gantt charts give a clear illustration of project status, but one problem with them is
that they don’t indicate task dependencies - you cannot tell how one task falling
behind schedule affects other tasks. The PERT chart, another popular project
management charting method, is designed to do this. Automated Gantt charts store
more information about tasks, such as the individuals assigned to specific tasks, and
notes about the procedures. They also offer the benefit of being easy to change, which
is helpful. Charts may be adjusted frequently to reflect the actual status of project
tasks as, almost inevitably, they diverge from the original plan.
4.4 Work Breakdown structure
In this chapter a planning technique called Work Breakdown Structure (WBS) is
presented. The aim of this chapter is to:
1) Give the reader an understanding on the one hand on the key components of the
technique, and 2) to explain the meaning and use of the key components of the
technique.

4.4.1 Using WBS
Work Breakdown Structure is used to divide projects into individually planned
subprojects/phases, which can then be planned and executed individually. The
potential uses of WBS include:
Dividing the project into phases
Dividing the project into responsibility areas within the organisation
Dividing the schedule of the project into sub-schedules whose interrelations are
known
Giving grounds to following the cost of the project by defining clear targets (work
packages) to it
Giving hierarchical outlining and coding for the work to be done
Enabling integration planning and managing of the project from both financial and
scheduling perspective
(Pelin, 1996;116)
Finding out the best use of WBS in different organisations and different situations is
always an iterative and heuristic process; there are no generic answers that apply to all
situations. The best way to start this process is to know the components of WBS,
which are presented in next chapter.
4.4.2 Components of WBS
Structure. A/the WBS diagram is drawn like the organisation chart (see figure 9).
Different desktop applications offer functionalities to easily create this kind of
diagrams.
Description. Each WBS element should be described with a title. The meaning of
each title should be clear. On the other hand, to restrict the size of the diagram (and to
keep WBS effective method for communication) the length of the title might have to
be restricted.
Coding. One of the main features of WBS is the ability to uniquely code the different
elements of the work. The coding system can be alphabetic, numeric (figure 9) or
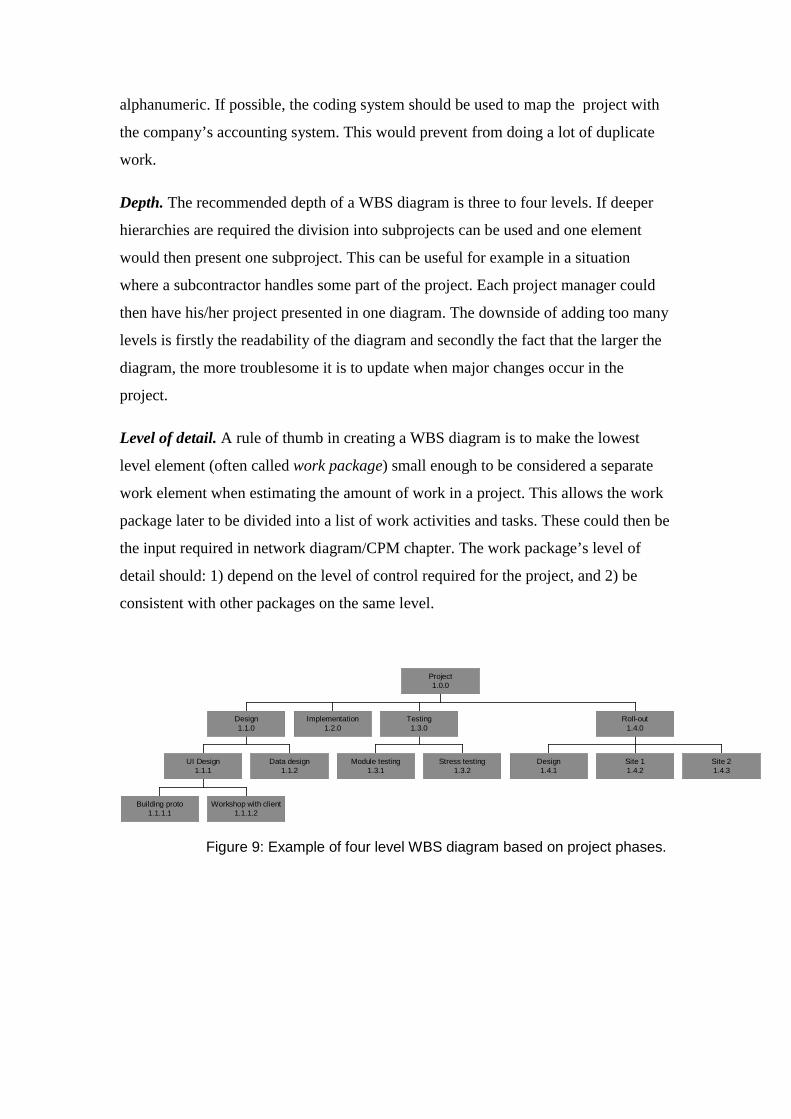
alphanumeric. If possible, the coding system should be used to map the project with
the company’s accounting system. This would prevent from doing a lot of duplicate
work.
Depth. The recommended depth of a WBS diagram is three to four levels. If deeper
hierarchies are required the division into subprojects can be used and one element
would then present one subproject. This can be useful for example in a situation
where a subcontractor handles some part of the project. Each project manager could
then have his/her project presented in one diagram. The downside of adding too many
levels is firstly the readability of the diagram and secondly the fact that the larger the
diagram, the more troublesome it is to update when major changes occur in the
project.
Level of detail. A rule of thumb in creating a WBS diagram is to make the lowest
level element (often called work package) small enough to be considered a separate
work element when estimating the amount of work in a project. This allows the work
package later to be divided into a list of work activities and tasks. These could then be
the input required in network diagram/CPM chapter. The work package’s level of
detail should: 1) depend on the level of control required for the project, and 2) be
consistent with other packages on the same level.
Building proto1.1.1.1
Workshop with client1.1.1.2
UI Design1.1.1
Data design1.1.2
Design1.1.0
Implementation1.2.0
Module testing1.3.1
Stress testing1.3.2
Testing1.3.0
Design1.4.1
Site 11.4.2
Site 21.4.3
Roll-out1.4.0
Project1.0.0
Figure 9: Example of four level WBS diagram based on project phases.

4.5 What technique to use and why in different situations?
4.5.1 Evaluating
In this chapter two views on planning technique selection are discussed. The aim is to
try to figure out ground rules of which technique to use in which phase of the
planning. Additionally the use of different techniques is considered in the context of
projects of different nature.
4.5.2 WBS, Gantt and other techniques in relation to other phases of projectplanning
After learning the components of the WBS and Gantt still only the mechanics of the
techniques are understood. To be able to use the technique in a useful way one also
needs to understand what inputs are needed to prepare a WBS diagram or a Gantt
chart and how the diagram should be used to further aid the planning process. In a
model presented by Young1 (Figure 10) the WBS diagram is seen to be preceded by
Logic diagram and followed by the milestone schedule. Milestone schedule in
addition leads to either Network diagrams (PERT or CPM) or Gantt chart or bar chart
(a simplified subtype of Gantt chart) depending on whether a detailed analysis of the
project is needed.
1 Figure presented only partially to show subject relevant to this work

Figure 10: The planning flow (Young, 1993;126)

4.5.3 Different types of projects
Different types of projects require different kind of approaches. This also applies to
project planning. Bringing a man to the moon should be planned in a different way
than building a shed. In the following were trying to offer some ideas of how to
choose planning method based on the type of the project.
4.5.3.1 Type 1: Projects of different scale
The most natural distinction between projects is size. When planning large projects it
is important to figure out different phases/subprojects (possibly using WBS) and to
figure out relationships between tasks using Network Diagrams to keep project from
failing. For small and simple projects just listing the tasks and tying them to
resources2 is probably enough.
4.5.3.2 Type 2: Related projects (programme)
Sometimes the reform required is so huge that it (mihin viittaa?) cannot or at least
should not be managed as a single project. This kind of situation often occurs in IT
projects nowadays when companies are often using multiple contractors to fulfil their
IT fantasies. Work Breakdown Structure would then be a good tool to control things
(the programme) from high level. Work package size would in this situation be a
subproject. Within the subprojects the projects could then be managed based on needs
and skills of the project manager and team in question (many IT companies have their
own specialised project planning methods which they most probably use more
efficiently than any method forced upon them).
4.5.3.3 Type 3: Global project, rollout as a subproject
In global companies the rolling out of the finished system to multiple sites is often the
key task in a project. An example of this kind of a project would be implementing
relatively simple packaged software to be used in a large company. Tailoring the
2 ‘PM by Excel’

software might be quite a trivial task, but acquiring infrastructure, doing installations,
setting up support and training users in multiple sites could be biggest hurdle. The
nature of this kind of effort is often quite different from for example implementation
projects. In this kind of a project the rollout phase often requires considerable effort.
Planning the use of scarce resources as technical experts doing the installations
around the world can become the most important task of planning in these projects.
Because of the amount of different actors affecting the outcome quite detailed
planning of the project is required. Different kinds of Network diagrams like PERT
and CMP could be useful in this kind of situation.
4.5.3.4 Type 4: An incremental project
Nowadays many projects are implemented incrementally with different levels of
iterations in between/within phases. This forces the project planner to make the plans
quite flexible. On the other hand detailed design might still be required if the project
is complex. The answer could be to plan otherwise normally but use WBS to single
out iterative phases (which could then be re-used). This would require that there is a
clear connection with WBS diagram and rest of the planning.
4.6 Summary
In this chapter we have covered different aspects of project planning. Firstly the basic
concepts of project planning were presented and an overview of different techniques
was given. After that two of the main planning techniques, Gantt charts and Work
Breakdown Structure diagrams were presented in a bit more detail. The Gantt chart
was found to be a convenient and popular method for planning tasks in all but most
complex projects. The Work Breakdown Structure diagram was on the other hand
found the be a useful tool in dividing projects into subprojects or phases and being a
good base of more detailed planning. Finally choosing different techniques in
different situations was discussed. Two approaches were presented, firstly considering
the phases of the project planning. It was found that different techniques are used in
different phases and that outputs of some techniques can be used as inputs of others.
Secondly the choice and use of techniques in projects of different nature were
discussed.

REFERENCES
Artto, K., Kähkönen, K. & Koskinen, K. (1999) Managing Business by Projects.Volume 1, Tummavuoren kirjapaino Oy,Vantaa.
Artto, K., Kähkönen, K. & Koskinen, K. (1999) Managing Business by Projects.Volume 2, Tummavuoren kirjapaino Oy, Vantaa.
Burke, Rory (1993) Project Management: Planning and Control, Management Press.
Derkinderen, F. G. J. & Crum, R. L. (1979) Project set Strategies. Martinus Nijhoffpublishing, Boston.
Interview:Marita Järvi, Project Manager (ICL Invia) 3/2001
Interview:Teija Maronen, Project Manager (Nokia IM) 3/2001
Martin E. (1996) A Professional's Guide to Systems Analysis, Modell, 2nd. Ed.McGraw Hill.
Pelin, Risto (1996) Projektinhallinnan käsikirja, Gummerus kirjapaino Oy
Ropponen, U (1988) Käytännön ohjeita projektin hallintaan. Oy Rastor Ab/Rastor-Julkaisut, Helsinki.
Ruuska, K. (1997) Projekti hallintaan. Suomen Atk-kustannus Oy, Espoo.
Salonen, L. (1991) Let’s do a Project. Posiplan LTD,
The Systems Group (1998) Process Management Works – if only implemented.
Systems Group Publications.
Youg, Trevor L. (1993) Planning Projects, The Industrial Society.