Multi-criteria analysis techniques to support land-use planning ...
16
Multi-criteria analysis techniques to support land-use planning for REDD+ Corinna Ravilious, UNEP World Conservation Monitoring Centre, September 2015
-
Upload
khangminh22 -
Category
Documents
-
view
2 -
download
0
Transcript of Multi-criteria analysis techniques to support land-use planning ...

Multi-criteria analysis techniques to support land-use planning for REDD+
Corinna Ravilious,
UNEP World Conservation Monitoring Centre,
September 2015

Multi-criteria analysis:
selecting most appropriate action or suitable locations based on multiple factors
Can be used in a variety of situations and types of decisions (in this instance REDD+ planning)
Multiple types of data, tools and information which can be used
Here we are specifically talking about spatial multi-criteria analysis for REDD+ planning
What is Multi-criteria Analysis?

What is spatial multi-criteria analysis?
• At the simplest level, a collection of techniques for analysing geographic data across a range of criteria
• The results of the analysis depend on the spatial arrangement of the overlayed data
• Can be carried out as a string of geo-processing processeswhich meet a defined objective
• Different approaches have different levels of subjectivity

What is spatial Multi-criteria Analysis?
The quality of the analysis will be dependant upon the information fed in and these can range from:-
– Scientifically-derived hard data
– Subjective interpretations
– Uncertain probabilities
– Inform on the targets to be achieved

What is spatial Multi-criteria Analysis?
• Hard data can also be variable:
• Simple presence/absence, e.g. Protected area
• Data spread across a range of values, e.g. Carbon density
• Approaches (ranging from simple to complex) vary in the way they treat the data.
• Two main approaches are:
• Boolean
• Weighted Combination

Boolean intersection• The simplest variant of criteria processing
• Often referred to as constraint mapping
• Prior to the combination, each input criteria is standardised to a certain scale of suitability
• i.e. Reducing all the factors to Boolean raster datasets of suitable and unsuitable areas (or reclassifying into 2 classes of 1 and 0)
• Factors can then be combined using Boolean algebra
• In ArcGIS using vaious tools located under the Spatial Analyst - Math – Logical toolset

Fuzzy Overlay• Fuzzy overlay results in degree of membership, whereas
boolean or weighted overlay either belong or don’t belong
• The combining analysis step in Fuzzy Overlay analysis quantifies each location's possibility of belonging to specified sets from various input rasters.

Fuzzy membership tools• In ArcGIS there are various tools which can be used
to normalise the data to a range between 0 – 1.
• Different tools can be used to spread the data i.e. determines how the fuzzy membership values relate to the true value.
The simplest of these is a linear relationship which divides the values in the continuous raster by the maximum number

Weighted Combination
• Gives varying levels of ‘importance’ or weight to the different input layers
• Additive overlay analysis
– Weighted overlays
– Weighted sums
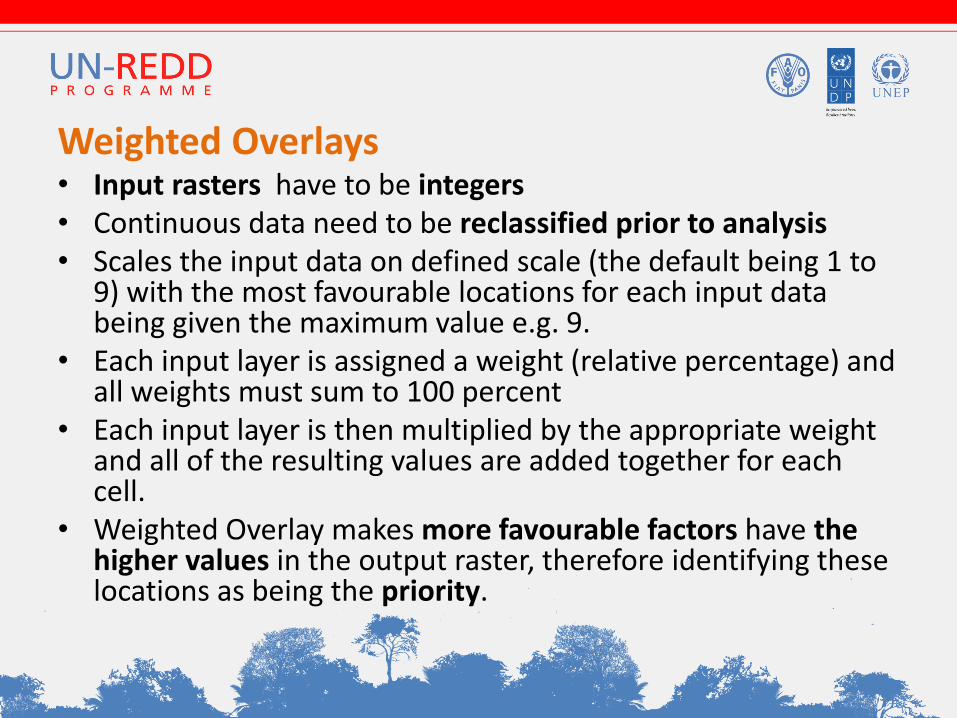
Weighted Overlays• Input rasters have to be integers• Continuous data need to be reclassified prior to analysis• Scales the input data on defined scale (the default being 1 to
9) with the most favourable locations for each input data being given the maximum value e.g. 9.
• Each input layer is assigned a weight (relative percentage) and all weights must sum to 100 percent
• Each input layer is then multiplied by the appropriate weight and all of the resulting values are added together for each cell.
• Weighted Overlay makes more favourable factors have the higher values in the output raster, therefore identifying these locations as being the priority.

Weighted Sum• Similar to weighed overlay but allows continuous data.
• Does not automatically scale input data
• Also unlike weighted overlay, weights assigned to the input rasters can be any value and do not need to add to a specific sum
• Output values are a direct result of the summation of the multiplication of each value by the weights.
• Maintains the attribute resolution of the values entered in the model (unlike Weighted Overlay, values are not rescaled back to a defined scale)

Reclassifying data
• Need to identify thresholds for suitability in input layer to Boolean analysis and for class breaks in inputs to overlay analysis
• Try to reduce subjectivity by choosing appropriate thresholds informed by literature, policy or expert consultation.
• Understand the data and ensure that the values chosen are appropriate for the data being used.
• Do the values make sense for the question you are trying to answer? How do they inform questions about REDD+ planning?

An example of weighted approach for mapping drivers using ranking method
10 0 0 2
9 5 4 3
7 4 0 0
0 0 9 10
1 0 8 7
0 2 1 1
Driver 1 Driver 2
Each commune
(squares in this
case) are ranked on
a common scale of
0-10 of how much
impact that driver
has in the commune
Before summing the drivers each driver may be further weighted according to
it’s influence (e.g. it’s effect on forest – i.e. 100 being total removal and 75
being highly degraded etc. or weighted according to likelihood of intervention
success on the driver
Determining weights
• Need to identify what weight to put on different input layers within weighted analysis
• Should consider:
• Policy aims
• Political priorities
• Stakeholder needs
• Consultations can be important

Summary
• Important that analysis addresses objectives
• Several approaches to spatial multi-criteria analysis
• The question and objectives should determine the analysis undertaken (rather than preselecting a method)
• Important to link closely with stakeholder consultation
• Clearly presenting the inputs that feed a multi-criteria analysis can support understanding and interpretation of results (and preferably present them spatially in addition to the combined output).

Thank You!
Corinna Ravilious
Website: http://www.un-redd.org