CHAPTER 1 Tension and Compression 1.1 Internal Effects of ...
11
Msc Yessar Ameer Ali Strength of Material Al-Mustaqbal University College CHAPTER 1 Tension and Compression 1.1Internal Effects of Forces The bodies themselves will no longer be considered to be perfectly rigid as was assumed in statics; instead, the calculation of the deformations of various bodies under a variety of loads will be one of our primary concerns in the study of strength of materials. Axially Loaded Bar The simplest case to consider at the start is that of an initially straight metal bar of constant cross section, loaded at its ends by a pair of oppositely directed collinear forces coinciding with the longitudinal axis of the bar and acting through the centroid of each cross section. For static equilibrium the magnitudes of the forces must be equal. If the forces are directed away from the bar, the bar is said to be in tension; if they are directed toward the bar, a state of compression exists. These two conditions are illustrated in Fig. 1-1. Under the action of this pair of applied forces, internal resisting forces are set up within the bar and their characteristics may be studied by imagining a plane to be passed through the bar anywhere along its length and oriented perpendicular to the longitudinal axis of the bar. Such a plane is designated as a-ain Fig. 1-2(a). If for purposes of analysis the portion of the bar to the right of this plane is considered to be removed, as in Fig. 1-2(b), then it must be replaced by whatever effect it exerts upon the left portion. By this technique of introducing a cutting plane, the originally internal forces now become external with respect to the remaining portion of the body. For equilibrium of the portion to the left this ‘‘effect’’ must be a horizontal force of magnitude P. However, this force P acting normal to the cross section a-a is
-
Upload
khangminh22 -
Category
Documents
-
view
0 -
download
0
Transcript of CHAPTER 1 Tension and Compression 1.1 Internal Effects of ...
Msc Yessar Ameer Ali Strength of Material Al-Mustaqbal University College
CHAPTER 1
Tension and Compression
1.1 Internal Effects of Forces
The bodies themselves will no longer be considered to be perfectly rigid as was
assumed in statics; instead, the calculation of the deformations of various bodies
under a variety of loads will be one of our primary concerns in the study of strength
of materials.
Axially Loaded Bar
The simplest case to consider at the start is that of an initially straight metal bar of
constant cross section, loaded at its ends by a pair of oppositely directed collinear
forces coinciding with the longitudinal axis of the bar and acting through the centroid
of each cross section. For static equilibrium the magnitudes of the forces must be
equal. If the forces are directed away from the bar, the bar is said to be in tension; if
they are directed toward the bar, a state of compression exists. These two conditions
are illustrated in Fig. 1-1.
Under the action of this pair of applied forces, internal resisting forces are set up
within the bar and their characteristics may be studied by imagining a plane to be
passed through the bar anywhere along its length and oriented perpendicular to the
longitudinal axis of the bar. Such a plane is designated as a-ain Fig. 1-2(a). If for
purposes of analysis the portion of the bar to the right of this plane is considered to
be removed, as in Fig. 1-2(b), then it must be replaced by whatever effect it exerts
upon the left portion. By this technique of introducing a cutting plane, the originally
internal forces now become external with respect to the remaining portion of the
body. For equilibrium of the portion to the left this ‘‘effect’’ must be a horizontal
force of magnitude P. However, this force P acting normal to the cross section a-a is
Msc Yessar Ameer Ali Strength of Material Al-Mustaqbal University College
actually the resultant of distributed forces acting over this cross section in a direction
normal to it.
At this point it is necessary to make some assumption regarding the manner of
variation of these distributed forces, and since the applied force P acts through the
centroid it is commonly assumed that they are uniform across the cross section.
Normal Stress
Instead of speaking of the internal force acting on some small element of area, it is
better for comparative purposes to treat the normal force acting over a unit area of
the cross section. The intensity of normal force per unit area is termed the normal
stress and is expressed in units of force per unit area, N/m2. If the forces applied to
the ends of the bar are such that the bar is in tension, then tensile stresses are set up
in the bar; if the bar is in compression we have compressive stresses. The line of
action of the applied end forces passes through the centroid of each cross section of
the bar.
Normal Strain
Let us suppose that the bar of Fig. 1-1 has tensile forces gradually applied to the
ends. The elongation per unit length, which is termed normal strain and denoted by
Δ, may be found by dividing the total elongation ∆ by the length L, i.e.,
𝜀 =∆
𝐿
The strain is usually expressed in units of meters per meter and consequently is
dimensionless.
Stress-Strain Curve
As the axial load in Fig. 1-1 is gradually increased, the total elongation over the bar
length is measured at each increment of load and this is continued until fracture of
the specimen takes place. Knowing the original cross-sectional area of the test
specimen, the normal stress, denoted by s, may be obtained for any value of the axial
load by the use of the relation
𝜎 =𝑃
𝐴
where (P) denotes the axial load in newtons and (A) The original cross-sectional
area. Having obtained numerous pairs of values of normal stress s and normal strain
Msc Yessar Ameer Ali Strength of Material Al-Mustaqbal University College
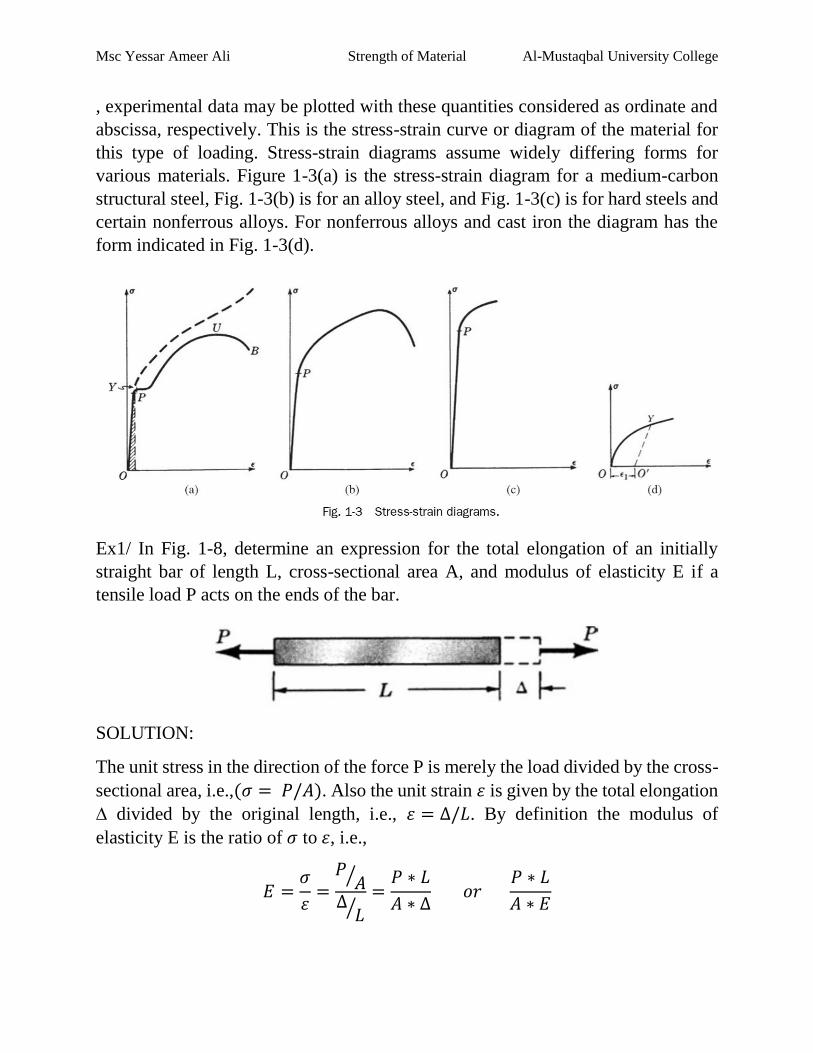
, experimental data may be plotted with these quantities considered as ordinate and
abscissa, respectively. This is the stress-strain curve or diagram of the material for
this type of loading. Stress-strain diagrams assume widely differing forms for
various materials. Figure 1-3(a) is the stress-strain diagram for a medium-carbon
structural steel, Fig. 1-3(b) is for an alloy steel, and Fig. 1-3(c) is for hard steels and
certain nonferrous alloys. For nonferrous alloys and cast iron the diagram has the
form indicated in Fig. 1-3(d).
Ex1/ In Fig. 1-8, determine an expression for the total elongation of an initially
straight bar of length L, cross-sectional area A, and modulus of elasticity E if a
tensile load P acts on the ends of the bar.
SOLUTION:
The unit stress in the direction of the force P is merely the load divided by the cross-
sectional area, i.e.,(𝜎 = 𝑃/𝐴). Also the unit strain 𝜀 is given by the total elongation
∆ divided by the original length, i.e., 𝜀 = ∆/𝐿. By definition the modulus of
elasticity E is the ratio of 𝜎 to 𝜀, i.e.,
𝐸 =𝜎
𝜀=
𝑃𝐴⁄
∆𝐿⁄
=𝑃 ∗ 𝐿
𝐴 ∗ ∆ 𝑜𝑟
𝑃 ∗ 𝐿
𝐴 ∗ 𝐸
Msc Yessar Ameer Ali Strength of Material Al-Mustaqbal University College
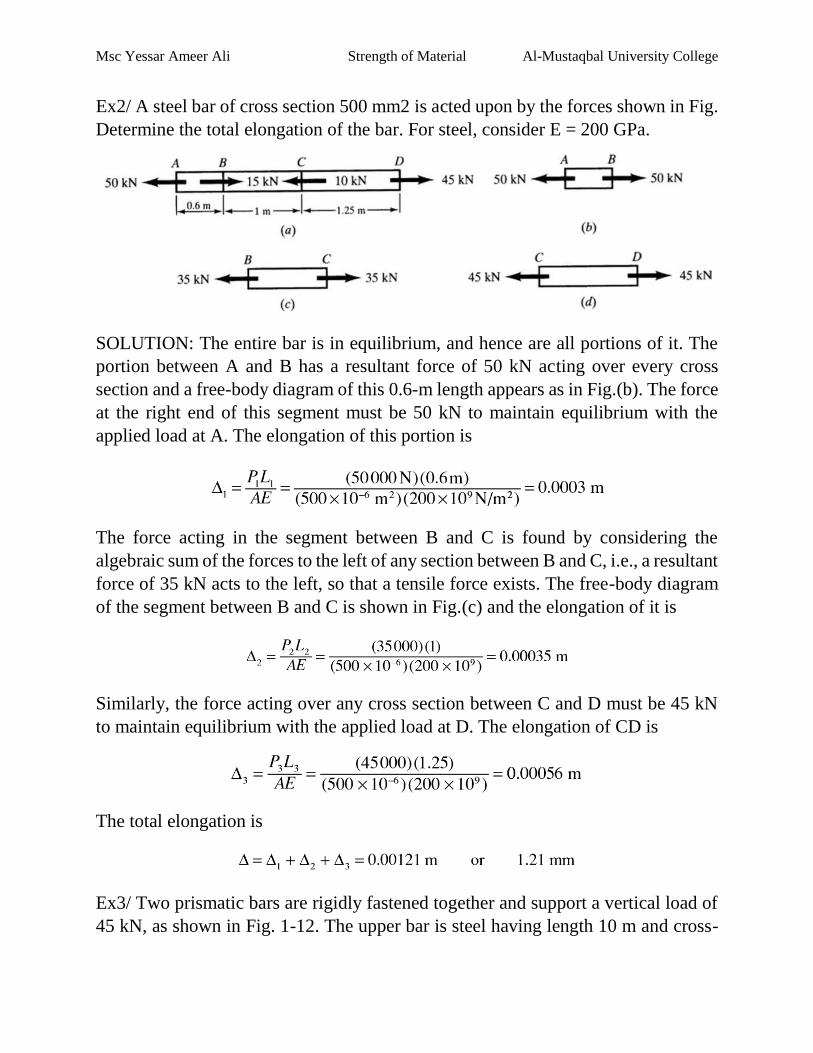
Ex2/ A steel bar of cross section 500 mm2 is acted upon by the forces shown in Fig.
Determine the total elongation of the bar. For steel, consider E = 200 GPa.
SOLUTION: The entire bar is in equilibrium, and hence are all portions of it. The
portion between A and B has a resultant force of 50 kN acting over every cross
section and a free-body diagram of this 0.6-m length appears as in Fig.(b). The force
at the right end of this segment must be 50 kN to maintain equilibrium with the
applied load at A. The elongation of this portion is
The force acting in the segment between B and C is found by considering the
algebraic sum of the forces to the left of any section between B and C, i.e., a resultant
force of 35 kN acts to the left, so that a tensile force exists. The free-body diagram
of the segment between B and C is shown in Fig.(c) and the elongation of it is
Similarly, the force acting over any cross section between C and D must be 45 kN
to maintain equilibrium with the applied load at D. The elongation of CD is
The total elongation is
Ex3/ Two prismatic bars are rigidly fastened together and support a vertical load of
45 kN, as shown in Fig. 1-12. The upper bar is steel having length 10 m and cross-
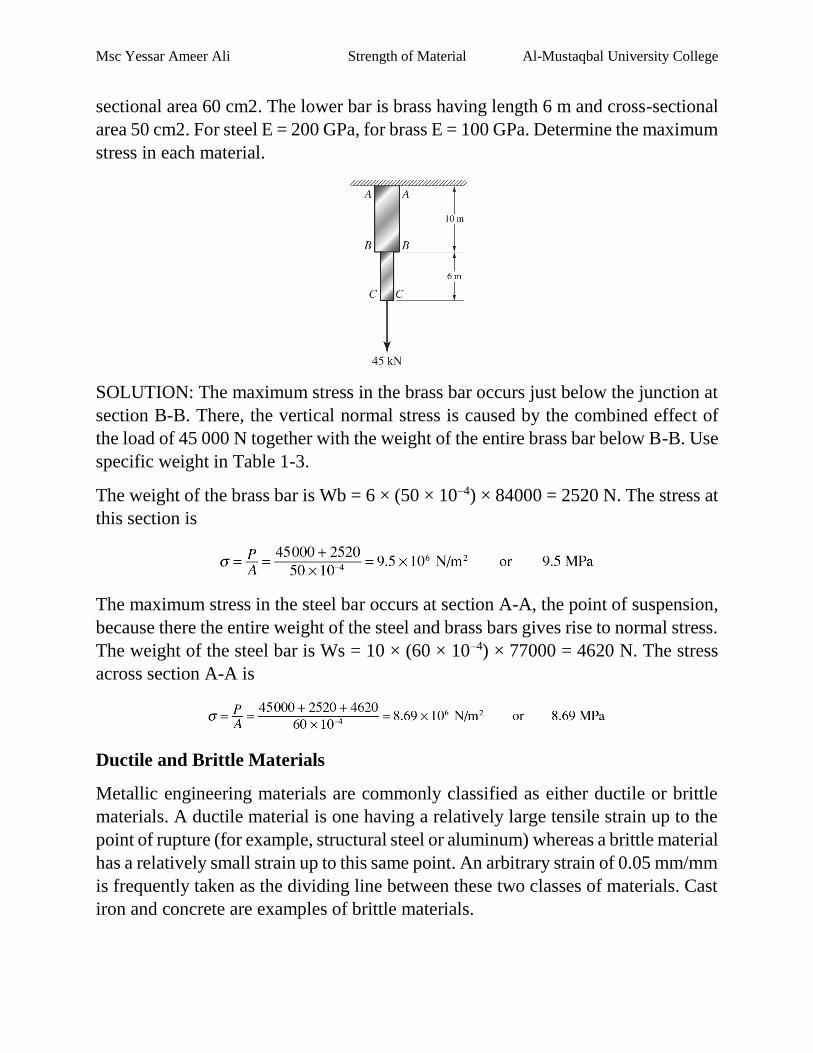
Msc Yessar Ameer Ali Strength of Material Al-Mustaqbal University College
sectional area 60 cm2. The lower bar is brass having length 6 m and cross-sectional
area 50 cm2. For steel E = 200 GPa, for brass E = 100 GPa. Determine the maximum
stress in each material.
SOLUTION: The maximum stress in the brass bar occurs just below the junction at
section B-B. There, the vertical normal stress is caused by the combined effect of
the load of 45 000 N together with the weight of the entire brass bar below B-B. Use
specific weight in Table 1-3.
The weight of the brass bar is Wb = 6 × (50 × 10–4) × 84000 = 2520 N. The stress at
this section is
The maximum stress in the steel bar occurs at section A-A, the point of suspension,
because there the entire weight of the steel and brass bars gives rise to normal stress.
The weight of the steel bar is Ws = 10 × (60 × 10–4) × 77000 = 4620 N. The stress
across section A-A is
Ductile and Brittle Materials
Metallic engineering materials are commonly classified as either ductile or brittle
materials. A ductile material is one having a relatively large tensile strain up to the
point of rupture (for example, structural steel or aluminum) whereas a brittle material
has a relatively small strain up to this same point. An arbitrary strain of 0.05 mm/mm
is frequently taken as the dividing line between these two classes of materials. Cast
iron and concrete are examples of brittle materials.
Msc Yessar Ameer Ali Strength of Material Al-Mustaqbal University College
Hooke’s Law
For any material having a stress-strain curve of the form shown in Fig. 1-3(a), (b),
or (c), it is evident that the relation between stress and strain is linear for
comparatively small values of the strain. This linear relation between elongation and
the axial force causing it is called Hooke’s law. To describe this initial linear range
of action of the material we may consequently write
𝜎 = 𝐸 ∗ 𝜀
where E denotes the slope of the straight-line portion OP of each of the curves in
Figs.1-3(a), (b), and (c). The quantity E, i.e., the ratio of the unit stress to the unit
strain, is the modulus of elasticity of the material in tension, or, as it is often called,
Young’s modulus. Values of E for various engineering materials are tabulated in
handbooks. Table 1-3 for common materials appears at the end of this chapter. Since
the unit strain is a pure number (being a ratio of two lengths) it is evident that Ehas
the same units as does the stress, N/m2. For many common engineering materials
the modulus of elasticity in compression is very nearly equal to that found in tension.
It is to be carefully noted that the behavior of materials under load as discussed in
this book is restricted (unless otherwise stated) to the linear region of the stress-strain
curve.
1.2 Mechanical Properties of Materials
The stress-strain curve shown in Fig. 1-3(a) may be used to characterize several
strength characteris tics of the material. They are:
Proportional Limit
The ordinate of the point P is known as the proportional limit, i.e., the maximum
stress that may be developed during a simple tension test such that the stress is a
linear function of strain. For a material having the stress-strain curve shown in Fig.
1-3(d), there is no proportional limit.
Elastic Limit
The ordinate of a point almost coincident with P is known as the elastic limit, i.e.,
the maximum stress that may be developed during a simple tension test such that
there is no permanent or residual deformation when the load is entirely removed. For
many materials the numerical values of the elastic limit and the proportional limit
are almost identical and the terms are sometimes used synonymously. In those cases
Msc Yessar Ameer Ali Strength of Material Al-Mustaqbal University College
where the distinction between the two values is evident, the elastic limit is almost
always greater than the proportional limit.
Elastic and Plastic Ranges
The region of the stress-strain curve extending from the origin to the proportional
limit is called the elastic range. The region of the stress-strain curve extending from
the proportional limit to the point of rupture is called the plastic range.
Yield Point
The ordinate of the point Y in Fig. 1-3(a), denoted by syp, at which there is an
increase in strain with no increase in stress, is known as the yield point of the
material. After loading has progressed to the point Y, yielding is said to take place.
Some materials exhibit two points on the stress-strain curve at which there is an
increase of strain without an increase of stress. These are called upper and lower
yield points.
Ultimate Strength or Tensile Strength
The ordinate of the point Uin Fig. 1-3(a), the maximum ordinate to the curve, is
known either as the ultimate strength or the tensile strength of the material.
Breaking Strength
The ordinate of the point B in Fig. 1-3(a) is called the breaking strength of the
material.
Modulus of Resilience
The work done on a unit volume of material, as a simple tensile force is gradually
increased from zero to such a value that the proportional limit of the material is
reached, is defined as the modulus of resilience. This may be calculated as the area
under the stress-strain curve from the origin up to the proportional limit and is
represented as the shaded area in Fig. 1-3(a). The unit of this quantity is N · m/m3
in the SI system. Thus, resilience of a material is its ability to absorb energy in the
elastic range.
Modulus of Toughness
The work done on a unit volume of material as a simple tensile force is gradually
increased from zero to the value causing rupture is defined as the modulus of
toughness. This may be calculated as the entire area under the stress-strain curve
Msc Yessar Ameer Ali Strength of Material Al-Mustaqbal University College
from the origin to rupture. Toughness of a material is its ability to absorb energy in
the plastic range of the material.
Percentage Reduction in Area
The decrease in cross-sectional area from the original area upon fracture divided by
the original area and multiplied by 100 is termed percentage reduction in area. It is
to be noted that when tensile forces act upon a bar, the cross-sectional area decreases,
but calculations for the normal stress are usually made upon the basis of the original
area. This is the case for the curve shown in Fig. 1-3(a). As the strains become
increasingly larger it is more important to consider the instantaneous values of the
cross-sectional area (which are decreasing), and if this is done the truestress-strain
curve is obtained. Such a curve has the appearance shown by the dashed line in Fig.
1-3(a).
Percentage Elongation
The increase in length of a bar after fracture divided by the initial length and
multiplied by 100 is the percentage elongation. Both the percentage reduction in area
and the percentage elongation are considered to be measures of the ductility of a
material.
Working Stress
The above-mentioned strength characteristics may be used to select a working stress.
Frequently such a stress is determined merely by dividing either the stress at yield
or the ultimate stress by a number termed the safety factor. Selection of the safety
factor is based upon the designer’s judgment and experience. Specific safety factors
are sometimes specified in design codes.
Strain Hardening
If a ductile material can be stressed considerably beyond the yield point without
failure, it is said to strainharden. This is true of many structural metals. The nonlinear
stress-strain curve of a brittle material, shown in Fig. 1-3(d), characterizes several
other strength measures that cannot be introduced if the stress-strain curve has a
linear region. They are:
Yield Strength
The ordinate to the stress-strain curve such that the material has a predetermined
permanent deformation or ‘‘set’’ when the load is removed is called the yield
Msc Yessar Ameer Ali Strength of Material Al-Mustaqbal University College
strength of the material. The permanent set is often taken to be either 0.002 or 0.0035
mm per mm. These values are of course arbitrary. In Fig. 1-3(d) a set 1 is denoted
on the strain axis and the line O′Y is drawn parallel to the initial tangent to the curve.
The ordinate of Y represents the yield strength of the material, sometimes called the
proof stress.
Tangent Modulus
The rate of change of stress with respect to strain is known as the tangent modulus
of the material. It is essentially an instantaneous modulus given by
𝐸𝑡 =𝑑𝜎
𝑑𝜀
Coefficient of Linear Expansion
This is defined as the change of length per unit length of a straight bar subject to a
temperature change of one degree and is usually denoted by a. The value of this
coefficient is independent of the unit of length but does depend upon the temperature
scale used. For example, from Table 1-3 at the end of this chapter the coefficient for
steel is 12 × 10–6/°C. Temperature changes in a structure give rise to internal
stresses, just as do applied loads. The thermal strain due to a temperature change ∆T
is
𝜀𝑡 = 𝛼 ∗ ∆𝑇
Ex4/ A solid brass of length L=100mm of diameter D= 15mm is used to fix two rigid
surfaces. Find the stresses induced into it if the temperature of the bar is raised by
20cͦ. Given α= 19x10−6/cͦ and E=103GPa/m².
Solution:
𝜎 = −𝐸𝛼∆𝑇 (𝑜𝑟 − 𝐸𝛼𝑇)
𝜎𝑥 = −103 × 109 × 19 × 10−6 × 20
= −39.1 𝑀𝑃𝑎
It is interesting to note that this result does not depend on either the length or
diameter of the cylinder
Msc Yessar Ameer Ali Strength of Material Al-Mustaqbal University College
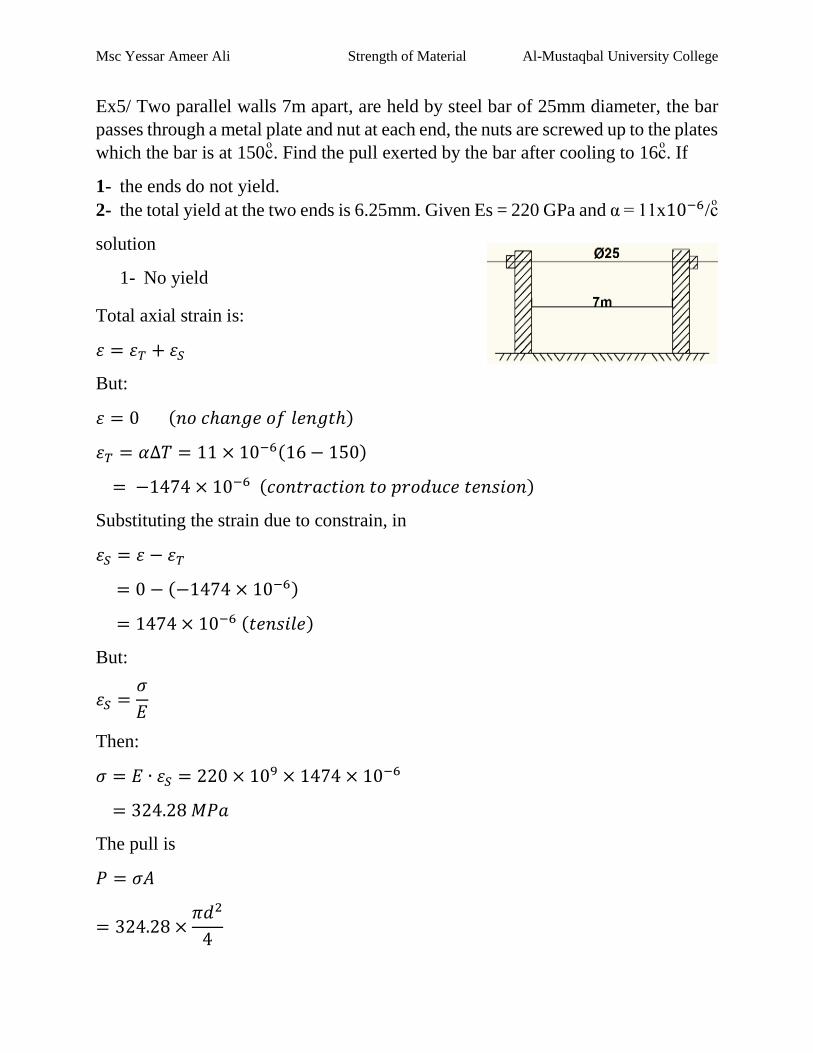
Ex5/ Two parallel walls 7m apart, are held by steel bar of 25mm diameter, the bar
passes through a metal plate and nut at each end, the nuts are screwed up to the plates
which the bar is at 150cͦ. Find the pull exerted by the bar after cooling to 16cͦ. If
1- the ends do not yield.
2- the total yield at the two ends is 6.25mm. Given Es = 220 GPa and α = 11x10−6/cͦ
solution
1- No yield
Total axial strain is:
𝜀 = 𝜀𝑇 + 𝜀𝑆
But:
𝜀 = 0 (𝑛𝑜 𝑐ℎ𝑎𝑛𝑔𝑒 𝑜𝑓 𝑙𝑒𝑛𝑔𝑡ℎ)
𝜀𝑇 = 𝛼∆𝑇 = 11 × 10−6(16 − 150)
= −1474 × 10−6 (𝑐𝑜𝑛𝑡𝑟𝑎𝑐𝑡𝑖𝑜𝑛 𝑡𝑜 𝑝𝑟𝑜𝑑𝑢𝑐𝑒 𝑡𝑒𝑛𝑠𝑖𝑜𝑛)
Substituting the strain due to constrain, in
𝜀𝑆 = 𝜀 − 𝜀𝑇
= 0 − (−1474 × 10−6)
= 1474 × 10−6 (𝑡𝑒𝑛𝑠𝑖𝑙𝑒)
But:
𝜀𝑆 =𝜎
𝐸
Then:
𝜎 = 𝐸 ∙ 𝜀𝑆 = 220 × 109 × 1474 × 10−6
= 324.28 𝑀𝑃𝑎
The pull is
𝑃 = 𝜎𝐴
= 324.28 ×𝜋𝑑2
4
Msc Yessar Ameer Ali Strength of Material Al-Mustaqbal University College
= 324.28 ×𝜋 × (0.025)2
4= 159180.57 𝑁 = 159.2 𝑘𝑁
2- When yielding in ΔL=6.25 mm
The total axial strain in:
𝜀 = 𝜀𝑇 + 𝜀𝑆 ,
but:
𝜀 =6.25
7000= −893 × 10−6 (𝑐𝑜𝑛𝑡𝑟𝑎𝑐𝑡𝑖𝑜𝑛)
Thermal strain is
𝜀𝑇 = 𝛼∆𝑇 = 11 × 10−6(16 − 150)
= −1474 × 10−6 (𝑐𝑜𝑛𝑡𝑟𝑎𝑐𝑡𝑖𝑜𝑛 )
Therefore the induced strain is:
𝜀𝑆 = 𝜀 − 𝜀𝑇
= −893 × 10−6 − (−1474 × 10−6)
= 581 × 10−6 (𝑡𝑒𝑛𝑠𝑖𝑙𝑒)
The axial stress is:
𝜎 = 𝐸 ∙ 𝜀𝑆 = 220 × 109 × 581 × 10−6
= 127.82 𝑀𝑃𝑎
𝑃 = 𝜎𝐴
= 127.82 ×𝜋 × (0.025)2
4= 62743.5 𝑁 = 62.7434 𝑘𝑁