Changing Roles of Forests and their Cross- Sectorial ...
172
i Background Paper 2 Changing Roles of Forests and their Cross- Sectorial Linkages in the Course of Economic Development 1 Uma Lele, Alain Karsenty, Catherine Benson, Judicaël Fétiveau, Manmohan Agarwal and Sambuddha Goswami 2 Background paper prepared for the United Nations Forum on Forests 2 April, 2013 1 This is one of three background papers commissioned by the United Nations Forum for Forests. Background paper 1: Focuses on economic contributions of forests, by Agrawal, Shepherd and Cashore; Background Paper 2: Forests and cross-sectorial linkages, by Lele, Karsenty, Benson, Fétiveau, Agarwal and Goswami; and Background paper 3: The role of forests in a future world, by Agrawal et al. This paper does not explore issues inside the forest sector, confining itself to cross- sectional linkages of forests with other sectors. 2 Uma Lele is independent scholar and was formerly senior advisor in the World Bank’, Alain Karsenty is economist at Cirad (France), Catherine Benson is PhD candidate at the University of Michigan, Judicaël Fétiveau is independent consultant in Natural Resources Management, Manmohan Agarwal is senior fellow at the Center for International Governance, Waterloo, Canada and Sambuddha Goswami is research assistant.
-
Upload
khangminh22 -
Category
Documents
-
view
0 -
download
0
Transcript of Changing Roles of Forests and their Cross- Sectorial ...
i
Background Paper 2
Changing Roles of Forests and their Cross- Sectorial
Linkages in the Course of Economic Development1
Uma Lele, Alain Karsenty, Catherine Benson, Judicaël Fétiveau,
Manmohan Agarwal and Sambuddha Goswami2
Background paper prepared for the United Nations Forum on Forests
2 April, 2013
1 This is one of three background papers commissioned by the United Nations Forum for Forests. Background paper 1: Focuses on
economic contributions of forests, by Agrawal, Shepherd and Cashore; Background Paper 2: Forests and cross-sectorial linkages, by
Lele, Karsenty, Benson, Fétiveau, Agarwal and Goswami; and Background paper 3: The role of forests in a future world, by Agrawal
et al. This paper does not explore issues inside the forest sector, confining itself to cross- sectional linkages of forests with other
sectors.
2 Uma Lele is independent scholar and was formerly senior advisor in the World Bank’, Alain Karsenty is economist at Cirad
(France), Catherine Benson is PhD candidate at the University of Michigan, Judicaël Fétiveau is independent consultant in Natural
Resources Management, Manmohan Agarwal is senior fellow at the Center for International Governance, Waterloo, Canada and
Sambuddha Goswami is research assistant.

i
The views and opinions expressed herein are those of the authors and do not necessarily reflect those of
the United Nations Secretariat. The designations and terminology employed may not conform to United
Nations practice and do not imply the expression of any opinion whatsoever on the part of the
Organization.
ii
Table of Contents
Findings, Conclusions and Implications for the Future………………………………………….. 1
Introduction………………………………………………………………………………………………………. 25
Key Questions and Outline of the Paper………………………………………………………………… 28
A Record of Forest Cover Loss Gain and Changes in Other Forest Values Over the
1990-2010 Periods………………………………………………………………………………………………
30
Unprecedented Record of Economic Growth in Developing Countries as a Group…….. 31
What Explains Rapid Economic Growth Performance and decline in Forest Cover
Loss?............................................................................................................................
40
Cross-Sectorial Linkages between Forests and Other Sectors in Depth…………………….. 51
Agriculture and Forestry…………………………………………………………………………………….. 51
Drivers of Deforestation: Exploring Regional Differences and New Patterns............... 54
Effects of Urbanization on Agriculture…………………………………………………………………. 61
Setting Aside Degraded Marginal Lands for Reforestation……………………………………… 65
Case Studies of Forested Countries............................................................................... 66
Forestry and Water…………………………………………………………………………………………. 74
Opportunities & Challenges…………………………………………………………………………………………………….. 77
Linkages between Forests and Energy………………………………………………………………….. 78
Key Points……………………………………………………………………………………………………………………………... 79
Despite Diversification in Energy Sources Oil, Coal and Natural Gas Dominate………………………… 84
Alternative Energy Sources……………………………………………………………………………………………………. 85
Wind Capacity has Grown Rapidly…………………………………………………………………………………………. 88
The Global Grid Connected Biomass Capacity………………………………………………………………………….. 88
Fuel wood……………………………………………………………………………………………………………………………… 88
Fuel wood and Household Energy Use…………………………………………………………………………………… 89
Steps to Address the Fuel wood Crisis……………………………………………………………………………………… 90
Hydropower………………………………………………………………………………………………………………………….. 91
Future Demand……………………………………………………………………………………………………………………… 96
Bioenergy……………………………………………………………………………………………………………………………… 96
Bioenergy Trade-offs……………………………………………………………………………………………………………… 97
Cross-Sectoral Linkages between Forests and Transport……………………………………….. 98
Overview………………………………………………………………………………………………………………………………. 98
Transport and Agriculture……………………………………………………………………………………………………… 100
Tradeoffs………………………………………………………………………………………………………………………………. 100
Cross-Sectoral Linkages between Forests and Mining……………………………………………. 101
Overview………………………………………………………………………………………………………………………………. 101
Deforestation, Forest Degradation and Change in Forest Type…………………………………………………. 103
Indirect Impacts on Forests……………………………………………………………………………………………………. 104
Forest Regeneration………………………………………………………………………………………………………………. 105
Policies…………………………………………………………………………………………………………………………………. 106
Cross-Sectoral Linkages between Forests and Health…………………………………………….. 109
Overview………………………………………………………………………………………………………………………………. 109
iii
Forests and Human Disease……………………………………………………………………………………………………. 110
Forest Products as a Source of Medicine…………………………………………………………………………………… 111
Forests and Their Pharmaceutical Values………………………………………………………………………………... 112
Additional Linkages between Forests and Health……………………………………………………………………… 113
Payments for Environmental Services………………………………………………………………….. 114
Definitions of Environmental Services……………………………………………………………………………………… 114
PES, Ecosystem Services and Externalities………………………………………………………………………………. 116
PES and Trade-offs between Efficiency and Equity…………………………………………………………………... 117
Two Different Perspectives on Equity in PES Payments……………………………………………………………. 118
PES and Perverse Incentives................................................................................................................... 119
Containing PES’s Perverse Incentives.................................................................................................... 120
Recognition of Forest Land Rights in PES Schemes.............................................................................. 121
Land Tenure and Deforestation.................................................................................... 122
Two Different Frameworks of Causal Relationships............................................................................ 123
Land Tenure Clarification: A Prerequisite For REDD+ and PES Implementation............................. 125
REDD+………………………………………………………………………………………………………………. 126
The “Three Phases” Approach…………………………………………………………………………………………………. 128
Main Potential Architectures for REDD+…………………………………………………………………………………. 129
Strengths and Weaknesses of the Various Architecture Proposals……………………………………………… 130
Non-fungibility in a Market-based Approach?...................................................................................... 130
The “Nested Approach”: Solution, Compromise or Back to Project-based?......................................... 131
The Fund-based Approaches…………………………………………………………………………………………………… 133
Funds Allow for Multiple Objectives beyond Carbon…………………………………………………………………. 134
An Approach that Avoids the Thorny Issue of Baseline/Reference Setting………………………………….. 135
The Limits of the Theory of Rational Choices and of Financial Incentives…………………………………… 135
Are States Rational and Autonomous Agents?...................................................................................... 136
Forest-related Policies in Fragile States…………………………………………………………………………………… 137
Discussing and Broadening the Notion of Performance....................................................................... 138
Who Could Assess Broadened Performance?......................................................................................... 141
A New Conditionality?............................................................................................................................ 142
Conclusion……………………………………………………………………………………………………………………………… 143
References…………………………………………………………………………………………………………. 144
List of Figures
Figure 1.1 a, b, c and d: Greenhouse Gas Emissions by Sector: World and High, Middle, and Low
Income Countries……………………………………………………………………………………………………………………
28
Figure 1.2: Global Emissions from Fossil Fuels & Cement and Land-use Change (1960-2011)……… 28
Figure 2a: GDP Growths by Region (constant 2000 US$) (1970-2011) (Base Year 1970=100)…….. 32
Figure 2b: GDP Growths by Region (constant 2000 US$) (2000-2011) (Base Year 2000=100)…… 33
Figure 3: Merchandise Trade (% of GDP) by Region (1990-2011)………………………………………………. 33
Figure 4: Gross Fixed Capital Formation (% of GDP) by Region……………………………………………….. 34
Figure 5: Total Foreign Direct Investment (Inward + Outward) by Region (% of GDP) (1991-
2011)……………………………………………………………………………………………………………………………………..
34
iv
Figure 6: Total Agricultural Products Imports by Region (Import Value in Million$)
(Real=Nominal/MUV) (MUV Index 2000=100) (1970-2011)……………………………………………………..
35
Figure 7: Total Agricultural Products Exports by Region (Export Value in Million$)
(Real=Nominal/MUV) (MUV Index 2000=100) (1970-2011)……………………………………………………..
36
Figure 8: Total Forest Products Exports by Region (Export Value in Million$)
(Real=Nominal/MUV) (MUV Index 2000=100) (1970-2011)……………………………………………………..
38
Figure 9: Total Forest Products Imports by Region (Import Value in Million$)
(Real=Nominal/MUV) (MUV Index 2000=100)……………………………………………………………………….
39
Figure 10: Total Forest Products Imports (Import Value in Million$) (Real=Nominal/MUV)
(MUV Index 2000=100) (Brazil, India, Indonesia and China)…………………………………………………….
39
Figure 11: Total Forest Products Exports (Export Value in Million$) (Real=Nominal/MUV) (MUV
Index 2000=100) (Brazil, India, Indonesia and China)………………………………………………………………
40
Figure 12: DAC Members’ Total Net Resource Flows to Developing Countries (1970-2010)
(Constant 2009 USD billion)…………………………………………………………………………………………………….
42
Figure 13: Urban Population by Major Geographical Area (in per cent of total population)………… 43
Figure 14: Number of Poor (Millions) by Region (using 2005 PPP and $1.25/day poverty line)
(1981-2010)…………………………………………………………………………………………………………………………….
45
Figure 15: Number of Undernourished by Region, 1990-92 and 2010-12…………………………………….. 45
Figure 16: Areas of Physical and Economic Water Scarcity……………………………………………………….. 47
Figure 17: Declining Share of ODA Compounded by OECD Economic Woes……………………………….. 49
Figure 18: Share of Agricultural Commitments by World Bank and ODA (FY1960-FY2011)………… 49
Figure 19: Bilaterals and Multilaterals ODA to Agriculture + Forestry + Fishing by Major Donors
(Total Commitments) (2010 USD Millions) (Constant Prices) (1995-2010)…………………………………..
50
Figure 20: Food Price Index vs. Share of Agricultural ODA………………………………………………………. 51
Figure 21: Food Price Index vs. Food Supply (1970-2011)………………………………………………………….. 53
Figure 22: Agricultural TFP Indexes Growths (Brazil, India, Indonesia and China) (1961-2009)…. 56
Figure 23: Population living below $1.25 a day (1981, 1990 and 2010)………………………………………. 56
Figure 24: Difference between the Share of Value Added and Share of Employment in Agriculture
(Brazil, India, Indonesia and China) (1980-2009)……………………………………………………………………..
58
Figure 25: Palm Oil Import by India & China and Export by Indonesia (tonnes) (1961-2010)……… 61
Figure 26: Total Food Supply by Region (Crops Primary Equivalent + Livestock and Fish
Primary Equivalent) (kcal/capita/day) (1961-2007)…………………………………………………………………
64
Figure 27: Food and Energy Real Price Indices (1960-2011)……………………………………………………… 79
Figure 28: Total Primary Energy Consumption by Region (Million tonnes oil equivalent) (1970-
2011)………………………………………………………………………………………………………………………………………
80
Figure 29: Energy use per $1,000 GDP (constant 2005 PPP) by Region (Kg of oil equivalent)
(1980-2009)……………………………………………………………………………………………………………………………
81
Figure 30: Energy Use (kg of oil equivalent per capita) vs. GNI per capita by Developing Region
Only (1971-2009)……………………………………………………………………………………………………………………
82
Figure 31: Energy Use (kg of oil equivalent per capita) vs. GNI per capita by Developed and
Developing Region (1971-2009)………………………………………………………………………………………………..
83
Figure 32: Carbon Dioxide Emissions by Region (Million tonnes carbon dioxide) (1965-2011)……… 84
Figure 33: World--Share of Total Primary Energy Consumption by Fuel (%) (2011)………………….. 85
Figure 34, 35 and 36: Share of Total Primary Energy Consumption by Fuel (%): Asia and Pacific
Region, Europe and Eurasia Region and North America Region (2011)………………………………………
87
Figure 37: Fuel Wood Consumption by Region (1996 to 2008)…………………………………………………… 89
Figure 38: Global Hydro Resource Potential……………………………………………………………………………. 93

v
Figure 39: Top 35 Countries with Collective> 90%+ of Global Forest Loss and Their Ranking in
Governance Index……………………………………………………………………………………………………………………
108
Figure 40: Top 18 Countries with> 90% of Forest Gain and their Ranking in Governance Index….. 109
List of Tables
Table 1: Growth Rates (%) of Total Merchandise, Agricultural Products and Forest Products
Imports and Exports by Region for different Period (1970-2010)………………………………………………..
37
Table 2: Regression Result of the Economic Model………………………………………………………………….… 41
Table 3: Long Term Global Food Challenge……………………………………………………………………………... 44
Table 4: Total ODA from All Donors 1967-2010……………………………………………………………………….. 48
Table 5: Hydropower Resource Potential by Country……………………………………………………………….. 91
Table 6: Top Ten Countries by Installed Hydropower Capacity and by Generation Share (2010)… 92
Table 7: Bundle of Rights Associated with Positions………………………………………………………………….. 125
List of Maps
Map 1: Agricultural TFP growth in China............................................................................................. 57
Map 2: Brazil--State Level Variation in TFP Growth Rate (Average % per Year over Period)………. 63
List of Boxes
Box 1: Deforestation in Brazil, Indonesia and Congo Basin................................................................. 13
Box 2: Deforestation in Brazil................................................................................................................. 66
Box 3: Deforestation in Indonesia......................................................................................................... 68
Box 4: Drivers of Deforestation and Degradation in the Congo Basin………………………………………… 71
Box 5: Challenges in Assessing impacts of Watershed PES Schemes…………………………………………... 78
Box 6: The Issue of Permanence………………………………………………………………………………………………. 133

1
Changing Roles of Forests and Their Cross-Sectorial Linkages in
the Course of Economic Development3
Uma Lele, Alain Karsenty, Catherine Benson, Judicaël Fétiveau, Manmohan Agarwal and Sambuddha Goswami
Findings, Conclusions and Implications for the Future
Questions We Address
In this paper we addressed several questions: 1. What key factors underlie changes in forest cover as countries undergo structural transformation, i.e., shift from being predominantly forest and agricultural producers and exporters to manufacturing and service sectors, urbanize and move from low to high income countries? 2. What can we learn from the experience of the past several decades about the relationship of forests to other sectors and particularly to the dynamic external environment? 3. Is economic growth and prosperity possible without causing further damage to the forest cover and quality and the environment? 4. What is the future of forests in a globalized world given dramatic changes in the global context? 5. What are the implications for policies and investments for more pro-forest outcomes going forward? The United Nations Forum on Forests has rightly called for better mapping of the forest finance landscape to create a clearer understanding of the types and potential impacts of complementary public and private investment on future forests. Also a question arises: financing for what? To bridge the gap between the finance and substantive issues the UNFF commissioned three background papers including this one on the cross-sectorial linkages of forests in the course of economic development. The principle message of this
3 United Nations Forum on Forests Open-ended Intergovernmental Ad Hoc Expert Group on Forest financing, Second Meeting
(AHEG2).

2
paper is that forests are complexly woven with other sectors of the economy. Therefore focusing narrowly on forests has increasingly diminishing returns. Furthermore focusing on the environmental aspects of forests, without regard to hard core development issues have few returns in terms of sustainable forest management. The Continued Challenges of Reconciling Environment and Development
and the Unequal Voice in International Deliberations
As a background to the findings of our study and their implications for the future we first outline the complex substantive challenge of forest management in the course of economic development. This is then followed by a brief history of the response of the international community to that challenge. Our purpose in providing this background before presenting our findings is to establish that international interventions in forest management of developing countries have often lacked a holistic view of the land use and land use changes caused by the fundamental processes of development. They have often been focused on a single issue, and the external engagement has typically been fickle. Furthermore far too often the international focus has been driven by constituencies with the perspectives of developed countries. The interventions have only partially achieved their objectives but concurrently, and perhaps unwittingly, diverted attention from the key challenges developing countries face in formulating and implementing holistic, farsighted, consistent and predictable cross-sectorial policies and practices needed to foster sustainable forest management concurrently with rapid, broad-based and sustainable overall economic growth. That is the central purpose of this paper. Forests’ Multiple Values and the Analytical Challenges
Forests’ multiple values and their nature have compounded the challenge of being able to view them holistically. They provide services ranging from their sheer existence value, to values of timber, biodiversity, ecosystem services of water, soil, carbon, cultural values, livelihood for forest dependent people, recreational, medicinal and human health benefits. But forests are also influenced by factors outside the forest sector, land conversion to agriculture and livestock, investments in transportation, power and urbanization needs. Forests have not simply been a source of subsistence, medicinal products and health but also sources of scourges of human diseases and conflict movements. They provide bundles of public, private and common pool goods and “bads”. Given their remoteness, they are often associated with poor governance, massive corruption, and poverty of forest dependent people, ambiguous property rights and contested claims. Forests have recently been at the forefront of climate change mitigation, whereas they are also severely affected by climate change. Some features are neither quantifiable, nor have market values. Others entail subsistence activities and

3
informal exchange. Many of these features of forests are multi-sectorial and interact in a complex way. Analytical tools and data are often woefully inadequate from the existing disciplinary armour to get a full handle over them. There is a growing consensus reinforced by this current UNFF process that the full contribution of forests is poorly understood, grossly undervalued, inadequately measured and neglected at best4. As a result forests have not been recognized to have contributed their full potential to sustainable development. To correct this situation a renewed effort is needed to look at the forest sector for what it offers. The urgency is great. As developing countries grow rapidly, much as they have in the last few decades, their growth will continue to exert enormous and growing pressure on natural resources of land, water and forests, driving land use changes, with profound implications for forest outcomes, and their contribution to economic growth, equity and environmental sustainability. This paper is meant to shed light on some of these issues from a review of the changing roles and not insignificantly, changing views of forests. Today’s Debates in the Context of the Post-World War II International
Cooperation on Forests
Following the unceremonious abandonment of the Tropical Forestry Action Program (TFAP), for its alleged top down nature, FAO’s estimates of the dramatic increase in the loss of tropical forests in the 1980s attracted much attention, especially in the run up to the UNCED conference in Rio de Janeiro in 1991.5 TFAP was established by FAO in 1985 with the active support of the World Bank, UNDP and the World Resources Institute. The international concern about forest loss which ensued in the late 1980s has many parallels with today’s REDD+. In place of the focus on climate change now, then the concern was rather exclusively focused on conserving biodiversity in the primary tropical moist forests, although other forests with substantial biodiversity and other uses, such as fuel wood and fodder were also disappearing at an alarming rate. Indeed some were on the verge of extinction, e.g. forests in Mata Atlántica in Brazil and the Western Ghats of India and the dry forests of Africa, e.g. in Tanzania, Zambia and Sudan. Apart from their rich biodiversity, many of these forests were and still remain home to the poorest forest dependent peoples. Fortunately, the Convention on Biodiversity was established to support conservation of all types of forest biodiversity, leading to the establishment of the Global Environmental Facility in 1992. But the funding was too small and too focused on biodiversity conservation without
4 A concurrent paper by Arun Agrawal et al estimates that the non-cash contributions of forests in the form of food, fuel wood, fibre,
building material, timber, medicinal products is two to four times the cash values.
5 1935 million ha, of which 1200 million ha were closed forests and 735 million ha were open tree formations. In addition, fallow
forest land amounted to 410 million ha. The potential sustained yield capacity of the closed tropical forests was estimated at 5000
million m3 of wood per year, assuming a growth of approximately 4 m3/yr./ha. Although this estimate may be on the high side.
4
understanding the full complexity of interactions between biodiversity, poverty and particularly the pressures on protected areas outside forests, except in the remotest areas of the world, a weakness the GEF is now attempting to correct by promoting a landscape approach. The issue of the fragmented support through the various conventions of biodiversity, international waters, climate and land degradation however continues. In the current fragmented international environmental architecture there is also no link between the carbon funds and the conventions as the UNFF study on forest financing makes clear (Lele et al 2011a). Private finance is currently the most significant source of investment for forestry. Estimated to total around us$ 15 billion per year in developing countries and countries in transition, private-sector investment in the forestry sector far outstrips the combined investments of governments and development agencies (Asen, Savenije and Schmidt 2012). Although broad sectorial investment parameters are generally well understood, the knowledge of the exact shape and weight of domestic and international flows is still work in progress with divergent estimates of private sector finance. With the influence of international NGOS, the World Bank established its forest strategy in 1991 and became the largest single financial supporter of the forest sector. While acting as the implementer of GEF projects, it also provided direct lending and policy advisory support to the forest sectors of developing countries. The World Bank established ten environmental, social and cultural safeguards which became the standard for other international financial institutions. In a recent evaluation by the World Bank’s IEG Bank safeguards were said to have become out of date. Other international organizations including the UN agencies, the regional development banks and the IFC, living less in a fish bowl, and hence less subject to external scrutiny, were able to be more agile and have followed more flexible safeguards (IEG 2010). The implementation of the World Bank’s 1991 forest strategy had been limited in the forest rich countries in the 1990s. An interface between forestry and agricultural land conversion was lacking in the Bank’s forest strategy but active on the ground in the forest rich countries. An IEG (then OED) evaluation of the Bank’s 1991 forest strategy in 2000 concluded that the strategy’s almost exclusive focus on conservation of the tropical moist forests, including the “logging ban” had a chilling effect on the demand for World Bank engagement particularly in the forest rich countries (World Bank 2002). Notwithstanding the conservation focus of the 1991 forest strategy the World Bank’s operational approach was rightly more pragmatic and more eclectic, but it had mixed results. It succeeded in helping to contain forest fires and expanding forest plantations in China, supporting joint forest management in India but tended to be caught in the controversy surrounding the issues of sustainable forest management in forest rich countries, which typically shunned the Bank’s presence. They wished to exploit their substantial forest resources for economic growth, while their forest sectors were often
5
also mired in corruption. The World Bank persevered to improve forest concessions in countries such as Cameroon. The revised World Bank forest strategy formed in 2002in light of the implementation experience reviewed in the OED evaluation, and based on world- wide consultations was an attempt to better reconcile development objectives of developing countries and yet maintain a conservation focus. It was accompanied by the revision of the operational policy towards sustainable forest management which softened the approach to forest management away from the blunt instrument of the logging ban after experience demonstrated that the World Bank staying away from financing logging did not stop logging, but undermined the Bank developing an understanding of the factors causing it. Providing a more balanced approach, the 2002 strategy’s three pillars, were an acknowledgement of the roles of forests in achieving social equity and environmental sustainability as well as economic growth. This means improving forest governance and trade as well as improving management of industrial logging using instruments such as reform of the forest concessions policy and implementation, forest certification and FLEGT, (Forest Law Enforcement, Governance and Trade), while concurrently supporting the expansion of protected areas and participatory forest management involving forest dependent communities. Agriculture forestry links and how to foster them were still perhaps a weak link in the 2002 forest strategy although Bank operations in agriculture increasingly incorporated support for trees in agricultural projects. The 2013 IEG evaluation of the World Bank’s 2002 forest strategy, played out since the UNFF meeting in Vienna in January 2013, rightly pushes for more evidence of impacts of Bank interventions in the forest sector. But it has also reopened the Pandora’s Box about whether the World Bank should be involved in forest concession management, as if keeping the World Bank out of being engaged in improving concession management will get developing countries to abandon forest concessions as a tool of forest management or profit.6 The Committee on Development Effectiveness, (CODE) of the World Bank’s Executive Board which represents all member governments, rightly expressed strong and unambiguous support for continued World Bank Group (WBG) engagement in the Forest Sector, recognizing a unique role of the Bank group in supporting effective sustainable forest management in client countries, including supporting timber concession reforms. It rejected IEG’s recommendation urging a review of the Bank support to industrial logging regarding timber concession reform in tropical moist forest countries including an analysis of the outcomes that could be
6 IEG Recommendation #3, “ Undertake and disclose a comprehensive review of the economic, environmental and social outcomes
associated with World Bank support for industrial timber concession reforms in tropical moist forest countries with weak
governance, including an analysis of the outcomes that could be achieved under alternative land-use schemes. Based on the
evidence, determine whether and how the World Bank Group can realistically support effective sustainable forest management in
tropical moist forest countries.” (IEG 2013).

6
achieved under alternative land-use schemes to determine whether and how the World Bank Group can realistically support effective sustainable forest management in tropical moist forest countries”. It agreed with Bank management that the evaluation was swayed by particular interests and did not take into account the full evidence of the Bank effort. The controversy surrounding the desirability or otherwise of the World Bank’s presence in managing industrial concessions may have unwittingly high-jacked the international debate, yet once again, from the important underlying factors affecting the future of forests and missed an important opportunity. Arguments Behind REDD and REDD+
Failing to learn lessons from the implementation of the 1991 forest strategy as well, the international community moved on towards a single carbon centric, focus in the context of climate change negotiations, while effectively side-lining concerns about biodiversity conservation, poverty reduction among others, leading to a large number of forest carbon funds where international forest financing is now concentrated (Lele, Zazueta, Singer 2011c). REDD (Reducing Deforestation and Degradation, eventually leading to REDD+ ― the + denoting loss of other forest values and functions beyond carbon, was launched at the COP 15 meeting in Bali as a mitigation strategy to combat climate change, thus in reality with a continued focus on carbon. Developing countries have demanded adaptation funds to address the adverse impacts of climate change on their economies. These have been slow to take off on the argument that adaptation is difficult to distinguish from normal development activities and the capacity of countries most adversely affected by climate change has been limited to prepare “bankable” projects. The justification for REDD+ has been as follows: • Forest carbon emissions are significant. (They were estimated to contribute an estimated 17 percent of GHG emissions at the time of COP 15, but are now estimated to be between 10 and 15 percent partly due to a slow decline in forest emissions and partly due to unabated increase in fossil fuel related emissions). • Almost all forest related emissions come from developing countries. • Due to the supposedly lower opportunity costs in developing countries, it would be cheaper to compensate forest owners and users in developing countries to achieve carbon sequestration through avoided deforestation compared to the cost of mitigation in industrial countries, and, • It is in the interest of industrial countries to compensate developing countries for avoided deforestation based on independently verified and certified emissions given that

7
historically industrial countries have contributed the most to climate change. While economists have presented this as an economically rational argument (World Bank 2010), others have considered it an “environmental debt”, and a moral duty of industrialized countries to organize transfers of money, know-how and technology for abating climate change which is likely to adversely affect developing countries in Asia and Africa containing the greatest incidence of poverty. In addition, if a global agreement is to emerge in 2015 with quantified targets for all the countries, it is in the interest of industrialized countries to provide such transfers starting immediately. But the likelihood of a binding global agreement is increasingly viewed with great scepticism.7
The Current State of REDD+, Cap and Trade and Carbon Tax Debate
After five years of slow progress on an agreement relating to the post-Kyoto regime, and many obstacles in finalizing the operational design and implementing REDD+ the Doha round of COP generated lukewarm headlines at best: • "The honeymoon for REDD+ is over": consensus not yet reached in Doha on MRV, finance”. • “A delay in key decisions at Doha could see REDD+ lose its climate change focus”. • “Doha: Future climate agreement may merge agriculture, land use change and forestry”. • “UN Carbon market has collapsed”. Given the belief in the importance of a market approach it would be technically easy to raise carbon prices by withdrawing the dubious credits and the HFC-related credits, tighten eligibility to the CDM, etc., as EU senior officials have noted, but it is politically impossible to reach a consensus on this issue. As reported in an earlier paper private entrepreneurs in the US have indicated there is small return to private investment in reducing emissions unless carbon prices reach at least $25 to $30. Some have argued that the current cap and trade agreement is so watered down that it is unlikely to bring a significant reduction in carbon emissions and have been urging imposition of carbon taxes as a fiscally and environmentally win-win solution (Lele, Key Note 2013, Vienna 14-18 January). Other weaknesses of REDD+ are discussed in the body of this report.
7 In the US although President Obama has strongly affirmed his commitment to addressing issues of climate change and the US
government including the US military has taken a variety steps using executive powers, the chances of a legislative action are
considered to be dim.

8
An important and strong continuing difference has been between Brazil and Norway on the principle of independent verification on grounds of sovereignty. It in turn raises a variety of geopolitical and technical issues of their own, including the drivers of deforestation and the extent of incentives developing countries have to conserve forests, in view of the opportunity cost of land and forest resources and relatedly the extent of political will, institutional capacity and credibility of developing countries, particularly those with the most forest to lose or protect. In this regard, the growing differentiation among developing countries in terms of policy capacity itself poses challenges as well as opportunities, in dealing with a variety of technical questions which have been debated about REDD+. These include the reference level, verification, and the types of programs—whether national or project based, and funding, whether, market based or publicly funded. Climate Change to Exceed 2 °C?
In the meantime, a 2012 World Bank Report “Turn down the heat” postulates that under the current business as usual scenario temperatures could rise by 4 degrees Celsius by the end of the century with more catastrophic events than envisaged under a more moderate temperature rise of 2 degrees Celsius (World Bank 2012). If the events of the past decade have not been convincing that an adaptation strategy is needed in developing countries most affected by climate change, including in support of their food security objectives, the “turn down the heat” should be a wake-up call. The Duel Challenge of Managing Over and Under-Consumption
A further caveat is called for as background to the findings of this study. This paper does not tackle the elephant in the room, namely, the issue of global consumerism and overconsumption. Admittedly it is compounded by the changes in food and other consumption patterns in emerging countries (including the growing consumption of resource intensive foods such as animal products) which are contributing to climate change. The large inequalities between and within nations are clear from the differences in the consumption levels presented in this paper in many respects—ranging from food to energy use and its implications for arduous labour of the poor. It presents a moral dilemma. How can one ask developing countries’ deprived populations to curtail their consumption, often from their already low levels, without simultaneously asking for actions in developed countries, and from the rich of the developing nations, to change their consumption levels? There has been relatively little progress on this latter front. On the contrary the gap within emerging countries’ consumption styles has increased where the middle-upper classes have adopted the (worst) food consumption patterns of the West (fats, sodas, sugar) with disastrous health impacts on the way in terms of
9
increased incidence of heart disease and a menacing epidemic of diabetes concurrently with many public health diseases of the poor, such as diarrheal. The very fact that REDD+ has been the only game in town on climate change is an abundant testimonial to this reality. Vested Interests in Current Modes of Thinking
There is a further risk that so wedded may be the various interest groups to continue business as usual including on REDD+ that they might be unwilling or unable to consider a radical rethink of the kind which looks at the future of forests through the glass of an enabling environment in developing countries, rather than conditioned aid. The latter is based on measuring narrowly focused and impossible to measure outcomes that are unlikely to materialize, unless and until countries develop. The concept of “output-based aid” or (for REDD+ “performance-based payments”) will remain illusory without investing massively and sustainably in rebuilding the institutions not just in fragile States but even in seemingly strong emerging countries where institutional dysfunction in the public sector is pervasive. Furthermore, the “performance-based payments” principle (if performance is narrowly defined as emission reductions from forests) is tricky when deforestation drivers are more and more globalized and beyond the reach of governments. Findings of this Study
The Good News is that: • According to FAO’s latest data, forest cover loss in 2000-2010 has slowed in 35 developing countries and with one notable exception of a developed country Australia. The most notable slowdown has been in Brazil and Indonesia, the two largest emitters of forest carbon. Together the 35 countries constitute well over 90 percent of the loss (FAO 2010). • Several middle income developing countries (most notably China, but also India and Viet Nam) have increased their forest cover.
• Protected areas have also increased.
• Tree cover outside the forest sector has increased.8
8 While we know the characteristics of the new integrated farming systems, we know less about what is causing them to occur and
policy implications, e.g., the extent to which they are policy induced, a Boserup type intensification from increased population
densities with de facto growth of land rights, as distinct from being a result of spontaneous innovation aided by NGO and research
activity. According to Garritty “Each involves the integration of tree species into food crop farming in ways that increase and sustain
grain production, and diversify and increase household income. The trees sustain a green cover on the land resulting in higher

10
• Reduced forest loss and increased gain have occurred despite accelerated rates of global economic growth. Indeed since 1990, unlike in the past, economic growth has occurred in all developing regions including Latin America and Sub-Saharan Africa where growth had lagged in the 1980s due to a debt burden.
• Share of forest emissions in total global carbon emissions has declined since the 2005 estimates.
• These achievements are the result of the efforts of developing countries themselves with relatively insignificant external financing.
• As the UNFF study on external financing documents, much of the increase in forest financing has been in support of REDD+. Given the focus of REDD+ on mitigation, most of the forest financing has gone to forest rich middle income countries, most notably Brazil and Indonesia. Even then most of this financing is provided for the early stage of “REDD readiness”. Little has actually been disbursed for the implementation of the payments for certified emission reductions at the national level. Therefore it is safe to conclude that most of the reduction in the forest cover loss among the largest emitters of forest carbon has been the result of the developments in international agriculturalmarkets and prices and domestic exchange rates, or due to strengthened enforcement of existing laws, as in Brazil as discussed in the body of the report. Forests and Watershed Protection
The growing forest and tree cover, in some parts of the world, has been accompanied by substantial growth in the payment for environmental services programs, particularly in middle income developing countries, the largest among them being in China. Mexico and other Latin American countries also have been engaged in major PES programs. These are typically countries which have reached a tipping point in forest loss but also have the domestic capacity to plan and implement national PES programs. The PES programs have more often been either rewards to forest owners (e.g. in Costa Rica) or socially-oriented schemes (e.g. in Mexico), or have been prompted by concerns about floods and droughts and water requirements of the urban sector, with growing middle class populations in need of water services, rather than as triggers for forest recovery. It is easy to charge consumers for assured water supply and increased water quality So far biomass production that contributes to enhanced soil fertility and increased fodder production. And they have enabled practical
ways of reducing soil tillage to improve rainwater-use efficiency, increase soil carbon accumulation, and improve soil health. In each
national case there is evidence that the practices increased household and national food security, and that they have reached a level
of adoption that may be sustainable in the long term with adequate farm advisory support. Further, there is evidence in all four cases
that governments are deepening their support for the expansion of these Evergreen Agriculture systems throughout their
territories”. Clearly reform of rights to land, trees and water helps.

11
there is limited evidence that PES implementation is the cause of forest cover recovery. Most of the PES programs are funded by resources of developing countries themselves to protect ecosystem functions, e.g., biodiversity, soil and water protection, social and cultural values. Impacts of PES on outcomes are difficult to establish independently and unequivocally because their monitoring and evaluation is limited, and yet they have been growing in popularity. Other Factors explaining reduced Rate of Forest Loss and Increased Forest
Gain in Selected Forest Rich and Forest Poor Countries
Critics argue that viewing achievements of individual forest rich and forest poor countries masks the impact of growing global agricultural and forest trade on displacement of land uses. The forest rich countries continued to “import” deforestation, from the growing demand for forest and agricultural products from the large emerging forest poor countries. The forest poor countries, on their part, while intensifying their agriculture to meet domestic food demand and discouraging deforestation at home, also increased their imports of food and forest products from countries such as Brazil and Indonesia. The results are reflected in accelerated global trade in food, agriculture and forestry. Europe maintained its dominant share in the growing agricultural and forest product trade, but in imports, the share of the East Asia Region grew particularly rapidly and within East Asia, China’s share in food and forest product imports grew even more rapidly. These changes are part of a structural transformation of economies developing countries are going through whereby the shares of agriculture and forestry in GDP and employment are declining, rural-urban migration is taking place together with the growth of the services and the manufacturing sectors and a demographic transition is leading to a reduction in the population growth rates. With more intensive agriculture and economic development more land is becoming available for forest regeneration under a mosaic of land uses. Yet the substitution of old growth natural forests with the fast growing plantation forests entails considerable losses of ecosystem services including the loss of biodiversity and soil carbon which takes years to replenish. Besides the structural transformation process including demographic transition is at different stages in different parts of the world. Latin America is highly urbanized with low population growth rates, much of Asia is transitioning and Sub-Saharan Africa is at a less advanced stage of transformation (World Bank 2008). In this context, China’s forest product exports are noteworthy. Their increase reflects the increased value added through manufacturing to meet the increased global demand for forest product consumption. Indeed, since the start of the recession in 2007, and the onset of the food crisis, the value of the global food and forest trade grew more rapidly than the overall merchandize trade, compared to the years preceding. These developments reflect the growing integration of food, energy and financial markets together with the impacts of
12
extreme weather on food production with implications for the future of forests discussed below. Now the bad news is:
There are still nearly a billion poor and hungry in the world, two thirds in Asia and a third in Africa. The net global gain in forest cover is less impressive than appears on the surface because some, mainly fast growing countries, have “exported” their deforestation, despite intensifying their agriculture. Others are still practicing low productivity extensive agriculture. Is Governance the Key?
As a general tendency across a large number of countries factors that most explain the forest loss are the initial size of the forest cover and the level of per capita income. Per capita income in turn is closely related to the quality of governance. In a cross country regression, together they explain most of the rates of forest cover loss. The higher the initial size of the forest cover, the greater the net loss. All else being equal, better the quality of governance, less the forest cover loss. This result also makes sense from a structural transformation perspective as the share of agriculture and forestry in the total economy declines with growth of the urban –manufacturing sectors. Among the nearly 200 countries for which governance indicators are available for well over a decade, the various components of the governance indicators tend to be highly correlated with each other and with per capita income. Yet the causality between governance and per capita income is unclear. Does improved governance lead to increased per capita income or the other way around? Clearly the relationship is complex and interactive. Besides determinants of forest cover loss or gain are very country and period specific. They relate to the issues of clarity of land tenure, enforcement of rule of law, but to international and domestic markets and prices. The relative roles of these factors are difficult to disentangle in the cases of Brazil, Indonesia and Congo Basin (Box1).
13
Box 1: Deforestation in Brazil, Indonesia and Congo Basin At least half of the reduction in the forest cover loss in Brazil in the new millennium compared to the previous decade is explained by conservation policies and decisions made by the government in 2004 and 2008. They increased command and control in the enforcement of forest laws, reduced credit subsidies and increased the cost of expansion of agriculture on forested lands. Reduction in soybean prices until 2007 and strengthening of the Brazilian Real vis-à-vis the US$, also reduced the incentive to open up new lands. Several factors have played a part including Brazil’s capacity through satellite imagery to monitor changes in the forest cover on a real time basis, its strong political will to withstand pressure from powerful state governments and enforce existing legislation because Brazil sees itself as a responsible global environmental steward. Besides the already deforested land is now available to use for production expansion. Not the least important, changes in commodity prices and economics of agricultural production, all have played a role. Clearly these various factors are reversible with internationally more attractive alternatives, changes in governments, and domestic political and economic pressures to deforest. But Brazil’s assets in this regard are considerable which other countries lack, including the internal capacity to develop real time data and information on forest cover changes, ability to form and enforce forest protection laws and regulations effectively and at least so far, sustained political commitment. Causes for reduction in deforestation in Indonesia in the second decade are complex too, although changes in the sources of deforestation from one period to another are clear, e.g. reduced role of logging to feeding the timber processing industry and the increased role of palm oil plantations in Sumatra and Kalimantan using direct forest investment by Malayans companies. Some possible causes include the decreasing forest stock that can be profitably converted. The “go east” trend (logging and oil palm moving to Papua) is continuing, but is limited by high costs. Indonesia has shown less decisive leadership in addressing issues of forest governance. It has experienced one of the most rapid expansions of plantation agriculture in the world (more than half of palm oil plantations are in Indonesia and
14
Centrality of Agricultural Productivity Growth
Rapid technical change in the agricultural sector has frequently been ascribed the role in accelerating deforestation. Yet growth in agricultural factor productivity is critical to achieve structural transformation of countries, keep urban wage growth under control in a period of economic growth, and keeping food prices low, particularly for the poor, who spend a disproportionate share of their income on food. These arguments are often obscured in the literature on deforestation from the exclusive perspective of land use changes. Agricultural productivity growth has played quite a different role in land short and land surplus countries. Productivity growth was most rapid in the state of Mato Grosso, which experienced considerable deforestation in the 90s from the increased returns to agricultural production. The growth of oil palm in Indonesia is similarly a result of new technology for oil palm production imported from Malaysia together with
Malaysia). For the world’s largest producer and exporters of palm oil India and China are the main importers. Oil palm plantations are established on forest land because companies are looking for the timber value, and not because of a problem of scarcity of degraded lands. In its REDD + effort, backed by $ 1 billion commitment by Norway, it is only in May 2011 that the Indonesian government ordered a two-year suspension on new concession permits on primary forests and peat lands. Yet provinces continue to exert pressure not to extend the moratorium much as do the states in Brazil. Although Indonesia has pledged to move agricultural development from forests to degraded lands, implementation has been slow because of loopholes and breaches. The rate of deforestation in the Congo Basin has been limited to coastal areas and along navigable rivers with high population densities. Unlike Latin America and, to a lesser extent, South-East Asia, where large-scale commercial agriculture and ranching are the main drivers of deforestation,, deforestation in Africa is still largely driven by small-scale activities, both for subsistence and commercial agriculture, with outlets on local or sub-regional markets but also exports on the international markets to Europe and South-East Asia. Charcoal and logging are important drivers of degradation, and are triggers that can facilitate eventual deforestation.
15
increased foreign investment. An important policy question in Indonesia is whether it could have achieved increased oil palm production on degraded or logged over forests without deforesting new lands. Evidence seems to suggest that deforestation was in part to provide rents to investors from logging forests, while profitability would be lower for plantations on degraded land, due to transaction costs of establishing property rights, and due to lower soil fertility. The continued bad news from the perspective of deforestation is that despite some slowing in the accelerated speed of globalization following the great recession in 2008- globalization will continue- accompanied by increased, savings and foreign direct investment, integration of global commodity, financial , land and foreign exchange markets. The speed of integration may well accelerate over the long haul with demographic pressures, urbanization, and income growth expanding markets for food, agriculture, and minerals. Thus whereas the share of forest emissions in total emissions has declined, this is only in part because deforestation has slowed, but also because with structural transformation emissions in other sectors have increased. Furthermore percentage increase in demand for energy with increased income tends to be far higher than demand for food with damaging effects of increased emissions in other sectors on forests and agriculture, unless energy efficiency increases and energy policies result in climate friendly energy investments, rather than continuing reliance on oil and coal that currently dominate energy use in many countries. In this context biofuels policies and subsidies of developed countries are the wild card. They exert pressure on forests through land use changes. Since 2007 they have reduced supply of cereals traded on the global markets leading to increased food prices. Forests and Food (In) Security
Globally three areas of food and forest interactions seem to be critical. • The importance of productivity growth in agriculture to meet demand for food. • The growing synergy between food and energy prices and their incentives for biofuel production. • Traditional fuel wood as a source of energy and policy implications for reforestation including particularly integration of trees in the farming systems. Agro-forestry outside forests. Long term demand for food and agriculture will increase with economic growth, urbanization and changes in tastes and preferences to more land and water intensive

16
crops in all developing regions. With increased food and energy price volatility risks of high food prices particularly to the poor who spend a high share of their income on food has also increased. The high food prices in the 1970s triggered a major global response in the form of increased investments in food and agricultural R and D whereas aid to food and agriculture has increased. Increase in the official development assistance is nowhere near the peak of investments it had reached in the mid -1980s, nor have government investments in developing countries—barring a few notable exceptions of Brazil and China- increased anywhere near needed to increase agricultural productivity on a sustained basis. Forests and the “degraded lands” are battlegrounds in the food and energy insecurity nexus going forward. As energy prices have risen and moved closer together with food prices, incentives to deforest to produce biofuels have strengthened. Experts have considered the damaging impacts of the diversion of land and grains/oilseeds on the food consumption of the world’s poor greater than any foreign aid program could compensate, stressing the importance of avoiding diverting food crops and land used for them, away from food to energy production. EU has imposed a ceiling of 5 percent in the use of food crops in the first generation of biofuels. Such policies are not evident in the US. Most of Asia has already reached the limits of land and water use in the agricultural sector. While increasing its own efficiency of land and water resources, the Asian continent has already turned to and would continue to turn to global markets for food and forest products. North America and Europe hold the dominant shares of world trade in food, agriculture and forestry. Latin America and Africa, where “surplus” land currently exists are beginning to play a growing role, Latin America in food and agricultural exports, and Africa, which is still at an early stage of development, in the so-called “ land grab”. Or direct foreign investment in land, both prompted by high prices of food and energy. What the future holds is unclear. Some (World Bank 2009) have suggested that Latin America has perhaps better prospects of meeting the growing world food demand due to its more developed infrastructure, institutions and market integration than SSA. In any case, investing in agricultural research and development, which continues to be a neglected area by government policy is of highest priority for all governments, if reliance on international food trade is not to increase, due to domestic food production failures. Climate change has increased the already high market risks to food and agriculture, calling for redoubling of effort to invest in agricultural research and development, to improve domestic agricultural policies and institutions including particularly introducing clarity in land, water and tree tenure rights as an important way of improving governance.
17
Forests, Fuel wood, Biofuels and Energy Demand
Even though energy consumption has been growing rapidly in developing countries as incomes grow, there continues to remain a huge gap in per capita energy consumption between developed and developing countries and within countries among the rich and the poor. All developing countries have experienced increased energy efficiency. Yet, energy consumption in developing countries is likely to continue to increase rapidly as an essential element of development. Therefore, increasing energy efficiency further and shifting to cleaner sources of energy is of high priority. Fuel wood is a major source of degradation and eventual deforestation in the areas of poverty as charcoal becomes a thriving industry in forest areas including those with, but not confined to, easy access to urban centres. Some 3 billion people are dependent on fuel wood and there is clear evidence that regions with the greatest incidence of poverty, most notably Sub-Saharan Africa and low income households in Asia, are the most dependent on fuel wood. Fuel wood uses have multiple downsides—not only of forest degradation and deforestation but of use of long hours by women in fetching fuel wood, respiratory diseases from smoke inhalation among women and children and GHG emissions. At the same time agro-forestry has multiple benefits of improving soils, providing fodder and other by-products and stabilizing and enhancing the quality of natural resources. The implication is an urgent need to promote agro forestry and alternative sources of clean energy—such as hydropower, or solar energy-cook stoves, or individual and community forest plantations that provide an assured supply of wood and coal for clean stoves. Despite known solutions and many boutique examples of successful use of solar or alternative energy, particularly in Asia, there appears to have been very little scaled up spread of alternative energy in rural areas (with perhaps the possible exception of China) as a way to reduce forest degradation and deforestation. In rural Africa, there seem to be fewer options outside of the forest sector for energy. The world energy consumption is still dominated by fossil fuels and coal, two major sources of GHG emissions, thanks to subsidies and access, even though alternative forms of energy are making headway, albeit from a small initial base. Total energy consumption increased most rapidly in Asia, particularly in China, although energy efficiency measured in terms of energy use with respect per capita income has also increased in many parts of the world. The substantial progress made on alternative sources of energy, e.g. in solar
18
and wind energy, in Europe and the US and China, has brought down energy prices. Such clean energy development in advanced countries will benefit developing countries in due course although currently its expansion is constrained by initial capital costs. Yet innovation in clean energy sector received a major setback as a result of the fiscal challenges in OECD countries following the global economic recession. Technological changes in gas exploration is bringing down energy prices in the US and may eventually do the same in the rest of the world but the technology remains controversial and its potential impacts are as yet speculative. These new opportunities must be considered in the context of the “black-swans”, in the energy sector, (the Tsunami and the earthquake in Japan, the Arab Spring and the technological innovation in gas fracking which is changing the political and economic dynamics of nuclear, oil and gas technologies). They make predicting the prospects for the use of cleaner alternative energy sources on a large scale in developing countries difficult. And yet the potential to reduce pressure on forests is enormous. Forests and Mining
Mining is a growing industry and will likely remain so. Many minerals are found in forest rich areas with substantial indigenous populations. Impacts of small scale artisanal mining on forest are believed to be limited and location specific. Those of large scale mining raise questions of benefit sharing among affected population and long term environmental impacts; appropriateness of legislation that ensures transparency and accountability including adequate compensation to those affected needs to be in place. International agencies such as the World Bank have concluded that they have a role to play in assisting developing countries in the exploitation of minerals and coal (e.g. in South Africa) while minimizing the adverse impacts the environment and affected populations. Forests and Health
Three types of interactions between forests and health are evident. Forest biodiversity—both in the form of plants, birds and animals is a major source of food security and medicines as well as of poaching and crime, not just for the populations directly dependent on forests, but in the urban areas of developed and developing countries, many of which depend on the medicinal/pharmaceutical values on a large scale. Close access to forests is also a source of spread of zoonotic diseases. There is considerable evidence that increased interactions between human populations and forests including forest fragments are leading to the spread of disease. Urbanization and
19
reduced access to forests seems to reduce this risk. Areas needing future work include information and knowledge about forests and health, and in benefit sharing of the intellectual property with regard to the values of biodiversity found in rich tropical forests.
Forests and Transport
Impacts of transportation routes on deforestation are well documented, particularly of roads. Development of roads needs to take these impacts into account in planning their placement as well perhaps of shifting from heavy reliance of roads relative to railroads, not to mention the indirect impacts of road traffic expansion on fossil fuel consumption. Forest Tenure
The trend toward forest privatization and tenure devolution to communities and local councils has been significant in the last 20 years, especially in Latin America. However, the trend seems to be slowing down in the last years. The new interest for lands, following the 2008’s food crisis, the high price of minerals and the new technologies allowing extracting oil and gases in difficult places and profitable conditions, have prompted governments to keep the control over forest lands, in order to foster economic development though agribusiness and extractive industries. Community forestry, the institutional innovation of the 90’s, has achieved mixed results. They are quite positive in Latin America, even for joint management of protected areas, but contrast with poor results in Africa. In Asia, the environmental outcomes of community forestry are heterogeneous, and in South East Asia, many community forests have been abandoned in favour of integration with oil palm plantations schemes (sometimes in nucleus estate schemes). In Central Africa, the few experiments in community forests have been very deceptive, with their being embedded in illegal exploitation networks and their capture by the elites. One lesson derived from such mixed results, is that the institutional instrument or the tenure category are not a panacea, and the interaction with the prevailing culture, historical pathways, demographic structures and governance can create heterogeneous situations. Large scale forest concessions, a legacy of the colonial era, are under pressure from agriculture and small-scale enterprises in areas with fast population-growth they tend to be downsized or to be removed. On the other hand, in many areas of low population densities, the forest concessions are structuring the territories, and providing some services which national or local governments are unable to supply. Small-scale enterprises are generally unviable in such low-density areas with high costs for accessing the markets, and large concessions still have a future there –unless they are encroached by mines or extensive crop plantations estates. All things being equal the

20
FLEGT initiatives will tend to back, the concessions regimes – notably in Africa - since these large companies could more easily comply with the legal verification requirements. It seems difficult to provide incentives to local populations to maintain forests without recognising their tenure rights on the lands they use. Paying for environmental services under REDD+ schemes entails a contractual responsibility over an area, which, in turn, calls for recognition of rights (at least, exclusive rights). Another REDD+ strategy could be the expansion of protected areas. But in the contexts of growing rural populations, it is unlikely that such protected areas can be sustainable, unless they are based on some recognition of the communities’ tenure rights (at the exclusion or full ownership), joint management and some kind of incentives to accept the restriction of land use rights associated with the protection status. Recognitions of tenure rights and associated economic benefits can be one dimension of these incentives. In addition, identifying, mapping and registering collective forest land tenure will help in preventing large-scale land acquisitions, compared to a situation when the State is, legally or presumably, the only land owner. Devolving rights does not mean less government in the forest. Community-based management is increasingly thwarted by the heterogeneity of forest users, consequences of people’s voluntary and involuntary migrations, more accepted or undergone by the native communities. Given growing scarcity of land conflicts are unavoidable, and they may result in external interventions. REDD+: the New “Silver Bullet”?
Will REDD+ be the “silver bullet” the international community was eagerly looking for to stop the deforestation process on a global scale? REDD+ has been developed as a “positive incentive” to compensate countries for reducing emissions from deforestation and forest degradation, with an assumption that this will lead to development pathways towards sustainable land use. REDD+ is a positive incentive instrument by design, and not a cap-and-trade instrument, due to its voluntary nature (meaning developing countries choose to participate in it) and the “no-liability” design, meaning that there are no sanctions for participating countries that do not reduce, or even increase, emissions. Not being bound to a cap-and-trade type system the question of REDD+ architecture is remains open, and should be determined by the most cost-effective method of reaching the objectives of REDD+. REDD+ is praised for its “performance-based” dimension (payments are conditioned upon verified results in emissions reduction from deforestation and degradation and proportioned to them), and are opposed to more
21
traditional approaches where financial transfers were associated with the design of nationals plans (typically the National Forest Action Plans) without regard to the results. The second feature making REDD+ attractive is the non-intervention principle that respects sovereignty: REDD+ countries are free to decide which means they will use for achieving their targets. It represents a shift from approaches based on “conditionality”, in which disbursements were released only if certain public policy actions and legal measures were taken. Such an approach, often associated with the “structural adjustment” periods under the auspices of the IMF and the World Bank, is seen as preventing the ownership of reforms – adopted under “external pressure” – and, therefore, with limited effectiveness. REDD+’s Huge Implementation Challenges
However, such attractive features are facing huge implementation challenges and the ambition exhibited at the inception of REDD+ in 2005 is clouded by the mounting doubts about the workability of the mechanism. The design of the mechanism raises concerns about its capacity to deliver effective and permanent emission reductions, due notably to the potential arbitrary choice of the “reference”, i.e. the level of emissions against which the reduction will be calculated. As for the CDM, the REDD+ mechanism rests on the creation of “business-as-usual “scenarios, which by definition are impossible to verify (if the programme is implemented, then the reference scenario cannot be checked for validity), and thus subject to manipulation. Therefore, the risk of massive “hot air” creation, weakening carbon prices already laminated is real and is a major source of concern for the EU, which has decided not to accept any forest carbon credits (from CDM or REDD+) at least until 2020. REDD+ is questioned from the perspective of environmental integrity but also for it potential impact on local communities and indigenous people who might lose some critical access rights if governments decide to create new protected area that deprives resources users of most of their rights in the name of “reducing emissions”. In the international negotiations the difficulty to move, from principles agreed upon by countries to an operational mechanism with precise rules, highlights the gap between simple ideas based on the economic theories of “rational choices” and “incentives” on which REDD+ has been based, and the complexity of dealing with national decision processes and the effects of globalization that increase land demand and foster displacements of land uses. The principle of basing payments on measurable “performance” in reducing emissions from deforestation (i.e. quantified reductions on a given period of time against an agreed reference level), is not really workable when countries face severe institutional dysfunctions of a variety of kind which limit the effectiveness of the government and the reach of public interventions.
22
A growing amount of evidence shows that before performance-based payments become practicable, there is a need to invest over a long period and work along with governments to create the necessary conditions for tackling the drivers of deforestation, and sometimes it is about rebuilding national institutions which have deteriorated over time– not a swift and cheap action. The ambition, once exhibited, to shift from an “old” to a “new” principle of international cooperation is stumbling on the issue of local governance, “fragile states” and the limited reach of national public policies including external factors linked to liberalized and globalized markets. There is currently a growing awareness of such limitations, and, without abandoning the principle of designing a “performance-based” payments mechanism, reflections are developing on the possibility to widen the scope of acknowledging “performance”, linking them with a process (with milestones and “proxies”) and not only to a measurable output in term of emission reductions. In sum, the “REDD+ community” is following the same pathway the aid community has taken two decades ago about the concept of conditioning aid to performances, under the so-called “output-based aid”. In the ODA (Official Development Assistance) case, the concept of “performance-based aid” has remained more an ambition than a reality, even though it has been helpful for better understanding the obstacles on development and designing more effective aid policies. No “Quick-and-Cheap” Solution
Whatever the architecture finally decided, it seems more and more clear that REDD+ will not be a “quick and cheap” mean for curbing global greenhouse gases emissions. The “performance-based” remuneration principle, the expected comparative advantage of this incentive instrument, will prove to be hardly workable in the majority of potential REDD+ countries, characterized by ill-functioning institutions, poor governance quality and limited reach of the public action. Perhaps the only country where payments for performance would prove workable, would be Brazil, where national policies has been effective for curbing deforestation (even though not all the “performance” is attributable to the intentional action of the government, making the decrease of deforestation at least partially reversible). But Brazil’s case has also shown that financial incentives have not been decisive for adopting policies tackling deforestation: the balance of social forces has been moved in favor of forests’ protectors (especially for the indigenous populations and national ambition of Brazil to be recognized as a global power called for building up an environmental credibility vis-à-vis the rest of the world. If political will to tackle deforestation is related to the need to build up credibility (at both national and international level), incentives can be useful for helping committed politicians to justify their decisions in favor of forest protection and to circumvent vested interests; but conceived as such, it seems clear such incentives should not be necessarily in financial terms (joint and sustained investments for “greening” the
23
economy and tackling the drivers of deforestation would certainly be more useful) for “performance” in emission reductions which does not depend entirely of the governments’ action.
Implications of Forest’s Cross-Sectorial Linkages Going Forward
REDD+ as currently conceived and implemented is narrow in its focus, has been facing huge implementation challenges and is not workable when countries lack “just in time” information and face severe institutional dysfunction. Performance based aid is more an ambition than a reality in most developing countries barring exceptions of a few middle income countries such as Brazil, China, Turkey, India or Vietnam. In the least developed countries finances are less a problem than political will and institutional capacity although external finance has not been forthcoming to do the right things, i.e., for building internal capacity. In the more advanced countries the finances are not large enough to compensate countries for the opportunity cost of land. There are more useful and likely effective ways to proceed if the purpose is to improve outcomes in the forest sector over a long haul. This calls for a wider rural development strategy including: 1. An urgent need to improve global data sets on land use changes on a routine “just in time” basis. Brazil’s example shows that the developing world has the capacity to extend this know-how to international organizations and other developing countries but this potential is currently not sufficiently exploited.9 2. Strategy and implementation of agricultural intensification and broad based economic development since it gets people out of poverty and extensive agriculture. To avoid the “rebound effect” of increased agricultural profitability on deforestation, countries should simultaneously introduce policies to contain forest conversion, such as the use of PES in the forest frontier areas. Yet at the global level, net deforestation/land use changes may be unavoidable since global food supply will equate with food demand, the precise extent of deforestation depending on the nature, extent and location of technical change in agriculture. 3. The twin objectives of food security and avoided deforestation need to go hand in hand. Without achieving food security for all any efforts at avoided deforestation would be ineffective. Agriculture and deforestation agendas should not only be interconnected but merged through a landscape approach. This will require a very different approach to
9 An example may be the FAO -INPE/FUNCATE support to DRC National Forest Monitoring system to be linked with the INPE
platform Terra Congo named after Terra Amazon.
24
planning and implementation of natural resources than the current sector based approaches which operate in silos. 4. An effective energy policy needs to promote agro-forestry to increase fuel wood supply while also adopting strategies that will get the poor out of poverty and reduce their fuel wood consumption in favor of clean energy including hydropower, solar and wind power. Options in Africa may be limited to wood plantations, SFM, improved charcoal making. Elsewhere widespread use of electricity, solar power or LNG will also help promote education of children. 5. Secure land tenure will likely have ambiguous effects on deforestation. Yet any incentive policy for tackling deforestation, such as PES, would have to rest on tenure security, a condition for liability, including strengthening of administrative and judicial institutions. New protected areas should be accompanied by recognition of customary land rights, as a basis for joint management and benefits sharing of the conservation and the sustainable use of the forest resources. 6. A transportation strategy should help shift from road to rail transport, stricter emission standards, reduced subsidies to dirty fuels and more active incentives for innovation which will shift energy consumption to clean energy. 7. A population and health strategy should focus on information and knowledge about the interactions between forests and health and benefit sharing of biodiversity among those most dependent on forest products. Investing in health care of pregnant women and newborn children would help diminish infant mortality while also contributing to incentives to reduce birth rates. 8. An education strategy focusing particularly on girl’s education will increase the opportunity cost of women’s labor in fuel wood gathering, spur reduction in population growth rates and promote demographic transitions. 9. The rapid growth of private investment, calls for a global strategy towards the corporate sector which ensures consumer and civil society involvement such that private investments are undertaken in a transparent and accountable manner and social and environmental outcomes become an integral part of routine corporate social accountability. Instruments such as (certifications, Round Table, labeling) have become popular and are hopefully leading to improved forest management on a significant scale. 10. A global policy environment which eliminates subsidies for biofuels in OECD countries eliminates subsidies for oil generally and introduces transparency and
25
accountability among all nations to ensure growth outcomes are socially equitable and environmentally sustainable on a global scale.
Introduction
When countries develop they undergo substantial changes associated with structural transformation of economies with several characteristics: (1) declining share of GDP originating in agriculture and forestry, (2) declining share of employment in agriculture and forestry, (3) rural-urban migration, (4) growth of the services and the manufacturing sectors and (5) a demographic transition with reduction in the population growth rates. Differences in labor productivity between the agricultural/forestry/rural sector and non -agricultural sectors narrow as countries develop whereas at early stages of development, there is often a huge and even a widening gap in productivities between sectors. The difference between the typically large share of employment in traditional agriculture and forestry and their much smaller share in GDP at early stages reflects the magnitude of rural poverty. The rural –urban divide begins to narrow as rural poverty is eliminated over time (Lele et al 2011b). Drawing on the works of several analysts, Hertel describes the changes in land use, from predominantly natural ecosystems with hunting and gathering as the primary sources of food and fuel to subsistence farming followed by intensive agriculture and urbanization of most of the population (Hertel 2011 & 2012). The mosaic of land uses include a combination of agriculture, natural and planted forests, forest areas set aside for biodiversity protection and ecosystem functions (such as watershed protection), and recreational uses. They include public and private forests established for timber production, community forests, including but not confined to the uses by indigenous peoples, and increased uses of land for agriculture to meet the growing food demand of the urban population. But as agriculture and forestry eventually decline in importance some of the agricultural land goes back to secondary forests with loss of some biodiversity. Payments for environmental services (PES) to protect ecosystem functions become an important part of this nexus as urban consumer demand for water, food and environmental quality increases with increased incomes and governments have the resources to invest in PES programs. During the course of transformation developing countries also invest in energy, transportation and communications needed for the growth of the service and manufacturing sectors. The massive expansion in agricultural production, energy, transport, and urban systems leads to new sources of deforestation and but also offers opportunities for reforestation. Each produces associated environmental and human impacts that are both positive and negative. The two way impacts of deforestation and reforestation associated with structural transformation are numerous, and many are quite site and country specific although some general outcomes are discernible. For
26
example, using one measure, the share of developing countries in global emission has increased with economic development in recent years and their total emissions are now larger than the emissions of OECD countries although their energy efficiency (when measured in terms of energy used per ’000 $) has also been increasing.10 Growth in global CO2 emissions from energy use continued in 2011, but at a slower rate than in 2010. Beyond these changes within countries, external factors have become more important. The accelerated speed of globalization and the recent food and energy price rises, volatility and the financial crisis have added to land use changes; for example, growth in global trade in food and forestry products has increased since 2007-2008 together with concerns about food and energy security and their impacts and implications for the future land use changes (including lands under forests, pastures) as well as for food insecurity of the poor and climate change. Among these, biofuels are clearly a wild card. With technological possibilities and policies in the energy sector they could affect croplands, grasslands, permanent crops and forests in a profound way (Hertel 2011 & 2012). Furthermore, “food-competing biofuels can do more harm to the welfare of the poor and landless, globally, than the greatest conceivable aid efforts or productivity increases could compensate” (Wright 2012). Yet their potential long term impacts must be seen in the context of the kinds of “black swans” which change long term structural changes in energy outlook, e.g. the tumultuous events of the ‘Arab Spring’ which disrupted oil supplies, the earthquake and tsunami in Japan which changed public opinion towards nuclear power, and the revolution in shale gas production in the US, which resulted in record discounts in US oil prices after hitting an all-time record high. Climate change and its impacts on agriculture and forests is an added dimension. The key question then is not just how to how to pursue growth and prosperity without causing further damage to the environment including to and from forests. Forest carbon was estimated to contribute 17 percent of the share of GHG emissions and agriculture was 14 percent in 2005. Forest carbon is now estimated to have declined to 9 percent (reported by Global Carbon Budget 2012) for good and bad reasons: in part due to slowing forest emissions and in part due to growing emissions from fossil fuels, which signifies that global action on fossil fuel emissions is not making sufficient progress (Figure 1.1a and 1.2). All the forest related GHG emissions from developing countries come from land use changes. In low income countries GHG emissions (at an average of 2 tons CO2 equivalent) are nearly a third of the emissions of middle income countries (6 tons per capita GHG emissions). Fifty percent from land-use change and forestry and 20 percent from agriculture of emissions in low income countries come from land use
10 All of the net growth in energy in 2011 took place in emerging economies, with China alone accounting for 71 percent of global
energy consumption growth. OECD consumption declined, led by a sharp decline in Japan – in volumetric terms, the world’s largest
decline.
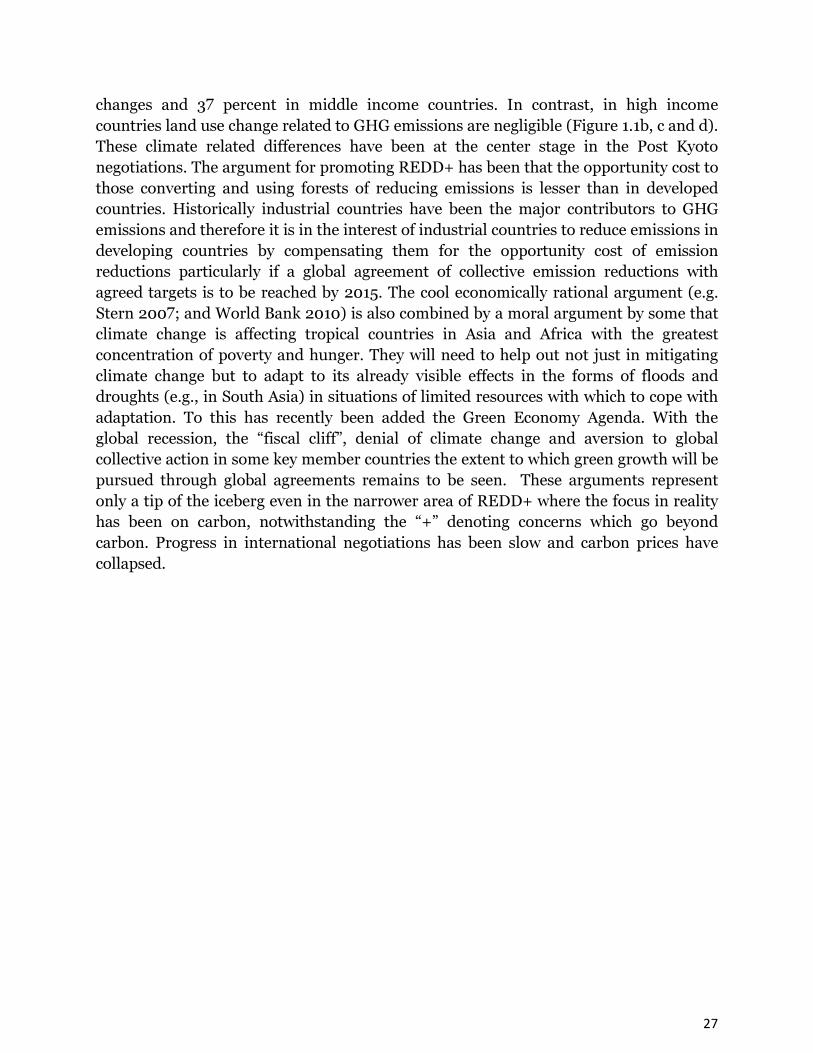
27
changes and 37 percent in middle income countries. In contrast, in high income countries land use change related to GHG emissions are negligible (Figure 1.1b, c and d). These climate related differences have been at the center stage in the Post Kyoto negotiations. The argument for promoting REDD+ has been that the opportunity cost to those converting and using forests of reducing emissions is lesser than in developed countries. Historically industrial countries have been the major contributors to GHG emissions and therefore it is in the interest of industrial countries to reduce emissions in developing countries by compensating them for the opportunity cost of emission reductions particularly if a global agreement of collective emission reductions with agreed targets is to be reached by 2015. The cool economically rational argument (e.g. Stern 2007; and World Bank 2010) is also combined by a moral argument by some that climate change is affecting tropical countries in Asia and Africa with the greatest concentration of poverty and hunger. They will need to help out not just in mitigating climate change but to adapt to its already visible effects in the forms of floods and droughts (e.g., in South Asia) in situations of limited resources with which to cope with adaptation. To this has recently been added the Green Economy Agenda. With the global recession, the “fiscal cliff”, denial of climate change and aversion to global collective action in some key member countries the extent to which green growth will be pursued through global agreements remains to be seen. These arguments represent only a tip of the iceberg even in the narrower area of REDD+ where the focus in reality has been on carbon, notwithstanding the “+” denoting concerns which go beyond carbon. Progress in international negotiations has been slow and carbon prices have collapsed.
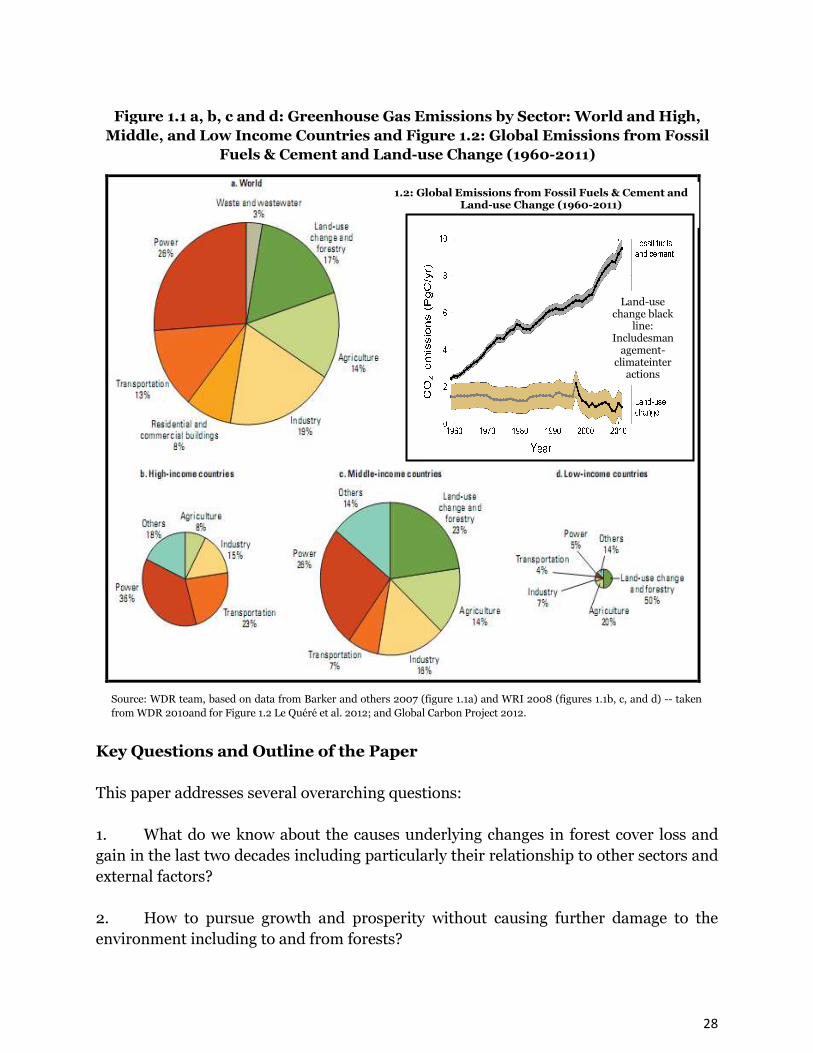
28
Key Questions and Outline of the Paper
This paper addresses several overarching questions: 1. What do we know about the causes underlying changes in forest cover loss and gain in the last two decades including particularly their relationship to other sectors and external factors? 2. How to pursue growth and prosperity without causing further damage to the environment including to and from forests?
Figure 1.1 a, b, c and d: Greenhouse Gas Emissions by Sector: World and High,
Middle, and Low Income Countries and Figure 1.2: Global Emissions from Fossil
Fuels & Cement and Land-use Change (1960-2011)
1.2: Global Emissions from Fossil Fuels & Cement and Land-use Change (1960-2011)
Land-use change black
line: Includesman
agement-climateinter
actions
Source: WDR team, based on data from Barker and others 2007 (figure 1.1a) and WRI 2008 (figures 1.1b, c, and d) -- taken
from WDR 2010and for Figure 1.2 Le Quéré et al. 2012; and Global Carbon Project 2012.
29
3. How would forests fare in the course of economic development in the future given the dramatic changes in the global context in the last two decades? 4. What are the implications of what we know (and do not know) for policies and investments for more pro-forest outcomes going forward?
The paper presents a picture of changes in forest cover and its many and varied linkages with other sectors of the economy at different stages of development at multiple levels ranging from the global to local. It offers no silver bullets but rather a way of looking at the role of forests with their multiple and changing functions. Using quite diverse sets of data, evidence and analytical methods and drawing on evidence from a number of studies, its purpose is to illustrate the diversity and richness of insights that can be derived from an eclectic approach for policy making and institutional choices going forward at many levels. The paper is organized as follows: Section 1 reviews the global record of forest cover changes over the 1990-2010 periods, particularly the good news of the deceleration in the rate of forest loss from higher rates in the preceding decade. It naturally raises questions of the causes underlying these changes and their lessons. Section 2 reviews unprecedented economic growth performance of developing countries over the same period in the context of which this deceleration has occurred. Section 3 explores at the global level the various hypotheses/drivers of forest cover loss in 32 countries,11 using an econometric approach to examine the role of factors such as the initial size of the forest, the level of economic development, and changes in total agricultural factor productivity growth, among others. Section 4 sets out the radically changed global context, reflected in 20 global trends in the last two decades. Section 5 further explores the large share of the variation explained by size of the initial forest cover and the level of economic development as reflected in per capita income, first at the general level based on the evidence on the drivers of deforestation and then by discussing case studies of Brazil, Indonesia and the Congo Basin, each of which have experienced the most loss and which offer new evidence on the drivers of deforestation as well as on the role of governance. The evidence suggests that factors driving deforestation are not just country specific but period specific. The paper then explores interactions between deforestation and reforestation between water, energy, transport, mining, and health. New Instruments for financing forests are discussed next in light of this evidence, including the concepts
11 Those 35 countries explained 92 percent of the forest area loss globally in 1990-2010--Angola, Argentina, Australia, Bolivia
(Plurinational State of), Botswana, Brazil, Cambodia, Cameroon, Chad, Colombia, Democratic People's Republic of Korea,
Democratic Republic of the Congo, Ecuador, Ethiopia, Ghana, Honduras, Indonesia, Lao People's Democratic Republic, Malaysia,
Mali, Mexico, Mongolia, Mozambique, Myanmar, Nigeria, Papua New Guinea, Paraguay, Peru, Somalia, Sudan, Uganda, United
Republic of Tanzania, Venezuela (Bolivarian Republic of), Zambia and Zimbabwe. Here, for our econometric analysis we have taken
32 countries excluding Democratic People's Republic of Korea, Myanmar and Somalia because of data unavailability.

30
underlying Payments for Environmental Services, Land Tenure and Deforestation and Market Based Institutions. The paper ends with a discussion of opportunities and challenges including Expectations and Realities of Incentives, Externalities, Governance, Rule of Law, Financial, Human and Institutional Resources and Conclusions and Recommendations. A Record of Forest Cover Loss Gain and Changes in Other Forest Values
Over the 1990-2010 Periods
At the global level forest cover loss slowed in the decade of the 2000 and more forest and tree cover was gained compared to the previous decade. According to FAO, forest loss without taking into account the additional information on afforestation and on natural expansion of forest declined from 12.4 million hectares per year in the decade of the 1990s to 10.2 million per year in the first decade of the new millennium.12 A total of 35 countries explained 92 percent of the loss in each decade. Whereas the number of countries contributing to the loss remained mostly the same as the previous period13 the loss was smaller, most notably in the two large countries, Brazil and Indonesia, which together had lost 48 million hectares and contributed 39 percent of the total loss in the 1990s. In the 2000s they had lost 31 million hectares and contributed 31 percent of total loss. Whereas all those losing forest in the 1990s were developing countries, a notable exception in the post 2000 period was Australia, a developed country, which ranked second among those losing forest cover. The reduced rate of loss or the gain in others reported below does not take into account the extent of forest degradation or fully reliable estimates of the continued large dependence on fuel wood as a source of energy in developing countries, most notably in Sub-Saharan Africa and Asia where poverty dominates, or watersheds are lost or threatened, excessive groundwater exploitation
12 We have estimated those values from FRA 2010 datasheet by taking the Forest area data for different years (1990, 2000 and 2010)
for 233 countries and then calculated the change in area of forest for each country and got the values of total forest loss and gain
globally by summing up the set of countries which have lost and gained their forested area respectively. But according to FRA 2010
Report-- At the global level, it decreased from an estimated 16 million hectares per year in the 1990s to around 13 million hectares
per year in the last decade; where earlier only 13 million hectares/year was reported for 1990-2000 (FRA Report 2005, FAO 2006).
The 3 million hectares/year ex-post expansion was explained as follows—Previous figures underestimated the global deforestation
rate for the 1990s-- FRA 2010, like FRA 2005, did not directly compile data on deforestation rates because few countries have this
information. In FRA 2005 the global deforestation rate was estimated from net changes in forest area Additional information on
afforestation and on natural expansion of forest for the past 20 years has now made it possible to also take into account
deforestation within those countries that have had an overall net gain in forest area. As a result, the revised estimate of the global
rate of deforestation and loss from natural causes for 1990–2000 (close to 16 million hectares per year) is higher, but more accurate,
than was estimated in FRA 2005 (13 million hectares per year) ( FRA Report 2010, page 22, FAO 2010).
13 33 countries are the same in both periods (those are –Angola, Argentina, Bolivia (Plurinational State of), Botswana, Brazil,
Cambodia, Cameroon, Chad, Colombia, Democratic People's Republic of Korea, Democratic Republic of the Congo, Ecuador,
Ethiopia, Ghana, Honduras, Indonesia, Lao People's Democratic Republic, Malaysia, Mali, Mexico, Mongolia, Mozambique,
Myanmar, Nigeria, Papua New Guinea, Paraguay, Peru, Somalia, Uganda, United Republic of Tanzania, Venezuela (Bolivarian
Republic of), Zambia and Zimbabwe) apart from Nepal and Sudan in 1990-2000 and Australia and Namibia in 2000-2010.

31
exists, and increased salinity occurs. These issues are discussed in the later sections. Yet a question remains: what may explain the forest cover changes? Eighteen countries14 gained forest cover, together explaining over 90 percent of the total gain. The biggest gain in forest cover in the 1990s was in China, which gained nearly 20 million hectares, nearly half of the global gains in forest cover. Whereas developed countries showed significant forest gain, the notable feature was that a number of large middle and lower middle income developing countries were among the gainers-- Vietnam, India and the Philippines in Asia. Several, such as Chile and Cuba in the American hemisphere, which gained forest cover in the 1990s, maintained or improved their position in the post 2000 period. Turkey joined the ranks of gainers. However, most forest loss continued to take place in countries and areas in the tropical regions, while most of the gain took place in the temperate and boreal zones and in some emerging economies. Beyond forest cover, there is evidence that tree cover outside forests also increased (Garrity et al 2010). Tree cover is now greater than 10 percent on over half of the world’s farmland. In some regions, tree cover is 30 percent. The term “evergreen” coined by Swaminathan and others has been defined by ICRAF to mean that a green cover is maintained throughout the year. “Evergreen agriculture” is one of several types of agroforestry. The growing forest and tree cover has been accompanied by substantial growth in payment for environmental services, particularly in middle income developing countries, again, the largest among them being in China, discussed in the section on Payments for Environmental Services. Most of these are funded by resources of developing countries themselves to protect ecosystem functions, e.g., biodiversity, soil and water protection, social and cultural values. Unprecedented Record of Economic Growth in Developing Countries as a
Group
The smaller net forest loss in the decade of the new millennium must be seen in the context global economic growth, which is being driven by developing countries. Developing countries are expected to continue to drive global growth and will affect developments in the forest sector. Overall economic growth in developing countries had picked up starting the early 1990s and accelerated further in the post 2000 period (Figure 2a), with a buoyant demand for commodities ranging from minerals, oils and raw materials to agricultural and forest products, and growing international trade
14 13 countries are the same in both periods (those are-- Belarus, Chile, China, Cuba, France, India, Italy, Philippines, Spain, Turkey,
United States of America, Uruguay and Viet Nam) apart from Australia, Finland, Germany, New Zealand and Russian Federation in
1990-2000 and Bulgaria, Greece, Norway, Poland and Sweden in 2000-2010.

32
volumes in agriculture and forest products (Figure 6, 7, 8 and 9).Indeed developing countries in all regions of the world grew more rapidly until 2007-2008 as agricultural and energy prices began to rise in tandem. The United States and Europe were by far the biggest players in agricultural and forestry trade but developing countries had begun to increase their shares (Figure 6, 7, 8 and 9).World economic growth stalled starting 2008 with the global recession (Figure 2b) and a huge drop in merchandise trade volumes as share of GDP (Figure 3), but developing countries continued to grow more rapidly than high income countries (Figure 2a and 2b). Whereas the global economic crisis slowed the high and rising gross domestic capital formation in developing countries, East Asia, led by China, continued to show rising gross domestic capital formation even after the crisis (Figure 4). The volume of trade and foreign direct investment had grown substantially too but slowed after the great recession (Figure 5).
Figure 2a: GDP Growths by Region (constant 2000 US$) (1970-2011) (Base
Year 1970=100)
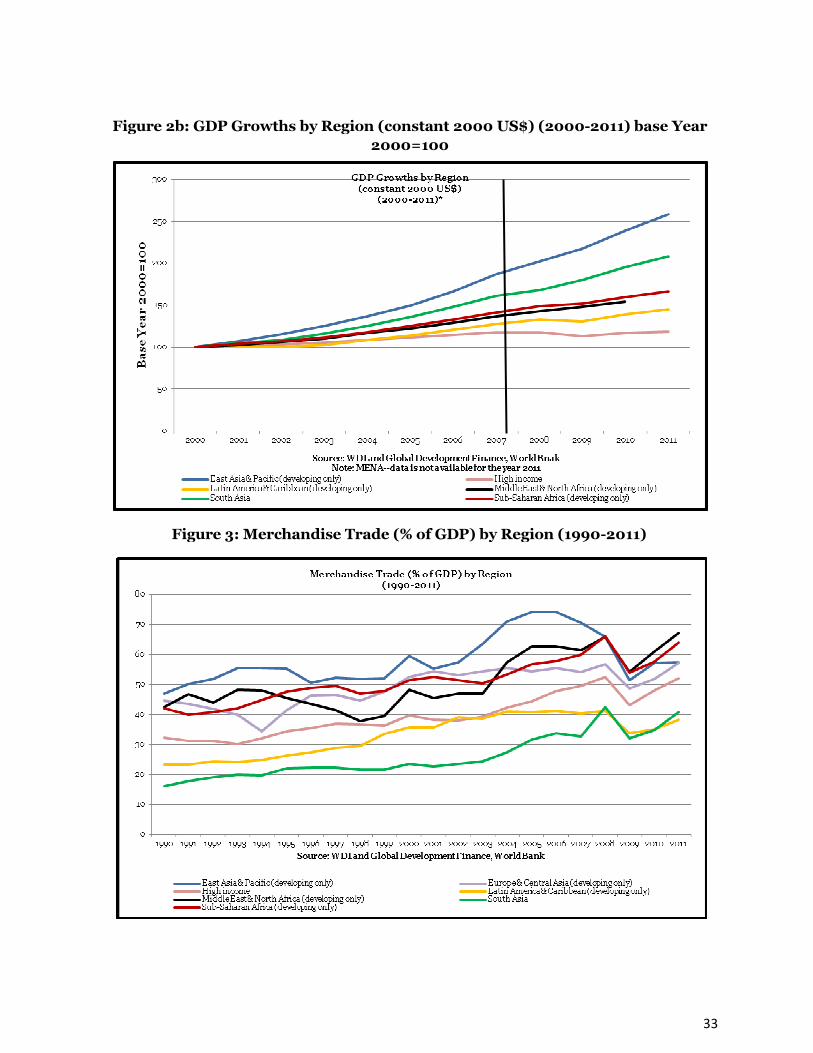
33
Figure 2b: GDP Growths by Region (constant 2000 US$) (2000-2011) base Year
2000=100
Figure 3: Merchandise Trade (% of GDP) by Region (1990-2011)
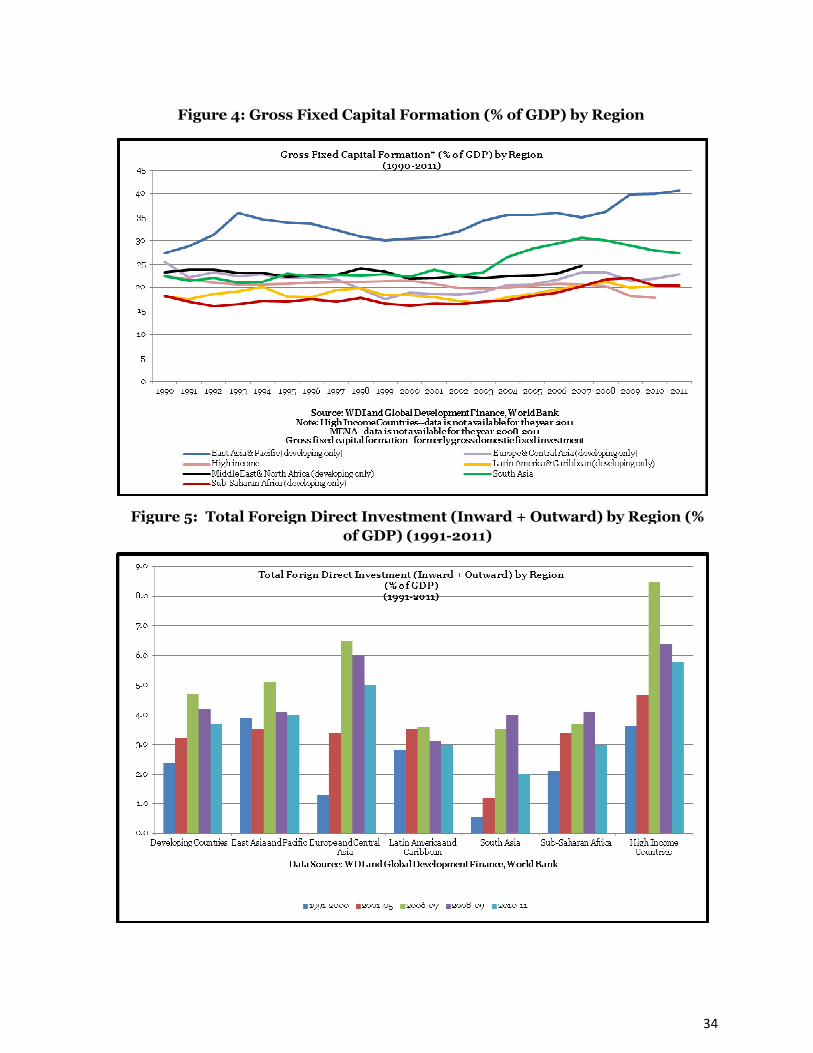
34
Figure 4: Gross Fixed Capital Formation (% of GDP) by Region
(1990-2011)
Figure 5: Total Foreign Direct Investment (Inward + Outward) by Region (%
of GDP) (1991-2011)
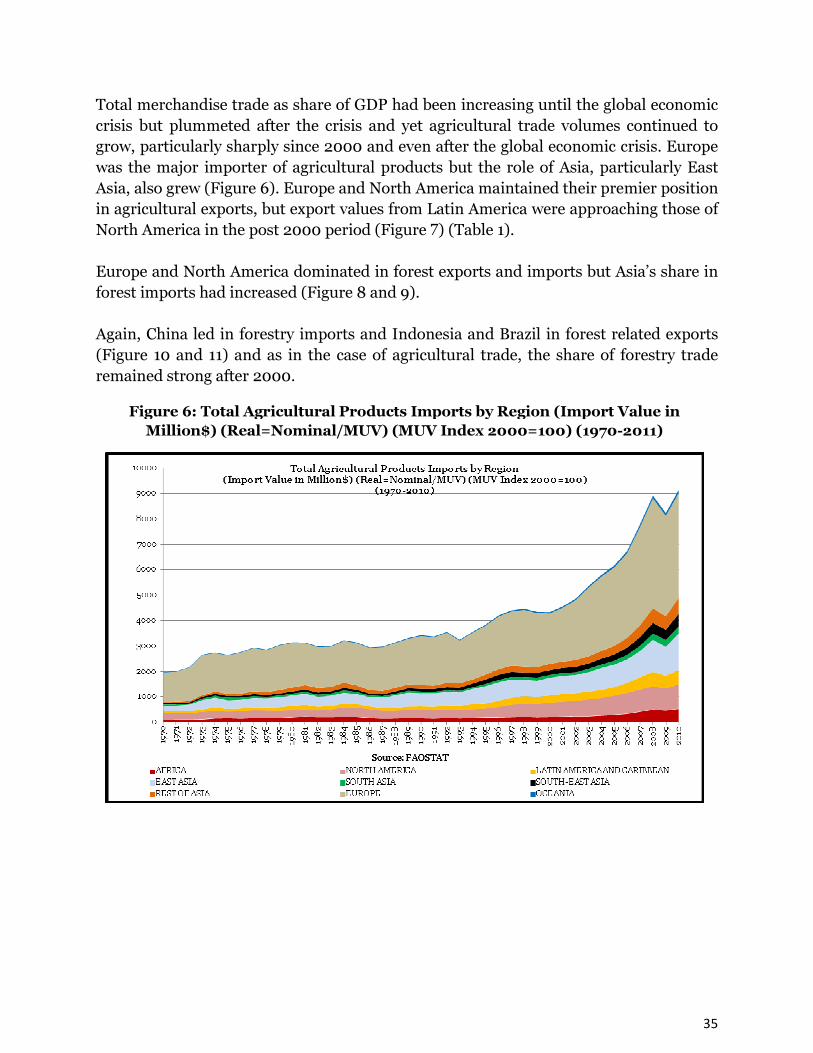
35
Total merchandise trade as share of GDP had been increasing until the global economic crisis but plummeted after the crisis and yet agricultural trade volumes continued to grow, particularly sharply since 2000 and even after the global economic crisis. Europe was the major importer of agricultural products but the role of Asia, particularly East Asia, also grew (Figure 6). Europe and North America maintained their premier position in agricultural exports, but export values from Latin America were approaching those of North America in the post 2000 period (Figure 7) (Table 1). Europe and North America dominated in forest exports and imports but Asia’s share in forest imports had increased (Figure 8 and 9). Again, China led in forestry imports and Indonesia and Brazil in forest related exports (Figure 10 and 11) and as in the case of agricultural trade, the share of forestry trade remained strong after 2000.
Figure 6: Total Agricultural Products Imports by Region (Import Value in
Million$) (Real=Nominal/MUV) (MUV Index 2000=100) (1970-2011)
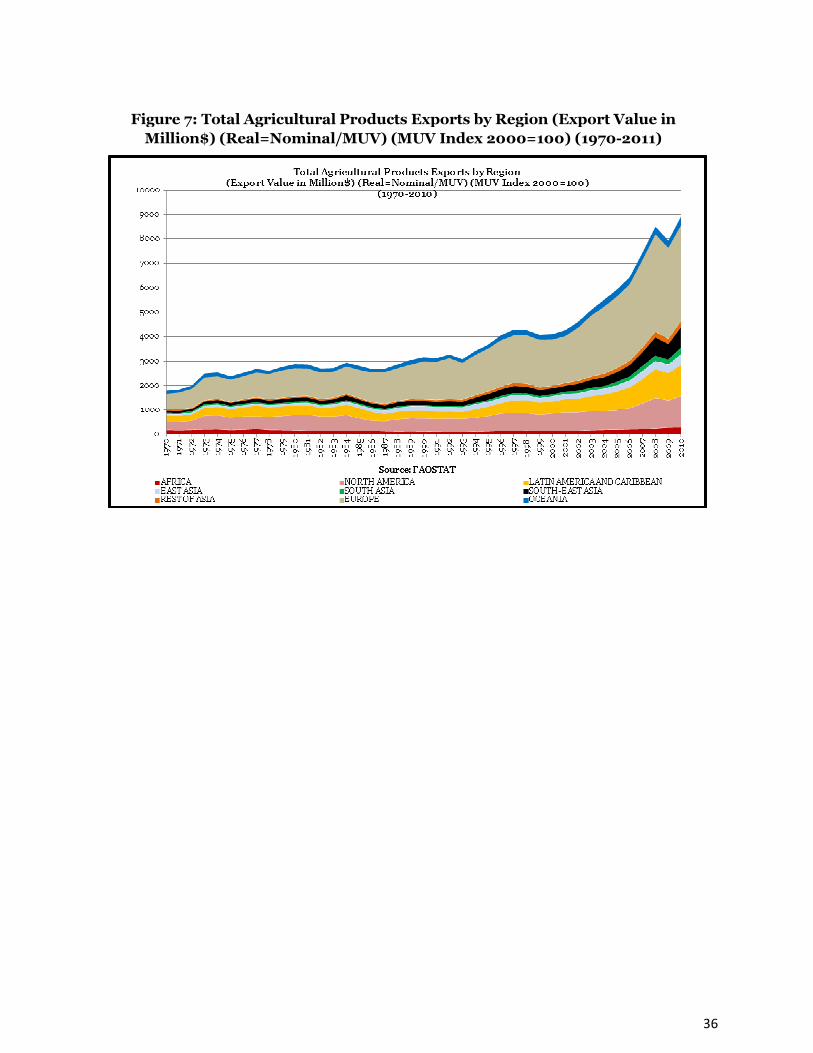
36
Figure 7: Total Agricultural Products Exports by Region (Export Value in
Million$) (Real=Nominal/MUV) (MUV Index 2000=100) (1970-2011)
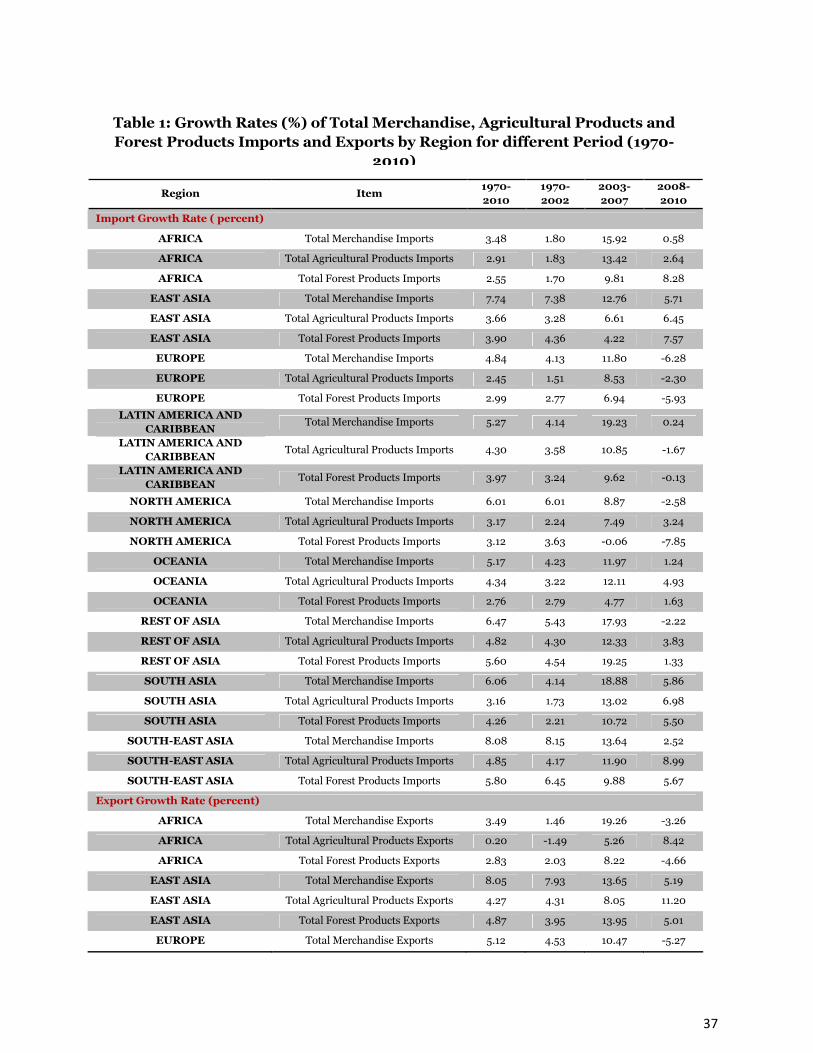
37
Region Item 1970-
2010
1970-
2002
2003-
2007
2008-
2010
Import Growth Rate ( percent)
AFRICA Total Merchandise Imports 3.48 1.80 15.92 0.58
AFRICA Total Agricultural Products Imports 2.91 1.83 13.42 2.64
AFRICA Total Forest Products Imports 2.55 1.70 9.81 8.28
EAST ASIA Total Merchandise Imports 7.74 7.38 12.76 5.71
EAST ASIA Total Agricultural Products Imports 3.66 3.28 6.61 6.45
EAST ASIA Total Forest Products Imports 3.90 4.36 4.22 7.57
EUROPE Total Merchandise Imports 4.84 4.13 11.80 -6.28
EUROPE Total Agricultural Products Imports 2.45 1.51 8.53 -2.30
EUROPE Total Forest Products Imports 2.99 2.77 6.94 -5.93
LATIN AMERICA AND
CARIBBEAN Total Merchandise Imports 5.27 4.14 19.23 0.24
LATIN AMERICA AND
CARIBBEAN Total Agricultural Products Imports 4.30 3.58 10.85 -1.67
LATIN AMERICA AND
CARIBBEAN Total Forest Products Imports 3.97 3.24 9.62 -0.13
NORTH AMERICA Total Merchandise Imports 6.01 6.01 8.87 -2.58
NORTH AMERICA Total Agricultural Products Imports 3.17 2.24 7.49 3.24
NORTH AMERICA Total Forest Products Imports 3.12 3.63 -0.06 -7.85
OCEANIA Total Merchandise Imports 5.17 4.23 11.97 1.24
OCEANIA Total Agricultural Products Imports 4.34 3.22 12.11 4.93
OCEANIA Total Forest Products Imports 2.76 2.79 4.77 1.63
REST OF ASIA Total Merchandise Imports 6.47 5.43 17.93 -2.22
REST OF ASIA Total Agricultural Products Imports 4.82 4.30 12.33 3.83
REST OF ASIA Total Forest Products Imports 5.60 4.54 19.25 1.33
SOUTH ASIA Total Merchandise Imports 6.06 4.14 18.88 5.86
SOUTH ASIA Total Agricultural Products Imports 3.16 1.73 13.02 6.98
SOUTH ASIA Total Forest Products Imports 4.26 2.21 10.72 5.50
SOUTH-EAST ASIA Total Merchandise Imports 8.08 8.15 13.64 2.52
SOUTH-EAST ASIA Total Agricultural Products Imports 4.85 4.17 11.90 8.99
SOUTH-EAST ASIA Total Forest Products Imports 5.80 6.45 9.88 5.67
Export Growth Rate (percent)
AFRICA Total Merchandise Exports 3.49 1.46 19.26 -3.26
AFRICA Total Agricultural Products Exports 0.20 -1.49 5.26 8.42
AFRICA Total Forest Products Exports 2.83 2.03 8.22 -4.66
EAST ASIA Total Merchandise Exports 8.05 7.93 13.65 5.19
EAST ASIA Total Agricultural Products Exports 4.27 4.31 8.05 11.20
EAST ASIA Total Forest Products Exports 4.87 3.95 13.95 5.01
EUROPE Total Merchandise Exports 5.12 4.53 10.47 -5.27
Table 1: Growth Rates (%) of Total Merchandise, Agricultural Products and
Forest Products Imports and Exports by Region for different Period (1970-
2010)
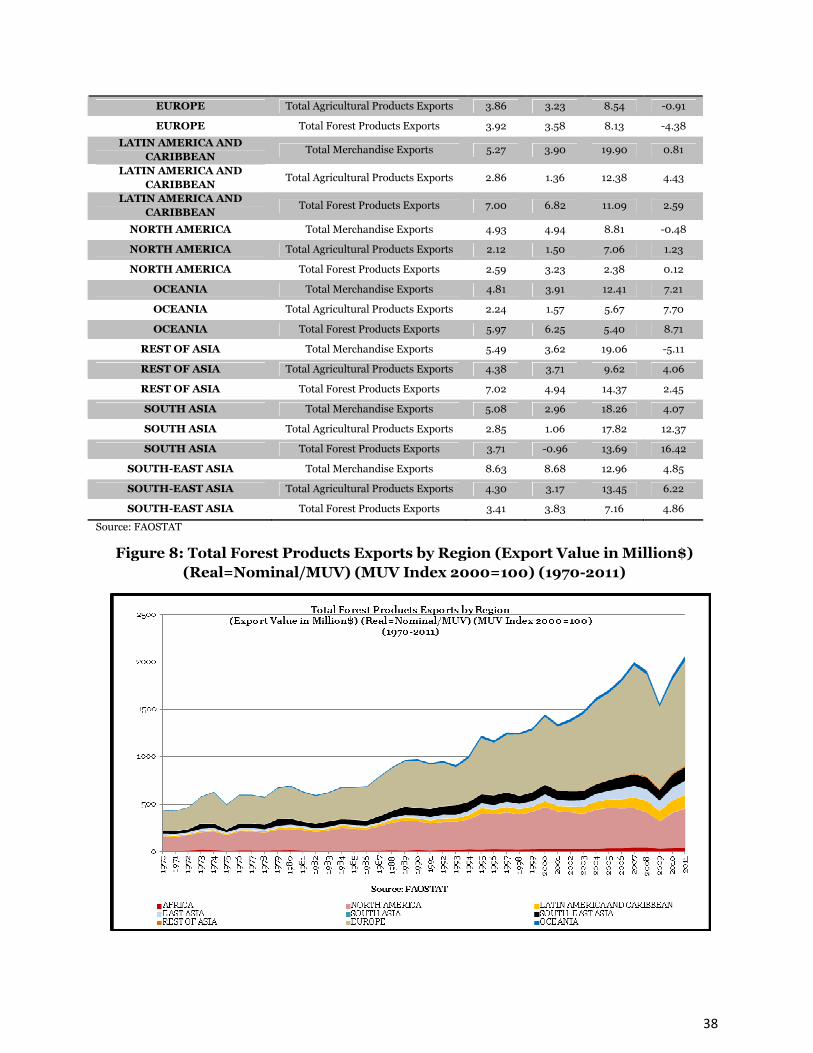
38
EUROPE Total Agricultural Products Exports 3.86 3.23 8.54 -0.91
EUROPE Total Forest Products Exports 3.92 3.58 8.13 -4.38
LATIN AMERICA AND
CARIBBEAN Total Merchandise Exports 5.27 3.90 19.90 0.81
LATIN AMERICA AND
CARIBBEAN Total Agricultural Products Exports 2.86 1.36 12.38 4.43
LATIN AMERICA AND
CARIBBEAN Total Forest Products Exports 7.00 6.82 11.09 2.59
NORTH AMERICA Total Merchandise Exports 4.93 4.94 8.81 -0.48
NORTH AMERICA Total Agricultural Products Exports 2.12 1.50 7.06 1.23
NORTH AMERICA Total Forest Products Exports 2.59 3.23 2.38 0.12
OCEANIA Total Merchandise Exports 4.81 3.91 12.41 7.21
OCEANIA Total Agricultural Products Exports 2.24 1.57 5.67 7.70
OCEANIA Total Forest Products Exports 5.97 6.25 5.40 8.71
REST OF ASIA Total Merchandise Exports 5.49 3.62 19.06 -5.11
REST OF ASIA Total Agricultural Products Exports 4.38 3.71 9.62 4.06
REST OF ASIA Total Forest Products Exports 7.02 4.94 14.37 2.45
SOUTH ASIA Total Merchandise Exports 5.08 2.96 18.26 4.07
SOUTH ASIA Total Agricultural Products Exports 2.85 1.06 17.82 12.37
SOUTH ASIA Total Forest Products Exports 3.71 -0.96 13.69 16.42
SOUTH-EAST ASIA Total Merchandise Exports 8.63 8.68 12.96 4.85
SOUTH-EAST ASIA Total Agricultural Products Exports 4.30 3.17 13.45 6.22
SOUTH-EAST ASIA Total Forest Products Exports 3.41 3.83 7.16 4.86
Source: FAOSTAT
Figure 8: Total Forest Products Exports by Region (Export Value in Million$)
(Real=Nominal/MUV) (MUV Index 2000=100) (1970-2011)
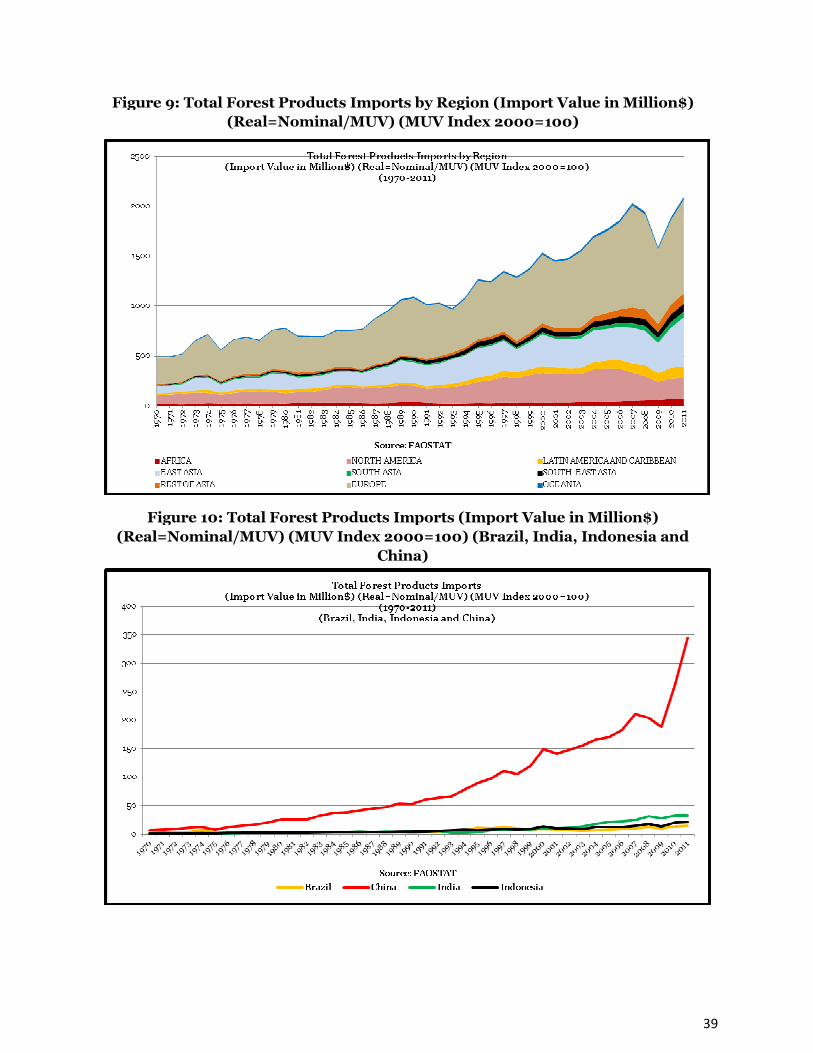
39
Figure 9: Total Forest Products Imports by Region (Import Value in Million$)
(Real=Nominal/MUV) (MUV Index 2000=100)
Figure 10: Total Forest Products Imports (Import Value in Million$)
(Real=Nominal/MUV) (MUV Index 2000=100) (Brazil, India, Indonesia and
China)
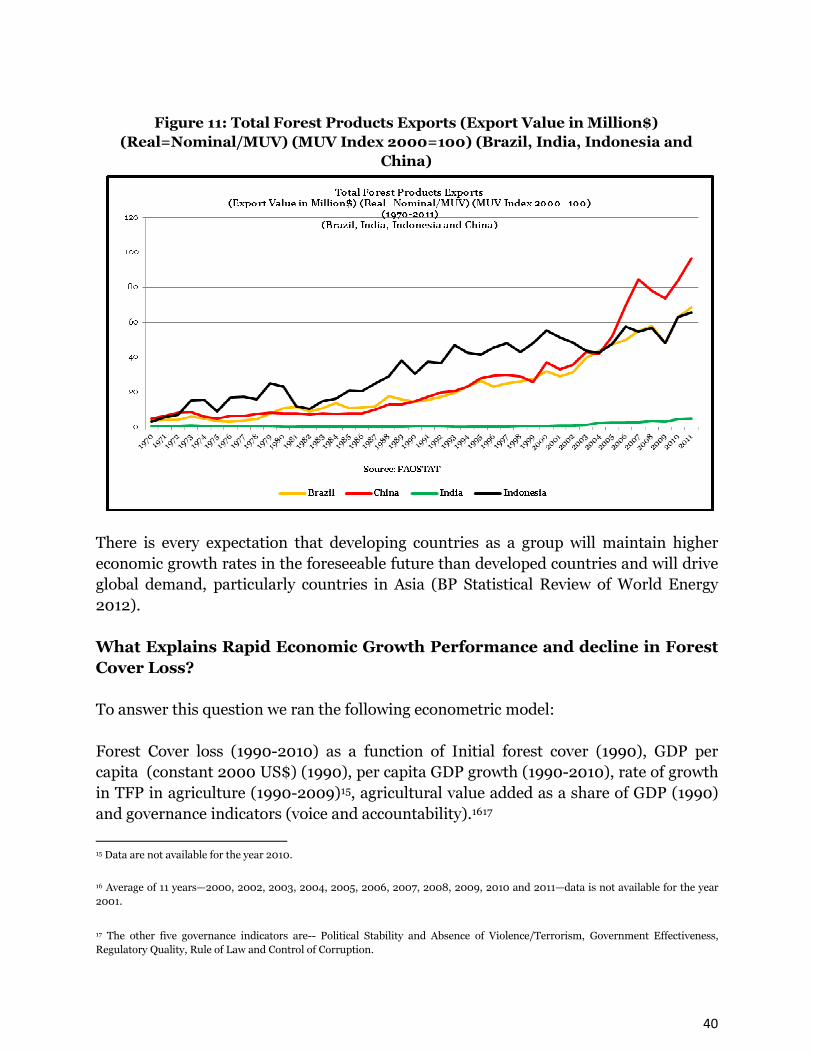
40
There is every expectation that developing countries as a group will maintain higher economic growth rates in the foreseeable future than developed countries and will drive global demand, particularly countries in Asia (BP Statistical Review of World Energy 2012).
What Explains Rapid Economic Growth Performance and decline in Forest
Cover Loss? To answer this question we ran the following econometric model: Forest Cover loss (1990-2010) as a function of Initial forest cover (1990), GDP per capita (constant 2000 US$) (1990), per capita GDP growth (1990-2010), rate of growth in TFP in agriculture (1990-2009)15, agricultural value added as a share of GDP (1990) and governance indicators (voice and accountability).1617
15 Data are not available for the year 2010.
16 Average of 11 years—2000, 2002, 2003, 2004, 2005, 2006, 2007, 2008, 2009, 2010 and 2011—data is not available for the year
2001.
17 The other five governance indicators are-- Political Stability and Absence of Violence/Terrorism, Government Effectiveness,
Regulatory Quality, Rule of Law and Control of Corruption.
Figure 11: Total Forest Products Exports (Export Value in Million$)
(Real=Nominal/MUV) (MUV Index 2000=100) (Brazil, India, Indonesia and
China)

41
The results show a good fit as follows: Two variables essentially explain most of the extent of deforestation in part because of multi-collinearity among several variables. The greater the initial forest cover, the greater the loss. The higher the per capita income, the lesser the loss. Both these factors make logical sense. Brazil and Indonesia’s smaller forest loss in the second period for example was in part because they had less easily accessible forest left to lose, particularly in the case of Indonesia. Yet factors explaining the reduced rate of loss are far more complex than captured in an aggregate equation. We explore these developments first by outlining the radical changes in the overarching context in the “external environment” in which global economic growth and forest cover changes have occurred. At least 20 such trends in the global context are noteworthy since the early 1990s: 1. Developing countries have pursued relatively liberal macro-economic and trade regimes following protracted debt crises in the 1980s in Latin America and Sub-Saharan Africa, the two regions that experienced the worst economic performance in a decade of structural adjustment. They learnt from their own economic management mistakes to be more prudent and risk averse. They increased savings and investments expanded their outward orientation and gave major boosts to agricultural and forestry exports in countries like Brazil and Indonesia.
Table 2: Regression Result of the Economic Model
Source | SS df MS Number of obs = 32 -------------+------------------------------ F( 6, 25) = 33.33 Model | 2.6789e+09 6 446476481 Prob> F = 0.0000 Residual | 334871820 25 13394872.8 R-squared = 0.8889 -------------+------------------------------ Adj R-squared = 0.8622 Total | 3.0137e+09 31 97217119.6 Root MSE = 3659.9 ------------------------------------------------------------------------------ forestcove~a | Coef. Std. Err. t P>|t| [95% Conf. Interval] -------------+---------------------------------------------------------------- initialfor~a | -.0948775 .0072431 -13.10 0.000 -.1097949 -.07996 gdppercapi.. | .7148208 .261723 2.73 0.011 .1757923 1.253849 gdp~19902010 | -302.6025 444.4848 -0.68 0.502 -1218.036 612.8311 tfp~19902009 | -6146.356 60366.38 -0.10 0.920 -130473.2 118180.5 agricultur~p | -15.4289 50.54096 -0.31 0.763 -119.52 88.66216 voiceandac~y | -1209.095 1160.163 -1.04 0.307 -3598.497 1180.306 _cons | -1183.603 1928.041 -0.61 0.545 -5154.479 2787.272
Note: Detailed regression results are available from authors on request.
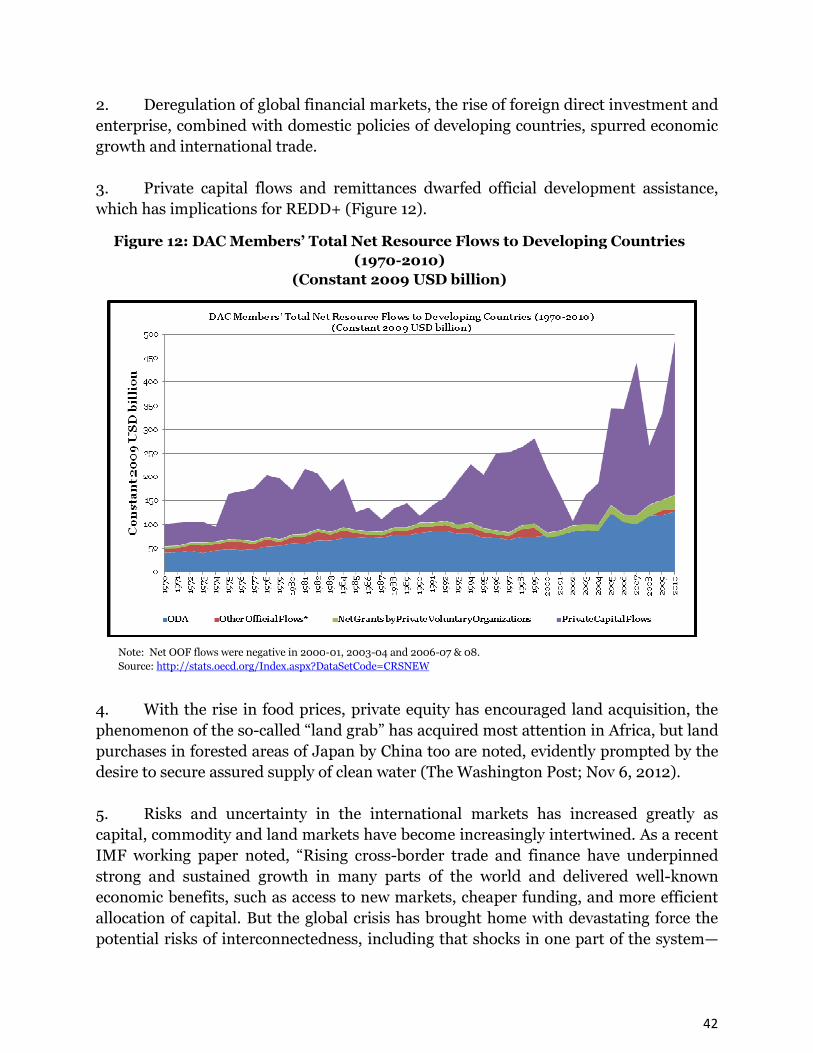
42
2. Deregulation of global financial markets, the rise of foreign direct investment and enterprise, combined with domestic policies of developing countries, spurred economic growth and international trade. 3. Private capital flows and remittances dwarfed official development assistance, which has implications for REDD+ (Figure 12). 4. With the rise in food prices, private equity has encouraged land acquisition, the phenomenon of the so-called “land grab” has acquired most attention in Africa, but land purchases in forested areas of Japan by China too are noted, evidently prompted by the desire to secure assured supply of clean water (The Washington Post; Nov 6, 2012). 5. Risks and uncertainty in the international markets has increased greatly as capital, commodity and land markets have become increasingly intertwined. As a recent IMF working paper noted, “Rising cross-border trade and finance have underpinned strong and sustained growth in many parts of the world and delivered well-known economic benefits, such as access to new markets, cheaper funding, and more efficient allocation of capital. But the global crisis has brought home with devastating force the potential risks of interconnectedness, including that shocks in one part of the system—
Figure 12: DAC Members’ Total Net Resource Flows to Developing Countries
(1970-2010)
(Constant 2009 USD billion)
Note: Net OOF flows were negative in 2000-01, 2003-04 and 2006-07 & 08.
Source: http://stats.oecd.org/Index.aspx?DataSetCode=CRSNEW

43
sometimes seemingly small in proportion to the whole—can be transmitted widely and quickly. With fragility and limited policy buffers expected to persist in the advanced economy core of the global financial system, the potential for systemic volatility remains high. The Fund’s recent Triennial Surveillance Review (IMF 2011b) called for enhancing our understanding of interconnectedness and incorporating this understanding into the analysis of risks and policies. In a significant deviation of its standard polity, the IMF also acknowledged the need for restrictions on capital account at the insistence of emerging countries. 6. Major droughts and forest fires in major exporting countries (e.g., Russia in 2010, Australia and the US in 2012), which scientists (and even the skeptics among them) have begun to attribute to climate change, make it difficult to project the future based on the past performance. 7. Half the world population already lived in urban areas in 2012. By 2050, 70 percent of the population is expected to be urban (UN population projections). This shifting demographic trend is changing demand for environmental management (Figure 13). 8. Urbanization and income growth have been associated with increased food demand and changing consumption patterns, typically increasing caloric consumption and shifting to higher value, often to more water consuming crops and products, including livestock, fisheries, fruits and vegetables. This shift spurs forest conversion to
Figure 13: Urban Population by Major Geographical Area (in per cent of total
population)
Source: United Nations, Department of Economic and Social Affairs, Population Division: World Urbanization Prospects, the 2011 Revision. New York, 2012.
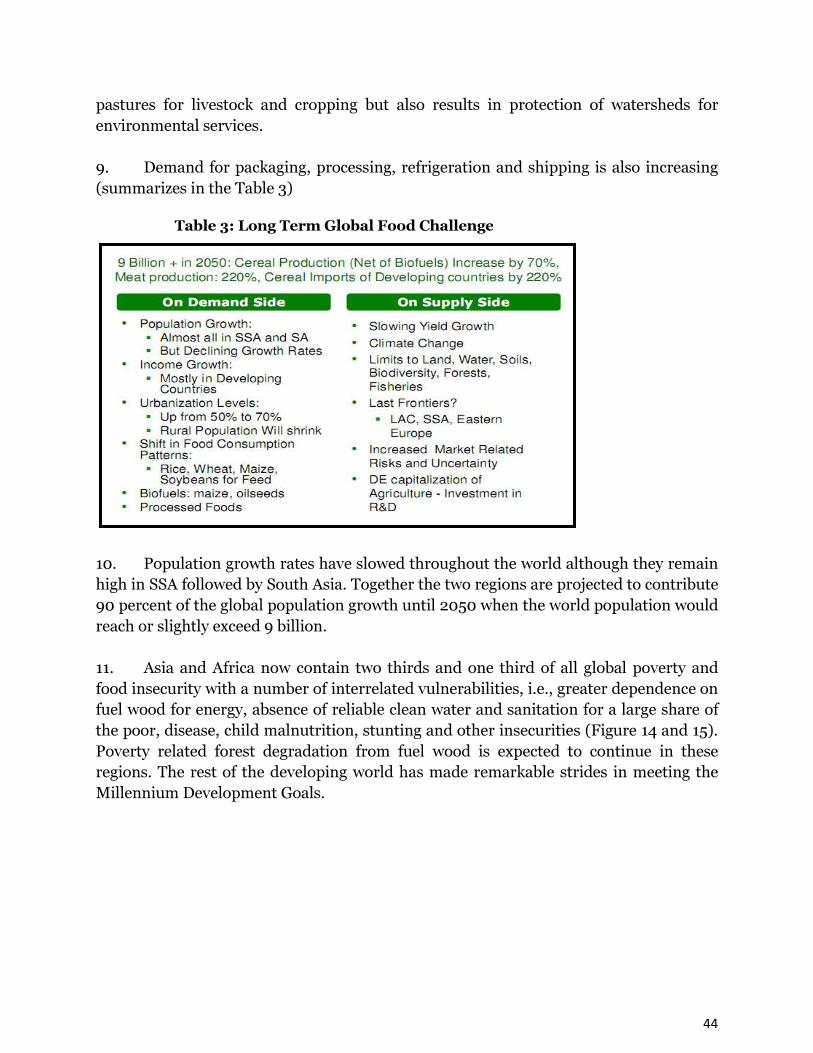
44
pastures for livestock and cropping but also results in protection of watersheds for environmental services. 9. Demand for packaging, processing, refrigeration and shipping is also increasing (summarizes in the Table 3) 10. Population growth rates have slowed throughout the world although they remain high in SSA followed by South Asia. Together the two regions are projected to contribute 90 percent of the global population growth until 2050 when the world population would reach or slightly exceed 9 billion. 11. Asia and Africa now contain two thirds and one third of all global poverty and food insecurity with a number of interrelated vulnerabilities, i.e., greater dependence on fuel wood for energy, absence of reliable clean water and sanitation for a large share of the poor, disease, child malnutrition, stunting and other insecurities (Figure 14 and 15). Poverty related forest degradation from fuel wood is expected to continue in these regions. The rest of the developing world has made remarkable strides in meeting the Millennium Development Goals.
Table 3: Long Term Global Food Challenge
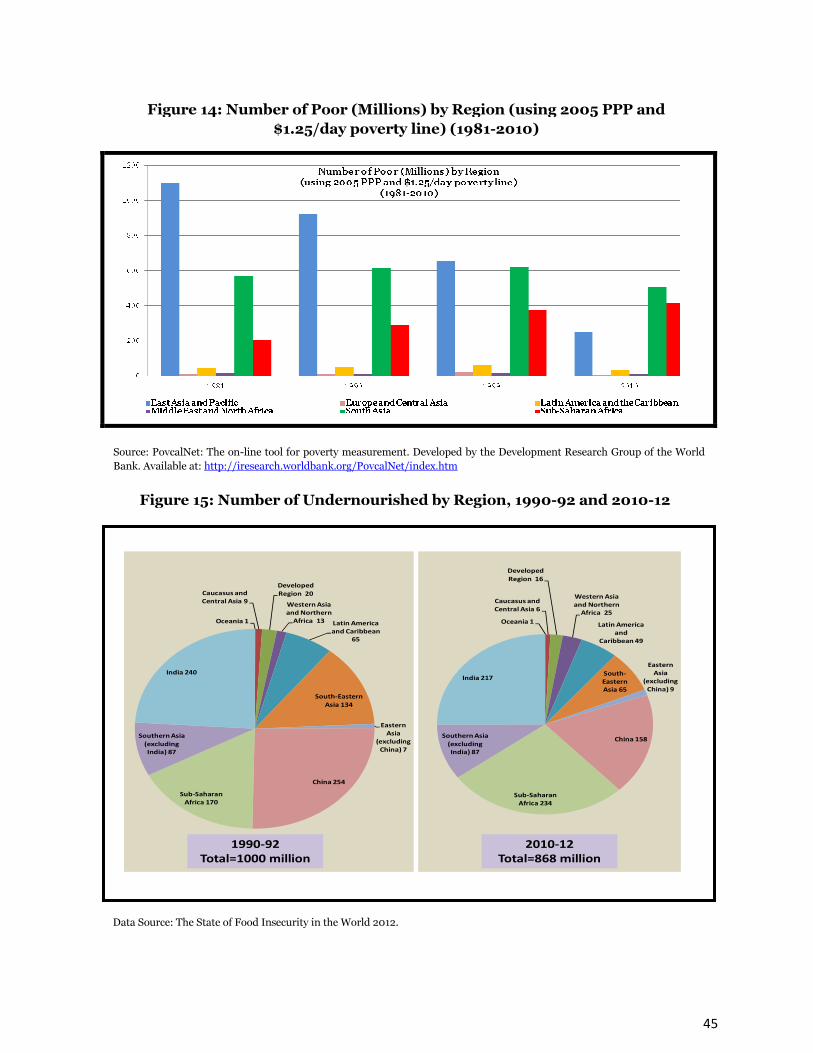
45
Figure 14: Number of Poor (Millions) by Region (using 2005 PPP and
$1.25/day poverty line) (1981-2010)
Source: PovcalNet: The on-line tool for poverty measurement. Developed by the Development Research Group of the World
Bank. Available at: http://iresearch.worldbank.org/PovcalNet/index.htm
Figure 15: Number of Undernourished by Region, 1990-92 and 2010-12
Oceania 1
Caucasus and
Central Asia 9
Developed
Region 20
Western Asia
and Northern
Africa 13 Latin America
and Caribbean
65
South-Eastern
Asia 134
Eastern
Asia
(excluding
China) 7
China 254
Sub-Saharan
Africa 170
Southern Asia
(excluding
India) 87
India 240
Oceania 1
Caucasus and
Central Asia 6
Developed
Region 16
Western Asia
and Northern
Africa 25
Latin America
and
Caribbean 49
South-
Eastern
Asia 65
Eastern
Asia
(excluding
China) 9
China 158
Sub-Saharan
Africa 234
Southern Asia
(excluding
India) 87
India 217
1990-92
Total=1000 million
2010-12
Total=868 million
Data Source: The State of Food Insecurity in the World 2012.

46
12. Having reached the limits of extensive land margin, most of Asia, (barring a few exceptions such as Indonesia and Cambodia), with high population densities and dynamic economic growth, has been driving global demand for food and energy. 13. Latin America, with its abundant land and other natural resources and the advantage of developed transportation and communications, has become (and will likely be) the major source of food supply to Asia. Brazil was also able to export corn and soybeans to the US during the severe drought in 2012. 14. Even though Africa is more open in terms of the share of trade in GDP than other regions and there is much debate about the likely impact of land grab in Central Africa, the World Bank 2009 notes that, relative to other regions, Sub-Saharan Africa today suffers from the triple disadvantages of low population density, long distance, and deep division of language and national borders defined by a colonial history that put the continent at a developmental disadvantage. These spatial dimensions reduce proximity between economic agents within Sub-Saharan Africa, and between Africa and the rest of the world. “Cumulative causation” between these forces catches many countries in Sub-Saharan Africa in a “proximity trap” leading to weak agglomeration forces, high transportation costs, and reduced factor mobility. Africa will remain more constrained in its regional and global integration through industrialization, trade in comparison with other regions, most notably Latin America and Asia where populations are concentrated in the coastal areas. Small land locked countries, limited physical infrastructure, high transportation costs and divisions by language and history (World Bank 2009) make economic exploitation of natural resources such as water, energy, forests and food more challenging(Figure 16). Collier and Venables (2012) make a similar argument. But not everyone accepts this line of argument. They point to the considerable variability in population densities in Africa and the fact that African countries are more open in terms of share of trade in GDP than many Asian countries. But they too acknowledge that unless accompanied by substantial investment in physical infrastructure to open up lands for resource exploitation, (as witnessed by China’s recent investments in Africa), and better maintenance of existing infrastructure land conversion of forests to agriculture and other uses will likely be limited in Africa than Latin America and South East Asia. 15. Increased investments in biofuels in response to rising energy prices post 2000 are already making additional demands on land and agricultural and forest products as a substitute for traditional forms of energy and they will remain a wild card in countries such as Brazil and Indonesia with access to international and domestic capital and technology for the expansion of the first and second generation bio-fuels. The impact of biofuels could be limited by lack of infrastructure in Africa and the new gas discoveries
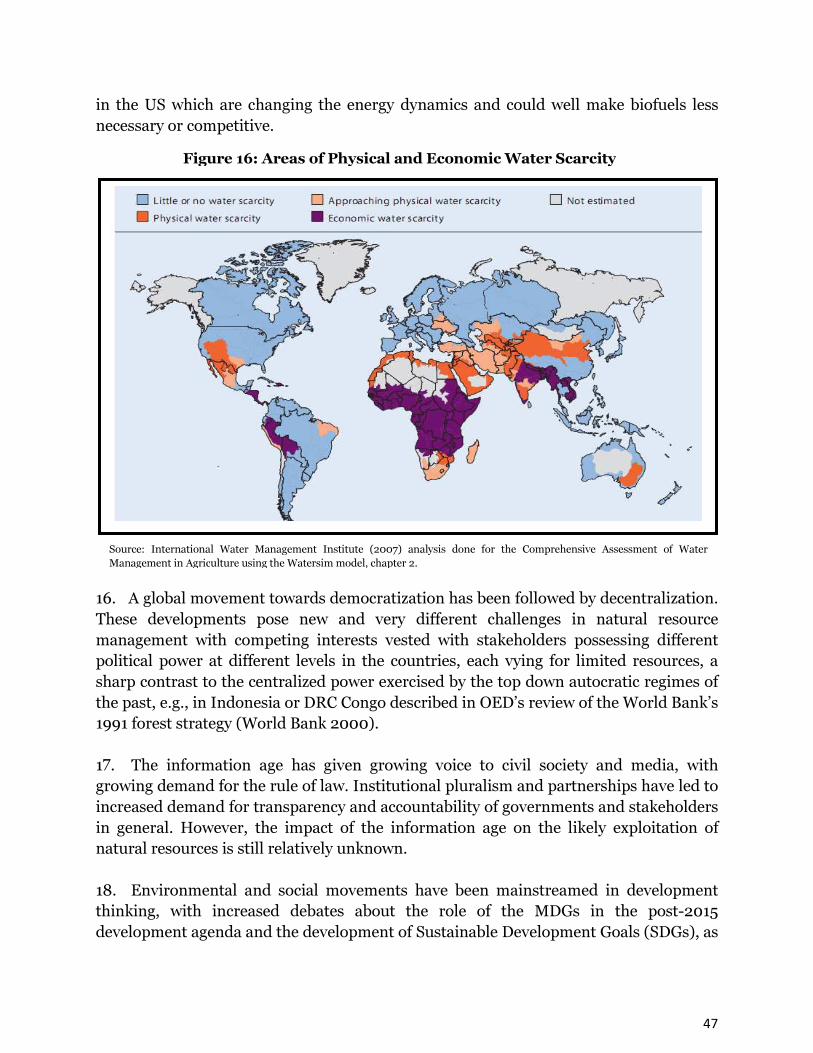
47
in the US which are changing the energy dynamics and could well make biofuels less necessary or competitive.
16. A global movement towards democratization has been followed by decentralization. These developments pose new and very different challenges in natural resource management with competing interests vested with stakeholders possessing different political power at different levels in the countries, each vying for limited resources, a sharp contrast to the centralized power exercised by the top down autocratic regimes of the past, e.g., in Indonesia or DRC Congo described in OED’s review of the World Bank’s 1991 forest strategy (World Bank 2000). 17. The information age has given growing voice to civil society and media, with growing demand for the rule of law. Institutional pluralism and partnerships have led to increased demand for transparency and accountability of governments and stakeholders in general. However, the impact of the information age on the likely exploitation of natural resources is still relatively unknown. 18. Environmental and social movements have been mainstreamed in development thinking, with increased debates about the role of the MDGs in the post-2015 development agenda and the development of Sustainable Development Goals (SDGs), as
Figure 16: Areas of Physical and Economic Water Scarcity
Source: International Water Management Institute (2007) analysis done for the Comprehensive Assessment of Water
Management in Agriculture using the Watersim model, chapter 2.
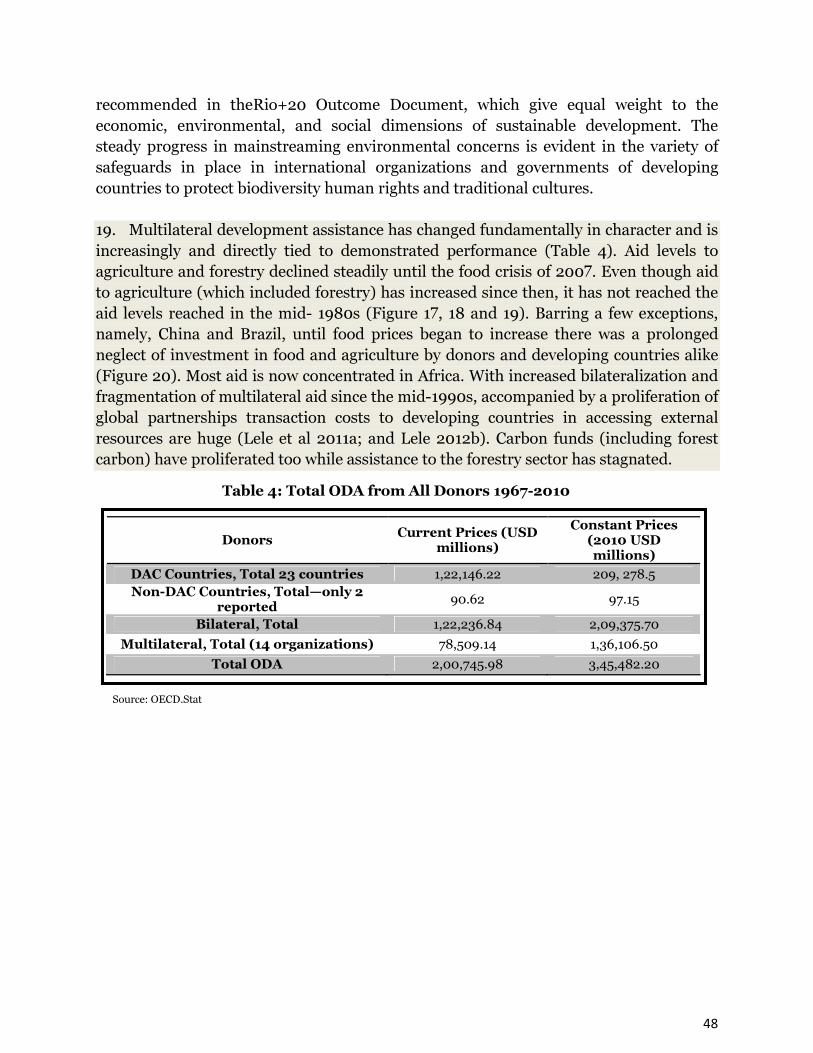
48
recommended in theRio+20 Outcome Document, which give equal weight to the economic, environmental, and social dimensions of sustainable development. The steady progress in mainstreaming environmental concerns is evident in the variety of safeguards in place in international organizations and governments of developing countries to protect biodiversity human rights and traditional cultures. 19. Multilateral development assistance has changed fundamentally in character and is increasingly and directly tied to demonstrated performance (Table 4). Aid levels to agriculture and forestry declined steadily until the food crisis of 2007. Even though aid to agriculture (which included forestry) has increased since then, it has not reached the aid levels reached in the mid- 1980s (Figure 17, 18 and 19). Barring a few exceptions, namely, China and Brazil, until food prices began to increase there was a prolonged neglect of investment in food and agriculture by donors and developing countries alike (Figure 20). Most aid is now concentrated in Africa. With increased bilateralization and fragmentation of multilateral aid since the mid-1990s, accompanied by a proliferation of global partnerships transaction costs to developing countries in accessing external resources are huge (Lele et al 2011a; and Lele 2012b). Carbon funds (including forest carbon) have proliferated too while assistance to the forestry sector has stagnated.
Table 4: Total ODA from All Donors 1967-2010
Donors Current Prices (USD
millions)
Constant Prices (2010 USD millions)
DAC Countries, Total 23 countries 1,22,146.22 209, 278.5
Non-DAC Countries, Total—only 2 reported
90.62 97.15
Bilateral, Total 1,22,236.84 2,09,375.70
Multilateral, Total (14 organizations) 78,509.14 1,36,106.50
Total ODA 2,00,745.98 3,45,482.20
Source: OECD.Stat

49
Figure 17: Declining Share of ODA Compounded by OECD Economic Woes
0
5
10
15
20
25
30
35
40
FY60
FY61
FY62
FY63
FY64
FY65
FY66
FY67
FY68
FY69
FY70
FY71
FY72
FY73
FY74
FY75
FY76
FY77
FY78
FY79
FY80
FY81
FY82
FY83
FY84
FY85
FY86
FY87
FY88
FY89
FY90
FY91
FY92
FY93
FY94
FY95
FY96
FY97
FY98
FY99
FY00
FY01
FY02
FY03
FY04
FY05
FY06
FY07
FY08
FY09
FY10
FY11
Source: OECD.Stat and Data sent by Sanjiva Cooke from World Bank
Agriculture Down
Share of Agriculture (%) (IBRD+IDA) Share of Agriculture (%) (ODA)
Establishment of the CGIAR
1972
McNamara Speech 1973
WB’s 1997 Vision to Action
WB 2002 Reaching the
Poor
WB 2008 WDR
World Bank
ODA
Figure 18: Share of Agricultural Commitments by World Bank and ODA
(FY1960-FY2011)

50
Note: Other DAC Countries are—Austria, Belgium, Denmark, Finland, Greece, Ireland, Italy, Korea, Luxembourg, New
Zealand, Portugal, Sweden and Switzerland.
Other Multilateral Donors are—AFESD, GEF, IDB Sp.Fund, Isl.Dev Bank, Nordic Dev.Fund, OFID, UNDP, UNECE and
UNPBF.
Non-DAC Countries are—Kuwait and United Arab Emirates.
Figure 19: Bilaterals and Multilaterals ODA to Agriculture + Forestry +
Fishing by Major Donors (Total Commitments) (2010 USD Millions)
(Constant Prices) (1995-2010)

51
20. The growth of private capital combined with environmental and social concerns pose new challenges for sustainable and equitable development. Because they are driven by these global trends and yet are location specific they call for domestic capacity to address the new norm of growing complexity outlined in the rest of this paper.
Cross-Sectorial Linkages between Forests and Other Sectors in Depth
Agriculture and Forestry
In this section we explore how structural transformation of countries can be reconciled with the growing debate about the merit of increasing agricultural productivity through intensification and its impacts on land use changes in the course of development. Economists have considered agricultural productivity growth as being crucial to the economic transformation process outlined in the introduction to this paper. Technological change increases food supply and brings down food prices, which plays a major role in consumer budgets, particularly those of the poor. Low food prices are essential to contain demand for increased wages from urban workers in the course of industrialization. High wage bill puts pressure on savings and can be a disincentive to employ more labor in the non-agricultural sector, an essential feature of structural
Source: Josef Schmidhuber, IPC 2010
Figure 20: Food Price Index vs Share of Agricultural ODA
52
transformation. As the food supply curve shifts to the right under factor neutral technical change, low elasticity of demand for food leads to fall in prices and so will the value of land, particularly on marginal land where lower returns result in a profit squeeze and abandonment of land for agriculture. In a land short Asia with millions of hungry mouths to feed, increasing food productivity has also been important on welfare grounds. Nobel Peace Prize winning Norman Borlaug, the father of the Green Revolution, often argued that without productivity growth millions of more hectares of land would have been needed to feed today’s hungry and the growing population.18 The CGIAR was founded to generate technologies for agricultural intensification on the basis of this argument. But of course lands are increasingly used for economic transformation, substitution of forms of energy among others, as discussed later in this paper. Some forest economists on the other hand have argued that technological change has a “rebound effect” of increasing deforestation by increasing returns to land and providing incentive for further land clearing (Fearnside 1997; pp. 537-570).19 Others have stressed the ambiguous effects of technological change on forests (World Bank 2008; and Angelson & Kaimowitz 1999). These various outcomes are possible depending on land constrained or land surplus situations, which were well identified in the World Bank’s evaluation of the 1991 forest strategy as well as the neglect of cross sectoral linkages which drive deforestation (World Bank 2000). In cases where additional land is available and there are either no constraints to land expansion and marginal cost of accessing new land is low, or government actively promotes agricultural expansion through credit or other forms of subsidies as the OED evaluation then noted in the case of Brazil and Indonesia, productivity growth would in all likelihood lead to expansion of area under cultivation. This same phenomenon is discussed below albeit in a changed more globalized context. The tension between those concerned with the environment and others concerned with development is evident from these arguments since trade-offs often exist, over time and across space and their overt discussion tends to be unpopular with the search for a vague “win-win-win” particularly with a focus on developing countries. Relative to the effects of technological change in food production, which is needed for human survival, effects of biofuel expansion in industrial countries are of course less benign. Technological change or policies that promote biofuels divert food or edible oils tend to reduce food supplies in the market increasing food prices as Wright notes in the
18 “If the global cereal yields of 1950still prevailed in 2000, we would have needed nearly 1.2 billion more hectares of the same
quality, instead of the 660 million hectares used, to achieve 2000'sglobal harvest. Moreover, had environmentally fragile land been
brought into agricultural production […] loss of forests […] would have been disastrous” (Borlaug 2007).
19 Crops (Pirard & Belna 2012).
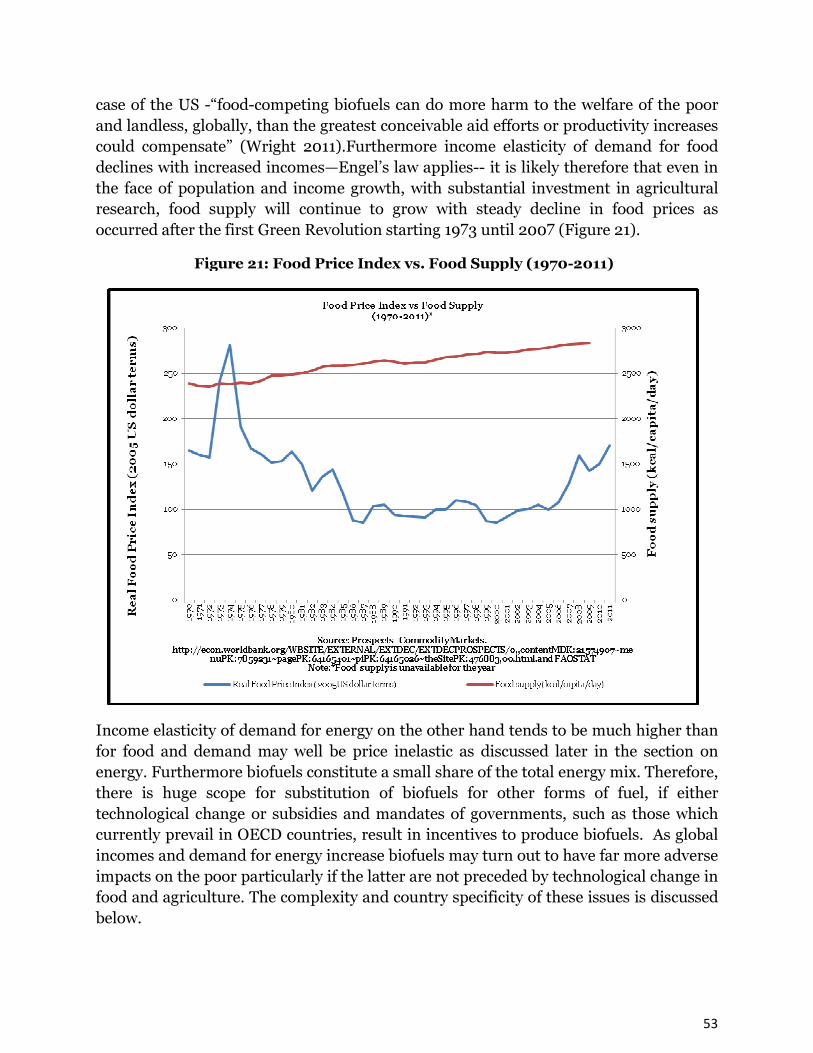
53
case of the US -“food-competing biofuels can do more harm to the welfare of the poor and landless, globally, than the greatest conceivable aid efforts or productivity increases could compensate” (Wright 2011).Furthermore income elasticity of demand for food declines with increased incomes—Engel’s law applies-- it is likely therefore that even in the face of population and income growth, with substantial investment in agricultural research, food supply will continue to grow with steady decline in food prices as occurred after the first Green Revolution starting 1973 until 2007 (Figure 21). Income elasticity of demand for energy on the other hand tends to be much higher than for food and demand may well be price inelastic as discussed later in the section on energy. Furthermore biofuels constitute a small share of the total energy mix. Therefore, there is huge scope for substitution of biofuels for other forms of fuel, if either technological change or subsidies and mandates of governments, such as those which currently prevail in OECD countries, result in incentives to produce biofuels. As global incomes and demand for energy increase biofuels may turn out to have far more adverse impacts on the poor particularly if the latter are not preceded by technological change in food and agriculture. The complexity and country specificity of these issues is discussed below.
Figure 21: Food Price Index vs. Food Supply (1970-2011)
54
Drivers of Deforestation: Exploring Regional Differences and New Patterns
A recent consensus has emerged on the increasing role of urban and export demand in driving deforestation in a globalized economy, such as in studies on the drivers of deforestation using new sources of satellite data following the UNFCCC COP meeting in Cancun (Rudel et al 2009a; and DeFries et al 2010). This new consensus should complement the conventional wisdom about the role of subsistence farming and firewood collection as the causes of deforestation where poverty exists (Boucher et al 2011).20 Agricultural expansion was the key driver of deforestation in the tropics since the 1960s (Gibbs et al 2010). Drivers also vary regionally and indeed within countries as shown in the case of Brazil and Indonesia and change over time. Most such analysis is largely based on local or regional case studies (Geist and Lambin 2002) or on coarse assessments on the continental and global scales, with less focus on the national level. Moreover, discrepancies in estimates of forest losses, for instance, between FAO Forest Resource Assessment 2010 and the remote sensing based estimates of Hansen et al 2010, suggest that knowledge of context-specific drivers is needed but tends often to be lacking, highlighting the current knowledge and data gaps. Only 12 of 100 (sub) tropical non-Annex I countries were able to provide quantitative data (Hosonuma et al 2012) to the review of driver data collection engaged at the national level as part of UNFCCC REDD+ readiness activities, including setting of the required reference level. These suggest that in Africa and Asia subsistence and commercial agriculture contribute roughly equally while commercial agriculture is the main driver in Latin America. Mining plays a minor direct role. The degradation patterns are more similar in Latin America and Asia with the predominance of logging. Fuelwood and small-scale agriculture are the main drivers of deforestation in Africa (Hosonuma et al 2012; and also see below in the case of Central Africa). Although the predominance of agriculture and logging as drivers of deforestation is confirmed, there are relatively few systematic studies of agricultural and forestry interactions except in frontier expansion, as discussed below in the case of Brazil. As the real time availability of deforestation data has increased, so has the quality of analysis and knowledge on the sources of deforestation. Globally, however, the task is constrained by the fact that data on agriculture and forestry sectors are maintained by separate ministries and therefore by FAO, rather than on land use changes per se. With the notable exception of Brazil, real time data on deforestation has been difficult to come by. The vast literature on total factor productivity growth (TFP) in agriculture does not take into account the environmental consequences of productivity growth whether on forest land conversion,
20 Uma Lele’s field visits in the state of Gujarat and Maharashtra during November and December 2012 illustrated that firewood
collection remains extensive among the rural poor in India.
55
or with regard to water and soils. Studies on Brazil and Indonesia which address forest conversion are reported below. Among developing countries detailed time series estimates of TFP growth are now available. Among the largest developing countries, China has experienced some of the fastest growth in agricultural TFP, followed by Brazil and Indonesia (Figure 22) (Map 1). More detailed country by country decade by decade rates of productivity growth, which vary, are in Annex 1 (Table 1 and Table 2). India shows slower rate of total factor productivity growth in agriculture than either China or Indonesia and the incidence of poverty is also greater in India (Figure 23). But the performance of these three countries on forest cover loss/gain has been quite different. Indonesia has had a rich forest in outer islands to lose and technical progress and international demand to convert forests into oil palm have been attractive much as in the case of soybean and pastures in Brazil in the earlier period. Indeed the opportunity cost of producing oil palm with gross margin of US$ 2000 to US$ 3000 even compared to the $1 billion from Norway is not self –evident since the donor money goes to the treasury and it is unclear how much and how it reaches the producers does not compare favorably. Measures of agricultural TFP growth do not take into account changes in natural resource stocks (soil loss, water depletion, changes in biodiversity), or other environmental externalities resulting from land use changes, like carbon emissions, etc. What TFP growth implies for environmental resources on the whole is ambiguous. In some cases we are undercounting resource changes and in other cases over counting them. For example, to the extent that productivity growth reduces conversion of forests to cropland, there are environmental benefits not counted in TFP. In the US, large reductions have been noted in greenhouse gas (GHG) emissions per unit of meat and milk production due to productivity growth in livestock. On the other hand, growth in large feedlot operations (which have contributed to measured growth in TFP) also pose larger risks to water pollution from livestock wastes (Personal communication with Keith Fuglie; Dec 11, 2012). In Indonesia’s case, when new land is brought into production, it adds to the resources used in production. If resources (land etc.) in oil palm doubles and oil palm output doubles, there is no growth in TFP. If output more than doubles, then that excess is attributed to improvements in TFP. But these calculations do not account for the loss of environmental services from previously forested areas (Personal communication with Keith Fuglie; Dec 11, 2012). Clearly better accounting of environmental impacts of agricultural TFP growth is overdue in the context of climate change discussions.
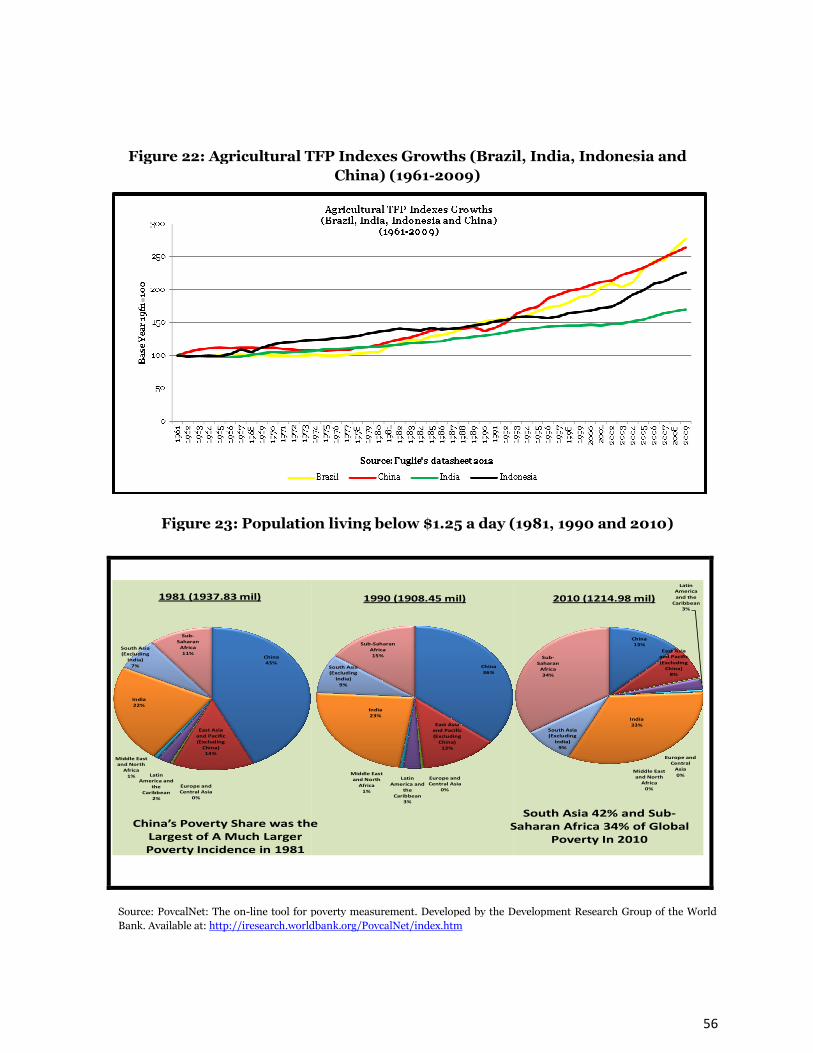
56
Figure 22: Agricultural TFP Indexes Growths (Brazil, India, Indonesia and
China) (1961-2009)
Figure 23: Population living below $1.25 a day (1981, 1990 and 2010)
Source: PovcalNet: The on-line tool for poverty measurement. Developed by the Development Research Group of the World
Bank. Available at: http://iresearch.worldbank.org/PovcalNet/index.htm
China
43%
East Asia
and Pacific
(Excluding
China)
14%
Europe and
Central Asia
0%
Latin
America and
the
Caribbean
2%
Middle East
and North
Africa
1%
India
22%
South Asia
(Excluding
India)
7%
Sub-
Saharan
Africa
11%
1981 (1937.83 mil)
China
36%
East Asia
and Pacific
(Excluding
China)
13%
Europe and
Central Asia
0%
Latin
America and
the
Caribbean
3%
Middle East
and North
Africa
1%
India
23%
South Asia
(Excluding
India)
9%
Sub-Saharan
Africa
15%
1990 (1908.45 mil)
2010 (1214.98 mil)
China’s Poverty Share was the
Largest of A Much Larger
Poverty Incidence in 1981
China
13%
East Asia
and Pacific
(Excluding
China)
8%
Europe and
Central
Asia
0%
Latin
America
and the
Caribbean
3%
Middle East
and North
Africa
0%
India
33%South Asia
(Excluding
India)
9%
Sub-
Saharan
Africa
34%
2010 (1214.98 mil)
South Asia 42% and Sub-
Saharan Africa 34% of Global
Poverty In 2010
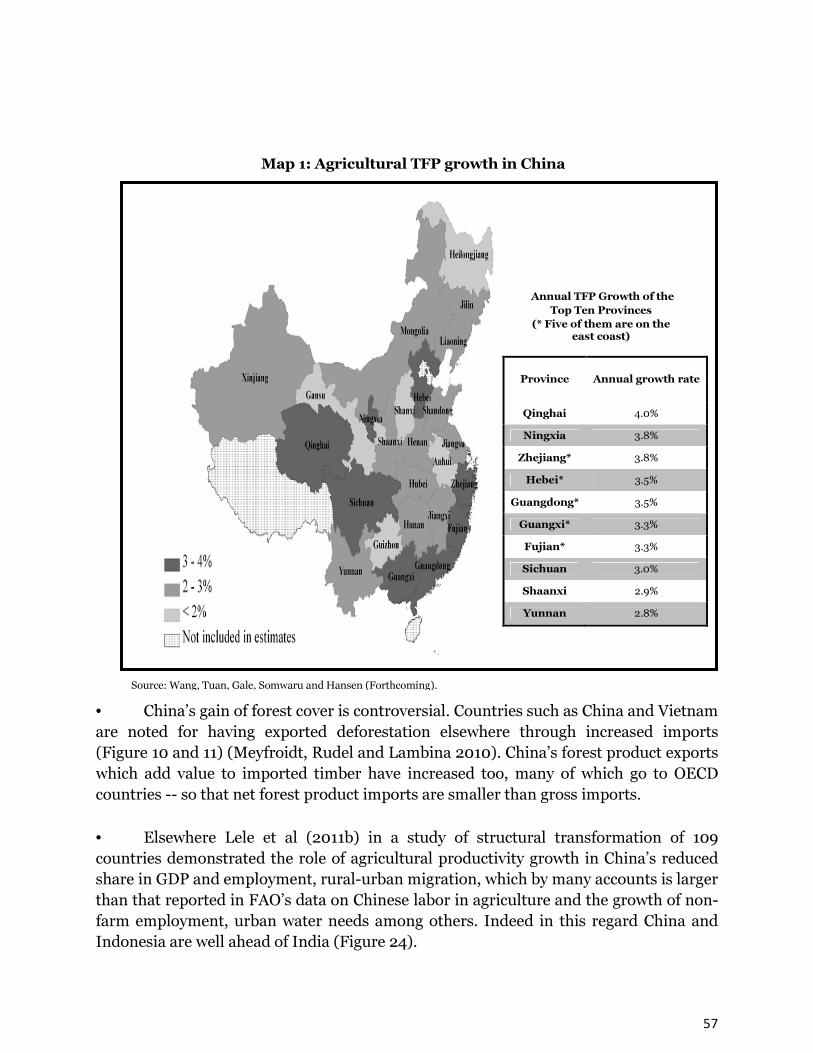
57
• China’s gain of forest cover is controversial. Countries such as China and Vietnam are noted for having exported deforestation elsewhere through increased imports (Figure 10 and 11) (Meyfroidt, Rudel and Lambina 2010). China’s forest product exports which add value to imported timber have increased too, many of which go to OECD countries -- so that net forest product imports are smaller than gross imports. • Elsewhere Lele et al (2011b) in a study of structural transformation of 109 countries demonstrated the role of agricultural productivity growth in China’s reduced share in GDP and employment, rural-urban migration, which by many accounts is larger than that reported in FAO’s data on Chinese labor in agriculture and the growth of non-farm employment, urban water needs among others. Indeed in this regard China and Indonesia are well ahead of India (Figure 24).
Map 1: Agricultural TFP growth in China
The top ten provinces in TFP growth
for the 1985-2007 period
(* Six of them are on the east coast)
Jiangxi 8.17%
Guangdong* 8.11%
Hebei* 7.95%
Fujian* 7.89%
Shandong* 7.37%
Hubei 7.34%
Inner
Mongolia 7.26%
Zhejiang* 7.19%
Sichuan 7.18%
Liaoning* 6.83%
Province Annual growth rate
Qinghai 4.0%
Ningxia 3.8%
Zhejiang* 3.8%
Hebei* 3.5%
Guangdong* 3.5%
Guangxi* 3.3%
Fujian* 3.3%
Sichuan 3.0%
Shaanxi 2.9%
Yunnan 2.8%
Annual TFP Growth of the
Top Ten Provinces
(* Five of them are on the east coast)
Source: Wang, Tuan, Gale, Somwaru and Hansen (Forthcoming).
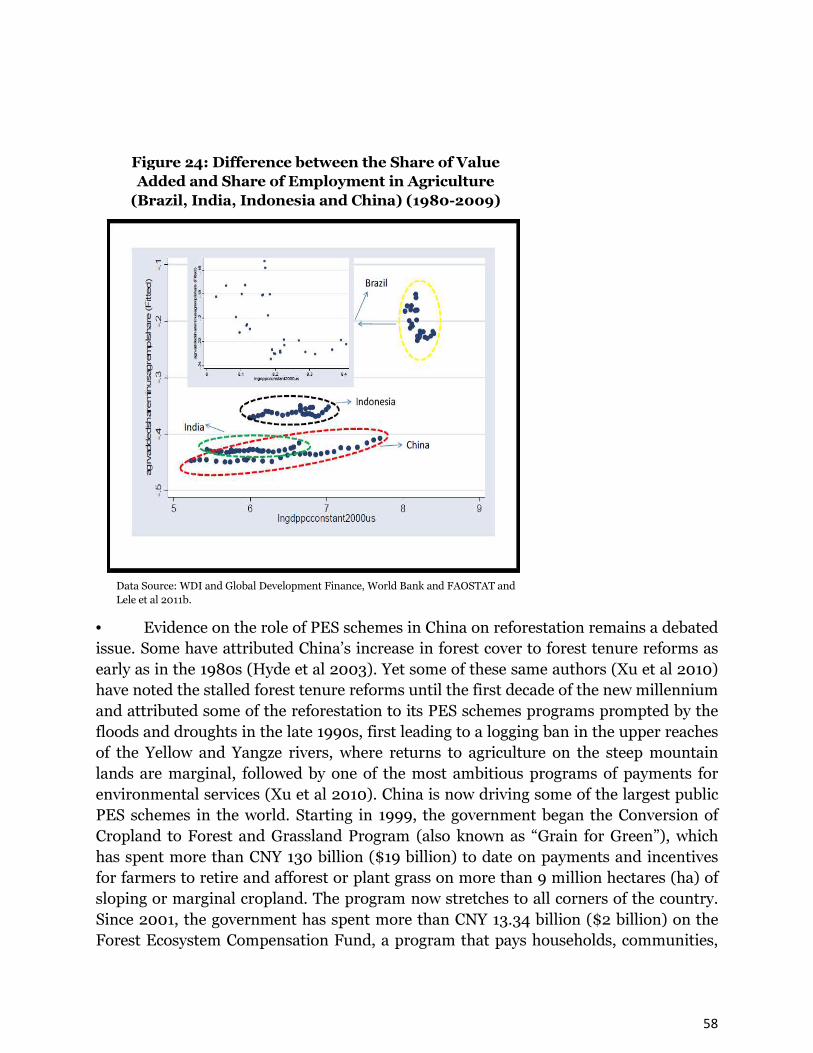
58
• Evidence on the role of PES schemes in China on reforestation remains a debated issue. Some have attributed China’s increase in forest cover to forest tenure reforms as early as in the 1980s (Hyde et al 2003). Yet some of these same authors (Xu et al 2010) have noted the stalled forest tenure reforms until the first decade of the new millennium and attributed some of the reforestation to its PES schemes programs prompted by the floods and droughts in the late 1990s, first leading to a logging ban in the upper reaches of the Yellow and Yangze rivers, where returns to agriculture on the steep mountain lands are marginal, followed by one of the most ambitious programs of payments for environmental services (Xu et al 2010). China is now driving some of the largest public PES schemes in the world. Starting in 1999, the government began the Conversion of Cropland to Forest and Grassland Program (also known as “Grain for Green”), which has spent more than CNY 130 billion ($19 billion) to date on payments and incentives for farmers to retire and afforest or plant grass on more than 9 million hectares (ha) of sloping or marginal cropland. The program now stretches to all corners of the country. Since 2001, the government has spent more than CNY 13.34 billion ($2 billion) on the Forest Ecosystem Compensation Fund, a program that pays households, communities,
Figure 24: Difference between the Share of Value
Added and Share of Employment in Agriculture
(Brazil, India, Indonesia and China) (1980-2009)
Data Source: WDI and Global Development Finance, World Bank and FAOSTAT and
Lele et al 2011b.
59
and local governments to protect about 44.53 million ha of key forest areas across 30 provinces. The variety of payment schemes for watershed services have increased in popularity in recent years, from eight in 1999 to more than 47 in 2008, with an estimated transacted value of $7.8 billion and covering about 290 million ha. Others (including Karsenty) question the role the PES is playing in China’s or indeed in countries such as Costa Rica and Mexico where it has been in vogue in increasing forest cover (see section below on PES). Notwithstanding the ongoing design, implementation, and funding challenges, these programs have generated significant momentum for the development of future ecosystem services markets in China and elsewhere although as discussed in the next section and later in the section on PES benefits of watershed protection, are not always easy to measure, Chinese experts suggest protecting watersheds in the yellow river and Yangtze river have stabilized water flows and improved water quality (Lele’s discussion with Zyani Gao, President of International Irrigation and Drainage Commission; November 30, 2012). Demand for ecosystem services seems to increase with increases in per capita income as does the consumer willingness to pay, or at least the ability of governments to charge urban populations water rates. Although the precise benefits of these services are not known, “In 2007, it is estimated that annual payments under all payment schemes and markets for ecosystem services totaled around $77 billion worldwide, and these total payments are expected to increase to approximately $300 billion by 2020 (Carroll and Jenkins 2008).” Environmental management raises important issues of an appropriate balance between centralization and decentralization in contexts where there are huge spillovers, externalities, tradeoffs between the long and short term, and huge measurement challenges both in costs and benefits. Yet these issues are also imbedded in the polities, bureaucracies and histories of each country where there are few generalizations, transferable lessons or silver bullets possible. China’s seemingly relatively more successful environmental management in the last two decades, using a landscape approach, is made possible by the fact that constitutionally all natural resources in China are state owned, the Chinese central authorities have demonstrated strong commitment to environmental management, have substantial state capability to pilot and learn from experiments and take a long term view of planning and implementation of scaled up large scale and long term development program including its adverse consequences (e.g. resettlement). Some have expressed a concern that REDD+ is leading to an unnecessary or unwarranted centralization of forest management and have advocated decentralized solutions (Phelps et al 2010). In recent papers on water management Lele et al on the other hand have demonstrated the challenges in water management in a decentralized democracy such as India with often weak central, state and local governments (Lele 2012a, Oct 18; and Lele et al forthcoming). Successful
60
action has taken place at the state level, e.g. forest management in the state of West Bengal, where an enabling environment has been created by forest tenure rights, or in water management in the state of Gujarat, where the states have shown leadership and an ability to undertake strong and consistent policy decisions, and ensured their successful implementation. State level is where the action is increasingly centered in India but responsible state action is often an exception than a reality in natural resource management. International markets for carbon involving developing countries are unlikely to emerge without state capacity in developing countries combined with an overarching agreement that clarifies rules of the game and establishes standards and norms for carbon credits. Such a market will call for breaking the current impasse between developed and developing countries on the need for independent verification of certifiable carbon credits. The higher incidence of poverty in India relative to China or Indonesia on the other hand should be expected to result in the greater use of fuel wood. Indeed, data cited for fuelwood use in China and the rest of Asia in the section on forests and energy in following sections lends support to this hypothesis. In Indonesia, not only is the growth in total factor productivity in agriculture and structural transformation more advanced higher than in India as shown in Figure 22, but it is explained in part by the TFP growth in the outer islands. Figures 10 and 11 show Indonesia’s thriving forest exports and imports—In the case of oil palm the TFP growth was accompanied by forest conversion using new agricultural technologies from Malaysia (Fuglie et al 2012). Growing demand from India and China for palm oil from Indonesia has led to export growth (Lele et al 2011b) (Figure 25).Demand for oil for cooking is more income elastic than demand for food crops, explaining Indonesia’s palm oil exports to India and China. So far there is no evidence that oil palm is leading to the increased production of biofuels; however, it does offer Indonesia the flexibility to use oil palm production for biofuels than as edible oil exports.
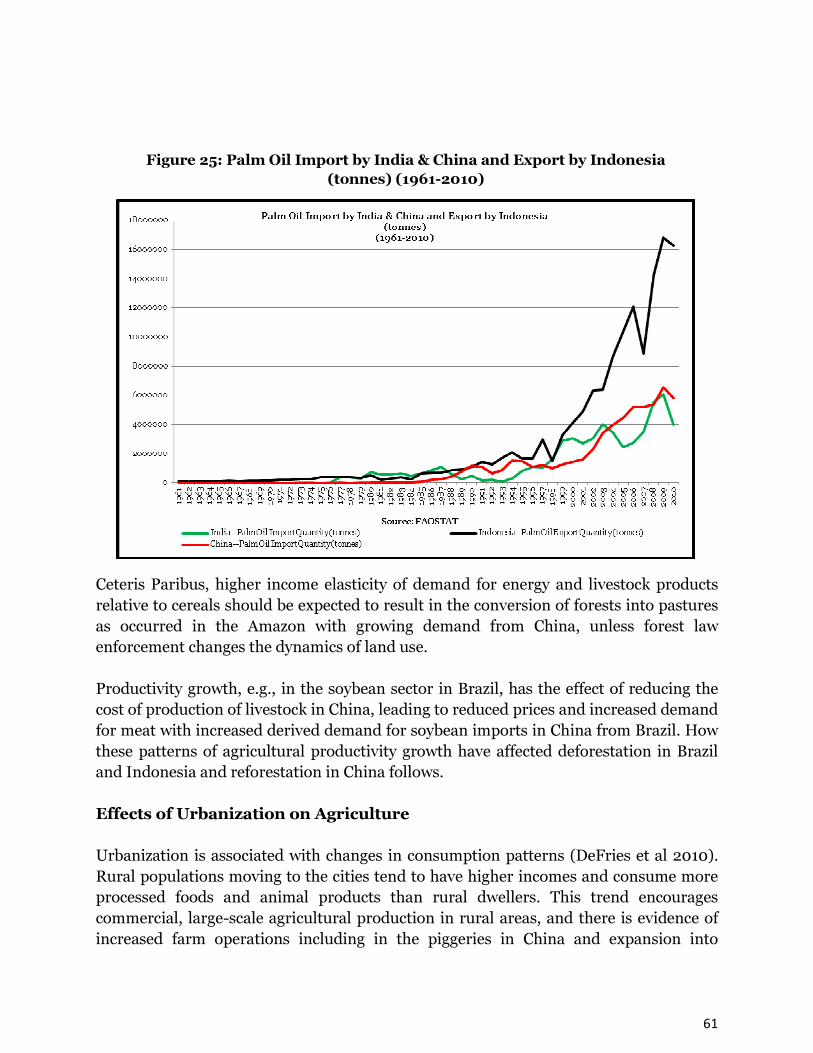
61
Ceteris Paribus, higher income elasticity of demand for energy and livestock products relative to cereals should be expected to result in the conversion of forests into pastures as occurred in the Amazon with growing demand from China, unless forest law enforcement changes the dynamics of land use. Productivity growth, e.g., in the soybean sector in Brazil, has the effect of reducing the cost of production of livestock in China, leading to reduced prices and increased demand for meat with increased derived demand for soybean imports in China from Brazil. How these patterns of agricultural productivity growth have affected deforestation in Brazil and Indonesia and reforestation in China follows. Effects of Urbanization on Agriculture
Urbanization is associated with changes in consumption patterns (DeFries et al 2010). Rural populations moving to the cities tend to have higher incomes and consume more processed foods and animal products than rural dwellers. This trend encourages commercial, large-scale agricultural production in rural areas, and there is evidence of increased farm operations including in the piggeries in China and expansion into
Figure 25: Palm Oil Import by India & China and Export by Indonesia
(tonnes) (1961-2010)

62
forests, in this case seemingly in Brazil. Traditional clearing of forests for small-scale subsistence farming and local market production is thus no longer the only prime reason for deforestation in many regions, particularly in countries that are growing rapidly and have reached middle income urbanized state such as China or Brazil. In Africa, the rates of urbanization are lower; urbanization is not causing such a large shift in consumption patterns. However, with urban migration, if less labor is available in villages for clearing forests in an already labor constrained agriculture that still uses very low level of technology; increased food imports may follow (Fuglie et al 2011). In addition, in oil or mining countries, urbanization is often associated with Dutch Disease syndrome (and food imports), which tends to reduce pressure on forests, but also create less domestic linkages between agricultural and non-agricultural growth. The governments of course can give large tracts of forest land to oil palm developers but then the employment implications of large scale farming on domestic economies remain a relatively less researched area in Africa, unlike in Latin America where new literature on farm size and efficiency suggests that with modern computer based technologies many management costs of employing large scale labor can be reduced with relatively little labor or management. A U shaped curve with respect to farm size is notable, i.e., small farms are more efficient than large farms until a certain size is reached and then farm efficiency increases with scale due to an altogether different level of technology which employs much less labor (Deininger and Byerlee 2011; and Helfand and Levine 2004). To summarize, with liberalized global food markets, production will take place where it is most economic and this will likely mean where forests exist and there is scope for land conversion, unless the cost of such conversion is increases through policy design. These options are evident in the case of Brazil with its technologically advanced agriculture. The 109 country study reported earlier showed that Brazil has been shedding substantial labor from agriculture than the general trend for all 109 countries, explaining the growing contribution of its large farms to agricultural TFP growth compared to the average trends. Brazil’s agriculture is becoming more capital intensive and its farm size is increasing whereas poverty remains isolated in the north-east. Productivity studies also show that agricultural factor productivity has been faster in the states of Mato Grosso and Para adjacent to the Amazon where deforestation has taken place on a large scale (MAP 2) than in the rest of the country (Lele et al 2011b).

63
In view of the growing importance of large scale farming some have argued that efforts need to focus on reducing deforestation for industrial-scale, export-oriented agricultural production, concomitant with efforts to increase yields in non-forested lands to satisfy demands for agricultural products (DeFries et al 2010). Rudel et al (2009b) propose to focus on promoting environmental stewardship in areas conducive to industrial agriculture. While noting the greater capacity of large farms to destroy forests, they argue that the shift from poverty-driven to industry-driven deforestation may offer new opportunities for rainforest conservation in that it is easier for pressure groups to target corporations and enterprises rather than millions of poor farmers engaged in subsistence activities. This is provided public opinion keeps up the pressure on large corporations, effects of displacement of land-use are limited, and evidence of declining footprints are not accompanied by corrupt corporate practices that have now begun to be extensively documented. For example, in the case of Wal-Mart, its environmental footprint is reportedly declining but its cash flow is increasing rapidly, so its total
Map 2: Brazil--State Level Variation in TFP Growth
Rate (Average % per Year over Period)
Source: Authors’ own creation based on the data from Gasquez et al 2011. “Productivity
and Structural Transformation in Brazilian Agriculture: Analysis of Agricultural Census”.
Ch. 7 in Productivity Growth in Agriculture: An International Perspective, ed. Keith O.
Fuglie, Sun Ling Wang and V. Eldon Ball. CAB International.

64
footprint is expanding. Further, in Mexico it is alleged to have broken both Mexican and US laws. Urban consumers could be targeted as well in the strategy to curb deforestation. The success of the 2006 soybean moratorium in Brazil (Rudorff et al 2011) and its duplication for the beef cattle industry in 2009 lend support to the proposal. In both cases, after Greenpeace issued a report, officials called for a crackdown and cut of financial incentives. The industry responded with a moratorium on buying products from previously forested areas and a promise to implement improved supply-chain tracking mechanisms (Butler and Laurence 2008; and Boucher et al 2011). Yet, reflecting overconsumption trends throughout the world, per capita caloric consumption in Latin America, including from animal products, now is close to US levels and disparities among developing regions in caloric consumption are staggeringly high South Asia being at the bottom (Figure 26).
Figure 26: Total Food Supply by Region (Crops Primary Equivalent +
Livestock and Fish Primary Equivalent) (kcal/capita/day) (1961-2007)

65
Eco-certification schemes like the Roundtable on Sustainable Palm Oil (RSPO) initiated by the World Wildlife Fund(WWF) in 2002 (first companies certified in 2008) of “partnered governance” emerged in a context where globalization and specialization created a vacuum in control of the inputs of the value chain, as a way to prevent further state regulation. Some have noted that RSPO has been more successful than FSC in promoting the sustainable management of forests (Nikoloyuk et al 2010) but the two are complementary, FSC about exploited forests and RSPO about avoided deforestation, as the FLEGT and the Lacey Act intend to do for wood products imported in the European or American market. Such private or public regulation has a limited impact if non-certified production can be sold without much difficulty. Moreover, the relative success of the moratorium in Brazil has been possible because of its national capacities (near-real time monitoring of deforestation) and a favorable governance context more conducive to compliance, even when, (or because?) a large influential player such as Cargil was involved and had a reputation to protect. Similar cases are not noticeable in Indonesia, for instance, illustrating how strong governments of developing countries have to be to withstand multinational pressures. Even if the profitability of Amazon cattle ranching and soy farming soar in the future, some believe with Norway’s $1 billion commitment, the marketplace transition within the beef and soy industries could take place to exclude Amazon deforesters from their supply chains, and pasture intensification as ways to achieve the end of deforestation in Amazon. Legal compliance could be facilitated through land-use zoning plans and compensation for the opportunity costs incurred in maintaining private forests beyond what the law requires (Nepstad et al 2009). However, promises of intensification should be examined carefully against the environmental capacity to support it (i.e., in water constrained areas) or the political economy context. This may explain the lack of correlation between soil quality and forest clearing, the land tenure issues, land speculation and money-laundering (Fearnside 2005). Setting Aside Degraded Marginal Lands for Reforestation
A number of developing countries have expanded national forest areas over the recent decades (Lambin and Meyfroidt 2011) because of a combination of increase in agricultural productivity, in the more productive areas of the country, greater reliance on international trade in agriculture and setting aside the marginal areas for reforestation, most notably China, which explains the large areas brought under forests by a single country. India and Vietnam have undertaken similar efforts in forest regeneration, using mixtures of agricultural intensification, land use zoning, forest protection, increased reliance on imported food and wood products, the creation of off-farm jobs, foreign capital investments, and remittances (Lambin and Meyfroidt 2011; and Xu et al 2010).
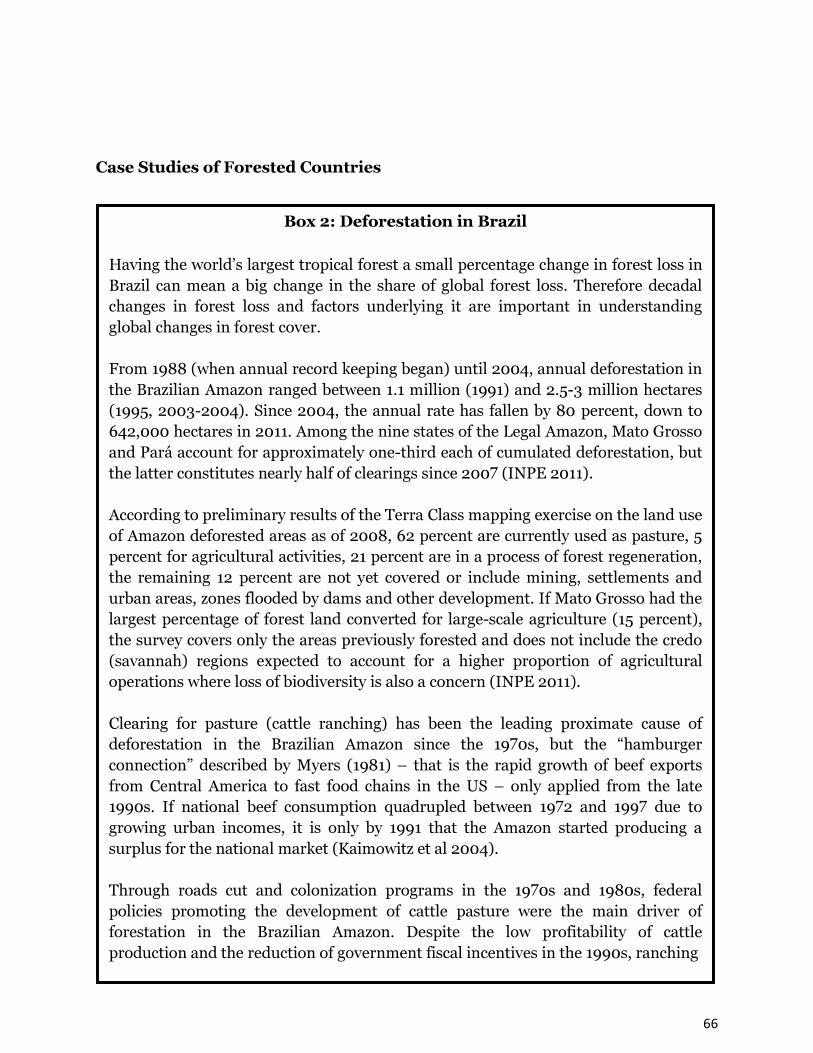
66
Case Studies of Forested Countries
Box 2: Deforestation in Brazil
Having the world’s largest tropical forest a small percentage change in forest loss in Brazil can mean a big change in the share of global forest loss. Therefore decadal changes in forest loss and factors underlying it are important in understanding global changes in forest cover. From 1988 (when annual record keeping began) until 2004, annual deforestation in the Brazilian Amazon ranged between 1.1 million (1991) and 2.5-3 million hectares (1995, 2003-2004). Since 2004, the annual rate has fallen by 80 percent, down to 642,000 hectares in 2011. Among the nine states of the Legal Amazon, Mato Grosso and Pará account for approximately one-third each of cumulated deforestation, but the latter constitutes nearly half of clearings since 2007 (INPE 2011). According to preliminary results of the Terra Class mapping exercise on the land use of Amazon deforested areas as of 2008, 62 percent are currently used as pasture, 5 percent for agricultural activities, 21 percent are in a process of forest regeneration, the remaining 12 percent are not yet covered or include mining, settlements and urban areas, zones flooded by dams and other development. If Mato Grosso had the largest percentage of forest land converted for large-scale agriculture (15 percent), the survey covers only the areas previously forested and does not include the credo (savannah) regions expected to account for a higher proportion of agricultural operations where loss of biodiversity is also a concern (INPE 2011). Clearing for pasture (cattle ranching) has been the leading proximate cause of deforestation in the Brazilian Amazon since the 1970s, but the “hamburger connection” described by Myers (1981) – that is the rapid growth of beef exports from Central America to fast food chains in the US – only applied from the late 1990s. If national beef consumption quadrupled between 1972 and 1997 due to growing urban incomes, it is only by 1991 that the Amazon started producing a surplus for the national market (Kaimowitz et al 2004). Through roads cut and colonization programs in the 1970s and 1980s, federal policies promoting the development of cattle pasture were the main driver of forestation in the Brazilian Amazon. Despite the low profitability of cattle production and the reduction of government fiscal incentives in the 1990s, ranching
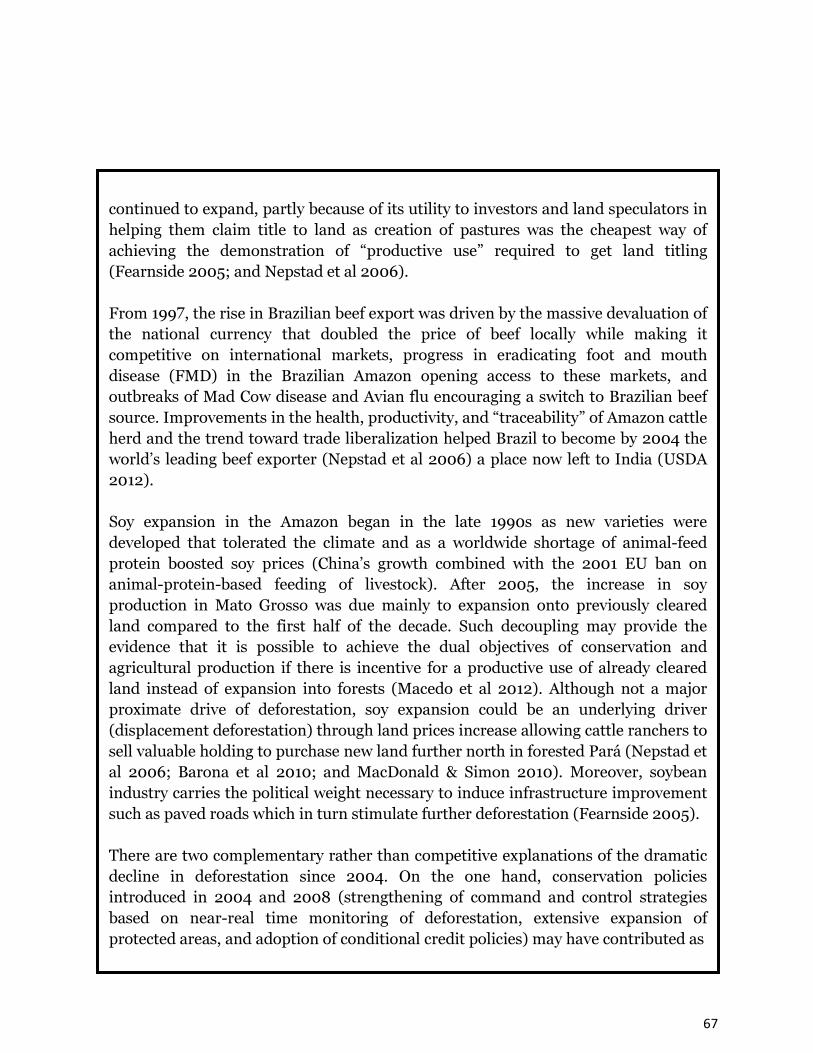
67
continued to expand, partly because of its utility to investors and land speculators in helping them claim title to land as creation of pastures was the cheapest way of achieving the demonstration of “productive use” required to get land titling (Fearnside 2005; and Nepstad et al 2006). From 1997, the rise in Brazilian beef export was driven by the massive devaluation of the national currency that doubled the price of beef locally while making it competitive on international markets, progress in eradicating foot and mouth disease (FMD) in the Brazilian Amazon opening access to these markets, and outbreaks of Mad Cow disease and Avian flu encouraging a switch to Brazilian beef source. Improvements in the health, productivity, and “traceability” of Amazon cattle herd and the trend toward trade liberalization helped Brazil to become by 2004 the world’s leading beef exporter (Nepstad et al 2006) a place now left to India (USDA 2012). Soy expansion in the Amazon began in the late 1990s as new varieties were developed that tolerated the climate and as a worldwide shortage of animal-feed protein boosted soy prices (China’s growth combined with the 2001 EU ban on animal-protein-based feeding of livestock). After 2005, the increase in soy production in Mato Grosso was due mainly to expansion onto previously cleared land compared to the first half of the decade. Such decoupling may provide the evidence that it is possible to achieve the dual objectives of conservation and agricultural production if there is incentive for a productive use of already cleared land instead of expansion into forests (Macedo et al 2012). Although not a major proximate drive of deforestation, soy expansion could be an underlying driver (displacement deforestation) through land prices increase allowing cattle ranchers to sell valuable holding to purchase new land further north in forested Pará (Nepstad et al 2006; Barona et al 2010; and MacDonald & Simon 2010). Moreover, soybean industry carries the political weight necessary to induce infrastructure improvement such as paved roads which in turn stimulate further deforestation (Fearnside 2005). There are two complementary rather than competitive explanations of the dramatic decline in deforestation since 2004. On the one hand, conservation policies introduced in 2004 and 2008 (strengthening of command and control strategies based on near-real time monitoring of deforestation, extensive expansion of protected areas, and adoption of conditional credit policies) may have contributed as

68
these turning points coincide with sharp decrease in deforestation. Actually, a recent study showed that half of avoided deforestation between 2005 and 2009 could be attributed to conservation policies. On the other hand, falling agriculture prices between 2003 to 2007 before the global economic crisis may have inhibited the clearing of forest areas for the expansion of farmland. The study shows that the relationship between deforestation and agriculture differs for crops and cattle products, it being more heterogeneous for the latter (Assunção et al 2012). Not only the international price of beef and soya fell from 2003 to 2007 but over that period, the Brazilian currency almost doubled relative to US dollar, cutting profits of commodity exporters (Fearnside 2011). International demand, currency valuation, domestic policies in agriculture, all factors outside the forest sector, have a big impact on outcomes in Brazil but policies towards the forest sector have also played a critical part–in both positive and negative way for deforestation—e.g. policies to promote land clearing vs. increased forest law enforcement particularly in the second half of the last decade, based on near-real time monitoring of deforestation to check compliance with the legal reserve provision in the legal Amazon (80/20 in most cases). One very effective way has been conditioning the access of banking credits to the verification of compliance with the provisions of the legal reserve.
Box 3: Deforestation in Indonesia
A Rapid Decline but Uncertain Figures
From 162 M ha in 1950, Indonesia has lost 40 percent of its forest cover in 50 years (FWI/GFW, 2002), a rapid decline confirmed over the period 1990-2010, in spite of discrepancies between estimates (FAO FRA 2005 and 2010; Hansen et al 2009; Ekadinata et al 2011; and Saatchi et al 2011). According to the ALLREDDI project, forests covered 68 percent of the country’s area in 1990 (128 Mha) but 53 percent (99.7 Mha) in 2005. In the meantime, undisturbed forests declined from 105 m ha to 58 M. ha while over-logged forests increased from 22 Mha to 39 Mha (40 percent of remaining cover), and timber plantation doubled over the period(above 3 Mha).
69
The detailed analysis of land-cover change shows that unsustainable logging and forest fires were the main causes of deforestation in the 1990s period while meeting demands for agricultural products and export commodities were primary causes of the latter deforestation (Ekadinata et al 2011). The first attempt to provide annual map of forest cover loss covers the 2000-2008 period in Sumatra and Kalimantan accounting for a minimum of 40 percent to a maximum of 55 percent of total deforestation when peaking above 900,000 hectares in 2005. It revealed high fluctuations in spatio-temporal trends of forest-cover loss which are in part due to the harvesting of tree plantations and to variations in governance form on district to another (Broichet al 2011 a,b).
A Changing Pattern of Deforestation over Time to Feed the Wood
Industry
Historically, transmigration, to relieve the demographic pressure on Java, from the 1960s up to the late 1990s, moved millions of people from Java to the outer, forested, islands. The magnitude of its impact on deforestation is debated (imprecise and conflicting definitions of deforestation and shifting cultivation led to overstatement of shifting cultivation and understatement of logging) but has been significant, about 20 percent (FWI/GFW 2002). According to estimates endorsed by the World Bank in early 1990s, 67 percent of deforestation was imputable to government sponsored programs (Sunderlin and Resosudarmo 1996). During Asia’s economic crisis, the fall of the Suharto’s regime (1988) made the room for “big bang” decentralization, particularly dramatic in the forestry sector. Deprived by force of their customary rights from 1970 by the central government which started granting large-scale permits, forest-dependent communities recovered the exercise of their rights to negotiate directly with logging companies. Not only the forestry law passed in 1999 formalized these community use rights, which were then sold by communities to firms (Palmer and Engel 2007), but it also transferred authority to local governments, and allowed resource-rich regions to retain a larger share of the fiscal revenues generated within their jurisdictions, fueling illegal logging through an ongoing struggle over the economic rents associated with timber production (proliferation of permits, license granting to sale illegally logged timber) (Barr et al 2006; and Arnold 2008).
70
Under Suharto, cronyism in the forestry sector left timber companies free to operate out of any regulation while overcapacities in the timber processing industry raised pressure on the natural forests (FWI/GFW 2002, OED case study on Indonesia). Unregulated logging, with high intensity of timber removal (over 100-120 m3 per hectare in some rich-primary forests) have a direct impact on forests, especially when fires run through the logged-over forest.
Intensive and unregulated logging reduced dramatically the potential profitability of a second harvest, thus raising pressures for converting over-logged forests in cash crop fields or in pulpwood plantations. Under-investment in tree plantations by the pulp and paper industry has entailed a high reliance of this industry on natural forests for fiber supply. This industry has taken advantage of a legislation which stated that any natural forest with a standing stock below 20 m3 per ha could be clear-cut and turned into plantation (Pirard 2008). In the meantime, the expansion of plantations, sometimes non-productive, appeared as a tool of laundering illegally logged wood (Nellemann 2012). The Rise of the Oil Palm Industry, New Main Driver of Deforestation
Since 1990, Indonesia experienced one of the most rapid plantation expansions worldwide (more than a half of palm oil plans are in Indonesia and Malaysia) and became the world’s largest producer and exporter of palm oil, of which India is the main outlet (USDA/FAS 2012). The Agricultural Ministry’s records indicate that from 1990 to2010, oil palm area increased 600 percent to 7.8 Mha. Over 90 percent of this development occurred in Sumatra and Kalimantan (Carlson et al 2012). During the period 1990–2005, at least 56 percent of oil palm plantation in Indonesia occurred at the expenses of forests (Koh and Wilcove 2008). With price which quadrupled since 2000 and gross margin of up to 2,000 – 3,000 US$ and more per ha on industrial complexes, make oil palm a highly profitable enterprise, even for small-holders. By 2006, about 12 percent of plantations were owed by the government, 35 percent by the small-holders, and the remaining 53 percent by companies (Indonesian Palm Oil Board 2007). This private sector is highly concentrated and partly belongs to the same conglomerate that control the logging, wood processing, and pulp and paper industry (FWI/GFW 2002). Oil palm plantations are made on forest land because companies are looking for the timber value and not because of a problem of land scarcity.
71
In its REDD effort, backed with $1 billion commitment of Norway, in May 2011 the Indonesian government ordered a two-year suspension on new concession permits on primary forests and peat land which suffered from loopholes and breaches. In addition, Indonesia has pledged to move agricultural development from forests to already degraded lands (Murdiyarso et al 2011; Austin et al 2012; and Greenpeace 2012). A great deal will depend on how under a more decentralized regime than Suharto’s provincial governors view forest exploitation.
An Emerging Threat: Mining
Indonesian coal production has increased in recent years, driven by regional demand. Although not ranking among the world's top ten in coal reserves, Indonesia is currently is the world's largest exporter of steam coal (U.S. EIA 2011). Most of Indonesia’s coal reserves are situated in Sumatra and Kalimantan. The activity is contributing to an economic boom in rural/forested areas and has visible impacts on forests. The moratorium allowing underground resource extraction in protected forests (zoned to maintain watersheds and ecosystem function, not for logging or conservation) could be a boon to miners that have exhausted surface deposits.
Box 4: Drivers of Deforestation and Degradation in the Congo Basin
With a net deforestation rate of dense forests of 0.35 percent (+/- 0.16) according to the OFAC (Observatory of Forests of Central Africa), Congo basin is still at an early stage of the forest transition curve. The rate of deforestation has been limited so far, and has been concentrated mostly in coastal areas and in some places along navigable rivers with high population densities too. Unlike Latin America and, to a lesser extent, South-East Asia, where large-scale commercial agriculture and ranching are the main drivers of deforestation, currently, deforestation in Africa is still largely driven by small-scale activities (DeFries et al 2010; and Fisher 2010), both for subsistence and commercial agriculture, with outlets on local or sub-regional markets but also exports on the international markets. Charcoal and logging are important drivers of degradation, and are triggers that can facilitate eventual deforestation, when there is population pressure for land and opportunities of market access for agriculture production.

72
In DRC, where the deforestation rate is the highest in the sub-region, Defourny et al (2011) found strong positive correlations between rural population densities and deforestation. Spatially-modeled analysis undertaken in the study found that one of the main drivers of deforestation is traditional smallholders’ agriculture activities, which are dominated by roots crops (cassava, yams and cocoyam), and bananas and plantains. These have low productivity, are based on shifting cultivation and use minimal to no external inputs. Population increase in rural areas, forest fragmentation and roads are compounding factors, but Defourny et al (2011) found no significant association between deforestation and protected areas – a quite expected result – but also forest concessions – which is a less obvious result. One of the big issues is what will be the future of the degradation and the deforestation in the Congo Basin, and especially in the DRC. Zhang et al (2002) predicted a rate of annual deforestation of 1.2 percent in 2030 due to the interlinked dynamics of population growth and shifting cultivation. This hypothesis is contested by Tollens (2010), a leading agricultural researcher on DRC’s agriculture, who sees the state of agriculture as “a declining and neglected smallholder agricultural sector, rapidly increasing food imports, and existing plantations trying to maintain only their productive capacity with replanting”. The potential of large-scale agriculture is huge in the Congo Basin, especially for oil palm and rubber wood, but also for many other food and biofuel crops. Many observers anticipate a large increase of large-scale commercial agriculture in the Congo Basin as influence of commercial globalized agriculture are expected to increase, as these countries move to the next phase of the forest transition. Around 1.2 million ha could be developed for oil palm in Cameroon (planified activities and negotiated contracts) in the coming years, mostly on degraded forest areas but also on dense forests. This country seems to be the most favored by agribusiness international investments so far and tend to have comparative advantages in the sub-region. In Gabon and Congo Brazzaville, multinational companies plan also to develop important plantations of oil palm and rubber wood, but investors face the problem of the cost and the limited availability of the local workforce. For DRC, Tollens considers that “The investment climate and business conditions do not attract newcomers entering the sector. The lack of public support for the agricultural sector, the lack of adequate infrastructure and support services and Dutch disease type problems result in a lack of international competitiveness compared to similar forest areas in particularly South East Asia”.

73
These findings lead to five overarching conclusions about deforestation: First: In a strong, non-fragile state, with good governance, public policies can make a difference, even in a globalized and liberalized world.
Those diverging views on the dynamics of land-use are a big challenge for the setting of a REDD+ “reference scenario”, which is meant to anticipate deforestation rates. Mining is the emerging driver of deforestation in Central Africa. The escalating prices of minerals has triggered new explorations and further exploitation of iron, cobalt, copper and other metals in both non forested and forested areas. Terrestrial oil and gas resources are also considered for extraction in the forested areas. Oil resources are suspected in the close basin of the Congo River in the DRC. Oil exploration is expected to start soon in one of the oldest national park in Africa, in the Virunga (close to Rwanda). Mining and oil/gas extraction will probably not destroy very large areas of forests, but will contribute to the fragmentation of the dense forest, with many adverse ecological effects and risks of further degradation and deforestation, due to unlocked access to the forests. In spite of the active involvement of the Congo Basin’s governments in the REDD+ negotiation process, it seems this is not likely to modify anyway the intention of the governments to utilize as soon as possible the mining and oil extraction potential, and it does not seems to prevent these same governments to court the agribusiness investors for developing oil palm and rubber wood plantations in their countries. This is particularly the case of Cameroon, with impressive development of oil palm plantations, but also in Gabon and Congo-Brazzaville. In the DRC, the government is to go ahead with the oil exploration in the Virunga National Park. Overall, even if the governments were sincerely committed towards designing future land use planning in order to reduce deforestation, the reach of the public authorities is very limited in countries that remain “fragile States”, where corruption is still omnipresent and the judiciary system is down (Karsenty and Ongolo 2012).
74
Second: In a globalized and liberalized world with instable prices and technological changes (that modify comparative advantage), the achievements on reducing forest loss can be fragile and can be reversed quickly. The forest transition theory is useful but is not a guarantee for the state of the future. Transitions toward a green economy with new consumption and production paradigms are the only chance for consolidating these results. Neither the developed nor the developing world is following this pathway if per capita caloric consumption and its sources are considered. Third: International financial incentives, such as those through REDD+ have not been the determining factor for Brazil, Indonesia, or the Congo Basin countries to curb the internal policies of indiscriminate provision of credit without law enforcement on land set asides or small scale farming. Rather in the case of Brazil gaining international stature and credibility that correspond to the status of new global power has certainly been the most important incentive. This is good news for the “common but differentiated responsibilities”, but the bad news is that financial incentives are not enough if there are not (heavily) complemented by the political will to become credible. Indonesia has not reached this stage yet and neither has Congo. Additionally, some of the deforestation which was previously taking place in the Amazon has moved to the cerrados (biodiversity-rich savannah partially wooded, with high quantities of carbon into soils) and with the growing importance of biofuels beyond sugarcane based ethanol in which Brazil dominates the future of the savannahs remain in the balance. Fourth: Without completing accounting of natural capital gain and loss and its externalities and valuation at an appropriate level, individual countries and the global community will continue to rely on partial incomplete measures to save the environment. This means estimations of factor productivity growth too will have to be modified from the perspective of the long term sustainability of the natural systems and their local and global impacts. Fifth: Notwithstanding the terminology of market based ecosystem services explored further in section on Payments for Environmental Services and REDD+, governments remain the key actors in achieving results. 70 percent of all ecosystem programs in the world are funded by governments.
Forestry and Water
• Forested catchments supply three quarters of freshwater (Fischlin and Midgley
2007) used for domestic, agricultural and industrial needs. The availability and quality and water in many regions are threatened by widely documented overuse, misuse or

75
pollution (Lele et al forthcoming), whereas it is now widely recognized that both are strongly influenced by forests and thus depend on proper forest management there is less agreement on the impacts of forest protection on watersheds. Climate change is altering forest’s role in regulating water flows and influencing the availability of water resource. The amount of water used by forests is also an issue of concern, particularly as the world increasingly looks to planted forests for carbon fixation, renewable energy, wood supply alternative to natural forests and landscape rehabilitation. • As forested catchments supply competing needs, a key challenge faced by land, forest and water managers is to maximize the wide range of multispectral forest benefits without detriment to water resources and ecosystem function. Indeed the trade-offs between the many forest service’s stakeholders derive at different spatial and temporal scales are only now begun to be understood. In line with the WSSD (2003), and the Shiga Declaration prior to the third World Water Summit (2003), many countries have begun to develop integrated water resource management(IWRM) – i.e. multispectral, including forestry and foresters – plans at the watershed or the river-basin level as fostered by the Global Water Partnership (GWP). • Since regulatory frameworks have often proved ineffective or unable to reconcile conflicting needs, payments for watershed services (PWS) schemes, a subset of payments for environmental services (PES) based on conditionality, has gained popularity as the way to improve the efficiency of watershed management in several middle income countries, most notably Costa Rica, Mexico and increasingly China. Providing an incentive to upstream land users to adopt practices that ensure to downstream user the supply of environmental services, many PWS include forest conservation, regeneration or plantation. It difficult, if not impossible, to unequivocally link all causes and effects including the ability to demonstrate both the threats to existing services and the effectiveness of the practices ensuring the service provision, in view of the complexity and natural variability of watershed processes. • It is in maintaining high water quality that forests contribute the most significantly to the hydrological characteristics of watershed ecosystems. Maintaining or restoring forest cover 1) minimizes soil erosion in sloping lands and prevent landslide; 2) reduces the run-off impact on sediment losses of soils and sediment concentration in water bodies; 3) filters water pollutants (organic matter and agricultural or industrial chemicals) on run off pathways or in riparian zone (i.e. along streams). However, trees exposed to high levels of air pollution capture sculpture and nitrogen and can increase water acidification. • One of the most poorly understood (though by no means under-researched) forest-water interactions is the impact of forests on water yield. The enduring debate on
76
the outcome of extension or reduction of the forest cover is less a matter of gap between public perception and scientific knowledge (Calder 2002) than a sharp division in the scientific community between a ‘demand-side school’ working at very local micro-perspective (<1km2to 10 km2) and a ‘supply-side school’ modeling at larger spatial scales (Ellison et al 2012). Against the ‘conventional wisdom’ that ‘the more trees the more water’, the demand-side school has opposed the assertion (based on empirical evidence) that ‘trees use water’ (evapotranspiration) and that deforestation leads to a period of increased water availability while afforestation reduces runoff. • From such a demand-side perspective, the forest-water debate implies some important trade-off, especially in areas where climate change threatens water resource, like in semi-arid areas. Large-scale forest planting for climate change mitigation purpose or fast-growing and water-demanding forest crops (fuelwood) have potential to accentuate water shortages. As natural upstream forests reduce dry-season flows as much as or more than they reduce water yield, a forest removal policy has sometimes been suggested as a mean of mitigating drought in water-constrained areas. Such a practice has to be weighed against the consequent loss of other forest services and goods and should definitely be avoided in fragile ecosystems like in saline-prone areas, and in mountain cloud forest. • The importance of upstream forest cover in regulating hydrological flows (maintaining water flow during the dry season and reducing flood risk during the rainy season) seems to have been overestimated. Impacts of forest cover removal are evident only at the micro-level: forests can mitigate small and local floods but do not appear to influence either extreme floods or those at the large catchment scale. Even if scientific evidence refutes the ‘myth’ that deforestation in the Himalayas causes big floods in the lowlands of the Ganges and Brahmaputra (Hofer and Messerli 2006) – and that reforestation can prevent it – the controversy has not ended so far (Bradshaw et al vs. Bruijnzeel et al 2007). Rather than discarding the need for proper management and conservation of upland forests, it points out the need of integrated approaches in river-basin management beyond simplistic forest-based “solutions” (FAO and CIFOR 2005). • Hydrologists have focused on ‘blue water’ (how freshwater in rivers and aquifers is made available for human use in irrigation systems), ‘grey water’ (conditions under which ‘used’ water can return to the cycle without ecological damage), ‘green water’ (how a substantial part of rainfall recycled to the atmosphere forest and any other vegetation is lost for human use). Emerging ‘rainbow water’ focus tackles the origin of rainfall that waste missing part of the water cycle studies. In this perspective, the new concept of “precipitation shed”– as an atmospheric watershed –helps to understand the impact of land change cover on rainfall-dependant areas (Keys et al 2012) while
77
advocating for increased attention to the role of ecosystems as water producers rather than consumers (Ellison et al 2012). • Seeing trees and forests as consumers of available water and competitors for other (human) downstream water uses – as the demand-side proponents do – misses the beneficial side of this consumption. The same evapotranspiration that consumes water at one scale supplies water to the atmosphere, such a precipitation recycling through cloud formation. It not only raises the likelihood of local precipitation, it also favors the cross-continental transport of moisture vapor and thus increases at regional and global scales. For the proponents of the supply-side, large forest expanses should be seen as ‘biotic pumps’ renewing and intensifying the water cycle. Reviews of many studies find support for the connection between deforestation and declining precipitations (Ellison et al 2012). • As exposed in a SBSTA 36 side-event organized by ICRAF (Bonn, May 2012), although forests are mobilized against global warming to boost carbon sequestration, fossil fuel substitution and biodiversity protection, little attention is paid to the ‘tangible’ influence of forests on the local and regional patterns of rainfall. For example, existing climate data exclude microclimatic effects of trees while predicting crop growth under climate change scenarios does not include the option of modifying local climate by increasing tree cover in strategic location. Moreover, if water transpired in the Congo Basin would feed rainfall over the water-constrained Sahel, understanding regional climate drivers can give impetus to climate negotiations and cooperation at a more regional level. However, further work will be necessary to quantify how specific land cover change (e.g. from forest to savannah) affect the water cycle. Opportunities & Challenges
• A subset of the payments for environmental services (PES), payments for watershed services (PWS), appear to have potential to improve resource management as a conditional (result-based payments) watershed management tool where existing regulatory framework often proved unable to reconcile competing needs and traditional tools such as integrated watershed management plan in which rewards and investments were not contingent to contract compliance. Payments dot not necessarily involve money, often taking form of development services a community has been lacking. • According to Wunder’s definition (2005), PES transactions are: (1) voluntary (2) between at least one service buyer (3) and at least one seller (4), focused on a well-defined service (or a land use likely to provide that service), and (5) conditional upon contract compliance. In practice, two generic PWS types are being implemented. Small-to-medium sized, the user-financed schemes are emerging from the negotiation process
78
between buyers and sellers (often through intermediaries) like the Vittel watershed scheme in France and municipal programs in Latin America. In government-financed PWS schemes, the state acts on behalf of service users, using tax revenues or obligatory user fees for payments and targeting poverty alleviation and regional development co-benefits (far from the archetypal nature of PES deals). Some are nominally focused on watershed protection, such as the Chinese Sloping Land Conversion Program (7.2 million ha land retired; 4.9 million ha planted with trees), or Mexico’s national watershed protection program (126,000 ha). Others have a broader scope, such as the Costa Rica’s PES scheme (600,000 ha), and the United States Conservation Reserve Program (about 14.5 million ha).
Linkages between Forests and Energy
The relationships between GDP growth, population growth and growth in energy consumption have become issues of growing interest in the context of climate change. It is a vast subject and this section is confined to a more modest objective, namely of addressing it in only two ways: 1. The direct contribution of forests and agricultural lands to energy, e.g. through the use of fuel wood, largely associated with poverty and underdevelopment, and bio-energy (the modern form of energy being developed in middle and high income countries in the form of the first and second generation biofuels) and 2. Indirect relationships/impacts on forests and forest related emissions and forest dependent people of energy development in other energy sub-sectors, (e.g. hydropower,
Box 5: Challenges in Assessing impacts of Watershed PES Schemes
The criterion of the well-defined service is particularly critical for watershed services, because the biophysical linkages between land use change and service outcomes can be complex. Case studies reviews (Hamilton 2008) indicate that almost none of the existing PSE schemes are bases on both good science (proper scientific measurement of the impact of projects) and good economics (reliable valuation of the benefits of theses impacts). There is a general absence of scientific data to support the evaluation of trade-offs: most of initiatives were based on conventional wisdom, secondary sources of information, and selective reference to forest hydrology literature. For example, payments are based on the opportunity costs of returning cleared land to forest cover, with no attempt to model relationships between land use and hydrology (Asquith and Wunder 2008).
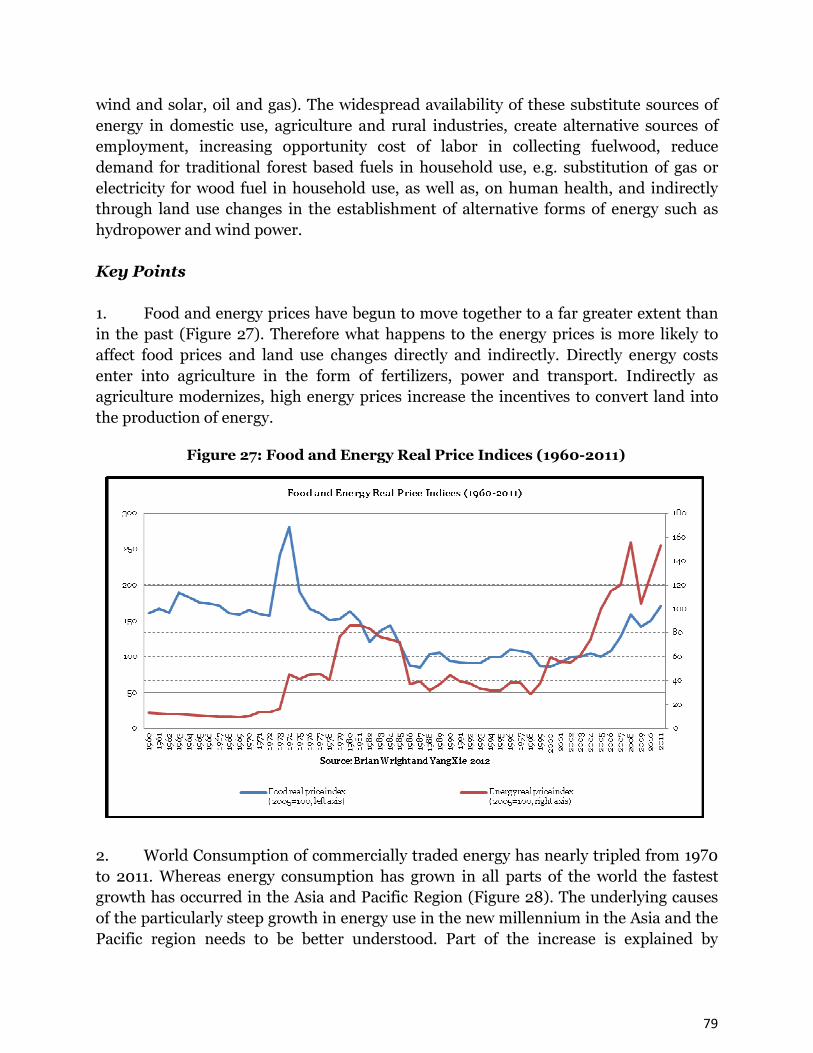
79
wind and solar, oil and gas). The widespread availability of these substitute sources of energy in domestic use, agriculture and rural industries, create alternative sources of employment, increasing opportunity cost of labor in collecting fuelwood, reduce demand for traditional forest based fuels in household use, e.g. substitution of gas or electricity for wood fuel in household use, as well as, on human health, and indirectly through land use changes in the establishment of alternative forms of energy such as hydropower and wind power.
Key Points
1. Food and energy prices have begun to move together to a far greater extent than in the past (Figure 27). Therefore what happens to the energy prices is more likely to affect food prices and land use changes directly and indirectly. Directly energy costs enter into agriculture in the form of fertilizers, power and transport. Indirectly as agriculture modernizes, high energy prices increase the incentives to convert land into the production of energy. 2. World Consumption of commercially traded energy has nearly tripled from 1970 to 2011. Whereas energy consumption has grown in all parts of the world the fastest growth has occurred in the Asia and Pacific Region (Figure 28). The underlying causes of the particularly steep growth in energy use in the new millennium in the Asia and the Pacific region needs to be better understood. Part of the increase is explained by
Figure 27: Food and Energy Real Price Indices (1960-2011)

80
increase domestic consumption. Yet at least a significant part of it is a result of Asia, and particularly China, becoming the world’s biggest factory and producing consumer goods exported to all parts of the developed and developing world where consumption is increasing. 3. The good news is that energy efficiency (measured over the 1980 to 2009 period as energy use in kgs of oil equivalent per $1,000 GDP) has declined sharply in the Asia Pacific Region and in other developing regions where energy consumption has been growing (Figure 29). But energy use per $1000 increased in the Middle East and North Africa. In SSA where it increased first but has returned to the 1980 levels, and in Latin America where is has not changed. Data on energy consumption are perhaps less reliable for the African region so there is need for caution in interpreting them. But it is unclear why the energy use was so high in East Asia in the 1980s (Figure 29).
Figure 28: Total Primary Energy Consumption by Region
(Million tonnes oil equivalent)
(1970-2011)

81
4. Clearly the efficiency gain has not been fast enough to slow down the rate of temperature change. The range in the levels of energy efficiency use per $1,000 is also very large from the lowest level of 140 kgs of oil equivalent in LAC region to over 260 kgs in Asia in 2009 to well over 300 kgs in SSA, and when compared to high income countries suggesting that there is still considerable scope for increasing energy efficiency. 5. Energy consumption is rising more steeply in developing countries relative to energy use in middle income countries (Figure 30). And yet relative to developed
Figure 29: Energy use per $1,000 GDP (constant 2005 PPP) by Region
(Kg of oil equivalent)(1980-2009)
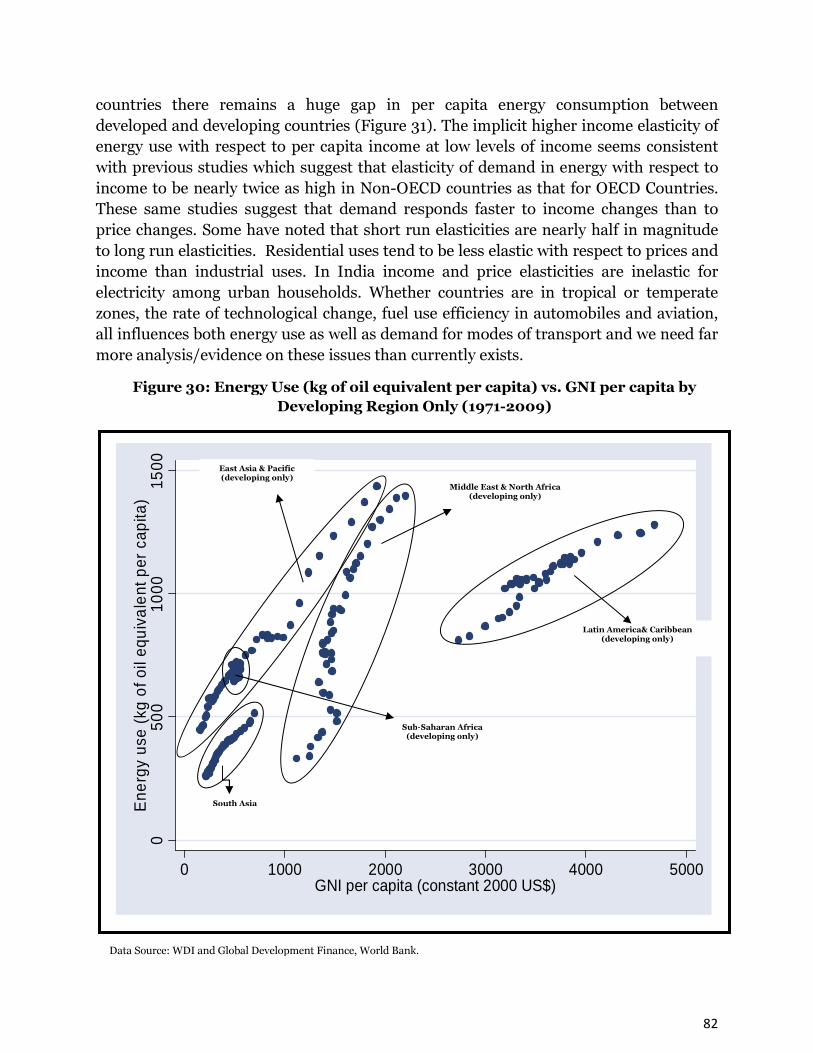
82
countries there remains a huge gap in per capita energy consumption between developed and developing countries (Figure 31). The implicit higher income elasticity of energy use with respect to per capita income at low levels of income seems consistent with previous studies which suggest that elasticity of demand in energy with respect to income to be nearly twice as high in Non-OECD countries as that for OECD Countries. These same studies suggest that demand responds faster to income changes than to price changes. Some have noted that short run elasticities are nearly half in magnitude to long run elasticities. Residential uses tend to be less elastic with respect to prices and income than industrial uses. In India income and price elasticities are inelastic for electricity among urban households. Whether countries are in tropical or temperate zones, the rate of technological change, fuel use efficiency in automobiles and aviation, all influences both energy use as well as demand for modes of transport and we need far more analysis/evidence on these issues than currently exists.
Figure 30: Energy Use (kg of oil equivalent per capita) vs. GNI per capita by
Developing Region Only (1971-2009)
050
010
0015
00E
nerg
y us
e (k
g of
oil
equi
vale
nt p
er c
apita
)
0 1000 2000 3000 4000 5000GNI per capita (constant 2000 US$)
Data Source: WDI and Global Development Finance, World Bank.
Latin America& Caribbean (developing only)
Middle East & North Africa (developing only)
South Asia
East Asia & Pacific (developing only)
Sub-Saharan Africa (developing only)
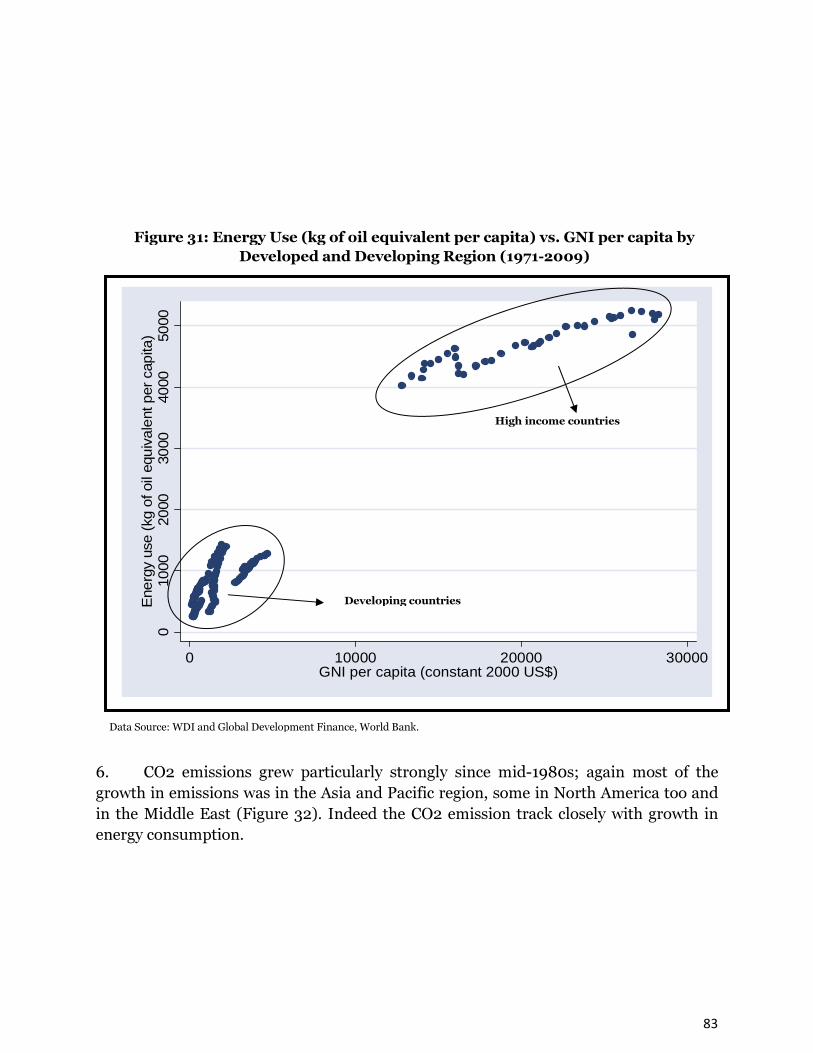
83
6. CO2 emissions grew particularly strongly since mid-1980s; again most of the growth in emissions was in the Asia and Pacific region, some in North America too and in the Middle East (Figure 32). Indeed the CO2 emission track closely with growth in energy consumption.
Figure 31: Energy Use (kg of oil equivalent per capita) vs. GNI per capita by
Developed and Developing Region (1971-2009)
010
0020
0030
0040
0050
00E
nerg
y us
e (
kg o
f oil
equiv
alent
per
cap
ita)
0 10000 20000 30000GNI per capita (constant 2000 US$)
Data Source: WDI and Global Development Finance, World Bank.
High income countries
Developing countries

84
Despite Diversification in Energy Sources Oil, Coal and Natural Gas
Dominate
The share of oil, coal and natural gas was 87 percent of the world energy consumption in 2011 (Figure 33). Persistent energy subsidies have encouraged the dominance of fossil fuel consumption: in 2010, fossil fuel subsidies amounted to $409 billon globally and without policy reforms fossil fuels are expected to remain the dominant energy source for the foreseeable future. The International Energy Agency’s World Energy Outlook (IEA 2011)
Figure 32: Carbon Dioxide Emissions by Region (Million tonnes carbon dioxide)
(1965-2011)
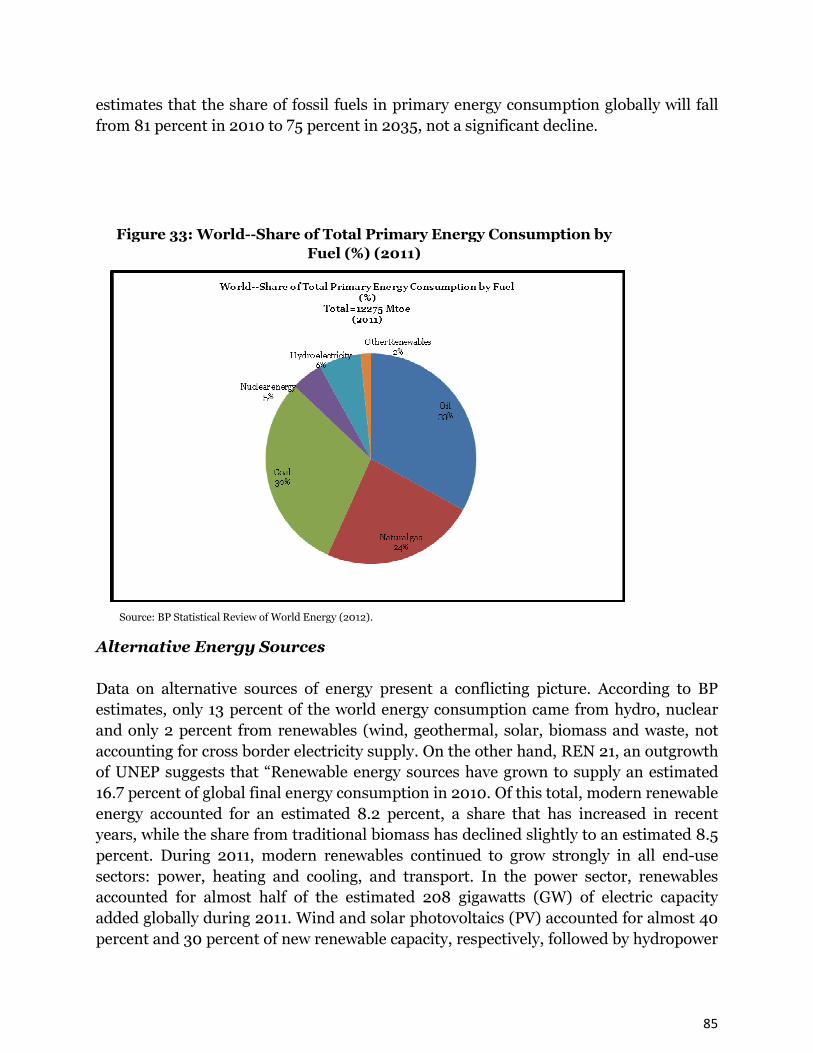
85
estimates that the share of fossil fuels in primary energy consumption globally will fall from 81 percent in 2010 to 75 percent in 2035, not a significant decline.
Alternative Energy Sources
Data on alternative sources of energy present a conflicting picture. According to BP estimates, only 13 percent of the world energy consumption came from hydro, nuclear and only 2 percent from renewables (wind, geothermal, solar, biomass and waste, not accounting for cross border electricity supply. On the other hand, REN 21, an outgrowth of UNEP suggests that “Renewable energy sources have grown to supply an estimated 16.7 percent of global final energy consumption in 2010. Of this total, modern renewable energy accounted for an estimated 8.2 percent, a share that has increased in recent years, while the share from traditional biomass has declined slightly to an estimated 8.5 percent. During 2011, modern renewables continued to grow strongly in all end-use sectors: power, heating and cooling, and transport. In the power sector, renewables accounted for almost half of the estimated 208 gigawatts (GW) of electric capacity added globally during 2011. Wind and solar photovoltaics (PV) accounted for almost 40 percent and 30 percent of new renewable capacity, respectively, followed by hydropower
Figure 33: World--Share of Total Primary Energy Consumption by
Fuel (%) (2011)
Source: BP Statistical Review of World Energy (2012).

86
(nearly 25 percent). By the end of 2011, total renewable power capacity worldwide exceeded 1,360 GW, up 8 percent over 2010; renewables comprised more than 25 percent of total global power-generating capacity (estimated at 5,360 GW in 2011) and supplied an estimated 20.3 percent of global electricity. Non-hydropower renewables exceeded 390 GW, a 24 percent capacity increase over 2010” (REN 21: 2012). The top seven countries for non-hydro renewable electric capacity—China, the United States, Germany, Spain, Italy, India, and Japan—accounted for about 70 percent of total capacity worldwide. The ranking was quite different on a per-person basis, with Germany in the lead followed by Spain, Italy, the United States, Japan, China, and India (REN21; 2012). At least 118 countries, more than half of which are developing countries, had renewable energy targets in place by early 2012, up from 109 as of early 2010. Alternative energy increase in the recent past has been result of a combination of incentives, investments, policies and subsidies that promote increased adoption of renewable energy as a way to reduce dependence on fossil fuels. As technology develops and prices for alternative energy sources fall, adoption of alternative energy sources should increase. But fiscal challenges in the US and Germany each of which have actively encouraged alternative energy sources in the last four years have led to decline or elimination of subsidies, slowing down the rates of technological innovation (REN21; 2012). Although there is still a long way to go to provide energy access for all, some argue that more people than ever before derive energy from renewables as capacity continues to grow, prices continue to fall, and shares of global energy from renewables continue to increase. Yet China’s hydropower and natural gas production illustrates the point. It has increased substantially, but it still constituted only 2.3 percent and 3.4 percent of the total energy supply in China respectively with continued dependence on coal. 2 percent of all energy in the rest of Asia comes from nuclear and equal or less from hydropower whereas as much as 10 percent of all energy supply in Latin America comes from hydropower. The biggest growth in hydropower was in Europe, followed by Asia. The same is true in the case of the rest of Asia as regards nuclear energy, which has lost political support since the Fukushima tsunami and the earthquake and hydropower. Less than 2 percent of all energy in the rest of Asia comes from nuclear. There is considerable regional variation too in the sources of energy growth (Figure 34, 35 and 36). The Asia Pacific Region experienced growth in all sub-sectors of energy, and although China was a leader in the growth in hydro, solar panels and wind energy, according to one estimate the share of coal had increased over time in energy consumption in Asia.
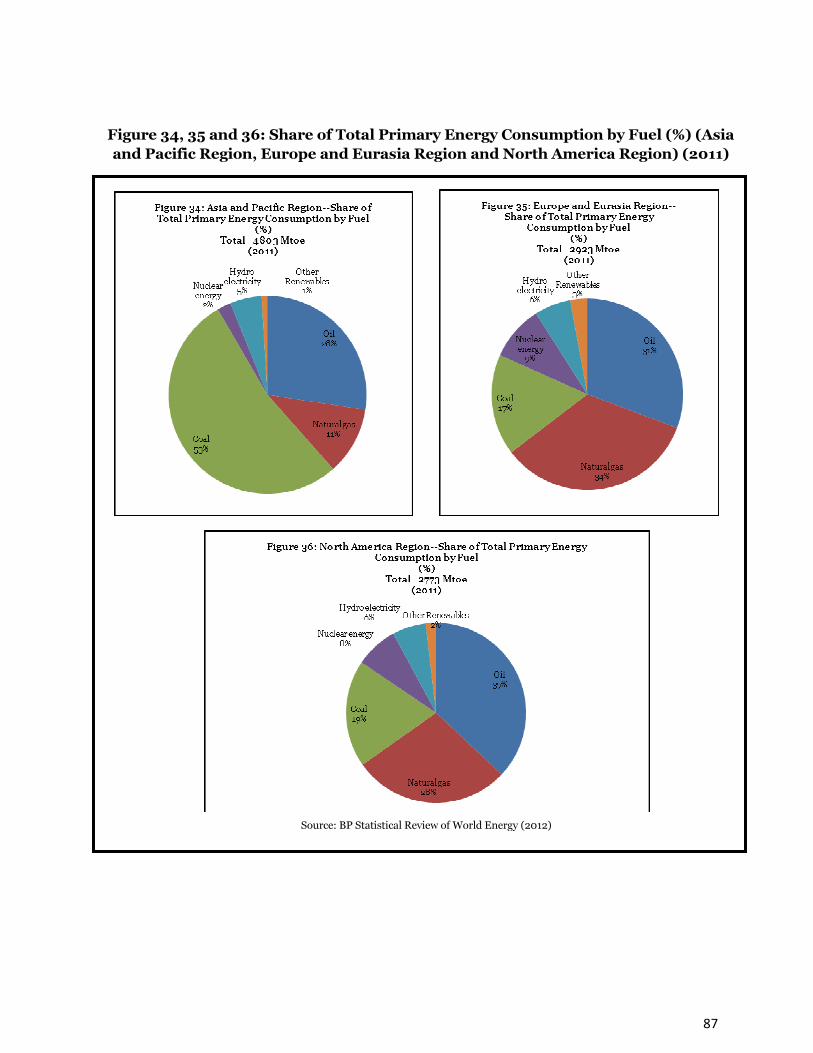
87
Figure 34, 35 and 36: Share of Total Primary Energy Consumption by Fuel (%) (Asia
and Pacific Region, Europe and Eurasia Region and North America Region) (2011)
Source: BP Statistical Review of World Energy (2012)
88
Wind Capacity has Grown Rapidly
Despite the high growth in wind capacity the initial capital costs are high and therefore it is unlikely low income countries can afford it in the foreseeable future without substantial further reduction in costs although donors are supporting a number of projects in developing countries. The Global Grid Connected Biomass Capacity
Again the biggest grid is largely a developed or a middle income country phenomenon. It is in Europe and North America, some in Oceania, China, Brazil and India. It seems to be insignificant in the rest of the world. Fuelwood
Asia with close to 0.9 billion cubic meters of wood in 1996 dominated in the traditional forms of fuelwood to 2008, which is consumed largely by the poor. But levels of fuelwood consumption in Asia had declined to 0.73 billion m3. Africa’s level of fuelwood use on the other hand has increased from 0.5 billion m3 to slightly over 0.6 billion. Latin American consumption of fuelwood has remained about the same at 0.2 b m3 (Figure 37). In terms of direct influence on deforestation and degradation, fuelwood use is of particular importance but at low levels of income and economic development seems directly related to access and opportunity cost of labour. Developing countries account for nearly 90 percent of fuel wood and charcoal consumption and wood is the primary source of energy for cooking and heating in developing countries. Given that 95 percent of all staple foods need to be cooked to be digested, securing an affordable supply of energy for cooking is crucial. In addition fuel wood use has adverse impacts on health. To make biomass use sustainable, a comprehensive supply and demand side approach is needed. Accurate and up to date country-level data on fuel wood use is often limited or no reliable because of the informality of extraction and use, the high cost of conducting surveys to assess the supply and demand and the highly location specific nature of fuel wood use.
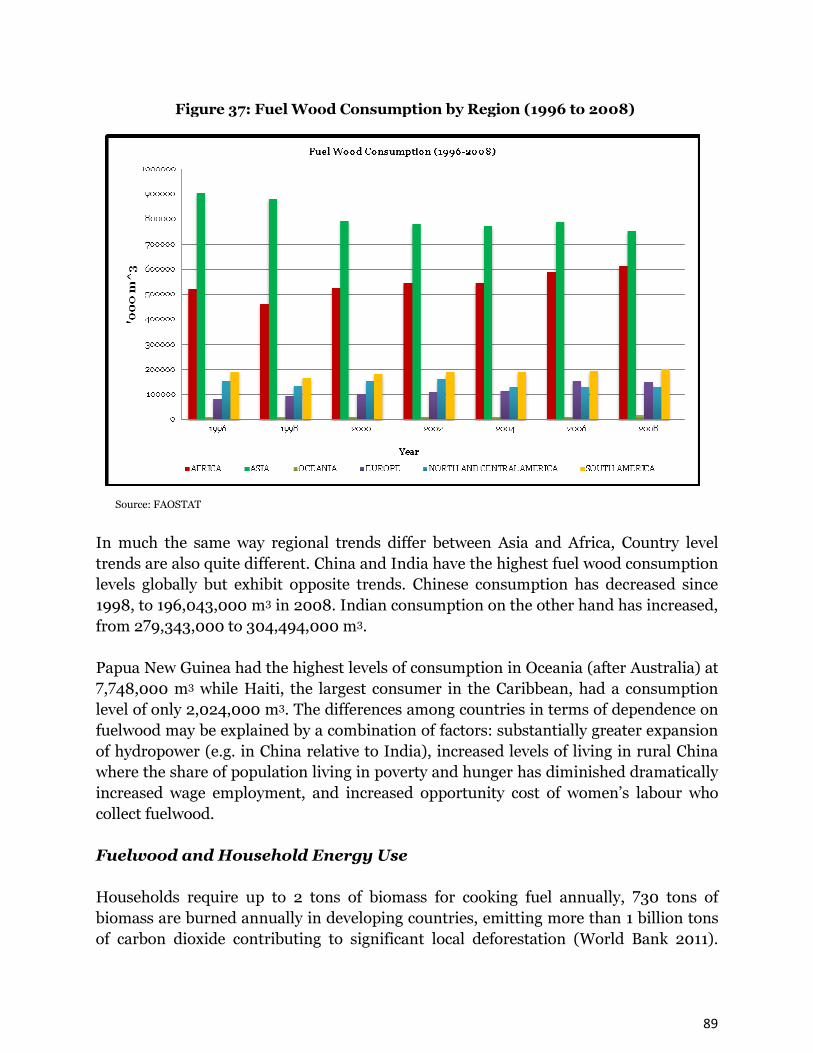
89
In much the same way regional trends differ between Asia and Africa, Country level trends are also quite different. China and India have the highest fuel wood consumption levels globally but exhibit opposite trends. Chinese consumption has decreased since 1998, to 196,043,000 m3 in 2008. Indian consumption on the other hand has increased, from 279,343,000 to 304,494,000 m3. Papua New Guinea had the highest levels of consumption in Oceania (after Australia) at 7,748,000 m3 while Haiti, the largest consumer in the Caribbean, had a consumption level of only 2,024,000 m3. The differences among countries in terms of dependence on fuelwood may be explained by a combination of factors: substantially greater expansion of hydropower (e.g. in China relative to India), increased levels of living in rural China where the share of population living in poverty and hunger has diminished dramatically increased wage employment, and increased opportunity cost of women’s labour who collect fuelwood. Fuelwood and Household Energy Use
Households require up to 2 tons of biomass for cooking fuel annually, 730 tons of biomass are burned annually in developing countries, emitting more than 1 billion tons of carbon dioxide contributing to significant local deforestation (World Bank 2011).
Figure 37: Fuel Wood Consumption by Region (1996 to 2008)
Source: FAOSTAT
90
Nearly 3 billion people in the developing world use traditional cook stoves and open fires to cook, which results in two million deaths a year from exposure to cook stove smoke, more than the number of deaths from either malaria or tuberculosis (World Bank 2011). Women and children are disproportionately affected, both in terms of their health (from exposure to air pollution) and security (searching for biomass, occasionally in insecure areas).21 Steps to Address the Fuelwood Crisis
The clean cook stove and fuel industry is developing programs to promote cleaner, more efficient cook stoves but their use has not yet reached any significant scale in part due to the high cost of such technologies, particularly for poor households, lack of information, and lack of finance. Even though financing instruments linked to climate change mitigation, such as carbon funds, climate investment funds, and traditional sources such as the Global Environmental Facility, are helping to lower, the impacts are minimal (World Bank 2011). Increased information is needed on the impacts of firewood collection on land degradation to help identify and target regions with the highest potential to achieve climate benefits from scaling up clean cook stove and fuel programs. Densely populated South Asia with relatively greater market access holds a greater potential to shift to alternative sources of energy, solar panels and solar cook stoves, than perhaps African rural populations. But it is clear that after 20 years of effort and government policy to promote alternative sources of energy the solar technology is not moving. A recent impact evaluation called it a failure (Hanna, Duflo and Greenstone 2012) as did our field visits22. An approach particularly suited to Africa is the promotion of community forests for energy. The Senegal Sustainable and Participatory Energy Management Project (PROGEDE), a World Bank–sponsored project established a permanent, community based forest management system capable of producing more than 370,600 tons of
21 Methane emissions are the 2nd largest contributor to climate change after carbon dioxide and black carbon is estimated to
contribute 25-50 percent of global carbon dioxide emissions (Global Alliance for Clean Cookstoves (GACC) Climate Factsheet,
United Nations Foundation 2010). Residential uses of black carbon (generally associated with cooking) produce 26 percent of black
carbon emissions—higher than the amount of black carbon produced by either the transport sector or industrial uses (GACC Climate
Factsheet, United Nations Foundation 2010).
22Solar cook stoves are being sold at $30 a unit in the state of Gujarat under the Aga Khan Program of development; Some Chinese
cook stoves are available in India at $20 a unit. But the rural women Lele visited are not using it. The per capita income of those
living below the poverty line in India is Rs. 37 a day, two thirds of a $ at the official exchange rate of Rs.55. By comparison, the price
of the stove seems too high. Access to finance is not easy and the rural women interviewed seemed unconvinced of the benefits of
cook stoves pointing instead to the amount of firewood, kindling and cow dung cakes they had stockpiled for the year.
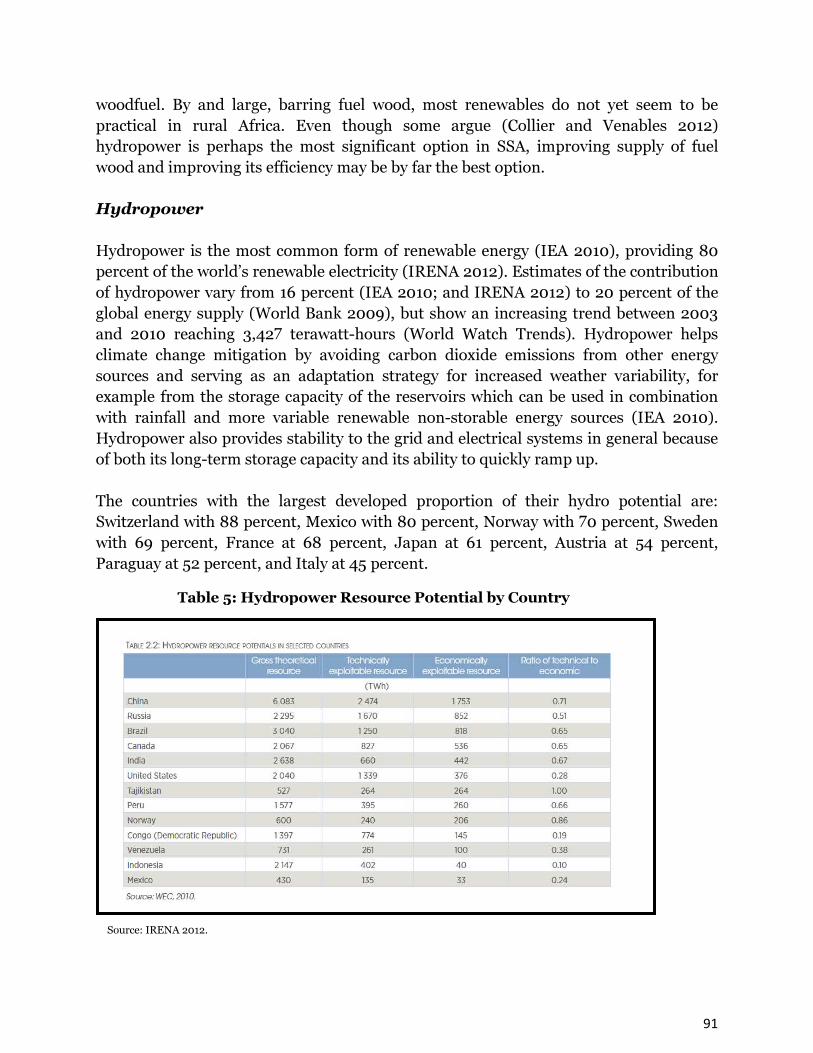
91
woodfuel. By and large, barring fuel wood, most renewables do not yet seem to be practical in rural Africa. Even though some argue (Collier and Venables 2012) hydropower is perhaps the most significant option in SSA, improving supply of fuel wood and improving its efficiency may be by far the best option.
Hydropower
Hydropower is the most common form of renewable energy (IEA 2010), providing 80 percent of the world’s renewable electricity (IRENA 2012). Estimates of the contribution of hydropower vary from 16 percent (IEA 2010; and IRENA 2012) to 20 percent of the global energy supply (World Bank 2009), but show an increasing trend between 2003 and 2010 reaching 3,427 terawatt-hours (World Watch Trends). Hydropower helps climate change mitigation by avoiding carbon dioxide emissions from other energy sources and serving as an adaptation strategy for increased weather variability, for example from the storage capacity of the reservoirs which can be used in combination with rainfall and more variable renewable non-storable energy sources (IEA 2010). Hydropower also provides stability to the grid and electrical systems in general because of both its long-term storage capacity and its ability to quickly ramp up. The countries with the largest developed proportion of their hydro potential are: Switzerland with 88 percent, Mexico with 80 percent, Norway with 70 percent, Sweden with 69 percent, France at 68 percent, Japan at 61 percent, Austria at 54 percent, Paraguay at 52 percent, and Italy at 45 percent.
Table 5: Hydropower Resource Potential by Country
Source: IRENA 2012.
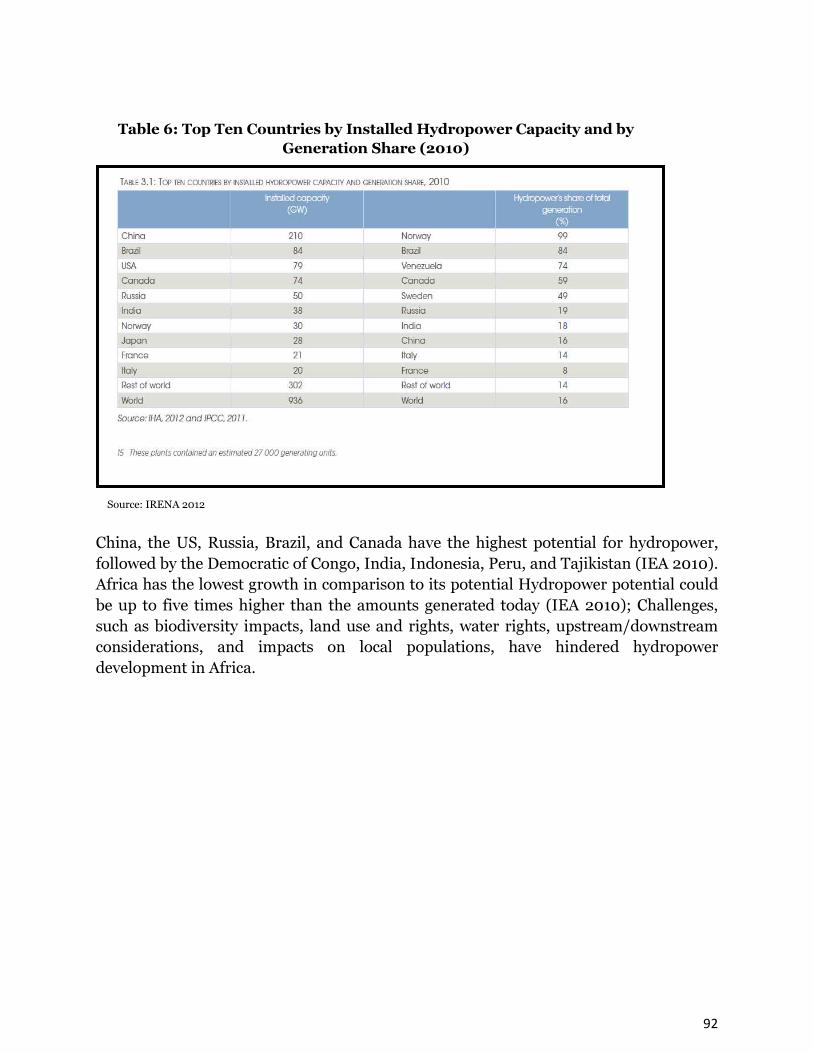
92
China, the US, Russia, Brazil, and Canada have the highest potential for hydropower, followed by the Democratic of Congo, India, Indonesia, Peru, and Tajikistan (IEA 2010). Africa has the lowest growth in comparison to its potential Hydropower potential could be up to five times higher than the amounts generated today (IEA 2010); Challenges, such as biodiversity impacts, land use and rights, water rights, upstream/downstream considerations, and impacts on local populations, have hindered hydropower development in Africa.
Table 6: Top Ten Countries by Installed Hydropower Capacity and by
Generation Share (2010)
Source: IRENA 2012

93
Forest conservation is critical in ensuring hydropower supply. For instance, in Bhutan, which generates 99 percent of its electricity from hydropower, the continued conservation of forests and watersheds is necessary to ensure continued hydropower generation (World SHP Development Report 2012). Although good hydropower practices, including safeguards and self-assessment measures, have been developed by the International Hydropower Association, the International Energy Agency, the World Commission on Dams, the World Bank, the Equator Banks, and the UN Environment Program, technical capacity to implement hydropower project is still lacking in many countries and regions. The IEA recommends policy-makers consider four key issues when deciding on using hydropower to meet energy generation needs: economic equity; protection from droughts and floods; land rights; and protection of air, land, biodiversity, and water (IEA 2010). Hydroelectric power can help to meet increased energy demand, but it can also negatively impact forestry and river ecology, contributing to deforestation and changing
Figure 38: Global Hydro Resource Potential
Source: IRENA 2012

94
hydrological characteristics of rivers. Dams change the flow of water, biota, energy, nutrients and sediments in a river, altering its ecological processes (Ligon et al 1995). Dam walls can trap sediments, hindering physical processes and downstream habitats, including coastal wetlands, deltas, floodplains or barrier islands. Dam walls also block fish migrations, in some instances separating spawning and rearing habitats. In the lower Snake River in the north-western US, the construction of four dams blocked and eliminated salmon spawning habitat, contributing to declines in the salmon populations (Kareiva et al 2000). Brazil plans to build more than thirty large dams in the Amazon region over the next decade to boost its hydroelectric potential, underscoring the trade-offs that countries face between meeting increased demand for electricity and conserving their forest areas (Lyons 2012, The New York Times: Sunday Review, June 30; and Romero 2012, The New York Times, May 5). Critics of the dam projects state that over 120,000 acres of rainforest will be flooded as a result of the dam, resulting in releases of methane gas that outweigh the energy benefits of the dams. These dams are also predicted to destroy animal habitat, divert rivers, and displace communities (Lyons 2012, The New York Times: Sunday Review, June 30). At the same time, the Brazilian government has stressed that Brazil will need 56 percent more electricity within the next decade and hydropower generation is the cheapest and cleanest option to meet this demand (Lyons 2012, The New York Times: Sunday Review, June 30). These findings suggest that hydropower development in countries like Brazil is likely to continue to at a large-scale. Brazil plans to construct several dams and physical infrastructure which will impact forests (Fearnside and Graca 2006). In the Andean Amazon too, governments have promoted hydroelectric dams along the six major Andean tributaries of the Amazon River as a solution to long-term energy needs in Bolivia, Brazil, Colombia, Ecuador, and Peru. Over the next 20 years, there are plans to construct 151 new dams (with capacity of 2 MW or higher), increasing the number of dams in the LAC region by over 300 percent (Finer and Jenkins 2012). Finer and Jenkins (2012) contend that 47 percent of the potential new dams (n=71) will have high ecological impacts with only 19 percent are likely to have low impacts, More than 80 percent of the planned dams would contribute to deforestation through forest clearing, inundation, new roads, and transmission lines, particularly in more remote areas where new road systems will be required. 79 percent of the planned dams would require new transmission line routes while occur in 36 percent of the dam construction projects would require new road construction. The loss of river connectivity as potential ecological impacts of these dams, pointing out that “the placement of dams within a river network relative to one another is just as important to consider as the total number and size of the dams.” Finer and Jenkins (2012: p. 2). Similar issues are extensive in Asia too.

95
Such scenarios underscore the tensions and potentially huge trade-offs between meeting energy needs and protecting forests. These tensions are also visible between different government ministries and development practitioners and environmentalists, each of whom often has a different view on the benefits and limitations of dams. Critics of hydropower also point to the social impacts of hydropower projects. E.g. in Cambodia’s Cardamom forest range, a 14,354-square-kilometer area containing over 50 species of endangered animals, including the Siamese crocodile and clouded leopard, and 450 species of birds, and endangered timber species such as rosewood. Although the Cambodian government has protected a 4,020-square-kilometer area of the forest range as the Central Cardamom Protected Forest sanctuary, deforestation, illegal logging, and allegations of timber-laundering operations persist in the area. The biggest impact on the forest will likely result from four Chinese-funded hydropower projects; expected to legally remove thousands of trees in creating reservoirs. Examples of violence associated with environmental protection and the huge sums of money made from thefts of valuable biodiversity abound23. Hydropower projects also entail social impacts on local populations, including the displacement of local populations for dam construction. The World Commission on Dams report highlights the negative effect dams can have on people and societies living both upstream and downstream from the dams.24 Governments of developing countries worked with the World Commission of Dams but do not necessarily go along with its conclusions and recommendations. Hydropower projects can both contribute to and mitigate climate change. For instance, hydroelectric dams produce carbon dioxide and methane emissions (Fearnside 1997 & 2002). At the same time, hydropower projects have been promoted under the flexible mechanisms of the Kyoto Protocol because they produce comparably less emissions than fossil fuels, though the percentage of emissions varies widely by climatic conditions, geographic location, land cover, and project and technology types, making it difficult to generalize about lifecycle GHG emissions from hydropower projects (IPCC 2011). Hydropower is the leading renewable energy source under the Clean
23 In April 2012, Chute Wutty, a Cambodian environmentalist, was shot to death during a confrontation with military police and
logging company security officers in an area of the forest where the government had licensed the timber company to remove logs for
the construction of the Chinese hydropower reservoir (The Millbrook Independent 2012).
24 The report states that poor and vulnerable groups and future generations bear a disproportionate cost from large dam projects
without gaining similar economic benefits. Finer and Jenkins (2012) found that planned dam construction in the Andean Amazon
region would impact upstream communities by causing displacement and flooding while downstream communities would face
disrupted water flow.

96
Development Mechanism, representing 27 percent of total projects. Approximately 75 percent of these projects are in Brazil, China, India, and Mexico (IPCC 2011). Future Demand
An estimate of future demand varies depending on the set of assumptions. BP estimates energy efficiency to continue to improve globally, at an accelerating rate of 2.0 percent p.a. vs. 1.2 percent p.a. over the past 20 years leading to restraining the overall growth of primary energy consumption25. FAO on the other hand projects demand in developing countries to increase by 3 percent annually compared to 0.9 percent growth in developed countries’ energy consumption. In both projections the proportion of global energy consumption consumed in developing countries also shifts, increasing from 46 to 58 percent between 2004 and 2030 (U.S. EIA 2007; and FAO 2008). The number of people relying on biomass for cooking is expected to increase from 2.5 to 2.7 billion by 2030 (U.S. EIA 2007; and FAO 2008). While traditional fuelwood production is expected to decline e.g. in Asia Pacific, the increased production of bio energy in the forest industry and in response to renewable energy targets will likely offset the potential for a net decrease (FAO 2008). Bioenergy
Biomass is projected to increase four-fold from 227 to 983 by 2030 and biofuels are projected to increase from 15 to 147 Mtoe. FAO (2008) notes that “the contribution of forestry to future energy production will be influenced by: the competitiveness of wood-based energy in achieving the objectives of recent energy-related policies; the costs and benefits of wood-energy-related systems vis-a-vis other options in social, economic and environmental terms; policies and institutions that provide the framework within which forestry and other sectors acts” (FAO 2008; p. 27). Climate and soil, infrastructure, land and labour availability, location relative to supply and demand, and governance and social structures also influence adoption of wood-based energy. Wood energy is most price competitive when generated as a wood industry by-product (FAO 2008). Examples of available, low cost wood residues include residue from timber operations, residue from mills, and rejected pieces of wood left in the forest after harvesting (e.g. tree crowns). These wood residues make up about 50 percent of total biomass removed from forests.
25 BP estimates assume global population growth of 1.4 billion over the next 20 years (or 0.9 percent p.a.) with GDP growth to
accelerate, driven by low and medium income economies to 3.7 percent p.a. from 3.2 percent p.a. between 1990 and 2010
accelerating growth of per capital income. Primary energy consumption growth to 2030 is expected to decelerate to 1.6 percent p.a.
(compared to 2.0 percent p.a. the last 20 years); energy consumption per capita grows at 0.7 percent p.a., about the same rate as it
has since 1970.
97
Traditional biomass use is currently the most widespread application of bioenergy though adoption of liquid biofuels is expected to increase (IPCC 2011). The FAO predicts that transitions to liquid and solid biofuels are likely for three reasons: high fossil fuel prices; perceived risks related to fossil fuel dependence; and increasing GHG emissions. Bioenergy Trade-offs
As forest plantations for energy production have become more common, there have been increasing concerns about the trade-offs related to bioenergy use, particularly its effects on forest area and carbon dioxide emissions and indirect land use effects. Competition among land for food, fibre, and fuel is predicted to increase and research has increasingly shown that the production of bioenergy results in deforestation and increased food prices. Increased biomass production could also stress water supplies (IPCC 2011). Further, competition for wood products between markets, including bio refinery markets, is projected to increase as competition for forest land increases. The IPCC (2011) recommends land and water use management plans and increased understandings of the environmental, energy, and social interactions associated with bioenergy production and use to ensure that expanding bioenergy production is sustainable. In addition, the IPCC (2011) recommends best fertilizer management practices, utilization of surplus heat, and process integration to lower GHG emissions from bioenergy production. Additional research has questioned the climate change benefits from transitions to bioenergy as discussed earlier Land conversion from forests to biofuel production contributes to climate change emissions, particularly in land high in carbon such as forests and drained peat areas. Oil palm plantations in Southeast Asia have also been located on drained peat lands, contributing to GHG emissions. Still, there are other promising technologies such as Jatropha production, which grows well on marginal lands and can be used to restore degraded land. Recent research has also begun to question the contribution of liquid biofuels in mitigating climate change, drawing attention to relative reductions in biofuels in comparison with fossil fuels (Douglas and Simula 2010; and Popp et al 2011) predict that most carbon dioxide emissions from bioenergy will be in Sub-Saharan Africa, Latin America, and Pacific Asia over time, adding further pressure on land systems. Researchers increasingly agree that bioenergy contributes to GHG emissions and emphasize that these emissions will occur well into the future. The IPCC (2011) on the other hand concludes that most biofuel production systems significantly reduce GHG emissions in comparison with the fossil fuels displaced, at levels up to 80 to 90 percent reductions, “if no iLUC effects are considered” (IPCC 2011: p. 50; emphasis added). iLUC can lessen, or even neutralize, net GHG mitigation impacts (IPCC 2011). The FAO
98
(2008: p.19) suggests that 2nd generation liquid biofuels offer greater potential because they place less stress on soil and water and can have higher yields. The IPCC (2011) also suggests that advanced or next-generation biofuels may provide higher GHG mitigation than current bioenergy systems. Bioenergy also affects food availability and food prices. Like Hertel and Wright cited earlier, Douglas and Simula (2010) also point to trade-offs between biofuels and food, citing estimates that increased biofuel production contributes to a 10 to 30 percent increase in food prices.
Cross-Sectoral Linkages between Forests and Transport
Overview
Transport itself is generally not identified as a stand-alone driver of deforestation, but rather a proximate cause of deforestation (Geist and Lambin 2001). Transportation infrastructures, particularly roads, contribute to deforestation in both direct and indirect ways. For instance, the creation of roads may result in forest clearance while the roads themselves may facilitate additional activities that contribute to deforestation by opening up forests to agriculture or logging or facilitating human settlement in new areas or increasing access to the forest for non-timber products, all of which can further contribute to deforestation. On the whole, road construction is recognized as contributing to deforestation and greater road density in nations is associated with higher deforestation both in that country and in neighboring countries (Pfaff 1999). Road reconstruction and improvements (such as paving an unpaved road or adding lanes to an existing road) are increasingly common, also contributing to deforestation (Nelson et al 2004). The number and type of road networks that are constructed and promoted shape the amount and spatial patterns of remaining forests. For instance, Mertens and Lambin (1997) identify several characteristic spatial deforestation patterns across the tropical belt that result from the clearing of forests for roads and transportation infrastructure, including: geometric (large-scale clearings for modern sector activities); corridor (commonly associated with roadside colonization by spontaneous migrants); fishbone (planned resettlement schemes); diffuse (smallholder, traditional subsistence agriculture); patchy (high density population areas with residual forest patches); and island patterns (peri-urban areas). Schneider (1995) recommends intensive road building in the developing world, creating dense road networks around market centers, as opposed to extensive road development that extends roads into areas with low population densities. Roads are also modulated by local factors, such as land tenure status and soil characteristics.
99
Forest clearance from road creation also results in associated negative impacts on biodiversity, from increased erosion to increased edge effects. When roads cut across previously forested landscapes, they fragment the landscape, resulting in smaller patches that produce edge effects, which results in changes in community structure, declines in biomass, and negative impacts on wildlife and other species (Wilkie et al 2000). In England, for example, the construction of roads in forested landscapes resulted in the classification of the common dormouse as an endangered species because the dormouse does not cross open areas larger than 100 meters (Schoon 1996 cited in Wilkie et al 2000). In the Congo Basin, road construction and resulting deforestation results in increased bush meat hunting (Wilkie et al 2000). In the Amazon, road construction and the extension of roads are widely recognized as contributing to deforestation and some studies suggest highway construction has been the biggest driver of deforestation in the region (Geist and Lambin 2001; and Viana et al 2008). Nepstad et al (2001) found that over two-thirds of deforestation in the Amazon occurred within 50 km of major paved highways. The Brazilian government began to build roads linking the Amazon to other parts of Brazil in the early 1960s (Pfaff et al 2007) and launched the Trans-Amazon Highway project, which crosses the Amazon from east to west, in 1970 (Fearnside and Graca 2006). This initial road construction then contributed to additional forest clearance for secondary road construction, creating a fishbone effect (Pfaff et al 2007). Road reconstruction in the Amazon is also associated with deforestation, with deforestation typically spreading from roads upon their establishment but also accelerating upon their improvement (Fearnside and Graca 2006). Road construction and repaving has been heavily debated in the Amazon (Fearnside and Graca 2006; and Pfaff et al 2007). For instance, repaving of the BR-319 highway that connects two Brazilian state capitals (Manaus and Porto Velho) and crosses 875 km of rainforest, has been repeatedly postponed despite its impassable condition at some parts. In Bolivia, the planned construction of a 182-mile highway would necessitate paving 32 miles through the Isiboro Sécure National Park and Indigenous Territory (TIPNIS), which connects the Andes and Amazon basins. This highway was originally planned as part of the Brazilian-led Initiative for the Regional Integration of South America (IIRSA; now renamed the South American Council on Infrastructure and Planning, COSIPLAN), a network of 531 projects, including bridges, electrical power systems, highways, and hydroelectric dams, many of which will be carried out in the Amazon basin. Advocates of the TIPNIS highway point to Bolivia’s under-developed road system, which has only one paved east-west highway, while critics counter the road would clear forests and disrupt wildlife habitat, open additional forest areas to logging and settlement, contaminate nearby rivers and threaten the livelihoods of indigenous communities in the area. One
100
study by the Bolivian government predicts that up to six square miles will be deforested for every mile of paved highway. Other critics note that the road through TIPINIS would primarily cut transport time for goods, facilitating the transport of Brazilian soybeans to Pacific ports, providing more benefits for industry than for the local populations (Friedman-Rudovsky 2012). Transport and Agriculture
New roads open up market access for agricultural products, timber, and non-timber forest products from previously remote areas (Chomitz and Gray 1996) and road extension is considered a direct driver of agricultural expansion. In an examination of the causes of deforestation in 152 cases across the world, Geist and Lambin (2001) found that 37 percent of cases can be explained by the “infrastructure-agriculture tandem.” They explain that, once road networks expand, land under permanent cultivation for food and commercial crops (or land under pasture) expands, resulting in additional deforestation. Geist and Lambin (2001: p. 47) state that this infrastructure-agriculture-deforestation tandem is most common in South American countries, such as Belize, Bolivia, Brazil, Colombia, Costa Rica, Ecuador, Honduras, Mexico, and Peru, though examples also exist in African and Asian countries. In the Brazilian Amazon, for example, paving the 900 km BR-163 highway would facilitate the export of soy products from the region (Pffaf et al 2007). In contrast to assumptions that subsistence farmers will colonize along any available roadway, Chomitz and Gray (1996) found that the impact of roads on subsistence farming is highly sensitive to soil quality in the low population-density context of Belize though only moderately sensitive to market access. Their results suggest that road building in areas with agriculturally poor soils and low population densities –which dominate in tropical areas– could be a “lose-lose” strategy, causing habitat fragmentation in biodiversity-rich forests and providing low economic returns. They further suggest that a plot of land may be undeveloped not because it is far from the road—it may be far from the road because it is not suitable for development (Chomitz and Gray 1996). Tradeoffs
While roads contribute to and facilitate deforestation, road construction is promoted for agricultural development, rural development, and poverty alleviation and researchers have noted the strong correlation between road development, economic growth, and national wealth (Chomitz and Gray 1996; and Wilkie et al 2000). For instance, placement of rural roads, including feeder roads, can have positive effects on rural incomes although such roads may increase deforestation pressures. Chomitz and Gray
101
(1996) recommend that planners quantify the impact of road building (extension or improvement) on both deforestation and development to assess the severity of the trade-offs between environmental preservation and economic growth. For instance, planners who consider these tradeoffs can choose to locate roads in ways that minimize deforestation while promoting development. Coordination of road policies with land and forest tenure regularization can also minimize trade-offs between environmental protection and rural incomes (Chomitz et al 2007). Chomitz and Gray (1996) propose considering the following questions when evaluating the impacts of planned development on forests: “How far from the road do conversion effects extend? What kind of conversion is induced? Whom does it benefit?” (Chomitz and Gray 1996: p.487).
Another consideration is whether different transport options could reduce the impacts of the transport sector on forests. Research shows that rail transportation can be up to 30 percent cheaper than roads and that additional investment costs associated with building a railroad instead of a highway are less than the costs of controlling the deforestation that would result from road construction. The key environmental advantage of railroads over highways is that they allow greater control of access to the adjacent land by limiting the construction of new secondary roads. Viana et al (2008) promote the construction of railroads in the Amazon, rather than highways and roads, as an option that could limit further deforestation, mitigate climate mitigation, and generally promote sustainable development in the region. Cross-Sectoral Linkages between Forests and Mining
Overview
Mining typically receives limited attention within broader forest policy discussions. Most discussions of forest challenges include mining references to the linkages between mining and forestry, though such references often just state that mining has the potential to contribute to deforestation. While reforestation efforts and ecological recovery in previously mined areas have received comparably more attention in the academic literature, the minimal attention to forests in the mining literature and to mining in the forest literature underscore the importance of a cross-sectoral approach to encourage explicit linkages between these two sectors. Mines are frequently described as having a relatively small environmental impact compared to sectors such as agriculture because mines occupy less than one percent of the Earth’s surface. Bridge (2004) notes that a central tenet on the environmental impacts of mining was that the effects of mines were assumed to be localized and small. However, this assumption of mines having discrete, local impacts is increasingly challenged and researchers are drawing attention to how “mining modifies ecological

102
processes over broad geographical scales” (Bridge 2004: p.214-5). Studies of the impacts of mines now emphasize that while the amount of land converted to mines is small, the resulting changes in the ecosystems are significant (e.g. Peterson and Heemskerk 2001; Simmons et al 2008; Douglas and Simula 2010; and Mishra and Reddy 2011). In addition, forest conversion from mining can create opportunities for further forest deforestation and degradation, underscoring the importance of attention to both direct and indirect deforestation and habitat destruction. Mining frequently occurs in areas with high conservation value or watershed stressed areas. The World Resources Institute’s (WRI) Mining and Critical Ecosystems Framework found that 75 percent of active mines and exploration areas occur in areas of high conservation value and high watershed stress (Miranda et al 2003). The study also found that 33 percent of active mines and exploration areas overlap with intact ecosystems considered of high conservation value and over 25 percent of active mines and exploration areas are located in or within a 10 kilometer radius of a strictly protected area (IUCN I-V) (Miranda et al 2003). In Papua New Guinea, over 25 percent of forests classified by the government as “fragile” overlap with oil, gas, and mining concessions and one-third of the countries forests have already been allocated to such concessions. Further, 42 percent of PNG’s mangrove forests have been allocated in oil, gas, and mining concessions. In the Philippines, 56 percent of all exploration areas and mining leases overlap with highly ecologically vulnerable areas (Miranda et al 2003). This overlap between high conservation areas and mines has the potential to increase as countries, such as Ghana and Indonesia, consider allowing mining in protected areas. In India, Mishra and Reddy (2011) note many forested areas also contain rich mineral resources and that the average forest cover in India’s major mineral-producing districts represents 18 percent of India’s total forest cover. Further, mining activities may occur in areas that are not yet formally protected but have high biodiversity levels. In the Congo Basin, such overlaps between forests and mining are already occurring. For instance, Schure et al (2012) found that 20 percent of diamond and gold artisanal miners in Cameroon mined inside the forest reserve, usually near forest streams, and collected NTFPs, including bushmeat, as a supplementary income. Schure et al (2012) caution that the overlaps between mining and timber concessions in the Congo Basin are likely to lead to increased pressure on the Sangha Tri-National landscape forest conservation area over time. The sections below consider the impacts of mining on deforestation, forest degradation, and change in forest type as well as the indirect effects of mining on forests and the potential for forest regeneration following mining. This section on mining then concludes with a brief discussion of mining safeguards.
103
Deforestation, Forest Degradation and Change in Forest Type
Tropical forest areas and mineral rich areas often overlap, resulting in the need to clear forest areas for mining purposes. Mining results in forest and land conversion, habitat fragmentation, and associated biodiversity effects. The relative effect of mining varies by country and region. For instance, WRI (1997) identifies energy development, mining, and new infrastructure as the second largest threat (after commercial logging) to large, ecologically intact forests globally after commercial logging. In Russia, WRI (1997) found that mining, roads, and infrastructure threaten 51 percent of remaining frontier forests. In other locations, mining may result in only small levels of deforestation. In an analysis of forest conversion and loss between 1972 and 2002in Papua New Guinea, Shearman et al (2009), attributed only 0.6 percent of forest loss to mining, in part because of previous infrastructure development in the mining areas. They conclude that, while mining has intense local effects, particularly in Western Province, it has affected only a relatively small area. Artisanal and small-scale mining (ASM) can also contribute to significant deforestation. Hirons (2011) states that deforestation and forest degradation is one of the most significant environmental impacts associated with ASM. Peterson and Heemskerk (2001) estimate deforestation from gold mining at 48-96 km^2 annually in Suriname, suggesting that deforestation will reach 750-2280 km^2 by 2009. Peterson and Heemskerk (2001) stress that while the area of deforestation as a result of mining may seem small in comparison to deforestation from logging and ranching in the Amazon, the concentration of mining in particular areas and the slow rates of recovery mean that the local impacts of small-scale gold mining are significant, contributing to deforestation and loss of ecosystem services. In Ghana, ASM for gold is associated with significant deforestation, degradation, and erosion (Hilson 2002; Hilson and Nyame 2006; and Akpalu and Parks 2007). Akpalu and Parks (2007) state that surface gold mining is the main cause of deforestation in Ghana. They found that surface mining resulted in annual deforestation rates of 2 million acres. In Wassa West District, which they describe as a typical gold mining district in Ghana, gold mining activities contributed to the loss of 60 percent of the forested area. Hilson (2002) notes that significant deforestation has occurred unnecessarily because miners search for ore without knowing precise gold deposit locations.
104
Mining also significantly impacts forests by altering forest type. For instance, clearing edge forests for mining converts adjacent interior forest to edge forest, contributing to the loss of interior forest even if mining itself does not result in the loss of interior forest. In Southern Appalachia, Wickham et al (2007) found that forest loss in the interior forests was 1.75-5.0 times higher than forest loss directly attributable to mountaintop mining and that interior forest loss ranged from 7.4 percent to 20.5 percent. Wickham et al (2007) also point out that such shifts in forest types alter the ecological composition, processes and structure of forests and the keystone services provided by these interior forests. They conclude that mountaintop mining has the potential to indirectly eliminate all interior forests in Southern Appalachia. Indirect Impacts on Forests
Mining also has several indirect effects on forests, including opening up the forest to human activities through road construction and placing stress on associated forest benefits. Miranda et al (2003) emphasize that mining requires supporting infrastructure and processing facilities that means that the environmental effects of mining can extend beyond the actual concession area. They point out that once roads are built, these roads may facilitate colonization into the area and contribute to additional deforestation, resulting in a domino deforestation effect. Because mining results in cleared forests, mining can indirectly contribute to the loss of NTFP collection by local populations. Hilson and Nyame (2006) note that mining developments in Ghana pose threats to the rights of indigenous communities to gather forest products. In Wassa West District in Ghana, Akpalu and Parks (2007) found that gold mining activities affected the livelihoods of communities who depend on the forests for food, medicine, and craft and construction material. Conversely, miners who temporary reside in the forest can place additional impacts on forests. Miners can contribute directly to deforestation by clearing forest areas for their own temporary residences (Hilson2002). Shearman et al (2009) and Douglas and Simula (2010) note that mining may result in small-scale deforestation as a result of small-scale agriculture to grow food for mine workers. Miners may also place pressure on forest resources by collecting NTFPs and using forest materials for construction and fuel wood. Ingram et al (2011) found that 42 percent of Cameroonian miners and 34 percent of miners in the Central African Republic collect NTFPs and bush meat to supplement their livelihoods, but concluded that these impacts were minor because of the small number of miners and diamond and gold artisanal mining’s seasonal, temporary nature in the region. However, Ingram et al (2011) also found that 67 percent of miners did not believe that mining contributed to negative environmental impacts. Consequently, given this low understanding of environmental effects and the likelihood of increased mining pressure in the future, they caution that mining impacts are likely to
105
increase in the future and recommend measures to maintain mining’s low environmental footprint. In general, ASM typically corresponds to increased NTFP collection. Additional indirect environmental and social impacts of mining on forests can include increased conflict with indigenous or local communities, mercury contamination, and sedimentation (WRI 1997). Forest Regeneration
Mining produces two effects on land use change: from pre-mining to a mining landscape and from a mining to a post-mining landscape (Larondelle and Haase 2012). In the conversion from forested land to surface mining sites, the site is cleared of all vegetation and the top soil horizons are removed. Next, additional soil and rock are removed, often with high water pressure, and the mineral is removed. Finally, during the reclamation process, soil is typically replaced and seeded. Several studies illustrate the regeneration potential of forests following mining. These studies generally agree that mining areas can be reforested and point to the role of nearby forests as seed sources and good soil composition in regeneration. Simmons et al (2008) stress, however, that land use change from forested to mining areas leads to significant, long-term changes in ecosystem functions. In Brazil, Rodrigues et al (2004) analyzed natural regeneration in a degraded area of Mato Grosso State that was originally covered by tropical rainforest and then deforested for gold mining. They found that the conservation of forest fragments in the surrounding areas was critical in the natural regeneration process because they serve as seed sources and can promote floristic composition and regeneration. Consequently, they recommend the conservation of critical forest fragments to ensure natural regeneration following mining activities. Similarly, in the Czech Republic, Mudrak et al (2010) found the spontaneous establishment of forests without any reclamation efforts in some previously forested mining sites. Consequently, Mudrak et al (2010) argue that mining sites can be successfully restored through spontaneous succession and that planting forest trees is not necessary for restoring vegetation cover. Within 22 years, the sites in the previous brown-coal mining district had 50 percent forest cover. They point to the role of undisturbed habitats to support recruitment of new colonizers and reasonable soil conditions as key contributions to regeneration. Larondelle and Haase (2012) agree that forests can recover from the impacts of mining over time but illustrate that these reforested areas will often not contain the same diversity of ecosystem services as the pre-mined forest. They assessed the effects of open cut lignite mining near Leipzig, Germany, one of the largest opencast lignite mining

106
areas in Europe, over a 100 year period. Mining activity began in 1921 and restoration efforts began in 1990. They found evidence that the restored landscapes can provide potential ecosystem services but cannot provide the same variety of ecosystem services contained in the pre-mining ecosystem. Other studies emphasize that mining results in long-term effects on soil and forest areas. Schimann et al (2012) compared tropical primary forest with five disturbed forests areas in gold mining sites to evaluate degradation levels in French Guiana. They found that that the process of washing forest soil with high pressure jets to extract gold deposits leads to deforestation, soil erosion, and heavy metal pollution. They conclude that gold mining had a significant impact on soil microbial processes, with Denitrifying Enzyme Activity (DEA) ten times lower in the mined forests than in the reference forests and significantly lower levels of Substrate Induced Respiration (SIR) in mined areas. Simmons et al (2008) evaluate the changes in ecosystem function and structure following forest conversion to coal mining to reclaimed forested areas in the Appalachian region of the US through a comparison of mined and non-mined watersheds over a 15 year period. The reclaimed mine site had significantly thinner soil and lower carbon, nitrogen, and phosphorous levels as a result of woody biomass removal. The mining area also exhibited multiple hydrological effects, including decreased soil infiltration rates, resulting in narrower, taller storm water runoff. Simmons et al (2008) conclude that land use change from forested to mining areas leads to significant, long-term changes in ecosystem functions and argue for mine reclamation goals to consider not just re-vegetation but also broader ecological processes. Forest regeneration following mining is slower than regeneration following any other land uses because mining causes higher levels of disturbance by turning over the soil and eliminating seeds, roots, and tree saplings. For instance, Peterson and Heemskerk (2001) found that after 4 years, 20 percent of mined areas in Surinam remained bare and no regeneration had occurred while other areas were also characterized as having bare ground, grass, and standing water. They found some tree regeneration in some areas but levels of regeneration and resprouting were significantly below the levels in old-growth forests. In summary, forest regeneration following mining can and does occur throughout the world, though the forest composition and ecosystem services associated with the forest may not be as diverse as in the pre-mined ecosystem.
107
Policies
While some national mining legislation addresses the impact of mining on forests, additional collaboration among forest and mining officials could facilitate increased cross-sectoral attention to role of mining in deforestation and help to limit mining in areas of high forest diversity. For instance, the Government of India recently recommended eight parameters to evaluate forests before allowing mining to protect biodiversity, forests, and wildlife areas (Chauhan 2012; and Sethi 2012) and proposed land acquisition legislation is expected to address issue such as employment generation and compensation. However, India’s Land Acquisition Bill, now referred to as “The Right to Fair Compensation, Resettlement, Rehabilitation and Transparency in Land Acquisition” remains in discussion, after being referred to a Group of Ministers in August 2012, following reservations raised by some ministers raised reservations on certain provisions of the proposed legislation (Chauhan 2012; and Sethi 2012). Nearly 25 percent of active mines and exploration sites occur in countries with weak governance structures, suggesting that mining in such areas is unlikely to contribute to economic development and drawing attention to the need to ensure safeguards to ensure responsible mining (Miranda et al 2003). An additional concern is that the unregulated nature of ASM means that it represents a constant threat to forests, particularly when mining is not included in forest management policies. Mining safeguards and policies have been at the forefront of the World Bank’s works. Its Extractive Industries Review (EIR initiated in July 2001) considered whether extractive industries projects are compatible with the World Bank’s goals of sustainable development and poverty reduction, which has implications for overall considerations between sustainable development and the mining sector. The Review concluded that there is a role for the World Bank in the oil, gas, and mining sectors if the right conditions are in place, namely: 1) pro-poor public and corporate governance; much more effective social and environmental policies; and respect for human rights (EIR 2003: Executive Summary p. 1). On mining, the Review recommended that the IBRD and IDA should help governments develop policies on artisanal and small-scale mining to address poverty while also recognizing the rights of communities over mining rights and the formation of a special unit on artisanal and small-scale mining. In practice good practices in mining are challenged by governance issues in countries well endowed with natural resources. Figure 39 and 40 shows forest cover and ranking of countries on governance.
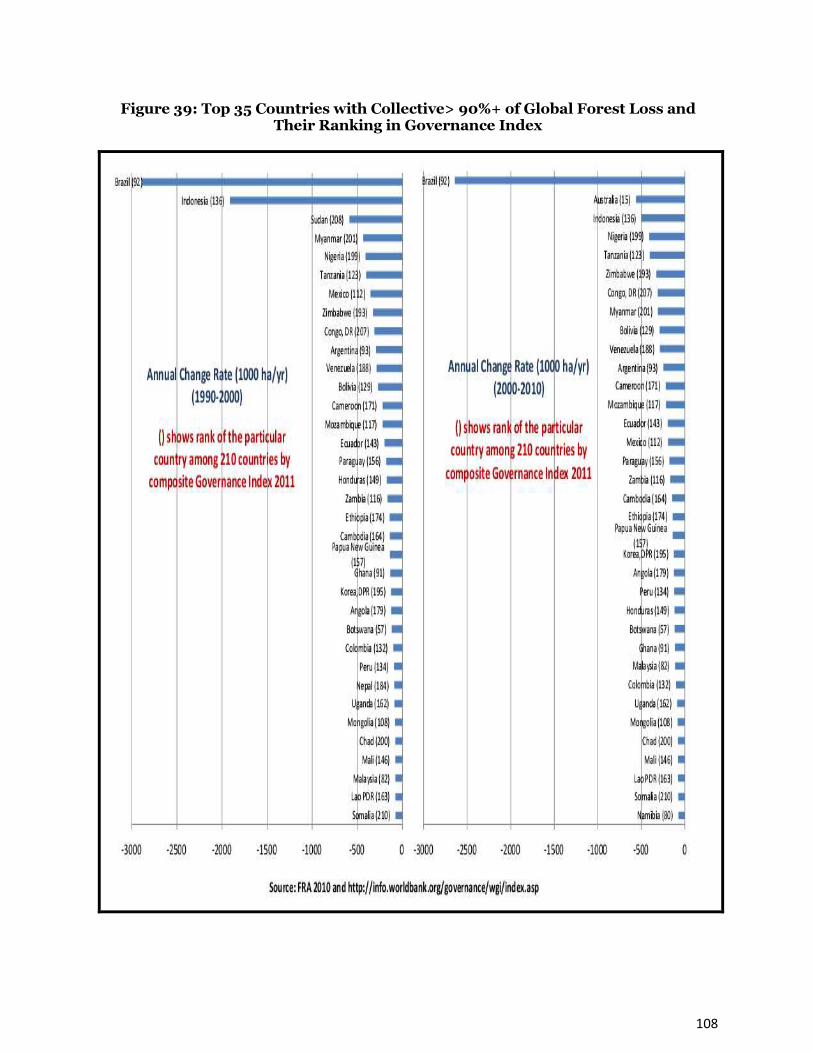
108
Figure 39: Top 35 Countries with Collective> 90%+ of Global Forest Loss and Their Ranking in Governance Index

109
Cross-Sectoral Linkages between Forests and Health
Overview
This section considers three key relationships between forests and health: forests as a way of spreading disease; forests and forest products as providing a source of medicine; and forests and their pharmaceutical values. Finally, the section points to the complexities of the linkages between forests and health, noting the multidimensional, complex, and context specific nature of these linkages. Forests provide many benefits as
Figure 40: Top 18 Countries with> 90% of Forest Gain and their Ranking in Governance Index
110
described in this section. At the same time, forest clearance has been associated in some cases with overall benefits for human health. Butler (2008), for example, suggests that human health in general has benefitted from forest clearing for agriculture and development of cities. Activities enabled by forest clearing have in turn allowed for the development of large populations in Europe, US, Japan, and China that have transformed themselves from being predominantly hunters, gatherers and forest dependent people. These populations have then stimulated and developed specialized fields and technologies that have brought health advances to large numbers of people. Further, as Colfer et al (2006) illustrate the importance of forests for people varies along a continuum from hunter-gatherers to swidden farmers, to recent in-migrants, to agriculturists, to urban dwellers. Recognizing and understanding this continuum is important in understanding and improving human health and forest sustainability. Forests and Human Disease
There is clear evidence that forest clearance, deforestation, and forest fragmentation affect the emergence of infectious and other diseases. Researchers have illustrated relationships between forest area and disease, including the emergence of new infectious diseases such as HIV and the Ebola virus, which often originate in animals (e.g. MEA 2003; and Karjalainen et al 2010). As Wilcox and Ellis (2006) put it: “Forest land use changes and practices, particularly when unregulated and unplanned, frequently lead to increased prevalence of zoonotic and vector-borne diseases, and occasionally boost the prevalence of diseases capable of producing catastrophic pandemics.” (p. 17). Examples of diseases that have been linked to forests include increases in leishmaniasis in the regions of the Amazon and the Nile (Patz et al 2005) and increases in schistosomiasis in Cameroon (Chivian and Bernstein 2008: p. 297) and Ghana (Hunter 2003). In other cases, bush meat consumption has been implicated in the emergence of HIV/AIDS and such meat may be a vector for other disease transmission (Chivian and Bernstein 2008). The sale of bush meat has been facilitated by roads and other development, following forest clearance (Orubuloye et al 1993). In addition, destruction of forest habitat can lead to replacement of benign vector species with a more effective disease vector. One example is the Anopheles mosquito species that has replaced a more benign native species, resulting in more virulent strains of malaria following deforestation in parts of Southeast Asia and the Amazon (Chivian and Bernstein 2008). In addition, following forest clearing in locations such as the Terai region of Nepal and parts of Panama, humans have moved into previously forested areas, where malaria was previously present, contributing to increased exposure to malaria (Colfer et al 2006).

111
While the relationship between forests and infectious disease is most common in tropical forest regions, other diseases occur outside of tropical forests, such as Lyme disease and tick-borne encephalitis, both of which occur in more developed, non-tropical nations. In the northeastern US, for example, deforestation and forest fragmentation have been attributed to increased risks of Lyme disease (Karjalainen 2010). Still, while the relationship between forests and the spread of disease has become more clear, the causal pathways involved in the relationship between disease and forest condition are complex and likely context specific, making generalizations between forest modification and disease emergence difficult (Butler 2008; and Colfer et al 2006). Butler points out that the threshold for forest modification that leads to disease transmission is not known. Nevertheless, many studies conclude that improved forest resource management can help mitigate disease. Patz et al (in the MEA 2005) find evidence that undisturbed ecosystems can retard infectious disease transmission. An example of improved management to address disease spread is the use of afforestation to reclaim swamplands, which helped control malaria in early twentieth-century Italy (Wilcox and Ellis 2006). This relationship between forest modification and disease should be a consideration in forest land use and forest resource planning and management (e.g. Wilcox and Ellis 2006; and Patz et al 2005). In addition, greater collaboration among the agricultural, forest and public health sectors could facilitate cross-sectoral policies and practices to prevent and control such diseases. Forest Products as a Source of Medicine
Forest products and ecosystem services provide health benefits to many populations who depend on non-timber forest products as sources of food and medicine, as also noted in BP1 (MEA 2003; and Karjalainen 2010). The WHO estimates that between 65 to 80 percent of the world's population (about 3 billion people) do not use prescription drugs, but rely on naturopathic or homeopathic medicines, many of which are derived from forests, as their primary form of health care. One frequently cited advantage of forest products is that they are often freely accessible in the world’s forests, making them an affordable source of medicine for populations that might otherwise be unable to afford medicine or who lack access to formal health care services. The benefits of forests in traditional health care are particularly prominent in Africa, Asia, and Latin America (Karjalainen 2010). But such forest extraction may also be associated with increased exposure to forest related disease vectors. There seems to be relatively little analysis of the costs and benefits of forest exploitation to human health taking into account these various impacts together.
112
Forest food also offers a safety net for the most vulnerable population groups in developing countries and can play an important role in household nutrition, as discussed in BP1, therefore contributing to improved health. Forest products can also support human health and nutrition through the use of natural insecticides and fungicides in the agricultural sector, can increase survival of food crops. This relationship between forests, health, and agriculture is relatively less studied (Chivian and Berstein 2008), yet represents an important synergy in understanding the complex cross-sectoral relationships of forests. While the negative health impacts on humans from forest wildlife in terms of spread disease are listed above some have argued that forest ecosystems may also help in the regulation of infectious diseases by providing lessons for how different forest species survive and protect themselves against diseases (Chivan and Bernstein 2008). For instance, owls, squirrels, and Rhesus monkeys serve as important models for learning how animals protect themselves from diseases such as malaria. Researchers and health practitioners hope to draw upon these examples to develop vaccines to protect humans against P. Falciparum malaria. Forests and Their Pharmaceutical Values
Forests represent natural pharmacies with rich stores of plant, animal, and microbial material with known or potential medicinal value (Chivian & Bernstein 2008; MEA 2005; and Karjalainen et al 2010). For example, in the US, half or more of the most prescribed medicines come from natural sources (Chivian & Bernstein 2008) and 70 percent of all new drugs introduced in the United States in the past 25 years have been derived from natural products (Newman and Cragg 2007). In Asia, mushrooms are now recognized as having significant pharmacological potential because of their antimicrobial effects (Karjalainen et al 2010). At the same time, the economic benefits from forest products with pharmaceutical value can result in overharvesting of some species, contributing to negative effects on forests (Karjalainen et al 2010). Using natural products from forests and traditional knowledge about those products to develop medicines to enhance human health can be a financially lucrative business. For example, of the 3,000 plants used for anti-cancer drugs, 70 percent come from rainforests according to US National Cancer Institute (Rainforests, The Earth Times 2011, April 27). Benefit sharing from such bioprospecting remains an issue. Colfer et al (2006) describe this concern: “pharmaceutical companies have sometimes been charged with reaping unacceptably large benefits from forest peoples’ knowledge given the widespread
113
poverty in forested areas. Issues relating to intellectual property rights, implications for cultural integrity, and amounts and recipients of benefits are complex” (p. 7). One of the three pillars of the Convention on Biological Diversity (CBD) is to ensure the fair and equitable benefits from genetic resources. CBD Article 15 addressees’ access to genetic resources, including facilitating access, prior informed consent (PIC), mutually agreed terms (MAT) and benefit-sharing. In addition, related CBD articles refer to traditional knowledge (Article 8(j)), access to and transfer of technology (Article 16.3), and handling and distribution of benefits of biotechnology (Article 19). The mechanisms for implementing Article 15 and realizing benefits for populations such as forest peoples’ have remain underdeveloped to date though recent efforts may significantly improve benefit sharing rights. At the Tenth Conference of the Parties to the CBD in 2010, delegates adopted the Nagoya Protocol on Access and Benefit Sharing. The Nagoya Protocol aims to share “the benefits from the utilization of genetic resources in a fair and equitable way, including by appropriate access to genetic resources and by appropriate transfer of relevant technologies, taking into account all rights over those resources and to technologies, and by appropriate funding, thereby contributing to the conservation of biodiversity and the sustainable use of its components” (Nagoya Protocol 2010, CBD). There are currently 92 signatories to the Protocol and five ratifications (Gabon, Jordan, Mexico, Rwanda, and the Seychelles). The Nagoya Protocol will enter into force 90 days after the 50th nation deposits its ratification with the CBD and has the potential to serve as a transformative mechanism to address benefit sharing from forest resources. Additional Linkages between Forests and Health
Another health benefit of forests that is less frequently addressed or recognized is their contribution to both physical and mental health. Forest visits promote physical and mental health by providing physical exercise opportunities and reducing stress. For instance, studies have shown that individuals, who spend time in nature, including forests, can recover from attentional fatigue and focus better as well as showing improvements in mood and decreases in tensions (Karjalainen et al 2010). Some countries have explicitly encouraged the link between forests and physical and mental health through specific programs; for instance, the British Green Gym program encourages physical activity through environmental and gardening work while Japan has designated specific forests as “forest therapy bases” in recognition of their relaxing effects on populations (Karjalainen et al 2010). Forests can both contribute to health and present risks to help. In some cases, forests help people avoid injury from natural hazards (e.g., mudslides due to lack of tree cover) and avoid harmful contamination (e.g. by regulating water supply). Forests can also present risks to human health by exposing people to physical hazards such as forest
114
fires, floods, drought, soil slides, and haze as well as potentially dangerous wildlife and toxic fruits, foliage, and fungi. For example, flora and fauna in forests can provoke allergic or irritant reactions; pollen from trees or other plants or insect or snake bites can cause serious reactions or even death in people (Karjalainen et al 2010; and Nilsson 2011). Finally, while the evidence above illustrates the importance of relationships between forests and health, the health field has paid comparatively little attention to people living in forests (Colfer et al 2006). Instead, health studies usually focus on larger urban populations with higher numbers of inhabitants. Payments for Environmental Services
Paying actors to conduct environmentally friendly initiatives or to give up destructive practices is the purpose of payments for environmental services (PES). Interest in PES has been increasing rapidly over the past decade. There are today more than 300 programs implemented worldwide predominantly used to address biodiversity, watershed services, carbon sequestration and landscape beauty. Nation-wide programs are running in China, Costa Rica, Ecuador, Mexico, Vietnam, the United Kingdom and the United States. Substantial empirical evidence tends to indicate that water-related PES have been more effective than others in terms of institutional design and funds collection26probably because the payers are the direct beneficiaries of the service – making easier for authorities to justify a levy on water consumption for funding the PES scheme, but evidence on their benefits in terms of effective protection of water resources is thin as discussed below, in part because monitoring and evaluation often tends to be weak and measuring biophysical benefits is difficult and highly location specific requiring the level of effort which is often not exerted and is typically not affordable, For biodiversity and carbon PES, the direct interest of the service’s buyer–who act as an intermediary for the world’s inhabitants and the future generations, to ensure additionality and absence of leakage outside the perimeter of the project is not so strong. Therefore their protection is frequently more of a global public good than watershed protection tends to be, which is often a national or a regional public good. Definitions of Environmental Services
One of the most commonly used definitions is that of Sven Wunder (2005): “a voluntary transaction in which a well-defined environmental service (ES) or a form of land use
26In terms of water quality or flows, the effectiveness is not straightforward since the relationships between land cover and water
flows is more complex than generally thought (see FAO-CIFOR 2005; Bruijnzeel 2004; and Bruijnzeel et al 2007). In some cases,
such as Vittel, the water quality has been maintained thanks to the change of agricultural practice of the riparian farmers, changes
paid by the company through agreements which have been called, afterthought, PES.
115
likely to secure that service is bought by at least one ES buyer from a minimum of one ES provider, if and only if the provider continues to supply that service (conditionality)”. This definition uses market terminology (buying), which is not free of ambiguities about the nature of the service that is the support of the transaction and can even create confusion about possible “ownership of the services” (in market relationships, one can only sell what one possesses). Environmental services are qualities associated with elements (for example the quality of water flowing through a drainage basin, or the carbon storage capacity of a forest) that are collective or public goods at different levels by nature. Furthermore, PES are not really about selling environmental services. In most cases, PES agreements provide for compensations for agreed restrictions on land use (e.g. stopping natural habitat destruction practices) and, in that sense, compare to conservation easements. Another useful definition has been proposed by Muradian et al (2010, p. 1205) “PES as a transfer of resources between social actors, which aims to create incentives to align individual and/or collective land use decisions with the social interest in the management of natural resources”. As pointed out by Farley and Costanza (2010) “most PES schemes actually pay for land uses associated with generating the service” (p. 2062). PES, therefore, can hardly be coined “market-based instruments”. While markets are defined by the transfer of property rights (Commons 1931; Hodgson 1988; and Coase 1992), the nature of PES is based on a contractual relationship between actors for the compensation of avoided land use change, and such contractual nature is decoupled from the creation of a market that aims at exchanging and transferring property rights (such as the emission permits markets). In addition, many national PES programs (such as in Costa Rica, Mexico and Ecuador) are principally funded through taxes (on fuel distribution in Costa Rica, on water in Mexico). Therefore, the amount of the PES differs from the monetary value of the service. If there is no market, as for biodiversity, the scope of the monetary evaluation is limited, especially as it is difficult to establish an economic value for heterogeneous assets. If the service has a market, however, as for carbon, the price of the service will depend on the relationship between supply and demand, but will not correspond to the market price due to operating and transaction costs. The amount of a PES and the implementation of PES schemes therefore do not depend on the monetary evaluation of natural assets. They are determined by means of negotiations, which may or may not be balanced, and the amount should in principle cover at least the net cost of giving up an activity (the opportunity cost) linked to the usage restrictions or changes. Indexing payments on the opportunity cost nevertheless has certain disadvantages and negative side effects. “Carbon” PES (especially through avoided deforestation, the basis of the REDD mechanism) may be sources of financial gains for operators. In a carbon market (voluntary or regulated) with a single price per
116
ton of CO2 resulting from supply and demand, some agents providing an avoided
deforestation service will have opportunity costs that are lower than the value of avoided emissions, calculated on the basis of the price per ton of CO2.
This difference between the “production cost” of avoided deforestation and its “purchasing price” creates a surplus. This surplus may be conserved by the agents, but will more likely be captured by carbon market brokers or PES project promoters, who will there by pay themselves to varying extents. Moreover, conserving forests in agricultural frontiers in the Amazon instead of cultivating soybean, or in South East Asia instead of planting oil palms, generates opportunity costs that are often high since these crops are very lucrative. PES programs will therefore concentrate on forests that are under less threat at the risk of paying actors who have nothing to lose by avoiding deforestation (zero opportunity cost). PES, Ecosystem Services and Externalities
In the Millennium Ecosystem Assessment (MEA 2003), ecosystem services are defined as “the benefits people obtain from ecosystems”. Ecosystem services include all outputs from agricultural activities, including outputs as diverse as food production and climate regulation. As noted by FAO (2007), “Outputs such as food are generally produced intentionally for sale or direct consumption, and buyers or consumers can influence the production of these outputs through the prices they are willing to pay for them. Many other ecosystem services, however, are provided only as “externalities”, in that they are unintended consequences of the primary activity (e.g. food production), and the individuals who are affected by these consequences cannot influence their production. Externalities typically involve “off-site” impacts that affect others, in contrast to “on-site” impacts felt directly by farmers”. Hence, “the term environmental services is used to refer specifically to the subset of ecosystem services characterized by externalities”, which justify to refer to PES as “payment for environmental services” rather than for ecosystems. A recurrent challenge addressed to PES is the uncertainty related to the environmental service, especially because the relationships between a given land use and the targeted service is not straightforward and uncertainties remains. Farley and Costanza (2010) suggest it is better to pay for a bundle of “poorly defined services” than to try to maximize one of them − and to measure precisely, which entail high transaction costs: “Ecosystems and the services they generate are complex, and it may be appropriate to pay even for poorly defined services. For example, in real life there is considerable uncertainty concerning the water regulation services provided by forests and other land uses, yet dozens of schemes nonetheless pay for these services. One of the best defined
117
services currently is carbon sequestration, but payments for this single service can have perverse outcomes Transaction costs may also increase as services are more explicitly defined. In the face of ecosystem complexity, we believe that payments for a bundle of loosely defined services are more likely to maximize social benefits”.
PES and Trade-offs between Efficiency and Equity
PES are caught between two stumbling blocks: where the opportunity cost is high (and it can increase over time), the sums available are often not enough; but where the opportunity cost is low, the risk of paying for environmental services that are not endangered (lack of additionality) is high. Verifying additionality would require significant means in order to analyze local situations, which would imply higher costs. The Costa Rican PSA scheme is often considered a model, but has been criticized for not being sufficiently efficient (lack of additionality); Pfaff et al (2007) find very low impact of the PSA scheme on deforestation, since most of the payments went to land holders who would not have deforested even without payments. PES programs often make fixed uniform payments on a per hectare basis and have been criticized for that. The OECD pointed out that individual land holders are likely to have different opportunity costs of ecosystem service provision and suggests taking these differences into account. But such a choice encompasses other challenges. A major problem where PES and their social acceptability are concerned is that compensation based on the opportunity cost is inequitable for the poorest populations. Freezing user rights such as clearing, hunting or even the prospect of working in a forestry company deprives people of opportunities to lift themselves out of poverty. Moreover, within communities, it is often the poorest that depend on natural resources and have limited voice in designing the agreements. By giving up certain activities, they lose vital access rights that are often not offset by the payments, which are based on the average opportunity cost for the whole community and, therefore, often not coincide with the one of those who rely exclusively on the access to natural resources. Moreover, many organizations are reluctant to use cash money and favor in-kind transfers, with a mix of collective assets (school building or refurbishment, well digging, collective training) and individualized goods which do not automatically benefit the poorest. When cash transfers or salary opportunities (through surveying patrols or other remunerated tasks) are offered, it is not unusual for these payments to be monopolized by the “elites” and their families. Simply compensating the opportunity cost for very poor farmers therefore raises ethical objections and is enough to justify envisaging another basis for payments. Finally, adopting the opportunity cost as a basis for compensation does not prepare for the long term. Compensating for the loss of income from giving up certain subsistence activities may free up working time but does not release any new resources to acquire
118
the capital needed to implement new agricultural or agroforestry technologies. Although a sophisticated national PES program in Mexico is based on assessment of various opportunity costs at local level, one can think that, in poorest countries, the feasibility of large-scale PES strategy will depend upon the design of “assets-building” PES. This means going beyond the opportunity cost compensation logic that leaves the poorest in their condition and gives no other perspective than an infinite horizon for paying (even escalating payments if opportunity costs increase over time). However, although the ecological intensification of agriculture is a necessary condition for reducing pressure on ecosystems, it is insufficient. This is seen in the mitigated results yielded by the Alternative to slash-and-burn (ASB) programs of the past two decades: with the extra income generated thanks to intensification programs, farmers developed new cash crops elsewhere at the expense of the forests “rebound effect” (Fearnside 1997). Hence the proposal to combine investment in more intensive agricultural technologies with direct incentives linked to ecosystem preservation provided by PES. Broader PES, in other words aimed at investment, may combine direct incentives with a conditionality on land use practices that was previously lacking. It means also that PES programs should be implemented on quite large territorial units, to avoid displacement of deforestation activities (“leakages”) associated with the new revenues allowed by the investments on-site. Two Different Perspectives on Equity in PES Payments
As acknowledged by economists, PES programs offer few gains if the compensated services are not additional (Pattanayak et al 2010). Therefore the “economic rationality” suggests that PES should reward effective provision of services, which means either a change in practices or continuation of conservation/sustainable forest management practices, while opportunities for conversion become more and more tangible (as suggested by a baseline scenario and analysis of opportunity costs of sustainable forestry in the area). Payments concentrated only on “objectively threatened forests” in the name of efficiency (again not clear what efficiency refers to here—do you mean efficiency in the payment services?) is recommended in such an approach. It makes sense for changing the behavior of migrant farmers. As Wunder (2007) put it: “PES payments need to be applied strategically so that additionality can be demonstrated clearly. Only in this manner can users’ willingness to pay overtime be enhanced. Yet this also means people already living in approximate harmony with nature without any credible internal or external threat to service provision will generally not qualify as PES recipients.” But such a recommendation is challenged from an equity perspective. Many consider that those who conserve their forests, and therefore deliver an environmental service, should be paid regardless of their opportunity cost to conserve this forest. This is considered to be especially applicable to indigenous and forest-dependent peoples, the

119
“forest guardians”. Indeed, there is a risk that PES based on opportunity cost simply rewards potential destroyers who threaten the ecosystems. Such a perspective is reflected in the emphasis put recently on “carbon rights” in the REDD+ debate by authors such as Cotula and Mayers (2009) and Schwarte and Mohammed (2011). Wunder (2007) argued that although this is an issue, it could prepare the ground for general environmental blackmailing: “To reward, in the name of fairness, anybody who delivers an environmental service seems a dangerous avenue.… Across-the-board entitlements to PES could endorse blackmail by anybody owning an unthreatened environmental asset, from Scandinavian forest owners menacing to cut down their trees for receiving carbon credits, to upland settlers threatening to deliberately pollute a river to receive watershed payments. It seems crucial not to take the PES-underlying victim pays principle to such absurd extremes.” This debate should also take into account the “imperfection” of the existing REDD+ schemes, where asymmetry of information about the true opportunity cost is borne by the PES candidate. When political interferences influence the design of PES schemes and the priority areas where programs are to be implemented, such as in Mexico, an “adverse selection” process can lead to the opening of profitable opportunities to large landowners (who can more easily hide information on their intentions, with some implicit blackmailing, and opportunity costs) while disempowered smallholders and communities would simply be excluded. The conditionality and the sanctions are not implemented in the way that the PES theory recommends. As noted by Bond (2009): “Although conditionality and sanctions are important design features, there is very little evidence in our case studies of them being fully applied outside of the Pimampiro Scheme [Ecuador], where some families were excluded from the program due to non-compliance (Wunder and Alban 2008). Elsewhere, the use of conditionality has been deficient – either because the rules are too flexible and ad hoc, and the program is too new (Bolsa Floresta), or because program monitoring is inadequate, making exclusion and non-payment difficult when contract breaches are discovered (Mexico PSA-H)”.
PES and Perverse Incentives
There are difficulties to introduce PES in an already existing regulating framework where the legal constraint is prominent but hardly enforceable. For instance, in many places, when deforestation is forbidden or subject to legal authorization, using PES for encouraging law compliance raise an issue about the simultaneous use of incentives and
120
prescriptions. The issue is exacerbated when wealthy famers are taking advantage of such financial incentives. Using PES to provide stakeholders and additional incentive to comply with the law would undermine civic motivations and make further use of constraining regulation unlikely without paying. In such a situation, one should decide whether public policies should rely on the legal prescription for land use or on financial incentives through PES. If PES are chosen, removing legal prescription for allowing PES implementation would be necessary to avoid the destruction of civic spirit, a declining value it is capital to preserve and restore. A generalisation of PES in the name of “incentives” could undermine disinterested motivations to conserve and manage ecosystems, as pointed out also by Corbera (2012). And emphasizing efficiency in PES design, as claimed by most of the economists (Wunder 2007; and Tacconi 2012), amplifies such a shift in motivations. Assessing the efficiency of PES by setting a “business-as-usual” scenario and evaluating the opportunity cost of the landholder to conserve the ecosystem might incite this latter to take advantage of the asymmetry of information for disguising its intention related to its preferences and future actions, i.e. formulating the worst-case scenario for maximizing claimed compensation levels. Exclusion of the benefit from a PES scheme (for lack of additionality, if PES are designed as such) might push some landholders or users to formulate environmental blackmail (and possibly to act as such). Promoters of PES programmes are often aware of such potential drawbacks. In a workshop on PES held in 2011 in DR Congo, responding to a question about researches having shown the lack of additionality of PES schemes in Costa Rica (more than 90percent of the landholders having received payments would not have deforest anyway), the director of FONAFIFO (Costa Rica institutions handling the public PES program) explained it was a deliberate choice not to condition payment upon demonstrated additionality in order to avoid risks of environmental blackmailing (Personal communication with O. Sanchez Chaves; March 7, 2012). Corbera (2012) is, therefore, right to raise the fact that PES logic contribute … “to the framing of conservation in utilitarian rather than ethical terms (…) and may result in the undermining of intrinsic motivations” (p. 5).
Containing PES’s Perverse Incentives
By addressing, through setting positive incentives, a genuine difficulty for nature conservation, namely the frequent divergence between the private cost borne by individuals (opportunity cost compounded by high private discount rates that entail
121
disregard for long-term benefits associated with conservation) and the social cost of ecosystems degradation, PES are instruments that cannot be easily dismissed. As for any economic instrument, they embody potential drawbacks effects and can also generate perverse incentives, such as environmental blackmailing. Containing these potential perverse incentives might be more likely when PES are going beyond land-use restrictions and incorporate significant investment for building economic alternatives with the active participation of the land users. The principle of a payment above the opportunity cost sketches what could be a dividing line between PES that are based solely on compensation for user rights and investment-oriented PES to foster a development pathway that uses environmental resources sparingly and could become autonomous in the long term (i.e. ending the payments). By moving the core principle from compensation (still required) to investment into “forest friendly” rural practices (ecological intensification of the crops, planting cash crops in degraded areas, NTFPs valorisation, ecotourism, etc.), one could expect moving also the conversation with landholders from a rhetoric one can typified as “if you don’t pay we will destroy”, towards the cost and the condition of adopting new practices that will generate eventually higher revenues (a condition for dropping progressively the compensation payments). Recognition of Forest Land Rights in PES Schemes
Clarifying effective management and exclusion rights is a precondition for contracting and foreseeing possible PES for forest keeping (Wunder 2007; and Kaimowitz 2008). Protecting a forest needs effective and, eventually, legal capacity to exclude outsiders (such as encroachers and illegal loggers) and to manage a given piece of forest land to ensure liability (fulfilment of contractual commitments). Contracting for PES on well identified territories with local dwellers will lead to de facto recognition of some property rights on the forest land and effective management and exclusion rights, the minimum basis for enforcing such contractual agreements. De facto recognition of key property rights will exacerbate the tension between customary rights and de jure public ownership and will call for land tenure reforms in those countries where the forests remain under state ownership. As suggested by Karsenty and Assembé (2011) for Congo Basin countries, two key policy instruments can be used to allow for such an evolution: participatory mapping – an operation already undertaken by conservation programs, NGOs and even logging companies in many countries – and registration of forest tenure rights. The purpose would be to (i) identify and map out the various customary territories as they are recognized by community members and their neighbours, and (ii) to clarify and register

122
the overlapping rights exercised over those spaces by the various stakeholder groups/actors using them. The purpose of the clarification and registering process is to understand who (families, lineages, village community, indigenous peoples) hold effective property and tenure rights over which area, where and over what conflicts might occur as well as where collective areas are, and finally to allow for land rights protection of minorities (for instance migrants). This work could be undertaken by up scaled administrations, delegated to local authorities, private companies or civil society organizations using a set of specifications detailing the methods to be employed and the categories to be used. This has already been tested (with more or less satisfactory outcomes between countries) in operations called “Rural land tenure plans”, supported by the World Bank, among others, in some African countries in the two last decades, but it still needs to be adopted in law. Such operations, however, were designed for agricultural land rather than for forest areas. The information found could be used in national zoning plans, to inform the land-use planning exercises that are essential for a designing and implementing effective national REDD+ strategies. Land Tenure and Deforestation
We are adopting the definition of land tenure as “a set of property rights associated with the land, and the institutions that uphold those rights” (Bruce et al 2010), where property rights refer to a bundle of rights guiding the use, management and transfer of assets. The issue here addressed is the role of land tenure on deforestation, and the particular issue of community forestry. The issue of land tenure and natural resources management has been influenced by the well-known Garrett Hardin’s interpretation of the “tragedy of the commons” in a context of growing pressure on land driven by the demography. It has instilled the idea that there are intrinsic shortcomings with collective land tenure when land becomes scarce, leading to accelerating destruction of open-access resources entailed by self-interest and rational individual calculus (consuming the resource for my own profit before my neighbour does it for his own). Although Hardin’s prescriptions for land tenure individualization has been challenged by numerous scholars, and notably by E. Ostrom, for not distinguishing between open access and collective tenure (which is often effectively managed by internal rules of access and use), the ideas distilled by Hardin have been operationalized by large programs of land titling, often designed and supported by the World Bank. Such programs have been designed first for the agricultural land, but could apply to forest too. The rational of such titling operations is to provide clarity in rights, which it is
123
hoped will result in land tenure security and allow for long-term investment and credit access. Two Different Frameworks of Causal Relationships
As for the relationships between land tenure security and forest conservation, it is interesting to see there are quite opposite views. One can stylize the most common perspective by saying that unclear land tenure tends to favour deforestation since it encourages land clearing which is generally associated with (or prepare) private holding. A couple of studies have underlined this for Brazil (Araujo-Bonjean et al 2009). They show how the legislation incentivizes squatters to occupy forested land and to clear it to claim land rights. Several studies on Sub-Saharan Africa have shown how the combination of customary rules (“the land is given to those who are able to make them productive”) and government rules (appropriation is conditioned upon land development for a continuous period of 10 years in many countries) have created incentives for deforestation (Karsenty and Assembé 2011). In addition, unclear land tenure prevents reforestation since it is not favourable to long term investment. An alternative interpretation has been provided by Angelsen (2007): if land clearing is considered as an investment, the absence of security in land tenure refrain the investor from maximizing its effort (i.e. clearing more forestland). Angelsen can therefore propose the following statement: “(from this simple model) tenure insecurity saves the forest!” An illustration of such a phenomenon is also implicit in Tollens’ analysis on Central Africa (2010) who thinks large-scale investors for perennial crops will not be successful in Africa, due to “investment climate and business conditions” (among which the multiple claim on forest lands). But the conclusion (“tenure insecurity saves forests”) should be taken cautiously, notably related to the policy recommendations that one could derive from it. Angelsen warns that the reality on the ground is more complex. For instance, “insecure land tenure will lead to less land investments and more soil exhaustion, thus increasing the need and/or incentives for cutting down more forest to replace degraded land” (p. 23). In fallow agriculture, and since insecurity is greater on land not occupied, farmers tend to shorten fallow (which is detrimental to fertility management) (Goldstein and Udry 2005). The nature of the “investment” should also be considered: if the investment is essentially working time and if labour is not scarce (and has no or limited opportunity cost), the trade-off between fearing to lose the investment (insecurity favouring forest conservation) and the opportunity to claim property rights through land development, will frequently be resolved in favour of deforestation.

124
Moreover, agricultural investment is not the only driver of deforestation. Firewood collection and charcoal making are often major factors in explaining deforestation, especially in countries where the revenues collected from agriculture sources are low or declining. An extreme example is given by Somalia today: an AFP report (November 11, 2012) about Somalia reveals that 20 percent of the forests of Somaliland (North of Somalia) have disappeared these last ten years, due to charcoal making, one of the only sources of revenues for local people – and even one of the rare goods exported by the Sheba rebels. The general insecurity and the crisis affecting herding (herds have declined due to diseases) have led the fast-growing local population to turn massively to charcoal. “Insecure tenure has contradictory effects on the rate of deforestation” (Angelsen 2007). Indeed, land tenure is often second in the decision processes, and economic conditions, demography, market opportunities and threats, seems to have much more influence on deforestation rates. Bromley (2008) insists on the idea that the degradation of the commons often arises from factors outside of the commons rather than arising from ‘perverse’ property rights and selfish behaviour within the commons. Less-favoured areas are typically characterized by a combination of low agricultural potential or poor market access, and often exist in an institutional setting that is not conducive to alternative viable development pathways. Bromley (2008) classifies less favoured areas in Africa as suffering from institutional isolation and decay. With institutional isolation, purchase of inputs and sale of outputs must “run a gauntlet” of high information costs, high contracting costs, and high enforcement costs. This phenomenon is also present in South Asia. High transaction costs prevent remote farmers from using purchased inputs in the ideal quantities, and thus hinder adoption of soil and water conservation practices. Necessary investments are postponed, cropping intensity suffers, production declines, net economic returns are diminished, and a gradual degradation in the natural resource base is the inevitable result (Bromley 2008). A meta-analysis prepared by Robinson et al (2011), tends to show that “although greater implied tenure security seems to improve the probability of positive forest outcomes, tenure security by no means prevents change in forest cover” (p. 20). The author specifies that their results show that “all forms of tenure are susceptible to tenure insecurity” and warns against the idea that property rights over natural resources “are often naïvely viewed along a spectrum of “strength’ from unstable open access systems to strong private ownership”. Their statistical analysis reveals an “association between negative forest outcomes and communal land in Africa” (as opposite to Central and South America).The authors think they could be explained by “the effects of regional conflicts” (p. 29). This does not seem a convincing explanation, since most of the case studies are related to Tanzania, Kenya and Zambia, countries not really affected by regional conflicts. Such negative results of communal land tenure with respect to

125
forestry outcomes could be confirmed with the “community forests” in Cameroon, plagued by governance problem (Yufanyi Movuh and Schusser 2012; and Vermeulen et al 2006). A parallel can be drawn with Bromley’s argument about institutional decay: local governance in community forestry is highly sensitive to the overall governance conditions prevailing at national and local scale (“decentralization of the corruption”, to paraphrase Prud’homme, 1995), since they are “embedded” into various institutional arrangements. Tenure security is not given by a paper (a title) but depends on the institutional context that prevails locally and the importance of land pressures, which itself depend on several factors, inter alia, demographic dynamics in rural areas (including migrations), potential and nature of the investment, etc. Where property rights creation are linked (by customs or by the national legislation) to forest clearing, and if there is growing land competition, there are institutionalized incentives for conversion. If collective land tenure is recognized and protected, the outcome in terms of forest protection might be better than on private holding, since the clearing decision will need a collective agreement which can be difficult to reach. Land Tenure Clarification: A Prerequisite For REDD+ and PES
Implementation
Instruments for incentivizing forest conservation and sustainable management, such as PES, requires nonetheless land tenure clarity and security. Schlager and Ostrom (1992) framework analysis about the “bundle of rights” (for land, but also for resources such as trees)is now widely adopted by scholars. This framework includes, respectively, right of access, withdrawal, management, exclusion and alienation, each of which incorporates the previous ones. The concept of bundle of rights acknowledges that individuals may hold some forms of rights, while not holding others. Only the “owner” holds all the rights mentioned here.
Owner Proprietor Claimant Authorized user
Access and withdrawal X X X X
Management X X X 1)
Exclusion X X 2) 3)
Alienation X 4) 5) 6)
Table 7: Bundle of Rights Associated with Positions
Source: Schlager and Ostrom 1992.

126
Changes in land tenure rules may be crucial for implementing user-oriented incentive systems at the local level. In many tropical countries, tropical forests are state property in one form or another. Access to the forest is through forest concessions, for timber exploitation, or different kinds of land concessions when the purpose is to clear the land for agricultural development. In many tropical countries, private ownership of land (with partial or full property rights) is still conditional upon developing the land, i.e. deforesting it to plant crops. In French speaking African countries, this is the clause of “mise en valeur” (development of the land) that can be found in almost all land tenure codes. Reforming such land tenure codes to allow individuals, families and communities to claim property or collective tenure rights on the land they use, without being pushed to deforest in support of such claims, will be an important policy shift to encourage within national REDD+ strategies (Karsenty and Assembé 2011). Clarifying effective management and exclusion rights is a precondition for contracting and foreseeing possible PES for keeping the forest (Wunder 2007; and Kaimowitz 2008). Protecting a forest requires an effective and, possibly, legal capacity to exclude outsiders (such as encroachers and illegal loggers) and to manage a given piece of forest land to ensure liability (fulfilment of contractual commitments). The right to alienate is contingent in such contexts, and would not be appropriate in situations where individual (family) rights to lands are embedded in communitarian rights. Contracting for PES on well identified territories with local dwellers will lead to de facto recognition of some property rights to the forest land (effective management and exclusion rights), the minimum basis for enforcing such contractual agreements. De facto recognition of key property rights will exacerbate the tension with the de jure public ownership and will call for land tenure reforms in countries where forests remain under state ownership. REDD+ Will REDD+ be the “silver bullet” the international community was eagerly looking for to stop the deforestation process at global scale? REDD+ has been developed as a “positive incentive” to compensate countries for reducing emissions from deforestation and forest degradation, with an assumption that this will lead to development pathways towards sustainable land use. REDD+ is a positive incentive instrument by design, and not a cap-and-trade instrument27, due to the voluntary nature (meaning developing countries choose to participate) and the “no-liability” design, meaning that there are no sanctions for participating countries that do not reduce, or even increase, emissions. The question of REDD+ architecture is not bound to a cap-and-trade type system, but
27A cap-and-trade scheme requires an authority to decide a maximum amount (rationing) of “rights” (emission rights, catching
rights, production rights….) to be put at the disposal of economic agents for a given portion of time. The rights can be allocated
through different ways (free allocation, administrative selling, auctioning) and are transferable among the agents.
127
remains open, and should be determined by the most cost-effective method of reaching the objectives of REDD+. REDD+ is praised for its “performance-based” dimension (payments are conditioned upon verified results in emissions reduction from deforestation and degradation and proportioned to them), and opposed to more traditional approaches where financial transfers were associated to the design of nationals plans (typically the National Forest Action Plans) without regard to the results. The second feature making REDD+ attractive is the non-intervention principle that respect sovereignty: REDD+ countries are free to decide which means they will use for achieving their targets. It represents a shift from approaches based on “conditionalities”, in which disbursements were released only if certain public policy actions and legal measures were taken. Such an approach, often associated with the “structural adjustment” periods under the auspices of the IMF and the World Bank, is seen as preventing the ownership of reforms – adopted under “external pressure” – and, therefore, with limited effectiveness. However, we will see that such attractive features are facing huge implementation challenges and the ambition exhibited at the inception of REDD+ in 2005 is shaded with mounting doubts about the workability of the mechanism. The design of the mechanism raises concerns about its capacity to deliver effective and permanent emission reductions, due notably to the potential arbitrary choice of the “reference”, i.e. the level of emissions against which the reduction will be calculated. REDD+ is questioned from the perspective of environmental integrity but also for it potential impact on local communities and indigenous people who might lose some critical access rights in the name of “reducing emissions” (Phelps et al 2011).
The difficulty to move, in the international negotiation, from principles agreed upon by countries to an operational mechanism with precise rules, highlights the gap between simple ideas based on the economic theories of “rational choices” and “incentives” on which REDD+ has been based, and the complexity of dealing with national decision processes and the effects of globalization that increase land demand and foster displacements of land uses. The principle of basing payments on measurable “performance” in reducing emissions from deforestation (i.e. quantified reductions on a given period of time against an agreed reference level), is not really workable when countries face severe institutional dysfunctions which limit the effectiveness of the government and the reach of public interventions. A growing number of evidences show that before performance-based payments become practicable, there is a need to invest over a long period and work along with governments to create the necessary conditions for tackling the drivers of deforestation, and sometimes it is about rebuilding national institutions – not a swift and cheap action. The ambition, once exhibited, to shift from an “old” to a “new” principle of international cooperation is stumbling on the issue of local governance, “fragile states” and the limited reach of national public policies regarding external factors linked to liberalized and globalized markets. There is currently a growing awareness of such limitations, and, without abandoning the

128
principle of designing a “performance-based” payments mechanism, reflections are developing on the possibility to widen the scope of acknowledging “performance”, linking them with a process (with milestones and “proxies”) and not only to a measurable output in term of emission reductions. In sum, the “REDD+ community” is following the same pathway the aid community has taken two decades ago about the concept of conditioning aid to performances, under the so-called “output-based aid”. In the ODA (Official Development Assistance) case, the concept of “performance-based aid” has remained more an ambition than a reality, even though it has been helpful for better understanding the obstacles on development and designing more effective aid policies.
The “Three Phases” Approach
The three-phase approach, which has wide support within the UNFCCC negotiations on REDD+, has been clearly detailed in the Meridian Institute Report (Zarin et al 2009) and is featured as “a flexible, phased approach to implementation”. This approach has been endorsed by the Cancun Agreements. The Meridian Institute Report details the three phases as: • Phase 1focusing on “National REDD+ strategy development, including national dialogue, institutional strengthening, and demonstration activities”. This phase is intended to be funded by multilateral institutions with immediately available voluntary contributions, such as the Forest Carbon Partnership Facility (FCPF) and the United Nations collaborative initiative on Reduced Emissions from Deforestation and Forest Degradation (UN-REDD), and bilateral assistance. • Phase 2 is to allow “implementation of policies and measures (PAMs) proposed in those national REDD+ strategies”. The funding of this phase is supposed to be ensured by “internationally binding finance instrument with enforceable commitments, such as assigned amount units (AAU) auctioning revenue”. Zarin et al (2009) suggest that “eligibility for access to those funds should be based on a demonstrated national commitment to REDD+ strategy implementation, with continued access based on performance including proxy indicators of emission reductions and/or removal enhancements (e.g. reduction in area deforested)”. Clearly, phase 2 is intended to be a transition between general support to reinforcement of institutions and a performance-based scheme. Here the “performance” notion is associated with demonstrated national commitment to implement a REDD+ strategy, albeit determined outcomes, via indicators in terms of reduced deforestation.
129
• Phase 3 focuses on “Payment for performance on the basis of quantified forest emissions and removals against agreed reference levels”. The Meridian Report leaves the financing option open, outlining the sale of REDD+ units within global compliance markets or a non-market compliance mechanism as two broad options.
Main Potential Architectures for REDD+
One can identify four main approaches, with possible combinations and variations in each option. 1. REDD+ as a global market-based (cap-and-trade type) mechanism rewarding national governments with (fully or partially) marketable “carbon credits” for the reduction of deforestation (and degradation, if monitoring proves to be possible) in a given commitment period post-2012; � Dual market: To protect the carbon market against possible “flooding” (over-supply) of carbon credits, REDD+ can be designed as a specific (forest-only or LULUCF-only) market-based mechanism, not fungible with Kyoto emission allowances. REDD+ countries would be rewarded with specific carbon assets for achieving national targets of deforestation reduction, with industrialized governments having agreed to purchase a specified amount of such assets. 2. REDD+ as a project-based scheme (extended CDM type), in which the reduction of emissions from projects will be certified and project-holders would have the possibility to sell their certified emission reductions on the global market. � In order to avoid loopholes and leakage risks associated with a full project-based approach, a “nested approach” has been proposed by Pedroni et al (2009). In the nested approach, accounting and crediting takes place at both the sub-national (project) and the national level. At the end of each accounting period, the country would have to deduct all credits issued and committed at the sub-national level from national credits for country-wide emission reductions (Angelsen 2008). A key question mark remains though: Should the national level fail to deliver carbon benefits, would independently validated and verified sub-national activities still be credited, and if so, by whom? 3. REDD+ as a centralised funding scheme (backed by an international fund), rewarding the government for succeeding in curbing deforestation against an agreed target or baseline. This non-market approach is essentially the same as what was previously called the Brazilian proposal (Federal Republic of Brazil 2007), even though the Brazilian government has considered the possibility of selling carbon credits on its domestic market if the industrialised countries first reduce their emissions. Many

130
“innovative financing sources” have been proposed that could provide the income for such a fund without relying on government aid. 4. REDD+ as an investment instrument (backed by an international fund) for financing (sectoral and extra-sectoral) policies and measures. In such an approach there is no baseline, but agreements with governments to implement cross-sectoral and integrative strategies focusing on agriculture changes, land tenure and land-use incentives mainly for farmers. Performances will be assessed through policy implementation indicators rather than through changes in deforestation rates against a baseline. Strengths and Weaknesses of the Various Architecture Proposals
Leaving aside the difficulties associated with the “performance-based” approaches (the first three options) which entail baselines settings, or to the issue of additionality and the associated risk of “hot air” (or uncontrolled inflation of the costs of REDD+ in a fund-based approach), we will explore other features of the proposals, and further explore option 4 which bypasses the problem of quantifying emissions reductions and baseline setting by basing performance on the achievement of agreed policies and measures.
Non-fungibility in a Market-based Approach?
One variant or “specific market-based mechanism” of proposal 1 is based on the non-fungibility of REDD+ credits in order to protect the carbon price on existing markets which are sensitive to the oversupply of credits. The assumed strength of proposals based on carbon markets would be potential to collect large amounts of money thanks to the private companies that will have to offset their emissions to fulfill their legal obligations (compliance market) on the national territories or regional jurisdiction they operate. Here, the expected demand would be created by voluntary commitments of Annex I governments28 in addition to their reductions targets in the non-forest sectors. There is a risk that Annex I governments could be reluctant to increase their reduction burden, or that they will implicitly balance (i.e. revise downward) their non-forest commitments with their anticipated REDD+ commitments. A possible alternative would be to create a dual market for land based credits (fungibility between REDD+ and LULUCF credits only) and to set new, additional 28 Annex I countries are those who adopted quantified greenhouse gases mitigation objectives when the Kyoto Protocol has been
adopted. Most of the industrialized countries endorsed the Protocol (except the USA, which signed but not endorse it). In 2011, the
Canada decided to withdraw from the Protocol. China, now the largest emitter, and other emerging countries such as India or Brazil,
are not willing to adopt quantitative caps on their emissions in a future regime to be discussed by 2015.

131
targets for these sectors. However, the potential demand for carbon credits which cannot be used widely to offset fossil emissions in a compliance market is quite uncertain. Furthermore, choosing such a government-based approach may no longer require a “market” on which to trade credits, since the Annex I governments are not doing their reductions “at home”, but are relying on the capacity to use flexibility mechanisms29 if they cannot meet their targets at reasonable costs. In sum, this variant is not fundamentally different from the centralized funding approach, except that it makes it easier for bilateral cooperation between potential buyers (Annex I countries) and sellers (developing countries) of REDD+ carbon credits.
The “Nested Approach”: Solution, Compromise or Back to Project-based?
The nested approach attempts to reconcile carbon trading with crediting projects directly through project developers rather than via governments. Through this, it would meet the expectations of both the private sector looking for project-based carbon business opportunities and the “project developers” (notably conservation NGOs) who do not trust the governments to redistribute REDD+ monies or to financially support REDD+ projects in a national-based approach. The nested approach can be considered as the current “mainstream”, though it is hard to see how it actually differs from a mere project-based approach. In a box entitled “How a nested approach could work”, Angelsen et al (2008) indicate that: “A project generates 1000 tons of carbon dioxide emission reductions during the accounting period. The country’s overall reduction (carbon credits) is 5000 tons during the period. The 1000 tons already credited to the project have to be deducted from the national balance. To allow for project-level leakage, monitoring, reporting and verification (MRV) costs, and the risk of non-permanence (higher emissions in the future), the government may retain a certain share of the carbon credits assigned to the project. Thus the government and the project might make a deal that the project keeps 70 percent of the credits while the government keeps 30 percent. In this scenario, the project would keep 700 credits and the government 4300 credits.”
29 Flexibility mechanisms differ from the cap-and-trade mechanism in the sense they are project-based activities, while the cap-and-
trade regime is based on national objectives of emission reductions (and passed on to the economic branches, ultimately to the
enterprises). Project-based emission reductions need the design of a business-as-usual scenario (“what would be the emissions
without the incentives to reduce?”) and can generate potentially a very large number of certificates of emissions reduction (“carbon
credits”) since the number of potential projects is almost unlimited(the main difference with a cap-and-trade regime). The two main
flexibility mechanisms used for the Kyoto Protocol are the Joint Implementation scheme (projects in Annex I country) and the Clean
Development Mechanism (projects in non-Annex I and developing countries), this last generating around 90% of the carbon credits
of those flexibility mechanisms. A maximum of 10% of carbon credits issued through such mechanisms are allowed for Annex I
countries to fulfill their national objectives. China, India and Brazil have benefited the much from the CDM, through the sale of CDM
credits generated by their domestic projects (e.g. industrial GHG gases removal) to Northern companies.
132
In short, the projects are credited first (possibly with a discount to cope with the various risks) and the government takes the credits from reductions that are surplus to the aggregated reductions from projects (provided that there is one). But what happens if a country sees an increase in national deforestation (i.e. deforestation above the agreed reference level), while all the projects are certified as having reduced deforestation in their areas of intervention? The nested approach seems to have been conceived with small countries in mind, where aggregated project areas would cover a significant share of the country’s forest surface. But in large countries such as Brazil, the Democratic Republic of Congo (DRC) and Indonesia, it is most likely that “REDD+ projects” would cover only a fraction of the forested area nationwide. It is likely that a country would encourage, on the one hand, REDD+ projects in given areas, while on the other hand allocating large tracts of forest land to timber companies and agribusiness in other areas. Alternatively, leakage could take place from the areas under REDD+ projects, with a displacement of the pressure of deforestation in the other forested areas. As the nested approach is implicitly a market-based approach, it would create hot air, unless a safeguard would prevent crediting projects if there is no reduction of deforestation at national level. But Angelsen et al (2008) specify: “Should the national level fail to deliver carbon benefits, independently validated and verified sub-national activities would still be credited.” This position is logical: the former option (no crediting) would prevent private actors to invest in carbon projects where they do not manage the outcome in terms of crediting. But it would be at the expense of environmental integrity. Acknowledging such a difficulty, a working paper of the CDC Climate (Deheza and Bellassen 2012) suggests the government (or the jurisdictional entity, such as the sub-national State) could guarantee the project promoters a purchase (and a subsequent destruction for avoiding selling “hot air”) of the carbon credits emitted by the project (and verified), in order to secure the investor for being rewarded for their own “carbon performance” whatever the national results would be. However, it would call for clear commitments and a strong credibility of national and sub-national governments, something which is precisely one significant part of the problem for fighting global deforestation. In a real commodity market, the buyer and seller usually have opposite interests as regards the measurement of volumes exchanged. In an open forest carbon market where buyers are constrained to buy offsets, where uncertainty on MRV data, liabilities and origin could be very high, both the seller and the buyer could have an interest in overestimating volumes (the project to sell more, the company to offset more and/or to pay low prices).
133
The Fund-based Approaches
Fund-based30 approaches in REDD+ are often disregarded for their alleged incapacity to collect enough money, compared to market-based approaches (EdF and IPAM 2007;
30 In this instance, “fund-based” refers to all options to raising finance which do not involve trading credits on a carbon market. This
includes public monies, as well as potential taxes and levies (including on carbon markets) and private investment. The “fund” where
monies are raised is not contractually bound to a project or emissions reduction, which allows different options to be explored for
the distribution of financial incentives.
Box 6: The Issue of Permanence
As with the CDM, non-permanence is a critical issue for REDD+, especially in an approach in which carbon credits would be used as offsets to “compensate” for actual emissions: forest emissions removals can only be guaranteed for the duration of REDD+ (probably a few decades) whereas the emissions from fossil fuels that forest offsets would allow are irreversible. Although no decision has been made in the UNFCCC negotiations on this point, the debates are similar to those that took place in the development of the CDM. Some, like those who prepared the seminal proposal (Santilli et al 2005), consider that the same solution would apply, i.e. the issuance of temporary credits. Others (Zarin et al 2009) are looking for alternative accounting solutions such as setting aside a certain quantity of credits over commitments periods (“buffer accounts”) or insurance schemes (although an insurance scheme cannot prevent the non-permanent carbon credits from being used as an emission permit elsewhere). In a carbon trading approach, to cope with non-permanence, REDD+ credits would have to be discounted. Indeed, discounting is the traditional economic response in the face of risky assets. Discounting has also been proposed as a way of mitigating the risk of non-additionality or leakage (The Nature Conservancy, Conservation International & Wildlife Conservation Society 2010). Buffer accounts are also an indirect manner of discounting, since only a fraction of the credits are available by the host country for selling. However, it is frequently overlooked that discounting reduces incentives, especially when the opportunity costs of conserving forests are high. There is in fact a contradiction between the (fully rational) claims that there must be a high level of incentives for developing countries to reduce deforestation, and the (no less rational) statement that to cope with the risks of non-permanence, limited additionality and potential leakage, the carbon assets that constitute these incentives should be discounted.

134
and Swickard and Carnahan 2010). There are also numerous issues associated with the governance of an international fund, regarding the balanced representation of donors and recipient countries, of civil society, and of international organizations such as the International Monetary Fund (IMF) and the World Bank; eligibility criteria; and disbursement procedures. Large funds could also generate an internal bureaucracy and cumbersome procedures that often undermine their efficiency and legitimacy in REDD+ Countries. Yet, the Durban Agreements encourage the operating entities of the financial mechanism of the Convention (i.e. the GEF and the emerging Green Climate Fund) to provide results-based finance for REDD+.
Funds Allow for Multiple Objectives beyond Carbon
One advantage with a fund-based approach is that it allows for multiple objectives. Biodiversity will more readily be taken into account in the REDD+ activities under a fund-based approach than under a market-based one which, in spite of all the safeguards and the guidelines that will be produced, will inevitably tend to focus on the only "marketable asset", carbon (Phelps et al 2011) and on the safest, most profitable areas. For example dry forests – where many rural poor live, especially in Africa and South Asia, and where there are high levels of biodiversity – are currently neglected as targets for REDD+ demonstration activities (Wertz-Kanounnikoff and Kongphan-apirak 2009). The market-based approach is criticized by NGOs and analysts who emphasize that REDD+ may disempower local people, through recentralization (Phelps et al 2010) and “land-grabbing” for carbon. Collecting enough money for an international fund is technically feasible, but it is essentially a question of political will. In a draft paper entitled “Mobilizing Climate Finance – A Paper Prepared at the Request of G20 Finance Ministers” (IMF 2011a), the international institutions in charge of its writing recall that “Its starting point is the commitment made in the Copenhagen Accord and Cancun Agreements on the part of developed countries to provide new and additional resources for climate change activities in developing countries. This commitment approaches US $30 billion for the period 2010–2012 and US $100 billion per year by 2020, drawing on a wide range of resources, public and private, bilateral and multilateral, including innovative sources.” Innovative sources include international taxation schemes. For Nordhaus (2009), such schemes are the only ones that could finance very large investments, which are predictable and sustainable. It could be a tax on international financial transactions and on financial exchanges, a national or European “carbon tax” with the proceeds of “border adjustment tax” (to protect against imports from countries without emissions constraints) to be poured in the Green Climate Fund, or it could be a levy on international aviation and maritime bunker fuels. It could be also a portion of the

135
auctioning of emissions permits, as contemplated by the EU for the next commitment period of the European Trading Scheme (ETS). Clearly many of these options are workable only if they are implemented by a critical mass of Countries, in order to avoid unfair competition and the displacement of industries and activities in tax-free countries, etc. It is difficult to predict how the global and European governance will evolve in the coming years.
An Approach that Avoids the Thorny Issue of Baseline/Reference Setting
A fundamental difference between the architecture of options 3 and 4 is that the last one bypasses the difficulty (which many consider insoluble) of setting a reference level (prediction of future deforestation, possibly compounded by political negotiation) against which the “performance” of the country would be measured. Option 3 is about rewarding “performance” (with financial incentives), while option 4 is about investing, along with committed governments, to address the drivers of deforestation and to engage the country under a different development pathway, referred to as a “green economy” (UNEP 2011) or "low emission rural development strategies". The Limits of the Theory of Rational Choices and of Financial Incentives
“REDD+ countries have an incentive to reduce deforestation up to the point where the marginal cost of reductions (i.e. the national supply curve of REDD) is equal to the international compensation, for example, the market price for REDD+ credits” (Angelsen 2008). Such a statement is typical of the “theory of rational choices”, an approach we will discuss now in relation to the issue of “fragile states”. The very notion of "fragile states", albeit controversial, refers to the OECD (2007) definition which characterizes countries where there is a “lack of political will and/or capacity to provide the basic functions needed for poverty reduction, development and to safeguard the security and human rights of their populations”. Such a definition emphasizes the two issues we want to address: the will and the capacity to implement public policies that would tackle vested interests for changing the existing trends favoring deforestation. The “storyline” of REDD+ as an incentives-based system, inspired by the rational choices theory, can be stated as follows: “Deforestation in developing countries is a problem of opportunity cost: the governments (or actors in developing countries?) decide to deforest, or not, the countries chose to deforest as they earn more compared to conservation or SFM. The state can be assimilated to any other economic agent, making rational decisions by comparing the relative prices associated with the alternatives offered. Then, the government is acting by adopting the appropriate measures for reducing deforestation and modifying its development pathway.” This storyline is

136
consistent with the position of that describes REDD+ as “not encroaching on the sovereign discretion of nations to design acceptable and adequate policies and measures nationally” (Streck 2010; p. 389). Two assumptions underlying the REDD+ proposal are particularly arguable: (i) the idea that the governments of such states are in a position to make a decision for shifting its development pathway on the basis of a cost-benefits analysis anticipating financial rewards, and (ii) the idea that, once such a decision has been made, the financial rewards enable the “fragile” state to implement and enforce the appropriate policies and measures which could translate into reduced deforestation (Karsenty and Ongolo 2012). Are States Rational and Autonomous Agents?
Can a state be regarded as having an economic objective function with a single set of preferences, able to adjust its behavior on the basis of incentives? An economic agent is expected to have an ordered set of preferences (any option can be classified hierarchically according to its utility) and make decisions based on a calculation of value. It is easy to understand that any state is subject to conflicts of interest between government departments and public agencies, a situation that is exacerbated in countries where the state does not have sufficient autonomy to impose solutions of general interest on the different competing parties. Moreover, public policies are characterized by legacies to be managed, and a high level of path-dependence vis-à-vis previous choices that prohibit “autonomy” of public decision-making similar to that envisaged for the theoretical agents who are capable of comparing relative prices and making decisions accordingly. It is difficult to believe that even Brazil (which is not a fragile state) could suddenly break with its development model, which is based on the development of agro-exports which, in turn, are based on national capitalism; it is also unlikely that Indonesia (which could be considered as relatively more fragile than Brazil) would be able to enforce a forest law in provinces that have been empowered since the late 1990s; it is also unlikely that the Democratic Republic of Congo (one of the most fragile states) would give up state ownership of forests that allow governments to enjoy monetary and political benefits through the allocation of forest concessions and lands. Paradoxically, the “democratization” and “decentralization” that have marked changes in the last twenty years in countries of the South may have contributed to further complicating the decision-making process at the national level. National parliaments are more or less openly relaying the position of some economic pressure groups, and parliamentarians have become much more sensitive to the problem of maintaining jobs in their constituencies, especially when the need to increase revenue for central

137
government leads to the elimination of a number of activities that generate revenue and employment in forested areas. The assimilation of a government to an economic agent appears to be problematic in light of the theory of incentives. There is a second assumption underlying the “REDD+ proposal”, that a government can voluntarily (because encouraged to do so) reduce the levels of deforestation on its own territory. This assumption has become questionable since nation states have had to deal with liberalized global markets. Furthermore, the fact that many of the countries targeted under the REDD+ initiative are going through a period of crisis (as in the case of the DRC), the assumption becomes even more difficult to support. Forest-related Policies in Fragile States
Since deforestation is a cross-sectoral issue, meeting REDD+ objectives will only be possible if significant changes occur outside the forest sector: agriculture, land tenure, transports, mines, energy and governance and, indeed, globally. Yet the agendas of the other stakeholders often differ from that of the ministry in charge of the forests and the “REDD+ community”. There are specific difficulties, particularly in fragile states, to ensure that the public interest (as opposed to vested interests) is adequately represented in the political system, especially if potential losers from REDD+ implementation (such as farmers, logging or agribusiness companies) are not guaranteed proper compensation. To counter the influence of vested interests that will benefit from forest conversion, the “financial approach” based on the compensation of opportunity costs is unlikely to deliver. Other stakeholders’ interests will need to be heard to influence the decision process. But there is a significant risk that "improved" enforcement under REDD+ hits the most vulnerable citizens first, jeopardizing their livelihoods and silencing their claims. REDD+ implementation and incentives should therefore target the biggest players first, and with proportionate means. For all these reasons – the consolidation of fragile states, the gradual promotion of the general interest over vested interests and the proportionate progress of the rule of law – are long but necessary detours for enabling REDD+ to work in these countries: and an appropriate REDD+ strategy can be a catalyst for these changes and contribute to their implementation.
138
Discussing and Broadening the Notion of Performance
The notion of performance-based payments is critical in the three-phased approach as it is the basis for continuing disbursement of incentives in phase 2 and (especially so) in phase 3. The “performance” referred to by Zarin et al (2009) is primarily based on measurable results in curbing deforestation, and only secondarily on the commitment of governments to policy implementation. With respect to efficiency, the emphasis on this specific dimension of performance leads back to the issue of the baseline, whether it is a BAU baseline or “crediting baseline” giving room for national circumstances. An “inappropriate” baseline (providing there is a possibility to do accurate predictions on the evolution of deforestation for a given commitment period, a point of contestation in the literature) would allow countries to claim “performance” that to a greater or lesser degree would have been created by the baseline design. The Australian case (Macintosh 2010) provides a good illustration of this kind of situation (“[Australia’s] deforestation baseline under the Kyoto Protocol was deliberately manipulated”), and the author warns: “More than simply highlighting how difficult reducing REDD emissions in developing countries is likely to be, the Australian experience is a reminder of how the environmental credibility of an international REDD scheme could be undermined”. The notion of “performance” relies on the idea that all governments have an equal capacity to curb deforestation once they have taken the decision to enter the REDD+ scheme. The example of Brazil shows that a newly industrialized country, with a committed government and a high level of human and technical capacities, can succeed at reducing deforestation through better law enforcement and proactive measures (despite the overlooked leakage in terms of carbon emissions associated with the displacement of large-scale agriculture operations in the Cerrados (biodiversity and carbon-rich savannahs). However the situation in the majority of developing and forested countries is very different to that of Brazil. Indonesia, which is yet an emerging economy, whose government has not succeeded in imposing a genuine moratorium in the face of the agriculture and pulp industry lobbies (even for a temporary two-year period) on natural forest conversion31, despite an incentive of US $1 billion pledged by Norway, is an illustration of that difference. The majority of highly forested tropical countries are less advanced, and with a lower level of human and technical capacities. Many African countries lie in this category. It is very unlikely that these countries will be in a position to significantly curb deforestation and degradation whatever the incentives they are offered. Recalling how long it took for Australia to translate formally adopted measures into tangible results, Macintosh (2010) indicates: “The difficulty that Australia has experienced in controlling deforestation should serve as a warning about the potential obstacles that stand in the way of an environmentally effective international
31 Only the primary forests, already protected by law for the bulk of them, are covered by the promulgated moratorium (Murdiyarso
et al 2011).
139
REDD scheme. If a country like Australia finds it hard to halt deforestation, what is the outlook for developing countries with less advanced institutional, governance, monitoring and economic systems?” It is not a mere issue of traditional “institutional building” programs which are required under phase 2 to curb deforestation in these countries; it is about rehabilitating the state in countries described as “fragile” states. In this respect, there are two options: i. Disregard these countries participation in the REDD+ mechanism, which would limit REDD+ to a handful of countries that could in all likelihood reduce deforestation without external incentives; ii. Reconsider the notion of “performance”, moving from physical and measurable results in deforestation/degradation reductions to concrete evidences of effective and sustained implementation of political decisions that are explicitly designed to reduce deforestation. This does not mean that donors should “dictate” the content of the policies and measures to be adopted; otherwise the appropriation of these policies is likely to be very formal with weak implementation. This issue has been already discussed in the literature focusing of the effectiveness of aid. For instance Collier et al (1997), who advocate a performance-based approach for the delivery of Official Development Assistance (ODA), acknowledge that “even where outcomes are fully observable, they are usually not fully under the control of the government”, and that “some of the outcomes in which donors are the most interested are slow changing, most notably poverty, and so conditioning aid upon these outcomes becomes problematic”. If one replaces the term “poverty” by “deforestation”, the parallel between the two conversations becomes striking. Collier et al (1997) further suggest “performance would need to be evaluated over a longer period than the current tranche-based system” and, in order to take into account “circumstances” and minimizing the risk of “punishing governments which are unfortunate and rewarding those which are fortunate”, they suggest to undertake ex-post “effective evaluation should therefore … attempt to correct for circumstances outside the control of the governments”. It seems extremely unlikely that “performance” could be translated entirely, even during phase3, into measurable results in terms of reduced emissions from deforestation and forest degradation. Without coming back to additionality (and its corollary, effectiveness) and the baseline-setting issue, the uneven capacities of governments to control the interacting factors that constitute the embedded causes of deforestation, call for a pragmatic and differentiated approach. In “fragile” states, the governance issue would have to be addressed well beyond the “capacity building” dimension of phase 2.

140
“Performance” should be understood in a broad sense, with a mix of indicators based on the effective and sustained implementation of policies and measures and some elements of performance that can be considered as correct “proxies” for reduced deforestation and the resultant emission reductions. Perhaps you should mention this earlier—more generally every term that is used in a way different than what most people understand, better to define it the first time it is mentioned. It is not technically difficult, for example, for even a weak government to cancel the forest concessions which are not properly implementing a compulsory management plan (for which quantitative indicators can be easily derived). Beyond such measures, what would matter will be the coherence of the public policies designed, their relevance for curbing deforestation and degradation, the sustained efforts for implementing the measures proposed and overcome the various obstacles (institutional or politic). Of course, the measured evolution of deforestation would be also part of the evaluation, but evidences that such evolution is connected with the policies and measures implemented would be needed to avoid misinterpretations of the monitored trends. For instance, there is a debate in Brazil about what has driven the dramatic fall in deforestation rate. As Mongabay.com (2011) put it: "Deforestation in Brazil remains a serious problem despite the fall in rates between 2005 and 2010. Only part of this decrease was the result of government programs or stricter enforcement of environmental laws," eminent Amazon scientist Philip Fearnside wrote in an op-ed published (November 28, 2011) in The Financial Times. "The main reason was that the international price of beef and soya fell from 2003 to 2007, and this was followed by the global economic collapse that began in 2008. Over that period, the Brazilian real almost doubled relative to currencies such as the US dollar. This cut the profits of commodity exporters deeply, as all their expenses remained in reals while their revenues were in diminished foreign currencies." In a working paper published in early 2012, Brazilian researchers (Assunção et al 2012) presented the results of an econometric study attempting to disentangle between prices changes and public policies for explaining the slowdown of deforestation in the Brazilian Amazon. They have seen a positive correlation between rising agriculture crop prices and deforestation, but a negative correlation between cattle prices and deforestation32 that can be explained by the contrasting effect of higher prices on ranchers’ strategies (high prices incite both to increase the number of cattle with pressure on the forestland, on one hand, and to sell more cattle to benefit from the high prices, which diminish the sizes of the herds and loosen the pressure). They attribute around 50 percent of the
32 Which differs for what Chomitz et al (2007) found for the 2001-03 period in the Brazilian Amazon where a clear correlation was
shown between high farm gate prices of beef and deforestation rates.
141
deforestation decrease to change in prices; the rest is attributed to the public policies33. Although a very preliminary study which needs refinement for better understanding of the disaggregated cause-effects dynamics (for example the strengthening of the Real vis-à-vis the USD which weakens the competitiveness of Brazilian exports seems not having being factored), this is a very valuable contribution to a better understanding of “what shapes performance?” that could inform the evaluation process (remaining aware that Brazil is probably, for the time being, the only country where both deforestation and economic data are accurate enough to undertake such econometric analysis). These analyses tend also to indicate that this reduction of deforestation is, at least partially, reversible, since new macro-economic conditions could foster a new surge of deforestation. Overall, it is crucial for donors to understand that most of these explanators of “performance” will require “sustained investments” in various sectoral activities, which in the less-developed countries, should be the priority for foreign donors anyway. Who Could Assess Broadened Performance?
A market-based (carbon trading) approach can work only with a narrow definition of performance, expressed in ton of CO2 equivalent avoided or sequestered, is adopted as established by MRV (Monitoring, Reporting and Verification) procedures. Broadening the definition of performances leads logically to consider another financing scheme for REDD+, with a collective decision process about financing the countries, informed by several indicators, studies and empirical evidences. Unlike many previous initiatives, REDD+ is conceived as a multilateral initiative, a situation that might have impacts on the nature of the activities supported and the definition of “performance”. Within bilateral agreements, the donor country can decide in agreement with the recipient country exactly what to pay for, what kind of activities will be supported and which are the conditions and safeguards to be put on disbursements. In fund-based REDD+ architecture the multilateral perspective makes this approach more challenging, especially when the content of national policies is at stake. The notion of “performance” might be differently addressed; even though many observers acknowledge that reducing performance to “emissions reduction against a reference level” is full of risk, due to the unresolved issue of the setting of the reference level (and difficulties in monitoring), it could be that this narrow definition will constitute the lowest common denominator acceptable in a multilateral scheme for the so-called phase 3.
33 With some empirical evidences showing sharp falls in deforestation rates after two major policy turning points in 2004 and 2008.
142
A broader and more effective approach would require agreed governance principles. A global fund for tropical forests will need a set of commonly shared principles such as “adopting a positive ‘investment’ approach towards socially and environmentally sustainable businesses of rights-holders” as suggested by an IIED review (McQueen 2010) and independent expert reviewing, as established in the Global Fund to fight AIDS, tuberculosis and malaria (GFATM). Under such a set of principles, it can be foreseen that recipient governments will have to make proposals on strategies they intend to implement to achieve the REDD+ objectives. Independent expert reviewing would provide the basis for the decision of funding or not the proposed strategies through national REDD+ funds or national REDD+ programs (for instance to establish large-scale investment-oriented PES programs or to secure land tenure rights). A New Conditionality?
For the donors, one of the most appealing characteristic of REDD+ is the “performance-based payments”, meaning the recipient country chooses freely the means it will use (providing it complies with the safeguards agreed upon within the UNFCCC process) and the magnitude of efforts it will consent. In that sense, it could be featured as moving away for the practice of imposing “conditionalities” to the recipient country for debt relief and continuing funding, a practice generally associated with the IMF and the World Bank, which has been criticized for preventing the national ownership of policies designed and decided in offices abroad (Seymour and Dubash 2000). However, it worth to notice such conditions were associated with “structural adjustment programs” (SAP), a kind of brutal medicine for cutting dramatically in public expenditures, reducing the number of civil servants and so forth. If REDD+ provided sustained investments to the partners’ countries, resulting in a more productive and sustainable agriculture, clarified land rights, land-use planning, reinforced institutions (justice, forests…),34 the issue of “ownership” can hardly compare with what took place during the SAP times. One could expect more cooperative relationships, allowing for more balanced discussions on how to estimate the “performance” and to create the conditions to reach them. Admittedly, as far as financial transfers are concerned, the design of the policies and measures and their implementation will raise potentially diverging views between the donors and the recipient governments.
34 One should keep in mind that, in essence, REDD+ transfers are about financial compensations for the opportunity cost of
conserving forests. Therefore, normally the “benefits” from REDD+ are those which derive from keeping and managing sustainably
forests (employments of the forest industry, timber taxes, NTFPs, and many other ecosystem services. In an investment-oriented
REDD+ scheme, one should add to the formers the benefits produced by the investments in institutional building, agriculture, etc.

143
Conclusion
Whatever the architecture finally decided, it seems more and more clear that REDD+ will not be a “quick and cheap” mean for curbing global greenhouse gases emissions. The “performance-based” remuneration principle, the expected comparative advantage of this incentive instrument, will prove to be hardly workable in the majority of potential REDD+ countries, characterized by ill-functioning institutions, poor governance quality and limited reach of the public action. Perhaps the only country where payments for performance would prove workable, would be Brazil, where national policies has been effective for curbing deforestation (even though not all the “performance” is attributable to the intentional action of the government, making the decrease of deforestation at least partially reversible). But Brazil’s case has also shown that financial incentives35 have not been decisive for adopting policies tackling deforestation: the balance of social forces has been moved in favor of forests’ protectors (especially for the indigenous populations) with the election of the Worker’s Party (PT) candidate in 2002, and national ambition of Brazil to be recognized as a global power and become a permanent member of the UN, called for building up an environmental credibility vis-à-vis the rest of the world. If political will to tackle deforestation is related to the need to build up credibility (at both national and international levels), incentives can be useful for helping committed politicians to justify their decisions in favor of forest protection and to circumvent vested interests; but conceived as such, it seems clear such incentives should not be necessarily in financial terms (joint and sustained investments for “greening” the economy and tackling the drivers of deforestation would certainly be more useful) for “performance” in emission reductions which does not depend entirely of the governments’ action.
35 Norway pledged up to one billion US$ to pour in the Amazon Fund if the trend of reduced deforestation is confirmed over time. It
is unlikely such a pledge has been the trigger of the new policy trend vis-à-vis the Amazon, even if it could have comforted the
government in the national debate with the agribusiness lobbies.
144
References
AFP (Agence France Presse). (2012). http://www.afp.fr/fr/node/668091).Released on Nov 11. Akpalu, W., & Parks, P. J. (2007). Natural resource use conflict: gold mining in tropical rainforest in Ghana. Environment and Development Economics, 12(01), 55-72. Angelsen, A. (2008). How do we set the reference levels for REDD payments? In A. Angelsen (Ed.) Moving ahead with REDD+: Issues, options and implications. Bogor, Indonesia: CIFOR. Angelsen, A. (2007). Forest cover change in space and time: Combining the Von Thunen and forest transition theories. World Bank Policy Research Working Paper WPS 4117. Angelsen A., & Kaimowitz D., (1999). Rethinking the causes of deforestation: Lessons from economic models. The World Bank Research Observer, 14(1), 73–98.
Araujo-Bonjean, C. Bonjean, C. Combes, J. Combes-Motel, P. Reis, E. (2009). Property rights and deforestation in the Brazilian Amazon. Ecological Economics, 68, 2461-2468. Arnold L. (2008). Deforestation in decentralized Indonesia: What’s law got to do with it? Law, Environment and Development Journal, 4 (2), 75-101. Asen, A., H. Savenije, and F. Schmidt. (2012). Good Business: Making Private Investments Work for Tropical Forests. Wageningen: European tropical forest research network (ETFRN). Asquith, N. & Wunder, S. (eds). 2008. Payments for Watershed Services: The Bellagio Conversations. Fundación Natura Bolivia: Santa Cruz de la Sierra. Assunção J., Clarissa C., Gandour, E., Rocha, R. (2012). Deforestation slowdown in the legal Amazon: Prices or policies? Climate Policy Initiative Working Paper CPI/ PUC-Rio, 6 February 2012. Austin, K., Sheppard, S. and Stolle F. (2012). Indonesia’s moratorium on new forest concessions: Key findings and next steps. WRI Working Paper. Washington DC: World Resources Institute. Available online at http://www.wri.org/publication/indonesia-moratorium-on-new-forest-concessions.
145
Barona, E., Ramankutty, N., Hyman, G., & Coomes, O. T. (2010). The Role of Pasture and Soybean in Deforestation of The Brazilian Amazon. Environmental Research Letters, 5(2), 024002.
Barr, C., Resosudarno, I., A., McCarthy, J., and Dermawan, A. (2006). Decentralisation of Forest Administration in Indonesia: Implications for Forest Sustainability, Economic Development and Community Livelihoods, Bogor, Indonesia: Centre for International Forestry Research (CIFOR). Boucher, D., Elias, P., Lininger, K., May-Tobin, C., Roquemore, S, and Saxon, E. (2011). The Root of the Problem: What’s Triving Tropical Deforestation Today? Cambridge, MA: Union of Concerned Scientists. Borlaug N. 2007. Feeding A Hungry World. Science. 318(5849):359. Bond, I. (2009). Incentives to Sustain Forest Ecosystem Services: A Review and Lessons for REDD (No. 16). International Inst for Environment. BP (Firm). (2012). Statistical Review of World Energy. London, England: BP, Inc. http://www.bp.com/sectionbodycopy.do?categoryId=7500&contentId=7068481. Bradshaw, C. J., Sodhi, N. S., PEH, K. S. H.,& Brook, B. W. (2007). Global Evidence that Deforestation Amplifies Flood Risk and Severity in the Developing World. Global Change Biology, 13(11), 2379-2395.
Bridge, G. (2004). Contested Terrain: Mining and the Environment. Annu. Rev. Environ. Resour., 29, 205-259.
Broich, M, Hansen, MC, Potapov, P, Adusei, B, Lindquist, E, & Stehman, SV (2011b). Time-series Analysis of Multi-resolution Optical Imagery for Quantifying Forest Cover Loss in Sumatra and Kalimantan, Indonesia.International Journal of Applied Earth Observation and Geoinformation, 13(2), 277-291.
Broich M, Hansen M, Stolle F, Potapov P, Margono BA and Adusei B (2011a). Remotely sensed forest cover loss shows high spatial and temporal variation across Sumatera and Kalimantan, Indonesia 2000–2008, Environ. Res. Lett. 6 (January-March 2011) 014010. Bromley, D. W. (2008). Resource degradation in the African commons: accounting for institutional decay. Environment and Development Economics, 13(05), 539-563.
146
Bruce J, Wendland K and Naughton-Treves L. (2010). Whom to pay? Key concepts andconservation. Madison, WI: Land Tenure Center. Bruijnzeel L., A., van Dijk A., I., J., van Noordwijk, M., Chapepell, N., A., and Schellekens, J. (2007). Tropical deforestation, people and flooding: A recent global analysis claiming that tropical deforestation amplifies flood risk and severity proves less than solid. World Agroforestry Center. Available at: http://www.worldagroforestrycentre.org/water/downloads/bca_bruijnzeel.pdf. Bruijnzeel L. A., (2004). Hydrological functions of tropical forests: Not seeing the soil for the trees? Agriculture, Ecosystems and Environment 104 (1): 185-228. Butler, R. and W. Laurance, (2008). New strategies for conserving tropical Forests, Trends Ecol Evol. 23(9):469-72. Butler, C. (2008). Human health and forests: An overview, In Colfer, C. J. P., Sheil, D., Kaimowitz, D., & Kishi, M. Forests and human health in the tropics: some important connections. UNASYLVA-FAO-57(2), 3. Calder, I., R. (2002). Forests and hydrological services: reconciling public and science perceptions. Land Use and Water Resources Research, 2, 1–12. Carroll, N., and Jenkins, M. (2008). The matrix: mapping ecosystem service markets. Ecosystem Marketplace. [online] http://www.ecosystemmarketplace.com/pages/dynamic/article.page.php?page_id=5917§ion=home&eod=1. Carlson, Kimberly M., Curran, Lisa M., Ratnasari, Dessy, Pittman, Alice M., Soares-Filho, Britaldo S., Asner, Gregory P., Trigg, Simon N., Gaveau, David A., Lawrence, Deborah, and Rodrigues, Hermann O. (2012). Committed carbon emissions, deforestation, and community land conversion from oil palm plantation expansion in West Kalimantan, Indonesia. National Academy of Sciences. 109(19): 7559–
7564.http://www.pubmedcentral.nih.gov/articlerender.fcgi?artid=3358834. Chauhan, C. (2012). New guidelines to mark no-mining zone in forests. Hindustan Times 3 September 2012. Chivian, E. and Bernstein, A. (2008). Sustaining life: how human health depends on biodiversity. Oxford: Oxford University Press.

147
Chomitz, K. M., Buys, P., De Luca, G., Thomas, T. S. & Wertz-Kanounnikoff, S. (2007). at loggerheads? Agricultural expansion, poverty reduction, and environment in the tropical forests. World Bank Policy Research Report. Washington DC: World Bank. Chomitz, K. M., & Gray, D. A. (1996). Roads, land use, and deforestation: a spatial model applied to Belize. The World Bank Economic Review, 10(3), 487-512.
Coase, R. H., 1992. The institutional structure of the production. The American Economic Review, 82 (4), 713-719.
Colfer, C. J. P., Sheil, D., Kaimowitz, D., & Kishi, M. (2006). Forests and human health in the tropics: some important connections. UNASYLVA-FAO, 57 (2), 3. Collier, P., Guillaumont, P., Guillaumont, S. & Gunning, J. W. (1997). Redesigning conditionality. World Development25 (9), 1399-1407. Collier, P. & Venables, A. J. (2012). Greening Africa? Technologies, Endowments and the Latecomer Effect. Energy Economics, Elsevier, vol. 34 (S1), S75-S84. Commons, J. R., (1931). The American Economic Review 21, 648-657. Convention on Biological Diversity (CBD). Available at :http://www.cbd.int/convention/text .......................................... Nagoya Protocol 2010. The Nagoya Protocol on Access and Benefit-sharing. http://www.cbd.int/abs. Corbera, E., (2012). Problematizing REDD+ as an experiment in payments for ecosystem services, Curr Opin Environ Sustain (In Press). Cotula, L., and Mayers, J., (2009). Tenure in REDD – Start-point or after thought? Natural Resource Issues 15. London, UK: International Institute for Environment and Development. DeFries R, Rudel TK, Uriarte M, and Hansen M (2010). Deforestation driven by urban population growth and agricultural trade in the twenty-first century, Nature Geoscience. 3: 178–81.
Defourny P., Delhage C., KibambeLubamba J.-P., (2011). Analyse quantitative des causes de la déforestationet de la dégradation des forêts en République Démocratique du Congo. UCL/FAO/CN REDD.
148
Deheza, M.; & Bellassen, V. (2012). La transmission des incitations REDD+ aux acteurslocaux: leçons de la gestion du carboneforestierdans les pays développés. ÉtudeClimat 35. CDC ClimatRecherche, Paris. Deininger, K.W., and D. Byerlee. 2011. The Rise of Large-Scale Farms in Land-Abundant Developing Countries: Does It Have a Future?. Washington, DC: World Bank. Douglas, J., & Simula, M. (2010). The Future of the World's Forests: Ideas Vs Ideologies (Vol. 7). Springer. EIR (2003). Striking a Better Balance - The World Bank Group and Extractive Industries : The Final Report of the Extractive Industries Review. World Bank. World Bank. http://www.intute.ac.uk/sciences/cgi-bin/fullrecord.pl?handle=20070526-191258. Ekadinata A, Widayati A, Dewi S, Rahman S, van Noordwijk M. (2011). Indonesia's
land‐use and land‐cover changes and their trajectories. (1990, 2000 and 2005).
ALLREDDI Brief 01. Bogor, Indonesia: World Agroforestry Centre (ICRAF) Southeast Asia Regional Program Online. Ellison, D., Futter, M., and Bishop, K. (2012). On the forest cover – water yield debate: from demand to supply-side thinking, Global Change Biology, 18, 806-820. Environmental Defense (EdF) and Instituto de Persquisa Ambiental da Amazonia (IPAM). (2007). Reducing Emissions from Deforestation in Developing Countries: Policy approaches to stimulate action. Submission to the UNFCCC. Farley, J. and R. Costanza. (2010). Payments for ecosystem services: From local to global. Ecological Economics 69: 2060–2068. FAO-CIFOR. (2005). Forests and floods: Drowning in fiction or thriving on facts? FAO-CIFOR, Bangkok-Bogor. Fearnside P. (2011). The biome faces a variety of increasing threats, Financial Times [London], 28 November 2011, Edition 1, Special Report: Sustainable Business Amazonia, p. 3.

149
.......................... (2005). Deforestation in Brazilian Amazonia: History, rates, and consequences, Conservation Biology 19(3), June 2005, 680-688. ……………………………….. (2002). Greenhouse gas emissions from a hydroelectric reservoir (Brazil's Tucuruí Dam) and the energy policy implications. Water, Air and Soil
Pollution 133(1-4): 69-96.
……………………………. (1997). Transmigration in Indonesia: Lessons from its environmental and social impacts, Environmental Management 21 (4): 553–570.
Fearnside, P. M., & de Alencastro Graça, P. M. L. (2006). BR-319: Brazil’s Manaus-Porto Velho Highway and the potential impact of linking the arc of deforestation to central Amazonia. Environmental Management, 38(5), 705-716.
Finer M., and Jenkins C.N. (2012). Proliferation of hydroelectric dams in the andean amazon and implications for andes-amazon connectivity. PLoS ONE. 7 (4). Fisher B., (2010). African exception to drivers of deforestation, Nature Geoscience 3: 375–376.
Fischlin, A., Midgley, G.F. (2007). Ecosystems, their properties, goods, and services. In: Parry, M.L., Canziani, O.F., Palutikof, J.P., van der Linden, P.J. and Hanson, C.E. (eds.) Climate change 2007: Impacts, adaptation and vulnerability. Contribution of Working Group II to the Fourth Assessment Report of the Intergovernmental Panel on Climate Change, 211-272.Cambridge University Press, Cambridge. Food and Agriculture Organization of the United Nations (FAO). (2012). The State of Food Insecurity in the World 2012. Food and Agriculture Organization of the United Nations. ……………………….. (2010). Global Forest Resources Assessment 2010: Main Report. Rome: Food and Agriculture Organization of the United Nations. …………………………. (2008). Forests and Energy: Key Issues. Rome: Food and Agriculture Organization of the United Nations of the United Nations. ……………………… (2007). The State of Food and Agriculture 2007. Part I: Paying farmers for environmental services. Rome: Food and Agriculture Organization of the United Nations.
150
………………………….. (2006). Global Forest Resources Assessment 2005: Progress towards Sustainable Forest Management. Rome: Food and Agriculture Organization of the United Nations. …………………………… FAO Statistics Division (FAOSTAT). Food and Agriculture Organization of the United Nations (FAO). faostat.fao.org/. &www.fao.org/worldfoodsituation/wfs-home/foodpricesindex/en/. ………………………….. FAO: FAO Hunger Portal. www.fao.org/hunger/. Friedman-Rudovsky, J. (2012). The bully from Brazil. Foreign Policy. July. Fuglie, K. (2012). Excel worksheet on regional agricultural productivity growth. Personal communication. Fuglie, Keith Owen, Sun Ling Wang, and V. Eldon Ball. (2012). Productivity Growth in Agriculture: An International Perspective. Wallingford Oxfordshire, UK: CABI. Fuglie, K. O., Lee, D. R., & Ndulo, M. (2011). Agricultural productivity in sub-Saharan Africa. The food and financial crises in sub-Saharan Africa: origins, impacts and policy implications, 122-153. FWI/GFW (Forest Watch Indonesia/Global Forest Watch) (2002). The state of the forest: Indonesia. Bogor, Indonesia and Washington DC: Forest Watch Indonesia, and Global Forest Watch. Gasquez et al. (2011). “Productivity and Structural Transformation in Brazilian Agriculture.” Ch. 7 In Productivity Growth in Agriculture: An International Perspective, ed. Keith O. Fuglie, Sun Ling Wang and V. Eldon Ball. CAB International, Wallingford, Oxon OX10 8DE, UK. Garrity, D. P., Akinnifesi, F. K., Ajayi, O. C., Weldesemayat, S. G., Mowo, J. G., Kalinganire, A., & Bayala, J. (2010). Evergreen Agriculture: A Robust Approach to Sustainable Food Security in Africa. Food Security, 2(3), 197-214. Geist, H.J. and Lambin E.F. (2002). Proximate Causes and Underlying Driving Forces of Tropical Deforestation. Bio Science.Vol. 52, No 2, pp 143- 150. ……………………….. (2001). What Drives Tropical Deforestation? A Meta-Analysis of Proximate and Underlying Causes of Deforestation Based on Sub national Case Study
151
Evidence. Louvain-la-Neuve (Belgium): LUCC. International Project Office, LUCC Report Series no. 4. Gibbs HK, A.S. Ruesch, F. Achard, M.K. Clayton, P. Holmgren, N. Ramankutty and J.A. Foley (2010). Tropical forests were the primary sources of new agricultural land in the 1980s and 1990s, PNAS 107 (38), 16732-37. Global Carbon Budget 2012. http://www.globalcarbonproject.org/carbonbudget/ Goldstein, M., Udry, C., (2005). The profits of power: Land rights and agricultural investment in Ghana. In Discussion paper: Economic growth center, Yale University. Greenpeace (2012). Frying the forest: How India’s use of palm oil is having a devastating impact on Indonesia’s rainforests, tigers and the global climate. Hamilton L. S. (2008). Forests and water – A thematic study prepared in the framework of the Global Forest Resources Assessment 2005 / FAO Forestry Paper 155. Hanna, R, E. Duflo, and M. Greenstone. (2012). Up in Smoke: The Influence of Household Behavior on The Long-run Impact of Improved Cooking Stoves. Cambridge, Mass: National Bureau of Economic Research. Hansen MC, Stehman S. V. and Potapov P. V. (2010). Quantification of global gross forest cover loss Proc. Natl Acad. Sci. USA 107 (19), 8650–5. Hansen, M.C., Stehman, S.V., Potapov, P.V., Arunarwati, B., Stolle, F., and Pittman, K., (2009), Quantifying changes in the rates of forest clearing in Indonesia from 1990 to 2005 using remotely sensed data sets, Environmental Research Letters, 4(3) doi: 10.1088/1748-9326/4/3/034001. Helfand, S. M., & Levine, E. S. (2004). Farm size and the determinants of productive
efficiency in the Brazilian Center‐West. Agricultural Economics, 31(2‐3), 241-249.
Hertel, T W. (2012). Competition for Land in the Global Bioeconomy. Based on a paper with U. C. Baldos and J. Steinbuks, Purdue University. Plenary presentation for the Triennial Congress of the IAAE in Brazil. August 22.

152
……………………… (2011). The global supply and demand for agricultural land in 2050: A perfect storm in the making?. American Journal of Agricultural Economics, 93(2), 259-275.
Hilson, G. (2002). The environmental impact of small‐scale gold mining in Ghana:
identifying problems and possible solutions. The Geographical Journal, 168(1), 57-72. Hilson, G., & Nyame, F. (2006). Gold mining in Ghana's forest reserves: a report on the current debate. Area, 38(2), 175-185. Hirons M. 2011. Locking-in carbon, locking-out livelihoods? Artisanal mining and REDD in sub-Saharan Africa. Journal of International Development. 23 (8): 1140-1150. Hodgson, G. M., (1988). Economic and institutions: A manifesto for a modern institutional economics. Polity Press. Hofer, T., and B. Messerli. 2006. Floods in Bangladesh: history, dynamics and rethinking the role of the Himalayas. Tokyo [etc.]: United Nations University Press. Hofer, T. and Messerli, B. (1997). Floods in Bangladesh: Process understanding and development strategies. A synthesis paper prepared for the Swiss Agency for Development and Cooperation. Institute of Geography, University of Berne, Berne. Hosonuma, N., Herold, M., De Sy, V., De Fries, R. S., Brockhaus, M., Verchot, L., & Romijn, E. (2012). An assessment of deforestation and forest degradation drivers in developing countries. Environmental Research Letters, 7(4), 044009. Hunter, J. M. (2003). Inherited burden of disease: agricultural dams and the persistence of bloody urine (Schistosomiasishematobium) in the Upper East Region of Ghana, 1959–1997. Social science & medicine, 56(2), 219-234.
Hyde, W. F., Belcher, B., & Xu, J. (Eds.). (2003). China's forests. RFF Press. International Energy Agency (IEA) (2011). World Energy Outlook 2011. Paris: IEA, International Energy Agency. ............................. (2010). Renewable Energy Essentials: Hydropower. Paris.

153
Independent Evaluation Group (IEG). (2013). Managing Forest Resources for Sustainable Development: An Evaluation of World Bank Group Experience. Washington, DC : The World Bank. February 5. ………………………………….. (2010). Safeguards and Sustainability Policies in a Changing World: An Independent Evaluation of World Bank Group experience. Washington, D.C.: World Bank. Indonesian Palm Oil Board (2007). Indonesian Palm Oil in Numbers. Ministry of Trade and Ministry of Agriculture. Republic of Indonesia. International Monetary Fund (IMF) (2011a). Mobilizing Climate Finance – A Paper Prepared at the Request of G20 Finance Ministers.http://www.imf.org/external/np/g20/pdf/110411c.pdf. ……………………….. (2011b). 2011 Triennial Surveillance Review—Overview Paper. http://www.imf.org/external/np/pp/eng/2011/082911.pdf. Intergovernmental Panel on Climate Change (IPCC). (2011). Special Report Renewable Energy Sources and Climate Change Mitigation, Working Group III-Mitigation of Climate Change, IPCC. International Water Management Institute (IWMI) (2007). Analysis done for the Comprehensive Assessment of Water Management in Agriculture using the Watersim model; chapter 2. INPE (Brazilian National Institute for Space Research) (2011). Program for the Estimation of Amazon Deforestation (Projeto PRODES Digital). Ingram, V., Tieguhong, J. C., Schure, J., Nkamgnia, E., & Tadjuidje, M. H. (2011). Where
artisanal mines and forest meet: Socio‐economic and environmental impacts in the
Congo Basin. In Natural Resources Forum. 35(4), 304-320. International Renewable Energy Agency (IRENA). (2012). Renewable Energy Technologies: Cost Analysis Series – Hydropower. Volume 1: Power Sector Issue 3/5.

154
Kaimowitz D., (2008). The prospects for reduced emissions from deforestation and degradation (REDD) in Mesoamerica. International Forestry Review 10(3), 485-495.
Kaimowitz D, B. Mertens, S. Wunder, and P. Pacheco (2004). Hamburger Connection Fuels Amazon Destruction: Cattle ranching and deforestation in Brazil's Amazon, CIFOR, 2004, 10 pp. Kareiva, P., M. Marvier, and M. McClure. 2000. Recovery and Management Options for Spring/Summer Chinook Salmon in the Columbia River Basin. Science 290:977–979. Karsenty, A., & Ongolo, S. (2012). Can “fragile states” decide to reduce their deforestation? The inappropriate use of the theory of incentives with respect to the REDD mechanism. Forest Policy and Economics, 18, 38-45. Karsenty A., Assembé S. (2011). Les régimes fonciers et la mise en œuvre de la REDD+ en Afrique centrale.Land Tenure Journal 2(11). FAO Available at: www.fao.org/nr/tenure/land-tenure-journal/index.php/LTJ/article/view/35/75. Karjalainen, E., Sarjala, T., & Raitio, H. (2010). Promoting human health through forests: overview and major challenges. Environmental health and preventive medicine, 15(1), 1-8.
Keys, P. W., Van der Ent, R. J., Gordon, L. J., Hoff, H., Nikoli, R., &Savenije, H. H. G. (2012). Analyzing precipitationsheds to understand the vulnerability of rainfall dependent regions. Biogeosciences, 9, 733-746. Koh, L. P., & Wilcove, D. S. (2008). Is oil palm agriculture really destroying tropical biodiversity?. Conservation Letters, 1(2), 60-64. Lambin, E. F., & Meyfroidt, P. (2011). Global land use change, economic globalization, and the looming land scarcity. Proceedings of the National Academy of Sciences, 108(9), 3465-3472.
Larondelle, N., & Haase, D. (2012). Valuing post-mining landscapes using an ecosystem services approach—An example from Germany. Ecological Indicators, 18, 567-574. Le Quéré, C. et al (2012). The Global Carbon Budget 1959–2011, Earth System Science Data Discussions (in review), http://www.earth-syst-sci-data-discuss.net/5/1107/2012, DOI:10.5194/essdd-5-1107-2012.
155
Lele, U. (2013). Sustainable Forest Financing or Financing of Sustainable Natural Resource Management through Landscapes? Reconciling Tensions between Financing Instruments and Sustainable Development Needs. Key Note at Open-ended Intergovernmental Ad Hoc Expert Group on Forest Financing, Second meeting (AHEG2). United Nations Forum on Forests. Vienna, 14-18 January. ………………………. (2012a). Water and Food Security and Governance in Asia. Presented at Atlantic Council @ 50, 1101 15th Street, NW, 11th Floor, Washington, DC 20005, October 18, 2012. ………………………. (2012b). Towards A More Effective Global Architecture for Food and Agriculture. Presented in Global Architecture for Food and Agriculture: Re-Calibrating Traditional Institutions and Integrating New Players Conference at Expo Center IV A1 (Rafain Convention Center), International Agricultural Economic Association (IAEA), Iguasu Falls, Brazil. August 20. Lele, U., Klousia, M., Goswami, S. Good governance for food and water security. An article written for On the Water Front, a publication of World Water Week, Global Water Partnership (Forthcoming). Lele, U., Agwarwal, M., and Goswami, S. (2011a). Towards A More Effective Architecture for Food and Agriculture. Presented at American Agricultural Economic Association (AAEA), 2011. July 26. Lele, U., Agarwal, M., Timmer, P., and Goswami, S. (2011b). Patterns of Structural Transformation and Agricultural Productivity Growth With Special Focus on Brazil, China, Indonesia and India, A paper Prepared for “Policy Options and Investment priorities for Accelerating Agricultural Productivity Growth" organized jointly by Indira Gandhi Institute of Development Research (IGIDR) and Institute for Human Development (IHD)and supported by the Planning Commission (India), the Food & Agriculture Organization (FAO) and the World Bank, November 9-11, New Delhi, India. (Forthcoming as World Bank Working Paper). Lele, U., Zazueta, A., and Singer, B. (2011c). The Environment and Global Governance: Can the Global Community Rise to the Challenge? in Ingram G. K. and Hong, Y-H (eds.) Climate Change and Land Policies. Cambridge, Mass: Lincoln Institute of Land Policy. Ligon, F. K., W. E. Dietrich, and W. J. Trush. 1995. Downstream ecological effects of dams. Bioscience 45:183–192.

156
Lyons, C. (2012). The Dam Boom in the Amazon. The New York Times: Sunday Review, June 30. MacDonald M, Simon J (2010). Cattle, soyanization, and climate change: Brazil's agricultural revolution, Brighter Green, 31 December 2010. Macedo, M. N., DeFries, R. S., Morton, D. C., Stickler, C. M., Galford, G. L., & Shimabukuro, Y. E. (2012). Decoupling of deforestation and soy production in the southern Amazon during the late 2000s. Proceedings of the National Academy of Sciences, 109(4), 1341-1346.
Macintosh, A. (2010). Reducing emissions from deforestation and forest degradation in developing countries: A cautionary tale from Australia. Australian Institute Policy brief, 12. McQueen, D.J. (2010). Review of funds which aim to protect tropical forests. Report to an Open Society Foundation and Global Witness initiative to explore a new global REDD fund. Edinburgh, UK: IIED. Mertens, B., & Lambin, E. F. (1997). Spatial modelling of deforestation in southern Cameroon: spatial disaggregation of diverse deforestation processes. Applied
Geography, 17(2), 143-162.
Millennium Ecosystem Assessment (MEA). (2005). Millennium Ecosystem Assessment synthesis report. [S.l.]: Millennium Ecosystem Assessment. ............................... (2003). Millennium Ecosystem Assessment. Meyfroidt, P., Rudel T. K., Lambin E. (2010). Forest transitions, trade, and the global displacement of land use, PNAS, vol. 107, no. 49: 20917-
20922.http://www.pnas.org/cgi/doi/10.1073/pnas.1014773107. Miranda, M. et al (2003). Mining and critical ecosystems: mapping the risks. Washington, DC: World Resources Institute. Mishra, P. and M. G. Reddy (2011). Threat to forest Commons : Mapping the livelihoods of mining induced communities in the Eastern Ghats of Andhra Pradesh. Hyderabad, India : Center for Economic and Social Studies (CESS).

157
Mongabay.com (2011). Brazil passes controversial Forest Code reform environmentalists say will be 'a disaster' for the Amazon by Rhett A. Butler, December 06. http://news.mongabay.com/2011/1207-forest_code_passed.html. Mudrák, O., Frouz, J., & Velichová, V. (2010). Understory vegetation in reclaimed and unreclaimed post-mining forest stands. Ecological Engineering, 36(6), 783-790. Muradian, R., Corbera, E., Pascual, U., Kosoy, N., & May, P. H. (2010). Reconciling theory and practice: An alternative conceptual framework for understanding payments for environmental services. Ecological Economics, 69(6), 1202-1208. Murdiyarso D, Dewi S, Lawrence D, and Seymour F. (2011). Indonesia’s forest moratorium: A stepping stone to better forest governance? Working Paper 76.CIFOR, Bogor, Indonesia. Nellemann, C., INTERPOL Environmental Crime Programme (eds). (2012). Green carbon, black trade: Illegal logging, tax fraud and laundering in the worlds tropical forests. A rapid response assessment. United Nations Environment Programme, GRIDArendal. Nelson, G., De Pinto, A., Harris, V., & Stone, S. (2004). Land use and road improvements: a spatial perspective. International Regional Science Review, 27(3), 297-325.
Nepstad, D., Carvalho, G., Cristina Barros, A., Alencar, A., Paulo Capobianco, J., Bishop, J., & Prins, E. (2001). Road paving, fire regime feedbacks, and the future of Amazon forests. Forest ecology and management, 154(3), 395-407. Nepstad, D., Soares-Filho, B. S., Merry, F., Lima, A., Moutinho, P., Carter, J., & Stella, O. (2009). The end of deforestation in the Brazilian Amazon. Science, 326(5958), 1350-1351.
Nepstad, D., Stickler, C. M., & Almeida, O. T. (2006). Globalization of the Amazon soy and beef industries: opportunities for conservation. Conservation Biology, 20(6), 1595-1603.
Newman D. J., and G. M. Cragg (2007). Natural products as sources of new drugs over the last 25 years. Journal of Natural Products. 70 (3): 461-77.
158
Nikoloyuk, J., Burns, T. R., & de Man, R. (2010). The promise and limitations of partnered governance: The case of sustainable palm oil. Corporate Governance, 10(1), 59-72.
Nilsson, S. (2011). The mega trends and the forest sector. Sweden: The Secretariat for International Forestry Issues. Nordhaus, W. (2009). Economic Issues in a Designing a Global Agreement on Global Warming, Keynote Address Prepared for Climate Change: Global Risks, Challenges, and Decisions, Copenhagen, Denmark. Organisation for Economic Co-operation and Development (OECD). (2007). The Principles for Good International Engagement in Fragile States and Situations. OECD, Paris. OECD.Stat. Organization for Economic Co-operation and Development. http://stats.oecd.org/Index.aspx?DataSetCode=CRSNEW. Orubuloye, I. O., Caldwell, P., & Caldwell, J. C. (1993). The role of high-risk occupations in the spread of AIDS: truck drivers and itinerant market women in Nigeria. International Family Planning Perspectives, 43-71. Palmer, C., & Engel, S. (2007). For better or for worse? Local impacts of the decentralization of Indonesia’s forest sector. World Development, 35(12), 2131-2149. Pattanayak, S. K., Wunder, S., & Ferraro, P. J. (2010). Show me the money: do payments supply environmental services in developing countries?. Review of Environmental Economics and Policy, 4(2), 254-274.
Patz, J. A., Confalonieri, U. E. C., Amerasinghe, F. P., Chua, K. B., Daszak, P., & Hyatt, A. D. (2005). Human health: ecosystem regulation of infectious diseases. Millennium Ecosystem Assessment.Condition and Trends Working Group. Ecosystems and Human Well-Being: Current State and Trends. Vol. 1: Findings of the Condition and Trends Working Group, 391-415. Pedroni, L., M. Dutschke, C. Streck and M. Estrada (2009). Creating incentives for avoiding further deforestation: the nested approach. Climate Policy, 9: 207–220. Peterson, G. D., & Heemskerk, M. (2001). Deforestation and forest regeneration following small-scale gold mining in the Amazon: the case of Suriname. Environmental Conservation, 28(2), 117-126.

159
Pfaff, A.S.P. (1999). What drives deforestation in the Brazilian Amazon? Evidence from satellite and socioeconomic data. Journal of Environmental Economics and
Management. 37 (1): 26-43.
Pfaff, A., Robalino, J., Walker, R., Aldrich, S., Caldas, M., Reis, E., & Kirby, K. (2007). Road Investments, Spatial Spillovers, and Deforestation in the Brazilian Amazon. Journal of Regional Science, 47(1), 109-123.
Pfaff, A., Robalino, J.A. and Sanchez-Azofeifa, G.A., (2006). Payments for environmental services: Empirical analysis for Costa Rica. New York : Columbia University. Phelps, J., Webb, E. L., & Agrawal, A. (2010). Does REDD+ threaten to recentralize forest governance?. Science, 328(5976), 312-313. Phelps, J., Webb, E. L., & Koh, L. P. (2011). Risky business: An uncertain future for biodiversity conservation finance through REDD+. Conservation Letters, 4(2), 88-94.
Pirard, R., & Belna, K. (2012). Agriculture and Deforestation: Is REDD+ Rooted In Evidence?. Forest Policy and Economics. Pirard, R. (2008). Estimating opportunity costs of Avoided Deforestation (REDD): application of a flexible stepwise approach to the Indonesian pulp sector. International Forestry Review, 10(3), 512-522.
Popp, A., J. P. Dietrich, H. Lotze-Campen, D. Klein, N. Bauer, M. Krause, T. Beringer, D. Gerten, and O. Edenhofer. (2011). The Economic Potential of Bioenergy for Climate Change Mitigation with Special Attention Given to Implications for The Land System. Environmental Research Letters. 6 (3). PovcalNet: The on-line tool for poverty measurement. Developed by the Development Research Group of the World Bank. Available at:http://iresearch.worldbank.org/PovcalNet/index.htm Prud'Homme, R. (1995). The Dangers of Decentralization. The World Bank Research
Observer, 10(2), 201-220.
Rainforests, The Earth Times (2011). Rainforests by Michael Evans. April 27. http://www.earthtimes.org/encyclopaedia/environmental-issues/rainforests/.

160
Renewable Energy Policy Network for the 21st Century (REN 21). 2012. Renewables 2012 Global Status Report. [Paris, France]: REN21 Secretariat c/o UNEP. http://www.map.ren21.net/GSR/GSR2012.pdf. Robinson, B., Holland, M. Naughton-Treves, L. (2011). Does secure land tenure save forests? A review of the relationship betwxeen land tenure and tropical deforestation.CCAFS Working Paper 7, Copenhagen. Rodrigues, R. R., Martins, S. V., & de Barros, L. C. (2004).Tropical rain forest regeneration in an area degraded by mining in MatoGrosso State, Brazil. Forest Ecology and Management, 190(2), 323-333.
Romero, S. (2012). Amid Brazil’s Rush to Develop, Workers Resist. The New York Times, May 5. Rudel TK, De Fries R, Asner GP and Laurance WF (2009a). Changing drivers of deforestation and new opportunities for conservation, Conservation Biology, 23 1396–405.
Rudel TK, Schneider L, Uriarte M, Turner II BL, DeFries R, Lawrence D, Geoghegan J, Hecht S, Ickowitz A, Lambin EF, Birkenholtz T, Baptista S and Grau R (2009b). Agricultural intensification and changes in cultivated areas, 1970–2005, PNAS 106 (49): 20675-80.
Rudorff, B. F. T., Adami, M., Aguiar, D. A., Moreira, M. A., Mello, M. P., Fabiani, L., Amaral, D. F. & Pires, B. M. (2011) .The soy moratorium in the Amazon biome monitored by remote sensing images. Remote Sensing, 3, 185-202. Santilli, M., Moutinho, P., Schwartzman, S., Nepstad, D., Curran, L., & Nobre, C. (2005). Tropical deforestation and the Kyoto Protocol. Climatic Change, 71(3), 267-276.
Saatchi, S. S., Harris, N. L., Brown, S., Lefsky, M., Mitchard, E. T., Salas, W., & Morel, A. (2011). Benchmark map of forest carbon stocks in tropical regions across three continents. Proceedings of the National Academy of Sciences, 108(24), 9899-9904. Schimann, H., Petit-Jean, C., Guitet, S., Reis, T., Domenach, A. M., &Roggy, J. C. (2012). Microbial bioindicators of soil functioning after disturbance: The case of gold mining in tropical rainforests of French Guiana. Ecological Indicators, 20, 34-41. Schlager, E., & Ostrom, E. (1992). Property-rights regimes and natural resources: a conceptual analysis. Land economics, 249-262.
161
Schmidhuber, J. (2010). FAO’s Long-term Outlook for Global Agriculture Factors Driving Prices and Volatility. Food and Agriculture Organization of the United Nations. IPC 2010. Barcelona, May 26-27. Schneider, R. R. (1995). Government and the economy on the Amazon frontier (No. 11).World Bank Publications. Washington, DC: The World Bank. Schoon, N. (1996). Sleepy dormice wake up to a rescue move: Heritage of the wild. The Independent. 29 April:7. Schure, J., Ingram, V., Sakho-Jimbira, M. S., Levang, P., &Wiersum, K. F. (2012). Energy for Sustainable Development. Schwarte, C., Mohammed, E.Y. (2011). Carbon righteousness: How to lever pro-poor benefits from REDD+? London: IIED. Sethi, N. (2012). Forests off limits for all mining? Times of India 13 June 2012. Available at :http://articles.timesofindia.indiatimes.com/2012-06-13/flora-fauna/32214343_1_catchment-forest-survey-forest-areas. Seymour, F. & Dubash, N. (2000). Right conditions: the World Bank, structural adjustment, and forest policy reform. Washington, DC, USA, World Resources Institute. Shearman, P. L., Ash, J., Mackey, B., Bryan, J. E., & Lokes, B. (2009). Forest conversion and degradation in Papua New Guinea 1972–2002. Biotropica, 41(3), 379-390. Simmons, J. A., Currie, W. S., Eshleman, K. N., Kuers, K., Monteleone, S., Negley, T. L., & Thomas, C. L. (2008). Forest to reclaimed mine land use change leads to altered ecosystem structure and function. Ecological Applications, 18(1), 104-118. Stern, N. (2007). The Economics of Climate Change: the Stern Report. Cambridge, UK. Streck, C. (2010). Reducing emissions from deforestation and forest degradation: national implementation of REDD schemes. Climatic change, 100(3), 389-394. Sunderlin WD, Resosudarmo IAP (1996). Rates and causes of deforestation in Indonesia: Towards a resolution of the ambiguities, CIFOR Occasional paper 6, Bogor, Indonesia.

162
Swickard, N. and Carnahan, K. (2010). Integrating project and national REDD+: The importance of the private sector. In Zhu, X., Moller, L.R., De Lopez, T. & Romero, M.Z. (Eds) Pathways for implementing REDD+: Experiences from carbon markets and communities. Copenhagen, Denmark: UNEP Risoe Centre. Tacconi, L. (2012). Redefining payments for environmental services. Ecological Economics, 73(1), 29-36.
Tollens, E., (2010). Potential impacts of agriculture development on the forest cover in the Congo Basin. Washintgon, DC : The World Bank. The Millbrook Independent. (2012). Olesia Plokhii Detained In Cambodia. http://themillbrookindependent.com/news/olesia-plokhii-detained-cambodia. The Nature Conservancy (TNC), Conservation International (CI) & Wildlife Conservation Society (WCS). (2010). Reducing Emissions from Deforestation and Degradation (REDD): A Casebook of On-the-Ground Experience. Virginia, USA: TNC, CI and WCS. The Washington Post; Nov 6, 2012. http://www.washingtonpost.com/. United Nations Department of Economic and Social Affairs (UN DESA), (2012). Population Division: World Urbanization Prospects. 2011 Revision. New York, 2012. United Nations Environment Programme (UNEP). (2011). Towards a Green Economy: Pathways to Sustainable Development and Poverty Eradication. Nairobi : UNEP. United Nations Foundation. (2010). Global Alliance for Clean Cookstoves. Fact Sheet. Available at www.unfoundation.org/assets/pdf/global-alliance-for-clean-cookstoves-factsheet.pdf. USDA/FAS. (2012). www.fas.usda.gov/cmp/circular_schedule.asp. U.S. EIA (United States Energy Information Administration). 2011. International Energy Outlook 2011. Washington, DC, USA. Available at: http://www.eia.gov/forecasts/ieo/. ............................. 2007. International Energy Outlook 2007. Washington, DC, USA. Available at: ftp://ftp.eia.doe.gov/forecasting/0484(2007).pdf.

163
Vermeulen C., Dethier M., Delvingt W., Ekodeck H., Nguenang G.-M., Vandenhaute M., (2006). De kompia à djolempoum: Sur les sentierstortueux de l’aménagement et de l’exploitation des forêtscommunautaires au Cameroun. Vertigo, 17 (1), Availableat :http://vertigo.revues.org/2149. Viana, V. M., Cenamo, M. C., Pavan, M. N., Carrero, G. C., & Quinlan, M. D. (2008). Railroads in the Amazon: A key strategy for reducing deforestation. CCLR The Carbon & Climate Law Review, 2(3), 292-299.
Wang, S., L., Tuan, F., Gale, F., Somwaru, A., and Hansen, J. China's regional agricultural productivity growth in 1985-2007: a multilateral comparison. Agricultural Economics, (Forthcoming). Wertz-Kanounnikoff, S. Kongphan-apirak, M. (2009). Emerging REDD+. A preliminary survey of demonstration and readiness activities.CIFOR Working Paper 46. Wickham, J. D., Riitters, K. H., Wade, T. G., Coan, M., & Homer, C. (2007). The effect of Appalachian mountaintop mining on interior forest. Landscape Ecology, 22(2), 179-187.
Wilcox, B. A., & Ellis, B. (2006). Forests and emerging infectious diseases of humans. UNASYLVA-FAO, 57(2), 11. Wilkie, D., Shaw, E., Rotberg, F., Morelli, G., &Auzel, P. (2000). Roads, development, and conservation in the Congo Basin. Conservation Biology, 14(6), 1614-1622. World Bank (2012). Turn Down the Heat Why a 4 [degree]C Warmer World Must be Avoided. A Report for the World Bankby the Potsdam Institute for Climate Impact Research andClimate Analytics. Washington, D.C.: The World Bank. ……………………… (2011). Household Cookstoves, Environment, Health, and Climate Change: A New Look at an Old Problem. Washington, D.C.: World Bank. .............................. (2010). World Development Report (WDR) 2010. Development and Climate Change. Washington, DC : The World Bank. ……………………….. (2009). World Development Report (WDR) 2009. Reshaping Economic Geography. Washington, DC : The World Bank.
164
……………………..... (2008). World Development Report (WDR) 2008. Agriculture for Development. Washington, DC : The World Bank. ……………………….. (2002). Sustaining Forests—A Development Strategy. Washington DC: World Bank ………………………….. Prospects - Commodity Markets. http://econ.worldbank.org/WBSITE/EXTERNAL/EXTDEC/EXTDECPROSPECTS/0,,contentMDK:21574907~menuPK:7859231~pagePK:64165401~piPK:64165026~theSitePK:476883,00.html. …………………………. http://info.worldbank.org/governance/wgi/index.asp. World Bank, Operations Evaluation Department. (2000). Forest Strategy: Striking the Right Balance. Washington, DC : The World Bank. World Development Indicators (WDI) and Global Development Finance (GDF). The World Bank. http://databank.worldbank.org/data/views/variableSelection/selectvariables.aspx?source=world-development-indicators. World Resources Institute (WRI). (1997). Last Frontier Forests: Ecosystems and Economies on the Edge. Washington, DC: WRI. World SHP Development Report (2012). Country Report: Bhutan. Draft Version. International Center on Small Hydro Power (ICSHP) http://www.inshp.org/Img_Lib/UploadImg/20127309474769.pdf. Wright, B. (2012). Food and Bio-Energy: Economics, Politics and Policy. Plenary Address, ICAE. ARE, UC Berkeley. Brazil. August 19. ……………………….. (2011). The Economics of Grain Price Volatility. Applied Economic Perspectives and Policy, 33(1), 32-58.
Wright, B. & Xie, Y. (2012). Excel worksheet on Food and energy real price indices 1960-2011. Personal communication. Wunder, S. (2007). The efficiency of payments for environmental services in tropical conservation. Conservation biology, 21(1), 48-58.
165
…………………… (2005). Payments for environmental services: Some nuts and bolts (No. 42). Bogor: CIFOR. Wunder, S., & Albán, M. (2008). Decentralized payments for environmental services: The cases of Pimampiro and PROFAFOR in Ecuador. Ecological Economics, 65(4), 685-698.
Xu, J., White, A., and Lele, U. (2010). China’s Forest land Tenure Reforms, Impacts and Implications for Choice, Conservation and Climate Change Peking University, January. Yufanyi Movuh, M. C. and C. Shusser. (2012). Power: The hidden factor in Development Cooperation: An example of Community Forestry in Cameroon, Open Journal of Forestry. Zarin, D., Angelsen, A., Brown, S., Loisel, C., Peskett, T. & Streck, C. (2009). Reducing emissions from deforestation and forest degradation (REDD): An Options Assessment Report. Meridian Institute. Zhang, Q., Justice, C. O., & Desanker, P. V. (2002). Impacts of simulated shifting cultivation on deforestation and the carbon stocks of the forests of Central Africa. Agriculture, ecosystems & environment 90(2), 203-209.

166