Exploring Differences in Family Involvement and Depressive Symptoms across Latino Adolescent Groups
Hindawi Publishing CorporationJournal of Nutrition and MetabolismVolume 2012, Article ID 848403, 9 pagesdoi:10.1155/2012/848403
Research Article
Changes in Body Mass Index across Age Groups inIranian Women: Results from the National Health Survey
Enayatollah Bakhshi,1 Behjat Seifi,2 Akbar Biglarian,1 and Kazem Mohammad3
1 Department of Statistics and Computer, University of Social Welfare and Rehabilitation Sciences, Tehran, Iran2 Department of Physiology, Medicine School, Tehran University of Medical Sciences, Tehran, Iran3 Department of Biostatistics, School of Public Health and Institute of Public Health Research,Tehran University of Medical Sciences, Tehran, Iran
Correspondence should be addressed to Enayatollah Bakhshi, [email protected]
Received 19 July 2011; Revised 12 October 2011; Accepted 16 October 2011
Academic Editor: Abdulrahman O. Musaiger
Copyright © 2012 Enayatollah Bakhshi et al. This is an open access article distributed under the Creative Commons AttributionLicense, which permits unrestricted use, distribution, and reproduction in any medium, provided the original work is properlycited.
Background. To investigate the associations between some factors with weight gain across age groups in Iranian women. Methods.Proportional odds model was used to estimate the probability of BMI categorized as a function of education, economic index,workforce, smoking, marital status, and place of residence adjusted for age, using data from the “National Health Survey in Iran”database. It included 14176 women aged 20–69 years. Results. For all covariates, age was directly associated with overweight andobesity before 60 years of age. Among women aged 20–40 years, the rates of change in probabilities of overweight and obesity werehighest. Among women, being inactive, with high economic index, married, being nonsmoker, in an urban residence, with lowereducational attainment, all increased the probabilities of overweight and obesity. Conclusions. Women aged 20–40 years gainedweight faster than other groups. They may need additional information and more support on how to reduce their risk for weightgain through positive health behaviors.
1. Introduction
Overweight and obesity are as public health problems, due toboth their rapid growth in recent decades and to their relatedhealth disorders, such as cardiovascular diseases, diabetes,some cancers, and other diseases [1–8]. Studies have alsoshowed relationships between obesity and chronic pain [9]and Alzheimer’s disease [10].
In 2002, nearly half a billion of the world populationconsidered to be overweight or obese [11]. Obesity isassuming epidemic proportions in both developed anddeveloping countries [12–15]. In 2003-04, 17.1% of USchildren and adolescents were overweight and 32.2% ofadults were obese [16]. Almost one third of adult Canadiansare at increased risk of disability, disease, and prematuredeath due to obesity [17]. Obesity is relatively common inEurope, especially in southern and eastern countries, andstudies from repeated surveys suggest that the prevalence ofobesity has been increasing last years [18]. Up to 2000, the
prevalence of obesity in Western countries was suggested tovary between 15 percent and 20 percent [19].
In recent years, the statistics were appalling. The preva-lence of obesity in USA, Canada, Australia, United Kingdom,Iran, and Egypt was 31.8, 24.3, 25.1, 24.9, 21.6, and 34.6,respectively [20]. Overall, more than one out of ten of theworld adult population was obese. Nearly 1.5 billion adults,20 and older, are now considered to be overweight or obese.Of these, nearly 300 million women and more than 200million men were obese [21]. In 2010, almost 43 millionchildren (35 million in developing countries and 8 millionin developed countries) were estimated to be overweight orobese [22].
Most studies have investigated the relationship betweensociodemographic factors and obesity. It has found a signifi-cant association between weight gain and aging [23–26].
Sobal and Stunkard [27] found a strong inverse relation-ship between socioeconomic status and obesity in women inaffluent societies, with a higher proportion of obese women

2 Journal of Nutrition and Metabolism
in lower socioeconomic groups. In low-income countries,obesity is more common among middle-age women, peopleof higher socioeconomic status, and people living in urbancommunities [28, 29].
Although the association of overweight with smoking,alcohol consumption, dietary habits, and physical activityhas been analyzed in many studies, the findings are notconsistent. Wilsgaard et al. [30] showed that being a smokeris associated with lower BMI values.
We aimed to assess the associations between some factorswith weight gain across age groups among women by usingcross-sectional data from the National Health Survey in Iran(NHSI).
2. Material and Methods
2.1. Study Population. The National Health Survey in Iran(NHSI) is a survey designed to gain comprehensive knowl-edge and information about health care problems anddifficulties throughout the country, 1999-2000. The surveywas conducted under the supervision and with the financialsupport of the Iranian Ministry of Health and MedicalEducation. The population sample of the survey consistedof one thousandth of the total Iranian population; non-Iranian were excluded. They were randomly chosen bycluster sampling. Each cluster comprises of 8 households.The choice of 8 households for the cluster size was basedon one-day performance capacity of the data collectiongroup: four persons (2 physicians, 1 interviewer, and 1lab technician). The statistical framework was based onthe household lists available with every Health Departmentin the provinces, usually updated annually. Data from theNational Health Survey were considered in this investigation.In this study, 14176 women, 8957 urban, and 5219 ruralaged 20–69 years were investigated. These data were collectedby the National Research Center of Medical Sciences andare presented partially at the Department of Biostatisticsand Epidemiology/Tehran University of Medical Sciencesfor research [31]. We excluded pregnant women from theanalyses. This study was approved by the Ethic Committee ofthe University of Social Welfare and Rehabilitation Sciences.
2.2. Measurements
2.2.1. Response Variable. Height and weight were measuredrather than self-reported. Height was measured withoutshoes to the nearest 5 mm. Weight was measured to the near-est 0.1 kg with the subject in light indoor clothes, with emp-tied pockets and without shoes. BMI (body mass index) wascalculated as weight in kilograms divided by square of heightin meters, squared, and subjects were classified into under-weight defined as BMI < 18.5, normal weight as BMI 18.5–24.9, overweight as BMI 25.0–29.9, and obese as BMI ≥ 30.
2.2.2. Independent Variables
Age. Information about the respondent age was based ontheir self-reported birth year, and subjects were stratified intofive 10-year age groups (20–29, 30–39, 40–49, 50–59, and 60–69 years).
Education. Educational level was measured in years ofschool. Years of schooling were divided into three groups:person with basic (0–8 years), moderate (9–12 years), or high(more than 12 years) education.
Economic Index. Due to ethical considerations, we did notask respondents about their income. Because they were afraidof paying their taxes. We surrogated economic index fortheir household income. Economic index was defined assquare meter of living place divided by number of household.Participants were classified by their economy index statusinto four classes: (1) low (economic index ≤ Quartile 1), (2)lower-middle (Quartile 1 < economic index ≤ Quartile 2),(3) upper-middle (Quartile 2 < economic index ≤ Quartile3), and (4) high (economic index > Quartile 3).
Place of Residence. The subjects were grouped according totheir place of residence as living in cities (urban) or villages(rural).
Workforce. Active workforce was defined as the part of thefemale population that belongs to the currently employed (asemployees) or self-employed category as opposed to inactiveworkforce (being a housewife/houseworker, pensioner, stu-dent, or unemployed).
Smoking. Smoking status was dichotomized into smoker(those who smoke every day and have smoked at least 100cigarettes in their lives) versus nonsmoker (others).
Marital Status. To make the marital status variable, it wasdichotomized into legally married and nonmarried groups.
Note that we have no information on household incomeand physical activity, but economic index is surrogate forhousehold income and we used workforce factor. Due toethical considerations, we did not ask respondents abouttheir income, because they were afraid of paying their taxes.The consumption of alcohol is prohibited in Iran. Therefore,there were no information on alcohol consumption.
2.3. Statistical Analysis. We used proportional odds modelto assess the influence of the independent variables listedpreviously on the probability of obesity and overweight. Wecarried out score tests for the proportional odds assumption,which was found to hold. In addition, we tested the inter-action terms using reduced models excluding nonsignificantterms. For obesity and overweight, odds ratios and 95%confidence intervals were calculated. For all covariates, wecalculated the probability of obesity and overweight acrossage groups. All analyses were performed using SAS software,version 9.1 for windows.
3. Results
The mean BMI of women was 25.33 kg m−2 (95% CI: 25.25–25.41). Prevalence (%) of the body mass index levels accord-ing to independent variables was assessed (Table 1). Table 1shows that obesity is much more prevalent among women

Journal of Nutrition and Metabolism 3
Table 1: Prevalence (%) of underweight, normal weight, overweight, and obesity according to sociodemographic and smoking in a randomsample of 14176 women in Iran, 1999-2000.
Variable Underweight Normal weight overweight obese
Age group (years)
20–30 10.5 57.8 22.6 9.1
30–40 4.0 42.4 33.5 20.1
40–50 3.2 35.8 35.2 25.8
50–60 2.6 35.0 37.1 25.3
60–69 4.4 41.4 36.2 18.0
Education level
Basic 5.8 44.6 30.8 18.8
Moderate 6.5 47.9 30.9 14.6
High 11.0 63.4 19.9 5.7
Economic index
Low 8.0 50.6 27.2 14.2
Lower-middle 5.5 44.2 30.9 19.4
Upper-middle 5.4 45.0 31.5 18.1
High 5.2 42.9 32.9 19.0
Workforce
Inactive 5.2 44.0 31.8 18.9
Active 13.1 61.0 20.0 6.0
Smoking status
Nonsmoker 6.1 45.9 30.5 17.5
Smoker 6.6 46.5 31.1 15.8
Marital status
Non-married 8.1 49.4 29.9 12.6
Married 5.6 45.0 30.6 18.8
Place of residence
Rural 8.3 54.4 25.8 11.5
Urban 4.8 41.0 33.2 21.0
aged 40–60 years, less educated, high economic index,inactive workforce, nonsmoker, married, and resident in city.
We started by fitting a preliminary proportional oddsmodel including only age to observe the influence of thepotential confounders on overweight and obesity. Unad-justed odds ratios were 2.50, 3.41, 3.52, and 2.45 for agegroups 30–40, 40–50, 50–60, and 60–69 years, respectively.
To assess effects of factors in obesity and overweightacross age groups, adjustment for age was performed byusing proportional odds model. With four response cate-gories, the model had three intercepts. They are of interestfor computing response probabilities. For all covariates, theprobability of overweight and obesity was calculated. Theresults are presented in Figures 1–6.
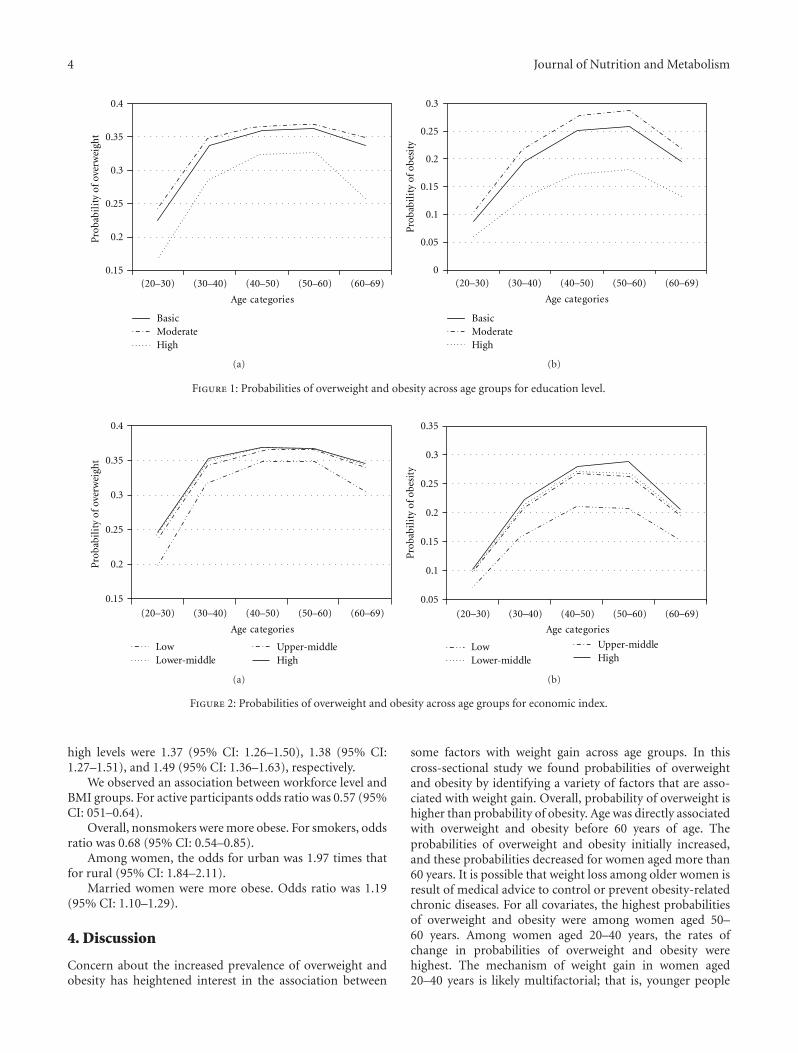
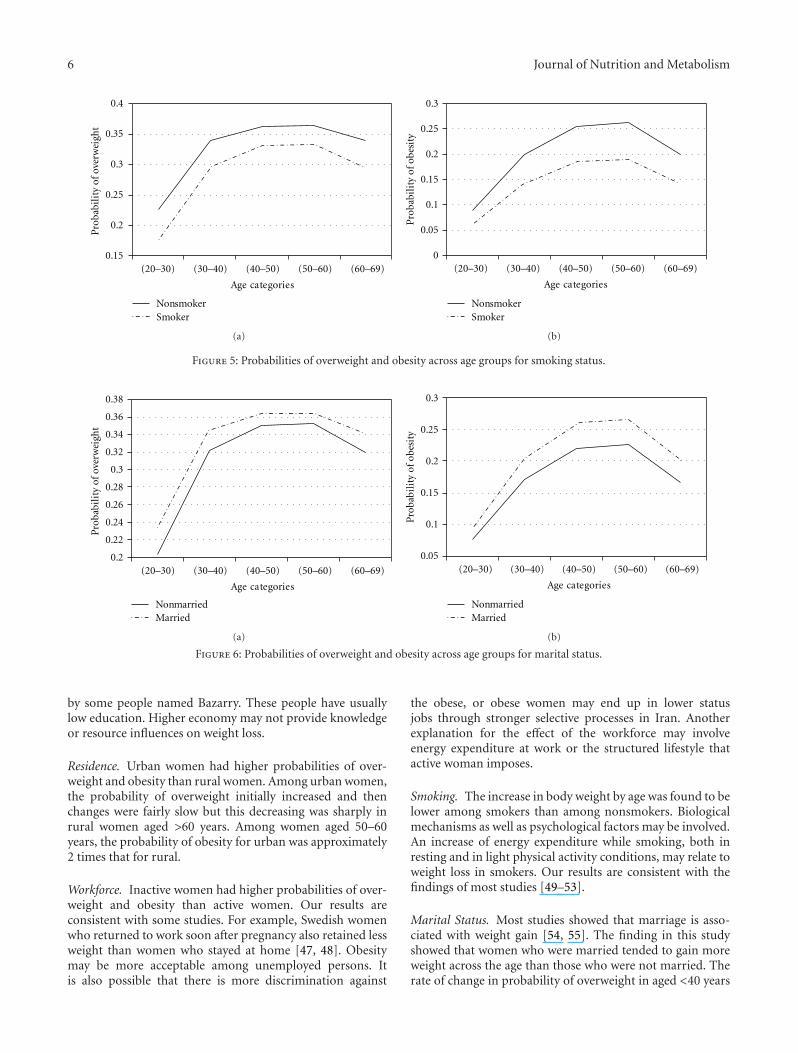
Figures 1–6 show that age was directly associated withoverweight and obesity before 60 years of age. In other words,the probabilities of overweight and obesity increase from 20to about 50 years of age and decrease after age 60 years. Thecurves are either flat or in increase in the 50–60 age group.We observe rise in a very high rate among women aged 20–40 years.
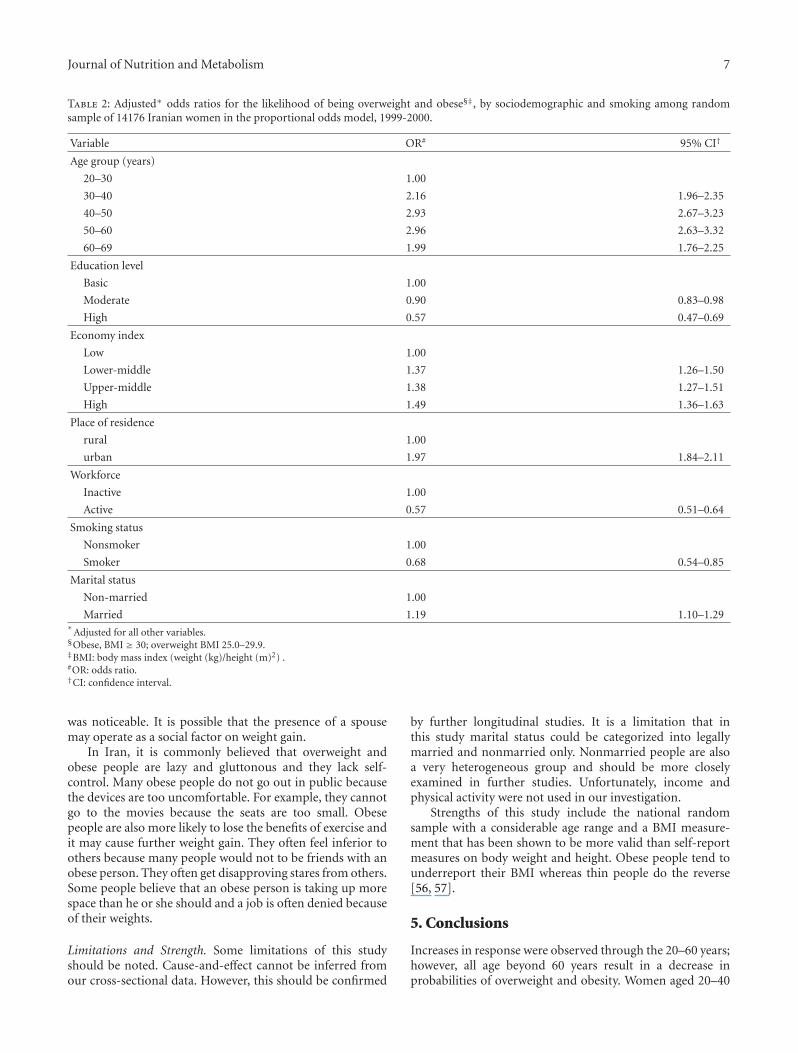
We used proportional odds model including age, eco-nomic index, workforce status, education level, place ofresidence, smoking status, and marital status. All weresignificantly associated with underweight, normal weight,overweight, and obesity. Odds ratios and 95% confidenceintervals were calculated (Table 2).
Table 2 shows that among women, being inactive, withhigh economic index, married, being nonsmoker, in anurban residence, with lower educational attainment, allincreased the probability of overweight and obesity. Youngerage decreased the probability of overweight and obesity. Theodds ratios were 2.16 (95% CI: 1.96–2.35), 2.93 (95% CI:2.67–3.23), 2.96 (95% CI: 2.63–3.32), and 1.99 (95% CI:1.76–2.25) for age groups 30–40, 40–50, 50–60, and 60–69years, respectively.
For overweight and obese participants with moderateand high education, odds ratios were 0.90 (95% CI: 0.83–0.98) and 0.57 (95% CI: 0.47–0.69), respectively.
Women with high economic index were more likely to beoverweight and obese. The odds ratios for overweight andobese participants with lower-middle, upper-middle, and
4 Journal of Nutrition and Metabolism
0.15
0.2
0.25
0.3
0.35
0.4
(20–30) (30–40) (40–50) (50–60) (60–69)
Age categories
Pro
babi
lity
of o
verw
eigh
t
BasicModerateHigh
(a)
0
0.05
0.1
0.15
0.2
0.25
0.3
Pro
babi
lity
of o
besi
ty
BasicModerateHigh
Age categories
(20–30) (30–40) (40–50) (50–60) (60–69)
(b)
Figure 1: Probabilities of overweight and obesity across age groups for education level.
LowLower-middle
Upper-middleHigh
0.15
0.2
0.25
0.3
0.35
0.4
Age categories
Pro
babi
lity
of o
verw
eigh
t
(20–30) (30–40) (40–50) (50–60) (60–69)
(a)
0.05
0.1
0.15
0.2
0.25
0.3
0.35
LowLower-middle
Upper-middleHigh
Age categories
Pro
babi
lity
of o
besi
ty
(20–30) (30–40) (40–50) (50–60) (60–69)
(b)
Figure 2: Probabilities of overweight and obesity across age groups for economic index.
high levels were 1.37 (95% CI: 1.26–1.50), 1.38 (95% CI:1.27–1.51), and 1.49 (95% CI: 1.36–1.63), respectively.
We observed an association between workforce level andBMI groups. For active participants odds ratio was 0.57 (95%CI: 051–0.64).
Overall, nonsmokers were more obese. For smokers, oddsratio was 0.68 (95% CI: 0.54–0.85).
Among women, the odds for urban was 1.97 times thatfor rural (95% CI: 1.84–2.11).
Married women were more obese. Odds ratio was 1.19(95% CI: 1.10–1.29).
4. Discussion
Concern about the increased prevalence of overweight andobesity has heightened interest in the association between
some factors with weight gain across age groups. In thiscross-sectional study we found probabilities of overweightand obesity by identifying a variety of factors that are asso-ciated with weight gain. Overall, probability of overweight ishigher than probability of obesity. Age was directly associatedwith overweight and obesity before 60 years of age. Theprobabilities of overweight and obesity initially increased,and these probabilities decreased for women aged more than60 years. It is possible that weight loss among older women isresult of medical advice to control or prevent obesity-relatedchronic diseases. For all covariates, the highest probabilitiesof overweight and obesity were among women aged 50–60 years. Among women aged 20–40 years, the rates ofchange in probabilities of overweight and obesity werehighest. The mechanism of weight gain in women aged20–40 years is likely multifactorial; that is, younger people

Journal of Nutrition and Metabolism 5
RuralUrban
0.15
0.2
0.25
0.3
0.35
0.4
Age categories
Pro
babi
lity
of o
verw
eigh
t
(20–30) (30–40) (40–50) (50–60) (60–69)
(a)
0.05
0.1
0.15
0.2
0.25
0.3
0.35
Age categories
Pro
babi
lity
of o
best
ity
RuralUrban
0
(20–30) (30–40) (40–50) (50–60) (60–69)
(b)
Figure 3: Probabilities of overweight and obesity across age groups for place of residence.
InactiveActive
0.15
0.2
0.25
0.3
0.35
0.4
Age categories
Pro
babi
lity
of o
verw
eigh
t
(20–30) (30–40) (40–50) (50–60) (60–69)
(a)
0
0.05
0.1
0.15
0.2
0.25
0.3P
roba
bili
ty o
f obe
sity
Age categories
InactiveActive
(20–30) (30–40) (40–50) (50–60) (60–69)
(b)
Figure 4: Probabilities of overweight and obesity across age groups for workforce level.
love fast food and their spouses have to follow them. Anincreased consumption of fast foods by young adults hasbeen repeatedly shown to be associated with obesity andexcess weight gain [32]. Although some studies showed thatany association between number of children and weight gainis a result of lifestyle and behaviors associated with familylife rather than being as result of the biological impact ofpregnancy in women [31, 33], it may include physiologicalmechanisms in the women, especially after their pregnancy.Prevention of weight gain among women aged 20–40 yearsmay have a significant public health impact [34] and furtherwork is needed to understand these relationships.
Education. Women with moderate education had higherprobabilities of overweight and obesity than high edu-cated women. Our results are consistent with some studies
[26, 35–38]. Note that the women with moderate educationhad higher probabilities of overweight and obesity thanbasic educated women. The differences in probabilities ofoverweight and obesity between high educated and twoother levels were noticeable. Higher education may provideknowledge or resource influences on weight loss.
Economic Index. Many studies have found an inverse relationbetween socioeconomic level and weight [39–45]. It is notstraightforward matter to compare those results with ours,because of the different study designs, time span, differentregion, and method of analysis. In our study, subjects withhigh level had higher probabilities of overweight and obesitythan the other level. These results are consistent with thefindings of some study in developing country [46]. In Iran,economy, business, social affair, and so forth are controlled
6 Journal of Nutrition and Metabolism
NonsmokerSmoker
0.15
0.2
0.25
0.3
0.35
0.4
Age categories
Pro
babi
lity
of o
verw
eigh
t
(20–30) (30–40) (40–50) (50–60) (60–69)
(a)
0
0.05
0.1
0.15
0.2
0.25
0.3
Pro
babi
lity
of o
besi
ty
Age categories
NonsmokerSmoker
(20–30) (30–40) (40–50) (50–60) (60–69)
(b)
Figure 5: Probabilities of overweight and obesity across age groups for smoking status.
0.2
0.22
0.24
0.26
0.28
0.3
0.32
0.34
0.36
0.38
Pro
babi
lity
of o
verw
eigh
t
NonmarriedMarried
Age categories
(20–30) (30–40) (40–50) (50–60) (60–69)
(a)
NonmarriedMarried
0.05
0.1
0.15
0.2
0.25
0.3P
roba
bili
ty o
f obe
sity
Age categories
(20–30) (30–40) (40–50) (50–60) (60–69)
(b)
Figure 6: Probabilities of overweight and obesity across age groups for marital status.
by some people named Bazarry. These people have usuallylow education. Higher economy may not provide knowledgeor resource influences on weight loss.
Residence. Urban women had higher probabilities of over-weight and obesity than rural women. Among urban women,the probability of overweight initially increased and thenchanges were fairly slow but this decreasing was sharply inrural women aged >60 years. Among women aged 50–60years, the probability of obesity for urban was approximately2 times that for rural.
Workforce. Inactive women had higher probabilities of over-weight and obesity than active women. Our results areconsistent with some studies. For example, Swedish womenwho returned to work soon after pregnancy also retained lessweight than women who stayed at home [47, 48]. Obesitymay be more acceptable among unemployed persons. Itis also possible that there is more discrimination against
the obese, or obese women may end up in lower statusjobs through stronger selective processes in Iran. Anotherexplanation for the effect of the workforce may involveenergy expenditure at work or the structured lifestyle thatactive woman imposes.
Smoking. The increase in body weight by age was found to belower among smokers than among nonsmokers. Biologicalmechanisms as well as psychological factors may be involved.An increase of energy expenditure while smoking, both inresting and in light physical activity conditions, may relate toweight loss in smokers. Our results are consistent with thefindings of most studies [49–53].
Marital Status. Most studies showed that marriage is asso-ciated with weight gain [54, 55]. The finding in this studyshowed that women who were married tended to gain moreweight across the age than those who were not married. Therate of change in probability of overweight in aged <40 years
Journal of Nutrition and Metabolism 7
Table 2: Adjusted∗ odds ratios for the likelihood of being overweight and obese§‡, by sociodemographic and smoking among randomsample of 14176 Iranian women in the proportional odds model, 1999-2000.
Variable OR# 95% CI†
Age group (years)
20–30 1.00
30–40 2.16 1.96–2.35
40–50 2.93 2.67–3.23
50–60 2.96 2.63–3.32
60–69 1.99 1.76–2.25
Education level
Basic 1.00
Moderate 0.90 0.83–0.98
High 0.57 0.47–0.69
Economy index
Low 1.00
Lower-middle 1.37 1.26–1.50
Upper-middle 1.38 1.27–1.51
High 1.49 1.36–1.63
Place of residence
rural 1.00
urban 1.97 1.84–2.11
Workforce
Inactive 1.00
Active 0.57 0.51–0.64
Smoking status
Nonsmoker 1.00
Smoker 0.68 0.54–0.85
Marital status
Non-married 1.00
Married 1.19 1.10–1.29∗
Adjusted for all other variables.§Obese, BMI ≥ 30; overweight BMI 25.0–29.9.‡BMI: body mass index (weight (kg)/height (m)2) .#OR: odds ratio.†CI: confidence interval.
was noticeable. It is possible that the presence of a spousemay operate as a social factor on weight gain.
In Iran, it is commonly believed that overweight andobese people are lazy and gluttonous and they lack self-control. Many obese people do not go out in public becausethe devices are too uncomfortable. For example, they cannotgo to the movies because the seats are too small. Obesepeople are also more likely to lose the benefits of exercise andit may cause further weight gain. They often feel inferior toothers because many people would not to be friends with anobese person. They often get disapproving stares from others.Some people believe that an obese person is taking up morespace than he or she should and a job is often denied becauseof their weights.
Limitations and Strength. Some limitations of this studyshould be noted. Cause-and-effect cannot be inferred fromour cross-sectional data. However, this should be confirmed
by further longitudinal studies. It is a limitation that inthis study marital status could be categorized into legallymarried and nonmarried only. Nonmarried people are alsoa very heterogeneous group and should be more closelyexamined in further studies. Unfortunately, income andphysical activity were not used in our investigation.
Strengths of this study include the national randomsample with a considerable age range and a BMI measure-ment that has been shown to be more valid than self-reportmeasures on body weight and height. Obese people tend tounderreport their BMI whereas thin people do the reverse[56, 57].
5. Conclusions
Increases in response were observed through the 20–60 years;however, all age beyond 60 years result in a decrease inprobabilities of overweight and obesity. Women aged 20–40

8 Journal of Nutrition and Metabolism
years gained weight faster than other groups. They may needadditional information and more support on how to reducetheir risk for weight gain through positive health behaviors.
References
[1] W. B. Kannel, R. B. D’Agostino, and J. L. Cobb, “Effect ofweight on cardiovascular disease,” American Journal of ClinicalNutrition, vol. 63, no. 3, pp. 195–225, 1996.
[2] T. K. Murphy, E. E. Calle, C. Rodriguez, H. S. Kahn, and M. J.Thun, “Body mass index and colon cancer mortality in a largeprospective study,” American Journal of Epidemiology, vol. 152,no. 9, pp. 847–854, 2000.
[3] P. A. Van den Brandt, D. Spiegelman, S. S. Yaun et al., “Pooledanalysis of prospective cohort studies on height, weight, andbreast cancer risk,” American Journal of Epidemiology, vol. 152,no. 6, pp. 514–527, 2000.
[4] H. E. Resnik, P. Valsania, J. B. Halter, and X. Lin, “Relationof weight gain and weight loss on subsequent diabetes risk inoverweight adults,” Journal of Epidemiology and CommunityHealth, vol. 54, no. 8, pp. 596–602, 2000.
[5] M. M. Corrada, C. H. Kawas, F. Mozaffar, and A. Paganini-Hill, “Association of body mass index and weight changewith all-cause mortality in the elderly,” American Journal ofEpidemiology, vol. 163, no. 10, pp. 938–949, 2006.
[6] P. K. E. Magnusson, F. Rasmussen, D. A. Lawlor, P. Tynelius,and D. Gunnell, “Association of body mass index with suicidemortality: a prospective cohort study of more than one millionmen,” American Journal of Epidemiology, vol. 163, no. 1, pp. 1–8, 2006.
[7] K. A. O. Tikkinen, A. Auvinen, H. Huhtala, and T. L. J.Tammela, “Nocturia and obesity: a population-based study inFinland,” American Journal of Epidemiology, vol. 163, no. 11,pp. 1003–1011, 2006.
[8] V. Mishra, F. Arnold, G. Semenov, R. Hong, and A. Mukuria,“Epidemiology of obesity and hypertension and related riskfactors in Uzbekistan,” European Journal of Clinical Nutrition,vol. 60, no. 12, pp. 1355–1366, 2006.
[9] L. H. Mccarthy, M. E. Bigal, M. Katz, C. Derby, and R.B. Lipton, “Chronic pain and obesity in elderly people:results from the einstein aging study,” Journal of the AmericanGeriatrics Society, vol. 57, no. 1, pp. 115–119, 2009.
[10] H. J. Milionis, M. Florentin, and S. Giannopoulos, “Metabolicsyndrome and alzheimer’s disease: a link to a vascularhypothesis?” CNS Spectrums, vol. 13, no. 7, pp. 606–613, 2008.
[11] S. Rossner, “Obesity: the disease of the twenty-first century,”International Journal of Obesity, vol. 26, supplement 4, pp. S2–S4, 2002.
[12] A. H. Mokdad, M. K. Serdula, W. H. Dietz, B. A. Bowman, J. S.Marks, and J. P. Koplan, “The spread of the obesity epidemic inthe United States, 1991–1998,” Journal of the American MedicalAssociation, vol. 282, no. 16, pp. 1519–1522, 1999.
[13] J. S. Seidell and A. M. Rissanen, “Time trends in the world-wide prevalence of obesity,” in Handbook of Obesity, G. A. Bray,Bouchard, and W. P. T. James, Eds., pp. 79–91, Marcel Dekker,New York, NY, USA, 1998.
[14] World Health Organisation, “Obesity: preventing and man-aging the global epidemic,” Report of a WHO Consultationon Obesity, World Health Organisation, Geneva, Switzerland,1998.
[15] K. Kuulasmaa, H. Tunstall-Pedoe, A. Dobson et al., “Estima-tion of contribution of changes in classic risk factors to trendsin coronary-event rates across the WHO MONICA project
populations,” The Lancet, vol. 355, no. 9205, pp. 675–687,2000.
[16] C. L. Ogden, M. D. Carroll, L. R. Curtin, M. A. McDowell, C. J.Tabak, and K. M. Flegal, “Prevalence of overweight and obesityin the United States, 1999–2004,” Journal of the AmericanMedical Association, vol. 295, no. 13, pp. 1549–1555, 2006.
[17] C. L. Birmingham, J. L. Muller, A. Palepu, J. J. Spinelli, and A.H. Anis, “The cost of obesity in Canada,” Canadian MedicalAssociation Journal, vol. 160, no. 4, pp. 483–488, 1999.
[18] J. C. Seidell, “Obesity in Europe: scaling an epidemic,” Interna-tional Journal of Obesity and Related Metabolic Disorders, vol.19, pp. 1–4, 1995.
[19] J. C. Seidell, “Obesity, insulin resistance and diabetes—aworldwide epidemic,” British Journal of Nutrition, vol. 83,supplement 1, pp. S5–S8, 2000.
[20] http://www.who.int/gho/ncd/risk factors/overweight/en/in-dex.html.
[21] http://www.who.int/mediacentre/factsheets/fs311/en/index.html.
[22] M. de Onis, M. Blossner, and E. Borghi, “Global prevalenceand trends of overweight and obesity among preschoolchildren,” The American Journal of Clinical Nutrition, vol. 92,no. 5, pp. 1257–1264, 2010.
[23] K. M. Flegal, M. D. Carroll, R. J. Kuczmarski, and C.L. Johnson, “Overweight and obesity in the United States:prevalence and trends, 1960–1994,” International Journal ofObesity, vol. 22, no. 1, pp. 39–47, 1998.
[24] C. E. Lewis, D. R. Jacobs, H. McCreath et al., “Weightgain continues in the 1990s: 10 year trends in weight andoverweight from the CARDIA study,” American Journal ofEpidemiology, vol. 151, no. 12, pp. 1172–1181, 2000.
[25] A. Bagust, B. L. Roberts, A. R. Haycox, and S. Barrow,“The additional cost of obesity to the health service and thepotential for resource savings from effective interventions,”European Journal of Public Health, vol. 9, no. 4, pp. 258–264,1999.
[26] J. Klumbiene, J. Petkeviciene, V. Helasoja, R. Prattala, andA. Kasmel, “Sociodemographic and health behaviour factorsassociated with obesity in adult populations in Estonia,Finland and Lithuania,” European Journal of Public Health, vol.14, no. 4, pp. 390–394, 2004.
[27] J. Sobal and A. J. Stunkard, “Socioeconomic status and obesity:a review of the literature,” Psychological Bulletin, vol. 105, no.2, pp. 260–275, 1989.
[28] The INCLEN Multicentre Collaborative Group, “Socio-economic status and risk factors for cardiovascular disease:a multicentre collaborative study in the international clinicalepidemiology network (INCLEN),” Journal of Clinical Epi-demiology, vol. 47, no. 12, pp. 1401–1409, 1994.
[29] M. Nube, W. K. Asenso-Okyere, and G. J. M. van denBoom, “Body mass index as indicator of standard of living indeveloping countries,” European Journal of Clinical Nutrition,vol. 52, no. 2, pp. 136–144, 1998.
[30] T. Wilsgaard, B. K. Jacobsen, and E. Arnesen, “Determin-ing lifestyle correlates of body mass index using multilevelanalyses: the Tromso study, 1979–2001,” American Journal ofEpidemiology, vol. 162, no. 12, pp. 1179–1188, 2005.
[31] E. Bakhshi, M. R. Eshraghian, K. Mohammad et al., “Thepositive association between number of children and obesityin Iranian women and men: results from the national healthsurvey,” BMC Public Health, vol. 8, article 213, 2008.
[32] S. A. French, M. Story, and R. W. Jeffery, “Environmentalinfluences on eating and physical activity,” Annual Review ofPublic Health, vol. 22, pp. 309–335, 2001.

Journal of Nutrition and Metabolism 9
[33] R. Hardy, D. A. Lawlor, S. Black, M. E. J. Wadsworth, andD. Kuh, “Number of children and coronary heart disease riskfactors in men and women from a British birth cohort,” BJOG:An International Journal of Obstetrics and Gynaecology, vol.114, no. 6, pp. 721–730, 2007.
[34] M. L. Klem, J. E. Viteri, and R. R. Wing, “Primary preventionof weight gain for women aged 25–34: the acceptability oftreatment formats,” International Journal of Obesity, vol. 24,no. 2, pp. 219–225, 2000.
[35] S. Sarlio-Lahteenkorva and E. Lahelma, “The association ofbody mass index with social and economic disadvantage inwomen and men,” International Journal of Epidemiology, vol.28, no. 3, pp. 445–449, 1999.
[36] D. Laurier, M. Guiguet, N. P. Chau, J. A. Wells, and A.J. Valleron, “Prevalence of obesity: a comparative surveyin France, the United Kingdom and the United States,”International Journal of Obesity, vol. 16, no. 8, pp. 565–572,1992.
[37] A. Molarius, J. C. Seidell, S. Sans, J. Tuomilehto, and K.E. Kuulasmaa, “Educational level, relative body weight, andchanges in their association over 10 years: an internationalperspective from the WHO MONICA project,” AmericanJournal of Public Health, vol. 90, no. 8, pp. 1260–1268, 2000.
[38] S. P. Wamala, A. Wolk, and K. Orth-Gomer, “Determinantsof obesity in relation to socioeconomic status among middle-aged Swedish women,” Preventive Medicine, vol. 26, no. 5, pp.734–744, 1997.
[39] S. J. Paxton, A. Sculthorpe, and K. Gibbons, “Weight-lossstrategies and beliefs in high and low socioeconomic areas ofMelbourne,” Australian Journal of Public Health, vol. 18, no. 4,pp. 412–417, 1994.
[40] M. G. Stephenson, A. S. Levy, N. L. Sass, and W. E. McGarvey,“1985 NHIS findings: nutrition knowledge and baseline datafor the weight-loss objectives,” Public Health Reports, vol. 102,no. 1, pp. 61–67, 1987.
[41] S. A. French and R. W. Jeffery, “Consequences of dieting to loseweight:effects on physical activity and mental health,” HealthPsychology, vol. 13, pp. 195–212, 1994.
[42] M. K. Serdula, M. E. Collins, D. F. Williamson, R. F. Anda,E. Pamuk, and T. E. Byers, “Weight control practices of U.S.adolescents and adults,” Annals of Internal Medicine, vol. 119,no. 7, pp. 667–671, 1993.
[43] L. Biener and A. Heaton, “Women dieters of normal weight:their motives, goals, and risks,” American Journal of PublicHealth, vol. 85, no. 5, pp. 714–717, 1995.
[44] S. A. French and R. W. Jeffery, “Current dieting, weight losshistory, and weight suppression: behavioral correlates of threedimensions of dieting,” Addictive Behaviors, vol. 22, no. 1, pp.31–44, 1997.
[45] R. W. Jeffery, S. A. French, J. L. Forster, and V. M. Spry,“Socioeconomic status differences in health behaviors relatedto obesity: the healthy worker project,” International Journal ofObesity, vol. 15, no. 10, pp. 689–696, 1991.
[46] P. Griffiths and M. Bentley, “Women of higher socio-economicstatus are more likely to be overweight in Karnataka, India,”European Journal of Clinical Nutrition, vol. 59, no. 10, pp.1217–1220, 2005.
[47] A. Ohlin and S. Rossner, “Development of body weight duringand after pregnancy,” in Proceedings of the Obesity in Europe88: The First European Congress on Obesity, P. Bjortorp and S.Rossner, Eds., pp. 115–120, John Libbey, London, UK, 1989.
[48] A. Ohlin and S. Rossner, “Trends in eating patterns, physicalactivity and sociodemodemographic factors in relation to
postpartum body weight development,” British Journal ofNutrition, vol. 71, pp. 457–570, 1990.
[49] R. W. Jeffery, J. L. Forster, A. R. Folsom, R. V. Luepker, D. R.Jacobs Jr., and H. Blackburn, “The relationship between socialstatus and body mass index in the Minnesota heart healthprogram,” International Journal of Obesity, vol. 13, no. 1, pp.59–67, 1989.
[50] T. Kawada, “Difference of body mass index stratified by theperiod of smoking cessation from a cross-sectional study,”Archives of Medical Research, vol. 35, no. 2, pp. 181–184, 2004.
[51] M. Laaksonen, O. Rahkonen, and R. Prattala, “Smoking statusand relative weight by educational level in Finland, 1978–1995,” Preventive Medicine, vol. 27, no. 3, pp. 431–437, 1998.
[52] E. Rasky, W. J. Stronegger, and W. Freidl, “The relationshipbetween body weight and patterns of smoking in women andmen,” International Journal of Epidemiology, vol. 25, no. 6, pp.1208–1212, 1996.
[53] A. Molarius, J. C. Seidell, S. Sans, J. Tuomilehto, and K. Kuu-lasmaa, “Smoking and relative body weight: an internationalperspective from the WHO MONICA project,” Journal ofEpidemiology and Community Health, vol. 51, no. 3, pp. 252–260, 1997.
[54] R. W. Jeffery and A. M. Rick, “Cross-sectional and longitudinalassociations between body mass index and marriage-relatedfactors,” Obesity Research, vol. 10, no. 8, pp. 809–815, 2002.
[55] J. Sobal, B. Rauschenbach, and E. A. Frongillo, “Marital statuschanges and body weight changes: a US longitudinal analysis,”Social Science and Medicine, vol. 56, no. 7, pp. 1543–1555,2003.
[56] G. Bostrom and F. Diderichsen, “Socioeconomic differences inmisclassification of height, weight and body mass index basedon questionnaire data,” International Journal of Epidemiology,vol. 26, pp. 860–866, 1997.
[57] A. Kuskowska-Wolk, R. Bergstrom, and G. Bostrom, “Rela-tionship between questionnaire data and medical records ofheight, weight and body mass index,” International Journal ofObesity, vol. 16, no. 1, pp. 1–9, 1992.
Copyright © 2022 FDOKUMEN