CHANGE DETECTION OF MANGROVE FOREST COVER IN THE CITY OF PUERTO PRINCESA, PALAWAN BETWEEN 2003 AND...
6
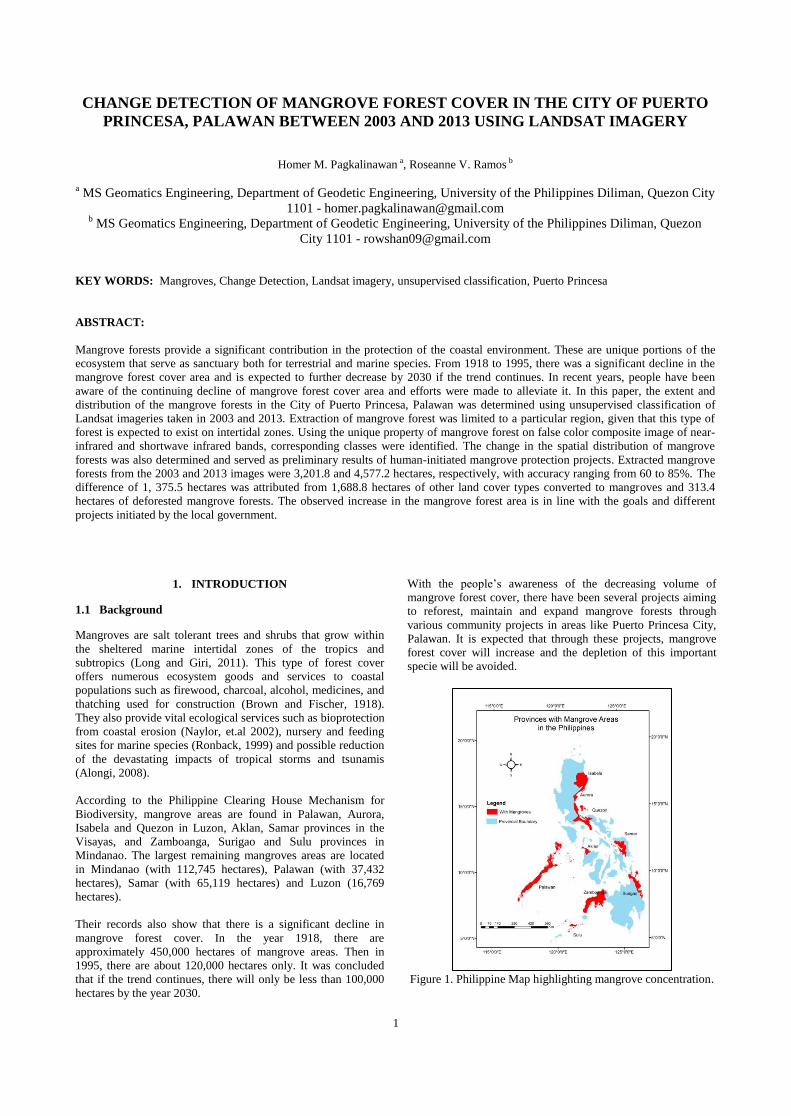
1 CHANGE DETECTION OF MANGROVE FOREST COVER IN THE CITY OF PUERTO PRINCESA, PALAWAN BETWEEN 2003 AND 2013 USING LANDSAT IMAGERY Homer M. Pagkalinawan a , Roseanne V. Ramos b a MS Geomatics Engineering, Department of Geodetic Engineering, University of the Philippines Diliman, Quezon City 1101 - [email protected] b MS Geomatics Engineering, Department of Geodetic Engineering, University of the Philippines Diliman, Quezon City 1101 - [email protected] KEY WORDS: Mangroves, Change Detection, Landsat imagery, unsupervised classification, Puerto Princesa ABSTRACT: Mangrove forests provide a significant contribution in the protection of the coastal environment. These are unique portions of the ecosystem that serve as sanctuary both for terrestrial and marine species. From 1918 to 1995, there was a significant decline in the mangrove forest cover area and is expected to further decrease by 2030 if the trend continues. In recent years, people have been aware of the continuing decline of mangrove forest cover area and efforts were made to alleviate it. In this paper, the extent and distribution of the mangrove forests in the City of Puerto Princesa, Palawan was determined using unsupervised classification of Landsat imageries taken in 2003 and 2013. Extraction of mangrove forest was limited to a particular region, given that this type of forest is expected to exist on intertidal zones. Using the unique property of mangrove forest on false color composite image of near- infrared and shortwave infrared bands, corresponding classes were identified. The change in the spatial distribution of mangrove forests was also determined and served as preliminary results of human-initiated mangrove protection projects. Extracted mangrove forests from the 2003 and 2013 images were 3,201.8 and 4,577.2 hectares, respectively, with accuracy ranging from 60 to 85%. The difference of 1, 375.5 hectares was attributed from 1,688.8 hectares of other land cover types converted to mangroves and 313.4 hectares of deforested mangrove forests. The observed increase in the mangrove forest area is in line with the goals and different projects initiated by the local government. 1. INTRODUCTION 1.1 Background Mangroves are salt tolerant trees and shrubs that grow within the sheltered marine intertidal zones of the tropics and subtropics (Long and Giri, 2011). This type of forest cover offers numerous ecosystem goods and services to coastal populations such as firewood, charcoal, alcohol, medicines, and thatching used for construction (Brown and Fischer, 1918). They also provide vital ecological services such as bioprotection from coastal erosion (Naylor, et.al 2002), nursery and feeding sites for marine species (Ronback, 1999) and possible reduction of the devastating impacts of tropical storms and tsunamis (Alongi, 2008). According to the Philippine Clearing House Mechanism for Biodiversity, mangrove areas are found in Palawan, Aurora, Isabela and Quezon in Luzon, Aklan, Samar provinces in the Visayas, and Zamboanga, Surigao and Sulu provinces in Mindanao. The largest remaining mangroves areas are located in Mindanao (with 112,745 hectares), Palawan (with 37,432 hectares), Samar (with 65,119 hectares) and Luzon (16,769 hectares). Their records also show that there is a significant decline in mangrove forest cover. In the year 1918, there are approximately 450,000 hectares of mangrove areas. Then in 1995, there are about 120,000 hectares only. It was concluded that if the trend continues, there will only be less than 100,000 hectares by the year 2030. With the people’s awareness of the decreasing volume of mangrove forest cover, there have been several projects aiming to reforest, maintain and expand mangrove forests through various community projects in areas like Puerto Princesa City, Palawan. It is expected that through these projects, mangrove forest cover will increase and the depletion of this important specie will be avoided. Figure 1. Philippine Map highlighting mangrove concentration.
-
Upload
up-diliman -
Category
Documents
-
view
1 -
download
0
Transcript of CHANGE DETECTION OF MANGROVE FOREST COVER IN THE CITY OF PUERTO PRINCESA, PALAWAN BETWEEN 2003 AND...
1
CHANGE DETECTION OF MANGROVE FOREST COVER IN THE CITY OF PUERTO
PRINCESA, PALAWAN BETWEEN 2003 AND 2013 USING LANDSAT IMAGERY
Homer M. Pagkalinawan a, Roseanne V. Ramos b
a MS Geomatics Engineering, Department of Geodetic Engineering, University of the Philippines Diliman, Quezon City
1101 - [email protected] b MS Geomatics Engineering, Department of Geodetic Engineering, University of the Philippines Diliman, Quezon
City 1101 - [email protected]
KEY WORDS: Mangroves, Change Detection, Landsat imagery, unsupervised classification, Puerto Princesa
ABSTRACT:
Mangrove forests provide a significant contribution in the protection of the coastal environment. These are unique portions of the
ecosystem that serve as sanctuary both for terrestrial and marine species. From 1918 to 1995, there was a significant decline in the
mangrove forest cover area and is expected to further decrease by 2030 if the trend continues. In recent years, people have been
aware of the continuing decline of mangrove forest cover area and efforts were made to alleviate it. In this paper, the extent and
distribution of the mangrove forests in the City of Puerto Princesa, Palawan was determined using unsupervised classification of
Landsat imageries taken in 2003 and 2013. Extraction of mangrove forest was limited to a particular region, given that this type of
forest is expected to exist on intertidal zones. Using the unique property of mangrove forest on false color composite image of near-
infrared and shortwave infrared bands, corresponding classes were identified. The change in the spatial distribution of mangrove
forests was also determined and served as preliminary results of human-initiated mangrove protection projects. Extracted mangrove
forests from the 2003 and 2013 images were 3,201.8 and 4,577.2 hectares, respectively, with accuracy ranging from 60 to 85%. The
difference of 1, 375.5 hectares was attributed from 1,688.8 hectares of other land cover types converted to mangroves and 313.4
hectares of deforested mangrove forests. The observed increase in the mangrove forest area is in line with the goals and different
projects initiated by the local government.
1. INTRODUCTION
1.1 Background
Mangroves are salt tolerant trees and shrubs that grow within
the sheltered marine intertidal zones of the tropics and
subtropics (Long and Giri, 2011). This type of forest cover
offers numerous ecosystem goods and services to coastal
populations such as firewood, charcoal, alcohol, medicines, and
thatching used for construction (Brown and Fischer, 1918).
They also provide vital ecological services such as bioprotection
from coastal erosion (Naylor, et.al 2002), nursery and feeding
sites for marine species (Ronback, 1999) and possible reduction
of the devastating impacts of tropical storms and tsunamis
(Alongi, 2008).
According to the Philippine Clearing House Mechanism for
Biodiversity, mangrove areas are found in Palawan, Aurora,
Isabela and Quezon in Luzon, Aklan, Samar provinces in the
Visayas, and Zamboanga, Surigao and Sulu provinces in
Mindanao. The largest remaining mangroves areas are located
in Mindanao (with 112,745 hectares), Palawan (with 37,432
hectares), Samar (with 65,119 hectares) and Luzon (16,769
hectares).
Their records also show that there is a significant decline in
mangrove forest cover. In the year 1918, there are
approximately 450,000 hectares of mangrove areas. Then in
1995, there are about 120,000 hectares only. It was concluded
that if the trend continues, there will only be less than 100,000
hectares by the year 2030.
With the people’s awareness of the decreasing volume of
mangrove forest cover, there have been several projects aiming
to reforest, maintain and expand mangrove forests through
various community projects in areas like Puerto Princesa City,
Palawan. It is expected that through these projects, mangrove
forest cover will increase and the depletion of this important
specie will be avoided.
Figure 1. Philippine Map highlighting mangrove concentration.

2
Figure 2. Total Area of Mangroves from 1918(estimated)
to 2030 (projected).
1.2 Land Cover Classification
In order to quantify the changes in this type of land cover,
various studies were conducted to provide current, reliable and
accurate information on its areal extent through geographic
information system (GIS) and remote sensing (RS) applications.
From the 2011 study by Long and Giri entitled “Mapping the
Philippines’ Mangrove Forests Using Landsat Imagery”, an
unsupervised classification technique was implemented to
extract mangrove forest cover from Landsat images. The
classification technique used is the Iterative Self-Organizing
Data Analysis Techniques (ISODATA), which requires user to
choose the initial estimates of class means. Each pixel is
assigned to classes with a similar mean, and the process of
assigning pixels to a class is repeated until reaching the
maximum number of iterations set by the user. The result of the
study is a three-class land cover classification (mangrove,
terrestrial non-mangrove, and water) from merged clusters with
spectral similarities based on ISODATA.
1.3 Objectives
In this research project, we aim to quantify the areal extent and
to be able to map the distribution of mangrove forests. We also
intend to detect the change in the spatial distribution of the
mangroves through temporal analysis of satellite images
acquired on the years 2003 and 2013. Knowing the extent of the
temporal change in mangrove forest cover will help identify
critical areas for its proliferation.
2. METHODOLOGY
2.1 Study Area
The scope of the project is the City of Puerto Princesa in
Palawan (Figure 3). Mangrove forests can be found in almost all
shorelines in the province. In the latest publication of the
Palawan Council for Sustainable Development (PCSD) State of
the Environment Report, it indicated that from out of the
province’s total land area of 1.485 million hectares, about
58,400 hectares of that is covered by mangroves and is
considered the highest in the country.
Figure 3. Landsat 8 Satellite Image of City of Puerto Princesa.
The local government is one of the frontier in promoting the
protection and increase of mangrove forests with community-
based plantation and livelihood projects since 2002.
2.2 Data
Publicly available satellite images taken by the Landsat Data
Continuity Mission were downloaded through the USGS Global
Visualization Viewer website and served as our primary source
of data for information extraction and analysis. One image
scene covers the entire study area. For the 2003 image, a scene
captured on March 12, 2003, with 4.85% cloud cover, by the
Landsat 7 sensor was downloaded. For the 2013 image, a scene
captured on June 3, 2013, with 11.34% cloud cover, by the
Landsat 8 sensor was also downloaded.
Vector data of mangrove areas were obtained for the
comparison and accuracy assessment of the classification
results. Shapefiles of the mangrove forests in Palawan acquired
on 2000 and 2010 were provided by the Fauna and Flora
International Philippines and the Forest Management Bureau,
respectively.
2.3 Methodology
The acquired satellite images were processed in order to extract
mangrove forest areas and other land cover types. The process
involved conversion to radiance and reflectance (pre-
processing), unsupervised classification and assigning of land
cover type to each classes. Results of classification were then
assessed for their accuracy. Based on the results, maps were
created showing the location of the mangrove forests for each
year as well as the change in the extent of mangrove forest
cover area between the two periods.
0
100,000
200,000
300,000
400,000
500,000
1918 1995 2030
Mangrove Areas in the Philippines (in ha)
3
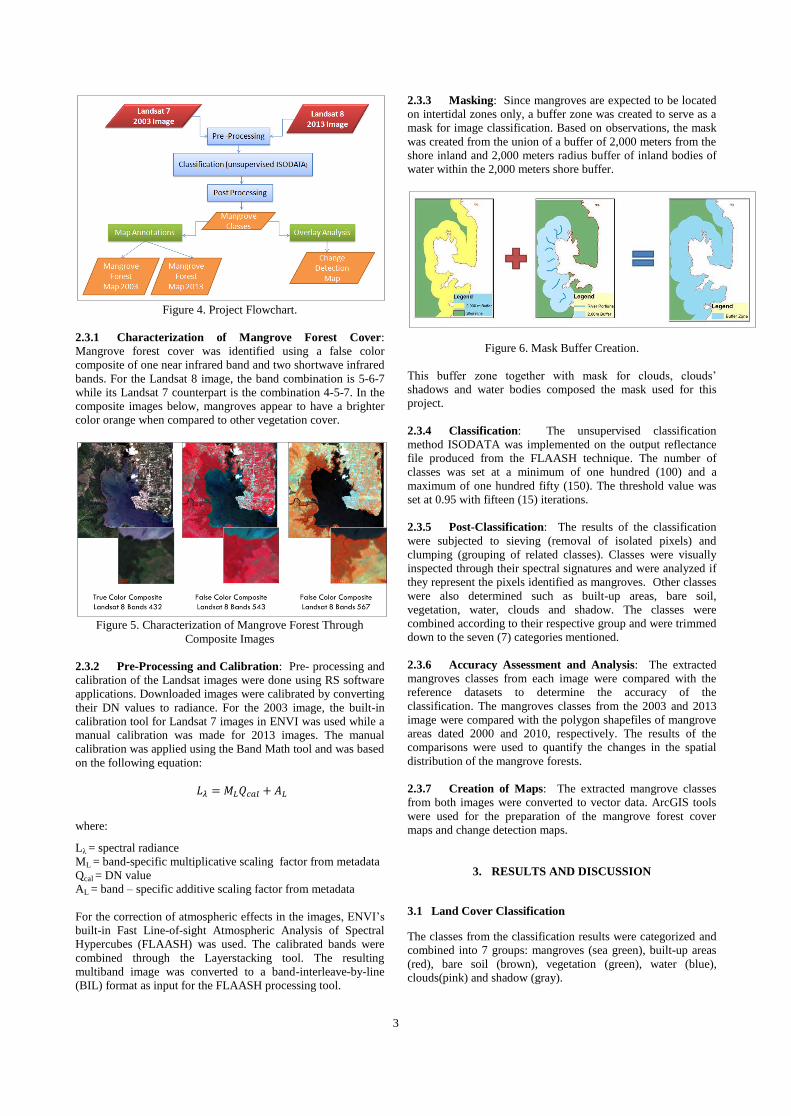
Figure 4. Project Flowchart.
2.3.1 Characterization of Mangrove Forest Cover:
Mangrove forest cover was identified using a false color
composite of one near infrared band and two shortwave infrared
bands. For the Landsat 8 image, the band combination is 5-6-7
while its Landsat 7 counterpart is the combination 4-5-7. In the
composite images below, mangroves appear to have a brighter
color orange when compared to other vegetation cover.
Figure 5. Characterization of Mangrove Forest Through
Composite Images
2.3.2 Pre-Processing and Calibration: Pre- processing and
calibration of the Landsat images were done using RS software
applications. Downloaded images were calibrated by converting
their DN values to radiance. For the 2003 image, the built-in
calibration tool for Landsat 7 images in ENVI was used while a
manual calibration was made for 2013 images. The manual
calibration was applied using the Band Math tool and was based
on the following equation:
where:
Lλ = spectral radiance
ML = band-specific multiplicative scaling factor from metadata
Qcal = DN value
AL = band – specific additive scaling factor from metadata
For the correction of atmospheric effects in the images, ENVI’s
built-in Fast Line-of-sight Atmospheric Analysis of Spectral
Hypercubes (FLAASH) was used. The calibrated bands were
combined through the Layerstacking tool. The resulting
multiband image was converted to a band-interleave-by-line
(BIL) format as input for the FLAASH processing tool.
2.3.3 Masking: Since mangroves are expected to be located
on intertidal zones only, a buffer zone was created to serve as a
mask for image classification. Based on observations, the mask
was created from the union of a buffer of 2,000 meters from the
shore inland and 2,000 meters radius buffer of inland bodies of
water within the 2,000 meters shore buffer.
Figure 6. Mask Buffer Creation.
This buffer zone together with mask for clouds, clouds’
shadows and water bodies composed the mask used for this
project.
2.3.4 Classification: The unsupervised classification
method ISODATA was implemented on the output reflectance
file produced from the FLAASH technique. The number of
classes was set at a minimum of one hundred (100) and a
maximum of one hundred fifty (150). The threshold value was
set at 0.95 with fifteen (15) iterations.
2.3.5 Post-Classification: The results of the classification
were subjected to sieving (removal of isolated pixels) and
clumping (grouping of related classes). Classes were visually
inspected through their spectral signatures and were analyzed if
they represent the pixels identified as mangroves. Other classes
were also determined such as built-up areas, bare soil,
vegetation, water, clouds and shadow. The classes were
combined according to their respective group and were trimmed
down to the seven (7) categories mentioned.
2.3.6 Accuracy Assessment and Analysis: The extracted
mangroves classes from each image were compared with the
reference datasets to determine the accuracy of the
classification. The mangroves classes from the 2003 and 2013
image were compared with the polygon shapefiles of mangrove
areas dated 2000 and 2010, respectively. The results of the
comparisons were used to quantify the changes in the spatial
distribution of the mangrove forests.
2.3.7 Creation of Maps: The extracted mangrove classes
from both images were converted to vector data. ArcGIS tools
were used for the preparation of the mangrove forest cover
maps and change detection maps.
3. RESULTS AND DISCUSSION
3.1 Land Cover Classification
The classes from the classification results were categorized and
combined into 7 groups: mangroves (sea green), built-up areas
(red), bare soil (brown), vegetation (green), water (blue),
clouds(pink) and shadow (gray).

4
Figure 7. Subset of the Classification Image (limited to City of
Puerto Princesa).
Figure 8. A zoom window of the classification image showing
the different land cover classification.
Figure 9. Zoom windows showing the different land cover
classification - mangroves (sea green), built-up areas (red), bare
soil (brown), vegetation (green), water (blue), clouds(pink) and
shadow (gray).
3.2 Accuracy Assessment
A confusion matrix for each classification was generated to
quantify the accuracy of the results. The reference datasets were
converted to regions of interests (ROIs) in ENVI to compute the
following matrices for the 2003 image (Table 1) and 2013
image (Table 2).
Table 1. Classification Confusion Matrix for the 2003 Image.
Table 2. Classification Confusion Matrix for the 2013 Image.
Overall accuracy yielded for the 2003 image was 75. 29 %
while the 2013 image has 65.72% overall accuracy. Kappa
coefficients for the two images were 0.3625 and 39.76,
respectively. For the mangrove land cover, the 2003 image
obtained 62.5% in producer’s accuracy and 78.95% in user’s
accuracy. For the 2013 image, user’s and producer’s accuracy
for mangroves are 65.87% and 81.3%.
Table 3. Overall Accuracy and Kappa Coefficient
Statistic 2003 Image 2013 Image
Overall
Accuracy (%) 75.29 65.72
Kappa
Coefficient 0.3625 0.3976
Table 4. Classification Accuracy for the 2003 Image
Class
Producer's
Accuracy (%)
User's
Accuracy (%)
mangroves 62.5 78.95
built-up 42.91 3.5
soil 22.96 46.1
vegetation 85.19 89.8
water 22.53 3.4
Table 5. Classification Accuracy for the 2013 Image
Class
Producer's
Accuracy (%)
User's
Accuracy (%)
mangroves 65.87 81.3
built-up 49.83 25.02
soil 27.04 55.82
vegetation 82.58 77.23
water 27.91 14.93
3.3 Creation of Maps
Using the formatting tools and by adding annotations, the
following mangrove forest cover map were created. The
mangroves built-up bare soil vegetation water Total
unclassified 448 2 86 857 0 1,393
mangroves 30,267 4 2,147 5,693 224 38,335
built-up 497 2,776 24,764 50,988 385 79,410
bare soil 31 2,101 20,689 21,838 218 44,877
vegetation 12,165 1,417 41,023 485,841 590 541,036
water 5,021 170 1,399 5,114 412 12,116
Total 48,429 6,470 90,108 570,331 1,829 717,167
Cla
ssif
ied
Map
(2003)
Confusion MatrixReference Data (2000)
mangroves built-up bare soil vegetation water Total
unclassified 2677 829 4153 11383 260 19,302
mangroves 38251 129 1980 6039 653 47,052
built-up 2422 16101 25103 20225 489 64,340
bare soil 2379 5308 36774 19928 1493 65,882
vegetation 9049 9684 66384 293338 1384 379,839
water 3293 263 1588 4301 1657 11,102
Total 58,071 32,314 135,982 355,214 5,936 587,517C
lass
ifie
d M
ap
(20
13
)
Confusion MatrixReference Data (2010)

5
following land cover were combined into one class representing
terrestrial non-mangroves area – built-up areas, bare soil,
vegetation, water.
Figure 10. 2003 Mangrove Forest Cover Map
Figure 11. 2013 Mangrove Forest Cover Map
3.4 Change Detection
From 2003 to 2013, 1,688.8 hectares was converted to
mangrove forest while 313.4 hectares was deforested, according
to the classification results. Thus, it resulted to a net increase of
1,374.5 hectares in mangroves forest area. However, it worth
noting that 612.9 hectares of 2013 mangroves forests were
covered with clouds and its shadows on the 2003 image.
Likewise, 45 hectares of 2003 mangrove forest were covered by
clouds and shadows on the 2013 image. Refer to Table 6 for the
breakdown of change detection.
Table 6. Other Land Cover (2003) Converted to Mangroves
Land Cover Area (ha)
Built-Up 55.2
Bare Soil 7.6
Non-Mangrove
Vegetation 740.4
Water 263.8
Clouds &
Shadows 621.9
TOTAL 1,688.8
Table 7. Mangrove Conversion to Other Land Cover
Land Cover Area (ha)
Built-Up 12.8
Bare Soil 14.8
Non-Mangrove
Vegetation 119.0
Water 58.7
Clouds &
Shadows 108.1
TOTAL 313.4
Below are the two maps showing areas of conversion to
mangroves and deforestation of mangrove areas.
Figure 12. Reforested Forest Cover Map
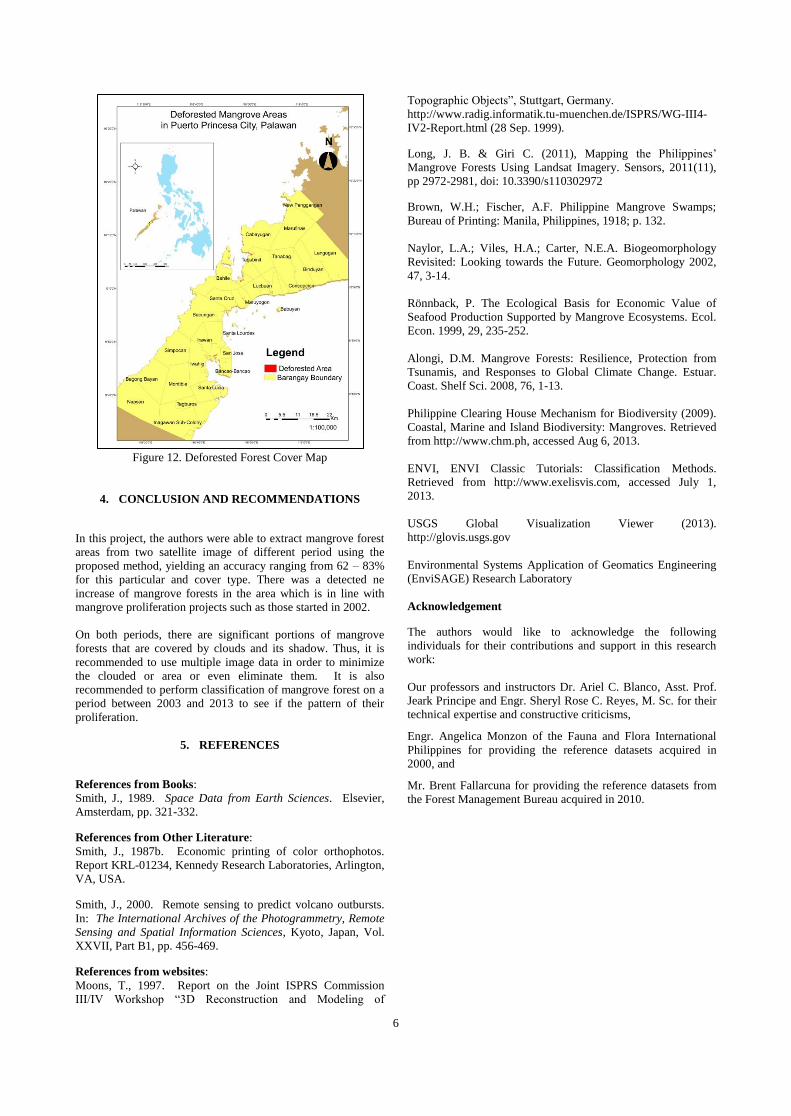
6
Figure 12. Deforested Forest Cover Map
4. CONCLUSION AND RECOMMENDATIONS
In this project, the authors were able to extract mangrove forest
areas from two satellite image of different period using the
proposed method, yielding an accuracy ranging from 62 – 83%
for this particular and cover type. There was a detected ne
increase of mangrove forests in the area which is in line with
mangrove proliferation projects such as those started in 2002.
On both periods, there are significant portions of mangrove
forests that are covered by clouds and its shadow. Thus, it is
recommended to use multiple image data in order to minimize
the clouded or area or even eliminate them. It is also
recommended to perform classification of mangrove forest on a
period between 2003 and 2013 to see if the pattern of their
proliferation.
5. REFERENCES
References from Books:
Smith, J., 1989. Space Data from Earth Sciences. Elsevier,
Amsterdam, pp. 321-332.
References from Other Literature:
Smith, J., 1987b. Economic printing of color orthophotos.
Report KRL-01234, Kennedy Research Laboratories, Arlington,
VA, USA.
Smith, J., 2000. Remote sensing to predict volcano outbursts.
In: The International Archives of the Photogrammetry, Remote
Sensing and Spatial Information Sciences, Kyoto, Japan, Vol.
XXVII, Part B1, pp. 456-469.
References from websites:
Moons, T., 1997. Report on the Joint ISPRS Commission
III/IV Workshop “3D Reconstruction and Modeling of
Topographic Objects”, Stuttgart, Germany.
http://www.radig.informatik.tu-muenchen.de/ISPRS/WG-III4-
IV2-Report.html (28 Sep. 1999).
Long, J. B. & Giri C. (2011), Mapping the Philippines’
Mangrove Forests Using Landsat Imagery. Sensors, 2011(11),
pp 2972-2981, doi: 10.3390/s110302972
Brown, W.H.; Fischer, A.F. Philippine Mangrove Swamps;
Bureau of Printing: Manila, Philippines, 1918; p. 132.
Naylor, L.A.; Viles, H.A.; Carter, N.E.A. Biogeomorphology
Revisited: Looking towards the Future. Geomorphology 2002,
47, 3-14.
Rönnback, P. The Ecological Basis for Economic Value of
Seafood Production Supported by Mangrove Ecosystems. Ecol.
Econ. 1999, 29, 235-252.
Alongi, D.M. Mangrove Forests: Resilience, Protection from
Tsunamis, and Responses to Global Climate Change. Estuar.
Coast. Shelf Sci. 2008, 76, 1-13.
Philippine Clearing House Mechanism for Biodiversity (2009).
Coastal, Marine and Island Biodiversity: Mangroves. Retrieved
from http://www.chm.ph, accessed Aug 6, 2013.
ENVI, ENVI Classic Tutorials: Classification Methods.
Retrieved from http://www.exelisvis.com, accessed July 1,
2013.
USGS Global Visualization Viewer (2013).
http://glovis.usgs.gov
Environmental Systems Application of Geomatics Engineering
(EnviSAGE) Research Laboratory
Acknowledgement
The authors would like to acknowledge the following
individuals for their contributions and support in this research
work:
Our professors and instructors Dr. Ariel C. Blanco, Asst. Prof.
Jeark Principe and Engr. Sheryl Rose C. Reyes, M. Sc. for their
technical expertise and constructive criticisms,
Engr. Angelica Monzon of the Fauna and Flora International
Philippines for providing the reference datasets acquired in
2000, and
Mr. Brent Fallarcuna for providing the reference datasets from
the Forest Management Bureau acquired in 2010.