Chamber QoE - A Multi-instrumental Apporach to Explore Affective Aspects in relation to Quality of...
14
Chamber QoE – A Multi-instrumental Approach to Explore Affective Aspects in relation to Quality of Experience Katrien De Moor* a1 , Filippo Mazza b , Isabelle Hupont c , Miguel Ríos Quintero d , Toni Mäki e , Martín Varela e a Dept. of Telematics, NTNU, Trondheim, Norway; b IRCCyN-IVC, Ecole Centrale de Nantes, Nantes, France; c Instituto Tecnológico de Aragón, Zaragoza, Spain; d Assessment of IP-based Applications, TUBerlin, Berlin, Germany; e VTT Technical Research Institute, Converging Networks Laboratory, Oulu, Finland *[email protected]; phone +47735 92783; fax +47 73 59 69 73; www.item.ntnu.no ABSTRACT Evaluating (audio)visual quality and Quality of Experience (QoE) from the user’s perspective, has become a key element in optimizing users’ experiences and their quality. Traditionally, the focus lies on how multi-level quality features are perceived by a human user. The interest has however gradually expanded towards human cognitive, affective and behavioral processes that may impact on, be an element of, or be influenced by QoE, and which have been under- investigated so far. In addition, there is a major discrepancy between the new, broadly supported and more holistic conceptualization of QoE proposed by Le Callet et al. (2012) and traditional, standardized QoE assessment. This paper explores ways to tackle this discrepancy by means of a multi-instrumental approach. More concretely, it presents results from a lab study on video quality (N=27), aimed at going beyond the dominant QoE assessment paradigm and at exploring affective aspects in relation to QoE and in relation to perceived overall quality. Four types of data were collected: ‘traditional’ QoE self-report measures were complemented with ‘alternative’, emotional state- and user engagement-related self-report measures to evaluate QoE. In addition, we collected EEG (physiological) data, gaze- tracking data and facial expressions (behavioral) data. The video samples used in test were longer in duration than is common in standard tests allowing us to study e.g. more realistic experience and deeper user engagement. Our findings support the claim that the traditional QoE measures need to be reconsidered and extended with additional, affective state- related measures. Keywords: Quality of Experience, (audio)visual quality, emotional state, user engagement, EEG, eyetracking, facial expressions 1. INTRODUCTION Evaluating (audio)visual quality and Quality of Experience (QoE) from the user’s perspective, has become a key element in optimizing users’ experiences and their quality. Traditionally, the focus lies on how multi-level quality features are perceived by a human user. In this context, quantitative psycho-perceptual evaluation methods are commonly used. The interest has however gradually expanded towards human cognitive, affective and behavioral processes that may impact on, be an element of, or be influenced by QoE and which have been under-investigated so far. In 2012, a new, broadly supported definition of QoE was introduced [1], defining QoE as an emotional state, i.e., ‘the degree of delight or annoyance of the user of an application or service. It results from the fulfillment of his or her expectations with respect to the utility and / or enjoyment of the application or service in the light of the user's personality and current state'. QoE may be influenced by factors at the human, system and context level [1]. As will be discussed in more detail in Section 2, there is however a major discrepancy between this holistic conceptualization and 1 This work was carried out during the tenure of an ERCIM "Alain Bensoussan" Fellowship Programme (Katrien De Moor). The research leading to these results has received funding from the European Union Seventh Framework Programme (FP7/2007-2013) under grant agreement n° 246016.
Transcript of Chamber QoE - A Multi-instrumental Apporach to Explore Affective Aspects in relation to Quality of...
Chamber QoE – A Multi-instrumental Approach to Explore Affective Aspects in relation to Quality of Experience
Katrien De Moor*a1, Filippo Mazzab, Isabelle Hupontc, Miguel Ríos Quinterod,
Toni Mäkie, Martín Varelae aDept. of Telematics, NTNU, Trondheim, Norway; bIRCCyN-IVC, Ecole Centrale de Nantes, Nantes, France; cInstituto Tecnológico de Aragón, Zaragoza, Spain; dAssessment of IP-based
Applications, TUBerlin, Berlin, Germany; eVTT Technical Research Institute, Converging Networks Laboratory, Oulu, Finland
*[email protected]; phone +47735 92783; fax +47 73 59 69 73; www.item.ntnu.no
ABSTRACT
Evaluating (audio)visual quality and Quality of Experience (QoE) from the user’s perspective, has become a key element in optimizing users’ experiences and their quality. Traditionally, the focus lies on how multi-level quality features are perceived by a human user. The interest has however gradually expanded towards human cognitive, affective and behavioral processes that may impact on, be an element of, or be influenced by QoE, and which have been under-investigated so far. In addition, there is a major discrepancy between the new, broadly supported and more holistic conceptualization of QoE proposed by Le Callet et al. (2012) and traditional, standardized QoE assessment. This paper explores ways to tackle this discrepancy by means of a multi-instrumental approach. More concretely, it presents results from a lab study on video quality (N=27), aimed at going beyond the dominant QoE assessment paradigm and at exploring affective aspects in relation to QoE and in relation to perceived overall quality. Four types of data were collected: ‘traditional’ QoE self-report measures were complemented with ‘alternative’, emotional state- and user engagement-related self-report measures to evaluate QoE. In addition, we collected EEG (physiological) data, gaze-tracking data and facial expressions (behavioral) data. The video samples used in test were longer in duration than is common in standard tests allowing us to study e.g. more realistic experience and deeper user engagement. Our findings support the claim that the traditional QoE measures need to be reconsidered and extended with additional, affective state-related measures. Keywords: Quality of Experience, (audio)visual quality, emotional state, user engagement, EEG, eyetracking, facial expressions
1. INTRODUCTION
Evaluating (audio)visual quality and Quality of Experience (QoE) from the user’s perspective, has become a key element in optimizing users’ experiences and their quality. Traditionally, the focus lies on how multi-level quality features are perceived by a human user. In this context, quantitative psycho-perceptual evaluation methods are commonly used. The interest has however gradually expanded towards human cognitive, affective and behavioral processes that may impact on, be an element of, or be influenced by QoE and which have been under-investigated so far.
In 2012, a new, broadly supported definition of QoE was introduced [1], defining QoE as an emotional state, i.e., ‘the degree of delight or annoyance of the user of an application or service. It results from the fulfillment of his or her expectations with respect to the utility and / or enjoyment of the application or service in the light of the user's personality and current state'. QoE may be influenced by factors at the human, system and context level [1]. As will be discussed in more detail in Section 2, there is however a major discrepancy between this holistic conceptualization and
1This work was carried out during the tenure of an ERCIM "Alain Bensoussan" Fellowship Programme (Katrien De Moor). The research leading to these results has received funding from the European Union Seventh Framework Programme (FP7/2007-2013) under grant agreement n° 246016.
traditional, standardized QoE assessment: influencing factors are insufficiently taken into account and QoE is not evaluated in terms of experienced affect.
In this paper, we present results from a follow-up lab study [2] on video QoE (N=27) in an IPTV context, aimed at going beyond the dominant QoE assessment paradigm and at further exploring the relation between perceived overall quality and experienced affect. We therefore complement the use of ‘traditional’ QoE self-report measures with ‘alternative’, emotional state- and user engagement-related self-report measures and explore how they relate to each other. In addition, we collected EEG (physiological) data by means of a consumer-grade EEG device, gaze-tracking data and facial expressions (behavioral) data. Also the assessed content differs from the ‘traditional’ video samples in their length and narrative respecting arrangement: three 5-minute excerpts from an action movie were used as test content. Packet loss-based errors were inserted (with slicing errors as produced error type, see Section 3.2) and their impact on QoE is investigated. In this paper, the focus is primarily on the self-report data. As a complement, we also take a brief look at the initial findings from one of the other data sources and reflect on methodological challenges related to research on QoE and affect based on our ‘lessons learned’.
This remainder of this paper is organized as follows: the next section discusses a number of dynamics that contextualize the study, briefly discusses a number of implications of the new, more holistic definition of QoE and gives a brief overview of relevant related work on video QoE. Thereupon, Section 3 introduces the methodological setup of the study presented in this paper. The results are presented in Section 4. Finally, Section 5 discusses the findings and concludes the paper. In addition, we point to a number of limitations of the study and reflect on a number of interesting directions for future research.
2. CONTEXT AND RELATED WORK
2.1 Quality of Experience and implications of its new definition
Over the last years, the young and multidisciplinary field of QoE has been characterized by a number of important dynamics that are challenging the related research community while at the same time pushing the ongoing evolution towards a more mature research field. Some of these dynamics need to be briefly considered, as they constitute the context of the study presented in this paper. As mentioned in the introduction, a new definition of QoE [1] was proposed in 2011 in the context of COST IC1003 Qualinet, a European network of excellence on QoE. Not only does this definition represent a shift away from the rather vague concept of ‘overall acceptability’ as measure of QoE (the dominant ITU definition of QoE [3]), it also opens up the field to an important extent by pointing explicitly to the possible influence of factors situated at the human level (e.g., motivation, mood, previous experiences, …), factors linked to the system (e.g., network-related, content-related, …) and its characteristics and factors related to context (social setting, price, temporal context, …). The conceptual understanding of QoE as reflected in this new, broadly supported definition, has important implications at different levels. It implies a plea for going beyond the predominantly instrumental and utilitarian perspective: Quality of Experience is no longer only about satisfying expectations related to the utility of a service or application. It is also – and more importantly – about how users feel, about how experiences with technology involve and move people emotionally [4]. This is reflected in the emphasis on desired outcomes of ‘delight’ and ‘enjoyment’ (and thus, the fulfillment of not only instrumental but also hedonic needs) and on avoiding annoyance and negative feelings. As a result, it could be argued that the field of QoE comes closer to other, related concepts such as User Experience (UX). To some extent this is the case, but as argued by Wechsung and De Moor [5], the field of QoE is still much more technology-driven than the field of UX. An important difference has to do with the emphasis on ‘experience’: although the concept QoE implies that it is dealing with the quality of human experiences related to the active or passive use of an application or service, its focus is traditionally on how technical (e.g., performance-related) quality features are perceived. This focus is also deeply embedded in the dominant quality assessment approaches to measure and evaluate QoE. This seamlessly shifts the focus to a second crucial implication for research on QoE: as this new definition has important consequences at the conceptual level, the dominant approaches for empirically investigating QoE, also need to be critically re-assessed. As argued by De Moor, Ríos Quintero et al. [2], there is an important discrepancy between the theoretical concepts embedded in the definition of QoE and the actual research practices: the measures that are traditionally used for evaluating QoE, do not provide accurate insight into delight or annoyance, nor do they allow to measure enjoyment and related expectations. Moreover, very few studies so far have focused on personality traits and
current states (e.g., more enduring affective states such as moods) in relation to QoE (see e.g., [6]) and if they do, they color outside the lines of the rigid recommendations and standardized approaches that stipulate how QoE should be evaluated and investigated. Considering the wide range of influence factors that potentially have a very big impact on QoE and that are to date under-investigated, it has increasingly been argued that alternative, more affect-related measures of QoE need to be further explored and that the traditional methods and approaches need to be extended [2, 7]. As a result, increasing attention in QoE research has gone out to the exploration of alternative, affective state-related measures and tools in QoE research, based on self-reports [2, 8], using physiological [7, 9] as well as behavioral measures and tools [10]. In particular, there has been a growing interest in emotions, as one type of affective states [11]. An additional complexity lies in the fact that emotional states can be elements of QoE, as well as factors that influence QoE and the related perceptual processes. Thirdly, they may also be influenced by a certain experience and its quality. Emotions play an important role in how people perceive and approach the world around them and react to external stimuli [12]. In the field of QoE, a deeper understanding of how emotions and other affective states modify and interfere with the perceptual process, but also of how emotions can be measured, modeled, taken into account, is badly needed. Although research on emotions in relation to QoE is relatively new, the scientific literature on emotions and human affect is far from new. It goes beyond the scope of this paper to give an extensive overview of the different definitions and models of emotions that have been proposed so far, but the literature on emotions and human affect is overwhelmingly extensive [11, 13, 14]. In terms of measurement, emotions have mainly been assessed directly through questionnaires and psychological interviews [15], or indirectly through electrophysiology and other techniques that exploit the reflection of emotions on some physiological parameters – such as hearth rate or brain activity – that can be monitored and collected through autonomic and physiological measures. Evidence of this have been found both multiple times and many different types of measurement have been proposed [16]. While using self-assessment through questionnaires can be simpler and more direct, this strategy opens to different problems and possible subjective and introspection-related biases [17, 18]. Recognizing, naming and describing emotions is not an easy task, especially when emotions are strong or intimate and different interpretations can possible. For this reason, in our study, self-reports were complemented with additional and more ‘objective’ measures.
2.2 QoE in the context of video and IPTV
As our study investigates QoE in the context of video and IPTV, we briefly point to a number of related works and relevant concepts. Several methods have been developed and are widely used to assess audiovisual quality as perceived by users. The most prominent method is to use single stimulus tests with ratings on a 5-point Absolute Category Rating scale (ACR, commonly referred to as MOS-scale, Mean Opinion Score). This type of tests are usually organized in lab environments with standardized conditions [19, 20]. Moreover, the length of the video content is commonly limited from 10 to 15 seconds in order to maximize the amount of conditions a test subject can evaluate and minimize fatigue, which has been shown to produce unreliable results. Despite the high degree of reliability that can be obtained for these subjective tests, these methods tend to be time- and resource consuming, and their viability in ecologically valid contexts is questionable. In order to circumvent their limitations, subjective audio-visual assessment methods have been complemented with instrumental (objective) methods. The combination of these methods made possible the development of models able to estimate user-perceived audio-visual quality [21, 22]. However in the case of IPTV services the content is an important factor in the users’ evaluation of the experience that is not taken in consideration by the standardized laboratory tests. An initial attempt to understand if there is a relation between the content and how the user perceives quality was carried out in the study by Fröhlich et al [23]. This study tried to understand whether the perception of the quality of the user changes depending of the duration of the stimuli. In this test, the subjects had to evaluate perceived quality of video sequences with durations ranging from 10 seconds to 4 minutes long. All the videos were rated using the standard 5-points ACR scale. The presented videos were processed using 3 different video quality profiles where the modified factor was the encoding quality. The results obtained show that longer sequences were slightly better rated than the short sequences typically used in standard quality tests. For accurately assessing QoE in a more realistic fashion, it is also more appropriate to know how quality is perceived in the relevant real-life context, and how relevant quality is for the user at a given moment in time, or for an accumulated number of service usage episodes [24]. Here, it is important to know the value of the overall service quality perceived by the user during real-life usage. However, models that map perceived quality directly to an estimation of a user-specific value or acceptance are not available from the literature to date. The problem in creating such a model lies in the complexity of the interaction between several contextual (and many times unknown and not knowable) factors. To study
the interaction between all contextual factors involved in a close to realistic setup, Staelens et al. [25] performed a test where a set of DVDs with three short degraded sections within the movie were distributed to 56 subjects. In this test, the subjects were not aware of the impairments in the videos. After watching the DVDs the test subjects answered a questionnaire. Additionally, the test subjects were interviewed one day after the screening. The obtained results indicate that as long as the continuity of the sequence was not entirely affected, the videos were acceptable to certain extent. A similar conclusion was made in [23] highlighting the importance of the content (and its fluency) in the process of evaluating perceived quality and acceptability beyond laboratory conditions. Similarly, in [2] the importance of the content and the video flow experience during watching is also underlined. This study took place in a living room-lab environment in order to get closer to more realistic viewing conditions. As in [25], the test subjects were not informed that there would be impairments in the video sequences. Moreover, in order to enable a deeper user engagement, the test content was also significantly longer than is the case in standard video quality assessment. Ten minute movie excerpts with similar temporal and spatial complexity and with similar error profiles as those used in the study presented in this paper, were evaluated by means of traditional and alternative self-report measures. The clips without errors were perceived as ‘best’, not only in terms of perceived quality, but also in terms of self-reported pleasure and enjoyment (which were highest). Moreover, the findings indicated that the absence of errors and higher engagement seem to go hand in hand and that the ‘likeability’ of the content and interest in the content are important factors in relation to engagement. The error profile containing low, but continuous errors, was perceived as ‘worst’: perceived quality was worse, annoyance was higher, enjoyment, attention and involvement were significantly lower. Further, this study indicated that although overall perceived quality seemed to be a good indicator of the degree of annoyance, it was only very weakly correlated to the reported enjoyment and engagement, implying that alternative measures beyond MOS need to be considered in order to measure QoE in terms of ‘delight’. As mentioned above, the study presented here is a follow-up of the study presented in [2]. In the next section, we discuss the methodological setup of the study.
3. METHODOLOGY
3.1 Test procedure
The test content consisted of three 5-minute movie excerpts with different error profiles (see 3.4) and the test procedure was as follows: In the introduction (part 1), the participant was welcomed and given a set of instructions by the test leader. After filling in a short pre-test questionnaire, the EEG headset was fitted on the participant’s head and electrode signals were checked. The questionnaire included the Pick-a-Mood (PAM) scale [26] and questions to collect contextual information about the participant’s TV viewing behavior and basic socio-demographical profile.
Part 2 consisted of four viewing sessions, all preceded by a standard calibration of the participant’s gaze. During the first viewing session, a neutral relaxation video of approximately two minutes was shown to the participant. Next, the three 5-minute video clips (the actual test content) were shown one by one and after every test clip, the participant filled a during-test questionnaire (see 3.3).
During part 3, the participant filled in a short post-test questionnaire, which contained the PAM-scale [26] once again, as well as two questions to explore the possible influence of previous experiences/memories on the experienced affect. The possible influence of the test setup was also briefly evaluated. Next, the EEG headset was removed and every participant received two cinema tickets as compensation. The test duration was around 55-60 minutes total. Figure 1 gives a schematic overview of the test instrumentation.
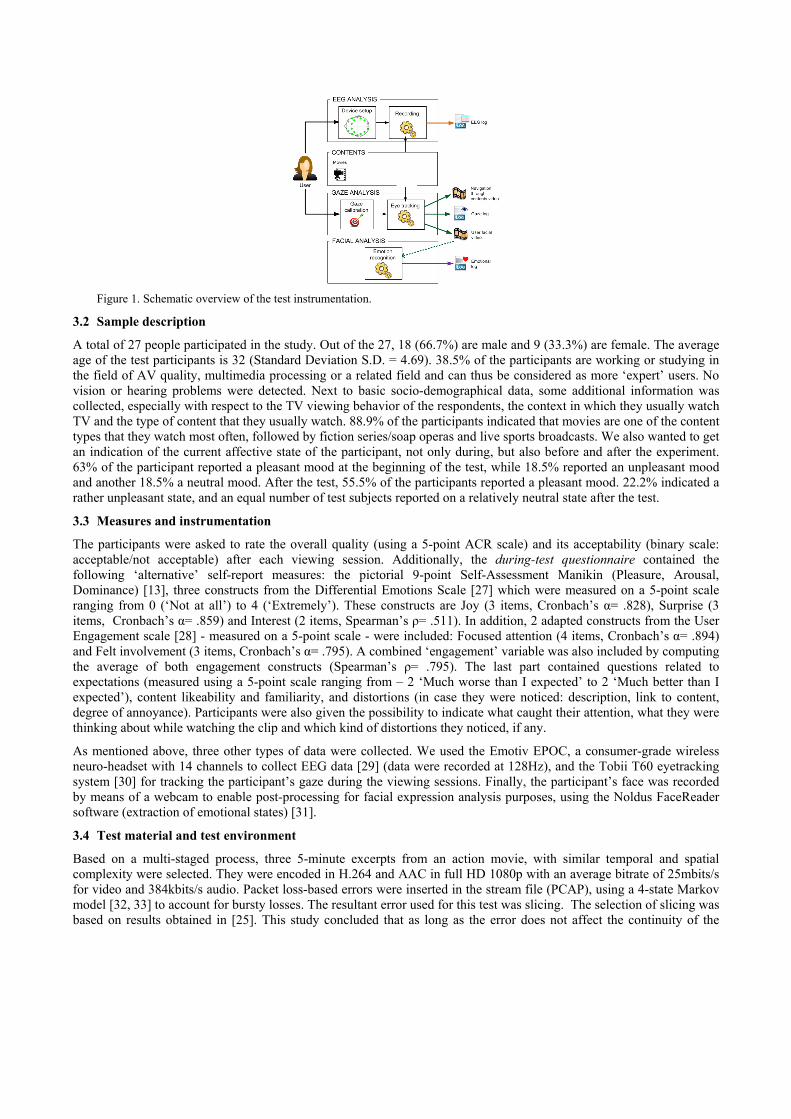
Figure 1. Schematic overview of the test instrumentation.
3.2 Sample description
A total of 27 people participated in the study. Out of the 27, 18 (66.7%) are male and 9 (33.3%) are female. The average age of the test participants is 32 (Standard Deviation S.D. = 4.69). 38.5% of the participants are working or studying in the field of AV quality, multimedia processing or a related field and can thus be considered as more ‘expert’ users. No vision or hearing problems were detected. Next to basic socio-demographical data, some additional information was collected, especially with respect to the TV viewing behavior of the respondents, the context in which they usually watch TV and the type of content that they usually watch. 88.9% of the participants indicated that movies are one of the content types that they watch most often, followed by fiction series/soap operas and live sports broadcasts. We also wanted to get an indication of the current affective state of the participant, not only during, but also before and after the experiment. 63% of the participant reported a pleasant mood at the beginning of the test, while 18.5% reported an unpleasant mood and another 18.5% a neutral mood. After the test, 55.5% of the participants reported a pleasant mood. 22.2% indicated a rather unpleasant state, and an equal number of test subjects reported on a relatively neutral state after the test.
3.3 Measures and instrumentation
The participants were asked to rate the overall quality (using a 5-point ACR scale) and its acceptability (binary scale: acceptable/not acceptable) after each viewing session. Additionally, the during-test questionnaire contained the following ‘alternative’ self-report measures: the pictorial 9-point Self-Assessment Manikin (Pleasure, Arousal, Dominance) [13], three constructs from the Differential Emotions Scale [27] which were measured on a 5-point scale ranging from 0 (‘Not at all’) to 4 (‘Extremely’). These constructs are Joy (3 items, Cronbach’s α= .828), Surprise (3 items, Cronbach’s α= .859) and Interest (2 items, Spearman’s ρ= .511). In addition, 2 adapted constructs from the User Engagement scale [28] - measured on a 5-point scale - were included: Focused attention (4 items, Cronbach’s α= .894) and Felt involvement (3 items, Cronbach’s α= .795). A combined ‘engagement’ variable was also included by computing the average of both engagement constructs (Spearman’s ρ= .795). The last part contained questions related to expectations (measured using a 5-point scale ranging from – 2 ‘Much worse than I expected’ to 2 ‘Much better than I expected’), content likeability and familiarity, and distortions (in case they were noticed: description, link to content, degree of annoyance). Participants were also given the possibility to indicate what caught their attention, what they were thinking about while watching the clip and which kind of distortions they noticed, if any.
As mentioned above, three other types of data were collected. We used the Emotiv EPOC, a consumer-grade wireless neuro-headset with 14 channels to collect EEG data [29] (data were recorded at 128Hz), and the Tobii T60 eyetracking system [30] for tracking the participant’s gaze during the viewing sessions. Finally, the participant’s face was recorded by means of a webcam to enable post-processing for facial expression analysis purposes, using the Noldus FaceReader software (extraction of emotional states) [31].
3.4 Test material and test environment
Based on a multi-staged process, three 5-minute excerpts from an action movie, with similar temporal and spatial complexity were selected. They were encoded in H.264 and AAC in full HD 1080p with an average bitrate of 25mbits/s for video and 384kbits/s audio. Packet loss-based errors were inserted in the stream file (PCAP), using a 4-state Markov model [32, 33] to account for bursty losses. The resultant error used for this test was slicing. The selection of slicing was based on results obtained in [25]. This study concluded that as long as the error does not affect the continuity of the
scene, as is the case when there are freezing errors, the users tend to rate the sequence as acceptable. Audio and video were multiplexed. The error profiles (see Table 1) were randomized across the sequences and the narrative structure was respected when presenting the sequences. Contents where displayed on the 17” Tobii T60 TFT monitor, with a 1280x1024 resolution. The aspect ratio of the sequences was not modified to fit the SXGA resolution of the monitor. The tests took place at the VTT Multimedia Lab, where the user was isolated. Room luminosity was between 21-25 Lux from the back of the screen and sound was reproduced in desktop speakers set to approximately 60 dB.
Table 1: error profiles
Error profile Average packet loss rate
Resulting error type Error frequency
No errors 0% - - Constant error 0,125% slicing Constant visual error between minute 2 and 5 Strong Intermittent error 0,25% slicing Every 2 minutes with 1 minute duration
4. RESULTS
4.1 Traditional measures
We first of all take a look at the findings for the ‘traditional’ self-report measures that were included. As can be observed from Table 2, the overall quality ratings for the clips without errors are – as expected – higher than the ratings for the clips containing constant or strong intermittent errors.
Table 2. Descriptive statistics (averages, standard deviations and median) of subjective measures, per error profile
Error Profile No errors Constant error Strong intermittent
error
M S.D. Mdn M S.D. Mdn M S.D. Mdn Overall quality 4.22 0.64 4.00 2.48 0.97 2.00 2.88 0.76 3.00 Pleasure 5.96 1.31 6.00 4.81 1.46 5.00 4.84 1.22 5.00 Arousal 3.92 1.68 3.00 4.37 1.71 4.00 4.42 1.30 4.00 Dominance 5.59 1.64 6.00 5.07 1.81 5.00 5.30 1.40 5.00 Joy 1.30 0.85 1.33 1.12 0.83 1.00 1.24 0.60 1.16 Surprise 0.71 0.67 0.66 0.66 0.59 0.66 0.76 0.76 0.83 Interest 2.14 0.81 2.00 1.92 0.80 2.00 2.11 0.79 2.00 Focused attention 2.78 0.85 2.75 2.37 0.93 2.25 2.55 0.83 2.50 Felt involvement 3.23 0.73 3.00 2.86 0.87 3.00 2.89 0.71 2.83 Engagement 3.01 0.75 3.00 2.62 0.86 2.45 2.72 0.74 2.52 Expectations 0.74 0.85 1.00 -0.70 0.86 -1.00 -0.68 0.80 -1.00 Annoyance slicing 3.20 1.48 3.00 3.81 1.14 4.00 4.00 0.86 4.00 Content likeability 2.62 1.04 3.00 2.51 1.08 2.00 2.64 0.86 3.00
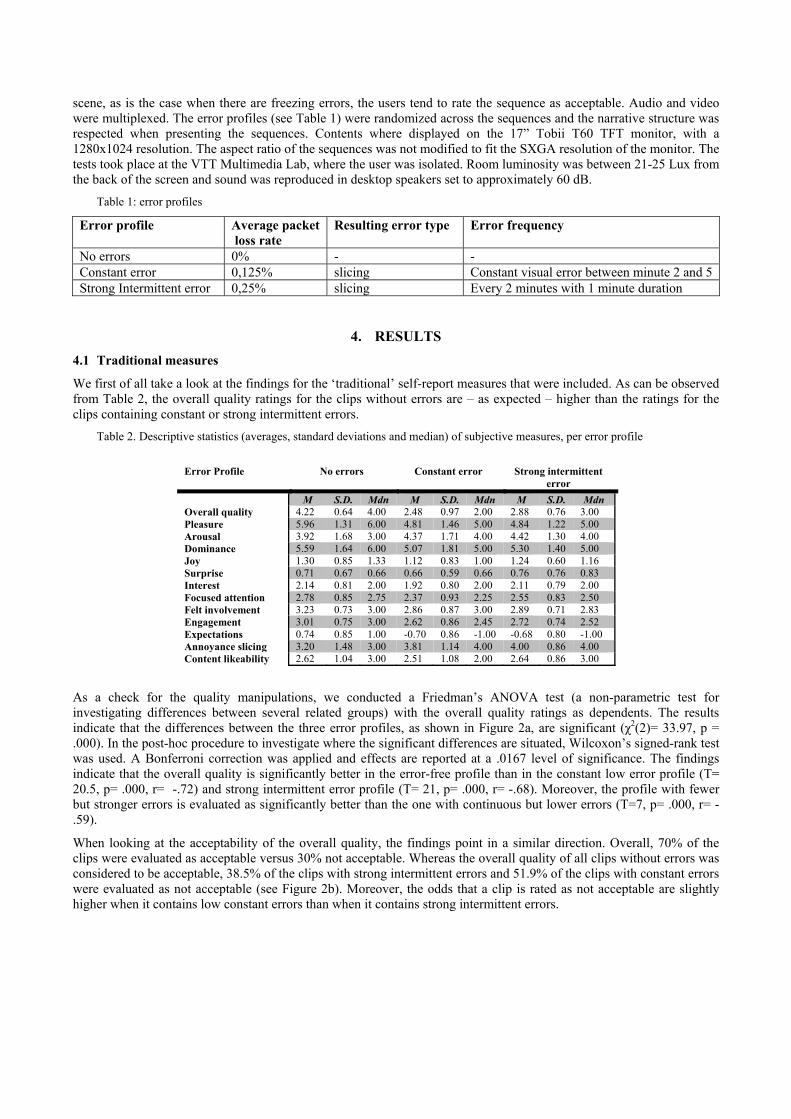
As a check for the quality manipulations, we conducted a Friedman’s ANOVA test (a non-parametric test for investigating differences between several related groups) with the overall quality ratings as dependents. The results indicate that the differences between the three error profiles, as shown in Figure 2a, are significant (χ2(2)= 33.97, p = .000). In the post-hoc procedure to investigate where the significant differences are situated, Wilcoxon’s signed-rank test was used. A Bonferroni correction was applied and effects are reported at a .0167 level of significance. The findings indicate that the overall quality is significantly better in the error-free profile than in the constant low error profile (T= 20.5, p= .000, r= -.72) and strong intermittent error profile (T= 21, p= .000, r= -.68). Moreover, the profile with fewer but stronger errors is evaluated as significantly better than the one with continuous but lower errors (T=7, p= .000, r= -.59).
When looking at the acceptability of the overall quality, the findings point in a similar direction. Overall, 70% of the clips were evaluated as acceptable versus 30% not acceptable. Whereas the overall quality of all clips without errors was considered to be acceptable, 38.5% of the clips with strong intermittent errors and 51.9% of the clips with constant errors were evaluated as not acceptable (see Figure 2b). Moreover, the odds that a clip is rated as not acceptable are slightly higher when it contains low constant errors than when it contains strong intermittent errors.
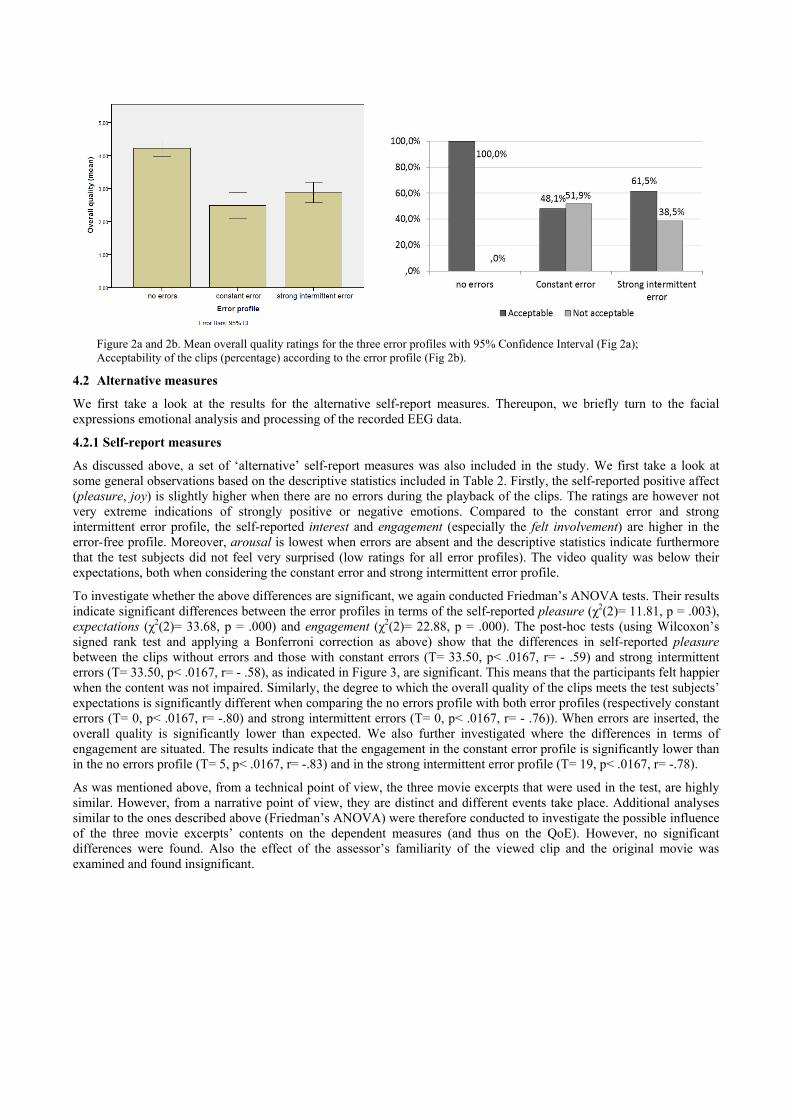
Figure 2a and 2b. Mean overall quality ratings for the three error profiles with 95% Confidence Interval (Fig 2a); Acceptability of the clips (percentage) according to the error profile (Fig 2b).
4.2 Alternative measures
We first take a look at the results for the alternative self-report measures. Thereupon, we briefly turn to the facial expressions emotional analysis and processing of the recorded EEG data.
4.2.1 Self-report measures
As discussed above, a set of ‘alternative’ self-report measures was also included in the study. We first take a look at some general observations based on the descriptive statistics included in Table 2. Firstly, the self-reported positive affect (pleasure, joy) is slightly higher when there are no errors during the playback of the clips. The ratings are however not very extreme indications of strongly positive or negative emotions. Compared to the constant error and strong intermittent error profile, the self-reported interest and engagement (especially the felt involvement) are higher in the error-free profile. Moreover, arousal is lowest when errors are absent and the descriptive statistics indicate furthermore that the test subjects did not feel very surprised (low ratings for all error profiles). The video quality was below their expectations, both when considering the constant error and strong intermittent error profile.
To investigate whether the above differences are significant, we again conducted Friedman’s ANOVA tests. Their results indicate significant differences between the error profiles in terms of the self-reported pleasure (χ2(2)= 11.81, p = .003), expectations (χ2(2)= 33.68, p = .000) and engagement (χ2(2)= 22.88, p = .000). The post-hoc tests (using Wilcoxon’s signed rank test and applying a Bonferroni correction as above) show that the differences in self-reported pleasure between the clips without errors and those with constant errors (T= 33.50, p< .0167, r= - .59) and strong intermittent errors (T= 33.50, p< .0167, r= - .58), as indicated in Figure 3, are significant. This means that the participants felt happier when the content was not impaired. Similarly, the degree to which the overall quality of the clips meets the test subjects’ expectations is significantly different when comparing the no errors profile with both error profiles (respectively constant errors (T= 0, p< .0167, r= -.80) and strong intermittent errors (T= 0, p< .0167, r= - .76)). When errors are inserted, the overall quality is significantly lower than expected. We also further investigated where the differences in terms of engagement are situated. The results indicate that the engagement in the constant error profile is significantly lower than in the no errors profile (T= 5, p< .0167, r= -.83) and in the strong intermittent error profile (T= 19, p< .0167, r= -.78).
As was mentioned above, from a technical point of view, the three movie excerpts that were used in the test, are highly similar. However, from a narrative point of view, they are distinct and different events take place. Additional analyses similar to the ones described above (Friedman’s ANOVA) were therefore conducted to investigate the possible influence of the three movie excerpts’ contents on the dependent measures (and thus on the QoE). However, no significant differences were found. Also the effect of the assessor’s familiarity of the viewed clip and the original movie was examined and found insignificant.
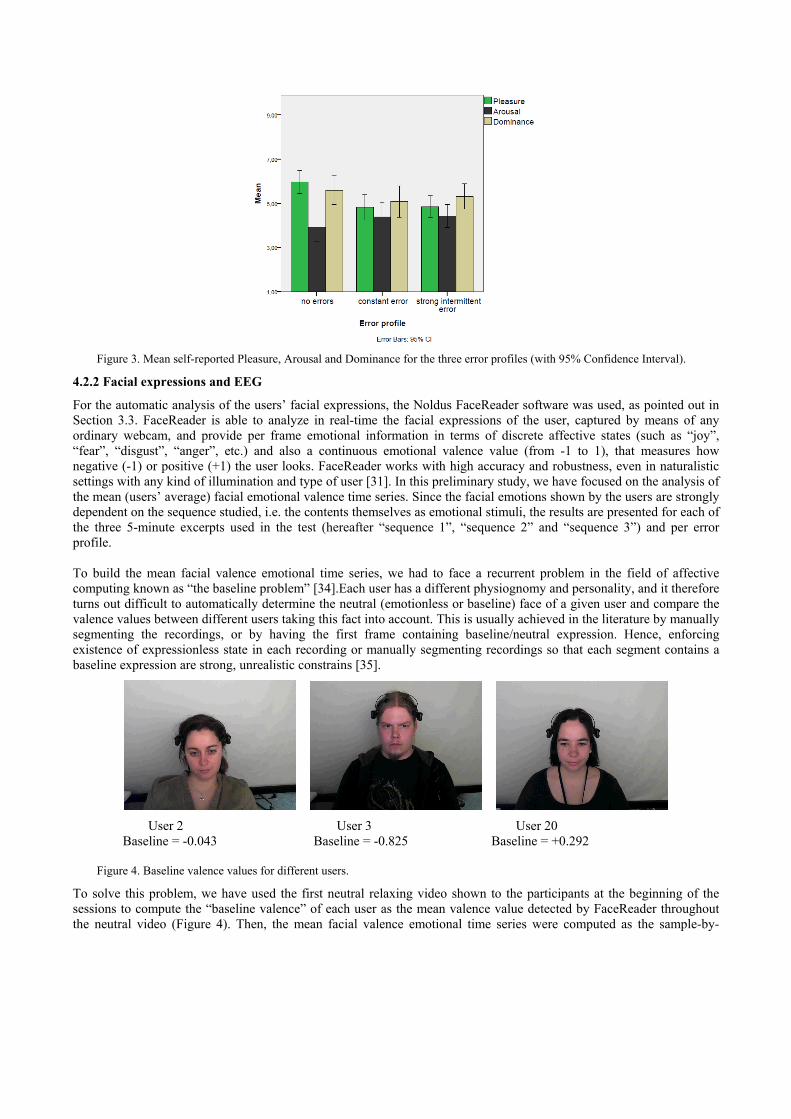
Figure 3. Mean self-reported Pleasure, Arousal and Dominance for the three error profiles (with 95% Confidence Interval).
4.2.2 Facial expressions and EEG
For the automatic analysis of the users’ facial expressions, the Noldus FaceReader software was used, as pointed out in Section 3.3. FaceReader is able to analyze in real-time the facial expressions of the user, captured by means of any ordinary webcam, and provide per frame emotional information in terms of discrete affective states (such as “joy”, “fear”, “disgust”, “anger”, etc.) and also a continuous emotional valence value (from -1 to 1), that measures how negative (-1) or positive (+1) the user looks. FaceReader works with high accuracy and robustness, even in naturalistic settings with any kind of illumination and type of user [31]. In this preliminary study, we have focused on the analysis of the mean (users’ average) facial emotional valence time series. Since the facial emotions shown by the users are strongly dependent on the sequence studied, i.e. the contents themselves as emotional stimuli, the results are presented for each of the three 5-minute excerpts used in the test (hereafter “sequence 1”, “sequence 2” and “sequence 3”) and per error profile. To build the mean facial valence emotional time series, we had to face a recurrent problem in the field of affective computing known as “the baseline problem” [34].Each user has a different physiognomy and personality, and it therefore turns out difficult to automatically determine the neutral (emotionless or baseline) face of a given user and compare the valence values between different users taking this fact into account. This is usually achieved in the literature by manually segmenting the recordings, or by having the first frame containing baseline/neutral expression. Hence, enforcing existence of expressionless state in each recording or manually segmenting recordings so that each segment contains a baseline expression are strong, unrealistic constrains [35].
User 2 User 3 User 20 Baseline = -0.043 Baseline = -0.825 Baseline = +0.292
Figure 4. Baseline valence values for different users.
To solve this problem, we have used the first neutral relaxing video shown to the participants at the beginning of the sessions to compute the “baseline valence” of each user as the mean valence value detected by FaceReader throughout the neutral video (Figure 4). Then, the mean facial valence emotional time series were computed as the sample-by-
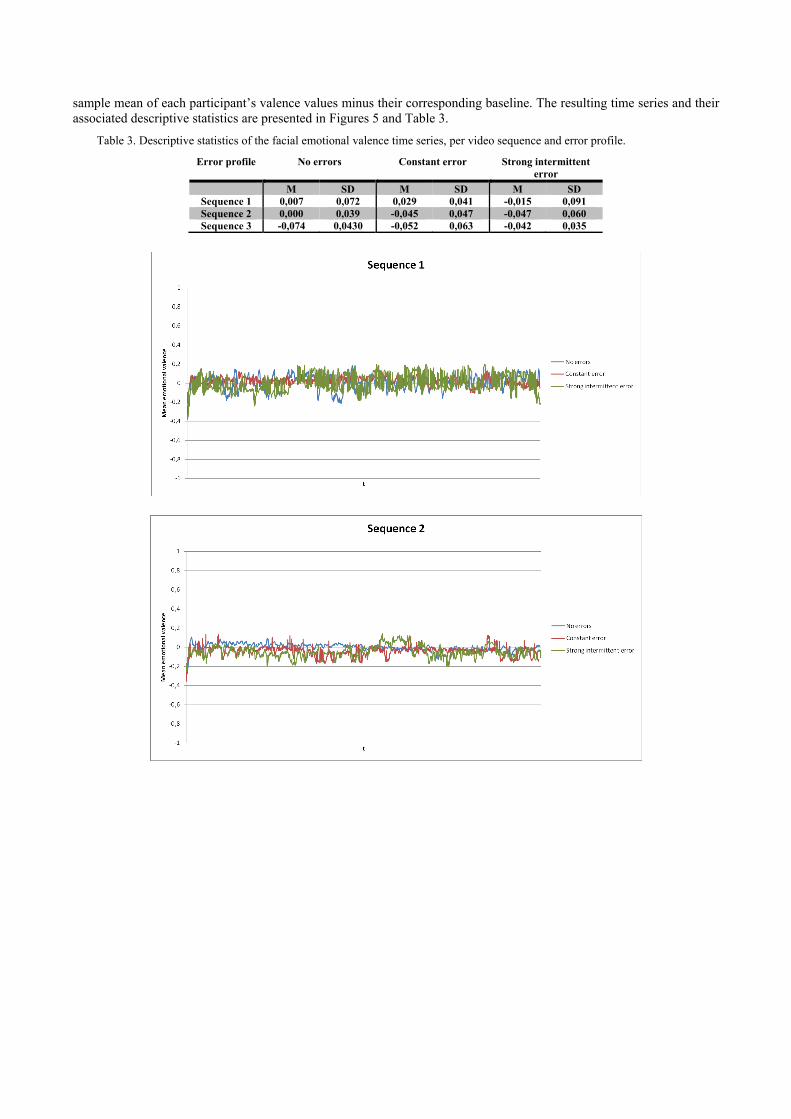
sample mean of each participant’s valence values minus their corresponding baseline. The resulting time series and their associated descriptive statistics are presented in Figures 5 and Table 3.
Table 3. Descriptive statistics of the facial emotional valence time series, per video sequence and error profile.
Error profile No errors Constant error Strong intermittent error
M SD M SD M SD Sequence 1 0,007 0,072 0,029 0,041 -0,015 0,091 Sequence 2 0,000 0,039 -0,045 0,047 -0,047 0,060 Sequence 3 -0,074 0,0430 -0,052 0,063 -0,042 0,035
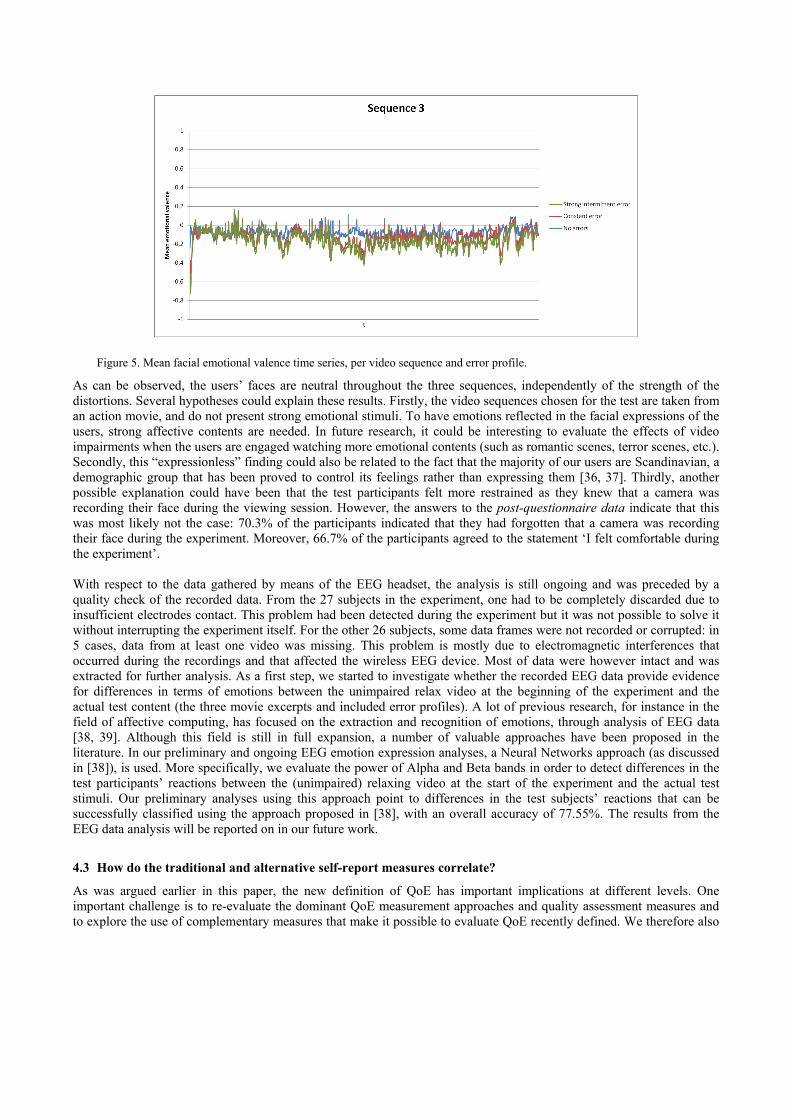
Figure 5. Mean facial emotional valence time series, per video sequence and error profile.
As can be observed, the users’ faces are neutral throughout the three sequences, independently of the strength of the distortions. Several hypotheses could explain these results. Firstly, the video sequences chosen for the test are taken from an action movie, and do not present strong emotional stimuli. To have emotions reflected in the facial expressions of the users, strong affective contents are needed. In future research, it could be interesting to evaluate the effects of video impairments when the users are engaged watching more emotional contents (such as romantic scenes, terror scenes, etc.). Secondly, this “expressionless” finding could also be related to the fact that the majority of our users are Scandinavian, a demographic group that has been proved to control its feelings rather than expressing them [36, 37]. Thirdly, another possible explanation could have been that the test participants felt more restrained as they knew that a camera was recording their face during the viewing session. However, the answers to the post-questionnaire data indicate that this was most likely not the case: 70.3% of the participants indicated that they had forgotten that a camera was recording their face during the experiment. Moreover, 66.7% of the participants agreed to the statement ‘I felt comfortable during the experiment’. With respect to the data gathered by means of the EEG headset, the analysis is still ongoing and was preceded by a quality check of the recorded data. From the 27 subjects in the experiment, one had to be completely discarded due to insufficient electrodes contact. This problem had been detected during the experiment but it was not possible to solve it without interrupting the experiment itself. For the other 26 subjects, some data frames were not recorded or corrupted: in 5 cases, data from at least one video was missing. This problem is mostly due to electromagnetic interferences that occurred during the recordings and that affected the wireless EEG device. Most of data were however intact and was extracted for further analysis. As a first step, we started to investigate whether the recorded EEG data provide evidence for differences in terms of emotions between the unimpaired relax video at the beginning of the experiment and the actual test content (the three movie excerpts and included error profiles). A lot of previous research, for instance in the field of affective computing, has focused on the extraction and recognition of emotions, through analysis of EEG data [38, 39]. Although this field is still in full expansion, a number of valuable approaches have been proposed in the literature. In our preliminary and ongoing EEG emotion expression analyses, a Neural Networks approach (as discussed in [38]), is used. More specifically, we evaluate the power of Alpha and Beta bands in order to detect differences in the test participants’ reactions between the (unimpaired) relaxing video at the start of the experiment and the actual test stimuli. Our preliminary analyses using this approach point to differences in the test subjects’ reactions that can be successfully classified using the approach proposed in [38], with an overall accuracy of 77.55%. The results from the EEG data analysis will be reported on in our future work.
4.3 How do the traditional and alternative self-report measures correlate?
As was argued earlier in this paper, the new definition of QoE has important implications at different levels. One important challenge is to re-evaluate the dominant QoE measurement approaches and quality assessment measures and to explore the use of complementary measures that make it possible to evaluate QoE recently defined. We therefore also
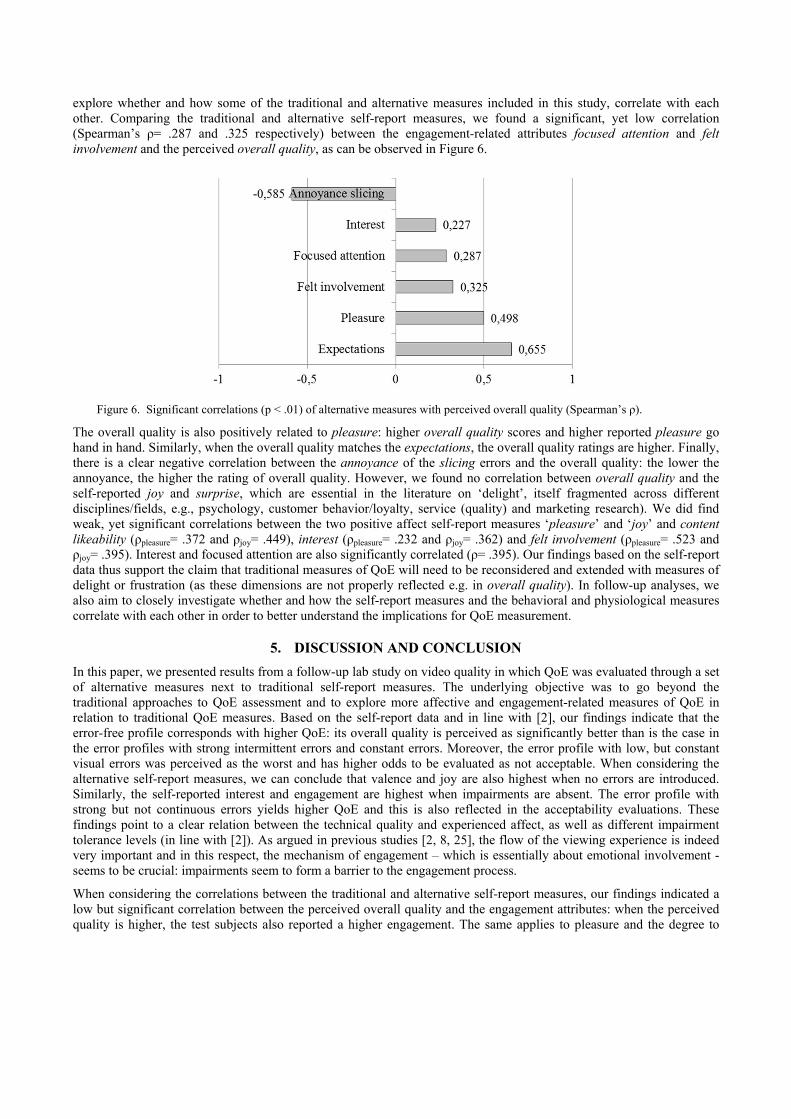
explore whether and how some of the traditional and alternative measures included in this study, correlate with each other. Comparing the traditional and alternative self-report measures, we found a significant, yet low correlation (Spearman’s ρ= .287 and .325 respectively) between the engagement-related attributes focused attention and felt involvement and the perceived overall quality, as can be observed in Figure 6.
Figure 6. Significant correlations (p < .01) of alternative measures with perceived overall quality (Spearman’s ρ).
The overall quality is also positively related to pleasure: higher overall quality scores and higher reported pleasure go hand in hand. Similarly, when the overall quality matches the expectations, the overall quality ratings are higher. Finally, there is a clear negative correlation between the annoyance of the slicing errors and the overall quality: the lower the annoyance, the higher the rating of overall quality. However, we found no correlation between overall quality and the self-reported joy and surprise, which are essential in the literature on ‘delight’, itself fragmented across different disciplines/fields, e.g., psychology, customer behavior/loyalty, service (quality) and marketing research). We did find weak, yet significant correlations between the two positive affect self-report measures ‘pleasure’ and ‘joy’ and content likeability (ρpleasure= .372 and ρjoy= .449), interest (ρpleasure= .232 and ρjoy= .362) and felt involvement (ρpleasure= .523 and ρjoy= .395). Interest and focused attention are also significantly correlated (ρ= .395). Our findings based on the self-report data thus support the claim that traditional measures of QoE will need to be reconsidered and extended with measures of delight or frustration (as these dimensions are not properly reflected e.g. in overall quality). In follow-up analyses, we also aim to closely investigate whether and how the self-report measures and the behavioral and physiological measures correlate with each other in order to better understand the implications for QoE measurement.
5. DISCUSSION AND CONCLUSION
In this paper, we presented results from a follow-up lab study on video quality in which QoE was evaluated through a set of alternative measures next to traditional self-report measures. The underlying objective was to go beyond the traditional approaches to QoE assessment and to explore more affective and engagement-related measures of QoE in relation to traditional QoE measures. Based on the self-report data and in line with [2], our findings indicate that the error-free profile corresponds with higher QoE: its overall quality is perceived as significantly better than is the case in the error profiles with strong intermittent errors and constant errors. Moreover, the error profile with low, but constant visual errors was perceived as the worst and has higher odds to be evaluated as not acceptable. When considering the alternative self-report measures, we can conclude that valence and joy are also highest when no errors are introduced. Similarly, the self-reported interest and engagement are highest when impairments are absent. The error profile with strong but not continuous errors yields higher QoE and this is also reflected in the acceptability evaluations. These findings point to a clear relation between the technical quality and experienced affect, as well as different impairment tolerance levels (in line with [2]). As argued in previous studies [2, 8, 25], the flow of the viewing experience is indeed very important and in this respect, the mechanism of engagement – which is essentially about emotional involvement - seems to be crucial: impairments seem to form a barrier to the engagement process.
When considering the correlations between the traditional and alternative self-report measures, our findings indicated a low but significant correlation between the perceived overall quality and the engagement attributes: when the perceived quality is higher, the test subjects also reported a higher engagement. The same applies to pleasure and the degree to
which the overall quality corresponds with the expectations of the test subjects regarding overall quality. The relation between annoyance and perceived overall quality is clear and negative: lower quality evaluations and indications of higher annoyance go hand in hand. This is also in line with the findings from [2], where it was concluded that the perceived overall quality seems to be a good indicator of the degree of annoyance, but not necessarily of the degree of delight. Similarly, in our study, we found no correlation between perceived quality and the two constructs that are linked to delight in the literature, namely joy and surprise. Although the set-up of this study was not entirely the same as in [2] (e.g., lab environment, extension with additional behavioral and physiological measures), the test content has similar characteristics and the same error profiles, traditional and alternative self-report measures were used in the study. We can conclude that the results from both studies point in the same direction with an important implication: the new definition of QoE requires a critical revision of the self-report measures that are traditionally used and the latter need to be extended with alternative, affect- and engagement-oriented measures.
Based on the preliminary facial expression emotional analysis, no major differences between the three error profiles and between the 3 video sequences were detected. As was discussed in Section 4, the participants’ faces were predominantly neutral. As discussed earlier, different explanations are possible in this respect (i.e., affective load of the content, cultural factors, test-setup, etc.). In turn, the self-report data provided a more nuanced picture and pointed – as discussed above – to significant differences between the three error profiles. As the results indicate, the absence of clear facial expressions of emotions does thus not mean that emotions are absent. The self-reports indicated (both in the closed and open questions) that the content was involving and that the inserted impairments also had some effect, but at the same time the content did not evoke facial expressions of specific emotions. In general, facial expression analysis has important advantages compared to self-reports, for instance, there is no need for introspection and recall, and continuous measurement is possible. Moreover, it can be used more ecologically valid setups (e.g., using a simple, built-in webcam) and can thus also be used for research seeking to investigate QoE in a more natural context and with more natural user behavior. However, based on our findings, we need to account for its limitations. Facial expression capturing and analysis may be very useful for detecting emotional cues without interfering with the experience or having to ask users for explicit feedback, but its applicability may be limited to QoE research in which specific types of content, with a very clear affective load, are investigated or where clear emotional expressions may be evoked.
The study presented in this paper also bears a number of other limitations due to the methodological choices that were made. Although we underlined the importance of more ecologically valid QoE research, especially in the context of IPTV and other entertainment-oriented services, our study took place in an artificial and unnatural lab environment. In our follow-up research, we intend to explore the applicability of the measurement approach to more realistic environments, in particular in a living room lab as in [2]. Secondly, the use of EEG is rather invasive and may therefore have influenced the test subjects’ experienced affect. Based on the evaluations of the set-up in the post-questionnaire, it seems however that the test subjects were not too bothered by the EEG headset. Only 18.5% of the respondents could not forget that he or she was wearing it during the test and 66.6% of the participants did not experience the headset as bothering, indicating that its possible influence should not be overestimated. Apart from this, another limitation is that we used a consumer-grade EEG device and not a medical-grade EEG device. Thirdly, all test stimuli were extracted from the same movie. In our follow-up research we therefore intend to extend the test material to other genres, in order to investigate whether similar findings apply. Moreover, the content was also limited in terms of its potential to evoke emotions through facial expressions, as was mentioned above. An additional limitation and challenge when investigating emotions as elements of QoE has to do with uncertainties related to measurement, the interpretation, and meaning of the findings: are emotions really evoked by the content, by the impairments, by the methodological setup and context or e.g., by memories of previous experiences triggered during the viewing session?
In our ongoing and future work, we aim to further analyze the gaze information to investigate whether users look at the distortions (by assessing whether the gaze coordinates are located inside the distortion region of interest). We also aim to evaluate the possible correlation between users’ emotional valence and the distortions value on the one hand, and between the emotional valence and whether or not users are looking at the distortion on the other hand. There are however some additional challenges to deal with in order to be able to perform these analyses. One challenge has to do with the extraction of errors and defining the distortion region of interest in longer duration video content: existing video quality models are only to a minor extent usable when using longer duration videos and they cannot produce quality indications with the desired frequency of less than 4 seconds. In addition, detailed analyses of the recorded EEG data are also planned in order to investigate whether significant differences between the three error profiles can be detected and if so, whether these differences correspond with the results from the self-reports. Finally, in our future work, we also aim to
explore the applicability of other – more implicit and behavioral – measures of user engagement in order to better understand the role of engagement in relation to fostering high QoE.
More generally speaking and as also argued in [2], it needs to be further investigated what the implications of delight and annoyance are in the context of QoE, not only at one moment in time, but also over time. Secondly, an important challenge for future research is to translate the understanding of drivers and barriers in this respect into actionable input for different stakeholders.
ACKNOWLEDGMENTS
This work was partially supported by the COST IC1003 European Network on Quality of Experience in Multimedia Systems and Services – QUALINET. M. Varela and T. Mäki’s work was partially funded by Tekes, the Finnish agency for research innovation, in the context of the CELTIC+ project QuEEN.
REFERENCES
[1] P. Le Callet, S. Möller, and A. Perkis, [Qualinet White Paper on Definitions of Quality of Experience, version 1.1, June 3, 2012] European Network on Quality of Experience in Multimedia Systems and Services (COST Action IC 1003), Lausanne(2012).
[2] K. De Moor, M. Rios Quintero, D. Strohmeier et al., [Evaluating QoE by means of traditional and alternative subjective measures: an exploratory 'living room lab' study on IPTV], Vienna, Austria(2013).
[3] ITU, [ITU-T Rec. P.10/G.100 (01/2007) Vocabulary for performance and quality of service Amendment 1: New Appendix I – Definition of Quality of Experience (QoE)] International Telecommunication Union, Geneva(2007).
[4] J. McCarthy, and P. Wright, [Technology as Experience] MIT Press, Massachusetts(2004). [5] I. Wechsung, and K. De Moor, [Quality of Experience vs. User Experience] Springer, Berlin(2014). [6] U. Reiter, K. Brunnström, K. De Moor et al., [Factors Influencing Quality of Experience] Springer,
Berlin(2014). [7] J.-N. Antons, S. Arndt, R. Schleicher et al., [Brain Activity Correlates of Quality of Experience] Springer,
Berlin(2014). [8] B. J. Villa, K. De Moor, P. E. Heegaard et al., [Investigating Quality of Experience in the context of adaptive
video streaming: findings from an experimental user study] Akademika forlag Stavanger, Norway(2013). [9] S. Arndt, J.-N. Antons, R. Schleicher et al., [Perception of low-quality videos analyzed by means of
electroencephalography] IEEE, (2012). [10] F. Dobrian, V. Sekar, A. Awan et al., “Understanding the impact of video quality on user engagement,”
SIGCOMM Comput. Commun. Rev., 41(4), 362-373 (2011). [11] R. Schleicher, and J.-N. Antons, [Evoking Emotions and Evaluating Emotional Impact] Springer, Berlin(2014). [12] A. Damasio, [Descartes' error: Emotion, reason, and the human brain] Putnam, New York (2005). [13] P. J. Lang, [Behavioral treatment and bio-behavioral assessment: computer applications.] Ablex,
Norwood(1980). [14] J. A. Russell, “Evidence of convergent validity on the dimensions of affect,” Journal of personality and social
psychology, 36(10), 1152 (1978). [15] P. Desmet, [Measuring emotion: Development and application of an instrument to measure emotional responses
to products] Kluwer, Dordrecht(2005). [16] G. Chanel, C. Rebetez, M. Bétrancourt et al., “Emotion assessment from physiological signals for adaptation of
game difficulty,” Systems, Man and Cybernetics, Part A: Systems and Humans, IEEE Transactions on, 41(6), 1052-1063 (2011).
[17] K. De Moor, and U. Reiter, "A viewer-centered revision of Audiovisual content classifiers." [18] K. Poels, [The Heart of Advertising. A Multifaceted Study on Emotions in Advertising] Ghent University,
(2007). [19] ITU-T, “Recommendation BT.500-13 (01.12) Methodology for the subjective assessment of the quality of
television pictures,” (2012). [20] ITU-T, “Recommendation P.910 (04/08) Subjective video quality assessment methods for multimedia
applications,” (2008).
[21] A. Raake, M. N. Garcia, S. Moller et al., "T-V-model: Parameter-based prediction of IPTV quality." 1149-1152. [22] S. Wolf, and M. Pinson, "Application of the NTIA general video quality metric (VQM) to HDTV quality
monitoring." [23] P. Fröhlich, S. Egger, R. Schatz et al., "QoE in 10 seconds: Are short video clip lengths sufficient for Quality of
Experience assessment?." 242-247. [24] P. Reichl, and F. Hammer, "Charging for Quality-of-Experience:A New Paradigm for Pricing IP-based
Service." [25] N. Staelens, S. Moens, W. Van den Broeck et al., “Assessing quality of experience of IPTV and video on
demand services in real-life environments,” IEEE Transactions on Broadcasting, 56(4), 458-466 (2010). [26] P. M. A. Desmet, M. H. Vastenburg, D. Van Bel et al., "Pick-A-Mood; development and application of a
pictorial mood-reporting instrument." [27] C. E. Izard, [The psychology of emotions] Plenum Press, New York(1991). [28] H. L. O'Brien, and E. G. Toms, “The development and evaluation of a survey to measure user engagement in e-
commerce environments,” Journal of the American Society for Information Science and Technology, 61(1), 50-69 (2010).
[29] “Emotiv EPOC headset, http://www.emotiv.com/ ”. [30] [Tobii T60], http://www.tobii.com/en/eye-tracking-research/global/products/hardware/tobii-t60t120-eye-
tracker/ (2013). [31] M. J. Den Uyl, and H. Van Kuilenburg, “The FaceReader: Online facial expression recognition,” Proceedings
of Measuring Behavior, 589-590 (2005). [32] J. McDougall, J. J. John, Y. Yu et al., "An improved channel model for mobile and ad-hoc network
simulations." 352-357. [33] O. Hohlfeld, R. Geib, and G. Haßlinger, "Packet loss in real-time services: Markovian models generating QoE
impairments." 239-248. [34] H. Gunes, and M. Pantic, “Automatic, dimensional and continuous emotion recognition,” International Journal
of Synthetic Emotions (IJSE), 1(1), 68-99 (2010). [35] A. Nakasone, H. Prendinger, and M. Ishizuka, "Emotion recognition from electromyography and skin
conductance." 219-222. [36] B. M. Erickson, and J. S. Simon, [Scandinavian families: Plain and simple] Guilford, New York(1996). [37] J. W. Pennebaker, B. Rimé, and V. E. Blankenship, “Stereotypes of emotional expressiveness of northerners
and southerners: a cross-cultural test of Montesquieu's hypotheses,” Journal of personality and social psychology, 70(2), 372 (1996).
[38] D. O. Bos, “EEG-based emotion recognition - the Influence of Visual and Auditory Stimuli,” Capita Selecta, 1-17 (2006).
[39] C. P. Niemic, “Studies of Emotion: A Theoretical and Emperical Review of Psychophysiological Studies of Emotion,” Jur, 1(1), (2002).