Challenges for Australian education : results from PISA 2009 : the PISA 2009 assessment of students'...
339
Programme for International Student Assessment The PISA 2009 assessment of students’ reading, mathematical and scientific literacy Sue Thomson Lisa De Bortoli Marina Nicholas Kylie Hillman Sarah Buckley Challenges for Australian Education: Results from PISA 2009
Transcript of Challenges for Australian education : results from PISA 2009 : the PISA 2009 assessment of students'...

Programme for International Student Assessment
The PISA 2009 assessment ofstudents’ reading, mathematical
and scientific literacy
Sue ThomsonLisa De Bortoli
Marina NicholasKylie Hillman
Sarah Buckley
Challenges for Australian
Education: Results from
PISA 2009

Programme for International Student Assessment
The PISA 2009 assessment ofstudents’ reading, mathematical
and scientific literacy
Sue ThomsonLisa De Bortoli
Marina NicholasKylie Hillman
Sarah Buckley
Challenges for Australian
Education: Results from
PISA 2009

First published 2011 by ACER Press, an imprint of Australian Council for Educational Research Ltd 19 Prospect Hill Road, Camberwell Victoria, 3124, Australia
www.acerpress.com.au [email protected]
Text © Sue Thomson, 2011 Design and typography © ACER Project Publishing Department 2011
This book is copyright. All rights reserved. Except under the conditions described in the Copyright Act 1968 of Australia and subsequent amendments, and any exceptions permitted under the current statutory licence scheme administered by Copyright Agency Limited (www.copyright.com.au), no part of this publication may be reproduced, stored in a retrieval system, transmitted, broadcast or communicated in any form or by any means, optical, digital, electronic, mechanical, photocopying, recording or otherwise, without the written permission of the publisher.
Cover and text design by ACER, Project Publishing Department Printed in Australia by Blue Star Print Group Australia Pty Ltd
National Library of Australia Cataloguing-in-Publication data:
Title: Challenges for Australian education: results from PISA 2009: the PISA 2009 assessment of students’ reading, mathematical and scientific literacy / Sue Thomson ... [et al.].
ISBN: 9781742860169 (pbk.)
Series: PISA national reports.
Notes: Includes bibliographical references.
Subjects: Programme for International Student Assessment. Education-- Australia. Competency based education--Australia. Educational evaluation--Australia.
Other Authors/Contributors: Thomson, Sue, 1958- Australian Council for Education Research.
Dewey Number: 370.994
This publication is the result of research that formed part of a program supported by a grant to the Australian Council for Educational Research by Commonwealth, State and Territory governments. The support provided by these governments is gratefully acknowledged.
The views expressed in this report are those of the authors and not necessarily those of the Commonwealth, State and Territory governments..

Challenges for Australian Education: Results for Australian Students in PISA 2009
Contents
Executive Summary ........................................................................................................................ i
List of Tables .................................................................................................................................xv
List of Figures ..............................................................................................................................xxi
Acknowledgements ................................................................................................................... xxiv
Reader’s Guide ........................................................................................................................... xxv
Chapter 1 Introduction ................................................................................................. 1The main goals of PISA .................................................................................................................. 1
Features of PISA 2009 .................................................................................................................... 1
Implementing PISA ....................................................................................................................... 2
What do PISA participants do? ................................................................................................ 2
Participants in PISA 2009 ............................................................................................................... 3
Countries ................................................................................................................................. 3
Students ................................................................................................................................... 5
PISA 2009 students and language spoken at home ................................................................... 8
Organisation of the report ........................................................................................................ 9
Further information .................................................................................................................. 9
Chapter 2 Reading literacy .......................................................................................... 11The reading literacy framework – then and now .......................................................................... 11
How is reading literacy defined in PISA?...................................................................................... 11
How reading literacy is measured in PISA ................................................................................... 12
Texts ...................................................................................................................................... 14
Aspects .................................................................................................................................. 16
Situation ................................................................................................................................ 18
The structure of the assessment ................................................................................................... 19
Item response formats ............................................................................................................ 19
Distribution of items .............................................................................................................. 19
Constructing the assessment booklets .................................................................................... 20
Scaling the reading literacy tasks ............................................................................................ 20
Reading proficiency levels in PISA 2009 ...................................................................................... 21
Sample reading literacy items and responses ............................................................................... 25
Brushing your teeth ................................................................................................................ 27
Mobile phone safety ............................................................................................................. 29
Balloon ................................................................................................................................. 33
Blood donation notice ........................................................................................................... 37
Miser ..................................................................................................................................... 38
The play’s the thing ............................................................................................................... 41
Telecommuting ...................................................................................................................... 44
Summary ............................................................................................................................... 45
Chapter 3 Australian students’ performance in reading literacy .................................. 47Key Findings ................................................................................................................................ 47
Reporting reading literacy performance: mean scores and proficiency levels ............................... 49
Mean scores and distribution of scores .................................................................................. 49
Proficiency levels ................................................................................................................... 49

Challenges for Australian Education: Results for Australian Students in PISA 2009
Student performance in reading literacy....................................................................................... 50
Reading literacy performance from an international perspective ............................................ 50
Reading literacy performance and gender from an international perspective .......................... 55
Reading literacy performance across Australian states and territories ...................................... 57
Reading literacy performance and school sector .................................................................... 61
Reading literacy performance and Indigenous status .............................................................. 63
Reading literacy performance and geographic location of school ........................................... 65
Reading literacy performance and socioeconomic background .............................................. 66
Reading literacy performance and immigrant status ............................................................... 67
Reading literacy performance and language background ....................................................... 67
Student performance on the reading literacy subscales: aspect .................................................... 68
Performance on access and retrieve from an international perspective ................................... 68
Performance on integrate and interpret from an international perspective .............................. 74
Performance on reflect and evaluate from an international perspective .................................. 80
Performance on the aspect subscales across Australian states and territories........................... 86
Performance on the aspect subscales and Indigenous status ................................................... 95
Performance on the aspect subscales and geographic location of school ................................ 96
Performance on the aspect subscales and socioeconomic background ................................... 97
Student performance on the reading literacy subscales: text format ............................................. 98
Performance on continuous texts from an international perspective ....................................... 98
Performance on non-continuous texts from an international perspective .............................. 104
Performance on the text format subscales across Australian states and territories .................. 110
Performance on the text format subscales and Indigenous status .......................................... 116
Performance on the text format subscales and geographic location of school ....................... 117
Performance on the text format subscales and socioeconomic background .......................... 118
Monitoring reading literacy changes over time ......................................................................... 120
Reading literacy performance over time from an international perspective ........................... 120
Reading literacy performance and gender over time, from an international perspective ....... 124
Reading literacy performance over time, across Australian states and territories ................... 126
Reading literacy performance over time and Indigenous students......................................... 128
Chapter 4 Australian students’ reading habits and learning strategies ....................... 129Key Findings .............................................................................................................................. 129
Reading habits ........................................................................................................................... 130
Enjoyment of reading ........................................................................................................... 130
Time spent reading ............................................................................................................... 134
Diversity of reading materials ............................................................................................... 137
Use of learning strategies .......................................................................................................... 141
General learning strategies ................................................................................................... 141
Elaboration strategies .......................................................................................................... 144
Control strategies ................................................................................................................ 147
Learning strategies in reading literacy .................................................................................. 150
Relationships between reading attitudes, habits and learning strategies ..................................... 158
Summary ................................................................................................................................... 159
Chapter 5 Australian students’ performance in mathematical literacy ...................... 161Key Findings .............................................................................................................................. 161
How is mathematical literacy defined in PISA? .......................................................................... 163
How is mathematical literacy measured in PISA ........................................................................ 163
Situations and context .......................................................................................................... 164

Challenges for Australian Education: Results for Australian Students in PISA 2009
Mathematical content .......................................................................................................... 164
Mathematical processes ....................................................................................................... 165
The structure of the assessment ................................................................................................. 166
Reporting mathematical literacy performance: mean scores and proficiency levels ................... 166
Mean scores and distribution of scores ................................................................................ 166
Proficiency levels ................................................................................................................. 167
Sample mathematical literacy items and responses .................................................................... 168
Exchange Rate ..................................................................................................................... 169
Number Cubes .................................................................................................................... 171
Walking ............................................................................................................................... 172
Robberies ............................................................................................................................ 175
Carpenter ............................................................................................................................. 176
Student performance in mathematical literacy ........................................................................... 177
Mathematical literacy performance from an international perspective .................................. 177
Mathematical literacy performance and gender from an international perspective ............... 181
Mathematical literacy performance across the Australian states and territories ..................... 183
Mathematical literacy performance and school sector .......................................................... 187
Mathematical literacy performance and Indigenous students ............................................... 189
Mathematical literacy performance and geographic location of school ................................ 190
Mathematical literacy performance and socioeconomic background ................................... 191
Mathematical literacy performance and immigrant status ..................................................... 192
Mathematical literacy performance and language background ............................................. 193
Monitoring mathematical literacy changes over time ................................................................ 194
Chapter 6 Australian students’ performance in scientific literacy ............................. 201Key Findings .............................................................................................................................. 201
How is scientific literacy defined in PISA? ................................................................................. 202
How is scientific literacy measured in PISA? .............................................................................. 203
Situations and context .......................................................................................................... 203
Scientific competencies ....................................................................................................... 204
Scientific knowledge ............................................................................................................ 205
The structure of the assessment ................................................................................................. 207
Item response formats .......................................................................................................... 207
Reporting scientific literacy performance: mean scores and proficiency levels .......................... 208
Mean scores and distribution of scores ................................................................................ 208
Proficiency levels ................................................................................................................. 209
Sample scientific literacy items and responses ........................................................................... 210
Clothes ................................................................................................................................ 211
Genetically Modified Crops ................................................................................................. 213
Acid Rain ............................................................................................................................ 214
Greenhouse ......................................................................................................................... 217
Student performance in scientific literacy ................................................................................. 220
Performance on scientific literacy from an international perspective .................................... 220
Scientific literacy performance and gender from an international perspective ...................... 225
Scientific literacy performance across the Australian states and territories ........................... 227
Scientific literacy performance and school sector ................................................................. 231
Scientific literacy performance and Indigenous status .......................................................... 233
Scientific literacy performance and geographic location of school ....................................... 234
Scientific literacy performance and socioeconomic background .......................................... 235
Scientific literacy performance and immigrant status ............................................................ 236

Challenges for Australian Education: Results for Australian Students in PISA 2009
Scientific literacy performance and language background .................................................... 237
Monitoring scientific literacy changes over time ....................................................................... 238
Performance over time on scientific literacy from an international perspective ..................... 238
Scientific literacy performance over time across Australian states ......................................... 242
Scientific literacy performance over time for Indigenous students......................................... 243
Chapter 7 Characteristics of Australian schools in PISA ............................................ 245Key Findings .............................................................................................................................. 245
Selecting and organising students into schools and classrooms .................................................. 246
Age-of-entry policies ............................................................................................................ 246
School admission policies .................................................................................................... 248
Student transfer policies ....................................................................................................... 250
Ability grouping within school ............................................................................................. 252
The learning environment .......................................................................................................... 254
Student–teacher relations ..................................................................................................... 254
Disciplinary climate ............................................................................................................. 256
Student-related factors affecting school climate .................................................................... 258
Teacher-related factors affecting school climate ................................................................... 261
School autonomy ...................................................................................................................... 263
School autonomy in allocating resources ............................................................................. 263
School autonomy in curriculum and assessment ................................................................. 264
Early childhood education ........................................................................................................ 265
Time resources .......................................................................................................................... 266
Learning time in school ....................................................................................................... 266
Learning time out-of-school ................................................................................................ 268
Extracurricular activities ....................................................................................................... 269
Human resources ...................................................................................................................... 271
Teacher shortages................................................................................................................. 271
The association between school characteristics and student performance .................................. 272
Chapter 8 Equity in learning opportunities and outcomes ........................................ 277Key Findings .............................................................................................................................. 277
Socioeconomic gradients ........................................................................................................... 278
Differences in the socioeconomic background of students and schools ..................................... 291
Chapter 9 Policy implications ................................................................................... 295Performance .............................................................................................................................. 295
Reading literacy ................................................................................................................... 295
Mathematical literacy .......................................................................................................... 296
Scientific literacy ................................................................................................................. 297
Equity ........................................................................................................................................ 297
Socioeconomic background ................................................................................................. 297
Gender ............................................................................................................................... 298
Indigenous students ................................................................................................................... 299
Students in remote locations ...................................................................................................... 299
In conclusion ............................................................................................................................. 299
References ................................................................................................................. 301Appendix 1 Links to online documents and statistical tables ..................................... 303

Challenges for Australian Education: Results from PISA 2009 i
Executive Summary
PISA seeks to measure how well young adults, at age 15 and therefore near the end of compulsory schooling in most participating education systems, are prepared to use knowledge and skills in particular areas to meet real-life challenges. PISA’s orientation reflects a change in the goals and objectives of curricula, which increasingly address how well students are able to apply what they learn at school.
This report presents the results of the PISA assessment for Australia. It presents the results for the Australian states and territories, for Australia as a whole, and, where relevant, to the other participants in the study, so that Australia’s results can be viewed in the context of its participation in this international study.
What does PISA assess?The primary focus of PISA is on public policy issues related to education provision. Questions guiding the development of PISA are:
◗ How well are young adults prepared to meet the challenges of the future? What skills do they possess that will facilitate their capacity to adapt to rapid societal change?
◗ Are some ways of organising schools and school learning more effective than others?
◗ What influence does the quality of school resources have on student outcomes?
◗ What educational structures and practices maximise the opportunities of students from disadvantaged backgrounds? How equitable is education provision for students from all backgrounds?
Who is assessed?PISA assesses a random sample of students aged 15 years old, drawn from a nationally representative sample of schools. In 2009, 65 countries1 (all 34 OECD countries and 31 partner countries), and almost half-a-million students, participated in the PISA assessment.
In Australia, 353 schools and a total of 14,251 students participated in PISA 2009. The larger sample was taken in Australia because:
◗ Smaller states and Indigenous students were oversampled so that reliable estimates could be inferred for those populations; and
◗ The PISA 2009 sample will become a cohort of the Longitudinal Surveys of Australian Youth (LSAY). These students are contacted in future years to trace their progress through school and entry into further education and the workforce.
What is assessed?The PISA assessment focuses on young people’s ability to apply their knowledge and skills to real-life problems and situations. The term literacy is attached to each domain to reflect the focus on these broader skills, and as concept is used in a much broader sense than simply being able to read and write. The OECD considers that mathematics, science and technology are so pervasive in modern life that it is important for students to be `literate´ in these areas as well.
1 A number of economies participated in PISA 2009. For ease of reading these are referred to as ‘countries’.

ii Executive Summary
Assessment tasks typically contain some text describing a real-life situation and a series of two or more questions for students to answer about the text. For the mathematical and scientific components of the assessment, the text typically presents situations in which mathematical or scientific problems are posed, or mathematical or scientific concepts need to be understood. Some of the PISA 2009 items were multiple-choice items, but for others, students had to construct and write their own answers.
A different domain is chosen to be the focus in each assessment cycle. Reading literacy was the major domain in PISA 2000, mathematical literacy in PISA 2003, and scientific literacy was the major focus of the PISA 2006 assessment. Reading literacy was the major domain for PISA 2009, and while the core of the PISA 2000 framework was retained, additions were made in order to integrate new developments and recognise changes in the world in which we learn and live. The PISA 2009 reading literacy framework contains two new elements: the incorporation of electronic texts and the elaboration of reading engagement and meta-cognition.
The concept of reading literacy in PISA is described along three dimensions:
◗ texts (the range and format of the reading material),
◗ aspects (the type of reading task or reading processes involved), and
◗ situations (the range of contexts for which the text was constructed).
In addition to the overall reading literacy scale, three aspect subscales (access and retrieve, integrate and interpret, and reflect and evaluate) and two text format subscales (continuous and non-continuous texts) have been defined and reported.
What did participants need to do?Students who participated in PISA 2009 completed a booklet with questions from reading literacy (the major domain), and questions from either mathematical literacy, scientific literacy, or both. A sub-sample of students also completed an assessment of electronic reading. Students also answered a questionnaire, which included scales to measure their attitudes to reading and learning strategies, as well as questions to collect information on their backgrounds. School principals completed a short questionnaire that focused on information about their schools.
How are results reported? Results are reported for reading, mathematical and scientific literacy overall, as well as for the three aspect subscales (access and retrieve, integrate and interpret, and reflect and evaluate) and two text subscales (continuous and non-continuous texts).
For each of the literacy domains, a mean score across OECD countries has been defined: 493 score points, with a standard deviation of 93 for reading literacy; 496 score points with a standard deviation of 92 for mathematical literacy; and 501 score points with a standard deviation of 94 for scientific literacy.
This report presents results as average scores, as distributions of scores, and as percentages of students who attain each of a set of defined levels of proficiency. Each of the literacy proficiency scales (and subscales) contain descriptions of the skills typically shown by students achieving at each level, as defined by international experts. In PISA 2009 there are seven levels of reading literacy proficiency and six levels of mathematical and scientific literacy performance.

Challenges for Australian Education: Results from PISA 2009 iii
PISA 2009 in Australia ◗ Just over 14,000 students from 353 schools participated, from all states and territories and all
sectors of schooling.
◗ Data were gathered between late-July and early September 2009.
◗ Test Administrators, trained in PISA procedures, administered the assessment sessions, in order to ensure that testing occurred in a standard and consistent manner.
◗ A group of teachers were trained to code students´ answers to questions requiring a written response.
◗ Students´ results were sent to their schools. Apart from this, all information in PISA at student and school levels is kept strictly confidential.
Australia’s performance in PISA 2009Overall, Australian students performed very well in PISA 2009.This section provides a summary of the findings to be found in more detail in the report. It should be noted that differences are only mentioned if tests of statistical significance showed that these were likely to be real differences.
Internationally:
In reading literacy:
◗ Australian students, with a mean score of 515 points, scored significantly higher than the OECD average of 493 points.
◗ Australia was significantly outperformed by six countries: Shanghai – China, Korea, Finland, Hong Kong – China, Singapore and Canada. Australia’s performance was not significantly different from that of New Zealand, Japan and the Netherlands. All other countries performed at a level significantly lower than Australia.
◗ Australia’s result on each of the aspect subscales was above the OECD average. Australia’s mean scores on both the access and retrieve and the integrate and interpret subscales was 513 score points, while the mean score on the reflect and evaluate subscale was 523 points, suggesting that this is a relative strength. Australia was outperformed by seven countries on the access and retrieve and reflect and evaluate subscales, and by six countries on the integrate and interpret subscale.
◗ The Australian mean scores on the text format subscales were also significantly higher than the OECD average. Australia achieved a mean score of 513 points on the continuous texts subscale, while the mean performance on the non-continuous texts subscale was higher, at 524 points. On the text format subscales, Australia was outperformed by six countries on the continuous texts subscale and by five countries on the non-continuous texts subscale.
In mathematical literacy:
◗ Australia achieved a mean score of 514 points, which was significantly higher than the OECD average of 496 score points.
◗ Australia was outperformed by twelve countries: Shanghai – China, Singapore, Hong Kong – China, Korea, Chinese Taipei, Finland, Liechtenstein, Switzerland, Japan, Canada, the Netherlands, and Macao – China, in mathematical literacy performance. Four countries (New Zealand, Belgium, Germany and Estonia) had mean scores not significantly different from Australia. Australia performed at a significantly higher level than all other countries.

iv Executive Summary
In scientific literacy:
◗ Australia achieved a mean score of 527 points, which was significantly higher than the OECD average of 501 score points.
◗ Australia was outperformed by six countries: Shanghai – China, Finland, Hong Kong – China, Singapore, Japan and Korea. Australia’s performance was not significantly different from that of seven countries: New Zealand, Canada, Estonia, the Netherlands, Chinese Taipei, Germany and Liechtenstein. All other countries performed at a level significantly lower than Australia.
Distribution of scores: ◗ In Australia, the ranges of scores between the 5th and 95th percentile is comparatively wider
than the OECD average for reading literacy and scientific literacy, and similar to the OECD average for mathematical literacy. A narrower range of scores indicates that there is a smaller gap between the highest- and lowest-achieving students.
Proficiency levels:
For reading literacy:
◗ At the highest Proficiency Level, Level 6, students can make multiple inferences, comparisons and contrasts that are both detailed and precise; demonstrate a full and detailed understanding of one or more texts, which may involve integrating information from more than one text; deal with unfamiliar ideas in the presence of prominent competing information; and generate abstract categories for interpretations. Two per cent of Australia’s students achieved this level. Thirteen per cent of Australian students were placed at Level 5 or above in reading literacy, 37 per cent at Level 4 or above and 65 per cent at Level 3 or above. Level 2 has been defined internationally as a ‘baseline’ proficiency level and defines the level of achievement on the PISA scale at which students begin to demonstrate the reading literacy competencies that will enable them to actively participate in real-life situations. Only 14 per cent of Australian students did not reach Level 2 or above in reading literacy.
◗ On the aspect subscales, 12 per cent of Australian students achieved Level 5 or above on the access and retrieve subscale, (14 per cent on the integrate and interpret subscale and 16 per cent on the reflect and evaluate subscale. Fourteen per cent of Australian students did not reach Level 2 on the access and retrieve subscale, 16 per cent on the integrate and interpret subscale and 13 per cent on the reflect and evaluate subscale.
◗ On the text format subscales, 13 per cent of Australian students achieved Level 5 or above on the continuous texts subscale (highest was Shanghai – China with 24%; the OECD average was 8%) and 15 per cent on the non-continuous texts subscale (highest was New Zealand with 19%; the OECD average was 8%). Fifteen per cent of Australian students did not reach Level 2 on the continuous texts subscale (OECD average was 19%) and 13 per cent of students on the non-continuous texts subscale (OECD average was 20%).
For mathematical literacy:
◗ Four per cent of Australia’s students achieved Level 6, the highest mathematical literacy proficiency, compared to the OECD average of three per cent. The country with the highest proportion of students achieving Level 6 was Shanghai – China, with half of its students reaching Level 6.
◗ Sixteen per cent of Australian students were placed at Level 5 or above in mathematical literacy, 38 per cent at Level 4 or above and 64 per cent at Level 3 or above.
◗ Sixteen per cent of Australian students did not reach Level 2 or above in mathematical literacy.
Challenges for Australian Education: Results from PISA 2009 v
For scientific literacy:
◗ Three per cent of Australia’s students achieved Level 6, the highest scientific literacy proficiency, compared to one per cent across the OECD and one-quarter of students in Shanghai – China.
◗ Fourteen per cent of Australian students were placed at Level 5 or above in scientific literacy, 39 per cent at Level 4 or above and 67 per cent at Level 3 or above (OECD average was 58%).
◗ Twelve per cent of Australian students did not reach Level 2 or above in scientific literacy compared with the OECD average of 18 per cent.
Results for the Australian states and territories:
For reading literacy:
◗ Tasmania scored similarly to the OECD average for reading literacy, and the Northern Territory scored significantly lower than the OECD average. All other states performed significantly higher than the OECD average in reading literacy.
◗ Students in the Australian Capital Territory, Western Australia, Queensland and New South Wales performed at a similar level, generally outperforming students in the other states and territories. Students in Victoria were outperformed by those in the Australian Capital Territory but scored on a par with those in Western Australia, Queensland, New South Wales and South Australia. Tasmania and the Northern Territory scored significantly lower on average than the other states and were statistically similar to each other.
◗ The difference in mean reading literacy scores between students in the highest and lowest performing states and territories is 50 score points, the equivalent to over two-thirds of a proficiency level or one-and-a-half years of schooling.
For mathematical literacy:
◗ Students in Western Australia, the Australian Capital Territory, Queensland, New South Wales and Victoria scored on a par with each other; however, the Australian Capital Territory scored statistically significantly higher than Victoria. South Australia was outperformed by Western Australia and the Australian Capital Territory, and scored similarly to Queensland, New South Wales and Victoria. The lowest performing states were Tasmania and the Northern Territory.
◗ The difference in mean mathematical literacy scores between students in the highest and lowest performing states and territories is 41 score points, the equivalent to approximately two-thirds of a proficiency level or one year of schooling.
◗ Tasmania and the Northern Territory performed at a level not significantly different from the OECD average, while all other states performed statistically significantly higher than the OECD average in reading literacy.
For scientific literacy:
◗ The Australian Capital Territory, Western Australia, New South Wales and Queensland performed similarly to one another in scientific literacy. The Australian Capital Territory and Western Australia performed significantly higher than four states (Victoria, South Australia, Tasmania and the Northern Territory), and New South Wales and Queensland performed statistically similarly to Victoria and South Australia, as well as significantly higher than Tasmania and the Northern Territory.
◗ The difference in mean scientific literacy scores between students in the highest and lowest performing states and territories is 54 score points, the equivalent to approximately three-quarters of a proficiency level or almost one-and-a-half years of schooling.
◗ Tasmania and the Northern Territory achieved similarly to the OECD average. All other states performed significantly higher than the OECD average in scientific literacy.

vi Executive Summary
Results for females and males:
In reading literacy:
◗ Internationally, females significantly outperformed males in reading literacy, in all participating countries. The gender difference in Australia was 37 score points, which was similar to the OECD average (of 39 score points), and equivalent to around half a proficiency level or about one year of schooling.
◗ Gender differences were also evident in favour of females across the three aspect subscales and the two text format subscales. In Australia, gender differences in the mean performance on each of the subscales were slightly less than to the OECD average.
◗ A higher proportion of Australian females achieved Level 5 or above than on average across the OECD, with 16 per cent of females compared to 10 per cent of males in Australia reaching Level 5 or above, whilst 10 per cent of females and six per cent of males across OECD countries reached this level.
◗ There were twice as many Australian males (20%) as females (9%) who failed to reach Level 2. However, these figures compare favourably with the OECD average of 12 per cent of females and almost 25 per cent of males not reaching Level 2.
In mathematical literacy:
◗ Significant gender differences were found in approximately half the participating countries, with males significantly outperforming females by 12 score points on average across OECD countries. Only one country (Lithuania) reported gender differences in favour of females.
◗ Australian males scored significantly higher (by 10 score points on average) than Australian females.
◗ A similar proportion of Australian females and males did not reach Level 2. There was a slightly higher proportion of male students (18%) than female students (15%) who performed at Level 5 or above. A similar pattern was found across OECD countries.
In scientific literacy:
◗ Internationally there were significant gender differences in scientific literacy in 21 countries: 11 in favour of females and 10 in favour of males.
◗ There was no significant gender differences found in Australia for scientific literacy.
◗ There were slightly more Australian males (16%) than Australian females (14%) who achieved Level 5 or above in scientific literacy. These proportions were higher than the OECD average of almost 10 per cent for males and females.
◗ The proportion of Australian males who did not reach Level 2 was also slightly higher than Australian females, with 14 per cent and 11 per cent respectively. These proportions were smaller than the OECD average (18% for males and 17% for females).
Changes over time:
In reading literacy (between PISA 2000 and PISA 2009):
◗ Although the OECD average for reading literacy has not changed between 2000 and 2009, 10 countries have significantly improved their performance over this time, while five countries, including Australia, have declined significantly.
◗ Australia was the only high performing country to show a significant decline (by 13 score points) in reading literacy between PISA 2000 (with a mean score of 528 points) and PISA 2009 (with a mean score of 515 points). A decline in average scores was also noted between PISA 2000 and PISA 2006, when reading literacy was a minor domain.

Challenges for Australian Education: Results from PISA 2009 vii
◗ Although there was no significant change in the proportion of Australian students not achieving Level 2 between PISA 2000 and PISA 2009, the proportion of Australian students reaching Level 5 or above significantly declined from 18 per cent in PISA 2000 to 13 per cent in PISA 2009.
◗ The mean performance for Australian males has significantly declined by 17 score points, while the OECD average remained statistically similar for males. There was no significant difference in the mean performance of Australian females.
◗ There was a significant decline in the proportion of Australian females (by 6%) and males (by 4%) who achieved Level 5 or above. The decline at the higher end of the reading literacy proficiency scale also occurred across the OECD, although it was significant and smaller (by 1%). A significant increase (of 4%) was found in the proportion of Australian males who did not reach Level 2. There was a significant increase, of two per cent of females, across the OECD who did not reach Level 2, while there was one per cent increase, which was not significant, for males across the OECD countries not reaching Level 2.
◗ Mean reading literacy performance decreased significantly between PISA 2000 and PISA 2009 in four states and territories. There was a 31 score point decline in Tasmania and South Australia, which is the equivalent of almost half a proficiency level or about one full year of schooling. New South Wales and the Australian Capital Territory reported declines of around 20 score points, representing approximately one-third of a proficiency level or about half a year of schooling.
◗ South Australia, Tasmania, Western Australia and the Australian Capital Territory showed a significant decline at the higher end of the reading literacy proficiency scale. The Australian Capital Territory, South Australia and New South Wales showed a significant decline at the lower end of the reading literacy proficiency scale.
◗ The proportion of students not reaching Level 2 in reading literacy increased significantly in the Australian Capital Territory (by 5%), South Australia (by 5%) and New South Wales (by 4%), while the proportion of students achieving Level 5 or above significantly declined in South Australia (by 9%), Tasmania (by 8%), Western Australia (by 7%) and in the Australian Capital Territory (by 6%).
◗ The mean reading literacy performance for females significantly declined in South Australia (by 27 score points) and in Tasmania (by 36 score points) between PISA 2000 and PISA 2009. For males, the mean reading literacy performance significantly decreased in South Australia (by 32 score points) and in New South Wales (by 30 score points).
In mathematical literacy (between PISA 2003 and PISA 2009):
◗ The average mathematical literacy performance of Australia declined significantly (by 10 score points) between PISA 2003 and PISA 2009, while there was no significant change in the OECD average over this time. There was no significant change in the average performance of Australian students between PISA 2003 and PISA 2006 in mathematical literacy.
◗ There was a significant decline in the proportion of Australian students reaching Level 5 or above, from 20 per cent of students in PISA 2003 to 16 per cent of students in PISA 2009. There were no significant differences between the proportion of students not reaching Level 2 between PISA 2003 and PISA 2009.
◗ The Australian Capital Territory, New South Wales, South Australia and Western Australia all showed a significant decline in mathematical literacy performance between PISA 2003 and PISA 2009. The largest change was in South Australia, where the average score decreased by 26 score points, then the Australian Capital Territory with a decrease of 20 score points, Western Australia with a decrease of 19 score points, and New South Wales with a decrease of 14 score points.
◗ Students in Victoria, the Northern Territory, Queensland and Tasmania showed no change in scores over the three cycles (2003, 2006 and 2009).
◗ The proportion of students not reaching Level 2 in mathematical literacy increased significantly (by 5%) in South Australia and Western Australia. The proportion of students reaching Level 5 or above significantly declined in South Australia (by 9%) and in the Australian Capital Territory (by 6%).

viii Executive Summary
In scientific literacy (between PISA 2006 and PISA 2009):
◗ The mean performance of Australian students in scientific literacy remained unchanged between PISA 2006 and PISA 2009.
◗ The proportion of Australian students not achieving Level 2 and the proportion of Australian students reaching Level 5 or above remained unchanged.
◗ There were no significant changes in scientific literacy performance within each of the states between PISA 2006 and PISA 2009.
◗ There were no changes in the proportions of students from different states who performed below Level 2 in scientific literacy. However, South Australia showed a significant decrease (by 5%) in the proportion of students achieving Level 5 or above.
Indigenous students’ results: ◗ Altogether, 1,143 Indigenous students were assessed in PISA 2009.
In reading literacy:
◗ On average, the performance of Indigenous Australians in reading literacy was 82 score points lower than that of non-Indigenous Australians. This difference is equivalent to more than one proficiency level or more than two full years of schooling. Indigenous students performed significantly lower than the OECD average by 57 score points.
◗ The scores for Indigenous students on the three aspect subscales and two text format subscales were also significantly lower than the scores for non-Indigenous students and the OECD average.
◗ Indigenous females performed 47 score points higher on average than Indigenous males in reading literacy. In terms of schooling, this places Indigenous males more than one year behind Indigenous females.
◗ Indigenous students were under-represented at the higher end of the reading literacy proficiency scale and over-represented at the lower end. Two per cent of Indigenous students reached Level 5 or above (compared to 13 per cent of non-Indigenous students), including 0.3 per cent of Indigenous students who achieved Level 6, and almost 40 per cent of Indigenous students did not reach Level 2. Fourteen per cent of non-Indigenous students did not reach Level 2.
In mathematical literacy:
◗ Indigenous students performed, on average, 76 score points lower than non-Indigenous students in mathematical literacy. This equates to more than one proficiency level or almost two full years of schooling.
◗ Four per cent of Indigenous students achieved Level 5 or above compared to 17 per cent of non-Indigenous students, while 41 per cent of Indigenous students did not reach Level 2 compared to 15 per cent of non-Indigenous students.
In scientific literacy:
◗ Indigenous students performed, on average, 81 score points lower than non-Indigenous students in scientific literacy. This equates to more than one proficiency level or more than two full years of schooling.
◗ Around two per cent of Indigenous students achieved Level 5 or above compared to 15 per cent of non-Indigenous students, while 35 per cent of Indigenous students did not reach Level 2 compared to 12 per cent of non-Indigenous students.
Results for the Australian school sectors: ◗ PISA results for the government, Catholic and independent school sectors in Australia are
reported specifically for 2009.

Challenges for Australian Education: Results from PISA 2009 ix
◗ Students in independent schools scored, on average, 56 score points higher than students in government schools and 21 score points higher than students in Catholic schools. Students in Catholic schools scored, on average, 35 points higher than students in government schools.
◗ It was noted that an individual student’s socioeconomic background, and the peer effect of the average socioeconomic level of the school itself, has an effect on student performance. Performance by school sector is also reported after adjusting for student and school socioeconomic background. Once differences in students’ socioeconomic background were taken into account there were no longer any statistically significant differences in the average reading, mathematical and scientific literacy scores of students from the different school sectors.
◗ Similar proportions of students in government and Catholic schools performed at the highest levels of reading literacy, with 10 per cent of students from the government school sector and 14 per cent of students from the Catholic school sector at Level 5 or above. The proportion of students from the independent school sector was higher, with 22 percent of students who achieved Level 5 or above.
◗ There were a higher proportion of students in government schools (19%) compared to Catholic schools (8%) or independent schools (5%) who did not reach Level 2 on the reading literacy proficiency scale.
Results for geographic location: ◗ The geographic location of schools was classified using the broad categories defined in the
MCEECDYA Schools Location Classification.
In reading literacy:
◗ The average reading literacy score of students attending schools in remote areas was significantly lower than that of students attending schools in either provincial areas (by 32 score points) or metropolitan areas (by 56 score points). The gap between students in metropolitan and remote schools is equivalent to three-quarters of a proficiency level or about one-and-a-half years of schooling.
◗ Six per cent of students (including only 0.4% at Level 6) from remote schools, compared to eight per cent from provincial schools and 14 per cent from metropolitan schools, performed at Level 5 or above on the reading literacy proficiency scale. Twenty-nine per cent of students from remote schools did not achieve Level 2, compared to 17 per cent in provincial schools and 13 per cent in metropolitan schools.
In mathematical literacy:
◗ In mathematical literacy, the average score of students attending remote schools was 34 score points lower than that of students attending schools in provincial areas, and 55 score points lower than that of students attending schools in metropolitan areas. The gap between students in metropolitan and remote schools was equivalent to almost one full proficiency level or almost one-and-a-half years of schooling.
◗ Eight per cent of students in remote schools performed at Level 5 or above, compared to 12 per cent of students in provincial areas and 18 per cent of students in metropolitan areas on the mathematical literacy proficiency scale. Thirty-three per cent of students in remote areas did not reach Level 2 compared to 19 per cent of students in provincial areas and 15 per cent of students in metropolitan areas.
In scientific literacy:
◗ In scientific literacy, the average score of students who attended schools in remote areas was 36 score points lower than that of students attending schools in provincial areas, and 53 score points lower than that of students in metropolitan areas. The mean score difference between students in metropolitan and remote schools equates to more than half a proficiency level or almost one-and-a-half years of schooling.

x Executive Summary
◗ At the higher end of the scientific literacy proficiency scale, only six per cent of students in remote areas achieved Level 5 or above, compared with 11 and 15 per cent of students in provincial and metropolitan schools respectively. Almost one-quarter of students in remote schools were not achieving Level 2, compared with 14 per cent of students in provincial areas and 12 per cent of students in metropolitan areas.
Results by socioeconomic background:
In PISA, the socioeconomic background of students is measured using a composite index: the index of economic, social and cultural status (ESCS), which is based on the highest level of the occupation of the students’ parents or guardians; the highest level of education of parents (converted into years of education); and an index of home possessions, including educational resources, cultural possessions and other items in the homeAcross all literacy domains, the results show the higher the level of socioeconomic background, the higher the student performance.
In reading literacy:
◗ The average reading literacy score of students in the lowest socioeconomic quartile was significantly lower than that of students in the highest socioeconomic quartile (by 91 score points). This gap is equivalent to more than one proficiency level or more than two full years of schooling.
◗ Four per cent of students from the lowest socioeconomic quartile, compared to 25 per cent of students from the highest socioeconomic quartile performed at Level 5 or above, while 25 per cent of students in the lowest socioeconomic quartile compared to five per cent of students in the highest socioeconomic quartile did not reach Level 2 on the reading literacy proficiency scale.
In mathematical literacy:
◗ In mathematical literacy, students in the lowest socioeconomic quartile scored, on average, 90 scores points lower than students in the highest socioeconomic quartile.
◗ Twenty-eight per cent of students in the lowest socioeconomic quartile were not achieving Level 2 in mathematical literacy, compared to five per cent of students in the highest socioeconomic quartile. Only six percent of students in the lowest socioeconomic quartile achieved Level 5 or above, compared with 29 per cent of students in the highest socioeconomic quartile.
In scientific literacy:
◗ In scientific literacy, the gap between students in the highest and lowest socioeconomic quartiles was, on average, 96 score points.
◗ Twenty-two per cent of students in the lowest socioeconomic quartile did not reach Level 2 in scientific literacy, compared to four per cent of students in the highest socioeconomic quartile. Only six per cent of students in the lowest socioeconomic quartile achieved Level 5 or above, compared with 28 per cent of students in the highest socioeconomic quartile.
Results for immigrant status and language background:
Immigrant status was based on students’ responses to questions regarding where they and their parents were born. Language background was based on students’ responses regarding the main language spoken at home.
Challenges for Australian Education: Results from PISA 2009 xi
In reading literacy:
◗ Australian-born students achieved at a similar level to foreign-born students. Both were significantly outperformed (by 15 score points for Australian-born students and 10 score points for foreign-born students) by first-generation students Twelve per cent of Australian-born students, 16 per cent of first-generation students and 14 per cent of foreign-born students achieved Level 5 or above in reading literacy, while 14 per cent of Australian-born students, 11 per cent of first-generation students and 15 per cent of foreign-born students did not reach Level 2.
◗ There were no significant differences in the average reading literacy performance of students who spoke English as their main language at home compared to those students whose main language at home was a language other than English.
◗ Thirteen per cent of students who spoke English at home and 20 per cent of students who spoke another language performed at Level 5 or above. There was a higher proportion of students who spoke a language other than English not reaching Level 2, compared to those students who spoke English at home (20% and 13% respectively).
In mathematical literacy:
◗ Australian-born students performed significantly lower than first-generation students (by 15 score points). No significant differences were found between the performance of Australian-born and foreign-born students, nor between the performance of first-generation and foreign-born students.
◗ Fifteen per cent of Australian-born students, 19 per cent of foreign-born students and 20 per cent of first-generation students achieved Level 5 or above, while 16 per cent of Australian-born students, 13 per cent of first-generation students and 17 per cent of foreign-born students did not reach Level 2 on the mathematical literacy proficiency scale.
◗ There were no significant differences found between students who spoke English as their main language at home and students whose main language at home was a language other than English in mathematical literacy.
◗ Twenty-two per cent of students who spoke English at home performed at Level 5 or above on the mathematical literacy proficiency scale compared to 16 per cent of students who spoke a language other than English. Twenty per cent of students from an English-speaking background did not reach Level 2 compared to 14 per cent of students whose language background at home was not English.
In scientific literacy:
◗ Australian-born students performed significantly lower than first-generation students (by 12 score points), but not statistically different to the performance of foreign-born students. First-generation students performed at a significantly higher level (by 12 score points) than foreign-born students.
◗ Fourteen per cent of Australian-born students, 17 per cent of first-generation students and 16 per cent of foreign-born students achieved Level 5 or above on the scientific literacy proficiency scale, while 12 per cent of Australian-born students, 10 per cent of first-generation students and 15 per cent of foreign-born students did not reach Level 2.
◗ Students who spoke English at home scored significantly higher in scientific literacy than students who spoke a language other than English at home, by 20 score points.
◗ Similar proportions of students who spoke English at home and students who spoke another language performed at Level 5 or above in scientific literacy, at 15 and 14 per cent respectively. At the lower end of the scientific literacy proficiency scale, there was a greater proportion of students (19 per cent) who spoke a language other than English at home who did not reach Level 2, compared to the 11 per cent of students who spoke English at home.

xii Executive Summary
In relation to socioeconomic background: ◗ The terms ‘socioeconomic gradient’ or ‘social gradient’ refer to the relationship between
an outcome and socioeconomic background. PISA data show that there is a significant relationship between students’ performance and their socioeconomic background as measured by ESCS. This relationship is evident in Australia and all other PISA countries, although the strength of the relationship differs among countries. In a graphical representation, the line of best fit for the points that represent performance against socioeconomic background (ESCS) provides information about several aspects of the relationship. This line is referred to as the socioeconomic or social gradient.
◗ The analysis of socioeconomic gradients is a means of characterising student performance and providing guidance for educational policy. Socioeconomic gradients can be used to compare the relationships between outcomes and student background across and within countries, and to examine changes in equity that occur from one cycle of PISA to another.
◗ Four types of information are relevant to a consideration of social gradients:
– The average level of the line in the graph gives an indication of how well the overall population has achieved on the given assessment. Lines at higher levels indicate higher mean performance by students.
– The strength of the relationship between achievement and socioeconomic background. The closer all the points are to the line of best fit, the greater is the strength of the relationship. This aspect of the social gradient is represented by the percentage of the variation in performance that can be explained by the ESCS index. If the percentage is large it indicates that performance is relatively highly determined by ESCS, whereas if it is small it indicates that performance is not highly determined by ESCS.
– The slope of the gradient line is an indication of the extent of inequality in the relationship between students’ results and their socioeconomic background (as measured by ESCS). A steeper slope indicates a greater difference in performance between low socioeconomic background students and high socioeconomic background students. Education systems typically aim to decrease the differences in performance between different social groups. Greater equity would thus be indicated by a flatter gradient.
– The length of the line indicates the range of ESCS. The graphs are plotted between the 5th percentile and 95th percentile of ESCS; that is, the graphs span the middle 90 per cent of the values of ESCS for each country. A smaller range indicates less difference in socioeconomic background between students from the highest and lowest socioeconomic backgrounds in the country.
◗ The slope of the gradient for Australia follows the general pattern for the international population as a whole – each increment on the PISA ESCS index is associated with a roughly consistent increase in performance on the reading literacy scale.
◗ The association between socioeconomic background and performance for Australian students is similar to that found on average over OECD countries. Almost 13 per cent of the explained variance in student performance in Australia was found to be attributable to students’ socioeconomic background.
◗ The slope of the gradient for Australia is significantly steeper than that for the OECD, indicating that the effect of socioeconomic advantage on performance is greater than for OECD countries on average. Australian students’ scores on the reading literacy scale are 46 score points higher for each extra unit on the PISA ESCS index, whereas for the OECD, on average, this increase is only 38 points.
◗ For most Australian states and territories, there is a moderately steep slope, indicating that there is a moderately strong relationship between socioeconomic background and achievement.
◗ The relationship between equity (the strength of the social gradient) and mean reading literacy was explored in 2009. In the PISA 2000 international report, Australia’s overall performance in reading literacy was described as ‘High Quality – Low Equity’, meaning that while the overall

Challenges for Australian Education: Results from PISA 2009 xiii
scores in reading literacy were higher than the OECD average, the impact of socioeconomic status was also higher than the OECD average. For this cycle, Australia still classified as a ‘High Quality’ country, having above average performance, but delivered results indicating average impact for socioeconomic background, so Australia can be classified as Average Equity.
◗ Each of the Australian states and territories are classified as Average Equity as the differences in the strength of the relationship and the OECD average is not significant.
◗ The amount of variance between schools is lower than the OECD average; the amount of variance within schools is greater. However, there is still a substantial amount of variation between schools.
◗ A large proportion of the between-schools variance is due to socioeconomic background.
◗ The highest and the smallest range of socioeconomic levels were found in the Australian Capital Territory, and of all Australian students those with the lowest ESCS were in Tasmania. The largest ranges in ESCS were found in Victoria, Queensland and New South Wales. Socioeconomic levels for both students and schools in the independent and Catholic school sectors were much higher than those for students and schools in the government sector.
◗ Regardless of their own socioeconomic background, students attending schools with a high average socioeconomic background tend to perform better than students enrolled in a school with a low average socioeconomic background.
Students’ reading habits and learning strategies: ◗ Australian students revealed the same level of enjoyment of reading, as measured by the
index, as the OECD average. Students from Shanghai – China, however, reported much greater enjoyment of reading than Australian students and also than students across OECD countries.
◗ Females reported higher levels of enjoyment of reading, on average, than males. This difference was greater among Finnish and Canadian students, while the difference between Australian females and males was similar to that found for New Zealand students and across the OECD.
◗ When asked how often they read for their own enjoyment, over one-third (37%) of Australian students reported that they do not read for their own enjoyment.
◗ Female students had higher scores in reading literacy irrespective of how much time they spent reading; however, in Australia the gap between the scores of males and females decreased as the frequency of reading increased. For students who read frequently, there was no significant gender difference in average reading literacy scores.
◗ Greater proportions of females reported reading fiction books regularly, while greater proportions of males reported reading comic books ‘a few times a year or more’ regularly.
◗ Female students also reported greater use of memorisation and control strategies when they studied than did male students. There were no differences, however, in male and female students’ use of elaboration techniques.
◗ Indigenous students, on average, reported lower rates of reading for enjoyment, less diversity of reading material and less awareness of effective strategies for understanding, remembering and summarising texts than non-Indigenous students. They also reported lower use of more general study strategies, such as memorisation and control strategies.
◗ Comparison of the average index scores of students from different socioeconomic backgrounds also found a pattern of disadvantage, with students from the lowest socioeconomic quartile scoring lower on all of the indices – reporting less enjoyment of reading, reading less often, reading less diverse materials, and using fewer study strategies than students from higher socioeconomic backgrounds.
◗ Enjoyment of reading had the strongest association with reading literacy performance, while greater use of control strategies when studying was also positively associated with higher reading literacy scores.
◗ Reading fiction and non-fiction books regularly was positively associated with reading literacy performance.

xiv Executive Summary
Characteristics of Australian schools: ◗ The average age at which Australian children commenced primary school was 5.2 years, which
was younger than for students in Singapore, Finland and Shanghai – China, whose mean age of 6.7 years.
◗ Schools in Hong Kong – China, Korea, Shanghai – China and Singapore were more likely to be academically focused than schools in Australia. Academic performance was considered more often for school admissions, language classes were more orderly and disciplined, and more students attended enrichment or remedial lessons out-of-school in these countries.
◗ Student absenteeism was identified as a factor that hindered learning in Australia. On average, one-half of Australian students attended schools in which the principal reported student absenteeism affected instruction ‘to some extent’ or ‘a lot’. This was similar to the average reported across OECD countries.
◗ Australian states reported more positive ratings of student–teacher relations than the OECD average. The Australian Capital Territory had higher ratings compared to the other states.
◗ The majority (more than 90 per cent) of Australian students in the PISA sample had attended preschool.
◗ The relationships between learning environment and student performance, between preschool attendance and student performance, and between the availability of extracurricular activities and student performance, were all found to be positive, albeit small, with correlation coefficients between 0.1 and 0.3.
◗ The association between teacher shortages and student performance was negative and small, showing the higher the level of teacher shortage, the lower the student performance.
Policy issues Australia remains committed to the principle of equity and social justice in education and to the goal of allowing and encouraging all children to fulfil their full educational potential. To a large extent, these goals are realised, as evidenced by the high average achievement levels in all three assessment domains in PISA.
However, this report has highlighted a number of challenges for Australian education:
The average scores of Australian students in reading literacy and mathematical literacy have declined significantly over the past few years.
There is a large gender gap in reading literacy, with females achieving at a much higher level than males; and a gender gap in mathematics, with males outperforming females, which was present in PISA 2006 but before then had not been seen for many years.
The relatively low performance of students in remote locations, with an average score in reading literacy almost two years of schooling lower than that of students in metropolitan schools.
Despite the better than average scores, significant levels of educational disadvantage related to socioeconomic background exist in Australia, and the performance gap between students of the same age from different backgrounds can be equivalent to up to three years of schooling. This gap places an unacceptable proportion of 15-year-old students at serious risk of not achieving levels sufficient for them to effectively participate in the 21st century workforce and to contribute to Australia as productive citizens.
Educational inequality is not a given. Some schools, some school systems, and some countries do more to mitigate inequality than others. Australia has chosen to participate in PISA in order to monitor national outcomes on a regular basis – the challenge is to act on these findings as other countries have, to lift educational outcomes for all students.

Challenges for Australian Education: Results from PISA 2009 xv
List of Tables
Table 1.1 Australian PISA 2009 schools by state and sector ....................................................... 4
Table 1.2 Australian PISA 2009 students by state and sector ...................................................... 5
Table 1.3 Distribution of students by year level and state# ........................................................ 6
Table 1.4 Australian PISA 2009 students by Indigenous status .................................................... 6
Table 1.5 Australian PISA 2009 students by geographic location................................................ 7
Table 1.6 Indigenous and non-Indigenous students by quartiles of socioeconomic background (ESCS) ..................................................................................................... 7
Table 1.7 Students attending schools in different geographic locations by quartiles of socioeconomic background (ESCS) ............................................................................. 8
Table 1.8 Australian PISA 2009 students by immigrant status ..................................................... 8
Table 1.9 Australian PISA 2009 students by language spoken at home ....................................... 8
Table 2.1 Distribution of reading literacy items, by reading aspect and item response format... 19
Table 3.1 Mean reading literacy scores, confidence intervals and variations by country ........... 52
Table 3.3 Mean reading literacy scores, confidence intervals and variations by state ............... 58
Table 3.4 Multiple comparisons of mean performance in reading literacy by state ................... 58
Table 3.6 Mean reading literacy scores (unadjusted for student and school socioeconomic background) by school sector .......................................................... 62
Table 3.7 Differences in reading literacy scores after adjustment for student and school socioeconomic background ..................................................................................... 63
Table 3.8 Mean reading literacy scores, confidence intervals and variation for Indigenous and non-Indigenous students .................................................................. 64
Table 3.9 Mean reading literacy scores by gender and gender differences by Indigenous status ................................................................................................. 64
Table 3.10 Mean reading literacy scores, confidence intervals and variations by geographic location .................................................................................................................... 65
Table 3.11 Mean reading literacy scores, confidence intervals and variations by quartiles of socioeconomic background ..................................................................................... 66
Table 3.12 Mean reading literacy scores, confidence intervals and variations by immigrant status .................................................................................................. 67
Table 3.13 Mean reading literacy scores, confidence intervals and variations by language background .............................................................................................................. 68
Table 3.14 Mean access and retrieve scores, confidence intervals and variations by country ..... 69
Table 3.15 Mean access and retrieve scores by gender and gender differences by country......... 73
Table 3.16 Mean integrate and interpret scores, confidence intervals and variations by country 75
Table 3.17 Mean integrate and interpret scores by gender and gender differences by country .... 79
Table 3.18 Mean reflect and evaluate scores, confidence intervals and variations by country .... 81
Table 3.19 Mean reflect and evaluate scores by gender and gender differences by country ........ 85
Table 3.20 Multiple comparisons of mean performance on access and retrieve by state ............ 87
Table 3.21 Multiple comparisons of mean performance on integrate and interpret by state ........ 87
Table 3.22 Multiple comparisons of mean performance on reflect and evaluate by state ........... 88
Table 3.23 Mean reading literacy subscales scores for aspect by state and gender ..................... 91
Table 3.24 Mean scores for Indigenous and non-Indigenous students on the subscales for aspect ................................................................................................................. 95
Table 3.25 Mean scores for geographic location on the subscales for aspect .............................. 96

xvi Challenges for Australian Education: Results from PISA 2009
Table 3.26 Mean scores on the subscales for aspect by quartiles of socioeconomic background .................................................................................... 97
Table 3.27 Mean continuous texts scores, confidence intervals and variations by country ......... 99
Table 3.29 Mean non-continuous texts scores, confidence intervals and variations by country .............................................................................................................. 105
Table 3.30 Mean non-continuous texts scores by gender and gender differences by country ... 109
Table 3.31 Multiple comparisons of mean performance on continuous texts by state ............... 111
Table 3.32 Multiple comparisons of mean performance on non-continuous texts by state ....... 111
Table 3.33 Mean reading literacy subscales scores for text format by state and gender............. 113
Table 3.34 Mean scores for Indigenous and non-Indigenous students on the subscales for text format ........................................................................................................ 117
Table 3.35 Mean scores for geographic location on the subscales for text format ..................... 118
Table 3.36 Mean scores on the subscales for text format by quartiles of socioeconomic background ............................................................................... 119
Table 3.37 Mean reading literacy scores for PISA 2000 and PISA 2009 and differences in performance by country ......................................................................................... 121
Table 3.38 Mean reading literacy scores by gender and gender differences by country for PISA 2000 and PISA 2009 ................................................................................. 125
Table 3.39 Percentage of males and females performing below Level 2 or achieving Level 5 or above on the reading literacy scale in PISA 2000 and PISA 2009 for Australia and the OECD average ....................................................................... 126
Table 3.40 Mean reading literacy scores for PISA 2000 and PISA 2009, and differences between performance in cycles by states .............................................................................. 127
Table 3.41 Percentage of students performing below Level 2 or achieving Level 5 or above on the reading literacy scale in PISA 2000 and PISA 2009 by state .................................... 127
Table 3.42 Mean reading literacy scores by gender and gender differences by state for PISA 2000 and PISA 2009 ....................................................................................................... 128
Table 3.43 Mean reading literacy scores for PISA 2000 and PISA 2009, and differences between performance for Indigenous students ...................................................................... 128
Table 3.44 Percentage of students performing below Level 2 or achieving Level 5 or above on the reading literacy scale in PISA 2000 and PISA 2009 by Indigenous status ................ 128
Table 4. 1 Enjoyment of Reading Index scores for selected counties, with gender difference ... 131
Table 4. 2 Percentage of students agreeing or strongly agreeing to Enjoyment of Reading items by state ....................................................................................................................... 132
Table 4. 3 Enjoyment of Reading Index scores by state, with gender difference ....................... 132
Table 4. 4 Percentage of students agreeing or strongly agreeing to Enjoyment of Reading items by Indigenous status .................................................................................................... 133
Table 4.6 Reading Literacy performance by quartiles on the Enjoyment of Reading Index ...... 134
Table 4.7 Percentage of students reading or not reading for enjoyment for selected countries, with gender difference ........................................................................................... 135
Table 4.8 Percentage of students reading for enjoyment by state ............................................ 136
Table 4.9 Percentage of students reading for enjoyment by Indigenous status ........................ 136
Table 4.10 Percentage of students reading for enjoyment by socioeconomic quartiles ............. 136
Table 4.11 Regularity of reading different materials ................................................................. 138
Table 4.12 Diversity of Reading Index scores for selected countries, with gender difference .... 138
Table 4.13 Diversity of Reading Index scores by state, with gender difference ......................... 139
Table 4.14 Regularity of reading different materials by gender ................................................. 139
Table 4.15 Mean Diversity of Reading Index scores by Indigenous status ................................. 139
Table 4.16 Regularity of reading different materials by Indigenous status ................................. 140

Challenges for Australian Education: Results from PISA 2009 xvii
Table 4.17 Diversity of Reading Index scores by socioeconomic quartile ................................. 140
Table 4.18 Correlations between Diversity of Reading Index scores, items and reading literacy 141
Table 4.19 Memorisation Strategies Index scores for selected countries, with gender difference ........................................................................................... 142
Table 4.20 Percentage of students often or always using various memorisation techniques by state ................................................................................................................... 142
Table 4.21 Memorisation Strategies Index scores by state, with gender difference .................... 143
Table 4.22 Percentage of students often or almost always using various memorisation techniques, and mean Memorisation Strategies Index scores by Indigenous status .................... 143
Table 4.23 Percentage of students often or almost always using various memorisation techniques, and mean Memorisation Strategies Index scores by socioeconomic quartiles ......... 144
Table 4.24 Elaboration Strategies Index scores for selected countries, with gender difference .. 145
Table 4.25 Percentage of students often or almost always using various elaboration techniques by state ................................................................................................................... 145
Table 4.26 Elaboration Strategies Index scores by State, with gender difference ....................... 146
Table 4.27 Percentage of students often or almost always using various elaboration techniques and mean Elaboration Strategies Index scores by Indigenous status ........................ 146
Table 4.28 Percentage of students often or almost always using various elaboration techniques and mean Elaboration Strategies Index scores by socioeconomic quartiles ............. 147
Table 4.29 Control Strategies Index scores for selected countries, with gender difference ........ 148
Table 4.30 Percentage of students often or almost always using various control techniques by state ................................................................................................................... 148
Table 4.31 Control Strategies Index scores by state, with gender difference ............................. 149
Table 4.32 Percentage of students often or almost always using various control techniques and mean Control Strategies Index scores by Indigenous status .............................. 149
Table 4.33 Percentage of students often or always using various control techniques and mean Control Strategies Index scores by socioeconomic quartiles ................... 150
Table 4.34 Mean Reading Literacy scores by quartiles on the Control Strategies Index ............. 150
Table 4.35 Understanding and Remembering Index scores for selected countries, with gender difference ........................................................................................... 151
Table 4.36 Perceived utility of various understanding and remembering techniques by state .... 152
Table 4.37 Understanding and Remembering Index scores by state, with gender difference .... 152
Table 4.38 Perceived utility of various understanding and remembering techniques, and mean Understanding and Remembering Index scores, by Indigenous status ..................... 153
Table 4.39 Perceived utility of various understanding and remembering techniques and mean Understanding and Remembering Index scores, by socioeconomic quartile ........... 154
Table 4.40 Reading Literacy performance by quartiles of the Understanding and Remembering Index ........................................................................................ 154
Table 4.41 Summarising Index scores for selected countries, with gender difference ............... 155
Table 4.42 Perceived utility of various summarising techniques by state .................................. 156
Table 4.43 Summarising Index scores by state, with gender difference ..................................... 156
Table 4.44 Perceived utility of various summarising techniques and mean Summarising Index scores, by Indigenous status .......................................................................... 157
Table 4.45 Perceived utility of various summarising techniques and mean Summarising Index scores, by socioeconomic quartile ................................................................ 158
Table 4.46 Mean Reading Literacy performance by quartiles of the Summarising Index ........... 158
Table 4.47 Correlations between reading attitudes, habits and learning strategies .................... 159
Table 5.1 Distribution of mathematical literacy items, by mathematical content and item type ......................................................................................................... 166

xviii Challenges for Australian Education: Results from PISA 2009
Table 5.2 Mean mathematical literacy scores, confidence intervals and variations by country ....................................................................................... 178
Table 5.3 Mean mathematical literacy scores by gender and gender difference by country .... 182
Table 5.4 Mean mathematical literacy scores, confidence intervals and variations by state .... 184
Table 5.5 Multiple comparisons of mean performance in mathematical literacy by state........ 184
Table 5.6 Mean mathematical literacy scores by gender and gender differences by state ....... 185
Table 5.7 Mean mathematical literacy scores (unadjusted for student and school socioeconomic background) by school sector ...................................... 188
Table 5.8 Differences in mathematical literacy scores after adjustment for student and school socioeconomic background ................................................................. 188
Table 5.9 Mean mathematical literacy scores, confidence intervals and variations for Indigenous and non-Indigenous students .......................................................... 189
Table 5.10 Mean mathematical literacy scores by gender and gender differences by Indigenous status ............................................................................................... 189
Table 5.11 Mean mathematical literacy scores, confidence intervals and variations by geographic location ........................................................................................... 191
Table 5.12 Mean mathematical literacy scores, confidence intervals and variations by quartiles of socioeconomic background ............................................................ 192
Table 5.13 Mean mathematical literacy, confidence intervals and variations scores by immigrant status ................................................................................................ 193
Table 5.14 Mean mathematical literacy scores, confidence intervals and variations by language background ........................................................................................ 193
Table 5.15 Mean mathematical literacy scores for PISA 2003 and PISA 2009, and differences in performance between cycles by country .................................... 195
Table 5.16 Mean mathematical literacy scores for PISA 2003, PISA 2006 and PISA 2009, and differences in performance between cycles by state and for Australia overall .......... 198
Table 5.17 Percentage of students performing below Level 2 or achieving Level 5 or above on the mathematical literacy scale in PISA 2003 and 2009 by state and for Australia overall ............................................................................. 198
Table 5.18 Mean mathematical literacy scores for PISA 2000, PISA 2003 and PISA 2009, and differences in performance between cycles for Indigenous students ................ 199
Table 5.19 Percentage of students performing below Level 2 or achieving Level 5 or above on the mathematical literacy scale in PISA 2003 and PISA 2009 by Indigenous status ....... 199
Table 6.1 Distribution of scientific literacy items, by science competencies and content area in PISA 2006 and PISA 2009 ..................................................................................... 208
Table 6.2 Mean scientific literacy scores, confidence intervals and variations by country ...... 222
Table 6.3 Mean scientific literacy scores by gender and gender difference by country ........... 226
Table 6.4 Mean scientific literacy scores, confidence intervals and variations by state ........... 228
Table 6.5 Multiple comparisons of mean performance in scientific literacy by state ............... 228
Table 6.6 Mean scientific literacy scores by gender and gender differences by state ............... 229
Table 6.7 Mean scientific literacy scores (unadjusted for student and school socioeconomic background) by school sector ........................................................ 232
Table 6.8 Differences in scientific literacy scores after adjustment for student and school socioeconomic background ................................................................................... 232
Table 6.9 Mean scientific literacy scores, confidence intervals and variations for Indigenous and non-Indigenous students .......................................................... 233
Table 6.10 Mean scientific literacy scores by gender and gender differences by Indigenous status .............................................................................................. 233
Table 6.11 Mean scientific literacy scores, confidence intervals and variations by geographic location ........................................................................................... 234
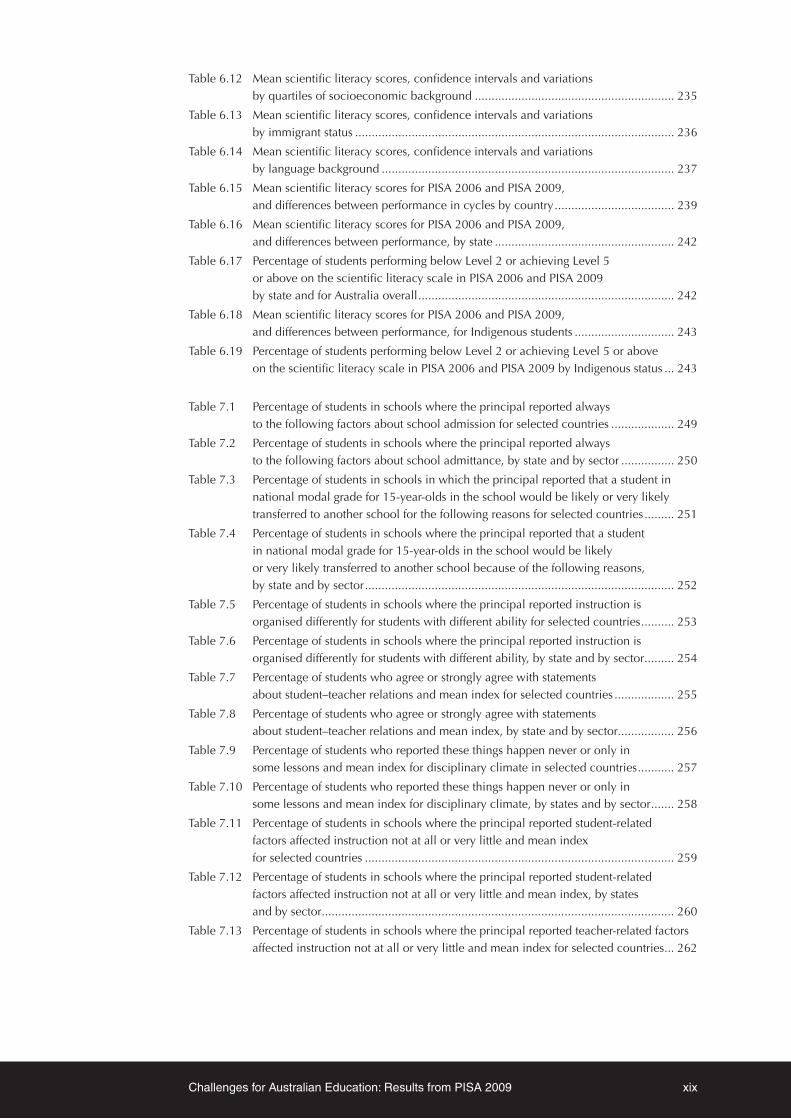
Challenges for Australian Education: Results from PISA 2009 xix
Table 6.12 Mean scientific literacy scores, confidence intervals and variations by quartiles of socioeconomic background ............................................................ 235
Table 6.13 Mean scientific literacy scores, confidence intervals and variations by immigrant status ................................................................................................ 236
Table 6.14 Mean scientific literacy scores, confidence intervals and variations by language background ........................................................................................ 237
Table 6.15 Mean scientific literacy scores for PISA 2006 and PISA 2009, and differences between performance in cycles by country .................................... 239
Table 6.16 Mean scientific literacy scores for PISA 2006 and PISA 2009, and differences between performance, by state ...................................................... 242
Table 6.17 Percentage of students performing below Level 2 or achieving Level 5 or above on the scientific literacy scale in PISA 2006 and PISA 2009 by state and for Australia overall ............................................................................. 242
Table 6.18 Mean scientific literacy scores for PISA 2006 and PISA 2009, and differences between performance, for Indigenous students .............................. 243
Table 6.19 Percentage of students performing below Level 2 or achieving Level 5 or above on the scientific literacy scale in PISA 2006 and PISA 2009 by Indigenous status ... 243
Table 7.1 Percentage of students in schools where the principal reported always to the following factors about school admission for selected countries ................... 249
Table 7.2 Percentage of students in schools where the principal reported always to the following factors about school admittance, by state and by sector ................ 250
Table 7.3 Percentage of students in schools in which the principal reported that a student in national modal grade for 15-year-olds in the school would be likely or very likely transferred to another school for the following reasons for selected countries ......... 251
Table 7.4 Percentage of students in schools where the principal reported that a student in national modal grade for 15-year-olds in the school would be likely or very likely transferred to another school because of the following reasons, by state and by sector ............................................................................................. 252
Table 7.5 Percentage of students in schools where the principal reported instruction is organised differently for students with different ability for selected countries .......... 253
Table 7.6 Percentage of students in schools where the principal reported instruction is organised differently for students with different ability, by state and by sector ......... 254
Table 7.7 Percentage of students who agree or strongly agree with statements about student–teacher relations and mean index for selected countries .................. 255
Table 7.8 Percentage of students who agree or strongly agree with statements about student–teacher relations and mean index, by state and by sector................. 256
Table 7.9 Percentage of students who reported these things happen never or only in some lessons and mean index for disciplinary climate in selected countries ........... 257
Table 7.10 Percentage of students who reported these things happen never or only in some lessons and mean index for disciplinary climate, by states and by sector ....... 258
Table 7.11 Percentage of students in schools where the principal reported student-related factors affected instruction not at all or very little and mean index for selected countries ............................................................................................. 259
Table 7.12 Percentage of students in schools where the principal reported student-related factors affected instruction not at all or very little and mean index, by states and by sector .......................................................................................................... 260
Table 7.13 Percentage of students in schools where the principal reported teacher-related factors affected instruction not at all or very little and mean index for selected countries ... 262

xx Challenges for Australian Education: Results from PISA 2009
Table 7.14 Percentage of students in schools where the principal reported teacher-related factors affected instruction not at all or very little and mean index, by state and by sector .......................................................................................................... 262
Table 7.15 School autonomy in allocating resources index by selected countries .................... 263
Table 7.16 School autonomy in resource allocation index by state and sector ......................... 264
Table 7.17 School autonomy in curriculum and assessment index by selected countries ......... 264
Table 7.18 School autonomy in curriculum and assessment index by state and sector ............. 265
Table 7.19 Percentage of students who attended preschool for selected countries .................... 266
Table 7.20 Percentage of students who attended preschool by state and by sector ................... 266
Table 7.21 Mean learning time at school in the language of instruction, mathematics and science for selected countries .......................................................................... 267
Table 7.22 Mean learning time at school in the language of instruction, mathematics and science, by state and by sector ........................................................................ 268
Table 7.23 Percentage of students attending out-of-school enrichment or remedial lessons for selected countries ............................................................................................. 269
Table 7.24 Percentage of students attending out-of-school enrichment or remedial lessons by state and by sector ............................................................................................. 269
Table 7.25 Extracurricular Activities Index by selected countries .............................................. 270
Table 7.26 Extracurricular activities index by state and by sector ............................................. 271
Table 7.27 Teacher Shortage Index by selected countries ......................................................... 271
Table 7.28 Teacher Shortage Index by state and by sector ........................................................ 272
Table 7.29 Correlations between student performance and selecting and organising student constructs, for Australia overall, for Australian states, and for the school sectors ..... 273
Table 7.30 Correlations between student performance and learning environment constructs for Australia overall, for Australian states, and for school sectors ............................. 273
Table 7.31 Correlations between student performance and school autonomy constructs for Australia overall, for Australian states, and for school sectors ............................. 274
Table 7.32 Correlations between student performance and time spent in the language of instruction, and student performance and extracurricular activities, for Australia overall, for Australian states, and for school sectors ............................. 275
Table 7.33 Correlations between teacher shortages and student performance for Australia overall, for Australian states, and for school sectors ............................. 275
Table 8.1 Socioeconomic relationships for Australia and selected countries ........................... 282

Challenges for Australian Education: Results from PISA 2009 xxi
Figure 1.1 Countries participating in PISA 2009 .......................................................................... 3
Figure 2.1 Main features of the PISA 2009 reading literacy framework ...................................... 13
Figure 2.2 The relationship between items and students on the reading literacy scale ............... 21
Figure 2.3 Summary descriptions of the seven proficiency levels on the overall reading literacy scale ............................................................................................................ 22
Figure 2.4 Summary descriptions of the seven proficiency levels on the reading subscales for aspect (access and retrieve, integrate and interpret, and reflect and evaluate) ...... 24
Figure 2.5 Summary descriptions of the seven proficiency levels on the reading subscales for text format (continuous texts and non-continuous texts) ...................................... 25
Figure 2.6 Aspect (access and retrieve, integrate and interpret, and reflect and evaluate) and text format (continuous and non-continuous) of the sample reading literacy items by proficiency level location ........................................................................... 26
Figure 3.1 Reading literacy proficiency levels by country .......................................................... 54
Figure 3.2 Proficiency levels for students in reading literacy by gender, Australia and OECD average .................................................................................... 57
Figure 3.3 Proficiency levels in reading literacy by state ............................................................ 60
Figure 3.4 Proficiency levels in reading literacy by state and gender ......................................... 61
Figure 3.5 Proficiency levels in reading literacy by school sector .............................................. 63
Figure 3.6 Proficiency levels for Indigenous and non-Indigenous students in reading literacy .... 64
Figure 3.7 Proficiency levels in reading literacy by geographic location .................................... 65
Figure 3.8 Proficiency levels in reading literacy by socioeconomic background ........................ 66
Figure 3.9 Proficiency levels in reading literacy by immigrant status ......................................... 67
Figure 3.10 Proficiency levels in reading literacy by language background ................................. 68
Figure 3.11 Proficiency levels for students on access and retrieve by country .............................. 71
Figure 3.12 Proficiency levels for students on access and retrieve by gender, Australia and OECD average .................................................................................... 74
Figure 3.13 Proficiency levels for students on integrate and interpret by country ......................... 77
Figure 3.14 Proficiency levels for students on integrate and interpret by gender, Australia and OECD average .................................................................................... 80
Figure 3.15 Proficiency levels for students on reflect and evaluate by country ............................. 83
Figure 3.16 Proficiency levels for students on reflect and evaluate by gender, Australia and OECD average .................................................................................... 86
Figure 3.17 Proficiency levels on access and retrieve by state ..................................................... 89
Figure 3.18 Proficiency levels on integrate and interpret by state ................................................ 90
Figure 3.19 Proficiency levels on reflect and evaluate by state .................................................... 91
Figure 3.20 Proficiency levels on access and retrieve by state and gender ................................... 92
Figure 3.21 Proficiency levels on integrate and interpret by state and gender .............................. 93
Figure 3.22 Proficiency levels on reflect and evaluate by state and gender .................................. 94
Figure 3.23 Proficiency levels for Indigenous and non-Indigenous students on the subscales for aspect ................................................................................................................. 95
Figure 3.24 Proficiency levels for geographic location on the subscales for aspect ...................... 97
Figure 3.26 Proficiency levels for students on continuous texts by country ................................ 101
Figure 3.27 Proficiency levels for Australian students on continuous texts by gender ................. 104
Figure 3.28 Proficiency levels for students on non-continuous texts by country......................... 107
List of Figures

xxii Challenges for Australian Education: Results from PISA 2009
Figure 3.29 Proficiency levels for Australian students on non-continuous texts by gender ......... 110
Figure 3.30 Proficiency levels on continuous texts by state ....................................................... 112
Figure 3.31 Proficiency levels on non-continuous texts by state ................................................ 113
Figure 3.32 Proficiency levels on continuous texts by state and gender ..................................... 114
Figure 3.33 Proficiency levels on non-continuous texts by state and gender .............................. 116
Figure 3.34 Proficiency levels for Indigenous and non-Indigenous students on the subscales for text format ........................................................................................................ 117
Figure 3.35 Proficiency levels for geographic location on the subscales for text format ............. 118
Figure 3.36 Proficiency levels for socioeconomic background on the subscales for text format . 119
Figure 3.37 Percentage of students performing below Level 2 on the reading literacy scale in PISA 2000 and PISA 2009 by country ................................................................. 123
Figure 3.38 Percentage of students performing at Level 5 or above on the reading literacy scale in PISA 2000 and PISA 2009 by country ................................................................. 124
Figure 4. 1 Summary of reading attitudes and habits measured in PISA 2009 ........................... 130
Figure 4.2 Mean reading literacy scores by frequency of reading for enjoyment, by gender..... 137
Figure 5.1 The components of the PISA mathematical literacy framework ............................... 164
Figure 5.2 Summary descriptions of the six proficiency levels on the overall mathematical literacy scale .................................................................................... 167
Figure 5.3 Sample items and cut-off score points for the mathematical literacy proficiency scale ........................................................................................ 168
Figure 5.4 Mathematical literacy proficiency levels by country ............................................... 180
Figure 5.5 Proficiency levels for students in mathematical literacy by gender, Australia and OECD average .................................................................................. 183
Figure 5.6 Proficiency levels in mathematical literacy by state ................................................ 185
Figure 5.7 Proficiency levels in mathematical literacy by state and gender .............................. 187
Figure 5.8 Proficiency levels in mathematical literacy by school sector ................................... 189
Figure 5.9 Proficiency levels for Indigenous and non-Indigenous students in mathematical literacy ......................................................................................... 190
Figure 5.10 Proficiency levels in mathematical literacy by geographic location ........................ 191
Figure 5.11 Proficiency levels in mathematical literacy by socioeconomic background ............ 192
Figure 5.12 Proficiency levels in mathematical literacy by immigrant status .............................. 193
Figure 5.13 Proficiency levels in mathematical literacy by language background ...................... 194
Figure 5.14 Percentage of students peforming below Level 2 on the mathematical literacy scale in PISA 2003 and PISA 2009 by country ................................................................. 196
Figure 5.15 Percentage of students performing at Level 5 or above on the mathematical literacy scale in PISA 2003 and PISA 2009 by country...................... 197
Figure 6.1 The components of the PISA scientific literacy framework ...................................... 203
Figure 6.2 Contexts for the PISA scientific literacy assessment ................................................. 204
Figure 6.3 PISA scientific competencies ................................................................................. 204
Figure 6.4 PISA categories of knowledge of science ................................................................ 206
Figure 6.5 PISA categories of knowledge about science .......................................................... 207
Figure 6.6 Summary descriptions of the six proficiency levels on the overall scientific literacy scale ........................................................................................... 209
Figure 6.7 Sample items and cut-off score points for the scientific literacy proficiency scale ... 210
Figure 6.8 Scientific literacy proficiency levels by country ...................................................... 224
Figure 6.9 Proficiency levels for students in scientific literacy by gender, Australia and OECD average .................................................................................. 227

Challenges for Australian Education: Results from PISA 2009 xxiii
Figure 6.10 Proficiency levels in scientific literacy by state ....................................................... 230
Figure 6.11 Proficiency levels in scientific literacy by state and gender ..................................... 231
Figure 6.12 Proficiency levels in scientific literacy by school sector .......................................... 233
Figure 6.13 Proficiency levels for Indigenous and non-Indigenous students in scientific literacy ................................................................................................ 234
Figure 6.14 Proficiency levels in scientific literacy by geographic location ................................ 235
Figure 6.15 Proficiency levels in scientific literacy by socioeconomic background.................... 236
Figure 6.16 Proficiency levels in scientific literacy by immigrant status ..................................... 237
Figure 6.17 Proficiency levels in scientific literacy by language background ............................. 237
Figure 6.18 Percentage of students performing below Level 2 on the scientific literacy scale in PISA 2006 and PISA 2009 by country ................................................................. 240
Figure 6.19 Percentage of students performing at Level 5 or above on the scientific literacy scale in PISA 2006 and PISA 2009 by country ................................................................. 241
Figure 7.1 Age of students when starting primary school by country ....................................... 247
Figure 7.2 Age of students, including minimum age requirements, when starting primary school by state .......................................................................................... 247
Figure 8.1 Socioeconomic gradients for Australia and the OECD ............................................ 280
Figure 8.2 Socioeconomic gradients for Australia and selected countries ................................ 281
Figure 8.3 Socioeconomic gradients for Australia and the states and territories ....................... 283
Figure 8.4 Socioeconomic gradients for South Australia and the Australian Capital Territory ... 283
Figure 8.5 Equity of performance in reading literacy .............................................................. 284
Figure 8.6 Variation in reading literacy performance between and within schools................... 286
Figure 8.7 Variation in reading literacy performance explained by students’ and schools’ socioeconomic background. .................................................................................. 288
Figure 8.8 Effects of students’ and schools’ socioeconomic background on reading literacy performance ............................................................................. 290
Figure 8.9 Range of students’ socio-economic backgrounds .................................................... 291
Figure 8.10 Range of schools’ socioeconomic backgrounds ...................................................... 293

xxiv Challenges for Australian Education: Results from PISA 2009
AcknowledgementsThe Commonwealth, state and territory governments provided the funding for the Australian component of the 2009 PISA assessment. All of Australia’s share of the international overheads and half of the basic funding for PISA within Australia was contributed by the Australian Government Department of Education, Employment and Workplace Relations, while each state and territory government school system provided funding in proportion to the numbers of 15-year-old students enrolled in their schools. The Australian Government also met the additional cost of increasing the size of the sample for PISA 2009 to enable it to become the basis for a cohort of the Longitudinal Surveys of Australian Youth.
In Australia, PISA is guided by a National Advisory Committee (NAC). ACER wishes to thank the NAC members for their continued interest and commitment throughout every phase of the project. Their involvement included reviewing assessment items, assisting with the implementation of PISA in schools from their state and territory, and providing valuable information to ensure the success of PISA in Australia.
Appreciation is also extended to Kristie Van Omme, Eve Postle and Jessica Yelavich, from the Australian Government Department of Education, Employment and Workplace Relations for their constructive comments and suggestions during the preparation of the national report.
The undertaking of PISA 2009 was a collaborative effort. A national survey such as PISA could not be successful without the cooperation of school systems, principals, teachers, students and parents. For high quality data, a high participation rate of the randomly selected schools and students is essential, and it is thanks to this level of cooperation that Australia was able to satisfy the internationally set response criteria fully for PISA 2009. ACER gratefully acknowledges the assistance of education system officials Australia-wide, and the principals, teachers and students in the participating schools who so generously gave their time and support to the project.
Challenges for Australian Education: Results from PISA 2009 xxv
Reader’s Guide
OECD average
An OECD average was calculated for most indicators in this report and is presented for comparative purposes. The OECD average represents OECD countries as a single entity, and each country contributes to the average with equal weight. The OECD average is equivalent to the arithmetic mean of the respective country statistics.
Rounding of figures
Because of rounding, some figures in tables may not exactly add to the totals. Totals, differences and averages are always calculated on the basis of exact numbers and are rounded only after calculation. When standard errors have been rounded to one or two decimal places and the value 0.0 or 0.00 is shown, this does not imply that the standard error is zero, but that it is smaller than 0.05 or 0.005 respectively.
Reporting of student data
The report uses “15-year-olds” as shorthand for the PISA target population. In practice, the target population is students who were aged between 15 years and 3 (complete) months and 16 years and 2 (complete) months at the beginning of the assessment period and who were enrolled in an educational institution that they were attending full-time or part-time.
Confidence intervals and standard errors
In this and other reports, student achievement is often described by a mean score. For PISA, each mean score is calculated from the sample of students who undertook the PISA assessment, and is referred to as the sample mean. These sample means are an approximation of the actual mean score, known as the population mean, which would have been obtained had all students in Australia actually sat the PISA assessment. Since the sample mean is just one point along the range of student achievement scores, more information is needed to gauge whether the sample mean is an under-estimation or over-estimation of the population mean. The calculation of confidence intervals can assist assessment of a sample mean’s precision as a population mean. Confidence intervals provide a range of scores within which we are ‘confident’ that the population mean actually lies. In this report, sample means are presented with an associated standard error. The confidence interval, which can be calculated using the standard error, indicates that there is a 95 per cent chance that the actual population mean lies within plus or minus 1.96 standard errors of the sample mean.
Bonferroni correction
The Bonferroni correction states that if an experimenter is testing “n” independent hypotheses on a set of data, then the statistical significance level that should be used for each hypothesis separately is 1/n times what it would be if only one hypothesis were tested. The Bonferroni correction was used in the multiple comparison tables in PISA 2000 and PISA 2003. However, it is widely acknowledged that there are technical issues with using the Bonferroni correction for such a large group of countries, and that its results are very conservative. As such, the Bonferroni correction has not been used in PISA 2009.
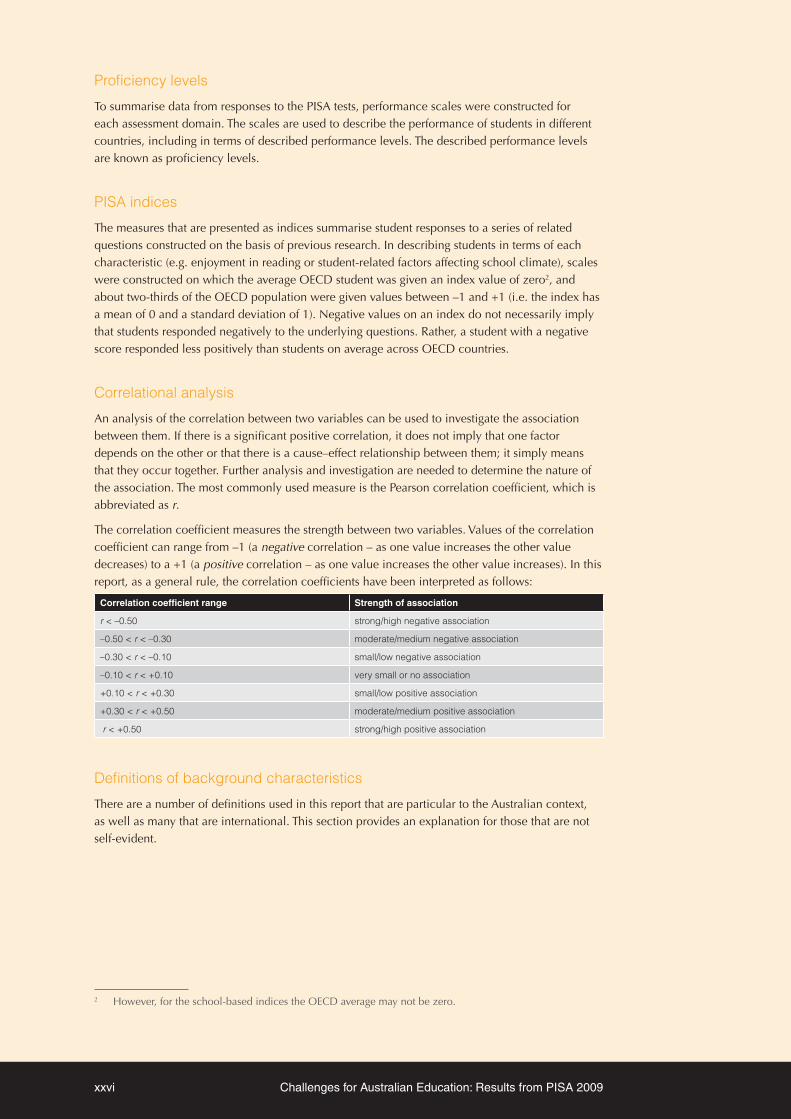
xxvi Challenges for Australian Education: Results from PISA 2009
Proficiency levels
To summarise data from responses to the PISA tests, performance scales were constructed for each assessment domain. The scales are used to describe the performance of students in different countries, including in terms of described performance levels. The described performance levels are known as proficiency levels.
PISA indices
The measures that are presented as indices summarise student responses to a series of related questions constructed on the basis of previous research. In describing students in terms of each characteristic (e.g. enjoyment in reading or student-related factors affecting school climate), scales were constructed on which the average OECD student was given an index value of zero2, and about two-thirds of the OECD population were given values between –1 and +1 (i.e. the index has a mean of 0 and a standard deviation of 1). Negative values on an index do not necessarily imply that students responded negatively to the underlying questions. Rather, a student with a negative score responded less positively than students on average across OECD countries.
Correlational analysis
An analysis of the correlation between two variables can be used to investigate the association between them. If there is a significant positive correlation, it does not imply that one factor depends on the other or that there is a cause–effect relationship between them; it simply means that they occur together. Further analysis and investigation are needed to determine the nature of the association. The most commonly used measure is the Pearson correlation coefficient, which is abbreviated as r.
The correlation coefficient measures the strength between two variables. Values of the correlation coefficient can range from –1 (a negative correlation – as one value increases the other value decreases) to a +1 (a positive correlation – as one value increases the other value increases). In this report, as a general rule, the correlation coefficients have been interpreted as follows:
Correlation coefficient range Strength of association
r < –0.50 strong/high negative association
–0.50 < r < –0.30 moderate/medium negative association
–0.30 < r < –0.10 small/low negative association
–0.10 < r < +0.10 very small or no association
+0.10 < r < +0.30 small/low positive association
+0.30 < r < +0.50 moderate/medium positive association
r < +0.50 strong/high positive association
Definitions of background characteristics
There are a number of definitions used in this report that are particular to the Australian context, as well as many that are international. This section provides an explanation for those that are not self-evident.
2 However, for the school-based indices the OECD average may not be zero.

Challenges for Australian Education: Results from PISA 2009 xxvii
Indigenous status
Indigenous status is derived from information provided by the school, which was taken from school records. Students were identified as being of Australian Aboriginal or Torres Strait Islander descent. For the purposes of this report, data for the two groups are presented together under the term “Indigenous Australian students”.
Socioeconomic background
Two measures are used by the OECD to represent elements of socioeconomic background. One is the highest level of the father’s and mother’s occupation (known as HISEI), which is coded in accordance with the International Standard Classification of Occupations. The other measure is the index of economic, social and cultural status (ESCS), which was created to capture the wider aspects of a student’s family and home background. The ESCS is based on three indices: the highest occupational status of parents (HISEI), the highest educational level of parents in years of education (PARED), and home possessions (HOMEPOS). The index of home possessions (HOMEPOS) comprises all items on the indices of family wealth, cultural resources, access to home educational and cultural resources, and books in the home.
Geographic location
In Australia, participating schools were coded with respect to the MCEECDYA Schools Geographic Location Classification. For the analysis in this report, only the broadest categories are used:
◗ Metropolitan – including mainland state capital cities or major urban districts with a population of 100,000 or more (e.g. Queanbeyan, Cairns, Geelong, Hobart)
◗ Provincial – including provincial cities and other non-remote provincial areas (e.g. Darwin, Ballarat, Bundaberg, Geraldton, Tamworth)
◗ Remote – Remote areas and very remote areas. Remote: very restricted accessibility of goods, services and opportunities for social interaction (e.g. Coolabah, Mallacoota, Capella, Mt Isa, Port Lincoln, Port Hedland, Swansea, Alice Springs). Very remote: very little accessibility of goods, services and opportunities for social interaction (e.g. Bourke, Thursday Island, Yalata, Condingup, Nhulunbuy).
Immigrant status
For the analysis in this report, immigrant status has been defined by the following categories:
◗ Australian-born students – students born in Australia with both parents born in Australia
◗ First-generation students – students born in Australia with at least one parent born overseas
◗ Foreign-born students – students born overseas with both parents also born overseas.

xxviii Challenges for Australian Education: Results from PISA 2009

Challenges for Australian Education: Results from PISA 2009 1
The main goals of PISAPISA seeks to measure how well young adults, at age 15 and therefore near the end of compulsory schooling in most participating education systems, are prepared to use knowledge and skills in particular areas to meet real-life challenges. This is in contrast to assessments that seek to measure the extent to which students have mastered a specific curriculum. PISA’s orientation reflects a change in the goals and objectives of curricula, which increasingly address how well students are able to apply what they learn at school.
As part of the PISA process, students complete an assessment on reading literacy, mathematical literacy and scientific literacy as well as an extensive background questionnaire. School principals complete a survey describing the context of education at their school, including the level of resources in the school and qualifications of staff. The reporting of the findings from PISA is then able to focus on issues such as:
◗ How well are young adults prepared to meet the challenges of the future? Can they analyse, reason and communicate their ideas effectively? What skills do they possess that will facilitate their capacity to adapt to rapid societal change?
◗ Are some ways of organising schools or school learning more effective than others?
◗ What influence does the quality of school resources have on student outcomes?
◗ What educational structures and practices maximise the opportunities of students from disadvantaged backgrounds? How equitable is the provision of education within a country or across countries?
Features of PISA 2009The fourth assessment of PISA, completed in 2009, marked not only the beginning of a new round of PISA but a return to reading literacy as the major focus. In PISA 2009:
◗ the reading literacy framework was revised to reflect changes since 2000 in the way people read and to incorporate the assessment of digital media.
◗ the assessment focused on how well students access and retrieve information; how well students integrate and interpret what they read; and how well students reflect on and evaluate what they read.
◗ the reading literacy proficiency scale was extended to obtain more detailed descriptions at the lower and the higher ends of the scale in order to better describe the performance of lower and higher performing students.
◗ changes in reading literacy performance from PISA 2000 could be examined.
Chapter
1 Introduction

2 Introduction
◗ the student questionnaire reflected the main cognitive assessment area (reading literacy) by asking students about their engagement in reading activities and use of different learning strategies.
◗ twenty countries, including Australia, undertook an assessment of the reading of digital texts.
Implementing PISA
What do PISA participants do?
Cognitive Assessment Booklets
In PISA 2009, the majority of the assessment was devoted to reading literacy, with mathematical literacy and scientific literacy assessed to a lesser extent. Participating students each responded to a two-hour paper-and-pen assessment. In all, there were 13 assessment booklets that contained questions about one or more of the domains being tested, with all booklets containing reading items. This resulted in a total of about seven hours of assessment items.
A sub-sample of students who participated in the paper-and-pen assessment also completed an electronic assessment of reading literacy, which used the information technology infrastructure at schools and took 40-minutes to complete.
Context Questionnaires
The data collected in the 35-minute Student Questionnaire provides an opportunity to investigate factors that may influence performance and consequently provide context to the achievement scores. A set of ‘core’ questions are collected in each cycle about the student and their family background, (including age, year level and socioeconomic status). Students were also asked about their engagement with reading, reading activities, learning strategies, and aspects of instruction (including instructional time and class size).
Australia also took part in two of the international optional questionnaires: one on students’ familiarity with information and communication technology (ICT) and another on educational career paths. These questionnaires were incorporated into the student questionnaire.
Information at school-level was collected through a 30-minute online School Questionnaire, answered by the principal (or the principal’s designate). The questionnaire sought descriptive information about the school and information about instructional practices.
Time of Testing
PISA standards stipulate that testing should take place in the second half of the academic year. In Australia, the PISA assessment took place in a six-week period, from late July to early September 2009. For most countries in the Northern Hemisphere, the testing period was between March and May. Together with appropriate application of the student age definition, this resulted in the students in Australia being at both a comparable age and a comparable stage in the school year to those in the Northern Hemisphere who had been tested earlier in 2009.

Challenges for Australian Education: Results from PISA 2009 3
Participants in PISA 2009
Countries
Although PISA was originally created by OECD governments, it has become a major assessment tool in many regions and countries around the world. Since the first PISA assessment in 2000, the number of countries or economic regions who have participated from one PISA cycle to the next has increased. Sixty-five countries participated in PISA 2009 with 34 OECD countries and 31 partner countries/economies3 (Figure 1.1).
AlbaniaArgentinaAzerbaijanBrazilBulgariaChinese TaipeiColombiaCroatiaDubai (UAE)Hong Kong – ChinaIndonesiaJordan
KazakhstanKyrgyzstanLatviaLiechtensteinLithuaniaMacao – ChinaMontenegroPanamaPeruQatarRomaniaRussian Federation
SerbiaShanghai – ChinaSingaporeThailandTrinidad and TobagoTunisiaUruguay
Partner Countries/EconomiesAustraliaAustriaBelgiumCanadaChileCzech RepublicDenmarkEstoniaFinlandFranceGermanyGreece
HungaryIcelandIrelandIsraelItalyJapanKoreaLuxembourgMexicoNetherlandsNew ZealandNorway
PolandPortugalSlovak RepublicSloveniaSpainSwedenSwitzerlandTurkeyUnited KingdomUnited States
OECD Countries
Figure 1.1 Countries participating in PISA 20094
During 2010, a further nine countries/economies (Costa Rica, Georgia, Himachal Pradesh – India, Malaysia, Malta, Miranda – Venezuela, Nadu – India, Netherlands – Antilles and Vietnam) participated in a second round of PISA 2009, called PISA Plus. The results for PISA Plus will be released in 2011.
3 Throughout this report, for ease, an economic region such as Shanghai – China is referred to as a country.4 Although 65 countries participated in PISA 2009, only those countries with a mean score higher than the
lowest scoring OECD country, Mexico, have been reported in this publication.

4 Introduction
Schools
In most countries, 150 schools and 35 students in each school were randomly selected to participate in PISA. In some countries, including Australia, a larger sample of schools and students participated. This allows for countries to carry out specific national options at the same time as the PISA assessment, or for meaningful comparisons to be made between different sub-groups of the population.
In each PISA cycle, a larger sample of Australian schools and students has participated in PISA for three main reasons:
◗ In order that comparisons can be made between states5. It is necessary to ‘oversample’ the smaller states because a random sample proportionate to state populations would not yield sufficient students in the smaller states to give a result that would be sufficiently precise.
◗ To ensure there is a sufficiently large sample of Australia’s Indigenous students, so that valid and reliable separate analysis can be conducted.
◗ Since PISA 2003, the Australian PISA sample has been used as a cohort for the Longitudinal Surveys of Australian Youth6 (LSAY). These students will be tracked, and contacted in future years to trace their progress through school and entry into further education and the work force. A large sample is needed to allow for attrition: over time a proportion of the original sample is not able to be traced.
In PISA 2009, there were 353 schools in the achieved sample. The sample was designed so that schools were selected with a probability proportional to the enrolment of 15-year-olds in each school. Several variables were used in the stratification of the school sample including state, school sector, geographic location, gender of students at the school and a socioeconomic background variable7. Table 1.1 shows the distribution of the schools by state and sector that participated in the Australian PISA sample in 2009.
Table 1.1 Australian PISA 2009 schools by state and sector8
StateSector
TotalCatholic Government Independent
ACT 8 13 4 25
NSW 17 52 12 81
VIC 13 35 11 59
QLD 11 39 11 61
SA 7 26 8 41
WA 7 22 9 38
TAS 6 21 4 31
NT 4 9 4 17
Total 73 217 63 353
Eighty-six per cent of the Australian PISA schools were co-educational. The number of all-female and all-male single-sex schools was similar (eight per cent and six per cent respectively). Sixteen per cent of single-sex schools were government schools, approximately 57 per cent were Catholic and 27 per cent were independent.
The PISA participating schools were also stratified with respect to the MCEECDYA Schools Geographic Location Classification9. In PISA 2009, 68 per cent of schools were located in a metropolitan zone, 28 per cent were from provincial zones and around four per cent of schools were in remote areas.
5 Throughout this report, the Australian states and territories will be collectively referred to as ‘the states’.6 LSAY is a program of longitudinal surveys that follows the progress of young people from their mid-teens
to mid-twenties and is managed by the Department of Education, Employment and Workplace Relations (DEEWR).
7 Based on the Australian Bureau of Statistic’s Socio-Economic Indexes for Areas SEIFA index (SEIFA).8 Based on unweighted data.9 Refer to the Reader’s Guide for a complete definition.

Challenges for Australian Education: Results from PISA 2009 5
Students
The target population for PISA is students who are 15 years old10 and enrolled at an educational institution, either full- or part-time, at the time of testing. An age-based sample, focusing on students nearing the end of compulsory schooling, was chosen over a grade-based sample because of the complexities of defining an internationally comparable sample based on grade. There are many differences between the countries with regard to the nature of pre-school education and the age at which formal education commences. These differences also exist within Australia.
Internationally, the desired minimum number of students to be assessed per country is 4,500. From each country, a random sample of 35 students is selected with equal probability from each school using a list of all 15-year-old students that is submitted by the school. In some countries, including Australia, Belgium, Canada, Italy, Mexico, Spain, Switzerland and the United Kingdom, the sample size was increased so that particular language groups or regions could be adequately represented or for other agreed purposes. In a few small countries, such as Iceland, Liechtenstein and Luxembourg, the whole cohort of age-eligible students was assessed. Almost half-a-million students, representing 26 million 15-year-old students, took part in PISA 2009.
In PISA 2009, the Australian student sample was refined to improve sampling methodologies. This resulted in 48 non-Indigenous students and all age-eligible Indigenous students being sampled per school.
The Australian PISA 2009 sample of 14,251 students, whose results are featured in the national and international reports, was drawn from all states and school sectors according to the distributions shown in Table 1.2.
Table 1.2 Australian PISA 2009 students by state and sector
StateTotal
ACT NSW VIC QLD SA WA TAS NT
Government
N students* 528 2177 1279 1649 920 842 867 453 8715
Weighted N# 2366 47275 32117 32269 10559 13983 3981 1296 143846
Catholic
N students* 355 676 542 456 304 321 272 172 3098
Weighted N# 1481 17319 14815 9168 3524 5450 1132 252 53141
Independent
N students* 153 460 475 426 300 323 138 163 2438
Weighted N# 752 11504 11298 9313 3885 5704 870 537 43863
Totals
N students* 1036 3313 2296 2531 1524 1486 1277 788 14251
Weighted N# 4599 76098 58230 50750 17968 25137 5983 2085 240850
* Achieved Sample
# Number of students in target population represented by sample
As the sample is age-based the students come from various year levels, but they are mostly from Years 9, 10 and 11. There are some variations to the year-level composition of the sample in the different states as shown in Table 1.3, because of differing school starting ages in different states.
10 Refer to the Reader’s Guide for more information about the target population for PISA.

6 Introduction
Table 1.3 Distribution of students by year level and state#
StateYear level (%)
8 9 10 11 12
ACT 14 85 1
NSW ∆ 11 84 5
VIC ∆ 20 78 2
QLD 1 50 48 ∆
SA ∆ 6 85 10 ∆
WA ∆ 2 45 53 ∆
TAS ∆ 33 67 ∆
NT 5 84 11 ∆
AUS ∆ 10 71 19 ∆
∆ Percentage ≤ 0.3
# The percentages are based on weighted data; state totals may not add up to 100 because of rounding.
The aim of PISA is to be as inclusive as possible of the population of 15-year-old students in each country and strict guidelines are enforced with regard to the exclusion of schools and students (which cannot exceed five per cent of the nationally desired target population).11
There are strict criteria regarding population coverage, response rates and sampling procedures. For initially selected schools, a minimum response rate of 85 per cent (weighted and unweighted) was required as well as a minimum rate of 80 per cent (weighted and unweighted) of selected students. Countries that obtained an initial school response rate between 65 and 85 per cent could still obtain an acceptable school response by the use of replacement schools. Schools with a student participation response rate of less than 50 per cent were not regarded as a participating school. Australia successfully achieved the required response rates.
PISA 2009 students and Indigenous status
To examine the performance of Indigenous students, all age-eligible Indigenous students from participating schools were sampled for PISA. The Indigenous students in PISA 2009 were identified from information provided by the school, which was taken from school records. Table 1.4 shows the number of participating Indigenous and non-Indigenous students in PISA 2009.
Table 1.4 Australian PISA 2009 students by Indigenous status
Indigenous status N students* Weighted N# Weighted %
Indigenous students 1143 7708 3%
Non-indigenous students 13108 233143 97%
* Achieved Sample
# Number of students in target population represented by sample
PISA 2009 students and geographic location of schools
As mentioned previously, the location of schools were classified using the MCEECDYA Schools Geographic Location Classification. In PISA 2009, three-quarters of students attended schools located in metropolitan areas, almost one-quarter were from provincial areas, and the remaining students attended schools in remote areas (Table 1.5).
11 Information on the Australian sampling is available on the National PISA website at: http://www.acer.edu.au/ozpisa

Challenges for Australian Education: Results from PISA 2009 7
Table 1.5 Australian PISA 2009 students by geographic location
Geographic location N students* Weighted N# Weighted %
Metropolitan 9890 180203 75
Provincial 3908 57465 24
Remote 453 3183 1
* Achieved Sample
# Number of students in target population represented by sample
The distribution of non-Indigenous students by geographic location was similar to the data reported in Table 1.5 (76% of students from metropolitan schools, 23% from provincial schools and 1% from remote schools). However, a different distribution was found for participating Indigenous students: 49 per cent were from metropolitan schools, 42 per cent from provincial schools and nine per cent from remote schools.
PISA 2009 students and socioeconomic background
In the PISA student questionnaire, students were asked several questions about their family and home background. This information was used to construct a measure of socioeconomic background: the economic, social and cultural status index (ESCS)12. Using this index, participating students were distributed into quartiles of socioeconomic background.
Table 1.6 provides the distribution of Indigenous and non-Indigenous students by quartiles of socioeconomic background. The proportion of non-Indigenous students in each of the socioeconomic quartiles was close to one-quarter, while the proportion of Indigenous students decreased as the level of socioeconomic background increased.
Table 1.6 Indigenous and non-Indigenous students by quartiles of socioeconomic background (ESCS)
Socioeconomic background
Indigenous students Non-Indigenous students Total
N students* Weighted N# Weighted % N students* Weighted N# Weighted %Weighted % of PISA population
Lowest quartile 522 3657 50 3139 55334 24 25
Second quartile 277 1800 25 3233 57213 25 25
Third quartile 202 1389 19 3220 57572 25 25
Highest quartile 83 461 6 3257 58535 26 25
* Achieved Sample# Number of students in target population represented by sample
In metropolitan schools, there were similar proportions of students across the quartiles of socioeconomic background. This was not the case for provincial and remote schools, where there was a greater proportion of students in the lowest quartile and a smaller proportion of students in the highest quartile of socioeconomic background (Table 1.7).
12 Refer to the Reader’s Guide for more information about the ESCS.

8 Introduction
Table 1.7 Students attending schools in different geographic locations by quartiles of socioeconomic background (ESCS)
Socioeconomic background
Metropolitan Provincial Remote Total
N students*
Weighted N#
Weighted %
N students*
Weighted N#
Weighted %
N students*
Weighted N#
Weighted %
Weighted % of PISA population
Lowest quartile 2167 38888 22 1333 18822 33 161 1281 42 25
Second quartile 2328 42342 24 1049 15726 28 133 945 31 25
Third quartile 2475 45673 26 842 12612 22 105 676 22 25
Highest quartile 2723 49806 28 579 9041 16 38 149 5 25
* Achieved Sample# Number of students in target population represented by sample
PISA 2009 students and immigrant status
The PISA student questionnaire collected information about students’ and parents’ country of birth. This data was used to create three categories of immigrant status: Australian-born, first-generation and foreign-born13.
Almost 60 per cent of students were Australian-born, 32 per cent of students were first-generation and 11 per cent were foreign-born students (Table 1.8).
Table 1.8 Australian PISA 2009 students by immigrant status
Immigration status N students* Weighted N# Weighted %
Australian-born 8396 134241 57
First-generation 4103 74243 32
Foreign-born 1365 26642 11
* Achieved Sample
# Number of students in target population represented by sample
PISA 2009 students and language spoken at home
Students provided details about what language was spoken in their homes most of the time. The majority (90%) of participating students indicated English was spoken at home, whereas 10 per cent of students indicated they spoke a language other than English at home most of the time (Table 1.9).
Table 1.9 Australian PISA 2009 students by language spoken at home
Language spoken at home N students* Weighted N# Weighted %
English spoken at home 12654 211702 90
Language other than English spoken at home 1226 23416 10
* Achieved Sample
# Number of students in target population represented by sample
13 Refer to the Reader’s Guide for more information about immigrant status.

Challenges for Australian Education: Results from PISA 2009 9
Organisation of the report
This report focuses on Australia’s results from PISA 2009. Chapter 2 provides the definition and the conceptual framework for the assessment of reading literacy in 2009. Chapter 3 provides a profile of student performance in reading literacy overall and for the three aspect subscales and two text format subscales. Reading performance from PISA 2000 to PISA 2009 is also examined. Chapter 4 focuses on Australian students’ reading habits and learning strategies. Chapters 5 and 6 are devoted to student performance in mathematical literacy and scientific literacy. Chapter 7 examines characteristics of Australian schools. Chapter 8 considers the relationship between socioeconomic background and performance. Chapter 9 discusses policy implications.
Further information
For more information about the PISA assessment, visit the Australian PISA website: http://www.acer.edu.au/ozpisa.

10 Introduction

Challenges for Australian Education: Results from PISA 2009 11
The reading literacy framework – then and nowThe PISA system of rotating the major domain of assessment every cycle allows for in-depth coverage of one of the domains every nine years. In 2000, reading literacy was the major domain, which meant that in 2009 participating countries were presented with the first opportunity to revisit reading literacy as the main focus of assessment since 2000, beginning with a review of the framework and the development of new reading literacy items. Although the core of the PISA 2000 reading literacy framework was retained, additions were made in order to integrate new developments in theory and practice, as well as recognising the changes in the world in which we learn and live. Thus, the PISA 2009 reading literacy framework contains two new elements: the incorporation of electronic texts and the elaboration of reading engagement and meta-cognition.
Electronic texts were referred to only briefly in the PISA 2000 reading literacy framework, but coverage of this key area has been further developed in the revised 2009 framework to reflect the increasing use of digital texts in different areas of our lives. Assessment of electronic reading was introduced as an international option, with 20 countries, including Australia, taking part. Results from the electronic reading assessment will be released in a separate report in 2011.
The PISA 2000 definition of reading literacy referred to cognitive competencies and the role the reader has in achieving their goals, referring peripherally to reading engagement and motivation. Given further understanding of the importance of engagement and motivation in reading literacy, resulting from research published since the 2000 framework was developed, it was considered imperative to revise the 2009 PISA reading literacy framework to incorporate these important constructs in the definition of reading literacy.
How is reading literacy defined in PISA?The PISA concept of reading literacy emphasises the ability to use written information in situations that students may encounter in their life at and beyond school. PISA 2009 defines reading literacy as:
understanding, using, reflecting on and engaging with written texts, in order to achieve one’s goals, to develop one’s knowledge and potential, and to participate in society.
The definition is broader than decoding information and literal comprehension. It implies that reading literacy involves understanding, using and reflecting on written information in a range of situations. Furthermore, it recognises the awareness of and the ability to use a variety of appropriate strategies when processing texts.
14 Parts of this chapter have been taken from the PISA 2009 assessment framework: Key competencies in reading, mathematics and science and PISA 2009 Results: What students know and can do (Volume 1)
Chapter
2 Reading literacy12

12 Reading literacy
To further understand the definition of reading literacy, each part of the definition is considered:
Understanding refers to the ability to gain meaning from what is read. This can include the meaning of words or it can be more complex in identifying the underlying theme of a narrative.
Using relates to the notions of application and function (i.e. applying what has been read to an immediate task or goal, or using what is read to reinforce or change beliefs).
Reflecting on emphasises the notion that reading is interactive, where readers make connections with their own thoughts and experiences when engaging with a text.
Engaging with involves the reader’s motivation to read and is comprised of constructs including interest in and enjoyment of reading, a sense of control over what one reads, and reading practices.
Written texts includes texts from a variety of media – hand-written, printed and electronic. They can include visual displays such as diagrams, pictures and comic strips. Written texts can be in a variety of formats, including continuous and non-continuous, and in a variety of text types, such as narrative, expository and interactive.
In order to achieve one’s goals, to develop one’s knowledge and potential, and to participate in society – this statement is intended to capture the full scope of situations in which reading literacy plays a role. To achieve one’s goals and to develop one’s knowledge and potential refers to the idea that reading literacy enables the fulfilment of individual aspirations. The word participate is used because it implies that reading literacy allows people to contribute to society as well as to meet their own needs.
This definition is consistent with the view of literacy for the Australian Curriculum:
Literacy conventionally refers to reading, writing, speaking, viewing, and listening effectively in a range of contexts. In the 21st century, the definition of literacy has expanded to refer to a flexible, sustainable mastery of a set of capabilities in the use and production of traditional texts and new communications technologies using spoken language, print and multimedia. Students need to be able to adjust and modify their use of language to better meet contextual demands in varying situations.
Australian Curriculum, Assessment and Reporting Authority, 2009, p. 6
How reading literacy is measured in PISA PISA acknowledges that readers respond to a given text in a variety of ways as they seek to use and understand what it is they are reading. The concept of reading literacy in PISA can be described along three dimensions: texts (the range and format of the reading material), aspects (the type of reading task or reading processes involved), and situations (the range of contexts for which the text was constructed). The relationships between the major dimensions are shown in Figure 2.1.

Challenges for Australian Education: Results from PISA 2009 13
Medium: in whatfrom does the textappear?
Environment: can the reader change digital texts?
• Print• Digital
• Authored (reader is receptive)• Message based (reader can change)
Text Format: how is the text presented?
• Continuous texts (in sentences)• Non-continuous texts (in lists, like this one)• Mixed texts (combining these)• Multiple texts (brought together from more than one source)
Text Type: what isthe text trying to do?
• Description (typically answering ‘what’ questions)• Narration (typically ‘when’)• Exposition (typically ‘how’)• Argumentation (typically ‘why)• Direction (providing instructions)• Transaction (exchanging information)
TextsWhat kind oftexts muststudents read?
Access and Retrieve: information in the text
Integrate and Interpret: what they read
Reflect and Evaluate: standing back from a text and relating it to their own experience
AspectsWhat readingtasks muststudents perform?
Personal: to satisfy one’s own interests
Public: relating to wider society
Educational: used in instruction
Occupational: related to the world of work
SituationsWhat kinds oftexts muststudents readin terms of theirintended use?
Figure 2.1 Main features of the PISA 2009 reading literacy framework
These dimensions define the PISA reading literacy framework and formed the foundation used by test developers to construct the tasks that make up the 2009 assessment. Some of the elements in the three dimensions are used as the basis for constructing scales and subscales, and subsequently for reporting, whereas other elements ensure that reading literacy is adequately covered.

14 Reading literacy
Texts
Texts cover the range of materials that are read. There are many kinds of texts and any assessment should include a broad range. Four main classifications are included in the PISA 2009 reading literacy framework: medium, environment, text format, and text type.
Medium
New to the PISA 2009 reading literacy framework is the important classification by medium, divided into print or digital media text. Print medium texts appear on paper in many different forms – single sheets, brochures, magazines and books. The static nature of the printed text is usually read in a particular sequence and the amount of text is visible to the reader. In contrast, digital medium text (which refers to hypertext; that is, a text with navigation tools and features) is dynamic. The text can be read in a non-sequential manner with only a fraction of the available text seen at any one time. To access text, readers use navigation tools and features such as scroll bars, buttons, menus and tabs.
Although the PISA 2009 concept of reading encompasses reading in both print and digital media, and the framework is built to reflect this unitary conceptualisation, the skills and knowledge applied to reading in the two media are not identical. Print reading (the paper-and-pen assessment) and digital reading (the electronic reading assessment) are therefore reported on separate scales to explore the differences (and similarities) in reading among 15 year olds.
Environment
Text environment is a new category in the PISA 2009 framework and applies only to digital medium texts. Digital texts exist in a number of environments, including the web environment and emails. There are other digital environments that use written text such as mobile phone text messages and electronic diaries. For the purposes of PISA 2009, only computer-based environments are considered, with two kinds of digital environments identified for the assessment of reading of digital texts. The distinction between these environments is based on whether or not the reader has the potential to influence the content of the site.
An authored environment is one in which the reader is primarily receptive – the content cannot be modified. They are self-contained environments and readers use these sites mainly for obtaining information. Some examples of authored environments are text objects within home pages, government information sites, news sites and lists of search results.
The second kind of digital environment is the message-based environment, where the reader has the opportunity to contribute by adapting the content. Readers use these sites not only for obtaining information, but also as a way of communicating. Examples of message-based environments include emails, blogs, chat rooms, web forums and online forms.
The environment classifications are not strictly partitioned: a given website, for example, may include some authored text and a section in which the reader is invited to add a comment. A task that requires the integration of both authored and message-based texts is classified as mixed. However, an individual task generally draws predominantly upon one of the environment categories and is classified accordingly.
Text format
In PISA 2009, there are four different text formats: continuous and non-continuous texts (which were identified in PISA 2000), and two new text format categories labelled as mixed and multiple texts. The salience of text format as an important classification of texts was reflected in results from PISA 2000, in which countries performed differently across the two formats and the performance of boys and girls tended to differ on continuous texts to a greater extent than on non-continuous texts.

Challenges for Australian Education: Results from PISA 2009 15
Continuous texts are formed by sentences that are, in turn, organised into paragraphs. These may fit into even larger structures such as sections, chapters, and books. Examples of text objects in continuous text format in the print medium include newspaper reports, essays, short novels, reviews and letters.
Non-continuous texts are organised in matrix format, based on combinations of lists. Some are single, simple lists, but most consist of several simple lists combined. Examples of non-continuous texts are lists, tables, diagrams, advertisements, catalogues, indexes and forms. The different organisation of text objects in continuous and non-continuous texts requires a different kind of reading approach.
Mixed texts are single, coherent objects consisting of a set of elements in both a continuous and non-continuous format. In well-constructed mixed texts the components (for example, a prose explanation including a graph or table) are mutually supportive. Mixed text in the print medium is a common format in magazines, reference books and reports, and on web pages and online forms, where the author has used a variety of presentations to communicate information.
In PISA, multiple texts are defined as collections of independently generated texts that are not necessarily presented in the same context in which they were originally authored. Instead the texts are juxtaposed for a particular occasion or may be loosely linked together for the purposes of the assessment. The relationship between the texts may not be obvious; they may be complementary or may contradict one another. For example, a collection of websites from different companies that provide travel advice may or may not provide similar directions to tourists. Multiple texts may have one format, such as continuous text, or may be a combination of both continuous and non-continuous texts.
Tasks in the print medium assessment are classified for the most part as either continuous or non-continuous, whereas in the digital medium assessment the proportion of tasks based on multiple texts is much greater.
Text type
All texts in PISA are classified by text type according to the main rhetorical purpose of the text. This ensures the assessment includes a range of tests that represent different types of reading. It is not conceived of as a variable that influences the difficulty of a task. Text type has been classified into six categories:
Description – in which the information refers to properties of objects in space and typically provides answers to what questions. Descriptions can take on several forms: impressionistic descriptions present information from the point of view of subjective impressions of relations, qualities, and directions in space; and technical descriptions present information from the point of view of objective observation in space. A depiction of a particular place in a travelogue or diary, a catalogue, a geographical map, an online flight schedule or a process in a technical manual are all examples of text in a descriptive format.
Narration – in which the information refers to properties of objects in time and typically answers questions relating to when, or in what sequence. Narration can take different forms. Narratives present change from the point of view of subjective selection and emphasis. Reports present actions and events that can be objectively verified by others. News stories enable readers to form their own independent opinion of facts and events. Examples of narratives include novels, short stories, plays, biographies, comic strips, and reports of events in a newspaper.

16 Reading literacy
Exposition – in which the information is presented as composite concepts or mental constructs and often answers questions about how. Expository essays provide a simple explanation of concepts, mental constructs, or conceptions from a subjective point of view. Definitions explain how terms or names are interrelated with mental concepts. Explications are a form of synthetic exposition used to explain how a mental concept can be linked with words or terms. Summaries are a form of synthetic exposition used to explain and communicate texts in a shorter form than the original text requires. Minutes are a record of the results of meetings or presentations. Text interpretations are a form of both analytic and synthetic exposition used to explain the abstract concepts that are realised in a particular (fictional or non-fictional) text or group of texts. Examples of expositions include a scholarly essay, a diagram showing a model of memory, a graph of population trends, a concept map, and an entry in an online encyclopaedia.
Argumentation – presents the relationship among concepts or propositions, typically answering why questions. Persuasive and opinionative texts refer to opinions and points of view. Comment relates the concepts of events, objects, and ideas to a private system of thought, values, and beliefs. Scientific argumentation relates concepts of events, objects, and ideas to systems of thought and knowledge so that the resulting propositions can be verified as valid or non-valid. A letter to the editor, a poster advertisement, posts in an online forum, and web-based reviews of a book or film are examples of argumentation.
Instruction – provides directions on what to do. Instructions present directions for certain behaviours in order to complete a task. Rules, regulations, and statutes specify requirements for certain behaviours based on impersonal authority, such as practical validity or public authority. Examples of instruction are a recipe, a series of diagrams showing a procedure for giving first aid, and guidelines for operating digital software.
Transaction – refers to the exchange of information in an interaction with the reader. Letters and invitations explore and maintain relationships. Surveys, questionnaires and interviews seek to collect information. Examples of transactional texts are a personal letter to share family news, an email exchange to plan holidays, and a text message to arrange a meeting.
Aspects
The second dimension that characterises the PISA 2009 framework of reading literacy is aspects, which refer to the cognitive strategies, approaches or purposes that readers use to negotiate their way into, around and between texts. Five aspects guide the development of the reading literacy assessment task: retrieving information, forming a broad understanding, developing an interpretation, reflecting on and evaluating the content of a text, and reflecting on and evaluating the form of a text. It is expected that all readers, irrespective of their overall proficiency, will be able to demonstrate some level of competency in each of these aspects.
As it is not possible to include sufficient items in the PISA assessment to report on each of the five aspects as a separate subscale, for reporting on reading literacy these five aspects are organised into three broad aspect categories: access and retrieve, integrate and interpret, and reflect and evaluate. A fourth category, referred to as complex, describes those tasks that inextricably combine and depend on all three of the processes.
The three aspects are not conceived as entirely separate and independent, but rather as interrelated and interdependent; however, in PISA the tasks are designed to emphasise one or another of the aspects.
Challenges for Australian Education: Results from PISA 2009 17
Access and retrieve
Accessing and retrieving draws upon skills associated with finding, selecting and collecting relevant information; for example, from a page of continuous text, a table or a list of information. Readers need to retrieve information, which is most often found in a single location, though in some cases the information may need to be accessed in two or more sentences or in different parts of a list.
Some items may require retrieving information only, especially in the print medium where the information is immediately visible and where the reader only has to select what is appropriate. Readers may use navigation features such as headings or captions to find their way to the appropriate section. On the other hand, some items in the digital medium require little more than accessing (for example, clicking on an embedded link to open a web page or clicking to select an item in a list of search results). A digital item that assesses accessing and retrieving might involve navigating across several pages of a website, or using menus, lists or tabs to locate relevant information.
Integrate and interpret
Integrate and interpret tasks involve processing what is read to make internal sense of a text.
Integrating focuses on demonstrating an understanding of the relations between different parts of a text. It can involve recognising coherence between adjacent sentences, understanding the relationship between several paragraphs, or recognising connections across multiple texts. In each case, integrating involves connecting various pieces of information to make meaning, whether it is identifying similarities and differences, making comparisons, or understanding cause and effect relationships.
Interpreting refers to the process of making meaning from something that is not stated. It may involve recognising a relationship that is not made explicit or inferring (from evidence and reasoning) the connotation of a phrase or a sentence. When interpreting, a reader is identifying the underlying assumptions or implications of part or all of a text.
Within this aspect some tasks might require the student to identify a specific piece of text, such as when a theme or main idea is explicitly stated. Other tasks may require the student to focus on more than one part of the text; for instance, if the reader has to deduce the theme from the repetition of a particular category of information.
Reflect and evaluate
Tasks that involve reflecting and evaluating skills draw upon knowledge, ideas or attitudes beyond the text in order to relate the information provided within the text to one’s own conceptual and experiential frames of reference.
In reflecting on a text, readers relate their own experience or knowledge to compare, contrast or hypothesise. In evaluating a text, readers make a judgment about it, drawing on personal experience or on knowledge of the world that may be formal or content-based. Reflecting on and evaluating the content of a text requires the reader to connect information in a text to knowledge from outside sources. To do so, readers must be able to develop an understanding of what is said and intended in a text. They must then test that mental representation against what they know and believe on the basis of either prior information or information found in other texts.
Reflecting on and evaluating the form of a text requires readers to stand apart from the text, to consider it objectively and to evaluate its quality and appropriateness. Knowledge of text structure, the style typical of different kinds of texts, and register all play an important role in these tasks. While the kinds of reflection and evaluation called for in the print medium assessment are also required in the digital medium, evaluation in the digital medium takes on a slightly different emphasis.

18 Reading literacy
Complex
A few digital reading tasks are classified as complex, in that they may draw on all aspects described above. There are no print medium tasks classified as complex. Complex tasks have been designed to take advantage of the relative freedom of reading in the digital medium, where the arrangement and organisation given to a print text by the author’s ordering of pages, chapters or larger sections is absent, and the sequence of steps to be taken by the reader in completing a task is thus much more fluid. These tasks involve the interaction between accessing, retrieving, interpreting, integrating and reflecting, as they are intended to simulate the uncertainty of negotiating hyperspace and thus are not as readily classified as belonging predominantly to one of the three aspects.
Situation
Situation is used in PISA to define texts and their associated tasks, and refers to the contexts and uses for which the author constructed the text. While content is not used for the purpose of reporting results, by sampling texts across a variety of situations the intent is to maximise the diversity of content included in the PISA reading literacy assessment. In PISA, texts are assigned to one of four situations – personal, public, educational and occupational – according to their supposed audience and purpose, rather than on the place where the reading activity may be carried out. For example, literary texts, which are often used in classrooms, are generally not written for educational purposes but rather for readers’ personal enjoyment and appreciation. They are therefore classified as personal. Conversely, textbooks are read both in schools and in homes, and the process and purpose probably differ little from one setting to another. Such texts are classified as educational in PISA.
The personal category relates to texts that are intended to satisfy an individual’s personal interests. This category also includes texts that are intended to maintain or develop personal connections with other people and experiences. It includes personal letters, fiction, biography, and informational texts that are intended to be read to satisfy curiosity, as a part of leisure or recreational activities. In the digital medium, it includes personal emails, instant messages and diary-style blogs.
The public category includes texts that relate to activities and concerns of the larger society. The category includes official documents as well as information about public events. In general, the texts associated with this category assume a more or less anonymous contact with others; they also include forum-style blogs, news websites and public notices that are encountered both online and in print.
The content of educational texts is usually designed specifically for the purpose of instruction and imparting knowledge. Printed textbooks and interactive learning software are typical examples of material generated for this kind of reading. Educational reading normally involves acquiring information as part of a larger learning task. The materials are often not chosen by the reader, but instead assigned by an instructor. The tasks that draw on these sorts of texts may be described as focusing on ‘reading to learn’.
Occupational texts are those associated with the workplace, often texts that support the accomplishment of some immediate task. Such texts might be intended to help readers searching for a job, either in a print newspaper’s classified advertisement section or online; or following workplace directions. The tasks addressing this kind of text are often referred to as ‘reading to do’ as opposed to the ‘reading to learn’ of educational texts.

Challenges for Australian Education: Results from PISA 2009 19
The structure of the assessment The framework serves as the conceptual basis for assessing students’ proficiency in reading literacy. New tasks and questions were developed to reflect the concepts in the framework. The incorporation of electronic texts into the framework required two different assessments: a paper-and-pen assessment and a computer-based assessment. Details about the paper-and-pen assessment are included in the current report, whereas the assessment of electronic reading will be described in a separate, dedicated report.
Item response formats
Reading literacy was assessed through a range of item response formats to cover the full range of cognitive abilities and knowledge identified in the PISA 2009 framework. These included multiple-choice items, in which students were required to select one correct response from among four or five possible response options; complex multiple-choice items, where students were required to select the correct response to each of a number of statements or questions; closed constructed-response items, to which students were to provide their own responses with a limited range of acceptable answers; short response items, which required students to provide a brief answer similar to the closed constructed-response items, but with a wider range of possible answers; and open constructed-response items, in which students wrote a short explanation in response to a question, showing the methods and thought processes they had used in constructing their response.
Distribution of items
The PISA 2009 reading literacy items were distributed across the three different aspects (access and retrieve, integrate and interpret, and reflect and evaluate), the two text formats (continuous and non-continuous) and the four situations (personal, public, occupational and educational).
Of the 131 reading literacy items assessed in PISA 2009, 52 were multiple-choice items; 10 were complex multiple-choice items; 13 were closed constructed-response items; 11 were short response items; and 45 were open constructed-response items. As shown in Table 2.1, multiple-choice and open constructed-response items were the most common item formats.
Table 2.1 Distribution of reading literacy items, by reading aspect and item response format
Item Type
TotalMultiple-
choice itemsComplex multiple-
choice items
Closed constructed-
response items
Short response
items
Open constructed-
response items
Number of items
Distribution of reading items by aspect of reading task
Access and retrieve 6 3 9 10 3 31
Integrate and interpret 38 6 4 1 18 67
Reflect and evaluate 8 1 0 0 24 33
Distribution of reading items by format
Continuous 36 6 4 4 31 81
Non-continuous 10 3 7 6 12 38
Mixed 4 1 0 1 1 7
Multiple 0 2 2 0 1 5
Distribution of reading items by situation
Personal 10 2 5 3 17 37
Public 19 2 2 2 10 35
Occupational 4 3 3 1 10 21
Educational 19 3 3 5 8 38

20 Reading literacy
Responses to the multiple-choice items and closed constructed-response items were captured automatically for processing and analysis. The open constructed-response items required coding by trained expert coders where codes are assigned using predefined response categories. Approximately 40 per cent of the tasks required expert judgement in coding across the three aspects (with 11 per cent in access and retrieve, 14 per cent in integrate and interpret, and 18 per cent in reflect and evaluate). The coder assigns a code that best fits the kind of response provided by the student.
For responses where a student provided a correct response and showed the highest level of understanding of the topic appropriate for a 15-year-old, full credit was assigned. A response that showed very little evidence of understanding (i.e. the response was incorrect) or responses that were irrelevant or missing, received no credit. There were, however, some open constructed-responses that showed varying levels of understanding and thus required partial credit scoring. A student was assigned a partial credit where the response was less sophisticated in the understanding displayed but still factually correct.
Constructing the assessment booklets
Over 130 reading literacy items, equivalent to 270 minutes of assessment time, were developed to ensure the broadest possible coverage of reading literacy was achieved. Students were assigned a two-hour assessment booklet that contained a subset of the total pool of items. Each assessment booklet was organised into four 30-minute clusters. As reading literacy was the major domain, every booklet included at least one cluster of reading literacy tasks, with the other clusters assessing either mathematics or science. While the number of reading literacy clusters varied among assessment booklets, every student completed at least one cluster on reading literacy. The balanced, rotated test design ensured that each cluster appeared in each of the four possible positions in the booklets, and each pair of clusters appeared in at least one of the 13 assessment booklets.
Scaling the reading literacy tasks
The scale of reading literacy was constructed using Item Response Theory, with reading literacy items ranked by difficulty and linked to student proficiency. Using such methods means that the relative ability of students taking a particular test can be estimated by considering the proportion of test items they answer correctly, while the relative difficulty of items in a test can be estimated by considering the proportion of students getting each item correct. On this scale, it is possible to estimate the location of individual students, and to describe the degree of reading literacy that they possess.
The relationship between items and students on the reading literacy scale (shown in Figure 2.2) is probabilistic. The estimate of student proficiency reflects the kinds of tasks they would be expected to successfully complete. A student whose ability places them at a certain point on the PISA reading literacy scale would most likely be able to successfully complete tasks at or below that location, and increasingly more likely to complete tasks located at progressively lower points on the scale, but would be less likely to be able to complete tasks above that point, and increasingly less likely to complete tasks located at progressively higher points on the scale.

Challenges for Australian Education: Results from PISA 2009 21
Reading literacyscale
Items with relatively high difficulty
Student A, with relatively high proficiency
Student C, with relatively low proficiency
Student B, with moderate proficiency
Items with relatively low difficulty
Items with moderatedifficulty
Item VI
Item V
Item IV
Item III
Item II
Item I
It is expected that student A will be able to complete items I to V successfully, and probably item VI as well.
It is expected that student B will be able to complete items I, II and III successfully, will have a lower probability of completing item IV and is unlikely to complete items V and VI successfully.
It is expected that student C will be unable to complete items II to VI successfully, and will also have a low probability of completing item I successfully.
Figure 2.2 The relationship between items and students on the reading literacy scale
Reading proficiency levels in PISA 2009Student performance in PISA is reported in terms of statistics, such as mean scores and measures of distributions of achievement, which allow for comparisons against other countries and subgroups. However mean scores do not provide information on the tasks that students can do or what they know and understand. To provide information about these aspects of performance, PISA also provides results in descriptive terms, where meaning is attached to the achievement results, called proficiency levels.
The previous section described how the items are scaled to produce a continuum of reading literacy proficiency. The reading literacy scale describes achievement in terms of the skills that students with increasing levels of proficiency are able to demonstrate.
The inclusion of a broader range of reading literacy tasks in PISA 2009 has enabled the reading literacy proficiency scale to be expanded from the five levels identified in 2000, to seven levels (Figure 2.3). The new levels describe the reading literacy skills at each end of the proficiency scale – those students with very high or very low reading proficiency. A new level (Level 6) located above Level 5 describes the reading literacy skills of students with very high levels of reading proficiency. At the other end of the proficiency scale, Level 1 has been re-labelled as Level 1a and a new level (Level 1b) has been introduced to describe the skills of those students who previously were simply described as not having achieved Level 1. The unbounded level below Level 1b does not provide a description about these students as there is an insufficient number of items on which to base a description of these students’ reading proficiency.
The other levels (2, 3, 4 and 5) remain the same in PISA 2009 as they were for PISA 2000. Expanding the reading literacy proficiency scale in PISA 2009 allows for almost all PISA students to be accurately described.

22 Reading literacy
As has been the case in previous PISA cycles, Level 2 has been defined internationally as a “baseline” proficiency level. This level does not separate reading literacy and illiteracy; rather it defines the level of achievement on the PISA scale at which students begin to demonstrate the reading literacy competencies that will enable them to actively participate in life situations. Students performing below this baseline are considered to be at serious risk of not achieving at levels sufficient to allow them to adequately participate in the 21st century work force and contribute as productive citizens.
Proficiency level Characteristics of tasks
6
Tasks at this level typically require the reader to make multiple inferences, comparisons and contrasts that are both detailed and precise. They require demonstration of a full and detailed understanding of one or more texts and may involve integrating information from more than one text. Tasks may require the reader to deal with unfamiliar ideas, in the presence of prominent competing information, and to generate abstract categories for interpretations. Reflect and evaluate tasks may require the reader to hypothesise about or critically evaluate a complex text on an unfamiliar topic, taking into account multiple criteria or perspectives, and applying sophisticated understandings from beyond the text. A salient condition for access and retrieve tasks at this level is precision of analysis and fine attention to detail that is inconspicuous in the texts.
698.3 score points
5
Tasks at this level that involve retrieving information require the reader to locate and organise several pieces of deeply embedded information, inferring which information in the text is relevant. Reflective tasks require critical evaluation or hypothesis, drawing on specialised knowledge. Both interpretative and reflective tasks require a full and detailed understanding of a text whose content or form is unfamiliar. For all aspects of reading, tasks at this level typically involve dealing with concepts that are contrary to expectations.
625.6 score points
4
Tasks at this level that involve retrieving information require the reader to locate and organise several pieces of embedded information. Some tasks at this level require interpreting the meaning of nuances of language in a section of text by taking into account the text as a whole. Other interpretative tasks require understanding and applying categories in an unfamiliar context. Reflective tasks at this level require readers to use formal or public knowledge to hypothesise about or critically evaluate a text. Readers must demonstrate an accurate understanding of long or complex texts whose content or form may be unfamiliar.
552.9 score points
3
Tasks at this level require the reader to locate, and in some cases recognise the relationship between, several pieces of information that must meet multiple conditions. Interpretative tasks at this level require the reader to integrate several parts of a text in order to identify a main idea, understand a relationship or construe the meaning of a word or phrase. They need to take into account many features in comparing, contrasting or categorising. Often the required information is not prominent or there is much competing information; or there are other obstacles in the text, such as ideas that are contrary to expectation or negatively worded. Reflective tasks at this level may require connections, comparisons, and explanations, or they may require the reader to evaluate a feature of the text. Some reflective tasks require readers to demonstrate a fine understanding of the text in relation to familiar, everyday knowledge. Other tasks do not require detailed text comprehension but require the reader to draw on less common knowledge.
480.2 score points
2
Some tasks at this level require the reader to locate one or more pieces of information, which may need to be inferred and may need to meet several conditions. Others require recognising the main idea in a text, understanding relationships, or construing meaning within a limited part of the text when the information is not prominent and the reader must make low level inferences. Tasks at this level may involve comparisons or contrasts based on a single feature in the text. Typical reflective tasks at this level require readers to make a comparison or several connections between the text and outside knowledge, by drawing on personal experience and attitudes.
407.5 score points
1a
Tasks at this level require the reader to locate one or more independent pieces of explicitly stated information; to recognise the main theme or author’s purpose in a text about a familiar topic, or to make a simple connection between information in the text and common, everyday knowledge. Typically the required information in the text is prominent and there is little, if any, competing information. The reader is explicitly directed to consider relevant factors in the task and in the text.
334.8 score points
1b
Tasks at this level require the reader to locate a single piece of explicitly stated information in a prominent position in a short, syntactically simple text with a familiar context and text type, such as a narrative or a simple list. The text typically provides support to the reader, such as repetition of information, pictures or familiar symbols. There is minimal competing information. In tasks requiring interpretation the reader may need to make simple connections between adjacent pieces of information.
262.0 score points
Figure 2.3 Summary descriptions of the seven proficiency levels on the overall reading literacy scale15
15 The cut-off points are also applicable to the reading literacy subscales.
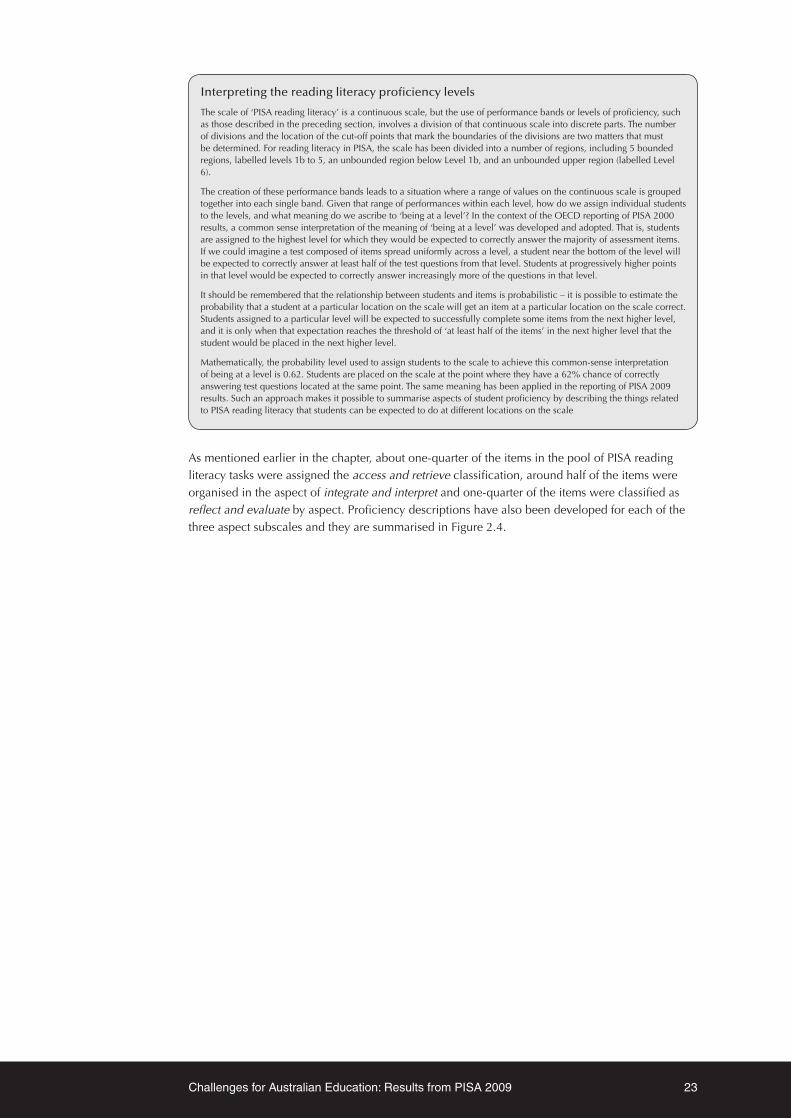
Challenges for Australian Education: Results from PISA 2009 23
Interpreting the reading literacy proficiency levels
The scale of ‘PISA reading literacy’ is a continuous scale, but the use of performance bands or levels of proficiency, such as those described in the preceding section, involves a division of that continuous scale into discrete parts. The number of divisions and the location of the cut-off points that mark the boundaries of the divisions are two matters that must be determined. For reading literacy in PISA, the scale has been divided into a number of regions, including 5 bounded regions, labelled levels 1b to 5, an unbounded region below Level 1b, and an unbounded upper region (labelled Level 6).
The creation of these performance bands leads to a situation where a range of values on the continuous scale is grouped together into each single band. Given that range of performances within each level, how do we assign individual students to the levels, and what meaning do we ascribe to ‘being at a level’? In the context of the OECD reporting of PISA 2000 results, a common sense interpretation of the meaning of ‘being at a level’ was developed and adopted. That is, students are assigned to the highest level for which they would be expected to correctly answer the majority of assessment items. If we could imagine a test composed of items spread uniformly across a level, a student near the bottom of the level will be expected to correctly answer at least half of the test questions from that level. Students at progressively higher points in that level would be expected to correctly answer increasingly more of the questions in that level.
It should be remembered that the relationship between students and items is probabilistic – it is possible to estimate the probability that a student at a particular location on the scale will get an item at a particular location on the scale correct. Students assigned to a particular level will be expected to successfully complete some items from the next higher level, and it is only when that expectation reaches the threshold of ‘at least half of the items’ in the next higher level that the student would be placed in the next higher level.
Mathematically, the probability level used to assign students to the scale to achieve this common-sense interpretation of being at a level is 0.62. Students are placed on the scale at the point where they have a 62% chance of correctly answering test questions located at the same point. The same meaning has been applied in the reporting of PISA 2009 results. Such an approach makes it possible to summarise aspects of student proficiency by describing the things related to PISA reading literacy that students can be expected to do at different locations on the scale
As mentioned earlier in the chapter, about one-quarter of the items in the pool of PISA reading literacy tasks were assigned the access and retrieve classification, around half of the items were organised in the aspect of integrate and interpret and one-quarter of the items were classified as reflect and evaluate by aspect. Proficiency descriptions have also been developed for each of the three aspect subscales and they are summarised in Figure 2.4.

24 Reading literacy
Proficiency
level
Aspect
Access and retrieve Integrate and interpret Reflect and evaluate
Characteristic of tasks
6
Combine multiple pieces of independent information, from different parts of a mixed text, in an accurate and precise sequence, working in an unfamiliar context.
Make multiple inferences, comparisons and contrasts that are both detailed and precise. Demonstrate a full and detailed understanding of the whole text or specific sections. May involve integrating information from more than one text. Deal with unfamiliar abstract ideas, in the presence of prominent competing information. Generate abstract categories for interpretations.
Hypothesise about or critically evaluate a complex text on an unfamiliar topic, taking into account multiple criteria or perspectives, and applying sophisticated understandings from beyond the text. Generate categories for evaluating text features in terms of appropriateness for an audience.
5
Locate, and possibly combine, multiple pieces of deeply embedded information, some of which may be outside the main body of the text. Deal with strongly distracting, competing information.
Demonstrate a full and detailed understanding of a text. Construe the meaning of nuanced language. Apply criteria to examples scattered throughout a text, using high level inference. Generate categories to describe relationships between parts of a text. Deal with ideas that are contrary to expectations.
Hypothesise about a text, drawing on specialised knowledge, and on deep understanding of long or complex texts that contain ideas contrary to expectations. Critically analyse and evaluate potential or real inconsistencies, either within the text or between the text and ideas outside the text.
4
Locate several pieces of embedded information, each of which may need to meet multiple criteria, in a text with unfamiliar context or form. Possibly combine verbal and graphical information. Deal with extensive and/or prominent competing information.
Use text-based inferences to understand and apply categories in an unfamiliar context, and to construe the meaning of a section of text by taking into account the text as a whole. Deal with ambiguities and ideas that are negatively worded.
Use formal or public knowledge to hypothesise about or critically evaluate a text. Show accurate understanding of long or complex texts.
3
Locate several pieces of information, each of which may need to meet multiple criteria. Combine pieces of information within a text. Deal with competing information.
Integrate several parts of a text in order to identify the main idea, understand a relationship or construe the meaning of a word or phrase. Compare, contrast or categorise, taking many criteria into account. Deal with competing information.
Make connections or comparisons, give explanations, or evaluate a feature of a text. Demonstrate a detailed understanding of the text in relation to familiar, everyday knowledge, or draw on less common knowledge.
2
Locate one or more pieces of information, each of which may need to meet multiple criteria. Deal with some competing information.
Identify the main idea in a text, understand relationships, form or apply simple categories, or construe meaning within a limited part of the text when the information is not prominent and low level inferences are required.
Make a comparison or connections between the text and outside knowledge, or explain a feature of the text by drawing on personal experience or attitudes.
1a
Locate one or more independent pieces of explicitly stated information meeting a single criterion, by making a literal or synonymous match. The target information may not be prominent in the text but there is little or no competing information.
Recognise the main theme or author’s purpose in a text about a familiar topic, when the required information in the text is prominent.
Make a simple connection between information in the text and common, everyday knowledge.
1b
Locate a single piece of explicitly stated information in a prominent position in a simple text, by making a literal or synonymous match, where there is no competing information. May make simple connections between adjacent pieces of information.
Either recognise a simple idea that is reinforced several times in the text (possibly with picture cues), or interpret a phrase, in a short text on a familiar topic.
There are no questions at this level in the existing reading question pool.
Figure 2.4 Summary descriptions of the seven proficiency levels on the reading subscales for aspect (access and retrieve, integrate and interpret, and reflect and evaluate)
Although the reading literacy framework identified four text formats – continuous, non-continuous, mixed and multiple — only two of these were used as subscales. About two-thirds of the items related to continuous texts and one-third to non-continuous texts. Figure 2.5 provides the proficiency descriptions at each level for each of the two text format subscales.

Challenges for Australian Education: Results from PISA 2009 25
Proficiency
level
Text format
Continuous texts Non-continuous texts
Characteristic of tasks
6
Negotiate single or multiple texts that may be long, dense or deal with highly abstract and implicit meanings. Relate information in texts to multiple, complex or counterintuitive ideas.
Identify and combine information from different parts of a complex document that has unfamiliar content, sometimes drawing on features that are external to the display, such as footnotes, labels and other organisers. Demonstrate a full understanding of the text structure and its implications.
5
Negotiate texts whose discourse structure is not obvious or clearly marked, in order to discern the relationship of specific parts of the text to the implicit theme or intention.
Identify patterns among many pieces of information presented in a display that may be long and detailed, sometimes by referring to information that is in an unexpected place in the text or outside the text.
4
Follow linguistic or thematic links over several paragraphs, often in the absence of clear discourse markers, in order to locate, interpret or evaluate embedded information.
Scan a long, detailed text in order to find relevant information, often with little or no assistance from organisers such as labels or special formatting, to locate several pieces of information to be compared or combined.
3
Use conventions of text organisation, where present, and follow implicit or explicit logical links such as cause and effect relationships across sentences or paragraphs in order to locate, interpret or evaluate information.
Consider one display in the light of a second, separate document or display, possibly in a different format, or draw conclusions by combining several pieces of graphical, verbal and numeric information.
2
Follow logical and linguistic connections within a paragraph in order to locate or interpret information; or synthesise information across texts or parts of a text in order to infer the author’s purpose.
Demonstrate a grasp of the underlying structure of a visual display such as a simple tree diagram or table, or combine two pieces of information from a graph or table.
1a
Use redundancy, paragraph headings or common print conventions to identify the main idea of the text, or to locate information stated explicitly within a short section of text.
Focus on discrete pieces of information, usually within a single display such as a simple map, a line graph or bar graph that presents only a small amount of information in a straightforward way, and in which most of the verbal text is limited to a small number of words or phrases.
1b
Recognise information in short, syntactically simple texts that have a familiar context and text type, and include ideas that are reinforced by pictures or by repeated verbal cues.
Identify information in a short text with a simple list structure and a familiar format.
Figure 2.5 Summary descriptions of the seven proficiency levels on the reading subscales for text format (continuous texts and non-continuous texts)
Sample reading literacy items and responses16
A small number of reading literacy items have been publicly released to help illustrate the dimensions outlined in the framework (aspect, situation and text format), the range of tasks included in the assessments and the scope of PISA’s reading literacy domain. The majority of reading literacy items is retained for future PISA assessments to facilitate monitoring of performance over time (across cycles).
The sample items presented below are categorised according to the PISA 2009 reading literacy framework, which considers each item’s aspect, situation, text format, proficiency level and score point difficulty. The examples include the question as seen by the student, as well as actual responses from students who completed the assessment.
Figure 2.6 presents a map of the sample reading literacy items included in this section. The most difficult items are located at the top of the figure, at the higher proficiency levels, and the least difficult, at the lower levels, at the bottom. Cut-off score points between proficiency levels are also displayed. Each of the items is placed in the relevant proficiency level according to the difficulty of the item (the number in brackets), and in the aspect (access and retrieve, integrate and interpret and reflect and evaluate) and text format (continuous and non-continuous) subscales they are assessing.
16 The overall percent correct is not provided for the reading tasks (as is available for the sample mathematical literacy and scientific literacy tasks) because some units were only used by partner countries and some units were only used by OECD countries, and comparing percentages between those questions and others might lead to misinterpretation.
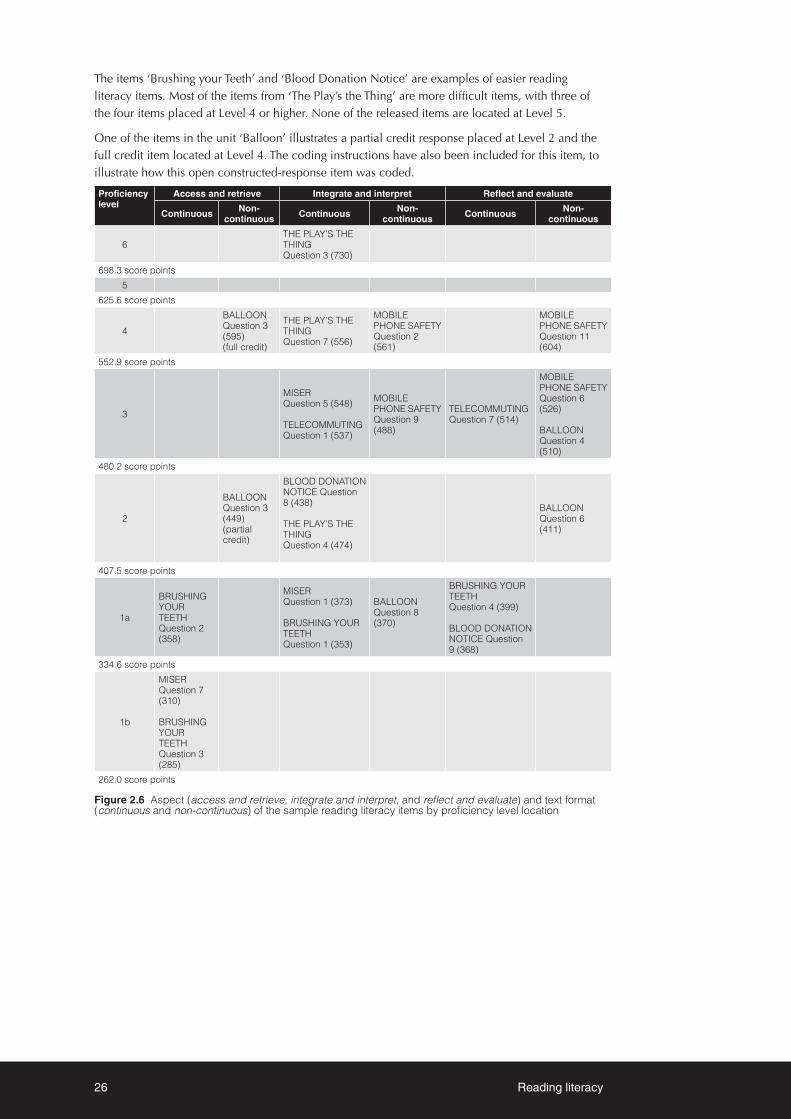
26 Reading literacy
The items ‘Brushing your Teeth’ and ‘Blood Donation Notice’ are examples of easier reading literacy items. Most of the items from ‘The Play’s the Thing’ are more difficult items, with three of the four items placed at Level 4 or higher. None of the released items are located at Level 5.
One of the items in the unit ‘Balloon’ illustrates a partial credit response placed at Level 2 and the full credit item located at Level 4. The coding instructions have also been included for this item, to illustrate how this open constructed-response item was coded.
Proficiency level
Access and retrieve Integrate and interpret Reflect and evaluate
Continuous Non-continuous Continuous Non-
continuous Continuous Non-continuous
6THE PLAY’S THE THINGQuestion 3 (730)
698.3 score points
5
625.6 score points
4
BALLOONQuestion 3 (595)(full credit)
THE PLAY’S THE THINGQuestion 7 (556)
MOBILE PHONE SAFETY Question 2 (561)
MOBILE PHONE SAFETY Question 11 (604)
552.9 score points
3
MISERQuestion 5 (548)
TELECOMMUTINGQuestion 1 (537)
MOBILE PHONE SAFETY Question 9 (488)
TELECOMMUTINGQuestion 7 (514)
MOBILE PHONE SAFETY Question 6 (526)
BALLOONQuestion 4 (510)
480.2 score points
2
BALLOONQuestion 3 (449) (partial credit)
BLOOD DONATION NOTICE Question 8 (438)
THE PLAY’S THE THINGQuestion 4 (474)
BALLOONQuestion 6 (411)
407.5 score points
1a
BRUSHING YOUR TEETH Question 2 (358)
MISERQuestion 1 (373)
BRUSHING YOUR TEETH Question 1 (353)
BALLOONQuestion 8 (370)
BRUSHING YOUR TEETH Question 4 (399)
BLOOD DONATION NOTICE Question 9 (368)
334.6 score points
1b
MISERQuestion 7 (310)
BRUSHING YOUR TEETH Question 3 (285)
262.0 score points
Figure 2.6 Aspect (access and retrieve, integrate and interpret, and reflect and evaluate) and text format (continuous and non-continuous) of the sample reading literacy items by proficiency level location

Challenges for Australian Education: Results from PISA 2009 27
Brushing your teeth
The stimulus, shown below, is a short text about the everyday topic of brushing your teeth accompanied by a supporting illustration. The stimulus for this task is an example of expository writing in a continuous text format, classified as an educational situation.
All of the items relating to ‘Brushing your teeth’ are among the easiest PISA reading literacy items, located at the lower end of the reading literacy proficiency scale. This unit assesses all three reading aspects.
Brushing your teeth Question 1
The first question is a multiple-choice item that requires students to recognise a broad generalisation about what the article describes. The aspect involved with this task is integrate and interpret. The required information in the text is prominent, making it an easy reading task with a difficulty of 353 score points, located at Level 1a on the reading literacy proficiency scale.

28 Reading literacy
Brushing your teeth Question 2
This item has a similar difficulty (with 358 score points) to the previous question and is located at Level 1a. The task requires students to retrieve a synonymous piece of information from the text and is therefore classified as access and retrieve.
Brushing your teeth Question 3
This item is one of the easiest questions in the PISA 2009 reading literacy assessment, with a difficulty of 285 score points, located towards the bottom of Level 1b. The task, assigned to the aspect of access and retrieve, asks for a single piece of information directly stated in the text to be located and written out. Students can easily identify the exact place to locate the required information by using the two terms (‘tongue’ and ‘Bette Hansen’) provided in the wording of the question. To receive a correct response, students had to refer to ‘bacteria’ and/or ‘getting bad breath’. Responses could be paraphrased or quoted directly from the text. The answer shown below is correct.
Brushing your teeth Question 4
The final question in this unit, a multiple-choice item, is classified as reflect and evaluate and requires students to recognise the purpose of an analogy, in this instance referring to a pen in helping to understand how to hold a toothbrush. Students need to reflect on and evaluate why the pen was mentioned in the text. Again, this item is among one of the easier reading literacy tasks, located near the top of Level 1a, with a difficulty of 399 score points.

Challenges for Australian Education: Results from PISA 2009 29
Mobile phone safety
The ‘Mobile phone safety’ unit assesses two aspects of the PISA reading literacy assessment — integrate and interpret and reflect and evaluate. The stimulus, set in a public context/situation, and sourced from a website, uses non-continuous texts in the form of two tables and key points, as shown below.

30 Reading literacy
Mobile phone safety Question 2
The first question in this unit, a multiple-choice item, asked students to recognise the purpose of a section (a table) in an expository text.
This task was classified as belonging to the integrate and interpret aspect, and is an example of a more difficult item associated with addressing the broad understanding category. The ‘key points’ in the text are related to, but do not summarise, the information in the body of the two main tables, so the student needs to focus on what appears as a peripheral part of the text structure. To achieve a full credit, students need to establish a hierarchy among the ideas presented and choose the one that is most general and overarching. This item was located at Level 4 with a difficulty of 561 score points.

Challenges for Australian Education: Results from PISA 2009 31
Mobile phone safety Question 11
The next question, another multiple-choice item, assessed students’ skills in reflecting on and evaluating the content of a text. Students were required to recognise the relationship between a generalised statement external to the text and a pair of statements in a table.
This item was the most difficult task in this unit, placed on the boundary of Level 4 and 5, with a difficulty of 604 score points. The difficulty was associated with several factors: the stem statement using abstract terminology, working out which of the two tables was relevant to the task and which point to look at, assimilating the structure of the relevant table, discerning precisely how the NO statement challenges the YES statement in a particular instance, and matching the relationship between the YES and NO statements with one of the options in the multiple-choice format.
Mobile phone safety Question 6
This is another item in which the student needed to reflect on and evaluate the content of a text. Students were required to use their prior knowledge to reflect on information presented in a text. To obtain a correct response, students had to provide a factor in modern lifestyles that could be related to fatigue, headaches or loss of concentration. The following three examples received full credit.

32 Reading literacy
However, no credit was given to answers that provided vague, insufficient or irrelevant responses, such as the response presented below. This item had a difficulty of 526 score points and was thus located in the upper half of Level 3.
Mobile phone safety Question 9
The final question in this unit focused on the integrate and interpret aspect. Students were directed to look at the second table in this task and asked to recognise its underlying assumption (which is located in the last boxed ‘Key Point’). This item was placed at Level 3, with a difficulty of 488 score points.

Challenges for Australian Education: Results from PISA 2009 33
Balloon
The stimulus ‘Balloon’ is an example of a non-continuous text, presented with different kinds of graphs and captions with a minimum of text. Items in this unit ranged from levels 1a to 4, were set in an educational context and involved all reading aspects.
Balloon Question 8
The first question is a multiple-choice item requiring students to recognise the main idea of a diagrammatic descriptive text, which is prominently displayed and repeated throughout the text, including in the title.
The item is classified as integrate and interpret because it involves forming a broad understanding of the text. It is the easiest of the items in this unit, placed about the middle of Level 1a with a difficulty of 370 score points.
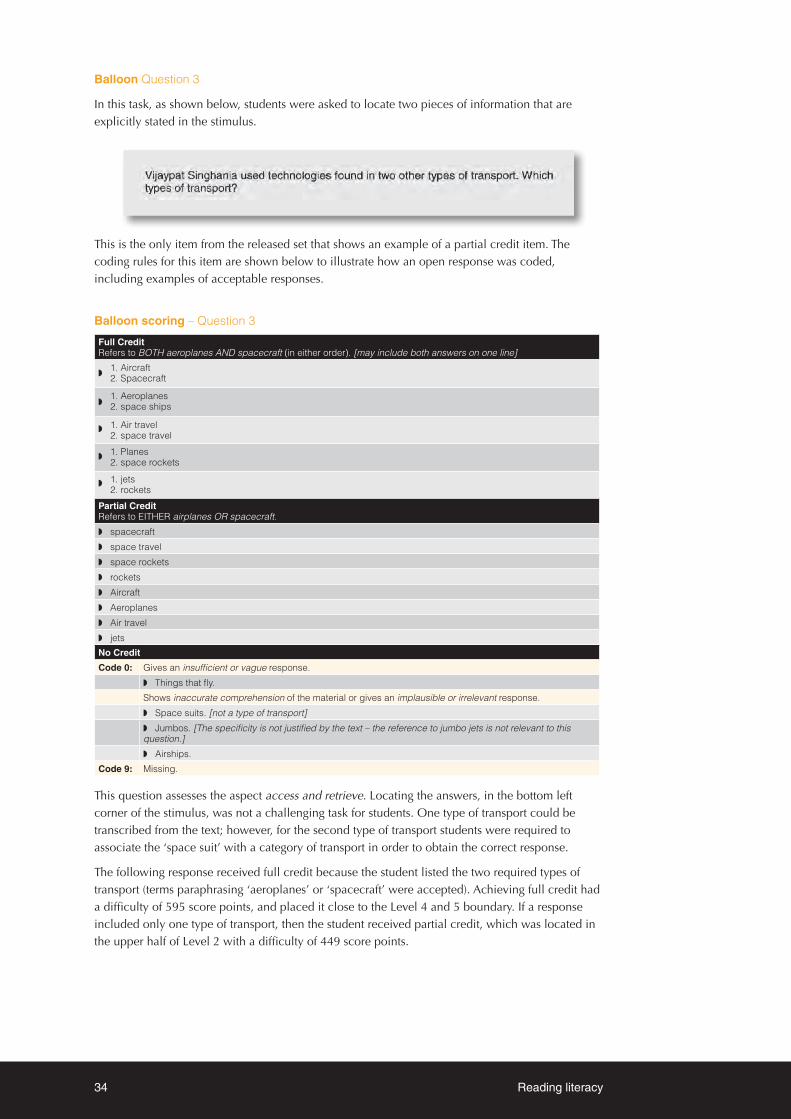
34 Reading literacy
Balloon Question 3
In this task, as shown below, students were asked to locate two pieces of information that are explicitly stated in the stimulus.
This is the only item from the released set that shows an example of a partial credit item. The coding rules for this item are shown below to illustrate how an open response was coded, including examples of acceptable responses.
Balloon scoring – Question 3
Full CreditRefers to BOTH aeroplanes AND spacecraft (in either order). [may include both answers on one line]
◗
1. Aircraft2. Spacecraft
◗
1. Aeroplanes 2. space ships
◗
1. Air travel 2. space travel
◗
1. Planes 2. space rockets
◗
1. jets 2. rockets
Partial CreditRefers to EITHER airplanes OR spacecraft.
◗ spacecraft
◗ space travel
◗ space rockets
◗ rockets
◗ Aircraft
◗ Aeroplanes
◗ Air travel
◗ jets
No Credit
Code 0: Gives an insufficient or vague response.
◗ Things that fly.
Shows inaccurate comprehension of the material or gives an implausible or irrelevant response.
◗ Space suits. [not a type of transport]
◗ Jumbos. [The specificity is not justified by the text – the reference to jumbo jets is not relevant to this question.]
◗ Airships.
Code 9: Missing.
This question assesses the aspect access and retrieve. Locating the answers, in the bottom left corner of the stimulus, was not a challenging task for students. One type of transport could be transcribed from the text; however, for the second type of transport students were required to associate the ‘space suit’ with a category of transport in order to obtain the correct response.
The following response received full credit because the student listed the two required types of transport (terms paraphrasing ‘aeroplanes’ or ‘spacecraft’ were accepted). Achieving full credit had a difficulty of 595 score points, and placed it close to the Level 4 and 5 boundary. If a response included only one type of transport, then the student received partial credit, which was located in the upper half of Level 2 with a difficulty of 449 score points.

Challenges for Australian Education: Results from PISA 2009 35
Balloon Question 4
The next question in the ‘Balloon’ unit was another open constructed-response item. Students were required to reflect on and evaluate the content of a text when they were asked:
In order to gain credit for this item, students needed to recognise the persuasive intent of including an illustration of a jumbo jet. Student responses referring to the height of the balloon or to the record, as shown in the following two examples, were awarded credit. This task was placed at Level 3 with a difficulty of 510 score points.

36 Reading literacy
Balloon Question 6
Although the intent of both this item and the previous one was to reflect on and evaluate the context of a text, this is an easier task, with a difficulty of 411 score points (the lower end of Level 2). This item requires students to recognise and use linked illustrations in a diagrammatic descriptive text.

Challenges for Australian Education: Results from PISA 2009 37
Blood donation notice
The ‘blood donation notice’ unit features a persuasive piece of writing about blood donation, set in a context that students are familiar with and come into contact with regularly. Students were asked three questions relating to this unit. The first question, a multiple-choice item (not shown here), asked students to recognise the main purpose of an advertisement.
Blood donation notice Question 8
The second question in the ‘blood donation notice’ unit assessed the aspect integrate and interpret and required the student to make links across the text to reach a conclusion. Students needed to carefully match the case described in the question stem with the correct pieces of information (the age and sex of the prospective donor, the number of times a person is allowed to give blood and the suggested interval between donations). The last piece of required information is to stipulate under what conditions the young woman is allowed to give blood again. The following response is an example of a correct response. This question had a difficulty of 438 score points, located around the middle of Level 2.

38 Reading literacy
Blood donation notice Question 9
The final item is a multiple-choice question that asks students to recognise the persuasive purpose of a phrase in the advertisement. Students need to consider the wider context of what is meant by a statement in the stimulus and recognise the author’s motive for including it. For this reason, the question has been assigned the aspect of reflect and evaluate. This item was relatively easy, located in the lower half of Level 1a with a difficulty of 368 score points.
Miser
This fable by Aesop is a well-known story and a favourite text type in reading assessments because it is short, self-contained, and has an identifiable moral.

Challenges for Australian Education: Results from PISA 2009 39
Miser Question 1
This first question is a closed constructed-response item (the only example of this item format response in the released set of items). This question requires students to integrate and interpret the text. They were asked to put a series of statements about the story into the correct order. This makes the item an easy task with a difficulty of 373 score points, located in the middle of Level 1a. The following example achieved credit for the response.
Miser Question 7
The next question in the ‘Miser’ unit focused on accessing and retrieving information is one of the easiest items in the reading literacy pool, located in the middle of Level 1b with a difficulty of 310 score points. Students were asked to locate information that was explicitly stated at the beginning of the short piece of text and make the connection between the miser selling all that he had and buying gold, as shown in the following response.

40 Reading literacy
Miser Question 5
This item assessed students’ skills in integrating and interpreting. Students were presented with a part of a conversation between two people who have conflicting interpretations of the story. Their task in responding to this item was to relate a detail of the fable to the main idea.
To achieve a full credit response, students had to make sense of the neighbour’s speech in the story and then express the idea that wealth has no value unless it is used. The following example shows a response that received full credit.
This item was the most difficult of all the ‘Miser’ questions, placed at the higher end of Level 3 with a difficulty of 548 score points. Responses that were insufficient or vague, such as the response below, were given no credit.
The final task in this unit was a multiple-choice item (not shown here) that asked students to recognise the main idea of the fable.

Challenges for Australian Education: Results from PISA 2009 41
The play’s the thing
The stimulus for the unit ‘The play’s the thing’ is the beginning of a play by the Hungarian dramatist Ferenc Molnár, and involves a conversation between three characters about the relationship between life and art and the challenges of writing for the theatre. This text is quite long in comparison to other stimuli in PISA 2009. It is set in a personal context and all of the tasks require students to integrate and interpret the text, assessing their skills across three different proficiency levels.

42 Reading literacy
The play’s the thing Question 3
This question requires a high level of interpretation to define the meaning of the question’s terms in relation to the text. The question asks what the characters were doing just before the curtain went up, and so students need to distinguish between the characters and the actors. The response below achieved full credit. Responses referring to the actors, such as ‘off the stage’, ‘talking loudly behind a door’ or ‘thinking about how to begin the play’ were scored as incorrect. The complexity of this item placed it in the highest proficiency level (Level 6) with a difficulty of 730 score points.

Challenges for Australian Education: Results from PISA 2009 43
The play’s the thing Question 4
The second question in the unit was an easier item, placed near the Level 2 and Level 3 boundary (with a difficulty of 474 score points). The question stem includes lines quoted directly from the text so the student can refer to the relevant section in the play. The student then needs to understand the context in which the line is spoken in order to respond correctly to the item.
The next item in ‘The play’s the thing’ unit (not shown) asked students to support an opinion by constructing a character’s motivation in a play.
The play’s the thing Question 7
The final question in this unit was a multiple-choice item that requires students to recognise the conceptual theme of a play, where the theme is literary and abstract. This item had a difficulty of 556 score points and was placed at Level 4.
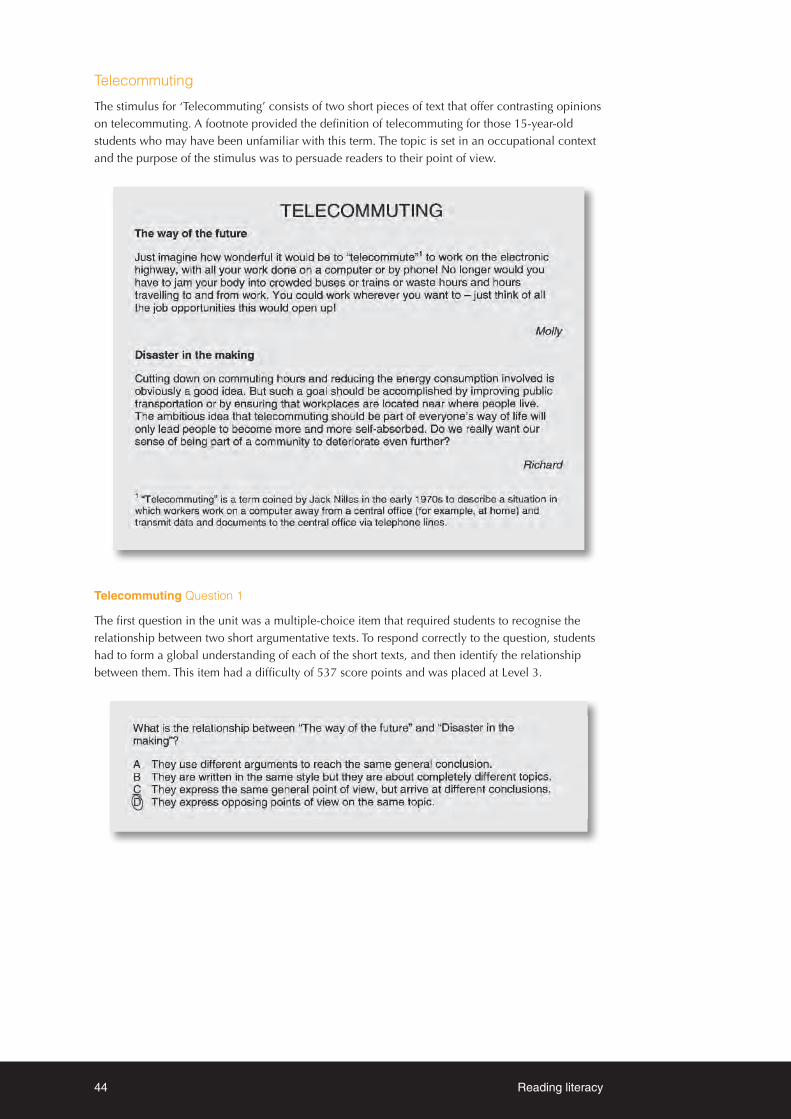
44 Reading literacy
Telecommuting
The stimulus for ‘Telecommuting’ consists of two short pieces of text that offer contrasting opinions on telecommuting. A footnote provided the definition of telecommuting for those 15-year-old students who may have been unfamiliar with this term. The topic is set in an occupational context and the purpose of the stimulus was to persuade readers to their point of view.
Telecommuting Question 1
The first question in the unit was a multiple-choice item that required students to recognise the relationship between two short argumentative texts. To respond correctly to the question, students had to form a global understanding of each of the short texts, and then identify the relationship between them. This item had a difficulty of 537 score points and was placed at Level 3.

Challenges for Australian Education: Results from PISA 2009 45
Telecommuting Question 7
This question relied on students using their prior knowledge to provide an example that fits a category described in a text; in this case, a profession in which it would be difficult to telecommute. Students needed to link their comprehension of the text with outside knowledge, as no specific profession was mentioned in the text.
To achieve full credit, as shown in the following two examples, students had to identify a profession and provide a plausible explanation as to why a person who does that kind of work could not telecommute.
Students did not receive credit for a response that identified an occupation but did not provide an explanation why this would make it difficult to telecommute. This item was placed around the middle of Level 3 with a difficulty of 514 score points.
The final item in the unit (not shown) was a multiple-choice item that asked students to indicate which statements Molly and Richard (the authors of the text) would agree with. Students were required to develop an interpretation and recognise a common position expressed in the two pieces of text.
Summary
This chapter provided the definition of reading literacy used in PISA 2009 and described the conceptual framework for the assessment of reading literacy competencies for 15-year-old students. This included the type of reading tasks that were being assessed, the situations or contexts for which the text was constructed, the organisation of texts (for e.g., paragraphs, lists or tables) and the different item formats used in the assessment. The development of the reading literacy scale and the scaling of the individual items were described, and details provided about the proficiency scales for reading literacy as a single scale and for each of the five subscales (access and retrieve, integrate and interpret, reflect and evaluate, continuous and non-continuous texts). Sample reading literacy items and responses were included to illustrate how responses were coded and students’ skills measured.
The next chapter discusses Australian students’ performance in reading literacy in PISA 2009.

46 Reading literacy

Challenges for Australian Education: Results from PISA 2009 47
This chapter focuses on Australian students’ performance in reading literacy in PISA 2009. Results are reported by means (average scores) and proficiency levels across the overall reading literacy scale, as well as on the five reading literacy subscales. Comparisons of student performance in reading literacy are provided at an international level, describing Australia’s performance relative to other participating countries, and at a national level, where the focus is on the performance of different (social) groups in Australian society, such as the Australian states, Australian school sectors, males and females, Indigenous students, students from different socioeconomic backgrounds, students attending schools in different geographic locations, students’ immigrant status and language spoken at home.
Chapter
3Australian students’ performance in reading literacy
Key Findings ◗ Australia was outperformed by six countries in reading literacy: Shanghai – China, Korea,
Finland, Hong Kong – China, Singapore and Canada. Australia’s performance was not significantly different from that of New Zealand, Japan and the Netherlands. All other countries performed at a level significantly lower than Australia.
◗ Australia’s results in reading literacy, with a mean score of 515 points, were significantly above the OECD average, with a mean score of 493 points.
◗ Thirteen per cent of Australian students were highly skilled readers (Level 5 or above) compared to eight per cent of students across OECD countries.
◗ Only 14 per cent of Australian students did not reach Level 2 in reading literacy compared to 19 per cent of students across the OECD.
◗ Significant gender differences in reading literacy, in favour of females, were found in all PISA 2009 countries. The gender difference in Australia, with a difference of 37 score points in favour of females, was similar to that of the OECD average of 39 score points.
◗ Sixteen per cent of females and ten per cent of males in Australia reached Level 5 or above, compared to 10 per cent of females and six per cent of males on average across OECD countries.
◗ Twenty per cent of males and nine per cent of females from Australia compared to 25 per cent of males and 12 per cent of females on average across the OECD did not reach Level 2.
◗ The Australian Capital Territory outperformed Victoria, South Australia, Tasmania and the Northern Territory, and performed similarly to Western Australia, Queensland and New South Wales in reading literacy. Western Australia performed significantly higher on average than South Australia, Tasmania and the Northern Territory and on a par with Queensland, New South Wales and Victoria. Tasmania and the Northern Territory scored significantly lower on average than the other states and were statistically similar to each other.

48 Australian students’ performance in reading literacy
◗ Tasmania scored similarly to the OECD average for reading literacy, and the Northern Territory scored significantly lower than the OECD average. All other states performed significantly higher than the OECD average in reading literacy.
◗ No significant differences were found between school sectors (Catholic, Government and Independent) on reading literacy performance once a student’s individual socioeconomic background and the socioeconomic background of peers at school are taken into account.
◗ The average reading literacy performance of Indigenous students was significantly lower, by more than two years of schooling, than that of non-Indigenous students. There is a substantial under-representation of Indigenous students at the higher end of the reading literacy proficiency scale (2% of Indigenous students compared to 13% of non-Indigenous students) and a similarly substantial over-representation of Indigenous students at the lower end (40% of Indigenous students compared to 13% of non-Indigenous students).
◗ The average reading literacy performance of students in metropolitan schools was significantly higher than students in provincial or remote schools. The difference in reading literacy performance between students in metropolitan schools and remote schools was equivalent to about one-and-a-half years of schooling.
◗ Six per cent of students in remote schools reached Level 5 or above compared to 14 per cent of students in metropolitan schools. Almost 30 per cent of students in remote areas did not reach Level 2 while 13 per cent of students in metropolitan schools did not reach this level.
◗ The data showed that the higher the level of socioeconomic background, the better the performance in reading literacy. The difference in mean reading literacy performance between students in the highest quartile and lowest quartile of socioeconomic background was equivalent to almost three years of schooling.
◗ Australia was outperformed by seven countries on the access and retrieve and reflect and evaluate subscales, and by six countries on the integrate and interpret and continuous texts subscales, and five countries on the non-continuous texts subscale. Australia’s average scores on access and retrieve, integrate and interpret and continuous texts were similar to Australia’s overall reading literacy score, while results on reflect and evaluate and non-continuous texts suggest that this may be a relative strength.
◗ Australia’s performance on each of the reading literacy subscales was significantly higher than the OECD average.
◗ Reading literacy performance was compared in 33 countries between PISA 2000 and PISA 2009. Australia was the only high performing country to show a significant decline in reading literacy performance.
◗ The mean performance for Australian females and males has significantly declined between PISA 2000 and PISA 2009, while the OECD average remained statistically similar for females and males.
◗ From PISA 2000 to PISA 2009, there was a significant decline in the proportion of Australian females and males who reached Level 5 or above (a decrease of 6% for females and 4% for males between PISA 2000 and PISA 2009) and a significant increase (4%) in the proportion of Australian males who did not reach Level 2.
◗ Tasmania, South Australia, New South Wales and the Australian Capital Territory, showed on average a significant decline from PISA 2000 to PISA 2009 in reading literacy overall.
◗ South Australia, Tasmania, Western Australia and the Australian Capital Territory, showed a significant decline at the higher end of the reading literacy proficiency scale, while the Australian Capital Territory, South Australia and New South Wales showed a significant decline at the lower end of the reading literacy scale between PISA 2000 to PISA 2009.

Challenges for Australian Education: Results from PISA 2009 49
Reporting reading literacy performance: mean scores and proficiency levelsReading literacy has now been assessed in four cycles of PISA. In PISA 2000, reading literacy was first assessed as a major domain and the results were summarised on a single, overall reading literacy scale and on five subscales — three aspect or process subscales (retrieving information, interpreting texts and reflection and evaluation) and two text format subscales (continuous and non-continuous). In PISA 2003 and PISA 2006, reading literacy was a minor domain of assessment and results were reported only on the overall reading literacy scale.
In PISA 2009, with the majority of assessment time once again devoted to reading literacy, the reporting of results are provided on an overall scale as well as on five separate subscales: three aspect subscales (access and retrieve, integrate and interpret and reflect and evaluate) and two text format subscales (continuous texts and non-continuous texts).
Mean scores and distribution of scores
The mean score on the PISA 2009 overall reading literacy scale across participating OECD countries was 493 score points, with a standard deviation of 93. This establishes the benchmark against which each country’s reading performance in PISA 2009 is compared. The OECD average for the aspect subscales were as follows: 495 score points for access and retrieve, 493 score points for integrate and interpret, and 494 score points for reflect and evaluate. On the two text format subscales, the OECD average was 494 score points for continuous texts and 493 score points for non-continuous texts.
Proficiency levels
While mean scores provide a convenient summary of student performance, proficiency levels are developed in PISA to provide a description of the knowledge and skills students could be expected to have at particular levels.
As mentioned in Chapter 2, seven levels of reading literacy proficiency were defined in PISA 2009, with two unbounded regions for Below Level 1b and Level 6. The proficiency levels range in difficulty from the lowest described level, Below Level 1b to the highest described level, Level 6. The range of reading literacy proficiency levels allows approximately 98.9 per cent of 15-year-old students’ skills and knowledge, across OECD countries, to be described.
Level 2 has been defined internationally as a ‘baseline’ proficiency level. At the other end of the spectrum, students who achieved Level 5 or 6 (that is, scored 625.6 score points or more) are described as high performers in PISA.
50 Australian students’ performance in reading literacy
Student performance in reading literacy
Interpreting differences in PISA scores: how big is ‘big’?
In terms of proficiency levels:
A difference of 73 score points represents one proficiency level on the PISA reading literacy scale. This can be considered a comparatively large difference in student performance in substantive terms. For example, compare the skill set for those students who are proficient at Level 2 and those who are at Level 3. Students who reach Level 2 on the reading literacy scale are able to locate information that meets several conditions, make comparisons or contrasts around a single feature, work out what a well-defined part of a text means, even when the information is not prominent, and make connections between the text and personal experience. However, students who perform at Level 3 are proficient with the tasks at Level 2 and can also locate multiple pieces of information, link different parts of a text and relate a text to previously acquired knowledge.
In terms of schooling
It is possible to compare the performance of students in different grades or year levels in the 34 OECD countries in which there are a sizeable number of 15-year-olds in at least two different year levels in the PISA sample. Analysis of these data indicate that one school year corresponds to 39 score points, on average, across OECD countries on the PISA reading literacy scale17. A difference in student performance that is larger than 39 score points can then be interpreted as being similar to a difference of one year of schooling. For Australia, the data indicate that one school year corresponds to 33 score points on average18.
Reading literacy performance from an international perspective
Thirteen of the 34 OECD countries (Korea, Finland, Canada, New Zealand, Japan, Australia, the Netherlands, Belgium, Norway, Estonia, Switzerland, Poland and Iceland) achieved a mean score that was significantly above the OECD average of 493 score points. Nine OECD countries (the United States, Sweden, Germany, Ireland, France, Denmark, the United Kingdom, Hungary and Portugal) achieved mean scores that were not statistically significantly different from the OECD average. The remaining 12 OECD countries (Italy, Slovenia, Greece, Spain, Czech Republic, Slovak Republic, Israel, Luxembourg, Austria, Turkey, Chile and Mexico) achieved a mean score that was significantly below the OECD average.
Three of the five highest performing countries were OECD partner countries: Shanghai – China, Hong Kong – China and Singapore.
17 OECD, 2010, (Volume 2), pg. 2718 OECD, 2010, (Volume 1), pg. 169

Challenges for Australian Education: Results from PISA 2009 51
Australian students achieved a mean score of 515 points on the overall reading literacy scale. Six countries, three of which were OECD countries, performed significantly higher than Australia: Shanghai – China (556 score points); Korea (539 score points); Finland (536 score points); Hong Kong – China (533 score points); Singapore (526 score points); and Canada (524 score points). Three countries had mean scores that were not significantly different from that of Australia: New Zealand (521 score points); Japan (520 score points); and the Netherlands (508 score points). All other countries (including the United States, Chinese Taipei and the United Kingdom) performed at a level significantly lower than Australia.
Table 3.1 provides the mean reading literacy scores, along with the standard error, confidence interval around the mean and the difference between the 5th and 95th percentile for participating countries. Although there are 65 participating countries in PISA 2009, not all are reported in this chapter. For clarity in figures, the Australian report details results for those countries which achieved a mean score higher than the lowest performing OECD country, Mexico19.
19 For brevity, results for those countries who achieved a mean score lower than 425 score points have not been included in this table or in this chapter. The countries are: Albania, Argentina, Azerbaijan, Brazil, Colombia, Indonesia, Jordan, Kazakhstan, Kyrgyzstan, Montenegro, Panama, Peru, Qatar, Romania, Thailand, Trinidad and Tobago and Tunisia. Results for these countries are included in the OECD International PISA report.

52 Australian students’ performance in reading literacy
Table 3.1 Mean reading literacy scores, confidence intervals and variations by country
Country Mean score S.E. Confidence
intervalDifference between 5th
and 95th percentile
Shanghai – China 556 2.4 551 - 561 262
Korea 539 3.5 532 - 546 258
Finland 536 2.3 531 - 540 284
Hong Kong – China 533 2.1 529 - 537 279
Singapore 526 1.1 524 - 528 320
Canada 524 1.5 521 - 527 296
New Zealand 521 2.4 516 - 525 335
Japan 520 3.5 513 - 527 328
Australia 515 2.3 510 - 519 325
Netherlands 508 5.1 498 -518 285
Belgium 506 2.3 501 -511 330
Norway 503 2.6 498 - 508 301
Estonia 501 2.6 496 - 506 274
Switzerland 501 2.4 496 -505 308
Poland 500 2.6 495 - 506 293
Iceland 500 1.4 498 - 503 317
United States 500 3.7 493 - 507 317
Liechtenstein 499 2.8 494 - 505 270
Sweden 497 2.9 492 - 503 325
Germany 497 2.7 492 - 503 307
Ireland 496 3.0 490 - 501 309
France 496 3.4 489 - 502 347
Chinese Taipei 495 2.6 490 - 500 284
Denmark 495 2.1 491 - 499 274
United Kingdom 494 2.3 490 - 499 312
Hungary 494 3.2 488 - 500 300
OECD average 493 0.5 492 - 494 305
Portugal 489 3.1 483 - 495 286
Macao – China 487 0.9 485 - 488 251
Italy 486 1.6 483 - 489 311
Latvia 484 3.0 478 - 490 262
Slovenia 483 1.0 481 -485 297
Greece 483 4.3 474 - 491 311
Spain 481 2.0 477 - 485 287
Czech Republic 478 2.9 473 - 484 302
Slovak Republic 477 2.5 472 - 482 297
Croatia 476 2.9 470 - 481 284
Israel 474 3.6 467 - 481 366
Luxembourg 472 1.3 470 - 475 342
Austria 470 2.9 465 - 476 326
Lithuania 468 2.4 464 - 473 283
Turkey 464 3.5 457 - 471 270
Dubai (UAE) 459 1.1 457 - 462 350
Russian Federation 459 3.3 453 - 466 298
Chile 449 3.1 443 - 455 274
Serbia 442 2.4 437 - 447 274
Bulgaria 429 6.7 416 - 442 368
Uruguay 426 2.6 421 - 431 327
Mexico 425 2.0 421 - 429 276
Significantly higher than
Australia
Not significantly different to Australia
Significantly lower than Australia

Challenges for Australian Education: Results from PISA 2009 53
The OECD average between the 5th and 95th percentile was 305 score points. However, the difference in scores between the 5th and 95th percentile varied considerably within the different countries. Among the OECD countries, the widest differences between the lowest and highest performing students were found in Israel (366 score points), France (347 score points) and Luxembourg (342 score points). There was 325 score points between the 5th and 95th percentile in Australia. For partner countries, the widest differences were found in Bulgaria (368 score points) and Dubai (UAE) with 350 score points.
The narrowest differences between the lowest and highest performing students were found in the partner country, Macao – China, with 251 score points between the 5th and 95th percentile, followed by Korea and Shanghai – China, both top performing countries with a difference of 258 and 262 score points respectively between the lowest and highest performing students.
The reading literacy proficiency levels provide further detail about student performance by describing the competencies students at each level have displayed. The proportion of students at each reading literacy proficiency level, from Below Level 1b to Level 6, are presented by country in Figure 3.1. Countries have been ordered by the percentage of students classified as below Level 2 (the OECD baseline), with the lowest proportions of students below Level 2 placed at the top of the figure and countries with the highest proportion of students below Level 2 at the bottom.
As described in Chapter 2, those students at the higher end of the reading literacy proficiency scale are more skilled readers. Students who scored between 626 and 698 score points were placed at Level 5 and students who scored more than 698 score points were placed at Level 6.
At Level 6, students are able to make multiple inferences, comparisons and contrasts that are detailed and are able to hypothesise about or critically evaluate a complex text on an unfamiliar topic. These students are also capable of integrating information from more than one text and can apply sophisticated understandings from beyond the text. On average, almost one per cent (0.8%) of students across OECD countries performed at this level. New Zealand and Singapore had more than twice as many students as the OECD average performing at Level 6, with three per cent. Australia was one of six countries (along with the United States, Finland, Canada, Japan and Shanghai – China) to have around two per cent of students at Level 6.
Students who were proficient at Level 5 were capable of locating and organising several pieces of deeply embedded information and were able to critically evaluate or draw hypotheses by drawing on specialised knowledge. Those students who had achieved Level 6 were also proficient at Level 5 tasks and students achieving at these levels are referred to as top performers. On average, the proportion of students across OECD countries who achieved Level 5 or 6 was eight per cent. In Shanghai – China, almost one-fifth (20%) of students achieved this level. Other countries who were top performers, achieving high mean scores, also achieved the highest proportion of students placed at Level 5 or 6. These countries were: Hong Kong – China (12%); Canada (13%); Australia (13%); Korea (13%); Japan (13%); Finland (15%); Singapore (16%) and New Zealand (16%).
It is not only important to examine those students who are highly proficient readers, but also to identify those students who are at the lower end of the reading literacy proficiency scale. These are the students who have less developed reading literacy skills. As discussed in Chapter 2, students who have not reached a proficiency of Level 2 are considered, according to the PISA definition, to be at serious risk of not being able to participate adequately in the 21st century work-force and contribute as productive citizens.
On average, across OECD countries, almost one-fifth (19%) of students did not perform at Level 2 (between 408 and 480 score points). In some countries, the proportion of students who did not reach Level 2 was twice that of the OECD average–Uruguay (42%), Bulgaria (41%) and Mexico (40%) are such examples. Fourteen per cent of Australian students failed to reach Level 2, similar to the proportions in New Zealand and Japan. Shanghai – China and Korea had the lowest percentages of students who failed to achieve Level 2 with four and six per cent of students, respectively.
Students who perform at Level 1a are able to locate one or more independent pieces of explicitly stated information, recognise the main theme or author’s purpose in a text about a familiar topic, and make a simple connection between information in the text and common, everyday knowledge. Thirteen per cent of students across all OECD countries performed at Level 1a, while in Australia, only 10 per cent of students were classified at this level.

54 Australian students’ performance in reading literacy
In cases in which the proportion of students in a proficiency level is one per cent or less, the level still appears in the figure but the numeric label “1”, does not. This convention has been used for all figures about proficiency levels in this chapter.
0 20 40 60 80 100100 80 60 40 20
Uruguay
Bulgaria
Mexico
Serbia
Dubai (UAE)
Chile
Austria
Russian Federation
Israel
Luxembourg
Turkey
Lithuania
Czech Republic
Croatia
Slovak Republic
Greece
Slovenia
Italy
France
Spain
OECD average
Germany
United Kingdom
Belgium
Portugal
United States
Latvia
Hungary
Sweden
Ireland
Iceland
Switzerland
Liechtenstein
Chinese Taipei
Denmark
Poland
Norway
Macao – China
New Zealand
Netherlands
Australia
Japan
Estonia
Singapore
Canada
Hong Kong – China
Finland
Korea
Shanghai – China
Below Level 1b Level 1a Level 2 Level 3 Level 4 Level 5 Level 6Level 1b
Percentage of students
3 13 29 35 17 2
5 15 33 33 12
2 6 17 30 31 13 2
7 16 31 32 11
2 8 20 30 27 11 2
3 9 19 28 26 13 3
2 11 26 34 21 5
3 9 18 28 27 11 2
3 10 20 28 24 11 2
2 12 25 28 24 9
3 10 19 26 25 13 3
3 12 31 35 17 3
3 11 24 31 22 8
3 11 24 31 22 7
3 12 26 33 21 4
4 11 25 34 21 5
3 13 24 31 25 4
4 12 23 30 23 7
4 12 22 31 22 8
2 4 12 23 31 22 6
2 4 12 23 30 20 8
5 12 24 31 22 6
3 14 29 33 17 3
4 13 24 28 21 8 2
4 13 26 32 20 5
5 12 20 26 25 10
4 13 25 29 20 7
4 13 22 29 23 7
5 13 24 29 21 7
5 14 27 33 18 3
2 6 12 21 27 22 8
5 14 24 29 20 5
5 15 26 29 19 4
6 14 26 29 18 5
6 16 28 29 17 4
5 16 27 31 16 3
5 17 27 27 17 5
6 18 30 29 14 3
6 18 32 29 12 2
3 7 16 24 27 17 5
4 8 15 22 25 18 6
2 7 19 32 27 11 3
2 8 17 24 26 17 5
7 22 33 26 9
4 9 18 25 23 15 5
2 9 22 33 25 8
3 11 25 33 21 5
8 13 20 23 22 11 3
6 12 24 28 20 8 2
Figure 3.1 Reading literacy proficiency levels by country
Challenges for Australian Education: Results from PISA 2009 55
At Level 1b, students are able to locate a single piece of explicitly stated information in a prominent position in a short, simple text and they can make simple connections between adjacent pieces of information. Across OECD countries five per cent of students, on average, performed at Level 1b. More than ten per cent of students from Bulgaria, Uruguay and Mexico performed at Level 1b. Only three per cent of Australian students were placed at this level, while in top performing countries such as Shanghai – China and Korea less than one per cent of students were at Level 1b.
Students who scored less than 262 score points were classified as below Level 1b. It is not possible to provide a detailed description of the skills of these students, as there were only two items in the PISA 2009 assessment that were at this level. However, students who performed at this level demonstrated limited reading skills that will likely negatively impact their lives. On average, one per cent of students across OECD countries were placed below Level 1b, which was similar to the proportion of students in Australia at this level of proficiency. Shanghai – China (0.1%), Hong Kong – China (0.2%), Finland (0.2%) and Korea (0.2%) had very few students classified at this level.
Reading literacy performance and gender from an international perspective
Table 3.2 provides the mean scores and standard errors for females and males and displays the difference between average male and female performance graphically. There were statistically significant gender differences in reading literacy performance in all participating countries, with females significantly outperforming males by 39 score points, on average, across OECD countries. The difference in the average performance of females and males in Australia was 37 score points – around half of a proficiency level or the equivalent of about one year of schooling.
With the exception of Finland, the gender difference in countries that performed significantly better than Australia was close to the OECD average: Shanghai – China (40 score points), Korea (35 score points), Canada (34 score points), Hong Kong – China (33 score points) and Singapore (31 score points). In Finland, the gender difference was one of the widest, at 55 score points, and this was also seen in Bulgaria (61 score points), Lithuania (59 score points), Slovenia (55 score points) and Poland (50 score points). Those countries with the narrowest gender gap, all OECD countries, included Chile (22 score points), the Netherlands (24 score points), the United States (25 score points), Mexico (25 score points) and the United Kingdom (25 score points).

56 Australian students’ performance in reading literacy
Table 3.2 Mean reading literacy scores by gender and gender differences by country
Country
Gender differences
Females MalesDifference in mean score
Mean score S.E. Mean score S.E.
Bulgaria 461 5.8 400 7.3
0 20 40 60 80
Females scorehigher
Gender differences significantGender differences not significant
Lithuania 498 2.6 439 2.8
Finland 563 2.4 508 2.6
Slovenia 511 1.4 456 1.6
Slovak Republic 503 2.8 452 3.5
Croatia 503 3.7 452 3.4
Dubai (UAE) 485 1.5 435 1.7
Poland 525 2.9 476 2.8
Czech Republic 504 3.0 456 3.7
Latvia 507 3.1 460 3.4
Norway 527 2.9 480 3.0
Greece 506 3.5 459 5.5
Italy 510 1.9 464 2.3
New Zealand 544 2.6 499 3.6
Sweden 521 3.1 475 3.2
Russian Federation 482 3.4 437 3.6
Estonia 524 2.8 480 2.9
Iceland 522 1.9 478 2.1
Turkey 486 4.1 443 3.7
Israel 495 3.4 452 5.2
Uruguay 445 2.8 404 3.2
Austria 490 4.0 449 3.8
France 515 3.4 475 4.3
Shanghai – China 576 2.3 536 3.0
Germany 518 2.9 478 3.6
Serbia 462 2.5 422 3.3
Luxembourg 492 1.5 453 1.9
Ireland 515 3.1 476 4.2
OECD average 513 0.5 474 0.6
Japan 540 3.7 501 5.6
Switzerland 520 2.7 481 2.9
Portugal 508 2.9 470 3.5
Hungary 513 3.6 475 3.9
Chinese Taipei 514 3.6 477 3.7
Australia 533 2.6 496 2.9
Korea 558 3.8 523 4.9
Canada 542 1.7 507 1.8
Macao – China 504 1.2 470 1.3
Hong Kong – China 550 2.8 518 3.3
Liechtenstein 516 4.5 484 4.5
Singapore 542 1.5 511 1.7
Spain 496 2.2 467 2.2
Denmark 509 2.5 480 2.5
Belgium 520 2.9 493 3.4
United Kingdom 507 2.9 481 3.5
Mexico 438 2.1 413 2.1
United States 513 3.8 488 4.2
Netherlands 521 5.3 496 5.1
Chile 461 3.6 439 3.9

Challenges for Australian Education: Results from PISA 2009 57
The proportions of females and males at each of the reading literacy proficiency levels in Australia and across the OECD countries are shown in Figure 3.2. The proportion of females tended to be higher in the higher proficiency levels and lower at the lower proficiency levels.
In Australia, 16 per cent of females and 10 per cent of males reached Level 5 or 6, compared to 10 per cent of females and just over five per cent of males across OECD countries. However, there were twice as many males (20%) as females (9%) who failed to reach Level 2. These figures compare favourably with the OECD average of almost 25 per cent of males and 12 per cent of females not reaching Level 2.
Males
Females
Males
Females
Aus
tralia
OEC
D a
vera
ge
0 20 40 60 80 100100 80 60 40 20
Below Level 1b Level 1a Level 2 Level 3 Level 4 Level 5 Level 6Level 1b
2 7 19 30 27 13 3
2 5 13 23 27 21 8 2
3 9 22 31 25 9
2 7 17 26 27 17 5
Percentage of students
Figure 3.2 Proficiency levels for students in reading literacy by gender, Australia and OECD average
Reading literacy performance across Australian states and territories
The reading literacy performance for students in each of the Australian states is presented in Table 3.3, together with the standard error, confidence interval and the spread of scores between the 5th and 95th percentile. Table 3.3 has been ordered by state with the mean scores for Australia, Shanghai – China (the highest performing country) and the OECD average have been included for comparison.
Students in the Australian Capital Territory achieved the highest mean score in reading literacy performance with 531 points. The lowest performing state was the Northern Territory, with a mean of 481 score points. While the Northern Territory performed significantly below the OECD average and Tasmania performance at a statistically similar level, the other states all performed significantly higher than the OECD average.
South Australia had the narrowest spread of scores, with 303 score points between the students at the 5th and 95th percentile, whereas the Northern Territory had the widest spread of scores with 385 score points. The difference in scores between the 5th and 95th percentile for other states ranged from 316 to 339 score points and all States and Territories except for South Australia had a spread of scores wider than the OECD average.

58 Australian students’ performance in reading literacy
Table 3.3 Mean reading literacy scores, confidence intervals and variations by state
State Mean score S.E. Confidence interval Difference between 5th and 95th percentile
ACT 531 6.0 520 - 543 339
NSW 516 5.6 505 - 527 330
VIC 513 4.7 504 - 523 316
QLD 519 7.0 505 - 532 327
SA 506 4.8 497 - 516 303
WA 522 6.3 510 - 534 328
TAS 483 5.8 472 - 495 332
NT 481 5.6 469 - 492 385
Australia 515 2.3 510 - 519 325
Shanghai – China 556 2.4 551 - 561 262
OECD average 493 0.5 492 - 494 305
Table 3.4 provides a comparison of reading performance between each of the states. The Australian Capital Territory outperformed four states (Victoria, South Australia, Tasmania and the Northern Territory) and performed similarly to Western Australia, Queensland and New South Wales. Western Australia performed significantly higher on average than three states (South Australia, Tasmania and the Northern Territory) and equivalent to Queensland, New South Wales and Victoria.
The mean scores for Queensland, New South Wales, Victoria and South Australia were not statistically different from one another. Tasmania and the Northern Territory scored significantly lower on average than the other states, but were not statistically different from one another.
Table 3.4 Multiple comparisons of mean performance in reading literacy by state
ACT WA QLD NSW VIC SA TAS NT OECD
Mean 531 522 519 516 513 506 483 481 493
Mean S.E. 6.0 6.3 7.0 5.6 4.7 4.8 5.8 5.6 0.5
ACT 531 6.0 ● ● ● ▲ ▲ ▲ ▲ ▲
WA 522 6.3 ● ● ● ● ▲ ▲ ▲ ▲
QLD 519 7.0 ● ● ● ● ● ▲ ▲ ▲
NSW 516 5.6 ● ● ● ● ● ▲ ▲ ▲
VIC 513 4.7 ▼ ● ● ● ● ▲ ▲ ▲
SA 506 4.8 ▼ ▼ ● ● ● ▲ ▲ ▲
TAS 483 5.8 ▼ ▼ ▼ ▼ ▼ ▼ ● ●
NT 481 5.6 ▼ ▼ ▼ ▼ ▼ ▼ ● ▼
Note: Read across the row to compare a state’s performance with the performance of each state listed in the column heading.
▲ Average performance statistically significantly higher than in comparison state
● No statistically significant difference from comparison state
▼ Average performance statistically significantly lower than in comparison state
Females in every state performed at a significantly higher level on average than males in reading literacy. The mean reading literacy scores for females and males are shown in Table 3.5 with the associated standard errors and the difference in mean scores. The largest gender difference of 42 score points was found in Tasmania, closely followed by New South Wales and the Northern Territory, with gender differences of 41 score points. These differences are equivalent to just over half a proficiency level or almost one year of schooling. Queensland reported the smallest gender difference, at 31 score points.

Challenges for Australian Education: Results from PISA 2009 59
Table 3.5 Mean reading literacy scores by gender and gender differences by state
State
Gender differences
Females MalesDifference in mean score
Mean score S.E. Mean score S.E.
TAS 505 8.9 463 7.5
0 20 40 60 80
Females scorehigher
Gender differences significantGender differences not significant
NSW 536 5.3 495 7.6
NT 501 8.9 460 5.4
ACT 550 9.0 513 9.5
VIC 531 5.7 495 6.1
WA 539 6.4 504 8.1
SA 524 4.3 490 7.3
QLD 534 6.8 503 8.0
Figure 3.3 shows the proportion of students at each of the proficiency levels in each state, along with the percentages for Australia overall, the OECD average and the highest scoring country, Shanghai – China, for comparison.
Three per cent of students from the Australian Capital Territory and Queensland achieved the highest proficiency, Level 6, in reading literacy, which was greater than the proportion of students in Shanghai – China who performed at this level. Two per cent of students in New South Wales, Western Australia and Victoria achieved Level 6, a similar proportion to Shanghai – China. One per cent of students from the Northern Territory, Tasmania and South Australia achieved Level 6, which was similar to the OECD average.
Almost 20 per cent of students in the Australian Capital Territory performed at Level 5 or 6, while fewer than 10 per cent of students from the Northern Territory and Tasmania, and around eight per cent of students across the OECD, achieved at these levels.
At the lower end of the reading literacy proficiency scale, almost one-fifth of students across the OECD failed to reach Level 2, less than the percentage of students from the Northern Territory or Tasmania who were placed at these levels (24% and 23% respectively). In other states, 13 per cent of students in Western Australia and the Australian Capital Territory, 14 per cent in Queensland, New South Wales and Victoria and 15 per cent in South Australia failed to reach Level 2.
The proportion of students who have not reached Level 2 is a concern, as these students have not been able to demonstrate the reading literacy competencies that will enable them to participate actively in society. One in twenty students from the Northern Territory and Tasmania failed to reach Level 2. Of greater concern, however, is the proportion of students who were placed below Level 1b; five per cent of students from the Northern Territory and two per cent of students from Tasmania were in this category and are thus at serious risk. For the other states, there was a smaller proportion of one per cent of students who were placed at Below Level 1b.

60 Australian students’ performance in reading literacy
0 20 40 60 80 100100 80 60 40 20
OECD average
Shanghai – China
Australia
NT
TAS
SA
VIC
NSW
QLD
ACT
WA
Below Level 1b Level 1a Level 2 Level 3 Level 4 Level 5 Level 6Level 1b
Percentage of students
3 8 20 27 26 12 2
3 9 17 24 28 15 3
3 10 20 28 24 11 3
4 10 20 28 24 11 2
3 11 20 30 24 10 2
3 11 22 30 23 9
2 6 15 25 25 20 6
5 7 13 23 24 20 8
3 10 20 28 24 11 2
3 13 29 35 17 2
5 13 24 29 21 7
Figure 3.3 Proficiency levels in reading literacy by state
Greater proportions of females were placed at Level 5 or Level 6 in all states (Figure 3.4). All states except Tasmania had a higher proportion of females who had reached Level 5 or 6 than the OECD average (10% of females). There were 22 per cent of females in the Australian Capital Territory and 19 per cent of females in Western Australia who were placed at Level 5 or 6. The proportion of females in other states who performed at Level 5 or 6 ranged from 10 per cent in Tasmania to 16 per cent in New South Wales and Queensland. There were higher proportions of males from the Australian Capital Territory (15%) and Queensland (12%) who reached at least Level 5 compared to the other states, where the proportion of males who performed at these high levels of reading literacy proficiency ranged from five per cent in Tasmania to 10 per cent in Western Australia and New South Wales. All states, except Tasmania, had a higher proportion of males placed at Level 5 or 6 than the OECD average for males (5%).
There were higher proportions of males at the lower end of the reading literacy proficiency scale — across the OECD, twice as many males as females failed to reach Level 2, and this was also the case in most Australian states. Almost one-third of males and one-fifth of females from the Northern Territory and Tasmania had not reached Level 2, compared to the corresponding proportions of males (17%) and females (9%) in the ACT (a higher performing state). The differences in the proportions of females and males who performed below Level 2 ranged from eight per cent in Western Australia to 13 per cent in Tasmania.

Challenges for Australian Education: Results from PISA 2009 61
Males
Females
Males
Females
Males
Females
Males
Females
Males
Females
Males
Females
Males
Females
Males
Females
Males
Females
Males
Females
100 80 60 40 20 00 20 40 60 80 100
Below Level 1b Level 1a Level 2 Level 3 Level 4 Level 5 Level 6Level 1b
OEC
D a
vera
ge
Aus
tralia
N
T TA
S W
A
SA
QLD
VI
C
NSW
A
CT
2 7 14 24 32 18 4
2 5 10 19 24 24 13 3
2 6 18 29 28 13 3
5 13 23 27 20 8 2
2 7 19 31 27 12 2
5 14 22 28 20 8
2 7 18 30 28 13 3
2 4 12 22 27 20 10 2
7 21 32 26 11
2 4 15 23 29 20 7
2 6 18 26 29 16 3
2 4 11 22 27 24 9
3 13 24 26 23 8 2
4 8 17 26 23 17 5
4 5 9 21 24 25 10 2
5 9 17 25 24 15 5
2 7 18 30 27 13 3
2 5 13 23 27 21 8 2
3 9 22 31 25 9
2 7 17 26 27 17 5
Percentage of students
Figure 3.4 Proficiency levels in reading literacy by state and gender
Reading literacy performance and school sector
PISA results for each of the school sectors in Australia – government, Catholic and independent – are being reported for the first time in 2009. Previous cycles of PISA have shown that “on average across the countries with a significant share of private enrolment, students in private schools outperform students in public schools in 21 countries, while public schools outperform private ones in four countries” (OECD, 2007, p.230).
The International report goes on to note that:
“In the interpretation of these figures, it is important to recognise that there are many factors that affect school choice. Insufficient family wealth can, for example, be an important impediment to students wanting to attend independent private schools with a high level of tuition fees. Even government-dependent private schools that charge no tuition fees can cater for a different clientele or apply more restrictive transfer or selection practices.” (OECD, 2007, p. 231)

62 Australian students’ performance in reading literacy
In the interpretation of these results, therefore, it is important to recognise the effect an individual student’s family background or socioeconomic status has on their performance, and the peer effect of the socioeconomic level of the school itself on student performance. To accomplish this statistically, we use multi-level regression to account for the student’s socioeconomic background and also that of the school they attend. The proxy for the socioeconomic background of the school is derived by aggregating the student-level socioeconomic background of the students to school level.
The purpose of “accounting for socioeconomic background” is to statistically adjust the mean scores to allow for the differing effects of socioeconomic background. After this “adjustment”, the scores that result are those which might be obtained, for example, by students from similar socioeconomic backgrounds attending different types of schools.
The unadjusted means for reading literacy by school sector show that on average, students in the independent school sector achieved significantly higher than those in the Catholic or government school sectors, and students in Catholic schools scored significantly higher than students in government schools. All mean scores were significantly higher than the OECD average (Table 3.6).
Table 3.6 Mean reading literacy scores (unadjusted for student and school socioeconomic background) by school sector
School Sector Mean score S.E. Confidence interval Difference between 5th and 95th percentile
Government 497 3.9 489 - 504 333
Catholic 532 4.3 524 - 541 281
Independent 553 3.9 546 - 561 291
Catholic schools had the narrowest spread of scores, with 281 score points between the students at the 5th and 95th percentile, whereas the difference in scores between the 5th and 95th percentile for Independent schools was slightly wider at 291 score points. The spread of scores between the lowest and highest performing students in reading literacy was widest in government schools with 333 score points. This reflects the fact that government schools cater for a broader range of students in terms of achievement levels than either Catholic or independent schools.
However, how much of this difference in scores is due to what the students bring to school with them in terms of socioeconomic background20, and how much is due to the pooled resources of the school community, represented by the aggregate socioeconomic background? When student-level socioeconomic background is taken into account, students in Catholic and independent schools still performed at a significantly higher level than students in government schools, although the differences are reduced (Table 3.7).
School-level socioeconomic background (the so-called ‘peer effect’) should also be accounted for21. Once it is included in the analysis the advantage of schools in the Catholic and independent sectors disappears, with no significant differences between achievement levels in the different school sectors. In other words, students in the Catholic or independent school sectors bring with them an advantage from their socioeconomic background that is not as strongly characteristic of students in the government school sector. In previous cycles of PISA the OECD has noted that the differences between public and private schools disappear once similar adjustments are made in most OECD countries and suggests that “private schools may realise their advantage not only from the socioeconomic advantage that students bring with them, but even more so because their combined socioeconomic intake allows them to create a learning environment that is more conducive to learning” (OECD, 2007, p. 231).
20 The measure of socioeconomic background is based on the economic, social and cultural status (ESCS) index. For more information please refer to the Reader’s Guide.
21 School-level socioeconomic background is calculated as the aggregated average of the socioeconomic background of the PISA students in the school.
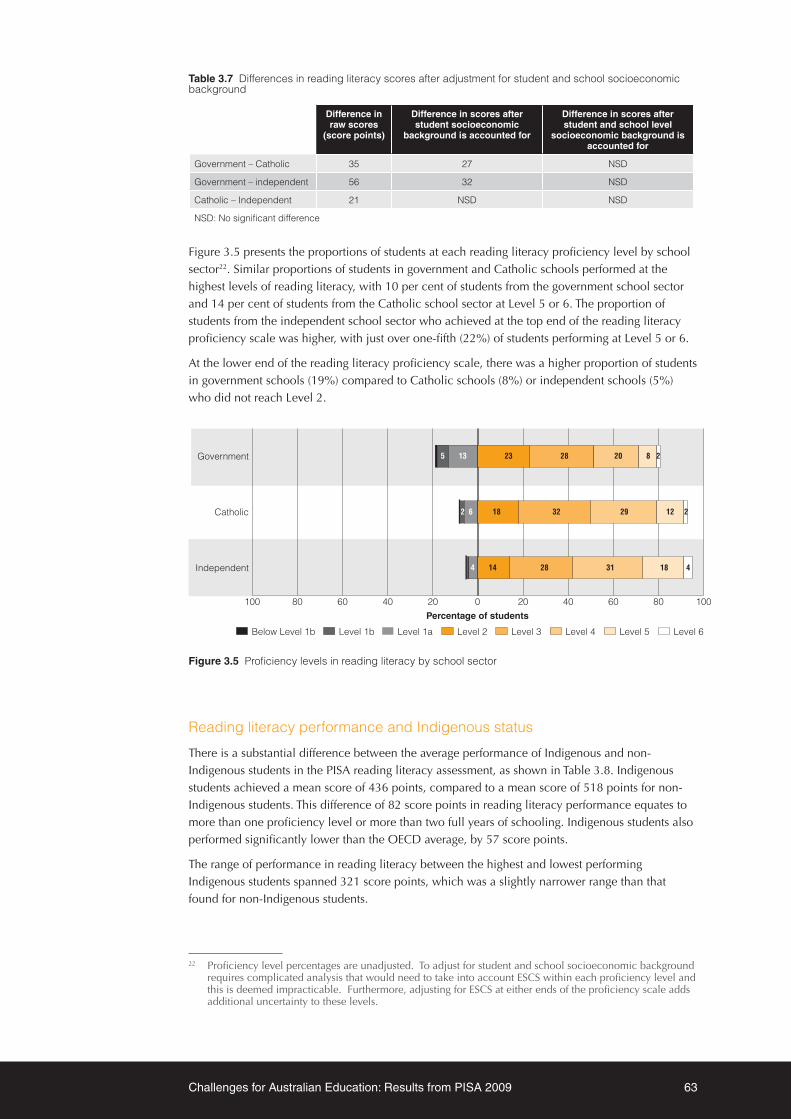
Challenges for Australian Education: Results from PISA 2009 63
Table 3.7 Differences in reading literacy scores after adjustment for student and school socioeconomic background
Difference in raw scores
(score points)
Difference in scores after student socioeconomic
background is accounted for
Difference in scores after student and school level
socioeconomic background is accounted for
Government – Catholic 35 27 NSD
Government – independent 56 32 NSD
Catholic – Independent 21 NSD NSD
NSD: No significant difference
Figure 3.5 presents the proportions of students at each reading literacy proficiency level by school sector22. Similar proportions of students in government and Catholic schools performed at the highest levels of reading literacy, with 10 per cent of students from the government school sector and 14 per cent of students from the Catholic school sector at Level 5 or 6. The proportion of students from the independent school sector who achieved at the top end of the reading literacy proficiency scale was higher, with just over one-fifth (22%) of students performing at Level 5 or 6.
At the lower end of the reading literacy proficiency scale, there was a higher proportion of students in government schools (19%) compared to Catholic schools (8%) or independent schools (5%) who did not reach Level 2.
100 80 60 40 20 0
Independent
Catholic
Government
20 40 60 80 100
Below Level 1b Level 1a Level 2 Level 3 Level 4 Level 5 Level 6Level 1b
5 13 23 28 20 8 2
2 6 18 32 29 12 2
4 14 28 31 18 4
Percentage of students
Figure 3.5 Proficiency levels in reading literacy by school sector
Reading literacy performance and Indigenous status
There is a substantial difference between the average performance of Indigenous and non-Indigenous students in the PISA reading literacy assessment, as shown in Table 3.8. Indigenous students achieved a mean score of 436 points, compared to a mean score of 518 points for non-Indigenous students. This difference of 82 score points in reading literacy performance equates to more than one proficiency level or more than two full years of schooling. Indigenous students also performed significantly lower than the OECD average, by 57 score points.
The range of performance in reading literacy between the highest and lowest performing Indigenous students spanned 321 score points, which was a slightly narrower range than that found for non-Indigenous students.
22 Proficiency level percentages are unadjusted. To adjust for student and school socioeconomic background requires complicated analysis that would need to take into account ESCS within each proficiency level and this is deemed impracticable. Furthermore, adjusting for ESCS at either ends of the proficiency scale adds additional uncertainty to these levels.

64 Australian students’ performance in reading literacy
Table 3.8 Mean reading literacy scores, confidence intervals and variations for Indigenous and non-Indigenous students
Indigenous status Mean score S.E. Confidence intervals Difference between 5th and 95th percentile
Indigenous 436 6.3 423 - 448 321
Non-Indigenous 518 2.2 513 - 522 332
Indigenous females performed 47 score points higher on average than Indigenous males in reading literacy. In terms of schooling, this places Indigenous males more than one year behind Indigenous females. Non-Indigenous males also achieved significantly lower than non-Indigenous females, but the difference in the mean scores was not as large as found for Indigenous students, at 36 score points. Indigenous females performed 77 score points, lower than non-Indigenous females, or more than one proficiency level. The difference between Indigenous and non-Indigenous males was 88 score points (Table 3.9).
Table 3.9 Mean reading literacy scores by gender and gender differences by Indigenous status
Indigenous status
Gender differences
Females Males Difference (F – M)
Mean score S.E. Mean score S.E. Score dif. S.E.
Indigenous 458 7.0 411 7.4 48 6.8
Non-Indigenous 535 2.6 499 2.7 36 3.0
Note: Values that are statistically significant are indicated in bold
According to the information displayed in Figure 3.6, there is a substantial under-representation of Indigenous students at the higher end of the reading literacy proficiency scale and a similarly substantial over-representation of Indigenous students at the lower end. Only two per cent (2.4%) of Indigenous students reached Level 5 and there were even fewer Indigenous students (0.3%) who were placed at Level 6. The proportion of Indigenous students who had achieved at least Level 5 (2.7%) was much lower than the eight per cent of students across OECD countries and 13 per cent of non-indigenous students who performed at these levels.
Almost 40 per cent of Indigenous students failed to reach Level 2, compared to 19 per cent of students across the OECD and 13 per cent of non-Indigenous students in Australia. These results indicate that a startling proportion of Indigenous students may not be adequately prepared to function in today’s society, through lacking the necessary skills and knowledge.
100 80 60 40 20 0
OECD average
Non-Indigenous
Indigenous
20 40 60 80 100
Below Level 1b Level 1a Level 2 Level 3 Level 4 Level 5 Level 6Level 1b
4 12 22 26 23 10 2
3 10 20 29 25 11 2
5 13 24 29 21 7
Percentage of students
Figure 3.6 Proficiency levels for Indigenous and non-Indigenous students in reading literacy

Challenges for Australian Education: Results from PISA 2009 65
Reading literacy performance and geographic location of school
The geographic location of schools was classified using the broad categories from the MCEECDYA Schools Location Classification23. Students attending schools in metropolitan areas performed at a significantly higher level than students in schools from provincial areas, who in turn performed at a significantly higher level than students attending schools in remote areas.
The difference between the average performance of students in metropolitan and provincial schools, and between provincial and remote schools was 24 score points and 32 score points respectively. The gap between students in metropolitan and remote schools was 56 score points on average, which is equivalent to three-quarters of a proficiency level or about one-and-a-half years of schooling.
As shown in Table 3.10, the spread of scores between the 5th and 95th percentile for metropolitan and provincial schools were comparable, while the range was slightly wider for students in remote schools.
Table 3.10 Mean reading literacy scores, confidence intervals and variations by geographic location
Geographic location Mean score SE Confidence intervals Difference between 5th and 95th percentile
Metropolitan 521 2.9 516 - 527 322
Provincial 497 4.0 489 - 505 323
Remote 465 9.8 446 - 485 348
Six per cent of students (including only 0.4% at Level 6) from remote schools, compared to eight per cent from provincial schools and 14 per cent from metropolitan schools performed at the higher end of the reading literacy proficiency scale (Levels 5 and 6).
The proportion of students achieving below Level 2 in remote schools was much higher than the proportions of students in metropolitan or provincial schools (Figure 3.7) at this level. In remote schools, 29 per cent of students failed to reach Level 2, compared to 17 per cent in provincial schools and 13 per cent in metropolitan schools.
100 80 60 40 20 0
Remote
Provincial
Metropolitan
20 40 60 80 100
Below Level 1b Level 1a Level 2 Level 3 Level 4 Level 5 Level 6Level 1b
3 9 20 28 25 12 2
4 12 23 29 21 7
3 10 16 22 28 14 5
Percentage of students
Figure 3.7 Proficiency levels in reading literacy by geographic location
23 For more information about the MCEECDYA Schools Location Classification refer to the Reader’s Guide.

66 Australian students’ performance in reading literacy
Reading literacy performance and socioeconomic background
Socioeconomic background in PISA is measured by an index of economic, social and cultural status (ESCS), which is based on student responses to several questions about a student’s family and home background24. Table 3.11 shows the mean scores for reading literacy performance by quartile of socioeconomic background. These results show that the higher the level of socioeconomic background, the higher the performance in reading literacy.
Students in the highest quartile of ESCS achieved a mean score of 562 points compared to students in the lowest quartile who achieved a mean score of 471 points. This difference was statistically significant and was equivalent to almost three full years of schooling or more than one proficiency level. The difference in performance between one quartile of ESCS and the next was also significant, at around 30 score points on average.
Table 3.11 Mean reading literacy scores, confidence intervals and variations by quartiles of socioeconomic background
Socioeconomic background
Mean score S.E. Confidence intervals Difference between 5th and 95th percentile
Lowest quartile 471 1.7 468 - 475 306
Second quartile 504 1.5 501 - 507 302
Third quartile 532 1.9 528 - 536 302
Highest quartile 562 2.1 558 - 566 292
Figure 3.8 shows the proportions of students at each of the proficiency levels by quartiles of socioeconomic background. Close to one quarter (24%) of students in the highest socioeconomic quartile performed at Levels 5 or 6, compared to 15 per cent of students in the third quartile, eight per cent of students in the second quartile and five per cent of students in the lowest quartile. Only five per cent of students in the highest quartile of ESCS failed to reach Level 2, while there were nine per cent of students in the third quartile, 15 per cent in the third quartile and almost one quarter (24%) of students in the lowest quartile at this level.
100 80 60 40 20 0
Highest quartile
Third quartile
Second quartile
Lowest quartile
20 40 60 80 100
Below Level 1b Level 1a Level 2 Level 3 Level 4 Level 5 Level 6Level 1b
Percentage of students
2 6 17 29 28 15 4
3 11 23 32 22 7
2 7 18 30 28 13 3
4 12 26 33 20 5
Figure 3.8 Proficiency levels in reading literacy by socioeconomic background
24 For more information about the economic, social and cultural status index refer to the Reader’s Guide.

Challenges for Australian Education: Results from PISA 2009 67
Reading literacy performance and immigrant status
Three categories of immigrant status were defined based on students’ responses to questions regarding where they and their parents were born25. The mean scores, standard error, confidence interval and the difference between the 5th and 95th percentile for the three categories of immigrant status are shown in Table 3.12. Australian-born students achieved a mean score of 512 points which was significantly lower than the average score for first-generation students by 15 score points. First-generation students scored 10 points higher on average than foreign-born students. No significant differences were found between the average scores of Australian-born and foreign-born students.
The range of scores between the highest and lowest performing students was wider for foreign-born students compared to that for Australian-born or first-generation students.
Table 3.12 Mean reading literacy scores, confidence intervals and variations by immigrant status
Immigrant status Mean score S.E. Confidence intervals Difference between 5th and 95th percentile
Australian-born 512 2.4 507 -516 318
First-generation 527 3.0 521 - 533 314
Foreign-born 517 6.4 504 - 529 342
Figure 3.9 shows the distribution of students across the reading literacy proficiency levels by immigrant status. There were 12 per cent of Australian-born students, 16 per cent of first-generation and 14 per cent of foreign-born students who achieved Levels 5 or 6. At the other end of the scale, 14 per cent of Australian-born students, 11 per cent of first-generation students and 15 per cent of foreign-born students failed to reach Level 2.
100 80 60 40 20 0
Foreign-born
First-generation
Australian-born
20 40 60 80 100
Below Level 1b Level 1a Level 2 Level 3 Level 4 Level 5 Level 6Level 1b
3 10 21 29 24 10 2
2 8 19 28 26 13 3
3 11 20 27 23 11 3
Percentage of students
Figure 3.9 Proficiency levels in reading literacy by immigrant status
Reading literacy performance and language background
It is interesting to note that, while the reading literacy assessment was presented in English only, there were no significant differences in the average performances of students who spoke English as their main language at home compared to those students whose main language at home was a language other than English, with mean scores of 519 points and 503 points respectively. The data presented in Table 3.13 does show, however, that the range of scores between the 5th and 95th percentile for students who spoke a language other than English was 355 score points – slightly wider than for students who spoke English at home (315 score points).
25 For more information about Immigrant Status refer to the Reader’s Guide.

68 Australian students’ performance in reading literacy
Table 3.13 Mean reading literacy scores, confidence intervals and variations by language background
Language background Mean score S.E. Confidence intervals Difference between 5th and 95th percentile
Speak English at home 519 2.0 515 - 523 315
Language other than English spoken at home 503 8.8 486 - 520 355
The proportions of students who performed at Level 5 or 6 were similar, with 13 per cent of students who spoke English at home and 20 per cent of students who spoke another language attaining these high levels. However there was a higher proportion of students who spoke a language other than English not reaching Level 2, compared to those students who spoke English at home (20% and 13% respectively) (Figure 3.10).
100 80 60 40 20 0
Language otherthan English
spoken at home
Speak Englishat home
20 40 60 80 100
Below Level 1b Level 1a Level 2 Level 3 Level 4 Level 5 Level 6Level 1b
3 9 20 29 25 11 2
2 5 13 20 26 21 10 3
Percentage of students
Figure 3.10 Proficiency levels in reading literacy by language background
Student performance on the reading literacy subscales: aspectIn addition to the overall reading literacy scale, PISA 2009 includes three aspect subscales that allow for further investigation of students proficiencies in negotiating their ways into, around and between texts: access and retrieve, integrate and interpret, and evaluate and reflect. Approximately one-quarter of the questions in the pool of reading tasks in PISA 2009 were classified as access and retrieve items. About half of the questions are classified according to integrate and interpret, and the remaining questions were classified as reflect and evaluate. Students’ performance in each of these aspects is thus able to be reported on separate subscales.
Performance on access and retrieve from an international perspective
Table 3.14 shows student performance on the aspect subscale, access and retrieve, for participating countries. The top performing country on access and retrieve was Shanghai – China, with a mean score of 549 points. Australia’s mean score on access and retrieve was 513 score points. Australia was outperformed by seven countries on access and retrieve (four OECD and three partner countries): Shanghai – China (549 score points); Korea (542 score points); Finland (532 score points); Japan (530 score points); Hong Kong – China (530 score points); Singapore (526 score points) and New Zealand (521 score points). Five countries (the Netherlands, Canada, Belgium, Norway and Liechtenstein) performed at an equivalent level to Australia. Australia performed at a significantly higher level on access and retrieve than the remaining countries in Table 3.14.
There were 14 OECD countries, including Australia, and four partner countries who performed significantly higher than the OECD average (495 score points) on access and retrieve. Eleven countries, including the United States and the United Kingdom, achieved a mean score that was not statistically different from the OECD average. The remaining 12 OECD countries achieved a mean score that was significantly below the OECD average.

Challenges for Australian Education: Results from PISA 2009 69
Table 3.14 Mean access and retrieve scores, confidence intervals and variations by country
Country Mean score S.E. Confidence interval
Difference between 5th and 95th percentile
Shanghai – China 549 2.9 544 - 555 312
Korea 542 3.6 535 - 549 287
Finland 532 2.7 527 - 538 326
Japan 530 3.8 522- 537 357
Hong Kong – China 530 2.7 524 - 535 308
Singapore 526 1.4 524 - 529 335
New Zealand 521 2.4 516 - 526 342
Netherlands 519 5.1 509 - 529 297
Canada 517 1.5 514 - 520 310
Belgium 513 2.4 509 - 518 350
Australia 513 2.4 509 - 518 328
Norway 512 2.8 506 - 517 325
Liechtenstein 508 4.0 500 - 515 307
Iceland 507 1.6 503 - 510 353
Switzerland 505 2.7 500 - 511 321
Sweden 505 2.9 499 - 510 343
Estonia 503 3.0 497 - 509 302
Denmark 502 2.6 497 - 507 309
Hungary 501 3.7 494 - 509 339
Germany 501 3.5 494 - 507 340
Poland 500 2.8 495 - 506 333
Ireland 498 3.3 492 - 505 322
Chinese Taipei 496 2.8 491 - 501 344
OECD average 495 0.5 494 -496 331
Macao – China 493 1.2 491 - 495 289
United States 492 3.6 485 - 499 325
France 492 3.8 484 - 499 359
Croatia 492 3.1 485 - 498 329
United Kingdom 491 2.5 486 - 496 330
Slovak Republic 491 3.0 485 - 497 337
Slovenia 489 1.1 487 - 491 322
Portugal 488 3.3 482 - 495 305
Italy 482 1.8 478 - 485 344
Spain 480 2.1 476 - 484 329
Czech Republic 479 3.2 473 - 485 326
Austria 477 3.2 471 - 484 355
Lithuania 476 3.0 471 - 482 333
Latvia 476 3.6 469 - 483 298
Luxembourg 471 1.3 468 - 473 379
Russian Federation 469 3.9 461 -476 339
Greece 468 4.4 459 - 477 342
Turkey 467 4.1 459 - 475 311
Israel 463 4.1 455 -471 397
Dubai (UAE) 458 1.4 456 - 461 381
Serbia 449 3.1 443 - 455 311
Chile 444 3.4 437 - 451 300
Mexico 433 2.1 429 - 437 306
Bulgaria 430 8.3 413 - 446 454
Uruguay 424 2.9 419 - 430 365
Significantly higher than
Australia
Not significantly different to Australia
Significantly lower than Australia

70 Australian students’ performance in reading literacy
Figure 3.11 shows the proportions of students at each proficiency level on access and retrieve for participating countries. Countries have been ordered by the percentage of students classified as below Level 2, with the lowest proportions of students below Level 2 placed at the top of the figure and countries with the highest proportion of students below Level 2 at the bottom.
Countries with the highest proportion of students achieving Level 5 or 6 on this subscale were located in Shanghai – China (22%), Japan (18%), Finland (17%), Korea (17%) and Singapore (16%). Twelve per cent of Australian students were placed at these levels of proficiency on access and retrieve, which was similar to the OECD average of nine per cent.
When comparing performance on the overall reading literacy scale with performance on the access and retrieve subscale, New Zealand, Singapore, Australia and Canada had similar proportions of students who reached Level 5 or 6 on the subscale and the overall scale. On the other hand, Shanghai – China, Japan, Finland, Korea and Hong Kong – China had larger percentages of students at these levels on the access and retrieve subscale than on the overall reading literacy scale.
At the lower end of the proficiency scale, one-fifth of students across OECD countries failed to reach Level 2 on access and retrieve. Korea (7%), Shanghai – China (8%), Hong Kong – China (10%) and Finland (11%) had the lowest proportions of students below Level 2 on this subscale. Fourteen per cent of Australian students were placed at these lower levels, which was around the same proportion of students who failed to reach Level 2 on the overall reading literacy scale.
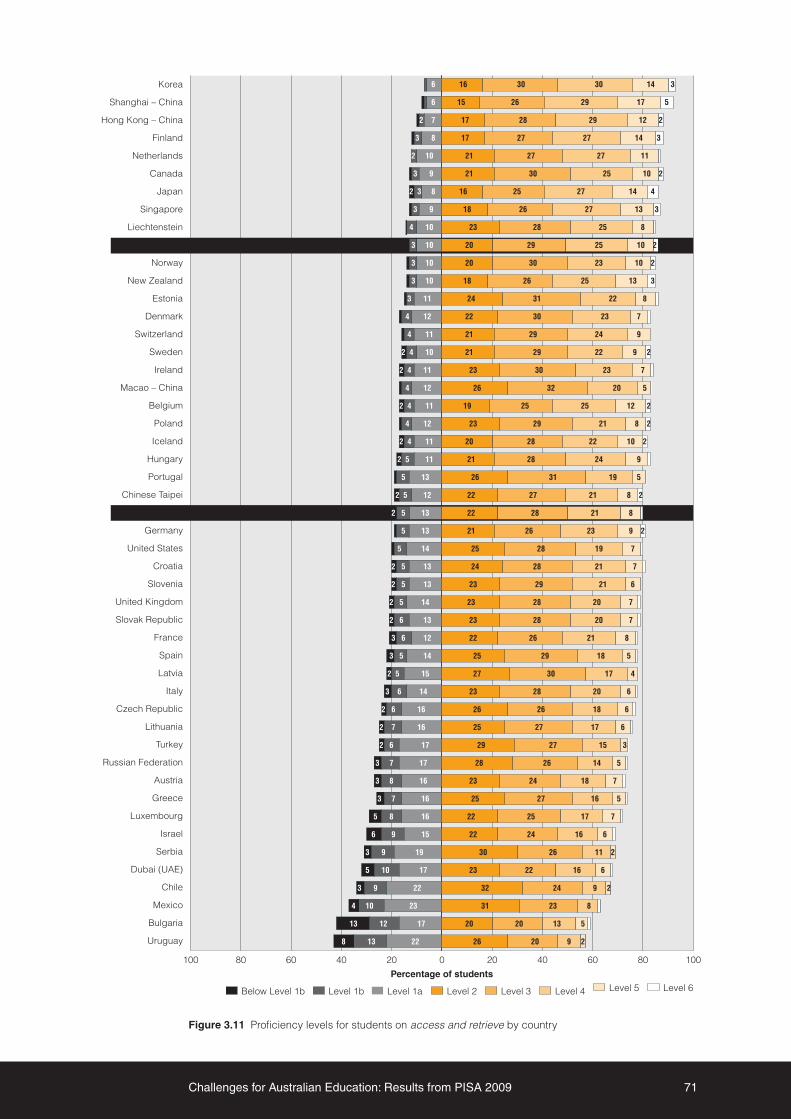
Challenges for Australian Education: Results from PISA 2009 71
0 20 40 60 80 100100 80 60 40 20
Uruguay
Bulgaria
Mexico
Chile
Dubai (UAE)
Serbia
Israel
Luxembourg
Greece
Austria
Russian Federation
Turkey
Lithuania
Czech Republic
Italy
Latvia
Spain
France
Slovak Republic
United Kingdom
Slovenia
Croatia
United States
Germany
OECD average
Chinese Taipei
Portugal
Hungary
Iceland
Poland
Belgium
Macao – China
Ireland
Sweden
Switzerland
Denmark
Estonia
New Zealand
Norway
Australia
Liechtenstein
Singapore
Japan
Canada
Netherlands
Finland
Hong Kong – China
Shanghai – China
Korea 6 16 30 30 14 3
6 15 26 29 17 5
2 7 17 28 29 12 2
3 8 17 27 27 14 3
2 10 21 27 27 11
3 9 21 30 25 10 2
2 3 8 16 25 27 14 4
3 9 18 26 27 13 3
4 10 23 28 25 8
3 10 20 29 25 10 2
3 10 20 30 23 10 2
3 10 18 26 25 13 3
3 11 24 31 22 8
4 12 22 30 23 7
4 11 21 29 24 9
2 4 10 21 29 22 9 2
2 4 11 23 30 23 7
4 12 26 32 20 5
2 4 11 19 25 25 12 2
4 12 23 29 21 8 2
2 4 11 20 28 22 10 2
2 5 11 21 28 24 9
5 13 26 31 19 5
2 5 12 22 27 21 8 2
2 5 13 22 28 21 8
5 13 21 26 23 9 2
5 14 25 28 19 7
2 5 13 24 28 21 7
2 5 13 23 29 21 6
2 5 14 23 28 20 7
2 6 13 23 28 20 7
3 6 12 22 26 21 8
3 5 14 25 29 18 5
2 5 15 27 30 17 4
3 6 14 23 28 20 6
2 6 16 26 26 18 6
2 7 16 25 27 17 6
2 6 17 29 27 15 3
3 7 17 28 26 14 5
3 8 16 23 24 18 7
3 7 16 25 27 16 5
5 8 16 22 25 17 7
6 9 15 22 24 16 6
3 9 19 30 26 11 2
5 10 17 23 22 16 6
3 9 22 32 24 9 2
4 10 23 31 23 8
13 12 17 20 20 13 5
8 13 22 26 20 9 2
Below Level 1b Level 1a Level 2 Level 3 Level 4 Level 5 Level 6Level 1b
Percentage of students
Figure 3.11 Proficiency levels for students on access and retrieve by country

72 Australian students’ performance in reading literacy
Across most of the OECD countries, females performed significantly higher on average than males on the access and retrieve subscale (see Table 3.15). The difference between females and males in Australia was 36 score points on average, which was slightly smaller than the OECD average of 40 score points. Bulgaria, Lithuania and Finland showed the largest gender differences (with 59 or more score points difference) while Chile, the United States and Mexico showed the smallest gender differences on access and retrieve.
For most countries, gender differences between the overall reading literacy scale and access and retrieve were very similar. The exception to this was Turkey, where the gender difference on access and retrieve was ten points less than on the overall reading literacy scale.

Challenges for Australian Education: Results from PISA 2009 73
Table 3.15 Mean access and retrieve scores by gender and gender differences by country
Country
Gender differences
Females MalesDifference in mean score
Mean score S.E. Mean score S.E.
Bulgaria 463 7.0 399 9.3
0 20 40 60 80
Females scorehigher
Gender differences significantGender differences not significant
Lithuania 508 2.7 446 3.8
Finland 562 2.8 503 3.1
Slovenia 518 1.5 461 1.7
Slovak Republic 518 3.3 463 4.3
Croatia 519 3.9 467 3.7
Czech Republic 506 3.5 455 4.4
Sweden 531 3.2 479 3.3
Iceland 532 2.3 481 2.4
Poland 525 3.1 475 3.1
Latvia 501 3.6 452 4.2
New Zealand 546 2.7 497 3.5
Norway 537 3.0 488 3.5
Israel 486 3.7 439 6.2
Dubai (UAE) 482 1.8 436 1.9
Russian Federation 491 4.1 446 4.2
Greece 490 4.1 445 5.5
Ireland 521 3.4 476 4.5
Luxembourg 493 1.6 449 2.0
Italy 504 2.2 460 2.6
France 511 3.6 471 4.7
Estonia 523 3.2 484 3.4
OECD average 515 0.6 475 0.7
Serbia 469 3.1 430 4.2
Chinese Taipei 516 3.8 477 4.0
Uruguay 443 3.1 404 3.5
Canada 536 1.6 498 1.9
Germany 520 3.8 482 4.5
Portugal 506 3.2 469 3.9
Switzerland 524 2.8 487 3.3
Shanghai – China 568 2.6 531 3.7
Australia 531 2.7 495 2.9
Japan 548 4.0 512 6.1
Austria 494 4.3 459 4.1
Hungary 519 4.4 484 4.4
Liechtenstein 525 6.5 492 6.2
Turkey 484 4.6 451 4.5
Singapore 543 1.9 510 2.0
Belgium 530 3.0 498 3.5
Korea 558 3.9 527 5.0
Denmark 518 2.9 486 3.1
Macao – China 509 1.3 477 1.6
United Kingdom 507 2.9 476 3.9
Spain 495 2.5 465 2.2
Hong Kong – China 545 3.2 516 4.1
Netherlands 532 5.4 506 5.0
United States 504 3.8 480 4.0
Mexico 443 2.2 422 2.4
Chile 454 3.4 434 4.4
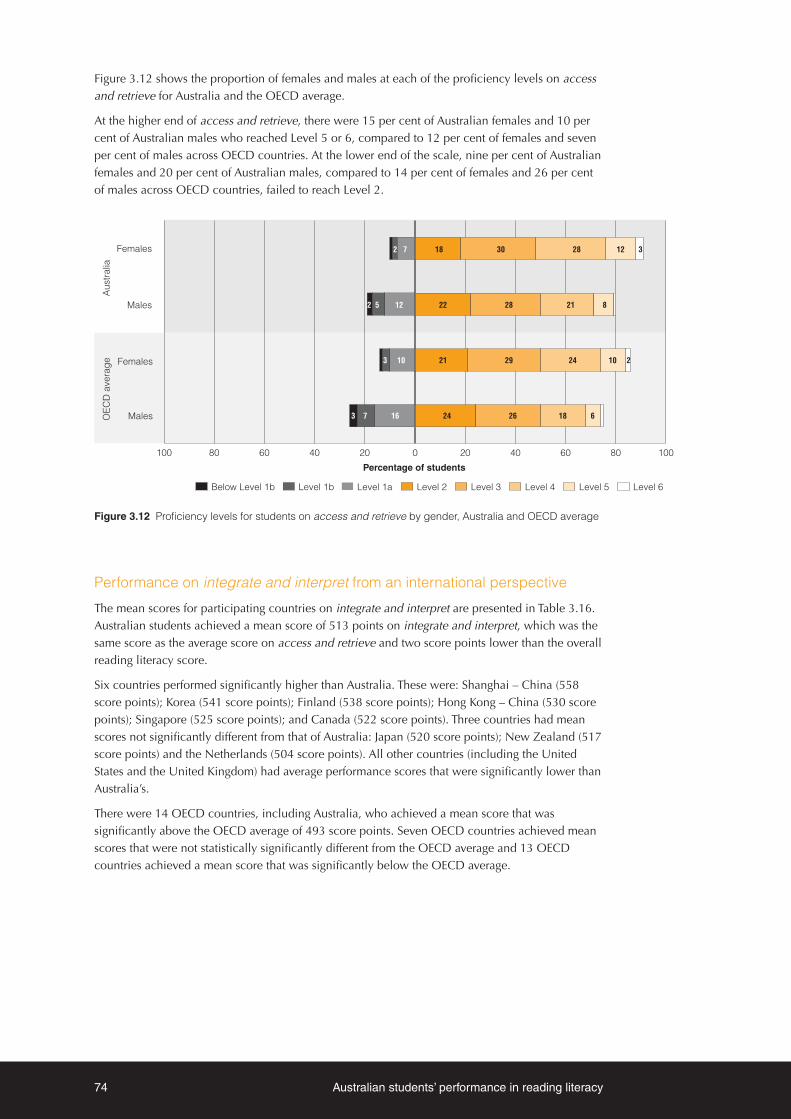
74 Australian students’ performance in reading literacy
Figure 3.12 shows the proportion of females and males at each of the proficiency levels on access and retrieve for Australia and the OECD average.
At the higher end of access and retrieve, there were 15 per cent of Australian females and 10 per cent of Australian males who reached Level 5 or 6, compared to 12 per cent of females and seven per cent of males across OECD countries. At the lower end of the scale, nine per cent of Australian females and 20 per cent of Australian males, compared to 14 per cent of females and 26 per cent of males across OECD countries, failed to reach Level 2.
Males
Females
Males
Females
Aus
tralia
OEC
D a
vera
ge
0 20 40 60 80 100100 80 60 40 20
Below Level 1b Level 1a Level 2 Level 3 Level 4 Level 5 Level 6Level 1b
2 7 18 30 28 12 3
2 5 12 22 28 21 8
3 10 21 29 24 10 2
3 7 16 24 26 18 6
Percentage of students
Figure 3.12 Proficiency levels for students on access and retrieve by gender, Australia and OECD average
Performance on integrate and interpret from an international perspective
The mean scores for participating countries on integrate and interpret are presented in Table 3.16. Australian students achieved a mean score of 513 points on integrate and interpret, which was the same score as the average score on access and retrieve and two score points lower than the overall reading literacy score.
Six countries performed significantly higher than Australia. These were: Shanghai – China (558 score points); Korea (541 score points); Finland (538 score points); Hong Kong – China (530 score points); Singapore (525 score points); and Canada (522 score points). Three countries had mean scores not significantly different from that of Australia: Japan (520 score points); New Zealand (517 score points) and the Netherlands (504 score points). All other countries (including the United States and the United Kingdom) had average performance scores that were significantly lower than Australia’s.
There were 14 OECD countries, including Australia, who achieved a mean score that was significantly above the OECD average of 493 score points. Seven OECD countries achieved mean scores that were not statistically significantly different from the OECD average and 13 OECD countries achieved a mean score that was significantly below the OECD average.

Challenges for Australian Education: Results from PISA 2009 75
Table 3.16 Mean integrate and interpret scores, confidence intervals and variations by country
Country Mean score S.E. Confidence interval
Difference between 5th and 95th percentile
Shanghai – China 558 2.5 553 - 563 267
Korea 541 3.4 534 - 547 266
Finland 538 2.3 534 - 543 289
Hong Kong – China 530 2.2 526 - 534 294
Singapore 525 1.2 522 - 527 333
Canada 522 1.5 519 - 525 307
Japan 520 3.5 513 - 526 332
New Zealand 517 2.4 512 - 522 343
Australia 513 2.4 508 - 517 336
Netherlands 504 5.4 494 - 515 305
Belgium 504 2.5 499 - 509 342
Poland 503 2.8 498 - 508 299
Iceland 503 1.5 500 - 505 322
Norway 502 2.7 497 - 507 311
Switzerland 502 2.5 497 - 507 318
Germany 501 2.8 495 - 506 313
Estonia 500 2.8 495 - 506 276
Chinese Taipei 499 2.5 494 - 504 286
Liechtenstein 498 4.0 490 - 505 297
France 497 3.6 490 - 504 364
Hungary 496 3.2 490 - 502 291
United States 495 3.7 488 - 502 329
Sweden 494 3.0 488 - 500 336
Ireland 494 3.0 488 - 500 313
OECD average 493 0.5 492 - 494 309
Denmark 492 2.1 488 - 496 275
United Kingdom 491 2.4 496 - 495 320
Italy 490 1.6 487 - 493 307
Slovenia 489 1.1 487 - 491 296
Macao – China 488 0.8 487 - 490 256
Czech Republic 488 2.9 482 - 493 305
Portugal 487 3.0 481 - 493 287
Latvia 484 2.8 479 - 490 258
Greece 484 4.0 477 - 492 304
Slovak Republic 481 2.5 476 - 486 293
Spain 481 2.0 477 -485 285
Luxembourg 475 1.1 473 - 477 343
Israel 473 3.4 466 - 480 360
Croatia 472 2.9 467 - 478 272
Austria 471 2.9 466 - 477 321
Lithuania 469 2.4 464 - 473 276
Russian Federation 467 3.1 461 - 473 296
Turkey 459 3.3 453 - 466 258
Dubai (UAE) 457 1.3 454 - 459 348
Chile 452 3.1 446 - 458 283
Serbia 445 2.4 440 - 450 273
Bulgaria 436 6.4 424 - 449 347
Uruguay 423 2.6 418 - 428 320
Mexico 418 2.0 415 - 422 286
Significantly higher than
Australia
Not significantly different to Australia
Significantly lower than Australia

76 Australian students’ performance in reading literacy
The spread of scores between the 5th and 95th percentile within a country on integrate and interpret ranged from 256 points in Macao – China to 364 points in France. The differences between the 5th and 95th percentile for Korea (266 score points), Shanghai – China (267 score points) and Finland (289 score points) were smaller than the OECD average of 309 points. The difference between the lowest and highest performing students in Australia was 336 points. Countries with a similar spread of scores included Singapore, Sweden and Belgium.
The distribution of students across the proficiency levels for integrate and interpret for a selection of countries is presented in Figure 3.13. In Shanghai – China, one in five students (21%) performed at Level 5 or 6 and only four per cent failed to reach Level 2. Fourteen per cent of Australian students reached the highest proficiency levels (Level 5 and 6) while 16 per cent of students failed to reach Level 2. Although New Zealand, Finland and Singapore were all top performing countries and had 16 per cent of students in Level 5 or 6 on the integrate and interpret subscale, Finland had fewer students (8%) who did not reach Level 2 compared to Singapore (13%) and New Zealand (16%). On average, eight per cent of students across OECD countries performed at Level 5 and 6, and almost one-fifth (19%) of students did not reach Level 2 on this subscale.
The proportion of students at Level 5 or 6 on the integrate and interpret subscale from Shanghai – China, Korea, Finland, Canada, Hong Kong – China and Singapore, the top performing countries, was slightly higher (with a difference of between 1 and 2 per cent) compared to the proportion of students who achieved at the same levels on the overall reading literacy scale. There were no differences between the proportion of students at Level 5 or higher on the overall reading literacy scale and the integrate and interpret subscale in Japan, Australia and New Zealand.

Challenges for Australian Education: Results from PISA 2009 77
0 20 40 60 80 100100 80 60 40 20
Mexico
Uruguay
Bulgaria
Dubai (UAE)
Serbia
Chile
Israel
Austria
Turkey
Luxembourg
Russian Federation
Lithuania
Croatia
Slovak Republic
Greece
France
Czech Republic
United Kingdom
United States
Slovenia
Spain
Italy
OECD average
Belgium
Sweden
Portugal
Ireland
Germany
Switzerland
Latvia
Iceland
Hungary
Liechtenstein
Netherlands
Norway
Denmark
Australia
New Zealand
Chinese Taipei
Poland
Macao – China
Estonia
Japan
Singapore
Canada
Hong Kong – China
Finland
Korea
Shanghai – China 3 13 28 33 18 3
5 16 32 32 13
6 17 30 30 14 2
2 7 18 30 29 12 2
2 9 21 29 25 11 2
3 10 19 26 25 13 3
3 9 19 27 26 11 3
2 12 25 33 21 6
2 12 30 34 17 3
3 12 24 30 22 8
3 12 24 33 21 6
4 11 20 25 23 13 3
4 11 21 28 23 11 3
3 12 27 33 20 4
4 12 24 30 21 8
3 14 24 26 22 10
4 12 23 30 23 5
4 13 24 31 22 6
4 12 22 29 22 8
3 14 30 33 17 3
4 12 22 28 23 8
4 13 22 28 23 8
2 4 13 24 29 21 7
4 14 27 31 18 5
2 5 13 23 28 19 8 2
5 13 21 25 23 11 2
5 14 24 28 20 7
5 14 24 29 20 6
5 14 27 32 17 3
5 15 25 29 20 5
5 15 25 26 19 8 2
4 15 25 28 19 7
4 16 26 27 19 6
3 6 12 20 26 22 10 2
5 15 27 29 18 5
5 16 28 29 17 5
5 17 29 31 15 2
5 19 31 28 14 3
6 18 31 27 13 4
3 7 16 24 26 18 6
5 20 34 28 11
2 7 18 25 26 17 5
3 8 15 23 25 18 6
7 21 33 25 10 2
2 8 22 33 25 8
3 10 19 25 23 14 5
6 13 21 25 22 11 3
5 13 25 29 19 7
4 13 27 31 19 5
Below Level 1b Level 1a Level 2 Level 3 Level 4 Level 5 Level 6Level 1b
Percentage of students
Figure 3.13 Proficiency levels for students on integrate and interpret by country
78 Australian students’ performance in reading literacy
Table 3.17 shows the mean scores and standard errors for females and males, and the difference between the average scores on the integrate and interpret subscale. Females performed significantly better than males in all countries. The average difference across the OECD countries was 36 score points, while in Australia the difference was 34 score points. This difference was almost a half of a proficiency level, or the equivalent of one full year of schooling.
In the top performing countries Singapore, Hong Kong – China, Canada and Korea, the gender difference was around 30 score points, while for Shanghai – China, the difference was closer to the OECD average. The difference in the average scores of males and females in Finland was 50 score points, one of the largest differences, similar to those found in Slovenia (50 score points), Bulgaria (56 score points) and Lithuania (58 score points).

Challenges for Australian Education: Results from PISA 2009 79
Table 3.17 Mean integrate and interpret scores by gender and gender differences by country
Country
Gender differences
Females MalesDifference in mean score
Mean score S.E. Mean score S.E.
Lithuania 498 2.5 440 2.8
0 20 40 60 80
Females scorehigher
Gender differences significantGender differences not significant
Bulgaria 465 5.7 409 7.0
Finland 564 2.6 513 2.6
Slovenia 514 1.5 464 1.5
Slovak Republic 505 2.9 456 3.4
Czech Republic 513 3.2 465 3.7
Poland 526 3.0 479 3.0
Dubai (UAE) 480 1.7 434 1.9
Croatia 497 3.5 450 3.4
Latvia 506 3.0 462 3.3
Russian Federation 489 3.3 445 3.5
Italy 512 1.8 469 2.3
Estonia 522 2.9 480 3.3
Norway 524 3.2 481 3.0
New Zealand 539 3.0 497 3.8
Turkey 480 3.9 440 3.5
Greece 504 3.6 464 4.9
Germany 521 3.0 481 3.9
Sweden 514 3.4 475 3.4
France 516 3.6 477 4.4
Austria 490 4.0 451 3.6
Iceland 522 2.2 483 2.2
Uruguay 440 2.8 403 3.1
Serbia 463 2.6 426 3.2
Switzerland 521 2.7 484 2.9
Luxembourg 494 1.4 457 1.8
Ireland 512 3.1 476 4.4
Israel 491 3.4 454 5.0
Hungary 514 3.6 478 4.0
OECD average 512 0.5 476 0.6
Japan 538 3.8 502 5.6
Shanghai – China 576 2.3 540 3.2
Australia 529 2.8 495 2.9
Portugal 503 2.9 469 3.5
Liechtenstein 515 6.5 482 5.3
Chinese Taipei 515 3.7 483 3.7
Korea 557 4.1 526 4.7
Macao – China 504 1.0 473 1.2
Canada 537 1.8 507 1.9
Hong Kong – China 546 3.0 516 3.6
Singapore 539 1.7 511 1.9
Spain 494 2.2 468 2.1
Mexico 431 2.1 406 2.2
Denmark 504 2.5 480 2.5
Belgium 516 3.2 492 3.4
United Kingdom 501 3.0 479 3.6
Netherlands 515 5.5 494 5.4
United States 506 3.8 484 4.4
Chile 463 3.4 442 3.9

80 Australian students’ performance in reading literacy
The proportion of females and males in Australia and across the OECD countries who performed at each of the proficiency levels for integrate and interpret is shown in Figure 3.14. Sixteen per cent of Australian females and 10 per cent of Australian males reached Level 5 or 6, while 10 per cent of Australian females and 21 per cent of Australian males did not reach Level 2. Across OECD countries, 10 per cent of females and six per cent of males achieved at least Level 5, while there were 14 per cent of females and 25 per cent of males who did not reach Level 2. The distributions of females and males across the proficiency scale on integrate and interpret were similar to the distributions across proficiency levels for reading literacy overall.
Males
Females
Males
Females
Aus
tralia
OEC
D a
vera
ge
0 20 40 60 80 100100 80 60 40 20
Below Level 1b Level 1a Level 2 Level 3 Level 4 Level 5 Level 6Level 1b
2 8 19 29 26 13 3
2 5 14 23 26 20 8 2
3 10 22 30 24 9
2 6 17 26 26 17 5
Percentage of students
Figure 3.14 Proficiency levels for students on integrate and interpret by gender, Australia and OECD average
Performance on reflect and evaluate from an international perspective
Table 3.18 shows the mean scores for participating countries on reflect and evaluate. Australian students scored 523 points on average on reflect and evaluate — higher than the mean scores on the two other aspect subscales, and eight score points higher than the mean score on the overall reading literacy scale.
Seven countries scored significantly higher than Australia: these were Shanghai – China (557 score points); Korea (542 score points); Hong Kong – China (540 score points); Finland (536 score points); Canada (535 score points); New Zealand (531 score points) and Singapore (529 score points). Japan, with a mean score of 521 score points, was not significantly different from Australia. Australia performed at a significantly higher level than all other countries.
Fourteen OECD countries, including Australia, recorded a mean score that was significantly above the OECD average of 494 score points. Nine OECD countries had mean scores that were not statistically significantly different from the OECD average and 11 countries had mean scores that were significantly lower than the OECD average.

Challenges for Australian Education: Results from PISA 2009 81
Table 3.18 Mean reflect and evaluate scores, confidence intervals and variations by country
Country Mean score S.E. Confidence interval Difference between 5th and 95th percentile
Shanghai – China 557 2.4 553 - 561 278
Korea 542 3.9 534 - 550 280
Hong Kong – China 540 2.5 535 - 544 288
Finland 536 2.2 531 - 540 284
Canada 535 1.6 532 - 538 300
New Zealand 531 2.5 526 - 536 353
Singapore 529 1.1 527 - 531 329
Australia 523 2.5 518 - 528 336
Japan 521 3.9 513 - 528 362
United States 512 4.0 504 - 520 322
Netherlands 510 5.0 501 - 520 279
Belgium 505 2.5 501 - 510 349
Norway 505 2.7 500 - 510 307
United Kingdom 503 2.4 498 - 508 323
Estonia 503 2.6 497 - 508 282
Ireland 502 3.1 496 - 509 322
Sweden 502 3.0 496 - 508 331
Poland 498 2.8 492 - 503 299
Liechtenstein 498 3.2 491 - 504 295
Switzerland 497 2.7 492 - 503 318
Portugal 496 3.3 490 - 503 306
Iceland 496 1.4 493 - 499 309
France 495 3.4 488 - 502 353
OECD average 494 0.5 493 - 495 319
Denmark 493 2.6 488 - 498 287
Chinese Taipei 493 2.8 487 - 498 287
Latvia 492 3.0 486 - 498 266
Germany 491 2.8 486 - 496 319
Greece 489 4.9 480 - 499 343
Hungary 489 3.3 482 - 495 307
Spain 483 2.2 479 - 488 312
Israel 483 4.0 475 - 491 380
Italy 482 1.8 478 - 485 341
Macao – China 481 0.8 479 - 482 260
Turkey 473 4.0 465 - 480 306
Croatia 471 3.5 464 - 478 327
Luxembourg 471 1.1 469 - 473 348
Slovenia 470 1.2 468 - 473 328
Slovak Republic 466 2.9 460 - 472 322
Dubai (UAE) 466 1.1 463 - 468 355
Lithuania 463 2.5 458 - 468 295
Austria 463 3.4 456 - 470 352
Czech Republic 462 3.1 456 - 468 329
Chile 452 3.2 446 - 459 276
Russian Federation 441 3.7 433 -448 320
Uruguay 436 2.9 430 - 441 343
Mexico 432 1.9 428 - 436 286
Serbia 430 2.6 425 - 435 295
Bulgaria 417 7.1 403 - 431 397
Significantly higher than
Australia
Not significantly different to Australia
Significantly lower than Australia

82 Australian students’ performance in reading literacy
Figure 3.15 presents the proportions of students at each of the proficiency levels for reflect and evaluate for a selection of countries. In Shanghai – China and New Zealand, one in five students (21% and 20% respectively) achieved at Level 5 or 6, while 17 per cent of students in Singapore and Japan, 16 per cent in Korea, Canada and Australia, and 15 per cent of students from Hong Kong – China and Finland performed at these high levels of proficiency.
Only five per cent of students in Shanghai – China, seven per cent of students in Korea, eight per cent of students in Finland and Hong Kong – China and nine per cent of students in Canada failed to reach Level 2 on reflect and evaluate. In comparison, 13 per cent of students from Australia and New Zealand did not reach Level 2.
Comparison of the distributions across the proficiency scales for the top performing countries revealed that some countries, including Shanghai – China (2%), Australia, Korea, Hong Kong – China, Canada and Japan (3%) and New Zealand (4%) had slightly higher proportions of students at Level 5 or 6 on the reflect and evaluate subscale compared to the proportions who met these proficiency levels on the overall reading literacy scale. In Finland, however, there were no differences in the proportions of students who reached Level 5 or 6 on this subscale and the proportion who reached Levels 5 or 6 in overall reading literacy.

Challenges for Australian Education: Results from PISA 2009 83
0 20 40 60 80 100100 80 60 40 20
Bulgaria
Serbia
Uruguay
Mexico
Russian Federation
Dubai (UAE)
Austria
Czech Republic
Chile
Slovak Republic
Lithuania
Slovenia
Luxembourg
Croatia
Turkey
Israel
Italy
Greece
Spain
France
Hungary
Germany
OECD average
Belgium
Switzerland
Macao – China
Iceland
Portugal
Ireland
United Kingdom
Denmark
Liechtenstein
Sweden
Chinese Taipei
Poland
Norway
Japan
United States
Latvia
New Zealand
Australia
Estonia
Netherlands
Singapore
Canada
Hong Kong – China
Finland
Korea
Shanghai – China 4 13 28 33 18 3
5 15 30 32 14 2
6 17 30 30 13 2
2 6 15 30 32 13 2
2 7 18 29 28 13 3
3 9 18 27 25 14 4
2 11 25 29 24 9
3 10 25 32 22 6
3 9 19 27 25 13 3
3 10 17 24 25 15 5
3 12 28 34 19 4
3 11 22 27 23 10 2
2 4 9 18 26 25 13 4
4 11 23 31 22 8
4 11 24 31 21 6
4 12 25 33 21 5
2 4 11 23 30 21 8 2
4 12 23 32 23 6
3 13 26 32 20 5
4 12 24 28 21 9 2
4 11 21 29 23 9
4 13 24 30 21 7
4 12 23 31 21 6
3 14 31 34 16 2
5 12 23 29 22 7
2 5 11 19 26 25 11
2 5 13 23 28 21 8
2 5 13 23 29 22 6
5 14 24 30 20 6
2 6 12 21 27 22 9
2 5 13 25 31 19 5
2 6 13 23 28 20 7
3 6 15 23 27 20 6
4 7 13 21 25 19 8 2
6 17 28 28 16 4
2 7 17 26 26 16 5
4 8 16 24 27 17 5
2 8 17 24 27 17 4
7 19 29 27 14 3
2 8 17 27 26 15 4
7 21 32 27 10
3 8 19 27 25 14 4
4 9 16 23 26 17 4
4 8 18 24 24 16 6
4 10 22 30 22 10 2
3 10 24 32 23 7
5 12 22 27 21 10 3
4 11 24 30 22 7
11 13 19 23 20 10 3
Below Level 1b Level 1a Level 2 Level 3 Level 4 Level 5 Level 6Level 1b
Percentage of students
Figure 3.15 Proficiency levels for students on reflect and evaluate by country

84 Australian students’ performance in reading literacy
Table 3.19 shows the mean scores for females and males, and the difference between these scores, on the reflect and evaluate subscale. In Australia, as in Macao – China, Hong Kong – China and Germany, the difference in the average performance of females and males was 42 score points, which was similar to the OECD average (44 score points). Bulgaria showed the largest gender difference of 70 score points, while Chile, Mexico and the United Kingdom had the smallest recorded differences between scores for females and males on reflect and evaluate.
Generally, gender differences on reflect and evaluate were larger than those found on the overall reading literacy scale. In Turkey, Shanghai – China, Croatia, Greece and Hong Kong – China, the gender differences on the reflect and evaluate subscale were around ten scale points larger than those found on the overall reading literacy scale.

Challenges for Australian Education: Results from PISA 2009 85
Table 3.19 Mean reflect and evaluate scores by gender and gender differences by country
Country
Gender differences
Females MalesDifference in mean score
Mean score S.E. Mean score S.E.
Bulgaria 453 5.9 384 7.8
0 20 40 60 80
Females scorehigher
Gender differences significantGender differences not significant
Slovenia 503 1.6 439 1.6
Lithuania 495 2.8 432 2.7
Croatia 503 4.4 442 4.1
Finland 565 2.3 506 2.6
Greece 518 3.8 460 6.3
Dubai (UAE) 495 1.5 438 1.7
Slovak Republic 494 3.0 437 4.1
Poland 526 2.9 469 3.1
Norway 533 2.9 478 3.1
Czech Republic 491 3.4 436 3.9
Turkey 500 4.5 447 4.4
Italy 509 2.2 456 2.5
Sweden 529 3.3 476 3.2
Iceland 522 2.0 470 2.0
New Zealand 556 2.8 506 3.8
Shanghai – China 582 2.4 531 2.9
Latvia 516 3.2 467 3.4
Estonia 528 2.7 479 3.2
Uruguay 458 3.1 410 3.5
Israel 506 4.0 458 5.5
Austria 486 4.6 439 4.2
Russian Federation 464 3.9 417 4.1
Japan 545 4.0 498 6.0
Portugal 519 3.3 473 3.7
Serbia 453 2.7 408 3.5
France 517 3.5 472 4.3
OECD average 517 0.6 472 0.7
Korea 565 4.3 521 5.4
Switzerland 519 2.9 476 3.3
Germany 513 2.9 470 3.9
Hong Kong – China 562 3.2 520 3.7
Australia 543 2.7 501 3.0
Macao – China 502 1.2 460 1.2
Luxembourg 492 1.5 450 1.8
Chinese Taipei 514 3.9 472 3.7
Hungary 509 3.7 469 4.1
Ireland 522 3.5 484 4.2
Canada 555 1.9 516 1.9
Singapore 548 1.6 511 1.8
Denmark 511 2.9 475 2.9
Liechtenstein 516 5.6 481 4.7
Spain 501 2.3 467 2.6
Belgium 520 3.1 491 3.7
United States 527 4.1 498 4.6
Netherlands 524 5.2 496 5.0
United Kingdom 516 3.1 489 3.8
Mexico 445 2.0 419 2.1
Chile 465 3.6 441 3.7

86 Australian students’ performance in reading literacy
Figure 3.16 shows the proportion of females and males at each of the proficiency levels for reflect and evaluate for Australia and the OECD average. At the higher end of the reflect and evaluate proficiency scale, there were 20 per cent of Australian females and 11 per cent of Australian males who reached Level 5 or 6, compared to 12 per cent of females and six per cent of males across OECD countries. At the lower end of the scale, eight per cent of Australian females and 20 per cent of Australian males, compared to 13 per cent of females and 25 per cent of males across OECD countries, who failed to reach Level 2.
Males
Females
Males
Females
Aus
tralia
OEC
D a
vera
ge
0 20 40 60 80 100100 80 60 40 20
Below Level 1b Level 1a Level 2 Level 3 Level 4 Level 5 Level 6Level 1b
2 6 17 27 28 16 4
2 5 13 21 26 21 9 2
3 9 21 30 25 10 2
2 7 16 25 26 17 5
Percentage of students
Figure 3.16 Proficiency levels for students on reflect and evaluate by gender, Australia and OECD average
Performance on the aspect subscales across Australian states and territories
Table 3.20 shows the mean scores of the Australian states on the access and retrieve subscale, with comparisons between states as well as the difference in the mean score on the access and retrieve subscale compared to the overall reading literacy scale.
The Australian Capital Territory performed significantly higher (with 529 score points) than three states (South Australia, Tasmania and the Northern Territory), but was not significantly different from Western Australia, Queensland, Victoria and New South Wales. Western Australia, Queensland, Victoria, New South Wales and South Australia recorded statistically similar scores and performed significantly better than Tasmania and the Northern Territory. The mean scores for Tasmania and the Northern Territory were not statistically significantly different from one another.
The highest achieving country on the access and retrieve subscale was Shanghai – China, and their outstanding performance was significantly better than that of all Australian states — 20 points higher than the average score for students from the Australian Capital Territory and 68 points higher than the mean score in the Northern Territory. The mean scores on the access and retrieve subscale for the Australian Capital Territory, Western Australia, Queensland, Victoria, New South Wales and South Australia were significantly higher than the OECD average. Tasmania performed on a par with the OECD average, while the average score of students from the Northern Territory was significantly lower than the OECD average.

Challenges for Australian Education: Results from PISA 2009 87
Table 3.20 Multiple comparisons of mean performance on access and retrieve by state
ACT WA QLD VIC NSW SA TAS NT Difference between the
subscale and the overall state mean
Mean 529 519 519 513 512 506 484 481
Mean S.E. 6.6 7.0 7.3 5.3 5.6 5.6 5.9 6.9
ACT 529 6.6 ● ● ● ● ▲ ▲ ▲ -2
WA 519 7.0 ● ● ● ● ● ▲ ▲ -3
QLD 519 7.3 ● ● ● ● ● ▲ ▲ 0
VIC 513 5.3 ● ● ● ● ● ▲ ▲ 0
NSW 512 5.6 ● ● ● ● ● ▲ ▲ -4
SA 506 5.6 ▼ ● ● ● ● ▲ ▲ 0
TAS 484 5.9 ▼ ▼ ▼ ▼ ▼ ▼ ● 1
NT 481 6.9 ▼ ▼ ▼ ▼ ▼ ▼ ● 0
Note: Read across the row to compare a state’s performance with the performance of each state listed in the column heading.
▲ Average performance statistically significantly higher than in comparison state
● No statistically significant difference from comparison state
▼ Average performance statistically significantly lower than in comparison state
Table 3.21 shows the performance of states on the aspect subscale, integrate and interpret. The Australian Capital Territory scored significantly higher (with a mean score of 530 score points) than five states (New South Wales, Victoria, South Australia, Tasmania and the Northern Territory), but was not statistically significantly different from Western Australia and Queensland. Western Australia, Queensland, New South Wales, Victoria and South Australia performed on par with each other, but significantly better than Tasmania and the Northern Territory. Tasmania and the Northern Territory achieved similar mean scores on integrate and interpret.
Shanghai – China’s mean score was 28 points higher than the average score of students from the Australian Capital Territory and 81 points higher than the mean score in the lowest performing state, the Northern Territory. The mean scores on integrate and interpret for the Australian Capital Territory, Western Australia, Queensland, Victoria, New South Wales and South Australia were significantly higher than the OECD average. On the other hand, Tasmania and the Northern Territory scored statistically significantly lower than the OECD average.
Table 3.21 Multiple comparisons of mean performance on integrate and interpret by state
ACT WA QLD NSW VIC SA TAS NT Difference between the
subscale and the overall state mean
Mean 530 519 517 513 511 504 481 477
Mean S.E. 5.8 6.4 7.2 5.9 4.6 5.0 5.8 5.3
ACT 530 5.8 ● ● ▲ ▲ ▲ ▲ ▲ -1
WA 519 6.4 ● ● ● ● ● ▲ ▲ -3
QLD 517 7.2 ● ● ● ● ● ▲ ▲ -2
NSW 513 5.9 ▼ ● ● ● ● ▲ ▲ -3
VIC 511 4.6 ▼ ● ● ● ● ▲ ▲ -2
SA 504 5.0 ▼ ● ● ● ● ▲ ▲ -2
TAS 481 5.8 ▼ ▼ ▼ ▼ ▼ ▼ ● -2
NT 477 5.3 ▼ ▼ ▼ ▼ ▼ ▼ ● -4
Note: Read across the row to compare a state’s performance with the performance of each state listed in the column heading.
▲ Average performance statistically significantly higher than in comparison state
● No statistically significant difference from comparison state
▼ Average performance statistically significantly lower than in comparison state

88 Australian students’ performance in reading literacy
Table 3.22 shows the performance of states on reflect and evaluate. With a mean score of 537 points, the Australian Capital Territory again outperformed the other states, scoring significantly higher than four states (Victoria, South Australia, Tasmania and the Northern Territory) and on a par with Western Australia, New South Wales and Queensland. Western Australia outperformed three states (South Australia, Tasmania and the Northern Territory) and achieved statistically similar results to the other states. Queensland, Victoria, New South Wales and South Australia recorded similar scores to one another and scored significantly higher than Tasmania and the Northern Territory. The mean scores for Tasmania and the Northern Territory were not significantly different.
Again, Shanghai – China’s results were significantly higher than any of the Australian states. The mean scores on reflect and evaluate for the all states, except Tasmania and the Northern Territory, were significantly higher than the OECD average. The mean scores for Tasmania and the Northern Territory were not statistically significantly different from the OECD average.
Table 3.22 Multiple comparisons of mean performance on reflect and evaluate by state
ACT WA NSW QLD VIC SA TAS NT Difference between the
subscale and the overall state mean
Mean 537 530 526 525 520 512 488 484
Mean S.E. 6.7 6.8 5.8 7.1 4.9 5.4 6.2 6.5
ACT 537 6.7 ● ● ● ▲ ▲ ▲ ▲ 6
WA 530 6.8 ● ● ● ● ▲ ▲ ▲ 8
NSW 526 5.8 ● ● ● ● ● ▲ ▲ 10
QLD 525 7.1 ● ● ● ● ● ▲ ▲ 6
VIC 520 4.9 ▼ ● ● ● ● ▲ ▲ 7
SA 512 5.4 ▼ ▼ ● ● ● ▲ ▲ 6
TAS 488 6.2 ▼ ▼ ▼ ▼ ▼ ▼ ● 5
NT 484 6.5 ▼ ▼ ▼ ▼ ▼ ▼ ● 3
Note: Read across the row to compare a state’s performance with the performance of each state listed in the column heading.
▲ Average performance statistically significantly higher than in comparison state
● No statistically significant difference from comparison state
▼ Average performance statistically significantly lower than in comparison state
Overall, in terms of relative performance, there were very small differences in access and retrieve and integrate and interpret, with only up to four score points difference between the mean subscale score and the mean score for reading literacy overall. For access and retrieve, Queensland, Victoria, South Australia and the Northern Territory had a mean subscale score that was identical to their mean scores for reading literacy overall. All states performed relatively better on reflect and evaluate, scoring higher on this subscale than on the overall reading literacy scale. The largest difference between the mean score on the reflect and evaluate subscale and the overall reading literacy scale was in New South Wales, with a difference of 10 points.
The distributions of students across the proficiency levels for access and retrieve in the Australian states, Shanghai – China (the highest performing country) and the OECD average are presented in Figure 3.17. Eighteen per cent of students from the Australian Capital Territory performed at Level 5 or 6, almost twice the OECD average of 10 per cent of students at these high levels. Queensland, Western Australia, New South Wales and Victoria also had proportions of students at these levels that were greater than the OECD average, ranging from 12 per cent to 14 per cent. The proportion of students in South Australia, Tasmania and the Northern Territory achieving at least Level 5 was lower than the OECD average (with 9%, 8% and 8% respectively).
Tasmania and the Northern Territory had the highest proportions of students who had not achieved Level 2, with almost a quarter (24%) of students in the Northern Territory and over one-fifth (23%) of students in Tasmania not meeting this benchmark. These proportions were also higher than the OECD average of 20 per cent of students below Level 2. Western Australia had 12 per cent of students, and Queensland and the Australian Capital Territory had 13 per cent of students who had failed to reach Level 2, while South Australia, Victoria and New South Wales had between 14 and 15 per cent of students who had not reached this level.
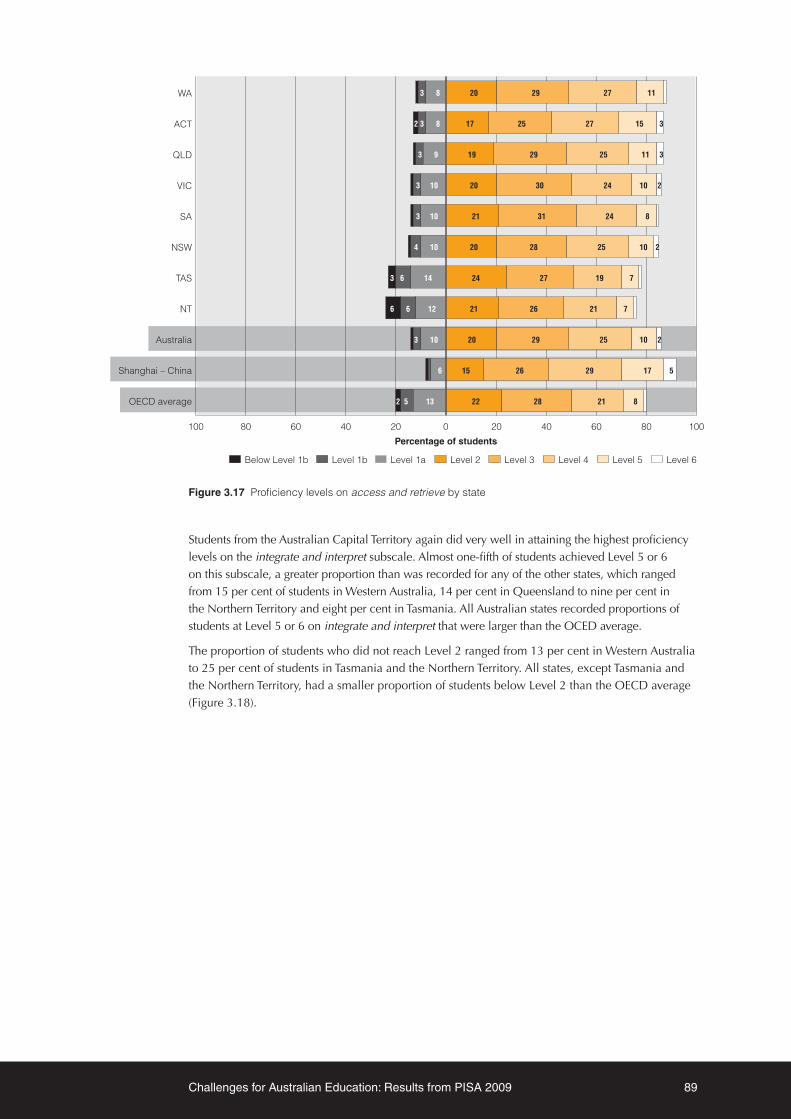
Challenges for Australian Education: Results from PISA 2009 89
Below Level 1b Level 1a Level 2 Level 3 Level 4 Level 5 Level 6Level 1b
100 80 60 40 20 0
OECD average
Shanghai – China
Australia
NT
TAS
NSW
SA
VIC
QLD
ACT
WA
20 40 60 80 100
3 8 20 29 27 11
2 3 8 17 25 27 15 3
3 9 19 29 25 11 3
3 10 20 30 24 10 2
3 10 21 31 24 8
4 10 20 28 25 10 2
3 6 14 24 27 19 7
6 6 12 21 26 21 7
3 10 20 29 25 10 2
6 15 26 29 17 5
2 5 13 22 28 21 8
Percentage of students
Figure 3.17 Proficiency levels on access and retrieve by state
Students from the Australian Capital Territory again did very well in attaining the highest proficiency levels on the integrate and interpret subscale. Almost one-fifth of students achieved Level 5 or 6 on this subscale, a greater proportion than was recorded for any of the other states, which ranged from 15 per cent of students in Western Australia, 14 per cent in Queensland to nine per cent in the Northern Territory and eight per cent in Tasmania. All Australian states recorded proportions of students at Level 5 or 6 on integrate and interpret that were larger than the OCED average.
The proportion of students who did not reach Level 2 ranged from 13 per cent in Western Australia to 25 per cent of students in Tasmania and the Northern Territory. All states, except Tasmania and the Northern Territory, had a smaller proportion of students below Level 2 than the OECD average (Figure 3.18).

90 Australian students’ performance in reading literacy
Below Level 1b Level 1a Level 2 Level 3 Level 4 Level 5 Level 6Level 1b
100 80 60 40 20 0
OECD average
Shanghai – China
Australia
NT
TAS
SA
NSW
VIC
QLD
ACT
WA
20 40 60 80 100
3 9 20 25 26 12 3
3 10 16 24 27 15 3
3 10 20 28 22 11 3
4 11 21 29 23 10 2
4 11 20 28 23 10 3
4 12 23 28 21 10
2 7 16 24 25 17 7
5 7 13 23 23 19 8
4 11 21 28 23 11 3
3 13 28 33 18 3
5 14 24 28 20 7
Percentage of students
Figure 3.18 Proficiency levels on integrate and interpret by state
Figure 3.19 shows the proportion of students at each proficiency level on the reflect and evaluate subscale by state. Western Australia recorded the highest proportion of students at Level 5 and 6, over 20%, which was well above the OECD average of nine per cent. In the other states, the proportion of students who achieved at least Level 5 ranged from nine per cent in Tasmania to 17 per cent in South Australia, the Australian Capital Territory and New South Wales.
South Australia and Western Australia (with 12 per cent of students) and New South Wales and the Australian Capital Territory (with 13 per cent of students) had the lowest proportion of students who failed to reach Level 2. Queensland and Victoria had 14 per cent of their students below Level 2. On the other hand, Tasmania and the Northern Territory had the highest proportions of students who did not reach Level 2, with 23 and 25 per cent of students respectively. Across the OECD countries, the average proportion of students performing below Level 2 on reflect and evaluate was 20 per cent.

Challenges for Australian Education: Results from PISA 2009 91
Below Level 1b Level 1a Level 2 Level 3 Level 4 Level 5 Level 6Level 1b
100 80 60 40 20 0
OECD average
Shanghai – China
Australia
NT
TAS
VIC
QLD
ACT
NSW
WA
SA
20 40 60 80 100
3 8 18 25 27 14 3
3 8 16 22 28 17 4
3 9 19 27 25 13 4
3 9 19 26 25 13 4
3 10 19 28 25 12 3
3 10 21 30 23 10
2 6 15 22 26 20 8
5 7 13 21 24 20 9 2
3 9 19 27 25 13 3
4 13 28 33 18 3
2 5 13 23 28 21 8
Percentage of students
Figure 3.19 Proficiency levels on reflect and evaluate by state
Gender differences were evident across the three aspect subscales in each state, with females outperforming males. The one exception was in the Australian Capital Territory, where females and males performed at a statistically similar level on the integrate and interpret subscale. Table 3.23 presents the mean scores for females and males across the Australian states for each of the aspect subscales; the mean scores for females ranged from 496 to 557 score points, and for males, from 458 to 516 score points.
Table 3.23 Mean reading literacy subscales scores for aspect by state and gender
Access and retrieve Integrate and interpret Reflect and evaluate
Gender differences Gender differences Gender differences
Females Males Difference (F - M) Females Males Difference
(F - M) Females Males Difference (F - M)
State Mean score S.E. Mean
score S.E. Score dif. S.E. Mean
score S.E. Mean score S.E. Score
dif. S.E. Mean score S.E. Mean
score S.E. Score dif. S.E.
ACT 550 8.6 507 10.2 43 13.6 546 9.3 514 10.5 32 15.9 557 9.7 516 8.7 41 13.5
NSW 533 5.2 490 7.7 44 7.1 531 5.6 495 7.9 36 7.3 549 5.5 502 7.5 47 6.7
VIC 529 5.9 495 6.3 34 5.8 527 5.9 494 6.0 32 7.6 540 6.1 500 6.5 41 8.0
QLD 533 7.2 505 8.1 28 4.6 531 7.0 502 8.4 29 5.1 544 6.9 506 8.2 37 5.2
SA 525 5.0 489 7.8 36 5.5 523 4.5 487 8.1 36 7.1 531 5.4 494 7.6 38 5.7
WA 535 7.4 502 8.7 33 8.8 536 7.0 501 8.2 35 8.7 549 6.4 509 8.9 40 7.5
TAS 503 9.3 465 7.0 38 12.1 501 9.4 461 8.1 39 13.5 511 8.6 466 8.0 45 11.4
NT 498 8.9 463 7.2 36 8.7 496 7.9 458 5.8 38 9.1 504 9.5 462 5.9 42 9.4
Note: Figures in bold indicate statistical significance between females and males.

92 Australian students’ performance in reading literacy
Figure 3.20 shows the proportions of female and male students at each proficiency level on access and retrieve by state. At the higher end of the proficiency scale, the largest proportions of males who reached Levels 5 or 6 were from the Australian Capital Territory (14%) and Queensland (12%). In the Australian Capital Territory, 23 per cent of female students attained at least Level 5 on access and retrieve. Only five per cent of males from Tasmania and nine per cent of females from the Northern Territory and Tasmania performed at these high levels of proficiency on the access and retrieve subscale.
In most states there were almost twice as many males who did not achieve Level 2 compared to females. The Northern Territory recorded the greatest proportion of males who did not reach Level 2 on access and retrieve (29%), followed by Tasmania (27%). Western Australia had the smallest proportion of males at this level (16%). The proportions of females who did not reach Level 2 were generally smaller, ranging from 19 per cent in the Northern Territory to nine per cent in Western Australia and the Australian Capital Territory.
Males
Females
Males
Females
Males
Females
Males
Females
Males
Females
Males
Females
Males
Females
Males
Females
Males
Females
Males
Females
100 80 60 40 20 0 20 40 60 80 100
Below Level 1b Level 1a Level 2 Level 3 Level 4 Level 5 Level 6Level 1b
OEC
D a
vera
ge
Aus
tralia
N
T TA
S W
A
SA
QLD
VI
C
NSW
A
CT
2 6 14 24 31 19 4
3 4 11 19 25 24 11 3
2 7 17 30 28 12 3
2 6 13 22 27 20 8
2 7 18 32 27 11 3
2 5 13 22 28 20 8 2
2 7 17 31 28 12 3
2 4 11 21 28 21 10 2
2 7 19 33 27 10
2 5 13 24 29 21 6
2 6 18 29 29 14 2
2 3 11 21 28 25 8
4 12 23 28 23 9
4 8 15 26 26 16 5
5 4 10 18 27 26 8
7 7 15 24 24 16 6
2 7 18 30 28 12 3
2 5 12 22 28 21 8
3 10 21 29 24 10 2
3 7 16 24 26 18 6
Percentage of students
Figure 3.20 Proficiency levels on access and retrieve by state and gender

Challenges for Australian Education: Results from PISA 2009 93
Sixteen per cent of males from the Australian Capital Territory achieved Level 5 or 6 on the integrate and interpret subscale, followed by 13 per cent of males in Queensland and 11 per cent of males in Western Australia. In all Australian states, apart from Tasmania, the proportion of males who reached the higher proficiency levels on this subscale was greater than the OECD average of six per cent. The proportion of females achieving at least Level 5 ranged from 21 per cent in the Australian Capital Territory to 11 per cent in the Northern Territory and Tasmania. While the proportions of females in Tasmania and the Northern Territory who performed at Level 5 or 6 on the integrate and interpret subscale were similar to the OECD average of 10 per cent, the proportions recorded in all other states were higher than the OECD average.
The proportion of males who failed to reach Level 2 ranged from 19 per cent in Western Australia to 31 per cent in the Northern Territory and Tasmania, while for females, the percentage who did not reach Level 2 ranged from nine per cent in the Australian Capital Territory to 19 per cent in the Northern Territory (Figure 3.21).
Males
Females
Males
Females
Males
Females
Males
Females
Males
Females
Males
Females
Males
Females
Males
Females
Males
Females
Males
Females
100 80 60 40 20 0 20 40 60 80 100
Below Level 1b Level 1a Level 2 Level 3 Level 4 Level 5 Level 6Level 1b
OEC
D a
vera
ge
Aus
tralia
N
T TA
S W
A
SA
QLD
VI
C
NSW
A
CT
2 7 15 25 30 17 4
2 5 13 16 23 25 13 3
2 8 18 29 26 12 4
2 6 14 22 27 19 8 2
2 8 19 31 26 12 2
5 15 23 27 20 8 2
2 8 19 29 25 13 4
2 5 13 22 26 20 10 3
9 22 30 23 13 2
2 6 14 24 26 19 7
2 6 19 25 27 15 4
2 5 12 21 26 24 9 2
4 14 24 27 20 9 2
4 9 18 25 23 15 5
4 5 10 21 24 24 9 2
6 9 16 26 22 14 7
2 8 19 29 26 13 3
2 5 14 23 26 20 8 2
3 10 22 30 24 9
2 6 17 26 26 17 5
Percentage of students
Figure 3.21 Proficiency levels on integrate and interpret by state and gender

94 Australian students’ performance in reading literacy
On the reflect and evaluate subscale, the Australian Capital Territory had the highest proportion of males who attained Level 5 and 6, with 17 per cent, which was above the OECD average of 12 per cent. Queensland had 13 per cent, and Western Australia and New South Wales had 12 per cent of males who performed at these high proficiency levels. The smallest proportion of males who reached at least Level 5 was recorded in Tasmania (6%). The Australian Capital Territory had the highest proportion of females attaining Level 5 and 6 (26%), followed by New South Wales with 22 per cent, Queensland with 20 per cent and Victoria with 17 per cent, while Tasmania and the Northern Territory had the lowest proportion of females reaching at least Level 5, with 12 and 14 per cent respectively (Figure 3.22).
At the lower end of the reflect and evaluate subscale, 29 per cent of males from Tasmania and 31 per cent of males from the Northern Territory did not reach Level 2. The proportion of males who failed to reach Level 2 in other states ranged from 17 to 20 per cent. The proportion of females not reaching Level 2 ranged from seven per cent in the Australian Capital Territory and New South Wales to close to 20 per cent in the Northern Territory.
Males
Females
Males
Females
Males
Females
Males
Females
Males
Females
Males
Females
Males
Females
Males
Females
Males
Females
Males
Females
100 80 60 40 20 0 20 40 60 80 100
Below Level 1b Level 1a Level 2 Level 3 Level 4 Level 5 Level 6Level 1b
OEC
D a
vera
ge
Aus
tralia
N
T TA
S W
A
SA
QLD
VI
C
NSW
A
CT
2 5 14 23 30 21 5
2 5 10 19 21 26 14 3
2 5 16 26 29 17 5
5 13 22 26 21 9 3
7 16 29 29 14 3
4 14 22 27 21 9 2
2 6 17 27 29 15 5
2 5 12 20 27 21 10 3
7 19 31 26 13 2
2 5 13 23 28 20 8
2 5 16 25 29 18 4
2 4 11 20 26 25 10 2
3 12 22 27 23 10 2
4 8 17 23 24 17 5
4 5 9 19 24 24 12 2
5 9 17 23 23 16 6
2 6 17 27 28 16 4
2 5 13 21 26 21 9 2
2 7 16 25 26 17 5
3 9 21 30 25 10 2
Percentage of students
Figure 3.22 Proficiency levels on reflect and evaluate by state and gender

Challenges for Australian Education: Results from PISA 2009 95
Performance on the aspect subscales and Indigenous status
Table 3.24 shows the means and standard errors for Indigenous and non-Indigenous students across the three aspect subscales. The mean score for Indigenous students’ performance ranged from 435 points on access and retrieve to 441 points on reflect and evaluate, but on each subscale the average score for Indigenous students was significantly lower than the average score for non-Indigenous students. These differences in mean scores are equivalent to more than one proficiency level or about two-and-a-half full years of schooling on each of the aspect subscales.
In terms of relative performance on the three subscales, there were very small differences in the performance of Indigenous students on the access and retrieve, integrate and interpret, and reflect and evaluate subscales compared with the mean score for reading literacy overall (with only one, three and five score points difference, respectively). Indigenous and non-Indigenous students tended to score higher on the reflect and evaluate subscale and lower on the other two subscales, compared to their overall reading literacy scores.
Table 3.24 Mean scores for Indigenous and non-Indigenous students on the subscales for aspect
Indigenous status
Access and retrieve Difference
between the subscale and
the overall Indigenous
mean
Integrate and interpret Difference
between the subscale and
the overall Indigenous
mean
Reflect and evaluate
Difference between the
subscale and the overall
Indigenous mean
Mean score S.E. Mean
score S.E. Mean score S.E.
Indigenous 435 6.5 -1 433 6.3 -3 441 5.7 5
Non-Indigenous 516 2.3 -2 515 2.3 -2 526 2.4 8
The proportions of Indigenous and non-Indigenous students at each of the proficiency levels for all three aspect subscales are presented in Figure 3.23. The proportion of Indigenous students who achieved Level 5 or higher and the Indigenous students who failed to reach Level 2 on each of the three reading literacy subscales was similar. This was also the case for non-Indigenous students.
In access and retrieve, two per cent of Indigenous students compared to 12 per cent of non-Indigenous students achieved Level 5 or 6. At the other end of the scale 38 per cent of Indigenous students and 13 per cent of non-Indigenous students failed to reach Level 2. On integrate and interpret, three per cent of Indigenous students and 14 per cent of non-Indigenous students achieved Level 5 or 6, while 40 per cent of Indigenous students, compared to 14 per cent of non-Indigenous students, failed to reach Level 2. On the reflect and evaluate subscale, three per cent of Indigenous students and 16 per cent of non-Indigenous achieved at least Level 5, while 37 per cent of Indigenous students and 13 per cent of non-Indigenous students did not reach Level 2.
Figure 3.23 Proficiency levels for Indigenous and non-Indigenous students on the subscales for aspect
Ref
lect
and
eval
uate
Acc
ess
and
retri
eve
Inte
grat
e an
din
terp
et
100 80 60 40 20 0
Non-Indigenous
Indigenous
Non-Indigenous
Indigenous
Non-Indigenous
Indigenous
20 40 60 80 100
Below Level 1b Level 1a Level 2 Level 3 Level 4 Level 5 Level 6Level 1b
6 11 21 26 22 11 2
3 9 20 29 25 10 2
4 13 23 28 19 9 3
3 10 20 28 23 11 3
5 12 20 27 23 10 3
3 9 19 27 26 13 3
Percentage of students

96 Australian students’ performance in reading literacy
Performance on the aspect subscales and geographic location of school
Across the three aspect subscales, the mean score of students in metropolitan schools was significantly higher than that of students in provincial schools, while students in provincial schools performed significantly better than those in remote areas. On each of the subscales, the differences in average performance of students in metropolitan and remote geographical areas equates to about one-and-a-half years of schooling or about three-quarters of a proficiency level. The lowest mean score was recorded by students in remote schools on the integrate and interpret subscale (457 points), while the highest mean score of 530 points was recorded by students in metropolitan schools on the reflect and evaluate subscale.
The mean scores on the reflect and evaluate subscale were slightly higher than the mean scores on the other two subscales, regardless of geographic location of schools (Table 3.25). The difference between mean scores on the reflect and evaluate subscale and the overall reading literacy scale were nine points for metropolitan schools, five points for provincial schools and six points for remote schools. The difference between the mean scores on the integrate and interpret subscale and the overall reading literacy scale was greater in remote schools (a difference of 8 points) compared to metropolitan and provincial schools (a difference of two points). Across the different groups of schools, average performance on the access and retrieve subscale was very similar to average performance on the overall reading literacy scale.
Table 3.25 Mean scores for geographic location on the subscales for aspect
Geographic location
Access and retrieve
Difference between the
subscale and the overall geographic
location mean
Integrate and interpret
Difference between the
subscale and the overall geographic
location mean
Reflect and evaluate
Difference between the
subscale and the overall geographic
location mean
Mean score S.E. Mean
score S.E. Mean score S.E.
Metropolitan 519 3.0 -2 519 3.0 -2 530 3.0 9
Provincial 498 4.7 1 495 3.9 -2 502 4.7 5
Remote 464 6.9 -1 457 8.1 -8 472 12.5 7
As would be expected from the mean scores, the proportion of students from provincial and remote schools who performed at the higher levels of proficiency is smaller than the proportion of students from metropolitan schools who performed at these levels (Figure 3.24).
On the access and retrieve subscale, 13 per cent of students from metropolitan schools, compared to nine per cent of students in provincial schools and five per cent of students in remote schools, performed at Level 5 or 6. Thirteen per cent of students from metropolitan schools, compared to 18 per cent of students in provincial schools and 30 per cent of students in remote schools, did not reach Level 2.
On the integrate and interpret subscale, 15 per cent of students from metropolitan schools reached Level 5 or 6, compared to nine per cent of students in provincial schools and five per cent of students in remote schools. At the other end of the proficiency subscale, 14 per cent of students from metropolitan schools, compared to 19 per cent of students in provincial schools and 31 per cent of students in remote schools, failed to reach Level 2.
On the reflect and evaluate subscale, 18 per cent of students from metropolitan schools, 11 per cent of students in provincial schools and eight per cent of students in remote schools achieved Level 5 or 6. The proportions of students who did not reach Level 2 were 12 per cent for metropolitan schools, compared to 18 per cent for provincial schools and 28 per cent for remote schools.
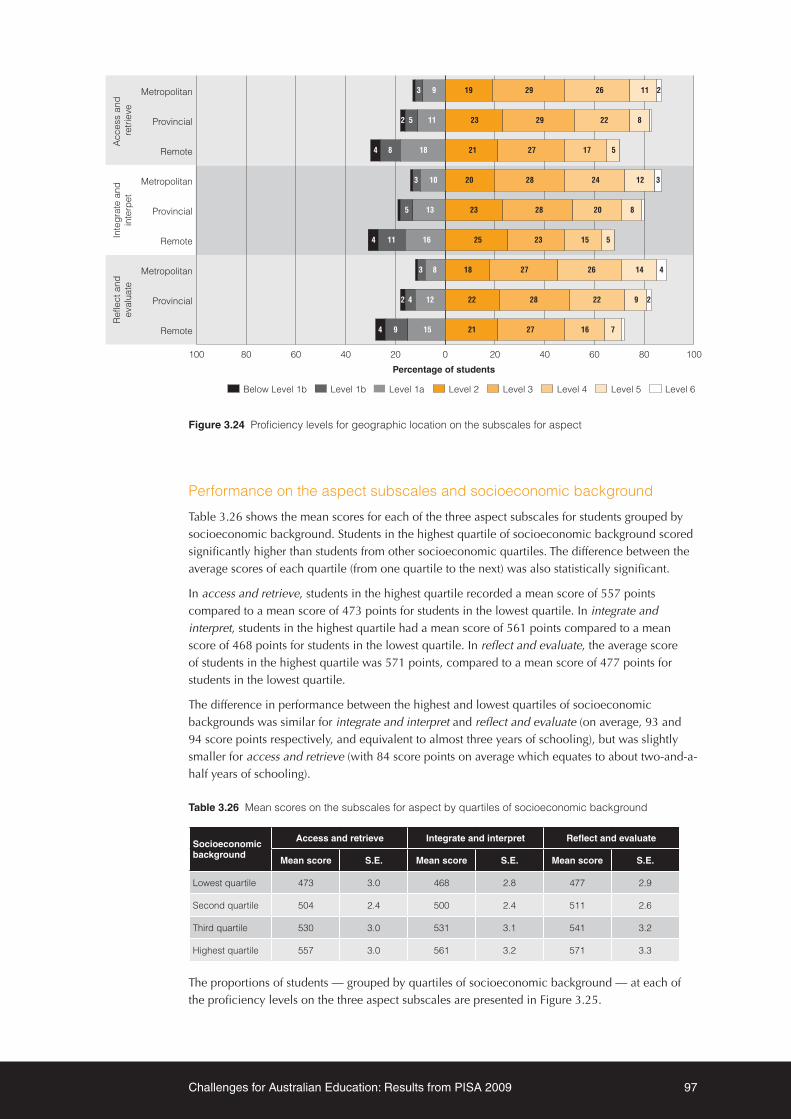
Challenges for Australian Education: Results from PISA 2009 97
Ref
lect
and
eval
uate
Acc
ess
and
retri
eve
Inte
grat
e an
din
terp
et
Below Level 1b Level 1a Level 2 Level 3 Level 4 Level 5 Level 6Level 1b
100 80 60 40 20 0
Remote
Provincial
Metropolitan
Remote
Provincial
Metropolitan
Remote
Provincial
Metropolitan
20 40 60 80 100
3 9 19 29 26 11 2
2 5 11 23 29 22 8
4 8 18 21 27 17 5
3 10 20 28 24 12 3
5 13 23 28 20 8
4 11 16 25 23 15 5
3 8 18 27 26 14 4
2 4 12 22 28 22 9 2
4 9 15 21 27 16 7
Percentage of students
Figure 3.24 Proficiency levels for geographic location on the subscales for aspect
Performance on the aspect subscales and socioeconomic background
Table 3.26 shows the mean scores for each of the three aspect subscales for students grouped by socioeconomic background. Students in the highest quartile of socioeconomic background scored significantly higher than students from other socioeconomic quartiles. The difference between the average scores of each quartile (from one quartile to the next) was also statistically significant.
In access and retrieve, students in the highest quartile recorded a mean score of 557 points compared to a mean score of 473 points for students in the lowest quartile. In integrate and interpret, students in the highest quartile had a mean score of 561 points compared to a mean score of 468 points for students in the lowest quartile. In reflect and evaluate, the average score of students in the highest quartile was 571 points, compared to a mean score of 477 points for students in the lowest quartile.
The difference in performance between the highest and lowest quartiles of socioeconomic backgrounds was similar for integrate and interpret and reflect and evaluate (on average, 93 and 94 score points respectively, and equivalent to almost three years of schooling), but was slightly smaller for access and retrieve (with 84 score points on average which equates to about two-and-a-half years of schooling).
Table 3.26 Mean scores on the subscales for aspect by quartiles of socioeconomic background
Socioeconomic background
Access and retrieve Integrate and interpret Reflect and evaluate
Mean score S.E. Mean score S.E. Mean score S.E.
Lowest quartile 473 3.0 468 2.8 477 2.9
Second quartile 504 2.4 500 2.4 511 2.6
Third quartile 530 3.0 531 3.1 541 3.2
Highest quartile 557 3.0 561 3.2 571 3.3
The proportions of students — grouped by quartiles of socioeconomic background — at each of the proficiency levels on the three aspect subscales are presented in Figure 3.25.

98 Australian students’ performance in reading literacy
In access and retrieve, 22 per cent of students in the highest socioeconomic quartile reached Level 5 or 6, compared to 14 per cent of students in the third quartile, nine per cent of students in the second quartile and five per cent of students in the lowest socioeconomic quartile. Six per cent of students in the highest quartile failed to reach Level 2, compared to 10 per cent of students in the second quartile, 15 per cent in the third quartile and 24 per cent of students in the lowest quartile. A similar trend in the proportion of students who performed at Level 5 or 6 and the proportion of students who failed to reach Level 2 was found in the integrate and interpret and reflect and evaluate subscales.
Ref
lect
and
eval
uate
Acc
ess
and
retri
eve
Inte
grat
e an
din
terp
et
Below Level 1b Level 1a Level 2 Level 3 Level 4 Level 5 Level 6Level 1b
100 80 60 40 20 0
Highest quartile
Third quartile
Second quartile
Lowest quartile
Highest quartile
Third quartile
Second quartile
Lowest quartile
Highest quartile
Third quartile
Second quartile
Lowest quartile
20 40 60 80 100
2 6 16 28 28 15 4
4 10 22 32 23 8
2 7 17 30 28 12 2
4 12 27 33 18 4
2 6 18 29 26 14 4
4 12 23 30 21 7
2 7 18 29 27 13 3
5 12 26 31 19 6
2 6 16 27 27 16 5
3 10 21 30 24 9 2
2 6 16 28 29 15 4
3 11 23 33 22 7
Percentage of students
Figure 3.25 Proficiency levels for socioeconomic background on the subscales for aspect
Student performance on the reading literacy subscales: text format In addition to reporting student performance on the three aspect subscales, results can also be reported on the type or text format students responded to. As discussed in Chapter 2, four different text formats have been defined in the assessment framework; however, only two types of text format (continuous texts and non-continuous texts) are reported as subscales. A little under two-thirds of the questions in the PISA reading literacy item pool were classified as continuous texts and the remaining items were classified as non-continuous texts.
Performance on continuous texts from an international perspective
The mean scores for participating countries on continuous texts are shown in Table 3.27. Australian students recorded a mean score of 513 points, which was two score points lower than the mean score on the overall reading literacy scale.
Six countries, of which three were OECD countries, scored significantly higher than Australia on continuous texts: Shanghai – China (564 score points); Korea (538 score points); Hong Kong – China (538 score points); Finland (535 score points); Canada (524 score points) and Singapore (522 score points). Three countries had mean scores not significantly different from that of Australia: Japan (520 score points); New Zealand (518 score points) and the Netherlands (506 score points). All other countries performed at a significantly lower level than Australia.

Challenges for Australian Education: Results from PISA 2009 99
The OECD average on continuous texts was 494 score points. Ten OECD countries, including Australia, scored significantly higher than the OECD average. Another 12 OECD countries scored similarly to the OECD average and 12 OECD countries scores significantly lower than the OECD average.
Table 3.27 Mean continuous texts scores, confidence intervals and variations by country
Country Mean score S.E. Confidence interval
Difference between 5th and 95th percentile
Shanghai – China 564 2.5 559 - 569 267
Korea 538 3.5 531 - 545 263
Hong Kong – China 538 2.3 534 - 543 292
Finland 535 2.3 531 - 540 282
Canada 524 1.5 521 - 527 308
Singapore 522 1.1 520 - 524 330
Japan 520 3.6 513 - 528 340
New Zealand 518 2.4 513 - 523 343
Australia 513 2.5 508 - 518 336
Netherlands 506 5.0 497 - 516 288
Norway 505 2.6 500 - 510 312
Belgium 504 2.4 500 - 509 331
Poland 502 2.7 497 - 507 294
Iceland 501 1.6 497- 504 326
United States 500 3.7 492 - 507 330
Sweden 499 3.0 493 - 505 334
Switzerland 498 2.5 493 - 503 312
Estonia 497 2.7 492 - 503 267
Hungary 497 3.3 490 - 503 304
Ireland 497 3.3 490 - 503 321
Chinese Taipei 496 2.6 491 - 502 290
Denmark 496 2.1 492 -501 284
Germany 496 2.7 491 - 501 312
Liechtenstein 495 3.0 489 - 500 282
OECD average 494 0.5 493 - 495 311
France 492 3.5 485 - 499 357
Portugal 492 3.2 486 - 498 295
United Kingdom 492 2.4 487 - 496 320
Italy 489 1.6 486 - 492 316
Macao – China 488 0.9 486 - 490 265
Greece 487 4.3 478 - 495 322
Spain 484 2.1 480 - 489 297
Slovenia 484 1.1 482 - 486 308
Latvia 484 3.0 478 - 490 261
Slovak Republic 479 2.6 474 - 484 297
Czech Republic 479 2.9 473 - 485 305
Croatia 478 2.9 472 - 484 294
Israel 477 3.6 470 - 484 367
Luxembourg 471 1.2 469 - 474 348
Lithuania 470 2.5 465 - 475 282
Austria 470 2.9 464 - 476 324
Turkey 466 3.5 459 - 473 274
Dubai (UAE) 461 1.2 458 - 463 356
Russian Federation 461 3.1 455 - 467 292
Chile 453 3.1 447 - 459 283
Serbia 444 2.3 439 - 448 271
Bulgaria 433 6.8 419 - 446 381
Uruguay 429 2.7 424 - 434 338
Mexico 426 2.0 422 - 430 284
Significantly higher than
Australia
Not significantly different to Australia
Significantly lower than Australia

100 Australian students’ performance in reading literacy
Figure 3.26 shows the proportions of students at each of the proficiency levels for continuous texts for a selection of countries. On average, eight per cent of students across OECD countries reached Level 5 or 6 on continuous texts. A quarter of students from Shanghai – China performed at these high levels, followed by 16 per cent of students in New Zealand, 15 per cent of students in Hong Kong – China, Singapore, 14 per cent of students in Japan and Finland, and 13 per cent of students in Canada, Australia and Korea.
At the lower end of the non-continuous texts subscale, one-fifth (19%) of students across OECD countries failed to reach Level 2. Only four per cent of students from Shanghai – China did not reach Level 2, followed by six per cent in Korea and eight per cent in Hong Kong – China and Finland. Fifteen per cent of Australian students failed to reach Level 2, which was similar to the proportions recorded in Japan (14%), Singapore (14%) and New Zealand (16%).
When comparing the proportion of students who reached the highest proficiency levels on the continuous texts subscale and the overall reading literacy scale, Shanghai – China, Hong Kong – China and Japan had a slightly higher proportion of students achieving at Level 5 and 6 on the subscale compared to the overall scale. In Australia, Korea, New Zealand, Canada, Finland and Singapore, however, the proportions at Level 5 and 6 were very similar for the continuous texts subscale and the overall reading literacy scale.

Challenges for Australian Education: Results from PISA 2009 101
0 20 40 60 80 100100 80 60 40 20
Uruguay
Bulgaria
Mexico
Serbia
Dubai (UAE)
Chile
Austria
Russian Federation
Luxembourg
Israel
Turkey
Lithuania
Czech Republic
Slovak Republic
Croatia
Slovenia
Greece
France
Italy
United Kingdom
Spain
OECD average
United States
Germany
Belgium
Ireland
Switzerland
Liechtenstein
Sweden
Portugal
Latvia
Iceland
Hungary
Macao – China
Chinese Taipei
Denmark
Norway
New Zealand
Australia
Poland
Netherlands
Estonia
Singapore
Japan
Canada
Finland
Hong Kong – China
Korea
Shanghai – China
Below Level 1b Level 1a Level 2 Level 3 Level 4 Level 5 Level 6Level 1b
Percentage of students
3 12 26 34 20 4
5 15 32 33 12
2 6 16 29 31 13 2
2 6 17 30 30 13
2 8 20 29 26 11 2
2 4 9 18 27 27 12 2
3 10 19 27 25 12 3
2 11 26 35 20 5
2 12 26 28 23 9
3 11 24 31 22 7
4 10 21 27 23 11 2
4 11 19 25 24 13 3
4 11 22 29 23 8
3 12 25 32 21 5
4 11 24 33 21 5
3 13 29 34 17 4
4 12 24 30 22 7
4 12 21 30 22 8
3 14 29 33 17 3
4 13 26 31 20 6
2 4 11 23 29 20 9 2
4 14 23 32 22 4
5 12 23 29 22 7
2 4 12 23 30 22 7
5 12 21 25 24 10
5 13 23 28 23 7
4 14 24 26 20 9 2
5 13 24 28 21 7
5 13 26 32 19 4
4 14 25 28 19 7
5 14 23 29 21 6
3 6 12 21 26 21 9
6 14 24 28 19 6
6 15 25 28 19 6
5 16 27 29 17 4
5 16 27 29 17 4
5 17 27 27 16 5
5 18 29 29 14 3
5 18 31 29 13 2
4 8 15 22 26 18 7
3 8 15 24 26 17 5
6 19 32 27 11 3
2 8 18 24 26 17 5
7 21 32 26 10 2
4 9 18 25 24 15 5
2 8 22 34 26 8
4 11 24 33 22 6
8 12 20 23 22 12 3
6 12 23 28 20 9 2
Figure 3.26 Proficiency levels for students on continuous texts by country

102 Australian students’ performance in reading literacy
The results presented in Table 3.28 indicate that females performed significantly better on average than males did on continuous texts. In Australia, the difference between the average scores for females and males was 38 score points, slightly higher than the OECD average (42score points). Bulgaria, Lithuania and Slovenia recorded the largest gender differences (with 59 or more score points difference), while the United States, the United Kingdom, the Netherlands and Chile showed the narrowest gender gap on continuous texts (with 26 score points).
While in some countries any gender differences that were found on the continuous text subscale were similar to those found on the overall reading literacy scale (e.g. Belgium, Singapore and Japan), in Dubai (UAE) the gender difference on continuous texts was seven score points larger than the gender difference on the overall reading literacy scale.

Challenges for Australian Education: Results from PISA 2009 103
Table 3.28 Mean continuous texts by gender and gender differences by country
Country
Gender differences
Females MalesDifference in mean score
Mean score S.E. Mean score S.E.
Bulgaria 466 5.9 401 7.4
0 20 40 60 80
Females scorehigher
Gender differences significantGender differences not significant
Lithuania 502 2.6 440 2.8
Slovenia 514 1.5 455 1.6
Dubai (UAE) 490 1.7 433 1.9
Finland 563 2.4 507 2.6
Croatia 508 3.7 452 3.4
Slovak Republic 506 2.7 452 3.7
Poland 528 2.9 476 2.9
Czech Republic 507 3.1 455 3.7
Norway 532 2.9 480 3.0
Greece 512 3.6 461 5.4
Italy 514 1.9 465 2.3
Latvia 508 3.1 459 3.5
Turkey 491 4.1 443 3.7
Iceland 524 2.3 477 2.4
Uruguay 451 2.9 404 3.4
New Zealand 542 3.0 495 3.6
Russian Federation 484 3.2 437 3.3
Sweden 523 3.3 476 3.2
Estonia 521 2.6 475 3.0
Shanghai – China 587 2.4 541 3.1
Israel 499 3.5 454 5.1
Austria 492 4.1 448 3.8
Luxembourg 493 1.3 450 1.9
Serbia 465 2.5 423 3.2
Hungary 518 3.7 476 4.0
France 512 3.6 470 4.3
OECD average 515 0.5 473 0.6
Portugal 512 3.0 471 3.7
Germany 517 3.0 476 3.7
Ireland 517 3.6 476 4.5
Switzerland 519 2.7 478 2.9
Japan 541 3.8 501 5.7
Chinese Taipei 516 3.6 477 3.7
Australia 532 2.8 493 3.0
Hong Kong – China 559 3.0 520 3.5
Korea 558 4.0 520 4.8
Macao – China 507 1.1 469 1.2
Canada 543 1.7 506 1.9
Liechtenstein 513 5.6 479 4.8
Denmark 512 2.6 480 2.5
Singapore 538 1.5 506 1.7
Spain 500 2.3 469 2.3
Mexico 440 2.1 411 2.2
Belgium 518 3.0 491 3.4
Chile 466 3.5 440 3.9
Netherlands 519 5.2 493 5.0
United Kingdom 504 3.0 478 3.8
United States 513 3.8 487 4.4
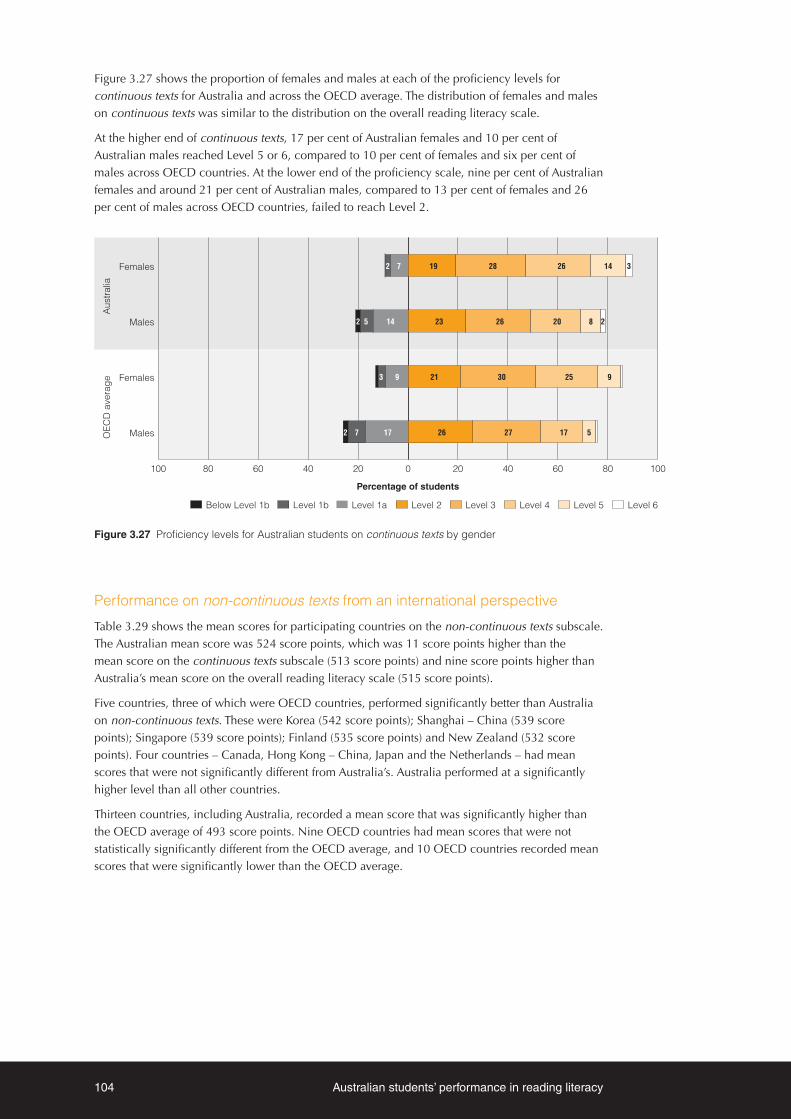
104 Australian students’ performance in reading literacy
Figure 3.27 shows the proportion of females and males at each of the proficiency levels for continuous texts for Australia and across the OECD average. The distribution of females and males on continuous texts was similar to the distribution on the overall reading literacy scale.
At the higher end of continuous texts, 17 per cent of Australian females and 10 per cent of Australian males reached Level 5 or 6, compared to 10 per cent of females and six per cent of males across OECD countries. At the lower end of the proficiency scale, nine per cent of Australian females and around 21 per cent of Australian males, compared to 13 per cent of females and 26 per cent of males across OECD countries, failed to reach Level 2.
Aus
tralia
OEC
D a
vera
ge
Below Level 1b Level 1a Level 2 Level 3 Level 4 Level 5 Level 6Level 1b
Percentage of students
100 80 60 40 20 0
Males
Females
Males
Females
20 40 60 80 100
2 7 19 28 26 14 3
2 5 14 23 26 20 8 2
3 9 21 30 25 9
2 7 17 26 27 17 5
Figure 3.27 Proficiency levels for Australian students on continuous texts by gender
Performance on non-continuous texts from an international perspective
Table 3.29 shows the mean scores for participating countries on the non-continuous texts subscale. The Australian mean score was 524 score points, which was 11 score points higher than the mean score on the continuous texts subscale (513 score points) and nine score points higher than Australia’s mean score on the overall reading literacy scale (515 score points).
Five countries, three of which were OECD countries, performed significantly better than Australia on non-continuous texts. These were Korea (542 score points); Shanghai – China (539 score points); Singapore (539 score points); Finland (535 score points) and New Zealand (532 score points). Four countries – Canada, Hong Kong – China, Japan and the Netherlands – had mean scores that were not significantly different from Australia’s. Australia performed at a significantly higher level than all other countries.
Thirteen countries, including Australia, recorded a mean score that was significantly higher than the OECD average of 493 score points. Nine OECD countries had mean scores that were not statistically significantly different from the OECD average, and 10 OECD countries recorded mean scores that were significantly lower than the OECD average.

Challenges for Australian Education: Results from PISA 2009 105
Table 3.29 Mean non-continuous texts scores, confidence intervals and variations by country
Country Mean score S.E. Confidence interval
Difference between 5th and 95th percentile
Korea 542 3.6 535 - 549 267
Shanghai – China 539 2.4 535 - 544 274
Singapore 539 1.1 536 - 541 312
Finland 535 2.4 530 - 540 292
New Zealand 532 2.3 528 - 537 336
Canada 527 1.6 524 - 530 303
Australia 524 2.3 520 - 529 325
Hong Kong – China 522 2.3 518 - 527 277
Japan 518 3.5 511 - 524 326
Netherlands 514 5.1 505 - 524 295
Estonia 512 2.7 507 - 517 297
Belgium 511 2.2 507 - 515 343
Liechtenstein 506 3.2 500 -512 278
United Kingdom 506 2.3 501 - 510 324
Switzerland 505 2.5 500 - 510 308
United States 503 3.5 496 - 510 311
Chinese Taipei 500 2.8 495 - 506 305
Iceland 499 1.5 496 - 502 314
France 498 3.4 492 - 505 338
Sweden 498 2.8 492 - 503 316
Norway 498 2.6 492 - 503 292
Germany 497 2.8 492 - 503 323
Ireland 496 3.0 490 - 502 311
Poland 496 2.8 490 - 501 311
OECD average 493 0.5 492 - 494 311
Denmark 493 2.3 488 - 497 278
Portugal 488 3.2 482 - 494 295
Hungary 487 3.3 481 - 494 299
Latvia 487 3.4 480 - 494 286
Macao – China 481 1.1 478 - 483 248
Italy 476 1.7 473 -480 331
Slovenia 476 1.1 474 - 478 289
Czech Republic 474 3.4 468 - 481 319
Spain 473 2.1 468 - 477 308
Austria 472 3.2 466 - 479 348
Greece 472 4.3 464 - 480 312
Croatia 472 3.0 466 - 478 295
Luxembourg 472 1.2 469 - 474 338
Slovak Republic 471 2.8 466 - 477 300
Israel 467 3.9 459 - 475 394
Lithuania 462 2.6 457 - 467 297
Turkey 461 3.8 454 - 468 283
Dubai (UAE) 460 1.3 457 - 462 365
Russian Federation 452 3.9 445 - 460 324
Chile 444 3.2 437 - 450 282
Serbia 438 2.9 432 - 443 310
Mexico 424 2.0 421 - 428 283
Bulgaria 421 7.2 407 - 435 405
Uruguay 421 2.7 416 - 426 343
Significantly higher than
Australia
Not significantly different to Australia
Significantly lower than Australia
106 Australian students’ performance in reading literacy
The proportions of students at each of the proficiency levels for non-continuous texts are shown for a selection of countries in Figure 3.28. Interestingly, the countries with the highest mean score were not always the countries with the greatest proportions of students performing at Levels 5 or 6 on non-continuous texts. One-fifth (19%) of students from New Zealand, 18 per cent of students from Singapore and 15 per cent of students from Australia, Finland, Korea and Shanghai – China reached Level 5 and 6 on non-continuous texts. On average, eight per cent of students across OECD countries reached the highest proficiency levels.
The countries who recorded the lowest proportion of students who failed to reach Level 2 on the non-continuous texts subscale were: Korea and Shanghai – China (6%), Finland (8%), Singapore and Hong Kong – China (9%) and Canada (10%). Australia, along with New Zealand, had 13 per cent of students who failed to reach Level 2, which was lower than the OECD average of 20 per cent.
New Zealand, Singapore, Korea and Australia had slightly higher proportions of students who performed at Level 5 and 6 on non-continuous texts compared to the proportions of their students who performed at similar levels on the overall reading literacy scale. Shanghai – China and Hong Kong – China had a slightly lower proportion of students achieving at Level 5 and 6 on non-continuous texts than on the overall reading literacy scale. The proportion of students achieving at Level 5 and 6 on the non-continuous texts subscale and on the overall reading literacy scale was very similar in Canada, Japan and Finland.

Challenges for Australian Education: Results from PISA 2009 107
0 20 40 60 80 100100 80 60 40 20
Uruguay
Bulgaria
Mexico
Serbia
Chile
Russian Federation
Dubai (UAE)
Israel
Lithuania
Austria
Turkey
Luxembourg
Italy
Slovak Republic
Croatia
Greece
Czech Republic
Spain
Slovenia
Hungary
OECD average
Germany
Latvia
Portugal
France
Poland
Belgium
Ireland
Macao – China
Sweden
Iceland
United Kingdom
Denmark
United States
Chinese Taipei
Norway
Switzerland
Liechtenstein
Japan
Netherlands
Estonia
New Zealand
Australia
Canada
Hong Kong – China
Singapore
Finland
Shanghai – China
Korea
Below Level 1b Level 1a Level 2 Level 3 Level 4 Level 5 Level 6Level 1b
Percentage of students
5 15 31 33 13 2
5 16 31 31 13 2
2 6 17 30 30 13 2
2 7 16 28 28 15 3
2 7 19 33 28 9
2 8 19 30 27 12 2
3 9 19 28 26 12 3
3 9 18 25 26 15 4
2 10 22 32 24 8
2 11 23 28 25 10
3 9 19 29 26 11 2
3 11 23 29 29 5
4 11 22 30 23 8
3 12 25 32 21 6
4 11 23 31 22 7
4 12 24 29 22 9
3 12 26 33 20 5
4 12 23 29 22 9 2
2 4 11 23 31 21 7
4 11 23 31 22 7
3 14 32 34 15 2
2 4 11 23 31 22 7
2 5 11 19 26 26 11 2
4 12 24 30 20 7
2 5 11 21 28 23 8
4 13 27 31 19 5
4 14 26 31 19 4
5 12 21 29 23 7
2 5 13 24 29 21 7
5 13 25 31 20 5
5 15 27 32 17 3
2 6 15 27 31 16 3
2 6 16 28 27 17 5
2 6 15 27 29 16 3
6 17 28 30 15 3
6 17 28 29 16 3
3 6 15 24 28 18 5
3 7 15 25 27 18 5
7 18 31 28 12 2
3 9 15 22 26 19 5
2 7 19 29 27 13 3
5 9 15 22 24 17 7
4 10 18 24 23 15 5
3 8 21 29 24 11 3
2 8 23 33 25 8
4 11 21 30 24 9
4 12 25 32 21 6
11 13 19 23 20 11 3
7 14 23 27 19 8 2
Figure 3.28 Proficiency levels for students on non-continuous texts by country

108 Australian students’ performance in reading literacy
The mean scores for females and males, and the gender difference for non-continuous texts is shown in Table 3.30. Across all OECD countries, the difference between the mean scores for females and males on the non-continuous texts subscale was 36 score points on average, which was similar to the difference of 34 score points between Australian females and males. Bulgaria, Lithuania and Finland recorded the largest gender differences (with 54 or more score points difference) while Chile and Mexico showed the smallest gender difference on non-continuous texts, with 15 and 20 score points respectively.
Generally, the gender differences on non-continuous texts were smaller than those found on the overall reading literacy scale. In Dubai (UAE) and Uruguay, for example, the gender difference on non-continuous texts was ten points smaller than on the overall reading literacy scale.

Challenges for Australian Education: Results from PISA 2009 109
Table 3.30 Mean non-continuous texts scores by gender and gender differences by country
Country
Gender differences
Females MalesDifference in mean score
Mean score S.E. Mean score S.E.
Bulgaria 451 6.1 393 8.0
0 20 40 60 80Gender differences significantGender differences not significant
Females scorehigher
Lithuania 491 2.6 434 3.0
Finland 562 2.7 508 2.6
Slovak Republic 495 3.0 448 3.9
Slovenia 500 1.5 453 1.6
Latvia 510 3.7 464 3.8
Poland 518 2.9 473 3.0
Sweden 521 3.2 475 3.0
Czech Republic 498 3.4 453 4.5
Croatia 495 3.9 451 3.7
Russian Federation 474 4.0 430 4.3
New Zealand 555 2.7 511 3.6
Italy 498 2.0 456 2.5
Estonia 534 2.8 491 3.2
Norway 519 2.9 477 3.0
Greece 493 3.5 450 5.5
Iceland 519 2.2 478 2.3
Dubai (UAE) 480 1.8 440 1.9
Germany 518 3.0 478 3.9
Israel 486 3.7 447 5.8
Serbia 457 3.0 418 3.8
Ireland 516 3.1 477 4.3
Japan 537 3.9 499 5.6
Austria 491 4.2 453 4.1
Switzerland 524 2.8 487 3.0
France 517 3.4 479 4.3
OECD average 511 0.5 475 0.6
Chinese Taipei 518 3.8 483 4.0
Turkey 479 4.3 444 4.1
Shanghai – China 557 2.4 522 3.1
Australia 541 2.7 507 2.9
Luxembourg 489 1.3 455 1.9
Portugal 504 3.2 471 3.7
Canada 544 1.9 511 1.8
Korea 559 3.7 527 5.1
Liechtenstein 523 4.7 491 5.2
Hungary 503 4.0 471 4.0
Uruguay 436 3.0 404 3.4
Belgium 526 2.8 496 3.5
Spain 487 2.2 458 2.5
Singapore 553 1.5 524 1.6
Macao – China 495 1.5 467 1.3
Denmark 506 2.7 479 2.8
Hong Kong – China 536 3.1 510 3.3
United Kingdom 518 3.0 492 3.6
Netherlands 527 5.3 502 5.1
United States 514 3.9 492 3.9
Mexico 434 2.1 415 2.3
Chile 451 3.4 436 4.1

110 Australian students’ performance in reading literacy
The proportion of females and males at each of the proficiency levels on non-continuous texts for Australia and across the OECD is shown in Figure 3.29. The distribution of females and males on non-continuous texts was similar to that found on the overall reading literacy proficiency scale.
Eighteen per cent of Australian females and 12 per cent of Australian males performed at Level 5 or 6 on the non-continuous texts subscale, compared to an average of 10 per cent of females and six per cent of males across OECD countries. At the lower end of the proficiency scale, eight per cent of Australian females and 16 per cent of Australian males, compared to 14 per cent of females and 25 per cent of males across OECD countries, failed to reach Level 2 on non-continuous texts.
Aus
tralia
OEC
D a
vera
ge
Below Level 1b Level 1a Level 2 Level 3 Level 4 Level 5 Level 6Level 1b
Percentage of students
100 80 60 40 20 0
Males
Females
Males
Females
20 40 60 80 100
2 6 17 29 29 15 3
4 11 21 28 22 10 2
3 10 22 31 24 9
2 7 16 25 27 17 5
Figure 3.29 Proficiency levels for Australian students on non-continuous texts by gender
Performance on the text format subscales across Australian states and territories
Table 3.31 presents the mean scores recorded for each of the Australian states on continuous texts and a comparison of mean scores across the states. The Australian Capital Territory performed on a par with Western Australia and Queensland. The Australian Capital Territory scored significantly better than the five other states. Western Australia recorded statistically similar scores to those of four states (the Australian Capital Territory, Queensland, New South Wales and Victoria) but scored significantly higher than South Australia, Tasmania and the Northern Territory. Queensland, New South Wales, Victoria and South Australia performed at a statistically similar level and performed significantly better than Tasmania and the Northern Territory. The mean scores for Tasmania and the Northern Territory were not significantly different from each other.
Shanghai – China was the highest performing country on continuous texts and outperformed all Australian states. The difference between the mean score of Shanghai – China and the Australian states ranged from 32 points for the Australian Capital Territory to 84 points for the Northern Territory. The mean scores on continuous texts for the Australian Capital Territory, Western Australia, Queensland, New South Wales, Victoria and South Australia were significantly higher than the OECD average of 494 score points. Tasmania and the Northern Territory scored significantly lower than the OECD average.

Challenges for Australian Education: Results from PISA 2009 111
Table 3.31 Multiple comparisons of mean performance on continuous texts by state
ACT WA QLD NSW VIC SA TAS NT Difference between the
subscale and the overall state mean
Mean 532 521 516 514 512 504 481 480
Mean S.E. 6.0 6.4 7.3 6.0 5.0 5.1 5.7 5.9
ACT 532 6.0 ● ● ▲ ▲ ▲ ▲ ▲ 1
WA 521 6.4 ● ● ● ● ▲ ▲ ▲ -1
QLD 516 7.3 ● ● ● ● ● ▲ ▲ -2
NSW 514 6.0 ▼ ● ● ● ● ▲ ▲ -2
VIC 512 5.0 ▼ ● ● ● ● ▲ ▲ -2
SA 504 5.1 ▼ ▼ ● ● ● ▲ ▲ -3
TAS 481 5.7 ▼ ▼ ▼ ▼ ▼ ▼ ● -3
NT 480 5.9 ▼ ▼ ▼ ▼ ▼ ▼ ● -1
Note: Read across the row to compare a state’s performance with the performance of each state listed in the column heading.
▲ Average performance statistically significantly higher than in comparison state
● No statistically significant difference from comparison state
▼ Average performance statistically significantly lower than in comparison state
The average scores of the states on the non-continuous texts subscale is shown in Table 3.32. The Australian Capital Territory performed significantly better than three states (South Australia, Tasmania and the Northern Territory) and on a par with the other four states. The mean scores for Queensland, New South Wales, Victoria and South Australia were not statistically different from one another; however, these states outperformed Tasmania and the Northern Territory. Tasmania and the Northern Territory performed on a par with each other.
The mean scores for the Australian Capital Territory, Western Australia and Queensland were statistically comparable to Korea, the highest performing country on the non-continuous text subscale, while students in New South Wales, Victoria, South Australia, Tasmania and the Northern Territory achieved significantly lower than students in Korea. All states, except Tasmania and the Northern Territory, scored significantly above the OECD average. The mean scores for Tasmania and the Northern Territory were not statistically different from the OECD average.
Table 3.32 Multiple comparisons of mean performance on non-continuous texts by state
ACT WA QLD NSW VIC SA TAS NT Difference between the
subscale and the overall state mean
Mean 536 530 529 525 523 517 491 480
Mean S.E. 6.2 7.2 7.4 5.3 4.5 5.6 6.0 7.3
ACT 536 6.2 ● ● ● ● ▲ ▲ ▲ 4
WA 530 7.2 ● ● ● ● ● ▲ ▲ 8
QLD 529 7.4 ● ● ● ● ● ▲ ▲ 11
NSW 525 5.3 ● ● ● ● ● ▲ ▲ 10
VIC 523 4.5 ● ● ● ● ● ▲ ▲ 9
SA 517 5.6 ▼ ● ● ● ● ▲ ▲ 11
TAS 491 6.0 ▼ ▼ ▼ ▼ ▼ ▼ ● 8
NT 480 7.3 ▼ ▼ ▼ ▼ ▼ ▼ ● 0
Note: Read across the row to compare a state’s performance with the performance of each state listed in the column heading.
▲ Average performance statistically significantly higher than in comparison state
● No statistically significant difference from comparison state
▼ Average performance statistically significantly lower than in comparison state

112 Australian students’ performance in reading literacy
Comparing the average scores on the two text format subscales and the overall reading literacy scale, there were very small differences (up to three score points) between the mean scores on the continuous texts subscale and the overall reading literacy scale. All states performed relatively better on the non-continuous texts subscale than on reading literacy overall. The largest difference between the mean score on non-continuous texts and the overall reading literacy scale was for Queensland and South Australia, both scoring 11 score points higher.
Figure 3.30 presents the proportions of students in each of the Australian states who performed at the seven proficiency levels on continuous texts. One-fifth of students from the Australian Capital Territory performed at Level 5 or 6, more than twice the OECD average (8%) for this subscale. Western Australia, Queensland, New South Wales, Victoria, South Australia and the Northern Territory also had proportions of students at these levels that were greater than the OECD average, ranging from 15 per cent to 10 per cent. The proportion of students in Tasmania who reached at least Level 5 was the same as the OECD average.
Tasmania and the Northern Territory had the highest proportion of students who failed to reach Level 2 on continuous texts, with approximately one-quarter of their students placed in these lower levels. This proportion was higher than the OECD average of 19 per cent. The Australian Capital Territory and Western Australia had the lowest percentage of students (13%) who had failed to reach Level 2, while the percentage of students not reaching Level 2 in the remaining states ranged from 15 per cent in New South Wales and Queensland to 16 per cent in South Australia and Victoria.
Below Level 1b Level 1a Level 2 Level 3 Level 4 Level 5 Level 6Level 1b
100 80 60 40 20 0
OECD average
Shanghai – China
Australia
NT
TAS
SA
VIC
NSW
QLD
WA
ACT
20 40 60 80 100
3 9 17 23 27 16 4
3 9 19 27 26 13 2
4 10 21 27 23 12 3
4 10 20 27 23 11 3
4 11 20 29 23 10 2
4 11 23 28 23 9
2 7 15 25 26 18 7
5 8 13 23 24 19 8
4 10 21 27 23 11 2
3 12 26 34 20 4
5 13 24 28 21 7
Percentage of students
Figure 3.30 Proficiency levels on continuous texts by state
Figure 3.31 shows the proportions of students at each of the proficiency levels on non-continuous texts by state. At the higher end of the non-continuous texts subscale, one-fifth of students from the Australian Capital Territory reached Level 5 or 6. The corresponding proportions were 17 per cent in Western Australia and Queensland, 15 per cent in New South Wales, 12 per cent in South Australia and nine per cent in the Northern Territory. All states, apart from Tasmania, had a higher proportion of students at Levels 5 or 6, which was greater than the OECD average (8%).
At the lower end of the proficiency scale, the greatest proportion of students who failed to reach Level 2 were from the Northern Territory (25%), followed by Tasmania (21%). These proportions were higher than the OECD average of 20%. Twelve per cent of students from South Australia, Western Australia, Victoria, New South Wales, the Australian Capital Territory and 11 per cent of students from Queensland did not reach Level 2 on this subscale.

Challenges for Australian Education: Results from PISA 2009 113
Below Level 1b Level 1a Level 2 Level 3 Level 4 Level 5 Level 6Level 1b
100 80 60 40 20 0
OECD average
Korea
Australia
NT
TAS
SA
NSW
ACT
VIC
QLD
WA
20 40 60 80 100
3 8 17 27 28 14 3
2 8 18 28 25 13 4
3 9 19 29 26 11 2
3 8 17 23 28 16 4
3 8 19 28 25 12 3
2 9 20 30 26 11
2 5 14 24 26 21 7
6 6 13 22 25 20 7 2
3 9 19 28 26 12 3
5 15 31 33 13 2
2 5 13 24 29 21 7
Percentage of students
Figure 3.31 Proficiency levels on non-continuous texts by state
The mean scores for females and males from each of the Australian states on the two text format subscales are presented in Table 3.33, along with the difference between these mean scores. Females in all states scored significantly higher on average than males in both continuous and non-continuous texts. The differences in the mean scores ranged from 34 points in Queensland to 43 points in the Northern Territory on the continuous texts subscale, and 29 score points in Queensland to 40 score points in the Australian Capital Territory and New South Wales on the non-continuous texts subscale.
Table 3.33 Mean reading literacy subscales scores for text format by state and gender
State
Continuous texts Non-continuous texts
Gender differences Gender differences
Females Males Difference (F - M) Females Males Difference
(F - M)
Mean score S.E. Mean
score S.E. Score dif. S.E. Mean
score S.E. Mean score S.E. Score
dif. S.E.
ACT 551 9.1 512 9.4 39 14.4 556 8.7 516 10.1 40 14.3
NSW 534 5.5 492 8.1 42 7.3 545 5.2 505 6.9 40 6.6
VIC 530 6.1 493 6.3 37 7.5 538 5.6 507 5.9 31 7.1
QLD 533 7.2 499 8.2 34 4.9 544 7.4 515 8.1 29 4.6
SA 522 4.7 486 7.7 36 6.1 534 5.1 501 8.1 33 6.6
WA 539 6.5 501 8.3 38 7.9 544 8.0 514 8.9 30 9.4
TAS 502 8.6 460 7.9 42 12.4 512 10.0 470 7.2 42 13.1
NT 501 8.7 458 6.0 43 9.4 498 9.9 461 6.8 37 8.8
Note: Figures in bold indicate statistical significance between females and males.

114 Australian students’ performance in reading literacy
The proportion of males who performed at Level 5 or 6 on the continuous texts subscale ranged from 16 per cent in the Australian Capital Territory to six per cent in the Northern Territory. Across the OECD countries, around six per cent of males, on average, performed at these high levels, and this was comparable to the proportion of males in the Northern Territory who reached this level. Five per cent of males in Tasmania reached Level 5 or 6, a proportion that was lower than the OECD average. Tasmania had 11 per cent of females who achieved Level 5 or 6, a similar proportion to the average across OECD countries. All other states had proportions of females at Levels 5 and 6 that were higher than the OECD average, ranging from 14 per cent in the Northern Territory to 24 per cent in the Australian Capital Territory (Figure 3.32).
At the lower levels of performance, around 30 per cent of males from the Northern Territory and Tasmania and 20 per cent of males from the other states failed to reach Level 2 on the continuous texts subscale. On average across the OECD countries, around 25 per cent of males did not reach Level 2. For females, the Northern Territory and Tasmania had the largest proportions who did not reach Level 2 on this subscale, with 19 and 17 per cent of females respectively at these lower levels. These proportions were larger than the OECD average of 13 per cent of females below Level 2, which was in turn larger than the proportions of females from the other states (around 10% or fewer) who were below Level 2.
100 80 60 40 20 0
Males
Females
Males
Females
Males
Females
Males
Females
Males
Females
Males
Females
Males
Females
Males
Females
Males
Females
Males
Females
20 40 60 80 100
Below Level 1b Level 1a Level 2 Level 3 Level 4 Level 5 Level 6Level 1b
OEC
D a
vera
ge
Aus
tralia
N
T TA
S W
A
SA
QLD
VI
C
NSW
A
CT
2 6 15 24 30 19 4
2 5 12 19 22 24 13 3
2 7 18 28 26 14 4
2 6 14 23 26 20 8 2
2 8 18 30 27 12 3
5 15 22 27 20 8
2 7 19 28 27 14 3
2 5 12 23 27 20 10 2
2 8 22 29 25 12
2 5 14 24 27 20 7
2 6 18 26 28 16 3
2 4 13 20 28 23 9
4 13 24 27 21 9 2
4 9 17 25 25 15 5
4 6 9 20 25 23 12 2
6 9 16 25 22 16 5
2 7 19 28 26 14 3
2 5 14 23 26 20 8 2
3 9 21 30 25 9
2 7 17 26 27 17 5
Percentage of students
Figure 3.32 Proficiency levels on continuous texts by state and gender
Challenges for Australian Education: Results from PISA 2009 115
Figure 3.33 shows the proportion of students at each proficiency level on non-continuous texts grouped by state and gender. Students’ performance on non-continuous texts was better than on the continuous texts subscale and this is reflected in the larger proportions of students at the higher proficiency levels on the non-continuous texts subscale, and the slightly smaller proportion of students at the lower end of the scale.
The Australian Capital Territory and Queensland had the highest proportions of males at Level 5 and 6 on the non-continuous texts subscale, with 17 and 15 per cent respectively. Ten per cent of males in Western Australia, New South Wales and Victoria, and eight per cent of males in South Australia performed at these higher levels, all above the OECD average of six per cent. Greater proportions of females compared to males were placed at the highest levels of proficiency in non-continuous texts, with about one-quarter of females from the Australian Capital Territory and about one-fifth of females from Western Australia, Queensland and New South Wales reaching these high levels of proficiency. Twelve per cent of females from the Northern Territory and 11 per cent of students from Tasmania reached Levels 5 and 6.
More than one-quarter of males from the Northern Territory and Tasmania failed to reach Level 2 on the non-continuous texts subscale, which was higher than the OECD average. In the other states, this percentage ranged from 16 per cent in Western Australia to 18 per cent in South Australia. For females, the Northern Territory and Tasmania had the highest proportion of students who had not reached Level 2 (20% and 15%, respectively). All other states had fewer than 10 per cent of their females failing to reach Level 2, with the lowest proportion (6%) recorded in South Australia.

116 Australian students’ performance in reading literacy
100 80 60 40 20 0
Males
Females
Males
Females
Males
Females
Males
Females
Males
Females
Males
Females
Males
Females
Males
Females
Males
Females
Males
Females
20 40 60 80 100
Below Level 1b Level 1a Level 2 Level 3 Level 4 Level 5 Level 6Level 1b
OEC
D a
vera
ge
Aus
tralia
N
T TA
S W
A
SA
QLD
VI
C
NSW
A
CT
2 6 14 24 31 19 5
2 5 10 19 23 25 14 3
2 5 16 29 28 15 4
5 11 22 28 22 9 2
6 17 30 29 13 3
4 11 22 28 23 9 2
2 6 16 28 29 15 4
3 11 20 28 21 12 3
5 19 31 29 13
2 4 12 22 29 22 8
2 6 16 26 29 17 4
2 4 10 18 28 26 11 2
3 12 23 27 24 9 2
4 7 16 25 26 18 5
5 5 10 20 25 24 10 2
7 7 15 25 25 15 5
2 6 17 29 29 15 3
4 11 21 28 22 10 2
3 10 22 31 24 9
2 7 16 25 27 17 5
Percentage of students
Figure 3.33 Proficiency levels on non-continuous texts by state and gender
Performance on the text format subscales and Indigenous status
Indigenous students scored an average of 433 points on continuous texts, which was significantly lower than the mean score of 516 points for non-Indigenous students. Indigenous students performed slightly better on the non-continuous texts subscale, with a mean score of 445 points compared to the mean score of 527 points for non-Indigenous students (Table 3.34). The difference between the mean scores of Indigenous and non-Indigenous students on continuous texts and non-continuous texts were similar in magnitude and represent the equivalent of about two-and-a-half years of schooling, or more than one proficiency level.
A comparison of the subscale scores with the overall reading literacy score found that, for Indigenous students there was a very small difference (of three score points) in for continuous texts between the mean subscale score and the overall reading literacy score. However, there was a larger difference of nine score points between the mean non-continuous texts subscale score and the mean score for reading literacy overall. This pattern of relative strength in non-continuous texts was also found for non-Indigenous students.

Challenges for Australian Education: Results from PISA 2009 117
Table 3.34 Mean scores for Indigenous and non-Indigenous students on the subscales for text format
Indigenous status
Continuous texts Difference between the
subscale and the overall
Indigenous mean
Non-continuous texts
Difference between the
subscale and the overall
Indigenous meanMean score S.E. Mean score S.E.
Indigenous 433 6.4 -3 445 5.8 10
Non-Indigenous 516 2.4 -2 527 2.2 9
The proportions of Indigenous and non-Indigenous students at each of the proficiency levels for the two text format subscales are shown in Figure 3.34. As expected, given the higher mean scores for both groups of students on the non-continuous texts subscale, there were smaller numbers of students who were at the lower proficiency levels on this subscale compared to the continuous texts subscale.
On the continuous texts subscale, two per cent of Indigenous students and 13 per cent of non-Indigenous students performed at Level 5 or 6, while at the lower end of the scale, 39 per cent of Indigenous students, compared to 15 per cent of non-Indigenous students, failed to reach Level 2. On the non-continuous texts subscale, three per cent of Indigenous students and 16 per cent of non-Indigenous students reached levels of Level 5 or above. Three times as many Indigenous students as non-Indigenous students did not reach Level 2 on this subscale with 35 per cent of Indigenous students and 12 per cent of non-Indigenous students performing below Level 1b or at Levels 1b or 1a.
Below Level 1b Level 1a Level 2 Level 3 Level 4 Level 5 Level 6Level 1b
Percentage of students100 80 60 40 20 0
Non-Indigenous
Indigenous
Non-Indigenous
Indigenous
20 40 60 80 100
6 11 22 28 21 9 2
4 10 20 28 24 11 2
5 9 21 26 24 12 3
3 8 19 28 26 13 3
Non
-co
ntin
uous
text
s
Con
tinuo
uste
xts
Figure 3.34 Proficiency levels for Indigenous and non-Indigenous students on the subscales for text format
Performance on the text format subscales and geographic location of school
Table 3.35 presents the means and standard errors on the two text format subscales for students in categorised according to the three defined geographic locations. For continuous texts, students in remote schools scored 459 points on average, while students in metropolitan schools scored significantly higher, with a mean score of 520 points. For non-continuous texts, the mean scores ranged from 475 points to 531 points for students in remote and metropolitan schools, respectively.
Students in all geographic locations performed relatively better on non-continuous texts than on continuous texts and the overall reading literacy scale. There was also a larger difference between the mean score on non-continuous texts and the overall reading literacy mean score for students in remote schools compared to those in metropolitan or provincial schools.

118 Australian students’ performance in reading literacy
Table 3.35 Mean scores for geographic location on the subscales for text format
Geographic location
Continuous texts Difference between the subscale
and the overall geographic
location mean
Non-continuous texts
Difference between the subscale
and the overall geographic
location meanMean score S.E. Mean score S.E.
Metropolitan 520 3.1 -2 531 2.9 9
Provincial 494 4.3 -3 506 4.0 10
Remote 459 10.7 -6 475 8.0 9
Figure 3.35 shows the proportions of students at each proficiency level for the two text format subscales grouped by geographic location.
On the continuous texts subscale, 15 per cent of students from metropolitan schools, nine per cent of students in provincial schools and five per cent of students in remote schools performed at Level 5 or 6. At the lower end of this scale, 14 per cent of students from metropolitan schools, compared to 20 per cent of students in provincial schools and 30 per cent of students in remote schools did not reach Level 2. When responding to non-continuous texts, 16 per cent of students from metropolitan schools compared to 11 per cent of students in provincial schools and six per cent of students in remote schools attained the higher proficiency levels of Level 5 or above, while 11 per cent of students from metropolitan schools, 16 per cent of students in provincial schools and 26 per cent of students in remote schools failed to reach Level 2.
Non
-co
ntin
uous
text
s
Con
tinuo
uste
xts
Below Level 1b Level 1a Level 2 Level 3 Level 4 Level 5 Level 6Level 1b
Percentage of students100 80 60 40 20 0
Remote
Provincial
Metropolitan
Remote
Provincial
Metropolitan
20 40 60 80 100
3 10 20 27 24 12 3
2 5 13 23 28 21 8
4 9 17 25 24 16 4
2 8 18 28 27 13 3
4 11 21 30 23 9 2
3 7 16 21 29 18 5
Figure 3.35 Proficiency levels for geographic location on the subscales for text format
Performance on the text format subscales and socioeconomic background
Table 3.36 shows the mean scores on the two text format subscales for students grouped by quartile of socioeconomic background. The differences between the mean scores of the first and second quartiles, the second and third quartiles, and the third and fourth quartiles, for both continuous texts and non-continuous texts, were statistically significant.
For continuous texts, students in the highest quartile recorded a mean score of 561 points, compared to a mean score of 469 points for students in the lowest quartile. On the non-continuous texts subscale, students in the highest quartile scored 570 points on average, 89 points higher than the average score of students in the lowest quartile (481 points).

Challenges for Australian Education: Results from PISA 2009 119
Table 3.36 Mean scores on the subscales for text format by quartiles of socioeconomic background
Socioeconomic background
Continuous texts Difference between the subscale
and the overall socioeconomic
background mean
Non-continuous texts
Difference between the subscale
and the overall socioeconomic
background meanMean score S.E. Mean score S.E.
Lowest quartile 469 2.8 -3 481 2.7 10
Second quartile 502 2.5 -2 514 2.3 10
Third quartile 530 3.1 -2 541 3.2 9
Highest quartile 561 3.5 -1 570 3.1 8
The proportions of students from each of the socioeconomic quartiles who performed at the seven proficiency levels on the two text format subscales are shown in Figure 3.36.
When responding to continuous texts, 25 per cent of students in the highest socioeconomic quartile achieved Level 5 or 6, compared to 16 per cent of students in the third quartile, nine per cent of students in the second quartile and only five per cent of students in the lowest quartile. At the lower end of the scale, five per cent of students in the highest quartile failed to reach Level 2, compared to 10 per cent of students in the second quartile, 17 per cent in the third quartile and 25 per cent of students in the lowest quartile.
For the non-continuous texts subscale, 28 per cent of students in the highest socioeconomic quartile, 18 per cent of students in the third quartile, 10 per cent of students in the second quartile and only six per cent of students in the lowest quartile performed at Level 5 or above. Five times as many students in the lowest socioeconomic quartile compared to the highest quartile failed to reach Level 2, with proportions of 21 per cent and four per cent, respectively. Eight per cent of students in the second quartile and 13 per cent of students in the third quartile did not reach Level 2 on this subscale.
Non
cont
inuo
uste
xts
Con
tinuo
uste
xts
Below Level 1b Level 1a Level 2 Level 3 Level 4 Level 5 Level 6Level 1b
Percentage of students
100 80 60 40 20 0
Highest quartile
Third quartile
Second quartile
Lowest quartile
Highest quartile
Third quartile
Second quartile
Lowest quartile
20 40 60 80 100
2 6 17 29 26 15 4
4 12 23 30 22 8
2 7 18 29 27 13 3
4 12 25 32 20 5
5 15 28 29 17 5
3 9 21 32 25 9
2 6 16 29 29 14 4
3 11 25 33 22 6
Figure 3.36 Proficiency levels for socioeconomic background on the subscales for text format

120 Australian students’ performance in reading literacy
Monitoring reading literacy changes over time One of the main aims of PISA is to examine student performance over time so that policy makers can monitor learning outcomes in both an international and national context. In PISA 2000 and PISA 2009, the majority of the assessment focused on reading literacy. Forty-one of the 130 reading literacy items used in PISA 2009 were taken from PISA 2000. The reading literacy scale used in PISA 2009 is the same as that used in PISA 2000 so that data can be interpreted in the same manner. The data from these two cycles allows for detailed comparisons to assess how student performance in reading literacy has changed in nine years26.
Reading literacy performance over time from an international perspective
Internationally, reading literacy performance can be compared in 32 countries27,28, between PISA 2000 and PISA 2009, including 26 OECD countries. Table 3.37 shows the mean scores on reading literacy performance for PISA 2000 and PISA 2009 along with the mean score differences between PISA 2000 and PISA 2009, shown graphically. There has been no change to the OECD average29, with a mean score of 496 points in PISA 2000 and in PISA 2009.
A number of countries have seen an improvement in their performance in reading literacy since PISA 2000. Seven OECD countries (Chile, Israel, Poland, Portugal, Korea, Hungary and Germany) and three partner countries (Latvia, Liechtenstein and Brazil) significantly improved their learning outcomes in reading literacy. Chile’s performance increased by 40 score points, Israel’s by 22 score points, Poland’s by 21 score points, and Latvia increased their performance by 26 score points. Germany, Hungary, Korea, Brazil, Liechtenstein and Portugal increased their performance by between 13 and 19 score points.
The reading literacy performance of four OECD countries (Ireland, Sweden, Czech Republic and Australia) declined significantly from PISA 2000 to PISA 2009. Ireland’s performance declined by 31 score points, Sweden by 19 points, the Czech Republic by 14 points, and Australia by 13 score points.
There were 15 OECD countries and three partner countries that showed no significant changes in their performance in reading literacy between PISA 2000 and PISA 2009. These included Finland, Canada, New Zealand, the United States and Hong Kong – China.
26 Comparisons can be made between reading literacy performance in other PISA cycles, however in PISA 2003 and PISA 2006 fewer reading literacy items were included in the assessment and this increases the risk of measurement errors.
27 Bulgaria, Chile, Hong Kong – China and Israel were participants in PISA 2000+.28 Albania, Argentina, Indonesia, Peru, Romania and Thailand were participants in PISA 2000+; however,
they have not been included in the comparisons between PISA 2000 and PISA 2009 because their mean performance in reading literacy was lower than the mean performance of the lowest scoring OECD country, Mexico.
29 This OECD average is based on the 26 countries who participated in both PISA 2000 and PISA 2009.

Challenges for Australian Education: Results from PISA 2009 121
Table 3.37 Mean reading literacy scores for PISA 2000 and PISA 2009 and differences in performance by country30
CountryPISA 2000 PISA 2009 Difference in mean score between
PISA 2000 and PISA 2009Mean score S.E. Mean score S.E.
Ireland 527 3.2 496 3.0
40 30 20 10 0 10 20 30 40 50
Reading literacyperformance
improved
Reading literacyperformance
declined
Differences between 2000 and 2009 significantDifferences between 2000 and 2009 not significant
Sweden 516 2.2 497 2.9
Czech Republic 492 2.4 478 2.9
Australia 528 3.5 515 2.3
Spain 493 2.7 481 2.0
Finland 546 2.6 536 2.3
Canada 534 1.6 524 1.5
France 505 2.7 496 3.4
New Zealand 529 2.8 521 2.4
Iceland 507 1.5 500 1.4
United States 504 7.0 500 3.7
Japan 522 5.2 520 3.5
Russian Federation 462 4.2 459 3.3
Norway 505 2.8 503 2.6
Denmark 497 2.4 495 2.1
Italy 487 2.9 486 1.6
Bulgaria 430 4.9 429 6.7
Belgium 507 3.6 506 2.3
OECD average-26 496 0.7 496 0.5
Mexico 422 3.3 425 2.0
Switzerland 494 4.2 501 2.4
Hong Kong – China 525 2.9 533 2.1
Greece 474 5.0 483 4.3
Germany 484 2.5 497 2.7
Hungary 480 4.0 494 3.2
Korea 525 2.4 539 3.5
Brazil 396 3.1 412 2.7
Liechtenstein 483 4.1 499 2.8
Portugal 470 4.5 489 3.1
Poland 479 4.5 500 2.6
Israel 452 8.5 474 3.6
Latvia 458 5.3 484 3.0
Chile 410 3.6 449 3.1
The difference in the mean reading literacy performance between PISA 2000 and PISA 2009 provides a summary of the overall changes between cycles; however additional information can be gained by examining the distribution of students along the reading literacy proficiency scale. Of interest to policymakers are the students at either ends of the proficiency scale; the lower performing students and the high-achieving students.
Level 2, as discussed earlier in this chapter, was described as the baseline level of proficiency. Students who have not reached Level 2 are considered the lower performing students in PISA. At the upper end of the proficiency scale, students who achieved Level 5 or 6 are highly proficient readers and are referred to as the top performers.
30 Luxembourg, the Netherlands and the United Kingdom have not been included in the comparisons. The Netherlands and the United Kingdom did not meet the minimum response rate and their results have not been reported. The assessment conditions in Luxembourg for PISA 2000 were substantially different from other PISA cycles, so their results are not comparable. In Austria, the comparability of PISA data between 2000 and 2009 cannot be ensured.

122 Australian students’ performance in reading literacy
Figure 3.37 shows the percentage of students who performed below Level 2 in PISA 2000 and PISA 2009 by country. Those countries with the lowest proportion achieving below Level 2 in PISA 2009 are placed at the left of the figure and the countries with the highest proportion performing below Level 2 are placed at the right. The background shading in the figure indicates those countries that had a significant change in the percentage of students below Level 2 in reading literacy between PISA 2000 and PISA 2009. On average, across the 26 OECD countries, there was a small (1%) yet significant decrease in the percentage of students who failed to reach Level 2 from PISA 2000 to PISA 2009.
There were several countries where the proportion of students performing below Level 2 was smaller for PISA 2009 than PISA 2000 (i.e. the performance of lower performing students improved over time). This included Chile (with 18 per cent fewer students achieving below Level 2), Latvia (with 13 per cent fewer students achieving below Level 2), and Portugal, Poland, Liechtenstein, Brazil, Hungary, Germany, Mexico, Switzerland and Denmark (with between 3 and 9 per cent fewer students achieving below Level 2).
There were six countries (Iceland, Spain, France, Sweden, Czech Republic and Ireland) where the proportion of students who failed to reach Level 2 increased from PISA 2000 to PISA 2009 (i.e. the performance of lower performing students declined over time). The change in the percentage of students below Level 2 ranged from two per cent in Iceland to six per cent in Ireland. For the remaining countries, there were no significant differences between the proportion of students below Level 2 between PISA 2000 and PISA 2009. This included Australia, where there were 12 per cent of students who failed to reach Level 2 in PISA 2000 compared to 14 per cent in PISA 2009.

Challenges for Australian Education: Results from PISA 2009 123
Bra
zil
Bul
garia
Mex
ico
Chi
leR
ussi
an F
eder
atio
nIs
rael
Cze
ch R
epub
licG
reec
eIta
lyFr
ance
Spai
nG
erm
any
OEC
D a
vera
ge-2
6B
elgi
umPo
rtug
alU
nite
d St
ates
Latv
iaH
unga
rySw
eden
Irela
ndIc
elan
dSw
itzer
land
Liec
hten
stei
nD
enm
ark
Pola
ndN
orw
ayN
ew Z
eala
ndA
ustra
liaJa
pan
Can
ada
Hon
g K
ong
– C
hina
Finl
and
Kor
ea
0
20
40
60
80
100PISA 2009 PISA 2000
Perc
enta
ge o
f stu
dent
s
Figure 3.37 Percentage of students performing below Level 2 on the reading literacy scale in PISA 2000 and PISA 2009 by country31
Figure 3.38 has a similar layout to Figure 3.37, except it shows the top performers: the percentage of students who performed at Level 5 or 6 in PISA 2000 and PISA 2009 by country. Across the 26 OECD countries, there was a small decrease (on average, 1%) in the percentage of students who achieved Level 5 or 6 from PISA 2000 to PISA 2009.
Korea was found to have the largest significant improvement in the proportion of students who achieved Level 5 or 6 from PISA 2000 to PISA 2009. Thirteen per cent of Korean students were top performers in PISA 2009 compared to six per cent in PISA 2000, with a difference of seven per cent. Japan, Israel, Hong Kong – China, Chile and Brazil were also countries who achieved a significantly higher proportion of students achieving Level 5 or 6 in PISA 2009. The change in proportion between PISA 2000 and PISA 2009 ranged from one to four per cent for these countries.
There were several countries where the proportion of students who achieved Level 5 or 6 declined significantly from PISA 2000 to PISA 2009. This included Australia, where there was a five per cent decrease in the proportion of top performing students, from 18 per cent in PISA 2000 to 13 per cent in PISA 2009. Some countries showed large declines in the proportion of students achieving at the highest level; for example Ireland had a decrease of seven per cent in the proportion of students achieving at the highest level between PISA 2000 and PISA 2009. The top performing countries, Canada and Finland, as well as Denmark, New Zealand, Norway, Sweden and the Czech Republic also showed significant declines (of between 2 and 4%) in the proportion of students achieving Level 5 or 6.
31 Background shading in the figure indicates countries with a significant change in the proportion of students performing below Level 2 in reading literacy from PISA 2000 and PISA 2009.

124 Australian students’ performance in reading literacy
0
20
40
60
80
100
New
Zea
land
Finl
and
Japa
nK
orea
Aus
tralia
Can
ada
Hon
g K
ong
– C
hina
Bel
gium
Uni
ted
Stat
esFr
ance
Swed
enIc
elan
dN
orw
aySw
itzer
land
OEC
D a
vera
ge-2
6
Ger
man
yIs
rael
Pola
ndIre
land
Hun
gary
Italy
Gre
ece
Cze
ch R
epub
licPo
rtug
al
Den
mar
kLi
echt
enst
ein
Spai
n
Rus
sian
Fed
erat
ion
Latv
iaB
ulga
riaB
razi
lC
hile
Mex
ico
PISA 2009 PISA 2000
Perc
enta
ge o
f stu
dent
s
Figure 3.38 Percentage of students performing at Level 5 or above on the reading literacy scale in PISA
2000 and PISA 2009 by country32
Reading literacy performance and gender over time, from an international perspective
Since PISA 2000, females have outperformed males in reading literacy. For the 26 OECD countries who participated in both PISA 2000 and PISA 2009, the gender gap was 32 score points in PISA 2000 and 39 score points in PISA 2009 (Table 3.38).
In two OECD countries, (Ireland and Sweden), the mean performance for both females and males declined significantly between PISA 2000 and PISA 2009. In five countries (Australia, the Czech Republic, France, Spain and Canada) the mean performance for males declined significantly. The mean reading literacy performance declined by between 12 score points in Canada to 37 score points in Ireland for males, and by 26 score points in Ireland for females.
In Latvia and Chile, the mean performance for both females and males improved significantly from PISA 2000 to PISA 2009. Females in Chile improved their performance by 40 score points and males by 42 score points.
The mean reading literacy performance for females in ten countries (Greece, Germany, Liechtenstein, Hong Kong – China, Hungary, Brazil, Korea, Portugal, Poland and Israel) improved significantly while the mean performance for males was statistically similar from PISA 2000 to PISA 2009. The mean score point differences ranged from 15 score points in Germany to 35 score points in Israel.
32 Background shading in the figure indicates countries with a significant change in the proportion of students performing at Level 5 or above in reading literacy in PISA 2000 and PISA 2009.

Challenges for Australian Education: Results from PISA 2009 125
Table 3.38 Mean reading literacy scores by gender and gender differences by country for PISA 2000 and PISA 2009
Country
PISA 2000 PISA 2009Difference in mean score between 2000 and 2009 (PISA 2009 – PISA 2000)
Females Males Females Males Females Males
Mean score S.E. Mean
score S.E. Mean score S.E. Mean
score S.E. Score dif. S.E. Score
dif. S.E.
Australia 546 4.7 513 4.0 533 2.6 496 2.9 -13 8.6 -17 8.3
Belgium 525 4.9 492 4.2 520 2.9 493 3.4 -5 8.8 0 8.6
Brazil 404 3.4 388 3.9 425 2.8 397 2.9 21 8.0 9 8.3
Bulgaria 455 6.3 407 4.9 461 5.8 400 7.3 6 10.9 -8 11.0
Canada 551 1.7 519 1.8 542 1.7 507 1.8 -10 7.1 -12 7.1
Chile 421 4.6 396 4.3 461 3.6 439 3.9 40 8.9 42 8.8
Czech Republic 510 2.5 473 4.1 504 3.0 456 3.7 -6 7.8 -17 8.7
Denmark 510 2.9 485 3.0 509 2.5 480 2.5 -1 7.7 -5 7.7
Finland 571 2.8 520 3.0 563 2.4 508 2.6 -8 7.6 -12 7.8
France 519 2.7 490 3.5 515 3.4 475 4.3 -4 8.0 -15 8.7
Germany 502 3.9 468 3.2 518 2.9 478 3.6 15 8.3 10 8.3
Greece 493 4.6 456 6.1 506 3.5 459 5.5 13 8.9 3 10.6
Hong Kong – China 533 3.6 518 4.8 550 2.8 518 3.3 17 8.1 0 8.9
Hungary 496 4.3 465 5.3 513 3.6 475 3.9 17 8.8 11 9.4
Iceland 528 2.1 488 2.1 522 1.9 478 2.1 -6 5.7 -10 5.8
Ireland 542 3.6 513 4.2 515 3.1 476 4.2 -26 8.2 -37 9.0
Israel 459 8.1 444 10.9 495 3.4 452 5.2 35 11.0 9 13.8
Italy 507 3.6 469 5.1 510 1.9 464 2.3 2 7.8 -5 8.8
Japan 537 5.4 507 6.7 540 3.7 501 5.6 3 9.4 -6 11.0
Korea 533 3.7 519 3.8 558 3.8 523 4.9 25 8.6 4 9.1
Latvia 485 5.4 432 5.5 507 3.1 460 3.4 23 9.1 28 9.3
Liechtenstein 500 6.8 468 7.3 516 4.5 484 4.5 17 10.6 16 10.9
Mexico 432 3.8 411 4.2 438 2.1 413 2.1 6 8.0 1 8.2
New Zealand 553 3.8 507 4.2 544 2.6 499 3.6 -8 8.1 -8 8.7
Norway 529 2.9 486 3.8 527 2.9 480 3.0 -1 7.8 -5 8.3
OECD average-26 512 0.8 480 0.9 515 0.6 476 0.7 3 6.8 -4 6.8
Poland 497 5.5 461 6.0 525 2.9 476 2.8 28 9.2 14 9.4
Portugal 482 4.6 458 5.0 508 2.9 470 3.5 26 8.7 12 9.1
Russian Federation 481 4.1 443 4.5 482 3.4 437 3.6 1 8.6 -6 8.9
Spain 505 2.8 481 3.4 496 2.2 467 2.2 -10 7.6 -14 7.8
Sweden 536 2.5 499 2.6 521 3.1 475 3.2 -15 7.8 -24 7.9
Switzerland 510 4.5 480 4.9 520 2.7 481 2.9 10 8.5 1 8.8
United States 518 6.2 490 8.4 513 3.8 488 4.2 -6 9.9 -2 11.6
Note: Values that are statistically significant are indicated in bold.

126 Australian students’ performance in reading literacy
From PISA 2000 to PISA 2009 there was a significant decline in the proportion of top performing Australian males and females and a significant increase in the proportion of males performing at lower levels (Table 3.39). In PISA 2000, 22 per cent of Australian females achieved Level 5 or above compared to 16 per cent in PISA 2009, and for Australian males, 14 per cent achieved Level 5 or above in PISA 2000 compared to 10 per cent in PISA 2009. The change in the proportion of top performing students from PISA 2000 to 2009 was six per cent for Australian females and four per cent for Australian males, which was less favourable than the OECD average that showed a significant decline of one per cent for males.
There was a four per cent increase in the proportion of Australian males who failed to reach Level 2, from 16 per cent in PISA 2000 to 20 per cent in PISA 2009. This change was greater than across OECD countries, who on average recorded no significant change. There was no significant difference between the proportion of Australian females who failed to reach Level 2, which was, different to that found for the OECD average where there were two per cent fewer students who had not achieved Level 2 in PISA 2009 compared to PISA 2000.
Table 3.39 Percentage of males and females performing below Level 2 or achieving Level 5 or above on the reading literacy scale in PISA 2000 and PISA 2009 for Australia and the OECD average
PISA 2000 PISA 2009
Difference in mean score between 2000 and 2009 (PISA 2009 – PISA 2000)
Below Level 2
Level 5 or above
Below Level 2
Level 5 or above Below Level 2 Level 5 or
above
% S.E. % S.E. % S.E. % S.E. % dif. S.E. % dif. S.E.
Australia Females 8 0.9 22 2.0 9 0.6 16 0.9 1 1.1 -6 2.2
Males 16 1.3 14 1.1 20 0.8 10 0.8 4 1.6 -4 1.3
OECD average-26
Females 14 0.3 11 0.2 12 0.2 11 0.2 -2 0.3 -1 0.3
Males 24 0.4 7 0.2 24 0.3 6 0.1 0 0.5 -1 0.2
Note: Values that are statistically significant are indicated in bold.
Reading literacy performance over time, across Australian states and territories
At a national level it is important to examine the decline in Australia’s overall performance in reading literacy from PISA 2000 to PISA 2009 in more detail. Although the difference in mean reading literacy scores decreased in all states between PISA 2000 and PISA 2009, statistically significant declines were found in only four states (Table 3.40). In Tasmania and South Australia, there was a 31 score point decline, which is the equivalent to almost half a proficiency level or about one full year of schooling. In New South Wales and the Australian Capital Territory, the decline in reading literacy performance was 23 and 21 score points respectively, which is representative of approximately one-third of a proficiency level or about half a year of schooling. The mean reading literacy performance in Queensland, Victoria, the Northern Territory and Western Australia from PISA 2000 and PISA 2009 was statistically similar.

Challenges for Australian Education: Results from PISA 2009 127
Table 3.40 Mean reading literacy scores for PISA 2000 and PISA 2009, and differences between performance in cycles by states
StatePISA 2000 PISA 2009 Difference in mean score between PISA
2000 and PISA 2009Mean S.E. Mean S.E.
TAS 514 9.7 483 5.8
40 30 20 10 0
Reading literacyperformance declined
Differences between 2000 and 2009 significant
Differences between 2000 and 2009 not significant
SA 537 7.7 506 4.8
NSW 539 6.3 516 5.6
ACT 552 4.6 531 6.0
WA 538 8.0 522 6.3
NT 489 5.6 481 5.6
VIC 516 7.6 513 4.7
QLD 521 8.6 519 7.0
There was a significant decline in the proportion of top performers in four states (the Australian Capital Territory, South Australia, Western Australia and Tasmania) from PISA 2000 to PISA 2009. There were nine per cent fewer students who had achieved Level 5 or above in South Australia, seven per cent in Western Australia, eight per cent in Tasmania and six per cent in the Australian Capital Territory.
For the lower performing students, there was an increase in the proportion of students who achieved below Level 2 from PISA 2000 to PISA 2009. This occurred in the Australian Capital Territory and South Australia, with an increase of five per cent, and in New South Wales, with an increase of four per cent of students performing below Level 2 (Table 3.41).
Table 3.41 Percentage of students performing below Level 2 or achieving Level 5 or above on the reading literacy scale in PISA 2000 and PISA 2009 by state
State
PISA 2000 PISA 2009 Change between 2000 and 2009 (PISA 2009 – PISA 2000)
Below Level 2 Level 5 or above Below Level 2 Level 5 or
above Below Level 2 Level 5 or above
% S.E. % S.E. % S.E. % S.E. % dif. S.E. % dif. S.E.
ACT 8 1.3 25 2.2 13 1.4 18 2.1 5 1.9 -6 3.1
NSW 10 1.5 18 2.3 14 1.3 13 1.9 4 2.0 -5 2.9
VIC 14 2.4 14 3.0 14 1.5 12 1.1 0 2.8 -2 3.2
QLD 14 2.0 16 2.4 14 1.5 14 2.3 -1 2.4 -2 3.3
SA 10 1.5 19 3.6 15 1.7 10 1.1 5 2.3 -9 3.8
WA 11 2.0 21 2.6 13 1.6 14 1.7 1 2.6 -7 3.1
TAS 17 2.6 15 2.8 23 2.0 7 1.3 6 3.3 -8 3.1
NT 22 2.5 10 1.9 24 2.2 9 1.3 2 3.3 -1 2.3
Australia 12 0.9 18 1.2 14 0.6 13 0.8 2 1.0 -5 1.4
Note: Values that are statistically significant are indicated in bold.
Table 3.42 shows the mean reading literacy scores from PISA 2000 to PISA 2009 as well as the difference in reading literacy performance between cycles for females and males by state. The decline in reading literacy performance for females was statistically significant in Tasmania and South Australia between PISA 2000 and PISA 2009. For Tasmanian females, reading literacy declined from, on average, 541 to 505 score points, a decrease of 36 score points (approximately half a proficiency level). In South Australia, the mean reading literacy performance declined 26 score points, from 551 to 524 score points.

128 Australian students’ performance in reading literacy
There was a statistically significant decline in the reading literacy performance of males in two states. In South Australia, the mean reading literacy performance for males in PISA 2000 was 522 score points, dropping to 490 score points in PISA 2009, a decline of 32 score points. In New South Wales, the mean reading literacy performance for males decreased from 525 to 495 score points, a decline of 30 score points.
Table 3.42 Mean reading literacy scores by gender and gender differences by state for PISA 2000 and PISA 2009
State
PISA 2000 PISA 2009
Change between 2000
and 2009 (PISA 2009 – PISA 2000)
PISA 2000 PISA 2009
Change between 2000
and 2009 (PISA 2009 – PISA 2000)
Mean score S.E. Mean
score S.E. Score dif. S.E. Mean
score S.E. Mean score S.E. Score
dif. S.E.
Females Males
ACT 565 10.1 550 9.0 -15 16.5 542 14.0 513 9.5 -29 16.9
NSW 555 6.9 536 5.3 -19 11.5 525 8.9 495 7.6 -30 11.7
VIC 532 13.3 531 5.7 -1 15.7 504 6.7 495 6.1 -9 9.1
QLD 545 11.6 534 6.8 -11 15.7 498 8.6 503 8.0 4 11.8
SA 551 9.3 524 4.3 -26 12.6 522 10.7 490 7.3 -32 13.0
WA 557 9.5 539 6.4 -18 14.1 523 9.6 504 8.1 -19 12.6
TAS 541 9.1 505 8.9 -36 14.8 491 12.1 463 7.5 -28 14.2
NT 505 7.1 501 8.9 -5 12.6 475 9.0 460 5.4 -15 10.5
Note: Values that are statistically significant are indicated in bold.
Reading literacy performance over time and Indigenous students
The mean reading literacy performance for Indigenous students in PISA 2000 was 448 score points. In PISA 2009, the mean reading literacy performance for Indigenous students declined to 436 score points; however, these changes were not statistically significant (Table 3.43). The mean reading literacy performance for non-Indigenous significantly declined between PISA 2000 and PISA 2009.
Table 3.43 Mean reading literacy scores for PISA 2000 and PISA 2009, and differences between performance for Indigenous students
Indigenous staus
PISA 2000 PISA 2009 Change between 2000 and 2009 (PISA 2009 – PISA 2000)
Mean score S.E. Mean score S.E. Score dif. S.E.
Indigenous 448 5.8 436 6.3 -12 9.9
Non-indigenous 531 3.4 518 2.2 -13 6.4
Note: Values that are statistically significant are indicated in bold.
There were no significant differences between the proportion of Indigenous students who performed below Level 2, or between the proportion of Indigenous students who achieved Level 5 or above from PISA 2000 to PISA 2009 (Table 3.44). There was, however, a significant decrease (of 4%) in the proportion of non-Indigenous students who achieved Level 5 or above from PISA 2000 to PISA 2009.
Table 3.44 Percentage of students performing below Level 2 or achieving Level 5 or above on the reading literacy scale in PISA 2000 and PISA 2009 by Indigenous status
Indigenous status
PISA 2000 PISA 2009 Change between 2000 and 2009 (PISA 2009 – PISA 2000)
Below Level 2 Level 5 or above Below Level 2 Level 5 or
above Below Level 2 Level 5 or above
% S.E. % S.E. % S.E. % S.E. % dif. S.E. % dif. S.E.
Indigenous students 33 3.4 4 1.3 39 2.6 2 0.6 6 4.3 -2 1.4
Non-Indigenous students
12 0.9 17 1.2 13 0.5 13 0.8 1 1.1 -4 1.4
Note: Values that are statistically significant are indicated in bold.

Challenges for Australian Education: Results from PISA 2009 129
Key Findings38
◗ Australian students revealed the same level of enjoyment of reading, as measured by the index, as the OECD average. Students from Shanghai – China, however, reported much greater enjoyment of reading than students in all other countries.
◗ Females reported higher levels of enjoyment of reading, on average, than males. This difference was greater among Finnish and Canadian students, while the difference between Australian females and males was similar to that found for New Zealand students and across the OECD.
◗ When asked how often they read for their own enjoyment, over one-third (37%) of Australian students reported that they do not read for their own enjoyment.
◗ Female students had higher scores in reading literacy irrespective of how much time they spent reading; however, the gap between the scores of males and females decreased as the frequency of reading increased. For students who read frequently, there was no significant difference between the average reading literacy scores of females and males.
◗ Greater proportions of females reported reading fiction books regularly, while greater proportions of males reported reading comic books ‘a few times a year’ or more regularly.
◗ Female students also reported greater use of memorisation and control strategies when they studied than did male students. There were no differences, however, in male and female students’ use of elaboration techniques.
◗ Indigenous students, on average, reported lower rates of reading for enjoyment, less diversity of reading material and less awareness of effective strategies for understanding, remembering and summarising texts than non-Indigenous students. They also reported lower use of more general study strategies, such as memorisation and control strategies.
◗ Comparison of the average index scores of students from different socioeconomic backgrounds also found a pattern of disadvantage, with students from the lowest socioeconomic quartile scoring lower on all of the indices – reporting less enjoyment of reading, reading less often, reading less diverse materials, and using fewer study strategies than students from higher socioeconomic backgrounds.
◗ Enjoyment of reading had the strongest association with reading literacy performance, while greater use of control strategies when studying was also positively associated with higher reading literacy scores.
◗ Reading fiction and non-fiction books regularly was positively associated with reading literacy performance.
Chapter
4Australian students’ reading habits and learning strategies
33 In this chapter, Australia’s results were compared with a selection of countries: Canada, New Zealand, the United Kingdom, United States, Finland, Hong Kong – China, Korea, Shanghai – China and Singapore. For the results for all participating countries, see the PISA international report.

130 Australian students’ reading habits and learning strategies
A wealth of research has demonstrated that students’ reading habits can impact on performance in reading-related activities. The types of learning strategies that students adopt in these activities can further influence their performance and determine whether they are engaging in deep or surface-level learning. Students who are highly engaged in a wide range of reading activities and use learning strategies that facilitate deeper levels of learning are more likely than other students to be effective learners and perform well at school (Guthrie & Wigfield, 2000; Guthrie, Wigfield, & You, in press). This chapter investigates students’ reading habits (see Figure 4.1); in particular, students’ enjoyment of reading, the time they spend on reading for enjoyment purposes, and the diversity of the reading materials they engage with. It also examines the types of learning strategies students use, both in general learning activities and in tasks that relate specifically to reading literacy. The relationships between these variables and students’ reading performance are also considered.
Enjoyment of reading
Reading for school Time spent readingReading habits
Diversity ofreading materials
Figure 4. 1 Summary of reading attitudes and habits measured in PISA 2009
PISA provides the opportunity to place Australian students’ responses in a wider, international context. For this chapter, nine countries were chosen for comparison with Australia. Finland was selected for its strong academic reputation, particularly in reading (see results for the PISA 2000 cycle). Canada, New Zealand, the United Kingdom and the United States were chosen for the purpose of making comparisons with other English-speaking OECD countries, and Hong Kong – China, Korea, Shanghai – China, and Singapore were selected as fellow countries in the Asia–Pacific region. All results were also compared with the OECD average.
For many of the variables discussed in this chapter, index scores are used to describe patterns in the data. In most cases, multiple items were used to measure most of these variables, and an index score is a way of aggregating the information that is gathered. Index scores were standardised so that the mean value for the OECD student population was zero and the standard deviation was one.
Reading habits
Enjoyment of reading
The majority of research on reading literacy has focused on cognitive aspects of reading; however, a growing number of researchers emphasise the need to investigate why children read (Wigfield, 2010). These motives affect students’ reading performance as well as their sustained engagement with reading in the future. Enjoyment is a key concept investigated in this area as an attitude that affects many of students’ achievement-related choices. In the PISA 2009 study, students’ enjoyment of reading was measured with the following 11 statements:
◗ I read only if I have to
◗ Reading is one of my favourite hobbies
◗ I like talking about books with other people

Challenges for Australian Education: Results from PISA 2009 131
◗ I find it hard to finish books
◗ I feel happy if I receive a book as a present
◗ For me, reading is a waste of time
◗ I enjoy going to a bookstore or a library
◗ I read only to get information that I need
◗ I cannot sit still and read for more than a few minutes
◗ I like to express my opinions about books I have read
◗ I like to exchange books with my friends
Students rated their level of agreement with each item on a four-point Likert scale – strongly disagree, disagree, agree and strongly agree. The Enjoyment of Reading Index was created using these 11 items and values were standardised so that the mean of zero represented the mean of the OECD student population. Higher scores on the index indicated that students responded with higher levels of reading enjoyment than on average across the OECD. Table 4.1 presents the average scores for students in Australia, Finland, neighbouring Asia-Pacific countries, and other English-speaking OECD countries. These scores are displayed overall for countries and for females and males separately.
Table 4. 1 Enjoyment of Reading Index scores for selected counties, with gender difference
CountryAll students Females Males Difference
Mean index S.E. Mean
index S.E. Mean index S.E. Dif. (F - M) S.E.
Australia 0.00 0.02 0.31 0.02 -0.33 0.02 0.64 0.03
Canada 0.13 0.01 0.55 0.02 -0.28 0.02 0.83 0.02
New Zealand 0.13 0.02 0.44 0.02 -0.17 0.02 0.61 0.03
United Kingdom -0.12 0.02 0.13 0.02 -0.37 0.02 0.50 0.03
United States -0.04 0.03 0.28 0.03 -0.35 0.03 0.63 0.03
Finland 0.05 0.02 0.50 0.02 -0.41 0.02 0.91 0.03
Hong Kong – China 0.32 0.01 0.51 0.02 0.16 0.02 0.35 0.02
Korea 0.13 0.02 0.27 0.02 0.00 0.02 0.27 0.03
Shanghai – China 0.57 0.01 0.75 0.01 0.39 0.02 0.35 0.02
Singapore 0.29 0.01 0.58 0.02 0.00 0.02 0.58 0.02
OECD average 0.00 0.00 0.31 0.00 -0.31 0.00 0.62 0.01
Note: Values that represent a statistically significant gender difference are indicated in bold.
On average, Australian students’ rating of enjoyment of reading was the same as the average for OECD countries. However, this rating was significantly lower than that of most of the countries chosen for comparison, except for the United Kingdom and the United States. Of these countries, students from Shanghai – China had the highest ratings of reading enjoyment followed by Hong Kong – China and Singapore.
Across all countries, females scored higher on the Enjoyment of Reading Index. The highest gender difference among the countries was reported by Finnish students and the lowest by Korean students. Australian females, on average, had enjoyment ratings more than half a standard deviation higher than males.
Table 4.2 shows the percentage of students in each of the Australian states who agreed or strongly agreed with the statements that formed the Enjoyment of Reading Index. Generally these percentages were similar to the Australian average. However, a relatively lower percentage of Tasmanian students reported that they enjoyed going to the bookstore or library. Furthermore, in contrast to the Australian Capital Territory, a relatively smaller percentage of students from Tasmania reported that they liked to express an opinion about books they had read. Students from the Australian Capital Territory generally gave responses indicating higher enjoyment of reading and reading-related activities, compared to other Australian states.

132 Australian students’ reading habits and learning strategies
Table 4. 2 Percentage of students agreeing or strongly agreeing to Enjoyment of Reading items by state
State
I enjoy going to a bookstore or
a library
I read only to get information
that I need
I cannot sit still and read for more than a few minutes
I like to express my
opinions about books I have
read
I read only if I have to
Reading is one of my favourite
hobbies
% S.E. % S.E. % S.E. % S.E. % S.E. % S.E.
ACT 52 1.4 37 1.8 20 1.6 54 2.0 35 1.7 44 1.9
NSW 49 1.6 40 1.6 22 1.1 49 1.4 38 1.5 38 1.7
VIC 43 1.5 44 1.4 24 1.1 44 1.4 43 1.3 33 1.5
QLD 50 1.5 42 1.6 25 1.6 46 1.3 40 1.5 36 1.6
SA 45 2.2 46 1.6 27 1.3 42 1.8 45 1.8 33 1.6
WA 44 2.1 44 1.6 24 1.7 45 1.6 43 1.4 34 1.5
TAS 39 2.2 45 2.1 25 1.6 39 1.6 42 1.8 31 1.5
NT 45 2.0 46 2.4 22 1.5 44 1.8 45 1.9 36 1.7
AUS 47 0.8 42 0.8 24 0.5 46 0.7 41 0.7 35 0.8
State
I like talking about books
with other people
I find it hard to finish books
I feel happy if I receive a book as a present
For me, reading is a
waste of time
I like to exchange
books with my friends
% S.E. % S.E. % S.E. % S.E. % S.E.
ACT 48 1.3 29 1.4 57 1.5 22 1.3 39 2.1
NSW 43 1.4 31 1.1 54 1.4 24 1.2 36 1.5
VIC 36 1.4 34 1.1 46 1.5 28 1.4 29 1.5
QLD 38 1.4 33 1.2 51 1.2 25 1.3 31 1.3
SA 35 2.1 37 1.1 48 1.7 29 1.5 29 2.0
WA 37 1.6 32 1.4 49 1.6 26 1.6 30 1.6
TAS 32 1.3 36 2.0 49 2.1 28 1.9 28 2.0
NT 38 2.0 35 2.4 50 1.8 25 1.5 32 1.9
AUS 39 0.7 33 0.5 51 0.6 26 0.6 32 0.7
A similar trend was apparent in the means across the states and territories on the Enjoyment of Reading Index itself – students from the Australian Capital Territory had the highest ratings, followed by students from New South Wales and then Queensland (see Table 4.3). Across all Australian states and territories, females reported significantly higher average ratings of enjoyment of reading than males.
Table 4. 3 Enjoyment of Reading Index scores by state, with gender difference
State
All students Females Males Difference
Mean index S.E. Mean
index S.E. Mean index S.E. Dif. (F – M) S.E.
ACT 0.19 0.04 0.47 0.07 -0.10 0.07 0.57 0.09
NSW 0.08 0.04 0.41 0.04 -0.28 0.04 0.69 0.05
VIC -0.06 0.04 0.25 0.05 -0.40 0.05 0.65 0.07
QLD 0.01 0.04 0.29 0.05 -0.29 0.04 0.57 0.07
SA -0.11 0.04 0.23 0.05 -0.43 0.05 0.66 0.07
WA -0.07 0.04 0.21 0.04 -0.37 0.04 0.59 0.06
TAS -0.13 0.04 0.19 0.06 -0.45 0.06 0.63 0.08
NT -0.01 0.04 0.28 0.07 -0.33 0.05 0.61 0.08
AUS 0.00 0.02 0.31 0.02 -0.33 0.02 0.64 0.03
Note: Values that represent a statistically significant gender difference are indicated in bold.

Challenges for Australian Education: Results from PISA 2009 133
Indigenous status
Table 4.4 presents the percentage of students in Australia who agreed or strongly agreed with the statements that formed the Enjoyment of Reading Index, according to Indigenous background. The average scores for this index for Indigenous and non-Indigenous students are also displayed.
Table 4. 4 Percentage of students agreeing or strongly agreeing to Enjoyment of Reading items by Indigenous status
Indigenous status
I read only if I have to
I enjoy going to a
bookstore or a library
I read only to get
information that I need
I cannot sit still and read for more than a few minutes
I like to express my
opinions about books I
have read
Reading is one of my favourite hobbies
% S.E. % S.E. % S.E. % S.E. % S.E. % S.E.
Indigenous 58 1.7 32 2.1 61 2.1 36 1.6 33 2.2 20 1.4
non-Indigenous 40 0.7 47 0.7 42 0.8 23 0.6 47 0.7 36 0.8
Indigenous status
I like talking about books
with other people
I find it hard to finish books
I feel happy if I receive a book as a
present
For me, reading is a
waste of time
I like to exchange
books with my friends
Enjoyment of reading
index
% S.E. % S.E. % S.E. % S.E. % S.E. Mean S.E.
Indigenous 23 1.7 43 1.7 39 1.8 38 1.8 21 1.3 -0.38 0.04
non-Indigenous 39 0.7 32 0.5 51 0.6 26 0.6 32 0.7 0.01 0.02
Indigenous students tended to report lower levels of enjoyment in relation to all reading activities. In particular, it is worrying that three out of every five Indigenous students read only for information, and that more than one-third say they cannot sit still and read for more than a few minutes. Indigenous students’ mean rating on the Enjoyment of Reading Index was also substantially lower than that of non-Indigenous students and the OECD average.
Socioeconomic background
Table 4.5 presents similar trends in results to the previous section in relation to the four socioeconomic groups identified in earlier chapters. Results for the item statements show that students in the lowest quartile report the most negative responses for reading enjoyment and students in the highest quartile the most positive responses. This pattern for the Enjoyment of Reading Index showed there was a statistically significant difference between mean ratings for all four socioeconomic groups, and a linear trend that mirrored the pattern found with the item statements – students in the lowest socioeconomic quartile had the most negative enjoyment ratings and students in the highest quartile had the most positive ratings.

134 Australian students’ reading habits and learning strategies
Table 4. 5 Percentage of students agreeing or strongly agreeing to Enjoyment of Reading items by socioeconomic quartile
Socioeconomic background
I read only if I have to
I enjoy going to a
bookstore or a library
I read only to get
information that I need
I cannot sit still and read for more than a few minutes
I like to express my
opinions about books I
have read
Reading is one of my favourite hobbies
% S.E. % S.E. % S.E. % S.E. % S.E. % S.E.
Lowest quartile 52 1.0 37 1.0 53 1.1 33 1.0 36 1.0 27 1.0
Second quartile 45 1.0 41 1.0 48 1.1 27 1.0 41 1.0 31 0.9
Third quartile 37 1.0 50 1.2 39 1.0 20 0.9 50 1.1 39 1.0
Highest quartile 29 0.9 58 1.1 29 1.0 14 0.6 58 1.2 45 1.3
Socioeconomic background
I like talking about books
with other people
I find it hard to finish books
I feel happy if I receive a book as a
present
For me, reading is a
waste of time
I like to exchange
books with my friends
Enjoyment of Reading
Index
% S.E. % S.E. % S.E. % S.E. % S.E. Mean S.E.
Lowest quartile 28 0.9 41 1.0 40 1.0 35 1.0 24 0.8 -0.29 0.02
Second quartile 34 1.0 35 0.8 47 0.9 28 0.9 28 1.0 -0.14 0.02
Third quartile 43 1.0 30 1.1 54 1.0 24 1.0 35 1.1 0.09 0.02
Highest quartile 51 1.2 25 0.8 62 1.1 16 0.7 42 1.4 0.35 0.03
Table 4.6 shows the average reading literacy scores of students who fell within the lowest to highest quartiles on the Enjoyment of Reading Index. The difference in average reading literacy scores on the Enjoyment of Reading Index for students in the lowest and highest quartiles was 133 points, the equivalent of just over four years of schooling.
Table 4.6 Reading Literacy performance by quartiles on the Enjoyment of Reading Index
Lowest quartile Second quartile Third quartile Highest quartile
Mean score S.E. Mean score S.E. Mean score S.E. Mean score S.E.
454 0.5 489 1.0 536 0.9 588 0.6
Enjoyment and performance
The results of a correlation analysis demonstrated that enjoyment of reading had a positive association with Australian students’ performance on the PISA 2009 tasks. A correlation of 0.51, a moderate effect according to Cohen’s (1988) criteria, was found between the index and performance scores. Thus, students who reported higher ratings of enjoyment of reading tended to have higher performance scores. The association between the Enjoyment of Reading Index and reading literacy scores was the strongest of any correlation between the reading attitudes and habits indices and student performance. This, and other results for the Enjoyment of Reading Index, demonstrate the important role of student attitudes for achievement and, furthermore, that these attitudes may be linked to contextual factors like Indigenous background and socioeconomic status.
Time spent reading
Research has documented a strong link between reading practices (how much people read at work and at home) and reading proficiency among adults (OECD and Statistics Canada, 2000). The time that students report reading for enjoyment represents a behavioural indicator of their attitude towards reading and complements data like the Enjoyment of Reading Index.
The PISA 2009 project asked students, “About how much time do you spend reading for enjoyment?”, and required them to respond to one of five alternatives:
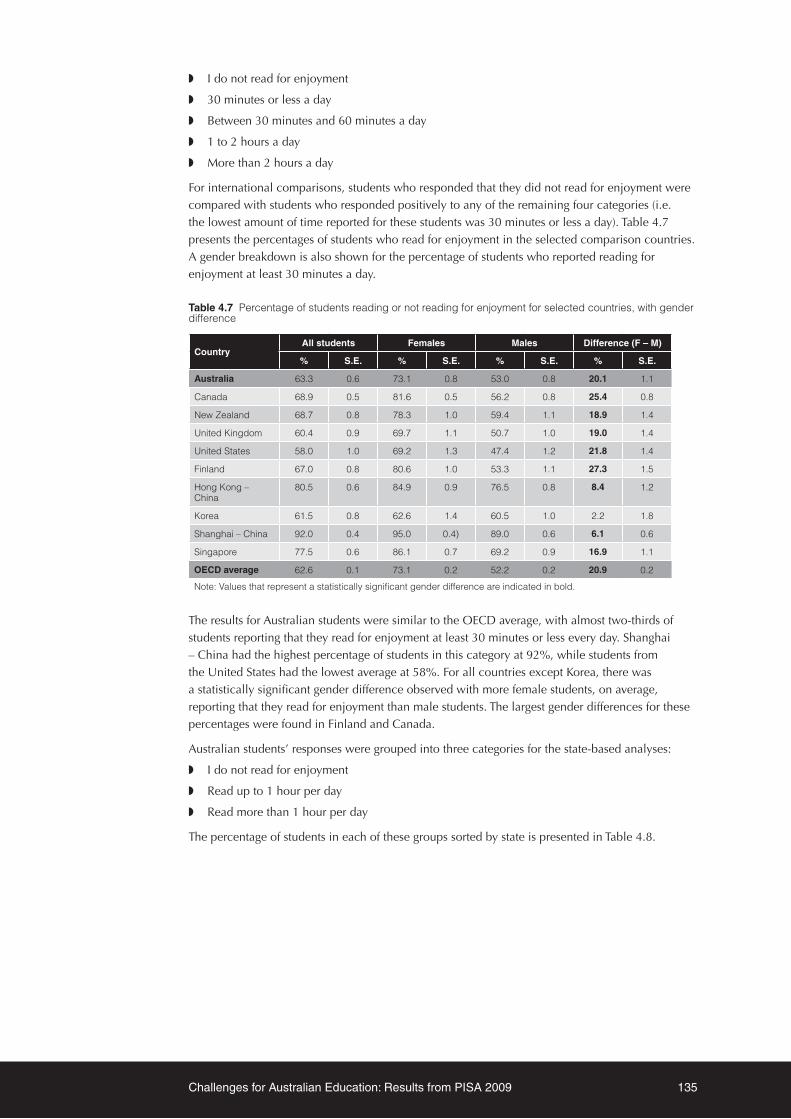
Challenges for Australian Education: Results from PISA 2009 135
◗ I do not read for enjoyment
◗ 30 minutes or less a day
◗ Between 30 minutes and 60 minutes a day
◗ 1 to 2 hours a day
◗ More than 2 hours a day
For international comparisons, students who responded that they did not read for enjoyment were compared with students who responded positively to any of the remaining four categories (i.e. the lowest amount of time reported for these students was 30 minutes or less a day). Table 4.7 presents the percentages of students who read for enjoyment in the selected comparison countries. A gender breakdown is also shown for the percentage of students who reported reading for enjoyment at least 30 minutes a day.
Table 4.7 Percentage of students reading or not reading for enjoyment for selected countries, with gender difference
CountryAll students Females Males Difference (F – M)
% S.E. % S.E. % S.E. % S.E.
Australia 63.3 0.6 73.1 0.8 53.0 0.8 20.1 1.1
Canada 68.9 0.5 81.6 0.5 56.2 0.8 25.4 0.8
New Zealand 68.7 0.8 78.3 1.0 59.4 1.1 18.9 1.4
United Kingdom 60.4 0.9 69.7 1.1 50.7 1.0 19.0 1.4
United States 58.0 1.0 69.2 1.3 47.4 1.2 21.8 1.4
Finland 67.0 0.8 80.6 1.0 53.3 1.1 27.3 1.5
Hong Kong – China
80.5 0.6 84.9 0.9 76.5 0.8 8.4 1.2
Korea 61.5 0.8 62.6 1.4 60.5 1.0 2.2 1.8
Shanghai – China 92.0 0.4 95.0 0.4) 89.0 0.6 6.1 0.6
Singapore 77.5 0.6 86.1 0.7 69.2 0.9 16.9 1.1
OECD average 62.6 0.1 73.1 0.2 52.2 0.2 20.9 0.2
Note: Values that represent a statistically significant gender difference are indicated in bold.
The results for Australian students were similar to the OECD average, with almost two-thirds of students reporting that they read for enjoyment at least 30 minutes or less every day. Shanghai – China had the highest percentage of students in this category at 92%, while students from the United States had the lowest average at 58%. For all countries except Korea, there was a statistically significant gender difference observed with more female students, on average, reporting that they read for enjoyment than male students. The largest gender differences for these percentages were found in Finland and Canada.
Australian students’ responses were grouped into three categories for the state-based analyses:
◗ I do not read for enjoyment
◗ Read up to 1 hour per day
◗ Read more than 1 hour per day
The percentage of students in each of these groups sorted by state is presented in Table 4.8.
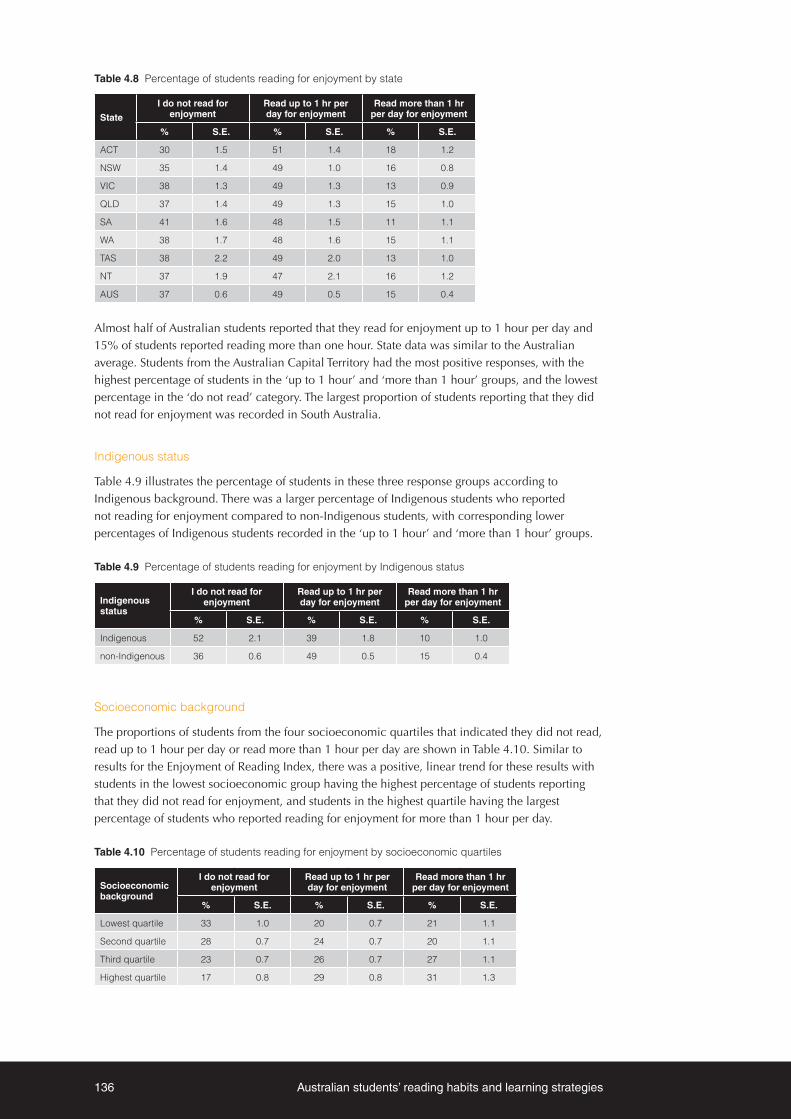
136 Australian students’ reading habits and learning strategies
Table 4.8 Percentage of students reading for enjoyment by state
State
I do not read for enjoyment
Read up to 1 hr per day for enjoyment
Read more than 1 hr per day for enjoyment
% S.E. % S.E. % S.E.
ACT 30 1.5 51 1.4 18 1.2
NSW 35 1.4 49 1.0 16 0.8
VIC 38 1.3 49 1.3 13 0.9
QLD 37 1.4 49 1.3 15 1.0
SA 41 1.6 48 1.5 11 1.1
WA 38 1.7 48 1.6 15 1.1
TAS 38 2.2 49 2.0 13 1.0
NT 37 1.9 47 2.1 16 1.2
AUS 37 0.6 49 0.5 15 0.4
Almost half of Australian students reported that they read for enjoyment up to 1 hour per day and 15% of students reported reading more than one hour. State data was similar to the Australian average. Students from the Australian Capital Territory had the most positive responses, with the highest percentage of students in the ‘up to 1 hour’ and ‘more than 1 hour’ groups, and the lowest percentage in the ‘do not read’ category. The largest proportion of students reporting that they did not read for enjoyment was recorded in South Australia.
Indigenous status
Table 4.9 illustrates the percentage of students in these three response groups according to Indigenous background. There was a larger percentage of Indigenous students who reported not reading for enjoyment compared to non-Indigenous students, with corresponding lower percentages of Indigenous students recorded in the ‘up to 1 hour’ and ‘more than 1 hour’ groups.
Table 4.9 Percentage of students reading for enjoyment by Indigenous status
Indigenous status
I do not read for enjoyment
Read up to 1 hr per day for enjoyment
Read more than 1 hr per day for enjoyment
% S.E. % S.E. % S.E.
Indigenous 52 2.1 39 1.8 10 1.0
non-Indigenous 36 0.6 49 0.5 15 0.4
Socioeconomic background
The proportions of students from the four socioeconomic quartiles that indicated they did not read, read up to 1 hour per day or read more than 1 hour per day are shown in Table 4.10. Similar to results for the Enjoyment of Reading Index, there was a positive, linear trend for these results with students in the lowest socioeconomic group having the highest percentage of students reporting that they did not read for enjoyment, and students in the highest quartile having the largest percentage of students who reported reading for enjoyment for more than 1 hour per day.
Table 4.10 Percentage of students reading for enjoyment by socioeconomic quartiles
Socioeconomic background
I do not read for enjoyment
Read up to 1 hr per day for enjoyment
Read more than 1 hr per day for enjoyment
% S.E. % S.E. % S.E.
Lowest quartile 33 1.0 20 0.7 21 1.1
Second quartile 28 0.7 24 0.7 20 1.1
Third quartile 23 0.7 26 0.7 27 1.1
Highest quartile 17 0.8 29 0.8 31 1.3

Challenges for Australian Education: Results from PISA 2009 137
Time spent reading and performance in reading literacy
Figure 4.2 maps the mean performance scores in reading for Australian female and male students who fit in the three response categories: do not read for enjoyment, read up to 1 hour per day, and read more than 1 hour per day. The figure illustrates a positive, linear pattern with performance increasing as the time spent reading increases. While females had higher scores in reading literacy no matter the frequency of their reading, the gap between the scores of males and females decreased as the frequency of reading increased. For students who said that they did not read for enjoyment, the gap was 24 score points while for students who said that they read frequently, the score difference was a non-significant five score points.
Females
Males
440 460 480 500 520 540 560 580 600
Do not readfor enjoyment
Readinfrequently
Readfrequently
Figure 4.2 Mean reading literacy scores by frequency of reading for enjoyment, by gender
Diversity of reading materials
Along with the amount of time students read for enjoyment, and the level of enjoyment they attribute to reading activities, students’ reading habits are also illustrated by the diversity of the material that they read. Furthermore, students who practice reading a variety of styles tend to have a better mastery of reading than students who are more restricted in their reading habits (Brozo, Shiel & Topping, 2007).
The PISA 2009 project assessed the diversity of students’ reading preferences by asking, “How often do you read these materials because you want to?”:
◗ Magazines
◗ Comic books
◗ Fiction (novels, narratives, stories)
◗ Non-fiction books
◗ Newspapers
Students marked how frequently they read each type of reading material on a five-point Likert scale – never or almost never, a few times a year, about once a month, several times a month and several times a week.
After inspecting the data, Australian students’ responses were collapsed into three broader groups. Never or almost never was retained as a group; however, a few times a year and about once a month were grouped together and referred to as ‘sometimes’, and several times a month and several times a week were grouped together and referred to as ‘regularly’. The percentage of Australian students whose responses fit these groupings for the different types of reading materials is presented in Table 4.11.

138 Australian students’ reading habits and learning strategies
Table 4.11 Regularity of reading different materials
Reading materialNever or almost never Sometimes Regularly
% S.E. % S.E. % S.E.
Magazines 7 0.3 43 0.5 50 0.6
Comic books 58 0.6 33 0.6 9 0.4
Fiction books 17 0.5 45 0.5 38 0.7
Non-fiction books 24 0.5 56 0.5 20 0.4
Newspapers 13 0.4 33 0.5 54 0.7
These data illustrate that Australian students most frequently read newspapers and magazines; with at least 50% of students reporting that they read these materials at least several times a month. Surprisingly, comic books were the least preferred type of reading material for the reading regularly category.
The Diversity of Reading Index was created using students’ responses (i.e. on the five-point Likert scale) to the five types of reading materials listed above. Values were standardised so that the mean of ‘zero’ represented the mean of the OECD student population. A higher score on the index illustrated a higher level of diversity in reading than overall for the OECD. An international comparison of these scores is represented in Table 4.12. Singaporean students had the largest average score on the index, indicating that these students had the most diverse reading preferences. Australian students demonstrated less diversity in their reading preferences than the OECD average. The lowest average score on the index was for students from the United States, and Shanghai – China was the only country where male students reported significantly more diversity in the reading materials they engaged with than females; for all other countries listed females recorded a greater diversity of reading material than did males.
Table 4.12 Diversity of Reading Index scores for selected countries, with gender difference
Country
All students Females Males Difference (F – M)
Mean index S.E. Mean
index S.E. Mean index S.E. Dif. (F – M) S.E.
Australia -0.12 0.01 -0.06 0.01 -0.19 0.02 0.13 0.02
Canada -0.11 0.01 0.01 0.01 -0.24 0.02 0.25 0.02
New Zealand 0.05 0.01 0.13 0.02 -0.03 0.02 0.16 0.03
United Kingdom -0.11 0.02 -0.02 0.02 -0.21 0.02 0.19 0.03
United States -0.32 0.02 -0.24 0.02 -0.40 0.03 0.16 0.03
Finland 0.45 0.02 0.55 0.02 0.36 0.02 0.19 0.02
Hong Kong – China 0.46 0.02 0.48 0.02 0.45 0.03 0.03 0.03
Korea 0.01 0.02 0.06 0.03 -0.03 0.03 0.09 0.04
Shanghai – China 0.43 0.02 0.39 0.02 0.47 0.03 -0.08 0.03
Singapore 0.53 0.02 0.57 0.02 0.49 0.02 0.08 0.03
OECD average 0.00 0.00 0.09 0.00 -0.09 0.00 0.18 0.01
Note: Values that represent a statistically significant gender difference are indicated in bold.
Table 4.13 shows scores on the Diversity of Reading Index by state. While the mean score appeared highest for students from the Northern Territory, this score was not significantly different from the score for Tasmanian, Australian Capital Territory and Victorian students. Students from South Australia scored significantly lower on this index than these four states and territories. Across Australia, females reported more diversity in the types of materials that they read, and in all states and territories, except the Australian Capital Territory, this gender difference was statistically significant. The largest gap between genders was observed in the Northern Territory and South Australia.
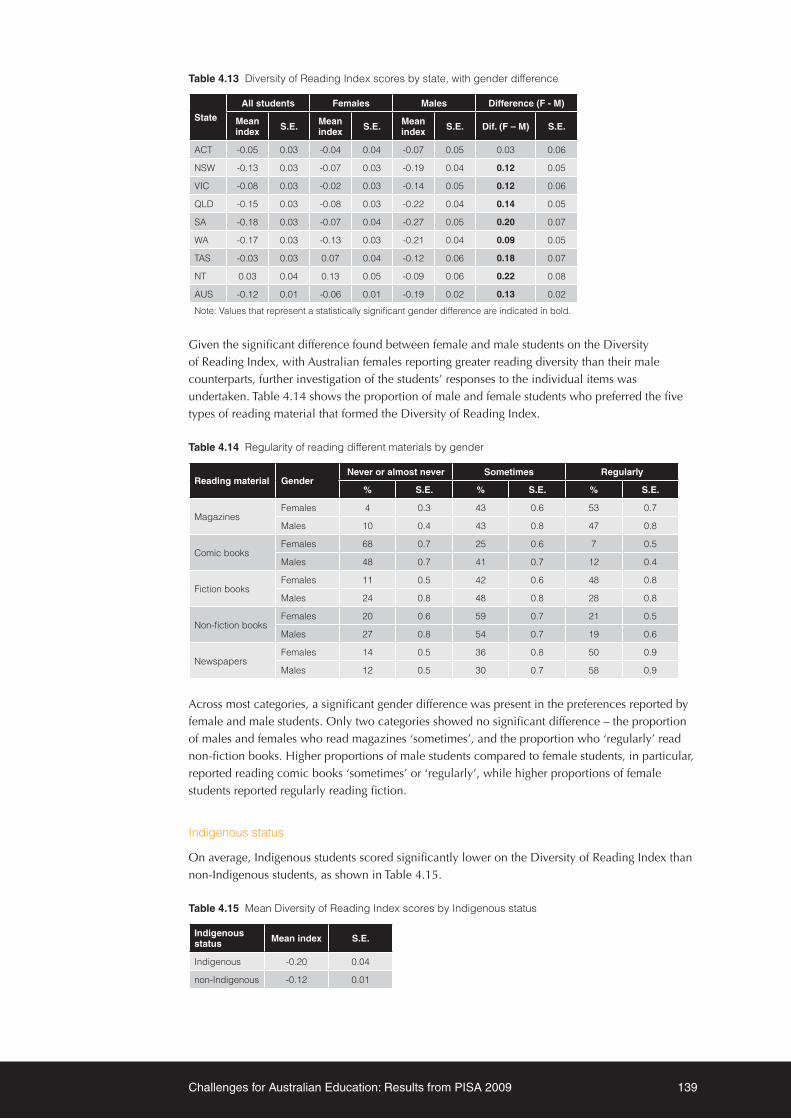
Challenges for Australian Education: Results from PISA 2009 139
Table 4.13 Diversity of Reading Index scores by state, with gender difference
State
All students Females Males Difference (F - M)
Mean index S.E. Mean
index S.E. Mean index S.E. Dif. (F – M) S.E.
ACT -0.05 0.03 -0.04 0.04 -0.07 0.05 0.03 0.06
NSW -0.13 0.03 -0.07 0.03 -0.19 0.04 0.12 0.05
VIC -0.08 0.03 -0.02 0.03 -0.14 0.05 0.12 0.06
QLD -0.15 0.03 -0.08 0.03 -0.22 0.04 0.14 0.05
SA -0.18 0.03 -0.07 0.04 -0.27 0.05 0.20 0.07
WA -0.17 0.03 -0.13 0.03 -0.21 0.04 0.09 0.05
TAS -0.03 0.03 0.07 0.04 -0.12 0.06 0.18 0.07
NT 0.03 0.04 0.13 0.05 -0.09 0.06 0.22 0.08
AUS -0.12 0.01 -0.06 0.01 -0.19 0.02 0.13 0.02
Note: Values that represent a statistically significant gender difference are indicated in bold.
Given the significant difference found between female and male students on the Diversity of Reading Index, with Australian females reporting greater reading diversity than their male counterparts, further investigation of the students’ responses to the individual items was undertaken. Table 4.14 shows the proportion of male and female students who preferred the five types of reading material that formed the Diversity of Reading Index.
Table 4.14 Regularity of reading different materials by gender
Reading material GenderNever or almost never Sometimes Regularly
% S.E. % S.E. % S.E.
Magazines Females 4 0.3 43 0.6 53 0.7
Males 10 0.4 43 0.8 47 0.8
Comic books Females 68 0.7 25 0.6 7 0.5
Males 48 0.7 41 0.7 12 0.4
Fiction books Females 11 0.5 42 0.6 48 0.8
Males 24 0.8 48 0.8 28 0.8
Non-fiction books Females 20 0.6 59 0.7 21 0.5
Males 27 0.8 54 0.7 19 0.6
Newspapers Females 14 0.5 36 0.8 50 0.9
Males 12 0.5 30 0.7 58 0.9
Across most categories, a significant gender difference was present in the preferences reported by female and male students. Only two categories showed no significant difference – the proportion of males and females who read magazines ‘sometimes’, and the proportion who ‘regularly’ read non-fiction books. Higher proportions of male students compared to female students, in particular, reported reading comic books ‘sometimes’ or ‘regularly’, while higher proportions of female students reported regularly reading fiction.
Indigenous status
On average, Indigenous students scored significantly lower on the Diversity of Reading Index than non-Indigenous students, as shown in Table 4.15.
Table 4.15 Mean Diversity of Reading Index scores by Indigenous status
Indigenous status Mean index S.E.
Indigenous -0.20 0.04
non-Indigenous -0.12 0.01

140 Australian students’ reading habits and learning strategies
The differences in the Diversity of Reading Index were explored further by examining Indigenous and non-Indigenous students’ responses to the individual items. Table 4.16 presents the proportion of Indigenous and non-Indigenous students who reported reading the five types of material that formed the Diversity of Reading Index. While there were no differences in the proportion of Indigenous and non-Indigenous students who read magazines and comics with any regularity, there were significant differences in the other three reading materials. A significantly higher proportion of Indigenous students compared to non-Indigenous students never/almost never reported reading fiction and non-fiction books, while the proportion of non-Indigenous students regularly reading both sorts of books was significantly higher than that observed for Indigenous students. A greater proportion of Indigenous students reported that they read newspapers ‘regularly’, while a greater proportion of non-Indigenous students reported that they never/almost never read newspapers.
Table 4.16 Regularity of reading different materials by Indigenous status
Reading material Indigenous status
Never or almost never Sometimes Regularly
% S.E. % S.E. % S.E.
Magazines non-Indigenous 7 0.3 43 0.5 43 0.6
Indigenous 5 0.7 40 1.3 40 1.5
Comic books non-Indigenous 58 0.6 33 0.6 9 0.4
Indigenous 62 2.1 29 1.7 9 1.1
Fiction books non-Indigenous 17 0.5 44 0.5 39 0.6
Indigenous 25 2.3 51 1.5 24 1.6
Non-fiction books non-Indigenous 23 0.5 56 0.5 20 0.4
Indigenous 33 1.8 51 1.7 16 1.5
Newspapers non-Indigenous 13 0.4 33 0.5 54 0.7
Indigenous 9 1.3 31 1.8 60 1.9
Socioeconomic background
Similar to previous findings in this chapter, there was a linear trend between students’ socioeconomic background and their reading diversity (see Table 4.17). Students from the lowest quartile had the least diversified reading pattern and students from the highest quartile had the most diverse reading preferences, with an index score (0.10) much higher than the Australian average (-0.12). The difference between ratings of each of the four groups was statistically significant.
Table 4.17 Diversity of Reading Index scores by socioeconomic quartile
Socioeconomic background Mean index S.E.
Lowest quartile -0.31 0.02
Second quartile -0.19 0.02
Third quartile -0.08 0.02
Highest quartile 0.10 0.02
Reading diversity and performance
Table 4.18 shows the correlation between the Diversity of Reading Index, the specific reading materials forming the index, and performance scores. There was a small positive association (0.22) between the index and achievement. Similarly, the correlation between performance and non-fiction books represents evidence of a minor association between the two. On the other hand, the positive correlation between performance and students’ preference for reading fiction books shows a moderate association, such that students who reported reading fiction more frequently tended to have higher performance scores.

Challenges for Australian Education: Results from PISA 2009 141
Table 4.18 Correlations between Diversity of Reading Index scores, items and reading literacy
R
Reading diversity index .22
Magazines -.07
Comic books -.01
Fiction books .45
Non-fiction books .23
Newspapers .07
Use of learning strategies Along with knowledge, skills and attitudes, another important outcome of education is the acquisition of strategies for continuing to learn; in other words, learning how to learn. Young people who develop the ability to manage their own learning, select appropriate learning goals and apply different strategies according to the task are not only in a better position to do well while at school, but are also likely to enter society better prepared to tackle the challenges they will face as rapid technological changes require everyone to become lifelong learners (Boekaerts, 2009; Ryan & Deci, 2009).
To be effective and efficient learners, students need to have a range of different learning strategies available to them, as different learning situations will demand different approaches. PISA 2009 focused on three learning strategies that students might use for studying and learning in a general sense: memorisation strategies, elaboration strategies, and control strategies; and two strategies specifically in relation to dealing with texts and reading literacy tasks: strategies to understand and remember information, and strategies to summarise information.
General learning strategies
Memorisation strategies
Memorisation strategies generally involve rote learning of facts, materials or examples through repetition and rehearsal, without a deeper understanding or processing of the material. For example, a student might learn all the names of Shakespeare’s published plays in the order of publication, the order of the Prime Ministers of Australia, or the periodic table, by reciting (or writing out) the lists over and over again. This learning strategy leads to surface-level learning and information is often not retained in long-term memory.
In PISA 2009, students were asked how often they used the following strategies when studying:
◗ I try to memorise everything that is covered in the text
◗ I try to memorise as many details as possible
◗ I read the text so many times that I can recite it
◗ I read the text over and over again
Response options were on a four-point Likert scale – almost never, sometimes, often and almost always. The index of memorisation strategies was constructed using the items above, with higher positive values indicating more frequent use of memorisation strategies.
Of the countries highlighted for comparison with Australia, Finland recorded the lowest mean on the Memorisation Strategies Index (see Table 4.19). Most of the countries in the Asian region – Hong Kong – China, Korea and Singapore – recorded higher use of memorisation strategies compared to Australian students, except for students from Shanghai – China, whose average score on the index was similar to that of Australian students. Use of memorisation strategies by students in other English-speaking countries varied, with students in Australia, Canada and the United

142 Australian students’ reading habits and learning strategies
States recording lower average scores on this index than students in New Zealand and the United Kingdom.
Gender differences were found in all of the countries in Table 4.19 (apart from Singapore) with females reporting higher use of memorisation strategies, on average, than males. This difference was most apparent in Canada and New Zealand.
Table 4.19 Memorisation Strategies Index scores for selected countries, with gender difference
Country
All students Females Males Difference
Mean index
S.E. Mean index
S.E. Mean index
S.E. Dif. (F – M) S.E.
Australia -0.06 0.01 0.05 0.02 -0.17 0.02 0.22 0.02
Canada -0.02 0.01 0.12 0.02 -0.16 0.02 0.28 0.02
New Zealand 0.05 0.02 0.19 0.02 -0.09 0.03 0.27 0.03
United Kingdom 0.04 0.01 0.10 0.02 -0.02 0.02 0.12 0.02
United States -0.04 0.02 0.06 0.03 -0.15 0.03 0.21 0.03
Finland -0.25 0.01 -0.17 0.02 -0.33 0.02 0.17 0.02
Hong Kong – China
0.13 0.01 0.21 0.02 0.06 0.02 0.15 0.03
Korea 0.08 0.02 0.19 0.02 -0.02 0.03 0.21 0.03
Shanghai – China -0.07 0.01 0.00 0.02 -0.14 0.01 0.14 0.02
Singapore 0.06 0.01 0.08 0.02 0.04 0.02 0.04 0.03
OECD average 0.00 0.00 0.09 0.00 -0.09 0.00 0.17 0.01
Note: Values that represent a statistically significant gender difference are indicated in bold.
Table 4.20 presents the percentage of students in each of the Australian states who indicated that they often or almost always use these memorisation strategies when studying. Greater proportions of students responded often or almost always to ‘I try to memorise as many details as possible’ than to ‘I try to memorise everything that is covered in the text’ or ‘I read the text so many times that I can recite it’.
Table 4.20 Percentage of students often or always using various memorisation techniques by state
State
I try to memorise everything that is covered in the text
I try to memorise as many details as
possible
I read the text so many times that I can
recite it
I read the text over and over again
% S.E. % S.E. % S.E. % S.E.
ACT 40 1.8 67 1.6 17 1.5 43 1.7
NSW 46 1.1 72 0.9 26 1.0 51 1.4
VIC 44 1.3 70 1.2 23 1.2 45 1.2
QLD 40 1.0 65 1.2 21 1.1 44 1.1
SA 36 1.4 64 1.1 18 0.9 41 1.4
WA 41 2.1 67 1.9 22 1.3 46 1.7
TAS 36 0.9 62 1.6 18 1.1 38 1.7
NT 37 1.9 64 2.0 19 1.5 43 2.1
AUS 43 0.5 69 0.5 23 0.5 46 0.6
Overall, students in Australia recorded lower use of memorisation strategies than the OECD average, but there was variation across the states as well, as shown in Table 4.21. Students from New South Wales had significantly higher scores on the Memorisation Strategies Index, on average, than students from most other states, particularly Tasmania. Females in all states recorded higher scores on the Memorisation Strategies Index on average than their male peers did, with this gender difference being particularly apparent in Western Australia and Tasmania.

Challenges for Australian Education: Results from PISA 2009 143
Table 4.21 Memorisation Strategies Index scores by state, with gender difference
State
All students Females Males Difference
Mean index S.E. Mean
index S.E. Mean index S.E. Dif. (F – M) S.E.
ACT -0.17 0.04 -0.08 0.06 -0.26 0.05 0.18 0.07
NSW 0.06 0.03 0.17 0.04 -0.06 0.03 0.23 0.05
VIC -0.05 0.03 0.04 0.04 -0.15 0.04 0.19 0.05
QLD -0.14 0.03 -0.04 0.03 -0.24 0.05 0.20 0.05
SA -0.19 0.03 -0.08 0.03 -0.28 0.04 0.20 0.05
WA -0.10 0.04 0.03 0.04 -0.24 0.06 0.28 0.07
TAS -0.28 0.03 -0.13 0.02 -0.41 0.07 0.28 0.07
NT -0.19 0.04 -0.09 0.04 -0.29 0.07 0.20 0.08
AUS -0.06 0.01 0.05 0.02 -0.17 0.02 0.22 0.03
Note: Values that represent a statistically significant gender difference are indicated in bold.
Indigenous status
The proportion of Indigenous and non-Indigenous students who reported using different memorisation strategies often or almost always when they were studying is presented in Table 4.22, along with the average Memorisation Strategies Index score and standard error for each of these groups of students.
Table 4.22 Percentage of students often or almost always using various memorisation techniques, and mean Memorisation Strategies Index scores by Indigenous status
Indigenous status
I try to memorise
everything that is covered in
the text
I try to memorise as
many details as possible
I read the text so many times that I
can recite it
I read the text over and over
again
Memorisation Strategies Index
% S.E. % S.E. % S.E. % S.E. Mean S.E.
Indigenous 39 1.8 62 2.3 24 1.6 38 1.9 -0.20 0.04
non-Indigenous 43 0.5 69 0.5 23 0.5 46 0.6 -0.05 0.01
While there appeared to be some small differences in the proportions of Indigenous and non-Indigenous students who reported using various memorisation strategies, these differences did not reach statistical significance. There was, however, a significant difference in the mean Memorisation Strategies Index score for Indigenous and non-Indigenous students, with Indigenous students using fewer of these strategies, on average, than their non-Indigenous peers.
Socioeconomic background
Table 4.23 presents the proportion of students from each of the socioeconomic background quartiles who reported using different memorisation strategies often or almost always when they were studying, and the average Memorisation Strategies Index score for these four groups of students.

144 Australian students’ reading habits and learning strategies
Table 4.23 Percentage of students often or almost always using various memorisation techniques, and mean Memorisation Strategies Index scores by socioeconomic quartiles
Socioeconomic background
I try to memorise
everything that is covered in
the text
I try to memorise as
many details as possible
I read the text so many times that I
can recite it
I read the text over and over
again
Memorisation Strategies Index
% S.E. % S.E. % S.E. % S.E. Mean S.E.
Lowest quartile 38 0.9 61 0.9 23 1.0 40 0.9 -0.21 0.02
Second quartile 42 0.9 68 0.9 21 0.8 45 0.9 -0.09 0.02
Third quartile 44 1.0 72 0.9 23 0.9 48 1.1 0.00 0.02
Highest quartile 47 1.1 74 1.0 23 1.0 51 1.3 0.06 0.02
The proportion of students in the lowest quartile of socioeconomic background who reported trying to memorise ‘everything that is covered in the text’ (38%) or ‘as many details as possible’ (61%) or ‘reading the text over and over again’ (40%) when studying was significantly lower than the proportion of students from families in the highest socioeconomic quartile who used these strategies often or almost always when studying (47%, 74%, and 51% respectively).
Comparison of the mean Memorisation Strategies Index scores of the four groups indicated that students in the lowest quartile of socioeconomic background had significantly lower scores on this index than all other students. Students from the highest quartile had the highest scores on average, followed by students from the third socioeconomic quartile, who in turn scored significantly higher on average than students in the second socioeconomic quartile.
Memorisation strategies and performance
These differences in the use of memorisation strategies by different groups of students do not necessarily translate to a great advantage in terms of performance in reading literacy, however. The correlation between the Memorisation Strategies Index and the overall reading literacy score among Australian students was only 0.1, a small effect according to Cohen (1988).
Elaboration strategies
Elaboration strategies refer to those techniques that involve students trying to understand material better by relating it to things they already know, relating new material to things learned in other subjects, or trying to determine how the information might be useful in the real world. PISA 2009 presented students with four items seeking to measure elaboration strategies, and students were required to indicate how often they employed the following techniques when studying:
◗ I try to relate new information to prior knowledge acquired in other subjects
◗ I figure out how the information might be useful outside school
◗ I try to understand the material better by relating it to my own experience
◗ I figure out how the text information fits in with what happens in real life.
The Elaboration Strategies Index was created using these items, with higher scores indicating greater use of elaboration strategies. Table 4.24 presents the average scores for students in Australia, Finland (the highest performing country in PISA 2009 reading literacy), neighbouring OECD countries in the Asia-Pacific region, and other English-speaking OECD countries, overall and for females and males separately.
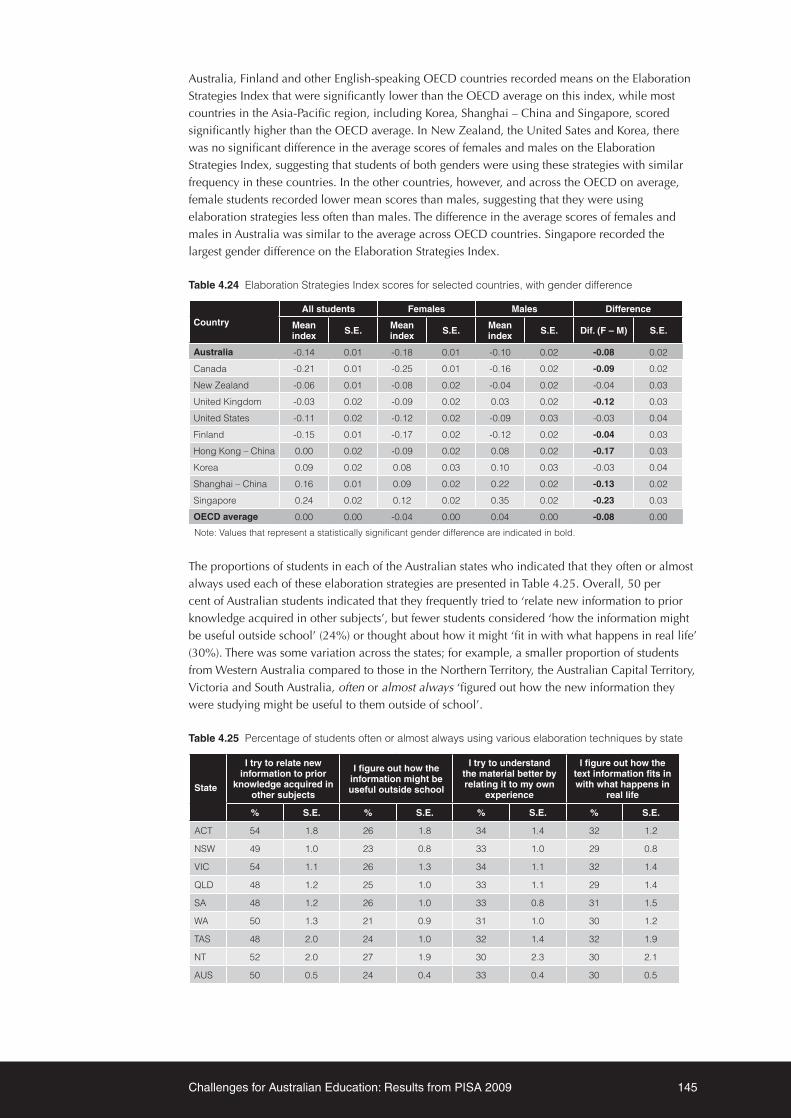
Challenges for Australian Education: Results from PISA 2009 145
Australia, Finland and other English-speaking OECD countries recorded means on the Elaboration Strategies Index that were significantly lower than the OECD average on this index, while most countries in the Asia-Pacific region, including Korea, Shanghai – China and Singapore, scored significantly higher than the OECD average. In New Zealand, the United Sates and Korea, there was no significant difference in the average scores of females and males on the Elaboration Strategies Index, suggesting that students of both genders were using these strategies with similar frequency in these countries. In the other countries, however, and across the OECD on average, female students recorded lower mean scores than males, suggesting that they were using elaboration strategies less often than males. The difference in the average scores of females and males in Australia was similar to the average across OECD countries. Singapore recorded the largest gender difference on the Elaboration Strategies Index.
Table 4.24 Elaboration Strategies Index scores for selected countries, with gender difference
CountryAll students Females Males Difference
Mean index S.E. Mean
index S.E. Mean index S.E. Dif. (F – M) S.E.
Australia -0.14 0.01 -0.18 0.01 -0.10 0.02 -0.08 0.02
Canada -0.21 0.01 -0.25 0.01 -0.16 0.02 -0.09 0.02
New Zealand -0.06 0.01 -0.08 0.02 -0.04 0.02 -0.04 0.03
United Kingdom -0.03 0.02 -0.09 0.02 0.03 0.02 -0.12 0.03
United States -0.11 0.02 -0.12 0.02 -0.09 0.03 -0.03 0.04
Finland -0.15 0.01 -0.17 0.02 -0.12 0.02 -0.04 0.03
Hong Kong – China 0.00 0.02 -0.09 0.02 0.08 0.02 -0.17 0.03
Korea 0.09 0.02 0.08 0.03 0.10 0.03 -0.03 0.04
Shanghai – China 0.16 0.01 0.09 0.02 0.22 0.02 -0.13 0.02
Singapore 0.24 0.02 0.12 0.02 0.35 0.02 -0.23 0.03
OECD average 0.00 0.00 -0.04 0.00 0.04 0.00 -0.08 0.00
Note: Values that represent a statistically significant gender difference are indicated in bold.
The proportions of students in each of the Australian states who indicated that they often or almost always used each of these elaboration strategies are presented in Table 4.25. Overall, 50 per cent of Australian students indicated that they frequently tried to ‘relate new information to prior knowledge acquired in other subjects’, but fewer students considered ‘how the information might be useful outside school’ (24%) or thought about how it might ‘fit in with what happens in real life’ (30%). There was some variation across the states; for example, a smaller proportion of students from Western Australia compared to those in the Northern Territory, the Australian Capital Territory, Victoria and South Australia, often or almost always ‘figured out how the new information they were studying might be useful to them outside of school’.
Table 4.25 Percentage of students often or almost always using various elaboration techniques by state
State
I try to relate new information to prior
knowledge acquired in other subjects
I figure out how the information might be useful outside school
I try to understand the material better by relating it to my own
experience
I figure out how the text information fits in with what happens in
real life
% S.E. % S.E. % S.E. % S.E.
ACT 54 1.8 26 1.8 34 1.4 32 1.2
NSW 49 1.0 23 0.8 33 1.0 29 0.8
VIC 54 1.1 26 1.3 34 1.1 32 1.4
QLD 48 1.2 25 1.0 33 1.1 29 1.4
SA 48 1.2 26 1.0 33 0.8 31 1.5
WA 50 1.3 21 0.9 31 1.0 30 1.2
TAS 48 2.0 24 1.0 32 1.4 32 1.9
NT 52 2.0 27 1.9 30 2.3 30 2.1
AUS 50 0.5 24 0.4 33 0.4 30 0.5

146 Australian students’ reading habits and learning strategies
Students from the Australian Capital Territory and Victoria used elaboration strategies more frequently than students from Western Australia and New South Wales, who had the lowest scores on the index (–0.20 and –0.16, respectively; see Table 4.26). While for Australian students overall there was a tendency for males to report higher use of elaboration strategies than females, among the states this difference was only statistically significant for students from New South Wales and Victoria.
Table 4.26 Elaboration Strategies Index scores by State, with gender difference
State
All students Females Males Difference
Mean index S.E. Mean
index S.E. Mean index S.E. Dif. (F – M) S.E.
ACT -0.03 0.04 -0.08 0.05 0.02 0.04 -0.10 0.06
NSW -0.16 0.02 -0.21 0.03 -0.10 0.03 -0.11 0.04
VIC -0.08 0.03 -0.13 0.04 -0.04 0.03 -0.09 0.05
QLD -0.15 0.03 -0.18 0.03 -0.12 0.04 -0.06 0.05
SA -0.12 0.02 -0.14 0.03 -0.10 0.04 -0.04 0.05
WA -0.20 0.02 -0.22 0.04 -0.17 0.03 -0.05 0.05
TAS -0.13 0.03 -0.09 0.04 -0.17 0.04 0.09 0.06
NT -0.12 0.04 -0.15 0.06 -0.10 0.05 -0.05 0.08
AUS -0.14 0.01 -0.18 0.01 -0.10 0.02 -0.08 0.02
Note: Values that represent a statistically significant gender difference are indicated in bold.
Indigenous status
Fewer Indigenous students compared to non-Indigenous students reported trying ‘to relate new information to prior knowledge acquired in other subjects‘ or trying ’to understand the material better by relating it to my own experience‘, as shown in Table 4.27. Unsurprisingly, given the difference in use of these particular strategies, Indigenous students scored significantly lower on the Elaboration Strategies Index, on average, than non-Indigenous students.
Table 4.27 Percentage of students often or almost always using various elaboration techniques and mean Elaboration Strategies Index scores by Indigenous status
Indigenous status
I try to relate new information
to prior knowledge acquired in
other subjects
I figure out how the information might be useful outside school
I try to understand the material better
by relating it to my own experience
I figure out how the text
information fits in with what
happens in real life
Elaboration Strategies Index
% S.E. % S.E. % S.E. % S.E. Mean S.E.
Indigenous 41 2.2 22 1.3 28 1.8 29 1.8 -0.29 0.04
non-Indigenous 50 0.5 24 0.5 33 0.5 30 0.5 -0.13 0.01
Socioeconomic background
The proportions of students from the four socioeconomic groups who indicated that they used elaboration strategies often or almost always when studying are displayed in Table 4.28, along with their mean scores on the Elaboration Strategies Index. Use of all of the elaboration strategies was higher among students in the highest quartile of socioeconomic background than among students in the lowest quartile. This was particularly evident in relation to relating new information to knowledge in other subjects; the proportion of students who reported using this technique increased across the four socioeconomic groups, with significant differences between each of the groups.

Challenges for Australian Education: Results from PISA 2009 147
Table 4.28 Percentage of students often or almost always using various elaboration techniques and mean Elaboration Strategies Index scores by socioeconomic quartiles
Socioeconomic background
I try to relate new information to
prior knowledge acquired in other
subjects
I figure out how the information might be useful outside school
I try to understand the
material better by relating it to my own experience
I figure out how the text
information fits in with what happens
in real life
Elaboration Strategies
Index
% S.E. % S.E. % S.E. % S.E. Mean S.E.
Lowest quartile 41 0.9 23 0.8 29 1.0 27 0.9 -0.30 0.02
Second quartile 46 0.9 23 0.8 32 0.9 29 0.8 -0.21 0.02
Third quartile 53 1.1 25 0.8 34 0.9 32 1.0 -0.09 0.02
Highest quartile 61 0.9 26 1.0 38 1.0 33 1.0 0.05 0.02
This relationship between socioeconomic group and use of elaboration strategies was also evident when comparing the group means on the Elaboration Strategies Index – the average score of students in the lowest quartile was significantly lower than that of students in the second quartile, who in turn scored lower on average than students in the third quartile, while students in the highest quartile recorded a mean score on the index that was significantly higher than for all other socioeconomic groups.
Elaboration Strategies and performance
The relationship between reading literacy performance and use of elaboration strategies, as measured by the index, was not a strong one; the correlation between these two variables was 0.10.
Control strategies
Control strategies in PISA 2009 are defined as the plans students say they use to ensure that they reach their learning goals. These involve determining what one has already learned and working out what one still needs to learn. The index of control strategies measures whether students know which concepts they have not understood from their reading, check whether they remember the most important points from the text they have read, and look for additional information to clarify what they do not understand. Students indicated how often (almost never, sometimes, often or almost always) they did the following when studying:
◗ I start by figuring out what exactly I need to learn
◗ I check if I understand what I have read
◗ I try to figure out which concepts I still haven’t really understood
◗ I make sure that I remember the most important points in the text
◗ When I study and I don’t understand something, I look for additional information to clarify this
The Control Strategies Index was created using these five items and standardised to have a mean of zero for the OECD student population. Higher scores on the index indicate greater use of control strategies for general study than for the OECD on average.
Of the countries highlighted for comparison with Australia, Finland recorded the lowest mean on the Control Strategies Index, followed by Shanghai – China and Korea (see Table 4.29). Singapore scored well above the OECD mean for control strategies, at 0.30, while Australia, Canada, the United Kingdom and the Unites States were close to the OECD average.
Gender differences were found in all of the countries in Table 4.29, with females reporting higher use of control strategies, on average, than males. This difference was most apparent in Canada and New Zealand, followed by Australia.

148 Australian students’ reading habits and learning strategies
Table 4.29 Control Strategies Index scores for selected countries, with gender difference
Country
All students Females Males Difference
Mean index S.E. Mean
index S.E. Mean index S.E. Dif. (F – M) S.E.
Australia 0.06 0.02 0.21 0.02 -0.10 0.02 0.31 0.03
Canada 0.10 0.01 0.30 0.01 -0.09 0.02 0.39 0.02
New Zealand 0.17 0.02 0.35 0.02 -0.01 0.03 0.36 0.03
United Kingdom 0.08 0.02 0.16 0.02 -0.01 0.02 0.17 0.02
United States -0.04 0.02 0.09 0.03 -0.17 0.02 0.27 0.03
Finland -0.34 0.02 -0.22 0.02 -0.45 0.02 0.23 0.03
Hong Kong – China -0.14 0.02 -0.11 0.03 -0.17 0.03 0.06 0.04
Korea -0.27 0.02 -0.20 0.03 -0.34 0.04 0.14 0.05
Shanghai – China -0.28 0.01 -0.24 0.02 -0.32 0.02 0.08 0.02
Singapore 0.30 0.01 0.33 0.02 0.26 0.02 0.07 0.03
OECD average 0.00 0.00 0.14 0.00 -0.13 0.00 0.27 0.01
Note: Values that represent a statistically significant gender difference are indicated in bold.
There was some variation in how frequently students from the different Australian states reported using various control strategies when studying, as displayed in Table 4.30. While ‘figuring out what exactly I need to learn’ was a fairly common strategy for most students, significantly smaller proportions of students from the Northern Territory and Tasmania sought additional information and clarification when faced with something they did not understand (i.e. ‘if I don’t understand something, I look for additional information to clarify this’) compared to students from the Australian Capital Territory.
Table 4.30 Percentage of students often or almost always using various control techniques by state
State
I start by figuring out
what exactly I need to learn
I check if I understand what I have
read
I try to figure out which concepts I still haven’t really
understood
I make sure that I remember the most important
points in the text
When I study and I don’t understand
something, I look for additional information
to clarify this
% S.E. % S.E. % S.E. % S.E. % S.E.
ACT 70 1.6 71 2.0 61 2.5 76 1.4 64 1.7
NSW 74 1.0 69 1.1 59 1.3 77 1.1 58 1.3
VIC 71 1.0 70 1.1 60 1.4 77 1.2 61 0.9
QLD 69 1.4 64 1.1 55 1.8 71 1.6 55 1.7
SA 66 1.1 65 1.1 52 1.4 70 1.2 56 1.7
WA 69 1.4 64 2.3 57 1.8 73 2.0 56 1.9
TAS 66 1.7 62 1.2 48 2.0 69 1.7 54 1.4
NT 66 3.0 63 2.6 53 2.7 71 2.8 53 3.2
AUS 71 0.5 67 0.5 57 0.7 74 0.6 58 0.6
Comparing the mean scores on the Control Strategies Index for students from each of the states revealed that students from Tasmania scored significantly lower on this index than students in all other states.
There were significant differences between the mean scores of females and males on the Control Strategies Index in all of the Australian states, as there were across all of the countries in Table 4.31, with females scoring higher (and thus using control strategies to a greater extent) than males. The differences between females and males in Tasmania, New South Wales and the Northern Territory were greater than the OECD average on this index, while gender differences in the other states were similar in magnitude to the OECD average.

Challenges for Australian Education: Results from PISA 2009 149
Table 4.31 Control Strategies Index scores by state, with gender difference
State
All students Females Males Difference
Mean index S.E. Mean
index S.E. Mean index S.E. Dif. (F – M) S.E.
ACT 0.14 0.04 0.26 0.06 0.03 0.07 0.23 0.09
NSW 0.15 0.03 0.32 0.04 -0.03 0.04 0.35 0.06
VIC 0.09 0.03 0.22 0.04 -0.05 0.04 0.27 0.06
QLD -0.03 0.04 0.12 0.04 -0.19 0.06 0.31 0.07
SA -0.06 0.03 0.09 0.04 -0.19 0.05 0.28 0.06
WA 0.02 0.06 0.16 0.06 -0.13 0.08 0.29 0.10
TAS -0.14 0.04 0.06 0.04 -0.34 0.06 0.40 0.07
NT -0.09 0.07 0.10 0.08 -0.30 0.08 0.40 0.11
AUS 0.06 0.02 0.21 0.02 -0.10 0.02 0.31 0.03
Note: Values that represent a statistically significant gender difference are indicated in bold.
Indigenous status
The proportions of Indigenous students who reported using any of the control strategies measured in PISA 2009 were smaller than the proportions of non-Indigenous students who used these strategies, as shown in Table 4.32. Unsurprisingly, given the difference in use of these particular strategies, Indigenous students scored significantly lower on the Control Strategies Index, on average, than did non-Indigenous students. While the average Control Strategies Index score for non-Indigenous students (0.07) was higher than the OECD average (0.0), Indigenous students (–0.35) scored significantly lower than the OECD average.
Table 4.32 Percentage of students often or almost always using various control techniques and mean Control Strategies Index scores by Indigenous status
Indigenous status
I start by figuring out what exactly
I need to learn
I check if I understand what I have
read
I try to figure out which concepts I still haven’t
really understood
I make sure that I remember the most important points in the text
When I study and I don’t understand something, I look for additional
information to clarify this
Control Strategies
Index
% S.E. % S.E. % S.E. % S.E. % S.E. Mean S.E.
Indigenous 60 1.8 56 2.3 41 2.0 61 2.1 43 1.8 -0.35 0.05
non-Indigenous 71 0.5 67 0.5 58 0.7 75 0.6 58 0.6 0.07 0.02
Socioeconomic background
Table 4.33 presents the proportions of students from the four socioeconomic groups who reported using control strategies often or almost always when studying. The same pattern emerged as was evident for the other learning strategies, with the proportion of students who reported using each strategy increasing significantly between each of the socioeconomic groups. In other words, a higher proportion of students from the highest quartile reported using these strategies compared to students from the third quartile. The proportion of students from the third quartile who used these strategies was higher than the proportion of students from the second quartile who did so, while the proportion of students from the lowest socioeconomic quartile who used each of these strategies was the smallest of all four groups. This pattern was also evident when the mean scores of these groups on the Control Strategies Index were compared.

150 Australian students’ reading habits and learning strategies
Table 4.33 Percentage of students often or always using various control techniques and mean Control Strategies Index scores by socioeconomic quartiles
Socioeconomic background
I start by figuring out what exactly I need to
learn
I check if I understand what I have
read
I try to figure out which concepts I still haven’t
really understood
I make sure that I remember the most important
points in the text
When I study and I don’t understand something, I look for additional
information to clarify this
Control Strategies
Index
% S.E. % S.E. % S.E. % S.E. % S.E. Mean S.E.
Lowest quartile 62 0.8 58 1.0 46 1.0 63 1.0 46 1.0 -0.28 0.02
Second quartile 69 1.0 64 1.1 53 1.0 72 0.9 55 0.9 -0.03 0.02
Third quartile 73 0.9 70 0.9 60 1.1 79 0.9 61 0.9 0.16 0.03
Highest quartile 78 0.8 76 0.9 71 1.0 84 0.7 69 0.9 0.40 0.02
Control Strategies and reading literacy performance
Unlike the previous two learning strategies indices, the Control Strategies Index showed a statistically significant, moderate correlation of 0.38 with reading literacy performance. The average reading literacy scores of students who fell within the lowest through highest quartiles in the Control Strategies Index are presented in Table 4.34. The difference in scores between students in the lowest quartile and highest quartile of the Control Strategies Index was around 100 score points, or around three years of schooling for Australian students (see Chapter 3, this volume).
Table 4.34 Mean Reading Literacy scores by quartiles on the Control Strategies Index
Lowest quartile Second quartile Third quartile Highest quartile
Mean score S.E. Mean score S.E. Mean score S.E. Mean score S.E.
462 2.6 510 2.3 535 2.9 560 3.0
Learning strategies in reading literacy
Along with the learning strategies for general study discussed above, PISA 2009 also included two measures of student awareness of effective strategies for reading literacy. Students were presented with a scenario in which they were required to read texts and then perform a related task – either understand and remember the contents or write a summary of the text.
Strategies to understand and remember information
Students were presented with six different methods that they might use when trying to understand and remember the information in a text:
◗ concentrate on the parts of the text that are easy to understand
◗ quickly read through the text twice
◗ after reading the text, I discuss its contents with other people
◗ underline important parts of the text
◗ summarise the text in my own words
◗ read the text aloud to another person
They were asked to indicate how useful each of these strategies would be, from not useful at all through to very useful. The Understanding and Remembering Strategies Index was created so that higher scores indicated greater awareness that discussing the contents of the text, underlining important parts and summarising the text in their own words were the more effective strategies for understanding and remembering information. Lower scores on the index were indicative of lower levels of awareness of these effective strategies.

Challenges for Australian Education: Results from PISA 2009 151
Table 4.35 presents the mean values for the Understanding and Remembering Index, and the difference in the average index value for females and males for Australia, selected comparison countries and the OECD as a whole. Awareness of effective strategies for understanding and remembering text was greater in Shanghai – China and the United Kingdom, and lowest in Hong Kong – China and the United States. Australia’s score on this index was not significantly different to that of Finland, Korea or the OECD average. On average, females scored higher on this index than did males in all of the countries presented in Table 4.35. The greatest difference was recorded in Finland, where females scored significantly higher than the OECD average and males scored significantly lower than the OECD average. This pattern was also found in Australia, Canada and New Zealand.
Table 4.35 Understanding and Remembering Index scores for selected countries, with gender difference
Country
All students Females Males Difference
Mean index S.E. Mean
index S.E. Mean index S.E. Dif. (F – M) S.E.
Australia 0.02 0.01 0.15 0.02 -0.13 0.02 0.28 0.02
Canada -0.03 0.01 0.12 0.01 -0.17 0.02 0.29 0.02
New Zealand -0.04 0.02 0.11 0.02 -0.18 0.03 0.28 0.04
United Kingdom 0.09 0.02 0.19 0.02 -0.01 0.02 0.20 0.03
United States -0.21 0.02 -0.11 0.02 -0.31 0.03 0.20 0.03
Finland 0.03 0.02 0.30 0.02 -0.25 0.03 0.56 0.03
Hong Kong – China
-0.20 0.02 -0.06 0.03 -0.33 0.03 0.27 0.03
Korea 0.03 0.03 0.15 0.03 -0.07 0.04 0.23 0.05
Shanghai – China 0.14 0.02 0.26 0.02 0.01 0.02 0.26 0.03
Singapore 0.05 0.01 0.09 0.02 0.02 0.02 0.07 0.02
OECD average 0.00 0.00 0.13 0.00 -0.13 0.00 0.27 0.01
Note: Values that represent a statistically significant gender difference are indicated in bold.
The proportions of students in each of the Australian states that reported that understanding and remembering strategies were not useful at all, somewhat useful or very useful (recoded into these three categories from the original six point scale) are presented in Table 4.36. Fewer than half of the students in each of the states identified the more effective strategies as being very useful to them, with around one-quarter of Australian students indicating that discussing the contents of a text would be not at all useful in helping to understand and remember it – a concerning misapprehension.

152 Australian students’ reading habits and learning strategies
Table 4.36 Perceived utility of various understanding and remembering techniques by state
State
I concentrate on the parts of the text that are easy to understand I quickly read through the text twice After reading the text, I discuss its
content with other people
Not useful at all
Somewhat useful
Very useful
Not useful at all
Somewhat useful
Very useful
Not useful at all
Somewhat useful
Very useful
% S.E. % S.E. % S.E. % S.E. % S.E. % S.E. % S.E. % S.E. % S.E.
ACT 26 1.4 57 1.6 17 1.1 47 1.5 43 1.7 10 1.1 19 1.1 45 1.2 36 1.1
NSW 22 0.9 56 1.0 21 0.8 47 1.1 41 1.0 12 0.7 24 1.0 45 1.1 31 1.0
VIC 23 1.1 59 1.3 18 0.8 44 1.2 45 1.2 11 0.5 22 1.1 47 1.1 31 1.5
QLD 25 0.8 56 1.0 19 0.8 48 1.0 40 0.9 12 0.8 25 1.2 44 1.3 31 2.1
SA 22 0.9 58 1.3 20 1.3 44 1.6 45 1.6 11 0.8 24 1.2 48 1.3 28 1.4
WA 23 0.9 60 1.5 17 1.3 48 1.4 41 1.2 11 0.7 21 1.1 47 1.3 32 1.6
TAS 21 1.6 63 1.1 16 1.1 46 2.0 44 1.7 11 0.8 25 1.6 48 2.2 27 2.5
NT 22 2.0 59 2.0 19 1.5 46 2.3 39 2.1 15 1.5 24 1.8 45 2.3 31 2.4
AUS 23 0.4 57 0.5 19 0.4 46 0.5 42 0.5 11 0.3 23 0.5 46 0.5 31 0.7
State
I underline important parts of the text
I summarise the text in my own words
I read the text aloud to another person
Not useful at all
Somewhat useful
Very useful
Not useful at all
Somewhat useful
Very useful
Not useful at all
Somewhat useful
Very useful
% S.E. % S.E. % S.E. % S.E. % S.E. % S.E. % S.E. % S.E. % S.E.
ACT 18 1.1 40 2.0 43 2.1 17 1.2 36 1.7 46 2.0 46 1.5 38 1.6 16 1.0
NSW 14 0.8 38 0.9 48 1.1 17 0.8 37 1.2 47 1.2 46 1.0 37 0.9 16 0.6
VIC 15 0.9 40 1.6 45 1.9 15 1.0 41 1.4 43 1.7 45 1.3 38 1.0 16 0.9
QLD 18 1.1 38 0.9 44 1.5 18 1.2 40 1.2 42 1.7 46 1.2 38 1.3 16 0.8
SA 21 1.2 39 1.3 40 1.6 19 1.4 44 1.5 37 1.3 49 1.5 35 1.1 16 1.1
WA 14 1.1 39 1.4 47 1.6 15 1.4 38 1.8 47 2.0 46 2.0 40 1.4 14 1.2
TAS 20 1.2 43 1.4 37 1.9 18 1.3 43 1.8 39 2.1 48 1.9 38 1.6 14 1.1
NT 20 1.9 35 1.8 44 2.6 17 1.8 41 1.9 42 2.2 49 2.5 35 2.1 16 1.5
AUS 16 0.4 39 0.6 45 0.6 17 0.4 39 0.7 44 0.7 46 0.6 38 0.5 16 0.4
The mean scores on the Understanding and Remembering Index for students in each state, along with average scores of females and males, are presented in Table 4.37. Students in Western Australia scored higher than students in all states except for those from the Australian Capital Territory, while students in Tasmania scored lower than students in all states apart from the Northern Territory and South Australia. Females in all states were better able to identify effective strategies for understanding and remembering texts than were their male peers.
Table 4.37 Understanding and Remembering Index scores by state, with gender difference
State
All students Females Males Difference
Mean index S.E. Mean
index S.E. Mean index S.E. Dif. (F – M) S.E.
ACT 0.06 0.05 0.21 0.08 -0.09 0.06 0.30 0.10
NSW 0.04 0.03 0.17 0.03 -0.09 0.04 0.26 0.05
VIC 0.01 0.04 0.15 0.05 -0.14 0.05 0.28 0.07
QLD -0.02 0.04 0.14 0.04 -0.18 0.05 0.32 0.07
SA -0.09 0.03 0.03 0.05 -0.20 0.05 0.24 0.07
WA 0.12 0.04 0.22 0.06 0.01 0.05 0.21 0.08
TAS -0.10 0.04 0.10 0.06 -0.30 0.06 0.40 0.09
NT -0.04 0.04 0.14 0.07 -0.24 0.05 0.38 0.08
AUS 0.02 0.01 0.15 0.02 -0.13 0.02 0.28 0.03
Note: Values that represent a statistically significant gender difference are indicated in bold.

Challenges for Australian Education: Results from PISA 2009 153
Indigenous status
The responses of Indigenous and non-Indigenous students to the Understanding and Remembering text items are displayed in Table 4.38, along with the average index scores for these groups of students. Fewer Indigenous students compared to non-Indigenous students identified discussing the content of text with other people or summarising the text in their own words as very useful strategies. The mean scores on the Understanding and Remembering Index reflected these differences, with Indigenous students recording a significantly lower score on average than non-Indigenous students. Incorporating information about effective study strategies into classes and directly teaching students how to study and learn could go some way to reducing this disparity.
Table 4.38 Perceived utility of various understanding and remembering techniques, and mean Understanding and Remembering Index scores, by Indigenous status
Indigenous staus
I concentrate on the parts of the text that are easy to understand I quickly read through the text twice After reading the text, I discuss its
content with other people
Not useful at all
Somewhat useful
Very useful
Not useful at all
Somewhat useful Very useful Not useful
at allSomewhat
usefulVery
useful
% S.E. % S.E. % S.E. % S.E. % S.E. % S.E. % S.E. % S.E. % S.E.
Indigenous students 22 1.9 61 1.9 17 1.1 44 1.6 43 1.7 13 1.4 33 1.8 44 2.1 23 1.7
non-Indigenous students
23 0.4 57 0.6 20 0.4 47 0.5 42 0.5 11 0.3 23 0.5 46 0.6 31 0.7
Indigenous staus
I underline important parts of the text
I summarise the text in my own words
I read the text aloud to another person
Not useful at all
Somewhat useful
Very useful
Not useful at all
Somewhat useful Very useful Not useful
at allSomewhat
usefulVery
useful
% S.E. % S.E. % S.E. % S.E. % S.E. % S.E. % S.E. % S.E. % S.E.
Indigenous students 25 1.6 40 1.9 35 2.0 24 1.6 43 2.0 33 2.1 50 1.7 34 1.7 16 1.6
non-Indigenous students
16 0.4 39 0.6 46 0.7 17 0.4 39 0.7 44 0.7 46 0.6 38 0.5 16 0.4
Indigenous staus
Understanding and Remembering Index
Mean S.E.
Indigenous students -0.32 0.04
non-indigenous students
0.03 0.01
Socioeconomic background
The proportions of students from the highest quartile of socioeconomic background who identified discussing text content with other people, underlining the important parts of the text or summarising the text in their own words as being effective strategies for understanding and remembering texts, were significantly higher than the proportions of students from the lowest quartile who did so (see Table 4.39). Greater proportions of students from the lowest quartile indicated that these effective strategies would be ‘not at all useful’, suggesting that these students did not see any of the options as effective study strategies for them.
A comparison of the mean scores on the Understanding and Remembering Index for these four groups revealed that those in the lowest quartile scored significantly lower on average than students in the other three quartiles; students in the second quartile scored significantly lower than students in the third and highest quartiles of socioeconomic background, and students in the third quartile scored significantly lower on average than students in the highest quartile.

154 Australian students’ reading habits and learning strategies
Table 4.39 Perceived utility of various understanding and remembering techniques and mean Understanding and Remembering Index scores, by socioeconomic quartile
Socioeconomic background
I concentrate on the parts of the text that are easy to
understand
I quickly read through the text twice
After reading the text, I discuss its content with other people
Not useful at all
Somewhat useful
Very useful
Not useful at all
Somewhat useful
Very useful
Not useful at all
Somewhat useful
Very useful
% S.E. % S.E. % S.E. % S.E. % S.E. % S.E. % S.E. % S.E. % S.E.
Lowest quartile 20 0.8 62 1.0 18 0.8 43 1.1 46 1.1 11 0.6 31 0.8 47 0.9 23 0.8
Second quartile 21 0.7 58 1.0 21 0.8 46 1.0 42 0.9 12 0.7 25 0.9 48 0.9 27 1.0
Third quartile 25 0.8 56 1.1 19 0.8 48 0.9 41 0.9 11 0.4 20 0.8 46 0.9 34 1.1
Highest quartile 26 0.9 54 1.0 20 0.9 49 1.1 39 0.9 12 0.7 15 0.8 43 1.1 41 1.1
Socioeconomic background
I underline important parts of the text
I summarise the text in my own words
I read the text aloud to another person
Not useful at all
Somewhat useful
Very useful
Not useful at all
Somewhat useful
Very useful
Not useful at all
Somewhat useful
Very useful
% S.E. % S.E. % S.E. % S.E. % S.E. % S.E. % S.E. % S.E. % S.E.
Lowest quartile 22 0.8 41 1.1 36 1.3 23 0.9 42 1.0 35 0.9 51 1.0 35 1.0 13 0.6
Second quartile 18 0.9 40 1.1 42 0.9 18 0.8 41 1.0 41 1.0 49 1.1 37 1.0 15 0.7
Third quartile 13 0.7 37 0.8 50 1.0 14 0.7 40 1.0 46 1.1 44 1.0 39 1.0 17 0.8
Highest quartile 10 0.6 36 0.9 53 1.0 11 0.6 35 1.1 54 1.3 41 1.1 40 0.7 19 0.8
Socioeconomic background
Understanding and Remembering Index
Mean S.E.
Lowest quartile -0.24 0.02
Second quartile -0.06 0.02
Thrid quartile 0.12 0.02
Highest quartile 0.26 0.02
The Understanding and Remembering Index was significantly and moderately correlated (0.40) with reading literacy performance among Australian students. The average reading literacy scores of students in the lowest through highest socioeconomic quartiles on the Understanding and Remembering Index are presented in Table 4.40. Again the difference in score in reading literacy between those in the lowest and highest quartiles was substantial – 100 score points, or the equivalent of around three years of schooling.
Table 4.40 Reading Literacy performance by quartiles of the Understanding and Remembering Index
Lowest quartile Second quartile Third quartile Highest quartile
Mean score S.E. Mean score S.E. Mean score S.E. Mean score S.E.
466 2.8 508 2.6 535 2.5 566 2.8
Strategies to summarise information
To investigate student awareness of strategies that would be of most use when summarising texts during study, PISA 2009 presented them with the following scenario:
You have just read a long and rather difficult two-page text about fluctuations in the water level of a lake in Africa. You have to write a summary. How do you rate the usefulness of the following strategies for writing a summary of this two-page text?
◗ I write a summary. Then I check that each paragraph is covered in the summary, because the content of each paragraph should be included
◗ I try to copy out accurately as many sentences as possible
◗ Before writing the summary, I read the text as many times as possible
◗ I carefully check whether the most important facts in the text are represented in the summary
◗ I read through the text, underlining the most important sentences. Then I write them in my own words as a summary

Challenges for Australian Education: Results from PISA 2009 155
Response options were on a six-point scale, ranging from not very useful at all (1) to very useful (6). These items were then combined to create the Summarising Index, with higher values on this index indicating that students were more aware of effective strategies for summarising texts.
Table 4.41 presents mean scores for the Summarising Index and the difference in the mean values for females and males for Australia, selected comparison countries, and the OECD as a whole. Awareness of effective strategies for summarising text was greatest in Singapore and lowest in Hong Kong – China. Australia’s score on this index was significantly lower than the OECD average, suggesting that Australian students are not as aware of effective strategies to apply when summarising texts as students across the OECD, on average.
As with all of the other indices related to learning strategies, females scored higher on average on this index than did males, with the greatest difference recorded in Finland, in which females scored significantly higher than the OECD average and males significantly lower than the OECD average. This pattern was also found in Australia, Canada and among the OECD student population as a whole.
Table 4.41 Summarising Index scores for selected countries, with gender difference
Country
All students Females Males Difference
Mean index S.E. Mean
index S.E. Mean index S.E. Dif. (F – M) S.E.
Australia -0.09 0.02 0.11 0.02 -0.30 0.02 0.42 0.03
Canada 0.02 0.01 0.24 0.01 -0.19 0.01 0.43 0.02
New Zealand -0.14 0.02 0.05 0.02 -0.33 0.03 0.38 0.04
United Kingdom -0.06 0.02 0.05 0.03 -0.18 0.03 0.23 0.03
United States -0.18 0.02 -0.02 0.03 -0.34 0.03 0.33 0.03
Finland 0.08 0.02 0.38 0.02 -0.22 0.03 0.60 0.03
Hong Kong – China -0.53 0.02 -0.41 0.03 -0.63 0.03 0.22 0.04
Korea 0.04 0.03 0.20 0.03 -0.10 0.04 0.30 0.05
Shanghai – China 0.06 0.01 0.15 0.02 -0.03 0.02 0.18 0.03
Singapore 0.17 0.01 0.30 0.02 0.04 0.02 0.26 0.03
OECD average -0.01 0.00 0.17 0.00 -0.18 0.00 0.35 0.01
Note: Values that represent a statistically significant gender difference are indicated in bold.
Overall, more than 50 per cent of Australian students identified the most effective strategies for summarising (i.e. checking that the most important facts from the text are represented in the summary and underlining the most important sentences in the text and then writing these in their own words) as being very useful (see Table 4.42) and very few students indicated that these strategies would be not at all useful. Smaller proportions of students from South Australia and Tasmania compared to those from Western Australia and the Australian Capital Territory indicated that they thought these strategies would be very useful.

156 Australian students’ reading habits and learning strategies
Table 4.42 Perceived utility of various summarising techniques by state
State
I write a summary. Then I check that each paragraph is covered
in the summary, because the content of each paragraph
should be included
I try to copy out accurately as many sentences as possible
Before writing the summary, I read the text as many times as
possible
Not useful at all
Somewhat useful
Very useful
Not useful at all
Somewhat useful
Very useful
Not useful at all
Somewhat useful
Very useful
% S.E. % S.E. % S.E. % S.E. % S.E. % S.E. % S.E. % S.E. % S.E.
ACT 20 1.3 51 1.8 29 1.7 49 1.7 42 1.8 8 1.0 23 1.6 50 1.9 28 1.7
NSW 20 0.7 49 0.9 31 0.9 45 1.4 43 1.3 12 0.7 20 0.8 49 0.8 31 1.0
VIC 19 1.0 54 1.3 27 1.1 48 1.4 43 1.2 9 0.6 20 1.3 51 1.3 29 1.2
QLD 23 1.1 50 0.9 27 1.1 45 1.9 43 1.5 11 0.8 23 1.2 48 1.2 29 1.1
SA 20 1.1 56 1.4 24 1.7 46 1.7 46 1.5 8 0.5 19 1.2 52 1.7 29 1.7
WA 21 1.3 52 1.2 28 1.4 50 1.4 41 1.3 9 0.8 18 1.3 52 1.4 30 1.9
TAS 24 1.1 55 1.3 21 1.0 46 1.9 45 1.6 9 0.7 22 1.0 52 1.3 26 1.0
NT 23 1.8 50 2.1 27 1.8 49 2.0 42 1.8 9 1.2 19 1.6 52 2.0 29 1.6
AUS 21 0.4 51 0.5 28 0.5 47 0.6 43 0.6 10 0.3 21 0.5 50 0.6 30 0.5
State
I carefully check whether the most important facts in the text are represented in the
summary
I read through the text, underlining the most important sentences. Then I write them in my own words as a summary.
Not useful at all
Somewhat useful
Very useful
Not useful at all
Somewhat useful
Very useful
% S.E. % S.E. % S.E. % S.E. % S.E. % S.E.
ACT 8 1.2 33 1.8 59 2.2 14 1.6 35 1.7 51 1.9
NSW 9 0.7 34 1.0 58 1.3 13 0.8 32 0.9 55 1.2
VIC 8 1.0 36 1.4 56 1.9 13 1.0 36 1.3 51 1.8
QLD 10 0.9 37 1.5 53 2.1 15 1.0 35 0.9 51 1.5
SA 10 1.0 39 1.3 50 1.8 16 0.7 37 1.2 47 1.6
WA 7 1.0 37 1.7 56 2.1 10 1.0 33 1.9 57 2.4
TAS 11 0.8 41 1.1 49 1.3 16 1.4 38 1.8 47 2.1
NT 12 1.4 36 1.9 52 2.1 14 1.4 33 1.6 53 1.9
AUS 9 0.4 36 0.6 55 0.7 13 0.4 34 0.5 52 0.7
The mean values on the Summarising Index for students from each of the states, along with the mean values for females and males, are presented in Table 4.43. Students from Western Australia scored significantly higher on the Summarising Index than students in all states apart from the Australian Capital Territory and Victoria. Females in all states recorded significantly higher mean values on the index than males.
Table 4.43 Summarising Index scores by state, with gender difference
StateAll students Females Males Dif. (F – M)
Mean S.E. Mean S.E. Mean S.E. Mean S.E.
ACT -0.04 0.06 0.11 0.08 -0.20 0.08 0.30 0.11
NSW -0.09 0.03 0.10 0.03 -0.30 0.05 0.40 0.05
VIC -0.08 0.04 0.14 0.05 -0.32 0.05 0.47 0.07
QLD -0.14 0.04 0.04 0.04 -0.32 0.06 0.36 0.07
SA -0.15 0.03 0.08 0.05 -0.37 0.05 0.44 0.07
WA 0.04 0.05 0.26 0.05 -0.20 0.05 0.46 0.07
TAS -0.19 0.05 0.07 0.06 -0.45 0.07 0.51 0.09
NT -0.12 0.04 0.09 0.06 -0.35 0.06 0.44 0.08
AUS -0.09 0.02 0.11 0.02 -0.30 0.02 0.42 0.03
Note: Values that represent a statistically significant gender difference are indicated in bold.

Challenges for Australian Education: Results from PISA 2009 157
Indigenous status
Table 4.44 presents the responses of Indigenous and non-Indigenous students to the summarising text items along with the average index scores for these groups of students. Fewer Indigenous students compared to non-Indigenous students identified ‘checking that the most important facts from the text are represented in the summary’ and ‘underlining the most important sentences in the text and then writing these in their own words’ as very useful strategies. The mean scores on the Summarising Index reflected these differences, with Indigenous students recording significantly lower scores on average than non-Indigenous students.
Table 4.44 Perceived utility of various summarising techniques and mean Summarising Index scores, by Indigenous status
Indigenous background
I write a summary. Then I check that each paragraph is covered
in the summary, because the content of each paragraph
should be included
I try to copy out accurately as many sentences as possible
Before writing the summary, I read the text as many times as
possible
Not useful at all
Somewhat useful
Very useful
Not useful at all
Somewhat useful
Very useful
Not useful at all
Somewhat useful
Very useful
% S.E. % S.E. % S.E. % S.E. % S.E. % S.E. % S.E. % S.E. % S.E.
Indigenous 29 2.0 50 1.8 21 1.7 39 2.0 49 2.0 12 1.1 26 1.8 46 2.2 28 2.0
non-Indigenous 20 0.4 51 0.5 28 0.5 47 0.6 43 0.6 10 0.3 20 0.5 50 0.6 30 0.5
Indigenous background
I carefully check whether the most important facts in the text are represented in the summary
I read through the text, underlining the most important sentences. Then I write them in my own words as a summary.
Not useful at all
Somewhat useful
Very useful
Not useful at all
Somewhat useful
Very useful
% S.E. % S.E. % S.E. % S.E. % S.E. % S.E.
Indigenous 17 1.5 44 2.1 39 2.0 19 2.0 42 2.0 39 1.9
non-Indigenous
9 0.4 36 0.6 56 0.7 13 0.4 34 0.6 53 0.7
Socioeconomic background
The responses of students from the quartiles of socioeconomic background to the summarising text items are presented in Table 4.45. Greater proportions of students from the highest quartile identified ‘checking that the most important facts from the text are represented in the summary’ and ‘underlining the most important sentences in the text and then writing these in their own words’ (the most effective strategies) as very useful compared to students from the other socioeconomic groups. These students also reported the moderately effective strategies of ‘reading the text as many times as possible’ and ‘ensuring that every paragraph in the text is covered in the summary’ as being very useful at higher rates than other students.
A comparison of the mean scores on the Summarising Index for these four groups revealed that those in the lowest quartile scored significantly lower on average than students in the other three quartiles; students in the second quartile scored significantly lower than students in the third and highest quartiles of socioeconomic background, and students in the third quartile scored significantly lower on average than students in the highest quartile.

158 Australian students’ reading habits and learning strategies
Table 4.45 Perceived utility of various summarising techniques and mean Summarising Index scores, by socioeconomic quartile
Socioeconomic background
I write a summary. Then I check that each paragraph is covered
in the summary, because the content of each paragraph
should be included
I try to copy out accurately as many sentences as possible
Before writing the summary, I read the text as many times as
possible
Not useful at all
Somewhat useful
Very useful
Not useful at all
Somewhat useful
Very useful
Not useful at all
Somewhat useful
Very useful
% S.E. % S.E. % S.E. % S.E. % S.E. % S.E. % S.E. % S.E. % S.E.
Lowest quartile 27 0.9 51 1.1 22 0.9 42 1.1 48 1.1 11 0.6 24 0.9 50 1.1 26 0.8
Second quartile 21 0.7 52 1.0 27 1.0 44 1.1 45 1.1 11 0.7 21 0.8 50 1.1 29 0.9
Third quartile 18 0.8 52 1.1 29 0.9 48 1.0 42 1.0 10 0.6 19 0.8 51 1.0 31 0.9
Highest quartile 16 0.8 50 0.9 34 0.9 53 1.1 39 1.0 9 0.5 18 0.8 49 1.0 33 1.0
Socioeconomic background
I carefully check whether the most important facts in the text are represented in the
summary
I read through the text, underlining the most important sentences. Then I write them in my own words as a summary. Summarising Index
Not useful at all
Some-what
useful
Very useful
Not useful at all
Somewhat useful
Very useful
% S.E. % S.E. % S.E. % S.E. % S.E. % S.E. Mean S.E.
Lowest quartile 14 0.7 44 1.0 42 1.1 19 0.9 39 0.9 42 1.0 -0.34 0.02
Second quartile 10 0.6 38 1.1 52 1.1 14 0.7 37 1.0 48 1.1 -0.18 0.02
Third quartile 7 0.5 34 0.9 59 1.0 11 0.7 32 0.9 57 0.9 0.01 0.02
Highest quartile 5 0.5 27 1.1 68 1.2 9 0.6 28 0.9 63 1.0 0.17 0.03
The Summarising Index showed a statistically significant, moderate correlation of 0.47 with reading literacy performance among Australian students. The average reading literacy scores of students who fell within the lowest through highest quartiles on the Summarising Index are presented in Table 4.46. The difference in average reading literacy scores of students in the lowest and highest quartiles on the Summarising Index was around 120 points, the equivalent of close to four years of schooling.
Table 4.46 Mean Reading Literacy performance by quartiles of the Summarising Index
Lowest quartile Second quartile Third quartile Highest quartile
Mean score S.E. Mean
score S.E. Mean score S.E. Mean
score S.E.
454 2.1 509 2.5 544 2.5 571 2.8
Relationships between reading attitudes, habits and learning strategiesFigure 4.1, presented at the beginning of this chapter, suggests that the measures of reading attitudes, habits and learning strategies included in PISA 2009 may be related to one another. We might expect, for example, that students who score highly on the Enjoyment of Reading Index may also score highly on the Diversity of Reading Index. It may also be the case, however, that students are reading one sort of material to the exclusion of others and that, although they enjoy their reading, they do not read a range of different materials. Do students use one sort of learning strategy to the exclusion of others, or is greater use of elaboration strategies related to greater use of control strategies but lower use of memorisation strategies? The relationships between all of the reading habits and learning strategies indices covered in this chapter were explored using correlation analysis, and the resulting statistics are presented in the matrix below (see Table 4.47).

Challenges for Australian Education: Results from PISA 2009 159
Table 4.47 Correlations between reading attitudes, habits and learning strategies
Index Diversity of Reading
Memorisation strategies
Elaboration strategies
Control strategies
Understanding and
RememberingSummarising
Enjoyment of Reading .491** .244** .239** .409** .283** .329**
Diversity of Reading .258** .292** .325** .148** .171**
Memorisation strategies .456** .646** .127** .087**
Elaboration strategies .558** .122** .095**
Control strategies .323** .299**
Understanding and Remembering
.477**
Note: ** p<.001
While all of the correlations were statistically significant, they did vary in magnitude from ‘trivial’ (between 0.0 and 0.1) through to ‘large’ (0.5 to 0.7) according to Cohen’s classification. Some interesting groupings emerged, with the learning strategies – memorisation, control and elaboration – showing moderate to strong relationships with one another, and with the specific learning and metacognition strategies ‘Summarising’ and ‘Understanding and Remembering’ also being related. Enjoyment of Reading was positively and moderately correlated with the Diversity of Reading Index, suggesting that the more enjoyment students gain from reading, the greater the range of materials they read (or vice versa).
SummaryIn each cycle of PISA, students complete a questionnaire that includes questions pertaining to their attitudes, study habits and learning strategies. In 2009, these questions focused on the students’ reading habits and attitudes – how much they enjoyed reading, how often they read and what materials they preferred – as well as their approaches to studying in general and to reading literacy-related tasks in particular.
Significant gender differences in the average scores on most of the indices were found for Australia as a whole, and for each of the states and territories. The exceptions to this included state differences for the Diversity of Reading Index, on which there was no significant difference between the mean scores of males and females from the Australian Capital Territory, and the Elaboration Strategies Index, on which gender differences only reached significance in New South Wales and Victoria.
There were also significant differences in the average scores of Indigenous and non-Indigenous students on all of the reading habits and learning strategies indices. Indigenous students scored lower, on average, than their non-Indigenous peers, indicating lower rates of reading for enjoyment, less diversity of reading material and less awareness of effective strategies for understanding, remembering and summarising. They also reported lower use of more general study strategies, such as memorisation and control strategies.
Comparison of the average index scores of students from different socioeconomic backgrounds also found a pattern of disadvantage, with students from the lowest socioeconomic quartile scoring lower on all of the indices.
While some of the constructs, such as the memorisation and elaboration strategies indices and the Diversity of Reading Index, were only weakly associated with reading literacy performance, the relationships between other indices and reading literacy were stronger. Enjoyment of Reading had the strongest association with performance of all the indices. In some cases, differences in the reading performance of students who scored in the lowest and the highest quartiles of each of the indices were equivalent to three to four years of schooling – a substantial difference.

160 Australian students’ reading habits and learning strategies

Challenges for Australian Education: Results from PISA 2009 161
Key Findings ◗ Australia was outperformed by twelve countries (Shanghai – China, Singapore, Hong Kong
– China, Korea, Chinese Taipei, Finland, Liechtenstein, Switzerland, Japan, Canada, the Netherlands and Macao – China) in mathematical literacy performance. Four countries (New Zealand, Belgium, Germany and Estonia) had mean scores not significantly different from Australia. Australia performed at a significantly higher level than all other countries.
◗ Australia achieved a mean score of 514 points, which was significantly higher than the OECD average (496 score points) in mathematical literacy performance.
◗ Sixteen per cent of Australian students were capable of advanced mathematical thinking and reasoning (Level 5 or above) in mathematical literacy, compared to 13 per cent of students across OECD countries. Only 16 per cent of Australian students did not reach Level 2 in mathematical literacy compared to 22 per cent of students across the OECD.
◗ Significant gender differences were found in approximately half the participating countries, with males significantly outperforming females by, on average, 12 score points, across OECD countries. Males significantly outperformed females in Australia by 10 score points, on average. Fifteen per cent of females and 18 per cent of males in Australia reached Level 5 or above in the mathematical literacy proficiency scale compared to 10 per cent of females and 15 per cent of males across OECD countries.
◗ Sixteen per cent of females and 15 per cent of males in Australia did not reach Level 2, while 23 per cent of females and 21 per cent of males across the OECD did not reach Level 2.
◗ Western Australia, the Australian Capital Territory, Queensland, New South Wales and Victoria scored on a par with each other; however, the Australian Capital Territory scored statistically significantly higher than Victoria. South Australia was outperformed by Western Australia and the Australian Capital Territory and scored similarly to Queensland, New South Wales and Victoria. The lowest performing states were Tasmania and the Northern Territory.
◗ Tasmania and the Northern Territory performed at a level not significantly different from the OECD average, while all other states performed statistically higher than the OECD average.
◗ Significant gender differences in favour of males were found in Victoria, South Australia and Queensland, with differences of at least 10 score points between the average scores for males and females in these states.
◗ No significant differences were found between school sectors (i.e. government, Catholic and independent) in mathematical literacy once a student’s individual socioeconomic background and the socioeconomic background of peers at school were taken into account.
Chapter
5Australian students’ performance in mathematical literacy

162 Australian students’ performance in mathematical literacy
◗ Indigenous students performed at a significantly lower level compared to non-Indigenous students in mathematical literacy, with a difference of almost two full years of schooling.
◗ Four per cent of Indigenous students reached Level 5 or above and 40 per cent failed to reach Level 2. In comparison, 17 per cent of non-Indigenous students reached Level 5 or above and 15 per cent failed to reach Level 2.
◗ Students in metropolitan schools performed at a significantly higher level than students in provincial or remote schools. The difference in mathematical literacy performance was equivalent to about one-and-a-half years of schooling.
◗ Eight per cent of students in remote schools reached Level 5 or above compared to 18 per cent of students in metropolitan schools. Almost 33 per cent of students in remote areas did not reach Level 2, while only 15 per cent of students in metropolitan schools did not reach this level.
◗ The average mathematical literacy performance of students in the highest socioeconomic quartile was significantly higher than that of students in the lowest socioeconomic quartile (with a difference of more than two years of schooling).
◗ The mathematical literacy performance of ten OECD countries, including Australia, declined significantly from PISA 2003 to PISA 2009. Six countries saw an improvement in their performance in mathematical literacy since PISA 2003.
◗ The Australian Capital Territory, New South Wales, South Australia and Western Australia) all showed a significant decline in mathematical literacy performance from PISA 2003 to PISA 2009.
◗ Between PISA 2003 and PISA 2009,there was a significant decline in the proportion of students who reached Level 5 or above in mathematical literacy in the Australian Capital Territory and South Australia, and an increase in the proportion of students who had failed to reach Level 2 in South Australia and Western Australia.
How well can young adults use their mathematical knowledge and understanding to participate in today’s changing world? Do they have the capacity to analyse and solve everyday problems involving mathematics? Do they have the ability to communicate ideas and information from a mathematical standpoint? The assessment of mathematical literacy in PISA addresses these questions through the use of ‘real-world’ tasks.
The in-depth assessment of mathematical literacy took place in PISA 2003, when mathematical literacy was the major domain, allowing mathematics performance to be assessed in detail. Mathematical literacy was assessed as a minor domain in this current PISA cycle (as well as in PISA 2006). The assessment of mathematical literacy as a minor domain in PISA 2009 provides results for the mathematical literacy scale overall (but not by subscale).
This chapter begins34 with PISA’s definition of mathematical literacy, an overview of the assessment framework, a description of how mathematical literacy is reported, and a selection of examples to illustrate the assessment of mathematical literacy. The next part of the chapter discusses Australian students’ performance in mathematical literacy, first from an international context, and then from a national context, assessing performance by several different subgroups. The final part of the chapter examines mathematical literacy performance since PISA 2003.
34 The first part of this chapter has been adapted from the National PISA 2006 report (Exploring scientific literacy: How Australia measures up).

Challenges for Australian Education: Results from PISA 2009 163
How is mathematical literacy defined in PISA?The PISA mathematical literacy domain is concerned with the capacities of students to analyse, reason and communicate ideas effectively as they pose, formulate, solve and interpret mathematical problems in a variety of situations. The PISA assessment framework defines mathematical literacy as:
… an individual’s capacity to identify and understand the role that mathematics plays in the world, to make well-founded judgements and to use and engage with mathematics in ways that meet the needs of that individual’s life as a constructive, concerned and reflective citizen.
In this conception, mathematical literacy is about meeting life needs. Mathematical literacy is expressed through using and engaging with mathematics, making informed judgements, and understanding the usefulness of mathematics in relation to the demands of life.
The PISA mathematics assessment directly confronts the importance of the functional use of mathematics by placing primary emphasis on a real-world problem situation, and on the mathematical knowledge and competencies that are likely to be useful to deal effectively with such a problem. The PISA mathematics framework was written to encourage an approach to teaching and learning mathematics that gives strong emphasis to the processes associated with confronting a problem in a real-world context, transforming the problem into one amenable to mathematical treatment, making use of the relevant mathematical knowledge to solve it, and evaluating the solution in the original problem context. If students can learn to do these things, they will be much better equipped to make use of their mathematical knowledge and skills throughout their lives.
How is mathematical literacy measured in PISAThe PISA framework for mathematical literacy is organised into three broad components: the situations and contexts in which problems are located and that are used as sources of stimulus material; the mathematical content to which different problems and questions relate, and which are organised by certain overarching ideas; and the mathematical competencies that must be activated to connect the real world (in which problems are generated) with mathematics, and then used to solve the problems. The three components and their interactions are shown in Figure 5.1.

164 Australian students’ performance in mathematical literacy
Situations
Context
Overarching ideas
Content
Problemand Solution
Problem format
Processes
Competency clusters
Mathematical Competencies
Figure 5.1 The components of the PISA mathematical literacy framework
Situations and context
An important aspect of mathematical literacy is engagement with mathematics: using and doing mathematics in a variety of situations. As in previous PISA cycles, students were shown written materials that described various situations that students could conceivably confront, and which required them to apply their mathematical knowledge, understanding or skill to analyse and deal with the situation. Four situations are defined in the PISA mathematical literacy framework: personal, educational/occupational, public and scientific, and the assessment items are framed in each of these contexts.
The situations differ in terms of how directly each problem affects students’ lives; that is, the proximity of the connection between the student and the problem context. For example, personal situations are closest to the student and are characterised by the direct perceptions involved. The situations also differ in the extent to which the mathematical aspects are explicit. Although some tasks in the assessment refer only to mathematical objects, symbols or structures, and make no reference to matters outside the mathematical world, more typically, the problems are not stated in explicit mathematical terms. This reflects the strong emphasis in the PISA mathematical literacy assessment on exploring the extent to which students can both identify mathematical features of a problem presented in a non-mathematical context, and activate their mathematical knowledge to explore and solve such a problem.
Mathematical content
The PISA framework defines mathematical content in terms of four broad knowledge domains and includes the kinds of problems individuals come across through interaction with day-to-day phenomena and that are based on a conception of the ways in which mathematical content presents itself to people. These broad knowledge domains, referred to as overarching ideas, reflect historically established branches of mathematical thinking and underpin mathematical curricula in education systems throughout the world. Together, these broad content areas cover the range of

Challenges for Australian Education: Results from PISA 2009 165
mathematics that 15-year-old students need as a foundation for life and for further extending their horizon in mathematics. The four overarching ideas are as follows:
◗ Space and shape, which relates to spatial and geometric phenomena and relationships, drawing on the curriculum of geometry. Space and shape requires looking for similarities and differences when analysing the components of shapes, recognising shapes in different representations and different dimensions as well as understanding the properties of objects and their relative positions, and the relationship between visual representations (both two- and three-dimensional) and real objects.
◗ Change and relationships, which relates most closely to the curriculum area of algebra and recognises that the world is not a constant – every phenomenon is a manifestation of change. These changes can be presented in a number of ways, including a simple equation, an algebraic expression, a graph or table. As different representations are appropriate in different situations, translation between representations is an important skill when dealing with situations and tasks.
◗ Quantity involves numeric phenomena and quantitative relationships and patterns. It relates to the understanding of relative size, the recognition of numerical patterns, and the use of numbers to represent quantities and quantifiable attributes of real world objects (counting and measuring). Furthermore, quantity deals with the processing and understanding of numbers that are represented in various ways.
◗ Uncertainty involves probabilistic and statistical phenomena and relationships. Uncertainty is present in daily life, where a great deal of information is often presented as precise and having no error, when in fact there is a varying amount of uncertainty.
Although the overarching ideas together generally encompass the range of mathematical topics that students are expected to have learned, the approach to content in PISA is somewhat different in terms of mathematical instruction and the curricular strands taught. The assessment in PISA is related more to the application of mathematical knowledge rather than what content has been learnt.
In PISA 2003, results were reported for each of these four overarching ideas, as well as for mathematical literacy overall. As noted above, separate reporting by subscale is not possible for mathematical literacy in 2009.
Mathematical processes
While the overarching ideas define the main areas of mathematics that are assessed in PISA, they do not make explicit the mathematical processes that students apply as they attempt to solve problems. The PISA mathematics framework uses the term mathematisation to define the cycle of activity for investigating and solving real-world problems. Beginning with a problem situated in reality, students must organise it according to mathematical concepts. They progressively trim away the reality in order to transform the problem into one that is amenable to direct mathematical solution. Students can then apply specific mathematical knowledge and skills to solve the mathematical problem before using some form of translation of the mathematical results into a solution that works for the original problem context; for example, this may involve the formulation of an explanation or justification of proof.
Various competencies are called into play as the mathematisation process is employed. Each of these competencies can be possessed at different levels of mastery. The PISA mathematical literacy framework discusses and groups the competencies in three competency clusters: the reproduction cluster (which involve the reproduction of practised knowledge); the connections cluster (which builds on the reproduction cluster by applying problem solving to situations that are not routine but still familiar); and the reflection cluster (which involves reflecting about the process needed or used to solve a problem).
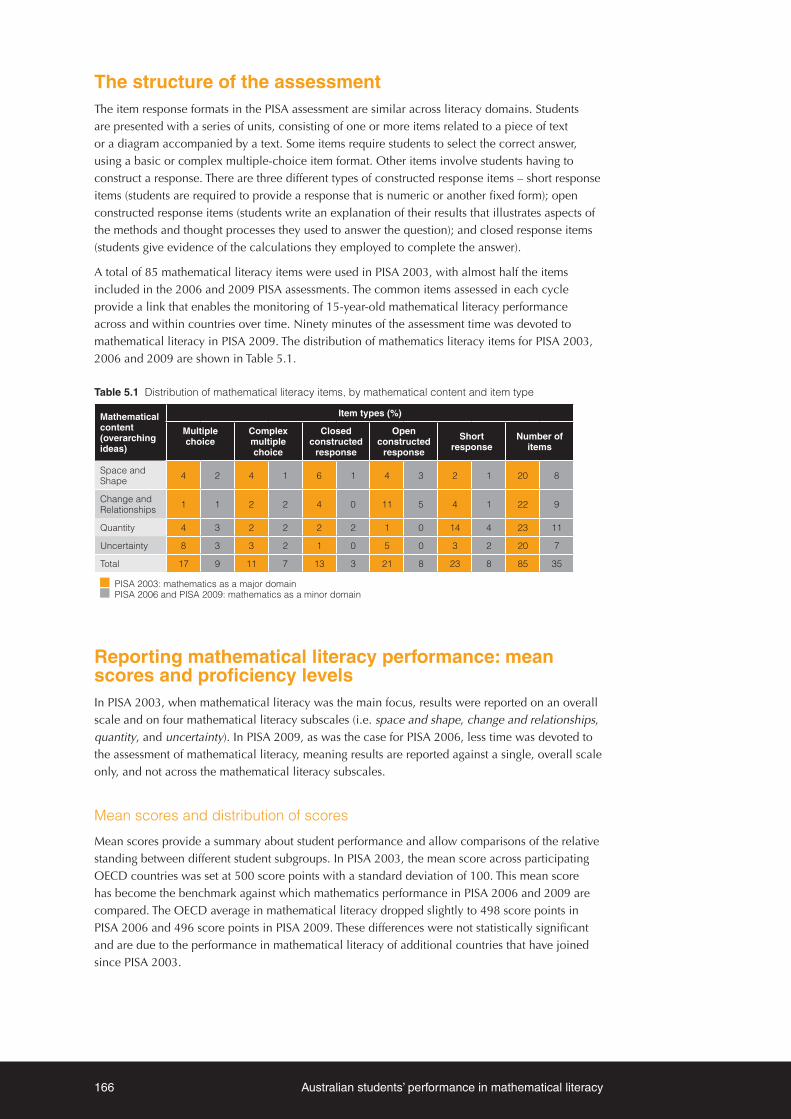
166 Australian students’ performance in mathematical literacy
The structure of the assessment The item response formats in the PISA assessment are similar across literacy domains. Students are presented with a series of units, consisting of one or more items related to a piece of text or a diagram accompanied by a text. Some items require students to select the correct answer, using a basic or complex multiple-choice item format. Other items involve students having to construct a response. There are three different types of constructed response items – short response items (students are required to provide a response that is numeric or another fixed form); open constructed response items (students write an explanation of their results that illustrates aspects of the methods and thought processes they used to answer the question); and closed response items (students give evidence of the calculations they employed to complete the answer).
A total of 85 mathematical literacy items were used in PISA 2003, with almost half the items included in the 2006 and 2009 PISA assessments. The common items assessed in each cycle provide a link that enables the monitoring of 15-year-old mathematical literacy performance across and within countries over time. Ninety minutes of the assessment time was devoted to mathematical literacy in PISA 2009. The distribution of mathematics literacy items for PISA 2003, 2006 and 2009 are shown in Table 5.1.
Table 5.1 Distribution of mathematical literacy items, by mathematical content and item type
Mathematical content (overarching ideas)
Item types (%)
Multiple choice
Complex multiple choice
Closed constructed
response
Open constructed
response
Short response
Number of items
Space and Shape 4 2 4 1 6 1 4 3 2 1 20 8
Change and Relationships 1 1 2 2 4 0 11 5 4 1 22 9
Quantity 4 3 2 2 2 2 1 0 14 4 23 11
Uncertainty 8 3 3 2 1 0 5 0 3 2 20 7
Total 17 9 11 7 13 3 21 8 23 8 85 35
PISA 2003: mathematics as a major domain PISA 2006 and PISA 2009: mathematics as a minor domain
Reporting mathematical literacy performance: mean scores and proficiency levels In PISA 2003, when mathematical literacy was the main focus, results were reported on an overall scale and on four mathematical literacy subscales (i.e. space and shape, change and relationships, quantity, and uncertainty). In PISA 2009, as was the case for PISA 2006, less time was devoted to the assessment of mathematical literacy, meaning results are reported against a single, overall scale only, and not across the mathematical literacy subscales.
Mean scores and distribution of scores
Mean scores provide a summary about student performance and allow comparisons of the relative standing between different student subgroups. In PISA 2003, the mean score across participating OECD countries was set at 500 score points with a standard deviation of 100. This mean score has become the benchmark against which mathematics performance in PISA 2006 and 2009 are compared. The OECD average in mathematical literacy dropped slightly to 498 score points in PISA 2006 and 496 score points in PISA 2009. These differences were not statistically significant and are due to the performance in mathematical literacy of additional countries that have joined since PISA 2003.

Challenges for Australian Education: Results from PISA 2009 167
Proficiency levels
While mean scores provide a comparison of student performance on a numerical level, proficiency levels provide a description of the knowledge and skills that students are typically capable of displaying. This produces a picture of the distribution of student performance within a country (or other groups of students) across the various proficiency levels. In PISA 2003, six levels of proficiency for mathematical literacy were defined, which have remained unchanged for subsequent cycles. The process of creating the proficiency scales in each literacy domain is similar and is described in Chapter 2.
The continuum of increasing mathematical literacy (with Level 6 as the highest and Level 1 as the lowest proficiency level) is shown in Figure 5.2, along with the summary descriptions of the kinds of mathematical competencies associated with the different levels of proficiency. A difference of 62 score points represents one proficiency level on the PISA mathematical literacy scale.
Proficiency level
General mathematical literacy proficiencies students should have at each level
6
At Level 6, students can conceptualise, generalise, and utilise information based on their investigations and modelling of complex problem situations. They can link different information sources and representations and flexibly translate among them. Students at this level are capable of advanced mathematical thinking and reasoning. These students can apply this insight and understandings along with a mastery of symbolic and formal mathematical operations and relationships to develop new approaches and strategies for attacking novel situations. Students at this level can formulate and precisely communicate their actions and reflections regarding their findings, interpretations, arguments, and the appropriateness of these to the original situations.
669.3 score points
5
At Level 5, students can develop and work with models for complex situations, identifying constraints and specifying assumptions. They can select, compare, and evaluate appropriate problem solving strategies for dealing with complex problems related to these models. Students at this level can work strategically using broad, well-developed thinking and reasoning skills, appropriate linked representations, symbolic and formal characterisations, and insights pertaining to these situations. They can reflect on their actions, and formulate and communicate their interpretations and reasoning.
607.0 score points
4
At Level 4, students can work effectively with explicit models for complex concrete situations that may involve constraints or call for making assumptions. They can select and integrate different representations, including symbolic, linking them directly to aspects of real-world situations. Students at this level can utilise well-developed skills and reason flexibly, with some insight, in these contexts. They can construct and communicate explanations and arguments based on their interpretations, arguments, and actions.
544.7 score points
3
At Level 3, students can execute clearly described procedures, including those that require sequential decisions. They can select and apply simple problem solving strategies. Students at this level can interpret and use representations based on different information sources and reason directly from them. They can develop short communications reporting their interpretations, results and reasoning.
482.4 score points
2
At Level 2, students can interpret and recognise situations in contexts that require no more than direct inference. They can extract relevant information from a single source and make use of a single representational mode. Students at this level can employ basic algorithms, formulae, procedures, or conventions. They are capable of direct reasoning and making literal interpretations of the results.
420.1 score points
1
At Level 1, students can answer questions involving familiar contexts where all relevant information is present and the questions are clearly defined. They are able to identify information and to carry out routine procedures according to direct instructions in explicit situations. They can perform actions that are obvious and follow immediately from the given stimuli.
357.8 score points
Figure 5.2 Summary descriptions of the six proficiency levels on the overall mathematical literacy scale
Students who scored below 358 score points are placed below Level 1. Although these students were not necessarily incapable of performing any mathematical operation, they were unable to utilise mathematical skills in a given situation as required by the easiest PISA tasks. Their pattern of answers was such that they would be expected to be able to solve fewer than half of the tasks in a test made up solely of questions drawn from Level 1. These students are likely to have serious difficulties in using mathematics to benefit from further education and learning opportunities in life.
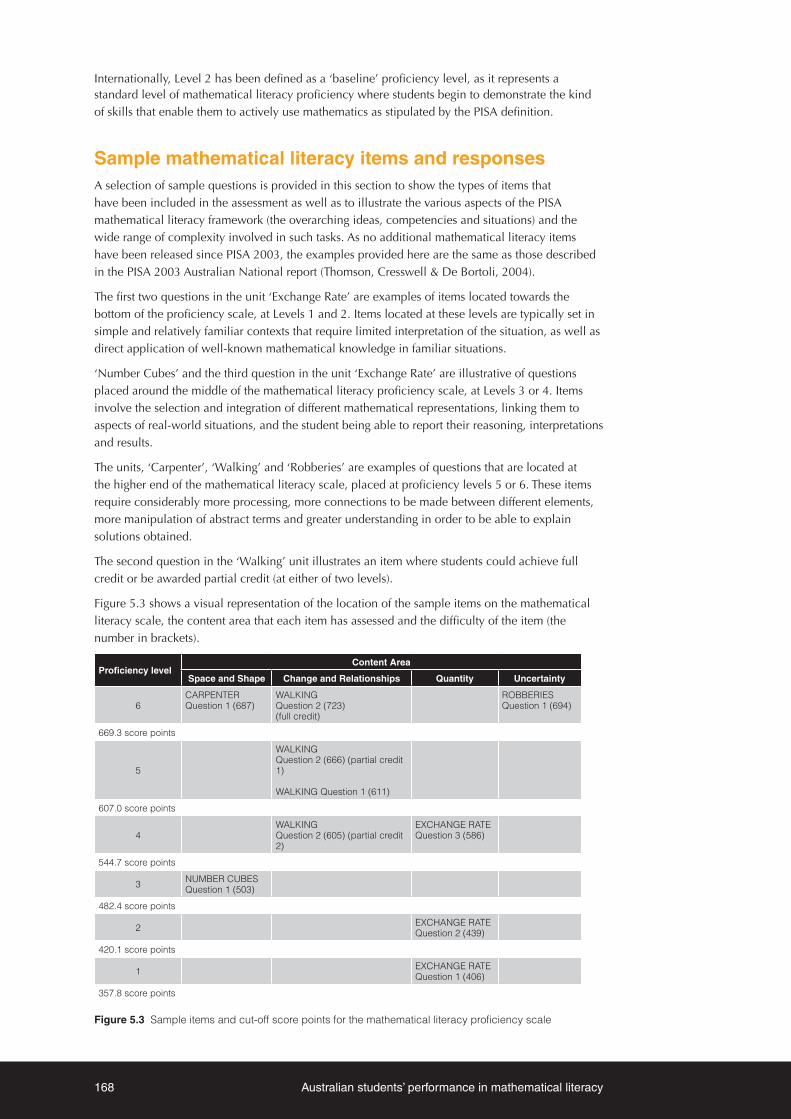
168 Australian students’ performance in mathematical literacy
Internationally, Level 2 has been defined as a ‘baseline’ proficiency level, as it represents a standard level of mathematical literacy proficiency where students begin to demonstrate the kind of skills that enable them to actively use mathematics as stipulated by the PISA definition.
Sample mathematical literacy items and responsesA selection of sample questions is provided in this section to show the types of items that have been included in the assessment as well as to illustrate the various aspects of the PISA mathematical literacy framework (the overarching ideas, competencies and situations) and the wide range of complexity involved in such tasks. As no additional mathematical literacy items have been released since PISA 2003, the examples provided here are the same as those described in the PISA 2003 Australian National report (Thomson, Cresswell & De Bortoli, 2004).
The first two questions in the unit ‘Exchange Rate’ are examples of items located towards the bottom of the proficiency scale, at Levels 1 and 2. Items located at these levels are typically set in simple and relatively familiar contexts that require limited interpretation of the situation, as well as direct application of well-known mathematical knowledge in familiar situations.
‘Number Cubes’ and the third question in the unit ‘Exchange Rate’ are illustrative of questions placed around the middle of the mathematical literacy proficiency scale, at Levels 3 or 4. Items involve the selection and integration of different mathematical representations, linking them to aspects of real-world situations, and the student being able to report their reasoning, interpretations and results.
The units, ‘Carpenter’, ‘Walking’ and ‘Robberies’ are examples of questions that are located at the higher end of the mathematical literacy scale, placed at proficiency levels 5 or 6. These items require considerably more processing, more connections to be made between different elements, more manipulation of abstract terms and greater understanding in order to be able to explain solutions obtained.
The second question in the ‘Walking’ unit illustrates an item where students could achieve full credit or be awarded partial credit (at either of two levels).
Figure 5.3 shows a visual representation of the location of the sample items on the mathematical literacy scale, the content area that each item has assessed and the difficulty of the item (the number in brackets).
Proficiency levelContent Area
Space and Shape Change and Relationships Quantity Uncertainty
6CARPENTER Question 1 (687)
WALKING Question 2 (723) (full credit)
ROBBERIES Question 1 (694)
669.3 score points
5
WALKING Question 2 (666) (partial credit 1)
WALKING Question 1 (611)
607.0 score points
4WALKING Question 2 (605) (partial credit 2)
EXCHANGE RATE Question 3 (586)
544.7 score points
3 NUMBER CUBES Question 1 (503)
482.4 score points
2 EXCHANGE RATE Question 2 (439)
420.1 score points
1 EXCHANGE RATE Question 1 (406)
357.8 score points
Figure 5.3 Sample items and cut-off score points for the mathematical literacy proficiency scale

Challenges for Australian Education: Results from PISA 2009 169
Exchange Rate
The unit ‘Exchange Rate’ consisted of three items involving number operations (multiplication and division) set in the overarching Quantity area and a public context. The concept of foreign exchange rates, and the possibility of both increasing and decreasing movements, formed the basis of this constructed response unit. Exposure to the operation and use of exchange rates may not be common to all students but the concept can be seen as belonging to skills and knowledge required in the global economy.
Exchange Rate Question 1
The first item in ‘Exchange Rate’ required students to interpret a simple, explicit mathematical relationship (the exchange rate for 1 Singapore dollar/1 South African rand), and then apply a small reasoning step to apply the relationship directly to 3000 Singapore dollars, using the calculation (3000 x 4.2). This short constructed response item belongs to the reproduction competency cluster. This item, with a clearly defined question, is set in a relatively familiar context and the direct application of well-known mathematical knowledge places this item at proficiency level 1, with a difficulty of 406 score points. Eighty-one per cent of Australian students correctly answered this item in 2003. The following answer is an example of a student response that was awarded full credit.
Overall percent correct14
Liechtenstein (Highest achieving country) 95%
Australian males 83%
Australia 81%
Australian females 80%
OECD average 80%
Brazil (Lowest achieving country) 37%
35 The students’ results for the sample mathematical literacy items were derived from the PISA 2003 dataset.

170 Australian students’ performance in mathematical literacy
Exchange Rate Question 2
The second item in ‘Exchange Rate’ was also a short constructed response item, which required a limited form of mathematisation (understanding a simple text) as well as deciding that division was the correct procedure.
Students were required to interpret a simple, explicit mathematical relationship and only a small reasoning step was required to apply the relationship directly to 3900 South African rand using a calculation (3900/4.0). This question belonged to the reproduction competency cluster and proficiency level 2, with a difficulty of 439 score points. Three quarters of Australian students correctly answered this question. An example of a correct student response is provided below.
Overall percent correct
Liechtenstein (Highest achieving country) 93%
Australian males 76%
Australia 75%
Australian females 74%
OECD average 74%
Brazil (Lowest achieving country) 25%
Exchange Rate Question 3
The mathematics required to solve the problem in this open constructed response item was more demanding as students needed to reflect on the concept of exchange rate movements and the subsequent consequences. The required procedural knowledge was more complex, and involved students applying flexible reasoning and reflection.
The student example below achieved full credit. Students had to interpret the specified change in the exchange rate and apply basic computational skills or quantitative comparison skills to solve the problem. Students also needed to provide an explanation of their conclusion. This item belongs to the reflection cluster and represents proficiency level 4, with a difficulty of 586 score points.

Challenges for Australian Education: Results from PISA 2009 171
Students found this item more difficult than the previous two questions in this unit, with about half of the Australian students in 2003 successfully answering this question.
Overall percent correct
Liechtenstein (Highest achieving country) 64%
Australian females 47%
Australia 46%
Australian males 45%
OECD average 40%
Mexico (Lowest achieving country) 13%
Number Cubes
During their education, students would have encountered many games and activities, whether formal or informal, that use number cubes or dice. Somewhat challenging was the problem posed below, which required spatial insight or mental visualisation technique, as students needed to imagine how the four planes of number cubes, if reconstructed into a three-dimensional number cube, obey the numerical construction rule given in the information (i.e. two opposite sides have a total of seven dots).

172 Australian students’ performance in mathematical literacy
Full credit was given to students who correctly identified the four expected results, as shown in the example below. This complex multiple-choice item is situated in a personal context, is placed in the overarching area of Space and Shape and illustrates proficiency level 3, with a difficulty of 503 score points. Approximately two-thirds of Australian students correctly answered this item.
Overall percent correct
Korea (Highest achieving country) 81%
Australian males 71%
Australia 69%
Australian females 66%
OECD average 63%
Mexico (Lowest achieving country) 29%
This problem required the encoding and spatial interpretation of two-dimensional objects, interpretation of the connected three-dimensional object, and checking certain basic computational relations. Thus this item fits within the connections competency cluster, an essential part of mathematical literacy, because students live in three-dimensional space and are often confronted with two-dimensional representations.
Walking
Reflecting on embedded mathematics from daily life is part of acquiring mathematical literacy and the unit ‘Walking’ is an example of this phenomenon. Students would be familiar with seeing their footprints in sand or soil but probably would not have given much thought to the relationship between the ‘number of steps taken per minute’ and ‘pace length’.

Challenges for Australian Education: Results from PISA 2009 173
The two questions in this unit were open constructed response items, in the Change and Relationships area and situated in a personal context.
Walking Question 1
The first item required problem solving by asking students to make use of a formal algebraic expression – substituting a simple formula and carrying out a routine calculation: if 70/p = 140 what is the value of p? Students needed to recognise that as the pace length increases, so the number of steps per minute will decrease, and in order to gain credit for this item students needed to carry out the actual calculation.
This item belongs to the reproduction competency cluster and illustrates Level 5 proficiency, with a difficulty of 611 score points. The following example gained full credit for showing the correct substitution of numbers in the formula, along with the correct answer. One-third of Australian students achieved full credit on this item.
Overall percent correct
Hong Kong – China (Highest achieving country) 62%
Australian males 35%
Australia 34%
Australian females 34%
OECD average 36%
Brazil (Lowest achieving country) 14%

174 Australian students’ performance in mathematical literacy
Walking Question 2
The second item in ‘Walking’ also involved the relationship between ‘the number of steps per minute’ and ‘pace length’, but with the added requirement of using a non-routine calculation. Students needed to calculate the number of steps per minute when the pace length is given (0.8m), which requires proper substitution: n/0.80 = 140 and the observation that this equals n = 140 x 0.80 = 112 (steps per minute).
More than routine operations were required here, with substitution in an algebraic expression being used followed by manipulating the resulting formula, in order to carry out the required calculation. The next step required going beyond the observation that the number of steps is 112, as the question also asked for the speed per minute – the subject walks 112 x 0.80 = 89.6 metres, so his speed is 89.6 metres/minute. The final step is to transform this speed in metres/minute into kilometres/hour – a more common unit of speed.
Full credit for this item illustrates the high level of skills and knowledge required at proficiency level 6, with a difficulty of 723 score points. Only one-fifth of Australian students received full credit for their response. Students providing the above explanations were given full credit as they showed they were able to complete the conversions and provide a correct answer in both the requested units. This problem is rather complex and belongs to the connections competency cluster. Not only is use of a formal algebraic expression required, but also completing a sequence of different but connected calculations that need proper understanding of transforming formulae and units of measure. The following sample response was awarded full credit.
Students who scored at a high level of partial credit for this item demonstrated high Level 5 ability with a difficulty of 666 score points, only 3 score points below Level 6. Although students were able to go further than finding the number of steps per minute, and made some progress towards the conversions, their final responses were not entirely correct or remained incomplete.
A lower level of partial credit was given when students showed they had understood the formula and correctly substituted the appropriate values, finding the number of steps per minute. These responses were placed at the top part of Level 4 with a difficulty of 605 score points – just two score points below the boundary of Level 5.
Overall percent correct*
Hong Kong – China (Highest achieving country) 45%
Australian males 22%
Australia 22%
Australian females 21%
OECD average 21%
Brazil (Lowest achieving country) 6%
* These results are percentages weighted for the numbers of fully and partially correct answers.

Challenges for Australian Education: Results from PISA 2009 175
Robberies
The unit ‘Robberies’, situated in the public context, provided a graphical representation showing the number of robberies within a two-year period, along with a statement made by a reporter. This type of item is frequently presented in the media where graphics have been used to support a predetermined message.
The item involved data interpretation, placing it in the overarching area of Uncertainty and in the connections competency cluster, as students needed to rely on reasoning and interpretation competencies together with communication skills. Students were asked, using an open constructed response, to consider the reporter’s statement and with the use of the graph explain whether the statement fitted the data.
An example of a full credit response is shown below. To obtain full credit, students had to indicate that the statement was not reasonable and explain their judgment in appropriate detail. Answers had to focus on an increase given by the exact number of robberies in absolute terms and also in relative terms.
This item illustrated a proficiency at Level 6 with a difficulty of 694 score points. The question required students to be able to communicate an argument based on interpretation of data, using some proportional reasoning in a statistical context. Forty per cent of Australian students correctly responded to this item.
Overall percent correct
Finland (Highest achieving country) 46%
Australian males 40%
Australia 40%
Australian females 40%
OECD average 30%
Indonesia (Lowest achieving country) 2%

176 Australian students’ performance in mathematical literacy
Carpenter
‘Carpenter’, also a complex multiple-choice item, fits into the educational context and belongs to the Space and Shape area. Students were presented with four possible designs for garden beds and were asked to determine if each design could be made with 32 metres of timber.
Students needed to rely on their geometric knowledge, not only recognising the three rectangular shapes but also the parallelogram and that it requires more than 32 metres of timber. This use of geometric insight and argumentation skills and technical geometric knowledge makes this one of the more difficult items at Level 6, with a difficulty of 687 score points.
To obtain full credit, as shown below, students had to correctly identify which of the garden beds could be constructed. Partial credit was given when students correctly identified three of the four answers. A quarter of Australian students were awarded full credit for their response to this question.
Overall percent correct
Hong Kong – China (Highest achieving country) 40%
Australian males 26%
Australia 24%
Australian females 21%
OECD average 20%
Tunisia (Lowest achieving country) 5%

Challenges for Australian Education: Results from PISA 2009 177
Student performance in mathematical literacy
Interpreting differences in PISA mathematical literacy scores: how big is ‘big’?
In terms of proficiency levels
A difference of 62 score points represents one proficiency level on the PISA mathematical literacy scale. This can be considered a comparatively large difference in student performance in substantive terms. For examples, compare the skill set for those students who are proficient at Level 2 and those who are proficient at Level 3. Students who reach Level 2 on the mathematical literacy scale are able to interpret and recognise situations in contexts that require no more than direct inference and extract relevant information from a single source. However, students who perform at Level 3 are proficient with the tasks at Level 2 and can also make sequential decisions and interpret and reason from different information sources.
In terms of schooling
It is possible to compare the performance of students in different year levels in 26 OECD countries in which there are a sizeable number of 15-year-olds in at least two different year levels in the PISA sample. Analysis of these data indicate that one school year corresponds to 41 score points, on average, across OECD countries on the PISA mathematical literacy scale36. For Australia, the data indicate that one school year also corresponds to 41 score points on average.37
Mathematical literacy performance from an international perspective
Table 5.2 provides the mean mathematical literacy scores, along with the standard error, confidence interval around the mean, and the difference between the 5th and 95th percentile for participating countries.
The international results show an outstanding performance by first-time participant Shanghai – China, achieving an average score of 600 score points on the mathematical literacy assessment, which is significantly higher than the mean score for any other country or economy38. The next highest score is another first-time participant, Singapore (562), whose score was significantly higher than that of all countries other than Shanghai – China. The scores for these two countries are more than one proficiency level higher than the OECD average, or the equivalent of two-and-a-half years of additional schooling.
Korea (546 score points) was the highest performing OECD country. Other OECD countries with mean scores above the OECD average were Finland (541 score points), Switzerland (534 score points), Japan (529 score points), Canada (527 score points), the Netherlands (526 score points), New Zealand (519 score points), Belgium (515 score points), Australia (514 score points), Germany (513 score points), Estonia (512 score points), Iceland (507 score points), Denmark (503 score points), and Slovenia (501 score points). Four other partner countries performed above the OECD average: Hong Kong – China (555 score points), Chinese Taipei (543 score points), Liechtenstein (536 score points), and Macao – China (525 score points).
Twelve countries, of which seven were OECD countries, performed significantly higher than Australia’s score of 514 points: the highest scoring countries Shanghai – China, Singapore, Hong Kong – China, and Korea, as well as Chinese Taipei, Finland, Liechtenstein, Switzerland, Japan, Canada, Netherlands, and Macao – China. Four countries had mean scores that were not significantly different from that of Australia: New Zealand, Belgium, Germany, and Estonia.
36 OECD, 2004, pg. 60.37 OECD, 2004, pg,. 311.38 A number of economies have participated in PISA 2009, which are parts of countries that may or may not
participate in PISA as a whole. For ease of reading these are referred to as ‘countries’ from this point onwards.

178 Australian students’ performance in mathematical literacy
All other countries (including the United States and the United Kingdom) performed at a level significantly lower than Australia.
Table 5.2 Mean mathematical literacy scores, confidence intervals and variations by country39
Country Mean score S.E. Confidence interval
Difference between 5th and 95th percentile
Shanghai – China 600 2.8 595 - 606 336
Singapore 562 1.4 559 - 565 342
Hong Kong – China 555 2.7 549 - 560 313
Korea 546 4.0 538 - 554 292
Chinese Taipei 543 3.4 537 - 550 342
Finland 541 2.2 536 - 545 270
Liechtenstein 536 4.1 528 - 544 286
Switzerland 534 3.3 527 - 540 326
Japan 529 3.3 522 - 536 308
Canada 527 1.6 524 - 530 286
Netherlands 526 4.7 517 - 535 287
Macao – China 525 0.9 523 - 527 281
New Zealand 519 2.3 515 - 524 316
Belgium 515 2.3 511 - 520 340
Australia 514 2.5 509 - 519 308
Germany 513 2.9 507 - 518 319
Estonia 512 2.6 508 - 517 265
Iceland 507 1.4 504 - 509 300
Denmark 503 2.6 498 - 508 286
Slovenia 501 1.2 499 - 504 314
Norway 498 2.4 493 - 503 283
France 497 3.1 491 - 503 331
Slovak Republic 497 3.1 491 - 503 311
Austria 496 2.7 491 - 501 312
OECD average 496 0.5 495 - 497 300
Poland 495 2.8 489 - 500 290
Sweden 494 2.9 489 - 500 304
Czech Republic 493 2.8 487 - 498 308
United Kingdom 492 2.4 488 - 497 287
Hungary 490 3.5 483 - 497 303
Luxembourg 489 1.2 487 - 491 319
United States 487 3.6 480 - 494 300
Ireland 487 2.5 482 - 492 280
Portugal 487 2.9 481 - 493 301
Spain 483 2.1 479 - 488 298
Italy 483 1.9 479 - 487 302
Latvia 482 3.1 476 - 488 259
Lithuania 477 2.6 471 - 482 290
Russian Federation 468 3.3 461 - 474 280
Greece 466 3.9 458 - 474 294
Croatia 460 3.1 454 - 466 292
Dubai (UAE) 453 1.1 450 - 455 325
Israel 447 3.3 440 - 453 343
Turkey 445 4.4 437 - 454 310
Serbia 442 2.9 437 - 448 298
Azerbaijan 431 2.8 426 - 436 207
Bulgaria 428 5.9 417 - 440 324
Romania 427 3.4 420 - 434 260
Uruguay 427 2.6 422 - 432 300
Chile 421 3.1 415 - 427 266
Thailand 419 3.2 412 - 425 259
Mexico 419 1.8 415 - 422 259
39 Countries with means lower than Mexico are not included in the national report: Albania, Argentina, Brazil, Colombia, Indonesia, Jordan, Kazakhstan, Kyrgyzstan, Montenegro, Panama, Peru, Qatar, Trinidad and Tobago, and Tunisia.
Significantly higher than
Australia
Not significantly different to Australia
Significantly lower than Australia

Challenges for Australian Education: Results from PISA 2009 179
The average range of scores between the 5th and 95th percentile for the OECD was 300 score points. However, the difference in scores between the 5th and 95th percentile varied considerably across the different countries. The widest differences between the lowest and highest performing students within OECD countries were found in Israel (343 score points) and Belgium (340 score points). For partner countries, the widest differences were found in the some of the highest scoring countries: Chinese Taipei and Singapore, with 342 score points, and Shanghai – China with a 336 score point difference. In Australia, the spread was substantially smaller at 308 score points.
The narrowest differences between the lowest and highest performing students were found in the OECD country Mexico and the partner countries, Thailand and Latvia, all with 259 score points between the 5th and 95th percentile.
The mathematical literacy proficiency levels provide further detail about student performance by describing the competencies students at each level have displayed. The proportion of students at each literacy proficiency level, from Below Level 1 to Level 6, is presented by country in Figure 5.4.
Countries have been ordered by the percentage of students classified as below Level 2 (the OECD baseline), with countries with the lowest proportions of students below Level 2 placed at the top of the figure and countries with the highest proportions of students below Level 2 at the bottom.
As previously described, those students at the higher end of the mathematical literacy proficiency scale demonstrate more abstract understanding and are capable of advanced mathematical thinking and reasoning. Students who scored between 607 and 669 score points were placed at Level 5 and students who scored more than 669 score points were placed at Level 6.
At Level 6, students are able to conceptualise, generalise, and utilise information based on their investigations and modelling of complex problem situations. On average, just over three per cent (3.1%) of students across OECD countries performed at this level. In Shanghai – China, more than one-quarter (26.6%) of students were performing at this level, while in Singapore almost 16 per cent, and in Chinese Taipei and Hong Kong – China about 11 per cent (11.3% and 10.8% respectively) of students performed at this level. In eleven countries, including Australia, more than four per cent of students achieved at this high level: Korea (7.8%), Switzerland (7.8%), Japan (6.2%), Belgium (5.8%), New Zealand (5.3%), Liechtenstein (5.0%), Finland (4.9%), Germany (4.6%), Australia (4.5%), Canada (4.4%) and Macao – China (4.4%).
It is not only important to examine those students who are highly proficient at mathematics, but also to identify those students who are at the lower end of the mathematical literacy proficiency scale. According to the PISA definition, these students would be considered to be at serious risk of not being able to participate adequately in the 21st century workforce and contribute as productive citizens.
On average, across OECD countries, more than one-fifth (22%) of students did not perform at Level 2 (lower than 420 score points). In some countries, the proportion of students who did not reach Level 2 was twice that of the OECD average – Thailand (53%), Chile (51%), Mexico (51%), Uruguay (48%), Bulgaria (47%) and Azerbaijan (45%). Sixteen per cent of Australian students failed to reach Level 2, similar to the proportions in New Zealand (15%), Iceland (17%) and Denmark (17%). Shanghai – China had the lowest percentage of students who failed to achieve Level 2, with just five per cent of students not achieving this baseline.

180 Australian students’ performance in mathematical literacy
In cases in which the proportion of students in a proficiency level is one per cent or less, the level still appears in the figure but the numeric label “1”, does not. This convention has been used for all figures about proficiency levels in this chapter.
Percentage of students100 80 60 40 20 0
Thailand
Chile
Mexico
Uruguay
Bulgaria
Romania
Azerbaijan
Turkey
Serbia
Israel
Dubai (UAE)
Croatia
Greece
Russian Federation
Lithuania
Italy
Luxembourg
Spain
Portugal
United States
Austria
Latvia
France
Czech Republic
Hungary
OECD average
Sweden
Slovak Republic
Ireland
Poland
Slovenia
United Kingdom
Belgium
Germany
Norway
Denmark
Iceland
Australia
New Zealand
Switzerland
Netherlands
Chinese Taipei
Estonia
Japan
Canada
Macao – China
Singapore
Liechtenstein
Hong Kong – China
Korea
Finland
Shanghai – China
20 40 60 80 100
3 9 15 21 24 27
2 6 16 27 28 17 5
2 6 16 24 26 18 8
3 6 13 22 25 20 11
3 7 15 26 31 13 5
3 7 13 19 23 20 16
3 8 20 28 25 13 4
3 8 19 27 25 14 4
4 9 17 26 24 15 6
3 10 23 30 23 10 2
4 9 16 21 22 17 11
3 11 19 24 24 15 4
4 9 16 23 23 16 8
5 10 19 24 22 14 5
5 11 20 26 22 12 4
6 11 21 27 21 10 3
5 12 23 27 21 9 2
6 13 24 28 20 8 2
6 12 19 23 22 13 5
8 11 17 22 21 15 6
6 14 25 27 18 8 2
7 14 22 24 19 10 4
6 14 24 26 19 8 2
7 14 24 29 19 6
7 14 23 25 18 9 4
8 11 23 25 19 9 2
8 14 22 24 19 10 3
8 14 23 26 18 8 2
7 15 24 24 17 8 3
9 13 20 24 20 10 3
6 17 27 28 16 5
8 15 21 23 20 10 3
8 15 24 25 17 8 2
8 15 24 25 18 8 2
9 15 24 27 18 7
10 14 23 23 19 9 2
9 16 24 25 17 7 2
9 17 26 25 15 6
10 19 28 25 13 4
11 19 26 24 14 5
12 21 27 23 13 4
18 21 23 20 12 5
21 19 23 20 12 5
18 23 26 20 9 3
18 24 25 17 10 4
11 34 35 15 4
20 27 29 17 6
24 23 23 17 8 3
23 25 25 17 8 2
22 29 28 16 5
22 29 27 15 6
30 27 14 522
Below Level 1 Level 2 Level 3 Level 4 Level 5 Level 6Level 1
Figure 5.4 Mathematical literacy proficiency levels by country

Challenges for Australian Education: Results from PISA 2009 181
Mathematical literacy performance and gender from an international perspective
Table 5.3 provides the mean scores and standard errors for females and males and displays the difference between average male and female performance in mathematics graphically. There were statistically significant gender differences in mathematical literacy performance in many participating countries, with males significantly outperforming females by 12 score points, on average, across OECD countries. The difference in the average performance of females and males in Australia was 10 score points, similar to that seen in Canada (12 score points) but substantially lower than that seen in the United Kingdom (21 score points) or the United States (20 score points).
The gender difference in countries that performed significantly better than Australia varied greatly. For five countries: Shanghai – China, Korea, Chinese Taipei, Finland and Japan, there was no significant gender difference, while the scores in seven other countries ranged from five score points in Singapore to the most extreme gender difference of 24 score points in Liechtenstein, both in favour of males. Only in Lithuania was there a significant gender difference in favour of females, a difference of six score points.

182 Australian students’ performance in mathematical literacy
Table 5.3 Mean mathematical literacy scores by gender and gender difference by country
Country
Gender differences
Females MalesDifference in mean score
Mean score S.E. Mean score S.E.
Lithuania 480 3.0 474 3.1
30 20 10 0 10 20 30
Femalesscorehigher
Malesscorehigher
Gender difference significant
Gender differences not significant
Bulgaria 430 6.0 426 6.2
Sweden 495 3.3 493 3.1
Shanghai – China 601 3.1 599 3.7
Slovenia 501 1.7 502 1.8
Latvia 481 3.4 483 3.5
Russian Federation 467 3.5 469 3.7
Dubai (UAE) 451 1.6 454 1.5
Finland 539 2.5 542 2.5
Slovak Republic 495 3.4 498 3.7
Korea 544 4.5 548 6.2
Romania 425 3.8 429 3.9
Iceland 505 1.9 508 2.0
Poland 493 3.2 497 3.0
Thailand 417 3.8 421 3.9
Chinese Taipei 541 4.8 546 4.8
Czech Republic 490 3.0 495 3.9
Norway 495 2.8 500 2.7
Singapore 559 2.0 565 1.9
Ireland 483 3.0 491 3.4
New Zealand 515 2.9 523 3.2
Azerbaijan 427 3.0 435 3.1
Israel 443 3.3 451 4.7
Estonia 508 2.9 516 2.9
Japan 524 3.9 534 5.3
Australia 509 2.8 519 3.0
Croatia 454 3.9 465 3.6
Turkey 440 5.6 451 4.6
Macao – China 520 1.4 531 1.3
Serbia 437 3.2 448 3.8
OECD average 490 0.6 501 0.6
Portugal 481 3.1 493 3.3
Canada 521 1.7 533 2.0
Hungary 484 3.9 496 4.2
Uruguay 421 2.9 433 3.0
Mexico 412 1.9 425 2.1
Greece 459 3.3 473 5.4
Hong Kong – China 547 3.4 561 4.2
Italy 475 2.2 490 2.3
Germany 505 3.3 520 3.6
Denmark 495 2.9 511 3.0
France 489 3.4 505 3.8
Netherlands 517 5.1 534 4.8
Spain 474 2.5 493 2.3
Austria 486 4.0 506 3.4
Luxembourg 479 1.3 499 2.0
Switzerland 524 3.4 544 3.7
United States 477 3.8 497 4.0
United Kingdom 482 3.3 503 3.2
Chile 410 3.6 431 3.7
Belgium 504 3.0 526 3.3
Liechtenstein 523 5.9 547 5.2

Challenges for Australian Education: Results from PISA 2009 183
Figure 5.5 shows the proportion of Australian male and female students at each level of mathematical proficiency, along with the OECD average. Despite the 10 point difference in scores between males and females in Australia, there was little difference in the proportion of students at the lowest proficiency levels, and only slight differences at the higher proficiency levels. A slightly higher proportion of female than male students performed at proficiency level 3 and proficiency level 4, while 15 per cent of females and 18 per cent of males performed at proficiency level 5 and proficiency level 6. This is similar to the pattern seen across the OECD.
Aus
tralia
OEC
D a
vera
ge
Below Level 1 Level 2 Level 3 Level 4 Level 5 Level 6Level 1
Percentage of students
100 80 60 40 20 0
Males
Females
Males
Females
20 40 60 80 100
5 11 21 27 21 11 4
5 10 19 25 22 13 5
8 15 23 25 18 8 2
8 13 21 24 19 11 4
Figure 5.5 Proficiency levels for students in mathematical literacy by gender, Australia and OECD average
Mathematical literacy performance across the Australian states and territories
The mathematical literacy performance for students in each of the Australian states is presented in Table 5.4, together with the standard error, confidence interval and the spread of scores between the 5th and 95th percentile. Its partner, Table 5.5, provides the multiple comparisons of mathematics performance between each of the states. The mean scores for Australia, Shanghai – China (the highest performing country) and the OECD average have been included for comparison.
There was not a lot of variation seen between Western Australia, the Australian Capital Territory, Queensland, New South Wales and Victoria, with scores not significantly different to each other and all within the range of 512–529 score points. The only exception to this was that the Australian Capital Territory’s score was significantly higher than that of Victoria. The lowest performing states were Tasmania and the Northern Territory, with mean scores of 487 score points. Tasmania and the Northern Territory performed at a level not significantly different from the OECD average, while the other states all performed significantly higher than the OECD average.
South Australia had the narrowest spread of scores, with 284 score points between the students at the 5th and 95th percentile, while the Northern Territory had the widest spread of scores with a range of 332 score points.

184 Australian students’ performance in mathematical literacy
Table 5.4 Mean mathematical literacy scores, confidence intervals and variations by state
State Mean score S.E. Confidence intervals Difference between 5th and 95th percentile
ACT 528 6.4 516 - 541 323
NSW 512 5.2 502 - 523 313
VIC 512 4.9 502 - 522 297
QLD 518 7.5 503 - 533 311
SA 509 5.3 499 - 519 284
WA 529 7.2 515 - 543 317
TAS 487 5.1 477 - 497 307
NT 487 4.9 478 - 497 332
Australia 514 2.5 509 - 519 308
Shanghai – China 600 2.8 595 - 606 336
OECD average 496 0.5 495 - 497 300
Table 5.5 Multiple comparisons of mean performance in mathematical literacy by state
WA ACT QLD NSW VIC SA NT TAS OECD
Mean 529 528 518 512 512 509 487 487 496
Mean SE 7.2 6.4 7.5 5.2 4.9 5.3 4.9 5.1 0.5
WA 529 7.2 ● ● ● ● ▲ ▲ ▲ ▲
ACT 528 6.4 ● ● ● ▲ ▲ ▲ ▲ ▲
QLD 518 7.5 ● ● ● ● ● ▲ ▲ ▲
NSW 512 5.2 ● ● ● ● ● ▲ ▲ ▲
VIC 512 4.9 ● ▼ ● ● ● ▲ ▲ ▲
SA 509 5.3 ▼ ▼ ● ● ● ▲ ▲ ▲
NT 487 4.9 ▼ ▼ ▼ ▼ ▼ ▼ ● ●
TAS 487 5.1 ▼ ▼ ▼ ▼ ▼ ▼ ● ●
Note: Read across the row to compare a state’s performance with the performance of each state listed in the column heading.
▲ Average performance statistically significantly higher than in comparison state
● No statistically significant difference from comparison state
▼ Average performance statistically significantly lower than in comparison state
Figure 5.6 shows the proportion of students at each of the proficiency levels in each state, along with the percentages for Australia overall, the OECD average and the highest scoring country, Shanghai – China, for comparison.
Seven per cent of students from the Australian Capital Territory and six per cent of students from Western Australia achieved the highest proficiency, Level 6, in mathematical literacy, which was lower than the 27 per cent of students in Shanghai – China who performed at this level. The Australian results are similar to those found for the OECD on average, with three per cent of students achieving proficiency level 6. Around one in five students achieved at least proficiency level 5 in mathematics in Western Australia (22%), the Australian Capital Territory (22%) and Queensland (18%), while in the Northern Territory and Tasmania only 10 per cent of students achieved at least level 5.
The proportion of students who have not reached Level 2 is a serious concern, as these students have not been able to demonstrate the mathematical literacy competencies that will enable them to participate actively in society. Slightly more than one-fifth of students across the OECD (22%) failed to reach Level 2, which was less than the percentage of students from the Northern Territory or Tasmania who were placed at these levels (24% and 25% respectively). In other states, the proportion of students who failed to reach Level 2 ranged from 14 per cent in Western Australia and the Australian Capital Territory to 16 per cent in South Australia, Victoria and New South Wales.

Challenges for Australian Education: Results from PISA 2009 185
Below Level 1 Level 2 Level 3 Level 4 Level 5 Level 6Level 1
Percentage of students
100 80 60 40 20 0
OECD average
Shanghai – China
Australia
NT
TAS
NSW
SA
VIC
QLD
ACT
WA
20 40 60 80 100
5 9 17 23 24 16 6
5 9 17 24 24 15 7
5 10 20 25 22 13 5
5 11 21 27 22 11 4
4 12 21 27 22 11 2
5 11 20 26 21 11 5
12 12 22 24 20 8 2
9 16 23 25 17 8 2
5 11 20 26 22 12 4
3 9 15 21 24 27
8 14 22 24 19 10 3
Figure 5.6 Proficiency levels in mathematical literacy by state
The mean mathematical literacy scores for females and males are shown in Table 5.6 with the associated standard errors and the difference in mean scores. There were significant differences seen in three states, Victoria (15 score points), South Australia (14 score points), and Queensland (10 score points).
Table 5.6 Mean mathematical literacy scores by gender and gender differences by state
State
Gender differences
Females MalesDifference in mean score
Mean score S.E. Mean score S.E.
NT 485 7.4 490 5.4
30 20 10 0 10 20 30
Males scorehigher
Females scorehigher
Gender differences significant
Gender differences not significant
NSW 509 5.2 516 7.1
WA 525 7.9 532 8.7
ACT 524 9.2 532 10.5
QLD 513 7.2 523 8.5
TAS 481 8.7 492 6.9
SA 502 4.4 516 6.8
VIC 505 6.0 520 5.8

186 Australian students’ performance in mathematical literacy
Greater proportions of males than females were placed at Level 5 and Level 6 in all of the states (Figure 5.7). Twenty-five per cent of males in the Australian Capital Territory, 23 per cent of those in Western Australia and 20 per cent of those in Queensland reached Level 5 and 6, substantially above the OECD average (15% of males). The proportion of males in other states who performed at Level 5 and 6 ranged from 11 per cent in Tasmania and the Northern Territory to 18 per cent in Victoria. There were higher proportions of females from Western Australia (21%) and the Australian Capital Territory (18%) who reached at least Level 5, compared to the OECD average for females (11%). The proportion of females who performed at these high levels of mathematical literacy proficiency was around the OECD average in three states: New South Wales (14%), Victoria (12%) and South Australia (10%), and lower than the OECD average in Tasmania and the Northern Territory (9% of female students achieved these levels in both states). Western Australia has succeeded in having a large proportion of both males and females achieving at these very high levels. In the Australian Capital Territory, while the proportions of males and females achieving these levels were both well above the OECD average, there was a substantial difference between the proportions of males and females who reached at least Level 5 in mathematical literacy (8%).
As has already been seen, on average in Australia around 16 per cent of females and 15 per cent of males were not performing at Level 2, which was lower than the OECD average of around 23 per cent of females and 21 per cent of males not performing at this level. Across Australian states this varied widely, with around one-quarter of both males and females in both the Northern Territory (24% of each) and Tasmania failing to reach this level. In the Australian Capital Territory and Western Australia, two of the highest performing states, almost the same proportion of males and females (14% and 13% respectively) did not reach Level 2, far fewer than the OECD average. The only gender gap in the proportion of males and females not achieving at Level 2 was in South Australia, where 14 per cent of males and 18 per cent of females performed at these lower levels (Level 1 or below Level 1).

Challenges for Australian Education: Results from PISA 2009 187
Below Level 1 Level 2 Level 3 Level 4 Level 5 Level 6Level 1
Percentage of students
Females
Males
Females
Males
100 80 60 40 20 0 20 40 60 80 100
OEC
D
Aus
tralia
N
T TA
S W
A
SA
QLD
VI
C
NSW
A
CT
4 9 17 26 26 13 5
6 8 18 21 23 17 9
5 11 21 27 21 10 4
6 11 20 25 21 12 6
4 12 24 28 20 9 3
5 10 19 26 23 13 5
5 11 20 26 22 12 4
5 10 19 24 22 14 6
4 13 22 28 22 9
4 10 21 26 22 13 3
5 9 19 24 23 15 6
4 9 16 23 25 16 6
10 17 24 24 17 7 2
8 15 22 25 18 9 2
12 12 22 24 20 7 2
11 13 21 24 20 8 3
5 11 21 27 21 11 4
5 10 19 25 22 13 5
8 15 23 25 18 8 2
8 13 21 24 19 11 4
Females
Males
Females
Males
Females
Males
Females
Males
Females
Males
Females
Males
Females
Males
Females
Malesaver
age
Figure 5.7 Proficiency levels in mathematical literacy by state and gender
Mathematical literacy performance and school sector
The unadjusted means for mathematical literacy by school sector show that, on average, students in the independent school sector achieved significantly higher than those in the Catholic or government school sectors, and those in the Catholic sector significantly outperformed those in the government sector. Mean scores for the Catholic and independent sectors were significantly higher than the OECD average, and those for the government sector were not significantly different from the OECD mean (Table 5.7).

188 Australian students’ performance in mathematical literacy
Table 5.7 Mean mathematical literacy scores (unadjusted for student and school socioeconomic background) by school sector
School Sector Mean score S.E. Confidence interval Difference between 5th and 95th percentile
Government 499 4.0 491 - 507 317
Catholic 527 4.5 518 - 536 273
Independent 548 3.7 541 - 556 285
Table 5.7 also provides the differences between the highest and lowest performing students in mathematical literacy. Government schools catered for the broadest range of students with 317 score points, whereas the difference in scores between the 5th and 95th percentile for Independent schools was slightly wider at 285 score points. Catholic schools had the narrowest spread of scores, with 273 score points between the students at the 5th and 95th percentile.
Once student-level socioeconomic background is taken into account, the mean performance of students in Catholic and independent schools are not statistically significantly different and the mean performance of students in Catholic and independent schools are significantly higher than students in government schools, although the differences are reduced. When school-level socioeconomic background is also accounted for, the mean performance of students in government, Catholic and independent schools are statistically similar (Table 5.8).
Table 5.8 Differences in mathematical literacy scores after adjustment for student and school socioeconomic background
Difference in raw scores
(score points)
Difference in scores after student socioeconomic
background is accounted for
Difference in scores after student and school level
socioeconomic background is accounted for
Government – Catholic 28 20 NSD
Government – Independent 49 21 NSD
Catholic – Independent 21 NSD NSD
NSD: No significant difference
Figure 5.8 shows the proportion of students at each of the proficiency levels in each school sector40. These are raw proportions, i.e. there has been no adjustment for socioeconomic background.
Not surprisingly, given that most independent schools in Australia are selective in terms of academic achievement, one-quarter of the students at independent schools were performing at proficiency levels 5 and 6. The proportion of students performing at this level in government schools (14%) was around the same as the OECD average, while the proportion of students in Catholic schools (17%, and again many Catholic schools have selective entrance policies) was slightly higher than the OECD average.
The proportion of students not reaching proficiency level 2 similarly reflects selection processes. Twenty-one per cent of students attending government schools were not performing at this minimum standard, compared to around 10 per cent of students in Catholic schools and eight per cent of students in independent schools.
40 Proficiency level percentages are unadjusted. To adjust for student and school socioeconomic background requires complicated analysis, which would need to take into account ESCS within each proficiency level and this is deemed impracticable. Furthermore, adjusting for ESCS at either ends of the proficiency scale adds additional uncertainty to these levels.

Challenges for Australian Education: Results from PISA 2009 189
100 80 60 40 20 0
Independent
Catholic
Government
20 40 60 80 100
Below Level 1 Level 2 Level 3 Level 4 Level 5 Level 6Level 1
7 14 23 25 18 10 4
3 7 19 29 26 13 4
2 6 14 25 27 18 7
Percentage of students
Figure 5.8 Proficiency levels in mathematical literacy by school sector
Mathematical literacy performance and Indigenous students
As was found for reading literacy (see Chapter 3, this volume), there is a substantial difference between the average performance of Indigenous and non-Indigenous students in the PISA mathematical literacy assessment, as shown in Table 5.9. Indigenous students recorded a mean score of 441 points, compared to a mean score of 517 points for non-Indigenous students. This difference of 76 score points in mathematical literacy performance equates to more than one proficiency level or almost two full years of schooling. Indigenous students also performed significantly lower than the OECD average, by 55 score points.
The range of performance in mathematical literacy between the highest and lowest performing Indigenous students spanned 298 score points, which was a slightly narrower range than that found for non-Indigenous students.
Table 5.9 Mean mathematical literacy scores, confidence intervals and variations for Indigenous and non-Indigenous students
Indigenous status Mean score S.E. Confidence intervals Difference between 5th and 95th percentile
Indigenous 441 5.3 431 - 452 298
Non-Indigenous 517 2.5 512 - 522 305
While Indigenous females and males performed statistically similar on mathematical literacy, there were substantial and significant differences between the mean score of Indigenous and non-Indigenous females (72 score points) and Indigenous and non-Indigenous males (80 score points). These differences in average performance are equivalent to more than one proficiency level, or almost two years of schooling (Table 5.10).
Indigenous females performed 56 score points lower on average than females across OECD countries and Indigenous males performed 54 score points lower than the OECD average for males.
Table 5.10 Mean mathematical literacy scores by gender and gender differences by Indigenous status
Indigenous status
Gender differences
Females Males Difference (F - M)
Mean score S.E. Mean score S.E. Score dif. S.E.
Indigenous 440 6.3 442 6.0 -2 6.3
Non-Indigenous 512 2.8 522 2.9 -10 2.9
Note: Values that are statistically significant are indicated in bold.

190 Australian students’ performance in mathematical literacy
According to the information displayed in Figure 5.9, there is a substantial under-representation of Indigenous students at the higher end of the mathematical literacy proficiency scale and a similarly substantial over-representation of Indigenous students at the lower end. Just over two per cent (2.5%) of Indigenous students reached Level 5 and there were even fewer Indigenous students (0.7%) who were placed at Level 6. The proportion of Indigenous students who had achieved at least Level 5 (3.2%) was much lower than the 13 per cent of students across OECD countries and the 17 per cent of non-indigenous students who performed at these levels.
Four in every ten (40%) Indigenous students failed to reach Level 2, compared to around one in five (22%) students across the OECD and less than one in five (15%) of non-Indigenous students in Australia. These results indicate that a substantial proportion of Indigenous students may not be prepared adequately to function in today’s society in that they are lacking the necessary mathematical skills and knowledge.
100 80 60 40 20 0
OECD average
Non-Indigenous
Indigenous
20 40 60 80 100
Below Level 1 Level 2 Level 3 Level 4 Level 5 Level 6Level 1
19 21 25 22 9 3
5 10 20 26 22 12 5
8 14 22 24 19 10 3
Percentage of students
Figure 5.9 Proficiency levels for Indigenous and non-Indigenous students in mathematical literacy
Mathematical literacy performance and geographic location of school
The mean scores, confidence intervals and spread of scores for students by geographic location are shown in Table 5.11. As explained in Chapter 3, the geographic location of schools was classified using the broad categories from the MCEECDYA Schools Location Classification.
Students attending schools in metropolitan schools performed at a significantly higher level than students in schools from provincial areas and remote areas, and students in provincial areas significantly outperformed students in remote schools41. The difference between the average performance of students in metropolitan and provincial schools was 21 score points, and between provincial and remote schools 34 score points. The average gap between students in metropolitan and remote schools was 55 score points, which is equivalent to almost one full proficiency level or almost one-and-a-half years of schooling.
As shown in Table 5.11, the spread of scores between the 5th and 95th percentile for metropolitan and provincial schools were comparable, while the range was wider for students in remote schools.
41 Although the confidence intervals for these two groups overlap, a t-test shows that they are significantly different with p < .05
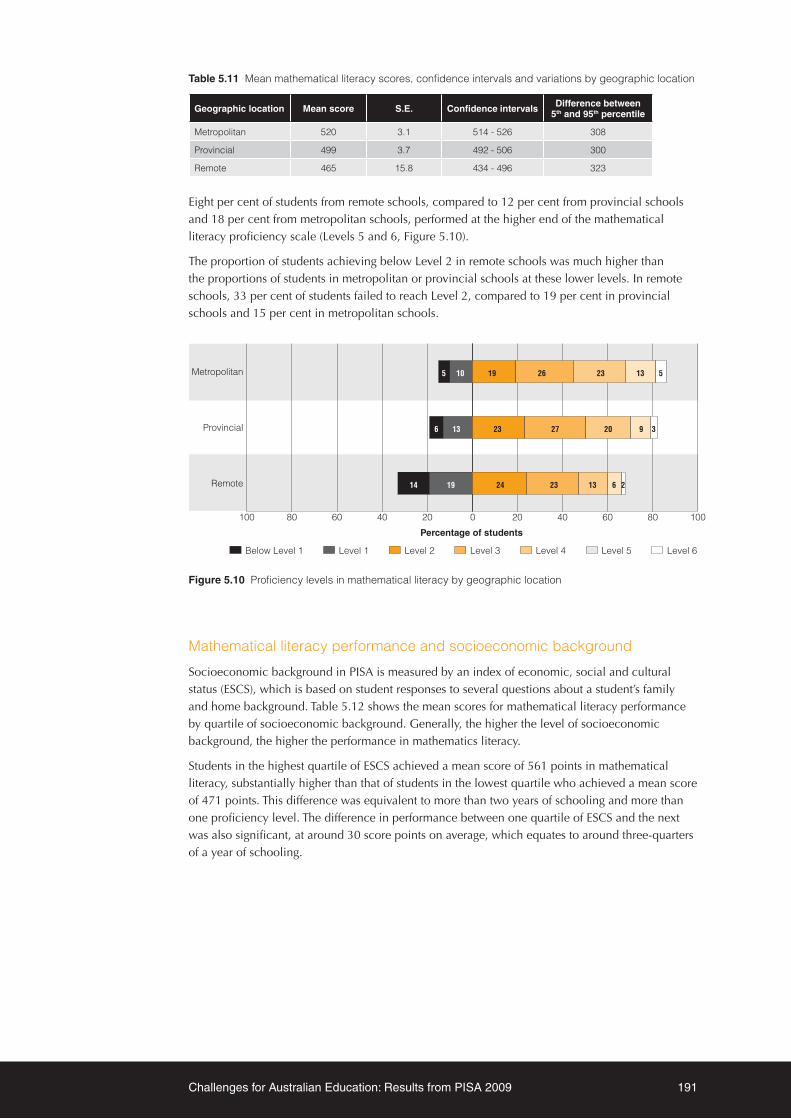
Challenges for Australian Education: Results from PISA 2009 191
Table 5.11 Mean mathematical literacy scores, confidence intervals and variations by geographic location
Geographic location Mean score S.E. Confidence intervals Difference between 5th and 95th percentile
Metropolitan 520 3.1 514 - 526 308
Provincial 499 3.7 492 - 506 300
Remote 465 15.8 434 - 496 323
Eight per cent of students from remote schools, compared to 12 per cent from provincial schools and 18 per cent from metropolitan schools, performed at the higher end of the mathematical literacy proficiency scale (Levels 5 and 6, Figure 5.10).
The proportion of students achieving below Level 2 in remote schools was much higher than the proportions of students in metropolitan or provincial schools at these lower levels. In remote schools, 33 per cent of students failed to reach Level 2, compared to 19 per cent in provincial schools and 15 per cent in metropolitan schools.
100 80 60 40 20 0
Remote
Provincial
Metropolitan
20 40 60 80 100
Below Level 1 Level 2 Level 3 Level 4 Level 5 Level 6Level 1
5 10 19 26 23 13 5
6 13 23 27 20 9 3
14 19 24 23 13 6 2
Percentage of students
Figure 5.10 Proficiency levels in mathematical literacy by geographic location
Mathematical literacy performance and socioeconomic background
Socioeconomic background in PISA is measured by an index of economic, social and cultural status (ESCS), which is based on student responses to several questions about a student’s family and home background. Table 5.12 shows the mean scores for mathematical literacy performance by quartile of socioeconomic background. Generally, the higher the level of socioeconomic background, the higher the performance in mathematics literacy.
Students in the highest quartile of ESCS achieved a mean score of 561 points in mathematical literacy, substantially higher than that of students in the lowest quartile who achieved a mean score of 471 points. This difference was equivalent to more than two years of schooling and more than one proficiency level. The difference in performance between one quartile of ESCS and the next was also significant, at around 30 score points on average, which equates to around three-quarters of a year of schooling.

192 Australian students’ performance in mathematical literacy
Table 5.12 Mean mathematical literacy scores, confidence intervals and variations by quartiles of socioeconomic background
Socioeconomic background Mean score S.E. Confidence intervals Difference between
5th and 95th percentile
Lowest quartile 471 2.6 466 - 476 290
Second quartile 503 2.5 498 - 508 280
Third quartile 530 3.0 524 - 536 291
Highest quartile 561 3.1 555 - 567 278
Figure 5.11 shows the proportions of students at each of the proficiency levels by quartiles of socioeconomic background. Almost 30 per cent of students in the highest socioeconomic quartile performed at Levels 5 or 6, compared to 19 per cent of students in the third quartile, 11 per cent of students in the second quartile and just six per cent of students in the lowest quartile. Only five per cent of students in the highest quartile of ESCS failed to reach Level 2, while there were 11 per cent of students in the third quartile, 17 per cent in the second quartile and more than one quarter (28%) of students in the lowest quartile at or below Level 1 (and thus below Level 2 and the OECD baseline for mathematical literacy).
Below Level 1 Level 2 Level 3 Level 4 Level 5 Level 6Level 1
100 80 60 40 20 0
Highest quartile
Third quartile
Second quartile
Lowest quartile
20 40 60 80 100
10 18 28 25 13 5
5 12 23 28 21 9 2
3 8 19 27 25 14 5
4 11 24 29 20 9
Percentage of students
Figure 5.11 Proficiency levels in mathematical literacy by socioeconomic background
Mathematical literacy performance and immigrant status
Three categories of immigrant status were defined based on students’ responses to questions regarding where they and their parents were born42. The mean scores, standard error, confidence interval and the difference between the 5th and 95th percentile for the three categories of immigrant status are shown in Table 5.13. Australian-born students achieved a mean score of 511 points, which was significantly lower than the average score for first-generation students, by 15 score points. No significant differences were found between the average scores of Australian-born and foreign-born students, nor between the scores of first-generation and foreign-born students.
As may be expected, given the wide range of backgrounds and experiences of immigrants that come to Australia, the range of scores between the highest and lowest performing students was wider for foreign-born students compared to that for Australian-born or first-generation students.
42 For more information about the categorisation of immigrant status, refer to the Reader’s Guide.
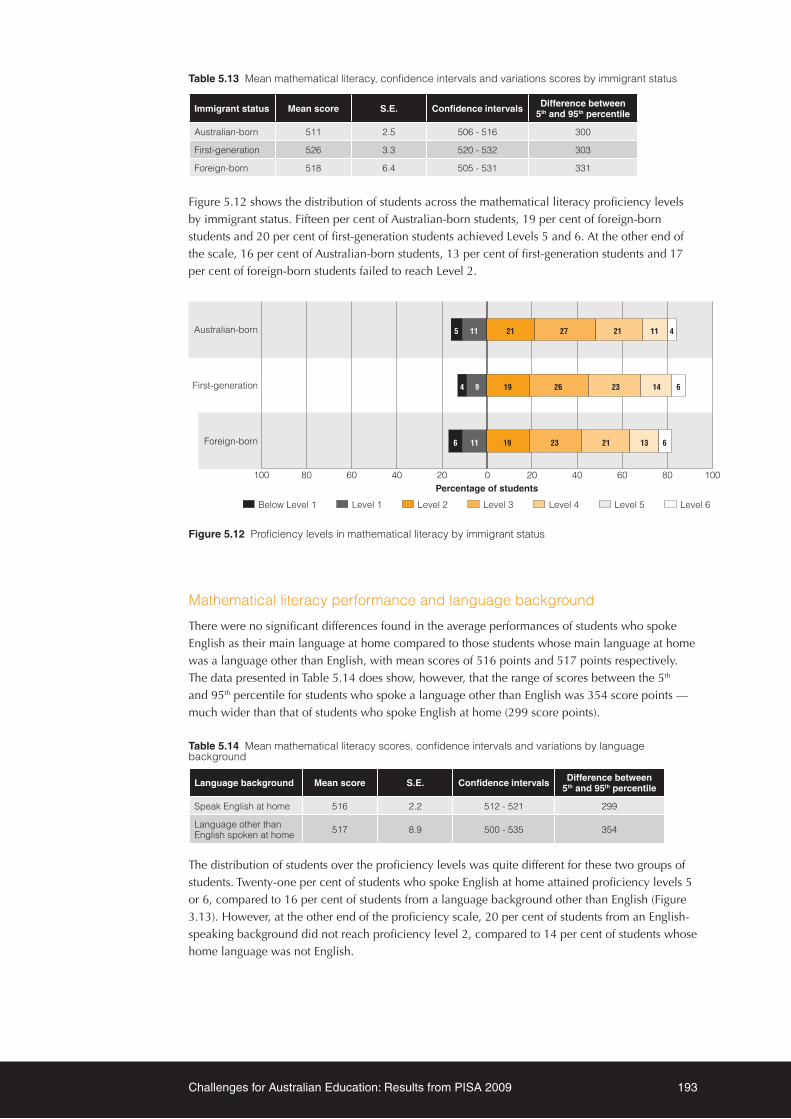
Challenges for Australian Education: Results from PISA 2009 193
Table 5.13 Mean mathematical literacy, confidence intervals and variations scores by immigrant status
Immigrant status Mean score S.E. Confidence intervals Difference between 5th and 95th percentile
Australian-born 511 2.5 506 - 516 300
First-generation 526 3.3 520 - 532 303
Foreign-born 518 6.4 505 - 531 331
Figure 5.12 shows the distribution of students across the mathematical literacy proficiency levels by immigrant status. Fifteen per cent of Australian-born students, 19 per cent of foreign-born students and 20 per cent of first-generation students achieved Levels 5 and 6. At the other end of the scale, 16 per cent of Australian-born students, 13 per cent of first-generation students and 17 per cent of foreign-born students failed to reach Level 2.
100 80 60 40 20 0
Foreign-born
First-generation
Australian-born
20 40 60 80 100
Below Level 1 Level 2 Level 3 Level 4 Level 5 Level 6Level 1
5 11 21 27 21 11 4
4 9 19 26 23 14 6
6 11 19 23 21 13 6
Percentage of students
Figure 5.12 Proficiency levels in mathematical literacy by immigrant status
Mathematical literacy performance and language background
There were no significant differences found in the average performances of students who spoke English as their main language at home compared to those students whose main language at home was a language other than English, with mean scores of 516 points and 517 points respectively. The data presented in Table 5.14 does show, however, that the range of scores between the 5th and 95th percentile for students who spoke a language other than English was 354 score points — much wider than that of students who spoke English at home (299 score points).
Table 5.14 Mean mathematical literacy scores, confidence intervals and variations by language background
Language background Mean score S.E. Confidence intervals Difference between 5th and 95th percentile
Speak English at home 516 2.2 512 - 521 299
Language other than English spoken at home 517 8.9 500 - 535 354
The distribution of students over the proficiency levels was quite different for these two groups of students. Twenty-one per cent of students who spoke English at home attained proficiency levels 5 or 6, compared to 16 per cent of students from a language background other than English (Figure 3.13). However, at the other end of the proficiency scale, 20 per cent of students from an English-speaking background did not reach proficiency level 2, compared to 14 per cent of students whose home language was not English.

194 Australian students’ performance in mathematical literacy
Below Level 1 Level 2 Level 3 Level 4 Level 5 Level 6Level 1
100 80 60 40 20 0
Language otherthan English spoken
at home
Speak Englishat home
20 40 60 80 100
4 10 20 26 22 12 4
7 13 18 21 20 13 8
Percentage of students
Figure 5.13 Proficiency levels in mathematical literacy by language background
Monitoring mathematical literacy changes over time Internationally, mathematical literacy performance can be compared in 36 countries43, including 29 OECD countries, across the three most recent cycles of PISA. Table 5.15 shows the mean scores on mathematical literacy performance for PISA 2003, PISA 2006 and PISA 2009, along with the mean score differences between PISA 2003 and PISA 2009. There has been no significant change to the OECD average, with a mean score of 500 points in PISA 2003, 497 points in PISA 2006 and 499 score points in PISA 2009.
A handful of countries have seen an improvement in their performance in mathematical literacy since PISA 2003. Mexico’s performance increased by 33 score points, Turkey’s by 22 score points, Portugal and Greece’s by 21 score points, Italy’s by 17 points and Germany’s by 10 score points.
The mathematical literacy performance of nine OECD countries, including Australia, declined significantly from PISA 2003 to PISA 2009. The largest declines were in the Czech Republic, where the average score declined by 24 score points, Ireland by 16 score points, Sweden by 15 score points, Belgium and France by 14 score points, the Netherlands by 12 score points, Denmark by 11 score points, Australia by 10 score points, and Iceland by eight score points.
43 Comparisons are made between countries who participated in PISA 2003 and PISA 2009, with a mean performance in mathematical literacy that was higher than the mean performance of the lowest scoring OECD country, Mexico. Austria and the United Kingdom have not been included in the comparison. Results for the United Kingdom in 2003 were not reported and results for PISA 2009 in Austria are not comparable with their data in PISA 2003.

Challenges for Australian Education: Results from PISA 2009 195
Table 5.15 Mean mathematical literacy scores for PISA 2003, PISA 2006 and PISA 2009, and differences in performance between cycles by country
CountryPISA 2003 PISA 2006 PISA 2009
Mean score difference between 2003 and 2009Mean
score S.E. Mean score S.E. Mean
score S.E.
Czech Republic 516 3.5 510 3.6 493 2.8
40 30 20 10 0 10 20 30 40
Differences between 2003 and 2009 significantDifferences between 2003 and 2009 not significant
Mathematical literacy
performance declined
Mathematical literacy
performance improved
Ireland 503 2.4 501 2.8 487 2.5
Sweden 509 2.6 502 2.4 494 2.9
France 511 2.5 496 3.2 497 3.1
Belgium 529 2.3 520 3.0 515 2.3
Netherlands 538 3.1 531 2.6 526 4.7
Denmark 514 2.7 513 2.6 503 2.6
Australia 524 2.1 520 2.2 514 2.5
Iceland 515 1.4 506 1.8 507 1.4
Canada 532 1.8 527 2.0 527 1.6
Japan 534 4.0 523 3.3 529 3.3
New Zealand 523 2.3 522 2.4 519 2.3
Luxembourg 493 1.0 490 1.1 489 1.2
Finland 544 1.9 548 2.3 541 2.2
Macao – China 527 2.9 525 1.3 525 0.9
Spain 485 2.4 480 2.3 483 2.1
Slovak Republic 498 3.3 492 2.8 497 3.1
Latvia 483 3.7 486 3.0 482 3.1
Russian Federation 468 4.2 476 3.9 468 3.3
OECD average-28 500 0.6 497 0.6 499 0.6
Hungary 490 2.8 491 2.9 490 3.5
Liechtenstein 536 4.1 525 4.2 536 4.1
Thailand 417 3.0 417 2.3 419 3.2
Norway 495 2.4 490 2.6 498 2.4
Korea 542 3.2 547 3.8 546 4.0
Hong Kong – China 550 4.5 547 2.7 555 2.7
United States 483 2.9 474 4.0 487 3.6
Uruguay 422 3.3 427 2.6 427 2.6
Poland 490 2.5 495 2.4 495 2.8
Serbia 437 3.8 435 3.5 442 2.9
Switzerland 527 3.4 530 3.2 534 3.3
Germany 503 3.3 504 3.9 513 2.9
Italy 466 3.1 462 2.3 483 1.9
Portugal 466 3.4 466 3.1 487 2.9
Greece 445 3.9 459 3.0 466 3.9
Turkey 423 6.7 424 4.9 445 4.4
Mexico 385 3.6 406 2.9 419 1.8

196 Australian students’ performance in mathematical literacy
Figure 5.14 shows the proportion of students not achieving proficiency level 2 for PISA 2003 and PISA 2009 in mathematical literacy, and the shading in the background indicates that the difference is significant.
Mexico, Turkey and Greece showed the largest improvement (i.e. decreasing the proportion of students not reaching Level 2), although this represents a large change from a very low starting point. In Mexico, the proportion of students not achieving Level 2 decreased by 15 percentage points from 66 per cent in PISA 2003 to 51 per cent in PISA 2009. In Turkey, the proportion declined by 10 percentage points, from 52 per cent to 42 per cent, and in Greece from 39 per cent to 30 per cent. Italy and Portugal saw decreases of seven and six percentage points respectively in the proportion of students not attaining Level 2, also from a baseline of about 30 per cent of students in PISA 2003. The OECD average decreased by one percentage point over this period, falling to 21 per cent in PISA 2009.
Seven countries, all OECD member countries, showed a significant increase in the proportion of students not reaching Level 2. In France and the Czech Republic, there was an increase of six percentage points from the PISA 2003 base of 17 per cent of students, while Iceland, Belgium, Ireland, Sweden and Luxembourg showed an increase of two to four percentage points from PISA 2003 to PISA 2009 in the proportion of students not achieving Level 2. In Australia there was no significant difference in the proportion not achieving this level.
0
20
40
60
80
100
Thai
land
Mex
ico
Uru
guay
Turk
eySe
rbia
Gre
ece
Rus
sian
Fed
erat
ion
Italy
Luxe
mbo
urg
Spai
nPo
rtug
alU
nite
d St
ates
Latv
iaFr
ance
Cze
ch R
epub
licH
unga
rySw
eden
Slov
ak R
epub
licO
ECD
ave
rage
-28
Irela
ndPo
land
Bel
gium
Ger
man
yN
orw
ayD
enm
ark
Icel
and
Aus
tralia
New
Zea
land
Switz
erla
ndN
ethe
rland
sJa
pan
Can
ada
Mac
ao –
Chi
naLi
echt
enst
ein
Hon
g K
ong
– C
hina
Kor
eaFi
nlan
d
PISA 2009 PISA 2003
Perc
enta
ge o
f stu
dent
s
Figure 5.14 Percentage of students peforming below Level 2 on the mathematical literacy scale in PISA 2003 and PISA 2009 by country44
Figure 5.15 has a similar layout to Figure 5.14, except it shows the top performers in mathematical literacy: the percentage of students who performed at Levels 5 and 6 in PISA 2003 and PISA 2009 by country. Across the 29 OECD countries, there was a small decrease (on average, 1%) in the percentage of students who achieved Level 5 or 6 from PISA 2003 to PISA 2009.
44 Background shading in the figure indicates countries with a significant change in the proportion of students performing below Level 2 in mathematical literacy in PISA 2003 and PISA 2009.

Challenges for Australian Education: Results from PISA 2009 197
Three countries (Greece, Italy and Portugal) showed significant improvement in the proportion of students who reached Level 5 or above from PISA 2003 to PISA 2009. In Portugal, the proportion increased by five percentage points, from five per cent to 10 per cent, and in Italy and Greece, there was a two per cent increase in the proportion of students achieving at the highest levels.
Ten countries, nine of which were OECD countries, showed a significant decline in the proportion of students reaching Level 5 or above. The Czech Republic showed the largest decrease of seven percentage points from PISA 2003 to PISA 2009. Other countries showing a decline were: Belgium, the Netherlands, Ireland, Sweden, Denmark, Latvia, Canada and Iceland (with a decrease of between 2% and 7% in the proportion of students who reached Level 5 or above from PISA 2003 to PISA 2009). In PISA 2003, 20 per cent of Australian students reached Level 5 or above, compared to 15 per cent of students across the OECD. In PISA 2009, the proportion of Australian students decreased to 16 per cent, while the proportion of students who reached Level 5 or above declined to 13 per cent across OECD countries.
0
20
40
60
80
100
Hon
g K
ong
– C
hina
Kor
eaSw
itzer
land
Finl
and
Japa
nB
elgi
umN
ethe
rland
sN
ew Z
eala
ndC
anad
aLi
echt
enst
ein
Ger
man
yM
acao
– C
hina
Aus
tralia
Fran
ceIc
elan
dO
ECD
ave
rage
-28
Slov
ak R
epub
licC
zech
Rep
ublic
Den
mar
kSw
eden
Luxe
mbo
urg
Pola
ndN
orw
ayH
unga
ryU
nite
d St
ates
Port
ugal
Italy
Spai
nIre
land
Gre
ece
Latv
iaTu
rkey
Rus
sian
Fed
erat
ion
Serb
iaU
rugu
ayTh
aila
ndM
exic
o
PISA 2009 PISA 2003
Perc
enta
ge o
f stu
dent
s
Figure 5.15 Percentage of students performing at Level 5 or above on the mathematical literacy scale in PISA 2003 and PISA 2009 by country45
Table 5.16 shows the mean scores in mathematical literacy for PISA 2003, PISA 2006 and PISA 2009, plus the change between 2009 and 2003 for Australian states. Four states: the Australian Capital Territory, New South Wales, South Australia and Western Australia all showed large and significant declines in average scores from PISA 2003. The largest change was in South Australia, where the average score decreased by 26 score points, then the Australian Capital Territory with a decrease of 20 score points, Western Australia with a decrease of 19 score points, and New South Wales with a decrease of 14 score points. Students in Victoria, Northern Territory, Queensland and Tasmania showed no change in average scores over the three cycles.
45 Background shading in the figure indicates countries with a significant change in the proportion of students performing at Level 5 or above in mathematical literacy in PISA 2003 and PISA 2009.

198 Australian students’ performance in mathematical literacy
Table 5.16 Mean mathematical literacy scores for PISA 2003, PISA 2006 and PISA 2009, and differences in performance between cycles by state
State
PISA 2003 PISA 2006 PISA 2009Difference in mean score between
2003 and 2009Mean score S.E. Mean
score S.E. Mean score S.E.
SA 535 4.9 520 4.3 509 5.3
40 30 20 10 0 10 20 30 40
Differences between 2003 and 2009 significant
Differences between 2003 and 2009 not significant
Mathematical literacy
performance declined
Mathematical literacy
performance improved
TAS 507 9.4 502 3.8 487 5.1
ACT 548 3.5 539 5.6 528 6.4
WA 548 4.1 531 6.5 529 7.2
NSW 526 4.3 523 5.0 512 5.2
NT 496 4.9 481 6.2 487 4.9
QLD 520 6.9 519 4.4 518 7.5
VIC 511 5.1 513 4.0 512 4.9
To explore the differences in the data in Table 5.16 a little further, the proportion of students at the two extremes of the distribution is shown in Table 5.17. In South Australia and Western Australia, the proportion of students not reaching Level 2 in mathematical literacy increased significantly by five percentage points, and at the same time the proportion of students in South Australia in the highest achievement levels decreased by nine percentage points. The only other state in which there was a significant change in the proportion of students achieving at the highest levels was the Australian Capital Territory, in which the proportion of students achieving Levels 5 and 6 decreased from 27 per cent in PISA 2003 to 21 per cent in PISA 2009.
Table 5.17 Percentage of students performing below Level 2 or achieving Level 5 or above on the mathematical literacy scale in PISA 2003 and 2009 by state and for Australia overall
State
PISA 2003 PISA 2009 Change between 2003 and 2009
Below Level 2
Level 5 or above
Below Level 2
Level 5 or above Below Level 2 Level 5 or
above
% S.E. % S.E. % S.E. % S.E. % dif. S.E. % dif. S.E.
ACT 11 1.3 27 1.8 14 2.1 21 2.4 3 2.4 -6 3.0
NSW 14 1.2 20 1.9 17 1.3 16 1.9 3 1.7 -5 2.7
VIC 17 1.6 15 1.4 16 1.7 15 1.3 -1 2.3 0 1.9
QLD 16 2.1 18 2.2 15 1.5 18 2.8 -1 2.6 0 3.6
SA 11 1.3 23 1.9 16 1.8 14 1.8 5 2.2 -9 2.7
WA 8 1.0 28 1.6 13 1.9 22 2.4 5 2.2 -6 2.9
TAS 18 3.3 14 2.3 24 2.3 10 1.3 7 4.0 -4 2.6
NT 21 1.9 14 2.9 24 2.7 10 1.6 2 3.3 -4 3.4
Australia 14 0.7 20 0.8 16 0.7 16 0.9 2 1.0 -3 1.2
Note: Values that are statistically significant are indicated in bold.
The mean mathematical literacy performance for Indigenous students in PISA 2003 was 440 score points, and in PISA 2006 it was 442 score points. In PISA 2009, the mean mathematical literacy performance for Indigenous students stayed about the same as in previous cycles, at 441 score points (Table 5.18). In PISA 2009, the mean mathematical literacy score for non-Indigenous students was significantly lower than it was in PISA 2003, by nine score points.

Challenges for Australian Education: Results from PISA 2009 199
Table 5.18 Mean mathematical literacy scores for PISA 2003, PISA 2006 and PISA 2009, and differences in performance between cycles for Indigenous students
Indigenous status
PISA 2003 PISA 2006 PISA 2009 Change between 2003 and 2009(PISA 2009 – PISA 2003)
Mean score S.E. Mean
score S.E. Mean score S.E. Score dif. S.E.
Indigenous 440 5.4 442 7.3 441 5.3 1 7.9
Non-Indigenous 526 2.1 522 2.3 517 2.5 -9 3.8
Note: Values that are statistically significant are indicated in bold.
There were no significant differences between the proportion of Indigenous students who performed below Level 2, or between the proportion of Indigenous students who reached Level 5 or above from PISA 2003 to PISA 2009 (Table 5.19). There was, however, a significant decrease (of 3%) in the proportion of non-Indigenous students who performed at Level 5 or above between PISA 2003 and PISA 2009.
Table 5.19 Percentage of students performing below Level 2 or achieving Level 5 or above on the mathematical literacy scale in PISA 2003 and PISA 2009 by Indigenous status
Indigenous status
PISA 2003 PISA 2009 Change between 2003 and 2009(PISA 2009 – PISA 2003)
Below Level 2
Level 5 or above
Below Level 2
Level 5 or above Below Level 2 Level 5 or
above
% S.E. % S.E. % S.E. % S.E. % dif. S.E. % dif. S.E.
Indigenous students 43 4.0 5 1.0 40 2.5 3 0.7 -3 4.7 -1 1.2
Non-Indigenous students 14 0.7 20 0.8 15 0.6 17 0.9 1 0.9 -3 1.2
Note: Values that are statistically significant are indicated in bold.

200 Australian students’ performance in mathematical literacy

Challenges for Australian Education: Results from PISA 2009 201
Key Findings ◗ Australia was outperformed by six countries: Shanghai – China, Finland, Hong Kong
– China, Singapore, Japan and Korea in scientific literacy. Australia’s performance was not significantly different from seven countries: New Zealand, Canada, Estonia, the Netherlands, Chinese Taipei, Germany and Liechtenstein. All other countries performed at a level significantly lower than Australia.
◗ Australia’s mean score of 527 points was significantly higher than the OECD average of 501 points for scientific literacy.
◗ Fourteen per cent of Australia’s students achieved the highest scientific literacy proficiency levels (Level 5 or above) compared to eight per cent of students across OECD countries.
◗ Only 12 per cent of Australian students did not reach Level 2 in scientific literacy compared to 18 percent of students across the OECD.
◗ Significant gender differences in scientific literacy scores in favour of females were found 11 countries, and in favour of males in 10 other countries. No significant gender differences in average scientific literacy scores were found in Australia.
◗ In Australia, 13 per cent of females and 16 percent of males achieved Level 5 or above compared to eight per cent of females and nine per cent of males across OECD countries. Fourteen per cent of Australian males and 11 per cent of Australian females failed to reach Level 2, which was lower than the proportions across the OECD of 17 per cent for females and 18 per cent for males.
◗ The Australian Capital Territory, Western Australia, New South Wales and Queensland performed similarly in scientific literacy, with the Australian Capital Territory and Western Australia performing significantly higher than four states (Victoria, South Australia, Tasmania and the Northern Territory). New South Wales and Queensland performed statistically similar to Victoria and South Australia and performed significantly higher than Tasmania and the Northern Territory.
◗ Tasmania and the Northern Territory achieved similar results to the OECD average. All other states performed significantly higher than the OECD average in scientific literacy.
◗ No significant differences in scientific literacy scores were found between school sectors once a student’s individual socioeconomic background and the socioeconomic background of peers at school were taken into account.
◗ The mean performance of Indigenous students in scientific literacy was significantly lower than that of non-Indigenous students by more than two years of schooling.
◗ Two per cent of Indigenous students reached Level 5 or above in scientific literacy, compared to 15 per cent of non-Indigenous students. Thirty-five per cent of Indigenous students, compared to 12 per cent of non-Indigenous students, did not reach Level 2.
Chapter
6Australian students’ performance in scientific literacy

202 Australian students’ performance in scientific literacy
◗ Students in metropolitan schools performed at a significantly higher level than students in provincial or remote schools, with a difference of almost one-and-a-half years of schooling.
◗ Six per cent of students in remote schools reached Level 5 or above compared to 15 per cent of students in metropolitan schools. Twenty-four per cent of students in remote schools did not reach Level 2 compared to 12 per cent of students in metropolitan schools that did not reach this level.
◗ Students in the highest socioeconomic quartile performed significantly higher in scientific literacy than students in the lowest socioeconomic quartile. This difference is about two-and-a-half years of schooling.
◗ Six per cent of students in the lowest quartile of socioeconomic background reached Level 5 or above compared to 28 per cent of students in the highest quartile of socioeconomic background. Twenty-two per cent of students in the lowest quartile of socioeconomic background did not reach Level 2 while four per cent of students in the highest quartile of socioeconomic background did not reach this level.
◗ Scientific literacy performance in PISA 2006 and PISA 2009 was compared in 34 countries, with 12 countries showing a significant change in their performance across the cycles.
◗ No significant changes in scientific literacy performance were found for Australia or for any of the Australian states from PISA 2006 to PISA 2009.
To what extent have students learned fundamental scientific concepts and theories? How well can they identify scientific issues, explain phenomena scientifically, and use scientific evidence as they encounter, interpret, and solve real-life problems involving science and technology? The assessment of scientific literacy in PISA aims to answer these questions.
Scientific literacy was a major domain in PISA 2006 and provided an in-depth analysis of knowledge and skills of 15-year-old students. The rotating cycle of major domains of assessment for PISA means that, in 2009, reading literacy replaced scientific literacy as the major domain of assessment and scientific literacy was assessed as a minor domain. For this reason, results are reported for the scientific literacy scale overall, but not by subscale.
The first part of this chapter provides a summary of the scientific literacy domain and the assessment framework, a description of how PISA measures scientific literacy and some examples of scientific literacy items used in PISA46. The second part of the chapter focuses on the achievement of Australian students in scientific literacy in PISA 2009, following a similar format as employed in Chapters 3 and 5 – commencing with a discussion of Australia’s results in an international context, moving then to a national context, and followed by a comparison of scientific literacy performance in PISA 2006 and PISA 2009.
How is scientific literacy defined in PISA?An understanding of science and technology is central to a young person’s preparedness for life in modern society, in which science and technology play a significant role. This understanding also empowers individuals to participate appropriately in understanding public policy where issues of science and technology impact on their lives, and contributes significantly to the personal, social, professional and cultural lives of everyone.
The PISA scientific literacy domain refers to an individuals’:
… scientific knowledge and use of that knowledge to identify questions, acquire new knowledge, to explain scientific phenomena and to draw evidence-based conclusions about science related issues; their understanding of the characteristic features of
46 The first part of this chapter has been adapted from the National PISA 2006 report Exploring scientific literacy: How Australia measures up

Challenges for Australian Education: Results from PISA 2009 203
science as a form of human knowledge and enquiry; their awareness of how science and technology shape our material, intellectual and cultural environments; and their willingness to engage with science-related issues, and with the ideas of science, as a reflective citizen.
The definition includes knowledge of science, which refers to the knowledge of the natural world across the major fields of physics, chemistry, biological science, Earth and space science, and science-based technology, and knowledge about science, which refers to the knowledge of the means (scientific enquiry) and the goals (scientific explanations) of science. The PISA framework further elaborates on, and gives greater emphasis to, knowledge about science as an aspect of science performance, through the addition of elements that underscore students’ knowledge about the characteristic features of science. The term ‘scientific literacy’ used in this report refers collectively to both knowledge about science and knowledge of science.
How is scientific literacy measured in PISA?The scientific literacy framework comprises four interrelated aspects: the contexts in which tasks are embedded, the competencies that students need to apply, the knowledge domains involved, and students’ attitudes towards science. These are shown in Figure 6.1.
ContextLive situations thatinvolve scienceand technology
Competencies• Identify scientific issues
• Explain phenomena scientifically
• Use scientific evidence
Requiresyou to:
Knowledge
What you know:
• About the natural world (knowledge of science)
• About science itself (knowledge about science)
Attitudes
How you respond to science issues:
• interest
• support for scientific enquiry
• responsibility
How youdo so is influenced by:
Figure 6.1 The components of the PISA scientific literacy framework
Situations and context
PISA’s orientation focuses on preparing students for their future lives, and so the items for the PISA science assessment are situated in general life, not just life in the classroom. In the PISA scientific literacy assessment, the focus of the items is on situations relating to the self, family and peer groups (personal), to the community (social) and to life across the world (global). Some items are framed in a historical situation, in which an understanding of the advances in scientific knowledge can be assessed.
The context of an item is its specific setting within a situation. It includes all of the detailed elements used to formulate the question.
Figure 6.2 lists the applications of science, within personal, social and global situations, which are primarily used as the contexts for the PISA assessment. These are not definitive: other situations, such as technical and historical, and areas of application are also used in PISA. The applications were drawn from a wide variety of life situations and were generally consistent with the areas of application for scientific literacy in the PISA 2000 and 2003 frameworks, prior to PISA 2006 when

204 Australian students’ performance in scientific literacy
scientific literacy was the major domain. The areas of application are: health, natural resources, the environment, hazards and the frontiers of science and technology. These are the areas in which scientific literacy has particular value for individuals and communities in enhancing and sustaining quality of life, and in the development of public policy.
Personal (self, family and peer groups) Social (the community) Global (life across the world)
Health maintenance of health, accidents, nutrition
control of disease, social transmission, food choices, community health
epidemics, spread of infectious diseases
Natural resources
personal consumption of materials and energy
maintenance of human populations, quality of life, security, production and distribution of food, energy supply
renewable and non-renewable energy sources, natural systems, population growth, sustainable uses of species
Environment environmentally friendly behaviour, use and disposal of materials
population of distribution, disposal of waste, environmental impact, local weather
biodiversity, ecological sustainability, control of pollution, production and loss of soil
Hazard natural and human-induced decisions about housing
rapid changes (earthquakes, severe weather), slow and progressive changes (coastal erosion, sedimentation), risk assessment
climate change, impact of modern warfare
Frontiers for science and technology
interest in science’s explanations of natural phenomena, science-based hobbies, sport and leisure, music and personal technology
new materials, devices and processes, genetic modification, weapons technology, transport
extinction of species, exploration of space, origin and structure of the universe
Figure 6.2 Contexts for the PISA scientific literacy assessment
Scientific competencies
The PISA scientific literacy assessment items required students to identify scientifically oriented issues, explain phenomena scientifically, and use scientific evidence. These three competencies were chosen because of their importance to the practice of science and their connection to key cognitive abilities such as inductive and deductive reasoning, systems-based thinking, critical decision-making, transformation of information (e.g. creating tables or graphs out of raw data), and thinking in terms of models and use of science. The essential features of each of the three competencies are described and elaborated in Figure 6.3.
Identifying scientific issues• Recognising issues that are possible to investigate scientifically
• Identifying keywords to search for scientific information
• Recognising the key features of a scientific investigation
Explaining phenomena scientifically• Applying knowledge of science in a given situation
• Describing or interpreting phenomena scientifically and predicting changes
• Identifying appropriate descriptions, explanations and predictions
Using scientific evidence• Interpreting scientific evidence and making and communicating decisions
• Identifying the assumptions, evidence and reasoning behind conclusions
• Reflecting on the societal implications of science and technological developments
Figure 6.3 PISA scientific competencies

Challenges for Australian Education: Results from PISA 2009 205
Scientific issues must lend themselves to answers based on scientific evidence. The competency identifying scientific issues includes recognising questions that it would be possible to investigate scientifically in a given situation and identifying keywords to search for scientific information on a given topic. It also involves recognising key features of a scientific investigation; for example, what things should be compared, what variables should be changed or controlled, what additional information is needed, or what action should be taken so that relevant data can be collected. Identifying scientific issues requires students to possess knowledge about science itself, and may also draw on students’ knowledge of science.
Students demonstrate explaining phenomena scientifically by applying appropriate knowledge of science in a given situation. The competency includes describing or interpreting phenomena and predicting changes, and may involve recognising or identifying appropriate descriptions, explanations, and predictions.
The competency using scientific evidence requires students to make sense of scientific findings as evidence for claims or conclusions. The required response can involve knowledge about science or knowledge of science or both. Students should be able to assess scientific information and produce arguments based on scientific evidence. The competency may also involve: selecting from alternative conclusions in relation to evidence, giving reasons for or against a given conclusion in terms of the process by which the conclusion was derived from the data provided, and identifying the assumptions made in reaching a conclusion. Reflecting on the societal implications of scientific or technological developments is another perspective of this competency.
Scientific knowledge
As noted previously, scientific knowledge refers to both knowledge of science (Knowledge about the natural world) and knowledge about science itself.
Knowledge of science
Clearly only a sample of students’ knowledge of science could be assessed in any one PISA assessment, and the focus of the assessment is the extent to which students are able to apply their knowledge in contexts of relevance to their lives. The assessed knowledge was selected from the major fields of physics, chemistry, biology, Earth and space science, and technology according to the following criteria. Items had to be:
◗ relevant to real-life situations – scientific knowledge differs in the degree to which it is useful to the life of individuals;
◗ representative of important scientific concepts and thus have enduring utility; and
◗ appropriate to the developmental level of 15-year-old students.
Figure 6.4 shows the four content areas defined within knowledge of science. The four areas represent knowledge required for understanding the natural world and for making sense of experiences in personal, social and global contexts. For this reason the framework uses the term “systems” instead of “sciences” in the descriptors of the content areas. The intention is to convey the idea that citizens have to understand concepts from the physical and life sciences, Earth and space science, and technology in different contexts.
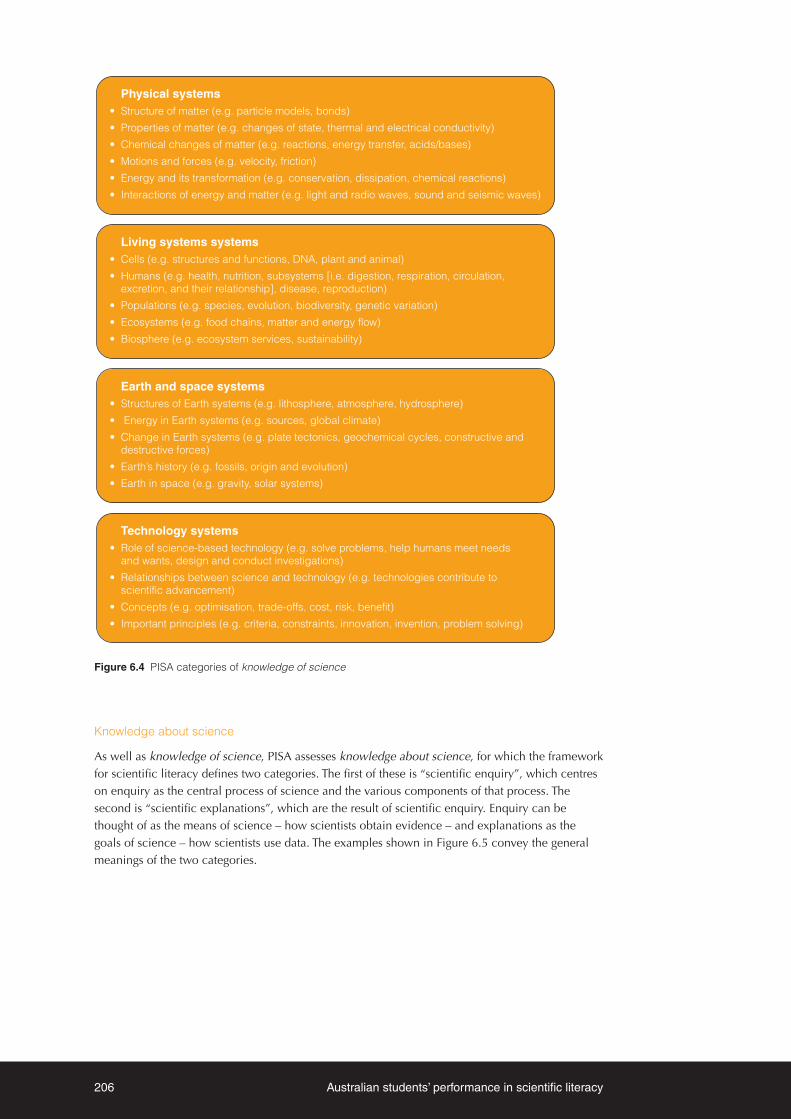
206 Australian students’ performance in scientific literacy
Physical systems• Structure of matter (e.g. particle models, bonds)
• Properties of matter (e.g. changes of state, thermal and electrical conductivity)
• Chemical changes of matter (e.g. reactions, energy transfer, acids/bases)
• Motions and forces (e.g. velocity, friction)
• Energy and its transformation (e.g. conservation, dissipation, chemical reactions)
• Interactions of energy and matter (e.g. light and radio waves, sound and seismic waves)
Technology systems• Role of science-based technology (e.g. solve problems, help humans meet needs and wants, design and conduct investigations)
• Relationships between science and technology (e.g. technologies contribute to scientific advancement)
• Concepts (e.g. optimisation, trade-offs, cost, risk, benefit)
• Important principles (e.g. criteria, constraints, innovation, invention, problem solving)
Earth and space systems• Structures of Earth systems (e.g. lithosphere, atmosphere, hydrosphere)
• Energy in Earth systems (e.g. sources, global climate)
• Change in Earth systems (e.g. plate tectonics, geochemical cycles, constructive and destructive forces)
• Earth’s history (e.g. fossils, origin and evolution)
• Earth in space (e.g. gravity, solar systems)
Living systems systems• Cells (e.g. structures and functions, DNA, plant and animal)
• Humans (e.g. health, nutrition, subsystems [i.e. digestion, respiration, circulation, excretion, and their relationship], disease, reproduction)
• Populations (e.g. species, evolution, biodiversity, genetic variation)
• Ecosystems (e.g. food chains, matter and energy flow)
• Biosphere (e.g. ecosystem services, sustainability)
Figure 6.4 PISA categories of knowledge of science
Knowledge about science
As well as knowledge of science, PISA assesses knowledge about science, for which the framework for scientific literacy defines two categories. The first of these is “scientific enquiry”, which centres on enquiry as the central process of science and the various components of that process. The second is “scientific explanations”, which are the result of scientific enquiry. Enquiry can be thought of as the means of science – how scientists obtain evidence – and explanations as the goals of science – how scientists use data. The examples shown in Figure 6.5 convey the general meanings of the two categories.
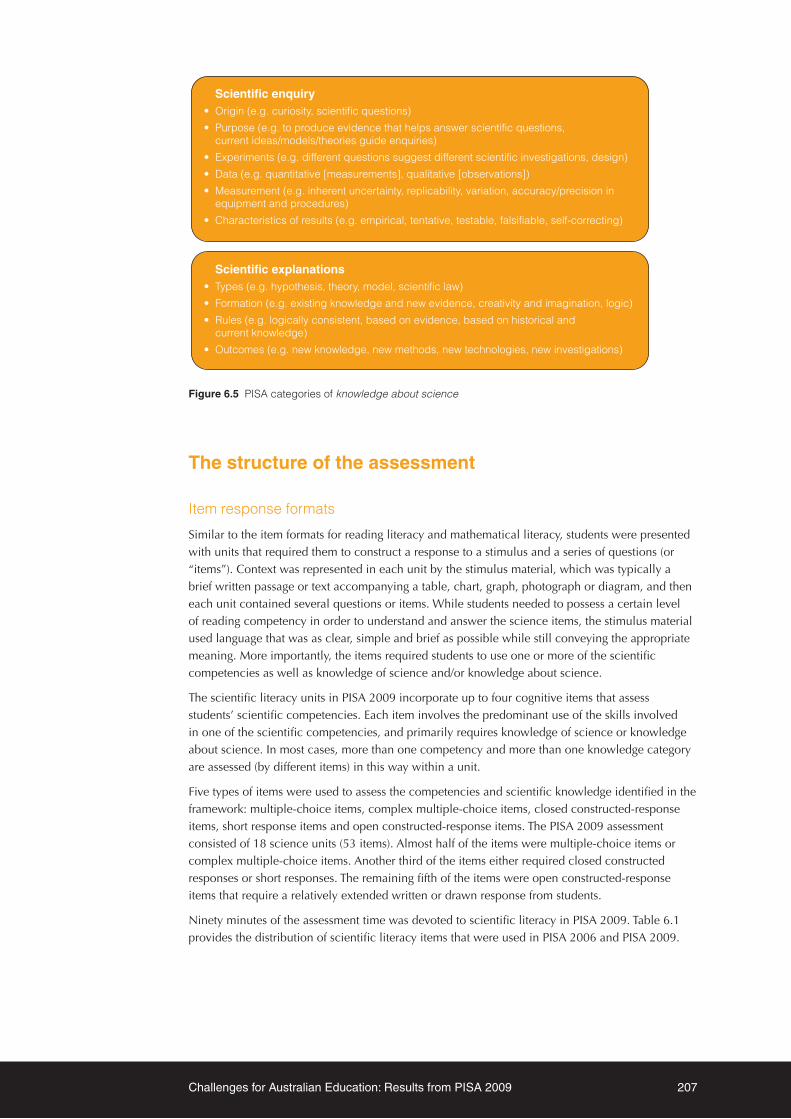
Challenges for Australian Education: Results from PISA 2009 207
Scientific enquiry• Origin (e.g. curiosity, scientific questions)
• Purpose (e.g. to produce evidence that helps answer scientific questions, current ideas/models/theories guide enquiries)
• Experiments (e.g. different questions suggest different scientific investigations, design)
• Data (e.g. quantitative [measurements], qualitative [observations])
• Measurement (e.g. inherent uncertainty, replicability, variation, accuracy/precision in equipment and procedures)
• Characteristics of results (e.g. empirical, tentative, testable, falsifiable, self-correcting)
Scientific explanations• Types (e.g. hypothesis, theory, model, scientific law)
• Formation (e.g. existing knowledge and new evidence, creativity and imagination, logic)
• Rules (e.g. logically consistent, based on evidence, based on historical and current knowledge)
• Outcomes (e.g. new knowledge, new methods, new technologies, new investigations)
Figure 6.5 PISA categories of knowledge about science
The structure of the assessment
Item response formats
Similar to the item formats for reading literacy and mathematical literacy, students were presented with units that required them to construct a response to a stimulus and a series of questions (or “items”). Context was represented in each unit by the stimulus material, which was typically a brief written passage or text accompanying a table, chart, graph, photograph or diagram, and then each unit contained several questions or items. While students needed to possess a certain level of reading competency in order to understand and answer the science items, the stimulus material used language that was as clear, simple and brief as possible while still conveying the appropriate meaning. More importantly, the items required students to use one or more of the scientific competencies as well as knowledge of science and/or knowledge about science.
The scientific literacy units in PISA 2009 incorporate up to four cognitive items that assess students’ scientific competencies. Each item involves the predominant use of the skills involved in one of the scientific competencies, and primarily requires knowledge of science or knowledge about science. In most cases, more than one competency and more than one knowledge category are assessed (by different items) in this way within a unit.
Five types of items were used to assess the competencies and scientific knowledge identified in the framework: multiple-choice items, complex multiple-choice items, closed constructed-response items, short response items and open constructed-response items. The PISA 2009 assessment consisted of 18 science units (53 items). Almost half of the items were multiple-choice items or complex multiple-choice items. Another third of the items either required closed constructed responses or short responses. The remaining fifth of the items were open constructed-response items that require a relatively extended written or drawn response from students.
Ninety minutes of the assessment time was devoted to scientific literacy in PISA 2009. Table 6.1 provides the distribution of scientific literacy items that were used in PISA 2006 and PISA 2009.

208 Australian students’ performance in scientific literacy
Table 6.1 Distribution of scientific literacy items, by science competencies and content area in PISA 2006 and PISA 2009
Item types (%)
Multiple choice
Complex multiple choice
Closed constructed
response
Open constructed
response
Short response
Number of items
Distribution of science items by science competencies
Identifying scientific issues
9 4 10 6 0 0 5 3 0 0 24 13
Explaining phenomena scientifically
22 8 11 7 4 1 16 6 0 0 53 22
Using scientific evidence
7 6 8 4 1 0 15 8 0 0 31 18
Distribution of science items by content area
Knowledge of science ‘physical systems’
8 3 3 2 2 1 4 0 0 0 17 6
Knowledge of science ‘living systems’
9 2 7 3 1 0 8 4 0 0 25 9
Knowledge of science ‘Earth and space’
5 3 2 2 1 0 4 2 0 0 12 7
Knowledge of science ‘technology systems’
2 1 3 2 0 0 3 1 0 0 8 4
Knowledge about science ‘scientific enquiry’
9 4 10 6 0 0 6 4 0 0 25 14
Knowledge about science ‘scientific explanations’
5 5 4 2 1 0 11 6 0 0 21 13
Total 38 18 29 17 5 1 36 17 0 0 108 53
PISA 2006: scientific literacy as a major domain
PISA 2009: scientific literacy as a minor domain
Reporting scientific literacy performance: mean scores and proficiency levels Scientific literacy was the main focus of the PISA 2006 assessment, allowing for the scientific literacy proficiency scale to be defined and described in-depth. Results were reported on an overall scale and on the three scientific competencies (identifying scientific issues, explaining phenomena scientifically and using scientific evidence). In PISA 2009, scientific literacy was a minor focus of assessment with results reported on an overall scale only.
Mean scores and distribution of scores
In PISA 2009, the mean score in scientific literacy was set at 501 points. The PISA 2006 scientific literacy mean score for OECD countries was set at 498 points47. This mean score is the benchmark against which scientific literacy performance in PISA 2009 is compared and will be the benchmark for other future comparisons.
47 The mean score was originally 500 points in PISA 2006 with the 30 OECD countries, but 498 score points after taking into account the 4 new OECD countries.

Challenges for Australian Education: Results from PISA 2009 209
Proficiency levels
PISA 2009 used the six proficiency levels for scientific literacy that were developed in PISA 2006, with Level 6 as the highest and Level 1 as the lowest. Each level provides a description of the scientific knowledge and skills that students can typically do at that level (Figure 6.6).
Proficiency level General scientific literacy proficiencies students should have at each level
6
At Level 6, students can consistently identify, explain and apply scientific knowledge and knowledge about science in a variety of complex life situations. They can link different information sources and explanations and use evidence from those sources to justify decisions. They clearly and consistently demonstrate advanced scientific thinking and reasoning, and they are willing to use their scientific understanding in support of solutions to unfamiliar scientific and technological situations. Students at this level can use scientific knowledge and develop arguments in support of recommendations and decisions that centre on personal, social, or global situations.
707.9 score points
5
At Level 5, students can identify the scientific components of many complex life situations, apply both scientific concepts and knowledge about science to these situations, and can compare, select and evaluate appropriate scientific evidence for responding to life situations. Students at this level can use well-developed inquiry abilities, link knowledge appropriately and bring critical insights to situations. They can construct explanations based on evidence and arguments based on their critical analysis.
633.3 score points
4
At Level 4, students can work effectively with situations and issues that may involve explicit phenomena requiring them to make inferences about the role of science or technology. They can select and integrate explanations from different disciplines of science or technology and link those explanations directly to aspects of life situations. Students at this level can reflect on their actions and they can communicate decisions using scientific knowledge and evidence.
558.7 score points
3
At Level 3, students can identify clearly described scientific issues in a range of contexts. They can select facts and knowledge to explain phenomena and apply simple models or inquiry strategies. Students at this level can interpret and use scientific concepts from different disciplines and can apply them directly. They can develop short statements using facts and make decisions based on scientific knowledge.
484.1 score points
2
At Level 2, students have adequate scientific knowledge to provide possible explanations in familiar contexts or draw conclusions based on simple investigations. They are capable of direct reasoning and making literal interpretations of the results of scientific inquiry or technological problem solving.
409.5 score points
1At Level 1, students have such a limited scientific knowledge that it can only be applied to a few, familiar situations. They can present scientific explanations that are obvious and follow explicitly from given evidence.
334.9 score points
Figure 6.6 Summary descriptions of the six proficiency levels on the overall scientific literacy scale
Students who performed below the lower boundary of Level 1 (334.9 score points) could not be reliably described because there are not enough scientific literacy items located in this lower region of the scale. However, students placed at this lower level of the scientific literacy proficiency scale are considered to be lacking the necessary skills to participate fully in society beyond school.
Level 2 was established as the baseline level of scientific literacy, defining the level of achievement on the PISA scientific literacy scale at which students begin to demonstrate the scientific knowledge and skills that will enable them to participate actively in life situations related to science and technology.
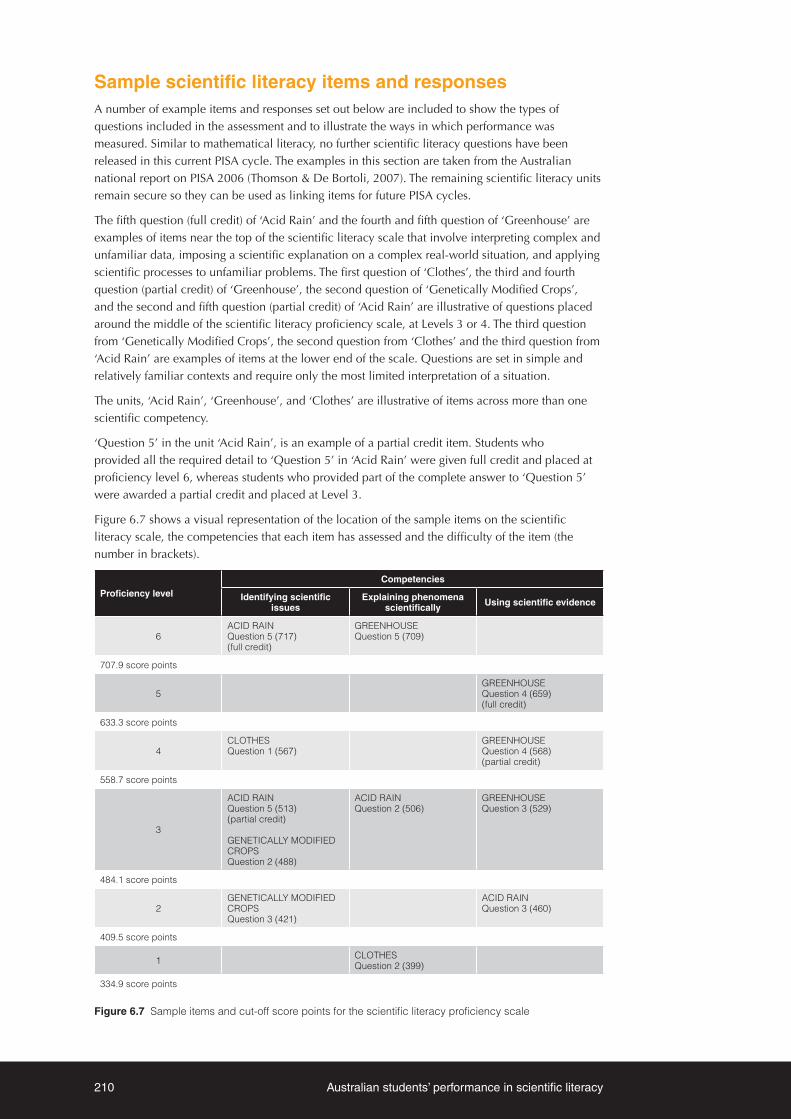
210 Australian students’ performance in scientific literacy
Sample scientific literacy items and responsesA number of example items and responses set out below are included to show the types of questions included in the assessment and to illustrate the ways in which performance was measured. Similar to mathematical literacy, no further scientific literacy questions have been released in this current PISA cycle. The examples in this section are taken from the Australian national report on PISA 2006 (Thomson & De Bortoli, 2007). The remaining scientific literacy units remain secure so they can be used as linking items for future PISA cycles.
The fifth question (full credit) of ‘Acid Rain’ and the fourth and fifth question of ‘Greenhouse’ are examples of items near the top of the scientific literacy scale that involve interpreting complex and unfamiliar data, imposing a scientific explanation on a complex real-world situation, and applying scientific processes to unfamiliar problems. The first question of ‘Clothes’, the third and fourth question (partial credit) of ‘Greenhouse’, the second question of ‘Genetically Modified Crops’, and the second and fifth question (partial credit) of ‘Acid Rain’ are illustrative of questions placed around the middle of the scientific literacy proficiency scale, at Levels 3 or 4. The third question from ‘Genetically Modified Crops’, the second question from ‘Clothes’ and the third question from ‘Acid Rain’ are examples of items at the lower end of the scale. Questions are set in simple and relatively familiar contexts and require only the most limited interpretation of a situation.
The units, ‘Acid Rain’, ‘Greenhouse’, and ‘Clothes’ are illustrative of items across more than one scientific competency.
‘Question 5’ in the unit ‘Acid Rain’, is an example of a partial credit item. Students who provided all the required detail to ‘Question 5’ in ‘Acid Rain’ were given full credit and placed at proficiency level 6, whereas students who provided part of the complete answer to ‘Question 5’ were awarded a partial credit and placed at Level 3.
Figure 6.7 shows a visual representation of the location of the sample items on the scientific literacy scale, the competencies that each item has assessed and the difficulty of the item (the number in brackets).
Proficiency level
Competencies
Identifying scientific issues
Explaining phenomena scientifically Using scientific evidence
6ACID RAIN Question 5 (717) (full credit)
GREENHOUSE Question 5 (709)
707.9 score points
5GREENHOUSE Question 4 (659) (full credit)
633.3 score points
4CLOTHES Question 1 (567)
GREENHOUSE Question 4 (568) (partial credit)
558.7 score points
3
ACID RAIN Question 5 (513) (partial credit)
GENETICALLY MODIFIED CROPS Question 2 (488)
ACID RAIN Question 2 (506)
GREENHOUSE Question 3 (529)
484.1 score points
2GENETICALLY MODIFIED CROPS Question 3 (421)
ACID RAIN Question 3 (460)
409.5 score points
1 CLOTHES Question 2 (399)
334.9 score points
Figure 6.7 Sample items and cut-off score points for the scientific literacy proficiency scale

Challenges for Australian Education: Results from PISA 2009 211
Clothes
Two competencies are assessed in the unit ‘Clothes’, the stimulus for which follows.
Clothes Question 1
The first question, set out below, is a complex multiple-choice question, which assesses the identifying scientific issues competency. Students are asked whether claims made in the article can be tested through scientific investigation in a laboratory, and students need to rely on their knowledge about science, specifically scientific enquiry, to complete this question. The question is set in a social context and is framed in the setting ‘frontiers of science and technology’, as the stimulus refers to the development of a new device, ‘a waistcoat made of a unique electrotextile’.

212 Australian students’ performance in scientific literacy
This question is located at the lower boundary of Level 4 with a difficulty of 567 score points. Approximately two-thirds of Australian students correctly answered this question.
Overall per cent correct27
Liechtenstein (Highest achieving country) 71%
Australian females 67%
Australia 64%
Australian males 61%
OECD average 48%
Kyrgyzstan and Azerbaijan (Lowest achieving country) 11%
Clothes Question 2
The second question in the ‘Clothes’ unit asks the student to recall a single piece of laboratory equipment that could check that the fabric was conducting electricity. This question assesses the ‘explaining phenomena scientifically’ competency and is located in the knowledge of science area – technical systems. The item is framed in the personal setting in the frontiers area. This item is an example of an easy scientific literacy item, with a multiple-choice format, located at the bottom of the proficiency scale at Level 1 (with a difficulty of 399 score points). Eighty-two per cent of students answered this item correctly.
Overall per cent correct
Finland (Highest achieving country) 95%
Australian males 84%
Australia 82%
Australian females 80%
OECD average 79%
Qatar (Lowest achieving country) 37%
48 The students’ results for the sample scientific literacy items were derived from the PISA 2006 dataset.

Challenges for Australian Education: Results from PISA 2009 213
Genetically Modified Crops
The competency ‘identifying scientific issues’ was assessed in the unit ‘Genetically Modified Crops’, the stimulus for which follows. Students are required to demonstrate knowledge about the design of science experiments. The nature of this unit places this question in the frontiers category within a social context.
Genetically Modified Crops Question 2
This question is a complex multiple-choice item, which asks students to identify the factors that were varied in the scientific investigation. This item was placed at Level 3 with a difficulty of 488 score points. About two-thirds of Australian students successfully answered this item.
Overall per cent correct
Korea (Highest achieving country) 77%
Australian females 67%
Australia 64%
Australian males 61%
OECD average 61%
Kyrgyzstan (Lowest achieving country) 26%

214 Australian students’ performance in scientific literacy
Genetically Modified Crops Question 3
This multiple-choice item, located at Level 2 with 421 score points, asks students a simple question about varying conditions in a scientific investigation. The majority (82%) of Australian students correctly responded to this item.
Overall per cent correct
Finland (Highest achieving country) 87%
Australian females 86%
Australia 82%
Australian males 85%
OECD average 74%
Tunisia (Lowest achieving country) 29%
Acid Rain
There are three cognitive questions in the unit ‘Acid Rain’, which assess each of the three competencies.
The ‘Acid Rain’ stimulus features a photograph of the Caryatids statues from the Acropolis in Athens and a short paragraph of text, as shown here.

Challenges for Australian Education: Results from PISA 2009 215
Acid Rain Question 2
This question assesses the competency ‘explaining phenomena scientifically’. To answer this question, students must have knowledge of science, and in particular of physical systems. The context of this question relates to hazards and it is framed in a social setting. This item was placed at Level 3 with a difficulty of 506 score points.
In the stem of the question, students are told ‘acid rain is more acidic than normal rain because it has absorbed gases like sulphur oxides and nitrogen oxides as well’. They are asked where sulphur oxides and nitrogen oxides in the air come from. Responses were coded correct if they included any one of car exhausts, factory emissions, burning fossil fuels (such as oil and coal), gases from volcanoes, or other similar things. Approximately 58 per cent of Australian students completed this question correctly.
Overall per cent correct
Finland and Hong Kong – China (Highest achieving country) 73%
Australian males 60%
Australia 58%
Australian females 57%
OECD average 58%
Indonesia (Lowest achieving country) 14%
Acid Rain Question 3
The next question assesses the competency ‘using scientific evidence’ and is placed at Level 2 with a difficulty of 460 score points. The science-related situation of this question relates to a hazard that is caused by humans and is set in a personal context. Knowledge of physical systems is required to successfully answer the question. Students were provided with a simple model showing the influence of acid rain on marble and were asked to draw a conclusion about the effects of vinegar on marble. Almost three-quarters of Australian students completed this question correctly.

216 Australian students’ performance in scientific literacy
Overall per cent correct
Korea (Highest achieving country) 84%
Australian males 74%
Australia 72%
Australian females 69%
OECD average 67%
Qatar (Lowest achieving country) 35%
Acid Rain Question 5
The final cognitive question in this unit assesses the competency identifying scientific issues and involves knowledge about scientific enquiry. The question is set in a personal context and the situation involves hazards humans have to overcome. Students have to demonstrate an ability to understand scientific investigation and the purpose of using a control variable. In the previous question students were provided information about the effects of vinegar on marble. In this question students were asked to explain why some chips were placed in distilled water overnight.
This question is an example of a partial credit item. To achieve full credit, students had to explain that the marble chips placed in distilled water were to compare with the test of vinegar and marble, to show that the acid (vinegar) was necessary for the reaction to occur. A full credit item was located at Level 6 with a difficulty of 717 score points. Below is an example of a response that achieved full credit.
To achieve a partial credit, with a difficulty of 513 score points (Level 3), students provided a response that included a comparison with the test of vinegar and marble, but did not make clear that this was being done to show that the acid (vinegar) is necessary for the reaction. A partial credit response is shown below.
Overall per cent correct*
New Zealand (Highest achieving country) 47%
Australian females 47%
Australia 45%
Australian males 44%
OECD average 36%
Qatar (Lowest achieving country) 8%
* These results are percentages weighted for the numbers of fully and partially correct answers.

Challenges for Australian Education: Results from PISA 2009 217
Greenhouse
The unit ‘Greenhouse’ assesses two competencies, ‘using scientific evidence’ and ‘explaining phenomena scientifically’, from an environmental perspective with a global focus.

218 Australian students’ performance in scientific literacy
Greenhouse Question 3
This question is an open constructed-response item assessing the ‘using scientific evidence’ competency. It also assesses students’ knowledge about scientific explanation. For this question, students are asked to identify information in two graphs that support a conclusion. Students must interpret the graphs to conclude there is an increase in both average temperature and carbon dioxide emissions. This question is placed at Level 3 with a difficulty of 529 score points. Two-thirds of Australian students correctly responded to this item.
Overall per cent correct
Hong Kong – China (Highest achieving country) 75%
Australian females 69%
Australia 67%
Australian males 65%
OECD average 54%
Kyrgyzstan (Lowest achieving country) 11%
Greenhouse Question 4
This next question is an open constructed-response item with full and partial credit awarded. It assesses the competency ‘using scientific evidence’ and students must rely on their knowledge about scientific explanation.
Students are asked to provide an example of the two graphs that do not support André’s conclusion. To achieve full credit students must identify a segment on both graphs in which the curves are not both descending or both climbing and give a corresponding explanation. A full credit response was located at Level 5 with 659 score points. The following example shows a response that achieved full credit.
Students were awarded a partial credit result if they mentioned the correct period, but without any explanation mentioned only one particular year (not a period of time) with an acceptable explanation, or referred to differences between the two curves without mentioning a specific period. A partial credit response was located at Level 4 with 568 score points.

Challenges for Australian Education: Results from PISA 2009 219
Overall per cent correct*
Japan (Highest achieving country) 54%
Australian males 45%
Australia 44%
Australian females 43%
OECD average 35%
Kyrgyzstan (Lowest achieving country) 4%
* These results are percentages weighted for the numbers of fully and partially correct answers.
Greenhouse Question 5
The final question in the unit ‘Greenhouse’ assesses the competency ‘explaining phenomena scientifically’ and students’ knowledge of Earth and space systems. This question is one of the harder scientific literacy items to complete, placed at Level 6 with a difficultly of 709 score points. Only one-fifth of Australian students were awarded a correct response. In this question students must provide a factor that could influence the greenhouse effect. The following example shows a correct response.
Overall per cent correct
The Netherlands (Highest achieving country) 34%
Australian males 22%
Australia 22%
Australian females 21%
OECD average 19%
Kyrgyzstan (Lowest achieving country) 3%

220 Australian students’ performance in scientific literacy
Student performance in scientific literacy
Interpreting differences in PISA scientific literacy scores: how big is ‘big’?
In terms of proficiency levels:
A difference of 75 score points represents one proficiency level on the PISA scientific literacy scale. This can be considered a comparatively large difference in student performance in substantive terms. For example, compare the skill set for those students who are proficient at Level 2 and those who are at Level 3. Students who reach Level 3 are able to select facts and knowledge to explain phenomena and apply simple models or inquiry strategies, whereas students who perform at Level 2 are only able to engage in direct reasoning and make literal interpretations.
In terms of schooling
It is possible to compare the performance of students in different grades or year levels in the 28 OECD countries in which there is a sizeable number of 15-year-olds in at least two different year levels in the PISA sample. Analysis of these data indicate that one school year corresponds to 38 score points, on average, across OECD countries on the PISA scientific literacy scale49. A difference in student performance that is larger than 38 score points can then be interpreted as being similar to a difference of one year of schooling. For Australia, the data indicate that one school year corresponds to 37 score points on average50.
Performance on scientific literacy from an international perspective
Fifteen of the 34 OECD countries (Finland, Japan, Korea, New Zealand, Canada, Estonia, Australia, the Netherlands, Germany, Switzerland, the United Kingdom, Slovenia, Poland, Ireland and Belgium) recorded a mean score that was significantly above the OECD average of 501 score points. The highest performing partner countries were Shanghai – China, Hong Kong – China and Singapore.
Six OECD countries (Hungary, the United States, Czech Republic, Norway, Denmark and France) recorded mean scores that were not statistically significantly different from the OECD average. The remaining 13 OECD countries (Iceland, Sweden, Austria, Portugal, Slovak Republic, Italy, Spain, Luxembourg, Greece, Israel, Turkey, Chile and Mexico) had mean scores that were significantly below the OECD average.
49 OECD, 2007, pg. 55.50 OECD, 2007, pg. 338.

Challenges for Australian Education: Results from PISA 2009 221
Australian students achieved a mean score of 527 points on the scientific literacy scale. Six countries, three of which were OECD countries, performed significantly higher than Australia: Shanghai – China (575 score points); Finland (554 score points); Hong Kong – China (549 score points); Singapore (542 score points); Japan (539 score points); and Korea (538 score points). Seven countries had mean scores that were not significantly different from that of Australia: New Zealand (532 score points); Canada (529 score points); Estonia (528 score points); the Netherlands (522 score points); Chinese Taipei (520 score points); Germany (520 score points); and Liechtenstein (520 score points). All other countries (including the United Kingdom, Macao – China and the United States) performed at a level significantly lower than Australia.
Table 6.2 shows the mean scientific literacy scores, along with the standard error, confidence interval around the mean, and the difference between the 5th and 95th percentile for participating countries. As with Chapters 3 and 5, only those countries who recorded a mean score higher than the lowest performing country, Mexico, are presented in Table 6.151.
51 Countries who recorded a mean score lower than 416 points on scientific literacy have not been included in this table or in this chapter. The countries are: Albania, Argentina, Azerbaijan, Brazil, Colombia, Indonesia, Jordan, Kazakhstan, Kyrgyzstan, Montenegro, Panama, Peru, Qatar, Trinidad and Tobago, and Tunisia. Results for these countries are included in the OECD International PISA report.

222 Australian students’ performance in scientific literacy
Table 6.2 Mean scientific literacy scores, confidence intervals and variations by country
Country Mean score S.E. Confidence interval Difference between 5th
and 95th percentile
Shanghai – China 575 2.3 570 - 579 270
Finland 554 2.3 550 - 559 294
Hong Kong – China 549 2.8 544 - 554 287
Singapore 542 1.4 539 - 544 342
Japan 539 3.4 533 - 546 325
Korea 538 3.4 531 - 545 266
New Zealand 532 2.6 527 - 537 349
Canada 529 1.6 526 - 532 292
Estonia 528 2.7 523 - 533 277
Australia 527 2.5 522 - 532 333
Netherlands 522 5.4 512 - 533 311
Chinese Taipei 520 2.6 515 - 526 284
Germany 520 2.8 515 - 526 330
Liechtenstein 520 3.4 513 - 527 286
Switzerland 517 2.8 511 - 522 314
United Kingdom 514 2.5 509 - 519 324
Slovenia 512 1.1 510 - 514 306
Macao – China 511 1.0 509 - 513 251
Poland 508 2.4 503 - 513 286
Ireland 508 3.3 502 - 514 315
Belgium 507 2.5 502 - 512 340
Hungary 503 3.1 496 - 509 288
United States 502 3.6 495 - 509 321
OECD average 501 0.5 500 - 502 308
Czech Republic 500 3.0 495 - 506 318
Norway 500 2.6 495 - 505 298
Denmark 499 2.5 494 - 504 302
France 498 3.6 491 - 505 339
Iceland 496 1.4 493 - 498 317
Sweden 495 2.7 490 - 500 327
Austria 494 3.2 488 - 501 332
Latvia 494 3.1 488 - 500 254
Portugal 493 2.9 487 - 499 273
Lithuania 491 2.9 486 - 497 280
Slovak Republic 490 3.0 484 - 496 308
Italy 489 1.8 485 - 492 314
Spain 488 2.1 484 - 492 286
Croatia 486 2.8 481 - 492 276
Luxembourg 484 1.2 482 - 486 342
Russian Federation 478 3.3 472 - 485 297
Greece 470 4.0 462 - 478 298
Dubai (UAE) 466 1.2 464 - 469 344
Israel 455 3.1 449 - 461 348
Turkey 454 3.6 447 - 461 265
Chile 447 2.9 442 - 453 268
Serbia 443 2.4 438 - 447 277
Bulgaria 439 5.9 428 - 451 344
Romania 428 3.4 422 - 435 257
Uruguay 427 2.6 422 - 432 316
Thailand 425 3.0 419 - 431 262
Mexico 416 1.8 412 - 419 254
Significantly higher than
Australia
Not significantly different to Australia
Significantly lower than Australia

Challenges for Australian Education: Results from PISA 2009 223
The distribution of scores between the highest and lowest performing students in scientific literacy varied and ranged from 251 score points in Macao – China to 349 score points in New Zealand. The OECD average between the 5th and 95th percentile was 308 score points.
Among the highest performing countries, the narrowest distributions between the 5th and 95th percentile were found in Korea (266 score points), and Shanghai – China (270 score points). Singapore (342 score points) and Japan (325 score points) were the high performing countries with the widest distributions between the lowest and highest performing students.
Among OECD countries, Mexico (254 score points), Turkey (265 score points) and Chile (268 score points) showed the narrowest distributions in scientific literacy between the 5th and 95th percentile, while New Zealand (349 score points), Israel (348 score points), Luxembourg (342 score points) and Belgium (340 score points) had the widest distributions between the lowest and highest performing students. Australia also showed a relatively wide distribution of student performance in scientific literacy, with 333 score points between the 5th and 95th percentile.
The scientific literacy proficiency levels provide further information about the acquired scientific skills and knowledge 15-year-old students have acquired. Figure 6.8 provides the proportion of students at each scientific literacy level, from Below Level 1 to Level 6, for participating countries. Countries have been ordered by the percentage of students classified as below Level 2, the internationally assigned benchmark, with countries with the lowest proportions of students below Level 2 placed at the top of the figure and countries with the highest proportion of students below Level 2 at the bottom.
The top performers in scientific literacy were those students who were placed at Level 5 or 6 on the scientific literacy proficiency scale. Students who scored between 633 and 708 score points were placed at Level 5 and students who scored more than 708 score points were placed at Level 6.
On average, one per cent of students across OECD countries performed at Level 6. The greatest proportions of students achieving Level 6 were in Singapore (5% of students), New Zealand and Shanghai – China (4%). Australia, along with Finland and Japan, had three per cent of students performing at the highest proficiency level and Hong Kong – China, Canada, Switzerland, Germany and the United Kingdom had two per cent of their students achieving this level. All other countries had very small proportions of students (with one per cent or less) at Level 6.
On average, eight per cent of students across OECD countries performed at Level 5 or above. Almost one-quarter (24%) of students from Shanghai – China and one-fifth of students from Singapore achieved levels 5 and 6. Countries who achieved between 15 and 19 per cent of students performing at levels 5 and 6 were Australia, Hong Kong – China, Japan, New Zealand and Finland. Six countries: Mexico, Romania, Thailand, Serbia, Chile and Turkey, had one per cent of students or less at these levels.
Also of interest are students who perform at a low level, i.e. those students who have not reached Level 2 on the proficiency scale. Students who scored between 409 and 484 score points were placed at Level 2, students who scored between 335 and 409 score points were placed at Level 1, and students who scored less than 335 score points were placed at below Level 1.
As mentioned earlier in the chapter, Level 2 has been established as the baseline level, defining the level of achievement on the PISA scale at which students begin to demonstrate the science competencies that will enable them to participate actively in life situations related to science and technology.
At Level 1, students have such a limited scientific knowledge that it can only be applied to a few, familiar situations. Students who perform below Level 1 usually do not succeed at the most basic levels of science that PISA measures. Such students will have serious difficulties in using science to benefit from further education and learning opportunities, and to participate in life situations related to science and technology. On average, 18 per cent of students performed below Level 2 in OECD countries. In some countries, such as Mexico, Thailand, Uruguay and Romania, the proportion of students not reaching Level 2 was over 40 per cent. This was very different to the very low proportion of students found in high performing countries (with nine per cent or less of students in Shanghai – China, Finland, Korea, Hong Kong – China and Estonia performing below Level 2). Twelve per cent of Australian students were placed below Level 2.

224 Australian students’ performance in scientific literacy
100 80 60 40 20 0 20 40 60 80 100
MexicoThailandUruguayRomaniaBulgaria
SerbiaIsraelChile
Dubai (UAE)Turkey
GreeceLuxembourg
Russian FederationAustria
ItalyFrance
Slovak RepublicSwedenCroatia
SpainUnited States
BelgiumOECD average
IcelandCzech Republic
LithuaniaDenmarkPortugalNorwayIreland
United KingdomGermanySlovenia
LatviaHungary
SwitzerlandNew ZealandNetherlands
PolandAustralia
SingaporeLiechtenstein
Chinese TaipeiJapan
Macao – ChinaCanadaEstonia
Hong Kong – ChinaKorea
FinlandShanghai – China
34
35
29
34
27
34
26
35
26
35
30
24
31
24
25
22
28
26
30
28
25
21
24
26
26
29
26
29
27
23
23
20
24
29
26
21
18
22
26
20
17
24
21
16
25
21
21
15
19
15
11
17
20
20
21
24
24
24
23
25
28
27
29
27
29
29
29
28
31
32
28
27
29
30
29
32
31
32
31
30
29
27
29
36
33
30
26
27
32
28
25
30
33
27
38
31
34
29
33
29
26
3
4
7
4
11
7
13
8
15
9
14
18
14
21
19
22
18
19
17
18
20
24
21
19
20
17
20
18
20
23
22
25
23
18
22
24
25
25
21
25
26
25
26
30
23
26
26
33
30
31
36
2
3
5
3
6
4
7
5
7
6
7
3
4
8
9
7
6
7
4
6
4
6
8
9
11
9
3
5
9
14
11
7
11
15
9
8
14
5
11
9
14
11
15
20
0
2
2
2
4
3
5
3
2
2
3
4
33
31
26
29
22
24
19
24
19
23
18
15
17
14
15
12
14
13
15
14
14
12
13
12
13
14
12
13
12
11
11
11
12
12
10
11
9
11
11
9
9
10
9
7
8
8
7
5
5
5
3
15
12
17
12
17
10
14
8
11
7
7
8
5
7
6
7
5
6
4
5
4
6
5
5
5
3
4
3
4
4
4
4
3
2
4
3
4
3
2
3
3
2
3
2
2
Below Level 1 Level 2 Level 3 Level 4 Level 5 Level 6Level 1
In cases in which the proportion of students in a proficiency level is one per cent or less, the level still appears in the figure but the numeric label “1”, does not. This convention has been used for all figures about proficiency levels in this chapter.
Percentage of students
Figure 6.8 Scientific literacy proficiency levels by country

Challenges for Australian Education: Results from PISA 2009 225
Scientific literacy performance and gender from an international perspective
Table 6.3 provides the mean scores and standard errors for females and males and displays the difference between average male and female performance in scientific literacy graphically. Several countries showed statistically significant gender differences in favour of males, with the greatest differences in favour of males (of 9 to 16 score points) in Chile, the United Kingdom, Denmark, the United States and Liechtenstein.
In a number of countries, females significantly outperformed males. The greatest differences in favour of females were found in Dubai (UAE) (27 score points), Bulgaria (20 score points), Lithuania (17 score points) and Finland (16 score points).
Australia was among several countries in which no significant differences were found between the average performance of male and female students. This group of countries included the highest performing countries Shanghai – China, Hong Kong – China, Singapore, Japan and Korea.

226 Australian students’ performance in scientific literacy
Table 6.3 Mean scientific literacy scores by gender and gender difference by country
Country
Gender differences
Females MalesDifference in mean score
Mean score S.E. Mean score S.E.
Dubai (UAE) 480 1.6 453 1.8
30 20 10 0 10 20 30
Gender differences significantGender differences not significant
Males score higher
Females score higher
Bulgaria 450 5.3 430 6.8
Lithuania 500 2.9 483 3.5
Finland 562 2.6 546 2.7
Slovenia 519 1.6 505 1.7
Thailand 431 3.4 418 3.8
Turkey 460 4.5 448 3.8
Japan 545 3.9 534 5.5
Romania 433 3.7 423 3.9
Greece 475 3.7 465 5.1
Croatia 491 3.9 482 3.5
Latvia 497 3.2 490 3.7
New Zealand 535 2.9 529 4.0
Poland 511 2.8 505 2.7
Czech Republic 503 3.2 498 4.0
Sweden 497 3.2 493 3.0
Norway 502 2.8 498 3.0
Portugal 495 3.0 491 3.4
Russian Federation 480 3.5 477 3.7
Israel 456 3.2 453 4.4
Ireland 509 3.8 507 4.3
Macao – China 512 1.2 510 1.3
Korea 539 4.2 537 5.0
Italy 490 2.0 488 2.5
Serbia 443 2.8 442 3.1
Uruguay 428 2.6 427 3.2
Singapore 542 1.8 541 1.8
Chinese Taipei 521 4.0 520 3.7
Australia 528 2.8 527 3.1
Estonia 528 3.1 527 3.1
Slovak Republic 491 3.2 490 4.0
Shanghai – China 575 2.3 574 3.1
Hungary 503 3.5 503 3.8
OECD average 501 0.6 501 0.6
Iceland 495 2.0 496 2.1
Hong Kong – China 548 3.4 550 3.8
France 497 3.5 500 4.6
Netherlands 520 5.9 524 5.3
Canada 526 1.9 531 1.9
Germany 518 3.3 523 3.7
Belgium 503 3.2 510 3.6
Mexico 413 1.9 419 2.0
Luxembourg 480 1.6 487 2.0
Spain 485 2.3 492 2.5
Austria 490 4.4 498 4.2
Switzerland 512 3.0 520 3.2
Chile 443 3.5 452 3.5
United Kingdom 509 3.2 519 3.6
Denmark 494 2.9 505 3.0
United States 495 3.7 509 4.2
Liechtenstein 511 5.1 527 5.0

Challenges for Australian Education: Results from PISA 2009 227
Figure 6.9 provides the proportions of females and males at each end of the scientific literacy proficiency levels in Australia and across OECD countries. In Australia, there were slightly more males (16%) than females (14%) who achieved Level 5 or higher, whereas across the OECD the proportion of males (9%) was similar to females (8%).
The proportions of Australian males and females who did not reach Level 2 in scientific literacy were smaller than the OECD averages— 14 per cent of Australian males compared to 18 per cent across OECD countries, and 11 per cent of Australian females compared to 17 per cent on average across the OECD.
Males
Females
Males
Females
Aus
tralia
OEC
D a
vera
ge
20 40 60 80 100100 80 60 40 20 0
24
25
19
21
27
30
27
30
21
21
24
25
8
7
12
11
4
3
13
13
10
8
5
4
4
3
Below Level 1 Level 2 Level 3 Level 4 Level 5 Level 6Level 1
Percentage of students
Figure 6.9 Proficiency levels for students in scientific literacy by gender, Australia and OECD average
Scientific literacy performance across the Australian states and territories
The scientific literacy performance for students in each of the Australian states is presented in Table 6.4, together with the standard error, confidence interval and the spread of scores between the 5th and 95th percentile. The mean scores for Australia, Shanghai – China (the highest performing country) and the OECD average have been included for comparison. Table 6.5 provides further details about the performance of states with a comparison of scientific literacy performance between each of the states.
Students in the Australian Capital Territory recorded the highest mean score in scientific literacy performance with 546 points, while the Northern Territory was the lowest performing state with a mean of 492 score points. The difference in mean scores between students in the highest and lowest performing states is equivalent to approximately three-quarters of a proficiency level or almost one-and-a-half years of schooling.
Shanghai – China performed significantly higher than all Australian states. Tasmania and the Northern Territory performed at a statistically similar level to the OECD average, while the other states all performed significantly higher than the OECD average.
South Australia had the narrowest spread of scores, with 303 score points between the students at the 5th and 95th percentile, which was similar to the OECD average of 308 score points. The Northern Territory had the widest spread of scores with 392 score points. The difference in scores between the 5th and 95th percentile for other states ranged from 324 to 353 score points.

228 Australian students’ performance in scientific literacy
Table 6.4 Mean scientific literacy scores, confidence intervals and variations by state
State Mean score S.E. Confidence intervals Difference between 5th and 95th percentile
ACT 546 6.0 534 - 558 353
NSW 531 5.7 519 - 542 341
VIC 521 4.9 512 - 531 324
QLD 530 7.5 515 - 544 332
SA 519 5.0 509 - 529 303
WA 539 7.3 525 - 553 334
TAS 497 5.3 487 - 508 327
NT 492 7.7 477 - 507 392
Australia 527 2.5 522 - 532 333
Shanghai – China 575 2.3 570 - 579 270
OECD average 501 0.5 500 - 502 308
The Australian Capital Territory, Western Australia, New South Wales and Queensland performed similarly statistically to each other, with the Australian Capital Territory and Western Australia performing significantly higher than four states (Victoria, South Australia, Tasmania and the Northern Territory). New South Wales and Queensland performed similarly to Victoria and South Australia, and performed significantly higher than Tasmania and the Northern Territory. Tasmania and the Northern Territory scored significantly lower on average than the other states, but were not statistically different from one another. All states performed significantly higher than the OECD average, except for Tasmania and the Northern Territory who performed statistically similar to countries across the OECD.
Table 6.5 Multiple comparisons of mean performance in scientific literacy by state
ACT WA NSW QLD VIC SA TAS NT OECD
Mean 546 539 531 530 521 519 497 492 501
Mean S.E. 6.0 7.3 5.7 7.5 4.9 5.0 5.3 7.7 0.5
ACT 546 6.0 ● ● ● ▲ ▲ ▲ ▲ ▲
WA 539 7.3 ● ● ● ▲ ▲ ▲ ▲ ▲
NSW 531 5.7 ● ● ● ● ● ▲ ▲ ▲
QLD 530 7.5 ● ● ● ● ● ▲ ▲ ▲
VIC 521 4.9 ▼ ▼ ● ● ● ▲ ▲ ▲
SA 519 5.0 ▼ ▼ ● ● ● ▲ ▲ ▲
TAS 497 5.3 ▼ ▼ ▼ ▼ ▼ ▼ ● ●
NT 492 7.7 ▼ ▼ ▼ ▼ ▼ ▼ ● ●
Note: Read across the row to compare a state’s performance with the performance of each state listed in the column heading.
▲ Average performance statistically significantly higher than in comparison state
● No statistically significant difference from comparison state
▼ Average performance statistically significantly lower than in comparison state
As shown in Table 6.6, there were no statistically significant gender differences in scientific literacy performance in any of the Australian states, which is not surprising given the lack of difference between the average scores of males and females for Australia as a country.

Challenges for Australian Education: Results from PISA 2009 229
Table 6.6 Mean scientific literacy scores by gender and gender differences by state
State
Gender differences
Females MalesDifference in mean score
Mean score S.E. Mean score S.E.
NSW 535 5.4 526 7.8
30 20 10 0 10 20 30
Females score higher
Males score higher
Gender differences significant
Gender differences not significant
ACT 549 10.6 543 10.5
TAS 499 8.9 496 7.4
WA 540 7.7 538 9.3
NT 493 10.3 492 7.7
VIC 521 6.6 522 6.4
SA 517 4.3 521 6.8
QLD 525 7.0 534 8.6
Figure 6.11 shows the proportion of students at each of the scientific literacy proficiency levels in each state, along with the percentages for Australia overall, the OECD average and the highest scoring country, Shanghai – China, for comparison. The states are ordered with the lowest proportions of students below Level 2 placed at the top of the figure and countries with the highest proportion of students below Level 2 at the bottom.
One-fifth of students from the Australian Capital Territory and slightly less than one-fifth (18%) of students from Western Australia achieved Level 5 or above, which was lower than the proportion of students in Shanghai – China who performed at these levels. There were 16 per cent of students from Queensland and New South Wales, 13 per cent from Victoria, 11 per cent from South Australia, and 10 per cent from the Northern Territory who reached at least Level 5. Eight per cent of students from Tasmania were placed at Level 5 or above.
At the lower end of the scale, 20 per cent of students from Tasmania and 22 per cent of students from the Northern Territory did not achieve Level 2. These proportions were higher than the OECD average of 18 per cent. There were 11 per cent of students in the Australian Capital Territory, 10 per cent in Western Australia, 12 per cent of students in Queensland and South Australia, and 13 per cent of students in Victoria and New South Wales who did not reach Level 2.

230 Australian students’ performance in scientific literacy
Below Level 1 Level 2 Level 3 Level 4 Level 5 Level 6Level 1
100 80 60 40 20 0
OECD average
Shanghai – China
Australia
NT
TAS
NSW
SA
VIC
QLD
ACT
WA
20 40 60 80 100
3 7 18 27 27 15 3
3 8 15 25 29 15 5
3 9 20 28 24 12 4
3 9 21 31 25 9 2
4 9 19 28 25 12 4
3 10 21 29 23 11 2
6 14 24 28 20 7
10 12 21 26 21 9
3 9 20 28 25 11 3
3 11 26 36 20 4
5 13 24 29 21 7
Percentage of students
Figure 6.10 Proficiency levels in scientific literacy by state
The proportions of females and males at each of the scientific literacy proficiency levels by state are shown in Figure 6.11. The highest proportion of males achieving Level 5 or above were from the Australian Capital Territory (22%), followed by Western Australia (19%) and Queensland (18%). Other states had between eight and 16 per cent of males who performed at Level 5 or above. Tasmania recorded the lowest proportion of students at the higher end of the scientific literacy proficiency scale, with both females and males achieving eight per cent – less than the OECD average of nine per cent.
The highest proportions of females who achieved levels 5 and 6 were also from the Australian Capital Territory and Western Australia, with 18 per cent and 17 per cent respectively. All other states, except Tasmania, recorded proportions of students at these levels that were above the OECD average of eight per cent, ranging from nine per cent in South Australia and the Northern Territory to 15 per cent in New South Wales. Eight per cent of Tasmanian females performed at Level 5 or above in scientific literacy.
In Tasmania, there was no difference in the proportions of males and females who performed at the higher proficiency level in scientific literacy, while in Queensland there was a difference of six per cent, with more females than males performing at levels 5 and 6. Differences in the other states lay between these two extremes.
The largest proportions of males who did not reach Level 2 were from the Northern Territory (24%) and Tasmania (21%), both higher than the OECD average of 18 per cent. The proportions of males from other states who performed at these lower levels were below the average for OECD countries, ranging from 12 per cent in Western Australia and Queensland to 15 per cent in New South Wales and Victoria.
Twenty per cent of females from the Northern Territory did not reach Level 2, compared to the OECD average of 19 per cent. Tasmania followed closely behind with 18 per cent of females failing to reach Level 2. The proportion of females from other states who did not reach the baseline level for scientific literacy were smaller, with 12 per cent in Victoria and Queensland, 11 per cent in South Australia, 10 per cent in New South Wales and Western Australia and nine per cent in the Australian Capital Territory. Differences between the proportions of males and females who failed to reach Level 2 ranged from one per cent in Queensland to five per cent in New South Wales.

Challenges for Australian Education: Results from PISA 2009 231
Below Level 1 Level 2 Level 3 Level 4 Level 5 Level 6Level 1
Females
Males
Females
Males
Females
Males
Females
Males
Females
Males
Females
Males
Females
Males
Females
Males
Females
Males
Females
Males
100 80 60 40 20 0 20 40 60 80 100
OEC
D
Aus
tralia
N
T TA
S W
A
SA
QLD
VI
C
NSW
A
CT
2 7 15 27 31 14 4
4 8 16 23 26 16 6
3 7 19 30 26 12 3
5 10 19 26 24 12 4
2 10 23 31 23 10 2
4 11 20 28 24 11 3
3 9 21 30 25 10 2
3 9 20 26 23 13 5
2 9 23 33 25 8
4 10 20 29 25 10 2
3 7 18 28 27 14 3
4 8 18 25 26 15 4
4 14 26 28 20 7
7 14 22 28 21 7
10 10 22 26 23 8
10 14 20 26 18 10
3 8 21 30 25 11 3
4 10 19 27 24 12 4
4 13 25 30 21 7
5 13 24 27 21 8aver
age
Percentage of students
Figure 6.11 Proficiency levels in scientific literacy by state and gender
Scientific literacy performance and school sector
Scientific literacy performance by school sector is reported in a similar manner to previous chapters, providing the unadjusted mean scores as well as the adjusted mean scores for student-level and school-level socioeconomic background (Table 6.7).
On average, the unadjusted means for scientific literacy by school sector show that students in the independent school sector recorded a mean score of 566 score points, which was significantly higher than those in the Catholic school sector (540 score points) or the government school sector (511 score points). Mean scores for all sectors were significantly higher than the OECD average of 501 score points.

232 Australian students’ performance in scientific literacy
Table 6.7 Mean scientific literacy scores (unadjusted for student and school socioeconomic background) by school sector
School Sector Mean score S.E. Confidence interval Difference between 5th and 95th percentile
Government 511 4.3 502 - 519 344
Catholic 540 3.4 533 - 547 285
Independent 566 4.0 558 - 574 307
Catholic schools had the narrowest spread of scores, with 285 score points between the students at the 5th and 95th percentile, whereas the difference in scores between the 5th and 95th percentile for Independent schools was slightly wider at 307 score points. The spread of scores between the lowest and highest performing students in reading literacy was widest in government schools with 344 score points. This reflects the fact that government schools cater for a broader range of students in terms of achievement levels than either Catholic or independent schools.
Once student-level socioeconomic background is taken into account, significant differences between government and Catholic schools, and between government and independent schools remain; however, no significant differences between Catholic and independent schools were found. When school-level socioeconomic background is also accounted for, the difference in mean performance of students in government, Catholic and independent schools is not statistically significant (Table 6.8).
Table 6.8 Differences in scientific literacy scores after adjustment for student and school socioeconomic background
Science Difference in raw scores (score points)
Difference in scores after student socioeconomic
background is accounted for
Difference in scores after student and school level
socioeconomic background is accounted for
Government - Catholic 29 15 NSD
Government - independent 55 23 NSD
Catholic - Independent 26 NSD NSD
NSD: No significant difference
Figure 6.12 provides the proportions of students at each scientific literacy proficiency level by school sector52. While similar proportions of students in government schools (12%) and Catholic schools (14%) achieved Level 5 or above, twice the proportion of students in independent schools performed at these high levels in scientific literacy (25 per cent).
Similar proportions of students from Catholic schools (7%) and Independent schools (5%) performed at the lower end of the scientific literacy proficiency scale, compared to more than twice as many students from government schools (17%) who did not reach Level 2.
52 Proficiency level percentages are unadjusted. To adjust for student and school socioeconomic background requires complicated analysis, which would need to take into account ESCS within each proficiency level and this is deemed impracticable. Furthermore, adjusting for ESCS at either ends of the proficiency scale adds additional uncertainty to these levels.

Challenges for Australian Education: Results from PISA 2009 233
Below Level 1 Level 2 Level 3 Level 4 Level 5 Level 6Level 1
Percentage of students
100 80 60 40 20 0 20 40 60 80 100
Independent
Catholic
Government
13
18
23
27
32
27
30
29
21
19
12
9
6
2
3
4
6
12 5
Figure 6.12 Proficiency levels in scientific literacy by school sector
Scientific literacy performance and Indigenous status
The mean performance of Indigenous and non-Indigenous students in scientific literacy is shown in Table 6.9. Indigenous students recorded a mean score of 449 points, compared to a mean score of 530 points for non-Indigenous students. The difference between these mean scores in scientific literacy performance, 81 score points, is the equivalent of more than one proficiency level or more than two full years of schooling. Indigenous students also performed significantly lower than the OECD average, by 52 score points.
Indigenous students had a similar spread in mean scientific literacy scores between students at the 5th and 95th percentile (330 score points) to non-Indigenous students (329 score points).
Table 6.9 Mean scientific literacy scores, confidence intervals and variations for Indigenous and non-Indigenous students
Indigenous status Mean score S.E. Confidence intervals Difference between 5th and 95th percentile
Indigenous 449 6.2 437 - 461 330
Non-Indigenous 530 2.4 525 - 535 329
Table 6.10 provides the mean scores for Indigenous females and males, and non-Indigenous females and males, for comparison. While there was no statistically significant difference between the mean scores of Indigenous females and males, there were substantial and significant differences between the mean scores of Indigenous and non-Indigenous females (76 score points) and Indigenous and non-Indigenous males (86 score points). These differences in average performance are equivalent to one proficiency level, or two entire years of schooling. Indigenous females also performed significantly lower (by 47 score points) than females across the OECD average, while Indigenous males scored 58 points lower, on average, than did males across all OECD countries.
Table 6.10 Mean scientific literacy scores by gender and gender differences by Indigenous status
Indigenous status Gender differences
Females Males Difference (F – M)
Mean score S.E. Mean score S.E. Score dif. S.E.
Indigenous 454 7.0 443 7.4 11 7.4
Non-Indigenous 530 2.8 529 3.0 1 3.2
Note: Values that are statistically significant are indicated in bold..
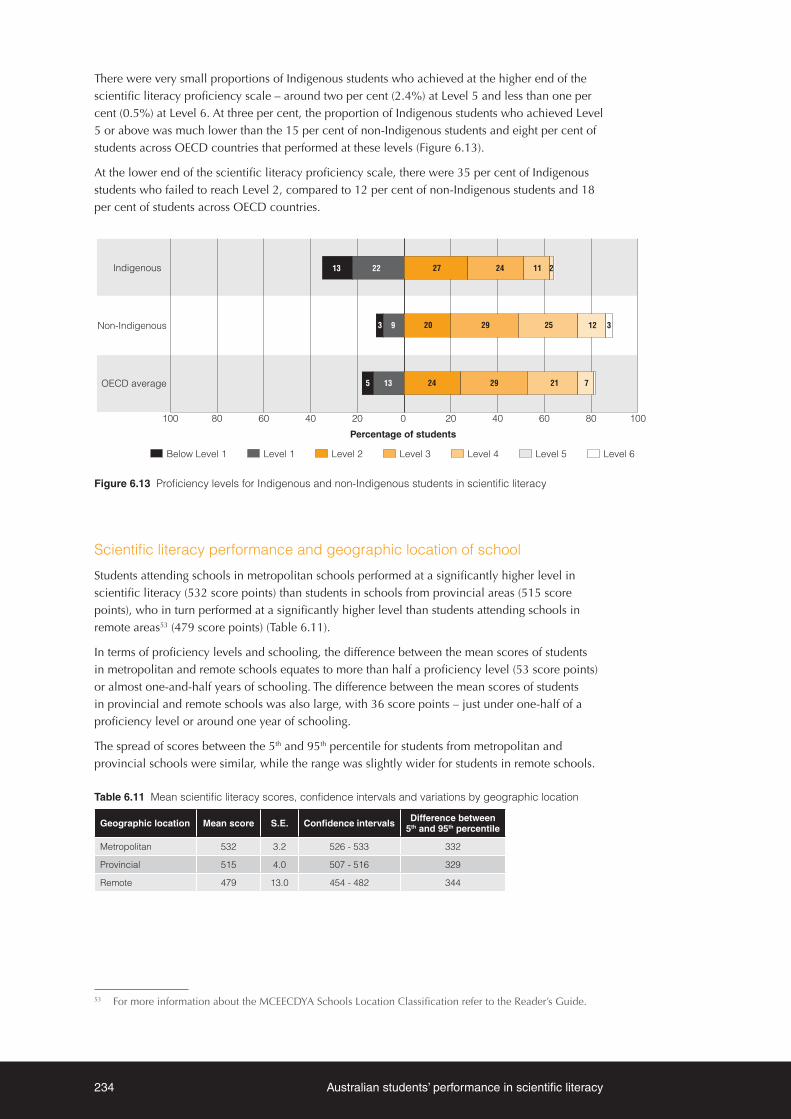
234 Australian students’ performance in scientific literacy
There were very small proportions of Indigenous students who achieved at the higher end of the scientific literacy proficiency scale – around two per cent (2.4%) at Level 5 and less than one per cent (0.5%) at Level 6. At three per cent, the proportion of Indigenous students who achieved Level 5 or above was much lower than the 15 per cent of non-Indigenous students and eight per cent of students across OECD countries that performed at these levels (Figure 6.13).
At the lower end of the scientific literacy proficiency scale, there were 35 per cent of Indigenous students who failed to reach Level 2, compared to 12 per cent of non-Indigenous students and 18 per cent of students across OECD countries.
100 80 60 40 20 0
OECD average
Non-Indigenous
Indigenous
20 40 60 80 100
Below Level 1 Level 2 Level 3 Level 4 Level 5 Level 6Level 1
24
20
27
29
29
24
21
25
11
7
12
2
3
13
9
22
5
3
13
Percentage of students
Figure 6.13 Proficiency levels for Indigenous and non-Indigenous students in scientific literacy
Scientific literacy performance and geographic location of school
Students attending schools in metropolitan schools performed at a significantly higher level in scientific literacy (532 score points) than students in schools from provincial areas (515 score points), who in turn performed at a significantly higher level than students attending schools in remote areas53 (479 score points) (Table 6.11).
In terms of proficiency levels and schooling, the difference between the mean scores of students in metropolitan and remote schools equates to more than half a proficiency level (53 score points) or almost one-and-half years of schooling. The difference between the mean scores of students in provincial and remote schools was also large, with 36 score points – just under one-half of a proficiency level or around one year of schooling.
The spread of scores between the 5th and 95th percentile for students from metropolitan and provincial schools were similar, while the range was slightly wider for students in remote schools.
Table 6.11 Mean scientific literacy scores, confidence intervals and variations by geographic location
Geographic location Mean score S.E. Confidence intervals Difference between 5th and 95th percentile
Metropolitan 532 3.2 526 - 533 332
Provincial 515 4.0 507 - 516 329
Remote 479 13.0 454 - 482 344
53 For more information about the MCEECDYA Schools Location Classification refer to the Reader’s Guide.

Challenges for Australian Education: Results from PISA 2009 235
Figure 6.14 shows there were a higher proportion of students from metropolitan (15%) and provincial schools (11%), compared to students in remote schools (6%), who achieved Level 5 or above. The proportions of students who did not reach Level 2 were lower in metropolitan schools (12%) and provincial schools (14%) compared to remote schools (24%).
100 80 60 40 20 0
Remote
Provincial
Metropolitan
20 40 60 80 100
Below Level 1 Level 2 Level 3 Level 4 Level 5 Level 6Level 1
19 28 25 12 3 9 3
22 30 23 9 2 10 4
27 25 18 5 15 9
Percentage of students
Figure 6.14 Proficiency levels in scientific literacy by geographic location
Scientific literacy performance and socioeconomic background
The mean scores for students’ scientific literacy performance grouped by quartile of socioeconomic background54, as well as the standard error, confidence interval and the difference between the 5th and 95th percentile, are shown in Table 6.12. Students in the highest quartile of socioeconomic background recorded a mean score of 577 score points, which was 32 points higher than the mean score for students in the third quartile, 62 points higher than the mean score for students in the second quartile, and 96 points higher than the mean score for students in the lowest quartile of socioeconomic background. The differences in scientific literacy performance between one quartile of socioeconomic background and the next were all statistically significant. The differences in performance between students in the highest quartile and lowest quartile of socioeconomic background (96 score points) equates to about two-and-a-half years of schooling or more than one proficiency level.
Table 6.12 Mean scientific literacy scores, confidence intervals and variations by quartiles of socioeconomic background
Socioeconomic background Mean score S.E. Confidence intervals Difference between 5th and 95th percentile
Lowest quartile 481 2.8 476 - 487 312
Second quartile 515 2.6 510 - 520 302
Third quartile 545 3.1 539 - 551 315
Highest quartile 577 3.1 571 - 583 300
The range of scores between the highest and lowest performing students in each quartile was wider for students in the lowest and third quartile of socioeconomic background (312 and 315 score points, respectively), but slightly narrower for students in the second and highest quartile of socioeconomic background (302 and 300 score points, respectively).
Figure 6.15 shows the proportions of students at each of the scientific literacy proficiency levels by quartiles of socioeconomic background. At the higher end of the scientific literacy proficiency scale, there were four times as many students in the highest quartile that had reached Level 5
54 The measure of socioeconomic background is the index of economic, social and cultural status (ESCS).
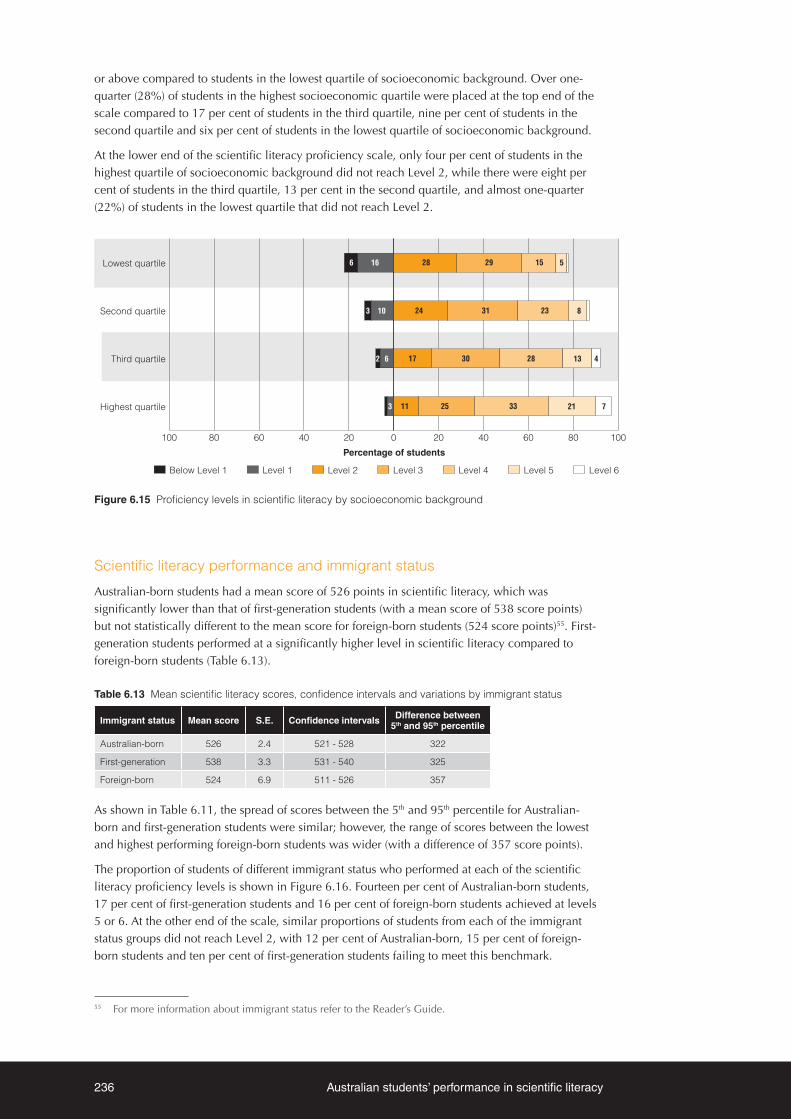
236 Australian students’ performance in scientific literacy
or above compared to students in the lowest quartile of socioeconomic background. Over one-quarter (28%) of students in the highest socioeconomic quartile were placed at the top end of the scale compared to 17 per cent of students in the third quartile, nine per cent of students in the second quartile and six per cent of students in the lowest quartile of socioeconomic background.
At the lower end of the scientific literacy proficiency scale, only four per cent of students in the highest quartile of socioeconomic background did not reach Level 2, while there were eight per cent of students in the third quartile, 13 per cent in the second quartile, and almost one-quarter (22%) of students in the lowest quartile that did not reach Level 2.
Below Level 1 Level 2 Level 3 Level 4 Level 5 Level 6Level 1
100 80 60 40 20 0
Highest quartile
Third quartile
Second quartile
Lowest quartile
20 40 60 80 100
28 29 15 5 16 6
24 31 23 8 10 3
17 30 28 13 4 6 2
11 25 33 21 7 3
Percentage of students
Figure 6.15 Proficiency levels in scientific literacy by socioeconomic background
Scientific literacy performance and immigrant status
Australian-born students had a mean score of 526 points in scientific literacy, which was significantly lower than that of first-generation students (with a mean score of 538 score points) but not statistically different to the mean score for foreign-born students (524 score points)55. First-generation students performed at a significantly higher level in scientific literacy compared to foreign-born students (Table 6.13).
Table 6.13 Mean scientific literacy scores, confidence intervals and variations by immigrant status
Immigrant status Mean score S.E. Confidence intervals Difference between 5th and 95th percentile
Australian-born 526 2.4 521 - 528 322
First-generation 538 3.3 531 - 540 325
Foreign-born 524 6.9 511 - 526 357
As shown in Table 6.11, the spread of scores between the 5th and 95th percentile for Australian-born and first-generation students were similar; however, the range of scores between the lowest and highest performing foreign-born students was wider (with a difference of 357 score points).
The proportion of students of different immigrant status who performed at each of the scientific literacy proficiency levels is shown in Figure 6.16. Fourteen per cent of Australian-born students, 17 per cent of first-generation students and 16 per cent of foreign-born students achieved at levels 5 or 6. At the other end of the scale, similar proportions of students from each of the immigrant status groups did not reach Level 2, with 12 per cent of Australian-born, 15 per cent of foreign-born students and ten per cent of first-generation students failing to meet this benchmark.
55 For more information about immigrant status refer to the Reader’s Guide.

Challenges for Australian Education: Results from PISA 2009 237
100 80 60 40 20 0
Foreign-born
First-generation
Australian-born
20 40 60 80 100
Below Level 1 Level 2 Level 3 Level 4 Level 5 Level 6Level 1
20
19
20
26
28
29
23
26
25
12
13
11
4
4
3
11
8
9
4
2
3
Percentage of students
Figure 6.16 Proficiency levels in scientific literacy by immigrant status
Scientific literacy performance and language background
The mean scores, standard error, confidence interval and the difference between the 5th and 95th percentile for students who spoke English and students who spoke a language other than English are shown in Table 6.14. On average, students who spoke English scored significantly higher in scientific literacy (532 score points) than did students who spoke a language other than English (512 score points). The range of scores between students in the 5th and 95th percentile was wider among students who spoke a language other than English than for students who spoke English at home.
Table 6.14 Mean scientific literacy scores, confidence intervals and variations by language background
Language background Mean score S.E. Confidence intervals Difference between 5th and 95th percentile
Speak English at home 532 2.1 528 - 536 321
Language other than English spoken at home 512 9.9 493 - 531 376
Figure 6.17 shows the distribution of students from different home language backgrounds across the scientific literacy proficiency levels. Similar proportions of students who spoke English at home and students who spoke another language attained Level 5 or 6 in scientific literacy, at 15 and 14 per cent respectively. At the other end of the proficiency scale, however, a greater proportion of students who spoke a language other than English at home did not reach Level 2, with 19 per cent compared to 11 per cent of students who spoke English at home.
Below Level 1 Level 2 Level 3 Level 4 Level 5 Level 6Level 1
100 80 60 40 20 0
Language otherthan English
spoken at home
Speak Englishat home
20 40 60 80 100
3 8 20 29 25 12 3
6 13 21 24 21 10 4
Percentage of students
Figure 6.17 Proficiency levels in scientific literacy by language background

238 Australian students’ performance in scientific literacy
Monitoring scientific literacy changes over time Unlike reading literacy or mathematical literacy, performance changes in scientific literacy can only be measured against results from PISA 2006, when scientific literacy was the major area of assessment. Scientific literacy performance can be compared between 2006 and 2009 in 47 countries56, including all 33 OECD countries.
Performance over time on scientific literacy from an international perspective
Table 6.15 provides the mean scores on scientific literacy performance for PISA 2006 and PISA 2009 along with a graphic display of the mean score differences between PISA 2006 and PISA 2009. There has been little change to the OECD average from a mean score of 49857 points in PISA 2006 to a mean score of 501 points in PISA 2009.
There were six OECD countries and one partner country that significantly improved their performance in scientific literacy between PISA 2006 and PISA 2009. Turkey’s performance increased by 30 score points, Portugal by 19 score points, Korea by 16 score points, Italy by 13 score points, Norway and the United States by 13 score points, and Poland by 10 score points.
Scientific literacy performance significantly declined in four countries, of which three were OECD countries. The mean performance in scientific literacy declined significantly in the Czech Republic and Chinese Taipei by 12 score points, in Finland by nine score points and in Slovenia by seven score points.
The performance of Australian students in scientific literacy remained unchanged from PISA 2006 to PISA 2009 with a mean score of 527 score points.
56 Argentina, Azerbaijan, Brazil, Colombia, Indonesia, Jordan, Kyrgyzstan, Montenegro, Qatar and Tunisia have not been included in the comparisons between PISA 2006 and PISA 2009 because their mean performance in scientific literacy was lower than the mean performance of the lowest scoring OECD country, Mexico.
57 Includes all 33 OECD countries, except Austria because their data between PISA 2006 and PISA 2009 is not comparable.

Challenges for Australian Education: Results from PISA 2009 239
Table 6.15 Mean scientific literacy scores for PISA 2006 and PISA 2009, and differences between performance in cycles by country
CountryPISA 2006 PISA 2009
Difference in mean score between 2006 and 2009Mean score S.E. Mean score S.E.
Czech Republic 513 3.5 500 3.0
40 30 20 10 0 10 20 30 40
Scientificliteracy
performancedeclined
Scientificliteracy
performanceimproved
Differences between 2006 and 2009 significantDifferences between 2006 and 2009 not significant
Chinese Taipei 532 3.6 520 2.6
Finland 563 2.0 554 2.3
Sweden 503 2.4 495 2.7
Slovenia 519 1.1 512 1.1
Croatia 493 2.4 486 2.8
Canada 534 2.0 529 1.6
Belgium 510 2.5 507 2.5
Estonia 531 2.5 528 2.7
Greece 473 3.2 470 4.0
Netherlands 525 2.7 522 5.4
Luxembourg 486 1.1 484 1.2
Liechtenstein 522 4.1 520 3.4
Hungary 504 2.7 503 3.1
Russian Federation 479 3.7 478 3.3
United Kingdom 515 2.3 514 2.5
Uruguay 428 2.7 427 2.6
Ireland 508 3.2 508 3.3
Spain 488 2.6 488 2.1
Macao – China 511 1.1 511 1.0
Australia 527 2.3 527 2.5
Israel 454 3.7 455 3.1
New Zealand 530 2.7 532 2.6
Slovak Republic 488 2.6 490 3.0
OECD average-33 498 0.5 501 0.5
France 495 3.4 498 3.6
Denmark 496 3.1 499 2.5
Lithuania 488 2.8 491 2.9
Thailand 421 2.1 425 3.0
Latvia 490 3.0 494 3.1
Germany 516 3.8 520 2.8
Iceland 491 1.6 496 1.4
Switzerland 512 3.2 517 2.8
Bulgaria 434 6.1 439 5.9
Mexico 410 2.7 416 1.8
Hong Kong – China 542 2.5 549 2.8
Serbia 436 3.0 443 2.4
Japan 531 3.4 539 3.4
Chile 438 4.3 447 2.9
Romania 418 4.2 428 3.4
Poland 498 2.3 508 2.4
United States 489 4.2 502 3.6
Norway 487 3.1 500 2.6
Italy 475 2.0 489 1.8
Korea 522 3.4 538 3.4
Portugal 474 3.0 493 2.9
Turkey 424 3.8 454 3.6

240 Australian students’ performance in scientific literacy
Figure 6.18 shows the percentage of students who performed below Level 2 in PISA 2006 and PISA 2009 by country. Countries have been ordered so that countries with the lowest proportion of students achieving below Level 2 in PISA 2009 are located at the left of the figure and countries with the highest proportion of students at these levels are at the right. The background shading in the figure indicates those countries that had a significant change in the percentage of students below Level 2 in scientific literacy between PISA 2006 and PISA 2009.
Across the 33 OECD countries, there was a small (2%) but statistically significant decrease in the proportion of students who did not reach Level 2 between PISA 2006 to PISA 2009. Turkey, the country with the largest increase in scientific literacy performance from PISA 2006 to PISA 2009, recorded a significant decrease of 17 per cent in the proportion of students who were placed below Level 2. Other countries who showed a significant decrease (of between three and eight per cent) in the proportion of students below Level 2 were Portugal, Chile, the United States, Norway, Korea, Italy, Serbia, Poland, Mexico, Lithuania and Iceland.
Two countries showed significant increases in the proportion of students who did not reach Level 2: increases of two per cent in Finland and three per cent in Sweden.
The proportion of students who did not reach Level 2 in Australia remained unchanged between PISA 2006 to PISA 2009, at 13 per cent.
0
20
40
60
80
100
PISA 2009 PISA 2006
Finl
and
Kor
eaH
ong
Kon
g –
Chi
naEs
toni
aC
anad
aM
acao
– C
hina
Japa
nC
hine
se T
aipe
iLi
echt
enst
ein
Aus
tralia
Pola
ndN
ethe
rland
sN
ew Z
eala
ndSw
itzer
land
Hun
gary
Latv
iaSl
oven
iaG
erm
any
Uni
ted
Kin
gdom
Irela
ndN
orw
ayPo
rtug
alD
enm
ark
Lith
uani
aC
zech
Rep
ublic
Icel
and
OEC
D a
vera
ge-3
3B
elgi
umU
nite
d St
ates
Spai
nC
roat
iaSw
eden
Slov
ak R
epub
licFr
ance
Italy
Rus
sian
Fed
erat
ion
Luxe
mbo
urg
Gre
ece
Turk
eyC
hile
Isra
elSe
rbia
Bul
garia
Rom
ania
Uru
guay
Thai
land
Mex
ico
Perc
enta
ge o
f stu
dent
s
Figure 6.18 Percentage of students performing below Level 2 on the scientific literacy scale in PISA 2006 and PISA 2009 by country58
58 Background shading in the figure indicates countries with a significant change in the proportion of students performing below Level 2 in scientific literacy in PISA 2006 and PISA 2009

Challenges for Australian Education: Results from PISA 2009 241
The percentage of students who performed at Level 5 or above (the top performers) in PISA 2006 and PISA 2009 are shown by country in Figure 6.19. Across the 33 OECD countries, there was a very small, yet statistically significant decrease (on average, 0.3%) in the percentage of students who achieved Level 5 or 6 between PISA 2006 to PISA 2009.
Chinese Taipei had the largest significant decline (of six per cent) in the proportion of students who achieved Level 5 or above between PISA 2006 to PISA 2009. The Czech Republic, Slovenia, the United Kingdom, Canada and Chile also recorded significantly lower proportions of students achieving Level 5 or 6 in PISA 2009 compared to their results in PISA 2006. These decreases ranged from one to three per cent.
There was only one country, Italy, who showed a small (1.2%) and significant increase in the proportion of students who performed at levels 5 and 6.
In 2006 and 2009, 15 per cent of Australian students performed at levels 5 and 6 in scientific literacy.
PISA 2009 PISA 2006
Mex
ico
Rom
ania
Thai
land
Serb
iaC
hile
Turk
eyU
rugu
ayB
ulga
riaG
reec
eLa
tvia
Cro
atia
Isra
elSp
ain
Port
ugal
Rus
sian
Fed
erat
ion
Lith
uani
aM
acao
– C
hina
Hun
gary
Italy
Slov
ak R
epub
licN
orw
ayLu
xem
bour
gD
enm
ark
Icel
and
Pola
ndSw
eden
Fran
ceC
zech
Rep
ublic
OEC
D a
vera
ge-3
3Ire
land
Chi
nese
Tai
pei
Uni
ted
Stat
esLi
echt
enst
ein
Slov
enia
Bel
gium
Esto
nia
Switz
erla
ndU
nite
d K
ingd
omK
orea
Can
ada
Net
herla
nds
Ger
man
yA
ustra
liaH
ong
Kon
g –
Chi
naJa
pan
New
Zea
land
Finl
and
100
90
80
70
60
50
40
30
20
10
0
Perc
enta
ge o
f stu
dent
s
Figure 6.19 Percentage of students performing at Level 5 or above on the scientific literacy scale in PISA 2006 and PISA 2009 by country59
59 Background shading in the figure indicates countries with a significant change in the proportion of students performing at Level 5 or above in scientific literacy in PISA 2006 and PISA 2009

242 Australian students’ performance in scientific literacy
Scientific literacy performance over time across Australian states
The mean scores for scientific literacy in 2006 and 2009 for each of the states are provided in Table 6.16, along with the differences between the scores for these PISA cycles. As expected, given the lack of change for Australia as a whole, there were no significant changes in scientific literacy performance within each of the states between PISA 2006 to PISA 2009.
Table 6.16 Mean scientific literacy scores for PISA 2006 and PISA 2009, and differences between performance, by state
StatePISA 2006 PISA 2009 Difference in mean score between PISA 2006 and PISA 2009
Mean score S.E. Mean
score S.E.
SA 532 4.9 519 5.0
40 30 20 10 0 10 20 30 40
Scientificliteracy
performancedeclined
Scientificliteracy
performanceimproved
Difference between 2006 and 2009 significantDifference between 2006 and 2009 not significant
TAS 507 4.6 497 5.3
NSW 535 4.6 531 5.7
WA 543 6.8 539 7.3
ACT 549 4.9 546 6.0
NT 490 6.6 492 7.7
QLD 522 4.2 530 7.5
VIC 513 4.9 521 4.9
Table 6.17 provides the proportions of students from each of the states who achieved below Level 2 and the proportion of students who achieved at Level 5 or above in scientific literacy in PISA 2006 and PISA 2009. South Australia was the only state to show a significant difference between PISA 2006 and PISA 2009 in scientific literacy. Unfortunately, this change was a decline – in PISA 2006, 15 per cent of students achieved Level 5 or above, while in 2009 the proportion of students in South Australia who performed at these levels was just over 10 per cent, with a difference of five per cent.
Table 6.17 Percentage of students performing below Level 2 or achieving Level 5 or above on the scientific literacy scale in PISA 2006 and PISA 2009 by state and for Australia overall
State
PISA 2006 PISA 2009 Change between 2006 and 2009
Below Level 2 Level 5 or above Below Level 2 Level 5 or
above Below Level 2 Level 5 or above
% S.E. % S.E. % S.E. % S.E. % dif. S.E. % dif. S.E.
ACT 10 1.5 21 1.7 11 1.3 20 2.2 1 2.0 -1 2.8
NSW 11 1.0 17 1.5 12 1.3 15 1.8 1 1.6 -2 2.4
VIC 16 1.5 11 1.1 13 1.4 13 1.3 -3 2.1 2 1.7
QLD 13 1.0 13 1.3 12 1.4 15 2.2 -1 1.7 2 2.6
SA 11 1.2 15 1.7 12 1.8 10 1.2 1 2.1 -5 2.1
WA 10 1.8 19 1.6 11 1.6 18 2.4 1 2.4 -1 2.9
TAS 18 1.8 11 1.1 20 1.9 8 1.3 2 2.6 -3 1.7
NT 26 2.3 13 1.6 22 2.5 10 1.8 -4 3.4 -3 2.4
Australia 13 0.6 15 0.7 13 0.6 15 0.8 0 1 0 1.1
Note: Values that are statistically significant are indicated in bold.

Challenges for Australian Education: Results from PISA 2009 243
Scientific literacy performance over time for Indigenous students
In PISA 2006, the mean scientific literacy performance for Indigenous students was 441 score points, while in 2009 the average score for Indigenous students was 449 points, which does not represent a statistically significant change in average performance between the PISA cycles (Table 6.18). The mean scores for non-Indigenous students in PISA 2006 and PISA 2009 were similar and not significantly different.
Table 6.18 Mean scientific literacy scores for PISA 2006 and PISA 2009, and differences between performance, for Indigenous students
Indigenous status
PISA 2006 PISA 2009 Change between 2006 and 2009
Mean score S.E. Mean score S.E. Score dif. S.E.
Indigenous 441 7.8 449 6.2 8 10.3
Non-Indigenous 529 2.3 530 2.4 1 4.2
Note: Values that are statistically significant are indicated in bold.
Table 6.19 shows there were no significant differences found between the proportion of Indigenous students who performed below Level 2 in PISA 2006 and 2009, or between the proportion of Indigenous students who achieved Level 5 or above. The proportions of non-Indigenous students who performed at each of these extreme ends of the scientific literacy proficiency scale did not change between 2006 and 2009 either.
Table 6.19 Percentage of students performing below Level 2 or achieving Level 5 or above on the scientific literacy scale in PISA 2006 and PISA 2009 by Indigenous status
Indigenous status
PISA 2006 PISA 2009 Change between 2006 and 2009
Below Level 2
Level 5 or above
Below Level 2
Level 5 or above
Below Level 2
Level 5 or above
% S.E. % S.E. % S.E. % S.E. % dif. S.E. % dif. S.E.
Indigenous 40 3.5 4 1.1 35 2.7 3 0.7 -5 4.4 -1 1.3
Non-Indigenous 12 0.6 15 0.7 12 0.6 15 0.8 0 0.8 0 1.1
Note: Values that are statistically significant are indicated in bold.

244 Australian students’ performance in scientific literacy

Challenges for Australian Education: Results from PISA 2009 245
Key Findings60
◗◗ The average age at which Australian children commenced primary school was 5.2 years, which was younger than for students in Singapore, Finland and Shanghai – China, with a mean age of 6.7 years.
◗◗ Schools in Hong Kong – China, Korea, Shanghai – China and Singapore were more likely to be academically focused than schools in Australia. Academic performance was considered more often for school admissions, language classes were more orderly and disciplined, and more students attended enrichment or remedial lessons out-of-school in these countries.
◗◗ Student absenteeism was identified as a factor that hindered learning in Australia. On average, one-half of Australian students attended schools in which the principal reported student absenteeism affected instruction ‘to some extent’ or ‘a lot’. This was similar to the average reported across OECD countries.
◗◗ Australian states reported more positive ratings of student–teacher relations than the OECD average. The Australian Capital Territory had higher ratings compared to the other states.
◗◗ The majority (more than 90 per cent) of Australian students in the PISA sample had attended preschool.
◗◗ The relationships between learning environment and student performance, between preschool attendance and student performance, and between the availability of extracurricular activities and student performance, were all found to be positive, albeit small, with correlation coefficients between 0.1 and 0.3.
◗◗ The association between teacher shortages and student performance was negative and small, showing the higher the level of teacher shortage, the lower the student performance.
60 In this chapter, Australia’s results are compared with those of a selection of countries: Canada, New Zealand, the United Kingdom, United States, Finland, Hong Kong – China, Korea, Shanghai – China and Singapore. For the results for all participating countries, see the PISA international report.
Chapter
7Characteristics of Australian schools in PISA

246 Characteristics of Australian schools in PISA
Earlier chapters in this report described student performance for Australia and other countries that participated in PISA 2009. Why do 15-year-old students in some countries perform better than those in other countries? And can these differences be related back to school policies, school resources, instructional practices and the learning environment?61 PISA collects a wealth of information about these issues in order to explore their potential influence on student performance.
This chapter discusses several school characteristics: how students are selected and organised into schools and classrooms, the learning environment, time resources, and human resources. These constructs are examined for a selection of countries and for the Australian states. Data by school sector are also presented to provide further insight into the Australian education system, and, as will be seen, different patterns emerge by school sector for some school characteristics when patterns within states are less clear. The relationship between these factors and student performance are explored using correlational analyses in the final part of the chapter.
Nine countries (Canada, Finland, Hong Kong – China, Korea, New Zealand, Shanghai – China62, Singapore, the United Kingdom and the United States), as well as the OECD average, have been chosen for comparison with Australia in this chapter. These countries (except for the United Kingdom and the United States) were the top performers in reading literacy in PISA 2009. In discussing results, these countries have been grouped into English-speaking countries and Asian countries, and are often referred to as such. Finland remains in a group of its own.
When interpreting the data from students and principals, it is important to note that these are self-reports and that such responses may be influenced by cross-cultural differences, including that certain responses may be more socially desirable than others.
Selecting and organising students into schools and classroomsPISA collected data about the different policies schools may have in place for selecting and organising students, such as age-of-entry policies, school admission policies, student transfer policies, and ability grouping policies.
In education systems, age-of-entry policies, school admission policies and student transfer policies provide a framework for selecting students. School policies can shape the student population to create a more homogeneous learning environment. In so doing, it can help to meet the needs of students and make it easier for teachers to focus their teaching.
Schools can also establish policies related to academic ability. The student composition of a classroom can differ from that of the school overall through allowing students to be streamed into classes. Classes can consist of students with different abilities or students can be organised into classes of different ability.
Age-of-entry policies
Age-of-entry policies provide guidelines for when children can begin formal schooling. The age at which children commence school can differ across countries, as well as within countries, and results in students of the same age being in different year levels.
Students were asked at what age (approximately) they commenced primary school. In Australia, the mean age of entry into primary school was 5.2 years, which was lower than the OECD average of 6.1 years. The mean age of entry into primary school for English-speaking countries was similar, generally within a 12 months range. Students from neighbouring Asian countries were slightly older at commencement of school, with a mean age ranging from 6.0 years in Korea to 6.8 years in Shanghai – China. Finland’s mean age of entry was 6.7 years (Figure 7.1).
61 The influence of socioeconomic background and student performance is discussed in Chapter 8.62 Shanghai–China is an economy; however for ease is referred to as a country in the chapter.

Challenges for Australian Education: Results from PISA 2009 247
4 years old 5 years old 6 years old 7 years old and older
0% 10% 20% 30% 40% 50% 60% 70% 80% 90% 100%
Shanghai-China
Finland
Singapore
OECD average
Hong Kong-China
Korea
United States
Australia
Canada
New Zealand
United Kingdom
Country Mean age
5.0
5.1
5.1
5.2
5.8
6.0
6.1
6.1
6.7
6.7
6.8
Figure 7.1 Age of students when starting primary school by country
In Australia, around 10 per cent of students started primary school at four years of age, the majority (58%) started at five years of age, 26 per cent started at six years of age, and very few students (4%) started primary school at seven years of age or older.
Among the countries listed in Figure 7.1, Canada and the United States had the largest proportion of students who entered primary school at the age of four, while the other countries had less than five per cent of students starting school at this age. Shanghai – China, Singapore and Finland had more than two-thirds of students who were seven years or older when they commenced primary school. The youngest students beginning primary school in Finland were six years old. In Korea, almost all (99%) students commenced primary school when they were six years old.
Although the age-of-entry policies differ across the Australian states, the mean age of starting primary school as found in PISA 2009 are very similar, ranging from 5.0 years in Tasmania to 5.5 years in Queensland. Figure 7.2 presents the mean age of entry into primary school and the proportion of students who commenced primary school at different ages.
4 years old 5 years old 6 years old 7 years old and older
Mean age
5.1
5.2
5.1
5.5
5.1
5.4
5.0
5.2
0% 10% 20% 30% 40% 50% 60% 70% 80% 90% 100%
ACT
NSW
VIC
QLD
SA
WA
TAS
NT
Figure 7.2 Age of students, including minimum age requirements, when starting primary school by state

248 Characteristics of Australian schools in PISA
School admission policies
While many education systems have policies concerning admission (i.e. which students can enrol in which schools), some selective policies may lead to more homogeneous student populations; for example, students with similar academic abilities may be selected to attend the same school.
In PISA 2009, information about the selectivity of education systems was collected by asking school principals whether they considered the following factors when admitting students to their school:
◗◗ Residence in a particular area
◗◗ Student’s record of academic performance (including placement tests)
◗◗ Recommendation of feeder schools
◗◗ Parents’ endorsement of the instructional or religious philosophy of the school
◗◗ Whether the student requires or is interested in a special program
◗◗ Preference given to family members of current or former students
◗◗ Other
Principals were asked to indicate how often they considered these factors on a three-point Likert scale (never; sometimes; and always).
Table 7.1 provides the percentage of students in schools where the principal63 reported always to several factors related to admission in school. Not only do principals consider a variety of factors when admitting students to their school, the importance of these factors also differs across countries.
Residence in a particular area and the student’s record of academic performance were the two factors most often considered in admitting students to a school, with 44 per cent and 31 per cent respectively of students across OECD countries attending schools in which these factors were always considered.
Approximately three-quarters of students in the United States, Canada and Finland, and around half of the students in the United Kingdom, New Zealand and Australia, attended schools where residing in a particular area was always considered when admitting students into a school.
In the Asian countries, the student’s record of academic performance was an important factor when admitting students into schools: 82 per cent of students in Hong Kong – China and Singapore, and approximately 50 per cent of students in Shanghai – China and Korea, were attending schools in which principals reported that academic performance was always considered in admission. This was not the case for English-speaking schools or in Finland, where the proportion of students in schools where the principal indicated the student’s record of academic performance was always considered when admitting students to schools was much lower, between one per cent in Finland to 23 per cent in Australia and the United States.
Australia, along with the United Kingdom and New Zealand, had much higher proportions of students attending schools in which preference was given to family members of current or former students than was reported in other countries and across the OECD.
63 Responses from school principals have been weighted to reflect the number of 15-year-olds enrolled in each school.

Challenges for Australian Education: Results from PISA 2009 249
Table 7.1 Percentage of students in schools where the principal reported always to the following factors about school admission for selected countries
Country
Residence in a
particular area
Student’s record of academic
performance (including placement
tests)
Recommendation of feeder schools
Parents’ endorsement
of the instructional or religious
philosophy of the school
Whether the student
requires or is
interested in a special
program
Preference given to family
members of current or former students
Other
% S.E. % S.E. % S.E. % S.E. % S.E. % S.E. % S.E.
Australia 45 2.5 23 2.7 25 2.5 30 1.9 14 2.1 43 2.4 11 1.9
Canada 73 1.6 16 1.5 22 1.6 14 1.5 18 2.1 13 1.2 6 1.6
New Zealand 50 3.0 21 2.8 22 2.7 20 2.1 13 2.1 35 3.0 22 4.6
United Kingdom 55 2.8 12 1.8 11 1.9 13 2.3 3 1.2 39 3.5 14 2.8
United States 78 2.7 23 2.8 19 3.0 10 2.3 13 2.7 5 1.5 9 4.2
Finland 74 3.4 1 0.8 3 1.3 1 0.9 8 2.0 3 1.1 1 0.7
Hong Kong – China 1 0.7 82 2.9 17 3.2 27 3.6 10 2.5 10 1.9 36 6.0
Korea 13 2.3 50 3.9 9 2.1 5 2.0 18 3.2 3 1.5 3 1.7
Shanghai – China 41 3.0 54 3.4 13 2.9 44 3.8 12 2.6 7 2.2 4 1.4
Singapore 26 0.3 82 0.2 12 0.3 11 1.1 9 1.0 5 0.1 7 1.2
OECD average 44 0.5 31 0.4 16 0.4 14 0.4 20 0.5 18 0.4 9 0.4
Within the Australian states, schools considered a number of factors when admitting students into schools (Table 7.2). Over half of the students in New South Wales, Tasmania and the Australian Capital Territory attended schools in which residence in a particular area was always considered. Almost 30 per cent of students in New South Wales and Victoria attended schools where the student’s record of academic performance was always considered, while in the Australian Capital Territory and Tasmania, this was not a factor considered by school principals.
A higher proportion of students from New South Wales and Victoria attended schools where school admission was informed by the recommendation of feeder schools, compared to students in other states.
The Northern Territory had the lowest proportion of students who attended schools where the parents’ endorsement of the instructional or religious philosophy of the schools was always a factor in admitting students, while in the other states this factor was considered more often, with 22 per cent of students in Tasmania and up to 38 per cent of students in Victoria attending schools that took this endorsement of philosophy into consideration when admitting students.
Although 23 per cent of students in the Northern Territory attended schools where principals indicated that the student requiring or showing interest in a special program was considered as a factor in admitting students, in other states the proportions were much lower. Seventy-one per cent of students in the Australian Capital Territory attended schools where preference was given to family members of current or former students, compared to 23 per cent of students in the Northern Territory. The proportions in other states ranged from 40 to 50 per cent of students.

250 Characteristics of Australian schools in PISA
Table 7.2 Percentage of students in schools where the principal reported always to the following factors about school admittance, by state and by sector
State/sector
Residence in a particular
area
Student’s record of academic
performance (including placement
tests)
Recommendation of feeder schools
Parents’ endorsement of the instructional
or religious philosophy of the
school
Whether the student requires or
is interested in a special
program
Preference given to family
members of current or former students
Other
Always Always Always Always Always Always Always
% S.E. % S.E. % S.E. % S.E. % S.E. % S.E. % S.E.
ACT 54 5.2 0 0.0 0 0.0 30 4.7 8 3.9 71 8.6 18 6.2
NSW 65 4.0 27 5.2 38 5.8 29 3.4 13 4.1 44 5.0 9 3.0
VIC 48 6.6 27 7.0 30 6.7 38 5.0 12 4.6 49 5.7 11 4.6
QLD 19 5.2 27 6.7 18 5.6 25 4.5 20 5.8 32 4.9 12 4.6
SA 40 6.9 6 4.0 7 4.1 26 5.4 14 5.3 48 7.3 11 5.2
WA 34 5.3 19 7.0 16 6.4 33 5.0 9 4.6 41 8.0 15 5.6
TAS 57 5.1 0 0.0 3 0.3 22 6.8 2 1.6 45 8.3 14 3.8
NT 20 1.6 14 0.9 16 1.1 11 4.9 23 1.4 23 4.5 0 0.0
Government 60 3.4 19 7.2 29 3.8 5 1.8 15 2.7 28 3.0 3 1.3
Catholic 38 5.8 25 3.6 32 6.9 80 4.0 17 6.1 68 5.9 29 7.1
Independent 4 2.8 26 6.0 6 3.1 53 7.7 4 2.5 64 7.1 17 4.7
Unsurprisingly, use of admission policies also differed across school sectors. In government schools, 60 per cent of students were in schools in which the principal reported that residence in a particular area was always a factor, compared to 38 per cent of students in Catholic schools and four per cent of students in independent schools. Principals of 80 per cent of students in Catholic schools and 53 per cent of students in independent schools reported that the parents’ endorsement of the instructional or religious philosophy of the school was always a consideration when admitting students into a school, while only five per cent of students in government schools were in schools in which this factor was always considered. Catholic and independent schools also had higher proportions of students (68 per cent and 64 per cent respectively) where the principal indicated preference was given to family members of current or former students, compared to 28 per cent of students in government schools.
Student transfer policies
Principals were asked to indicate how likely, on a three-point Likert scale (not likely, likely, and very likely), students in the national modal grade64 were to be transferred to another school for the following reasons:
◗ Low academic achievement
◗ High academic achievement
◗ Behavioural problems
◗ Special learning needs
◗ Parents’ or guardians’ request
◗ Other
Thirty-one per cent of students, on average across OECD countries, attended a school in which the principal reported that the school would transfer students with low academic achievement. The proportion of students in English-speaking countries, Finland and Singapore was much lower than the OECD average, with one per cent of students in New Zealand, two per cent in Singapore, five per cent in Australia, six per cent in Finland and just over 10 per cent of students in the United
64 This is the year level attended by most 15-year-olds in a country. In Australia, the national modal grade for 15-year-olds is Year 10.

Challenges for Australian Education: Results from PISA 2009 251
States and Canada attending schools with such policies. In contrast, the proportions of students attending schools in which the principal reported that students would be transferred to another school because of low academic achievement: Korea (36%), Shanghai – China (40%) and Hong Kong – China (76%), were much higher than the OECD average (Table 7.3).
Transferring students to other schools because of high academic achievement was less common than transferring students because of low academic achievement – only 11 per cent of students on average across OECD countries attended a school in which the principal reported that the school would likely transfer students for this reason. In Australia, the proportion of students who attended a school in which the principal reported that student transfers occur because of high academic achievement was similar to the OECD average, at nine per cent. In the other English-speaking countries and in Finland, there were very few students (five per cent or less) who attended schools that would transfer them because of high academic achievement. Singapore and Korea had slightly higher proportions of students in schools (13% and 16% respectively) with such policies, while in Shanghai – China and Hong Kong – China the proportions of students in schools where the principal reported transferring students due to high academic achievement was even higher, at 26 per cent and 38 per cent of students respectively.
Table 7.3 Percentage of students in schools in which the principal reported that a student in national modal grade for 15-year-olds in the school would be likely or very likely transferred to another school for the following reasons for selected countries
Country
Low academic
achievement
High academic
achievement
Behavioural problems
Special learning needs
Parents’ or guardians’
requestOther
% S.E. % S.E. % S.E. % S.E. % S.E. % S.E.
Australia 5 1.4 9 1.7 35 3.0 14 2.3 47 2.9 15 2.6
Canada 14 1.5 2 0.6 41 2.3 33 2.1 62 2.5 30 3.1
New Zealand 1 0.6 5 1.4 21 2.8 7 1.7 32 3.2 14 3.5
United Kingdom 4 1.2 5 1.7 31 3.3 16 2.7 43 3.0 11 2.9
United States 12 3.1 2 1.2 42 4.0 18 3.4 44 4.1 15 4.3
Finland 6 2.0 1 1.0 21 3.3 22 3.4 54 3.9 23 3.7
Hong Kong – China 76 3.9 38 4.1 77 3.7 59 3.9 83 3.3 42 6.6
Korea 36 4.2 16 3.2 70 3.9 24 3.8 81 3.3 52 4.5
Shanghai – China 40 4.0 26 3.7 49 3.7 62 4.8 84 3.4 67 4.3
Singapore 2 0.5 13 0.4 10 0.2 12 0.3 37 0.7 15 0.7
OECD average 31 0.5 11 0.4 51 0.6 37 0.6 69 0.5 39 0.7
In Korea and Hong Kong – China, more than 70 per cent of students attended a school whose principal reported that students transfer because of behavioural problems. The proportions were lower in Shanghai – China, at 49 per cent, which was similar to the OECD average of 51 per cent. In English-speaking countries, the proportion of students transferring because of behavioural problems varied from 21 per cent in New Zealand to 42 per cent in the United States. Thirty-five per cent of Australian students attended schools in which the principal indicated transfers were likely when there were behavioural problems.
On average across OECD countries, 37 per cent of students attended a school in which the principal reported special learning needs as a reason for transferring students to other schools. Transferring for this reason varied between countries, with proportions lower than the OECD average in New Zealand, Singapore and Australia (between 7% and 14%), and proportions higher than the OECD average in Hong Kong – China and Shanghai – China, at 59 per cent and 62 per cent of students respectively.
The most likely reason students transfer from one school to another is at their parents’ or guardians’ request. This seems to be a common reason across the countries reported here with 69 per cent of students on average across OECD countries attending schools in which this would be a reason for transferring. Shanghai – China, Hong Kong – China and Korea had the highest proportions of students attending schools in which the principal indicated student transfers occurred because of parents’ or guardians’ requests, at over 80 per cent, followed by Canada (62%), Finland (54%), and Australia (47%).

252 Characteristics of Australian schools in PISA
Table 7.4 provides the percentage of students who attended schools where the principal indicated that students were likely or very likely to be transferred for the aforementioned reasons, by state and by sector. Across the states, the two most common reasons for transferring students from one school to another were at a parents’ or guardians’ request or because of students’ behavioural problems. The proportion of students who attended schools where the principal indicated that transfer of students was likely or very likely due to a parents’ or guardians’ request ranged from 33 per cent of students in schools from the Australian Capital Territory to 57 per cent of students in schools from Victoria. Principals of five per cent of students in schools from the Australian Capital Territory and 50 per cent of students in Victorian schools indicated student transfers were likely or very likely when there were behavioural problems. Although student transfers did occur because of students’ low academic achievement, high academic achievement or special education needs, these were less commonly reported as likely reasons for transferring students in all Australian states.
Table 7.4 Percentage of students in schools where the principal reported that a student in national modal grade65 for 15-year-olds in the school would be likely or very likely transferred to another school because of the following reasons, by state and by sector
State/sector
Low academic achievement
High academic achievement
Behavioural problems
Special learning needs
Parents’ or guardians’
requestOther
% S.E. % S.E. % S.E. % S.E. % S.E. % S.E.
ACT 0 0.0 0 0.0 5 0.3 0 0.0 33 7.6 29 6.3
NSW 2 1.4 9 3.4 25 5.0 10 3.4 49 5.0 10 4.0
VIC 7 3.6 13 4.9 50 7.1 19 5.6 57 7.5 18 6.1
QLD 10 4.2 11 4.4 39 8.0 16 5.4 38 7.0 14 5.2
SA 9 4.9 4 4.3 37 8.3 14 5.9 52 8.8 25 8.8
WA 3 3.0 5 3.5 26 6.1 12 6.6 37 8.6 17 8.0
TAS 4 3.9 0 0.0 19 6.6 9 6.4 39 9.6 10 4.8
NT 15 1.4 26 4.9 14 0.9 19 4.1 43 3.1 14 1.9
Government 3 1.3 9 2.4 33 3.9 14 2.9 48 3.5 12 2.9
Catholic 3 2.3 5 3.3 37 6.4 7 3.2 38 6.9 10 4.3
Independent 16 5.9 16 5.0 37 7.3 23 7.5 56 8.1 29 7.9
Greater proportions of students in independent schools, compared to those in government or Catholic schools, had principals who indicated that low academic achievement and high academic achievement were reasons for student transfer. There were no sectoral differences in the proportion of students attending schools in which behavioural problems were a likely reason for student transfer. Greater proportions of students in independent schools had principals who indicated it was likely or very likely that students transfer because of special learning needs or parents’ or guardians’ requests compared to students in government schools, with the lowest proportions of students who would be transferred for these reasons found in the Catholic school system.
Ability grouping within school
In some schools systems, and in particular for some school subjects, students are grouped into classes according to their abilities. In classes without such ability groupings there is a heterogeneous student population, while classes that are organised according to ability grouping result in a more homogenous learning environment. Principals were asked to indicate whether:
◗ Students are grouped by ability into different classes
◗ Students are grouped by ability within their classes.
The response options offered were for all subjects, for some subjects and not for any subjects.
65 This is the year level attended by most 15-year-olds in a country. In Australia, the national modal grade for 15-year-olds is Year 10.

Challenges for Australian Education: Results from PISA 2009 253
In English-speaking countries, the majority of students attended schools in which students were grouped by ability in some subjects. This ranged from 77 per cent of students in Canadian schools to 94 percent of students in New Zealand schools (Table 7.5). In Finland the situation was quite different, with 56 per cent of students attending schools in which some subjects were grouped by ability, and 42 per cent of students were in schools in which students were not grouped by ability for any subjects.
Korea and Singapore showed similarities to English-speaking countries, with the majority of students (86%) attending schools where students were grouped by ability in some subjects. In Hong Kong – China and Shanghai – China, 65 per cent and 51 per cent of students respectively attended schools where the principal reported that students were grouped by ability for some subjects. Thirty-six per cent of students in Shanghai – China and 24 per cent of students in Hong Kong – China attended schools where students were not grouped by ability.
On average across OECD countries, 64 per cent of students were in schools where principals reported that students were grouped by ability in some subjects, 25 per cent of students were in schools where there was no ability grouping, and 11 per cent of students were in schools where students were grouped by ability in all subjects.
Table 7.5 Percentage of students in schools where the principal reported instruction is organised differently for students with different ability for selected countries
CountryNo ability grouping Ability grouping for
some subjectsAbility grouping for all
subjects
% S.E. % S.E. % S.E.
Australia 5 1.1 92 1.5 4 1.1
Canada 10 1.0 77 1.9 13 1.6
New Zealand 2 1.0 94 1.6 5 1.3
United Kingdom 1 0.9 91 1.9 8 1.9
United States 9 2.2 84 3.1 7 2.2
Finland 42 4.0 56 4.2 1 0.9
Hong Kong – China 24 3.0 65 3.7 11 2.6
Korea 10 2.8 86 3.2 4 1.6
Shanghai – China 36 4.1 51 4.5 13 2.7
Singapore 0 0.0 86 0.5 14 0.5
OECD average 25 0.9 64 1.1 11 0.7
Table 7.6 indicates the percentage of students who attended schools where the principal indicated if instruction was organised differently for students with different abilities, for each of the Australian states and territories. Across the states, more than 89 per cent of students were in schools where the students were grouped by ability in some subjects. All students in the Northern Territory attended schools in which there was ability grouping for some subjects.
Across the school sectors, there were similar findings, with the majority of students grouped by ability for some subjects.

254 Characteristics of Australian schools in PISA
Table 7.6 Percentage of students in schools where the principal reported instruction is organised differently for students with different ability, by state and by sector
State/sectorNo ability grouping Ability grouping for
some subjectsAbility grouping for all
subjects
% S.E. % S.E. % S.E.
ACT 0 0.0 95 4.7 5 4.7
NSW 2 1.6 91 3.4 7 3.1
VIC 2 1.2 94 2.2 4 1.8
QLD 11 4.0 89 4.0 0 0.0
SA 11 4.0 89 4.0 0 0.0
WA 3 2.5 95 2.9 2 1.5
TAS 3 3.1 91 5.0 6 3.9
NT 0 0.0 100 0.0 0 0.0
Government 4 1.2 94 1.7 2 1.1
Catholic 8 2.9 87 4.4 5 3.3
Independent 3 2.5 89 3.7 8 2.6
The learning environmentIn PISA 2000 and PISA 2003, the student questionnaire collected information about the teaching and learning environment in schools. Results from those cycles showed that students and schools performed at a higher level when students were disciplined, and when the relationship between students and teachers was supportive.
In PISA 2009, questions about student–teacher relations, the disciplinary climate, and behaviours of students and teachers were again included in the questionnaire.
When interpreting the data, it is important to keep in mind that PISA is capturing information about the learning environment at one point in time, whereas students’ educational experiences are in fact cumulative. Also, inferences about teaching and learning are made indirectly from the perspective of students and school principals as PISA did not collect this data from teachers.
Student–teacher relations
The importance of a positive relationship between students and teachers has been shown in previous PISA assessments. Five items were included in the PISA 2009 student questionnaire to measure the relationship between students and their teachers in school:
◗ I get along well with most of my teachers
◗ Most of my teachers are interested in my well-being
◗ Most of my teachers really listen to what I have to say
◗ If I need extra help, I will receive it from my teachers
◗ Most of my teachers treat me fairly.
Students were asked to indicate the extent to which they agreed with these items on a four-point Likert scale (strongly agree, agree, disagree, and strongly disagree). These statements were used to create an index of student–teacher relations, with higher (positive) values indicating better relationships between student and teacher, and lower (negative) values indicating poor student–teacher relations.
Table 7.7 provides the percentage of students for Australia, other English-speaking countries, Asian countries and Finland, who agreed or strongly agreed with statements related to student–teacher relations, along with the mean scores and standard errors for the index of student–teacher relations.

Challenges for Australian Education: Results from PISA 2009 255
Eighty-five per cent of students across OECD countries indicated they get along with most of their teachers, 79 per cent of students indicated, if they needed extra help, that they received it from their teachers and that most of their teachers treat them fairly. Two-thirds of students indicated that most of their teachers were interested in their well-being and that most of their teachers listened to what they had to say.
In Australia, students responded favourably about their relationship with teachers, with between 71 per cent and 85 per cent of students reporting they agreed or strongly agreed with each of the statements.
There is wide variation in the index of student–teacher relations across the countries listed in Table 7.7. Hong Kong – China had a mean score that was similar to the OECD average, while Korea and Finland recorded the lowest levels, indicating poorer student–teacher relations compared to the OECD average, with mean scores of –0.16 and –0.27 respectively. All other countries recorded mean index scores that were higher than the OECD average, with students in the United States and Canada reporting the strongest student–teacher relations. Australian students had similar scores on the Student–Teacher Relations Index to students in the United Kingdom, and higher scores than the OECD average.
Table 7.7 Percentage of students who agree or strongly agree with statements about student–teacher relations and mean index for selected countries
Country
I get along well with most of my teachers
Most of my teachers are interested in
my well-being
Most of my teachers really listen to what I
have to say
If I need extra help, I will
receive it from my teachers
Most of my teachers treat me
fairly
Index of student–teacher
relations
% S.E. % S.E. % S.E. % S.E. % S.E. Mean index S.E.
Australia 85 0.4 78 0.5 71 0.5 84 0.4 85 0.4 0.11 0.01
Canada 89 0.3 80 0.4 74 0.4 89 0.3 88 0.3 0.32 0.01
New Zealand 88 0.5 77 0.6 73 0.7 87 0.6 86 0.5 0.19 0.02
United Kingdom 86 0.6 78 0.7 69 0.8 88 0.6 83 0.7 0.12 0.02
United States 90 0.5 81 0.8 74 1.0 88 0.5 89 0.4 0.32 0.02
Finland 87 0.6 49 0.9 63 0.8 84 0.7 80 0.7 -0.16 0.02
Hong Kong – China 89 0.5 71 0.7 67 0.9 89 0.5 82 0.6 -0.03 0.02
Korea 79 0.7 60 0.1 57 0.9 83 0.7 75 0.7 -0.27 0.02
Shanghai – China 89 0.5 81 0.7 79 0.7 90 0.5 85 0.5 0.21 0.02
Singapore 91 0.5 81 0.5 74 0.8 88 0.6 87 0.5 0.24 0.01
OECD average 85 0.1 66 0.1 67 0.1 79 0.1 79 0.1 0.00 0.00
The percentage of students who agreed or strongly agreed with statements about student–teacher relations in each of the states and territories and school sectors are provided in Table 7.8. There were few differences in the proportions of students across the states who agreed with the statements about student–teacher relations. The general pattern was for slightly lower proportions of students to agree that most of their teachers really listened to what they had to say, compared with the other statements related to student–teacher relations.
All states recorded a mean Student–Teacher Relations Index score that was higher than the OECD average, indicating that Australian students perceive the relationships they have with teachers as positive. Students from the Australian Capital Territory recorded the highest level of positive student–teacher relations with a mean index score of 0.20, which was significantly higher than the mean index score for New South Wales, South Australia, the Northern Territory and Tasmania. Tasmania, with a mean index score of 0.05, recorded the lowest level of student–teacher relations compared to other states, significantly lower than the mean score for the Australian Capital Territory and for Queensland, but not significantly different to the mean scores for other states.

256 Characteristics of Australian schools in PISA
Table 7.8 Percentage of students who agree or strongly agree with statements about student–teacher relations and mean index, by state and by sector
State/sector
I get along well with
most of my teachers
Most of my teachers are interested in
my well-being
Most of my teachers really listen to what I
have to say
If I need extra help, I will
receive it from my teachers
Most of my teachers treat me
fairly
Index of student–teacher
relations
% S.E. % S.E. % S.E. % S.E. % S.E. Mean index S.E.
ACT 89 1.2 83 1.1 73 1.4 87 0.9 87 1.4 0.20 0.20
NSW 84 0.6 76 0.9 69 1.1 82 0.9 83 0.8 0.08 0.08
VIC 85 0.8 77 1.0 73 1.1 84 1.1 85 0.9 0.13 0.13
QLD 86 0.9 79 1.0 73 1.2 86 0.9 86 1.1 0.14 0.14
SA 85 1.3 78 1.3 71 1.5 84 1.2 85 1.3 0.06 0.06
WA 85 1.1 80 1.6 73 1.7 86 0.9 86 1.3 0.12 0.12
TAS 82 1.0 77 1.5 71 1.2 81 1.0 84 1.1 0.05 0.05
NT 86 1.4 72 2.0 66 2.0 85 1.6 86 1.6 0.06 0.06
Government 83 0.5 74 0.6 68 0.7 81 0.6 83 0.6 0.02 0.02
Catholic 85 0.8 79 0.9 74 1.3 88 0.7 85 1.0 0.14 0.03
Independent 89 0.8 74 0.6 80 1.0 81 0.6 83 0.6 0.35 0.02
Disciplinary climate
Previous PISA assessments have shown that classrooms that are disruptive and disorderly have a negative impact on learning and subsequently can impede student performance. In PISA 2009, students were asked to indicate on a four-point Likert scale (never or hardly ever, in some lessons, most lessons, and every lesson) how often the following examples of disruptive behaviour occurred in their language classes:
◗◗ Students don’t listen to what the teacher says
◗◗ There is noise and disorder
◗◗ The teacher has to wait a long time for the students to quieten down
◗◗ Students cannot work well
◗◗ Students don’t start working for a long time after the lesson begins.
These statements were used to create an index of disciplinary climate in language classrooms, with low values indicating a poor disciplinary climate in which disruptive behaviours occur more frequently.
As the statements are asking about negative behaviours, a positive school environment would be one in which higher proportions of students responded that these things happen infrequently – never or hardly ever, or only in some classes.66 Table 7.9 shows that a large proportion of students reported a favourable disciplinary climate in their language lessons. Across OECD countries, students reported that they never or only in some lessons feel that: there is noise and disorder (68% of students); students don’t listen to what the teacher says (71% of students); the teacher has to wait a long time for the students to quieten down (72% of students); students don’t start working for a long time after the lesson begins (75% of students); and students cannot work well (81% of students). The proportion of Australian students who responded never or only in some lessons that students cannot work well and students don’t start working for a long time after the lesson begins was similar to the OECD average. However, the proportion of Australian students who reported that other disciplinary issues, such as students not listening to what the teacher says, happened infrequently in their classes (never or only in some classes) was slightly lower than the OECD average, indicating that these issues might be more common in Australian classes.
66 While it may seem more intuitive to report the proportions of students who indicated that these disciplinary issues occurred more frequently, the data reported here are in line with the reporting of the international data by the OECD.

Challenges for Australian Education: Results from PISA 2009 257
In general, higher proportions of students from Asian countries reported that the disciplinary issues listed above occurred never or only in some lessons, compared to students from English-speaking countries. It is of interest to note that Finland, one of the top performing countries in multiple cycles of PISA, recorded the lowest proportions of students reporting that these disciplinary issues occurred infrequently in their lessons compared to the other high performing countries.
Table 7.9 Percentage of students who reported these things happen never or only in some lessons and mean index for disciplinary climate in selected countries
Country
Students don’t listen to what the
teacher says
There is noise and disorder
The teacher has to wait a long time for
the students to quieten down
Students cannot
work well
Students don’t start working
for a long time after the lesson begins
Index of disciplinary
climate
% S.E. % S.E. % S.E. % S.E. % S.E. Mean index S.E.
Australia 68 0.7 61 0.7 71 0.7 82 0.5 76 0.6 -0.07 0.02
Canada 71 0.6 61 0.6 72 0.6 82 0.5 73 0.6 -0.08 0.01
New Zealand 68 0.8 61 1.1 68 0.9 82 0.7 74 0.8 -0.12 0.02
United Kingdom 73 0.9 68 1.0 74 0.9 86 0.7 81 0.8 0.11 0.03
United States 76 0.8 72 0.8 79 0.8 87 0.6 82 0.8 0.16 0.02
Finland 60 1.0 52 1.1 63 1.0 80 0.8 68 1.0 -0.29 0.02
Hong Kong – China 87 0.6 88 0.6 89 0.5 88 0.6 86 0.7 0.37 0.02
Korea 90 0.7 77 0.8 88 0.6 90 0.7 87 0.8 0.38 0.03
Shanghai – China 85 0.7 88 0.6 90 0.6 87 0.6 89 0.5 0.45 0.02
Singapore 78 0.5 70 0.7 77 0.5 87 0.5 83 0.5 0.12 0.02
OECD average 71 0.2 68 0.2 72 0.2 81 0.1 75 0.1 0.00 0.00
The mean Disciplinary Climate Index scores for Asian countries were all above the OECD average, indicating that disruptive behaviours occur less frequently in their language lessons compared to the OECD average. Mean scores on the index for Asian countries ranged from 0.12 in Singapore to 0.45 in Shanghai – China. Among English-speaking countries, Australia (–0.07), Canada (–0.08) and New Zealand (–0.12) recorded mean index scores comparable with the OECD average, with the scores indicating that disruptive behaviours occurred more frequently in classes in these countries than across the OECD as a whole. In the United Kingdom and the United States, higher than average means were recorded on the Disciplinary Climate Index, with 0.11 and 0.16 respectively. Finland recorded the lowest mean score of the selected countries with –0.29.
There was little variation across the Australian states or between the sectors in terms of the proportions of students who reported disciplinary issues in their language lessons (Table 7.10). South Australia, the Australian Capital Territory, New South Wales, the Northern Territory, Victoria and Tasmania recorded mean Disciplinary Climate Index scores that were lower than the OECD average, ranging from –0.06 in South Australia to –0.24 in Tasmania. Western Australia and Queensland recorded mean scores on the index that were similar to the OECD average, with 0.04 and 0.06 respectively.
The mean score for government schools on the Disciplinary Climate Index was lower than the OECD average, indicating more disciplinary issues in language classes in these schools, while the mean index score for Catholic schools was the same as the OECD average. Students in independent schools reported fewer disciplinary issues in their classes compared to the OECD average.

258 Characteristics of Australian schools in PISA
Table 7.10 Percentage of students who reported these things happen never or only in some lessons and mean index for disciplinary climate, by states and by sector
State/sector
Students don’t listen to what the
teacher says
There is noise and disorder
The teacher has to wait a long time for
the students to quieten down
Students cannot
work well
Students don’t start working
for a long time after the lesson
begins
Index of disciplinary
climate
% S.E. % S.E. % S.E. % S.E. % S.E. Mean index S.E.
ACT 65 1.7 60 2.3 67 1.8 81 1.2 74 1.7 -0.08 0.05
NSW 68 1.3 60 1.4 70 1.5 81 1.0 76 1.3 -0.09 0.04
VIC 63 1.4 56 1.3 66 1.3 80 1.5 73 1.2 -0.20 0.04
QLD 71 2.0 65 1.7 76 1.6 85 1.2 81 1.3 0.06 0.05
SA 69 1.8 62 2.0 71 2.0 84 1.6 77 1.5 -0.06 0.05
WA 72 2.0 65 2.4 76 2.3 86 1.3 77 1.6 0.04 0.05
TAS 63 2.8 56 2.9 66 3.1 80 1.8 74 2.0 -0.24 0.07
NT 65 2.3 57 2.3 69 1.8 81 2.6 76 2.1 -0.13 0.05
Government 64 1.1 56 1.0 67 1.0 79 0.8 72 0.9 -0.18 0.03
Catholic 69 1.5 63 1.4 73 1.5 84 1.2 80 1.3 0.00 0.04
Independent 77 1.6 72 1.7 81 1.6 90 1.0 86 1.1 0.19 0.04
Student-related factors affecting school climate
PISA also collected information about student behaviour and disciplinary climate from the perspective of school principals by asking them to indicate the extent to which learning of students is hindered by the following incidents:
◗◗ Student absenteeism
◗◗ Disruption of classes by students
◗◗ Students skipping classes
◗◗ Students lacking respect for teachers
◗◗ Students use of alcohol or illegal drugs
◗◗ Student intimidating or bullying other students.
Response options were on a four-point Likert scale (not at all, very little, to some extent, and a lot). As with the statements regarding disciplinary issues in the previous section, these student-related factors affecting school climate are negative behaviours, and thus a positive school environment would be one in which principals responded that these things have little impact on student learning (response options not at all or very little).
These statements were used to create an index of student-related factors affecting school climate. Higher positive values indicate that principals see student-related behaviours hindering learning to a lesser extent, while negative values indicate that principals believe student-related behaviours hinder learning to a greater extent compared to the OECD average.
Across OECD countries, student use of alcohol or illegal drugs or students intimidating or bullying other students were reported to affect instruction only minimally, with 92 per cent and 87 per cent of students attending schools in which these issues were not a problem according to principals. Student use of alcohol or illegal drugs appeared to be more of a problem affecting instruction in Shanghai – China and Canada, while greater proportions of Finnish students were in schools affected by bullying and intimidation or absenteeism. In Australia, almost all (96%) students attended schools where the principal reported that the use of alcohol or illegal drugs by students was not affecting instruction, and the majority of students (81%) attended schools in which principals reported that intimidating or bullying other students was not a factor.

Challenges for Australian Education: Results from PISA 2009 259
On average across OECD countries, 76 per cent of students attended schools whose principal reported learning was not hindered because students lacked respect for their teachers. In Australia, the proportion of students was similar to the OECD average with 77 per cent of students. For other countries, this ranged from 67 per cent of students in Finnish schools to 88 per cent of students in schools from the United Kingdom.
Using the figures from Table 7.11 it is possible to identify those student-related factors that were most commonly considered to limit learning by subtracting the proportion of combined responses of not at all and very little from 100. The remaining proportion represents those students who are in schools in which principals report that learning is being negatively impacted by these student behaviours. Instruction was hindered by student absenteeism for about half the students attending Australian schools, and the proportions were even greater in Finland and Canada, where approximately 70 per cent of students attended schools where principals reported instruction was hindered by absenteeism. Shanghai – China, Singapore and the United Kingdom reported slightly fewer problems with absenteeism, with 40 per cent of students attending schools in which this was a problem. In Hong Kong – China and Korea, only 20 per cent of students attended schools in which the principal indicated the student absenteeism affected instruction to at least some extent.
On average across OECD countries, 40 per cent of students attended schools in which the principal indicated classes were disrupted by students to the point where instruction was hindered at least to some extent. This was similar to the proportion for Finland, while responses of principals in countries such as Australia and Canada indicated that student disruption of classes was less of an issue, affecting around 30 per cent of students.
Between 33% and 11% of students in the United Kingdom, New Zealand, and the United States attended schools in which skipping classes impacted on instruction. Skipping classes was more of a problem among students in Canada and Finland compared to the OECD average, while just over one-fifth of Australian students attended schools in which the principal reported that students skipping classes impacted on instruction at least to some extent.
Table 7.11 Percentage of students in schools where the principal reported student-related factors affected instruction not at all or very little and mean index for selected countries
Country
Student absenteeism
Disruption of classes
by students
Students skipping classes
Students lacking
respect for teachers
Students use of
alcohol or illegal drugs
Students intimidating or bullying
other students
Index of student-
related factors affecting
school climate
% S.E. % S.E. % S.E. % S.E. % S.E. % S.E. Mean index S.E.
Australia 52 2.5 69 2.5 77 2.3 77 2.1 96 1.0 81 2.2 0.01 0.04
Canada 31 1.8 71 1.8 42 1.9 82 1.8 70 2.1 85 1.6 -0.41 0.03
New Zealand 46 2.6 68 2.7 67 2.4 80 2.6 90 2.2 90 1.9 -0.16 0.04
United Kingdom 62 2.8 85 2.4 89 1.9 88 2.4 97 1.1 97 0.8 0.19 0.04
United States 44 3.8 84 2.6 70 3.5 79 3.0 79 3.5 91 2.3 -0.16 0.06
Finland 27 3.6 38 3.8 57 4.3 67 4.0 96 1.7 71 3.7 -0.43 0.06
Hong Kong – China 83 2.4 83 2.9 90 2.3 84 2.8 98 1.0 92 2.2 0.48 0.07
Korea 79 3.9 76 3.9 93 2.3 71 4.3 92 2.5 87 2.8 0.40 0.07
Shanghai – China 61 3.6 64 3.7 64 3.5 64 3.8 69 3.2 74 3.1 0.11 0.13
Singapore 64 0.6 75 0.9 83 0.7 86 0.2 100 0.0 94 0.1 0.36 0.01
OECD average 52 0.6 60 0.5 67 0.5 76 0.5 91 0.3 86 0.4 -0.0636 0.01
67 The OECD average mean index score for some of the school-based indices may not be zero.

260 Characteristics of Australian schools in PISA
The average index scores for student-related factors affecting school climate indicated that learning was disrupted by student behaviour to a greater extent in Canada (–0.41) and Finland (–0.43) compared to other countries. New Zealand and the United States also recorded negative values on this index, indicating principals believed student behaviours hindered learning to a greater extent than the OECD average. On the other hand, student behaviour is less of a concern in Asian countries, with positive values on the index ranging from 0.11 in Shanghai – China to 0.48 in Hong Kong – China. The mean index score for Australia was not significantly different to the OECD average.
Across the Australian states, student absenteeism was the most commonly reported student-related disruption to learning. In the Northern Territory, 81 per cent of students attended schools in which principals considered this student behaviour to affect learning to some extent, while 38 per cent of students attending schools in the Australian Capital Territory through to 57 per cent of students in Tasmanian schools were affected by this behaviour (Table 7.12).
The Northern Territory, Tasmania and South Australia recorded the highest negative mean scores on the index, indicating principals considered student behaviours hindered learning to a greater extent compared to the OECD average. New South Wales, Queensland and Western Australia recorded mean scores on the index that were similar to the OECD average, while Victoria and the Australian Capital Territory had positive values on the index, indicating that principals in these two states had fewer concerns about the negative impact of student behaviour on instruction than did principals across the OECD population.
Table 7.12 Percentage of students in schools where the principal reported student-related factors affected instruction not at all or very little and mean index, by states and by sector
State/sector
Student absenteeism
Disruption of classes
by students
Students skipping classes
Students lacking
respect for teachers
Students use of
alcohol or illegal drugs
Students intimidating or bullying
other students
Index of student-related factors
affecting school climate
% S.E. % S.E. % S.E. % S.E. % S.E. % S.E. Mean index S.E.
ACT 62 4.2 77 4.2 76 5.7 85 6.8 96 0.2 87 4.7 0.26 0.05
NSW 52 5.0 61 5.4 78 4.5 73 4.3 98 1.5 79 4.6 -0.02 0.05
VIC 51 5.6 71 5.5 79 5.5 76 4.3 99 1.5 83 4.6 0.12 0.07
QLD 58 4.4 78 4.2 73 4.9 78 4.0 96 2.5 81 4.4 -0.03 0.05
SA 45 7.3 63 5.4 72 6.4 78 5.7 89 5.0 78 6.8 -0.12 0.07
WA 51 8.7 79 5.4 80 6.7 88 5.7 95 3.7 79 6.6 0.05 0.07
TAS 43 6.1 60 10.6 69 8.5 65 9.0 88 4.3 81 6.5 -0.30 0.06
NT 19 5.5 62 3.5 72 1.8 90 0.8 100 0.0 97 1.1 -0.34 0.04
Government 32 3.5 55 3.7 62 3.8 64 3.3 94 1.6 73 3.3 -0.43 0.03
Catholic 77 4.7 87 4.2 99 0.6 94 2.8 99 0.7 92 3.6 0.51 0.05
Independent 87 4.0 95 3.5 96 2.8 99 1.1 100 0.0 92 4.7 0.84 0.06
Student absenteeism was a greater problem among students in government schools than Catholic or independent schools, with almost 70 per cent of students in this sector attending schools in which principals felt this behaviour impacted on learning to some extent. A similar pattern was evident across the other student-related behaviours, with the proportion of students in government schools in which the various factors impacted on learning being greater than the corresponding proportions in either Catholic or independent schools. Given this pattern, it is not surprising that average scores on the student-related behaviours that impact on learning index were lower in government schools, indicating greater problems, than in Catholic or independent schools.
Challenges for Australian Education: Results from PISA 2009 261
Teacher-related factors affecting school climate
In PISA 2009, the extent to which teacher-related behaviours influenced student learning was also assessed. Principals were asked to indicate on a four-point Likert scale (not at all, very little, to some extent, and a lot) the extent to which they perceived learning in their schools to be hindered by the following factors:
◗◗ Teachers’ low expectations of students
◗◗ Poor student–teacher relations
◗◗ Teachers not meeting individual students’ needs
◗◗ Teacher absenteeism
◗◗ Staff resisting change
◗◗ Teachers being too strict with students
◗◗ Students not being encouraged to achieve their full potential.
These statements were used to create an index of teacher-related factors affecting school climate. Higher positive values indicate principals’ perceptions that teacher-related behaviours hinder learning to a lesser extent, and negative values indicate that principals believe teacher-related behaviours hinder learning to a greater extent compared to the OECD average.
Table 7.13 shows that the majority of students across OECD countries attended schools in which principals agreed that teacher-related factors in their schools affected learning ‘not at all’ or ‘very little’. Across the OECD, 72 per cent of students attended schools whose principals indicated that teachers not meeting individual students’ needs and staff resisting change did not impact on learning, and 90 per cent of students attended schools whose principals indicated that teachers being too strict with students was not an issue.
In Australian schools, the most commonly reported teacher-related factors that impacted on instruction were teachers not meeting individual students’ needs, with 42 per cent of Australian students attending schools in which this affected instruction to at least some extent according to principals. Staff resisting change was also an issue for schools attended by 39 per cent of Australian students.68
Of the countries reported here, only the United Kingdom recorded a positive mean index score for teacher-related factors affecting school climate. The lowest mean index score was recorded in Shanghai – China, an interesting finding given their positive scores on the other indices reported in this chapter. In Australia, the mean score on this index was –0.23, indicating that Australian principals felt that teacher-related factors impacted on learning to a greater extent on average than across the OECD.
68 These percentages represent the proportion of responses of to some extent or a lot, calculated by subtracting the proportions reported in the table from the total of 100.

262 Characteristics of Australian schools in PISA
Table 7.13 Percentage of students in schools where the principal reported teacher-related factors affected instruction not at all or very little and mean index for selected countries
Country
Teachers’ low expectations of students
Poor student–teacher
relations
Teachers not
meeting individual students’
needs
Teacher absenteeism
Staff resisting change
Teachers being too strict with students
Students not being
encouraged to achieve their full potential
Index of teacher-
related factors affecting
school climate
% S.E. % S.E. % S.E. % S.E. % S.E. % S.E. % S.E. Mean index S.E.
Australia 68 2.4 85 2.0 58 2.8 86 1.8 61 2.9 96 1.3 78 2.2 -0.23 0.04
Canada 86 1.6 89 1.6 75 1.8 88 1.5 62 2.3 94 1.1 86 1.3 -0.08 0.03
New Zealand 63 3.4 83 2.6 57 3.5 95 1.4 73 3.4 95 1.5 82 2.8 -0.20 0.05
United Kingdom 79 2.9 97 1.2 77 2.8 87 2.2 83 2.6 98 1.1 92 1.9 0.07 0.05
United States 77 3.2 90 2.1 72 3.7 91 2.0 68 3.3 96 1.6 84 2.5 -0.17 0.06
Finland 94 2.0 88 2.8 67 4.2 80 3.3 84 3.2 97 1.5 86 2.4 -0.06 0.06
Hong Kong – China 58 3.6 93 1.5 52 4.1 87 2.8 77 3.0 94 1.6 69 3.5 -0.32 0.06
Korea 66 4.3 90 2.5 67 4.2 99 0.7 66 4.2 84 3.4 83 3.2 -0.14 0.07
Shanghai – China 59 3.7 59 3.5 45 4.3 71 3.3 60 3.4 73 3.8 47 4.2 -0.60 0.11
Singapore 64 0.6 83 0.2 59 0.4 84 1.0 83 0.2 90 1.0 90 0.2 -0.13 0.01
OECD average 78 0.5 88 0.4 72 0.5 83 0.4 72 0.5 90 0.3 77 0.5 -0.09 0.01
Responses to these teacher-related factors across the Australian states are shown in Table 7.14. Of most concern to principals were teachers not meeting the individual needs of students, with about half of the students attending schools in Tasmania, Victoria and the Northern Territory reporting this was an issue impacting on student learning to at least some extent.
All Australian states, apart from the Australian Capital Territory, had mean index scores that were significantly lower than the OECD average, indicating a greater impact of teacher-related factors on instruction. The Northern Territory had the lowest mean index of –0.61, indicating that principals believed that the behaviours of teachers hindered the learning of students in their schools to a greater extent than in schools in other states.
Table 7.14 Percentage of students in schools where the principal reported teacher-related factors affected instruction not at all or very little and mean index, by state and by sector
State/sector
Teachers’ low expectations of students
Poor student–teacher
relations
Teachers not meeting individual students’
needs
Teacher absenteeism
Staff resisting change
Teachers being too strict with students
Students not being
encouraged to achieve their full potential
Index of teacher-
related factors affecting school
climate
% S.E. % S.E. % S.E. % S.E. % S.E. % S.E. % S.E. Mean index S.E.
ACT 84 7.1 100 0.0 64 4.4 92 4.0 70 8.0 96 4.0 83 6.1 -0.01 0.03
NSW 65 5.8 82 4.7 56 5.2 84 4.0 57 5.6 93 3.0 78 4.8 -0.30 0.05
VIC 59 6.9 83 4.0 52 6.7 85 4.9 62 7.8 98 1.9 80 5.0 -0.21 0.07
QLD 77 5.1 89 4.2 66 5.9 86 3.6 66 7.1 98 1.9 78 5.4 -0.14 0.06
SA 63 6.6 80 6.1 60 7.1 86 6.0 58 8.3 95 3.9 72 6.2 -0.32 0.07
WA 78 7.4 89 5.3 58 8.1 91 5.1 59 8.1 95 3.5 77 6.9 -0.13 0.09
TAS 63 10.0 85 7.2 46 8.8 85 7.0 61 11.1 98 2.7 79 7.8 -0.32 0.07
NT 65 2.2 72 1.8 53 2.9 70 3.4 58 2.7 91 0.7 83 8.0 -0.61 0.01
Government 57 3.7 76 3.3 48 4.1 80 3.0 54 4.0 96 1.5 71 3.4 -0.47 0.04
Catholic 78 5.8 96 3.0 64 5.7 92 2.2 70 6.5 94 3.4 87 4.6 -0.03 0.06
Independent 92 3.7 99 1.2 83 5.0 95 3.1 73 7.4 98 2.1 91 3.6 0.32 0.07
The mean index score for government schools was –0.47, which was lower than the mean index for Catholic and independent schools and lower than the OECD average. This again indicates that student learning in these schools is impacted on by teacher-related factors, as it was by student-related factors, to a greater extent than in the other sectors. Independent schools had a mean index score of 0.32, significantly higher than the OECD average.

Challenges for Australian Education: Results from PISA 2009 263
School autonomy
School autonomy in allocating resources
Principals were asked to report which staff had considerable responsibility for the following tasks:
◗◗ Selecting teachers for hire
◗◗ Firing teachers
◗◗ Establishing teachers’ starting salaries
◗◗ Determining teachers’ salary increases
◗◗ Formulating the school budget
◗◗ Deciding on budget allocations within the school.
The list of response options included: the principal, teachers, school council, state education authority, and the national education authority. Principals were able to select as many options as appropriate.
An index of school autonomy in allocating resources was created using the above information. Higher positive values indicate greater levels of autonomy for schools in allocating resources, whereas negative values indicate less autonomy.
There were varying degrees of autonomy in allocating resources across the selected countries (Table 7.15). Korea, Singapore, Canada and Finland reported the lowest levels, indicating that schools do not have responsibility for hiring and firing teachers, establishing and determining teachers’ salaries, and formulating and allocating school budgets. Australia had a mean index score of –0.07, which was similar to the OECD average. Principals from Shanghai – China and the United States reported the highest levels of responsibility for allocating resources in their school.
Table 7.15 School autonomy in allocating resources index by selected countries
Country Mean index S.E.
Australia -0.07 0.03
Canada -0.39 0.02
New Zealand 0.11 0.04
United Kingdom 0.83 0.07
United States 0.40 0.06
Finland -0.39 0.03
Hong Kong – China 0.20 0.05
Korea -0.44 0.07
Shanghai – China 0.83 0.07
Singapore -0.43 0.01
OECD average -0.06 0.01
As can be seen in Table 7.16, there was variation in the degree of autonomy reported by principals in the different states and territories of Australia. Principals in New South Wales, Tasmania, Queensland, South Australia and the Australian Capital Territory reported less school autonomy in allocating resources compared to their counterparts in Western Australia, Victoria and the Northern Territory.
New South Wales had the lowest level of autonomy in allocating resources with a mean index score of –0.25, while principals in the Northern Territory reported the highest levels of responsibility for allocating resources in the school (with a mean index score of 0.21).
Principals from independent schools reported having more responsibility for allocating resources in the school compared to Catholic or government schools. Government schools reported having the lowest levels of school autonomy in allocating resources.

264 Characteristics of Australian schools in PISA
Table 7.16 School autonomy in resource allocation index by state and sector
State/sector Mean index S.E.
ACT -0.05 0.05
NSW -0.25 0.03
VIC 0.18 0.08
QLD -0.15 0.08
SA -0.10 0.10
WA 0.06 0.16
TAS -0.15 0.10
NT 0.21 0.08
Government -0.50 0.01
Catholic -0.03 0.08
Independent 1.29 0.15
School autonomy in curriculum and assessment
In addition to assessing whether schools have the responsibility for allocating resources, principals were asked about who has considerable responsibility for making decisions about curricula and assessment. These responsibilities were:
◗◗ Establishing student assessment policies
◗◗ Choosing which textbooks are used
◗◗ Determining course content
◗◗ Deciding which courses are offered.
The personnel that principals could choose from included the principal, teachers, school council, the state education authority, and the national education authority. Principals were able to choose as many options as were appropriate.
An index of school autonomy in curriculum and assessment was created using the above information. Higher positive values indicate greater autonomy for schools in making decisions about curricula and assessment, whereas negative values indicate less autonomy for schools.
Canada and the United States reported the lowest levels of school autonomy in making decisions about curricula and assessment, while Korea, New Zealand, the United Kingdom and Hong Kong – China reported the highest levels. Principals in Australia reported that schools had more responsibility in making decisions about curricula and assessment than across the OECD on average (Table 7.17).
Table 7.17 School autonomy in curriculum and assessment index by selected countries
Country Mean index S.E.
Australia 0.17 0.05
Canada -0.66 0.03
New Zealand 0.81 0.04
United Kingdom 0.83 0.05
United States -0.20 0.06
Finland -0.15 0.06
Hong Kong – China 0.92 0.06
Korea 0.79 0.08
Shanghai – China -0.09 0.08
Singapore -0.09 0.01
OECD average -0.06 0.01

Challenges for Australian Education: Results from PISA 2009 265
Table 7.18 shows that most of the Australian states recorded a mean index score that was similar to the OECD average. Principals in Victoria recorded the highest levels of school autonomy in making decisions about curricula and assessment, followed by Queensland and South Australia.
Not surprisingly, principals in independent schools reported having much higher levels of autonomy in making decisions about curricula and assessment than principals in Catholic or government schools.
Table 7.18 School autonomy in curriculum and assessment index by state and sector
Country Mean index S.E.
ACT 0.06 0.12
NSW -0.03 0.1
VIC 0.50 0.12
QLD 0.20 0.09
SA 0.13 0.15
WA 0.02 0.16
TAS 0.05 0.10
NT -0.01 0.09
Government 0.04 0.07
Catholic 0.14 0.12
Independent 0.63 0.10
Early childhood education There are educational benefits for children who attend pre-school prior to entering formal education (Pagani, Fitzpatrick & Archambault, 2010). In PISA 2009, students were asked whether they had attended preschool69, and for those students who did, whether they had attended for one year or less, or for more than one year.
The majority of students in PISA 2009 reported they had attended preschool (Table 7.19). Almost three-quarters of students on average across the OECD had attended preschool for more than one year, while only eight per cent of students across OECD countries had not attended preschool.
For English-speaking countries, about half the students from Australia and Canada had attended preschool for more than one year, and in New Zealand, the United Kingdom and the United States approximately two-thirds of students had attended preschool for this length of time. Two-thirds of students from Finland had also attended preschool for more than one year.
Almost all of the students from Asian countries had attended preschool for more than one year: over 90 per cent of students in Singapore and Hong Kong – China, almost 90 per cent of students in Shanghai – China, and about 80 per cent of students from Korea.
69 Preschool is known by a variety of names and refers to children attending an educational setting in the year or two years prior to the beginning of formal education.

266 Characteristics of Australian schools in PISA
Table 7.19 Percentage of students who attended preschool for selected countries
Country
No attendance at preschool
Attended preschool for one year or less
Attended preschool for more than one year
% S.E. % S.E. % S.E.
Australia 4 0.3 45 0.6 50 0.7
Canada 9 0.3 42 0.7 48 0.7
New Zealand 9 0.5 22 0.7 69 0.8
United Kingdom 6 0.5 28 0.7 66 0.8
United States 2 0.2 28 0.9 71 1.0
Finland 5 0.5 29 0.9 66 1.0
Hong Kong – China 3 0.4 5 0.3 92 0.5
Korea 6 0.5 16 0.7 78 1.0
Shanghai – China 2 0.5 11 0.7 87 1.0
Singapore 2 0.2 7 0.4 91 0.4
OECD average 8 0.1 20 0.1 72 0.1
The vast majority of students across the Australian states and territories had some experience of preschool. Over 50 per cent of students in New South Wales and Victoria; between 40 per cent and 46 per cent of students in Queensland, South Australian and Western Australia; 37 per cent of students in Tasmania; and 30 per cent of students in the Northern Territory, had attended preschool for more than one year (Table 7.20).
Table 7.20 Percentage of students who attended preschool by state and by sector
State/sectorNo attendance at preschool Attended preschool for one
year or less Attended preschool for more
than one year
% S.E. % S.E. % S.E.
ACT 3 0.8 57 2.3 40 2.4
NSW 3 0.4 38 1.2 58 1.3
VIC 5 0.8 39 1.3 56 1.8
QLD 5 0.5 55 1.0 40 1.0
SA 4 0.8 54 1.7 42 1.5
WA 5 0.8 49 3.0 46 3.0
TAS 5 0.4 58 1.7 37 1.8
NT 6 1.1 64 1.7 30 1.9
Government 5 0.4 48 0.7 47 0.9
Catholic 3 0.5 43 1.3 54 1.4
Independent 3 0.5 39 1.9 57 2.0
Time resourcesDoes the time spent learning in and out of school have an influence on student performance? Are there variations in time spent in schools between countries and between the Australian states?
In PISA 2009, data was collected on the amount of time students spent in formal instruction in school, as well as after school to provide further insight into student learning practices.
Learning time in school
PISA asked students about the amount of time they spent in class learning their language of instruction, mathematics and science.

Challenges for Australian Education: Results from PISA 2009 267
Although PISA provides data about time-on-task in school, it is important to keep in mind that this data was collected from students and not at teacher or school level. The student population is comprised of 15-year-old students drawn from different year levels, and students will not necessarily be spending the same amount of time in class; for example, some students may not be undertaking any mathematics at all, whereas other students may be enrolled in one or more mathematics classes.
Table 7.21 provides the mean time students spent learning their language of instruction, mathematics and science in school. The data show that students spent differing amounts of time on learning, with the top-performing countries not all spending the longest amount of time-on-task.
On average across OECD countries, students reported spending approximately 220 minutes per week in lessons on the language of instruction. Canadian students spent more time than the OECD average, and Finnish students reported spending the lowest amount of time with 150 minutes per week. In Australia, the mean time spent learning English was about 245 minutes per week.
Students reported spending approximately 215 minutes, on average across OECD countries, in mathematics lessons. Again, Finnish students indicated they spent the lowest amount of time, with 172 minutes per week, while students from Canada and Singapore reported spending over 300 minutes per week in mathematics lessons. Australian students reported spending 246 minutes per week in mathematics lessons.
On average across OECD countries, students reported spending approximately 200 minutes per week in science lessons. The average time students from Korea and Finland spent in science lessons was 180 minutes and 194 minutes per week respectively, compared to students from Hong Kong – China, Canada and Singapore with more than 300 minutes per week. Australian students reported spending a mean of 219 minutes per week in science lessons.
Table 7.21 Mean learning time at school in the language of instruction, mathematics and science for selected countries
Country
Regular lessons at school in language of instruction
Regular lessons at school in mathematics
Regular lessons at school in science
Time student spent for learning per week (minutes)
Time student spent for learning per week (minutes)
Time student spent for learning per week (minutes)
Mean S.E. Mean S.E. Mean S.E.
Australia 243 1.9 246 1.9 219 2.7
Canada 326 2.8 323 2.7 317 2.9
New Zealand 243 1.3 242 1.5 244 2.4
United Kingdom 219 2.3 212 2.3 280 2.4
United States 258 3.2 258 3.3 258 3.1
Finland 150 2.0 172 2.1 194 3.2
Hong Kong – China 274 2.5 269 2.6 302 4.7
Korea 212 3.7 217 3.8 180 4.4
Shanghai – China 256 3.0 274 3.5 202 7.2
Singapore 283 2.1 343 2.1 345 2.8
OECD average 219 0.4 214 0.4 203 0.6
The mean time students spent within each of the subjects listed in Table 7.22 was similar across the Australian states. In the language of instruction (English lessons), the mean time students reported spending in these lessons ranged from 222 minutes per week in Queensland to 251 minutes per week in the Northern Territory. For mathematics, the mean time spent learning mathematics ranged from 226 minutes per week in the Australian Capital Territory to 255 minutes per week in the Northern Territory. For science, the mean time spent learning science ranged from 204 minutes per week in Victoria to 243 minutes in the Northern Territory.
The mean time spent in lessons by school sector is also presented in Table 7.25, and the means for each of the sectors are similar.

268 Characteristics of Australian schools in PISA
Table 7.22 Mean learning time at school in the language of instruction, mathematics and science, by state and by sector
State/sector
Regular lessons at school in language of instruction
Regular lessons at school in mathematics
Regular lessons at school in science
Time student spent for learning per week (minutes)
Time student spent for learning per week (minutes)
Time student spent for learning per week (minutes)
Mean S.E. Mean S.E. Mean S.E.
ACT 223 6.4 226 6.4 215 7.4
NSW 240 3.2 240 2.6 229 2.9
VIC 248 3.7 251 4.3 204 4.2
QLD 222 4.0 227 3.6 205 11.0
SA 236 3.1 240 2.7 233 3.1
WA 240 5.1 243 6.5 239 8.3
TAS 233 5.9 242 5.4 205 8.3
NT 251 4.6 255 4.5 243 3.9
Government 241 2.2 242 2.0 219 4.0
Catholic 233 3.7 237 3.6 213 3.4
Independent 231 4.2 237 4.4 227 5.9
Learning time out-of-school
PISA asked students about whether they were currently attending any out-of-school lessons in their language of instruction, mathematics or science, such as enrichment or remedial lessons.
The proportions of students from selected countries who attended enrichment or remedial lessons that were held out-of-school in the above areas are provided in Table 7.23. Generally, a higher percentage of students undertook enrichment or remedial classes in mathematics than in the language of instruction or science. The percentage of students across OECD countries that indicated they attended out-of-school lessons ranged from, on average, eight per cent of students attending remedial lessons in science to 17 per cent of students attending enrichment lessons in mathematics.
The proportion of students attending enrichment or remedial classes outside of school was similar among English-speaking countries, with the exception of the United Kingdom where slightly more students spent time learning out-of-school. In Australia between six per cent and 14 per cent of students attended an enrichment or remedial class outside of school in one of these subjects, compared to between nine per cent and 24 per cent of students in the United Kingdom.
Only nine per cent of Finnish students indicated they attended remedial lessons in mathematics outside of school, and there were even fewer students who attended enrichment lessons in mathematics, or enrichment or remedial lessons in their language of instruction or science (no more than two per cent).
In comparison, the proportions of students in Asian countries who reported attending out-of-school enrichment or remedial lessons were higher. For example, the percentage of students attending remedial lessons in mathematics ranged from 22 per cent in Hong Kong – China to 61 per cent of students in Korea, and the proportion of students attending enrichment lessons in mathematics ranged from 28 per cent of students in Shanghai – China to 49 per cent of students in Singapore.

Challenges for Australian Education: Results from PISA 2009 269
Table 7.23 Percentage of students attending out-of-school enrichment or remedial lessons for selected countries
Country
Language of instruction Mathematics Science
Enrichment lessons
Remedial lessons
Enrichment lessons
Remedial lessons
Enrichment lessons
Remedial lessons
% S.E. % S.E. % S.E. % S.E. % S.E. % S.E.
Australia 8 0.3 5 0.3 14 0.5 8 0.3 6 0.3 4 0.2
Canada 6 0.3 5 0.2 12 0.4 8 0.3 6 0.3 4 0.2
New Zealand 7 0.5 5 0.4 12 0.6 7 0.4 6 0.4 4 0.3
United Kingdom 9 0.5 17 0.8 17 0.9 24 0.9 12 0.6 19 0.9
United States 10 0.5 7 0.4 15 0.5 9 0.6 11 0.6 7 0.5
Finland 1 0.1 2 0.2 2 0.2 9 0.5 2 0.2 2 0.2
Hong Kong – China 19 0.8 12 0.6 30 1.0 22 0.8 17 0.8 13 0.7
Korea 27 1.4 54 2.4 38 1.5 61 2.2 17 1.2 45 2.5
Shanghai – China 13 0.8 18 0.9 28 1.0 38 0.9 9 0.8 7 0.7
Singapore 27 0.7 30 0.6 49 0.7 49 0.6 34 0.7 42 0.6
OECD average 10 0.6 10 0.7 17 0.8 18 0.8 9 0.6 8 0.6
The proportions of students across the Australian states who attended enrichment or remedial lessons outside of school were not large, with between four and 16 per cent of students attending enrichment lessons and between two and nine per cent of students attending remedial lessons. There was little variation in the proportion of students from the different school sectors who attend out-of-school lessons (Table 7.24).
Table 7.24 Percentage of students attending out-of-school enrichment or remedial lessons by state and by sector
State/sector
Language of instruction Mathematics Science
Enrichment lessons
Remedial lessons
Enrichment lessons
Remedial lessons
Enrichment lessons
Remedial lessons
% S.E. % S.E. % S.E. % S.E. % S.E. % S.E.
ACT 5 0.7 3 0.6 12 1.1 7 0.8 5 0.8 3 0.6
NSW 9 0.6 5 0.4 16 0.8 9 0.6 7 0.8 4 0.4
VIC 7 0.6 4 0.4 13 1.0 7 0.6 5 0.4 2 0.3
QLD 8 0.7 5 0.8 14 1.4 7 0.8 6 0.9 4 0.6
SA 6 0.8 4 0.5 10 0.8 5 0.7 4 0.6 3 0.4
WA 7 0.7 7 0.9 13 1.0 8 0.9 8 0.7 6 0.7
TAS 6 0.8 5 0.9 11 1.0 6 0.8 6 0.7 4 0.8
NT 10 1.5 6 0.9 14 2.0 9 1.4 9 1.0 5 0.9
Government 9 0.5 6 0.4 13 0.7 7 0.4 6 0.5 4 0.3
Catholic 7 0.5 4 0.5 14 0.8 8 0.6 5 0.4 3 0.3
Independent 6 0.6 3 0.5 15 1.3 8 1.0 5 0.6 3 0.5
Extracurricular activities
Research has shown there is a positive relationship between participation in activities outside of the school day and academic performance (Moriana, Alos & Alcala, 2006). For this reason, PISA collected information about the various extracurricular activities that schools may offer to students.

270 Characteristics of Australian schools in PISA
School principals were asked whether their school offered the following activities: band, orchestra or choir; school plays or school musicals; a school yearbook, a newspaper or magazine; volunteering or service activities; a book club; a debating club or debating activities; a school club or school competition for foreign language, mathematics or science; an academic club; an art club or art activities; sporting team or sporting activities; lectures and/or seminars (e.g. guest speakers such as writers or journalists); collaboration with local libraries; collaboration with local newspapers; and work experience.
An index of extracurricular activities was created using the activities listed above with higher levels on the index indicating greater availability of extracurricular activities.
Of the countries reported in Table 7.25, Finland had the lowest availability of extracurricular activities, with a mean index score of –0.28, which was lower than the OECD average. The mean index scores for the other countries were all higher than the OECD average.
Australia’s mean score on the Extracurricular Activities Index was 0.67, which was similar to the mean index for Canada (0.71). Other English-speaking countries had even higher mean index scores, around 1.00 for the United Kingdom and the United States and 1.21 for New Zealand.
Hong Kong – China had the greatest availability of extracurricular activities, with a mean score of 1.26. The mean scores on the Extracurricular Activities Index for Shanghai – China, Korea and Singapore ranged from 0.94 to 1.07.
Table 7.25 Extracurricular Activities Index by selected countries
Country Mean index S.E.
Australia 0.67 0.04
Canada 0.71 0.03
New Zealand 1.21 0.05
United Kingdom 1.01 0.06
United States 1.02 0.06
Finland -0.28 0.05
Hong Kong – China 1.26 0.07
Korea 1.01 0.07
Shanghai – China 0.94 0.07
Singapore 1.07 0.01
OECD average 0.17 0.01
All Australians states had a mean index score higher than the OECD average. Queensland, Victoria and the Australian Capital Territory reported having a greater availability of extracurricular activities than the other states. The Northern Territory had the lowest availability of extracurricular activities of all states (Table 7.26).

Challenges for Australian Education: Results from PISA 2009 271
Table 7.26 Extracurricular activities index by state and by sector
State/sector Mean index S.E.
ACT 0.79 0.05
NSW 0.54 0.04
VIC 0.82 0.05
QLD 0.86 0.05
SA 0.40 0.06
WA 0.52 0.09
TAS 0.63 0.05
NT 0.30 0.05
Government 0.60 0.03
Catholic 0.74 0.06
Independent 0.81 0.06
Principals from independent schools reported having greater availability of extracurricular activities than Catholic or government schools.
Human resources
Teacher shortages
Principals were asked to provide information about the extent to which they thought instruction in their school was hindered by a lack of qualified teachers. An index of teacher shortages was created from this information. Higher positive values on the index indicate the perception of more problems with instruction due to teacher shortages, while negative values indicate there are fewer problems with instruction due to teacher shortages.
In interpreting these results it is important to keep in mind that principals from different countries, or even within countries, may have different expectations about what adequate resources might be (how many teachers is enough?) and whether there are adequate human resources within their school.
Principals from Hong Kong – China, the United States and Finland reported having fewer problems with instruction due to teacher shortages (Table 7.27). Shanghai – China had the highest mean score on the Teacher Shortage Index, indicating principals perceived teacher shortages hindered instruction to a greater extent than the OECD average in this country. Australian principals also reported that teacher shortages hindered instruction to some extent, with a mean index score of 0.14.
Table 7.27 Teacher Shortage Index by selected countries
Country Mean index S.E.
Australia 0.14 0.06
Canada -0.23 0.03
New Zealand 0.07 0.05
United Kingdom -0.08 0.06
United States -0.45 0.06
Finland -0.42 0.04
Hong Kong – China -0.50 0.07
Korea -0.02 0.09
Shanghai – China 0.55 0.11
Singapore 0.10 0.01
OECD average -0.04 0.01

272 Characteristics of Australian schools in PISA
While the PISA Teacher Shortages Index is not an in-depth examination of the complicated issues of human resources in education, the findings here are in line with those of other studies. The Staff in Australian Schools project (SiAS) found teacher shortages in Australian secondary schools, with reported teacher shortages being greater in government schools than non-government schools (McKenzie, Kos, Walker & Hong, 2008). The results from PISA 2009 produced the same findings. The mean index for teacher shortages across all but one state (were significantly higher than the OECD average indicating teacher shortages were considered to hinder instruction. The Northern Territory, Queensland and Tasmania reported the highest mean scores of 0.59 or more (Table 7.28).
New South Wales was the only state in which principals reported having fewer problems with instruction due to teacher shortages, recording a negative value on the index, and Victoria’s mean score was not significantly different to the OECD average.
Principals from government schools reported greater teacher shortages that affected instruction compared to principals in either Catholic or independent schools. Catholic schools had a mean index around the OECD average and independent schools had a mean index that was higher than the OECD average.
Table 7.28 Teacher Shortage Index by state and by sector
State/sector Mean index S.E.
ACT 0.48 0.06
NSW -0.22 0.05
VIC 0.04 0.07
QLD 0.61 0.07
SA 0.26 0.06
WA 0.17 0.08
TAS 0.59 0.08
NT 0.74 0.02
Government 0.29 0.04
Catholic 0.00 0.05
Independent -0.20 0.07
The association between school characteristics and student performanceThis part of the chapter focuses on the association or relationship between school characteristics, as measured by a number of the PISA 2009 indices, and student performance in reading literacy for Australian students overall, as well as for the Australian states and for school sectors.
The influence of selection and organisation of students into schools and classrooms based on student performance was examined using three constructs from PISA 2009: age-of-entry policies, school admission policies, and ability groupings within schools. In Australia, these constructs were shown to have no significant association with student performance70 (Table 7.29).
In most states, there was no relationship between age of entry into school and student performance. This was also the case for school admission policies and practices centred on ability grouping or streaming. There was, however, a small positive association between ability groupings and student performance in the Australian Capital Territory and in Tasmania.
There was no relationship between any of the constructs and student performance in the different school sectors.
70 As reading literacy was the major focus of PISA 2009, any reference to student performance in this chapter refers to reading literacy performance.

Challenges for Australian Education: Results from PISA 2009 273
Table 7.29 Correlations between student performance and selecting and organising student constructs, for Australia overall, for Australian states, and for the school sectors
Age of entry into school School admission policies Ability grouping
r S.E. r S.E. r S.E.
Australia 0.12 0.01 0.03 0.03 0.03 0.03
ACT 0.04 0.04 -0.09 0.15 0.17 0.09
NSW 0.15 0.02 -0.01 0.07 0.03 0.04
VIC 0.13 0.03 -0.05 0.08 0.09 0.08
QLD 0.12 0.02 0.11 0.07 -0.05 0.06
SA 0.03 0.03 0.03 0.09 0.08 0.07
WA 0.13 0.04 0.11 0.06 -0.02 0.03
TAS -0.05 0.03 0.08 0.09 0.17 0.09
NT -0.01 0.04 -0.09 0.04 0.00 0.00
Government 0.11 0.02 0.05 0.05 0.05 0.03
Catholic 0.06 0.03 -0.01 0.04 0.00 0.03
Independent 0.10 0.03 -0.04 0.07 -0.06 0.08
For Australian students, there was a small positive association between the PISA indices related to learning environment and student performance. Students with good relationships with their teachers attend English classes that are orderly and disciplined, and where the learning atmosphere is not hindered by negative student or teacher behaviours they tended to perform better in the reading literacy assessments than students who did not report these positive environmental conditions. The correlations between learning environment constructs and student performance are provided in Table 7.30. There was some variation in the relationships across the Australian states or school sectors. The correlation between student–teacher relations and student performance was lower in the Australian Capital Territory, Tasmania and the Northern Territory than in other states. There was less correlation between disciplinary climate and student performance in Victoria, and in the Northern Territory there was less correlation between student-related behaviours and student performance than in other states. New South Wales, Queensland, Western Australia and Tasmania had similar correlations between teacher-related behaviours and student performance, while the Northern Territory had the lowest correlation, and the Australian Capital Territory, Victoria and South Australia reported the highest correlations.
The correlations between the learning environment and student performance were similar across the sectors; however independent schools had a lower correlation between teacher-related behaviours and student performance than government or Catholic schools.
Table 7.30 Correlations between student performance and learning environment constructs for Australia overall, for Australian states, and for school sectors
Student–teacher relations Disciplinary climate Student-related
behavioursTeacher-related
behaviours
r S.E. r S.E. r S.E. r S.E.
Australia .28 .01 .24 .01 .29 .02 .19 .02
ACT .19 .04 .25 .03 .32 .06 .27 .05
NSW .27 .02 .28 .02 .25 .04 .16 .05
VIC .29 .02 .12 .03 .34 .06 .25 .06
QLD .30 .02 .27 .03 .26 .04 .16 .05
SA .30 .03 .20 .03 .26 .05 .25 .04
WA .26 .03 .29 .03 .31 .06 .16 .09
TAS .19 .04 .24 .05 .31 .07 .12 .10
NT .19 .04 .28 .03 .08 .03 -.02 .04
Government .27 .02 .16 .02 .16 .05 .13 .05
Catholic .25 .01 .24 .02 .22 .03 .14 .03
Independent .27 .02 .18 .03 .13 .05 .07 .05

274 Characteristics of Australian schools in PISA
In Australia, there was a small positive association between school autonomy in allocating resources and student performance (Table 7.31). This was also the case in all states, apart from the Northern Territory in which there was no relationship between school autonomy in resource allocation and average student performance in reading literacy.
There was no association found between school autonomy in curriculum and assessment and student performance among Australian students. Similar results were also found in the states, apart from the Australian Capital Territory, which had a weak negative association between school autonomy in curriculum and assessment and student performance.
In each of the school sectors, there was no significant relationship found between student performance and either of the school autonomy constructs.
Table 7.31 Correlations between student performance and school autonomy constructs for Australia overall, for Australian states, and for school sectors
School autonomy – resource allocation
School autonomy – curriculum and assessment
r S.E. r S.E.
Australia 0.19 0.02 0.01 0.03
ACT 0.22 0.09 -0.18 0.08
NSW 0.19 0.04 0.09 0.07
VIC 0.21 0.04 0.00 0.06
QLD 0.18 0.04 -0.05 0.06
SA 0.18 0.04 -0.01 0.08
WA 0.20 0.06 -0.06 0.09
TAS 0.28 0.07 0.06 0.06
NT 0.04 0.06 -0.09 0.03
Government 0.06 0.03 -0.02 0.03
Catholic -0.02 0.03 -0.06 0.05
Independent 0.09 0.04 -0.04 0.05
Table 7.32 presents the correlations between student performance and the amount of time spent in the language of instruction, and student performance and availability of extracurricular activities for Australian students. The availability of extracurricular activities index and student performance were positively associated in a number of Australian states, and in Catholic and independent schools. There was no such relationship found between learning time in the language of instruction and student performance, however. This finding was unexpected and further research may be required to provide further information. As mentioned earlier in the chapter, there are complexities surrounding the collection of this information (i.e. data on learning time was collected from students, who are in different year levels and the subjects they undertake are not known) that may have influenced the findings. Or it may be that the amount of time spent in language classes is not directly related to student performance but influences performance through an intermediary relationship with another variable.

Challenges for Australian Education: Results from PISA 2009 275
Table 7.32 Correlations between student performance and time spent in the language of instruction, and student performance and extracurricular activities, for Australia overall, for Australian states, and for school sectors71
Learning time in language of instruction Extracurricular activities
r S.E. r S.E.
Australia -0.03 0.02 0.11 0.02
ACT -0.05 0.05 0.23 0.07
NSW 0.03 0.02 0.07 0.06
VIC -0.10 0.04 0.21 0.05
QLD -0.04 0.04 0.08 0.05
SA -0.03 0.05 0.03 0.05
WA 0.02 0.05 0.11 0.07
TAS -0.13 0.05 0.13 0.07
NT -0.08 0.06 0.09 0.04
Government -0.01 0.02 0.03 0.04
Catholic -0.03 0.04 0.10 0.03
Independent -0.01 0.03 0.14 0.05
A small negative correlation was found between teacher shortages and student performance in Australia, with higher levels of teacher shortages being associated with lower levels of student performance. In some states (South Australia, Tasmania and the Australian Capital Territory) there was a slightly stronger relationship between teacher shortages and student performance compared to the other states (Table 7.33).
Table 7.33 Correlations between teacher shortages and student performance for Australia overall, for Australian states, and for school sectors
Teacher shortages
R S.E.
Australia -0.14 0.03
ACT -0.25 0.09
NSW -0.16 0.05
VIC -0.15 0.07
QLD -0.10 0.07
SA -0.20 0.06
WA -0.16 0.08
TAS -0.23 0.09
NT 0.10 0.04
Government -0.12 0.05
Catholic -0.10 0.04
Independent -0.09 0.05
71 Correlational analyses are not provided for learning time out-of-school.

276 Characteristics of Australian schools in PISA

Challenges for Australian Education: Results from PISA 2009 277
Key Findings ◗ The socioeconomic gradient for Australia follows that of all other countries: each
increment of the PISA scale of economic, social and cultural status is associated with a roughly consistent increase in performance in reading literacy.
◗ The key proxy for equity in PISA is the ‘strength’ of the relationship between socioeconomic background and performance, i.e. the amount of variance in reading literacy scores explained by students’ socioeconomic background. On this measure, the strength of the relationship is similar for Australia to the OECD, such that we are classified as an average equity country.
◗ The slope of the socioeconomic gradient is steeper than on average across the OECD, meaning that in Australia the effect of socioeconomic background on performance is greater.
◗ The amount of variance between schools is lower than the OECD average, the amount of variance within-schools is greater. With 31 per cent of the variance between-schools though, it still matters which school a child attends.
◗ A large proportion of the between-schools variance is due to socioeconomic background.
◗ The highest and the smallest range of socioeconomic levels was found in the Australian Capital Territory, and of all Australian students those with the lowest ESCS were in Tasmania, and the largest range in Victoria, Queensland and New South Wales. Socioeconomic levels of both students and schools in the independent and Catholic school sectors were much higher than those of students and schools in the government sector.
◗ Regardless of their own socioeconomic background, students attending schools in which the average socioeconomic background is high tend to perform better than when they are enrolled in a school with a low average socioeconomic background.
Chapter
8Equity in learning opportunities and outcomes

278 Equity in learning opportunities and outcomes
The relationship between a student’s socioeconomic background and their performance has been touched on in each of the chapters of this report examining performance. In each of the assessment areas of reading literacy, mathematical literacy and scientific literacy, there were significant increases in average performance from one socioeconomic quartile to the next. This relationship was also explored at the school sector level in Chapter 3, which showed that the average performance differences between sectors disappear once student and average school-level socioeconomic background is accounted for – in other words, the differences in student performance that are usually attributed to differences in the environments of independent, Catholic and government schools may be more to do with the socioeconomic background of the families of the students, and the cumulative effect of the cohort of students with whom the student attends school.
One of the most important indicators of equity is the strength of the relationship between the social background of students and their educational achievement. If this relationship is strong, the education system is not succeeding in achieving equitable outcomes, and could be reinforcing educational privilege.
In PISA, the socioeconomic background of students is measured using a composite index: the index of economic, social and cultural status (ESCS), which is based on the highest level of the occupation of the students’ parents or guardians, the highest level of education of parents (converted into years of education), an index of home possessions, including educational resources, cultural possessions and other items in the home72.
This chapter of the report examines the extent to which socioeconomic background is related to performance in the Australian states and territories, particularly in comparison to the group of countries that have previously been used in Chapters 4, 7 and 8 for comparison.
Socioeconomic gradientsThe terms ‘socioeconomic gradient’ or ‘social gradient’ refer to the relationship between an outcome and socioeconomic background. In the case of PISA the outcome is students’ performance and the measure of socioeconomic performance is the ESCS index. PISA data show that there is a significant relationship between students’ performance and their socioeconomic background as measured by ESCS. This relationship is evident in Australia and all other PISA countries, although the strength of the relationship differs among countries. Using a graphical representation, the line of best fit for the points that represent performance against socioeconomic background (ESCS) provides information about several aspects of the relationship. This line is referred to as the socioeconomic or social gradient.
The analysis of socioeconomic gradients is a means of characterising equity in terms of student performance and providing guidance for educational policy. Socioeconomic gradients can be used to compare the relationships between outcomes and student background across and within countries, and to examine changes in equity that occur from one cycle of PISA to another.
72 For more information about the ESCS please refer to the Reader’s Guide.

Challenges for Australian Education: Results from PISA 2009 279
Five types of information are relevant to a consideration of social gradients:
◗ The strength of the relationship between achievement and socioeconomic background. Although it is not always evident from a graphical presentation (even if individual data points for students are represented as a scatter plot) it is important to consider how closely individual results fit to the line of best fit. In other words, are the points representing the performance and ESCS measures for all the individual students situated close to the line of best fit or are they widely scattered about it? The closer all the points are to the line of best fit, the greater is the strength of the relationship. This aspect of the social gradient is represented by the percentage of the variation in performance that can be explained by the ESCS index. If the percentage is large it indicates that performance is relatively highly determined by ESCS, whereas if it is small it indicates that performance is not highly determined by ESCS. For OECD countries as a whole, the strength of the relationship between reading achievement and socioeconomic background is 14%, meaning that 14% of the variation in student performance is accounted for by socioeconomic background.
◗ The slope of the gradient line is an indication of the extent of inequality in the relationship between students’ results and their socioeconomic background (as measured by ESCS). A steeper slope indicates a greater impact of socioeconomic background on performance such that there is a bigger difference in performance between low socioeconomic background students and high socioeconomic background students than in systems with gentler slopes. Education systems typically aim to decrease the differences in performance between different social groups. Greater equity would thus be indicated by a flatter gradient.
◗ The average level of the line in the graph gives an indication of how well the overall population has achieved on the given assessment. Lines at higher levels indicate higher mean performance by the students.
◗ The length of the line indicates the range of ESCS. The graphs in this chapter are plotted between the 5th percentile of ESCS and the 95th percentile of ESCS, that is, the graphs span the middle 90 per cent of the values of ESCS for each country. A smaller range indicates less difference in socioeconomic background between students from the highest and lowest socioeconomic backgrounds in the country. The range can be measured by projecting the starting point and finishing point of the gradient onto the horizontal axis.
◗ The linearity of the gradient. This measures the extent to which the performance edge associated with an advantaged background remains constant across levels of socioeconomic background. The index of curvilinearity allows us to judge this. A positive index indicates that the socioeconomic gradient becomes steeper for more advantaged socioeconomic students, in other words as socioeconomic background increases there is an increase in the extent to which this translates into higher performance scores. A negative index indicates a flattening off of the gradient at higher socioeconomic levels – as socioeconomic advantage increases there is a decrease in the amount of effect this has on performance.

280 Equity in learning opportunities and outcomes
The slope and the strength of the gradient measure different aspects of the relationship between socioeconomic background and performance. If the slope of the gradient is steep and the strength of the relationship between socioeconomic background and performance is strong, the challenges for systems are the greatest. That is, students in these systems are more likely to perform at a level determined by their socioeconomic background and there is a greater performance differential between students from the most advantaged and least advantaged backgrounds.
Figure 8.1 shows the socioeconomic gradient for Australia plotted with the average gradient of the OECD countries that took part in the PISA 2009 reading literacy assessment. It can be seen that the slope of the gradient for Australia follows the general pattern for the international population as a whole – that is each increment on the PISA ESCS scale is associated with a roughly consistent increase in performance on the reading literacy scale.
Care should be taken in interpreting the association between achievement and socioeconomic background, however, especially when it is expressed as a single line as in Figure 8.1. The line represents an average indication of the association between achievement and socioeconomic background. If all students were situated on the line, it would mean that reading achievement could be predicted accurately simply by knowing a student’s socioeconomic background. This, however, is not the case, as there is a diverse range of scores that students achieve that do not fall on the line. To illustrate the range of results that was obtained, 2000 students were randomly chosen from the Australian sample and their results plotted as points on the graph. Each point represents one student. It can be seen that the range of results is vast, with a large number of low socioeconomic background students achieving high scores and, conversely, students with a high socioeconomic backgrounds achieving very low scores.
ESCS Index
3.0 2.5 2.0 1.5 1.0 0.5 0.0 0.5 1.0 1.5 2.0 2.5 3.00
200
400
600
800
0
200
400
600
800
OECD average Australia
Figure 8.1 Socioeconomic gradients for Australia and the OECD
In terms of socioeconomic gradients and PISA, two aims of an equitable system are to have constantly high achievement across the range of socioeconomic backgrounds, that is, a shallow slope or flat line at a high level, and to have only a small amount of variation in performance explained by socioeconomic background, or a weak strength of relationship.

Challenges for Australian Education: Results from PISA 2009 281
Figure 8.2 shows the socioeconomic gradients for a number of comparative countries (the high scorers plus countries with which we usually make comparisons), and Table 8.1 provides the data underlying the graph. Shanghai – China’s socioeconomic gradient is at the top of the graph, showing high levels of achievement right along the socioeconomic spectrum. The length of the socioeconomic gradient line also shows that the education system in Shanghai – China has to manage a very wide range of socioeconomic backgrounds amongst the students in the system, and the lack of curve of the line indicates that the effect of socioeconomic background is constant across the range.
The socioeconomic gradient for Hong Kong – China shows that this education system also caters for a very wide range of socioeconomic backgrounds, but it does so in a varying fashion. In contrast to the gradient for Shanghai – China, the line has a distinct flattening, meaning as socioeconomic background becomes more advantaged, there is a decline in the extent to which inequalities in socioeconomic background translate into performance differences. Achievement at the lower levels of socioeconomic background is very high, second only to Shanghai – China and some 65 score points higher than the OECD average. At the highest level of socioeconomic background, however, the scores for Hong Kong – China are around the same as the OECD average (less than eight score points different).
The socioeconomic gradient for the United States is also worth discussing as it shows a different pattern of curvilinearity. Students at both ends of the socioeconomic scale scored at a level significantly higher than the OECD average (around 17 score points for those at the lower end and 30 score points at the higher end), while students in the middle part of the socioeconomic scale scored at a level not different to the OECD average (a difference of around six score points).
2 1.5 1 0.5 0 0.5 1 1.5 2
ESCS Index
400
500
600
Rea
ding
lite
racy
per
form
ance
Finland
United States
Canada
Hong Kong-China
Shanghai-China
Singapore
OECD average
New Zealand
United Kingdom
Korea
Australia
Figure 8.2 Socioeconomic gradients for Australia and selected countries
The association between socioeconomic background and performance for Australian students is similar to that found on average over OECD countries. Almost 13 per cent of the explained variance in student performance in Australia was found to be attributable to students’ socioeconomic background, compared to around 17 per cent in New Zealand and the United States, and as little as five per cent in Hong Kong – China and eight per cent in Finland. It is this measure, the measure of the strength of the relationship between socioeconomic background and performance, that is used as the proxy for equity in PISA, and so Australia is considered ‘average’ in terms of equity.

282 Equity in learning opportunities and outcomes
The slope of the gradient for Australia is significantly steeper than that for the OECD, however, indicating that the effect of socioeconomic advantage on performance is greater than on average across OECD countries. Australian students’ scores on the reading literacy scale are 46 score points higher for each extra unit on the PISA index of economic, social and cultural status whereas for the OECD on average, this increase is only 38 points. More specifically, students at the lower levels of socioeconomic advantage scored about 11 score points higher than the OECD average, students in the middle levels scored about 19 score points higher and students at the higher levels of socioeconomic advantage scored about 30 score points higher. Table 8.1 shows, furthermore, that the Australian school system is slightly more homogenous than the other systems illustrated in Figure 8.3, with the narrowest range of ESCS scores between the 5th and 95th percentile.
Table 8.1 Socioeconomic relationships for Australia and selected countries
Country
Strength of the relationship between student performance
and the PISA index of economic, social and cultural status (ESCS)*
Slope of the socio-economic
gradient*
Index of curvilinearity
Difference between 95th and 5th percentile
of the ESCS
Australia 12.7 0.8 46.0 1.8 -2.6 1.4 2.4 0.0
Canada 8.6 0.7 31.7 1.4 2.8 1.1 2.6 0.0
Finland 7.8 0.8 31.1 1.7 -3.6 1.4 2.5 0.1
Hong Kong-China 4.5 1.1 17.4 2.2 -3.2 1.2 3.4 0.1
Korea 11.0 1.5 31.9 2.5 -0.1 1.4 2.7 0.0
New Zealand 16.6 1.1 52.3 1.9 -0.2 1.7 2.5 0.0
OECD average 14.0 0.2 38.3 0.3 -1.0 0.3 2.9 0.0
Shanghai – China 12.3 1.8 27.0 2.1 0.8 1.3 3.3 0.0
Singapore 15.3 1.1 47.2 1.7 2.7 1.4 2.6 0.0
United Kingdom 13.7 1.0 44.2 1.9 0.8 1.4 2.5 0.0
United States 16.8 1.7 42.4 2.3 6.6 1.4 3.0 0.1
* In these columns values that are statistically significantly different from the OECD average are indicated in bold
Figure 8.3 displays the socioeconomic gradients for the Australian states and territories. It is informative to examine the average achievement of students of the same socioeconomic background in different states. At the very lowest levels of socioeconomic background, students in Western Australia, New South Wales, Victoria, South Australia and Queensland clearly score substantially higher than students in Tasmania and the Northern Territory. Surprisingly, it also shows that low socioeconomic students in the Australian Capital Territory are not particularly well-served by their education system, with average scores for these students only just above those for Tasmania and the Northern Territory, and between 19 and 24 score points lower than students of the same socioeconomic level in the other five states.
The vertical line at ESCS=0 in Figure 8.3 shows that there were quite different reading literacy scores for students of average ESCS in the different states. Students in the Australian Capital Territory have ‘caught up’ with their peers in Western Australia, Victoria, New South Wales, South Australia and Queensland, and students in these six jurisdictions performed at a higher level than those in the Northern Territory or Tasmania.
At the highest level of socioeconomic background, students in Queensland, Western Australia and the Australian Capital Territory achieve at the same level, outperforming those in Victoria and New South Wales, who at the same time outperformed those in South Australia, Northern Territory and Tasmania.

Challenges for Australian Education: Results from PISA 2009 283
2 1.5 1 0.5 0 0.5 1 1.5 2
ESCS Index
400
500
600
Rea
ding
lite
racy
per
form
ance
NSW
SAWA
QLD
VIC
TAS
AUS
NT
ACT
Figure 8.3 Socioeconomic gradients for Australia and the states and territories
Figure 8.4 shows the socioeconomic gradients just for the Australian Capital Territory and South Australia, as they are quite different. The steepness of the slope for the Australian Capital Territory indicates that there are substantial increments in educational achievement with increments in privilege. In contrast, South Australia has the flattest slope of all Australian states and territories, indicating that in this state there is much less of a gain in educational achievement associated with higher levels of socioeconomic background.
2 1.5 1 0.5 0 0.5 1 1.5 2
ESCS Index
400
500
600
Rea
ding
lite
racy
per
form
ance SA
ACT
Figure 8.4 Socioeconomic gradients for South Australia and the Australian Capital Territory

284 Equity in learning opportunities and outcomes
There are many differences in the extent to which countries are able to moderate the association between socioeconomic background and performance. The relationship between equity and mean reading literacy for a sample of countries that participated in PISA 2009 is shown in Figure 8.5. The horizontal axis represents the strength of the relationship between socioeconomic background and performance, used as a proxy for equity in the distribution of learning opportunities. Countries like Shanghai – China, Hong Kong – China, Canada and Finland in which the strength of the relationship between socioeconomic background and performance is significantly lower than for the OECD on average are plotted to the right of the line which delineates the average strength of the relationship across the OECD. Mean performance is plotted on the vertical axis, with the line at 493 representing the OECD average.
Countries whose performance places them in the top right-hand quadrant, with reading literacy scores higher than the OECD average and the strength of the relationship between socioeconomic background lower than that of the OECD, are classified as High Quality, High Equity. Similarly, countries to the left of the OECD average slope line have a higher impact of socioeconomic background than the OECD average, and so are classified as Low Equity, with those achieving at a higher level than the OECD average classed as High Quality and those below as Low Quality. As with all data there are confidence intervals. The orange markers on Figure 8.5 represent countries in which the difference between the score and the OECD average for equity is not significant.
In the PISA 2000 International report, Australia’s overall performance in reading literacy was described as “High Quality – Low Equity”, meaning that while the overall scores in reading literacy were higher than the OECD average, the impact of socioeconomic status was also higher than the OECD average. Figure 8.5 shows that over nine years, Australia has improved this position slightly, so that equity is not significantly different to the OECD average. Of course during this time the number of countries in the OECD has changed, and so the average equity has also changed.
The high-scoring countries such as Shanghai – China, Hong Kong – China, Finland and Canada are clearly in the High Quality, High Equity quadrant. All of these countries significantly outperformed Australia in reading in PISA 2009.
Although graphically the states and territories appear in different quadrants, the differences in the strength of the relationship between each of the jurisdictions and the OECD average is not significant, so all can be classified as Average Equity.
Percentage of variance in performance in reading literacy explained by the ESCS index (r-squared × 100)
ACT
New ZealandSingapore
Australia
United StatesUnited Kingdom
SA
NT
TAS
WAQLD NSW
Canada
Finland
Korea
Shanghai – China
Hong Kong – China
VIC
Rea
ding
Lite
racy
per
form
ance
30 25 20 15 10 5 0430
450
470
490
510
530
550
570High QualityLow Equity
Low QualityLow Equity
High QualityHigh Equity
Low QualityHigh Equity
OECD average -
Quality
OE
CD
ave
rage
-
Equ
ity
Figure 8.5 Equity of performance in reading literacy

Challenges for Australian Education: Results from PISA 2009 285
It is also of interest to examine results at the school level. Figure 8.6 shows the proportion of variance in achievement for each country, divided into the amount of variation that occurs between schools (i.e. the performance variation attributable to differences in student results in different schools) and the amount of variation that occurs within schools (the performance variation attributable to the range of student results that cannot be attributed to differences between schools).
In countries like Norway and Finland, there is very little variation between schools, meaning it is not so important which school parents send their children to. In countries such as Austria and Germany, there is a large amount of variation between schools brought about by the very design of the school system – one which streams students from an early age into different types of schools according to their performance. In Australia, the amount of variation between schools is lower than on average across the OECD, and the amount of variation within schools is higher than on average across the OECD. This pattern is similar to that seen in the United Kingdom, New Zealand, the United States and Canada. While the Australian school system is not streamed as in some countries, there are differences between schools that could have important implications for parents in terms of which school to send their child to.

286 Equity in learning opportunities and outcomes
OECD average 42%
Percentage of variance
100 80 60 40 20 0
Bulgaria 148
Israel 144
Dubai (UAE) 131
France 129
Luxembourg 124
New Zealand 122
Belgium 120
Japan 116
Austria 116
Uruguay 114
Australia 113
Sweden 112
Singapore 110
United States 108
Iceland 106
Italy 106
United Kingdom 105
Greece 105
Ireland 105
Germany 104
Switzerland 101
Czech Republic 98
Norway 96
Slovenia 95
Canada 94
Slovak Republic 94
Hungary 94
Russian Federation 93
Poland 92
Netherlands 91
Croatia 89
Spain 88
Portugal 87
Lithuania 86
Finland 86
Chinese Taipei 86
Mexico 83
Hong Kong-China 81
Serbia 81
Denmark 81
Estonia 80
Liechtenstein 80
Chile 79
Turkey 77
Shanghai-China 74
Latvia 74
Korea 72
Macao-China 67
20 40 60 80 100
OECD average 65%
Variation between schoolsVariation within schools
Note: Countries are ranked in ascending order of the total variance as a proportion of the overall variance in student performance across the OECD, which appears next to the country name.
Figure 8.6 Variation in reading literacy performance between and within schools

Challenges for Australian Education: Results from PISA 2009 287
Figure 8.7 shows the proportion of the between- and within- school variation in reading literacy performance that can be attributed to socioeconomic differences within and between schools. The dark part of the bar represents the between-school variation that is explained by students’ socioeconomic background; the light bar represents the within-school variation that is explained by the socioeconomic background of students within schools. The sum of both lengths gives an indication of the extent to which socioeconomic differences are associated with performance differences. Countries are ranked according to this total.
Across OECD countries, differences in the socioeconomic backgrounds of students attending different schools accounts for some 55 per cent of the performance differences between schools. However this varies widely across countries. In Finland, Iceland and Norway, differences in the socioeconomic intake of schools accounts for less than 30 per cent of the already small performance differences between schools. In New Zealand, the United Kingdom and the United States, the proportion of between-school performance explained by the socioeconomic background of the students attending the school was more than 70 per cent. In Australia it was almost the same, at 68 per cent.

288 Equity in learning opportunities and outcomes
Percentage of variance in reading literacy performance explained by the PISA ESCS index for students and schools
Variation in performance explained by students' socioeconomic background within schools
Variation in performance explained by schools' socioeconomic background between schools
0 10 20 30 40 50 60 70 80 90 100
LuxembourgUnited Kingdom
New ZealandUnited States
SwedenDenmarkUruguay
PolandAustralia
TurkeyLiechtenstein
ChileShanghai-China
BelgiumBulgaria
Czech RepublicGermany
SingaporeHungaryPortugal
IrelandOECD average
Slovak RepublicFranceKorea
Chinese TaipeiSpainLatvia
SwitzerlandAustriaJapan
LithuaniaSerbia
CroatiaIsrael
CanadaEstonia
NetherlandsRussian Federation
ItalySloveniaGreece
Dubai (UAE)Mexico
Macao-ChinaNorwayFinlandIceland
Hong Kong-China
Figure 8.7 Variation in reading literacy performance explained by students’ and schools’ socioeconomic background.

Challenges for Australian Education: Results from PISA 2009 289
The previous sections have shown that a student’s socioeconomic background, and that of their school, is associated with the level of reading literacy achieved as measured in PISA 2009. Figure 8.8 shows the differences in scores on the PISA reading literacy scale that are associated with a difference of half an international standard deviation on the PISA ESCS index for the individual student (black bar) and for the average for the student’s school (orange bar). In almost all countries, and for all students, this figure shows a clear advantage in attending a school whose students are, on average, from more socioeconomically advantaged backgrounds. Regardless of their own socioeconomic background, students attending schools in which the average socioeconomic background is high tend to perform better than if they are enrolled in a school with below average socioeconomic intake. In the majority of countries shown in Figure 8.8, the effect of the average socioeconomic background of the students in a school on performance variation far outweighs the effects of the individual student’s own socioeconomic background.
In a number of countries the effect of school level socioeconomic background is substantial. In Japan, for example, a difference of one-half of a unit on the ESCS scale at the school level translates into an advantage of around 70 score points for a student. In Australia, the advantage is around 33 score points. In contrast, the within-school differences in socioeconomic backgrounds among students are generally not as strong as that for schools. In Australia the student-level socioeconomic background has an effect of about 15 score points for half of a standard deviation increase in ESCS.

290 Equity in learning opportunities and outcomes
0 10 20 30 40 50 60 70 80 90 100
Japan 0.58Czech Republic 0.45
Germany 0.71Liechtenstein 0.84
Belgium 0.82Israel 0.68
Netherlands 0.50Singapore 0.46
Bulgaria 0.72France 0.59
Dubai (UAE) 0.77Austria 0.61
Slovenia 0.70Hungary 0.85
Slovak Republic 0.58Croatia 0.57
Argentina 1.14United Kingdom 0.53
Italy 0.85Switzerland 0.58
Australia 0.55Luxembourg 0.82
OECD average 0.65United States 0.73
Korea 0.58New Zealand 0.56
Turkey 0.94Shanghai – China 0.90
Ireland 0.50Serbia 0.58
Sweden 0.42Chinese Taipei 0.55
Chile 1.06Uruguay 0.93Greece 0.66
Lithuania 0.67Denmark 0.55
Estonia 0.50Portugal 0.80
Russian Federation 0.57Hong Kong – China 0.65
Canada 0.50Norway 0.31
Latvia 0.61Mexico 1.15Poland 0.54Spain 0.78
Finland 0.43Macao – China 0.53
Iceland 0.55
Effect of schools’ ESCSEffect of students’ ESCS
Note: Data to the left of the bars are values of the interquartile range of the school-level average ESCS index.Countries are ranked in ascending order of the effect of schools’ ESCS.
The effect of the students’ and schools’ socioeconomic background is defined as the slope of the within and between socioeconomic gradient for half a standard deviation on the socio-economic background of students.
Score point difference
Figure 8.8 Effects of students’ and schools’ socioeconomic background on reading literacy performance

Challenges for Australian Education: Results from PISA 2009 291
Differences in the socioeconomic background of students and schoolsGiven these findings, and the findings from earlier chapters that showed achievement levels were higher in some states, in Catholic and independent schools, and in metropolitan schools, further investigation was carried out examining socioeconomic backgrounds in these systems and schools. Figure 8.9 shows the interquartile73 range for student-level ESCS by state, by school sector and by geographic location, while Figure 8.10 shows that the dispersion of schools’ socioeconomic backgrounds is similar, with a gap of about half of that of students (0.65 across OECD countries). These figures together show that the range between these two percentiles, both between schools and individuals, varies within a country, between states, between geographic locations and between school systems. The longer the bars, the more diverse the background of students and schools.
-2.5 -2.0 -1.5 -1.0 -0.5 0.0 0.5 1.0 1.5 2.0 2.5 OECD average
Australia
Metropolitan
Provincial
Rural
Government schools
Independent schools
Catholic schools
VIC
NSW
QLD
SA
TAS
WA
NT
ACT
PISA index of economic, social and cultural status
25th percentile 75th percentile
0.93
1.01
1.05
1.07
1.08
1.10
1.11
1.12
0.96
0.96
1.05
0.90
1.02
1.10
1.09
1.29
Figure 8.9 Range of students’ socioeconomic backgrounds
73 The interquartile range, or the range between the 25th and 75th percentiles, is used by the OECD as the benchmark for measuring performance gaps because this value describes realistic differences between schools in terms of their socioeconomic composition.
292 Equity in learning opportunities and outcomes
On average across OECD countries, the difference between the 25th and 75th percentile on the ESCS index for students is 1.29 units. The range for the states between the 25th and 75th percentile varies between 0.93 for the Australian Capital Territory to 1.12 in Victoria, but clearly from the figure, the 25th and 75th percentiles for the Australian Capital Territory are much higher than that for any other state, while those for Tasmania are lower than in the other states. As would be expected, given that these are the most populous states, the range of students’ socioeconomic background is most diverse in New South Wales, Victoria and Queensland, and least diverse in the Australian Capital Territory, although Western Australia, Victoria and New South Wales have the lowest proportion of low socioeconomic students. The range of schools’ socioeconomic background is highest in Western Australia, South Australia and Victoria.
Figure 8.9 and Figure 8.10 illustrate the differences in the socioeconomic background of students at Catholic, independent and government schools. The ESCS index for government school students ranges from -0.4 at the 25th percentile to 0.7 at the 75th percentile, compared to between 0 and 1 for Catholic students and between 0.3 and 1.3 for independent school students. The range is slightly greater at government schools and, in addition, the number of students from low socioeconomic backgrounds is clearly much greater in government schools than in either Catholic or independent schools.
The differences in the socioeconomic background of schools also varies widely by school sector. The 25th percentile for independent schools is actually higher than the 75th percentile for government schools, and almost higher than that of Catholic schools.
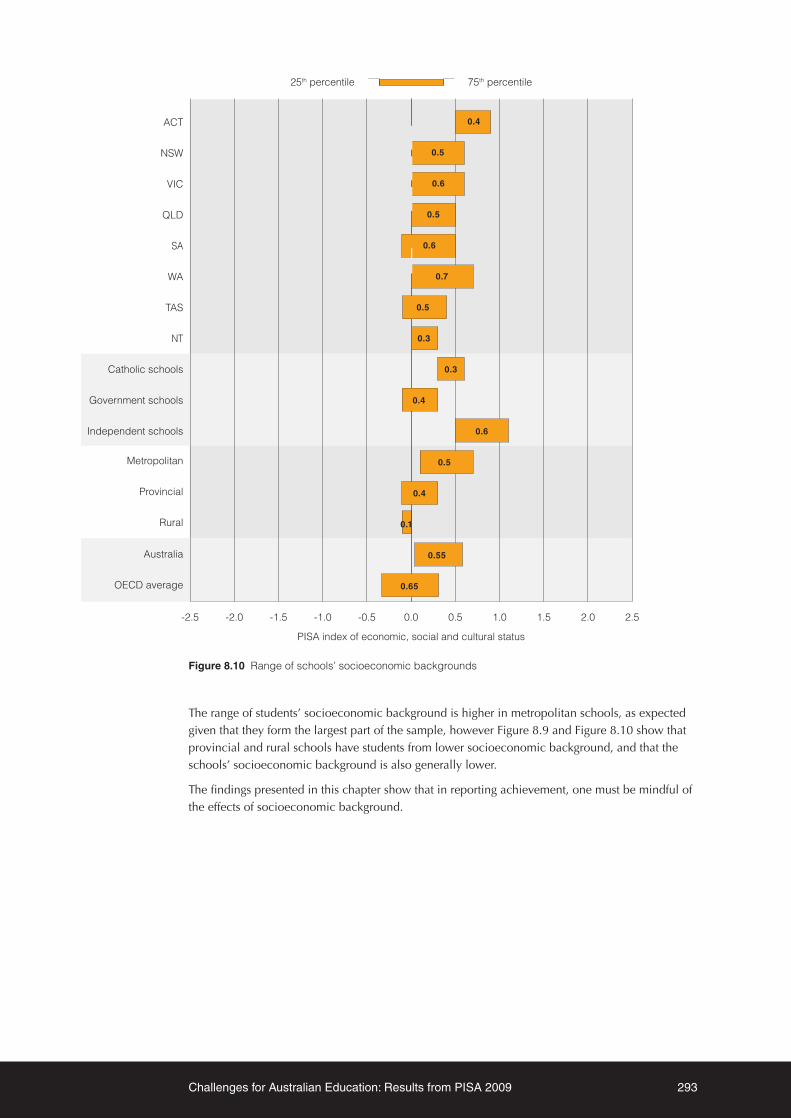
Challenges for Australian Education: Results from PISA 2009 293
25th percentile 75th percentile
PISA index of economic, social and cultural status
-2.5 -2.0 -1.5 -1.0 -0.5 0.0 0.5 1.0 1.5 2.0 2.5
OECD average
Australia
Rural
Provincial
Metropolitan
Independent schools
Government schools
Catholic schools
NT
TAS
WA
SA
QLD
VIC
NSW
ACT 0.4
0.5
0.6
0.5
0.6
0.7
0.5
0.3
0.3
0.4
0.6
0.5
0.4
0.1
0.55
0.65
Figure 8.10 Range of schools’ socioeconomic backgrounds
The range of students’ socioeconomic background is higher in metropolitan schools, as expected given that they form the largest part of the sample, however Figure 8.9 and Figure 8.10 show that provincial and rural schools have students from lower socioeconomic background, and that the schools’ socioeconomic background is also generally lower.
The findings presented in this chapter show that in reporting achievement, one must be mindful of the effects of socioeconomic background.

294 Equity in learning opportunities and outcomes

Challenges for Australian Education: Results from PISA 2009 295
PISA was designed to help governments not only understand but to enhance the effectiveness of their educational systems. PISA is used by policy makers internationally to compare student literacy skills to those of students in other countries, to establish benchmarks for educational improvement in terms of either performance or equity, and to understand the relative strengths and weaknesses of their own educational systems. In Australia, the results from PISA are used to provide data on the progress of Australian school students towards achieving the Educational Goals for Young Australians as described in the Melbourne Declaration (MCEECDYA, 2008). These goals aim to promote equity and excellence in Australian schools, to ensure a world-class curriculum, and world-class outcomes. The Council of Australian Governments (COAG) has agreed that results from PISA will be one of the indicative progress measures used to provide information on the progress of Australian schooling towards achieving the COAG agreed outcome “Australian students excel by international standards”.
PerformanceAustralia has now participated in four cycles of PISA. Throughout these four cycles, Australian students have performed at a level significantly higher than the OECD average in all three assessment areas: reading literacy, mathematical literacy and scientific literacy.
Reading literacy
In PISA 2000, in which the major focus of the assessment was reading literacy, it was reported that Australian students had been significantly outperformed only by Finland.
In PISA 2003, with reading literacy a minor domain, students in Finland were again the only ones to significantly outperform Australian students.
In PISA 2006, with reading literacy again a minor domain, Australian students were outperformed by students in Finland, Korea, Hong Kong – China, Canada and New Zealand.
In PISA 2009, with reading literacy a major domain again, Australia was outperformed by Finland, Korea and Canada (the latter two countries whose scores were not significantly different to those of Australia in PISA 2000), Hong Kong – China (whose score was significantly lower than that of Australia in PISA 2003), and by newcomers Shanghai – China and Singapore.
Chapter
9 Policy implications

296 Policy implications
Australia’s reading literacy performance, has declined not only in terms of comparisons amongst other participating countries, but also in terms of average student performance. Australia was the only high performing country to show a significant decline in reading literacy performance between PISA 2000 and PISA 2009. Of concern is that the decline is primarily among the high-achieving students, and that the proportion of both males and females in the highest two proficiency levels declined significantly and substantially over the nine-year period, while the proportion of males in the lowest proficiency levels increased. Arguments that teachers are not paying attention to the top performers but instead teaching to the bottom levels in order to improve performance at these levels are not substantiated by these data. In terms of proficiency levels, 14 per cent of Australian 15-year-olds were not achieving at proficiency level 2, the baseline set by the OECD, and just over one-third (34%) did not meet the proficiency standard, set by MCEECDYA, of attaining Level 3.
Enjoyment of reading was found to have a strong relationship with performance; however, one-third of Australian students reported that they did not read for enjoyment. Students in Shanghai-China reported the highest levels of reading for enjoyment.
While the proportion of Australian students in the lower proficiency levels has not changed significantly since 2000, there have been significant declines in the achievement of lower-performing students: the Australian Capital Territory, South Australia and New South Wales at the lower end of the reading literacy scale between PISA 2000 and PISA 2009. Furthermore, it is of some concern that in two of those jurisdictions, South Australia and the Australian Capital Territory, this came hand-in-hand with a significant decline in the proportions of students at proficiency levels 5 and 6. In Western Australia and Tasmania there was only a decline at the higher end of achievement.
PISA data from 2009 were similar to findings from PISA 2000, showing that Australian students performed better with what PISA describes as non-continuous texts than continuous texts. Examples of non-continuous texts are schematic diagrams, application forms, workplace instructions, maps and timetables. The main examples of continuous text are narratives.
South Australia, New South Wales and Queensland students did particularly well on non-continuous texts, gaining scores around 10 points higher than for the overall state average in reading literacy. No state did particularly well on continuous texts, with scores all below the overall reading literacy average for the state. While no judgement is made about whether either skill is more important than the other, the proliferation of short pieces of fragmented text, through SMS messages, social networking programs such as Twitter and Facebook, news headlines and short pieces of news on the internet mean that the skills associated with engaging in longer or more literary pieces of text are likely to decrease more unless they are explicitly taught in schools.
Mathematical literacy
In PISA 2003, when the major focus was mathematical literacy, Australian students were significantly outperformed by students in only four countries: the Netherlands, Korea, Finland and Hong Kong – China.
In PISA 2006, with mathematical literacy a minor domain, Australia was outperformed by the Netherlands, Korea, Finland, Hong Kong – China, Switzerland, Canada and Macao – China, and by first- time PISA participants Chinese Taipei.
In mathematical literacy in PISA 2009, Australia was outperformed by twelve countries (including the eight countries that outperformed us in PISA 2006) as well as Japan, Liechtenstein and new participants Shanghai – China and Singapore. Again, the decline is not just in terms of the number of countries outperforming Australia, but in terms of Australia’s mean score since 2003.

Challenges for Australian Education: Results from PISA 2009 297
This decline in scores was significant in four states: South Australia, the Australian Capital Territory, Western Australia and New South Wales. In South Australia and Western Australia the proportion of students not achieving the baseline of proficiency level 2 increased significantly and the proportion of students achieving at least proficiency level 5 decreased. In the Australian Capital Territory, the proportion of students at the highest levels declined significantly also.
Scientific literacy
In PISA 2006 the major domain for assessment was scientific literacy. Australian students were only significantly outperformed by students in Finland, Hong Kong – China and Canada.
In scientific literacy for PISA 2009, Australia was outperformed by six countries (Finland and Hong Kong – China, both of which performed significantly higher than Australia in PISA 2006; Japan and Korea, which had equivalent scores to Australia in PISA 2006; and new-comers Shanghai – China and Singapore). However, the score for Australia in scientific literacy for PISA 2009 was not significantly different to that in PISA 2006.
If Australia is to be internationally competitive, and if it is to continue attracting international students to study in Australia, then we need to pay urgent attention to the declines in mathematics and reading scores. In terms of developing a national curriculum, we need to examine which local school systems and curricula are producing consistent results, and which have improved over time, and use them as a model for future development.
Equity
Socioeconomic background
In Chapter 3 for reading literacy and in the other achievement chapters the average scores for students in different quartiles of socioeconomic background, as measured by the PISA index of economic, social and cultural status (ESCS), were provided. These scores showed that there was a relationship between socioeconomic background and performance – students in the highest socioeconomic quartile performed, on average, at a significantly higher level than students in the lowest socioeconomic quartile. This difference was about 90 score points for reading – one full proficiency level and the equivalent of nearly three years of schooling. At the higher socioeconomic levels the average score is higher than the average for Shanghai – China (a top-performing country), and at the lowest level it is significantly lower than the OECD average.
These chapters also provided the scores by sector for Australian schools. These showed, not surprisingly, that scores for students in independent schools were significantly higher than scores for students in Catholic schools, which were in turn significantly higher than scores for students in government schools. However, further analysis of the school sector results found that after adjusting for the effects of students’ socioeconomic background and the effects of schools’ socioeconomic background (the aggregate of the student-level socioeconomic backgrounds), there were no significant differences between the average scores of students in government schools and those in Catholic or independent schools, or between those in Catholic and independent schools. In other words, the socioeconomic background of the school is what matters, rather than the type of school.

298 Policy implications
These effects are noted in Chapter 5 of Volume 2 of the international PISA report:
… schools with a higher average socioeconomic status among their students are likely to have fewer disciplinary problems, better teacher-student relations , higher teacher morale, and a general school climate that is oriented towards higher performance. Such schools also often have a faster-paced curriculum. Talented and motivated teachers are more likely to be attracted to schools with higher socioeconomic status and less likely to transfer to another school, or to leave the profession … some of the contextual effect associated with high socioeconomic status may also occur as talented students work with each other.
(OECD 2010)
Analysis provided in Chapter 8 further explored the relationship between socioeconomic background and performance. While performance differences in Australia are much larger within schools than they are between schools, there are still differences that could have important implications for parents in terms of which school to send their child to. In almost all countries, and for all students, analysis showed a clear advantage in attending a school whose students are, on average, from more socioeconomically advantaged backgrounds. Regardless of their own socioeconomic background, students attending schools in which the average socioeconomic background is high tend to perform better than if they are enrolled in a school with below average socioeconomic intake. In the majority of countries the effect of the average socioeconomic background of the students in a school on performance far outweighs the effects of the individual student’s own socioeconomic background.
The average socioeconomic background of students in independent schools was higher than that of students in Catholic schools, which was in turn, higher than that of students in government schools. Students in metropolitan areas had a higher average socioeconomic background than students in provincial or rural areas, and the average socioeconomic background of students varied among the states and territories. These factors go some way to explaining the difference between schools by school sector, location, and state.
The OECD considers that the most successful countries are those whose students achieve at a high level regardless of their socioeconomic background. One of the more successful countries in this respect is Hong Kong – China, which has a relatively high and flat social gradient, meaning that their less advantaged students are achieving at a level almost as high as that reached by their more advantaged classmates. Australia still has some way to go in achieving similar.
Gender
Significant gender differences in reading literacy in favour of females were found in all PISA 2009 countries. The OECD average difference between male and female scores was 39 points, and the Australian average difference was 37 score points. This is clearly a large gap, representing around one year of schooling and is similar to the gap reported in each PISA cycle. Males are substantially overrepresented below the MCCECDYA baseline of proficiency level 3. To raise Australia’s performance level in reading literacy, raising the performance of males is vital. Programs to raise awareness of this issue and promote participation in reading activities by boys may contribute to addressing this imbalance.
Reading fiction and non-fiction books was found to be positively associated with performance; a greater proportion of females reported reading fiction books regularly, while males tended to report reading comics on a regular basis. For Australian students who reported reading frequently, there were no significant gender differences in reading literacy.
Challenges for Australian Education: Results from PISA 2009 299
Significant gender differences in mathematics were found in about half of the participating countries. Unfortunately, Australia was one of these countries with a difference of 10 points in favour of males, although only in three states – Victoria, South Australia and Queensland – were the differences significant. The difference of 10 score points on average for Australia is similar to that seen across the OECD. The re-emergence of gender differences as shown in PISA since 2006 are a salutary reminder to schools and systems that this is still a significant issue and that if Australia is to improve its performance in mathematics, girls’ scores must improve. Programs to support girls’ participation in mathematics and science should be continued and strengthened.
Indigenous studentsThe low achievement of Australia’s Indigenous students continues to be a concern. As in PISA 2006, a little more than 60 per cent of Indigenous students achieved a level higher than proficiency level 2 in reading literacy and a few individual students achieved at a very high level. Further investigation at a later date will examine the data more closely to isolate the factors that will assist in boosting the performance of Indigenous students.
Students in remote locationsThe relatively low performance of students in remote locations, with an average score in reading literacy 56 score points (the equivalent of almost two years of schooling) lower than students in metropolitan schools, also deserves attention. Schools in remote locations face many issues such as attracting and retaining qualified and experienced teachers, maintaining services and providing resources, and in terms of the logistics of their staff attending professional development. Solutions to these issues still prove evasive, so new paradigms may be needed to help address them.
In conclusionAustralia remains committed to the principle of equity and social justice in education and to the goal of allowing and encouraging all children to fulfil their full educational potential. To a large extent, these goals are realised, as evidenced by the high average achievement levels in all three assessment domains in PISA.
However, this report has highlighted three major issues. The average scores of Australian students in reading literacy and mathematical literacy have declined significantly over the past few years. The score for reading literacy is the same as that in PISA 2006, but is significantly lower than scores obtained in PISA 2000. The score for mathematical literacy has also declined since PISA 2003. In addition, there is a large gender gap in reading literacy, with females achieving at a much higher level than males, and a gender gap in mathematics, with males outperforming females that was present in PISA 2006, but before then had not been seen for many years. Finally, despite the better than average scores, significant levels of educational disadvantage related to socioeconomic background exist in Australia, and that the performance gap between students of the same age from different backgrounds can be equivalent to up to three years of schooling. This gap places an unacceptable proportion of 15-year-old students at serious risk of not achieving levels sufficient for them to effectively participate in the 21st century work force and to contribute to Australia as productive citizens.
Educational inequality is not a given. Some schools, some school systems, and some countries do more to mitigate inequality than others. Australia has chosen to participate in PISA in order to monitor national outcomes on a regular basis – the challenge is to act on these findings as other countries have, to lift educational outcomes for all students.

300 Policy implications

Challenges for Australian Education: Results from PISA 2009 301
References
Australian Curriculum, Assessment and Reporting Authority. (2009). Shape of the Australian Curriculum: English. Barton, ACT: Commonwealth of Australia.
Brozo, W.G., Shiel, G. & Topping, K. (2007). Engagement in reading: Lessons learned from three PISA countries. Journal of Adolescent and Adult Literacy, 51 (4), 304 – 315.
Cohen, J. (1988). Statistical power analysis for the behavioral sciences (2nd ed.). New Jersey: Lawrence Erlbaum.
Guthrie, J.T., Wigfield, A. & You, W. (2012). Instructional contexts for engagement and achievement in reading. In S.L. Christenson, A.L. Reschly & C.Wylie (Eds.), Handbook of Research on Student Engagement (Part 4, pp 601-634). US: Springer Science+Business Media.
Guthrie, J. T., Wigfield, A. (2000). Engagement and motivation in reading. In M.L. Kamil, P.B. Mosenthal, P. D. Pearson, & R. Barr (Eds.), Handbook of reading research (3rd Ed.). New York: Longman.
McKenzie, P., Kos, J., Walker, M., & Hong, J. (2008). Staff in Australia’s schools 2007. Canberra: Department of Education, Employment and Workplace Relations.
Ministerial Council for Education, Employment, Training and Youth Affairs. (2008). Melbourne Declaration on Educational Goals for Young Australians. Carlton: Curriculum Corporation. (http://www.mceecdya.edu.au/verve/_resources/National_Declaration_on_the_Educational_Goals_for_Young_Australians.pdf)
Moriana, J., Alos, F. & Alcala, R. (2006). Extra-curricular activities and academic performance in secondary students. Research in Educational Psychology, 4(1), 35 – 46.
OECD (2004). Learning for tomorrow’s world: First results from PISA 2003. Paris: OECD.
OECD (2007). PISA 2006: Science competencies for tomorrow’s world (Vol.1). Paris: OECD.
OECD (2009). PISA 2009: Assessment framework - Key competencies in reading, mathematics and science. Paris: OECD
OECD (2010). PISA 2009 Results: What students know and can do (Vol. 1). Paris: OECD.
OECD (2010). PISA 2009 Results: Overcoming social background (Vol 2). Paris: OECD.
Pagani, L., Fitzpatrick, C. & Archambault, I. (2010). School readiness and later achievement: A French Canadian replication and extension. Developmental Psychology,46(5), 984 – 994.
Thomson, S., Cresswell, J. & De Bortoli, L. (2004). Facing the future: A focus on mathematical literacy among Australian 15-year-old students in PISA 2003. Camberwell, VIC: ACER Press.
Thomson, S. & De Bortoli, L. (2007). Exploring scientific literacy: How Australia measures up. Camberwell, VIC: ACER Press.
Wigfield, A. (2010). Children’s motivation for reading and reading engagement. In J.A. Mally, B.A. Marinak & L.B. Gambrell (Eds.), Essential Readings on Motivation (pp. 13 – 27). Newark: International Reading Association, Inc.

302 References

Challenges for Australian Education: Results from PISA 2009 303
The following documents are available online from the ACER PISA National website (http://www.acer.edu.au/ozpisa/reports):
Statistical tables
The data underlying the figures and tables in this report are provided in Excel spreadsheets.
PISA’s procedures
This document provides information about the scope and operational procedures of the assessment.
Sampling
Details about the Australian PISA 2009 sample and sampling procedures and included in this document.
Highlights from PISA 2000, PISA 2003 and PISA 2006
This document includes a brief background on Australia’s results from previous PISA assessments.
Members of the International Assessments National Advisory Committee
The list of members on the International Assessments National Advisory Committee is available at: http://www.acer.edu.au/documents/IANAC_members.pdf.
Appendix
1Links to online documents and statistical tables

www.oecd.org • www.ozpisa.acer.edu.au
The 2009 survey of students’ scientific, reading and mathematical literacy skills
Challenges for Australian Education: Results for Australian Students in PISA 2009
ISBN 978-0-86431-968-5
9 780864 319685
SAMPLE