PISA 2015 Assessment and Analytical Framework
202
P I S A P r o g r a m m e f o r I n t e r n a t i o n a l S t u d e n t A s s e s s m e n t PISA 2015 Assessment and Analytical Framework SCIENCE, READING, MATHEMATIC AND FINANCIAL LITERACY
-
Upload
khangminh22 -
Category
Documents
-
view
0 -
download
0
Transcript of PISA 2015 Assessment and Analytical Framework

PISAP r o g r a m m e f o r I n t e r n a t i o n a l S t u d e n t A s s e s s m e n t
PISA 2015 Assessment and Analytical Framework SCIENCE, READING, MATHEMATIC AND FINANCIAL LITERACY


PISA 2015 Assessment and Analytical Framework
SCIENCE, READING, MATHEMATIC AND FINANCIAL LITERACY
PISA

Photo credits: © Geostock / Getty Images © Hero Images Inc. / Hero Images Inc. / Corbis© LIUSHENGFILM / Shutterstock© RelaXimages / Corbis© Shutterstock /Kzenon © Simon Jarratt/Corbis
Corrigenda to OECD publications may be found on line at: www.oecd.org/about/publishing/corrigenda.htm.
© OECD 2016
You can copy, download or print OECD content for your own use, and you can include excerpts from OECD publications, databases
and multimedia products in your own documents, presentations, blogs, websites and teaching materials, provided that suitable
acknowledgment of the source and copyright owner is given. All requests for public or commercial use and translation rights should
be submitted to [email protected]. Requests for permission to photocopy portions of this material for public or commercial use shall be
addressed directly to the Copyright Clearance Center (CCC) at [email protected] or the Centre français d’exploitation du droit de copie
(CFC) at [email protected].
This work is published under the responsibility of the Secretary-General of the OECD. The
opinions expressed and arguments employed herein do not necessarily reflect the official
views of the OECD member countries.
This document and any map included herein are without prejudice to the status of or
sovereignty over any territory, to the delimitation of international frontiers and boundaries
and to the name of any territory, city or area.
Please cite this publication as: OECD (2016), PISA 2015 Assessment and Analytical Framework: Science, Reading, Mathematic and Financial Literacy, PISA, OECD Publishing, Paris.
http://dx.doi.org/10.1787/9789264255425-en
ISBN (print) 978-92-64-25541-8 ISBN (PDF) 978-92-64-25542-5
ISSN (print): 19908539ISSN (online): 19963777

Foreword
PISA 2015 ASSESSMENT AND ANALYTICAL FRAMEWORK: SCIENCE, READING, MATHEMATIC AND FINANCIAL LITERACY © OECD 2016 3
The OECD Programme for International Student Assessment (PISA), created in 1997, represents a commitment by the governments of OECD countries to monitor the outcomes of education systems, in terms of student achievement, within a common, internationally agreed framework. PISA is a collaborative effort, bringing together scientific expertise from the participating countries/economies and steered jointly by their governments on the basis of shared policy interests. Experts from participating countries also serve on working groups that are charged with linking the PISA policy objectives with the best available substantive and technical expertise in the field of internationally comparable assessments. Through involvement in these expert groups, countries ensure that the PISA assessment instruments are internationally valid and take into account the cultural and curricular context of the PISA-participating countries and economies.
PISA 2015 is the sixth cycle of the triennial assessment. For the first time, PISA 2015 delivers the assessments of all subjects – science, reading, mathematics and financial literacy – via computer. However a paper-based assessment instrument, consisting only of trend items, is provided for countries/economies that choose not to test their students on computer.
As in 2006, scientific literacy is the main focus of this survey. The framework for assessing science was fully revised for the PISA 2015 assessment and introduces a refined notion of “knowledge about science” that has been split into two components – procedural knowledge and epistemic knowledge. In addition, the construct “Support for scientific enquiry” has been changed to “Valuing scientific approaches to enquiry”, which is essentially a change in terminology to better reflect what is measured. In addition, the contexts in PISA 2015 have been changed from “personal, social and global” in the 2006 assessment to “personal, local/national and global” to make the headings more coherent across the domains.
The framework for assessing reading was revised for PISA 2009 while the frameworks for assessing mathematics and financial literacy were revised for PISA 2012. These frameworks remained unchanged in PISA 2015. The analytic framework on which the development of the various questionnaires was based was also redeveloped for PISA 2015.
This publication presents the guiding principles behind the PISA 2015 assessment, which are described in terms of the knowledge and competencies students need to acquire and use to solve scientific problems, the contexts in which knowledge and competencies are applied, and students’ attitudes towards science. Sample tasks are also included.
The framework for assessing science was developed by the scientific literacy expert group with the guidance of John de Jong, Rose Clesham, Christine Rozunick, Peter Foltz, Mark Robeck and Catherine Hayes from Pearson. The scientific literacy expert group was chaired by Jonathan Osborne from Stanford University.
The framework for the PISA 2015 questionnaires was developed by the questionnaire expert group with the guidance of Eckhard Klieme from the German Institute for International Educational Research (DIPF) in Germany. The questionnaire expert group was chaired by David Kaplan from the University of Wisconsin, United States. Other experts who contributed to the development of the questionnaire framework are Sonja Bayer, Jonas Bertling, Bieke de Fraine, Art Graesser, Silke Hertel, Nina Jude, Franz Klingebiel, Susanne Kuger Patrick Kyllonen, Leonidas Kyriakides, Katharina Müller, Manfred Prenzel, Christine Sälzer, Tina Seide, Anja Schiepe-Tiska, Svenja Vieluf and Nadine Zeidler.

FOREWORD
4 © OECD 2016 PISA 2015 ASSESSMENT AND ANALYTICAL FRAMEWORK: SCIENCE, READING, MATHEMATIC AND FINANCIAL LITERACY
The frameworks have also been reviewed by expert panels in each of the participating countries. The chapters were drafted by the respective expert groups under the direction of their chairs. The members of the expert groups are listed in Annex B.
The publication was prepared by the OECD Secretariat, principally by Sophie Vayssettes, Marilyn Achiron, Sophie Limoges and Hélène Guillou.
The report is published under the responsibility of the Secretary-General of the OECD.

Table of Contents
PISA 2015 ASSESSMENT AND ANALYTICAL FRAMEWORK: SCIENCE, READING, MATHEMATIC AND FINANCIAL LITERACY © OECD 2016 5
CHAPTER 1 WHAT IS PISA? ��������������������������������������������������������������������������������������������������������������������������������������������������������������������������������������������������������������9
What makes PISA unique �����������������������������������������������������������������������������������������������������������������������������������������������������������������������������������������������������������������10The PISA 2015 test ��������������������������������������������������������������������������������������������������������������������������������������������������������������������������������������������������������������������������������12An overview of what is assessed in each domain ������������������������������������������������������������������������������������������������������������������������������������������������������������12The evolution of reporting student performance in PISA ������������������������������������������������������������������������������������������������������������������������������������������14The context questionnaires �������������������������������������������������������������������������������������������������������������������������������������������������������������������������������������������������������������15A collaborative project �����������������������������������������������������������������������������������������������������������������������������������������������������������������������������������������������������������������������16
CHAPTER 2 PISA 2015 SCIENCE FRAMEWORK ������������������������������������������������������������������������������������������������������������������������������������������������������������17
Defining scientific literacy���������������������������������������������������������������������������������������������������������������������������������������������������������������������������������������������������������������18• The competencies required for scientific literacy �������������������������������������������������������������������������������������������������������������������������������������������������20• The evolution of the definition of scientific literacy in PISA ��������������������������������������������������������������������������������������������������������������������������22
Organising the domain of science ���������������������������������������������������������������������������������������������������������������������������������������������������������������������������������������������23• Contexts of assessment items ����������������������������������������������������������������������������������������������������������������������������������������������������������������������������������������������23• Scientific competencies ����������������������������������������������������������������������������������������������������������������������������������������������������������������������������������������������������������24• Scientific knowledge ����������������������������������������������������������������������������������������������������������������������������������������������������������������������������������������������������������������26• Sample items ����������������������������������������������������������������������������������������������������������������������������������������������������������������������������������������������������������������������������������29• Attitudes ��������������������������������������������������������������������������������������������������������������������������������������������������������������������������������������������������������������������������������������������36
Assessing scientific literacy �������������������������������������������������������������������������������������������������������������������������������������������������������������������������������������������������������������38• Cognitive demand ����������������������������������������������������������������������������������������������������������������������������������������������������������������������������������������������������������������������38• Test characteristics ����������������������������������������������������������������������������������������������������������������������������������������������������������������������������������������������������������������������40• Assessment structure �����������������������������������������������������������������������������������������������������������������������������������������������������������������������������������������������������������������41• Reporting proficiency in science ��������������������������������������������������������������������������������������������������������������������������������������������������������������������������������������42
References ���������������������������������������������������������������������������������������������������������������������������������������������������������������������������������������������������������������������������������������������������44
CHAPTER 3 PISA 2015 READING FRAMEWORK ����������������������������������������������������������������������������������������������������������������������������������������������������������47
Defining reading literacy ������������������������������������������������������������������������������������������������������������������������������������������������������������������������������������������������������������������49
Organising the domain of reading ���������������������������������������������������������������������������������������������������������������������������������������������������������������������������������������������50• Situation ��������������������������������������������������������������������������������������������������������������������������������������������������������������������������������������������������������������������������������������������51• Text �������������������������������������������������������������������������������������������������������������������������������������������������������������������������������������������������������������������������������������������������������52• Aspect �������������������������������������������������������������������������������������������������������������������������������������������������������������������������������������������������������������������������������������������������54
Assessing reading literacy �����������������������������������������������������������������������������������������������������������������������������������������������������������������������������������������������������������������56• Factors affecting item difficulty ������������������������������������������������������������������������������������������������������������������������������������������������������������������������������������������56• Response formats ������������������������������������������������������������������������������������������������������������������������������������������������������������������������������������������������������������������������57• Coding and scoring �������������������������������������������������������������������������������������������������������������������������������������������������������������������������������������������������������������������57• Transition from paper-based to computer-based delivery �������������������������������������������������������������������������������������������������������������������������������58• Reporting proficiency in reading ��������������������������������������������������������������������������������������������������������������������������������������������������������������������������������������58
Note �����������������������������������������������������������������������������������������������������������������������������������������������������������������������������������������������������������������������������������������������������������������60
References ���������������������������������������������������������������������������������������������������������������������������������������������������������������������������������������������������������������������������������������������������60
CHAPTER 4 PISA 2015 MATHEMATICS FRAMEWORK���������������������������������������������������������������������������������������������������������������������������������������������63
Defining mathematical literacy ����������������������������������������������������������������������������������������������������������������������������������������������������������������������������������������������������64
Organising the domain of mathematics ���������������������������������������������������������������������������������������������������������������������������������������������������������������������������������65• Mathematical processes and the underlying mathematical capabilities �����������������������������������������������������������������������������������������������66• Mathematical content knowledge �����������������������������������������������������������������������������������������������������������������������������������������������������������������������������������70

TABLE OF CONTENTS
6 © OECD 2016 PISA 2015 ASSESSMENT AND ANALYTICAL FRAMEWORK: SCIENCE, READING, MATHEMATIC AND FINANCIAL LITERACY
Assessing Mathematical literacy ��������������������������������������������������������������������������������������������������������������������������������������������������������������������������������������������������75• Structure of the survey instrument �����������������������������������������������������������������������������������������������������������������������������������������������������������������������������������75• Response formats ������������������������������������������������������������������������������������������������������������������������������������������������������������������������������������������������������������������������75• Item scoring ������������������������������������������������������������������������������������������������������������������������������������������������������������������������������������������������������������������������������������75• Computer-based assessment of mathematics �����������������������������������������������������������������������������������������������������������������������������������������������������������75• Reporting proficiency in mathematics ��������������������������������������������������������������������������������������������������������������������������������������������������������������������������76
Note �����������������������������������������������������������������������������������������������������������������������������������������������������������������������������������������������������������������������������������������������������������������78
References ���������������������������������������������������������������������������������������������������������������������������������������������������������������������������������������������������������������������������������������������������78
CHAPTER 5 PISA 2015 FINANCIAL LITERACY FRAMEWORK �����������������������������������������������������������������������������������������������������������������������������79
Policy interest in financial literacy ���������������������������������������������������������������������������������������������������������������������������������������������������������������������������������������������80• Demographic and cultural shifts ��������������������������������������������������������������������������������������������������������������������������������������������������������������������������������������80• Risk shift and increased individual responsibility �������������������������������������������������������������������������������������������������������������������������������������������������80• Greater supply of a wide range of financial products and services ����������������������������������������������������������������������������������������������������������81• Increased demand for financial products and services �������������������������������������������������������������������������������������������������������������������������������������81• Expected benefits of financial education and improved levels of financial literacy ����������������������������������������������������������������������81• Focus on youth �����������������������������������������������������������������������������������������������������������������������������������������������������������������������������������������������������������������������������82• The need for data ������������������������������������������������������������������������������������������������������������������������������������������������������������������������������������������������������������������������83• Measuring financial literacy in PISA ������������������������������������������������������������������������������������������������������������������������������������������������������������������������������84
Defining financial literacy ���������������������������������������������������������������������������������������������������������������������������������������������������������������������������������������������������������������85
Organising the domain of financial literacy ������������������������������������������������������������������������������������������������������������������������������������������������������������������������86• Content ����������������������������������������������������������������������������������������������������������������������������������������������������������������������������������������������������������������������������������������������87• Planning and managing finances �������������������������������������������������������������������������������������������������������������������������������������������������������������������������������������88• Risk and reward ���������������������������������������������������������������������������������������������������������������������������������������������������������������������������������������������������������������������������88• Processes ������������������������������������������������������������������������������������������������������������������������������������������������������������������������������������������������������������������������������������������89• Contexts ���������������������������������������������������������������������������������������������������������������������������������������������������������������������������������������������������������������������������������������������90• Non-cognitive factors ���������������������������������������������������������������������������������������������������������������������������������������������������������������������������������������������������������������92
Assessing financial literacy ��������������������������������������������������������������������������������������������������������������������������������������������������������������������������������������������������������������93• The structure of the assessment �����������������������������������������������������������������������������������������������������������������������������������������������������������������������������������������93• Response formats and coding ���������������������������������������������������������������������������������������������������������������������������������������������������������������������������������������������93• Distribution of score points ��������������������������������������������������������������������������������������������������������������������������������������������������������������������������������������������������94
The impact of other domain knowledge and skills on financial literacy ���������������������������������������������������������������������������������������������������������95
Reporting financial literacy �������������������������������������������������������������������������������������������������������������������������������������������������������������������������������������������������������������96
Notes ���������������������������������������������������������������������������������������������������������������������������������������������������������������������������������������������������������������������������������������������������������������98
References ���������������������������������������������������������������������������������������������������������������������������������������������������������������������������������������������������������������������������������������������������98
CHAPTER 6 PISA 2015 CONTEXT QUESTIONNAIRES FRAMEWORK ��������������������������������������������������������������������������������������������������������101
Defining the core of context assessment in PISA ���������������������������������������������������������������������������������������������������������������������������������������������������������103• Outline of core content: Constructs to be covered �������������������������������������������������������������������������������������������������������������������������������������������103• Previous use of PISA context data: Measures that were important for analysis and reporting ��������������������������������������������105• Selecting and organising the core content ��������������������������������������������������������������������������������������������������������������������������������������������������������������105
Expanding the framework for broader coverage of policy issues ����������������������������������������������������������������������������������������������������������������������107• Modular approach to the PISA design �����������������������������������������������������������������������������������������������������������������������������������������������������������������������107• Assessing non-cognitive outcomes ������������������������������������������������������������������������������������������������������������������������������������������������������������������������������108• Assessing teaching and learning processes ������������������������������������������������������������������������������������������������������������������������������������������������������������111• Assessing school policies and governance �������������������������������������������������������������������������������������������������������������������������������������������������������������115• Assessing student background (Modules 7 – 9) ���������������������������������������������������������������������������������������������������������������������������������������������������118
Notes ������������������������������������������������������������������������������������������������������������������������������������������������������������������������������������������������������������������������������������������������������������120
References ������������������������������������������������������������������������������������������������������������������������������������������������������������������������������������������������������������������������������������������������120
Annex 6.A1 ����������������������������������������������������������������������������������������������������������������������������������������������������������������������������������������������������������������������������������������������127
ANNEX A PISA 2015 BACKGROUND QUESTIONNAIRES �������������������������������������������������������������������������������������������������������������������������������129
ANNEX B PISA 2015 EXPERT GROUPS ����������������������������������������������������������������������������������������������������������������������������������������������������������������������������197

TABLE OF CONTENTS
PISA 2015 ASSESSMENT AND ANALYTICAL FRAMEWORK: SCIENCE, READING, MATHEMATIC AND FINANCIAL LITERACY © OECD 2016 7
BOXES
Box 1�1 Key features of PISA 2015 ��������������������������������������������������������������������������������������������������������������������������������������������������������������������������������������������������11
Box 1�2 2015 mode study ������������������������������������������������������������������������������������������������������������������������������������������������������������������������������������������������������������������12
Box 1�3 Definitions of the domains �������������������������������������������������������������������������������������������������������������������������������������������������������������������������������������������������13
Box 2�1 Scientific knowledge: PISA 2015 terminology �������������������������������������������������������������������������������������������������������������������������������������������������������������19
Box 2�2 The 2015 definition of scientific literacy �����������������������������������������������������������������������������������������������������������������������������������������������������������������������20
Box 3�1 The 2015 definition of reading literacy ��������������������������������������������������������������������������������������������������������������������������������������������������������������������������49
Box 4�1 The 2015 definition of mathematical literacy ��������������������������������������������������������������������������������������������������������������������������������������������������������������65
Box 5�1 OECD activities in relation to financial education �����������������������������������������������������������������������������������������������������������������������������������������������������82
Box 5�2 The 2015 definition of scientific literacy �����������������������������������������������������������������������������������������������������������������������������������������������������������������������85
Box 6�1 Measures based on questionnaires used in PISA 2009 Results: What Students Know and Can Do �������������������������������������������������������� 105
FIGURE
Figure 2�1 Aspects of the scientific literacy assessment framework for PISA 2015 ���������������������������������������������������������������������������������������������������������������23
Figure 2�2 Inter-relations between the four aspects ������������������������������������������������������������������������������������������������������������������������������������������������������������������������23
Figure 2�3 Contexts in the PISA 2015 scientific literacy assessment �����������������������������������������������������������������������������������������������������������������������������������������24
Figure 2�4a PISA 2015 scientific competencies: Explain phenomena scientifically ���������������������������������������������������������������������������������������������������������������24
Figure 2�4b PISA 2015 scientific competencies : Evaluate and design scientific enquiry �����������������������������������������������������������������������������������������������������25
Figure 2�4c PISA 2015 scientific competencies: Interpret data and evidence scientifically ������������������������������������������������������������������������������������������������25
Figure 2�5 Knowledge of the content of science ������������������������������������������������������������������������������������������������������������������������������������������������������������������������������26
Figure 2�6 PISA 2015 procedural knowledge �����������������������������������������������������������������������������������������������������������������������������������������������������������������������������������27
Figure 2�7 PISA 2015 epistemic knowledge ��������������������������������������������������������������������������������������������������������������������������������������������������������������������������������������28
Figure 2�8 Framework categorisation for GREENHOUSE question 1 ����������������������������������������������������������������������������������������������������������������������������������������30
Figure 2�9 Framework categorisation for GREENHOUSE question 2 ����������������������������������������������������������������������������������������������������������������������������������������30
Figure 2�10 Framework categorisation for GREENHOUSE question 3 ����������������������������������������������������������������������������������������������������������������������������������������30
Figure 2�11 GREENHOUSE presented onscreen: Stimulus page 1 �����������������������������������������������������������������������������������������������������������������������������������������������31
Figure 2�12 GREENHOUSE presented onscreen: Stimulus page 2 �����������������������������������������������������������������������������������������������������������������������������������������������31
Figure 2�13 GREENHOUSE presented onscreen: Question 1 ��������������������������������������������������������������������������������������������������������������������������������������������������������32
Figure 2�14 GREENHOUSE presented onscreen: Question 2 ��������������������������������������������������������������������������������������������������������������������������������������������������������32
Figure 2�15 GREENHOUSE presented onscreen: Question 3 ��������������������������������������������������������������������������������������������������������������������������������������������������������33
Figure 2�16 SMOKING: Question 1 �������������������������������������������������������������������������������������������������������������������������������������������������������������������������������������������������������33
Figure 2�17 Framework categorisation for SMOKING question 1 ������������������������������������������������������������������������������������������������������������������������������������������������34
Figure 2�18 SMOKING: Question 2 �������������������������������������������������������������������������������������������������������������������������������������������������������������������������������������������������������34
Figure 2�19 Framework categorisation for SMOKING question 2 ������������������������������������������������������������������������������������������������������������������������������������������������35
Figure 2�20 ZEER POT: Stimulus ��������������������������������������������������������������������������������������������������������������������������������������������������������������������������������������������������������������35
Figure 2�22 Framework categorisation for ZEERPOT question 1���������������������������������������������������������������������������������������������������������������������������������������������������36
Figure 2�21 ZEER POT: Question 1 ���������������������������������������������������������������������������������������������������������������������������������������������������������������������������������������������������������36
Figure 2�23 PISA 2015 Framework for Cognitive Demand �������������������������������������������������������������������������������������������������������������������������������������������������������������39
Figure 2�24 A tool for constructing and analysing assessment units and items ������������������������������������������������������������������������������������������������������������������������40
Figure 2�25 Initial draft of proficiency scale descriptions for science������������������������������������������������������������������������������������������������������������������������������������������42
Figure 3�1 Relationship between the reading framework and the aspect subscales �������������������������������������������������������������������������������������������������������������54
Figure 3�2 Summary description of the seven levels of reading proficiency in PISA 2015 �����������������������������������������������������������������������������������������������59

TABLE OF CONTENTS
8 © OECD 2016 PISA 2015 ASSESSMENT AND ANALYTICAL FRAMEWORK: SCIENCE, READING, MATHEMATIC AND FINANCIAL LITERACY
Figure 4�1 A model of mathematical literacy in practice ��������������������������������������������������������������������������������������������������������������������������������������������������������������66
Figure 4�2 Relationship between mathematical processes (top row) and fundamental mathematical capabilities (left-most column) ���������������69
Figure 4�3 Summary description of the six levels of mathematics proficiency in PISA 2015 �������������������������������������������������������������������������������������������77
Figure 5�1 Relationship between the content of financial literacy and mathematical literacy in PISA ��������������������������������������������������������������������������95
Figure 6�1 Measures to be included in the core context assessment for PISA ��������������������������������������������������������������������������������������������������������������������� 106
Figure 6�2 Modular structure of the PISA 2015 context assessment design ������������������������������������������������������������������������������������������������������������������������� 107
Figure 6�3 Measures of non-cognitive outcomes included in the PISA 2015 main survey ��������������������������������������������������������������������������������������������� 109
Figure 6�4 Assessment of learning time and loss of learning time in PISA 2015 ���������������������������������������������������������������������������������������������������������������� 113
Figure 6�5 Teacher-related measures in the PISA 2015 field trial �������������������������������������������������������������������������������������������������������������������������������������������� 114
Figure 6�6 Measures in PISA 2015 related to assessment, evaluation and accountability ���������������������������������������������������������������������������������������������� 116
TABLES
Table 2�1 Desired distribution of items, by competency �������������������������������������������������������������������������������������������������������������������������������������������������������������26
Table 2�2 Desired distribution of items, by content ����������������������������������������������������������������������������������������������������������������������������������������������������������������������27
Table 2�3 Desired distribution of items, by type of knowledge �������������������������������������������������������������������������������������������������������������������������������������������������28
Table 2�4 Desired distribution of items for knowledge ����������������������������������������������������������������������������������������������������������������������������������������������������������������29
Table 2�5 Distribution of items by depth of knowledge ���������������������������������������������������������������������������������������������������������������������������������������������������������������39
Table 3�1 Relationship between mode and text display space for 2015 ��������������������������������������������������������������������������������������������������������������������������������48
Table 3�2 Desired distribution of reading items, by situation �����������������������������������������������������������������������������������������������������������������������������������������������������51
Table 3�3 Desired distribution of reading items, by text format ������������������������������������������������������������������������������������������������������������������������������������������������53
Table 3�4 Desired distribution of reading items, by aspect ���������������������������������������������������������������������������������������������������������������������������������������������������������56
Table 3�5 Approximate distribution of tasks, by coding requirement for PISA 2015 ����������������������������������������������������������������������������������������������������������57
Table 4�1 Desired distribution of mathematics items, by process ���������������������������������������������������������������������������������������������������������������������������������������������68
Table 4�2 Desired distribution of mathematics items, by content ���������������������������������������������������������������������������������������������������������������������������������������������72
Table 4�3 Desired distribution of mathematics items, by context ���������������������������������������������������������������������������������������������������������������������������������������������74
Table 5�1 Approximate distribution of score points in financial literacy, by content����������������������������������������������������������������������������������������������������������94
Table 5�2 Approximate distribution of score points in financial literacy, by process����������������������������������������������������������������������������������������������������������94
Table 5�3 Approximate distribution of score points in financial literacy, by context ����������������������������������������������������������������������������������������������������������94
Look for the StatLinks2at the bottom of the tables or graphs in this book. To download the matching Excel® spreadsheet, just type the link into your Internet browser, starting with the http://dx.doi.org pre�x, or click on the link from the e-book edition.
Follow OECD Publications on:
This book has... StatLinks2A service that delivers Excel �les from the printed page! ®
http://twitter.com/OECD_Pubs
http://www.facebook.com/OECDPublications
http://www.linkedin.com/groups/OECD-Publications-4645871
http://www.youtube.com/oecdilibrary
http://www.oecd.org/oecddirect/ OECD
Alerts
What is PISA?1
PISA 2015 ASSESSMENT AND ANALYTICAL FRAMEWORK: SCIENCE, READING, MATHEMATIC AND FINANCIAL LITERACY © OECD 2016 9

What is Pisa?1
10 © OECD 2016 PISA 2015 ASSESSMENT AND ANALYTICAL FRAMEWORK: SCIENCE, READING, MATHEMATIC AND FINANCIAL LITERACY
“What is important for citizens to know and be able to do?” In response to that question and to the need for cross-nationally comparable evidence on student performance, the Organisation for Economic Co-operation and Development (OECD) launched the Programme for International Student Assessment (PISA) in 1997� PISA assesses the extent to which 15-year-old students, near the end of their compulsory education, have acquired key knowledge and skills that are essential for full participation in modern societies�
The triennial assessment focuses on the core school subjects of science, reading and mathematics� Students’ proficiency in an innovative domain is also assessed (in 2015, this domain is collaborative problem solving)� The assessment does not just ascertain whether students can reproduce knowledge; it also examines how well students can extrapolate from what they have learned and can apply that knowledge in unfamiliar settings, both in and outside of school� This approach reflects the fact that modern economies reward individuals not for what they know, but for what they can do with what they know�
PISA is an ongoing programme that, over the longer term, will lead to the development of a body of information for monitoring trends in the knowledge and skills of students in various countries as well as in different demographic subgroups of each country� In each round of PISA, one of the core domains is tested in detail, taking up nearly two-thirds of the total testing time� The major domain in 2015 is science, as it was in 2006� Reading was the major domain in 2000 and 2009, and mathematics was the major domain in 2003 and 2012�
Through questionnaires distributed to students, parents, school principals and teachers, PISA also gathers information about students’ home background, their approaches to learning and their learning environments�
With this alternating schedule of major domains, a thorough analysis of achievement in each of the three core areas is presented every nine years; an analysis of trends is offered every three years� Combined with the information gathered through the various questionnaires, the PISA assessment provides three main types of outcomes:
• Basic indicators that provide a baseline profile of the knowledge and skills of students�
• Indicators derived from the questionnaires that show how such skills relate to various demographic, social, economic and educational variables�
• Indicators on trends that show changes in outcome levels and distributions, and in relationships between student-level, school-level and system-level background variables and outcomes�
Policy makers around the world use PISA findings to gauge the knowledge and skills of students in their own country/economy in comparison with those in other participating countries/economies, establish benchmarks for improvements in the education provided and/or in learning outcomes, and understand the relative strengths and weaknesses of their own education systems�
This publication presents the theory underlying the PISA 2015 assessment – the sixth since the programme’s inception� It includes frameworks for assessing the three core subjects – science, reading and mathematics (Chapters 2, 3 and 4, respectively) – and the framework for an assessment of students’ financial literacy (Chapter 5)� The framework for the assessment of collaborative problem solving – and the results of that assessment – will be published upon completion of a validation study� The chapters outline the knowledge content that students need to acquire in each domain, the processes that students need to be able to perform, and the contexts in which this knowledge and these skills are applied� They also discuss how each domain is assessed� Chapter 6 explains the theory underlying the context questionnaires distributed to students, their parents, school principals and teachers�
What MaKEs Pisa UNiQUE
PISA is the most comprehensive and rigorous international programme to assess student performance and to collect data on the student, family and institutional factors that can help to explain differences in performance� Decisions about the scope and nature of the assessments and the background information to be collected are made by leading experts in participating countries, and are steered jointly by governments on the basis of shared, policy-driven interests� Substantial efforts and resources are devoted to achieving cultural and linguistic breadth and balance in the assessment materials� Stringent quality-assurance mechanisms are applied in translation, sampling and data collection� As a consequence, the results of PISA have a high degree of validity and reliability�

What is Pisa?1
PISA 2015 ASSESSMENT AND ANALYTICAL FRAMEWORK: SCIENCE, READING, MATHEMATIC AND FINANCIAL LITERACY © OECD 2016 11
PISA’s unique features include its:
• Policy orientation, which connects data on student learning outcomes with data on students’ backgrounds and attitudes towards learning, and on key factors that shape their learning in and outside school, in order to highlight differences in performance patterns and identify the characteristics of schools and education systems that perform well�
• Innovative concept of “literacy”, which refers to students’ capacity to apply knowledge and skills in key subjects, and to analyse, reason and communicate effectively as they identify, interpret and solve problems in a variety of situations�
• Relevance to lifelong learning, as PISA asks students to report on their motivation to learn, their beliefs about themselves and their learning strategies�
• Regularity, which enables countries to monitor their progress in meeting key learning objectives�
• Breadth of coverage, which, in PISA 2015, encompasses the 34 OECD countries and 38 partner countries and economies�
Box 1�1 Key features of Pisa 2015
The content
The PISA 2015 survey focused on science, with reading, mathematics and collaborative problem solving as minor areas of assessment� PISA 2015 also included an assessment of young people’s financial literacy, which was optional for countries and economies�
PISA assesses not only whether students can reproduce knowledge, but also whether they can extrapolate from what they have learned and apply their knowledge in new situations� It emphasises the mastery of processes, the understanding of concepts, and the ability to function in various types of situations�
The students
In PISA 2012, around 510 000 students completed the assessment, representing about 28 million 15-year-olds in the schools of the 65 participating countries and economies� An additional 7 countries participated in 2015�
The assessment
Computer-based tests were used, with assessments lasting a total of two hours for each student, in a range of countries and economies�
Test items were a mixture of multiple-choice questions and questions requiring students to construct their own responses� The items were organised in groups based on a passage setting out a real-life situation� About 390 minutes of test items were covered, with different students taking different combinations of test items�
Students also answered a background questionnaire, which took 35 minutes to complete� The questionnaire sought information about the students themselves, their homes, and the school and learning experiences� School principals completed a questionnaire that covered the school system and the learning environment� For additional information, some countries/economies decided to distribute a questionnaire to their teachers� It was the first time that this optional teacher questionnaire was offered to PISA-participating countries/economies� In some countries/economies optional questionnaires were distributed to parents, who were asked to provide information on their perceptions of and involvement in their child’s school, their support for learning in the home, and their child’s career expectations, particularly in science� Countries could choose two other optional questionnaires for students: one asked students about their familiarity with and use of information and communication technologies (ICT); and the second sought information about their education to date, including any interruptions in their schooling, and whether and how they are preparing for a future career�
The relevance of PISA results is confirmed by studies tracking young people in the years following the assessment� Studies in Australia, Canada and Denmark show a strong relationship between 15-year-old students’ performance in reading in the PISA 2000 assessment and the likelihood of a student completing secondary school and continuing with post-secondary studies at age of 19� For example, Canadian students who had attained reading proficiency Level 5 at the age of 15 were 16 times more likely to be enrolled in post-secondary studies when they were 19 years old than those who had not attained Level 1 in reading proficiency�

What is Pisa?1
12 © OECD 2016 PISA 2015 ASSESSMENT AND ANALYTICAL FRAMEWORK: SCIENCE, READING, MATHEMATIC AND FINANCIAL LITERACY
thE Pisa 2015 tEst
For the first time, PISA 2015 delivers the assessments of all subjects via computer� Paper-based assessment instruments were provided for countries that choose not to test their students by computer, but the paper-based assessment was limited to reading, mathematics and science trends items only� New items were developed only for the computer-based assessment� A field trial was used to study the effect of the change of mode of delivery� Data were collected and analysed to establish equivalence between the computer- and paper-based assessments�
Box 1�2 2015 mode study
A study similar to the mode study for the OECD Programme for the International Assessment of Adult Competencies (PIAAC) was planned for the PISA 2015 field trial� Students were randomly assigned to either a computer-based or paper-based assessment of reading, mathematical and scientific literacy� Each domain included six clusters of paper-based trend items that were used in previous cycles of PISA� These items were adapted for computer delivery so that countries opting to take the computer-based assessment would be able to link back to previous cycles and would be comparable with countries choosing the paper-based option� Some two-thirds of the items from PISA use objective scoring, such as multiple-choice, true false, and simple open-ended response formats that are easily adapted and reliably scored by computer; the rest are scored by expert coders within each country� These more complex open-ended items were retained and scored in a similar fashion for PISA 2015� Analyses of the PISA field trial were used to determine the comparability between the two modes of presentation across all trend items� Results were presented to and agreed with the PISA Technical Advisory Group, the OECD and all participating countries in 2014�
The 2015 computer-based assessment was designed as a two-hour test� Each test form allocated to students comprised four 30-minute clusters of test material� This test design included six intact clusters from each of the domains of science, reading and mathematics to measure trends� For the major subject of science, an additional six clusters of items were developed to reflect the new features of the 2015 framework� In addition, three clusters of collaborative problem-solving items were developed for the countries that decided to participate in this assessment�
There were 66 different test forms, Students spent one hour on the science assessment (one cluster each of trends and new science items) plus one hour on another subject – reading, mathematics or collaborative problem solving – or 30 minutes on each of the two other subjects� For the countries/economies that chose not to participate in the collaborative problem-solving assessment, 36 test forms were prepared�
Countries that chose paper-based delivery for the main survey measured student performance with 30 paper-and-pencil forms containing trends items from two of the three core PISA domains�
Each test form was completed by a sufficient number of students for appropriate estimates to be made of the achievement levels on all items by students in each country and in relevant subgroups within a country (such as boys and girls, and students from different social and economic contexts)�
The assessment of financial literacy is offered as an option in PISA 2015 based on the same framework as the one developed for PISA 2012 The financial literacy assessment was developed as a one-hour exercise, comprising two clusters distributed to a subsample of students in combination with the science, mathematics and reading assessments�
aN OVERViEW OF What is assEssED iN EaCh DOMaiN
Box 1�3 presents definitions of the three domains assessed in PISA 2015� The definitions all emphasise functional knowledge and skills that allow one to participate fully in society� Such participation requires more than just being able to carry out tasks imposed externally by, for example, an employer; it also means being able to participate in decision making� The more complex tasks in PISA require students to reflect on and evaluate material, not just to answer questions that have one correct answer�

What is Pisa?1
PISA 2015 ASSESSMENT AND ANALYTICAL FRAMEWORK: SCIENCE, READING, MATHEMATIC AND FINANCIAL LITERACY © OECD 2016 13
Box 1�3 Definitions of the domains
Scientific literacy: The ability to engage with science-related issues, and with the ideas of science, as a reflective citizen� A scientifically literate person is willing to engage in reasoned discourse about science and technology, which requires the competencies to:
• Explain phenomena scientifically – recognise, offer and evaluate explanations for a range of natural and technological phenomena�
• Evaluate and design scientific enquiry – describe and appraise scientific investigations and propose ways of addressing questions scientifically�
• Interpret data and evidence scientifically – analyse and evaluate data, claims and arguments in a variety of representations and draw appropriate scientific conclusions�
Reading literacy: An individual’s capacity to understand, use, reflect on and engage with written texts, in order to achieve one’s goals, to develop one’s knowledge and potential, and to participate in society�
Mathematical literacy: An individual’s capacity to formulate, employ and interpret mathematics in a variety of contexts� It includes reasoning mathematically and using mathematical concepts, procedures, facts and tools to describe, explain and predict phenomena� It assists individuals to recognise the role that mathematics plays in the world and to make the well-founded judgments and decisions needed by constructive, engaged and reflective citizens�
Scientific literacy (Chapter 2) is defined as the ability to engage with science-related issues, and with the ideas of science, as a reflective citizen� A scientifically literate person is willing to engage in reasoned discourse about science and technology, which requires the competencies to explain phenomena scientifically, evaluate and design scientific enquiry, and interpret data and evidence scientifically�
PISA assesses students’ performance in science through questions related to:
Contexts: Personal, local/national and global issues, both current and historical, which demand some understanding of science and technology� The contexts in PISA 2015 were changed from “personal, social and global” in the 2006 assessment to “personal, local/national and global” to make the headings more coherent�
Knowledge: An understanding of the major facts, concepts and explanatory theories that form the basis of scientific knowledge� Such knowledge includes knowledge of both the natural world and technological artefacts (content knowledge), knowledge of how such ideas are produced (procedural knowledge), and an understanding of the underlying rationale for these procedures and the justification for their use (epistemic knowledge)� The major difference from PISA 2006 is that the notion of “knowledge about science” has been specified more clearly and split into two components: procedural knowledge and epistemic knowledge�
Competencies: The ability to explain phenomena scientifically, evaluate and design scientific enquiry, and interpret data and evidence scientifically�
Attitudes: A set of attitudes towards science indicated by an interest in science and technology, valuing scientific approaches to enquiry, where appropriate, and a perception and awareness of environmental issues� The second, “support for scientific enquiry” in the previous cycles, was changed to a measure of “valuing scientific approaches to enquiry”, which is essentially a change in terminology to better reflect what is measured�
Reading literacy (Chapter 3) is defined as students’ ability to understand, use and reflect on written text to achieve their purposes�
PISA assesses students’ performance in reading through questions related to:
Text format: PISA uses continuous texts or prose organised in sentences and paragraphs, and non-continuous texts that present information in other ways, such as in lists, forms, graphs or diagrams� The test uses a range of prose forms, such as narration, exposition and argumentation�

What is Pisa?1
14 © OECD 2016 PISA 2015 ASSESSMENT AND ANALYTICAL FRAMEWORK: SCIENCE, READING, MATHEMATIC AND FINANCIAL LITERACY
Processes (aspects): Students are not assessed on the most basic reading skills, as it is assumed that most 15-year-old students will have acquired these� Rather, students are expected to demonstrate their proficiency in accessing and retrieving information, forming a broad general understanding of the text, interpreting it, reflecting on its content, and reflecting on its form and features�
Situations: These are defined by the use for which the text was constructed� For example, a novel, personal letter or biography is written for people’s personal use; official documents or announcements for public use; a manual or report for occupational use; and a textbook or worksheet for educational use� Since some groups may perform better in one reading situation than in another, a range of types of reading is included in the test�
Mathematical literacy (Chapter 4) is defined as students’ ability to analyse, reason and communicate ideas effectively as they pose, formulate, solve and interpret solutions to mathematical problems in a variety of situations�
PISA assesses students’ performance in mathematics through questions related to:
Processes: These are defined in terms of three categories: formulating situations mathematically; employing mathematical concepts, facts, procedures and reasoning; and interpreting, applying and evaluating mathematical outcomes (herein referred to as “formulate”, “employ” and “interpret”)� They describe what students do to connect the context of a problem with the mathematics involved and thus solve the problem� These three processes each draw on seven fundamental mathematical capabilities: communicating; mathematising; representing; reasoning and argument; devising strategies for solving problems; using symbolic, formal and technical language and operations; and using mathematical tools� All of these capabilities are based on the problem solver’s detailed mathematical knowledge about individual topics�
Content: These are four ideas (quantity, space and shape, change and relationships, and uncertainty and data) that are related to familiar curricular subjects, such as numbers, algebra and geometry, in overlapping and complex ways�
Contexts: These are the settings in a student’s world in which the problems are placed� The framework identifies four contexts: personal, educational, societal and scientific�
thE EVOLUtiON OF REPORtiNG stUDENt PERFORMaNCE iN Pisa
Results from PISA are reported using scales� Initially, the OECD average score for all three subjects was 500 with a standard deviation of 100, which meant that two-thirds of students across OECD countries scored between 400 and 600 points� These scores represent degrees of proficiency in a particular domain� In subsequent cycles of PISA, the OECD average score has fluctuated slightly around the original�
Reading literacy was the major domain in 2000, and the reading scales were divided into five levels of knowledge and skills� The main advantage of this approach is that it is useful for describing what substantial numbers of students can do with tasks at different levels of difficulty� Results were also presented through three “aspect” subscales of reading: accessing and retrieving information; integrating and interpreting texts; and reflecting and evaluating texts� A proficiency scale was also available for mathematics and science, though without described levels�
PISA 2003 built upon this approach by specifying six proficiency levels for the mathematics scale� There were four “content” subscales in mathematics: space and shape, change and relationships, quantity, and uncertainty.
Similarly, the reporting of science in PISA 2006 specified six proficiency levels� The three “competency” subscales in science related to identifying scientific issues, explaining phenomena scientifically and using scientific evidence� Country performance was compared on the bases of knowledge about science and knowledge of science� The three main areas of knowledge of science were physical systems, living systems, and earth and space systems�
PISA 2009 marked the first time that reading literacy was re-assessed as a major domain� Trend results were reported for all three domains� PISA 2009 added a Level 6 to the reading scale to describe very high levels of reading proficiency� The bottom level of proficiency, Level 1, was relabelled as Level 1a� Another level, Level 1b, was introduced to describe the performance of students who would previously have been rated as “below Level 1”, but who show proficiency in relation to new items that are easier than those included in previous PISA assessments� These changes allow countries to know more about what kinds of tasks students with very high and very low reading proficiency are capable of completing�

What is Pisa?1
PISA 2015 ASSESSMENT AND ANALYTICAL FRAMEWORK: SCIENCE, READING, MATHEMATIC AND FINANCIAL LITERACY © OECD 2016 15
Mathematics was re-assessed as a major domain in PISA 2012� In addition to the “content” subscales (with the “uncertainty” scale re-named as “uncertainty and data” for improved clarity), three new subscales were developed to assess the three processes in which students, as active problem solvers, engage� These three “process” subscales are: formulating situations mathematically; employing mathematical concepts, facts, procedures and reasoning; and interpreting, applying and evaluating mathematical outcomes (known as “formulating”, “employing” and “interpreting”)�
Science, which was the main subject of assessment in PISA 2006, is again the main domain in PISA 2015� The assessment measures students’ ability to: explain phenomena scientifically; evaluate and design scientific enquiry; and interpret data and evidence scientifically� The science scale has also been extended by the addition of a Level “1b” to better describe the proficiency of students at the lowest level of ability who demonstrate minimal scientific literacy and who would previously not have been included in the reporting scales�
thE CONtEXt QUEstiONNaiREs
To gather contextual information, PISA asks students and the principals of their schools to respond to questionnaires� These take about 35 and 45 minutes, respectively, to complete� The responses to the questionnaires are analysed with the assessment results to provide at once a broader and more nuanced picture of student, school and system performance� Chapter 6 presents the questionnaire framework in detail� The questionnaires from all assessments since PISA’s inception are available on the PISA website: www�pisa�oecd�org.
The questionnaires seek information about:
• Students and their family backgrounds, including their economic, social and cultural capital�
• Aspects of students’ lives, such as their attitudes towards learning, their habits and life in and outside of school, and their family environment�
• Aspects of schools, such as the quality of the schools’ human and material resources, public and private management and funding, decision-making processes, staffing practices and the school’s curricular emphasis and extracurricular activities offered�
• Context of instruction, including institutional structures and types, class size, classroom and school climate, and reading activities in class�
• Aspects of learning, including students’ interest, motivation and engagement�
Four additional questionnaires are offered as options:
• A computer familiarity questionnaire, focusing on the availability and use of information and communications technology (ICT) and on students’ ability to carry out computer tasks and their attitudes towards computer use�
• An educational career questionnaire, which collects additional information on interruptions in schooling, on preparation for students’ future career, and on support with language learning�
• A parent questionnaire, focusing on parents’ perceptions of and involvement in their child’s school, their support for learning at home, school choice, their child’s career expectations, and their background (immigrant/non-immigrant)�
• A teacher questionnaire, which is new to PISA, will help illustrate the similarities and differences between groups of teachers in order to better establish the context for students’ test results� The level of analysis of data gathered from the optional teacher questionnaire is the school level� Science teachers are asked to describe their teaching practices through a parallel questionnaire that also focuses on teacher-directed teaching and learning activities in science lessons, and a selected set of inquiry-based activities� The teacher questionnaire asks about the content of a school’s science curriculum and how it is communicated to parents too� The new optional teacher questionnaire gathers information on transformational leadership as well�
The contextual information collected through the student, school and optional questionnaires comprises only a part of the information available to PISA� Indicators describing the general structure of the education systems (their demographic and economic contexts – for example, costs, enrolments, school and teacher characteristics, and some classroom processes) and their effect on labour market outcomes are routinely developed and applied by the OECD (e�g� in the annual OECD publication, Education at a Glance)�

What is Pisa?1
16 © OECD 2016 PISA 2015 ASSESSMENT AND ANALYTICAL FRAMEWORK: SCIENCE, READING, MATHEMATIC AND FINANCIAL LITERACY
a COLLaBORatiVE PROJECtPISA is the result of a collaborative effort among OECD and partner governments� The assessments are developed co-operatively, agreed by participating countries/economies, and implemented by national organisations� The co-operation of students, teachers and principals in participating schools has been crucial to the success of PISA during all stages of development and implementation�
The PISA Governing Board (PGB), representing all countries/economies at senior policy levels, determines the policy priorities for PISA in the context of OECD objectives and oversees adherence to these priorities during the implementation of the programme� The PGB sets priorities for developing indicators, for establishing assessment instruments and for reporting results� Experts from participating countries/economies also serve on working groups tasked with linking PISA policy objectives with the best available technical expertise in the different assessment domains� By participating in these expert groups, countries/economies ensure that the instruments are internationally valid and take into account differences in the cultures and education systems�
Participating countries/economies implement PISA at the national level, through National Centres managed by National Project Managers, subject to the agreed administration procedures� National Project Managers play a vital role in ensuring that implementation is of high quality� They also verify and evaluate the survey results, analyses, reports and publications�
The development of the science and collaborative problem-solving frameworks and the adaptation of the frameworks for reading and mathematics are the responsibility of Pearson, while the design and development of the questionnaires are the responsibility of the Deutsches Institut für Pädagogische Forschung (DIPF)� Management and oversight of this survey, the development of the instruments, scaling, and analysis are the responsibility of the Educational Testing Service (ETS) as is the development of the electronic platform� Other partners or subcontractors involved with ETS include cApStAn Linguistic Quality Control and the Department of Experimental and Theoretical Pedagogy at the University of Liège (SPe) in Belgium; the Center for Educational Technology (CET) in Israel; the Public Research Centre (CRP) Henri Tudor and the Educational Measurement and Research Center (EMACS) of the University of Luxembourg in Luxembourg; and GESIS – Leibniz‐Institute for the Social Sciences in Germany� Westat assumed responsibility for survey operations and sampling with the subcontractor, the Australian Council for Educational Research (ACER)�
The OECD Secretariat has overall managerial responsibility for the programme, monitors its implementation on a day-to-day basis, acts as the secretariat for the PGB, builds consensus among countries, and serves as the interlocutor between the PGB and the contractors charged with implementation� The OECD Secretariat is also responsible for the production of the indicators, and the analysis and preparation of the international reports and publications in co-operation with the contractors and in close consultation with member countries both at the policy level (PGB) and at the implementation level (National Project Managers)�

2
PISA 2015 ASSESSMENT AND ANALYTICAL FRAMEWORK: SCIENCE, READING, MATHEMATIC AND FINANCIAL LITERACY © OECD 2016 17
PISA 2015 Science framework
Science is the main subject of assessment in the Programme for International Student Assessment (PISA) in 2015. This chapter defines “scientific literacy” as assessed in PISA. It describes the types of contexts, knowledge, competencies and attitudes towards science that are reflected in the assessment’s science problems and provides several sample items. The chapter also discusses how student performance in science is measured and reported.

Pisa 2015 sCiENCE FRaMEWORK2
18 © OECD 2016 PISA 2015 ASSESSMENT AND ANALYTICAL FRAMEWORK: SCIENCE, READING, MATHEMATIC AND FINANCIAL LITERACY
This document provides a description of and rationale for the framework that forms the basis of the instrument to assess scientific literacy – the major domain in PISA 2015� Previous PISA frameworks for the science assessment (OECD, 1999, 2004, 2006) have elaborated a conception of scientific literacy as the central construct for science assessment� These documents have established a broad consensus among science educators of the concept of scientific literacy� This framework for PISA 2015 refines and extends the previous construct, in particular by drawing on the PISA 2006 framework that was used as the basis for assessment in 2006, 2009 and 2012�
Scientific literacy matters at both the national and international levels as humanity faces major challenges in providing sufficient water and food, controlling diseases, generating sufficient energy and adapting to climate change (UNEP, 2012)� Many of these issues arise, however, at the local level where individuals may be faced with decisions about practices that affect their own health and food supplies, the appropriate use of materials and new technologies, and decisions about energy use� Dealing with all of these challenges will require a major contribution from science and technology� Yet, as argued by the European Commission, the solutions to political and ethical dilemmas involving science and technology “cannot be the subject of informed debate unless young people possess certain scientific awareness” (European Commission, 1995: 28)� Moreover, “this does not mean turning everyone into a scientific expert, but enabling them to fulfil an enlightened role in making choices which affect their environment and to understand in broad terms the social implications of debates between experts” (ibid�: 28)� Given that knowledge of science and science-based technology contributes significantly to individuals’ personal, social, and professional lives, an understanding of science and technology is thus central to a young person’s “preparedness for life”�
The concept of scientific literacy in this framework refers to a knowledge of both science and science-based technology, even though science and technology do differ in their purposes, processes and products� Technology seeks the optimal solution to a human problem, and there may be more than one optimal solution� In contrast, science seeks the answer to a specific question about the natural, material world� Nevertheless, the two are closely related� For instance, new scientific knowledge leads to the development of new technologies (think of the advances in material science that led to the development of the transistor in 1948)� Likewise, new technologies can lead to new scientific knowledge (think of how knowledge of the universe has been transformed through the development of better telescopes)� Individuals make decisions and choices that influence the directions of new technologies (consider the decision to drive a smaller, more fuel-efficient car)� Scientifically literate individuals should therefore be able to make more informed choices� They should also be able to recognise that, while science and technology are often a source of solutions, paradoxically, they can also be seen as a source of risk, generating new problems that can only be solved through the use of science and technology� Therefore, individuals need to be able to weigh the potential benefits and risks of applying scientific knowledge to themselves and society�
Scientific literacy also requires not just knowledge of the concepts and theories of science but also knowledge of the common procedures and practices associated with scientific enquiry and how these enable science to advance� Therefore, individuals who are scientifically literate have a knowledge of the major concepts and ideas that form the foundation of scientific and technological thought; how such knowledge has been derived; and the degree to which such knowledge is proved by evidence or theoretical explanations�
Undoubtedly, many of the challenges of the 21st century will require innovative solutions that have a basis in scientific thinking and scientific discovery� Societies will require a cadre of well-educated scientists to undertake the research and nurture the innovation that will be essential to meet the economic, social and environmental challenges that the world faces�
For all of these reasons, scientific literacy is perceived to be a key competency (Rychen and Salganik, 2003) and defined in terms of the ability to use knowledge and information interactively – that is “an understanding of how it [a knowledge of science] changes the way one can interact with the world and how it can be used to accomplish broader goals” (ibid�: 10)� As such, it represents a major goal for science education for all students� Therefore, the view of scientific literacy that forms the basis for the 2015 international assessment of 15-year-old students is a response to the question: What is important for young people to know, value and be able to do in situations involving science and technology?
DEFiNiNG sCiENtiFiC LitERaCYCurrent thinking about the desired outcomes of science education is rooted strongly in a belief that an understanding of science is so important that it should be a feature of every young person’s education (American Association for the Advancement of Science, 1989; Confederacion de Sociedades Cientificas de España, 2011; Fensham, 1985; Millar and Osborne, 1998; National Research Council, 2012; Sekretariat der Ständigen Konferenz der Kultusminister der Länder in der Bundesrepublik Deutschland [KMK], 2005; Taiwan Ministry of Education, 1999)� Indeed, in many countries science is an obligatory element of the school curriculum from kindergarten until the completion of compulsory education�
Pisa 2015 sCiENCE FRaMEWORK2
PISA 2015 ASSESSMENT AND ANALYTICAL FRAMEWORK: SCIENCE, READING, MATHEMATIC AND FINANCIAL LITERACY © OECD 2016 19
Many of the documents and policy statements cited above give pre-eminence to an education for citizenship� However, many of the curricula for school science across the world are based on a view that the primary goal of science education should be the preparation of the next generation of scientists (Millar and Osborne, 1998)� These two goals are not always compatible� Attempts to resolve the tension between the needs of the majority of students who will not become scientists and the needs of the minority who will have led to an emphasis on teaching science through enquiry (National Academy of Science, 1995; National Research Council, 2000), and new curriculum models (Millar, 2006) that address the needs of both groups� The emphasis in these frameworks and their associated curricula lies not on producing individuals who will be “producers” of scientific knowledge, i�e� the future scientists; rather, it is on educating all young people to become informed, critical users of scientific knowledge�
To understand and engage in critical discussions about issues that involve science and technology requires three domain-specific competencies� The first is the ability to provide explanatory accounts of natural phenomena, technical artefacts and technologies, and their implications for society� Such an ability requires a knowledge of the fundamental ideas of science and the questions that frame the practice and goals of science� The second is the knowledge and understanding of scientific enquiry to: identify questions that can be answered by scientific enquiry; identify whether appropriate procedures have been used; and propose ways in which such questions might be answered� The third is the competency to interpret and evaluate data and evidence scientifically and evaluate whether the conclusions are justified� Thus, scientific literacy in PISA 2015 is defined by the three competencies to:
• explain phenomena scientifically
• evaluate and design scientific enquiry
• interpret data and evidence scientifically�
All of these competencies require knowledge� Explaining scientific and technological phenomena, for instance, demands a knowledge of the content of science (hereafter, content knowledge)� The second and third competencies, however, require more than a knowledge of what is known; they depend on an understanding of how scientific knowledge is established and the degree of confidence with which it is held� Some have argued for teaching what has variously been called “the nature of science” (Lederman, 2006), “ideas about science” (Millar and Osborne, 1998) or “scientific practices” (National Research Council, 2012)� Recognising and identifying the features that characterise scientific enquiry requires a knowledge of the standard procedures that underlie the diverse methods and practices used to establish scientific knowledge (hereafter, procedural knowledge)� Finally, the competencies require epistemic knowledge – an understanding of the rationale for the common practices of scientific enquiry, the status of the knowledge claims that are generated, and the meaning of foundational terms, such as theory, hypothesis and data�
Box 2�1 scientific knowledge: Pisa 2015 terminology
This document is based upon a view of scientific knowledge as consisting of three distinguishable but related elements� The first of these and the most familiar is a knowledge of the facts, concepts, ideas and theories about the natural world that science has established� For instance, how plants synthesise complex molecules using light and carbon dioxide or the particulate nature of matter� This kind of knowledge is referred to as “content knowledge” or “knowledge of the content of science”�
Knowledge of the procedures that scientists use to establish scientific knowledge is referred to as “procedural knowledge”� This is a knowledge of the practices and concepts on which empirical enquiry is based such as repeating measurements to minimise error and reduce uncertainty, the control of variables, and standard procedures for representing and communicating data (Millar, Lubben, Gott and Duggan, 1995)� More recently these have been elaborated as a set of “concepts of evidence” (Gott, Duggan and Roberts, 2008)�
Furthermore, understanding science as a practice also requires “epistemic knowledge” which refers to an understanding of the role of specific constructs and defining features essential to the process of knowledge- building in science (Duschl, 2007)� Epistemic knowledge includes an understanding of the function that questions, observations, theories, hypotheses, models and arguments play in science; a recognition of the variety of forms of scientific enquiry; and the role peer review plays in establishing knowledge that can be trusted�
A more detailed discussion of these three forms of knowledge is provided in the later section on scientific knowledge and in Figures 2�5, 2�6 and 2�7�

Pisa 2015 sCiENCE FRaMEWORK2
20 © OECD 2016 PISA 2015 ASSESSMENT AND ANALYTICAL FRAMEWORK: SCIENCE, READING, MATHEMATIC AND FINANCIAL LITERACY
Both procedural and epistemic knowledge are necessary to identify questions that are amenable to scientific enquiry, to judge whether appropriate procedures have been used to ensure that the claims are justified, and to distinguish scientific issues from matters of values or economic considerations� This definition of scientific literacy assumes that, throughout their lives, individuals will need to acquire knowledge, not through scientific investigations, but through the use of resources such as libraries and the Internet� Procedural and epistemic knowledge are essential to decide whether the many claims of knowledge and understanding that pervade contemporary media are based on the use of appropriate procedures and are justified�
People need all three forms of scientific knowledge to perform the three competencies of scientific literacy� PISA 2015 focuses on assessing the extent to which 15-year-olds are capable of displaying the three aforementioned competencies appropriately within in a range of personal, local/national (grouped in one category) and global contexts� (For the purposes of the PISA assessment, these competencies are only tested using the knowledge that 15-year-old students can reasonably be expected to have already acquired�) This perspective differs from that of many school science programmes that are dominated by content knowledge� Instead, the framework is based on a broader view of the kind of knowledge of science required of fully engaged citizens�
In addition, the competency-based perspective also recognises that there is an affective element to a student’s display of these competencies: students’ attitudes or disposition towards science will determine their level of interest, sustain their engagement, and may motivate them to take action (Schibeci, 1984)� Thus, the scientifically literate person would typically have an interest in scientific topics; engage with science-related issues; have a concern for issues of technology, resources and the environment; and reflect on the importance of science from a personal and social perspective� This requirement does not mean that such individuals are necessarily disposed towards becoming scientists themselves, rather such individuals recognise that science, technology and research in this domain are an essential element of contemporary culture that frames much of our thinking�
These considerations led to the definition of scientific literacy used in PISA 2015 (see Box 2�2)� The use of the term “scientific literacy”, rather than “science”, underscores the importance that the PISA science assessment places on the application of scientific knowledge in the context of real-life situations�
Box 2�2 the 2015 definition of scientific literacy
Scientific literacy is the ability to engage with science-related issues, and with the ideas of science, as a reflective citizen�
A scientifically literate person is willing to engage in reasoned discourse about science and technology, which requires the competencies to:
• Explain phenomena scientifically – recognise, offer and evaluate explanations for a range of natural and technological phenomena�
• Evaluate and design scientific enquiry – describe and appraise scientific investigations and propose ways of addressing questions scientifically�
• Interpret data and evidence scientifically – analyse and evaluate data, claims and arguments in a variety of representations and draw appropriate scientific conclusions�
The competencies required for scientific literacy
Competency 1: Explain phenomena scientificallyThe cultural achievement of science has been to develop a set of explanatory theories that have transformed our understanding of the natural world (in this document, “natural world” refers to phenomena associated with any object or activity occurring in the living or the material world), such as the idea that day and night is caused by a rotating Earth, or the idea that diseases can be caused by invisible micro-organisms� Moreover, such knowledge has enabled us to develop technologies that support human life by, for example, preventing disease or enabling rapid human communication across the globe� The competency to explain scientific and technological phenomena is thus dependent on a knowledge of these major explanatory ideas of science�

Pisa 2015 sCiENCE FRaMEWORK2
PISA 2015 ASSESSMENT AND ANALYTICAL FRAMEWORK: SCIENCE, READING, MATHEMATIC AND FINANCIAL LITERACY © OECD 2016 21
Explaining scientific phenomena, however, requires more than the ability to recall and use theories, explanatory ideas, information and facts (content knowledge)� Offering scientific explanations also requires an understanding of how such knowledge has been derived and the level of confidence we might hold about any scientific claims� For this competency, the individual requires a knowledge of the standard forms and procedures used in scientific enquiry to obtain such knowledge (procedural knowledge) and an understanding of their role and function in justifying the knowledge produced by science (epistemic knowledge)�
Competency 2: Evaluate and design scientific enquiryScientific literacy implies that students have some understanding of the goal of scientific enquiry, which is to generate reliable knowledge about the natural world (Ziman, 1979)� Data collected and obtained by observation and experiment, either in the laboratory or in the field, lead to the development of models and explanatory hypotheses that enable predictions that can then be tested experimentally� New ideas, however, commonly build on previous knowledge� Scientists themselves rarely work in isolation; they are members of research groups or teams that engage, nationally and internationally, in extensive collaboration with colleagues� New knowledge claims are always perceived to be provisional and may lack justification when subjected to critical peer review – the mechanism through which the scientific community ensures the objectivity of scientific knowledge (Longino, 1990)� Hence, scientists have a commitment to publish or report their findings and the methods used in obtaining their evidence� Doing so enables empirical studies, at least in principle, to be replicated and results confirmed or challenged� However, measurements can never be absolutely precise; they all contain a degree of error� Much of the work of the experimental scientist is thus devoted to resolving uncertainty by repeating measurements, collecting larger samples, building instruments that are more accurate and using statistical techniques that assess the degree of confidence in any result�
In addition, science has well-established procedures that are the foundations of any experiment to establish cause and effect� The use of controls enables the scientist to claim that any change in a perceived outcome can be attributed to a change in one specific feature� Failure to use such techniques leads to results where effects are confounded and cannot be trusted� Likewise, double-blind trials enable scientists to claim that the results have not been influenced either by the subjects of the experiment, or by the experimenter themselves� Other scientists, such as taxonomists and ecologists, are engaged in the process of identifying underlying patterns and interactions in the natural world that warrant a search for an explanation� In other cases, such as evolution, plate tectonics or climate change, scientists examine a range of hypotheses and eliminate those that do not fit with the evidence�
Facility with this competency draws on content knowledge, a knowledge of the common procedures used in science (procedural knowledge), and the function of these procedures in justifying any claims advanced by science (epistemic knowledge)� Procedural and epistemic knowledge serve two functions� First, such knowledge is required by individuals to appraise scientific investigations and decide whether they have followed appropriate procedures and whether the conclusions are justified� Second, individuals who have this knowledge should be able to propose, at least in broad terms, how a scientific question might be investigated appropriately�
Competency 3: Interpret data and evidence scientificallyInterpreting data is such a core activity of all scientists that some rudimentary understanding of the process is essential for scientific literacy� Initially, data interpretation begins with looking for patterns, constructing simple tables and graphical visualisations, such as pie charts, bar graphs, scatterplots or Venn diagrams� At a higher level, it requires the use of more complex data sets and the use of the analytical tools offered by spreadsheets and statistical packages� It would be wrong, however, to look at this competency as merely an ability to use these tools� A substantial body of knowledge is required to recognise what constitutes reliable and valid evidence and how to present data appropriately�
Scientists make choices about how to represent the data in graphs, charts or, increasingly, in complex simulations or 3D visualisations� Any relationships or patterns must then be read using a knowledge of standard patterns� Whether uncertainty has been minimised by standard statistical techniques must also be considered� All of this draws on a body of procedural knowledge� The scientifically literate individual can also be expected to understand that uncertainty is an inherent feature of all measurement, and that one criterion for expressing confidence in a finding is determining the probability that the finding might have occurred by chance�

Pisa 2015 sCiENCE FRaMEWORK2
22 © OECD 2016 PISA 2015 ASSESSMENT AND ANALYTICAL FRAMEWORK: SCIENCE, READING, MATHEMATIC AND FINANCIAL LITERACY
It is not sufficient, however, to understand the procedures that have been applied to obtain any data set� The scientifically literate individual needs to be able to judge whether they are appropriate and the ensuing claims are justified (epistemic knowledge)� For instance, many sets of data can be interpreted in multiple ways� Argumentation and critique are essential to determining which is the most appropriate conclusion�
Whether it is new theories, novel ways of collecting data or fresh interpretations of old data, argumentation is the means that scientists and technologists use to make their case for new ideas� Disagreement among scientists is normal, not extraordinary� Determining which interpretation is the best requires a knowledge of science (content knowledge)� Consensus on key scientific ideas and concepts has been achieved through this process of critique and argumentation (Longino, 1990)� Indeed, it is a critical and sceptical disposition towards all empirical evidence that many would see as the hallmark of the professional scientist� The scientifically literate individual understands the function and purpose of argument and critique and why they are essential to the construction of knowledge in science� In addition, they should be able both to construct claims that are justified by data and to identify any flaws in the arguments of others�
The evolution of the definition of scientific literacy in PISAIn PISA 2000 and 2003, scientific literacy was defined as:
“…the capacity to use scientific knowledge, to identify questions and to draw evidence-based conclusions in order to understand and help make decisions about the natural world and the changes made to it through human activity�” (OECD, 2000, 2004)
In 2000 and 2003, the definition embedded knowledge of science and understandings about science within the one term “scientific knowledge”� The 2006 definition separated and elaborated the term “scientific knowledge” by dividing it into two components: “knowledge of science” and “knowledge about science” (OECD, 2006)� Both definitions referred to the application of scientific knowledge to understanding and making informed decisions about the natural world� In PISA 2006, the definition was enhanced by the addition of knowledge of the relationship between science and technology – an aspect that was assumed but not elaborated in the 2003 definition�
“For the purposes of PISA, scientific literacy refers to an individual’s:
• Scientific knowledge and use of that knowledge to identify questions, acquire new knowledge, explain scientific phenomena and draw evidence-based conclusions about science-related issues�
• Understanding of the characteristic features of science as a form of human knowledge and enquiry�
• Awareness of how science and technology shape our material, intellectual and cultural environments�
• Willingness to engage in science-related issues, and with the ideas of science, as a reflective citizen�” (OECD, 2006)�
These ideas have evolved further in the PISA 2015 definition of scientific literacy� The major difference is that the notion of “knowledge about science” has been specified more clearly and split into two components – procedural knowledge and epistemic knowledge�
In 2006, the PISA framework was also expanded to include attitudinal aspects of students’ responses to scientific and technological issues within the construct of scientific literacy� In 2006, attitudes were measured in two ways: through the student questionnaire and through items embedded in the student test� Discrepancies were found between the results from the embedded questions and those from the background questionnaire with respect to “interest in science” for all students and gender differences in these issues (OECD, 2009; see also Drechsel, Carstensen and Prenzel, 2011)� More important, embedded items extended the length of the test� Hence, in PISA 2015, attitudinal aspects are only measured through the student questionnaire; there are no embedded attitudinal items�
As for the constructs measured within this domain, the first (“interest in science”) and third (“environmental awareness”) remain the same as in 2006� The second (“support for scientific enquiry”) has been changed to a measure of “valuing scientific approaches to enquiry”, which is essentially a change in terminology to better reflect what is measured�
In addition, the contexts in PISA 2015 have been changed from “personal, social and global” in the 2006 assessment to “personal, local/national and global” to make the headings more coherent�

Pisa 2015 sCiENCE FRaMEWORK2
PISA 2015 ASSESSMENT AND ANALYTICAL FRAMEWORK: SCIENCE, READING, MATHEMATIC AND FINANCIAL LITERACY © OECD 2016 23
ORGaNisiNG thE DOMaiN OF sCiENCEThe PISA 2015 definition of scientific literacy consists of four interrelated aspects (see Figures 2�1 and 2�2)�
Figure 2�1 • aspects of the scientific literacy assessment framework for Pisa 2015
Contexts Personal, local/national and global issues, both current and historical, which demand some understanding of science and technology�
Knowledge An understanding of the major facts, concepts and explanatory theories that form the basis of scientific knowledge� Such knowledge includes knowledge of both the natural world and technological artefacts (content knowledge), knowledge of how such ideas are produced (procedural knowledge), and an understanding of the underlying rationale for these procedures and the justification for their use (epistemic knowledge)�
Competencies The ability to explain phenomena scientifically, evaluate and design scientific enquiry, and interpret data and evidence scientifically�
Attitudes A set of attitudes towards science indicated by an interest in science and technology, valuing scientific approaches to enquiry where appropriate, and a perception and awareness of environmental issues�
Figure 2�2 • inter-relations between the four aspects
How an individual does this is influenced byRequire individuals
to display
Contexts
• Personal
• Local/national
• GlobalKnowledge
• Content
• Procedural
• Epistemic
Attitudes
• Interest in science
• Valuing scientific approaches to enquiry
• Environmental awareness
Competencies
• Explain phenomena scientifically
• Evaluate and design scientific enquiry
• Interpret data and evidence scientifically
Contexts of assessment itemsPISA 2015 assesses scientific knowledge in contexts that are relevant to the science curricula of participating countries� Such contexts are not, however, restricted to the common aspects of participants’ national curricula� Rather, the assessment requires evidence of the successful use of the three competencies required for scientific literacy in situations set in personal, local/national and global contexts�
Assessment items are not limited to school science contexts� In the PISA 2015 scientific literacy assessment, the items focus on situations relating to the self, family and peer groups (personal), to the community (local and national), and to life across the world (global)� Technology-based topics may be used as a common context� Some topics may be set in historical contexts, which are used to assess students’ understanding of the processes and practices involved in advancing scientific knowledge�
Figure 2�3 shows how science and technology issues are applied within personal, local/national and global settings� The contexts are chosen in light of their relevance to students’ interests and lives� The areas of application are: health and disease, natural resources, environmental quality, hazards, and the frontiers of science and technology� They are the areas in which scientific literacy has particular value for individuals and communities in enhancing and sustaining quality of life, and in developing public policy�
The PISA science assessment is not an assessment of contexts� Rather, it assesses competencies and knowledge in specific contexts� These contexts are chosen on the basis of the knowledge and understanding that students are likely to have acquired by the age of 15�
Sensitivity to linguistic and cultural differences is a priority in item development and selection, not only for the sake of the validity of the assessment, but also to respect these differences among participating countries�

Pisa 2015 sCiENCE FRaMEWORK2
24 © OECD 2016 PISA 2015 ASSESSMENT AND ANALYTICAL FRAMEWORK: SCIENCE, READING, MATHEMATIC AND FINANCIAL LITERACY
Figure 2�3 • Contexts in the Pisa 2015 scientific literacy assessment
Personal Local/National Global
Health and disease Maintenance of health, accidents, nutrition
Control of disease, social transmission, food choices, community health
Epidemics, spread of infectious diseases
Natural resources Personal consumption of materials and energy
Maintenance of human populations, quality of life, security, production and distribution of food, energy supply
Renewable and non-renewable natural systems, population growth, sustainable use of species
Environmental quality Environmentally friendly actions, use and disposal of materials and devices
Population distribution, disposal of waste, environmental impact
Biodiversity, ecological sustainability, control of pollution, production and loss of soil/biomass
Hazards Risk assessments of lifestyle choices
Rapid changes (e�g� earthquakes, severe weather), slow and progressive changes (e�g� coastal erosion, sedimentation), risk assessment
Climate change, impact of modern communication
Frontiers of science and technology
Scientific aspects of hobbies, personal technology, music and sporting activities
New materials, devices and processes, genetic modifications, health technology, transport
Extinction of species, exploration of space, origin and structure of the universe
Scientific competenciesFigures 2�4a, 2�4b and 2�4c provide a detailed description of how students may display the three competencies required for scientific literacy� The set of scientific competencies in Figures 2�4a, 2�4b and 2�4c reflects a view that science is best seen as an ensemble of social and epistemic practices that are common across all sciences (National Research Council, 2012)� Hence, all these competencies are framed as actions� They are written in this manner to convey the idea of what the scientifically literate person both understands and is capable of doing� Fluency with these practices is, in part, what distinguishes the expert scientist from the novice� While it would be unreasonable to expect a 15-year-old student to have the expertise of a scientist, a scientifically literate student can be expected to appreciate the role and significance of these practices and try to use them�
Figure 2�4a • Pisa 2015 scientific competencies: Explain phenomena scientifically
Explain phenomena scientifically
Recognise, offer and evaluate explanations for a range of natural and technological phenomena demonstrating the ability to:
• Recall and apply appropriate scientific knowledge�
• Identify, use and generate explanatory models and representations�
• Make and justify appropriate predictions�
• Offer explanatory hypotheses�
• Explain the potential implications of scientific knowledge for society�
Demonstrating the competency of explaining phenomena scientifically requires students to recall the appropriate content knowledge in a given situation and use it to interpret and explain the phenomenon of interest� Such knowledge can also be used to generate tentative explanatory hypotheses in contexts where there is a lack of knowledge or data� A scientifically literate person is expected to be able to draw on standard scientific models to construct simple representations to explain everyday phenomena, such as why antibiotics do not kill viruses, how a microwave oven works, or why gases are compressible but liquids are not, and use these to make predictions� This competency includes the ability to describe or interpret phenomena and predict possible changes� In addition, it may involve recognising or identifying appropriate descriptions, explanations and predictions�

Pisa 2015 sCiENCE FRaMEWORK2
PISA 2015 ASSESSMENT AND ANALYTICAL FRAMEWORK: SCIENCE, READING, MATHEMATIC AND FINANCIAL LITERACY © OECD 2016 25
Figure 2�4b • Pisa 2015 scientific competencies : Evaluate and design scientific enquiry
Evaluate and design scientific enquiry
Describe and appraise scientific investigations and propose ways of addressing questions scientifically demonstrating the ability to:
• Identify the question explored in a given scientific study�
• Distinguish questions that could be investigated scientifically�
• Propose a way of exploring a given question scientifically�
• Evaluate ways of exploring a given question scientifically�
• Describe and evaluate how scientists ensure the reliability of data, and the objectivity and generalisability of explanations�
The competency of evaluating and designing scientific enquiry is required to evaluate reports of scientific findings and investigations critically� It relies on the ability to distinguish scientific questions from other forms of enquiry or recognise questions that could be investigated scientifically in a given context� This competency requires a knowledge of the key features of a scientific investigation – for example, what things should be measured, what variables should be changed or controlled, or what action should be taken so that accurate and precise data can be collected� It requires an ability to evaluate the quality of data, which, in turn, depends on recognising that data are not always completely accurate� It also requires the ability to determine whether an investigation is driven by an underlying theoretical premise or, alternatively, whether it seeks to determine patterns�
A scientifically literate person should also be able to recognise the significance of previous research when judging the value of any given scientific enquiry� Such knowledge is needed to situate the work and judge the importance of any possible outcomes� For example, knowing that the search for a malaria vaccine has been an ongoing programme of scientific research for several decades, and given the number of people who are killed by malarial infections, any findings that suggested a vaccine would be achievable would be of substantial significance�
Moreover, students need to understand the importance of developing a sceptical attitude towards all media reports in science� They need to recognise that all research builds on previous work, that the findings of any one study are always subject to uncertainty, and that the study may be biased by the sources of funding� This competency requires students to possess both procedural and epistemic knowledge but may also draw on their content knowledge of science, to varying degrees�
Figure 2�4c • Pisa 2015 scientific competencies: interpret data and evidence scientifically
Interpret data and evidence scientifically
Analyse and evaluate scientific data, claims and arguments in a variety of representations and draw appropriate conclusions, demonstrating the ability to:
• Transform data from one representation to another�
• Analyse and interpret data and draw appropriate conclusions�
• Identify the assumptions, evidence and reasoning in science-related texts�
• Distinguish between arguments that are based on scientific evidence and theory and those based on other considerations�
• Evaluate scientific arguments and evidence from different sources (e�g� newspapers, the Internet, journals)�
A scientifically literate person should be able to interpret and make sense of basic forms of scientific data and evidence that are used to make claims and draw conclusions� Displaying this competency may require all three forms of scientific knowledge�
Those who possess this competency should be able to interpret the meaning of scientific evidence and its implications to a specified audience in their own words, using diagrams or other representations as appropriate� This competency requires the use of mathematical tools to analyse or summarise data, and the ability to use standard methods to transform data into different representations�
This competency also includes accessing scientific information and producing and evaluating arguments and conclusions based on scientific evidence (Kuhn, 2010; Osborne, 2010)� It may also involve evaluating alternative conclusions using

Pisa 2015 sCiENCE FRaMEWORK2
26 © OECD 2016 PISA 2015 ASSESSMENT AND ANALYTICAL FRAMEWORK: SCIENCE, READING, MATHEMATIC AND FINANCIAL LITERACY
evidence; giving reasons for or against a given conclusion using procedural or epistemic knowledge; and identifying the assumptions made in reaching a conclusion� In short, the scientifically literate individual should be able to identify logical or flawed connections between evidence and conclusions�
Table 2�1 shows the desired distribution of items, by competency, in the PISA 2015 science assessment�
Table 2.1 Desired distribution of items, by competency
Competency Percentage of total itemsExplain phenomena scientifically 40-50
Evaluate and design scientific enquiry 20-30
Interpret data and evidence scientifically 30-40
Scientific knowledge
Content knowledgeGiven that only a sample of the content domain of science can be assessed in the PISA 2015 scientific literacy assessment, clear criteria are used to guide the selection of the knowledge that is assessed� The criteria are applied to knowledge from the major fields of physics, chemistry, biology, earth and space sciences, and require that the knowledge:
• has relevance to real-life situations
• represents an important scientific concept or major explanatory theory that has enduring utility
• is appropriate to the developmental level of 15-year-olds�
It is thus assumed that students have some knowledge and understanding of the major explanatory ideas and theories of science, including an understanding of the history and scale of the universe, the particle model of matter, and the theory of evolution by natural selection� These examples of major explanatory ideas are provided for illustrative purposes; there has been no attempt to list comprehensively all the ideas and theories that might be considered fundamental for a scientifically literate individual�
Figure 2�5 • Knowledge of the content of science
Physical systems that require knowledge of:
• Structure of matter (e�g� particle model, bonds)
• Properties of matter (e�g� changes of state, thermal and electrical conductivity)
• Chemical changes of matter (e�g� chemical reactions, energy transfer, acids/bases)
• Motion and forces (e�g� velocity, friction) and action at a distance (e�g� magnetic, gravitational and electrostatic forces)
• Energy and its transformation (e�g� conservation, dissipation, chemical reactions)
• Interactions between energy and matter (e�g� light and radio waves, sound and seismic waves)
Living systems that require knowledge of:
• Cells (e�g� structures and function, DNA, plant and animal)
• The concept of an organism (e�g� unicellular and multicellular)
• Humans (e�g� health, nutrition, subsystems such as digestion, respiration, circulation, excretion, reproduction and their relationship)
• Populations (e�g� species, evolution, biodiversity, genetic variation)
• Ecosystems (e�g� food chains, matter and energy flow)
• Biosphere (e�g� ecosystem services, sustainability)
Earth and space systems that require knowledge of:
• Structures of the Earth systems (e�g� lithosphere, atmosphere, hydrosphere)
• Energy in the Earth systems (e�g� sources, global climate)
• Change in Earth systems (e�g� plate tectonics, geochemical cycles, constructive and destructive forces)
• Earth’s history (e�g� fossils, origin and evolution)
• Earth in space (e�g� gravity, solar systems, galaxies)
• The history and scale of the universe and its history (e�g� light year, Big Bang theory)

Pisa 2015 sCiENCE FRaMEWORK2
PISA 2015 ASSESSMENT AND ANALYTICAL FRAMEWORK: SCIENCE, READING, MATHEMATIC AND FINANCIAL LITERACY © OECD 2016 27
Figure 2�5 shows the content knowledge categories and examples selected by applying these criteria� Such knowledge is required for understanding the natural world and for making sense of experiences in personal, local/national and global contexts� The framework uses the term “systems” instead of “sciences” in the descriptors of content knowledge� The intention is to convey the idea that citizens have to understand concepts from the physical and life sciences, and earth and space sciences, and how they apply in contexts where the elements of knowledge are interdependent or interdisciplinary� Things viewed as subsystems at one scale may be viewed as whole systems at a smaller scale� For example, the circulatory system can be seen as an entity in itself or as a subsystem of the human body; a molecule can be studied as a stable configuration of atoms but also as a subsystem of a cell or a gas� Thus, applying scientific knowledge and exhibiting scientific competencies requires a determination of which system and which boundaries apply in any particular context�
Table 2�2 shows the desired distribution of items, by content of science�
Table 2.2 Desired distribution of items, by content
System Percentage of total items
Physical 36Living 36Earth and space 28Total 100
Procedural knowledgeA fundamental goal of science is to generate explanatory accounts of the material world� Tentative explanatory accounts are first developed and then tested through empirical enquiry� Empirical enquiry relies on certain well-established concepts, such as the notion of dependent and independent variables, the control of variables, types of measurement, forms of error, methods of minimising error, common patterns observed in data, and methods of presenting data�
It is this knowledge of the concepts and procedures that are essential for scientific enquiry that underpins the collection, analysis and interpretation of scientific data� Such ideas form a body of procedural knowledge that has also been called “concepts of evidence” (Gott, Duggan and Roberts, 2008; Millar et al�, 1995)� One can think of procedural knowledge as knowledge of the standard procedures scientists use to obtain reliable and valid data� Such knowledge is needed both to undertake scientific enquiry and engage in critical reviews of the evidence that might be used to support particular claims� It is expected, for instance, that students will know that scientific knowledge has differing degrees of certainty associated with it, and so can explain why there is a difference between the confidence associated with measurements of the speed of light (which has been measured many times with ever more accurate instrumentation) and measurements of fish stocks in the North Atlantic or the mountain lion population in California� The examples listed in Figure 2�6 convey the general features of procedural knowledge that may be tested�
Figure 2�6 • Pisa 2015 procedural knowledge
Procedural knowledge
• The concept of variables, including dependent, independent and control variables�
• Concepts of measurement, e�g� quantitative (measurements), qualitative (observations), the use of a scale, categorical and continuous variables�
• Ways of assessing and minimising uncertainty, such as repeating and averaging measurements�
• Mechanisms to ensure the replicability (closeness of agreement between repeated measures of the same quantity) and accuracy of data (the closeness of agreement between a measured quantity and a true value of the measure)�
• Common ways of abstracting and representing data using tables, graphs and charts, and using them appropriately�
• The control-of-variables strategy and its role in experimental design or the use of randomised controlled trials to avoid confounded findings and identify possible causal mechanisms�
• The nature of an appropriate design for a given scientific question, e�g� experimental, field-based or pattern-seeking�
Epistemic knowledgeEpistemic knowledge refers to an understanding of the role of specific constructs and defining features essential to the process of knowledge building in science (Duschl, 2007)� Those who have such knowledge can explain, with examples, the distinction between a scientific theory and a hypothesis or a scientific fact and an observation� They know that models, whether representational, abstract or mathematical, are a key feature of science, and that such models are

Pisa 2015 sCiENCE FRaMEWORK2
28 © OECD 2016 PISA 2015 ASSESSMENT AND ANALYTICAL FRAMEWORK: SCIENCE, READING, MATHEMATIC AND FINANCIAL LITERACY
like maps rather than accurate pictures of the material world� These students can recognise that any particle model of matter is an idealised representation of matter and can explain how the Bohr model is a limited model of what we know about the atom and its constituent parts� They recognise that the concept of a “theory” as used in science is not the same as the notion of a “theory” in everyday language, where it is used as a synonym for a “guess” or a “hunch”� Procedural knowledge is required to explain what is meant by the control-of-variables strategy; epistemic knowledge is required to explain why the use of the control-of-variables strategy or the replication of measurements is central to establishing knowledge in science�
Scientifically literate individuals also understand that scientists draw on data to advance claims to knowledge, and that argument is a commonplace feature of science� In particular, they know that some arguments in science are hypothetico-deductive (e�g. Copernicus’ argument for the heliocentric system), some are inductive (the conservation of energy), and some are an inference to the best explanation (Darwin’s theory of evolution or Wegener’s argument for moving continents)� They also understand the role and significance of peer review as the mechanism that the scientific community has established for testing claims to new knowledge� As such, epistemic knowledge provides a rationale for the procedures and practices in which scientists engage, a knowledge of the structures and defining features that guide scientific enquiry, and the foundation for the basis of belief in the claims that science makes about the natural world�
Figure 2�7 represents what are considered to be the major features of epistemic knowledge necessary for scientific literacy�
Figure 2�7 • Pisa 2015 epistemic knowledge
Epistemic knowledge
The constructs and defining features of science� That is:
• The nature of scientific observations, facts, hypotheses, models and theories�
• The purpose and goals of science (to produce explanations of the natural world) as distinguished from technology (to produce an optimal solution to human need), and what constitutes a scientific or technological question and appropriate data�
• The values of science, e�g� a commitment to publication, objectivity and the elimination of bias�
• The nature of reasoning used in science, e�g� deductive, inductive, inference to the best explanation (abductive), analogical, and model-based�
The role of these constructs and features in justifying the knowledge produced by science� That is:
• How scientific claims are supported by data and reasoning in science�
• The function of different forms of empirical enquiry in establishing knowledge, their goal (to test explanatory hypotheses or identify patterns) and their design (observation, controlled experiments, correlational studies)�
• How measurement error affects the degree of confidence in scientific knowledge�
• The use and role of physical, system and abstract models and their limits�
• The role of collaboration and critique, and how peer review helps to establish confidence in scientific claims�
• The role of scientific knowledge, along with other forms of knowledge, in identifying and addressing societal and technological issues�
Epistemic knowledge is most likely to be tested pragmatically in a context where a student is required to interpret and answer a question that requires some of this type of knowledge rather than assessing directly whether they understand the features detailed in Figure 2�7� For example, students may be asked to identify whether the conclusions are justified by the data, or what piece of evidence best supports the hypothesis advanced in an item and explain why�
Table 2�3 describes the desired distribution of items by type of knowledge�
Table 2.3 Desired distribution of items, by type of knowledge
Knowledge Percentage of total itemsContent 54-66Procedural 19-31Epistemic 10-22
The desired balance, by percentage of items, among the three knowledge components – content, procedural and epistemic – is shown in Table 2�4� These weightings are broadly consistent with the previous framework and reflect a consensus view among the experts consulted during the drafting of this framework�

Pisa 2015 sCiENCE FRaMEWORK2
PISA 2015 ASSESSMENT AND ANALYTICAL FRAMEWORK: SCIENCE, READING, MATHEMATIC AND FINANCIAL LITERACY © OECD 2016 29
Table 2.4 Desired distribution of items for knowledge
Knowledge typesSystems
Physical Living Earth and space Total over systemsContent 20-24 20-24 14-18 54-66Procedural 7-11 7-11 5-9 19- 31Epistemic 4-8 4-8 2-6 10-22Total over knowledge types 36 36 28 100
Sample itemsIn this section, three examples of science units are presented� The first is from PISA 2006 and is included to demonstrate the linkage between the 2006 and the 2015 frameworks� Questions from the unit are shown in the original paper-based format and also how they might be transposed and presented on screen� The second example is a new onscreen unit illustrating the 2015 scientific literacy framework� The third example illustrates an interactive, simulated scientific-enquiry environment which allows for assessing students’ proficiency in science within a real world setting�
Other examples of science items are available on the PISA website (www�oecd�org/pisa/), including interactive examples (forthcoming, November 2016)�
Science example 1: GREENHOUSEScience example 1 is entitled GREENHOUSE and deals with the increase in the average temperature of the Earth’s atmosphere� The stimulus material consists of a short text introducing the term “Greenhouse effect” and includes graphical information on the average temperature of the Earth’s atmosphere and carbon dioxide emissions on Earth over time�
The area of application is Environment Quality within a global setting�
Read the texts and answer the questions that follow.
THE GREENHOUSE EFFECT: FACT OR FICTION?Living things need energy to survive. The energy that sustains life on the Earth comes from the Sun, which radiates energy into space because it is so hot. A tiny proportion of this energy reaches the Earth.The Earth’s atmosphere acts like a protective blanket over the surface of our planet, preventing the variations in temperature that would exist in an airless world. Most of the radiated energy coming from the Sun passes through the Earth’s atmosphere. The Earth absorbs some of this energy, and some is reflected back from the Earth’s surface. Part of this reflected energy is absorbed by the atmosphere. As a result of this the average temperature above the Earth’s surface is higher than it would be if there were no atmosphere. The Earth’s atmosphere has the same effect as a greenhouse, hence the term greenhouse effect.The greenhouse effect is said to have become more pronounced during the twentieth century. It is a fact that the average temperature of the Earth’s atmosphere has increased. In newspapers and periodicals the increased carbon dioxide emission is often stated as the main source of the temperature rise in the twentieth century.
A student named André becomes interested in the possible relationship between the average temperature of the Earth’s atmosphere and the carbon dioxide emission on the Earth�
In a library he comes across the following two graphs�
André concludes from these two graphs that it is certain that the increase in the average temperature of the Earth’s atmosphere is due to the increase in the carbon dioxide emission�
20
Years
10
0
Carbon dioxide emission(thousand millions of tonnes per year)
1870
1880
1890
1900
1910
1920
1930
1940
1950
1960
1970
1980
1990
1860
15�4
15�0
Average temperatureof the Earth’s atmosphere (°C)
14�6 Years
1870
1880
1890
1900
1910
1920
1930
1940
1950
1960
1970
1980
1990
1860

Pisa 2015 sCiENCE FRaMEWORK2
30 © OECD 2016 PISA 2015 ASSESSMENT AND ANALYTICAL FRAMEWORK: SCIENCE, READING, MATHEMATIC AND FINANCIAL LITERACY
GREENHOUSE – QUESTION 1
What is it about the graphs that supports André’s conclusion?....................................................................................................
Figure 2�8 • Framework categorisation for GREENhOUsE question 1
Framework categories 2006 Framework 2015 FrameworkKnowledge type Knowledge about science Epistemic Competency Explaining phenomena scientifically Explaining phenomena scientificallyContext Environmental, global Environmental, globalCognitive demand Not applicable Medium
Question 1 demonstrates how the 2015 framework largely maps onto the same categories as the 2006 framework, using the same competency and context categorisations� The 2006 framework included two categorisations of scientific knowledge: knowledge of science (referring to knowledge of the natural world across the major fields of science) and knowledge about science (referring to the means and goals of science)� The 2015 framework elaborates on these two aspects, subdividing knowledge about science into procedural and epistemic knowledge� Question 1 requires students not only to understand how the data is represented in the two graphs, but also to consider whether this evidence scientifically justifies a given conclusion� This is one of the features of epistemic knowledge in the 2015 framework� The context categorisation is “environmental, global”� A new feature of the 2015 framework is consideration of cognitive demand (see Figure 2�23)� This question requires an interpretation of graphs involving a few linked steps; thus, according to the framework, it is categorised as medium cognitive demand�
GREENHOUSE – QUESTION 2
Another student, Jeanne, disagrees with André’s conclusion. She compares the two graphs and says that some parts of the graphs do not support his conclusion.
Give an example of a part of the graphs that does not support André’s conclusion. Explain your answer.
....................................................................................................................................................................
Figure 2�9 • Framework categorisation for GREENhOUsE question 2
Framework categories 2006 Framework 2015 FrameworkKnowledge type Knowledge about science Epistemic
Competency Explaining phenomena scientifically Explaining phenomena scientifically
Context Environmental, global Environmental, global
Cognitive demand Not applicable Medium
Question 2 requires students to study the two graphs in detail� The knowledge, competency, context and cognitive demand are in the same categories as question 1�
GREENHOUSE – QUESTION 3
André persists in his conclusion that the average temperature rise of the Earth’s atmosphere is caused by the increase in the carbon dioxide emission. But Jeanne thinks that his conclusion is premature. She says: “Before accepting this conclusion you must be sure that other factors that could influence the greenhouse effect are constant”.
Name one of the factors that Jeanne means.
....................................................................................................................................................................
Figure 2�10 • Framework categorisation for GREENhOUsE question 3
Framework categories 2006 Framework 2015 FrameworkKnowledge type Knowledge about science Procedural Competency Explaining phenomena scientifically Explaining phenomena scientificallyContext Environmental, global Environmental, globalCognitive demand Not applicable Medium
Question 3 requires students to consider control variables in terms of the critical review of evidence used to support claims� This is categorised as “procedural knowledge” in the 2015 framework�

Pisa 2015 sCiENCE FRaMEWORK2
PISA 2015 ASSESSMENT AND ANALYTICAL FRAMEWORK: SCIENCE, READING, MATHEMATIC AND FINANCIAL LITERACY © OECD 2016 31
The screenshots below illustrate how the GREENHOUSE question would be presented in an onscreen environment� The text and graphs are essentially unchanged, with students using page turners on the top right of the screen to view graphs and text as required� As the original questions were open responses, the onscreen version also necessitates an open-response format in order to replicate the paper version as closely as possible, ensuring comparability between delivery modes and therefore protecting comparability of data over time�
Figure 2�11 • GREENhOUsE presented onscreen: stimulus page 1
Figure 2�12 • GREENhOUsE presented onscreen: stimulus page 2
?PISA 2015
Greenhouse effectIntroduction
THE GREENHOUSE EFFECT: FACT OR FICTION?
Living things need energy to survive. The energy that sustains life on the Earth comes from the Sun, which radiates energy into space because it is so hot. A tiny proportion of this energy reaches the Earth.
The Earth’s atmosphere acts like a protective blanket over the surface of our planet, preventing the variations in temperature that would exist in an airless world.Most of the radiated energy coming from the Sun passes through the Earth’s atmosphere. The Earth absorbs some of this energy, and some is re�ected back from the Earth’s surface. Part of this re�ected energy is absorbed by the atmosphere.
As a result of this the average temperature above the Earth’s surface is higher than it would be if there were no atmosphere. The Earth’s atmosphere has the same effect as a greenhouse, hence the term greenhouse effect.
The greenhouse effect is said to have become more pronounced during the twentieth century.
It is a fact that the average temperature of the Earth’s atmosphere has increased. In newspapers and periodicals the increased carbon dioxide emission is often stated as the main source of the temperature rise in the twentieth century.
2
?PISA 2015
Greenhouse effectIntroduction
Now click on Next to view the �rst question. A student named André becomes interested in the possible relationship between theaverage temperature of the Earth’s atmosphere and the carbon dioxide emission on the Earth.In a library he comes across the following two graphs.
André concludes from these two graphs that it is certain that the increase in the averagetemperature of the Earth’s atmosphere is due to the increase in the carbon dioxideemission.
21
20
Years
10
0
Carbon dioxide emission(thousand millionsof tonnes per year)
Average temperatureof the Earth’s
atmosphere (°C)
1870
1880
1890
1900
1910
1920
1930
1940
1950
1960
1970
1980
1990
1860
15.4
15.0
14.6 Years
1870
1880
1890
1900
1910
1920
1930
1940
1950
1960
1970
1980
1990
1860

Pisa 2015 sCiENCE FRaMEWORK2
32 © OECD 2016 PISA 2015 ASSESSMENT AND ANALYTICAL FRAMEWORK: SCIENCE, READING, MATHEMATIC AND FINANCIAL LITERACY
Figure 2�13 • GREENhOUsE presented onscreen: Question 1
Figure 2�14 • GREENhOUsE presented onscreen: Question 2
?PISA 2015
Greenhouse effectQuestion 1/3
Type your answer to the question below.
What is it about the graphs that supportsAndré’s conclusion?
THE GREENHOUSE EFFECT: FACT OR FICTION?
Living things need energy to survive. The energy that sustains life on the Earth comes from the Sun, which radiates energy into space because it is so hot. A tiny proportion of this energy reaches the Earth.
The Earth’s atmosphere acts like a protective blanket over the surface of our planet, preventing the variations in temperature that would exist in an airless world.Most of the radiated energy coming from the Sun passes through the Earth’s atmosphere. The Earth absorbs some of this energy, and some is re�ected back from the Earth’s surface. Part of this re�ected energy is absorbed by the atmosphere.
As a result of this the average temperature above the Earth’s surface is higher than it would be if there were no atmosphere. The Earth’s atmosphere has the same effect as a greenhouse, hence the term greenhouse effect.
The greenhouse effect is said to have become more pronounced during the twentieth century.
It is a fact that the average temperature of the Earth’s atmosphere has increased. In newspapers and periodicals the increased carbon dioxide emission is often stated as the main source of the temperature rise in the twentieth century.
2
?PISA 2015
Greenhouse effectQuestion 2/3
Type your answer to the question below.
Another student, Jeanne, disagrees withAndré’s conclusion. She compares the twographs and says that some parts of the graphsdo not support his conclusion.
Give an example of a part of the graphs that does not support André’s conclusion. Explain your answer.
THE GREENHOUSE EFFECT: FACT OR FICTION?
Living things need energy to survive. The energy that sustains life on the Earth comes from the Sun, which radiates energy into space because it is so hot. A tiny proportion of this energy reaches the Earth.
The Earth’s atmosphere acts like a protective blanket over the surface of our planet, preventing the variations in temperature that would exist in an airless world.Most of the radiated energy coming from the Sun passes through the Earth’s atmosphere. The Earth absorbs some of this energy, and some is re�ected back from the Earth’s surface. Part of this re�ected energy is absorbed by the atmosphere.
As a result of this the average temperature above the Earth’s surface is higher than it would be if there were no atmosphere. The Earth’s atmosphere has the same effect as a greenhouse, hence the term greenhouse effect.
The greenhouse effect is said to have become more pronounced during the twentieth century.
It is a fact that the average temperature of the Earth’s atmosphere has increased. In newspapers and periodicals the increased carbon dioxide emission is often stated as the main source of the temperature rise in the twentieth century.
2

Pisa 2015 sCiENCE FRaMEWORK2
PISA 2015 ASSESSMENT AND ANALYTICAL FRAMEWORK: SCIENCE, READING, MATHEMATIC AND FINANCIAL LITERACY © OECD 2016 33
Science example 2: SMOKINGThis new 2015 exemplar unit explores various forms of evidence linked to the harmful effects of smoking and the methods used to help people to stop smoking� New scientific literacy items for 2015 are only developed for computer-based delivery and therefore this exemplar is only shown in an onscreen format�
All onscreen standard question types in the PISA 2015 computer platform have a vertical split screen with the stimuli presented on the right side and the questions and answer mechanisms on the left side�
Figure 2�15 • GREENhOUsE presented onscreen: Question 3
?PISA 2015
Greenhouse effectQuestion 3/3
Type your answer to the question below.
André persists in his conclusion that theaverage temperature rise of the Earth’satmosphere is caused by the increase in thecarbon dioxide emission. But Jeanne thinks thathis conclusion is premature. She says: “Beforeaccepting this conclusion you must be sure thatother factors that could in�uence thegreenhouse effect are constant”.
Name one of the factors that Jeanne means.
THE GREENHOUSE EFFECT: FACT OR FICTION?
Living things need energy to survive. The energy that sustains life on the Earth comes from the Sun, which radiates energy into space because it is so hot. A tiny proportion of this energy reaches the Earth.
The Earth’s atmosphere acts like a protective blanket over the surface of our planet, preventing the variations in temperature that would exist in an airless world.Most of the radiated energy coming from the Sun passes through the Earth’s atmosphere. The Earth absorbs some of this energy, and some is re�ected back from the Earth’s surface. Part of this re�ected energy is absorbed by the atmosphere.
As a result of this the average temperature above the Earth’s surface is higher than it would be if there were no atmosphere. The Earth’s atmosphere has the same effect as a greenhouse, hence the term greenhouse effect.
The greenhouse effect is said to have become more pronounced during the twentieth century.
It is a fact that the average temperature of the Earth’s atmosphere has increased. In newspapers and periodicals the increased carbon dioxide emission is often stated as the main source of the temperature rise in the twentieth century.
2
PISA 2015 Unit Name: SMOKING
Question 1/9
John and Rose are researching cigarette smoking for a school project.Read John's research on the right.Then respond to the question below.Select two reasons from the list below that suggest why cigarette companiescould claim there was no evidence thattar from cigarette smoke caused cancer in humains.
John's research
In the 1950s research studies found that tar from cigarette smoke caused cancer in mice. Tobacco companies claimed there was no evidence that smoking caused cancer in humains. They also began to produce �lter-tip cigarettes.
Humans are immune to tar
Experiments were carried out with miceChemicals from smoking decreased the effects of tarHumans may react differently from miceFilter-tip cigarettes remove all tar from smoke
Figure 2�16 • sMOKiNG: Question 1

Pisa 2015 sCiENCE FRaMEWORK2
34 © OECD 2016 PISA 2015 ASSESSMENT AND ANALYTICAL FRAMEWORK: SCIENCE, READING, MATHEMATIC AND FINANCIAL LITERACY
SMOKING – QUESTION 1
This question requires students to interpret given evidence using their knowledge of scientific concepts� They need to read the information in the stimulus about early research into the potential harmful effects of smoking, and then select two options from the menu to answer the question�
In this question, students have to apply content knowledge using the competency of “explaining phenomena scientifically”� The context is categorised as “health and disease” in a local/national setting� The cognitive demand requires the use and application of conceptual knowledge and is therefore categorised as a medium level of demand�
Figure 2�17 • Framework categorisation for sMOKiNG question 1
Framework categories 2015 FrameworkKnowledge type Content Competency Explaining phenomena scientificallyContext Health and disease, local and nationalCognitive demand Medium
SMOKING – QUESTION 2
This question explores students’ understanding of data�
The right side of the screen shows authentic data of cigarette consumption and deaths from lung cancer in men over an extended period of time� Students are asked to select the best descriptor of the data by clicking on one of the radio buttons next to answer statements on the left side of the screen�
This unit tests content knowledge using the competency of “interpreting data and evidence scientifically”�
The context is “health and disease” applied to a local/national setting� As students need to interpret the relationship between two graphs, the cognitive demand is categorised as medium�
PISA 2015 Unit Name: SMOKING
Question 3/9
Rose found a graph while doingresearch on smoking.
Refer to Rose’s research on the right.Then select the best response to the question below.
Which statement best describes the data shown in the graph?
• The graph shows that all men whosmoked cigarettes developed lung cancer
• The graph shows that more mensmoked cigarettes in the 1940’s thanin 2010.
• There is no link betweencigarettes smoked and deaths fromlung cancer.
• There is a positive linkbetween cigarettes smoked and deaths from lung cancer.
Rose's research
Lungcancerdeaths(per100,000people)
Cigarettessmoked
per personper year
4000
Cigaretteconsumption
(men)Lung cancer
(men)3000
2000
1000
150
100
1900 1920 1940 1960 1980
50
Figure 2�18 • sMOKiNG: Question 2

Pisa 2015 sCiENCE FRaMEWORK2
PISA 2015 ASSESSMENT AND ANALYTICAL FRAMEWORK: SCIENCE, READING, MATHEMATIC AND FINANCIAL LITERACY © OECD 2016 35
Figure 2�19 • Framework categorisation for sMOKiNG question 2
Framework categories 2015 FrameworkKnowledge type Content Competency Interpret data and evidence scientificallyContext Health and disease, local and nationalCognitive demand Medium
Science example 3: ZEER POTThis new 2015 exemplar unit features the use of interactive tasks using simulations of scientific enquiry to explore and assess scientific literacy knowledge and competencies�
This unit focuses on an authentic low-cost cooling container called a Zeer pot, developed for local use in Africa, using readily available local resources� Cost and lack of electricity limit the use of refrigerators in these regions, even though the hot climate requires that people keep food cool so that it can be kept for a longer time before bacterial growth renders it a risk to health�
The first screen shot of this simulation introduces what a Zeer pot looks like and how it works� Students are not expected to have an understanding of how the process of evaporation causes cooling, just that it does�
Using this simulation, students are asked to investigate the conditions that will produce the most effective cooling effects (4°C) for keeping food fresh in the Zeer pot� The simulator keeps certain conditions constant (the air temperature and the humidity), but includes this information to enhance the authentic contextual setting� In the first question, students are asked to investigate the optimum conditions to keep the maximum amount of food fresh in the Zeer pot by altering the thickness of the sand layer and the moisture conditions�
PISA 2015 Unit name: ZEER POT
Introduction
A zeer pot refrigeration is an invention to keep food cool without electricity,usually found in African countries.
A small clay pot sits inside a larger clay pot with a clay or fabric lid. The space between the two pots is �lled with sand.This creates an insulating layer around the inner pot. The sand is kept damp by adding water at regular intervals. When the water evaporates, the temperature in the inner pot is reduced.
Local people make zeer pots out of clay,a locally available resource.
Inner clay pot.Food is placed here
Outerclay pot
Cloth orfabric lid
Layer of dampsand
Stand
ZEER POT
Figure 2�20 • ZEER POt: stimulus

Pisa 2015 sCiENCE FRaMEWORK2
36 © OECD 2016 PISA 2015 ASSESSMENT AND ANALYTICAL FRAMEWORK: SCIENCE, READING, MATHEMATIC AND FINANCIAL LITERACY
When students have set their conditions (which also alter the visual display of the on screen Zeer pot), they press the record-data button, which then runs the simulation and populates the data chart� They need to run a number of data simulations, and can remove data or repeat any simulations as required� This screen then records their response to the maximum amount of food kept fresh at 4oC� Their approaches to the design and evaluation of this form of scientific enquiry can be assessed in subsequent questions�
The knowledge categorisation for this item is “procedural”, and the competence is “evaluate and design scientific enquiry”� The context categorisation is “natural resources”, although it also has links to “health and disease”� The cognitive demand of this question is categorised as high because students are given a complex situation, and they need to develop a systematic sequence of investigations to answer the question�
Figure 2�22 • Framework categorisation for ZEERPOt question 1
Framework categories 2015 FrameworkKnowledge type Procedural Competency Evaluate and design scientific enquiryContext Natural resourcesCognitive demand High
AttitudesWhy attitudes matterPeoples’ attitudes towards science play a significant role in their interest, attention and response to science and technology, and to issues that affect them specifically� One goal of science education is to develop attitudes that lead students to engage with scientific issues� Such attitudes also support the subsequent acquisition and application of scientific and technological knowledge for personal, local/national and global benefit, and lead to the development of self-efficacy (Bandura, 1997)�
Figure 2�21 • ZEER POt: Question 1
PISA 2015 Unit name: ZEER POT
Task 1
You have been asked to investigate the best design of a Zeer pot for a family tokeep their food fresh.
Food is best kept at a temperature of4°C to maximise freshness andminimise bacterial growth.
Use the simulator opposite to work out the maximum amount of food that can be kept fresh (at 4°C) by varying thethickness and moisture condition of the sand layer.
You can run a number of simulations,and repeat or remove any data �ndings.
Maximum amount of food kept fresh
at 4°C is kg
Inner clay pot
Outer clay pot
Thickness ofsand layer (cm)
Constant variables
Air temp 38°C Humidity 20%
Thickness ofsand layer (cm)
Amount offood (kg)
Sand moisture
Record data Clear data
Damp
1 2 3 4 5
0 4 8 12 16 20
Dry
Amount offood (kg)
Sand moisture(damp/dry) Temperature (°C)
Layer of sand
StandLid
Pisa 2015 sCiENCE FRaMEWORK2
PISA 2015 ASSESSMENT AND ANALYTICAL FRAMEWORK: SCIENCE, READING, MATHEMATIC AND FINANCIAL LITERACY © OECD 2016 37
Attitudes form part of the construct of scientific literacy� That is, a person’s scientific literacy includes certain attitudes, beliefs, motivational orientations, self-efficacy and values� The construct of attitudes used in PISA draws upon Klopfer’s (1976) structure for the affective domain in science education and reviews of attitudinal research (Gardner, 1975; Osborne, Simon and Collins, 2003; Schibeci, 1984)� A major distinction made in these reviews is between attitudes towards science and scientific attitudes� While the former is measured by the level of interest displayed in scientific issues and activities, the latter is a measure of a disposition to value empirical evidence as the basis of belief�
Defining attitudes towards science in PISA 2015The PISA 2015 assessment evaluates students’ attitudes towards science in three areas: interest in science and technology, environmental awareness, and valuing scientific approaches to enquiry (see Figure 2�23), which are considered core to the construct of scientific literacy� These three areas were selected for measurement because a positive attitude towards science, a concern for the environment and an environmentally sustainable way of life, and a disposition to value the scientific approach to enquiry are characteristics of a scientifically literate individual� Thus, the extent to which individual students are, or are not interested in science and recognise its value and implications is considered an important measure of the outcome of compulsory education� Moreover, in 52 of the countries (including all OECD countries) that participated in PISA 2006, students with a higher general interest in science performed better in science (OECD, 2007:143)�
Interest in science and technology was selected because of its established relationships with achievement, course selection, career choice and lifelong learning� For instance, there is a considerable body of literature which shows that interest in science is established by age 14 for the majority of students (Ormerod and Duckworth, 1975; Tai et al�, 2006)� Moreover, students with such an interest are more likely to pursue scientific careers� Policy concerns in many OECD countries about the number of students, particularly girls, who choose to pursue the study of science make the measurement of attitudes towards science an important aspect of the PISA assessment� The results may provide information about a perceived declining interest in the study of science among young people (Bøe et al�, 2011)� This measure, when correlated with the large body of other information collected by PISA through the student, teacher and school questionnaires, may provide insights into the causes of any decline in interest�
Valuing scientific approaches to enquiry was chosen because scientific approaches to enquiry have been highly successful at generating new knowledge – not only within science itself, but also in the social sciences, and even finance and sports� Moreover, the core value of scientific enquiry and the Enlightenment is the belief in empirical evidence as the basis of rational belief� Recognising the value of the scientific approach to enquiry is, therefore, widely regarded as a fundamental objective of science education that warrants assessing�
Appreciation of, and support for, scientific enquiry implies that students can identify and also value scientific ways of gathering evidence, thinking creatively, reasoning rationally, responding critically and communicating conclusions as they confront life situations related to science and technology� Students should understand how scientific approaches to enquiry function, and why they have been more successful than other methods in most cases� Valuing scientific approaches to enquiry, however, does not mean that an individual has to be positively disposed towards all aspects of science or even use such methods themselves� Thus, the construct is a measure of students’ attitudes towards the use of a scientific method to investigate material and social phenomenon and the insights that are derived from such methods�
Environmental awareness is of international concern, as well as being of economic relevance� Attitudes in this area have been the subject of extensive research since the 1970s (see, for example, Bogner and Wiseman, 1999; Eagles and Demare, 1999; Rickinson, 2001; Weaver, 2002)� In December 2002, the United Nations approved resolution 57/254 declaring the ten-year period beginning on 1 January 2005 to be the United Nations Decade of Education for Sustainable Development (UNESCO, 2003)� The International Implementation Scheme (UNESCO, 2005) identifies the environment as one of the three spheres of sustainability (along with society, including culture, and economy) that should be included in all education programmes for sustainable development�
Given the importance of environmental issues to the continuation of life on Earth and the survival of humanity, young people today need to understand the basic principles of ecology and the need to organise their lives accordingly� This means that developing environmental awareness and a responsible disposition towards the environment is an important element of contemporary science education�
In PISA 2015 these specific attitudes towards science are measured through the student questionnaire� Further detail of these constructs can be found in the Questionnaire framework, Chapter 5�

Pisa 2015 sCiENCE FRaMEWORK2
38 © OECD 2016 PISA 2015 ASSESSMENT AND ANALYTICAL FRAMEWORK: SCIENCE, READING, MATHEMATIC AND FINANCIAL LITERACY
assEssiNG sCiENtiFiC LitERaCY
Cognitive demandA key new feature of the PISA 2015 framework is the definition of levels of cognitive demand within the assessment of scientific literacy and across all three competencies of the framework� In assessment frameworks, item difficulty, which is empirically derived, is often confused with cognitive demand� Empirical item difficulty is estimated from the proportion of test-takers who solve the item correctly, and thus assesses the amount of knowledge held by the test-taker population, whereas cognitive demand refers to the type of mental processes required (Davis and Buckendahl, 2011)� Care needs to be taken to ensure that the depth of knowledge required, i�e� the cognitive demand test items, is understood explicitly by the item developers and users of the PISA framework� For instance, an item can have high difficulty because the knowledge it is testing is not well known, but the cognitive demand is simply recall� Conversely, an item can be cognitively demanding because it requires the individual to relate and evaluate many items of knowledge – each of which is easily recalled� Thus, not only should the PISA test instrument discriminate in terms of performance between easier and harder test items, the test also needs to provide information on how students across the ability range can deal with problems at different levels of cognitive demand (Brookhart and Nitko, 2011)�
The competencies are articulated using a range of terms defining cognitive demand through the use of verbs such as “recognise”, “interpret”, “analyse” and “evaluate”� However, in themselves these verbs do not necessarily indicate a hierarchical order of difficulty that is dependent on the level of knowledge required to answer any item� Various classifications of cognitive demand schemes have been developed and evaluated since Bloom’s Taxonomy was first published (Bloom, 1956)� These have been largely based on categorisations of knowledge types and associated cognitive processes that are used to describe educational objectives or assessment tasks�
Bloom’s revised Taxonomy (Anderson and Krathwohl, 2001) identifies four categories of knowledge – factual, conceptual, procedural and meta-cognitive� This categorisation considers these forms of knowledge to be hierarchical and distinct from the six categories of performance used in Bloom’s first taxonomy – remembering, understanding, applying, analysing, evaluating and creating� In Anderson and Krathwohl’s framework, these two dimensions are now seen to be independent of each other, allowing for lower levels of knowledge to be crossed with higher order skills, and vice versa�
A similar framework is offered by Marzano and Kendall’s Taxonomy (2007), which also provides a two-dimensional framework based on the relationship between how mental processes are ordered and the type of knowledge required� The use of mental processes is seen as a consequence of a need to engage with a task with meta-cognitive strategies that define potential approaches to solving problems� The cognitive system then uses either retrieval, comprehension, analysis or knowledge utilisation� Marzano and Kendall divide the knowledge domain into three types of knowledge, information, mental procedures and psychomotor, compared to the four categories in Bloom’s revised Taxonomy� Marzano and Kendall argue that their taxonomy is an improvement upon Bloom’s Taxonomy because it offers a model of how humans actually think rather than simply an organising framework�
A different approach is offered by Ford and Wargo (2012), who offer a framework for scaffolding dialogue as a way of considering cognitive demand� Their framework uses four levels that build on each other: recall, explain, juxtapose and evaluate� Although this framework has not been specifically designed for assessment purposes, it has many similarities to the PISA 2015 definition of scientific literacy and the need to make more explicit references to such demands in the knowledge and competencies�
Another schema can be found in the framework based on Depth of Knowledge developed by Webb (1997) specifically to address the disparity between assessments and the expectations of student learning� For Webb, levels of depth can be determined by taking into account the complexity of both the content and the task required� His schema consists of four major categories: level 1 (recall), level 2 (using skills and/or conceptual knowledge), level 3 (strategic thinking) and level 4 (extended thinking)� Each category is populated with a large number of verbs that can be used to describe cognitive processes� Some of these appear at more than one level� This framework offers a more holistic view of learning and assessment tasks, and requires an analysis of both the content and cognitive process demanded by any task� Webb’s Depth of Knowledge (DOK) approach is a simpler but more operational version of the SOLO Taxonomy (Biggs and Collis, 1982) which describes a continuum of student understanding through five distinct stages of pre-structural, unistructural, multistructural, relational and extended abstract understanding�

Pisa 2015 sCiENCE FRaMEWORK2
PISA 2015 ASSESSMENT AND ANALYTICAL FRAMEWORK: SCIENCE, READING, MATHEMATIC AND FINANCIAL LITERACY © OECD 2016 39
All the frameworks described briefly above have served to develop the knowledge and competencies in the PISA 2015 Framework� In drawing up such a framework, it is recognised that there are challenges in developing test items based on a cognitive hierarchy� The three main challenges are that:
a) Too much effort is made to fit test items into particular cognitive frameworks, which can lead to poorly developed items�
b) Intended items (with frameworks defining rigorous, cognitively demanding goals) may differ from actual items (which may operationalise the standard in a much less cognitively demanding way)�
c) Without a well-defined and understood cognitive framework, item writing and development often focuses on item difficulty and uses a limited range of cognitive processes and knowledge types, which are then only described and interpreted post hoc, rather than building from a theory of increasing competency�
The approach taken in this framework is to use an adapted version of Webb’s Depth of Knowledge grid (Webb, 1997) alongside the desired knowledge and competencies� As the competencies are the central feature of the framework, the cognitive framework needs to assess and report on them across the student ability range� Webb’s Depth of Knowledge Levels offer a taxonomy for cognitive demand that requires items to identify both the cognitive demand from the verbal cues that are used, e�g� analyse, arrange, compare, and the expectations of the depth of knowledge required�
Figure 2�23 • Pisa 2015 Framework for Cognitive Demand
The grid in Figure 2�23 provides a framework for mapping items against the two dimensions of knowledge and competencies� In addition, each item can also be mapped using a third dimension based on a depth-of-knowledge taxonomy� This provides a means of operationalising cognitive demand as each item can be categorised as making demands that are:
• LowCarry out a one-step procedure, for example recall a fact, term, principle or concept, or locate a single point of information from a graph or table�
• MediumUse and apply conceptual knowledge to describe or explain phenomena, select appropriate procedures involving two or more steps, organise/display data, interpret or use simple data sets or graphs�
• HighAnalyse complex information or data; synthesise or evaluate evidence; justify; reason, given various sources; develop a plan or sequence of steps to approach a problem�
The distribution of items by depth of knowledge is described in Table 2�5�
Table 2.5 Distribution of items by depth of knowledge
Depth of knowledge Percentage of itemsLow 8 Medium 30High 61Total 100
Low MediumHighCompetencies
Depth of Knowledge
Kno
wle
dge
ContentknowledgeProceduralknowledgeEpistemicknowledge
Explainphenomenascienti�cally
Evaluate and design scienti�c
enquiry
Interpret dataand evidencescienti�cally

Pisa 2015 sCiENCE FRaMEWORK2
40 © OECD 2016 PISA 2015 ASSESSMENT AND ANALYTICAL FRAMEWORK: SCIENCE, READING, MATHEMATIC AND FINANCIAL LITERACY
Items that merely require recall of one piece of information make low cognitive demands, even if the knowledge itself might be quite complex� In contrast, items that require recall of more than one piece of knowledge, and require a comparison and evaluation of the competing merits of their relevance would be seen as having high cognitive demand� The difficulty of any item, therefore, is a combination both of the degree of complexity and range of knowledge it requires, and the cognitive operations that are required to process the item�
Therefore, the factors that determine the demand of items assessing science achievement include:
• The number and degree of complexity of elements of knowledge demanded by the item�
• The level of familiarity and prior knowledge that students may have of the content, procedural and epistemic knowledge involved�
• The cognitive operation required by the item, e�g. recall, analysis, evaluation�
• The extent to which forming a response is dependent on models or abstract scientific ideas�
This four-factor approach allows for a broader measure of scientific literacy across a wider range of student ability� Categorising the cognitive processes required for the competencies that form the basis of scientific literacy together with a consideration of the depth of knowledge required offers a model for assessing the level of demand of individual items� In addition, the relative simplicity of the approach offers a way to minimise the problems encountered in applying such frameworks� The use of this cognitive framework also facilitates the development of an a priori definition of the descriptive parameters of the reporting proficiency scales (see Figure 2�25)�
Test characteristicsFigure 2�24 is a variation of Figure 2�2 that presents the basic components of the PISA framework for the 2015 scientific literacy assessment in a way that can be used to relate the framework with the structure and the content of assessment units� This may be used as a tool both to plan assessment exercises and to study the results of standard assessment exercises� As a starting point to construct assessment units, it shows the need to consider the contexts that will serve as stimulus material, the competencies required to respond to the questions or issues, the knowledge central to the exercise, and the cognitive demand�
Figure 2�24 • a tool for constructing and analysing assessment units and items
Competencies(see Figures 2�4a, b and c)
• Explain phenomena scientifically
• Evaluate and design scientific enquiry
• Interpret data and evidence scientifically
Contexts(see Figure 2�3)
• Personal
• Local/national
• Global
Knowledge(see Figures 2�5, 2�6 and 2�7)
• Content
• Procedural
• Epistemic
Cognitive Demand(DOK – see Figure 2�23)
• Low
• Medium
• High
A test unit is defined by specific stimulus material, which may be a brief written passage, or text accompanying a table, chart, graph or diagram� In units created for PISA 2015, the stimulus material may also include non-static stimulus material, such as animations and interactive simulations� The items are a set of independently scored questions of various types, as illustrated by the examples already discussed� Further examples can be found at the PISA website (www�oecd�org/pisa/) (forthcoming, November 2016).

Pisa 2015 sCiENCE FRaMEWORK2
PISA 2015 ASSESSMENT AND ANALYTICAL FRAMEWORK: SCIENCE, READING, MATHEMATIC AND FINANCIAL LITERACY © OECD 2016 41
PISA uses this unit structure to facilitate the use of contexts that are as realistic as possible, reflecting the complexity of real-life situations, while making efficient use of testing time� Using situations about which several questions can be posed, rather than asking separate questions about a larger number of different situations, reduces the overall time required for a student to become familiar with the material in each question� However, the need to make each score point independent of others within a unit needs to be taken into account� It is also necessary to recognise that, because this approach reduces the number of different assessment contexts, it is important to ensure that there is an adequate range of contexts so that bias due to the choice of contexts is minimised�
PISA 2015 test units require the use of all three scientific competencies and draw on all three forms of science knowledge� In most cases, each test unit assesses multiple competencies and knowledge categories� Individual items, however, assess only one form of knowledge and one competency�
The need for students to read texts in order to understand and answer written questions on scientific literacy raises an issue of the level of reading literacy that are required� Stimulus material and questions use language that is as clear, simple and brief, and as syntactically simplified as possible while still conveying the appropriate meaning� The number of concepts introduced per paragraph is limited� Questions within the domain of science that assess reading or mathematical literacy are avoided�
Response formatsThree classes of items are used to assess the competencies and scientific knowledge identified in the framework� About one-third of the items are in each of the three classes:
• simple multiple choice: items calling for
– selection of a single response from four options
– selection of a “hot spot”, an answer that is a selectable element within a graphic or text
• complex multiple choice: items calling for
– responses to a series of related “Yes/No” questions that are treated for scoring as a single item (the typical format in 2006)
– selection of more than one response from a list
– completion of a sentence by selecting drop-down choices to fill multiple blanks
– “drag-and-drop” responses, allowing students to move elements on screen to complete a task of matching, ordering or categorising
• constructed response: items calling for written or drawn responses
– Constructed-response items in scientific literacy typically call for a written response ranging from a phrase to a short paragraph (e�g. two to four sentences of explanation)� A small number of constructed-response items call for drawing (e�g. a graph or diagram)� In a computer-based assessment, any such item is supported by simple drawing editors that are specific to the response required�
In 2015, some responses are captured by interactive tasks, for example, a student’s choices for manipulating variables in a simulated scientific enquiry� Responses to these interactive tasks are likely scored as complex multiple-choice items� Some kinds of responses to interactive tasks may be sufficiently open-ended that they are treated as constructed response�
Assessment structureComputer is the primary mode of delivery for all domains, including scientific literacy, in PISA 2015� All new science literacy items are only available on computer� However a paper-based assessment instrument, consisting only of the trend items, is provided for countries choosing not to test their students by computer� (The PISA 2015 field trial studied the effect on student performance of the change in mode of delivery� For further details see Box 1�2�)
Scientific literacy items are organised into 30-minute sections called “clusters”� Each cluster includes either only new units or only trend units� Overall for 2015, the target number of clusters included in the main survey is:
• six clusters of trend units in 2015 main survey
• six clusters of new units in 2015 main survey�
Each student is assigned one two-hour test form� A test form is composed of four clusters, with each cluster designed

Pisa 2015 sCiENCE FRaMEWORK2
42 © OECD 2016 PISA 2015 ASSESSMENT AND ANALYTICAL FRAMEWORK: SCIENCE, READING, MATHEMATIC AND FINANCIAL LITERACY
to occupy thirty minutes of testing time� The clusters are placed in multiple computer-based test forms, according to a rotated test design�
Each student spends one hour on scientific literacy, with the remaining time assigned to either one or two of the additional domains of reading, mathematics and collaborative problem solving� For any countries taking the paper-based assessment instrument, intact clusters of 2006 units are formed into a number of test booklets� The paper-based assessment is limited to trend items and does not include any newly developed material� In contrast, the computer-based instrument includes newly developed items as well as trend items� When transposing paper-based trend items to an onscreen format, the presentation, response format and cognitive demand remain comparable�
Item contexts are spread across personal, local/national and global settings roughly in the ratio 1:2:1, as was the case in 2006� A wide selection of areas of application are used for units, subject to satisfying as far as possible the various constraints imposed by the distribution of items shown in Tables 2�1 and 2�4�
Reporting proficiency in scienceTo achieve the aims of PISA, scales must be developed to measure student proficiency� A descriptive scale of levels of competence needs to be based on a theory of how the competence develops, not just on a post-hoc interpretation of what items of increasing difficulty seem to be measuring� The 2015 draft framework therefore defined explicitly the parameters of increasing competence and progression, allowing item developers to design items representing this growth in ability (Kane, 2006; Mislevy and Haertel, 2006)� Initial draft descriptions of the scales are offered below, though it is recognised that these may need to be updated after the main survey� Although comparability with the 2006 scale descriptors (OECD, 2007) has been maximised in order to enable trend analyses, the new elements of the 2015 framework, such as depth of knowledge, have also been incorporated� The scales have also been extended by the addition of a level “1b” to specifically address and provide a description of students at the lowest level of ability who demonstrate minimal scientific literacy and would previously not have been included in the reporting scales� The initial draft scales for 2015 Framework therefore propose more detailed and more specific descriptors of the levels of scientific literacy, and not an entirely different model as shown in Figure 2�25�
Figure 2�25 • initial draft of proficiency scale descriptions for science
Level Descriptor
6 At Level 6, students are able to use content, procedural and epistemic knowledge to consistently provide explanations, evaluate and design scientific enquiries, and interpret data in a variety of complex life situations that require a high level of cognitive demand� They can draw appropriate inferences from a range of different complex data sources, in a variety of contexts and provide explanations of multi-step causal relationships� They can consistently distinguish scientific and non-scientific questions, explain the purposes of enquiry, and control relevant variables in a given scientific enquiry or any experimental design of their own� They can transform data representations, interpret complex data and demonstrate an ability to make appropriate judgments about the reliability and accuracy of any scientific claims� Level 6 students consistently demonstrate advanced scientific thinking and reasoning requiring the use of models and abstract ideas and use such reasoning in unfamiliar and complex situations� They can develop arguments to critique and evaluate explanations, models, interpretations of data and proposed experimental designs in a range of personal, local and global contexts�
5 At Level 5, students are able to use content, procedural and epistemic knowledge to provide explanations, evaluate and design scientific enquiries and interpret data in a variety of life situations in some but not all cases of high cognitive demand� They draw inferences from complex data sources, in a variety of contexts and can explain some multi-step causal relationships� Generally, they can distinguish scientific and non-scientific questions, explain the purposes of enquiry, and control relevant variables in a given scientific enquiry or any experimental design of their own� They can transform some data representations, interpret complex data and demonstrate an ability to make appropriate judgments about the reliability and accuracy of any scientific claims� Level 5 students show evidence of advanced scientific thinking and reasoning requiring the use of models and abstract ideas and use such reasoning in unfamiliar and complex situations� They can develop arguments to critique and evaluate explanations, models, interpretations of data and proposed experimental designs in some but not all personal, local and global contexts�
Figure 2�25 [continued] • initial draft of proficiency scale descriptions for science
…

Pisa 2015 sCiENCE FRaMEWORK2
PISA 2015 ASSESSMENT AND ANALYTICAL FRAMEWORK: SCIENCE, READING, MATHEMATIC AND FINANCIAL LITERACY © OECD 2016 43
4 At Level 4, students are able to use content, procedural and epistemic knowledge to provide explanations, evaluate and design scientific enquiries and interpret data in a variety of given life situations that require mostly a medium level of cognitive demand� They can draw inferences from different data sources, in a variety of contexts and can explain causal relationships� They can distinguish scientific and non-scientific questions, and control variables in some but not all scientific enquiry or in an experimental design of their own� They can transform and interpret data and have some understanding about the confidence held about any scientific claims� Level 4 students show evidence of linked scientific thinking and reasoning and can apply this to unfamiliar situations� Students can also develop simple arguments to question and critically analyse explanations, models, interpretations of data and proposed experimental designs in some personal, local and global contexts�
3 At Level 3, students are able to use content, procedural and epistemic knowledge to provide explanations, evaluate and design scientific enquiries and interpret data in some given life situations that require at most a medium level of cognitive demand� They are able to draw a few inferences from different data sources, in a variety of contexts, and can describe and partially explain simple causal relationships� They can distinguish some scientific and non-scientific questions, and control some variables in a given scientific enquiry or in an experimental design of their own� They can transform and interpret simple data and are able to comment on the confidence of scientific claims� Level 3 students show some evidence of linked scientific thinking and reasoning, usually applied to familiar situations� Students can develop partial arguments to question and critically analyse explanations, models, interpretations of data and proposed experimental designs in some personal, local and global contexts�
2 At Level 2, students are able to use content, procedural and epistemic knowledge to provide explanations, evaluate and design scientific enquiries and interpret data in some given familiar life situations that require mostly a low level of cognitive demand� They are able to make a few inferences from different sources of data, in few contexts, and can describe simple causal relationships� They can distinguish some simple scientific and non-scientific questions, and distinguish between independent and dependent variables in a given scientific enquiry or in a simple experimental design of their own� They can transform and describe simple data, identify straightforward errors, and make some valid comments on the trustworthiness of scientific claims� Students can develop partial arguments to question and comment on the merits of competing explanations, interpretations of data and proposed experimental designs in some personal, local and global contexts�
1a At Level 1a, students are able to use a little content, procedural and epistemic knowledge to provide explanations, evaluate and design scientific enquiries and interpret data in a few familiar life situations that require a low level of cognitive demand� They are able to use a few simple sources of data, in a few contexts and can describe some very simple causal relationships� They can distinguish some simple scientific and non-scientific questions, and identify the independent variable in a given scientific enquiry or in a simple experimental design of their own� They can partially transform and describe simple data and apply them directly to a few familiar situations� Students can comment on the merits of competing explanations, interpretations of data and proposed experimental designs in some very familiar personal, local and global contexts�
1b At Level 1b, students demonstrate a little evidence to use content, procedural and epistemic knowledge to provide explanations, evaluate and design scientific enquiries and interpret data in a few familiar life situations that require a low level of cognitive demand� They are able to identify straightforward patterns in simple sources of data in a few familiar contexts and can offer attempts at describing simple causal relationships� They can identify the independent variable in a given scientific enquiry or in a simple design of their own� They attempt to transform and describe simple data and apply them directly to a few familiar situations�
The proposed level descriptors are based on the 2015 Framework described in this document and offer a qualitative description of the differences between levels of performance� The factors used to determine the demand of items assessing science achievement that have been incorporated into this outline of the proficiency scales include:
• The number and degree of complexity of elements of knowledge demanded by the item�
• The level of familiarity and prior knowledge that students may have of the content, procedural and epistemic knowledge involved�
• The cognitive operation required by the item, e�g� recall, analysis, evaluation�
• The extent to which forming a response is dependent on models or abstract scientific ideas�

Pisa 2015 sCiENCE FRaMEWORK2
44 © OECD 2016 PISA 2015 ASSESSMENT AND ANALYTICAL FRAMEWORK: SCIENCE, READING, MATHEMATIC AND FINANCIAL LITERACY
References
American Association for the Advancement of Science (1989), Science for all Americans: a Project 2061 Report on Literacy Goals in Science, Mathematics and Technology, AAS Publishing, Washington, DC, www�project2061�org/publications/sfaa/online/sfaatoc�htm�
Anderson, L.W. and D.R. Krathwohl (2001), A Taxonomy for Learning, Teaching and Assessing: A Revision of Bloom’s Taxonomy of Educational Objectives, Longman Publishing, London�
Bandura, A. (1997), Self-Efficacy: The Exercise of Control, W�H� Freeman and Company, Macmillan Publishers, New York�
Biggs, J. and K. Collis (1982), Evaluating the Quality of Learning: The SOLO Taxonomy, Academic Press, New York�
Bloom, B.S. (eds�) (1956), Taxonomy of Educational Objectives Book 1: Cognitive Domain, Longmans Publishing, London�
Bøe, M.V. et al� (2011), “Participation in science and technology: Young people’s achievement-related choices in late-modern societies”, Studies in Science Education, Vol� 47/1, pp� 37-72, http://dx�doi�org/10�1080/03057267�2011�549621�
Bogner, F. and M. Wiseman (1999), “Toward measuring adolescent environmental perception”, European Psychologist, Vol� 4/3, http://dx�doi�org/10�1027//1016-9040�4�3�139�
Brookhart, S.M. and A.J. Nitko (2011), “Strategies for constructing assessments of higher order thinking skills”, in G� Schraw and D�R� Robinson (eds�), Assessment of Higher Order Thinking Skills, IAP, Charlotte, NC, pp� 327-359�
Confederacion de Sociedades Cientificas de España (2011), Informe ENCIENDE, Enseñanza de las Ciencias en la Didáctica Escolar para edades tempranas en España, Madrid�
Davis, S.L. and C.W. Buckendahl (2011), “Incorporating cognitive demand in credentialing examinations”, in G� Schraw and D�R� Robinson (eds), Assessment of Higher Order Thinking Skills, IAP, Charlotte, NC, pp� 327-359�
Drechsel, B., C. Carstensen and M. Prenzel (2011), “The role of content and context in PISA interest scales: A study of the embedded interest items in the PISA 2006 science assessment”, International Journal of Science Education, Vol� 33/1, pp� 73-95�
Duschl, R. (2007), “Science education in three-part harmony: Balancing conceptual, epistemic and social learning goals”, Review of Research in Education, Vol� 32, pp� 268-291, http://dx�doi�org/10�3102/0091732X07309371�
Eagles, P.F.J. and R. Demare (1999), “Factors influencing children’s environmental attitudes”, The Journal of Environmental Education, Vol� 30/4, www�researchgate�net/profile/Paul_Eagles/publication/271994465_Factors_Influencing_Children’s_Environmental_Attitudes/links/ 553e677b0cf20184050f83a6�pdf�
European Commission (1995), “Teaching and learning: Towards the learning society”, White Paper on Education and Training, Office for Official Publications in European Countries, Luxembourg, http://europa�eu/documents/comm/white_papers/pdf/com95_590_en�pdf�
Fensham, P. (1985), “Science for all: A reflective essay”, Journal of Curriculum Studies, Vol� 17/4, pp� 415-435, http://dx�doi�org/10�1080/ 0022027850170407�
Ford, M.J. and B.M. Wargo (2012), “Dialogic framing of scientific content for conceptual and epistemic understanding”, Science Education, Vol� 96/3, pp� 369-391, http://dx�doi�org/10�1002/sce�20482�
Gardner, P.L. (1975), “Attitudes to Science”, Studies in Science Education, Vol� 2, pp� 1-41�
Gott, R., S. Duggan and R. Roberts (2008),” Concepts of evidence”, University of Durham, www�dur�ac�uk/rosalyn�roberts/Evidence/cofev�htm, (accessed 23 September 2012)�
Kane, M. (2006), “Validation”, in R�L� Brennan (eds�), Educational Measurement, 4th ed�, Praeger Publishers and the American Council on Education, Westport, CT, pp� 17-64�
Klopfer, L.E. (1971), “Evaluation of learning in science” in B�S� Bloom, J�T� Hastings and G�F� Madaus (eds�), Handbook of Formative and Summative Evaluation of Student Learning, McGraw-Hill Book Company, London�
Klopfer, L.E. (1976), “A structure for the affective domain in relation to science education”, Science Education, Vol� 60/3, pp� 299-312, http://dx�doi�org/ 10�1002/sce�3730600304�
Kuhn, D. (2010), “Teaching and learning science as argument”, Science Education, Vol� 94/5, pp� 810-824, http://dx�doi�org/ 10�1002/sce�20395�
Lederman, N.G. (2006), “Nature of science: Past, present and future”, in S� Abell and N�G� Lederman (eds�), Handbook of Research on Science Education, Lawrence Erlbaum, Mawah, NJ, pp� 831-879�
Longino, H.E. (1990), Science as Social Knowledge, Princetown University Press, Princetown, NJ�
Marzano, R.J. and J.S. Kendall (2007), The New Taxonomy of Educational Objectives, Corwin Press, Thousand Oaks, CA�
Pisa 2015 sCiENCE FRaMEWORK2
PISA 2015 ASSESSMENT AND ANALYTICAL FRAMEWORK: SCIENCE, READING, MATHEMATIC AND FINANCIAL LITERACY © OECD 2016 45
Millar, R. (2006), “Twenty first century science: Insights from the design and implementation of a scientific literacy approach in school science”, International Journal of Science Education, Vol� 28/13, pp� 1499-1521, http://dx�doi�org/ 10�1080/09500690600718344�
Millar, R. and J.F. Osborn (eds�) (1998), Beyond 2000: Science Education for the Future, School of Education, King’s College, London, www�nuffieldfoundation�org/sites/default/files/Beyond%202000�pdf�
Millar, R. et al� (1995), “Investigating in the school science laboratory: Conceptual and procedural knowledge and their influence on performance”, Research Papers in Education, Vol� 9/2, pp� 207-248, http://dx�doi�org/ 10�1080/0267152940090205�
Mislevy, R.J. and G.D. Haertel (2006), “Implications of evidence-centered design for educational testing”, Educational Measurement: Issues and Practice, Vol� 25/4, pp� 6-20�
National Academy of Science (1995), National Science Education Standards, National Academy Press, Washington, DC�
National Research Council (2012), A Framework for K-12 Science Education: Practices, Crosscutting Concepts, and Core Ideas, Committee on a Conceptual Framework for New K-12 Science Education Standards, Board on Science Education, Division of Behavioral and Social Sciences and Education, Washington, DC�
National Research Council (2000), Inquiry and the National Science Education Standards, National Academy Press, Washington DC�
OECD (2012), “What kinds of careers do boys and girls expect for themselves?”, PISA in focus, No 14, OECD Publishing, Paris, http://dx�doi�org/10�1787/5k9d417g2933-en�
OECD (2009), PISA 2006 Technical Report, PISA, OECD Publishing, Paris, http://dx�doi�org/10�1787/9789264048096-en�
OECD (2007), PISA 2006: Science Competencies for Tomorrow’s World: Volume 1: Analysis, PISA, OECD Publishing, Paris, http://dx�doi�org/10�1787/9789264040014-en�
OECD (2006), Assessing Scientific, Reading and Mathematical Literacy: A Framework for PISA 2006, PISA, OECD Publishing, Paris, http://dx�doi�org/10�1787/9789264026407-en�
OECD (2004), The PISA 2003 Assessment Framework: Mathematics, Reading, Science and Problem Solving Knowledge and Skills, PISA, OECD Publishing, Paris, http://dx�doi�org/10�1787/9789264101739-en�
OECD (2000), Measuring Student Knowledge and Skills: The PISA 2000 Assessment of Reading, Mathematical and Scientific Literacy, PISA, OECD Publishing, Paris, http://dx�doi�org/10�1787/9789264181564-en�
OECD (1999), Measuring Student Knowledge and Skills: A New Framework for Assessment, OECD Publishing, Paris, http://dx�doi�org/10�1787/9789264173125-en�
Ormerod, M.B. and D. Duckworth (1975), Pupils’ Attitudes to Science, National Foundation for Educational Reasearch, Slough, UK�
Osborne, J.F. (2010), “Arguing to learn in science: The role of collaborative, critical discourse”, Science, Vol� 328/5977, pp� 463-466, http://dx�doi�org/ 10�1126/science�1183944�
Osborne, J.F. and J. Dillon (2008), Science Education in Europe: Critical Reflections, Nuffield Foundation, London�
Osborne, J.F., S. Simon and S. Collins (2003), “Attitudes towards science: A review of the literature and its implications”, International Journal of Science Education, Vol� 25/9, pp� 1049–1079, http://dx�doi�org/10�1080/0950069032000032199�
Rickinson, M. (2001), “Learners and learning in environmental education: A critical review of the evidence”, Environmental Education Research, Vol� 7/3, http://citeseerx�ist�psu�edu/viewdoc/download?doi=10�1�1�454�4637&rep=rep1&type=pdf�
Rychen, D.S. and L. H. Salganik (eds�) (2003), Definition and Selection of Key Competencies: Executive Summary, Hogrefe Publishing, Göttingen, Germany�
Schibeci, R.A. (1984), “Attitudes to science: An update”, Studies in Science Education, Vol� 11, pp� 26-59�
Sekretariat der Ständigen Konferenz der Kultusminister der Länder in der Bundesrepublik Deutschland (KMK) (2005), Bildungsstandards im Fach Biologie für den Mittleren Schulabschluss (Jahrgangsstufe 10)�
Tai, R.H. et al� (2006), “Planning early for careers in science”, Science, Vol� 312, pp� 1143-1145�
Taiwan Ministry of Education (1999), Curriculum outlines for “Nature science and living technology”, Ministry of Education, Taipei, Taiwan�
UNEP (2012), 21 Issues for the 21st Century: Result of the UNEP Foresight Process on Emerging Environmental Issues, United Nations Environment Programme (UNEP), Nairobi, Kenya, www�unep�org/pdf/Foresight_Report-21_Issues_for_the_21st_Century�pdf�
UNESCO (2003), “UNESCO and the international decade of education for sustainable development (2005-2015)”, UNESCO International Science, Technology and Environmental Education Newsletter, Vol� XXVIII, No� 1-2, UNESCO, Paris�
Pisa 2015 sCiENCE FRaMEWORK2
46 © OECD 2016 PISA 2015 ASSESSMENT AND ANALYTICAL FRAMEWORK: SCIENCE, READING, MATHEMATIC AND FINANCIAL LITERACY
UNESCO (2005), “International implementation scheme” United Nations Decade of Education for Sustainable Development (2005-2014), UNESCO, Paris, www�bibb�de/dokumente/pdf/a33_unesco_international_implementation_scheme�pdf�
Weaver, A. (2002), “Determinants of environmental attitudes: A five-country comparison”, International Journal of Sociology, Vol� 32/1�
Webb, N.L. (1997), “Criteria for alignment of expectations and assessments in mathematics and science education”, Council of Chief State School Officers and National Institute for Science Education Research Monograph, National Institution for Science Education, Washington, DC�
Wiliam, D. (2010), “What counts as evidence of educational achievement? The role of constructs in the pursuit of equity in assessment”, Review of Research in Education, Vol� 34, pp� 254-284�
Ziman, J. (1979), Reliable Knowledge: An Exploration of the Grounds for Belief in Science, Cambridge University Press, Cambridge, UK�

3
PISA 2015 ASSESSMENT AND ANALYTICAL FRAMEWORK: SCIENCE, READING, MATHEMATIC AND FINANCIAL LITERACY © OECD 2016 47
PISA 2015 Reading framework
This chapter defines “reading literacy” as assessed in the Programme for International Student Assessment (PISA) in 2015 and the competencies required for reading literacy. It describes the cognitive processes (aspects) involved in reading that are assessed, the types of texts and response formats used in the assessment, and how student performance in reading is measured and reported.

Pisa 2015 REaDiNG FRaMEWORK3
48 © OECD 2016 PISA 2015 ASSESSMENT AND ANALYTICAL FRAMEWORK: SCIENCE, READING, MATHEMATIC AND FINANCIAL LITERACY
In PISA 2015, reading literacy is assessed as a minor domain, providing an opportunity to make comparisons in student performance over time� This framework uses the same description and illustrations of the PISA reading assessment as included in the 2009 framework, when reading was re-examined and updated for use as the major domain in that cycle� The framework does not, however, cover digital reading (also referred to as electronic reading in 2009)� This is because the 2009 report provided separate scales for print reading and digital reading� Since reading is a minor domain in PISA 2015, and since digital reading was not assessed in all participating countries in 2009 or in 2012, there are no separate data on digital reading, nor was digital reading included as part of the overall concept of reading literacy�
For PISA 2015, the computer is the primary mode of delivery for all domains, including reading literacy� However, paper-based assessment instruments are provided for countries that choose not to test their students by computer� The reading literacy component of both the computer-based and paper-based instruments is composed of the same clusters of reading trend items� The number of trend items in the minor domains are increased compared with previous PISA assessments, thereby increasing the construct coverage while reducing the number of students responding to each question� This design is intended to reduce potential bias while stabilising and improving the measurement of trends�
With the move to computer-based delivery for 2015, the 2012 text classification “medium: print and digital” is a potential source of confusion� For 2015, the terminology has been updated to “fixed text” and “dynamic text” to distinguish between delivery mode and the space in which the text is displayed (hereafter referred to as “text display space”), regardless of whether it is printed or on screen� It is important to note, however, that the constructs of the 2009 framework remain unchanged�
2015 reading literacy terminology
Mode: refers only to the delivery channel� The following distinctions are made:
Paper-based: items delivered on paper
Computer-based: items delivered on computer
Text display space: In 2009, a broad classification, “medium”, was used to describe the features of print and digital texts� For 2015, the classification remains, but is renamed “text display space”�
Fixed text: what was previously called “print-medium text”� As this type of text is presented on a screen in PISA 2015, the term “print” no longer applies�
Dynamic text: what was previously called “digital-medium text”� As “print-medium” texts are also presented on a screen in PISA 2015, the term “digital” applies to both text display spaces�
Digital reading: The term “digital reading assessment” is retained for historical purposes to refer specifically to the 2009/2012 optional domain�
Note: This new terminology is intended to be provisional, for use only in 2015 when items previously delivered on paper and classified as “print” are delivered on a screen� The purpose is to make a clearer distinction between the mode of delivery and the features of the classification previously known as “medium”� In 2018, when reading literacy will once again become the major domain, both the framework and these terms will be revisited and updated�
In 2015, only fixed-text items are used in the assessment, and these are delivered primarily in a computer-based mode� This is shown in Table 3�1 below�
Table 3.1 Relationship between mode and text display space for 2015
Mode / Text display space Fixed text Dynamic text Paper-based mode ✔ ✘
Computer-based mode ✔ ✔ (but not assessed in 2015)
Reading literacy was the major domain assessed in 2000, for the first PISA cycle and in 2009, for the fourth PISA cycle� For the sixth PISA cycle (PISA 2015), reading is a minor domain and its framework has not changed from the PISA 2009 cycle (OECD, 2010)� There were two major modifications to the PISA 2009 version of the reading framework: the incorporation of an assessment of digital reading and the elaboration of the constructs of reading engagement and metacognition� However, reading is a minor domain in PISA 2015� The reading of digital texts is not included and no data on engagement or metacognition in reading are collected�

Pisa 2015 REaDiNG FRaMEWORK3
PISA 2015 ASSESSMENT AND ANALYTICAL FRAMEWORK: SCIENCE, READING, MATHEMATIC AND FINANCIAL LITERACY © OECD 2016 49
The PISA framework for assessing the reading literacy of students towards the end of compulsory education, therefore, must focus on skills that include finding, selecting, interpreting and evaluating information from a full range of texts, including those encountered both inside and outside the classroom�
DEFiNiNG REaDiNG LitERaCYDefinitions of reading and reading literacy have changed over time in parallel with changes in society, economy and culture� The concept of learning, particularly the concept of lifelong learning, has expanded the perception of reading literacy� Literacy is no longer considered to be an ability acquired only in childhood during the early years of schooling� Instead, it is viewed as an expanding set of knowledge, skills and strategies that individuals build on throughout life in various contexts, through interaction with their peers and the wider community�
Cognitive-based theories of reading literacy emphasise the interactive nature of reading and the constructive nature of comprehension, in the print medium (Binkley and Linnakylä, 1997; Bruner, 1990; Dole et al�, 1991) and to an even greater extent in the digital medium (Fastrez, 2001; Legros and Crinon, 2002; Leu, 2007; Reinking, 1994)� The reader generates meaning in response to text by using previous knowledge and a range of text and situational cues that are often socially and culturally derived� While constructing meaning, the reader uses various processes, skills and strategies to foster, monitor and maintain understanding� These processes and strategies are expected to vary with context and purpose as readers interact with a variety of continuous and non-continuous texts in the print medium and (typically) with multiple texts in the digital medium�
The PISA 2015 definition of reading literacy, the same as used in PISA 2009, as shown in Box 3�1:
Box 3�1 the 2015 definition of reading literacy
Reading literacy is understanding, using, reflecting on and engaging with written texts, in order to achieve one’s goals, develop one’s knowledge and potential, and participate in society�
Reading literacy…
The term “reading literacy” is preferred to “reading” because it is likely to convey to a non-expert audience more precisely what the survey is measuring� “Reading” is often understood as simply decoding, or even reading aloud, whereas the intention of this survey is to measure something broader and deeper� Reading literacy includes a wide range of cognitive competencies, from basic decoding, to knowledge of words, grammar and larger linguistic and textual structures and features, to knowledge about the world�
In this study, “reading literacy” is intended to express the active, purposeful and functional application of reading in a range of situations and for various purposes� According to Holloway (1999), reading skills are essential to the academic achievement of middle- and high school students� PISA assesses a wide range of students� Some will go on to university; some will pursue further studies in preparation for joining the labour force; some will enter the workforce directly after completing compulsory education� Achievement in reading literacy is not only a foundation for achievement in other subject areas within the education system, but also a prerequisite for successful participation in most areas of adult life (Cunningham and Stanovich, 1998; Smith et al�, 2000)� Indeed, regardless of their academic or labour-force aspirations, students’ reading literacy is important for their active participation in their community and economic and personal life�
Reading literacy skills matter not just for individuals, but for economies as a whole� Policy makers and others are coming to recognise that in modern societies, human capital – the sum of what the individuals in an economy know and can do – may be the most important form of capital� Economists have for many years developed models showing generally that a country’s education levels are a predictor of its economic growth potential (Coulombe et al�, 2004)�
…is understanding, using, reflecting on…
The word “understanding” is readily connected with “reading comprehension”, a well-accepted element of reading� The word “using” refers to the notions of application and function – doing something with what we read� “Reflecting on” is added to “understanding” and “using” to emphasise the notion that reading is interactive: readers draw on their own thoughts and experiences when engaging with a text� Of course, every act of reading requires some reflection, drawing on information from outside the text� Even at the earliest stages, readers draw on symbolic knowledge to decode a text

Pisa 2015 REaDiNG FRaMEWORK3
50 © OECD 2016 PISA 2015 ASSESSMENT AND ANALYTICAL FRAMEWORK: SCIENCE, READING, MATHEMATIC AND FINANCIAL LITERACY
and require a knowledge of vocabulary to construct meaning� As readers develop their stores of information, experience and beliefs, they constantly, often unconsciously, test what they read against outside knowledge, thereby continually reviewing and revising their sense of the text�
…and engaging with…
A reading literate person not only has the skills and knowledge to read well, but also values and uses reading for a variety of purposes� It is therefore a goal of education to cultivate not only proficiency but also engagement in reading� Engagement in this context implies the motivation to read and comprises a cluster of affective and behavioural characteristics that include an interest in and enjoyment of reading, a sense of control over what one reads, involvement in the social dimension of reading, and diverse and frequent reading practices�
…written texts…
The term “written texts” is meant to include all those coherent texts in which language is used in its graphic form, whether printed and digital� Instead of the word “information”, which is used in some other definitions of reading, the term “texts” was chosen because of its association with written language and because it more readily connotes literary as well as information-focused reading�
These texts do not include aural language artefacts, such as voice recordings; nor do they include film, TV, animated visuals or pictures without words� They do include visual displays, such as diagrams, pictures, maps, tables, graphs and comic strips that include some written language (for example, captions)� These visual texts can exist either independently or they can be embedded in larger texts� Digital texts are distinguished from printed texts in a number of respects, including physical readability; the amount of text visible to the reader at any one time; the way different parts of a text and different texts are connected with one another through hypertext links; and, given these text characteristics, the way that readers typically engage with digital texts� To a much greater extent than with printed or hand-written texts, readers need to construct their own pathways to complete any reading activity associated with a digital text�
…in order to achieve one’s goals, develop one’s knowledge and potential, and participate in society.
This phrase is meant to capture the full scope of situations in which reading literacy plays a role, from private to public, from school to work, from formal education to lifelong learning and active citizenship� “To achieve one’s goals and to develop one’s knowledge and potential” spells out the idea that reading literacy enables the fulfilment of individual aspirations – both defined ones, such as graduating or getting a job, and those less defined and less immediate that enrich and extend personal life and lifelong education� The word “participate” is used because it implies that reading literacy allows people to contribute to society as well as to meet their own needs� “Participating” includes social, cultural and political engagement�
ORGaNisiNG thE DOMaiN OF REaDiNGThis section describes how the domain is represented, a vital issue because the organisation and representation of the domain determines the test design and, ultimately, the evidence about student proficiencies that can be collected and reported�
Reading is a multidimensional domain� While many elements are part of the construct, not all can be taken into account in building the PISA assessment� Only those considered most important were selected�
The PISA reading literacy assessment is built on three major task characteristics to ensure a broad coverage of the domain:
• situation, which refers to the range of broad contexts or purposes for which reading takes place
• text, which refers to the range of material that is read
• aspect, which refers to the cognitive approach that determines how readers engage with a text�
In PISA, features of the text and aspect variables (but not of the situation variable) are also manipulated to influence the difficulty of a task�
Reading is a complex activity� The elements of reading do not exist independently of one another in neat compartments� The assignment of texts and tasks to framework categories does not imply that the categories are strictly partitioned or that the materials exist in atomised cells determined by a theoretical structure� The framework scheme is provided to ensure coverage, to guide the development of the assessment and to set parameters for reporting, based on what are considered the marked features of each task�

Pisa 2015 REaDiNG FRaMEWORK3
PISA 2015 ASSESSMENT AND ANALYTICAL FRAMEWORK: SCIENCE, READING, MATHEMATIC AND FINANCIAL LITERACY © OECD 2016 51
Examples of reading items are available in the PISA 2012 Assessment and Analytical Framework (OECD, 2013) and on the PISA website (www�oecd�org/pisa/)�
SituationThe PISA situation variables were adapted from the Common European Framework of Reference (CEFR) developed for the Council of Europe (Council of Europe, 1996)� The four situation variables – personal, public, educational and occupational – are described in the following paragraphs�
The personal situation relates to texts that are intended to satisfy an individual’s personal interests, both practical and intellectual� This category also includes texts that are intended to maintain or develop personal connections with other people� It includes personal letters, fiction, biography, and informational texts that are intended to be read to satisfy curiosity, as a part of leisure or recreational activities� In the digital medium it includes personal e-mails, instant messages and diary-style blogs�
The public category describes the reading of texts that relate to activities and concerns of the larger society� The category includes official documents and information about public events� In general, the texts associated with this category assume a more or less anonymous contact with others; they also therefore include forum-style blogs, news websites and public notices that are encountered both on line and in print�
The content of educational texts is usually designed specifically for the purpose of instruction� Printed text books and interactive learning software are typical examples of material generated for this kind of reading� Educational reading normally involves acquiring information as part of a larger learning task� The materials are often not chosen by the reader, but instead assigned by an instructor� The model tasks are those usually identified as “reading to learn” (Sticht, 1975; Stiggins, 1982)�
Many 15-year-olds will move from school into the labour force within one to two years� A typical occupational reading task is one that involves the accomplishment of some immediate task� It might include searching for a job, either in a print newspaper’s classified advertisement section, or on line; or following workplace directions� The model tasks of this type are often referred to as “reading to do” (Sticht, 1975; Stiggins, 1982)�
Situation is used in PISA reading literacy to define texts and their associated tasks, and refers to the contexts and uses for which the author constructed the text� The manner in which the situation variable is specified is therefore about supposed audience and purpose, and is not simply based on the place where the reading activity is carried out� Many texts used in classrooms are not specifically designed for classroom use� For example, a piece of literary text may typically be read by a 15-year-old in a mother-tongue language or literature class, yet the text was written (presumably) for readers’ personal enjoyment and appreciation� Given its original purpose, such a text is classified as personal in PISA� As Hubbard (1989) has shown, some kinds of reading usually associated with out-of-school settings for children, such as rules for clubs and records of games, often take place unofficially at school as well� These texts are classified as public in PISA� Conversely, textbooks are read both in schools and in homes, and the process and purpose probably differ little from one setting to another� Such texts are classified as educational in PISA�
The four categories overlap� In practice, for example, a text may be intended both to delight and to instruct (personal and educational); or to provide professional advice that is also general information (occupational and public)� While content is not a variable that is specifically manipulated in this study, by sampling texts across a variety of situations the intent is to maximise the diversity of content that is included in the PISA reading literacy survey�
Table 3�2 shows the desired distribution of items by situation for reading tasks�
Table 3.2 Desired distribution of reading items, by situation
Situation Percentage of total items
Personal 30
Educational 25
Occupational 15
Public 30
Total 100

Pisa 2015 REaDiNG FRaMEWORK3
52 © OECD 2016 PISA 2015 ASSESSMENT AND ANALYTICAL FRAMEWORK: SCIENCE, READING, MATHEMATIC AND FINANCIAL LITERACY
TextReading requires material for the reader to read� In an assessment, that material – a text (or a set of texts) related to a particular task – must be coherent within itself� That is, the text must be able to stand alone without requiring additional material to make sense to the proficient reader�1 While it is obvious that there are many different kinds of texts and that any assessment should include a broad range, it is not so obvious that there is an ideal categorisation of kinds of texts�
PISA 2009 and PISA 2012In PISA 2009 and PISA 2012, the addition of digital reading to the framework made this issue still more complex� There were four main text classifications, because of the print and digital reading assessments proposed in these surveys:
• Medium: print and digital
• Environment: authored, message-based and mixed (only applicable to digital medium)
• Text format: continuous, non-continuous, mixed and multiple
• Text type: description, narration, exposition, argumentation, instruction and transaction
PISA 2015As explained above, in PISA 2015 only the items used previously for the “print reading assessment” are delivered on computer or paper, and there are only two text classifications:
• Text format
• Text type
Text display space is a third classification of text with two categories, fixed texts and dynamic text� It is not used in PISA 2015 but will be integrated into the PISA 2018 survey�
In PISA 2015, the term ‘text display space” is used to describe the features of the space – fixed or dynamic – and not the mode in which the text is presented�
Fixed texts usually appear on paper in forms such as single sheets, brochures, magazines and books, but tend to appear more and more on a screen as PDFs and on e-readers� This development results in further blurring the distinction between what was labelled “print reading” and “digital reading” in the PISA 2009 framework� As PISA 2015 uses only what was labelled “print reading” in 2009 there are no conceptual change in this aspect for PISA 2015� The physical status of the fixed text encourages (though it may not compel) the reader to approach the content of the text in a particular sequence� In essence, such texts have a fixed or static existence� In real life and in the assessment context, the extent or amount of the text is immediately visible to the reader�
When moving the fixed-text “print” reading trend items from paper to computer-based delivery in the 2015 assessment, care needed to be taken to use navigation tools typical of dynamic texts sparingly and only the most obvious among them� Effects of presenting the original paper-based items on the computer were examined during the mode-effect study in the field trial�
Dynamic texts only appear on a screen� Dynamic text is synonymous with hypertext: a text or texts with navigation tools and features that make possible and indeed even require non-sequential reading� Each reader constructs a “customised” text from the information encountered at the links he or she follows� In essence, such texts have an unfixed, dynamic existence� In dynamic texts, typically only a fraction of the available text can be seen at any one time, and often the extent of text available is unknown� No dynamic texts are included in PISA 2015�
The environment classification was a new variable for the PISA 2009 reading framework� Since it applies only to dynamic texts it is not discussed in the 2015 PISA framework�
Text formatAn important classification of texts is the distinction between continuous and non-continuous texts�
Texts in continuous and non-continuous format appear in both the print and digital media� Mixed and multiple format texts are also prevalent in both media, particularly so in the digital medium� Each of these four formats is elaborated as follow:
Continuous texts are formed by sentences organised into paragraphs� These may fit into even larger structures, such as sections, chapters, and books (e�g� newspaper reports, essays, novels, short stories, reviews and letters including on e-book readers)�

Pisa 2015 REaDiNG FRaMEWORK3
PISA 2015 ASSESSMENT AND ANALYTICAL FRAMEWORK: SCIENCE, READING, MATHEMATIC AND FINANCIAL LITERACY © OECD 2016 53
Non-continuous are most frequently organised in matrix format, composed of a number of lists (Kirsch and Mosenthal, 1990) (e�g� lists, tables, graphs, diagrams, advertisements, schedules, catalogues, indexes and forms)� They thus require a different approach to reading than continuous texts do�
Many texts are single, coherent artefacts consisting of a set of elements in both a continuous and non-continuous format� In well-constructed mixed texts, the constituents (e�g� a prose explanation, along with a graph or table) are mutually supportive, with coherence and cohesion links throughout� Mixed text in the print medium is a common format in magazines, reference books and reports� In the digital medium, authored web pages are typically mixed texts, with combinations of lists, paragraphs of prose, and often graphics� Message-based texts, such as online forms, e-mail messages and forums, also combine texts that are continuous and non-continuous in format�
Multiple texts are defined as those that have been generated independently, and make sense independently; they are juxtaposed for a particular occasion or may be loosely linked together for the purposes of the assessment� The relationship between the texts may not be obvious; they may be complementary or may contradict one another� For example, a set of websites from different companies providing travel advice may or may not provide similar directions to tourists� Multiple texts may have a single “pure” format (for example, continuous), or may include both continuous and non-continuous texts�
Table 3�3 shows the desired distribution of items by text format�
Table 3.3 Desired distribution of reading items, by text format
Text format Percentage of total items
Continuous 60
Non-continuous 30
Mixed 5
Multiple 5
Total 100
Text typeA different categorisation of text is by text type: description, narration, exposition, argumentation, instruction and transaction�
Texts, as they are found in the world, typically resist categorisation; they are usually not written with rules in mind, and tend to cut across categories� In order to ensure that the reading instrument represents different types of reading, PISA categorises texts based on their predominant characteristics�
The following classification of texts used in PISA is adapted from the work of Werlich (1976)�
Description is the type of text in which the information refers to properties of objects in space� The typical questions that descriptive texts answer are “what” questions (e�g� a depiction of a particular place in a travelogue or diary, a catalogue, a geographical map, an online flight schedule or a description of a feature, function or process in a technical manual)�
Narration is the type of text in which the information refers to properties of objects in time� Narration typically answers questions relating to “when”, or “in what sequence”� “Why characters in stories behave as they do” is another question that narration typically answers (e�g� a novel, a short story, a play, a biography, a comic strip, fictional texts and a newspaper report of an event)�
Exposition is the type of text in which the information is presented as composite concepts or mental constructs, or those elements into which concepts or mental constructs can be analysed� The text provides an explanation of how the different elements interrelate in a meaningful whole, and often answers questions about “how” (e�g� a scholarly essay, a diagram showing a model of memory, a graph of population trends, a concept map and an entry in an online encyclopaedia)�
Argumentation is the type of text that presents the relationship among concepts or propositions� Argument texts often answer “why” questions� An important sub-classification of argument texts is persuasive and opinionative texts, referring to opinions and points of view� Examples of text in the text type category argumentation are a letter to the editor, a poster advertisement, the posts in an online forum and a web-based review of a book or film�

Pisa 2015 REaDiNG FRaMEWORK3
54 © OECD 2016 PISA 2015 ASSESSMENT AND ANALYTICAL FRAMEWORK: SCIENCE, READING, MATHEMATIC AND FINANCIAL LITERACY
Instruction is the type of text that provides directions on what to do� The text presents directions for certain behaviours in order to complete a task (e�g� a recipe, a series of diagrams showing a procedure for giving first aid, and guidelines for operating digital software)�
Transaction is the kind of text that aims to achieve a specific purpose outlined in the text, such as requesting that something is done, organising a meeting or making a social engagement with a friend� Before the spread of digital communication, this kind of text was a significant component of some kinds of letters and, as an oral exchange, the principal purpose of many phone calls� This text type was not included in Werlich’s (1976) categorisation� It was used for the first time in the PISA 2009 framework because of its prevalence in the digital medium (e�g� everyday e-mail and text message exchanges between colleagues or friends that request and confirm arrangements)�
AspectWhereas navigation tools and features are the visible or physical features that allow readers to negotiate their way into, around and between texts, aspects are the mental strategies, approaches or purposes that readers use to negotiate their way into, around and between texts�
Five aspects guide the development of the reading literacy assessment tasks:
• retrieving information
• forming a broad understanding
• developing an interpretation
• reflecting on and evaluating the content of a text
• reflecting on and evaluating the form of a text�
As it is not possible to include sufficient items in the PISA assessment to report on each of the five aspects as a separate subscale, these five aspects are organised into three broad aspect categories for reporting on reading literacy:
• access and retrieve
• integrate and interpret
• reflect and evaluate�
Retrieving information tasks, which focus the reader on separate pieces of information within the text, are assigned to the access and retrieve scale�
Forming a broad understanding and developing an interpretation tasks focus the reader on relationships within a text� Tasks that focus on the whole text require readers to form a broad understanding; tasks that focus on relationships between parts of the text require developing an interpretation� The two are grouped together under integrate and interpret�
Tasks addressing the last two aspects, reflecting on and evaluating the content of a text and reflecting on and evaluating the form of a text, are grouped together into a single reflect and evaluate aspect category� Both require the reader to draw primarily on knowledge outside the text and relate it to what is being read� Reflecting on and evaluating content tasks are concerned with the notional substance of a text; reflecting on and evaluating form tasks are concerned with its structure or formal features�
Figure 3�1 • Relationship between the reading framework and the aspect subscales
Use content primarily from within the text Draw primarily upon outside knowledge
Access and retrieve
Retrieve information
Reflect on and evaluate content of text
Reflect on and evaluate form of text
Form a broad understanding
Develop an interpretation
Integrate and interpret
Reflect and evaluate
READING LITERACY

Pisa 2015 REaDiNG FRaMEWORK3
PISA 2015 ASSESSMENT AND ANALYTICAL FRAMEWORK: SCIENCE, READING, MATHEMATIC AND FINANCIAL LITERACY © OECD 2016 55
Figure 3�1 shows the relationship between the five aspects targeted in the test development and the three broad reporting aspects�
An elaboration of the three broad aspect categories is given below�
Access and retrieveAccessing and retrieving involves going to the information space provided and navigating in that space to locate and retrieve one or more distinct pieces of information� Access and retrieve tasks can range from locating the details required by an employer from a job advertisement, to finding a telephone number with several prefix codes, to finding a particular fact to support or disprove a claim someone has made�
While retrieving describes the process of selecting the required information, accessing describes the process of getting to the place, the information space, where the required information is located� Some items may require retrieving information only, especially in fixed texts where the information is immediately visible and where the reader only has to select what is appropriate in a clearly specified information space� On the other hand, some items in the dynamic space require little more than accessing (for example, clicking to select an item in a list of search results)� However, only the former processes are involved in the access and retrieve tasks in PISA 2015 as the digital reading assessment is not offered� Such access and retrieve items in the fixed-text display space might require readers to use navigation features, such as headings or captions, to find their way to the appropriate section of the text before locating the relevant information� The process of accessing and retrieving information involves skills associated with selecting, collecting and retrieving information�
Integrate and interpretIntegrating and interpreting involves processing what is read to make internal sense of a text�
Integrating focuses on demonstrating an understanding of the coherence of the text� Integrating involves connecting various pieces of information to make meaning, whether it be identifying similarities and differences, making comparisons of degree, or understanding cause-and-effect relationships�
Interpreting refers to the process of making meaning from something that is not stated� When interpreting, a reader is identifying the underlying assumptions or implications of part or all of the text�
Both integrating and interpreting are required to form a broad understanding. A reader must consider the text as a whole or in a broad perspective� Students may demonstrate initial understanding by identifying the main topic or message or by identifying the general purpose or use of the text�
Both integrating and interpreting are also involved in developing an interpretation, which requires readers to extend their initial broad impressions so that they develop a deeper, more specific or more complete understanding of what they have read� Integrating tasks include identifying and listing supporting evidence, and comparing and contrasting information in which the requirement is to draw together two or more pieces of information from the text� In order to process either explicit or implicit information from one or more sources in such tasks, the reader must often infer an intended relationship or category� Interpreting tasks may involve drawing an inference from a local context, for example, interpreting the meaning of a word or phrase that gives a particular nuance to the text� This process of comprehension is also assessed in tasks that require the student to make inferences about the author’s intention, and to identify the evidence used to infer that intention�
The relationship between the processes of integration and interpretation may therefore be seen as intimate and interactive� Integrating involves first inferring a relationship within the text (a kind of interpretation), and then bringing pieces of information together, therefore allowing an interpretation to be made that forms a new integrated whole�
Reflect and evaluateReflecting and evaluating involves drawing upon knowledge, ideas or attitudes beyond the text in order to relate the information provided within the text to one’s own conceptual and experiential frames of reference�
Reflect items may be thought of as those that require readers to consult their own experience or knowledge to compare, contrast or hypothesise� Evaluate items are those that ask readers to make a judgement drawing on standards beyond the text�
Reflecting on and evaluating the content of a text requires the reader to connect information in a text to knowledge from outside sources� Readers must also assess the claims made in the text against their own knowledge of the world�

Pisa 2015 REaDiNG FRaMEWORK3
56 © OECD 2016 PISA 2015 ASSESSMENT AND ANALYTICAL FRAMEWORK: SCIENCE, READING, MATHEMATIC AND FINANCIAL LITERACY
Often readers are asked to articulate and defend their own points of view� To do so, readers must be able to develop an understanding of what is said and intended in a text� They must then test that mental representation against what they know and believe on the basis of either prior information, or information found in other texts� Readers must call on supporting evidence from within the text and contrast it with other sources of information, using both general and specific knowledge as well as the ability to reason abstractly�
Reflecting on and evaluating the form of a text requires readers to stand apart from the text, to consider it objectively and to evaluate its quality and appropriateness� Implicit knowledge of text structure, the style typical of different kinds of texts and register play an important role in these tasks� Evaluating how successful an author is in portraying some characteristic or persuading a reader depends not only on substantive knowledge but also on the ability to detect subtleties in language�
Some examples of assessment tasks characteristic of reflecting on and evaluating the form of a text include determining the usefulness of a particular text for a specified purpose and evaluating an author’s use of particular textual features in accomplishing a particular goal� The student may also be called upon to describe or comment on the author’s use of style and to identify the author’s purpose and attitude� To some extent, every critical judgement requires the reader to consult his or her own experience; some kinds of reflection, on the other hand, do not require evaluation (for example, comparing personal experience with something described in a text)� Thus evaluation might be seen as a subset of reflection�
Inter-relation and interdependence of the three aspectsThe three broad aspects defined for PISA reading literacy are not conceived of as entirely separate and independent, but rather as interrelated and interdependent� Indeed, from a cognitive-processing perspective, they can be considered semi-hierarchical: it is not possible to interpret or integrate information without having first retrieved it; and it is not possible to reflect on or evaluate information without having made some sort of interpretation� In PISA, however, the framework description of reading aspects distinguishes approaches to reading that are demanded for different contexts and purposes; these are then reflected in assessment tasks that emphasise one or other aspect� Table 3�4 shows the desired distribution of items by aspect�
Table 3.4 Desired distribution of reading items, by aspect
Aspect Percentage of total itemsAccess and retrieve 25Integrate and interpret 50Reflect and evaluate 25Total 100
assEssiNG REaDiNG LitERaCYThe previous section outlined the conceptual framework for reading literacy� The concepts in the framework must, in turn, be represented in tasks and questions in order to collect evidence of students’ proficiency in reading literacy�
The distribution of tasks across the major framework variables of situation, text and aspect was discussed in the previous section� In this section some of the other major issues in constructing and operationalising the assessment are considered: factors affecting item difficulty, and how difficulty can be manipulated; the choice of response formats; and some issues around coding and scoring� Considerations of moving the fixed-text “print-medium” trend items to computer-based delivery in 2015 are also discussed further in this section�
Factors affecting item difficultyThe difficulty of any reading literacy task depends on an interaction among several variables� Drawing on Kirsch and Mosenthal’s work (see, for example, Kirsch, 2001; Kirsch and Mosenthal, 1990), we can manipulate the difficulty of items by applying knowledge of the following aspect and text format variables�
In access and retrieve tasks, difficulty depends on the number of pieces of information that the reader needs to locate, the amount of inference required, the amount and prominence of competing information, and the length and complexity of the text�
In integrate and interpret tasks, difficulty is affected by the type of interpretation required (for example, making a comparison is easier than finding a contrast); the number of pieces of information to be considered; the degree and prominence of competing information in the text; and by the nature of the text: the less familiar and the more abstract the content, and the longer and more complex the text, the more difficult the task is likely to be�

Pisa 2015 REaDiNG FRaMEWORK3
PISA 2015 ASSESSMENT AND ANALYTICAL FRAMEWORK: SCIENCE, READING, MATHEMATIC AND FINANCIAL LITERACY © OECD 2016 57
In reflect and evaluate tasks, difficulty is affected by the type of reflection or evaluation required (from least to most difficult, the types of reflection are: connecting; explaining and comparing; hypothesising and evaluating); the nature of the knowledge that the reader needs to bring to the text (a task is more difficult if the reader needs to draw on narrow, specialised knowledge rather than broad and common knowledge); the relative abstraction and length of the text; and by the depth of understanding of the text required to complete the task�
In tasks relating to continuous texts, difficulty is influenced by the length of the text, the explicitness and transparency of its structure, how clearly the parts are related to the general theme, and whether there are text features, such as paragraphs or headings, and discourse markers, such as sequencing words�
In tasks relating to non-continuous texts, difficulty is influenced by the amount of information in the text; the list structure (simple lists are easier to negotiate than more complex lists); whether the components are ordered and explicitly organised, for example with labels or special formatting; and whether the information required is in the body of the text or in a separate part, such as a footnote�
Response formatsThe form in which the evidence is collected – the response format – varies according to what is considered appropriate given the kind of evidence that is being collected, and also according to the pragmatic constraints of a large-scale assessment� As in any large-scale assessments the range of feasible item formats is limited, with multiple-choice (simple and complex) and constructed response items (where students write their own answer) being the most manageable formats�
Students in different countries are more or less familiar with various response formats� Including items in a variety of formats is likely to provide some balance between more and less familiar formats for all students, regardless of nationality�
To ensure proper coverage of the ability ranges in different countries, to ensure fairness given the inter-country and gender differences observed, and to ensure a valid assessment of the reflect and evaluate aspect, both multiple choice and open constructed response items continue to be used in PISA reading literacy assessments regardless of the change in delivery mode� Any major change in the distribution of item types in print reading might also impact on the measurement of trends�
Table 3�5 shows target coding requirements for PISA reading tasks� The distribution is shown in relation to the three aspects of reading literacy assessment� Items that require expert judgement consist of open constructed responses� Items that do not require coder judgement consist of simple multiple-choice, complex-multiple choice and closed constructed-response items� The closed constructed response items are those that require the student to generate a response, but require minimal judgement on the part of a coder� For example, a task in which a student is asked to copy a single word from the text, where only one word is acceptable, would be classified as a closed constructed response item� Such items impose a minor cost burden in operational terms and therefore from a pragmatic perspective, these closed constructed response items can be grouped with multiple choice items�
Table 3.5 approximate distribution of tasks, by coding requirement for Pisa 2015
Aspect% of tasks requiring
expert judgement in coding% of tasks not requiring
expert judgement in coding % of testAccess and retrieve 11 14 25Integrate and interpret 14 36 50Reflect and evaluate 18 7 25Total 43 57 100
Table 3�5 indicates that while there is some distribution of items that require coder judgement and those that do not across the aspects, they are not distributed evenly� The reflection and evaluation aspect tasks are assessed through a larger percentage of constructed response items, which require expert coder judgement�
Given that the delivery of the 2015 assessment is computer-based, it may be possible to use computer coding for some responses not requiring expert judgement without affecting the construct or attributes of the items�
Coding and scoringCodes are applied to test items, either by a more or less automated process of capturing the alternative chosen by the student for a multiple-choice answer, or by a human judge (expert coder) selecting a code that best captures the kind of response given by a student to an item that requires a constructed response� The code is then converted to a score for the item�

Pisa 2015 REaDiNG FRaMEWORK3
58 © OECD 2016 PISA 2015 ASSESSMENT AND ANALYTICAL FRAMEWORK: SCIENCE, READING, MATHEMATIC AND FINANCIAL LITERACY
For multiple-choice or closed-response format items, the student has either chosen the designated correct answer or not, so the item is scored as 1 (full credit) or 0 (no credit), respectively� For more complex scoring of constructed response items, some answers, even though incomplete, indicate a higher level of reading literacy than inaccurate or incorrect answers, and thus receive partial credit�
Transition from paper-based to computer-based deliveryThe main mode of delivery for the previous PISA assessments was paper� In moving to computer-based delivery in 2015, care must be taken to maintain comparability between the assessments� Some of the factors considered when transposing items from paper to computer mode are discussed below�
• Item types: The computer provides a range of opportunities for designers of test items, including new item formats (e�g� drag-and-drop, hotspots)� Since the purpose of the 2015 assessment is to study trends, there is less opportunity to exploit innovative item types� The majority of response formats remains unchanged in 2015, although some drop-down or hotspot items may be used to enable computer coding of items that were previously scored by experts, but only where no expert judgement is required and the item construct is not affected�
• Stimulus presentation: A feature of fixed texts defined in the construct is that “the extent or amount of the text is immediately visible to the reader”� Clearly, it is impossible, both on paper and on a screen, to have long texts displayed on a single page or screen� To allow for this and still satisfy the construct of fixed texts, pagination is used for texts rather than scrolling� Texts that cover more than one page are presented in their entirety before the student sees the first question�
• IT skills: Just as paper-based assessments rely on a set of fundamental skills for working with printed materials, so computer-based assessments rely on a set of fundamental skills for using computers� These include knowledge of basic hardware (e�g� keyboard and mouse) and basic conventions (e�g� arrows to move forward and specific buttons to press to execute commands)� The intention is to keep such skills to a minimal core level�
There is research evidence that a computer-based testing environment can influence students’ performance in reading� Some early studies indicated that reading speed was slower in a computer-based environment (Dillon, 1994) and less accurate (Muter et al�, 1982), although these studies were conducted on proofreading tasks, not in an assessment situation�
There is a large body of more recent literature on paper- and computer-based tests’ equivalency (see e�g� Macedo-Rouet et al�, 2009; Paek, 2005); however these still reveal conflicting findings� A meta-analysis of studies looking at K-12 students’ mathematics and reading achievement (Wang et al, 2008) indicated that, overall, administration mode has no statistically significant effect on scores�
A mode-effects study was conducted as part of the OECD Programme for the International Assessment of Adult Competencies (PIAAC) field trial� In this study, adults were randomly assigned to either a computer-based or paper-based assessment of literacy and numeracy skills� The majority of the items used in the paper-delivery mode was adapted for computer delivery and used in this study� Analyses of these data revealed that almost all of the item parameters were stable across the two modes, thus showing that responses could be measured along the same literacy and numeracy scales� This study, along with the results, was written up as part of the Technical Report of the Survey of Adult Skills (OECD, 2014)� Given this evidence, it was hypothesised that 2009 reading items could be transposed onto a screen without affecting trend data� (The PISA 2015 field trial studied the effect on student performance of the change in mode of delivery� For further details see Box 1�2�)
Reporting proficiency in readingPISA reports results in terms of proficiency scales that are interpretable for the purposes of policy� In PISA 2015, reading is a minor domain, and fewer reading items are administered to participating students� A single reading literacy scale is reported based upon the overall combined scale for reading�
To capture the progression of complexity and difficulty in PISA 2015, this reading literacy scale is based on the PISA 2009 combined print reading literacy scale and is divided into seven levels� Figure 3�2 describes these seven levels of reading proficiency� Level 6 is the highest described level of proficiency (Level 5 was the highest level before PISA 2009)� The bottom level of measured proficiency is Level 1b (for the PISA 2009 and all subsequent PISA reading assessments, Level 1 was re-labelled as Level 1a and a new level was added, Level 1b, that describes students who would previously have been rated as “below Level 1”)� These different levels of proficiency allow countries to know more about the kinds of tasks students with very high and very low reading proficiency are capable of performing� Levels 2, 3, 4 and 5 remain the same in PISA 2015 as in PISA 2000�
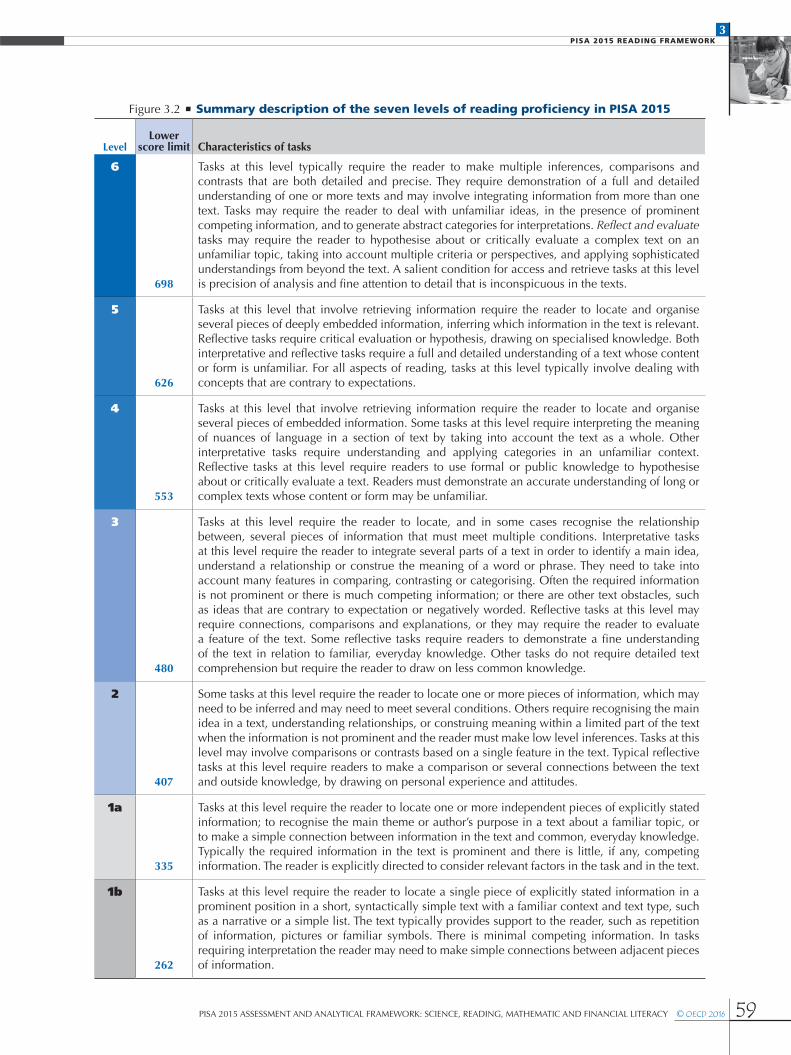
Pisa 2015 REaDiNG FRaMEWORK3
PISA 2015 ASSESSMENT AND ANALYTICAL FRAMEWORK: SCIENCE, READING, MATHEMATIC AND FINANCIAL LITERACY © OECD 2016 59
Figure 3�2 • summary description of the seven levels of reading proficiency in Pisa 2015
LevelLower
score limit Characteristics of tasks
6
698
Tasks at this level typically require the reader to make multiple inferences, comparisons and contrasts that are both detailed and precise� They require demonstration of a full and detailed understanding of one or more texts and may involve integrating information from more than one text� Tasks may require the reader to deal with unfamiliar ideas, in the presence of prominent competing information, and to generate abstract categories for interpretations� Reflect and evaluate tasks may require the reader to hypothesise about or critically evaluate a complex text on an unfamiliar topic, taking into account multiple criteria or perspectives, and applying sophisticated understandings from beyond the text� A salient condition for access and retrieve tasks at this level is precision of analysis and fine attention to detail that is inconspicuous in the texts�
5
626
Tasks at this level that involve retrieving information require the reader to locate and organise several pieces of deeply embedded information, inferring which information in the text is relevant� Reflective tasks require critical evaluation or hypothesis, drawing on specialised knowledge� Both interpretative and reflective tasks require a full and detailed understanding of a text whose content or form is unfamiliar� For all aspects of reading, tasks at this level typically involve dealing with concepts that are contrary to expectations�
4
553
Tasks at this level that involve retrieving information require the reader to locate and organise several pieces of embedded information� Some tasks at this level require interpreting the meaning of nuances of language in a section of text by taking into account the text as a whole� Other interpretative tasks require understanding and applying categories in an unfamiliar context� Reflective tasks at this level require readers to use formal or public knowledge to hypothesise about or critically evaluate a text� Readers must demonstrate an accurate understanding of long or complex texts whose content or form may be unfamiliar�
3
480
Tasks at this level require the reader to locate, and in some cases recognise the relationship between, several pieces of information that must meet multiple conditions� Interpretative tasks at this level require the reader to integrate several parts of a text in order to identify a main idea, understand a relationship or construe the meaning of a word or phrase� They need to take into account many features in comparing, contrasting or categorising� Often the required information is not prominent or there is much competing information; or there are other text obstacles, such as ideas that are contrary to expectation or negatively worded� Reflective tasks at this level may require connections, comparisons and explanations, or they may require the reader to evaluate a feature of the text� Some reflective tasks require readers to demonstrate a fine understanding of the text in relation to familiar, everyday knowledge� Other tasks do not require detailed text comprehension but require the reader to draw on less common knowledge�
2
407
Some tasks at this level require the reader to locate one or more pieces of information, which may need to be inferred and may need to meet several conditions� Others require recognising the main idea in a text, understanding relationships, or construing meaning within a limited part of the text when the information is not prominent and the reader must make low level inferences� Tasks at this level may involve comparisons or contrasts based on a single feature in the text� Typical reflective tasks at this level require readers to make a comparison or several connections between the text and outside knowledge, by drawing on personal experience and attitudes�
1a
335
Tasks at this level require the reader to locate one or more independent pieces of explicitly stated information; to recognise the main theme or author’s purpose in a text about a familiar topic, or to make a simple connection between information in the text and common, everyday knowledge� Typically the required information in the text is prominent and there is little, if any, competing information� The reader is explicitly directed to consider relevant factors in the task and in the text�
1b
262
Tasks at this level require the reader to locate a single piece of explicitly stated information in a prominent position in a short, syntactically simple text with a familiar context and text type, such as a narrative or a simple list� The text typically provides support to the reader, such as repetition of information, pictures or familiar symbols� There is minimal competing information� In tasks requiring interpretation the reader may need to make simple connections between adjacent pieces of information�

Pisa 2015 REaDiNG FRaMEWORK3
60 © OECD 2016 PISA 2015 ASSESSMENT AND ANALYTICAL FRAMEWORK: SCIENCE, READING, MATHEMATIC AND FINANCIAL LITERACY
Note
1� This does not preclude the use of several texts in a single task, but each of the texts should be coherent in itself�
References
Binkley, M. and P. Linnakylâ (1997), “Teaching reading in the United States and Finland”, in M� Binkley, K� Rust and T� Williams (eds�), Reading Literacy in an International Perspective, US Department of Education, Washington, DC�
Bruner, J. (1990), Acts of meaning, Harvard University Press, Cambridge, MA�
Coulombe, S., J.F. Tremblay and S. Marchand (2004), “Literacy scores, human capital, and growth across fourteen OECD countries”, International Adult Literacy Surevey, Statistics Canada, Ottawa�
Council of Europe (1996), Modern Languages: Learning, Teaching, Assessment: A Common European Framework of Reference, CC LANG, Vol� 95/5, Rev� IV, Council of Europe, Strasbourg�
Cunningham, A.E. and K.E. Stanovich (1998), “Early reading acquisition and its relation to reading experience and ability 10 years later”, Developmental Psychology, Vol� 33, pp� 934-945�
Dillon, A. (1994), Designing Usable Electronic Text: Ergonomic Aspects of Human Information Usage, Taylor and Francis, London�
Dole, J.G. et al� (1991), “Moving from the old to the new: Research on reading comprehension instruction”, Review of Educational Research, Vol� 16/2, pp� 239-264�
Fastrez, P. (2001), “Characteristic(s) of hypermedia and how they relate to knowledge”, Education Media International, Vol� 38/2-3, pp� 101-110�
Halpern, D.F. (1989), Thought and Knowledge: An Introduction to Critical Thinking, Lawrence Erlbaum Associates, Hillsdale, NJ�
Holloway, J.H. (1999), “Improving the reading skills of adolescents”, Educational Leadership, Vol� 57/2, pp� 80-82�
Hubbard, R. (1989), “Notes from the underground: Unofficial literacy in one sixth grade”, Anthropology and Education Quarterly, Vol� 20, pp� 291-307�
Kirsch, I. (2001), The International Adult Literacy Survey: Understanding What Was Measured, Educational Testing Service, Princeton, NJ�
Kirsch, I. and P.B. Mosenthal (1990), “Exploring document literacy: Variables underlying the performance of young adults”, Reading Research Quarterly, Vol� 25/1, pp� 5-30�
Legros, D. and J. Crinon (eds�) (2002), Psychologie des Apprentissages et Multimédia, Armand Colin, Paris�
Leu, D. (2007), “Expanding the Reading Literacy Framework of PISA 2009 to include online reading comprehension”, unpublished document�
Macedo-Rouet, M. et al� (2009), “Students’ performance and satisfaction with web vs� paper-based practice quizzes and lecture notes”, Computers and Education, Vol� 53, pp� 375–384�
Muter, P. et al� (1982), “Extended reading of continuous text on television screens”, Human Factors, Vol� 24, pp� 501-508�
OECD (2014), Technical Report of the Survey of Adult Skills (PIAAC), pre-publication, OECD, Paris, www�oecd�org/site/piaac/_Technical%20Report_17OCT13�pdf�
OCDE (2013), PISA 2012 Assessment and Analytical Framework: Mathematics, Reading, Science, Problem Solving and Financial Literacy, PISA, OECD Publishing, Paris, http://dx�doi�org/10�1787/9789264190511-en�
OECD (2010), PISA 2009 Assessment Framework: Key Competencies in Reading, Mathematics and Science, PISA, OECD Publishing, Paris, http://dx�doi�org/10�1787/9789264062658-en�
Paek, P. (2005), Recent Trends in Comparability Studies: Pearson Educational Measurement, Pearson Educational Measurement, http://images�pearsonassessments�com/images/tmrs/tmrs_rg/TrendsCompStudies�pdf (accessed 21 November 2007)�
Pew Internet and American Life Project (2005), “Internet: The mainstreaming of online life”, Trends 2005, Pew Research Center, Washington, DC�
Reinking, D. (1994), “Electronic literacy” (Perspectives Series No�1-PS-N-07), The National Reading Research Center, Athens, GA, and College Park, MD�
Shetzer, H. and M. Warschauer (2000), “An electronic literacy approach to network-based language teaching”, in M� Warschauer and R� Kem (eds�), Network-based Language Teaching: Concepts and Practice, Cambridge University Press, New York, pp� 171-185�

Pisa 2015 REaDiNG FRaMEWORK3
PISA 2015 ASSESSMENT AND ANALYTICAL FRAMEWORK: SCIENCE, READING, MATHEMATIC AND FINANCIAL LITERACY © OECD 2016 61
Smith, M.C. et al� (2000), “What will be the demands of literacy in the workplace in the next millennium?”, Reading Research Quarterly, Vol� 35/3, pp� 378-383�
Sticht, T.G. (ed�) (1975), Reading for Working: A Functional Literacy Anthology, Human Resources Research Organization, Alexandria, VA�
Stiggins, R.J. (1982), “An analysis of the dimensions of job-related reading”, Reading World, Vol� 82, pp� 237-247�
Sweets, R. and A. Meates (2004), ICT and Low Achievers: What Does PISA Tell us?, Hungarian Ministry of Education, Budapest, and OECD, Paris�
Wang, S. et al� (2007), “A meta-analysis of testing mode effects in Grade K–12 mathematics tests”, Educational and Psychological Measurement, Vol� 67, pp� 219-238�
Warschauer, M. (1999), Electronic Literacies: Language Culture and Power in Online Education, Lawrence Erlbaum Associates, Mahwah, NJ�
Werlich, E. (1976), A Text Grammar of English, Quelle and Meyer, Heidelberg�


4
PISA 2015 ASSESSMENT AND ANALYTICAL FRAMEWORK: SCIENCE, READING, MATHEMATIC AND FINANCIAL LITERACY © OECD 2016 63
PISA 2015 Mathematics Framework
This chapter defines “mathematical literacy” as assessed in the Programme for International Student Assessment (PISA) in 2015 and the competencies required for mathematical literacy. It explains the processes, content knowledge and contexts reflected in the assessment’s mathematics problems, and how student performance in mathematics is measured and reported.

Pisa 2015 MathEMatiCs FRaMEWORK4
64 © OECD 2016 PISA 2015 ASSESSMENT AND ANALYTICAL FRAMEWORK: SCIENCE, READING, MATHEMATIC AND FINANCIAL LITERACY
In PISA 2015, mathematics is assessed as a minor domain, providing an opportunity to make comparisons of student performance over time� This framework continues the description and illustration of the PISA mathematics assessment as set out in the 2012 framework, when mathematics was re-examined and updated for use as the major domain in that cycle�
For PISA 2015, the computer is the primary mode of delivery for all domains, including mathematical literacy� However, paper-based assessment instruments are provided for countries that choose not to test their students by computer� The mathematical literacy component for both the computer-based and paper-based instruments are composed of the same clusters of mathematics trend items� The number of trend items in minor domains are increased, compared with previous PISA assessments, therefore increasing the construct coverage while reducing the number of students responding to each question� This design is intended to reduce potential bias while stabilising and improving the measurement of trends�
In PISA 2012, as the computer-based assessment of mathematics (CBAM) was an optional domain and was not taken by all countries, it is not part of the mathematical literacy trend� Therefore, CBAM items developed for PISA 2012 are not included in the 2015 assessment where mathematical literacy is a minor domain, despite the change in delivery mode�
The framework has been updated to reflect the change in delivery mode, and includes a discussion of the considerations of transposing paper items to a screen and examples of what the results look like� The definition and constructs of mathematical literacy however, remain unchanged and consistent with those used in 2012�
The PISA 2015 mathematics framework is organised into several major sections� The first section, “Defining Mathematical Literacy,” explains the theoretical underpinnings of the PISA mathematics assessment, including the formal definition of the mathematical literacy construct� The second section, “Organising the Domain of Mathematics,” describes three aspects: a) the mathematical processes and the fundamental mathematical capabilities (in previous frameworks the “competencies”) underlying those processes; b) the way mathematical content knowledge is organised in the PISA 2015 framework, and the content knowledge that is relevant to an assessment of 15-year-old students; and c) the contexts in which students face mathematical challenges� The third section, “Assessing Mathematical Literacy”, outlines the approach taken to apply the elements of the framework previously described, including the structure of the survey, the transfer to a computer-based assessment and reporting proficiency� The 2012 framework was written under the guidance of the 2012 Mathematics Expert Group (MEG), a body appointed by the main PISA contractors with the approval of the PISA Governing Board (PGB)� The ten MEG members included mathematicians, mathematics educators, and experts in assessment, technology, and education research from a range of countries� In addition, to secure more extensive input and review, a draft of the PISA 2012 mathematics framework was circulated for feedback to over 170 mathematics experts from over 40 countries� Achieve and the Australian Council for Educational Research (ACER), the two organisations contracted by the Organisation for Economic Co-operation and Development (OECD) to manage framework development, also conducted various research efforts to inform and support development work� Framework development and the PISA programme generally have been supported and informed by the ongoing work of participating countries (e�g� the research described in OECD, 2010)� This PISA 2015 Framework is an update written under the guidance of the 2015 Mathematics Expert Group (MEG), a body appointed by the Core 1 contractor with the approval of the PISA Governing Board (PGB)�
DEFiNiNG MathEMatiCaL LitERaCYAn understanding of mathematics is central to a young person’s preparedness for life in modern society� A growing proportion of problems and situations encountered in daily life, including in professional contexts, require some level of understanding of mathematics, mathematical reasoning and mathematical tools, before they can be fully understood and addressed� Mathematics is a critical tool for young people as they confront issues and challenges in personal, occupational, societal, and scientific aspects of their lives� It is thus important to have an understanding of the degree to which young people emerging from school are adequately prepared to apply mathematics to understanding important issues and solving meaningful problems� An assessment at age 15 provides an early indication of how individuals may respond in later life to the diverse array of situations they will encounter that involve mathematics�
The construct of mathematical literacy used in this report is intended to describe the capacities of individuals to reason mathematically and use mathematical concepts, procedures, facts and tools to describe, explain and predict phenomena� This conception of mathematical literacy supports the importance of students developing a strong understanding of concepts of pure mathematics and the benefits of being engaged in explorations in the abstract world of mathematics� The construct of mathematical literacy, as defined for PISA, strongly emphasises the need to develop students’ capacity to use mathematics in context, and it is important that they have rich experiences in their mathematics classrooms to accomplish this� For the purposes of PISA 2012, mathematical literacy was defined as shown in Box 4�1�
Pisa 2015 MathEMatiCs FRaMEWORK4
PISA 2015 ASSESSMENT AND ANALYTICAL FRAMEWORK: SCIENCE, READING, MATHEMATIC AND FINANCIAL LITERACY © OECD 2016 65
Box 4�1 the 2015 definition of mathematical literacy
Mathematical literacy is an individual’s capacity to formulate, employ and interpret mathematics in a variety of contexts� It includes reasoning mathematically and using mathematical concepts, procedures, facts and tools to describe, explain and predict phenomena� It assists individuals to recognise the role that mathematics plays in the world and to make the well-founded judgements and decisions needed by constructive, engaged and reflective citizens�
This definition is also used in the PISA 2015 assessment�
The focus of the language in the definition of mathematical literacy is on active engagement in mathematics, and is intended to encompass reasoning mathematically and using mathematical concepts, procedures, facts and tools in describing, explaining and predicting phenomena� In particular, the verbs “formulate”, “employ”, and “interpret” point to the three processes in which students as active problem solvers will engage�
The language of the definition is also intended to integrate the notion of mathematical modelling, which has historically been a cornerstone of the PISA framework for mathematics (e�g� OECD, 2004), into the PISA 2015 definition of mathematical literacy� As individuals use mathematics and mathematical tools to solve problems in contexts, their work progresses through a series of stages (individually developed later in the document)�
The modelling cycle is a central aspect of the PISA conception of students as active problem solvers; however, it is often not necessary to engage in every stage of the modelling cycle, especially in the context of an assessment (Niss et al�, 2007)� The problem solver frequently carries out some steps of the modelling cycle but not all of them (e�g� when using graphs), or goes around the cycle several times to modify earlier decisions and assumptions�
The definition also acknowledges that mathematical literacy helps individuals to recognise the role that mathematics plays in the world and in helping them make the kinds of well-founded judgements and decisions required of constructive, engaged and reflective citizens�
Mathematical tools mentioned in the definition refer to a variety of physical and digital equipment, software and calculation devices� The 2015 computer-based survey includes an online calculator as part of the computer-based test material provided for some questions�
ORGaNisiNG thE DOMaiN OF MathEMatiCs
The PISA mathematics framework defines the domain of mathematics for the PISA survey and describes an approach to assessing the mathematical literacy of 15-year-olds� That is, PISA assesses the extent to which 15-year-old students can handle mathematics adeptly when confronted with situations and problems – the majority of which are presented in real-world contexts�
For purposes of the assessment, the PISA 2015 definition of mathematical literacy can be analysed in terms of three interrelated aspects:
• The mathematical processes that describe what individuals do to connect the context of the problem with mathematics and thus solve the problem, and the capabilities that underlie those processes�
• The mathematical content that is targeted for use in the assessment items�
• The contexts in which the assessment items are located�
The following sections elaborate these aspects� In highlighting these aspects of the domain, the PISA 2012 mathematics framework, which is also used in PISA 2015, helps to ensure that assessment items developed for the survey reflect a range of processes, content and contexts, so that, considered as a whole, the set of assessment items effectively operationalises what this framework defines as mathematical literacy� To illustrate the aspects of mathematic literacy, examples are available in the PISA 2012 Assessment and Analytical Framework (OECD, 2013) and on the PISA website (www�oecd�org/pisa/)�

Pisa 2015 MathEMatiCs FRaMEWORK4
66 © OECD 2016 PISA 2015 ASSESSMENT AND ANALYTICAL FRAMEWORK: SCIENCE, READING, MATHEMATIC AND FINANCIAL LITERACY
Several questions, based on the PISA 2015 definition of mathematical literacy, lie behind the organisation of this section of the framework� They are:
• What processes do individuals engage in when solving contextual mathematics problems, and what capabilities do we expect individuals to be able to demonstrate as their mathematical literacy grows?
• What mathematical content knowledge can we expect of individuals – and of 15-year-old students in particular?
• In what contexts can mathematical literacy be observed and assessed?
Mathematical processes and the underlying mathematical capabilitiesMathematical processesThe definition of mathematical literacy refers to an individual’s capacity to formulate, employ and interpret mathematics� These three words – formulate, employ and interpret – provide a useful and meaningful structure for organising the mathematical processes that describe what individuals do to connect the context of a problem with the mathematics and thus solve the problem� Items in the 2015 PISA mathematics survey are assigned to one of three mathematical processes:
• formulating situations mathematically
• employing mathematical concepts, facts, procedures and reasoning
• interpreting, applying and evaluating mathematical outcomes�
It is important for both policy makers and those engaged more closely in the day-to-day education of students to know how effectively students are able to engage in each of these processes� The formulating process indicates how effectively students are able to recognise and identify opportunities to use mathematics in problem situations and then provide the necessary mathematical structure needed to formulate that contextualised problem into a mathematical form� The employing process indicates how well students are able to perform computations and manipulations and apply the concepts and facts that they know to arrive at a mathematical solution to a problem formulated mathematically� The interpreting process indicates how effectively students are able to reflect upon mathematical solutions or conclusions, interpret them in the context of a real-world problem, and determine whether the results or conclusions are reasonable� Students’ facility in applying mathematics to problems and situations is dependent on skills inherent in all three of these processes, and an understanding of their effectiveness in each category can help inform both policy-level discussions and decisions being made closer to the classroom level�
Challenge in real world context
Mathematical content categories: Quantity; Uncertainty and data; Change and relationships; Space and shape
Real world context categories: Personal; Societal; Occupational; Scientific
Mathematical thought and action
Mathematical concepts, knowledge and skills
Fundamental mathematical capabilities: Communication; Representation; Devising strategies; Mathematisation; Reasoning and argument; Using symbolic, formal and technical language and operations; Using mathematical tools
Processes: Formulate; Employ; Interpret/Evaluate
Formulate
Interpret
EmployEvaluate
Resultsin context
Problemin context
Mathematicalproblem
Mathematicalresults
Figure 4�1 • a model of mathematical literacy in practice

Pisa 2015 MathEMatiCs FRaMEWORK4
PISA 2015 ASSESSMENT AND ANALYTICAL FRAMEWORK: SCIENCE, READING, MATHEMATIC AND FINANCIAL LITERACY © OECD 2016 67
Formulating situations mathematicallyThe word formulate in the definition of mathematical literacy refers to individuals being able to recognise and identify opportunities to use mathematics and then provide mathematical structure to a problem presented in some contextualised form� In the process of formulating situations mathematically, individuals determine where they can extract the essential mathematics to analyse, set up and solve the problem� They translate from a real-world setting to the domain of mathematics and provide the real-world problem with mathematical structure, representations and specificity� They reason about and make sense of constraints and assumptions in the problem� Specifically, this process of formulating situations mathematically includes activities such as the following:
• identifying the mathematical aspects of a problem situated in a real-world context and identifying the significant variables
• recognising mathematical structure (including regularities, relationships and patterns) in problems or situations
• simplifying a situation or problem in order to make it amenable to mathematical analysis
• identifying constraints and assumptions behind any mathematical modelling and simplifications gleaned from the context
• representing a situation mathematically, using appropriate variables, symbols, diagrams and standard models
• representing a problem in a different way, including organising it according to mathematical concepts and making appropriate assumptions
• understanding and explaining the relationships between the context-specific language of a problem and the symbolic and formal language needed to represent it mathematically
• translating a problem into mathematical language or a representation
• recognising aspects of a problem that correspond with known problems or mathematical concepts, facts or procedures
• using technology (such as a spreadsheet or the list facility on a graphing calculator) to portray a mathematical relationship inherent in a contextualised problem�
Employing mathematical concepts, facts, procedures and reasoningThe word employ in the definition of mathematical literacy refers to individuals being able to apply mathematical concepts, facts, procedures and reasoning to solve mathematically formulated problems to obtain mathematical conclusions� In the process of employing mathematical concepts, facts, procedures and reasoning to solve problems, individuals perform the mathematical procedures needed to derive results and find a mathematical solution (e�g� performing arithmetic computations, solving equations, making logical deductions from mathematical assumptions, performing symbolic manipulations, extracting mathematical information from tables and graphs, representing and manipulating shapes in space, and analysing data)� They work on a model of the problem situation, establish regularities, identify connections between mathematical entities, and create mathematical arguments� Specifically, this process of employing mathematical concepts, facts, procedures and reasoning includes activities such as:
• devising and implementing strategies for finding mathematical solutions
• using mathematical tools1, including technology, to help find exact or approximate solutions
• applying mathematical facts, rules, algorithms and structures when finding solutions
• manipulating numbers, graphical and statistical data and information, algebraic expressions and equations, and geometric representations
• making mathematical diagrams, graphs and constructions, and extracting mathematical information from them
• using and switching between different representations in the process of finding solutions
• making generalisations based on the results of applying mathematical procedures to find solutions
• reflecting on mathematical arguments and explaining and justifying mathematical results�
Interpreting, applying and evaluating mathematical outcomesThe word interpret used in the definition of mathematical literacy focuses on the abilities of individuals to reflect upon mathematical solutions, results, or conclusions and interpret them in the context of real-life problems� This involves translating mathematical solutions or reasoning back into the context of a problem and determining whether the results are reasonable and make sense in the context of the problem� This mathematical process category encompasses both the “interpret” and “evaluate” arrows noted in the previously defined model of mathematical literacy in practice (see Figure 4�1)�

Pisa 2015 MathEMatiCs FRaMEWORK4
68 © OECD 2016 PISA 2015 ASSESSMENT AND ANALYTICAL FRAMEWORK: SCIENCE, READING, MATHEMATIC AND FINANCIAL LITERACY
Individuals engaged in this process may be called upon to construct and communicate explanations and arguments in the context of the problem, reflecting on both the modelling process and its results� Specifically, this process of interpreting, applying and evaluating mathematical outcomes includes activities such as:
• interpreting a mathematical result back into the real-world context
• evaluating the reasonableness of a mathematical solution in the context of a real-world problem
• understanding how the real world impacts the outcomes and calculations of a mathematical procedure or model in order to make contextual judgements about how the results should be adjusted or applied
• explaining why a mathematical result or conclusion does, or does not, make sense given the context of a problem
• understanding the extent and limits of mathematical concepts and mathematical solutions
• critiquing and identifying the limits of the model used to solve a problem�
Desired distribution of items by mathematical processThe goal in constructing the assessment is to achieve a balance that provides approximately equal weighting between the two processes that involve making a connection between the real world and the mathematical world and the process that calls for students to be able to work on a mathematically formulated problem� Table 4�1 shows the desired distribution of items by process�
Table 4.1 Desired distribution of mathematics items, by process category
Process category Percentage of items
Formulating situations mathematically 25
Employing mathematical concepts, facts, procedures and reasoning 50
Interpreting, applying and evaluating mathematical outcomes 25
Total 100
Fundamental mathematical capabilities underlying the mathematical processesA decade of experience in developing PISA items and analysing the ways in which students respond to items has revealed that there is a set of fundamental mathematical capabilities that underpins each of these reported processes and mathematical literacy in practice� The work of Mogens Niss and his Danish colleagues (Niss, 2003; Niss and Jensen, 2002; Niss and Højgaard, 2011) identified eight capabilities – referred to as “competencies” by Niss and in the PISA 2003 framework (OECD, 2004) – that are instrumental to mathematical behaviour�
The PISA 2015 framework uses a modified formulation of this set of capabilities, which condenses the number from eight to seven based on an investigation of the operation of the competencies through previously administered PISA items (Turner et al�, 2013)� These cognitive capabilities are available to or learnable by individuals in order to understand and engage with the world in a mathematical way, or to solve problems� As the level of mathematical literacy possessed by an individual increases, that individual is able to draw to an increasing degree on the fundamental mathematical capabilities (Turner and Adams, 2012)� Thus, increasing activation of fundamental mathematical capabilities is associated with increasing item difficulty� This observation has been used as the basis of the descriptions of different proficiency levels of mathematical literacy reported in previous PISA surveys and discussed later in this framework�
The seven fundamental mathematical capabilities used in this framework are as follows:
• Communication: Mathematical literacy involves communication� The individual perceives the existence of some challenge and is stimulated to recognise and understand a problem situation� Reading, decoding and interpreting statements, questions, tasks or objects enables the individual to form a mental model of the situation, which is an important step in understanding, clarifying and formulating a problem� During the solution process, intermediate results may need to be summarised and presented� Later on, once a solution has been found, the problem solver may need to present the solution, and perhaps an explanation or justification, to others�
• Mathematising: Mathematical literacy can involve transforming a problem defined in the real world to a strictly mathematical form (which can include structuring, conceptualising, making assumptions, and/or formulating a model), or interpreting or evaluating a mathematical outcome or a mathematical model in relation to the original problem� The term mathematising is used to describe the fundamental mathematical activities involved�

Pisa 2015 MathEMatiCs FRaMEWORK4
PISA 2015 ASSESSMENT AND ANALYTICAL FRAMEWORK: SCIENCE, READING, MATHEMATIC AND FINANCIAL LITERACY © OECD 2016 69
• Representation: Mathematical literacy frequently involves representations of mathematical objects and situations� This can entail selecting, interpreting, translating between, and using a variety of representations to capture a situation, interact with a problem, or to present one’s work� The representations referred to include graphs, tables, diagrams, pictures, equations, formulae and concrete materials�
• Reasoning and argument: This capability involves logically rooted thought processes that explore and link problem elements so as to make inferences from them, check a justification that is given, or provide a justification of statements or solutions to problems�
• Devising strategies for solving problems: Mathematical literacy frequently requires devising strategies for solving problems mathematically� This involves a set of critical control processes that guide an individual to effectively recognise, formulate and solve problems� This skill is characterised as selecting or devising a plan or strategy to use mathematics to solve problems arising from a task or context, as well as guiding its implementation� This mathematical capability can be demanded at any of the stages of the problem-solving process�
• Using symbolic, formal and technical language and operations: Mathematical literacy requires using symbolic, formal and technical language and operations� This involves understanding, interpreting, manipulating, and making use of symbolic expressions within a mathematical context (including arithmetic expressions and operations) governed by mathematical conventions and rules� It also involves understanding and utilising formal constructs based on definitions, rules and formal systems and also using algorithms with these entities� The symbols, rules and systems used vary according to what particular mathematical content knowledge is needed for a specific task to formulate, solve or interpret the mathematics�
• Using mathematical tools1: Mathematical tools include physical tools, such as measuring instruments, as well as calculators and computer-based tools that are becoming more widely available� In addition to knowing how to use these tools to assist them in completing mathematical tasks, students need to know about the limitations of such tools� Mathematical tools can also have an important role in communicating results�
…
Figure 4�2 • Relationship between mathematical processes (top row) and fundamental mathematical capabilities (left-most column)
Formulating situations mathematically
Employing mathematical concepts, facts, procedures and reasoning
Interpreting, applying and evaluating mathematical outcomes
Communicating Read, decode, and make sense of statements, questions, tasks, objects or images, in order to form a mental model of the situation
Articulate a solution, show the work involved in reaching a solution and/or summarise and present intermediate mathematical results
Construct and communicate explanations and arguments in the context of the problem
Mathematising Identify the underlying mathematical variables and structures in the real world problem, and make assumptions so that they can be used
Use an understanding of the context to guide or expedite the mathematical solving process, e�g� working to a context- appropriate level of accuracy
Understand the extent and limits of a mathematical solution that are a consequence of the mathematical model employed
Representation Create a mathematical representation of real-world information
Make sense of, relate and use a variety of representations when interacting with a problem
Interpret mathematical outcomes in a variety of formats in relation to a situation or use; compare or evaluate two or more representations in relation to a situation
Reasoning and argument
Explain, defend or provide a justification for the identified or devised representation of a real-world situation
Explain, defend or provide a justification for the processes and procedures used to determine a mathematical result or solution
Connect pieces of information to arrive at a mathematical solution, make generalisations or create a multi-step argument
Reflect on mathematical solutions and create explanations and arguments that support, refute or qualify a mathematical solution to a contextualised problem
Devising strategies for solving problems
Select or devise a plan or strategy to mathematically reframe contextualised problems
Activate effective and sustained control mechanisms across a multi-step procedure leading to a mathematical solution, conclusion or generalisation
Devise and implement a strategy in order to interpret, evaluate and validate a mathematical solution to a contextualised problem

Pisa 2015 MathEMatiCs FRaMEWORK4
70 © OECD 2016 PISA 2015 ASSESSMENT AND ANALYTICAL FRAMEWORK: SCIENCE, READING, MATHEMATIC AND FINANCIAL LITERACY
These capabilities are evident to varying degrees in each of the three mathematical processes� The ways in which these capabilities manifest themselves within the three processes are described in Figure 4�1�
A good guide to the empirical difficulty of items can be obtained by considering which aspects of the fundamental mathematical capabilities are required for planning and executing a solution (Turner, 2012, Turner and Adams, 2012; Turner et al�, 2013)� The easiest items will require the activation of few capabilities and in a relatively straightforward way� The hardest items require complex activation of several capabilities� Predicting difficulty requires consideration of both the number of capabilities and the complexity of activation required�
Mathematical content knowledgeAn understanding of mathematical content – and the ability to apply that knowledge to the solution of meaningful contextualised problems – is important for citizens in the modern world� That is, to solve problems and interpret situations in personal, occupational, societal and scientific contexts, there is a need to draw upon certain mathematical knowledge and understandings�
Mathematical structures have been developed over time as a means to understand and interpret natural and social phenomena� In schools, the mathematics curriculum is typically organised around content strands (e�g� number, algebra and geometry) and detailed topic lists that reflect historically well-established branches of mathematics and that help in defining a structured curriculum� However, outside the mathematics classroom, a challenge or situation that arises is usually not accompanied by a set of rules and prescriptions that shows how the challenge can be met� Rather, it typically requires some creative thought in seeing the possibilities of bringing mathematics to bear on the situation and in formulating it mathematically� Often a situation can be addressed in different ways drawing on different mathematical concepts, procedures, facts or tools�
Since the goal of PISA is to assess mathematical literacy, an organisational structure for mathematical content knowledge is proposed based on the mathematical phenomena that underlie broad classes of problems and which have motivated the development of specific mathematical concepts and procedures� Because national mathematics curricula are typically designed to equip students with knowledge and skills that address these same underlying mathematical phenomena, the outcome is that the range of content arising from organising content this way is closely aligned with that typically found in national mathematics curricula� This framework lists some content topics appropriate for assessing the mathematical literacy of 15-year-old students, based on analyses of national standards from eleven countries�
To organise the domain of mathematics for purposes of assessing mathematical literacy, it is important to select a structure that grows out of historical developments in mathematics, that encompasses sufficient variety and depth to reveal the essentials of mathematics, and that also represents, or includes, the conventional mathematical strands in an acceptable way� Thus, a set of content categories that reflects the range of underlying mathematical phenomena was selected for the PISA 2015 framework, consistent with the categories used for previous PISA surveys�
Figure 4�2 [continued] • Relationship between mathematical processes (top row) and fundamental mathematical capabilities (left-most column)
Formulating situations mathematically
Employing mathematical concepts, facts, procedures and reasoning
Interpreting, applying and evaluating mathematical outcomes
Using symbolic, formal and technical language and operations
Use appropriate variables, symbols, diagrams and standard models in order to represent a real-world problem using symbolic/formal language
Understand and utilise formal constructs based on definitions, rules and formal systems as well as employing algorithms
Understand the relationship between the context of the problem and representation of the mathematical solution� Use this understanding to help interpret the solution in context and gauge the feasibility and possible limitations of the solution
Using mathematical tools
Use mathematical tools in order to recognise mathematical structures or to portray mathematical relationships
Know about and be able to make appropriate use of various tools that may assist in implementing processes and procedures for determining mathematical solutions
Use mathematical tools to ascertain the reasonableness of a mathematical solution and any limits and constraints on that solution, given the context of the problem

Pisa 2015 MathEMatiCs FRaMEWORK4
PISA 2015 ASSESSMENT AND ANALYTICAL FRAMEWORK: SCIENCE, READING, MATHEMATIC AND FINANCIAL LITERACY © OECD 2016 71
The following list of content categories, therefore, is used in PISA 2015 to meet the requirements of historical development, coverage of the domain of mathematics and the underlying phenomena which motivate its development, and reflection of the major strands of school curricula� These four categories characterise the range of mathematical content that is central to the discipline and illustrate the broad areas of content used in the test items for PISA 2015:
• Change and relationships
• Space and shape
• Quantity
• Uncertainty and data
With these four categories, the mathematical domain can be organised in a way that ensures a spread of items across the domain and focuses on important mathematical phenomena, but at the same time, avoids a too fine division that would work against a focus on rich and challenging mathematical problems based on real situations� While categorisation by content category is important for item development and selection, and for reporting of assessment results, it is important to note that some specific content topics may materialise in more than one content category� Connections between aspects of content that span these four content categories contribute to the coherence of mathematics as a discipline and are apparent in some of the assessment items selected for the PISA 2015 assessment�
The broad mathematical content categories and the more specific content topics appropriate for 15-year-old students described later in this section reflect the level and breadth of content that is eligible for inclusion on the PISA 2015 survey� Narrative descriptions of each content category and the relevance of each to solving meaningful problems are provided first, followed by more specific definitions of the kinds of content that are appropriate for inclusion in an assessment of mathematical literacy of 15-year-old students� These specific topics reflect commonalities found in the expectations set by a range of countries and education jurisdictions� The standards examined to identify these content topics are viewed as evidence not only of what is taught in mathematics classrooms in these countries but also as indicators of what countries view as important knowledge and skills for preparing students of this age to become constructive, engaged and reflective citizens�
Descriptions of the mathematical content knowledge that characterise each of the four categories – change and relationships, space and shape, quantity, and uncertainty and data – are provided below�
Change and relationshipsThe natural and designed worlds display a multitude of temporary and permanent relationships among objects and circumstances, where changes occur within systems of inter-related objects or in circumstances where the elements influence one another� In many cases these changes occur over time, and in other cases changes in one object or quantity are related to changes in another� Some of these situations involve discrete change; others change continuously� Some relationships are of a permanent, or invariant, nature� Being more literate about change and relationships involves understanding fundamental types of change and recognising when they occur in order to use suitable mathematical models to describe and predict change� Mathematically this means modelling the change and the relationships with appropriate functions and equations, as well as creating, interpreting, and translating among symbolic and graphical representations of relationships�
Change and relationships is evident in such diverse settings as growth of organisms, music, and the cycle of seasons, weather patterns, employment levels and economic conditions� Aspects of the traditional mathematical content of functions and algebra, including algebraic expressions, equations and inequalities, tabular and graphical representations, are central in describing, modelling and interpreting change phenomena� Representations of data and relationships described using statistics also are often used to portray and interpret change and relationships, and a firm grounding in the basics of number and units is also essential to defining and interpreting change and relationships� Some interesting relationships arise from geometric measurement, such as the way that changes in perimeter of a family of shapes might relate to changes in area, or the relationships among lengths of the sides of triangles�
Space and shapeSpace and shape encompasses a wide range of phenomena that are encountered everywhere in our visual and physical world: patterns, properties of objects, positions and orientations, representations of objects, decoding and encoding of visual information, navigation and dynamic interaction with real shapes as well as with representations� Geometry serves as an essential foundation for space and shape, but the category extends beyond traditional geometry in content, meaning and method, drawing on elements of other mathematical areas such as spatial visualisation, measurement and algebra�

Pisa 2015 MathEMatiCs FRaMEWORK4
72 © OECD 2016 PISA 2015 ASSESSMENT AND ANALYTICAL FRAMEWORK: SCIENCE, READING, MATHEMATIC AND FINANCIAL LITERACY
For instance, shapes can change, and a point can move along a locus, thus requiring function concepts� Measurement formulas are central in this area� The manipulation and interpretation of shapes in settings that call for tools ranging from dynamic geometry software to Global Positioning System (GPS) software are included in this content category�
PISA assumes that the understanding of a set of core concepts and skills is important to mathematical literacy relative to space and shape� Mathematical literacy in the area of space and shape involves a range of activities such as understanding perspective (for example in paintings), creating and reading maps, transforming shapes with and without technology, interpreting views of three-dimensional scenes from various perspectives and constructing representations of shapes�
QuantityThe notion of Quantity may be the most pervasive and essential mathematical aspect of engaging with, and functioning in, our world� It incorporates the quantification of attributes of objects, relationships, situations and entities in the world, understanding various representations of those quantifications, and judging interpretations and arguments based on quantity� To engage with the quantification of the world involves understanding measurements, counts, magnitudes, units, indicators, relative size, and numerical trends and patterns� Aspects of quantitative reasoning – such as number sense, multiple representations of numbers, elegance in computation, mental calculation, estimation and assessment of reasonableness of results – are the essence of mathematical literacy relative to quantity�
Quantification is a primary method for describing and measuring a vast set of attributes of aspects of the world� It allows for the modelling of situations, for the examination of change and relationships, for the description and manipulation of space and shape, for organising and interpreting data, and for the measurement and assessment of uncertainty� Thus mathematical literacy in the area of quantity applies knowledge of number and number operations in a wide variety of settings�
Uncertainty and dataIn science, technology and everyday life, uncertainty is a given� Uncertainty is therefore a phenomenon at the heart of the mathematical analysis of many problem situations, and the theory of probability and statistics as well as techniques of data representation and description have been established to deal with it� The uncertainty and data content category includes recognising the place of variation in processes, having a sense of the quantification of that variation, acknowledging uncertainty and error in measurement, and knowing about chance� It also includes forming, interpreting and evaluating conclusions drawn in situations where uncertainty is central� The presentation and interpretation of data are key concepts in this category (Moore, 1997)�
There is uncertainty in scientific predictions, poll results, weather forecasts and economic models� There is variation in manufacturing processes, test scores and survey findings, and chance is fundamental to many recreational activities enjoyed by individuals� The traditional curricular areas of probability and statistics provide formal means of describing, modelling and interpreting a certain class of uncertainty phenomena, and for making inferences� In addition, knowledge of number and of aspects of algebra, such as graphs and symbolic representation, contribute to facility in engaging in problems in this content category� The focus on the interpretation and presentation of data is an important aspect of the uncertainty and data category�
Desired distribution of items by content categoryThe trend items selected for PISA 2015 are distributed across the four content categories, as shown in Table 4�2� The goal in constructing the survey is a balanced distribution of items with respect to content category, since all of these domains are important for constructive, engaged and reflective citizens�
Table 4.2 Desired distribution of mathematics items, by content category
Content category Percentage of items
Change and relationships 25
Space and shape 25
Quantity 25
Uncertainty and data 25
Total 100
Pisa 2015 MathEMatiCs FRaMEWORK4
PISA 2015 ASSESSMENT AND ANALYTICAL FRAMEWORK: SCIENCE, READING, MATHEMATIC AND FINANCIAL LITERACY © OECD 2016 73
Content topics for guiding the assessment of mathematical literacyTo effectively understand and solve contextualised problems involving change and relationships, space and shape, quantity and uncertainty and data requires drawing upon a variety of mathematical concepts, procedures, facts, and tools at an appropriate level of depth and sophistication� As an assessment of mathematical literacy, PISA strives to assess the levels and types of mathematics that are appropriate for 15-year-old students on a trajectory to become constructive, engaged and reflective citizens able to make well-founded judgements and decisions� It is also the case that PISA, while not designed or intended to be a curriculum-driven assessment, strives to reflect the mathematics that students have likely had the opportunity to learn by the time they are 15 years old�
The content included in PISA 2015 is the same as that developed in PISA 2012� The four content categories of change and relationships, space and shape, quantity and uncertainty and data serve as the foundation for identifying this range of content, yet there is not a one-to-one mapping of content topics to these categories� The following content is intended to reflect the centrality of many of these concepts to all four content categories and reinforce the coherence of mathematics as a discipline� It intends to be illustrative of the content topics included in PISA 2015, rather than an exhaustive listing:
• Functions: the concept of function, emphasising but not limited to linear functions, their properties, and a variety of descriptions and representations of them� Commonly used representations are verbal, symbolic, tabular and graphical�
• Algebraic expressions: verbal interpretation of and manipulation with algebraic expressions, involving numbers, symbols, arithmetic operations, powers and simple roots�
• Equations and inequalities: linear and related equations and inequalities, simple second-degree equations, and analytic and non-analytic solution methods�
• Co-ordinate systems: representation and description of data, position and relationships�
• Relationships within and among geometrical objects in two and three dimensions: static relationships such as algebraic connections among elements of figures (e�g� the Pythagorean theorem as defining the relationship between the lengths of the sides of a right triangle), relative position, similarity and congruence, and dynamic relationships involving transformation and motion of objects, as well as correspondences between two- and three-dimensional objects�
• Measurement: quantification of features of and among shapes and objects, such as angle measures, distance, length, perimeter, circumference, area and volume�
• Numbers and units: concepts, representations of numbers and number systems, including properties of integer and rational numbers, relevant aspects of irrational numbers, as well as quantities and units referring to phenomena such as time, money, weight, temperature, distance, area and volume, and derived quantities and their numerical description�
• Arithmetic operations: the nature and properties of these operations and related notational conventions�
• Percents, ratios and proportions: numerical description of relative magnitude and the application of proportions and proportional reasoning to solve problems�
• Counting principles: simple combinations and permutations�
• Estimation: purpose-driven approximation of quantities and numerical expressions, including significant digits and rounding�
• Data collection, representation and interpretation: nature, genesis and collection of various types of data, and the different ways to represent and interpret them�
• Data variability and its description: concepts such as variability, distribution and central tendency of data sets, and ways to describe and interpret these in quantitative terms�
• Samples and sampling: concepts of sampling and sampling from data populations, including simple inferences based on properties of samples�
• Chance and probability: notion of random events, random variation and its representation, chance and frequency of events, and basic aspects of the concept of probability�
ContextsThe choice of appropriate mathematical strategies and representations is often dependent on the context in which a mathematics problem arises� Context is widely regarded as an aspect of problem solving that imposes additional demands on the problem solver (see Watson and Callingham, 2003, for findings about statistics)� For the PISA survey, it is important that a wide variety of contexts is used� This offers the possibility of connecting with the broadest possible range of individual interests and with the range of situations in which individuals operate in the 21st century�

Pisa 2015 MathEMatiCs FRaMEWORK4
74 © OECD 2016 PISA 2015 ASSESSMENT AND ANALYTICAL FRAMEWORK: SCIENCE, READING, MATHEMATIC AND FINANCIAL LITERACY
For purposes of the PISA 2015 mathematics framework, four context categories have been defined and are used to classify assessment items developed for the PISA survey:
• Personal – Problems classified in the personal context category focus on activities of one’s self, one’s family or one’s peer group� The kinds of contexts that may be considered personal include (but are not limited to) those involving food preparation, shopping, games, personal health, personal transportation, sports, travel, personal scheduling and personal finance�
• Occupational – Problems classified in the occupational context category are centred on the world of work� Items categorised as occupational may involve (but are not limited to) such things as measuring, costing and ordering materials for building, payroll/accounting, quality control, scheduling/inventory, design/architecture and job-related decision making� Occupational contexts may relate to any level of the workforce, from unskilled work to the highest levels of professional work, although items in the PISA survey must be accessible to 15-year-old students�
• Societal – Problems classified in the societal context category focus on one’s community (whether local, national or global)� They may involve (but are not limited to) such things as voting systems, public transport, government, public policies, demographics, advertising, national statistics and economics� Although individuals are involved in all of these things in a personal way, in the societal context category the focus of problems is on the community perspective�
• Scientific – Problems classified in the scientific category relate to the application of mathematics to the natural world and issues and topics related to science and technology� Particular contexts might include (but are not limited to) such areas as weather or climate, ecology, medicine, space science, genetics, measurement and the world of mathematics itself� Items that are intramathematical, where all the elements involved belong in the world of mathematics, fall within the scientific context�
PISA assessment items are arranged in units that share stimulus material� It is therefore usually the case that all items in the same unit belong to the same context category� Exceptions do arise; for example stimulus material may be examined from a personal point of view in one item and a societal point of view in another� When an item involves only mathematical constructs without reference to the contextual elements of the unit within which it is located, it is allocated to the context category of the unit� In the unusual case of a unit involving only mathematical constructs and being without reference to any context outside of mathematics, the unit is assigned to the scientific context category�
Using these context categories provides the basis for selecting a mix of item contexts and ensures that the assessment reflects a broad range of uses of mathematics, ranging from everyday personal uses to the scientific demands of global problems� Moreover, it is important that each context category be populated with assessment items having a broad range of item difficulties� Given that the major purpose of these context categories is to challenge students in a broad range of problem contexts, each category should contribute substantially to the measurement of mathematical literacy� It should not be the case that the difficulty level of assessment items representing one context category is systematically higher or lower than the difficulty level of assessment items in another category�
In identifying contexts that may be relevant, it is critical to keep in mind that a purpose of the assessment is to gauge the use of mathematical content knowledge, processes and capabilities that students have acquired by the age of 15� Contexts for assessment items, therefore, are selected in light of relevance to students’ interests and lives, and the demands that will be placed upon them as they enter society as constructive, engaged and reflective citizens� National project managers from countries participating in the PISA survey are involved in judging the degree of such relevance�
Desired distribution of items by context categoryThe trend items selected for the PISA 2015 mathematics survey represent a spread across these context categories, as described in Table 4�3� With this balanced distribution, no single context type is allowed to dominate, providing students with items that span a broad range of individual interests and a range of situations that they might expect to encounter in their lives�
Table 4.3 Desired distribution of mathematics items, by context
Content category Percentage of itemsPersonal 25Occupational 25Societal 25Scientific 25
Total 100

Pisa 2015 MathEMatiCs FRaMEWORK4
PISA 2015 ASSESSMENT AND ANALYTICAL FRAMEWORK: SCIENCE, READING, MATHEMATIC AND FINANCIAL LITERACY © OECD 2016 75
assEssiNG MathEMatiCaL LitERaCYThis section outlines the approach taken to apply the elements of the framework described in previous sections to PISA 2015� This includes the structure of the mathematics component of the PISA survey, arrangements for transferring the paper-based trend items to a computer-based delivery, and reporting mathematical proficiency�
Structure of the survey instrumentIn 2012, when mathematical literacy was the major domain, the paper-based instrument contained a total of 270 minutes of mathematics material� The material was arranged in nine clusters of items, with each cluster representing 30 minutes of testing time� The item clusters were placed in test booklets according to a rotated design, they also contained linked materials�
Mathematical literacy is a minor domain in 2015 and students are asked to complete fewer clusters� However the item clusters are similarly constructed and rotated� Six mathematics clusters from previous cycles, including one “easy” and one “hard”, are used in one of three designs, depending on whether countries take the Collaborative Problem Solving option or not, or whether they take the test on paper� Using six clusters rather than three as was customary for the minor domains in previous cycles results in a larger number of trend items, therefore the construct coverage is increased� However, the number of students responding to each question is lower� This design is intended to reduce potential bias, thus stabilising and improving the measurement of trends� The field trial was used to perform a mode-effect study and to establish equivalence between the computer- and paper-based forms�
Response formatsThree types of response format are used to assess mathematical literacy in PISA 2015: open constructed-response, closed constructed-response and selected-response (simple and complex multiple-choice) items� Open constructed-response items require a somewhat extended written response from a student� Such items also may ask the student to show the steps taken or to explain how the answer was reached� These items require trained experts to manually code student responses�
Closed constructed-response items provide a more structured setting for presenting problem solutions, and they produce a student response that can be easily judged to be either correct or incorrect� Often student responses to questions of this type can be keyed into data-capture software, and coded automatically, but some must be manually coded by trained experts� The most frequent closed constructed-responses are single numbers�
Selected- response items require students to choose one or more responses from a number of response options� Responses to these questions can usually be automatically processed� About equal numbers of each of these response formats is used to construct the survey instruments�
Item scoringAlthough most of the items are dichotomously scored (that is, responses are awarded either credit or no credit), the open constructed-response items can sometimes involve partial credit scoring, which allows responses to be assigned credit according to differing degrees of “correctness” of responses� For each such item, a detailed coding guide that allows for full credit, partial credit or no credit is provided to persons trained in the coding of student responses across the range of participating countries to ensure coding of responses is done in a consistent and reliable way� To maximise the comparability between the paper-based and computer-based assessments, careful attention is given to the scoring guides in order to ensure that the important elements are included�
Computer-based assessment of mathematicsThe main mode of delivery for the PISA 2012 assessment was paper-based� In moving to computer-based delivery for 2015, care is taken to maximise comparability between the two assessments� The following section describes some of the features intrinsic to a computer-based assessment� Although these features provide the opportunities outlined below, to ensure comparability the PISA 2015 survey consists solely of items from the 2012 paper-based assessment� The features described here, however, will be used in future PISA assessments when their introduction can be controlled to ensure comparability with prior assessments�
Increasingly, mathematics tasks at work involve some kind of electronic technology, so that mathematical literacy and computer use are melded together (Hoyles et al�, 2002)� For employees at all levels of the workplace, there is now an interdependency between mathematical literacy and the use of computer technology� Solving PISA items on a computer rather than on paper moves PISA into the reality and the demands of the 21st century�
Pisa 2015 MathEMatiCs FRaMEWORK4
76 © OECD 2016 PISA 2015 ASSESSMENT AND ANALYTICAL FRAMEWORK: SCIENCE, READING, MATHEMATIC AND FINANCIAL LITERACY
There is a great deal of research evidence into paper- and computer-based test performance, but findings are mixed� Some research suggests that a computer-based testing environment can influence students’ performance� Richardson et al� (2002) reported that students found computer-based problem-solving tasks engaging and motivating, often despite the unfamiliarity of the problem types and the challenging nature of the items� They were sometimes distracted by attractive graphics, and sometime used poor heuristics when attempting tasks�
In one of the largest comparisons of paper-based and computer-based testing, Sandene et al� (2008) found that eighth-grade students’ mean score was four points higher on a computer-based mathematics test than on an equivalent paper-based test� Bennett et al� (2008) concluded from his research that computer familiarity affects performance on computer-based mathematics tests, while others have found that the range of functions available through computer-based tests can affect performance� For example, Mason (2001) found that students’ performance was negatively affected in computer-based tests compared to paper-based tests when there was no opportunity on the computer version to review and check responses� Bennett (2003) found that screen size affected scores on verbal-reasoning tests, possibly because smaller computer screens require scrolling�
By contrast, Wang et al (2008) conducted a meta-analysis of studies pertaining to K-12 students’ mathematics achievements which indicated that administration mode has no statistically significant effect on scores� Moreover, recent mode studies that were part of the Programme for the International Assessment of Adult Competencies (PIAAC) suggested that equality can be achieved (OECD, 2014)� In this study, adults were randomly assigned to either a computer-based or paper-based assessment of literacy and numeracy skills� The majority of the items used in the paper delivery mode were adapted for computer delivery and used in this study� Analyses of these data revealed that almost all of the item parameters were stable across the two modes, thus demonstrating the ability to place respondents on the same literacy and numeracy scale� Given this, it is hypothesised that mathematics items used in PISA 2012 can be transposed onto a screen without affecting trend data� (The PISA 2015 field trial studied the effect on student performance of the change in mode of delivery� For further details see Box 1�2�)
Just as paper-based assessments rely on a set of fundamental skills for working with printed materials, computer-based assessments rely on a set of fundamental information and communications technology (ICT) skills for using computers� These include knowledge of basic hardware (e�g� keyboard and mouse) and basic conventions (e�g� arrows to move forward and specific buttons to press to execute commands)� The intention is to keep such skills to a minimal, core level in the computer-based assessment�
Reporting proficiency in mathematicsThe outcomes of the PISA mathematics survey are reported in a number of ways� Estimates of overall mathematical proficiency are obtained for sampled students in each participating country, and a number of proficiency levels are defined� Descriptions of the degree of mathematical literacy typical of students in each level are also developed� For PISA 2003, scales based on the four broad content categories were developed� In Figure 4�3, descriptions of the six proficiency levels reported for the overall PISA mathematics scale in 2012 are presented� These form the basis of the PISA 2015 mathematics scale� The finalised 2012 scale is used to report the PISA 2015 outcomes� As mathematical literacy is a minor domain in 2015, only the overall proficiency scale is reported�
Fundamental mathematical capabilities play a central role in defining what it means to be at different levels of the scales for mathematical literacy overall and for each of the reported processes� For example, in the proficiency scale description for Level 4 (see Figure 4�3), the second sentence highlights aspects of mathematising and representation that are evident at this level� The final sentence highlights the characteristic communication, reasoning and argument of Level 4, providing a contrast with the short communications and lack of argument of Level 3 and the additional reflection of Level 5� In an earlier section of this framework and in Figure 4�2, each of the mathematical processes was described in terms of the fundamental mathematical capabilities that individuals might activate when engaging in that process�

Pisa 2015 MathEMatiCs FRaMEWORK4
PISA 2015 ASSESSMENT AND ANALYTICAL FRAMEWORK: SCIENCE, READING, MATHEMATIC AND FINANCIAL LITERACY © OECD 2016 77
Figure 4�3 • summary description of the six levels of mathematics proficiency in Pisa 2015
Level What students can typically do
6 At Level 6, students can conceptualise, generalise and utilise information based on their investigations and modelling of complex problem situations, and can use their knowledge in relatively non-standard contexts� They can link different information sources and representations and flexibly translate among them� Students at this level are capable of advanced mathematical thinking and reasoning� These students can apply this insight and understanding, along with a mastery of symbolic and formal mathematical operations and relationships, to develop new approaches and strategies for attacking novel situations� Students at this level can reflect on their actions, and can formulate and precisely communicate their actions and reflections regarding their findings, interpretations, arguments, and the appropriateness of these to the original situation�
5 At Level 5, students can develop and work with models for complex situations, identifying constraints and specifying assumptions� They can select, compare and evaluate appropriate problem-solving strategies for dealing with complex problems related to these models� Students at this level can work strategically using broad, well-developed thinking and reasoning skills, appropriate linked representations, symbolic and formal characterisations, and insight pertaining to these situations� They begin to reflect on their work and can formulate and communicate their interpretations and reasoning�
4 At Level 4, students can work effectively with explicit models for complex concrete situations that may involve constraints or call for making assumptions� They can select and integrate different representations, including symbolic, linking them directly to aspects of real-world situations� Students at this level can utilise their limited range of skills and can reason with some insight, in straightforward contexts� They can construct and communicate explanations and arguments based on their interpretations, arguments and actions�
3 At Level 3, students can execute clearly described procedures, including those that require sequential decisions� Their interpretations are sufficiently sound to be a base for building a simple model or for selecting and applying simple problem-solving strategies� Students at this level can interpret and use representations based on different information sources and reason directly from them� They typically show some ability to handle percentages, fractions and decimal numbers, and to work with proportional relationships� Their solutions reflect that they have engaged in basic interpretation and reasoning�
2 At Level 2, students can interpret and recognise situations in contexts that require no more than direct inference� They can extract relevant information from a single source and make use of a single representational mode� Students at this level can employ basic algorithms, formulae, procedures or conventions to solve problems involving whole numbers� They are capable of making literal interpretations of the results�
1 At Level 1, students can answer questions involving familiar contexts where all relevant information is present and the questions are clearly defined� They are able to identify information and to carry out routine procedures according to direct instructions in explicit situations� They can perform actions that are almost always obvious and follow immediately from the given stimuli�

Pisa 2015 MathEMatiCs FRaMEWORK4
78 © OECD 2016 PISA 2015 ASSESSMENT AND ANALYTICAL FRAMEWORK: SCIENCE, READING, MATHEMATIC AND FINANCIAL LITERACY
Note1� In some countries, “mathematical tools” can also refer to established mathematical procedures, such as algorithms� For the purposes of the PISA framework, “mathematical tools” refers only to the physical and digital tools described in this section�
ReferencesBennett, R.E. (2003), Online Assessment and the Comparability of Score Meaning, Research Memorandum, Educational Testing Service, Princeton, NJ�
Bennett, R.E. et al� (2008), “Does it matter if i take my mathematics test on computer? A second empirical study of mode effects in NAEP”, Journal of Technology, Learning, and Assessment, Vol� 6/9�
Hoyles, C. et al� (2002), Mathematical Skills in the Workplace: Final Report to the Science Technology and Mathematics Council, Institute of Education, University of London, London, http://eprints�ioe�ac�uk/1565/�
Mason, B., M. Patry and D. Berstein (2001), “An examination of the equivalence between non-adaptive computer based and traditional testing”, Journal of Education Computing Research, Vol� 1/24, pp� 29-39�
Moore, D. (1997), “New pedagogy and new content: The case of statistics”, International Statistical Review, Vol� 2/65, pp� 123-137�
Niss, M. (2003), “Mathematical competencies and the learning of mathematics: The Danish KoM Project”, in A� Gagatsis and S� Papastavridis (eds�), 3rd Mediterranean Conference on Mathematics Education, Hellenic Mathematical Society, Athens, pp� 116-124�
Niss, M., W. Blum and P. Galbraith (2007), “Introduction”, in W� Blum, P�L� Galbraith, H�W� Henn and M� Niss (eds�), Modelling and Applications in Mathematics Education (The 14th ICMI Study), Springer, New York, pp� 3-32�
Niss, M. and T.H. Jensen (2002), “Kompetencer og matematiklæring: Ideer og inspiration til udvikling af matematikundervisning i Danmark, uddannelsesstyrelsens temahæfteserie”, No� 18, Ministry of Education, Copenhagen, http://pub�uvm�dk/2002/kom/�
Niss, M. and T. Højgaard (eds�) (2011), “Competencies and mathematical learning: Ideas and inspiration for the development of mathematics teaching and learning in Denmark”, Ministry of Education, Report No� 485, Roskilde University, Roskilde, https://pure�au�dk/portal/files/41669781/thj11_mn_kom_in_english�pdf�
OECD (2014), Technical Report of the Survey of Adult Skills (PIAAC), pre-publication, OECD, Paris, www�oecd�org/site/piaac/_Technical%20Report_17OCT13�pdf�
OECD (2013), PISA 2012 Assessment and Analytical Framework: Mathematics, Reading, Science, Problem Solving and Financial Literacy, PISA, OECD Publishing, Paris, http://dx�doi�org/10�1787/9789264190511-en�
OECD (2010), Pathways to Success: How Knowledge and Skills at Age 15 Shape Future Lives in Canada, PISA, OECD Publishing, Paris, http://dx�doi�org/10�1787/9789264081925-en�
OECD (2004), The PISA 2003 Assessment Framework: Mathematics, Reading, Science and Problem Solving Knowledge and Skills, PISA, OECD Publishing, Paris, http://dx�doi�org/10�1787/9789264101739-en�
Richardson, M. et al� (2002), “Challenging minds? Students’ perceptions of computer-based world class tests of problem solving”, Computers in Human Behavior, Vol� 18/6, pp� 633-649�
Sandene, B. et al� (2005), Online Assessment in Mathematics and Writing: Reports from the NAEP Technology-Based Assessment Project, Research and Development Series (NCES 2005–457)� US Department of Education, National Center for Education Statistics, US Government Printing Office, Washington, DC�
Turner, R. and R.J. Adams (2012), “Some drivers of test item difficulty in mathematics: an analysis of the competency rubric”, paper presented at the annual meeting of the American Educational Research Association (AERA), 13-17 April, Vancouver, http://research�acer�edu�au/pisa/7/�
Turner, R. et al� (2013), “Using mathematical competencies to predict item difficulty in PISA”, in M� Prenzel et al� (eds), Research on PISA: Research Outcomes of the PISA Research Conference 2009, Springer, New York, pp� 23-27�
Watson, J.M. and R. Callingham (2003), “Statistical literacy: A complex hierarchical construct”, Statistics Education Research Journal, Vol� 2/2, pp� 3-46�
Wang, S. et al� (2007), “A meta-analysis of testing mode effects in Grade K–12 mathematics tests”, Educational and Psychological Measurement, Vol� 67, pp� 219-238�
5
PISA 2015 ASSESSMENT AND ANALYTICAL FRAMEWORK: SCIENCE, READING, MATHEMATIC AND FINANCIAL LITERACY © OECD 2016 79
PISA 2015 Financial Literacy Framework
This chapter describes the rationale behind measuring 15-year-olds’ financial literacy in the Programme for International Student Assessment (PISA) and defines the term. It explains the content, processes and contexts that are reflected in the financial literacy problems used in the assessment, and describes how student proficiency in financial literacy is measured and reported.

Pisa 2015 FiNaNCiaL LitERaCY FRaMEWORK5
80 © OECD 2016 PISA 2015 ASSESSMENT AND ANALYTICAL FRAMEWORK: SCIENCE, READING, MATHEMATIC AND FINANCIAL LITERACY
PISA 2012 was the first large-scale international study to assess the financial literacy of young people� The assessment found wide variations in levels of financial literacy within and across countries� The PISA 2015 assessment provides information about trends and data from countries that have not previously participated in this optional assessment�
This framework is based on that developed for the 2012 assessment� It discusses how the items and the language used to measure and describe financial literacy were designed and developed� It also contains a definition of financial literacy and organises the domain around the content, processes and contexts that are relevant to 15-year-old students� Content areas include money and transactions, planning and managing finances, risk and reward and the financial landscape� The framework covers some of the processes through which students exhibit their financial literary, such as identify financial information, analyse information in a financial context, evaluate financial issues, and apply financial knowledge and understanding� Items are set in the education and work, home and family, individual and societal contexts� In addition, the framework discusses the relationship between financial literacy and non-cognitive skills and between both mathematics and reading literacy� It also discusses how students’ financial behaviour and experience are measured�
POLiCY iNtEREst iN FiNaNCiaL LitERaCYIn recent years, developed and emerging countries and economies have become increasingly concerned about the level of financial literacy among their citizens� This has stemmed, in particular, from shrinking public and private support systems, shifting demographic profiles, including the ageing of the population, and wide-ranging developments in the financial marketplace� A lack of financial literacy contributes to ill-informed financial decisions, and these decisions could, in turn, have tremendous adverse effects on both personal and, ultimately, global finance (OECD/INFE, 2009; OECD, 2009a; see also Gerardi et al�, 2010, for empirical analysis of financial literacy and mortgage delinquency)� As a result, financial literacy is now acknowledged as an important element of economic and financial stability and development� This is reflected in the G20 endorsement of the OECD/INFE (International Network on Financial Education) High-level Principles on National Strategies for Financial Education (G20, 2012; OECD/INFE, 2012), the OECD/INFE policy handbook on national strategies for financial education and core competencies on financial literacy for youth, and its statement supporting the widespread use of instruments to measure financial literacy, including the PISA financial literacy assessment (G20, 2013; OECD INFE, 2015b; OECD INFE, 2015c)�
Demographic and cultural shiftsIn most countries, longevity is increasing, and in many the birth rate is falling� At the same time, women’s participation in the labour force and the proportion of people entering higher education are both increasing, and grown-up children are less likely to continue to live in close proximity to older family members than in previous generations� The likely outcome of these shifts will be a greater need for financial security in retirement and professional care in old age, resulting in additional government expenditure (Colombo et al�, 2011)� Working-age adults may be expected to shoulder the tax burden to finance this expenditure while at the same time also saving for their own retirement, potentially repaying their own student loans, and managing increasingly varied working-life trajectories, which may include periods of inactivity, self-employment and/or retraining�
Risk shift and increased individual responsibilityThere has been a widespread transfer of risk from both governments and employers to individuals, meaning that now many people face the financial risks associated with longevity, investment, credit, out-of-pocket healthcare and long-term care� The number of financial decisions that individuals have to make, and the significance of these decisions, is increasing as a consequence of changes in the market and the economy� For instance, longer life expectancy means individuals need to ensure that they accumulate savings to cover much longer periods of retirement than previous generations, despite the steadily rising age of retirement in many countries� Traditional pay-as-you-go (PAYG) public pension schemes are supplemented by privately funded schemes in which the individual may be responsible for making investment decisions, including the contribution rate, the investment allocation and the type of pay-out product� Moreover, defined-contribution pension plans are quickly replacing defined-benefit pension plans for new entrants, shifting onto workers the risks of uncertain investment performance and of longer life expectancy�
Even when individuals use the services of financial intermediaries and advisors, they need to be financially literate in order to understand what is being offered or advised, and to manage the products they choose� They should also be aware that some advisors may face a conflict of interest� Depending on the national legal framework for financial advice, individuals may be fully responsible for the financial product they decide to purchase, facing all the direct consequences of their choice�

Pisa 2015 FiNaNCiaL LitERaCY FRaMEWORK5
PISA 2015 ASSESSMENT AND ANALYTICAL FRAMEWORK: SCIENCE, READING, MATHEMATIC AND FINANCIAL LITERACY © OECD 2016 81
Surveys show that a majority of workers are unaware of the risks they now have to face, and have neither sufficient financial knowledge nor the skills to manage such risks adequately, even if they are aware of them (OECD, 2008; Money and Pensions Panel, 2013; Barrett et al�, 2013)�
Greater supply of a wide range of financial products and servicesIn addition, in all countries, growing numbers of consumers have access to a wide range of financial products and services from a variety of providers, delivered through various channels�1 Greater financial inclusion in emerging economies, as well as worldwide developments in technology and deregulation have resulted in widening access to all kinds of financial products, from current accounts and remittances products to revolving credit and equity portfolios� The products available are also becoming more complex, and individuals are required to compare these products in a number of ways, such as the fees charged, interest rates paid or received, length of contract and exposure to risk� Individuals must also identify appropriate providers and delivery channels from the vast array of possibilities, including community groups, traditional financial institutions, online banks and mobile phone companies�
Increased demand for financial products and servicesEconomic and technological developments have brought greater global connectedness and massive changes in both the methods and frequency of communications and financial transactions, as well as in social interactions and consumer behaviour� Such changes have made it more important that individuals are able to interact with financial providers and their intermediaries� In particular, consumers often need access to financial services (including banks and other providers, such as post offices) in order to make and receive electronic payments, like income, remittances and online transactions, and even to conduct face-to-face transactions when cash or cheques are no longer favoured� Together, these trends have transferred the responsibility of major financial decisions to individuals, enlarged the options for the majority of the population (including new financial consumers) and increased the level of complexity they face� Against this backdrop, individuals are expected to be sufficiently financially literate to take the necessary steps to protect themselves and their relatives and ensure their financial well-being�
Expected benefits of financial education and improved levels of financial literacyExisting empirical evidence shows that young people and adults in both developed and emerging economies who have been exposed to good-quality financial education are subsequently more likely than others to plan ahead, save and engage in other responsible financial behaviours (Bernheim et al�, 2001; Cole et al�, 2011; Lusardi, 2009; Atkinson et al� 2015; Bruhn et al� 2013; Miller et al� 2014)� This evidence suggests a possible causal link between financial education and outcomes, and indicates that improved levels of financial literacy can lead to positive behaviour change�
Other research indicates a number of potential benefits of being financially literate� There is mounting evidence that in developed countries those with higher financial literacy are better able to manage their money, participate in the stock market and perform better on their portfolio choice, and that they are more likely to choose mutual funds with lower fees (Hastings and Tejeda-Ashton, 2008; Hilgert et al�, 2003; Lusardi and Mitchell, 2008, 2011; Stango and Zinman, 2009; van Rooij et al�, 2011; Yoong, 2011)� In emerging economies, financial literacy is shown to be correlated with holding basic financial products, like bank accounts, and buying insurance (OECD/INFE, 2013; Xu and Zia, 2012)� Similarly, 15-year-old students with bank accounts have higher levels of financial literacy than those without, on average across the OECD countries participating in the 2012 PISA exercise (OECD, 2014c)� Moreover, adults who have greater financial knowledge are more likely to accumulate more wealth (Lusardi and Mitchell, 2011)�
Higher levels of financial literacy have been found to be related not only to asset building but also to debt and debt management, with more financially literate individuals opting for less costly mortgages and avoiding high interest payments and additional fees (Gerardi et al�, 2010; Lusardi and Tufano, 2009a, 2009b; Moore et al�, 2003)�
In addition to the benefits identified for individuals, large-scale financial literacy can be expected to improve economic and financial stability for a number of reasons (OECD, 2005)� Financially literate consumers can make more informed decisions and demand higher-quality services, which can, in turn, encourage competition and innovation in the market� As individuals can protect themselves to a greater extent against income or expenditure shocks and are less likely to default on credit commitments, macro-level shocks are likely to have a lower impact on financially literate populations� Financially literate consumers are also less likely to react to market conditions in unpredictable ways, less likely to make unfounded complaints and more likely to take appropriate steps to manage the risks transferred to them� All of these factors can lead to a more efficient financial services sector� They can also ultimately help to reduce government aid (and taxation) aimed at assisting those who have taken unwise financial decisions – or no decision at all�

Pisa 2015 FiNaNCiaL LitERaCY FRaMEWORK5
82 © OECD 2016 PISA 2015 ASSESSMENT AND ANALYTICAL FRAMEWORK: SCIENCE, READING, MATHEMATIC AND FINANCIAL LITERACY
Box 5�1 OECD activities in relation to financial education
In 2002, the OECD initiated a far-reaching financial education project to address governments’ emerging concerns about the potential consequences of low levels of financial literacy� This project is serviced by the OECD Committee on Financial Markets and the Insurance and Private Pensions Committee in co-ordination with other relevant bodies, including the Education Policy Committee, on issues related to schools� The project takes a holistic approach to financial-consumer issues that highlights how, alongside improved financial access, adequate consumer protection and regulatory frameworks, financial education has a complementary role to play in promoting the outcome of financial literacy�
One of the first milestones of the financial education project was the adoption of the Recommendation on Principles and Good Practices for Financial Education and Awareness by the OECD Council (OECD, 2005a)� Alongside these recommendations, the publication, Improving Financial Literacy: Analysis of Issues and Policies, details the reasons for focusing on financial education, and provides a first international overview of financial education work being undertaken in various countries (OECD, 2005b)� The book also includes principles and good practices for policy makers and other stakeholders seeking to improve levels of financial literacy in their country� It is complemented by a global clearinghouse on financial education, the OECD International Gateway for Financial Education (www�financial-education�org/home�html), which gathers data, resources, research and news on financial education issues and programmes from around the world�
Recognising the increasingly global nature of financial literacy and education issues, in 2008 the OECD created the International Network on Financial Education (INFE) to benefit from and encompass the experience and expertise of developed and emerging economies� More than 240 public institutions from more than 110 countries and economies are members of the INFE (2015 figures)� Members meet twice a year to discuss the latest developments in their country, share their expertise, and collect evidence, as well as to develop analytical and comparative studies, methodologies, good practice, policy instruments and practical guidance on key priority areas�
Financial education for youth and in schools
The 2005 OECD Recommendation advised that “financial education should start at school� People should be educated about financial matters as early as possible in their lives” (OECD, 2005a)� Two main reasons underpin the OECD recommendation: the importance of focusing on youth in order to provide them with key life skills before they start to become active financial consumers; and the relative efficiency of providing financial education in schools rather than attempting remedial actions in adulthood�
At the time the OECD Recommendation was published, there was a lack of guidance on ways to implement financial education initiatives for youth and in schools� The OECD/INFE subsequently created a dedicated expert subgroup to develop policy and practical tools� The resulting publication was welcomed by G20 leaders in September 2013 (OECD, 2014b)� The publication includes guidelines for financial education in schools and guidance on financial education learning frameworks, which were also supported by the Ministers of Finance of the Asia-Pacific Economic Cooperation in August 2012�
Young people are increasingly seen as an important target group for financial education� A survey of individual financial literacy schemes supported by the European Commission (Habschick et al�, 2007) found that most were directed at children and young people; and stock-taking exercises launched by the OECD/INFE demonstrated that many OECD and non-OECD countries have developed or are developing programmes in schools to varying extents (OECD 2014b; Messy and Monticone, 2016a forthcoming, 2016b)�
Note: The Joint Ministerial Statement from the 2012 APEC Finance Ministerial Meeting is available at http://mddb�apec�org�
Focus on youthPeople form habits and behaviours from a young age, learning from their parents and others around them� This shows how important it is to intervene early to help shape beneficial behaviours and attitudes (Whitebread and Bingham, 2013)� Young people need to understand basic financial principles and practices from an early age in order to operate within the complex financial landscape they are likely to find themselves, often before reaching adulthood� Younger generations are
Pisa 2015 FiNaNCiaL LitERaCY FRaMEWORK5
PISA 2015 ASSESSMENT AND ANALYTICAL FRAMEWORK: SCIENCE, READING, MATHEMATIC AND FINANCIAL LITERACY © OECD 2016 83
not only likely to face ever-increasing complexity in financial products, services and markets, but, as noted above, they are more likely to have to bear more financial risks in adulthood than their parents� In particular, they are likely to bear more responsibility for planning their own retirement savings and investments, and covering their healthcare needs; and they will have to deal with more sophisticated and diverse financial products�
Young people may learn beneficial behaviours from their friends and family, such as prioritising their expenditure or putting money aside “for a rainy day”; but the recent changes in the financial marketplace and social welfare systems make it unlikely that they can gain adequate knowledge or information about these systems unless they work in related fields�2 The majority of young people will have to apply their skills to search for information and solve problems, and know when to make informed use of professional financial advice� Efforts to improve financial knowledge in the workplace or in other settings can be severely limited by a lack of early exposure to financial education and by a lack of awareness of the benefits of continuing financial education� It is therefore important to provide early opportunities for establishing the foundations of financial literacy�
In addition to preparing young people for their adult life, financial education for youth and in schools can also address the immediate financial issues facing young people� Children are often consumers of financial services from a young age� The results of the PISA 2012 financial literacy assessment revealed that, on average across the 13 participating OECD countries and economies, almost 60% of 15-year-old students have a bank account (OECD, 2014c)� Moreover, it is not uncommon for them to have accounts with access to online payment facilities or to use mobile phones (with various payment options) even before they become teenagers� Clearly, they would benefit from improved financial literacy skills� Before leaving school, they may also need to make decisions about issues such as scooter or car insurance, savings products and overdrafts�
In many countries, adolescents (around the age of 15 to 18) and their parents face one of their most important financial decisions: that is, whether or not to invest in tertiary education� The gap in wages between university-educated workers and those who had not attended university has widened in many economies (OECD, 2014a)� At the same time, the education costs borne by students and their families have increased, often resulting in large student loans to repay, and potentially leading towards a reliance on credit (Bradley, 2012; OECD, 2014b; Ratcliffe and McKernan, 2013; Smithers, 2010)�
Efficiency of providing financial education in schoolsResearch suggests that there is a link between financial literacy and a family’s economic and educational background: those who are more financially literate disproportionately come from highly educated families that hold a wide range of financial products (Lusardi et al�, 2010)� Results of the 2012 PISA financial literacy assessment show that, on average across OECD countries and economies, 14% of the variation in student performance in financial literacy within each country and economy is associated with the student’s socio-economic status, and that students with at least one parent who has tertiary-level education score higher, on average, than other students (OECD, 2014c)� In order to provide equal opportunities to all students, it is important to offer financial education to those who would not otherwise have access to it� Schools are well-positioned to advance financial literacy among all demographic groups and reduce gaps and inequalities in financial literacy, including across generations�
Recognising both the importance of financial literacy for youth and the unique potential to create more skilled and knowledgeable future generations, an increasing number of countries have begun to develop financial education programmes for children and young people� These are either dedicated to youth generally or to (some part of) the school population, and include programmes at the national, regional and local levels as well as pilot exercises�
The need for dataPolicy makers, educators and researchers need high-quality data on levels of financial literacy in order to inform financial education strategies and the implementation of financial education programmes in schools by identifying priorities and measuring change across time�
Several countries have undertaken national surveys of financial literacy across their adult population; and the OECD has developed a questionnaire designed to capture levels of financial literacy among adults at an international level, which was first piloted in 2010 and is now being used for a second international comparative study (Atkinson and Messy, 2012; OECD/INFE, 2011; OECD/INFE, 2015a)� However, until financial literacy was included in the 2012 PISA assessment, there were few efforts to collect data on the levels of financial literacy among young people under the age of 18, and none that could be compared across countries�

Pisa 2015 FiNaNCiaL LitERaCY FRaMEWORK5
84 © OECD 2016 PISA 2015 ASSESSMENT AND ANALYTICAL FRAMEWORK: SCIENCE, READING, MATHEMATIC AND FINANCIAL LITERACY
A robust measure of financial literacy among young people provides information at the national level that can indicate whether the current approach to financial education is effective� In particular, it can help to identify issues that need addressing through schools or extracurricular activities or programmes that will enable young people to be properly and equitably equipped to make financial decisions in adulthood� Such a measure can also be used as a baseline against which the success of school and other programmes can be assessed and reviewed in the future�
An international study provides additional benefits to policy makers and other stakeholders� Comparing levels of financial literacy across countries makes it possible to see which countries have the highest levels of financial literacy and begin to identify particularly effective national strategies and good practices� It also makes it possible to recognise common challenges and explore the possibility of finding international solutions to the issues faced�
Thus, collecting robust and internationally comparable financial literacy data in the student population provides policy makers, educators, curriculum and resource developers, researchers and others with:
• international evidence on how young people are distributed across the financial literacy proficiency scale, which can be used to develop more targeted programmes and policies
• an opportunity to compare financial education strategies across countries and explore good practice
• comparable data over time to track trends in financial literacy and potentially assess the association between financial literacy and the availability of financial education in schools�
In addition, developing a financial literacy assessment framework that is applicable across countries provides national authorities with detailed guidance about the scope and operational definition of financial literacy without having to fund national studies� As noted in the article, “Financial Literacy and Education Research Priorities”, there has been a gap in the research on financial literacy related to the lack of consistency in defining and measuring programme success� There is a need for researchers to develop a clear understanding of what it means to be ‘financially educated’” (Schuchardt et al�, 2009)�
Measuring financial literacy in PISAPISA 2012 was the first large-scale international study to assess the financial literacy of young people� PISA assesses the readiness of students for their life beyond compulsory schooling – and, in particular, their capacity to use knowledge and skills – by collecting and analysing cognitive and other information from 15-year-olds in countries and economies�
PISA financial literacy data provides a rich set of comparative data that policy makers and other stakeholders can use to make evidence-based decisions� International comparative data on financial literacy can answer questions such as, “How well are young people prepared for the new financial systems that are becoming more global and more complex?” and “In which countries/economies do students show high levels of financial literacy?”�
As with the core PISA domains of reading, mathematics and science, the main focus of the financial literacy assessment in PISA is on measuring the proficiency of 15-year-old students in demonstrating and applying knowledge and skills� And like the other PISA domains, financial literacy is assessed using an instrument designed to provide data that are valid, reliable and comparable�
The PISA financial literacy assessment framework developed in 2012 (OECD, 2013a) provided the first step in constructing an assessment that satisfies these three broad criteria� The main benefit of constructing an assessment framework is improved measurement, as it provides an articulated plan for developing the individual items and designing the instrument that will be used to assess the domain� A further benefit is that it provides a common language for discussion of the domain, thereby improving understanding of what is being measured� It also promotes an analysis of the kinds of knowledge and skills associated with competency in the domain, thus providing the groundwork for building a described proficiency scale or scales that can be used to interpret the results�
The development of the PISA frameworks can be described as a sequence of the following six steps:
• Develop a definition for the domain and a description of the assumptions that underlie that definition�
• Identify a set of key characteristics that should be taken into account when constructing assessment tasks for international use�
• Operationalise the set of key characteristics that will be used in test construction, with definitions based on existing literature and experience in conducting other large-scale assessments�

Pisa 2015 FiNaNCiaL LitERaCY FRaMEWORK5
PISA 2015 ASSESSMENT AND ANALYTICAL FRAMEWORK: SCIENCE, READING, MATHEMATIC AND FINANCIAL LITERACY © OECD 2016 85
• Evaluate how to organise the set of tasks constructed in order to report to policy makers and researchers on achievement in each assessment domain for 15-year-old students in participating countries�
• Validate the variables and assess the contribution each makes to understanding task difficulty across the various participating countries�
• Prepare a described proficiency scale for the results�
The 2015 framework maintains the definition of the domain used in 2012 while updating the operationalisation of the domain to ensure that it is in line with recent developments in financial markets and the latest research findings�
DEFiNiNG FiNaNCiaL LitERaCYIn developing a working definition of financial literacy that can be used as the basis for designing an international financial literacy assessment, the Financial Literacy Expert Group (FEG) looked both to existing PISA domain definitions of literacies and to articulations of the nature of financial education�
PISA conceives of literacy as students’ capacity to apply knowledge and skills in key subject areas and to analyse, reason and communicate effectively as they pose, solve and interpret problems in a variety of situations� PISA is forward-looking, focusing on young people’s ability to use their knowledge and skills to meet real-life challenges, rather than merely on the extent to which they have mastered specific curricular content (OECD, 2010a)�
In its Recommendation on Principles and Good Practices for Financial Education and Awareness, the OECD defined financial education as “the process by which financial consumers/investors improve their understanding of financial products, concepts and risks and, through information, instruction and/or objective advice, develop the skills and confidence to become more aware of financial risks and opportunities, to make informed choices, to know where to go for help, and to take other effective actions to improve their financial well-being” (OECD, 2005a)�
The FEG agreed that “understanding”, “skills” and the notion of applying understanding and skills (“effective actions”) were key elements of this definition� It was recognised, however, that the definition of financial education describes a process – education – rather than an outcome� What was required for the assessment framework was a definition encapsulating the outcome of that process in terms of competency or literacy�
The definition of financial literacy for PISA is as shown in Box 5�2�
Box 5�2 the 2015 definition of scientific literacy
Financial literacy is knowledge and understanding of financial concepts and risks, and the skills, motivation and confidence to apply such knowledge and understanding in order to make effective decisions across a range of financial contexts, to improve the financial well-being of individuals and society, and to enable participation in economic life.
This definition, like other PISA domain definitions, has two parts� The first part refers to the kind of thinking and behaviour that characterises the domain� The second part refers to the purposes for developing the particular literacy�
In the following paragraphs, each part of the definition of financial literacy is considered in turn to help clarify its meaning in relation to the assessment�
Financial literacy…Literacy is viewed as an expanding set of knowledge, skills and strategies, which individuals build on throughout life, rather than as a fixed quantity, a line to be crossed, with illiteracy on one side and literacy on the other� Literacy involves more than the reproduction of accumulated knowledge, although measuring prior financial knowledge is an important element in the assessment� It also involves a mobilisation of cognitive and practical skills, and other resources, such as attitudes, motivation and values� The PISA assessment of financial literacy draws on a range of knowledge and skills associated with the capacity to deal with the financial demands of everyday life and uncertain futures within contemporary society�
…is knowledge and understanding of financial concepts and risks…
Financial literacy is thus contingent on some knowledge and understanding of fundamental elements of the financial world, including key financial concepts as well as the purpose and basic features of financial products� This also includes risks that may threaten financial well-being as well as insurance policies and pensions� It can be assumed that 15-year-olds
Pisa 2015 FiNaNCiaL LitERaCY FRaMEWORK5
86 © OECD 2016 PISA 2015 ASSESSMENT AND ANALYTICAL FRAMEWORK: SCIENCE, READING, MATHEMATIC AND FINANCIAL LITERACY
are beginning to acquire this knowledge and gain experience of the financial environment that they and their families inhabit and the main risks they face� All of them are likely to have been shopping to buy household goods or personal items; some will have taken part in family discussions about money and whether what is wanted is actually needed or affordable; and a sizeable proportion of students will have already begun to earn and save money� Some students already have experience of financial products and commitments through a bank account or a mobile phone contract� A grasp of concepts such as interest, inflation, and value for money are soon going to be, if they are not already, important for their financial well-being�
…and the skills,…
These skills include generic cognitive processes, such as accessing information, comparing and contrasting, extrapolating and evaluating, applied in a financial context� They include basic skills in mathematical literacy, such as the ability to calculate a percentage, undertake basic mathematical operations or convert from one currency to another, and language skills, such as the capacity to read and interpret advertising and contractual texts�
…motivation and confidence…
Financial literacy involves not only the knowledge, understanding and skills to deal with financial issues, but also non-cognitive attributes: the motivation to seek information and advice in order to engage in financial activities, the confidence to do so, and the ability to manage emotional and psychological factors that influence financial decision making� These attributes are considered as a goal of financial education, as well as being instrumental in building financial knowledge and skills�
…to apply such knowledge and understanding in order to make effective decisions…
PISA focuses on the ability to activate and apply knowledge and understanding in real-life situations rather than on the ability to reproduce knowledge� In assessing financial literacy, this translates into a measure of young people’s ability to transfer and apply what they have learned about personal finance into effective decision making� The term “effective decisions” refers to informed and responsible decisions that satisfy a given need�
…across a range of financial contexts…
Effective financial decisions apply to a range of financial contexts that relate to young people’s present daily life and experience, but also to steps they are likely to take in the near future as adults� For example, young people may currently make relatively simple decisions such as how they will use their pocket money or, at most, which mobile phone contract they will choose; but they may soon be faced with major decisions about education and work options with long-term financial consequences�
…to improve the financial well-being of individuals and society…
Financial literacy in PISA is primarily conceived of as literacy around personal or household finance, distinguished from economic literacy, which includes concepts such as the theories of demand and supply, market structures and so on� Financial literacy is concerned with the way individuals understand, manage and plan their own and their households’ – which often means their families’ – financial affairs� It is recognised, however, that good financial understanding, management and planning on the part of individuals has some collective impact on the wider society, in contributing to national and even global stability, productivity and development�
…and to enable participation in economic life.
Like the other PISA literacy definitions, the definition of financial literacy implies the importance of the individual’s role as a thoughtful and engaged member of society� Individuals with a high level of financial literacy are better equipped to make decisions that are of benefit to themselves, and also to constructively support and critique the economic world in which they live�
ORGaNisiNG thE DOMaiN OF FiNaNCiaL LitERaCY
How the domain is represented and organised determines the assessment design, including item development and, ultimately, the evidence about student proficiencies that can be collected and reported� Many elements are part of the concept of financial literacy, not all of which can be taken into account in an assessment like PISA� It is necessary to select the elements that will best ensure construction of an assessment comprising tasks with an appropriate range of difficulty and a broad coverage of the domain�

Pisa 2015 FiNaNCiaL LitERaCY FRaMEWORK5
PISA 2015 ASSESSMENT AND ANALYTICAL FRAMEWORK: SCIENCE, READING, MATHEMATIC AND FINANCIAL LITERACY © OECD 2016 87
A review of approaches and rationales adopted in previous large-scale studies, and particularly in PISA, shows that most consider the relevant content, processes and contexts for assessment as they specify what they wish to assess� Content, processes and contexts can be thought of as three different perspectives on the area to be assessed�
• Content comprises the knowledge and understanding that are essential in the area of literacy in question�
• Processes describes the mental strategies or approaches that are called upon to negotiate the material�
• Contexts refers to the situations in which the domain knowledge, skills and understandings are applied, ranging from the personal to the global�
To construct the assessment, the different categories within each perspective are identified and weighted, and then a set of tasks is developed to reflect these categories� The three perspectives are also helpful in thinking about how achievement in the area is to be reported�
The following section examines each of the three perspectives and the framework categories into which they are divided� Examples of items drawn from the PISA 2012 field trial to illustrate these three different perspectives are available in the PISA 2012 Assessment and Analytical Framework (OECD, 2013b) and on the PISA website (www�oecd�org/pisa/)� While they are representative of those used in the main survey, these particular items are not used in the assessment instrument; only secure, unpublished items are used to protect the integrity of the data that is collected to measure student proficiency�
ContentThe content of financial literacy is conceived of as the areas of knowledge and understanding that must be drawn upon in order to perform a particular task� A review of the content of existing financial literacy learning frameworks from Australia, Brazil, England, Japan, Malaysia, the Netherlands, New Zealand, Northern Ireland, Scotland, South Africa and the United States indicates that there is some consensus on financial literacy content areas (OECD, 2014b)� The review shows that the content of financial education in schools was similar, albeit with some cultural differences, and that it was possible to identify a series of topics commonly included in these frameworks� These topics form the four content areas of the PISA financial literacy assessment: money and transactions, planning and managing finances, risk and reward, and financial landscape� Further work undertaken by the OECD/INFE to develop a core-competencies framework on financial literacy for young people provides additional guidance on how these content areas are mapped to desired outcomes (OECD/INFE, 2015c)�
Money and transactionsThis content area includes awareness of the different forms and purposes of money and managing monetary transactions, which may include spending or making payments, taking into account value for money, and using bank cards, cheques, bank accounts and currencies� It also covers practices such as taking care of cash and other valuables, calculating value for money, and filing documents and receipts�
Tasks in this content area can ask students to show that they are:
• Aware of the different forms and purposes of money� Students can:
– Recognise bank notes and coins�
– Understand that money can be exchanged for goods and services�
– Identify different ways to pay for items purchased in person or at a distance (from a catalogue or on line, for example)�
– Recognise that there are various ways of receiving money from other people and transferring money between people or organisations, such as cash, cheques, card payments in person or on line, or electronic transfers on line or via SMS�
– Understand that money can be borrowed or lent, and the purpose of interest (taking into account that the payment and receipt of interest is forbidden in some religions)�
• Confident and capable of handling and monitoring transactions� Students can:
– Use cash, cards and other payment methods to purchase items�
– Use cash machines to withdraw cash or to get an account balance�
– Calculate the correct change�
– Work out which of two consumer items of different sizes would give better value for money, taking into account the individual’s specific needs and circumstances�
– Check transactions listed on a bank statement and note any irregularities�

Pisa 2015 FiNaNCiaL LitERaCY FRaMEWORK5
88 © OECD 2016 PISA 2015 ASSESSMENT AND ANALYTICAL FRAMEWORK: SCIENCE, READING, MATHEMATIC AND FINANCIAL LITERACY
Planning and managing financesIncome, expenditure and wealth need planning and managing over both the short term and long term� This content area reflects the process of managing, planning and monitoring income and expenses and understanding ways of enhancing wealth and financial well-being� It includes content related to credit use as well as savings and wealth creation�
Tasks in this content area can ask students to show that they know about and can:
• Monitor and control income and expenses� Students can:
– Identify various types of income (e�g� allowances, salary, commission, benefits,) and ways of discussing income (such as hourly wage and gross or net annual income)�
– Draw up a budget to plan regular spending and saving and live within it�
• Use income and other available resources in the short and long term to enhance financial well-being� Students can:
– Understand how to manipulate various elements of a budget, such as identifying priorities if income does not meet planned expenses, or finding ways to increase savings, such as reducing expenses or increasing income�
– Assess the impact of different spending plans and be able to set spending priorities in the short and long term�
– Plan ahead to pay future expenses: for example, working out how much money needs to be saved each month to make a particular purchase or pay a bill�
– Understand the purposes of accessing credit and the ways in which expenditure can be smoothed over time through borrowing or saving�
– Understand the idea of building wealth, the impact of compound interest on savings, and the pros and cons of investment products�
– Understand the benefits of saving for long-term goals or anticipated changes in circumstance, such as living independently�
– Understand how government taxes and benefits affect personal and household finances�
Risk and rewardRisk and reward is a key area of financial literacy� It incorporates the ability to identify ways of balancing and covering risks and managing finances in uncertainty with an understanding of the potential for financial gains or losses across a range of financial contexts� There are two types of risk of particular importance in this domain� The first relates to financial losses that an individual cannot bear, such as those caused by catastrophic or repeated costs� The second is the risk inherent in financial products, such as credit agreements with variable interest rates, or investment products� This content area therefore includes knowledge of the types of products that may help people to protect themselves from the consequences of negative outcomes, such as insurance and savings, as well as the ability to assess the level of risk and reward related to different products, purchases, behaviours or external factors�
Tasks in this content area can ask students to show that they:
• Recognise that certain financial products, including insurance, and processes, such as saving, can be used to manage and offset various risks, depending on different needs and circumstances� Students know how to assess whether certain insurance policies may be of benefit�
• Understand the benefits of contingency planning, diversification and the dangers of default on payment of bills and credit agreements� Students can apply this knowledge to decisions about:
– limiting the risk to personal capital
– various types of investment and savings vehicles, including formal financial products and insurance products, where relevant
– various forms of credit, including informal and formal credit, unsecured and secured, rotating and fixed term, and those with fixed or variable interest rates
• Know about and can manage risks and rewards associated with life events, the economy and other external factors, such as the potential impact of:
– theft or loss of personal items, job loss, birth or adoption of a child, deteriorating health or mobility
– fluctuations in interest rates and exchange rates
– other market changes

Pisa 2015 FiNaNCiaL LitERaCY FRaMEWORK5
PISA 2015 ASSESSMENT AND ANALYTICAL FRAMEWORK: SCIENCE, READING, MATHEMATIC AND FINANCIAL LITERACY © OECD 2016 89
• Know about the risks and rewards associated with substitutes for financial products, particularly:
– saving in cash, or buying property, livestock or gold as a store of wealth
– taking credit or borrowing money from informal lenders
• Know that there may be unidentified risks and rewards associated with new financial products (examples may include innovative digital finance or “crowd funding”, but, by definition, such a list will change over time)�
Financial landscapeThis content area relates to the character and features of the financial world� It covers awareness of the role of regulation and consumer protection, knowing the rights and responsibilities of consumers in the financial marketplace and within the general financial environment, and the main implications of financial contracts� Information resources are also topics relevant to this content area� In its broadest sense, financial landscape also incorporates an understanding of the consequences of changes in economic conditions and public policies, such as changes in interest rates, inflation, taxation or welfare benefits for individuals, households and society�
Tasks in this content area can ask students to show that they:
• Are aware of the role of regulation and consumer protection�
• Know about rights and responsibilities� Students can:
– Understand that buyers and sellers have rights, such as being able to apply for redress�
– Understand that buyers and sellers have responsibilities, such as giving accurate information when applying for financial products (consumers and investors), disclosing all material facts (providers); and being aware of the implications of one of the parties not doing so (consumers and investors)�
– Recognise the importance of the legal documentation provided when purchasing financial products or services and the importance of understanding the content�
• Know and understand the financial environment� Students:
– Can identify which providers are trustworthy, and which products and services are protected through regulation or consumer-protection laws�
– Can identify whom to ask for advice when choosing financial products, and where to go for help or guidance in relation to financial matters�
– Are aware of existing financial crimes, such as identity theft and scams, knowledge of how to take appropriate precautions to protect personal data and avoid other scams, and knowledge of their rights and responsibilities in the event that they are a victim�
– Are aware of the potential for new forms of financial crime and awareness of the risks�
• Know and understand the impact of their own financial decisions on themselves and others� Students:
– Understand that individuals have choices in spending and saving, and each action can have consequences for the individual and for society�
– Recognise how personal financial habits, actions and decisions have an impact at an individual, community, national and international level�
• Understand the influence of economic and external factors� Students:
– Are aware of the economic climate and understand the impact of policy changes, such as reforms related to the funding of post-school training or compulsory savings for retirement�
– Understand how the ability to build wealth or access credit depends on economic factors, such as interest rates, inflation and credit scores�
– Understand that a range of external factors, such as advertising and peer pressure, can affect individuals’ financial choices and outcomes�
ProcessesThe process categories relate to cognitive processes� They are used to describe students’ ability to recognise and apply concepts relevant to the domain, and to understand, analyse, reason about, evaluate and suggest solutions� PISA defines four process categories for financial literacy: identify financial information, analyse information in a financial context,

Pisa 2015 FiNaNCiaL LitERaCY FRaMEWORK5
90 © OECD 2016 PISA 2015 ASSESSMENT AND ANALYTICAL FRAMEWORK: SCIENCE, READING, MATHEMATIC AND FINANCIAL LITERACY
evaluate financial issues and apply financial knowledge and understanding� While the verbs used here bear some resemblance to those in Bloom’s taxonomy of educational objectives (Bloom, 1956), an important distinction is that the processes in the financial literacy construct are not operationalised as a hierarchy of skills� They are, instead, parallel essential cognitive approaches, all of which are part of the financially literate individual’s repertoire� The order in which the processes are presented here relates to a typical sequence of thought processes and actions, rather than to an order of difficulty or challenge� At the same time, it is recognised that financial thinking, decisions and actions are most often dependent on a recursive and interactive blend of the processes described in this section� For the purposes of the assessment, each task is identified with the process that is judged most central to its completion�
Identify financial informationThis process is engaged when the individual searches and accesses sources of financial information, and identifies or recognises its relevance� In PISA 2015 the information is in the form of texts, such as contracts, advertisements, charts, tables, forms and instructions displayed on a screen� A typical task might ask students to identify the features of a purchase invoice, or recognise the balance on a bank statement� A more difficult task might involve searching through a contract that uses complex legal language to locate information that explains the consequences of defaulting on loan repayments� This process category is also reflected in tasks that involve recognising financial terminology, such as identifying “inflation” as the term used to describe increasing prices over time�
Analyse information in a financial contextThis process covers a wide range of cognitive activities undertaken in financial contexts, including interpreting, comparing and contrasting, synthesising, and extrapolating from information that is provided� Essentially, it involves recognising something that is not explicit: identifying the underlying assumptions or implications of an issue in a financial context� For example, a task may involve comparing the terms offered by different mobile phone contracts, or working out whether an advertisement for a loan is likely to include unstated conditions� An example in this process category is provided below, in the unit SHARES�
Evaluate financial issuesIn this process, the focus is on recognising or constructing financial justifications and explanations, drawing on financial knowledge and understanding applied in specified contexts� It involves such cognitive activities as explaining, assessing and generalising� Critical thinking is brought into play in this process, when students must draw on knowledge, logic and plausible reasoning to make sense of and form a view about a finance-related problem� The information that is required to deal with such a problem may be partly provided in the stimulus of the task, but students will need to connect such information with their own prior financial knowledge and understanding�
In the PISA context, any information that is required to understand the problem is intended to be within the expected range of experiences of a 15-year-old – either direct experiences or those that can be readily imagined and understood� For example, it is assumed that 15-year-olds are likely to be able to identify with the experience of wanting something that is not essential, such as a music player or games console� A task based on this scenario could ask about the factors that might be considered in determining the relative financial merits of making a purchase or deferring it, given specified financial circumstances�
Apply financial knowledge and understandingThe fourth process picks up a term from the definition of financial literacy: “to apply such [financial] knowledge and understanding”� It focuses on taking effective action in a financial setting by using knowledge of financial products and contexts, and understanding of financial concepts� This process is reflected in tasks that involve performing calculations and solving problems, often taking into account multiple conditions� An example of this kind of task is calculating the interest on a loan over two years� This process is also reflected in tasks that require recognition of the relevance of prior knowledge in a specific context� For example, a task might require the student to work out whether purchasing power will decline or increase over time when prices are changing at a given rate� In this case, knowledge about inflation needs to be applied�
ContextsDecisions about financial issues are often dependent on the contexts or situations in which they are presented� By situating tasks in a variety of contexts, the assessment offers the possibility of connecting with the broadest possible range of individual interests across a variety of situations in which individuals need to function in the 21st century�

Pisa 2015 FiNaNCiaL LitERaCY FRaMEWORK5
PISA 2015 ASSESSMENT AND ANALYTICAL FRAMEWORK: SCIENCE, READING, MATHEMATIC AND FINANCIAL LITERACY © OECD 2016 91
Certain situations will be more familiar to 15-year-olds than others� In PISA, assessment tasks are framed in situations of general life, which may include but are not confined to school contexts� The focus may be on the individual, family or peer group, on the wider community, or even on a global scale�
As a starting point, the Financial Literacy Expert Group (FEG) looked at the contexts used in the Programme for the International Assessment of Adult Competencies (PIAAC) literacy framework: education and work, home and family, leisure and recreation, and community and citizenship (PIAAC Literacy Expert Group, 2009)� For the purposes of the financial literacy domain, the heading leisure and recreation was replaced by individual to reflect the fact that many of the financial interactions that young people have are related to themselves as individual consumers� Such interactions may include leisure and recreation, but are not limited to these� It was further decided to replace community and citizenship with societal� While community and citizenship captures the idea of a perspective wider than the personal, it was felt that the term community was not wide enough�
Societal, by contrast, implicitly encompasses national and global situations as well as the more local, thus better fitting the potential reach of financial literacy� The contexts identified for the PISA financial literacy assessment are, then, education and work, home and family, individual and societal�
Education and workThe context of education and work is of great importance to young people� Virtually all 15-year-olds will be starting to think about financial matters related to both education and work, whether they are spending existing earnings, considering future education options or planning their working life�
The educational context is obviously relevant to PISA students, since they are, by definition, a sample of the school-based population; indeed, many of them will continue in education or training for some time� However, many 15-year-old students are also already engaged in some form of paid work outside school hours making the work context equally valid� In addition, many will move from education into some form of employment, including self-employment, before reaching their 20s�
Typical tasks within this context could include understanding payslips, planning to save for tertiary education, investigating the benefits and risks of taking out a student loan, and participating in workplace savings schemes�
Home and familyHome and family includes financial issues relating to the costs involved in running a household� Family is the most likely household circumstance for 15-year-olds; however, this category also encompasses households that are not based on family relationships, such as the kind of shared accommodation that young people often use shortly after leaving the family home� Tasks within this context may include buying household items or family groceries, keeping records of family spending, and making plans for family events� Decisions about budgeting and prioritising spending may also be framed within this context�
IndividualThe context of the individual is important within personal finance since there are many decisions that a person takes entirely for personal benefit or gratification, and many risks and responsibilities that must be borne by individuals� These decisions span essential personal needs as well as leisure and recreation� They include choosing personal products and services, such as clothing, toiletries or haircuts, buying consumer goods, such as electronic or sports equipment, and more long-term commitments, such as season tickets or a gym membership� They also cover the process of making personal decisions and the importance of ensuring individual financial security, such as keeping personal information safe and being cautious about unfamiliar products�
Although the decisions made by an individual may be influenced by the family and society (and may ultimately affect society), when it comes to opening a bank account, buying shares or getting a loan, it is typically the individual who has the legal responsibility and ownership� The context individual therefore includes contractual issues around events such as opening a bank account, purchasing consumer goods, paying for recreational activities, and dealing with relevant financial services that are often associated with larger consumption items, such as credit and insurance�
SocietalThe environment young people are living in is characterised by change, complexity and interdependence� Globalisation is creating new forms of interdependence where actions are subject to economic influences and consequences that

Pisa 2015 FiNaNCiaL LitERaCY FRaMEWORK5
92 © OECD 2016 PISA 2015 ASSESSMENT AND ANALYTICAL FRAMEWORK: SCIENCE, READING, MATHEMATIC AND FINANCIAL LITERACY
stretch well beyond the individual and the local community� While the core of the financial literacy domain is focused on personal finances, the societal context recognises that individual financial well-being cannot be entirely separated from the rest of society� Personal financial well-being affects and is affected by the local community, the nation and even global activities� Financial literacy within this context includes such matters as being informed about consumer rights and responsibilities, understanding the purpose of taxes and local government charges, being aware of business interests, and taking into account the role of consumer purchasing power� It also extends to considering financial choices, such as donating to non-profit organisations and charities�
Non-cognitive factorsThe PISA working definition of financial literacy includes the non-cognitive terms motivation and confidence, attitudes which, according to some, have an influence on money-management behaviour (Johnson and Staten, 2010)� PISA conceives of both financial attitudes and behaviour as aspects of financial literacy in their own right� Attitudes and behaviour are also of interest in terms of their interactions with the cognitive elements of financial literacy� Information collected about the financial attitudes and behaviour of 15-year-olds could also constitute useful baseline data for any longitudinal study of the financial literacy of adults, including their financial behaviours�
The Financial Literacy Expert Group identified four non-cognitive factors to include in the framework: access to information and education, access to money and financial products, attitudes towards and confidence about financial matters, and spending and saving behaviour.
Access to information and educationThere are various sources of financial information and education that may be available to students, including informal discussion with friends, parents or other family members, information from the financial sector, as well as formal school education� The literature in this area often refers to the process of “financial socialisation”, which can be seen as the process of acquiring financial literacy� Parents have a major role in the financial socialisation of children but, as discussed above, they may not have been exposed to all the financial contexts and decisions that their children face (Gudmondson and Danes, 2011; Otto, 2013)� Copying and discussing financial behaviours with friends can be another important source of socialisation, but this also may vary in terms of quality and reliability, with recent research from the UK indicating that money is rarely talked about honestly (Money Advice Service, 2014)� In addition, the amount and quality of formal education and training about money and personal finance received by students varies within and across countries (OECD, 2014b, 2014c)�
Data about students’ access to financial information and education can be collected through both the student questionnaire and the questionnaire for school principals� In the student questionnaire, students can be asked about their typical sources of information in order to analyse the extent to which each source is correlated with financial literacy� This is intended to provide a description of students’ main sources of financial socialisation, rather than assessing whether they understand the importance of using appropriate sources of information or advice, which is covered in the cognitive assessment� Students can also be asked about the types of tasks that they face and the financial concepts they are exposed to during curricular classes� The school questionnaire can ask principals about the availability and quality of financial education in their schools� Evidence about the extent to which there is a link between levels of financial literacy and financial education inside and outside schools is likely to be particularly useful in shaping education programmes for improving financial literacy�
Access to money and financial productsThe results of the 2012 PISA financial literacy exercise showed that, in the Flemish Community of Belgium, Estonia, New Zealand and Slovenia, students with a bank account scored higher in financial literacy than students with similar socio-economic status who did not hold a bank account (OECD, 2014c)� While this does not indicate a causal relationship, it is plausible to assume that real-life experiences of financial products may influence young people’s financial literacy and vice versa� Personal experience may come, for example, from using financial products, such as payment cards, from dealing with the banking system, or from occasional working activities outside of school hours�
Students who have had more personal experience in dealing with financial matters from earning money or receiving an allowance might also be expected to perform better on the cognitive assessment than those without such experience� However, a recent review suggests that the key factor may not be experience, but the extent to which parents are involved in the spending decisions made by young people, with higher financial literacy associated with more involved parents (Drever et al�, 2015)� The 2015 framework recognises the importance of knowing whether students have access to money and financial products�

Pisa 2015 FiNaNCiaL LitERaCY FRaMEWORK5
PISA 2015 ASSESSMENT AND ANALYTICAL FRAMEWORK: SCIENCE, READING, MATHEMATIC AND FINANCIAL LITERACY © OECD 2016 93
Attitudes towards and confidence about financial mattersThe PISA definition of financial literacy highlights the important role of attitudes� Individual preferences can determine financial behaviour and affect the ways in which financial knowledge is used� PISA 2012 showed that students’ perseverance and openness to problem solving were strongly associated with their financial literacy scores (OECD, 2014c)� In addition, the extent to which students believe that they are in control of their future, and their preference for current consumption may influence their financial decisions, their independence, and their propensity to learn how to make plans for their own financial security (Golsteyn et al�, 2013; Lee and Mortimer, 2009; Meier and Sprenger, 2013)�
Confidence in one’s own ability to make a financial decision may also be a key driver in explaining who will work through complex financial problems or make choices across several possible products� At the same time, however, confidence may turn into overconfidence, leading to a tendency to mistakes and overly risky decisions� The 2015 framework recognises the importance of a student’s perception of his or her own financial knowledge and skills�
Spending and saving behaviourWhile items in the cognitive assessment test students’ ability to make particular spending and savings decisions, it is also useful to have some measure of what their actual (reported) behaviour is: that is, how students save and spend in practice� The PISA financial literacy assessment provides the opportunity to look at the potential relationship between 15-year-olds’ spending and saving behaviour and their results on the cognitive financial literacy assessment�
assEssiNG FiNaNCiaL LitERaCYThe structure of the assessmentIn 2012, the PISA financial literacy assessment was developed as a one-hour, paper-based exercise to be completed in addition to one hour of material from other cognitive domains� The financial literacy assessment was composed of 40 items divided into two clusters, chosen from 75 tasks that were used in the field trial� The selection of items was made based on their psychometric properties, such as ensuring that each item distinguished between high- and low-scoring students�
In 2015, items are transferred to a computer-based platform� Additional items were developed for this form of delivery in order to replace items that had been released in the report of the 2012 results� The 2015 financial literacy assessment was developed as a one-hour exercise, comprising 43 items divided into two clusters�
As with other PISA assessment domains, computer-based financial literacy items are grouped in units composed of one or two items based around a common stimulus� The selection includes financially-focused stimulus material in diverse formats, including prose, diagrams, tables, charts and illustrations� All financial literacy assessments include a broad sample of items covering a range of difficulty that allows for measuring and describing the strengths and weaknesses of students and key subgroups of students�
Response formats and codingSome PISA items require short descriptive responses; others require more direct responses of one or two sentences or a calculation, while some can be answered by checking a box� Decisions about the form in which the data are collected – the response formats of the items – are based on what is considered appropriate given the kind of evidence that is being collected, and also on technical and pragmatic considerations� In the financial literacy assessment as in other PISA assessments, two broad types of items are used: constructed-response items and selected-response items�
Constructed-response items require students to generate their own answers� The format of the answer may be a single word or figure, or may be longer – a few sentences or a worked calculation� Constructed-response items that require a more extended answer are ideal for collecting information about students’ capacity to explain decisions or demonstrate a process of analysis�
The second broad type of item in terms of format and coding is selected response� This kind of item requires students to choose one or more alternatives from a given set of options� The most common type in this category is the simple multiple-choice item, which requires the selection of one from a set of (usually) four options�
A second type of selected-response item is complex multiple choice, in which students respond to a series of “Yes/No”-type questions� Selected-response items are typically regarded as most suitable for assessing items associated with identifying and recognising information, but they are also a useful way of measuring students’ understanding of higher-order concepts that they themselves may not easily be able to express�
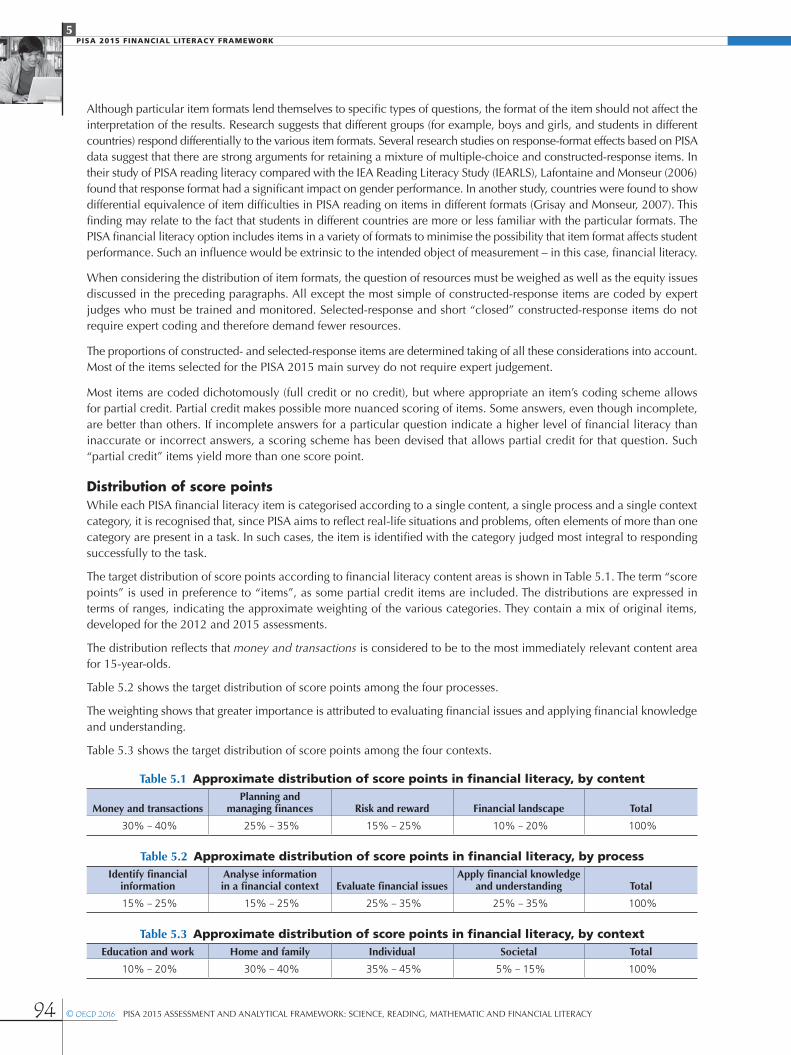
Pisa 2015 FiNaNCiaL LitERaCY FRaMEWORK5
94 © OECD 2016 PISA 2015 ASSESSMENT AND ANALYTICAL FRAMEWORK: SCIENCE, READING, MATHEMATIC AND FINANCIAL LITERACY
Although particular item formats lend themselves to specific types of questions, the format of the item should not affect the interpretation of the results� Research suggests that different groups (for example, boys and girls, and students in different countries) respond differentially to the various item formats� Several research studies on response-format effects based on PISA data suggest that there are strong arguments for retaining a mixture of multiple-choice and constructed-response items� In their study of PISA reading literacy compared with the IEA Reading Literacy Study (IEARLS), Lafontaine and Monseur (2006) found that response format had a significant impact on gender performance� In another study, countries were found to show differential equivalence of item difficulties in PISA reading on items in different formats (Grisay and Monseur, 2007)� This finding may relate to the fact that students in different countries are more or less familiar with the particular formats� The PISA financial literacy option includes items in a variety of formats to minimise the possibility that item format affects student performance� Such an influence would be extrinsic to the intended object of measurement – in this case, financial literacy�
When considering the distribution of item formats, the question of resources must be weighed as well as the equity issues discussed in the preceding paragraphs� All except the most simple of constructed-response items are coded by expert judges who must be trained and monitored� Selected-response and short “closed” constructed-response items do not require expert coding and therefore demand fewer resources�
The proportions of constructed- and selected-response items are determined taking of all these considerations into account� Most of the items selected for the PISA 2015 main survey do not require expert judgement�
Most items are coded dichotomously (full credit or no credit), but where appropriate an item’s coding scheme allows for partial credit� Partial credit makes possible more nuanced scoring of items� Some answers, even though incomplete, are better than others� If incomplete answers for a particular question indicate a higher level of financial literacy than inaccurate or incorrect answers, a scoring scheme has been devised that allows partial credit for that question� Such “partial credit” items yield more than one score point�
Distribution of score pointsWhile each PISA financial literacy item is categorised according to a single content, a single process and a single context category, it is recognised that, since PISA aims to reflect real-life situations and problems, often elements of more than one category are present in a task� In such cases, the item is identified with the category judged most integral to responding successfully to the task�
The target distribution of score points according to financial literacy content areas is shown in Table 5�1� The term “score points” is used in preference to “items”, as some partial credit items are included� The distributions are expressed in terms of ranges, indicating the approximate weighting of the various categories� They contain a mix of original items, developed for the 2012 and 2015 assessments�
The distribution reflects that money and transactions is considered to be to the most immediately relevant content area for 15-year-olds�
Table 5�2 shows the target distribution of score points among the four processes�
The weighting shows that greater importance is attributed to evaluating financial issues and applying financial knowledge and understanding�
Table 5�3 shows the target distribution of score points among the four contexts�
Table 5.1 approximate distribution of score points in financial literacy, by content
Money and transactions Planning and
managing finances Risk and reward Financial landscape Total
30% – 40% 25% – 35% 15% – 25% 10% – 20% 100%
Table 5.2 approximate distribution of score points in financial literacy, by processIdentify financial
informationAnalyse information in a financial context Evaluate financial issues
Apply financial knowledge and understanding Total
15% – 25% 15% – 25% 25% – 35% 25% – 35% 100%
Table 5.3 approximate distribution of score points in financial literacy, by contextEducation and work Home and family Individual Societal Total
10% – 20% 30% – 40% 35% – 45% 5% – 15% 100%

Pisa 2015 FiNaNCiaL LitERaCY FRaMEWORK5
PISA 2015 ASSESSMENT AND ANALYTICAL FRAMEWORK: SCIENCE, READING, MATHEMATIC AND FINANCIAL LITERACY © OECD 2016 95
Consistent with an assessment of personal financial literacy of 15-year-olds, there is a clear emphasis on individual, but also a weighting towards the financial interests of the household or family unit� Education and work and societal contexts are given less emphasis, but included in the scheme as they are important elements of financial experience�
thE iMPaCt OF OthER DOMaiN KNOWLEDGE aND sKiLLs ON FiNaNCiaL LitERaCYA certain level of numeracy (or mathematical literacy) is regarded as a prerequisite for financial literacy� Huston (2010) argues that “if an individual struggles with arithmetic skills, this will certainly impact his/her financial literacy� However, available tools (e�g� calculators) can compensate for these deficiencies; thus, information directly related to successfully navigating personal finances is a more appropriate focus than numeracy skills for a financial literacy measure”� Mathematically-related proficiencies, such as number sense, familiarity with multiple representations of numbers, and skills in mental calculation, estimation and the assessment of reasonableness of results, are intrinsic to some aspects of financial literacy�
On the other hand, there are large areas where the content of mathematical literacy and financial literacy do not intersect� As defined in the PISA 2012 mathematics literacy framework, mathematical literacy incorporates four content areas: change and relationships, space and shape, quantity and uncertainty� Of these, only quantity directly intersects with the content of the PISA financial literacy assessment� Unlike the mathematical literacy content area uncertainty, which requires students to apply probability measures and statistics, the financial literacy content area risk and reward requires an understanding of the features of a particular situation or product that indicate a that there will be a risk of losing money and (sometimes) a possibility of gains� This is a non-numeric appreciation of the way financial well-being can be affected by chance and an awareness of the related products and actions to protect against loss�
In the financial literacy assessment, the quantity-related proficiencies described above are applied to problems requiring more financial knowledge than can be expected in the mathematical literacy assessment� Similarly, knowledge about financial matters and the ability to apply such knowledge and reasoning in financial contexts (in the absence of any specifically mathematical content) characterise much of all four content areas of financial literacy: money and transactions, planning and managing finances, risk and reward and financial landscape� Figure 5�1 represents the relationship between the content of mathematical literacy and financial literacy in PISA�
Financial literacy
Content related to change and relationships, space and shape, uncertainty, and quantity not related to finance
Content assessed by items that require that students solve mathematical literacy problems in a familiar financial context where the underlying mathematics is not explicit
Content assessed by a number of basic
arithmetic items that require students to apply knowledge
in an everyday financial context
Content assessed by items that require some number sense and require students to apply more specialised financial knowledge� Any mathematics is minimal and explicit
Financial literacy content (excluding arithmetic processing) related to money and transactions, planning and managing finances, risk and reward and financial landscape
Mathematical literacy
Figure 5�1 • Relationship between the content of financial literacy and mathematical literacy in Pisa

Pisa 2015 FiNaNCiaL LitERaCY FRaMEWORK5
96 © OECD 2016 PISA 2015 ASSESSMENT AND ANALYTICAL FRAMEWORK: SCIENCE, READING, MATHEMATIC AND FINANCIAL LITERACY
Operationally, there are few items populating the portion of the diagram where the two circles intersect� In the financial literacy assessment, the nature of the mathematical literacy expected is basic arithmetic: the four operations (addition, subtraction, multiplication and division) with whole numbers, decimals and common percentages� Such arithmetic occurs as an intrinsic part of the financial literacy context and enables financial literacy knowledge to be applied and demonstrated�
Items that require such arithmetic skills involve basic mathematics of a level within the reach of most 15-year-olds� Use of financial formulae (requiring knowledge of algebra) is not considered appropriate� Dependence on calculation is minimised in the assessment; tasks are framed in such a way as to avoid the need for substantial or repetitive calculation� The calculators used by students in their classrooms and on the PISA mathematics assessment are also available in the financial literacy assessment, but success in the items will not depend on their use�
A similar reasoning holds for reading skills� It is assumed that all students taking part in the financial literacy assessment will have some basic reading proficiency, even while it is known from previous PISA surveys that reading skill varies widely both within and across countries (OECD, 2010b)� To minimise the level of reading literacy required, stimulus material and task statements are generally designed to be as clear, simple and brief as possible� In some cases, however, the stimulus may deliberately present complex or somewhat technical language� The capacity to read and interpret the language of financial documents or pseudo financial documents is regarded as part of financial literacy�
Highly technical terminology relating to financial matters is avoided� The Financial Literacy Expert Group has advised on terms that it judges reasonable to expect 15-year-olds to understand� Some of these terms may be the focus of assessment tasks�
In practice, the results of the 2012 PISA financial literacy assessment gave a more precise measure of students’ performance in financial literacy in comparison with reading and mathematics performance� The results indicated that around 25% of the financial literacy score reflected factors that are uniquely captured by the financial literacy assessment, while the remaining 75% of the financial literacy score reflected skills measured in the mathematics and/or reading assessments�
The association between financial literacy and other domains indicates that, in general, students who perform at higher levels in mathematics and/or reading also perform well in financial literacy� There were, however, wide variations in financial literacy performance for any given level of performance in mathematics and reading, meaning that the skills measured by the financial literacy assessment went beyond or fell short of the ability to use the knowledge that students acquired from subjects taught in compulsory education� For instance, in Australia, the Flemish Community of Belgium, the Czech Republic, Estonia, New Zealand and the Russian Federation, students performed better in financial literacy than students in other countries with similar performance in mathematics and reading, while, by contrast, in France, Italy and Slovenia, students’ performance in financial literacy was lower, on average, when compared to that of students in the other participating countries and economies who displayed the same level of proficiency in reading and mathematics (OECD, 2014c)�
REPORtiNG FiNaNCiaL LitERaCYThe data from the 2012 financial literacy assessment is held in a database separate from the main PISA database� In 2015, the data from all domains is presented together� The databases include, for the sampled students, their financial literacy, mathematics and reading cognitive results, the behaviour data from the short questionnaire on financial literacy, and data from the general student questionnaire and school questionnaire�
In each PISA cycle, financial literacy is reported as an independent result, and in relation to performance in other domains, financial behaviour, and to some background variables, such as socio-economic status and immigrant background� The data also allow for the development of further work under the aegis of the OECD Project on Financial Education�
The financial literacy cognitive data is scaled similarly to the other PISA data� A comprehensive description of the modelling technique used for scaling can be found in the PISA 2012 Technical Report (OECD, 2014d)�
Each item is associated with a particular point on the PISA financial literacy scale that indicates its difficulty, and each student’s performance is associated with a particular point on the same scale that indicates the student’s estimated proficiency�
As with the other PISA domains, the relative difficulty of tasks in a test is estimated by considering the proportion of test takers answering each question correctly� The relative proficiency of students taking a particular test is estimated by considering the proportion of test items that they answer correctly� A single continuous scale showing the relationship between the difficulty of items and the proficiency of students is constructed�

Pisa 2015 FiNaNCiaL LitERaCY FRaMEWORK5
PISA 2015 ASSESSMENT AND ANALYTICAL FRAMEWORK: SCIENCE, READING, MATHEMATIC AND FINANCIAL LITERACY © OECD 2016 97
Starting from the 2012 assessment, the scale was divided into levels, according to a set of statistical principles, and then descriptions were generated based on the tasks located within each level, to encapsulate the kinds of skills and knowledge needed to complete those tasks successfully� The scale and set of descriptions are known as a described proficiency scale�
By calibrating the difficulty of each item, it is possible to locate the degree of financial literacy that the item represents� By showing the proficiency of each student on the same scale, it is possible to describe the degree of financial literacy that the student possesses� The described proficiency scale helps to interpret what students’ financial literacy scores mean in substantive terms�
Following PISA practice, a scale is constructed (based on participating OECD countries) having a mean of 500 and a standard deviation of 100� Five levels of proficiency in financial literacy are described in the assessment, as a first step in reporting how financial literacy develops, and to compare student performance between and within participating countries and economies (see OECD, 2014c, Chapter 2)�

Pisa 2015 FiNaNCiaL LitERaCY FRaMEWORK5
98 © OECD 2016 PISA 2015 ASSESSMENT AND ANALYTICAL FRAMEWORK: SCIENCE, READING, MATHEMATIC AND FINANCIAL LITERACY
Notes
1� Financial inclusion increased from 51% of the adult population with an account at a financial institution or mobile money service in 2011, to 62% in 2014� However, two billion adults have no bank account at all (Demirguc-Kunt et al�, 2015)�
2� PISA 2012 indicates that students with a parent working in the financial services sector have higher levels of financial literacy, on average, although data are only available for a limited number of countries�
References
Atkinson, A. et al� (2015), “Financial Education for Long-term Savings and Investments: Review of Research and Literature”, OECD Working Papers on Finance, Insurance and Private Pensions, No� 39, OECD Publishing, Paris, http://dx�doi�org/10�1787/5jrtgzfl6g9w-en�
Atkinson, A. and F. Messy (2012), “Measuring Financial Literacy: Results of the OECD/International Network on Financial Education (INFE) Pilot Study”, OECD Working Papers on Finance, Insurance and Private Pensions, No� 15, OECD Publishing, Paris, http://dx�doi�org/10�1787/5k9csfs90fr4-en�
Barrett, A., I. Mosca and B.J. Whelan (2013), “(Lack of) Pension knowledge”, IZA Discussion Paper, No� 7596, August�
Bernheim, D., D. Garrett and D. Maki (2001), “Education and saving: The long-term effects of high school financial curriculum mandates”, Journal of Public Economics, No� 85, pp� 435-565�
Bloom, B.S. (ed�) (1956), Taxonomy of Educational Objectives: The Classification of Educational Goals, David McKay, New York�
Bradley, L. (2012), Young People and Savings: A Route to Improved Resilience, Institute for Public Policy Research, London�
Bruhn, M. et al� (2013), “The impact of high school financial education : Experimental evidence from Brazil”, Policy Research Working Paper, No� WPS 6723, Impact Evaluation series No� IE 109, World Bank Group, Washington, DC�, http://documents�worldbank�org/curated/en/2013/12/18640673/impact-high-school-financial-education-experimental-evidence-brazil�
Cole, S., T. Sampson and B. Zia (2011), “Prices or knowledge? What drives demand for financial services in emerging markets?”, The Journal of Finance, Vol� 66/6, pp� 1933-1967�
Colombo, F. et al. (2011), Help Wanted?: Providing and Paying for Long-Term Care, OECD Health Policy Studies, OECD Publishing, Paris, http://dx�doi�org/10�1787/9789264097759-en�
Demirguc-Kunt, A. et al� (2015), “The Global Findex Database 2014: Measuring financial inclusion around the world”, Policy Research Working Paper, No� 7255, World Bank, Washington, DC�
Drever, A.I. et al� (2015), “Foundation of financial well-being: Insights into the role of executive function, financial socialization and experience-based learning in childhood and youth”, Journal of Consumer Affairs, Vol� 49/1, Spring, pp� 13-38�
G20 (2013), “G20 Leaders Declaration”, Saint Petersburg, www�oecd�org/g20/summits/saint-petersburg/Saint-Petersburg-Declaration�pdf�
G20 (2012), “G20 Leaders Declaration”, Los Cabos, www�consilium�europa�eu/uedocs/cms_Data/docs/pressdata/en/ec/131069�pdf�
Gerardi, K., L. Goette and S. Meier (2010), “Financial literacy and subprime mortgage delinquency: evidence from a survey matched to administrative data”, Working Paper Series, No� 2010-10, Federal Reserve Bank of Atlanta, Atlanta, http://dx�doi�org/10�2139/ssrn�1600905�
Golsteyn, B., B.H. Grönqvist and L. Lindahl (2013), “Time preferences and lifetime outcomes”, IZA Discussion Paper, No� 7165, http://ssrn�com/abstract=2210825�
Grisay, A. and C. Monseur (2007), “Measuring the equivalence of item difficulty in the various versions of an international test”, Studies in Educational Evaluation, Vol� 33/1, pp� 69-86�
Gudmondson, C.G. and S.M. Danes (2011), “Family financial socialization: Theory and critical review”, Journal of Family and Economic Issues, Vol� 32, pp� 644-667�
Habschick, M., B. Seidl and J. Evers (2007), Survey of Financial Literacy Schemes in the EU27, Evers Jung, Hamburg�
Hastings, J. and L. Tejeda-Ashton (2008), “Financial literacy, information, and demand elasticity: Survey and experimental evidence from Mexico”, NBER Working Paper, No� 14538, Cambridge, MA�
Hilgert, M.A., J.M. Hogarth and S.G. Beverly (2003), “Household financial management: The connection between knowledge and behavior”, Federal Reserve Bulletin, Vol� 89/7, pp� 309-322�
Huston, S.J. (2010), “Measuring financial literacy”, The Journal of Consumer Affairs, Vol� 44/2, pp� 296-316�

Pisa 2015 FiNaNCiaL LitERaCY FRaMEWORK5
PISA 2015 ASSESSMENT AND ANALYTICAL FRAMEWORK: SCIENCE, READING, MATHEMATIC AND FINANCIAL LITERACY © OECD 2016 99
Johnson, C. and M. Staten (2010), “Do inter-temporal preferences trump financial education courses in driving borrowing and payment behaviour?”, paper presented at the 1st Annual Boulder Conference on Consumer Financial Decision Making, 27-29 June, Boulder, CO�
Lafontaine, D. and C. Monseur (2006), “Impact of Test Characteristics on Gender Equity Indicators in the Assessment of Reading Comprehension”, University of Liège, Liège�
Lee, J.C. and J.T. Mortimer (2009), “Family socialization, economic self-efficacy, and the attainment of financial independence in early adulthood”, Longitudinal and Life Course Studies, Vol� 1/1, pp� 45-62�
Lusardi, A. (2009), “Household savings behavior in the United States: The role of literacy, information, and financial education programs”, in C� Foote, L� Goette and S� Meier (eds�), Policymaking Insights from Behavioral Economics, Federal Reserve Bank of Boston, pp� 109-149�
Lusardi, A. and O.S. Mitchell (2011), “Financial literacy and planning: Implications for retirement wellbeing”, in A� Lusardi and O�S� Mitchell (eds�), Financial Literacy: Implications for Retirement Security and the Financial Marketplace, Oxford University Press, Oxford�
Lusardi, A. and O.S. Mitchell (2008), “Planning and financial literacy: How do women fare?”, American Economic Review, Vol� 98/2, pp� 413-417�
Lusardi, A. and P. Tufano (2009a), “Debt literacy, financial experiences, and overindebtedness”, NBER Working Paper, No� 14808, Cambridge, MA�
Lusardi, A. and P. Tufano (2009b), “Teach workers about the perils of debt”, Harvard Business Review, November, pp� 22-24�
Lusardi, A., O.S. Mitchell and V. Curto (2010), “Financial literacy among the young”, The Journal of Consumer Affairs, Vol� 44/2, pp� 358-380�
Meier, S. and C.D. Sprenger (2013), “Discounting financial literacy: Time preferences and participation in financial education programs”, Journal of Economic Behavior and Organization, Vol� 95, November, pp� 159-174, http://dx�doi�org/10�1016/j�jebo�2012�02�024�
Messy, F.A. and C. Monticone (2016a forthcoming), “Trends and recent developments on financial education in Europe”, OECD Working Papers on Finance, Insurance and Private Pensions, OECD Publishing, Paris, France, forthcoming�
Messy, F.A. and C. Monticone (2016b), “Financial education policies in Asia and Pacific”, OECD Working Papers on Finance, Insurance and Private Pensions, No� 40, OECD Publishing, Paris, http://dx�doi�org/10�1787/5jm5b32v5vvc-en�
Miller, M. et al� (2014), “Can you help someone become financially capable? A meta-analysis of the literature”, Policy Research Working Paper, No� WPS 6745, World Bank Group, Washington, DC�
Money Advice Service, (2014),”It’s time to talk: Young people and money regrets”, the Money Advice Service, London�
Money and Pensions Panel (2013), “Basic pension: The default option for labour-market pensions”, report by the Committee of the Money and Pension Panel, Danish Parliament, Copenhagen�
Moore, D. et al (2003), Survey of Financial Literacy in Washington State: Knowledge, Behavior, Attitudes, and Experiences, Technical Report 03-39, (Social and Economic Sciences Research Center, Washington State University), Washington State Department of Financial Institutions, Olympia, Washington�
OECD (2014a), Education at a Glance 2014: OECD Indicators, OECD Publishing, Paris, http://dx�doi�org/10�1787/eag-2014-en�
OECD (2014b), Financial Education for Youth: The Role of Schools, OECD Publishing, Paris, http://dx�doi�org/10�1787/9789264174825-en�
OECD (2014c), PISA 2012 Results: Students and Money (Volume VI): Financial Literacy Skills for the 21st Century, PISA, OECD Publishing, Paris, http://dx�doi�org/10�1787/9789264208094-en�
OECD (2014d), PISA 2012 Technical Report, PISA, OECD, Paris, www�oecd�org/pisa/pisaproducts/PISA-2012-technical-report-final�pdf�
OECD (2013a), PISA 2012 Assessment and Analytical Framework: Mathematics, Reading, Science, Problem Solving and Financial Literacy, PISA, OECD Publishing, Paris, http://dx�doi�org/10�1787/9789264190511-en�
OECD (2013b), PISA 2012 Assessment and Analytical Framework: Mathematics, Reading, Science, Problem Solving and Financial Literacy, PISA, OECD Publishing, Paris, http://dx�doi�org/10�1787/9789264190511-en�
OECD (2010a), PISA 2009 Assessment Framework: Key Competencies in Reading, Mathematics and Science, PISA, OECD Publishing, Paris, http://dx�doi�org/10�1787/9789264062658-en�
OECD (2010b), PISA 2009 Results: What Students Know and Can Do: Student Performance in Reading, Mathematics and Science (Volume I), PISA, OECD Publishing, Paris, http://dx�doi�org/10�1787/9789264091450-en�

Pisa 2015 FiNaNCiaL LitERaCY FRaMEWORK5
100 © OECD 2016 PISA 2015 ASSESSMENT AND ANALYTICAL FRAMEWORK: SCIENCE, READING, MATHEMATIC AND FINANCIAL LITERACY
OECD (2009a), Financial Literacy and Consumer Protection: Overlooked Aspects of the Crisis, OECD Recommendation on Good Practices on Financial Education and Awareness Relating to Credit, OECD, Paris, www�oecd�org/finance/financial-markets/43138294�pdf�
OECD (2009b), PISA 2006 Technical Report, PISA, OECD Publishing, Paris, http://dx�doi�org/10�1787/9789264048096-en�
OECD (2008), Improving Financial Education and Awareness on Insurance and Private Pensions, OECD Publishing, Paris, http://dx�doi�org/10�1787/9789264046399-en�
OECD (2005a), Recommendation on Principles and Good Practices for Financial Education and Awareness, OECD Publishing, Paris, www�oecd�org/finance/financial-education/35108560�pdf�
OECD (2005b), Improving Financial Literacy: Analysis of Issues and Policies, OECD Publishing, Paris, http://dx�doi�org/10�1787/ 9789264012578-en�
OECD/INFE (2015a), 2015 OECD/INFE Toolkit for Measuring Financial Literacy and Financial Inclusion, OECD, Paris, www�oecd�org/daf/fin/financial-education/2015_OECD_INFE_Toolkit_Measuring_Financial_Literacy�pdf�
OECD/INFE (2015b), National Strategies for Financial Education: OECD/INFE Policy Handbook, OECD, Paris, www�oecd�org/daf/fin/financial-education/National-Strategies-Financial-Education-Policy-Handbook�pdf�
OECD/INFE (2015c), OECD/INFE Core Competencies Framework on Financial Literacy for Youth, OECD, Paris, www�oecd�org/finance/Core-Competencies-Framework-Youth�pdf�
OECD/INFE (2013), Financial Literacy and Inclusion: Results of the OECD/INFE Survey across Countries and by Gender, OECD, Paris, www�oecd�org/daf/fin/financial-education/TrustFund2013_OECD_INFE_Fin_Lit_and_Incl_SurveyResults_by_Country_and_Gender�pdf�
OECD/INFE (2012), OECD/INFE High-Level Principles on National Strategies for Financial Education, OECD, Paris, www�oecd�org/finance/financial-education/OECD_INFE_High_Level_Principles_National_Strategies_Financial_Education_APEC�pdf�
OECD/INFE (2011), Measuring Financial Literacy: Core Questionnaire in Measuring Financial Literacy: Questionnaire and Guidance Notes for conducting an Internationally Comparable Survey of Financial literacy, OECD, Paris, www�oecd�org/finance/financial-education/49319977�pdf�
OECD/INFE (2009), Financial Education and the Crisis: Policy Paper and Guidance, OECD, Paris, www�oecd�org/finance/financial-education/50264221�pdf�
Otto, A. (2013), “Saving in childhood and adolescence: Insights from developmental psychology”, Economics of Education Review, Vol� 33, pp� 8-18�
PIAAC Literacy Expert Group (2009), “PIAAC literacy: A conceptual framework”, OECD Education Working Papers, No� 34, OECD Publishing, Paris, http://dx�doi�org/10�1787/220348414075�
Ratcliffe C. and S. McKernan (2013), Forever in Your Debt: Who Has Student Loan Debt, and Who’s Worried, The Urban Institute and FINRA Investor Education Foundation, Washington, DC�
Schuchardt, J. et al� (2009), “Financial literacy and education research priorities”, Journal of Financial Counseling and Planning, Vol� 20/1, pp� 84-95�
Smithers, R. (2010), “University students expect to graduate with debts in excess of £15,000”, The Guardian, 18 March, www�guardian�co�uk/money/2010/mar/18/university-students-graduate-mouting-debts�
Stango, V. and J. Zinman (2009), “Exponential growth bias and household finance”, Journal of Finance, Vol� 64/6, pp� 2807-2849�
Van Rooij, M.A., A. Lusardi and R. Alessie (2011), “Financial Literacy and stock market participation”, Journal of Financial Economics, Vol� 101/2, pp� 449-472�
Whitebread and Bingham (2013), Habit Formation and Learning in Young Children, The Money Advice Service, London�
Xu, L. and B. Zia (2012), “Financial literacy around the world: An overview of the evidence with practical suggestions for the way forward”, World Bank Policy Research Working Paper, No� 6107, Washington, DC�
Yoong, J. (2011), “Financial illiteracy and stock market participation: Evidence from the RAND American Life Panel”, in A� Lusardi and O�S� Mitchell (eds�), Financial Literacy: Implications for Retirement Security and the Financial Marketplace, Oxford University Press, Oxford�
www.oecd.org/daf/fin/financial-education/National-Strategies-Financial-Education-Policy-Handbook.pdf

6
PISA 2015 ASSESSMENT AND ANALYTICAL FRAMEWORK: SCIENCE, READING, MATHEMATIC AND FINANCIAL LITERACY © OECD 2016 101
PISA 2015 Context questionnaires
frameworkThis chapter describes the core content of the Programme for International Student Assessment (PISA) 2015 and PISA’s interest in measuring student’s engagement at school, dispositions towards school and their self-beliefs, and in gathering information about students’ backgrounds and the learning environment at school. The chapter discusses the content and aims of the Student Questionnaire, the School Questionnaire (completed by school principals), the optional Parent Questionnaire (completed by parents of students who sat the PISA test), the optional Educational Career Questionnaire (completed by students, concerning their educational and career aspirations), the optional ICT Familiarity Questionnaire (completed by students, concerning their attitudes towards and experience with computers) and the optional Teacher Questionnaire (completed by teachers, and introduced in PISA 2015).

Pisa 2015 CONtEXt QUEstiONNaiREs FRaMEWORK6
102 © OECD 2016 PISA 2015 ASSESSMENT AND ANALYTICAL FRAMEWORK: SCIENCE, READING, MATHEMATIC AND FINANCIAL LITERACY
Providing indicators on the effectiveness, equity and efficiency of education systems, setting benchmarks for international comparison, and monitoring trends over time are the most important goals of the Programme for International Student Assessment (PISA)� In addition, PISA builds a sustainable database that allows researchers worldwide to study basic and policy-oriented questions on education, including its relation to society and the economy�
In order to reach these goals, PISA not only needs reliable and valid measures for assessing cognitive student achievement (in reading, mathematics, science literacy and other “life skills”), but also information on non-cognitive outcomes (e�g� students’ motivation to learn), individual conditions (e�g� students’ cultural, ethnic and socio-economic background), and the structural and process characteristics of the institutional context (e�g� teaching practices and learning opportunities in classrooms, leadership and school policies for professional development, vertical and horizontal differentiation of the school system)� It is this diverse set of constructs that is measured through questioning various stakeholders, namely students and school principals, and (on an optional basis) parents and teachers�
PISA 2015 is the sixth wave of the programme� Since 2000, the so-called “Background Questionnaires” have gained substantially in importance� Meanwhile, questionnaires are of interest in their own right, beyond providing the “background” for reporting test results� PISA 2015 is a combination of student assessment in selected areas of achievement and context assessment on different policy-related issues� One reason for this change of perspective is that policy makers wanted the programme to report on a variety of issues that are relevant to professional practice, governance and policy making in education� Thus, the scope of issues to be covered has gradually expanded since PISA 2000� In addition to student achievement and its relation to individual background, learning opportunities and non-cognitive outcomes, educational policies and practices are monitored through indicators� Also, data analysis and reporting have become more complex, allowing for more in-depth reporting� In addition to providing tables of indicators, patterns of input, process and outcome variables are identified within and across countries; trends are reported, relations are explored, impact is estimated� These analyses require more sophisticated modelling approaches, and detailed data on contextual factors regarding students, schools and education systems�
Probably the most important characteristic of PISA, after 15 years of existence, is the availability of system-level trend data� PISA allows for the description of change in a country’s performance level over time, but also for the description of changes in non-cognitive outcomes, living conditions of adolescents and their families, professional practices and organisational structures for schooling� The more PISA moves towards repeated cycles of measurement, the more can be learned from examining the stability and variability of conditions, processes, outcomes and their relations: policy makers can use trend data for constant diagnosis and feedback; the explanatory power of the study will increase because changes in performance can be interpreted and explained more substantively, taking changes in input and process into account (Gustafsson, 2008; Hanushek and Wößmann, 2011); and trend analyses are less likely to be biased by cultural issues�
Quite often, policy makers and researchers have been reluctant to interpret “soft” constructs, such as school climate, students’ motivation, teachers’ job satisfaction or parents’ self-reported engagement, fearing that they are not sufficiently comparable across countries� Now that trends are available, the focus is on change rates within countries rather than on cross-sectional comparisons of status� For example, the question of whether well-being in schools is increasing or decreasing will be a relevant indicator within countries, and this indicator is not affected by response styles differing between countries� However, trend analyses require PISA to define a general set of constructs that will remain constant over several cycles in the future� This set of constructs will be referred to as “core content” in this chapter�1
This framework intends to explain the goals and the rationale for choosing appropriate questionnaire content, guiding both questionnaire development and the forthcoming reports� The document is organised into two main parts: a definition of the core content of the PISA questionnaires, and a description of the modular structure for broader coverage of policy issues�
The first part of this document links the current framework to the overarching (cross-cycle) structure of PISA context assessment set out in the PISA 2012 Framework (OECD 2013: 168 ff�)� The constructs that need to be covered for monitoring trends in education are revisited, with reference to the general background of Educational Effectiveness Research� Measures that have been used previously for initial reporting, for international indicators and for secondary analyses are overviewed, culminating in an outline of core content that should be assessed in all cycles, for all participants�
The second and larger part of this document explores the full breadth of policy issues to be covered, structured in 19 modules, and explains how the most important modules – i�e� those judged as high priority modules by the PISA Governing Board – have been implemented in PISA 2015� Here, detailed references to current research are provided�

Pisa 2015 CONtEXt QUEstiONNaiREs FRaMEWORK6
PISA 2015 ASSESSMENT AND ANALYTICAL FRAMEWORK: SCIENCE, READING, MATHEMATIC AND FINANCIAL LITERACY © OECD 2016 103
The development of questionnaire content for PISA 2015 has been challenged not only by the intention of covering a broad array of policy issues, but also by the introduction of Computer-Based Assessment (CBA) as the preferred mode of administration for both cognitive tests and questionnaires� In addition to developing new questions, all content from previous cycles had to be revisited, sometimes transformed into a CBA-friendly format (like using a “slider” that can be manipulated interactively instead of having the test-taker fill in numeric information), and field trialled anew� Finally, the analysis of process data based on logfile recording will deepen the understanding of response behaviour�
Based on careful analysis of the field trial data and thoughtful discussion of priorities among experts and policy makers, constructs, questions and items were selected for inclusion in the PISA 2015 main survey� The Student Questionnaire was targeted to last 35 minutes, on average�
DEFiNiNG thE CORE OF CONtEXt assEssMENt iN PisaChoosing from the many measures that might be incorporated in the PISA study design is a complex process, directed by the priorities that countries have set for the study, but also informed by education research� One of the major forces that drive the PISA design in general is the rhythmic change of focus in the cognitive assessment: reading literacy has been or will be the major domain of assessment in PISA 2000, 2009 and 2018; mathematics is the focus of PISA 2003, 2012 and 2021; science takes the lead in PISA 2006, 2015 and 2024� Whatever serves as the major domain of cognitive assessment shall also be a major focus of “domain-specific” context assessment� However, there is a need for some stability in measurement to understand trends in education�
The Questionnaire Framework for PISA 2012 established an overarching structure that delineated core questionnaire content that should be kept comparable across cycles (OECD 2013: 189 ff�) to allow for continuous monitoring of education systems� The overarching framework refers to domain-specific as well as domain-general measures assessing conditions, processes and outcomes of education for both individual students and schools� Finding an appropriate balance among these facets of the design is crucial for the long-term success of the PISA programme� In order to establish valid and reliable trends at the country level, it is important to implement a stable set of variables, which will be used as major reporting variables across PISA cycles�2
This overarching framework is discussed below, along with specifying the constructs and measures in more detail and providing arguments that support the choice of core content for PISA 2015�
Outline of core content: Constructs to be coveredTaking into account the goals of context assessment in PISA as stated in the introduction, strategic decisions made by the PISA Governing Board, the overarching framework developed for PISA 2012, and recommendations from the research literature, the current framework assumes that education policy makers in participating countries need to be informed in four broad areas: outcomes, student background, teaching and learning processes, and school policies and educational governance� These areas are described below� As stated above, the following sections elaborate in more detail what has already been established in the Questionnaire Framework for PISA 2012�
Non-cognitive outcomesThe main challenge of PISA concerns measuring and documenting the outcomes of education that have been reached up to the age of 15 years� Educating a person basically means fostering his or her individual development as a unique, self-determined, knowledgeable person who gradually gains in ability to participate in society� As each PISA assessment is a cross-sectional study, PISA cannot capture developmental processes; but PISA serves as a snapshot of development status at the age of 15�
This snapshot includes an assessment of literacy and life skills, but in addition to these cognitive outcomes, other factors are important, too� Success in school – and in life – depends on being committed, sharing values and beliefs, respecting and understanding others, being motivated to learn and to collaborate, and being able to regulate one’s own learning behaviour� These constructs can be perceived as prerequisites of cognitive learning, but may also themselves be judged as goals of education, as the OECD project Defining and Selecting Key Competencies (DeSeCo) has elaborated (Rychen and Salganik, 2003)� Education research and econometric analyses have shown that non-cognitive factors are most important for individual development as well as for success in life and well-being, and thus have an impact on individuals and society alike (Heckman, Stixrud and Urzua, 2006; Almlund et al�, 2011)�
Therefore, PISA addresses non-cognitive outcomes like attitudes, beliefs, motivation and aspirations, and learning-related behaviour, such as invested learning time� These non-cognitive outcomes are measured within the Student Questionnaire (StQ), but also in the ICT Familiarity Questionnaire (ICTQ)� They may be of a general nature, such as achievement

Pisa 2015 CONtEXt QUEstiONNaiREs FRaMEWORK6
104 © OECD 2016 PISA 2015 ASSESSMENT AND ANALYTICAL FRAMEWORK: SCIENCE, READING, MATHEMATIC AND FINANCIAL LITERACY
motivation and well-being of students, or related to the domains of the cognitive assessment, such as reading engagement, interest in mathematics or enjoyment of science� Domain-specific non-cognitive outcomes are also mentioned in the respective definitions of literacy, so this array of constructs serves as a link between test frameworks and context framework� Students’ self-efficacy beliefs – i�e� the strength of their belief in being able to solve tasks similar to the ones tested in the cognitive PISA tests – have been shown to be a strong correlate of student achievement both within and between countries�
Student backgroundIn order to understand education careers and to study equity issues within and across countries, family background variables, such as socio-economic status and immigrant background, have to be taken into account� The distribution of education opportunities and outcomes depending on these background variables shows whether countries succeed in providing equal opportunities�
PISA has become famous for its detailed, theory-based assessment of family background, socio-economic status and immigration background� A lot of effort went into the definition and operationalisation of individual student background indicators, finally leading to the establishment of a powerful, integrated indicator for students’ economic, social and cultural status (ESCS; Willms, 2006)� The components of this indicator need to be assessed in as stable a way as possible across the PISA cycles� In addition, information on parental support helps understanding of how formal education and family background interact in promoting student learning�
Furthermore, PISA gathers retrospective and prospective information about education pathways and careers across the lifespan� In recent years, researchers and others have stressed the importance of early childhood education (Blau and Curie, 2006; Cunha et al�, 2006)� Therefore, PISA intends to capture at least some information on primary and pre-primary education�
On top of individual student background, the social, ethnic and academic composition of the school he or she attends has an impact on learning processes and outcomes� Therefore, PISA uses aggregated student data to characterise background factors on the school level in addition to structural factors, such as school location, school type and school size�
Teaching and learningSchool-based instruction is the core process of formal, systematic education� Therefore, policy makers need information on teaching, learning and the organisation of schools� To increase the explanatory power of the study, assessment of teaching and learning focuses on the major domain of assessment, which, in 2015, is science� The knowledge base of educational effectiveness research (Scheerens and Bosker, 1997; Creemers and Kyriakides, 2008) allows for the identification of core factors: teachers’ qualifications, teaching practices and classroom climate, learning time and learning opportunities provided both within and out of school� For teaching processes, the focus should be on three basic dimensions (Klieme, Pauli and Reusser, 2009): structure and classroom management; teacher support; and cognitive challenge� Addressing teacher- and teaching-related factors in PISA is a challenge, because sampling is by age rather than by grade or class� Nevertheless, aggregated student data and School Questionnaires can serve to describe the learning environment offered by schools�
School policies and governanceAs policy makers have limited direct impact on teaching and learning processes, information on school-level factors that help to improve schools, and thus indirectly improve student learning, have high priority� As with teacher and teaching variables, school-effectiveness research has built a strong knowledge base showing that “essential supports” promote school effectiveness (Bryk et al�, 2010; see also Creemers and Reezigt, 1997; Scheerens and Bosker, 1997): professional capacity, with a focus on professional development; a well-organised curriculum; leadership and school management; parental involvement; school climate (truthful interactions between stakeholders, clear norms and shared values, high achievement expectations); and the use of assessment and evaluation for improvement� These factors are addressed in the PISA questionnaires as domain-general processes on the school level� Also covered is school-level support for teaching the major domain, such as the provision of laboratory space, information and communication technology (ICT), and a school curriculum for science education�
To meet policy requests directly, PISA also needs to address issues related to governance on the system level (Hanushek and Wößmann 2011; Wößmann et al�, 2007)� “Locus of decision making” measures and accountability practices describe main aspects of governance, namely the distribution of power and control between central and local stakeholders� Allocation, selection, and assessment and evaluation are the basic processes that policy makers and/or school administrators use to control school quality, and to monitor and foster school improvement� Some of this information can be gained from other sources (as documented in Education at a Glance), some can be assessed through the PISA School Questionnaire�

Pisa 2015 CONtEXt QUEstiONNaiREs FRaMEWORK6
PISA 2015 ASSESSMENT AND ANALYTICAL FRAMEWORK: SCIENCE, READING, MATHEMATIC AND FINANCIAL LITERACY © OECD 2016 105
Previous use of PISA context data: Measures that were important for analysis and reportingIn order to evaluate the importance of questionnaire content for PISA, it is worthwhile to look at previous cycles and how their data fed into analysis and reporting� Thus, the relevance of specific measures for policy making and research can be taken into account, in addition to the more abstract constructs mentioned before�
PISA questionnaire data have been used for several types of analyses and reports in addition to OECD reports, for instance to construct education indicators (e�g� Education at a Glance) and in scientific research papers� Box 6�1 presents the questionnaire material used in the PISA 2009 report, including non-cognitive outcomes and the impact of background variables, individual and school characteristics, processes and policies as well as system-level factors�
Box 6�1 Measures based on questionnaires used in PISA 2009 Results: What Students Know and Can Do
Volume I: Student Performance in Reading, Mathematics and Science
Student background: Gender
Volume II: Overcoming Social Background: Equity in Learning Opportunities and Outcome
Student background: ESCS, gender, immigration status, language spoken at home, age of arrival, country of origin
Individual support assessed through Parent Questionnaire: Parental support (at beginning of primary education/at age 15), pre-primary education (attendance, quality)
Volume III: Learning to Learn: Student Engagement, Strategies and Practice
Student background: ESCS, gender, immigration status, language spoken at home
Outcomes: Enjoyment of reading, time and material used for reading, metacognition (awareness of strategies), self-reported use of reading strategies (memorisation, elaboration, control)
Volume IV: What Makes a School Successful? Resources, Policies and Practices
Student background: socio-economic status, age of school entry, grade repetition
Student-reported processes: learning time (previous education, learning time at school, enrichment/remedial education, after-school lessons), teacher-student relations, disciplinary climate, teacher’s stimulation of reading engagement
School input, policies and processes (reported by the principal): type of school (public/private), number of programmes, class size, educational resources (e�g� ICT, library), school responsibility for assessment and curriculum/for resource allocation, extracurricular activities provided, school admittance/grouping/transfer policies, assessment practices/purposes, use of achievement data, school accountability, methods for monitoring teachers, teacher and student behaviour, parent involvement and expectations, leadership�
Source: OECD, 2010a, 2010b, 2010d and 2010e�
The initial report on PISA 2006 studied the impact of schools on student outcomes, while many papers listed on the Education Resources Information Center (ERIC) international data base discuss non-cognitive, domain-specific outcomes using PISA 2006 data� Seventeen of the publications that used multivariate analyses are listed in Appendix 1�
Selecting and organising the core contentAddressing policy needs, and covering measures that have been used for reporting in previous cycles, a selection of core questionnaire content for PISA 2015 and beyond can be proposed� Figure 6�1 organises the suggested content according to the model that has informed the design of international large-scale assessments for a long time (see e�g� Purves, 1987; OECD 2013: 173 ff�)� The model allocates background, process and outcome characteristics of education at respective levels of action (i�e� the system level, the school level, including instruction/class/teacher factors, and the individual student level)�

Pisa 2015 CONtEXt QUEstiONNaiREs FRaMEWORK6
106 © OECD 2016 PISA 2015 ASSESSMENT AND ANALYTICAL FRAMEWORK: SCIENCE, READING, MATHEMATIC AND FINANCIAL LITERACY
Figure 6�1 • Measures to be included in the core context assessment for Pisa
Student and school background Processes Non-cognitive outcomesSystem level Governance:
Decision making, horizontal and vertical differentiation
(aggregated student data)
School level School location, type and size of school, amount and source of resources (incl� ICT)
Social/ethnic/academic composition
Class size, teacher qualification
School policies: Programmes offered, admission and grouping policies, allocated learning time, additional learning time and study support, extracurricular activities, professional development, leadership, parental involvement, assessment/evaluation/accountability policies, school climate (teacher and student behaviour)
Teaching and learning:Disciplinary climate, teacher support, cognitive challenge
(aggregated student data)
Student level Gender, socio-economic status (parents’ education and occupation, home possessions, number of books at home), language and migration background, grade level, pre-primary education, age at school entry
Grade repetition, programme attended, learning time at school (mandatory lessons and additional instruction), out-of-school learning
Domain-general non-cognitive outcomes (e�g� achievement motivation, well-being in school)
Domain-specific non-cognitive outcomes (motivation, domain-related beliefs and strategies, self-related beliefs, domain-related behaviour)
Note: Measures in italics are adapted to the respective major domain, e�g� science in PISA 2015�
The set of measures included in Figure 6�1 comprises a core context design that covers all construct areas mentioned above, i�e� non-cognitive outcomes, student background, teaching and learning, school policies and governance; and allows for reporting all the analyses that have been included in initial reports, conducting all the research mentioned in Appendix 1, and calculating all indicators that have been developed for Education at a Glance (see above)3� Figure 6�1 includes all questionnaire indices that have been shown to be strongly correlated with PISA achievement measures (e�g� number of books at home, socio-economic status, self-efficacy, and disciplinary climate), and thus will be instrumental in estimating test scores in PISA (“plausible values”)� Therefore, this set of measures is considered for use in further PISA cycles including and beyond PISA 2015� Keeping this core design stable across cycles will enable trend analyses and complex modelling of system-level changes�
Most of the measures mentioned in Figure 6�1 have already been used in previous cycles, mainly in PISA 2006 or PISA 2012, and thus they represent “trend” content that may be kept constant in the future� This includes the science-specific measures from PISA 2006� When reading and mathematics were the major domain of assessment (PISA 2009 and 2012, respectively), different measures were used to represent the same overarching constructs:
• Cognitive challenge in classrooms has been represented by teachers’ stimulation of reading engagement (2009), opportunities-to-learn (OTL) question types and experience with applied mathematical tasks (2012), and inquiry-based teaching and learning (2006, 2015)�
• Student motivation has been operationalised by enjoyment of reading (2009), interest in mathematics (2012), and enjoyment of science (2006, 2015)�
• Domain-related behaviour has been represented by reading for school and diversity of reading material (2009), mathematics work ethics and math behaviour (2012), and media-related science activities (2006, 2015)�
• Domain-related beliefs and strategies have been represented by subjective norms on mathematics (2012) and environmental awareness and optimism (2006, 2015); self-related beliefs have been represented by mathematics self-efficacy (2012) and science self-efficacy (2015)� PISA 2009 introduced a measure of metacognition instead of reading-related beliefs�

Pisa 2015 CONtEXt QUEstiONNaiREs FRaMEWORK6
PISA 2015 ASSESSMENT AND ANALYTICAL FRAMEWORK: SCIENCE, READING, MATHEMATIC AND FINANCIAL LITERACY © OECD 2016 107
EXPaNDiNG thE FRaMEWORK FOR BROaDER COVERaGE OF POLiCY issUEsModular approach to the PISA designWhen the contractor for questionnaire development in PISA 2015 and the Questionnaire Expert Group started their work, they revisited the content areas described above – non-cognitive outcomes, student background, teaching and learning, school policies and governance – and further differentiated them into 19 more fine-graded “modules”, which were approved by the PISA Governing Board (PGB) at its meeting in October 2011 – as the building blocks of the PISA 2015 design for context assessment� Figure 6�2 provides a schematic overview of this modular structure, positioning the modules within the overarching structure of background, process and outcome characteristics�
Columns one and two summarise student background characteristics related to their family and the education they received, the three columns in the middle refer to education processes at different levels (system governance, school policies, teaching and learning), and the columns on the right list various outcomes of education� In Figure 6�2, the lower part deals with domain-general topics, while the upper part includes modules that mainly deal with domain-specific (in this case: science-related) topics, including the learning environment at the school level that specifically supports science education (Module 3), such as laboratories, science-related school curricula, collaboration among science staff, and the value attributed to science within the school community� Thus, Figure 6�2 illustrates the combination of domain-general and domain-specific approaches to international large-scale assessment that is typical for all PISA cycles, with either science, reading or mathematics as the major focus of assessment� As PISA integrates cross-curricular achievement measures, like problem solving (in 2012) or collaborative problem solving (in 2015), appropriate non-cognitive outcomes are added (Module 11)�
Traditionally, PISA treats the standard questionnaires (School Questionnaire and Student Questionnaire) separately from optional questionnaires that countries may choose to implement or not� PISA 2015 also keeps these questionnaires separate from an operational and reporting point of view, but the Questionnaire Expert Group intended to make the connections between standard and optional questionnaires as transparent as possible� All modules are included in the standard questionnaires to some extent, while the optional questionnaires are used to treat some modules in depth: Educational Career questions address Modules 2, 9, 12 and 14, while the ICT Familiarity Questionnaire contributes to Modules 7, 10 and 16, and the Parent Questionnaire provides content for Modules 5, 8, 9 and 14� The Teacher Questionnaire, which has been added to the design for PISA 2015, is relevant for Modules 1, 2, 11, 12, 15, 16 and 19� Thus, countries opting for any of these additional questionnaires will have additional information available for in-depth analysis of respective policy issues�
Figure 6�2 • Modular structure of the Pisa 2015 context assessment design
Student background Processes Non-cognitive outcomesFamily Education Actors Core processes Resource allocation
Scie
nce-
rela
ted
to
pic
s
5� Out-of-school science experience
1� Teacher qualification and professional knowledge
2� Science teaching practices
12� Learning time and curriculum
4� Science-related outcomes: motivation, interest, beliefs…
Teaching and learning
3� School-level learning environment for science
Gen
eral
to
pic
s
7� Student SES and family
8� Ethnicity and imigration
9� Educational pathways in early childhood
14� Parental involvement
15� Leardership and school management
13� School climate: interpersonal relations, trust, expectations
16� Resources 6� Career aspirations
10� General behaviour and attitudes
11� Dispositions for collaborative problem solving
School policies
17� Locus of decision making within the school system
19� Assessment evaluation and accountability
18� Allocation, selection and choice
Governance

Pisa 2015 CONtEXt QUEstiONNaiREs FRaMEWORK6
108 © OECD 2016 PISA 2015 ASSESSMENT AND ANALYTICAL FRAMEWORK: SCIENCE, READING, MATHEMATIC AND FINANCIAL LITERACY
The expanded model will guide analysis and reporting in a systematic way:
• Each of the modules can be conceived as a thematic focus for analysis, as will be shown below� Based on a comprehensive review of the corresponding research literature, each module covers main components that are relevant for a specific field of education practice or policy making� Information gathered from students, school leaders and – for countries choosing those options – parents and teachers can be combined to understand patterns and relations within countries and to compare between systems�
• Equity issues in education can be researched by studying outcomes in relation to background factors� (Un-)equal opportunities can be researched by studying schooling offered to various subgroups of students, while efficiency can be described as the relation between outcomes and resources�
• Models of educational effectiveness can be specified and tested by linking schooling to education outcomes, controlling for background factors�
Every module represents a focus of policy making� Thus, the set of 19 modules covers a wide array of policy issues that are relevant across countries� This set is comprehensive, as can be seen by comparing the modular structure with literature on education policy� For example, most topics treated by Sykes, Schneider and Plank (2009) in their state-of-the-art review of education policy research are covered here�
To sum up, the modular approach to context assessment in PISA 2015 allows for a broad coverage of policy issues and related research questions� However, the PISA design sets strict limits on the length of questionnaires; to cover the requested breath of concepts, only some modules or constructs within modules can be focused in more detail� To find relevant points of interest, PGB members were asked to indicate the top priority modules for further development work, based on policy relevance and the need for improvement from previous cycles� More emphasis has been devoted to those areas identified as priorities�
The areas receiving the highest votes for high policy relevance and need of further development work included non-cognitive outcomes (Modules 4 and 10), teaching and learning (Modules 2, 12 and 1), and school policies (Modules 19 and 15)� These modules will be discussed in detail in the following sections� Considerable efforts have been made to include measures for those modules in the PISA 2015 field trial and main survey� Other modules will be discussed in a less detailed manner, as their content was drawn from previous cycles with little change�
Assessing non-cognitive outcomes4
This section summarises the conceptual foundations for high-priority Modules 10 (domain-general student behaviour and attitudes) and 4 (science-related outcomes: motivation, attitudes, beliefs) as well as those of lower-priority Modules 6 (science career) and 11 (dispositions for collaborative problem solving)�
Traditionally, PISA assessed student outcomes in terms of achievement tests� Students’ motivations, attitudes, beliefs and behaviours were seen as important precursors of and predictors for scholastic performance, educational attainment and labour-market success� But education policy and labour-market policy are increasingly concerned about these “non-cognitive outcomes” because they are instrumental for personal growth, individual success and the success of society as a whole�
Research has shown the predictive power of non-cognitive outcomes for success in secondary education, higher education and the workforce in general (e�g� Heckman, Stixrud and Urzua, 2006; Lindqvist and Vestman, 2011; Poropat, 2009; Richardson et al�, 2012; Roberts et al�, 2007)� Also, professional and public debates often question the purely achievement-oriented approach of past student assessments� There is more to education than knowledge and cognitive skills; thus non-cognitive outcomes have become increasingly interesting as stand-alone outcomes in their own right� Non-cognitive dispositions are important goals, and they often function as moderators and mediators for relations of other constructs in the assessment� PISA offers a unique opportunity to investigate complex relations between non-cognitive outcomes and achievement at the individual, school and country levels�
Previous PISA cycles have focused on domain-specific student attitudes and behaviours, for instance measuring attitudes towards reading and mathematics, mathematics self-concept, or maths anxiety� Most of these scales display robust relations with student proficiency scores� This tradition is continued with Module 4 (science-related outcomes) in PISA 2015� In addition, the current framework includes a set of domain-general, non-cognitive student factors to broaden the coverage of relevant constructs, increase the policy relevance of the PISA 2015 database, and acknowledge the increased interest in non-cognitive assessments in both policy and research� Questions cover, for example, general achievement motivation� As in PISA 2012, anchoring vignettes (King and Wand, 2007) are used for better measurement to identify and correct for construct-unrelated response styles� This increases the cross-cultural comparability of the derived indices�

Pisa 2015 CONtEXt QUEstiONNaiREs FRaMEWORK6
PISA 2015 ASSESSMENT AND ANALYTICAL FRAMEWORK: SCIENCE, READING, MATHEMATIC AND FINANCIAL LITERACY © OECD 2016 109
Science-related outcomes (Module 4)As science is the major domain assessed in PISA 2015, students’ interest and motivation in science, technology, engineering and mathematics (STEM) subjects, plus related beliefs and behaviour are considered to be an important assessment dimension� The second column in Figure�6�3 provides an overview of the respective constructs in the broader domains of self, interest, attitudes, and motivation, beliefs and preferences�
Motivation to learn science and beliefs about oneself as a science learner are important policy and education goals in many countries� Moreover, it has been shown that they are positively associated with students’ performance in science (OECD, 2007)� This relationship is reciprocal: science-related beliefs and attitudes can be both a consequence and a cause of better science performance�
From a policy point of view, the shortage of skilled workers in technical and science professions – especially among women – has become a concern in recent years, and it is expected to rise in the future (European Commission, 2004, 2006; OECD, 2008)� Therefore, PISA aims to identify how interested students are in science� Measures of enjoyment of science and instrumental motivation will allow for reporting trends since 2006�
In addition, environmental issues are a global concern� Threats to the environment are prominently discussed in the media, and students are challenged to understand complex environmental issues� Further, students’ levels of environmental awareness and optimism affect their engagement in environmental concerns and, in turn, affect the world’s global climate, the economy and society as a whole� Therefore, PISA 2015 includes two measures of environmental beliefs that were developed for PISA 2006�
The following paragraphs provide relevant research background information and the different measures included in the PISA 2015 field trial to cover these outcomes�
Self-related beliefs referring to science learning: Positive self-efficacy belief is highly related to motivation, learning behaviour, general expectations for the future and students’ performance (OECD, 2007)�
Motivation to learn science covers three constructs: interest in broad science topics, enjoyment of science and instrumental motivation� Motivation to learn that is based on interest and enjoyment is experienced as self-determinate and intrinsic (Krapp and Prenzel, 2011)� It affects student engagement, learning activities, performance and career choices, and can be shaped by classroom instructions and parental motivation practices (Gottfried et al�, 2009; Kunter, 2005; Rakoczy, Klieme
Figure 6�3 • Measures of non-cognitive outcomes included in the Pisa 2015 main survey
Area Science-related (Module 4) Domain-general (Modules 6, 10, 11)Self Self-efficacy Test anxiety
Well-being in general (life satisfaction) Well-being at school (sense of belonging)
Interest, attitudes, and motivation
Interest in broad science topics
Enjoyment of science
Instrumental motivation
Achievement motivation
Beliefs and preferences Epistemological beliefs
Environmental awareness
Environmental optimism
Collaboration and teamwork dispositions
Career aspirations
Technology – ICT ICT use
Interest in ICT
Perceived ICT competence
Perceived Autonomy in using ICT
ICT use in social interaction
Behaviour Health: physical activities
Time use: activities before/after school
Note: bold = trend measures�

Pisa 2015 CONtEXt QUEstiONNaiREs FRaMEWORK6
110 © OECD 2016 PISA 2015 ASSESSMENT AND ANALYTICAL FRAMEWORK: SCIENCE, READING, MATHEMATIC AND FINANCIAL LITERACY
and Pauli, 2008; Ryan and Deci, 2000)� In addition, instrumental motivation is an important predictor for course selection, career choices and performance (Eccles, 1994; Eccles and Wigfield, 1995; Wigfield, Eccles and Rodriguez, 1998)� All three constructs have been used in previous PISA cycles, but the interest scale has been substantially revised and split into two measures�
Beliefs about science: Epistemological beliefs are closely related to students’ general values of science and scientific inquiry (Fleener, 1996; Hofer and Pintrich, 2002)� They include beliefs about science as an evolving and changing subject and how individuals justify knowledge (Conley et al�, 2004)� Epistemological beliefs have been assessed in the PISA domain of mathematics but not yet in the domain of science�
Environmental issues are a distinct area of beliefs that is covered by two constructs: environmental awareness and environmental optimism� PISA 2006 showed that students from more socio-economically advantaged backgrounds reported higher levels of awareness of environmental issues and that this construct is linked with students’ science performance (OECD, 2007)� In addition, students reported low levels of environmental optimism, which was negatively associated with students’ performance�
Domain-general student attitudes and behaviours (Module 10)Domain-general attitudes, beliefs and behaviours can be defined as a set of student factors or constructs that cut across curricular topics, or that are independent of curricula, but are nevertheless important for and reflective of success in education� PISA 2015 does not intend to measure global dispositional traits but behavioural tendencies and preferences that are relevant in the context of learning and that can be conceptualised as outcomes of education in general, and schooling specifically�
As shown in the right column of Figure 6�3, the content of Module 10 can be grouped into broader areas that partly parallel the science-related outcomes, widening the goal of assessment well beyond science and technology� The following paragraphs provide links to previous work at the OECD and other research, especially focusing on constructs that are new to PISA, such as well-being, health and time use�
Self-related beliefs and attitudes towards school: Generalised beliefs about one’s own success or failure in academic learning have been shown to be strong predictors for further effort and success, including test scores in student assessments� PISA 2015 uses a revised (and generalised) version of a test-anxiety scale that was predictive for mathematics achievement in previous PISA cycles� In addition, a new indicator for generalised achievement motivation (e�g� “I want to be the best, whatever I do”) has been introduced� A set of anchoring vignettes (King and Wand, 2007) is implemented to control for response biases and increase cross-cultural equivalence�
Subjective well-being: Subjective well-being can be defined as “good mental states, including all of the various evaluations, positive and negative, that people make of their lives and the affective reactions of people to their experiences” (OECD, 2013, p� 10)� The growing recent interest in this construct among researchers and policy makers has resulted in recommendations to statistical agencies to “incorporate questions on subjective well-being in their standard surveys to capture people’s life evaluations, hedonic experiences and life priorities” (Stiglitz et al�, 2009: 216)�
The OECD (2013) responded to this charge by providing guidelines on measuring subjective well-being� To date, 27 out of 34 OECD national statistical offices have committed to collecting at least the minimal information proposed by the OECD guidelines (the single “general life satisfaction” question), which is now included in PISA 2015� The guidelines suggest that it is appropriate to collect such information from 15-year-olds, and even younger students, because the evidence suggests that they are “capable of responding effectively to subjective well-being questions from as young as age 11 with respect to measures of life evaluation and affective state” (OECD, 2013: 152)� To assess well-being specifically within the context of school, PISA 2015 uses a question that has been labelled “sense of belonging” in previous cycles�
ICT: ICT-related behavioural characteristics and motivational attributes can be regarded as domain-general student outcomes� Since ICT subsumes a broad range of devices, it may play a role across all education domains� Following the OECD’s DeSeCo project and the 21st-Century Skills Initiative, students should exhibit general skills related to information, media and technology above and beyond the traditional core subjects (OECD, 2005; Partnership for 21st Century Skills, 2008)� PISA 2015 assesses students’ interest in ICT, (self-determined) practices of ICT use, their perceived competence and autonomy in using ICT, and a specific question on use of social media within the ICT Familiarity Questionnaire�

Pisa 2015 CONtEXt QUEstiONNaiREs FRaMEWORK6
PISA 2015 ASSESSMENT AND ANALYTICAL FRAMEWORK: SCIENCE, READING, MATHEMATIC AND FINANCIAL LITERACY © OECD 2016 111
Health: This area addresses the practice of healthy behaviours, particularly behaviour pertaining to regular exercise, and health-related lifestyle choices� Research has shown that poverty and low socio-economic status is associated with poor health outcomes (Spurrier et al�, 2003)� Research has also shown that physical activity can improve academic performance due to the activity itself and to the consequent reduction of more passive activities (Salmon et al�, 2005)�
Physical exercise can be (positively as well as negatively) influenced by teacher behaviours and school practices� The approach to measuring physical activity in PISA 2015 is adapted from and closely aligned with the Global School-based Student Health Survey of the World Health Organization� That survey is conducted among adolescents of roughly the same age as the PISA population� Relating these data to PISA measures of student and school background will help to develop an understanding of the issues of equity and health in education�
Career aspirations (Module 6)The PISA 2015 Student Questionnaire includes two questions about career aspirations that were used in 2006� They ask about the highest education level the student expects to complete and the job he or she expects to have at the age of 30�
Non-cognitive outcomes related to collaborative problem solving (Module 11)In order to cover dispositions related to the new domain of assessment introduced in PISA 2015, namely Collaborative Problem Solving, a set of items on valuing team work, co-operating, guiding others and negotiating was developed based on research by Wang and colleagues (2009)� The Teacher Questionnaire covers types of activities and grouping, and rewards for team work from another perspective�
Assessing teaching and learning processes5
This section summarises the conceptual foundations for high-priority Modules 2 (science teaching practices), 12 (learning time and curriculum) and 1 (teacher qualifications and professional knowledge) as well as those of lower-priority Module 5 (out-of-school science experience)�
Teaching and learning are at the heart of schooling� Most cognitive and non-cognitive, curricular and cross-curricular goals of school education are achieved – or not – by the way students and teachers interact in classrooms� While teaching is the core process in schools, the curriculum determines its content, and professional teachers implement the curriculum, orchestrate learning activities, and thus arrange for quality learning time�
PISA has been designed as a yield study, assessing life-skills and broad areas of literacy rather than curricular domains, sampling a birth cohort rather than a grade level or intact classrooms� Thus, it might be questioned why this programme should address teaching and learning processes at all� However, there is ample evidence that teaching and learning activities are the best predictors of student competencies, whatever their character might be� So, if PISA is to inform education policy making at the system and the school levels, it must cover this important area�
Clearly, the PISA study should focus on more general and internationally comparable constructs rather than fine-grained content matter� Therefore, Module 2 describes science education by broad lists of teaching and learning activities, covering both inquiry-based teaching (which was assessed in PISA 2006) and teacher-directed practices� In addition, general dimensions of teaching quality, such as classroom disciplinary climate, teacher support, feedback and adaptability, are applied to science education� Module 12 covers learning time – including non-mandatory, additional instruction within and out of school – as well as the science curriculum� In addition, the teaching force is described in terms of initial education, beliefs and professional development (Module 1)�
Science teaching practices (Module 2)According to the PISA approach to scientific literacy, the main task of science teaching is to foster students’ capacity to explain phenomena scientifically, understand scientific enquiry and interpret scientific evidence� The key topic of the framework outlined below is the extent to which schools are mastering this task�
A number of processes at the classroom level have been found to be relevant for effectiveness in science education� In this framework, both domain-specific instructional approaches and activities, and more general dimensions of instructional quality are combined, as they are equally suited to support learning activities and describe processes on the classroom level� However, in PISA 2015, all questions about teaching and learning activities are framed within the context of school science, sometimes even referring to one specific course� The aim is to describe science teaching in the classroom by country-specific profiles of teaching practices, and to investigate their relation to students’ outcomes�
Pisa 2015 CONtEXt QUEstiONNaiREs FRaMEWORK6
112 © OECD 2016 PISA 2015 ASSESSMENT AND ANALYTICAL FRAMEWORK: SCIENCE, READING, MATHEMATIC AND FINANCIAL LITERACY
Analyses based on PISA 2006 show that a student’s outcome can be predicted by different profiles of practices in teaching (Kobarg et al�, 2011)� While some teaching patterns are related to high performance, others are related to high student interest and motivation� The results indicate that the items and scales for science teaching practices are applicable to in-depth descriptions of science teaching in the classroom� Moreover, a comparison of the patterns allows for detailed analyses of both students’ science performance and students’ interest in science topics across countries (Kobarg et al�, 2011; Prenzel, Seidel and Kobarg, 2012)� The teaching-practices items are developed and chosen in order to discriminate between different patterns of teaching�
Teaching and learning activities: Research has shown that inquiry-based teaching practices, which play a significant role in science education, have a positive effect on student learning, particularly students’ engagement in the cognitive dimensions of inquiry and teacher-led inquiry activities (Furtak et al�, 2012)� Inquiry-based instruction seems not only to improve achievement (Blanchard et al�, 2010), but also attitudes towards the subject and transferable critical thinking skills (Hattie, 2009)�
There is a renewed interest in embedding science teaching and learning in contexts that are real and meaningful for learners (Fensham, 2009; King and Stephen, 2012)� Scientific argumentation as a central goal of science education (Osborne, 2012) needs classroom situations with sufficient opportunities for social interaction� Instruction that emphasises students’ active thinking and drawing conclusions from data seems to be particularly beneficial for students’ development (Minner, Levy and Century, 2010)� According to these findings and the analysis of the PISA 2006 items (Kobarg et al�, 2011, Taylor, Stuhlsatz and Bybee, 2009), a subset of nine items from PISA 2006 is used for this scale: six of the items are unchanged from 2006; three were slightly revised�
In addition to the inquiry-based teaching practices, teacher-directed teaching and learning activities in science focus on classroom management activities and teaching methods, and broaden the perspective of domain-specific practices� The purpose is to obtain student-reported information about their actions in school science lessons and to get a realistic picture of what is going on in science classes – including classes with little inquiry-based learning�
The student perspective on science teaching is complemented by the Teacher Questionnaire, for those countries that participate in this option� Science teachers are asked to describe their teaching practices through a parallel questionnaire that also focuses on teacher-directed teaching and learning activities in science lessons, and a selected set of inquiry-based activities� Both perspectives may be combined and compared on the school level�
Dimensions of teaching quality: Several classroom studies confirm the impact of three basic dimensions of instructional quality on students’ cognitive and motivational development: clear, well-structured classroom management; supportive, student-oriented classroom climate; and cognitive activation with challenging content (Klieme, Pauli and Reusser, 2009)� In previous PISA cycles, the first two dimensions were covered by questions about classroom disciplinary climate and teacher support, respectively� As a school-climate variable, the purpose of the disciplinary climate question is to gather information on the structure and efficiency of classroom management, which can be seen as a prerequisite for student learning� The teacher-support question measures how often the teacher helps students with their learning (OECD, 2004)�
Research has shown that the scale is positively related to students’ interest (Vieluf, Lee and Kyllonen, 2009)� Concerning a measure of cognitive activation, it is assumed that the level of cognitive challenge is determined by the type of problem and the way it is presented in the lesson� Therefore, “inquiry-based science education” serves as an indicator of cognitive activation in PISA 2015� In addition to these three dimensions, PISA 2015 includes a measure of adaptability in teaching, as perceived by students�
Learning time and curriculum (Module 12), including out-of-school science experience (Module 5)The learning time and curriculum to which students are exposed in the course of their education are closely related to student outcomes (e�g� Schmidt and Maier, 2009; Abedi et al�, 2006; Scherff and Piazza, 2008)�
Learning time has proven to be a central factor in student learning and achievement (Gándara et al�, 2003; Patall, Cooper and Allen, 2010; Scheerens and Bosker, 1997; Seidel and Shavelson, 2007)� Such positive relationships were replicated in international comparative research, pointing to the cross-cultural comparability of the construct and its effects (e�g� OECD, 2011; Martin et al�, 2008; Schmidt et al�, 2001)� Yet although there is an overall positive relation between learning time and achievement, there are large differences within and across countries and among different groups of students and schools (Ghuman and Lloyd, 2010; OECD, 2011)�

Pisa 2015 CONtEXt QUEstiONNaiREs FRaMEWORK6
PISA 2015 ASSESSMENT AND ANALYTICAL FRAMEWORK: SCIENCE, READING, MATHEMATIC AND FINANCIAL LITERACY © OECD 2016 113
Overall it is important to distinguish among learning time that is provided by the school system, realised or implemented by the school and the teacher in the classroom, and used by the students� On this path from “gross” learning time as allocated in system-level policies to student “time-on-(the right) task”, many factors, at different levels (school, classroom and student) reduce available learning time to varying degrees across countries (Gillies and Quijada, 2008; Benavot, 2004)� Differences in that reduction among various subgroups of students can indicate equity – or lack thereof – in education opportunities, because research shows that relations with outcomes are stronger when learning time is more narrowly defined (e�g� time-on-task instead of allocated learning time)� Therefore, PISA 2015 intends to apply a broader view of learning time (Abadzi, 2009; Berliner, 1990; Millot and Lane, 2002)�
At the school level, PISA 2015 assesses provided learning time (PT), but there is loss of time due to such factors as local festivities, teachers’ strikes, illness or other teacher absenteeism (see Ghuman and Lloyd, 2010; Chaudhury et al�, 2006)� Another proportion of time is then used in the classroom, resulting in realised learning time (rt)� Time loss at the classroom level is most commonly due to non-teaching activities like classroom management, collecting homework or waiting time (e�g� MacKay, 2009; The PROBE Team, 1999), which leaves realised learning time as the fraction of time during which a class is taught�6 The proportion of realised learning time during which a student learns course content is engaged learning time (ET)� This excludes periods in which a student does not attend class due to illness, truancy, being late or being physically present but mentally disengaged� Engaged learning time is the only time during which students actually learn� Figure 6�4 provides a summary of these time-related constructs, how they are defined and how they may be estimated�
Moreover, it has been shown that next to the absolute amount of time available for learning, students’ time-use patterns relate to success variables and can help explain associations between student background variables (such as socio-economic status) and performance variables (such as mediator variables, see Porterfield and Winkler, 2007)� In the PISA 2015 main survey, students’ time use before and after school is assessed with a set of newly designed questions that was developed in parallel to Kahneman’s et al� (2004) “Day-reconstruction method”�
Figure 6�4 • assessment of learning time and loss of learning time in Pisa 2015
Student Questionnaire School Questionnaire
Use
Student + Additional instruction and study (time use)
- Truancy
Engaged time (ET) =
RT – student absenteeism, truancy, mentally disengaged time
Prov
isio
n
Classroom - Disciplinary climate and loss in science classes
Realised learning time (RT) =
PT – loss due to classroom management, assessment time, waiting time, etc�
School + Amount of school learning time
+ Number and type of science classes
- Loss on school level
Provided learning time (PT) =
AT – loss due to weather, holidays, teacher absenteeism, etc�
In addition to learning times for mandatory schooling, other in-school and out-of-school learning activities are also taken into account� PISA 2015 attempts to identify additional learning time in a cross-culturally valid way, incorporating, for example, different formats, location, content and purposes� Information from the School and Student Questionnaires, and from the optional Educational Career Questionnaire can be combined to get the full picture� Similarly, information on extracurricular learning activities, time use before and after school every day, and science-related experiences is gathered from students, from parents in the optional Parent Questionnaire, and from school leaders in the School Questionnaire�
Curriculum: There may be great differences between the curriculum designed at the system level, the curriculum delivered by the teacher or in the textbook, and the curriculum as understood by students� For the major domain of PISA 2015, “science”, differences in the curriculum are particularly large across tracks, grades, schools and countries (Schmidt et al�, 2001; Martin et al�, 2008)� In order to examine some of this variety, the optional PISA 2015 Science Teacher Questionnaire asks about the content of a school’s science curriculum and how it is communicated to the parents�

Pisa 2015 CONtEXt QUEstiONNaiREs FRaMEWORK6
114 © OECD 2016 PISA 2015 ASSESSMENT AND ANALYTICAL FRAMEWORK: SCIENCE, READING, MATHEMATIC AND FINANCIAL LITERACY
Teacher qualification and knowledge/beliefs (Module 1)Many studies show a clear link between teacher-related factors and student learning� In addition to teachers’ professional behaviour within the classroom (see above), the age and education level of the teaching force, teachers’ initial education and qualifications, their individual beliefs and competencies, and their professional practices on the school level, such as collaboration and professional development, have been core topics in education policy�
Some basic information on these topics will be available from the PISA 2015 School Questionnaire, while the optional Teacher Questionnaire, which is partly based on instruments previously established in the OECD Teaching and Learning International Survey (TALIS), features additional constructs, both science-specific and domain-general (Figure 6�5)� This instrument is new to PISA, although national instruments have been added to the PISA design in Germany and Ireland in previous cycles, with broad support from the teaching force� Other large-scale studies, such as Trends in International Mathematics and Science Study (TIMSS), have implemented teacher questionnaires without any loss in participation� Thus, the new optional instrument will finally give teachers a voice in PISA�
Figure 6�5 • teacher-related measures in the Pisa 2015 field trial
Science-related GeneralBackground Gender, age, employment status, job experience, subjects studied
Initial education
Goal of first qualification, type of teacher education and training programme (if attended), mode of qualification
Number of teachers by education level (ScQ)
Science-related content
Number of science teachers by level of qualification (ScQ)
Professional development
Participation in different type of activities
Obligation amount of participation, school policies (ScQ)
Collaboration
Science-related content
Co-operation
General content
Beliefs Self-efficacy (related to science content and teaching science) Job satisfaction
Note: If not indicated otherwise, constructs are included in the optional PISA 2015 Teacher Questionnaire�
Across these topics, a distinction is adapted that Shulman (1985) suggested for research on teachers: teachers’ beliefs and activities can be related either to the subject matter taught, its conceptual foundations, basic ideas, etc� (content), to teaching and learning the subject matter, including issues of student understanding, teaching practices, assessment procedures, etc� (pedagogical content), or to general concepts, such as classroom management (pedagogy)�
Shulman’s model has been most influential in research on teachers (e�g� Hill, Rowan and Ball, 2005; Baumert et al�, 2010; Bloemeke et al�, 2012)� In line with this research, PISA 2015 identifies content, pedagogical content, and/or pedagogy as the foci of teacher-related constructs, including initial education and professional development� There is no attempt to measure teachers’ knowledge�
Teachers’ background and initial education: Understanding the multiple pathways leading to the teaching profession, including mid-life career changes, is important for education policy because there is a growing need to recruit teachers from non-traditional backgrounds� For these people, but also for novice teachers with traditional training, the induction stage is important (Portner, 2005)� Teacher retention is another concern in many countries (Ingersoll and Perda, 2010)� In addition to formal qualifications (tertiary/secondary education certificates and academic degrees), a major in the subject being taught, the type of teacher education and training programmes attended, and professional experience (i�e� years having taught science at school), PISA 2015 asks teachers about the representation of the three foci in their initial education�
Professional development and collaboration: Professional development refers to any activity that equips teachers with the tools and resources necessary to provide quality instruction� It includes school-based programmes as well as networking, coaching, seminars or other types of training activities that foster in-service learning and thus promote the professionalisation of teaching� Even though professional development is generally regarded as crucial for improving

Pisa 2015 CONtEXt QUEstiONNaiREs FRaMEWORK6
PISA 2015 ASSESSMENT AND ANALYTICAL FRAMEWORK: SCIENCE, READING, MATHEMATIC AND FINANCIAL LITERACY © OECD 2016 115
teaching and student achievement, Sykes referred to the ineffectiveness of common trainings as “the most serious unsolved problem for policy and practice” (Sykes, 1996: 465)� However, more recent studies report positive effects on teaching practices and classroom climate (Cuevas et al�, 2005; Desimone et al�, 2002; Jeanpierre, Oberhause and Freeman, 2005; Supovitz and Turner, 2000; Timperley et al�, 2007), as well as on student achievement (e�g� McDowall et al�, 2007; Shayer and Adhami, 2007)� This apparent inconsistency may be partly resolved by accounting for different features of the programmes examined� Summarising previous studies, Buczynski and Hansen describe ineffective programmes as being “too conventionally taught, too top-down, and too isolated from school and classroom realities to have much impact on practice” (Buczynski and Hansen, 2010: 600)�
As early as in the 1980s, scholars indicated the benefits of supportive networks for teachers (e�g� Darling-Hammond, 1984; Rosenholtz, 1989; Bryk and Driscoll, 1988)� In the 1990s the idea of “professional learning communities” emerged� This notion refers to groups of teachers who co-operatively reflect and improve their professional practices (Hord, 1997)� Research on professional learning communities is still limited, but there is some indication of positive effects on education processes and outcomes (e�g� Lomos, Hofman and Bosker, 2011)� In China, for example, teachers are often organised in groups that work together studying national guidelines and defining teaching goals, that co-operate for preparing and improving teaching, and that organise observation visits to provide colleagues with feedback and involve teachers in out-of-school activities (Paine and Ma, 1993)� Similarly, in Japan “lesson studies” are common practice among teachers (Stigler and Hiebert, 1999)� TALIS further suggests that the pattern of activities also varies between countries (Vieluf et al�, 2011)�
The PISA School Questionnaire in 2000 and 2012 included a question about the proportion of teachers who had recently (within the previous three months) participated in some kind of professional development activity� In 2012, the same question was asked with a focus on mathematics teachers� However, this information did not show any substantial relation to student outcomes� Therefore, PISA 2015 intended to enhance measurement of professional development by adapting questions from TALIS and other sources (e�g� Steinert et al�, 2006)�
Professional beliefs: PISA uses a measure of job satisfaction also used in TALIS� Science teachers are asked to report self-efficacy beliefs regarding science content and how it is taught�
Teachers’ morale and commitment was assessed in PISA cycles 2000, 2003 and 2012 in the School Questionnaire that was completed by the principal (or some other member of the school management team), aiming to assess attitudes among teaching staff� These measures are included in PISA 2015 in Module 13, “school climate”�
The main level of analysis for data gathered in the optional Teacher Questionnaire is the school level� No weighting for individual teacher responses are available� All data from the Teacher Questionnaire are thus treated as school variables�
Assessing school policies and governance7
This section summarises the conceptual foundations of high-priority Module 19 (assessment, evaluation and accountability) as well as those of lower-priority Modules 3 (school-level learning environment for science) and 13-18�
Assessment, evaluation, and accountability (Module 19)Assessing students and evaluating schools8 is a common practice in most countries� Since the 1980s, policy instruments, such as performance standards, standard-based assessment, annual reports on student progress and school inspectorates, have been promoted and implemented across continents� Reporting and sharing data from assessments and evaluations with different stakeholders provides multiple opportunities for monitoring, feedback and improvement�
In recent years, there has been a growing interest in the use of assessment and evaluation results through feedback to students, parents, teachers and schools as one of the most powerful tools for quality management and improvement (OECD 2010d: 76)� Accountability systems based on these instruments are increasingly common in OECD countries (Scheerens, 2002: 36)� Accountability is often linked to market-oriented reforms� Rewards/penalties for good/poor assessment and evaluation results are said to change behaviours in ways that improve student achievement (Wößmann et al�, 2009)� However, there are huge differences in assessment and evaluation practices and purposes�9
Previous PISA cycles have covered aspects of assessment, evaluation and accountability in the School Questionnaire, with a strong focus on the use of standardised tests� In PISA 2015, this module asks both about standardised and less standardised practices� Internal and external evaluations address different purposes and consequences and will be dealt with separately� Teacher evaluation is also addressed as a means of quality management�

Pisa 2015 CONtEXt QUEstiONNaiREs FRaMEWORK6
116 © OECD 2016 PISA 2015 ASSESSMENT AND ANALYTICAL FRAMEWORK: SCIENCE, READING, MATHEMATIC AND FINANCIAL LITERACY
Formative assessment and feedback are increasingly popular in research and teaching practice� These types of assessment and evaluation differ with respect to their respective purposes and criteria, practices, use and consequences (Pellegrino, Chudowsky and Glaser, 2001; Scriven, 2003; Wilson, 2004) (see Figure 6�6)� These aspects are covered in the PISA 2015 questionnaires as much as possible�
In the following section, relevant research on school evaluation and student assessment is summarised to provide the rationale for questionnaire development in PISA 2015�
Evaluation: The evaluation of schools is used as a means of assuring transparency, judging systems, programmes, educational resources and processes, and also guiding school development (Faubert, 2009)� Evaluation criteria need to be defined and applied from the viewpoints of different stakeholders (Sanders and Davidson, 2003)�
Evaluation can be either external or internal (Berkemeyer and Müller, 2010)� It is called external evaluation if the process is controlled and headed by an external body and the school does not define the areas that are judged� An evaluation is called internal if it is part of a process controlled by the school and in which the school defines which areas are judged� The evaluation may be conducted by members of the school (self-evaluation) or by persons/institutions commissioned by the school� Different evaluation practices generally coexist and benefit from each other (Ryan, Chandler and Samuels, 2007)�
External evaluation can expand the scope of internal evaluation, validate results and implement standards or goals; internal evaluation can improve the interpretation and increase the use of external evaluation results (Nevo, 2002)� However, improvement of schools seems to be more likely when an internal evaluation is applied, compared to external evaluation� Therefore, processes and outcomes of evaluation might differ, depending on whether the evaluation is internal or external� Moreover, country- and school-specific factors may influence the implementation of evaluations as well as the conclusions and effects for schools� In many countries, individual evaluations of teachers and principals, separate from school-wide evaluation, are also common (Faubert, 2009; Santiago and Benavides, 2009); they are treated here as a separate type of evaluation�
Figure 6�6 • Measures in Pisa 2015 related to assessment, evaluation and accountability
External evaluation Teacher evaluation Internal evaluation Formative assessmentPurpose and criteria
General assessment practice (ScQ)Purpose of assessment results (ScQ)
Evaluation policies (ScQ) Teacher’s grading (TQG)
Practices Teacher-evaluation methods (ScQ)
Classroom-assessment instruments (TQG/TALIS)
Use and consequences
Processes of external evaluation (ScQ)
Use of achievement data for accountability (ScQ)
Consequences of internal evaluation (ScQ)
Feedback: student perception (StQ)
Adaptation of instruction (StQ)
Results of evaluations may be used in a formative way (e�g� to guide the analysis and improvement of processes) or in a more summative way (e�g� for accountability)� Formative evaluation aims at closing the gap between the as-is state and the target state� Here, teaching and school-based processes are to be guided to a predetermined goal� Summative evaluation focuses on student outcomes and encourages schools to meet specific standards� Formative evaluation has turned out to be more effective in school improvement than summative evaluation (Creemers and Kyriakides, 2008)� Effects or consequences of evaluation may differ, depending on the focus of evaluation, the procedure chosen for the evaluation, or a school’s goals and priorities�
Assessment: Communication and clarification of achievement goals within schools is essential in students’ learning (Brookhart, 2007; Stiggins, 2007)� National standards that have emerged in recent years define what students should know (Koeppen et al�, 2008; Shepard, 2006)� These education standards directly shape school policies and classroom instruction by urging schools and teachers to communicate specific aims leading to a shared understanding� To check whether these goals are met, schools follow a given assessment practice or define their own� This can be implemented in the classroom learning process by more or less standardised tests and oral examinations developed by the teacher�
Pisa 2015 CONtEXt QUEstiONNaiREs FRaMEWORK6
PISA 2015 ASSESSMENT AND ANALYTICAL FRAMEWORK: SCIENCE, READING, MATHEMATIC AND FINANCIAL LITERACY © OECD 2016 117
In addition, mandatory and non-mandatory standardised and externally developed tests verify and compare student outcomes at the classroom, school, district, state or international level (Shepard, 2006)� Irrespective of the purpose and the stakeholder administering the assessment, a test must fulfil a number of quality criteria (Scheerens, Glas and Thomas, 2003)� In general, standardised tests are more reliable measures, but may be less aligned with the school curriculum, and vice versa for teacher-made assessments�
The distinction between formative and summative, internal and external approaches also holds for student assessment� In its summarising function, assessment takes place in order to grade, certify or record progress� Summative assessment, whether external or internal, thus indicates and monitors standards, but may also raise standards by encouraging students, as well as teachers and schools, to put more effort into their work (Harlen and Deakin Crick, 2002)� On the other hand, summative assessment might lead to lower self-esteem and diminished effort of students at risk, and therefore can increase the gap between lower- and higher-achieving students (Black and Wiliam, 2004)�
Another negative aspect of assessment may arise when teaching solely focuses on answering questions, rather than on developing skills and knowledge (Harlen and Deakin Crick, 2002)� Grading is arguably the most prevalent type of classroom assessment, and an essential aspect of effective teaching (McMillan, 2001; Guskey, 2007)� Grades have been shown to be unreliable and of limited validity, but there is very little comparative research on grading practices in different countries�
Formative assessment can be a significant source of improvement in student learning processes (e�g� Shepard, 2006; Black and Wiliam, 2004; McMillan, 2007; OECD, 2006b)� Especially for low achievers, formative assessment can lead to sizable gains in student achievement (Abrams, 2007)� Formative assessment and reciprocal feedback might not just be useful for students, but also for teachers, helping them to adapt their instruction to their students’ needs� However, there is large variation in the implementation and impact of formative assessment practices (e�g� Kingston and Nash, 2011; Shute, 2008; Hattie and Timperley, 2007; Black and Wiliam, 1998)� Therefore, it is worthwhile to study cross-national variation in formative assessment practices through PISA 2015�
The School Questionnaire for PISA 2015 includes several questions on general assessment practices and results, external evaluation and teacher evaluation that have been used in previous cycles, to report trends� However, in line with the research cited above, internal school evaluation and formative, classroom-based assessments are given more weight in PISA 2015 than in previous cycles�
Other school policies and approaches to educational governanceDuring the past two decades, research on educational effectiveness has largely been concerned with the impact of school-level factors on students’ learning� Studies show that school qualities have effects on student progress, with variation in schools appearing to affect students’ behaviour� It has been asserted that the environment at the school level can influence the behaviour of teachers and students and thus – mostly indirectly – their consequent success in teaching and in learning� Both “soft” factors, such as school climate and parental involvement, and “hard” factors, such as school management activities and allocation policies, vary and are related to student outcomes within and across countries�
School climate (Module 13): School climate encompasses shared norms and values, the quality of relationships and the general atmosphere of a school� An academic focus – a general consensus about the mission of the school and the value of education, shared by school leaders, staff, and parents – influences the norms in student peer groups and facilitates learning� In addition, an orderly learning atmosphere maximises the use of learning time� By contrast, disrespectfulness and an unruly environment are counterproductive for teachers and students alike and distract from the school’s actual mission� As in previous PISA assessments, indicators for school climate is gathered through the School Questionnaire (“behaviour affecting school climate”)�
PISA 2015 adds two new measures covering aspects of school climate that are often hidden, but nevertheless highly important from both a pedagogical and a policy point of view: bullying by peers and unfair treatment by teachers, as perceived by the students� Bullying has been identified as an important factor of school culture (Ertesvag and Roland, 2015) and school climate (Wang, Berry and Swearer, 2013) that is relevant across cultures (Smith et al�, 2002)�
Parental involvement (Module 14): Over the past years, the involvement of parents in education has gained importance in the education debate, and to some extent it has also become relevant for education policy� Parents are not only an important audience, but powerful stakeholders in education� Thus information on parents’ opinions and engagement is highly valuable for large-scale assessments like PISA� Parental involvement in education has been assessed in PISA

Pisa 2015 CONtEXt QUEstiONNaiREs FRaMEWORK6
118 © OECD 2016 PISA 2015 ASSESSMENT AND ANALYTICAL FRAMEWORK: SCIENCE, READING, MATHEMATIC AND FINANCIAL LITERACY
since 2006 when the Parent Questionnaire, which directly addresses the parents of PISA students, was administered for the first time� For PISA 2015, specific aspects of parental involvement are added to the School Questionnaire (for parent-school communication and collaboration), and to the Student Questionnaire (for parental support in learning)� In particular, four items on parental support are asked in parallel of students and of their parents, so that perceptions can be compared on an individual level�
Leadership and school management (Module 15): School principals play a key role in school management� They can shape teachers’ professional development, define the school’s education goals, ensure that instructional practice is directed towards achieving these goals, suggest modifications to improve teaching practices, and help solve problems that may arise within the classroom or among teachers� The PISA measure of educational leadership saw a major revision in the 2012 study� This work has been reviewed, and the leadership scale could be considerably shortened� In addition, the new optional Teacher Questionnaire gathers information on transformational leadership from teachers as well, because research has shown that the teachers’ perspective on leadership can differ from the positions held by school administrators�
Resources (Module 16): Information on school type (public vs� private) and class size has always been included in the School Questionnaire� In addition to these trend questions, PISA 2015 allows for distinguishing between types of private schools (religious/denominational, not-for-profit, for-profit)� All PISA cycles so far have included a question on the degree of problems a school experiences due to missing resources� The different approaches over time are systematised and implemented in one coherent question in the School Questionnaire�
Locus of decision making (Module 17): Education systems have been classified by the amount of control that is left to the school (i�e� school board, staff and school leaders) when decisions on admission, curriculum, allocation of resources and personnel have to be made� These indicators are based on questions in the School Questionnaire that are left unchanged to allow for trend reporting�
Allocation, selection, choice and grade repetition (Module 18): The way students are channelled into education pathways, schools, tracks or courses is a core issue of educational governance (“stratification”)� On the school level, selection and allocation procedures are important aspects of school organisation� Highly selective schools provide a learning environment that may differ from the environment offered by more comprehensive schools� For all those reasons, appropriate trend questions answered by school administrators and parents have been retained�
School learning environment for science (Module 3): Conceptually, this module overlaps to a considerable degree with other modules dealing with school-level factors, such as Module 12 (Learning time and curriculum), Module 15 (School leadership and management), and Module 19 (Assessment, evaluation and accountability)� In addition to those, there are questions addressing the size and qualification level of the science teaching staff, and concerning available resources, such as laboratories and equipment for hands-on student activities�
Assessing student background (Modules 7 – 9)10
This section covers three modules that were given lower priority by the PISA Governing Board: Module 7 (student socio-economic status, family and home background), Module 8 (ethnicity and migration) and Module 9 (educational pathways in early childhood)� Nevertheless, these topics, and Module 7 in particular, are important, because they contain the basic information needed for calculation of the PISA index of economic, social and cultural status (ESCS)�
Student socio-economic status, family and home background (Module 7): In order to compare equity related to social and ethnic factors across PISA cycles, PISA 2015 keeps measures of socio-economic status and other background variables basically unchanged� However, some minor changes have become necessary� Due to extensive development in the ICT sector, for example, questions on technology equipment in the student’s home are slightly outdated� Thus, the measures of home possessions have been updated to ensure better coverage of within and across country variation of home possessions� These changes are expected not to have any effect on the important trend measures in this module�
Ethnicity and migration (Module 8): Linguistic and cultural diversity are basic facts of life in most regions of the world� Many nations are home to several subpopulations with different languages and cultures� International migration perpetuates this diversity� In OECD countries, first- and second-generation immigrant students currently comprise 10% to 20% of the student population (OECD, 2010)� At the same time, students from ethnic minority groups and immigrant students often face particular challenges� In a number of education systems, immigrant students perform at significantly lower levels than their non-immigrant peers in key school subjects (Stanat and Christensen, 2006); both groups are often faced with overt or covert discrimination with potentially detrimental consequences for their psychological development and well-being� Thus, providing students from different linguistic and cultural backgrounds with equal opportunities is often considered

Pisa 2015 CONtEXt QUEstiONNaiREs FRaMEWORK6
PISA 2015 ASSESSMENT AND ANALYTICAL FRAMEWORK: SCIENCE, READING, MATHEMATIC AND FINANCIAL LITERACY © OECD 2016 119
one of the central challenges for education systems in the 21st century� Due to cultural concerns in some countries and time restrictions in the Student Questionnaires, however, PISA 2015 retains the questions on immigration and language background that have been used in previous cycles� This information is slightly enhanced by asking principals to estimate the percentage of minority students (language minorities, socio-economically disadvantaged and special needs) among 15-year-old students in their school�
Education pathways in early childhood (Module 9): When children enter primary school, they already differ in their language, pre-reading and early numeracy skills, and these differences are often maintained later in life� Promoting school readiness and better adjustment to school is hypothesised to be an efficient means of raising the achievement levels of all children, but especially of those children who lack parental support or who grow up in disadvantaged circumstances� It has been argued that investing in early education programmes will have large, long-term monetary and non-monetary benefits (Heckman, 2006)� The importance of pre-school quality has been acknowledged and analysed by OECD reporting as well�
According to UNESCO (2006), early childhood care and education (ECCE) is defined as “programmes that, in addition to providing children with care, offer a structured and purposeful set of learning activities either in formal institutions (pre-primary) or as part of a non-formal child development programme”� The focus of the internationally comparable statistics, International Standard Classification of Education Level 0 (ISCED 0), is much narrower� Currently, at least four strands of research support the relevance of applying a broader definition of ECCE than focusing on ISCED 0 alone: brain research, studies on domain-specific development and support, evaluation studies of model programmes, and longitudinal large-scale studies all rely on the broader definition of ECCE� Thus, conclusions about the importance of early child care should be drawn with ECCE and not with ISCED 0 in mind�
However, when evaluating the body of research it becomes obvious that, in fact, a number of characteristics of the kind of ECCE provided seem to determine whether benefits can be observed or not, and whether these benefits disappear or persist� Students’ opportunities to learn in early childhood are best assessed in terms of curriculum, quantity and quality of early childhood learning experiences� For example, one of the best sources available, the British Effective Provision of Pre-School Education (EPPE) Study, did find short-term effects showing that pre-school attendance was beneficial for cognitive and socio-emotional development, particularly for children from disadvantaged backgrounds� However, in the long term only those children who attended a high-quality pre-school centre showed persistent beneficial pre-school effects (e�g� Sammons et al�, 2008; Sylva et al�, 2011a; see also Valenti and Tracey, 2009)� A certain degree of intensity in terms of hours per week/months seems to be a precondition for beneficial effects of attendance at pre-school programmes (Logan et al�, 2011; Sylva et al�, 2011b)�
Thus, asking about early education experience in PISA only makes sense if specific aspects of programme duration, quality and curriculum can be retrieved retrospectively, which is more than unlikely (Fivush and Hamond, 1990; Markowitsch and Welzer, 2009)� As a consequence, PISA 2015, while keeping a short question on ISCED 0 attendance in the Student Questionnaire, includes a series of questions in the Parent Questionnaire, expecting parents to be a more reliable source of information� Those countries that distribute the optional Parent Questionnaire will acquire information on basic characteristics of the early childhood education and care arrangements of PISA participants, and reasons for attending or not attending early childhood education and care�

Pisa 2015 CONtEXt QUEstiONNaiREs FRaMEWORK6
120 © OECD 2016 PISA 2015 ASSESSMENT AND ANALYTICAL FRAMEWORK: SCIENCE, READING, MATHEMATIC AND FINANCIAL LITERACY
Notes1� In the past, other, more technical notions of “core” have been used in the PISA Questionnaire Design� One approach used “core” to denote a set of variables in the Student Questionnaires that are measured for all students in a given PISA cycle – even in cases where different booklets are assigned to them� Another approach defined “core” as the set of variables used for imputing plausible values of test scores� A third approach referred to “core” as the set of domain-general variables, i�e� those not related to the major domain of assessment� Please note that in contrast to those definitions, this framework identifies “core content” as a set of conceptual constructs that defines the most basic context assessment necessary in PISA� This set of constructs (has been and) should therefore be included in all PISA cycles, albeit in some cases adapted to the major domain�
2� From a technical point of view, it is also important to note that this stable set of background variables guarantees a strong set of conditioning variables used to impute measures of student proficiencies, as explained in the PISA Technical Reports (e�g� OECD 2014: 146)�
3� With the exception of optional material, such as the Parent Questionnaire, the ICT Familiarity Questionnaire, the Educational Career Questionnaire and the PISA 2000 Questionnaire on cross-curricular competencies�
4� This section is based on working papers submitted by Anja Schiepe-Tiska, Christine Sälzer and Manfred Prenzel for Module 4, Jonas Bertling and Patrick Kyllonen for Module 10� Module 11 was developed in co-operation with Core 1 and the Collaborative Problem Solving Expert Group chaired by Art Graesser�
5� This section is based on working papers submitted by Katharina Müller, Manfred Prenzel and Tina Seidel for Module 2, Susanne Kuger for Module 12, Eckhard Klieme, Franz Klingebiel and Svenja Vieluf for Module 1�
6� At least at this level, “time loss” refers to diminished learning time that focuses on curricular content and therefore on domain-specific cognitive outcomes� More overarching goals of education, such as self-regulation, interest or social competencies, might very well be stimulated during “lost” time periods�
7� This section is based on working papers submitted by Sonja Bayer, Eckhard Klieme and Nina Jude for Module 19, Leonidas Kyriakides for Module 3, Silke Hertel, Nadine Zeidler and Nina Jude for Module 14 (Parental Involvement) and Bieke de Fraine for Module 15 (School Management)�
8� The terms “evaluation” and “assessment” are defined quite differently in the literature� Sometimes they are even treated as synonyms� In this section the definition used conforms to that used in current OECD literature (see e�g� Rosenkvist, 2010)� The term evaluation or school evaluation is used for processes on the school and system levels� Evaluators collect evidence to judge systems, education programmes, policies and practices� This may include an evaluation of individual performance among professionals, such as teacher evaluation� Assessment or student assessment, on the other hand, directly refers to student performance or student learning processes (see also Harlen, 2007)� Notably, there is a strong link between assessment and evaluation� For instance, results from student assessments may be used for school evaluation purposes�
9� See OECD’s country reviews of assessment and evaluation www�oecd�org/education/preschoolandschool/oecdreviewonevaluation andassessmentframeworksforimprovingschooloutcomescountryreviews�htm�
10� This section is based on working papers submitted by Wolfram Schulz for Module 7, Svenja Vieluf for Module 8, Susanne Kuger and Hans-Günter Roßbach for Module 9�
ReferencesAbadzi, H. (2009), “Instructional time loss in developing countries: concepts, measurement, and implications”, The World Bank Research Observer, Vol� 24/2, pp� 267-290�
Abedi, J. et al� (2006), English Language Learners and Math Achievement: A Study of Opportunity to Learn and Language Accommodation, CSE Tech� Rep� No� 702, National Center for Research on Evaluation, Standards, and Student Testing (CRESST), University of California, Los Angeles, CA�
Abrams, L.M. (2007), “Implications of high-stakes testing for the use of formative classroom assessment”, in J�H� McMillan (ed�), Formative Classroom Assessment: Theory into Practice, Teachers College, Columbia University, New York, pp� 79-98�
Ainley, M. and J. Ainley (2011a), “Student engagement with science in early adolescence: The contribution of enjoyment to students’ continuing interest in learning about science”, Contemporary Educational Psychology, Vol� 36/1, pp� 4-12�
Ainley, M. and J. Ainley (2011b), “A cultural perspective on the structure of student interest in science”, International Journal of Science Education, Vol� 33/1, pp� 51-71�
Almlund, M. et al� (2011), “Personality psychology and economics”, IZA Discussion Papers 5500, Institute for the Study of Labour (IZA), Bonn�
Basl, J. (2011), “Effect of school on interest in natural sciences: A comparison of the Czech Republic, Germany, Finland, and Norway based on PISA 2006”, International Journal of Science Education, Vol� 33/1, pp� 145-157�

Pisa 2015 CONtEXt QUEstiONNaiREs FRaMEWORK6
PISA 2015 ASSESSMENT AND ANALYTICAL FRAMEWORK: SCIENCE, READING, MATHEMATIC AND FINANCIAL LITERACY © OECD 2016 121
Baumert, J. et al� (2010), “Teachers’ mathematical knowledge, cognitive activation in the classroom, and student progress”, American Educational Research Journal, Vol� 47/1, pp� 133-180�
Benavot, A. (2004), “A global study of intended instructional time and official school curricula, 1980-2000”, background paper commissioned by the International Bureau of Education for the UNESCO-EFA Global Monitoring Report 2005: The Quality Imperative, IBE, Geneva�
Berkemeyer, N. and S. Müller (2010), “Schulinterne Evaluation – nur ein Instrument zur Selbststeuerung von Schulen?” in H� Altrichter and K� Maag Merki (eds�), Handbuch neue Steuerung im Schulsystem, VS Verlag für Sozialwissenschaften, Wiesbaden, pp� 195-218�
Berliner, D.C. (1990), “What’s all the fuss about instructional time?” in M� BenPeretz and R� Bromme (eds�), Life in Classrooms, reissued with a new introduction, Teachers College Press, New York, pp� 3-35�
Black, P. and D. Wiliam (2004), “Classroom assessment is not (necessarily) formative assessment (and vice-versa),” in M� Wilson (ed�), Towards Coherence between Classroom Assessment and Accountability, Yearbook of the National Society for the Study of Education, Vol� 103/2, University of Chicago Press, Chicago, IL, pp� 183-188�
Black, P. and D. Wiliam (1998), “Assessment and classroom learning”, Assessment in Education: Principles, Policy & Practice, Vol� 5/1, Routledge, London, pp� 7-74�
Blanchard, M.R. et al� (2010), “Is inquiry possible in light of accountability? A quantitative comparison of the relative effectiveness of guided inquiry and verification laboratory instruction”, Science Education, Vol� 94/4, pp� 577-616�
Blau, D. and J. Curie (2006), “Preschool, day care, and afterschool care: Who’s minding the kids?”, The National Bureau of Economic Research, Working Paper No� 10670, Handbook of the Economics of Education, Elsevier, North Holland� www�nber�org/papers/w10670�pdf�
Bloemeke, S. et al� (2012), “Family background, entry selectivity and opportunities to learn: What matters in primary teacher education? An international comparison of fifteen countries”, Teaching and Teacher Education, Vol� 28/1, pp� 44-55�
Brookhart, S.M. (2007), “Expanding views about formative classroom assessments: A review of the literature”, in J�H� McMillan (ed�), Formative Classroom Assessment, Teachers College Press, New York, pp� 43-62�
Bryk, A.S. et al� (2010), Organizing School for Improvement: Lessons from Chicago, The University of Chicago, IL�
Bryk, A.S. and M.E. Driscoll (1988), The High School as Community: Contextual Influences and Consequences for Students and Teachers, National Center on Effective Secondary Schools, University of Wisconsin, Madison, WI�
Buccheri, G., N.A. Gürber and C. Brühwiler (2011), “The impact of gender on interest in science topics and the choice of scientific and technical vocations”, International Journal of Science Education, Vol� 33/1, pp� 159-178�
Buczynski, S. and B. Hansen (2010), “Impact of professional development on teacher practice: uncovering connections”, Teaching and Teacher Education, Vol� 26/3, pp� 599-607�
Chaudhury, N. et al� (2006), “Missing in action: Teacher and health worker absence in developing countries”, The Journal of Economic Perspectives, Vol� 20/1, pp� 91-A4�
Coll, R.K., C. Dahsah and C. Faikhamta (2010), “The influence of educational context on science learning: A cross-national analysis of PISA”, Research in Science and Technological Education, Vol� 28/1, pp� 3-24�
Conley, A.M. et al� (2004), “Changes in epistemological beliefs in elementary science students: Epistemological development and its impact on cognition in academic domains”, Contemporary Educational Psychology, Vol� 29/2, pp� 186-204�
Creemers, B.P.M. and G.J. Reezigt (1997), “School effectiveness and school improvement: Sustaining links”, School Effectiveness and School Improvement, Vol� 8/4, pp� 396-429�
Creemers, B.P.M. and L. Kyriakides (2008), The Dynamics of Educational Effectiveness: A Contribution to Policy, Practice and Theory in Contemporary Schools, Routledge, London�
Cunha, F. et al� (2006), “Interpreting the evidence on life cycle skill formation”, in E� Hanushek and F� Welch (eds�), Handbook of the Economics of Education, Elsevier, North Holland, pp� 697-812�
Cuevas, P. et al� (2005), “Improving science inquiry with elementary students of diverse backgrounds”, Journal of Research in Science Teaching, Vol� 42/3, pp� 337-357�
Darling-Hammond, L. (1984), Beyond the Commission Reports: The Coming Crisis in Teaching, Rand Corporation, Santa Monica, CA�
Desimone, L.M. et al� (2002), “Effects of professional development on teachers’ instruction: Results from a three-year longitudinal study”, Educational Evaluation and Policy Analysis, Vol� 24/2, pp� 81-112�
Diener, E. and T. William (2012), “National accounts of well-being”, in K�C� Land, J� Sirgy and A� Michalos (eds), Handbook of Social Indicators and Quality of Life Research, Springer, New York�

Pisa 2015 CONtEXt QUEstiONNaiREs FRaMEWORK6
122 © OECD 2016 PISA 2015 ASSESSMENT AND ANALYTICAL FRAMEWORK: SCIENCE, READING, MATHEMATIC AND FINANCIAL LITERACY
Dincer, M.A. and G. Uysal (2010), “The determinants of student achievement in Turkey”, International Journal of Educational Development, Vol� 30/6, pp� 592-598�
Drechsel, B., C. Carstensen and M. Prenzel (2011), “The role of content and context in PISA interest scales: A study of the embedded interest items in the PISA 2006 science assessment”, International Journal of Science Education, Vol� 33/1, pp� 73-95�
Eccles, J. S. (1994), “Understanding women’s educational and occupational choices: Applying the Eccles et al� model of achievement-related choices”, Psychology of Women Quarterly, Vol� 18/4, pp� 585–609�
Eccles, J.S. and A. Wigfield (1995), “In the mind of the actor: The structure of adolescents’ achievement task values and expectancy-related beliefs”, Personality and Social Psychology Bulletin, Vol� 21/3, pp� 215-225�
Ertesvag, S.K. and E. Roland (2015), “Professional cultures and rates of bullying”, School Effectiveness and School Improvement, Vol� 26/2, pp� 195-214�
European Commission (ed�) (2006), Science Education Now: A Renewed Pedagogy for the Future of Europe, European Commission Directorate-General for Research, Brussels, http://ec�europa�eu/research/science-society/document_library/pdf_06/report-rocard-on-science-education_en�pdf (accessed 10 April 2012)�
European Commission (ed�) (2004), Europe Needs More Scientists!, European Commission, Directorate-General for Research, High Level Group on Human Resources for Science and Technology in Europe, Brussels, http://ec�europa�eu/research/conferences/2004/sciprof/pdf/final_en�pdf (accessed 10 April 2012)�
Faubert, V. (2009), “School evaluation: Current practices in OECD countries and a literature review”, OECD Education Working Papers, No� 42, OECD Publishing, Paris, http://dx�doi�org/10�1787/218816547156�
Fensham, P.J. (2009), “Real world contexts in PISA science: Implications for context-based science education”, Journal of Research in Science Teaching, Vol� 46/8, pp� 884-896�
Fivush, R. and N.R. Hamond (1990), Knowing and Remembering in Young Children, University Press, New York, Cambridge�
Fleener, M.J. (1996), “Scientific world building on the edge of chaos: High school students’ beliefs about mathematics and science”, School Science and Mathematics, Vol� 96/6, pp� 312320�
Furtak, E.M. et al� (2012), “Experimental and quasi-experimental studies of inquiry-based science teaching: a meta-analysis”, Review of Educational Research, Vol� 82/3, pp� 300-329�
Gándara, P. et al� (2003), “English learners in California schools: Unequal resources, unequal outcomes”, Education Policy Analysis Archives, Vol� 11/36, http://dx�doi�org/10�14507/epaa�v11n36�2003�
Ghuman, S. and C. Lloyd (2010), “Teacher absence as a factor in gender inequalities in access to primary schooling in rural Pakistan”, Comparative Education Review, Vol� 54/4, pp� 539-554�
Gillies, J. and J.J. Quijada (2008), “Opportunity to learn: A high impact strategy for improving educational outcomes in developing countries”, Working Paper, Washington, DC�
Gottfried, A.E. et al� (2009), “A latent curve model of parental motivational practices and developmental decline in math and science academic intrinsic motivation”, Journal of Educational Psychology, Vol� 101/3, pp� 729-739�
Guskey, T.R. (2007), “Multiple sources of evidence: An analysis of stakeholders’ perceptions of various indicators of student learning”, Educational Measurement: Issues and Practice, Vol� 26/1, pp� 19-27�
Gustafsson, J.E. (2008), “Effects of international comparative studies on educational quality on the quality of educational research”, European Educational Research Journal, Vol� 7/1, pp� 1-17�
Hanushek, E.A. and L. Wößmann (2011), “The economics of international differences in educational achievement”, in E�A� Hanushek, S� Machin and L� Wößmann (eds�), Handbook of the Economics of Education, North Holland, Amsterdam, Vol� 3, pp� 89-200�
Harlen, W. (2007), Assessment of learning, Sage, London�
Harlen, W. and R. Deakin Crick (2002), A Systematic Review of the Impact of Summative Assessment and Tests on Students’ Motivation for Learning, review conducted by the Assessment and Learning Research Synthesis Group, EPPI Center, London�
Hattie, J.A.C. (2009), Visible Learning: A Synthesis of over 800 Meta-analyses Relating to Achievement, Routledge, London and New York�
Hattie, J. and H. Timperley (2007), “The power of feedback”, Review of Educational Research, Vol� 77/1, pp� 81-112�
Heckman, J. (2006), “Skill formation and the economics of investing in disadvantaged children”, Science, Vol� 312/5782, pp� 1900-1902�
Heckman J.J., J. Stixrud and S. Urzua (2006), “The effects of cognitive and noncognitive abilities on labor market outcomes and social behavior”, Journal of Labor Economics, Vol 24/3, pp� 411-482�

Pisa 2015 CONtEXt QUEstiONNaiREs FRaMEWORK6
PISA 2015 ASSESSMENT AND ANALYTICAL FRAMEWORK: SCIENCE, READING, MATHEMATIC AND FINANCIAL LITERACY © OECD 2016 123
Hill, H.C., B. Rowan and D.L. Ball (2005), “Effects of teachers’ mathematical knowledge for teaching on student achievement”, American Educational Research Journal, Vol� 42/2, pp� 371406�
Ho, E.S.C. (2010), “Family influences on science learning among Hong Kong adolescents: What we learned from PISA”, International Journal of Science and Mathematics Education, Vol� 8/3, pp� 409-428�
Hofer, B.K. and P.R. Pintrich (2002), Personal Epistemology: The Psychology of Beliefs about Knowledge and Knowing, Lawrence Erlbaum Associates Publishers, Mahwah, NJ�
Hord, S.M. (1997), Professional Learning Communities: Communities of Continuous Inquiry and Improvement, Southwest Educational Development Laboratory, Austin, TX�
Ingersoll, R.M. and D. Perda (2010), “Is the supply of mathematics and science teachers sufficient?”, American Educational Research Journal, Vol� 47/3, pp� 563-694�
Jeanpierre, B., K. Oberhauser and C. Freeman (2005), “Characteristics of professional development that effect change in secondary science teachers’ classroom practices”, Journal of Research in Science Teaching, Vol� 42/6, pp� 668-690�
Kahneman, D. et al� (2004), “A survey method for characterizing daily life experience: The day reconstruction method”, Science, Vol� 306/5702, pp� 1776-1760�
King, D. and M.R. Stephen (2012), “Learning science through real-world contexts”, in B�J� Fraser, K� Tobin and C� McRobbie (eds�), Springer International Handbooks of Education, Second International Handbook of Science Education, Springer, Dordrecht, Vol� 24, pp� 69-79�
King, G. and J. Wand (2007), “Comparing incomparable survey responses: New tools for anchoring vignettes”, Political Analysis, Vol� 15, pp� 46-66�
Kingston, N. and B. Nash (2011), “Formative assessment: A meta-analysis and a call for research”, Educational Measurement: Issues and Practice, Vol� 30/4, pp� 28-37�
Kjærnsli, M. and S. Lie (2011), “Students’ preference for science careers: International comparisons based on PISA 2006”, International Journal of Science Education, Vol� 33/1, pp� 121-144�
Klieme, E., C. Pauli and K. Reusser (2009), “The Pythagoras study: Investigating effects of teaching and learning in Swiss and German mathematics classrooms”, in T� Janik and T� Seidel (eds�), The Power of Video Studies in Investigating Teaching and Learning in the Classroom, Waxmann, Münster, pp� 137-160�
Kobarg, M. et al� (2011), An International Comparison of Science Teaching and Learning: Further Results from PISA 2006, Waxmann, Münster�
Koeppen, K. et al� (2008), “Current issues in competence modeling and assessment”, Journal of Psychology, Vol� 216/2, pp� 61-73�
Krapp, A. and M. Prenzel (2011), “Research on interest in science: Theories, methods, and findings”, International Journal of Science Education, Vol� 33/1, pp� 27-50�
Kubiatko, M. and K. Vlckova (2010), “The relationship between ICT use and science knowledge for Czech students: A secondary analysis of PISA 2006”, International Journal of Science and Mathematics Education, Vol� 8/3, pp� 523-543�
Kunter, M. (2005), “Multiple Ziele im Mathematikunterricht”, Pädagogische Psychologie und Entwicklungspsychologie, Band 51, Waxmann, Münster�
Lavonen, J. and S. Laaksonen (2009), “Context of teaching and learning school science in Finland: Reflections on PISA 2006 results”, Journal of Research in Science Teaching, Vol� 46/8, pp� 922-944�
Lindqvist, E. and R. Vestman (2011), “The labor market returns to cognitive and noncognitive ability: Evidence from the Swedish enlistment”, American Economic Journal: Applied Economics, Vol� 3/1, pp� 101-128�
Logan, J. et al� (2011), “Children’s attendance rates and quality of teacher-child interactions in at-risk preschool classrooms: Contribution to children’s expressive language growth”, Child and Youth Care Forum, Vol� 40/6, pp� 457-477�
Lomos, C., R.H. Hofman and R.J. Bosker (2011), “Professional communities and student achievement: A meta-analysis, School Effectiveness and School Improvement, Vol� 22/2, pp� 121-148�
Luu, K. and J.G. Freeman (2011), “An analysis of the relationship between information and communication technology (ICT) and scientific literacy in Canada and Australia”, Computers and Education, Vol� 56/4, pp� 1072-1082�
MacKay, R. (2009), “Remarks on the inefficient use of time in the teaching and learning of mathematics in five secondary schools”, in J�H� Meyer and A� van Biljon (eds�), Proceedings of the 15th Annual Congress of the Association for Mathematics Education of South Africa (AMESA): Mathematical Knowledge for Teaching, pp� 79-85, www�amesa�org�za/AMESA2009/Volume109�pdf#page=85 (accessed 3 April 2012)�

Pisa 2015 CONtEXt QUEstiONNaiREs FRaMEWORK6
124 © OECD 2016 PISA 2015 ASSESSMENT AND ANALYTICAL FRAMEWORK: SCIENCE, READING, MATHEMATIC AND FINANCIAL LITERACY
Markowitsch, H.J. and H. Welzer (2009), The Development of Autobiographical Memory, Psychology Press, London�
Martin, M.O., I.V.S. Mullis and P. Foy (2008), TIMSS 2007 International Science Report: Findings from IEA’s Trends in International Mathematics and Science Study at the Eighth and Fourth Grades, Boston College, Chestnut Hill, MA�
McConney et al� (2011), “Bridging the gap? A comparative, retrospective analysis of science literacy and interest in science for indigenous and non-indigenous Australian students”, International Journal of Science Education, Vol� 33/14, pp� 2017-2035�
McDowall, S. et al� (2007), Evaluation of the Literacy Professional Development Project, Ministry of Education, New Zealand.
McMillan, J.H. (2001), “Secondary teachers’ classroom assessment and grading practices”, Educational Measurement, Vol� 20, pp� 20-32�
McMillan, J.H. (ed�) (2007), Formative Classroom Assessment: Theory into Practice, Teachers College Columbia University, New York�
Millot, B. and J. Lane (2002), “The efficient use of time in education”, Education Economics, Vol� 10/2, pp� 209-228�
Minner, D.D., A.J. Levy and J. Century (2010), “Inquiry-based science instruction: What is it and does it matter?”, results from a research synthesis 1984 to 2002, Journal of Research in Science Teaching, Vol� 47/4, pp� 474-496�
Nagengast, B. and H.W. Marsh (2014), “Motivation and engagement in science around the globe: Testing measurement invariance with multigroup structural equation models across 57 Countries using PISA 2006”, in L� Rutkowski, M�v Davier and D� Rutkowski (eds�), Handbook of International Large-Scale Assessment, CRC Press, Boca Raton, FL, pp� 317-344�
Nevo, D. (ed�) (2002), School-Based Evaluation: An International Perspective, JAI Press, Amsterdam�
OECD (2014), PISA 2012 Technical Report, OECD, Paris, www�oecd�org/pisa/pisaproducts/PISA-2012-technical-report-final�pdf�
OECD (2013), PISA 2012 Assessment and Analytical Framework: Mathematics, Reading, Science, Problem Solving and Financial Literacy, PISA, OECD Publishing, Paris, http://dx�doi�org/10�1787/9789264190511-en�
OECD (2011), Quality Time for Students: Learning In and Out of School, PISA, OECD Publishing, Paris, http://dx�doi�org/10�1787/ 9789264087057-en�
OECD (2010a), PISA 2009 Results: What Students Know and Can Do: Student Performance in Reading, Mathematics and Science (Volume I), PISA, OECD Publishing, Paris, http://dx�doi�org/10�1787/9789264091450-en�
OECD (2010b), PISA 2009 Results: Overcoming Social Background: Equity in Learning Opportunities and Outcomes (Volume II), PISA, OECD Publishing, http://dx�doi�org/10�1787/9789264091504-en�
OECD (2010c), The High Cost of Low Educational Performance: The Long-run Economic Impact of Improving PISA Outcomes, PISA, OECD Publishing, Paris, http://dx�doi�org/10�1787/9789264077485-en�
OECD (2010d), PISA 2009 Results: What Makes a School Successful?: Resources, Policies and Practices (Volume IV), PISA, OECD Publishing, Paris, http://dx�doi�org/10�1787/9789264091559-en�
OECD (2010e), PISA 2009 Results: Learning to Learn: Student Engagement, Strategies and Practices (Volume III), PISA, OECD Publishing, Paris, http://dx�doi�org/10�1787/9789264083943-en�
OECD (2008), Encouraging Student Interest in Science and Technology Studies, OECD Publishing, Paris, http://dx�doi�org/10�1787/ 9789264040892-en�
OECD (2007), PISA 2006: Science Competencies for Tomorrow’s World: Volume 1: Analysis, PISA, OECD Publishing, Paris, http://dx�doi�org/10�1787/9789264040014-en�
OECD (2006a), Where Immigrant Students Succeed : A Comparative Review of Performance and Engagement in PISA 2003, PISA, OECD Publishing, Paris, http://dx�doi�org/10�1787/9789264023611-en�
OECD (2006b), « Improving learning through formative assessment », dans OECD, Education Policy Analysis 2006: Focus on Higher Education, OECD Publishing, Paris, http://dx�doi�org/10�1787/epa-2006-5-en�
OECD (2005), “The definition and selection of key competencies: Executive summary”, p� 11, www�oecd�org/dataoecd/47/61/ 35070367�pdf (accessed 2 March 2012)�
OECD (2004), Learning for Tomorrow’s World: First Results from PISA 2003, PISA, OECD Publishing, Paris, http://dx�doi�org/10�1787/ 9789264006416-en�
Olsen, R.V. and S. Lie (2011), “Profiles of students’ interest in science issues around the world: Analysis of data from PISA 2006”, International Journal of Science Education, Vol� 33/1, pp� 97-120�
Osborne, J. (2012), “The role of argument: Learning how to learn in school science”, in B�J� Fraser, K� Tobin and C� McRobbie (eds�), Second International Handbook of Science Education, Springer International Handbooks of Education, Springer, Dordrecht, Vol� 24, pp� 933-949�

Pisa 2015 CONtEXt QUEstiONNaiREs FRaMEWORK6
PISA 2015 ASSESSMENT AND ANALYTICAL FRAMEWORK: SCIENCE, READING, MATHEMATIC AND FINANCIAL LITERACY © OECD 2016 125
Paine, L. and L. Ma (1993), “Teachers working together: A dialogue on organisational and cultural perspectives of Chinese teachers”, International Journal of Educational Research, Vol� 19/8, pp� 675-697�
Partnership for 21st Century Skills (2008), 21st Century Skills, Education & Competitiveness: A Resource and Policy Guide, Partnership for 21st Century Skills, Tucson, AZ�
Patall, E.A., H. Cooper and A.B. Allen (2010), “Extending the school day or school year”, Review of Educational Research, Vol� 80/3, pp� 401-436�
Pellegrino, J., N. Chudowsky and R. Glaser (eds�) (2001), Knowing what Students Know: The Science and Design of Educational Assessment, National Academy Press, Washington, DC�
Poropat, A.E. (2009), “A meta-analysis of the five factor model of personality and academic performance”, Psychological Bulletin, Vol� 135/2, pp� 322-338�
Porterfield, S. and A.E. Winkler (2007), “Teen time use and parental education: Evidence from the CPS, MTF, and ATUS”, Monthly Labor Review, May 2007, pp� 37-56�
Portner, H. (ed�) (2005), Teacher Mentoring and Induction: The State of the Art and Beyond, Corwin, Thousand Oaks, CA�
Prenzel, M., T. Seidel and M. Kobarg (2012), “Science teaching and learning: An international comparative perspective”, in B�J� Fraser, K� Tobin and C� McRobbie (eds�), Second International Handbook of Science Education, Springer International Handbooks of Education, Springer, Dordrecht, Vol� 24, pp� 667-678�
Purves, A.C. (1987), “I�E�A� an Agenda for the Future”, International Review of Education, Vol� 33/1, pp� 103-107�
Rakoczy, K., E. Klieme and C. Pauli (2008), “Die Bedeutung der wahrgenommenen Unterstützung motivationsrelevanter Bedürfnisse und des Alltagsbezugs im Mathematikunterricht für die selbstbestimmte Motivation”, Zeitschrift für Pädagogische Psychologie/ German Journal of Educational Psychology, Vol� 22/1, pp� 25-35�
Richardson, M., C. Abraham and R. Bond (2012), “Psychological correlates of university students’ academic performance: A systematic review and meta-analysis”, Psychological Bulletin, Vol� 138/2, pp� 353-387�
Roberts, B.W. et al� (2007), “The power of personality: The comparative validity of personality traits, socioeconomic status, and cognitive ability for predicting important life outcomes”, Perspectives on Psychological Science, Vol� 2/4, pp� 313-345�
Rosenholtz, S.J. (1989), Teachers’ Workplace: The Social Organization of Schools, Longman, New York�
Rosenkvist, M.A. (2010), “Using student test results for accountability and improvement: A literature review”, OECD Education Working Papers, No� 54, OECD Publishing, Paris, http://dx�doi�org/10�1787/5km4htwzbv30-en�
Ryan, R.M. and E.L. Deci (2000), “Intrinsic and extrinsic motivations: Classic definitions and new directions”, Contemporary Educational Psychology, Vol� 25/1, pp� 54-67�
Ryan, K.E., M. Chandler and M. Samuels (2007), “What should school-based evaluation look like?”, Studies in Educational Evaluation, Vol� 33/3-4, pp� 197-212�
Rychen, DS. and L.H. Salganik (eds�) (2003), Defining and Selecting Key Competencies, Contributions to the Second DeSeCo Symposium, Geneva, Switzerland, www�oecd�org/pisa/35070367�pdf�
Salmon, J. et al� (2005), “Reducing sedentary behaviour and increasing physical activity among 10-year-old children: Overview and process evaluation of the ‘Switch-Play’ intervention”, Health Promotion International, Vol� 20/1, pp� 7-17�
Sammons, P. et al� (2008), “Children’s cognitive attainment and progress in English primary schools during Key Stage 2: Investigating the potential continuing influences of pre-school education”, Frühpädagogische Förderung in Institutionen: Zeitschrift für Erziehungswissenschaft, VS Verlag für Sozialwissenschaften, Wiesbaden, pp� 179-198�
Sanders, J.R. and E.J. Davidson (2003), “A model for school evaluation”, in T� Kellaghan, D�L� Stufflebeam and L�A� Wingate (eds), International Handbook of Educational Evaluation, Vol� 9, Kluwer International Handbooks of Education, Springer, Dordrecht, pp� 807-826�
Santiago, P. and F. Benavides (2009), Teacher Evaluation: A Conceptual Framework and Examples of Country Practices, OECD, Paris, www�oecd�org/edu/school/44568106�pdf�
Scheerens, J. (2002), “School self-evaluation: Origins, definition, approaches, methods and implementation”, in D� Nevo (ed�), School-based Evaluation: An International Perspective, Emerald Group Publishing Limited, Bingley, UK, pp� 35-69�
Scheerens, J. and Roel J. Bosker (1997), “The foundations of educational effectiveness”, International Review of Education, Vol� 45/1, pp� 113-120, http://dx�doi�org/10�1023/A:1003534107087�
Scheerens, J., C.A.W. Glas and S. Thomas (eds�) (2003), Educational Evaluation, Assessment, and Monitoring: A Systemic Approach, Contexts of Learning, Swets & Zeitlinger, Lisse, Netherlands and Exton, PA�

Pisa 2015 CONtEXt QUEstiONNaiREs FRaMEWORK6
126 © OECD 2016 PISA 2015 ASSESSMENT AND ANALYTICAL FRAMEWORK: SCIENCE, READING, MATHEMATIC AND FINANCIAL LITERACY
Scherff, L. and C.L. Piazza (2008), “Why now more than ever, we need to talk about opportunity to learn”, Journal of Adolescent and Adult Literacy, Vol� 52/4, pp� 343-352�
Schleicher, A. (ed�) (2012), Preparing Teachers and Developing School Leaders for the 21st Century: Lessons from around the World, International Summit on the Teaching Profession, OECD Publishing, Paris, http://dx�doi�org/10�1787/9789264174559-en�
Schmidt, W.H. and A. Maier (2009), “Opportunity to learn”, Chapter 44, in G� Sykes, B� Schneider and D�N� Plank (eds�), Handbook of Education Policy Research, Routledge, New York, pp� 541559�
Schmidt, W.H. et al� (2001), Why Schools Matter: A Cross-National Comparison of Curriculum and Learning, Jossey-Bass, San Francisco, CA�
Scriven, M. (2003), “Evaluation theory and metatheory”, in T� Kellaghan, D�L� Stufflebeam and L�A� Wingate (eds), International Handbook of Educational Evaluation, Vol� 9, Kluwer International Handbooks of Education, Springer, Dordrecht, pp� 15-31�
Seidel, T. and R.J. Shavelson (2007), “Teaching effectiveness research in the past decade: The role of theory and research design in disentangling meta-analysis results”, Review of Educational Research, Vol� 77/4, pp� 454-499�
Shayer, M. and Adhami, M. (2007), “Fostering cognitive development through the context of mathematics: Results of the CAME project”, Educational Studies in Mathematics, Vol� 64/3, pp� 265-291, http://dx�doi�org/10�1007/s10649-006-9037-1�
Shepard, L.A. (2006), “Classroom assessment”, in R�L� Brennan (ed�), Educational Measurement, Praeger Publishers, Westprot, CT, pp� 623-646�
Shulman, L.S. (1985), “Paradigms and research programs in the study of teaching: A contemporary perspective”, in M�C� Wittrock, (ed�), Handbook of Research on Teaching, 3rd ed, Macmillan, New York, pp� 3-36�
Shute, V.J. (2008), “Focus on formative feedback”, Review of Educational Research, Vol� 78/1, pp� 153-189�
Smith, P.K. et al� (2002), “Definitions of bullying: Comparison of terms used, and age and gender differences, in a fourteen-country international comparison”, Child Development, Vol� 73/4, pp� 1119-1133�
Spurrier, N. et al� (2003), “Socio-economic differentials in the health-related quality of life of Australian children: Results of a national study”, Australian and New Zealand Journal of Public Health, Vol� 27/1, pp� 27-33�
Steinert, B. et al� (2006), “Lehrerkooperation in der Schule” (Teacher co-operation in schools), Zeitschrift für Pädagogik, Vol� 52/2, pp� 185-203�
Stigler, J.W. and J. Hiebert (1999), The Teaching Gap: Best Ideas from the World’s Teachers for Improving Education in the Classroom, Free Press, New York�
Stiggins, R.J. (2007), “Conquering the formative assessment frontier”, in J�H� McMillan (ed�), Formative Classroom Assessment: Theory into Practice, Teachers College Columbia University, New York, pp 8-28�
Stiglitz, J.E., A. Sen and J.-P. Fitoussi (2009), Report by the Commission on the Measurement of Economic Performance and Social Progress, INSEE, Paris�
Supovitz, J.A. and H.M. Turner (2000), “The effects of professional development on science teaching practices and classroom culture”, Journal of Research in Science Teaching, Vol� 37/9, pp� 963-980�
Sykes, G. (1996), “Reform of and as professional development”, Phi Delta Kappan, Vol� 77/7, pp� 465-467�
Sykes G., B. Schneider and D.N. Plank (eds�) (2009), Handbook of Education Policy Research, Routledge, New York�
Sylva, K. et al� (2011a), “Pre-school quality and educational outcomes at age 11: Low quality has little benefit”, Journal of Early Childhood Research, Vol� 9/2, pp� 109-124�
Sylva, K. et al� (2011b), “Effects of early child-care on cognition, language, and task-related behaviours at 18 months: An English study”, British Journal of Developmental Psychology, Vol� 29/1, pp� 18-45�
Taylor, J.A., M.A.M. Stuhlsatz and R.W. Bybee (2009), “Windows into high-achieving science classrooms”, in R�W� Bybee and B� McCrae (eds�), PISA Science 2006, Implications for Science Teachers and Teaching, NSTA Press, Arlington, VA, pp� 123-132�
The PROBE Team (1999), Public Report on Basic Education in India, Oxford University Press, New Delhi�
Timperley, H. et al� (2007), Teacher Professional Learning and Development: Best Evidence Synthesis Iteration [BES], Wellington, Ministry of Education, New Zealand, www�educationcounts�govt�nz/goto/BES (accessed 15 April 2011)�
UNESCO (2006), Education for all Global Monitoring Report 2007: Strong Foundations, UNESCO Publishing, Paris�
Vieluf, S. et al� (2012), Teaching Practices and Pedagogical Innovations: Evidence from TALIS, TALIS, OECD, Paris, http://dx�doi�org/ 10�1787/9789264123540-en�

Pisa 2015 CONtEXt QUEstiONNaiREs FRaMEWORK6
PISA 2015 ASSESSMENT AND ANALYTICAL FRAMEWORK: SCIENCE, READING, MATHEMATIC AND FINANCIAL LITERACY © OECD 2016 127
Vieluf, S., J. Lee and P. Kyllonen (2009), “The predictive power of variables from the PISA 2003 Student Questionnaire”, QEG(0910)5a�doc, paper presented at the QEG meeting, Offenbach, Germany, 19-21 October�
Valenti, J.E. and D.H. Tracey (2009), “Full-day, half-day, and no preschool effects on urban children’s first-grade reading achievement”, Education and Urban Society, Vol� 41/6, pp� 695-711�
Wang, C., P. Berry and S.M. Swearer (2013), “The critical role of school climate in effective bullying prevention”, Theory into Practice, Vol� 52/4, pp� 296-302�
Wang, L. et al� (2009), “Assessing teamwork and collaboration in high school students: A multimethod approach”, Canadian Journal of School Psychology, Vol� 24/2, pp� 108-124�
Wigfield, A., J.S. Eccles and D. Rodriguez (1998), “The development of children’s motivation in school contexts”, Review of Research in Education, Vol� 23, p� 73�
Willms, J.D. (2010), “School composition and contextual effects on student outcomes”, Teachers College Record, Vol� 112/4, pp� 1008-1037�
Willms, J.D. (2006), Learning Divides: Ten Policy Questions about the Performance and Equity of Schools and Schooling Systems, UNESCO Institute for Statistics, Montreal, Canada�
Wilson, M. (ed�) (2004), Towards Coherence between Classroom Assessment and Accountability, National Society for the Study of Education Yearbooks, University of Chicago Press, Chicago, IL�
Wößmann, L. et al� (2009), School Accountability, Autonomy and Choice around the World, Edward Elgar Publishing, MA�
Wößmann, L. et al� (2007), “School accountability, autonomy, choice, and the level of student achievement: International evidence from PISA 2003”, OECD Education Working Papers, No� 13, OECD Publishing, Paris, http://dx�doi�org/10�1787/246402531617�
Annex 6.A1
Selected analytical models used in publications on the PISA 2006 data for contexts of science achievement
Publication Research Question or ModelNagengast and Marsh (2014) Cross-cultural measurement invariance for motivation and engagement in scienceDrechsel, Carstensen and Prenzel (2011) Dimensionality of science interestOlsen and Lie (2011) Country- and culture specific profiles of interest Ainley and Ainley (2011a) Students’ enjoyment, learning engagement, and achievement Ainley and Ainley (2011b) Knowledge, affect, value, and students’ interest in science Lavonen and Laaksonen (2009) Learning activities, interest in science, self-efficacy, self-concept, and performanceFensham (2009) Gender, task context and science performanceBuccheri, Gruber and Bruhwiler (2011) Gender specificity in interest and vocational choicesMc Conney et al� (2011) Science interests among minority students Luu and Freeman (2011)
Scientific literacy and ICT-related variablesKubiatko and Vlckova (2010)Ho (2010) Parental involvement and students’ science performanceBasl (2011)
Explaining interest in future science-related careers Kjaernsli and Lie (2011)Willms (2010) School composition, school and classroom context, and students’ literacy skills Dincer and Uysal (2010) Effects of school programme typesColl et al� (2010) influence of educational context in a western vs� Asian country

PISA 2015 ASSESSMENT AND ANALYTICAL FRAMEWORK: SCIENCE, READING, MATHEMATIC AND FINANCIAL LITERACY © OECD 2016 129
Annex APISA 2015 BACKGROUND QUESTIONNAIRES
Annex A presents the background questionnaires used in the PISA 2015. These are the school questionnaire distributed to school principals; the student questionnaire distributed to all participating students; two optional questionnaires for students: the educational career questionnaire and the ICT familiarity questionnaire; an optional questionnaire for parents; an optional questionnaire for teachers.

aNNEX a: Pisa 2015 BaCKGROUND QUEstiONNaiREs
130 © OECD 2016 PISA 2015 ASSESSMENT AND ANALYTICAL FRAMEWORK: SCIENCE, READING, MATHEMATIC AND FINANCIAL LITERACY
SCHOOL QUESTIONNAIRE
Computer-based version/main survey versionThe school principal completed the school questionnaire� The questionnaire takes about 60 minutes to complete and covers:
• School background information
• School management
• Teaching staff
• Assessment and evaluation
• Targeted groups
• School climate
Technical terms are given in <brackets> and are adapted to the national context by the national data collection centre of the participating country or economy. In this annex, an explanation of the technical terms is given below the questionnaire item.
school background information
SC001SC001Q01TA
Which of the following definitions best describes the community in which your school is located?(Please select one response.)
A village, hamlet or rural area (fewer than 3 000 people) 1
A small town (3 000 to about 15 000 people)2
A town (15 000 to about 100 000 people)3
A city (100 000 to about 1 000 000 people)4
A large city (with over 1 000 000 people)5
SC002As at <February 1, 2015>, what was the total school enrolment (number of students)?(Please enter a number for each response. Enter “0” [zero] if there are none.)
SC002Q01TA Number of boys:
SC002Q02TA Number of girls:
SC003SC003Q01TA
What is the average size of <test language> classes in <national modal grade for 15-year-olds> in your school?(Please select one response.)
15 students or fewer1
16-20 students 2
21-25 students 3
26-30 students 4
31-35 students 5
36-40 students 6
41-45 students 7
46-50 students 8
More than 50 students 9

Pisa 2015 BaCKGROUND QUEstiONNaiREs: aNNEX a
PISA 2015 ASSESSMENT AND ANALYTICAL FRAMEWORK: SCIENCE, READING, MATHEMATIC AND FINANCIAL LITERACY © OECD 2016 131
SC004The goal of the following set of questions is to gather information about the student-computer ratio for students in the <national modal grade for 15-year-olds> at your school. (Please enter a number for each response. Enter “0” [zero] if there are none.)
Number
SC004Q01TA At your school, what is the total number of students in the <national modal grade for 15-year-olds>?
SC004Q02TA Approximately, how many computers are available for these students for educational purposes?
SC004Q03TA Approximately, how many of these computers are connected to the Internet/World Wide Web?
SC004Q04NA Approximately, how many of these computers are portable (e�g� laptop, tablet)?
SC004Q05NA Approximately how many interactive whiteboards are available in the school altogether?
SC004Q06NA Approximately how many data projectors are available in the school altogether?
SC004Q07NA Approximately how many computers with internet connection are available for teachers in your school?
SC053<This academic year>, which of the following activities does your school offer to students in the <national modal grade for 15-year-olds>?(Please select one response in each row.)
Yes No
SC053Q01TA Band, orchestra or choir 1 2
SC053Q02TA School play or school musical 1 2
SC053Q03TA School yearbook, newspaper or magazine 1 2
SC053Q04TA Volunteering or service activities, e�g� <national examples> 1 2
SC053Q05NA Science club 1 2
SC053Q06NA Science competitions, e�g� <national examples> 1 2
SC053Q07TA Chess club 1 2
SC053Q08TA Club with a focus on computers/ information and communication technology 1 2
SC053Q09TA Art club or art activities 1 2
SC053Q10TA Sporting team or sporting activities 1 2
SC053Q11TA <country specific item> 1 2
SC059Which of the following are true for the science department of your school?(Please select one response in each row.)
Yes No
SC059Q01NA Compared to other departments, our school‘s <school science department> is well equipped� 1 2
SC059Q02NA If we ever have some extra funding, a big share goes into improvement of our <school science> teaching� 1 2
SC059Q03NA <School science> teachers are among our best educated staff members� 1 2
SC059Q04NA Compared to similar schools, we have a well-equipped laboratory� 1 2
SC059Q05NA The material for hands-on activities in <school science> is in good shape� 1 2
SC059Q06NA We have enough laboratory material that all courses can regularly use it� 1 2
SC059Q07NA We have extra laboratory staff that helps support <school science> teaching� 1 2
SC059Q08NA Our school spends extra money on up-to-date <school science> equipment� 1 2
SC052For 15-year-old students, does your school provide the following study help? (Please select one response in each row.)
Yes No
SC052Q01NA Room(s) where the students can do their homework 1 2
SC052Q02NA Staff help with homework 1 2

aNNEX a: Pisa 2015 BaCKGROUND QUEstiONNaiREs
132 © OECD 2016 PISA 2015 ASSESSMENT AND ANALYTICAL FRAMEWORK: SCIENCE, READING, MATHEMATIC AND FINANCIAL LITERACY
school management
SC009Below are statements about your management of this school. Please indicate the frequency of the following activities and behaviours in your school during <the last academic year>. (Please select one response in each row.)
Did not occur
1-2 times during
the year
3-4 times during
the yearOnce a month
Once a week
More than once
a week
SC009Q01TA I use student performance results to develop the school’s educational goals� 1 2 3 4 5 6
SC009Q02TA I make sure that the professional development activities of teachers are in accordance with the teaching goals of the school�
1 2 3 4 5 6
SC009Q03TA I ensure that teachers work according to the school’s educational goals� 1 2 3 4 5 6
SC009Q04TA I promote teaching practices based on recent educational research� 1 2 3 4 5 6
SC009Q05TA I praise teachers whose students are actively participating in learning� 1 2 3 4 5 6
SC009Q06TA When a teacher has problems in his/her classroom, I take the initiative to discuss matters�
1 2 3 4 5 6
SC009Q07TA I draw teachers’ attention to the importance of pupils’ development of critical and social capacities�
1 2 3 4 5 6
SC009Q08TA I pay attention to disruptive behaviour in classrooms� 1 2 3 4 5 6
SC009Q09TA I provide staff with opportunities to participate in school decision-making� 1 2 3 4 5 6
SC009Q10TA I engage teachers to help build a school culture of continuous improvement� 1 2 3 4 5 6
SC009Q11TA I ask teachers to participate in reviewing management practices� 1 2 3 4 5 6
SC009Q12TA When a teacher brings up a classroom problem, we solve the problem together� 1 2 3 4 5 6
SC009Q13TA I discuss the school’s academic goals with teachers at faculty meetings� 1 2 3 4 5 6

Pisa 2015 BaCKGROUND QUEstiONNaiREs: aNNEX a
PISA 2015 ASSESSMENT AND ANALYTICAL FRAMEWORK: SCIENCE, READING, MATHEMATIC AND FINANCIAL LITERACY © OECD 2016 133
SC010Regarding your school, who has a considerable responsibility for the following tasks? (Please select as many boxes as appropriate in each row.)
Principal Teachers
<School governing
board>
<Regional or local
education authority>
National education authority
SC010Q01T Selecting teachers for hire 1 1 1 1 1
SC010Q02T Firing teachers 1 1 1 1 1
SC010Q03T Establishing teachers’ starting salaries 1 1 1 1 1
SC010Q04T Determining teachers’ salary increases 1 1 1 1 1
SC010Q05T Formulating the school budget 1 1 1 1 1
SC010Q06T Deciding on budget allocations within the school 1 1 1 1 1
SC010Q07T Establishing student disciplinary policies 1 1 1 1 1
SC010Q08T Establishing student assessment policies 1 1 1 1 1
SC010Q09T Approving students for admission to the school 1 1 1 1 1
SC010Q10T Choosing which textbooks are used1 1 1 1 1
SC010Q11T Determining course content1 1 1 1 1
SC010Q12T Deciding which courses are offered1 1 1 1 1
SC012How often are the following factors considered when students are admitted to your school?(Please select one response in each row.)
Never Sometimes Always
SC012Q01TA Student’s record of academic performance (including placement tests) 1 2 3
SC012Q02TA Recommendation of feeder schools 1 2 3
SC012Q03TA Parents’ endorsement of the instructional or religious philosophy of the school 1 2 3
SC012Q04TA Whether the student requires or is interested in a special programme 1 2 3
SC012Q05TA Preference given to family members of current or former students 1 2 3
SC012Q06TA Residence in a particular area 1 2 3
SC012Q07TA Other 1 2 3
SC013SC013Q01TA
Is your school a public or a private school?(Please select one response.)
A public school
(This is a school managed directly or indirectly by a public education authority, government agency, or governing board appointed by government or elected by public franchise.)
1
A private school
(This is a school managed directly or indirectly by a non-government organisation; e.g. a church, trade union, business, or other private institution.)
2
This is a filter question:If the school is a private school (SC013Q01TA is ”A private school”), then respondents answer SC014Q01NA�Else proceed to SC016�

aNNEX a: Pisa 2015 BaCKGROUND QUEstiONNaiREs
134 © OECD 2016 PISA 2015 ASSESSMENT AND ANALYTICAL FRAMEWORK: SCIENCE, READING, MATHEMATIC AND FINANCIAL LITERACY
SC014SC014Q01NA
This is a filtered question:Only if SC013Q01TA is ”A private school”� Else proceed to SC016�
What kind of organisation runs your school?(Please select one response.)
A church or other religious organisation 1
Another not-for-profit organisation 2
A for-profit organisation 3
SC016About what percentage of your total funding for a typical school year comes from the following sources?(Please enter a number for each response. Enter “0” [zero] if there are none.)
%
SC016Q01TA Government (includes departments, local, regional, state and national)
SC016Q02TA Student fees or school charges paid by parents
SC016Q03TA Benefactors, donations, bequests, sponsorships, parent fundraising
SC016Q04TA Other
Total 100%
Consistency check/soft reminder if sum is more or less than 100�
SC017Is your school’s capacity to provide instruction hindered by any of the following issues?(Please select one response in each row.)
Not at all Very littleTo some extent A lot
SC017Q01NA A lack of teaching staff� 1 2 3 4
SC017Q02NA Inadequate or poorly qualified teaching staff� 1 2 3 4
SC017Q03NA A lack of assisting staff� 1 2 3 4
SC017Q04NA Inadequate or poorly qualified assisting staff� 1 2 3 4
SC017Q05NA A lack of educational material (e�g� textbooks, IT equipment, library or laboratory material)� 1 2 3 4
SC017Q06NA Inadequate or poor quality educational material (e�g� textbooks, IT equipment, library or laboratory material)�
1 2 3 4
SC017Q07NA A lack of physical infrastructure (e�g� building, grounds, heating/cooling, lighting and acoustic systems)� 1 2 3 4
SC017Q08NA Inadequate or poor quality physical infrastructure (e�g� building, grounds, heating/cooling, lighting and acoustic systems)�
1 2 3 4

Pisa 2015 BaCKGROUND QUEstiONNaiREs: aNNEX a
PISA 2015 ASSESSMENT AND ANALYTICAL FRAMEWORK: SCIENCE, READING, MATHEMATIC AND FINANCIAL LITERACY © OECD 2016 135
teaching staff
SC018
How many of the following teachers are on the staff of your school?Include both full-time and part-time teachers. A full-time teacher is employed at least 90% of the time as a teacher for the full school year. All other teachers should be considered part-time. Regarding the qualification level, please refer only to the teacher’s highest qualification level.(Please enter a number in each space provided. Enter “0” [zero] if there are none.)
Full-time Part-time
SC018Q01TA Teachers in TOTAL
SC018Q02TA Teachers <fully certified> by <the appropriate authority>
SC018Q05NA Teachers with an <ISCED Level 5A Bachelor degree> qualification
SC018Q06NA Teachers with an <ISCED Level 5A Master’s degree> qualification
SC018Q07NA Teachers with an <ISCED Level 6> qualification
SC019
How many of the following teachers are on the <school science> staff of your school?Include both full-time and part-time teachers. A full-time teacher is employed at least 90% of the time as a teacher for the full school year. All other teachers should be considered part-time.(Please enter a number in each space provided. Enter “0” [zero] if there are none.)
Full-time Part-time
SC019Q01NA <School science> teachers in TOTAL
SC019Q02NA <School science> teachers <fully certified> by <the appropriate authority>
SC019Q03NA <School science> teachers with an <ISCED Level 5A or higher> qualification <with a major> in <school science>
SC025
During the last three months, what percentage of teaching staff in your school has attended a programme of professional development?A programme of professional development here is a formal programme designed to enhance teaching skills or pedagogical practices. It may or may not lead to a recognised qualification. The programme must last for at least one day in total and have a focus on teaching and education. (Please move the slider to the appropriate percentage. If none of your teachers participated in any professional development activities select “0” [zero].)
SC025Q01NA All teaching staff at your school
SC025Q02NA Science teaching staff at your school
Slider bar: parking position, “0-100”; step=1�
SC027Which of the following types of in-house professional development exist at your school?(Please select one response in each row.)
Yes No
SC027Q01NA The teachers in our school cooperate by exchanging ideas or material when teaching specific units or series of lessons� 1 2
SC027Q02NA Our school invites specialists to conduct in-service training for teachers� 1 2
SC027Q03NA Our school organises in-service workshops which deal with specific issues that our school faces� 1 2
SC027Q04NA Our school organises in-service workshops for specific groups of teachers (e�g� newly appointed teachers)� 1 2

aNNEX a: Pisa 2015 BaCKGROUND QUEstiONNaiREs
136 © OECD 2016 PISA 2015 ASSESSMENT AND ANALYTICAL FRAMEWORK: SCIENCE, READING, MATHEMATIC AND FINANCIAL LITERACY
assessment and evaluation
SC032During <the last academic year>, have any of the following methods been used to monitor the practice of teachers at your school?(Please select one response in each row.)
Yes NoSC032Q01TA Tests or assessments of student achievement 1 2
SC032Q02TA Teacher peer review (of lesson plans, assessment instruments, lessons) 1 2
SC032Q03TA Principal or senior staff observations of lessons 1 2
SC032Q04TA Observation of classes by inspectors or other persons external to the school 1 2
SC034
Generally, in your school, how often are students in <national modal grade for 15-year-olds> assessed using the following methods?If you need further explanation of the term “<standardised tests>”, please use the help button.(Please select one response in each row.)
Never1-2 times
a year3-5 times
a year MonthlyMore than
once a monthSC034Q01NA Mandatory <standardised tests>,
e�g� <country specific example> 1 2 3 4 5
SC034Q02NA Non-mandatory <standardised tests> (e�g� publicly or commercial available standardised test material like <country specific example>)
1 2 3 4 5
SC034Q03TA Teacher-developed tests 1 2 3 4 5
SC034Q04TA Teachers’ judgmental ratings 1 2 3 4 5
Help button <Standardised tests> are consistent in design, content, administration and scoring� Results can be compared across students and schools�
This is a filter question:If either SC034Q01NA, or SC034Q02TA, or SC034Q03TA is larger than 1 (“never”), then respondents answer SC035�Else respondents skip the question on the use of test results and proceed to SC036�
SC035
This is a filtered question: Only if SC034Q01NA, or SC034Q02TA, or SC034Q03TA is larger than 1 (“never”)� Else proceed to SC036�
In your school, are <standardised tests> and/or teacher-developed tests of students in <national modal grade for 15-year-olds> used for any of the following purposes?If you need further explanation of the term “<standardised tests>”, please use the help button.(Please select either “yes” or “no” to indicate the use of <standardised tests> and teacher-developed tests for each of the specified purposes.)
<Standardised tests> Teacher-developed testsYes No Yes No
SC035Q01N To guide students’ learning 1 2 1 2
SC035Q02T To inform parents about their child’s progress 1 2 1 2
SC035Q03T To make decisions about students’ retention or promotion 1 2 1 2
SC035Q04T To group students for instructional purposes 1 2 1 2
SC035Q05T To compare the school to <district or national> performance 1 2 1 2
SC035Q06T To monitor the school’s progress from year to year 1 2 1 2
SC035Q07T To make judgements about teachers’ effectiveness 1 2 1 2
SC035Q08T To identify aspects of instruction or the curriculum that could be improved 1 2 1 2
SC035Q09N To adapt teaching to the students’ needs 1 2 1 2
SC035Q10T To compare the school with other schools 1 2 1 2
SC035Q11N To award certificates to students 1 2 1 2
Help button The term <standardised tests> includes standardised mandatory tests (mandated e�g� by national, state or district authorities) as well as standardised non-mandatory tests (e�g� publicly or commercially available standardised test material)� These tests are consistent in design, content, administration and scoring� Results can be compared across students and schools�
Table of drop down menus, each providing answering options “yes” and “no”�

Pisa 2015 BaCKGROUND QUEstiONNaiREs: aNNEX a
PISA 2015 ASSESSMENT AND ANALYTICAL FRAMEWORK: SCIENCE, READING, MATHEMATIC AND FINANCIAL LITERACY © OECD 2016 137
SC036In your school, are achievement data used in any of the following <accountability procedures>?Achievement data include aggregated school or grade-level test scores or grades, or graduation rates.(Please select one response in each row.)
Yes No
SC036Q01TA Achievement data are posted publicly (e�g� in the media) 1 2
SC036Q02TA Achievement data are tracked over time by an administrative authority 1 2
SC036Q03NA Achievement data are provided directly to parents 1 2
SC037
Do the following arrangements aimed at quality assurance and improvements exist in your school and where do they come from?If you need further explanation of the term “internal school evaluation” or “external school evaluation”, please use the help button.(Please select one response in each row.)
Yes, this is mandatory, e.g. based on district or ministry
policies
Yes, based on school initiative No
SC037Q01TA Internal evaluation/Self-evaluation 1 2 3
SC037Q02TA External evaluation 1 2 3
SC037Q03TA Written specification of the school’s curricular profile and educational goals 1 2 3
SC037Q04TA Written specification of student performance standards 1 2 3
SC037Q05NA Systematic recording of data such as teacher or student attendance and professional development 1 2 3
SC037Q06NA Systematic recording of student test results and graduation rates 1 2 3
SC037Q07TA Seeking written feedback from students (e�g� regarding lessons, teachers or resources) 1 2 3
SC037Q08TA Teacher mentoring 1 2 3
SC037Q09TA Regular consultation aimed at school improvement with one or more experts over a period of at least six months 1 2 3
SC037Q10NA Implementation of a standardised policy for science subjects (i�e� school curriculum with shared instructional materials accompanied by staff development and training)
1 2 3
Help button Internal school evaluation: Evaluation as part of a process controlled by a school in which the school defines which areas are judged; the evaluation may be conducted by members of the school or by persons/institutions commissioned by the school�
Help button External school evaluation: Evaluation as part of a process controlled and headed by an external body� The school does not define the areas which are judged�
This is a filter question: If SC037Q01TA is “Yes, this is mandatory, e�g� based on district or ministry policies” or “Yes, based on school initiative” then respondents answer additional questions on internal evaluation (SC040)�Else proceed to questions on external evaluation (SC041) if SC037Q02TA is ”Yes, this is mandatory, e�g� based on district or ministry policies” or “Yes, based on school initiative”�Else skip all evaluation items and proceed to question SC042�

aNNEX a: Pisa 2015 BaCKGROUND QUEstiONNaiREs
138 © OECD 2016 PISA 2015 ASSESSMENT AND ANALYTICAL FRAMEWORK: SCIENCE, READING, MATHEMATIC AND FINANCIAL LITERACY
SC040
This is a filtered question:Only if SC037Q01NTA is “Yes, this is mandatory, e�g� based on district or ministry policies” or “Yes, based on school initiative”�Else proceed to questions on external evaluation (SC041) if SC037Q2TA is “Yes, this is mandatory, e�g� based on district or ministry policies” or “Yes, based on school initiative”�Else proceed to SC042�
Based on your last internal school evaluation results, did your school implement any measures in the following areas?If you need further explanation of the term “internal school evaluation”, please use the help button.(Please select one response in each row.)
Yes
No, because
results were satisfactory
No, for other
reasons
SC040Q02NA Educational staff (e�g� workload, personal requirements, qualifications) 1 2 3
SC040Q03NA Implementation of the curriculum 1 2 3
SC040Q05NA Quality of teaching and learning 1 2 3
SC040Q11NA Parental engagement in school 1 2 3
SC040Q12NA Teacher professional development 1 2 3
SC040Q15NA Student achievement 1 2 3
SC040Q16NA Students’ cross-curricular competencies 1 2 3
SC040Q17NA Equity in school 1 2 3
Help button Internal school evaluation: Evaluation as part of a process controlled by a school in which the school defines which areas are judged; the evaluation may be conducted by members of the school or by persons/institutions commissioned by the school�
SC041
This is a filtered question:Only if SC037Q01NTA is “Yes, this is mandatory, e�g� based on district or ministry policies” or “Yes, based on school initiative”�Else proceed to SC042�
Thinking about the last external evaluation in your school: do the following statements apply?If you need further explanation of the term “external school evaluation”, please use the help button.(Please select one response in each row.)
Yes No
SC041Q01NA The results of external evaluations led to changes in school policies� 1 2
SC041Q03NA We used the data to plan specific action for school development� 1 2
SC041Q04NA We used the data to plan specific action for the improvement of teaching� 1 2
SC041Q05NA We put measures derived from the results of external evaluations into practice promptly� 1 2
SC041Q06NA The impetus triggered by the external evaluation “disappeared” very quickly at our school� 1 2
Help button External school evaluation: Evaluation as part of a process controlled and headed by an external body� The school does not define the areas which are judged�

Pisa 2015 BaCKGROUND QUEstiONNaiREs: aNNEX a
PISA 2015 ASSESSMENT AND ANALYTICAL FRAMEWORK: SCIENCE, READING, MATHEMATIC AND FINANCIAL LITERACY © OECD 2016 139
targeted groups
Some schools organise instruction differently for students with different abilities�
SC042What is your school’s policy about this for students in <national modal grade for 15-year-olds>?(Please select one response in each row.)
For all subjects
For some subjects
Not for any subjects
SC042Q01TA Students are grouped by ability into different classes 1 2 3
SC042Q02TA Students are grouped by ability within their classes 1 2 3
SC048
Please estimate the percentage of students in <national modal grade for 15-year-olds> at your school who have the following characteristics.
(Please consider that students may fall into multiple categories.)(Please move the slider to the appropriate percentage.)
0% 100%
SC048Q01NA Students whose <heritage language> is different from <test language>
SC048Q02NA Students with special needs
SC048Q03NA Students from socioeconomically disadvantaged homes
Slider bar: parking position, 0-100%; step=1�
school climate
SC061In your school, to what extent is the learning of students hindered by the following phenomena?(Please select one response in each row.)
Not at all Very littleTo some extent A lot
SC061Q01TA Student truancy 1 2 3 4
SC061Q02TA Students skipping classes 1 2 3 4
SC061Q03TA Students lacking respect for teachers 1 2 3 4
SC061Q04TA Student use of alcohol or illegal drugs 1 2 3 4
SC061Q05TA Students intimidating or bullying other students 1 2 3 4
SC061Q06TA Teachers not meeting individual students’ needs 1 2 3 4
SC061Q07TA Teacher absenteeism 1 2 3 4
SC061Q08TA Staff resisting change 1 2 3 4
SC061Q09TA Teachers being too strict with students 1 2 3 4
SC061Q10TA Teachers not being well prepared for classes 1 2 3 4
SC063Do the following statements about parental involvement apply to your school?(Please select one response in each row.)
Yes No
SC063Q02NA Our school provides a welcoming and accepting atmosphere for parents to get involved�1 2
SC063Q03NA Our school designs effective forms of school-to-home and home-to-school communications about school programmes and children’s progress� 1 2
SC063Q04NA Our school includes parents in school decisions� 1 2
SC063Q06NA Our school provides information and ideas for families about how to help students at home with homework and other curriculum-related activities, decisions, and planning� 1 2
SC063Q07NA Our school identifies and integrates resources and services from the community to strengthen school programmes, family practices, and student learning and development� 1 2
SC063Q09NA There is a <national, state or district legislation> on including parents in school activities� 1 2

aNNEX a: Pisa 2015 BaCKGROUND QUEstiONNaiREs
140 © OECD 2016 PISA 2015 ASSESSMENT AND ANALYTICAL FRAMEWORK: SCIENCE, READING, MATHEMATIC AND FINANCIAL LITERACY
SC064
During <the last academic year>, what proportion of students’ parents participated in the following school-related activities?(Please move the slider to the appropriate position. If no parents participated in the activity, please select “0” [zero]. Select “100” (one hundred) if all parents participated in the activity.)
%
SC064Q01TA Discussed their child’s progress with a teacher on their own initiative
SC064Q02TA Discussed their child’s progress on the initiative of one of their child’s teachers
SC064Q03TA Participated in local school government (e�g� parent council or school management committee)
SC064Q04NA Volunteered in physical or extra-curricular activities (e�g� building maintenance, carpentry, gardening or yard work, school play, sports, field trip)
Slider bar: parking position, 0-100%; step=1�

PISA 2015 BACKGROUND QUESTIONNAIRES: ANNEX A
PISA 2015 ASSESSMENT AND ANALYTICAL FRAMEWORK: SCIENCE, READING, MATHEMATIC AND FINANCIAL LITERACY © OECD 2016 141
STUDENT QUESTIONNAIRE
Computer-based version/main survey versionStudents complete the student questionnaire after the literacy assessment� The questionnaire takes about 35 minutes to complete�
The core questions on home background are similar to those used in previous PISA assessments� The questionnaire covers:
• Student, student’s family and student’s home
• Student’s view about his/her life
• Student’s school
• Student’s school schedule and learning time
• Science learning in school
• Student’s views about science
Technical terms are given in <brackets> and are adapted to the national context by the national data collection centre of the participating country or economy. In this annex, an explanation of the technical terms is given below the questionnaire item.
student, student’s family and student’s home
ST001ST001Q01TA
What <grade> are you in?(Please select from the drop-down menu to answer the question.)
Option A
Option B
Option C
Option …
Drop down menu, including all possible grades attended by 15-year-olds, according to your study programme table as agreed on in the Demographic Tasks�
ST002ST002Q01TA
Which one of the following <programmes> are you in?(Please select one response.)
<Programme 1> 1
<Programme 2> 2
<Programme 3> 3
<Programme 4> 4
<Programme 5> 5
<Programme 6> 6

ANNEX A: PISA 2015 BACKGROUND QUESTIONNAIRES
142 © OECD 2016 PISA 2015 ASSESSMENT AND ANALYTICAL FRAMEWORK: SCIENCE, READING, MATHEMATIC AND FINANCIAL LITERACY
ST003On what date were you born?(Please select the day, month and year from the drop-down menus to answer the question.)
ST003Q01TA Day
Option A
Option B
Option C
Option …
1234567810…
ST003Q02TA Month
Option A
Option B
Option C
Option …
JanuaryFebruaryMarchAprilMayJuneJuly
AugustSeptemberOctober
NovemberDecember
ST003Q03TA Year
Option A
Option B
Option C
Option …
1998199920002001
Consistency check/soft reminder if day, month or year is missing: “Please enter your complete birth date”�
ST004ST004Q01TA
Are you female or male?(Please select one response.)
Female Male
1 2
ST005ST005Q01TA
What is the <highest level of schooling> completed by your mother?If you are not sure which box to choose, please ask the <test administrator> for help.(Please select one response.)
<ISCED level 3A>1
<ISCED level 3B, 3C>2
<ISCED level 2>3
<ISCED level 1>4
She did not complete <ISCED level 1>5

PISA 2015 BACKGROUND QUESTIONNAIRES: ANNEX A
PISA 2015 ASSESSMENT AND ANALYTICAL FRAMEWORK: SCIENCE, READING, MATHEMATIC AND FINANCIAL LITERACY © OECD 2016 143
ST006Does your mother have any of the following qualifications?If you are not sure how to answer this question, please ask the <test administrator> for help.(Please select one response in each row.)
Yes No
ST006Q01TA <ISCED level 6> 1 2
ST006Q02TA <ISCED level 5A> 1 2
ST006Q03TA <ISCED level 5B> 1 2
ST006Q04TA <ISCED level 4> 1 2
ST007ST007Q01TA
What is the <highest level of schooling> completed by your father?If you are not sure which box to choose, please ask the <test administrator> for help.(Please select one response.)
<ISCED level 3A> 1
<ISCED level 3B, 3C> 2
<ISCED level 2> 3
<ISCED level 1> 4
He did not complete <ISCED level 1> 5
ST008Does your father have any of the following qualifications?If you are not sure how to answer this question, please ask the <test administrator> for help.(Please select one response in each row.)
Yes No
ST008Q01TA <ISCED level 6> 1 2
ST008Q02TA <ISCED level 5A> 1 2
ST008Q03TA <ISCED level 5B> 1 2
ST008Q04TA <ISCED level 4> 1 2
ST011Which of the following are in your home?(Please select one response in each row.)
Yes No
ST011Q01TA A desk to study at 1 2
ST011Q02TA A room of your own 1 2
ST011Q03TA A quiet place to study 1 2
ST011Q04TA A computer you can use for school work 1 2
ST011Q05TA Educational software 1 2
ST011Q06TA A link to the Internet 1 2
ST011Q07TA Classic literature (e�g� <Shakespeare>) 1 2
ST011Q08TA Books of poetry 1 2
ST011Q09TA Works of art (e�g� paintings) 1 2
ST011Q10TA Books to help with your school work 1 2
ST011Q11TA <Technical reference books> 1 2
ST011Q12TA A dictionary 1 2
ST011Q16NA Books on art, music or design 1 2
ST011Q17TA <Country-specific wealth item 1> 1 2
ST011Q18TA <Country-specific wealth item 2> 1 2
ST011Q19TA <Country-specific wealth item 3> 1 2

ANNEX A: PISA 2015 BACKGROUND QUESTIONNAIRES
144 © OECD 2016 PISA 2015 ASSESSMENT AND ANALYTICAL FRAMEWORK: SCIENCE, READING, MATHEMATIC AND FINANCIAL LITERACY
ST012How many of these are there at your home?(Please select one response in each row.)
None One TwoThree or
more
ST012Q01TA Televisions1 2 3 4
ST012Q02TA Cars1 2 3 4
ST012Q03TA Rooms with a bath or shower1 2 3 4
ST012Q05NA <Cell phones> with Internet access (e�g� smartphones)1 2 3 4
ST012Q06NA Computers (desktop computer, portable laptop or notebook) 1 2 3 4
ST012Q07NA <Tablet computers> (e�g� <iPad®>, <BlackBerry® PlayBookTM>) 1 2 3 4
ST012Q08NA E-book readers (e�g� <KindleTM>, <Kobo>, <Bookeen>)1 2 3 4
ST012Q09NA Musical instruments (e�g� guitar, piano)1 2 3 4
ST013ST013Q01TA
How many books are there in your home?There are usually about 40 books per metre of shelving. Do not include magazines, newspapers or your schoolbooks.(Please select one response.)
0-10 books1
11-25 books2
26-100 books3
101-200 books4
201-500 books5
More than 500 books6
ST014 The following two questions concern your mother’s job:(If she is not working now, please tell us her last main job.)
ST014Q01TA What is your mother’s main job? (e�g� school teacher, kitchen-hand, sales manager)
Please type in the job title. ________________________________
ST014Q02TA What does your mother do in her main job? (e�g� teaches high school students, helps the cook prepare meals in a restaurant, manages a sales team)
Please use a sentence to describe the kind of work she does or did in that job. _________________________________
ST015 The following two questions concern your father’s job:(If he is not working now, please tell us his last main job.)
ST015Q01TA What is your father’s main job? (e�g� school teacher, kitchen-hand, sales manager)
Please type in the job title. _________________________________
ST015Q02TA What does your father do in his main job? (e�g� teaches high school students, helps the cook prepare meals in a restaurant, manages a sales team)
Please use a sentence to describe the kind of work he does or did in that job. _________________________________

PISA 2015 BACKGROUND QUESTIONNAIRES: ANNEX A
PISA 2015 ASSESSMENT AND ANALYTICAL FRAMEWORK: SCIENCE, READING, MATHEMATIC AND FINANCIAL LITERACY © OECD 2016 145
ST123Thinking about the <this academic year>: to what extent do you agree or disagree with the following statements?(Please select one response in each row.)
Strongly disagree Disagree Agree
Strongly agree
ST123Q01NA My parents are interested in my school activities�1 2 3 4
ST123Q02NA My parents support my educational efforts and achievements� 1 2 3 4
ST123Q03NA My parents support me when I am facing difficulties at school�1 2 3 4
ST123Q04NA My parents encourage me to be confident�1 2 3 4
ST019In what country were you and your parents born?(Please select one response in each column.)
YouST019Q01TA
MotherST019Q01TB
FatherST019Q01TC
<Country A> 1 1 1
<Country B> 2 2 2
<Country C> 3 3 3
<Country D> 4 4 4
<…etc�> 5 5 5
Other country 6 6 6
This is a filter question� If the student was born in <country of test> skip ST021� If he or she was NOT born in <country of test> go to ST021� ELSE go to ST022�
ST021ST021Q01TA
à Only if answer in ST019 “you” was NOT “<country of test>”� ELSE skip and proceed to ST022�
How old were you when you arrived in <country of test>?(Please select from the drop-down menu to answer the question.If you were less than 12 months old, please select “age 0-1” [age zero to one])
Option A
Option B
Option C
Option …
age 0-1 1age 1 2age 2 3age 3 4age 4 5age 5 6age 6 7age 7 8age 8 9age 9 10age 10 11age 11 12age 12 13age 13 14age 14 15age 15 16age 16 17

ANNEX A: PISA 2015 BACKGROUND QUESTIONNAIRES
146 © OECD 2016 PISA 2015 ASSESSMENT AND ANALYTICAL FRAMEWORK: SCIENCE, READING, MATHEMATIC AND FINANCIAL LITERACY
ST022What language do you speak at home most of the time?(Please select one response.)
ST022Q01TA <Language 1> 1
ST022Q02TA <Language 2> 2
ST022Q03TA <Language 3> 3
ST022Q04TA < …etc� > 4
ST022Q05TA Other language 5
ST125ST125Q01NA
How old were you when you started <ISCED 0>?(Please choose from the drop-down menu to answer the question.)
Years:
Option A
Option B
Option C
Option …
Drop-down menu, offering answers “1 year or younger”, 2 years, 3 years, 4 years, 5 years, “6 years or older”, “I did not attend <ISCED 0>”, “I do not remember”�
ST126ST126Q01TA
How old were you when you started <ISCED 1>?(Please choose from the drop-down menu to answer the question.)
Years:
Option A
Option B
Option C
Option …
Drop-down menu, offering answers “3 years or younger”, 4 years, 5 years, 6 years, 7 years, 8 years, “9 years or older”�
ST127Have you ever repeated a <grade>?(Please select one response in each row.)
No, never Yes, onceYes, twice or more
ST127Q01TA At <ISCED 1> 1 2 3
ST127Q02TA At <ISCED 2> 1 2 3
ST127Q03TA At <ISCED 3> 1 2 3

PISA 2015 BACKGROUND QUESTIONNAIRES: ANNEX A
PISA 2015 ASSESSMENT AND ANALYTICAL FRAMEWORK: SCIENCE, READING, MATHEMATIC AND FINANCIAL LITERACY © OECD 2016 147
student’s view about his/her life
ST016ST016Q01NA
The following question asks how satisfied you feel about your life, on a scale from “0” to “10”. Zero means you feel “not at all satisfied” and “10” means “completely satisfied”.Overall, how satisfied are you with your life as a whole these days?(Please move the slider to the appropriate number.)
Slider bar: parking position, range 0-10 (not at all satisfied, completely satisfied), step = 1�
ST111ST111Q01TA
Which of the following do you expect to complete?(Please select one response.)
<ISCED level 2> 1
<ISCED level 3B or C> 2
<ISCED level 3A> 3
<ISCED level 4> 4
<ISCED level 5B> 5
<ISCED level 5A or 6> 6
ST114ST114Q01TA What kind of job do you expect to have when you are about 30 years old?
Please type in the job title. ________________________________
ST118To what extent do you disagree or agree with the following statements about yourself?(Please select one response in each row.)
Strongly disagree Disagree Agree
Strongly agree
ST118Q01NA I often worry that it will be difficult for me taking a test� 1 2 3 4
ST118Q02NA I worry that I will get poor <grades> at school�1 2 3 4
ST118Q03NA Even if I am well prepared for a test I feel very anxious�1 2 3 4
ST118Q04NA I get very tense when I study for a test�1 2 3 4
ST118Q05NA I get nervous when I don’t know how to solve a task at school� 1 2 3 4
ST119To what extent do you disagree or agree with the following statements about yourself?(Please select one response in each row.)
Strongly disagree Disagree Agree
Strongly agree
ST119Q01NA I want top grades in most or all of my courses�1 2 3 4
ST119Q02NA I want to be able to select from among the best opportunities available when I graduate� 1 2 3 4
ST119Q03NA I want to be the best, whatever I do�1 2 3 4
ST119Q04NA I see myself as an ambitious person�1 2 3 4
ST119Q05NA I want to be one of the best students in my class�1 2 3 4

ANNEX A: PISA 2015 BACKGROUND QUESTIONNAIRES
148 © OECD 2016 PISA 2015 ASSESSMENT AND ANALYTICAL FRAMEWORK: SCIENCE, READING, MATHEMATIC AND FINANCIAL LITERACY
ST121
Please read the descriptions about the following three students. Based on the information provided here, how much would you disagree or agree with the statement that this student is motivated?(Please select one response in each row.)
Strongly disagree Disagree Agree
Strongly agree
ST121Q01NA <NAME 1> gives up easily when confronted with a problem and is often not prepared for his classes�
<Name 1> is motivated.1 2 3 4
ST121Q02NA <NAME 2> mostly remains interested in the tasks she starts and sometimes does more than what is expected from her�
<Name 2> is motivated.
1 2 3 4
ST121Q03NA <NAME 3> wants to get top grades at school and continues working on tasks until everything is perfect�
<Name 3> is motivated.1 2 3 4
student’s school
ST082To what extent do you disagree or agree with the following statements about yourself?(Please select one response in each row.)
Strongly disagree Disagree Agree
Strongly agree
ST082Q01NA I prefer working as part of a team to working alone�1 2 3 4
ST082Q02NA I am a good listener�1 2 3 4
ST082Q03NA I enjoy seeing my classmates be successful�1 2 3 4
ST082Q08NA I take into account what others are interested in�1 2 3 4
ST082Q09NA I find that teams make better decisions than individuals� 1 2 3 4
ST082Q12NA I enjoy considering different perspectives�1 2 3 4
ST082Q13NA I find that teamwork raises my own efficiency�1 2 3 4
ST082Q14NA I enjoy cooperating with peers�1 2 3 4
ST034Thinking about your school: to what extent do you agree with the following statements?(Please select one response in each row.)
Strongly agree Agree Disagree
Strongly disagree
ST034Q01TA I feel like an outsider (or left out of things) at school� 1 2 3 4
ST034Q02TA I make friends easily at school� 1 2 3 4
ST034Q03TA I feel like I belong at school� 1 2 3 4
ST034Q04TA I feel awkward and out of place in my school� 1 2 3 4
ST034Q05TA Other students seem to like me� 1 2 3 4
ST034Q06TA I feel lonely at school� 1 2 3 4

PISA 2015 BACKGROUND QUESTIONNAIRES: ANNEX A
PISA 2015 ASSESSMENT AND ANALYTICAL FRAMEWORK: SCIENCE, READING, MATHEMATIC AND FINANCIAL LITERACY © OECD 2016 149
ST039During the past 12 months, how often did you have the following experiences at school?(Please select one response in each row.)
Never or almost never
A few times a year
A few times a month
Once a week or
moreST039Q01NA Teachers called on me less often than they called
on other students� 1 2 3 4
ST039Q02NA Teachers graded me harder than they graded other students� 1 2 3 4
ST039Q03NA Teachers gave me the impression that they think I am less smart than I really am� 1 2 3 4
ST039Q04NA Teachers disciplined me more harshly than other students�1 2 3 4
ST039Q05NA Teachers ridiculed me in front of others�1 2 3 4
ST039Q06NA Teachers said something insulting to me in front of others�1 2 3 4
ST038During the past 12 months, how often have you had the following experiences in school?(Please select one response in each row.)
Never or almost never
A few times a year
A few times a month
Once a week or
moreST038Q01NA I got called names by other students� 1 2 3 4
ST038Q02NA I got picked on by other students� 1 2 3 4
ST038Q03NA Other students left me out of things on purpose� 1 2 3 4
ST038Q04NA Other students made fun of me� 1 2 3 4
ST038Q05NA I was threatened by other students� 1 2 3 4
ST038Q06NA Other students took away or destroyed things that belonged to me� 1 2 3 4
ST038Q07NA I got hit or pushed around by other students� 1 2 3 4
ST038Q08NA Other students spread nasty rumours about me� 1 2 3 4
student’s school schedule and learning time
ST059How many <class periods> per week are you typically required to attend for the following subjects?(Please enter a number in each row. Enter “0” [zero] if you have none.)
ST059Q01TA Number of <class periods> per week in <test language>ST059Q02TA Number of <class periods> per week in mathematicsST059Q03TA Number of <class periods> per week in <science>
Open text entry full numbers only� Consistency check, if entries are greater than 15�
ST060ST060Q01NA
In a normal, full week at school, how many <class periods> are you required to attend in total?(Please move the slider to the number of <class periods> per week.)
Number of ALL <class periods>
Slider bar: parking position, range 0–“80 or more”, step 1; consistency check/soft reminder for values smaller than 10 and greater than 60�
ST061ST061Q01NA
How many minutes, on average, are there in a <class period>?(Please move the slider to the number of minutes per <class period>.)
Average minutes in a <class period>
Slider range 0–“120 or more”; consistency check/soft reminder for values smaller than 10 and greater than 80; step 5�

ANNEX A: PISA 2015 BACKGROUND QUESTIONNAIRES
150 © OECD 2016 PISA 2015 ASSESSMENT AND ANALYTICAL FRAMEWORK: SCIENCE, READING, MATHEMATIC AND FINANCIAL LITERACY
ST062In the last two full weeks of school, how often did the following things occur? (Please select one response in each row.)
NeverOne or two
timesThree or
four timesFive or more
times
ST062Q01TA I <skipped> a whole school day 1 2 3 4
ST062Q02TA I <skipped> some classes 1 2 3 4
ST062Q03TA I arrived late for school 1 2 3 4
ST071
This school year, approximately how many hours per week do you spend learning in addition to your required school schedule in the following subjects? (Please include the total hours for homework, additional instruction and private study.)(Please move the slider to the number of total hours. Select “0” [zero] if you do not do homework, study or practice for a subject.)
ST071Q01NA <School science>
ST071Q02NA Mathematics
ST071Q03NA <Test language>
ST071Q04NA <Foreign language>
ST071Q05NA Other
Slider bar: parking position, range 0–“30 hours per week or more”, step = 1; consistency check/soft reminder for values > 20�
ST031ST031Q01NA
This school year, on average, on how many days do you attend physical education classes each week?(Please select from the drop-down menu to answer the question.)
Option A
Option B
Option C
Option …
Drop down menu, 0“<number of instructional days per calendar week> days”�
ST032 Outside of school, during the past 7 days, on how many days did you engage in the following? (Please select one response from the drop-down menus to answer the questions.)
ST032Q01NA Moderate physical activities for a total of at least 60 minutes per day (e�g� walking, climbing stairs, riding a bike to school, <country-specific>)
Option A
Option B
Option C
Option …
ST032Q02NA Vigorous physical activities for at least 20 minutes per day that made you sweat and breathe hard (e�g� running, cycling, aerobics, soccer, skating, <country-specific>) Option A
Option B
Option C
Option …
Drop down menus 0-7 days�

PISA 2015 BACKGROUND QUESTIONNAIRES: ANNEX A
PISA 2015 ASSESSMENT AND ANALYTICAL FRAMEWORK: SCIENCE, READING, MATHEMATIC AND FINANCIAL LITERACY © OECD 2016 151
science learning in school
ST063Which of the following <school science> courses did you attend this school year or last school year? (Please select all that apply in each row.)
This year Last year
ST063Q01N Physics1 1
ST063Q02N Chemistry1 1
ST063Q03N Biology1 1
ST063Q04N <Earth and space> 1 1
ST063Q05N Applied sciences and technology (e� g� <country-specific example>)1 1
ST063Q06N <General, integrated, or comprehensive science> course (e� g� <country-specific example>) 1 1
This is a filter question� ST064-ST107 only apply if sum of clicks in category “this year” is greater than 0 (at least one science course this year)� Else skip ST064-ST107 and proceed to section on “Student's view on science”�
ST064à Only applies if the student answered to attend at least one <school science> course in this school year in ST063�
To what extent can you choose the following for your <school science> courses?(Please select one response in each row.)
No, not at all
Yes, to a certain degree
Yes, I can choose
freely
ST064Q01NA I can choose the <school science> course(s) I study�1 2 3
ST064Q02NA I can choose the level of difficulty�1 2 3
ST064Q03NA I can choose the number of <school science> courses or <class periods>� 1 2 3
ST097à Only applies if the student answered to attend at least one <school science> course in this school year in ST063�
How often do these things happen in your <school science> lessons?(Please select one response in each row.)
Every lesson
Most lessons
Some lessons
Never or hardly ever
ST097Q01TA Students don’t listen to what the teacher says�1 2 3 4
ST097Q02TA There is noise and disorder�1 2 3 4
ST097Q03TA The teacher has to wait a long time for students to quiet down� 1 2 3 4
ST097Q04TA Students cannot work well�1 2 3 4
ST097Q05TA Students don’t start working for a long time after the lesson begins� 1 2 3 4

ANNEX A: PISA 2015 BACKGROUND QUESTIONNAIRES
152 © OECD 2016 PISA 2015 ASSESSMENT AND ANALYTICAL FRAMEWORK: SCIENCE, READING, MATHEMATIC AND FINANCIAL LITERACY
ST098à Only applies if the student answered to attend at least one <school science> course in this school year in ST063�
When learning <school science> topics at school, how often do the following activities occur?(Please select one response in each row.)
In all lessons
In most lessons
In some lessons
Never or hardly ever
ST098Q01TA Students are given opportunities to explain their ideas�1 2 3 4
ST098Q02TA Students spend time in the laboratory doing practical experiments� 1 2 3 4
ST098Q03NA Students are required to argue about science questions�1 2 3 4
ST098Q05TA Students are asked to draw conclusions from an experiment they have conducted� 1 2 3 4
ST098Q06TA The teacher explains how a <school science> idea can be applied to a number of different phenomena (e�g� the movement of objects, substances with similar properties)�
1 2
3 4
ST098Q07TA Students are allowed to design their own experiments�1 2 3 4
ST098Q08NA There is a class debate about investigations�1 2 3 4
ST098Q09TA The teacher clearly explains the relevance of <broad science> concepts to our lives� 1 2 3 4
ST098Q10NA Students are asked to do an investigation to test ideas�1 2 3 4
When answering the following questions, please keep one of your current <school science> courses in mind all the time� You are free to choose which course this should be�
ST065ST065Q01NA
à Only applies if the student answered to attend at least one <school science> course in this school year in ST063�
What is the name of this <school science> course?(Please type the name of the course.)
ST100à Only applies if the student answered to attend at least one <school science> course in this school year in ST063�
How often do these things happen in your <school science> lessons?(Please select one response in each row.)
Every lesson
Most lessons
Some lessons
Never or hardly ever
ST100Q01TA The teacher shows an interest in every student’s learning� 1 2 3 4
ST100Q02TA The teacher gives extra help when students need it�1 2 3 4
ST100Q03TA The teacher helps students with their learning�1 2 3 4
ST100Q04TA The teacher continues teaching until the students understand� 1 2 3 4
ST100Q05TA The teacher gives students an opportunity to express opinions� 1 2 3 4

PISA 2015 BACKGROUND QUESTIONNAIRES: ANNEX A
PISA 2015 ASSESSMENT AND ANALYTICAL FRAMEWORK: SCIENCE, READING, MATHEMATIC AND FINANCIAL LITERACY © OECD 2016 153
ST103
à Only applies if the student answered to attend at least one <school science> course in this school year in ST063�
How often do these things happen in your lessons for this <school science> course? (Remember to answer this question in reference to the <school science> course you indicated earlier.)(Please select one response in each row.)
Never or almost
neverSome
lessonsMany
lessons
Every lesson or almost
every lesson
ST103Q01NA The teacher explains scientific ideas� 1 2 3 4
ST103Q03NA A whole class discussion takes place with the teacher� 1 2 3 4
ST103Q08NA The teacher discusses our questions� 1 2 3 4
ST103Q11NA The teacher demonstrates an idea� 1 2 3 4
ST104
à Only applies if the student answered to attend at least one <school science> course in this school year in ST063�
How often do these things happen in your lessons for this <school science> course?(Remember to answer this question in reference to the <school science> course you indicated earlier.)(Please select one response in each row.)
Never or almost never
Some lessons
Many lessons
Every lesson or almost
every lesson
ST104Q01NA The teacher tells me how I am performing in this course� 1 2 3 4
ST104Q02NA The teacher gives me feedback on my strengths in this <school science> subject� 1 2 3 4
ST104Q03NA The teacher tells me in which areas I can still improve� 1 2 3 4
ST104Q04NA The teacher tells me how I can improve my performance� 1 2 3 4
ST104Q05NA The teacher advises me on how to reach my learning goals� 1 2 3 4
ST107
à Only applies if the student answered to attend at least one <school science> course in this school year in ST063�
How often do these things happen in your lessons for this <school science> course?(Remember to answer this question in reference to the <school science> course you indicated earlier.)(Please select one response in each row.)
Never or almost never
Some lessons
Many lessons
Every lesson or almost
every lesson
ST107Q01NA The teacher adapts the lesson to my class’s needs and knowledge� 1 2 3 4
ST107Q02NA The teacher provides individual help when a student has difficulties understanding a topic or task� 1 2 3 4
ST107Q03NA The teacher changes the structure of the lesson on a topic that most students find difficult to understand� 1 2 3 4

ANNEX A: PISA 2015 BACKGROUND QUESTIONNAIRES
154 © OECD 2016 PISA 2015 ASSESSMENT AND ANALYTICAL FRAMEWORK: SCIENCE, READING, MATHEMATIC AND FINANCIAL LITERACY
student’s view on science
ST092How informed are you about the following environmental issues? (Please select one response in each row.)
I have never heard of
this
I have heard
about this but I would not be able to explain what it is
really about
I know something about this and could
explain the general
issue
I am familiar with this
and I would be able
to explain this well
ST092Q01TA The increase of greenhouse gases in the atmosphere 1 2 3 4
ST092Q02TA The use of genetically modified organisms (<GMO>) 1 2 3 4
ST092Q04TA Nuclear waste 1 2 3 4
ST092Q05TA The consequences of clearing forests for other land use 1 2 3 4
ST092Q06NA Air pollution 1 2 3 4
ST092Q08NA Extinction of plants and animals 1 2 3 4
ST092Q09NA Water shortage 1 2 3 4
ST093Do you think problems associated with the environmental issues below will improve or get worse over the next 20 years?(Please select one response in each row.)
ImproveStay about the same Get worse
ST093Q01TA Air pollution 1 2 3
ST093Q03TA Extinction of plants and animals 1 2 3
ST093Q04TA Clearing of forests for other land use 1 2 3
ST093Q05TA Water shortages 1 2 3
ST093Q06TA Nuclear waste 1 2 3
ST093Q07NA The increase of greenhouse gases in the atmosphere 1 2 3
ST093Q08NA The use of genetically modified organisms (<GMO>) 1 2 3
ST094How much do you disagree or agree with the statements about yourself below?(Please select one response in each row.)
Strongly disagree Disagree Agree
Strongly agree
ST094Q01NA I generally have fun when I am learning <broad science> topics� 1 2 3 4
ST094Q02NA I like reading about <broad science>�1 2 3 4
ST094Q03NA I am happy working on <broad science> topics�1 2 3 4
ST094Q04NA I enjoy acquiring new knowledge in <broad science>�1 2 3 4
ST094Q05NA I am interested in learning about <broad science>�1 2 3 4

PISA 2015 BACKGROUND QUESTIONNAIRES: ANNEX A
PISA 2015 ASSESSMENT AND ANALYTICAL FRAMEWORK: SCIENCE, READING, MATHEMATIC AND FINANCIAL LITERACY © OECD 2016 155
ST095To what extent are you interested in the following <broad science> topics?(Please select one response in each row.)
Not interested
Hardly interested Interested
Highly interested
I don’t know what this is
ST095Q04NA Biosphere (e�g� ecosystem services, sustainability) 1 2 3 4 5
ST095Q07NA Motion and forces (e�g� velocity, friction, magnetic and gravitational forces) 1 2 3 4 5
ST095Q08NA Energy and its transformation (e�g� conservation, chemical reactions) 1 2 3 4 5
ST095Q13NA The Universe and its history 1 2 3 4 5
ST095Q15NA How science can help us prevent disease 1 2 3 4 5
ST113How much do you agree with the statements below?(Please select one response in each row.)
Strongly agree Agree Disagree
Strongly disagree
ST113Q01TA Making an effort in my <school science> subject(s) is worth it because this will help me in the work I want to do later on�
1 2 3 4
ST113Q02TA What I learn in my <school science> subject(s) is important for me because I need this for what I want to do later on�
1 2 3 4
ST113Q03TA Studying my <school science> subject(s) is worthwhile for me because what I learn will improve my career prospects�
1 2 3 4
ST113Q04TA Many things I learn in my <school science> subject(s) will help me to get a job� 1 2 3 4
ST129How easy do you think it would be for you to perform the following tasks on your own?(Please select one response in each row.)
I could do this easily
I could do this with a
bit of effort
I would struggle to do this on my own
I couldn’t do this
ST129Q01TA Recognise the science question that underlies a newspaper report on a health issue� 1 2 3 4
ST129Q02TA Explain why earthquakes occur more frequently in some areas than in others� 1 2 3 4
ST129Q03TA Describe the role of antibiotics in the treatment of disease� 1 2 3 4
ST129Q04TA Identify the science question associated with the disposal of garbage� 1 2 3 4
ST129Q05TA Predict how changes to an environment will affect the survival of certain species� 1 2 3 4
ST129Q06TA Interpret the scientific information provided on the labelling of food items� 1 2 3 4
ST129Q07TA Discuss how new evidence can lead you to change your understanding about the possibility of life on Mars� 1 2 3 4
ST129Q08TA Identify the better of two explanations for the formation of acid rain� 1 2 3 4

ANNEX A: PISA 2015 BACKGROUND QUESTIONNAIRES
156 © OECD 2016 PISA 2015 ASSESSMENT AND ANALYTICAL FRAMEWORK: SCIENCE, READING, MATHEMATIC AND FINANCIAL LITERACY
ST131How much do you disagree or agree with the statements below?(Please select one response in each row.)
Strongly disagree Disagree Agree
Strongly agree
ST131Q01NA A good way to know if something is true is to do an experiment�1 2 3 4
ST131Q03NA Ideas in <broad science> sometimes change�1 2 3 4
ST131Q04NA Good answers are based on evidence from many different experiments� 1 2 3 4
ST131Q06NA It is good to try experiments more than once to make sure of your findings� 1 2 3 4
ST131Q08NA Sometimes <broad science> scientists change their minds about what is true in science� 1 2 3 4
ST131Q11NA The ideas in <broad science> science books sometimes change�1 2 3 4
ST146How often do you do these things?(Please select one response in each row.)
Very often Regularly SometimesNever or
hardly ever
ST146Q01TA Watch TV programmes about <broad science> 1 2 3 4
ST146Q02TA Borrow or buy books on <broad science> topics 1 2 3 4
ST146Q03TA Visit web sites about <broad science> topics 1 2 3 4
ST146Q04TA Read <broad science> magazines or science articles in newspapers 1 2 3 4
ST146Q05TA Attend a <science club> 1 2 3 4
ST146Q06NA Simulate natural phenomena in computer programs/virtual labs 1 2 3 4
ST146Q07NA Simulate technical processes in computer programs/virtual labs 1 2 3 4
ST146Q08NA Visit web sites of ecology organisations 1 2 3 4
ST146Q09NA Follow news of science, environmental, or ecology organizations via blogs and microblogging 1 2 3 4
ST076On the most recent day you attended school, did you do any of the following before going to school?(Please select one response in each row.)
Yes No
ST076Q01NA Eat breakfast 1 2
ST076Q02NA Study for school or homework 1 2
ST076Q03NA Watch TV/<DVD>/Video 1 2
ST076Q04NA Read a book/newspaper/magazine 1 2
ST076Q05NA Internet/Chat/Social networks (e�g� <Facebook>, <country-specific social network>) 1 2
ST076Q06NA Play video games 1 2
ST076Q07NA Meet friends or talk to friends on the phone 1 2
ST076Q08NA Talk to your parents 1 2
ST076Q09NA Work in the household or take care of other family members 1 2
ST076Q10NA Work for pay 1 2
ST076Q11NA Exercise or practice a sport 1 2
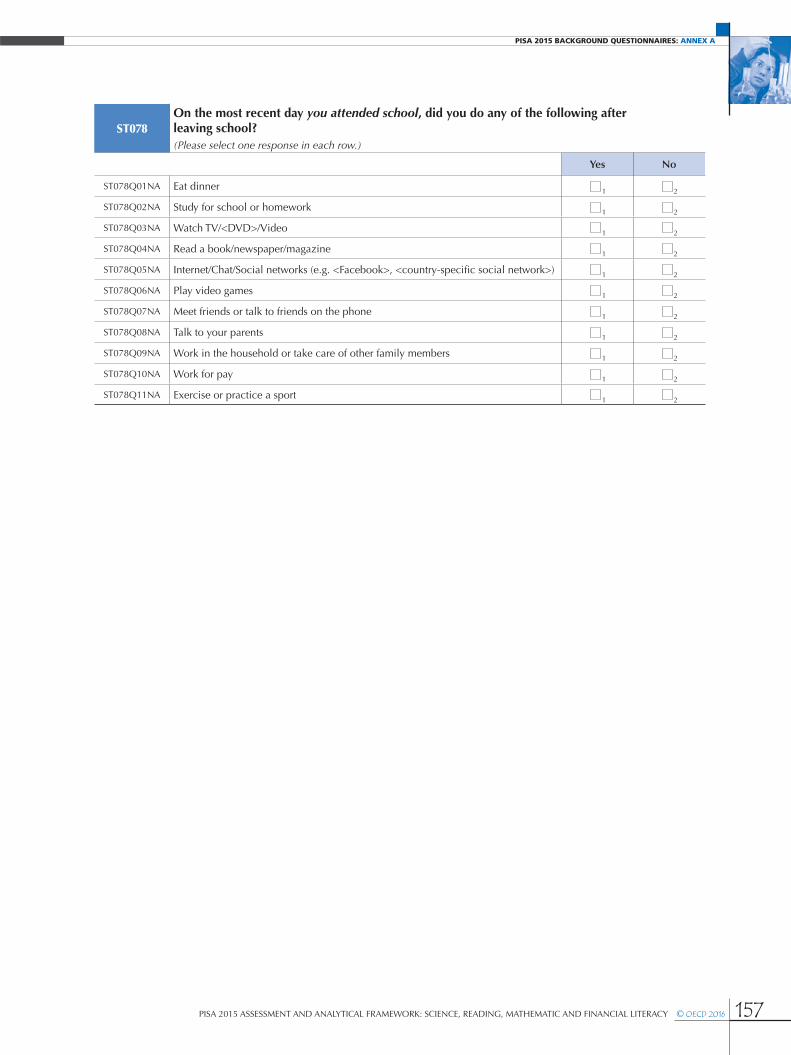
PISA 2015 BACKGROUND QUESTIONNAIRES: ANNEX A
PISA 2015 ASSESSMENT AND ANALYTICAL FRAMEWORK: SCIENCE, READING, MATHEMATIC AND FINANCIAL LITERACY © OECD 2016 157
ST078On the most recent day you attended school, did you do any of the following after leaving school? (Please select one response in each row.)
Yes No
ST078Q01NA Eat dinner 1 2
ST078Q02NA Study for school or homework 1 2
ST078Q03NA Watch TV/<DVD>/Video 1 2
ST078Q04NA Read a book/newspaper/magazine 1 2
ST078Q05NA Internet/Chat/Social networks (e�g� <Facebook>, <country-specific social network>) 1 2
ST078Q06NA Play video games 1 2
ST078Q07NA Meet friends or talk to friends on the phone 1 2
ST078Q08NA Talk to your parents 1 2
ST078Q09NA Work in the household or take care of other family members 1 2
ST078Q10NA Work for pay 1 2
ST078Q11NA Exercise or practice a sport 1 2

ANNEX A: PISA 2015 BACKGROUND QUESTIONNAIRES
158 © OECD 2016 PISA 2015 ASSESSMENT AND ANALYTICAL FRAMEWORK: SCIENCE, READING, MATHEMATIC AND FINANCIAL LITERACY
EDUCATIONAL CAREER QUESTIONNAIRE(International option)
Main Survey VersionAs in previous PISA cycles, additional questionnaires were developed and offered as options to the participating countries and economies� In PISA 2015, these optional questionnaires are the educational career questionnaire and the ICT familiarity questionnaire for students, the parent questionnaire and the teacher questionnaire�
The educational career questionnaire covers:
• Additional instruction in science
• Additional instruction in mathematics
• Additional instruction in <test language>
• Educational pathway
The following questions ask about any additional instruction in school subjects and other domains that you attend in this school year� This instruction might take place at school or somewhere else, but is not part of your mandatory school schedule� Please consider all regularly attended, institutionalised, organised additional learning activities in which you receive some kind of instruction, guidance or support (e�g� <national examples>)�
EC001
In this school year, approximately how many hours per week do you attend additional instruction in the following domains in addition to mandatory school lessons? (An hour here refers to 60 minutes, not to a class period.)
(Please move the slider to the number of hours you attend, move it to “0” [zero] if you don’t attend any additional instruction.)
EC001Q01NA <School science> or <broad science>
EC001Q02NA Mathematics
EC001Q03NA <Test language>
EC001Q04NA <Foreign languages>
EC001Q05NA Social sciences (e�g� history, sociology, politics)
EC001Q06NA Music (e�g� musical instrument, choir, composition)
EC001Q07NA Sports (e�g� in clubs, lessons, team)
EC001Q08NA Performing arts (e�g� dancing, acting)
EC001Q09NA Visual arts (e�g� photography, drawing, sculpting)
EC001Q10NA Other
Slider bar: “parking position”, “0”-“20 or more”
This question is a filter question� a) The following question EC003 only applies, if any of the answers in EC001 are greater than 0�b) The following sections A, B, and C only apply if a student attends “additional instruction” in this subject domain: Section A applies only if
a students attends some kind of <school science> or <broad science> “additional instruction”, section B only applies if a student attends “additional mathematics instruction” and section C only applies if a student attends “additional instruction” in <test language>�
All students not attending either form of additional instruction proceed to the respective questions on reasons for not attending “additional instruction”�

PISA 2015 BACKGROUND QUESTIONNAIRES: ANNEX A
PISA 2015 ASSESSMENT AND ANALYTICAL FRAMEWORK: SCIENCE, READING, MATHEMATIC AND FINANCIAL LITERACY © OECD 2016 159
PaRt a aDDitiONaL iNstRUCtiON iN sCiENCE
EC003
à Questions EC003-EC012 only apply, if a student attends any “additional science instruction”� Otherwise skip ECN003-ECN012 and proceed to ECN0013�
Which <school science> subjects are covered in your additional science instruction? (Please select all that apply.)
EC003Q01NA Physics 1
EC003Q02NA Chemistry 1
EC003Q03NA Biology 1
EC003Q04NA <Earth and space> 1
EC003Q05NA Applied science and technology (e�g� <country-specific example>) 1
EC003Q06NA <General, integrated, or comprehensive science> (e�g� <country-specific example>) 1
EC004
à Questions EC003-EC012 only apply, if a student attends any “additional science instruction”� Otherwise skip EC003-EC012 and proceed to EC0013�
Which of the following does this additional science instruction cover?(Please select one response in each row.)
Yes No
EC004Q01NA Content covered in regular school courses 1 2
EC004Q02NA New or additional content not covered in regular school courses 1 2
EC005
à Questions EC003-EC012 only apply, if a student attends any “additional science instruction”� Otherwise skip EC003-EC012 and proceed to EC0013�
Which type of additional science instruction do you participate in during this school year?(Please select all that apply.)
EC005Q01NA One-on-one tutoring with a person1
EC005Q02NA Internet tutoring with a person (including e�g� <SkypeTM>) 1
EC005Q03NA Internet or computer tutoring with a programme or application1
EC005Q04NA Live instruction by a person1
EC005Q05NA Video-recorded instruction by a person 1
EC005Q06NA Small group study or practice (2 to 7 students)1
EC005Q07NA Large group study or practice (8 or more students)1
EC005Q08NA Other additional science instruction1
EC007
à Questions EC003-EC012 only apply if a student attends any “additional science instruction”� Otherwise skip EC003-EC012 and proceed to EC0013�
Where do you attend this additional science instruction?(Please select all that apply.)
EC007Q01NA In my regular school building 1
EC007Q02NA At some other place, i�e� not in my regular school building 1

ANNEX A: PISA 2015 BACKGROUND QUESTIONNAIRES
160 © OECD 2016 PISA 2015 ASSESSMENT AND ANALYTICAL FRAMEWORK: SCIENCE, READING, MATHEMATIC AND FINANCIAL LITERACY
EC008
à Questions EC003-EC012 only apply, if a student attends any “additional science instruction”� Otherwise skip EC003-EC012 and proceed to EC013�
Which of the following best describes your teacher or instructor in your additional science instruction?(Please select all that apply.)
EC008Q01NA The teacher is one of my regular teachers in this year’s school courses� 1
EC008Q02NA The teacher regularly teaches students my age in school but is not my teacher in any of my regular courses� 1
EC008Q03NA The teacher mainly works for a business or organisation specialised in additional instruction� 1
EC008Q04NA The teacher is not specialised teaching personnel (e�g� a student)� 1
EC009
à Questions EC003-EC012 only apply, if a student attends any “additional science instruction”� Otherwise skip EC003-EC012 and proceed to EC013�
Compare your <school science> lessons at school and your additional science instruction. Where are the following teacher characteristics more likely to occur?(If you have more than one <school science> teacher in school, please keep one and the same <school science > teacher in mind for all comparisons.)(Please select one response in each row.)
More likely in my regular
school lessonsNo
difference
More likely in my
additional instruction
EC009Q03NA My teacher does a lot to help me� 1 2 3
EC009Q07NA My teacher is pleased when I come up with new solutions to a problem� 1 2 3
EC009Q10NA My teacher gives hints or offers strategies that help me to solve a task� 1 2 3
EC009Q12NA My teacher helps me to find ways to solve a problem� 1 2 3
EC009Q13NA Once we identify why I have a certain problem, my teacher provides me with a working strategy� 1 2 3
EC009Q14NA My teacher adapts the content and method to my needs� 1 2 3
EC010
à Questions EC003-EC012 only apply, if a student attends any “additional science instruction”� Otherwise skip EC003-EC012 and proceed to ECN013�
Compare <school science> lessons in your regular school and your additional science instruction. Where are the following situations more likely to occur?(If you have more than one <school science> teacher in school, please keep one and the same <school science > teacher in mind for all comparisons.)(Please select one response in each row.)
More likely in my regular
school lessonsNo
difference
More likely in my
additional instruction
EC010Q04NA It takes a long time until I have gathered all the material to get started� 1 2 3
EC010Q06NA I talk about things that don’t have anything to do with our tasks and the topic� 1 2 3
EC010Q07NA At the end of a lesson, my teacher summarises the learning content I have covered� 1 2 3
EC010Q08NA My teacher points out the most important aspects of a topic� 1 2 3
EC010Q09NA I am often bored� 1 2 3
EC010Q10NA It takes very long until I am ready to get started� 1 2 3
EC010Q11NA My teacher tells me what I should learn in a certain activity� 1 2 3
EC010Q12NA My teacher points out the broader context of a learning unit� 1 2 3

PISA 2015 BACKGROUND QUESTIONNAIRES: ANNEX A
PISA 2015 ASSESSMENT AND ANALYTICAL FRAMEWORK: SCIENCE, READING, MATHEMATIC AND FINANCIAL LITERACY © OECD 2016 161
EC011
à Questions EC003-EC012 only apply, if a student attends any “additional science instruction”� Otherwise skip EC003-EC012 and proceed to EC013�
Compare <school science> lessons in your school and your additional science instruction. Where are the following teacher-student interactions more likely to occur?(If you have more than one <school science> teacher in school, please keep one and the same <school science> teacher in mind for all comparisons.)(Please select one response in each row.)
More likely in my regular
school lessonsNo
difference
More likely in my
additional instruction
EC011Q01NA I get along well with my teacher� 1 2 3
EC011Q02NA My teacher is interested in my well-being� 1 2 3
EC011Q03NA My teacher really listens to what I have to say� 1 2 3
EC011Q04NA If I need extra help, I will receive it from my teacher� 1 2 3
EC011Q05NA My teacher treats me fairly� 1 2 3
EC012
à Questions EC003-EC012 only apply, if a student attends any “additional science instruction”� Otherwise skip EC003-EC012 and proceed to EC013�
Why do you attend additional science instruction in this school year?(Please select all that apply.)
EC012Q01NA I want to learn more� 1
EC012Q02NA I want to prepare for exams� 1
EC012Q03NA I was attracted by the tutoring advertisement� 1
EC012Q04NA My parents wanted me to attend� 1
EC012Q05NA Many of my friends are doing it� 1
EC012Q06NA My teachers recommend it� 1
EC012Q07NA I want to improve my grades� 1
EC012Q08NA I need to improve my grades� 1
EC012Q09NA It is gratifying to study� 1
EC012Q10NA It looks good on a résumé� 1
EC012Q11NA It is necessary for a job� 1
EC012Q12NA Other reason� 1
EC013à Only if a student does not attend any “additional science instruction”� Otherwise skip and proceed to EC014�
Why don’t you attend additional science instruction in this school year?(Please select all that apply.)
EC013Q01NA I don’t need any additional science instruction� 1
EC013Q02NA None of the available offerings seem to suit my needs� 1
EC013Q03NA Not many of my friends are doing it� 1
EC013Q04NA I don’t have time� 1
EC013Q05NA I don’t have the money� 1
EC013Q06NA My school teachers are knowledgeable enough� 1
EC013Q07NA My parents don’t want me to do it� 1
EC013Q08NA It doesn’t seem worth the money� 1
EC013Q09NA My teachers say it is not useful� 1
EC013Q10NA I have never considered taking additional science instruction� 1
EC013Q11NA Additional science instruction is not available where I live� 1
EC013Q12NA My family helps me instead� 1
EC013Q13NA My peers and friends help me instead� 1

ANNEX A: PISA 2015 BACKGROUND QUESTIONNAIRES
162 © OECD 2016 PISA 2015 ASSESSMENT AND ANALYTICAL FRAMEWORK: SCIENCE, READING, MATHEMATIC AND FINANCIAL LITERACY
PaRt B aDDitiONaL iNstRUCtiON iN MathEMatiCs
EC014
à Questions EC014-EC022 only apply, if a student attends any “additional mathematics instruction”� Otherwise skip EC014-EC022 and proceed to EC023�
Which of the following does this additional mathematics instruction cover?(Please select one response in each row.)
Yes No
EC014Q01NA Content covered in regular school courses 1 2
EC014Q02NA New or additional content not covered in regular school courses 1 2
EC015
à Questions EC014-EC022 only apply, if a student attends any “additional mathematics instruction”� Otherwise skip EC014-EC022 and proceed to EC023�
Which type of additional mathematics instruction do you participate in during this school year?(Please select all that apply.)
EC015Q01NA One-on-one tutoring with a person1
EC015Q02NA Internet tutoring with a person (including e�g� <SkypeTM>) 1
EC015Q03NA Internet or computer tutoring with a programme or application1
EC015Q04NA Live instruction by a person1
EC015Q05NA Video-recorded instruction by a person 1
EC015Q06NA Small group study or practice (2 to 7 students)1
EC015Q07NA Large group study or practice (8 or more students)1
EC015Q08NA Other additional mathematics instruction1
EC017
à Questions EC014-EC022 only apply, if a students attend any “additional mathematics instruction”� Otherwise skip EC014-EC022 and proceed to EC023�
Where do you attend this additional mathematics instruction?(Please select all that apply.)
EC017Q01NA In my regular school building1
EC017Q02NA At some other place, i�e� not in my regular school building1
EC018
à Questions EC014-EC022 only apply if a student attends any “additional mathematics instruction”� Otherwise skip EC014-EC022 and proceed to EC023�
Which of the following best describes your teacher or instructor in your additional mathematics instruction?(Please select all that apply.)
EC018Q01NA The teacher is one of my regular teachers in this year’s school courses�1
EC018Q02NA The teacher regularly teaches students my age in school but is not my teacher in any of my regular school courses�
1
EC018Q03NA The teacher mainly works for a business or organisation specialised in additional instruction�1
EC018Q04NA The teacher is not specialised teaching personnel (e�g� a student)�1

PISA 2015 BACKGROUND QUESTIONNAIRES: ANNEX A
PISA 2015 ASSESSMENT AND ANALYTICAL FRAMEWORK: SCIENCE, READING, MATHEMATIC AND FINANCIAL LITERACY © OECD 2016 163
EC019
à Questions EC014-EC022 only apply if a student attends any “additional mathematics instruction”� Otherwise skip EC014-EC022 and proceed to EC023�
Compare your mathematics lessons at school and your additional mathematics instruction. Where are the following teacher characteristics more likely to occur?(If you have more than one mathematics teacher in school, please keep one and the same mathematics teacher in mind for all comparisons.) (Please select one response in each row.)
More likely in
my regular school lessons
No difference
More likely in my
additional instruction
EC019Q03NA My teacher does a lot to help me� 1 2 3
EC019Q07NA My teacher is pleased when I come up with new solutions to a problem� 1 2 3
EC019Q10NA My teacher gives hints or offers strategies that help me to solve a task� 1 2 3
EC019Q12NA My teacher helps me to find ways to solve a problem� 1 2 3
EC019Q13NA Once we identify why I have a certain problem, my teacher provides me with a working strategy� 1 2 3
EC019Q14NA My teacher adapts the content and method to my needs� 1 2 3
EC020
à Questions EC014-EC022 only apply, if a student attends any “additional mathematics instruction”� Otherwise skip EC014-EC022 and proceed to EC023�
Compare mathematics lessons in your regular school and your additional mathematics instruction. Where are the following situations more likely to occur?(If you have more than one mathematics teacher in school, please keep one and the same mathematics teacher in mind for all comparisons.)(Please select one response in each row.)
More likely in
my regular school lessons
No difference
More likely in my
additional instruction
EC020Q04NA It takes a long time until I have gathered all the material to get started� 1 2 3
EC020Q06NA I talk about things that don’t have anything to do with our tasks and the topic� 1 2 3
EC020Q07NA At the end of a lesson, my teacher summarises the learning content I have covered� 1 2 3
EC020Q08NA My teacher points out the most important aspects of a topic� 1 2 3
EC020Q09NA I am often bored� 1 2 3
EC020Q10NA It takes very long until I am ready to get started� 1 2 3
EC020Q11NA My teacher tells me what I should learn in a certain activity� 1 2 3
EC020Q12NA My teacher points out the broader context of a learning unit� 1 2 3

ANNEX A: PISA 2015 BACKGROUND QUESTIONNAIRES
164 © OECD 2016 PISA 2015 ASSESSMENT AND ANALYTICAL FRAMEWORK: SCIENCE, READING, MATHEMATIC AND FINANCIAL LITERACY
EC021
à Questions EC014-EC022 only apply, if a student attends any “additional mathematics instruction”� Otherwise skip EC014-EC022 and proceed to EC023�
Compare mathematics lessons in your school and your additional mathematics instruction. Where are the following student-teacher interactions more likely to occur?(If you have more than one mathematics teacher in school, please keep one and the same mathematics teacher in mind for all comparisons.)(Please select one response in each row.)
More likely in my regular
school lessonsNo
difference
More likely in my
additional instruction
EC021Q01NA I get along well with my teacher� 1 2 3
EC021Q02NA My teacher is interested in my well-being� 1 2 3
EC021Q03NA My teacher really listens to what I have to say� 1 2 3
EC021Q04NA If I need extra help, I will receive it from my teacher� 1 2 3
EC021Q05NA My teacher treats me fairly� 1 2 3
EC022
à Questions EC014-EC022 only apply, if a student attends any “additional mathematics instruction”� Otherwise skip EC014-EC022 and proceed to EC023�
Why do you attend additional mathematics instruction in this school year?(Please select all that apply.)
EC022Q01NA I want to learn more� 1
EC022Q02NA I want to prepare for exams� 1
EC022Q03NA I was attracted by the tutoring advertisement� 1
EC022Q04NA My parents wanted me to attend� 1
EC022Q05NA Many of my friends are doing it� 1
EC022Q06NA My teachers recommend it� 1
EC022Q07NA I want to improve my grades� 1
EC022Q08NA I need to improve my grades� 1
EC022Q09NA It is gratifying to study� 1
EC022Q10NA It looks good on a résumé� 1
EC022Q11NA It is necessary for a job� 1
EC022Q12NA Other reason� 1
EC023
à Only if a student does not attend any “additional mathematics instruction”� Otherwise skip and proceed to EC024�
Why don’t you attend additional mathematics instruction in this school year?(Please select all that apply.)
EC023Q01NA I don’t need any additional mathematics instruction� 1
EC023Q02NA None of the available offerings seem to suit my needs� 1
EC023Q03NA Not many of my friends are doing it� 1
EC023Q04NA I don’t have time� 1
EC023Q05NA I don’t have the money� 1
EC023Q06NA My school teachers are knowledgeable enough� 1
EC023Q07NA My parents don’t want me to do it� 1
EC023Q08NA It doesn’t seem worth the money� 1
EC023Q09NA My teachers say it is not useful� 1
EC023Q10NA I have never considered taking additional mathematics instruction� 1
EC023Q11NA Additional mathematics instruction is not available where I live� 1
EC023Q12NA My family helps me instead� 1
EC023Q13NA My peers and friends help me instead� 1

PISA 2015 BACKGROUND QUESTIONNAIRES: ANNEX A
PISA 2015 ASSESSMENT AND ANALYTICAL FRAMEWORK: SCIENCE, READING, MATHEMATIC AND FINANCIAL LITERACY © OECD 2016 165
PaRt C aDDitiONaL iNstRUCtiON iN <tEst LaNGUaGE>
EC024
à Questions EC024-EC027 only apply, if a student attends any “additional <test language> instruction”� Otherwise skip EC024-EC027 and proceed to EC028�
Which type of additional <test language> instruction do you participate in during this school year?(Please select all that apply.)
EC024Q01NA One-on-one tutoring with a person 1
EC024Q02NA Internet tutoring with a person (including e�g� <SkypeTM>) 1
EC024Q03NA Internet or computer tutoring using a programme or application 1
EC024Q04NA Live instruction by a person 1
EC024Q05NA Video-recorded instruction by a person 1
EC024Q06NA Small group study or practice (2 to 7 students) 1
EC024Q07NA Large group study or practice (8 or more students) 1
EC024Q08NA Other additional <test language> instruction 1
EC026
à Questions EC024-EC027 only apply, if a student attends any “additional <test language> instruction”� Otherwise skip EC024-EC027 and proceed to EC028�
Where do you attend this additional <test language> instruction?(Please select all that apply.)
EC026Q01NA In my regular school building 1
EC026Q02NA At some other place, i�e� not in my regular school building 1
EC027
à Questions EC024-EC027 only apply if a student attends any “additional <test language> instruction”� Otherwise skip EC024-EC027 and proceed to EC028�
Which of the following best describes your teacher or instructor in your additional <test language> instruction?(Please select all that apply.)
EC027Q01NA The teacher is one of my regular teachers in this year’s school courses�1
EC027Q02NA The teacher regularly teaches students my age in school but is not my teacher in any of my regular school courses� 1
EC027Q03NA The teacher mainly works for a business or organisation specialised in additional instruction�1
EC027Q04NA The teacher is not specialised teaching personnel (e�g� a student)�1
PaRt D EDUCatiONaL PathWaY
EC028Did you attend additional instruction earlier in your education?(Please select one response in each row.)
Yes No
EC028Q01NA In <ISCED 0> 1 2
EC028Q02NA In <ISCED 1> 1 2
EC028Q03NA In <ISCED 2> 1 2
This is a filter question� EC029 only applies, if any of the answers in EC028 is greater than 0�

ANNEX A: PISA 2015 BACKGROUND QUESTIONNAIRES
166 © OECD 2016 PISA 2015 ASSESSMENT AND ANALYTICAL FRAMEWORK: SCIENCE, READING, MATHEMATIC AND FINANCIAL LITERACY
EC029EC029Q01NA
à Only if any answer in EC028 = 1 (student attended “additional instruction” earlier in education)
How many years altogether have you attended additional instruction?(Please select from the drop-down menu to answer the question.)
Years:
Option A
Option B
Option C
Option …
Drop down menu: answering options 0-16�
EC030In your family, who helps you regularly with your homework or private study?(Please select one response in each row.)
Yes No
EC030Q01NA Mother or other female guardian 1 2
EC030Q02NA Father or other male guardian 1 2
EC030Q03NA Sister(s)/brother(s) 1 2
EC030Q04NA Grandparents 1 2
EC030Q05NA Other relatives 1 2
EC030Q06NA Nobody 1 2
EC030Q07NA Other person 1 2
EC031Did you change schools when you were attending <ISCED 1>?(Please select one response.)
EC031Q01TA No, I attended all of <ISCED 1> at the same school� 1
EC031Q02TA Yes, I changed schools once� 2
EC031Q03TA Yes, I changed schools twice or more� 3
EC032Did you change schools when you were attending <ISCED 2>?(Please select one response.)
EC032Q01TA No, I attended all of <ISCED 2> at the same school� 1
EC032Q02TA Yes, I changed schools once� 2
EC032Q03TA Yes, I changed schools twice or more� 3
EC033Have you ever changed your <study programme>? (<example>)(Please select one response.)
EC033Q01NA No 1
EC033Q02NA Yes, I changed the <study programme> once� 2
EC033Q03NA Yes, I changed the <study programme> twice or more� 3

PISA 2015 BACKGROUND QUESTIONNAIRES: ANNEX A
PISA 2015 ASSESSMENT AND ANALYTICAL FRAMEWORK: SCIENCE, READING, MATHEMATIC AND FINANCIAL LITERACY © OECD 2016 167
ICT FAMILIARITY QUESTIONNAIRE
(International option)
Main Survey VersionThe information and communication technology (ICT) familiarity questionnaire consists of questions regarding the availability of ICT and the student’s use of, and attitudes towards, computers� Students can complete the questionnaire in about five minutes, after they have completed the student questionnaire�
The questionnaire covers:
• Availability of ICT
• General computer use
• Use of ICT outside of school
• Use of ICT at school
• Attitudes towards computers
In the following questions, you will be asked about different aspects related to digital media and digital devices, including desktop computers, portable laptops, notebooks, smartphones, tablet computers, cell phones without internet access, game consoles and internet-connected television�
IC001Are any of these devices available for you to use at home?(Please select one response in each row.)
Yes, and I use it
Yes, but I don’t use it No
IC001Q01TA Desktop computer 1 2 3
IC001Q02TA Portable laptop, or notebook 1 2 3
IC001Q03TA <Tablet computer> (e�g� <iPad®>, <BlackBerry® PlayBookTM>) 1 2 3
IC001Q04TA Internet connection 1 2 3
IC001Q05TA <Video games console>, e�g� <Sony® PlayStation®> 1 2 3
IC001Q06TA <Cell phone> (without Internet access) 1 2 3
IC001Q07TA <Cell phone> (with Internet access) 1 2 3
IC001Q08TA Portable music player (Mp3/Mp4 player, iPod® or similar) 1 2 3
IC001Q09TA Printer 1 2 3
IC001Q10TA USB (memory) stick 1 2 3
IC001Q11TA <ebook reader>, e�g� <Amazon® KindleTM> 1 2 3
IC009Are any of these devices available for you to use at school?(Please select one response in each row.)
Yes, and I use it
Yes, but I don’t use it No
IC009Q01TA Desktop computer 1 2 3
IC009Q02TA Portable laptop or notebook 1 2 3
IC009Q03TA <Tablet computer> (e�g� <iPad®>, <BlackBerry® PlayBookTM>) 1 2 3
IC009Q05NA Internet-connected school computers 1 2 3
IC009Q06NA Internet connection via wireless network 1 2 3
IC009Q07NA Storage space for school-related data, e�g� a folder for own documents 1 2 3
IC009Q08TA USB (memory) stick 1 2 3
IC009Q09TA <ebook reader>, e�g� <Amazon® KindleTM> 1 2 3
IC009Q10NA Data projector, e�g� for slide presentations 1 2 3
IC009Q11NA Interactive whiteboard, e�g� <SmartBoard®> 1 2 3

ANNEX A: PISA 2015 BACKGROUND QUESTIONNAIRES
168 © OECD 2016 PISA 2015 ASSESSMENT AND ANALYTICAL FRAMEWORK: SCIENCE, READING, MATHEMATIC AND FINANCIAL LITERACY
IC002IC002Q01NA
How old were you when you first used a digital device?(Please think of different kinds of digital devices such as for example desktop computers, portable laptops, notebooks, smartphones, tablet computers, cell phones without internet access, game consoles, or internet-connected television.)(Please select one response.)
6 years old or younger 7-9 years old
10-12 years old
13 years old or older
I had never used a digital device until
today
1 2 3 4 5
à If the student selects “I have never used a digital device until today”, the questionnaire will terminate because the following questions will not be relevant to the student�
IC003IC003Q01TA
How old were you when you first used a computer?(Please select one response.)
6 years old or younger 7-9 years old
10-12 years old
13 years old or older
I had never used a
computer until today
1 2 3 4 5
IC004IC004Q01T
How old were you when you first accessed the Internet?(Please select one response.)
6 years old or younger 7-9 years old
10-12 years old
13 years old or older
I have never accessed
the Internet
1 2 3 4 5
This is a filter question� If a student responds “5”, I have never accessed the Internet, IC005-IC007 are not applicable and students will proceed to IC008�
IC005IC005Q01TA
à Only if students answered “1”-“4” in IC004�
During a typical weekday, for how long do you use the Internet at school?(Please select one response.)
No time1-30 minutes
per day31-60 minutes
per day
Between 1 hour
and 2 hours per day
Between 2 hours
and 4 hours per day
Between 4 hours
and 6 hours per day
More than 6 hours per day
1 2 3 4 5 6 7
IC006 IC006Q01TA
à Only if students answered “1”-“4” in IC004�
During a typical weekday, for how long do you use the Internet outside of school?(Please select one response.)
No time1-30 minutes
per day31-60 minutes
per day
Between 1 hour
and 2 hours per day
Between 2 hours
and 4 hours per day
Between 4 hours
and 6 hours per day
More than 6 hours per day
1 2 3 4 5 6 7
IC007 IC007Q01TA
à Only if students answered “1”-“4” in IC004�
On a typical weekend day, for how long do you use the Internet outside of school?(Please select one response.)
No time1-30 minutes
per day31-60 minutes
per day
Between 1 hour
and 2 hours per day
Between 2 hours
and 4 hours per day
Between 4 hours
and 6 hours per day
More than 6 hours per day
1 2 3 4 5 6 7

PISA 2015 BACKGROUND QUESTIONNAIRES: ANNEX A
PISA 2015 ASSESSMENT AND ANALYTICAL FRAMEWORK: SCIENCE, READING, MATHEMATIC AND FINANCIAL LITERACY © OECD 2016 169
IC008How often do you use digital devices for the following activities outside of school?(Please select one response in each row.)
Never or hardly ever
Once or twice a month
Once or twice a week
Almost every day Every day
IC008Q01TA Playing one-player games 1 2 3 4 5
IC008Q02TA Playing collaborative online games 1 2 3 4 5
IC008Q03TA Using email 1 2 3 4 5
IC008Q04TA <Chatting online> (e�g� <MSN®>) 1 2 3 4 5
IC008Q05TA Participating in social networks (e�g� <Facebook>, <MySpace>) 1 2 3 4 5
IC008Q07NA Playing online games via social networks (e�g� <Farmville®>, <The Sims Social>) 1 2 3 4 5
IC008Q08TA Browsing the Internet for fun (such as watching videos, e�g� <YouTube™>) 1 2 3 4 5
IC008Q09TA Reading news on the Internet (e�g� current affairs) 1 2 3 4 5
IC008Q10TA Obtaining practical information from the Internet (e�g� locations, dates of events)
1 2 3 4 5
IC008Q11TA Downloading music, films, games or software from the internet 1 2 3 4 5
IC008Q12TA Uploading your own created contents for sharing (e�g� music, poetry, videos, computer programs)
1 2 3 4 5
IC008Q13NA Downloading new apps on a mobile device 1 2 3 4 5
IC010How often do you use digital devices for the following activities outside of school?(Please select one response in each row.)
Never or hardly ever
Once or twice a month
Once or twice a week
Almost every day Every day
IC010Q01TA Browsing the Internet for schoolwork (e�g� for preparing an essay or presentation) 1 2 3 4 5
IC010Q02NA Browsing the Internet to follow up lessons, e�g� for finding explanations 1 2 3 4 5
IC010Q03TA Using email for communication with other students about schoolwork 1 2 3 4 5
IC010Q04TA Using email for communication with teachers and submission of homework or other schoolwork
1 2 3 4 5
IC010Q05NA Using social networks for communication with other students about schoolwork (e�g� <Facebook>, <MySpace>)
1 2 3 4 5
IC010Q06NA Using social networks for communication with teachers (e�g� <Facebook>, <MySpace>) 1 2 3 4 5
IC010Q07TA Downloading, uploading or browsing material from my school’s website (e�g� timetable or course materials)
1 2 3 4 5
IC010Q08TA Checking the school’s website for announcements (e�g� absence of teachers) 1 2 3 4 5
IC010Q09NA Doing homework on a computer 1 2 3 4 5
IC010Q10NA Doing homework on a mobile device 1 2 3 4 5
IC010Q11NA Downloading learning apps on a mobile device 1 2 3 4 5
IC010Q12NA Downloading science learning apps on a mobile device 1 2 3 4 5

ANNEX A: PISA 2015 BACKGROUND QUESTIONNAIRES
170 © OECD 2016 PISA 2015 ASSESSMENT AND ANALYTICAL FRAMEWORK: SCIENCE, READING, MATHEMATIC AND FINANCIAL LITERACY
IC011How often do you use digital devices for the following activities at school?(Please select one response in each row.)
Never or hardly ever
Once or twice a month
Once or twice a week
Almost every day Every day
IC011Q01TA <Chatting online> at school� 1 2 3 4 5
IC011Q02TA Using email at school� 1 2 3 4 5
IC011Q03TA Browsing the Internet for schoolwork� 1 2 3 4 5
IC011Q04TA Downloading, uploading or browsing material from the school’s website (e�g� <intranet>)�
1 2 3 4 5
IC011Q05TA Posting my work on the school’s website� 1 2 3 4 5
IC011Q06TA Playing simulations at school� 1 2 3 4 5
IC011Q07TA Practicing and drilling, such as for foreign language learning or mathematics�
1 2 3 4 5
IC011Q08TA Doing homework on a school computer� 1 2 3 4 5
IC011Q09TA Using school computers for group work and communication with other students� 1 2 3 4 5
IC013
Thinking about your experience with digital media and digital devices: to what extent do you disagree or agree with the following statements?(Please think of different kinds of digital devices such as for example desktop computers, portable laptops, notebooks, smartphones, tablet computers, cell phones without internet access, game consoles, or internet-connected television.)(Please select one response in each row.)
Strongly disagree Disagree Agree
Strongly agree
IC013Q01NA I forget about time when I’m using digital devices� 1 2 3 4
IC013Q04NA The Internet is a great resource for obtaining information I am interested in (e�g� news, sports, dictionary)�
1 2 3 4
IC013Q05NA It is very useful to have social networks on the Internet� 1 2 3 4
IC013Q11NA I am really excited discovering new digital devices or applications� 1 2 3 4
IC013Q12NA I really feel bad if no internet connection is possible� 1 2 3 4
IC013Q13NA I like using digital devices� 1 2 3 4
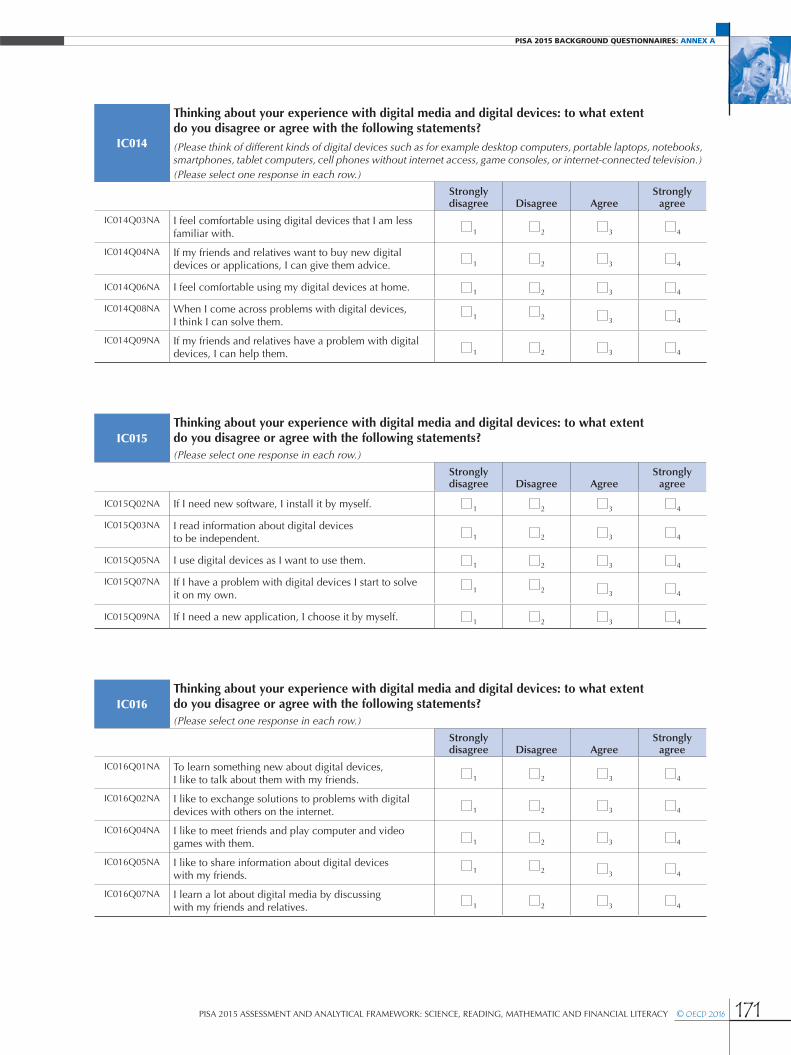
PISA 2015 BACKGROUND QUESTIONNAIRES: ANNEX A
PISA 2015 ASSESSMENT AND ANALYTICAL FRAMEWORK: SCIENCE, READING, MATHEMATIC AND FINANCIAL LITERACY © OECD 2016 171
IC014
Thinking about your experience with digital media and digital devices: to what extent do you disagree or agree with the following statements?(Please think of different kinds of digital devices such as for example desktop computers, portable laptops, notebooks, smartphones, tablet computers, cell phones without internet access, game consoles, or internet-connected television.)(Please select one response in each row.)
Strongly disagree Disagree Agree
Strongly agree
IC014Q03NA I feel comfortable using digital devices that I am less familiar with� 1 2 3 4
IC014Q04NA If my friends and relatives want to buy new digital devices or applications, I can give them advice� 1 2 3 4
IC014Q06NA I feel comfortable using my digital devices at home� 1 2 3 4
IC014Q08NA When I come across problems with digital devices, I think I can solve them� 1 2 3 4
IC014Q09NA If my friends and relatives have a problem with digital devices, I can help them� 1 2 3 4
IC015Thinking about your experience with digital media and digital devices: to what extent do you disagree or agree with the following statements?(Please select one response in each row.)
Strongly disagree Disagree Agree
Strongly agree
IC015Q02NA If I need new software, I install it by myself� 1 2 3 4
IC015Q03NA I read information about digital devices to be independent� 1 2 3 4
IC015Q05NA I use digital devices as I want to use them� 1 2 3 4
IC015Q07NA If I have a problem with digital devices I start to solve it on my own� 1 2 3 4
IC015Q09NA If I need a new application, I choose it by myself� 1 2 3 4
IC016Thinking about your experience with digital media and digital devices: to what extent do you disagree or agree with the following statements?(Please select one response in each row.)
Strongly disagree Disagree Agree
Strongly agree
IC016Q01NA To learn something new about digital devices, I like to talk about them with my friends� 1 2 3 4
IC016Q02NA I like to exchange solutions to problems with digital devices with others on the internet� 1 2 3 4
IC016Q04NA I like to meet friends and play computer and video games with them� 1 2 3 4
IC016Q05NA I like to share information about digital devices with my friends� 1 2 3 4
IC016Q07NA I learn a lot about digital media by discussing with my friends and relatives� 1 2 3 4
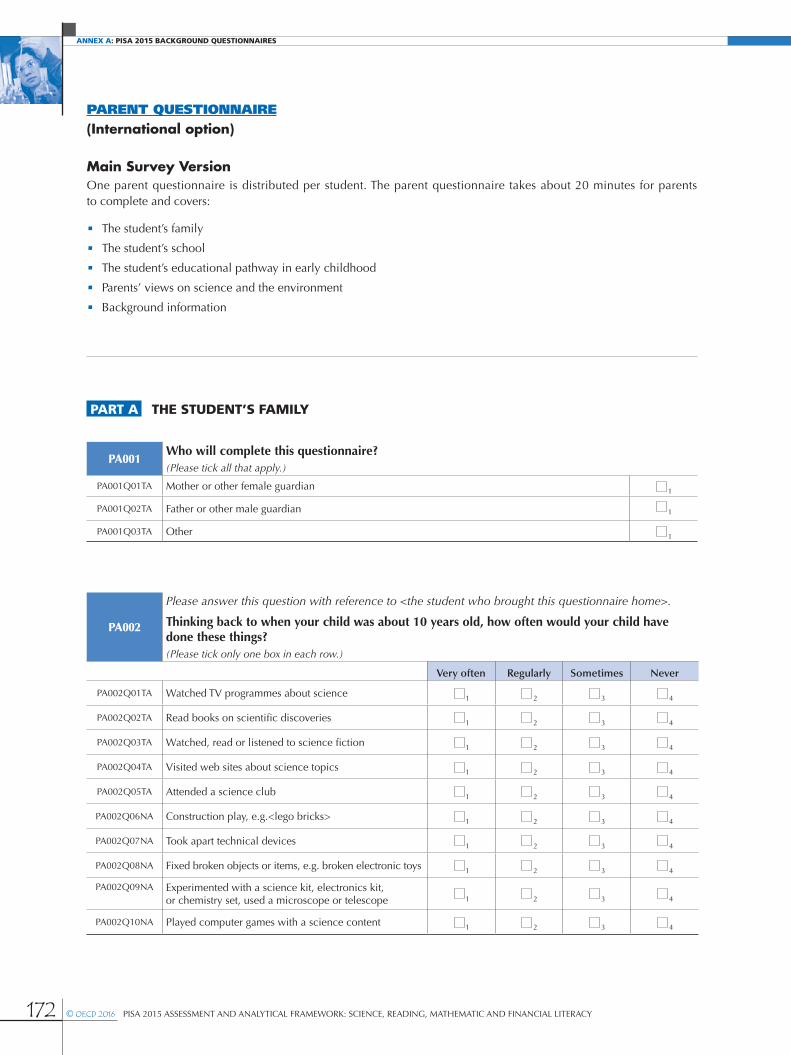
ANNEX A: PISA 2015 BACKGROUND QUESTIONNAIRES
172 © OECD 2016 PISA 2015 ASSESSMENT AND ANALYTICAL FRAMEWORK: SCIENCE, READING, MATHEMATIC AND FINANCIAL LITERACY
PARENT QUESTIONNAIRE (International option)
Main Survey VersionOne parent questionnaire is distributed per student� The parent questionnaire takes about 20 minutes for parents to complete and covers:
• The student’s family
• The student’s school
• The student’s educational pathway in early childhood
• Parents’ views on science and the environment
• Background information
PaRt a thE stUDENt’s FaMiLY
PA001Who will complete this questionnaire?(Please tick all that apply.)
PA001Q01TA Mother or other female guardian 1
PA001Q02TA Father or other male guardian 1
PA001Q03TA Other 1
PA002
Please answer this question with reference to <the student who brought this questionnaire home>.
Thinking back to when your child was about 10 years old, how often would your child have done these things?(Please tick only one box in each row.)
Very often Regularly Sometimes Never
PA002Q01TA Watched TV programmes about science 1 2 3 4
PA002Q02TA Read books on scientific discoveries 1 2 3 4
PA002Q03TA Watched, read or listened to science fiction 1 2 3 4
PA002Q04TA Visited web sites about science topics 1 2 3 4
PA002Q05TA Attended a science club 1 2 3 4
PA002Q06NA Construction play, e�g�<lego bricks> 1 2 3 4
PA002Q07NA Took apart technical devices 1 2 3 4
PA002Q08NA Fixed broken objects or items, e�g� broken electronic toys 1 2 3 4
PA002Q09NA Experimented with a science kit, electronics kit, or chemistry set, used a microscope or telescope 1 2 3 4
PA002Q10NA Played computer games with a science content 1 2 3 4

PISA 2015 BACKGROUND QUESTIONNAIRES: ANNEX A
PISA 2015 ASSESSMENT AND ANALYTICAL FRAMEWORK: SCIENCE, READING, MATHEMATIC AND FINANCIAL LITERACY © OECD 2016 173
PA003How often do you or someone else in your home do the following things with your child?(Please tick only one box in each row.)
Never or hardly ever
Once or twice a year
Once or twice a month
Once or twice a week
Every day or almost every day
PA003Q01TA Discuss how well my child is doing at school� 1 2 3 4 5
PA003Q02TA Eat <the main meal> with my child around a table� 1 2 3 4 5
PA003Q03TA Spend time just talking to my child� 1 2 3 4 5
PA003Q04NA Help my child with his/her science homework� 1 2 3 4 5
PA003Q05NA Ask how my child is performing in science class� 1 2 3 4 5
PA003Q06NA Obtain science-related materials (e�g� applications, software, study guides, etc�) for my child�
1 2 3 4 5
PA003Q07NA Discuss with my child how science is used in everyday life� 1 2 3 4 5
PA003Q08NA Discuss <science related career> options with my child� 1 2 3 4 5
PA004Thinking about <the last academic year>, to what extent do you agree with the following statements?(Please tick only one box in each row.)
Strongly disagree Disagree Agree
Strongly agree
PA004Q01NA I am interested in my child’s school activities� 1 2 3 4
PA004Q02NA I am supportive of my child’s efforts at school and his/her achievements� 1 2 3 4
PA004Q03NA I support my child when he/she is facing difficulties at school� 1 2 3 4
PA004Q04NA I encourage my child to be confident� 1 2 3 4
PaRt B thE stUDENt's sChOOL
We are interested in the options you had as parents when choosing the school your child is currently attending�
PA005PA005Q01TA
Which of the following statements best describes the schooling available to students in your location?(Please tick only one box.)
There are two or more other schools in this area that compete with the school my child is currently attending� 1
There is one other school in this area that competes with the school my child is currently attending� 2
There are no other schools in this area that compete with the school my child is currently attending� 3

ANNEX A: PISA 2015 BACKGROUND QUESTIONNAIRES
174 © OECD 2016 PISA 2015 ASSESSMENT AND ANALYTICAL FRAMEWORK: SCIENCE, READING, MATHEMATIC AND FINANCIAL LITERACY
PA006How important are the following reasons for choosing a school for your child?(Please tick only one box in each row.)
Not important
Somewhat important Important
Very important
PA006Q01TA The school is at a short distance to home� 1 2 3 4
PA006Q02TA The school has a good reputation� 1 2 3 4
PA006Q03TA The school offers particular courses or school subjects� 1 2 3 4
PA006Q04TA The school adheres to a particular <religious philosophy>�1 2 3 4
PA006Q05TA The school has a particular approach to <pedagogy/didactics, e�g� example>� 1 2 3 4
PA006Q06TA Other family members attended the school�1 2 3 4
PA006Q07TA <Expenses are low> (e�g� tuition, books, room and board)�1 2 3 4
PA006Q08TA The school has < financial aid> available, such as a school loan, scholarship or grant� 1 2 3 4
PA006Q09TA The school has an active and pleasant school climate� 1 2 3 4
PA006Q10TA The academic achievements of students in the school are high�1 2 3 4
PA006Q11TA There is a safe school environment� 1 2 3 4
We are interested in what you think about your child’s school�
PA007How much do you agree or disagree with the following statements?(Please tick only one box in each row.)
Strongly agree Agree Disagree
Strongly disagree
PA007Q01TA Most of my child’s school teachers seem competent and dedicated� 1 2 3 4
PA007Q02TA Standards of achievement are high in my child’s school� 1 2 3 4
PA007Q03TA I am happy with the content taught and the instructional methods used in my child’s school� 1 2 3 4
PA007Q04TA I am satisfied with the disciplinary atmosphere in my child’s school� 1 2 3 4
PA007Q05TA My child’s progress is carefully monitored by the school� 1 2 3 4
PA007Q06TA My child’s school provides regular and useful information on my child’s progress� 1 2 3 4
PA007Q07TA My child’s school does a good job in educating students� 1 2 3 4
PA007Q09NA My child’s school provides an inviting atmosphere for parents to get involved� 1 2 3 4
PA007Q11NA My child’s school provides effective communication between the school and families� 1 2 3 4
PA007Q12NA My child’s school involves parents in the school’s decision-making process� 1 2 3 4
PA007Q13NA My child’s school offers parent education (e�g� <courses on family literacy>) or family support programmes (e�g� <to assist with health, nutrition>)�
1 2 3 4
PA007Q14NA My child’s school informs families about how to help students with homework and other school-related activities� 1 2 3 4
PA007Q15NA My child’s school cooperates with <community services> to strengthen school programmes and student development� 1 2 3 4
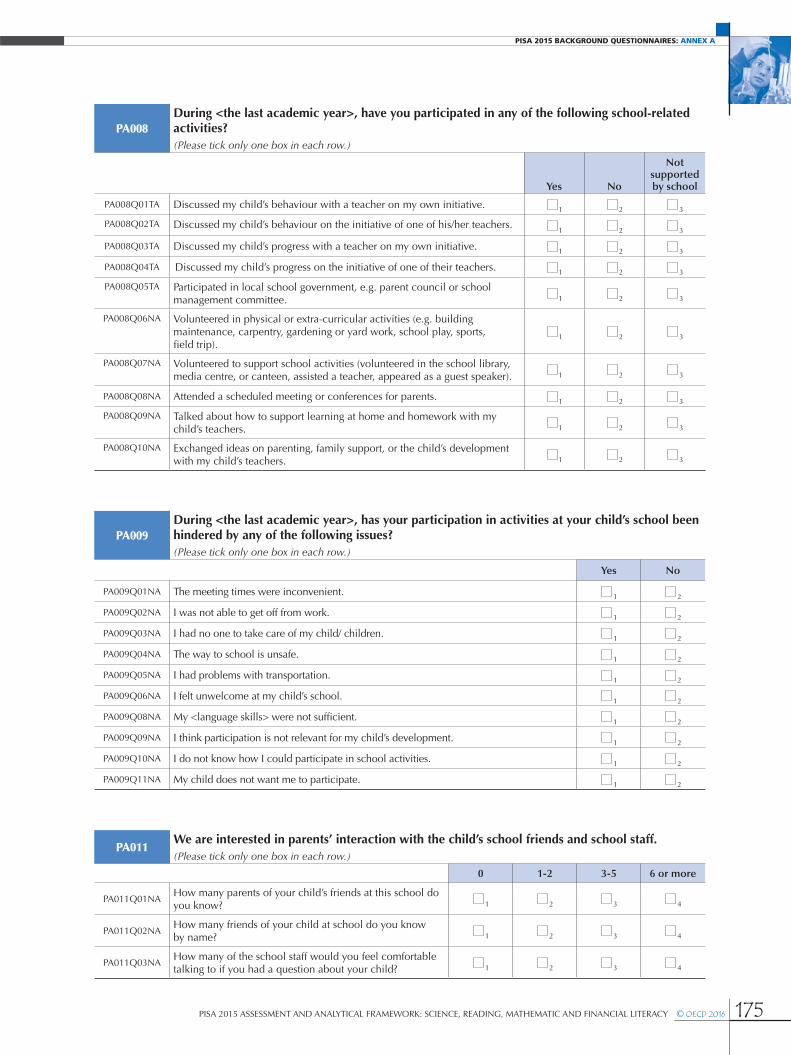
PISA 2015 BACKGROUND QUESTIONNAIRES: ANNEX A
PISA 2015 ASSESSMENT AND ANALYTICAL FRAMEWORK: SCIENCE, READING, MATHEMATIC AND FINANCIAL LITERACY © OECD 2016 175
PA008During <the last academic year>, have you participated in any of the following school-related activities?(Please tick only one box in each row.)
Yes No
Not supported by school
PA008Q01TA Discussed my child’s behaviour with a teacher on my own initiative� 1 2 3
PA008Q02TA Discussed my child’s behaviour on the initiative of one of his/her teachers�1 2 3
PA008Q03TA Discussed my child’s progress with a teacher on my own initiative� 1 2 3
PA008Q04TA Discussed my child’s progress on the initiative of one of their teachers� 1 2 3
PA008Q05TA Participated in local school government, e�g� parent council or school management committee� 1 2 3
PA008Q06NA Volunteered in physical or extra-curricular activities (e�g� building maintenance, carpentry, gardening or yard work, school play, sports, field trip)�
1 2 3
PA008Q07NA Volunteered to support school activities (volunteered in the school library, media centre, or canteen, assisted a teacher, appeared as a guest speaker)� 1 2 3
PA008Q08NA Attended a scheduled meeting or conferences for parents� 1 2 3
PA008Q09NA Talked about how to support learning at home and homework with my child’s teachers� 1 2 3
PA008Q10NA Exchanged ideas on parenting, family support, or the child’s development with my child’s teachers� 1 2 3
PA009During <the last academic year>, has your participation in activities at your child’s school been hindered by any of the following issues?(Please tick only one box in each row.)
Yes No
PA009Q01NA The meeting times were inconvenient� 1 2
PA009Q02NA I was not able to get off from work� 1 2
PA009Q03NA I had no one to take care of my child/ children� 1 2
PA009Q04NA The way to school is unsafe� 1 2
PA009Q05NA I had problems with transportation� 1 2
PA009Q06NA I felt unwelcome at my child’s school� 1 2
PA009Q08NA My <language skills> were not sufficient� 1 2
PA009Q09NA I think participation is not relevant for my child’s development� 1 2
PA009Q10NA I do not know how I could participate in school activities� 1 2
PA009Q11NA My child does not want me to participate� 1 2
PA011We are interested in parents’ interaction with the child’s school friends and school staff.(Please tick only one box in each row.)
0 1-2 3-5 6 or more
PA011Q01NAHow many parents of your child’s friends at this school do you know? 1 2 3 4
PA011Q02NAHow many friends of your child at school do you know by name? 1 2 3 4
PA011Q03NAHow many of the school staff would you feel comfortable talking to if you had a question about your child? 1 2 3 4

ANNEX A: PISA 2015 BACKGROUND QUESTIONNAIRES
176 © OECD 2016 PISA 2015 ASSESSMENT AND ANALYTICAL FRAMEWORK: SCIENCE, READING, MATHEMATIC AND FINANCIAL LITERACY
PaRt C thE stUDENt’s EDUCatiONaL PathWaY iN EaRLY ChiLDhOOD
PA014 At what age did your child start attending <ISCED 1>?PA014Q01NA Years: ___________
PA018Did your child regularly attend an arrangement with one of the following main purposes prior to <grade 1 in ISCED 1>?(Please tick only one box in each row.)
Yes No
PA018Q01NA Supervision and care (e�g� <national examples>) 1 2If yes, please answer questions 19–22�
PA018Q02NA Early childhood educational development (e�g� <national examples>) 1 2
If yes, please answer questions 23 and 26�
PA018Q03NA Pre-primary education (e�g� <national examples>) 1 2If yes, please answer questions 27–30�
In case your child did not visit any <early childhood education and care arrangement> prior to <grade 1 in ISCED 1> please proceed to Q32�
PA019At what ages did your child attend a <supervision and care arrangement> prior to <grade 1 in ISCED 1>? (Please tick all that apply.)
PA019Q01NA Up to age 1 1
PA019Q02NA Age 1 1
PA019Q03NA Age 2 1
PA019Q04NA Age 3 1
PA019Q05NA Age 4 1
PA019Q06NA Age 5 1
PA019Q07NA Age 6 1
PA019Q08NA Age 7 1
PA020Who took care of or educated your child in a <supervision and care arrangement>?(Please tick all that apply.)
PA020Q01NA An underage sibling of the child 1
PA020Q02NA An adult relative of the child (e�g� grandparents) 1
PA020Q03NA An adult untrained in child care, not a relative (e�g� baby-sitter, friend, neighbour) 1
PA020Q04NA A trained adult (e�g� <teacher>, nurse) 1
PA021Where was your child cared for or educated in a <supervision and care arrangement>?(Please tick all that apply.)
PA021Q01NA The child’s own home 1
PA021Q02NA Another person’s private home 1
PA021Q03NA An institutional setting (e�g� <national example>) 1
PA021Q04NA Another place 1
PA022PA022Q01NA
What was the most important reason why your child attended a <supervision and care arrangement>?(Please tick only one box.)
Attendance was mandatory� 1
We/I could not care for the child (e�g� work, illness)� 2
We/I wanted additional learning stimulation for the child (e�g� social, academic)� 3
Most other children attended a < supervision and care arrangement>� 4

PISA 2015 BACKGROUND QUESTIONNAIRES: ANNEX A
PISA 2015 ASSESSMENT AND ANALYTICAL FRAMEWORK: SCIENCE, READING, MATHEMATIC AND FINANCIAL LITERACY © OECD 2016 177
PA023At what ages did your child attend an <early childhood educational development arrangement> prior to <grade 1 in ISCED 1>?(Please tick all that apply.)
PA023Q01NA Up to age 1 1
PA023Q02NA Age 1 1
PA023Q03NA Age 2 1
PA023Q04NA Age 3 1
PA023Q05NA Age 4 1
PA023Q06NA Age 5 1
PA023Q07NA Age 6 1
PA023Q08NA Age 7 1
PA026PA026Q01NA
What was the most important reason why your child attended an <early childhood educational development arrangement>?(Please tick only one box.)
Attendance was mandatory� 1
We/I could not care for the child (e�g� work, illness)� 2
We/I wanted additional learning stimulation for the child (e�g� social, academic)� 3
Most other children attended a <early childhood educational development arrangement>� 4
PA027At what ages did your child attend a <pre-primary education arrangement> prior to <grade 1 in ISCED 1>? (Please tick all that apply.)
PA027Q01NA Up to age 1 1
PA027Q02NA Age 1 1
PA027Q03NA Age 2 1
PA027Q04NA Age 3 1
PA027Q05NA Age 4 1
PA027Q06NA Age 5 1
PA027Q07NA Age 6 1
PA027Q08NA Age 7 1
Please consider now the last <pre-primary education arrangement> which your child attended prior to <grade 1 in ISCED 1>�
PA028 PA028Q01NA
What type of provider offered this <pre-primary education arrangement>?(Please tick only one box.)
Public management and mainly public funding (e�g� <national example>) 1
Private management and mainly public funding (e�g� <national example>) 2
Private management and mainly private funding (e�g� <national example>) 3
PA029PA029Q01NA
How many hours per week did your child attend a <pre-primary education arrangement> at the age of three years?(Please tick only one box.)
0 hours per week 1
up to 10 hours per week 2
11-20 hours per week 3
21-30 hours per week 4
31-40 hours per week 5
41-50 hours per week 6
51 hours per week or more 7

ANNEX A: PISA 2015 BACKGROUND QUESTIONNAIRES
178 © OECD 2016 PISA 2015 ASSESSMENT AND ANALYTICAL FRAMEWORK: SCIENCE, READING, MATHEMATIC AND FINANCIAL LITERACY
PA030 PA030Q01NA
What was the most important reason why your child attended a <pre-primary education arrangement>?(Please tick only one box.)
Attendance was mandatory� 1
We/I could not care for the child (e�g� work, illness)� 2
We/I wanted additional learning stimulation for the child (e�g� social, academic)� 3
Most other children attended a <pre-primary education arrangement >� 4
PaRt D PaRENts’ ViEWs ON sCiENCE aND thE ENViRONMENt
The following questions refer to <science-related careers>� A <science-related career> is one that requires studying science at tertiary level (e�g� university)� So, careers like engineer (involving physics), weather forecaster (involving Earth science), optician (involving biology and physics) and medical doctors (involving the medical sciences) are all examples of <science-related careers>�
PA032Please answer the questions below.(Please tick only one box in each row.)
Yes No
PA032Q01TA Does anybody in your family (including you) work in a <science-related career>? 1 2
PA032Q02TA Does your child show an interest in working in a <science-related career>? 1 2
PA032Q03TA Do you expect your child will go into a < science-related career>? 1 2
PA032Q04TAHas your child shown interest in studying science after completing <secondary school>? 1 2
PA032Q05TA Do you expect your child will study science after completing <secondary school>? 1 2
PA033
Science is an important part of the PISA study. We are interested in parents’ opinions on science and on environmental issues.The following question asks about your views towards science.
How much do you agree with the following statements?(Please tick only one box in each row.)
Strongly agree Agree Disagree
Strongly disagree
PA033Q02TA <Broad science> is important to help us to understand the natural world� 1 2 3 4
PA033Q06TA <Broad science> is valuable to society� 1 2 3 4
PA033Q07TA <Broad science> is very relevant to me� 1 2 3 4
PA033Q08TA I find that <broad science> helps me to understand the things around me� 1 2 3 4
PA033Q09TA Advances in <broad science> usually bring social benefits� 1 2 3 4

PISA 2015 BACKGROUND QUESTIONNAIRES: ANNEX A
PISA 2015 ASSESSMENT AND ANALYTICAL FRAMEWORK: SCIENCE, READING, MATHEMATIC AND FINANCIAL LITERACY © OECD 2016 179
PA035Do you see the environmental issues below as a serious concern for yourself and/or others?(Please tick only one box in each row.)
This is a serious concern for me personally as well as others
This is a serious concern for other
people in my country but not
for me personally
This is a serious concern only for people in
other countries
This is not a serious concern
for anyone
PA035Q01TA Air pollution 1 2 3 4
PA035Q03TA Extinction of plants and animals 1 2 3 4
PA035Q04TA Clearing of forests for other land use 1 2 3 4
PA035Q05TA Water shortages 1 2 3 4
PA035Q06TA Nuclear waste 1 2 3 4
PA035Q07NA Extreme weather conditions 1 2 3 4
PA035Q08NA Human contact with animal diseases 1 2 3 4
PA036Do you think problems associated with the environmental issues below will improve or get worse over the next 20 years?(Please tick only one box in each row.)
ImproveStay about the same Get worse
PA036Q01TA Air pollution 1 2 3
PA036Q03TA Extinction of plants and animals 1 2 3
PA036Q04TA Clearing of forests for other land use 1 2 3
PA036Q05TA Water shortages 1 2 3
PA036Q06TA Nuclear waste 1 2 3
PA036Q07NA Extreme weather conditions 1 2 3
PA036Q08NA Human contact with animal diseases 1 2 3
PaRt E PaRENt's BaCKGROUND
PA039In what country were the following people in the child’s family born?(Please tick only one answer per column.)
Mother Father
Maternal grand-mother
Maternal grand-father
Paternal grand-mother
PA039Q01TA PA039Q02TA PA039Q03TA PA039Q04TA PA039Q05TA
<Country of test>1 1 1 1 1
<Country A>2 2 2 2 2
<Country B>3 3 3 3 3
<Country C>4 4 4 4 4
<Country D>5 5 5 5 5
<Country E>6 6 6 6 6
<Country F>7 7 7 7 7

ANNEX A: PISA 2015 BACKGROUND QUESTIONNAIRES
180 © OECD 2016 PISA 2015 ASSESSMENT AND ANALYTICAL FRAMEWORK: SCIENCE, READING, MATHEMATIC AND FINANCIAL LITERACY
PA041PA041Q01TA
Please answer the following question thinking just of expenses related to <the student who brought this questionnaire home>.
In the last twelve months, about how much would you have paid to educational providers for services?In determining this, please include any tuition fees you pay to your child’s school, any other fees paid to individual teachers in the school or to other teachers for any tutoring your child receives, as well as any fees for cram school.
Do not include the costs of goods like sports equipment, school uniforms, computers or textbooks if they are not included in a general fee (that is, if you have to buy these things separately).
(Please tick only one box.)
Nothing 1
<More than $0 but less than $W> 2
<$W or more but less than $X> 3
<$X or more but less than $Y> 4
<$Y or more but less than $Z> 5
<$Z> or more 6
PA042PA042Q01TA
What is your annual household income?Please add together the total income, before tax, from all members of your household.
Please remember we ask you to answer questions only if you feel comfortable doing so, and that all responses are kept strictly confidential.
(Please tick only one box.)
Less than <$A> 1
<$A> or more but less than <$B> 2
<$B> or more but less than <$C> 3
<$C> or more but less than <$D> 4
<$D> or more but less than <$E> 5
<$E> or more 6

PISA 2015 BACKGROUND QUESTIONNAIRES: ANNEX A
PISA 2015 ASSESSMENT AND ANALYTICAL FRAMEWORK: SCIENCE, READING, MATHEMATIC AND FINANCIAL LITERACY © OECD 2016 181
TEACHER QUESTIONNAIRE
(International Option)
Main Survey VersionsFor PISA 2015, countries had the option to add a questionnaire for teachers� There is a version of this questionnaire for science teachers and a different version for teachers who teach other subjects� In both cases, the questionnaire takes about 30 minutes to complete�
For science teachers, the questionnaire covers:
• Background information
• Teacher’s initial education and professional development
• Teacher’s school
• Science teaching practices
For other teachers, the questionnaire covers:
• Background information
• Teacher’s initial education and professional development
• Teacher’s school
• Teaching practices
PaRt a sCiENCE tEaChER QUEstiONNaiRE
Background information
TC001TC001Q01NA
Are you female or male? (Please select one response.)
Female 1
Male 2
TC002TC002Q01NA
How old are you?(Please move the slider to the appropriate number of years.)
Years:
Slider bar: Parking position; range: “20 years or younger”-“70 years or older”; step=1�
TC004 TC004Q01NA
What is your employment status as a teacher at this school?(Please select one response.)
Permanent employment (an ongoing contract with no fixed end-point before the age of retirement) 1
Fixed-term contract for a period of more than 1 school year 2
Fixed-term contract for a period of 1 school year or less 3

ANNEX A: PISA 2015 BACKGROUND QUESTIONNAIRES
182 © OECD 2016 PISA 2015 ASSESSMENT AND ANALYTICAL FRAMEWORK: SCIENCE, READING, MATHEMATIC AND FINANCIAL LITERACY
TC005What is your current employment status as a teacher?(Please consider your employment status at this school and for all your teaching employments together.)(Please select one response in each row.)
Full-time (more than 90% of full-time hours)
Part-time (71-90% of full-time hours)
Part-time (50-70%
of full-time hours)
Part-time (less than
50% of full-time hours)
TC005Q01NA My employment status at this school 1 2 3 4
TC005Q02NA All my teaching employments together 1 2 3 4
TC006 TC006Q01NA
In how many schools have you worked over the course of your teaching career?(Include all schools, even if you worked at several schools at once.)
(Please move the slider to the appropriate number of schools.)
Schools:
Slider bar: Parking position; range: “1 school”-“20 schools or more”; step=1
TC007How many years of work experience do you have? (Please round up to whole years no matter whether you worked part-time or full-time and move the slider to the appropriate number of years. If any option does not apply to you select “0” [zero].)
TC007Q01NA Year(s) working as a teacher at this school
TC007Q02NA Year(s) working as a teacher in total
Slider bar: Parking position; range: “0 years”-“50 years or more”; step=1�Consistency check/soft reminder if the response to item TC007Q01NA is bigger than to item TC007Q02NA�
teacher’s initial education and professional development
TC012 TC012Q01NA
What is the highest level of formal education you have completed?(Please select one response.)
<Below ISCED Level 5> 1
<ISCED Level 5B> 2
<ISCED Level 5A Bachelor degree> 3
<ISCED Level 5A Master’s degree> 4
<ISCED Level 6> 5
TC013 TC013Q01NA
After completing <ISCED level 3 or below>, was your goal to pursue a career in the teaching profession?(Please select one response.)
Yes 1
No 2
TC014 TC014Q01NA
Did you complete a teacher education or training programme?(Please select one response.)
Yes 1
No 2

PISA 2015 BACKGROUND QUESTIONNAIRES: ANNEX A
PISA 2015 ASSESSMENT AND ANALYTICAL FRAMEWORK: SCIENCE, READING, MATHEMATIC AND FINANCIAL LITERACY © OECD 2016 183
TC015TC015Q01NA
How did you receive your teaching qualifications?(Please select one response.)I attended a standard teacher education or training programme at a <educational institute which is eligible to educate or train teachers>� 1
I attended an in-service teacher education or training programme� 2
I attended a work-based teacher education or training programme� 3
I attended training in another pedagogical profession� 4
Other 5
TC018
Were any of the following included in your teacher education or training programme or other professional qualification and do you teach them to the <national modal grade for 15-year-olds> in the current school year?(Because this is an international survey, we had to categorise many of the actual subjects taught in schools into broad categories. If the exact name of one of your subjects is not listed, please mark the category you think best fits the subject.)
(If you need further explanation for terms used in this question, please use the help button.)
Please select all that apply.)
Included in my teacher education
or training programme or
other professional qualification
I teach it to the <national
modal grade for 15-year-olds> in the current school year
TC018Q01N Reading, writing and literature 1 1
TC018Q02N Mathematics 1 1
TC018Q03N Science 1 1
TC018Q04N Technology 1 1
TC018Q05N Social studies 1 1
TC018Q06N Modern foreign languages 1 1
TC018Q07N Ancient languages (e�g� Latin) 1 1
TC018Q08N Arts 1 1
TC018Q09N Physical education 1 1
TC018Q10N Religion and/or ethics 1 1
TC018Q11N Practical and vocational skills 1 1
Help button Reading, writing and literature: reading and writing (and literature) in the mother tongue, in the language of instruction, or in the tongue of the country (region) as a second language (for non-natives); language studies, public speaking, literatureMathematics: mathematics, mathematics with statistics, geometry, algebra, etc�Science: natural sciences, physics, physical science, chemistry, biology, human biology, earth and space sciences, environmental science, agriculture/horticulture/forestryTechnology: orientation in technology, including information technology, computer studies, construction/surveying, engineering, electronics, graphics and design, keyboard skills, word processing, workshop technology/design technologySocial studies: social studies, community studies, contemporary studies, economics, environmental studies, geography, history, humanities, legal studies, studies of the own country, social sciences, ethical thinking, philosophyModern foreign languages: languages different from the language of instructionAncient languages (e�g� Latin)Arts: arts, music, visual arts, practical art, drama, performance music, photography, drawing, creative handicraft, creative needleworkPhysical education: physical education, gymnastics, dance, healthReligion and/or ethics: religion, history of religions, religion culture, ethicsPractical and vocational skills: vocational skills (preparation for a specific occupation), technics, domestic science, accountancy, business studies, career education, clothing and textiles, driving, home economics, polytechnic courses, secretarial studies, tourism and hospitality, handicraft�
Consistency check/soft reminder if any button remains unmarked�

ANNEX A: PISA 2015 BACKGROUND QUESTIONNAIRES
184 © OECD 2016 PISA 2015 ASSESSMENT AND ANALYTICAL FRAMEWORK: SCIENCE, READING, MATHEMATIC AND FINANCIAL LITERACY
TC029
What proportion of your teacher education or training programme or other professional qualification was dedicated to each of the following areas?(For each area please enter an approximate percentage, e.g. “20” in the first row to indicate 20% of initial education time used for <broad science> and technology content matter.)
(Note that the percentages must add up to 100.)
TC029Q01NA<Broad science> and technology content matter: knowledge and skills in any <broad science> discipline ———— %
TC029Q02NATeaching and learning <school science>: teaching methodology related to <school science>, instructional skills (e�g� use of experiments), student misconceptions ———— %
TC029Q03NAGeneral topics in education: e�g� teacher-student interaction, classroom management, school evaluation, special education ———— %
TC029Q04NA Other topics ———— %
Consistency check/soft reminder if sum is more or less than 100%�
What proportion of your teacher education or training programme or other professional qualification was dedicated to each of the following areas?(For each area please enter an approximate percentage, e.g. “20” in the first row to indicate 20% of initial education time used for <broad science> and technology content matter.)
(Note that the percentages must add up to 100.)
Extent
<Broad science> and technology content matter: knowledge and skills in any <broad science> discipline
55%
Teaching and learning <school science>: teaching methodology related to <school science>, instructional skills (e�g� use of experiments), student misconceptions
20%
General topics in education: e�g� teacher-student interaction, classroom management, school evaluation, special education
15%
Other topics 10%
The pie chart gives immediate interactive feedback and the respondent can change answers as often as desired�
TC020During the last 12 months, did you participate in any of the following activities?(Please select one response in each row.)
Yes No
TC020Q01NA Qualification programme (e�g� a <degree programme>) 1 2
TC020Q02NAParticipation in a network of teachers formed specifically for the professional development of teachers 1 2
TC020Q03NA Individual or collaborative research on a topic of interest to you professionally 1 2
TC020Q04NAMentoring and/or peer observation and coaching, as part of a formal school arrangement 1 2
TC020Q05NA Reading professional literature (e�g� journals, evidence-based papers, thesis papers) 1 2
TC020Q06NAEngaging in informal dialogue with your colleagues on how to improve your teaching 1 2

PISA 2015 BACKGROUND QUESTIONNAIRES: ANNEX A
PISA 2015 ASSESSMENT AND ANALYTICAL FRAMEWORK: SCIENCE, READING, MATHEMATIC AND FINANCIAL LITERACY © OECD 2016 185
TC030
During the last 12 months, what proportion of your professional development activities was dedicated to each of the following areas?(For each area please enter an approximate percentage, e.g. “20” in the first row to indicate 20% of professional development activity time used for <broad science> and technology content matter.)
(Note that the percentages must add up to 100.)
TC030Q01NA<Broad science> and technology content matter: knowledge and skills in any <broad science> discipline ———— %
TC030Q02NATeaching and learning <school science>: teaching methodology related to <school science>, instructional skills (e�g� use of experiments), student misconceptions ———— %
TC030Q03NAGeneral topics in education: e�g� teacher-student interaction, classroom management, school evaluation, special education ———— %
TC030Q04NA Other topics ———— %
Consistency check/soft reminder if sum is more or less than 100 %�
During the last 12 months, what proportion of your professional development activities was dedicated to each of the following areas?(For each area please enter an approximate percentage, e.g. “20” in the first row to indicate 20% of initial education time used for <broad science> and technology content matter.)
(Note that the percentages must add up to 100.)
Extent
<Broad science> and technology content matter: knowledge and skills in any <broad science> discipline
55%
Teaching and learning <school science>: teaching methodology related to <school science>, instructional skills (e�g� use of experiments), student misconceptions
20%
General topics in education: e�g� teacher-student interaction, classroom management, school evaluation, special education
15%
Other topics 10%
The pie chart gives immediate interactive feedback and the respondent can change answers as often as desired�
TC021 TC021Q01NA
Are you required to take part in professional development activities?(Please select one response.)
Yes 1
No 2

ANNEX A: PISA 2015 BACKGROUND QUESTIONNAIRES
186 © OECD 2016 PISA 2015 ASSESSMENT AND ANALYTICAL FRAMEWORK: SCIENCE, READING, MATHEMATIC AND FINANCIAL LITERACY
teacher’s school
TC028Is your school’s capacity to provide instruction hindered by any of the following issues?(Please select one response in each row.)
Not at all Very littleTo some extent A lot
TC028Q01NA A lack of teaching staff 1 2 3 4
TC028Q02NA Inadequate or poorly qualified teaching staff 1 2 3 4
TC028Q03NA A lack of assisting staff 1 2 3 4
TC028Q04NA Inadequate or poorly qualified assisting staff 1 2 3 4
TC028Q05NA A lack of educational material (e�g� textbooks, IT equipment, library or laboratory material) 1 2 3 4
TC028Q06NA Inadequate or poor quality educational material (e�g� textbooks, IT equipment, library or laboratory material)
1 2 3 4
TC028Q07NA A lack of physical infrastructure (e�g� building, grounds, heating/cooling, lighting and acoustic systems) 1 2 3 4
TC028Q08NA Inadequate or poor quality physical infrastructure (e�g� building, grounds, heating/cooling, lighting and acoustic systems)
1 2 3 4
TC039 TC039Q01NA
Is there any formal curriculum for <school science> in <national modal grade for 15-year-olds>?(Please consider national, state, regional, or school policies.)(Please select one response.)
Yes 1
No 2
TC041
à Only, if TC039 = ‘yes’� Else proceed to TC031�
How much emphasis is given to the following approaches and processes in the intended <school science> curriculum for <the national modal grade of 15-year-olds>?(Please select one response in each row.)
No emphasis
Very little emphasis
Some emphasis
A lot of emphasis
TC041Q01NA Knowing basic science facts and principles 1 2 3 4
TC041Q02NA Observing natural phenomena and describing what is seen 1 2 3 4
TC041Q03NA Providing explanations of what is being studied 1 2 3 4
TC041Q04NA Designing and planning experiments or investigations 1 2 3 4
TC041Q05NA Conducting experiments or investigations 1 2 3 4
TC041Q06NA Integrating science with other subjects 1 2 3 4
TC041Q07NA Relating what students are learning to their daily lives 1 2 3 4
TC041Q08NA Incorporating the experiences of different ethnic/cultural groups 1 2 3 4

PISA 2015 BACKGROUND QUESTIONNAIRES: ANNEX A
PISA 2015 ASSESSMENT AND ANALYTICAL FRAMEWORK: SCIENCE, READING, MATHEMATIC AND FINANCIAL LITERACY © OECD 2016 187
TC043TC043Q01NA
à Only if TC039 = ‘yes’� Else proceed to TC031�
Are parents informed about the availability and content of the <school science> curriculum (e.g. in a parent-teacher conference or a newsletter)?(Please select one response.)
Yes 1
No 2
TC031To what extent do you disagree or agree with the following statements about regular cooperation among your fellow <school science> teachers and yourself? (Please select one response in each row.)
Strongly disagree Disagree Agree
Strongly agree
TC031Q04NA We discuss the achievement requirements for <school science> when setting tests� 1 2 3 4
TC031Q07NA It is natural for us to cooperate on what homework to give to our students� 1 2 3 4
TC031Q11NA We discuss the criteria we use to grade written tests� 1 2 3 4
TC031Q13NA We exchange tasks for lessons and homework that cover a range of different levels of difficulty� 1 2 3 4
TC031Q14NA I prepare a selection of teaching units with my fellow <school science> teachers� 1 2 3 4
TC031Q15NA We discuss ways to teach learning strategies and techniques to our students� 1 2 3 4
TC031Q18NA My fellow <school science> teachers benefit from my specific skills and interests� 1 2 3 4
TC031Q20NA We discuss ways to better identify students’ individual strengths and weaknesses� 1 2 3 4
TC026We would like to know how you generally feel about your job. How strongly do you agree or disagree with the following statements?(Please select one response in each row.)
Strongly disagree Disagree Agree
Strongly agree
TC026Q01NA The advantages of being a teacher clearly outweigh the disadvantages� 1 2 3 4
TC026Q02NA If I could decide again, I would still choose to work as a teacher� 1 2 3 4
TC026Q04NA I regret that I decided to become a teacher� 1 2 3 4
TC026Q05NA I enjoy working at this school� 1 2 3 4
TC026Q06NA I wonder whether it would have been better to choose another profession� 1 2 3 4
TC026Q07NA I would recommend my school as a good place to work� 1 2 3 4
TC026Q09NA I am satisfied with my performance in this school� 1 2 3 4
TC026Q10NA All in all, I am satisfied with my job� 1 2 3 4

ANNEX A: PISA 2015 BACKGROUND QUESTIONNAIRES
188 © OECD 2016 PISA 2015 ASSESSMENT AND ANALYTICAL FRAMEWORK: SCIENCE, READING, MATHEMATIC AND FINANCIAL LITERACY
science teaching practices
TC037How often do these things happen in your <school science> lessons?(Please select one response in each row.)
Never or almost never
Some lessons
Many lessons
Every lesson or almost
every lessonTC037Q01NA Students are asked to draw conclusions from
an experiment they have conducted� 1 2 3 4
TC037Q02NA Students are given opportunities to explain their ideas� 1 2 3 4
TC037Q03NA I explain scientific ideas� 1 2 3 4
TC037Q04NA A small group discussion between students takes place� 1 2 3 4
TC037Q05NA A whole class discussion takes place in which I participate� 1 2 3 4
TC037Q06NA Current scientific issues are discussed� 1 2 3 4
TC037Q07NA Students make calculations using scientific formulas� 1 2 3 4
TC037Q08NA I use an interactive whiteboard� 1 2 3 4
TC037Q09NA Students do their own scientific study and related research� 1 2 3 4
TC037Q10NA I discuss questions that students ask� 1 2 3 4
TC037Q11NA Students carry out practical work� 1 2 3 4
TC037Q12NA Students write up laboratory reports� 1 2 3 4
TC037Q13NA I demonstrate an idea� 1 2 3 4
TC037Q14NA I discuss questions of practical relevance� 1 2 3 4
TC037Q15NA Students read materials from a textbook� 1 2 3 4
TC037Q16NA Students take notes from the board� 1 2 3 4
TC037Q17NA Students discuss materials from a textbook� 1 2 3 4
TC037Q18NA Students watch videos� 1 2 3 4
TC037Q19NA Students use the internet� 1 2 3 4
TC037Q20NA The class corrects homework or a test� 1 2 3 4
TC037Q21NA Students fill out worksheets� 1 2 3 4
TC037Q22NA Students present something to the rest of the class� 1 2 3 4
TC033To what extent can (or could) you do the following?(Please select one response in each row.)
Not at all Very littleTo some extent
To a large extent
TC033Q04NA Design experiments and hands-on activities for <inquiry-based learning> 1 2 3 4
TC033Q05NA Assign tailored tasks to the weakest as well as to the best students 1 2 3 4
TC033Q06NA Use a variety of assessment strategies 1 2 3 4
TC033Q08NA Facilitate a discussion among students on how to interpret experimental findings 1 2 3 4

PISA 2015 BACKGROUND QUESTIONNAIRES: ANNEX A
PISA 2015 ASSESSMENT AND ANALYTICAL FRAMEWORK: SCIENCE, READING, MATHEMATIC AND FINANCIAL LITERACY © OECD 2016 189
TC034To what extent can (or could) you do the following?(If you need further explanation of the term my “scientific discipline”, please use the help button.)
(Please select one response in each row.)
Not at all Very littleTo some extent
To a large extent
TC034Q01NAExplain a complex scientific concept to a fellow teacher 1 2 3 4
TC034Q02NAState and defend an informed position on ethical problems relating to <broad science> 1 2 3 4
TC034Q04NA Read state-of-the art papers in my scientific discipline 1 2 3 4
TC034Q06NAExplain the links between biology, physics and chemistry 1 2 3 4
Help buttonYour <scientific discipline> refers to one specific <broad science> discipline your main <school science> subject belongs to� If you teach the same number of hours for several <school science> subjects, you should choose only one and relate your answer to it�
PaRt B GENERaL tEaChER QUEstiONNaiRE
Background information
TC001TC001Q01NA
Are you female or male? (Please select one response.)
Female 1
Male 2
TC002TC002Q01NA
How old are you?(Please move the slider to the appropriate number of years.)
Years:
Slider bar: Parking position; range: “20 years or younger”-“70 years or older”; step=1�
TC004 TC004Q01NA
What is your employment status as a teacher at this school?(Please select one response.)
Permanent employment (an ongoing contract with no fixed end-point before the age of retirement) 1
Fixed-term contract for a period of more than 1 school year 2
Fixed-term contract for a period of 1 school year or less 3
TC005What is your current employment status as a teacher?(Please consider your employment status at this school and for all your teaching employments together.)(Please select one response in each row.)
Full-time (more than 90% of full-time hours)
Part-time (71-90%
of full-time hours)
Part-time (50-70%
of full-time hours)
Part-time (less than
50% of full-time hours)
TC005Q01NA My employment status at this school 1 2 3 4
TC005Q02NA All my teaching employments together 1 2 3 4

ANNEX A: PISA 2015 BACKGROUND QUESTIONNAIRES
190 © OECD 2016 PISA 2015 ASSESSMENT AND ANALYTICAL FRAMEWORK: SCIENCE, READING, MATHEMATIC AND FINANCIAL LITERACY
TC006 TC006Q01NA
In how many schools have you worked over the course of your teaching career?(Include all schools, even if you worked at several schools at once.)
(Please move the slider to the appropriate number of schools.)
Schools:
Slider bar: Parking position; range: “1 school”-“20 schools or more”; step=1
TC007How many years of work experience do you have? (Please round up to whole years no matter whether you worked part-time or full-time and move the slider to the appropriate number of years. If any option does not apply to you select “0” [zero].)
TC007Q01NA Year(s) working as a teacher at this school
TC007Q02NA Year(s) working as a teacher in total
Slider bar: Parking position; range: “0 years”-“50 years or more”; step=1�Consistency check/soft reminder if the response to item TC007Q01NA is bigger than to item TC007Q02NA�
teacher’s initial education and professional development
TC012 TC012Q01NA
What is the highest level of formal education you have completed?(Please select one response.)
<Below ISCED Level 5> 1
<ISCED Level 5B> 2
<ISCED Level 5A Bachelor degree> 3
<ISCED Level 5A Master’s degree> 4
<ISCED Level 6> 5
TC013 TC013Q01NA
After completing <ISCED level 3 or below>, was your goal to pursue a career in the teaching profession?(Please select one response.)
Yes 1
No 2
TC014 TC014Q01NA
Did you complete a teacher education or training programme?(Please select one response.)
Yes 1
No 2
TC015 TC015Q01NA
How did you receive your teaching qualifications?(Please select one response.)
I attended a standard teacher education or training programme at an <educational institute which is eligible to educate or train teachers>�
1
I attended an in-service teacher education or training programme� 2
I attended a work-based teacher education or training programme� 3
I attended training in another pedagogical profession� 4
Other 5

PISA 2015 BACKGROUND QUESTIONNAIRES: ANNEX A
PISA 2015 ASSESSMENT AND ANALYTICAL FRAMEWORK: SCIENCE, READING, MATHEMATIC AND FINANCIAL LITERACY © OECD 2016 191
TC018
Were any of the following included in your teacher education or training programme or other professional qualification and do you teach them to the <national modal grade for 15-year-olds> in the current school year?(Because this is an international survey, we had to categorise many of the actual subjects taught in schools into broad categories. If the exact name of one of your subjects is not listed, please mark the category you think best fits the subject.)
(If you need further explanation for terms used in this question, please use the help button.)(Please select all that apply.)
Included in my teacher education
or training programme or
other professional qualification
I teach it to the <national
modal grade for 15-year-olds> in the current school year
TC018Q01N Reading, writing and literature 1 1
TC018Q02N Mathematics 1 1
TC018Q03N Science 1 1
TC018Q04N Technology 1 1
TC018Q05N Social studies 1 1
TC018Q06N Modern foreign languages 1 1
TC018Q07N Ancient languages (e�g� Latin) 1 1
TC018Q08N Arts 1 1
TC018Q09N Physical education 1 1
TC018Q10N Religion and/or ethics 1 1
TC018Q11N Practical and vocational skills 1 1
Help button Reading, writing and literature: reading and writing (and literature) in the mother tongue, in the language of instruction, or in the tongue of the country (region) as a second language (for non-natives); language studies, public speaking, literature
Mathematics: mathematics, mathematics with statistics, geometry, algebra, etc�
Science: natural sciences, physics, physical science, chemistry, biology, human biology, earth and space sciences, environmental science, agriculture/horticulture/forestry
Technology: orientation in technology, including information technology, computer studies, construction/surveying, engineering, electronics, graphics and design, keyboard skills, word processing, workshop technology/design technology
Social studies: social studies, community studies, contemporary studies, economics, environmental studies, geography, history, humanities, legal studies, studies of the own country, social sciences, ethical thinking, philosophy
Modern foreign languages: languages different from the language of instruction
Ancient languages (e�g� Latin)
Arts: arts, music, visual arts, practical art, drama, performance music, photography, drawing, creative handicraft, creative needlework
Physical education: physical education, gymnastics, dance, health
Religion and/or ethics: religion, history of religions, religion culture, ethics
Practical and vocational skills: vocational skills (preparation for a specific occupation), technics, domestic science, accountancy, business studies, career education, clothing and textiles, driving, home economics, polytechnic courses, secretarial studies, tourism and hospitality, handicraft
Consistency check/soft reminder if any button remains unmarked�
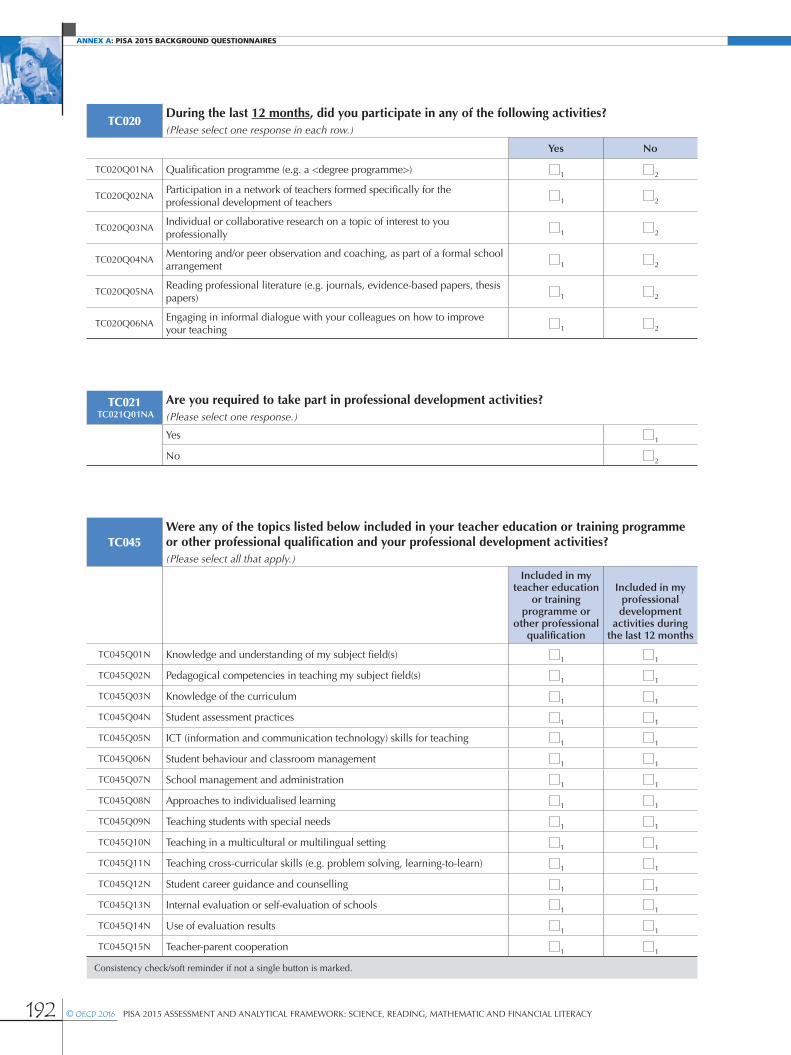
ANNEX A: PISA 2015 BACKGROUND QUESTIONNAIRES
192 © OECD 2016 PISA 2015 ASSESSMENT AND ANALYTICAL FRAMEWORK: SCIENCE, READING, MATHEMATIC AND FINANCIAL LITERACY
TC020During the last 12 months, did you participate in any of the following activities?(Please select one response in each row.)
Yes No
TC020Q01NA Qualification programme (e�g� a <degree programme>) 1 2
TC020Q02NAParticipation in a network of teachers formed specifically for the professional development of teachers 1 2
TC020Q03NAIndividual or collaborative research on a topic of interest to you professionally 1 2
TC020Q04NAMentoring and/or peer observation and coaching, as part of a formal school arrangement 1 2
TC020Q05NAReading professional literature (e�g� journals, evidence-based papers, thesis papers) 1 2
TC020Q06NAEngaging in informal dialogue with your colleagues on how to improve your teaching 1 2
TC021 TC021Q01NA
Are you required to take part in professional development activities?(Please select one response.)
Yes 1
No 2
TC045Were any of the topics listed below included in your teacher education or training programme or other professional qualification and your professional development activities?(Please select all that apply.)
Included in my teacher education
or training programme or
other professional qualification
Included in my professional development
activities during the last 12 months
TC045Q01N Knowledge and understanding of my subject field(s) 1 1
TC045Q02N Pedagogical competencies in teaching my subject field(s) 1 1
TC045Q03N Knowledge of the curriculum 1 1
TC045Q04N Student assessment practices 1 1
TC045Q05N ICT (information and communication technology) skills for teaching 1 1
TC045Q06N Student behaviour and classroom management 1 1
TC045Q07N School management and administration 1 1
TC045Q08N Approaches to individualised learning 1 1
TC045Q09N Teaching students with special needs 1 1
TC045Q10N Teaching in a multicultural or multilingual setting 1 1
TC045Q11N Teaching cross-curricular skills (e�g� problem solving, learning-to-learn) 1 1
TC045Q12N Student career guidance and counselling 1 1
TC045Q13N Internal evaluation or self-evaluation of schools 1 1
TC045Q14N Use of evaluation results 1 1
TC045Q15N Teacher-parent cooperation 1 1
Consistency check/soft reminder if not a single button is marked�

PISA 2015 BACKGROUND QUESTIONNAIRES: ANNEX A
PISA 2015 ASSESSMENT AND ANALYTICAL FRAMEWORK: SCIENCE, READING, MATHEMATIC AND FINANCIAL LITERACY © OECD 2016 193
teacher’s school
TC028Is your school’s capacity to provide instruction hindered by any of the following issues?(Please select one response in each row.)
Not at all Very littleTo some extent A lot
TC028Q01NA A lack of teaching staff 1 2 3 4
TC028Q02NA Inadequate or poorly qualified teaching staff 1 2 3 4
TC028Q03NA A lack of assisting staff 1 2 3 4
TC028Q04NA Inadequate or poorly qualified assisting staff 1 2 3 4
TC028Q05NA A lack of educational material (e�g� textbooks, IT equipment, library or laboratory material) 1 2 3 4
TC028Q06NA Inadequate or poor quality educational material (e�g� textbooks, IT equipment, library or laboratory material)
1 2 3 4
TC028Q07NA A lack of physical infrastructure (e�g� building, grounds, heating/cooling, lighting and acoustic systems)
1 2 3 4
TC028Q08NA Inadequate or poor quality physical infrastructure (e�g� building, grounds, heating/cooling, lighting and acoustic systems)
1 2 3 4
TC060To what extent do you disagree or agree with the following statements regarding your school?(Please select one response in each row.)
Strongly disagree Disagree Agree
Strongly agree
TC060Q02NA The principal tries to achieve consensus with all staff when defining priorities and goals in school� 1 2 3 4
TC060Q04NA The principal is aware of my needs� 1 2 3 4
TC060Q06NA The principal inspires new ideas for my professional learning� 1 2 3 4
TC060Q07NA The principal treats teaching staff as professionals� 1 2 3 4
TC060Q09NA The principal ensures our involvement in decision making� 1 2 3 4
TC046On average, how often do you do the following in this school?(Please select one response in each row.)
Never
Once a year or less
2-4 times a year
5-10 times a year
1-3 times a month
Once a week or more
TC046Q01NA Teach jointly as a team in the same class 1 2 3 4 5 6
TC046Q02NA Observe other teachers’ classes and provide feedback 1 2 3 4 5 6
TC046Q03NA Engage in joint activities across different classes and age groups (e�g� projects) 1 2 3 4 5 6
TC046Q04NA Exchange teaching materials with colleagues 1 2 3 4 5 6
TC046Q05NA Engage in discussions about the learning development of specific students 1 2 3 4 5 6
TC046Q06NA Work with other teachers in my school to ensure common standards in evaluations for assessing student progress
1 2 3 45 6
TC046Q07NA Attend team conferences1 2 3 4 5 6
TC046Q08NA Take part in collaborative professional learning 1 2 3 4 5 6

ANNEX A: PISA 2015 BACKGROUND QUESTIONNAIRES
194 © OECD 2016 PISA 2015 ASSESSMENT AND ANALYTICAL FRAMEWORK: SCIENCE, READING, MATHEMATIC AND FINANCIAL LITERACY
TC026We would like to know how you generally feel about your job. How strongly do you agree or disagree with the following statements?(Please select one response in each row.)
Strongly disagree Disagree Agree
Strongly agree
TC026Q01NA The advantages of being a teacher clearly outweigh the disadvantages� 1 2 3 4
TC026Q02NA If I could decide again, I would still choose to work as a teacher� 1 2 3 4
TC026Q04NA I regret that I decided to become a teacher� 1 2 3 4
TC026Q05NA I enjoy working at this school� 1 2 3 4
TC026Q06NA I wonder whether it would have been better to choose another profession� 1 2 3 4
TC026Q07NA I would recommend my school as a good place to work� 1 2 3 4
TC026Q09NA I am satisfied with my performance in this school� 1 2 3 4
TC026Q10NA All in all, I am satisfied with my job� 1 2 3 4
teaching practices
TC048How often do you assign the following activities to your students? (Please select one response in each row.)
Never or almost
never
Once a year or less
2-4 times a year
5-9 times a year
1-3 times a month
Once a week or more
TC048Q01NA Doing some short task (10 minutes to 2 hours) in teams such as exercises or problems
1 2 3 4 5 6
TC048Q02NA Conducting a longer project (over several weeks) in teams such as writing a document, inventing something, etc�
1 2 3 4 5 6
TC048Q03NA Preparing and giving a talk/presentation together 1 2 3 4 5 6
TC051How often do you use the following appreciations during students´ team collaboration activities?(Please select one response in each row.)
Never or almost never Sometimes Often
Always or almost
always
TC051Q01NA No appreciations 1 2 3 4
TC051Q02NA Individual appreciations for individual performance 1 2 3 4
TC051Q03NA Collective appreciations for a group product 1 2 3 4
TC051Q04NA Collective appreciations for individual contributions 1 2 3 4
TC051Q05NA Individual appreciations for a group product 1 2 3 4

PISA 2015 BACKGROUND QUESTIONNAIRES: ANNEX A
PISA 2015 ASSESSMENT AND ANALYTICAL FRAMEWORK: SCIENCE, READING, MATHEMATIC AND FINANCIAL LITERACY © OECD 2016 195
TC052How often do you use the following types of collaboration during students´ team collaboration activities?(Please select one response in each row.)
Never or almost never Sometimes Often
Always or almost
always
TC052Q01NA Members of groups work according to specialisation of each member 1 2 3 4
TC052Q02NA Members of groups work on a collective outcome 1 2 3 4
TC052Q03NA Group members receive different information (resource interdependence) 1 2 3 4
TC052Q04NA Group members are assigned different roles (role interdependence) 1 2 3 4
TC053How often do you use the following grouping practices during students´ team collaboration activities?(Please select one response in each row.)
Never or almost
never Sometimes Often
Always or almost
always
TC053Q01NA Groups with a mix of abilities 1 2 3 4
TC053Q02NA Groups of students with similar abilities 1 2 3 4
TC053Q03NA Groups as the students choose them 1 2 3 4
TC054How often do you use the following methods of assessing student learning?(If you need further explanation of the term “<standardised tests>”, please use the help button.)(Please select one response in each row.)
Never or almost
neverSome
lessonsMany
lessons
Every lesson or almost
every lesson
TC054Q01NA I develop and administer my own assessment� 1 2 3 4
TC054Q02NA I administer a <standardised test>� 1 2 3 4
TC054Q03NA I have individual students answer questions in front of the class� 1 2 3 4
TC054Q04NA I provide written feedback on student work in addition to a <mark, i�e� numeric score or letter grade>� 1 2 3 4
TC054Q05NA I let students judge their own progress� 1 2 3 4
TC054Q06NA I observe students when working on particular tasks and provide immediate feedback� 1 2 3 4
TC054Q07NA I collect data from classroom assignments or home work� 1 2 3 4
Help button Here, the term <standardised tests> includes standardised mandatory tests (mandated e�g� by national, state or district authorities) as well as standardised non-mandatory tests (e�g� publicly or commercial available standardised test material)� These tests are consistent in design, content, administration and scoring� Results can be compared across students and schools�

ANNEX A: PISA 2015 BACKGROUND QUESTIONNAIRES
196 © OECD 2016 PISA 2015 ASSESSMENT AND ANALYTICAL FRAMEWORK: SCIENCE, READING, MATHEMATIC AND FINANCIAL LITERACY
TC055
To what extent do you use the following approaches to assign final <semester> grades to students in <national modal grade for 15-year-olds>.(If you need further explanation of the term “<standardised tests>”, please use the help button.)(Please select one response in each row.)
Not at all Very littleTo some extent
To a large extent
TC055Q01NA I consider students’ individual improvement of performance since the beginning of the <semester>� 1 2 3 4
TC055Q02NA I consider students’ problem solving ability� 1 2 3 4
TC055Q03NA I consider students’ critical thinking ability� 1 2 3 4
TC055Q04NA I consider students’ performance in collaborative problem solving activities� 1 2 3 4
TC055Q05NA I recognise students’ effort; even if performance does not improve� 1 2 3 4
TC055Q06NA I compare student performance in the current course to that of students from the previous course� 1 2 3 4
TC055Q07NA I compare a student’s performance to that of other students in the course� 1 2 3 4
TC055Q08NA I compare students’ performance to written <national or regional performance standards>� 1 2 3 4
TC055Q11NA I consider the degree to which the student participates in the class� 1 2 3 4
TC055Q13NA I base grades on <standardised tests> mandated by national, state or district authorities, e�g� <country specific example>�
1 2 3 4
TC055Q14NA I base grades on non-mandatory, publicly or commercially available <standardised tests>, e�g� <country specific example>�
1 2 3 4
Help button <Standardised tests> are consistent in design, content, administration and scoring� Results can be compared across students and schools� This excludes teacher-developed tests!

PISA 2015 ASSESSMENT AND ANALYTICAL FRAMEWORK: SCIENCE, READING, MATHEMATIC AND FINANCIAL LITERACY © OECD 2016 197
Annex B lists the members of the expert groups who were involved in developing the PISA 2015 framework for the major domain (science) and the questionnaires. The lists of the experts involved in developing the PISA 2009 framework for reading and the 2012 framework for mathematics and financial literacy can be found in the OECD publications PISA 2009 Assessment Framework – Key competencies in Reading, Mathematics and Science (2009) and PISA 2012 Frameworks – Mathematics, Problem Solving and Financial Literacy (2013), respectively.
Annex BPISA 2015 EXPERT GROUPS
ANNEX B: PISA 2012 EXPERT GROUPS
198 © OECD 2016 PISA 2015 ASSESSMENT AND ANALYTICAL FRAMEWORK: SCIENCE, READING, MATHEMATIC AND FINANCIAL LITERACY
Science expert group (SEG)
Jonathan Osborne (SEG Chair) Stanford University United States and United Kingdom
Marcus Hammann Munster University Germany
Sarah Howie University of Pretoria South Africa
Jody Clarke-Midura University of Harvard United States
Robin Millar University of York United Kingdom
Andrée Tiberghien University of Lyon France
Russell Tytler Deakin University Australia
Darren Wong National Institute of Education Singapore
Extended Scientific Literacy Expert Group
Rodger Bybee Biological Sciences Curriculum Study (BSCS) United States
Jens Dolin University of Copenhagen Denmark
Harrie Eijkelhof Utrecht University Netherlands
Geneva Haertel SRI United States
Michaela Mayer University of Roma Tre� Italy
Eric Snow
SRI United States
Manabu Sumida Ehime University Japan
Benny Yung University of Hong Kong Hong Kong, China
Questionnaire expert group (QEG)
David Kaplan (QEG chair as of 2014) University of Wisconsin United States
Eckhard Klieme (QEG chair until 2013) DIPF, Frankfurt Germany
Gregory Elacqua Diego Portales University Chile
Marit Kjærnsli University of Oslo Norway
Leonidas Kyriakides University of Cyprus Cyprus
Henry M. Levin Columbia University United States
Naomi Miyake University of Tokyo Japan
Jonathan Osborne Stanford University United States
Kathleen Scalise University of Oregon United States
Fons van de Vijver Tilburg University Netherlands
Ludger Wößmann University of Munich Germany

OECD PUBLISHING, 2, rue André-Pascal, 75775 PARIS CEDEX 16
(98 2016 02 1P) ISBN 978-92-64-25541-8 – 2016
The OECD is a unique forum where governments work together to address the economic, social and
environmental challenges of globalisation. The OECD is also at the forefront of efforts to understand and
to help governments respond to new developments and concerns, such as corporate governance, the
information economy and the challenges of an ageing population. The Organisation provides a setting
where governments can compare policy experiences, seek answers to common problems, identify good
practice and work to co-ordinate domestic and international policies.
The OECD member countries are: Australia, Austria, Belgium, Canada, Chile, the Czech Republic,
Denmark, Estonia, Finland, France, Germany, Greece, Hungary, Iceland, Ireland, Israel, Italy, Japan, Korea,
Luxembourg, Mexico, the Netherlands, New Zealand, Norway, Poland, Portugal, the Slovak Republic, Slovenia,
Spain, Sweden, Switzerland, Turkey, the United Kingdom and the United States. The European Union takes part
in the work of the OECD.
OECD Publishing disseminates widely the results of the Organisation’s statistics gathering and research
on economic, social and environmental issues, as well as the conventions, guidelines and standards agreed
by its members.
ORGANISATION FOR ECONOMIC CO-OPERATIONAND DEVELOPMENT

PISA 2015 Assessment and Analytical Framework SCIENCE, READING, MATHEMATIC AND FINANCIAL LITERACY
“What is important for citizens to know and be able to do?” The OECD Programme for International Student Assessment (PISA) seeks to answer that question through the most comprehensive and rigorous international assessment of student knowledge and skills. The PISA 2015 Assessment and Analytical Framework presents the conceptual foundations of the sixth cycle of the triennial assessment. Similar to the previous cycles, the 2015 assessment covers science, reading and mathematics, with the major focus on scientific literacy this cycle. Financial literacy is also evaluated as an optional assessment, as it was in 2012. A questionnaire about students’ background is distributed to all participating students. Students may also choose to complete additional questionnaires: one about their future studies and career, a second about their familiarity with information and communication technologies. School principals complete a questionnaire about the learning environment in their schools, and parents of students who sit the PISA test can choose to complete a questionnaire about the home environment. In addition, countries can opt to distribute a new questionnaire to teachers regarding their education, professional development and teaching practices as well as their school environment. Seventy‑one countries and economies, including all 34 OECD countries, participated in the PISA 2015 assessment.
Contents
Chapter 1. What is PISA?
Chapter 2. PISA 2015 Science Framework
Chapter 3. PISA 2015 Reading Framework
Chapter 4. PISA 2015 Mathematics Framework
Chapter 5. PISA 2015 Financial Literacy Framework
Chapter 6. PISA 2015 Context Questionnaires Framework
THE OECD PROGRAMME FOR INTERNATIONAL STUDENT ASSESSMENT (PISA)
PISA does not just ascertain whether students can reproduce knowledge; it also examines how well students can extrapolate from what they have learned and can apply that knowledge in unfamiliar settings, both in and outside of school. This approach reflects the fact that modern economies reward individuals not for what they know, but for what they can do with what they know.
PISA’s unique features include its:
• policy orientation, which connects data on student learning outcomes with data on students’ backgrounds and attitudes towards learning, and on key factors that shape their learning in and outside school, in order to highlight differences in performance patterns and identify the characteristics of schools and education systems that perform well
• innovative concept of “literacy”, which refers to students’ capacity to apply knowledge and skills in key subjects, and to analyse, reason and communicate effectively as they identify, interpret and solve problems in a variety of situations
• relevance to lifelong learning, as PISA asks students to report on their motivation to learn, their beliefs about themselves and their learning strategies
• regularity, which enables countries to monitor their progress in meeting key learning objectives
• breadth of coverage, which, in PISA 2015, encompasses the 34 OECD countries and 37 partner countries and economies.
ISBN 978-92-64-25541-8 98 2016 02 1P
Consult this publication on line at: http://dx.doi.org/10.1787/9789264255425-en
This work is published on the OECD iLibrary, which gathers all OECD books, periodicals and statistical databases. Visit www.oecd-ilibrary.org and do not hesitate to contact us for more information.