Literacy, Skills and Welfare: Effects of Participation in Adult Literacy Programs
44
Electronic copy available at: http://ssrn.com/abstract=905583 Electronic copy available at: http://ssrn.com/abstract=905583 Electronic copy available at: http://ssrn.com/abstract=905583 Literacy, Skills and Welfare: Effects of Participation in Adult Literacy Programs * Niels-Hugo Blunch Department of Economics Washington and Lee University & IZA Claus C P¨ ortner Department of Economics University of Washington August 2009 * We thank Aya Aoki, Paul Glewwe, Shelly Lundberg, David Ribar, John Strauss, Christopher Udry, participants at the Ghana at the Half Century Conference in Accra and two anonymous referees for helpful comments and suggestions. All remaining errors and omissions are our own. This work was financed in part by the World Bank’s Human Development Network Education Department. The views and findings expressed here are those of the authors and should not be attributed to the World Bank or any of its member countries.
Transcript of Literacy, Skills and Welfare: Effects of Participation in Adult Literacy Programs

Electronic copy available at: http://ssrn.com/abstract=905583Electronic copy available at: http://ssrn.com/abstract=905583Electronic copy available at: http://ssrn.com/abstract=905583
Literacy, Skills and Welfare:Effects of Participation in Adult Literacy Programs∗
Niels-Hugo BlunchDepartment of Economics
Washington and Lee University& IZA
Claus C PortnerDepartment of EconomicsUniversity of Washington
August 2009
∗We thank Aya Aoki, Paul Glewwe, Shelly Lundberg, David Ribar, John Strauss, Christopher Udry,participants at the Ghana at the Half Century Conference in Accra and two anonymous referees for helpfulcomments and suggestions. All remaining errors and omissions are our own. This work was financed inpart by the World Bank’s Human Development Network Education Department. The views and findingsexpressed here are those of the authors and should not be attributed to the World Bank or any of its membercountries.

Electronic copy available at: http://ssrn.com/abstract=905583Electronic copy available at: http://ssrn.com/abstract=905583Electronic copy available at: http://ssrn.com/abstract=905583
Abstract
This paper examines the effect of adult literacy program participation on householdconsumption in Ghana. The adult literacy programs in Ghana are of special interestsince they are more comprehensive than standard literacy programs and incorporatemany additional topics. We use community fixed effects combined with instrumen-tal variables to account for possible endogenous program placement and self-selectioninto program participation. For households where none of the adults have completedany formal education we find a substantial, positive and statistically significant effecton household consumption. Our preferred estimate of the effect of participation forhouseholds without education is equivalent to a ten percent increase in consumptionper adult equivalent. The effects of participation on welfare for other households aresmaller and not statistically significant, and become smaller the more educated thehousehold is. We find positive and statistically significant effects of participation onliteracy and numeracy rates, although the increases are too small to be the only ex-planation for the welfare effects. There is also evidence that participants are morelikely to engage in market activities and to sell a variety of agricultural goods. Takingaccount of both direct cost and opportunity cost we argue that the social returns toadult literacy programs are substantial.Keywords: Literacy, program evaluation, consumption, poverty, GhanaJEL: D1, I2, I3, J2, O1
2

1 Introduction
In a population where many adults cannot read or write, adult literacy programs may be aneffective way of improving people’s livelihoods since numerous studies have found a positiveimpact on economic outcomes from literacy and numeracy.1 Large scale adult literacy pro-grams have, however, generally not lived up to the expectation that they would be a cheapand effective way to educate the adult population. Most programs have performed poorlyin terms of enrollment, graduation rates and the long-term literacy of participants. Duringthe 1970s, for example, many programs had efficiency rates of about 12.5 percent with fewgraduates having stable literacy skills (Abadzi 2003, p. 2). These experiences lead the WorldBank to finance almost no adult literacy programs during the 1980s and to questions in thedevelopment community about whether literacy is really necessary for development. A casein point is Venezuela’s recent attempt to eliminate illiteracy through the “Mision Robinson”campaign; as shown by Ortega and Rodriguez (2008) there are at best small gains in literacyas a result of the program.
Surprisingly there has been little rigorous analysis of the impact of adult literacy programson economic outcomes. Existing studies find a beneficial impact for participants who becameliterate, but suffer from several methodological problems that cast doubts on the validity ofthe results.2 First, the samples are small.3 Second, typically only simple statistics such asthe fraction of completers who are able to read and/or do written calculations are reported.Finally, and most importantly, they do not take account of possible endogeneity in programplacement and participation decisions.
This paper therefore examines the effect of participation in adult literacy programs onthe standard of living, measured by household expenditures per adult equivalent, using datafrom a large household survey from Ghana. As described below, the programs in Ghana aredifferent from other literacy programs in that they take much longer to complete and teachmany other topics in addition to literacy. After controlling for the possibilities of endogenousprogram placement and self-selection into the program we find a substantial and statisticallysignificant effect on consumption for households where no adults have completed any formaleducation. For other households the effects are smaller in magnitude and not statisticallysignificant. While there are significant effects on literacy and numeracy from participation,these are comparable to what have been found for other literacy programs and hence arelikely too small to be the only explanation for the positive effect on welfare. Participationdo, however, also lead to households being significantly more likely to be engaged in marketactivities such as selling agricultural goods.
Adult literacy programs in Ghana have a long history going back to the eighteenth
1 See, for example, Glewwe (1999), Vijverberg (1999) and Jolliffe (1999) on Ghana, Boissiere, Knight, andSabot (1985) on Kenya and Tanzania and Moll (1998) on South Africa. For developed countries, examplesinclude Mitra (2002), Murnane, Willett, and Levy (1995), Tyler, Murname, and Willett (2000), Ishikawaand Ryan (2002), Green and Riddell (2003), Chiswick, Lee, and Miller (2003) and Dustmann and Fabbri(2003).
2See, for example, Carron, Mwiria, and Righa (1989) and Carr-Hill, Kweka, Rusimbi, and Chengelele(1991)
3In Carron, Mwiria, and Righa (1989) the treatment and control groups are 291 and 66 individuals,respectively. The equivalent numbers from Carr-Hill, Kweka, Rusimbi, and Chengelele (1991) are 272 and59.
3

century and were mainly religiously based until after the Second World War.4 The firstnational literacy program was introduced in 1948 but collapsed in 1968 after the Nkrumahgovernment’s fall in 1966 since it had become closely politically associated with the Nkrumahmovement and since the skills taught were often not considered relevant by the participants.In 1987 the Non-Formal Education Division was established in the Ministry of Education toorganise and co-ordinate adult literacy programs and other non-formal education. Baselinestudies were undertaken to ensure that what is taught would be of immediate use andrelevance to participants. Based on the baseline studies 28 main themes covering issues asvaried as nutrition, immunization, family planning and traditional and modern farming wereidentified as important issues and concerns of communities to be addressed in adult literacyprograms. The themes can be divided into three broad areas: Social and health issues,income-generation/occupational skills and civic awareness.5 One of the main features of theprogram is income generation, which aims at equipping participants with occupational skillsappropriate for the area they live in. It takes about 21 months to complete the course andthe classes meet two to three times a week for two to three hours each time. For comparison,the Venezulean “Mision Robinson” courses mentioned above last only seven weeks. In mostcases there are 20 to 30 participants to an instructor/facilitator.
2 Estimation Strategy
This section discusses the estimation strategy and the associated potential econometric is-sues. Denote the outcome of interest for household i by yi and let yi1 be the outcome withparticipation and yi0 the outcome without participation. Furthermore, let pi be a binaryvariable equal to one if household i participated in the program and zero if not. We canthen describe the outcome of interest by
yi = αpi + xiβ + ui, (1)
where xi are other explanatory variables (including a constant) and ui is an error term.The parameter of interest is α, which reflects the effect of participation. The two maineconometric issues are the possibility of endogenous program placement and self-selectioninto program participation. We discuss each in turn.
Endogenous program placement refers to the possibility that programs may not be ran-domly distributed, spatially and/or temporally, throughout the country.6 While this in itselfis not a problem, it does lead to biased estimates if any of the factors that determine program
4For a more complete description of the history of adult literacy programs and their current function andcurriculums see Blunch and Portner (2004).
5 For social and health issues topics include family planning, teenage pregnancy, environmental hygiene,immunization, aids, safe motherhood and child care, drug abuse, traditional medicine, safe drinking water.For income-generation topics include cocoa farming, maize cultivation, dry season farming, basket weaving,animal husbandry, bee-keeping, oil palm cultivation, borrowing money for work, hygienic way of preservingand selling fish, farm extension services, pottery and soap making. Finally, for civic awareness topics in-clude taxation, bush fires, interstate succession law, child labor, chieftaincy, community empowerment andexpensive funerals.
6See discussions in, for example, Rosenzweig and Wolpin (1986), Pitt, Rosenzweig, and Gibbons (1995)and Angeles, Guilkey, and Mroz (1998).
4

placement also influence the outcomes of interest and are unobservable to the researcher. Saythat a local administrator is charged with placing literacy programs in his area and that heplaces them according to his perception of how much “entrepreneurial spirit” there are inthe different communities. Given that “entrepreneurial spirit” is also likely to be an unob-servable determinant of the outcomes of interest our estimates of the program’s effectivenesswill be biased if we do not take account of the endogenous program placement.7
Given the constraints that the available data impose the best available option for deal-ing with endogenous program placement is to use community fixed effects. This effectivelyremoves all community characteristics that might influence both placement and outcomesand if the communities are small enough there will be no bias from endogenous programplacement. Using community fixed effects means, however, that the effect of the program isidentified purely from the differences between individuals and households within the commu-nity. This is also the main downside of using community fixed effects: It becomes harder toaddress the issue of self-selection into the programs because we cannot use variation betweencommunities.
The two main methods for dealing with possible self-selection into participation are the“ignorability of treatment” approach described by Rosenbaum and Rubin (1983) and in-strumental variables (Wooldridge 2002, p. 603).8 The “ignorability of treatment” methodassumes that, conditional on a set of explanatory variables x, the participation p and theoutcomes (y0, y1) are independent. This is unlikely to hold here since factors such as theunobservable ability of individuals potentially affect both participation and the outcomesof interest.9 Hence, we use instrumental variables to deal with self-selection into partici-pation. What is needed are instruments that affect the decision to participate net of theother explanatory variables but are not correlated with the unobservable heterogeneity. Thechallenge is to find a set of instruments that vary within communities and which do notdirectly affect the outcome(s) of interest. In the absence of community fixed effects an ob-vious candidate would be the exposure one has had to the literacy program, measured, forexample, by how long the program has been available, but this clearly does not vary withinthe community. It is, however, likely that different types of individuals and households willrespond differently to the introduction of a program. In that case a valid set of instruments isprogram exposure interacted with exogenous individual or household characteristics. Theseinteractions should have no direct effect on the outcome variables and will not be correlatedwith unobservables like innate ability. One drawback of the instrumental variables approachis, however, that what we identify is the effect of participation among those for whom theinstruments affect the decision to participate. We discuss our choice of instruments in moredetail below.
As discussed by Wooldridge (2002, Chapter 18, p. 621-625) the effect of participation
7The direction of the bias depends on how the omitted variable(s) affect the placement decision and theoutcome(s) of interest. If the most “entrepreneurial” communities get the programs first and also do betterin terms of the outcome variables then the estimates of the program’s effectiveness will be biased upward.
8This is obviously a simplification as can be seen from the review of methods in Ribar (2003).9Imagine that someone with higher ability face a higher return to participation than somebody with lower
ability and that higher ability people also do better in terms of the outcome(s) of interest. In this case thepredicted effect of participation will be biased upward if we do not take account of self-selection into theprogram.
5

can be estimated under relatively relaxed conditions using a modified two-stage method.The first stage estimates the determinants of the participation decision. In the second stagethe consumption equation is estimated by IV using the predicted probabilities from the firststage and x, which includes all other explanatory variables and an intercept, as instruments.An attractive feature of this approach is that the results are robust even if the participationequation is not correctly specified.
3 Data
The Ghana Living Standards Survey (GLSS) is a nationally representative stratified multi-purpose household survey collected in 1987, 1988, 1991 and 1998, consisting of a householdsurvey, a community survey covering the rural areas and a price survey. We use the mostrecent of these (GLSS 4) here.
The household part of the GLSS contains modules ranging from education and healthto migration, credit and assets. For our purposes, the most important modules are the edu-cation and household expenditure modules. The education module includes information oneducational attainment, participation in adult literacy courses and literacy and numeracyproficiency (reading and writing in a Ghanaian language, English reading and writing andability to do written calculations). The module on household expenditures includes informa-tion on food and non-food expenditures, where the former is additionally decomposed intofrequently and less frequently purchased items. From the community questionnaire we useinformation whether there is or has been an adult literacy program in the community and ifso, for how long.
GLSS 4 employed a two-stage sampling design. Out of the available enumeration areas300 were chosen in the first stage with a probability based on the size of the EA in the 1984Census. In the second stage 20 households were selected from each of the chosen enumerationareas, yielding a total of 5,998 households and 24,611 individuals. We drop 13,145 individualswho are less than 18 years of age, since our focus is on adult literacy and participation inadult literacy programs. Furthermore, we drop 529 adults who are either not family members(hired help or tenants) or are household members who do not fulfill the GLSS’s definition ofbeing present and therefore had no information collected about them, leaving 12,737 adults.Of these, 253 have missing information about their schooling and/or their participation inadult literacy programs. Since there is only information on adult literacy programs in thecommunity survey and the community survey was only done in rural areas we drop all 4,613individuals who live in urban areas. An additional 38 individuals are dropped because therewas no information about the household head in the survey and 124 individuals are droppedbecause of inconsistent or unusable age and/or education data.
A number of enumeration areas had multiple communities within them and the enumera-tors were supposed to note which households belonged to which communities. Unfortunately,this did not happen for the vast majority of the areas.10 As mentioned above we rely oncommunity fixed effects to counter any potential bias from endogenous program placement
10While it is in principle possible to deduce where the individual households reside from the raw dataGhana Statistical Service has not done this and will not allow non-employees access to the relevant rawdata.
6

and to avoid problems for this approach we drop all enumeration areas that covered morethan one community, which leads to 987 individuals being dropped.11 This ensures thatenumeration area fixed effects are exactly the same as community fixed effects. On averagean enumeration area covers less than 18 km2 (or just less than 7 square miles), which meansthat it is in principle possible to walk from one end to the other in a little over one hourwithout too much effort. The 1984 population census had a total of 13,012 enumeration ar-eas and even though enumeration areas were likely bigger in rural areas than in urban areasmost houses in rural areas tend to be clustered in communities close to roads, paths or watersources.12 Hence, we are confident that any bias from possible endogenous program place-ment within an enumeration area will be negligible. After dropping these observations ourbase sample consists of 6,713 adults from 3,219 households living in 166 communities. Hence,there are just over 40 individuals and just below 20 households within each community.
3.1 Variables
Tables 1 and 2 present the descriptive statistics for the sample of individuals and the sampleof households, respectively. The variables are divided into dependent, individual, householdand instrumental variables. The four variables that are treated as dependent or endogenousvariables are attendance in an adult literacy program, log of per adult equivalent expenditureand literacy and numeracy. This section presents the variables for the base sample andthe associated basic descriptive statistics. The following section examines the descriptivestatistics for program partipation, welfare, literacy and numeracy in more detail.
Information on participation in adult literacy programs comes from the Education sectionof the GLSS 4 which includes the question: “Has (NAME) ever attended a literacy course?”13
All individuals who answer yes are coded one and the rest zero. Households where at leastone adult member answers yes are coded one and those where nobody has participated arecoded zero. For the base sample about 11 percent of all individuals have participated in anadult literacy program, while 20 percent of the households have at least one member whohave attended.
We use household expenditures per year as our measure of household welfare. As isoften discussed in poverty analyses, not all household members require the same level ofconsumption; children and adults, for example, have different caloric requirements. Wetherefore use an adult-equivalent corrected measure of consumption, where different types ofhousehold members are assigned different weights depending on their age and sex, and totalconsumption is divided by the sum of these weights.14 Henceforth, when we refer to welfare,
11Of the 997 individuals dropped because of this, 233 live in enumeration areas where some communitieshave a literacy program and some do not, 360 live in enumeration areas where the program has not beenavailable the same number of years in different communities and the remainder are dropped simply becausethe community survey states that there are multiple communities within the enumeration area.
12The enumeration areas are described in more detail in Central Bureau of Statistics [Ghana] (1984) andhad to be small enough to be handled by an enumerator covering all households in one day. In 1984 theaverage population of an enumeration area was 1000 in urban areas and 700 in rural areas (Central Bureauof Statistics [Ghana] 1984, p. 7).
13Note that there is unfortunately no information about whether the individual has finished the course orwhen participation took place.
14The results for the per-capita consumption measure are available on request from the authors. They are
7

consumption or expenditures this should be taken to mean per adult equivalent expendituresper year.
Consumption or household expenditures are preferable to earnings or wages as a measureof economic well-being for at least two reasons. First, if households smooth their consump-tion over time the link between latent household economic well-being and earnings or wagesis weaker than that between latent household economic well-being and consumption expen-ditures. Second, consumption expenditures are likely to be more accurately measured thanearnings or income (Appleton 2002). This is especially the case for our sample which consistspurely of rural households, most of which have agricultural production as their main andoften only income source.
The average of the log of per adult equivalent expenditure is around 13.8 for both theindividual and the household samples. This is approximately equal to 985,000 Cedis peradult equivalent.15 For comparison, previous work on poverty in Ghana using the same dataset employ two poverty lines: An upper line at 900,000 cedis and a lower at 700,000 cedis(Canagarajah and Portner 2003). Consuming above the upper poverty line means that one isable to meet one’s nutritional requirements and basic non-food needs. The lower poverty lineis the level at which an individual is not able to meet his minimum nutrition requirements,even if he allocates his entire budget to food.
We consider a person literate if he can read a letter in either English or a Ghanaianlanguage, while he is considered numerate if he answers yes to being able to do writtencalculations.16 Both the ability to read a letter and do written calculations are self-reported,although if the respondent was not present during the interview the main respondent is askedto supply the information. Of the individuals in the base sample 41 percent report that theycan read a letter in either English or a Ghanaian language, while 45 percent can do writtencalculations. The distribution of literacy and numeracy by education levels and programparticipation is discussed below.
Slightly more than half of the individuals are female and, as expected given the populationgrowth in Ghana, relatively young. To ease interpretation, we use four age groupings forindividuals: 18 to 29, 30 to 44, 45 to 59 and 60 to 99. These age groups roughly correspondto young adults, prime age adults, middle-aged and older and constitute 33, 31, 20 and 16percent of the sample, respectively. More than half (53 percent) of all adults in the samplehave not completed any education, while 12 percent have completed primary school, 29percent middle school and six percent a post middle school education.
Just over thirty percent lives in households that own land, while around ten percent arein non-agricultural households, which are households that report no agricultural productionat all. The remainder hence lives in households where the only land available is rentedland. The three household level education variables measure the percentage of individualswithin a household that have completed a given level of education. The distribution isapproximately the same as for individual education and varies little whether one looks at
broadly similar to the results for the adult-equivalent consumption measure.15Note that in 2007 Ghana redenominated its currency with 10,000 old cedis equal to 1 new cedis. All
values here are given in old cedis (which are called second cedi).16The relevant questions in GLSS are “Can (NAME) read a letter in English?” and “In what Ghanaian
language can (NAME) read a letter?”. The former is answered yes/no, while the latter includes the option“None”. Numeracy is based on the question: “Can (NAME) do written calculations?”.
8

the sample of individuals or the household sample. It is worth noting that in just over halfof all households, none of the adults have completed any formal education. In the individualsample households consist of on average just over five persons of which 2.6 are adults, whilein the household sample the corresponding numbers are 4.4 and just over two.17 For thehousehold sample age is defined as average age of the adults in the households and split intosix groups: 18 to 29, 30 to 34, 35 to 39, 40 to 49, 50 to 59 and 60 to 99. These groups areof approximately the same size.
We use as instruments the exposure to the literacy program in the community inter-acted with individual and household characteristics. Exposure is defined as the length oftime the program has been in the community and is capped at 15 years since the nationalprogram essentially was non-existent from 1968 until 1986 and generally believed to be oflittle use before 1968.18 For the individual sample the variables interacted with exposure arefemale, the age groups, ownership of land, non-farming household, the levels of educationin the household in percent, household size and number of adults in the household. For thehousehold sample the same set is used except that there is no female dummy and that thehousehold average age groups are used instead of individual age groups.
What is important for the performance of the instruments is the role exposure plays inthe decision to participate. One can think of two opposite effects of increasing exposure:One where the return to participation is known and one where it is not. First, the longerthe program has been in an area the more likely it is that those individuals with higherexpected net returns will have participated. In practice, even with a higher expected returnthan other individuals, there are likely factors preventing at least some of the high net returnindividuals from participating right away.19 If this is the case, one would expect increasingexposure to lead to a divergence in the proportion who have participated between those typesof individuals with a high expected net return and those with a lower expected net return.The second possible effect arises from people learning about the return to participationover time. Even provided the program has a positive return, we would expect the mostrisk averse (and/or credit constrained) individuals to postpone participation until more andbetter information is available about the effect of participation. In this case the expectedresult is a convergence in participation over time.
No matter which of these effects dominate, the important point is whether the interactionsbetween exposure and characteristics capture differences in the likelihood of participationfor each of these groups. We will discuss this in detail below when we present the results.Furthermore, while we would expect age and the other variables to have a direct effect onoutcomes it is unlikely that the interactions of these variables with exposure should have
17A possible concern with including variables reflecting household characteristics is that some individualsmight have participated in an adult literacy program before joining the households. Hence, those variablescould in principle be influenced by the participation decision and subsequent outcomes rather than the otherway around. This could, for example, happen if a person who has learned to read through an adult literacyprogram is a more attractive partner than somebody with the same characteristics who has not. As weshow below it appears that relatively few individuals are very young when they participated in the programmaking these issues less of a concern.
18The relevant questions in the community questionnaire are: “Is there, or has there been, an adult literacyprogram in this community?” and “In what year was this program launched?”
19This can, for example, be the case if there are not enough space to accommodate all interested partici-pants when they first apply to participate.
9

Table 1: Descriptive Statistics - Individuals
Variable Mean Std. Dev. Min Max
Dependent:Attended literacy program 0.11 0.32 0.00 1.00Log of per adult equivalent expenditure 13.76 0.68 11.68 17.09Literate 0.41 0.49 0.00 1.00Numerate 0.45 0.50 0.00 1.00
Individual:Female 0.55 0.50 0.00 1.00Aged 30-44 0.31 0.46 0.00 1.00Aged 45-59 0.20 0.40 0.00 1.00Aged 60-99 0.16 0.37 0.00 1.00Primary education 0.12 0.33 0.00 1.00Middle education 0.29 0.45 0.00 1.00Post middle education 0.06 0.23 0.00 1.00
Household:Owns land 0.31 0.46 0.00 1.00Non-farming household 0.10 0.30 0.00 1.00Percent with primary education 0.12 0.23 0.00 1.00Percent with middle education 0.29 0.33 0.00 1.00Percent with post middle education 0.06 0.17 0.00 1.00Household size 5.29 2.77 1.00 21.00Number of adults in household 2.64 1.30 1.00 8.00
Instruments:Female × exposure 2.94 4.07 0.00 15.00Aged 30-44 × exposure 1.63 3.36 0.00 15.00Aged 45-59 × exposure 1.11 2.90 0.00 15.00Aged 60-99 × exposure 0.88 2.58 0.00 15.00Owns land × exposure 1.54 3.18 0.00 15.00Non-farming × exposure 0.44 1.89 0.00 15.00Primary education (%) × exposure 0.69 1.70 0.00 15.00Middle education (%) × exposure 1.63 2.64 0.00 15.00Post middle education (%) × exposure 0.30 1.09 0.00 15.00Household size × exposure 29.18 31.09 0.00 225.00Number of adults × exposure 14.57 15.52 0.00 105.00
Number of observations 6,713Number of communities 166
a direct effect on outcomes once we control for observable and unobservable communitycharacteristics through fixed effects and the direct effect of the individual and householdcharacteristics. This is the case even if exposure works mainly through learning about thereturn to participation. Consider as an example the difference in participation of men and
10

Table 2: Descriptive Statistics - Households
Variable Mean Std. Dev. Min Max
Dependent:Attended literacy program 0.20 0.40 0.00 1.00Log of per adult equivalent expenditure 13.87 0.71 11.68 17.09
Household:Owns land 0.30 0.46 0.00 1.00Non-farming household 0.13 0.34 0.00 1.00Average age 30-34 0.18 0.39 0.00 1.00Average age 35-39 0.17 0.38 0.00 1.00Average age 40-49 0.21 0.40 0.00 1.00Average age 50-59 0.12 0.32 0.00 1.00Average age 60-99 0.14 0.34 0.00 1.00Percent with primary education 0.12 0.26 0.00 1.00Percent with middle education 0.28 0.36 0.00 1.00Percent with post middle education 0.05 0.18 0.00 1.00Household size 4.37 2.54 1.00 21.00Number of adults in household 2.09 1.07 1.00 8.00
Instruments:Avg age 30-34 × exposure 0.91 2.59 0.00 15.00Avg age 35-39 × exposure 0.90 2.63 0.00 15.00Avg age 40-49 × exposure 1.14 2.93 0.00 15.00Avg age 50-59 × exposure 0.66 2.32 0.00 15.00Avg age 60-99 × exposure 0.64 2.11 0.00 15.00Owns land × exposure 1.46 3.08 0.00 15.00Non-farming × exposure 0.58 2.11 0.00 15.00Primary education (%) × exposure 0.66 1.83 0.00 15.00Middle education (%) × exposure 1.54 2.75 0.00 15.00Post middle education (%) × exposure 0.25 1.06 0.00 15.00Household size × exposure 23.34 26.05 0.00 225.00Number of adults × exposure 11.18 12.10 0.00 105.00
Number of observations 3,219Number of communities 166
women. If women are more risk averse and/or otherwise constrained that should clearly havean effect on their average consumption, but once we control for being a woman the interactionbetween being a woman and exposure should not have an impact on consumption exceptthrough participation in the adult literacy program.
11

4 Descriptive Analysis
This section provides a more detailed look at the descriptive statistics for program partici-pation, literacy, numeracy and welfare. It first looks at participation, literacy and numeracyand then at welfare. Table 3 shows participation rates by completed education level andliteracy and numeracy rates for participants and non-participants, also by level of completededucation. Not surprisingly, participation rates decrease with level of education. Of thosewho have not completed primary school 17 percent have attended an adult literacy program,while just over ten percent of adults who have completed primary school have. For thosewith middle school and those with more than middle school the participation rates are 3.6and 1.5 percent, respectively.20 The differences in participation rates across education levelsdo not reflect differences in access to an adult literacy program. Around 80 percent of alladults in the sample have access to an adult literacy program in their community and thereappears to be little difference in access rate by education level.21
Table 3: Participation, Literacy and NumeracyRates by Program Availability and Education
Completed Partici- Participants Non-Participants Number ofeducation pated Literate Numerate Literate Numerate observations
Complete Sample
None / Koranic 0.170 0.148 0.149 0.031 0.062 3, 592Primary 0.103 0.571 0.607 0.480 0.667 816Middle 0.036 0.986 0.971 0.926 0.955 1, 914Post Middle 0.015 1.000 1.000 0.992 0.992 391
No Program Available
None / Koranic 0.119 0.177 0.167 0.027 0.065 809Primary 0.072 0.818 0.818 0.433 0.688 152Middle 0.037 1.000 1.000 0.910 0.967 382Post Middle 0.009 1.000 1.000 0.991 0.982 111
Program Available
None / Koranic 0.184 0.142 0.146 0.032 0.061 2, 783Primary 0.110 0.534 0.575 0.491 0.662 664Middle 0.036 0.982 0.964 0.930 0.952 1, 532Post Middle 0.018 1.000 1.000 0.993 0.996 280
Note. A person in considered literate if he can read a letter in either English or a Ghanaian languageand numerate if he answers yes to being able to do written calculations. Program availability is basedthe question in the community questionnaire is: “Is there, or has there been, an adult literacy programin this community?”
20The low participation rates for the two highest education levels mean that the sample of participantsfrom these groups consists of only 75 adults (69 for middle and 6 for post middle).
21The possible exception is among those with post middle education where just over 71 percent currentlyhave access.
12

For all education levels participants in adult literacy programs generally have higherliteracy and numeracy rates than those who have not participated. It is clear, however, thateven among participants the literacy and numeracy rates are still low. For those withouteducation only around 15 percent of adults who have participated in a program can read anddo written calculations, compared to three percent literate and six percent numerate amongnon-participants. Among adults who have completed primary school, literacy increases from48 percent without participation to 57 with participation, while numeracy appears to declinefrom 67 percent to 61 percent. Only for graduates of middle school and above do literacyand numeracy rates approach 100 percent and even then there are more than seven percentof those who have graduated from middle school who report being unable to read a letter ineither English or a Ghanaian language.
We can learn three important things from these results. First, it appears that the adultliteracy programs in Ghana do poorly in terms of teaching people literacy and numeracy,although the efficiency rates are in line with those discussed in Abadzi (2003). Secondly,that the literacy and numeracy rates are so low even after six years of education indicatesthat the quality of the rural primary schools in Ghana is indeed low. Finally, it appearsthat overestimation of respondents’ ability to read and do math is not a serious issue. Thelatter is important since there is often a perception that self-reporting of literacy will lead totoo high literacy rates. Ortega and Rodriguez (2008), for example, argue that semiliteratepersons might claim that they are literate after participation in a “Mision Robinson” course.It is, however, also possible that participation in an adult literacy program will lead toparticipants learning that they really cannot read.
A noticeable feature of the data is that a substantial number of people report havingparticipated in an adult literacy program, but live in communities without a program. Notsurprisingly the participation rate is generally larger in areas with a program, although thedifferences are not as substantial as one might expect: The largest differences is for individ-uals without any completed education, where the participation rate is about 19 percent inareas with a program and 12 percent in communities without. The differences in literacyand numeracy rates among non-participants in communities with and without an adult lit-eracy program are small, with literacy rates lower among those who live in areas withouta program. There are, however, substantial differences between participants who live incommunities with an adult literacy program and participants in communities without a pro-gram. What is particularly interesting is that the literacy and numeracy rates are higher incommunities without a program. For participants with no completed education the literacyrates are 17.7 and 14.3 percent in communities without and with a program, respectively.Especially striking are the corresponding rates for those who have completed primary school,where the literacy rate for participants in communities without a program is 81.8 percentwhile it is only 52.8 percent among participants in communities with a program.
The high participation rate and the higher literacy and numeracy rates among individualswho state they have participated in an adult literacy program, yet live in communities wherea program is not available are important since they influence the strength of our instrumen-tal variable estimation strategy. As discussed above, we include community fixed effects tocontrol for endogenous program placement. Then to account for unobservable individualcharacteristics that may influence both the decision to participate and the outcomes we relyon the length of exposure to the program interacted with observable characteristics to in-
13

strument for participation. This means that our instruments, once we control for communityfixed effects, will have no explanatory power for individuals in areas without an adult literacyprogram since exposure is zero. Given that the effect of participation is only identified forthose affected by the instruments, our instrumental variable estimations essentially ignoreanybody living in an community without an adult literacy program, which includes the sub-group of participants who have higher literacy and numeracy rates than other participants.We will discuss this further in Section 5.
4.1 Welfare
Table 4 shows levels of consumption and associated statistics by participation and educationusing the household sample. In addition to the complete sample, households are divided intofour exclusive groups by the highest education level among its adult members. Hence, say,the “Middle” households all have at least one member who has completed Middle school andno members that have completed an education level higher than that. Within each group thestatistics are presented for both those households that have had no members participate inan adult literacy program, those that have had members participate and the two categoriescombined.
As expected, consumption increases with the level of highest education within the house-hold, although the differences might not seem large. While the difference in mean con-sumption between households where no adults have completed any level of schooling andthose where at least one adult has completed a post middle education is 26 percent, thedifferences between the no education group and the middle and primary groups are only7.3 and 5.0 percent, respectively. Furthermore, even if we, in general, measure consumptionmore precisely than income there is still potential for measurement error. In the case ofsubsistence households, who may barter for the part of their consumption which they do notproduce themselves, we impute expenditures, which obviously introduce the possibility oferrors. This may explain the very low values for the minimum observation expenditures inTable 4, which are substantially below the lower poverty line, even for the better educatedhouseholds.22
What is mainly of interest here are the differences between households with adults whohave participated in a literacy program and those without. The only group where averageconsumption is higher among participants than non-participants is the no education group,where there is almost a 19 percent difference. For everybody else, the participant householdshave substantially lower consumption than the non-participant households; participant mid-dle education households have an average consumption which is more than twenty percentlower than non-participant households.23 Note that it is difficult to say anything about thecausal impact of participating in an adult literacy program on household consumption fromthese numbers. It is possible that the participant households would have done even worse inthe absence of participation or that there are substantial differences in area characteristicsthat influence consumption.
22It is, of course, possible that the poverty lines themselves are not perfect measures of the actual cost ofthe minimun nutritional requirements.
23The biggest difference is for post middle education households but there are very few participants in thisgroup.
14

Table 4: Per Adult Equivalent Expenditures byParticipation and Education Level of Household
Participant Meana Min Max Std. Dev. N
Complete Sample
No 1, 387 118 26, 486 1, 198 2, 588Yes 1, 296 183 11, 110 1, 150 631All 1, 369 118 26, 486 1, 189 3, 219
Post Middleb
No 1, 731 208 26, 486 1, 937 281Yes 945 183 2, 657 530 42All 1, 629 183 26, 486 1, 835 323
Middleb
No 1, 438 170 7, 615 1, 014 1, 006Yes 1, 151 236 11, 110 1, 000 229All 1, 385 170 11, 110 1, 017 1, 235
Primaryb
No 1, 377 247 6, 198 1, 025 315Yes 1, 261 252 8, 510 1, 260 74All 1, 355 247 8, 510 1, 073 389
Noneb
No 1, 240 118 12, 240 1, 124 986Yes 1, 473 195 9, 287 1, 268 286All 1, 292 118 12, 240 1, 161 1, 272
Note. Participation status reflect whether at least one memberhas participated in an adult literacy program.a Expenditures measured in 1000 Cedis.b At least one adult with this level of education and none withmore.
To investigate these possibilities further Table 5 presents the statistics from Table 4stratified by adult literacy program availability, participation status and education group.Two interesting findings emerge. First, communities with adult literacy programs generallyappear to be poorer than those without. This holds whether we compare non-participanthouseholds across communities with and without literacy programs or compare participantsand non-participants combined across communities. One interpretation of this is that lessdeveloped communities are more likely recipients of adult literacy programs than more de-veloped ones. This underscores the potential importance of unobservable community char-acteristics that affect the placement of programs even after the level of development or theschooling level of the community are taken into account.
A second important finding is that for all but the post middle education group participanthouseholds that live in communities without an adult literacy program have substantially
15

Table 5: Per Adult Equivalent Expenditure by Participation,Program Availability and Education Level within Household
Program Partici- Std.Available pant Meana Min Max Dev N
Complete Sample
NoNo 1, 547 170 26, 486 1, 683 598Yes 1, 681 270 11, 110 1, 562 104
YesNo 1, 339 118 12, 240 1, 004 1, 990Yes 1, 220 183 9, 287 1, 035 527
All 1, 369 118 26, 486 1, 189 3, 219
Post Middleb
NoNo 2, 298 256 26, 486 3, 326 72Yes 871 428 1, 695 456 8
YesNo 1, 536 208 6, 860 1, 060 209Yes 962 183 2, 657 551 34
All 1, 629 183 26, 486 1, 835 323
Middleb
NoNo 1, 632 198 7, 615 1, 360 204Yes 1, 435 270 11, 110 1, 655 41
YesNo 1, 388 170 6, 009 899 802Yes 1, 089 236 7, 246 783 188
All 1, 385 170 11, 110 1, 017 1, 235
Primaryb
NoNo 1, 474 260 6, 072 1, 118 69Yes 1, 895 670 6, 884 1, 795 11
YesNo 1, 349 247 6, 198 999 246Yes 1, 151 252 8, 510 1, 126 63
All 1, 355 247 8, 510 1, 073 389
Noneb
NoNo 1, 285 170 9, 133 1, 236 253Yes 2, 003 346 6, 710 1, 488 44
YesNo 1, 224 118 12, 240 1, 082 733Yes 1, 377 195 9, 287 1, 203 242
All 1, 292 118 12, 240 1, 161 1, 272
Note. Participation status reflect whether at least one member hasparticipated in an adult literacy program.a Expenditures measured in 1000 Cedis.b At least one adult with this level of education and none with more.
16

higher average consumption than participant households that live in areas with an adultliteracy program. The differences are 46, 64 and 32 percent for the no education, primaryand middle school groups, respectively. Furthermore, these households constitute more thansixteen percent of all the households that have adult members who have participated inan adult literacy program. As discussed above our instrumental variable estimations essen-tially ignore this subgroup of participants who appears to do very well compared to otherparticipants.
With the substantial number of individuals who have participated in an adult literacyprogram, yet live in a community where no program is available, and these participants’overall higher welfare it is worthwhile examining possible explanations for how and whythey came to participate. The most obvious explanation is that people travel to neighbour-ing communities to participate when one is not available in their own community. Second,individuals who have participated somewhere else could migrate in search of better oppor-tunities. Finally, the community questionnaire could have mis-coded the presence of anadult literacy program. Starting with the latter it is difficult to imagine why there wouldbe a correlation between how wealthy a community is and coding errors in the communityquestionnaire; nonetheless, there are three communities in which eight households (out oftwenty) have participanted, but where the community questionnaire does not show an adultliteracy program. This is, of course, also a possible outcome if individuals travel to nearbycommunities to participate. Unfortunately there is no information in the GLSS 4 aboutneighbouring communities or where or when somebody participated in a program, whichmeans that we cannot determine the extent to which this has taken place. We are in abetter position to examine migration.24 While the non-participants are similar with respectto migration, fewer participants in areas without a program are born in their current placeof residence than participants in areas with a program. Furthermore, substantially fewerhave always lived in the village or town they are currently living in and are more likely tohave moved away from their current residence for a year or more. Hence, we cannot rule outthat the better performance of the participants in communities without a program is due toa combination of both participation in neighbouring communities and selective migration.For both possible explanations it is, however, the case that these participants might be moremotivated, which could explain why these participants do better on average both in termsof the consumption of their households and their skill levels as discussed above.
5 Welfare Effects of Participation
The descriptive analyses indicate that while there is only a small effect of attending an adultliteracy program on literacy and numeracy the effect on welfare is sizeable. The problemwith the cross-tabulations is that they do not take account of the problems of potentialendogenous program placement and self-selection into participation and may therefore bebiased. Hence, this section presents estimates of the effects of participation on welfare, whichis the main outcome of interest. We first present the results with community fixed effectsand compare them to the OLS estimates. This is followed by a reduced form analysis andfinally by the instrumental variables community fixed effects results.
24The tables are available upon request.
17

Tables 6 and 7 show the results for the community fixed effects models for the individualand household samples, respectively. When using the full samples the estimated effect ofparticipation in an adult literacy program is equivalent to a more than five percent increasein consumption for both the individual level and household level estimations. Furthermore,this effect is statistically significant for both samples. It is, however, likely that this overalleffect masks substantial differences in the effect of participation across different types ofhouseholds. Hence, as for the descriptive statistics in Tables 4 and 5, we divide the samplesinto groups depending on the highest education level completed by an adult in the household.The idea behind this is that the marginal effect of participation should be stronger if thehuman capital level of the household is lower.
The most interesting results are the estimates for the households without completed ed-ucation. They show an increase in consumption of more than ten percent for the individuallevel estimation and almost fourteen percent for the household level estimation and both es-timates are strongly statistically significant. This effect is substantial, especially consideringthat most of the literature has found modest or no effect of literacy programs. It is worthkeeping in mind, however, that the Ghanaian literacy programs take substantially longer tocomplete than most and teaches other topics than literacy as detailed in the Introduction. Amore suitable comparison might therefore be the return to education in Ghana, which Cana-garajah and Thomas (1997) found to be between four and six percent per year of schoolingcompleted. Given the length of the program and the effort required by participants thesereturns are comparable.
The effect of participation is substantially lower for the other groups and declines withincreasing levels of completed education. For primary education households the estimatedeffect of participation is just over three percent, while the effect of participation for the middleeducation households is around two percent, although none of these effects are statisticallysignificant. The effect for the “Post Middle” group is negative and large, although again notstatistically significant. In interpreting these results it is worth keeping in mind that thesamples are relatively small. This might especially be a problem for the “Primary” groupsince there are only 389 households in that sample but they are spread over 135 communities.Hence, it is possible that the statistically insignificance for this group is mainly due to thesmall sample size combined with a large number of community fixed effects.25
Comparison of the community fixed effects results with the standard OLS results providesan indication of whether endogenous program placement is a significant problem. AppendixTables A-1 and A-2 show the equivalent results to Tables 6 and 7 except that communityfixed effects are not included. The OLS results show that the estimated average effect ofparticipation in an adult literacy program is about a ten percent increase in consumption peradult equivalent, while the OLS effect for the “No Education” group is over 20 percent. Inother words, the OLS estimates are twice the size of the community fixed effects estimates.The large differences between the OLS and fixed effects estimates indicate that endogenousprogram placement is a real concern in this case and lead to substantial biases in the esti-mated effects of participation. Furthermore, it appears that programs are allocated, at least
25The “Post Middle” group consists of only 323 households of which 42 have had at least one memberparticipate in an adult literacy program, while in the “Middle” group there are 1235 households with 229participating.
18

Table 6: Individual Participation’s Effect onHousehold Welfare - Community Fixed Effects
Complete Level of Completed Education in Householda
Variables Sample Post Middle Middle Primary None
Attended literacy program 0.052∗∗ −0.057 0.019 0.031 0.108∗∗∗
(0.020) (0.055) (0.026) (0.043) (0.028)Female 0.020∗ −0.011 −0.020 0.012 0.044∗∗∗
(0.010) (0.020) (0.015) (0.024) (0.015)Aged 30-44 0.006 0.079∗∗ −0.013 −0.063 0.030
(0.015) (0.036) (0.023) (0.039) (0.029)Aged 45-59 0.021 0.035 −0.027 −0.036 0.066∗∗
(0.016) (0.036) (0.023) (0.045) (0.030)Aged 60-99 0.054∗∗ 0.005 −0.017 −0.078 0.119∗∗∗
(0.021) (0.043) (0.032) (0.072) (0.034)Primary education 0.024∗∗∗ −0.011 −0.008 −0.013
(0.008) (0.016) (0.010) (0.023)Middle education 0.033∗∗∗ −0.003 −0.011
(0.010) (0.023) (0.014)Post middle education 0.039∗∗∗ −0.012
(0.013) (0.026)Owns land 0.044 0.086 0.059 0.092 −0.018
(0.027) (0.104) (0.037) (0.087) (0.057)Non-farming household 0.070 0.143 0.119 0.062 −0.077
(0.046) (0.112) (0.092) (0.167) (0.072)Percent with primary education 0.052 0.155 −0.001 0.338∗∗
(0.039) (0.264) (0.082) (0.145)Percent with middle education 0.179∗∗∗ 0.161 0.339∗∗∗
(0.030) (0.151) (0.077)Percent with post middle education 0.380∗∗∗ 0.630∗∗∗
(0.067) (0.191)Household size −0.089∗∗∗ −0.077∗∗∗ −0.084∗∗∗ −0.089∗∗∗ −0.112∗∗∗
(0.008) (0.016) (0.010) (0.025) (0.012)Number of adults in household 0.022 0.069∗∗ 0.022 0.076 −0.015
(0.014) (0.029) (0.021) (0.056) (0.034)Constant 14.023∗∗∗ 13.751∗∗∗ 14.030∗∗∗ 13.822∗∗∗ 14.075∗∗∗
(0.038) (0.193) (0.083) (0.157) (0.064)
Observations 6713 883 2849 779 2202Communities 166 127 161 135 162R-squared 0.19 0.21 0.21 0.16 0.27
Note. Robust standard errors in parentheses. Dependent variable is log of per adult equivalent expenditure peryear.a At least one adult with this level of education and none with more within household.* Statistically significant at 10%.** Statistically significant at 5%.*** Statistically significant at 1%.
19

Table 7: Household Participation’s Effect onHousehold Welfare - Community Fixed Effects
Complete Level of Completed Education in Householda
Variables Sample Post Middle Middle Primary None
Attended literacy program 0.055∗∗∗ −0.108 0.024 0.031 0.139∗∗∗
(0.021) (0.104) (0.035) (0.069) (0.027)Owns land 0.048∗ 0.029 0.052 0.096 0.008
(0.026) (0.120) (0.038) (0.091) (0.049)Non-farming household −0.027 0.016 0.025 0.001 −0.104
(0.044) (0.125) (0.072) (0.158) (0.075)Average age 30-34 −0.053∗∗ −0.021 −0.063 −0.086 −0.082
(0.026) (0.105) (0.040) (0.093) (0.056)Average age 35-39 −0.014 0.272∗∗ −0.070∗ −0.038 −0.008
(0.031) (0.134) (0.039) (0.096) (0.061)Average age 40-49 −0.040 0.113 −0.084∗ −0.192∗∗ 0.027
(0.031) (0.135) (0.047) (0.091) (0.055)Average age 50-59 0.034 0.104 0.014 −0.184 0.038
(0.035) (0.144) (0.060) (0.124) (0.054)Average age 60-99 0.075∗ 0.197 −0.031 −0.078 0.072
(0.038) (0.220) (0.090) (0.184) (0.057)Percent with primary education 0.121∗∗∗ 0.537∗∗ 0.028 0.272
(0.037) (0.268) (0.075) (0.183)Percent with middle education 0.251∗∗∗ 0.325∗ 0.357∗∗∗
(0.032) (0.196) (0.073)Percent with post middle education 0.404∗∗∗ 0.752∗∗∗
(0.066) (0.255)Household size −0.118∗∗∗ −0.095∗∗∗ −0.103∗∗∗ −0.118∗∗∗ −0.144∗∗∗
(0.006) (0.019) (0.010) (0.020) (0.010)Number of adults in household 0.036∗∗∗ 0.064∗ 0.028 0.089 0.021
(0.013) (0.036) (0.020) (0.055) (0.030)Constant 14.191∗∗∗ 13.756∗∗∗ 14.147∗∗∗ 14.093∗∗∗ 14.238∗∗∗
(0.036) (0.251) (0.083) (0.203) (0.061)
Observations 3219 323 1235 389 1272Communities 166 127 161 135 162
Note. Robust standard errors in parentheses. A household is considered to have attended if at least one of itsmembers has participated in an adult literacy program.a At least one adult with this level of education and none with more within household.* Statistically significant at 10%.** Statistically significant at 5%.*** Statistically significant at 1%.
20

partly, based on where they would generate the highest return.
5.1 Reduced Form Results
While community fixed effects control for endogenous program placement there is still thepotential issue of self-selection into participation based on unobservable characteristics thatcould also influence the welfare of the household. As we discuss above, finding suitableinstruments is a challenge once we include community fixed effects. To provide an idea of howthe instruments, exposure interacted with a set of individual and household characteristics,influence welfare Tables 8 and 9 show reduced form estimations with the instruments includedinstead of participation in adult literacy program. These results are shown only for the “NoEducation” sample for four models with an increasing number of variables included.26
For the sample of individuals the main statistically significant effects are from the inter-actions between exposure and being in age group 45 to 59 and household size. The effectsfor the other two age groups relative to the 18 to 29 age groups are substantially smaller.This seems to indicate that the effect of having an adult literacy program in the communityis mainly concentrated in the middle aged group.
The results for the sample of households show a strong effect of exposure interacted withaverage age of adults being 40 to 49. The estimates for other average age groups interactedwith exposure indicate an effect which is almost as large in size, although none of theother age groups interacted with exposure are statistically significant. Finally, note that theinteraction variables are jointly statistically significant for the household level estimationsbut not for the individual level estimations.
5.2 Instrumental Variables Estimations
An important aspect of the instruments is their ability to explain the decision to participate.Tables 10 and 11 show the estimates for individual and household participation together withthe χ2 test statistics for all identifying instruments being jointly equal to zero. In both cases,the instrumental variables perform well for the complete sample and the “No Education”households. The best performance is for the individual sample with only “No Education”households, where the identifying instruments are jointly statistically significant at less thanthe one percent level, while the corresponding level for the sample of households is worse atthe eight percent significance level.
The instruments perform substantially worse for the other three subgroups and are farfrom being statistically significant.27 A major reason for this poor performance is likely to bethe low number of observations, which is exacerbated by our use of community fixed effectswhich both restricts the number of available instruments and lowers the number of degrees offreedom. This highlights the trade off between controlling for endogenous program placementand controlling for self-selection into program participation when evaluating programs: Themore finely we define a community the harder it becomes to find instruments that can beused to deal with unobservable characteristics that influence both participation and the
26The corresponding results for the other groups are available upon request.27No convergence was achieved for the sample of households where the highest education level was “Post
Middle”.
21

Table 8: Individual Level Reduced Form Effects on HouseholdWelfare for “No Education” Sample - Community Fixed Effects
Variables Model I Model II Model III Model IV
Female 0.011 0.009 0.009 0.003(0.025) (0.026) (0.026) (0.026)
Aged 30-44 0.026 0.023 0.023 0.004(0.050) (0.051) (0.051) (0.049)
Aged 45-59 0.008 0.001 0.001 −0.003(0.051) (0.052) (0.052) (0.051)
Aged 60-99 0.083 0.075 0.075 0.080(0.059) (0.059) (0.059) (0.057)
Owns land −0.021 0.081 0.081 0.084(0.056) (0.089) (0.089) (0.086)
Non-farming household −0.091 −0.070 −0.070 −0.064(0.073) (0.105) (0.105) (0.106)
Household size −0.113∗∗∗ −0.113∗∗∗ −0.113∗∗∗ −0.091∗∗∗
(0.012) (0.012) (0.012) (0.017)Number of adults in household −0.016 −0.017 −0.017 −0.046
(0.034) (0.034) (0.034) (0.041)Female × exposure 0.005 0.005 0.005 0.007
(0.004) (0.004) (0.004) (0.004)Aged 30-44 × exposure 0.002 0.003 0.003 0.008
(0.006) (0.007) (0.007) (0.006)Aged 45-59 × exposure 0.013∗ 0.015∗∗ 0.015∗∗ 0.017∗∗
(0.007) (0.008) (0.008) (0.007)Aged 60-99 × exposure 0.007 0.009 0.009 0.009
(0.008) (0.008) (0.008) (0.008)Owns land × exposure −0.021 −0.021 −0.021
(0.014) (0.014) (0.014)Non-farming × exposure −0.005 −0.005 −0.006
(0.018) (0.018) (0.018)Household size × exposure −0.005∗
(0.003)Number of adults × exposure 0.006
(0.006)Observations 2202 2202 2202 2202Communities 162 162 162 162
Note. Robust standard errors in parentheses. Sample consists of households where no adultmember has completed any level of schooling.* Statistically significant at 10%.** Statistically significant at 5%.*** Statistically significant at 1%.
22

Table 9: Household Level Reduced Form Effects on HouseholdWelfare for “No Education” Sample - Community Fixed Effects
Variables Model I Model II Model II
Owns land 0.001 0.110 0.113(0.048) (0.078) (0.078)
Non-farming household −0.125 −0.104 −0.101(0.077) (0.114) (0.114)
Average age 30-34 0.000 −0.015 −0.034(0.088) (0.091) (0.089)
Average age 35-39 −0.062 −0.059 −0.076(0.096) (0.095) (0.099)
Average age 40-49 −0.060 −0.070 −0.080(0.088) (0.090) (0.090)
Average age 50-59 −0.004 −0.018 −0.023(0.079) (0.082) (0.082)
Average age 60-99 0.012 −0.002 −0.003(0.091) (0.094) (0.094)
Household size −0.146∗∗∗ −0.146∗∗∗ −0.133∗∗∗
(0.010) (0.011) (0.016)Number of adults in household 0.028 0.028 0.005
(0.032) (0.032) (0.039)Avg age 30-34 × exposure −0.017 −0.013 −0.010
(0.014) (0.015) (0.014)Avg age 35-39 × exposure 0.012 0.013 0.017
(0.013) (0.013) (0.014)Avg age 40-49 × exposure 0.018 0.021 0.024∗
(0.013) (0.014) (0.014)Avg age 50-59 × exposure 0.010 0.015 0.017
(0.012) (0.013) (0.014)Avg age 60-99 × exposure 0.012 0.016 0.017
(0.014) (0.014) (0.014)Owns land × exposure −0.023∗ −0.023
(0.013) (0.014)Non-farming × exposure −0.004 −0.005
(0.020) (0.020)Household size × exposure −0.003
(0.003)Number of adults × exposure 0.005
(0.006)Observations 1272 1272 1272Communities 162 162 162
Note. Robust standard errors in parentheses. Sample consists of householdswhere no adult member has completed any level of schooling.* Statistically significant at 10%.** Statistically significant at 5%.*** Statistically significant at 1%.
23

outcomes of interest. As we mentioned above, the standard OLS results are twice as largeas the community fixed effects results indicating that endogenous program placement mayindeed be a serious concern in this case. There are, however, clearly advantages to usingcommunity fixed effects beside accounting for endogenous program placement. In our data,as in most other household surveys, there is little or no information on a number of factors,such as land quality, which may affect the decision to participate and the outcomes. To theextent that most of the variation of these variables is between villages the use of communityfixed effects will help alleviate the bias from these unobserved variables.
The effects of the other explanatory variables on participation is generally in line withwhat we would expect. Females are less likely to participate than males, although it appearsthat most of this effect comes from the group without any education; for those with postmiddle, middle school or primary education women are, in fact, more likely to participatealthough the effect is only statistically significant for the former. As expected, given that wemeasure age at the time of the survey rather than age when participating in the program,the age profile is relatively flat; it is, however, consistent with the program being in the areasfor up to 15 years. The more education an individual has completed the less likely she is toparticipate. Neither of the variables relating to land are statistically significant.
With respect to the instruments, none of the age groups have a statistically significanteffect on participation although the negative estimated effects for the two youngest groupsindicate that the longer the program has been available the less age matters for whethersomebody has participated, although part of that effect could come from simple age progres-sion where those who participated early move up to another age group. The non-farminginteraction with exposure is large and negative relative to the estimated direct effect onparticipation of being a non-farming household. The likely interpretation is not so muchthat non-farming households become less likely to participate the longer the program hasbeen available, but rather that the other types of households pull further away from thenon-farming ones and that the gap widens over time.
Tables 12 and 13 present the instrumental variable community fixed effects results forthe effect of participation on consumption. As is clear from above, the instruments performsatisfactorily only for the complete sample and for the “No Education” group; nonetheless,the estimates for the other groups are included for completeness. Again, the most interestingresults are for the “No Education” group. Using the invididual level data the estimatedeffect of participation increases slightly after instrumentation from 0.108 to 0.117, while thehousehold level data shows a decrease from 0.139 to 0.085. As expected, especially giventhe large number of community fixed effects, the standard errors for both samples increasesubstantially and none of these effects are statistically significant. Hence, the point estimatesstill indicate a substantial effect of participation in an adult literacy program on expenditureand it does not appear that there is a large effect of unobservable individual and householdcharacteristics on the participation decision.
In summary, there is a strong effect of participation for households where no adult hascompleted any level of schooling with an estimated effect of between 8.5 and 14 percentpercent increase in expenditures, depending on specification. The instruments are not strongenough to produce believable results for other households than the no education households
24

Table 10: Individual Participation in LiteracyProgram - Community Fixed Effects Logit
Complete Level of Completed Education in Householda
Variables Sample Post Middle Middle Primary None
Female −0.438∗∗∗ 1.715∗∗ −0.120 −0.174 −0.863∗∗∗
(0.157) (0.873) (0.284) (0.546) (0.247)Aged 30-44 0.778∗∗∗ 1.778 0.953∗∗ 0.646 0.562
(0.238) (1.455) (0.372) (0.937) (0.417)Aged 45-59 1.096∗∗∗ 0.455 1.603∗∗∗ 1.487 0.786∗
(0.240) (1.145) (0.394) (0.915) (0.418)Aged 60-99 0.815∗∗∗ 2.039 1.868∗∗∗ 1.428 −0.156
(0.255) (1.405) (0.446) (1.011) (0.432)Primary education −0.688∗∗∗ 0.646 −0.560∗ −0.388
(0.209) (0.905) (0.324) (0.405)Middle education −2.254∗∗∗ −1.795∗∗ −2.012∗∗∗
(0.199) (0.775) (0.255)Post middle education −2.932∗∗∗ −2.291∗∗∗
(0.503) (0.835)Owns land −0.007 1.202 0.096 0.326 −0.112
(0.206) (3.005) (0.356) (0.880) (0.377)Non-farming household −0.194 1.426 0.355 . 0.776
(0.378) (3.249) (0.750) . (0.587)Percent with primary education −0.306 0.682 0.362 0.210
(0.410) (4.848) (0.940) (1.992)Percent with middle education 0.547∗ −0.706 0.042
(0.327) (4.514) (0.807)Percent with post middle education 0.302 −9.396∗
(0.778) (5.293)Household size −0.035 1.081∗∗ 0.007 −0.152 −0.090
(0.040) (0.425) (0.065) (0.197) (0.070)Number of adults in household 0.029 −2.529∗∗ 0.075 0.451 −0.137
(0.098) (0.996) (0.174) (0.490) (0.223)Female × exposure 0.023 −0.168 0.030 0.029 0.020
(0.022) (0.114) (0.039) (0.072) (0.038)Aged 30-44 × exposure −0.016 −0.256 −0.036 0.138 −0.013
(0.034) (0.205) (0.052) (0.147) (0.061)Aged 45-59 × exposure −0.031 0.021 −0.058 0.147 −0.059
(0.035) (0.149) (0.054) (0.145) (0.063)Aged 60-99 × exposure −0.009 −0.271 −0.092 0.136 0.039
(0.037) (0.191) (0.061) (0.157) (0.065)Primary (%) × exposure 0.071 −0.597 0.047 0.041
(0.048) (0.674) (0.113) (0.227)Middle (%) × exposure 0.025 0.267 0.085
(0.043) (0.733) (0.105)Post middle (%) × exposure 0.058 1.596∗
(0.107) (0.827)Owns land × exposure 0.036 −0.407 0.011 0.164 −0.008
(0.031) (0.375) (0.054) (0.155) (0.056)Non-farming × exposure −0.166∗∗ −1.167∗ −0.113 1.395 −0.568∗∗∗
(0.072) (0.633) (0.125) (179.708) (0.149)Household size × exposure 0.014∗∗ −0.091 0.009 0.042 0.018∗
(0.006) (0.071) (0.010) (0.030) (0.010)Number of adults × exposure −0.045∗∗∗ 0.227 −0.044∗ −0.126∗ −0.027
(0.014) (0.143) (0.024) (0.068) (0.034)Observations 5813 287 2093 360 1598Communities 145 37 104 49 106χ2 test: Instruments = 0 20.47∗∗ 10.60 10.13 8.13 20.41∗∗∗
Prob > χ2 0.039 0.477 0.429 0.521 0.009
Note. Robust standard errors in parentheses. Depedent variable is whether the individual has participated in an adultliteracy program or not.a At least one adult with this level of education and none with more within household.* Statistically significant at 10%.** Statistically significant at 5%.*** Statistically significant at 1%.
25
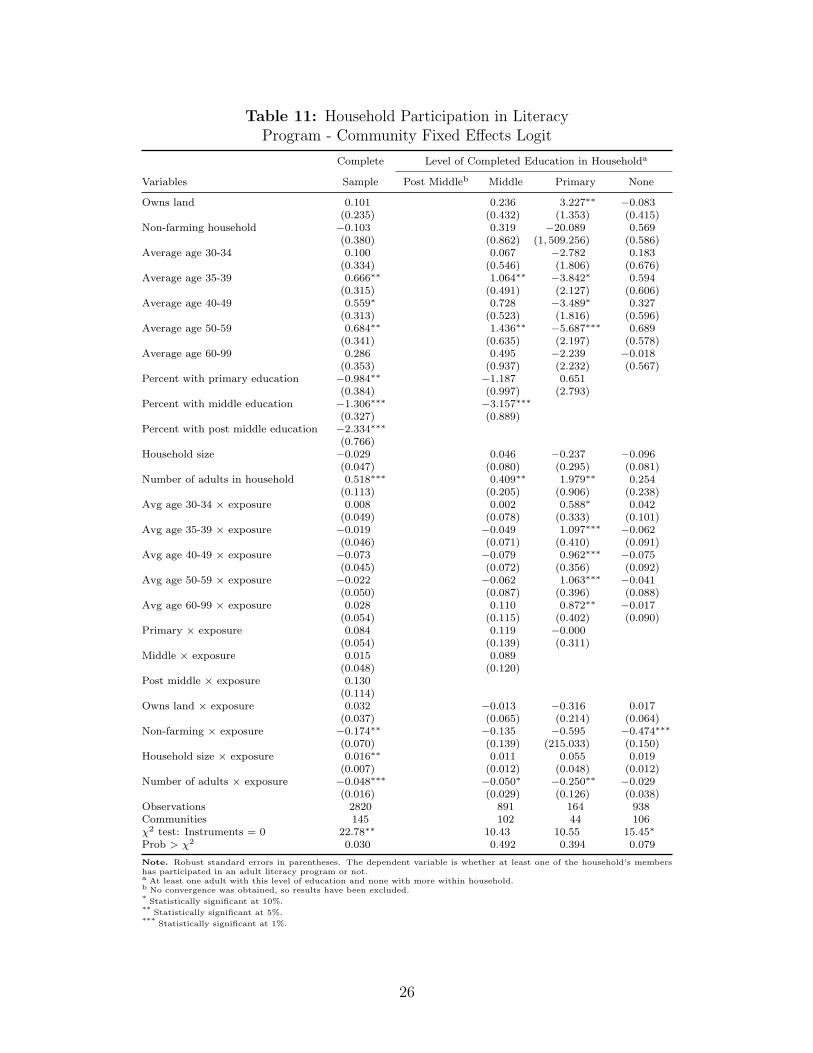
Table 11: Household Participation in LiteracyProgram - Community Fixed Effects Logit
Complete Level of Completed Education in Householda
Variables Sample Post Middleb Middle Primary None
Owns land 0.101 0.236 3.227∗∗ −0.083(0.235) (0.432) (1.353) (0.415)
Non-farming household −0.103 0.319 −20.089 0.569(0.380) (0.862) (1, 509.256) (0.586)
Average age 30-34 0.100 0.067 −2.782 0.183(0.334) (0.546) (1.806) (0.676)
Average age 35-39 0.666∗∗ 1.064∗∗ −3.842∗ 0.594(0.315) (0.491) (2.127) (0.606)
Average age 40-49 0.559∗ 0.728 −3.489∗ 0.327(0.313) (0.523) (1.816) (0.596)
Average age 50-59 0.684∗∗ 1.436∗∗ −5.687∗∗∗ 0.689(0.341) (0.635) (2.197) (0.578)
Average age 60-99 0.286 0.495 −2.239 −0.018(0.353) (0.937) (2.232) (0.567)
Percent with primary education −0.984∗∗ −1.187 0.651(0.384) (0.997) (2.793)
Percent with middle education −1.306∗∗∗ −3.157∗∗∗
(0.327) (0.889)Percent with post middle education −2.334∗∗∗
(0.766)Household size −0.029 0.046 −0.237 −0.096
(0.047) (0.080) (0.295) (0.081)Number of adults in household 0.518∗∗∗ 0.409∗∗ 1.979∗∗ 0.254
(0.113) (0.205) (0.906) (0.238)Avg age 30-34 × exposure 0.008 0.002 0.588∗ 0.042
(0.049) (0.078) (0.333) (0.101)Avg age 35-39 × exposure −0.019 −0.049 1.097∗∗∗ −0.062
(0.046) (0.071) (0.410) (0.091)Avg age 40-49 × exposure −0.073 −0.079 0.962∗∗∗ −0.075
(0.045) (0.072) (0.356) (0.092)Avg age 50-59 × exposure −0.022 −0.062 1.063∗∗∗ −0.041
(0.050) (0.087) (0.396) (0.088)Avg age 60-99 × exposure 0.028 0.110 0.872∗∗ −0.017
(0.054) (0.115) (0.402) (0.090)Primary × exposure 0.084 0.119 −0.000
(0.054) (0.139) (0.311)Middle × exposure 0.015 0.089
(0.048) (0.120)Post middle × exposure 0.130
(0.114)Owns land × exposure 0.032 −0.013 −0.316 0.017
(0.037) (0.065) (0.214) (0.064)Non-farming × exposure −0.174∗∗ −0.135 −0.595 −0.474∗∗∗
(0.070) (0.139) (215.033) (0.150)Household size × exposure 0.016∗∗ 0.011 0.055 0.019
(0.007) (0.012) (0.048) (0.012)Number of adults × exposure −0.048∗∗∗ −0.050∗ −0.250∗∗ −0.029
(0.016) (0.029) (0.126) (0.038)Observations 2820 891 164 938Communities 145 102 44 106χ2 test: Instruments = 0 22.78∗∗ 10.43 10.55 15.45∗
Prob > χ2 0.030 0.492 0.394 0.079
Note. Robust standard errors in parentheses. The dependent variable is whether at least one of the household’s membershas participated in an adult literacy program or not.a At least one adult with this level of education and none with more within household.b No convergence was obtained, so results have been excluded.* Statistically significant at 10%.** Statistically significant at 5%.*** Statistically significant at 1%.
26

Table 12: Individual Participation’s Effect onHousehold Welfare - IV Community Fixed Effects
Complete Level of Completed Education in Householda
Variables Sample Post Middle Middle Primary None
Attended literacy program 0.064 −0.166 −0.129 −0.060 0.117(0.184) (0.153) (0.389) (0.374) (0.224)
Female 0.027∗ −0.008 −0.009 0.007 0.045(0.014) (0.056) (0.022) (0.053) (0.035)
Aged 30-44 0.007 0.159∗∗∗ −0.021 −0.031 0.015(0.018) (0.061) (0.030) (0.082) (0.040)
Aged 45-59 0.033 0.100 −0.018 −0.036 0.070∗
(0.023) (0.063) (0.050) (0.132) (0.039)Aged 60-99 0.061∗∗∗ 0.069 0.001 −0.050 0.108∗∗∗
(0.023) (0.079) (0.060) (0.136) (0.037)Primary education 0.030 0.001 −0.019 −0.021
(0.031) (0.109) (0.050) (0.066)Middle education 0.042 −0.013 −0.034
(0.040) (0.087) (0.079)Post middle education 0.051 −0.034
(0.055) (0.084)Owns land 0.037∗∗ −0.004 0.072∗∗∗ 0.091 −0.072∗
(0.017) (0.088) (0.027) (0.103) (0.039)Non-farming household 0.055∗ 0.099 0.084 0.072 −0.115∗
(0.031) (0.149) (0.055) (0.135) (0.068)Percent with primary education 0.031 −0.327 −0.019 0.273∗
(0.039) (0.233) (0.072) (0.150)Percent with middle education 0.170∗∗∗ −0.067 0.292∗∗∗
(0.031) (0.173) (0.056)Percent with post middle education 0.312∗∗∗ 0.635∗∗∗
(0.059) (0.221)Household size −0.090∗∗∗ −0.059∗∗∗ −0.067∗∗∗ −0.093∗∗∗ −0.121∗∗∗
(0.003) (0.019) (0.006) (0.017) (0.007)Number of adults in household 0.023∗∗∗ 0.064 0.005 0.085∗∗ 0.012
(0.008) (0.040) (0.014) (0.041) (0.020)Constant 14.031∗∗∗ 13.638∗∗∗ 14.044∗∗∗ 13.833∗∗∗ 14.103∗∗∗
(0.043) (0.209) (0.091) (0.159) (0.094)
Observations 5813 287 2093 360 1598Communities 145 37 104 49 106
Note. Robust standard errors in parentheses.a At least one adult with this level of education and none with more within household.* Statistically significant at 10%.** Statistically significant at 5%.*** Statistically significant at 1%.
27

Table 13: Household Participation’s Effect onHousehold Welfare - IV Community Fixed Effects
Complete Level of Completed Education in Householda
Variables Sample Post Middleb Middle Primary None
Attended literacy program 0.570 1.214∗∗ 0.519 0.085(0.376) (0.608) (0.334) (0.252)
Owns land 0.018 0.040 −0.043 −0.032(0.031) (0.063) (0.175) (0.050)
Non-farming household −0.003 −0.015 0.209 −0.156∗
(0.050) (0.113) (0.246) (0.080)Average age 30-34 −0.059∗ −0.091 −0.062 −0.127∗
(0.035) (0.072) (0.189) (0.077)Average age 35-39 −0.042 −0.250∗∗ −0.208 −0.041
(0.046) (0.108) (0.211) (0.072)Average age 40-49 −0.036 −0.159∗∗ −0.254 0.033
(0.034) (0.078) (0.174) (0.067)Average age 50-59 0.020 −0.165 −0.270 0.058
(0.050) (0.149) (0.188) (0.071)Average age 60-99 0.052 −0.254 −0.303 0.037
(0.045) (0.184) (0.283) (0.063)Percent with primary education 0.158∗∗∗ 0.123 0.210
(0.053) (0.158) (0.297)Percent with middle education 0.338∗∗∗ 0.795∗∗∗
(0.070) (0.269)Percent with post middle education 0.479∗∗∗
(0.095)Household size −0.123∗∗∗ −0.110∗∗∗ −0.127∗∗∗ −0.151∗∗∗
(0.007) (0.018) (0.032) (0.010)Number of adults in household 0.016 −0.009 0.075 0.035
(0.020) (0.035) (0.086) (0.029)Constant 14.127∗∗∗ 13.771∗∗∗ 14.041∗∗∗ 14.312∗∗∗
(0.064) (0.239) (0.351) (0.095)
Observations 2820 891 164 938Communities 145 102 44 106
Note. Robust standard errors in parentheses. A household is considered to have attended if at least one of itsmembers has participated in an adult literacy program.a At least one adult with this level of education and none with more within household.b No convergence was obtained, so results have been excluded.* Statistically significant at 10%.** Statistically significant at 5%.*** Statistically significant at 1%.
28

but the results from the standard community fixed effects estimations are interesting.28 Theeffect of participation for households where the most educated adult has completed primaryschool is around 3 percent, while for households where the most educated adult has completedmiddle school the effect is between 1.9 to 2.4 percent. Clearly, the effects are only statisticallysignificant for no education households, but these results show that there might be benefitsto participation even for households with higher levels of human capital and in line with thestandard theory of decreasing marginal return to human capital the effect of participationdeclines with prior level of household human capital.
6 What Explains the Effect on Welfare?
This section examines some of the potential pathways through which participation in adultliteracy programs affect consumption and whether there are alternative explanations for theeffect on welfare. Given that the strongest and most robust results are for the group ofhouseholds where no adult member has finished even primary school this section focuses onthis group. In addition, this group has the highest rate of participation and accounts forover one third of the total sample of households. The section first analyses the effects ofparticipation on literacy and numeracy skills. It then investigates how participation affectbusiness ownership, credit and sale of goods. Finally, the section discusses whether othergovernmental interventions might be responsible for the positive effect found.
6.1 Participation and Literacy and Numeracy
Tables 14 and 15 present the determinants of literacy and numeracy for individuals livingin “No Education” households.29 All models are linear probability models with the firstcolumn showing the results using standard OLS, the second column includes communityfixed effects and the final column the community fixed effect instrumental variable resultsusing the method described above. There is relatively little difference between the OLS andthe fixed effects results for both literacy and numeracy, with the effect slightly smaller forthe fixed effects estimates. According to the fixed effects estimates, participation in an adultliteracy program increases the probability of being able to read by just over ten percentagepoints and the probability of being able to do written calculations by around seven percentagepoints. All of the OLS and fixed effects estimates of the effect of participation are stronglystatistically significant.
While there is little difference between the OLS and the community fixed effects resultsusing instrumental variables lead to substantial changes in the estimated effects of partici-pation on literacy. The effect of participation on literacy becomes three times as large, at36 percentage points, and remains statistically significant. For numeracy the point estimateremains the same as the fixed effects one, but the standard error increases dramaticallymaking the effect far from statistically significant. One interpretation of the increase in theestimated effect on literacy is that unobserved ability is negatively correlated with participa-tion. This could happen if the value of time for a higher ability individual was substantially
28Those estimates obviously do not control for possible self-selection into participation.29The corresponding results for the other groups are available upon request.
29
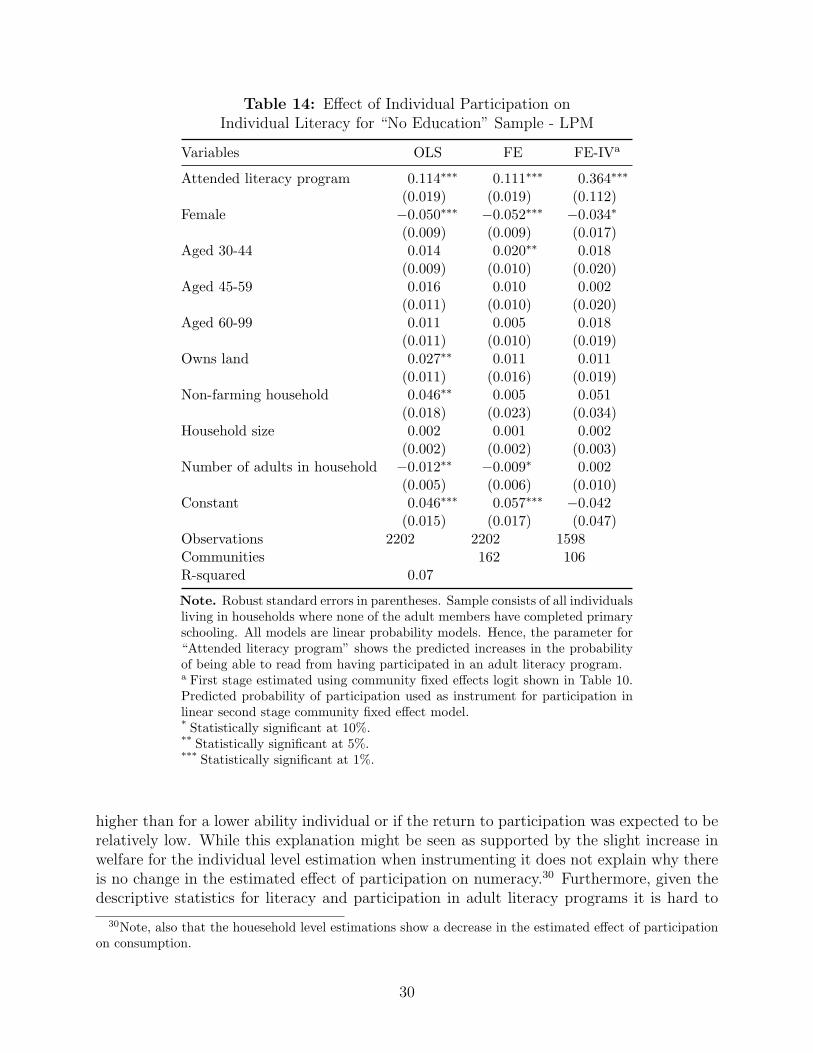
Table 14: Effect of Individual Participation onIndividual Literacy for “No Education” Sample - LPM
Variables OLS FE FE-IVa
Attended literacy program 0.114∗∗∗ 0.111∗∗∗ 0.364∗∗∗
(0.019) (0.019) (0.112)Female −0.050∗∗∗ −0.052∗∗∗ −0.034∗
(0.009) (0.009) (0.017)Aged 30-44 0.014 0.020∗∗ 0.018
(0.009) (0.010) (0.020)Aged 45-59 0.016 0.010 0.002
(0.011) (0.010) (0.020)Aged 60-99 0.011 0.005 0.018
(0.011) (0.010) (0.019)Owns land 0.027∗∗ 0.011 0.011
(0.011) (0.016) (0.019)Non-farming household 0.046∗∗ 0.005 0.051
(0.018) (0.023) (0.034)Household size 0.002 0.001 0.002
(0.002) (0.002) (0.003)Number of adults in household −0.012∗∗ −0.009∗ 0.002
(0.005) (0.006) (0.010)Constant 0.046∗∗∗ 0.057∗∗∗ −0.042
(0.015) (0.017) (0.047)Observations 2202 2202 1598Communities 162 106R-squared 0.07
Note. Robust standard errors in parentheses. Sample consists of all individualsliving in households where none of the adult members have completed primaryschooling. All models are linear probability models. Hence, the parameter for“Attended literacy program” shows the predicted increases in the probabilityof being able to read from having participated in an adult literacy program.a First stage estimated using community fixed effects logit shown in Table 10.Predicted probability of participation used as instrument for participation inlinear second stage community fixed effect model.* Statistically significant at 10%.** Statistically significant at 5%.*** Statistically significant at 1%.
higher than for a lower ability individual or if the return to participation was expected to berelatively low. While this explanation might be seen as supported by the slight increase inwelfare for the individual level estimation when instrumenting it does not explain why thereis no change in the estimated effect of participation on numeracy.30 Furthermore, given thedescriptive statistics for literacy and participation in adult literacy programs it is hard to
30Note, also that the houesehold level estimations show a decrease in the estimated effect of participationon consumption.
30

Table 15: Effect of Individual Participation onIndividual Numeracy for “No Education” Sample - LPM
Variables OLS FE FE-IVa
Attended literacy program 0.097∗∗∗ 0.074∗∗∗ 0.074(0.020) (0.018) (0.115)
Female −0.063∗∗∗ −0.075∗∗∗ −0.083∗∗∗
(0.011) (0.011) (0.018)Aged 30-44 −0.020 −0.014 −0.008
(0.019) (0.015) (0.020)Aged 45-59 −0.055∗∗∗ −0.043∗∗∗ −0.051∗∗
(0.019) (0.016) (0.020)Aged 60-99 −0.087∗∗∗ −0.088∗∗∗ −0.093∗∗∗
(0.019) (0.017) (0.019)Owns land 0.041∗∗∗ −0.035∗ −0.069∗∗∗
(0.014) (0.019) (0.020)Non-farming household 0.068∗∗∗ 0.032 0.013
(0.025) (0.028) (0.035)Household size −0.004 −0.003 −0.004
(0.003) (0.003) (0.003)Number of adults in household −0.015∗∗ −0.000 0.008
(0.006) (0.007) (0.010)Constant 0.166∗∗∗ 0.161∗∗∗ 0.165∗∗∗
(0.025) (0.023) (0.048)Observations 2202 2202 1598Communities 162 106R-squared 0.06
Note. Robust standard errors in parentheses. Sample consists of all individualsliving in households where none of the adult members have completed primaryschooling. All models are linear probability models. Hence, the parameter for“Attended literacy program” shows the predicted increases in the probabilityof being able to do written calculations from having participated in an adultliteracy program.a First stage estimated using community fixed effects logit shown in Table 10.Predicted probability of participation used as instrument for participation inlinear second stage community fixed effect model.* Statistically significant at 10%.** Statistically significant at 5%.*** Statistically significant at 1%.
imagine that there is sufficient bias from selection on unobservables and measurement errorto explain the estimated effect.
A substantial part of the problem is likely to be the instruments. Different sets ofinstruments make the first stage instruments perform substantially worse but do not changethe estimated effect of program participation on literacy much.31 This reinforces the point
31This is only the case for literacy. For welfare and numeracy there are large changes and the estimates
31

made above that using community fixed effects to control for endogenous program placementmakes it more difficult to also take account of self-selection into the programs and thisproblem is exacerbated when analysing sub-samples, which limits the number of availableinstruments and observations even further.
Despite these issues it seems clear that participating in an adult literacy program dohave positive, albeit small, effects on literacy and numeracy. Given the large effects ofparticipation on welfare, it seems unlikely that these effects are explained solely by theincrease in literacy and/or numeracy.32 Therefore, we now turn to the effects of participatingin an adult literacy programs on other aspects that might increase household welfare.
6.2 Business Ownership, Credit and Sale of Agricultural Produce
Since the Ghanaian adult literacy programs have a substantial focus on other areas thanliteracy and numeracy it is worthwhile attempting to further understand how participationin a program affect the households. Income data is available in the GLSS 4 but is of sub-stantially worse quality than the expenditure data which precludes using that to understandhow literacy programs work. It is, however, possible to examine whether participation affectsfactors that can impact income such as whether the household owns a business, its access toand use of credit and whether it sells various goods.
Table 16 presents community fixed effects lineary probability model results for the effectsof participation on business ownership and various aspects of credit market participationusing the household level data.33 The outcomes examined are whether the household ownsa business (not including agriculture), whether it currently has a loan, if it has had a loananytime over the twelve months before the survey, what the source of the loan was and forwhat purpose the loan was taken.
A household is considered to own a business if any member of the household has workedfor himself, other than on a farm or raising animals. While there is a three percent increase inthe probability of someone in the household being self-employed from having participated inan adult literacy program this effect is not statistically significant. The effect of participationon whether the household owe money to someone is also positive, but again statisticallyinsignificant and small.
For the loan source and loan purpose we use only those households that currently have aloan outstanding since there unfortunately is no information about loans that have been paidoff (unless the household has a current loan). This substantially reduces the sample size; thereare now only 342 households from 115 communities. For loan sources two possibilities areconsidered. The first is formal sources, which include state bank, private bank, cooperative,government agency, NGO, business firm or other formal. The increased likelihood of lendingfrom a formal source after participating in a program is small at two percentage points andnot statistically significant. The same is the case for having at least one loan which is notfrom relatives, friends or neighbours.
become too large to be believable.32At least that would seem to require that the returns to literacy and numeracy would be a factor ten
larger than returns to schooling.33Community fixed effects logit results are available on request, but show marginal effects that are quali-
tatively similarly to the results in Table 16.
32

Table 16: Business Ownership, Credit and LiteracyProgram Participation - Community Fixed Effects LPM
Owns a Current Loan Source Loan Purpose
Variables Business Loan Formala Not familyb Investment Business Agriculture
Attended literacy 0.030 0.023 0.020 0.015 0.045 0.006 0.045program (0.031) (0.029) (0.032) (0.063) (0.065) (0.057) (0.050)
Owns land −0.079∗∗ −0.019 −0.040 −0.114 0.132 0.008 0.124∗∗
(0.036) (0.033) (0.040) (0.078) (0.080) (0.071) (0.061)Non-farming household 0.102∗∗ −0.095∗∗ −0.051 −0.024 0.001 0.163 −0.162∗
(0.050) (0.046) (0.056) (0.110) (0.114) (0.100) (0.087)Average age 30-34 0.017 −0.054 0.010 −0.101 −0.133 −0.015 −0.115
(0.051) (0.047) (0.058) (0.113) (0.116) (0.103) (0.089)Average age 35-39 −0.024 −0.046 0.028 −0.169 −0.046 0.015 −0.057
(0.050) (0.046) (0.055) (0.107) (0.111) (0.097) (0.084)Average age 40-49 −0.034 −0.011 0.040 −0.115 −0.096 −0.029 −0.062
(0.048) (0.044) (0.052) (0.101) (0.104) (0.092) (0.079)Average age 50-59 −0.068 −0.030 0.007 −0.074 −0.250∗∗ −0.157∗ −0.099
(0.048) (0.044) (0.051) (0.100) (0.103) (0.091) (0.079)Average age 60-99 −0.111∗∗ −0.203∗∗∗ −0.003 −0.245∗∗ −0.068 −0.103 0.041
(0.046) (0.042) (0.054) (0.106) (0.109) (0.096) (0.083)Household size 0.015∗∗ 0.006 −0.028∗∗∗ −0.001 0.018 0.016 0.000
(0.007) (0.007) (0.008) (0.015) (0.016) (0.014) (0.012)Number of adults −0.003 −0.016 0.078∗∗∗ 0.023 0.068 0.023 0.043
(0.021) (0.019) (0.026) (0.050) (0.051) (0.045) (0.039)Observations 1272 1272 342 342 342 342 342Communities 162 162 115 115 115 115 115
Note. Robust standard errors in parentheses. Sample consists of households where no adult member has completed primary school. Ahousehold is considered to have attended if at least one of its members has participated in an adult literacy program. All models are linearprobability models with community fixed effects. Hence, the parameter for “Attended literacy program” shows the predicted increases inthe probability from having participated in an adult literacy program.a At least one loan obtained from a formal institution, which include state bank, private bank, cooperative, government agency, NGO,business firm and other formal.b At least one loan obtained from a source other than relative, friend or neighbour.* Statistically significant at 10%.** Statistically significant at 5%.*** Statistically significant at 1%.
The last three columns show whether participating in an adult literacy program has aneffect on the likelihood of obtaining a loan for investment purposes, which consists of twopossible uses, business expansion and agriculture.34 Neither of these effects are statisticallysignificant. The effect on business expansion is essentially zero, while there is a much largereffect on the likelihood of using a loan for agricultural investment. The latter increases by4.5 percentage points and while it is not statistically significant this is hardly surprisinggiven the low number of degrees of freedom after controlling for other characteristics and forcommunity fixed effects.
To examine whether participation lead households to be more engaged in market activitiesTable 17 shows community fixed effects linear probability model results for the effects of
34Agriculture investments include land, equipment and inputs.
33

participation on whether the household sell various agricultural goods. The five groups ofgoods are livestock; grains and cash crops; roots, fruits and vegetables; other produce andprocessed produce.35 For the first four the household is asked if it has sold any of the goodsin the particular category during the twelve monts prior to the survey, while for the lastcategory the question is only asked for the two weeks prior to the survey.
Table 17: Sale of Agricultural Goods - Community Fixed EffectsLPM
Grains and Roots, Fruits Other ProcessedVariables Livestocka Cash Cropsb and Vegetablesc Produced Producee
Attended literacy 0.073∗∗ 0.030 0.039∗ 0.043∗ 0.013program (0.029) (0.029) (0.023) (0.025) (0.023)
Owns land 0.034 0.135∗∗∗ 0.116∗∗∗ 0.015 −0.018(0.033) (0.033) (0.027) (0.029) (0.026)
Non-farming household −0.083∗ −0.488∗∗∗ −0.114∗∗∗ −0.112∗∗∗ −0.076∗∗
(0.046) (0.045) (0.037) (0.040) (0.036)Average age 30-34 −0.042 −0.023 0.018 0.038 −0.002
(0.047) (0.047) (0.038) (0.041) (0.037)Average age 35-39 −0.007 0.016 0.047 0.021 0.007
(0.046) (0.046) (0.037) (0.040) (0.037)Average age 40-49 −0.007 0.006 0.005 0.013 0.008
(0.044) (0.044) (0.035) (0.038) (0.035)Average age 50-59 0.014 −0.060 −0.010 0.010 0.043
(0.044) (0.044) (0.035) (0.038) (0.035)Average age 60-99 −0.022 −0.059 0.005 −0.057 −0.007
(0.042) (0.042) (0.034) (0.037) (0.033)Household size 0.010 −0.006 −0.005 −0.004 0.013∗∗
(0.007) (0.007) (0.005) (0.006) (0.005)Number of adults 0.049∗∗ 0.071∗∗∗ 0.031∗∗ 0.019 0.005
(0.019) (0.019) (0.016) (0.017) (0.015)Observations 1272 1272 1272 1272 1272Communities 162 162 162 162 162
Note. Robust standard errors in parentheses. Sample consists of households where no adult member has completedprimary school. A household is considered to have attended if at least one of its members has participated in anadult literacy program. All models are linear probability models with community fixed effects. Hence, the parameterfor “Attended literacy program” shows the predicted increases in the probability from having participated in anadult literacy program. For all groups of goods, except for “Processed Produce” the relevant period covered is 12months. For “Processed Produce” only the last two weeks before the survey are covered.a Draught animals (donkey,horse, bullock) cattle (including cows), sheep, goats, pigs, rabbits, chicken, other poultry,other livestock, fish, crab and other.b Cocoa, coconut, coffee, cotton, kenef, rubber, wood, groundnut/peanut, maize, rice, sorghum/millet/guinea corn,beans/peas, tobacco, sugar cane and other crops.c Avocado pear, bananas, cola nut, mango, oil palm, oranges, pawpaw, plantains, other fruit trees, cassava, co-coyam, onion, swt. potatoes/potatoes, yam, garden eggs/egg plant, leafy vegetables, okro, pepper, tomatoes, othervegetables and pineapple.d hunting (including snail collection), honey, drinks (palm wine/akpeteshie, pito, mmedaa, etc), fruit/berries, milkand other dairy products, eggs, hides, wool, skin and mushrooms.e Maize flour, flour from other grains, husked/polished rice, home-brewed drink, cassava flour, shelled groundnuts,processed fish, gari, sheabutter, other nuts.* Statistically significant at 10%.** Statistically significant at 5%.*** Statistically significant at 1%.
35A more detailed description of each category is given in the footnotes to the table.
34

The largest and most statistically significant impact from participation is the increasedlikelihood that a household engaged in selling of goods in the livestock category (whichalso includes output from fishing). Households that have participated in an adult literacyprogram are seven percentage points more likely to have sold some type of livestock overthe twelve months prior to the survey. There are also statistically significant effects ofparticipation on the probability that a household have sold roots, fruits and vegetables andother produce over the last year, but for those two categories the effect is smaller at arounda four percentage point increase. Interestingly, there is no statistically significant effect ofparticipation on whether the household sells grain and cash crops, although the effect is stillpositive.
The effect on sale of processed produce is small and far from statistically significant.This is surprising given that one would expect these goods to be higher value goods andto be goods that require more investment and human capital which can be gained throughparticipation in an adult literacy program. A possible explanation for the small, insignificanteffect is that only thirteen percent of all households report selling these goods, which maybe a result of the short period covered for these goods as mentioned above. It is worthnoting that the share of households who sell these goods is almost twice than high amongparticipants as among non-participants (18 vs 10 percent, respectively).
The conclusion is that there is not one factor that explains the large, positive effect ofparticipation on household consumption. It does appear that households that have partic-ipated are more likely to be engaged in market activities, owing a business and especiallygetting a loan to invest in agriculture, although none of these effects are statistically signifi-cant. There are, however, significant effects on the likelihood of a household selling at leastsome types of agricultural good, but even here the increases are not large. Hence, as wediscuss below, understanding how the adult literacy programs affect household welfare is animportant area for future research.
6.3 Other Government Interventions
Clearly, given the available data it is difficult to disentangle how participating in an adultliteracy program increases welfare. Part of the effect is likely through skills acquisition,although the effect appears to be too small to explain the entire increase in consumption.Furthermore, while there are positive effects of participation on factors that might be relatedto business and agriculture these effects are small and only statistically significant for the saleof some types of goods. This makes it more important to examine whether other governmentprograms, interventions or other community characteristics might be responsible for theobserved effect. This could, for example, be the case if other programs or interventions wererolled out at the same time and to the same areas as the adult literacy programs. Table 18therefore shows correlation coefficients for a variety of government programs, interventionsand community characteristics for the 166 communities in the base data set.
In addition to adult literacy programs the community characteristics include whetherthere is a motorable road close to the community, whether there is a bank, daily market,hospital, health post, family planning clinic or agricultural extension center in the com-munity. While there are many community characteristics that are statistically significantlycorrelated the only characteristic that adult literacy program presence is statistically signifi-
35

Table 18: Correlation between Community Characteristics
Motorable Daily Health Family AgriculturalVariables Road Bank Market Hospital Post Planning Extension
Motorable 1.000road
Bank 0.149∗ 1.000(0.056)
Daily 0.176∗∗ 0.458∗∗∗ 1.000market (0.023) (0.000)
Hospital 0.053 0.356∗∗∗ 0.301∗∗∗ 1.000(0.497) (0.000) (0.000)
Health 0.230∗∗∗ 0.439∗∗∗ 0.347∗∗∗ 0.101 1.000post (0.003) (0.000) (0.000) (0.195)
Family 0.139∗ 0.433∗∗∗ 0.289∗∗∗ 0.171∗∗ 0.661∗∗∗ 1.000planning (0.076) (0.000) (0.000) (0.028) (0.000)
Agricultural 0.147∗ 0.381∗∗∗ 0.363∗∗∗ 0.163∗∗ 0.558∗∗∗ 0.511∗∗∗ 1.000extension (0.059) (0.000) (0.000) (0.037) (0.000) (0.000)
Literacy 0.139∗ −0.108 −0.075 −0.038 −0.016 0.021 0.105program (0.074) (0.168) (0.335) (0.624) (0.839) (0.791) (0.181)
Note. Level of significance in parentheses. Correlation coefficients and level of significance are based on the 166communities in the base data set.* Statistically significant at 10%.** Statistically significant at 5%.*** Statistically significant at 1%.
cantly correlated with is whether there is a motorable road nearby the community and eventhat correlation is small at 0.14. The correlation between the availability of an adult literacyprogram and and whether there is a bank in the community is negative and around 0.1,while the correlation with the presence of an agricultural extension program is around thesame size but positive. Neither correlation is statistically significant. Hence, it is unlikelythat other government programs, interventions or community characteristics are responsiblefor the positive effect of participation in adult literacy programs.
7 Conclusion
This paper examines the effect of adult literacy program participation on household consump-tion in Ghana. We use community fixed effects to deal with possible endogenous programplacement combined with instrumental variables to account for self-selection into programparticipation. We find substantial, positive and statistically significant effects on consump-tion for households where no adult members have completed any formal education. Forother households the effects are smaller and not statistically significant and become smallerthe more educated the household is. Based on the results our preferred estimated effect of
36

participation in an adult literacy program is an approximately ten percent increase in peradult equivalent consumption for no education households. For comparision Canagarajahand Thomas (1997) find that the return to education in Ghana is between four and sixpercent per year. Given the length of the program and the effort required by participantscombined with the focus on skills directly applicable to improving participants’ welfare thesereturns are approximately equal.
Another way of looking at the effectiveness of the program is to perform a simple cost-benefit analysis.36 The average cost per participant to the government of Ghana is USD33.40 (Oxenham 2002). The opportunity cost of participation is based on 21 months ofparticipation at ten hours per week with time valued at the average wage by sex of individualswho have not completed any formal schooling and who reported wage labour.37 Benefits arethe net present value of the increase in consumption from when the participants “graduate”from the program until and including age 55 using our preferred estimate of ten percentincrease per year. Hence, for, say, a 30 year old participant, we use the net present value ofincreased consumption from age 32 up to and including age 55. To simplify and keep theresults conservative we assume only one adult equivalent in the household; obviously theimpacts will be greater for larger families since the results above are per adult equivalent,not only for the participant. We use two levels of pre-participation expenditure: The lowerpoverty line of 700,000 Cedis per year and the upper poverty line of 900,000 Cedis peryear.38 The lowest internal rate of return based on these assumptions is 9.2 percent for a 40year old male participant who began at the lower poverty line, while the highest is close totwenty percent. These social rates of return are very respectable, especially considering thatthey do not include other potential benefits from participation than the impact on futureproductivity and the conservative nature of the assumptions.
The adult literacy programs in Ghana consist of several modules and hence determiningwhat makes the program effective is an important topic for future research. While par-ticipants are significantly more likely to be able to read and do written calculations thannon-participants, the literacy and numeracy rates for individuals without formal educationafter participation are not even close to those of individuals who have completed primaryschool (who have relatively low rates because of the poor quality of schooling). Furthermore,there are no statistically significant effects on variables such as whether the household ownsa business or obtains a loan, although participants are significantly more likely to sell sometypes of agricultural goods. It would therefore be tempting to conclude that the modules onincome generating activities are more important for the positive effect of participation thanthe actual literacy and numeracy skills. While this is certainly a possibility, it is also possi-ble that some or all of the positive effect comes from some other attribute of the program,
36The primary aim here is to illustrate the scale of benefits relative to the total cost of an adult participatingin a literacy program, not to conduct a complete cost-benefit analysis, which would require data on manyother outcomes besides earnings. For example, we do not include possible effects on health, fertility or theeducation of children. See, for example, Blunch (2006, 2009) for a discussion of literacy’s effect on theseoutcomes.
37As described above most programs run three times a week with each session lasting up to three hours;adding one hour for transport lead to ten hours a week.
38Table A-3 shows both the net benefits with a discount rate of five percent and the internal rates ofreturns (the discount rate at which the net present value of the benefits equal the combined costs).
37

such as an improvement in the participants’ network, or even from the combination of at-tributes. Furthermore, the fact that the effects for households with more educated membersare smaller than for the no education households, but still positive, seems to point towardsa more standard increase in human capital rather than the income generating modules, es-pecially since one might expect these to be complementary to household human capital. Itis, however, clear that it is not other government programs and interventions that drivesthe effect; there is no significant correlation between having an adult literacy program inthe community and all of the other community characteristics except for whether there is amotorable road and that correlation is small.
Part of the explanation for the difficulty in determining the pathways through whichprogram participation affects welfare, is that, in addition to literacy and numeracy, there areup to 28 themes and these can vary by area, but we only have information on participation,with no information on the provider or the timing of the program. A promising directionfor future research would be to run randomized experiments with varying combinations ofmodules to determine which ones are most important. It is already clear, however, that,despite the disappointing results from previous literacy programs, appropriately designedadult literacy programs can be an important component in the effort to improve the livelihoodof those that have not participated in the formal education system.
38

A OLS Estimates and Cost-Benefit Analysis
Table A-1: Individual Participation’s Effecton Household Welfare - OLS
Complete Level of Completed Education in Householda
Variables Sample Post Middle Middle Primary None
Attended literacy program 0.112∗∗∗ −0.105 0.046 0.002 0.202∗∗∗
(0.029) (0.096) (0.045) (0.059) (0.043)Female 0.056∗∗∗ 0.022 −0.014 0.044∗ 0.123∗∗∗
(0.010) (0.040) (0.012) (0.026) (0.025)Aged 30-44 −0.033 0.121∗ −0.024 −0.043 −0.067∗
(0.024) (0.064) (0.029) (0.052) (0.037)Aged 45-59 −0.017 0.036 −0.074∗∗∗ −0.060 0.013
(0.016) (0.053) (0.021) (0.057) (0.031)Aged 60-99 0.070∗∗∗ 0.005 −0.104∗∗ −0.092 0.167∗∗∗
(0.019) (0.062) (0.045) (0.063) (0.036)Primary education 0.038∗∗∗ −0.015 −0.029∗∗ −0.005
(0.007) (0.019) (0.011) (0.019)Middle education 0.062∗∗∗ 0.005 −0.025
(0.007) (0.020) (0.016)Post middle education 0.080∗∗∗ 0.008
(0.009) (0.033)Owns land 0.116∗∗∗ 0.104 0.148∗∗∗ 0.239∗∗∗ 0.031
(0.020) (0.086) (0.036) (0.057) (0.044)Non-farming household 0.299∗∗∗ 0.427∗∗∗ 0.307∗∗∗ 0.172∗∗ 0.183∗∗∗
(0.035) (0.122) (0.057) (0.064) (0.050)Percent with primary education 0.271∗∗∗ 0.474∗∗ 0.121 0.410∗∗∗
(0.043) (0.210) (0.097) (0.119)Percent with middle education 0.436∗∗∗ 0.611∗∗∗ 0.530∗∗∗
(0.030) (0.137) (0.063)Percent with post middle education 0.589∗∗∗ 1.114∗∗∗
(0.061) (0.184)Household size −0.085∗∗∗ −0.033∗ −0.076∗∗∗ −0.097∗∗∗ −0.108∗∗∗
(0.010) (0.018) (0.011) (0.020) (0.012)Number of adults in household −0.006 0.017 0.022 0.022 −0.058∗
(0.014) (0.042) (0.021) (0.052) (0.034)Constant 13.895∗∗∗ 13.210∗∗∗ 13.844∗∗∗ 13.884∗∗∗ 14.072∗∗∗
(0.050) (0.169) (0.073) (0.153) (0.087)
Observations 6713 883 2849 779 2202R-squared 0.24 0.27 0.22 0.27 0.28
Note. Robust standard errors in parentheses.a At least one adult with this level of education and none with more within household.* Statistically significant at 10%.** Statistically significant at 5%.*** Statistically significant at 1%.
39

Table A-2: Household Participation’s Effecton Household Welfare - OLS
Complete Level of Completed Education in Householda
Variables Sample Post Middle Middle Primary None
Attended literacy program 0.094∗∗∗ −0.195∗ 0.031 −0.017 0.202∗∗∗
(0.028) (0.101) (0.047) (0.074) (0.045)Owns land 0.140∗∗∗ 0.139∗ 0.157∗∗∗ 0.232∗∗∗ 0.093∗∗
(0.020) (0.074) (0.035) (0.056) (0.039)Non-farming household 0.203∗∗∗ 0.330∗∗∗ 0.217∗∗∗ 0.130∗∗ 0.138∗∗
(0.034) (0.095) (0.051) (0.058) (0.053)Average age 30-34 −0.079∗ −0.097 −0.099∗∗ −0.058 −0.093
(0.044) (0.116) (0.039) (0.115) (0.067)Average age 35-39 −0.077 0.036 −0.119∗∗ −0.123 −0.026
(0.051) (0.121) (0.056) (0.104) (0.073)Average age 40-49 −0.123∗∗∗ −0.014 −0.149∗∗∗ −0.279∗∗∗ −0.025
(0.035) (0.126) (0.041) (0.094) (0.076)Average age 50-59 −0.049 0.123 −0.078 −0.210∗ −0.028
(0.034) (0.126) (0.074) (0.102) (0.060)Average age 60-99 0.096∗∗ −0.137 −0.174∗ −0.034 0.116∗∗
(0.038) (0.215) (0.098) (0.119) (0.054)Percent with primary education 0.289∗∗∗ 0.374∗ 0.135 0.325∗
(0.041) (0.205) (0.092) (0.162)Percent with middle education 0.456∗∗∗ 0.600∗∗∗ 0.509∗∗∗
(0.030) (0.143) (0.066)Percent with post middle education 0.619∗∗∗ 1.053∗∗∗
(0.053) (0.188)Household size −0.115∗∗∗ −0.046∗∗ −0.099∗∗∗ −0.123∗∗∗ −0.143∗∗∗
(0.007) (0.019) (0.010) (0.018) (0.011)Number of adults in household −0.006 0.008 0.018 0.028 −0.065∗∗
(0.011) (0.037) (0.018) (0.057) (0.025)Constant 14.153∗∗∗ 13.467∗∗∗ 14.030∗∗∗ 14.182∗∗∗ 14.327∗∗∗
(0.049) (0.188) (0.068) (0.197) (0.079)
Observations 3219 323 1235 389 1272R-squared 0.30 0.29 0.29 0.33 0.32
Note. Robust standard errors in parentheses. A household is considered to have attended if at least oneof its members has participated in an adult literacy program.a At least one adult with this level of education and none with more within household.* Statistically significant at 10%.** Statistically significant at 5%.*** Statistically significant at 1%.
40

Table A-3: Cost-Benefit Analysisfor Adult Literacy Programs
Females Males
Cost
Direct cost: 33.40 33.40Opportunity Cost: 42.97 56.48Total Cost: 76.37 89.88
Benefits
Lower poverty line:30 year old 160.98 160.9840 year old 115.48 115.48
Upper poverty line:30 year old 206.98 206.9840 year old 148.48 148.48
Net Benefits
Lower poverty line:30 year old 84.61 71.1040 year old 39.11 25.60
Upper poverty line:30 year old 130.61 117.1040 year old 72.11 58.60
Internal Rateof Return
Lower poverty line:30 year old 14.7 12.240 year old 12.3 9.2
Upper poverty line:30 year old 19.4 16.340 year old 17.6 14.1
Note. All figures are in USD with an ex-change rate of 6000 Cedis to one USD.
41

References
Abadzi, H. (2003): “Adult Literacy: A Review of Implementation Experience,” OEDWorking Paper 29387, World Bank Operations Evaluation Department, Washington DC.
Angeles, G., D. K. Guilkey, and T. A. Mroz (1998): “Purposive Program Placementand the Estimation of Family Planning Program Effects in Tanzania,” Journal of theAmerican Statistical Association, 93(443), 884–99.
Appleton, S. (2002): “The Rich are Like Us, Only Richer: Poverty Functions or Con-sumption Functions,” Journal of African Economies, 10(4), 433–469.
Blunch, N.-H. (2006): “Skills, Schooling and Household Well-Being in Ghana,” Unpub-lished PhD dissertation, The George Washington University, Washington, DC.
(2009): “Human Capital, Religion and Contraceptive Use in Ghana,” Mimeo,Department of Economics, Washington and Lee University, Lexington, VA.
Blunch, N.-H., and C. C. Portner (2004): “Literacy, Skills and Welfare: Effects ofParticipation in Adult Literacy Programs,” Mimeo, University of Washington, Seattle,WA.
Boissiere, M., J. B. Knight, and R. H. Sabot (1985): “Earnings, Schooling, Ability,and Cognitive Skills,” American Economic Review, 75(5), 1016–30.
Canagarajah, S., and C. C. Portner (2003): “Evolution of Poverty and Welfare inGhana in the 1990s: Achievements and Challenges,” Africa Region Working Paper Se-ries 61, World Bank, Washington, DC.
Canagarajah, S., and S. Thomas (1997): “Ghana’s Labor Market (1987-92),” PolicyResearch Working Paper Series 1752, World Bank, Washington, DC.
Carr-Hill, R. A., A. N. Kweka, M. Rusimbi, and R. Chengelele (1991): “TheFunctioning and Effects of the Tanzanian Literacy Programme,” IIEP Research Report 93,International Institute of Educational Planning, UNESCO.
Carron, G., K. Mwiria, and G. Righa (1989): “The Functioning and Effects of theKenya Literacy Programme,” IIEP Research Report 76, International Institute of Educa-tional Planning, UNESCO.
Central Bureau of Statistics [Ghana] (1984): “1984 Population Census of Ghana:Preliminary Report,” Discussion paper, Central Bureau of Statistics, Accra, Ghana.
Chiswick, B. R., Y. L. Lee, and P. W. Miller (2003): “Schooling, Literacy, Numeracyand Labour Market Success,” Economic Record, 79(245), 165–81.
Dustmann, C., and F. Fabbri (2003): “Language Proficiency and Labour Market Per-formance of Immigrants in the UK,” Economic Journal, 113(489), 695–717.
42

Glewwe, P. (1999): “The Impact of Cognitive Skills on Wages,” in The Economics ofSchool Quality Investments in Developing Countries: An Empirical Study of Ghana, ed.by P. Glewwe. Macmillan, London.
Green, D. A., and W. C. Riddell (2003): “Literacy and Earnings: An Investigationof the Interaction of Cognitive and Unobserved Skills in Earnings Generation,” LabourEconomics, 10(2), 165–84.
Ishikawa, M., and D. Ryan (2002): “Schooling, Basic Skills and Economic Outcomes,”Economics of Education Review, 21(3), 231–43.
Jolliffe, D. (1999): “The Impact of Cognitive Skills on Income from Farming,” in TheEconomics of School Quality Investments in Developing Countries: An Empirical Studyof Ghana, ed. by P. Glewwe. Macmillan, London.
Mitra, A. (2002): “Mathematics Skill and Male-Female Wages,” Journal of Socio-Economics, 31(5), 443–56.
Moll, P. G. (1998): “Primary Schooling, Cognitive Skills and Wages in South Africa,”Economica, 65(263-84).
Murnane, R. J., J. B. Willett, and F. Levy (1995): “The Growing Importanceof Cognitive Skills in Wage Determination,” Review of Economics and Statistics, 77(2),251–66.
Ortega, D., and F. Rodriguez (2008): “Freed from Illiteracy? A Closer Look atVenezuela’s Mision Robinson Literacy Campaign,” Economic Development and CulturalChange, 57(1), 1 – 30.
Oxenham, J. (2002): “Review of World Bank Supported Projects in Adult Basic Educationand Literacy, 1977-2002 - Comparison of Costs - 1977 through 2002,” Mimeo, World Bank,Washington, DC.
Pitt, M. M., M. R. Rosenzweig, and D. M. Gibbons (1995): “The Determinantsand Consequences of the Placement of Government Programs in Indonesia,” in PublicSpending and the Poor: Theory and Evidence, ed. by D. van de Walle, and K. Nead, pp.114–149. Johns Hopkins University Press for the World Bank, Baltimore and London.
Ribar, D. C. (2003): “What Do Social Scientists know about the Benefits of Marriage?A Review of Quantitative Methodologies,” mimeo, George Washington University, Wash-ington, DC.
Rosenbaum, P. R., and D. B. Rubin (1983): “The Central Role of the Propensity Scorein Observational Studies for Causal Effects,” Biometrika, 70, 41–55.
Rosenzweig, M. R., and K. I. Wolpin (1986): “Evaluating the Effects of Optimally Dis-tributed Public Programs: Child Health and Family Planning Interventions,” AmericanEconomic Review, 76, 470–482.
43

Tyler, J. H., R. J. Murname, and J. B. Willett (2000): “Do the Cognitive Skillsof School Dropouts Matter in the Labor Market?,” Journal of Human Resources, 35(4),748–54.
Vijverberg, W. P. M. (1999): “The Impact of Schooling and Cognitive Skills on In-come from Non-Farm Self-Employment,” in The Economics of School Quality Investmentsin Developing Countries: An Empirical Study of Ghana, ed. by P. Glewwe. Macmillan,London.
Wooldridge, J. M. (2002): Econometric Analysis of Cross Section and Panel Data. TheMIT Press, Cambridge, MA.
44