CERDÀ AND BARCELONA
34
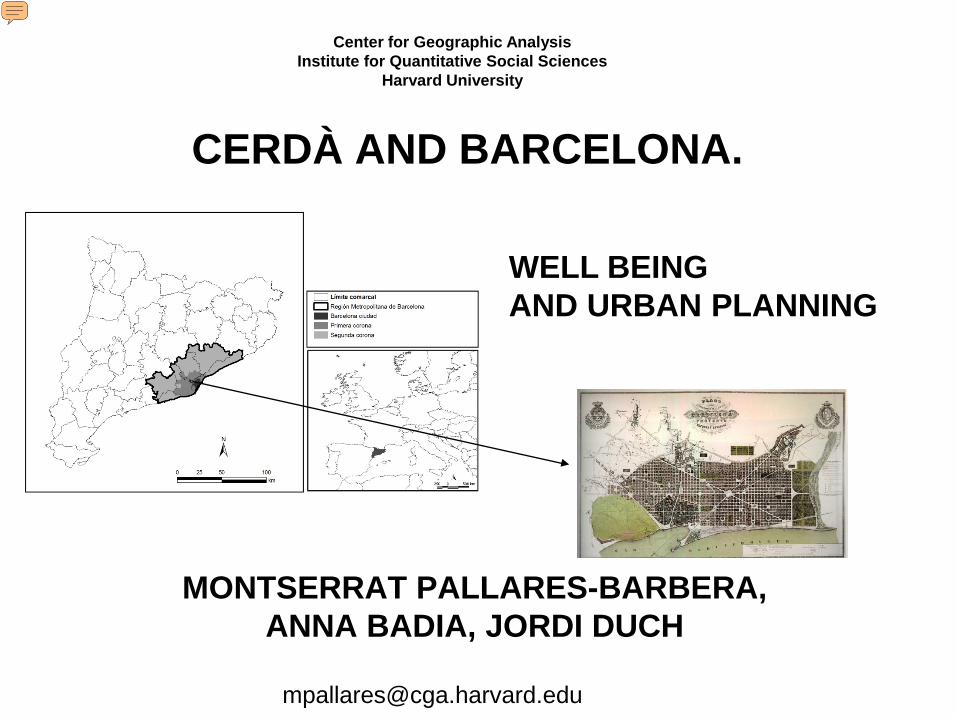
CERDÀ AND BARCELONA. MONTSERRAT PALLARES-BARBERA, ANNA BADIA, JORDI DUCH Center for Geographic Analysis Institute for Quantitative Social Sciences Harvard University [email protected] WELL BEING AND URBAN PLANNING
Transcript of CERDÀ AND BARCELONA
CERDÀ AND BARCELONA.
MONTSERRAT PALLARES-BARBERA, ANNA BADIA, JORDI DUCH
Center for Geographic AnalysisInstitute for Quantitative Social Sciences
Harvard University
WELL BEING AND URBAN PLANNING
Presenter
Presentation Notes
Today I am going to talk about how can urban planning could be used as a tool to redistribute the utility of individuals well being. And how to optimize the use of resources such as schools, markets, parks and hospitals. I focus on a case study, the Cerdà’s urban expansion of Barcelona done in 1860. We’ll be studying the pattern of location of services in the Cerdà’s proposal and how allocation of population can be done using current methodology from location theory, such as spatial location-allocation models and GIS for data capturing and analysis. Usually I get reactions from political economists or urban planners when I present this topic. They question about how to measure well being or spatial justice from services. And how to use this concept to capture the “true” of what in fact happening. I want to focus this presentation on how normative urban planning can be used as a tool for redistributing utility and in the aggregate increase the level of spatial well being. Why location of services need to be central planned? Why services have to regulated and do not leave market to decide where to locate them; or even let’s people decide if they need them? I work under the assumption, at the beginning of this project, that services are public goods. Parks, for instance, are pure public goods that need to be centrally planned; one of the reasons for planning services is that market, typically, under provide these goods.
Geography Dept. Universitat Autònoma de Barcelona
Center for Geographic Analysis. IQSS. Harvard University
2
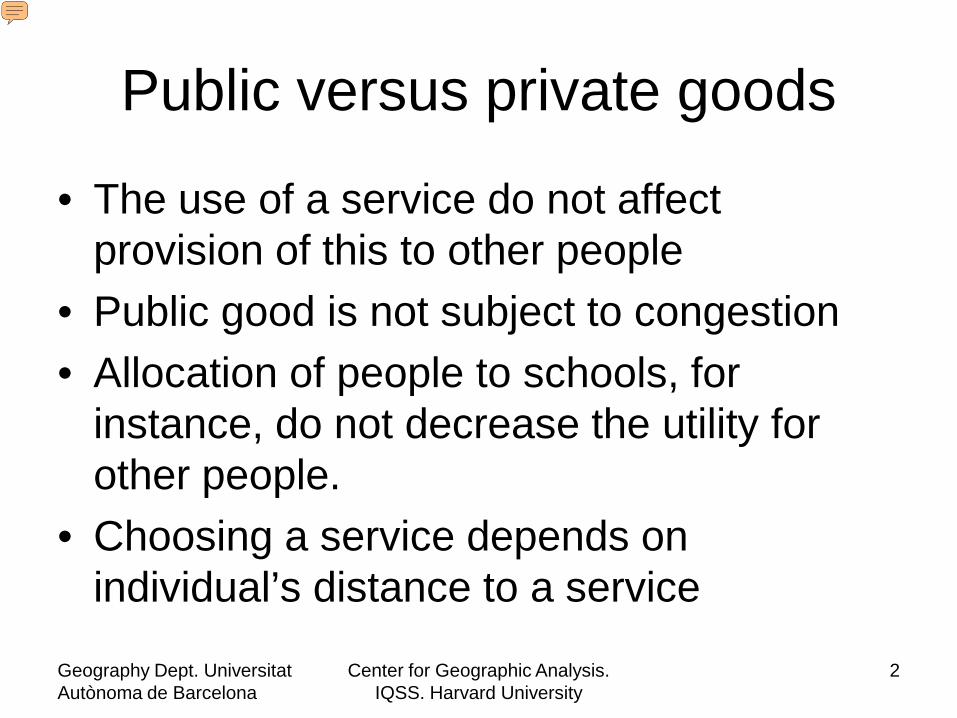
Public versus private goods
• The use of a service do not affect provision of this to other people
• Public good is not subject to congestion• Allocation of people to schools, for
instance, do not decrease the utility for other people.
• Choosing a service depends on individual’s distance to a service
Presenter
Presentation Notes
Decreasing utility depends on distance In this presentation I am talking about allocating people to a previous pattern of services already located At the end I will speak about more general case where location has to be decided, under a suboptimal pattern of nodes; and whether population have different income.
Geography Dept. Universitat Autònoma de Barcelona
Center for Geographic Analysis. IQSS. Harvard University
3
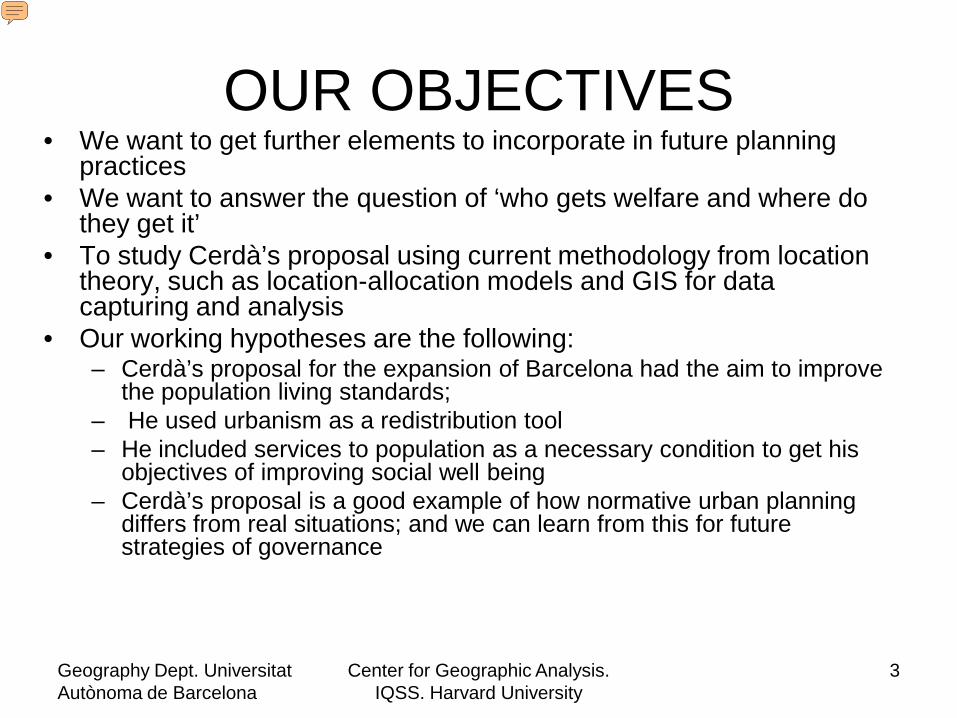
OUR OBJECTIVES• We want to get further elements to incorporate in future planning
practices • We want to answer the question of ‘who gets welfare and where do
they get it’• To study Cerdà’s proposal using current methodology from location
theory, such as location-allocation models and GIS for data capturing and analysis
• Our working hypotheses are the following:– Cerdà’s proposal for the expansion of Barcelona had the aim to improve
the population living standards; – He used urbanism as a redistribution tool – He included services to population as a necessary condition to get his
objectives of improving social well being– Cerdà’s proposal is a good example of how normative urban planning
differs from real situations; and we can learn from this for future strategies of governance
Presenter
Presentation Notes
Other uses of normative urban planning is the Prevention… and ….Prediction to Decrease vulnerability Well fare varies with location How to decide who and where?
Geography Dept. Universitat Autònoma de Barcelona
Center for Geographic Analysis. IQSS. Harvard University
4
Normative approach and governance
• How normative approach differs from current-real situations?
• “Villa Olímpica” Barcelona 1992-2011• Others:
– Cerdà’s Map and density. Variations in the housing occupation of current Barcelona’s blocks respect what was planned
– In-wall Barcelona density
Presenter
Presentation Notes
In fact what happens in the current world is that social “voices”, political groups, influence the decisions of how to distribute, and Who gets utility from service? Or pressure to get space for un-compatible uses: to locate factories and housing..
Geography Dept. Universitat Autònoma de Barcelona
Center for Geographic Analysis. IQSS. Harvard University
5
structure of the talk
• Problem and motivations of the problem• Literature review• Objectives• Case study• Methodology• Concluding unanswered questions
Presenter
Presentation Notes
After this introduction, I concentrate in the case study and methodology of this project
Geography Dept. Universitat Autònoma de Barcelona
Center for Geographic Analysis. IQSS. Harvard University
6
BASIC FACTS OF CERDÀ AND HIS PRECONDITIONS AS URBAN
PLANNER• “Técnica” Technology• “social order” need a container (Cerdà
1869, p. 6)• “movimiento y comunicatividad” movement
and communicability (Cerdà 1869, p. 8)• Strength to do it• “social philosophy and the urbanization
concept” (started in 1849 p. 9)
Presenter
Presentation Notes
Cerdà was an engineer. His personal life brought him from little-tiny small town to the North of Barcelona to study engineering in Madrid. He was the son of a wealthy rural family, which travel a lot around Europe and discover the improvements being done of the “técnica” technology applied to industry, to means of communication, which influence his thought of how the “social order” had to be embedded in a urban development where “movimiento y comunicatividad” movement and communicability had to be the basis for the new city. In addition to engineering he developed a military and a political careers, both in Madrid and Barcelona. In 1844 Cerdà started imagining a “social philosophy” (Cerdà 1869, p. 6, 1844), which had to be centered in “la idea urbanizadora” the urbanization idea. He discussed widely and rhetorically his urbanism developments in two volumes of approx 2,000 pages. (started in 1849 p. 9).
Geography Dept. Universitat Autònoma de Barcelona
Center for Geographic Analysis. IQSS. Harvard University
7
BASIC FACTS ABOUT BARCELONA 1860
• Plagues• Workers’ strikes 1855 (Engels, Toynbee p.
118)• Increasing population• “The walls” a political reason• 182 factories, 54272 workers (41%
women) (Cerdà 1869, p. 206)• 802 inhab/ha
Presenter
Presentation Notes
- After successive plagues (fatal, epidemic disease; a pestilence) and increases of population in Barcelona due to an increase in economic activity which needed labor force to work in factories, Barcelona increased population, which had to live inside the encircled walls of the city. For military purposes no construction was allowed behind this.
Geography Dept. Universitat Autònoma de Barcelona
Center for Geographic Analysis. IQSS. Harvard University
8
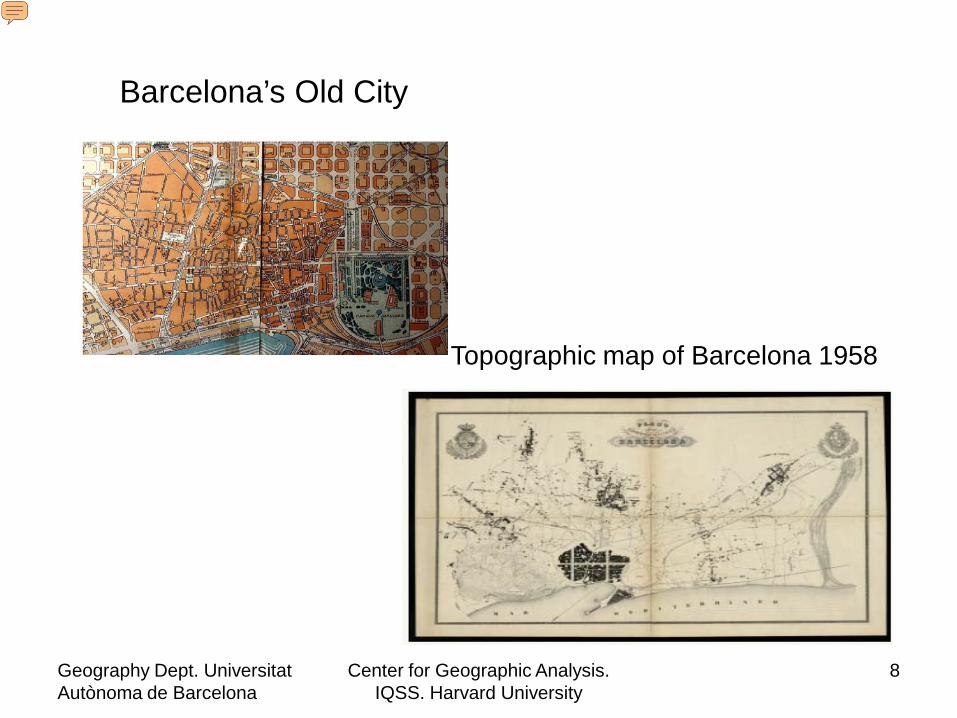
Barcelona’s Old City
Topographic map of Barcelona 1958
Presenter
Presentation Notes
All urban activity was confined to this 1.92 square km with tortuous streets of 1.5 meters o 3.5 meters.. Respect to neighboring small towns, the Old city had a continuity of plain space. His proposal was to extend Barcelona and attached to the neighboring populations of Sant Andreu, Gracia and others This plain surface which allowed to plan an “infinite” street grit, housing and garden blocks, from 196 ha of the Old City, to 1964 ha.
Geography Dept. Universitat Autònoma de Barcelona
Center for Geographic Analysis. IQSS. Harvard University
9
Cerdà and the Old City. the unbearable urban density
• “Monograph about statistics of the working class of Barcelona” (1856): living conditions
• “social statistics” as action tool– Density 11.44 sq m/person; 183,877 inhabitants
(Garriga i Roca 1857-1858)– Mortality as negative signal of well being
• food intake• family budget• working conditions
– House dimension-house density
Presenter
Presentation Notes
Look at Canedo Arnedo, M. Geohistòria ambiental de la Barcelona del segle XIX. Master Research Project. Universitat Autònoma de Barcelona. Geography Department, 2010. Cerdà believed in the goodness of “Social statistics”
Geography Dept. Universitat Autònoma de Barcelona
Center for Geographic Analysis. IQSS. Harvard University
10
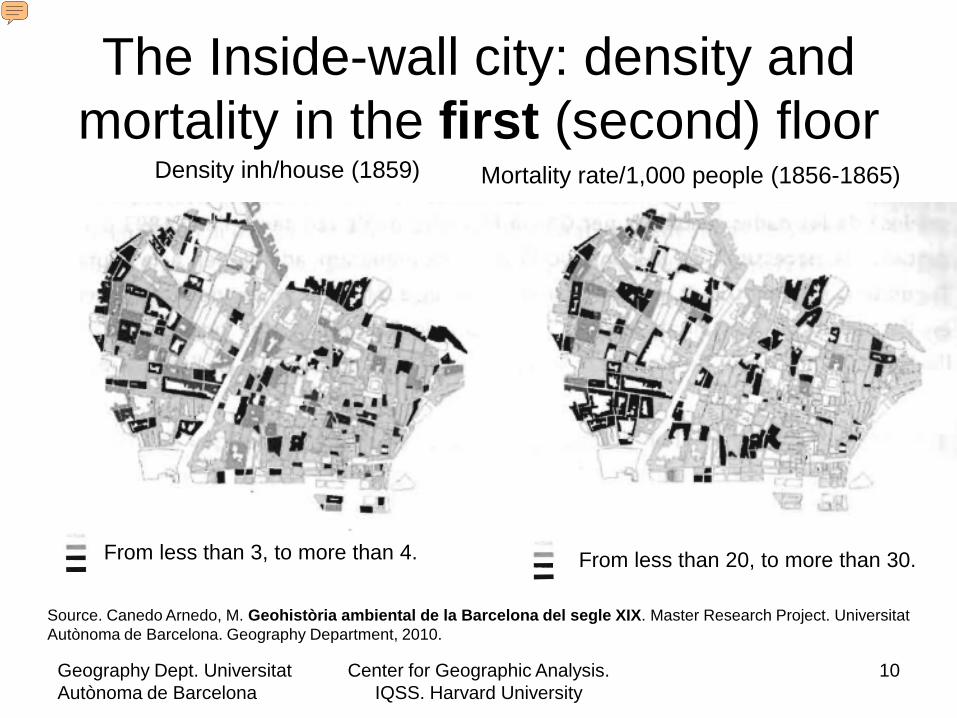
The Inside-wall city: density and mortality in the first (second) floor
Source. Canedo Arnedo, M. Geohistòria ambiental de la Barcelona del segle XIX. Master Research Project. Universitat Autònoma de Barcelona. Geography Department, 2010.
Density inh/house (1859) Mortality rate/1,000 people (1856-1865)
From less than 3, to more than 4. From less than 20, to more than 30.
Presenter
Presentation Notes
Posterior studies about Cerdà’s statistics went further to give a geographic reference of his tables of social statistics and relate density and mortality with social classes living in different floors inside the Old City… 1.92 Km2 the inside wall city and >100.000 inhabitants Density: >30,000 inhabitants per km2
Geography Dept. Universitat Autònoma de Barcelona
Center for Geographic Analysis. IQSS. Harvard University
11
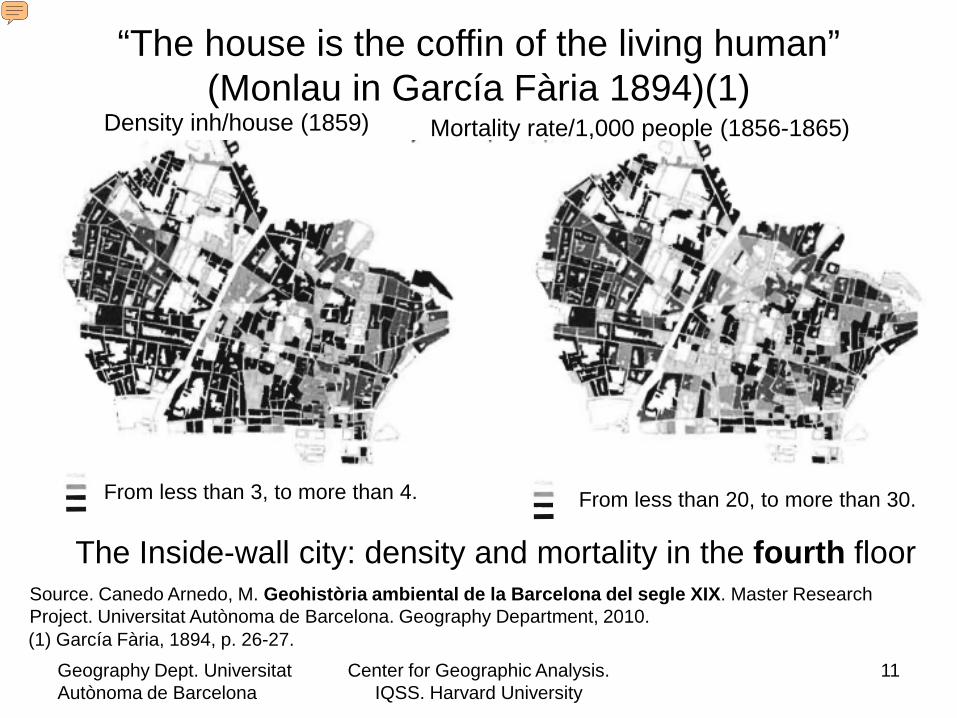
“The house is the coffin of the living human” (Monlau in García Fària 1894)(1)
Source. Canedo Arnedo, M. Geohistòria ambiental de la Barcelona del segle XIX. Master Research Project. Universitat Autònoma de Barcelona. Geography Department, 2010.(1) García Fària, 1894, p. 26-27.
The Inside-wall city: density and mortality in the fourth floor
Density inh/house (1859) Mortality rate/1,000 people (1856-1865)
From less than 3, to more than 4. From less than 20, to more than 30.
Presenter
Presentation Notes
This is representing the most important argument in Cerdà’s new plan for Barcelona
Geography Dept. Universitat Autònoma de Barcelona
Center for Geographic Analysis. IQSS. Harvard University
12
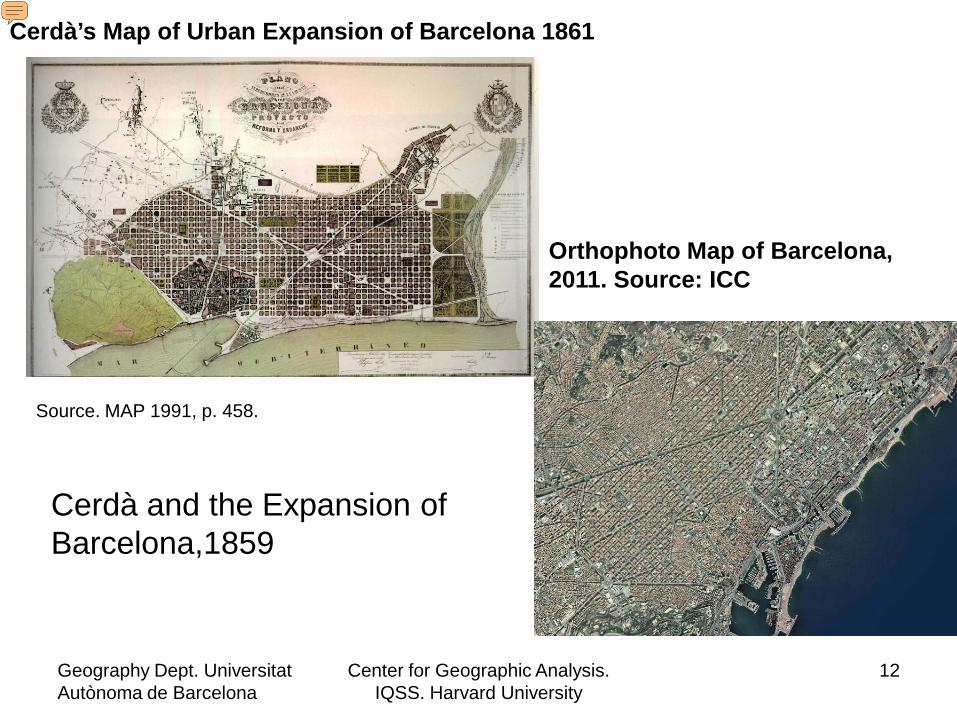
Cerdà’s Map of Urban Expansion of Barcelona 1861
Source. MAP 1991, p. 458.
Orthophoto Map of Barcelona, 2011. Source: ICC
Cerdà and the Expansion of Barcelona,1859
Presenter
Presentation Notes
Array of streets projected by Ildefonso Cerdà “Infinite” urbanization
Geography Dept. Universitat Autònoma de Barcelona
Center for Geographic Analysis. IQSS. Harvard University
13
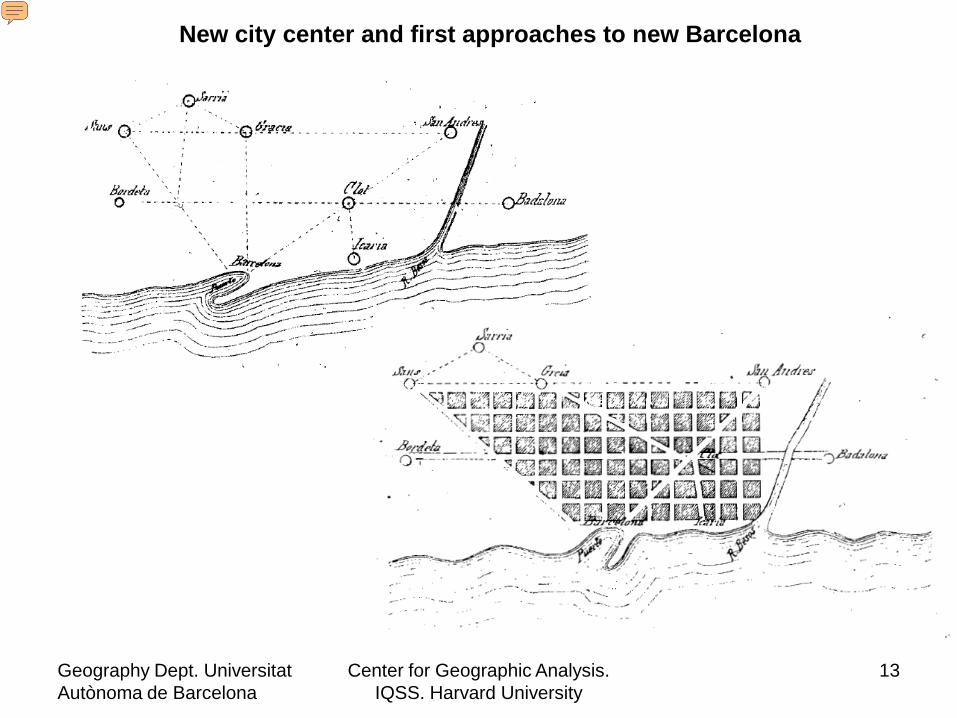
New city center and first approaches to new Barcelona
Presenter
Presentation Notes
Cerdà’s imagined the city center far away from the old city; in order to differentiate what the proposal was trying to do from the 1860’s Old City He even projected to demolish the Old City.
Geography Dept. Universitat Autònoma de Barcelona
Center for Geographic Analysis. IQSS. Harvard University
14
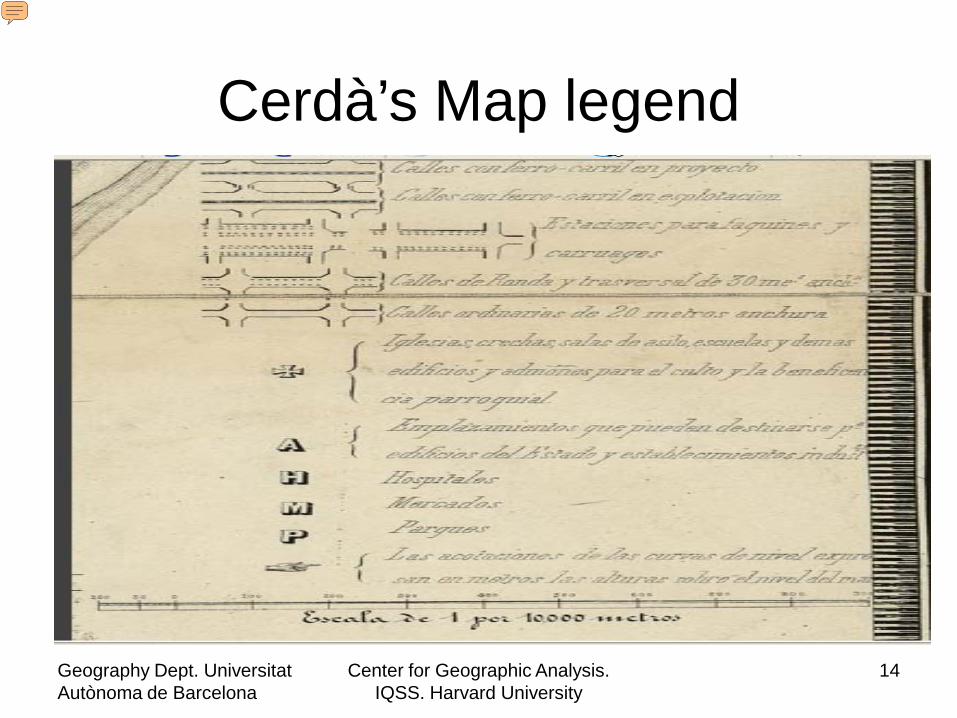
Cerdà’s Map legend
Presenter
Presentation Notes
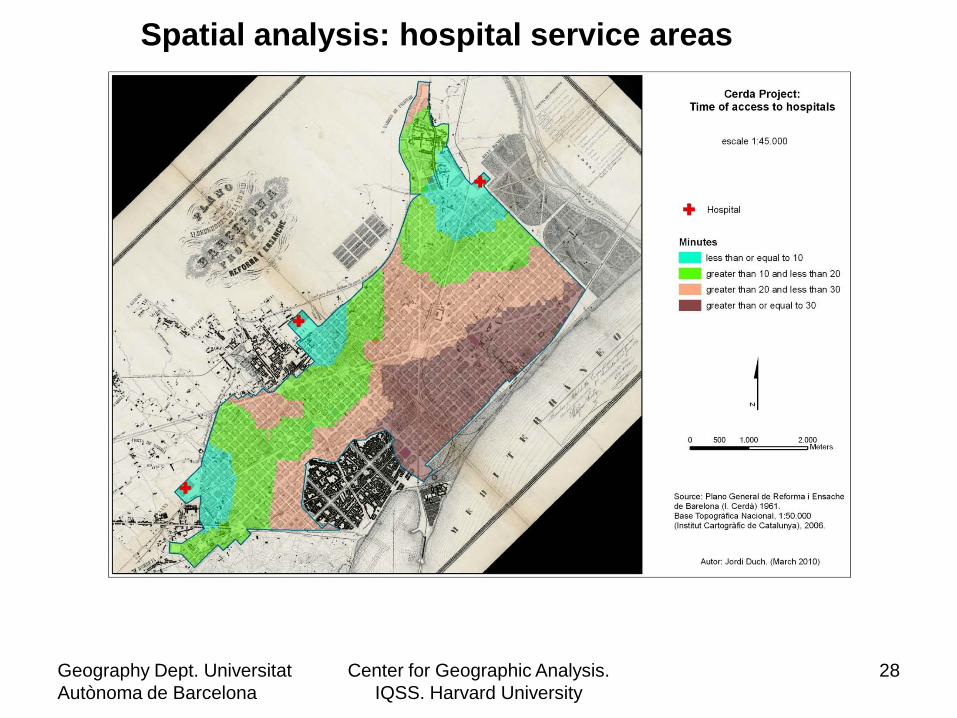
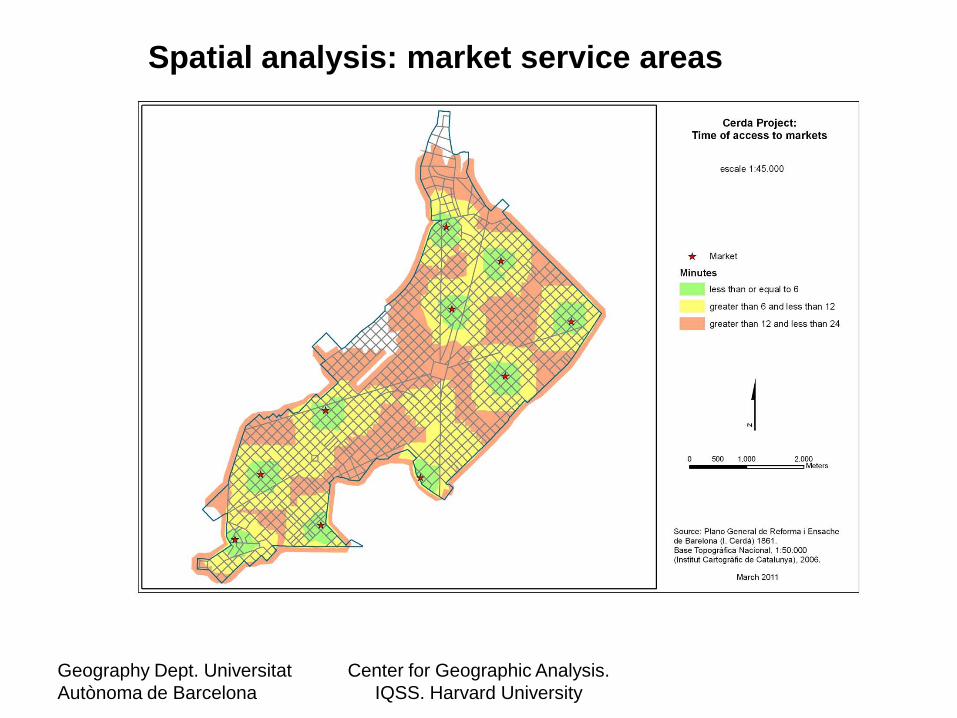
Projected location of amenities, such as schools and hospitals in Cerdà’s urban expansion of Barcelona; The Map contained 33 schools, 3 hospitals, 8 parks, 10 markets, and 12 administrative buildings.
Geography Dept. Universitat Autònoma de Barcelona
Center for Geographic Analysis. IQSS. Harvard University
15
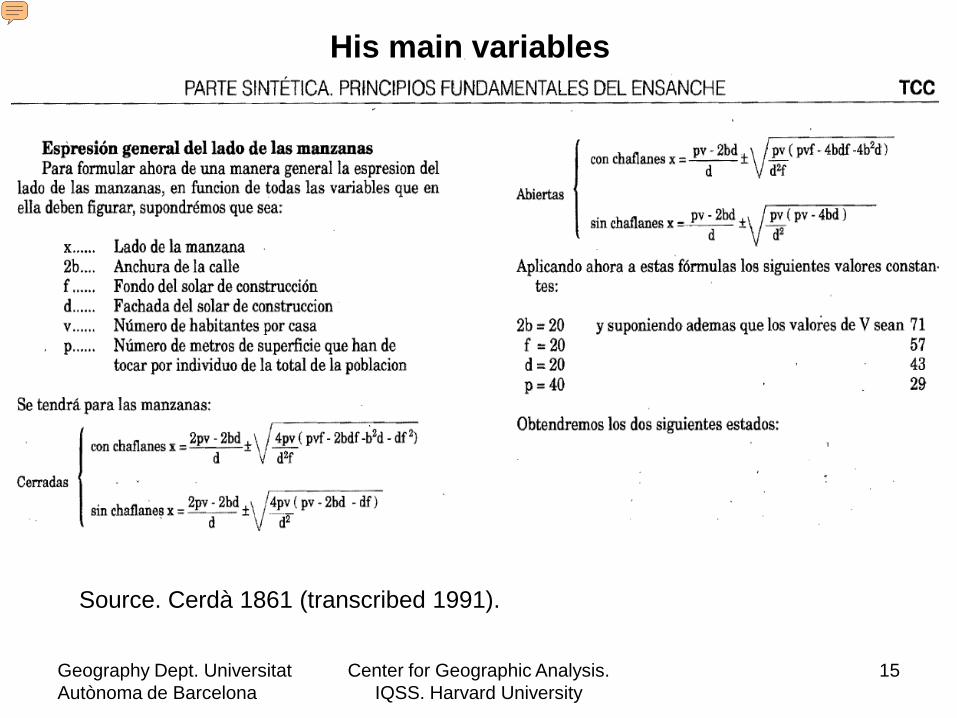
Source. Cerdà 1861 (transcribed 1991).
His main variables
Presenter
Presentation Notes
In this formula Cerdà delineates and emphasizes all his basic facts of his Urbanization Model. How long and wide has to be the container of his model “idea”? Dependent variable is the length of the block. It depends on the square meters per person p, On the population v, On how wide is the street 2b, Façade of the building d.
Geography Dept. Universitat Autònoma de Barcelona
Center for Geographic Analysis. IQSS. Harvard University
16
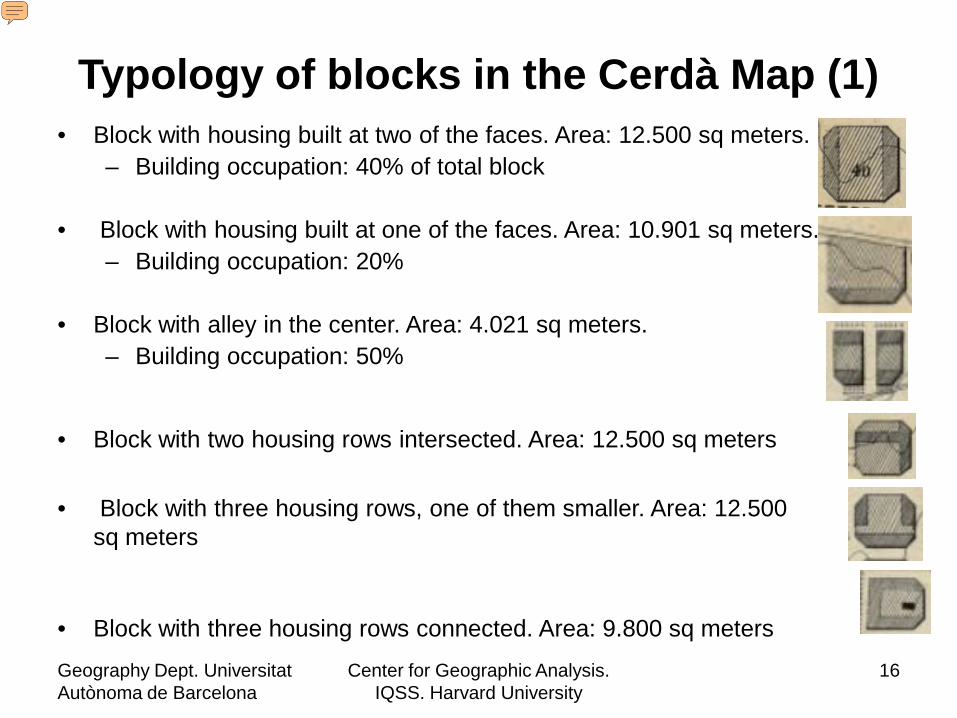
Typology of blocks in the Cerdà Map (1)• Block with housing built at two of the faces. Area: 12.500 sq meters.
– Building occupation: 40% of total block
• Block with housing built at one of the faces. Area: 10.901 sq meters.– Building occupation: 20%
• Block with alley in the center. Area: 4.021 sq meters.– Building occupation: 50%
• Block with two housing rows intersected. Area: 12.500 sq meters
• Block with three housing rows, one of them smaller. Area: 12.500 sq meters
• Block with three housing rows connected. Area: 9.800 sq meters
Presenter
Presentation Notes
From the model to what had to be adjusted in the topography and array of streets. Building occupation: 50%
Geography Dept. Universitat Autònoma de Barcelona
Center for Geographic Analysis. IQSS. Harvard University
17
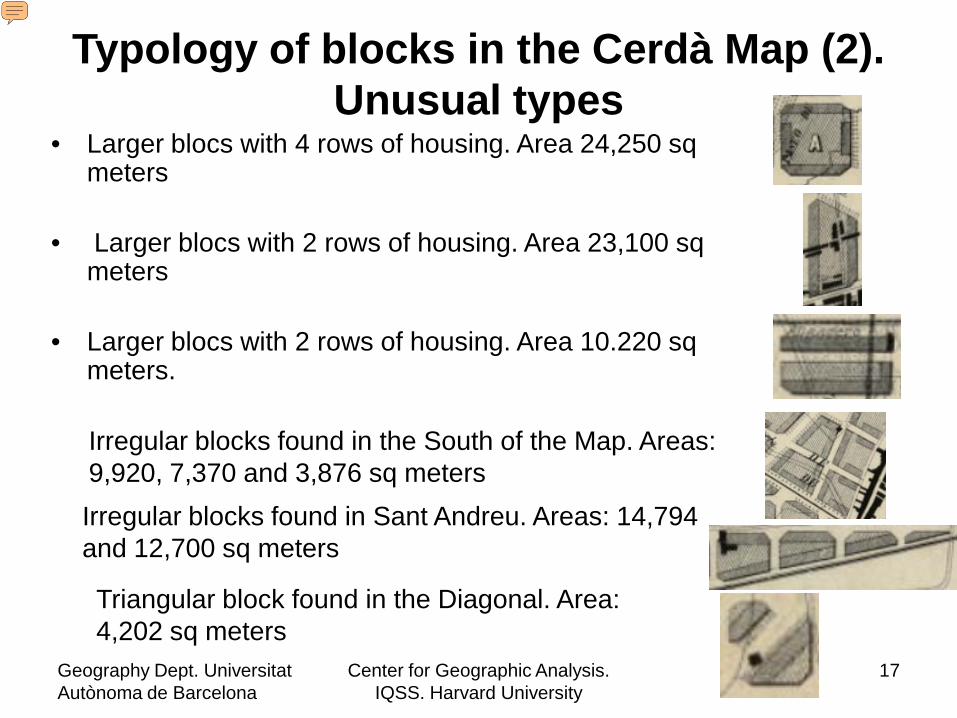
• Larger blocs with 4 rows of housing. Area 24,250 sq meters
• Larger blocs with 2 rows of housing. Area 23,100 sq meters
• Larger blocs with 2 rows of housing. Area 10.220 sq meters.
Typology of blocks in the Cerdà Map (2). Unusual types
Triangular block found in the Diagonal. Area: 4,202 sq meters
Irregular blocks found in the South of the Map. Areas: 9,920, 7,370 and 3,876 sq metersIrregular blocks found in Sant Andreu. Areas: 14,794 and 12,700 sq meters
Presenter
Presentation Notes
- He constructed a model with had to be translated to real variables, like considering slopes, rivers, …
Geography Dept. Universitat Autònoma de Barcelona
Center for Geographic Analysis. IQSS. Harvard University
18
Methodology: What are we doing• 1. Spatial-optimization models implemented in GIS and
SDSS• 2. Test and analyze the optimal and suboptimal
objectives and generate a number of compromised spatial solutions that can be both feasible and different from one another
• 3. Data capturing and spatial analysis: ArcGIS Network Analyst
– Spatial data: • Georeferentiation of the base map (Spatial referencing data)• Digitalization: arcs, nodes, polygons, blocks• Distance
– Alphanumeric data:• Population• Income
Presenter
Presentation Notes
First, we want to maximize the population being served by service. Location-allocation models from Location Theory would help to find results which satisfy demand’s needs. Data capturing or data collection: original map; georeferentiation, digitalization.
Geography Dept. Universitat Autònoma de Barcelona
Center for Geographic Analysis. IQSS. Harvard University
19
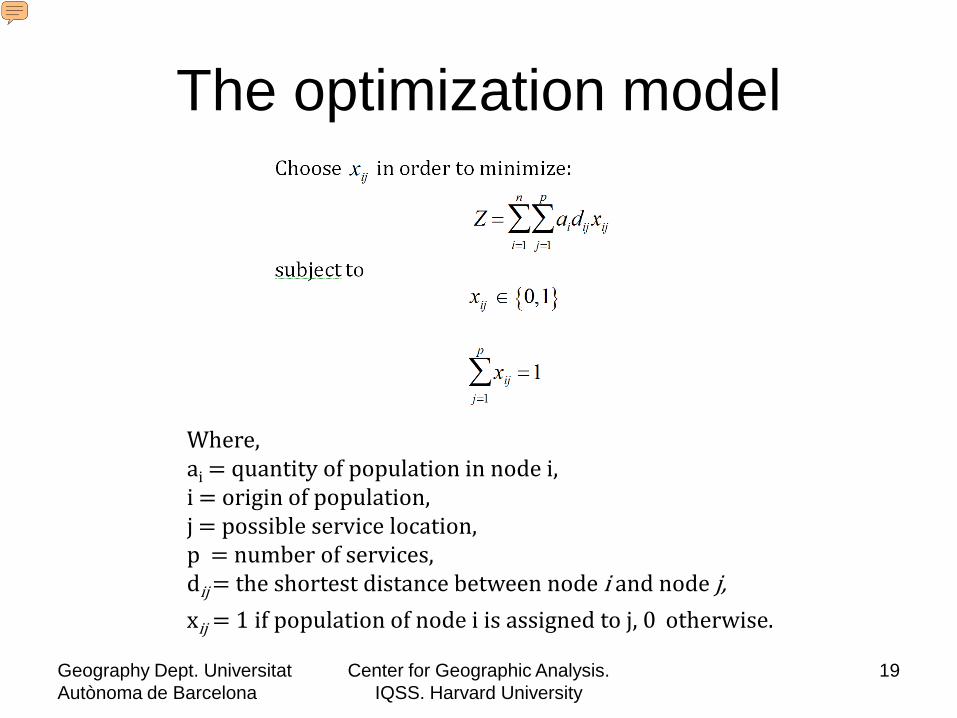
The optimization model
Where,ai = quantity of population in node i,i = origin of population,j = possible service location,p = number of services,dij = the shortest distance between node i and node j,xij = 1 if population of node i is assigned to j, 0 otherwise.
Presenter
Presentation Notes
We want to minimize the distance between population and service and Minimize the cost or utility population has to travel to get a service, Decision variable: The dichotomic variable is the decision variable (or binary variable (a mask)): 1 or 0 if population is served or otherwise. Subject to assumptions: All population has to be served, A number of services is given (p),
Geography Dept. Universitat Autònoma de Barcelona
Center for Geographic Analysis. IQSS. Harvard University
20
Imposing more constraints….
• Constraints:– All population is suppose to have the same
amount of income– Schools and services have unlimited capacity.
It is limited by the quantity of population allocated to service
– Facilities offer the same type of service, product, or quality
Presenter
Presentation Notes
In addition we have these other constraints: Which can be relaxed as we go on with the project…
Geography Dept. Universitat Autònoma de Barcelona
Center for Geographic Analysis. IQSS. Harvard University
21
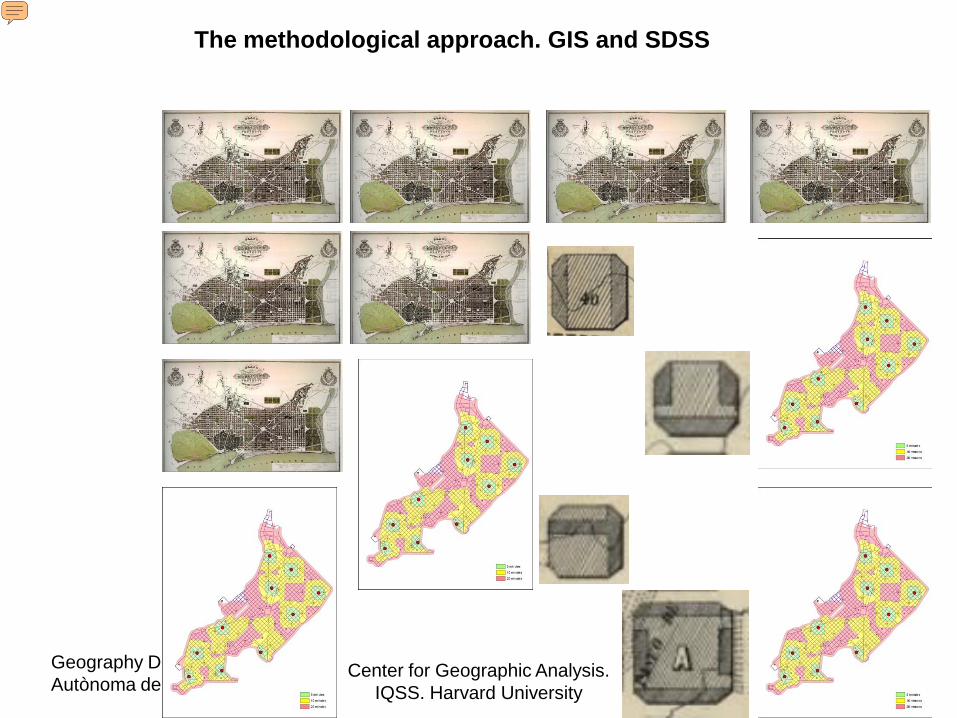
The methodological approach. GIS and SDSS
Presenter
Presentation Notes
GIS and spatial decision support systems SDSS. Using ArcGIS Network Analyst
Geography Dept. Universitat Autònoma de Barcelona
Center for Geographic Analysis. IQSS. Harvard University
22
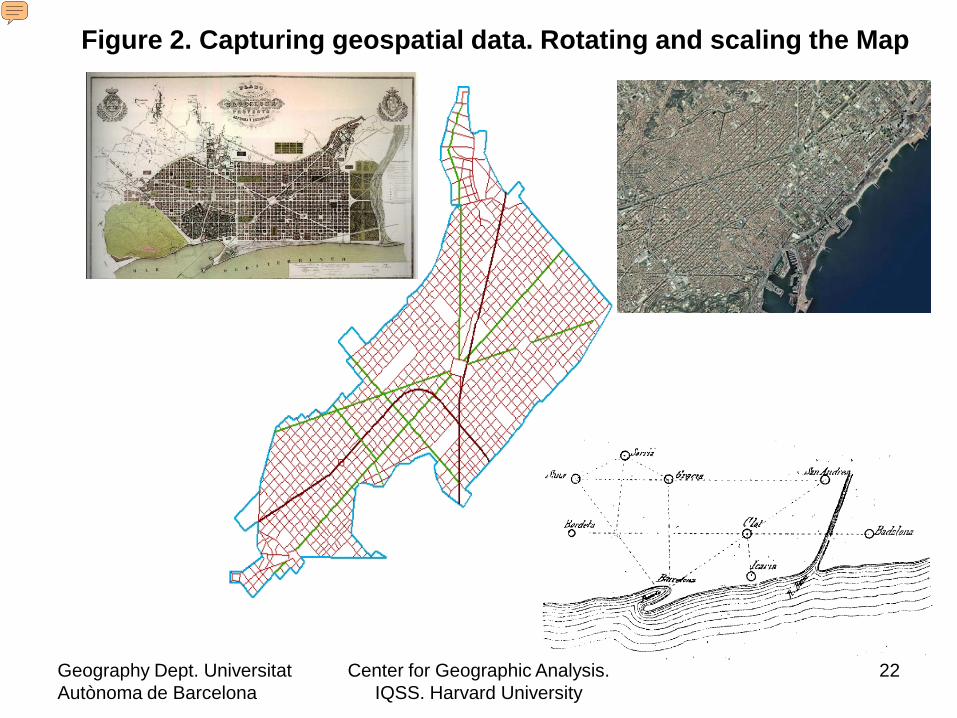
Figure 2. Capturing geospatial data. Rotating and scaling the Map
Presenter
Presentation Notes
Data collection of geospatial and alphanumerical data variables is the first most costly approach of the project. To have the Cerdàs’ Map spatially digitalized and efficiently work without having to generate the full map and construct it from zero; As we have seen that current Barcelona’s map retains the grit and most of the main characteristics of Cerdà’s proposal: streets wide and structure, pattern of blocks… We want to give to Cerdà’s map the UTM coordinates and to keep its geometric characteristics unchanged, we need to rotate and resize the image. How do we do it? Step one is to fix both maps –current Barcelona and Cerdà’s Map- in a common point: the Clock Tower located in the port of Barcelona. [The Clock Tower was chosen also by Cerdà for drawing the pattern of streets: exactly 45 degrees respect to the geographic North; in order to obtain the maximum number of light hours for housing blocks (Figure 2). Cerdà proposed also the Meridian and Parallel Avenues; and their projected lines intersect forming a square angle in which the vertex is the Clock Tower. These two avenues are targeted, as its name suggests, respectively from the North-South and from East-West.] NOT TO BE SAID IN THE PRESENTATION Com el Jordi molt bé em deia, no ens ha calgut fer de zero tot el mapa de Cerdà per què la Barcelona actual conserva les característiques morfològiques de la seva estructura urbana basant-se en el Mapa del Cerdà. �Per tant, el que hem fet és donar-li coordenades UTM al Mapa del Cerdà, a partir d'un punt en comú del Mapa Cerdà amb el mapa actual de Barcelona, The Clock Tower, i de 23 checkpoints, as the basis for geometrical correction of both images. Then, once, we have got the basic map of Cerdà, we have introduced Cerdà's location of services (schools, hospitals, markets...) train track, train stations,...
Geography Dept. Universitat Autònoma de Barcelona
Center for Geographic Analysis. IQSS. Harvard University
23
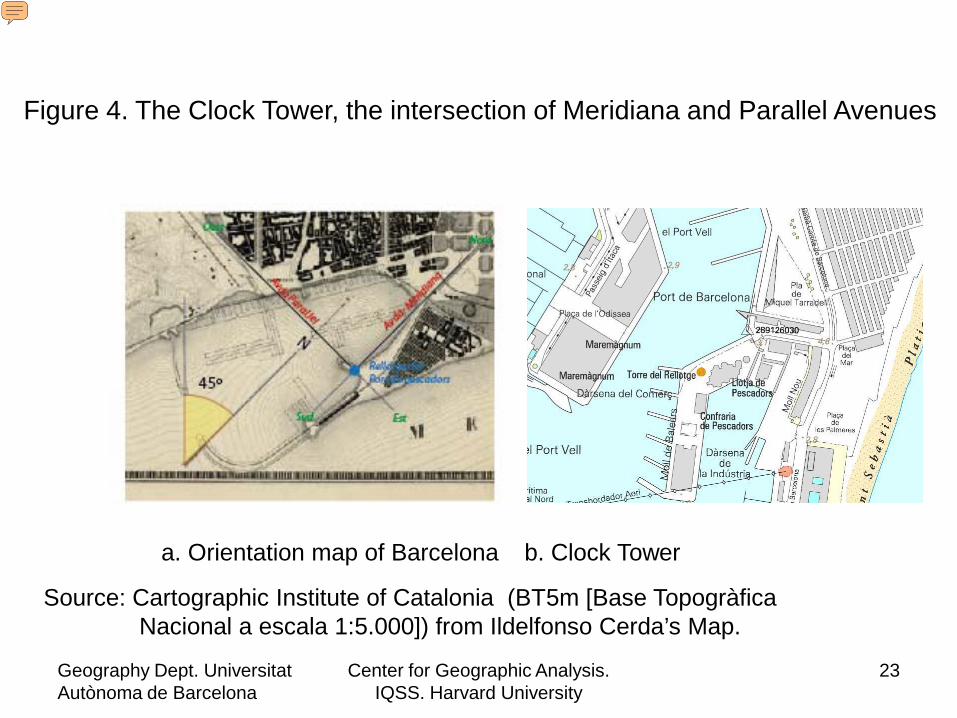
Figure 4. The Clock Tower, the intersection of Meridiana and Parallel Avenues
a. Orientation map of Barcelona b. Clock Tower
Source: Cartographic Institute of Catalonia (BT5m [Base Topogràfica Nacional a escala 1:5.000]) from Ildelfonso Cerda’s Map.
Presenter
Presentation Notes
[We argue that (a) knowing the UTMs of the Clock Tower; (b) identifying Clock Tower exact point in the original Map; (c) determining the exact area, length and wide, of Cerdà’s Plan; and (d) relating these dimensions to the current Barcelona; the Clock Tower will be the point allowing to rotate and overlay both morphological maps; and analyze the coincidences and possible deviations (Figure 4).] NOT TO BE SAID IN THE PRESENTATION [Length and wide of original JPG Cerdà’s Map are 7,591 by 5,325 pixels; with a resolution of 300 ppp (pixels/polsada) ppi (pixels per inch) [1 polsada (inch) = 1 inch 2.54cm. 1m. = 39.37 inch.. Area is 643 by 451 millimeters; with a numerical scale of 1:10,000. UTM coordinates of the Clock Tower are 31N, ED50. 432004, 4580903. Pixel positioning (with origin to top left corner) of the Clock Tower are column 2984, and row 4463. ] NOT TO BE SAID IN THE PRESENTATION
Geography Dept. Universitat Autònoma de Barcelona
Center for Geographic Analysis. IQSS. Harvard University
24
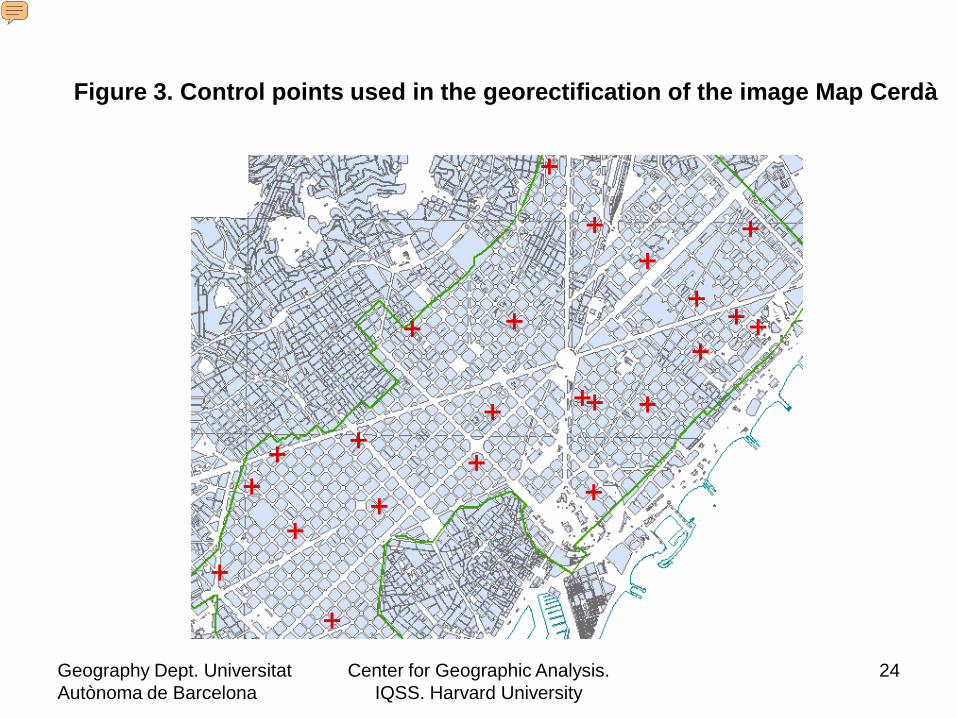
Figure 3. Control points used in the georectification of the image Map Cerdà
Presenter
Presentation Notes
We established 23 checkpoints as a basis for geometrical correction of images (Figure 3). These points match common street intersections of the two maps. Overlaying both maps resulted in a RMS not exceeding 4 meters. This new geographic configuration of the original Cerdà’s image would allow building the topographic database network structure. NOT TO BE SAID IN THE PRESENTATION
Geography Dept. Universitat Autònoma de Barcelona
Center for Geographic Analysis. IQSS. Harvard University
25
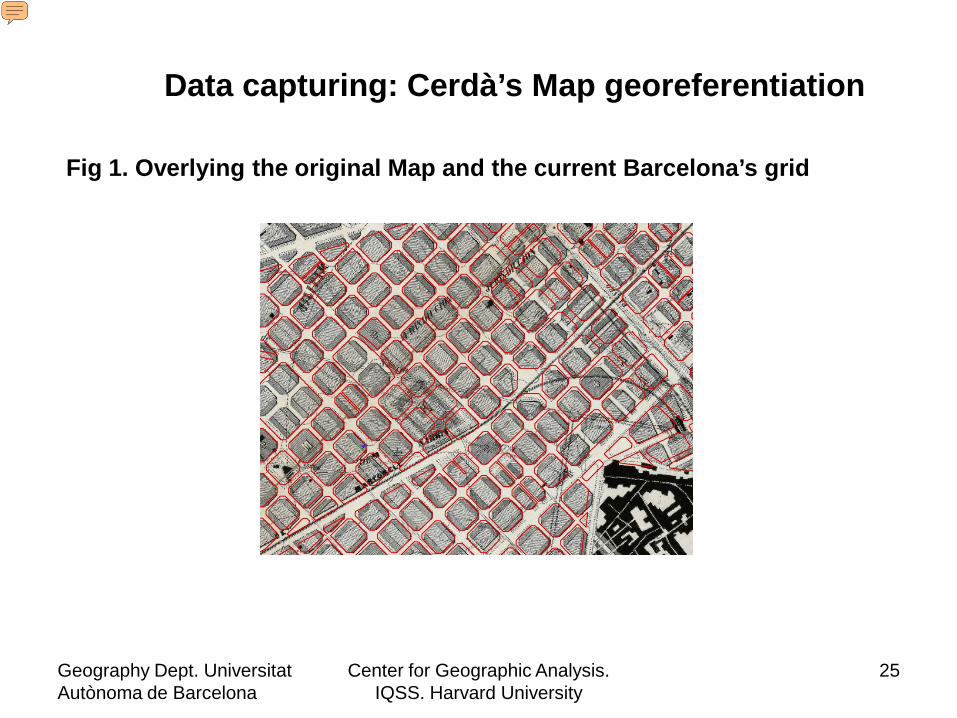
Data capturing: Cerdà’s Map georeferentiation
Fig 1. Overlying the original Map and the current Barcelona’s grid
Presenter
Presentation Notes
Source: Basic maps from the Institut Cartogràfic de Catalunya (BT50). Ildelfons Cerdà (Plano de Barcelona 1861)
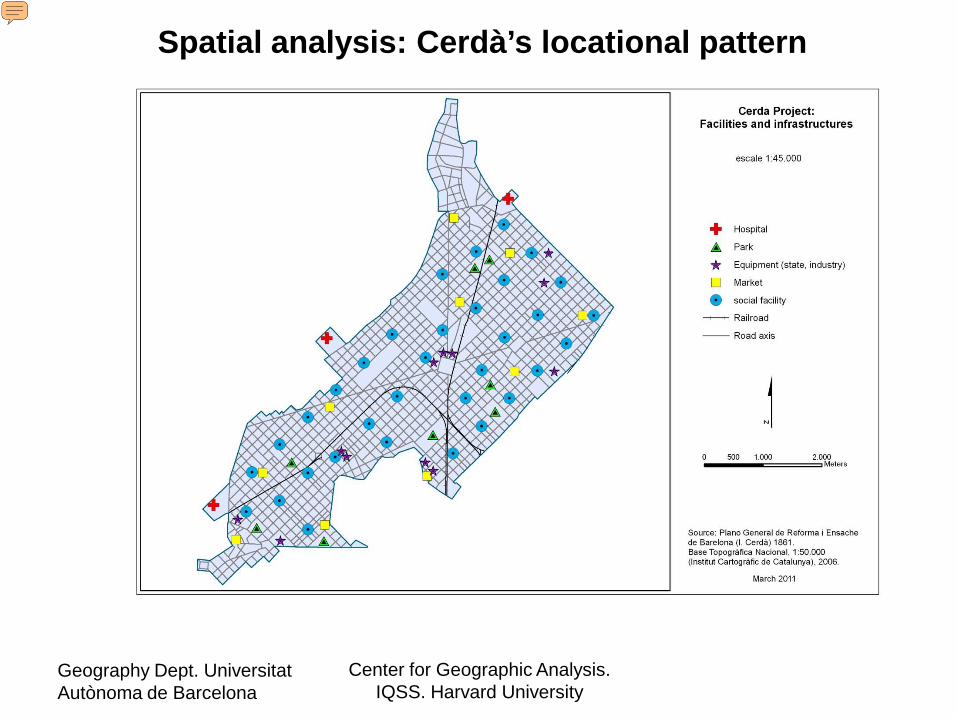
Spatial analysis: Cerdà’s locational pattern
Geography Dept. Universitat Autònoma de Barcelona
Center for Geographic Analysis. IQSS. Harvard University
Presenter
Presentation Notes
- We begin locating the facilities from the Map.
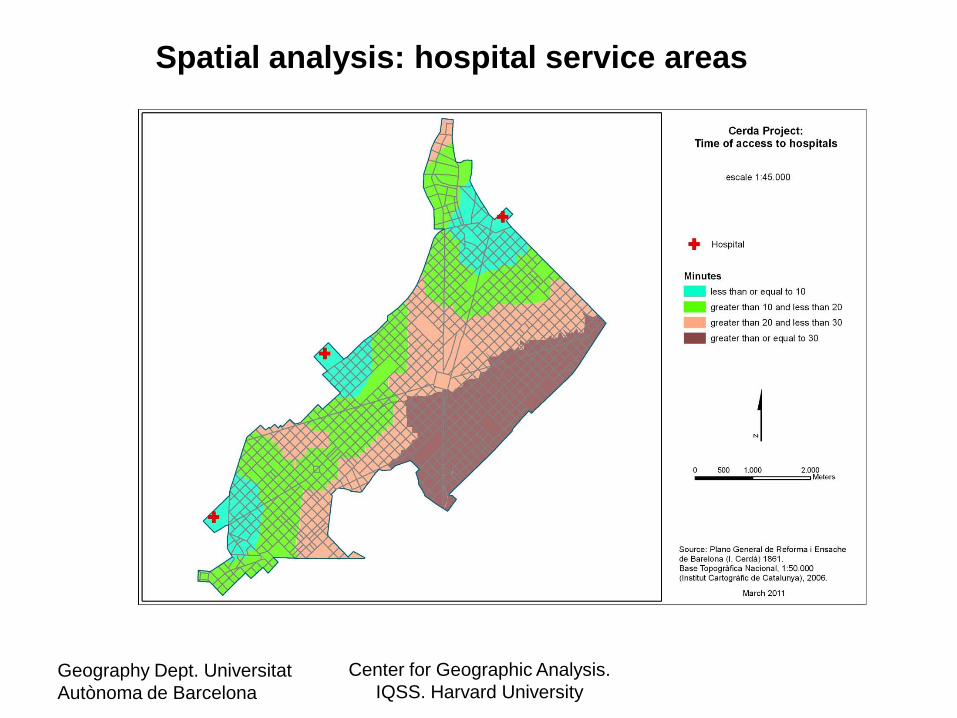
Spatial analysis: hospital service areas
Geography Dept. Universitat Autònoma de Barcelona
Center for Geographic Analysis. IQSS. Harvard University
Geography Dept. Universitat Autònoma de Barcelona
Center for Geographic Analysis. IQSS. Harvard University
28
Spatial analysis: hospital service areas
Geography Dept. Universitat Autònoma de Barcelona
Center for Geographic Analysis. IQSS. Harvard University
Spatial analysis: market service areas
Geography Dept. Universitat Autònoma de Barcelona
Center for Geographic Analysis. IQSS. Harvard University
30
Future research
• Taking into account capacity of services– Introducing different population densities
• Introducing variability of services• Considering different levels of income
– Transferable utility– Spatial justice
Geography Dept. Universitat Autònoma de Barcelona
Center for Geographic Analysis. IQSS. Harvard University
31
Transferable utility
• Distance versus willingness to pay for it• Public utility everyone gets the service; but• Assuming different level of income. People
would be willing to pay differently to get a service closer
• Who should get the service’s benefit, the person who pays more or the person who pays less? How to allocate stratified demand?
Presenter
Presentation Notes
We have a situation where we have a service. Demand have different income and willingness to pay for it How would we distribute population to services and get the maximum utility from adjusting to people’s income? How much a person is willing to pay for this service? One would pay 50, other would pay 1 What would we do? We can sell it to the rich one and get cash, which we can transfer to other utilities or services to the poorer one. What can happen if there is a situation where there are impediments to transfer service, utility to the other groups of society?
Geography Dept. Universitat Autònoma de Barcelona
Center for Geographic Analysis. IQSS. Harvard University
32
Questions about spatial justice• Is this situation always possible?• Could we have transferability without any
strategic policy to guide where and who gets wellbeing?
• How does livability can be increased in cities? • Can urban policies be transformed and adjusted
to fulfill population needs? • Might mechanisms to distribute resources in
space help to achieve a more even spatial justice?
Presenter
Presentation Notes
Most from political economy would answer that there must be a bottom up approach, where community participation would guide what different social groups need…
Geography Dept. Universitat Autònoma de Barcelona
Center for Geographic Analysis. IQSS. Harvard University
33
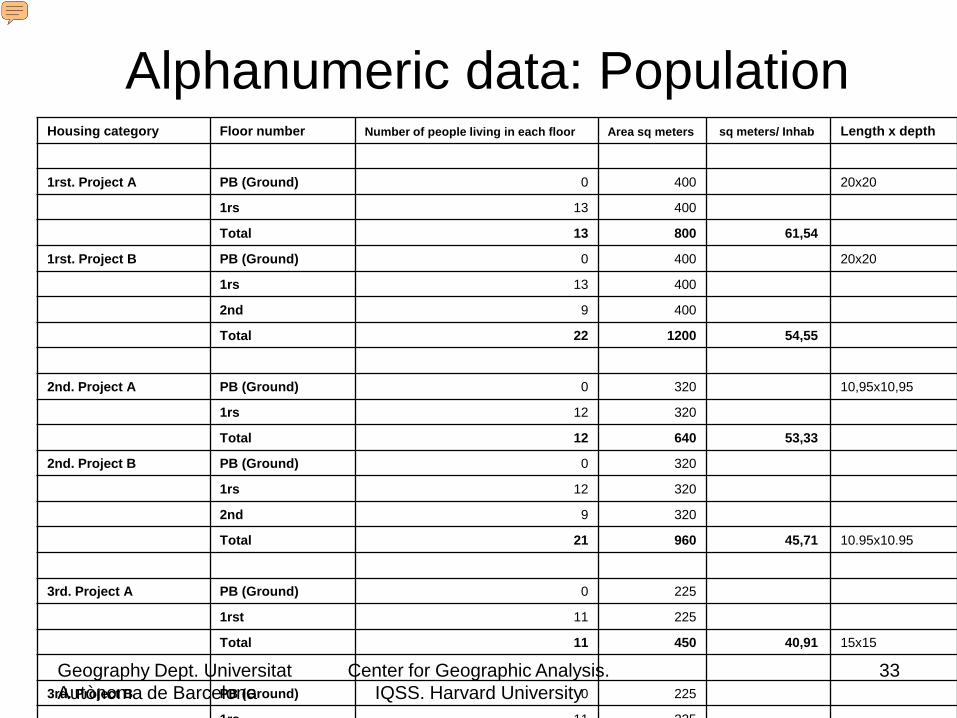
Alphanumeric data: PopulationHousing category Floor number Number of people living in each floor Area sq meters sq meters/ Inhab Length x depth
1rst. Project A PB (Ground) 0 400 20x20
1rs 13 400
Total 13 800 61,54
1rst. Project B PB (Ground) 0 400 20x20
1rs 13 400
2nd 9 400
Total 22 1200 54,55
2nd. Project A PB (Ground) 0 320 10,95x10,95
1rs 12 320
Total 12 640 53,33
2nd. Project B PB (Ground) 0 320
1rs 12 320
2nd 9 320
Total 21 960 45,71 10.95x10.95
3rd. Project A PB (Ground) 0 225
1rst 11 225
Total 11 450 40,91 15x15
3rd. Project B PB (Ground) 0 225
1rs 11 225
Presenter
Presentation Notes
Capturing alphanumeric data from Cerdàs original works Counting population
Geography Dept. Universitat Autònoma de Barcelona
Center for Geographic Analysis. IQSS. Harvard University
34
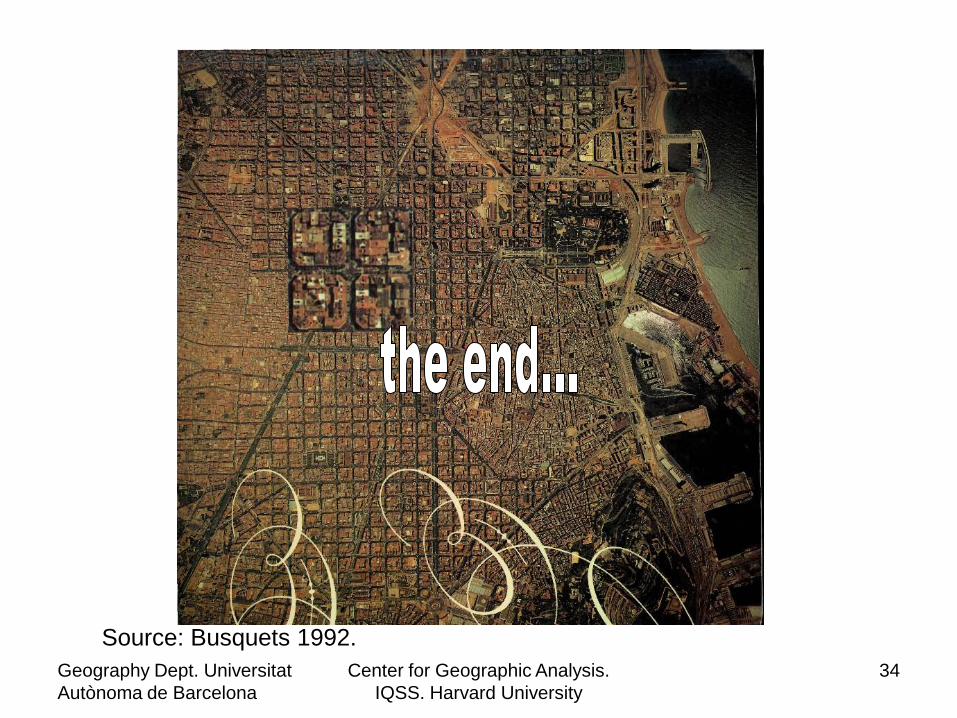
Source: Busquets 1992.