Social reproduction and inequality in the Barcelona area, 15th
197
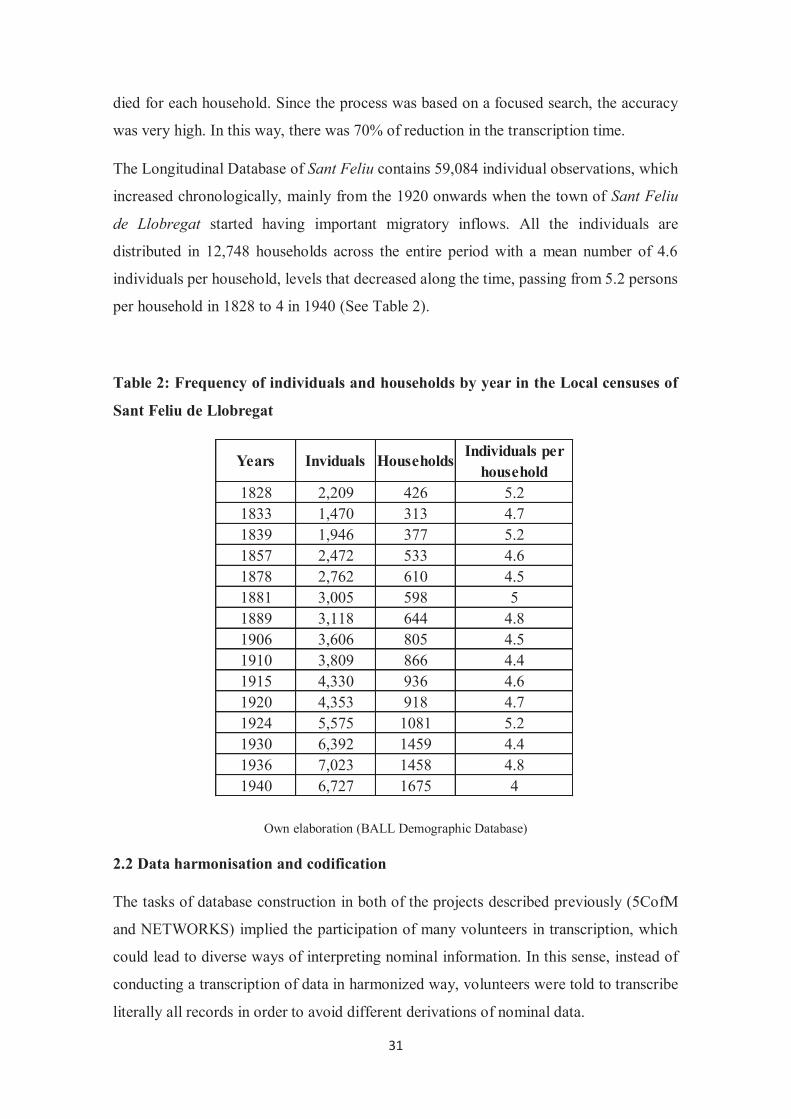
ADVERTIMENT. Lʼaccés als continguts dʼaquesta tesi doctoral i la seva utilització ha de respectar els drets de la persona autora. Pot ser utilitzada per a consulta o estudi personal, així com en activitats o materials dʼinvestigació i docència en els termes establerts a lʼart. 32 del Text Refós de la Llei de Propietat Intel·lectual (RDL 1/1996). Per altres utilitzacions es requereix lʼautorització prèvia i expressa de la persona autora. En qualsevol cas, en la utilització dels seus continguts caldrà indicar de forma clara el nom i cognoms de la persona autora i el títol de la tesi doctoral. No sʼautoritza la seva reproducció o altres formes dʼexplotació efectuades amb finalitats de lucre ni la seva comunicació pública des dʼun lloc aliè al servei TDX. Tampoc sʼautoritza la presentació del seu contingut en una finestra o marc aliè a TDX (framing). Aquesta reserva de drets afecta tant als continguts de la tesi com als seus resums i índexs. ADVERTENCIA. El acceso a los contenidos de esta tesis doctoral y su utilización debe respetar los derechos de la persona autora. Puede ser utilizada para consulta o estudio personal, así como en actividades o materiales de investigación y docencia en los términos establecidos en el art. 32 del Texto Refundido de la Ley de Propiedad Intelectual (RDL 1/1996). Para otros usos se requiere la autorización previa y expresa de la persona autora. En cualquier caso, en la utilización de sus contenidos se deberá indicar de forma clara el nombre y apellidos de la persona autora y el título de la tesis doctoral. No se autoriza su reproducción u otras formas de explotación efectuadas con fines lucrativos ni su comunicación pública desde un sitio ajeno al servicio TDR. Tampoco se autoriza la presentación de su contenido en una ventana o marco ajeno a TDR (framing). Esta reserva de derechos afecta tanto al contenido de la tesis como a sus resúmenes e índices. WARNING. The access to the contents of this doctoral thesis and its use must respect the rights of the author. It can be used for reference or private study, as well as research and learning activities or materials in the terms established by the 32nd article of the Spanish Consolidated Copyright Act (RDL 1/1996). Express and previous authorization of the author is required for any other uses. In any case, when using its content, full name of the author and title of the thesis must be clearly indicated. Reproduction or other forms of for profit use or public communication from outside TDX service is not allowed. Presentation of its content in a window or frame external to TDX (framing) is not authorized either. These rights affect both the content of the thesis and its abstracts and indexes. Social reproduction and inequality in the Barcelona area, 15th -20th centuries Gabriel Brea-Martínez
-
Upload
khangminh22 -
Category
Documents
-
view
2 -
download
0
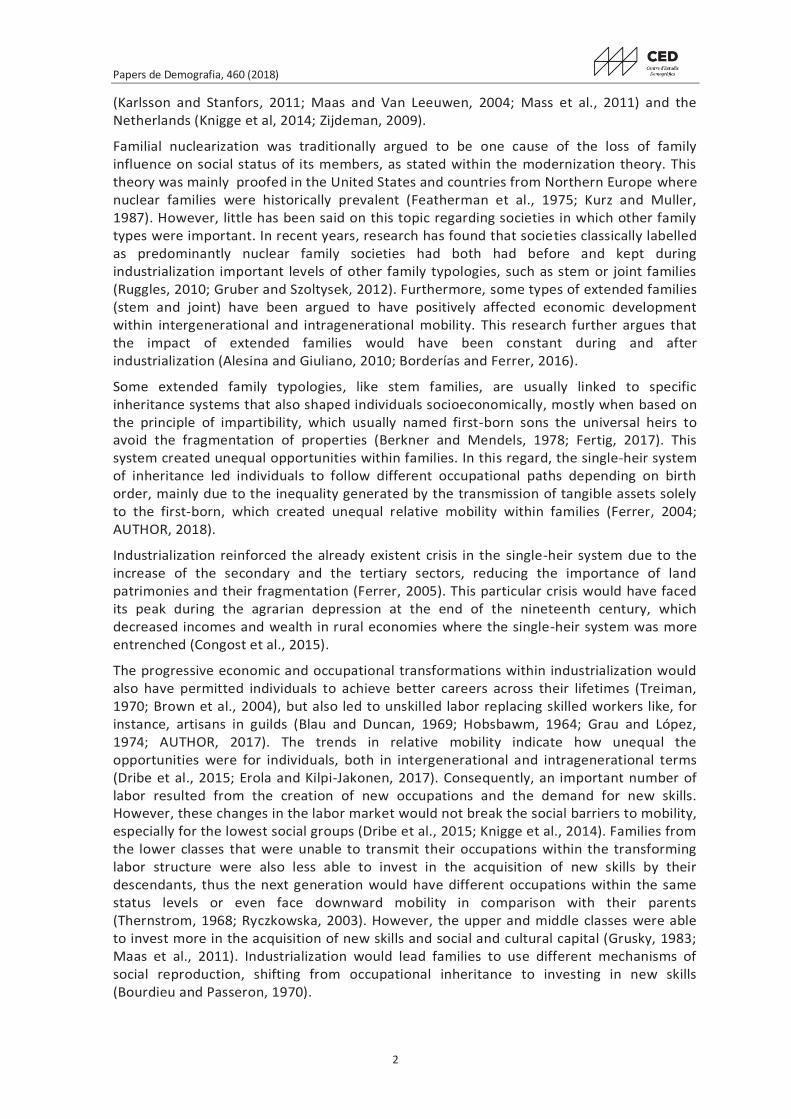
Transcript of Social reproduction and inequality in the Barcelona area, 15th
ADVERTIMENT. Lʼaccés als continguts dʼaquesta tesi doctoral i la seva utilització ha de respectar els drets de lapersona autora. Pot ser utilitzada per a consulta o estudi personal, així com en activitats o materials dʼinvestigació idocència en els termes establerts a lʼart. 32 del Text Refós de la Llei de Propietat Intel·lectual (RDL 1/1996). Per altresutilitzacions es requereix lʼautorització prèvia i expressa de la persona autora. En qualsevol cas, en la utilització delsseus continguts caldrà indicar de forma clara el nom i cognoms de la persona autora i el títol de la tesi doctoral. Nosʼautoritza la seva reproducció o altres formes dʼexplotació efectuades amb finalitats de lucre ni la seva comunicaciópública des dʼun lloc aliè al servei TDX. Tampoc sʼautoritza la presentació del seu contingut en una finestra o marc alièa TDX (framing). Aquesta reserva de drets afecta tant als continguts de la tesi com als seus resums i índexs.
ADVERTENCIA. El acceso a los contenidos de esta tesis doctoral y su utilización debe respetar los derechos de lapersona autora. Puede ser utilizada para consulta o estudio personal, así como en actividades o materiales deinvestigación y docencia en los términos establecidos en el art. 32 del Texto Refundido de la Ley de PropiedadIntelectual (RDL 1/1996). Para otros usos se requiere la autorización previa y expresa de la persona autora. Encualquier caso, en la utilización de sus contenidos se deberá indicar de forma clara el nombre y apellidos de la personaautora y el título de la tesis doctoral. No se autoriza su reproducción u otras formas de explotación efectuadas con fineslucrativos ni su comunicación pública desde un sitio ajeno al servicio TDR. Tampoco se autoriza la presentación desu contenido en una ventana o marco ajeno a TDR (framing). Esta reserva de derechos afecta tanto al contenido dela tesis como a sus resúmenes e índices.
WARNING. The access to the contents of this doctoral thesis and its use must respect the rights of the author. It canbe used for reference or private study, as well as research and learning activities or materials in the terms establishedby the 32nd article of the Spanish Consolidated Copyright Act (RDL 1/1996). Express and previous authorization of theauthor is required for any other uses. In any case, when using its content, full name of the author and title of the thesismust be clearly indicated. Reproduction or other forms of for profit use or public communication from outside TDXservice is not allowed. Presentation of its content in a window or frame external to TDX (framing) is not authorized either.These rights affect both the content of the thesis and its abstracts and indexes.
Social reproduction and inequality in the Barcelona area, 15th -20th centuries
Gabriel Brea-Martínez


European Review of Economic History, – © The Author(s) . Published by Oxford University Press on behalf of the European HistoricalEconomics Society. All rights reserved. For permissions, please e-mail: [email protected]:./ereh/hey
Estimating long-term socioeconomic inequalityin southern Europe: The Barcelona area,–
G A B R I E L B R E A - M A R T Í N E Z A N DJ O A N A - M A R I A P U J A D A S - M O R ACentre d’Estudis Demogràfics (CED), Autonomous University of Barcelona, Spain,
[email protected], [email protected]
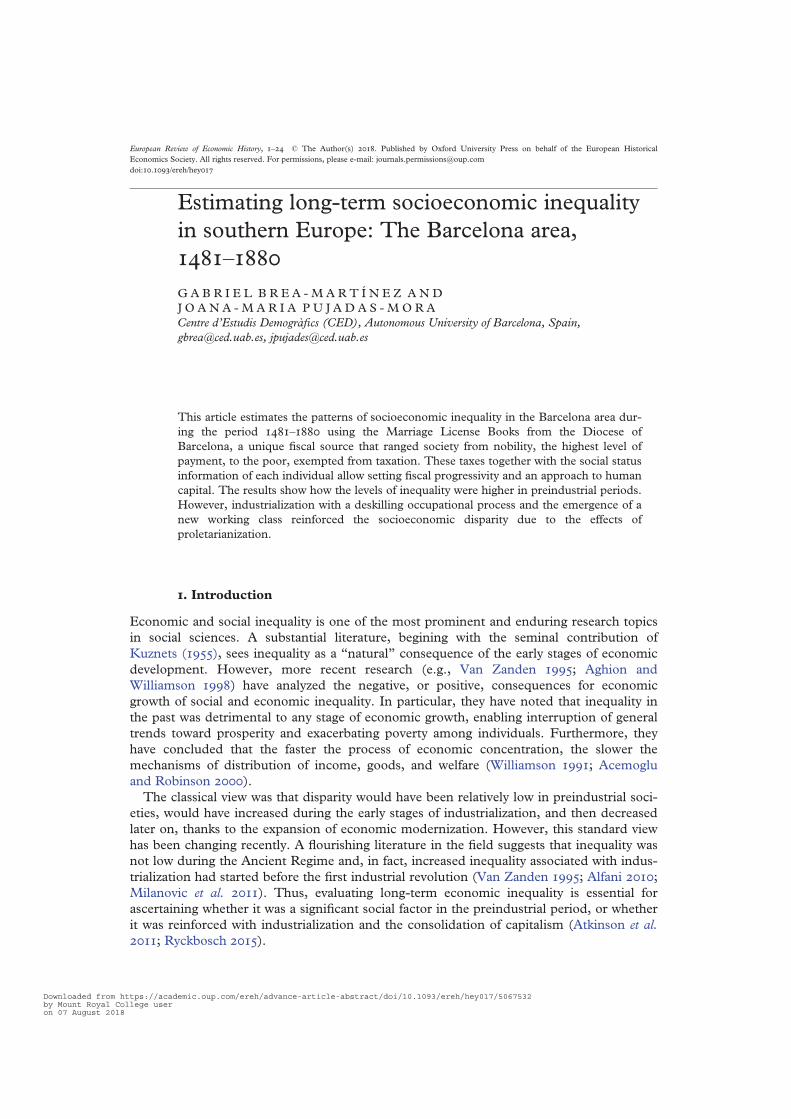
This article estimates the patterns of socioeconomic inequality in the Barcelona area dur-ing the period – using the Marriage License Books from the Diocese ofBarcelona, a unique fiscal source that ranged society from nobility, the highest level ofpayment, to the poor, exempted from taxation. These taxes together with the social statusinformation of each individual allow setting fiscal progressivity and an approach to humancapital. The results show how the levels of inequality were higher in preindustrial periods.However, industrialization with a deskilling occupational process and the emergence of anew working class reinforced the socioeconomic disparity due to the effects ofproletarianization.
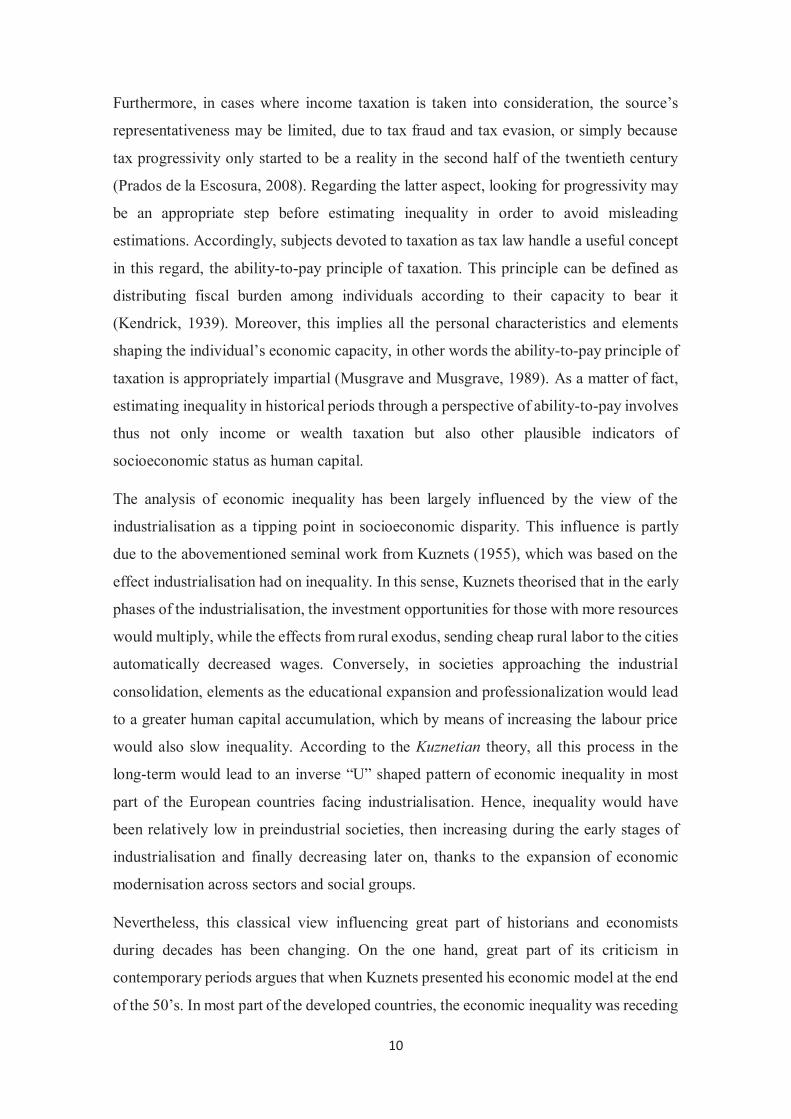
. Introduction
Economic and social inequality is one of the most prominent and enduring research topicsin social sciences. A substantial literature, begining with the seminal contribution ofKuznets (), sees inequality as a “natural” consequence of the early stages of economicdevelopment. However, more recent research (e.g., Van Zanden ; Aghion andWilliamson ) have analyzed the negative, or positive, consequences for economicgrowth of social and economic inequality. In particular, they have noted that inequality inthe past was detrimental to any stage of economic growth, enabling interruption of generaltrends toward prosperity and exacerbating poverty among individuals. Furthermore, theyhave concluded that the faster the process of economic concentration, the slower themechanisms of distribution of income, goods, and welfare (Williamson ; Acemogluand Robinson ).The classical view was that disparity would have been relatively low in preindustrial soci-
eties, would have increased during the early stages of industrialization, and then decreasedlater on, thanks to the expansion of economic modernization. However, this standard viewhas been changing recently. A flourishing literature in the field suggests that inequality wasnot low during the Ancient Regime and, in fact, increased inequality associated with indus-trialization had started before the first industrial revolution (Van Zanden ; Alfani ;Milanovic et al. ). Thus, evaluating long-term economic inequality is essential forascertaining whether it was a significant social factor in the preindustrial period, or whetherit was reinforced with industrialization and the consolidation of capitalism (Atkinson et al.
; Ryckbosch ).
Downloaded from https://academic.oup.com/ereh/advance-article-abstract/doi/10.1093/ereh/hey017/5067532by Mount Royal College useron 07 August 2018
There are few studies on long-term inequality which cover both preindustrial and indus-trial periods, owing to a scarcity of sources on economic data at the individual level prior tothe nineteenth century (Milanovic et al. ). In fact, the most significant approaches inestimating inequality in societies of the past tend to be related with wealth and/or incomesources. Probate inventories (Main ; Canbakal ) and real estate tax data (Alfani, ; Alfani and Ryckbosch ) are among the available sources used in researchestimating wealth. Conversely, approaches to income inequality are based on contemporaryinterpretations of income share among social groups, as is the case with the so-called socialtables (Milanovic et al. ), or they refer to a range of tax records (Prados de la Escosura; Santiago-Caballero ; Nicolini and Ramos Palencia ).Studying tax data is the most common way of estimating economic inequality, although
it is also highly problematic. Furthermore, in cases where income tax is considered, the rep-resentativeness of the source may be limited due to tax fraud or evasion, or simply becauseprogressive tax only started to be introduced in the second half of the twentieth century(Prados de la Escosura ). Finally, even when a more reliable primary source on tax-ation is found, it can often be fragmented over time and territory, thus presenting an obs-tacle to long-term analysis.In Spain, there are few studies on economic inequality in periods before the nineteenth
century, with the notable exceptions of work by Álvarez Nogal and Prados de la Escosura(), and Prados de la Escosura () for the regions of Castile, Andalusia, andCatalonia, using the ratio between rental income and wages in the sixteenth and nineteenthcenturies. Authors like Martínez-Galarraga et al. () have studied regional inequality inSpain through per capita income estimates, pointing to increased regional divergence in thesecond half of the nineteenth century. Furthermore, the study by Santiago-Caballero ()has estimated concentration of income in the eighteenth century using the price of wheat asa proxy, while an article by Nicolini and Ramos Palencia () measured inequality bymeans of fiscal sources like the Ensenada census of . In the case of Catalonia, amongstudies concerned with the relationship between inequality and employment during the per-iod of industrialization, are analyses by Mora-Sitja (, , ) in which a significantincrease in wage inequality is observed between and , especially in the textile sec-tor. In addition, García-Montero () has studied long-term (–) economicinequality in rural and urban areas of Catalonia, finding clear differences between the two.In fact, Catalonia would not be included in Kuznets’ “super curve” which claims thatincreased inequality in preindustrial times occurred during stages of economic growth (VanZanden ).The aim of this article is to analyze long-term trends of socioeconomic inequality on the
basis of continuous fiscal and occupational data conserved in the Marriage License Books(Llibres d’Esposalles) from the Diocese of Barcelona, a unique source covering Barcelonaand its hinterland in a period from to . We propose a way of estimating socio-economic inequality by relating occupational and socioeconomic status as a proxy of humancapital (Álvarez and Ramos Palencia, ), and introducing progressivity into a propor-tional or flat tax classification based on socioeconomic features. This is basically a combin-ation of fiscal information and occupational or social status related with the concept ofprogressive tax based on the ability-to-pay concept, in which the individual’s economic pos-ition is defined by income or wealth, and also status (Kendrick ). Since the source is amarriage register, estimations of economic inequality are carried out on an age-comparablebasis in the early stages of the life cycle and covers the entire social spectrum, from thenobility through to day laborers.
European Review of Economic History
Downloaded from https://academic.oup.com/ereh/advance-article-abstract/doi/10.1093/ereh/hey017/5067532by Mount Royal College useron 07 August 2018

When carrying out an estimate of long-term inequality trends (in terms of income,wealth, and socioeconomic status), it is important to have some awareness of the main con-straints and conditioning factors which may have shaped inequality evolving in any giventerritory. In this sense, Barcelona and its hinterland might be one of the best examples inSpain, due to its importance as political, administrative and economic center and its role asthe forerunner of Spanish industrialization. This historical process also enabled the forma-tion and consolidation of different social groups which may have influenced inequalitytrends in the period between the end of the fifteenth century and the nineteenth century.In the King Ferran II (Ferdinand II of Aragon) delivered the legal decree known as
the “Arbitral Decision of Guadalupe” which redeemed peasants from servitude by means ofpaying a fee (remensa) and thus put an end to a series of rebellions known as the War of theRemences (Serra i Puig ). As a result, most of the former serfs in the northeast ofCatalonia, including the Barcelona area, became “free” peasants. Although the decree wasfollowed by a process of reinforcing property rights and expanding tenancies (by appropri-ation of vacant farms) peasants continued paying feudal rents. During the sixteenth century,in what is historically known as Catalunya Vella (Old Catalonia), the territory with whichthis study is concerned, there was a progressive consolidation of an agrarian structure basedmainly on the medium-sized farm—the mas—which was basically worked by family units(Gifre ). Throughout the seventeenth and eighteenth centuries, land transmission bymeans of the inheritance system based on the principle of impartibility in which eldest sonswere usually the heir, and marital strategies, contributed to the formation of a new land-owning class, an intermediate peasant group which accumulated large areas of land withthe result that access to land became more limited (García Espuche ).Hence, in order to increase production and income, many landowners, rather than hiring
additional workers, hired out part of their estates with the establishment of an emphyteuticlease, one of the most common forms of which was the “rabassa morta” (a leasehold con-tract of long duration based on the life cycle of grapevines whereby a sharecropper couldwork the land as long as the plant lasted) in which the land was let out to peasant families.However, this latter option did not solve the problem of land access and, in many cases,individuals who were not the sole heir opted for artisan careers, for example, in wool-related guilds like that of the Fiber Preparers (Paraires) which, in Catalonia, ended upbecoming “the production organizers of the rural manufacturing” (Torras ; Pujadas-Mora et al. ). The constraints in the economic and legal contexts led to a shift, in thepopulation facing the early stages of the life cycle, from tangible assets to human capitalinvestments. This situation would have brought about an increase in ancillary employmentin what were previously rural zones thanks to a considerable presence of proto-industrialactivities in the Barcelonese hinterland. Some authors see this as being essential to the rela-tively early industrialization in Catalonia through the eighteenth and nineteenth centuries(García Espuche ) by producing, on the one hand, individuals acquiring resources andexperience to invest and, on the other, a pool of workers equipped with “nonformal”human capital and ready to respond to the demand for cheap skilled labor in the incipientfactory system (Rosés ; Ferrer ; Marfany ).After the end of the sixteenth century, the demand for wine in urban centers and Atlantic
areas led to the expansion of vineyards in the coastal zones (Valls Junyent ), a projectwhich required new sharecropper families for slash-and-burn preparation of land for plant-ing vines. The expansion of vineyards in Catalonia occurred in several waves between theseventeenth and nineteenth centuries (Vilar ). Among the growing industries, woolentextile production had, since the seventeenth century, began to expand in the Barcelona
Estimating long-term socioeconomic inequality in southern Europe
Downloaded from https://academic.oup.com/ereh/advance-article-abstract/doi/10.1093/ereh/hey017/5067532by Mount Royal College useron 07 August 2018
area, driven by crisis in some sectors of guilds in urban areas like Barcelona. The expandingindustry moved out from Barcelona into the hinterland surrounding the city and zones inthe pre-coastal area. The resulting boost to proto-industrial activities (García Espuche) and the associated proto-industrial population was fundamental for industrial devel-opment in Barcelona and its hinterland (Torras ). It should also be emphasized onceagain that Barcelona and its metropolitan area were groundbreakers in Spanish industrial-ization (Nadal ) which, by extension, would define this area as a forerunner in thechanges which occurred in patterns of socioeconomic structure and inequality.From the economic point of view all these elements are important for better contextualiz-
ing trends in socioeconomic inequality among individuals, especially those presumably con-templating marriage and forming a family. However, other noneconomic factors are alsolikely to be influential in this study of socioeconomic inequality. For instance, demographicand family drivers should be taken into account, and so should the abovementioned inherit-ance system and mortality constraints. With regard to the latter, fast-moving, widespreadcrises like the plague tended to drive inequality downward due to an increased demand forlabor and expanding land availability (Alfani , ).At this point, we can formulate a main question for further exploration. Was inequality
more significant before or after industrialization?
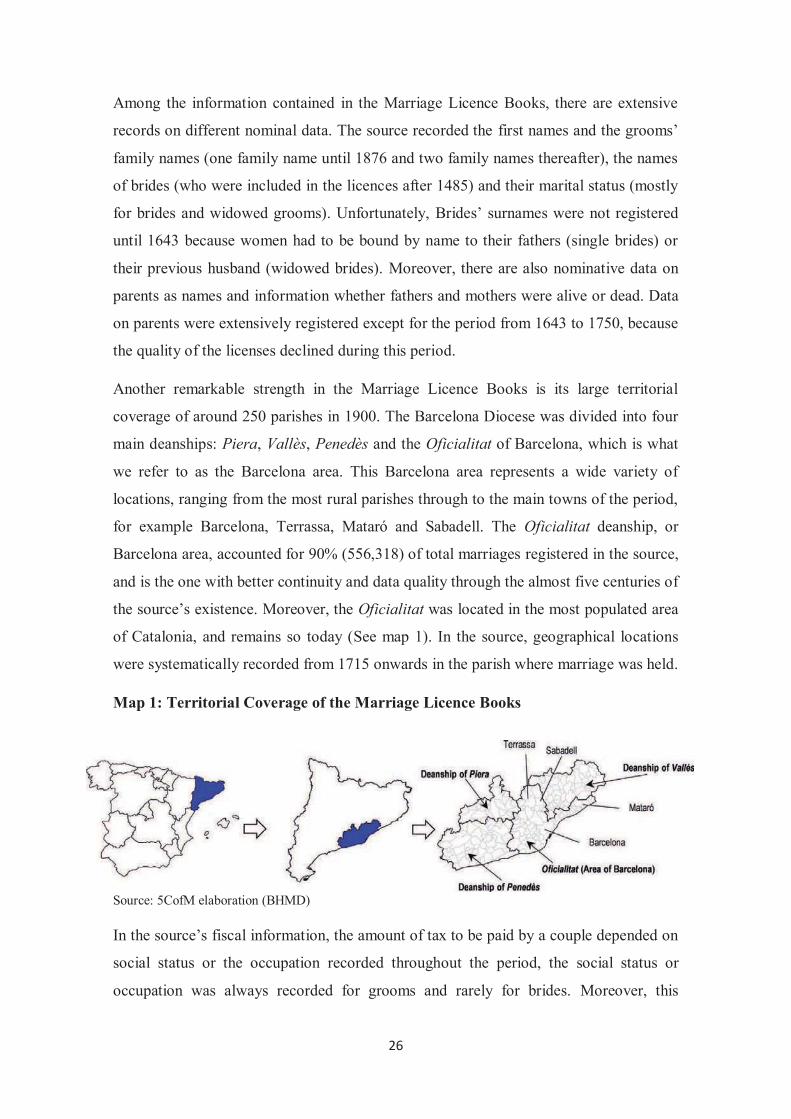
. The Marriage License Books and the Barcelona Historical Marriage
Database (–)
On September, , Pope Benedict XIII (Pedro Martínez de Luna, –), visitedBarcelona and granted the new Cathedral the power to impose a tax on marriage licenses(esposalles) to be levied on every marriage occurring in the Diocese. This tax was in force untilthe third decade of the twentieth century. Between and , the Marriage LicenseBooks, a centralized register, recorded all marriages and the fees charged according to thegroom’s social status. This exceptional documentary treasure consists of books withinformation on approximately , marriages held in parishes, ranging from the citycenter to the most rural villages in the periphery of the Diocese. Their impeccable conserva-tion for over four and a half centuries is unique in a region where parish archives have suf-fered massive destruction in several periods of upheaval, mainly during the last years.These marriage licenses have now been used to build the Barcelona Historical Marriage
Database. They record first names and the grooms’ family names, the names of brides (whowere included in the licenses after ) and their marital status (mostly for brides andwidowed grooms) as the items most commonly found in each record over five centuries.Brides’ surnames were not registered until because women had to be bound by surnameto their fathers (single brides) or their previous husband (widowed brides). Information onparents (names, and whether they were or were not alive at the time of their children’s wed-dings) was usually registered except for the period from to . Geographical locationwas systematically recorded from onward in the parish where marriage was held, and therecords were written in Catalan until , after which Spanish was used.The amount of tax to be paid by a couple depended on social status or the occupation
recorded throughout the period for grooms alone. The taxes reflect the entire social
Social status or occupation was always recorded for grooms and rarely for brides. This information for their par-ents can be found for the period –.
European Review of Economic History
Downloaded from https://academic.oup.com/ereh/advance-article-abstract/doi/10.1093/ereh/hey017/5067532by Mount Royal College useron 07 August 2018

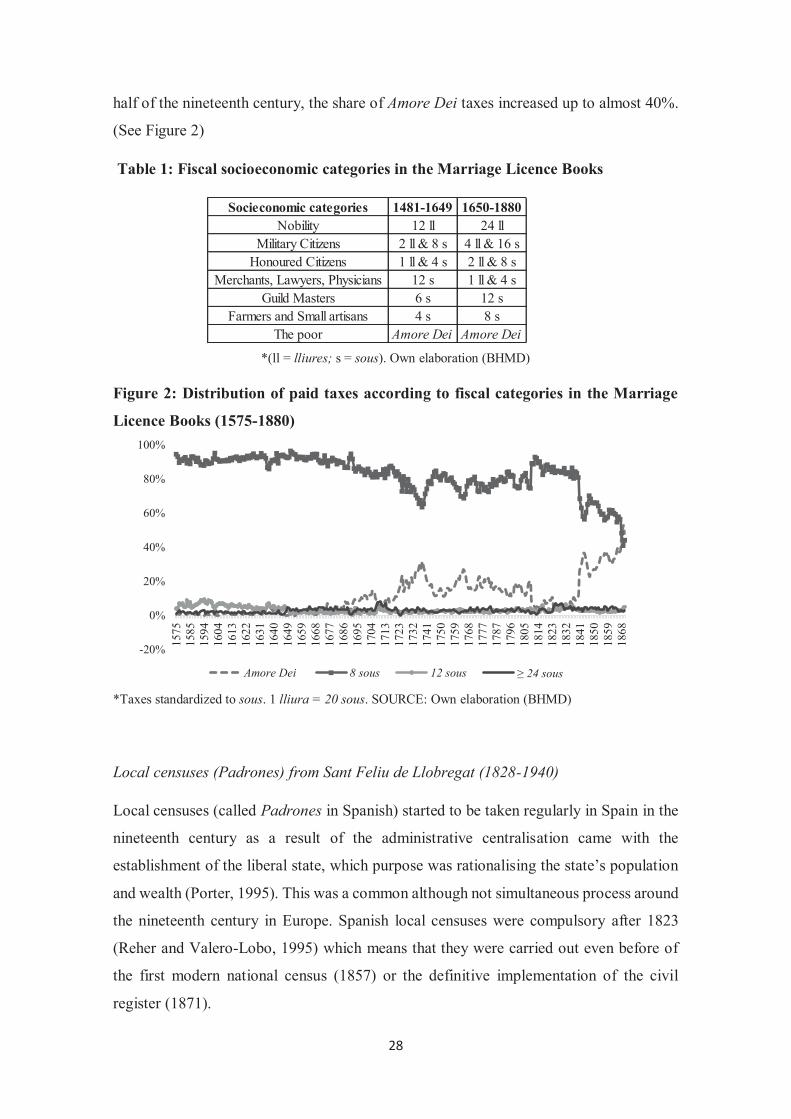
structure, from the nobility (with the highest amount), to those who were declared poorand thus exempted from the marriage tax. From to , the taxes were not strictlyclassified in accordance with the groom’s socioeconomic status and presented greater vari-ation in the values paid. However, from until , they were fixed in a seven-tierscale: . nobility, . military citizens (like knights), . honored citizens (those who couldhold public office), . merchants, lawyers, physicians, . guild masters, . farmers and smallartisans, and . the poor. This last level represents tax exemption for those unable to paythe fee and who therefore received their marriage licenses thanks to God’s love (Amore Dei
or Gratia Deo), even though most members of this group declared some kind ofoccupation.Taxes were calculated in lliures, sous and diners as units of currency, and the values
remained stable throughout the period (–), although they were paid with the typeof currency in circulation at each stage. This was a tax-based source in which the whole(married) population was registered, and it covered a long time span and large geographicalarea for the whole preindustrial period and the first decades of the industrialization inCatalonia. Moreover, it can be argued that even though the data are restricted to marriages,the representativeness of this sample is remarkable since, according to the seminal work ofHajnal on “European marriage pattern” (), in some parts of France and Catalonia theincidence of celibacy was quite low and marriage was widespread.
. Methodology
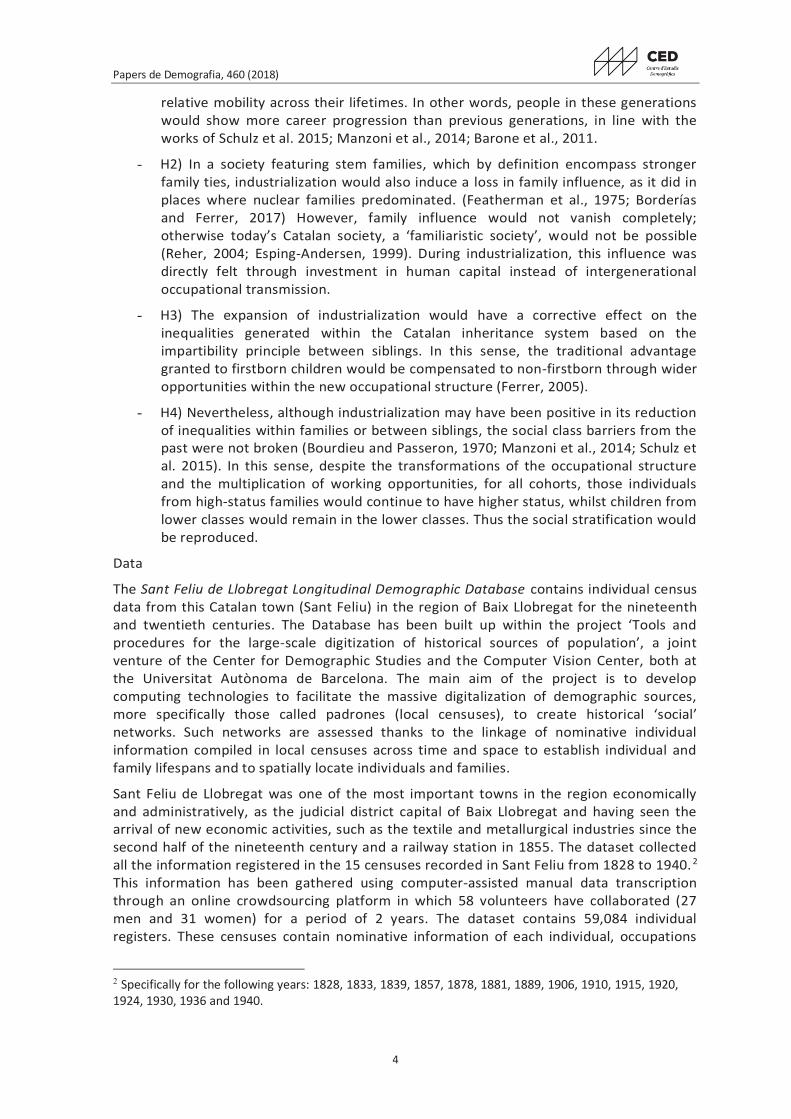
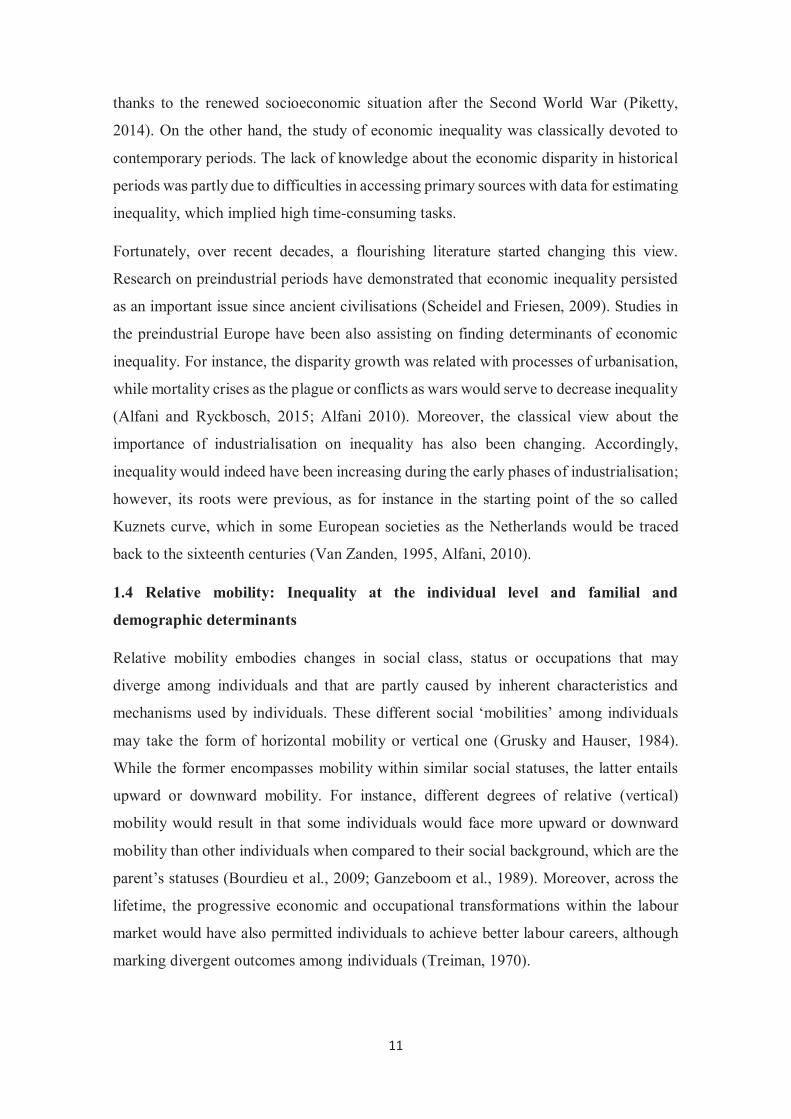
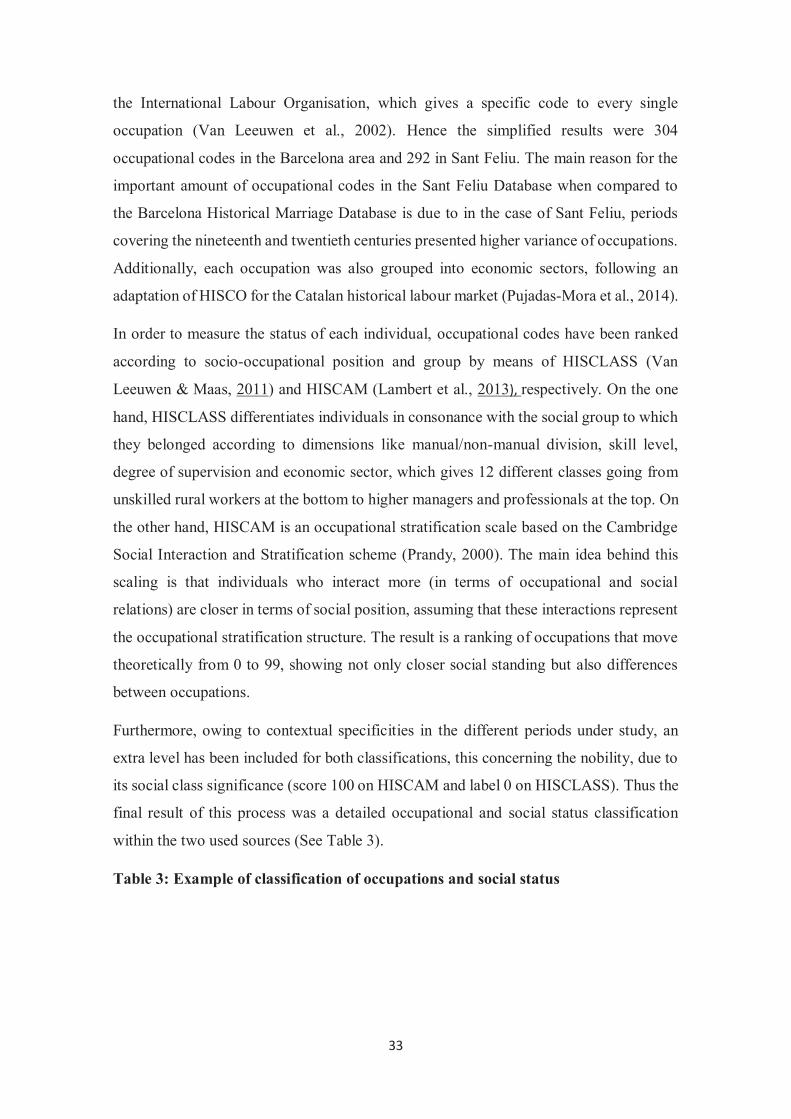
The tax of the Marriage License Books was based on proportional distribution rather than aprogressive one, which could disguise the real economic dispersion, while also contributingto underestimates of economic inequality. This is a common risk with sources prior to thesecond half of the twentieth century. In order to avoid this problem and to obtain a moreplausible estimation, this study proposes transforming the original categorization of taxesinto a progressive taxation system. The idea is based on the ability-to-pay concept (Kendrick), in which the economic capacity of an individual is not based on income alone butalso on other tangible and intangible assets such as social status, which is one of the bestmarkers for historical analysis. For instance, in a proportional tax categorization, a daylaborer could pay the same tax as an artisan or a peasant, although they clearly have differentsocio-occupational status and earning capacities. The case of an impoverished individualbelonging to a higher status group and paying lower tax obviously cannot be compared withthat of an individual of much lower status. Furthermore, individuals in the same occupa-tional group as a tradesman could have different earning capacities, which would not berevealed using classificatory schemes based on occupation alone. The table below shows theproportion of taxes paid by some of the main occupational groups. (table ). Finally, weassume the tax-exempt category as a proxy of circumstantial poverty or unemployment, dueto its coetaneous feature. Hence, when a groom was exempted from paying tax under theAmore Dei category, his ability-to-pay value was zero, because the assumption of povertywould transform him into an economically nonactive person.
This system is based on the Carolingian monetary system. The person in charge of registering and collecting the fees was usually a member of the clergy in the parish com-munity where marriages took place and who probably knew about the economic situation of grooms and brides.
Estimating long-term socioeconomic inequality in southern Europe
Downloaded from https://academic.oup.com/ereh/advance-article-abstract/doi/10.1093/ereh/hey017/5067532by Mount Royal College useron 07 August 2018

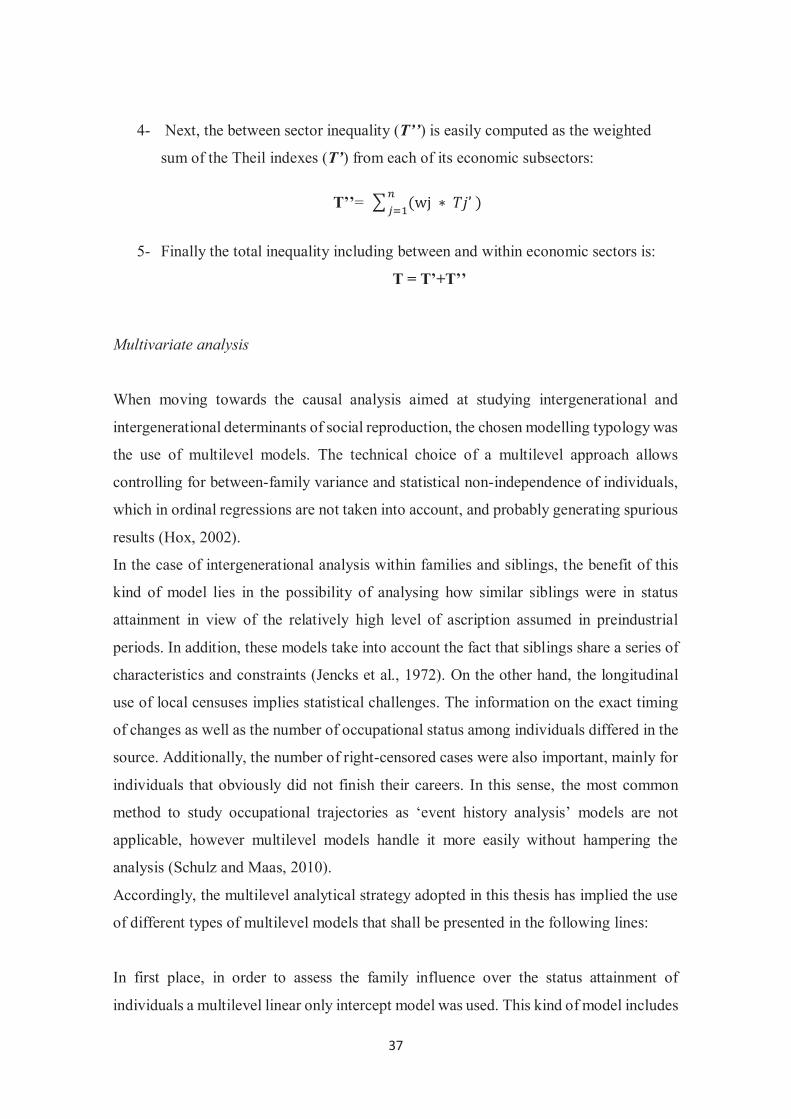
The fact that the marriage tax depends on the socio-occupational category or status ofthe groom means that the assessment of inequality is based on a socioeconomic criterionrather than an economic perspective alone, which makes that most part of the individualswere inside the same category in the lower part of the distribution (see figure ). As a result,applying the ability-to-pay approach, matching marriage taxes with the social and occupa-tional status data entailed establishing the use of an important factor for gauging humancapital. Recent studies in economic history have shown that earnings and income levels arerelated to the human capital achievements of individuals (Álvarez and Ramos Palencia), and this relation may be driven up through accumulation of experience (Schulz andMaas ). Having long-term information about these features in relation with time ofmarriage therefore introduces an interesting demographic dimension into the study ofinequality and of how the trends of socioeconomic inequality have evolved over the centur-ies. This analysis starts from the premise that, throughout history, marriage was a
Table . Tax dispersion among some of the main social and occupational groups in the
Barcelona Area (–)—Authors’ elaboration (BHMD)
Main tax levels – (–)
Amore
Dei
(%)
s(s)(%)
s(s)(%)
ll ands (s)(%)
ll and s(ll and s)(%)
ll and s(ll and s)(%)
ll(ll)(%)
n
Social-groupoccupation
Nobility - - - - ,Physician - ,Tradesman - - ,Peasant . . - - - ,Woolpreparer
. - - - ,
Weaver - - - - - ,Daylaborer
- - - - - ,
0%
10%
20%
30%
40%
50%
60%
70%
80%
90%
100%
157
5
158
5
159
4
160
4
161
3
162
2
163
1
164
0
164
9
165
9
166
8
167
7
168
6
169
5
170
4
171
3
172
3
173
2
174
1
175
0
175
9
176
8
177
7
178
7
179
6
180
5
181
4
182
3
183
2
184
1
185
0
185
9
186
8
Amore Dei 8 sous 12 sous ≥ 24 sous
Figure . Frequency of tax categories in sous in the Barcelona area (–)—
Authors’ elaboration (BHMD).
European Review of Economic History
Downloaded from https://academic.oup.com/ereh/advance-article-abstract/doi/10.1093/ereh/hey017/5067532by Mount Royal College useron 07 August 2018

fundamental event in the early stages in the individual’s life cycle and one which, inWestern societies, marked the starting point for family formation (Reher ).The progressive dispersal of taxes was achieved thanks to the combination of two factors:
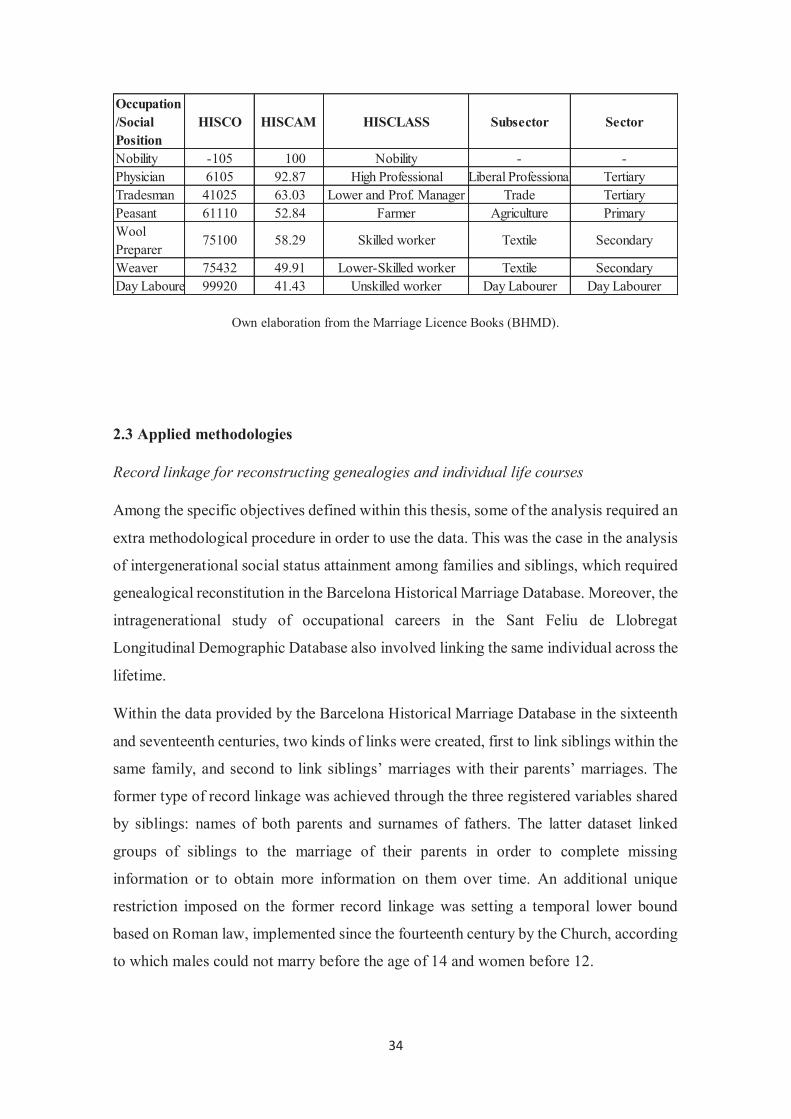
the tax system recorded in the Marriage License Books (mainly sous and lliures) and classifi-cation of the whole occupational structure. This classification is the result of applying theHistorical International Standard Classification of Occupations (HISCO), which gives aspecific code to every single occupation (Van Leeuwen et al. ). Once all the occupa-tions are codified, we rank them according to socio-occupational position by means ofHISCAM, a historical status scale allowing continuous social status measurement by scor-ing occupations in a ranking theoretically going from to (Lambert et al. ).The choice of HISCAM was because it offers the possibility of continuous measurement,
which provides greater variation. Other classifications, such as HISCLASS, even whenallowing a plausible social division, do not skip the tax flatness matter (Van Leeuwen andMaas ). Hence, the social group labeled in HISCLASS as “skilled workers” identifiesoccupations with different economic status, for example silversmiths and shoemakers, whilethe same social group is given different scores in the HISCAM classification: and ,respectively. With these data, the maximum score was set at to include the nobility,which is not reflected in HISCAM. The actual conversion from HISCO codes to HISCAMand HISCLASS scores can be seen in table for some of the main occupations in theMarriage License Books.We consider that the combination of inherent taxes and HISCAM can provide us with a
proxy for estimating disparity by means of an analysis based on the distribution of humancapital. Hence, multiplication of tax paid and the HISCAM score gives the result shownbelow, where Ai is the individual’s ability-to-pay, Ti is the tax paid by a certain individualand Hi is the HISCAM score.
= *A T Hi i i
In order to estimate socioeconomic inequality, we applied two different measures. Ginicoefficients have been computed through each individual’s ability-to-pay for the entire areaof Barcelona and for other geographic units in order to assess inequality levels.Additionally, in order to identify economic inequality among economic sectors and socialgroups, we have computed a set of Theil indexes, enabling breakdowns of the between andwithin inequality in the occupational or social structure. In the example below, the way in
Table . Occupational classification by schemes—Authors’ elaboration (BHMD)
HISCO HISCAM HISCLASS Subsector Sector
Social-groupoccupation
Nobility − Nobility - -Physician , . High Professional Liberal
ProfessionalTertiary
Tradesman , . Lower and Prof.Manager
Trade Tertiary
Peasant , . Farmer Agriculture PrimaryWool preparer , . Skilled worker Textile SecondaryWeaver , . Lower-Skilled
workerTextile Secondary
Day laborer , . Unskilled worker Day laborer Day laborer
Estimating long-term socioeconomic inequality in southern Europe
Downloaded from https://academic.oup.com/ereh/advance-article-abstract/doi/10.1093/ereh/hey017/5067532by Mount Royal College useron 07 August 2018
each instance of socioeconomic inequality appears among economic sectors is explained indetail:
() First, by identifying the total share of workers (n) and the proportion of ability-to-pay(w) from the different economic subsectors and sectors.
() Once the share of workers (n) and the proportion of ability-to-pay (w) of a certain eco-nomic subsector are known, we can estimate their contribution (ci) to the withininequality of a given sector:
= * [ ( )– ( )]c w w nln lni i i i
() The total within inequality of a given sector (T′) is thus calculated as:
∑= = ( )( = )
c cT i
i
n
ij
1
() Next, the between-sector inequality (T″) is easily computed as the weighted sum of theTheil indexes (T′) from each of its economic subsectors:
∑″ = ( ∗ )( = )
′w TT
j
n
j j
1
() Finally, the total inequality including between and within economic sectors is asfollows:
= ′ + ″T T T
Gini indexes were applied to measure socioeconomic inequality between individuals.However, this choice involves being aware of the limitations and strengths of Gini, the latterof which probably explain why it is the most commonly used indicator worldwide. Notableamong its strong points is its comparability between distributions of income, wealth orsocioeconomic scores (as in our case) from any kind of population regardless of size. For allthat, the Gini index also has several considerable limitations, including nondifferentiationof several kinds of inequalities, with the result that different patterns of distribution, fromthe top or the bottom distribution, can give similar Gini coefficients. In addition, we wouldadd that Gini coefficients are not easily decomposable or additive and that the index doesnot accurately reflect changes in the tails of a given distribution, as for instance in the high-est or lowest two deciles. This means that Gini is more sensitive to middle transfers in thedistribution (Cowell ).Nevertheless, other measures to estimate inequality have been also applied to marriage
licenses to compare with estimations obtained with Gini coefficients. For instance, theKakwani index, which was developed in order to measure tax progressivity (De Maio). Additionally, two more recent measures, namely, the Mehran and Piesch indexeswere used in order to adjust the Gini index’s sensitivity to changes in the middle parts ofthe distribution in order to give a better focus on the upper (Piesch) or lower (Mehran) tails(Aguilar-Gutiérrez ).Furthermore, it should be taken into account that lliures and sous in the Marriage License
Books were units of accountancy. After the beginning of the eighteenth century Cataloniadid not have its own currency and these units were used until the end of the nineteenth cen-tury in what are nowadays considered historical church sources and not only the one usedin this particular study. They were also used for factory payrolls and records of prices
European Review of Economic History
Downloaded from https://academic.oup.com/ereh/advance-article-abstract/doi/10.1093/ereh/hey017/5067532by Mount Royal College useron 07 August 2018
(Ventura ). In this regard, we have compiled daily wages for some years and someoccupations found in the literature to compare them with the taxes paid in our source. Forinstance, Vilar () notes that in the first half of the eighteenth century the daily wage ofrural occupations fluctuated between and sous (in our source, the fee paid for them atthe time was sous), while Codina (), in a work based on the southwest hinterland ofBarcelona, argues that during the second half of the fifteenth and the first half of the seven-teenth century the rural daily wages were quite stable, at around – sous (in our source, thefee is about four sous in this period). Yet, Codina also points that in the periods after theCatalan revolt (–), rural daily wages dropped to .–. sous on average. For otheroccupations like those related with the textile sector, Okuno () reports a wide variety ofdaily wages for a cotton spinner in the last quarter of the eighteenth century, which couldrange from . to . sous per day (in our source, the fee in this period was sous).Mora-Sitja () reports a mean daily wage of sous for one of the highest paying textilefactories in Barcelona in (in our source the fee for most textile occupations is around sous). Moreover, Feliu (b) delivers preindustrial daily wages for workers involved inchurch constructions from the sixteenth to the seventeenth century. For instance, the dai-ly wage of a master builder between and ranges between and sous (their taxof reference at the time was sous), while from to the end of the eighteenth centuryit varied between and sous (the tax of reference was sous). Again, similar trendsare observed for masons, carpenters, and day laborers in construction, all them with dailywages that varied in ranges surrounding the taxes of reference for their occupationsbetween the sixteenth and eighteenth centuries. Thus, the marriage licenses values cost,at least for waged workers, the equivalent of something close to one day’s work. Thisassumption is likely to seem valid when estimating inequality among individuals in a givenperiod; however, the information could be biased when comparing periods. In otherwords, if the same units of accountancy were used throughout almost five centuries, therewould be certainly a significant trend of devaluation in these units over time, as waspointed out by Feliu (a, p. ) with regard to the value of sous in terms of silvergrams. His observation is in line with the pioneering work of Hamilton (), American
Treasure and the Price Revolution in Spain, in which he notes major inflation due in part tothe growing influx of American silver. An example that may reflect the effects of thisdevaluation of units of accountancy over time would be the modification in taxes reportedbefore and after . For instance, in periods prior to the second half of the seventeenthcentury, the tax for farmers and artisans (the lowest tax) was sous. After , this for-mer tax was doubled ( sous), and the adjustment is the same for all the other categories.Thus, the tax structure doubled its nominal value from year to the next in a periodwhen, according to Feliu (a), the silver equivalent to a sou dropped from almost. g () to only . g ().In order to know how this could affect the notion of evolving economic patterns over
centuries, we have weighted taxes for each year with their respective values in grams ofsilver. The premise is that if the value of sous remained constant over long periods, thereal value was higher in the eighteenth and nineteenth centuries than in the previouscenturies. Hence, taxes in sous were weighted as follows, for instance sous in the peri-od – were valued at . ( sous/. g of silver) and, in the period –,the value was . ( sous/. g of silver). This allowed us to compute a measure ofability-to-pay per capita for the period –, which are the years with informationon sous and silver.
Estimating long-term socioeconomic inequality in southern Europe
Downloaded from https://academic.oup.com/ereh/advance-article-abstract/doi/10.1093/ereh/hey017/5067532by Mount Royal College useron 07 August 2018

With this exercise, we have attempted to obtain an overall insight of how economic pro-gress could have changed the meaning of inequality in the Barcelona area. We have usedthe estimated ability-to-pay per capita to calculate the extraction ratio based on the Giniindex (Milanovic et al. ). This is gauged in different steps. The first is to compute themaximum feasible Gini, which may be understood as the extreme inequality measure as if percent of a given population were lower class, a hypothetical scenario which would com-prise the inequality possibility frontier of a given society in a given period (Milanovic et al.
). In order to obtain the maximum feasible Gini, three steps are basically needed: . anestimation of gross domestic income for a given period (ability-to-pay in our case); . anassumption of the subsistence levels of a society for the same period; and . a hypothesisconcerning the share pertaining to the elites in the society being studied. Based onMilanovic, Lindert and Williamson’s () work, we have set the subsistence levels of theindividuals in our study at percent in terms of ability-to-pay per capita, and the share ofelites at most percent, as expressed below, where G∗ is the maximum feasible Gini, ɛ is theshare of the elite, μ is the ability-to-pay per capita, and s the subsistence level.
ε
μμ*
−( − )=G s
1
After establishing this term G, it is now only necessary divide the actual measured Gini coef-ficient by the maximum feasible Gini, which would then signal the extent of potential inequalityconverted into actual inequality or, in other words, how much of the total inequality isextracted by the elites, when the higher the extraction ratio the greater the inequality would
Table . Descriptive statics of the used variables—Author’s elaboration (BHMD)
Descriptives
Total casesn = ,
Minimum Maximum Mean SD
Period , ,Taxes (in sous) . .Status scores (HISCAM) . . .Ability to pay . . .
n
Occupational titles (HISCO)
Status (HISCAM)
Classes (HISCLASS) ()Georeferenced cases .Parishes
Geographic groups Periods
From To From To
Barcelona , , , ,Mataró - - , ,Terrassa - - , ,Sabadell - - , ,Rural , , , ,
European Review of Economic History
Downloaded from https://academic.oup.com/ereh/advance-article-abstract/doi/10.1093/ereh/hey017/5067532by Mount Royal College useron 07 August 2018

appear to be. In terms of our analysis, using the marriage taxes enables the measurement ofinequality between individuals in a same period but, as might be expected in a long-term, wecannot compare individuals from different periods in the same way since the same nominal taxcould have different values over time.The different variables regarding this study can be seen in table .
. Inequality among individuals in the Barcelona area, –
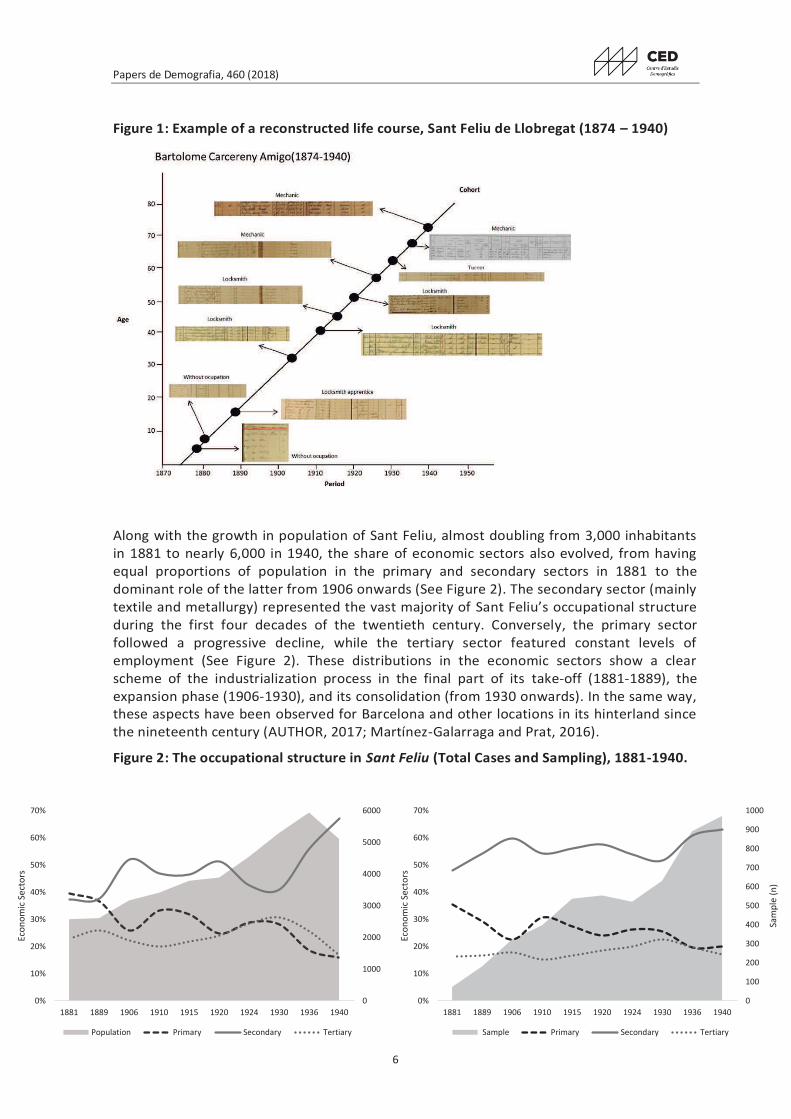
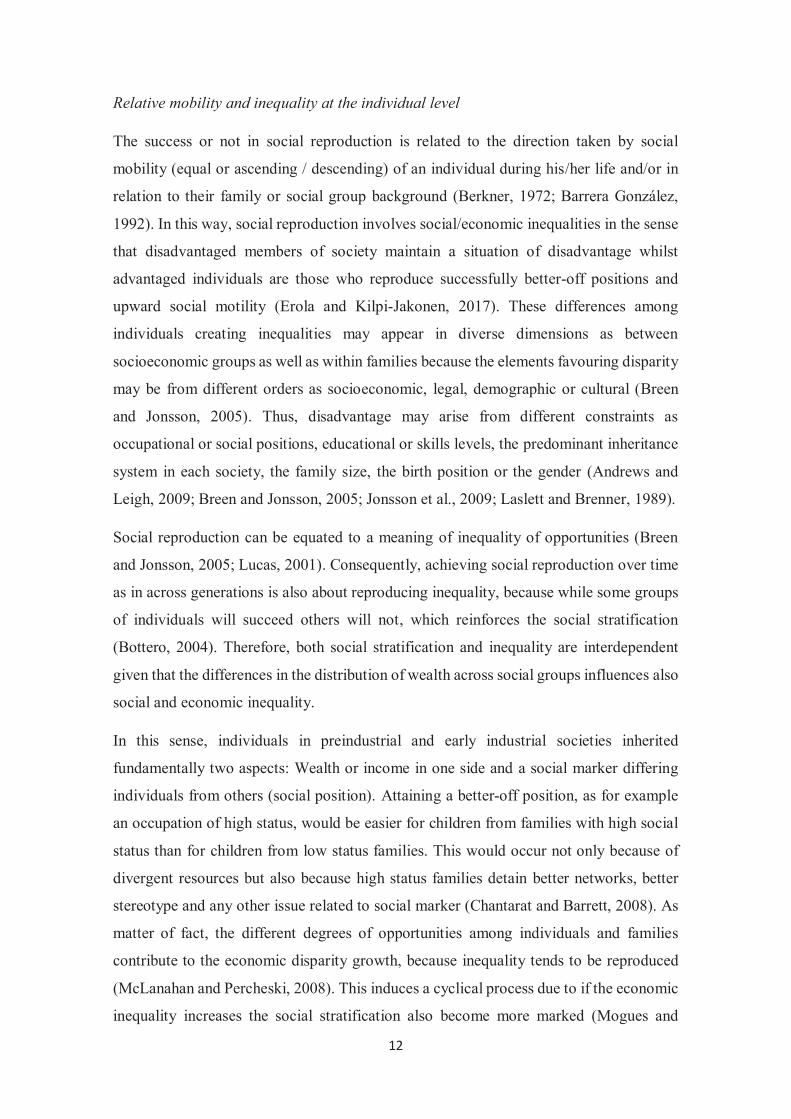
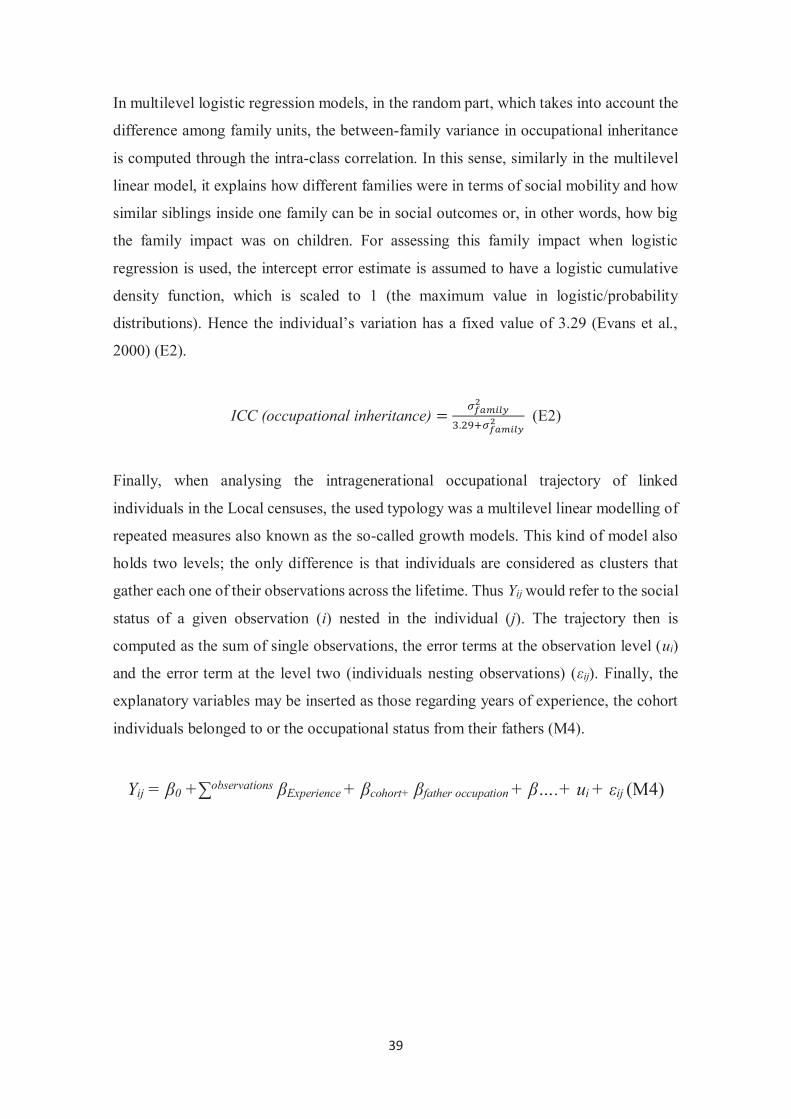
First of all, we have measured socioeconomic inequality between individuals in theBarcelona area (–) by means of different measures which have been brieflydescribed in Section dealing with methodology. As can be seen in figure , all the mea-sures present trends with similar shapes but with different impacts and levels. For instance,the Kakwani index, which was originally devised to measure the progressivity of tax systemsin any given distribution where it is argued that values closest to show greater progressiv-ity. In this case, it appears that the ability-to-pay approach may have accomplished one ofits aims, namely, applying progressivity to the proportional fiscal data.The Mehran index, which aimed to be more sensitive to changes in the lower tails, shows
higher levels of inequality. This is probably the result of changes that occurred with theAmore Dei tax exemptions. The Piesch index, which was designed to focus more on changesin the upper tails, shows the second-highest levels because it can be sensitive to the smallpresence of upper classes (like the nobility) in the distribution. Finally, Gini indexes show
0.00
0.10
0.20
0.30
0.40
0.50
0.60
0.70
0.80
1480–1489
1490–1499
1500–1509
1510–1519
1520–1529
1530–1539
1540–1549
1550–1559
1560–1569
1570–1579
1580–1589
1590–1599
1600–1609
1610–1619
1620–1629
1630–1639
1640–1649
1650–1659
1660–1669
1670–1679
1680–1689
1690–1699
1700–1709
1710–1719
1720–1729
1730–1739
1740–1749
1750–1759
1760–1769
1770–1779
1780–1789
1790–1799
1800–1809
1810–1819
1820–1829
1830–1839
1840–1849
1850–1859
1860–1869
1870–1879
Gini Mehran Piesch Kakwani
Figure . Inequality in the Barcelona estimate with different measures (–)—
Authors’ elaboration (BHMD).
Estimating long-term socioeconomic inequality in southern Europe
Downloaded from https://academic.oup.com/ereh/advance-article-abstract/doi/10.1093/ereh/hey017/5067532by Mount Royal College useron 07 August 2018
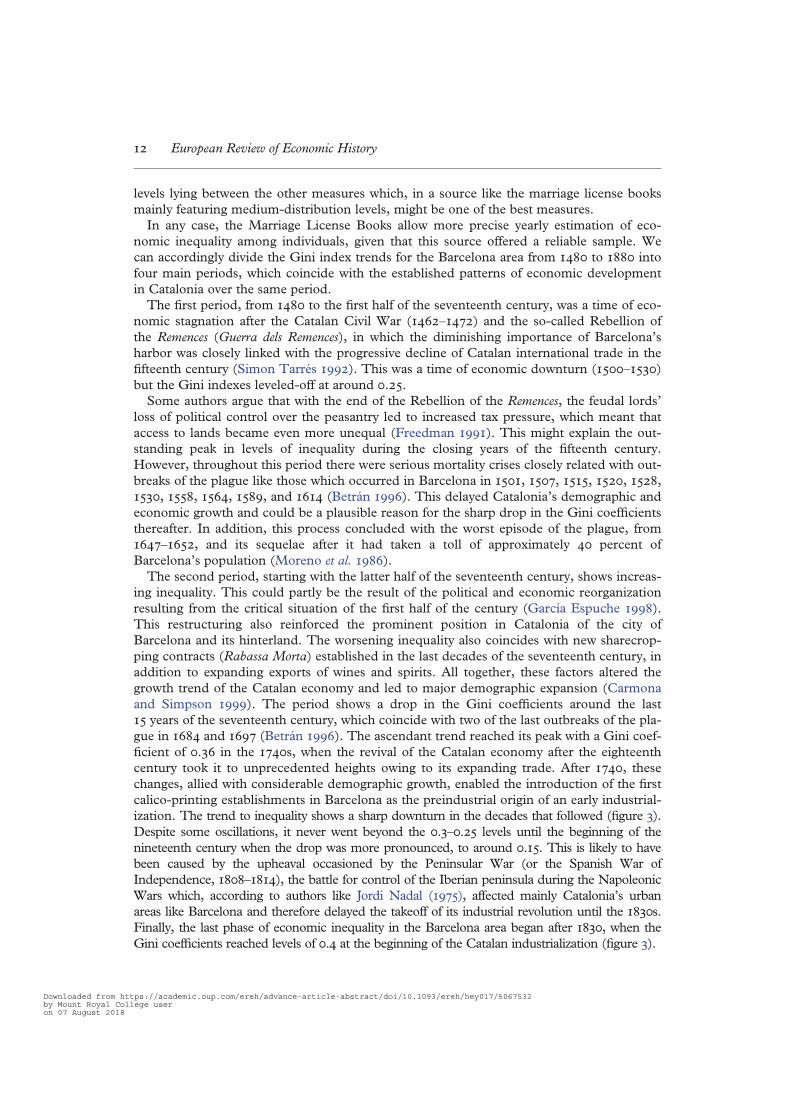
levels lying between the other measures which, in a source like the marriage license booksmainly featuring medium-distribution levels, might be one of the best measures.In any case, the Marriage License Books allow more precise yearly estimation of eco-
nomic inequality among individuals, given that this source offered a reliable sample. Wecan accordingly divide the Gini index trends for the Barcelona area from to intofour main periods, which coincide with the established patterns of economic developmentin Catalonia over the same period.The first period, from to the first half of the seventeenth century, was a time of eco-
nomic stagnation after the Catalan Civil War (–) and the so-called Rebellion ofthe Remences (Guerra dels Remences), in which the diminishing importance of Barcelona’sharbor was closely linked with the progressive decline of Catalan international trade in thefifteenth century (Simon Tarrés ). This was a time of economic downturn (–)but the Gini indexes leveled-off at around ..Some authors argue that with the end of the Rebellion of the Remences, the feudal lords’
loss of political control over the peasantry led to increased tax pressure, which meant thataccess to lands became even more unequal (Freedman ). This might explain the out-standing peak in levels of inequality during the closing years of the fifteenth century.However, throughout this period there were serious mortality crises closely related with out-breaks of the plague like those which occurred in Barcelona in , , , , ,, , , , and (Betrán ). This delayed Catalonia’s demographic andeconomic growth and could be a plausible reason for the sharp drop in the Gini coefficientsthereafter. In addition, this process concluded with the worst episode of the plague, from–, and its sequelae after it had taken a toll of approximately percent ofBarcelona’s population (Moreno et al. ).The second period, starting with the latter half of the seventeenth century, shows increas-
ing inequality. This could partly be the result of the political and economic reorganizationresulting from the critical situation of the first half of the century (García Espuche ).This restructuring also reinforced the prominent position in Catalonia of the city ofBarcelona and its hinterland. The worsening inequality also coincides with new sharecrop-ping contracts (Rabassa Morta) established in the last decades of the seventeenth century, inaddition to expanding exports of wines and spirits. All together, these factors altered thegrowth trend of the Catalan economy and led to major demographic expansion (Carmonaand Simpson ). The period shows a drop in the Gini coefficients around the last years of the seventeenth century, which coincide with two of the last outbreaks of the pla-gue in and (Betrán ). The ascendant trend reached its peak with a Gini coef-ficient of . in the s, when the revival of the Catalan economy after the eighteenthcentury took it to unprecedented heights owing to its expanding trade. After , thesechanges, allied with considerable demographic growth, enabled the introduction of the firstcalico-printing establishments in Barcelona as the preindustrial origin of an early industrial-ization. The trend to inequality shows a sharp downturn in the decades that followed (figure ).Despite some oscillations, it never went beyond the .–. levels until the beginning of thenineteenth century when the drop was more pronounced, to around .. This is likely to havebeen caused by the upheaval occasioned by the Peninsular War (or the Spanish War ofIndependence, –), the battle for control of the Iberian peninsula during the NapoleonicWars which, according to authors like Jordi Nadal (), affected mainly Catalonia’s urbanareas like Barcelona and therefore delayed the takeoff of its industrial revolution until the s.Finally, the last phase of economic inequality in the Barcelona area began after , when theGini coefficients reached levels of . at the beginning of the Catalan industrialization (figure ).
European Review of Economic History
Downloaded from https://academic.oup.com/ereh/advance-article-abstract/doi/10.1093/ereh/hey017/5067532by Mount Royal College useron 07 August 2018
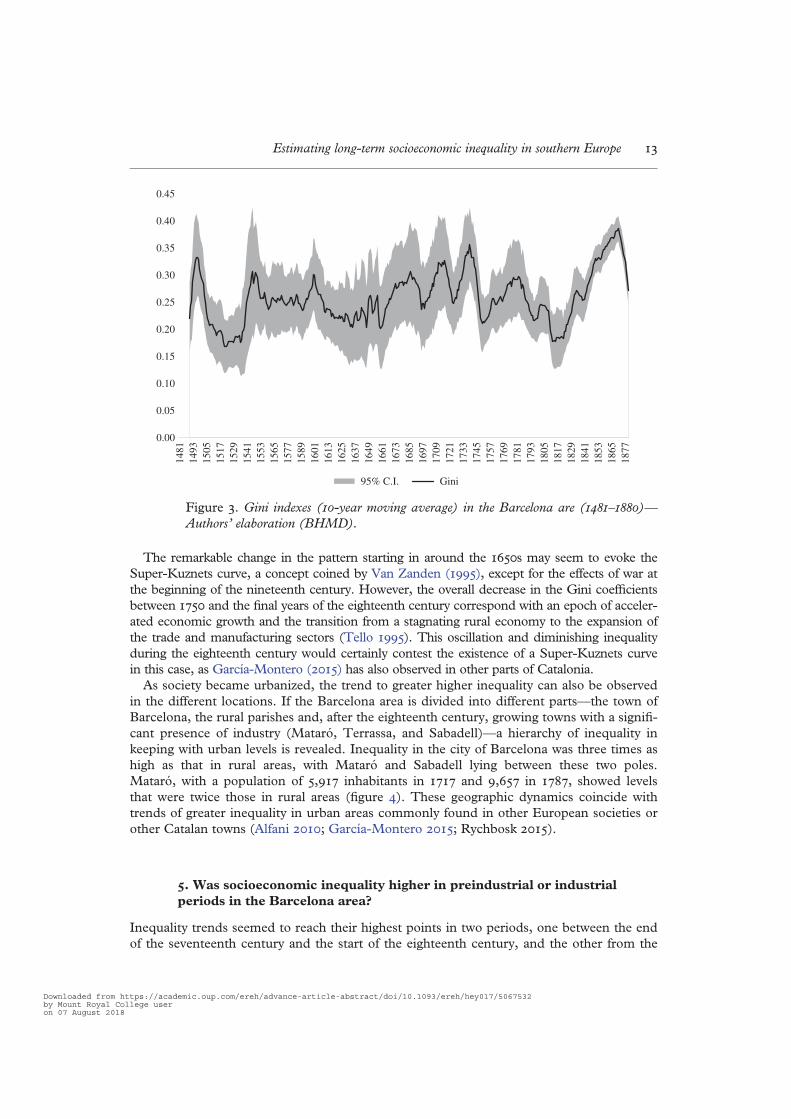
The remarkable change in the pattern starting in around the s may seem to evoke theSuper-Kuznets curve, a concept coined by Van Zanden (), except for the effects of war atthe beginning of the nineteenth century. However, the overall decrease in the Gini coefficientsbetween and the final years of the eighteenth century correspond with an epoch of acceler-ated economic growth and the transition from a stagnating rural economy to the expansion ofthe trade and manufacturing sectors (Tello ). This oscillation and diminishing inequalityduring the eighteenth century would certainly contest the existence of a Super-Kuznets curvein this case, as García-Montero () has also observed in other parts of Catalonia.As society became urbanized, the trend to greater higher inequality can also be observed
in the different locations. If the Barcelona area is divided into different parts—the town ofBarcelona, the rural parishes and, after the eighteenth century, growing towns with a signifi-cant presence of industry (Mataró, Terrassa, and Sabadell)—a hierarchy of inequality inkeeping with urban levels is revealed. Inequality in the city of Barcelona was three times ashigh as that in rural areas, with Mataró and Sabadell lying between these two poles.Mataró, with a population of , inhabitants in and , in , showed levelsthat were twice those in rural areas (figure ). These geographic dynamics coincide withtrends of greater inequality in urban areas commonly found in other European societies orother Catalan towns (Alfani ; García-Montero ; Rychbosk ).
. Was socioeconomic inequality higher in preindustrial or industrial
periods in the Barcelona area?
Inequality trends seemed to reach their highest points in two periods, one between the endof the seventeenth century and the start of the eighteenth century, and the other from the
0.00
0.05
0.10
0.15
0.20
0.25
0.30
0.35
0.40
0.45
95% C.I. Gini
1481
1493
1505
1517
1529
1541
1553
1565
1577
1601
1589
1613
1625
1637
1649
1661
1673
1685
1697
1709
1721
1733
1745
1757
1769
1781
1793
1805
1817
1829
1841
1853
1865
1877
Figure . Gini indexes (-year moving average) in the Barcelona are (–)—
Authors’ elaboration (BHMD).
Estimating long-term socioeconomic inequality in southern Europe
Downloaded from https://academic.oup.com/ereh/advance-article-abstract/doi/10.1093/ereh/hey017/5067532by Mount Royal College useron 07 August 2018

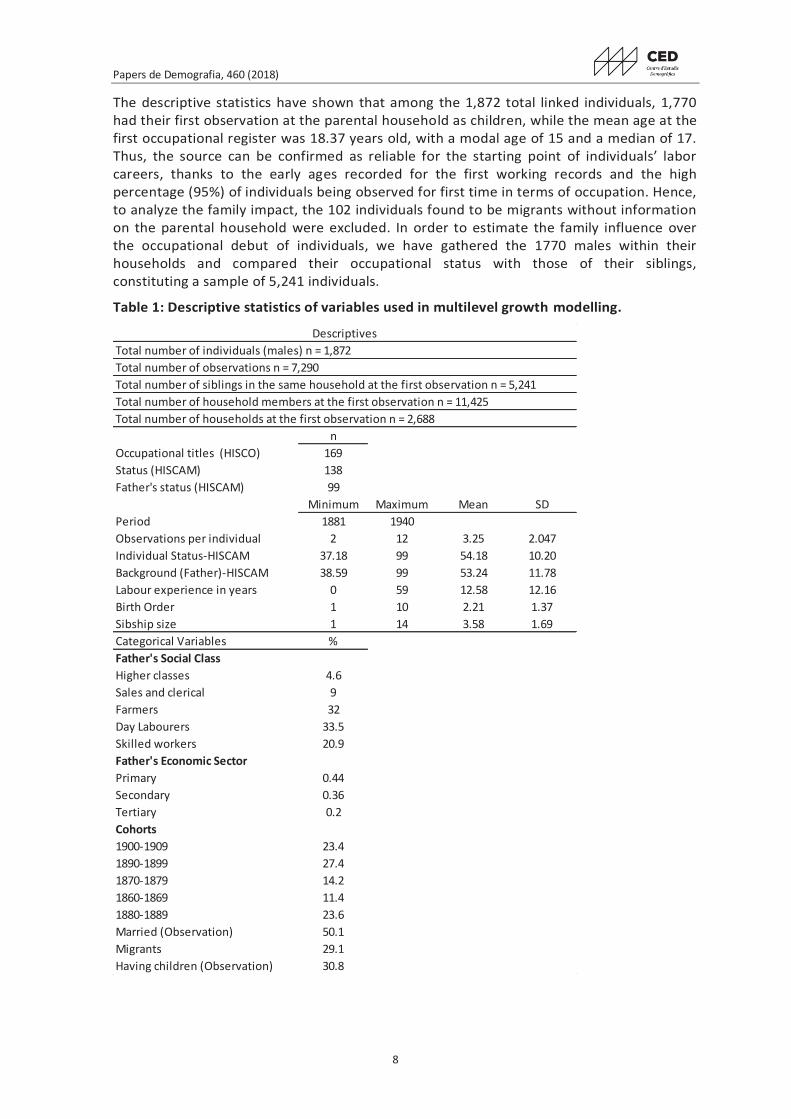
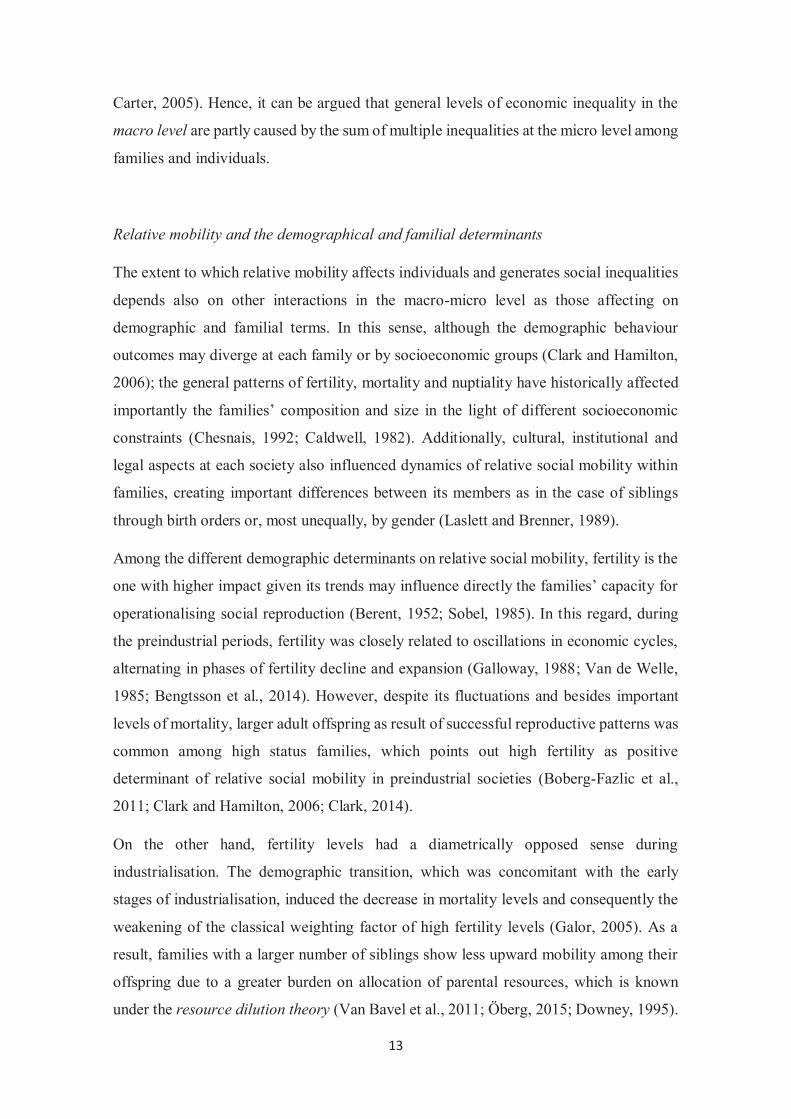
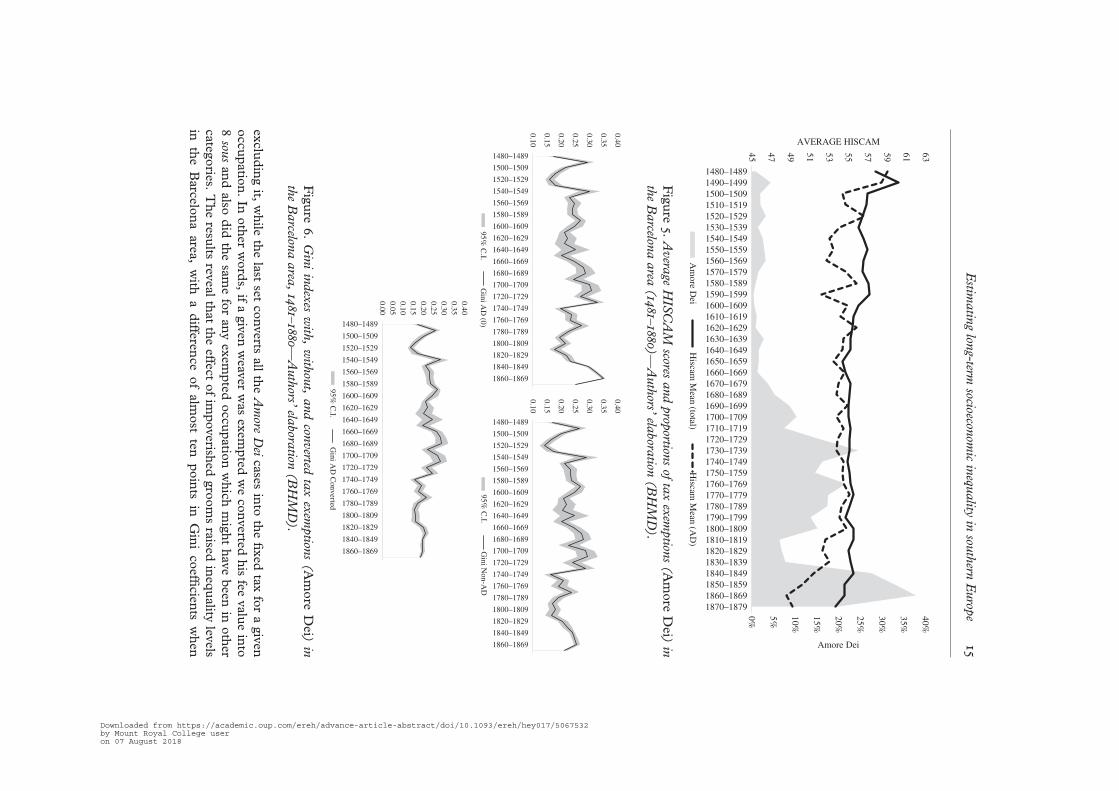
s onward. However, in the latter period, inequality estimates were driven up mainlybecause of the tax-exempt level applied to all grooms unable to pay the marriage license fee(Amore Dei). This exemption was granted to those grooms the church authorities con-sidered to be impoverished, and some of them could have been in this situation because oftemporary economic hardship or unemployment, since all them had declared an occupa-tion. How would this tax-exemption influence measurement of inequality? Assuming socio-economic poverty alone may be risky, since we cannot ascertain whether eligibility criteriachanged over time or whether the issue was strictly of an administrative nature rather thansocioeconomic.The proportion of grooms exempted from paying became noticeable from onward
and then, after a marked drop, in the two first decades of the nineteenth century.Individuals in this situation accounted for almost half of all the grooms who marriedbetween and (figure ). This rising tendency was significant in the period of thefirst stage of industrialization. Besides, the average HISCAM of those exempted droppedafter the s, owing to the considerable growth in the numbers of unskilled day laborers,which would seem logical since, toward the second half of the nineteenth century,Barcelona and a great part of its hinterland were moving into a factory system mode of pro-duction which gave rise to large flows of unskilled migrants (Mora-Sitja ).In order to better control for the likely effect of Amore Dei in our measures, we analyze
this influence with three different sets of Gini indexes, one including tax exemption, one
0.00
0.10
0.20
0.30
0.40
0.50
0.60
1560–69
1570–79
1580–89
1590–99
1600–09
1610–19
1620–29
1630–39
1640–49
1650–59
1660–69
1670–79
1680–89
1690–99
1700–09
1710–19
1720–29
1730–39
1740–49
1750–59
1760–69
1770–79
1780–89
1790–99
1800–09
1810–19
1820–29
1830–39
1840–49
1850–59
1860–69
1870–80
Barcelona 95% C.I. Rural 95% C.I.
Barcelona Gini Rural Gini
0.00
0.10
0.20
0.30
0.40
0.50
0.60
1720–29
1730–39
1740–49
1750–59
1760–69
1770–79
1780–89
1790–99
1800–09
1810–19
1820–29
1830–39
1840–49
1850–59
1860–69
1870–80
Barcelona 95% C.I. Mataró 95% C.I. Rural 95% C.I.
Barcelona Gini Mataró Gini Rural Gini
0.00
0.10
0.20
0.30
0.40
0.50
0.60
1720–29
1730–39
1740–49
1750–59
1760–69
1770–79
1780–89
1790–99
1800–09
1810–19
1820–29
1830–39
1840–49
1850–59
1860–69
1870–80
Barcelona 95% C.I. Sabadell 95% C.I. Rural 95% C.I.
Barcelona Gini Sabadell Gini Rural Gini
0.00
0.10
0.20
0.30
0.40
0.50
0.60
1720–29
1730–39
1740–49
1750–59
1760–69
1770–79
1780–89
1790–99
1800–09
1810–19
1820–29
1830–39
1840–49
1850–59
1860–69
1870–80
Barcelona 95% C.I. Terrassa 95% C.I. Rural 95% C.I.
Barcelona Gini Terrassa Gini Rural Gini
Figure . Gini indexes in Barcelona, Mataró, Terrassa, and Rural Zones—Authors’
elaboration (BHMD).
In this case, poverty was referred to as circumstantial, the kind of functional poverty that affected parts of thepopulation and that should not be confused with individuals comprising structural poverty, for example, beggarswho were common in preindustrial periods.
European Review of Economic History
Downloaded from https://academic.oup.com/ereh/advance-article-abstract/doi/10.1093/ereh/hey017/5067532by Mount Royal College useron 07 August 2018
excludingit,while
thelast
setcon
vertsallthe
Amore
Deicases
intothe
fixed
taxfor
agiven
occupation
.Inother
words,ifagiven
weaver
wasexem
ptedwecon
vertedhis
feevalu
einto
sou
sandalso
didthe
samefor
anyexem
ptedoccu
pationwhich
might
havebeen
inother
categories.Theresu
ltsreveal
thatthe
effectofimpoverished
groomsraised
inequ
alitylevels
inthe
Barcelon
aarea,
with
adifferen
ceofalm
ostten
pointsinGinicoeffi
cientswhen
0%
5%
10%
15%
20%
25%
30%
35%
40%
47
49
51
53
55
57
59
61
45
63
1480–1489
1490–1499
1500–1509
1510–1519
1520–1529
1530–1539
1540–1549
1550–1559
1560–1569
1570–1579
1580–1589
1590–1599
1600–1609
1610–1619
1620–1629
1630–1639
1640–1649
1650–1659
1660–1669
1670–1679
1680–1689
1690–1699
1700–1709
1710–1719
1720–1729
1730–1739
1740–1749
1750–1759
1760–1769
1770–1779
1780–1789
1790–1799
1800–1809
1810–1819
1820–1829
1830–1839
1840–1849
1850–1859
1860–1869
1870–1879
Amore Dei
AVERAGE HISCAM
Am
ore D
eiH
iscam M
ean (to
tal)H
iscam M
ean (A
D)
Figure
.Avera
geHISCAM
scoresandprop
ortionsof
taxexem
ption
s(Amore
Dei)
in
theBarcelon
aarea
(–)—
Authors’
elabora
tion(B
HMD).
0.1
0
0.1
5
0.2
0
0.2
5
0.3
0
0.3
5
0.4
0
1480–1489
1500–1509
1520–1529
1540–1549
1560–1569
1580–1589
1600–1609
1620–1629
1640–1649
1660–1669
1680–1689
1700–1709
1720–1729
1740–1749
1760–1769
1780–1789
1800–1809
1820–1829
1840–1849
1860–1869
95%
C.I.
Gin
i AD
(0)
0.1
0
0.1
5
0.2
0
0.2
5
0.3
0
0.3
5
0.4
0
1480–1489
1500–1509
1520–1529
1540–1549
1560–1569
1580–1589
1600–1609
1620–1629
1640–1649
1660–1669
1680–1689
1700–1709
1720–1729
1740–1749
1760–1769
1780–1789
1800–1809
1820–1829
1840–1849
1860–1869
95%
C.I.
Gin
i Non-A
D
0.0
0
0.0
5
0.1
0
0.1
5
0.2
0
0.2
5
0.3
0
0.3
5
0.4
0
1480–1489
1500–1509
1520–1529
1540–1549
1560–1569
1580–1589
1600–1609
1620–1629
1640–1649
1660–1669
1680–1689
1700–1709
1720–1729
1740–1749
1760–1769
1780–1789
1800–1809
1820–1829
1840–1849
1860–1869
95%
C.I.
Gin
i AD
Converted
Figure
.Giniindexes
with
,with
out,andcon
verted
taxexem
ption
s(Amore
Dei)
in
theBarcelon
aarea
,–—Authors’
elaboration
(BHMD).
Estim
atin
glon
g-termsocioecon
omicinequ
ality
insou
thern
Europ
e
Downloaded from https://academic.oup.com/ereh/advance-article-abstract/doi/10.1093/ereh/hey017/5067532by Mount Royal College useron 07 August 2018

comparing estimates with and without impoverished individuals, and the figure is even low-er with converted exemptions than without them (figure ).After , the levels of exemptions and inequality initiated a rising trend. And from
onward, when Amore Dei was included in the measurement, the rise in inequality wasmuch higher. The difference between the Gini trends was greater than percent. Themost noticeable aspect of this gap is explained by the occupational composition of tax-exempted grooms, a situation that was compounded in these years by a large proportion ofday laborers who came to constitute as much as percent of the group. Weavers andmany day laborers were among the first workers to be integrated into the incipient Catalanfactory system (Mora-Sitja ).Hence, the overall long-run trend of individual inequality seems to point to some possible
interpretations. First, in the latter half of the nineteenth century when the lowest economicstrata (Amore Dei) is included in the analysis, there is a notable increase in inequality, main-taining higher levels than in the past period and coinciding with the takeoff of Catalanindustrialization. Another plausible reason for this large increase in Amore Dei cases couldbe not so much a radical deterioration in workers’ living standards, as an aspect relatedwith changes in the labor calendar and its seasonality, given that after the s, most of thepopulation in Barcelona and other urban zones tended to marry in December and January,a phenomenon also observed in other countries like Sweden (Dribe and Van de Putte) where workers mainly chose to get married when there were breaks in industrialactivity. In other words, this could mean that Amore Dei indicates temporary unemploymentand was therefore circumstantial and not a sign of structural poverty. Second, when thetax-exempted group was not taken into consideration (absent or converted), we observedrising inequality in the first period of Catalan industrialization, although at lower levels.This would indicate that the preindustrial period of the seventeenth century was the mosteconomically unequal period in the years analyzed.Nevertheless, comparing inequality trends in the long run may be complicated, the premise
is that if the record of sous remained mainly constant over long periods, the real value of souswould be higher in the eighteenth and nineteenth centuries than in previous centuries. Inorder to give an insight of how this could affect evolving economic patterns over centuries,we have weighted taxes for each year with their respective values in grams of silver (see
0
200
400
600
800
1,000
1,200
1,400
1490–1499
1510–1519
1530–1539
1550–1559
1570–1579
1590–1599
1610–1619
1630–1639
1650–1659
1670–1679
1690–1699
1710–1719
1730–1739
1750–1759
1770–1779
1790–1799
Figure . Ability-to-pay per capita weighting sous with prices of silver grams—
Authors’ elaboration (BHMD) using data on silver prices from Feliu (a).
European Review of Economic History
Downloaded from https://academic.oup.com/ereh/advance-article-abstract/doi/10.1093/ereh/hey017/5067532by Mount Royal College useron 07 August 2018

Section ). This allows us to compute a measure of ability-to-pay per capita for the period–, the years with information on sous and silver (Feliu a). The result shows asignificantly rising pattern after the s (figure ). This gross estimate means that usingmarriage taxes seems to enable measurement of inequality between individuals (or groups) ina same period but in a long-run study, we cannot directly compare individuals from differentperiods in the same way since the same nominal tax could have different values over time.In an attempt at assessing whether socioeconomic inequality was higher in preindustrial
or industrial periods we computed the extraction ratio based on Gini coefficients, whichshows the extent of potential inequality converted into actual inequality (Milanovic et al.
), since it can be argued that higher ratios of extraction can mean a greater inequality.The extraction ratio shows, despite similar Gini measures, a downward trend toward theindustrialization period in different scenarios (with, without Amore Dei or converting Amore
Dei). There are signs of further evidence suggesting that the inequality in preindustrial peri-ods might have been higher than during industrialization (figure ).
. Within and between inequality among economic sectors
The general trends in economic inequality among individuals points to a likely influence ofstructural development in occupational terms through the four centuries under consider-ation. Long-term economic development can be observed thanks to structural changes inoccupation from to . When assessing the evolution of labor share from the occu-pational data registered in the source, the first noticeable element is the constant growth ofthe primary sector in the Barcelona area from to , which would confirm the rural-ization of the Catalan economy in the sixteenth and seventeenth centuries (Elliott ).
0.15
0.20
0.25
0.30
0.35
0.40
0.45
0.50
1490–1499
1540–1549
1590–1599
1640–1649
1690–1699
1740–1749
1790–1799
AD = 0 Non-AD Converted AD
Figure . Extraction ratio in some benchmark decades in the Barcelona area, –—
Authors’ elaboration (BHMD).
Estimating long-term socioeconomic inequality in southern Europe
Downloaded from https://academic.oup.com/ereh/advance-article-abstract/doi/10.1093/ereh/hey017/5067532by Mount Royal College useron 07 August 2018
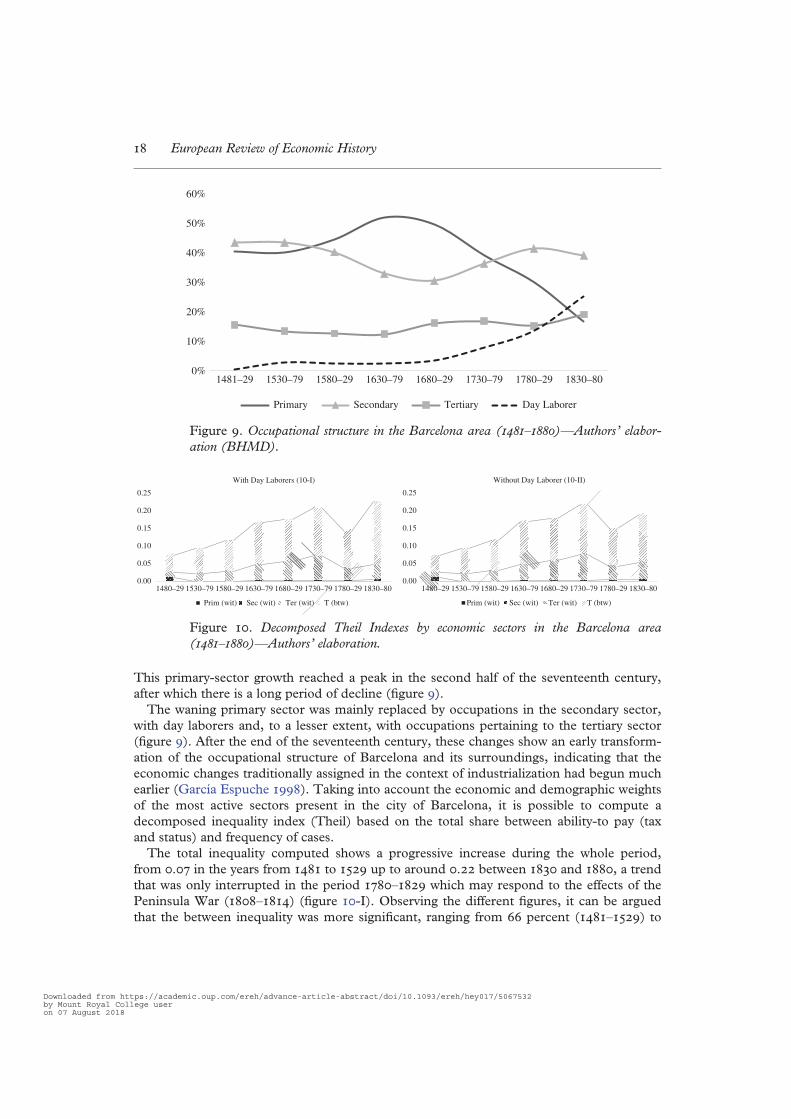
This primary-sector growth reached a peak in the second half of the seventeenth century,after which there is a long period of decline (figure ).The waning primary sector was mainly replaced by occupations in the secondary sector,
with day laborers and, to a lesser extent, with occupations pertaining to the tertiary sector(figure ). After the end of the seventeenth century, these changes show an early transform-ation of the occupational structure of Barcelona and its surroundings, indicating that theeconomic changes traditionally assigned in the context of industrialization had begun muchearlier (García Espuche ). Taking into account the economic and demographic weightsof the most active sectors present in the city of Barcelona, it is possible to compute adecomposed inequality index (Theil) based on the total share between ability-to pay (taxand status) and frequency of cases.The total inequality computed shows a progressive increase during the whole period,
from . in the years from to up to around . between and , a trendthat was only interrupted in the period – which may respond to the effects of thePeninsula War (–) (figure -I). Observing the different figures, it can be arguedthat the between inequality was more significant, ranging from percent (–) to
0%
10%
20%
30%
40%
50%
60%
1481–29 1530–79 1580–29 1630–79 1680–29 1730–79 1780–29 1830–80
Primary Secondary Tertiary Day Laborer
Figure . Occupational structure in the Barcelona area (–)—Authors’ elabor-
ation (BHMD).
0.00
0.05
0.10
0.15
0.20
0.25
1480–29 1530–79 1580–29 1630–79 1680–29 1730–79 1780–29 1830–80
Without Day Laborer (10-II)
Prim (wit) Sec (wit) Ter (wit) T (btw)
0.00
0.05
0.10
0.15
0.20
0.25
1480–29 1530–79 1580–29 1630–79 1680–29 1730–79 1780–29 1830–80
With Day Laborers (10-I)
Prim (wit) Sec (wit) Ter (wit) T (btw)
Figure . Decomposed Theil Indexes by economic sectors in the Barcelona area
(–)—Authors’ elaboration.
European Review of Economic History
Downloaded from https://academic.oup.com/ereh/advance-article-abstract/doi/10.1093/ereh/hey017/5067532by Mount Royal College useron 07 August 2018
percent (–), followed by the tertiary sector and, residually, by the secondaryand primary sectors.Nevertheless, although we consider the differences in Gini coefficients in the nineteenth
century, when the tax-exemption effect was controlled, we carry out the same exerciseamong sectors. With the exception of day laborers, the overall development of sectorinequality changed in the final period, –, in which inequality was slightly belowthat for the period –, and similar to that for – (figure -II). Moreover,the effects of between-sector inequality also decrease, indicating the effect of day laborersand, for first time, a part of the tertiary sector, while the within inequality of the secondarysector also rises after , which together with the inequality accounted for by daylaborers, indicates an early industrialization starting before than traditionally argued (Brea-Martínez and Pujadas-Mora ).So far, our analysis of the economic inequality trends has been based on the ability-to-
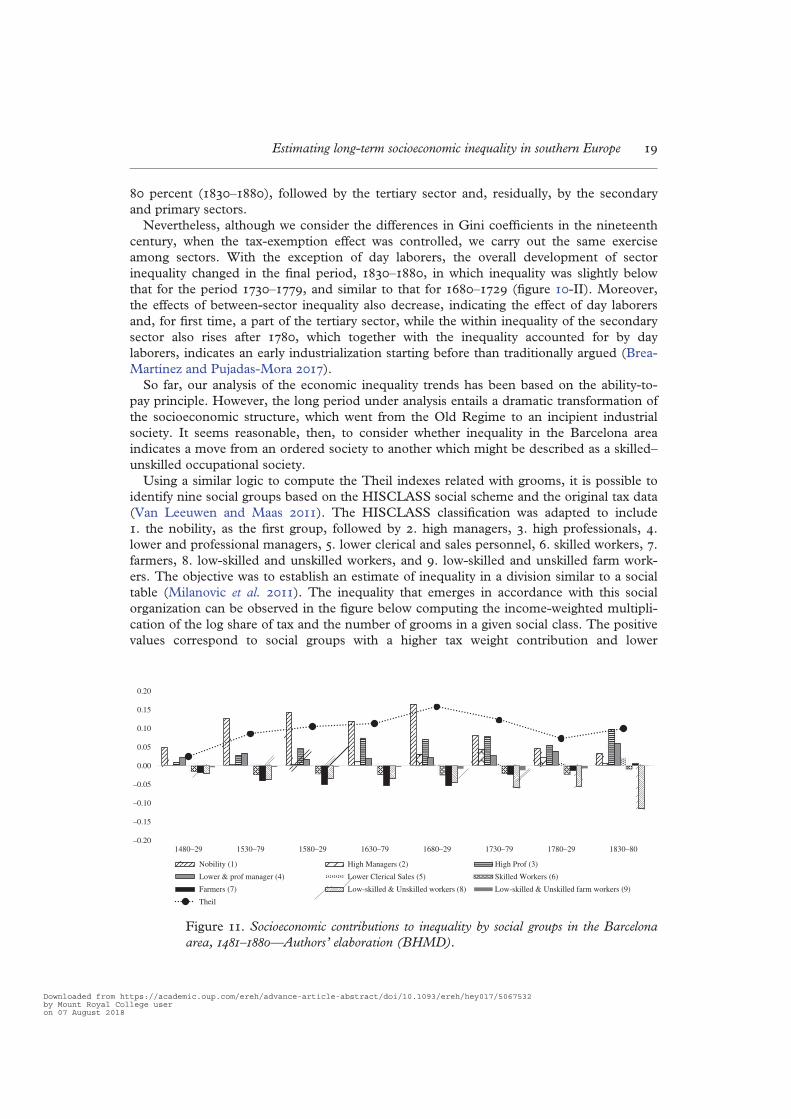
pay principle. However, the long period under analysis entails a dramatic transformation ofthe socioeconomic structure, which went from the Old Regime to an incipient industrialsociety. It seems reasonable, then, to consider whether inequality in the Barcelona areaindicates a move from an ordered society to another which might be described as a skilled–unskilled occupational society.Using a similar logic to compute the Theil indexes related with grooms, it is possible to
identify nine social groups based on the HISCLASS social scheme and the original tax data(Van Leeuwen and Maas ). The HISCLASS classification was adapted to include. the nobility, as the first group, followed by . high managers, . high professionals, .lower and professional managers, . lower clerical and sales personnel, . skilled workers, .farmers, . low-skilled and unskilled workers, and . low-skilled and unskilled farm work-ers. The objective was to establish an estimate of inequality in a division similar to a socialtable (Milanovic et al. ). The inequality that emerges in accordance with this socialorganization can be observed in the figure below computing the income-weighted multipli-cation of the log share of tax and the number of grooms in a given social class. The positivevalues correspond to social groups with a higher tax weight contribution and lower
–0.20
–0.15
–0.10
–0.05
0.00
0.05
0.10
0.15
0.20
1480–29 1530–79 1580–29 1630–79 1680–29 1730–79 1780–29 1830–80
Nobility (1) High Managers (2) High Prof (3)
Lower & prof manager (4) Lower Clerical Sales (5) Skilled Workers (6)
Farmers (7) Low-skilled & Unskilled workers (8) Low-skilled & Unskilled farm workers (9)
Theil
Figure . Socioeconomic contributions to inequality by social groups in the Barcelona
area, –—Authors’ elaboration (BHMD).
Estimating long-term socioeconomic inequality in southern Europe
Downloaded from https://academic.oup.com/ereh/advance-article-abstract/doi/10.1093/ereh/hey017/5067532by Mount Royal College useron 07 August 2018
population, whereas negative values represent exactly the opposite. In other words, positivevalues represent with the richer part of the society and negative values the poorer part.In this scheme based on the marriage taxes alone, the trends in total inequality (Theil) by
social groups would have increased progressively from the period – until and. However, from onward, the trends drop, showing even lower levels during theperiod –. Observing contributions from the social groups, until the period–, inequality was explained mainly by the positive contribution of the nobility whoaccounted for up to percent of total inequality (Figure ). However, from onward,the impact of the nobility lessens, which may be the result of a progressively declining pres-ence of this group in the social spectrum. Rather, total inequality starts to be explained bythe “negative” contribution of low-skilled and unskilled workers (basically day laborers andweavers) which progressively increases until –, when percent of inequality wasaccounted for by the group that was presumably introduced into the factory system(Figure ).
. Concluding remarks
Estimating socioeconomic inequality using the Barcelona Historical Marriage Database hasmade it possible to identify tax progressivity over a long period when this is rarely achiev-able using the other kinds of sources which have traditionally been used in this kind ofstudy.An overall view of the phases of the Catalan economy seems to offer a partial explanation
of trends in socioeconomic inequality, except for the second half of the eighteenth centurywhen, despite economic growth, inequality levels dropped or were interrupted by the effectsof the Peninsula War. This peculiarity also coincides with other cases described by differentauthors where the relationship between economic growth and increasing inequality (basedon empirical work) was not always visible, as happened, for instance, in preindustrialPortugal (Reis ), or in Florence, where inequality increased in times of economic stag-nation (Alfani and Ammannati ). Moreover, the overall trends observed in this areamatch with other studies, for instance, with higher levels of inequality in urban areas (Alfani; García-Montero ).The differences observed with the inequality which came with industrialization, when the
effects of tax exemption and low-skilled and unskilled industrial workers were taken intoaccount, together with insights from the extraction ratio in some benchmark decades, pointto a unique interpretation. The patterns of socioeconomic inequality would have been high-er in preindustrial periods, mainly during the second half of the seventeenth century andthe first half of the eighteenth century than in the “strictly” industrial period. The reasonfor this would seem to be the ordered social structure, which may have contributed to amore unequal society than one based on skilled and unskilled occupations. However, indus-trialization brought about a new situation, where processes like the deskilling occupationalstructure and the emergence of a new working class would have given rise to a new kind ofmounting inequality, probably due to the proletarianization effect.Paradoxically, in the second half of the eighteenth century the Barcelona area showed
lower socioeconomic inequality, in a break from the rising trends which started around theseventeenth century. If we relate this with knowledge from earlier studies in the region, per-haps the considerable increase in sharecropping contracts, allied with rising rural profitsand rather low salaries in manufacture, could explain the decline in inequality levels
European Review of Economic History
Downloaded from https://academic.oup.com/ereh/advance-article-abstract/doi/10.1093/ereh/hey017/5067532by Mount Royal College useron 07 August 2018
(Badia-Miró and Tello ). However, in the case of the Barcelona area, in the absence ofevidence of income inequality, and with the economic growth mismatch in the second halfof the eighteenth century, the only possible response is to formulate several hypotheses. Ifwe take into account the peculiarity of Catalonia regarding the universal (impartible) inher-itance system, together with the rural occupational structure, noninheriting individualscould have been contributing to rising inequality due to their lack of resources (Ferrer). Conversely, during the industrialization process, a possible reason for the decline insocioeconomic inequality in a period well known for economic growth could have been amore dynamic occupational structure, and also those noninheritors who were able to findnew and different occupations (perhaps in the secondary or tertiary sectors), thus allowingbetter balance in economic dispersion (Ferrer ). This last point signals the interest ofintroducing into analyses of inequality in economic history the effects that demography andfamily might have in terms of ages, mortality, fertility, and marriage processes as well asfamily composition, and this can be achieved through the analysis of individual microlevelinformation.
Acknowledgements
We are grateful to Anna Cabré, Isabel Moll Blanes, Gabriel Jover Avellà, and Juan Gabriel RodríguezHernández for all the support, helpful comments, and suggestions. A first version of this study wasalso presented in the EINITE conference held in Bocconi University in Milan () and in theBelfast ESSHC conference (), both organized by Guido Alfani to whom we thanks also valuablecomments.
Funding
This article was funded by the ERC Advanced Grant Project Five Centuries of Marriages(-), which was funded by the European Research Council (FP-ERC--AdG-) (PI Anna Cabré). The team includes researchers from the Universitat Autónomade Barcelona, its Centre for Demographic Studies (CED), and the Computer VisionCenter (CVC).
Conflict of interest statement. None declared.
References
ACEMOGLU, D. and ROBINSON, J.A. (). Why did the West extend the franchise? Democracy,inequality, and growth in historical perspective. The Quarterly Journal of Economics (),pp. –.
AGHION, P. and WILLIAMSON, J.G. (). Growth, Inequality, and Globalization: Theory, History, and
Policy. Cambridge, UK: Cambridge University Press.AGUILAR-GUTIÉRREZ, G. (). Why inequality declined in Mexico? Analysis with Gini, Mehran andPiesch Indexes, –. Economia Sociedad y Territorio (), pp. –.
ALFANI, G. (). Wealth inequalities and population dynamics in early modern northern Italy.Journal of Interdisciplinary History (), pp. –.
ALFANI, G. (). Economic inequality in northwestern Italy: a long-term view (fourteenth to eight-eenth centuries). The Journal of Economic History (), pp. –.
ALFANI, G. and AMMANNATI, F. (). Long-term trends in economic inequality: the case of theFlorentine state, c. –. The Economic History Review , pp. –.
Estimating long-term socioeconomic inequality in southern Europe
Downloaded from https://academic.oup.com/ereh/advance-article-abstract/doi/10.1093/ereh/hey017/5067532by Mount Royal College useron 07 August 2018
ALFANI, G. and RYCKBOSCH, W. (). Growing apart in early modern Europe? A comparison ofinequality trends in Italy and the Low Countries, –. Explorations in Economic History ,pp. –.
ALVAREZ-NOGAL, C. and PRADOS DE LA ESCOSURA, L. (). The decline of Spain (–): con-jectural estimates. European Review of Economic History (), pp. –.
ÁLVAREZ, B. and RAMOS PALENCIA, F. (). Human capital and earnings in eighteenth-centuryCastile. Explorations in Economic History (), pp. –.
ATKINSON, A.B., PIKETTY, T. and SAEZ, E. (). Top incomes in the long run of history. Journal ofEconomic Literature (), pp. –.
BADIA-MIRÓ, M. and TELLO, E. (). Vine-growing in Catalonia: the main agricultural changeunderlying the earliest industrialization in Mediterranean Europe (–). European Review of
Economic History (), pp. –.BETRÁN, J.L. (). La peste en la Barcelona de los Austrias, Vol. . Barcelona: Milenio.BREA-MARTÍNEZ, G. and PUJADAS-MORA, J. (). Transformación y desigualdad económica en laindustrialización en el área de Barcelona, –. Revista De Historia Económica/Journal of
Iberian and Latin American Economic History, pp. –. doi:./S.CANBAKAL, J. (). Wealth and inequality in Ottoman Bursa, –. Draft paper. http://www.econ.yale.edu/~egcenter/Wealth%and%Inequality%in%Ottoman%Bursa-Canbakal.pdf.
CARMONA, J. and SIMPSON, J. (). The “Rabassa Morta” in Catalan viticulture: the rise and declineof a long-term sharecropping contract, –s. The Journal of Economic History (),pp. –.
CODINA, J. (). Cost de la vida a l’Hospitalet de LLobregat. Increment de preus i salaris,–.Materials del Baix Llobregat , pp. –.
COWELL, F. ().Measuring inequality. Oxford: Oxford University Press.DE MAIO, F. (). Income inequality measures. Journal of Epidemiology & Community Health (),pp. –.
DRIBE, M. and VAN DE PUTTE, B. (). Marriage seasonality and the industrious revolution: south-ern Sweden, –. The Economic History Review (), pp. –.
ELLIOTT, J.H. (). The revolt of the Catalans. Cambridge, UK: Cambridge University Press.FELIU, G. (a). Precios y salarios en la Cataluña moderna. Vol. I: Alimentos. Madrid. Banco deEspaña.
FELIU, G. (b). Precios y salarios en la Cataluña moderna. Vol. II: Combustibles, productos man-ufacturados y salarios. Madrid. Banco de España.
FERRER, L. (). Segundones y actividad econòmica en Cataluña (siglos XVIII-XIX). Reflexiones apartir de la familia Berenguer de Artès. Revista de Demografía Histórica XXI(), pp. –.
FERRER, L. (). La diversitat de l’activitat econòmica a la Catalunya moderna: més enllà de larenda feudal. Pedralbes , pp. –.
FREEDMAN, P. (). The origins of peasant servitude in medieval Catalonia. Cambridge: CambridgeUniversity Press.
GARCÍA ESPUCHE, A. (). Un siglo decisivo: Barcelona y Cataluña, –, Vol. . Madrid:Alianza editorial.
GARCÍA-MONTERO, H. (). Long-term Trends in Wealth Inequality in Catalonia, –:Initial Results. Dondena Centre for Research. Working Paper. No. o. Document Number.
GIFRE, P. (). Els senyors útils i propietaris. La formació històrica d’un grup social pagès(Vegueria de Girona, –), Barcelona, Fundació Noguera-Editorial Pagès.
HAJNAL, J. (). European Marriage Patterns in Perspective. Population and Development Review
(–), pp. –.HAMILTON, E. (). American treasure and the price revolution in Spain, –. Harvard EconomicStudies. Cambridge, MA: Harvard University Press.
KENDRICK, M.S. (). The Ability-to-Pay Theory of Taxation. The American Economic Review, ,pp. –.
European Review of Economic History
Downloaded from https://academic.oup.com/ereh/advance-article-abstract/doi/10.1093/ereh/hey017/5067532by Mount Royal College useron 07 August 2018

KUZNETS, S. (). Economic growth and income inequality. The American Economic Review (),pp. –.
LAMBERT, P.S., ZIJDEMAN, R.L., VAN LEEUWEN, M.H., MAAS, I. and PRANDY, K. (). The construc-tion of HISCAM: a stratification scale based on social interactions for historical comparativeresearch. Historical Methods: A Journal of Quantitative and Interdisciplinary History (), pp. –.
MAIN, G.L. (). Inequality in early America: the evidence from probate records of Massachusettsand Maryland. The Journal of Interdisciplinary History (), pp. –.
MARFANY, J. (). Land, Proto-industry and Population in Catalonia, c. –: An Alternative
Transition to Capitalism? London: Ashgate.MARTÍNEZ-GALARRAGA, J., ROSÉS, J. and TIRADO, D.A. (). The long-term patterns of regionalincome inequality in Spain, –. Regional Studies (), pp. –.
MILANOVIC, B., LINDERT, P.H. and WILLIAMSON, J.G. (). Pre‐industrial inequality. The Economic
Journal (), pp. –.MORA-SITJA, N. (). Exploring changes in earnings inequality during industrialization: Barcelona,
–. Economics Group, Nuffield College, University of Oxford. Document Number.MORA-SITJA, N. (). Labour market integration in a pre-industrial economy: Catalonia,
–. Oxford Economic Papers (suppl_), pp. i–.MORA-SITJA, N. (). El primer proletariat català. Mà d’obra i relacions laborals a les fàbriques d’in-dianes de Barcelona. Barcelona quaderns d’història , pp. .
MORENO, A., PLANAGUMA, J. and DOMENECH, T. (). Las crisis demográficas en Cataluña SiglosXIV al XVII: Algunas reflexiones. Contrastes (Murcia, Spain) , pp. –.
NADAL, J. (). El Fracaso de la Revolución Industrial en España, –. Barcelona: Ariel.NICOLINI, E. and RAMOS PALENCIA, F. (). Decomposing income inequality in a backward pre‐industrial economy: Old Castile (Spain) in the middle of the eighteenth century. The Economic
History Review (), pp. –.OKUNO, Y. (). Entre la llana i el cotó. Una nota sobre l’extensió de la indústria del cotó als poblesde Catalunya el darrer quart del segle XVIII. Recerques: Història, Economia, Cultura , pp. –.
PRADOS DE LA ESCOSURA, L. (). Inequality, poverty and the Kuznets curve in Spain, –.European Review of Economic History (), pp. –.
PUJADAS-MORA, J.M., BREA-MARTÍNEZ, G., JORDÀ SÁNCHEZ, J.P. and CABRÉ, A. (). The apple neverfalls far from the tree: siblings and intergenerational transmission among farmers and artisans inthe Barcelona area in the sixteenth and seventeenth centuries. The History of the Family, pp. –.doi: ./X..
REIS, J. (). Deviant behaviour? Inequality in Portugal –. Cliometrica (), pp. –.REHER, D.S. (). Family ties in Western Europe: persistent contrasts. Population and Development
Review (), pp. –.ROSÉS, J. (). Measuring the contribution of human capital to the development of the Catalan fac-tory system (–). European Review of Economic History (), pp. –.
RYCKBOSCH, W. (). Economic inequality and growth before the industrial revolution: the case ofthe Low Countries (fourteenth to nineteenth centuries). European Review of Economic History (),pp. –.
SANTIAGO-CABALLERO, C. (). Income inequality in central Spain, –. Explorations in
Economic History (), pp. –.SCHULZ, W. and MAAS, I. (). Studying historical occupational careers with multilevel growthmodels. Demographic Research , pp. .
SERRA I PUIG, E. (). El règim feudal català abans i després de la sentència arbitral de Guadalupe.Recerques: Història, Economia, Cultura , pp. –.
SIMON TARRÉS, A. (). La població catalana a l’època moderna. Síntesi i actualització. Manuscrits:
Revista D’història Moderna , pp. –.TELLO, E. (). El fin de la expansión agraria en Cataluña del siglo XVIII: factores económicos ycrisis social. Agricultura y Sociedad , pp. –.
Estimating long-term socioeconomic inequality in southern Europe
Downloaded from https://academic.oup.com/ereh/advance-article-abstract/doi/10.1093/ereh/hey017/5067532by Mount Royal College useron 07 August 2018
TORRAS, J. (). Small towns, craft guilds and proto-industry in Spain. Jahrbuch für
Wirtschaftsgeschichte/Economic History Yearbook (), pp. –.VALLS JUNYENT, F. (). El Paper de les exportacions vitícoles en la configuració de les relacionsexteriors de l’economia catalana, –. Anuari de la Societat Catalana d’Economia , pp.–.
VAN LEEUWEN, M.H. and MAAS, I. (). HISCLASS: A Historical International Social Class Scheme.Leuven: University Press.
VAN LEEUWEN, M.H., MAAS, I. and MILES, A. (). HISCO: Historical International Standard
Classification of Occupations. Leuven: University Press.VAN ZANDEN, J.L. (). Tracing the beginning of the Kuznets curve: western Europe during theearly modern period. The Economic History Review (), pp. –.
VENTURA, J. (). La moneda a Catalunya durant el regnat de Carles III. Pedralbes: Revista
D’història Moderna , pp. –.VILAR, P. (). Catalunya dins l’Espanya Moderna. Vol III. Les Transformacions Agràries del Segle
XVIII Català. Barcelona: Edicions, pp. .VILAR, P. (). La Catalunya industrial: reflexions sobre una arrencada i sobre un destí. Recerques:
història, economia, cultura , pp. –.WILLIAMSON, J.G. (). British inequality during the industrial revolution: accounting for theKuznets curve. In Y. S. Brenner, H. Kaelble and M. Thomas (eds), Income Distribution in Historical
Perspective. Cambridge: Cambridge University Press, pp. –.
European Review of Economic History
Downloaded from https://academic.oup.com/ereh/advance-article-abstract/doi/10.1093/ereh/hey017/5067532by Mount Royal College useron 07 August 2018

TRANSFORMACIÓN Y DESIGUALDADECONÓMICA EN LA INDUSTRIALIZACIÓNEN EL ÁREA DE BARCELONA, 1715-1860*
GABRIEL BREA-MARTÍNEZ(Centre d’Estudis Demogràfics-Universitat Autònoma de Barcelona)a
JOANA-MARIA PUJADAS-MORA(Centre d’Estudis Demogràfics-Universitat Autònoma de Barcelona)a
Transformation and Economic Inequalityin the Industrialisation of the Area of Barcelona, 1715-1860
ABSTRACT
Labour market transformation and inequality were fundamental aspectsin the transition to the industrialisation. This article reconstructs theBarcelona’s area economic structure across the 18th and 19th centuriesthrough the Marriage Licences of the Barcelona’s Cathedral. Thesedocuments registered a proportional tax paid by the spouses’ according totheir occupational and social status. Since 1780, an important decrease inthe primary sector and an increase in the secondary and tertiary sectors areobserved. Inequality between economic sectors rose and also within thesecondary sector (textile) due to the proletarianization of the workers.Conversely, there was not an increase in inequality in the primary sectorwhile it decreased in the tertiary sector.
Keywords: Industrialisation, occupational structure, area of Barcelona,economic inequality, proletarianization.
JEL Classification: J21, N33, 014, O15, D63
* Received 27 February 2017. Accepted 11 October 2017. Este trabajo forma parte de la tesisdoctoral en curso del primer autor. La investigación se ha desarrollado en el proyecto “FiveCenturies of Marriages” dirigido por la Prof. Anna Cabré y financiado por el European ResearchCouncil (FP7-ERC-2010-AdG-269796). Agradecemos el apoyo e inspiración por parte de la ProfesoraAnna Cabré, sin la cual esta investigación no habría sido posible.
a C/ de Ca n’Altayó, Ed. E2, UAB, 08193 Bellaterra/Barcelona. Email: [email protected],[email protected].
Revista de Historia Económica, Journal of Iberian and Latin American Economic HistoryPage 1 of 33. doi:10.1017/S0212610917000234 © Instituto Figuerola, Universidad Carlos III de Madrid, 2017.
1
RESUMEN
La transformación del mercado laboral y sus desigualdades fueron fun-damentales en la transición hacia la industrialización. Este artículo recon-struye la estructura económica del área de Barcelona entre los siglos XVIII yXIX a través de los Libros de Esponsales de la Catedral de Barcelona, queregistraban el pago de un impuesto proporcional en función del estatussocial u ocupacional de los contrayentes. A partir de 1780 se observa unadisminución del sector primario y el crecimiento del secundario y terciario.La desigualdad entre sectores aumentó, al igual que en el interior del sectorsecundario (textil) que se entendería por un proceso de proletarización. En elprimario no se incrementaron las desigualdades y en el terciariodisminuyeron.
Palabras clave: Industrialización, estructura ocupacional, área deBarcelona, desigualdad económica, proletarización
1. INTRODUCCIÓN
La industrialización conllevó un importante proceso de diversificación yespecialización del mercado de trabajo causado por transformaciones queafectaron a la composición ocupacional, debido a la aparición, desaparición,declive y aumento de diferentes ocupaciones con un consecuente cambio enlos niveles de desigualdad. De hecho, se dio una especialización productiva(técnica y/o tecnológica) en diferentes sectores económicos, tanto enactividades relacionadas con la transformación de recursos naturales, comoen la producción de bienes de consumo (Broadberry et al. 2013; Shaw-Taylory Wrigley, 2014). A su vez, este proceso propició un traspaso de poblaciónactiva de la agricultura a la industria, provocando un éxodo rural, comoconsecuencia de una mejora técnica en la producción agrícola y sobre todo aldesarrollo del modo de producción fabril1.
El progreso tecnológico en muchas industrias permitió absorber a unnúmero importante de trabajadores que no necesariamente tenían unaespecialización concreta. En el caso de la industria textil, la adopción denuevas formas de producción posibilitó disminuir el tiempo de aprendizajeocupacional además de facilitar el acceso a trabajadores ajenos al sistemagremial2. De esta manera, en sectores como la manufactura, la construcción
1 Sobre la productividad agrícola previa a la industrialización véase Allen (2000) y Clark (1987).En la importancia de los movimientos migratorios relacionados durante la industrialización véaseCamps Cura (1995), Moch (2003), Oris (2003) y Vidal i Bendito (1979).
2 La industrialización conllevó a una disminución de la especialización del trabajador como seafirma en Form (1987) y Hanagan (1977).
GABRIEL BREA-MARTÍNEZ/JOANA MARIA PUJADAS-MORA
2 Revista de Historia Económica, Journal of Iberian and Latin American Economic History
y los transportes se reconfiguraron muchas de sus ocupaciones3. Elcrecimiento del sistema fabril en el siglo XIX implicó una especializaciónde parte de las ocupaciones manufactureras mientras que otros menesteresse proletarizaron (Form, 1987; Camps Cura, 1992). También se observael surgimiento de nuevas actividades en el sector del comercio, claramenteen expansión, o la eclosión del sector de las finanzas (Prat Sabartés, 2007;Sudrià, 2004).
En España, los estudios sobre la composición ocupacional en épocashistóricas se hicieron principalmente en los años ochenta del siglo XX,centrándose en los siglos XVIII y XIX, a partir de documentación censal yregistros civiles4. Desgraciadamente, los censos y padrones solo empezarona tener mayor información ocupacional a partir de la segunda mitad delochocientos5.
Tradicionalmente, se había presentado que la desigualdad era inferior enépocas anteriores a la modernización económica (industrialización) que enfases iniciales y de asentamiento de la revolución industrial. Esta disminuiríauna vez la industrialización se hubiese consolidado, un planteamiento de lallamada hipótesis de Kuznets (Kuznets, 1955). De esta manera, la crecientediferenciación entre ocupaciones cualificadas y no cualificadas podría habersupuesto un importante aumento de la desigualdad económica entretrabajadores en las primeras fases de la industrialización (Prados de laEscosura, 2008, Álvarez y Ramos Palencia; 2016). En la actualidad la visiónclásica de la inequidad en épocas anteriores a la industrialización se hamodificado, bajo el argumento que la desigualdad no era tan baja en
3 Sobre la transformación de la manufactura, la construcción y los transportes véase Arranz(1990), Cooney (1993), Grau y López (1974), Landes (2003) y Muset (1995).
4 Pocos trabajos en España se han dedicado a este tema. A nivel general se destacan: SotoCarmona (1989) sobre el trabajo industrial en España, utilizando censos desde 1857 hasta 1930.A nivel local para los siglos XVIII y XIX se cuenta con los trabajos de Almárcegui y Sarrión (1981)para Zaragoza, Almárcegui (1981) para Reus, Martín Cabreros y Sánchez Ruiz (1985) para Zamora,Roig (1985) para el Alt Empordà, Torras i Ribé (1987) para Igualada. Barcelona dispone del estudioclásico de Nadal y Giralt (1963), reconstruyendo la estructura ocupacional a partir del primercatastro borbónico (1717–1718) comparándose con la estructura reconstruida a partir del recuentode hogares de 1517 (fogatge).
5 Solo a partir del 1887 los censos y padrones empiezan a catalogar las ocupaciones de formamás precisa y homogénea, evitando que diferentes títulos ocupacionales pudieran referirse a unamisma ocupación (Camps Cura y Borderías, 2012). Hay que tener presente que con anterioridad alsiglo XIX y gracias al Censo de Floridablanca (1787) la población activa se puede categorizar porsectores económicos (Reher, 1986). Otras fuentes que recogen información ocupacional son losCensos Obreros surgidos en la segunda mitad del XIX, promovidos por las Juntas Locales deReformas Sociales entre 1919 y 1923. En Cataluña previamente ya se levantó un Censo Obrero en1905 para Barcelona y en Sabadell para 1858 y 1863. Otra fuente que contiene información ocu-pacional en Cataluña es la Monografía estadística de la clase obrera de Ildefons Cerdà publicada en1858. Las fuentes censales aunque recogen al grueso de la población son fotografías fijas en eltiempo y no permiten ver una evolución temporal pormenorizada. Las fuentes de carácter obreroúnicamente recogen actividades relacionadas con la industria y comercio, no ofreciendo unaimagen completa de la estructura ocupacional.
TRANSFORMACIÓN Y DESIGUALDAD ECONÓMICA
Revista de Historia Económica, Journal of Iberian and Latin American Economic History 3
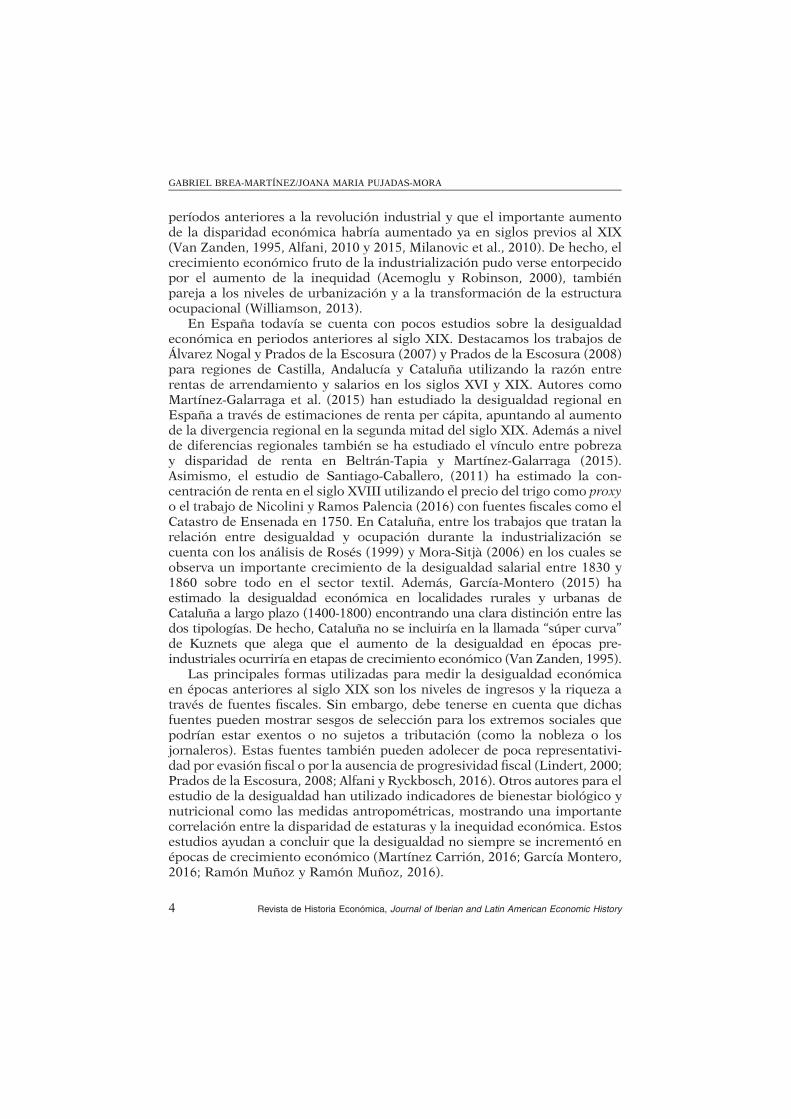
períodos anteriores a la revolución industrial y que el importante aumentode la disparidad económica habría aumentado ya en siglos previos al XIX(Van Zanden, 1995, Alfani, 2010 y 2015, Milanovic et al., 2010). De hecho, elcrecimiento económico fruto de la industrialización pudo verse entorpecidopor el aumento de la inequidad (Acemoglu y Robinson, 2000), tambiénpareja a los niveles de urbanización y a la transformación de la estructuraocupacional (Williamson, 2013).
En España todavía se cuenta con pocos estudios sobre la desigualdadeconómica en periodos anteriores al siglo XIX. Destacamos los trabajos deÁlvarez Nogal y Prados de la Escosura (2007) y Prados de la Escosura (2008)para regiones de Castilla, Andalucía y Cataluña utilizando la razón entrerentas de arrendamiento y salarios en los siglos XVI y XIX. Autores comoMartínez-Galarraga et al. (2015) han estudiado la desigualdad regional enEspaña a través de estimaciones de renta per cápita, apuntando al aumentode la divergencia regional en la segunda mitad del siglo XIX. Además a nivelde diferencias regionales también se ha estudiado el vínculo entre pobrezay disparidad de renta en Beltrán-Tapia y Martínez-Galarraga (2015).Asimismo, el estudio de Santiago-Caballero, (2011) ha estimado la con-centración de renta en el siglo XVIII utilizando el precio del trigo como proxyo el trabajo de Nicolini y Ramos Palencia (2016) con fuentes fiscales como elCatastro de Ensenada en 1750. En Cataluña, entre los trabajos que tratan larelación entre desigualdad y ocupación durante la industrialización secuenta con los análisis de Rosés (1999) y Mora-Sitjà (2006) en los cuales seobserva un importante crecimiento de la desigualdad salarial entre 1830 y1860 sobre todo en el sector textil. Además, García-Montero (2015) haestimado la desigualdad económica en localidades rurales y urbanas deCataluña a largo plazo (1400-1800) encontrando una clara distinción entre lasdos tipologías. De hecho, Cataluña no se incluiría en la llamada “súper curva”
de Kuznets que alega que el aumento de la desigualdad en épocas pre-industriales ocurriría en etapas de crecimiento económico (Van Zanden, 1995).
Las principales formas utilizadas para medir la desigualdad económicaen épocas anteriores al siglo XIX son los niveles de ingresos y la riqueza através de fuentes fiscales. Sin embargo, debe tenerse en cuenta que dichasfuentes pueden mostrar sesgos de selección para los extremos sociales quepodrían estar exentos o no sujetos a tributación (como la nobleza o losjornaleros). Estas fuentes también pueden adolecer de poca representativi-dad por evasión fiscal o por la ausencia de progresividad fiscal (Lindert, 2000;Prados de la Escosura, 2008; Alfani y Ryckbosch, 2016). Otros autores para elestudio de la desigualdad han utilizado indicadores de bienestar biológico ynutricional como las medidas antropométricas, mostrando una importantecorrelación entre la disparidad de estaturas y la inequidad económica. Estosestudios ayudan a concluir que la desigualdad no siempre se incrementó enépocas de crecimiento económico (Martínez Carrión, 2016; García Montero,2016; Ramón Muñoz y Ramón Muñoz, 2016).
GABRIEL BREA-MARTÍNEZ/JOANA MARIA PUJADAS-MORA
4 Revista de Historia Económica, Journal of Iberian and Latin American Economic History
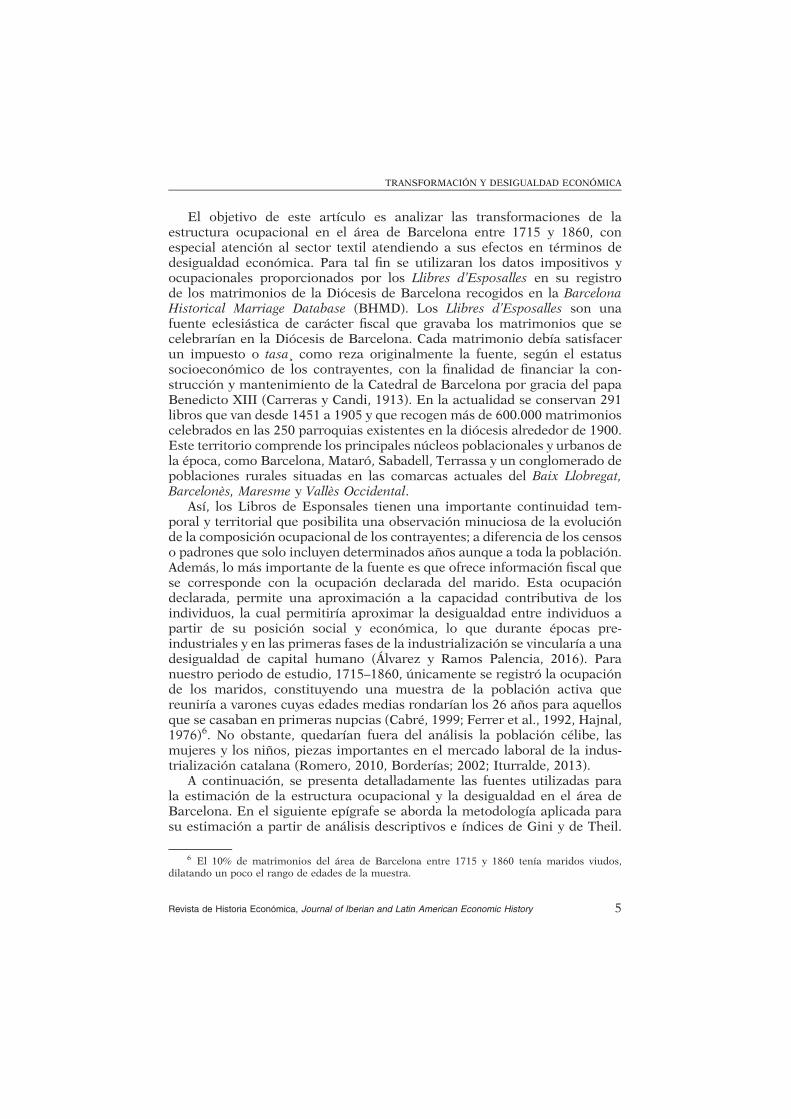
El objetivo de este artículo es analizar las transformaciones de laestructura ocupacional en el área de Barcelona entre 1715 y 1860, conespecial atención al sector textil atendiendo a sus efectos en términos dedesigualdad económica. Para tal fin se utilizaran los datos impositivos yocupacionales proporcionados por los Llibres d’Esposalles en su registrode los matrimonios de la Diócesis de Barcelona recogidos en la BarcelonaHistorical Marriage Database (BHMD). Los Llibres d’Esposalles son unafuente eclesiástica de carácter fiscal que gravaba los matrimonios que secelebrarían en la Diócesis de Barcelona. Cada matrimonio debía satisfacerun impuesto o tasa¸ como reza originalmente la fuente, según el estatussocioeconómico de los contrayentes, con la finalidad de financiar la con-strucción y mantenimiento de la Catedral de Barcelona por gracia del papaBenedicto XIII (Carreras y Candi, 1913). En la actualidad se conservan 291libros que van desde 1451 a 1905 y que recogen más de 600.000 matrimonioscelebrados en las 250 parroquias existentes en la diócesis alrededor de 1900.Este territorio comprende los principales núcleos poblacionales y urbanos dela época, como Barcelona, Mataró, Sabadell, Terrassa y un conglomerado depoblaciones rurales situadas en las comarcas actuales del Baix Llobregat,Barcelonès, Maresme y Vallès Occidental.
Así, los Libros de Esponsales tienen una importante continuidad tem-poral y territorial que posibilita una observación minuciosa de la evoluciónde la composición ocupacional de los contrayentes; a diferencia de los censoso padrones que solo incluyen determinados años aunque a toda la población.Además, lo más importante de la fuente es que ofrece información fiscal quese corresponde con la ocupación declarada del marido. Esta ocupacióndeclarada, permite una aproximación a la capacidad contributiva de losindividuos, la cual permitiría aproximar la desigualdad entre individuos apartir de su posición social y económica, lo que durante épocas pre-industriales y en las primeras fases de la industrialización se vincularía a unadesigualdad de capital humano (Álvarez y Ramos Palencia, 2016). Paranuestro periodo de estudio, 1715–1860, únicamente se registró la ocupaciónde los maridos, constituyendo una muestra de la población activa quereuniría a varones cuyas edades medias rondarían los 26 años para aquellosque se casaban en primeras nupcias (Cabré, 1999; Ferrer et al., 1992, Hajnal,1976)6. No obstante, quedarían fuera del análisis la población célibe, lasmujeres y los niños, piezas importantes en el mercado laboral de la indus-trialización catalana (Romero, 2010, Borderías; 2002; Iturralde, 2013).
A continuación, se presenta detalladamente las fuentes utilizadas parala estimación de la estructura ocupacional y la desigualdad en el área deBarcelona. En el siguiente epígrafe se aborda la metodología aplicada parasu estimación a partir de análisis descriptivos e índices de Gini y de Theil.
6 El 10% de matrimonios del área de Barcelona entre 1715 y 1860 tenía maridos viudos,dilatando un poco el rango de edades de la muestra.
TRANSFORMACIÓN Y DESIGUALDAD ECONÓMICA
Revista de Historia Económica, Journal of Iberian and Latin American Economic History 5

Posteriormente se presentan los resultados y se concluye con una discusiónsobre estos.
2. DATOS: BARCELONA HISTORICAL MARRIAGE DATABASE
La Barcelona Historical Marriage Database recoge los matrimonios regis-trados en los Libros de Esponsales de la Diócesis de Barcelona entre 1451 y1905. Para el 1715–1860, este registro fiscal y matrimonial recogía la filiaciónde los contrayentes, la ocupación o status del marido que determinaba elcorrespondiente impuesto. Para este estudio, únicamente se han tenido encuenta los individuos registrados en la Oficialidad de Barcelona, principaldecanato de la Diócesis que acumulaba el 90 por cien de los individuosregistrados, ya que agrupaba a las zonas más pobladas de la Diócesis7.Entre 1715 y 1860 se registraron 227.373 individuos que declararon unaocupación, un estatus o una condición de un total de 232.834 (Gráfico 1). El70 por cien de los individuos considerados se concentran entre 1785 y 1860,fenómeno que concuerda con el crecimiento de la población en Cataluña ymás concretamente con el de Barcelona, observado a partir de las últimasdécadas del siglo XVIII (Livi Bacci, 1987, Nadal, 1978). Sin embargo, hay quetener en cuenta que esta tendencia creciente se rompió con la Guerra deIndependencia (1808-1814).
Las ocupaciones registradas en los Libros de Esponsales, como enmuchas fuentes de demográficas, eran fruto de una auto-declaración o deuna descripción de otra persona (Hauser, 1982). De hecho, estas informa-ciones pudieron variar en el tiempo y/o en el espacio geográfico8. Además,con el fin de reconstruir la estructura ocupacional, es necesario agrupar lasocupaciones individuales para poder verificar si más de un título ocupacio-nal pueda referirse a una misma ocupación, o que con el tiempo una ocu-pación pudiera observar un cambio en su actividad (Broadberry et al.,2013)9. De esta manera, todas las ocupaciones han sido normalizadasortográficamente para luego ser codificadas con la clasificación HistoricalClassification of Occupations (HISCO) (Van Leeuwen, 2002)10.
Los 227.373 individuos muestran 12.770 títulos ocupacionales literalesdiferentes, que se han convertido en 304 códigos ocupacionales HISCO.Estos códigos han sido transformados en sectores y subsectores económicos
7 De los 612.489 matrimonios totales de la Diócesis entre 1451-1905, unos 556.318 casos son dela Oficialidad y 232.834 en el período de estudio 1715-1860, el Decanato del Penedès aportó 27.947 y13.528, el de Piera, 14.791 y 10.395 y el del Vallès, 13,433 y 9.469 respectivamente.
8 Como mostraron Hauser (1982) y Katz (1972) para Estados Unidos y el norte de Europa en elsiglo XIX.
9 Sin un proceso de clasificación y codificación ocupacional sería imposible estimar correc-tamente la estructura ocupacional y tener resultados comparables con otros lugares.
10 Una clasificación de amplia difusión en demografía histórica, historia social e historiaeconómica. Véase a modo de ejemplo De Pleijt y Weisdorf (2017), Maas y Van Leeuwen (2016)o Molitoris y Dribe (2016).
GABRIEL BREA-MARTÍNEZ/JOANA MARIA PUJADAS-MORA
6 Revista de Historia Económica, Journal of Iberian and Latin American Economic History
(Pujadas-Mora et al., 2014)11. Los denominados trabajadores y jornaleros nose han atribuido a ningún sector ya que se parte de la idea de que estasetiquetas ocupacionales describían a trabajadores temporales que podíanrealizar diferentes actividades en diferentes subsectores (De Pleijt y Weis-dorf, 2017). Finalmente, con el objetivo de profundizar en la evolución de laestructura ocupacional del sector textil se han categorizado las ocupacionestextiles en sus diferentes fases de producción dado que la clasificaciónHISCO no recoge este tipo de especificaciones (Cuadro 1)12. En esta cate-gorización no se han incluido las materias primas empleadas ya que en lafuente no se registró de manera frecuente. Esto se debió a que el proceso demecanización del sector textil durante los siglos XVIII y XIX hizo que ya nofuera tan necesaria la existencia de ocupaciones especializadas en unadeterminada materia (Thomson, 2003). Otra posible razón sería la adopcióngeneralizada del algodón, en detrimento de la lana o del lino, propiciando laomisión de la materia (Okuno, 1999)13.
GRÁFICO 1MATRIMONIOS EN EL ÁREA DE BARCELONA, 1715-1860
0
500
1.000
1.500
2.000
2.500
3.000
3.500
4.000
171
5
172
0
172
5
173
0
173
5
174
0
174
5
175
0
175
5
176
0
176
5
177
0
177
5
178
0
178
5
179
0
179
5
180
0
180
5
181
0
181
5
182
0
182
5
183
0
183
5
184
0
184
5
185
0
185
5
Área de Barcelona Barcelona (Ciudad)
Fuente: Estimado a partir de la Barcelona Historical Marriage Database.Notas: La parte destacada en gris se refiere al período de 1780-1784 en el que no
se conservan los correspondientes Llibres d’Esposalles.
11 Véase otros trabajos en España con clasificaciones basadas en HISCO en Álvarez y RamosPalencia (2016); el monográfico de la Revista de Demografía Histórica “HISCO y los sistemas declasificación profesional para la Historia., 2014, XXXII, 1 (http://www.adeh.org/?q=es/contenido/revista-de-demografia-historica-2014-xxxii-1).
12 Por contra HISCO distingue entre ocupaciones especializadas y no especializadas por el nivelde manejo de tecnología y las sitúa en una jerarquía (Van Leeuwen et al., 2002)
13 Cabe destacar la concentración territorial de la industria lanera en Cataluña durante el sigloXIX en torno a Sabadell y Terrassa como muestra Benaul (1995).
TRANSFORMACIÓN Y DESIGUALDAD ECONÓMICA
Revista de Historia Económica, Journal of Iberian and Latin American Economic History 7

El impuesto o tasa que satisfacían los contrayentes se expresaban enlibras y sueldos, a modo de unidades de cuenta, aunque el pago se efectuabacon la moneda en curso14. Estas tasas en los siglos XVIII y XIX se organi-zaron a partir de un sistema de imposición proporcional con ocho nivelesdiferentes (Cuadro 2)15. En la primera categoría de pago se halla la noblezatitulada (duques, marqueses, condes, etc.); siguen caballeros, ciudadanoshonrados16. En la parte central de la clasificación, se encuentran ocupa-ciones relacionadas con el comercio y las profesiones liberales. En la base de
CUADRO 1CATEGORIZACIÓN TEXTIL POR FASE DE PRODUCCIÓN
Fase de Producción Código HISCO Ocupación Literal
Preparación-Fibra 75135 Cardador
Preparación-Fibra 75145 Peinador
Hilatura 75220 Hilador
Hilatura 75240 Retorcedor
Preparación-Tisaje 75165 Tintorero
Tisaje 75400 Tejedor
Tisaje 75535 Calcetero
Tisaje 75450 Cintero
Tisaje 75710 Cordelero
Tisaje 75920 Pasamanero
Tisaje 75490 Velero
Tisaje 75430 Terciopelero
Confección 79100 Sastre
Confección 79310 Sombrerero
Confección 79500 Bordador
Confección 79600 Tapicero
Confección 79640 Colchonero
Estampado-Tejidos 92950 Pintor de Indianas
Fuente: Realizado a partir de la Barcelona Historical Marriage Database.
14 Cada Libra equivalía a veinte Sueldos.15 Entre 1715 y 1860 existían ocho categorías socioeconómicas en la clasificación fiscal de la
fuente que incluían la totalidad de estatus sociales u ocupacionales.16 Los Ciudadanos Honrados eran una aristocracia urbana presente en las principales ciudades
de la corona de Aragón desde la baja Edad Media, hasta los inicios del siglo XVIII. En el caso de laciudad de Barcelona eran los principales integrantes del Consejo de Ciento y son un símbolo delascenso al poder de estamentos urbanos en el seno de la crisis del Antiguo Régimen (Amelang,1986).
GABRIEL BREA-MARTÍNEZ/JOANA MARIA PUJADAS-MORA
8 Revista de Historia Económica, Journal of Iberian and Latin American Economic History

la tasación, los artesanos y campesinos. Por último, se halla un nivel nomonetario, es decir, a los que no podían satisfacer la tasa se les concedía lalicencia matrimonial por Amore Dei. Este nivel representa una exención delpago de la tasa y no agruparía una categoría ocupacional concreta, aunqueen el 95 por cien de los casos los individuos declaraban una ocupación. Poreste motivo, entendemos que el hecho de no satisfacer la tasa era reflejo deuna situación coyuntural de falta de trabajo ya fuese por enfermedad ocualquier contingencia del mercado laboral.
3. METODOLOGÍA
La categorización en diferentes tasas, permite cuantificar una aproximacióna la desigualdad económica entre los grupos sociales recogiendo una muestrasocioeconómica completa que incluye desde nobles hasta trabajadores nocualificados y se debe tener en cuenta que al tratarse de tasas registradas enunidades de cuenta, aunque pagadas con la moneda en curso, la informaciónreflejaría más la posición social y capital humano que los ingresos. No obstante,somos conscientes que la clasificación socioeconómica propia de la fuente norefleja totalmente la variedad posible de las capacidades económicas/con-tributivas que podían existir en la estructura ocupacional del área de Barcelona.Así determinados jornaleros pudieron pagar la misma tasa que campesinos otejedores siendo ocupaciones con diferente estatus. Además, individuos con unmismo tipo de ocupación pudieron satisfacer diferentes tasas como en el casode los comerciantes (Cuadro 3).
CUADRO 2NIVELES SOCIOECONÓMICOS DE LOS LIBROS DE ESPONSALES, (1786-1788,
VOLUMEN 157)a.
1- Pagan los señores como son Duques, Marqueses, Condes, Vizcondes y Barones...24libras
2- Los caballeros nobles y los señores de vasallos...4 libras y 16 sueldos
3- Los ciudadanos honrados, los burgueses y todos los doctores de cualquier facultadmayor...2 libras y 8 sueldos
4- Los Mercaderes...1 libra y 12 sueldos
5- Los negociantes, notarios, comerciantes de telas, sedas y paños; Boticarios,cirujanos, pintores, drogueros y todos los demás artistas...1 libra y 4 sueldos
6- Los corredores, causídicos, merceros, jóvenes tenderos y todos los demás jóvenesartistas...12 sueldos
7- Los campesinos y menestrales...8 sueldos
8- Los pobres ... Amore Dei
Fuente: Archivo Capitular de la Catedral de Barcelona, volumen 157, p.2Notas: aTranscripción al castellano realizada por los propios autores.
TRANSFORMACIÓN Y DESIGUALDAD ECONÓMICA
Revista de Historia Económica, Journal of Iberian and Latin American Economic History 9
CUADRO 3DISTRIBUCIÓN DE LAS TASAS PAGADAS POR ALGUNAS OCUPACIONES EN EL ÁREA DE BARCELONA ENTRE
1715 Y 1860a
Tasas
Amore Dei 8s 12s 1l y 12s 2l y 8s 4l y 16s 24l n
Social Nobleza - - - - - 73% 27% 123
Médico 7% 5% 57% 29% 1% 0.1% - 2.047
Posición Ocupacional Negociante 1% 11% 37% 50% 1% 0.1% - 3.917
Campesino 10% 90% - - - - - 48.255
Tejedor 37% 63% - - - - - 13.745
Jornalero 44% 56% - - - - - 16.468
Fuente: Estimado a partir de la Barcelona Historical Marriage Database.
Notas: a(l= libras y s= sueldos)
GABRIE
LBREA-M
ARTÍN
EZ/JO
ANAMARIA
PUJA
DAS-M
ORA
10RevistadeHistoriaEconómica,JournalofIberia
nandLatin
Americ
anEconomic
History
Con el objetivo de recoger los diferentes status de las ocupaciones junto ala posición socioeconómica reportada por la fuente, se han combinadolas tasas con el sistema de clasificación social HISCLASS (Historical Inter-national Social Class Scheme) que convierte y agrupa en clases sociales a losdiferentes códigos HISCO, basándose en los niveles de especialización,formación y jerarquía ocupacional17.
Una forma de evitar la subestimación de la desigualdad, que sería acu-sada si únicamente se hubiese calculado a través de los niveles impositivosde las tasas matrimoniales, es la estimación de la desigualdad a través de lainteracción entre la tasa matrimonial y la etiqueta/declaración ocupacional(HISCLASS) aplicando el principio de capacidad contributiva, en sudenominación inglesa se la conoce como ability-to-pay (Kendrick, 1939). Conesta interacción entre ambos elementos se busca establecer una cierta pro-gresividad fiscal que no se tendría si únicamente se utilizase la tasa matri-monial que se sufragaba según 7 niveles impositivos, en los cuales el 75 porcien de los varones registrados entre 1715 y 1860 pagaron 8 sueldos, el 18,3por cien estaban exentos de pago y el 6,7 por cien se distribuía en las cate-gorías fiscales restantes. Además, la interacción entre tasa y categoríaHISCLASS permite, no solo medir la capacidad contributiva de los diferentesindividuos, sino que también valorar si los individuos de una misma cate-goría ocupacional o social estaban en diferentes situaciones económicas. Laclasificación HISCLASS otorga valores, de forma ordinal, más altos a lostrabajadores menos cualificados y menores a los de mayor status social.
Por lo tanto, para poder combinar las tasas presentes en los libros deesponsales con el status ocupacional, es decir, para que las tasas más altas secorrespondan con los status más altos se han invertido los valores deHISCLASS. Adicionalmente, también se ha llevado a cabo la interacción conuna segunda clasificación de status ocupacional denominada HISCAM, quese basa en el Cambridge Social Interaction and Stratification Scale (CAMSIS),que en lugar de una estructura ordinal como la de HISCLASS establece unranking que va teóricamente de 0 a 99, asignando los valores más altos a loscódigos ocupacionales HISCO de mayor estatus18.
Debe remarcarse que la interacción entre la tasa matrimonial basada enla ocupación y la(s) clasificación(es) de status social son un buen instru-mento para conferir una mayor progresividad fiscal a la fuente y con elloreconstruir la desigualdad de capital humano a largo plazo. No obstante, lasestimaciones a partir de salarios, renta o riqueza serán más refinadas ya queno necesitan de aproximaciones dado que sus valores por si solos ya repre-sentan la diversidad económica. Por lo tanto, al tener una base distinta para
17 Véase: Van Leeuwen, M. H. and I. Maas (2011). HISCLASS: A historical international socialclass scheme, University Press Leuven. Se trata de una clasificación que convierte los códigosocupacionales derivados de HISCO en clases sociales, basándose en elementos como el grado deespecialización, la jerarquía ocupacional o si se trataban de trabajos manuales o no.
18 En Lambert, Zijdeman, Van Leeuwen, Maas y Prandy (2013)
TRANSFORMACIÓN Y DESIGUALDAD ECONÓMICA
Revista de Historia Económica, Journal of Iberian and Latin American Economic History 11
el cálculo de la desigualdad se debería prestar más atención a la evolución ylos cambios en la tendencia de la desigualdad que al valor singular de uníndice u otro, cuestión que retomaremos en el apartado de resultados.
La interacción entre tasa pagada y posición social (HISCLASS oHISCAM) se ha formulado de la siguiente forma:
Ci=Ti�Hi
Donde C es la capacidad contributiva de un determinado individuo comoresultado de la tasa pagada (T) y la posición social HISCLASS o HISCAM(H). El valor de la capacidad contributiva se obtiene a través de la interacciónentre la ocupación declarada y el impuesto satisfecho para la obtención de lalicencia matrimonial. Para la estimación de la desigualdad económica Sehan calculado dos tipos de indicadores: el coeficiente de Gini (G) permite laestimación de la desigualdad entre individuos, a su vez el índice de Theil (T)posibilita la descomposición de la desigualdad en términos de aportacióninterna y entre grupos19. El indicador de Gini se calcula a través de la sumade la proporción acumulada de la variable población (pi), (en este caso losvarones que declaraban una ocupación o status y pagaban una tasa), y laproporción acumulada de la variable capacidad contributiva (tasa combi-nada con posición social) (Ci) dividido por la proporción acumulada da lavariable población (pi).
G=
Ppi�Cið ÞPpi
El índice de Theil permite descomponer la desigualdad por grupos y sabercuánto aportan cada uno de ellos en términos globales a la desigualdadintra-grupos y entre-grupos. Identificando así si la desigualdad se explica máspor las diferencias internas de los grupos o por las diferencias entre grupos.La estimación del índice de Theil se ha hecho de la siguiente manera20:
1- Se estima la proporción total de trabajadores (n) y la proporción de lacapacidad contributiva (w) de los diferentes sectores y subsectoreseconómicos por la combinación de tasa y posición social.
19 Pese a que el índice de Gini es la medida más utilizada para medir desigualdad (en partegracias a su simplicidad) su interpretación tiene algunas limitaciones. Una de ellas es que loscoeficientes pueden establecer resultados iguales a distribuciones diferentes, por ejemplo si el 50%de una población no tiene nada y el otro 50% tiene todo, el coeficiente de Gini sería del 0,5 igual quesi el 25% de una población tuviera el 75% y el otro 25% concentrase los ¾ de la riqueza. Otralimitación es la imposibilidad de descomponer a través del índice de Gini la desigualdad entérminos intra y entre grupos, la razón por la cual se calculan también los índices de Theil en estetrabajo.
20 El índice de Theil se ha calculado a partir de la adaptación de Conceiçao y Ferreira (2000).
GABRIEL BREA-MARTÍNEZ/JOANA MARIA PUJADAS-MORA
12 Revista de Historia Económica, Journal of Iberian and Latin American Economic History
2- La aportación (fi) de cada subsector a la desigualdad económica se hacalculado de la siguiente manera:
fi=wi� ln wið Þ � ln nið Þ½ �
3- La desigualad interna de un determinado sector (T’) se calcula comola suma de las diferentes contribuciones de los subsectores:
T0
j=Fi=
Xn
j=1
fið Þ
4- La desigualdad entre sectores (T″) se puede estimar como la sumaponderada de la desigualdad interna de cada sector (T′):
T′′=Xn
j=1
wj�Tj0ð Þ
La desigualdad total, que incluye términos entre e intra sectores es solo lasuma de ambos índices: T=T′+T″
4. LA ESTRUCTURA OCUPACIONAL DEL ÁREA DE BARCELONA(1715-1860)
El sector primario dejó de ser dominante en la economía del área deBarcelona a partir de la segunda mitad del setecientos, siendo sustituido porel sector secundario (Gráfico 2). El sector primario pasó de aglutinar casi lamitad del total de individuos en la primera mitad del siglo XVIII a solo juntarel 30 por cien hacia finales de la década de los 70 del mismo siglo, un decliveque estuvo acompañado por el aumento del sector secundario.
De esta manera, se observaría una inversión de los pesos del primario ysecundario ya en la primera mitad del siglo XVIII que podría indicar que elcamino hacia la industrialización se inició en una fecha próxima a la delcomienzo de la Revolución Industrial Inglesa como ya ha notado SánchezSuárez (2000) con un estudio relacionado con el sector textil en Barcelona.La inversión temprana entre sector primario y secundario en el caso del áreade Barcelona coincide con la cronología del importante crecimiento de laindustria de indianas en la ciudad de Barcelona que alcanzó su auge en lasúltimas décadas del siglo XVIII, así como en zonas prelitorales con unaindustria dispersa protoindustrial21 (Mora-Sitjà, 2007; Sánchez Suárez,1993). Cabe destacar que la tendencia alcista del sector secundario se rompecon la Guerra de Independencia (1808-1814) por un menor registro dematrimonios en los núcleos urbanos, donde la guerra tuvo un mayor
21 Este sistema ha sido observado para la industria de indianas por Thomson (2003) o paraépoca protoindustrial por Torras (1984) y Marfany (2012).
TRANSFORMACIÓN Y DESIGUALDAD ECONÓMICA
Revista de Historia Económica, Journal of Iberian and Latin American Economic History 13
impacto, lo que podría explicar el aumento del peso del sector primario22
(Benaul, 1993; Fontana, 2008) (Gráfico 2).En el caso de los trabajadores y jornaleros, títulos de difícil atribución a un
sector concreto, cabe destacar que, posiblemente el primer término fue susti-tuido por el segundo a medida que avanzaba el tiempo. Entre 1715 y1760 únicamente se registró con la etiqueta “trabajador” (treballador). A partirde finales del siglo XVIII los términos de trabajador y jornalero coincidieron yen la segunda década del XIX casi exclusivamente se empleó la etiqueta de“jornalero” (jornaler). Sin embargo, si se consultan diccionarios de la época, sepuede observar que durante los siglos XVIII y XIX se diferenciaban los dostérminos. Los trabajadores podrían referirse únicamente a trabajadores ruralesy representan entre el seis por cien y el diez por cien de los casos registradosdurante la primera mitad del siglo XVIII23. Sin embargo, excepcionalmenteentre 1785 y 1789 representaron el 20 por cien del total de varones ocupados.Esto podría deberse a una etapa muy concreta de la agricultura catalana, enque el litigio entre propietarios y arrendatarios por los contratos de enfiteusiscomportó un aumento del valor de las rentas en la década de los 80 del sigloXVIII y la disminución del número de campesinos con usufructo de la tierra,afectando principalmente a las zonas litorales y pre-litorales (Tello, 1995,Badia-Miró y Tello, 2014, Badosa, 1990). Posteriormente, la etiqueta trabajadorpasó a tener un uso residual salvo durante la Guerra de Independencia (1808-1814). Los jornaleros, en cambio, son casi inexistentes hasta 1770, pasandoa representar a partir de 1855 un 25 por cien de los casos totales (Gráfico 2).La sustitución terminológica entre ambos términos podría indicar además unposible cambio de función por la que los trabajadores estarían relacionadosmayoritariamente con el sector primario y los jornaleros con ambos aunquecon el tiempo estarían más relacionados con los sectores secundario y terciario.
La correlación entre los declarados trabajadores y los individuos perte-necientes al sector primario es ligeramente negativa (-0.26) y significativa al98 por cien. Si se calcula la correlación entre jornaleros y sector secundario,la estimación es positiva (0,82) y con valores p> 0,01. Estas asociacionesparecen confirmar el binomio trabajadores-actividades rurales que se difer-enciarían de los campesinos (pagès) por el acceso a la tierra, tanto endominio útil o directo. Además, la fuerte correlación entre el sector secun-dario y el jornalero daría más fuerza al argumento de que estos últimos serelacionaban más con los sectores pujantes en la industrialización.
22 Además de una disminución del registro de ocupaciones del sector secundario, otro elementoque explicaría el aumento del peso del sector primario es el aumento de las segundas nupcias entrepropietarios agrícolas, lo que indicaría una mejor posición en el mercado matrimonial. Sinembargo, los matrimonios con viudas solo aumentan entre 1815 y 1819 cuando la guerra ya habíafinalizado.
23 En la edición de 1825 de Núñez de Taboada (DRAE). Véase El “Nuevo tesoro lexicográfico dela lengua española” (http://www.rae.es/recursos/diccionarios/diccionarios-anteriores-1726-1992/nuevo-tesoro-lexicografico).
GABRIEL BREA-MARTÍNEZ/JOANA MARIA PUJADAS-MORA
14 Revista de Historia Económica, Journal of Iberian and Latin American Economic History
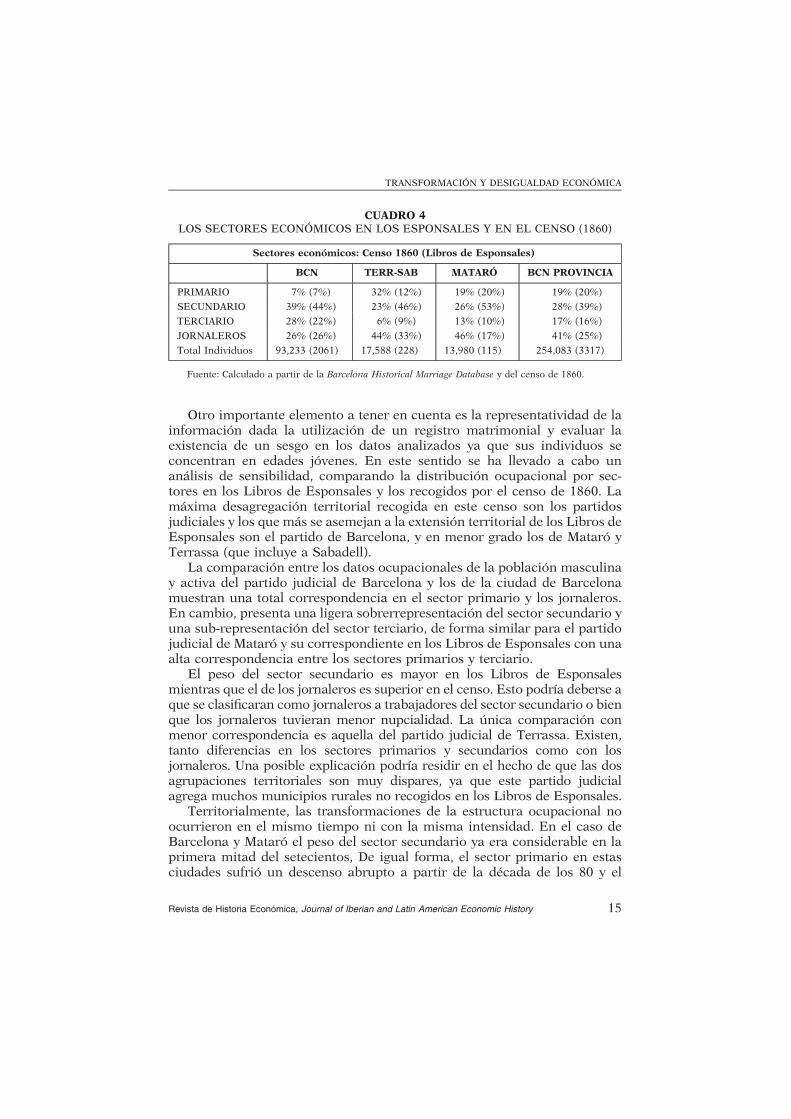
Otro importante elemento a tener en cuenta es la representatividad de lainformación dada la utilización de un registro matrimonial y evaluar laexistencia de un sesgo en los datos analizados ya que sus individuos seconcentran en edades jóvenes. En este sentido se ha llevado a cabo unanálisis de sensibilidad, comparando la distribución ocupacional por sec-tores en los Libros de Esponsales y los recogidos por el censo de 1860. Lamáxima desagregación territorial recogida en este censo son los partidosjudiciales y los que más se asemejan a la extensión territorial de los Libros deEsponsales son el partido de Barcelona, y en menor grado los de Mataró yTerrassa (que incluye a Sabadell).
La comparación entre los datos ocupacionales de la población masculinay activa del partido judicial de Barcelona y los de la ciudad de Barcelonamuestran una total correspondencia en el sector primario y los jornaleros.En cambio, presenta una ligera sobrerrepresentación del sector secundario yuna sub-representación del sector terciario, de forma similar para el partidojudicial de Mataró y su correspondiente en los Libros de Esponsales con unaalta correspondencia entre los sectores primarios y terciario.
El peso del sector secundario es mayor en los Libros de Esponsalesmientras que el de los jornaleros es superior en el censo. Esto podría deberse aque se clasificaran como jornaleros a trabajadores del sector secundario o bienque los jornaleros tuvieran menor nupcialidad. La única comparación conmenor correspondencia es aquella del partido judicial de Terrassa. Existen,tanto diferencias en los sectores primarios y secundarios como con losjornaleros. Una posible explicación podría residir en el hecho de que las dosagrupaciones territoriales son muy dispares, ya que este partido judicialagrega muchos municipios rurales no recogidos en los Libros de Esponsales.
Territorialmente, las transformaciones de la estructura ocupacional noocurrieron en el mismo tiempo ni con la misma intensidad. En el caso deBarcelona y Mataró el peso del sector secundario ya era considerable en laprimera mitad del setecientos, De igual forma, el sector primario en estasciudades sufrió un descenso abrupto a partir de la década de los 80 y el
CUADRO 4LOS SECTORES ECONÓMICOS EN LOS ESPONSALES Y EN EL CENSO (1860)
Sectores económicos: Censo 1860 (Libros de Esponsales)
BCN TERR-SAB MATARÓ BCN PROVINCIA
PRIMARIO 7% (7%) 32% (12%) 19% (20%) 19% (20%)
SECUNDARIO 39% (44%) 23% (46%) 26% (53%) 28% (39%)
TERCIARIO 28% (22%) 6% (9%) 13% (10%) 17% (16%)
JORNALEROS 26% (26%) 44% (33%) 46% (17%) 41% (25%)
Total Individuos 93,233 (2061) 17,588 (228) 13,980 (115) 254,083 (3317)
Fuente: Calculado a partir de la Barcelona Historical Marriage Database y del censo de 1860.
TRANSFORMACIÓN Y DESIGUALDAD ECONÓMICA
Revista de Historia Económica, Journal of Iberian and Latin American Economic History 15
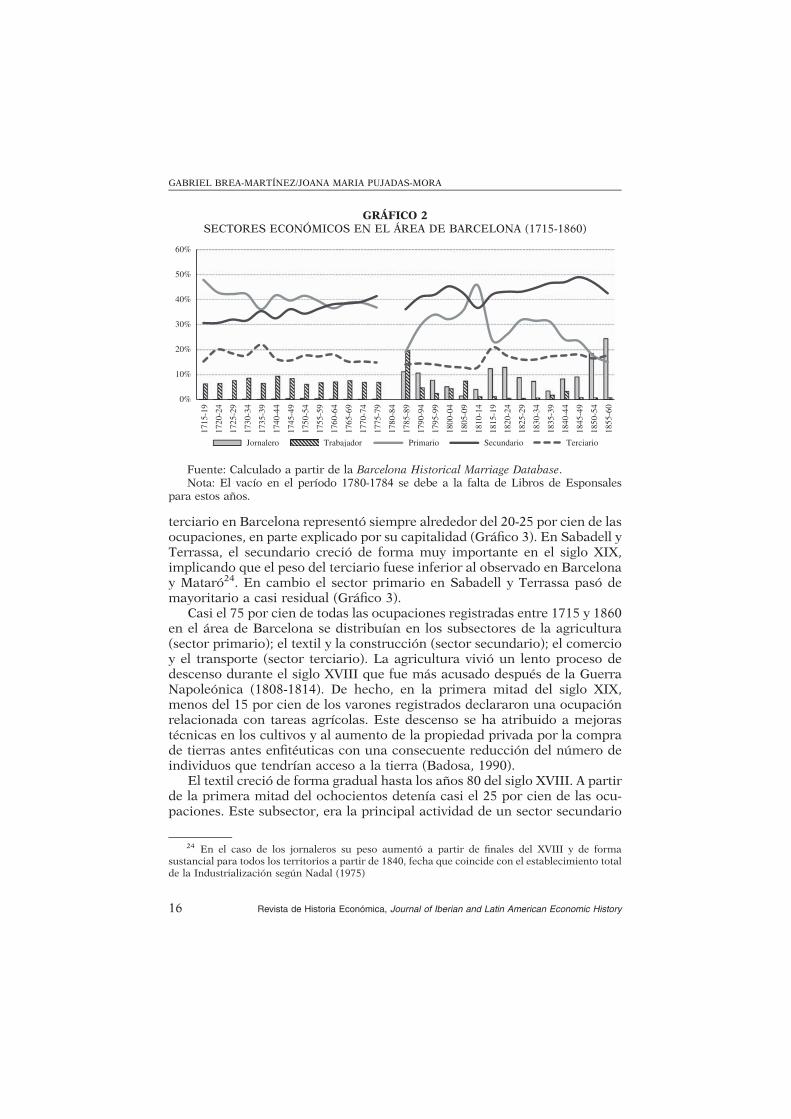
terciario en Barcelona representó siempre alrededor del 20-25 por cien de lasocupaciones, en parte explicado por su capitalidad (Gráfico 3). En Sabadell yTerrassa, el secundario creció de forma muy importante en el siglo XIX,implicando que el peso del terciario fuese inferior al observado en Barcelonay Mataró24. En cambio el sector primario en Sabadell y Terrassa pasó demayoritario a casi residual (Gráfico 3).
Casi el 75 por cien de todas las ocupaciones registradas entre 1715 y 1860en el área de Barcelona se distribuían en los subsectores de la agricultura(sector primario); el textil y la construcción (sector secundario); el comercioy el transporte (sector terciario). La agricultura vivió un lento proceso dedescenso durante el siglo XVIII que fue más acusado después de la GuerraNapoleónica (1808-1814). De hecho, en la primera mitad del siglo XIX,menos del 15 por cien de los varones registrados declararon una ocupaciónrelacionada con tareas agrícolas. Este descenso se ha atribuido a mejorastécnicas en los cultivos y al aumento de la propiedad privada por la comprade tierras antes enfitéuticas con una consecuente reducción del número deindividuos que tendrían acceso a la tierra (Badosa, 1990).
El textil creció de forma gradual hasta los años 80 del siglo XVIII. A partirde la primera mitad del ochocientos detenía casi el 25 por cien de las ocu-paciones. Este subsector, era la principal actividad de un sector secundario
GRÁFICO 2SECTORES ECONÓMICOS EN EL ÁREA DE BARCELONA (1715-1860)
0%
10%
20%
30%
40%
50%
60%
171
5-1
9
172
0-2
4
172
5-2
9
173
0-3
4
173
5-3
9
174
0-4
4
174
5-4
9
175
0-5
4
175
5-5
9
176
0-6
4
176
5-6
9
177
0-7
4
177
5-7
9
178
0-8
4
178
5-8
9
179
0-9
4
179
5-9
9
180
0-0
4
180
5-0
9
181
0-1
4
181
5-1
9
182
0-2
4
182
5-2
9
183
0-3
4
183
5-3
9
184
0-4
4
184
5-4
9
185
0-5
4
185
5-6
0
Jornalero Trabajador Primario Secundario Terciario
Fuente: Calculado a partir de la Barcelona Historical Marriage Database.Nota: El vacío en el período 1780-1784 se debe a la falta de Libros de Esponsales
para estos años.
24 En el caso de los jornaleros su peso aumentó a partir de finales del XVIII y de formasustancial para todos los territorios a partir de 1840, fecha que coincide con el establecimiento totalde la Industrialización según Nadal (1975)
GABRIEL BREA-MARTÍNEZ/JOANA MARIA PUJADAS-MORA
16 Revista de Historia Económica, Journal of Iberian and Latin American Economic History

basado mayoritariamente en industrias de producción de bienes de consumo(Horrell, 1996). Por lo que respecta a la construcción, esta dobló su pro-porción a partir del siglo XIX en relación al siglo XVIII. Esto es un impor-tante indicador del proceso urbanizador y de continuo crecimientodemográfico del siglo XIX (Arranz, 1990; De Vries, 2006).
El comercio era el subsector clave del sector terciario, en crecienteexpansión por la ampliación de los transportes (González Enciso, 1985).
GRÁFICO 3LOS SECTORES ECONÓMICOS POR TERRITORIO, ÁREA DE BARCELONA
(1715-1860)
Barcelona
171
5-1
9
172
5-2
9
173
5-3
9
174
5-4
9
175
5-5
9
176
5-6
9
177
5-7
9
178
5-8
9
179
5-9
9
180
5-0
9
181
5-1
9
182
5-2
9
183
5-3
9
184
5-4
9
185
5-6
0
0%
10%
20%
30%
40%
50%
60%
70%
80%
Mataró
171
5-1
9
172
5-2
9
173
5-3
9
174
5-4
9
175
5-5
9
176
5-6
9
177
5-7
9
178
5-8
9
179
5-9
9
180
5-0
9
181
5-1
9
182
5-2
9
183
5-3
9
184
5-4
9
185
5-6
0
0%
10%
20%
30%
40%
50%
60%
70%
80%
Sabadell
171
5-1
9
172
5-2
9
173
5-3
9
174
5-4
9
175
5-5
9
176
5-6
9
177
5-7
9
178
5-8
9
179
5-9
9
180
5-0
9
181
5-1
9
182
5-2
9
183
5-3
9
184
5-4
9
185
5-6
0
0%
10%
20%
30%
40%
50%
60%
70%
80%
Terrassa
171
5-1
9
172
5-2
9
173
5-3
9
174
5-4
9
175
5-5
9
176
5-6
9
177
5-7
9
178
5-8
9
179
5-9
9
180
5-0
9
181
5-1
9
182
5-2
9
183
5-3
9
184
5-4
9
185
5-6
0
0%
10%
20%
30%
40%
50%
60%
70%
80%
Rural
171
5-1
9
172
5-2
9
173
5-3
9
174
5-4
9
175
5-5
9
176
5-6
9
177
5-7
9
178
5-8
9
179
5-9
9
180
5-0
9
181
5-1
9
182
5-2
9
183
5-3
9
184
5-4
9
185
5-6
0
0%
10%
20%
30%
40%
50%
60%
70%
80%
Jornalero
Trabajador
Primario
Secundario
Terciario
Fuente: Calculados a partir de la Barcelona Historical Marriage Database.Nota: El vacío en el período 1780-1784 se debe a la falta de Libros de Esponsales
para estos años.
TRANSFORMACIÓN Y DESIGUALDAD ECONÓMICA
Revista de Historia Económica, Journal of Iberian and Latin American Economic History 17
Este subsector, pese a no tener un peso determinante en la estructura ocu-pacional recogía a los grupos ocupacionales que se transformaron de formamás acentuada entre el siglo XVIII y XIX. Se observa un aumento importantede los denominados negociantes que podría ser entendido como compra-dores al por mayor (Muset, 1997).
5. LA TRANSFORMACIÓN DEL TEXTIL EN LA INDUSTRIALIZACIÓN
La actividad que representa realmente la transformación económica y elproceso de industrialización catalán es indudablemente el textil, siendoademás uno de los subsectores más estudiados y de mayor importancia en laEuropa del sur (Martínez-Galarraga y Prat, 2015). Sin embargo, el estudiodel textil se ha centrado mayoritariamente en el análisis de las ocupacionesrelacionadas con la manufactura de una determinada materia prima ya fueselana, algodón o seda o en el estudio de alguna de las fases productivas demanera individual tales como la hilatura o el tisaje25. Por esta razón, en esteapartado se presenta un análisis de la composición ocupacional del textil através de todas y cada una de sus fases de producción: Preparación de fibras,hilatura, preparación del tisaje, tisaje, confección y estampado de tejidos26. Anivel general se advierte una continua disminución del número de artesanosque acompañaron su ocupación con el título de maestro (mestre) u oficial(Joves), ambos relacionados con el sistema gremial (Cuadro 5).
Estos títulos dejaron prácticamente de existir en el siglo XIX y a modo deejemplo empezaron a registrarse títulos ocupacionales como Tejedor deFábrica (Teixidor de Fàbrica) o Hilandero de Industria (Filador d’Indústria) loque parece indicar la transición hacia un sistema fabril y la disminución delpeso de los gremios en la manufactura (Molas, 1970).
El proceso de preparación de fibras que agrupaba principalmente ocu-paciones como pelaires, cardadores o peinadores cuentan 2.738 casosregistrados y de los cuales el 90 por cien son pelaires, en torno a un 15 porcien del total de trabajadores textiles registrados entre 1715 y 178027. A partirde entonces hasta la primera mitad del siglo XIX su peso bajó gradualmente(Gráfico 4). Los pelaires eran la principal ocupación de la Preparación deFibras, sus especialidades incluían tanto el cardado como el peinado y casi
25 Véase para la industria lanera de Sabadell y Terrassa los estudios de Benaul (1992 y1995),el sector algodonero de Barcelona en Sánchez Suárez, (2000), el sector indianero de Barcelona enThomson (2003), un análisis sobre los tejedores de Barcelona en Grau y López (1974) y sobre lahilatura en Ferrer (2004).
26 El estampado de tejidos estaba formado principalmente por Pintores de Indianas, unaactividad que tiene su auge en Barcelona en la segunda mitad del setecientos (Thomson, 2003).
27 Los Pelaires (Paraires) eran una de las ocupaciones más importantes del sector lanero.En muchos casos tenían el control de todo el proceso productivo y actuaban como negociantes.De hecho, Torras (1984) apunta que los pelaires introdujeron el putting-out system en muchaslocalidades catalanas.
GABRIEL BREA-MARTÍNEZ/JOANA MARIA PUJADAS-MORA
18 Revista de Historia Económica, Journal of Iberian and Latin American Economic History
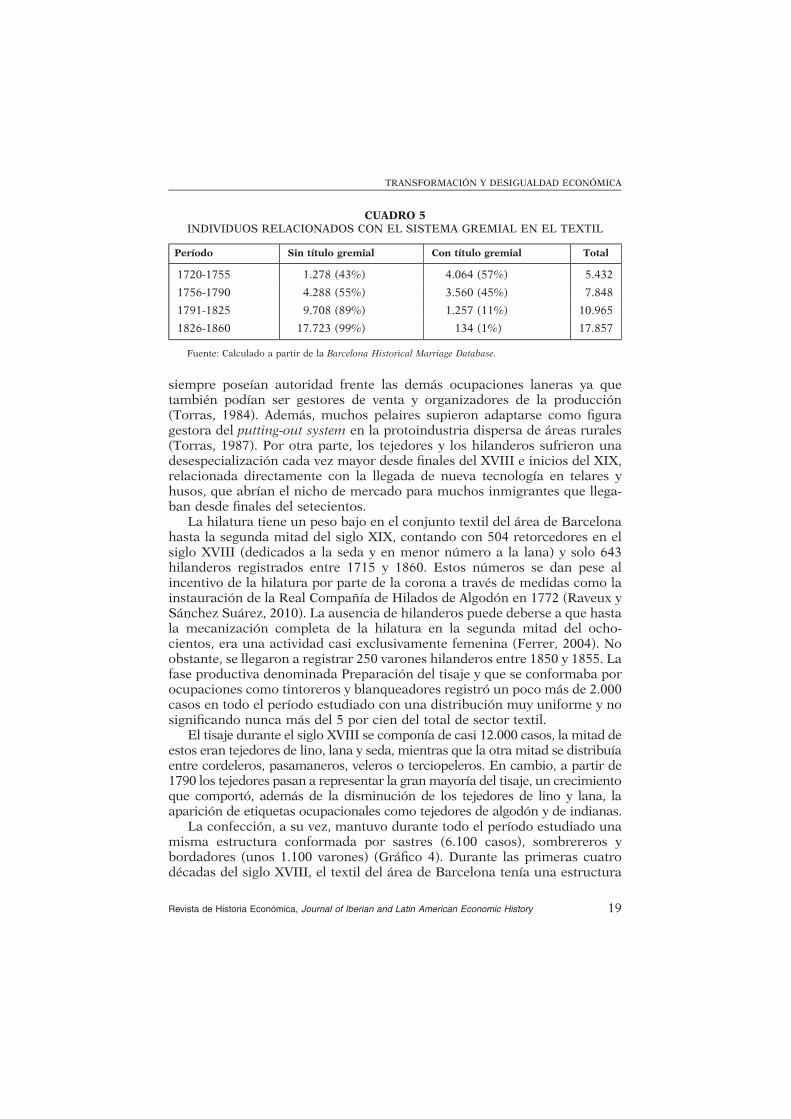
siempre poseían autoridad frente las demás ocupaciones laneras ya quetambién podían ser gestores de venta y organizadores de la producción(Torras, 1984). Además, muchos pelaires supieron adaptarse como figuragestora del putting-out system en la protoindustria dispersa de áreas rurales(Torras, 1987). Por otra parte, los tejedores y los hilanderos sufrieron unadesespecialización cada vez mayor desde finales del XVIII e inicios del XIX,relacionada directamente con la llegada de nueva tecnología en telares yhusos, que abrían el nicho de mercado para muchos inmigrantes que llega-ban desde finales del setecientos.
La hilatura tiene un peso bajo en el conjunto textil del área de Barcelonahasta la segunda mitad del siglo XIX, contando con 504 retorcedores en elsiglo XVIII (dedicados a la seda y en menor número a la lana) y solo 643hilanderos registrados entre 1715 y 1860. Estos números se dan pese alincentivo de la hilatura por parte de la corona a través de medidas como lainstauración de la Real Compañía de Hilados de Algodón en 1772 (Raveux ySánchez Suárez, 2010). La ausencia de hilanderos puede deberse a que hastala mecanización completa de la hilatura en la segunda mitad del ocho-cientos, era una actividad casi exclusivamente femenina (Ferrer, 2004). Noobstante, se llegaron a registrar 250 varones hilanderos entre 1850 y 1855. Lafase productiva denominada Preparación del tisaje y que se conformaba porocupaciones como tintoreros y blanqueadores registró un poco más de 2.000casos en todo el período estudiado con una distribución muy uniforme y nosignificando nunca más del 5 por cien del total de sector textil.
El tisaje durante el siglo XVIII se componía de casi 12.000 casos, la mitad deestos eran tejedores de lino, lana y seda, mientras que la otra mitad se distribuíaentre cordeleros, pasamaneros, veleros o terciopeleros. En cambio, a partir de1790 los tejedores pasan a representar la granmayoría del tisaje, un crecimientoque comportó, además de la disminución de los tejedores de lino y lana, laaparición de etiquetas ocupacionales como tejedores de algodón y de indianas.
La confección, a su vez, mantuvo durante todo el período estudiado unamisma estructura conformada por sastres (6.100 casos), sombrereros ybordadores (unos 1.100 varones) (Gráfico 4). Durante las primeras cuatrodécadas del siglo XVIII, el textil del área de Barcelona tenía una estructura
CUADRO 5INDIVIDUOS RELACIONADOS CON EL SISTEMA GREMIAL EN EL TEXTIL
Período Sin título gremial Con título gremial Total
1720-1755 1.278 (43%) 4.064 (57%) 5.432
1756-1790 4.288 (55%) 3.560 (45%) 7.848
1791-1825 9.708 (89%) 1.257 (11%) 10.965
1826-1860 17.723 (99%) 134 (1%) 17.857
Fuente: Calculado a partir de la Barcelona Historical Marriage Database.
TRANSFORMACIÓN Y DESIGUALDAD ECONÓMICA
Revista de Historia Económica, Journal of Iberian and Latin American Economic History 19
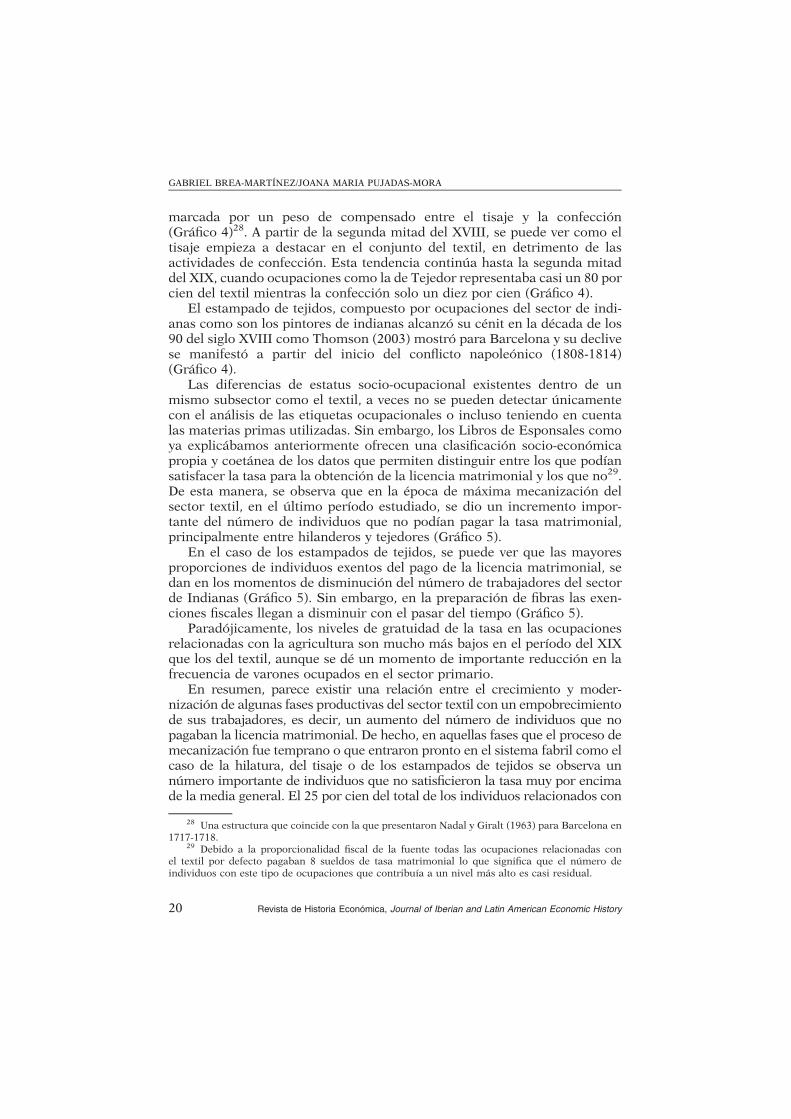
marcada por un peso de compensado entre el tisaje y la confección(Gráfico 4)28. A partir de la segunda mitad del XVIII, se puede ver como eltisaje empieza a destacar en el conjunto del textil, en detrimento de lasactividades de confección. Esta tendencia continúa hasta la segunda mitaddel XIX, cuando ocupaciones como la de Tejedor representaba casi un 80 porcien del textil mientras la confección solo un diez por cien (Gráfico 4).
El estampado de tejidos, compuesto por ocupaciones del sector de indi-anas como son los pintores de indianas alcanzó su cénit en la década de los90 del siglo XVIII como Thomson (2003) mostró para Barcelona y su declivese manifestó a partir del inicio del conflicto napoleónico (1808-1814)(Gráfico 4).
Las diferencias de estatus socio-ocupacional existentes dentro de unmismo subsector como el textil, a veces no se pueden detectar únicamentecon el análisis de las etiquetas ocupacionales o incluso teniendo en cuentalas materias primas utilizadas. Sin embargo, los Libros de Esponsales comoya explicábamos anteriormente ofrecen una clasificación socio-económicapropia y coetánea de los datos que permiten distinguir entre los que podíansatisfacer la tasa para la obtención de la licencia matrimonial y los que no29.De esta manera, se observa que en la época de máxima mecanización delsector textil, en el último período estudiado, se dio un incremento impor-tante del número de individuos que no podían pagar la tasa matrimonial,principalmente entre hilanderos y tejedores (Gráfico 5).
En el caso de los estampados de tejidos, se puede ver que las mayoresproporciones de individuos exentos del pago de la licencia matrimonial, sedan en los momentos de disminución del número de trabajadores del sectorde Indianas (Gráfico 5). Sin embargo, en la preparación de fibras las exen-ciones fiscales llegan a disminuir con el pasar del tiempo (Gráfico 5).
Paradójicamente, los niveles de gratuidad de la tasa en las ocupacionesrelacionadas con la agricultura son mucho más bajos en el período del XIXque los del textil, aunque se dé un momento de importante reducción en lafrecuencia de varones ocupados en el sector primario.
En resumen, parece existir una relación entre el crecimiento y moder-nización de algunas fases productivas del sector textil con un empobrecimientode sus trabajadores, es decir, un aumento del número de individuos que nopagaban la licencia matrimonial. De hecho, en aquellas fases que el proceso demecanización fue temprano o que entraron pronto en el sistema fabril como elcaso de la hilatura, del tisaje o de los estampados de tejidos se observa unnúmero importante de individuos que no satisficieron la tasa muy por encimade la media general. El 25 por cien del total de los individuos relacionados con
28 Una estructura que coincide con la que presentaron Nadal y Giralt (1963) para Barcelona en1717-1718.
29 Debido a la proporcionalidad fiscal de la fuente todas las ocupaciones relacionadas conel textil por defecto pagaban 8 sueldos de tasa matrimonial lo que significa que el número deindividuos con este tipo de ocupaciones que contribuía a un nivel más alto es casi residual.
GABRIEL BREA-MARTÍNEZ/JOANA MARIA PUJADAS-MORA
20 Revista de Historia Económica, Journal of Iberian and Latin American Economic History
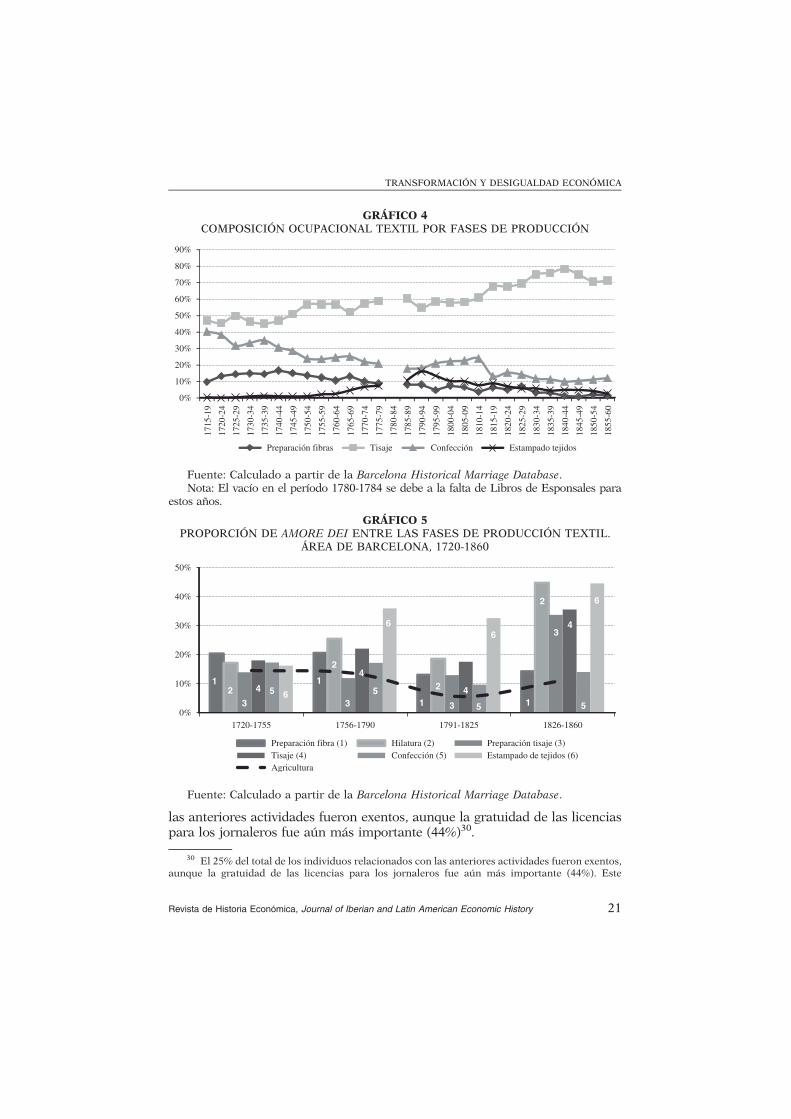
las anteriores actividades fueron exentos, aunque la gratuidad de las licenciaspara los jornaleros fue aún más importante (44%)30.
GRÁFICO 4COMPOSICIÓN OCUPACIONAL TEXTIL POR FASES DE PRODUCCIÓN
0%
10%
20%
30%
40%
50%
60%
70%
80%
90%
171
5-1
9
172
0-2
4
172
5-2
9
173
0-3
4
173
5-3
9
174
0-4
4
174
5-4
9
175
0-5
4
175
5-5
9
176
0-6
4
176
5-6
9
177
0-7
4
177
5-7
9
178
0-8
4
178
5-8
9
179
0-9
4
179
5-9
9
180
0-0
4
180
5-0
9
181
0-1
4
181
5-1
9
182
0-2
4
182
5-2
9
183
0-3
4
183
5-3
9
184
0-4
4
184
5-4
9
185
0-5
4
185
5-6
0
Preparación fibras Tisaje Confección Estampado tejidos
Fuente: Calculado a partir de la Barcelona Historical Marriage Database.Nota: El vacío en el período 1780-1784 se debe a la falta de Libros de Esponsales para
estos años.
GRÁFICO 5PROPORCIÓN DE AMORE DEI ENTRE LAS FASES DE PRODUCCIÓN TEXTIL.
ÁREA DE BARCELONA, 1720-1860
0%
10%
20%
30%
40%
50%
1720-1755 1756-1790 1791-1825 1826-1860
Preparación fibra (1) Hilatura (2) Preparación tisaje (3)
Tisaje (4) Confección (5) Estampado de tejidos (6)
Agricultura
1 1
1 1
2
2
2
2
3 3 3
3
64
4
4
4
5 5
5 5
6
6
6
Fuente: Calculado a partir de la Barcelona Historical Marriage Database.
30 El 25% del total de los individuos relacionados con las anteriores actividades fueron exentos,aunque la gratuidad de las licencias para los jornaleros fue aún más importante (44%). Este
TRANSFORMACIÓN Y DESIGUALDAD ECONÓMICA
Revista de Historia Económica, Journal of Iberian and Latin American Economic History 21

6. DESIGUALDAD ECONÓMICA EN EL ÁREA DE BARCELONA
Una de las principales características que diferencian a los Libros deEsponsales de otras fuentes históricas es que incluyen una categorización fiscaly socioeconómica propia. Esta categorización entre 1715 y 1860 se correspondíacon ocho niveles diferentes de tasas, con una división socioeconómica querecogía desde la nobleza titulada hasta los denominados pobres por la fuente.
Las principales ventajas de la clasificación socioeconómica de los Librosde Esponsales son su continuidad temporal y para el período de estudio semantuvieron los mismos niveles impositivos. Estos pueden entenderse comoun reflejo de la capacidad contributiva de los diferentes grupos sociales/ocupacionales que recoge la fuente. No obstante, pese a la existencia de estacategorización, no todos los individuos de un mismo grupo necesariamentepagaron la misma tasa.
De esta manera, negociantes o comerciantes pudieron pagar diferentes tasas,tanto superiores como inferiores a la categoría que tenían asignada por defecto.Asimismo, ocupaciones con diferentes estatus socioeconómicos eran gravadascon la misma tasa, como por ejemplo jornaleros, artesanos o campesinos (Tabla3). Por esta razón, entendemos que es necesario combinar el título ocupacional yla tasa satisfecha con el fin de proporcionar una mayor progresividad fiscal através del principio de capacidad contributiva (Kendrick, 1939). Al mismotiempo esto permitiría captar los cambios de estatus o disparidad económicainterna en un mismo grupo social u ocupacional. Las ocupaciones, ya codifi-cadas en HISCO, se transforman en grupos sociales a través de HISCLASS paraevitar la dispersión del uso de las etiquetas ocupacionales individuales.
Paralelamente, también se ha llevado a cabo el ejercicio de combinar lastasas inherentes a la fuente y el ranking de estatus socioeconómico HISCAM,con el fin de comparar los niveles de desigualdad calculados solo con lostasas y con la interacción de estas con las dos clasificaciones (Gráfico 6). Enel gráfico se puede observar como realmente si se estima la desigualdad soloteniendo en cuenta las categorías fiscales presentes en la fuente, los resul-tados de los coeficientes de Gini son mucho más bajos que cuando se cal-culan usando la interacción entre la tasa y el estatus ocupacional, muestra deque se subestimaría la desigualdad. Por otro lado, se puede observar comolos valores de ambas interacciones (HISCLASS y HISCAM), son muy simi-lares, razón por la cual a partir de ahora solo se presentarán los valorescalculados a partir de la combinación de las tasas y HISCLASS.
La desigualdad total se mantuvo mayoritariamente en niveles inferiores al0,3 con la excepción del periodo 1720-1739 así como a partir de 1840 en que
(footnote continued)
indicador de pobreza entre varones puede encajar en el fenómeno denominado por Mora-Sitjà(2007) el “primer proletariado catalán”, en el cual el inicio del desarrollo del sistema de fábrica enCataluña propició la entrada de trabajadores menos cualificados en trabajos más precarios.
GABRIEL BREA-MARTÍNEZ/JOANA MARIA PUJADAS-MORA
22 Revista de Historia Económica, Journal of Iberian and Latin American Economic History

alcanzó máximos del 0.33. Los niveles más bajos, de en torno al 0,16, senotaron durante la Guerra de Independencia (1808-1814) (Gráfico 7). Sinembargo, si se descompone la curva de desigualdad entre los individuos quepagaron su licencia matrimonial y los que no, la desigualdad de los primerosdisminuye frente al aumento de esta entre los segundos.
La desigualdad económica, si se excluye a los individuos que nosatisficieron la tasa de su licencia matrimonial, enseña coeficientes de Giniinferiores a la estimación total con una diferencia de apenas tres puntoshasta 1830. No obstante, a partir de 1840 la diferencia entre las estimacionesaumenta en casi diez puntos (Gráfico 7).
El aumento en la brecha entre la desigualdad incluyendo a los individuosque pagaron la tasa y a los que no, se da por el importante crecimiento de losexentos. No obstante, la parte más significativa de este cambio se explica porla composición del grupo de individuos que no pagaron. Más del 70 por ciende los individuos exentos eran jornaleros o pertenecientes a algunas ocupa-ciones textiles como las de tejedor e hilandero. Estas ocupaciones eran lasmás relacionadas con el sistema de fábrica, en una fecha de desplieguedefinitivo de la industrialización catalana (1840) y que se encuadraríandentro de un proceso de proletarización vigente en el seno del mercadolaboral, auspiciado por el aumento del éxodo rural (Mora-Sitjà, 2006 y 2011).
Los niveles de desigualdad presentados en este artículo difieren de los nivelesobtenidos en otros estudios que utilizan coeficientes de Gini, tales como loscalculados paraMadrid y Jerez, 0,77 y 0,5 respectivamente, para los siglos XVIII y
GRÁFICO 6COMPARACIÓN DE LOS NIVELES DE DESIGUALDAD SIN Y CON DIFERENTES
INTERACCIONES DE CLASIFICACIONES DE ESTATUS
0
0.05
0.1
0.15
0.2
0.25
0.3
0.35
1705-1729 1730-1754 1755-1779 1780-1804 1805-1829 1830-1854
Gin
i
HISCAM * TASA HISCLASS * TASA SOLO TASA
Fuente: Calculado a partir de la Barcelona Historical Marriage Database.
TRANSFORMACIÓN Y DESIGUALDAD ECONÓMICA
Revista de Historia Económica, Journal of Iberian and Latin American Economic History 23

XIX a partir de fuentes diferentes (Álvarez Nogal y Prados de la Escosura, 2007).Sin embargo, los mismos autores utilizan una medida de desigualdad basada enla relación entre renta de la tierra/salarios que muestra tendencias de desigualdaden Cataluña coincidentes en parte con el área de Barcelona (Gráfico 7).
Los valores bajos de desigualdad obtenidos en comparación con otrosestudios anteriores pueden deberse a dos temas. En primer lugar, la desi-gualdad para este trabajo concreto se ha medido a partir del estatus socio-económico y no directamente a través de ingresos o riqueza. En segundolugar, debe tenerse en cuenta la homogeneidad de la muestra trabajada, esdecir los individuos analizados son relativamente jóvenes en sus fases ini-ciales del ciclo vital propio y comparten un rango etario similar, no siendoasí cuando se recurre a otras fuentes. Estas fuentes incluirían individuos detodas las edades con lo cual los más mayores habrán tenido más tiempo deacumular más riqueza y por ende los niveles de desigualdad se presentaríansuperiores. De aquí se desprende que ante fuentes diferentes y muestras deindividuos dispares en cuanto a ciclo de vida sería más importante observarla tendencia de la desigualdad más que sus niveles concretos.
Las localidades más urbanas, pobladas y con mayor transformación de laestructura ocupacional mostraron mayor inequidad. La ciudad de Barcelonaera la más desigual, alcanzando coeficientes que rondaron el 0,3-0,35 hasta1830 y que alcanzaron el 0,45 a partir de 1840 (Gráfico 8). La segunda loca-lidad más desigual era Mataró con niveles del 0,2 que aumentaron al 0,3
GRÁFICO 7GINI Y PROPORCIÓN DE AMORE DEI (AD). ÁREA DE BARCELONA 1715-1860
0%
5%
10%
15%
20%
25%
30%
35%
0.15
0.17
0.19
0.21
0.23
0.25
0.27
0.29
0.31
0.33
0.35
172
0-2
9
173
0-3
9
174
0-4
9
175
0-5
9
176
0-6
9
177
0-7
9
178
0-8
9
179
0-9
9
180
0-0
9
181
0-1
9
182
0-2
9
183
0-3
9
184
0-4
9
185
0-5
9
Am
ore D
ei
Gin
i
Amore Dei (AD) Gini con AD Gini sin AD
Fuente: Calculado a partir de la Barcelona Historical Marriage Database.Nota: Aunque la etiqueta de los gráficos refiere al periodo 1780-1789, únicamente
se calcularon los datos para el período 1785-1789.
GABRIEL BREA-MARTÍNEZ/JOANA MARIA PUJADAS-MORA
24 Revista de Historia Económica, Journal of Iberian and Latin American Economic History
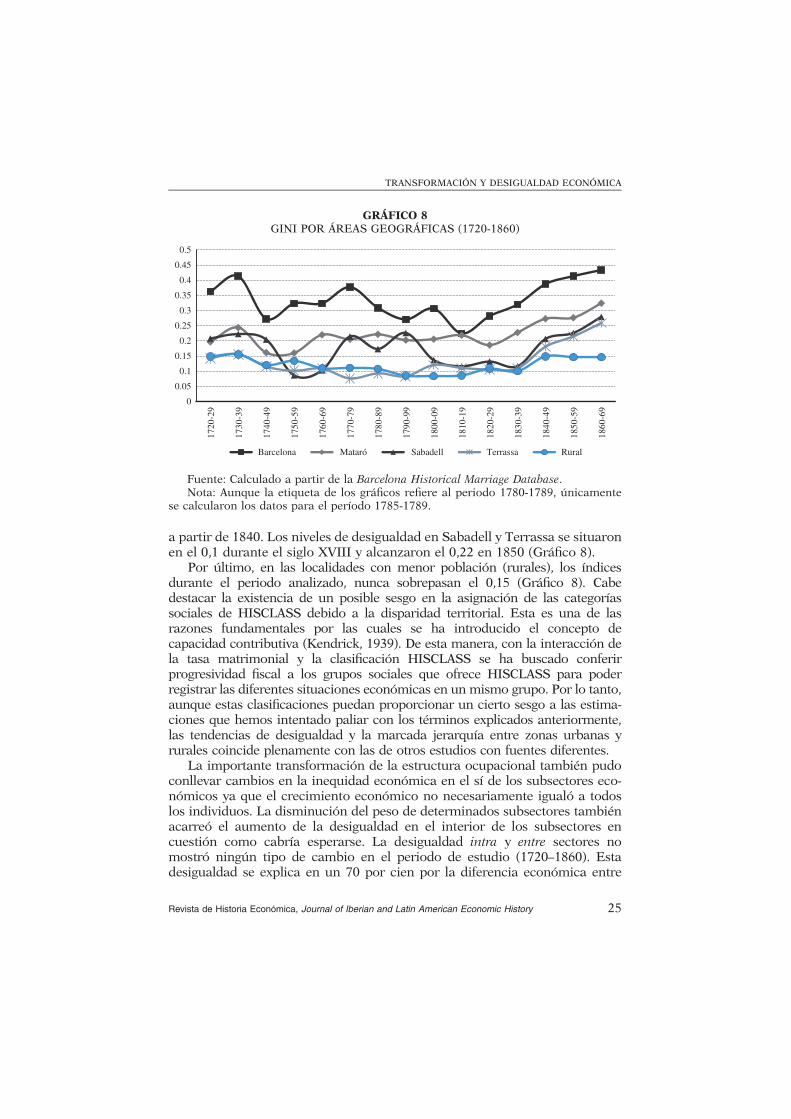
a partir de 1840. Los niveles de desigualdad en Sabadell y Terrassa se situaronen el 0,1 durante el siglo XVIII y alcanzaron el 0,22 en 1850 (Gráfico 8).
Por último, en las localidades con menor población (rurales), los índicesdurante el periodo analizado, nunca sobrepasan el 0,15 (Gráfico 8). Cabedestacar la existencia de un posible sesgo en la asignación de las categoríassociales de HISCLASS debido a la disparidad territorial. Esta es una de lasrazones fundamentales por las cuales se ha introducido el concepto decapacidad contributiva (Kendrick, 1939). De esta manera, con la interacción dela tasa matrimonial y la clasificación HISCLASS se ha buscado conferirprogresividad fiscal a los grupos sociales que ofrece HISCLASS para poderregistrar las diferentes situaciones económicas en un mismo grupo. Por lo tanto,aunque estas clasificaciones puedan proporcionar un cierto sesgo a las estima-ciones que hemos intentado paliar con los términos explicados anteriormente,las tendencias de desigualdad y la marcada jerarquía entre zonas urbanas yrurales coincide plenamente con las de otros estudios con fuentes diferentes.
La importante transformación de la estructura ocupacional también pudoconllevar cambios en la inequidad económica en el sí de los subsectores eco-nómicos ya que el crecimiento económico no necesariamente igualó a todoslos individuos. La disminución del peso de determinados subsectores tambiénacarreó el aumento de la desigualdad en el interior de los subsectores encuestión como cabría esperarse. La desigualdad intra y entre sectores nomostró ningún tipo de cambio en el periodo de estudio (1720–1860). Estadesigualdad se explica en un 70 por cien por la diferencia económica entre
GRÁFICO 8GINI POR ÁREAS GEOGRÁFICAS (1720-1860)
0
0.05
0.1
0.15
0.2
0.25
0.3
0.35
0.4
0.45
0.5
172
0-2
9
173
0-3
9
174
0-4
9
175
0-5
9
176
0-6
9
177
0-7
9
178
0-8
9
179
0-9
9
180
0-0
9
181
0-1
9
182
0-2
9
183
0-3
9
184
0-4
9
185
0-5
9
186
0-6
9
Barcelona Mataró Sabadell Terrassa Rural
Fuente: Calculado a partir de la Barcelona Historical Marriage Database.Nota: Aunque la etiqueta de los gráficos refiere al periodo 1780-1789, únicamente
se calcularon los datos para el período 1785-1789.
TRANSFORMACIÓN Y DESIGUALDAD ECONÓMICA
Revista de Historia Económica, Journal of Iberian and Latin American Economic History 25
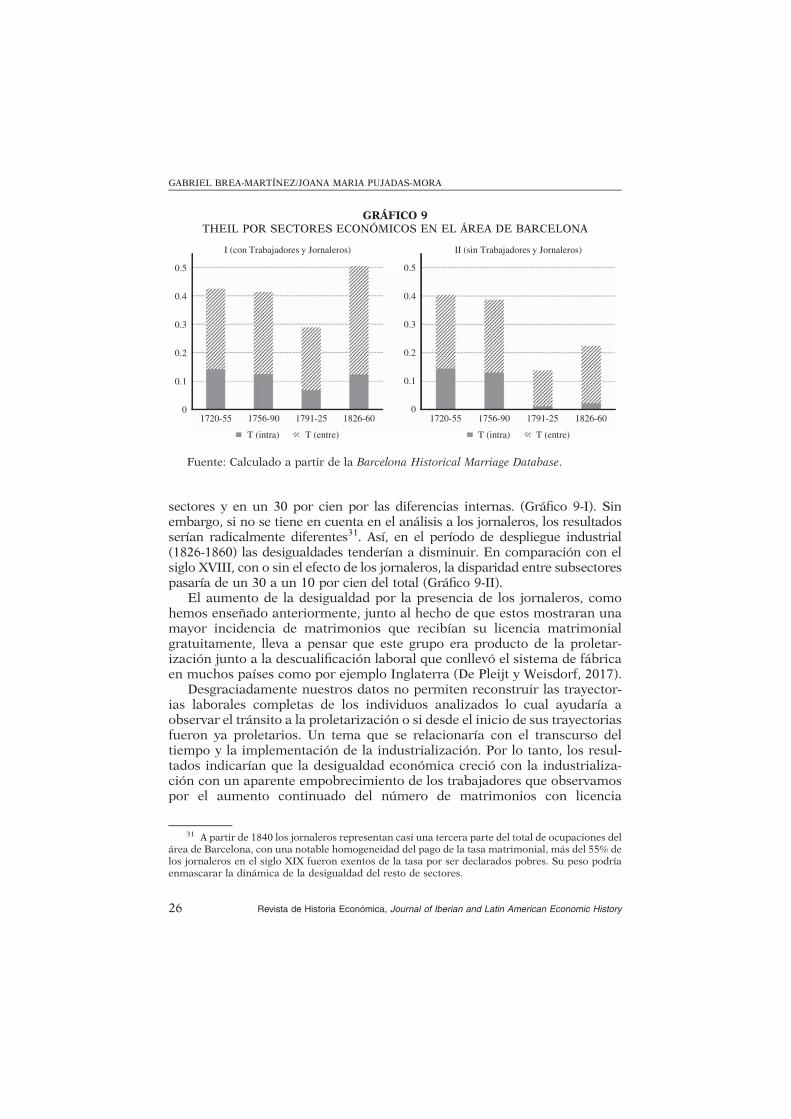
sectores y en un 30 por cien por las diferencias internas. (Gráfico 9-I). Sinembargo, si no se tiene en cuenta en el análisis a los jornaleros, los resultadosserían radicalmente diferentes31. Así, en el período de despliegue industrial(1826-1860) las desigualdades tenderían a disminuir. En comparación con elsiglo XVIII, con o sin el efecto de los jornaleros, la disparidad entre subsectorespasaría de un 30 a un 10 por cien del total (Gráfico 9-II).
El aumento de la desigualdad por la presencia de los jornaleros, comohemos enseñado anteriormente, junto al hecho de que estos mostraran unamayor incidencia de matrimonios que recibían su licencia matrimonialgratuitamente, lleva a pensar que este grupo era producto de la proletar-ización junto a la descualificación laboral que conllevó el sistema de fábricaen muchos países como por ejemplo Inglaterra (De Pleijt y Weisdorf, 2017).
Desgraciadamente nuestros datos no permiten reconstruir las trayector-ias laborales completas de los individuos analizados lo cual ayudaría aobservar el tránsito a la proletarización o si desde el inicio de sus trayectoriasfueron ya proletarios. Un tema que se relacionaría con el transcurso deltiempo y la implementación de la industrialización. Por lo tanto, los resul-tados indicarían que la desigualdad económica creció con la industrializa-ción con un aparente empobrecimiento de los trabajadores que observamospor el aumento continuado del número de matrimonios con licencia
GRÁFICO 9THEIL POR SECTORES ECONÓMICOS EN EL ÁREA DE BARCELONA
0
0.1
0.2
0.3
0.4
0.5
II (sin Trabajadores y Jornaleros)
0
0.1
0.2
0.3
0.4
0.5
1720-55 1756-90 1791-25 1826-60 1720-55 1756-90 1791-25 1826-60
I (con Trabajadores y Jornaleros)
T (intra) T (entre) T (intra) T (entre)
Fuente: Calculado a partir de la Barcelona Historical Marriage Database.
31 A partir de 1840 los jornaleros representan casi una tercera parte del total de ocupaciones delárea de Barcelona, con una notable homogeneidad del pago de la tasa matrimonial, más del 55% delos jornaleros en el siglo XIX fueron exentos de la tasa por ser declarados pobres. Su peso podríaenmascarar la dinámica de la desigualdad del resto de sectores.
GABRIEL BREA-MARTÍNEZ/JOANA MARIA PUJADAS-MORA
26 Revista de Historia Económica, Journal of Iberian and Latin American Economic History

gratuita. Este fenómeno se observaría de manera más acentuada en sectorescomo el textil. Sin embargo, en sectores con baja presencia de jornaleros,como el sector terciario, la disparidad económica habría disminuido inclusocoexistiendo ocupaciones tradicionales y nuevas.
El sector terciario siempre presentaba niveles de desigualdad superioresal primario o secundario como cabía esperar dada la heterogeneidad de lasocupaciones que reúne, incluyendo desde de servicios de menor estatuscomo el doméstico hasta profesionales liberales o militares (Gráfico 10). Endetalle, los valores de los coeficientes de Gini para el sector primario sesitúan alrededor del 0,3 para todo el periodo estudiado, a excepción de losaños del conflicto napoleónico (1808-1814). Mientras la desigualdad en elsector secundario creció durante la industrialización en casi diez puntos, lainequidad del sector terciario descendió del 0,48 en el 1756-1790 a 0,31 entre1826 y 1860 (Gráfico 10). Estas tendencias se explicarían por una polariza-ción menos acusada en el sector terciario observándose un proceso de pro-fesionalización de ciertas ocupaciones como las sanitarias (Abbott, 1993,Zarzoso, 2003). Paralelamente la proletarización del textil ilustraría estecomportamiento (Form, 1987; Grau y López, 1974; García Balañà, 2004).
7. VALORACIONES FINALES
El estudio de la evolución de la estructura ocupacional en el área deBarcelona ha mostrado su trascendencia para la estimación del efecto de laindustrialización en la desigualdad económica. La inequidad tendió al
GRÁFICO 10GINI POR SECTORES ECONÓMICOS, 1720-1860
0
0.1
0.2
0.3
0.4
0.5
0.6
1720-55 1756-90 1791-25 1826-60
Primario Secundario Terciario Total
Fuente: Calculado a partir de la Barcelona Historical Marriage Database.
TRANSFORMACIÓN Y DESIGUALDAD ECONÓMICA
Revista de Historia Económica, Journal of Iberian and Latin American Economic History 27

decrecimiento hasta la Guerra de Independencia (1808-1814) para mostraruna tendencia inversa a partir de 1840. De hecho, a medida que la desi-gualdad general iba en aumento, el sector primario descendía, el secundariose agrandaba y el número de matrimonios exentos de la tasa crecía. Ladesigualdad interna entre los sectores económicos a largo plazo se mantieneinalterada para el sector primario, mientras aumenta para el secundario ydisminuye para el terciario desde el inicio de la industrialización.
El sector secundario, clave de la industrialización catalana, sufrióimportantes transformaciones en términos de estructura ocupacional. Sepasó de un equilibrio entre el número de individuos dedicados a la pro-ducción manufacturera y a su confección a un predominio de las actividadesproductivas, lo cual supuso un aumento de la desigualdad inter-subsectorial.La ruptura de este equilibrio da indicios de la transición de una economíatradicional de escala local a otra que se expandía para suplir nuevos mer-cados, auspiciada por el crecimiento del comercio con el resto de España yAmérica. De aquí se entiende que las actividades relacionadas con el tisaje(sobre todo la de tejedor) fueron las más frecuentes entre los individuos quecontrajeron matrimonio en el área de Barcelona entre 1715 y 1860. Estosindividuos mostraron mayores niveles de exención de pago en sus licenciasmatrimoniales que otros grupos ocupacionales y en consecuencia se observóun aumento de la inequidad en el sector secundario.
El aumento del número de licencias por Amore Dei del secundario seríacomparable al observado entre los jornaleros. Estos niveles tanto de desigual-dad como de exenciones fiscales mostrarían como la industrialización conllevóun empobrecimiento de aquellos trabajadores relacionados con la producciónindustrial, lo cual podría indicar la existencia de un proceso de proletarización;algo que también se observa en otras sociedades industrializadas. Además,debe tenerse en cuenta, que los niveles totales de desigualdad del área deBarcelona pudieron ser aún mayores ya que las estimaciones presentadas eneste trabajo únicamente se refieren a individuos que contrajeron matrimonio,determinado por población analizada concentrada en edades más bien tem-pranas. Al hilo de este argumento debe tenerse en cuenta que los jornaleroseran el grupo social que contribuyó de manera más importante a la desigual-dad total entre sectores. De hecho, la no consideración de este grupo en elanálisis implicaría que la desigualdad total tendería a descender en el tiempo.
Los cambios en la estructura ocupacional y el proceso de proletarizaciónque se observa con la proliferación de jornaleros a partir del siglo XVIII en elárea de Barcelona conectarían con algunos de los elementos definitorios dela evolución de la desigualdad económica en fases preindustriales y detransición, tal y como se defiende en la hipótesis de Kuznets, en que eltrasvase de mano de obra no especializada del sector primario a la industriafavorecería el aumento de la inequidad (Van Zanden, 1995).
De igual manera, se pueden detectar indicios de la acumulación de capitalen los núcleos urbanos a partir de la jerarquía encontrada en sus niveles de
GABRIEL BREA-MARTÍNEZ/JOANA MARIA PUJADAS-MORA
28 Revista de Historia Económica, Journal of Iberian and Latin American Economic History
desigualdad. Sin embargo, pese a esto, no intuimos la presencia de una“súper curva de Kuznets” en el periodo de 1715-1860 en el área de Barcelonacomo ya había indicado también para el caso de Cataluña García Montero(2015). Esto se debe principalmente al hecho que se observa una disminu-ción de la desigualdad a partir de finales del ochocientos, momento en el quela estructura ocupacional inicia su transformación y la industrializaciónempieza en Cataluña, contradiciendo, al menos para el siglo XVIII, lainterrelación entre crecimiento económico y aumento de la inequidad.
REFERENCIAS
ABBOTT, A. (1993): «The Sociology of Work and Occupations». Annual Review ofSociology 187-209.
ACEMOGLU, D., Y ROBINSON, J. (2000): «Why Did the West Extend the Franchise?Democracy, Inequality, and Growth in Historical Perspective». The Quarterly Journalof Economics 115 (4), 1167-1199.
ALFANI, G. (2015): «Economic Inequality in Northwestern Italy: A Long-TermView (Fourteenth to Eighteenth centuries)». Journal of Economic History 75 (4),pp 1058-1096.
ALFANI, G. (2010): «Wealth Inequalities and Population Dynamics in Early ModernNorthern Italy». Journal of Interdisciplinary History 40, 513-549.
ALFANI, G., Y RYCKBOSCH, W. (2016): «Growing Apart in Early Modern Europe? AComparison of Inequality Trends in Italy and the Low Countries, 1500–1800».Explorations in Economic History 62, 143-153.
ALLEN, R. C. (2000): «Economic Structure and Agricultural Productivity in Europe,1300–1800». European Review of Economic History 4 (01), 1-25.
ALMÁRCEGUI, A. M. (1981): «Transformación socioprofesional, trayectoria demográfica yfamilia: Un estudio del artesanado reusense a partir de las actas de matrimonio:1601-1810». Pedralbes: revista d’història moderna 1, 77-102.
ALMÁRCEGUI, M, Y SARRIÓN, G (1981): «Población y estructura social de Zaragoza en 1787:la distribución por estados y profesiones». Jornadas Sobre el Estado Actual de LosEstudios Sobre Aragón (4ª. 1981. Alcañiz), 293-301.
ÁLVAREZ, B., Y RAMOS PALENCIA, F. (2016): “The Role of Human Capital inPre-Industrial Societies: Skills and Earnings in Eighteenth-Century Castile (Spain)”.Universidad Pablo de Olavide, Department of Economics, Quantitative Methods andEconomic History Working Papers, (16.03).
ÁLVAREZ-NOGAL, C., Y PRADOS de la Escosura, L. (2007): «The Decline of Spain(1500–1850): Conjectural Estimates». European Review of Economic History 11 (03),319-366.
AMELANG, J. S. (1986): Honored Citizens of Barcelona: Patrician culture and class relations,1490-1714. Princeton: Princeton University Press Princeton.
ARRANZ, M. (1990): «La construcció: un sector al marge de la revolució industrial?».Finestrelles (2), 146-153.
BADIA-MIRÓ, M., Y TELLO, E. (2014): «Vine-Growing in Catalonia: The Main AgriculturalChange Underlying the Earliest Industrialization in the Mediterranean Europe(1720-1939)». European Review of Economic History 18 (2), 203-226.
BADOSA, E. (1990): «Endeutament col· lectiu i desaparició de béns comunals a Catalunyaa la segona meitat del segle XVIII». Pedralbes: revista d’història moderna 10, 51-66.
TRANSFORMACIÓN Y DESIGUALDAD ECONÓMICA
Revista de Historia Económica, Journal of Iberian and Latin American Economic History 29
BELTRÁN-TAPIA, F., Y MARTÍNEZ-GALARRAGA, J. (2015): “Inequality and Poverty in aDeveloping Economy: Evidence from Regional Data (Spain, 1860-1930)”. EuropeanHistorical Economics Society (EHES) Working Papers, (0078).
BENAUL, J. M. (1995): «Cambio tecnológico y estructura industrial. Los inicios delsistema de fábrica en la industria pañera catalana, 1815–1835». Revista de HistoriaEconómica 13 (02), 199-226.
BENAUL, J. M. (1993): Guerra i canvi econòmic. L’impacte de la Guerra del francès en laindustria tèxtil llanera de Sabadell i Terrassa, 1808-1914. Sabadell, Sabadell. FundacióBosch i Cardellach.
BENAUL, J. M. (1992): «Los orígenes de la empresa textil lanera en Sabadell y Terrassa enel siglo XVIII». Revista de Historia industrial 1, 39-62.
BORDERÍAS, C. (2002): “Women Workers in the Barcelona Labour Market, 1856-1936.”Red Barcelona. Social Protest and Labor Mobilization in the Twentieth Century.London: Routledge: 142-166.
BROADBERRY, S., et al. (2013): «When Did Britain Industrialise? The Sectoral Distributionof the Labour Force and Labour Productivity in Britain, 1381–1851». Explorations ineconomic history 50 (1), 16-27.
CABRÉ, A. (1999): «El sistema català de reproducció. Cent anys de singularitatdemogràfica». Barcelona: Edicions Proa.
CAMPS CURA, E. (1995): La formación del mercado de trabajo industrial en la Cataluña delsiglo XIX. Madrid: Ministerio de Trabajo y Asuntos Sociales.
CAMPS CURA, E. (1992): «Population Turnover and the Family Cycle: The MigrationFlows in a Catalan Town during the Nineteenth Century». Continuity and Change 7.02.225-245.
CAMPS CURA, E., Y BORDERÍAS, C. (2012): “Historical International Classification ofoccupations”; Cataluña, siglos XIX-XX en: https://hiscodigos.files.wordpress.com.
CARRERAS I CANDI, F. (1914): «Les obres de la Catedral de Barcelona 1298-1445». Butlletíde la Reial Acadèmia de Bones Lletres de Barcelona 7 (49), 22-30.
CLARK, G. (1987): «Productivity Growth Without Technical Change in EuropeanAgriculture Before 1850». The Journal of Economic History 47 (02), 419-432.
CONCEIÇÃO, P., Y FERREIRA, P. (2000): “The Young Person’s Guide to the Theil Index:Suggesting Intuitive Interpretations and Exploring Analytical Applications”. UTIPworking papers. University of Texas.
COONEY, E. (1993): «Productivity, Conflict and Order in the British ConstructionIndustry: A Historical View». Construction History 9, 71-84.
DE VRIES, J. (2006): European Urbanization, 1500-1800 (Vol. 4). Routledge. New York.DE PLEIJT, A., Y WEISDORF, J. (2017): «Human Capital Formation from Occupations: the
‘Deskilling Hypothesis’ Revisited». Cliometrica 11 (1), pp. 1-30.FERNÁNDEZ, R. G, Y LÓPEZ, M. (1974): «Empresari i capitalista a la manufactura catalana
del segle XVIII. Introducció a l’estudi de les fàbriques d’indianes». Recerques:història, economia, cultura 4, 19-57.
FERRER, L. (2004): «Bergadanas, continuas y mules. Tres geografías de la hilaturadel algodón en cataluña (1790–1830)». Revista de Historia Económica 22 (2),337-386.
FERRER, L., et al. (1992): «Edat de casament i celibat definitiu a la Catalunya Central(1803-1807)». Manuscrits: revista d’història moderna (10), 259-286.
FONTANA, J. (2008): La guerra del Francès 1808-1814. Barcelona. Pòrtic.FORM, W. (1987): «On the Degradation of Skills». Annual Review of Sociology 29-47.GARCÍA BALAÑÀ, A. (2004): La fabricació de la fàbrica: treball i política a la Catalunya
cotonera, 1784-1874, Universitat de Barcelona.
GABRIEL BREA-MARTÍNEZ/JOANA MARIA PUJADAS-MORA
30 Revista de Historia Económica, Journal of Iberian and Latin American Economic History

GARCÍA-MONTERO, H. (2016): «The Nutritional Status of Manufacturing Workers andCraftsmen in Central Spain in the Eighteenth Century». Revista de Historia Industrial25 (64), 51-75.
GARCÍA-MONTERO, H. (2015): “Long-Term Trends in Wealth Inequality in Catalonia,1400-1800: Initial Results”. Dondena Working Papers, no. 79.
GONZÁLEZ ENCISO, A. (1985): «Especialización y competencia regionales: la expansión delnegocio catalán en Castilla a fines del siglo XVIII». Pedralbes: revista d’històriamoderna 5, 31-58.
HAJNAL, J. (1976): «European Marriage Patterns in Perspective». Population andDevelopment Review 2 (3-4), 101-143.
HANAGAN, M. (1977): «Artisan and Skilled Worker: The Problem of Definition».International Labor and Working-Class History 12, 28-31.
HAUSER, R. M. (1982): «Occupational Status in the Nineteenth and Twentieth Centuries».Historical Methods: A Journal of Quantitative and Interdisciplinary History 15 (3), 111-126.
HORRELL, S. (1996): «Home Demand and British Industrialization». The Journal ofEconomic History 56 (03), 561-604.
ITURRALDE, M. (2015): «Las edades de acceso al mercado de trabajo formal: de los oficiostradicionales a la industria algodonera moderna, Barcelona, 1784-1856». Revista deDemografía Histórica 33 (1), 65-97.
KATZ, M. B. (1972): «Occupational Classification in History». The Journal ofInterdisciplinary History 3 (1), 63-88.
KEIBEK, S. A., Y SHAW-TAYLOR, L. (2013): «Early Modern Rural By-Employments:A Re-Examination of the Probate Inventory Evidence». Agricultural History Review61 (2), 244-281.
KENDRICK, M. (1939): «The Ability-to-Pay Theory of Taxation». The American EconomicReview 29 (1), 92-101.
KUZNETS, S. (1955): «Economic Growth and Income Inequality». The American EconomicReview 45 (1), 1-28.
LAMBERT, P.; ZIJDEMAN, R.; VAN LEEUWEN, M.; MAAS, I., Y PRANDY, K. (2013): «TheConstruction of HISCAM: A Stratification Scale Based on Social Interactions forHistorical Comparative Research». Historical Methods: A Journal of Quantitative andInterdisciplinary History 46 (2), pp. 77-89.
LANDES, D. S. (2003): The Unbound Prometheus: Technological Change and IndustrialDevelopment in Western Europe from 1750 to the Present.
LINDERT, P. (2000): « “Three Centuries of Inequality in Britain and America». Handbookof Income Distribution” 1, 167-216.
LIVI-BACCI, M. (1987): «Il censimento di Floridablanca nel contesto dei censimentieuropei». Genus 137-151.
MAAS, I., Y VAN LEEUWEN, M. (2016): «Toward Open Societies? Trends in MaleIntergenerational Class Mobility in European Countries during Industrialization»1. American Journal of Sociology 122 (3), 838-885.
MARFANY, J. (2012): Land, Proto-Industry and Population in Catalonia, c. 1680-1829: AnAlternative Transition to Capitalism? Surrey: Ashgate Publishing, Ltd.
MARTÍN CABREROS, P., Y SÁNCHEZ RUIZ, J. (1985): «Aproximación a la estructura socio-profesional de la provincia de Zamora en el siglo XVIII a través de las respuestasgenerales del Catastro del Marqués de 1a Ensenada». Anuario 1985. Instituto deEstudios Zamoranos Florian de Ocampo 443-513.
MARTÍNEZ CARRIÓN, J.M. (2016): «Living Standards, Nutrition and Inequality in theSpanish Industrialisation. An Anthropometric View». Revista de Historia Industrial25 (64), 11-50.
TRANSFORMACIÓN Y DESIGUALDAD ECONÓMICA
Revista de Historia Económica, Journal of Iberian and Latin American Economic History 31
MARTÍNEZ‐GALARRAGA, J., Y PRAT, M. (2015): “Wages, Prices, and Technology in EarlyCatalan Industrialization”. The Economic History Review 69 (2), 548-574.
MARTÍNEZ-GALARRAGA, J, et al. (2015): «The Long-Term Patterns of Regional IncomeInequality in Spain, 1860–2000». Regional Studies 49 (4), 502-517.
MILANOVIC, B., et al. (2011): «Pre‐Industrial Inequality». The Economic Journal 121 (551),255-272.
MOCH, L. P. (2003): Moving Europeans: Migration in Western Europe since 1650. IndianaUniversity Press.
MOLAS RIBALTA, P. (1970): Los gremios barceloneses del siglo XVIII: la estructuracorporativa ante el comienzo de la revolución industrial. Madrid: ConfederaciónEspañola de Cajas de Ahorros.
MOLITORIS, J., Y DRIBE, M. (2016): «Industrialization and Inequality Revisited: MortalityDifferentials and Vulnerability to Economic Stress in Stockholm, 1878–1926».European Review of Economic History hev023.
MORA-SITJÀ, N. (2007): «Labour Market Integration in a Pre-Industrial Economy:Catalonia, 1772–1816». Oxford Economic Papers 59 (suppl 1), 156-177.
MORA-SITJA, N. (2006): “Exploring Changes in Earnings Inequality during Industrialization:Barcelona, 1856-1905”. Oxford University Economic and Social History Series, (_061).
MUSET, A. (1995): «Los arrieros y negociantes del Calaf y Copons y su implantación en elmercado español en el siglo XVIII». Revista de Historia Industrial 8, 193-210.
MUSET, A. (1997): Catalunya i el mercat espanyol al segle XVIII: els traginers i elsnegociants de Calaf i Copons, Abadía de Montserrat.
NADAL, J. (1978): La població catalana al segles XVI i XVIII. Barcelona, Salvat.NADAL, J. (1975): El fracaso de la revolución industrial en España, 1814-1913. Barcelona:
Ariel.NADAL, J, Y GIRALT, E. (1963): «Barcelona en 1717-1718. Un modelo de sociedad pre-
industrial». Homenaje a Don Ramon Carande. Madrid, Moneda y Crédito 20, 159-160.NICOLINI, E., Y RAMOS PALENCIA, F. (2016): “Decomposing Income Inequality in a
Backward Pre-Industrial Economy: Old Castile (Spain) in the Middle of theEighteenth Century”. The Economic History Review.
OKUNO, Y. (1999): «Entre la llana i el cotó. Una nota sobre l’extensió de la indústria delcotó als pobles de Catalunya el darrer quart del segle XVIII». Recerques: història,economia, cultura 38, 47-76.
ORIS, M. (2003): «The History of Migration as a Chapter in the History of the EuropeanRural Family: An Overview». The History of the Family 8 (2), 187-215.
PRADOS de la Escosura, L. (2008): «Inequality, Poverty and the Kuznets Curve in Spain,1850–2000». European Review of Economic History 12 (3), 287-324.
PRAT SABARTÉS, M. (2007): «Fabricants, comerciants i banquers. Les estructurescomercials de la indústria cotonera catalana en el mercat español (1840-1936)».Butlletí de la Societat Catalana d’Estudis Històrics vol. XVIII, p 205-212.
PUJADAS-MORA, J. M., et al. (2014): «Propuestas metodológicas para la aplicación deHISCO en el caso de Cataluña, siglos XV-XX». Revista de Demografía Histórica32 (1), 181-220.
RAVEUX, O., Y SÁNCHEZ, A. (2010): «La adaptación tecnológica como factor de localizaciónindustrial. Una revisión de las investigaciones sobre la industria de hilados dealgodón en Cataluña (1772–1885)». Investigaciones de Historia Económica 6 (17),65-94.
RAMÓN MUÑOZ, R., Y RAMÓN MUÑOZ, J.M. (2016): «The Biological Standard of Living inNineteenth-Century Industrial Catalonia: A Case Study». Revista de HistoriaIndustrial 25 (64), 71-118.
GABRIEL BREA-MARTÍNEZ/JOANA MARIA PUJADAS-MORA
32 Revista de Historia Económica, Journal of Iberian and Latin American Economic History

REHER, D. (1986): «Desarrollo urbano y evolución de la población: España 1787–1930».Revista de Historia Económica 4 (1), 39-66.
ROIG, M. P. (1985): «Vies d’estudi dels registres parroquials. Estructura social i oficis a l’AltEmpordà durant l’Antic Règim». Manuscrits: revista d’història moderna (1), 39-62.
ROMERO, J. (2010): «Estado, trabajadores y empleo femenino en los orígenes de laindustria en la España contemporánea». Mélanges de la Casa de Velázquez. Nouvellesérie (40-2), 95-115.
ROSÉS, J. (1999): “Explaining the Upwising of the Kuznets Curve during the EarlyIndustrialisation (Catalonia, 1830-1861)”. Manuscrito sin publicar. EuropeanHistorical Economics Society Conference, Lisboa.
RYCKBOSCH, W. (2016): «Economic Inequality and Growth Before the IndustrialRevolution: The Case of the Low Countries (Fourteenth to Nineteenth Centuries)».European Review of Economic History 20 (1), 1-22.
SÁNCHEZ SUÁREZ, A. (2000): «Crisis económica y respuesta empresarial. Los inicios delsistema fabril en la industria algodonera catalana, 1797-1839». Revista de HistoriaEconómica 18 (03), 485-523.
SÁNCHEZ SUÁREZ, A. (1993): «Les activitats econòmiques a Barcelona (1717–1833)», enSOBREQUÉS I CALLICÓ, J. (dir.), Història de Barcelona. El desplegament de la ciutatmanufacturera 217-265.
SANTIAGO-CABALLERO, C. (2011): «Income Inequality in Central Spain, 1690–1800».Explorations in Economic History 48 (1), 83-96.
SHAW-TAYLOR, L., Y WRIGLEY, A. (2014): “Occupational Structure and Population Change.”The Cambridge Economic History of Modern Britain: Volume 1, Industrialisation,1700–1870: 53.
SOTO CARMONA, A. (1989): El trabajo industrial en la España contemporánea, 1874-1936.Madrid Anthropos Editorial.
SUDRIÀ, C. (2004): «Comerç, finances i indústria en els inicis de la industrialitzaciócatalana». Barcelona quaderns d’història 11, 9-38.
TELLO, E. (1995): «El fin de la expansión agraria en Cataluña del siglo XVIII: factoreseconómicos y crisis social». Agricultura y sociedad (74), 109-158.
THOMSON, J. K. (2003): A Distinctive Industrialization: Cotton in Barcelona 1728-1832.Cambridge: Cambridge University Press.
TORRAS ELIAS, J. (1984): «Especialización agrícola e industria rural en Cataluña en elsiglo XVIII». Revista de Historia Económica 2 (03), 113-127.
TORRAS I RIBÉ, J. (1987): «Demografia i societat a Igualada durant els segles XVI i XVII».Miscellanea Aqualatensia (4), 87-111.
VAN LEEUWEN, M., et al. (2002): Historical International Standard Classification ofOccupations. Lovaina: Leuven University Press.
VAN ZANDEN, J. L. (1995): «Tracing the Beginning of the Kuznets Curve: Western EuropeDuring the Early Modern Period». The Economic History Review 48 (4), 643-664.
VIDAL i BENDITO, T. (1979): «Èxode rural i problemàtica demospacial a Catalunya (1860-1970)». Estudis d’Història Agrària 2, 193-207.
WILLIAMSON, J.G. (2013): Did British Capitalism Breed Inequality? London: Routledge.ZARZOSO, A (2003): La práctica médica a la Catalunya del segle XVIII, Tesis doctoral. J.
Institut Universitari d ́Història “Jaume Vicens i Vives”, Universitat Pompeu Fabra,Barcelona.
TRANSFORMACIÓN Y DESIGUALDAD ECONÓMICA
Revista de Historia Económica, Journal of Iberian and Latin American Economic History 33
THE HISTORY OF THE FAMILY, 2018
https://doi.org/10.1080/1081602X.2018.1426483
The apple never falls far from the tree: siblings and intergenerational transmission among farmers and artisans in the Barcelona area in the sixteenth and seventeenth centuries
Joana-Maria Pujadas-Moraa, Gabriel Brea-Martíneza, Joan-Pau Jordà Sáncheza and Anna Cabréa,b
aCentre d’Estudis Demogràfics (Center for Demographic Studies), Universitat Autònoma de Barcelona, Barcelona, Spain; bGeography Department, Universitat Autònoma de Barcelona, Barcelona, Spain
ABSTRACT
This article aims at studying the intergenerational transmission of status within farmers and artisans in the preindustrial area of Barcelona from a siblings’ attainment perspective in a context of impartible inheritance. The data source used are the Marriage License Books from the Barcelona's Diocese compiled in the Barcelona Historical Marriage Database, which for the sixteenth and seventeenth centuries provides a rich and continuous demographic and socioeconomic information through the use of the multilevel regression analysis. Our main findings points out the important family impact on the social fate of children. First-married children were the maximal inheritors of parental statuses in all social groups, especially for farmers and artisans, the former being more linked to ascription than the latter. However, farmers were found to be the group with the highest intergenerational occupational inheritance although artisans were who transmitted at most their social group. This divergent effect is due to the different strategies, or in a way a same strategy, used on non-first-married children to whom, families from the two social groups, when not able to transmit the same parental occupation, preferred to position the offspring in artisans’ careers thanks to a favourable context of a flourishing manufacturing industry at the countryside.
1. Introduction
Historically, families tended to place their members in better-off social and economic posi-
tions in order to biologically perpetuate their lineages over time. To achieve this aim they
used a range of intergenerational transmission strategies in the demographic, legal and
economic domains (Berkner & Mendels, 1978; Ganzeboom, Treiman, & Ultee, 1991). This
phenomenon led to a view of the pre-industrial society as unequivocally immobile, although
this has been revised and refuted in recent years (Boberg-Fazlic, Sharp, & Weisdorf, 2011;
Dambruyne, 1998). It is true, however, that levels of social transmission between generations
in these societies have remained high.1 However, this might vary among different social
© 2018 Informa UK Limited, trading as Taylor & Francis Group
KEYWORDS
Intergenerational transmission; sibship; sibling marriage order; artisans; farmers
ARTICLE HISTORY
Received 20 June 2017 Accepted 8 January 2018
CONTACT Joana-Maria Pujadas Mora [email protected]
2 J. M. PUJADAS-MORA ET AL.
groups. We will investigate the case of farmers and artisans – the two major groups socially
and economically speaking in the period under study – since they might have adapted their
strategies according to their own circumstances and the general context (Bourdieu, 1976;
Laslett, 1983), for example with the legal inheritance system or the total number of children
reaching adulthood which, in the end, necessarily involves class formation (Kocka, 1984).
It is noted that the legal context, and specifically inheritance systems, can strengthen
intergenerational transmission of occupations or status, particularly when the system is
based on the principle of impartibility, which usually granted eldest sons the privilege of
being heir2 (Barrera-González, 1992; Berkner & Mendels, 1978; Comas d'Argemir, 1988; Ferrer,
2007; Platteau & Baland, 2001; Thirsk, 1976). If there were no male offspring, the eldest
daughter would be made heiress (Arrizabalaga, 2005; Ferrer, 2005). It is clear that this system
marked not only the fate of first-born children but also the destinies of the rest of the siblings.
In the legal system of the time, inheritance was divided among a ‘universal inheritor’ and
the other siblings. The universal inheritor would give continuity to the house3 by obtaining
his/her inheritance through the marriage contract, and was expected to provide for the
future of his/her sisters and/or brothers. The non-inheritor siblings received what is known
as the ‘legitimate’ part of the inheritance, or the dowry in the case of women, to be used in
forming their own families or trades (Barrera-González, 1992; Fauve-Chamoux, 2005; Ferrer,
2004; Kurosu, 1996). The logic of this system implied that non-inheritor brothers would marry
downwards, by comparison with their families of origin (Ferrer, 2003, 2010a).
Hence, families looked for mechanisms to compensate for and mitigate sibling compe-
tition or rivalry4 for the same family resources, and to avoid parent–offspring conflict
(Schlomer, Ellis, & Garber, 2010; Trivers, 1974) and, consequently, resource dilution (Low,
1991; Shenk et al., 2010). In this sense, the existence of a specific legal inheritance system
based on a single heir might provide an institutionalised form of conflict resolution for
siblings by providing all the tangible endowments to only one offspring, the single inheritor.
Parents would have made this situation less or more ‘unfair’ through adopting different
strategies. They could multiply single-heir advantage by focusing on this one heir most of
the parental investments or, alternatively, opt for compensatory approaches with regard to
non-inheritors (Erola & Kilpi-Jakonen, 2017). However, even using compensatory strategies
could not totally resolve parent–offspring conflicts since single heirs, although they did
achieve through endowments greater stability in social status, would have had to shoulder
more responsibilities vis-à-vis their siblings.
With regard to the number of adult siblings5 in families, one strategy was to advance or
delay marriage depending on the siblings’ age and gender, and the number of siblings in
the family who could marry (Dribe & Lundh, 2010; van Poppel & Nelissen, 1999; Van de Putte
et al., 2009). Hence, gender, birth order, sibship and of course whether or not siblings were
heirs all came into play in establishing siblings’ ages at marriage (Barrera-González, 1992;
Dillon, 2010; Ferrer, 2010b; Gjerde & McCants, 1999; Suanet & Bras, 2014; Vilalta, 2006; Wall,
1996). It should be recalled that not all siblings entered the marriage market; some took up
a religious vocation and others, who remained unmarried, never left the parental home
(Ciuffreda, 1997; Ferrer, 2008, 2016). In fact, for historical societies, especially during the
fertility transition, there is evidence of an association between sibship size and social status
attainment (Beise & Voland, 2008; Bras, Kok, & Mandemakers, 2010; Nitsch, 2014; Van Bavel,
Moreels, Van de Putte, & Matthijs, 2011; Voland & Dunbar, 1995) by contrast with the negative
THE HISTORY OF THE FAMILY 3
or non-association found in contemporary societies (Angrist, Lavy, & Schlosser, 2010; Blake,
1986; Black, Devereux, & Salvanes, 2005; Leibowitz, 1974).
Resource dilution can therefore be one result of greater sibship size, assuming that families
with a larger number of siblings show less upward mobility among their offspring due to a
greater burden on allocation of parental resources (Downey, 1995; Öberg, 2015). However,
several authors did not find any effect of sibship size in adult life in historical populations
(Van Bavel, Moreels, Van de Putte & Matthijs, 2011; Wall, 1996). Bras et al. (2010) provided
insights and examples explaining this absence of association, including the household eco-
nomic cycle, in which families of greater sibship size would have more opportunities to
convert adult offspring into producers contributing to the shared family budget (Berkner,
1972). A second argument has to do with family typologies, and suggests that resource
dilution would affect nuclear families but apparently not extended families (as were common
in Catalonia), due to the greater likelihood of influence from other kin agents (Erola & Kilpi-
Jakonen, 2017; Knigge, Maas, Van Leeuwen & Mandemakers, 2014). In fact, for ancien régime
societies in a context of high fertility combined with high mortality, the incidence of fatality
might suggest markers of social group and status. Some authors have found larger family
sizes among the richest, while families of lower status would have been subject to many
involuntary pressures that diminished their size (Boberg-Fazlic et al., 2011; Clark & Hamilton,
2006). Other authors argue that in spite of the high mortality in that period, larger families
would generally have been preferred to dilution, particularly among peasants, in order to
increase their available labour pool, which is understood as a multiplicative effect for gen-
erating resources (Caldwell, Caldwell, Caldwell, McDonald, & Schindlmayr, 2006; Harrell,
1997).
Other ways in which mostly male non-inheritor siblings and families in rural areas com-
pensated for their unfavourable birth order and sought to improve their status comprised
finding an economic activity to complement the one carried out in the parental home, for
example cultivating pieces of land, owning small flocks or emigrating to the city in order to
become artisans (Epstein, 2004; Ferrer, 2016; Iszaevich, 1975; Kurosu, 1996). These strategies
can be understood as part of a so-called cooperative breeding6 framework which aims to
maximise the opportunities of all siblings or as deriving from an altruistic perspective involv-
ing not only parental tangible and intangible investments but also the participation of other
kin (Kurzban, Burton-Chellew, & West, 2015), as could be the case with the single heir con-
tributing towards the placement of siblings. The extra earnings would ease the family’s
economic burdens and facilitate the marriages of (all) siblings. Inter- and intra-generational
cooperation would thereby determine the fate of (all) siblings. Some European examples
from the nineteenth century showed that families would try their best to keep offspring at
home in rural areas and to provide cooperatively for all of them. However, when constraints
like unemployment at the macro level or disability at the micro level did not allow this,
small-scale migration, undertaken as a family decision involving parents and siblings, would
have been chosen as the agreed-upon option (Kesztenbaum, 2008; Kok, 1997).
This study explores the socio-occupational destinations for sons and daughters of peas-
ants and artisans in the area of Barcelona in the period between 1547 and 1643, which
corresponds with the early modern period. Their destinies are understood as a combination
of both ascription and achievement or, in a nutshell, the influence of parents’ socioeconomic
position and individual improvements in relation to family background, especially with sib-
lings who were not first-born. For such insights it is necessary to evaluate how the father’s

4 J. M. PUJADAS-MORA ET AL.
social characteristics could condition the integration of children into the same group,
controlling for demographic characteristics such as marriage order, a proxy of birth order,
and sibship size of those who married.
Our analysis aims to shed light on competitive or cooperative strategies adopted by
families in pre-industrial times in the Barcelona area, in order to provide for their descendants
in a context of impartible inheritance. Moreover, we seek to determine whether there were
certain patterns in the procedure of placing descendants in these groups, i.e. if there was a
group behaviour. For this purpose, we use a unique ecclesiastical and fiscal marriage source
called Llibres d’Esposalles (Marriage Licence Books) brought together in the Barcelona
Historical Marriage Database (BHMD), which includes all marriages held in the Diocese of
Barcelona between 1451 and 1905, and covering 250 parishes in 1900. For the period of our
analysis, 1547 to 1643, this source captured the occupations of fathers and children concur-
rently. This is a significant feature due to the regular use of marriage contracts as a way of
recording vital events during these periods. Parish registers were rare in Catalonia at the
time; their widespread use dates from the Council of Trent onwards.7 In fact, the Marriage
Licence Books represent one of the few sources for this kind of analysis in this period.
During the early modern period, Catalonia showed a demographic recovery, after a cen-
tury marked by many crises. Plagues and a civil war (1462–1472) accounted for a significant
reduction of its population. From 1553 to 1623, the Catalan population increased from more
than 250,000 to around 475,000 inhabitants (Nadal, 1978; Simon, 1992), thanks largely to a
flow of immigrants from France (Nadal & Giralt, 1960) and burgeoning economic expansion
(Junqueras, 2006; Lobato, 1995; Simon, 1992; Vilar, 1986). Scholars have attributed this eco-
nomic vigour to the expansion of vineyards and the spread of the textile industry in the
countryside, among other factors (García Espuche, 1998; Torras, 1993). This situation would
change during and after the Thirty Years’ War (1618–1648) and the outbreak of the revolution
of 1640 (Elliot, 1963) because of a combination of commercial/industrial crisis, heavy tax
pressure and bad harvests (Kamen, 1979; Serra, 2013; Yun Casalilla & Torras, 1999). In addition
to these factors, the already limited disposal of fields was further restricted by rising land
prices (Álvarez-Nogal & Prados de la Escosura, 2012). The single-heir inheritance system
began to be used in Catalan society in the Middle Ages. It spread progressively from the
north (Provence and today’s French Catalonia) to the south and east throughout the tenth
and thirteenth centuries and was eventually integrated in the Roman-Catalan legal code,
which had Carolingian roots (To, 1997, 1993). The original purpose of these practices was to
avoid land dissolution in a mainly rural society. By the early modern period, the inheritance
system played an integral role in families’ productive and reproductive dynamics (Comas
d'Argemir, 1988; Ferrer, 2010a) and was widespread across centuries and social groups in
Catalonia. In fact, this context could have been decisive in mitigating or increasing differences
between siblings that were prefigured in the inheritance system.
Some of the initial hypotheses regarding this study can be stated as:
• A first-married male sibling would inherit occupation and status from his father. The
fact that the eldest son would inherit most of the parents’ tangible endowments could
create an initial inequality of status ascription and opportunities among siblings, which
might be mitigated by compensation strategies and could diverge from the original
family social status and occupation. The likely effects of such compensatory strategies
would entail the allocation of inter- and intra-generational resources (either human
THE HISTORY OF THE FAMILY 5
or economic) to find an alternative path (social or occupational) for non-inheritor
children in order to ensure the socioeconomic reproduction of families. In this sense,
the non-first-married siblings might have the same occupation as the first-married
sibling, or work in a similar/related occupation due to the fact that it would be
easier for the family to use its relations/influences within its own economic sector/
activity. Conversely, when the family was not able to use this kind of strategy, the
non-first-married children (daughters and mostly sons) might show more mobility
in status attainment in comparison with the elder sibling.
• Another plausible hypothesis is that when placement of non-first-married children
failed, an alternative way of ensuring the social outcomes of at least some of their
descendants would be sought. Among non-peasant families, there might be a prefer-
ence for purchasing land as a way of securing a fixed asset. Accordingly, a non-first-mar-
ried sibling of an artisan father in this period might have some chances of becoming a
farmer. However, the fact that some farmers’ sons could have been artisans responded
to a context characterised by a significant expansion of manufacturing and limited
land availability.
2. Data and methodology
The Barcelona Historical Marriage Database (BHMD) brings together the marriage licences
recorded at the Llibres d’Esposalles covering the Diocese of Barcelona (formed by 250 parishes
in 1900) from 1451 to 1905, accounting for more than 600,000 marriages. The origin of the
source goes back to 1409, when Pope Benedict XIII (1328–1423, and considered an antipope
during the Western Schism) visited Barcelona and granted the new cathedral the power to
impose a marriage tax that would be charged for each union held in the diocese in order to
fund the cathedral’s construction and maintenance. Parishes were distributed from the city
of Barcelona to rural villages at the periphery of the diocese. During the five centuries of the
source’s lifetime, the items commonly listed in each marriage record were names and family
names of grooms (one family name8 until 1876 and two family names9 thereafter) and brides’
names.10 The source also includes the groom’s occupation, the marital status of both parties
(particularly brides and widowed grooms), and the tax paid, which was calculated in accord-
ance with the socioeconomic status of the couple. Brides’ surnames were not registered until
1643, and then surnames usually came from the father (if previously unmarried) or, if wid-
owed, the late husband.
Names and surnames of parents were registered quite often, but the father’s occupation
was only registered in the period 1547 to 1643. Consequently, and given that the aim of
this article is to analyse intergenerational transmission of social outcomes among farmers
and artisans through sibling differences, this is the period under study and it could make
a valuable contribution by shedding light on several facts. First, the (almost) century
between 1547 and 1643 comes into the framework of the classical historiographical dis-
cussion about the general crisis of the seventeenth century in the Mediterranean area as
a result of the inflationary Spanish Price Revolution (Fischer, 1996; Parker, 2013). Second,
in this general context, Catalonia represented an exception in which the constraints of the
time brought about an economic reconfiguration and the definitive integration of Barcelona
and its hinterland into a new urban system. The city worked as the economic and geographic

6 J. M. PUJADAS-MORA ET AL.
core, and these transformations were possible thanks to the decentralisation of Barcelona
manufacturing and the reconversion of the city’s activities to more specialised and com-
mercial endeavours (García Espuche, 1998; Junqueras, 2006).
This economic reconversion located Barcelona and its hinterland in the trade routes of
the Spanish empire (extending to the Americas) and in the Mediterranean trade together
with major ports like Genoa, Marseille and Naples (Braudel, 1995; García Espuche, 1998;
Junqueras, 2006), which makes the study of the family and intergenerational aspects of the
social class transmission a matter of scientific interest. Moreover, the database with recon-
structed genealogies of a remarkable sample size means that this study is one of the few
contributions for the sixteenth and seventeenth centuries with regard to this topic and also
for most of the area of study.
The taxation system covered the entire social hierarchy, from the nobility (the highest
level) to the so-called poor (exempted). For the period of study, taxes were fixed in a sev-
en-tiered scale: (1) nobility, (2) military citizens, (3) honoured citizens (those who could hold
public offices), (4) merchants, lawyers and physicians, (5) masters of guilds, (6) farmers and
small artisans and (7) the poor. Until 1715 the previous origin or residence of brides and
grooms were included in the marriage licences, but this was suppressed afterwards in favour
of the parish where the marriage was held. The main drawback of the source, mainly from
a demographic point of view, is the non-registration of the partners’ ages, which is a common
feature of old parish marriage registers.
The Barcelona Diocese was divided into four main deanships: Piera, Vallès, Penedès and
the Oficialitat of Barcelona, which is what we refer to as the Barcelona area. This Barcelona
area represents a wide variety of locations, ranging from the most rural parishes through to
the main towns of the period, for example Barcelona, Terrassa, Mataró and Sabadell. The
Oficialitat deanship, or Barcelona area, accounted for 90% (556,318) of total marriages reg-
istered in the source, and is the only one showing impeccable continuity and data quality
through the almost five centuries of the source’s existence. Moreover, the Oficialitat was
located in the most populated area of Catalonia, and remains so today (Map 1).
From 1547 to 1643, more than 80,000 marriage licences were recorded in the Barcelona
area. In spite of the fact that the study is concerned with intergenerational transmission
among peasants and artisans, the total social transmission will also be estimated. Only about
76,567 of those marriages, namely those in which occupations or status of grooms (sons
and sons-in-law) and fathers at the time of the children’s marriage were fully registered, can
be taken into consideration.11 Non-registration of information concerning fathers usually
occurred in the cases of fathers of non-native or widowed grooms. In addition, when
Map 1. Area of Barcelona.
THE HISTORY OF THE FAMILY 7
assessing the social destiny of siblings throughout this source, only families with at least two
marrying siblings were taken into account. An accurate process of nominal record linkage
was therefore required in order to bring together individuals (grooms/sons and brides/
daughters) who shared the same parents. Nominal data have been harmonised according
to language criteria to facilitate the record linkage to identify siblings (Jordà, 2016; Jordà,
Valls-Fígols, & Pujadas-Mora, 2013). Origins and residences have been geolocated, and occu-
pations have been coded using HISCO (Pujadas-Mora, Romero-Marín, & Villar, 2014; Van
Leeuwen, Maas, & Miles, 2002).
In order to measure the status of each individual, the only available social marker in the
Marriages Licence Books, as is common in demographic sources, is occupations, which have
been ranked according to socio-occupational position and group by means of HISCLASS
(Van Leeuwen & Maas, 2011) and HISCAM (Lambert et al., 2013), respectively. On the one
hand, HISCLASS differentiates individuals in consonance with the social group to which they
belonged according to dimensions like manual/non-manual division, skill level, degree of
supervision and economic sector, which gives 12 different classes going from unskilled rural
workers at the bottom to higher managers and professionals at the top. This class differen-
tiation allows us to distinguish the two main social groups under analysis – farmers and
artisans – and measure intergenerational transmission or mobility among classes. On the
other hand, HISCAM is an occupational stratification scale based on the Cambridge Social
Interaction and Stratification scheme (Prandy, 2000). The main idea behind this scaling is
that individuals who interact more (in terms of occupational and social relations) are closer
in terms of social position, assuming that these interactions represent the occupational
stratification structure. The result is a ranking of occupations that move theoretically from
0 to 99, showing not only closer social standing but also differences between occupations,
which would make it possible to observe intergenerational intra-class mobility.
Furthermore, owing to contextual specificities in the period under study, an extra level
has been included for both classifications, this concerning the nobility, due to its social class
significance (score 100 on HISCAM and label 0 on HISCLASS). The 12 HISCLASS labels have
been labelled in eight classes. This new grouping brings labels 3, 4 and 6 (Lower manager,
Lower professional and Clerical sales, Foremen) under the heading of only one label (3). We
have also united Low-skilled and Unskilled workers in label 7, and Low-skilled farm workers
and Unskilled farm workers in label 8 (Table 1). These changes respond to the need for a better
fit with the period’s socio-occupational structure, which had less occupational variety and
many cases concentrated in fewer occupations, which would have caused an overestimation
of upward and downward social mobility, for instance. It is also important to take into account
contextual specificities when applying international class schemes. A good example here is
Table 1. Adaption of the HISCLASS labels.
HISCLASS 8 + Nobility Labels (HISCLASS 12)
0 Nobility (0)1 High managers (1)2 High prof (2)3 Lower & prof manager (3, 4, 6)4 Lower clerical sales (5)5 Skilled workers (7)6 Farmers (8)7 Low-skilled workers (9, 11)8 Low-skilled & unskilled farm workers (10, 12)
8 J. M. PUJADAS-MORA ET AL.
the occupation called in Catalan paraire, codified as Fibre Preparers in the HISCO (code
75,100), which, for the local context, could embrace anyone from simple wool fibre preparers
to proto-industrial entrepreneurs in charge of all the production and commercialisation
processes of woollen fabrics in both guilds and putting-out systems, as Torras (1993, 1998)
has argued.
Since the aim of this study is to analyse social mobility among siblings by using marriage
registers, it was necessary to carry out a family reconstitution due to the fact that information
directly linking father and children was individual, which means that we must link individuals
(siblings) sharing the same parents. For this purpose, two kinds of links were created, first
to link siblings within the same family, and second to link siblings’ marriages with their
parents’ marriages. The former type of record linkage was achieved through the three reg-
istered variables shared by siblings: names of both parents and surnames of fathers. The
latter data-set linked groups of siblings to the marriage of their parents in order to complete
missing information or to obtain more information on them over time. An additional unique
restriction imposed on the former record linkage was setting a temporal lower bound based
on Roman law, implemented since the fourteenth century by the Church, according to which
males could not marry before the age of 14 and women before 12 (Gaudemet, 1987).
The record linkage was performed by means of the software programme Busca
Descendències (‘Looking for Offspring’) developed within the 5CofM project in collaboration
with researchers from the Computer Vision Centre (CVC) and the Centre d’Estudis Demogràfics
(CED). The programme integrated two string distances, the Bag distance and the Levenshtein
distance, together with a language model that palliated the effects of similarities in pronun-
ciation and penalised typographic errors (Villavicencio, Jordà, & Pujadas-Mora, 2015).12 There
were 48,392 father–children matches out of approximately 78,000 valid marriage licences,
although many signified over-links in which a groom or bride could have been assigned
several potential parents. From this process, only 27% (13,160) of cases were kept and the
rest were discarded. This significant decrease was due to repeated links and the fact that
some surnames in Catalan with completely different etymological roots used to be written
in a very similar way, as is clear when comparing strings, for example with surnames like
Roca and Roda (Rock and Wheel), Font and Pont (Fountain and Bridge), and others. Another
factor in data restriction was that when similarity indexes assessed by the Levenshtein and
Bag distances increased and were more egalitarian between potential fathers, other addi-
tional variables present in the source were used to discard subsequent over-links. We selected
only those licences in which all nominal information for father and mother was the same
and filtered out those in which the time between parents’ marriages and children’s marriages
was not more than 65 years.
We know from other studies using either nominative record linkage or marriage registers
that some selection effects can influence the representativeness of the analysed samples
(Bras et al., 2010; Knigge et al., 2014; Zijdeman, 2009). Hence, we used several steps in the
linkage process in order to minimise these consequences as much as possible, which to
some extent justifies the significant decrease (about 72%) in the total number of father–chil-
dren matches, because of a considerable presence of over-links. Studying the intergenera-
tional transmission or influence can therefore be biased if first marriages and remarriages
are not distinguished, which is one reason we work only with first marriages. Another possible
issue is related to the likely selection effects derived from dealing only with certain surnames
and, in this case, among the 528 surnames found by the record linkage procedure, their
THE HISTORY OF THE FAMILY 9
weight coincides with the total distribution of surnames in the entire source for the period
under study.13 Moreover, the likely migration of an individual could represent an aspect not
covered in the reconstructed ever-married families (which we do not analyse). In fact, not
all the marriage registers contained geographic information for both fathers and children.
However, we accounted for the premise in accordance with the historical context of the
period through the prominence of local movements that rarely exceeded distances of
15–20 km (Laslett, 1977; Moch, 2009; Postles, 2000), and that supposed a logical sequence
of mobility trends in Catalonia (Nadal & Giralt, 1960; Simon, 1992). The territory under study
(Barcelona area) has considerable coverage, including around 90 municipalities and 250
parishes in approximately 800 km2, which would include potential migratory movements.
In addition, the period analysed (1547–1643) featured a major influx of French migrants
during a time of demographic recovery, a fact that would minimise the number of emigrants
(Nadal & Giralt, 1960).
Once the record linkages were established, the total number of family units including at
least two siblings was 2752, and consisted of 6686 individuals. However, for the total number
of families, 52% (1330 families) brought together only sisters because, among the 76,567
marriage licences containing occupational information for both children and fathers, 62%
provided information on occupations of grooms and their fathers-in-law. The likely reason
for this might have been that it was a way of reporting the original social positions of brides
because their own occupations were not registered. Thus, given that one of the main aims
of this study was precisely to assess the status attainment of non-inheritor siblings in com-
parison with inheritors, it is necessary to include families with male siblings, mainly because
the single-heir system usually followed a primogenital and patrilineal logic.14 The total num-
ber of families including brothers and sisters was 1242, with 3480 individuals in sibships
ranging from two to eight (Table 2), including 2726 males and 754 females. Due to the
absence of female occupations, occupational information for sisters is approached through
the socio-occupational position of their future husbands.
Our analytical strategy was to apply the so-called sibling models by nesting siblings in
their families, using a multilevel regression approach. The benefit of this kind of model lies
in the possibility of analysing how similar siblings were in status attainment in view of the
relatively high level of ascription assumed in pre-industrial periods. In addition, these models
take into account the fact that siblings share a series of characteristics and constraints (Jencks
et al., 1972). In a pre-industrial society like Catalonia during this period, family and parental
social background would have affected individuals. The technical choice of a multilevel
approach allows us to control for between-family variance and statistical non-independence
of individuals, which in ordinal regressions are not taken into account, probably generating
spurious results (Hox, 2002).
In order to analyse the intergenerational aspects of social status transmission or mobility
from a sibling’s perspective, we individuated a set of variables for both fixed and random
Table 2. Number of families including brothers and sisters at the area of Barcelona, 1547–1643.
Number of siblings Number of families
2 6563 3214+ 265Total 1242

10 J. M. PUJADAS-MORA ET AL.
effects in our multilevel models. A group of control variables regarding the siblings’ marriage
order, the sibship size of those ever married, distance in years between parent and offspring
marriage, as well as the interval among marriage siblings, the parental social and occupa-
tional group, the sex of the child, and if the father was deceased at the time of the child’s
marriage were considered (Table 3). Among those variables, it is noticeable that the mean
distance in years between father’s and child’s marriage was 35 years, although its mode was
33, and the distribution is left-skewed towards 24 to 29 years of difference between the
events. As might be expected, females (31 years) have a lower mean difference in years than
males (36 years), because women married earlier. Moreover, a set of hierarchical linear models
is used to identify the extent to which the occupational status attainments of children were
linked to those of their parents, and how individuals were different among their siblings and
by social groups. Finally, multilevel logistic regressions dealing with occupations, status and
social groups of siblings were used to assess children’s socioeconomic destinations, based
on data about the dynamics of social and occupational destinations between siblings of
artisan and farmer fathers.
Our study has a number of limitations. The first is that we had to approach the social
group destination of daughters through the occupations of their future husbands, and this
is due to an inherent limitation of our source for this study (Marriage Licence Books), which
did not record female occupations, as was usually the case with parish registers. A second
drawback comes from having to measure sibship size only in terms of married children,
which is likely to give a biased view of real family dynamics since not all siblings married –
some entered religious orders, some stay unmarried, and some died before reaching mar-
riageable age. The data would be more reliable if they included complete life courses, but
for the time period and the area covered, it is almost impossible to obtain such data, due to
the non-existence and non-conservation of parish registers and huge territorial extension.
Certainly, unmarried siblings could be important agents for helping and providing for
Table 3. Descriptive statistics.
Descriptive statistics
Continuous variables Mean Std. deviation Min. Max.
Dependant Children status (HISCAM) 53.04 7.33 45 100Independent Father status (HISCAM) 52.34 5.76 45 100Sibship size (ever-married) 3.2 1.24 2 8Marriage order 2.1 1.14 1 8Distance in years 35.11 8.95 15 63Categorical variables Proportion Dependant Same occupation 0.69 Same status (HISCAM) 0.73 Upper HISCAM 0.16 Same status (HISCLASS) 0.74 Upward mobility (HISCLASS) 0.14 Downward mobility (HISCLASS) 0.13 Independent Deceased father 0.51 Children of farmer fathers 0.67 Children of artisan fathers 0.27 Females 0.22 Males 0.78
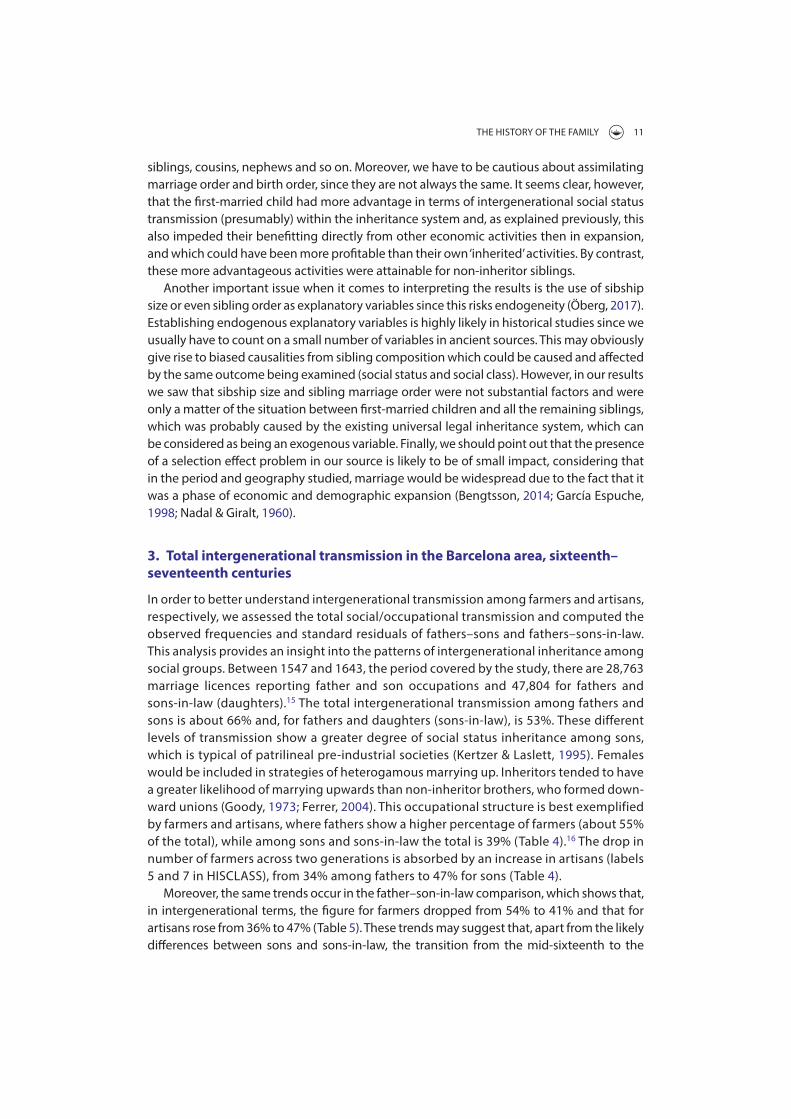
THE HISTORY OF THE FAMILY 11
siblings, cousins, nephews and so on. Moreover, we have to be cautious about assimilating
marriage order and birth order, since they are not always the same. It seems clear, however,
that the first-married child had more advantage in terms of intergenerational social status
transmission (presumably) within the inheritance system and, as explained previously, this
also impeded their benefitting directly from other economic activities then in expansion,
and which could have been more profitable than their own ‘inherited’ activities. By contrast,
these more advantageous activities were attainable for non-inheritor siblings.
Another important issue when it comes to interpreting the results is the use of sibship
size or even sibling order as explanatory variables since this risks endogeneity (Öberg, 2017).
Establishing endogenous explanatory variables is highly likely in historical studies since we
usually have to count on a small number of variables in ancient sources. This may obviously
give rise to biased causalities from sibling composition which could be caused and affected
by the same outcome being examined (social status and social class). However, in our results
we saw that sibship size and sibling marriage order were not substantial factors and were
only a matter of the situation between first-married children and all the remaining siblings,
which was probably caused by the existing universal legal inheritance system, which can
be considered as being an exogenous variable. Finally, we should point out that the presence
of a selection effect problem in our source is likely to be of small impact, considering that
in the period and geography studied, marriage would be widespread due to the fact that it
was a phase of economic and demographic expansion (Bengtsson, 2014; García Espuche,
1998; Nadal & Giralt, 1960).
3. Total intergenerational transmission in the Barcelona area, sixteenth–
seventeenth centuries
In order to better understand intergenerational transmission among farmers and artisans,
respectively, we assessed the total social/occupational transmission and computed the
observed frequencies and standard residuals of fathers–sons and fathers–sons-in-law.
This analysis provides an insight into the patterns of intergenerational inheritance among
social groups. Between 1547 and 1643, the period covered by the study, there are 28,763
marriage licences reporting father and son occupations and 47,804 for fathers and
sons-in-law (daughters).15 The total intergenerational transmission among fathers and
sons is about 66% and, for fathers and daughters (sons-in-law), is 53%. These different
levels of transmission show a greater degree of social status inheritance among sons,
which is typical of patrilineal pre-industrial societies (Kertzer & Laslett, 1995). Females
would be included in strategies of heterogamous marrying up. Inheritors tended to have
a greater likelihood of marrying upwards than non-inheritor brothers, who formed down-
ward unions (Goody, 1973; Ferrer, 2004). This occupational structure is best exemplified
by farmers and artisans, where fathers show a higher percentage of farmers (about 55%
of the total), while among sons and sons-in-law the total is 39% (Table 4).16 The drop in
number of farmers across two generations is absorbed by an increase in artisans (labels
5 and 7 in HISCLASS), from 34% among fathers to 47% for sons (Table 4).
Moreover, the same trends occur in the father–son-in-law comparison, which shows that,
in intergenerational terms, the figure for farmers dropped from 54% to 41% and that for
artisans rose from 36% to 47% (Table 5). These trends may suggest that, apart from the likely
differences between sons and sons-in-law, the transition from the mid-sixteenth to the
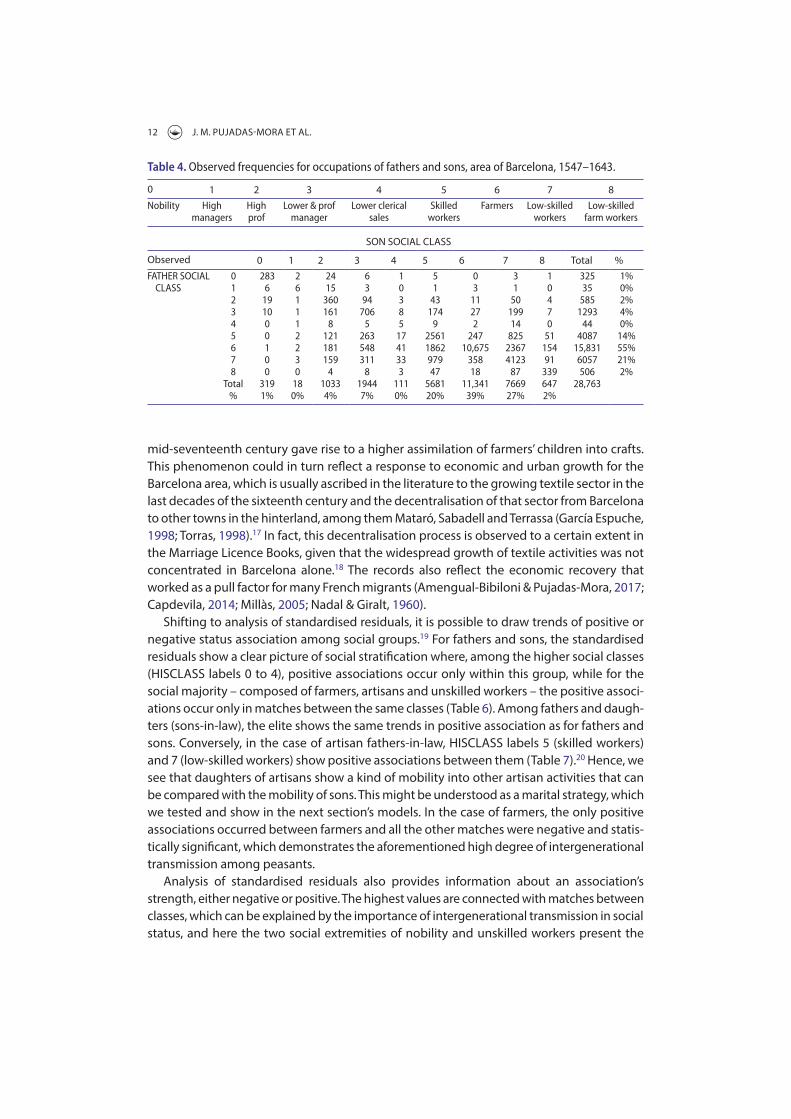
12 J. M. PUJADAS-MORA ET AL.
mid-seventeenth century gave rise to a higher assimilation of farmers’ children into crafts.
This phenomenon could in turn reflect a response to economic and urban growth for the
Barcelona area, which is usually ascribed in the literature to the growing textile sector in the
last decades of the sixteenth century and the decentralisation of that sector from Barcelona
to other towns in the hinterland, among them Mataró, Sabadell and Terrassa (García Espuche,
1998; Torras, 1998).17 In fact, this decentralisation process is observed to a certain extent in
the Marriage Licence Books, given that the widespread growth of textile activities was not
concentrated in Barcelona alone.18 The records also reflect the economic recovery that
worked as a pull factor for many French migrants (Amengual-Bibiloni & Pujadas-Mora, 2017;
Capdevila, 2014; Millàs, 2005; Nadal & Giralt, 1960).
Shifting to analysis of standardised residuals, it is possible to draw trends of positive or
negative status association among social groups.19 For fathers and sons, the standardised
residuals show a clear picture of social stratification where, among the higher social classes
(HISCLASS labels 0 to 4), positive associations occur only within this group, while for the
social majority – composed of farmers, artisans and unskilled workers – the positive associ-
ations occur only in matches between the same classes (Table 6). Among fathers and daugh-
ters (sons-in-law), the elite shows the same trends in positive association as for fathers and
sons. Conversely, in the case of artisan fathers-in-law, HISCLASS labels 5 (skilled workers)
and 7 (low-skilled workers) show positive associations between them (Table 7).20 Hence, we
see that daughters of artisans show a kind of mobility into other artisan activities that can
be compared with the mobility of sons. This might be understood as a marital strategy, which
we tested and show in the next section’s models. In the case of farmers, the only positive
associations occurred between farmers and all the other matches were negative and statis-
tically significant, which demonstrates the aforementioned high degree of intergenerational
transmission among peasants.
Analysis of standardised residuals also provides information about an association’s
strength, either negative or positive. The highest values are connected with matches between
classes, which can be explained by the importance of intergenerational transmission in social
status, and here the two social extremities of nobility and unskilled workers present the
Table 4. Observed frequencies for occupations of fathers and sons, area of Barcelona, 1547–1643.
0 1 2 3 4 5 6 7 8
Nobility High managers
High prof
Lower & prof manager
Lower clerical sales
Skilled workers
Farmers Low-skilled workers
Low-skilled farm workers
SON SOCIAL CLASS
Observed 0 1 2 3 4 5 6 7 8 Total %
FATHER SOCIAL CLASS
0 283 2 24 6 1 5 0 3 1 325 1%1 6 6 15 3 0 1 3 1 0 35 0%2 19 1 360 94 3 43 11 50 4 585 2%3 10 1 161 706 8 174 27 199 7 1293 4%4 0 1 8 5 5 9 2 14 0 44 0%5 0 2 121 263 17 2561 247 825 51 4087 14%6 1 2 181 548 41 1862 10,675 2367 154 15,831 55%7 0 3 159 311 33 979 358 4123 91 6057 21%8 0 0 4 8 3 47 18 87 339 506 2%
Total 319 18 1033 1944 111 5681 11,341 7669 647 28,763 % 1% 0% 4% 7% 0% 20% 39% 27% 2%
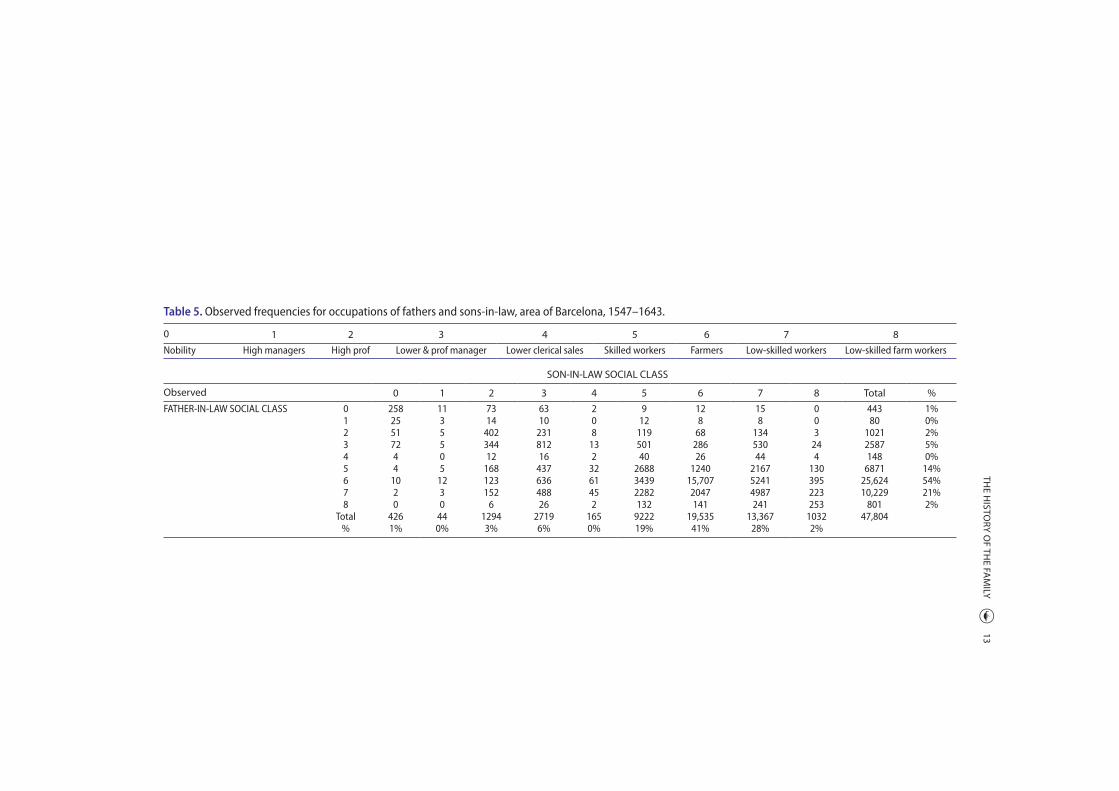
TH
E H
IST
OR
Y O
F T
HE
FAM
ILY
1
3
Table 5. Observed frequencies for occupations of fathers and sons-in-law, area of Barcelona, 1547–1643.
0 1 2 3 4 5 6 7 8
Nobility High managers High prof Lower & prof manager Lower clerical sales Skilled workers Farmers Low-skilled workers Low-skilled farm workers
SON-IN-LAW SOCIAL CLASS
Observed 0 1 2 3 4 5 6 7 8 Total %
FATHER-IN-LAW SOCIAL CLASS 0 258 11 73 63 2 9 12 15 0 443 1%1 25 3 14 10 0 12 8 8 0 80 0%2 51 5 402 231 8 119 68 134 3 1021 2%3 72 5 344 812 13 501 286 530 24 2587 5%4 4 0 12 16 2 40 26 44 4 148 0%5 4 5 168 437 32 2688 1240 2167 130 6871 14%6 10 12 123 636 61 3439 15,707 5241 395 25,624 54%7 2 3 152 488 45 2282 2047 4987 223 10,229 21%8 0 0 6 26 2 132 141 241 253 801 2%
Total 426 44 1294 2719 165 9222 19,535 13,367 1032 47,804 % 1% 0% 3% 6% 0% 19% 41% 28% 2%

14 J. M. PUJADAS-MORA ET AL.
highest values, as was expected. However, this intergenerational transmission is much
stronger for sons than for daughters (sons-in-law) and, in fact, in some social groups among
the elite, father–son-in-law associations were also noticeable in heterogeneous matches, in
which nobles (label 0) show positive associations with other social groups such as merchants
and doctors of law or medicine (labels 1, 2 and 3), suggesting once again the importance of
the female’s upwards marital strategy for some classes, as the literature has described for
Catalonia (Amelang, 1986; Boone, 1986; Ferrer, 2004, 2008).
In these general trends, one sees the importance of intergenerational status inheritance,
especially for fathers and sons (and, as expected, less strictly for daughters). In the next
section, taking into account the single-heir system in Catalonia and the likely differences
among sibling sizes and marriage order, we discuss family aspects and their interactions
with the occupations of farmer and artisan. Taking into account only the reconstructed
sample of 1242 family units (fathers and sons/daughters), the mean sibship size for farmers
is 3.3 and for artisans it is 2.8. Could this difference influence the social attainment of sons
and daughters?
Table 6. Standard residuals for occupations of fathers and sons, area of Barcelona, 1547–1643.
0 1 2 3 4 5 6 7 8
Nobility High managers
High prof
Lower & prof manager
Lower clerical sales
Skilled workers
Farmers Low-skilled workers
Low-skilled farm workers
SON SOCIAL CLASS
Stand. Residual 0 1 2 3 4 5 6 7 8
FATHER SOCIAL CLASS 0 147.2 4 3.6 −3.4 −0.2 −7.4 −11.3 −9 −2.31 9 40.4 12.3 0.4 −0.4 −2.2 −2.9 −2.7 −0.92 4.9 1 74 8.7 0.5 −6.7 −14.5 −8.5 −2.53 −1.1 0.2 16.8 66.2 1.3 −5.1 −21.4 −7.8 −4.14 −0.7 5.9 5.1 1.2 11.7 0.1 −3.7 0.7 −15 −6.7 −0.3 −2.1 −0.8 0.3 61.7 −34 −8 −4.36 −13.2 −2.5 −16.3 −16 −2.6 −22.6 56.1 −28.5 −10.77 −8.2 −0.4 −4 −4.9 2 −6.3 −41.5 62.4 −3.98 −2.4 −0.6 −3.3 −4.5 0.7 −5.3 −12.9 −4.1 97.1
Table 7. Standard residuals for occupations of fathers and sons-in-law, area of Barcelona, 1547–1643.
0 1 2 3 4 5 6 7 8
Nobility High managers
High prof
Lower & prof manager
Lower clerical sales
Skilled workers
Farmers Low-skilled workers
Low-skilled farm workers
SON-IN-LAW SOCIAL CLASS
Stand. Residual 0 1 2 3 4 5 6 7 8
FATHER-IN-LAW SOCIAL CLASS 0 127.9 16.6 17.6 7.5 0.4 −8.3 −12.6 −9.8 −3.11 28.8 10.8 8 2.6 −0.5 −0.9 −4.3 −3 −1.32 13.9 4.2 71.2 22.7 2.4 −5.6 −17.1 −9 −4.13 10.2 1.7 32.7 54.8 1.4 0.1 −23.7 −7.2 −4.34 2.3 −0.4 4 2.6 2.1 2.1 −4.4 0.4 0.55 −7.3 −0.5 −1.3 2.3 1.7 37.4 −29.6 5.6 −1.56 −14.4 −2.4 −21.7 −21.5 −2.9 −21.4 51.2 −22.7 −6.77 −9.3 −2.1 −7.5 −3.9 1.6 6.9 −33 39.8 0.18 −2.7 −0.9 −3.4 −2.9 −0.5 −1.8 −10.3 1.1 56.7
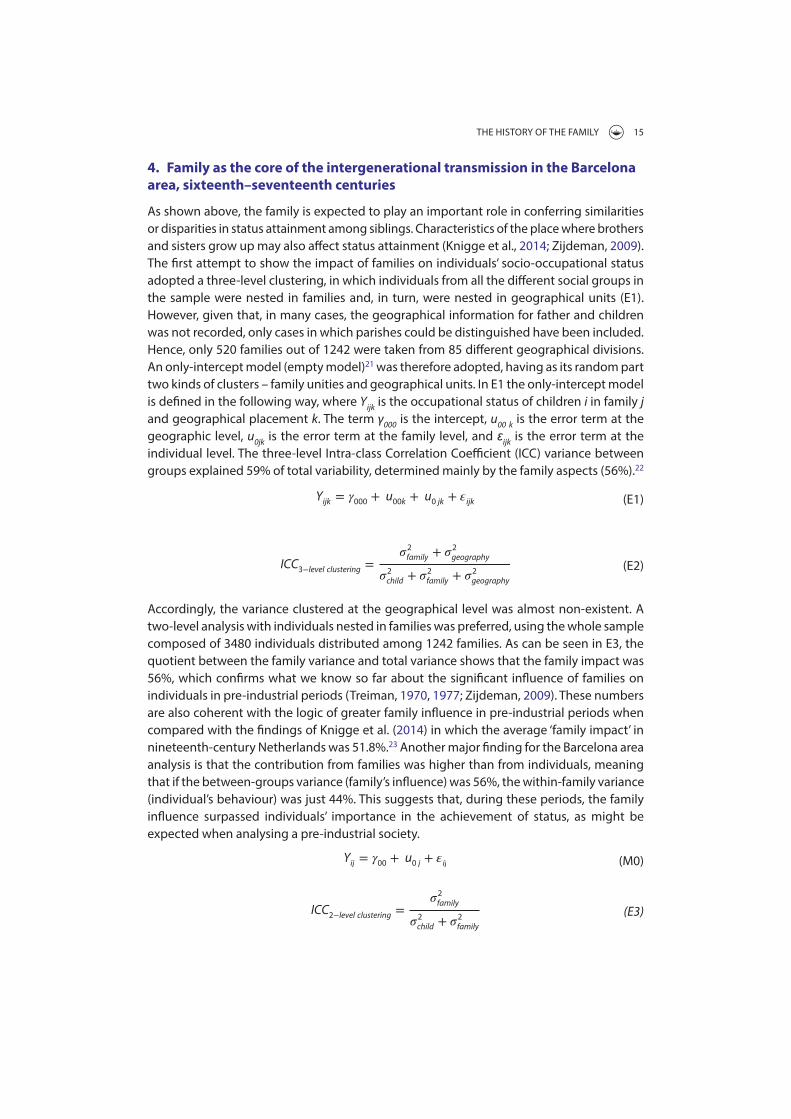
THE HISTORY OF THE FAMILY 15
4. Family as the core of the intergenerational transmission in the Barcelona
area, sixteenth–seventeenth centuries
As shown above, the family is expected to play an important role in conferring similarities
or disparities in status attainment among siblings. Characteristics of the place where brothers
and sisters grow up may also affect status attainment (Knigge et al., 2014; Zijdeman, 2009).
The first attempt to show the impact of families on individuals’ socio-occupational status
adopted a three-level clustering, in which individuals from all the different social groups in
the sample were nested in families and, in turn, were nested in geographical units (E1).
However, given that, in many cases, the geographical information for father and children
was not recorded, only cases in which parishes could be distinguished have been included.
Hence, only 520 families out of 1242 were taken from 85 different geographical divisions.
An only-intercept model (empty model)21 was therefore adopted, having as its random part
two kinds of clusters – family unities and geographical units. In E1 the only-intercept model
is defined in the following way, where Yijk
is the occupational status of children i in family j
and geographical placement k. The term γ000
is the intercept, u00
k is the error term at the
geographic level, u0jk
is the error term at the family level, and ijk
is the error term at the
individual level. The three-level Intra-class Correlation Coefficient (ICC) variance between
groups explained 59% of total variability, determined mainly by the family aspects (56%).22
Accordingly, the variance clustered at the geographical level was almost non-existent. A
two-level analysis with individuals nested in families was preferred, using the whole sample
composed of 3480 individuals distributed among 1242 families. As can be seen in E3, the
quotient between the family variance and total variance shows that the family impact was
56%, which confirms what we know so far about the significant influence of families on
individuals in pre-industrial periods (Treiman, 1970, 1977; Zijdeman, 2009). These numbers
are also coherent with the logic of greater family influence in pre-industrial periods when
compared with the findings of Knigge et al. (2014) in which the average ‘family impact’ in
nineteenth-century Netherlands was 51.8%.23 Another major finding for the Barcelona area
analysis is that the contribution from families was higher than from individuals, meaning
that if the between-groups variance (family’s influence) was 56%, the within-family variance
(individual’s behaviour) was just 44%. This suggests that, during these periods, the family
influence surpassed individuals’ importance in the achievement of status, as might be
expected when analysing a pre-industrial society.
(E1)Yijk = 𝛾000
+ u00k + u
0 jk + 𝜀ijk
(E2)ICC3−level clustering =
𝜎2
family + 𝜎2
geography
𝜎2
child + 𝜎2
family + 𝜎2
geography
(M0)Yij = 𝛾00+ u
0 j + 𝜀ij
(E3)ICC2−level clustering =
𝜎2
family
𝜎2
child + 𝜎2
family
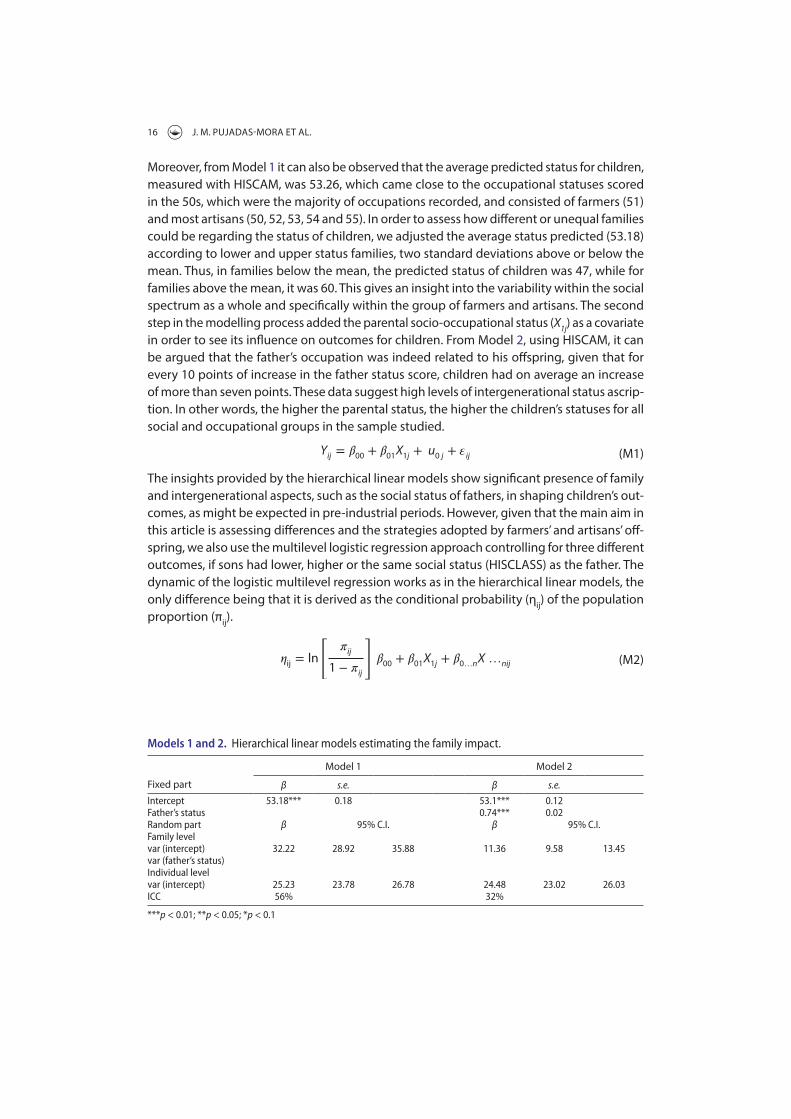
16 J. M. PUJADAS-MORA ET AL.
Moreover, from Model 1 it can also be observed that the average predicted status for children,
measured with HISCAM, was 53.26, which came close to the occupational statuses scored
in the 50s, which were the majority of occupations recorded, and consisted of farmers (51)
and most artisans (50, 52, 53, 54 and 55). In order to assess how different or unequal families
could be regarding the status of children, we adjusted the average status predicted (53.18)
according to lower and upper status families, two standard deviations above or below the
mean. Thus, in families below the mean, the predicted status of children was 47, while for
families above the mean, it was 60. This gives an insight into the variability within the social
spectrum as a whole and specifically within the group of farmers and artisans. The second
step in the modelling process added the parental socio-occupational status (X1j
) as a covariate
in order to see its influence on outcomes for children. From Model 2, using HISCAM, it can
be argued that the father’s occupation was indeed related to his offspring, given that for
every 10 points of increase in the father status score, children had on average an increase
of more than seven points. These data suggest high levels of intergenerational status ascrip-
tion. In other words, the higher the parental status, the higher the children’s statuses for all
social and occupational groups in the sample studied.
The insights provided by the hierarchical linear models show significant presence of family
and intergenerational aspects, such as the social status of fathers, in shaping children’s out-
comes, as might be expected in pre-industrial periods. However, given that the main aim in
this article is assessing differences and the strategies adopted by farmers’ and artisans’ off-
spring, we also use the multilevel logistic regression approach controlling for three different
outcomes, if sons had lower, higher or the same social status (HISCLASS) as the father. The
dynamic of the logistic multilevel regression works as in the hierarchical linear models, the
only difference being that it is derived as the conditional probability (ηij) of the population
proportion (πij).
(M1)Yij = 𝛽00+ 𝛽
01X1j + u
0 j + 𝜀ij
(M2)𝜂ij= ln
[𝜋ij
1 − 𝜋ij
]𝛽00+ 𝛽
01X1j + 𝛽
0…nX …nij
Models 1 and 2. Hierarchical linear models estimating the family impact.
***p < 0.01; **p < 0.05; *p < 0.1
Fixed part
Model 1 Model 2
β s.e. β s.e.
Intercept 53.18*** 0.18 53.1*** 0.12 Father’s status 0.74*** 0.02 Random part β 95% C.I. β 95% C.I.Family level var (intercept) 32.22 28.92 35.88 11.36 9.58 13.45var (father’s status) Individual level var (intercept) 25.23 23.78 26.78 24.48 23.02 26.03ICC 56% 32%
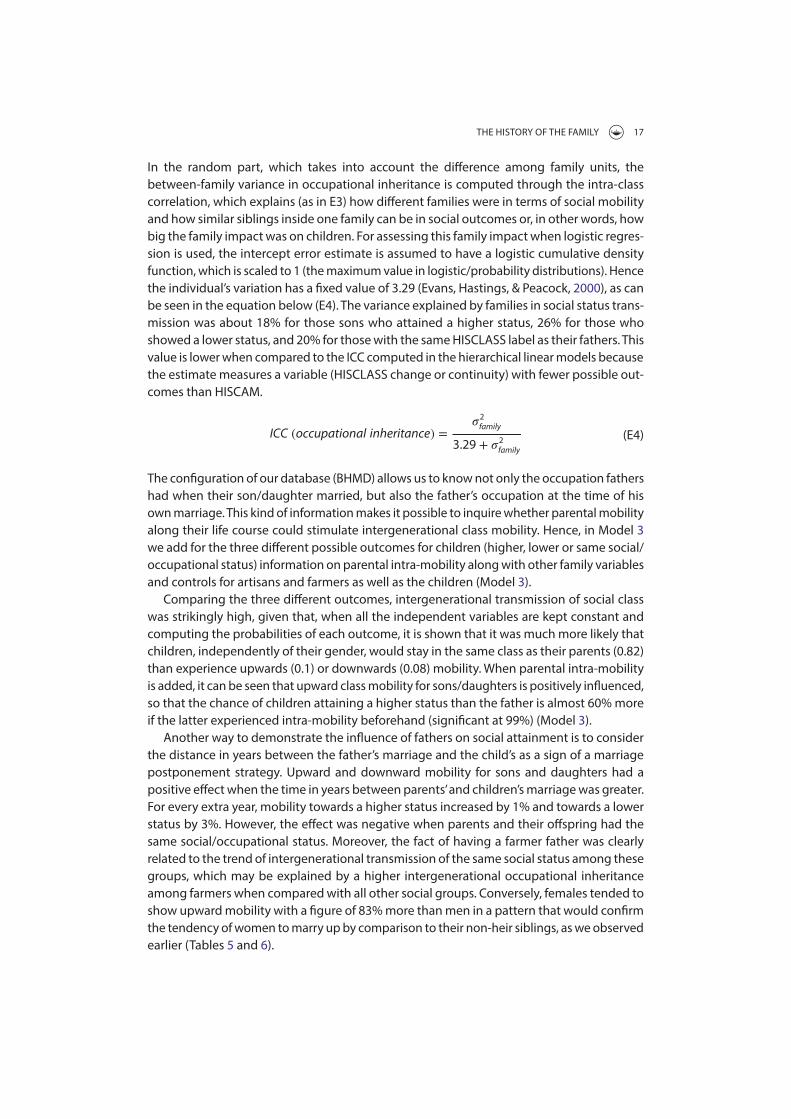
THE HISTORY OF THE FAMILY 17
In the random part, which takes into account the difference among family units, the
between-family variance in occupational inheritance is computed through the intra-class
correlation, which explains (as in E3) how different families were in terms of social mobility
and how similar siblings inside one family can be in social outcomes or, in other words, how
big the family impact was on children. For assessing this family impact when logistic regres-
sion is used, the intercept error estimate is assumed to have a logistic cumulative density
function, which is scaled to 1 (the maximum value in logistic/probability distributions). Hence
the individual’s variation has a fixed value of 3.29 (Evans, Hastings, & Peacock, 2000), as can
be seen in the equation below (E4). The variance explained by families in social status trans-
mission was about 18% for those sons who attained a higher status, 26% for those who
showed a lower status, and 20% for those with the same HISCLASS label as their fathers. This
value is lower when compared to the ICC computed in the hierarchical linear models because
the estimate measures a variable (HISCLASS change or continuity) with fewer possible out-
comes than HISCAM.
The configuration of our database (BHMD) allows us to know not only the occupation fathers
had when their son/daughter married, but also the father’s occupation at the time of his
own marriage. This kind of information makes it possible to inquire whether parental mobility
along their life course could stimulate intergenerational class mobility. Hence, in Model 3
we add for the three different possible outcomes for children (higher, lower or same social/
occupational status) information on parental intra-mobility along with other family variables
and controls for artisans and farmers as well as the children (Model 3).
Comparing the three different outcomes, intergenerational transmission of social class
was strikingly high, given that, when all the independent variables are kept constant and
computing the probabilities of each outcome, it is shown that it was much more likely that
children, independently of their gender, would stay in the same class as their parents (0.82)
than experience upwards (0.1) or downwards (0.08) mobility. When parental intra-mobility
is added, it can be seen that upward class mobility for sons/daughters is positively influenced,
so that the chance of children attaining a higher status than the father is almost 60% more
if the latter experienced intra-mobility beforehand (significant at 99%) (Model 3).
Another way to demonstrate the influence of fathers on social attainment is to consider
the distance in years between the father’s marriage and the child’s as a sign of a marriage
postponement strategy. Upward and downward mobility for sons and daughters had a
positive effect when the time in years between parents’ and children’s marriage was greater.
For every extra year, mobility towards a higher status increased by 1% and towards a lower
status by 3%. However, the effect was negative when parents and their offspring had the
same social/occupational status. Moreover, the fact of having a farmer father was clearly
related to the trend of intergenerational transmission of the same social status among these
groups, which may be explained by a higher intergenerational occupational inheritance
among farmers when compared with all other social groups. Conversely, females tended to
show upward mobility with a figure of 83% more than men in a pattern that would confirm
the tendency of women to marry up by comparison to their non-heir siblings, as we observed
earlier (Tables 5 and 6).
(E4)ICC (occupational inheritance) =𝜎2
family
3.29 + 𝜎2
family
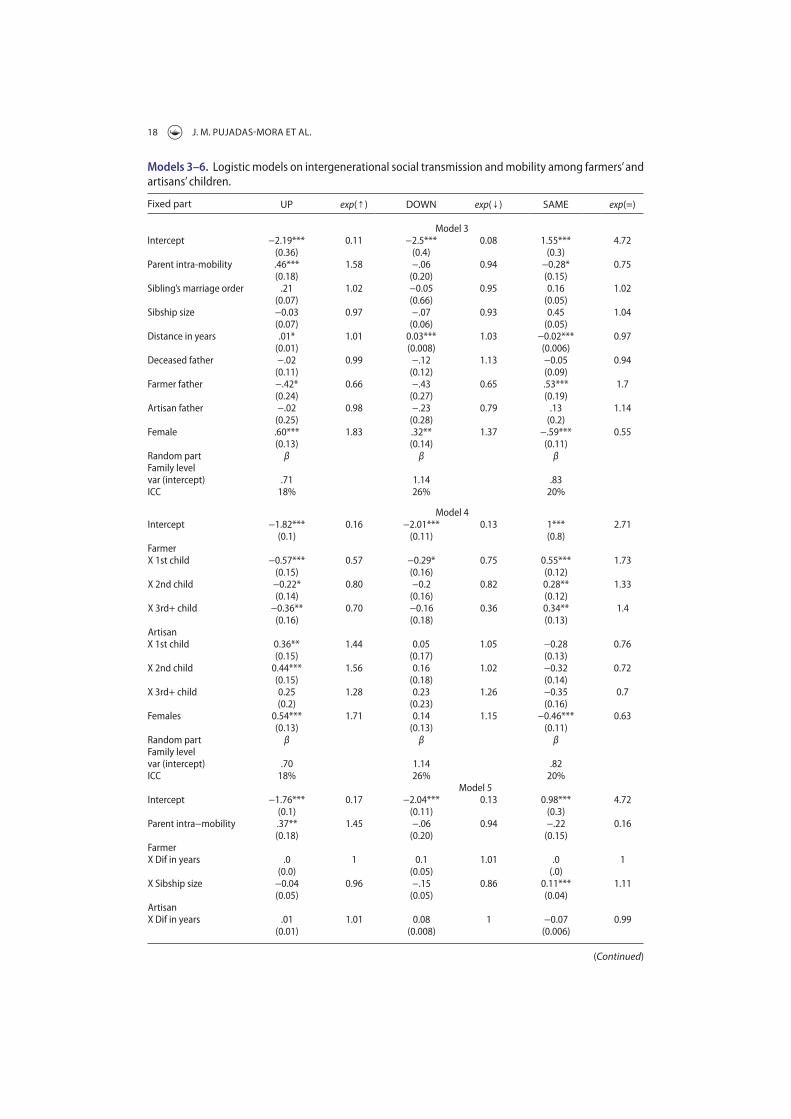
18 J. M. PUJADAS-MORA ET AL.
Models 3–6. Logistic models on intergenerational social transmission and mobility among farmers’ and artisans’ children.
Fixed part UP exp( ) DOWN exp( ) SAME exp(=)
Model 3Intercept −2.19*** 0.11 −2.5*** 0.08 1.55*** 4.72 (0.36) (0.4) (0.3) Parent intra-mobility .46*** 1.58 −.06 0.94 −0.28* 0.75 (0.18) (0.20) (0.15) Sibling’s marriage order .21 1.02 −0.05 0.95 0.16 1.02 (0.07) (0.66) (0.05) Sibship size −0.03 0.97 −.07 0.93 0.45 1.04 (0.07) (0.06) (0.05) Distance in years .01* 1.01 0.03*** 1.03 −0.02*** 0.97 (0.01) (0.008) (0.006) Deceased father −.02 0.99 −.12 1.13 −0.05 0.94 (0.11) (0.12) (0.09) Farmer father −.42* 0.66 −.43 0.65 .53*** 1.7 (0.24) (0.27) (0.19) Artisan father −.02 0.98 −.23 0.79 .13 1.14 (0.25) (0.28) (0.2) Female .60*** 1.83 .32** 1.37 −.59*** 0.55 (0.13) (0.14) (0.11) Random part β β β Family level var (intercept) .71 1.14 .83 ICC 18% 26% 20%
Model 4Intercept −1.82*** 0.16 −2.01*** 0.13 1*** 2.71 (0.1) (0.11) (0.8) Farmer X 1st child −0.57*** 0.57 −0.29* 0.75 0.55*** 1.73 (0.15) (0.16) (0.12) X 2nd child −0.22* 0.80 −0.2 0.82 0.28** 1.33 (0.14) (0.16) (0.12) X 3rd+ child −0.36** 0.70 −0.16 0.36 0.34** 1.4 (0.16) (0.18) (0.13) Artisan X 1st child 0.36** 1.44 0.05 1.05 −0.28 0.76 (0.15) (0.17) (0.13) X 2nd child 0.44*** 1.56 0.16 1.02 −0.32 0.72 (0.15) (0.18) (0.14) X 3rd+ child 0.25 1.28 0.23 1.26 −0.35 0.7 (0.2) (0.23) (0.16) Females 0.54*** 1.71 0.14 1.15 −0.46*** 0.63 (0.13) (0.13) (0.11) Random part β β β Family level var (intercept) .70 1.14 .82 ICC 18% 26% 20%
Model 5Intercept −1.76*** 0.17 −2.04*** 0.13 0.98*** 4.72 (0.1) (0.11) (0.3) Parent intra−mobility .37** 1.45 −.06 0.94 −.22 0.16 (0.18) (0.20) (0.15) Farmer X Dif in years .0 1 0.1 1.01 .0 1 (0.0) (0.05) (.0) X Sibship size −0.04 0.96 −.15 0.86 0.11*** 1.11 (0.05) (0.05) (0.04) Artisan X Dif in years .01 1.01 0.08 1 −0.07 0.99 (0.01) (0.008) (0.006)
(Continued)
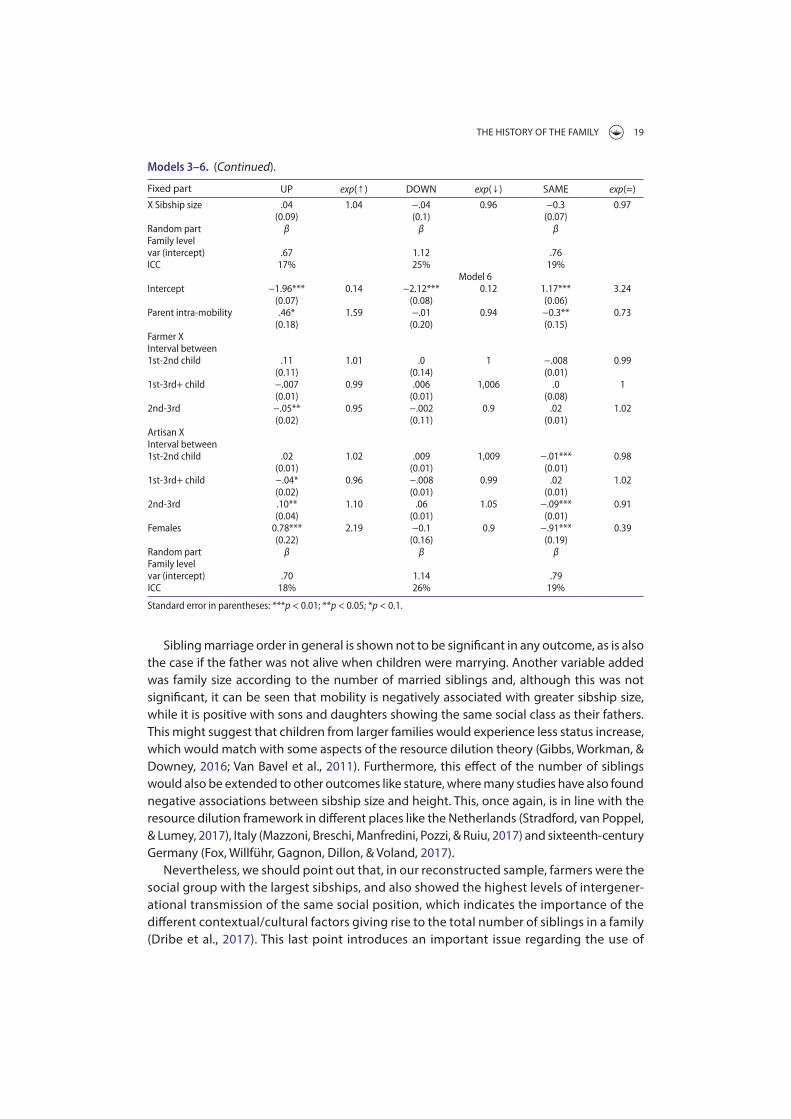
THE HISTORY OF THE FAMILY 19
Sibling marriage order in general is shown not to be significant in any outcome, as is also
the case if the father was not alive when children were marrying. Another variable added
was family size according to the number of married siblings and, although this was not
significant, it can be seen that mobility is negatively associated with greater sibship size,
while it is positive with sons and daughters showing the same social class as their fathers.
This might suggest that children from larger families would experience less status increase,
which would match with some aspects of the resource dilution theory (Gibbs, Workman, &
Downey, 2016; Van Bavel et al., 2011). Furthermore, this effect of the number of siblings
would also be extended to other outcomes like stature, where many studies have also found
negative associations between sibship size and height. This, once again, is in line with the
resource dilution framework in different places like the Netherlands (Stradford, van Poppel,
& Lumey, 2017), Italy (Mazzoni, Breschi, Manfredini, Pozzi, & Ruiu, 2017) and sixteenth-century
Germany (Fox, Willführ, Gagnon, Dillon, & Voland, 2017).
Nevertheless, we should point out that, in our reconstructed sample, farmers were the
social group with the largest sibships, and also showed the highest levels of intergener-
ational transmission of the same social position, which indicates the importance of the
different contextual/cultural factors giving rise to the total number of siblings in a family
(Dribe et al., 2017). This last point introduces an important issue regarding the use of
Models 3–6. (Continued).
Fixed part UP exp( ) DOWN exp( ) SAME exp(=)
X Sibship size .04 1.04 −.04 0.96 −0.3 0.97 (0.09) (0.1) (0.07) Random part β β β Family level var (intercept) .67 1.12 .76 ICC 17% 25% 19%
Model 6Intercept −1.96*** 0.14 −2.12*** 0.12 1.17*** 3.24 (0.07) (0.08) (0.06) Parent intra-mobility .46* 1.59 −.01 0.94 −0.3** 0.73 (0.18) (0.20) (0.15) Farmer X Interval between 1st-2nd child .11 1.01 .0 1 −.008 0.99 (0.11) (0.14) (0.01) 1st-3rd+ child −.007 0.99 .006 1,006 .0 1 (0.01) (0.01) (0.08) 2nd-3rd −.05** 0.95 −.002 0.9 .02 1.02 (0.02) (0.11) (0.01) Artisan X Interval between 1st-2nd child .02 1.02 .009 1,009 −.01*** 0.98 (0.01) (0.01) (0.01) 1st-3rd+ child −.04* 0.96 −.008 0.99 .02 1.02 (0.02) (0.01) (0.01) 2nd-3rd .10** 1.10 .06 1.05 −.09*** 0.91 (0.04) (0.01) (0.01) Females 0.78*** 2.19 −0.1 0.9 −.91*** 0.39 (0.22) (0.16) (0.19) Random part β β β Family level var (intercept) .70 1.14 .79 ICC 18% 26% 19%
Standard error in parentheses: ***p < 0.01; **p < 0.05; *p < 0.1.
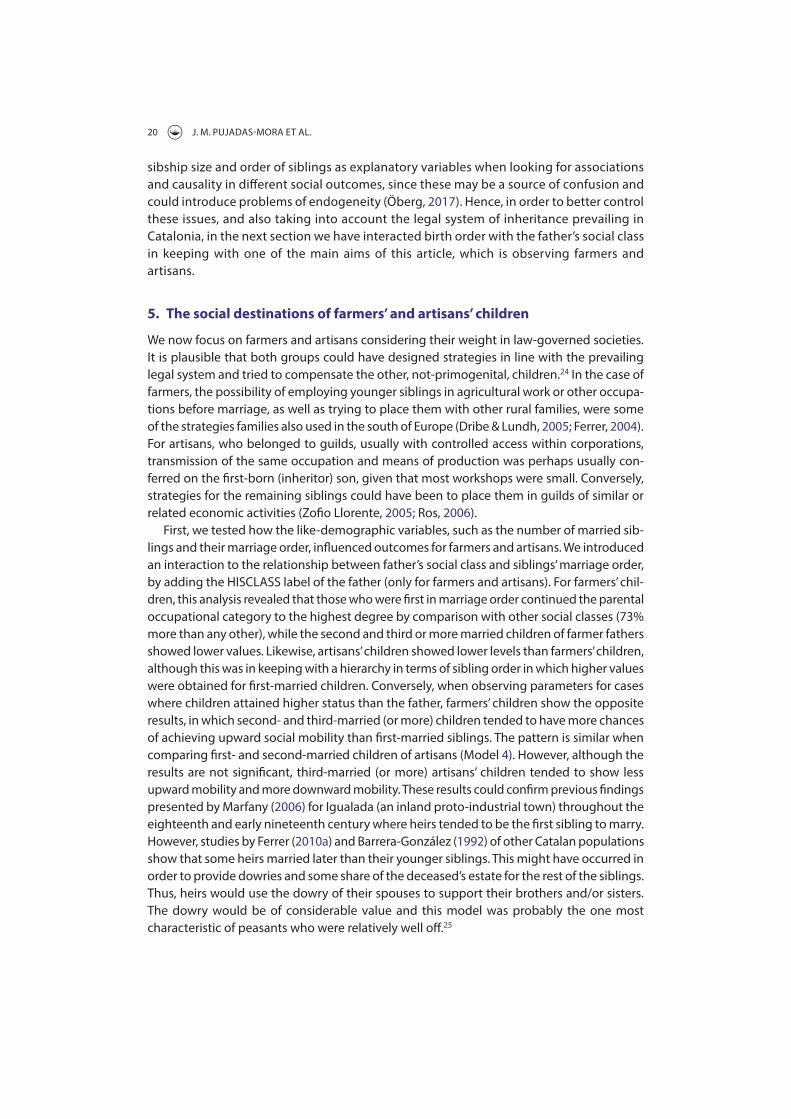
20 J. M. PUJADAS-MORA ET AL.
sibship size and order of siblings as explanatory variables when looking for associations
and causality in different social outcomes, since these may be a source of confusion and
could introduce problems of endogeneity (Öberg, 2017). Hence, in order to better control
these issues, and also taking into account the legal system of inheritance prevailing in
Catalonia, in the next section we have interacted birth order with the father’s social class
in keeping with one of the main aims of this article, which is observing farmers and
artisans.
5. The social destinations of farmers’ and artisans’ children
We now focus on farmers and artisans considering their weight in law-governed societies.
It is plausible that both groups could have designed strategies in line with the prevailing
legal system and tried to compensate the other, not-primogenital, children.24 In the case of
farmers, the possibility of employing younger siblings in agricultural work or other occupa-
tions before marriage, as well as trying to place them with other rural families, were some
of the strategies families also used in the south of Europe (Dribe & Lundh, 2005; Ferrer, 2004).
For artisans, who belonged to guilds, usually with controlled access within corporations,
transmission of the same occupation and means of production was perhaps usually con-
ferred on the first-born (inheritor) son, given that most workshops were small. Conversely,
strategies for the remaining siblings could have been to place them in guilds of similar or
related economic activities (Zofio Llorente, 2005; Ros, 2006).
First, we tested how the like-demographic variables, such as the number of married sib-
lings and their marriage order, influenced outcomes for farmers and artisans. We introduced
an interaction to the relationship between father’s social class and siblings’ marriage order,
by adding the HISCLASS label of the father (only for farmers and artisans). For farmers’ chil-
dren, this analysis revealed that those who were first in marriage order continued the parental
occupational category to the highest degree by comparison with other social classes (73%
more than any other), while the second and third or more married children of farmer fathers
showed lower values. Likewise, artisans’ children showed lower levels than farmers’ children,
although this was in keeping with a hierarchy in terms of sibling order in which higher values
were obtained for first-married children. Conversely, when observing parameters for cases
where children attained higher status than the father, farmers’ children show the opposite
results, in which second- and third-married (or more) children tended to have more chances
of achieving upward social mobility than first-married siblings. The pattern is similar when
comparing first- and second-married children of artisans (Model 4). However, although the
results are not significant, third-married (or more) artisans’ children tended to show less
upward mobility and more downward mobility. These results could confirm previous findings
presented by Marfany (2006) for Igualada (an inland proto-industrial town) throughout the
eighteenth and early nineteenth century where heirs tended to be the first sibling to marry.
However, studies by Ferrer (2010a) and Barrera-González (1992) of other Catalan populations
show that some heirs married later than their younger siblings. This might have occurred in
order to provide dowries and some share of the deceased’s estate for the rest of the siblings.
Thus, heirs would use the dowry of their spouses to support their brothers and/or sisters.
The dowry would be of considerable value and this model was probably the one most
characteristic of peasants who were relatively well off.25

THE HISTORY OF THE FAMILY 21
Models 5 and 6 again include the distance in years for both parent-child and between-
sibling marriages by means of showing interactions with the father’s social class (farmer or
artisan). For the estimates in Model 5, it can be argued that farmers’ children did not show
any substantial difference among them as a result of the distance between their marriage
and their parents’ marriage. However, in the case of sibship size among farmers, the chance
of each child attaining the parental class was 11% greater for each added offspring (Model
5). In the case of artisans’ children, although not to a significant degree, the greater the
temporal distance between father and children, the more negatively affected status attain-
ment was. Conversely, increasing sibship size brings out a slight positive relation with the
upward mobility. This is perhaps in line with the limited options that artisans had to transmit
their own occupation due to stringent access to guilds, and this represents a clear difference
from farmers (Dambruyne, 1998). While the parameters are not significant, these results for
artisans might suggest that younger sons, though not inheriting parental occupations, could
find employment related to or close to that of their fathers and older brothers.
In addition, Model 6 demonstrates that, for each year’s increase in the interval between
the first- and second-married siblings, there were no substantial or significant changes in
any outcome among farmers, and only a small negative effect for status attainment among
artisans. This latter result may imply that, in the specific case of artisans, spacing the marriage
between the first and the second child could benefit social reproduction by means of reduc-
ing the effects of resource dilution.
When accounting for the interval between second and third children in marriage order,
in the case of artisans the timing of a subsequent marriage could have been important for
ensuring a better position for those married later, thus diminishing the likelihood of their
keeping the parental social/occupational status, which is exactly the opposite result to that
for farmers’ children in the same situation. We might also infer, then, that artisan fathers
chose to engage their non-inheritor children in similar or related crafts because of likely ties
with other activities, or as a future investment for their own trades. Moving to artisan careers
with a higher status could mean spending more time as apprentices, and that would delay
marriage. Several authors have explained that, for Spain and Catalonia during the ancien
régime, the boundaries for guild activities were not clearly marked, so that people engaged
in different occupations in different guilds but within branches of the same wider productive
activity could perform similar tasks (Alberch, 1984; Mocarelli, 2008; Soly, 2008; Zofío Llorente,
2011).
The different trends observed in occupational attainment among farmers and artisans
by marriage order have required further refinement in order to disentangle the implications
for both groups. In this case, we have identified having the same occupation as fathers
(occupational inheritance), showing the same occupational status (HISCAM), and belonging
to the same social group (HISCLASS), as dependent variables for Model 7. The aim of differ-
entiating these three variables was to assess the extent of intergenerational transmission
by order of marriage. Starting from the maximum value, which represents inheritance of the
same occupation, a mid-level value represents achieving a different occupation but with a
similar status to the father’s and, finally, the minimum value is given to sharing the same
social class but with a different status.
In Model 7, these three dependent variables were controlled for the parental social group
(artisan or farmer) separately from the siblings’ marriage order. From this standpoint, we see
that farmers transmitted their occupation and socioeconomic status at much higher levels

22 J. M. PUJADAS-MORA ET AL.
than others did. Conversely, when estimating the transmission of the same social class, the
differences between farmers and other groups (artisans, elite, and unskilled workers) dimin-
ished. We ascribe this to the fact that artisans (the second most numerous group) presented
mobility in occupations and HISCAM statuses but remained within the artisan social group.
Secondly, the marriage order per se was not statistically significant. Nevertheless, marrying
after the father’s death signified a greater likelihood of having a different occupation, and
females tended to marry someone with a different occupation, status or social class from
that of their (deceased) fathers (Dribe & Lundh, 2009).
Consequently, in Model 8, the same modelling typology of occupational, status and social
class inheritance is tested, relating farmer fathers and artisan fathers with the children’s
marriage order categories. Farmers showed higher rates of occupational and socioeconomic
status inheritance but a lower level of social class inheritance, mainly because artisans also
tended to remain in the same class. Moreover, for farmers’ children, second-married sons
were those who least shared the parental occupation by comparison with the rest of the
brothers, although the differences with the third and subsequent children in marriage order
were not significant.
Models 7–8. Logistic models on intergenerational inheritance of occupation and social class.
Standard error in parentheses: ***p < 0.01; **p < 0.05; *p < 0.1.
Fixed part Occupation exp HISCAM exp HISCLASS exp
Model 7 – Having the same paternal:Intercept −.14*** 0.87 0.19 0.12 (0.21) (0.29) (0.20) Farmer 0.89*** 2.44 0.842*** 2.32 0.88*** 2.41 (0.19) (0.18) (0.18) Artisan −0.13 0.87 0.44* 1.56 −0.157 0.85 (0.19) (0.19) (0.19) 3rd+ child (ref ) 1st child 0.17* 1.18 0.19 1.2 0.18 1.19 (0.1) (0.1) (0.1) 2nd child 0.05 1.05 0.02 1.03 0.04 1.04 (0.9) (0.9) (0.9) Deceased father −0.2* 0.82 −0.11 0.9 −0.13 0.87 (0.9) (0.9) (0.89) Males 0.6 1.89 0.49*** 1.63 0.48* 1.62 (0.1) (0.1) (0.1)
Model 8 – Having the same paternal:Intercept 0.25*** 0.41*** 0.81*** (0.07) (0.07) (0.07) Farmer X 1st child 1.02*** 2.77 1.08*** 2.96 0.57*** 1.77 (0.11) (0.11) (0.11) X 2nd child 0.85*** 2.35 0.87*** 2.38 0.34*** 1.41 (0.11) (0.11) (0.11) X 3rd+ child 0.91*** 2.48 0.91*** 2.49 0.4*** 1.5 (0.12) (0.12) (0.12) Artisan X 1st child −0,82*** 0.44 −0.85*** 0.42 −0.28* 0.75 (0.12) (0.12) (0.12) X 2nd child −0.88*** 0.41 −0.89*** 0.41 −0.33* 0.72 (0.12) (0.12) (0.14) X 3rd+ child −1.1*** 0.33 −1.04*** 0.35 −0.39* 0.67 (0.16) (0.15) (0.19) Males 0.56 1.75 0.46*** 1.59 0.44* 1.56 (0.1) (0.1) (0.1)
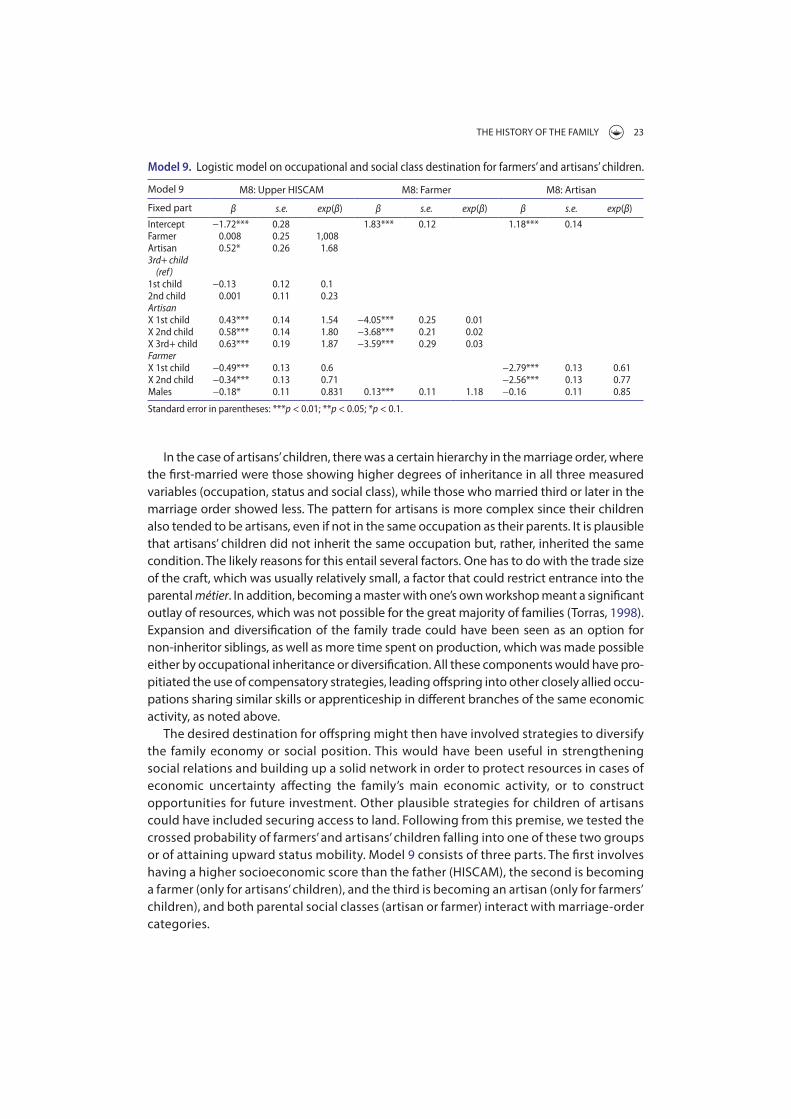
THE HISTORY OF THE FAMILY 23
In the case of artisans’ children, there was a certain hierarchy in the marriage order, where
the first-married were those showing higher degrees of inheritance in all three measured
variables (occupation, status and social class), while those who married third or later in the
marriage order showed less. The pattern for artisans is more complex since their children
also tended to be artisans, even if not in the same occupation as their parents. It is plausible
that artisans’ children did not inherit the same occupation but, rather, inherited the same
condition. The likely reasons for this entail several factors. One has to do with the trade size
of the craft, which was usually relatively small, a factor that could restrict entrance into the
parental métier. In addition, becoming a master with one’s own workshop meant a significant
outlay of resources, which was not possible for the great majority of families (Torras, 1998).
Expansion and diversification of the family trade could have been seen as an option for
non-inheritor siblings, as well as more time spent on production, which was made possible
either by occupational inheritance or diversification. All these components would have pro-
pitiated the use of compensatory strategies, leading offspring into other closely allied occu-
pations sharing similar skills or apprenticeship in different branches of the same economic
activity, as noted above.
The desired destination for offspring might then have involved strategies to diversify
the family economy or social position. This would have been useful in strengthening
social relations and building up a solid network in order to protect resources in cases of
economic uncertainty affecting the family’s main economic activity, or to construct
opportunities for future investment. Other plausible strategies for children of artisans
could have included securing access to land. Following from this premise, we tested the
crossed probability of farmers’ and artisans’ children falling into one of these two groups
or of attaining upward status mobility. Model 9 consists of three parts. The first involves
having a higher socioeconomic score than the father (HISCAM), the second is becoming
a farmer (only for artisans’ children), and the third is becoming an artisan (only for farmers’
children), and both parental social classes (artisan or farmer) interact with marriage-order
categories.
Model 9. Logistic model on occupational and social class destination for farmers’ and artisans’ children.
Standard error in parentheses: ***p < 0.01; **p < 0.05; *p < 0.1.
Model 9 M8: Upper HISCAM M8: Farmer M8: Artisan
Fixed part β s.e. exp(β) β s.e. exp(β) β s.e. exp(β)
Intercept −1.72*** 0.28 1.83*** 0.12 1.18*** 0.14 Farmer 0.008 0.25 1,008 Artisan 0.52* 0.26 1.68 3rd+ child
(ref)
1st child −0.13 0.12 0.1 2nd child 0.001 0.11 0.23 Artisan X 1st child 0.43*** 0.14 1.54 −4.05*** 0.25 0.01 X 2nd child 0.58*** 0.14 1.80 −3.68*** 0.21 0.02 X 3rd+ child 0.63*** 0.19 1.87 −3.59*** 0.29 0.03 Farmer X 1st child −0.49*** 0.13 0.6 −2.79*** 0.13 0.61X 2nd child −0.34*** 0.13 0.71 −2.56*** 0.13 0.77Males −0.18* 0.11 0.831 0.13*** 0.11 1.18 −0.16 0.11 0.85
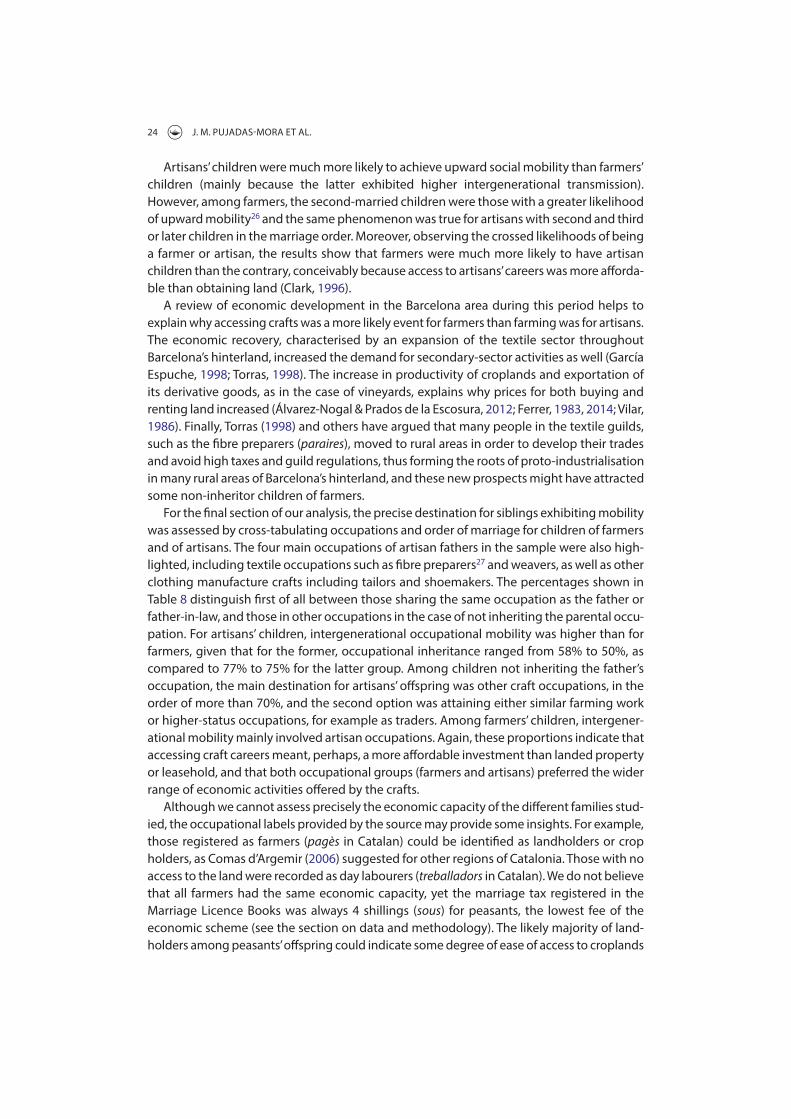
24 J. M. PUJADAS-MORA ET AL.
Artisans’ children were much more likely to achieve upward social mobility than farmers’
children (mainly because the latter exhibited higher intergenerational transmission).
However, among farmers, the second-married children were those with a greater likelihood
of upward mobility26 and the same phenomenon was true for artisans with second and third
or later children in the marriage order. Moreover, observing the crossed likelihoods of being
a farmer or artisan, the results show that farmers were much more likely to have artisan
children than the contrary, conceivably because access to artisans’ careers was more afforda-
ble than obtaining land (Clark, 1996).
A review of economic development in the Barcelona area during this period helps to
explain why accessing crafts was a more likely event for farmers than farming was for artisans.
The economic recovery, characterised by an expansion of the textile sector throughout
Barcelona’s hinterland, increased the demand for secondary-sector activities as well (García
Espuche, 1998; Torras, 1998). The increase in productivity of croplands and exportation of
its derivative goods, as in the case of vineyards, explains why prices for both buying and
renting land increased (Álvarez-Nogal & Prados de la Escosura, 2012; Ferrer, 1983, 2014; Vilar,
1986). Finally, Torras (1998) and others have argued that many people in the textile guilds,
such as the fibre preparers (paraires), moved to rural areas in order to develop their trades
and avoid high taxes and guild regulations, thus forming the roots of proto-industrialisation
in many rural areas of Barcelona’s hinterland, and these new prospects might have attracted
some non-inheritor children of farmers.
For the final section of our analysis, the precise destination for siblings exhibiting mobility
was assessed by cross-tabulating occupations and order of marriage for children of farmers
and of artisans. The four main occupations of artisan fathers in the sample were also high-
lighted, including textile occupations such as fibre preparers27 and weavers, as well as other
clothing manufacture crafts including tailors and shoemakers. The percentages shown in
Table 8 distinguish first of all between those sharing the same occupation as the father or
father-in-law, and those in other occupations in the case of not inheriting the parental occu-
pation. For artisans’ children, intergenerational occupational mobility was higher than for
farmers, given that for the former, occupational inheritance ranged from 58% to 50%, as
compared to 77% to 75% for the latter group. Among children not inheriting the father’s
occupation, the main destination for artisans’ offspring was other craft occupations, in the
order of more than 70%, and the second option was attaining either similar farming work
or higher-status occupations, for example as traders. Among farmers’ children, intergener-
ational mobility mainly involved artisan occupations. Again, these proportions indicate that
accessing craft careers meant, perhaps, a more affordable investment than landed property
or leasehold, and that both occupational groups (farmers and artisans) preferred the wider
range of economic activities offered by the crafts.
Although we cannot assess precisely the economic capacity of the different families stud-
ied, the occupational labels provided by the source may provide some insights. For example,
those registered as farmers (pagès in Catalan) could be identified as landholders or crop
holders, as Comas d’Argemir (2006) suggested for other regions of Catalonia. Those with no
access to the land were recorded as day labourers (treballadors in Catalan). We do not believe
that all farmers had the same economic capacity, yet the marriage tax registered in the
Marriage Licence Books was always 4 shillings (sous) for peasants, the lowest fee of the
economic scheme (see the section on data and methodology). The likely majority of land-
holders among peasants’ offspring could indicate some degree of ease of access to croplands

THE HISTORY OF THE FAMILY 25
by means of acquisition or leasehold, especially in the mid-seventeenth century, due to an
increasing number of sharecropper and emphyteusis contracts in vineyard farming in the
form of rabassa morta contracts (Ferrer, 1983, 2014; Carmona & Simpson, 1999).28
We have looked in more detail at the occupational destinations arising from the four main
occupations among artisan fathers, and noticed that occupational inheritance prevailed for
fibre preparers and weavers, with a figure exceeding 60% while, among tailors and shoe-
makers, inheritance barely reached a figure of 50% (Table 8). All in all, the attainment of crafts
differing from those of fathers and eldest brothers was the main employment destination
of the occupation’s non-inheritors, as described earlier. For instance, fathers who declared
their occupation as weavers tended to have children engaged in fibre preparation (paraires),
and vice versa, and the same pattern held with tailors and shoemakers. However, children
married last in the marriage order (third or later) tend to show some downward mobility by
comparison with the social group of fathers. It is also worth noting that last-married children
of shoemaker fathers mostly became farmers.
6. Discussion
High levels of intergenerational status inheritance and ascription are observed in the
Barcelona area due to the family impact on individual trajectories, as would be expected in
a pre-industrial society. This impact was closely linked to the effect of the parents’ social
class, a plausible fact in a law-governed society with an inheritance system based on
Table 8. Siblings’ destinations by father’s occupation in the Barcelona area, 1547–1643.
Father’s class
n = 926 Siblings’ order
Artisan 1 2 3+
Children’s occupational destination Same occupation 58% 56% 51%Upper status 14% 12% 10%Artisan 69% 64% 67%Farmers 10% 15% 15%Lower status 7% 8% 9%
Father’s class Farmer 1 2 3+Children’s occupational destination Same occupation 77% 74% 75%
Upper status 9% 13% 14%Artisan 73% 76% 74%Other farmers 8% 3% 4%Lower status 11% 8% 8%
Father’s occupation
n = 208 Siblings’ order n = 86 Siblings’ order
Fibre preparer 1 2 3+Father’s
occupation Tailor 1 2 3+
Children’s occupational destination
Same occupation
68% 72% 66% Children’s occupational destination
Same occupation
53% 45% 29%
Upper status 8% 13% 20% Upper status 12% 17% –Artisan 77% 74% 53% Artisan 71% 67% 80%Farmers 15% 4% 13% Farmers 12% 6% 10%Lower status – 9% 13% Lower status 6% 11% 10%
n = 99 Siblings’ order n = 64 Siblings’ orderChildren’s
occupational destination
Same occupation
62% 58% 64% Children’s occupational destination
Same occupation
44% 35% 40%
Upper status 21% 7% – Upper status 13% 13% 0%Artisan 79% 67% 67% Artisan 80% 53% 33%Farmers 0% 27% 22% Farmers – 13% 67%Lower status – – 11% Lower status 7% 20% –
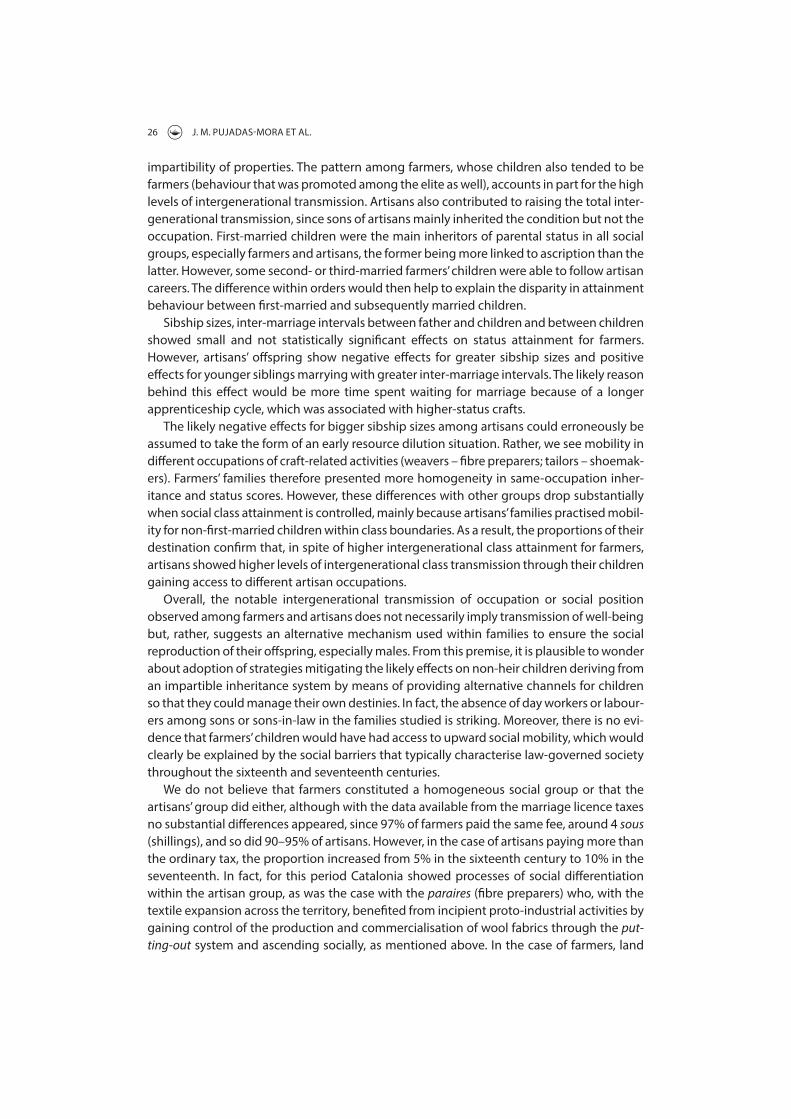
26 J. M. PUJADAS-MORA ET AL.
impartibility of properties. The pattern among farmers, whose children also tended to be
farmers (behaviour that was promoted among the elite as well), accounts in part for the high
levels of intergenerational transmission. Artisans also contributed to raising the total inter-
generational transmission, since sons of artisans mainly inherited the condition but not the
occupation. First-married children were the main inheritors of parental status in all social
groups, especially farmers and artisans, the former being more linked to ascription than the
latter. However, some second- or third-married farmers’ children were able to follow artisan
careers. The difference within orders would then help to explain the disparity in attainment
behaviour between first-married and subsequently married children.
Sibship sizes, inter-marriage intervals between father and children and between children
showed small and not statistically significant effects on status attainment for farmers.
However, artisans’ offspring show negative effects for greater sibship sizes and positive
effects for younger siblings marrying with greater inter-marriage intervals. The likely reason
behind this effect would be more time spent waiting for marriage because of a longer
apprenticeship cycle, which was associated with higher-status crafts.
The likely negative effects for bigger sibship sizes among artisans could erroneously be
assumed to take the form of an early resource dilution situation. Rather, we see mobility in
different occupations of craft-related activities (weavers – fibre preparers; tailors – shoemak-
ers). Farmers’ families therefore presented more homogeneity in same-occupation inher-
itance and status scores. However, these differences with other groups drop substantially
when social class attainment is controlled, mainly because artisans’ families practised mobil-
ity for non-first-married children within class boundaries. As a result, the proportions of their
destination confirm that, in spite of higher intergenerational class attainment for farmers,
artisans showed higher levels of intergenerational class transmission through their children
gaining access to different artisan occupations.
Overall, the notable intergenerational transmission of occupation or social position
observed among farmers and artisans does not necessarily imply transmission of well-being
but, rather, suggests an alternative mechanism used within families to ensure the social
reproduction of their offspring, especially males. From this premise, it is plausible to wonder
about adoption of strategies mitigating the likely effects on non-heir children deriving from
an impartible inheritance system by means of providing alternative channels for children
so that they could manage their own destinies. In fact, the absence of day workers or labour-
ers among sons or sons-in-law in the families studied is striking. Moreover, there is no evi-
dence that farmers’ children would have had access to upward social mobility, which would
clearly be explained by the social barriers that typically characterise law-governed society
throughout the sixteenth and seventeenth centuries.
We do not believe that farmers constituted a homogeneous social group or that the
artisans’ group did either, although with the data available from the marriage licence taxes
no substantial differences appeared, since 97% of farmers paid the same fee, around 4 sous
(shillings), and so did 90–95% of artisans. However, in the case of artisans paying more than
the ordinary tax, the proportion increased from 5% in the sixteenth century to 10% in the
seventeenth. In fact, for this period Catalonia showed processes of social differentiation
within the artisan group, as was the case with the paraires (fibre preparers) who, with the
textile expansion across the territory, benefited from incipient proto-industrial activities by
gaining control of the production and commercialisation of wool fabrics through the put-
ting-out system and ascending socially, as mentioned above. In the case of farmers, land

THE HISTORY OF THE FAMILY 27
accumulation or beneficial ownership could have been goals to be achieved in order to
prosper within the social group, although the circumstances of the period did not propitiate
this. It would explain why differences in taxes among farmers were almost non-existent,
while they increased among artisans.
We have then gone on to argue that both fathers and sons/sons-in-law who declared
themselves farmers would have had access to land, either by property or leasehold. Likewise,
these farmers (mainly non-inheritors) joined the then-existent waged rural labour market
which could sometimes be used as a way of complementing the earnings from their own
land. However, low availability of cropland, accompanied by the expansion of the textile
sector through early modern Catalonia, could have prompted families to encourage some
of their children (usually the non-first-married) to move into artisan activities. We can con-
ceive of an apprenticeship in an artisan career, usually starting at an early age, as another
long-term compensatory and strategic mechanism favouring children’s positioning. Hence,
rather than a model of sibling competition over family resources, we see a pattern of family
economic diversification, and probably the most paradigmatic example of this is the signif-
icant number of farmers with fibre preparer (paraire) children.
For artisans, the risk of sibling rivalry among non-inheritor children was ameliorated by
their ability to move into different but similar artisanal branches of the economy, where they
could contribute towards the creation of an economic and family network. In fact, the sig-
nificant increase in craft trades during this period undoubtedly reflects an ease of mobility
into other artisans’ occupational groups, given the almost-total absence of artisans’ children
in other social groups. Moreover, there can be no doubt that entering an artisan’s appren-
ticeship circuit was much more affordable than buying land, which was expensive and scarce.
The tendency for artisans to establish heterogeneous social relations, in which fathers han-
dled family affairs in accordance with known social norms and constructs in order to secure
a better position for their children, would have enlarged their network and in many cases
provided new economic opportunities. We argue that resource dilution due to competition
among siblings was far from the case in the Barcelona area. Rather, we find compensatory
effects deriving from cooperative ties that come not from the parental agency alone but
also from other relatives, including siblings and other kin from the extended family.
Notes
1. Intergenerational transmission of occupation and/or social position ranged in an order of 50%
to 70% in some European societies. Our own calculations using the data published by Boberg-
Fazlic et al. (2011) show levels of 50% in total transmission, 60% for artisans, and 51% for farmers
in eighteenth-century England. According to data published by Bearman and Deane (1992),
during the sixteenth and seventeenth centuries in the East Midlands, the total intergenerational
transmission ranged between 65% and 70%.
2. Apart from Catalonia, other regions such as southern France and Germany also presented
single-heir practices, although some instead used ultimogeniture (Willenbacher, 2003).
3. Here, house (casa in Catalan) refers to the family universe conceived as a unit of production
and reproduction to be safeguarded within and across generations.
4. The sibling competition model derives from the biology of animal species and has been
approached in fields of human evolutionary studies as a set of conflictive behaviour among
siblings in a low-resource context (Voland, 1990).
28 J. M. PUJADAS-MORA ET AL.
5. Here, adults are deemed to be those who are at a marriageable age. For the Roman legislation,
which dates from the fourteenth century, males could not marry before the age of 14 and
women before 12, a restriction generally followed by Christian churches (Gaudemet, 1987).
6. The concept of cooperative or mutual breeding is taken from biology and evolutionary studies
to explain the influence on offspring of helpers that are neither fathers nor mothers and can
be kin or non-kin (Kramer, 2010).
7. Throughout its history, the Barcelona Diocese has shrunk significantly in historical parochial
archives. Among the parishes that comprised the Oficialitat of Barcelona (corresponding to the
Barcelona area), the same area covered by the Marriage Licence Books, only the registers from
nine small parishes still have data going back to the establishment of the Council of Trent and
continuing through to the present day. Records from another nine small parishes are preserved
only from the seventeenth century onwards, even if they existed since the tenth and eleventh
centuries. Besides these, two other parish books were conserved only from the eighteenth
century, and six others from the nineteenth century, although they date back to the Middle
Ages. It is worth noting that in the city of Barcelona, only three out of eight parish registers
were kept. Finally, the records of the remaining 22 parishes from the area of Barcelona were
completely lost. This information has been drawn from the Inventari dels arxius sagramentals a
Catalunya. Segles XV-XIX, which was compiled in the research project La población de Cataluña.
Estudio histórico y territorial, 1787–1996, funded by the Ministerio de Educación y Cultura,
Dirección General de Enseñanza Superior, Programa de Promoción General del Conocimiento
for 1997–2000.
8. The first (or only) surnames are usually patrilineal.
9. Identification of people by two family names, the first usually handed down by fathers and
the second by mothers, is the result of the Civil Registration Law (1871) (De Salazar, 1991;
Salinero, 2010).
10. Inclusion of brides in the licences began in 1485.
11. Although the taxes were categorised in socioeconomic terms, all registered marriages of
farmers and artisans (the two majority groups) were charged exactly the same amount. Hence,
owing to the lack of variability, this does not allow us to study differences, although this does
not affect the wide variety of occupations reported in the source.
12. The most common changes in the spelling of family names found in the Marriage Licence Books
are the removal of the final etymological r, e.g. Ferrer/Ferré (Smith), and confusion between b
and v, e.g. Rivera/Ribera (Riverside). There were also miswritten letters, among them s, c, ç, z
and ss, e.g. Serra/Çerra (Hills/Mountains), and confusions between the letters y and i, j and g,
l and ll. We also saw the use of c instead of ch at the word’s end, e.g. Bosch/Bosc (Woods), as
well as h at the beginning of words starting with vowels, e.g. Homs/Oms (Elms). The software-
generated algorithm also accounted for similarities in the Catalan pronunciation which could
lead to different ways of writing the vowels a and e, e.g. Ferrer/Farrer (Smith), and o and u, e.g.
Bofi/Bufi, a variation of Bonfill (Good Son).
13. Between 1547 and 1643, 6555 different surnames were registered, and these, divided by
quartiles, share the same distribution as the 528 surnames from the father–children sample.
14. Although the inheritance system was skewed towards first-born sons, there were also female
inheritors known as pubilles in Catalonia (Ferrer, 2005).
15. This disparity in parental occupation for males and females is due to a larger register of women’s
fathers because of the absence of feminine occupational reporting.
16. Here, the 12 original HISCLASS codes were condensed into eight groups joining occupations
that tended to be similar and less frequent during the period under study in our region.
Moreover, nobles were considered and labelled separately.
17. Decentralisation of the textile industry brought about the movement of many fibre preparers
and weavers into the hinterland, while occupations devoted to the finishing processes of
clothing production remained in Barcelona (Torras, 1998).
18. For cases where the parish was reported in the marriage licences, we found that among the
589 sons and sons-in-law occupied in crafts, 42.3% were from urban centres such as Barcelona,
Mataró, Sabadell and Terrassa, while the other 57.7% were from rural parishes.
THE HISTORY OF THE FAMILY 29
19. Values lower than -2 reflect statistically significant negative associations, while numbers greater
than 2 (marked in bold in the tables) represent positive associations.
20. In label 7 we include fibre preparers (HISCO 75100) and weavers (HISCO 75432), while label 5
includes other crafts such as carpenters (HISCO 95410), tailors (HISCO 79120) and shoemakers
(HISCO 80110).
21. This kind of model includes only the fixed and random intercepts of the measured dependent
variable. Its main interest resides in the random variance for explaining how similar or non-
independent individuals within families and geographic units were.
22. In order to decompose the variance explained by the geographic level only, the geographical
variance is kept in the numerator of the ICC equation.
23. The family impact is approached quantitatively in a few studies. Knigge, Van Leeuwen &
Mandemakers (2014) found family impacts in the order of 50%.
24. It should be remembered that an important assumption has been made when treating first-
married sons as first-born.
25. Unfortunately, the information on taxes provided in the Marriage Licence Books is linked to
the occupational and social group. From this we can determine which groups paid more taxes,
but we cannot establish within-class differences, because it is impossible to determine who
among the peasants were richer or poorer.
26. Mainly towards crafts of higher status such as tailors, shoemakers and carpenters, among others.
27. The Catalan fibre preparers known as paraires were, according to the literature, engaged
not only in a textile occupation specialising in wool manufacturing, but also in a kind of
management position in the textile industry in charge of production coordination as well as
commercialisation. Moreover, they can be credited as being the founders of this proto-industrial
activity in Catalonia (Torras, 1998).
28. Rabassa morta refers to leasehold contracts of long duration which were based on the life cycle
of grapevines. A sharecropper could work the land as long as the plant lasted.
Disclosure statement
No potential conflict of interest was reported by the authors.
Funding
This work was supported by the Advanced Grant ‘Five Centuries of Marriages’ (PI Anna Cabré) from the
European Research Council [ERC-2010-AdvancedGrant-269796]
References
Alberch, R. (1984). Gremis i oficis a Girona: Treball i societat a l’època pre-industrial [Guilds and trades in
Girona: Work and society in the pre-industrial era]. Girona: Ajuntament de Girona.
Álvarez-Nogal, C., & Prados de la Escosura, L. (2012). The rise and fall of Spain (1270–1850). The economic
History Review, 66(1), 1–37.
Amelang, J. S. (1986). Honored Citizens of Barcelona: Patrician culture and class relations, 1490–1714.
Princeton: Princeton University Press.
Amengual-Bibiloni, M., & Pujadas-Mora, J. M. (2017). Orígens i destins de la immigració francesa a
l’àrea de Barcelona (1481-1643). Aportacions a partir de la Barcelona Historical Marriage Database
[Origins and destinations of French immigration in the area of Barcelona (1481–1643): Contributions
from the Barcelona Historical Marriage Database]. Manuscrits. Revista d’història moderna, 34, 35–61.
Angrist, J., Lavy, V., & Schlosser, A. (2010). Multiple experiments for the causal link between the quantity
and quality of children. Journal of Labor Economics, 28(4), 773–824.
Arrizabalaga, M. P. (2005). Succession strategies in the Pyrenees in the 19th century: The Basque case.
The History of the Family, 10(3), 271–292.
30 J. M. PUJADAS-MORA ET AL.
Barrera-González, A. S. (1992). Eldest and younger siblings in a stem-family system: The case of rural
Catalonia. Continuity and Change, 7(03), 335–355.
Bearman, P. S., & Deane, G. (1992). The structure of opportunity: Middle-class mobility in England,
1548-1689. American Journal of Sociology, 98(1), 30–66.
Beise, J., & Voland, E. (2008). Intrafamilial resource competition and mate competition shaped social-
group-specific natal dispersal in the 18th and 19th century Krummhörn population. American Journal
of Human Biology, 20(3), 325–336.
Bengtsson, T. (2014). The influence of economic factors on first marriages in historical Europe and Asia.
In C. Lundh and S. Kurosu (Eds.), Similarity in difference. Marriage in Europe and Asia, 1700–1900 (pp.
121–168). Massachusetts: MIT Press.
Berkner, L. K. (1972). The stem family and the developmental cycle of the peasant household: An
Eighteenth-Century Austrian Example. The American Historical Review, 77(2), 398–418.
Berkner, L., & Mendels, F. (1978). Inheritance systems, family structure and demographic patterns
in Western Europe. In C. Tilly (Ed.), Historical studies of changing fertility (pp. 209–223). Princeton:
Princeton University Press.
Black, S. E., Devereux, P. J., & Salvanes, K. G. (2005). The more the merrier? The effect of family size and
birth order on children’s education. The Quarterly Journal of Economics, 120(2), 669–700.
Blake, J. (1986). Sibship size and educational stratification: Reply to Mare and Chen. American Sociological
Review, 51(3), 413–417.
Boberg-Fazlic, N., Sharp, P., & Weisdorf, J. (2011). Survival of the richest? Social status, fertility and social
mobility in England 1541–1824. European Review of Economic History, 15(3), 365–392.
Boone, J. L. (1986). Parental investment and elite family structure in preindustrial states: A case study
of late medieval-early modern Portuguese genealogies. American anthropologist, 88(4), 859–878.
Bourdieu, P. (1976). Marriage strategies as strategies of social reproduction. In R. Forster & O. Ranum
(Eds.), Family and society. Selections from the Annales, Économies, Sociétés, Civilisations (pp. 117–144).
Baltimore, MD: The Johns Hopkins University Press.
Bras, H., Kok, J., & Mandemakers, K. (2010). Sibship size and status attainment across contexts: Evidence
from the Netherlands, 1840–1925. Demographic Research, 23(4), 73–104.
Braudel, F. (1995). The Mediterranean and the Mediterranean world in the age of Philip II (Vol. 2). Berkeley
and Los Angeles: Univ of California Press.
Caldwell, J., Caldwell, B., Caldwell, P., McDonald, P., & Schindlmayr, T. (2006). Demographic transition
theory. Dordrecht: Springer.
Capdevila, A. (2014). Quan la terra promesa era al sud. La immigració francesa al Maresme als segles XVI
i XVII [When the promised land was to the south. French immigration in the Maresme in the 16th
and 17th centuries]. Rubí: Fundació Iluro, Publicacions de l’Abadia de Montserrat.
Carmona, J., & Simpson, J. (1999). The “Rabassa Morta” in Catalan viticulture: the rise and decline of a
long-term sharecropping contract, 1670s–1920s. The Journal of Economic History, 59(2), 290–315.
Ciuffreda, A. (1997). Lo zio Prete. Individui, famiglie e parentela nella trasmissione dell’ufficio sacerdotale
in una comunità pugliese in età moderna [The oncle is priest. Individuals, families and relatives in the
transfer of sacerdotal affairs in a ‘pugliese’ community in modern age Disaggregations: Stratifications
and social mobility in the Italian population]. Diseguaglianze: Stratificazioni e mobilità sociale nella
popolazione italiana (Vol. 2, pp. 551–574). Bologna: Convegno italo-iberico di demografia storica.
Clark, G. (1996). Survival of the richest: The Malthusian mechanism in pre-industrial England. The Journal
of Economic History, 66(3), 707–736.
Clark, G., & Hamilton, G. (2006). Survival of the richest: the Malthusian mechanism in pre-industrial
England. The Journal of Economic History, 66(3), 707–736.
Comas d'Argemir, D. (1988). Household, family, and social stratification: Inheritance and labor strategies
in a Catalan village (Nineteenth and Twentieth Centuries). Journal of Family History, 13(1), 143–163.
Comas d’Argemir, D. (2006). Casa, familia y estratificación social: Estrategias de herencia y de trabajo en
una población rural catalana [Home, family and social stratification: inheritance and work strategies
in a Catalan rural population]. In X. Roigé (Ed.), Familias de ayer, familias de hoy: Continuidades y
cambios en Cataluña [Families yesterday, families of today: Continuities and changes in Catalonia]
(pp. 141–176). Barcelona: Icaria.
THE HISTORY OF THE FAMILY 31
Dambruyne, J. (1998). Guilds, social mobility and status in sixteenth-century Ghent. International Review
of Social History, 43(1), 31–78.
De Salazar, J. (1991). Génesis y evolución histórica del apellido en España [Genesis and historical evolution
of the surname in Spain]. Madrid: Real Academia Matritense de Heráldica y Genealogía.
Dillon, L. (2010). Parental and sibling influences on the timing of marriage, xviith and xviiith century
Québec. Annales de démographie historique, 119(1), 139–180.
Downey, D. B. (1995). When bigger is not better: Family size, parental resources, and children's
educational performance. American Sociological Review, 60(5), 746–1761.
Dribe, M., & Lundh, C. (2005). Finding the right partner: Rural homogamy in nineteenth-century Sweden.
International Review of Social History, 50(S13), 149–177.
Dribe, M., & Lundh, C. (2009). Partner choice and intergenerational occupational mobility: The case of
nineteenth-century rural Sweden. Continuity and Change, 24(03), 487–512.
Dribe, M., & Lundh, C. (2010). Marriage choices and social reproduction: The interrelationship
between partner selection and intergenerational socioeconomic mobility in 19th-century Sweden.
Demographic Research, 22, 347–382.
Dribe, M., Breschi, M., Gagnon, A., Gauvreau, D., Hanson, H. A., Maloney, T. N., & Mazzoni, H. (2017).
Socio-economic status and fertility decline: Insights from historical transitions in Europe and North
America. Population Studies, 71(1), 3–21.
Elliot, J. H. (1963). The revolt of the Catalans: A study in the decline of Spain, 1598–1640. Cambridge:
Cambridge University Press.
Epstein, S. R. (2004). Property rights to technical knowledge in premodern Europe, 1300–1800. The
American Economic Review, 94(2), 382–387.
Erola, J., & Kilpi-Jakonen, E. (2017). Compensation and other forms of accumulation in intergenerational
social inequality. In J. Erola & E. Kilpi-Jakonen (Eds.), Social inequality across the generations (pp. 3–24).
Cheltenham: Edward Elgar Publising.
Evans, M., Hastings, N., & Peacock, B. (2000). Statistical distributions. New York, NY: Wiley.
Fauve-Chamoux, A. (2005). A comparative study of family transmission systems in the central Pyrenees
and northeastern Japan. The History of the Family, 10(3), 231–248.
Ferrer, L. (1983). Censals, vendes a carta de gràcia i endeutament pagès al Bages (s. XVIII) [‘Censals’,
sales by letter of grace and peasant indebtedness in the Bages (18th century)]. Estudis d’història
agrària, 4, 101–128.
Ferrer, L. (2003). Segundones y actividad económica en Cataluña (siglos XVIII-XIX): Reflexiones a
partir de la familia Berenguer de Artés [‘Segundones’ and economic activity in Catalonia (XVIII-
XIX centuries): Reflections from the case of the Berenguer de Artés family]. Revista de Demografía
Histórica, 21(2), 93–126.
Ferrer, L. (2004). Kinship as a mechanism in the social structuring of rural Catalonia (eighteenth and
nineteenth centuries). Journal of Family History, 29(2), 135–152.
Ferrer, L. (2005). When there was no male heir: The transfer of wealth through women in Catalonia (the
pubilla). Continuity and Change, 20(1), 27–52.
Ferrer, L. (2007). Hereus, pubilles i cabalers: El sistema d’hereu a Catalunya [‘Hereus, Pubilles i Cabalers’
The heir’s system in Catalonia]. Catarroja: Afers.
Ferrer, L. (2008). Placing sons and daughters in the church: Strategies used by the gentry of Central
Catalonia to maintain social status in the 17th and 18th centuries. The History of the Family, 13(1),
26–41.
Ferrer, L. (2010a). Achieving well-being in Spain through the single heir system (18th -19th Centuries).
In M. Duraes, A. Fauve-Chamoux, L. Ferrer & J. Kok (Eds.), The transmission fo Well-being. Gendered
marriage strategies and Inheritance systems in Europe (17th-20th Centuries) (pp. 259–290). Bern: Peter
Lang.
Ferrer, L. (2010b). Matrimonial regimes in Catalonia and Spain. The logic of family systems. In M-P.
Arriazabalaga, I. Bolovan, M. Eppel, J. Kok & M. L. Nagata (Eds.), Many paths to happiness? Studies in
population and family history. A festschrift for Antoinette Fauve (pp. 347–361). Amsterdam: Aksant.
Ferrer, L. (2014). Derechos de propiedad y mercado de la tierra en la Cataluña Vieja (s. XV-XIX). El caso
de Artés (Bages) [Property rights and land market in Old Catalonia (15th-19th century). The case of
Artés (Bages)]. Revista de Historia Agraria, 33, 35–47.
32 J. M. PUJADAS-MORA ET AL.
Ferrer, L. (2016). La formació d’una estructura de la propietat de la terra a la Catalunya Vella (segles
XVI-XIX) [The formation of an agrarian structure of land ownership in the Old Catalonia (16th-19th
centuries)]. Manuscrits. Revista d’història moderna, 33, 67–93.
Fischer, D. H. (1996). Great wave: price revolutions and the rhythm of history. New York: Oxford University
Press.
Fox, J., Willführ, K., Gagnon, A., Dillon, L., & Voland, E. (2017). The consequences of sibling formation on
survival and reproductive success across different ecological contexts: A comparison of the historical
Krummhörn and Quebec populations. The History of the Family, 22(2-3), 364–423.
Ganzeboom, H., Treiman, D., & Ultee, W. C. (1991). Comparative intergenerational stratification research:
Three generations and beyond. Annual Review of Sociology, 17(1), 277–302.
García Espuche, A. (1998). Un siglo decisivo: Barcelona y Cataluña, 1550–1640 [A decisive century.
Barcelona and Catalonia, 1550–1640]. Madrid: Alianza editorial.
Gaudemet, J. (1987). Le mariage en Occident. Les moeurs et le droit [Marriage in the West Morals and the
law]. Paris: University of Notre Dame Press.
Gibbs, B. G., Workman, J., & Downey, D. B. (2016). The (conditional) resource dilution model: State-and
Community-Level Modifications. Demography, 53(3), 723–748.
Gjerde, J., & McCants, A. (1999). Individual life chances, 1850-1910: A Norwegian-American example.
Journal of Interdisciplinary History, 30(3), 377–405.
Goody, J. (1973). Strategies of heirship. Comparative Studies in Society and History, 15(01), 3–20.
Harrell, S. (1997). Human families. New York, NY: Avalon Publishing.
Hox, J. J. (2002). Sample sizes for multilevel modeling. In J. Jorg Blasius, J. Hox, E. deLeeuw & P. Schmidt
(Eds.), Proceedings of the fifth international conference on logic and methodology (pp. 1–19). Opladen,
Germany: Leske & Budrich Verlag.
Iszaevich, A. (1975). Corporate household and ecocentric kinship group in Catalonia. Ethnology, 20(4),
277–290.
Jencks, C., Smith, M., Acland, H., Jo Bane, M., Cohen, D., & Gintis, H. (1972). Reassessment of the effect of
family and schooling in America. New York, NY: Basic Books.
Jordà, J. P. (2016). Aproximación a las migraciones históricas a través del estudio de la información nominal
[Approaching historical migrations through the study of nominal information]. (PhD), Universitat
Autònoma de Barcelona, Bellaterra.
Jordà, J. P., Valls-Fígols, M., & Pujadas-Mora, J. M. (2013). Apellidos y migraciones. Estudio a través de los
fogatges catalanes de 1497 y 1553 [Surnames and migration. Study through the Catalan household
counts of the 1497 and 1553]. Revista de demografía histórica, 31(1), 105–130
Junqueras, O. (2006). Economia i pensament econòmic a la Catalunya de l’alta edat moderna (1520–
1630) [Economy and economic thought in Catalonia of the modern age (1520–1630)]. Bellaterra:
Universitat Autònoma de Barcelona, Serve de Publicacions.
Kamen, H. (1979). Una insurrecció oblidada del segle XVII: L’alçament dels camperols catalans de l’any
1688 [A forgotten insurrection of the 17th century: The rise of the Catalan peasants of the 1688].
Recerques: Història, economia cultura, 9, 11–28.
Kertzer, D., & Laslett, P. (1995). Aging in the past: Demography, society, and old age, Vol. 7. Berkeley:
University of California Press.
Kesztenbaum, L. (2008). Cooperation and coordination among siblings: Brothers’ migration in France,
1870–1940. The History of the Family, 13(1), 85–104.
Knigge, A., Maas, I., van Leeuwen, M. H., & Mandemakers, K. (2014). Status attainment of siblings during
modernization. American Sociological Review, 79(3), 549–574.
Kocka, J. (1984). Family and class formation: Intergenerational mobility and marriage patterns in
nineteenth-century Westphalian towns. Journal of Social History, 17(3), 411–433.
Kok, J. (1997). Youth labor migration and its family setting, The Netherlands 1850–1940. The History of
the Family, 2(4), 507–526.
Kramer, K. L. (2010). Cooperative breeding and its significance to the demographic success of humans.
Annual Review of Anthropology, 39, 417–436. doi:10.1146/annurev.anthro.012809.105054.
Kurosu, S. (1996). Leaving home in a stem family system: Departures of heirs and non-heirs in pre-
industrial Japan. The History of the Family, 1(3), 329–352.
THE HISTORY OF THE FAMILY 33
Kurzban, R., Burton-Chellew, M. N., & West, S. A. (2015). The Evolution of Altruism in Humans. Annual
Review of Psychology, 66(1), 575–599.
Lambert, P., et al. (2013). The Construction of HISCAM: A Stratification Scale Based on Social Interactions
for Historical Comparative Research. Historical Methods: A Journal of Quantitative and Interdisciplinary
History, 46(2), 77–89.
Laslett, P. (1977). Family life and illicit love in earlier generations. Cambridge University Press.
Laslett, P. (1983). A one-class society. Social divisions and power relations amongst nobility, gentry,
townsmen and peasants. In P. Laslett (Ed.), The World We Have Lost: Further explored (3rd ed., pp.
22–52). London: Routledge.
Leibowitz, A. (1974). Home investments in children. Journal of Political Economy, 82(2, Part 2), S111–S131
Lobato, I. (1995). Capital mercantil y actividad económica en la Cataluña preindustrial, compañias y
negocios en Barcelona en la segundad mitad del siglo XVII [Commercial capital and economic activity in
pre-industrial Catalonia. Companies and business in Barcelona in the second half of the seventeenth
century]. Barcelona: Publicacions de la Universitat de Barcelona.
Low, S. (1991). Family patterns in nineteenth-century Sweden: Impact of occupational status and
landownership. Journal of Family History, 16(2), 117–138.
Marfany, J. (2006). Choices and constraints: Marriage and inheritance in eighteenth-and early-
nineteenth-century Catalonia. Continuity and Change, 21(01), 73–106.
Mazzoni, S., Breschi, M., Manfredini, M., Pozzi, L., & Ruiu, G. (2017). The relationship between family
characteristics and height in Sardinia at the turn of the twentieth century. The History of the Family,
22(2-3), 291–309.
Millàs, C. (2005). Els altres catalans dels segles XVI i XVII: La immigració francesa al Baix Llobregat en temps
dels Àustria [The other Catalans from the 16th and 17th centuries: French immigration in the Baix
Llobregat in the period of the Habsburg]. Barcelona: Publicacions de l’Abadia de Montserrat.
Mocarelli, L. (2008). Guilds reappraised: Italy in the early modern period. International Review of Social
History, 53(S16), 159–178.
Moch, L. P. (2009). Moving Europeans: Migration in western Europe since 1650 (2nded.). Bloomington:
Indiana University Press.
Nadal, J. (1978). La població catalana als segles XVI i XVII [The Catalan population in the seventeenth
and eighteenth centuries]. In J. Nadal & P. Wolf (Eds.), Història de Catalunya (pp. 257–273). Barcelona:
Salvat.
Nadal, J., & Giralt, E. (1960). La Population catalane de 1553 à 1717: L’emmigration française et les autres
facteurs de son développement [The Catalan population from 1553 to 1717: The French emigration
and the others factors of its development]. Paris: SEVPEN.
Nitsch, A. (2014). The evolution of sibling interactions in Humans (PhD Thesis). University of Sheffield.
Öberg, S. (2015). Sibship size and height before, during, and after the fertility decline: A test of the
resource dilution hypothesis. Demographic Research, 32, 29–74.
Öberg, S. (2017). Too many is not enough: Studying how children are affected by their number of
siblings and resource dilution in families. The History of the Family, 22(2–3), 157–174.
Parker, G. (2013). Global crisis: War, climate change and catastrophe in the seventeenth century. New
Haven, CT: Yale University Press.
Platteau, J. P., & Baland, J. M. (2001). Impartible inheritance versus equal division: A comparative
perspective centered on Europe and Sub-Saharan Africa. Notre-Dame de la Paix, Sciences Economiques
et Sociales Papers, 209.
Postles, D. (2000). Migration and mobility in a less mature economy: English internal migration, c.
1200-1350. Social History, 25(3), 285–299.
Prandy, K. (2000). The social interaction approach to the measurement and analysis of social stratification.
International Journal of Sociology and Social Policy, XIX, 215–249.
Pujadas-Mora, J. M., Romero-Marín, J., & Villar, C. (2014). Propuestas metodológicas para la aplicación
de HISCO en el caso de Cataluña, siglos XV-XX. Revista de Demografía Histórica, 32, 181–219.
Ros, C. (2006). Les estratègies familiars i la mobilitat social dels menestrals a Catalunya en els segles
XVII-XIX: El cas de Mataró [Familial strategies and social mobility of crafts in the seventeenth and
eighteenth centuries]. Butlletí de la Societat Catalana d’Estudis Històrics [The case of Mataró], 16,
171–190.
34 J. M. PUJADAS-MORA ET AL.
Salinero, G. (2010). Sistemas de nominación e inestabilidad antroponómica moderna [Nomination
systems and modern anthroponomic instability]. In I. Testón (Ed.), Un juego de engaños: Movilidad,
nombres y apellidos en los siglos XV a XVIII [A game of deceptions: Mobility, names and surnames in
the XV to XVIII centuries] (pp. 9–27). Madrid: Casa de Velázquez.
Schlomer, G., Ellis, B., & Garber, J. (2010). Mother-Child Conflict and Sibling Relatedness: A Test of
Hypotheses From Parent-Offspring Conflict Theory. Journal of Research on Adolescence, 20(2), 287–
306.
Serra, E. (2013). La crisi del segle XVII a Catalunya [The Crisis of the 17th Century and Catalonia]. Butlletí
de la Societat Catalana d’Estudis Històrics, 24, 297–315.
Shenk, M. K., Borgerhoff Mulder, M., Beise, J., Clark, G., Irons, W., & Leonetti, D. (2010). Intergenerational
wealth transmission among agriculturalists: Foundations of agrarian inequality. Current Anthropology,
51(1), 65–83.
Simon, A. (1992). La població catalana a l’Època Moderna. Síntesi i actualització [The Catalan population
in the Modern Era. Synthesis and update]. Manuscrits: Revista d’Història Moderna, 10, 217–258.
Soly, H. (2008). The political economy of European craft guilds: Power relations and economic strategies
of merchants and master artisans in the medieval and early modern textile industries. International
Review of Social History, 53(S16), 45–71.
Stradford, L., van Poppel, F., & Lumey, L. H. (2017). Can resource dilution explain differences in height
by birth order and family size? A study of 389,287 male recruits in twentieth-century Netherlands.
The History of the Family, 22(2-3), 214–235.
Suanet, B., & Bras, H. (2014). Sibling position and Marriage timing in the Netherlands, 1840–1922. A
comparison across social classes, local contexts, and time. Journal of Family History, 39(2), 126–139.
Thirsk, J. (1976). The European debate on customs of inheritance, 1500–1700. In J. R. Goody, J. Thirsk, &
E. P. Thompson (Eds.), Family and Inheritance: Rural society in Western Europe, 1200–1800 (pp. 177–192).
Cambridge: Cambridge University Press.
To, L. (1993). Le mas catalan du XIIe s.: Genèse et évolution d’une structure d’encadrement et
d’asservissement de la paysannerie [The Catalan ‘Mas’ of the twelfth century: Genesis and evolution
of a structure of supervision and enslavement of the peasantry]. Cahiers de civilisation médiévale,
36(142), 151–177
To, L. (1997). Familia i hereu a la Catalunya nord-oriental (segles X-XII) [Family and heir in north-eastern
Catalonia (10th to 12th centuries)]. Barcelona: Abadia de Montserrat.
Torras, J. (1993). From craft to class. The changing organization of cloth manufacturing in a catalan
town. In T. Safley & L. Rosenbaund (Eds.), The workplace before the factory. Artisans and Proletarians
(1500–1800) (pp. 165–179). London: Cornell University Press.
Torras, J. (1998). Small Towns, Craft Guilds and Proto-Industry in Spain. Jahrbuch für Wirtschaftsgeschichte/
Economic History Yearbook, 39(2), 79–96
Treiman, D. J. (1970). Industrialization and social stratification. Sociological Inquiry, 40(2), 207–234.
Treiman, D. J. (1977). Occupational prestige in comparative perspective. New York: Academic Press.
Trivers, R. L. (1974). Parent-offspring conflict. Integrative and Comparative Biology, 14(1), 249–264.
Van Bavel, J., Moreels, S., Van de Putte, B., & Matthijs, K. (2011). Family size and intergenerational social
mobility during the fertility transition: Evidence of resource dilution from the city of Antwerp in
nineteenth century Belgium. Demographic Research, 24(14), 313–344.
Van de Putte, B., Van Poppel, F., Vanassche, S., Sanchez, M., Jidkova, S., & Eeckhaut, M. (2009). The rise of
age Homogamy in 19th century western Europe. Journal of Marriage and Family, 71(5), 1234–1253.
Van Leeuwen, M. H. D., & Maas, I. (2011). HISCLASS: A historical international social class scheme:
Universitaire Pers Leuven.
Van Leeuwen, M. H., Maas, I., & Miles, A. (2002). HISCO: Historical international standard classification of
occupations. Leuven: Leuven University Press.
van Poppel, F., & Nelissen, J. (1999). The proper age to marry: Social norms and behavior in nineteenth-
century Netherlands. The History of the Family, 4(1), 51–75.
Vilalta, M. J. (2006). La atracción de los iguales. Sociedad, migraciones y alianzas matrimoniales en
la Lleida del siglo XVI [The attraction of the equals. Society, migrations and matrimonial alliances
Lleida in the sixteenth century]. In J. A. Salas Auséns (Ed.), Migraciones y movilidad social en el Valle

THE HISTORY OF THE FAMILY 35
del Ebro (siglos XVI-XIX) [Migrations and social mobility in the Ebro Valley (centuries XVI–XIX)] (pp.
13–37). Bilbao: Servicio Editorial de la Universidad del Pais Vasco.
Vilar, P. (1986). Catalunya dins l’Espanya moderna: Recerques sobre els fonaments econòmics de les
estructures nacionals [Catalonia within modern Spain: Research on the economic foundations of
national structures]. Barcelona: Ariel.
Villavicencio, F., Jordà, J. P., & Pujadas-Mora, J. M. (2015). Reconstructing lifespans using historical
marriage records of Catalonia from the 16th and 17th centuries Population reconstruction (pp.
199–216): Springer International.
Voland, E. (1990). Differential reproductive success within the Krummhörn population (Germany, 18th
and 19th centuries). Behavioral Ecology and Sociobiology, 26(1), 65–72.
Voland, E., & Dunbar, R. (1995). Resource competition and reproduction. Human Nature, 6(1), 33–49.
Wall, R. (1996). Marriage, residence, and occupational choices of senior and junior siblings in the english
past. The History of the Family, 1(3), 259–271.
Willenbacher, B. (2003). Individualism and traditionalism in inheritance law in Germany, France, England,
and the United States. Journal of Family History, 28(1), 208–225.
Yun Casalilla, B., & Torras, J. (1999). Consumo, condiciones de vida y comercialización: Cataluña, Castilla,
siglos XVII-XIX [Consumption, living conditions and marketing: Catalonia, Castilla, XVII–XIX centuries].
Valladolid: Junta de Castilla y León, Consejería de Educación y Cultura.
Zijdeman, R. L. (2009). Like my father before me: Intergenerational occupational status transfer during
industrialization (Zeeland, 1811–1915). Continuity and Change, 24(3), 455–486.
Zofio, J. C. (2005). Gremios y artesanos en Madrid, 1500–1650: La sociedad del trabajo en una ciudad
cortesana preindustrial [Guilds and artisans in Madrid, 1500–1650: The society of work in a courtesan
preindustrial town]. Madrid: Instituto de Estudios Madrileños.
Zofío Llorente, J. C. (2011). Reproducción social y artesanos. Sastres, curtidores y artesanos de la madera
madrileños en el siglo XVII [Social reproduction and artisans. Tailors, tanners, and joiners of Madrid
in the 17th century]. Hispania, 71(237), 87–120.