CENTRIC 2013 Proceedings - Thinkmind.org.
145
CENTRIC 2013 The Sixth International Conference on Advances in Human oriented and Personalized Mechanisms, Technologies, and Services ISBN: 978-1-61208-306-3 October 27 - November 1, 2013 Venice, Italy CENTRIC 2013 Editors Lasse Berntzen, Vestfold University College - Tønsberg, Norway Stephan Böhm, RheinMain University of Applied Sciences - Wiesbaden, Germany 1 / 145
-
Upload
khangminh22 -
Category
Documents
-
view
0 -
download
0
Transcript of CENTRIC 2013 Proceedings - Thinkmind.org.

CENTRIC 2013
The Sixth International Conference on Advances in Human oriented and
Personalized Mechanisms, Technologies, and Services
ISBN: 978-1-61208-306-3
October 27 - November 1, 2013
Venice, Italy
CENTRIC 2013 Editors
Lasse Berntzen, Vestfold University College - Tønsberg, Norway
Stephan Böhm, RheinMain University of Applied Sciences - Wiesbaden, Germany
1 / 145

CENTRIC 2013
Forward
The Sixth International Conference on Advances in Human-oriented and PersonalizedMechanisms, Technologies, and Services (CENTRIC 2013), held on October 27 - November 1,2013 in Venice, Italy, addressed topics on human-oriented and personalized mechanisms,technologies, and services, commonly known as I-centric.
There is a cohort of technologies that favored the so called “user-centric” services andapplications. While some of them reached some maturity, others are to prove their economics(WiMax, IPTV, RFID, etc). The human-oriented and personalized technologies and services relyon a key set of features, some to be deployed, others getting more mature (personal profiles,preferences, identity, proximity, personal devices, etc.). Following, advanced applicationscovering human related activities benefit from personalized and human-oriented networks andservices, especially preventive and personalized medicine, body networks and devices, oranticipative systems.
The conference provided a forum where researchers were able to present recent researchresults and new research problems and directions related to them. The conference soughtcontributions presenting novel result and future research in all aspects of user-centricmechanisms, technologies, and services.
Similar to the previous editions, this event continued to be very competitive in its selectionprocess and very well perceived by the international community. As such, it attracted excellentcontributions and active participation from all over the world. We were very pleased to receivea large amount of top quality contributions.
We take here the opportunity to warmly thank all the members of the CENTRIC 2013 technicalprogram committee as well as the numerous reviewers. The creation of such a broad and highquality conference program would not have been possible without their involvement. We alsokindly thank all the authors that dedicated much of their time and efforts to contribute to theCENTRIC 2013. We truly believe that thanks to all these efforts, the final conference programconsists of top quality contributions.
This event could also not have been a reality without the support of many individuals,organizations and sponsors. We also gratefully thank the members of the CENTRIC 2013organizing committee for their help in handling the logistics and for their work that is makingthis professional meeting a success.
We hope the CENTRIC 2013 was a successful international forum for the exchange of ideas andresults between academia and industry and to promote further progress in personalizationresearch. We also hope the attendees enjoyed the charm of Venice.
2 / 145

CENTRIC 2013 Chairs
CENTRIC 2013 General Chairs
Lasse Berntzen, Vestfold University College - Tønsberg, Norway
Stephan Böhm, RheinMain University of Applied Sciences - Wiesbaden, Germany
CENTRIC Advisory Chairs
Michael Gebhart, Gebhart Quality Analysis (QA) 82, Germany
Vitaly Klyuev, University of Aizu, Japan
Mario Hoffmann, Fraunhofer-Institute for Secure Information Technology (SIT) - Darmstadt,
Germany
Guadalupe Ortiz, University of Cádiz, Spain
Maristella Matera, Politecnico di Milano, Italy
Thomas Marx, University of Applied Sciences Bingen, Germany
CENTRIC 2013 Research Institute Liaison Chairs
R. Hariprakash, Arulmighu Meenakashi Amman College of Engineering, India
Muhammad Iftikhar, University of Malaysia Sabah, Malaysia
Kong Cheng, Telcordia Technologies - Piscataway, USA
Gottfried Zimmermann, Stuttgart Media University, Germnay
CENTRIC 2013 Industry/Research Chairs
Eve Maler, Forrester Research, USA
Rainer Falk, Siemens AG - München, Deutschland
Juong-Sik Lee, Nokia Research Center - Palo Alto, USA
3 / 145

CENTRIC 2013
Committee
CENTRIC 2013 General Chairs
Lasse Berntzen, Vestfold University College - Tønsberg, NorwayStephan Böhm, RheinMain University of Applied Sciences - Wiesbaden, Germany
CENTRIC Advisory Chairs
Michael Gebhart, Gebhart Quality Analysis (QA) 82, GermanyVitaly Klyuev, University of Aizu, JapanMario Hoffmann, Fraunhofer-Institute for Secure Information Technology (SIT) - Darmstadt,GermanyGuadalupe Ortiz, University of Cádiz, SpainMaristella Matera, Politecnico di Milano, ItalyThomas Marx, University of Applied Sciences Bingen, Germany
CENTRIC 2013 Research Institute Liaison Chairs
R. Hariprakash, Arulmighu Meenakashi Amman College of Engineering, IndiaMuhammad Iftikhar, University of Malaysia Sabah, MalaysiaKong Cheng, Telcordia Technologies - Piscataway, USAGottfried Zimmermann, Stuttgart Media University, Germnay
CENTRIC 2013 Industry/Research Chairs
Eve Maler, Forrester Research, USARainer Falk, Siemens AG - München, DeutschlandJuong-Sik Lee, Nokia Research Center - Palo Alto, USA
CENTRIC 2013 Technical Program Committee
Giner Alor Hernandez, Instituto Tecnologico de Orizaba, MéxicoRémi Bastide, Université Champollion, FranceCarlos Becker Westphall, Federal University of Santa Catarina, BrazilMahmoud Boufaida, Mentouri University of Constantine, AlgeriaMahmoud Brahimi, University of Msila, AlgeriaLillian Brandão, Universidade Federal de Minas Gerais (UFMG), BrazilMarco Bruti, Telecom Italia Sparkle S.p.A. - Roma, ItalyKong Cheng, Applied Communication Sciences, USA
4 / 145

Kong Eng Cheng, Applied Communication Sciences/Ericsson, SwedenCarlos J. Costa, ISCTE-IUL, PortugalAyse Cufoglu, University of Westminster, UKJan Cuřín, IBM Research - Prague R&D Lab, Czech RepublicChristina Di Valentin, German Research Center for Artificial Intelligence (DFKI) GmbH -Saarbrücken, GermanyDamien Dudognon, IRIT, Toulouse University / OverBlog company, FranceRainer Falk, Siemens AG - München, DeutschlandStenio Fernandes, Federal University of Pernambuco, BrazilMajlinda Fetaji, South East European University, MacedoniaAgata Filipowska, Poznan University of Economics, PolandBisson Gilles, CNRS/LIG, FranceVic Grout, Glyndwr University, UKR. Hariprakash, Arulmighu Meenakashi Amman College of Engineering, IndiaCarlo Harpes, itrust consulting s.à r.l. - Berbourg, LuxembourgKari Heikkinen, Lappeenranata University of Technology, FinlandHans-Joachim Hof, Munich University of Applied Sciences, GermanyBjørn Olav Hogstad, University of Navarra - San Sebastian, SpainMuhammad Iftikhar, University of Malaysia Sabah, MalaysiaTomoko Izumi, Ritsumeikan University, JapanFumiko Kano, Copenhagen Business School, DenmarkVitaly Klyuev, University of Aizu, JapanHristo Koshutanski, University of Malaga, SpainLars Krüger, T-Systems, GermanyGabriele Lenzini, University of Luxembourg, LuxembourgCatherine Letondal, French Civil Aviation University - Interactive Computing Laboratory, FranceDavid Lizcano Casas, Universidad Politécnica de Madrid (UPM), SpainWassef Louati, University of Monastir, TunisiaKarla Felix Navarro, University of Technology - Sydney, AustraliaJosef Noll, University of Oslo/UNIK - Kjeller NorwayHenning Olesen, Aalborg University Copenhagen, DenmarkAris Ouksel, University of Illinois at Chicago, USAIgnazio Passero, University of Salerno, ItalyIsabel Pereira Marcelino, Polytechnic Institute of Leiria, PortugalWilly Picard, Poznan University of Economics, PolandAnn Reddipogu, ManyWorlds UK Ltd. - Aberdeen, UKMichele Risi, University of Salerno, ItalyJoel Rodrigues, University of Beira Interior, PortugalCarmen Santero, CNR-ISTI, ItalyMarcello Sarini, Università degli Studi Milano-Bicocca - Milano, ItalyGiuseppe Scanniello, University of Basilicata, ItalyDominique L. Scapin INRIA, FranceRainer Schmidt, HTW-Aalen, GermanyMonica M. L. Sebillo, University of Salerno, Italy
5 / 145

Jacques Simonin, Institut Télécom / Télécom Bretagne, FranceWeilian Su, Naval Postgraduate School - Monterey, USARoman Y. Shtykh, Rakuten, Inc., JapanRuck Thawonmas, Ritsumeikan University, JapanGenoveffa Tortora, University of Salerno, ItalyGiuliana Vitiello, Università degli studi di Salerno, ItalyBenjamin Weyers, University of Duisburg-Essen, GermanySherali Zeadally, University of the District of Columbia, USAHaifeng (Kevin) Zhao, University of California - Davis, USAGottfried Zimmermann, Media University Stuttgart, Germany
6 / 145

Copyright Information
For your reference, this is the text governing the copyright release for material published by IARIA.
The copyright release is a transfer of publication rights, which allows IARIA and its partners to drive the
dissemination of the published material. This allows IARIA to give articles increased visibility via
distribution, inclusion in libraries, and arrangements for submission to indexes.
I, the undersigned, declare that the article is original, and that I represent the authors of this article in
the copyright release matters. If this work has been done as work-for-hire, I have obtained all necessary
clearances to execute a copyright release. I hereby irrevocably transfer exclusive copyright for this
material to IARIA. I give IARIA permission or reproduce the work in any media format such as, but not
limited to, print, digital, or electronic. I give IARIA permission to distribute the materials without
restriction to any institutions or individuals. I give IARIA permission to submit the work for inclusion in
article repositories as IARIA sees fit.
I, the undersigned, declare that to the best of my knowledge, the article is does not contain libelous or
otherwise unlawful contents or invading the right of privacy or infringing on a proprietary right.
Following the copyright release, any circulated version of the article must bear the copyright notice and
any header and footer information that IARIA applies to the published article.
IARIA grants royalty-free permission to the authors to disseminate the work, under the above
provisions, for any academic, commercial, or industrial use. IARIA grants royalty-free permission to any
individuals or institutions to make the article available electronically, online, or in print.
IARIA acknowledges that rights to any algorithm, process, procedure, apparatus, or articles of
manufacture remain with the authors and their employers.
I, the undersigned, understand that IARIA will not be liable, in contract, tort (including, without
limitation, negligence), pre-contract or other representations (other than fraudulent
misrepresentations) or otherwise in connection with the publication of my work.
Exception to the above is made for work-for-hire performed while employed by the government. In that
case, copyright to the material remains with the said government. The rightful owners (authors and
government entity) grant unlimited and unrestricted permission to IARIA, IARIA's contractors, and
IARIA's partners to further distribute the work.
7 / 145

Table of Contents
MobileSage - A Prototype Based Case Study for Delivering Context-Aware, Personalized, On-Demand HelpContentTill Halbach and Trenton Schulz
1
Personalized Shopping Experience with NFC Smartphone Apps and Electronic Shelf LabelChia-Chi Teng, Mark Bishop, Jarom Brown, Andrew Hansen, Reed Kleinman, and Nigel Palmer
7
Student Driven Innovation: Designing University Library ServicesAlma Leora Culen and Andrea Alessandro Gasparini
12
UWB Radar with Array Antennas for Human Respiration and Heartbeat DetectionHuan Bang Li and Ryu Miura
18
Applying Augmented Reality to Tourism Pamphlet and its EvaluationTadashi Miyosawa, Kentaro Hara, and Kikunori Shinohara
24
Experiential Adaptation to Provide User-Centered Web Content PersonalizationSilvia Mirri, Catia Prandi, and Paola Salomoni
31
Development and Evaluation of a Rehabilitation Program using Kinect™ Motion Capture TechnologyTadashi Miyosawa, Shinya Yanagisawa, and Masao Okuhara
37
Interface Design Techniques for Electronic Nose Sensors:A SurveySaeed Samadi
44
Study of Cochlear Implants Electrodes Stimulation Based on the Physics of the Ear for Audio Signal IntegrityImprovementUmberto Cerasani and William Tatinian
50
Sightseeing Spot Communication System using Four-Frame StoriesTomoko Izumi, Masaki Masuda, and Yoshio Nakatani
55
An Opportunistic Tourism Navigation System using Photography Location RecommendationHiroya Sakaguchi, Tomoko Izumi, and Yoshio Nakatani
61
Disaster Information Sharing System Using Pictograms OnlyKakeru Kusano, Tomoko Izumi, and Yoshio Nakatani
67
Engaging Practitioners to Deliver Government Carbon and Energy Phased Reduction Targets: Toward a Web 3.0ApproachYacine Rezgui, Haijiang Li, Tom Beach, and Ioan Petri
73
1 / 2 8 / 145

Modeling of the Organ of Corti Stimulated by Cochlear Implant ElectrodesUmberto Cerasani and William Tatinian
80
Towards a Framework for Business Models in Event ManagementChristina Di Valentin, Andreas Segl, Dirk Werth, and Peter Loos
86
Privacy-Centric Modeling and Management of Context InformationFlorian Dorfmeister, Sebastian Feld, Claudia Linnhoff-Popien, and Stephan A. W. Verclas
92
Towards Context-Driven User Interfaces in Smart Homes - The Cloud4all Project’s Smart House DemoGottfried Zimmermann, Alexander Henka, Christophe Strobbe, Simone Mack, and Annette Landmesser
98
User-Centric Adaptive Automation through Formal Reconfiguration of User Interface ModelsBenjamin Weyers
104
A Multi-Method Approach to Assessing the Usability of Mobile Job AdvertisementsStephan Bohm, Susanne J. Niklas, and Wolfgang Jager
108
An Exploration of Relationships between Culture Images and User Experience of Gesture InteractionTian Lei and Shuaili Wei
112
The Case for Integrating Needs and Preferences in the Internet of ThingsAndy Heath, Gill Whitney, Irena Kolar, and Mark Springett
118
Process of Gamification. From the Consideration of Gamification to its Practical ImplementationCathie Marache-Francisco and Eric Brangier
126
Citizen-centric eGovernment ServiicesLasse Berntzen
132
Powered by TCPDF (www.tcpdf.org)
2 / 2 9 / 145

MobileSage — A Prototype Based Case Study forDelivering Context-Aware, Personalized, On-Demand
Help Content
Till Halbach & Trenton SchulzNorwegian Computing Center
Oslo, NorwayEmail: till.halbach,[email protected]
Abstract—We present the system design decisions for theMobileSage Prototype, a service for the on-demand delivery ofmultimodal help content to anyone in general and seniors in par-ticular. Findings from user-centered research formed the systemrequirements, design considerations and decisions. The designof the system also includes availability, relevance, accessibility,conciseness, and comprehensiveness of multimodal content. Theprototype has been evaluated in user trials with encouragingresults, showing the participants’ high appreciation of the system.
Keywords—Mobile; smartphone; application; assistance; guid-ance; help on demand; personalization; adaptive; accessible; us-able; multimodal; context; location aware; Ambient Assisted Living.
I. INTRODUCTION
Our everyday lives are becoming ever more technologicalwith an increasing number of machines and devices sur-rounding us. This leads to a continuously rising degree ofcomplexity in everyday life. This can be a challenge for many– particularly elderly persons. This is why many senior citizensmeet these solutions based on Information and CommunicationTechnology (ICT), such as ticket machines and web services,with anxiety.
At the same time, modern elderly – here defined as peopleaged 65 and older – live longer, are healthier, more active,mobile, independent, and more demanding customers [1].There are approximately 87 million elderly in Europe [2].They are increasingly looking for useful, user friendly, andpersonalized ICT services that add value to their active andmobile life; they also desire services that can help them tostay active despite various impairments. MobileSage providesa timely approach and solution that is detailed below.
The article is organized as follows: First, we present thesystem architecture of MobileSage and its main components.Next, we lay out the requirements for these components andtheir consequences for system design and content production.We then present results from the first round of user evaluationsin Norway. Finally, we conclude with next steps in the projectand other lessons learned. This work’s main contributionscover the thorough discussion of the needs of various usergroups, the derivation of constraints for the design of thesystem and the production of media content, as well as resultsand recommendations from user trials.
II. MOBILESAGE OVERVIEW
MobileSage stands for Situated Adaptive Guidance for theMobile Elderly. Its aim is to give the modern elderly a smartagent that provides relevant, accessible, usable, and multimodalassistance for carrying out and solving everyday tasks andproblems in the self-serve society, whenever and wherever theyoccur [3, 4]. Related research and solutions are discussed in[5].
A. MobileSage Components
MobileSage consists of two components: the Help-on-Demand (HoD) mobile application and the Content Manage-ment Service (CMS). Figure 1 shows the overall architecture.The system is developed in three major iterations, and thefindings here are from the first iteration.
Fig. 1. System architecture and major building blocks for HoD (left) andCMS (right)
1) Help-on-Demand Service: The HoD application is thepersonal agent, a thick-client application running on a smart-phone. It is built up in a service-oriented manner, see Figure 1.The user interacts with the Dialog Manager through the UserInterface. The Dialog Manager utilizes information from theProfile Service taking care of the user profile. The user profilestores personal preferences and usage patterns. User behaviorand User Interface events are logged and analyzed by thePersonalization Service, upon which the user profile is re-adjusted.
The Dialog Manager is in contact with the Reasoning Ser-vice to help determine the user’s context. Reasoning makes use
1Copyright (c) IARIA, 2013. ISBN: 978-1-61208-306-3
CENTRIC 2013 : The Sixth International Conference on Advances in Human-oriented and Personalized Mechanisms, Technologies, and Services
10 / 145

of network services such as Media Service, Search Service, andthe Content Service. The Reasoning Service gets help from theLocalization Service, which can determine the user’s locationbased on technologies like A-GPS, WLAN, GSM/GPRS, NFC,and triangulation methods.
The HoD Service requests the content from the CMS uponinitiation of the user.
2) Content Management Service: The CMS is a cloudservice running on a web server. Content producers interactwith the service’s Dialog Manager, which in turn controlsthe User Interface on a User Agent like a web browser. Thelogic for handling the multimodal content lies in the ContentManager, which has a modular design to be able to addadditional modalities in a simple way. The prototype supportsthe modules Video (with or without captions), Image, Audio,Text, and Formatted Text (basically simplified HTML). Thecontent is stored by the Content Service. It is also possibleto refer to content located elsewhere (e.g., from other videoservices).
There is no limitation in the kind of content that can befacilitated. This includes manuals, usage instructions, descrip-tions of travel routes, and geographical points of interest. Weanticipate that vendors or service providers generate most ofthe content. For instance, a particular vendor might providemanuals for their ticket machines, or the railway operatorthat runs these machines might do so. Even a municipalitymight be interested in producing such help content as a specialservice for their citizens and visitors. Other interested partiesare expected to add content to the CMS to fill in the gaps leftbehind by vendors or service providers, as they are likely tohave a direct interest in helping someone using HoD. Finally,there is nothing that prevents users of the HoD from producingand making help content available themselves.
III. USER AND SYSTEM REQUIREMENTS
The following sections address the formulation of the re-quirements and constraints for the system design. The primaryMobileSage users are those using the HoD service. Secondaryusers are content producers, and tertiary are vendors or serviceproviders.
A. Requirements for Primary Users
The derivation of the requirements of primary users is splitinto the gathering of the users’ expectations towards the system(user needs analysis), and the collection of user requirements.The system requirements were derived from the latter.
1) User Needs Analysis: Focus group work was conductedin the three countries Norway, Romania, and Spain to findthe needs of primary users [6]. The focus groups had 39participants and represented a broad range of parameters,including age (48 to 96), gender (24 female vs. 15 male),disabilities (sensory and cognitive impairments), nationality (4foreigners), and ICT experience and usage. Two scenarios werepresented to the participants: an individual with reduced visiontraveling in a foreign country where he was not proficient inthe language, and an elderly lady at home trying to understandhow to use an electric household appliance.
The focus groups’ results show that “modern elderly per-sons” is a very heterogeneous group with a wide range of– sometimes contradictory – needs and wishes. This appliesalso to the users’ familiarity with ICT in general and mobiletechnology, which ranges from none to professional users.However, it was possible to identify themes of what thesolution should have [6]. The solution should a) lead to higherindependence of elderly people according for the help-for-self-help principle, b) increase a person’s mobility, and be usablefor transportation and travel, including holidays and visits,c) be applicable in the home environment and throughoutdaily living, d) provide relevant, useful, context- and location-sensitive and multimodal assistance in an on-demand manner,e) be accessible, user-friendly, designed for all, possible topersonalize or customize, adaptive, social, and f) honor privacy,security, and trust matters.
2) User Requirements: The results from the user needsanalysis were collected and formulated as user requirements[7]. The roughly 50 requirements mirror the expectations ofprimary users regarding HoD, but were extended to be validfor the CMS as well. The user requirements served as inputto the process of formulating the first draft of the systemrequirements for the service’s two components.
3) System Requirements: The requirements for the Help onDemand and Content Management services were derived fromthe user requirements.
The requirements specification for HoD has over 60 re-quirements [8], while the CMS specification contains only40 [9]. Both address topics such as system functionality,user interface, and input and output matters. Also includedare sections on the technology choice and mockup examplesregarding the services’ user interfaces.
B. Requirements For Secondary and Tertiary Users
MobileSage’s focus is on primary users. Secondary andtertiary users have been accounted for by formulating a set ofrequirements representing the needs of the transport companyparticipating in the project. These are as follows: a) It shouldbe possible to identify one or several points of interests witha unique ID. b) There could be multiple help topics per ID.c) One topic could be presented in multiple languages. d) Theservice should support content hosted elsewhere (“upload once,available everywhere”). e) It should be possible to edit helpcontent in order to add locations, languages, and modalities.
IV. SYSTEM DESIGN
For the HoD service, a user profile lays the ground forpersonalization and adaption of the service. It contains theuser’s settings and preferences, such as font size, emergencynumber, accepted media types, and additional languages. Alsoother parameters are stored there, including usage log. Thislog is the basis for system adaptation. Screenshots of the HoDare shown in Figure 2.
Both primary and tertiary users have requested that itshould be possible to associate content with specific locationsor points of interest. However, it should also be possible to linkcertain content to several locations (e.g., “how to buy a ticket”is valid for any ticket machine in the Oslo area). Moreover,
2Copyright (c) IARIA, 2013. ISBN: 978-1-61208-306-3
CENTRIC 2013 : The Sixth International Conference on Advances in Human-oriented and Personalized Mechanisms, Technologies, and Services
11 / 145

Fig. 2. Screenshots of the Help-on-Demand application: set up (left), homescreen (middle), and search (right)
there are situations where several pieces of content are relevantat a single location (e.g., how to validate a ticket, arrival timeof the next bus, or choosing the correct platform for departure).
These issues have been solved by the Content Item, seeFigure 3. This uniquely identifiable item is a logical unit togather content that is related to each other. Multiple locationsin terms of latitude, longitude, and altitude can be linked to asingle Content Item, and so can Records, each representing aparticular topic. The topic itself is described by a Record’s titletogether with a language identifier. Language translations of atopic become a new Record. To avoid topics being mixed inthe result listing, the results are ordered according to languagefirst, and alphabetically by topic. The user needs analysisrecommended further to split content into several Steps orsegments, and to promote segmented content, something thepresented data model is capable of by combining multipleSteps into a Record. A Step has the same language as theRecord it belongs to and has one of the Media Types: text,formatted text (HTML), audio, an image or animation, video,or a video with captions. Further elements are a brief Summaryand an URI/URL pointing to the media itself. The URI canpoint to a server that is part of the CMS, but it may alsopoint to external resources (e.g., a video on YouTube). Forsuch external resources, the CMS effectively functions as aservice holding metadata on indexed resources. This modelsupports multiple media types not only for the same Step butalso mixing of media types per Record (i.e., several Steps)depending on which type suits a particular step best. Forinstance, video might be best suited to illustrate a movement,while often a still image is beneficial for highlighting a specificregion of a visual.
Fig. 3. Data model of the content
MobileSage is about just-in-time guidance and on-demandassistance. Based on suggestions from the primary-user stud-ies, it was deemed too intrusive to let the mobile applicationinitiate requests for help based on the location of the phoneat points of interest, nearby radio fields, etc. Thus, the userindicates a wish for assistance either by scanning a QR codeorNFC tag, or by sending a text phrase to the CMS. In theformer case, the code or tag carries the ID of a particularContent Item, which is read by the mobile app and sent tothe CMS, resulting in a list of all topics associated with thatID. Regarding the search phrase, topics are viewed as relevantregardless of the ID, accounting for both Record titles and Stepsummaries.
One of the challenges of MobileSage is to find relevantcontent and not to confuse the user with extraneous informa-tion [9], which helps individuals with orientation and problemsolving challenges. The key to this problem is determining theuser’s context, in terms of (most importantly) location, timeand date, user habits, and other aspects. Nearby objects areconsidered relevant in the CMS by calculating a proximityradius around the user’s current position; only Content Itemswith a location within this circle are returned as results to thephone. The exact radius of the circle was based on heuristicsand set to roughly 40 m.
Records are sent in “pages” to the phone, meaning thatHoD tells the server how many results per request to return.This is done first of all for practical reasons, i.e., bandwidthlimitation, and second because the user is likely to be interestedonly in the most relevant results, which are presented first. Theclient on the phone keeps track of the number of transmittedrecords and is hence able to request a particular page withresults, say, page 3 with the records 21 through 30 in case of10 allowed records per page. If the user scrolls down whilebeing at the bottom of the results list, the client fetches moreresults if available.
For simplicity, any media content is offered to the HoDas a file for download through HTTP. While this works greatwith text-based content, the performance in terms of respon-siveness of the playback on the media player is suboptimalwhen connected over a channel with very limited capacity,as discussed in Section VI-B because media downloads inmost clients have to finish before the media is rendered onan output device. Clients that support (true) media streamingand pseudo streaming methods like HTTP Live Streamingwill start rendering the output as soon as sufficient databecome available. These methods require the proper setup of astreaming media server and are planned for the next iteration.
V. CONTENT PRODUCTION
This section considers the production of content for Mo-bileSage in particular and educational and instructive contentin general.
The content found should be relevant, concise, and com-prehensive. However, as recent research surveys show [10–13], it is extremely difficult to develop methods which cancheck exactly that in a satisfactory manner. MobileSage offersa manual approach in its CMS [9]. As mentioned before, thesplitting of longer content into shorter steps is encouraged. Thecontent producer now provides the content abstraction on two
3Copyright (c) IARIA, 2013. ISBN: 978-1-61208-306-3
CENTRIC 2013 : The Sixth International Conference on Advances in Human-oriented and Personalized Mechanisms, Technologies, and Services
12 / 145

levels: A summary of the step itself, and a title wrapping-upof the entire record (see Figure 4). The content producer musttag the content with the proper descriptors for language, andits location, if applicable.
Currently, the content must be uploaded in a format ac-cepted by the Android OS. This applies to both the formatof the content tracks, be it video, audio, or captions, and theformat of the embedding media container. In future iterations,the CMS is planned to accept any format with transcodinginto a proper format supported by the OS. This targets locallystored and remote content likewise.
Fig. 4. Screenshot from the uploading of new content to the CMS.
While the video material could be presented at any resolu-tion, we chose to encode video with a resolution of 480×360pixels and a bitrate of roughly 200 Kbps @12 fps in H.264Baseline Profile Level 2.2 format, and embedded in an MP4transport container. The audio tracks (both stand-alone andas part of a video) had a rate of roughly 48 Kbps @22 KHzmono and were encoded in AAC format. A video containingone visual and one audio track thus had a bitrate of roughly260 Kbps, which includes overhead data used for track muxingand the container format. The length of the content variedfrom approximately 10 s to 4 min, but most of the content wasbetween 30 s and 45 s.
We used open-captioning, where a voice’s transcript areprinted as always visible titles on the screen, instead ofcomposing a separate captions track. This avoided the extrawork of producing a captions file and ensured that the videoplayer always worked properly, without any user action. Wechose a “slab serif” font that was originally designed for faxmachines, with a size of at least 36 points. One disadvantageto this approach is that more space is taken up on the contentserver to store each captioned video, but as the videos wereshort and at a low resolution, we believe this is a minor issue.
The content is currently provided in a single quality interms of resolution/sampling frequency and bitrate as men-tioned above. Both have implications for the bandwidth nec-essary to transmit a given content file to the client’s mediaplayer: the larger a picture (in pixels), and the higher theaudio sampling frequency (in Hz), the more bandwidth will benecessary. Likewise, the higher the encoder bitrate (in bps), themore bandwidth is required. Channel capacity of the cellularlink, however, is a limited resource for physical reasons. Ittakes time to transmit a particular amount of data over achannel, which also has an impact on the user experience. Theservice is thus required to respond upon user interaction withina reasonably short time span [7]. Currently, this requirementis not reflected in the system, but it is planned to honorit by measuring the duration of packet downloads at theclient side (which may vary over time according to the signalstrength and coverage) and include this information in theserver requests, together with information about the phone’sscreen size. In the next development iteration, content willbe provided in several resolutions or sampling frequencies,and several bitrates. Media searches at the server side canthen utilize this information about the channel conditions andlimit the results to media qualities that meet the bandwidthconstraints. For example, a phone with a 480 × 800-pixelscreen is connected to the network over a GSM (2G), andthe bandwidth averaged over 20 s is measured to be 100 Kbps.Based on the different resolutions and bandwidth, the serverdecides that a 480 × 360-pixel will still render acceptable togood quality. Yet, the 480 × 360-pixel video comes in twodifferent bitrates; one encoded at a rate of 260 Kbps, and oneencoded with 130 Kbps (assuming a constant encoding bitrate).The latter is closest to (but still above) the estimated channelcapacity and will be sent to the phone to minimize the service’sresponsiveness, together with a notification about poor channelconditions.
VI. USER EVALUATIONS
User trials were conducted in Norway, Spain, and Romaniain December 2012 to evaluate the service after the firstdevelopment cycle.
A. Setup
The evaluation in Norway consisted of a travel situation ata subway station in Oslo, where participants used the prototypeto find help with getting to a subway station, finding a ticketmachine, buying and validating a ticket, and choosing thecorrect platform. We created content for all of these scenarios,with a minimum of audio and video for each. All but oneof the scenarios had captioned video, and some had a textualmodality in addition. Each of audio, text, and video was doneboth in Norwegian and in English to allow users to choosean additional content language. We then created several NFCtags for each of the scenarios and used it as a way of gettingthe information. We also wanted to use QR-codes, but weultimately dropped it as it was to unreliable to scan withthe current version of the mobile application. We tested ontwo smartphones with an Android OS 4.1 and screen sizesof 480 × 800 and 720 × 1184 pixels without any discernibledifference in the results.
4Copyright (c) IARIA, 2013. ISBN: 978-1-61208-306-3
CENTRIC 2013 : The Sixth International Conference on Advances in Human-oriented and Personalized Mechanisms, Technologies, and Services
13 / 145
Eight participants were recruited for the evaluation. Theywere between 65 and 76 years old, and four of them had noexperience with smartphones; however, they were somewhatexperienced with computers. A few of them knew the locationto a certain extend. A session consisted of a short introduc-tion to the MobileSage idea, followed by a brief interviewconcerning their experience with mobile phones. Then, wedemonstrated the application. After this, we began the tasks.One evaluator would take notes, while the other would guidethe participant to make sure a task wasn’t forgotten. Aftercompleting the tasks, there was a short follow-up interviewabout the service and the participant’s experience about it.
B. Results
In the first task, the participants had to create a profilethat matched their preferences for text size, language, andtypes of media they wanted to receive help in. The usersunderstood the concept of several content languages, and themajority (75%) added English to their profile. The user-specificmedia types ranged from a single one to the entire rangeas detailed in Section IV, where captioned video was chosenmost often. The majority (90%) of test persons checked 4–5media types including audio, even though some participantssaid they would avoid wearing earbuds or headphones. Textwas never requested. Choosing video and captioned video wasinconsistent, hinting on a potential misunderstanding of theuser concerning the meaning of “captioning”. It is hence rec-ommended to improve the description of media types or showbrief examples of them. All participants but one expressed thatmaking the profile was sufficiently easy.
The second task concerned navigation, where the parti-cipants had to get from their current location to the nearestsubway station. All were able to enter the information needed,but the phone’s positioning worked unreliable, sometimesplacing the participant a block further south and/or facing thewrong direction. This issue sorted itself out when walking tothe location.
The next task dealt with getting help at the ticket machine.Two participants were not able to finish this task due to atechnical issue that caused no results to be returned from theCMS, which was corrected subsequently. All others succeededwith using NFC tags or by manually searching for informationabout where the ticket machine was, how to purchase a ticket,how to validate the ticket, and which platform they had to goto. Though only one was familiar with the technology, two hadheard about it, and the rest were unaware of what it was, allreally liked the technology and experienced it as easy to use.
A problem encountered was the effect the environment hadon the signal strength in the phones. While above ground,it was possible to get video and audio without any issues,and the selected item would show up almost instantly. Yet,underground in the subway station, it became very troublesomefor the phone to contact the content server. The main reasonfor this is that the only connections that are currently availablein this particular station are so-called Edge (2G) connections.They are much slower compared to a 3G connection and alsovery latent. This was no big issue when retrieving, say, theresults list. Participants had to wait a long time, though, ifthey wanted to watch a video. The audio fared a little better,
but downloading would not always complete. Sometimes,the application on the phone would simply give up and itwould be necessary to download the audio or video from thebeginning. Most participants noted that it took a while to getthe information in this case. With the continuing widespreadof 2G connections in many countries, it is recommendedto produce at least one version of low-resolution low-bitratecontent, and to use techniques that increase the responsivenessof media players, such as media streaming, as discussed inSection IV.
No users complained about the size, resolution, quality,frame rate, or length of the video. Some participants notedthat the font used for the captions indeed was sufficiently largeand easy to read. There was only one instance where peoplecommented on unclear information, where a video showed anunreadable display on a ticket machine.
All the participants felt that a help-on-demand systemwas something that would be useful for them. One of theparticipants even claimed that she was scared of using theticket machine and always went to a store to buy her tickets,but would now she would use the ticket machine since shefelt confident that she could use it based on the providedinstructions. Concerning potential improvements, the mostpopular suggestions were a shorter response time for videos(when in the subway station) and dynamic information, suchas time schedules. Those familiar with mobile applicationssuggested to include MobileSage’s functionality in the publictransport provider’s current smartphone application.
VII. CONCLUSION AND OUTLOOK
We presented a first version of the MobileSage prototype, aservice for delivery of context-aware, personalized help contentin an on-demand manner. MobileSage incorporates the needsof primary, secondary, and tertiary users and has been beenevaluated by primary users in user tests.
The aspects of content provision include multimodality andinternationalization to take care of user personalization, multi-resolution and multi-rate for device adaptivity, and location-aware media searches for relevance. It has been shown that thesystem can index both internal and external media databases.
The idea of MobileSage was well received, as the parti-cipants in all focus groups and user tests viewed the serviceas useful. Yet, they also pointed out areas for future improve-ment: The concept of media types is not fully understood, inparticular “captioning”/”subtitles” remains an unclear term tomost users. Positioning could be improved, for instance bycombining several techniques like A-GPS and WiFi triangu-lation. Also, users requested more information like transportschedules to be integrated into the service. The applicationneeds further improvement in presenting results. The challengeis to find content relevant for the given context and reducethe need to search for the correct result. For example, onlya single language and the “most rich” media type could bepresented for a particular topic. Finally, the responsiveness insituations with limited bandwidth could be improved by usingmore advanced protocols and device and channel adaptivity.
Content producers need guidelines on how to producecontent. While it is empowering that anyone can contribute
5Copyright (c) IARIA, 2013. ISBN: 978-1-61208-306-3
CENTRIC 2013 : The Sixth International Conference on Advances in Human-oriented and Personalized Mechanisms, Technologies, and Services
14 / 145

content, it is important that the offered content is usable.Guidelines should include information about the length of helpsections, phrasing of information, and how multimedia contentshould be organized. The results from the user trials can helpwith preparing these guidelines.
MobileSage will proceed its work with two more develop-ment iterations, combined by user evaluations, before the finalversion is going to be released early in 2014. In the next usertrials, we are also planning to give special attention to howQR codes are accepted as compared to NFC.
ACKNOWLEDGMENTS
This work is partly funded by the European Commissionthrough the AAL Joint Programme, the Norwegian ResearchCouncil, and national bodies in Spain and Romania. Theauthors would like to thank the consortium members for theirvaluable contributions and all individuals involved in the userstudies for their feedback.
REFERENCES
[1] D. Metz and M. Underwood, Older, Richer, Fitter: Identi-fying the Consumer Needs of Britain’s Ageing Population.Age Concern England, 2005.
[2] European Commission, “Digital Agenda: Commissionproposes rules to make government websites accessiblefor all,” retrieved 2013-08-20. [Online]. Available: http://europa.eu/rapid/press-release\ IP-12-1305\ en.htm
[3] V. Sanchez, “The MobileSage Project,” retrieved 2013-08-20. [Online]. Available: http://mobilesage.eu
[4] I. Solheim and T. H. Røssvoll, “MobileSage Projectfactsheet,” retrieved 2013-08-20. [Online]. Available:http://nr.no
[5] T. H. Røssvoll, “The European MobileSage Project –– Situated adaptive guidance for the mobile elderly,”in Electronic Government and Electronic Participation,Joint Proceedings of Ongoing Research and Projects ofIFIP EGOV and IFIP ePart 2012, H. J. Scholl, L. S.
Flak, M. Janssen, A. Macintosh, C. E. Moe, ØysteinSæbø, E. Tambouris, and M. A. Wimmer, Eds., vol.Schriftenreihe Informatik 39, International Federation forInformation Processing. Kristiansand (Norway): TraunerVerlag, Sep. 2012, pp. 215–222.
[6] Øystein Dale, “User needs analysis,” MobileSageConsortium, Tech. Rep. MobileSage DeliverableD2.1, 2012. [Online]. Available: http://mobilesage.eu/public-documents/public-deliverables
[7] T. H. Røssvoll, “User requirements specification,”MobileSage Deliverable D2.2, MobileSage Consortium,Tech. Rep., Feb. 2012. [Online]. Available: http://mobilesage.eu
[8] L. Curescu, I. Anghelache, and T. H. Røssvoll,“System requirements specification for help-on-demandservice,” MobileSage Deliverable D2.3, MobileSageConsortium, Tech. Rep., Apr. 2012. [Online]. Available:http://mobilesage.eu
[9] T. H. Røssvoll and V. A. Gracia, “Systemrequirements specification for content managementservice,” MobileSage Deliverable D2.4, MobileSageConsortium, Tech. Rep., Apr. 2012. [Online]. Available:http://mobilesage.eu
[10] R. Mohamad Rasli, S. C. Haw, and R. Mohamad Rasli,“A survey on optimizing image, video, and audio queryretrieval in multimedia databases,” International Journalof Advanced Computer Science, vol. 2, no. 6, 2012.
[11] D. Das and A. F. Martins, “A survey on automatic textsummarization,” Literature Survey for the Language andStatistics II course at CMU, vol. 4, pp. 192–195, 2007.
[12] D. Brezeale and D. J. Cook, “Automatic video classifi-cation: A survey of the literature,” Systems, Man, andCybernetics, Part C: Applications and Reviews, IEEETransactions on, vol. 38, no. 3, pp. 416–430, 2008.
[13] W. Hu, N. Xie, L. Li, X. Zeng, and S. Maybank, “A sur-vey on visual content-based video indexing and retrieval,”Systems, Man, and Cybernetics, Part C: Applications andReviews, IEEE Transactions on, vol. 41, no. 6, pp. 797–819, 2011.
6Copyright (c) IARIA, 2013. ISBN: 978-1-61208-306-3
CENTRIC 2013 : The Sixth International Conference on Advances in Human-oriented and Personalized Mechanisms, Technologies, and Services
15 / 145

Personalized Shopping Experience with
NFC Smartphone Apps and Electronic Shelf Label
Project Y-Mart
Chia-Chi Teng, Mark Bishop, Jarom Brown, Andrew Hansen, Reed Kleinman, Nigel Palmer
School of Technology
Brigham Young University
Provo, UT, USA
[email protected], [email protected], [email protected],
[email protected], [email protected], [email protected]
Abstract—Near Field Communication (NFC) capability has
become a standard feature in majority of smartphones on the
market today. As more users have adopted NFC enabled
smartphones, systems are developed to utilize the NFC
protocol for electronic payment and other convenient functions
to improve personalized shopping experiences. However, most
of the NFC enabled functions available today interact with
shoppers at point of sale (POS) which only provide limited
fraction of the rich customer benefit promised by this new
technology. By integrating NFC capable smartphone
applications with NFC enabled electronic shelf labels (ESL)
and back-end web services, we can provide a more interactive,
informed, efficient, fun and personalized shopping experience
at a variety of retail environments.
Keywords-NFC; Smartphone; RFID; Electronic Shopping
Label; ESL.
I. INTRODUCTION
The retail industry has been advocating “smart shopping” for many years by adopting various technologies to enhance the shopping experience at the retail environment. The vision of smart shopping promises to provide on-the-spot production information at your fingertip such as specifications, reviews, promotions, recipes, related products, payment through the use of technologies. For example, some of the most recent attempts include the use of camera enabled smartphones and QR (Quick Response) code to provide on-the-spot information by visually scanning QR code which takes you to a website. However, the technologies have not quite lived up to the expectations and promises of the smart shopping vision.
Some of the reasons why smart shopping has not been widely adopted relate to cost and ease of use. For example, while QR code can be an excellent way to bring online content to a smartphone, the scanning process can be cumbersome and unreliable. The Electronic Shelf Labels (ESL) can potentially improve the on-the-spot interactivity with the shoppers, but the higher cost and lack of standardization hinder the wide adoption and applications. As lower cost and NFC compliant ESL become available, it could conceivably make it easier for the retailers to justify
the investment if it could deliver the real smart shopping benefits to the shoppers.
Analysts have predicted that smartphones will play a bigger role in shopping [1]. As the use of NFC enabled smartphones become popular, the unique ID (UID) in each phone can become one’s personal identification. This feature can further enhance and personalize the smart shopping experience by providing purchasing history, targeted promotions, loyalty rewards, and much more.
Project Y-Mart was designed and developed to leverage the latest NFC enabled smartphones and low cost ESL in conjunction with back-end web services to build a complete end-to-end prototype system. NFC enabled smartphone apps are developed on the Android and Windows Phone platform to demonstrate the working prototype. Web portal is also provided to allow retailers to manage and customize the system.
Current state of ESL systems will be reviewed in Section 2, followed by a system overview of Y-Mart in Section 3. The design detail and conclusion will be covered in Section 4 and 5, respectively.
II. RELATED RESEARCH
The increasing use of smartphone with Internet data services [2] has made augmented reality a reality in many fields of research and application [3], such as travel, library, and in some cases the retail industry. We have seen many attempts by the researchers and retail industry to enhance the shopping experience through the use of technologies, such as RFID, camera phones, QR code, smartphones, ESL and now NFC [4-8]. However, none seem to have provided a solution that the retailers are willing to implement at scale.
While NFC-based applications have come a long way and promised to enhance personal experience [9], the implementations at retail environment currently seem to be limited to electronic payment at the point of sale (POS). One of the main reasons is that the NFC enabled on-the-spot product information and smart shopping experience would require ESL to interact with the personal smartphones. The current state of the art of ESL systems are the commercial systems provided by Pricer and Store Electronic System [10-
7Copyright (c) IARIA, 2013. ISBN: 978-1-61208-306-3
CENTRIC 2013 : The Sixth International Conference on Advances in Human-oriented and Personalized Mechanisms, Technologies, and Services
16 / 145
11], which are too expansive and based on proprietary systems. While they were originally designed for store management and not for smart shopping, some have begun to advertise NFC capabilities in the new ESL products. A startup RFID/NFC vendor Jogtek Corp. has developed a new class of ESL that is low cost, battery-less, RFID ISO 15693 and NFC compliant [12]. The Y-Mart system is designed and implemented based on the Jogtek ESL and standard RFID and NFC protocols in conjunction with NFC compliant Android [13] and Windows Phone [14] mobile devices.
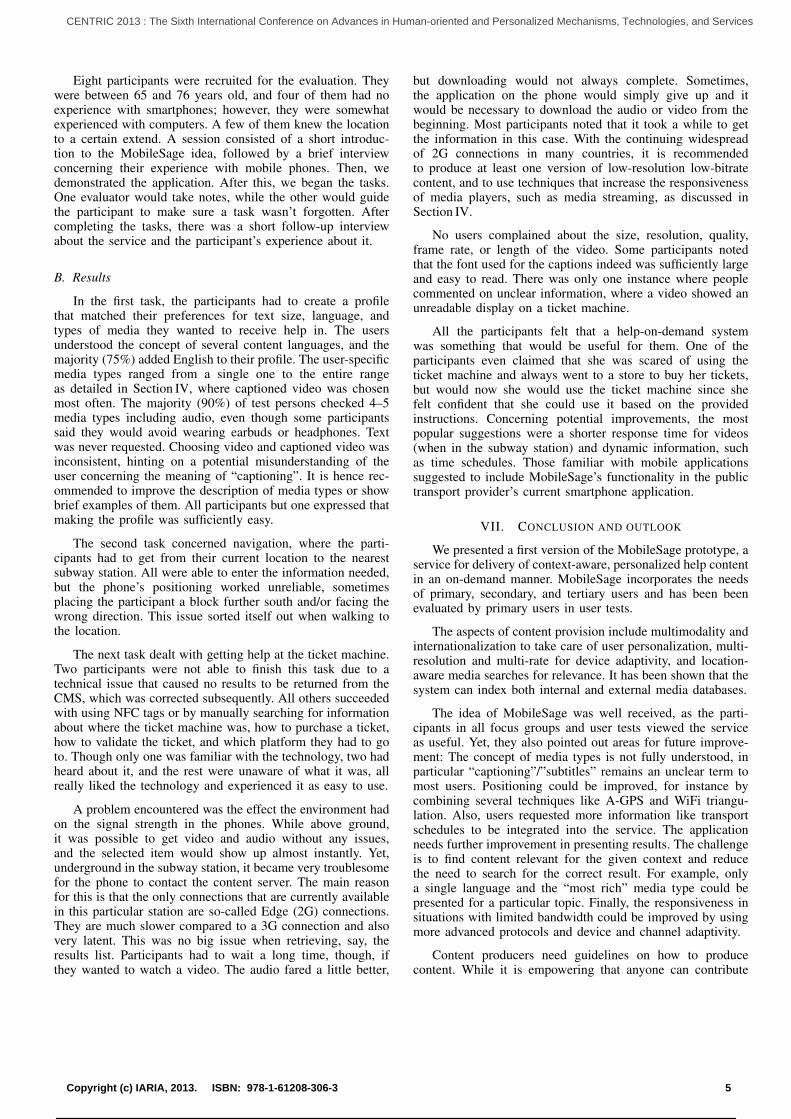
III. SYSTEM OVERVIEW
In order to provide end-to-end solution in this prototype, the Y-Mart system includes the following components as shown in Fig. 1.
• A back-end server with product database, smart shopping content (specification, promotion, recipe, etc.), user data (gender, age group, history, loyalty
reward, etc.), RESTful web service interface, and web management portal.
• Battery-less ESLs that contain NFC ID that can be mapped to product ID or SKU and product information in either hypertext or URL. The ESLs can be programmed through RFID ISO 15963 and read through NFC protocols.
• RFID driver and antenna that programs the ESLs.
• Mobile apps that run on NFC capable smartphones and tablets including Windows Phone 8 phone, Android phone, Android tablet.
A. Retailers’ Perspective
From the retailers’ perspective, the back-end server is the heart of the system which includes:
• A typical e-commerce product database that supports all the traditional services such as inventory and pricing.
Figure 1. Y-Mart System Overview Diagram
8Copyright (c) IARIA, 2013. ISBN: 978-1-61208-306-3
CENTRIC 2013 : The Sixth International Conference on Advances in Human-oriented and Personalized Mechanisms, Technologies, and Services
17 / 145
• A user database which may track users’ product queries and product purchases based on the smartphone NFC ID. For registered loyalty program customer, the database can potentially has more information, such as gender, age group, loyalty rewards, etc. The user information and/or history can be mined to provide targeted promotion, product suggestion, or advertisement through the smartphone apps.
• A smart shopping database that contains the enriched smart shopping content such as product details, (user
and expert) reviews, recipes (for food), and related products. The related products can be items in a recipe, accessories for electronics or many other scenarios.
• RESTful web services that provide programming access to the data mentioned above.
B. Shoppers’ perspective
From the shoppers’ perspective, the smartphone (or tablet) app is the heart of the system that makes the shopping experience informative, personal, and fun. For the shoppers to enjoy the full benefit of personalized smart shopping, they simply need to install the apps for their smart mobile device. The apps are developed by the retailers and post on the app distribution service for the mobile platform.
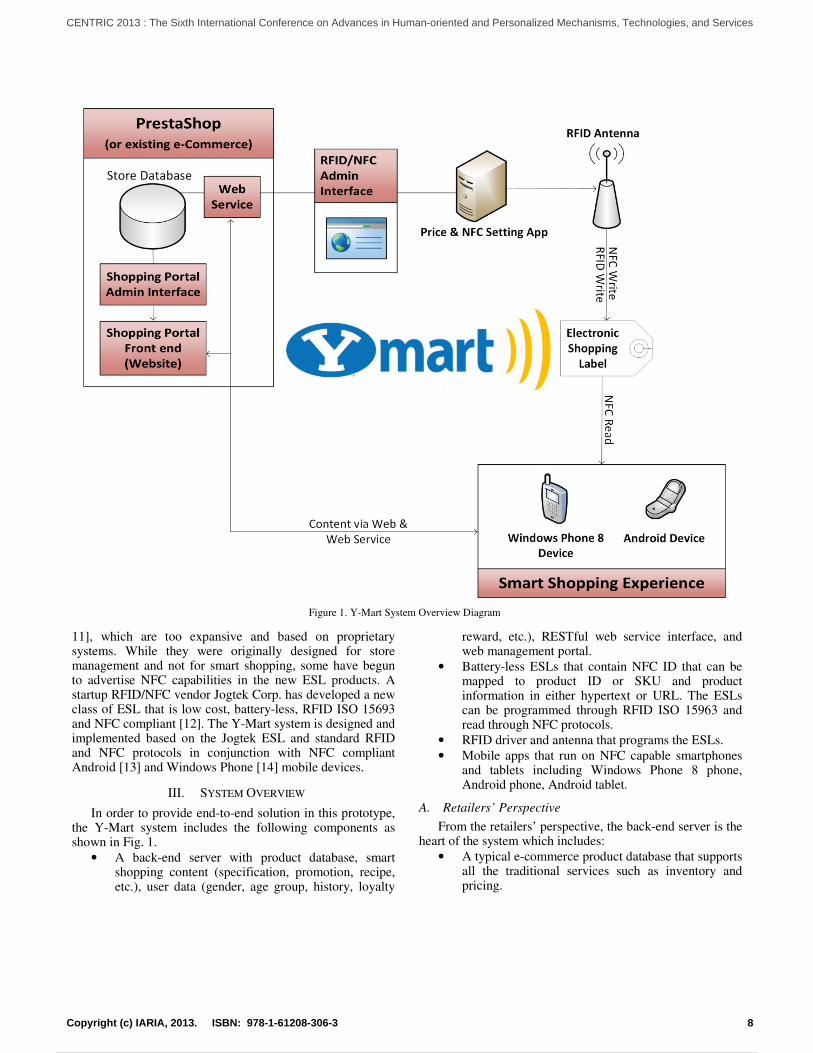
The common user scenario this system intends to address is when the shopper is at the product shelves in a retail store where they would simply need to tap the smartphone on the ESL to bring up the product information on the screen; any additional information, such as review and recipes, are just a finger tap away on the smartphone. The app will also inform shoppers of relevant products that are on sale based on user’s product query, history, and personal information. Fig. 2 shows examples of screenshots from the current prototype Y-Mart app for Windows Phone 8 device, where special promotion is prompted when user scanned a product item.
IV. IMPLEMENTATION
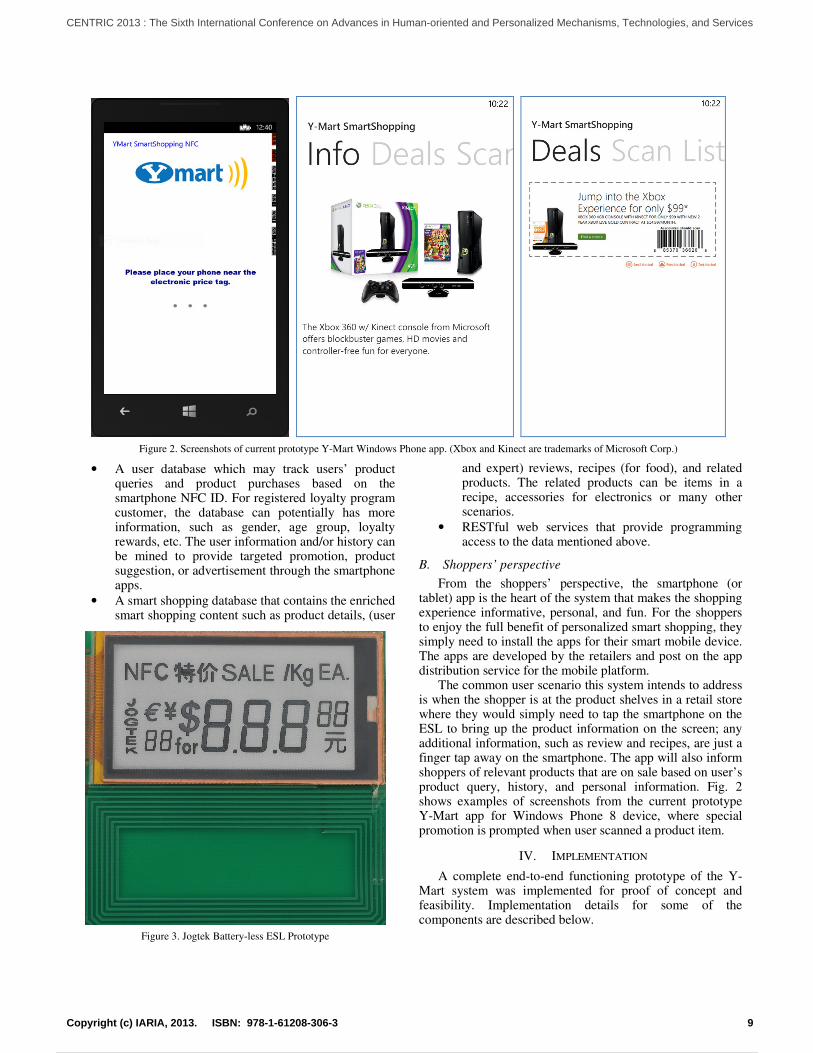
A complete end-to-end functioning prototype of the Y-Mart system was implemented for proof of concept and feasibility. Implementation details for some of the components are described below.
Figure 3. Jogtek Battery-less ESL Prototype
Figure 2. Screenshots of current prototype Y-Mart Windows Phone app. (Xbox and Kinect are trademarks of Microsoft Corp.)
9Copyright (c) IARIA, 2013. ISBN: 978-1-61208-306-3
CENTRIC 2013 : The Sixth International Conference on Advances in Human-oriented and Personalized Mechanisms, Technologies, and Services
18 / 145

A. ESL
The NFC enabled ESL is the component that facilitates the personal interaction at the product shelf, for large scale retailers that have tens or hundreds of thousands SKUs in a store. The cost and manageability of store ESLs are obviously major concerns. We prototyped the system based on a battery-less, low cost ESL technology (shown in Fig. 3) that can dramatically reduce the initial capital to install the ESLs on the product shelf. One additional benefit for the retailers is that an automated ESL update process can reflect more accurately the price labels, which can potentially lead to less overhead in regulatory compliance with consumer or government agencies.
B. Back-end server
The Y-Mart store back-end server is developed with the open-source PrestaShop e-commerce software [15] to provide a presentation and logic layer for the smartphone app and management web portal. The PrestaShop component represents an existing store platform, which most retailers
would already have. The smart shopping system would simply be an extension to the existing system. An example screenshot of the currently running Y-Mart customized PrestaShop prototype server is shown in Fig. 4, where stores can manage the additional smart shopping content.
RESTful web services were also developed as API (Application Programming Interface) for the management web portal and mobile apps to access product information, user data and smart shopping content. The web services are designed to be scalable in case of a large retail store where there could be hundreds of customer at a time.
Each UID on the NFC ESL is stored in the database and linked to a product ID (or SKU). Each UID on the NFC smartphone is also stored and linked to a user. When a customer scans an ESL for a product, the smartphone app reads the UID and calls the web services to retrieve the product information. At the same time, the mobile app will also use the UID of the NFC smartphone to retrieve the user information. The server can then use the combination of the product and user to present personalized content on the smartphone.
Figure 4. Y-Mart customized PrestaShop server example screenshot.
10Copyright (c) IARIA, 2013. ISBN: 978-1-61208-306-3
CENTRIC 2013 : The Sixth International Conference on Advances in Human-oriented and Personalized Mechanisms, Technologies, and Services
19 / 145

C. Price update server
The pricing data and smart shopping content on the ESL are updated wirelessly through RFID 15693 protocol. The Y-Mart prototype consists of a small power RFID driver and antenna which is connected to a price update server via USB. The price update process will run periodically to check changes in the PrestaShop server and update the ESL through the driver.
D. Mobile apps
A few popular NFC capable mobile devices were chosen to develop prototype Y-Mart apps.
• Nokia Windows Phone 8 phone
• Google Nexus One Android phone
• Google Nexus 7 Android tablet The apps use the standard NFC APIs provided by the
operating systems to read the NFC tags and use the HTTP protocols to call the back-end web services. Some example screenshots are shown in Fig. 2 and Fig. 5.
V. CONCLUSION AND FUTURE WORK
The Y-Mart project successfully implemented a personalized smart shopping experience with the latest NFC technologies. While only limited usability test were conducted, the preliminary result has shown that, comparing to scanning QR code, the users can more easily and reliably interact with the ESL through their smartphone to access the rich and personalized smart shopping content right at their fingertips.
There are certainly many features that we would like to add to the system; for example, shopping list, shopping cart, integration with payment, etc. Additional tests of usability and at scale are necessary as we continue to develop. As the ESL technology continues to advance, exciting personalized smart shopping experience could be here in the near future.
REFERENCES
[1] M. Hadley, “Smartphones to Play Bigger Role in Shopping,” USA Today, Nov. 15, 2012.
[2] J. Wortham, “Cellphones Now Used More for Data than for Calls,” New York Times, May 13, 2010, B1.
[3] H. Pense, “Smartphones, Smart Objects, and Augmented Reality,” The Reference Librian, vol. 52, pp. 136-145, 2011.
[4] V. Nguyen, T. Le, Q. Bui, M. Tran, and A. Duong, “Smart Shopping Assistant: A Multimedia and Social Media Augmented System with Mobile Device to Enhance Customers’ Experience and Interaction,” Proc. Pacific Asia Conference on Information Systems (PACIS2012), Jul. 2012.
[5] M. Schneider, “A Smart Shopping Assistant Utilising Adaptive Plan Recognition,” in A. Hoto & G. Stumme (Eds.), Lehren - Lernen - Wissen - Adaptivitdt (LLWA04), 2004, pp. 331-334.
[6] L. Fu, “Design of QR Code-based Mall Shopping Guide System,” Proc. International Conference on Information Science and Technology, Mar. 2011, pp. 450-453.
[7] Y. Xu, M. Spasojevic, J. Gao, and M. Jacob, “Designing a Vision-based Mobile Interface for In-store Shopping,” Proc. ACM NordiCHI 2008, Oct. 2008, pp. 393-402.
[8] B. Benyo, A. Vilmos, G. Fordos, B Sodor, and L Kovacs, “The StoLPan View of the NFC Ecosystem,” Proc. IEEE Wireless Telecommunication Symposium (WTS2009), Apr. 2009, pp. 1-5.
[9] V. Coskun, B. Ozdenizci, and K. Ok, “A Survey on Near Field Communication (NFC) Technology,” Wireless Personal Communications, Springer, doi:10.1007/s11277-012-0935-5.
[10] Pricer, http://www.pricer.com/, retrieved: Oct. 2013.
[11] Store Electornic Systems, http://www.ses-esl.com/, retrieved: Oct. 2013.
[12] Jogtek Corp., http://jogtek.com/, retrieved: Oct. 2013.
[13] Android, http://www.android.com/, retrieved: Oct. 2013.
[14] Windows Phone, http://windowsphone.com/, retrieved: Oct. 2013.
[15] PrestaShop, http://www.prestashop.com/, retrieved: Oct. 2013.
Figure 5. Example of Android app screenshot
11Copyright (c) IARIA, 2013. ISBN: 978-1-61208-306-3
CENTRIC 2013 : The Sixth International Conference on Advances in Human-oriented and Personalized Mechanisms, Technologies, and Services
20 / 145

Student Driven Innovation: Designing University Library Services
Alma Leora Culén Department of Informatics
University of Oslo Oslo, Norway
e-mail: [email protected]
Andrea Alessandro Gasparini Department of Informatics and University Library
University of Oslo Oslo, Norway
e-mail: [email protected]
Abstract— This paper addresses the question of how to engage students in design and innovation of library services. Student involvement in the design of the university library services is needed as they have distinct patterns of technology use: variety of platforms, nearly always including smart-phones and laptops, variety of social networks and often, a range of other digital tools. The involvement can take place in many different ways, e.g., participatory design projects, involvement through social media and others. In this paper, we describe our approach to innovation through student engagement in design of library services: innovation through an interaction design course and exposure to design thinking. Over a period of three years, our findings show that student projects have become increasingly original and creative. In addition, the level of engagement to produce finished products and services after taking the course has increased.
Keywords- innovation; user-driven; design; service design; design thinking.
I. INTRODUCTION Innovation is as old as humankind, but where and how
users could influence the path of innovation has changed significantly during the last decades [1]. Already in the 19th century a possibility was open to employees as domain experts or skilled labor, to influence processes and products within a company. Two types of internal innovator types arose: the core and the peripheral innovators [2], roughly indicating those who are paid to be creative and those who sit on the periphery but through their knowledge can participate and are interested in innovation processes [3], [4]. The third category of innovators includes everyone outside the company or organization and among them, includes users of products and services. When innovators build up their competence in the field of innovation, some problematic aspects may arise. One of them is related to the concept of “sticky” innovation, see [5], implying an accumulation of innovation forces, which are difficult to share afterwards. The consequence may be that other “innovation areas or problems” arise that always need to be delegated to the same group of innovators.
Students, at all levels, are users of university libraries. Their potential as innovators within university libraries, see [3], [6] or [7] is starting to be recognized. In this paper, we describe the case of service innovation through design and design thinking. Design is increasingly viewed as an important resource [8] and consequently companies and
organizations worldwide look at design as help to innovate [9], [10]. Innovation through design, combined with user participation in all phases of the design process, was chosen in order to facilitate and research the potential of a student-driven innovation in the context of the university library.
The possibility to get engaged in a design of innovative services for the library was offered through a course in interaction design. Students were free to choose their projects and for the past three years, eight projects in total were concerned with innovation in the library, engaging over 30 students in the design process as innovators.
The following question was the bases for our research: what if students, who are learning to design services and who, in addition, have the ability to develop them, and need them as users, get interested in innovation? Perhaps classical designer/user /developer gaps could be bridged?
The paper is structured as follows: we first describe the context for innovation within library services and why student driven, user centered view was chosen. In Section 3, we introduce the concept of the library living lab, describe projects related to innovation of library services and address the issue that our innovators are also developers, as well as the primary user group for the university library. Subsequently, in Section 4, we discuss findings from these projects and finally, draw conclusions and direction for the future work.
II. THE CASE OF STUDENT-DRIVEN INNOVATION IN THE LIBRARY
Libraries, in a world increasingly dominated by technology, are looking for ways to renew and re-invent themselves as service providers. The university library that we worked with was not an exception. In this case, a user centric perspective was a primary orientation of the library towards innovation and development of future services. Participatory design, user-centered design and co-design are all methods used in order to design systems, products or services that are more in tune with real user needs. These approaches also predict easier adoption of technologies designed with users for users [11].
The Library has a long history of offering services to users. These services were often based on a librarian’s tacit knowledge and skills related to lending, searching for information and resource guidance. These skills, and the need for them, are now under discussion. The students are
12Copyright (c) IARIA, 2013. ISBN: 978-1-61208-306-3
CENTRIC 2013 : The Sixth International Conference on Advances in Human-oriented and Personalized Mechanisms, Technologies, and Services
21 / 145

efficient in searching the net, a lot of resources are available online, as is some form of guidance. Thus, library users are generally much more self-sufficient. Some of the services offered by the libraries are time constrained, e.g., how long one can keep a book, some are requiring services from multiple departments or organizational groups, such as negotiation of copy rights, or loan from another library. These services are tangible. Yet, other services are intangible, such as exchange of knowledge between a librarian and a user. With the introduction of a large number of digital services over the last decade, an important shift in how services and communication with users are organized has occurred. For instance, the transition from the paper book to e-book was a complex process [12], where the library paid attention to technology adoption, but had a tendency to forget the user perspective in relation to these new digital services and e-books. Another example of an important change in services is the migration of many traditional library services to the web. The library, as a service provider, must adapt to the development and requirement of the information [13] related to user expectations and new technologies.
The university library also offers a range of services in situ, in the library building. These services are not always connected to lending out books, help from librarians with subject expertise and like. The library also provides services around facilities for users, such as rooms where they can read and work either alone or with others. The librarians could observe that the uses of these diverse library resources are changing, including the use of rooms in the building. One of the projects, described later, builds on this possibility, finding new ways of organizing the use of this space, enableing more democratic booking of rooms, as well as easier social and knowledge exchange.
In order to capture all types of changes and how they are reflect on users, the library initiated several projects, all with user in focus. The largest user group of the university library consists of students, and our approach in this project was to allow students to innovate with and for students. The innovating students were taking an interaction design course. Their home base was a computer science department, a program for design, use and interaction. These students work with technology as a design material. They also have the skills needed to make functional prototypes of their designs themselves, thus wearing developers hats to some extent as well. In contrast to education programs offered by design schools, such as product design or architecture, they do not focus primarily on the form but on the functionality of products or services that they design. The design thinking is used to map the problems space broad and open enough to foster creativity, as the students need to focus away from the very concrete, problem solving approach that they often have. This phenomenon is also a trend in the whole field of human-computer interaction (HCI) design. From the first wave of HCI often described as an era of usability testing in 80´s, through the second wave with the “human” in the center, HCI is currently in its third wave with user experience design and situated use of technology in focus [14].
In 2010, at the start of interaction design students’ involvement with library services, one could say that projects had the use of innovative technology in the library as a focus. The issues they investigated were related to digital content acquisition and use of these digital resources in course settings, using e-book readers and tablets. In 2011, students found the area of translation of web-services to mobile services to be of interest, in particular discussions such as should things be broken down into a series of apps or kept whole as accustomed. In the third year, 2012, real innovation started to happen. Students looked into what their own needs are, and there was no common denominator for the three projects other that they are all concerned with designing services that benefit students directly. We next describe the context and methodological tools that were used, and provide examples of projects that interaction design students were involved in.
III. THE LIVING LAB PROJECTS The central research concept that we have used in the
present work is that of a living lab. We consider the Wikipedia definition [15] of a living lab to be appropriate, even though our territorial context is narrowed to university libraries: “A living lab is a user-centred, open-innovation ecosystem,[1][2] often operating in a territorial context (e.g. city, agglomeration, region), integrating concurrent research and innovation processes[3] within a public-private-people partnership.” The citations in the definition relate to highly relevant work of von Hippel, Cheesbrough and Bilgram et al. [16]–[18].
A. 2010: Engaging with innovative technology Being the first year when the big educational disruptor,
the iPad, came out, one of the projects was concerned with its implementation as a classroom tool, how digital books would replace the paper books etc. [19], [20]. Like many others, e.g. [21], we wondered if these new devices will deliver innovation, inclusion and transformation of a range of practices, from learning to communication. The second project was concerned with a much less successful e-book reader, Boox [22]. Neither the iPad nor the Boox project reported on enthusiasm and desire to innovate by the students attending classes that used these new tools. By innovate, in this context, we mean to find novel ways to organize class materials, communication with other students from the class, schedules, to use new apps or to suggest what could be cool to have in the future. It was clear that Boox does not offer a new or added value to students. The analysis with the iPad was not as clear, but in the class in which it was applied, there was no time spent with it, apart from the time that it was used for the course or pure entertainment. In other words, student did not attempt to organize their work in new ways, make new apps or even customizations. So, this first year, the design students mostly studied the use of tablets rather than innovating themselves. In the case of Boox, attempt was made to design a better interface, but it was half-hearted: the design students considered the tablet,
13Copyright (c) IARIA, 2013. ISBN: 978-1-61208-306-3
CENTRIC 2013 : The Sixth International Conference on Advances in Human-oriented and Personalized Mechanisms, Technologies, and Services
22 / 145

just like the class that used it, to be a rather lost cause in terms of design.
B. 2011: web to mobile – app it or not? The next year’s generation of design students seemed to
be missing more services made for mobile platforms as all three project teams have chosen the theme of transferring services from the web to mobile platforms, see [23], [24], and [25].
Figure 1. The students from a project [24], 2011, considering services
within the library building.
The main problem that two of the project groups wrestled with were related to whether the services should be organized as they were on the net, arguing that familiarity could aid adoption, or broken into meaningful small groups and published as apps. The third group focused on the library building and what users might want to have while in the library. The group, as shown in Fig. 1, made a small selection of already existing services into an app, usable while on the premises only: get to talk to the librarian, book a room, see the map of the library and tweets, events and news feed.
C. 2012: services we did not have before! In 2012, the library related projects excelled in terms of
innovativeness and creative thinking. All three projects were different, both in terms of approach and methods used in their work.
Figure 2. The students [26], 2012, implemented a syllabus search.
One of the groups, see Fig. 2, addresses a real need that students have: a much better organized curriculum literature. They used a participatory design, and did not rely on only their own perceptions, but conducted surveys, user groups and included a small group of other stakeholders in the entire design process, in the Scandinavian spirit [27]. The students paid attention to need finding at the start of the semester, and truly by understanding that need with other stakeholders, including administrators responsible for course listings, as well as BYBSYS, a library management system, currently in use by the library Another project group, see Fig. 3 and Fig. 5, was interested in physically finding a book in the library with aid of a smart phone. Librarians traditionally were in the library for this purpose. They are still there. This engagement clearly demonstrates larger and larger individuation and need for being able to complete a task through self-service. In addition, this team was going for what we call a design of techno-cools [28]. This is the kind of applications librarians would not need, but students think it is cool.
Figure 3. App for finding a book in the library, and on the shelf [29].
The last project [30], combined value-based design, focusing on producing a democratic room booking system, with a fun social spin. Their storyboard motivated the design team, see Fig. 4.
Figure 4. Motivating the democratic booking system [30].
14Copyright (c) IARIA, 2013. ISBN: 978-1-61208-306-3
CENTRIC 2013 : The Sixth International Conference on Advances in Human-oriented and Personalized Mechanisms, Technologies, and Services
23 / 145

The social spin was based on the idea that one could join interesting conversation in the rooms if there was a free seat, by following social networks and finding out what is the basis for the conversation or discussion.
The description of the projects provided here is minimal, more than be seen from the references provided. The purpose of presenting them briefly is to ground our findings from following the designers, by direct participation in their design meetings and by observing their actions during and after the course.
IV. DISCUSSION From the library side, the support during all three years
has been given in form of competence and knowledge related to services they provide, equipment, stuff, technical support, etc. During the 2012, a project team of three library employees was added. In addition, consultations with a professional user-experience consultancy company (Netlife Research) were added. The efforts invested in these projects were well worth it, according to one of the library employees and a library leadership, who were interviewed at the end of the spring semester 2013. More exciting projects are starting this fall, expanding to some new buildings. Increased resources are allocated to projects in terms of one more researcher and a high level management being involved in project leadership. Thus, through their actions, in addition to words, the library is expressing a very positive attitude towards results of student driven innovation.
Seen through students’ words and actions, the library projects were very exciting. One student expressed it as follows: “I am so happy I chose this project! At the beginning of the semester, one does not know, so many things sounded so exciting, from designing automated rescue vehicles to designing interactive games for children. This sounded almost boring, but I trusted the others in the group. In retrospect, this was the most exciting project. I learned so much.” Again, seen through actions, in 2010 no projects went any further than the final delivery in class. In 2011, there was a lot of excitement around project [24] and students were given a possibility to, as paid employees continue the work on the app until it is published. Even when the director argued for a possible huge impact of their work on the new library the interest was only moderate, they responded negatively to the offer. The primary reason was that the most active member had a full time job in addition to the studies. In 2012, two groups got the offer to continue their work, the third group did not, as technical difficulties in connecting the app to the database required involvement that was not possible to make at that point. Both groups accepted the offer and the Bookworms, [29], app is now available from the Apple app store [31] and Google Play [32]. The Minesweeper [30] is scheduled for a test run in the Science Library during the fall semester. In conclusion, actions and words of both major stakeholders confirm that the experience with student-driven innovation is positive, and adds value for both the university library and students.
In addition, further research into what are the motivating factors for a student innovator is well under way, using
qualitative methods such as ethnography and in-depth interviews with participants. Some of the main factors that we have seen during the past three years are related to the clear definition of the context for design, time and finally, added value.
The context for innovation through design may have a large impact in how innovators behave. The context is an occasional property of action whose features are defined dynamically. On the other hand, context is not a form of information. Context is produced, maintained and enacted during an activity. Dourish [33] argues for a close relationship between activity and practice. For innovation, the possibility to create an arena where innovators can produce new context in which they can be creative and cooperate to achieve common results is crucial. In the examples above, the library building itself has been used as one such context, social networks are another example of a context that was used in [30]. Even from the short presentation of the projects above, it may be seen that the projects ([29], [30]) that were having such a context were the most successful ones.
Within both contexts, we as researchers are building the awareness that the library and the social networks connected to the library (Facebook, twitter and so on) are a living lab to be used by students to try their ideas, to experiment and to be creative.
The time as a factor has several dimensions. The interesting one is what we would call a digestion time. That is the time it takes to accept concepts related to design and context. A concept, for example, such as that of a living lab takes time to understand, not only cognitively, but with the whole body, as a phenomenon. After all, it is living, dynamic, experimental environment.
Time is also important in relation to co-creation through design methods involving users, such as participatory design or co-design. It takes time to shape and share design practice and space, even when designers are also users. Other students, who were not in the design course, were also involved.
Last, but not least, the time switches from Chronos (the linear time that nobody has enough of) to Kairos (the perceived time) as the engagement increases. For example, a member of the innovation team [29], also has a full time job as a physician, alongside of full time studies. Part, or even full time work, in addition to classes, is not an exceptional occurrence. People dedicated their time to the projects, as they were perceived as both valuable and cool. Thus, the time and the value are also deeply connected. The higher the perceived value, the less importance is paid to time spent.
The “added” value is interesting for us as a subjective perception of the worth of what we leave to the world, in this case the library, as a legacy. This same factor has motivated many hackers in hacker communities to achieve things believed to be impossible. The harder it is, the better. The members of both projects that are being implemented all believe that what they do has the possibility to be a success on one hand, and useful on the other. Another positive aspect of making something cool is kind of status
15Copyright (c) IARIA, 2013. ISBN: 978-1-61208-306-3
CENTRIC 2013 : The Sixth International Conference on Advances in Human-oriented and Personalized Mechanisms, Technologies, and Services
24 / 145

among students that is achieved. One not only makes cool things, but also becomes cool him/herself.
Another finding worth mentioning is that student innovators focused on useful things rather than fun interactions. For example, they could choose to design a huge screen game, ambient art or something with near field interactions. But usefulness, at least throughout these first three years, has been important for student innovators.
V. CONCLUSIONS In this paper, we have addresses the question of how to
engage students in design and innovation of library services. Our findings show that the library living lab provides a good context for developing new ideas. The time and the added value are both important factors supporting innovation through design. In addition, we could observe a clear progress in the quality of projects from year to year, attributing this to time it takes to embody the concepts innovators work with, such as for example, the concept of the living lab. The difficulty we have observed has to do with sharing and ownership issues regarding the results of innovation.
As for the future research, we would like to take a deeper and longer look at motivation for participating in student-driven innovation. There is a volume of work on this from many perspectives, but none covers the same context, at least to the best of our knowledge. In addition, we have seen in other areas of our work that gamification has a potential to form habits. It has not been used yet, but we are looking forward to exploring what gamification can do in forming new habits for students related to library services and new ways of acting and relating to library systems.
Discussing the possible problem with innovation mentioned in the introduction around sharing and ownership of the results of the innovation and its “stickiness” is important. In our case, the transition of the ownership from innovators to the library is not entirely problem free. The reason for that is insufficient sense of ownership over these new services on the library side. It is, however, too early to draw any conclusions around this at this time. The librarians have been included in the innovation through design processes, and increased involvement is planned for the fall. This aspect will thus be considered in our future work more closely.
ACKNOWLEDGMENT The authors are indebted to all student participants and
the university library employees for their involvement in, and support of the projects in diverse ways, most importantly by giving their time when needed and resources such as location for work, equipment etc. The National Library, in part, financed the project.
REFERENCES [1] E. von Hippel, “Democratizing innovation: The evolving
phenomenon of user innovation,” J. Für Betriebswirtschaft, vol. 55, no. 1, Mar. 2005, pp. 63–78.
[2] H. W. Chesbrough, Open Innovation: The New Imperative for Creating And Profiting from Technology. Harvard Business Press, 2006.
[3] Z. E. Brinkman Dzwig, “Innovative collection development for e-books at the TU Delft Library,” Inf. Serv. Use, vol. 33, no. 1, Jan. 2013, pp. 37–39.
[4] S. Thomke and E. von Hippel, “Customers as Innovators: A New Way to Create Value - Harvard Business Review,” Harvard Business Review, 2002. [Online]. Available: http://hbr.org/2002/04/customers-as-innovators-a-new-way-to-create-value/ar/1.
[5] E. von Hippel, “‘Sticky Information’ and the Locus of Problem Solving: Implications for Innovation,” Manag. Sci., vol. 40, no. 4, Apr. 1994, pp. 429–439.
[6] K. Rundblad, “The Academic Library Startup: UX, Innovation and Social Technologies,” AJCU Libr. Deans Dir. Conf., Apr. 2011.
[7] J. McCleneghan Smith and K. Clark, “Dream catcher: capturing student-inspired ideas for the libraries’ website”, in Studying students: the Undergraduate Research Project at the University of Rochester, Chicago: Association of College and Research Libraries, 2007.
[8] C. Dell’Era, A. Marchesi, and R. Verganti, “Mastering Technologies in Design-Driven Innovation,” Res.-Technol. Manag., vol. 53, no. 2, 2010, pp. 12–23.
[9] W. Lidwell, K. Holden, and J. Butler, Universal principles of design: 125 ways to enhance usability, influence perception, increase appeal, make better design decisions, and teach through design. Rockport Pub, 2010.
[10] “Design Thinking for Social Innovation (SSIR).” [Online]. Available: http://www.ssireview.org/articles/entry/design_ thinking_for_social_innovation/.
[11] M. Scaife, Y. Rogers, F. Aldrich, and M. Davies, “Designing for or designing with? Informant design for interactive learning environments,” in Proceedings of the ACM SIGCHI Conference on Human factors in computing systems, New York, NY, USA, 1997, pp. 343–350.
[12] A. L. Culén and A. Gasparini, “E-book Reader and the Necessity of Divergence from the Legacy of Paper Book,” in Proceedings of the 4th International Conference on Advances in Computer Human Interaction, 2011, pp. 267 – 273.
[13] X. Li, “Information Literacy Composition and Training Strategies of University Teaching Administrator,” in Proceedings of the International Conference on Information Engineering and Applications (IEA) 2012, Z. Zhong, Ed. Springer London, 2013, pp. 47–54.
[14] S. Bødker, “When second wave HCI meets third wave challenges,” in Proceedings of the 4th Nordic conference on Human-computer interaction: changing roles, New York, NY, USA, 2006, pp. 1–8.
[15] “Living lab - Wikipedia, the free encyclopedia.” [Online]. Available: http://en.wikipedia.org/wiki/Living_lab.
[16] E. von Hippel, “Lead users: a source of novel product concepts,” Manage Sci, vol. 32, no. 7, Jul. 1986, pp. 791–805.
[17] H. Chesbrough, Open innovation: the new imperative for creating and profiting from technology. Boston, Mass.: Harvard Business School Press, 2003.
16Copyright (c) IARIA, 2013. ISBN: 978-1-61208-306-3
CENTRIC 2013 : The Sixth International Conference on Advances in Human-oriented and Personalized Mechanisms, Technologies, and Services
25 / 145
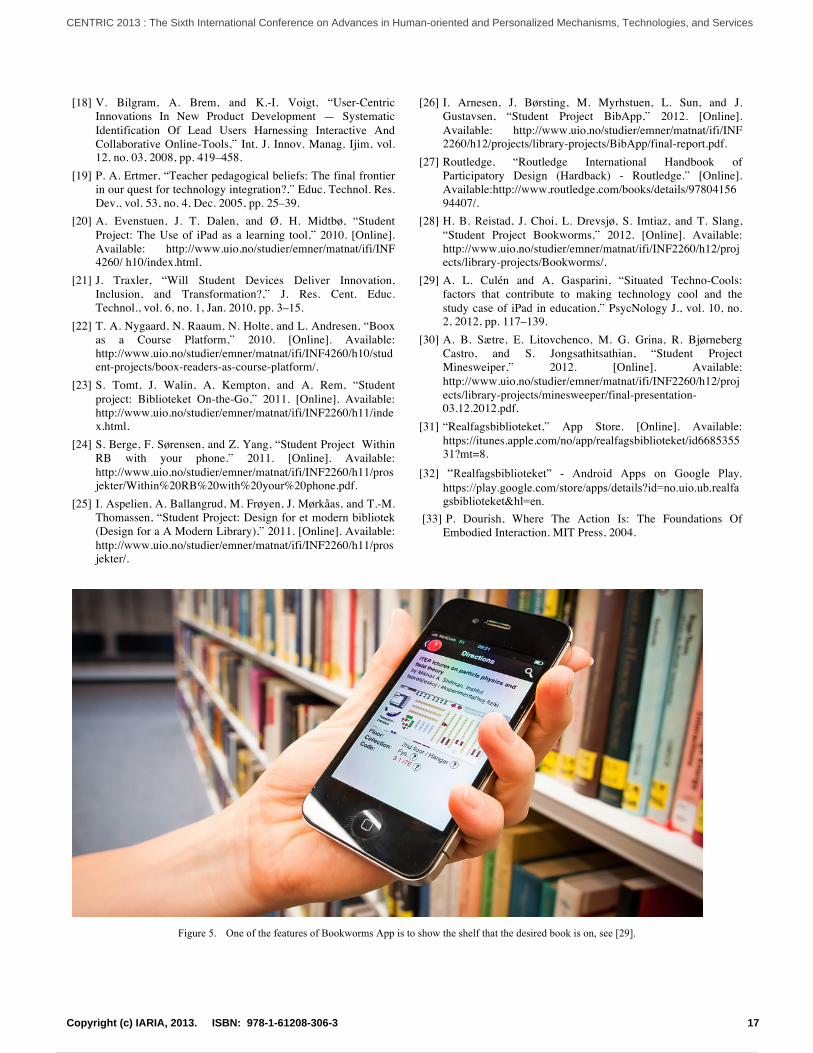
[18] V. Bilgram, A. Brem, and K.-I. Voigt, “User-Centric Innovations In New Product Development — Systematic Identification Of Lead Users Harnessing Interactive And Collaborative Online-Tools,” Int. J. Innov. Manag. Ijim, vol. 12, no. 03, 2008, pp. 419–458.
[19] P. A. Ertmer, “Teacher pedagogical beliefs: The final frontier in our quest for technology integration?,” Educ. Technol. Res. Dev., vol. 53, no. 4, Dec. 2005, pp. 25–39.
[20] A. Evenstuen, J. T. Dalen, and Ø. H. Midtbø, “Student Project: The Use of iPad as a learning tool,” 2010. [Online]. Available: http://www.uio.no/studier/emner/matnat/ifi/INF 4260/ h10/index.html.
[21] J. Traxler, “Will Student Devices Deliver Innovation, Inclusion, and Transformation?,” J. Res. Cent. Educ. Technol., vol. 6, no. 1, Jan. 2010, pp. 3–15.
[22] T. A. Nygaard, N. Raaum, N. Holte, and L. Andresen, “Boox as a Course Platform,” 2010. [Online]. Available: http://www.uio.no/studier/emner/matnat/ifi/INF4260/h10/student-projects/boox-readers-as-course-platform/.
[23] S. Tomt, J. Walin, A. Kempton, and A. Rem, “Student project: Biblioteket On-the-Go,” 2011. [Online]. Available: http://www.uio.no/studier/emner/matnat/ifi/INF2260/h11/index.html.
[24] S. Berge, F. Sørensen, and Z. Yang, “Student Project Within RB with your phone.” 2011. [Online]. Available: http://www.uio.no/studier/emner/matnat/ifi/INF2260/h11/prosjekter/Within%20RB%20with%20your%20phone.pdf.
[25] I. Aspelien, A. Ballangrud, M. Frøyen, J. Mørkåas, and T.-M. Thomassen, “Student Project: Design for et modern bibliotek (Design for a A Modern Library),” 2011. [Online]. Available: http://www.uio.no/studier/emner/matnat/ifi/INF2260/h11/prosjekter/.
[26] I. Arnesen, J. Børsting, M. Myrhstuen, L. Sun, and J. Gustavsen, “Student Project BibApp,” 2012. [Online]. Available: http://www.uio.no/studier/emner/matnat/ifi/INF 2260/h12/projects/library-projects/BibApp/final-report.pdf.
[27] Routledge, “Routledge International Handbook of Participatory Design (Hardback) - Routledge.” [Online]. Available:http://www.routledge.com/books/details/9780415694407/.
[28] H. B. Reistad, J. Choi, L. Drevsjø, S. Imtiaz, and T. Slang, “Student Project Bookworms,” 2012. [Online]. Available: http://www.uio.no/studier/emner/matnat/ifi/INF2260/h12/projects/library-projects/Bookworms/.
[29] A. L. Culén and A. Gasparini, “Situated Techno-Cools: factors that contribute to making technology cool and the study case of iPad in education,” PsycNology J., vol. 10, no. 2, 2012, pp. 117–139.
[30] A. B. Sætre, E. Litovchenco, M. G. Grina, R. Bjørneberg Castro, and S. Jongsathitsathian, “Student Project Minesweiper,” 2012. [Online]. Available: http://www.uio.no/studier/emner/matnat/ifi/INF2260/h12/projects/library-projects/minesweeper/final-presentation-03.12.2012.pdf.
[31] “Realfagsbiblioteket,” App Store. [Online]. Available: https://itunes.apple.com/no/app/realfagsbiblioteket/id668535531?mt=8.
[32] “Realfagsbiblioteket” - Android Apps on Google Play. https://play.google.com/store/apps/details?id=no.uio.ub.realfagsbiblioteket&hl=en.
[33] P. Dourish, Where The Action Is: The Foundations Of Embodied Interaction. MIT Press, 2004.
Figure 5. One of the features of Bookworms App is to show the shelf that the desired book is on, see [29].
17Copyright (c) IARIA, 2013. ISBN: 978-1-61208-306-3
CENTRIC 2013 : The Sixth International Conference on Advances in Human-oriented and Personalized Mechanisms, Technologies, and Services
26 / 145
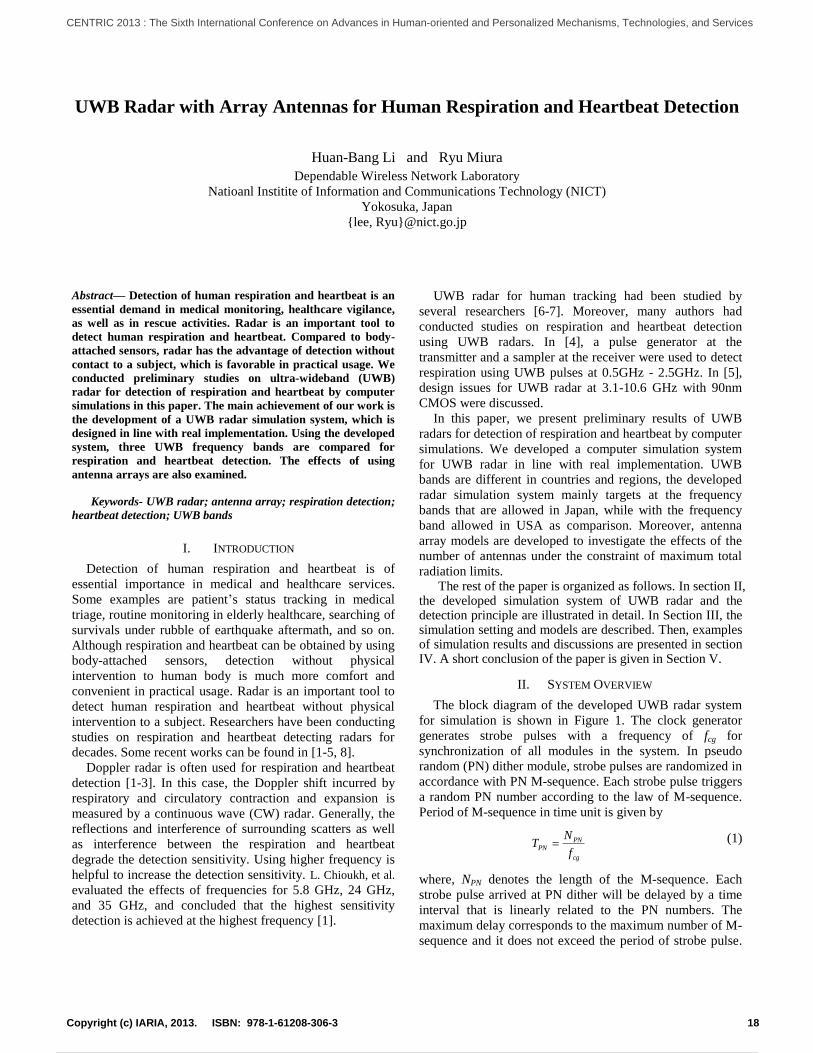
UWB Radar with Array Antennas for Human Respiration and Heartbeat Detection
Huan-Bang Li and Ryu Miura
Dependable Wireless Network Laboratory
Natioanl Institite of Information and Communications Technology (NICT)
Yokosuka, Japan
lee, [email protected]
Abstract— Detection of human respiration and heartbeat is an
essential demand in medical monitoring, healthcare vigilance,
as well as in rescue activities. Radar is an important tool to
detect human respiration and heartbeat. Compared to body-
attached sensors, radar has the advantage of detection without
contact to a subject, which is favorable in practical usage. We
conducted preliminary studies on ultra-wideband (UWB)
radar for detection of respiration and heartbeat by computer
simulations in this paper. The main achievement of our work is
the development of a UWB radar simulation system, which is
designed in line with real implementation. Using the developed
system, three UWB frequency bands are compared for
respiration and heartbeat detection. The effects of using
antenna arrays are also examined.
Keywords- UWB radar; antenna array; respiration detection;
heartbeat detection; UWB bands
I. INTRODUCTION
Detection of human respiration and heartbeat is of
essential importance in medical and healthcare services.
Some examples are patient’s status tracking in medical
triage, routine monitoring in elderly healthcare, searching of
survivals under rubble of earthquake aftermath, and so on.
Although respiration and heartbeat can be obtained by using
body-attached sensors, detection without physical
intervention to human body is much more comfort and
convenient in practical usage. Radar is an important tool to
detect human respiration and heartbeat without physical
intervention to a subject. Researchers have been conducting
studies on respiration and heartbeat detecting radars for
decades. Some recent works can be found in [1-5, 8].
Doppler radar is often used for respiration and heartbeat
detection [1-3]. In this case, the Doppler shift incurred by
respiratory and circulatory contraction and expansion is
measured by a continuous wave (CW) radar. Generally, the
reflections and interference of surrounding scatters as well
as interference between the respiration and heartbeat
degrade the detection sensitivity. Using higher frequency is
helpful to increase the detection sensitivity. L. Chioukh, et al.
evaluated the effects of frequencies for 5.8 GHz, 24 GHz,
and 35 GHz, and concluded that the highest sensitivity
detection is achieved at the highest frequency [1].
UWB radar for human tracking had been studied by
several researchers [6-7]. Moreover, many authors had
conducted studies on respiration and heartbeat detection
using UWB radars. In [4], a pulse generator at the
transmitter and a sampler at the receiver were used to detect
respiration using UWB pulses at 0.5GHz - 2.5GHz. In [5],
design issues for UWB radar at 3.1-10.6 GHz with 90nm
CMOS were discussed.
In this paper, we present preliminary results of UWB
radars for detection of respiration and heartbeat by computer
simulations. We developed a computer simulation system
for UWB radar in line with real implementation. UWB
bands are different in countries and regions, the developed
radar simulation system mainly targets at the frequency
bands that are allowed in Japan, while with the frequency
band allowed in USA as comparison. Moreover, antenna
array models are developed to investigate the effects of the
number of antennas under the constraint of maximum total
radiation limits. The rest of the paper is organized as follows. In section II,
the developed simulation system of UWB radar and the detection principle are illustrated in detail. In Section III, the simulation setting and models are described. Then, examples of simulation results and discussions are presented in section IV. A short conclusion of the paper is given in Section V.
II. SYSTEM OVERVIEW
The block diagram of the developed UWB radar system
for simulation is shown in Figure 1. The clock generator
generates strobe pulses with a frequency of fcg for
synchronization of all modules in the system. In pseudo
random (PN) dither module, strobe pulses are randomized in
accordance with PN M-sequence. Each strobe pulse triggers
a random PN number according to the law of M-sequence.
Period of M-sequence in time unit is given by
cg
PNPN
f
NT (1)
where, NPN denotes the length of the M-sequence. Each
strobe pulse arrived at PN dither will be delayed by a time
interval that is linearly related to the PN numbers. The
maximum delay corresponds to the maximum number of M-
sequence and it does not exceed the period of strobe pulse.
18Copyright (c) IARIA, 2013. ISBN: 978-1-61208-306-3
CENTRIC 2013 : The Sixth International Conference on Advances in Human-oriented and Personalized Mechanisms, Technologies, and Services
27 / 145
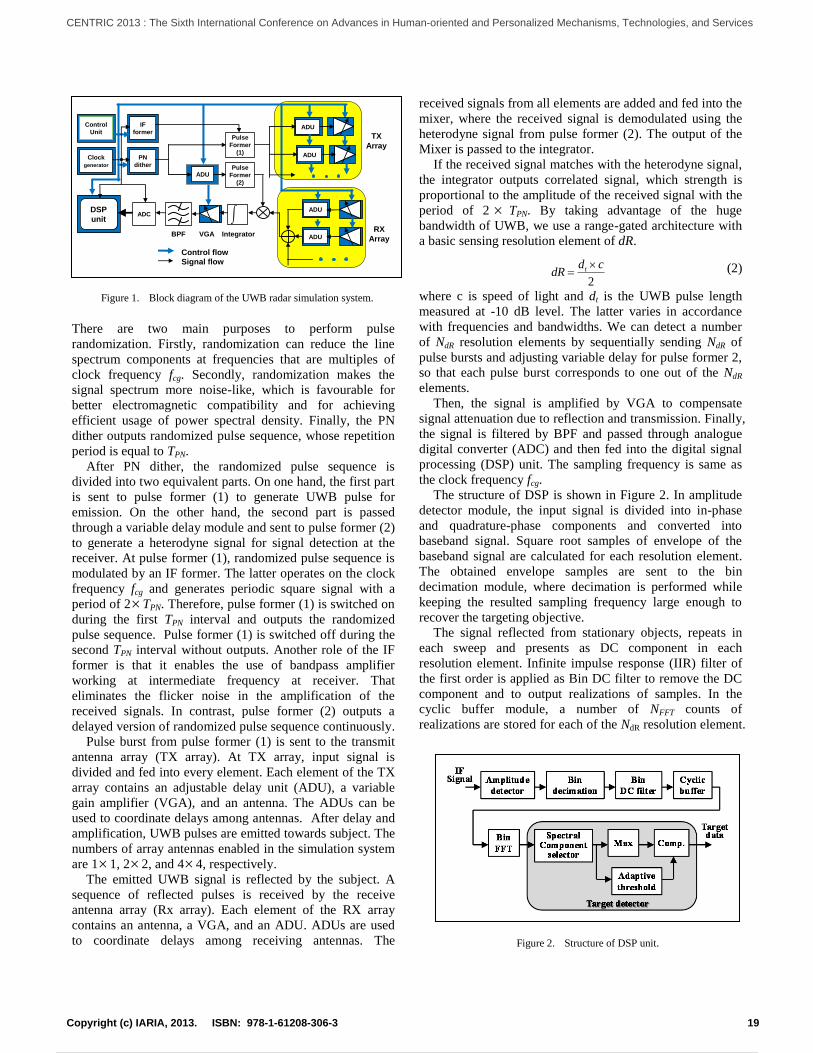
There are two main purposes to perform pulse
randomization. Firstly, randomization can reduce the line
spectrum components at frequencies that are multiples of
clock frequency fcg. Secondly, randomization makes the
signal spectrum more noise-like, which is favourable for
better electromagnetic compatibility and for achieving
efficient usage of power spectral density. Finally, the PN
dither outputs randomized pulse sequence, whose repetition
period is equal to TPN.
After PN dither, the randomized pulse sequence is
divided into two equivalent parts. On one hand, the first part
is sent to pulse former (1) to generate UWB pulse for
emission. On the other hand, the second part is passed
through a variable delay module and sent to pulse former (2)
to generate a heterodyne signal for signal detection at the
receiver. At pulse former (1), randomized pulse sequence is
modulated by an IF former. The latter operates on the clock
frequency fcg and generates periodic square signal with a
period of 2TPN. Therefore, pulse former (1) is switched on
during the first TPN interval and outputs the randomized
pulse sequence. Pulse former (1) is switched off during the
second TPN interval without outputs. Another role of the IF
former is that it enables the use of bandpass amplifier
working at intermediate frequency at receiver. That
eliminates the flicker noise in the amplification of the
received signals. In contrast, pulse former (2) outputs a
delayed version of randomized pulse sequence continuously.
Pulse burst from pulse former (1) is sent to the transmit
antenna array (TX array). At TX array, input signal is
divided and fed into every element. Each element of the TX
array contains an adjustable delay unit (ADU), a variable
gain amplifier (VGA), and an antenna. The ADUs can be
used to coordinate delays among antennas. After delay and
amplification, UWB pulses are emitted towards subject. The
numbers of array antennas enabled in the simulation system
are 11, 22, and 44, respectively.
The emitted UWB signal is reflected by the subject. A
sequence of reflected pulses is received by the receive
antenna array (Rx array). Each element of the RX array
contains an antenna, a VGA, and an ADU. ADUs are used
to coordinate delays among receiving antennas. The
received signals from all elements are added and fed into the
mixer, where the received signal is demodulated using the
heterodyne signal from pulse former (2). The output of the
Mixer is passed to the integrator.
If the received signal matches with the heterodyne signal,
the integrator outputs correlated signal, which strength is
proportional to the amplitude of the received signal with the
period of 2 TPN. By taking advantage of the huge
bandwidth of UWB, we use a range-gated architecture with
a basic sensing resolution element of dR.
2
cddR t (2)
where c is speed of light and dt is the UWB pulse length
measured at -10 dB level. The latter varies in accordance
with frequencies and bandwidths. We can detect a number
of NdR resolution elements by sequentially sending NdR of
pulse bursts and adjusting variable delay for pulse former 2,
so that each pulse burst corresponds to one out of the NdR
elements.
Then, the signal is amplified by VGA to compensate
signal attenuation due to reflection and transmission. Finally,
the signal is filtered by BPF and passed through analogue
digital converter (ADC) and then fed into the digital signal
processing (DSP) unit. The sampling frequency is same as
the clock frequency fcg.
The structure of DSP is shown in Figure 2. In amplitude
detector module, the input signal is divided into in-phase
and quadrature-phase components and converted into
baseband signal. Square root samples of envelope of the
baseband signal are calculated for each resolution element.
The obtained envelope samples are sent to the bin
decimation module, where decimation is performed while
keeping the resulted sampling frequency large enough to
recover the targeting objective.
The signal reflected from stationary objects, repeats in
each sweep and presents as DC component in each
resolution element. Infinite impulse response (IIR) filter of
the first order is applied as Bin DC filter to remove the DC
component and to output realizations of samples. In the
cyclic buffer module, a number of NFFT counts of
realizations are stored for each of the NdR resolution element.
Figure 2. Structure of DSP unit.
Control
Unit
Clock
generator
PN
dither
IF
formerPulse
Former
(1)
Pulse
Former
(2)
ADCDSP
unit
BPF VGA Integrator
ADU
Control flow
Signal flow
TX
Array
RX
Array
ADU
ADU
ADU
ADU
Figure 1. Block diagram of the UWB radar simulation system.
19Copyright (c) IARIA, 2013. ISBN: 978-1-61208-306-3
CENTRIC 2013 : The Sixth International Conference on Advances in Human-oriented and Personalized Mechanisms, Technologies, and Services
28 / 145

When the buffer is full of NFFT counts, a new incoming
count will drive out the oldest count so that the buffer is
continuously updated. Then, Bin FFT module performs
sequentially moving fast Fourier transform (FFT) with pre-
weighting by windowing function. A weighted realization
can be written as
1,,1,0
;___
FFT
ibiniwinbin
Nn
nwinnSnS
(3)
where nS ibin_ denotes the n’th realization of NFFT counts
for ith resolution element, and win(n) denotes the weighting
window. Bin FFT is performed as follows.
.1,,1,0
;1
2exp
1
0
____
FFT
N
n FFT
iwinbiniFFTbin
Nk
knN
inSkSFFT
(4)
The resulted spectral sample is given by
2__
2
____ ImRe kSkSkS iFFTbiniFFTbiniFFTbin (5)
Finally, the resulted spectral samples are sent to target detectors. In which, corresponding spectral components of respiration and heartbeat are tuned. The maximum value is chosen from the tuned spectral components, which is compared with a threshold. If the spectral component is larger than the threshold, the corresponding subject is detected.
III. SIMULATION SETTING
In this section, we describe the assumptions and
conditions that are used to carry out simulations with the
developed UWB radar system. We first show the frequency
bands examined, which affect the UWB pulses directly.
Then, parameters related to radar as well as parameters of
subject to be detected are illustrated.
A. Frequency Bands
The available UWB bands are different in countries or
regions. In the developed simulation system, we mainly
investigate the following three frequency bands.
(1) 3.4 - 4.8 GHz
(2) 7.25 – 10.25 GHz
(3) 3.1 -10.6 GHz
where, (1) and (2) are UWB low band and high band
regulated in Japan, while (3) is UWB band regulated in
USA. The reason that we select both low band and high
band of Japan is that low band will be impelled to more
strict regulation, although low frequency is suitable for radar
in general. A UWB pulse can be expressed as
tftaAts c2sinexp)( 22
max (6)
where, fc is the center frequency of the corresponding band,
a is a pulse parameter and is dependent on UWB band. Amax
is the maximum amplitude, which is restricted by
regulations and is also dependent on UWB band. For the
above three UWB bands and different antenna arrays, these
parameters are summarized in Table I.
TABLE I. PULES PARAMETERS RELATED TO UWB BANDS
Parameter 3.4-4.8GHz 7.25-10.25GHz 3.1-10.6GHz
Central frequency
fc (GHz) 4,1 8,75 6,85
Pulse parameter
a 1,210e9 2,592e9 9,903e9
Maximum
amplitude
Amax (v)
11 2,164 4,638 17,718
22 1.531 3.280 12.529
44 1.082 2.319 8.859
The detected frequencies at the target detector are
calculated as follows.
FFT
bins
N
fifif
_ (7)
where, i denotes the number of spectral components, f
denotes the frequency resolution of FFT. binsf _
is the
sampling frequency, which is given by
decimdRPN
cg
binsNNT
ff
2_
(8)
where, Ndecim denotes the performed decimation
number. All other parameters of the UWB radar used in the
simulations are summarized in Table II.
TABLE II. PARAMETERS USED IN THE SIMULATION
Parameter Value
PRF 1 MHz
ADC quantization 12 bits
Length of PN sequence (NPN) 31
weighting window Hanning/Hamming/Blackman
Number of resolution elements (NdR) 128
FFT dimension (NFFT) 1024
Decimation number (Ndecim) 6
B. Detection Setting
As shown in Figure 3, the radar is located at the ceiling of
a room. In our simulation system, omni antennas are
assumed. When 2 2 or 4 4 antenna array are used, the
neighbour antennas are separated by a distance of λ /2,
where λ is the wave length at the center frequency of the
UWB band. The body skin vibration caused by respiration
20Copyright (c) IARIA, 2013. ISBN: 978-1-61208-306-3
CENTRIC 2013 : The Sixth International Conference on Advances in Human-oriented and Personalized Mechanisms, Technologies, and Services
29 / 145
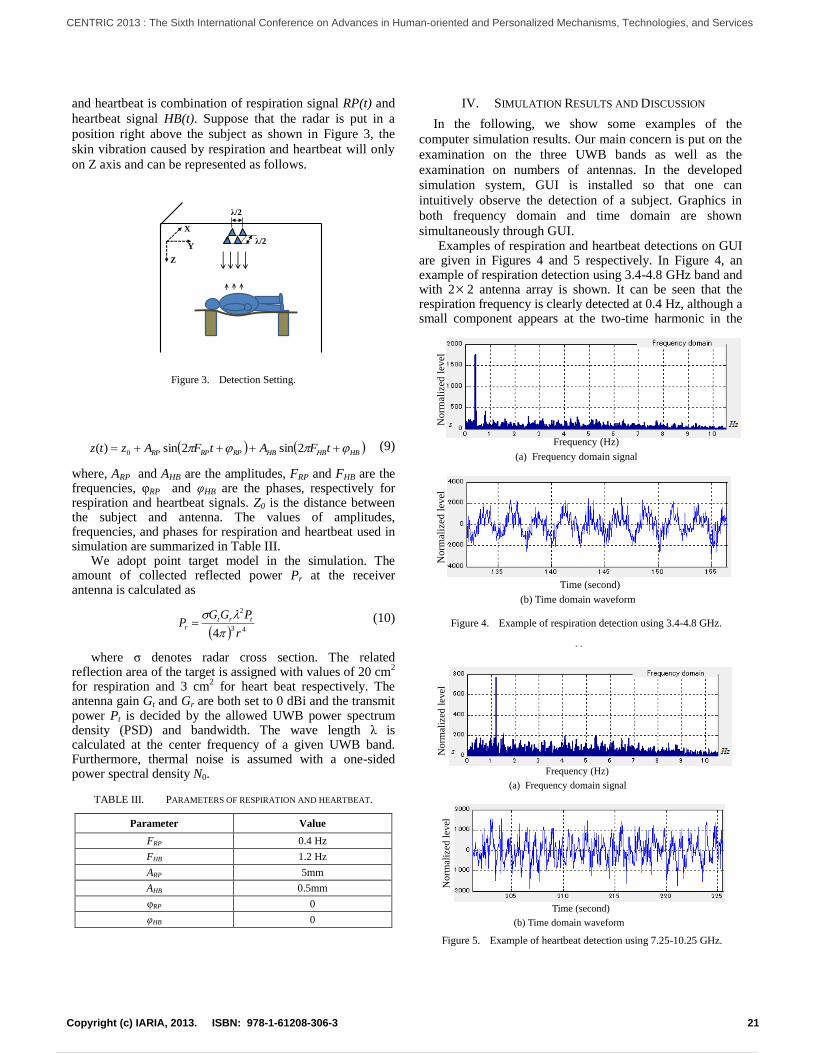
and heartbeat is combination of respiration signal RP(t) and
heartbeat signal HB(t). Suppose that the radar is put in a
position right above the subject as shown in Figure 3, the
skin vibration caused by respiration and heartbeat will only
on Z axis and can be represented as follows.
λ/2
λ/2
X
Y
Z
Figure 3. Detection Setting.
HBHBHBRPRPRP tFAtFAztz 2sin2sin)( 0 (9)
where, ARP and AHB are the amplitudes, FRP and FHB are the frequencies, φRP and φHB are the phases, respectively for respiration and heartbeat signals. Z0 is the distance between the subject and antenna. The values of amplitudes, frequencies, and phases for respiration and heartbeat used in simulation are summarized in Table III.
We adopt point target model in the simulation. The amount of collected reflected power Pr at the receiver antenna is calculated as
43
2
4 r
PGGP trt
r
(10)
where σ denotes radar cross section. The related reflection area of the target is assigned with values of 20 cm
2
for respiration and 3 cm2 for heart beat respectively. The
antenna gain Gt and Gr are both set to 0 dBi and the transmit power Pt is decided by the allowed UWB power spectrum density (PSD) and bandwidth. The wave length λ is calculated at the center frequency of a given UWB band. Furthermore, thermal noise is assumed with a one-sided power spectral density N0.
TABLE III. PARAMETERS OF RESPIRATION AND HEARTBEAT.
Parameter Value
FRP 0.4 Hz
FHB 1.2 Hz
ARP 5mm
AHB 0.5mm
φRP 0
φHB 0
IV. SIMULATION RESULTS AND DISCUSSION
In the following, we show some examples of the
computer simulation results. Our main concern is put on the
examination on the three UWB bands as well as the
examination on numbers of antennas. In the developed
simulation system, GUI is installed so that one can
intuitively observe the detection of a subject. Graphics in
both frequency domain and time domain are shown
simultaneously through GUI. Examples of respiration and heartbeat detections on GUI
are given in Figures 4 and 5 respectively. In Figure 4, an example of respiration detection using 3.4-4.8 GHz band and with 2 2 antenna array is shown. It can be seen that the respiration frequency is clearly detected at 0.4 Hz, although a small component appears at the two-time harmonic in the
Time (second)
Frequency (Hz)
(b) Time domain waveform
(a) Frequency domain signal
No
rmal
ized
lev
elN
orm
aliz
ed l
evel
Figure 4. Example of respiration detection using 3.4-4.8 GHz.
(2 2 antenna array)
Time (second)
Frequency (Hz)
(b) Time domain waveform
(a) Frequency domain signal
Norm
aliz
ed l
evel
Norm
aliz
ed l
evel
Figure 5. Example of heartbeat detection using 7.25-10.25 GHz.
21Copyright (c) IARIA, 2013. ISBN: 978-1-61208-306-3
CENTRIC 2013 : The Sixth International Conference on Advances in Human-oriented and Personalized Mechanisms, Technologies, and Services
30 / 145

frequency domain. In the time domain, the period of the respiration can be clearly recognized, which is about 2.5s. An example of heartbeat detection using 7.25-10.25 GHz band and with 44 antenna array is shown in Figure 5. The heartbeat is detected at 1.2 Hz in frequency domain and the period of heartbeat obtained in time domain is about 0.83s.
In Figure 6, required gains of the VGA that is located after the integrator are obtained. The detection target is respiration and the distance between the subject and radar antenna is fixed at 3m. For comparison convenience, the results are normalized to that of the 11 antenna case on 3.1-10.6 GHz band. Evaluation and comparison among the three frequency bands as well as the three patterns of array antennas are made.
It can be seen that for all three frequency bands,
increasing the number of antenna can steadily reduce the
required VGA gains. Compared to 11 antenna, 22 array
saves 9-10 dB gains, while 44 array further saves another
9-10 dB gains compared to 2 2 array. For each case of
antenna array, we give two results which correspond to two
detection status. The results show that 3.4-4.8 GHz band
and 7.25-10.25 GHz band present similar detection ability.
In comparison, 3.1-10.6 GHz band can save 3-4 dB gains
than the other twos. The reason that 3.4-4.8 GHz band and
7.25-10.25 GHz band give similar results can be explained
as follows. On one hand, the center frequency of 3.4-4.8
GHz band is slightly less than half of that of 7.25-10.25
GHz band. On the other hand, 7.25-10.25 GHz band has a
slightly larger bandwidth than double that of 3.4-4.8 GHz
band. The merit provided by the low center frequency is
waived by the merit of large bandwidth. Next, we investigate the maximum distance for heartbeat
detection for the three UWB bands. To make fair comparisons, in each frequency band and for each antenna combination we increase the maximum VGA gains as large as possible until ADC clipping occurs. The obtained results are summarized in Figure 7. It can be seen that when 3.4-4.8 GHz band and 7.25-10.25 GHz band are used, there is not big difference on maximum distance. However, when 3.1-10.6 GHz band is used, the detecting distance is increased.
Moreover, increasing the number of antennas results in large detecting distance. In Figure 7, using 3.1-10.6 GHz band with 4 4 array, the heartbeat can be detected from a distance of 3.4 m.
Finally, using heartbeat detection as an example, the relation of detecting distance with required gain are depicted in Figure 8. All three UWB band are investigated with 44 array and 22 array, respectively. The results for 22 array are shown with blank symbols while the results for 44 are shown with filled symbols. It can be seen that for each combination among the three UWB bands and two types of antenna arrays, the required gain almost linearly increases with detecting distance. The inclinations of increase for all cases are very similar. Except for a single point at 1m, 3.1-10.6 GHz band needs less gain than the other two bands. It is also obvious that 44 array presents constant gain against 2 2 array. The gain is around 8-11dB. This number also coincides with the result of respiration detection given in Figure 6, in which the gain obtained by 44 array over that of 2 2 array is 9-10 dB. Thus, it is an effective way to increase the radar detectability by increasing antennas.
-20
-15
-10
-5
0
5
10
15
1×1 2×2 4×4
×
3.4-4.8 GHz
7.25-10.25 GHz
3.1-10.6 GHz
Number of antennas
Norm
aliz
ed r
equ
ired
gai
n (
dB
)
Figure 6. Required gains for respiration detection at a distance of 3m.
0
0.5
1
1.5
2
2.5
3
3.5
4
1×1 2×2 4×4
×
3.4-4.8 GHz
7.25-10.25 GHz
3.1-10.6 GHz
Number of antennas
Max
imu
m d
ista
nce
(m
)
Figure 7. Maximum distance for heartbeat detection
0
5
10
15
20
25
0.5 1 1.5 2 2.5 3 3.5
3.4-4.8 GHz
7.25-10.25 GHz
3.1-10.6 GHz
2×2 4×4
Distance (m)
No
rmal
ized
req
uir
ed g
ain
(d
B)
Figure 8. Relation of detecting distance with required gain.
22Copyright (c) IARIA, 2013. ISBN: 978-1-61208-306-3
CENTRIC 2013 : The Sixth International Conference on Advances in Human-oriented and Personalized Mechanisms, Technologies, and Services
31 / 145

V. CONCLUSION
We conducted preliminary studies on UWB radar with antenna arrays for detection of human respiration and heartbeat. A computer simulation radar system is developed in line with the structure and processing of real radar systems. We also installed a GUI so that the detection of respiration and heartbeat can be shown intuitively.
As our goal is to develop a UWB radar system within the scope of regulation in Japan, the regulated UWB low band, 3.4-4.8 GHz, and UWB high band, 7.25-10.25 GHz, of Japan are investigated. The regulated USA UWB band, 3.1-10.6 GHz is presented as a comparison. Three types of antenna combinations, 1 1, 2 2, and 4 4, are also investigated. The simulation results show that UWB low band and UWB high band of Japan present identical detection performance. Both of them are a little deteriorated by the 3.1-10.6 GHz band. However, if the subject is under rubble, 3.4-4.8 GHz band should be superior because it can go through rubble more easily than the latter. Our results show that increasing antenna is an effective way to enhance detection ability.
REFERENCES
[1] L. Chioukh, H. Boutayeb, L. Lin, L. Yahia, and W. Ke,
“Integrated radar systems for precision monitoring of heartbeat and respiratory status”, Conference Record, Asia Pacific Microwave Conference 2009 (APMC2009), Singapore, Dec. 2009, pp.405-408.
[2] G. Lu, F. Yang, X. Jing, and J. Wang, “Contact-free measurement of heartbeat signal via a doppler radar using
adaptive filtering”, Conference Record, 2010 International Conference on Image Analysis and Signal Processing (IASP), Canada, Aug. 2010, pp. 89-92.
[3] O. Postolache, R. N. Madeira, P. S. , and G. Postolache, “Microwave FMCW Doppler radar implementation for in-house pervasive health care system”, Conference Record, 2010 IEEE International Workshop on Medical Measurements and Applications Proceedings (MeMeA2010), Canada, may 2010, pp. 47-52.
[4] B. Levitas and J. Matuzas, “UWB radar for breath detection”, Conference Record, 11th International Radar Symposium (IRS2010), Lithusnia, June 2010, pp. 1-3.
[5] D. Zito, D. Pepe, M. Mincica, F. Zito, D. De Rossi, A. Lanata, E. P. Scilingo, and A. Tognetti, “Wearable system-on-a-chip UWB radar for contact-less cardiopulmonary monitoring: Present status”, Conference Record, 30th Annual International Conference of the IEEE Engineering in Medicine and Biology Society, 2008 (EMBS 2008), Aug. 2008, pp. 5274-5277.
[6] S.-H. Chang, M. Wolf, and J. W. Burdick, “An MHT algorithm for UWB radar-based multiple human target tracking”, Conference Record, IEEE International Conference on Ultra-Wideband, 2009 (ICUWB 2009), Canada, Sep. 2009, pp.459-463.
[7] T. Sakamoto and T. Sato, “A target tracking method with a single antenna using time-reversal UWB radar imaging in a multi-path environment”, Conference Record, 2010 IEEE International Geoscience and Remote Sensing Symposium (IGARSS2010), Hawaii, July 2010, pp. 3319-3322.
[8] K.-M. Chen, Y. Huang, J. Zhang, A. Norman, “Microwave life-detection systems for searching human subjects under earthquake rubble or behind barrier”, IEEE Transaction on Biomedical Engineering, vol.27, no.1 pp.105-114, Jan. 2000.
23Copyright (c) IARIA, 2013. ISBN: 978-1-61208-306-3
CENTRIC 2013 : The Sixth International Conference on Advances in Human-oriented and Personalized Mechanisms, Technologies, and Services
32 / 145

Applying Augmented Reality to Tourism Pamphlet and its Evaluation
Tadashi Miyosawa, Kentaro Hara Department of Business Administration and Information
Tokyo University of Science, Suwa Chino, Japan
[email protected], [email protected]
Kikunori Shinohara Center of General Education and Humanities
Tokyo University of Science, Suwa Chino, Japan
Abstract—Various studies have been undertaken to adapt
Augmented Reality (AR) technology for use in real application. We see AR as being suitable for creating an enjoyable tourism pamphlet for users. In this study, we developed an AR tourism pamphlet and compared three types of different pamphlet (AR with map, AR-only and map-only). The results show that the combination of a map and AR performed better the traditional map pamphlet. By conducting an experiment where we measured the participants’ brain activities, we confirmed that the burden on spatial cognizance and working memory, as well as throughout the rest of the brain, was reduced with the map-and-AR combination. We also confirmed that the combination drew interest far more than the map-only pamphlet. We believe this shows that the proposed pamphlet is overall a more natural form of information and, when compared with a traditional pamphlet, has the potential to be more enjoyable and less stressful for users.
Keywords—Augmented Reality; Tourism; Pamphlet; Brain Activity; NIRStation
I. INTRODUCTION
A. Background Augmented Reality (AR) technology has gained
attention in recent years. AR is defined as an extended (or heightened) sense of realism. As its name implies, the technology is designed to extend (or intensify) the real world [1]. More specifically, it can show us a world containing a greater amount of content by layering digital information over the real world as seen through a computer or smartphone screen. AR is divided into several categories [2]. First is
marker-type AR, defined by a marker image that, when seen through the camera attached to a Personal Computer (PC) or similar device, interacts with the image to display digital data. In contrast, there is also marker-less-type AR, which detects specific shapes and colors in the camera image to display digital data without a marker. Both marker-type and marker-less-type AR use image recognition technology. There is also location-information-type AR, which uses the Global Positioning System (GPS) and sensors present in smartphones and similar devices to determine the specifics of the user’s location in displaying digital information.
AR allows worlds that previously only existed in comics and animation to be actualized, a concept that excites us with its amusement and charm. Kobayashi [2] states that “Media like television, movies, comics and games are not used solely for the purposes of entertainment. Pleasure is, of
course, a huge factor in these media, but it is possible to use that pleasure to our advantage to produce the experience of ‘being educated while being entertained’ (Edutainment) [3]. This point also applies to the new medium of AR.” With this principle in mind, we conducted research with the expectation that the excitement experienced by users using AR would also be effective for a tourism pamphlet.
B. Past research There have been various research works on the practical
use of AR. Kondo [4] states that one of the merits of composite
reality (roughly equivalent to AR) is the ability to expand upon traditional teaching media such as textbooks. In addition, he developed three-dimensional computer graphics (3DCG) and audio explanations of the structure of the human brain. Materials useful for teaching mathematic spatial diagrams were developed and implemented in a high-school lesson. After the lesson, 70% of the students reported that it was easier to understand the content with the composite-reality technology.
Alzua-Sorzabal et al. [5] presented a usability study of a new prototype based on AR technologies. The observation-based study revealed the possibilities and limitations of the design of the prototype on the basis of the behavior of users. Most participants agreed that the approach of using AR technologies enhanced the interactive experience with tourist content. Moreover, they positively assessed the usefulness of the prototype as a tourist information point because of its ability to provide location-based content.
Teshima and Kosugi [6] reported tests using cartography teaching materials made by the researchers. The tests demonstrated that AR 3DCG displays were effective in cartography study. It was confirmed that AR teaching materials significantly raised test scores when it came to questions about target locations and names. The researchers reasoned that AR had a great effect on the learning of important components (i.e., the place and name memorization) of cartography.
Miyosawa et al. [7] states that AR is suitable for creating an enjoyable learning experience (i.e., edutainment) for students. They developed an AR application based on the same content as conventional printed teaching material in the field of foreign-language study. The learning efficacy of the two media was assessed by comparing the results of verification tests and monitoring brain activity during the
24Copyright (c) IARIA, 2013. ISBN: 978-1-61208-306-3
CENTRIC 2013 : The Sixth International Conference on Advances in Human-oriented and Personalized Mechanisms, Technologies, and Services
33 / 145
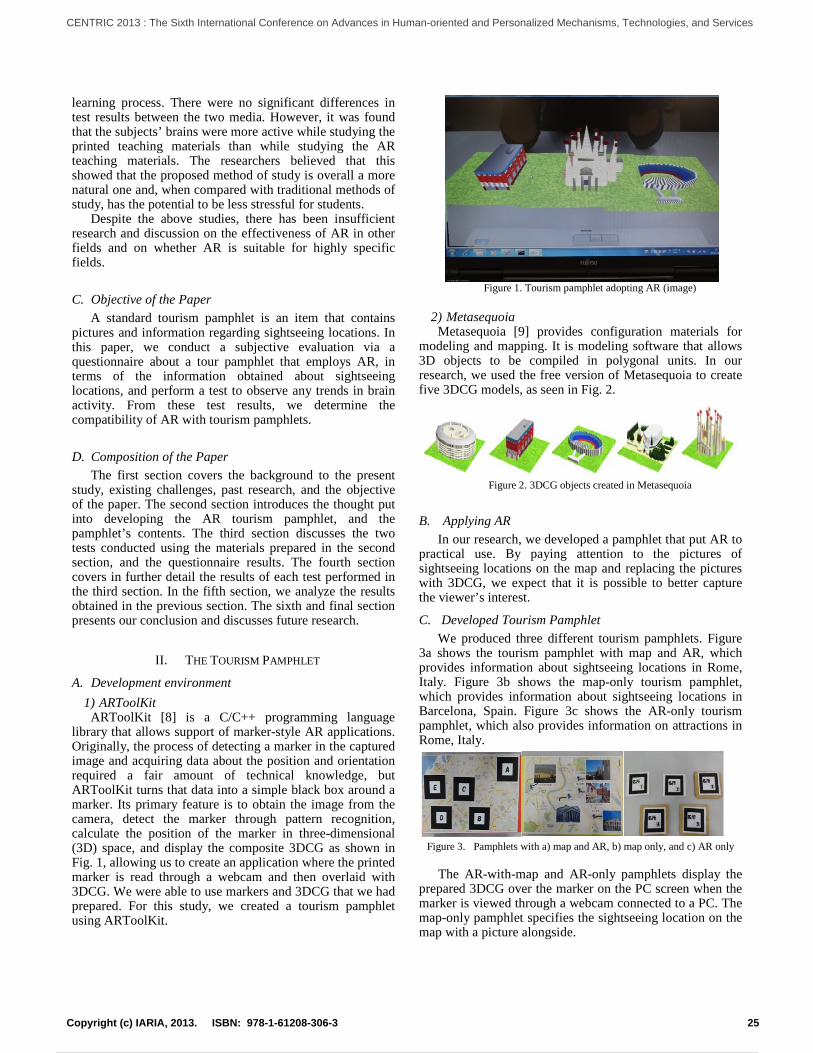
learning process. There were no significant differences in test results between the two media. However, it was found that the subjects’ brains were more active while studying the printed teaching materials than while studying the AR teaching materials. The researchers believed that this showed that the proposed method of study is overall a more natural one and, when compared with traditional methods of study, has the potential to be less stressful for students.
Despite the above studies, there has been insufficient research and discussion on the effectiveness of AR in other fields and on whether AR is suitable for highly specific fields.
C. Objective of the Paper A standard tourism pamphlet is an item that contains
pictures and information regarding sightseeing locations. In this paper, we conduct a subjective evaluation via a questionnaire about a tour pamphlet that employs AR, in terms of the information obtained about sightseeing locations, and perform a test to observe any trends in brain activity. From these test results, we determine the compatibility of AR with tourism pamphlets.
D. Composition of the Paper The first section covers the background to the present
study, existing challenges, past research, and the objective of the paper. The second section introduces the thought put into developing the AR tourism pamphlet, and the pamphlet’s contents. The third section discusses the two tests conducted using the materials prepared in the second section, and the questionnaire results. The fourth section covers in further detail the results of each test performed in the third section. In the fifth section, we analyze the results obtained in the previous section. The sixth and final section presents our conclusion and discusses future research.
II. THE TOURISM PAMPHLET
A. Development environment 1) ARToolKit
ARToolKit [8] is a C/C++ programming language library that allows support of marker-style AR applications. Originally, the process of detecting a marker in the captured image and acquiring data about the position and orientation required a fair amount of technical knowledge, but ARToolKit turns that data into a simple black box around a marker. Its primary feature is to obtain the image from the camera, detect the marker through pattern recognition, calculate the position of the marker in three-dimensional (3D) space, and display the composite 3DCG as shown in Fig. 1, allowing us to create an application where the printed marker is read through a webcam and then overlaid with 3DCG. We were able to use markers and 3DCG that we had prepared. For this study, we created a tourism pamphlet using ARToolKit.
Figure 1. Tourism pamphlet adopting AR (image)
2) Metasequoia
Metasequoia [9] provides configuration materials for modeling and mapping. It is modeling software that allows 3D objects to be compiled in polygonal units. In our research, we used the free version of Metasequoia to create five 3DCG models, as seen in Fig. 2.
Figure 2. 3DCG objects created in Metasequoia
B. Applying AR In our research, we developed a pamphlet that put AR to
practical use. By paying attention to the pictures of sightseeing locations on the map and replacing the pictures with 3DCG, we expect that it is possible to better capture the viewer’s interest.
C. Developed Tourism Pamphlet We produced three different tourism pamphlets. Figure
3a shows the tourism pamphlet with map and AR, which provides information about sightseeing locations in Rome, Italy. Figure 3b shows the map-only tourism pamphlet, which provides information about sightseeing locations in Barcelona, Spain. Figure 3c shows the AR-only tourism pamphlet, which also provides information on attractions in Rome, Italy.
Figure 3. Pamphlets with a) map and AR, b) map only, and c) AR only
The AR-with-map and AR-only pamphlets display the
prepared 3DCG over the marker on the PC screen when the marker is viewed through a webcam connected to a PC. The map-only pamphlet specifies the sightseeing location on the map with a picture alongside.
25Copyright (c) IARIA, 2013. ISBN: 978-1-61208-306-3
CENTRIC 2013 : The Sixth International Conference on Advances in Human-oriented and Personalized Mechanisms, Technologies, and Services
34 / 145

Figure 4. Examples of the included information sheets.
The pamphlets introduced in Fig. 3 include information
sheet on each location, as shown in Fig. 4.
III. EXPERIMENTS We performed two experiments. Section 3.1 outlines the
questionnaire for the first experiment using the pamphlet and information sheets. Section 3.2 details the second experiment in which brain activity was measured while the participants were given the pamphlets and informational sheets. Experiments 1 and 2 were carried out at the same time and for the same participants.
A. Experiment 1: Questionnaire Results 1) Experiment Objective
From the questionnaire results, we can examine whether the map with AR better conveys information and captures the interest of travelers than the traditional map-only pamphlet and AR-only pamphlet. The questionnaire results are used as indicators of the overall evaluation and points of possible improvement.
2) Participants Nineteen students (20 to 24 years old) from the Tokyo
University of Science, Suwa, participated in the experiment.
3) Materials The materials used in the experiment were a) the three tourism pamphlets (the AR+map tourism
pamphlet, the map-only pamphlet, and the AR-only pamphlet),
b) the three information sheets (information corresponding to each of the three pamphlets),
c) a laptop equipped with a webcam, and d) the questionnaire.
4) Experimental Method
Each participant took information from each pamphlet for 1 minute (i.e., a total of 3 minutes for the three pamphlets). The order of the pamphlets was changed for each participant to prevent any bias due to the order of presentation. The participants then filled out a questionnaire. We ran a training session for participants not familiar with AR.
5) Questionnaire Results Four evaluation options were provided: “strongly agree”,
“agree”, “disagree”, and “strongly disagree”. We chose four options to prevent a neutral answer. With each option respectively counting as four, three, two or one point, we used PASW Statistic (SPSS) to perform a statistical analysis. The significant variance using this software is below 5%.
Significant variations in results among pamphlets were found for the statements “It was easy to connect the name with the location”, “I was interested in the location”, “I want to visit the location”, and “I want to use the pamphlet again”.
The statements for the various pamphlets were compared using the Bonferroni method. This paper discusses only the significant variations that were observed.
Figure 5. Was it easy to connect the name with the location?
For the statement regarding how easy it was to connect
the name with the location, we observed significant variance between map-only and AR-only pamphlets and between AR+map and AR-only pamphlets. Figure 5 shows that the average ratings descended from best to worst in the order AR+map > map-only > AR-only. We can conclude from these results that the AR+map pamphlet was best able to connect the name with the location.
Figure 6. Were you interested in the location?
For the statement regarding interest about a location, we
observed significant variance between map-only and AR+map pamphlets. Figure 6 shows that the average ratings descended from best to worst in the order AR+map > AR-only > map-only. We can conclude from these results that the AR+map pamphlet elicited the most interest in the participants.
AR-onlyAR+mapmap-only
Estimated m
arginal means(EM
MEANS)
AR-onlyAR+mapmap-only
Estimated m
arginal means(EM
MEANS)
26Copyright (c) IARIA, 2013. ISBN: 978-1-61208-306-3
CENTRIC 2013 : The Sixth International Conference on Advances in Human-oriented and Personalized Mechanisms, Technologies, and Services
35 / 145

Figure 7. Did you want to visit the location?
For the statement regarding the participant’s desire to
visit a location, we observed significant variance between map-only and AR+map pamphlets. Figure 7 shows that the average ratings descended from best to worst in the order AR+map > AR-only > map-only. We can conclude from these results that the AR+map pamphlet elicited the most desire to visit a location.
Figure 8. Do you want to use the pamphlet again?
For the statement regarding the participant’s desire to
use the pamphlet again, we observed significant variance between map-only and AR+map pamphlets. Figure 8 shows the average ratings descended from best to worst in the order AR+map > AR-only > map-only. We can conclude from these results that, of the three pamphlets, participants most wanted to use the AR+map pamphlet again.
By condensing these statements, we can argue several points.
(1) The statements “It was easy to connect the name with the location” and “The information about the tourist locations was easy to understand” were categorized as statements measuring ease of comprehension. In that category, the order of results was AR+map > map-only > AR-only. There is a high probability that the AR-only pamphlet received low valuations because participants were unfamiliar with managing the markers. We also postulate that the AR+map pamphlet was the most intuitive scheme in allowing participants to understand the location. We can conclude that the AR+map pamphlet was easiest to understand.
(2) The statements “I was interested in the location”, “I want to visit the location” and “I want to use the pamphlet
again” were classified as statements measuring interest. In that category, the order of results was AR+map > AR-only > map-only. We can conclude that the map-only pamphlet was insufficient for capturing the participants’ interest as both AR+map and AR-only pamphlets received higher valuations.
B. Experiment 2: Measuring Brain Activity 1) Experiment Objective
By measuring the brain activity of participants as they take information from the AR+map, map-only and AR-only tourism pamphlets, we can investigate which parts of the brain are most active. We can also confirm which pamphlet was easiest to use through differences in brain activity of participants between each pamphlet.
2) Participants
We conducted the experiment with 19 students from the Tokyo University of Science, Suwa.
3) Materials
The materials used in the experiment were a) the three tourism pamphlets (AR+map tourism
pamphlet, the map-only pamphlet, and the AR-only pamphlet),
b) the three information sheets (information corresponding to each of the three pamphlets),
c) a laptop equipped with a webcam, and d) a brain-activity measuring device (NIRStation, a
multichannel near-infrared spectroscopy brain-activity measuring device).
As shown in Fig. 9, NIRStation measures changes in blood volume in the surface area of the cerebrum using optic fibers at the scalp to emit near-infrared light. Blood volume (oxyhemoglobin, oxy-Hb) is increased to send more oxygen to active parts of the brain. Near-infrared light enters 25–30 mm below the scalp and travels along the cerebral cortex and decays during a cycle of diffusion and absorption before returning in part to the scalp. From the light absorption levels and light path length in the oxy-Hb, we can detect changes in blood volume (indicating activity). As the equipment is non-invasive and unrestrictive for the wearer, it is possible to use the equipment in long and repeated measurements.
4) f-NIRStation Setup
As seen in Figs. 9 and 10, using the summits of the triangles formed by the eye sockets and auricles, the headgear follows the latitudes provided by the 10-20 system for brain activity between the 6ch and 11ch of the left brain, and between the 29ch and 34ch of the right brain, allowing for measurement of each channel. The number of channels in f-NIRStation was set to 44.
AR-onlyAR+mapmap-only
Estimated m
arginal means(EM
MEAN
S)
AR-onlyAR+mapmap-only
Estimated m
arginal means(EM
MEANS)
27Copyright (c) IARIA, 2013. ISBN: 978-1-61208-306-3
CENTRIC 2013 : The Sixth International Conference on Advances in Human-oriented and Personalized Mechanisms, Technologies, and Services
36 / 145

Figure 9. Measurements using the brain activity measuring device
(NIRStation).
Figure 10. Corresponding brain position and channel numbers
5) Experimental Method
Brain activity was measured in the participants as they reviewed information in the tourism pamphlet for a duration of 1 minute. Before receiving the information, we established a 20-second rest (no action or thinking) period. This allowed us to determine the difference between the brain’s activity during the rest period and during the task. The participants were given each pamphlet for 1 minute. The order of the pamphlets was changed for each participant to prevent order bias.
6) Process
Each participant was provided with a chart describing the process and a laptop with a Web camera for use with the AR+map pamphlet and AR-only pamphlet, with the AR application already prepared. For the map-only pamphlet, they were provided with only the pamphlet and the accompanying information sheet. Of the five sightseeing locations provided on each pamphlet, the participants were asked to select three. We had them repeat this three times for a total of nine places. We also provided information sheets about these locations.
IV. BRAIN ACTIVITY MEASUREMENT RESULTS
A. Statistical Analysis of Brain Activity Measurement Results (Average Values) With f-NIRStation, it is possible to output the brain
activity values during rest compared with the values during the task as a t-statistic. Using these t-statistics, we can perform a statistical analysis using PASW Statistic. The
percentage of significant variations is within 5%. The Bonferroni method was used simultaneously for multiple comparisons.
f-NIRStation outputs data for one experiment in 44 channels for each activity. Since the experiment was performed three times, there are three instances of data for all 44 channels for each participant. Using PASW Statistic, we were able to obtain the average value of all channels of brain activity for each of the map-only, AR-only and AR+map pamphlets and search for any significant variations between the three.
Figure 11. Differences in average brain activity between pamphlet
types. As a result, we were able to confirm significant
variations between the types of pamphlet. The bar graph in Fig. 11 shows the average amounts of brain activity. The figure shows that there is significant variation in brain activity for the AR+map and AR-only pamphlets. The descending order of average brain activity is AR-only > map-only > AR+map.
When using the AR-only pamphlet, the brain activity increased. As there was no map, we conjecture that participants were required to carefully read the information sheets and to pay close attention to the sightseeing location. We can conclude that for purposes of stimulating the brain, the AR-only pamphlet is most suitable.
There was little brain activity for the AR+map pamphlet. We postulate that this is because the pamphlet can be reviewed in a passive manner. When one is passively performing an action, brain activity is less than that when one is actively performing an action. As the AR will display the sightseeing location in 3DCG, it seems that one can comprehend the pamphlet without reading the additional information. We can conclude that for the purposes of not over-stimulating the brain, the AR+map pamphlet is most suitable.
B. Considerations Regarding Brain Activity Measurement Figure 12 displays the parts of the brain assigned to the
channels of f-NIRStation, the brain activity measurement device used.
Sections 1 through 14 in Fig. 12 correspond to the following areas of the brain: ①left dorsolateral prefrontal
AR-onlymap-onlyAR+map
Average amounts of brain activity
28Copyright (c) IARIA, 2013. ISBN: 978-1-61208-306-3
CENTRIC 2013 : The Sixth International Conference on Advances in Human-oriented and Personalized Mechanisms, Technologies, and Services
37 / 145

cortex, ②left inferior frontal gyrus, ③left angular gyrus, ④left superior frontal gyrus, ⑤left frontotemporal region, ⑥left superior parietal lobule, ⑦ left motor cortex, ⑧right dorsolateral prefrontal cortex, ⑨right inferior frontal gyrus, ⑩right angular gyrus,⑪right superior frontal gyrus, ⑫right frontotemporal region, ⑬right superior parietal lobule, ⑭ right motor cortex.
Figure 12. f-NIRStation’s channels in relation to portions of the brain
Parts in which significant variance was observed are
aggregated in Fig. 13. From left to right, each bar graph represents the results for the AR+map, map-only, and AR-only pamphlets. The bars display activity during the task as being in the plus-end, and at rest as being in the minus-end. The plus-ends of the graphs are proportionate to the amount of brain activity, while the minus-end is inversely proportionate.
Figure 13. Areas in which significant variation was observed
As seen by looking at each part in Fig. 13, significant variances were detected in ⑩ the right angular gyrus, ⑬the right superior parietal lobule, ⑪ the right superior frontal gyrus, ③ the left angular gyrus, ② the left inferior frontal gyrus, ④ the left superior frontal gyrus, and ⑤ the left frontotemporal region; however, after employing the Bonferroni method, we discovered there were no significant variations between types of pamphlet in the right superior frontal gyrus.
1) The angular gyrus (③ and ⑩) is the parts of the brain
responsible for language processing, particularly for figurative expressions and conjecturing [10]. When the parts of the brain are categorized, they are often grouped with the visual cortex. As seen in Fig. 13, the order of amount of activity descends in the order AR-only > AR with map > map-only. We postulate that with the AR-only pamphlet, the participants were able to confirm the contents of the information sheets using the 3DCG. Additionally, the AR allowed the participants to see the tourist locations before their own eyes and move around them freely. We believe it is possible that the AR gives the sensation that they are in fact in the place, rather than just viewing 3DCG on a screen. We believe it is for these reasons that the brain was more active for the AR-only pamphlet.
2) Significant variation was only detected in the right of
the superior parietal lobules (⑬). The parietal lobe is the part of the brain responsible for somatic sensations related to spatial reasoning. The right parietal lobe is concerned with input. As seen in Fig. 13, the order of amount of activity in the right parietal lobe descends in the order AR-only > AR with map > map-only. This part of the brain inputs information related to deciphering the spatial image and location of the 3DCG from the AR-only pamphlet (the image appears in front of the eyes rather than one simply on top of a map). We postulate that the brain activity was low for the map-only pamphlet as one only had to read the information sheets, which required little input from the parietal lobe.
3) The left and right superior frontal gyrus (④ and ⑪) is
part of the working memory [11] that deals with spatial cognizance and allows us to concentrate. As seen in Fig. 13, the order of the amount of activity in the superior frontal gyrus descends in the order map-only > AR-only > AR and map. As activity in this area was greatest for the map-only pamphlet, more concentration was required to closely read the supplied material as there was no 3DCG. We postulate that for that reason, the map-only pamphlet made the working memory more active.
4) Significant activity was detected only in the left
frontotemporal region (⑤). The temporal lobe is responsible for understanding spoken language and grasping meaning and form. As seen in Fig. 13, the amount of activity descends in the order AR-only > map-only > AR and map, with the AR-only pamphlet inducing the most activity. We
② ④ ⑨⑪
⑤
⑦
①
③ ⑥
⑭
⑧
⑫
⑬ ⑩
② ⑪
⑤
④
③⑬ ⑩
29Copyright (c) IARIA, 2013. ISBN: 978-1-61208-306-3
CENTRIC 2013 : The Sixth International Conference on Advances in Human-oriented and Personalized Mechanisms, Technologies, and Services
38 / 145

can postulate that by looking at computer graphics, our brain works harder at perceiving the form of an object. We believe that the activity was lowest for the AR+map pamphlet as the meaning and form of objects was easier to perceive and required less reasoning.
V. OVERALL CONSIDERATIONS
The objectives of this paper were to use AR with a map created by the researchers to examine any effect on interest of the observers in the field of tourism, to examine the compatibility of AR with tourism pamphlets, and to consider the effectiveness of AR with a typical tourism pamphlet.
We first performed an experiment using a questionnaire to obtain subjective opinions on the information received about sightseeing locations. It was found that ease of comprehension (based on differences in averages) descended in the order AR+map > map-only > AR-only. It is highly probable that the AR-only pamphlet had the lowest valuation because participants were unfamiliar with how to manipulate the pamphlet. It is believed that with the AR+map pamphlet, the locations of the sightseeing locations were conveyed in an intuitive manner. As such, the AR+map pamphlet was easiest to understand.
The interest in the locations (based on differences in averages) was found to descend in the order AR+map > AR-only > map-only. The map-only pamphlet failed in capturing interest when compared with the two pamphlets implementing AR.
We conducted another experiment to observe trends in brain activity and monitor any differences between the types of pamphlet. From the results, we can form the following conclusions for the combination of the map and AR.
1) In terms of spatial cognizance, combining AR with the map induced significantly less brain activity than using AR alone. We believe that this reduces stress on the brain.
2) In terms of working memory and grasping the significance/form of objects, a combination of AR and the map induced less brain activity than just one or the other alone.
3) The overall brain activity descended in the order AR-only > map-only > AR+map; this trend of brain activity applied to the whole brain.
From the above points, we see that the AR+map pamphlet created the least stress in inputting the significance and form of objects into the working memory, leading us to believe that the combination of AR and a map (when used to convey location information) is effective not just when applied to tour pamphlets.
VI. SUMMARY AND FUTURE PROSPECTS
We were able to grasp the features specific to each type of tourism pamphlet: one with a standard map, one with AR only, and one combining the map with AR.
We demonstrated that there was predominance particularly in the combination of the map and AR over the
traditional map pamphlet. By conducting an experiment where we measured the participants’ brain activities, we confirmed that the burden on spatial cognizance and working memory, and throughout the rest of the brain, was reduced with the map and AR combination. Additionally, we confirmed that the combination drew far more interest than the map-only pamphlet.
In previous practical studies of AR in foreign-language studies, the results for AR studies were much the same, demonstrating that AR allows for study with reduced stress. In our research, though we were able to demonstrate that combining map information and AR increased interest and reduced stress, there was much that we were unable to confirm, such as how long the information lasts in the mid-range memory. We are also interested in the differences between AR devices, for example a PC, Smartphone and head mount display. The effectiveness of AR may depend on the device type. We are thus planning to conduct more studies in this realm of research.
REFERENCES
[1] D.W.F. van Kreveren and R. Poelman, “A Survey of Augmented Reality Technologies, Application and Limitations”, The International Journal of Virtual Reality, 2010, 9(2) :1-20 Rekimoto et al., “All about Augmented Reality”, Nikkei Coomunicatio, NikkeiBP, 2009
[2] Akihito Kobayashi, “AR - Augmented Reality”, Mainichi Communications, 2010
[3] Pan, Zhigeng et al., Transactions on Edutainment V, Lecture Notes in Computer Science, Vol. 6530, Springer 2011
[4] Tomotsugu Kondo, “Educational Applications of Mixed Reality Technology and Current Issues”, Technical report of IEICE, vol. 106, Institute of Electronics, Information and Communication Engineers, 45-50, 2006
[5] Aurkene Alzua-Sorzabal, María Teresa Linaza and Marina Abad, “An Experimental Usability Study for Augmented Reality Technologies in the Tourist Sector” , Information and Communication Technologies in Tourism 2007 2007, pp 231-242
[6] Yuji Teshima and Daisuke Kosugi, “A Development of Educational Materials for Children Using Augmented Reality”, IEICE Transactions IEICE Transactions, Vol. J92-D, Institute of Electronics, Information and Communication Engineers, 2067-2071, 2009
[7] Tadashi Miyosawa, Mayuko Akahane, Kentaro Hara, and Kikunori Shinohara, “Applying Augmented Reality to E-Learning for Foreign Language Study and its Evaluation”, Proceedings Of The 2012 International Conference On E-Learning, E-Business, Enterprise Information Systems, & E-Government
[8] Hirokazu Kato, “ARToolKit: Library for Vision-based Augmented Reality”, Technical report of IEICE, Institute of Electronics, Information and Communication Engineers, PRMU 2001-232 (2002-2)
[9] Daisuke Harada, “New: Starting from Metasequoia”, Gijyutsu hyoronnsa, 2009
[10] Shun-ichi Amari, “Language and Thought in the Brain”, University of Tokyo Press, 2008
[11] Baddeley, A. “Working Memory”, Oxford University Press, 1986
30Copyright (c) IARIA, 2013. ISBN: 978-1-61208-306-3
CENTRIC 2013 : The Sixth International Conference on Advances in Human-oriented and Personalized Mechanisms, Technologies, and Services
39 / 145
Experiential Adaptation to Provide User-Centered Web Content Personalization
Silvia Mirri, Catia Prandi, Paola Salomoni
Department of Computer Science and Engineering
University of Bologna
Bologna, Italy
silvia.mirri, catia.prandi2, [email protected]
Abstract—Personalization of pages on the basis of each specific
users’ need is a key factor in navigating the Web, in particular
for those users who browse under specific conditions. This
paper proposes to track user’s behavior and to gain his/her
effective needs by means of machine learning concepts. Our
goal is to provide a system which improves Web legibility and
readability, customizing typographic characteristics of pages.
The system lets users adapt Web pages and learns how to
apply automatic personalization. This can be of great benefit
both for users with reading-related disabilities and for users
accessing with non-conventional devices.
Keywords-Content Adaptation; Web Personalization;
Profiling Users; Maching learning.
I. INTRODUCTION
Personalization is a key feature in providing services and content which are effective for users. Self-adaptation of Web pages is strongly overworked by Web 2.0 applications. Nevertheless, this issue is not usually exploited so as to meet specific user’s needs, making the Web pages personalization (both in terms of content and shape) an interesting and unsolved challenge [8, 14, 16].
In this field, a more user-centered approach is necessary to customize Web page elements, adapting their shape with the aim of meeting each single user’s needs. Such kind of approach can have a strong impact, in particular for those users with some reading-related disabilities (i.e., aging people, people with dyslexia, people with low vision, users with color blindness, etc.). Moreover, this approach can make the Web content more accessible even for those users who are equipped with devices with different capabilities (i.e., different screen sizes, different interactions systems), such as tablets, smartphones, smart TVs, etc. In these contexts, both readability and legibility are affected by Web pages characteristics [5, 12], users’ abilities [4, 9] and device capabilities.
In order to make Web pages (or just some parts of them, such as paragraphs, headings, links, tables, etc.) more legible and readable to users with disabilities and to users who exploit different devices, transcoding and adaptation activities can be performed. Transcoding and adaptation have been strongly exploited in research field and they are usually driven by categorizing device capabilities and users’ needs [1]. In this paper, we propose an innovative Web pages adaptation system based on the concept of experience-based transcoding, called “experiential transcoding” [2].
Comparing with more traditional forms of content transcoding and adaptation, the main advantage of experiential transcoding is that it is strongly user-centered. Furthermore, it applies techniques and mechanisms which adapt content on the basis of users’ experience, by understanding and predicting it [13].
The main aim of this work is to improve Web pages legibility and readability by adapting some characteristics (such as font size, font face, luminance contrasts, and so on) according to users’ preferences and needs. To reach this goal we have designed a system which lets users adapt Web documents, tracking users’ behavior (on the basis of the device in use), so as to learn and model their preferences and to automatically provide the best adaptation, tailored for each user, predicting his/her needs.
In order to understand user’s experience and to learn user’s preferences, we have used a machine learning mechanism, the Reinforcement Learning [15] one, based on the idea of reward/punishment. Thanks to this, we can build and feed a user’s profile which models his/her preferences in terms of Web page characteristics affecting his/her reading ability (both in positive and in negative ways). Thus, the Web content adaptation will be more user oriented, meeting each single user’s need.
In this paper, we present the system we have designed and a prototype we have developed which can adapt HTML pages. The main advantage of our system is the deep and detailed user’s profile we can gain: the system tracks the user’s behavior and continuously updates his/her profile, (the more the user exploits it and the more the profile will be accurate). This lets the system take into account users’ preferences and needs, even when they change. Moreover, this means that users are not categorized according their disabilities, but the system can provide Web content personalization for each single user. Without such adaptations a user’s need can conflict with general best practice, or can conflict with another user’s need. For instance, many people with dyslexia and other reading impairments need low contrast between text color and background color [9], while many people with low vision and many people with declining eyesight due to ageing need high contrast. On the contrary of other similar works, in which the entire content is customized according to user’s preferences and needs [7, 8, 9, 11, 16], our system adapts only those elements in the Web page which present some characteristics that can affect the user’s reading, without
31Copyright (c) IARIA, 2013. ISBN: 978-1-61208-306-3
CENTRIC 2013 : The Sixth International Conference on Advances in Human-oriented and Personalized Mechanisms, Technologies, and Services
40 / 145

distorting the whole page and its layout. Currently the prototype is under a testing phase by simulating users with low vision and dyslexia. An evaluation campaign with real users will be conducted next months: this will report users’ appreciation, the ease of use of the prototype, and the validity of our approach.
The remainder of the paper is organized as follows. Section 2 presents the system structure and it describes in details each system modules: the users profiling, the users’ preferences learning and the adaptation ones. Section 3 shows the prototype we have developed. Finally, Section 4 concludes the paper presenting further work.
II. SYSTEM STRUCTURE
In this section, we are going to describe our system structure, which includes: the users profiling module, the users’ preferences learning module and the adaptation module, as depicted in Figure 1. Each module is described in details in the following subsections.
P
Learning Module
Adaptation Module
Requested
Adaptation
Profiling Module
Figure 1. The whole system.
A. Users Profiling Module
Profiling users is an activity which can be useful in several contexts and applications, such as user interfaces and Web applications (i.e., recommendation system in e-commerce Web sites, personal data in social networks or in search engines filters, and so on). Data gathered in users’ profiles can range from personal data to contextual conditions, from user’s skills to his/her personal preferences [10]. Such data can be collected in different ways, for instance the user can explicitly declare them or they can be learnt by the system as the user exploits it.
In our system, the user profile is a collections of typographic characteristics gathered by the system (as described in the following Subsection 2.B), on the basis of adaptations (see Subsection 2.C) the user has requested in so as to improve Web content legibility and readability. Such a profile is shared among all the devices the user exploits and it takes into account different user’s needs according to capabilities of the device in use (i.e., different display size, etc.).
When the user exploits the system and asks for adaptations, our system computes automatic adaptations and related reward/punishment values, tracking the user’s behavior. Periodically, the system updates the user’s profile, adding new characteristics, updating reward/punishment
values for the already existing ones or adding new characteristic values as requested by the user.
The system provides adaptations as state changes: from the original one (let us call it A) to the adapted one (let us call it B), according to each user’s request. Let us use the following formalism to indicate the state change from the
original state A to the adapted state B: A→B.
Characteristics of state A (which are substituted by characteristics of state B) are the ones the user has discarded, while characteristics of state B are the ones the user has chosen. Hence, the system learns all the Web page characteristics which affect user’s reading ability (both in positive and in negative ways). Obviously, the user’s profile will be the more accurate the more the user asks for adaptations. As described in the following subsection, the system punishes discarded characteristics, while it rewards characteristics the user has chosen through the requested adaptations.
We have designed an xml-based profile which is structured in different parts, according to the devices the user exploits. In each of these parts, the system stores typographic characteristics (as tags) the user has preferred or the user has discarded, the related value (as the “v” attribute) and a
number (as the “w” attribute). Such a number states the
reward/punishment related to the adaptations asked by the user.
In fact, the “w” value varies according to user’s
behaviors and in particular:
if “w” is < 0: the user has discarded the characteristic
with the related “v” value;
if “w” is > 0: the user has asked for the characteristic
with the related “v” value;
if “w” is = 0: the characteristic with that “v” value has
obtained the same quantity of rewards and punishments.
The absence of a characteristic or of a specific “v”
value in the user’s profile, means that the user has never
asked for such characteristic adaptation or he/she has never
discarded or chosen such a “v” value.
Hence, the profile is composed by a set of Web page
characteristics the user has adapted and by the related values
he/she has asked and discarded, grouped by the devices the
user exploits. For each device, the profile stores the type, an
id value, the display width and the display height (in terms
of pixel). The device in use is deduced by the HTTP request
and its capabilities are collected from repositories [17].
The Web page characteristics our system takes into
account are related to text and to content features which can
affect both legibility and readability [5, 12]. Typographic
characteristics are related to fonts (i.e., face, size, style),
spaces (i.e., word and letter spacing, margins, line height,
alignment) and colors (i.e., background, foreground and
luminance ratio) [4], while content characteristics are
related to acronyms, abbreviations and foreign words or
sentences.
Figure 2 shows a fragment of a user’s profile, as an
example. Web page characteristics are grouped by a tablet
32Copyright (c) IARIA, 2013. ISBN: 978-1-61208-306-3
CENTRIC 2013 : The Sixth International Conference on Advances in Human-oriented and Personalized Mechanisms, Technologies, and Services
41 / 145

device. In such an example, the user has asked (among all
the adaptations): Arial as font face, 18 as font size, and 1.5
as line height. In the same example, the user has discarded:
Times new roman as font face, 9 as font size and 1 as line
height, while he/she has used the tablet.
Figure 2. A fragment of a user’s profile.
B. Users’ Preferences Learning Module
In order to learn users’ preferences, our system has been
modeled by using the Reinforcement Learning concept. The
learning algorithm adopted is the Q-learning algorithm [15].
Q-learning is a popular Reinforcement Learning algorithm
which works by estimating the values of state-action pairs.
The value Q(s, a) is defined to be the expected discounted
sum of future payoffs obtained by taking action a from state
s and following an optimal policy thereafter. Once these
values have been learned, the optimal action from any state
is the one with the highest Q-value. Q-learning works by
successively improving its evaluations of the quality of
particular actions at particular states. The system learns the
Q-values as the user exploits it. Then the system uses the
learnt Q-value for making better decision about possible
adaptations when the user requests a Web page. Q-values
can thus provide estimation of how successful that action
might be. The Q-learning algorithm has been already used
in several works, where systems have been design to
provide customizations according to learnt users’
preferences [11].
Our work focuses on directly interacting with the user to
learn his/her preferences. In fact, the user contributes by
helping the system which tracks the user’s behavior to
adaptations. In particular, the system obtains some
feedbacks from the user, in the form of reward or penalty.
This problem has to be formulated as a Reinforcement
Learning problem. In order to do this, we have to set up
states, actions and rewards. States represents sets of Web
page characteristics (font face, font size, word spacing, line
height, acronyms expansion, and so on). Actions are the
adaptations explicitly requested by users, the adaptations
proposed by the system and the adaptations the system
automatically performs. Rewards are related to user’s
behavior: if the user explicitly applies an adaptation or if the
user accepts an adaptation the system proposes, then the
reward for the chosen characteristics is +1. If the user
rejects an adaptation the system automatically performs then
the rewards is -1. A -1 reward is assigned also to those
discarded Web page characteristics as well.
Hence the whole system works in the following way:
1. when the user opens up a Web page, the system parses
its characteristics, taking into account the user’s profile.
2. If there are some characteristics the user has discarded
(with a negative “w” value, state A), then the system
computes if automatically adapting such characteristics,
substituting the original values with the ones the user
prefers (with the highest “w” value, state B) or just
proposing such adaptations, changing the state from A
to B (A→B).
3. Then the user exploits the Web page with a specific set
of characteristics (state B): font size and face, spacing,
alignment, background and foreground colors,
acronyms, and so on.
4. The system computes reward/penalty values tracking
user’s behavior, according to his/her feedbacks:
If the user ignores the adaptations the system has
automatically performed (hence the user implicitly
accepts state B characteristics), then the reward is
+1. Else, if the user rejects such adaptations then
the reward is -1.
If the user explicitly accepts the adaptations the
system has proposed (characteristics in state B)
then the reward is +1. Else, the reward is -1.
If the user applies a certain adaptation to a certain
set of Web page characteristics, changing from
original A state to the adapted B one (A→B) then
the system assigns +1, as a reward, to the requested
characteristics (in state B) and -1 to the discarded
ones (in state A).
Unchanged characteristics in state A and in state B
receive no reward.
5. Updated rewards and/or Web page characteristics
adapted for the first time are stored into the user’s
profile.
As an example, let us take into account a user who
exploits his/her PC and asks for a paragraph font size
increase in a Web page, from 10 to 18 pixel. The system
assigns +1 as reward to font size 18 (B state) and -1 as
reward to font size 8 (A state).
After updating the user’s profile, when the user opens
up another page, the system parses the characteristics and
finds a paragraph with font size 10. Such a characteristic is
stored in the profile with a negative “w” value (let us
consider the user’s profile depicted in Figure 2). In this
example, we can have the following system behavior:
if t < w < 0: the system proposes to adapt such a
characteristic by substituting it with the “v” value with
the highest “w” (font size 18, with “w=7”) only on the
…
<device type=”tablet” id=”2” display_width=””
display_height=””>
…
<font_face family=”sanserif” w=”5”
v=”arial”/>
<font_face family=”serif” w=”-2” v=”times
new roman”/>
<font_face family=”monospace” w=”-5”
v=”courier new”/>
…
<font_size w=”8” v=”18”/>
<font_size w=”-5” v=”9”/>
…
<line_height w=”5” v=”1.5”/>
<line_height w=”-2” v=”1”/>
…
</device>
…
33Copyright (c) IARIA, 2013. ISBN: 978-1-61208-306-3
CENTRIC 2013 : The Sixth International Conference on Advances in Human-oriented and Personalized Mechanisms, Technologies, and Services
42 / 145

mousehover event. The user can accept such a proposal,
then the system assigns a +1 reward to font size 18 (the
new “w” value will be 8) and a -1 reward to font size 10
(its new “w” value will be -5), else the system assigns a
-1 reward to font size 18 (its new “w” value will be 6);
if w < t: the system automatically adapts such a
characteristic by substituting it with the characteristics
with the highest “w” value (again font size 18, with
“w=7”). If the user rejects such an adaptation, then the
system assigns a -1 reward to font size 18 (the new “w”
value will be 6), else the system assigns a +1 reward to
font size 18 (the new “w” value will be 8) and a -1
reward to font size 10 (its new “w” value will be -5);
where t is a specific threshold. Such a threshold is a
negative integer value which can be differently set for each
characteristic. At the moment, we are conducting a testing
phase to define such thresholds for the most common
characteristics.
In this example, the system proposes the same
adaptation even when paragraphs with smaller font size are
found in the Web page. For instance, the system can
propose adaptation to font size 18 even for paragraphs with
font size 8. More generally, the same consideration is taken
into account also for those characteristics with numeric
values, such as luminance ratio, color contrasts, word and
letter spacing, line height, etc. Hence, if the user has
discarded a characteristic with a specific numeric value, the
system learns to adapt such characteristic with worse values.
C. Adaptation Module
Content adaptation is the action of transcoding or
transforming content so as to meet users’ preferences and
needs, even according to the device he/she is using.
In our system, we provide content adaptations with the
aim of improving Web pages readability and legibility. In
our system, the adaptation process is in charge locally, on
the client side. The system can locally decide and employ
the most appropriate adaptations, according to user’s profile,
which is fed on the basis of the user’s behavior.
The aim of the whole work is to adapt any kind of
markup document, such as LaTeX, PDF, RTF documents,
etc. But currently the system works on explicit and
descriptive markup documents, in particular HTML pages.
Our system performs adaptations by changing tags,
attributes and related values: the system injects new tags or
attributes and/or it substitutes original tags or attributes
value with the customized ones, changing markups.
When a user opens up a Web page, then the system
parses the DOM and the related style rules, by considering
those characteristics with a negative “w” value in the user’s
profile. If such characteristics are found in the page, then the
system decides if automatically adapting them (if the “w”
value is less than a threshold “t”) or if just proposing to the
user such an adaptation (if the “w” value is greater than
“t”). The discarded characteristics are substituted by the
“v” values with the highest “w”: since the user has chosen
them the most (to improve his/her reading ability), so we
can assume these are his/her preferences in terms of such
characteristics.
For instance, let us consider the user’s profile depicted
in Figure 2. If the user opens up a Web page and the system
finds a paragraph written in Times New Roman (with “w”
equal to -7), then the system proposes an adaptation from
Times New Roman to Arial as font face. The system
chooses Arial instead of Verdana, because Arial “w” value
is higher than Verdana one.
A list of adaptations the system can employ is the
following one:
Zooming font size: the system can increase font size by
a specific percentage or unit.
Changing font face: the system can substitute the
original font face with another one.
Changing font style: the system can set a specific style
(i.e., italic, underline or normal) to the text.
Changing spacing: the system can change spacing-
related attributes (i.e., letter spacing, word spacing,
line-height, margins, paddings, etc.).
Changing text alignment: the system can set users’
favorite text alignment (left, right, center or justify).
Enhancing luminance ratio: the system can increase the
luminance ratio. The system keeps the same
background color and computes a new foreground
color, so as to enhance the luminance contrast ratio.
Changing background and/or foreground colors: the
system can set different background and/or foreground
colors, according to users’ choice.
Language translation: the system can substitute original
words and/or sentences in translated ones.
Acronyms expansion: the system can substitute
acronyms with their related expansions.
III. PROTOTYPE
We have designed and developed a prototype of our
system which adapts HTML documents. Such a prototype
has been implemented as a Firefox extension. Users can
activate a contextual menu to set the preferred adaptations
on an HTML page. Then the system performs such
adaptations by suitably changing the HTML and/or the CSS
code of the page, on the client-side. In the meanwhile, the
system tracks users’ behaviors with the aim of learning their
preferences and then automatically applying or proposing
suitable adaptations.
This prototype has been implemented as a Firefox add-on
by means of Mozilla SDK [6]. Scripts have been created so
as to:
provide an ad-hoc contextual menu, letting users choose
among a sub-set of available adaptations (as shown in
the screenshot depicted in Figure 3): changing font face
changing font size, and changing background and
foreground colors.
34Copyright (c) IARIA, 2013. ISBN: 978-1-61208-306-3
CENTRIC 2013 : The Sixth International Conference on Advances in Human-oriented and Personalized Mechanisms, Technologies, and Services
43 / 145

Adequately modify the DOM of the HTML page,
injecting new attributes or changing values for the
already existing ones. In particular, the prototype can
add “style” attributes with CSS rules to the element
tag or can change the existing CSS rules values,
according to the adaptations the user has requested.
This way, thanks to CSS cascading feature, customized
values of inline rules override the same ones eventually
declared in external or internal CSSs.
Add scripts to create and activate pop-ups: when an
adaptation is just proposed to users, this is triggered on
the mousehover event, by means of AJAX scripts.
Currently, the prototype has been tested on laptops
(equipped with different operating systems) and on
Samsung Galaxy Tab 2 devices, equipped with Firefox
browser. More browsers extensions are needed and are
under development (i.e., for Chrome, Internet Explorer,
etc.), so as to provide a wider and more complete system.
Figure 3 shows a screenshot of a Web page with the
contextual menu of the prototype we have developed: after
activating such a menu, it is possible to zoom in, to zoom
out, to change the font family, to change the background
and foreground colors of the specific element the user has
chosen (which is highlighted by means of a colored border).
Figure 4 depicts a screenshot (of the same Web page in
Figure 3), when an adaptation is proposed to the user: a pop-
up is activated only on the mousehover event on the element
the system proposes to adapt. The user can accept or reject
the proposed adaptation, providing a feedback and letting
the system learn about his/her preferences.
Figure 5 shows a screenshot (of the same Web page in
Figures 3 and 4), when the chosen adaptation is
automatically performed. In particular, the text in the chosen
element has been increased from 16px to 24px, by means of
zoom in adaptation. Screenshots in Figure 3, 4 and 5 have
been taken from a PC equipped with Ubuntu 13.04 and
Firefox 21.0.
A synchronization mechanism is still under
development: synchronization among different devices used
by the same user is needed so as to let the user enjoy
customized Web pages on the basis of his/her preferences
and of different device capabilities. Figure 6 shows the
whole system architecture. Currently, each user stores
his/her profile, structured in device-related profile sections
(as reported in subsection 2.A), on each device he/she is
using. Updates to the user’s profile are locally stored (on the
device in use) and a synchronization mechanism is needed
to spread such updates on the other copies of the profile.
The different copies of the profile have to be periodically
synchronized. All the profiles will be stored on the server
side. The copy of the profile stored on the server will be
used in case of new devices associated to the same user:
when a new device joins the system, the user’s profile will
be downloaded from the server and a new profile section
will be added to all the copies of the profile, via the
synchronization mechanism.
Figure 3. A screenshot showing our contextual menu.
Figure 4. A screenshot showing an adaptation proposal.
Figure 5. A screenshot showing an adapted element.
P
P
P
P
P
P
Figure 6. System Architecture.
IV. CONCLUSION AND FUTURE WORK
Our work on improving Web pages legibility and
readability by means of experiential transcoding (learning
user’s profile by tracking his/her behavior) is still under
35Copyright (c) IARIA, 2013. ISBN: 978-1-61208-306-3
CENTRIC 2013 : The Sixth International Conference on Advances in Human-oriented and Personalized Mechanisms, Technologies, and Services
44 / 145

development, however we have presented in this paper the
system we have designed and a prototype we have
developed. The goal of our system is to adapt Web page
characteristics (such as font size, font family, colors,
luminance contrasts and so on) according to users’
preferences and needs. The system we have presented lets
users adapt such characteristics and tracks users’ behavior
with the aim of learning their preferences, so as to
automatically provide the best adaptations, tailored for each
single user, even on the basis of the exploited devices (PC,
tablet, smartphone, smart TV, etc.).
Further work is needed to develop extensions and/or
adds-on for the most commonly-used browsers (i.e.,
Chrome, Internet Explorer, etc.) and for other kinds of
documents viewers and readers, letting the system adapt not
only HTML pages, but also other markup documents (i.e.,
LaTeX ones). Moreover, further investigation is needed so
as to adapt also PDF documents: some researches have been
conducted studies on how to customize text characteristics
on tagged PDF documents [3]. In order to provide a wider
range of adaptable documents, these findings will be taken
into account in our future work.
A system testing phase is ongoing. This is important to
define suitable thresholds t for each document
characteristic (in order to support the system in deciding
when automatically adapt or just propose a specific
adaptation). Finally, a user testing phase is needed and it
would involve several users with different preferences and
specific needs (i.e., aging people, users with low vision,
users with dyslexia, users with color blindness, etc.)
equipped with different devices.
ACKNOWLEDGMENT
The authors wish to thank Giulio Cirnigliaro and Luca Spadazzi for their precious support.
REFERENCES
[1] C. Asakawa and H. Takagi, “Transcoding,” in Simon Harper
and Yeliz Yesilada, editors, Web Accessibility: A Foundation
for Research, Human-Computer Interaction Series, Springer,
2008, pp. 231–260.
[2] A. Brown, C. Jay, and S. Harper, “Audio access to calendars,”
Proc. ACM 7th International Cross-Disciplinary Conference
on Web Accessibility (W4A’10), ACM, Apr. 2010,
doi:10.1145/1805986.1806028.
[3] O. Drümmer, “How feasible is text customization for PDF
documents?,” in Text Customization for Readability, W3C
Online Symposium, Nov. 2012. Available from:
http://www.w3.org/WAI/RD/2012/text-customization/t6
[retrieved: August, 2013].
[4] S. L. Henry, “CSS for Readability: Analysis of user style
sheets to inform understanding users' text customization
needs,” in Text Customization for Readability, W3C Online
Symposium, Nov. 2012. Available from:
http://www.w3.org/WAI/RD/2012/text-customization/r14
[retrieved: August, 2013].
[5] G. Legge, “Psychophysics of Reading,” Lawrence Erlbaum
Associates, Mahwah, New Jersey, 2006.
[6] Mozilla Firefox Add-on Builder and SDK, 2013. Available
from: https://addons.mozilla.org/en-US/developers/
[retrieved: August, 2013].
[7] S. Panchanathan, T. McDaniel, and V. N. Balasubramanian,
“Person-Centered Accessible Technologies: Improved
Usability and Adaptation through Inspirations from Disability
Research,” Proc. International Workshop on User Experience
in e-Learning and Augmented Technologies in Education
(UXeLATE’12), ACM, Oct. 2012, pp- 1-6,
doi:10.1145/2390895.2390897.
[8] L. Rello and R. Baeza-Yates, “Optimal Colors to Improve
Readability for People with Dyslexia,” in Text Customization
for Readability, W3C Online Symposium, Nov. 2012.
Available from: http://www.w3.org/WAI/RD/2012/text-
customization/r11 [retrieved: August, 2013].
[9] L. Rello, M. Pielot, M. Marcos, and R. Carlini, “Size matters
(spacing not): 18 points for a dyslexic-friendly Wikipedia,”
Proc. ACM 10th International Cross-Disciplinary Conference
on Web Accessibility (W4A’13), ACM, May 2013,
doi:10.1145/2461121.2461125.
[10] P. Salomoni, S. Mirri, S. Ferretti, and M. Roccetti, “Profiling
Learners with Special Needs for Custom E-Learning
Experiences, a Closed Case?,” Proc. ACM 4th International
Cross-Disciplinary Conference on Web Accessibility
(W4A’07), ACM Press, May 2007, pp. 84-92,
doi:10.1145/1243441.1243462.
[11] P. Swapna Raj and B. Ravindran, “Personalized Web-page
Rendering System,” Proc. International Conference on
Management of Data (COMAD 2008), Dec. 2008, pp. 30–39,
doi:10.1.1.143.5393.
[12] M.A. Tinker, “The Legibility of Print,” Iowa State University
Press, 1963.
[13] Y. Yesilada, S. Harper, and S. Eraslan, “Experiential
Transcoding: an eye tracking approach,” Proc. ACM 10th
International Cross-Disciplinary Conference on Web
Accessibility (W4A’13), ACM Press, May 2013,
doi:10.1145/2461121.2461134.
[14] W. M. Watanabe, A. Candido, M. A. Amâncio, M. de
Oliveira, T. A. S. Pardo, R. P. M. Fortes, and S. M. Aluísio,
“Adapting web content for low-literacy readers by using
lexical elaboration and named entities labeling,” Proc. ACM
7th International Cross-Disciplinary Conference on Web
Accessibility (W4A’10), ACM Press, May 2010,
doi:10.1145/1805986.1805998.
[15] C.J.C.H. Watkins, “Learning from Delayed Rewards,” Ph.D.
thesis, Cambridge University, 1989.
[16] K. Wecel, T. Kaczmarek, and A. Filipowska, “Scalable
Adaptation of Web Applications to Users’ Behavior,” Proc.
4th International Conference on Computational Collective
Intelligence: technologies and applications (ICCCI'12),
Springer-Verlag Berlin, Heidelberg, Nov. 2012, pp. 79-88,
doi:10.1007/978-3-642-34707-8_9.
[17] WURFL ScientiaMobile, WURFL, 2013. Available from:
http://www.scientiamobile.com/ [retrieved: August 2013].
36Copyright (c) IARIA, 2013. ISBN: 978-1-61208-306-3
CENTRIC 2013 : The Sixth International Conference on Advances in Human-oriented and Personalized Mechanisms, Technologies, and Services
45 / 145

Development and Evaluation of a Rehabilitation Program using Kinect™ Motion Capture Technology
Tadashi Miyosawa, Shinya Yanagisawa, Masao Okuhara Department of Business Administration and Information
Tokyo University of Science, Suwa Nagano, Japan
e-mail: [email protected], okuhara @rs.suwa.tus.ac.jp
Abstract—A rehabilitation program was developed and applied using the recent development of Kinect motion capture technology. We tested the use of Kinect in the rehabilitation of people with physical disabilities (the elderly in our case). The rehabilitation takes advantage of Kinect without requiring a controller and the intuitive use of Kinect through physical gestures. Evaluation of an improved program in a second test identified new ways of using Kinect in future tests and as an exercise aid for the test subjects. Survey results collected following the tests indicate that many subjects were interested in the program as a new application, and the program encouraged exercise by reminding the subjects of when they were young.
Keywords—Rehabilitation Program; Motion Capture; Kinect; Elderly; Nursing
I. INTRODUCTION
A. Background In recent years, it has become increasingly common to
use motion capture technology for the movement of characters in three-dimensional (3D) movies and video games. This technology allows for the movements of humans in real life to be read by a computer. Since these data are a reproduction of the movements of actual humans, the recorded movements are extremely real.
Motion capturing is performed by attaching sensors to joints of the human body. Receiving sensors, such as those in cameras, record signals from the attached sensors and send them to a computer to be converted into digital data. By assigning the movements of each sensor to the joints of a computer-created person, it is possible to make the computer-created person move in the same way as an actual human.
However, using motion capture technology requires a wide space for filming and much technical machinery, such as cameras and computers, and it is thus not easy to use from a financial point of view.
In 2010, the public started using Kinect™ [1]. Once the potential of Kinect, which uses motion capture technology, was identified, Kinect was modified for use on computers.
The Kinect for Windows® software development kit (SDK) was officially released as a tool for personal computer (PC) development, on the prerequisite that it was not to be used for commercial purposes. As a result, Kinect is currently being used as a motion capture technology in
various research fields, e.g., research on games and video, nursing and medical care.
B. Kinect Kinect is an interactive system that allows the control of
video games without the use of a controller. It is a peripheral for the Xbox 360 released by Microsoft that allows for intuitive control using gestures and voice recognition as shown in Figure 1. The word “Kinect” is a combination of the words “Kinetics” and “Connect”.
Figure 1. Kinect Source: XBOX360 Kinect [1]
Kinect was released by Microsoft in 2010. At that time,
the Nintendo Wii, which was released in 2006, had opened up a new games market with its controller that used physical motions for controls. Users then found alternative uses for the interactive game systems. One of the biggest differences between Kinect and the Wii is that Kinect does not require the player to hold a controller, and it is possible to move characters in the game simply by making physical motions. Both consoles use motion capture technology. The Wii reflects the player’s movements in the game by performing detection along three axes: pointer movement (through acceleration), changes in movement and inclination via the motion sensor built into the controller and pointer detection using infrared light. Kinect uses a number of sensors and processors and does not need to attach markers to the body. Therefore, it can reflect movements in the game by estimating and constructing indirect parts on acquired skeletal images and using these to track movements in real time.
C. Past research Much research has been performed in the medical field
employing motion capture technology that uses Kinect.
37Copyright (c) IARIA, 2013. ISBN: 978-1-61208-306-3
CENTRIC 2013 : The Sixth International Conference on Advances in Human-oriented and Personalized Mechanisms, Technologies, and Services
46 / 145

1) Navigation support for the visually impaired The Human-Computer Interaction group of the
University of Konstanz in Germany is conducting a navigation support project for the visually impaired [2]. The project aims to provide aid for the blind as they walk down hallways, ascend and descend stairs, and open doors, using Kinect as a sensor.
This project involves scanning an environment with Augmented Reality using Kinect and then recognizing that environment. A system voice then tells the person wearing the device the distance to the next object (such as a door or staircase). By tying a device containing a vibration motor linked to the Kinect around the waist, it is possible to prevent the wearer from bumping into obstructions by physically (tactually) notifying them of danger, using vibration that becomes increasingly strong as the wearer approaches the obstruction in question.
2) NAIST Ballpool Hiroyuki Funaya of the Doctor’s Course in Information
Science and Technology at the Nara Institute of Science and Technology developed an application (app) called “NAIST Ballpool” [3], taking advantage of the fact that Kinect does not require a controller or the user to own a videogame console or computer. This app provides an exercise in which Kinect is used to move a robot displayed on a screen to touch a ball. The app was used in a retirement home [4] by residents aged 80–90 years. When asked what they thought of the experience, they said it was “fun”. Kinect is used to reflect physical movements on a screen, allowing the body to move freely in a virtual sense. However, the retirement home residents reported problems in implementing Kinect. First, “when using the Kinect for input-based controls, 3D input is not necessarily appropriate for two-dimensional display.” For example, when Kinect is used in lieu of a mouse, the arms must be continuously raised to perform input commands. This activity is tiresome compared with using a mouse controller, which allows easy input using only the fingers. Second, “when using the Kinect, there is nothing for the user to touch, so there’s no physical feedback.” This is because physical movements are reflected on a screen and there is no sense of being in control as there is no tactile feedback.
D. Kinect for Windows SDK and the Sample Shape Game Microsoft initially stated in the Kinect instruction
manual that Kinect should not be used to control a PC itself, but they acknowledged the use of Kinect on PCs for non-business purposes, provided that the internal algorithms would not be altered and that Kinect would not be used for the manipulation of Xbox games. Microsoft officially released a beta version of “Kinect for Windows SDK” (a program development kit for running the Kinect on a PC) on June 16, 2011 [5][6].
Kinect for Windows SDK contains a “Skeletal Viewer” and “Sample Shape Game” as sample programs. These were constructed in a basic program that allowed Kinect to be used on PCs, and provided a simple experience demonstrating the abilities of Kinect.
The Skeletal Viewer allows the display of depth images and color images, recognition of two people and indirect recognition of each person. Thus, source code from the Skeletal Viewer allowed users to study the basics of how to program and use Kinect for Windows SDK.
In the Sample Shape Game, the player must touch falling objects with his/her body to score points. It also supports voice recognition, allowing the player to control the game with commands such as “Reset” and “Faster”. However, to make use of the voice recognition function, a voice recognition framework must be installed.
E. Purpose and approach of this paper The purpose of this paper is to evaluate the effectiveness
of Kinect application as the rehabilitation program. Subjects in a nursing home played the Sample Shape Game program included in the Kinect for Windows SDK. We then asked which areas of the game they would like to see improved using questionnaire. Based on their request we made improved version of application and then had them play the improved version. After they experienced improved version, we asked questionnaire again to evaluate the effectiveness.
F. Composition of this paper The first section covers the background that brought us
to undertake our present study, existing challenges, past research, and the objective of the paper. The second section introduces the developed program. The third section discusses how an evaluation test was conducted. The fourth section presents the results of each test performed in the third section. The fifth section discusses observations related to the results obtained in the previous section. The sixth and final section summarizes the work and discusses future research.
II. DEVELOPED PROGRAM
A. Development environment We installed Kinect for Windows SDK on a PC so that
Kinect could be controlled using the PC. The development/implementation environment was as follows. PC System: FMV - F8370 CPU: Intel® Core™ 2 Duo CPU T8100 (2.1 GHz) Memory: 2.00 Gb OS: Windows 7 Professional
Furthermore, we used Microsoft Visual C# 2010 Express
as a development tool to implement improvements in the
38Copyright (c) IARIA, 2013. ISBN: 978-1-61208-306-3
CENTRIC 2013 : The Sixth International Conference on Advances in Human-oriented and Personalized Mechanisms, Technologies, and Services
47 / 145

Sample Shape Game program used in this test. Improvements were made according to survey results collected after test 1 (described below).
B. Falling objects The size, type and drop rates of falling objects were not
originally programmed with our test subjects in mind, so we made the objects simpler and bigger and reduced the drop rate. The program was changed as follows.
public void SetSize(double f)
baseShapeSize = f shapeSize = sceneRect.Height* baseShapeSize / 1000.0; public void SetDropRate(double f) dropRate = f ; - Changed underlined value: - 1000.0 → 500.0 - Increased size of falling objects - dropRate = f → dropRate = f/2 To simplify the objects, we changed the poly types to circular objects, such as circles and bubbles. Figure 2 shows the results of our changes.
Figure 2. Screen captures from the original program (left) and the changed
program (right).
C. Projecting the player on the game Originally, the top right of the main game window
displayed a tiny player image entered via the Kinect camera. We decided to make the player image the same size as the full window by overlaying the player image on the main game window. When we superimposed the Kinect camera image of the player on the game window, we encountered a problem that only the camera image was being displayed, and the game screen was not visible. Therefore, to make it look as if the player was transported into the game, we made the image from the Kinect camera semi-transparent and superimposed the camera image onto the skeletal frame-based image. The program was changed as follows.
<Image Name="video" Opacity="0.5" Margin="12,50,12,12" HorizontalAlignment="center"
Width="504" Height="550" VerticalAlignment="center" />
By changing the opacity value from 1.0 (non-
transparent) to 0.5 (semi-transparent), the player image was projected onto the game window. The semi-transparency meant that the screen images were slightly difficult to observe, but the result was adequate for our purposes.
D. Final program The results of the changes and improvements of the
program in Sections 2-B and 2-C are shown in Figure 3.
Figure 3. Example of the display for the final program.
We were, thus, able to improve the program in terms of
the falling objects and the superposition of the player image from the Kinect camera onto the game screen. The improved program was used and evaluated in test 2 (described below).
III. EVALUATION
A. Test 1: Sample Shape Game experience 1) Purpose of test 1
Elderly people living in nursing homes who do not usually exercise and people who require day services were asked to participate in the test. Both the subjects and their exercise instructors played the Sample Shape Game. This formed the basis of the test. We asked the subjects and their exercise instructors for their opinions and thoughts on how the program should be improved for test 2.
2) Test subjects Seven people receiving day services and one exercise
instructor were enrolled from the Suwa Central Hospital Union Nursing Home “Fureai no Sato”.
3) Materials The following materials were used.
– Kinect – one laptop PC
39Copyright (c) IARIA, 2013. ISBN: 978-1-61208-306-3
CENTRIC 2013 : The Sixth International Conference on Advances in Human-oriented and Personalized Mechanisms, Technologies, and Services
48 / 145

– one projector – the Sample Shape Game.
4) Procedure On the day of the test, people who receive day services
in the nursing home facility were asked to play the Sample Shape Game for about 30 minutes. We then asked them which aspects of the program they would like to see improved.
5) Comments and Opinions of the subjects
The thoughts/opinions/requests we received from the people who experienced the game were as follows: – The game should display the actual person as recognized by the camera, not just a skeletal frame. – The falling objects should be more interesting (e.g., money or strawberries). – The falling objects should be larger. – There should be recognition of wheelchairs (which are not detected properly). – There should be selectable levels of difficulty. – There should be familiar music (without music, there is little desire to play).
B. Test 2: Playing the improved Sample Shape Game 1) Changes from test 1
The following changes were made to the Sample Shape Game: – Changes were made to the falling objects. – Changes were made to the size of the falling objects (they were made twice as large). – Changes were made to the type of falling objects (they
were changed from squares, triangles, and stars to just circles).
– The falling rate was reduced and the intervals between falling objects were increased (by a factor of 2). – The players themselves were projected into the game by superimposing the player image captured by the Kinect camera (originally displayed in a small window at the top right of the screen).
2) Purpose of test 2 We made changes to the Sample Shape Game according
to the feedback we received from test 1, and we had the subjects play the improved version and take a survey afterwards. We used the results to study the usefulness of a program using Kinect in rehabilitation.
3) Test subjects
Seven people receiving day services (different subjects from test 1) and one exercise instructor were enrolled from the Suwa Central Hospital Union Nursing Home “Fureai no Sato”.
TABLE 1. NUMBER OF SUBJECTS THAT VISITED FOR DAY SERVICE CATEGORIZED BY AGE AND NURSING LEVEL.
Age Number of subjects 70–74 1 75–79 2 80–84 5 85–89 7 90–94 3
Nursing level Number of subjects 1 2 2 4 3 4 4 4 5 2
Support Required 2
On the day of the test, as shown in Table 1, 17 people came to the facility to receive day services. Seven subjects and one exercise instructor experienced the program.
4) Materials The following materials were used:
– Kinect – Two laptop PCs (one for connecting the Kinect, and the
other for connecting speakers and playing music) – The improved version of the Sample Shape Game produced by our group
– Two audio speakers – One projector – One music compact disc (the best of Bon festival dance) – Survey forms – Writing material
Figure 4. Configuration.
The speakers were connected to one PC to play music,
and the other PC was used to connect the Kinect and the
ScreenDiplayArea
ProjectorSpeaker
PC
Kinect
40Copyright (c) IARIA, 2013. ISBN: 978-1-61208-306-3
CENTRIC 2013 : The Sixth International Conference on Advances in Human-oriented and Personalized Mechanisms, Technologies, and Services
49 / 145

projectors as shown in Figure 4. The projector was used to display the combination of the game screen and the image obtained from the Kinect camera on the main screen.
5) Procedure We returned to the facility where we performed test 1 so
the subjects could experience the improved Sample Shape Game. In test 2, we played music during the test, in response to the subjects’ opinions in test 1. Since we used different subjects for test 2 and the testing time was restricted, we did not compare the program before and after improvements.
Figure 5. Test subjects experiencing the improved program.
Subjects used the improved program, as shown in Figure
5, and then filled out a survey, in which they were asked to provide a five-level evaluation (from “I agree” to “I disagree”) in response to five statements: “The game was easy to use”, “The game helps me exercise”, “I want to play again”, “There should be music” and “The size of the objects was appropriate”.
IV. TEST RESULTS
A. Results and observations for test 1 As stated above, the thoughts/opinions/requests we
received from subjects who played the game in test 1 were as follows: – The game should display the actual person as recognized by the camera, not just a skeletal frame. – The falling objects should be more interesting objects (e.g., money and strawberries). – The falling objects should be larger. – Wheelchairs should be detected properly. – The player should be able to select the level of difficulty. – Familiar music should be played.
Subjects wanted to see themselves projected in the game instead of a skeletal frame, suggesting the skeletal frame, which appeared inorganic, did not make them feel as if they were directly participating in the game.
Some subjects wanted more interesting objects to fall, but since the original program only contained very simple shapes such as circles and triangles, it was difficult to change the shapes into specific objects; we thus decided to use only one shape. The size of the objects was changed by adjusting some values in the program, but since this would increase the density of objects on the screen, we changed the speed and number of falling objects accordingly.
During the survey to determine which points required improvement for test 2, we encountered a problem not directly related to the program. Some subjects were wheelchair users, and they experienced problems in terms of being recognized by the game. Probable causes for this are that the game was not played within an area most suitable for using Kinect and that the armrests of the wheelchairs were mistakenly recognized as human arms.
We did not think of using music when we designed the test, but subjects suggested that music was necessary to make them want to exercise. Therefore, we decided to use traditional Japanese Bon festival music, such as “Tankō Bushi”, to provide music familiar to people of the subjects’ age.
B. Results and observations for test 2 Test 2 involved a survey with a five-level evaluation
(from “I agree” to “I disagree”) in response to five statements: “The game was easy to use”, “The game helps me exercise”, “I want to play again”, “There should be music” and “The size of the objects was appropriate”. The results are given in Table 2.
TABLE 2. SURVEY RESULTS
Evaluation Item 5 4 3 2 1 Game was easy to use 5 1 0 1 0 Game helps me exercise 2 3 2 0 0 I want to play again 5 1 0 1 0 There should be music 7 0 0 0 0 Size of objects was appropriate 7 0 0 0 0
The results are summarized as follows.
1) The game was easy to use; mean score: 4.4 The controls were simple, as the subjects only had to
move their arms and legs to score points, and the subjects were thus able to get used to the game relatively quickly. Sometimes the skeletal frame was not properly detected, resulting in the subjects not being able to control and play the game.
2) The game helps me exercise; mean score: 4.0 This statement referred to the question of whether the
subjects felt the game helped them exercise. The results varied slightly, but several subjects felt that the game would be a good incentive for exercise.
3) I want to play again; mean score: 4.4 Several subjects mentioned that the game reminded them
of being younger and that they would like to play again. 4) There should be music; mean score: 5.0
41Copyright (c) IARIA, 2013. ISBN: 978-1-61208-306-3
CENTRIC 2013 : The Sixth International Conference on Advances in Human-oriented and Personalized Mechanisms, Technologies, and Services
50 / 145

We did not use music during test 1, but in response to the opinions received during test 1, we played songs the subjects were familiar with, such as Tankō Bushi and Sōran Bushi, during test 2, resulting in the subjects being more motivated in their participation.
5) The size of the objects was appropriate; mean score: 5.0
We doubled the size of the falling objects in the original program to make them easier to recognize. There did not seem to be any particular problem in recognizing the objects and there were no negative opinions.
Comprehensive evaluation of the five statements
demonstrated that the game was easy to control and that it enabled the subjects to exercise by being reminded of when they were younger. It also demonstrates that playing music leads to more motivated participation and that feedback was generally positive.
When evaluating the desire to play again, it is important to take into account that the skeletal frames were not always properly detected and that the subjects might become bored with the game over long periods. We did not survey this point in the study.
The following positive and negative comments were made by the respondents outside of the five-level evaluation. Positive points – The game is a good incentive for exercise. – The game reminded me of my younger self. – The game gives me something to focus on. – The game enabled me to move my hands again by reminding me of when I was younger. – The game is nice in that the colors change. – The game reminded me of when I played basketball. – The game is good for exercise. Negative points – I was not used to the game, so the movements were a bit difficult. – I did not have a good impression of the game because it did not display me properly (the skeletal frame was not properly detected). – The game responded too slowly. – It would have been nicer if the game moved in accordance with the music (permitting dancing). – There should have been more variety in the falling objects.
One opinion that was particularly prevalent was that the game reminded the subjects of being younger, allowing them to move their bodies freely again. It is likely this was due to (1) increased motivation to move associated with their interest in new things (the Kinect system) and (2) music they were familiar with was being played.
Some subjects were not able to evaluate the game properly because their skeletal frame was not correctly detected. Most of these subjects were wheelchair users, implying that the problem was due to Kinect not being able
to distinguish armrests from arms and therefore failing to recognize a proper skeletal frame.
V. OBSERVATIONS The nursing home facility usually has a 45-minute
recreation session in the afternoon, where the elderly exercise by participating in bread-eating contests, playing balloon volleyball in which they move their arms in fan-like motions, or playing on a Wii (Wii Sports, Wii Fit). They also perform exercises that involve balancing, stretching, getting up and walking as a pastime while waiting for other people to finish their morning baths. In contrast to the kind of rehabilitation performed at hospitals, which is aimed at recovering a person’s motor functions (such as going to the bathroom alone) by practicing movements necessary for daily life, at the nursing home, rehabilitation involves the functions the person still possesses. Regarding the differences between the two kinds of rehabilitation, we received comments from the exercise instructors including “It’s good that they can use their whole bodies without the use of objects” and “The movements have been made slower, so it is different from things that are made for slightly younger people, like the Wii, and it provides a more comfortable exercise for people who cannot move quickly, such as the elderly.” As these comments show, the game was more playable for the elderly subjects in test 2 than those in test 1 by adjusting the rate and speed of the falling objects to be lower than those in the original program.
Next, we considered the opinions received in the survey. These opinions suggested that some of the subjects required a long time to get used to the controls, but since the movements were very simple, it did not take long to understand the game in general. Many subjects also stated that being able to remember their younger selves made them able to move their bodies again. It is likely that the music played at the time played a large part in this. Subjects stated that this program offered a new experience for the subjects, and we were able to get them interested and move their bodies actively because of this. However, this only reflects their evaluation of the program when first experiencing it. It is possible that they will be less interested with the program, if they use it numerous times. The program itself involves touching round objects that fall from above to earn points, but there is no fixed play time, and the same objects fall down (even if they change color). Therefore, there is not a lot of visual variety and subjects may become easily bored with the game when playing it repeatedly or for long periods. Regarding detection of the skeletal frame, recognition was insufficient during test 1. Several people experienced problems in having their skeletal frames detected because the distance from Kinect to the subjects had not been adjusted to the number of people present, and the test location was too bright. Also, sometimes Kinect had trouble discerning between the armrests of a wheelchair and the arms of the person in that wheelchair. However, in test 2,
42Copyright (c) IARIA, 2013. ISBN: 978-1-61208-306-3
CENTRIC 2013 : The Sixth International Conference on Advances in Human-oriented and Personalized Mechanisms, Technologies, and Services
51 / 145

detection of the skeletal frames was improved, because we had a better understanding of the optimal distance between Kinect and the test subjects.
A comprehensive evaluation of the results from test 2 showed that most suggestions received in test 1 were properly implemented in the revised program. Thus, test 1 allowed us to improve the game so that subjects could perform reasonable exercise, and disregarding the problem of experiencing the same program continuously, the program was fresh and new and stimulated the subjects. In addition, the game was relatively easy for the subjects to understand because of the intuitive controls of Kinect.
When comparing our program using Kinect with the Wii, we suggest that Kinect is more useful for rehabilitation programs, because it is easier to perform exercise with the easy controls, and because the movements can be slowed to the subjects' requirements.
VI. FUTURE WORK We asked the instructors who participated in test 2 what
they would like to see changed in the future. The following comments were received: – The program should change as time passes. – It might be fun if the objects came in from the sides as well from above. – There should be more room for competition. – The game should stimulate the subjects to bend their bodies and stretch their arms sideways by having the objects center on the subjects at first and then gradually fall in from the sides.
VII. SUMMARY The purpose of this study was to develop and apply a
rehabilitation program using the recent development of Kinect motion capture technology. We performed tests making use of the Kinect’s innate features of not requiring a controller and allowing intuitive play through physical gestures for the rehabilitation of people with physical disabilities, such as the elderly. Evaluation of the developed program in test 2 suggested new ways of using Kinect as an exercise aid for the test subjects.
Kinect was originally used for playing games and creating 3D images on PCs using motion capture technology. However, this study demonstrates that our revised program can be used with Kinect to offer rehabilitation to elderly people with physical disabilities.
Results of surveys taken after the tests indicated that many people were interested in the program and it yielded favorable impressions as a means of exercise by reminding the subjects of when they were young. In addition, playing music that the subjects were familiar with helped encourage subjects to participate.
However, some subjects could not use the program because their skeletal frames were not detected properly. This suggests it is necessary to alter the sensitivity of the skeletal frame detection program specifically for the environment used. In addition, the program should be enhanced to prevent the subjects from becoming bored during the long-term use required for rehabilitation.
Surveys results for problems with our program and suggested improvements demonstrated that Kinect can be used for rehabilitation programs. Therefore, future research should investigate the development of rehabilitation programs using Kinect. This study shows that the revised program in conjunction with Kinect was enjoyed by elderly people and it invoked their desire to exercise.
REFERENCES [1] Microsoft Japan , Kinect – Xbox Home Page,
http://www.xbox.com/ja-JP/kinect (retrieved: Aug, 2013) [2] Discovery Communications, “Using Kinect to help the visually
impaired”, http://news.discovery.com/tech/kinect-helps-visually-impaired-see-110322.htm (retrieved: Aug, 2013)
[3] Nikkei Business Publications, ”Second time: From mouse substitutes to medical care and art – home appliances/PCs – Tech-On !” http://techon.nikkeibp.co.jp/article/FEATURE/20111110/201213/?P=2 (retrieved: Aug, 2013)
[4] Hatena::Diary, ”Retirement homes and Kinect – Toshukūken Nikki” http://www.d.hatena.ne.jp/matoge/20110706/1309972805 (retrieved: Aug, 2013)
[5] K. Nakamura, S. Saito and H. Miyagi, “KINECT for Windows SDK Programming: C++”, Shuwa system CO., LTD. 2012
[6] K. Nakamura, “KINECT Sensor Programming” Shuwa system CO., LTD. , 2011
43Copyright (c) IARIA, 2013. ISBN: 978-1-61208-306-3
CENTRIC 2013 : The Sixth International Conference on Advances in Human-oriented and Personalized Mechanisms, Technologies, and Services
52 / 145

Interface Design Techniques for Electronic Nose Sensors:A Survey
Saeed Samadi
Dept. of Food Biotechnology
Research Institute of Food Science & Technology (RIFST)
Mashhad, Iran
Abstract—Electronic nose systems comprise a more or less
sophisticated hardware that is incorporated with sensors,
electronics, pumps, and flow controller, where the software
components ensure suitable technological hardware
monitoring, data pre-processing, statistical analysis, and
display of processed data. The current paper seeks to survey
on interface design techniques for electronic nose sensors, with
a specific focus on interface circuit design techniques for signal
conditioning of electronic nose sensors. In addition, the paper
classifies these circuits into two primary categories: integrated
circuits and non-integrated circuits. Lastly, tables are provided
to compare frequent methods used and specific application of
the e-nose.
Keywords- Electronic nose; Sensor; Interface; Circuit
I. INTRODUCTION
Electronic noses incorporate an array of chemical sensors that have varied specificities. They simultaneously respond to the volatile chemicals present in a gas sample [1]. According to recent researches, these sensors have cognitive ability based on human-computer interaction by means of sensor information processing. This makes researches related to this technology to employ a convergence of electronic, mechanical, and chemical engineering research [2]. Therefore, the entire performance of an e-nose system largely relies on the individual effectiveness and performance of its constituent features [3]. This implies that careful selection and design of frontal nose signals at the posterior of the conditioning circuit is of critical significance if optimum performance of the artificial odor sensing system is to be realized [4]. For this reason, the current research paper aims to survey the interface circuit design for signal conditioning of electronic nose systems. The paper classifies these circuits into two primary categories, which include: integrated circuits (which use very-large-scale integration (VLSI) circuits and sensors both on a chip), and non-integrated circuits (which uses discrete electronic components, such as microcontrollers, field programmable gate arrays (FPGAs), programmable logic devices (PLDs), and operational amplifiers (Op-Amps). At the end, tables are provided to compare frequent methods used and specific application of the e-nose.
The first section of this paper will discuss different types of integrated circuits as proposed by different experts. Besides, there will be a discussion on the different types of
technologies employed in developing these circuits. This will provide the reader with a deeper understanding on how these circuits operate with their significance. Section two will discuss the various types of non-integrated circuits. Thereby, it will also help the reader to get a deeper meaning of these circuits. There will also be a discussion on applications of these circuits in this section using a wide range of examples. The last section of the paper will summarize the whole paper in a qualitative analysis format and will include comparison table for these methods and for the application of circuits. Also, the paper ends with a conclusion of the whole study.
II. INTEGRATED APPROACH
In the paper published by Koickal and colleagues [5], the
authors have discussed extensively about VLSI circuit design and implementation of the components of an
adaptive neuromorphic odor sensing chip. This integrated
circuit system is composed of three systems, which include
an on-chip adaptive neuromorphic olfactory model, on-chip
sensor interface circuitry, and an on-chip chemosensor array.
This system is fabricated on a single chip platform that
utilizes the three component functional circuitry constituents.
During the 2011 14th International Symposium on Olfaction
and Electronic Nose, Aziz et al. [6] presented their findings,
where they proposed a different VLSI model that integrates
nine separate neuromorphic chips with an aim of creating a
comprehensive signal conditioning circuit, which is also capable of solving extremely complex odor sensing
problems. The typical circuit arrangement and functionality
of the VLSI chip is shown in Fig. 1. Furthermore, an earlier dissertation presented by Kea-
Tiong [7], proposes integrated system capable of applying an interface circuit that is represented as an analogue signal that can be amplified, linearized, offset, altered and compensated for temperature by integrating multiple platform chips. In the circuit design process, the primary approach is to incorporate a power connecting source and field-effect transistors (FET) sensor arrays. This is integrated into a differential circuit used in the processing of signals accelerated from the difference between FET coated array and active FET sensor array. This allows existing common mode signal to be suppressed at the analogue signal input processing unit. At this stage, band-pass filtering is taken into consideration in removing high frequency signal interface and effects related to low frequency drift. Temperature variations introduced by
44Copyright (c) IARIA, 2013. ISBN: 978-1-61208-306-3
CENTRIC 2013 : The Sixth International Conference on Advances in Human-oriented and Personalized Mechanisms, Technologies, and Services
53 / 145

electronics, analyze mixture and air passed over sensors are detected by a chip diode at this point [8].
Figure 1: Typical circuit arrangement and functionality of the VLSI chip
On the other hand, the chemosensor arrays consist of diverse sensor types adjusted to react to different biochemical complexes. These heterogeneous arrays have the potential to proliferate selectivity in the artificial olfactory system recognition tasks while imitating the function of the mammalian olfactory structure [9]. The chemosensor array is used as a platform on which olfactory sensors are implemented where carbon black composites are used as a sensing material together with an incorporated signal processing circuit [10]. This sensor interface circuit, as described later, contains a cancellation dc circuit, which ameliorates the loss of measurement ranges linked to array sensors. The signal processing point is formed with spiking neuron design from the olfactory bulb architecture. In addition to this chemosensor array, an on-chip spike-time-reliant conditioning-learning circuitry is incorporated to dynamically familiarize with weights needed in the classification and detection of odors [6].
It is crucial to implement an on-chip learning program in the chemosensor array design, so as to enable the system to sense, recognize, and distinguish odors before passing them into the next sensor interface circuit [7]. Koickal et al. notes that this approach provides a compensation for the VLSI analog imperfections and enables it emulate plasticity function present in biological olfactory systems in line with the environment where the device must operate [5]. In most research works, the chemosensor arrays circuit elaborated above has been successfully fabricated and emulated in silicon [3-6].
In the neuromorphic olfactory chip, the olfactory bulb circuit is fitted with an input that has chemosensors fabricated with a 0.6 μm Austria Micro System. Through chemoresistive arrays, a chemically sensitive film is fitted to measure sensor responses as a factor of change in resistance. Additionally, carbon black coating is used as a polymer material depending on the targeted odor employed in the pattern recognition task. Operatively, the materials work by merging carbon nanospheres with an insulation rubber that
provide electrical conductivity to the final resultant mixture. However, individual chemoresistant sensors across the circuit can be achieved by depositing carbon black polymers between any two sensor conductors. Gatet, Tap, and Lescure [11] denote that every sensor along the circuit is usually fitted with a baseline cancellation circuit, sensor, and a source of current. Hsieh & Tang [12] use multiplex mechanisms with an aim of giving access to individual sensing arrays without any complex circuits. Nonetheless, in integrated circuit approach, the problem is creating a sensing array that has individual outputs directly fitted to signal conditioning so that there is a continuous sensor response that is interfaced to neuronal circuits short of complex connections in achieving optimal amplification.
Once the chemosensor array is in place, the next stage is to design the sensor interface circuitry to mimic the neuromorphic model. Chible [9] recommends an active VLSI analogue input to ensure complexity and parameters of the model are quickly mapped to the VLSI environment. An undesirable characteristic associated with a heterogeneous chemosensor array is the large variation in baseline dc signals among the different sensors types in the array. Signal conditioning is aimed at performing a number of critical functions including noise cancelling, temperature compensation, offset control, amplification, linearization, multiplying array output signals, and sensor biasing [4].
According to [5], circuit building is achieved through two approaches: focusing on sensory output and designing an adaptive neuromorphic olfaction chip. First, the neuromorphic olfaction chip is realized by implementing various chip cycles. On sensory approach, the primary challenge in designing circuits is to compensate large differences in baseline sensors in the chemosensor arrays that can result in unrecoverable loss of measurement ranges. This is achieved by implementing a dc cancellation on the chip so to annul variations in baseline sensors. Second, implementation of neuromorphic model is linked to designing a circuit that has large time constraints and at the same time maintaining the neuron structure simple while occupying a limited space in the silicon area [7]. A case by Koickal et al. [5], uses simple operational transconductance amplifier-capacitor (OTA-C) structures to design on-chip learning circuit, synapses and neurons. In addition, the need for large space capacitors can be eliminated through reduction of transconductance on the OTA-C stage in the 300ms range.
III. NON-INTEGRATED APPROACH
A range of different circuit designs used in non-integrated systems applies discrete electronic components, such as microcontrollers, FPGAs, PLDs and Op-Amps. First, in the Op-amp, is well designed to address a number of challenges; variance in baseline resistance, which can be fabricated easily into tens of ohms to infinity ohms when polymer based resistance sensors are used, and the Op-amp also address large coefficient in temperatures in chemosensors which can reach 10(-2) Cº [13]. A signal conditioning approach based on Op-amp can solve this
45Copyright (c) IARIA, 2013. ISBN: 978-1-61208-306-3
CENTRIC 2013 : The Sixth International Conference on Advances in Human-oriented and Personalized Mechanisms, Technologies, and Services
54 / 145

problem as it is based on a principle proposed by Hatfield [14]. Hence this has the capability to remove common mode effects. The approach has been proposed previously by Dyer and Gardner [15], and also reflected in the works by Hatfield and Chueh [16], who instigated for its need to be reserved as a circuit interface in polymer sensor conductors. The circuit is formed by using two identical chemo resistors as shown in Fig. 2, where Ri is passivized with an impervious coating. In this case, the Op-amp circuit can be grouped as an innovative technique of an active divider circuit. The first Op-amp senses the current from the virtual earth and modulated by the passivized chemosensor (Ri), when it is introduced into the sensor. This offsets the baseline voltage present in the Op-amp circuit and this sensitivity can be amplified through a high gain voltage amplifier.
Figure 2: The ratio metric op-amp circuit
The second approach applies the FPGA implementation,
where its olfactory circuit is interconnected to multiple non-integrated chipsets. The sensors employ chemo-sensor carbon black with a signal processor circuit. Various scholars, such as Sudalina and Nalini [17], who designed integrated sensor systems, have designed the circuit and technology using spike time linked neuromorphic model to mimic an e-nose system in FPGA. The circuit includes a chemical sensor with a dc cancellation and spiking neuronal network is merged to form a signal processor while the learning platform continuously weighs classification and detection [4].
Tan and Halim [18], based on data acquisition system
shown in Fig. 3, have developed another non-integrated
technology that runs on the FPGA platform but utilizes
metal oxide technology. The technology is applied in
identification of sulphate reducing bacteria that causes
microbial corrosion in anaerobic environments. The sensor
type is composed of an array of semiconductor metal oxides
similar to one applied by Zhai et al. [19], an artificial neural network, and a data processing unit. The circuit architecture
has two components: one between FPGA and the sensor,
and another one between FPGA and the PC (Fig. 4). The
first structure consists of the sensing oxide gas, which is
designed to detect analog signal outputs so that the data can
be processed at the FPGA interface, while the second
component uses Quartus II software and Verilog language
for learning the odor in the system. Modern approaches that
have been developed are aimed at speeding or reducing the
period taken to detect the presence of sulphate-reducing
bacteria. Another non-integrated system has been proposed by Tang et al. [20], where a portable e-nose system is built in printed circuit board (PCB) interface with 8 commercially available microprocessors, and a sensor array (Fig. 5.a). Through the circuit, there is a data acquisition card and a display implemented on LabVIEW program for certifying the e-nose system. It is designed to mimic an olfactory system that can test complex fruit odors including litech, banana, and lemon. The interface PCB comprises an 8-bit analog-to-digital converter (ADC), eight to one multiplexer (MUX), and an eight interface processing circuits (IPC). Eight sensors are connected to 8 interface processing units and this adapts actively to the baseline voltage circuit. The IPC operates on two modes; sensing mode and adaption mode. The principle works similar to that developed by Harun, Covington and Gardner [21], where in the adaption mode, the circuit regulates its operational point to a given baseline preset voltage while the sensing mode establishes gate voltage by using a negative loop on the odor passed across the system (Fig. 5.b).
Figure 3: Data acquisition system architecture
Figure 4: Signal circuit detection interface
Based on Figaro sensor system, Mamat, Samad, and Hannan [22] implemented a technology for implementing and classifying beverages. Their circuit design incorporated temperature sensors and commercially available metal oxide gas sensors. The system uses Principal Component Analysis (PCA) and Multi-Layer Perception Neural Network (MLP)
46Copyright (c) IARIA, 2013. ISBN: 978-1-61208-306-3
CENTRIC 2013 : The Sixth International Conference on Advances in Human-oriented and Personalized Mechanisms, Technologies, and Services
55 / 145

platform and diverse sensor batches to authenticate the model’s reproducibility. For the circuit to work, the system requires a simple measuring and heating model. The two are built inside and require a 40 °C, which is realized through a constant voltage supply similar to work by Peris and Gilbert [23]. Here, two voltage inputs operate at 12 V and 5 V circuits (Fig. 6.a & 6.b). Units of 5 V are needed to stabilize the inner sensor circuit unit while the 12 V circuit is required in measuring the output sensor (Fig. 6.c).
Figure 5: (a) Interface PCB, (b) Basic architecture of the processing circuit
On their part Kim, Yang, Ha, Pyo, and Chang [24] have
proposed a miniaturized e-nose system developed using personal digital assistant (PDA) and 8-channel vapor detection array. The technology is based on PCB interface circuit and it is used to successfully classify and distinguish between essential oils including eucalyptus plants, lavender, and mint. The circuit is made up of manually assembled material including processing program, data acquisition, sensor chip array, and test samples. The primary element of the circuit is the 8 channel array chip whose fabrication is achieved by the carbon-black polymer, established in a substrate flexible polyimide. Inside the 8-sensor chip, there is a voltage divider system that weights large standard voltage (Fig. 7). The system is applied in sensing a wide array of fruit odors such as oranges, mangoes, and black-current.
Furthermore, Chiu, Tang, Chang, and Hsieh [25] have proposed a low power signal sensor technology based on a multi-walled nanotubes (MWNTs) circuitry interface, which is a polymer that swells reversibly upon exposure to chemicals. At low power, the sensor technology is formulated to identify 2-Butanone, chloroform, and carbon
tetrachloride. The circuit chip is based on microprocessor embedded on pattern sensing algorithm, digital-analog converter, and interface circuit (Fig. 8). The adaptive interface circuitry has a sensing mode and an adaptive mode and the system works like the one proposed by Mamat, Samad, and Hannan [22] as previously discussed.
Figure 6: Interface circuits for (a) TGS8xx sensor, (b) TGS2xxx sensor,
and (c) TGS6812 sensor
Another low power identifier system has been proposed by Young et al. [26] to form an intelligent wireless e-nose network (WENN) based on microcontroller interface. The interface is designed to incorporate two sections: first, there is a saturator that mixes with the target gas before releasing to the testing chamber; two, the WENN measures periodical gas entry from a thermal modulated microarray and neuronal-fuzzy network. The WENN system is designed to identify two binary gases, which are H2S and NH3.
Figure 7: PDA-based E-Nose system interface circuit
47Copyright (c) IARIA, 2013. ISBN: 978-1-61208-306-3
CENTRIC 2013 : The Sixth International Conference on Advances in Human-oriented and Personalized Mechanisms, Technologies, and Services
56 / 145

Figure 8: Adaptive interface circuit in Low power e-nose chip
In micro-electromechanical field, Stavrov et al. [27] have
proposed a piezoresistive sensor technology centered on fast signal processing and parallel operation. The system is based
on microcontroller circuit and mostly that of a silicon
cantilever and Wheatstone bridge. The length of the
cantilever is designed to avoid mechanical cross talk and to
simplify resonance frequency. The system also incorporates
4 input/output (I/O) to operate by deflecting self-sensing and
in supplying power. It measures a resonance spectrum in
mechanical checkups applied in e-nose during the
identification and characterization of various analytes. This
device can be produced from manufacturing technology,
basing on micro-mechanical cantilevers. In such a case, it relies on the ability to implement a parallel operation and a
faster signal processing.
IV. DISCUSSION
Table I gives a comparative summary of technological sensors largely used, their applications, and their interface circuit and research references. From the above analysis, about sensor types and their application it is clear that interface circuitry is a very important factor in achieving an appropriate technology and circuit olfactory sensor sensitivity. Most sensitivity circuits used in inorganic sensors employ microcontrollers, while organic sensors are largely used in organic olfactory systems. Even if the circuit sensitivities may be elevated with amplification, this improvement may be marginal because of the baseline voltage component in the signal amplification. On circuit interface and sensitivity application best circuit performance is achieved by eliminating sensor baseline voltage.
The circuits discussed above use the simplest technique of counteracting the baseline voltage through its second potential divider. As deliberated previously, a signal conditioning circuit that has a linear productivity characteristic imparts itself to the role of odor classification and analysis. Therefore, it may seem from the analyzed circuits that the most suitable presentation, in terms of linearity and sensitivity is ratio metric op-amp and the constant current resistance interrogation circuits. The Op-amp circuit interface has a large advantage of excluding the temperature effect from the baseline output signals through the application of a passivized active sensor copies.
TABLE I: DIFFERENT TECHNOLOGICAL SENSORS, THEIR APPLICATION
AND TYPE OF INTERFACE CIRCUITRY USED Technology/Sensor
type
Application Interface
Circuitry
Reference
1. Data acquisition
system
Sulphate
reducing
bacteria
FPGA [18]
2. Portable e-nose Complex fruit
odors e.g.
lemon, banana,
litech
Interface PCB
(printed circuit
board)
[20]
3. Figaro sensor-
Measurement and
Classification
Fruit sensor-
black current,
mango, orange
Microcontrollers
PCA, and MLP
[22]
4. Miniaturized e-
nose
Classification
of essential oils
eucalyptus,
lavender, mint.
PCB [24]
5. Low power e-nose
chip
Sensing 2-
butanone,
chloroform,
carbon
tetrachloride
MWNTs [25]
6. Intelligent wireless
e-nose (WENN)
Binary gas
mixtures H2s,
NH3
Microcontrollers [26]
7. Piezoresistive
sensors
Micro-electro-
mechanical
system
Microcontroller/
Wheatstone
brdge
[27]
8. Frontal-end signal Odor sensing Ratio-metric Op-
amp
[28]
9. Analog circuit
design
Odor
classification
and detection
Analog VLSI [5]
It can be established that, among the signal-conditioning
circuits examined, Op-amp circuits address majority of the issues that have been defined previously.
V. CONCLUSION
Individual e-nose performance relies on its performance and effectiveness and its constituent interface circuit. This survey paper has looked into various sensor technologies, their application and circuitry interfaces they use. It is clear that careful selection and design of frontal nose signals at the posterior of the conditioning circuit is of critical significance if optimum performance of the artificial odor sensing system is to be realized. However, most cases we have presented are proposals in theoretical works and studies that need to be developed further to determine their application in real-time odor sensing. Future technological aspects should address various challenges that are expected in the ultimate integration of a complete structure. This will require careful deposition of sensor material with wide diversity of chemical sensors that are needed together with screen process for every sensor, so as to ensure there is ideal chemical response recognition. Systems and circuit issues, such as the use of address event representation or spike output, layout optimization, component mismatch, and lasting weight storage also should be addressed.
Most examples for integrated circuits presented in this paper have differential circuits with ability to process signals accelerated from the difference between FET coated array
48Copyright (c) IARIA, 2013. ISBN: 978-1-61208-306-3
CENTRIC 2013 : The Sixth International Conference on Advances in Human-oriented and Personalized Mechanisms, Technologies, and Services
57 / 145

and active FET sensor array. Thus, allowing existing common mode signal to be suppressed at the analogue signal input-processing unit. On the other hand, most non-integrated circuits presented here have temperature sensors and commercially available metal oxide gas sensors. As evidenced from this paper, non-integrated circuits are characterized by change in resistance and low power consumption. From various findings in this paper, most of these circuits rely on Principal Component Analysis and Multi-Layer Perception Neural Network platforms and have diverse sensor batches for their systems authentication. Hence, this new technology is reliable for commercial purposes.
REFERENCES
[1] H. J. Kwon, D. G. Kim, and K. S. Hong, “Multiple Odor Recognition and Source Direction Estimation with an Electronic Nose System,” International Journal of Distributed Sensor Networks, vol. 2013, 7 pages, 2013.
[2] A.Z. Berna, A. R. Anderson, and S. C. Trowell, “Bio-Benchmarking of Electronic Nose Sensors,” PLoSOne, vol. 4,
no.7:e6406, 2009, doi: 10.1371/journal.pone.0006406.
[3] D. Jan, W. Hirnet, and S. Charpak, “External tufted cells drive the output of olfactory bulb glomeruli,” J. Neurosci, vol. 29, no.70, 2009, pp. 2043–2052.
[4] J. Brader,W. Senn, and S. Fusi, “Learning real-world stimuli in a neural network with spike-driven synaptic dynamics. Neural Comput, vol.19, no.11, 2007, pp. 2881–2912.
[5] T. Koickal, et al., “Analog VLSI Circuit Implementation of an Adaptive Neuromorphic Olfaction Chip,” Circuits and Systems I: Regular Papers, IEEE Transactions on, vol.54, no.1, 2007, pp.60-74.
[6] A. Aziz, F. Muhammad, F. Harun, J. Covington, and J. Gardner, “Towards an analogue neuromorphic VLSI instrument for the sensing of complex odours,” 14th International Symposium on Olfaction and Electronic Nose, New York, 2011, pp. 223-224.
[7] T. Kea-Tiong, “Neuromorphic VLSI circuits for an electronic nose chip,” Dissertation, 2001, pp.2-7.
[8] A. Wilson and M. Baietto, “Review: Applications and Advances in Electronic-Nose Technologies,” Sensors, vol.9, 2009, pp.5099-5148.
[9] H. Chible, “Analog Circuit for Synapse Neural Networks VLSI Implementation, Electronics, Circuits and Systems,” 7th IEEE International Conference on Electronics, Circuits and Systems, Jounieh, Lebanon: IEEE , 2000, pp. 1004-1007.
[10] Y. S. Kim, et al. , “Portable Electronic Nose System Based on the Carbon Black-Polymer Composite Sensor Array,” Sens. Actuat. B-Chem, vol.108, 2005, pp.285-291.
[11] L. Gatet, B. Tap, and M. Lescure, “Analog neural network implementation for a real-time surface classification application,” IEEE Sens J, vol.8, 2008, pp. 1413–1421.
[12] H. Hsieh and K. Tang, ,“ VLSI implementation of a bio-inspired olfactory spiking neural network,” IEEE Trans. Neural Netw. Learn. Syst, vol. 23, 2012, pp.1065–1073.
[13] M. Bicego, G. Tessari, G. Tecchiolli, and M. Bettinelli, “A comparative analysis of basic pattern recognition techniques for the development of small size electronic nose,” Sensors and Actuators B: Chemical,vol. 85, no. 1, 2002, pp. 137-144.
[14] M. Cole, J. Gardner, and P. Bartlett, “Artifcial Chemical Sensing: Olfaction and the Electronic Nose,” Electrochemical Society, 15, 2001, pp.117-120.
[15] D. C. Dyer and J. W. Gardner. “High-precision intelligent interface for a hybrid electronic nose,” Sensors and Actuators A: Physical ,vol.62, no.1, 1997, pp.724-728.
[16] J. Hatfield and H. Chueh, “A real-time data acquisition system for a hand-held electronic nose,” Sensors and Actuators . B: Chemica, vol.83, no.1, 2002, pp.262-269.
[17] D. Sudalina and J. Nalini, “FPGA Implementation of a Bio inspired olfactory system for odor Identification and Classification using ANN Algorithm,” International Journal of Emerging Trends in Electrical and Electronics, vol.3, no.2, 2013, pp.68-72.
[18] T. Tan and A. Halim, “Data Acquisition system development of an electronic nose for sulphate-reducing bacteria detection,” 4th International Conference on Intelligent and Advanced Systems, Penang, Malaysia , 2012, pp. 567-571.
[19] T. Zhai, et al., “A Comprehensive Review of One-Dimensional Metal-Oxide Nanostructure Photodetectors,” Sensors, vol.9, 2009, pp.6504-6529.
[20] K. T. Tang, et al., “Development of a Portable Electronic Nose System for the Detection and Classification of Fruity Odors,” Sensors, vol.10, 2010, pp. 9179-9193.
[21] F. Harun, J. Covington, and J. Gardner, “ Portable e-Mucosa System: Mimicking the Biological Olfactory,” Procedia Chem, 2009, pp.991-994.
[22] M. Mamat, S. Samad, and M. Hannan, “ An Electronic Nose for Reliable Measurement and Correct Classification of Beverages,” Sensors, vol.11, 2011, pp. 6435-6453.
[23] M. Peris and L. Gilabert, “A 21st century technique for food control: Electronic noses,” Anal. Chim. Acta, vol.638, 2009, pp.1-15.
[24] Y. Kim,Y. Yang, S. C. Ha, H. B. Pyo, and A. Chang, “Miniaturized Electronic Nose System Based on a Personal Digital Assistant,” ETRI Journal, 2005, pp.586-593.
[25] S. W. Chiu, K. T. Tang, M. F. Chang, and C. C. Hsieh, “A Low-Power Electronic Nose Signal-Processing Chip for a Portable Artificial Olfaction System,” IEEE Transactions on Biomedical Circuits and Systems, vol.5, no.4, 2011, pp.380-389.
[26] W.Young, H. Jung, and J. Jeon, “An Intelligent Wireless Electronic Nose Node for Monitoring Gas Mixtures Using,” CIMSA 2007 - IEEE International Conference on Computational Intelligence for Measurement Systems and Applications ,Ostuni - Italy: IEEE, 2007, pp. 104-104.
[27] V. Stavrov, E. Tomerov, G. Stavreva, V. Tsenev, and P. Philippov, “Novel MEMS Piezoresistive Sensor Array Cell,” In Electronics Technology, 30th International Spring Seminar on, IEEE, 2007, pp. 497-500.
[28] K. Arshak, G. Lyons, L. Cavanagh, S. Clifford , “Front-end signal conditioning used for resistance-based sensors in electronic nose systems: a review,” Sensor Review, vol.23, no.3, 2003, pp.230-241.
49Copyright (c) IARIA, 2013. ISBN: 978-1-61208-306-3
CENTRIC 2013 : The Sixth International Conference on Advances in Human-oriented and Personalized Mechanisms, Technologies, and Services
58 / 145
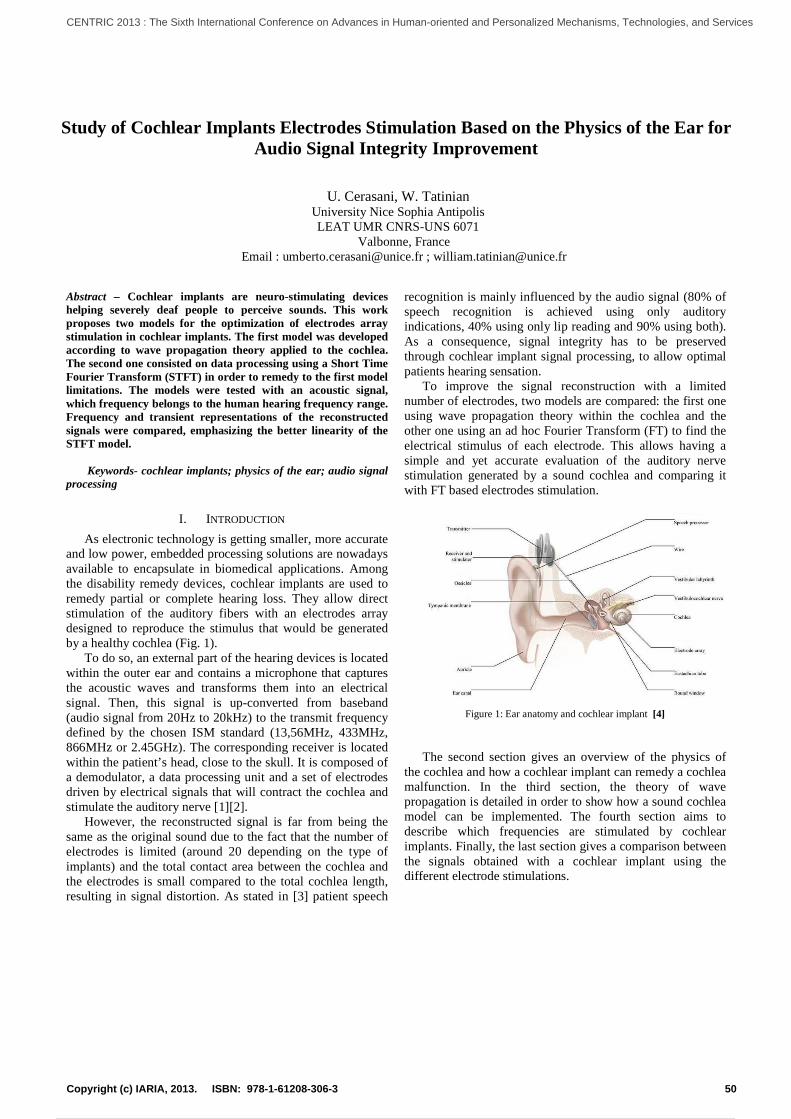
Study of Cochlear Implants Electrodes Stimulation Based on the Physics of the Ear for Audio Signal Integrity Improvement
Abstract – Cochlear implants are neuro-stimulating devices helping severely deaf people to perceive sounds. This work proposes two models for the optimization of electrodes array stimulation in cochlear implants. The first model was developed according to wave propagation theory applied to the cochlea. The second one consisted on data processing using a Short Time Fourier Transform (STFT) in order to remedy to the first model limitations. The models were tested with an acoustic signal, which frequency belongs to the human hearing frequency range. Frequency and transient representations of the reconstructed signals were compared, emphasizing the better linearity of the STFT model.
Keywords- cochlear implants; physics of the ear; audio signal processing
I. INTRODUCTION
As electronic technology is getting smaller, more accurate and low power, embedded processing solutions are nowadays available to encapsulate in biomedical applications. Among the disability remedy devices, cochlear implants are used to remedy partial or complete hearing loss. They allow direct stimulation of the auditory fibers with an electrodes array designed to reproduce the stimulus that would be generated by a healthy cochlea (Fig. 1).
To do so, an external part of the hearing devices is located within the outer ear and contains a microphone that captures the acoustic waves and transforms them into an electrical signal. Then, this signal is up-converted from baseband (audio signal from 20Hz to 20kHz) to the transmit frequency defined by the chosen ISM standard (13,56MHz, 433MHz, 866MHz or 2.45GHz). The corresponding receiver is located within the patient’s head, close to the skull. It is composed of a demodulator, a data processing unit and a set of electrodes driven by electrical signals that will contract the cochlea and stimulate the auditory nerve [1][2].
However, the reconstructed signal is far from being the same as the original sound due to the fact that the number of electrodes is limited (around 20 depending on the type of implants) and the total contact area between the cochlea and the electrodes is small compared to the total cochlea length, resulting in signal distortion. As stated in [3] patient speech
recognition is mainly influenced by the audio signal (80% of speech recognition is achieved using only auditory indications, 40% using only lip reading and 90% using both). As a consequence, signal integrity has to be preserved through cochlear implant signal processing, to allow optimal patients hearing sensation.
To improve the signal reconstruction with a limited number of electrodes, two models are compared: the first one using wave propagation theory within the cochlea and the other one using an ad hoc Fourier Transform (FT) to find the electrical stimulus of each electrode. This allows having a simple and yet accurate evaluation of the auditory nerve stimulation generated by a sound cochlea and comparing it with FT based electrodes stimulation.
Figure 1: Ear anatomy and cochlear implant [4]
The second section gives an overview of the physics of the cochlea and how a cochlear implant can remedy a cochlea malfunction. In the third section, the theory of wave propagation is detailed in order to show how a sound cochlea model can be implemented. The fourth section aims to describe which frequencies are stimulated by cochlear implants. Finally, the last section gives a comparison between the signals obtained with a cochlear implant using the different electrode stimulations.
U. Cerasani, W. Tatinian
University Nice Sophia Antipolis LEAT UMR CNRS-UNS 6071
Valbonne, France Email : [email protected] ; [email protected]
50Copyright (c) IARIA, 2013. ISBN: 978-1-61208-306-3
CENTRIC 2013 : The Sixth International Conference on Advances in Human-oriented and Personalized Mechanisms, Technologies, and Services
59 / 145

II. COCHLEA PHYSICS
When an acoustic wave traveling inside the outer ear channel strikes the eardrum, the ossicles located inside the middle ear amplify the sound intensity. This is achieved by producing a lever effect. The last ossicle (stirrup) hits the oval window of the cochlea. The fluid (perilymph) inside the scala vestibuli of the cochlea provides support for mechanical waves propagation. The amplification provided by the ossicles aims to correct the loss of energy associated with the impedance change at the air to liquid interface [5] (Figure 2).
Figure 2.a) ear schematic with inclusion of the electrodes array inside the cochlea. Figure 2.b) ear schematic and the wave propagation leading to a basilar membrane height change (h(x,t))
More precisely the cochlea works by converting a wave
propagating inside the perilymph into nerve a stimulation using the complex organ of Corti structure. Inside the cochlea, the Outer Hair Cells (OHC) are stimulated by a soft membrane (Basilar Membrane: BM) vibrations and release chemical messengers which excite nerve cells.
According to biophysical theories [6],[7] when a mechanical wave propagates inside the cochlea, the BM distorts to absorb the wave energy. In consequence, the height (denoted as h(x,t) in the following parts) of the BM excitement mainly depends on the sound intensity as well as the position along the x axis, which is the distance from base of the cochlea. The width, denoted as W(x), of the basilar membrane excitement around the resonance greatly depends on x as shown in the Section III. As the number of excited OHC depends on W(x) the number of auditory fibers excited is hence associated with the x variable.
If one or many functions described above are not working properly, the patient may suffer from hearing loss or deafness. In this case, a cochlear implant may substitute to the natural sound processing to provide the auditory nerve stimulation via an electrodes array sunk inside the scala tympani (Figs. 1 and 2).
The electrodes array (which is the connective link between the implant and the cochlea) is composed of a limited number of electrodes stimulated by an electric
current. The electric current at proximity of the auditory fibers permits theirs direct stimulations even with nonfunctional OHC.
We chose the device CI422 with Slim Half-Band Straight Electrode manufactured by Cochlear® [8], which is composed of 22 electrodes to implement our models. Then we compare the results with a FT approach, applied to only the frequencies stimulated by the electrodes, to select the electrodes.
III. SOUND WAVE PROPAGATION AND BASILAR MEMBRANE
DISPLACEMENT.
The wave propagation theory is quickly reviewed in this section for a better understanding of the biophysics of hearing and for determining the characteristics of the basilar membrane resonance in terms of amplitude and width. This theory and the computations are extracted from [9] and [10], the main results are recalled here for the reader’s convenience.
A sound wave φ1 propagating along the x axis is characterized by:
, (1)
Where A1 is the sound amplitude, k1 is the wave number and ω is the pulsation. At the oval window interface, the mechanical wave is converted into a wave propagating in a viscous fluid, resulting in impedance mismatch. Therefore, the transmitted power from the mechanical wave into the liquid wave is damped by 29dB.
As demonstrated by various authors, the main function of the ossicles in the middle ear is to reduce the power loss due to the impedance mismatch therefore the wave power at the oval window interface is equal to the power of the air wave minus 3dB [11][12].
The wave propagating inside the scala vestibuli (φ3) is expressed as:
3, 2 exp !
" exp !" exp !" exp !#
(2)
Where A3 is the amplitude of the wave, $ " is the wave number and z the complex variable: z = x +iy. Mathematical equations developed in [9] lead to the following relation between membrane height displacement and auditory wave:
%&, % %, ',
%' 3
Solving this equation permits to obtain the basilar membrane height displacement h(x,t) (spatial and transient
51Copyright (c) IARIA, 2013. ISBN: 978-1-61208-306-3
CENTRIC 2013 : The Sixth International Conference on Advances in Human-oriented and Personalized Mechanisms, Technologies, and Services
60 / 145

shape of the basilar membrane displacement is given in Figure 3)
Figure 3: Basilar membrane displacement (µm) with respect of the distance from the cochlea base (x in µm) and time (ms) for a 600Hz input acoustic
wave
One can observe that the BM displacement is a function of the distance from the cochlea base and the amplitude of the auditory wave. The auditory nerve stimulation is proportional to the BM displacement and this phenomenon has to be recreated artificially with electrodes stimulation.
IV. ELECTRODES ARRAY STIMULATION BASED ON THE
COCHLEA PHYSICS
The width of the BM displacement greatly depends the position x as shown in Fig. 4.a, when the BM is excited by a 600Hz sound wave and by a 300Hz sound wave which make it to resonate at different places and with different widths. The detection of a BM displacement permits to obtain the width of this excitement:
( ) &, * +,
-& ./ 0 | 234&, 5 &64&78*9 4
The basilar membrane movement compresses the organ of Corti resulting in a voltage variation in the corresponding auditory fiber. If this voltage variation is greater than a threshold voltage around 30mV for the human auditory nerve [13], the nerve fiber is excited. We implemented the mechanical model of the organ of Corti found in [14] (we simplified it by neglecting the Tectorial Membrane influence over the Reticular Lamina) and after converting the voltage threshold into the corresponding membrane height, we obtained the basilar height threshold value around 20µm. Extraction of the width W for acoustic waves of different frequencies varying from 60Hz to 20KHz (hence resulting in different place of excitation of the BM) is shown in Fig. 4.b.
Figure 4.a: BM excitation. Figure 4.b: Width of the BM excitement.
We use CI422 device characteristics with an insertion
depth of 20-25mm, a mean diameter of the electrodes around 0.35mm and a spacing between the electrodes around 0.45mm. As explained in [8], the number of nerve fibers stimulated by an electrode is a function of the power magnitude as well as the proximity of the electrodes with the BM. In fact, the electrodes array is sunk inside the scala vestibuli and due to spatial inhomogeneity of the cochlea, the distance between the electrodes and the BM may be fluctuating. For simplification purposes we supposed that the electrodes array is very close to the BM resulting in a rectangular window-like stimulation of the nerve fibers by the electrodes (Himplants.) displayed in Fig. 5.a. The selection and the power sent to the electrodes depends on the function h(x,t) as depicted in Figs. 5.b. and 5.c
The relation between the distance from the oval windows where the BM displacement is maximaland the frequency of the acoustic wave is given by the Greenwood function [15] and will be used thereafter in this paper to switch from the distance x where W(x) is maximal to the frequency of the input wave.
.
52Copyright (c) IARIA, 2013. ISBN: 978-1-61208-306-3
CENTRIC 2013 : The Sixth International Conference on Advances in Human-oriented and Personalized Mechanisms, Technologies, and Services
61 / 145

Figure 5.a: The auditory nerve fibers position stimulated by the electrodes
array. 5.b: BM displacement for a 1250Hz sine wave.
5.c: Resulting electrodes stimulated by the 1250 Hz sine wave based on the BM displacement theory
As can be seen on the figure, not all the frequencies can be stimulated by the electrodes and the main limitation of this model is that the input frequency must match with the frequencies coverage by the implant, which is rarely the case for high frequencies. In consequence, an alternative model has been developed
V. COMPARAISON WITH THE FT BASED AUDITORY NERVES
STIMULATION
The function Himplants presented in Section IV selects the frequencies stimulated by the electrodes array. We chose to only compute the Fourier Transform on the frequencies which can be stimulated by the cochlear implants. Hence we obtain the following equations for the FT computation:
. ; <=
<>? @ABCDEFGHIJKF
L
And
< 1N ; .
ODEFGHIJ=
ODEFGHIJ>? @ABCDEFGHIJKF
L 5
Where Xk are normalized frequencies (the normalizing frequency is the sampling frequency chosen at 44KHz, similar to audio formats as .wav, .mp3, etc.) ,fcentral is the central frequency of each rectangular sub window of Himplants(f) as one electrode can only have one voltage value and N is the number of electrodes. As the sampled audio signal contains more than N points, the sampled audio signal was cut into many windows of N samples where the previous
formula was applied (Short Time Fourier Transform (STFT) [16]).
The corresponding results for a 1250 Hz sine wave stimulus is shown in Fig. 6.a. As the frequency of 1250Hz does not match with a frequency covered by one electrode, the signal power is distributed over the frequencies covered by the electrodes, causing distortion in the reconstructed signal.
This test signal stimulates only two electrodes (in the actual physical model as presented figure 5.c) or all the electrodes (in the STFT model). Transient simulations were carried on and reconstructed signal from the STFT model was significantly less distorted than the other one (Fig. 6.c). However, when the frequency of the control signal was inside the frequency range corresponding to the electrodes position shown in Fig. 5.a, both models gave approaching results (not shown in this paper). In that case the most efficient model in terms of processing resources should be selected.
Figure 6.a: Normalized voltage sent to the electrodes for a 1250Hz input
auditory wave (using the SHFT model). 6.b:Normalized voltage sent to the electrodes for a 1250Hz input auditory
wave (using the BM displacement model). 6.c: Comparison between transient simulations of the reference signal, the signal reconstructed using all the electrodes and the signal reconstructed
using only 2 electrodes
53Copyright (c) IARIA, 2013. ISBN: 978-1-61208-306-3
CENTRIC 2013 : The Sixth International Conference on Advances in Human-oriented and Personalized Mechanisms, Technologies, and Services
62 / 145

Testing this hypothesis may provide new insights of the hearing process. In fact if the combined models would give better results in person using cochlear implants than the algorithms implemented at present, this could mean that the brain could adapt to these new nerve stimulation. In that case our combined models, if utilized in very young patients (maximal brain plasticity and with extended learning process), could give better results than the algorithms used commercially. For instance the modification of the current algorithms to include our model is the first step, before its implementation on the cochlear implants microprocessor for real time data processing
VI. CONCLUSION
We proposed an electrodes stimulation optimization which resides on the complementary nature of physical and mathematical models, therefore, deserving further work and tests. The two models proposed in this paper (physical cochlea model and FT based model) have been compared theoretically and the corresponding results have been presented for a 1250Hz sine wave input signal. At present general knowledge in hearing processes is improving due to a large community of biomedical research, which should bring further development in the modeling of the cochlea and the mechanism of hearing. In this context the implementation of our model in upcoming cochlear implants may add hearing accuracy.
REFERENCES
[1] J. K. Niparko, "Cochlear Implants: Principles and Practices (chapter 7)", Philadelphia USA, 2009.
[2] G. Clark, "Cochlear Implants: Fundamentals and Applications (ch. 4-8)", Springer-Verlag, 2003.
[3] J. Rouger et al., "Evidence that cochlear-implanted deaf patients are better multisensory integrators," 2007, vol. 104, no. 17, pp. 7295-7300,
[4] Shizao, "Cochlear Implant 1", July 2010, URL
[5] P. W. Alberti, «The anatomy and physiology of the ear and hearing».
[6] E.S. Olson, H. Duifhuis, C. R. Steele, "Von Bekesy and cochlear mechanics", Hearing Research, November 2012, Vol. 293, Issues 1–2, , pp. 31–43
[7] J. Ashmore et al., "The remarkable cochlear amplifier", Hearing Research, May 2010, Vol 266, pp.1-17
[8] Cochlear® ,"Delivering choice, cochlear’s electrodes portofolio-as unique as our customers", 2012, URL
[9] R. F. Lyon and C.A. Mead, "Cochlear hydrodynamics demystified", Vols. 1 sur 2 Caltech-CS-TR-88-4.
[10] J. Whittaker, "Physics of the ear, Comps II presentation", December 2006.
[11] "Sound pressure gain produced by the human middle ear", 1995, Vols. 1 on 2 no: 113 (4), pp. 349-355
[12] J. P. Wilson, "Mechanics of middle and inner ear", 1987, Vols. 1 on 2 no: 43(4), pp. 821-837
[13] C. K. Glass et al., "KCNQ4, a Novel Potassium Channel Expressed in Sensory Outer Hair Cells, Is Mutated in Dominant Deafness", Cell , February 1999, Volume 96, n° 1 Issue 3, pp. 437–446
[14] S. Stephen and J Elliott, "The cochlea as a smart structure", Smart
materials & structures, vol. 21, n° 16, 2012.
[15] D. D. Greenwood, "A cochlea frequency position function for several species – 29 years late" 1991.
[16] E. Jacobsen and R. Lyons, "The sliding DFT", March 2003.
[17] Rouger et al., "Evidence that cochlear-implanted deaf patients are better multisensory integrators," 2007, vol. 104, no. 17, pp. 7295-7300,
54Copyright (c) IARIA, 2013. ISBN: 978-1-61208-306-3
CENTRIC 2013 : The Sixth International Conference on Advances in Human-oriented and Personalized Mechanisms, Technologies, and Services
63 / 145

Sightseeing Spot Communication System using Four-Frame Stories
Tomoko Izumi
College of Information Science and
Engineering
Ritsumeikan University
Shiga, JAPAN
Masaki Masuda
Graduate School of Information
Science and Engineering
Ritsumeikan University
Shiga, JAPAN
Yoshio Nakatani
College of Information Science and
Engineering
Ritsumeikan University
Shiga, JAPAN
Abstract— Recently, many people introduced their personal
sightseeing trips on the Internet, with the effect that some of
the introduced sightseeing spots have attracted the attention of
tourists. In this research, we propose a sightseeing
communication system based on making and sharing a
sightseeing “story”. Users make a story consisting of four
frames about the sightseeing by editing pictures taken at
sightseeing spots. The story-creating process yields to new
discoveries about the appeal of sightseeing spots, because the
user will look for topics to feature in a story during their
sightseeing trip. We expect that such a process will make the
sightseeing more individual and creative. The produced story
is also shared among other users, which we anticipate to
generate interest in the sightseeing spots.
Keywords-Sightseeing support system, Four-frame story,
Tourism recommendation.
I. INTRODUCTION
A great deal of importance is placed on the tourism industry in Japan. Domestic and overseas trips are one of the main leisure activities of Japanese people. In recent years, the sightseeing style of Japanese consumers is changing. Traditionally, the package tour has been the most popular sightseeing style in Japan. The package tour is a travel product wherein the entire process including destinations, routes and time schedule, is managed by a tour company. Thus, the participants enjoy their sightseeing simply by following the instructions of a tour guide. However, another sightseeing style has come into use significantly in recent years. This is a style wherein tourists determine the process of their sightseeing themselves and enjoy their trip without using a package tour. Ishimori [1] describes this as “autonomous tourism.” In addition, “Travelers Trends 2010” [2], published by the Japan Travel Bureau Foundation, calculated that the number of people who were interested in gourmet food, history, urban tourism, and strolling had increased by 10% in 2009 compared to 2007. With all these factors, it can be said that tourists are interested in various activities and want experiences of various types. Therefore, just as Ishimori points out, the sightseeing style in Japan is changing from moving efficiently along a predetermined route to freely visiting places of interest anywhere, anytime, and tourists are looking for new discoveries and chance encounters.
In planning such a personal tour, many people gather information about sightseeing spots from social media such
as Facebook and Twitter, and take into account word-of-mouth information from such sites. A tourist who had a positive experience and memories uploads some stories and photos of their trip to the Internet, and other people who are planning their own tours are affected by these shared stories and photos. Since people have diversified personal preferences, the attractive factors of a sightseeing spot differ from person to person. Thus, people select information on the Internet, which matches their preferences and plan their personalized tours. Therefore, a desired recommendation system for sightseeing spots should propose not only standard destinations but also personalized destinations for each user, and lead to new discoveries about the appeal of sightseeing spots.
This paper proposes a novel sightseeing spot communication system. Our goal is to invite tourists to visit various new sightseeing spots by sharing their experiences and memories about trips with each other. As a way of sharing experiences of the sightseeing spots, we focus on the interesting part of making and reading a “story” using photos taken at the spots. That is, users make a four-frame story about their sightseeing experience by editing photos taken at sightseeing spots, and share the story using our system. The shared stories are read by other users, which we anticipate to generate interest in the introduced sightseeing spots. We consider that the processes of creating and sharing the stories will yield new discoveries about the appeal of sightseeing spots, because the user will look for topics to feature in the story during their sightseeing trip in the story-creating process, and in the sharing processes, the user will have access to the various perspectives of many other tourists.
This paper presents the results of an evaluation experiment using our prototype system. These results demonstrate the effectiveness of our system in terms of occurrence of discoveries about new appeal of sightseeing spots by creating four-frame stories, guidance to new spots by sharing stories, and the addition of narrative to sightseeing information.
In this paper, we present the related works in Section II. Sections III and IV show the outline and details of our proposed system. The evaluation results are shown in Section V, and we conclude this paper in Section VI.
55Copyright (c) IARIA, 2013. ISBN: 978-1-61208-306-3
CENTRIC 2013 : The Sixth International Conference on Advances in Human-oriented and Personalized Mechanisms, Technologies, and Services
64 / 145

II. RELATED WORK
In this section, we introduce sightseeing navigation systems, which attempt to create opportunities for encounters, and systems for sharing edited photos.
A. Encounter-Creating Navigation Systems
Most traditional sightseeing navigation systems used by tourists during sightseeing offer the shortest route and methods of transport from a departure to a destination, and attach a high value to the efficiency of user movement. However, it can be said that the user's area of activity is limited, and opportunities for new discoveries and chance encounters that may happen during sightseeing decrease in order to realize high efficiency. Considering the sightseeing trends in Japan in recent years, such methods are not effective because tourists who demand fun and memorable sightseeing are increasing.
In order to resolve these problems, some sightseeing navigation systems, which attempt to stimulate new discoveries and chance encounters, have been proposed [3]. These systems adapt the idea of “Benefit of Inconvenience”. Ichikawa, et al. proposes a system which shows a map consisting only of a rough handwritten route, some icons and the current position of the tourist (Fig. 1 (a)). In the system proposed by Tanaka et al., an electronic map hides the information related to the area immediately surrounding the tourist (Fig. 1(b)). By hiding detailed maps and routes, these systems promote interaction with the user’s previously unnoticed surrounding environment, and foster new discoveries and chance encounters. As an extended system, Takagi et al. built a navigation system, which hides most of the map’s information (Fig. 1(c)) [4]. In this system, only the current and destination positions, and some landmarks, are shown on the display. The landmarks are selected based on the user’s preferences.
(a) (b) (c) Figure 1. Screen images of navigation systems which promote interaction with the user’s surrounding environment.
B. Edited Photo-Sharing Systems
Due to the widespread use of smartphones, in recent years some tourists use photo-sharing applications, such as LINE camera [5]. Users of these applications take photos at sightseeing spots using their cell-phone or smartphone camera, edit these photos in the application, and share the edited photos with their friends or all other users. In LINE
camera, a user can edit a photo by adding text, stamps featuring characters, and decorated frames. The edited photos are shared on LINE, Facebook, and Twitter. The goal of these systems is only the sharing of photos, not the sharing of information about sightseeing spots such as their locations. Thus, they do not provide a function of navigation to sightseeing spots.
Dinh Pham Quang et al. propose a navigation support system to sightseeing spots by sharing photos with “graffiti” [6]. A tourist takes a photo at a spot, and enjoys editing the photo by adding graffiti freely. The photo with graffiti and the location data of the photo are shared on the Internet. Other users see the photo with graffiti on an electronic map. Evaluation results demonstrate that the expressing sightseeing as a narrative by adding graffiti to photos attracts other users’ interest. In addition, the system implements sightseeing spot navigation function by providing location information showing the place where the photo was taken. Some evaluators said that they would look for graffiti topics during their sightseeing trip. This fact indicates that the system creates opportunities for new discoveries and chance encounters.
Dinh Pham Quang et al. use only one photo to express a story. In our study, we use more than one photo; specifically, we use a four-frame story, because we consider that higher diversity of story will realize the provision of multiple opportunities for new discoveries and chance encounters.
III. OUTLINE OF PROPOSED METHOD
This paper proposes a novel communication system by
sharing four-frame stories based on photos taken at
sightseeing spots. The system targets tourists who are
carrying out casual sightseeing on foot. Through the action
of making and sharing stories, tourists obtain opportunities
for new discoveries and chance encounters.
A. Benefits of Story-Making
Cognitive actions related to creative processes occur in a
chain [7]. In order to perform a creative process, a human
responds sensitively to various visual features and
relationships between spatial locations of objects in a space,
and then creates conceptual meanings for the objects. Thus,
such responses lead to a new discovery for the human.
Our proposed method compels tourists to have active
interaction with their environment at sightseeing spots by
taking actions to create stories. This active interaction
provides a chain of cognitive actions and new discoveries.
B. Basic Policy of Method
We propose a sightseeing spot communication system,
which utilizes sharing of four-frame stories. A tourist takes
photos during their trip, and creates short stories of four
frames which introduce the trip. The created stories are
shared using our system, and other users read the shared
stories to learn about the introduced spots. In order to
consider four-part narrative structure, which is traditional in
Japan, we limit the length of the stories to four frames. This
structure is used internationally, one of the famous
56Copyright (c) IARIA, 2013. ISBN: 978-1-61208-306-3
CENTRIC 2013 : The Sixth International Conference on Advances in Human-oriented and Personalized Mechanisms, Technologies, and Services
65 / 145

examples is SNOOPY’s story [8]. Limiting the length of
story simplifies the process of story creation.
The scenarios for both modes of use, creating a story and
sharing a story, are as follows:
1) Scenario for the story-creating process
1. A tourist considers a four-frame story using photos
taken at sightseeing spots when he encounters
interesting objects such as scenery, buildings, shops,
food, etc. During this time of consideration, it is
important to conduct sightseeing with an awareness
of whether there is anything suitable for a story
around oneself, thereby developing sensitivity for
sightseeing.
2. If the tourist can construct a story, they create a
four-frame story by taking some photos and editing
them. Editing methods include attaching text
comments, appropriate characters and graffiti. More
than one spot may be included in a story.
3. The created story is sent to the system’s server in
order to share the story. Location information for
each photo in the story, obtained via GPS(Global
Positioning System), is also stored on the server.
2) Scenario for the story-sharing process
1. A user browses the shared four-frame stories from a
location outside of the spots introduced in the story.
However, the user cannot read the last frame of the
story outside of the spots introduced in the story.
This mechanism stimulates the user to wish to know
the ending of the story, and to visit the introduced
sightseeing spots.
2. The user conducts sightseeing based on the shared
story that they are interested in. A photo of each
frame in the shared story is shown at a
corresponding position on an electronic map. Thus,
the user can visit the spots that were introduced in
the stories that interest them. At the sightseeing spots,
the user can see all frames of the story, including the
last frame.
IV. SYSTEM DETAILS
In this section, we describe our prototype system.
A. Development Environment
Our system is assumed to be used during sightseeing.
Thus, the system needs to be developed for mobile
computers. In our prototype system, we use the iPhone as a
mobile computer. The system was developed as an iPhone
application in Objective-C. The server requires a database
function, for which we use XML and PHP.
B. System Architecture
Fig. 2 shows the architecture of our prototype system,
which consists of an iPhone and a server. The server stores
the four-frame stories uploaded by the user in a database. A
unique ID is attached to each uploaded story. Photo data for
each frame in the story are assigned a name with the ID of
the story and its order in the story, and stored in an image
folder. For each frame, the database stores its ID and
location information obtained via GPS(Global Positioning
System). The program to upload to and download from the
server uses PHP(Hypertext Preprocessor). The iPhone
device reads this PHP program in order to access the
database.
C. System Functions
Our system consists of the following three functions:
1) Store the photos taken at sightseeing spots, 2) create a
four-frame story, and 3) browse the shared four-frame
stories. In this section, the details of these functions are
described.
1) Photo Store Function
With this function, the user can take and store a photo.
There is a camera button on the lower left of the main
screen. When the user pushes this button, the equipped
camera is activated. The user takes photos and stores them
in the local memory of the iPhone. The stored photos are
shown on the electronic map. Therefore, the user can see
the photo image and the location where the photo was taken,
and select some of the photos to use in making a story.
2) Story Creation Function
With this function, the user selects a photo from the
stored ones in the iPhone, and edits the photo by adding
texts, characters, and graffiti to the photo. Fig. 3 shows an
example of screens during the creation process. Our system
provides six functions to edit photos, each of which
corresponds to a button at the bottom of the screen.
1. Pen button: When the user writes some graffiti on the
photo, they tap this button. The pen color can be
selected from three colors: red, blue, and green. The
pen also has five width settings.
2. Callout button: When the user adds some text in a
speech bubble, they tap the callout button. A speech
bubble of default size appears on the photo. The user
writes some text in the speech bubble, and then
Figure 2. System architecture.
57Copyright (c) IARIA, 2013. ISBN: 978-1-61208-306-3
CENTRIC 2013 : The Sixth International Conference on Advances in Human-oriented and Personalized Mechanisms, Technologies, and Services
66 / 145

moves it to an appropriate position in the photo (Fig.
3(a)).
3. Chara button: When the user taps this button, a list of
the characters in this system is displayed. The user
selects one of the characters, and double taps the
position where they want to place the character. The
character appears in a default size at the tapped
position (Fig. 3(b)).
4. Size button: The size of text in a speech bubble, the
speech bubble itself, and characters is changed by
tapping the size button.
5. ID button: The order of the edited photo in a story is
assigned by tapping the ID button. After tapping this
button, the user inputs the order.
6. Save button: After editing a photo, the user taps the
save button. When all frames in a story are created,
they are uploaded to the server.
3) Story Browse Function
Using the browse function, a user can see the shared
four-frame stories and learn the locations where the photos
in the story were taken. Fig. 4(a) shows an example of a
screen of the list of shared stories. The user selects one of
the stories that they want to read. Then, the user can read
each frame of the selected story, and learn the locations
where the photos in the story were taken. Fig. 4(b) shows an
example of a screen indicating the locations of a story. Thus,
when the user sees an interesting photo or story, they can go
to the place introduced in the photo or story by using this
map function.
When a user sees this list of shared stories from a place,
other than where the photos in the story were taken, the last
frames of these stories are not available for the user (Fig.
4(a)). This trick gives the user motivation to go to the
sightseeing spots introduced in the stories that they found
interesting.
V. EVALUATION EXPERIMENT
A. Experiment Method
We conducted an evaluation experiment with 12 human evaluators, who are students in Ritsumeikan University in Japan and are selected randomly from among applicants, in order to verify the effectiveness of this sightseeing spot communication system. The experiment was conducted with Kyoto as the experiment area, and subjects strolled in the eastern area of the city centered around the Kiyomizu-dera temple. The reasons why this area was chosen for the evaluation experiment are: (1) The area is suitable for casual sightseeing by foot,
because there are various famous spots including historical places, cultural places, etc.
(2) Tourists are able to enjoy the streetscape of Kyoto, which has many narrow alleyways.
(3) Many of the evaluators in this experiment had not visited this area before.
The evaluators in the experiment were 11 men and 1 woman in their twenties who live in the Kansai area, which includes Kyoto. The first experiment was carried out in December 2012 with half of the evaluators, and the second one in January 2013 with the remaining evaluators. They were assigned randomly to three groups regardless of their gender, age, previous experience of sightseeing in Kyoto, etc. Each group consisted of two persons.
Each group enjoyed the streetscape freely in the target area with at least one iPhone device installed with our prototype system. First, at a start point in the area, we explained the target area and how to use our system easily to the evaluators, and instructed them to return to the start point in 90 minutes. One observer accompanied each group to observe the behavior of the evaluators.
We asked the evaluators to answer a questionnaire in order to gather evaluation data on the usefulness of the system. In this questionnaire, questions about the following three facts were asked:
text
(a) Use of speech bubbles (b) Use of characters Figure 3. Examples of story creation function
(a) List of shared stories (b) Locations of photos in a
story
Figure 4. List screen of four-frame stories
58Copyright (c) IARIA, 2013. ISBN: 978-1-61208-306-3
CENTRIC 2013 : The Sixth International Conference on Advances in Human-oriented and Personalized Mechanisms, Technologies, and Services
67 / 145

(1) For each story the evaluators created: “why did you want to create this story?”
(2) For each visit to a spot which was introduced in a shared story: “why did you want to go there?”
(3) For the whole process of sightseeing using this system: “how would this system affect your sightseeing?”
B. Evaluation Results
1) New discoveries about the appeal of sightseeing
spots
First, we will examine the effect of creating stories during
sightseeing. We expected that the act of looking for topics
for stories would provide tourists with new discoveries
about the appeal of sightseeing spots. In answer to the question “How would this system affect
your sightseeing?” evaluators gave replies such as, “I focused on various objects in the sightseeing spots to look for a topic for a story,” “I walked with greater care than usual because I wanted to find some interesting objects to create a story,” etc. Most of the evaluators conducted their sightseeing actively and creatively by searching for interesting episodes and objects during their sightseeing, and by thinking about using these for story creation. For example, one of the groups created a story about interesting signs. They could also find some interesting objects in addition to funny signs because they looked around with curiosity.
A further interesting finding is that this system fosters a competitive spirit in the tourists. Some of the evaluators reported this fact in the questionnaire. Because the created stories are shared with other users, the evaluators made an effort to create a good story to get others’ attention. Therefore, they looked around themselves carefully to find something funny or interesting. That is, it can be said that the communication of sightseeing spots based on four-frame stories is effective for the realization of creative sightseeing.
At the end of this evaluation, the evaluators talked about the stories that they had created. Such feedback from other users is good motivation for creating good stories. One of our future tasks is implementing a function for receiving feedback from other users in order to sustain motivation.
2) Navigation function by sharing stories One of our aims in this study is to invite tourists to visit
various new sightseeing spots by sharing their experiences as a story. In our system, the locations where the photos in a story were taken are shown on an electronic map. As a result, the behavior of visiting spots introduced in the shared stories occurred three times in the first evaluation, and seven times in the second evaluation. The reason that the number of such visits by the second group was larger was that the first group conducted experimental sightseeing under conditions where there were no shared stories in the system. That is, the
evaluators in the first group could not see the shared stories at first, so they focused on the creation of stories.
The visits to the introduced spots can be classified into three categories based on motivation:
(1) Eight visits were motivated by interesting photos in the shared story.
(2) Three visits were motivated by the distance to the introduced spot.
(3) One visit was motivated by the desire to complete an incomplete task. Examples of the first motivation are photos of scenic views, a shop displaying favorite characters, and something unique. In answer to the question “Why did you want to go there?” some evaluators replied that they read an interesting story, and the story unfolded there. That is, they became interested in the photos by reading the shared stories. The second motivation is caused by the map function. In this system, a user can learn the locations of photos in shared stories. The evaluators found interesting spots close to their current position, and were able to go there easily. Moreover, it was demonstrated that the users shared information about less famous spots by sharing four-frame stories, and that this communication yielded new discoveries about the appeal of these spots. An evaluator stated that he wanted to go to ordinary places using our system, whereas he had tended to go only to major spots introduced in guidebooks. Another evaluator also reported that he obtained interesting information about unique sightseeing spots that could not be focused on by simply following a tour guide. By using this system, users encounter various perceptions of sightseeing spots. For example, one frames of two different shared stories are based on photos taken at the same shop. In one frame, the character good in the shop is perceived to be cute, but in the other, it is expressed as humorous. This was reflected by one of the evaluators, who reported that he realized that there are various ways of thinking about sightseeing.
3) Effect of adding narrative to sightseeing information. In this section, we describe the effect of sharing stories
based on photos, rather than sharing only edited photos. From the evaluators’ answers to the question “Why did you want to create the story?” we found that there are three methods of creating stories:
(1) The theme of story is decided previously. (2) The story is created in chronological order of
sightseeing. (3) The ending of the story is decided first, and the other
frames of the story are created subsequently.
59Copyright (c) IARIA, 2013. ISBN: 978-1-61208-306-3
CENTRIC 2013 : The Sixth International Conference on Advances in Human-oriented and Personalized Mechanisms, Technologies, and Services
68 / 145

In the first method, the evaluators set a theme for their story such as interesting spots or funny signs, and created all four frames based on the theme. In the stories created by this method, the evaluators used characters which matched their feelings at the sightseeing spots. They also expressed their feelings for the spots by adding some text in speech bubbles, which could not be expressed only by using characters. In the second method, the evaluators created four frames, which expressed only their experience of sightseeing. The evaluators who created their stories in this way added some information to the photos using characters, speech bubbles and graffiti to introduce interesting sightseeing spots. Fig. 5 shows an example of a story created this way. In the last method, the evaluators got an idea for the ending of the story first, and then looked for the other three spots to create the remaining three frames. In this case, they conducted their sightseeing wanting to take specific photos which could lead to the ending. Thus, the observers saw that the evaluators looked at various objects at the spots in order to discover something interesting. From the experiment results, we can identify the following effects of adding narrative to sightseeing information:
(1) Motivation to visit spots: All of the evaluators in the second half of the experiment said that “we wanted to go there because we wanted to know the ending of the stories.” This motivation is derived from adding narrative to sightseeing information and the trick of making the final frames unavailable.
(2) Self-expression: The evaluators tried to create good stories that would attract attention from other users. This behavior makes their sightseeing creative (see Section V-B-1).
(3) Discovering less famous sightseeing spots: The shared stories are triggers to go to the spots introduced in the stories. In the questionnaire, there were some answers, such as “we had not been interested in that spot, but the stories and its edited photos were very fun, so we went there.”
VI. CONCLUSION AND FUTURE WORK
This paper proposed a sightseeing spot communication system based on making and sharing a sightseeing story. Users of this system make a story of four frames about their sightseeing by editing pictures taken at sightseeing spots, and share it among other users. An evaluation experiment demonstrated that our proposed system is effective in terms of making the sightseeing individual and creative. In addition, by reading the shared stories, people are interested in new spots introduced in the stories.
Our future works aim to evaluate this system with more evaluators quantitatively, because this paper showed the results from 12 evaluators, and compare with other application. In addition, we limit the length of story to four frames, but there are may choices of story length, such as two, six or eight frames. The effect of story length and giving the choices to users should be revealed.
REFERENCES
[1] S. Ishimori, “The Potentialities of Autonomous Tourism in the Twenty-first Century,” Senri Ethnological Reports, vol. 23, 2001, pp. 5-14 (in Japanese).
[2] Japan Travel Bureau Foundation, “Travelers Trends 2010,” Japan Productivity Center , 2010.
[3] Y. Nakatani, K. Tanaka, and K. Ichikawa, "New Approach to a Tourist Navigation System that Promotes Interaction with Environment", Advances in Computer Science and Engineering, InTech Publishing, March, 2011, pp. 353-370.
[4] S. Takagi, T. Izumi, and Y. Nakatani, ”A Sightseeing Navigation System without Route Information”, Fifth International Conference on Advances in Human-oriented and Personalized Mechanisms, Technologies, and Services (CENTRIC 2012), November, 2012, pp. 50-55.
[5] NAVER Japan Corporation, “LINE camera”, https://itunes. apple.com/jp/app/id516561342 (retrieved: 5/30/2013).
[6] D. P. Quang, M. Masuda, and Y. Nakatani, “A Navigation System of Sightseeing Spots using Photos with Graffiti”, the 74th National Convention of IPSJ, March, 2012, pp. 303-304 (in Japanese).
[7] M. Suwa, “Discussion on Pragmatic Studies to Synthesize Creative Processes”, Journal of the Japanese Society for Artificial Intelligence, vol. 19,no. 2,March, 2012, pp. 205-213 (in Japanese).
[8] Peanuts, http://www.peanuts.com/ (retrieved: 8/13/2013).
Figure 5. An example of shared stories in this experiment(Since the story is written in Japanese, the text in the figure are translated into English.).
60Copyright (c) IARIA, 2013. ISBN: 978-1-61208-306-3
CENTRIC 2013 : The Sixth International Conference on Advances in Human-oriented and Personalized Mechanisms, Technologies, and Services
69 / 145

An Opportunistic Tourism Navigation System using
Photography Location Recommendation
Hiroya Sakaguchi
Graduate School of Information
Science and Engineering
Ritsumeikan University
Shiga, JAPAN
Tomoko Izumi
College of Information Science and
Engineering
Ritsumeikan University
Shiga, JAPAN
Yoshio Nakatani
College of Information Science and
Engineering
Ritsumeikan University
Shiga, JAPAN
Abstract— In recent years, a style of sightseeing, which is
planned by individuals and focuses on strolling has become widespread, while sightseeing navigation systems have attracted attention. However, most existing navigation systems support efficient sightseeing by giving users information such as the shortest route to their destination. Accordingly in this research, we propose an opportunistic sightseeing navigation system, which navigates users to a destination while recommending some photography locations that exist on the way to the
destination, and adapts to the users’ moods. An evaluation experiment conducted in Kyoto, Japan, demonstrated that conducting casual sightseeing on foot using this system enabled
opportunistic sightseeing suited to the users’ moods, which led to user enjoyment.
Keywords-Tourism Navigation System; Opportunistic
Planning; Benefit of Inconvenient; Photography Location
I. INTRODUCTION
A. Background
In previous tourism trends, many tourists participated in tourism where the destination, route, and time were all pre-determined by a travel agency. However, in recent years, many tourists decide on their destination and route by themselves and enjoy their trip freely. Tourism conducted in this way is called “autonomous tourism”, whereby tourists design their own itineraries to their preference [1].
In other words, the present trend is for tourists to visit their preferred places at their preferred times. However, many navigation systems for sightseeing that have been developed in recent years place a high value on efficiency, thus are not suitable for tourists who prefer to stroll casually.
In this study, we focus on “Opportunistic Planning” [2], which is a plan based on the principle of flexibly adapting to opportunities at the place, situation, and time. We consider that these principles will be effective in supporting casual sightseeing on foot. We propose an opportunistic sightseeing navigation system for casual sightseeing on foot. The system recommends sightseeing spots according to the tourist’s situation (i.e., their available time for sightseeing or the distance to a destination) and interests. This system changes the photography locations opportunistically when the user’s interest changes or when the user happens to encounter another attractive photography location. Users can enjoy
casual sightseeing on foot freely because sightseeing spots are recommended to them during sightseeing. We expect that adapting to the user’s situation and changes in interest will lead to discoveries of new attractions in sightseeing areas.
B. Relationship between of Photography and Sightseeing
In recent years, people who take photos in sightseeing
areas have increased dramatically in comparison to the age
when only analogue cameras were available. This is because
camera functions in current mobile devices have increased
in resolution and multi-functionality. Moreover, due to
widespread Internet use, photography is now not only
enjoyed by the photographers themselves. Especially, use of
social media such as Twitter and Facebook has spread
rapidly in recent years. Such sites include functions to
contribute photos, by which users can enjoy sharing the
pictures they have taken. Taking photos at sightseeing areas
can be considered an effective means to record one’s
memories of sightseeing. Moreover, by showing pictures
taken at sightseeing areas to others, it is possible to
recommend sightseeing areas to others.
Panoramio is a service, which connects photographs to
maps. Panoramio is one of several photo-sharing services
with location information, by which the user is able to view
photos shown on a map. Users can share their photos with
other users and can view photos contributed by other users
on a map. In this way, using photos can stimulate the users’
desire to go to the location. In this research, we focus on
photography that is frequently carried out during sightseeing,
and propose a system that navigates to sightseeing spots by
recommending attractive photography locations.
A brief outline of this paper follows. In Section 2, we
introduce studies related to this study. Section 3 and 4
describe system proposal and system function. Section 5
describes evaluation of the system and consideration.
Finally, Section 6 describes conclusion of this paper.
II. RELATED WORKS
A. Trends in Sightseeing Navigation
With the advancement of mobile environments in recent
years, many sightseeing navigation systems have been
61Copyright (c) IARIA, 2013. ISBN: 978-1-61208-306-3
CENTRIC 2013 : The Sixth International Conference on Advances in Human-oriented and Personalized Mechanisms, Technologies, and Services
70 / 145

developed for mobile devices. For example, NAVITIME [3]
has functions such as searching for the shortest route by
mixing train, bus and walking, and transport transfer guide
information. As such, it is very convenient for sightseeing
that places a high value on efficiency, but is not suitable for
casual sightseeing on foot.
In addition, a sightseeing navigation system for casual
sightseeing on foot was proposed in a study by Takagi et al.
[4]. The system recommends landmarks to the user based on
individual preferences of food, history and landscape by
presenting photos of landmarks. The user then chooses a landmark and heads for their
destination. However, as recommendation of landmarks is only based on the user’s pre-input preferences, this system cannot adapt to changes in the user’s interest or situation during sightseeing. On the other hand, Takagi et al.’s study indicates that photos of landmarks have an impact on the user’s choices and interests. Figure 1 shows the main screen of this system and a photo of a landmark.
(a)Main Screen (b)Photo of a Landmark
Figure 1. Previous System, Screen
B. Benefit of Inconvenience
In sightseeing, a person can feel a sense of uneasiness
due to not knowing detailed routes and buildings, etc. of the
places they are visiting for the first time. However, this
uneasiness can be transformed into excited anticipation of
what lies ahead. This kind of navigation is based on the
theory of the “Benefit of Inconvenience” [5], which
suggests that inconvenient things bring benefits. A
navigation system that uses the “Benefit of Inconvenience”
has the effect of providing opportunities to look around and
discover new aspects of the sightseeing area without
keeping the user glued to the system screen by not providing
detailed route indications. In the study by Takagi et al. [4],
the effect of the “Benefit of Inconvenience” was actually
demonstrated.
In the current study, we propose a system based on the
theory of the “Benefit of Inconvenience” that shows map
information via aerial photographs, whereby it is more
difficult to understand route details than using a normal map.
Moreover, the system can convey the ambience and scenery
of the sightseeing area to the user using aerial photographs,
and enables the user to discover photography locations and
other spots suitable to their interests. Also, the navigation to
these locations consists of showing the direction from the
user’s position to the destination, without showing a
detailed route.
III. OUTLINE OF PROPOSAL
A. Basic Policy of System
In this study, we propose a tourism navigation system that
supports users searching for sightseeing spots using
photography locations that are adapted to the users’ interests.
First, users input their destination and available time for
sightseeing in the tourism area. The system recommends
photography locations using photos from the information on
the location, distance to destination and the user’s available
time for sightseeing. The photography locations
recommended by this system include rare sights, food,
landscapes and other things associated with the tourism area.
Moreover, the system recommends not only famous
sightseeing spots introduced in guidebooks, but lesser-
known sightseeing spots. Therefore, the users are
encouraged to go to the location by viewing attractive
pictures. Users select a spot from a list of recommended
spots, according to how they feel at that moment, and head
for the spot based on the system’s navigation.
As users of the system increase, we assume that in future,
the data of photography locations can be collected from
photos taken by general tourists. That is to say, users will
upload picture data with location information as in
Panoramio. However, in this system, data of photography
location is registered in the system ahead of time. Based on
the theory of “Benefit of Inconvenience”, the system limits
the amount of information that is displayed when navigating
to the photography locations. Specifically, the system
navigates with only a map screen using aerial photographs,
whereby it is difficult to understand route information and
the direction to the photography location. Users head for the
photography location and use the ambience near the
photography location that they can perceive from the aerial
photographs, and direction, as hints. The system aims to
attract the users’ eyes to the surrounding landscapes, by
comparing the aerial photographs and real landscapes and
searching for the photography locations.
In this study, we propose a sightseeing navigation system
that changes photography locations opportunistically in
response to users’ changeable feelings and supports more
free casual sightseeing on foot. In sightseeing, there are
many varieties of places that users want to visit and these
depend on the user’s feelings at that time. This system
62Copyright (c) IARIA, 2013. ISBN: 978-1-61208-306-3
CENTRIC 2013 : The Sixth International Conference on Advances in Human-oriented and Personalized Mechanisms, Technologies, and Services
71 / 145

recommends destinations while repeating navigation in
accordance with the user’s moods, for example when their
feelings change and the user wants to visit other places.
Specific to the situation, users choose photography locations
that are recommended by the system and repeat the action of
heading for the location as a way to move to destination.
However, if while casually walking, the user’s interests
change to other things - for example, they take a photo at
another place and are satisfied - the system provides a new
recommendation of other photography locations.
Accordingly, users can change the next photography
location, in consideration of their mood or the situation at
any time.
B. System Flow
1) First, the user decides their destination and the target
time for the destination. The system uses these to calculate
which walking routes are possible, and recommends some
photography locations.
2) From the list of recommendations, the user chooses a
photography location in accordance with their feelings at
that time.
3) The system shows a map screen with aerial
photographs and directions to the destination calculated
from the location information of the photography location
and the user’s current location.
4) The user strolls freely while searching for the
photography location or other spots where they want to take
photos.
5) The user requests the system to recommend the next
photography location when the user reaches the
photography location, finds a favorite place or has a change
in interest.
6) The system calculates the remaining time and
recommends new photography locations.
7) The user heads for their destination, repeating Steps
2~6.
Figure 2. System Structure
Figure 2 shows this systems’ structure.
IV. OUTLINE OF SYSTEM
A. Development Environment)
The proposed system was developed as an application
for mobile devices using the Android OS, for the following
reasons.
Android mobile devices can be carried and used at
sightseeing areas.
Android mobile devices can use GPS function to
obtain location information.
Android mobile devices can use Google Maps to
obtain map information.
The development environment was Eclipse, and the
system was implemented in the Java programming language.
B. System Functions
In this system, we prepared photography locations
between the vicinity of Yasaka Shrine and the vicinity of
Kiyomizu Temple in Kyoto, Japan. The reasons for this
choice are that there are many sightseeing spots such as
historic buildings, appealing alleyways, souvenir shops and
cafés, and Kyoto is suitable to casual sightseeing on foot.
1) Initial screen
First, the user inputs their destination and available time
for sightseeing in minutes. The time is managed by the
system and a navigation screen is shown with a countdown
timer, which then starts. The system places a pin at the
destination obtained from the previously inputted
information. The user can confirm whether the location is
correct or not by tapping the pin.
2) Photography location recommendation screen
The system shows photography location candidates by
calculating possible routes from the inputted time and
location information of the user’s position and destination.
Figure 3 shows the recommendation screen. Photography
locations are retained in a database, which stores location
information and a photograph as data for each photography
location.
Next, the selection method of the photography locations
will be explained. The system calculates the walking time
from the user’s position to the photography location, and
from the photography location to the destination. When the
total time is shorter than the remaining time for sightseeing,
the photography location is recommended. In this system,
all spots that meet this condition are recommended to the
user. The system places a pin at the photography locations,
and the user can view a photo of the location by tapping the
pin. The user selects their preferred place and decides on
visiting a photography location.
63Copyright (c) IARIA, 2013. ISBN: 978-1-61208-306-3
CENTRIC 2013 : The Sixth International Conference on Advances in Human-oriented and Personalized Mechanisms, Technologies, and Services
72 / 145

Figure 3. Photography Location Recommendation Screen
3) Navigation screen
After the user decides on the photography location, the
system changes to the navigation screen, obtains the user’s
location information, calculates the direction to the
photography location and displays a compass. The system
shows the map as an aerial photograph. The system starts
measuring elapsed time as soon as the screen changes to the
navigation screen.
The user searches for the photography location using the
aerial photograph map and compass as clues. Figure 4
shows the system’s navigation screen.
Figure 4. Navigation Screen
When the user touches the “Refresh” button, the map’s
central position is refreshed to the user’s current location,
and the new direction is calculated. There are two reasons
for not renewing the user’s location at all times: 1) In order
to make it easy to comprehend the ambience of the
environment from the aerial photograph showing a
stationary landscape; 2) So that the user can search for
things that interest them and stroll freely without clinging to
the map information.
When the user touches the “Camera” button, the mobile
device’s camera initiates and the user can take a photo when
they have found a favorite spot.
When the user touches the “Next” button, the system
recommends new photography locations. This button is used
when the user has found the recommended photography
location or the user wants to go to another location. The
system recommends locations that are further from the
destination than the user’s current location. Thus, the user
can take a roundabout way and conduct casual sightseeing
on foot freely. This enables opportunistic sightseeing in
accordance with the user’s mood without being bound to the
user’s location or the photography location. Furthermore,
when there is little time remaining and no photography
locations satisfy the conditions, the system starts to navigate
to the destination. In this way, the user can go to their
destination while changing the visited locations according to
their feelings.
V. EVALUATION EXPERIMENT
A. Experiment Site
In our evaluation experiment, we set the start point as
Yasaka Shrine and the destination as Kiyomizu Temple in
Kyoto, Japan. There are four reasons for conducting the
experiment in Kyoto.
Most streets between the two locations have few cars
and are easy to walk in.
Many streets or buildings are historic and appealing.
There are many souvenir shops and restaurants.
There are many narrow streets suitable for casual
sightseeing on foot.
B. Evaluators
We conducted this experiment with the cooperation of
seven students who live in the Kansai area, which includes
Kyoto. The evaluators were separated into three groups
based on a preliminary survey that asked how many times
they had visited Kiyomizu Temple or Yasaka Shrine and
what they want to see during sightseeing. The purpose of
this group division was to investigate how the results of
limiting the route information is affected by the number of
visits. Moreover, the aim of separating three groups by their
tourism preferences was to investigate how this affects
users’ choices of photography locations or the type of
photos they take. Table 1 shows the evaluator group
composition.
64Copyright (c) IARIA, 2013. ISBN: 978-1-61208-306-3
CENTRIC 2013 : The Sixth International Conference on Advances in Human-oriented and Personalized Mechanisms, Technologies, and Services
73 / 145

TABLE I. EVALUATOR GROUP COMPOSITION
Group 1 Group 2 Group 3
Number of
People(Male:Female) 2(1:1) 3(3:0) 2(0:2)
Number of Previous
Visits 0 Over 3 1~2
Want to See Streets History Food
C. Experimental Procedure
The experiment was conducted for each group with the
start point of Yasaka Shrine and destination of Kiyomizu
Temple. Each group set their available time for sightseeing
freely and headed for Kiyomizu Temple using the system.
The first author accompanied the evaluators and observed
the circumstances of the experiment. After the experiment,
the evaluators were asked to complete a questionnaire, via
which we expected to examine the results and problems of
this study.
D. Purpose of Experiment
In this experiment, we conducted evaluation by paying
attention to the following points, in order to confirm this
study’s outcome.
1) Realization of opportunistic sightseeing, and its
difference to regular sightseeing
In this system, the users do not decide on the details of the
route. They can stroll freely according to their mood and can
choose photography locations that they want to visit, in
contrast to conventional navigation systems that show the
shortest route. We aimed to investigate how free situations
like this affect the users’ actions and whether that effect
gives users satisfaction in comparison to conventional
navigation systems.
2) Influence on sightseeing of photography location
recommendation, and of addition of camera function
We aimed to investigate whether the user’s eyes are
attracted to the surrounding environment, not to the system
screen, by “searching” for recommended photography
locations.
In addition to this, we aimed to evaluate whether the
system prompts users to discover new attractions in the
tourism area with the function of taking photos.
3) Balance of anticipation and uneasiness with
navigation using only aerial photograph maps and direction
information
In this system, users are navigated using only aerial
photograph maps and direction information. This is more
difficult and inconvenient than conventional navigation
systems. The uneasiness that this navigation style, based on
the “Benefit of Inconvenience”, inflicts on users is moderate.
We aim to inspect whether the system can change this
uneasiness into anticipation during sightseeing.
E. Experiment Results
1) Group 1
For both of Group 1’s members, this was their first visit
to Kyoto. Accordingly, they conducted sightseeing carefully
by refreshing their location information frequently, and
often got lost. From these points, we can consider that
navigation using only aerial photograph maps and direction
information inflicts uneasiness on people for whom it is
their first visit. However, on the other hand, the Group 1
members looked around well in order to search for the
recommended photography location carefully. They
initiated the camera function of the system and took photos
five times.
2) Group 2
The photos chosen by Group 2’s members were
inconsistent, and were a mixture of rare sights and streets.
Since all three members had visited Kyoto several times,
they were familiar with the surroundings, rarely updated
their location information, and did not lose their way.
Moreover, the photography locations chosen by Group 2
did not approach Kiyomizu Temple; instead, they went
around and sometimes left the Kiyomizu Temple area. The
members conducted sightseeing opportunistically and freely,
interrupting or diverting their route to go to photography
locations. However, because they diverted so much there
was no time, so they stopped in order to walk to Kiyomizu
Temple. For this reason, they regretted their preset time.
From this result, we determined that the system can support
users in conducting sightseeing that matches their moods at
that time by recommending photography locations
regardless of the user’s position and the genre of sightseeing.
On the other hand, we also discovered issues in the system,
including that users could not change the destination or time.
3) Group 3
All of Group 3’s members had previously visited Kyoto,
but they cautiously confirmed their position at the start of
the experiment.
However, they gradually decreased the frequency of
refreshing their position while walking and searching for
photography locations. In addition, although this group said
that they wanted to visit locations focused on food, they did
not choose a photography location related to food. They
gave the reason that they wanted to visit photography
locations recommended for other genres. However, as they
stopped by a sweetshop and a café, they took actions that
matched their feelings. This group used the camera function
positively, taking over ten pictures.
VI. CONSIDERATION
1) Realization of opportunistic sightseeing, and its
difference to regular sightseeing
In this system, users do not only choose a photography
location according to personal preference, and follow a
route while looking for the place; they can also freely
change the photography location according to their moods
while they head for the photography location. In the
evaluation experiment, users freely changed the
photography location according to their feelings at that time,
65Copyright (c) IARIA, 2013. ISBN: 978-1-61208-306-3
CENTRIC 2013 : The Sixth International Conference on Advances in Human-oriented and Personalized Mechanisms, Technologies, and Services
74 / 145
decided on a course spontaneously, took very roundabout
routes, and sometimes stopped or went away from the
destination. Thus, they were able to conduct sightseeing
freely. Moreover, they answered that they were able to
enjoy sightseeing using this system more than sightseeing
using a normal sightseeing navigation system, by always
acting in accordance with their feelings.
2) Influence on sightseeing of photography location
recommendation, and of addition of camera function
This system was able to prompt users to turn their
attention to their surroundings by letting users look for the
scenery in the photograph by recommending the photograph.
From the fact that all groups used the camera function of the
system and took pictures over five times, we can consider
that the system allowed users to consciously discover new
appeal of the sightseeing area.
3) Balance of anticipation and uneasiness with
navigation using only aerial photograph maps and direction
information
This system allows flexibility in the user’s route, by not
assigning the route during navigation. Instead, the
navigation uses only aerial photograph maps and direction
information, which inflicts uneasiness to many users but
also provides a further sense of anticipation. In addition to
this, users were able to enjoy sightseeing by taking their
favorite routes more than in regular sightseeing. However,
problems arose, including that this style of navigation can
inflict such uneasiness that it was easy for users visiting
Kyoto for the first time to lose their way.
VII. CONCLUSION
A. Problems
In this study, we proposed a sightseeing navigation
method that adapts to users’ feelings opportunistically, and
its efficacy was demonstrated. However, the system requires
a function to change or extend the sightseeing time, because
in the evaluation experiment there was a group that did not
have enough time. Moreover, the navigation system needs
to be developed in order to add a function that supports
when users want to change their destination depending on
their moods. In future, we will examine an even more
opportunistic sightseeing navigation system. In addition to
this, we will develop a sightseeing navigation system that
can recommend photography locations that to some extent
consider the weather or the user’s feelings, guessed
according to the user’s selection of photography locations,
not only using the available time for sightseeing.
B. Conclusion
In this research, we focused on photography that is
frequently conducted in sightseeing and proposed an
opportunistic sightseeing navigation system that navigates
to the destination by recommending photography locations
one by one. The method of navigation uses aerial maps and
direction to photography locations based on the “Benefit of
Inconvenience”, without showing or appointing a detailed
route. It was demonstrated that the freeness of sightseeing
using navigation that always follows the moods of the user,
the recommendation method of photography locations and
the display method of the navigation led to enjoyment of the
sightseeing. Moreover, the system allows users to pay
attention consciously to their surroundings by promoting
searching for the photography locations and taking photos,
and enables new discoveries in the sightseeing area.
REFERENCES
[1] S. Ishimori, “The Potentialities of Autonomous Tourism in the Twenty-first Century,” Senri Ethnological Reports, 2001, Vol.23, pp.5-14 (in Japanese).
[2] E. Horvitz, P. Koch, and M. Subramani, “Mobile Opportunistic Planning: Methods and Models,” User Modeling 2007, 2007, pp.228-237.
[3] NAVITIME JAPAN, NAVITIME, http://www.navitime.co.jp, [retrieved: 8, 2013].
[4] S. Takagi, M. Masuda, T. Izumi, and Y. Nakatani, “Tour Navigation System Using Landmarks that Are Customized by Personal Preference”, Human Interface Symposium 2012, 2012, pp.393-398 (in Japanese).
[5] K. Kawakami, “Toward System Design based on the Benefit of Inconvenience,” Human Interface. Transaction of Human Interface Society, 2009, Vol.11, No.1, pp.123-134 (in Japanese).
66Copyright (c) IARIA, 2013. ISBN: 978-1-61208-306-3
CENTRIC 2013 : The Sixth International Conference on Advances in Human-oriented and Personalized Mechanisms, Technologies, and Services
75 / 145
Disaster Information Sharing System
Using Pictograms Only
Kakeru Kusano Tomoko Izumi Yoshio Nakatani
Graduate School of Information College of Information Science and College of Information Science and
Science and Engineering Engineering Engineering
Ritsumeikan University Ritsumeikan University Ritsumeikan University
Shiga, JAPAN Shiga, JAPAN Shiga, JAPAN
[email protected] [email protected] [email protected]
Abstract- In the case of disasters, people’s comprehension of
the situation of the surrounding area is an important factor in
deciding corresponding actions. In an area overflowing with
people and rubble, it is dangerous to act recklessly. In this
paper, we propose an information sharing method to ascertain
present status and support decision of corresponding actions
when a disaster occurs. Users of the system can decide a course
of conduct and avoid risks such as injuries by ascertaining the
situation of the surrounding area ahead of time. The disaster
information collection system currently in operation in Japan
is difficult to use for users unfamiliar with machine operation
and is not intended for use by non-Japanese. This work aims to
support such people during a disaster. This system uses
pictograms that express meaning using shape and color instead
of language. It expresses information visually and aims to
provide easy operation by using mainly maps and pictograms.
Moreover, this system adopts a social media model, which was
recognized to be effective in the 2011 Tohoku Earthquake. We
promote use of the system when a disaster occurs via a means
for using the system in non-disaster situations. In this paper,
we describe the system’s effectiveness and prospects for the
future with an evaluation experiment targeting experts on
disaster prevention, non-Japanese and general users.
Keywords-Pictogram; Disaster Mitigation; Social Media;
Information Sharing;
I. INTRODUCTION
Japan is affected by many disasters; in fact, the country is an area that suffers a concentration of disasters. Although this area is only 0.25% of global landmass, it is the site of 20.5% of all earthquakes of magnitude over 6.0, 7.1% of all active volcanoes, and 16.0% of disaster-related damage costs worldwide [1]. Furthermore, Japan is expected to be affected by a large earthquake such as the Nankai Trough Quake and an earthquake in the Tokyo Metropolitan area within 30 years. For these reasons, interest in seismic countermeasures has increased and the government is beginning to take various measures. However, current disaster risk management is undertaken with local inhabitants, so measures for people unfamiliar with the area, such as tourists, are barely considered.
Meanwhile, Japan is aiming to make the country a global travel destination, which is being treated as important policy
in the 21st century [2]. As an example, Kyoto city is visited
by one million foreign tourists every year, and foreign
visitors across Japan are expected to increase in the future. Paris is a famous model of an internationally competitive sightseeing city, visited by 45 million tourists every year, 60% of whom are from overseas [3]. When a disaster strikes such sightseeing cities, many tourists will suffer from heavy damage. They are unfamiliar with the area, local language, culture and disasters. The safety of foreign tourists is critically important, and actions to protect them are the responsibility of the region and the nation. We focus on the problem of language in this research. Most disaster information systems and services use letters to provide necessary information. When a disaster occurs, foreign tourists will be in a precarious situation because they are not likely to have sufficient ability in the local language, which limits their methods to collect information.
On the other hand, there are many people who are not used to advanced information systems and services. As an ongoing problem, proportion of elderly population is rapidly increasing in Japan. Information collection in a disaster is difficult for the elderly, because many aged people are not proficient at using advanced information technology and services. A new approach is needed to support them collect disaster information by easy-to-use human machine interface.
In this study, in response to these situations, we aim to propose a unified and integrated method to share information for disaster victims who have various different requirements.
In the next section, related work is described. We present outline of proposed system in Section 3, and system architecture in Section 4. Then evaluation experiment is presented in Section 5. Finally, a conclusion and future work are described.
II. RELATED WORK
A. Universal Design of Disaster Prevention Pictograms
Kunoki et al. of Ritsumeikan University considered the provision of unified design of disaster prevention pictograms at tourist sites. They conducted an investigation into signs and guide plates at Kiyomizu Temple, a famous tourist attraction, as a target and suggested a method for improvement [4]. The summary of their results is as follows.
67Copyright (c) IARIA, 2013. ISBN: 978-1-61208-306-3
CENTRIC 2013 : The Sixth International Conference on Advances in Human-oriented and Personalized Mechanisms, Technologies, and Services
76 / 145

1) Guide plates that display foreign languages or use
pictograms are only about one quarter of the total.
2) Methods to express color, shape and content are
different depending on the place. There is no sense of unity
and this hinders understanding. From the summary of results, Kunoki et al. advocated the
necessity of offering information utilizing universal design to provide efficient evacuation guidance. These problems have been noticed by the Fire and Disaster Management Agency (FDMA) in Japan too. They are considering concretely implementing universal design [5]. Figure 1 shows sample models under consideration by the FDMA.
(a) Tsunami Warning (b) Tsunami Warning Area
(c) Tsunami Refuge Building
Figure 1. Graphic Symbols for Tsunami Signs
B. Analysis during the 2011 Tohoku Earthquake
In the 2011 Tohoku Earthquake, the Tokyo metropolitan area suffered from disaster for the first time after being developed as a modern city, and there were many people who had difficulty returning home. This is relevant to this study, as it is useful to design our system through analysis related to information media.
1) Analysis of Victim Behavior From the summary of a Cabinet Office survey conducted
via the Internet, there were 5.15 million persons who had difficulty returning home in the metropolitan area, which includes Tokyo, Kanagawa, Chiba, Saitama and Ibaraki [6]. The results of the survey into how people returned home are shown in Figure 2. In Figure 2, n = 5,372 persons who were affected by the
disaster and responded to the survey. The most common method of returning home was on foot, accounting for 37.0% of the total victims, and the second most common method was by car. The percentages of walking and car are very similar. The reason for these being the most common is that trains ceased operation immediately after the earthquake.
2) Necessary Information for Returning Home
Disaster victims felt that certain information was
necessary while returning home, as shown in Figure 3. In
descending order, information on their families’ safety,
investigation of the damage, and time until the trains and
subway would resume operation, were the most cited. If we
exclude family safety information, we can see that victims
need information about items required to return home.
Figure 2. Methods of Returning Home
Figure 3. Necessary Information
3) Future Methods of Obtaining Information Figure 4 shows the results of a survey conducted about
future methods of obtaining information hoped for by disaster victims. This survey targeted people who tried retuning home in a disaster. Results are grouped for three conditions related to whether victims were capable of returning home. In particular, the provision of information by TV is strongly hoped for. This reason is considered to be that TV is capable of providing information visually, and that people watching TV can know an overview of the disaster in various places. The number of people who wish to be provided information by cell phone is high, because it is easy to use while on the move. In particular, there is a tendency for this to be desired by people who tried to return home but were prevented. This may be estimated as due to the necessity for information to decide a new course of action after being prevented from returning home.
68Copyright (c) IARIA, 2013. ISBN: 978-1-61208-306-3
CENTRIC 2013 : The Sixth International Conference on Advances in Human-oriented and Personalized Mechanisms, Technologies, and Services
77 / 145

Figure 4. Desired Sources of Information in Future
C. Social Media
The effectiveness of social media was recognized during the 2011 Tohoku Earthquake, exemplified by Twitter. The “wisdom of crowds” was constructed from many users’ posts (Tweets) [7]. This is revolutionary as being the first system in which victims themselves provided information, in contrast to previous systems in which the victim is only provided information by the system. Official hash tags were provided by Twitter from the day after the disaster occurred. Examples of hash tags include ‘#j_j_helpme request rescue’, ‘#anpi safety’, and more. Various kinds of information was posted on Twitter, such as the appearance of the disaster-hit area, means of transport, available toilets, evacuation sites, places for lodging, and more.
D. An Information Collection Support System for disaster-
affected areas using Mini-blogs
Yokobe et.al., proposed an information collection system
using social medias and mini-blog to collect information
when disaster occurs [8]. In this paper, the evaluation results
using Twitter are shown. This research assumes the
following two conditions:
1) The useful information for victims is sent from
disaster-affected areas.
2) The reliability of information is evaluated by people
in the area where the information is sent.
Based on these assumptions, the system deletes
information which is sent at an area away from the disaster-
affected area because the information is decided as
unnecessary and unreliable. Specifically, assuming that
information with exact location data has high reliability, the
reliability of each tweet and user of Twitter is evaluated
based on the location data and the responses from people
living around a location where the tweet is sent. From the
results of the evaluation, it is shown that tweet including a
name of the place has high relationship with the disaster-
affected area. This fact implies that a name of place is
important in deciding the reliability of tweet. However, it is
known that most of tweets do not have information of its
location data. Thus, the detection of reliability based on
location data is not available in many cases.
III. OUTLINE OF PROPOSED SYSTEM
A. Pictogram
Pictograms are graphic symbols that express things or
general ideas instead of using words. For example, signs
such as ‘emergency exit’ and ‘disabled access’ are well
known. In Japan, pictograms are adopted in places that are
heavily used by the general public. Their biggest advantage
is to enable communication of information without the
restraints of language. In this paper, we devise a solution for
problems contained in the present Japanese disaster
information gathering and transmission system.
B. Visual Provision of Information
When victims need to evacuate or return home during a disaster, they are interested only in their present location and surrounding area. When a victim posts information, this can be expected to be a report of situation of their neighborhood. Recently it is easy to calculate present location by using GPS (Global Posting System) or networks. Also, the GIS (Geographic Information System) service is free of charge and easy to use too. We constructed a framework to show the information of present location and surrounding area using these two services. The system shows information automatically and visually, so it is easy to use. This is a highly important function in a disaster information system.
C. Overloaded Communication Lines
Cell phones and smartphones are one of the most frequently used methods to gather information when a disaster occurs. However, the calling function can barely be used, and mail and Internet is delayed significantly by limiting or congestion of communication lines. When we gather information using information infrastructure, the system needs to operate in this kind of situation. With this in mind, we propose a system built as a smartphone application.
D. Disaster Information to Provide
In this system, we deal with the kinds of information that were required during the 2011 Tohoku Earthquake. By determining information types beforehand, we can anticipate the degree of increase in comprehension and avoidance of misunderstanding. Furthermore, provision of information is separated into two types: information displayed by default and information displayed by user operation, as shown in Figure 5.
69Copyright (c) IARIA, 2013. ISBN: 978-1-61208-306-3
CENTRIC 2013 : The Sixth International Conference on Advances in Human-oriented and Personalized Mechanisms, Technologies, and Services
78 / 145

TABLE I. PROVISION OF INFORMATION
Pictogram Meaning of Pictogram
Usable Means of Transport
Evacuation Site
Place for Medical Treatment
Place for Rest
(a) Information Displayed by Default
Food, Drink
Available Toilet
Place for Available Network
Available Accommodation
(b) Information Displayed by User Operation
In the default settings, we limited the amount of pictograms to be displayed, so that it is easy to obtain information from the pictograms. The system can add pictograms to the display according to the user’s needs. In addition, if the user taps a pictogram, the time of the posting and the contributor are displayed as annotations.
E. Dissemination of System
At the present time, various measures are in place against disasters. However, their rate of utilization is a low percentage in total telecommunication services. We can consider that this is due to the fact that the service is not known among disaster victims. Information sharing systems cannot demonstrate effectiveness if they are not widely known.
Accordingly, we propose a social media model as a method to raise the rate of utilization. This model is can also be used outside of disaster occurrence, and the users can freely change the genre of information. Disaster information is treated as one genre. During non-disaster times, users can view information pictograms about places (for example, tourist attractions and store information) and read comments posted by other users. In addition, users can post pictograms and comments themselves and add to other users’ contributions. This system is different from current social media that mainly use text, because it mainly uses maps and icons made from pictograms. We expect that the amount of information will increase because disaster victims can post information themselves. We aim to design a system to be used by victims when a disaster occurs, by encouraging them to use and familiarize themselves with the system during non-disaster times. This study assumes such a form of utilization for the system.
IV. SYSTEM ARCHITECTURE
A. System Description
This system uses a client-sever model in which the client
is a smartphone application and the server is a web
application utilizing a database and PHP programs. The
database stores the pictogram type, location (latitude and
longitude), contributed time, contributor and pictogram ID
inputted by the user. PHP programs respond to requests by
the client, acquire information from the database, then send
the client information registered in server about their current
surroundings.
B. Disaster Data Collection
The system’s initial screen is showed in Figure 5. The user can collect information on their current surroundings via map information and icons on this screen. The functions of each button are described.
Figure 5. Information Collection Screen
The following is a description of the system flow during information collection. 1) Acquire latitude and longitude of current position from
GPS and network.
2) Using current position information, acquire information
on the surrounding area up to a 3km radius from the
database.
3) Display map information for the surrounding area up to
a 3km radius and place the pictograms in designated
positions on the screen. By tapping an icon, the users can find out the contributor
and posted time, which can aid in judging the situation, as showed in Figure 6.
Figure 6. Annotation when Tapping an Icon
When the user changes the information genre to information about disasters, the system displays only
70Copyright (c) IARIA, 2013. ISBN: 978-1-61208-306-3
CENTRIC 2013 : The Sixth International Conference on Advances in Human-oriented and Personalized Mechanisms, Technologies, and Services
79 / 145

important information. Other information can be seen by tapping the Layer Select Button.
There are two methods to update information. The ‘Information Update Button’ updates information. The ‘Information Formatting Button’ updates information and also changes the information genre to default. Both actions update the user’s current location and center the map on the user.
In this way, this system expresses information using shape and color without words, by which the user is able to collect information on their surrounding area.
C. Contributing Disaster Information
During disasters, the time and operations required to contribute information should be minimal. In this system, users can contribute with three steps, as shown in Figure 7. 1) Change to “Contribute” screen
2) Select the pictograms corresponding to the information
the user wants to contribute from the icons at the bottom
of screen
3) Tap “Contribute” Button
Figure 7. Contributing Information
Via this operation, the client-system sends the server
information that includes the current position (latitude and longitude), pictogram name, time of contribution and pictogram ID determining whether to display the default display or layer selection. This information is obtained from the system automatically, with the exception of the pictogram name, so the system saves the user’s time. In non-disaster situations, users can post comments and photos in the system, but if the information genre is changed to disaster, these functions are automatically suspended and text-based communication is prohibited. This reduces the amount of communication.
V. SYSTEM EVALUATION
A. Evaluation Method
To verify the effectiveness of the system, we conducted an evaluation experiment separated into two patterns: for experts and for normal users.
Three persons belong to Kyoto’s Disaster and Crisis Management Section and twelve persons belong to Konan Fire Department participated in the experiment as experts, performed simulated operation of the system and answered a questionnaire survey after we explained about the system.
Two students from China and six students from Japan participated in the experiment as normal users, and answered the same survey without hearing an explanation of how to use this system. Three of the students had not used social media or smartphones before. The items of the survey are listed below. 1) Do you think comprehension of the situation during a
disaster would increase by using this system?
2) Were the sizes and designs of pictogram appropriate?
3) Was the system sufficiently easy to use?
4) Are the types of information provided sufficient?
5) Do you have other points of feedback or improvement?
B. Expert Evaluation
The following is a summary of the evaluation by the experts.
1) Response to Question 1
a) There are big advantages for evacuating to
shelters and obtaining information for returning
home
b) Information is available quickly, as it is
expressed using easy-to-understand pictograms
c) Users can be psychologically reassured, as they can
gather information on their surrounding area
d) Comprehension of the situation can be increased,
as information about the destination is easy to
understand
2) Response to Question 2
a) Pictograms were appropriate (13 out of 15
experts)
b) Users should be able to change the size of the
pictograms (2 out of 15 experts)
3) Response to Question 3
a) If users already have smartphones, the system
could be operated without problems
b) Limiting the amount of provided information
leads to ease of use
c) Mental barriers to using this system are higher
for elderly people
4) Response to Question 4
a) Information about unavailable facilities, not
only available facilities, is necessary
b) Information about means of transport (operation
status and area) is necessary
5) Response to Question 5
a) Need accurate and safe user-contributed
information
b) Setting display periods for pictograms would
improve management of information
c) Wish to utilize Wi-Fi spots during disaster
situations, for example bus stops
C. Non-Japanese User Evaluation
The following is a summary of the evaluation by non-Japanese users (Chinese).
1) The provided types of information and size of
pictogram are appropriate.
71Copyright (c) IARIA, 2013. ISBN: 978-1-61208-306-3
CENTRIC 2013 : The Sixth International Conference on Advances in Human-oriented and Personalized Mechanisms, Technologies, and Services
80 / 145

2) It is easy to ascertain the situation in the surrounding
area via the combination of GIS and pictograms.
3) If we have experience of this system as social media
during non-disaster times, we can use it when a
disaster occurs.
4) We could not understand the difference between
‘Evacuation Site’ and ’Place for Rest’ only from the
pictogram.
D. General User Evaluation
The following is a summary of the evaluation by general users.
1) The provided information types, size of pictograms
and denotation are suitable on the whole.
2) It is easy to use this system because it only uses
pictograms.
3) If we have operated this system once, we can use
when a disaster occurs.
4) Because the display is based on maps, we could
ascertain both the geography and situation of our
surroundings simultaneously.
5) We could understand the meaning of the information
quickly, as there was no need to read text.
6) The pictograms for ‘Evacuation Site’, ’Place for
Rest’ and ‘Available Accommodation’ are too
similar to distinguish. They should be revised or
guidelines should be made.
E. Consideration
The results of our evaluation experiment are as follows. Although some deficiencies in the provided information and comprehension problems for some of the pictograms were pointed out, we were able to confirm that this system can be used as an easy-to-operate disaster information sharing system through evaluation from experts, non-Japanese and general Japanese users.
Advantages and disadvantages are shown below. 1) Advantages
a) Contributing and sharing the information is
easy
b) Various people can use the system
c) The disaster situation can be grasped
intuitively
2) Disadvantages
a) The system cannot transmit details of the
provided information
b) There is no guarantee of accuracy of user-
contributed information Perceptions of color and shape vary between countries and
cultures, because differences in sensitivities derive from the environment in which a person is raised. In this evaluation experiment there were only two non-Japanese evaluators, so we were unable to verify such differences. In future, we will pursue additional evaluations targeting more non-Japanese of multiple nationalities.
VI. CONCLUSION
In this paper, we focused on the importance of supporting persons who are affected heavily during disasters, such as those who are unaccustomed to using information-processing equipment, those who cannot read or speak the local language, elderly people, and foreign tourists. We designed a system whereby disaster victims can share information using pictograms instead of language, and correlate their current position on a digital map. The numbers of foreign tourists in Japan will increase more and more. Moreover, the proportion of elderly persons will increase in Japan’s aging society. Therefore, this system aims to support such people, and we are convinced that this support will be required in future.
In future work, we will conduct further evaluation experiments and conduct questionnaires with large numbers of non-Japanese and persons unaccustomed to using information devices as targets, and improve the system accordingly. Additionally on the server side, we will also implement system functions that reflect the results of the experts’ assessment, and clarify their effectiveness via further experiments.
REFERENCES
[1] Cabinet Office, Goverment of Japan. White Paper on Disaster Management 2010. (in Japanese) Tokyo:2010.
[2] Ministry of Land, Infrastructure, Transport and Tourism, Japan Tourism Agency. “Tourism Nation Promotion Basic Law” (in Japanese). http://www.mlit.go.jp/kankocho/kankorikkoku/kihonhou.html (Accessed on Aug. 9, 2013)
[3] H. Sakai, “General Investigative Report: Sightseeing Volunteers in Paris ‘Parisien d’un Jour’”, 2011 (in Japanese). http://www.pref.aichi.jp/ricchitsusho/gaikoku/report_letter/report/h23/paris1002.pdf (Accessed on Aug. 9, 2013)
[4] Fire and Disaster Management Agency, “Report of the Investigation Committee on Pictorial Symbols for Disasters” (in Japanese) http://www.fdma.go.jp/neuter/topics/houdou/h17/050329.pdf (Accessed on Aug. 9, 2013)
[5] S. Kunogi, K. Izuno and Y. Yagi, “Universal Design for Disaster Mitigation in Tourist Resorts”, Disaster Mitigation of Cultural Heritage and Historic Cities Vol. 6, July. 2012, pp. 369-376. (in Japanese)
[6] Cabinet Office Council for Disaster Victims Unable to Return Home during a Tokyo Metropolitan Earthquake, “Results of Survey on Status of Measures for Disaster Victims Unable to Return Home: Response to 3/11 and Subsequent Initiatives” (in Japanese) http://www.bousai.metro.tokyo.jp/japanese/tmg/pdf/4-1122kaigi.pdf (Accessed on Aug. 9, 2013)
[7] City of Kyoto Industry and Tourism Bureau, “Annual Report of Survey on Tourism in Kyoto City for 2010”, 2011.
[8] W. Yokobe and Y. Nakatani. “Information Collection, Distribution, and Provision Assistance in Disasters through Mini-blogs”. Innovations in Information and Communication Science and Technology IICST 2011, Tomsk, Russia October. 2011, pp. 32-41
72Copyright (c) IARIA, 2013. ISBN: 978-1-61208-306-3
CENTRIC 2013 : The Sixth International Conference on Advances in Human-oriented and Personalized Mechanisms, Technologies, and Services
81 / 145

Engaging Practitioners to Deliver Government Carbon and Energy PhasedReduction Targets: Toward a Web 3.0 Approach
Yacine Rezgui, Haijiang Li, Tom Beach, Ioan PetriBRE Institute in Sustainable Engineering
Cardiff UniversityCardiff, UK
e-mails: rezguiy, lih, beachts, [email protected]
Abstract—The construction industry is under pressure toincrease the sustainability of its practices to meet UnitedKingdom’s commitments to alleviating climate change. Thispaper, through the use of a mixed method approach, exploresthe readiness and level of engagement of constructionstakeholders in adopting government sustainability agendas.Limited sustainability best practice, regulation awareness, andinformation provision deficiencies emerged as key themes fromthe initial survey. Subsequent combined consultations exploredstakeholders’ knowledge, understanding, attitudes, values andbehaviours, and helped identify key barriers to sustainabilityengagement. This has informed the participative developmentof a “one-stop-shop” web-based platform that providesintegrated access to sustainability resources in the form ofinteractive, dynamic, and user-oriented services, delivered viadiscrete "widgets", that exploit web 2.0 concepts, includingsemantics, user profiling, and professional networking. Theinnovative dimension of the solution lies in its open, scalableand polymorphic context-based widgets approach thatreconfigure and update themselves to respond to changing usercontext and (sustainability related) queries, while enablingserendipitous information and knowledge discovery. Theauthors believe that the proposed web portal (a) has thepotential to engage further practitioners in deliveringsustainable interventions, and (b) contributes to the ongoingdebate and shaping of Web 3.0 and beyond.
Keywords-User engagement; Web 3.0; KnowledgeManagement; Ontology; Sustainability.
I. INTRODUCTION
Studies indicate that creation and operation of our builtenvironment is responsible for some of the most seriousglobal and local environmental changes [1, 2, 3], accountingfor at least 50% of all energy consumption in Europe(European Commission, 2005). In the United-Kingdom(UK), more than 50% of all carbon emissions can beattributed to energy use in buildings [4]. The UK Chancellorof the Exchequer announced in the 2008 budget that the UKgovernment aspires to achieve construction of zero carbonhomes from 2016, Public sector buildings from 2018, and allother non-domestic buildings from 2019 [5]. The Welshgovernment has set aspirations for zero carbon for newbuildings earlier than proposed in the rest of the UK [6].Consequently, the construction industry is under pressure to
increase the sustainability of its practices, the implication ofwhich is a requirement on the industry’s behalf to understandthe demands both from society and its clients, and its senseof corporate responsibility, which, in turn, implies majorchanges in its working practices [7, 8]. The large scaleconsultation reported in this paper indicates a clear need for adedicated resource to enable shared and value-added relevantresources of knowledge and expertise to inform sustainableand energy regulatory compliant design and constructionactivities. This is the core mission of the Script project,which sets the objective to develop an advanced Web-based“one-stop-shop” platform providing value added sustainableconstruction experience shared amongst communities ofpractitioners. Through our initial consultation, it has becomeapparent that such a “one-stop-shop” platform shouldaddress a number of attributes that exceed Web 2.0capabilities and prompted the authors to explore andcontribute to the ongoing debate about the realm of Web 3.0and beyond. The paper first introduces the methodology thatunderpins the research and initial consultation results. Theauthors then discuss perceived features of Web 3.0,interpreted in the context of the “Script” platform. The latteris then further supported by the description of theunderpinning system architecture and resulting interface. Thepaper then illustrates the core aspect of the Script platform,i.e., the sustainable construction ontology and its method ofdevelopment. The validation of the platform is thendiscussed, focusing on its fulfillment of an enhanced users’sustainable knowledge experience. The paper concludes witha critical discussion of our Web 3.0 definition and approach,its limitations, and directions for future research.
II. THE "SCRIPT" METHODOLOGY
Requirement capture and elicitation are some of the mostcritical tasks of any software development project. A socio-technical approach is employed underpinned by thefollowing three research questions (RQ):
RQ1: What are construction stakeholders’sustainability information needs and government provisiondeficiencies?
RQ2: What are construction stakeholders’engagement barriers with governmental carbon and energyreduction targets?
73Copyright (c) IARIA, 2013. ISBN: 978-1-61208-306-3
CENTRIC 2013 : The Sixth International Conference on Advances in Human-oriented and Personalized Mechanisms, Technologies, and Services
82 / 145

RQ3: Can the (above) elicited information needsand engagement barriers inform the development of areference "one-stop-shop" Web platform for sustainableconstruction?
These questions were explored via three mixed-methodstudies. The first study, which addressed RQ1, employed anonline Europe-wide survey (February – April 2009) fromwhich 252 responses were received with participants beingdemographically representative of the total populationsampled. Quantitative data were analyzed in SPSS andqualitative data were coded thematically in NVivo. Limitedsustainability best practice, regulation awareness andinformation provision deficiencies emerged as key themesfrom the consultation and provided the ground to addressRQ2. To address this question, the methodology employed afurther study focused on industry consultations in Wales.This involved three workshops (c.70 participants in total)and a series of 15 semi-structured interviews with keyindustry representatives (May – September 2009). The firsttwo workshops explored stakeholders’ knowledge,understanding, attitudes, values and behaviors, and helpedidentify key barriers to sustainability engagement in Wales,which were then debated and confirmed in a third workshophosted by the Low/Zero Carbon Hub in Wales (Wales LZCHub). The Wales LZC Hub is a coalition that is supported bythe Welsh Government, the building industry, housing, andvoluntary sectors, to help meet the policy targets. A numberof issues have been captured through our intensive industryconsultation and entails a need for construction stakeholdersto understand the changing landscape of sustainability andassociated legislation, which, in turn, demands easy andtimely access to fragmented and multi-faceted information.Moreover, construction stakeholders involved in new orrefurbishment projects are faced with: (a) complexlegislation related to low carbon buildings, (b) a plethora ofoverlapping commercial tools supporting the process ofdelivering low carbon buildings, (c) numerous guidelinesand documentation, (d) an increasingly rigorous energycertification process, and (e) lack of clarity on types offinancial assistance and eligibility criteria. Also, while agreat deal of expertise already exists in detailing andconstructing low-energy buildings, much of this expertise isfragmented and exists in various forms, with no realsystematic means or mechanisms to assist constructionstakeholders in their low carbon decision-making [7]. In thiscontext, it is imperative to make building energy expertisewidely available. The findings from these workshops fedforward to a series of interviews where identified barrierswere discussed from a variety of socio-technical perspectives.RQ3 formed the focus of our third study, which involved thescript platform requirement elicitation from extensiveconsultations with industry stakeholders including onlinesurveys, semi-structured interviews, collaborative workshopsand focus meetings (a mix of one to one and small groupconsultations). Moreover, 2 workshops and 13 focusmeetings (a mix of one-to-one and small group consultations)were organized (February – November 2010). A total of 27stakeholder organizations took part in the consultations,including: construction companies and practitioners,
advisory groups, umbrella professional organizations,consultants, policy makers and education and training bodies.
III. SCRIPT CONCEPT
The Semantic Web and Web Services are transformingthe Internet from a network of information to a network ofknowledge and services. Using the read-write nature of Web2.0 applications, new knowledge is inferred based onmashups that occur at the data, rather than at the applicationlevel. Web 3.0 in its present manifestation exploits SemanticWeb technologies integrated into large-scale Webapplications [9]. In fact, the foundations of Web 3.0 servicesinvolve Resource Description Framework (RDF) for linkingdata from multiple distributed databases or Web sites. TheSPARQL query language (a SQL-like standard for queryingRDF data) enables Web services and applications to usenative graph-based RDF stores and extract RDF data fromtraditional databases. Once the data is in RDF form, the useof Uniform Resource Identifiers (URIs) for merging andmapping data from different resources facilitatesdevelopment of multiple distributed and fragmented sitemashups [9]. RDF Schema (RDFS) and the Web OntologyLanguage (OWL) provide the ability to infer relationshipsbetween data in different applications or in different parts ofthe same application [10]. The term “linked data” is oftenused to describe the evolving RDF development space, and“Semantic Web” is increasingly being used to describecoupling linked data with RDFS and OWL. Thesecapabilities are currently being exploited to enableenterprise data integration and related functions [9].
As noted earlier, the Script consultation indicates a needfor far greater sophistication than is currently employed inthe nearest comparable web resources for knowledgeharvesting and sharing. The need to efficiently categorizeinformation coupled with requirements for bi-directionalchannels for knowledge sharing and enrichment, includingprofessional networking capabilities and access to dynamicinformation elements aimed at a large constituency,suggested a novel framework employing the concept of‘widgets’ (discrete information or service containers). Thisallows scalability and logical categorization of information,knowledge, and services, augmented with the capability fordifferent users to ‘personalize’ their Web experienceaccording to their individual needs. As the user is in controlof which widgets are visible at any given time, a key benefitof this system is that, rather than having to trawl through along list of search results for different subject areas inrelation to the topic being searched, the systemautomatically categorizes the results within those widgets ofparticular interest to that user. Figure 1 illustrates the mockinterface used to capture and confirm users' expectations ofthe modus-operandi of the proposed Web solution. Usingthe example of a search over "Ground Source Heat Pumps(GSHP)", the system would display widgets that containinformation about the search query, including (a) what are
74Copyright (c) IARIA, 2013. ISBN: 978-1-61208-306-3
CENTRIC 2013 : The Sixth International Conference on Advances in Human-oriented and Personalized Mechanisms, Technologies, and Services
83 / 145
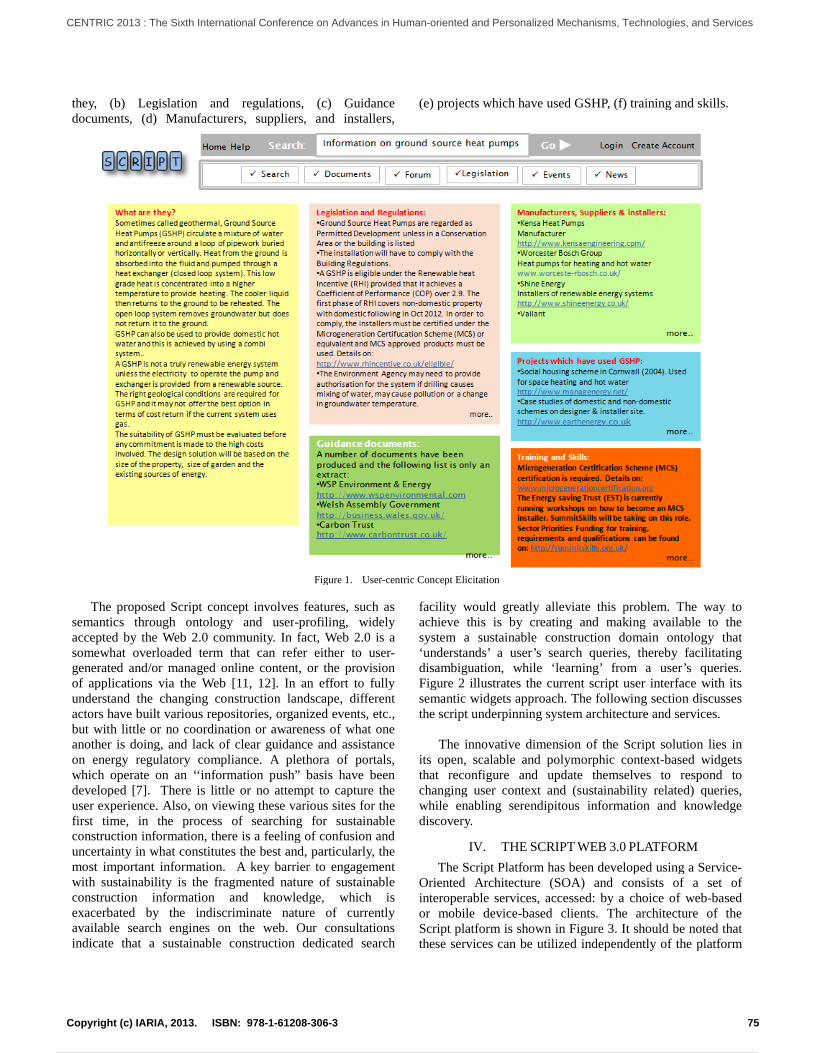
they, (b) Legislation and regulations, (c) Guidancedocuments, (d) Manufacturers, suppliers, and installers,
(e) projects which have used GSHP, (f) training and skills.
Figure 1. User-centric Concept Elicitation
The proposed Script concept involves features, such assemantics through ontology and user-profiling, widelyaccepted by the Web 2.0 community. In fact, Web 2.0 is asomewhat overloaded term that can refer either to user-generated and/or managed online content, or the provisionof applications via the Web [11, 12]. In an effort to fullyunderstand the changing construction landscape, differentactors have built various repositories, organized events, etc.,but with little or no coordination or awareness of what oneanother is doing, and lack of clear guidance and assistanceon energy regulatory compliance. A plethora of portals,which operate on an ‘‘information push” basis have beendeveloped [7]. There is little or no attempt to capture theuser experience. Also, on viewing these various sites for thefirst time, in the process of searching for sustainableconstruction information, there is a feeling of confusion anduncertainty in what constitutes the best and, particularly, themost important information. A key barrier to engagementwith sustainability is the fragmented nature of sustainableconstruction information and knowledge, which isexacerbated by the indiscriminate nature of currentlyavailable search engines on the web. Our consultationsindicate that a sustainable construction dedicated search
facility would greatly alleviate this problem. The way toachieve this is by creating and making available to thesystem a sustainable construction domain ontology that‘understands’ a user’s search queries, thereby facilitatingdisambiguation, while ‘learning’ from a user’s queries.Figure 2 illustrates the current script user interface with itssemantic widgets approach. The following section discussesthe script underpinning system architecture and services.
The innovative dimension of the Script solution lies inits open, scalable and polymorphic context-based widgetsthat reconfigure and update themselves to respond tochanging user context and (sustainability related) queries,while enabling serendipitous information and knowledgediscovery.
IV. THE SCRIPT WEB 3.0 PLATFORM
The Script Platform has been developed using a Service-Oriented Architecture (SOA) and consists of a set ofinteroperable services, accessed: by a choice of web-basedor mobile device-based clients. The architecture of theScript platform is shown in Figure 3. It should be noted thatthese services can be utilized independently of the platform
75Copyright (c) IARIA, 2013. ISBN: 978-1-61208-306-3
CENTRIC 2013 : The Sixth International Conference on Advances in Human-oriented and Personalized Mechanisms, Technologies, and Services
84 / 145

or within the platform brokered by our kernel. In thiscontext, we identify three types of provision that can beimplied: Direct provision of services, with each servicebeing delivered as a separate discrete service. Indirect provision of services occurs within theplatform. With this provision mechanism, each serviceinvocation is mediated by the kernel. In this method, the user
(client) requests functionality from the kernel and the kerneldelegates the execution of this functionality to theappropriate service. Inter-service provision. A service can requestfunctionality directly from another service within the system.This occurs frequently for our ontology as other servicesutilize its functionality.
Figure 2. The Script Web3.0 Concept
Each service has an associated ApplicationProgramming Interface (API), which serves as a descriptionfor possible access requests. The API defines a set ofmethods that a service can offer and a set of associatedparameters. In the design phase, care was taken to ensurethat the API provides maximum flexibility.
Figure 3 also shows how the services within the Scriptplatform interact. All communication within this system isdone using Simple Object Access Protocol (SOAP) and, for
communications purposes, the system can be divided intofour levels: The client level contains the client software with
which users interact with the system. Currently, Web-based and Android application clients have beenimplemented.
The kernel level facilitates the communicationbetween the clients and other levels of the platform.The kernel acts as a broker, delegating requests toother services within the system, and also as a service
76Copyright (c) IARIA, 2013. ISBN: 978-1-61208-306-3
CENTRIC 2013 : The Sixth International Conference on Advances in Human-oriented and Personalized Mechanisms, Technologies, and Services
85 / 145

directory allowing services to be added/removeddynamically.
The services level is the set of services that providesthe key functionality of the platform. These servicesinclude:
The Knowledge Base Service contains a corpus ofrelated guides, regulations and various existingdocumentation related to sustainability in construction. The Search Service performs semantic searching onthe platform knowledge base. The submitted query has a setof associated ontological concepts for improving theprecision and the recall of the returned results. The Professional Networking Service enables usersto collaborate using social networks, such and LinkedIn and
Twitter, while the communication is facilitated with voice-over-IP instruments, such as Skype and Google-Talk. The Events Calendar Service isnotification/reminder of the important events from theengineering community. Users can subscribe andsynchronize these events with their personal calendar. The News Feeds Service provides aggregation ofinformation and updated news relevant to the users’ interestsand discipline(s). The Forum Service allows users to interact bysharing data and information within the platform. The Sustainable Sourcing Service allows users tolookup products (based on their current location) fromcertified suppliers.
Figure 3. The Script Architecture
The core services level describes the servicesthat are not only used directly by users, but are
also utilized by other services within the system.This is the level in which the ontology service is
77Copyright (c) IARIA, 2013. ISBN: 978-1-61208-306-3
CENTRIC 2013 : The Sixth International Conference on Advances in Human-oriented and Personalized Mechanisms, Technologies, and Services
86 / 145

integrated alongside the Profiling Service. The lattermanages the identities of users and controls the access tothe platform. Each user has a set of associated interestsand disciplines, which are used as input data for otherservices, such as searching, professional networking ornews feeds.
V. VALIDATION OF SCRIPT PLATFORM ANDUNDERPINNING ONTOLOGY
Utilization of automatic or semi-automatic methods forthe construction of ontology is not uncommon, and severaldifferent examples can be seen in the literature. Rezgui [7]outlines a system where a new ontology for the constructiondomain is automatically constructed based on a set ofexisting ontologies for specific related sub-domains andfrom other semantic resources. Wachter and Schroeder [13]describe a semi-automatic system that enables ontologyconstruction within the Bioinformatics domain based on pdfdocument collections and the PubMed online database. Wuet al. (2009) describe a methodology utilizing LatentSemantic Analysis [14] to construct an ontology for thesemantic web by harvesting concepts from Web ServiceDescription Language (WSDL) files. The authors then applythe process to locate similar Web services based on thesimilarities between concepts, achieving an averageprecision of approximately 60%. The authors presentpromising results, but also state that an importantconclusion is that ontology construction can never be fullyautomated, but well designed semi-automatic systems canprovide significant value in assisting domainexperts/ontology engineers in their work.
Testing and validation relied on the group of usersinvolved in the initial requirement assessment phase and onan increasingly expanding constituency as the platform wasextended to further users. We also monitored user activityby employing Google Analytics. The initial feedback hasbeen positive and encouraging. The analysis of users’comments helped identify some key issues to be addressedin future releases of the platform, as summarized below: The ontology needs to be refined and the conceptsshould be expanded to increase the relevance in searching. A new widget is needed reflecting updates takingplace within the platform, such as new documents beingadded, new versions of documents being uploaded, or newevents being added. Explanation of the different types of documentsneeds to be available on the platform: due to the nature ofthe documents available, it is important to support end-usersin understanding the exact terminology used to defineregulatory (directives, decisions, etc.) and other documents(white papers, project results, etc.) A social networking widget is needed, where userscan access various social profiles such as LinkedIn, Twitter,Facebook. The integration with mobile devices represents animportant issue to address. It was identified that many of the
visitors prefer mobile devices for retrieving theirinformation. The legislation should be extended to UKlegislation and possibly to Europe. Graphical Interface: The interface should be moreintuitive to generally improve the usability of the platform.
To validate the ontology that has been developed, aseries of tests have been performed utilizing keywordsuggestion functionality. To carry out the validation, users ofthe sustainable construction platform have been asked toenter a predefined query which has been formulated by adomain expert and were then asked to comment on therelevant terms suggested thus indicating the percentage levelof accuracy of the ontology.
To conduct this experiment, ten pre-defined queries wereentered. Matching these queries to concepts in the ontologyproduced a result set of 131 terms with 72% of these termsbeing deemed accurate matches by the domain expert. Oncethis initial mapping was produced, the accuracy of therelated terms was also examined. To conduct thisexperiment, each relationship relevant to the queries wasanalyzed by a domain expert. In total, there were 242relationships, 73% of which were deemed to be correct.
VI. CONCLUSION AND FUTURE WORK
The Semantic Web, from a Web 3.0 perspective, relatesto the development of an environment where data,information and knowledge are inferred, processed, andaccessed: in a human friendly manner. The Semantic Web isthe symbiosis of Web technologies, knowledgerepresentation artificial intelligence concerned withconstructing and maintaining (potentially complex) modelsof the world. Beyond the potential for maintaining newbusiness models, such as online communities, online marketplaces and advertising supported site, new semantic webparadigm promises to offer facilities for using user profiles(including personal data) with a view of achieving a higherorder of knowledge integration and mining enabled byontology engineering [13]. As noted earlier, the innovativedimension of the Script platform lies in its open, scalableand polymorphic context-based widgets that reconfigure andupdate themselves to respond to changing user context and(sustainability related) queries, while enabling serendipitousinformation and knowledge discovery. The authors believethat the proposed web portal (a) has the potential to engagefurther practitioners in delivering sustainable interventionsas inferred through our portal validation work, and (b)contributes to the ongoing debate and shaping of Web 3.0and beyond. In that respect, key features for a true Web 3.0environment from our Script portal perspective include: Machine processable contents supporting (user)profile-based searching and serendipitous informationdiscovery across the sustainability domain.
78Copyright (c) IARIA, 2013. ISBN: 978-1-61208-306-3
CENTRIC 2013 : The Sixth International Conference on Advances in Human-oriented and Personalized Mechanisms, Technologies, and Services
87 / 145

Sustainability knowledge appraisal, nurturing,validation and feedback through virtual professionalcommunities. For instance, construction products withdefects or lack of performance can be quickly made known,while best practice are shared. Machine generated ontology for domainconceptualization with potential for evolutionary refinement.The Script ontology has been generated from a largesustainability document corpus while requiring minimalexpert input / validation. Plug and play capability of third party services thatexploit the Script ontology and user profiling. This providesthe advantage of widening the scope of users' accessibleknowledge while exploiting their profile for filteringinformation and avoiding information overload. Regional and global awareness in terms ofsustainability related events, trainings, and continuousprofessional development. Strong sense of professional community belongingwith a shared sense of sustainability and social corporateresponsibility. Management of virtual and physical objectsthrough Radio Frequency Identification (RFID) and Internetof things. For instance, through our Product database,virtual products (such as a building product or equipment)can be purchased, allocated an RFID tag, and then onmanaged across its lifecycle from delivery, installation,operation, to decommissioning / recycling.
This prompts a discussion on what could form evolutionsbeyond Web 3.0. The Script platform is currently beingenhanced and further developed to embed the capability oftransforming buildings and their components / systems intovirtual objects with semantics and behavior which can bequeried, managed remotely, and operated at optimumperformance levels. Moreover, given that Semantic Webtechnologies are maturing as a means of describing tangibleartifacts, we could use their representational power todescribe things in the real world. One view is that thephysical objects will become Web-accessible in that they willbe able to be represented via metadata. Just like applyingsemantic technologies to problems of interoperability inubiquitous computing environments, describing physicalthings will expand our scope beyond the current Web. Thisforms the focus of the authors’ ongoing work and plannedenhancements to the Script platform.
ACKNOWLEDGMENT
The European-wide study was funded by the EuropeanCommission under the FP7 program (Contract numberSI2.CPROCE021853800). The initial Wales study and thefollow-up ‘Script’ project were funded by the WelshGovernment under the Academic Expertise for Business(A4B) program. The authors would also like to acknowledgethe many industrial/stakeholder organizations (all listed inhttp://sustainablebuildingportal.co.uk/about) who havekindly taken part in the various studies.
REFERENCES
[1] BERR, Digest of UK Energy Statistics. Department forBusiness Enterprise and Regulatory Reform, 2007, London.http://stats.berr.gov.uk/energystats/dukes07_c6.pdf (accessed: 20June 2013).
[2] European Commission, Challenging and ChangingEurope’s Built Environment: A Vision for a Sustainable andCompetitive Construction Sector by 2030, European ConstructionTechnology Platform, 2005 (accessed: October 2013)
[3] J.A. Clarke, C.M. Johnstone, N.J. Kelly, P.A. Strachan,and P. Tuohy, The role of built environment energy efficiency in asustainable UK energy economy, Energy Policy 36, 2008, pp.4605–4609 (accessed: October 2013).
[4] R. McLeod, C.J. Hopfe, and Y. Rezgui, An investigationinto recent proposals for a revised definition of zero carbon homesin the UK, Energy Policy 46, 2012, pp. 25-35.(doi:10.1016/j.enpol.2012.02.066) (accessed: October 2013).
[5] BSRIA, Zero carbon targets on the construction industry,2009. http://www.bsria.co.uk/news/clean-home/ (accessed: 20 June2013).
[6] WG, Climate Change Strategy for Wales. WelshGovernment, 2010. ISBN 978 0 7504 5714 9http://wales.gov.uk/docs/desh/publications/101006ccstratfinalen.pdf (accessed: 30 July 2012).
[7] Y. Rezgui, Knowledge systems and value creation: Anaction research investigation, Industrial Management & DataSystems 107 (2), 2007, pp. 166-182 (accessed: October 2013).
[8] Y. Rezgui and J.C. Miles, Harvesting and ManagingKnowledge in Construction: From theoretical foundations tobusiness applications, Francis & Taylor, Spon Press, 2011.ISBN/ISSN: 10:0415545951, 2011(accessed: October 2013).
[9] J. Hendler, Web 3.0 Emerging, IEEE Computer, January2009 (accessed: October 2013).
[10] O. Lassila, and J. Hendler, Embracing "Web 3.0" IEEEInternet Computing, May-June 2007. (accessed: October 2013)
[11] T. O’Reilly, What is Web 2.0? Design patterns andbusiness models for the next generation of software, 2005. Seehttp://www.oreillynet.com/pub/a/oreilly/tim/news/2005/09/30/what-is-web-20.html (accessed October 2013).
[12] R. Haines, K. Khan, and J. Brooke, Bringing simulationto engineers in the field: a web 2.0 approach, Phil. Trans. R. Soc. A(2009) 367, 2009, pp. 2635–2644. doi:10.1098/rsta.2009.0047(accessed: October 2013).
[13] T. Wachter and M. Schroeder, Semi-automated ontologygeneration within OBO-Edit, Bioinformatics 26(12), 2010, pp. 88-96 (accessed: October 2013).
[14] S. T. Dumais, Latent semantic analysis. Annual Reviewof Information Science and Technology 38, 2004, pp. 188–230.(doi: 10.1002/aris.1440380105) (accessed: October 2013).
79Copyright (c) IARIA, 2013. ISBN: 978-1-61208-306-3
CENTRIC 2013 : The Sixth International Conference on Advances in Human-oriented and Personalized Mechanisms, Technologies, and Services
88 / 145

Modeling of the Organ of Corti Stimulated by Cochlear Implant Electrodes
Abstract – Cochlear implants are used by deaf people to recover partial hearing. The electrode array inserted inside the cochlea is an extensive area of research. The aim of the electrodes array is to directly stimulate the nerve fibers inside the Organ of Corti. The electrical model of the physical system consisting of Organ of Corti and the electrodes is presented in this paper. This model allowed to run Spice simulations in order to theoretically detect the minimal voltage sufficient for nerve fiber stimulation as well as the impact of the electrode voltage on the duration of nerve fibers stimulation. Besides, the perturbations introduced by one electrode on the neighboring electrodes were theoretically studied. Finally, the study of power consumption was performed, which is of great importance in such embedded system. Keywords: cochlear implant, electrical analog, transient simulations
I. INTRODUCTION
Cochlear implants are an electrical device used by severely
deaf people to gain or recover partial audition. They allow direct stimulation of the auditory fibers using an electrodes array designed to reproduce the stimulus that would be generated by a healthy cochlea.
To do so, an external part of the hearing devices is located outside the ear and contains a microphone that captures the acoustic waves and transforms them into an electrical signal used by the data processing unit. Then, this signal is transmitted to the receiver, located within the patient’s head, close the skull. The receiver is composed of a demodulator and a set of electrodes driven by electrical signals that will contract the cochlea and stimulate the auditory nerve [1] [2].
Cochlear implants directly stimulate the nerve fibers inside the cochlea, and requires surgery to pull the electrodes array inside the scala tympani (Figure 1).
The connection between the electrodes in the scala tympani and the auditory nerve fibers is critical for efficient nerve fibers stimulation.
In an healthy ear, when a sound wave is produced, it strikes the eardrum and this vibration is reported in the oval window using ossicles. The oval window is the very first part of the cochlea. This oval window vibration creates a wave propagating inside the scala vestibuli, which is filled with perilymph.
Figure 1. Cochlear implant device [2]
According to biophysical theories [3] [4] when a mechanical wave propagates inside the cochlea, the Basilar Membrane (BM) distorts to absorb the wave energy, resulting in a height variation of the BM which compresses the organ of Corti. As shown in Figure 2, the organ of Corti is composed of Hair Cells (HC) (Outer Hair Cells (OHC) and Inner Hair Cells (IHC)), which have stereocilia at their end. When BM vibrates, stereocilia position change allowing potassium channels to open [5] [6]. Opening of the potassium channels creates the depolarization of the HC allowing complex mechanisms to take place (reviewed in [7] [8] [9]), and finally, resulting in neurotransmitter released in the synapse. Once released, these neurotransmitters travel to the post synaptic cell (the nerve fiber) and creates the depolarization of the nerve fiber. This depolarization, if sufficiently important, generates an Action Potential (AP) running through the nerve cell membrane [10] [11].
U. Cerasani, W. Tatinian
University Nice Sophia Antipolis LEAT UMR CNRS-UNS 6071
Valbonne, France Email :
[email protected] [email protected]
80Copyright (c) IARIA, 2013. ISBN: 978-1-61208-306-3
CENTRIC 2013 : The Sixth International Conference on Advances in Human-oriented and Personalized Mechanisms, Technologies, and Services
89 / 145

Figure 2. Organ of Corti
The aim of the electrodes array of the cochlear implant is to
generate an AP once a sound is perceived. Consequently to obtain the same Action Potential at the nerve
fiber using only electrode stimulation, two possibilities exist. First the direct nerve fiber stimulation can be made by changing the nerve membrane potential in order to produce a membrane depolarization above the threshold of Voltage Sensitive Na+ Channels (Nav) to create an AP [12]. The second solution consists in opening the potassium channels of the stereocilia to recreate the complete stimulation process. As HC or stereocilia are disfunctionning in the vast majority of implanted patients, only the first mechanism is considered in this paper.
Electrical model of electrodes inserted within the cochlea have been proposed by Hartmann et al. [13], where the spatial distribution of electrical potential was measured for intracochlear stimulation. In addition, electronic model of electrode/neuron coupling is available in [14] in order to reveal the most efficient coupling conditions. However, both models lack of physical connection with AP generation. In this paper, we present an electrical description of the electrode and organ of Corti in order to obtain theoretical minimal stimulation voltage sent to the electrodes for AP generation. Furthermore, this model allowed us to link the stimulation voltage with the duration of the nerve fibers stimulation. Finally the impact of surrounding electrodes were theoretically investigated.
The next section presents the theoretical model developed for the Organ of Corti associated with the electrodes. Then, simulation results from Spice software are presented. Finally, the conclusion and future work direction are presented.
II. MATERIALS AND METHODS
The electrical equivalent circuit of human tissue used in this
paper is the one presented in figure 3 and extracted from Cole and Cole impedance model [15], which has been shown to fit experimental data. The human tissues considered were the one present in Figure 2. The value of Rs, Rp and Cp were obtained using a gain response extraction over frequencies analysis. As the maximum hearing frequency is 22khz, it was considered in this paper that Rp could be neglected as it models the energy loss in high frequencies.
Figure 3. Human tissue electrical analog [15]
To obtain the numerical values for Rs and Cp for all the
tissues or interfaces, we use the physical equations for the capacitance (parallel-plate capacitor) and for the resistance computation (cylindrical resistance model) [16] [17].
The values of the relative permeability and electrical conductivity for the nerves were extracted from [18] or from [19] for platinum as electrodes are mainly composed of it. However as far as the authors know, no relative permeability or electrical conductivity was available for Deiter cells or Basilar Membrane tissue. As Deiter cells are mainly composed of microtubules [20], which are involved in mechanical transport as actin proteins found in muscles cells and because the width of the BM is negligible compared to the Deiter cell height, we chose to take the relative permeability and electrical conductivity of muscle cells to characterize those two tissues.
On the other hand, the computation of the capacitance and the resistances (Cpatch, Rppatch, Rspatch ) between two electrodes is more complex, as highlighted Figure 4, those variables depend on the distance between the two electrodes. The Cable Model Theory was used to compute those variables as the space between two electrodes is composed of various tissues rendering the Cole and Cole model implementation difficult. We simplified the tissue between two electrodes as only made of Deiter cells, then we implemented the Cable Model Theory in order to obtain a general impedance depending on the electrodes distance.
Figure 4. Two surrounding electrodes influences the nerve fibers targeted.
To compute Rspatch, the cylindrical model of resistance was considered. The cylinder going from the first electrode to the second electrode, as defined in Figure 5.a, was used to compute Rspatch (expressed in (1)):
1
81Copyright (c) IARIA, 2013. ISBN: 978-1-61208-306-3
CENTRIC 2013 : The Sixth International Conference on Advances in Human-oriented and Personalized Mechanisms, Technologies, and Services
90 / 145
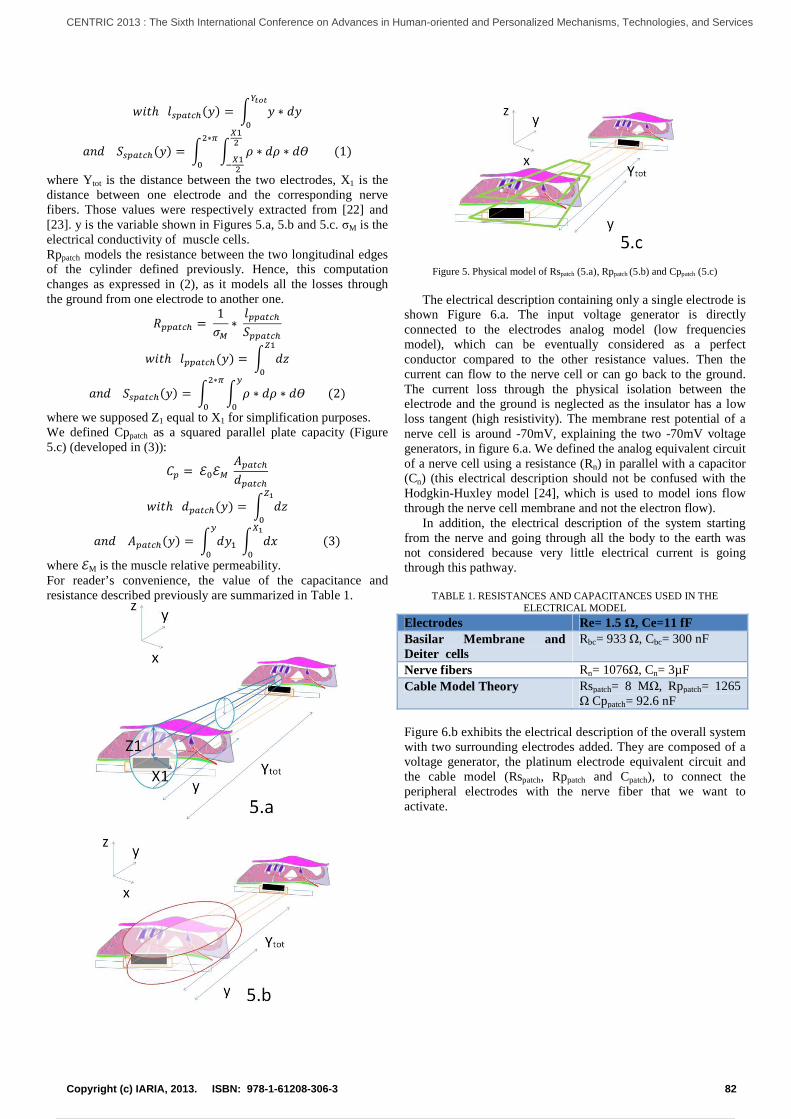
!"#
$!"#
# %
1
where Ytot is the distance between the two electrodes, X1 is the distance between one electrode and the corresponding nerve fibers. Those values were respectively extracted from [22] and [23]. y is the variable shown in Figures 5.a, 5.b and 5.c. σM is the electrical conductivity of muscle cells. Rppatch models the resistance between the two longitudinal edges of the cylinder defined previously. Hence, this computation changes as expressed in (2), as it models all the losses through the ground from one electrode to another one.
1
&'"
(
# %
2
where we supposed Z1 equal to X1 for simplification purposes. We defined Cppatch as a squared parallel plate capacity (Figure 5.c) (developed in (3)):
* ++ ,
&'-
, "(
.
!-
3
where +M is the muscle relative permeability. For reader’s convenience, the value of the capacitance and resistance described previously are summarized in Table 1.
Figure 5. Physical model of Rspatch (5.a), Rppatch (5.b) and Cppatch (5.c)
The electrical description containing only a single electrode is
shown Figure 6.a. The input voltage generator is directly connected to the electrodes analog model (low frequencies model), which can be eventually considered as a perfect conductor compared to the other resistance values. Then the current can flow to the nerve cell or can go back to the ground. The current loss through the physical isolation between the electrode and the ground is neglected as the insulator has a low loss tangent (high resistivity). The membrane rest potential of a nerve cell is around -70mV, explaining the two -70mV voltage generators, in figure 6.a. We defined the analog equivalent circuit of a nerve cell using a resistance (Rn) in parallel with a capacitor (Cn) (this electrical description should not be confused with the Hodgkin-Huxley model [24], which is used to model ions flow through the nerve cell membrane and not the electron flow).
In addition, the electrical description of the system starting from the nerve and going through all the body to the earth was not considered because very little electrical current is going through this pathway.
TABLE 1. RESISTANCES AND CAPACITANCES USED IN THE ELECTRICAL MODEL
Electrodes Re= 1.5 Ω, Ce=11 fF Basilar Membrane and Deiter cells
Rbc= 933 Ω, Cbc= 300 nF
Nerve fibers Rn= 1076Ω, Cn= 3µF Cable Model Theory Rspatch= 8 MΩ, Rppatch= 1265
Ω Cppatch= 92.6 nF Figure 6.b exhibits the electrical description of the overall system with two surrounding electrodes added. They are composed of a voltage generator, the platinum electrode equivalent circuit and the cable model (Rspatch, Rppatch and Cpatch), to connect the peripheral electrodes with the nerve fiber that we want to activate.
82Copyright (c) IARIA, 2013. ISBN: 978-1-61208-306-3
CENTRIC 2013 : The Sixth International Conference on Advances in Human-oriented and Personalized Mechanisms, Technologies, and Services
91 / 145
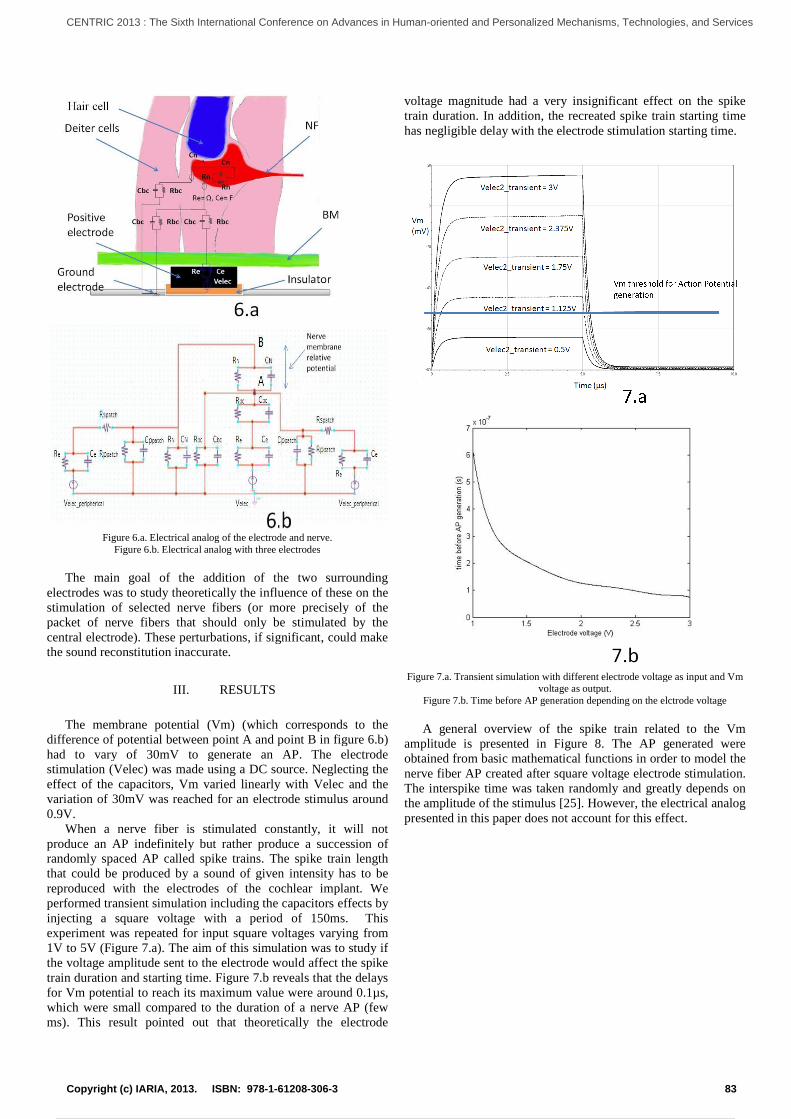
Figure 6.a. Electrical analog of the electrode and nerve. Figure 6.b. Electrical analog with three electrodes
The main goal of the addition of the two
electrodes was to study theoretically the influence of these on the stimulation of selected nerve fibers (or more precisely of the packet of nerve fibers that should only be stimulated by the central electrode). These perturbations, if significthe sound reconstitution inaccurate.
III. RESULTS
The membrane potential (Vm) (which
difference of potential between point A and point B in figure 6.b) had to vary of 30mV to generate an AP. stimulation (Velec) was made using a DC source. effect of the capacitors, Vm varied linearly with Velec and the variation of 30mV was reached for an electrode stimulus around 0.9V.
When a nerve fiber is stimulated conproduce an AP indefinitely but rather produce a succession of randomly spaced AP called spike trains. The spike train length that could be produced by a sound of given intensity has to be reproduced with the electrodes of the cochlear implant. We performed transient simulation including the capacitors effects by injecting a square voltage with a period of 1experiment was repeated for input square voltages varying from 1V to 5V (Figure 7.a). The aim of this simulation was to study if the voltage amplitude sent to the electrode would affect the spike train duration and starting time. Figure 7.b reveals that the delays for Vm potential to reach its maximum value which were small compared to the duration of a nerve AP (few ms). This result pointed out that theoretically the electrode
Electrical analog of the electrode and nerve.
Electrical analog with three electrodes
The main goal of the addition of the two surrounding electrodes was to study theoretically the influence of these on the stimulation of selected nerve fibers (or more precisely of the packet of nerve fibers that should only be stimulated by the central electrode). These perturbations, if significant, could make
corresponds to the A and point B in figure 6.b)
had to vary of 30mV to generate an AP. The electrode was made using a DC source. Neglecting the
varied linearly with Velec and the of 30mV was reached for an electrode stimulus around
When a nerve fiber is stimulated constantly, it will not indefinitely but rather produce a succession of
The spike train length that could be produced by a sound of given intensity has to be reproduced with the electrodes of the cochlear implant. We
including the capacitors effects by with a period of 150ms. This
oltages varying from .a). The aim of this simulation was to study if
to the electrode would affect the spike .b reveals that the delays
for Vm potential to reach its maximum value were around 0.1µs, duration of a nerve AP (few
out that theoretically the electrode
voltage magnitude had a very insignificant effect on the spike train duration. In addition, the recreated spike train has negligible delay with the electrode stimulation starting time
Figure 7.a. Transient simulation with different electrode voltage as input and Vm voltage
Figure 7.b. Time before AP generation depending on the elctrode voltage
A general overview of the spike train related to thamplitude is presented in Fobtained from basic mathematical functions in order to model nerve fiber AP created after square voltage electrode stimulation. The interspike time was taken randomly the amplitude of the stimulus presented in this paper does not account for this effect.
voltage magnitude had a very insignificant effect on the spike the recreated spike train starting time e electrode stimulation starting time.
with different electrode voltage as input and Vm
voltage as output. ime before AP generation depending on the elctrode voltage
iew of the spike train related to the Vm
amplitude is presented in Figure 8. The AP generated were obtained from basic mathematical functions in order to model the
AP created after square voltage electrode stimulation. The interspike time was taken randomly and greatly depends on
amplitude of the stimulus [25]. However, the electrical analog presented in this paper does not account for this effect.
83Copyright (c) IARIA, 2013. ISBN: 978-1-61208-306-3
CENTRIC 2013 : The Sixth International Conference on Advances in Human-oriented and Personalized Mechanisms, Technologies, and Services
92 / 145

Figure 8. Spike train generated by the electrode input voltage
We performed also a parametric simulation using the
electrical description of Figure 6.b, where the surrounding electrodes are added. The central electrode had a DC voltage of 1V and we varied the voltage of the surrounding electrodes between 0.9 and 5V. According to RC values used in figure 6.b, analytical computation showed that when the voltage of the surrounding electrodes was maximum (5V), the nerve fibers (above the central electrode) membrane potential Vm variation was 0.5mV, which was not high enough to stimulate these nerve fibers (the ones that should be stimulated only by the central electrode).
The overall system consumption is a great significance as cochlear implants are not convenient for the user to recharge. The study of the power consumption is presented Figure 9.
Figure 9. Current consumption during one stimulation period
The current peaks during each input signal transitions could reach 1A. Consequently, the maximum power consumed during a square input signal generation by the electrodes was around 1W (peak value), whereas the mean power consumed per period was around 50mW. These results may be used for the electrode array design to define battery size as well as electrode minimum width.
IV. CONCLUSION
The theoretical electrical description presented in this paper
was used to carry out simulations allowing the detection of the minimum voltage needed to ensure nerve fibers stimulation. This voltage was found around 0.9 V. Furthermore, the current peaks during each input signal transitions could reach 1A (peak value), and the mean power consumed per period was around 50mW. These results may be used as requirements for the electrode array design and corresponding control electronics.
It has also been suggested that two consecutive electrodes were not disturbing one another and that the duration of the stimulation did not depend on the input electrode voltage. A more complex model, including the spike trains frequency (which is the number of spikes generated per second) related to the electrode input voltage is being currently developed.
Besides physical tests are ongoing to ensure that the theoretical results obtained match the measurements. Deaf people using cochlear implants were asked to kindly submit themselves to cochlear implant reprogramming in order to test if the threshold of 0.9 V was sufficient; if not, it would greatly affect the perturbation between electrodes.
REFERENCES
[1] J. K. Niparko, Cochlear Implants: Principles and Practice, ch. 7. 2009. Lippincott Williams & Wilkins
[2] G. Clark, Cochlear Implants: Fundamentals and Application, ch. 4-8, 2003, Springer-Verlag
[3] G. Von Békésy, Experiments in Hearing, part 3. Chap 12-14, 1989, Acoustical Society of Amer
[4] F. Nobili and F. Mammano, "Biophysics of the cochlea: linear approximation," June 1993, 93(6), pp. 3320-32.
[5] C. Kubisch et al., "KCNQ4, a Novel Potassium Channel Expressed in Sensory Outer Hair Cells, Is Mutated in Dominant Deafness", 5 February 1999, vol. 96, no 3, pp. 437-446.
[6] L. Trussel, "Mutant ion channel in cochlear hair cells", April 11, 2000, vol. 97, no. 8, pp. 3786 –3788
[7] S.K.Griffiths, lecture: SPA 5102 entitled Auditory Anatomy and Physiology, inner ear, http://web.clas.ufl.edu/users/ sgriff/A&P.html.
[8] B. A. Hunter, M. Rick, S. Odland, and K. Juhn, "Blood-Labyrinth Barrier and Fluid Dynamics of the Inner Ear", Dec 2001, vol. 7, no. 2, pp. 78-83.
[9] R.A Altschuler and R. Yehoash, "Structure and innervation of the cochlea", 15 January 2003, no. 60, pp. 397 - 422.
[10] M. F. Bear, B. W. Connorsand, and Michael A. Paradiso, Neuroscience, Baltimore: Lippincott Williams & Wilkins, 2007.
[11] A. Siegel and H. N. Sapru, Essential Neuroscience, Section II The Neuron, April 2010, Lippincott Williams & Wilkins
[12] K. X. Charand, HyperPhysics lecture, hosted by the depatment of Physics and Astronomy, Georgia State University, http://hyperphysics.phy-astr.gsu.edu/hbase /biology/actpot.html.
[13] R. Hartmann, D. Mortazavi, R. Klinke, and A. Kral, "Spatial resolution of cochlear implants: the electrical field and excitation of auditory afferents", 1998, vol. 121(1-2), pp. 11-28.
[14] L. Sileo et al., "Electrical coupling of mammalian neurons to microelectrodes with 3D nanoprotrusions", Microelectronic engineering, vol. 111, 2013, pp.384-390
[15] Y. Ülgen and M. T. H. Solmaz, "Design of A Microcontroller
84Copyright (c) IARIA, 2013. ISBN: 978-1-61208-306-3
CENTRIC 2013 : The Sixth International Conference on Advances in Human-oriented and Personalized Mechanisms, Technologies, and Services
93 / 145

Based Cole-Cole Impedance Meter for Testing Biological Tissues", September 7-12 2009, vol. 25/7, pp 488-491.
[16] R. Nave. HyperPhysics lecture, hosted by the depatment of Physics and Astronomy, Georgia State University http://hyperphysics.phyastr.gsu.edu/hbase/electric/pplate.html.
[17] V. S. Kumar, G. Kelekanjeri, and Rosario A. Gerhardt, "Computation of the Complex Impedance of a Cylindrical Conductor in an Ideal Two-Probe Configuration", in Modeling and Simulation, ch. 6, June 2008, book edited by Giuseppe Petrone and Giuliano Cammarata
[18] D. Miklavcic and F. X. Hart, The Electrical Conductivity of Tissues, in Wiley Encyclopedia of Biomedical Engineering, 2006, John Wiley & Sons
[19] N. Ida, Electromagnetic properties of materials in Engineering Electromagnetics, 2003, Springer
[20] Nature Scitable Journal, 2013 Nature Education, "Microtubules and filaments" http://www.nature.com /scitable/topicpage/microtubules-and-filaments-14052932.
[21] Golowasch and Nadim, faculty members of the Department of Biological Sciences of Rutgers University-Newark, Linear Cable Theory, http://stg.rutgers.edu/courses/old/CompNeuro07/Handouts/Koch%20chapter2sm.pdf
[22] Cochlear® ,"Delivering choice, cochlear’s electrodes portofolio-as unique as our customers", 2012, URL
[23] JB. Wang and J. Yang, "Morphological observation and electrophysiological properties of isolated Deiters' cells from guinea pig cochlea", January 2000, vol. 14, no. 1, pp. 29-31
[24] A. L. Huxley and A. F. Hodgkin, "A quantitative description of membrane current and its application to conduction and excitation in nerve", 1952, vol. 117, no. 4, pp. 500-544
[25] X. Wang. "Neural representation of Sensory stimuli: Properties of Spike trains", Biosystems II: Neuroscience. Sensory Systems. Lecture 3, April 1998
[26] J. K. Niparko, Cochlear Implants: Principles and Practices ,ch. 7, Philadelphia USA, 2009.
85Copyright (c) IARIA, 2013. ISBN: 978-1-61208-306-3
CENTRIC 2013 : The Sixth International Conference on Advances in Human-oriented and Personalized Mechanisms, Technologies, and Services
94 / 145

Towards a Framework for Business Models in Event Management
Christina Di Valentin, Dirk Werth, Peter Loos
German Research Center for Artificial Intelligence (DFKI)
Saarbrücken, Germany
Christina.Di_Valentin | Dirk.Werth | [email protected]
Andreas Segl
Saarland University
Saarbrücken, Germany
Abstract—The choice of the right business model has proven to
be an important success factor, regardless of the industry.
Although in literature and practice the concept of business
models has been broadly discussed, a comprehensive definition
of business models in the context of event management has not
been provided so far. Due to the rising experience-orientation
of society – both in private and in business context – event
management has emerged to an industry sector of increasing
importance. By now, event management represents an
interdisciplinary field which requires efficient and effective
interactions of all involved business partners. This article
describes the derivation of the constituent elements of business
models in event management and classifies them to a business
model framework. The derived business model framework
depicts the underlying relationships between business model
elements to the concepts of strategy and business processes.
Keywords-Business models; event management; business
model components; business model framework
I. INTRODUCTION
The last two decades have been characterized by a strong development of society towards experience orientation [1]. In literature, this phenomenon is called “fun-society” [2]. Companies and event agencies satisfy this increasing demand of multi-sensual incentives through a diversified offer of events [3]. In doing so, companies and event agencies increasingly use new media and social networks to communicate their marketing activities to the specific target groups. Besides the use of new media and social networks, companies increasingly rely on live-events as communication tool, which supports the establishment of long-term customer relationships, as they enable a direct and personal contact to the recipients of marketing activities [4]. Besides the establishment of a sustainable customer loyalty, live-events allow to tailor information to the specific audience to overcome information overload, which represents nowadays a frequently occurring problem [5].
Recent studies about current trends in event management have shown an increase of expenditures in live-communication from 1.38 billion in 2005 to 2.55 billion in 2012 in Germany, which represents an increase of almost 85% within 7 years [6]. Within the same period the contribution of the total advertising budget that companies provide for events has increased from 14% to 19%. Additionally to this trend that companies initiated as
advertising and image improvement, the last years have also been characterized by an increase of society events, motivated by the rising demand of “special experiences within leisure activities” [7].
In the light of these developments, a large service sector for managing and carrying out events has emerged [8]. This sector includes, e.g., event agencies, technical providers, caterer, carriers of event agencies, artists, etc.
Event agencies are driven by two central motives to organize an event: “Own initiative” and “foreign initiative”. Event agencies that organize an event by their “own initiative” intend to achieve the maximum profit. Within “foreign initiative” events agencies are commissioned by external companies, public / state institutions or private persons, in whose name they act as service provider to plan and carry out the event.
Experts predict further growth in the event management sector which comes along with an increase of competitors in this industry sector [9]. Thus, agencies – whether service providing organizations or independent organizations – should be aware of their business models and the competitive advantages which come along with their business model to establish their organization in the market and prevail over competitors in the long run.
Generally speaking, a business model represents a conceptual tool containing a set of concepts, objects and their relationships amongst each other [10]. A business model supports companies to express their business logic [10], by offering an abstract view on a company’s organizational structure and its value creating activities [11], [12], [13], [14].
Regarding event management, so far literature and practice has mainly concerned about event marketing, not taking into consideration the entirety of key aspects that make up business models in event management. Although in recent time business model research has increasingly focused in specific industries such as the software industry [15] or electromobility [16], aspects about event management to date have not been covered by a scientific approach. This paper describes the derivation of a framework of business models in event management containing the basic elements of business models in this industry as well as a description of these derived business model elements to the concepts of strategy and business processes. The goal of the proposed framework is to support companies in event management to compose their business models according to their key
86Copyright (c) IARIA, 2013. ISBN: 978-1-61208-306-3
CENTRIC 2013 : The Sixth International Conference on Advances in Human-oriented and Personalized Mechanisms, Technologies, and Services
95 / 145

competencies. In doing so, start-up companies as well as companies that have been active in the market place for some time receive support for the definition of their business model.
The research work presented in this paper follows a design-oriented methodology. Subject matter of design science are artificially created artifacts [17]. These artifacts are classified amongst other things into constructs and models. Constructs represent a collection of terms with the goal to describe artifacts that are in the matter of interest whereas models describe specific artifacts under consideration of the derived constructs [17]. Constructs in the context of the research work in this paper represent business models, business model elements, business processes and event management. Models are described by the target groups (companies – particularly CEOs / COOs) in the event management industry) and an explanation of the relationship between the constituent elements of a business model to the concepts of strategy and business processes by the use of several examples.
The remainder of this paper is organized as follows.
Section 2 introduces basic definitions of business models
and event management and differentiates these concepts
from each other. Section 3 presents the basic elements of
business models in event management. These elements form
the basis of the event management business model
framework in Section 4. Section 5 summarizes the paper
and provides an outlook on future research. As specified in
the outlook the newly created artifacts will be evaluated in
future research using rigorous IS research methods.
II. TERMINOLOGICAL AND CONCEPTUAL BACKGROUND
This section explains the basic definitions and concepts
for the derivation of the business model framework in event
management. The first sections provide a basic
understanding about business models and business model
elements in general, followed by an explanation of the
underlying definitions and characteristics of event
management.
A. Business Models – Basic Concepts and Definitions
The business model concept is used as a management
tool to understand and analyze an enterprise’s current
business logic. Thereby business models support companies
to plan, design and test new business concepts that represent
future orientations and therewith enhance current concepts
[15]. Timmers, e.g., defines a business as “an architecture
for the product, service and information flows including a
description of the various business actors; and their roles;
and a description of the potential benefits for the various
business actors; and a description of the sources of
revenues” [18]. The academic analysis of business models
represents an emergent research field. Already early works
from 1957 [19] and 1960 [20] discuss business models in a
broader sense. However, when the dotcom bubble burst in
the late 1990s, extensive studies dealing with the business
model concept have extremely emerged [21], [22]. Thereby,
evolving business activities from traditional to web-based
business have been the main driver for the rising importance
of business model research [22].
Fig. 1 shows that business models are often seen as an
intermediary between a company’s strategy and its business
processes [24] [23]. This aspect reflects in different levels of
granularity [27]. Business models provide an architectural
as well as a conceptual basis for implementing a company’s
strategy into executable business processes [24], whereas
strategy represents the planning layer, as it encompasses all
tasks required for executing strategic management activities
[25]. Finally, the layer of business processes represents the
level of implementation. It represents the concrete process
implementation of a scenario in executable process steps
[26], [27], [28]. Fig. 1 shows the business model in its role
between a company’s strategy and its business processes:
Strategy
Layer of planning: strongly aggregated information
Business model
Layer of architecture: tactical information
Business processes
Layer of implementation: detailed information
Figure 1. Delimitation of the business model to the concepts of strategy and business processes [29].
Business strategy focuses on competitive aspects
whereas the business model describes collaboration of all
participating business resources. Finally business processes
describe how a business models is transferred in practice.
B. Business Model Elements
Business model elements do not represent an entire
business model, but they describe the integral parts that
make up a business model. One problem that often occurs in
literature and practice is the interchangeably use of the
terms “business models” and “business model elements”
[30]. To derive a framework for business models within a
specific industry (in this context event management), a
business model first has to be broken down into its
constituent components. Hence, underlying dependencies
within the business model itself and to related concepts such
as strategy and business processes can be depicted [12]. In
literature, several studies and analysis about the constituent
elements of business model elements in general have been
carried out [23], [31], [32], [33], [34], [35], [36]. The
business model elements derived by Di Valentin et al. form
87Copyright (c) IARIA, 2013. ISBN: 978-1-61208-306-3
CENTRIC 2013 : The Sixth International Conference on Advances in Human-oriented and Personalized Mechanisms, Technologies, and Services
96 / 145

the basis for the business model framework presented in this
paper [31]. Thereby, 12 articles about the constituent
elements of business models have been analyzed and
conveyed to a conceptual framework. According to the
literature studies, the main pillars of business models consist
of the following four elements [31]:
Value Proposition: Perceived value that a company
promises to its customers [37].
Resources: The products and services that a company
requires to create a unique service offering [38].
Architecture of Value Creation: Design of the
corporate information, product and service flows,
required to implement a business model. Hence, this
element forms the structural basis of a company,
including its technological and organizational
infrastructure [11].
Revenue Model: The different ways in which a
company generates its revenues [39].
C. Events and Event Management
A “special event” represents an orderly scheduled
occasion [40] with cultural, personal, leisure or
organizational objectives [41]. It can be classified into the
following categories: Leisure events (recreation, sports, etc.),
personal events (anniversaries, weddings, etc.), cultural
events (folklore, heritage, etc.) and organizational events
(sales, commercial, etc.) [41], whereas the latter is in the
focus of the framework provided in this paper. In
organizational context, companies mainly use events as
communication tool [42]. Thereby, the following
characteristics are relevant: Activation of the participants,
uniqueness, positive experience, selected target groups with
contact intensity, authenticity and exclusiveness of the in situ
experience [42].
Event management encompasses measures about aspects
like organization, execution and controlling required for an
event [43]. Furthermore, managing an event overlaps with
many aspects about project management, which is
considered as the entirety of executive functions like
organization, technics and measures for initializing,
definition and planning projects [8]. As many project related
aspects can be also applied to events – both are temporally
limited and carried out once – event management is
characterized by many project-related characteristics. In
terms of business models, influencing factors on event
management have to be taken into consideration. These
influencing factors are split into three categories:
Surrounding conditions,
shifts in the market place and within competitors and
customer interface.
Surrounding conditions encompass social and legal
frameworks, as tragic incidents like mass panics have a
strong influence on the safety stipulation of public events.
Furthermore, increased charges in event management come
along with an impact on existing pricing policies [44].
Particularly in terms of public events, the customer interface
is of great importance as directed advertisement represents
an important success factor within the preparatory stage of
an event.
III. BUSINESS MODEL ELEMENTS IN EVENT
MANAGEMENT
This section presents the business model elements for
event management which have been derived and enhanced
on the basis of the business model elements by Di Valentin
et al. Thereby, each sub-section presents one business model
element.
A. Target Groups: Clients and Visitors
Event agencies focus their offerings to two main target groups: “Potential clients” and “visitors”. Potential buyers make use of the agency as service provider. Thereby, a large group of people may be addressed such as companies that intend to present a new product at an event or celebrating an anniversary, cities and municipalities, sports associations and / or private persons. It is essential for these target groups to already provide in the initial phase the right frame conditions and concrete characteristics for the planned event.
One further target group present “potential visitors” of the event, whether the event is public or private. To meet the visitors’ expectations agencies must already prognosticate in an early stadium, which requirements are expected by the visitors from the event. Based on these estimations, the event offering has to be arranged [8].
B. Product Portfolio
An event managers’ product represents the event itself, which is consumed by the visitors. The agencies conceive, plan and realize all possible kinds of events. The event manager’s task is to carve out a coherent concept and to ensure a smooth execution of the event. A successful implementation of the event represents the tip of the event management iceberg. Fig. 2 shows the efforts in event management:
event
immediate surroundings,
(de)composition, logistics
planning, preparation, wrap-up
personal, physical, organizational & financial background
and support (stakeholder, supporters)
Figure 2. Expenditures in event management [43].
Fig. 2 demonstrates that expenditures for the preparation
and post-processing of an event as well as the preparation of
an appropriate infrastructure is not visible, however they
come along with the largest amount of efforts. It also shows
that activities of planning must be finished before the event
starts [43]. The main goal of event management is to offer
visitors a unique experience. A special challenge for event
agencies is to give periodical recurring events an individual
flair [43].
88Copyright (c) IARIA, 2013. ISBN: 978-1-61208-306-3
CENTRIC 2013 : The Sixth International Conference on Advances in Human-oriented and Personalized Mechanisms, Technologies, and Services
97 / 145

C. Resources and Competencies
The main competencies for event management agencies
represent employees including their knowledge, core
competencies and experiences. Effective organizational
structures as well as rapid responses on external influences
are inevitable aspects to prevail over competitors in the
market place. Additionally, an event management agency’s
core competencies should be continuously enhanced and
adjusted to the service offering.
D. Network of Business Partners
Events are highly complex services that are generated by
more than one partner [45]. The event manager acts as
orchestrator as s/he coordinates the services of the business
partners and controls the coherence of the final product (see
Fig. 3).
Partner 2
Partner 1
Event
agency
Event
agency
Figure 3. Coordinator – orchestrator model.
A network of authentic and competent business partners
is of great importance for the event manager. The network
includes, e.g., advertising agencies, caterer, technicians,
logistic support suppliers, artists, decorators, security
companies and service employees. Based on a large number
of service providers that are involved in the process of
organizing an event, unfulfilled obligations of partners have
a great impact on further areas of the planned event. Hence,
mistakes made by business partners can decide whether an
event will be successful or not.
E. Revenue Model
Planning and managing events comes along with a high
financial risk for event agencies. Hence, event agencies
have to determine the break-even point and prognosticate
occasional costs [46]. Comparing estimated costs with those
of former carried out event represents an advantage.
Moreover, running costs of the event managing agency have
to be taken into consideration in the calculations. The costs
are compensated by incomes, e.g., through entrance fees,
consuming of drinks and foods, stall rent, share of the
turnover, sponsor incomes as well as incomes from
exclusive rights and state subsidies.
In case the event is a remittance work, there exist two
different earnings models. Either the service is refunded by
a previously agreed form allowance or the expenditures are
paid after hours. In the first case, the event manager is
generally provided a fix budget.
IV. FRAMEWORK FOR BUSINESS MODELS IN EVENT
MANAGEMENT
Fig. 4 shows the framework for business models in event management. It has been derived based on the previously carved out business model elements for event management. The framework shows the business model in its intermediary role between business processes and strategy. Thereby, underlying interdependencies between the business model elements to the concepts of strategy and business processes are explained. The blue boxes represent the main pillars of the framework consisting of “strategy”, “business models” and “business processes”. The blue arrows between the different layers show that the business model is related to both concepts: strategy as well as business processes. The derived business model elements are classified to the business model layer. A description of the interdependencies between the business model elements is described in [31]. However, the dashed arrows show that the business model elements are in a mutual influence. The main characteristics of the business model element target groups are clients and visitors. The product portfolio is described by the provided services as well as the coherent concept for the execution of an event. An event agencies resources and competencies are described by the existing know-how whereas the business partner network is responsible for the coordination of services and business partners. The revenue model summarizes the financial flows of the underlying business model.
positioning in the market place
establishment of business segments
event types
Event Management Business Model
Business Strategy
Resources/Competencies
Product Portfolio
Business Processes
Target Groups
business model element
Business Partner Network
Revenue Model
coordination of services
coordination of
business partners
employees‘ know-how
effective organizational
structures
clients
visitors
service offering
coherent concept for the
execution of the event
occassional costs
break-even point
planning, realizing and controlling of events
relationship to strategy
and business processes
Legend
interdependencies between
business model elements
Figure 4. Framework for business models in event management.
89Copyright (c) IARIA, 2013. ISBN: 978-1-61208-306-3
CENTRIC 2013 : The Sixth International Conference on Advances in Human-oriented and Personalized Mechanisms, Technologies, and Services
98 / 145
In the following, the relationships between the business
model elements to the concept of strategy are going to be explained: On strategic level, information gained within the Network of Business Partners can be used for optimizing decision support and control of strategic consistency with the rest of the organizational structure of the event management agency. The business model element Resources and Competencies requires to be strongly focused on an event agencies strategic positioning [13]. Therefore, an event agencies resources and competencies have to be generated for each Target Group to keep an event agency’s customer loyalty on a high level [47]. The way, in which Resources and Competencies (of an event agency’s employees) are combined create new possibilities for carrying out events [12]. Hence, an ideal and efficient allocation of resources consequently depends on an event agency’s strategy. In order to carry on boosting an event agency’s business model, the Product Portfolio must be designed to continuously offering customers – whether visitors of an event or clients – an added value. Revenues within the Revenue Model can be determined by calculating financial key measures such sales per event within a certain market or customer segment [48].
The relationship between business models and business processes can be described as follows: Changing demands within the Network of Business Partners cause service level agreements to change. In order to bring about the changes which are necessary to provide the services or goods conforming to the service level agreements, the business processes that are carried out within the organization of an event may have to be changed. Within the business model element Target Groups processes offer the possibility to align all business activities to the customer’s preferences. This comes along with a higher degree of customer satisfaction after a successfully carried out event. The Revenue Model focuses on actions being carried out on operative level that have an influence on the financial structure. An efficient allocation of Resources and Competencies form the basis for the accomplishment of a successful event. On strategic level a decomposition of business processes offers clarity about the required resources and competencies for the execution of an event which run into the Product Portfolio to be offered [49].
V. CONCLUSIONS AND OUTLOOK
This paper presented a framework for business models in event management. To be able to obtain a basic understanding of business models in a specific industry sector, first the underlying components of business models have to be derived. So far, in literature and practice there is no consensus about the constituent elements of business models in event management. Hence, in a first step, the basic definitions of “business model”, “business model elements” and “event” have been derived. In a next step, the key components of business models in event management have been defined, which form the basis for the presented framework for business models in event management. This framework consists of the derived business model elements and describes the underlying interdependencies between the
derived business model elements to strategy and business processes.
The elaboration of this research work has shown that in recent years, many scientists addressed the concept of business models. So far, however, these concepts have not been sufficiently applied in the field of event management, although this industry is characterized by a growing number of companies. In the light of these developments, theoretical foundations should be further considered in future research work about business models and event management.
In future research, the derived artefacts will be implemented and evaluated according to rigorous design-science methods. Furthermore, the underlying interdependencies between the derived business model elements will be analyzed to enhance the current version of the framework. A transformation mechanism will be developed to transform changes on the business model in executable business processes, as changes within a company’s strategy and business model have an influence on the underlying business processes. Therefore, a value chain for the industry sector of event management will be derived, which consists of the main value creating activities in event management.
ACKNOWLEDGMENT
The research work presented in this paper was supported
by the Software Cluster and funded within the Leading-
Edge Cluster competition by the German Federal Ministry
of Education and Research (BMBF) under grant
01IC10S05.
REFERENCES
[1] A. Drengner, Imagewirkung von Eventmarketing - Entwicklung
eines ganzheitlichen Messansatzes. Wiesbaden: DUV, 2006.
[2] A. Hepp, Populäre Events - Medienevents, Spielevents, Spaßevents. Wiesbaden: VS Verlag für Sozialwissenschaften,
2010.
[3] C. Zanger, Stand und Perspektiven der Eventforschung. Wiesbaden: Gabler, 2010.
[4] N. Mahrdt, Corssmedia - Werbekampagnen erfolgreich planen
und umsetzen. Wiesbaden: Gabler, 2009. [5] W. Kroeber-Riel and P. Weinberg, Konsumentenverhalten.
Munich: Vahlen, 1996.
[6] “No Title.” [Online]. Available: http://www.famab.de/famab/home.html.
[7] W. Mueller, Eventmarketing - Grundlagen, Rahmenbedingungen,
Konzepte, Zielgruppe, Zukunft. Duesseldorf: Dr. Mueller, 2003. [8] O. Thomas, “Referenzgeschäftsprozesse des Event-
Managements.” Saarbruecken, 2005.
[9] J. Koehler, “Von der Muße zum Marketing - Die Perfektionierung der Feiertage,” in in Der Trend zum Event, P.
Kemper, Ed. Frankfurt: Suhrkamp, 2001, pp. 11–26.
[10] A. Osterwalder, Y. Pigneur, and C. L. Tucci, “Clarifying business models: Origins, present, and future of the concept,”
Communications of the Association for Information Systems, vol.
16, no. 1, pp. 1–25, 2005. [11] M. M. Al-Debei and D. Avison, “Developing a unified
framework of the BM concept,” European Journal of
Information Systems, vol. 19, no. 3, pp. 359–376, 2010.
90Copyright (c) IARIA, 2013. ISBN: 978-1-61208-306-3
CENTRIC 2013 : The Sixth International Conference on Advances in Human-oriented and Personalized Mechanisms, Technologies, and Services
99 / 145

[12] B. Demil and X. Lecocq, “Business Model Evolution: In Search
of Dynamic Consistency,” Long Range Planning, vol. 43, no. 2, pp. 227–246, 2010.
[13] J. Richardson, “The Business Model: An Integrative Framework
for Strategy Execution,” Strategic Change, vol. 17, no. 5, pp. 133–140, 2008.
[14] P. Staehler, Merkmale von Geschäftsmodellen in der digitalen
Ökonomie. St. Gallen: EUL, 2001. [15] M. Schief and P. Buxmann, “Business Models in the Software
Industry,” in International Conference on System Sciences, 2012,
pp. 1–10. [16] D. Kundisch, T. John, J. Honnacker, and C. Meier, “Approaches
for business model representation: An overview,” in
Multikonferenz Wirtschaftsinformatik, 2012, pp. 1–12. [17] A. R. Hevner, S. T. March, J. Park, and S. Ram, “Design Science
in Information Systems Research,” MIS Quarterly, vol. 28, no. 1,
pp. 75–105, 2004. [18] P. Timmers, “Business Models for Electronic Markets,” Journal
on Electronic Markets, vol. 8, no. 2, pp. 3–8, 1998.
[19] R. Bellman, C. Clark, D. Malcolm, and F. Ricciardi, “On the
construction of multistage, multi-person business game,”
Operations Research, vol. 5, no. 4, pp. 469–503, 1957.
[20] G. M. Jones, “Educators, Electrons, and Business Models: A Problem in Synthesis,” Accounting Reviews, vol. 35, no. 4, pp.
619–626, 1960.
[21] J. Hedman and T. Kalling, “The Business Model: A Means to Understand the Business Context of Information and
Communication Technology.” 2003. [22] J. Magretta, “Why Business Models Matter,” Harvard Business
Review, vol. 80, no. 5, 2002.
[23] M. Morris, M. Schindehutte, and J. Allen, “The Entrepreneur’s Business Model: Towards a unified Perspective,” Journal of
Business Research, vol. 58, no. 6, pp. 726–735, 2005.
[24] A. Osterwalder and Y. Pigneur, “An eBusiness Model Ontology for Modeling eBusiness,” in Proceedings of the 15th Bled
Electronic Commerce Conference – eReality: Constructing the
eEconomy, 2002, pp. 75–91. [25] I. Crespo, L. Bergmann, and T. Lacker, “Entwicklung und
Formulierung der Unternehmensstrategie,” in in Modernisierung
kleinerer und mittlerer Unternehmen – Ein ganzheitliches Konzept, U. Dombroski, Ed. Berlin: Springer, 2009.
[26] M. Hammer and J. Champy, Business Reengineering, 3rd ed.,
vol. 3. Frankfurt: Campus Verlag, 1994. [27] K. Andresen, C. Brockmann, and N. Roztocki, “Business Models
for Enterprise System Providers. Towards the Solution Based
Procedure,” in 17th Americas Conference on Information Systems (AMCIS `11), 2011, pp. 1–8.
[28] J. Gordjin, H. Akkermans, and H. van Vleet, “Business
Modelling is not Process Modelling,” in Proceedings on the 1st International Workshop on Conceptual Modeling Approaches for
e-Business, 2000, pp. 40–51.
[29] M. M. Al-Debei, R. El-Haddadeh, and D. Avison, “Defining the
Business Model in the New World of Digital Business,” in Americas Conference on Information Systems (AMCIS), 2008,
pp. 1–11.
[30] J. Linder and S. Cantrell, “Changing Business Models: Surveying the Landscape.” pp. 1–15, 2000.
[31] C. Di Valentin, A. Emrich, D. Werth, and P. Loos, “Conceiving
Adaptability for Business Models – A Literature-based Approach,” in International Conference on Information
Resources Management (Conf-IRM), 2012, pp. 1–13.
[32] A. Afuah and C. Tucci, Internet Business Models and Strategies: Text and Cases, 2nd ed. New York: McGraw Hill, 2004.
[33] R. Amit and C. Zott, “Business Model Design and the
Performance of Entrepreneurial Firms,” Organization Science, vol. 18, no. 2, pp. 181–199, 2007.
[34] F. Betz, “Strategic Business Models,” Engineering Management
Journal, vol. 14, no. 1, pp. 21–28, 2002. [35] W. Chesbrough, Open Business Models - How to thrive in the
new innovation landscape. Boston: Harvard Business School
Press, 2006.
[36] G. Hamel, Leading the Revolution. Boston: Harvard Business
Press, 2002.
[37] P. Kotler and G. Armstrong, Principles of Marketing, 14th ed. Upper Saddle River: Prentice Hall, 2012.
[38] K. Schögel, “Bezugsrahmen der Geschäftsmodellierung,” in in
Roadmap to E-Business, M. Schögel, T. Tomczak, and C. Belz, Eds. St. Gallen, 2002.
[39] A. Hitt, Michael, R. Amit, E. Lucier, Charles, and D. Nixon, Robert, Creating Value: Winners in the New Economy, 1st ed.
Malden: Blackwell Publishers, 2002.
[40] J. Goldblatt, Best practice in modern event management. New York: Wiley, 1997.
[41] A. Shone and B. Parry, Successful Event Management, 2nd ed.
London: Thomson Learning, 2004. [42] Bruhn, Kommunikationspolitik. Munich: Vahlen, 2005.
[43] U. Holzbaur, Eventmanagement - Veranstaltungen professionell
zum Erfolg führen. Berlin: Springer, 2010. [44] C. Klein, Eventmanagement in der Praxis. Bonn: interna, 2008.
[45] S. Paul and T. Sakscheski, Wissensmanagement für die
Veranstaltungsbranche. Wiesbaden: Gabler, 2012. [46] J. Wedekind and J. Harries, Der Eventmanager - Das Handbuch
aus der Agenturpraxis. Muenster: LIT, 2006.
[47] D. Teece, “Business Models, Business Strategy and Innovation,” Long Range Planning, vol. 42, no. 2, pp. 172–194, 2010.
[48] S. Kaplan, Robert and P. Norton, David, The Balanced Scorecard
- Translating Strategy into Action, 1st ed. New York: McGraw Hill, 1996.
[49] J. Gordijn, H. Akkermans, and H. Van Vliet, “Business
modelling is not process modelling,” in 1st International Workshop on Conceptual Modeling Approaches for e-Business
(eCOMO), 2000, pp. 40–51.
91Copyright (c) IARIA, 2013. ISBN: 978-1-61208-306-3
CENTRIC 2013 : The Sixth International Conference on Advances in Human-oriented and Personalized Mechanisms, Technologies, and Services
100 / 145

Privacy-Centric Modeling and Management of Context Information
Florian Dorfmeister, Sebastian Feld, Claudia Linnhoff-PopienMobile and Distributed Systems Group
Ludwig-Maximilians-Universitat MunchenMunich, Germany
Email: florian.dorfmeister, sebastian.feld, [email protected]
Stephan A. W. Verclas
T-Systems International GmbHMunich, Germany
Email: [email protected]
Abstract—Context-aware computing has been an intensivelyresearched topic for years already. Consequently, there exists aplethora of usage scenarios for context-aware applications as wellas several approaches for the modeling and management of auser’s context information, many of which focus on the efficientand scalable distribution of the latter. With the ongoing riseof smartphones as everyday mobile devices and their steadilyincreasing amount of sensing and communication capabilities,we finally find ourselves at the edge towards a widespread usageof these techniques. However, apart from technical issues suchas how to reliably determine a user’s current context, privacystill remains a crucial factor for these systems’ acceptance rate.Therefore, inspired by earlier works on privacy in context-awarecomputing and the authors’ beliefs in the necessity to put usersin control, this paper presents a novel approach for modeling andmanaging a mobile user’s context information in a user-centricand privacy-preserving way. To this end, this work’s contributionis twofold: First, based on widely recognized requirements forprivacy in context-aware applications, we propose a privacy-centric context model which allows for an intuitive and context-dependent definition of a user’s privacy preferences, directlyintegrating privacy aspects into the context model itself. Second,we present a generic and flexible architecture for the managementand distribution of context information in a privacy-preservingway fit for a multitude of different usage scenarios.
Keywords—context-awareness; context modeling; privacy-by-design; context-dependent privacy policies; context obfuscation.
I. INTRODUCTION
Both privacy-preserving computing of personal data as wellas the automatic extraction of context information – possiblyfrom a smartphone’s sensor readings – are very active areas ofresearch. One can think of many use cases for context-awareapplications, such as proactive route planning services takinginto consideration the current traffic volume and a user’s ap-pointment schedule, smart mechanisms automatically adjustinga phone’s audio profile based on the user’s current activity andoccupation, or buddy finder apps alerting the user when sharingthe current location with close friends of her. In addition, thereare applications such as the SmartBEEs context aware businessplatform [1], which do not act based on a single user or a peer-to-peer basis, but leverage the combined knowledge of multipleusers’ current contexts and their surroundings’ state, e.g., forbusiness process optimization.
Quite a number of slightly varying interpretations of whatcontext actually is can be found in literature. We base ourunderstanding of context on the famous definition given byAbowd et al. [2], declaring context to be any informationthat can be used to describe the situation an entity resides
in. Strictly following a user-centric approach, for this paperwe assume a user’s smartphone to be the primary source ofinformation about her current context. How different kinds ofcontext information can be acquired from sensor data is notwithin the scope of this work though. In order to offer highlevels of service quality, algorithms for context recognitiontypically aim at maximizing the resolution, freshness andaccuracy of their classification results. However, when talkingabout preserving a user’s privacy, different – and sometimeseven contradicting – objectives are to be pursued. For example,in many situations it might be perfectly sound to deliberatelyreduce the resolution of a piece of context information beforesharing it with others in order not to reveal too much. Theprivacy issue gets additionally tightened given the fact thatdue to the popularity of smartphones, we are heading towardsa full supply of small electronic devices with broadbandinternet access and extensive sensing capabilities. Enabling theacquisition of a user’s context information with the help ofher smartphone’s sensors and eligible reasoning mechanismsin return also enables spying on this person. Thereby “oneperson’s sensor is another person’s spy”, as [3] puts it.
Many approaches for modeling and managing context focuson the generation, processing and efficient distribution ofcontext information as well as the realization of context-awareapplications built thereon. Some works, however, argue that notonly the usability and utility of context-aware applications areparamount for a wide acceptance, but also the establishmentof appropriate privacy mechanisms which make the users feelcomfortable within such ubiquitous computing environments.Concordantly, in this paper we propose a new method for giv-ing the full control over the release and resolution of personal,private or characterizing context information to the data’sowner. Our work’s contribution is twofold: First, we defineour Context Representations (CoRe) model, which presents anovel approach for modeling a user’s context information in aprivacy-centric manner. Second, we introduce the design of ourLayered Architecture for Privacy Assertions in Context-AwareApplications (ALPACA) together with its privacy levels anddescribe the flexible interplay of the different components.
The remainder of this paper is structured as follows: InSection II, we will make our problem statement and present acomprehensive list of privacy requirements. We will then havea look at related work on privacy in context-aware applicationsin Section III. Section IV presents our privacy-centric CoRemodel, which marks the base component for our logical andphysical system architecture described in Section V. Afterdiscussing our results in Section VI, we conclude.
92Copyright (c) IARIA, 2013. ISBN: 978-1-61208-306-3
CENTRIC 2013 : The Sixth International Conference on Advances in Human-oriented and Personalized Mechanisms, Technologies, and Services
101 / 145

II. PROBLEM STATEMENT AND REQUIREMENTS
Given these preliminaries, with this work we aim at design-ing a generic solution for the modeling and management of auser’s static and dynamic context information. Consequently,we consider it essential to primarily focus on putting the userin full control over the capturing, release and resolution ofher personal data. As already stated before, we assume auser-centric, smartphone-based approach here. Hence, from aprivacy-oriented point of view the less data is going to leavethe user’s mobile device, the better. Yet in order to enable amultitude of context-aware applications and services, there isusually a need for communicating one’s current context infor-mation to other parties. For privacy reasons, however, we arguethat there must not be any party but the user herself able toaccess or control her complete context information at any pointin time, thereby ruling out any solutions based on a trustedthird party approach. On the other hand, proactively providinga central component with some kind of “handpicked” contextinformation seems nonetheless desirable in some situations,e.g., in order to allow for the efficient realization of multi-subject context-aware applications. A truly generic solutionshould hence be able to serve all kinds of context requesterswhile never sacrificing too much of a user’s privacy.
Based on existing works on privacy in context-aware ap-plications [4]–[7], we have identified and complemented a setof different techniques and requirements for realizing differentaspects of privacy. Naturally, a comprehensive approach forcontext modeling and management should incorporate all ofthese mechanisms. In the following, we will name and brieflyexplain the most important of these requirements:
• A minimum set of access control operators suchas grant and deny has to be available in order tobe able to define different requesters’ access rights.Additionally, users should be allowed to define theirprivacy preferences in a context-dependent way.
• Variable granularity can be used to reduce a pieceof context information’s resolution or accuracy. As anexample, consider a user reading her e-mails. Differentgranularities of her currently modeled activity contextmight contain read-e-mail, computer-work,office-work and working.
• Intentional ambiguity and plausible deniability canbe used in order to lower the confidence and validityof a piece of context information, respectively. Noticethat these kinds of “white lies” present everydayactions in the offline world such as, e.g., not answeringtelephone calls in order to pretend not to be present.
• Adjustable freshness and temporal resolution areother means for intentionally reducing a piece ofinformation’s quality, e.g., regarding its age or cap-turing time. It can hence be used in a similar way asintentional ambiguity to obfuscate a user’s context.
• We define consistency of a user’s privacy preferencesas another important requirement, stating that a con-text requester must not be able to retrieve ambiguousor contradicting pieces of context information.
• Notifications can optionally be sent to a user uponeach request of her context information. This can
hence be used as a social means able to prevent theintentional abuse of contextual information.
• Symmetry is especially important in peer-to-peer sce-narios, stating that a certain party has to reveal just asmuch of its own information as it requests.
• Considering that completely denying a request for apiece of a user’s context information might itself re-veal much, we define completeness to be the principleof answering any request with a plausible response.
• Other useful concepts in context-aware applicationsare anonymity, pseudonymity and k-anonymity.
Additional requirements are security, scalability, extensibilityand usability. In order to seamlessly protect a user’s privacy, italso seems beneficial to closely band together the modeling andmanagement of a user’s context information. With this work’sproblem statement and privacy requirements being established,we will review related work in the next section.
III. RELATED WORK
This section presents related work on privacy mechanismsfor context-aware applications. Several different categories ofapproaches can be found in literature. Some of them relyon trusted third party (TTP) solutions for efficient contextdissemination, whereas other systems adopt a peer-to-peer(P2P) based approach in order to avoid such central pointsof attack. On the other hand, there are rule languages fordefining access control based on contextual information as wellas different obfuscation techniques for adequately reducing therichness of a user’s context information before their release.
A common architectural model for the realization ofcontext-aware applications is the use of a TTP acting as somekind of middleware for the aggregation of its users’ contextinformation. It is necessary for all of the system’s partici-pants to fully trust this component. The CoPS architectureintroduced in [7] implements such a central privacy service.While allowing for different granularities of context items,it does not permit the definition of context-dependent accessrules. Another TTP-based approach called CPE [5] enables thedefinition of context-dependent privacy preferences, but lacksmechanisms for releasing information in different granulari-ties. With a focus on context-dependent security policies, theCoBrA platform [8] deploys the Rei policy language [9] inorder to enable the definition of access control rules dependingon a user’s current context. Beyond that there is much litera-ture on different techniques for the obfuscation of contextualinformation. As an example, [6] presents another centralizedapproach focussing on context ownership and offering obfus-cation mechanisms for several kinds of context informationbased on SensorML process chains, obfuscation ontologies anddetailed taxonomies describing dynamic granularity levels. Incontrast to these systems, purely P2P-based approaches suchas [10] get along without any central component. As a majordrawback, such architectures can hardly be efficiently deployedin applications depending on up-to-date context information ofa whole group of users at the same time.
Hence, to the best of our knowledge we are not aware ofany approach able to fully satisfy the requirements given inSection II and tackling the issue of preserving a user’s privacy
93Copyright (c) IARIA, 2013. ISBN: 978-1-61208-306-3
CENTRIC 2013 : The Sixth International Conference on Advances in Human-oriented and Personalized Mechanisms, Technologies, and Services
102 / 145

in context-aware applications comparable to our framework’suser-centric design. Therefore and based on these require-ments, we will now introduce our privacy-centric CoRe modeland the ALPACA system architecture for context modeling andmanagement in Sections IV and V, respectively.
IV. PRIVACY-CENTRIC CONTEXT MODELING
Based on the given requirements, we will now present anovel approach for modeling a user’s context information ina privacy-preserving way. As the name implies, our ContextRepresentions model is designed to store several heteroge-neous representations of one and the same kind of contextinformation, each of them being intended for variably trustwor-thy groups of requesters. Subsequently, we introduce a user-friendly and flexible trigger mechanism that allows for context-dependent definitions of privacy preferences on behalf of theuser. To this end, the trigger functionality has been devised to(optionally) depend on both the subject’s, the requester’s aswell as the environments’ current context. In Section IV-C wewill join the latter with our model in order to describe how ourapproach is able to dynamically cope with inconsistent policydefinitions at runtime.
A. Modeling context information using representations
In accordance with many existing approaches for contextmodeling (cf. [11] for a comprehensive survey), we adopta tree-based view on a user’s overall context informationas depicted in Figure 1. In this hierarchic scheme, the rootnode aggregates all different categories of a user’s contextinformation. At the second level distinctions between the basiccontext categories are made, such as a user’s current locationor activity. However, this catalog is not fixed and can readilybe extended to hold any additional kind of context informationin case new types of sensors or inference mechanisms becomeavailable. Each of the tree’s second-level nodes may be a parentto an arbitrary number of corresponding Representations, eachreflecting the given category in a different way, e.g., concerningthe respective item’s resolution or – in case of a white lie –maybe even its validity. One should thus notice that in contrastto existing context models such as MUSIC [12], which use theterm “representation” in order to label the data formats used forcommunication (such as XML, JSON, etc.), we define distinctRepresentations of a context information to differ from eachother on a semantic level, independent from any encoding.As an example, consider the three different Representationsof the user’s current location in Figure 1: The representationon the left holds the exact GPS position fix of the user. Incontrast, the one in the middle only states the user’s locationon a city level, while the third uses a non-geographic, symboliclocation identifier that cannot be mapped to a geographic one– at least not without any further knowledge about the user.The idea behind providing multiple representations of the samecategory is that from a privacy-centric point of view, a usershould be able to communicate different versions of her currentcontext information to different parties. Which representationis to be released to whom might, e.g., be based on the trustlevel assigned to a requester and the current context itself.
Following an ontology-based modeling approach, our con-text model consists of the three base classes shown in Figure2, namely Context, Representation and Audience. The
48.14985,11.59476
Accuracy: 10m
Obfuscation: geo. none
Context
ActivityContextLocationContext
Munich
Freshness: 200min
Obfuscation: geo. city-level
Workplace
Confidence: 0.8
Obfuscation: semantic ...
...
…
Obfuscation: ...
Fig. 1. An example context tree with its second-level Context nodes linking toan arbitrary number of Representations, each indicating its level of obfuscationbased on the semantics of the underlying information.
first two of them can have subclasses such as ActivityContextand ActivityRepresentation, respectively. As already explained,a certain subclass of context may be described by multipleinstances of Representation at the same time. Our model’sbasic structure was inspired by the ASC model by Stranget al. for enabling service interoperability based on a sharedunderstanding of and transformation rules for different, yet log-ically equivalent scales [13]. Quite the contrary, however, ourCoRe approach can be used to model different representationsof the same kind of context information, which – accordingto the requirements stated in Section II – do not necessarilyhave to share the same (or at least similar) meanings at all.Especially, in our case there must of course not exist anytransformation rules which allow for a simple conversion froma low-resolution representation to a high-resolution one.
Context Representation Audience
Base Classes representedBy visibleTo
represents canAccess
ActivityContext ActivityRepresentation
SubclassesrepresentedBy
represents
hasActivity
Representatio
n
subclassOf ObjectProperty functional Obj.Prop.subpropertyOf
Fig. 2. The classes, subclasses and properties of the CoRe model. Eachsubclass of Context might have an arbitrary number of Representations.
As an enabler for the definition of privacy preferencesbased on our model, a representation instance can be assignedto a certain Audience using subproperties of the canAccessproperty. An audience can be any entity requesting the user’scontext information and might be defined both statically (e.g.,based on group membership) and context-dependent, such as“entities near me”. As we will see in Section IV-C, however,an entity must not be assigned to more than one representationof the same class of context information at the same time. Weaccomplish this by marking every subproperty of canAccessas being functional. In order to be able to automatically assessthe resolution of a representation of a given class, each Repre-sentation stores additional information about its obfuscationlevel. A generic labeling approach for these levels seemsunfeasible, considering the great differences in semantics thatdifferent classes of context information might possess. Hence,each subclass of Representation is expected to define its ownobfuscation scales. Returning to the abstracted tree-based viewof our model, the base class Context can be interpreted asthe root node in the hierarchy. Subclasses thereof, such as
94Copyright (c) IARIA, 2013. ISBN: 978-1-61208-306-3
CENTRIC 2013 : The Sixth International Conference on Advances in Human-oriented and Personalized Mechanisms, Technologies, and Services
103 / 145

ActivityContext and LocationContext form the second-levelnodes, which might link to an arbitrary number of appropriatesubclass instances of Representation.
B. Defining context-dependent privacy preferences
In addition to the model’s base concepts just described,we have designed a trigger mechanism which allows fora simple, yet flexible and effective definition of context-dependent privacy preferences on behalf of the user. With oursystem following a conservative, whitelist-based approach (cf.Section V-A) in order to protect a user’s context informationfrom accidental leakage, explicitly defining a release triggeris the only possibility for a user to share any piece of infor-mation with others. The corresponding classes and propertiescan be seen in Figure 3. Broadly speaking, a Trigger canbe used for setting up preferences defining how the systemshould respond to any requests for context information. Atrigger fires each time the set of Conditions associated withthat instance matches the currently known overall situation,possibly taking into account the current states of both theuser’s, the requester’s and the surroundings’ contexts. As anEffect, one or more Representation instances of the requesteduser become accessible for the given Audience. From [7]we have adapted the idea that accessing a piece of contextinformation by a certain requester might have side effects suchas notifying the user, as we agree on that being a proper meanssuitable for possibly containing data abuse. If desired, a usercan hence also specify which SideEffect should be activatedwhen a certain kind of Representation is requested by a certainaudience. Additionally, a user is able to define the obfuscationlevel, accuracy, confidence and freshness properties the now-accessible representation has to fulfill for this audience underthe circumstances described in the corresponding conditions.
Effect
Trigger
Condition
hasEffect
Entity
Representation Audience
precedesOver
SideEffect
hasSideEffect
hasCondition
hasEntity hasContext
Context Representation
representedBy
effects visibleTo
Fig. 3. The structure of the Trigger mechanism enabling users to definecontext-dependent privacy preferences. Each Effect might also have SideEffectsdescribing reactions to requests for context information.
C. Dealing with inconsistent privacy preferences
We will now describe how our context modeling approachcan be used in conjunction with the trigger mechanism inorder to detect any inconsistencies arising from ambiguousor conflicting privacy preferences. For this work, we definea set of privacy preferences to be inconsistent if it enablesany requesting entity to access more than one representationof the same class of context information at the same time,as this situation is clearly prone to harm a user’s integrity.The issue becomes evident when considering two contradictingrepresentations, e.g., a user’s true and fake location informa-tion. If one requester is granted access to both representations,
the result is not only ambiguous, but also likely to negativelyinfluence the user’s respectability due to being caught lying.Logically, such situations might occur when a requester isbelonging to more than one (possibly dynamically defined)Audience. Hence, there has to be a way for detecting andsolving such preference conflicts. In order to prohibit suchsituations from occuring, we use the underlying ontology’sbuilt-in reasoning capabilites to dynamically check the model’sstate for consistency. By defining all subproperties of canAc-cess to be functional, we assure that each entity is allowed tosee at most one representation of the same class. This check isperformed each time a trigger fires. In order to solve conflictingsituations, the precedesOver property can be set. In a practicalimplementation, the first time an inconsistent state is detected,a user might be notified about the conflict and be able to choosewhich of the triggers involved should precede over the other.
This section presented a novel approach for privacy-centriccontext modeling as well as a trigger mechanism for a context-dependent definition of a user’s privacy preferences. In the nextsection we will describe the privacy layers and components ofthe ALPACA architecture built upon our model.
V. PRIVACY LAYERS AND SYSTEM ARCHITECTURE
We will now introduce our Layered Architecture for Pri-vacy Assertions in Context-Aware Applications and its fourdifferent privacy layers. These layers resemble what we be-lieve to be a good compromise about a privacy-aware user’ssensation of different levels of information accessibility andreduction of complexity. Afterwards, we will introduce ourarchitecture’s central component, the Privacy Manager anddescribe an example setup and communication flow.
A. Different layers for different audiences
Public Layer (IV)
Protected Layer (III)
Private Layer (II)
Reality (I)
Layer Audience
Everyone
Trusted Peers
Local Apps
Example information
Age group (25-31),gender, etc.
Exact GPS location forco-workers in casethe user is at work
Exact GPS location,appointments inschedule, etc.
Facts, discrete and continuousvalues, e.g. temperature,altitude, acceleration, etc.
Sensors
Blacklist
Whitelist
Trust Distinction
Fig. 4. The four different privacy layers defined in ALPACA and their mostlikely audiences, as well as some example context items for each layer.
As shown in Figure 4, ALPACA defines four logicallydifferent layers which can be mapped to a user’s privacylevels, as well as some kind of privacy gateways between theselayers. At the bottom layer we put reality, possibly containingmore information than any kinds of sensors and reasoningmechanisms will ever be able to capture. Although one doesnot have to implement anything on this layer, we still haveto define it as this layer is what is aimed to be reflectedin any context model. However, even today a user might
95Copyright (c) IARIA, 2013. ISBN: 978-1-61208-306-3
CENTRIC 2013 : The Sixth International Conference on Advances in Human-oriented and Personalized Mechanisms, Technologies, and Services
104 / 145

feel uncomfortable knowing that each of her smartphone’ssensors is recording data all the time. Hence, a user can setup a context-dependent blacklist for defining which sourcesof context information should be turned off under certainconditions.
The next layer is the private layer, holding all the in-formation a user wants to have available for herself, i.e.,context-aware services and applications running exclusivelyon her mobile device. Consider for example locally run appswhich adapt their appearance and behaviour according tothe user’s current context. In order for such services to beresponsive and proactive, this layer enables access to the mostfresh and sophisticated context representations. Naturally, thesehigh-resolution representations are probably not intended foreveryone else as well. Thus, the trigger mechanism describedin Section IV-B is used as a context-dependent whitelist forthe release of certain representations to the upper layers.
Context information which pass this whitelist enter theprotected layer and might hence be available for some otherentities, too, such as trusted services and peers. For example, auser might be reluctant to share her current whereabouts witheveryone, but maybe with some of her friends in her sparetime or with her employee during working hours. Naturally, thenumber and composition of context representations availableon this layer will hence change dynamically based on the user’sprivacy preferences and current context.
Additionally, a user might be willing to share some kindof information about herself with anyone, meaning that theseinformation are available on the public layer. This might, e.g.,be true for information that are somehow obvious anyway,such as personal profile data containing the user’s gender orage group. However, a user might still define notifications to bedisplayed when these kinds of information are being requested.That said, notice that our system’s user is of course not forcedto abide by these layers in the way we just described, but rathercan individually choose which level of visibility fits her ownsituation by the use of appropriate release triggers.
B. Components of our hybrid system architecture
We will now briefly describe the flexible architecture of theALPACA system, as well as the Privacy Manager as its corecomponent responsible for managing access to all of the user’scontext information. Figure 5 gives a component-oriented viewof our system. It is up to the privacy manager instancerunning on the user’s mobile device to enforce compliancewith the privacy preferences set up by the user at any time.Therefore, it is the only component which has full access to allrepresentations available in the context model in order to beable to fulfill the user’s blacklist and whitelist preferences. Theprivacy manager decides on the release of context informationon a per-request basis, thereby realizing some kind of lazyrule evaluation. This is necessary given the context-dependentnature of the user’s preferences: As explained in Section IV-B,the release of a certain context representation might welldepend on the requester’s current context. Hence, in suchcases, the requester has to communicate his own context tothe requested user’s privacy manager, which will then decideon whether or not to release the requested information.
Privacy Manager
ReleaseTriggers
ContextRecognitionAlgorithms
RawSensor
Readings
ObfuscationTechniques
...
Sensors
Reality
CoRe Model
Fig. 5. The client-side components of the ALPACA framework: The PrivacyManager acts as an exclusive interface to access a user’s context informationfor both local, peer-to-peer and third-party applications.
In accordance to the definitions of the different privacylayers, those representations belonging to the private layermust inalienably be managed on the mobile device itself.However, in order to enable the efficient and scalable imple-mentation of applications based on, e.g., the current contextsof several users, there might also exist less trustworthy, yetpossibly distributed instances of the privacy manager andthe user’s context model on the protected layer. If so, theprivacy manager residing on the user’s device will commit anyupdates in the set of currently released context representationsto the external instances of the model. Naturally, not allrepresentations currently released by the user’s whitelist willbe sent to the latters, but only those assigned to the respectiveapplication identified by the corresponding release triggers’Audience definitions. The ALPACA architecture can hence beconsidered flexible in the sense that it can be used both in apurely P2P-based fashion as well as in classic client/server-based applications without the need for a true TTP.
C. Communication flow in ALPACA
Having introduced the privacy layers and software com-ponents of ALPACA in the previous sections, we will nowdescribe the basic communication flow in an example setupof our system. For the sake of clarity, however, we will onlyrefer to the P2P-based case with one internal instance of theprivacy manager here.
As illustrated in Figure 5, we assume a number of differentsensors, algorithms for context recognition as well as obfus-cation techniques to be available on the user’s smartphone.These are responsible for capturing a user’s real context andtransforming it into instances of the Representation classfor our context model, also providing the necessary metainformation such as, e.g., freshness and obfuscation level.Every time one of the available sources of context informationproduces fresh data, the model will be updated. Additionally,the context-dependent blacklist defining which sensors andinference mechanisms to turn off under certain conditions willbe re-checked. Now different audiences might request someof the user’s context information from the privacy manager.Hence, it will first check which audiences the requester belongsto. In case the requesting entity is a local service that theuser wants to have full access to her high-resolution contextinformation, the privacy manager will return all matching
96Copyright (c) IARIA, 2013. ISBN: 978-1-61208-306-3
CENTRIC 2013 : The Sixth International Conference on Advances in Human-oriented and Personalized Mechanisms, Technologies, and Services
105 / 145

representations from the private layer. Otherwise, the privacymanager will take the requester’s context information con-tained in the request in order to re-interpret the user’s whitelistbased on these information, thereby possibly firing some ofthe release triggers. Eventually, given that no inconsistenyis detected, the privacy manager will return the appropriaterepresentation to the requester. In order for our system to beable to answer every incoming request even in case there is nosuch representation, some kind of highly obfuscated standardrepresentation will be returned (cf. Section II).
VI. DISCUSSION
We will now dicuss the pros and cons of our privacy-centric approach for modeling and managing a user’s context.Strictly following a user-centric point of view, all decisionsin the design process have been taken in order to offer amaximum level of control and privacy concerning the releaseof a user’s context information. As a result, our approachis able to fulfill the different privacy requirements presentedin Section II, which were collected from existing works onprivacy in context-aware applications: In order to be as genericas possible, we decoupled our model from the generation ofcontext information, thereby making it independent from exist-ing sensors, as well as reasoning mechanisms and obfuscationtechniques. The latters are able to realize the concepts ofvariable granularity, plausible deniability and the like. In prac-tical implementations, new sensors and inference algorithmscan simply register themselves at the privacy manager, whichwill inform the user about the additional context sources andobfuscation levels being available for the definition of herprivacy preferences. Also, our framework will always givean unambiguous answer – according to the user’s context-dependent preferences – to any incoming request, thanks tothe automatic detection and remedy of inconsistent privacypreferences based on the underlying ontology’s internal rea-soning capabilities and modeled precedence rules, respectively.However, for a secure implementation our system must be runon some kind of trusted computing platform able to preventthe privacy manager from being circumvented by malware.
The ALPACA architecture exhibits considerable flexibilitywith regard to the fact that it can be used both exclusivelyon a user’s mobile device as well as in P2P and client/serverapplications. Making usage of distributed instances of thecontext model and the privacy manager running on a server inthe Internet can also help against network layer attacks tryingto locate or identify a user by her current network location.However, there is a natural trade-off between a user’s privacyand the amount of context information stored on distributedservers likely to be under someone else’s administration.Finally, although having designed our trigger mechanism to beintuitive and user-friendly, it is not clear whether a majority ofusers will be likely to adopt such a restrictive whitelist-basedsystem, facing peer pressure and their own reluctance towardsmanually configuring release triggers.
VII. CONCLUSION
This paper presented a novel approach for modeling auser’s context-information in a privacy-centric way. We intro-duced our ontology-based CoRe model, which can be usedfor managing multiple, semantically different representations
of the same class of context information fit for differentlytrustworthy groups of context requesters. In order to enablecontext-dependent definitions of a user’s privacy preferences,a flexible whitelist-based trigger mechanism has been created.Eventually, we presented the design of our ALPACA systemarchitecture and discussed our approach.
At the time of writing, we are currently working on aprototype implementation of our system allowing us to conducta user study for evaluating the feasibility of our trigger mech-anism. As for our future work, we aim at finding additionalmechanisms capable of ensuring context consistency overseveral consecutive requests by a single entity. Furthermore,we want to analyze how to also protect the requesting entities’contexts, as well as how to handle possible deadlock situationsresulting from mutually exclusive privacy preferences. Finally,we will try to find new obfuscation techniques for differenttypes of context information and integrate them into ALPACA.
REFERENCES
[1] F. Dorfmeister, M. Maier, M. Schonfeld, and S. A. W. Verclas, “Smart-bees: Enabling smart business environments based on location informa-tion and sensor networks,” in 9. GI/KuVS-Fachgesprach ”OrtsbezogeneAnwendungen und Dienste”, 2012, pp. 23–37.
[2] G. D. Abowd et al., “Towards a better understanding of context andcontext-awareness,” in Handheld and ubiquitous computing. Springer,1999, pp. 304–307.
[3] M. Ackerman, T. Darrell, and D. J. Weitzner, “Privacy in context,”Human–Computer Interaction, vol. 16, no. 2-4, pp. 167–176, 2001.
[4] W. Bokhove, B. Hulsebosch, B. Van Schoonhoven, M. Sappelli, andK. Wouters, “User privacy in applications for well-being and well-working,” in AMBIENT 2012, The Second International Conferenceon Ambient Computing, Applications, Services and Technologies, 2012,pp. 53–59.
[5] M. Blount et al., “Privacy engine for context-aware enterprise applica-tion services,” in Embedded and Ubiquitous Computing, 2008. EUC’08.IEEE/IFIP International Conference on, vol. 2. IEEE, 2008, pp. 94–100.
[6] R. Wishart, K. Henricksen, and J. Indulska, “Context privacy andobfuscation supported by dynamic context source discovery and pro-cessing in a context management system,” in Ubiquitous Intelligenceand Computing. Springer, 2007, pp. 929–940.
[7] V. Sacramento, M. Endler, and F. N. Nascimento, “A privacy service forcontext-aware mobile computing,” in Security and Privacy for EmergingAreas in Communications Networks, 2005. SecureComm 2005. FirstInternational Conference on. IEEE, 2005, pp. 182–193.
[8] H. Chen, T. Finin, and A. Joshi, “An intelligent broker for context-aware systems,” in Adjunct proceedings of Ubicomp, vol. 3, 2003, pp.183–184.
[9] L. Kagal, T. Finin, and A. Joshi, “A policy language for a perva-sive computing environment,” in Policies for Distributed Systems andNetworks, 2003. Proceedings. POLICY 2003. IEEE 4th InternationalWorkshop on. IEEE, 2003, pp. 63–74.
[10] W. Apolinarski, M. Handte, D. Le Phuoc, and P. J. Marron, “Apeer-based approach to privacy-preserving context management,” inProceedings of the 7th international and interdisciplinary conferenceon Modeling and using context, ser. CONTEXT’11, 2011, pp. 18–25.
[11] C. Bettini et al., “A survey of context modelling and reasoning tech-niques,” Pervasive and Mobile Computing, vol. 6, no. 2, pp. 161–180,2010.
[12] R. Reichle et al., “A comprehensive context modeling framework forpervasive computing systems,” in Proceedings of the 8th IFIP WG 6.1international conference on Distributed applications and interoperablesystems, ser. DAIS’08, 2008, pp. 281–295.
[13] T. Strang, C. Linnhoff-Popien, and K. Frank, “Cool: A context ontologylanguage to enable contextual interoperability,” in Distributed applica-tions and interoperable systems. Springer, 2003, pp. 236–247.
97Copyright (c) IARIA, 2013. ISBN: 978-1-61208-306-3
CENTRIC 2013 : The Sixth International Conference on Advances in Human-oriented and Personalized Mechanisms, Technologies, and Services
106 / 145

Towards Context-Driven User Interfaces in Smart Homes
The Cloud4all Project’s Smart House Demo
Gottfried Zimmermann, Alexander Henka, Christophe Strobbe, Simone Mack, Annette Landmesser
Responsive Media Experience Research Group
Stuttgart Media University
Stuttgart, Germany
gzimmermann, henka, strobbe, sm136, [email protected]
Abstract—One of the challenges in AAL and smart homes is
the delivery of user interfaces that accommodate the needs and
preferences of a diverse group of users for providing a
"personal" user interface. Various technical solutions and
frameworks for adaptive user interfaces have been proposed in
the past. In this paper, we describe a smart house demo
application within the Cloud4all research project. This demo
combines the Universal Remote Console (URC) approach for
pluggable user interfaces with an adapt-at-runtime approach
of the Global Public Inclusive Infrastructure (GPII), thus
enabling the provision of personal user interfaces that can be
fine-tuned to fit a specific runtime context. Some preliminary
example user interfaces for smart house appliances are
provided.
Keywords-Cloud4all; URC; AAL; smart house; adaptive user
interfaces; GPII; user preferences; user preference set
I. INTRODUCTION
User interfaces for smart house and Ambient Assisted Living (AAL) environments should adapt to the preferences and needs of their users. We then call them "personal user interfaces". In addition to being personal, they should also take into account the user's device and its characteristics (e.g., screen size), and situational parameters of use (e.g., brightness or noise level in the environment). These parameters that drive adaptation are often summarized as "context" or "context of use".
Context-driven user interfaces are important for applications that are used by diverse types of users. Various technical approaches for the delivery of context-driven user interfaces have been proposed, including employment of abstract user interface models at design-time, and dynamic approaches at runtime (see Section II).
Context-driven user interfaces have not been widely adopted by the industry yet. Among the various reasons, the following are of particular interest for us:
1. Designers tend to imagine visual user interfaces that are
designed with "pixel fidelity" rather than thinking in abstract structures. For example, a designer would develop a drop-down menu rather than an abstract "pick one from many" interaction element, and a red "Click me" button with rounded corners rather than an abstract "function trigger". Therefore, if we want to get designers to develop flexible user interfaces, we need to
let them design a visual user interface as a basis for a context-driven one.
2. Similarly, developers and designers are familiar with tools that let them design the user interface in the traditional (i.e., visual) way. They will not switch to new tools that require them to learn new design paradigms. Therefore, if we want them to design for flexibility and adaptivity, we will have to allow them to use the development tools that they are familiar with, albeit with some possible extensions.
3. Most companies regard the user interfaces of their products as vehicles for conveying their corporate identity to the user. They want the users to identify themselves with the brand by looking at the product's frontend. Naturally, designers don't want "their" user interface to be changed in a way that could jeopardize the user's identification with the brand. At a minimum, they want to be in control of possible adaptations that could occur at runtime. Therefore, if we want industry to adopt possible adaptation approaches, we need to support them in designing "their" user interface, while allowing for tweaking the user interface at runtime along predictable lines for the purpose of personalization. Also, they should be able to design or let third parties (e.g., user interface experts) design alternative user interfaces that would make their products accessible to users of particular user groups and/or particular circumstances. This could help companies to overcome legislative requirements on accessibility without losing control over which user interface variation would be used under which conditions.
The European Cloud4all project [1] addresses the need
for adaptive user interfaces in mainstream products despite these challenges. Cloud4all is part of the international Global Public Inclusive Infrastructure (GPII) effort, whose purpose "is to ensure that everyone who faces accessibility barriers due to disability, literacy, digital literacy, or aging, regardless of economic resources, can access and use the Internet and all its information, communities, and services for education, employment, daily living, civic participation, health, and safety" [2].
As part of its development and dissemination work, Cloud4all is providing a simulation of its adaptive user interface technology on the example of a smart house and its
98Copyright (c) IARIA, 2013. ISBN: 978-1-61208-306-3
CENTRIC 2013 : The Sixth International Conference on Advances in Human-oriented and Personalized Mechanisms, Technologies, and Services
107 / 145

appliances. This simulation has been recently set up and will soon become available for the interested public [3].
The remainder of this paper is organized as follows: Section II provides an overview of related work on user interface adaptation at design time and/or runtime. Section III introduces the technical framework that underlies Cloud4all's smart house demonstration. Section IV gives a glimpse into the early development stage of the smart house demonstration, describing a few appliances and their adaptive user interfaces. Finally, in Section V we draw some conclusions and provide an outlook on further research and development within the Cloud4all smart house demo project.
II. RELATED WORK
User Interface Management Systems (UIMS) (e.g., COUSIN [4], HOMER [5]) are early predecessors of today's adaptive user interface systems. They featured a separate user interface management layer so that the user interface could be adapted to the runtime platform (desktop) and other parameters of use. UIMS and similar approaches have not been widely adopted for various reasons. According to [6], one of them is that designers want to control the look and feel of the interactions at a lower level than the UIMS abstraction allowed.
The User Interface Markup Language (UIML) standard by OASIS [7] has been designed to allow for the generation of platform-specific user interfaces, driven by rules for presentation and behavior that are unique for each runtime platform. However, UIML does not provide a vocabulary for user interface components and the development of such a vocabulary, together with an appropriate set of rules, is cumbersome. Also, UIML does not facilitate fully context-driven user interfaces since adaptation happens at design-time rather than runtime.
Of particular interest to us are approaches that focus on the automatic generation of user interfaces with dynamic runtime adaptation mechanisms. Pebbles [8] allows an author to provide an abstract user interface description at design-time which is used to render a control interface on a mobile device at runtime. Similarly, SUPPLE [9] uses a constraint-based algorithm to solve an optimization problem for a concrete layout at runtime. More recently, MyUI [10] has suggested defining abstract user interface models (based on state transitions) and interaction design patterns at design-time, and combining them at runtime based on a specific use context. Although these approaches can facilitate useful adaptations at runtime that may increase the level of accessibility for users with disabilities, they lack the ability for a designer to control the end result of the rendition process, and are therefore deemed unsuitable for mainstream use.
In the area of Web-based user interfaces, the Composite Capabilities / Preference Profile (CC/PP) standard [11] was specified to allow for fine-grained server-based adaptations to a client's runtime platform characteristics and user preferences. However, it has not been widely adopted by industry since it puts the onus on the Web browser manufacturers to create and maintain CC/PP files for each individual Web browser version and runtime platform. The
Fluid project [12] with its "user interface options" component offers a way for authors to make their Web pages adaptable to their users along a small set of presentational aspects such as font size, line spacing and button size. This approach works well for users and devices that need some fine-tuning ("tweaking") of the Web page, but does not cater for radical changes in device characteristics (e.g., screen size) or user needs (e.g., simplified user interface).
Finally, the Universal Remote Console (URC) framework [13] facilitates pluggable user interfaces based on an abstract user interface model (called "user interface socket"). Authors have full control over each pluggable user interface, since they can be specified as fine-grained as needed by the author. A distributed URC ecosystem (including a resource server) facilitates contributions of pluggable user interfaces by third parties (e.g., HCI experts and user groups), thus creating a market for user interfaces that is separate from the market of applications. However, there is still a risk for some users (in particular users with severe or multiple disabilities) to be left out due to the high effort of creating specialized pluggable user interfaces for each user group. This has motivated us to work towards a more flexible approach by combining URC's pluggable user interfaces with the runtime "tweaking" capabilities of Fluid, as employed by the smart house demo of the Cloud4all project described in this paper.
III. TECHNICAL FRAMEWORK
Cloud4all’s smart house demo application is based upon the URC framework [13] which is standardized as ISO/IEC 24752 [14]. Based upon the URC framework, the Universal Control Hub (UCH) architecture [15] facilitates a middleware-centered approach that can accommodate any networked target devices and applications (such as smart house appliances). Also, through the URC-HTTP protocol [16], it allows for any Web-based controller (such as smartphones, tablets, TVs and any other device featuring a Web browser) to be used.
On the client side, we employ up-to-date mainstream Web technologies, such as HTML5, CSS and JavaScript for HTML DOM manipulation. This allows us to provide a basically cross-platform user interface code (HTML5 & CSS) that can be tweaked in its structure, presentation and user interaction at runtime (JavaScript code) to respond to a concrete context of use. In principle, we can thus react to the following parts of a use context:
1. User needs and preferences, in particular those pertaining to the user interface. ISO/IEC 24751 (AccessForAll) defines a framework and vocabulary for expressing such personal user interface preferences but has not been widely adopted due to complexity and flexibility issues. Cloud4all is contributing to a revised framework and registry-based vocabulary for user preference sets, which is intended to be a basis for the revision of AccessForAll. Thus, personal preferences will impact the automatic activation of a suitable pluggable user interface (which can be provided at design time by any party and which is available from the
99Copyright (c) IARIA, 2013. ISBN: 978-1-61208-306-3
CENTRIC 2013 : The Sixth International Conference on Advances in Human-oriented and Personalized Mechanisms, Technologies, and Services
108 / 145
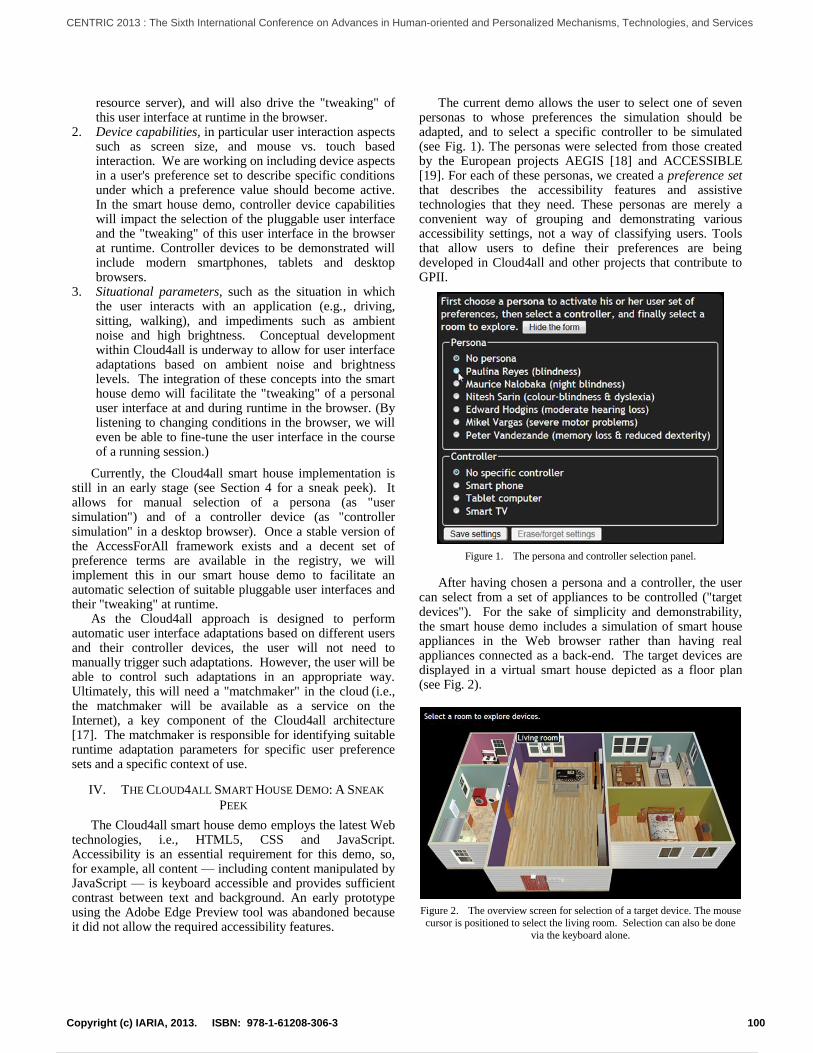
resource server), and will also drive the "tweaking" of this user interface at runtime in the browser.
2. Device capabilities, in particular user interaction aspects such as screen size, and mouse vs. touch based interaction. We are working on including device aspects in a user's preference set to describe specific conditions under which a preference value should become active. In the smart house demo, controller device capabilities will impact the selection of the pluggable user interface and the "tweaking" of this user interface in the browser at runtime. Controller devices to be demonstrated will include modern smartphones, tablets and desktop browsers.
3. Situational parameters, such as the situation in which the user interacts with an application (e.g., driving, sitting, walking), and impediments such as ambient noise and high brightness. Conceptual development within Cloud4all is underway to allow for user interface adaptations based on ambient noise and brightness levels. The integration of these concepts into the smart house demo will facilitate the "tweaking" of a personal user interface at and during runtime in the browser. (By listening to changing conditions in the browser, we will even be able to fine-tune the user interface in the course of a running session.)
Currently, the Cloud4all smart house implementation is still in an early stage (see Section 4 for a sneak peek). It allows for manual selection of a persona (as "user simulation") and of a controller device (as "controller simulation" in a desktop browser). Once a stable version of the AccessForAll framework exists and a decent set of preference terms are available in the registry, we will implement this in our smart house demo to facilitate an automatic selection of suitable pluggable user interfaces and their "tweaking" at runtime.
As the Cloud4all approach is designed to perform automatic user interface adaptations based on different users and their controller devices, the user will not need to manually trigger such adaptations. However, the user will be able to control such adaptations in an appropriate way. Ultimately, this will need a "matchmaker" in the cloud
(i.e.,
the matchmaker will be available as a service on the Internet), a key component of the Cloud4all architecture [17]. The matchmaker is responsible for identifying suitable runtime adaptation parameters for specific user preference sets and a specific context of use.
IV. THE CLOUD4ALL SMART HOUSE DEMO: A SNEAK
PEEK
The Cloud4all smart house demo employs the latest Web technologies, i.e., HTML5, CSS and JavaScript. Accessibility is an essential requirement for this demo, so, for example, all content — including content manipulated by JavaScript — is keyboard accessible and provides sufficient contrast between text and background. An early prototype using the Adobe Edge Preview tool was abandoned because it did not allow the required accessibility features.
The current demo allows the user to select one of seven personas to whose preferences the simulation should be adapted, and to select a specific controller to be simulated (see Fig. 1). The personas were selected from those created by the European projects AEGIS [18] and ACCESSIBLE [19]. For each of these personas, we created a preference set that describes the accessibility features and assistive technologies that they need. These personas are merely a convenient way of grouping and demonstrating various accessibility settings, not a way of classifying users. Tools that allow users to define their preferences are being developed in Cloud4all and other projects that contribute to GPII.
Figure 1. The persona and controller selection panel.
After having chosen a persona and a controller, the user can select from a set of appliances to be controlled ("target devices"). For the sake of simplicity and demonstrability, the smart house demo includes a simulation of smart house appliances in the Web browser rather than having real appliances connected as a back-end. The target devices are displayed in a virtual smart house depicted as a floor plan (see Fig. 2).
Figure 2. The overview screen for selection of a target device. The mouse
cursor is positioned to select the living room. Selection can also be done
via the keyboard alone.
100Copyright (c) IARIA, 2013. ISBN: 978-1-61208-306-3
CENTRIC 2013 : The Sixth International Conference on Advances in Human-oriented and Personalized Mechanisms, Technologies, and Services
109 / 145

After selecting the target device, the system provides a user interface for the target device in the browser; this user interface is adapted to the persona’s preference set and the selected controller (see Fig. 3 and 4). In a later version of the simulation, the user will be able to explore the differences between the adaptations by switching to a different persona and/or controller after selecting a device.
As examples of currently implemented pluggable user interfaces, we present the control clients for a stove (Fig. 3) and a coffee machine (Fig. 4). Both user interfaces are implemented as Web clients and are available in two versions each: a "standard" and a self-voicing version for visually impaired users (without needing a native or third-party screen reader). The self-voicing versions announce necessary information and events upon user interaction. This is achieved by including pre-recorded audio files in the web client (via HTML5 <audio> tags). All Web client versions are keyboard accessible.
Figure 3. A Web client for a stove. It allows for individual control of four
cooking plates (heat level 0-9 for each plate). In addition, it provides extra features, such as a child-lock to prevent a child from turning on the stove,
and a timer for automatic switch-off for each plate.
Figure 4. A Web client for a coffee machine. The upper-left button
indicates that the coffee machine is switched on. The user can select the
strength (1-3, i.e., weak to strong) and the size of the coffee cup (50ml to
150ml). The user receives notifications if either the water or the coffee reservoir is empty or the machine needs cleaning.
V. CONCLUSION & OUTLOOK
In this paper, we have introduced the smart house demo application of the European project Cloud4all. Its technical foundations are the URC framework, the UCH architecture, and the GPII preference set for user preferences and contextual conditions.
The smart house demo and its architecture address the previously mentioned industry concerns on adopting context-driven user interfaces (see Section I) in the following ways:
1. Based on the URC technology, designers can create a visual user interface as a "pluggable user interface" in a first step (see examples in Section IV). The pertinent abstract user interface can then be derived in a second step, resulting in the "user interface socket". The socket is required for enabling alternative (pluggable) user interfaces, possibly using other modalities.
2. For designing a visual user interface, Web designers can use the tools and technologies they are familiar with (in particular HTML5 editors and Web programming environments). However, they will have to add some JavaScript "glue" code manually for retrieving and displaying the values of the pertinent socket elements, and updating them upon user input. (This manual step could be eliminated by special extensions to the HTML editing tools.) Also, they will need to include some framework code (provided to them via a link) that will allow for tweaking the user interface at runtime based on a user preference set and contextual information. (This will also enable user-initiated adaptations at
101Copyright (c) IARIA, 2013. ISBN: 978-1-61208-306-3
CENTRIC 2013 : The Sixth International Conference on Advances in Human-oriented and Personalized Mechanisms, Technologies, and Services
110 / 145

runtime via a personal control panel, as currently developed by GPII.)
3. Regarding the control over the context-driven user interface at runtime, device manufacturers will have to live with the fact that their user interfaces are tweaked at runtime along previously known dimensions, such as font size, button size, and line height. However, they might construe completely third-party made user interfaces as damaging their corporate identity. Therefore, we need to make sure that the device manufacturer's user interfaces are used as default, and third-party user interfaces for special user groups (with disabilities) and special contexts are first approved by the device manufacturer before they are released to be used at runtime. This can be achieved via a certification process on the resource server which acts as an "app store" for user interfaces in our architecture. At the end, we hope, the resulting context-driven user interfaces will highly increase usability and accessibility of their devices, which will more than outweigh the device manufacturers' discomfort on giving away some control over the user interface at runtime.
The smart house demo application will soon be made available publicly as a showcase of pluggable user interfaces that adapt to a user's needs and preferences, to the controller's capabilities, and to situational constraints. It presents a showcase of emerging user interface adaptation technologies developed within GPII, which will allow for real context-driven user interfaces. The combination of the URC framework and context-driven runtime adaptations is deemed to be a major advancement in adaptive user interfaces for smart houses, Ambient Assisted Living environments, and beyond. URC allows the provision of a variety of pluggable user interfaces at design time, in order to accommodate for a heterogeneous user population with widely differing needs in terms of modalities and user interaction mechanisms. The client-side context-driven adaptation approach, based on user preferences, device capabilities and situational parameters, allows for low-level modifications ("tweaking") of user interface features at runtime, starting from one of the pluggable user interfaces provided at design time. We believe that such a hybrid approach is well suited to accommodate the needs of a broad range of users with disabilities, as well as providing enough incentives for mainstream industry to be adopted in the long run.
Currently, the Cloud4all smart house demo is still at an early stage, populated with a few exemplary appliances and user interfaces only. Further development work is planned to address:
Full support for the AccessForAll (ISO/IEC 24751) framework, and its registry of preference terms. Based on a user's preference set, the matchmaker will be able to automatically provide a first approximation of runtime user interface, and to adapt it at runtime to better suit the user's preferences and needs.
In addition to the automatic selection of an appropriate user interface, the user should be able to fine-tune its
settings via a personal control panel. For example, a blind user would automatically be provided with a self-voicing user interface, for which they could fine-tune the speech rate and volume at runtime.
Integration of more appliances and controller devices, together with pertinent user interfaces for all personas.
Integration of a real identification feature for the user, employing a USB stick or NFC token rather than having to select a persona. (However, we will keep the persona selection panel for demonstration purposes.)
Automatic detection of browser and runtime platform (including mobile devices) rather than having to select a controller device manually. Based on this information, the matchmaker will be able to automatically select an appropriate pluggable user interface and adapt it at runtime. (However, we will keep the controller selection panel for manual adaptions, for demonstration purposes.)
Automatic adaptation of user interface features based on situational parameters of use, such as ambient noise and brightness levels. Again, the matchmaker can use this information to adapt a user interface at runtime.
Usability studies on identifying appropriate ways of letting the user trigger and control automatic user interface adaptations. This is a core issue for overall user acceptance of the GPII framework since users want to be in full control of the user interface, but at the same time do not want to be distracted by frequent prompts on user interface issues.
Usability evaluations and comparison of alternative user interfaces with regard to their usability and acceptance level for a specific user group (optional).
These activities are planned to be conducted in the course of the Cloud4all project. In addition, other parties are encouraged to contribute to this open-source effort within the GPII realm. Interested parties are welcome to contact the authors in this matter.
ACKNOWLEDGMENT
This work has been funded by the US Dept of Education, NIDRR, under Grant H133E080022 (RERC on IT Access), and by the European Commission, under Grant 289016 (Cloud4all). The opinions herein are those of the authors and not necessarily those of the funding agencies.
REFERENCES
[1] "Cloud platforms Lead to Open and Universal access for people with Disabilities and for All" (Cloud4all) website: http://www.cloud4all.info (2013-10-17).
[2] Global Public Inclusive Infrastructure (GPII) website: http://www.gpii.net (2013-10-17).
[3] The Cloud4all public smarthouse demo website will be available at: http://smarthouse.remex.hdm-stuttgart.de.
[4] Hayes, P., Szekely, P., Lerner, R., 1985. Design alternatives for user interface management systems based on experience with COUSIN, Proceedings of the CHI’85 conference on Human factors in computing systems.
102Copyright (c) IARIA, 2013. ISBN: 978-1-61208-306-3
CENTRIC 2013 : The Sixth International Conference on Advances in Human-oriented and Personalized Mechanisms, Technologies, and Services
111 / 145

[5] Savidis, A., Stephanidis, C., 1995. Developing dual user interfaces for integrating blind and sighted users: the HOMER UIMS, Proceedings of the SIGCHI conference on Human Factors in Computing Systems.
[6] Myers, B., Hudson, S., Pausch, R., 2000. Past, present and future of user interface software tools. ACM Transactions on Computer–Human Interaction 7(1), 3–28.
[7] OASIS User Interface Markup Language (UIML) Technical Committee. http://www.oasis-open.org/committees/tc_home.php?wg_abbrev=uiml (2013-10-17).
[8] Nichols, J.; Rothrock, B.; Chau, D.H.; & Myers, B.A.(2006). Huddle: Automatically Generating Interfaces for Systems of Multiple Connected Appliances. ACM Symposium on User Interface Software and Technology, UIST'06, October 15-18, 2006, Montreux, Switzerland.
[9] Gajos, K.Z.; Wobbrock, J.O.; & Weld, D.S. (2008). Improving the performance of motor-impaired users with automatically-generated, ability-based interfaces. In: Proceedings of CHI'08, Florence, Italy, 2008.
[10] Peissner, M.; Häbe, D., & Schuller, A. (2012). MyUI deliverable D2.2. Adaptation concept and Multimodal User Interface Patterns Repository. http://myui.eu/deliverables/MyUI_D2-2_final.pdf (2013-10-17).
[11] Klyne, G.; Reynolds, F.; Woodrow, C.; Ohto, H.; Hjelm, J.; Butler, M.H.; & Tran, L. (2004). Composite Capability/Preference Profiles (CC/PP): Structure and Vocabularies 1.0. W3C Recommendation 15 January 2004. http://www.w3.org/TR/CCPP-struct-vocab/ (2013-10-17).
[12] Treviranus, J. (2009). "You say tomato, I say tomato, let's not call the whole thing off: the challenge of user experience design in distributed learning environments", On the Horizon, Vol. 17 Iss: 3 pp. 208 – 217.
[13] Vanderheiden, G.; and Zimmermann, G. (2005). Use of User Interface Sockets to Create Naturally Evolving Intelligent Environments. Proceedings of the 11th International Conference on Human-Computer Interaction (HCII 2005), July 22-27, 2005, Las Vegas, Nevada, USA.
[14] Zimmermann, G. (2008). ISO/IEC 24752:2008. Information Technology - User Interfaces - Universal Remote Console (5 parts). International Organization for Standardization (ISO).
[15] Thakur, P. & Zimmermann, G. (2012). Universal Control Hub 1.0. Technical Report. OpenURC Alliance. http://www.openurc.org/TR/uch1.0 (2013-10-17).
[16] Thakur, P. & Rosa, B. (2012). URC-HTTP Protocol 2.0. Technical Report. OpenURC Alliance. http://www.openurc.org/TR/urc-http-protocol2.0 (2013-10-17).
[17] Loitsch, C.; Stiegler, A.; Strobbe, C.; Tzovaras, D.; Votis, K.; Weber, G.; & Zimmermann, G. (2013). Improving Accessibility by Matching User Needs and Preferences. In Assistive Technology: From Research to Practice (pp. 1357–1365). IOS Press. doi:10.3233/978-1-61499-304-9-1357.
[18] AEGIS website: http://www.aegis-project.eu/ (2013-10-17). Project personas: http://www.aegis-project.eu/index.php?option=com_content&view=article&id=63&Itemid=53 (2013-10-17).
[19] ACCESSIBLE website: http://www.accessible-eu.org (2013-10-17).
103Copyright (c) IARIA, 2013. ISBN: 978-1-61208-306-3
CENTRIC 2013 : The Sixth International Conference on Advances in Human-oriented and Personalized Mechanisms, Technologies, and Services
112 / 145

User-Centric Adaptive Automation through
Formal Reconfiguration of User Interface Models
Benjamin Weyers
Dept. of Computer Science and Applied Cognitive Science
University of Duisburg-Essen
Duisburg, Germany
Abstract—This paper presents work in progress on a novel
approach for modeling and implementing user-centric
adaptive automation based on formal modeling and
reconfiguration of user interface models. The approach
addresses automation as relevant parameter in human-
machine interaction; it is responsible for increasing workload
during monitoring and control of complex technical systems
and thereby for human errors in interaction. By actively
involving the user into the adaptation process through user-
side applied reconfiguration and system-side, workload
depended adaptation, the user gets a deeper insight to the
automation of the system and automation gets adapted to his
or her needs. Thus, the main contribution of the work
presented in this paper is the close integration of the user into
the adaptation process of automation, resulting in a user-
centric adaptive automation approach.
Keywords-formal modeling; human-computer interaction;
adaptive automation
I. INTRODUCTION AND MOTIVATION
In the course of the last decade, the increasing automation of complex controlling tasks has significantly changed how control of complex technical systems is done. Examples from the chemical and energy industry show that the main task of operators is to monitor the (automated) technical process rather than to control it [1]. Research in cognitive psychology has revealed important consequences of automation with respect to the human operator’s workload in monitoring and control of technical processes, especially in critical, non-standard situations [2]. High workload is closely related to error rate, as well as to factors that influence the error rate in human-machine interaction, such as motivation, well-being, or situation awareness [3, 4].
Adaptive user interfaces are developed primarily in order to reduce workload and to increase human performance by adapting interaction to a specific user [5]. Thus, it seems obvious to adapt user interfaces in order to suit particular users’ needs and to introduce into the adaption process the degree of automation as an important parameter influencing human factors in human-machine interaction [6]. Here, the degree of automation defines whether the user has more or less control over the process, which system information in a critical situation is provided, or how the granularity of input operations is defined. Still, adaptive user interfaces require
information and data about the situation of user-system interaction to trigger and initialize certain adaptations. Here, mental workload has been identified as one primary reason for errors in user-system interaction. Especially in context of automated systems, the degree of automation is associated with potential increase of mental workload and thereby is an indicator whether the degree of automation is too high or too low and whether it should be adapted or not. Weert [7] describes how mental workload can be measured based on different physiological factors, such as heartbeat rate, facial expression, perspiration, or eye blink rate. Out of these factors, pupillometry has been identified as promising measurement for workload, especially in context of adaptive automation to increase human performance [8].
Motivated by these findings in cognitive psychology and work on adaptive automation, this paper presents an approach to combine system- and user-side triggered adaptation of the degree of automation as being integrated in a model-based and executable approach for describing user interfaces based on a formal and graph-based modeling approach for the creation of user interface models. This close integration of model-based creation and system-/user-side adaptation tries to make a first step into the direction of a “human-machine symbiosis”, without losing the focus of creating computer-based systems [9]. This gap between modeling and implementation highlights the problem of transforming models into executable code, as has been described in context of software development [10].
Therefore, the model-based approach described in Section 2 is executable and offers mechanisms for model-intrinsic adaptation through graph transformation systems. Therefore, the presented approach is graph-based and is transformed into reference nets, a special type of Petri net. Still, computer-based adaptation of automation assumes the accessibility of automation in a system’s architecture as a formal model or description. Based on this observation, Section 3 presents a modeling approach for integrating automation with the user’s current workload into an adaption concept, targeting formal user interface reconfiguration using predefined adaption rules. These adaption rules getting instantiated based on the measured data and being applied in a next step to the formal user interface model. Finally, Section 4 will conclude the paper and will discuss future work aspects, such as a planned evaluation study
104Copyright (c) IARIA, 2013. ISBN: 978-1-61208-306-3
CENTRIC 2013 : The Sixth International Conference on Advances in Human-oriented and Personalized Mechanisms, Technologies, and Services
113 / 145
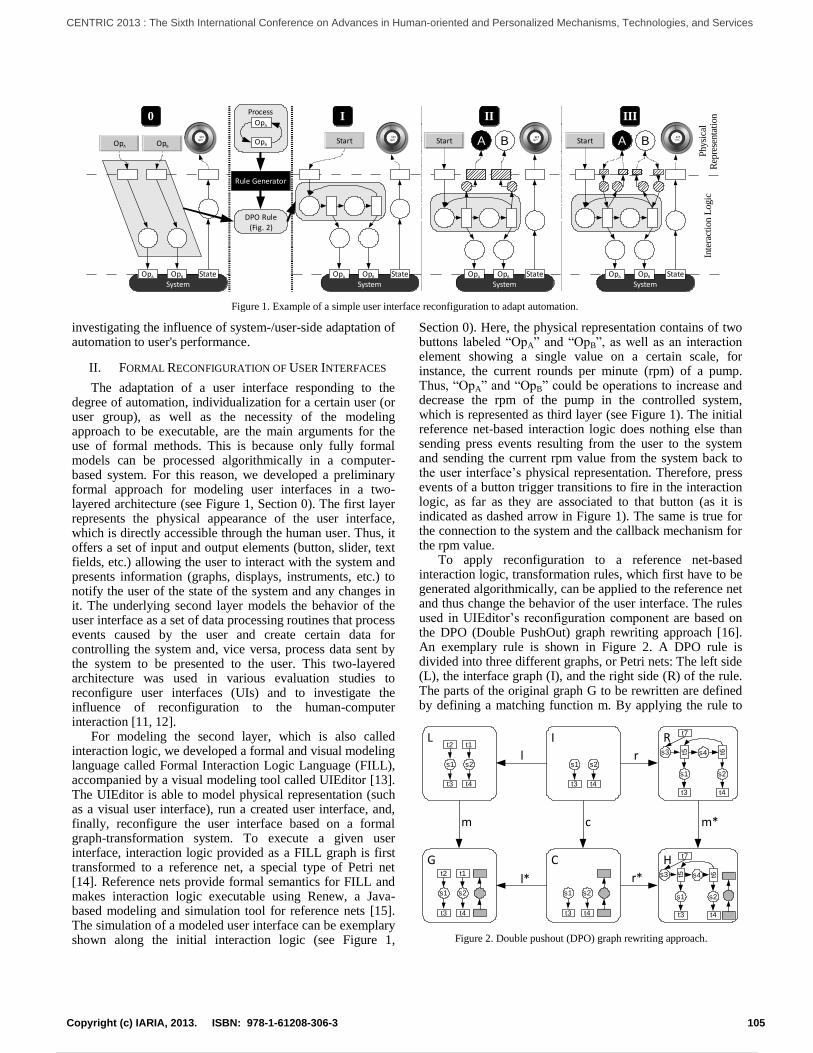
investigating the influence of system-/user-side adaptation of automation to user's performance.
II. FORMAL RECONFIGURATION OF USER INTERFACES
The adaptation of a user interface responding to the degree of automation, individualization for a certain user (or user group), as well as the necessity of the modeling approach to be executable, are the main arguments for the use of formal methods. This is because only fully formal models can be processed algorithmically in a computer-based system. For this reason, we developed a preliminary formal approach for modeling user interfaces in a two-layered architecture (see Figure 1, Section 0). The first layer represents the physical appearance of the user interface, which is directly accessible through the human user. Thus, it offers a set of input and output elements (button, slider, text fields, etc.) allowing the user to interact with the system and presents information (graphs, displays, instruments, etc.) to notify the user of the state of the system and any changes in it. The underlying second layer models the behavior of the user interface as a set of data processing routines that process events caused by the user and create certain data for controlling the system and, vice versa, process data sent by the system to be presented to the user. This two-layered architecture was used in various evaluation studies to reconfigure user interfaces (UIs) and to investigate the influence of reconfiguration to the human-computer interaction [11, 12].
For modeling the second layer, which is also called interaction logic, we developed a formal and visual modeling language called Formal Interaction Logic Language (FILL), accompanied by a visual modeling tool called UIEditor [13]. The UIEditor is able to model physical representation (such as a visual user interface), run a created user interface, and, finally, reconfigure the user interface based on a formal graph-transformation system. To execute a given user interface, interaction logic provided as a FILL graph is first transformed to a reference net, a special type of Petri net [14]. Reference nets provide formal semantics for FILL and makes interaction logic executable using Renew, a Java-based modeling and simulation tool for reference nets [15]. The simulation of a modeled user interface can be exemplary shown along the initial interaction logic (see Figure 1,
Section 0). Here, the physical representation contains of two buttons labeled “OpA” and “OpB”, as well as an interaction element showing a single value on a certain scale, for instance, the current rounds per minute (rpm) of a pump. Thus, “OpA” and “OpB” could be operations to increase and decrease the rpm of the pump in the controlled system, which is represented as third layer (see Figure 1). The initial reference net-based interaction logic does nothing else than sending press events resulting from the user to the system and sending the current rpm value from the system back to the user interface’s physical representation. Therefore, press events of a button trigger transitions to fire in the interaction logic, as far as they are associated to that button (as it is indicated as dashed arrow in Figure 1). The same is true for the connection to the system and the callback mechanism for the rpm value.
To apply reconfiguration to a reference net-based interaction logic, transformation rules, which first have to be generated algorithmically, can be applied to the reference net and thus change the behavior of the user interface. The rules used in UIEditor’s reconfiguration component are based on the DPO (Double PushOut) graph rewriting approach [16]. An exemplary rule is shown in Figure 2. A DPO rule is divided into three different graphs, or Petri nets: The left side (L), the interface graph (I), and the right side (R) of the rule. The parts of the original graph G to be rewritten are defined by defining a matching function m. By applying the rule to
L
G
R
H
s1l
l*
m m*
I
C
c
r
r*
t2
s2
t1
t3 t4
s1
t2
s2
t1
t3 t4
s1 s2
t3 t4
s1 s2
t3 t4
s1 s2
t3 t4
s3 t5 t6s4
t7
s1 s2
t3 t4
s3 t5 t6s4
t7
Figure 2. Double pushout (DPO) graph rewriting approach.
System
Start
OpA OpB State
System
Start
OpA OpB State
A B
System
Start
OpA OpB State
A B
Process
OpA
OpB
I II III
Inte
ract
ion L
ogic
Physi
cal
Rep
rese
nta
tion
System
OpA
0
OpB
DPO Rule
(Fig. 2)
OpA OpB State
Rule Generator
Figure 1. Example of a simple user interface reconfiguration to adapt automation.
105Copyright (c) IARIA, 2013. ISBN: 978-1-61208-306-3
CENTRIC 2013 : The Sixth International Conference on Advances in Human-oriented and Personalized Mechanisms, Technologies, and Services
114 / 145

G, the difference between L and I is deleted from G (resulting in C), and the difference between I and R is added to C, yielding the final result, H. Figure 2 shows the rule that is applied to the initial interaction logic (see Figure 1, Section 0), where the result is shown in Figure 1, Section I, accompanied by a change of the physical representation. Here, a specific part of a control process (e.g., alternating increasing and decreasing of the pump’s rpm) has been integrated into the interaction logic to automate the indicated process. Thus, automation becomes part of interaction logic as will be described in greater detail below. In many cases, this kind of reconfiguration of the user interface requires modifying the physical representation in respect to newly added interaction elements for input data or changes in how information is represented, as shown in Figure 1.
Thus, adaptation of user interfaces is implemented based on formal reconfiguration techniques that are used and integrated in a transformation-rule generator using context information, such as an automation model and user’s current mental workload. The main contribution of using formal methods is that the model is still executable after creating and reconfiguring the user interface, where the whole adaptation process is implemented in the same formalism. This prevents solutions to be loose combination of different modeling approaches, which run the risk to be incompatible or losing information by changing between different modeling concepts [10]. The section below presents a coherent solution of adaptation of automation based on the former described self-contained modeling approach.
III. ADAPTATION OF AUTOMATION
For adaptive automation based on formal user interface modeling, it is assumed that the automation concept is fully accessible through an external formal model that matches the underlying concept of formal user interface modeling; therefore, the automation model should employ a Petri net–based representation. Based on this assumption, automation can be further understood as formal abstraction of interaction processes between the human user and any given system that has been technically implemented. Thus, in our sense, automation is part of the above-introduced interaction logic.
Assume a discrete and recurrent process of two operations “OpA” and “OpB”, which have to be executed in iterative fashion, such as the process shown in Figure 1 and described before. According to the first assumption, this process can be introduced into reference net–based interaction logic as indicated by the bold arrow in Figure 1,
which represents the application of the DPO rule shown in Figure 2. The automation of this process can then be started by the user pressing the newly added “Start” button. From this point on, the user is only able to monitor the system’s state by observing the tachometer-like output widget, showing the current pump’s rpm being controlled. Thus, using the initial interface, s/he is not able to follow the operations that are automatically executed by the interaction logic.
As Parasuraman [1, 2] described, workload increases during critical situations because the user has to understand the system’s current situation, as well as how the automated control processes are reacting to the situation. The user has to gain insight into the automated process, resulting in increasing mental workload, sometimes dramatically. To adapt automation to this situation, the initial user interface can be reconfigured (see Figure 1, Section II), by adding more interaction elements providing deeper insight into the automated process. Two lamps are added to the physical representation accompanied by an extension of the interaction logic, now showing which operation is executed at any given moment. This makes interaction more finely grained and viewable to the user. A further reconfiguration extends the first by changing the simple lamps into buttons (see Figure 1, Section III), where the user is now able to control the automated process. Another possibility would be to remove the automation from the interaction logic and give all control back to the user without restriction or even, contrarily, to reduce the interaction and fully automate the process. The first would result in the initial user interface (see Figure 1, Section 0).
The second aspect for introducing adaptive automation into formal user interface models is that a system exists that is able to measure user’s workload (beside other possible measurements) as s/he interacts with the technical system. Therefore, adaptive automation will be implemented as a component of the UIEditor framework, which combines the perceived mental workload of the user and his/er individual requirements. Here, three components have to be realized: the workload identification component, which observes the user through such means as an eye-tracker and calculates the workload from the captured data. The second component is the rule generator, which generates formal reconfiguration rules to be applied by the existing reconfiguration component in the UIEditor. The third component will be based on UIEditor’s reconfiguration editor, which is able to apply individual reconfiguration operations to the interaction logic and thereby to the automation model by the user himself; called user-side adaptation above. Here, the user triggers the reconfiguration, selects the specific part of interaction logic to be reconfigured, and chooses the rule to be applied.
Various works have identified pupillometry as a possible indicator of user’s workload [7, 8, 17]. Thus, the rule generator is triggered by the workload identification component to generate and apply reconfiguration to the user interface, what is called system-side adaptation (see Figure 3). Rules are then generated from rule patterns that have already been derived and described in automation research, resulting in a reconfiguration as shown in the above-
Rule Generator
Workload Rule Patterns
User Interface
Eye Tracker Automation
Reconfigurer
Figure 3. Conceptual architecture of the automation adaption
module for the UIEditor.
106Copyright (c) IARIA, 2013. ISBN: 978-1-61208-306-3
CENTRIC 2013 : The Sixth International Conference on Advances in Human-oriented and Personalized Mechanisms, Technologies, and Services
115 / 145

described example, depending on the amount of detected workload (see Figure 1). Rule patterns consist primarily of specific structures to be added or deleted from reference net-based interaction logic and algorithmic implementation necessary to detect relevant parts of the reference net to be transformed. In conclusion, the combination of system- and user-side adaptation results in an integrative user-centric approach for adapting automation based on formal user interface models.
IV. CONCLUSION AND FUTURE WORK
In this paper, we presented a new approach to implement adaptive automation as part of a user interface modeling approach using formal methods to describe interaction logic. This integrative approach is a first step towards closing the gap between modeling, execution, and reconfiguration of user interfaces and integrating adaptive concepts to adapt user interface to user’s needs, as well as making the degree of automation accessible for system- and user-side adaptation. Based on visual modeling and graph-based languages accompanied with algorithmic transformation of reference nets, user interface models get executable and can be reconfigured by graph rewriting systems. Considering automation as part of interaction logic, reconfiguration can also change automation beside further individualizations of the user interface concerning user’s needs.
Finally, the described work in progress will be evaluated and further elaborated in context of former applied studies [12, 13]. Here, we investigated the influence of individualization of user interfaces using reconfiguration on monitoring and control of technical systems. The reduction of errors was in focus of these studies showing that it is possible to reduce errors through reconfiguration of user interfaces for interaction with technical system. Therefore, we will investigate the former introduced approach of adaptive automation concerning usability and applicability in a real monitoring and control scenario of a technical system (e.g., a simple simulation of a nuclear power plant), as well as analyze its influence on errors in interaction as measurable variable. We will run the test with two groups; one group will do predefined control tasks supported by system-side adaptation of automation, as well as user-side individual reconfiguration, whereas the control group will undertake the same tasks without support by the reconfiguration system.
The above introduced example (cf., Figure 1) is only one aspect of how automation fosters increasing workload and how it is possible to work against this effect through formal user interface reconfiguration. Therefore, future work will seek to identify further features of automation and to generate rule patterns in order to offer a comprehensive library that can deal with various situations and types of automation. Furthermore, an extension of the UIEditor tool for modeling, running, and reconfiguration via modularization and a more finely grained leveled architecture will be developed and implemented due to necessary refinement in the interaction logic model. Finally, the integration and reconfiguration of automation without
necessarily including the user but other models and requirements will be part of future work.
REFERENCES
[1] R. Parasuraman, T. Sheridan, and C.D. Wickens, “A model for types and levels of human interaction with automation,” IEEE Transactions on Systems, Man, and Cybernetics: Systems and Humans, vol. 30(3), 2000, pp. 286–297.
[2] R. Parasuraman and V. Riley, “Humans and automation: Use, misuse, disuse, abuse,” Human Factors, vol. 39(2), 1997, pp. 230–253.
[3] C.D. Wickens and J.G. Hollands, Engineering psychology and human performance, Addison Wesley, 1999.
[4] M.R. Endsley, “Toward a theory of situation awareness in dynamic systems,” Human Factors , vol. 37(1), 1995, pp. 32–64.
[5] A. Jameson, “Adaptive interfaces and agents,” in Human-Computer Interaction Handbook, Erlbaum, 2003, pp. 305–330.
[6] R. Parasuraman, K.A. Cosenzo, and E. De Visser, “Adaptive automation for human supervision of multiple uninhabited vehicles: Effects on change detection, situation awareness, and mental workload,” Military Psychology, vol. 21(2), 2009, pp. 270–297.
[7] J.C.M. Weert, “Ship operator workload assessment tool,” Department of mathematics and computer science. Technical University Eindhoven, Eindhoven, 2006.
[8] T. de Greef, H. Lafeber, H. van Oostendorp, and J. Lindenberg, “Eye Movement as Indicators of Mental Workload to Trigger Adaptive Automation,” in Proc. of Augmented Cognition, HCII 2009, LNAI 5638, Springer, 2009, pp. 219–228.
[9] P.A. Hancock et al., “Human-Automation Interaction Research: Past, Present, and Future,” Ergonomics in Design: The Quarterly of Human Factors Applications, vol. 21(2), 2013, pp. 9–14.
[10] F. Heidenreich, J. Johannes, M. Seifert, and C. Wende, “Closing the Gap between Modelling and Java,” Software Language Engineering, LNCS 5969, Springer, 2010, pp 374–383
[11] B. Weyers, D. Burkolter, A. Kluge, and W. Luther, “Formal modeling and reconfiguration of user interfaces for reduction of human error in failure handling of complex systems,” Human Computer Interaction, vol. 28(10), 2012, pp. 646–665.
[12] B. Weyers, W. Luther, and N. Baloian, “Interface creation and redesign techniques in collaborative learning scenarios,” Future Generation Computer Systems, vol. 27(1), 2011, pp. 127–138.
[13] B. Weyers, Reconfiguration of user interface models for monitoring and control of human-computer systems, Dr.-Hut, 2012. http://www.uieditor.org/publication.html
[14] O. Kummer, Referenznetze, Logos, 2002.
[15] O. Kummer et al., “An extensible editor and simulation engine for Petri nets: Renew,” Applications and Theory of Petri nets, LNCS 3099, Springer, 2004, pp. 484–493.
[16] H. Ehrig, K. Hoffmann, and J. Padberg, “Transformation of Petri nets,” Electronic Notes in Theoretical Computer Science, vol. 148(1), 2006, pp. 151–172.
[17] T. Halverson, J. Estepp, J. Christensen, and J. Monnin, “Classifying workload with eye movements in a complex task,” in Proc. HFES Annual Meeting, Human Factors and Ergonomics Society, 2012, pp. 168–172.
107Copyright (c) IARIA, 2013. ISBN: 978-1-61208-306-3
CENTRIC 2013 : The Sixth International Conference on Advances in Human-oriented and Personalized Mechanisms, Technologies, and Services
116 / 145

A Multi-Method Approach to Assessing the Usability of Mobile Job Advertisements
Stephan Böhm, Susanne J. Niklas, and Wolfgang Jäger RheinMain University of Applied Sciences
Department of Media Management Wiesbaden, Germany
e-mail: stephan.boehm, susanne.niklas, [email protected]
Abstract—Accessing the Web from mobile devices has become increasingly common even when searching for job information. Nowadays, most job board offerings are mobile-optimized. How-ever, the search results often refer to job advertisements (ads) and external career pages that are not completely optimized for mobile access. As a result, mobile users may be confronted with inadequate usability or a dissatisfactory user experience. In this context, the purpose of this study is to assess the usability of job ads posted on job portals to identify deficits and best practices. This paper is a work in progress and presents the intended multi-method approach as well as some preliminary findings for an exemplary sample of job ads posted on a German job board.
Keywords-Usability, User Experience, User Interfaces, Heuristic Evaluation, Mobile Recruiting
I. INTRODUCTION Recent studies point out that about 69 percent of all In-
ternet users access the web using mobile devices [1]. In this context, it is becoming more and more common to use these devices in order to retrieve job information as well. In Ger-many, 58 percent of all online job seekers are already access-ing job information via mobile devices; in high-tech indus-tries or the media sector as many as 63 percent browse the mobile Internet for a new professional challenge [3]. Thus, mobile optimization is becoming essential in order to main-tain reach among target groups and to keep up with the changing usage of media channels.
According to a multi-year study on mobile recruiting in Germany [5], HR managers attribute a growing relevance to mobile devices in personnel recruiting. In 2011, 95 percent of the participating HR managers stated that addressing po-tential candidates via mobile devices is becoming increasing-ly important. The proportion of companies and organizations using mobile recruiting technologies and applications rose from 8 percent in 2009 to 25 percent in 2011. A mobile op-timized career website is offered by 17 percent of the com-panies according to the afore-mentioned study [5]. More recent analyses suggest that 24 percent of all German com-panies already offer a mobile optimized career website, fol-lowed by 17 percent with company-owned iPhone applica-tions by the end of 2012 [3]. A study focusing on large en-terprises in Germany revealed that as many as 80 percent of the companies provide a mobile career website and about 30 percent have a mobile career app [14].
Mobile recruiting activities of individual companies are complemented by job boards. Their providers aggregate job ads and career information across companies and sectors. In 2011, an analysis of the Apple App Store already identified ten mobile job board applications for the German market [4]. Employers who place job ads on job boards usually get a package for the online channels supported by the portal. When doing this, job board providers mobile-optimize ac-cess to their own portal functions, but may not alter the de-sign of the job ads provided by a company. In that case, the search results of the job board can refer to a career website or a job ad that is not mobile-optimized. Thus, the mobile users may be confronted with inadequate usability or a dissatisfac-tory user experience.
As a result, all three interest groups are confronted with setbacks concerning their individual goals: The job seeker does not get the information he/she was looking for or has a poor user experience. Consequently, he or she probably decides to discontinue the app usage. The employer placing the job ad may experience a negative impact on the recruit-ing process, its employer branding, or may even lose a poten-tial applicant. The job board provider, in turn, loses an app user, i.e., reach, which constitutes the basis of the job board business model. But even if a user does not directly discon-tinue the app usage, the design of the mobile ad and its con-tent does play a major role concerning job ads’ efficacy in terms of recall and retention [19]. However, regular usability guidelines for mobile websites cannot be applied directly to mobile job ads. Job ads provide very specific information within a focused area of application and thus require adapted criteria for usability analysis. But, despite the importance of these aspects and their high practical relevance, neither spe-cially focused developer guidelines nor scientific research studies on mobile job advertising exist.
To fill this research gap, the study at hand aims to identi-fy deficits and best practices on a mobile-optimized job ad design, proposing a multi-method approach. The research framework will be described in Section II, followed by the intended research methodology in Section III. Some prelimi-nary findings and an outlook on further research are dis-cussed in the last part of the paper.
108Copyright (c) IARIA, 2013. ISBN: 978-1-61208-306-3
CENTRIC 2013 : The Sixth International Conference on Advances in Human-oriented and Personalized Mechanisms, Technologies, and Services
117 / 145

II. RESEARCH FRAMEWORK Requirements for the design of mobile-optimized job ads
can be found in guidelines for the user-interface design of mobile applications or mobile websites, e.g., the well-known Best Practice Guidelines of the World Wide Web Consorti-um (W3C) [24]). Here, recommendations are given regard-ing image format support, style sheet support, page weight, or color usage. However, two problems exist concerning the usage of such guidelines: firstly, the development as well as improvements of modern smartphones are occurring at a furious rate. As a result, guidelines on principles for mobile development rapidly become outdated [9]. Secondly, those guidelines merely refer to technical capabilities and do not address the importance of different design aspects from the user perspective or usage context [15]. Some existing ap-proaches, such as Nielsen’s usability heuristic [18] or the adapted metric of the Microsoft Usability Guidelines (MUG, [22]), present a more holistic view on aspects influencing system usability. The MUG guidelines are based on the ISO 9241 usability definition, defining usability as the “Extent to which a product can be used by specific users to achieve specified goals with effectiveness, efficiency, and satisfac-tion in a specified context of use” [13]. Besides structural evaluation in the form of heuristic analysis, user-oriented usability tests constitute an important evaluation method in order to measure efficiency, effectiveness as well as user satisfaction [12, 13]. User satisfaction can be measured by experience-based rating scales, product liking, or level of acceptance of the task solving effort [13].
As this study aims at giving practical recommendations for the design and development of mobile job ads, a multi-method approach with regard to both −structural evaluation as well as user based testing of usability aspects− will be adopted. In order to not just ensure success in terms of usa-bility, but also in terms of a company’s communication suc-cess, research on design aspects influencing the reception of job ads’ content will be conducted additionally. The intended research approach will be described in the next section.
III. METHODOLOGY Usability analysis can be classified in empirical and ana-
lytical methods. Empirical testing can comprise user and task observations of prototypes and final products by field or laboratory studies, including walk through and thinking-aloud analysis [2, 7, 18]. Heuristic evaluations, in turn, refer to assessment by a small group of evaluators according to a predefined set of usability guidelines or criteria [18]. As described above, mobile development often draws on tech-nical guidelines and best practice standards, leading to the problems of being quickly outdated as well as not seeing the goal of overall usability concerning user satisfaction and usage acceptance [9, 15]. Heuristic usability evaluations however, by implementing a systematic inspection of user interface design aspects, enable the identification of usability problems to which special attention should be paid [18]. Here, two main methodologies are available for evaluation. Firstly, validator tools offer a standardized evaluation and in-depth analysis of websites determining how well the site
performs on mobile devices. Secondly, a heuristic evaluation can be carried out by looking at interface design in accord-ance with certain rules as listed in the guidelines. Here, a small number of evaluators (at least three) assess the compli-ance of a user-interface with usability principles, the so-called heuristics [18]. As presented in Figure 1, phase 1 of the study at hand implements two methods of usability eval-uation for an exemplary set of mobile job ads: (1) A tool based usability evaluation by the W3C mobileOK Checker [25] and the mobiReady testing tool [17] validator. Both tools provide an overall value of “mobile fitness” as well as a detailed report on specific technical checks. (2) A heuristic analysis by evaluators, i.e., usability experts. The evaluation heuristic was defined by considering usability criteria of common standards, e.g., the W3C guidelines [24], the BBC Mobile Style Guide [10], the mobile applications of the MUG [22] or the Microsoft Mobile Design Guidelines [16].
Tool-basedValidation
HeuristicEvaluation
Usability (User Perspective)(User Walkthrough, Thinking Aloud)
User Satisfaction(User Questionnaire, Ranking of Job Ads)
Design Best Practices(A/B Testing, Variation of Design Elements)
Visual Perception and Effectiveness(Eye Tracking, Recall Test)
Usability (Design/System Perspective)
3rdPhase
2ndPhase
1ndPhase
Pro
toty
pes
Sam
ple
of J
ob A
ds
Figure 1. Study’s Multi-method Approach
In phase 2, empirical user testing is carried out to consid-er how users perceive mobile job ads and to identify usability issues and misconceptions from the user perspective [18]. Here, test subjects are asked to search for a job on the job board and to utilize presented job ads for this purpose (user walkthrough) by applying a thinking aloud approach for the analysis. This enables us to identify the job ads’ major aber-rations and drawbacks with which the user is confronted when attempting to achieve his or her goal and to evaluate design aspects within an actual usage context. Following this procedure, the test users will be asked to rate the likability of the observed job ads as well as to rank them in order of their preference to get a measure of the users’ final satisfaction with the ads [13].
As mentioned above, the aim of the study is not only to evaluate pure usability aspects but also to assess the commu-nication efficiency of the job ads. For this purpose, A/B testing will be combined with an eyetracking and a recall analysis in phase 3. Within the so-called A/B testing, various user interface design alternatives are analyzed to obtain de-sign recommendations, i.e., design best practices. Here, only one single design attribute is varied and evaluated, like type-face or button design. Analysis of the different versions can either be done in a live setting by, e.g., tracking conversion rates of design alternatives or within an experimental labora-tory environment [11]. An experimental setup enables a
109Copyright (c) IARIA, 2013. ISBN: 978-1-61208-306-3
CENTRIC 2013 : The Sixth International Conference on Advances in Human-oriented and Personalized Mechanisms, Technologies, and Services
118 / 145

combination of A/B testing with other types of analysis, e.g., to better understand user interaction and visual perception of the presented job ad [6]. For this purpose, one of the most advanced usability testing methods is the eyetracking tech-nique, which can be conducted directly on a mobile device (using head-mounted systems) or based on a simula-tion/representation of the design artefact on a desktop-based configuration. Thus, researchers are able to gain information on unconscious perception and information processing, which can be used to optimize user interfaces [6, 20]. As it has been shown that content related design aspects like struc-ture or visual design have a major influence on user percep-tion and comprehension [8], these aspects were included in the study. To allow for aggregated group analysis and be-cause the focus of this part of the study was on visual percep-tion and not on user interaction, the study incorporates a desktop-based test configuration. Factors for design variation to be considered are, i.e., length and complexity of job de-scription, single column vs. two column layout, or media richness. Aspects for such a variation can be identified with-in the preceding heuristic analysis and usability testing as well. The eyetracking analysis will be followed by recall tests on the user perception of the job ads’ content. Here, users will be asked to name companies, job titles or to recall employer brands in order to measure ad efficacy [19]. The combination of the results from the eyetracking and recall testing is intended to gain recommendations for improving both, usability as well as communication effectiveness of the job ads. Aspects of the information quality [21] provided in the mobile-optimized job ad and its implications on the ease of finding appropriate job information in job portals is not analyzed but might be subject to future research.
IV. STATUS QUO AND PRELIMINARY FINDINGS The implementation of the multi-stage research approach
to assess the usability of job ads within the research project is a work in progress and not completed yet. As a first step, the heuristic evaluation was applied to a sample of 13 exem-plary job ads from a German job board. As mentioned above, available mobile design guidelines were analyzed and con-solidated to define an appropriate heuristic. By doing this, e.g., the formerly advised maximum page size of maximum 20 KB [24] was identified as no longer being up to date, since processing power and data transmission have improved tremendously [9]. Therefore, some more recent studies sug-gest that mobile pages should ideally not exceed 50 or max-imum 100 kilobyte [23]. Other criteria refer to more detailed aspects like touch screen optimization, automatic redirects to mobile sites when accessed by mobile, the integration of inbuilt mobile functions like click-to-mail/-call, design as-pects like font, contrast and images, as well as content relat-ed aspects concerning the appropriateness and relevance of information, e.g., job description, company, qualification or application. As shown in Table I, a catalog with criteria subdivided into the categories access/navigation (ACN), design (DES), content (CON), and interactivity (INT) was derived. The catalog contained more than 30 criteria for the evaluation of the job ads and was intended to complement the tool-based assessment of “mobile fitness” mentioned in
the preceding section. The tools calculate the mobile fitness as a percentage of mobile optimization. Likewise each cate-gory of the heuristic evaluation was measured by a percent-age representing the extent to which the job ads comply with the criteria in the category as well as from an overall per-spective.
TABLE I. AREAS OF HEURISTIC EVALUATION
Category No. of. Criteria
Areas of Analysis (No. of Criteria)
ACN. Access/ Navigation
9 Mobile accessibility (3), use of mobile technologies (2), mobile optimized navigation (2), ease of access to addition-al sources (2)
DES Design 12 Layout and structure (3), text and readability (3), mobile optimized embedding of media (6)
CON Content 10 Corporate identity, appropri-ateness and relevance of em-ployer and job information (8), contact channels
INT Interactivity 5 Click-to-mail/-call, social media integration, locate job on map, option to apply mo-bile
The sample of job ads was assessed by eight evaluators
using these heuristic criteria. An overall result was calculated based on the ratings of the two validation tools (VAL) and the consolidated heuristic evaluation (HEU). At this stage of the study, no weighting of the criteria, categories or types of tests was applied. This means the overall result was calculat-ed as the arithmetic average of the partial results. Table II shows the preliminary results for this analysis in phase 1 of our study. The table also shows the lowest (Min.) and high-est (Max.) rating as well as the difference (Diff.) between the highest and lowest ranking job ad within each category and for the overall result.
TABLE II. PRELIMINARY RESULTS OF USABILITY ANALYSIS
VAL HEU
Heuristic (HEU) by Category Over-
all
ACN DES CON INT
Avg. 27% 50% 43% 56% 77% 24% 38% Min. 12% 38% 22% 37% 45% 3% 26% Max. 54% 69% 74% 83% 98% 48% 48% Diff. 42% 32% 51% 46% 53% 45% 22%
The key finding is that each of the examined job ads
needs to be improved in order to provide an acceptable mo-bile user experience. None of the thirteen tested job ads achieves an overall rating of 50 percent. This is mainly caused by the dissatisfactory results for most of the job ads in terms of technical validation. However, the results provid-ed by the validators and the heuristic rating differ greatly in the majority of the cases as presented in Figure 2. Many of
110Copyright (c) IARIA, 2013. ISBN: 978-1-61208-306-3
CENTRIC 2013 : The Sixth International Conference on Advances in Human-oriented and Personalized Mechanisms, Technologies, and Services
119 / 145
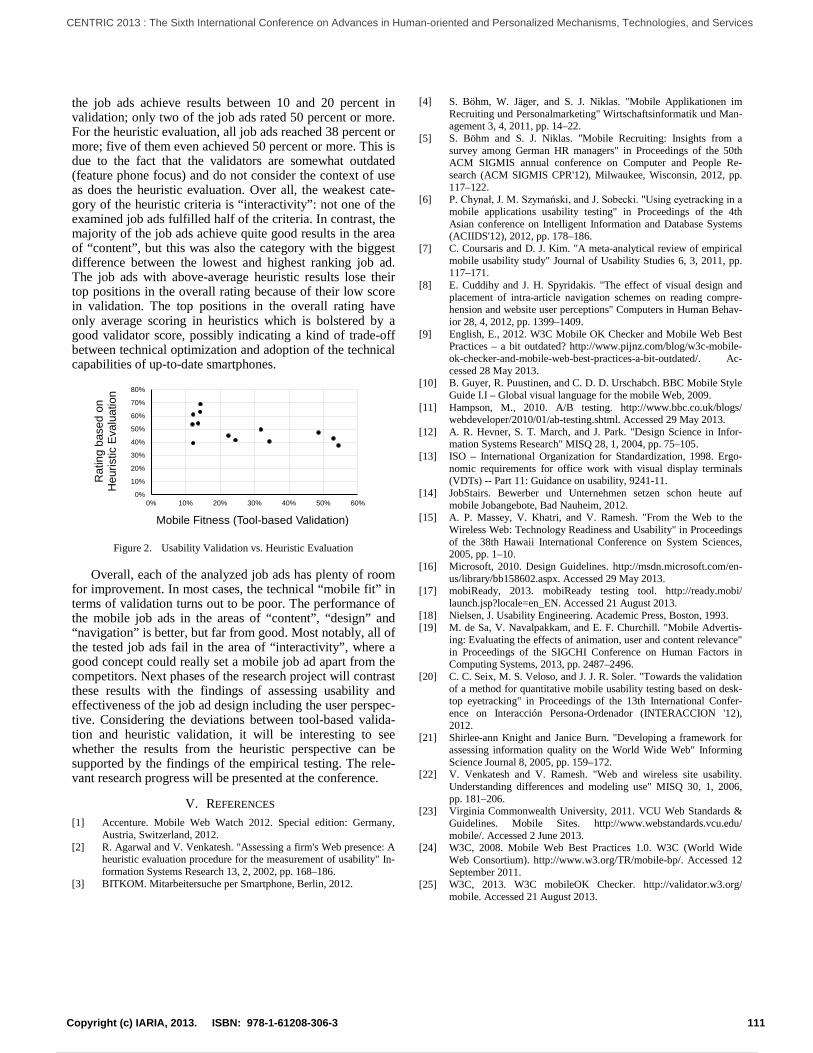
the job ads achieve results between 10 and 20 percent in validation; only two of the job ads rated 50 percent or more. For the heuristic evaluation, all job ads reached 38 percent or more; five of them even achieved 50 percent or more. This is due to the fact that the validators are somewhat outdated (feature phone focus) and do not consider the context of use as does the heuristic evaluation. Over all, the weakest cate-gory of the heuristic criteria is “interactivity”: not one of the examined job ads fulfilled half of the criteria. In contrast, the majority of the job ads achieve quite good results in the area of “content”, but this was also the category with the biggest difference between the lowest and highest ranking job ad. The job ads with above-average heuristic results lose their top positions in the overall rating because of their low score in validation. The top positions in the overall rating have only average scoring in heuristics which is bolstered by a good validator score, possibly indicating a kind of trade-off between technical optimization and adoption of the technical capabilities of up-to-date smartphones.
0%
10%
20%
30%
40%
50%
60%
70%
80%
0% 10% 20% 30% 40% 50% 60%
Rat
ing
base
d on
Heu
ristic
Eva
luat
ion
Mobile Fitness (Tool-based Validation)
Figure 2. Usability Validation vs. Heuristic Evaluation
Overall, each of the analyzed job ads has plenty of room for improvement. In most cases, the technical “mobile fit” in terms of validation turns out to be poor. The performance of the mobile job ads in the areas of “content”, “design” and “navigation” is better, but far from good. Most notably, all of the tested job ads fail in the area of “interactivity”, where a good concept could really set a mobile job ad apart from the competitors. Next phases of the research project will contrast these results with the findings of assessing usability and effectiveness of the job ad design including the user perspec-tive. Considering the deviations between tool-based valida-tion and heuristic validation, it will be interesting to see whether the results from the heuristic perspective can be supported by the findings of the empirical testing. The rele-vant research progress will be presented at the conference.
V. REFERENCES [1] Accenture. Mobile Web Watch 2012. Special edition: Germany,
Austria, Switzerland, 2012. [2] R. Agarwal and V. Venkatesh. "Assessing a firm's Web presence: A
heuristic evaluation procedure for the measurement of usability" In-formation Systems Research 13, 2, 2002, pp. 168–186.
[3] BITKOM. Mitarbeitersuche per Smartphone, Berlin, 2012.
[4] S. Böhm, W. Jäger, and S. J. Niklas. "Mobile Applikationen im Recruiting und Personalmarketing" Wirtschaftsinformatik und Man-agement 3, 4, 2011, pp. 14–22.
[5] S. Böhm and S. J. Niklas. "Mobile Recruiting: Insights from a survey among German HR managers" in Proceedings of the 50th ACM SIGMIS annual conference on Computer and People Re-search (ACM SIGMIS CPR'12), Milwaukee, Wisconsin, 2012, pp. 117–122.
[6] P. Chynał, J. M. Szymański, and J. Sobecki. "Using eyetracking in a mobile applications usability testing" in Proceedings of the 4th Asian conference on Intelligent Information and Database Systems (ACIIDS'12), 2012, pp. 178–186.
[7] C. Coursaris and D. J. Kim. "A meta-analytical review of empirical mobile usability study" Journal of Usability Studies 6, 3, 2011, pp. 117–171.
[8] E. Cuddihy and J. H. Spyridakis. "The effect of visual design and placement of intra-article navigation schemes on reading compre-hension and website user perceptions" Computers in Human Behav-ior 28, 4, 2012, pp. 1399–1409.
[9] English, E., 2012. W3C Mobile OK Checker and Mobile Web Best Practices – a bit outdated? http://www.pijnz.com/blog/w3c-mobile-ok-checker-and-mobile-web-best-practices-a-bit-outdated/. Ac-cessed 28 May 2013.
[10] B. Guyer, R. Puustinen, and C. D. D. Urschabch. BBC Mobile Style Guide I.I – Global visual language for the mobile Web, 2009.
[11] Hampson, M., 2010. A/B testing. http://www.bbc.co.uk/blogs/ webdeveloper/2010/01/ab-testing.shtml. Accessed 29 May 2013.
[12] A. R. Hevner, S. T. March, and J. Park. "Design Science in Infor-mation Systems Research" MISQ 28, 1, 2004, pp. 75–105.
[13] ISO – International Organization for Standardization, 1998. Ergo-nomic requirements for office work with visual display terminals (VDTs) -- Part 11: Guidance on usability, 9241-11.
[14] JobStairs. Bewerber und Unternehmen setzen schon heute auf mobile Jobangebote, Bad Nauheim, 2012.
[15] A. P. Massey, V. Khatri, and V. Ramesh. "From the Web to the Wireless Web: Technology Readiness and Usability" in Proceedings of the 38th Hawaii International Conference on System Sciences, 2005, pp. 1–10.
[16] Microsoft, 2010. Design Guidelines. http://msdn.microsoft.com/en-us/library/bb158602.aspx. Accessed 29 May 2013.
[17] mobiReady, 2013. mobiReady testing tool. http://ready.mobi/ launch.jsp?locale=en_EN. Accessed 21 August 2013.
[18] Nielsen, J. Usability Engineering. Academic Press, Boston, 1993. [19] M. de Sa, V. Navalpakkam, and E. F. Churchill. "Mobile Advertis-
ing: Evaluating the effects of animation, user and content relevance" in Proceedings of the SIGCHI Conference on Human Factors in Computing Systems, 2013, pp. 2487–2496.
[20] C. C. Seix, M. S. Veloso, and J. J. R. Soler. "Towards the validation of a method for quantitative mobile usability testing based on desk-top eyetracking" in Proceedings of the 13th International Confer-ence on Interacción Persona-Ordenador (INTERACCION '12), 2012.
[21] Shirlee-ann Knight and Janice Burn. "Developing a framework for assessing information quality on the World Wide Web" Informing Science Journal 8, 2005, pp. 159–172.
[22] V. Venkatesh and V. Ramesh. "Web and wireless site usability. Understanding differences and modeling use" MISQ 30, 1, 2006, pp. 181–206.
[23] Virginia Commonwealth University, 2011. VCU Web Standards & Guidelines. Mobile Sites. http://www.webstandards.vcu.edu/ mobile/. Accessed 2 June 2013.
[24] W3C, 2008. Mobile Web Best Practices 1.0. W3C (World Wide Web Consortium). http://www.w3.org/TR/mobile-bp/. Accessed 12 September 2011.
[25] W3C, 2013. W3C mobileOK Checker. http://validator.w3.org/ mobile. Accessed 21 August 2013.
111Copyright (c) IARIA, 2013. ISBN: 978-1-61208-306-3
CENTRIC 2013 : The Sixth International Conference on Advances in Human-oriented and Personalized Mechanisms, Technologies, and Services
120 / 145

An Exploration of Relationships between Culture Images
and User Experience of Gesture Interaction
Tian Lei Department of Industrial Design,
Huazhong University of Science and Technology
Wuhan, China
Shuaili Wei Department of Industrial Design,
Huazhong University of Science and Technology
Wuhan, China
Abstract—The application of gesture changed the mobile
interactive process greatly, as well as User Experience (UE).
For better UE, it requires information feedback triggered by
gesture to accord with users’ cognition, which is closely related
to their culture and values. Many previous studies have
described the differences of interaction under diverse cultural
atmospheres, which confirms that cultural factors do affect the
interaction process, but does this also hold for mobiles?
Whether the UE is good? This study carries out a series of
empirical research towards this end. The task flow of 20 apps
based on Android was analyzed for extraction of gestures used
with higher frequency. The ink-rhyme effect of Chinese
calligraphy culture was integrated into interactive feedback to
form gradient mode, which is applied to the three most
familiar gestures to users— tap, press, slide. The participants
judged the mode based on Hassenzahl’s surface usability
questionnaire to assess UE. The results showed that cultural
factors improve the user's emotional experience, but have little
impact on the operating experience. It is demonstrated that the
integration of cultural factors enhances UE, especially
emotional experience, and shows no negative impact on
usability.
Keywords—Culture Images; User Experience; Gesture
Interaction; Emotion.
I. INTRODUCTION
Gestures based on touch screen help people get rid of the dependence on traditional input device. They shorten distance between people and equipment, enrich the pleasure of interactions and enhance users’ satisfaction. All of these provide infinite advantage for gesture interaction [1][2]. However, damage caused by improper cognition and recognition of gesture in practice will upset users.
The feedback activated by gestures needs users’ rational cognition. In order to understand feedback mode better, cultural and value recognition from users are of great importance [1]. In a way, culture can be understood as the medium and tool used to think, work, and study [3]. Many studies have shown that selection, receiving and cognition of information will be affected due to different cultural backgrounds. Thus, the integration of culture and interactive system is very necessary [4]. However, what forms the culture will be absorbed, and whether it has positive influence on UE, are still problems that worth exploring.
In order to further develop our investigation, the following research questions should be taken into account: i) How to choose the object of study in a wide variety of gestures? To answer this first question, the research of 20 apps based on Android helped extract the typical gestures. ii) Which kind of form will cultural factors be blended into interaction? In this part of study, one of the representative of
traditional Chinese culture — calligraphy was used as
research object. The reason why we did not chose other cultural category is that we know it better than other items among countless cultural items. iii) How to evaluate the UE of interactive system integrated with cultural factors? In older to answer the third question, Hassenzahl’s surface usability questionnaire based on semantic scale was used to identify the UE [5].
The study reveals the relationship between feedback merged with culture elements and UE. It showed that better emotional experience was produced by cultural feedback, such as excitement, fun and deep impression. On the other hand, there was no much impact on operational experience, but a bit of cognitive burden for users.
Section 2 of this present study carried out detailed induction and analysis of previous related research, which provided instructional method for the subsequent experiments. In Section 3, 20 apps were used to extract typical gestures used in higher frequency. The ink-rhyme effect of Chinese calligraphy culture developed into two different modes in Section 4. Through the experiment of the fourth section, we understand the relationships between cultural factors and UE of interactive system. Combined with the discussion about the UE in Section 5, the conclusion showed that culture factors had a positive impact on emotional experience, but added a certain cognitive burden to users.
II. RELATED WORK
A. Gesture Interaction
Touch gestures are considered to be the most direct way of human-computer interaction [6]; they have convenient way to input, and reflect abundant semantics [7]. Currently, gestures based on the mobile platform can be subdivided into multi-touch gestures, stroke gestures, and combinational gestures. Even if multi-touch gestures produce an advantage as being more mature, they have not fully realized in
112Copyright (c) IARIA, 2013. ISBN: 978-1-61208-306-3
CENTRIC 2013 : The Sixth International Conference on Advances in Human-oriented and Personalized Mechanisms, Technologies, and Services
121 / 145

mainstream platforms, except operations related to rotation and scaling [1][8]. Multi-touch gestures, as they were, are mostly applied to a mobile platform, but have no unified standard. Previous Studies have pointed out that, integrating concepts of time and displacement, gesture can be reduced to action unit, which will converse into a basic set of gestures specific to whole system [9]. This research provides basis and reference for extraction of typical gesture based on mobile platforms.
B. Cultural Factors in Interaction
The effect of culture on interaction has been confirmed
by many research institutes [10][34][35], e.g., in image
search task, Chinese are more likely to generate search
keywords describing the overall properties of the target
images than European and Americans (EA); EA assigns
more space to the main objects than Chinese [10]. However,
how to blend culture factors with interactive system still
needs further discussion. Chi-Hsiung Chen and his
colleagues, scholars from Taiwan, suggested that culture
reflected on three levels: surface layer (visual and material),
middle layer (behavior and habits) and inner layer (thoughts
and spirit) [11]. In 1993, Ockman proposed the fusion point
of culture and design relied on users’ tastes, habits and
lifestyles [12]. Tien-Li Chen and Pei-Fen Hong also pointed
out those cultural images can be divided into two directions,
namely, implicit and explicit [13]. Thus the integration of
culture and design is from the inside to the outside. It is
user-oriented and should consider users’ behavior and habits
in some kind of conditions, through direct or indirect sensory
effects. Then it is showed through the sensory effects directly
or indirectly.
Chinese aesthetic culture represented by the calligraphy
is becoming a new source of design inspiration [14], the
simulation technology of calligraphy effect has been the
subject of many studies [15][16][17]. Imitations of
calligraphy brush strokes; however, it is a kind of retrieving
of outer appearance shape, which is in lack of behavioral
interpretation for calligraphy culture. Calligraphists will
strengthen the tendency of their creatures by controlling the
ink-rhyme [18]. Ink-rhyme is an extremely subtle factor in
calligraphy art, but also is directly controlled by the behavior.
Taking ink-rhyme effect as a breakthrough point of culture
and interactive systems, in conjunction with other conditions,
is likely to promote re-creation of artistic context and UE.
C. User Experience
UE is related with the process of interaction, it is a
combination of user’s behavior, results and emotion [19].
UE take emotion experience as more advanced level,
including hedonics, aesthetic and pleasure [5][20]. Sascha
Mahlke from Industrial University of Berlin thought UE
could be defined from four dimensions: perceived
usefulness, ease of use, perceived hedonic quality, perceived
visual attractiveness [21]. UE, therefore, is a process of
focus on cognition and feelings, based on usability and
affection. However, there still exists a question whether
cultural factors have a positive effect on UE.
III. STUDY 1: TYPICAL GESTURE EXTRACTION
The purpose of this study was to extract typical one in a
wide variety of gestures used in mobile terminal. The
intention is to take gestures that users are most familiar with
as variables for further research.
A. Material
We used 20 apps based on Android. According to the report that Linda Sui published in Strategy Analytics, which can be found at [28], there were 530000 smartphones supplied in the fourth quarter of 2012, 86% of which were based on Android. The selection of study platform was strongly supported, because the vast majority of the Chinese smartphone users were more familiar with Android. The apps were the top 20 selected from list at the end of May of Peasecod [29], which was reported to occupy more than 50% of mobile apps management market [30]. Table 1 contains the selected apps and games, together with their study IDs and times of installation.
TABLE I APPS WITH THEIR STUDY IDS AND INSTALL TIMES
Apps Games
ID Name Install
Times ID Name
Install
Times
1 QQ 110 11 Temple Run 19.61
2 WeChat 98.64 12 Tank ON 0.36
3 Qvod Player 29.09 13 Find Something 12.96
4 QQ Zone 52.15 14 Daddy Was A Thief 0.71
5 UC Browser 70.61 15 Carrot Fantasy 8.95
6 Sogou Input 79.26 16 Shine Runner 0.51
7 TTPOD 38.29 17 Subway Surfers 6.27
8 360 Guard 61.87 18 Angry Birds 21.2
9 Ink Weather 32.02 19 Fruit Ninja 19.03
10 Taobao 40.03 20 Pop Star 8.41
unit: million
B. Variable identification
In order to understand how gestures operate on an
interactive system of smartphones, each of the stimuli used
for the evaluation was identified. Table 2 contains definition
and legend of the gestures, which could be consulted in the
touch gesture reference guide provided by Luke Wroblewski
[31].
TABLE II GESTURES WITH THEIR STUDY IDS, LEGEND AND DEFINITION
ID Legend Gesture Description of Action
1
Tap Gently touch the screen and left
2
Double
Tap Touch the screen twice quickly
3
Press Touch the screen for a period of time
4
Slide Move fingertip over surface without
losing contact
5
Drag Hold the object on the screen then
slide
113Copyright (c) IARIA, 2013. ISBN: 978-1-61208-306-3
CENTRIC 2013 : The Sixth International Conference on Advances in Human-oriented and Personalized Mechanisms, Technologies, and Services
122 / 145

6
Zoom Touch surface with two fingers and
bring them closer or apart
7
Rotate
Touch surface with two fingers and
move them in a clockwise or
counterclockwise direction
8
Press and
Slide
Hold the screen with one finger, slide
with another one
9
Press and
Tap
Press surface with one finger and
briefly touch surface with second
finger
10
Other
Gestures e.g. shake
C. Task and Paocedure
Firstly, these 20 apps and games were underway of the
task flow analysis. After separating the function module of
each app, every step of the task was refined to single
gesture’s application, and marked with circle standing for
the gesture ID. Take Tecent QQ [32] as the example: to
enter the application, users first need to tap the icon to login,
then tap their account and password to input box. After
tapping “OK”, user will come to QQ’s message function
module to continue their operation. From such a short task
flow, it can be seen that the completion of this task requires
at least four taps. Figure 1 shows task flow analysis of QQ
on a wider scale. Corresponding to the analysis, type and
frequency of gestures used in QQ are counted in Table 3.
For the sake of an overall understanding of the whole
situation, gesture analysis can be applied to the rest of apps
in the same way.
Figure 1 Task flow analysis of QQ
TABLE III GESTURES USED IN QQ WITH THEIR STUDY IDS AND
FREQUENCY
ID Gestures Frequency ID Gestures Frequency
1 Tap 64 6 Zoom 0
2 Double
Tap 0
7 Rotate 0
3 Press 4 8 Press and Slide 0
4 Slide 3 9 Press and Tap 0
5 Drag 0 10 Other Gestures 0
D. Result
All of the 20 apps were analyzed in the method shown in
last part, the results were shown in Table 4.
According to the frequency statistics, "tap" was at the
highest frequency. The rest of the top four gestures were
“slide” (M = 7.2, SD = 2.936), “press” (M = 2.3, SD =
1.567), “drag” (M = 0.2, SD = 0.632). Among them, “tap”
was the most favorite gesture with users, as the use of which
was far more than other gestures. “Drag” was unusual
gesture with the same level of “zoom” and “double tap”.
“Rotate”, “press and slide”, while “press and tap” were
barely used in smartphone based on Android.
TABLE IV GESTURES WITH THEIR APPLICATION MEAN AND SD
Gestu
re
Ta
p
Do
ub
le
Ta
p
Press
Slid
e
Drag
Zoo
m
Oth
ers
Mean 65.100 0.200 2.300 7.200 0.300 0.200 0.200
SD 15.300 0.421 1.567 2.936 0.675 0.632 0.422
The results may be due to the following points: i) The
hardware limitations, e.g., the size of the screen limits the
operations by two or more fingers, because of bad usability.
It is proven in this view that some apps, like Meitu [33] use
combination of tap and slide instead of rotation or zooming.
ii) The standard of gesture design is faultiness. It will be
easy to be accepted if the design meets users’ mental model
and daily habits [1]. Intensive mapping is generated between
gestures and computer mouse: the function of tap is similar
with the left mouse button and press likes the right button.
In summary, we took “tap”, “press”, and “slide” as
stimuli in Study 2 to explore cultural factors effects on
interactive UE.
IV. STUDY 2: CULTURE FACTORS AND USER
EXPERIENCE
The purpose of Study 2 is to investigate the impacts of
two different feedback models on UE.
A. Participants
40 participants, 20 males and 20 females were involved
in this study. Two persons (males) gave invalid responses.
Therefore, there were 38 valid responses from participants
aged ranging from 20 to 34 years old. Thirty one (31) were
undergraduate and postgraduate students from department
of industrial design, while four were professionals with
education, logistics and engineering. All of them were
skilled users of Android and influenced by Chinese culture
since childhood.
B. Stimuli
There were three experiments based on tap, press and
slide, while included two contrast feedbacks in each group
114Copyright (c) IARIA, 2013. ISBN: 978-1-61208-306-3
CENTRIC 2013 : The Sixth International Conference on Advances in Human-oriented and Personalized Mechanisms, Technologies, and Services
123 / 145
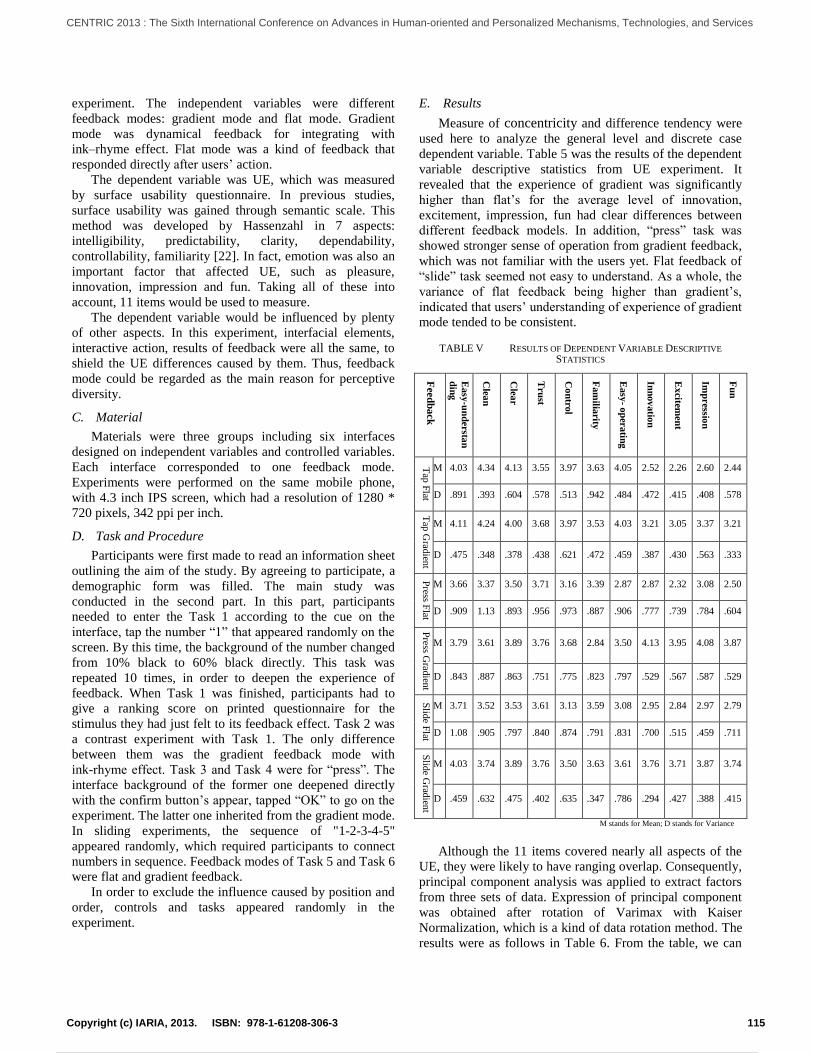
experiment. The independent variables were different
feedback modes: gradient mode and flat mode. Gradient
mode was dynamical feedback for integrating with
ink–rhyme effect. Flat mode was a kind of feedback that
responded directly after users’ action.
The dependent variable was UE, which was measured
by surface usability questionnaire. In previous studies,
surface usability was gained through semantic scale. This
method was developed by Hassenzahl in 7 aspects:
intelligibility, predictability, clarity, dependability,
controllability, familiarity [22]. In fact, emotion was also an
important factor that affected UE, such as pleasure,
innovation, impression and fun. Taking all of these into
account, 11 items would be used to measure.
The dependent variable would be influenced by plenty
of other aspects. In this experiment, interfacial elements,
interactive action, results of feedback were all the same, to
shield the UE differences caused by them. Thus, feedback
mode could be regarded as the main reason for perceptive
diversity.
C. Material
Materials were three groups including six interfaces
designed on independent variables and controlled variables.
Each interface corresponded to one feedback mode.
Experiments were performed on the same mobile phone,
with 4.3 inch IPS screen, which had a resolution of 1280 *
720 pixels, 342 ppi per inch.
D. Task and Procedure
Participants were first made to read an information sheet
outlining the aim of the study. By agreeing to participate, a
demographic form was filled. The main study was
conducted in the second part. In this part, participants
needed to enter the Task 1 according to the cue on the
interface, tap the number “1” that appeared randomly on the
screen. By this time, the background of the number changed
from 10% black to 60% black directly. This task was
repeated 10 times, in order to deepen the experience of
feedback. When Task 1 was finished, participants had to
give a ranking score on printed questionnaire for the
stimulus they had just felt to its feedback effect. Task 2 was
a contrast experiment with Task 1. The only difference
between them was the gradient feedback mode with
ink-rhyme effect. Task 3 and Task 4 were for “press”. The
interface background of the former one deepened directly
with the confirm button’s appear, tapped “OK” to go on the
experiment. The latter one inherited from the gradient mode.
In sliding experiments, the sequence of "1-2-3-4-5"
appeared randomly, which required participants to connect
numbers in sequence. Feedback modes of Task 5 and Task 6
were flat and gradient feedback.
In order to exclude the influence caused by position and
order, controls and tasks appeared randomly in the
experiment.
E. Results
Measure of concentricity and difference tendency were
used here to analyze the general level and discrete case
dependent variable. Table 5 was the results of the dependent
variable descriptive statistics from UE experiment. It
revealed that the experience of gradient was significantly
higher than flat’s for the average level of innovation,
excitement, impression, fun had clear differences between
different feedback models. In addition, “press” task was
showed stronger sense of operation from gradient feedback,
which was not familiar with the users yet. Flat feedback of
“slide” task seemed not easy to understand. As a whole, the
variance of flat feedback being higher than gradient’s,
indicated that users’ understanding of experience of gradient
mode tended to be consistent.
TABLE V RESULTS OF DEPENDENT VARIABLE DESCRIPTIVE
STATISTICS
Feed
ba
ck
Easy
-un
dersta
n
din
g
Clea
n
Clea
r
Tru
st
Co
ntro
l
Fam
iliarity
Easy
- op
eratin
g
Inn
ov
atio
n
Ex
citemen
t
Imp
ression
Fu
n
Tap
Flat
M 4.03 4.34 4.13 3.55 3.97 3.63 4.05 2.52 2.26 2.60 2.44
D .891 .393 .604 .578 .513 .942 .484 .472 .415 .408 .578
Tap
Grad
ient
M 4.11 4.24 4.00 3.68 3.97 3.53 4.03 3.21 3.05 3.37 3.21
D .475 .348 .378 .438 .621 .472 .459 .387 .430 .563 .333
Press F
lat
M 3.66 3.37 3.50 3.71 3.16 3.39 2.87 2.87 2.32 3.08 2.50
D .909 1.13 .893 .956 .973 .887 .906 .777 .739 .784 .604
Press G
radien
t
M 3.79 3.61 3.89 3.76 3.68 2.84 3.50 4.13 3.95 4.08 3.87
D .843 .887 .863 .751 .775 .823 .797 .529 .567 .587 .529
Slid
e Flat
M 3.71 3.52 3.53 3.61 3.13 3.59 3.08 2.95 2.84 2.97 2.79
D 1.08 .905 .797 .840 .874 .791 .831 .700 .515 .459 .711
Slid
e Grad
ient
M 4.03 3.74 3.89 3.76 3.50 3.63 3.61 3.76 3.71 3.87 3.74
D .459 .632 .475 .402 .635 .347 .786 .294 .427 .388 .415
M stands for Mean; D stands for Variance
Although the 11 items covered nearly all aspects of the
UE, they were likely to have ranging overlap. Consequently,
principal component analysis was applied to extract factors
from three sets of data. Expression of principal component
was obtained after rotation of Varimax with Kaiser
Normalization, which is a kind of data rotation method. The
results were as follows in Table 6. From the table, we can
115Copyright (c) IARIA, 2013. ISBN: 978-1-61208-306-3
CENTRIC 2013 : The Sixth International Conference on Advances in Human-oriented and Personalized Mechanisms, Technologies, and Services
124 / 145

know that at the tapping comparative experiments, four
pairs of factors (innovation, excitement, impression, fun)
had a high degree of positive correlation with Factor_1,
which was named emotional factor as it reflected the
emotional experience of users. Three pairs of factors
(control, easy-operating, clean) were found to have positive
impact on Factor 2, which mainly showed the operational
experience. Rest of items had significantly higher load on
Factor 3, which stood for the subjects' cognitive level. Thus
Factor 2 and Factor 3 were named operational factor and
cognitive factor. In comparative experiments of press and
slide, emotional factor had similar state to experiments of
tap, but operational and cognitive factors were not apart,
indicating that emotional experience of subject was more
obvious than the other two.
TABLE VI EXPRESSION OF PRINCIPAL COMPONENT
Gesture Component Score Coefficient Expression
Tap
FAC_1=-0.098*tap_1-0.046*tap_2-0.045*tap_3+0.057*tap_4+
0.052*tap_5-0.119*tap_6+0.040*tap_7+0.281*tap_8+0.276*tap
_9+0.279*tap_10+0.295*tap_11;
FAC_2=-0.184*tap_1+0.326*tap_2-0.037*tap_3+0.096*tap_4+0.382*tap_5-0.006*tap_6+0.375*tap_7-0.032*tap_8+0.000*tap
_9+0.058*tap_10-0.030*tap_11;
FAC_3=0.652*tap_1-0.001*tap_2+0.487*tap_3+0.230*tap_4-0.
142*tap_5+0.©214*tap_6-0.118*tap_7-0.006*tap_8+0.017*tap
_9-0.086*tap_10-0.068*tap_11;
Press
FAC_1=0.258*press_1+0.222*press_2+0.216*press_3+0.201*p
ress_4+0.17*press_5+0.21*press_6+0.132*press_7-0.054*press
_8-0.054*press_9-0.025*press_10-0.025*press_11
FAC_2=-0.083*press_1-0.044*press_2-0.002*press_3-0.022*pr
ess_4+0.045*press_5-0.18*press_6+0.081*press_7+0.259*press
_8+0.268*press_9+0.222*press_10+0.258*press_11
Slide
FAC_1=0.243*slide_1+0.261*slide_2+0.180*slide_3+0.146*slide_4+0.210*slide_5+0.236*slide_6+0.176*slide_7-0.076*slide
_8-0.072*slide_9-0.078*slide_10-0.059*slide_11;
FAC_2=-0.075*slide_1-0.092*slide_2+0.017*slide_3+0.042*sli
de_4-0.045*slide_5-0.111*slide_6+0.041*slide_7+0.269*slide_
8+0.294*slide_9+0.289*slide_10+0.274*slide_11; Extraction Method: Principal Component Analysis
Rotation Method: Varimax with Kaiser Normalization
Combined with the results of descriptive statistics,
emotional experience of gradient mode was clearly stronger
than the flat one, namely, users considered gradient
feedback more innovative and interesting, to create more
passion and leave deeper impression. In contrast with
experiment of tap, users thought there was no difference of
operational and cognitive experience according to two
feedback modes. Compared to experiment of press and slide,
users got better cognition, but poorer operational experience
of flat feedback than the gradient one. It is believed that the
impact on UE of two different feedback modes was mainly
focused on emotional experience. The gradient feedback
improved UE to some extent, meantime, it increased users’
cognitive load, which was primarily caused by
unfamiliarity.
V. DISCUSSION
The overall objective of this paper was to investigate the
relationships between cultural factors in interactive systems
and UE. In review of related work (Section 2), the
application of cultural factors in design was considered as
deep sense of users’ behavior or habits expressed by sensory
effect directly or indirectly. In study 2 (Section 4),
ink-rhyme effect was applied to mobile interactive feedback
model, the results proved that interaction with cultural
meaning feedback had an impact on the UE. On the
emotional experience, the cultural element had a positive
influence, but no significant improvement of operational
experience. The application of cultural factors was so
creative that it was unfamiliar to users, as a result, it caused
some cognitive burden.
UE is a complex sensory, consists of a comprehensive
experience, which is highly susceptible to environment,
users’ emotions and external factors. Emotional experience
serves as one of the most important parts of UE; however,
traditional human-computer interaction research is still
concentrated upon functional usability [23]. With increasing
concerns about emotional experience [24][25][26], feedback
integrated with cultural elements has been proved to have
better emotional experience. All of these offer much food
for thought and different choices to designers. Combining
cultural factors to interaction will help users to understand
their cultural images, significance, stories and emotion [27],
as well as usability.
VI. CONCLUSION
In this paper, two studies were used to evaluate the
relationships between feedback of cultural meaning and UE.
Study 1 helped to extract typical gestures those were
familiar to users. Study 2 was the experiment of UE
measurement, which made us understand the complex
relationships between feedback of cultural meaning and UE.
The results showed that gradient mode had a positive
correlation with emotional experience, users thought it more
innovative and interesting in creating more passion and
leaving deeper impression. Data also suggested that the
integration of cultural factors did not affect the operational
experience of interaction, but added a certain amount of
cognitive load, which primarily caused by unfamiliarity.
The direction of further research will focus on the
application of ink-rhyme to practical interactive systems,
which will be investigated in more complex interaction
processes. We also hope to expand cultural factors to have a
method or model to extract the elements from culture.
ACKNOWLEDGMENT
This paper was supported by high-level international course construction project of Huazhong University of Science and Technology and Fundamental Research Funds for the Central Universities (2013QN011).
REFERENCES
[1] Z. B. Wang, “Research of Gesture Types and Design Principles Based on Touch Screen Phone” (In Chinese). Silicon Valley. 2012(9) 108-109.
116Copyright (c) IARIA, 2013. ISBN: 978-1-61208-306-3
CENTRIC 2013 : The Sixth International Conference on Advances in Human-oriented and Personalized Mechanisms, Technologies, and Services
125 / 145

[2] S. Bhandari and Y. Lim. “Exploring Gestural Mode of Interaction with Mobile Phones”. In CHI’08 Extended Abstracts, pages 2979 – 2984. ACM, 2008.
[3] G. Fischer. “Beyond Interaction: Meta-Design and Cultures of Participation”. In OZCHI '11, pages 112 – 121, ACM, 2011.
[4] I. Gasparini and M. S. Pimenta, “Vive la Difference: a Survey of Culture-aware Issues in HCI”. IHC+CLIHC’11, pages 13-22, ACM, 2011.
[5] T. Lei, “Research of User Experience Design Based on Information Constructed”. Unpublished PhD dissertation, Zhejiang University.
[6] Y. Li, “Gesture Search: a Tool for Fast Mobile Data Access”. In Proc. UIST ‘10, pages 87– 96. ACM, 2010
[7] X. D. Jiao, H. Deng, F. Wang, “An Investigation of Two-handed Manipulation and Related Techniques in Multi-touch Interaction”. IEEE Computer Society, 2010: 565-568.
[8] J. Y. Zhao, “Research on the Algorithm of Multi-touch Gesture Recognition”. Unpublished Master dissertation, Beijing University of Technology
[9] G. H. Zhang, “Interaction Gesture Analysis and Design Based on Multi-touch Surface”. Application Research of Computers, 2010(5)1737-1739.
[10] D. Wei, “Cultural Difference in Image Searching”. CHI’11, pages 935-940, ACM, 2011
[11] C. Chen, “A Study of Innovation Design on Taiwan Culture Creative Product – A Case Study of the Facial Mask of Ba Ja Jang”. N. Aykin (Ed.): Internationalization, Design, LNCS 5623, pages 337–346, 2009
[12] J. Ockman, Architecture Culture, Rizzozi, pages 243–247 (1993)
[13] T. L. Chen, “The Study of the Cultural Image Constructed Factors of Paiwanese Glass Beads”. Journal of Design, 2008(8)89-107.
[14] W. C. Chang, “A Study on the Application of Cultural Elements in Product Design”. Proceedings of the 4th international conference on Proceedings of the 4th international conference, 2011, Orlando: Springer-Verlag, 2011:3-10
[15] X. F. Zhang, “Chinese Calligraphy Character Image Synthesis Based on Retrieval. P. Muneesawang et al”. (Eds.): PCM 2009, LNCS 5879, pages 167–178, 2009.
[16] Y. T. Zhuang, “Latent Style Model: Discovering writing styles for calligraphy works”. Language Resources and Evaluation, 2011: 95 - 119
[17] J. Dong, “The Creation Process of Chinese Calligraphy and Emulation of Imagery Thinking”. IEEE Intelligent Systems, 2008:56-62.
[18] B. Duan, “On the Historical Evolution and Style Meta of Ink-rhyme Represented in Calligraphy”. Unpublished Master dissertation, Shanxi Normal University.
[19] D. Andrew, “Beyond the usability:process,outcome and affect in HCI”[J].Canadian Journal of Library and Information Science,2002,26(4)57—69
[20] S. Ahlk, “Understanding Users’ Experience of Interaction”[C] // Proceedings of the 2005 annual conference on European association of cognitive ergonomics. Portugal:[S, n,],2005:25l-2
[21] S. Ahlke, “Factors influencing the experience of website usage” [C] // CHI’02 extended abstracts on human factors in computing systems. New York: ACM Press, 2002: 846-847
[22] Hassenzahl, M.Platz,A. Burmester, M.Lehner, K, “Hedonic and Ergonomic Quality Aspects Determine A Software’s Appeal” [C] // Proceedings of CHI 2000.NewYork: ACM Press, 2000: 201. 208
[23] Emotional Response as a Measure of Human Performance [C] // CHI '08 extended abstracts on Human factors in computing systems, Florence: ACM, 2008: 2612-2620.
[24] L. Carine, “Enhancing User Experience during Waiting Time in HCI: Contribution of Cognitive Psychology”. Proceedings of the Designing Interactive Systems Conference. Newcastle Upon Tyne, 2012: 751-760.
[25] P. W. Jordan, “The four pl easures: taking human factors beyond usability”. In Proc. Int’l Erg. Assoc. (1997) 2, 364-6.
[26] Don Norman. Emotional Design: Why We Love (or Hate) Everyday Things, Basic Books, 2005.
[27] Y. J. Lee, “Exploration of the Cultural Image of Chinese Form Using Culture Identity Design”. C. Stephanidis (Ed.): Universal Access in HCI, Part II, HCII 2011, LNCS 6766, pages 488–497, 2011
[28] http://www.strategyanalytics.com
[29] http://www.wandoujia.com/top
[30] http://www.gemag.com.cn/8/29967_1.html
[31] http://www.lukew.com/ff/entry.asp?1071
[32] http://en.wikipedia.org/wiki/Tencent_QQ
[33] http://xiuxiu.meitu.com/
[34] N. J. Patel, J. Clawson, N. Kang, “A Study of Cultural Effects on Mobile-Collocated Group Photo Sharing”. Proceedings of the 16th ACM international conference, Florida: ACM, 2010:121-130
[35] L. Wang, E. Champion, “A Pilot Study of Four Cultural Touch-Screen Games”. Proceedings of the 12th Annual Conference of the New Zealand Chapter of the ACM Special Interest Group, Hamilton: ACM, 2011:57-64
117Copyright (c) IARIA, 2013. ISBN: 978-1-61208-306-3
CENTRIC 2013 : The Sixth International Conference on Advances in Human-oriented and Personalized Mechanisms, Technologies, and Services
126 / 145

The Case for Integrating Needs and Preferences in the Internet of Things
Andy Heath
Axelrod Access For All
Sheffield, United Kingdom
Gill Whitney, Irena Kolar, Mark Springett
Design for All Research Group
Middlesex University
London, United Kingdom
[email protected] , [email protected],
Abstract— This paper was written because the authors believe
the Internet of Things has enormous potential to enrich the
lives of all people, but particularly those people sometimes
referred to as “disabled”, who are excluded from participating
in normal life processes that present fewer barriers to others
and by that exclusion experientially impoverished. Further, we
believe that there are grounds for personalization or
individualization to be the accessibility delivery mechanism of
choice to meet the diverse needs of this non-homogenous group
of people in diverse contexts and in fact, of all people. From
demographics it is clear that if the accessibility of the Internet
of Things is not approached effectively, then a problem will be
created for people with disabilities and older people. The
paper gives a direction forward driven both by results from
practical research with real users and theoretical
considerations of what approaches are available to apply to
this problem. We believe that Ambient Assisted Living (AAL)
is a significant aspect of the Internet of Things.
Keywords- Internet of Things, Accessibility, Standards
I. INTRODUCTION
A. The Problem to be Addressed
This paper presents an argument for integrating accessibility in the Internet of Things (IoT) in a particular way. It describes and makes the case for an approach to integration and presents some of the requirements that need to be considered.
Accessibility is a huge and very complex domain and it is essential to address it if the Internet of Things is not to impoverish our humanity by excluding many people from its numerous benefits. There is a need to incorporate accessibility in a way that supports its use by everyone and in all environments. We approach the argument first from demographics, and then consider common difficulties in using Information and Communication Technology (ICT) devices in several use cases that demonstrate the complexity of the field. Our central argument is that accessibility is so complex, from computational and human understanding perspectives, that an approach that makes it simpler for everyone is required. We go on to suggest what we believe should be the approach of choice in dealing with the complexity of modern technology in a way that works for all users. We present all of this in a context of evolving models of accessibility and social context.
The Internet of Things is not yet well defined but is a developing field. In one view of and application of IoT, items and computers are labeled with an electronic identifier consisting of a unique number called an IP address. The attachment of the labels supports the development of networking infrastructures where devices can autonomously communicate with one another and share control and communication. The successful implementation of IoT will require:
An IP address which can be associated with every possible source object that needs one (usually).
Software applications that can communicate with and manage the data from an ever-growing number of the enabled devices.
Consideration of requirements for ensuring IoT devices are accessible to all persons needing to directly access them or who are impacted by systems they connect to. We develop this in detail later in the paper.
The networking of devices has the potential to benefit people currently with requirements not well served by the design of mainstream systems and devices to date, especially if the network infrastructures or devices support the use of assistive or alternate technology. Examples might include a medicine cabinet that is continuously aware of the status of each medicine bottle stored inside the cabinet such as its name, contraindications and expiry date. It could communicate the need for replacements to the medical professional as well as to the drinks cabinet to warn of the need to avoid alcohol (if required). Another example is a fall detector linked to both the telephone system to call help, the cooker to switch off any item which the user can no longer control, and the central heating system to ensure the person is kept in a comfortable situation until they are rescued.
Practical research carried out at Middlesex University as part of a European Project has indicated a number of potential problems that occur when users require special features. The accessibility features within current ICT systems are often well hidden, meaning that users requiring those features need greater technical skills than others to reach them. This is impractical and unacceptable and could result in the IoT devices becoming a greater problem.
Many users have particular access requirements that are critical in that they are often unable to access some particular systems at all unless those systems are designed with
118Copyright (c) IARIA, 2013. ISBN: 978-1-61208-306-3
CENTRIC 2013 : The Sixth International Conference on Advances in Human-oriented and Personalized Mechanisms, Technologies, and Services
127 / 145

mechanisms to meet those access requirements. Such users are often described as “disabled”, which effectively places the cause of the access challenge at their door – it makes it “their fault”. This is not the only way to attribute causal factors and the authors particularly reject it in favour of a more balanced view where accessibility is thought of as a relationship between user and product and accessibility challenges represent a mismatch of product characteristics to required features.
For other users the lack of particular access mechanism means that their use of the system is possible but less than optimal. We believe the needs of every user can be best met by the adoption of an equitable system that does not apportion blame but considers accessibility as a relationship and develops systems and products that can be adapted to meet individual preferences. However, the term “disabled” is embedded in our cultures and is difficult to avoid. In this paper, where we present examples and results using the term, we are referring to those users for whom particular accessibility requirements are critical. That does not detract from the thesis that adaptation to individual preferences should be the approach to meet the needs of every user.
B. What is the Internet of Things?
There is no single agreed definition of the Internet of Things; different groups working in the area have different ideas of what it is. A fundamental distinction in the positions organizations take relates to whether the “people” dimension is considered part of the system. For example, The European Telecommunications Standards Institute (ETSI) [1] describe IoT in a “machine to machine” fashion as,
“Communication between two or more entities that do not necessarily need any direct human intervention. M2M services intend to automate decision and communication processes [2].
Whereas the International Telecommunication Union Telecommunication Standardization Sector (ITU-T) [3] gives this description
“A global infrastructure for the information society, enabling advanced services by interconnecting (physical and virtual) things based on, existing and evolving, interoperable information and communication technologies [ITU-T Y.2060]” [4], which implies that people need to be considered.
In this paper, we take as a tenet that the IoT involves people at some points. There are several different ways that people might be involved.
Some systems have direct human interfaces. In any such system, it is necessary to consider the requirements of all potential users in using those interfaces. Methods for consideration of the accessibility of interface technologies have been given much attention, for example in the Web Content Accessibility Guidelines (WCAG) 2.0 [5] and many other sets of guidelines. Technical and other guidelines, such as these, are essential but they are not always used and are not sufficient nor do they provide optimal accessibility [6] for every user.
Some systems may have no direct human interface but cascading effects on human interfaces in interconnected systems may need to be considered. A burglar alarm monitoring a factory might raise an alert on a system that it is connected to. As well as the need to address the accessibility of any such connected human interfaces there may be implications for the humans using that system of the information content transmitted by the alarm. The High Definition Multimedia Interface (HDMI), which is a standard concerned with the transmission of video data between computer monitors, digital televisions, video projectors and related devices and might be thought of as a machine-to-machine transmission standard not involving humans, was designed without the capability to carry closed captions as required for example by The Federal Communications Commission [7], which alone had a significant impact on a large number of humans and created further difficulties in lack of interoperability between systems adopting mechanisms to get around its limitations.
To meet both these requirements (systems with human interfaces and systems without but which might interconnect with those that do) we will argue that it is needed to look at both the accessibility of the device or system under consideration and the accessibility of possibly interconnected systems with a systemic (holistic) view in a common framework and that taking the tenet that we need to build systems that can respond to and adapt to individual preferences is an approach that can do that. It can provide an approach that can be used in different parts of heterogeneous systems with consistency.
C. Structure of this Paper.
This paper describes how the Internet of Things and personalization can have a greater positive effect for people with disabilities by describing firstly what is the `Internet of Things‟ and the numbers of older and disabled people who could benefit. In Section II the argument from demographics using a traditional medical model is presented. In Section III the paper focus on real world accessibility issues that people with disabilities can experience with current technology. Section IV then describes the solutions that exist for users with respect to Ambient Assisted Living, in which fine-tuning the match between system design and user needs and preferences can have overwhelming positive effects for the end user. The paper continues in Section V to describe a number of models of accessibility including the medical model of disability, the one or many sizes fit all approach, the approach offered by testing a product with groups of users, usually with disabilities. This section concludes by addressing the issue that the way to optimally meet the needs of every individual consumer is to establish communication between each consumer and producer. The paper concludes in Section VI by stating that in the context of changing demographics across the world there is a need to address accessibility effectively in The Internet of Things if we are not to exclude and impoverish many people.
119Copyright (c) IARIA, 2013. ISBN: 978-1-61208-306-3
CENTRIC 2013 : The Sixth International Conference on Advances in Human-oriented and Personalized Mechanisms, Technologies, and Services
128 / 145

II. DEMOGRAPHICS
In this section, we present the argument from demographics using a traditional medical model. This is necessary because it isn‟t possible to discuss demographics using “the individual” as the basis of approach and because there is so much existing culture and research that addresses it this way. In later sections, we show how the model is flawed as a way to deal with accessibility in the IoT.
The IoT has the potential to benefit many people currently not well-catered for by supporting control of information and communication systems using a personally accessible mechanism. More than one billion people in the world live with some form of disability, of whom nearly 200 million experience considerable difficulties in functioning and carrying out daily living tasks [8]. The increased ageing of the population will lead to an increase in this number and an increase in the number of people with disabilities requiring accessible interfaces. In 2000, there were 606 million persons aged 60 or over throughout the world. Fifty years later, the number of persons aged 60 or over is projected to expand by more than three times to reach nearly 2 billion in 2050 [8]. The International Classification of Functioning, Disability and Health defines disability as, "the ... result of complex relationships between an individual's health condition and personal factors, and of the external factors that represent the circumstances in which the individual lives". [9]. Technology such as Radio-Frequency Identifiers has the power to make people more or less disabled by altering the external factors and enabling people with disabilities to interact with items of technology which have been adapted to interact via a radio frequency interface.
To ensure that older citizens and those with disabilities can benefit from the Internet of Things it is necessary for services to be designed in a way so that they can be used by people with a sensory, cognitive, physical or multiple disabilities. It is also necessary to ensure that the functionality of the objects being controlled meets the needs of the end user. This will require designers to understand the full range of needs both in terms of utility and operational control. Addressing these needs properly would require a drastic change in the mindset of designers so that they consider all people as `normal‟ customers or as customers of `normal‟ products.
Establishing an appropriately user-sensitive design culture may be difficult. Recent research with the committee members of the British Standards Institute identified that 33.3% of those questioned said yes to the question “Do any of your standardization activities involve the standardization of products or services where the accessibility for older and disabled people needs to be considered?” Whilst 76.7% had said yes to “Do any of your standardization activities involve the standardization of products or services which are designed to be used by people? This suggests that older citizens and those with disabilities are not a typically recognized subset of the group „people‟. Also, as we explain later, the complexity of people‟s needs in different contexts is huge. Even without the need for a mindset change it is not
realistic to expect designers to absorb and operate with that complexity. Something new is needed.
III. CURRENT REAL WORLD ACCESSIBILITY
ISSUES
The integration of digital technology into everyday life has the potential to be of great benefit to older and mobility-limited people and people constrained by cognitive, emotional, social or other constraints by enabling them to carry out a wide range of tasks, including accessing many public services, using entertainment systems and communicating both remotely and locally.
The range of people who can access ICT systems and the contexts in which they can be accessed can both be extended by following accessibility guidelines such as Web Content Accessibility Guidelines (WCAG) 2.0 [5] and other hardware and software standards/guidelines. Such standards will have increased benefit in the design and practical application of the combination of technologies which is the IoT. As we argue elsewhere, however, they have many limitations and challenges.
Accessibility support and information provision on commercial media company websites is often hard to find and highlights an apparent lack of sensitivity to the importance and needs of customers with disabilities [10]. An inspection of three leading providers‟ sites on the World Wide Web illustrated this well. This inspection focused on the task of finding accessibility information pertaining to the companies‟ mobile products. It was found in one case that the information was not provided. In the other two sites inspected, the information was deeply buried and difficult to find. On one site a link was provided in a small font that, for example, those with vision problems are likely to miss. On another it was found that no explicit link existed, causing an extensive search, including use of keyword search and a lengthily browse through numerous options. The sub-tasks of scanning for obscure links, scanning large numbers of search results and, in general, protracted search seem to imply the assumption that all users are comfortably capable of these actions. There was no evidence of designers taking into account the difficulties that the typical users of accessibility features are likely to have.
IV. AMBIENT ASSISTED LIVING
The Internet of Things provides unprecedented opportunity to explore the space of possible life-enhancing solutions for specific individuals. However, the complex and varied nature of peoples‟ cognitive, perceptual and physical condition, and their life circumstances mean that bespoke solutions are needed. The case of Ambient Assisted Living is one where fine-tuning the match between system design and user needs and preferences is particularly critical. This is true both of the service design and of the interaction design. The nature of this type of system is that it is designed to support day-to-day living for a complex variety of user needs and contexts, and needs that are prone to significant changes over time. We identify two key distinct
120Copyright (c) IARIA, 2013. ISBN: 978-1-61208-306-3
CENTRIC 2013 : The Sixth International Conference on Advances in Human-oriented and Personalized Mechanisms, Technologies, and Services
129 / 145

levels at which design for individual needs is critical. These are firstly the service level and then the interaction level.
Complexity, asynchronous processes, time dependent behavior, and safety concerns are typical of the design problem for home environments. The definition of AAL we use here assumes different possible distributions of control between the technology, user control and third party control. One of the key elements of design is how control is distributed between these actors. One is the degree of control that a user requires over the technology. Will a person, or a technology controlled by a person procedurally, or controlled by a person declaratively, or by a secondary person, or automatically by technology, or combinations of these fulfill a task? The assessment of an individual‟s service requirements is partly a question of designing an optimal distribution of tasks. There is a danger that AAL technology may wrest too much control from the individual.
There are also hedonic considerations in design that should be weighted appropriately alongside considerations of functional requirements. Finding the „optimal‟ solution for task performance is not simply a matter of considering the efficiency of candidate design solutions, particularly with reference to the distribution of control. For example, it may be quicker to prepare meals if the beneficiary has minimal involvement. However, even a severely restricted individual may prefer to have control over the process. Tasks such as cooking are ones that have an important personal cache, and to simply surrender control to a device would not be acceptable. A further consideration is privacy. Removing control from individuals implies a greater level of ambient monitoring where data is collected from sensors embedded in the domestic environment, and possibly sharing of data with third parties. This may even include video footage.
The „calm computing‟ notion originally championed by Weiser (1990) [11] envisions that the environment anticipates and responds to perceived user needs. In this vision, the user is not actively manipulating devices and at times may not even be aware of the complex combination of sensors, processors and actuators around them. This is the philosophy used in „smart home‟ prototypes that were designed by Microsoft and others, in which domestic technologies were activated by human movement, environmental change and timing, but not by direct intentional human input. The concern is that such a model for AAL ignores both pragmatic and hedonic requirements of users. As discussed, users desire to have tasks done a certain way or just simply to have control, means that AAL design must be conceived on an individual service level, rather than simply automating processes that the beneficiary may find difficult. It is better to see AAL as a collection of individual services for which the degree of automation relative to direct user control is determined on a case-by-case basis.
At the interaction level, the design of control devices for ambient technologies is critical both to its accessibility and its range of utility. The perceptual and motor skills of potential AAL users vary considerably. This issue is compounded by the fact that older users in particular will be prone to diminishing capacities. Such devices may be
embedded in wheelchairs, domestic fittings or individual utilities, presenting a raft of potential design issues for interaction design. Therefore, design needs to allow for customization/personalization both initially and throughout the service lifecycle. Optimization of user controls such as joysticks involves the comfortable efficient and maximally effective control of the device. This may take a radically different solution dependent of the nature of the user‟s abilities. For example, a user may be best able to manipulate a joystick using their wrist rather than the front of the hand. Another may find that gripping a golf ball attached to the joystick allows greater control. It is important to allow for customizable input in design. The subtleties of input requirements should be researched early in projects, but the user should also be given the chance to „finish the design‟.
A further reason for supporting personalization is that user capacities are likely diminish progressively with age. Usability requirements are therefore subject to change over time. It may be that the requirements for text displays on device controls change several times during the lifetime of a product. Recent work, (e.g., Biswas et al 2011 [12]) has shown that some quite fine differences in perceptual and motor abilities can lead to significantly different requirements for interactive device design. This is particularly critical for AAL, where multiple use devices tend to be embedded in the physical environment.
Some progress has been made on providing for customization in AAL. One example is Casensa [13], a context-aware system that can be installed in houses of elderly to support them in everyday life activities. Users are given the power to create the supportive smart behavior of the house and have control over the activation and deactivation of the smart home facilities. It also allows for critical communication between ambient living devices and caregivers, which is particularly useful in cases where the elderly beneficiary may have diminished abilities, (e.g., dementia sufferers).
V. MODELS OF ACCESSIBILITY FOR THE
INTERNET OF THINGS
In this section, we look very briefly at the IoT accessibility requirement from the perspective of some models of accessibility provision. We explain why it is so important to incorporate needs and preferences in IoT network and device architectures and point at some ongoing work in Needs and Preferences and supporting delivery architectures. In fact there are many accessibility models, we describe here only a few and make no attempt to be exhaustive.
A. Accessibility as a Relationship and Changing Models of
Disability
Traditionally and historically persons even imagined as having characteristics not conformant with the norm have been separated from society and “blamed” for what has been often seen as “their problem”. A full treatment of this and ongoing societal changes would look at perception and complexity, psychological, sociological, philosophical models, organizational theories, history, religion and indeed
121Copyright (c) IARIA, 2013. ISBN: 978-1-61208-306-3
CENTRIC 2013 : The Sixth International Conference on Advances in Human-oriented and Personalized Mechanisms, Technologies, and Services
130 / 145

the nature of the universe and all that [14 ]. Such a treatment is beyond the scope of this paper and we rely here on anecdotal evidence and received historical wisdom of which examples are legion, ranging from the treatment of witches in Middle Age Europe to Eugenics and the treatment of disabled persons by the Third Reich [15]. Here, we merely observe and describe the changes underway.
Over a long period the view of “disability” has shifted and continues to shift, towards a view of accessibility as a relationship between system provider or producer and consumer or user. Approaches to accessibility can be seen as ways to manage that relationship.
1) The Medical Model The medical model of disability takes the view that a
“disabled person” has some characteristic(s) that lead to that person being unable to use some system or product in the fashion that some others can. Hidden behind the “in the fashion that some others can” phrase is often the view “in the way that we designed it and expect it to be used”. It is a view of the situation that posits people and behaviors as completely understandable and classifiable. Unfortunately, it fails to capture the richness of human behavior and functioning.
The International Classification of Functioning, Disability and Health [9] is a widely-accepted medical-model approach. This is an extensive complex classification of human functioning that some find difficult to understand and use. The medical model is only a model rather than a true representation of real people. As medical science advances so our understandings of conditions, behaviors and needs are refined and improved. This implies that in practice there is a gap between real needs and the model (otherwise the model would not need to develop and advance). The model isn‟t the person in the context, it merely predicts something about the functioning or behavior of the person and every model does this imperfectly. This gap between predicted need and actual or experienced need is often crucial in that it prevents delivery of a system from being optimal for every user. In addition, the nature of the model contributes one component of a computational complexity issue described below
2) One or many Sizes Fit All The Medical Model has some aspects with the flavor of
“One Size Fits All” (“this is what you are getting so it works for you”) or “Many Sizes Fit All” (“here are a few possibilities, one of them must work for you”). Imagine selecting a suit from a rack of suits for sale and no single suit has a perfect fit and contrast this with a tailor-made suit. The suit from a rack may not fit any person perfectly and for some particular person there may be no size that fits at all. Approaches to accessibility in the “Many Sizes Fit All” camp would include bundling together media modalities in a delivery package, such as captions and Audio Description along with a video or providing multiple ways into a building, some having wheelchair ramps and some having steps only. Clearly “Many Sizes Fit All” is an improvement on “One Size Fits All” and it has been widely used as a model to deliver accessible systems and products. It suffers from a number of limitations:
It has the same gap between system and user as the medical model because it “guesses” what the user needs.
On the one side of the relationship we have extremely varied users and contexts. On the other side, we have solutions, which are also extremely varied and also evolve over time, particularly in ICT where we have rapidly changing technology. Bridging between these two has a computational complexity close to exponential. Without some other mechanism we can only solve a limited number of cases with exact solutions. Given the diverse nature of individual needs it may be that not all cases can be solved optimally. That is, its likely that not all users will have a solution that is ideal for them in the context they are in and possible that no user at all will have a solution with a high usability.
Delivering all potential sizes in one package is unacceptably demanding on delivery systems and packages. In the ICT domain, trying to do so bloats data and uses unnecessary network bandwidth. In the world of supermarket car parks it means making every parking space large enough for families (which might be possible but wastes significant resources) and making each one close enough to the store that nobody has to walk far (which is not possible at all).
3) User Testing and Other Approaches Space precludes description of all of the models which
are employed to manage the accessibility relationship but all of them exist because of the complexity of the problem space and all of them attempt in some way to limit this complexity so as to make the problem solvable. The unfortunate characteristic is that in some way they all also compromise and limit the solutions, e.g., a commonly-used mechanism is that of testing a product with groups of users, usually with disabilities. This is a similar exercise to methods such as think-aloud protocols [16] which are commonly used in mainstream usability testing. The aim of such techniques is to establish generalizable results from a small sample of population. For example, if a mobile device‟s menu structure is found to be navigable by a sample of 15-20 non-impaired users it is broadly assumed to navigable by a whole population. However, this approach cannot be applied in the same way to a population of users with disabilities. It cannot be “exhaustive” with persons and contexts. Such exercises expose the product to only certain persons and it may not meet any individual‟s needs optimally. In fact, in many cases making a product meet the needs of one individual in the group may make it fail to meet the needs of another. For example, the needs of some persons for simplified information can conflict with needs associated with some cognitive “disabilities” for information to be presented in multiple forms. Individualization is the only mechanism that can get around this to deliver optimally to every user in every context.
4) Matching to Individual needs and Preferences An implication of our discussion of models is that the
only way to meet the needs of every individual consumer
122Copyright (c) IARIA, 2013. ISBN: 978-1-61208-306-3
CENTRIC 2013 : The Sixth International Conference on Advances in Human-oriented and Personalized Mechanisms, Technologies, and Services
131 / 145

optimally is to establish communication between each consumer and producer – anything else will have some element of guesswork about the needs of the particular consumer or some element of putting users in groups in which they may or may not (often not) fit. However, the idea, even with modern social network systems, of having a conversation between producer and every consumer around the use of every product in every context is computationally infeasible. What is needed is some way to manage the relationship that reduces the complexity whilst optimizing the needs of both parties in the communication – consumer and producer. As we mentioned above, in the case of media, it isn‟t reasonable or economically possible or sensible to deliver every possible alternative media format permutation to every user in every context. But in ICT it is feasible to deliver exactly what that user needs if we can find ways to build automated delivery systems that can do that.
A common way to reduce the complexity of problems involving relationship between two parts is to introduce an intermediate representation. Examples include the PBMPlus Image formats conversion kit [17]. PBMPlus set out to solve the problem of converting any of M image formats to any other of those M formats. At first sight it would appear to require M x (M – 1) convertors (every format to every other format) but by introducing a small number G of general formats and converting via the appropriate intermediate general format the number of required converters is reduced to 2 x M x G. Where M is large and G is small this is a much smaller number of convertors. A similar approach was taken in [18]. The approach would appear to apply to all problems where it is necessary to map one large domain to another, as it is here (an intermediate representation reduces the combinations and “manages” the relationship). It is particularly useful where the operation is expensive (so we keep G small to minimize costs) and whilst ICT solutions that meet the requirements of an individual are often cheap (because ICT is cheap and flexible), identifying those solutions is often expensive, on the scale of the Internet of Things ridiculously so – the world cannot afford to deal with the accessibility requirements of each device, person and context separately. It should be noted also that great care needs to be taken to design the intermediate representation, itself a model, so as not to exclude particular mappings. An intermediate representation between producer and consumer then would reduce the computational complexity of managing the relationship and improve the results quality.
A great deal of work is underway in ICT Accessibility to develop individualization approaches and a common way to do this is based around sets of individual preferences associated with a user and applying in specific contexts. A small sample of that work might include:
ISO/IEC 24751 Individualized Adaptability and Accessibility in Learning, Education and Training, currently under revision and to be re-titled as Access for All [19, 20, 21].
IMS Access for All – a family of specifications of personal needs and preferences and matching metadata, latest version is 3.0[22].
W3C IndieUI (Independent User Interfaces) Indie UI: User Context 1.0 [23].
Global Public Inclusive Infrastructure (GPII)[ 24].
A11yMetadata Project and Schema.org[25].
Preferences for Global Access [26].
Document Accessibility Profile [27]. This list is far from exhaustive and there are many
technical standards we have not been able to include. Other groups such as the ISO/IEC Joint Task Advisory
group working on Guidelines for incorporating accessibility in standards and ISO/IEC Special Working group on accessibility [28] also consider individualization important enough to incorporate in their roadmaps.
Individualization based around sets of individual preferences provides an intermediate representation between producer and consumer, that being the individual preferences that a user has for that context. There are not yet completely accepted definitions of the words “preference” and “need” and different groups working in the area use them differently, but the general principle is that systems including content and human interface can adapt to a set of individual preferences at or close to delivery time and thus come closer to meeting a individual‟s needs optimally. There are many ways individual preferences can be used, from static adaptation of interface to fetching matching content or requesting the production of content that matches. Examples and Use Cases for Individualization Using Preferences:
A video is being delivered with captions. That may be because the user has an expressed preference that auditory content be replaced with or augmented by textual content (for example the user may be deaf or it may be that the environment is noisy).
A user may have some vision impairment and require that text rendered on a screen is in a large font or alternatively the contrast is enhanced (each achieves a similar result)
A user may have difficulty using complex instructions and need that instructions are presented in simplified language. Another user might find a simplified interface frustrating and slow to use.
A user with limited dexterity at some times of day might have a preference to operate a device by voice input at those times and by physical means at other times.
A security video camera watching a house for movement might be set up so as to send text alerts, or video pictures to a remote location. A homeowner using such a camera might be driving and wish to be alerted to something the camera has detected by an auditory means. Preferences for that context and user (while driving) of auditory-for-visual or auditory-for-textual could trigger the delivery an auditory alert. The preference “textual for visual” might for a different context, say at the theatre, trigger the delivery of a textual (quiet) alert for the same event.
In each of these cases, given appropriate network infrastructure, a system might respond to specific user
123Copyright (c) IARIA, 2013. ISBN: 978-1-61208-306-3
CENTRIC 2013 : The Sixth International Conference on Advances in Human-oriented and Personalized Mechanisms, Technologies, and Services
132 / 145

preferences expressed in ways that are machine-readable and system-interpretable. Those preferences might be expressed in terms of required media modality adaptations or substitutions or interface customizations.
Making human interfaces to IoT systems and the messaging and media in those and in connected networks individualizable is likely to improve their accessibility significantly. However, on its own that won‟t solve the complexity problem. To solve that standardization is needed so that when an interface uses preferences for a particular user and context the same set of preferences is used across devices and contexts. Specific preferences relevant to a device and to a context may be different but some needs remain the same or closely-related. What is to be avoided is “unnecessary difference” in technological detail. We need to find the commonality (of technical and human needs) and build approaches around that.
For example, the need for enhanced visual display we mentioned above might be satisfied on one display by increasing a font size and on another by increasing the contrast and the solution adopted might be determined by the functionalities available on the device itself (consider for example the limited display functionalities of very cheap L.E.D. displays - a ubiquitous-device use case might require these) or by a combination of the display functionalities available and the environmental conditions at the time (say sunlight or shade). The “common preference” in this case would be for enhanced display and adaptation of fonts or contrast would be the solution. There are other solutions to this interaction need, such as delivering a different modality. We might in this case be able to deliver the information in auditory form – if we knew it was consumable – a factor of other user needs (being able perceive auditory content) and the environment (not too noisy to hear for that user and an environment in which sound is acceptable). However, in another case entirely it may be that increased contrast is both the preference and the solution.
There are common interoperability issues here that are often addressed by the development of appropriate standards and indeed many standards are in development to meet that need (some of which are mentioned above) and others are planned. Some specific requirements for IoT systems are developed later in this paper.
B. The Internet of Things
1) Relevance of Individualization If we accept that the Internet of Things has many places
where its necessary to have human interfaces or where there are implications for closely-connected systems and if we accept that people and contexts are so varied that there is a serious complexity issue in making those human interfaces and the information carried accessible then we must accept that building our management of the accessibility relationships in IoT is best done with personalization approaches. Any other way is too computationally expensive. It is far from feasible to expect every device designer to know about and use accessibility guidelines that characterize every “disability” and every human functionality.
An exciting use case and requirement is that of doing individualization not just “in” the heterogeneous networks that will be the backbone of the IoT but across those networks.
Consider a user requiring screen enhancement on a television screen. It‟s a strong possibility that the user might require similar enhancement on any display they are using. With individualization integrated in IoT we might for example be able to know on what that user required in similar contexts and to be able to provide it without asking. This is extremely useful in situations where a user is not able to ask for what they require.
Consider a device that transmits auditory information so a user can listen (perhaps a baby alarm) and a user who requires text-for-auditory in some contexts. It might be that the user has that requirement because the environment is noisy (preventing hearing), or it might be because the user is in a theatre listening to a performance (though not a baby alarm!) and so is unable to wear a listening device or disturb others, or it might be because the user has temporary or permanent hearing impairment. By knowing the context we might be able to infer what the user would require in a different context entirely without user input. Doing this requires architectures in which individualization is integrated with IoT.
Consider the benefits to a person unable to cope with complexity of being able to approach a cash machine or ATM and be provided with a simplified interface without asking for it.
Consider the benefits to a blind user travelling on a bus of information concerning the whereabouts of the bus and the next stop being delivered in auditory form directly to a personal device but consumed by sighted people as text.
2) Requirements and Issues for Integrating Preferences
in IOT In order to deliver adaptation to individual needs and
preferences across heterogeneous networks to meet the kinds of use case we have described a number of interdependent technical issues need to be approached – some are open questions not yet solved. We list some here along with tentative and even speculatory suggestions for mechanisms, considerations or areas to explore towards solutions:
Where are individual preferences stored? o In the cloud? How can that interoperate
across different vendor clouds?
How can we handle privacy given that in some cases we can deduce information about an individual from their preferences, particularly from multiple contexts? For example, if a user required enhanced visual access across multiple contexts it might suggest they have a visual impairment.
124Copyright (c) IARIA, 2013. ISBN: 978-1-61208-306-3
CENTRIC 2013 : The Sixth International Conference on Advances in Human-oriented and Personalized Mechanisms, Technologies, and Services
133 / 145

Where and how are “solutions” (“this works well in that context”) stored and where in IoT architectures can the engines that match solutions to devices live?
How can we determine whether the design of a device, system, or protocol will have impact for accessibility of systems connected indirectly to it?
Finally, whilst not completely accessibility-related, how can we ensure, particularly in loosely-coupled IoT systems such as those built around RFID [29] that ethical considerations are applied to those systems in which they are embedded.
VI. CONCLUSIONS
This paper has shown that in the context of changing demographics across the world towards more elderly populations there is a need to address accessibility effectively in The Internet of Things if we are not to exclude and impoverish many people. We have argued from practical and from computational complexity and purely theoretical considerations that current widely-used models of accessibility, including “medical models” and “one size fits all” are inadequate to meet the task and even “many sizes fit all” is inadequate alone and that we will need to use a combination of “many sizes fit all” and individualization or personalization to address the problem.
Our conjecture is that combining AAL and personalization in the IoT can in the future enrich the lives of many and that we need to start building infrastructure support for that approach in the heterogeneous networks and devices that will form the IoT.
REFERENCES
[1] The European Telecommunications Standards Institute, http://www.etsi.org/ [retrieved: May 2013]
[2] ETSI TS 102 689 Machine-to-Machine communications (M2M); M2M service requirements, http://www.in2eps.com/em2m/tk-etsi-m2m-102-689.html, [retrieved: May 2013]
[3] International Telecommunication Union Telecommunication Standardization Sector, http://www.itu.int/en/ITU-T/ , [retrieved: May 2013]
[4] New ITU standards define the Internet of Things and provide the blueprints for its development, http://www.itu.int/ITU-T/newslog/New+ITU+Standards+Define+The+Internet+Of+Things+And+Provide+The+Blueprints+For+Its+Development.aspx , [retrieved: May 2013]
[5] Web Content Accessibility Guidelines (WCAG) 2.0, http://www.w3.org/TR/2008/REC-WCAG20-20081211/, [retrieved: May 2013]
[6] H. Petrie and O. Kheir, “The relationship between accessibility and usability of websites,” CHI 2007, ACM Press, 2007 pp. 397-406.
[7] FCC Adopts Closed Captioning Rules for Online Video Programming, http://www.dwt.com/FCC-Adopts-Closed-Captioning-Rules-for-Online-Video-Programming-01-17-2012//, [retrieved:May 2013]
[8] World Health Organization (WHO), World report on disability, http://www.who.int/disabilities/world_report/2011/summary.pdf, June 2011, [retrieved: May 2013]
[9] World Health Organization (WHO), International Classification of Functioning, Disability and Health (ICF), http://www3.who.int/icf/intros/ICF-Eng-Intro.pdf, 2001 [retrieved: May 2013]
[10] Empirica Communications and Technology Research, “Accessing and Promoting e-Accessibility”, 2013 unpublished
[11] M. Weiser, “The Computer for the Twenty-First Century”, Scientific American, 1991 pp. 94-104.
[12] P. Biswas, P. Robinson, and P.M. Langdon, “Designing inclusive interfaces through user modeling and simulation”, International Journal of Human-Computer Interaction, 2011.
[13] A. Dohr, R. Modre-Opsrian, M.Drobics, D.Hayn, and G. Schreier, “The Internet of Things for Ambient Assisted Living”, ITNG '10 Proceedings of the 2010 Seventh International Conference on Information Technology: New Generations, IEEE, 2010 , pp804-809.
[14] D. Adams, “The Hitchhiker‟s Guide to the Galaxy”, Pan Books, United Kingdom, 1979.
[15] H. Gallagher, “By Trust Betrayed: Patients, Physicians and the License to Kill in the Third Reich”, 1990.
[16] K.A. Ericsson and H.A. Simon, “Protocol Analysis: Verbal Reports as Data (revised edition)”, MIT Press, Cambridge, Mass , 1993.
[17] Software. pbmplus - image file format conversion package, http://acme.com/software/pbmplus/ /, [retrieved: May 2013]
[18] G. Woo, C. Heung Seok, and J. Hanil, “An intermediate representation approach to reducing test suites for retargeted compilers”, Proceeding Ada-Europe'07 Proceedings of the 12th international conference on Reliable software technologies, Springer-Verlag Berlin, Heidelberg, 2007, pp 100-113.
[19] International Standards Organisation (ISO), 2008. ISO/IEC 24751-1 Information technology -- Individualized adaptability and accessibility in e-learning, education and training -- Part 1: Framework and reference model, www.iso.org/iso/catalogue_detail.htm?csnumber=41521 , [retrieved: May 2013]
[20] International Standards Organisation (ISO) 2008, ISO/IEC 24751-2 Information technology -- Individualized adaptability and accessibility in e-learning, education and training -- Part 2: "Access for all" personal needs and preferences for digital delivery, http://www.iso.org/iso/catalogue_detail?csnumber=43603, [retrieved: May 2013]
[21] International Standards Organisation (ISO) 2008, ISO/IEC 24751-3 Information technology -- Individualized adaptability and accessibility in e-learning, education and training -- Part 3: "Access for all" digital resource description, www.iso.org/iso/catalogue_detail?csnumber=43604, [retrieved: May 2013]
[22] The IMS Accessibility project group, 2012. IMS Access For All v3.0 Public Draft Specification, http://imsglobal.org/accessibility , [retrieved: May 2013]
[23] IndieUI 1.0: User Context. Contextual Information for User Interface Independence. W3C Editor's Draft 03 May 2013, https://dvcs.w3.org/hg/IndieUI/raw-file/default/src/indie-ui-context.html, [retrieved: May 2013]
[24] The Global Public Inclusive Infrastructure (GPII), 2011, http://gpii.net , [retrieved: May 2013]
[25] A11yMetadata Project,2013. A Schema.org Proposal for Accessibility Metadata, http://www.a11ymetadata.org/, [retrieved: May 2013]
[26] Fluid Project, Preferences for Global Access, http://wiki.fluidproject.org/display/fluid/Preferences+for+Global+Access , 2013, [retrieved: May 2013]
[27] U.S Department of Education; Student E-Rent Pilot Project., 2011, Document Accessibility Profile (BETA). Available at http://stepp.gatech.edu/label.php, [retrieved: May 2013]
[28] JTC 1 Special Working Group on Accessibility, http://www.jtc1access.org/, [retrieved: May 2013]
[29] Definition of RFID, www.webopedia.com/TERM/R/RFID.html , [retrieved: May 2013]
125Copyright (c) IARIA, 2013. ISBN: 978-1-61208-306-3
CENTRIC 2013 : The Sixth International Conference on Advances in Human-oriented and Personalized Mechanisms, Technologies, and Services
134 / 145

Process of Gamification From The Consideration of Gamification To Its Practical Implementation
Cathie Marache-Francisco PErSEUs ; SAP France
Lorraine University ; SAP Metz, France ; Levallois-Perret, France
Eric Brangier PErSEUs (EA 7312)
Université de Lorraine Metz, France
Abstract— The trend toward software gamification is increasingly important. But, it often implies the modification of a few simplistic surface elements (colorful aesthetic, personalization, points, badges and leaderboards, etc.) without actually integrating gamification into the overall design. Gamification is often downgraded to interface look and feel and point systems without questioning design practices. This article proposes a design approach focused on gamification. This user-centered approach aims to identify the factors to be taken into account in gamification design (intention, situation, task, users). The authors introduce a design guide consisting of a design process and a toolbox. It aims at facilitating effective gamification design by providing the means to overcome the difficulties encountered with interaction design process.
Keywords— Gamification; design process; user-centred design
I. INTRODUCTION The human-technology relationship has evolved
dramatically in the last 50 years, as the designers develop systems that are not only usable, but also persuasive and funny. Recently, the term gamification appeared, defined by Deterding et al. [1] as “An informal umbrella term for the use of video game elements in nongaming systems to improve User Experience (UX) and user engagement” (p.2).
Gamification aims at improving the technology use by applying in non-gaming or professional contexts video game techniques. Very often, these techniques are based on the concepts of motivation, enjoyment, engagement, commitment, attractiveness, emotion, etc., which, once implemented, are expected to improve user and business performance (e.g., Zichermann and Cunningham [2]; Kim [3]). According to Nicholson [4], meaningful gamification “is the integration of user-centered game design elements into non-game contexts”.
However, the concepts used are rather vague and unorganized. Indeed, at the beginning, gamification was mostly communicated through what Robert called slideshareatture (live presentation or downloadable slides [5]). Those practices are evolving (e.g., Werback and Hunter [6]; Kumar and Herger [7]) and, following that trend, the objective of this paper is to brainstorm, rationalize and define a general process for gamification design.
After defining gamification in section 2, the authors will present the gamification process in section 3 followed by a
toolbox consisting of four elements in section 4. They will introduce gamification core-principles, a context analysis guide and user-centered principles (task support, motivation, attractiveness). These principles are illustrated with definitions, charts and examples. Finally, the authors will offer a decision tree to help determine if gamification can improve a project. They will discuss the quality of this approach by analyzing interface examples that implement gamification elements in section 5. In Section 6, the paper is concluded and future work is described.
II. KEYS CONCEPTS RELATED TO GAMIFICATION The notion of the gamification loop developed by Liu et
al. [8] introduces a design process that consists of a challenge with winning conditions, a point system, a leader board and rewards linked to sub-goal achievements (badges). The authors also mention the modification of the user’s social and network status as well as the need for a “game-like” interface.
Several authors have emphasized the importance of going further than this kind of gamification design. For example, Kim [3] explains gamification from a social game designer point of view. She states that adding points, badges and leader boards is not enough to create a game-like experience because they are only feedback elements. Game design is about relying on intrinsic motivation through autonomy, mastery and purpose. She insists that we need to understand the social style of the users and their level of expertise, as well design an engagement loop. She concludes that game elements are to be used according to specific user profiles.
Three more articles can be mentioned for their interesting contribution to the gamification design definition. Werback and Hunter [6] introduce gamification concepts and provide a list of gamification elements (dynamics, mechanics and components). Gamification design is separated into six steps: “Define business objectives; Delineate target behaviors; Describe your players; Devise activity cycles; Don’t forget the fun!; Deploy the appropriate tools”.
Kumar and Herger [7] call gamification design a "Player Centered Design" that involves five steps: “Know your player; Identify the mission; Understand human motivation; Apply mechanics; Manage, monitor and measure”. They define a template Persona, and game mechanics to be used.
126Copyright (c) IARIA, 2013. ISBN: 978-1-61208-306-3
CENTRIC 2013 : The Sixth International Conference on Advances in Human-oriented and Personalized Mechanisms, Technologies, and Services
135 / 145

They also insist on the need for ethical and legal considerations.
Finally, Robinson and Bellotti [9] offer a taxonomy defining the gamification elements to be used depending on the level of anticipated user commitment.
As mentioned before, gamification being a quite recent trend, we have tried to analyze it and contribute to the gamification field by developing a design process which can be easily applied by designers, and guide the selection of elements based on the context of use of their system.
III. DESIGN PROCESS FOR GAMIFICATION
A. Method This process has been designed based on two studies led
by in Marache-Francisco and Brangier [10, 11]. It comprises an extensive literature review, which aimed at describing gamification [10], as well as an experiment led on 10 designers [11]; the goal was to identify the dimensions through which gamification design was perceived.
Based on this previous work, we have defined the gamification design process as consisting of two major steps (Figure 1): context analysis and iterative conception. We have also built several tools to guide the designers through gamification processes. We will describe our process and relate it to the literature which has led us to that design.
B. First step : Context Analysis One concern is that gamification cannot be efficient if it
is not designed based on a good understanding of the users and the context of use, as Nicholson [4] pointed out. A context analysis is thus a prerequisite; intentions must be analyzed and considered in the context of the situation, the task, as well as the user(s) profile(s). The toolbox provides a context analysis guide to help the designer during that phase (IV – B). It also provides gamification core principles (IV – A), which are to be considered during all the design phases.
The User Centered Design Field comprises several methods, as described in the ISO/TR 16982 [12], which can be interesting to apply during that first phase of gamification
design. For example, observations, interviews, questionnaires, diaries, focus groups or personas. The creation of gamified interfaces should be based on solidly established, real data, which can be collected directly from users, or through indirect sources.
C. Second step : Iterative Conception The second phase is about the choice of the gamification
experience to design for. We select first the elements using the conception grid (IV – C) and the decision tree (IV – D) and then plan the evolution of the interaction. Again, the gamification core principles (IV – A) provide additional elements to consider.
Once this is defined, an iterative conception phase takes place. The concepts are materialized through mockups or prototypes, and tested on representative users until the system proves to be efficient.
IV. TOOLS BOXES FOR GAMIFICATION: INFORMATION TO BE INTEGRATED INTO THE GAMIFICATION DESIGN PROCESS
A. Gamification core principles The first design tool – the gamification core principles –
regulates the conception process. It comprises six principles: • Freedom of choice (Marache-Francisco and Brangier
[11]): giving the user the freedom to exercise the user’s own will, for example being allowed to disable functionalities, or to opt out of the gamified system;
• Benefits and meaningfulness (Deterding [13]): The gamification influences must be relevant both to the owners of the system, who expect positive consequences, and to the end users themselves. Otherwise, non-meaningful elements will either have a bad influence on the perception of the system by the end users or be ignored by them;
• Personalized experience (Nicholson [4]): Different user profiles can lead to several different designs. This is where the added value of gamification comes from, through tailored triggers;
Figure 1: Gamification process principles.
127Copyright (c) IARIA, 2013. ISBN: 978-1-61208-306-3
CENTRIC 2013 : The Sixth International Conference on Advances in Human-oriented and Personalized Mechanisms, Technologies, and Services
136 / 145

• Long-term interaction (Kim [3]): Designing with the evolution of the interaction in mind, especially concerning the motivational elements;
• Unwanted secondary effects anticipation: Unwanted effects can include stress induced by pressures from efficiency requirements (Apter [14]), loss of the feeling of privacy and credibility, gaming the rules of the system, or focus on quantity over quality to obtain some reward (Montola et al. [15]);
• Legal and ethical matters (Werbach and Hunter [6]; Kumar and Herger [7]): They take into account the existing legal context, for example, data and privacy, and the interest of the end users.
B. Context Analysis Guide The second tool indicates factors, which have an impact
on the perception and the efficacy of the gamification elements. The guide advises on data collection and analysis. • Intent: (1) Goal (task or motivation-centered); (2)
concrete actions targeted. Note: The initial intent evolves based on new parameters arising from the analysis;
• Situation: (1) Context (for example, work or leisure); (2) Social Environment; (3) Motivators and Pain points;
• Task: (1) Goal; (2) Structure; (3) Other actors involved; • User(s): (1) Characteristics (for example: gender, age);
(2) Personality; (3) Culture (e.g., Khaled [16] investigated the differences between individualism vs collectivism); (4) Experience / Competency / Knowledge; (5) Motivators or Pain points.
C. Conception Grid The conception grid consists of three categories of
gamification design elements: task support, motivation and attractiveness.
This has been defined based on a comprehensive literature review [10] combined with an experiment we have led on gamification perception by designers [11]. Indeed, the first classification has been refined based on a better understanding on how to teach gamification to fit at best designers’ perception of it.
It is, thus, defined as follow:
• Task support: adapting the interaction to a given user with game-like targeted communication (Järvinen [17)] in order to increase his knowledge and abilities;
• Motivation: motivating the user through emotional and persuasive elements (accomplishment with self and social challenges and relevant feedbacks; self-expression and relationships mechanisms);
• Attractiveness: elements designed to generate positive emotions with an immersive universe, appealing interactions and the use of surprise (e.g., Hohl et al. [18]). Below is an inventory of the main elements which can be
integrated into the gamification proposal. Two display modes are created for this tool: cards summarizing the elements by category (Figure 2) and tables which describe each element and its use (Table 1). We have tried to be as comprehensive as possible when identifying the gamification elements, using the literature mentioned before as well as Antin and Churchill [19], the game mechanics playdeck by Schonfeld [20] and Graf et al. [21].
TABLE 1. CONCEPTION GRID: EXAMPLES OF DESCRIPTIONS
Element Description Means Rhetoric Definition: Providing information about how to reach
a goal. Example: Tips provided during splash screen Creating / Personalizing
Definition: Allowing the user to express his individuality. Example: giving to option to personalize one’s avatar
Sensory-Motor (Marache-Francisco and Brangier [10])
Definition: Elements to communicate and interact with the user. Units (Fox [22]): sound effects, music, verbalization, vibration, shaking, animating the body, colors, images, metaphors, 2D/3D, effects (e.g.,comics, round shapes), minimalistic interface, typography, animation through coding or movement. Composites (Dyck et al. [23]): Heads-Up display (data displayed on the screen to avoid having the user to look away from his focus of attention), Attention aware interface (elements changing their appearance depending on their relevancy for the user at a given moment), Context aware view behavior (dynamic adaptation of the screen with pan and zoom to display a relevant interface), Calm messaging (delivering information on a non-intrusive way without needing an explicit user action), Atmosphere / theme. Example: communicating an alert on a battlefield with sound and visual effects to attract the user attention
Figure 2: Gamification elements cards
128Copyright (c) IARIA, 2013. ISBN: 978-1-61208-306-3
CENTRIC 2013 : The Sixth International Conference on Advances in Human-oriented and Personalized Mechanisms, Technologies, and Services
137 / 145

D. Decision tree : When and how is gamification an asset ? The last tool, i.e., the decision tree, consists of questions
which guide the selection of the gamification elements. It offers recommendations of conception choices.
First, the decision tree covers the choice of gamification elements categories to consider based on the design intent. The context analysis will influence this phase (Figure 3). The social engagement loop described by Kim [3] is a good example of a personalized experience definition (a gamification core principle), i.e., that the intent depends on the user profile. The novice users have to learn about the system (knowledge, competency), the regular users need new things to do to keep using the system (engagement), while the enthusiasts need recognition elements, such as exclusive features, to keep being interested (engagement).
Second, the decision tree helps to analyze the task and suggests gamification elements based on its structure, the use and the importance of efficiency within the task’s context (Figure 4). The elements will be communicated with the Communication and Universe (sensory-motor) categories.
Third, the tree analyzes the motivation category of gamification elements. It first questions the motivators which will be meaningful for the end users and induce certain elements over others (Figure 5). Those categories can be combined if relevant.
Figures 6 and 7 offer other parameters which help deciding whether to use social elements or not, and which accomplishment elements are relevant.
According to Denny [24], the badges effect might only be observed if the behavior suggested is valuable for the end user. Regarding Accomplishment elements, leaderboards are to be designed with care to avoid demotivating. The end users should be compared with meaningful people and they should not be placed at the bottom of a ranking, but instead between other users (Zichermann and Cunningham [2]).
The motivation elements should be displayed and supported with task support elements and a relevant communication with the Communication and Universe (sensory-motor) categories of gamification element.
Figure 3: Decision tree: the intent
Concerning Attractiveness, efficiency should be considered. Depending on the context or user profile, we should avoid – or give the possibility to turn off – elements which are not relevant to the task or are out of phase with the system (e.g., narration interfering with the evolution as mentioned by Langer et al. [25], Easter egg). According to Bowser et al. [26], experts prefer a direct interface, while casual users appreciate badges and achievements.
Concerning the Universe sub-dimension of Attractiveness, the metaphor and its scope (punctual or wide-spread) should be chosen depending on the population and the context (e.g., avoiding a childish look and feel for adults systems). Finally, randomness should be used with caution as it can demotivate the end users.
Figure 4: Decision Tree: the task
Figure 5: Decision tree: motivators
129Copyright (c) IARIA, 2013. ISBN: 978-1-61208-306-3
CENTRIC 2013 : The Sixth International Conference on Advances in Human-oriented and Personalized Mechanisms, Technologies, and Services
138 / 145
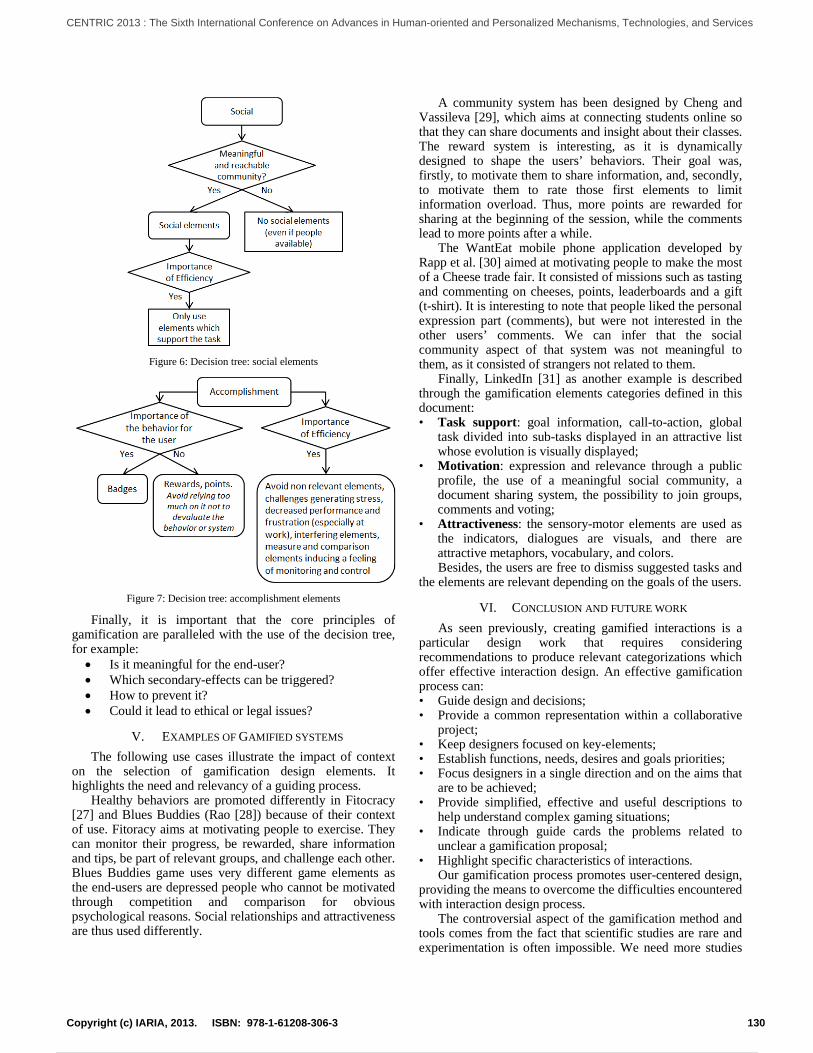
Figure 6: Decision tree: social elements
Figure 7: Decision tree: accomplishment elements
Finally, it is important that the core principles of gamification are paralleled with the use of the decision tree, for example: • Is it meaningful for the end-user? • Which secondary-effects can be triggered? • How to prevent it? • Could it lead to ethical or legal issues?
V. EXAMPLES OF GAMIFIED SYSTEMS The following use cases illustrate the impact of context
on the selection of gamification design elements. It highlights the need and relevancy of a guiding process.
Healthy behaviors are promoted differently in Fitocracy [27] and Blues Buddies (Rao [28]) because of their context of use. Fitoracy aims at motivating people to exercise. They can monitor their progress, be rewarded, share information and tips, be part of relevant groups, and challenge each other. Blues Buddies game uses very different game elements as the end-users are depressed people who cannot be motivated through competition and comparison for obvious psychological reasons. Social relationships and attractiveness are thus used differently.
A community system has been designed by Cheng and Vassileva [29], which aims at connecting students online so that they can share documents and insight about their classes. The reward system is interesting, as it is dynamically designed to shape the users’ behaviors. Their goal was, firstly, to motivate them to share information, and, secondly, to motivate them to rate those first elements to limit information overload. Thus, more points are rewarded for sharing at the beginning of the session, while the comments lead to more points after a while.
The WantEat mobile phone application developed by Rapp et al. [30] aimed at motivating people to make the most of a Cheese trade fair. It consisted of missions such as tasting and commenting on cheeses, points, leaderboards and a gift (t-shirt). It is interesting to note that people liked the personal expression part (comments), but were not interested in the other users’ comments. We can infer that the social community aspect of that system was not meaningful to them, as it consisted of strangers not related to them.
Finally, LinkedIn [31] as another example is described through the gamification elements categories defined in this document: • Task support: goal information, call-to-action, global
task divided into sub-tasks displayed in an attractive list whose evolution is visually displayed;
• Motivation: expression and relevance through a public profile, the use of a meaningful social community, a document sharing system, the possibility to join groups, comments and voting;
• Attractiveness: the sensory-motor elements are used as the indicators, dialogues are visuals, and there are attractive metaphors, vocabulary, and colors. Besides, the users are free to dismiss suggested tasks and
the elements are relevant depending on the goals of the users.
VI. CONCLUSION AND FUTURE WORK As seen previously, creating gamified interactions is a
particular design work that requires considering recommendations to produce relevant categorizations which offer effective interaction design. An effective gamification process can: • Guide design and decisions; • Provide a common representation within a collaborative
project; • Keep designers focused on key-elements; • Establish functions, needs, desires and goals priorities; • Focus designers in a single direction and on the aims that
are to be achieved; • Provide simplified, effective and useful descriptions to
help understand complex gaming situations; • Indicate through guide cards the problems related to
unclear a gamification proposal; • Highlight specific characteristics of interactions.
Our gamification process promotes user-centered design, providing the means to overcome the difficulties encountered with interaction design process.
The controversial aspect of the gamification method and tools comes from the fact that scientific studies are rare and experimentation is often impossible. We need more studies
130Copyright (c) IARIA, 2013. ISBN: 978-1-61208-306-3
CENTRIC 2013 : The Sixth International Conference on Advances in Human-oriented and Personalized Mechanisms, Technologies, and Services
139 / 145

to understand better how gamification can be successfully applied and to refine our process (e.g., adding factors on the decision tree). We also plan to test this process on a case study in order to demonstrate its usefulness.
ACKNOWLEDGMENT The authors would like to thank SAP and especially Steve KOPP, Christophe FAVART and Chahab NASTAR, Ph.D.
REFERENCES [1] S. Deterding, M. Sicart, L. Nacke, K. O’Hara and D. Dixon,
“Gamification: Using Game Design Elements in Non-Gaming Contexts,” Proceedings of CHI 2011 Workshop Gamification: Using Game Design Elements in Non-Game Contexts, May 2011, pp. 2-5.
[2] G. Zichermann and C. Cunningham, Gamification by Design: Implementing Game Mechanics in Web and Mobile Apps. Sebastopol, CA: O'Reilly Media, Inc., 2011.
[3] A.J. Kim, “Smart Gamification: Seven Core Concepts for Creating Compelling Experiences”, 2011. Retrieved February 2, 2012 from http://casualconnect.org/lectures/business/smart-Gamification-seven-core-concepts-for-creating-compelling-experiences-amy-jo-kim.
[4] S. Nicholson, “A User-Centered Theoretical Framework for Meaningful Gamification”, Proceedings of Games+Learning+Society 8.0, June 2012, pp. 223-229.
[5] T. Robert, “Gamification: la slideshareatture”, 2011. Retreived February 2, 2012 from: http://www.ludicite.ca/2011/10/ Gamification-la-slideshareatture.
[6] K. Werbach and D. Hunter, For the Win. How game thinking can revolutionize your business. Philadelphia, PA: Wharton Digital Press, 2012.
[7] J.M. Kumar and Herger, M., Gamification at Work: Designing Engaging Business Software. Aarhus, Denmark: The Interaction Design Foundation, 2013. Retrieved June, 15, 2013 from http://www.interaction-design.org/books/Gamification_at_work.html.
[8] Y. Liu, T. Alexandrova, and T. Nakajima, “Gamifying intelligent environments,” Proceedings of the 2011 international ACM workshop on Ubiquitous meta user interfaces, Ubi-MUI '11, December 2011, pp. 7-12.
[9] D. Robinson and V. Bellotti, “A Preliminary Taxonomy of Gamification Elements for Varying Anticipated Commitment,” Proceedings of CHI 2013 Workshop Designing Gamification: Creating Gameful and Playful Experiences, April 2013, pp. 69-74.
[10] C. Marache-Francisco and E. Brangier, “The Gamification Experience - UXD with a Gamification background” in Emerging Research and Trends in Interactivity and the Human-Computer Interface, K. Blashki and P. Isaias, Eds. IGI-Global, in press.
[11] C. Marache-Francisco and E. Brangier, “Perception of Gamification: between Graphical Design and Persuasive Design,” Proceedings of DUXU/HCII 2013, Part II, LNCS 8013, July 2013, pp. 558–567.
[12] ISO/TR 16982, Ergonomics of human-system interaction -- Usability methods supporting human-centred design, 2002.
[13] S. Deterding, “Meaningful Play. Getting Gamification right”, Mountain View, CA, USA: Google Tech Talk, 2011. Retreived June 15, 2013 from http://www.youtube.com/watch?v=7ZGCPap7GkY.
[14] M.J. Apter, “A Structural-Phenomenology of Play”, in Adult Play. A Reversal Theory Approach, H.Kerr and M.J. Apter, Eds. Amsterdam: Swets & Zeitlinger, 1991, pp. 13-22.
[15] M. Montola, T. Nummenmaa, A Lucero, M. Boberg, and H. Korhonen, H., “Applying game achievement systems to enhance user
experience in a photo sharing service,” Proceedings of the 13th International MindTrek Conference: Everyday Life in the Ubiquitous Era on - MindTrek '09, 2009, pp. 94-97.
[16] R. Khaled, “It’s not just whether you win or lose: thoughts on Gamification and culture,” Proceedings of CHI 2011 Workshop Gamification: Using Game Design Elements in Non-Game Contexts, May 2011, pp. 64-67.
[17] A. Järvinen, “Games without frontiers. Theories ans methods for game studies and design”, Doctoral dissertation, Finland: University of Tampere, 2008. Retrieved April 2, 2012 from http://ocw.metu.edu.tr/pluginfile.php/4468/mod_resource/content/0/ceit706/week3_new/AkiJarvinen_Dissertation.pdf.
[18] H. Hohl, K. Wissmann, and M. Burger, “The joy of telephony: designing appealing interactions” in Funology: From Usability to Enjoyment, M. A. Blythe, K. Overbeeke, A. F. Monk, and P. C. Wright, Eds. Norwell, MA, USA: Kluwer Academic Publishers, 2005, pp. 205-211.
[19] J. Antin and E.F. Churchill, “Badges in Social Media: A Social Psychological Perspective,” Proceedings of CHI 2011 Workshop Gamification: Using Game Design Elements in Non-Game Contexts, May 2011, pp. 10-13.
[20] E. Schonfeld, “SCVNGR's Secret Game Mechanics Playdeck”, 2010. Retreived May, 2 2013 from http://techcrunch.com/2010/08/25/scvngr-game-mechanics/.
[21] C. Graf, S. Niebuhr, and K. Kohler, “Enhancing Business Software through Fun-of-Use: A Pattern-based Approach” in Emotion in HCI: Joint Proceedings of the 2005, 2006, and 2007 International Workshops, C. Peter, R. Beale, E. Crane, L. Axelrod, and G. Blyth, Eds. Stuttgart: Fraunhofer IRB Verlag, 2008, pp. 101-109.
[22] B. Fox, Game Interface Design. Boston: Thomson Course Technology PTR, 2005.
[23] J. Dyck, D. Pinelle, B. Brown, and C. Gutwin, “Learning from Games: HCI Design Innovations in Entertainment Software,” Proceedings of Graphics Interface, Feb 2003, pp. 237-246.
[24] P. Denny, “The effect of virtual achievements on student engagement”, CHI '13 Proceedings of the SIGCHI Conference on Human Factors in Computing Systems, April 2013, pp. 763-772.
[25] R. Langer, M. Hancock, A.H. West, and N. Randall, “Applications as Stories,” Proceedings of CHI 2013 Workshop Designing Gamification: Creating Gameful and Playful Experiences, April 2013, pp. 36-39.
[26] A. Bowser, D. Hansen, and J. Preece, “Gamifying Citizen Science: Lessons and Future Directions,” Proceedings of CHI 2013 Workshop Designing Gamification: Creating Gameful and Playful Experiences, April 2013, pp. 5-8.
[27] https://www.fitocracy.com/ 14.08.2013. [28] V. Rao, “Challenges of Implementing Gamification for Behavior
Change: Lessons Learned from the Design of Blues Buddies,” Proceedings of CHI 2013 Workshop Designing Gamification: Creating Gameful and Playful Experiences, April 2013, pp. 61-64.
[29] R. Cheng and J. Vassileva, “Adaptive Reward Mechanism for Sustainable Online Learning Community” in Proceedings of the 2005 conference on Artificial Intelligence in Education: Supporting Learning through Intelligent and Socially Informed Technology, C.-K. Gord McCalla, B. Bredeweg, and J. Breuker, Eds. Amsterdam, The Netherlands, The Netherlands: IOS Press, 2005, pp. 152-159.
[30] A. Rapp, A. Marcengo, R. Simeoni, and L. Console, “Playing while Testing: How to Gamify a User Field Evaluation,” Proceedings of CHI 2013 Workshop Designing Gamification: Creating Gameful and Playful Experiences, April 2013, pp. 65-68.
[31] http://www.linkedin.com/ 09.12.2011.
131Copyright (c) IARIA, 2013. ISBN: 978-1-61208-306-3
CENTRIC 2013 : The Sixth International Conference on Advances in Human-oriented and Personalized Mechanisms, Technologies, and Services
140 / 145

Citizen-centric eGovernment Services Use of indicators to measure degree of user involvement in eGovernment service development
Lasse Berntzen Department of Business and Management
Vestfold University College Tonsberg, Norway
e-mail: [email protected]
Abstract—Citizen-centric eGovernment is about user involvement in all stages of the lifecycle of an eGovernment service. The wishes and requirements of the citizens and the administration are not always aligned. User involvement is an important measure to make sure that services become citizen- centric. NET-EUCEN, a EU-supported thematic network on citizen-centric eGovernment, has proposed a framework with a set of indicators to measure user involvement in eGovernment service development and provision. The indicator set is presented and some limitations are discussed.
Keywords – citizen-centric; user involvment, user participation; eGovernment; NET-EUCEN.
I. INTRODUCTION Citizen-centric eGovernment is about delivering
electronic services focusing on the wishes and requirements of the end-users. In order to capture these requirements, it is important to involve users throughout the whole life cycle of the service. This paper discusses such user involvement and how to measure it using a set of indicators.
User involvement in systems development has been discussed and practiced in the Scandinavian countries since 1975 [1]. Bjørn-Andersen and Hedberg [2] gave the following reasons for involving users in the development of software systems:
• improving the knowledge upon which systems are built,
• enabling people to develop realistic expectations, and reducing resistance to change, and
• increasing workplace democracy by giving the members of an organization the right to participate in decisions that are likely to affect their work.
In a meta-analysis of 25 studies on user engagement, Hwang and Thorn [3] found user involvement beneficial, but the magnitude of the benefits depends on how involvement and its effect are defined.
User involvement is not only important for system development projects. In his book “The Lean Startup”, Eric Ries [4] emphasizes the need to learn from customers in order to build products and services that will succeed in the market. He advocates the use of a build-measure-learn feedback loop, where products and services are continuously
validated by real customers to find out if they are fulfilling the expectations of the customers or not.
Also, eGovernment researchers have advocated user involvement in development of eGovernment researchers. Richard Heeks [5] remarks: “Of all the stakeholders, the users are those who tend to be most rooted in current system realities, and who best understand when technology-/rationality-driven models will be inappropriate. Giving users a bigger say in systems development can therefore help guard against e-government failure.”
In November 2005, the United Kingdom Presidency of the Council of the European Union held a Ministerial eGovernment Conference in Manchester. The ministers approved unanimously a declaration [6], which, among other items said: “During 2006 and 2007, Member States will, through the European Public Administration Network, exchange experiences in developing policies which are inclusive by design, for example, in citizen-centric service delivery or the use of multi-channel architectures”.
Blakemore et al. [7] were asked by the European Commission eGovernment Unit to do a 24 months study on citizen-centric eGovernment. The project, called cc:eGov, held a number of workshops and produced a set of “Think papers” to discuss different aspects of citizen-centric eGovernment. The final outcome of the project was a handbook [8]. The study did not emphasize user involvement in the development of services, but were more concerned with transformation of government to be more attentive to the needs and wishes of the citizens.
The European Commission also initiated other projects to explore citizen-centric eGovernment, e.g., “OneStopGov”. The project was started in January 2006, and was a thirty six month EU-funded research and development project that aimed at specifying, developing and evaluating a life-event oriented, all-inclusive, integrated, interoperable platform for online one-stop government [9].
User involvement in the whole lifecycle of eGovernment services received focus in 2010, with the establishment of the NET-EUCEN thematic network [13]. One of the activities of this network was to develop a framework for measuring user-centricity at all stages of the service lifecycle. This framework and its indicators will be discussed later.
132Copyright (c) IARIA, 2013. ISBN: 978-1-61208-306-3
CENTRIC 2013 : The Sixth International Conference on Advances in Human-oriented and Personalized Mechanisms, Technologies, and Services
141 / 145

II. PERSPECTIVES ON ELECTRONIC GOVERNMENT Electronic services are, under most circumstances,
beneficial for the users. eGovernment services typically includes at least three categories of services:
• Electronic access to government information, where citizens can service themselves (self-service).
• Online transactions with the government through use of electronic forms.
• Access to, and the ability to interact electronically with governmental officials, often through multiple channels (e-mail, chat, SMS).
The two first categories are normally available at all times and from all geographic locations. The last category is limited by the availability of government staff.
eGovernment services can be seen from two different
perspectives: the administrative perspective and the citizen perspective. These two perspectives may be in conflict. Verdegem and Hauttekeete [10] argue that eGovernment development suffers from deterministic conceptions, and that, consequently the user seems to be neglected; only minor attention is given to the impact of the electronic service on the customer.
A. Administrative perspective From the administrative perspective, electronic services
can save both time and work for government staff. The City of Copenhagen [11] has calculated the average cost to the municipality for different types of contact with the general public. The cost of a visit by a person is estimated to be close to 10 Euro, while a telephone conversation costs close to 5 Euro. Self-service through Internet costs only 0.40 Euro. These calculations indicate a potential for considerable savings by shifting the contact with the general public to the digital channel, whenever appropriate.
The success of an electronic service can be measured as the ratio between users of the service and the users making personal appearance or telephone calls.
B. Citizen perspective Citizens want services that are efficient and easy to use.
Bertot and Jaeger [12, p. 164] made the following observation: "While users may appreciate the cost savings to agencies for any number of reasons, their primary interest is in their ability to interact with eGovernment services with ease.”
For citizens the main objective is to get information, submit forms, or interact with the administration with a minimum of trouble. Neither physical visits to government or municipal offices nor sending ordinary letters are considered efficient.
C. Possible conflicts between the perspectives In practice, the two perspectives are not necessarily aligned. The following subsections will show some examples for each of the three categories of services mentioned above.
1) Information retrieval
For information retrieval, it is important that citizens can find the information they need. The web site structure must fit the perception of the users, and not the organizational structure of the administration. But, too often, government organization is used as a model for the hierarchical structure of the web site. A citizen may not know what department is handling his or her problem. An alternative solution is to fit the content to current life situation or the intentions of the citizens [9]. If you are a student, you look for certain services related to student loans, housing. etc. If you are a parent, you are more interested in kindergartens and schools, and if you are old, you may want information about care services. Government websites often use words and expressions that are not commonly used by the citizens. A good search mechanism with use of synonyms may help citizens to find what they are looking for.
2) Submission of electronic forms For the administration, the use of electronic forms may
be efficient, especially when the content of the form can be pipelined into back-office systems. But for the user, an electronic form may not be very efficient if the user has to type in information found in paper documents that could otherwise be copied and sent by mail. A user-centric solution would not ask for information the government already possesses. It would also allow the user to save the current work and get back later. If the form has multiple pages, it would allow the user to move back and forth. It would also provide help on how to fill in correct information, and validate this information to make sure that the user does not have to resubmit at later time.
3) Interaction with the government For the administration, it could be efficient to limit the
number of channels for communication. By providing more channels, it is possible to give the citizen options. The possibility to use chat when being in a public place is often preferable to the use of a phone, since chat provides more privacy.
The above cases have shown some examples of misalignment between the administration perspective and the citizen perspective. In order to fit the eGovernment service to the needs of the users, user involvement should be present in the design phase, the development phase, and the assessment phase.
III. NET-EUCEN NET-EUCEN [13] was a thematic network supported by
the European Commission. The network started its activities in April 2010, and the final review meeting was held in May 2013. The network had 23 initial partners, but the network grew to 231 members during the work period.
NET-EUCEN focused on “user-driven services”. The involvement of users goes beyond consultations with users or user representation. Users and government staff work together to determine what services to provide and how to provide them. The perspectives, views and skills of the users are complementing the skills of the public service officials.
133Copyright (c) IARIA, 2013. ISBN: 978-1-61208-306-3
CENTRIC 2013 : The Sixth International Conference on Advances in Human-oriented and Personalized Mechanisms, Technologies, and Services
142 / 145

As part of the network activities, the network developed a framework to define and measure user-centric services. This framework builds on user involvement in all stages of the service lifecycle.
• User involvement in the design stage. The users are involved in development of ideas and concepts. Focus is on needs and requirements of the users, not technological constraints.
• User involvement in the development and implementation stages. Users are engaged in the initial implementation of the service in order to evaluate its features. Mock-ups and prototypes are used to continuously check that the service is aligned with user wishes and requirements. The aim of the user involvement is to improve the service and to optimize the outcome of the development and implementation.
• User involvement in the deployment and running stages. Users validate the service through testing of flexibility and interoperability. Test results are used to improve and customize service according to changes in political, economic or social environment.
Based on this definition, the network examined case descriptions submitted to the ePractice portal together with cases submitted by network partners. Most of the descriptions on the ePractice portal did not discuss user involvement at all, but case owners were requested to submit additional information. The findings of this study revealed that very few cases were fully aligned with the above definition.
The next step was to construct an indicator set for measuring user-centricity.
IV. INDICATORS FOR CITIZEN-CENTRICITY One of the aims of the NET-EUCEN network was to
construct an indicator set to measure the user involvement in eGovernment projects. The indicator set was developed in workshops with NET-EUCEN partners and invited experts. The resulting indicator set [14] consists of three indicators for user involvement addressing different stages of the lifecycle of the service, and a fourth aggregate indicator to show total user involvement. In most cases, a service is improved during its lifetime through iterations. Figure 1 shows the lifecycle model.
The indicators measure user involvement in the development of a single service only. But, it would be easy to aggregate scores from several services to show how an organizational unit responsible for the services involves users in their portfolio of service development projects
To decide on a set of indicators is not easy, since too many and too complex indicators will make it hard to use, while few and simple indicators may not produce correct measurements. The three first indicators are calculated from a set of binary variables (yes/no answers). The proposed indicator set focuses on user involvement only. The limitations of this rather narrow focus will be discussed later.
Fig. 1. eGovernment service lifecycle model
A. Indicator 1 - Definition (of the service) This indicator measures the actual user involvement in
the definition of the service.
TABLE 1. VARIABLES FOR INDICATOR 1 Engagement of citizens/users in elicitation of needs Yes = 0.25
No = 0.00 Involvement of users in the service definition Yes = 0.25
No = 0.00 Involvement of users in functionalities definition Yes = 0.25
No = 0.00 Involvement of users in the complete interaction definition
Yes = 0.25 No = 0.00
I1 Max score is 1.0 The first variable is addressing the involvement of users
in processes being precursory to creation of lists of actual user needs. Such processes may address how to facilitate user involvement, and what additional user groups include. The second variable is about user involvement in the definition of the service. This is where the list of user needs is developed. The last two variables measure involvement of users in defining the functionality of the service, and the interaction between users and the service.
B. Indicator 2 – Development (of the service) This indicator measures the involvement of users in the
development process.
TABLE 2. VARIABLES FOR INDICATOR 2 Involvement of users/testers in common shared environment
Yes: 0.20 No: 0.00
Involvement of user in interface test and refining Yes: 0.20 No: 0.00
Involvement of user in functionalities test and refining
Yes: 0.20 No: 0.00
Involvement of user in check of documentation / guidelines
Yes: 0.20 No: 0.00
Involvement of ALL user categories in the tests Yes: 0.20 No: 0.00
I2 Max score is 1.0 The first variable measures the availability of a common
shared environment, where users can share and discuss their opinions related to design issues. The next three variables address user involvement related to different aspects of the
134Copyright (c) IARIA, 2013. ISBN: 978-1-61208-306-3
CENTRIC 2013 : The Sixth International Conference on Advances in Human-oriented and Personalized Mechanisms, Technologies, and Services
143 / 145

service itself: user interface, functionality, and documentation. The last variable emphasizes the importance to involve all user groups in the design process, since different user groups may have different perceptions on user interface, functionality and documentation. In such cases, user involvement may be an important driver for individual customization of the final service, e.g., the possibility to turn on additional functionality on demand.
C. Indicator 3 – Assessment (of the service) This indicator measures the involvement of users in the
(continuous) assessment of the service.
TABLE 3. VARIABLES FOR INDICATOR 3 Involvement of ALL user categories in the assessment
Yes: 0.33 No: 0.00
Instrument used gather the users’ feedback: phone calls
Yes: 0.0825 No: 0.00
Instrument used gather the users’ feedback: web modules
Yes: 0.0825 No: 0.00
Instrument used gather the users’ feedback: consultations
Yes: 0.0825 No: 0.00
Instrument used gather the users’ feedback: workshops
Yes: 0.0825 No: 0.00
Scope: improvement of the service usability Yes: 0.165 No: 0.00
Scope: definition of new features Yes: 0.165 No: 0.00
I3 Max score is 1.0 At this stage, the service is up and running, and used by active users. The involvement of all categories of users counts for one third of the score. It is important to include all categories of users, since they may have different assessments and ideas for improvements. Another one third of the score is allocated to the use of four different instruments for data collection. In order to reach all user categories, it may be necessary to engage users by different means. The last one third of the score focuses on the use of the collected data, if data is used for improvement of the usability and if data is used for defining new features.
D. Indicator 4 – Aggregation of previous indicators The last indicator is an aggregate of the scores from the
three previous indicators. These three indicators are weighted as equal, since user involvement at all stages is considered equally important. This aggregate score is computed as:
I4 = I1/3 + I2/3 + I3/3
E. User involvement in practice The indicators do not prescribe specific methods of user
involvement. The actual involvement can be done in different ways. Bertot and Jaeger [15] suggest the following range of tools and techniques:
• Focus groups and interviews (with experts and users);
• Usability, functionality, and accessibility testing throughout the design and development process;
• Encouraging real-time comments and suggestions about the services being used;
• Log file and transaction log analysis; • Providing interactive help screens or telephone
assistance; and • Developing and adhering to measures and standards
of service quality. User involvement may be done on different levels. On
the political level user organizations may be involved as representatives for all users, on the system level, some users may speak for the rest, and on the individual level, the user him/herself may be involved in customization of the service.
What methods to use, and which users to involve, will need to be decided for each development project based on the reach (number of users), size and other characteristics.
V. WHAT THE INDICATORS DO NOT MEASURE The indicators shown in the last section were developed
in workshops with network partners and invited experts. The indicators focus on user involvement, and the scores are calculated from a set of binary values (yes/no).
The problem with this “checklist” approach is that it neither quantifies the amount of user involvement, nor the quality of the involvement. The indicators may therefore not reflect the actual benefits received from the user involvement.
User involvement could be quantified by number of users participating and the time spent by the users. However, such quantifications may have limited value, since the optimal involvement will vary from project to project.
Qualitative measures could be efficiency gains as experienced by the users, the usability of the service, the usefulness of the service and such things as availability and accessibility. The users involved would be expected to address such issues, but these aspects themselves are not assessed.
The indicators do not measure the actual depth of user involvement. The involvement can of course be minimal, and the score can still get high.
The initial NET-EUCEN indicator set had some non-binary variables, e.g., percentage of activities that included user involvement, and percentage of user categories involved. During the validation process, these were substituted with binary values, since it was difficult to establish correct values for these variables.
VI. CONCLUSION AND DISCUSSION The work of the NET-EUCEN network was normative.
The network was committed to promote the idea of citizen-centricity through user involvement. The indicator set was one of several measures to draw attention to how users can be involved in lifecycle of eGovernment services. The indicators were chosen to give a high score to those organizations involving users in all stages of the service development.
Citizen-centricity is a mindset. It requires respect for the users as being experts on use. The whole idea of user
135Copyright (c) IARIA, 2013. ISBN: 978-1-61208-306-3
CENTRIC 2013 : The Sixth International Conference on Advances in Human-oriented and Personalized Mechanisms, Technologies, and Services
144 / 145

involvement is to listen to, understand and respect the opinions of the users. Collaboration and dialogue, even co-production needs an environment of mutual respect and willingness to see the different perspectives.
User involvement can lead to better services, and even more important, provide an insurance against failures.
A new trend within eGovernment is the movement towards open data. Open data is about giving citizens access to government data through standardized formats and interfaces. Open data brings new opportunities for citizen- centricity. In the future, citizens may develop or orchestrate their own services by interconnecting building blocks with open data sources. The next step for citizen-centric government will then be to provide both data and relevant building blocks. Citizens may then be able to build services themselves.
ACKNOWLEDGMENT The NET-EUCEN Thematic Network (Grant Agreement
no. 250522) was co-funded by the European Commission, Information Society and Media Directorate-General, under the ICT Policy Support Program (ICT PSP) as part of the Competitiveness and Innovation Framework Program http://ec.europa.eu/ict_psp
The author wants to thank NET-EUCEN partners for valuable and inspiring discussions on citizen-centric eGovernment.
REFERENCES [1] G. Bjerknes and T. Bratteteig, “User Participation and
Democracy: A Discussion of Scandinavian Research on System Development,” Scandinavian Journal of Information Systems, 1995, 7(1), pp. 73-98.
[2] N. Bjørn-Andersen and N. Hedberg. Designing Information Systems in an Organizational Perspective, Studies in the Management Sciences Prescriptive Models of Organizations vol 5, 1977, pp. 125- 142
[3] M.I. Hwang and R.G. Thorn. The effect of user engagement on system success: A meta-analytical integration of research findings. Information & Management 35 (1999) pp. 229-236.
[4] E. Ries. The Lean Startup. Penguin, 2011
[5] R. Heeks, Implementing and Managing eGovernment, London:Sage, 2006, pp, 3rd ed., vol. 2. Oxford: Clarendon, 1892, p.234
[6] UK Precidency of the European Council. Manchester Ministerial Declaration 2005. Retrieved from: http://m.epractice.eu/files/media/media2213.pdf; accessed: August 2013
[7] M. Blakemore, N. McDonald, N. Hall and R. Jucuite. Delivering citizen-centric public services through technologu-facilitated organizational change. In P.G. Nixon, V.N. Koutrakou and R. Rawal. Understanding e-Government in Europe – Issues and Challenges, Routledge, 2010, pp. 19-37.
[8] T.A. Undheim and M. Blakemore. (Eds.). A Handbook for Citizen-centric eGovernment, 2007, Retrieved from: http://www.epractice.eu/files/media/media1781.pdf; accessed: August 2013
[9] E. Tambouris and K. Tarabanis. A dialogue-based, life-event oriented, active portal for online one-stop government: The OneStopGov platform. dg.o ´08 Proceedings of the 2008 international conference on Digital Government research, Digital Government Society of North America, 2008, pp. 405-406.
[10] P. Verdegem and L. Hauttekeete. A User-Centric Approach in E-Government Policies – The Path to Effectiveness? In C.G. Reddick. Citizens and e-Government – Evaluating Policy and Management, IGI Global, 2010, pp.20-36.
[11] Norwegian Ministries. Digitizing Public Sector Services – Norwegian eGovernment Program, 2013. Retrieved from: http://www.regjeringen.no/upload/FAD/Kampanje/DAN/Regjeringensdigitaliseringsprogram/digit_prg_eng.pdf; accessed: August 2013
[12] J. Bertot, and P.T. Jaeger, User-centered e-government: challenges and benefits for government web sites. Government Information Quarterly, 23(2), pp. 163-168.
[13] NET-EUCEN. Deliverable 1.4 – Final Network Report. 2013. Retrieved from: http://95.110.228.151/elgg/file/download/3573; accessed: August 2013
[14] NET-EUCEN. Indicators for User Centricity in Public Services, 2012. Retrieved from: http://95.110.228.151/elgg/file/download/2969; accessed: August 2013
[15] P.T. Jaeger and J.C. Bertot. Designimg, Implementing and Evaluating User-Centered and Citizen-Centered E-Government In C.G. Reddick. Citizens and e-Government – Evaluating Policy and Management, IGI Global, 2010, pp. 1-19.
136Copyright (c) IARIA, 2013. ISBN: 978-1-61208-306-3
CENTRIC 2013 : The Sixth International Conference on Advances in Human-oriented and Personalized Mechanisms, Technologies, and Services
Powered by TCPDF (www.tcpdf.org)
145 / 145