Cellular stress, excessive apoptosis and the effect of metformin in a mouse model of type 2 diabetic...
35
Cellular stress, excessive apoptosis and the effect of metformin in a mouse model of type 2 diabetic embryopathy Yanqing Wu 1 , Fang Wang 1 , Mao Fu 2 , Cheng Wang 4 , Michael J. Quon 2 , Peixin Yang 1, 3 Author Affiliations: 1 Department of Obstetrics, Gynecology & Reproductive Sciences 2 Department of Medicine 3 Department of Biochemistry and Molecular Biology University of Maryland School of Medicine Baltimore, MD 21201 Olson Center for Women's Health 4 Department of Obstetrics and Gynecology University of Nebraska Medical Center Omaha, Nebraska 68198 First author’s surname and short title: Wu, A model of type 2 diabetic embryopathy Disclosure: None of the authors have a conflict of interest. Source of financial support: This research is supported by NIH R01DK083243, R56 DK095380, R01DK101972; R01DK103024 and Basic Science Award, American Diabetes Association (all to Peixin Yang). Address Correspondence to: Peixin Yang, PhD University of Maryland School of Medicine Department of Obstetrics, Gynecology & Reproductive Sciences BRB11-039, 655 W. Baltimore Street Baltimore, MD 21201 Email: [email protected] Tel: 410-706-8402 Fax: 410-706-5747 Word Count: 200 (abstract) 3994 (main text) Page 1 of 35 Diabetes Diabetes Publish Ahead of Print, published online February 26, 2015
-
Upload
independent -
Category
Documents
-
view
2 -
download
0
Transcript of Cellular stress, excessive apoptosis and the effect of metformin in a mouse model of type 2 diabetic...
Cellular stress, excessive apoptosis and the effect of metformin in a mouse model
of type 2 diabetic embryopathy
Yanqing Wu1, Fang Wang1, Mao Fu2, Cheng Wang4, Michael J. Quon2, Peixin Yang1, 3
Author Affiliations: 1Department of Obstetrics, Gynecology & Reproductive Sciences
2Department of Medicine
3Department of Biochemistry and Molecular Biology
University of Maryland School of Medicine
Baltimore, MD 21201
Olson Center for Women's Health 4Department of Obstetrics and Gynecology
University of Nebraska Medical Center
Omaha, Nebraska 68198
First author’s surname and short title: Wu, A model of type 2 diabetic embryopathy
Disclosure: None of the authors have a conflict of interest.
Source of financial support: This research is supported by NIH R01DK083243, R56 DK095380,
R01DK101972; R01DK103024 and Basic Science Award, American Diabetes Association (all to
Peixin Yang).
Address Correspondence to:
Peixin Yang, PhD
University of Maryland School of Medicine
Department of Obstetrics, Gynecology & Reproductive Sciences
BRB11-039, 655 W. Baltimore Street
Baltimore, MD 21201
Email: [email protected]
Tel: 410-706-8402
Fax: 410-706-5747
Word Count: 200 (abstract)
3994 (main text)
Page 1 of 35 Diabetes
Diabetes Publish Ahead of Print, published online February 26, 2015
ABSTRACT
Increasing prevalence of type 2 diabetes in women of childbearing age has led to higher incidence
of diabetes-associated birth defects. Here, we established a model of type 2 diabetic embryopathy by
feeding four-week old female mice with a high–fat diet (HFD, 60% fat). After 15 weeks on HFD,
these female mice showed characteristics of type 2 diabetes mellitus (DM) and were mated with lean
male mice. During pregnancy, control dams fed with a normal diet (10% fat) were maintained on
either normal diet or on HFD, serving as a control group with elevated circulating free fatty acids. DM
dams produced offspring with a rate of neural tube defects (NTDs) of 11.3%, whereas no embryos in
the control groups developed NTDs. Elevated markers of oxidative stress, endoplasmic reticulum
stress, caspase activation, and neuroepithelial cell apoptosis (causal events in type 1 diabetic
embryopathy) were observed in embryos of DM dams. DM dams treated with 200 mg/kg metformin in
drinking water ameliorated fasting hyperglycemia, glucose intolerance, and insulin resistance with
consequent reduction of cellular stress, apoptosis and NTDs in their embryos. We conclude that
cellular stress and apoptosis occur and metformin effectively reduces type 2 diabetic embryopathy in a
useful rodent model.
Page 2 of 35Diabetes
Globally, nearly 60 million women of reproductive age (18-44 years old) have diabetes, and
this number is expected to double by 2030 (1; 2). Pregestational maternal type 1 and 2 diabetes is
strongly associated with high rates of severe structural birth defects including neural tube defects
(NTDs) and congenital heart defects (3-6). The use of insulin during pregnancy in both animal
models and humans greatly reduces the incidence of diabetes-induced embryonic malformations (7;
8). However, euglycemia is difficult to achieve in and maintain in women with pregestational Type
1 or Type 2 diabetes. Thus, offspring of women with diabetes still have significantly higher rates of
birth defects than those of mothers without diabetes (5). Diabetic embryopathy remains a
significant health problem for both women with diabetes and their children and additional effective
therapeutic options are needed.
Previous studies in a type 1/insulin deficient diabetic embryopathy model demonstrate that
oxidative stress, endoplasmic reticulum (ER) stress, and cellular stress-induced cell apoptosis
(8-16) are causative events in induction of NTD formation. We and others have observed that
maternal diabetes induces oxidative stress by suppressing endogenous expression of antioxidant
enzymes while simultaneously increasing production of cellular reactive oxygen species (ROS)
(17-20). Maternal diabetes triggers a spectrum of ER stress markers (12). Treatment of embryos in
vitro with 4-Phenylbutyric acid, an ER stress inhibitor, ameliorates NTD formation induced by
hyperglycemia (12). Excess apoptosis is observed in the neuroepithelium of embryos exposed to
maternal diabetes, and deletion of proapoptotic kinase genes reduces NTD incidence in these
rodent embryos (9; 11; 12; 21). In addition, maternal diabetes-induced apoptosis is caspase 8
dependent (9; 11; 12; 21).
Page 3 of 35 Diabetes
Prior research to delineate mechanisms underlying diabetic embryopathy has almost
exclusively been performed using mouse models of type 1 diabetic/insulin deficient animals (9; 15;
16; 22; 23). Thus, the question remains whether similar mechanisms underlie type 2 diabetic
embryopathy, a health problem of increasing importance. Hyperglycemia, a prominent feature of
both type 1 and type 2 diabetes is a major contributing factor to teratogenicity of maternal diabetes
(19; 24; 25). Nevertheless, many aspects of the pathophysiology of Type 1 and Type 2 diabetes
are quite different. In particular, insulin resistance plays a prominent role in the pathophysiology of
Type 2 diabetes while insulin deficiency is the primary defect in Type 1 diabetes. Thus, effects of
Type 2 diabetes on developing embryos may be distinct from effects of Type 1 diabetes. As the
number of women with type 2 diabetes continues to increase (1), a type 2 diabetic embryopathy
model is urgently needed to help develop safe and effective therapeutic interventions to
complement current therapies that are inadequate to oppose the rising incidence and prevalence of
diabetes-induced embryopathy.
To date, animal models of type 2 diabetic embryopathy have not been well described or studied.
In C57BL/6J mice, use of high fat diet (HFD) to cause diet induced obesity (DIO) recapitulates
many features of the natural history of human obesity, metabolic syndrome, and frank type 2
diabetes (26; 27). This obese type 2 diabetic model manifests the characteristics of human type 2
diabetes (26; 27). After 15 weeks on HFD, female mice exhibit high fasting glucose levels,
hyperinsulinemia, glucose intolerance and insulin resistance (26; 27). In the present study, we use
the DIO mouse model to characterize study type 2 diabetic embryopathy and evaluate effects of
metformin therapy.
Page 4 of 35Diabetes
Research Design and Methods
Mice and high-fat diet treatment
The procedures for animal use were approved by the University of Maryland School of
Medicine Institutional Animal Care and Use Committee. Four-week old female C57BL/6J mice
were purchased from the Jackson Laboratory (Bar Harbor, Maine). Animals were maintained in a
temperature-controlled room on a 12-h light-dark cycle. After arrival, mice were divided into two
groups and fed either a high-fat diet (HFD) (Research Diets, New Brunswick, NJ) or a normal diet
(Research Diets, Harlan, US) for 15 weeks. The high-fat diet contained 20% protein, 20%
carbohydrate and 60% fat. The normal diet contained 20% protein, 70% carbohydrate and 10% fat.
Body weight was recorded weekly. After 15 weeks, the animals’ BMI was determined using the
Lee’s Index. HFD mice and mice fed with the normal diet were mated with lean male mice. During
pregnancy, mice in the normal diet group were either maintained on the normal diet (control group
1) or subsequently fed with HFD to serve as the high fatty acid control group (control group 2).
Day 0.5 (E0.5) of pregnancy was established at noon on the day when a vaginal plug was observed.
Fasting and random blood glucose levels were determined after 15 weeks on either HFD or normal
diet, and at embryonic day 8.5 (E8.5). Blood was collected from orbital veins and sera was
extracted by centrifugation and reserved to determine circulating free fatty acid and insulin
concentrations. For long term storage, sera were kept at -80℃.
Blood glucose measurement, glucose tolerance test (GTT) and insulin tolerance test (ITT)
Blood glucose was measured using a handheld glucometer with appropriate test strips
(FreeStyle Lite). For GTT, mice were fasted overnight and then injected intraperitoneally with
Page 5 of 35 Diabetes
glucose at a dose of 2 g/kg body weight. Blood glucose levels were measured prior to injection,
and at 15, 30, 60, 90, and 120 min after glucose injection. The trapezoidal rule was used to
determine the area under the curve for GTT (AUC). For ITT, mice were fasted for 5 h and then
injected intraperitoneally with insulin at a dose of 0.75 U/kg body weight. Blood glucose levels
were measured prior to injection, and at 15, 30, 60, 90, and 120 min after injection.
Serum free fatty acid and insulin measurements
Free fatty acid (FFA) levels were determined using the FFA quantification kit
(Sigma-Aldrich) according to the manufacturers' instructions. Palmitic acid standards and 6 µl of
serum per sample were incubated with reaction agents. Absorbance was measured at 570 nm in
each sample to determine concentrations of FFA. The rat/mouse Insulin ELISA kit (Millipore,
Cat.#EZRMI-13K) was used to assess the level of plasma insulin. Insulin standards and serum
samples were reacted with assay buffer. Absorbance was read at 450 nm and 590 nm for each
sample using a 96-well plate reader within 5 min. Quantitative insulin sensitivity check index
(QUICK)was calculated using the following formula:1/[log(fasting insulin, µU/ml)+log(fasting
glucose, mg/dl)].
Dihydroethidium (DHE) Staining
DHE staining was used to detect superoxide. DHE reacts with superoxide that is bound to
cellular components including protein and DNA and exhibits bright red fluorescence. E8.5
embryos were fixed in 4% paraformaldehyde (PFA) for 30 min, washed three times with PBS (5
min per wash), and then embedded in OCT. 10-µm frozen embryonic sections were incubated with
1.5 µM DHE for 5 min at room temperature, and then washed three times with PBS for 5 min per
Page 6 of 35Diabetes
wash. Sections were counterstained with DAPI and mounted with aqueous mounting medium
(Sigma, St Louis, MO).
Lipid hydroperoxide quantification
The degree of lipidperoxidation, an index of oxidative stress, was quantitatively assessed
with an LPO assay as described by others (28) using the Calbiochem Lipid Hydroperoxide Assay
Kit (Milliproe, Bedford, MA). Briefly, E8.5 embryos were homogenized in HPLC-grade water.
Lipid hydroperoxides were extracted from embryos by deoxygenated chloroform, and then
measurements of absorbance at 500 nm were taken after reaction with chromogen. Results were
expressed as µM lipid hydroperoxides per microgram protein. Protein concentrations were
determined with the BioRad DC protein assay kit (BioRad, Hercules, CA).
Real-time PCR (RT-PCR)
Using the Rneasy Mini kit (Qiagen), mRNA was isolated from E8.75 embryos, and then
reversed transcribed using the high-capacity cDNA archive kit (Applied Biosystem, Grand Island,
NY). RT-PCR for Calnexin, GRP94, PDIA, BiP, IRE1α, CHOP and β-actin were performed using
the Maxima SYBR Green/ROX qPCR Master Mix assay (Thermo Scientific, Rockford, IL) in the
StepOnePlus system (Applied Biosystem). Primer sequences used are listed in Supplementary
Table 1.
Immunoblotting
Immunoblotting was performed as previously described (29; 30). Briefly, embryos from
Page 7 of 35 Diabetes
different experimental groups were sonicated in lysis buffer containing a protease inhibitor cocktail
(Sigma, St Louis, MO). Equal amounts of protein and the Precision Plus Protein Standards
(Bio-Rad) were resolved by SDS-PAGE electrophoresis and transferred onto Immunobilon-P
membranes (Millipore, Billerica, MA). Membranes were incubated in 5% nonfat milk for 45 min
and then incubated for 18 h at 4 oC with the primary antibodies. To help determine whether
equivalent amounts of protein were loaded among all samples, membranes were stripped and
incubated with a mouse antibody against β-actin (Abcam) to generate a signal used as a loading
control. Signals were detected using the SuperSignal West Femto Maximum Sensitivity Substrate
kit (Thermo Scientific). The sources and dilutions of antibodies used in each experiment are listed
in Supplementary Table 2.
TUNEL assay
The TUNEL assay was performed using the ApopTag Fluorescein in Situ Apoptosis
Detection kit (Chemicon) as previously described (9; 11; 12; 21). Briefly, 10-µm frozen embryonic
sections were fixed with 4% PFA in PBS and incubated with TUNEL reaction agents. Three
embryos from three different dams (n = 3) per group were used, and two sections per embryo were
examined. TUNEL-positive cells in an area (about 200 cells) of neuroepithelium were counted.
The percentage of TUNEL-positive cells was calculated as a fraction of the total cell number,
multiplied by 100, and values were averaged within the sections of one embryo.
Metformin treatment
Dams were given metformin (Sigma, St. Louis, MO) in their drinking water from E0.5 to
Page 8 of 35Diabetes
E10.5. The water consumption per mouse per day (24 h) was pre-determined and monitored daily
during the course of metformin treatment. Because daily water consumption was different between
lean control dams and obese diabetic dams, metformin concentrations in drinking water were
adjusted accordingly to achieve comparable dosing. The purpose of giving metformin in drinking
water was to help maintain a constant level of metformin. Metformin is typically given to patients
in an extended release form so that effects of metformin can be sustained over long durations (31).
The final metformin intake per mouse per day was approximately 200 mg/kg body weight, a dose
previously described as safe and effective in mice (31-33). At E8.5, fasting glucose levels were
determined, and GTT and ITT were performed, as described above. At E10.5, embryonic NTD
formation was examined in metformin treated mice.
Statistical analyses
Data are presented as mean ± SE. Each set of experiments were repeated independently at
least three times with comparable results, and embryonic samples from each replicate were taken
from different dams. Statistical differences were evaluated using one-way analysis of variance
(ANOVA) with SigmaStat 3.5 software. For one-way ANOVA analyses a Tukey test was used to
estimate the significance of the results with P < 0.05 indicative of statistical significance. The Chi
square test was used to estimate the significance of differences in NTD rates among experimental
and control groups.
Page 9 of 35 Diabetes
RESULTS
Induction of obese type 2 diabetes in female mice
Four-week old female mice were fed a high-fat (HFD) or normal (control) diet for 15 weeks.
Mice in the HFD group continuously gained weight from 2 weeks onward and after 15 weeks. The
mean body weight of mice in the HFD group was significantly greater than the control group
(35.02 ± 0.81 versus 22.96 ± 0.49, P < 0.05) (Fig.1a). The body mass index (BMI) of mice in the
HFD group was also significantly higher than that of mice in the control group (Fig.1b).
Fasting glucose levels and random glucose levels of mice in the HFD group were
significantly elevated when compared with mice in the normal diet group (Fig.1c, d). Plasma
insulin levels in the HFD group were approximately two-fold higher than those of mice in the
normal diet group (Fig.1e), indicating hyperinsulinemia in the HFD group. Quantitative insulin
sensitivity check index (QUICKI) was used to assess insulin resistance. Mean QUICKI values of
mice in the HFD group were significantly less than those of mice in the normal diet group (Fig.1f).
Additionally, high FFA levels were observed in the HFD group (Fig.1g).
Glucose intolerance is the defining characteristic of type 2 diabetes. GTT was performed
after 15 weeks feeding with different diets. After injecting mice in both the HFD and the normal
diet group with glucose, blood glucose levels in all mice were increased during early time points of
the GTT test (Fig.1h). At 30 min, the peak mean glucose levels of mice in the HFD group was
much higher and glucose disappearance thereafter was much slower when compared with the mice
with normal diet (Fig.1h). Indeed, the mean area under the curve (AUC) for GTT in mice on HFD
was significantly higher than that of mice on normal diet (Fig. 1h). Thus, HFD induced significant
and substantial glucose intolerance in mice after 15 weeks.
Page 10 of 35Diabetes
Insulin tolerance test was employed to evaluate insulin resistance in the mice. After insulin
administration, blood glucose levels declined as expected in both groups; however, this decrease
was significantly less in mice on HFD when compared with mice on normal diet (Fig.1i). During
ITT, the glucose levels of mice in HFD group were higher at every time point when compared with
mice in the normal diet group. This clearly demonstrates insulin resistance in the HFD group.
Taken together, these findings are consistent with diet-induced obesity from HFD causing insulin
resistance and key characteristics of type 2 diabetes. Therefore, the HFD group is referred to as the
diabetes mellitus (DM) group hereafter.
Metabolic indices of obese type 2 diabetic dams
The mice in the normal diet group were randomized into two control groups: control group 1
(Ctrl 1)-normal diet the whole time including pregnancy, and the control group 2 (Ctrl 2), in which
mice were switched to HFD after achieving pregnancy to serve as the high FFA control group.
The metabolic indices of the DM group and the two control groups were determined at E8.5,
an important time point for embryonic neural tube formation. The fasting and random glucose
levels from mice in the DM group were significantly increased when compared with those from
mice in the two control groups (Table 1). The fasting insulin level of mice in the DM group was
more than two-fold greater than mice in either of the two control groups (Fig.1j). Furthermore, the
QUICKI in mice from the DM group was significantly less than in mice from either of the two
control groups (Fig.1k). The FFA level in mice from the DM group was significant higher than that
of mice in the Ctrl1group, but was comparable to that of mice in the Ctrl2 group (Fig.1l). DM
dams retained glucose intolerance and insulin resistance observed before pregnancy (Fig. 1m, n).
Page 11 of 35 Diabetes
Maternal type 2 diabetes induces NTD formation
To assess whether embryos from DM dams exhibit increased NTD formation, we examined
NTD formation at E10.5. As shown in Table 1, 12 out of 106 embryos (11.3%) from DM dams had
NTD, whereas no NTD was detected in embryos from either Ctrl 1 or Ctrl 2 dams. Histological
examination of embryo sections of NTD embryos confirmed the presence of open neural tube
structures in the DM group (Fig. 2a). In addition, 26 out of 132 embryos from diabetic dams
(19.7%) were resorbed, whereas the two control groups had lower or similar resorption rates,
respectively (Table 1). Blood glucose levels in the DM group with NTD embryos were
significantly higher than those in the two control groups but were only slightly higher than those in
the overall DM group (Fig. 2b).
Maternal type 2 diabetes triggers oxidative stress, ER stress, caspase activation and apoptosis in
the developing embryo
Previous studies show that oxidative stress and ER stress are involved in induction of maternal
type 1 diabetic embryopathy. In the present study, we examined whether maternal type 2 diabetes
also induces oxidative stress and ER stress. The abundance of superoxide was determined by DHE
staining. DHE-positive signals in the neruoepithelia of embryos from DM dams were robust (Fig.
2c). By contrast, minimal to no DHE signals were observed in either of the two control groups
(Fig.2c). In addition, lipid peroxidation levels in embryos of DM dams were significantly higher
than those in embryos from the two control groups (Fig.2d).
To determine the level of ER stress in embryos, we examined a number of ER stress markers.
Protein levels of p-PERK, p-eIF2α, p-IRE1α and CHOP were significantly up-regulated in the
Page 12 of 35Diabetes
embryos from DM dams when compared with those in embryos from control dams (Fig.3a, b, c, d).
Furthermore, maternal diabetes significantly increased mRNA levels of Calnexin, GRP94, PDIA,
BiP and CHOP (Fig.3e). Only the mRNA level of IRE1α did not differ among the three groups
(Fig.3e).
To test whether excessive cell apoptosis is involved in type 2 diabetic embryopathy, we used a
TUNEL assay. The number of apoptotic cells in the neuroepithelia of embryos from DM dams was
much greater than in embryos from the two control groups (Fig.4a). Cleaved caspase8 (an initiator
caspase) and cleaved caspase3 (an executive apoptosis molecule) levels in embryos of DM dams
were significantly increased when compared with embryos from either of the two control groups
(Fig.4b).
Metformin treatment partially normalizes the adverse metabolic phenotypes of type 2 diabetic
dams
Metformin is an anti-diabetic drug effective that increases insulin sensitivity and peripheral
glucose uptake while inhibiting hepatic glucose production in type 2 diabetes (34). We assessed the
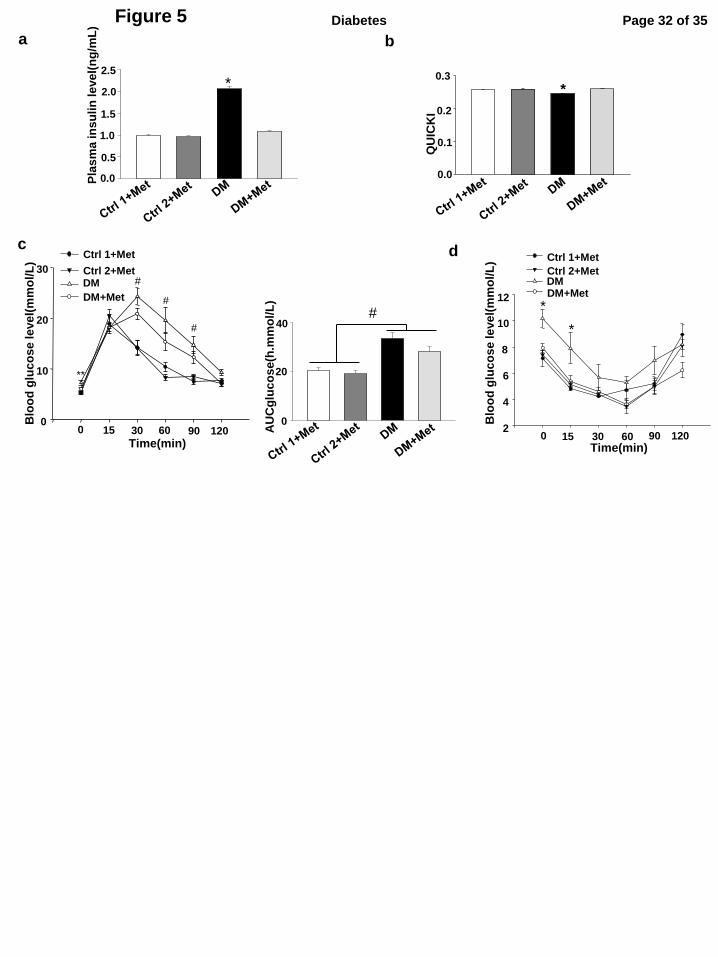
effect of metformin treatment on adverse metabolic phenotypes of type 2 dams. Fasting and
random glucose levels (Table 2), plasma insulin levels and QUICKI (Fig. 5a, b) were comparable
in the two control groups treated with metformin as well as in the DM group treated with
metformin. DM dams treated with metformin had demonstrated an amelioration of diabetic
phenotype when compared with DM dams with no metformin treatment (Table 2, Fig. 5a, b). GTT
and ITT were performed to evaluate effects of metformin therapy to ameliorate glucose intolerance
and insulin resistance. Metformin treatment partially improved glucose intolerance and completely
Page 13 of 35 Diabetes
reversed insulin resistance in DM dams (Fig.5c, d).
Metformin treatment alleviates maternal type 2 diabetes-induced NTD formation
To determine whether metformin treatment reduced type 2 diabetes-induced NTD formation,
embryonic NTD were examined in the absence and presence of metformin therapy. Similar to a
previous study reporting no adverse effects of metformin treatment on neurulation-stage (35),
metformin treatment in our study did not induce any NTD in embryos of the control dams (Table
2). The NTD rate in embryos from DM dams treated with metformin was only 1.5%, which was
significantly lower than that in embryos from DM dams without metformin treatment (11.9%)
(Table 2). Metformin treatment of DM dams reduced the NTD rate to that observed in either of the
control groups (Table 2). Metformin treatment reduced the resorption rate in DM dams but did not
completely prevent maternal diabetes-induced resorption (Table 2). Moreover, metformin
treatment alleviated oxidative stress, ER stress and apoptosis by reducing levels of lipid
hydroperoxide, phosphorylation of PERK, eIF2α, IRE1α, up-regulation of CHOP and cleavage of
caspase 3 and 8 (Fig. 6a-g). These data support the hypothesis that metformin is effective in
treating type 2 diabetes and associated diabetic embryopathy.
Page 14 of 35Diabetes
DISCUSSION
Prior animal studies performed to elucidate mechanisms underlying diabetic embryopathy
have been almost exclusively performed using a type 1/insulin deficient animal model (9; 15; 16;
22). With the increasing epidemic of type 2 diabetes in women of reproductive age, a useful animal
model of type 2 diabetic embryopathy will be essential for understanding mechanisms and
potential therapies for diabetic embryopathy from Type 2 diabetic women. In the present study, we
developed and characterized a model of type 2 diabetes embryopathy using DIO in C57BL/6J mice
on HFD. Although type 2 diabetes is a complex metabolic disorder, hyperglycemia with resulting
glucotoxicity is a major mediator of diabetes teratogenicity. The modest hyperglycemia (an
average blood glucose level: 9.56 ± 0.23 mmol/L) present in our type 2 diabetes animal model
causes significant birth defects, specifically NTDs, when compared with normal mice even on a
HFD after pregnancy to achieve comparable FFA levels and lipotoxicity. Our model of Type 2
diabetes pregnancy generates lower rates of NTD than models of type 1 diabetes, which have an
average blood glucose level of 21.3 + 1.2 mmol/L. These findings are consistent with observations
in a human study that the increase of hyperglycemia linearly increases the incidence of birth
defects (24).
In this study, treatment with metformin, a standard therapy for pregnant women with type
2 diabetes, inhibits gluconeogenesis in the liver (34), effectively normalized hyperglycemia in our
type 2 diabetes animal model. We found that metformin improved glucose metabolism, reduced
hyperglycemia and significantly ameliorated NTD formation. However, metformin treatment only
partially prevented glucose intolerance. The incomplete correction of defective glucose
metabolism by metformin may still allow transient hyperglycemia, which we may not have
Page 15 of 35 Diabetes
detected in our study. Transient increases in maternal glucose may explain why we observed a
higher NTD rate (1.5%) in diabetic dams treated with metformin compared with the rate in
nondiabetic dams. Indeed, in vitro embryo culture studies have demonstrated that transient
exposure to high glucose induces NTD formation (36).
The type 2 diabetic embryopathy model we employed displays hyperinsulinemia and high
free fatty acid levels. Hyperinsulinemia associated with type 2 diabetes is unlikely to cause NTD
formation because maternal insulin does not cross the blood/placental barrier (37). In addition,
NTDs are not caused by embryonic pancreas-derived insulin, as pancreatic β-cells do not produce
insulin until E11, which is after the neural tube closes (38). Although high fatty acid levels may
still affect embryonic development, our findings demonstrate that high fatty acid levels did not
contribute to NTD formation in our type 2 diabetic embryopathy model; lean mice fed a high-fat
diet during pregnancy did not produce embryos with NTDs.
Mechanistic studies performed in type 1 diabetic embryopathy models reveal that
oxidative stress, ER stress and caspase-dependent neuroepithelial cell apoptosis are causal events
leading to NTD formation (8-16; 39-43). In the present study, we found that superoxide production
and apoptosis was induced only in the developing neuroepithelia of embryos exposed to maternal
type 2 diabetes. We also observed that maternal type 2 diabetes triggered the UPR and ER stress in
the developing embryo. Additionally, we found that the cellular stress and apoptotic signaling
pathways in embryos of type 2 diabetic dams mirrored that of type 1 diabetic embryopathy.
suggesting that both type 1 and type 2 diabetic embryopathy share common mechanisms
underlying NTD formation.
We used the C57BL/6J background in our study. A previous report showed no
Page 16 of 35Diabetes
significant increase of NTDs in the C57BL6J strain; however, that study is inconclusive because
embryos from nondiabetic C57BL/6J dams have more than 12% NTDs (normal incidence 0-1%
NTDs), and the study sample size is very small (n = 4 dams) (44). That study is contradictory to a
report in 2001, which demonstrated that intravenous alloxan-induced diabetes in wild-type
C57BL/6J significantly increased the occurrence of NTDs (45). Recent studies from us (9; 12; 21)
and others (46; 47) have demonstrated that STZ-induced diabetes produces more than 22% NTDs
in the C57BL/6J background. Thus, the C57BL/6J strain responds well to maternal diabetes. The
11.3% NTD rate in embryos from type 2 diabetic dams are significantly higher than or many fold
higher than the 0% NTD rate from the nondiabetic group. In humans, maternal diabetes induces
2-6 fold higher NTD rates than those from the general population.
In summary, we employed obese type 2 diabetic mice to examine embryopathy caused by
type 2 diabetes. We found that type 2 diabetes induces oxidative stress and ER stress in the
developing neuroepithelium leading to NTD formation. Metformin treatment significantly reduced
NTD formation through partial normalization of the metabolic defects in the type 2 diabetic
embryopathy model. Hyperglycemia rather than lipotoxicity seems to be the predominant
pathogenic feature inducing embryopathy. The type 2 diabetic embryopathy model is a unique and
useful model that contains key aspects of the metabolic pathophysiology present in women with
type 2 diabetes. Thus, our new model may be valuable in elucidating underlying causes of
embryopathy in Type 2 diabetes that may lead to novel therapeutic interventions for
diabetes-induced birth defects.
Page 17 of 35 Diabetes
Author Contributions
Y. W. researched data and wrote the paper. F. W. researched data. M.J.Q participated in
data analyses and writing the manuscript. M. F. and C. W participated in data analyses. P. Y.
conceived the project, designed the experiments, and wrote the manuscript. All authors have
approved the final version of the paper.
Acknowledgments
This study is supported by National Institutes of Health (NIH) grants R01DK083243,
R56DK095380, R01DK101972, R01DK103024 and an American Diabetes Association Basic
Science Award (1-13-BS-220). We thank the Office of Dietary Supplements at the NIH. We thank
Dr. Julie Wu at the University of Maryland School of Medicine for critical reading and editing
assistance. Dr. Peixin Yang is the guarantor of this work and, as such, had full access to all of the
data in the study and takes responsibility for the integrity of the data and the accuracy of the data
analysis. No potential conflicts of interest relevant to this article were reported.
Page 18 of 35Diabetes
Figure Legends
Figure 1. Induction of obese type 2 diabetes in female mice and metabolic indices of obese
type 2 diabetic dams. a, Body weight measurements weekly during feeding with normal control
diet (10% fat) (n = 15) or high-fat diet (HFD) (60% fat) (n = 15). b, Body mass index in normal
diet group and high-fat diet group (n = 8) after 15 weeks feeding with different diet. c, Fasting
glucose level (n = 12), d, Random glucose level (n = 16), e, plasma insulin level (n = 5), f,
quantitative insulin sensitivity check index(QUICKI)(n = 5) and g, free fatty acid level (n = 7)
after 15 weeks diet treatment. h, Blood glucose levels and AUCglucose level during GTT (n = 13)
after 15 weeks feeding with different diets. i, Blood glucose levels during ITT (n = 6) after 15
weeks feeding with different diets. * indicate significant differences compared to the other group. j,
Plasma insulin levels, k, QUICKI and l, free fatty acid levels on the two control groups (Ctrl1 and
Ctrl2) and the obese type 2 diabetes mellitus (DM) group at E8.5. n = 10. m, Blood glucose levels
and AUCglucose levels during GTT at E8.5 (n = 6). n, Blood glucose levels during ITT at E8.5 (n =
7). * indicate significant differences compared to the other two groups. Ctrl1: the control chow
group in which mice were continuously fed with chow for 15 weeks and during pregnancy. Ctrl2:
the control group 2 in which mice were fed with chow for 15 weeks but fed with the HFD during
pregnancy. The control group 2 served as the controls of high FFA observed in the DM group. DM:
the obese type diabetes mellitus group.
Figure 2. Maternal type 2 diabetes induces NTD formation and oxidative stress in the
developing embryo. a, closed and open neural tube structures of E10.5 embryos from control
dams and diabetic dams (DM). b, Random blood glucose levels. n = 10 in the DM-NTD group.
Page 19 of 35 Diabetes
Sample sizes for the other three groups are shown in Table 1. c, representative images of DHE
staining. Red signals of DHE staining were observed in the V-shape neuroepithelium at E8.5. All
cell nuclei were stained with DAPI (Blue). Bars = 30 µm. d, levels of lipid hydroperoxide (LPO)
in E8.5 embryos. Experiments were performed using three embryos from three different dams (n =
3) per group. * indicate significant differences compared to the other groups. Ctrl1: the control
chow group in which mice were continuously fed with chow for 15 weeks and during pregnancy.
Ctrl2: the control group 2 in which mice were fed with chow for 15 weeks but fed with the HFD
during pregnancy. DM-NTD: the obese type 2 diabetes mellitus group with neural tube defects.
Figure 3. Maternal type 2 diabetes triggers ER stress in the developing embryo. Levels of
p-PERK (a), p-eIF2α (b), p-IRE1α (c), and CHOP (d) in E8.5 embryos. e, mRNA level of
Calnexin, GRP94 , PDIA, BiP, IRE1α and CHOP. Experiments were performed using three
embryos from three different dams (n = 3) per group. * indicate significant differences compared
to the other two groups. Ctrl1: the control chow group in which mice were continuously fed with
chow for 15 weeks and during pregnancy. Ctrl2: the control group 2 in which mice were fed with
chow for 15 weeks but fed with the HFD during pregnancy. DM: the obese type 2 diabetes
mellitus group.
Figure 4. Maternal type 2 diabetes activates caspase and induces neuroepithelial cell
apoptosis in the developing embryo. a, Representative images of the TUNEL assay showing
apoptotic cells (Red signal). Cell nuclei were stained with DAPI (Blue). The bar graph showed the
quantification of TUNEL positive cells. Three embryos from three different dams (n = 3) per group,
Page 20 of 35Diabetes
and two serial sections per embryo were analyzed. Bars = 30 µm. b, protein levels of cleaved
caspase 3 and caspase 8 in E8.5 embryos. Experiments were performed using three embryos from
three different dams (n = 3) per group. * indicate significant differences compared to the other two
groups. Ctrl1: the control chow group in which mice were continuously fed with chow for 15
weeks and during pregnancy. Ctrl2: the control group 2 in which mice were fed with chow for 15
weeks but fed with the HFD during pregnancy. DM: the obese type 2 diabetes mellitus group.
Figure 5. Metformin treatment normalizes some of the adverse metabolic phenotypes in type
2 diabetic dams. Plasma insulin levels (a) and QUICKI (b) after metformin treatments from E0.5
to the timing of assessment (E8.5). In order to reach a sustained effect, metformin was given
through the drinking water. Daily water consumption and body weight were monitored, and
metformin concentrations in the drinking water were adjusted accordingly. Dams were housed
individually. The final amount of metformin given to one dam was 200 mg/kg body weight per 24
hours. Ctrl1: the control chow group in which mice were continuously fed with chow for 15 weeks
and during pregnancy. Ctrl2: the control group 2 in which mice were fed with chow for 15 weeks
but fed with the HFD during pregnancy. DM: the obese type 2 diabetes mellitus group. Met:
metformin. In a and b, there were four experimental groups: Ctrl1+Met (Metformin), Ctrl2+Met,
DM+Met and the DM group without metformin treatment. c, Blood glucose levels and AUCglucose
levels during GTT at E8.5 after treating with metformin. d, Blood glucose levels during ITT at
E8.5 after treating with metformin. During GTT, the number dams per group were the Ctrl1+Met
group (n = 8), the DM+Met group(n = 6), Ctrl2+ Met (n = 8) and the DM group (n = 4). During
ITT, the number dams per group were the Ctrl1+Met group (n = 3), the DM+Met group (n = 9), the
Page 21 of 35 Diabetes
Ctrl2+Met group (n = 5) and the DM group (n = 6). *: indicate that the DM group was
significantly different compared to the DM+Met, Ctrl1+Met and Ctrl2+Met groups. **: indicate
that the DM group and the DM+Met group were not significantly different, and the DM group was
significantly different compared to the Ctrl 1+Met and Ctrl 2+Met group. # indicated that the
DM and DM+Met groups were not significantly different, but they were significantly different
compared to the Ctrl1+Met and Ctrl2+Met groups.
Figure 6. Metformin treatment alleviates maternal type 2 diabetic induced-cellular stress and
excessive apoptosis in the developing embryo. (a), levels of lipid hydroperoxide (LPO) in E8.5
embryos. Protein levels of p-PERK (b), p-eIF2α (c), p-IRE1α (d), CHOP (e), cleaved caspase 8 (f)
and caspase 3 (g) in E8.5 embryos. Experiments were performed using three embryos from three
different dams (n = 3) per group. * indicate significant differences compared to the other three
groups. Ctrl1 + Met: the control chow group in which mice were continuously fed with chow for
15 weeks and during pregnancy with metformin (Met) treatment. Ctrl2 + Met: the control group 2
in which mice were fed with chow for 15 weeks but fed with the HFD during pregnancy with
metformin treatment. DM: the obese type 2 diabetes mellitus group.
Page 22 of 35Diabetes
References
1. Diabetes in pregnancy: protecting maternal health. International Diabetes Federation, www.idf.org
2. Lawrence JM, Contreras R, Chen W, Sacks DA: Trends in the prevalence of preexisting diabetes and gestational
diabetes mellitus among a racially/ethnically diverse population of pregnant women, 1999-2005. Diabetes care
2008;31:899-904
3. Becerra JE, Khoury MJ, Cordero JF, Erickson JD: Diabetes mellitus during pregnancy and the risks for specific
birth defects: a population-based case-control study. Pediatrics 1990;85:1-9
4. Ramos-Arroyo MA, Rodriguez-Pinilla E, Cordero JF: Maternal diabetes: the risk for specific birth defects.
European journal of epidemiology 1992;8:503-508
5. Correa A, Gilboa SM, Besser LM, Botto LD, Moore CA, Hobbs CA, Cleves MA, Riehle-Colarusso TJ, Waller DK,
Reece EA: Diabetes mellitus and birth defects. American journal of obstetrics and gynecology 2008;199:237 e231-239
6. Loffredo CA, Wilson PD, Ferencz C: Maternal diabetes: an independent risk factor for major cardiovascular
malformations with increased mortality of affected infants. Teratology 2001;64:98-106
7. Reece EA, Wu YK: Prevention of diabetic embryopathy in offspring of diabetic rats with use of a cocktail of
deficient substrates and an antioxidant. American journal of obstetrics and gynecology 1997;176:790-797; discussion
797-798
8. Yang P, Zhao Z, Reece EA: Activation of oxidative stress signaling that is implicated in apoptosis with a mouse
model of diabetic embryopathy. American journal of obstetrics and gynecology 2008;198:130 e131-137
9. Yang P, Li X, Xu C, Eckert RL, Reece EA, Zielke HR, Wang F: Maternal hyperglycemia activates an
ASK1-FoxO3a-caspase 8 pathway that leads to embryonic neural tube defects. Science signaling 2013;6:ra74
10. Li X, Weng H, Reece EA, Yang P: SOD1 overexpression in vivo blocks hyperglycemia-induced specific PKC
isoforms: substrate activation and consequent lipid peroxidation in diabetic embryopathy. American journal of
obstetrics and gynecology 2011;205:84.e81-86
11. Li X, Weng H, Xu C, Reece EA, Yang P: Oxidative stress-induced JNK1/2 activation triggers proapoptotic
signaling and apoptosis that leads to diabetic embryopathy. Diabetes 2012;61:2084-2092
12. Li X, Xu C, Yang P: c-Jun NH2-terminal kinase 1/2 and endoplasmic reticulum stress as interdependent and
reciprocal causation in diabetic embryopathy. Diabetes 2013;62:599-608
13. Wang F, Reece EA, Yang P: Superoxide dismutase 1 overexpression in mice abolishes maternal diabetes-induced
endoplasmic reticulum stress in diabetic embryopathy. American journal of obstetrics and gynecology 2013;209:345
e341-347
14. Wang F, Wu Y, Gu H, Reece EA, Fang S, Gabbay-Benziv R, Aberdeen G, Yang P: Ask1 gene deletion blocks
maternal diabetes-induced endoplasmic reticulum stress in the developing embryo by disrupting the unfolded protein
response signalosome. Diabetes 2014;
15. Wentzel P, Gareskog M, Eriksson UJ: Decreased cardiac glutathione peroxidase levels and enhanced mandibular
apoptosis in malformed embryos of diabetic rats. Diabetes 2008;57:3344-3352
16. Phelan SA, Ito M, Loeken MR: Neural tube defects in embryos of diabetic mice: role of the Pax-3 gene and
apoptosis. Diabetes 1997;46:1189-1197
17. Yang X, Borg LA, Eriksson UJ: Altered metabolism and superoxide generation in neural tissue of rat embryos
exposed to high glucose. The American journal of physiology 1997;272:E173-180
18. Sakamaki H, Akazawa S, Ishibashi M, Izumino K, Takino H, Yamasaki H, Yamaguchi Y, Goto S, Urata Y, Kondo T,
Nagataki S: Significance of glutathione-dependent antioxidant system in diabetes-induced embryonic malformations.
Diabetes 1999;48:1138-1144
19. Yang P, Li H: Epigallocatechin-3-gallate ameliorates hyperglycemia-induced embryonic vasculopathy and
Page 23 of 35 Diabetes
malformation by inhibition of Foxo3a activation. American journal of obstetrics and gynecology 2010;203:75 e71-76
20. Yang P, Cao Y, Li H: Hyperglycemia induces inducible nitric oxide synthase gene expression and consequent
nitrosative stress via c-Jun N-terminal kinase activation. American journal of obstetrics and gynecology 2010;203:185
e185-111
21. Xu C, Li X, Wang F, Weng H, Yang P: Trehalose prevents neural tube defects by correcting maternal
diabetes-suppressed autophagy and neurogenesis. American journal of physiology Endocrinology and metabolism
2013;305:E667-678
22. Salbaum JM, Kappen C: Neural tube defect genes and maternal diabetes during pregnancy. Birth defects research
2010;88:601-611
23. Salbaum JM, Kruger C, Zhang X, Delahaye NA, Pavlinkova G, Burk DH, Kappen C: Altered gene expression and
spongiotrophoblast differentiation in placenta from a mouse model of diabetes in pregnancy. Diabetologia
2011;54:1909-1920
24. Greene MF, Hare JW, Cloherty JP, Benacerraf BR, Soeldner JS: First-trimester hemoglobin A1 and risk for major
malformation and spontaneous abortion in diabetic pregnancy. Teratology 1989;39:225-231
25. Miller E, Hare JW, Cloherty JP, Dunn PJ, Gleason RE, Soeldner JS, Kitzmiller JL: Elevated maternal hemoglobin
A1c in early pregnancy and major congenital anomalies in infants of diabetic mothers. The New England journal of
medicine 1981;304:1331-1334
26. Winzell MS, Ahren B: The high-fat diet-fed mouse: a model for studying mechanisms and treatment of impaired
glucose tolerance and type 2 diabetes. Diabetes 2004;53 Suppl 3:S215-219
27. Surwit RS, Kuhn CM, Cochrane C, McCubbin JA, Feinglos MN: Diet-induced type II diabetes in C57BL/6J mice.
Diabetes 1988;37:1163-1167
28. Smyth JW, Hong TT, Gao D, Vogan JM, Jensen BC, Fong TS, Simpson PC, Stainier DY, Chi NC, Shaw RM:
Limited forward trafficking of connexin 43 reduces cell-cell coupling in stressed human and mouse myocardium. The
Journal of clinical investigation 2010;120:266-279
29. Yang P, Reece EA: Role of HIF-1alpha in maternal hyperglycemia-induced embryonic vasculopathy. American
journal of obstetrics and gynecology 2011;204:332 e331-337
30. Yang P, Zhao Z, Reece EA: Blockade of c-Jun N-terminal kinase activation abrogates hyperglycemia-induced yolk
sac vasculopathy in vitro. American journal of obstetrics and gynecology 2008;198:321 e321-327
31. Rattan R, Graham RP, Maguire JL, Giri S, Shridhar V: Metformin suppresses ovarian cancer growth and metastasis
with enhancement of cisplatin cytotoxicity in vivo. Neoplasia 2011;13:483-491
32. Hou M, Venier N, Sugar L, Musquera M, Pollak M, Kiss A, Fleshner N, Klotz L, Venkateswaran V: Protective
effect of metformin in CD1 mice placed on a high carbohydrate-high fat diet. Biochemical and biophysical research
communications 2010;397:537-542
33. Mao-Ying QL, Kavelaars A, Krukowski K, Huo XJ, Zhou W, Price TJ, Cleeland C, Heijnen CJ: The anti-diabetic
drug metformin protects against chemotherapy-induced peripheral neuropathy in a mouse model. PloS one
2014;9:e100701
34. Hundal RS, Krssak M, Dufour S, Laurent D, Lebon V, Chandramouli V, Inzucchi SE, Schumann WC, Petersen KF,
Landau BR, Shulman GI: Mechanism by which metformin reduces glucose production in type 2 diabetes. Diabetes
2000;49:2063-2069
35. Lee HY, Wei D, Loeken MR: Lack of metformin effect on mouse embryo AMPK activity: implications for
metformin treatment during pregnancy. Diabetes/metabolism research and reviews 2014;30:23-30
36. Reece EA, Wiznitzer A, Homko CJ, Hagay Z, Wu YK: Synchronization of the factors critical for diabetic
teratogenesis: an in vitro model. American journal of obstetrics and gynecology 1996;174:1284-1288
37. Adam PA, Teramo K, Raiha N, Gitlin D, Schwartz R: Human fetal insulin metabolismearly in gestation. Response
Page 24 of 35Diabetes
to acutelevation of the fetal glucose concentration and placental tranfer of human insulin-I-131. Diabetes
1969;18:409-416
38. Prasadan K, Daume E, Preuett B, Spilde T, Bhatia A, Kobayashi H, Hembree M, Manna P, Gittes GK: Glucagon is
required for early insulin-positive differentiation in the developing mouse pancreas. Diabetes 2002;51:3229-3236
39. Wang F, Reece EA, Yang P: Advances in revealing the molecular targets downstream of oxidative stress -induced
pro-apoptotic kinase signaling in diabetic embryopathy. American journal of obstetrics and gynecology 2015;
40. Wang F, Reece EA, Yang P: Oxidative stress is responsible for maternal diabetes-impaired transforming growth
factor beta signaling in the developing mouse heart. American journal of obstetrics and gynecology 2015;
41. Wu Y, Wang F, Reece EA, Yang P: Curcumin ameliorates high glucose-induced neural tube defects by suppressing
cellular stress and apoptosis. American journal of obstetrics and gynecology 2015;
42. Yang P, Reece EA, Wang F, Gabbay-Benziv R: Decoding the oxidative stress hypothesis in diabetic embryopathy
through proapoptotic kinase signaling. American journal of obstetrics and gynecology 2014;
43. Gu H, Yu J, Dong D, Zhou Q, Wang JY, Yang P: The miR-322-TRAF3 circuit mediates the pro-apoptotic effect of
high glucose on neural stem cells. Toxicological sciences : an official journal of the Society of Toxicology 2014;
44. Pani L, Horal M, Loeken MR: Polymorphic susceptibility to the molecular causes of neural tube defects during
diabetic embryopathy. Diabetes 2002;51:2871-2874
45. Machado AF, Zimmerman EF, Hovland DN, Jr., Weiss R, Collins MD: Diabetic embryopathy in C57BL/6J mice.
Altered fetal sex ratio and impact of the splotch allele. Diabetes 2001;50:1193-1199
46. Kamimoto Y, Sugiyama T, Kihira T, Zhang L, Murabayashi N, Umekawa T, Nagao K, Ma N, Toyoda N, Yodoi J,
Sagawa N: Transgenic mice overproducing human thioredoxin-1, an antioxidative and anti-apoptotic protein, prevents
diabetic embryopathy. Diabetologia 2010;53:2046-2055
47. Sugimura Y, Murase T, Oyama K, Uchida A, Sato N, Hayasaka S, Kano Y, Takagishi Y, Hayashi Y, Oiso Y, Murata
Y: Prevention of neural tube defects by loss of function of inducible nitric oxide synthase in fetuses of a mouse model
of streptozotocin-induced diabetes. Diabetologia 2009;52:962-971
Page 25 of 35 Diabetes
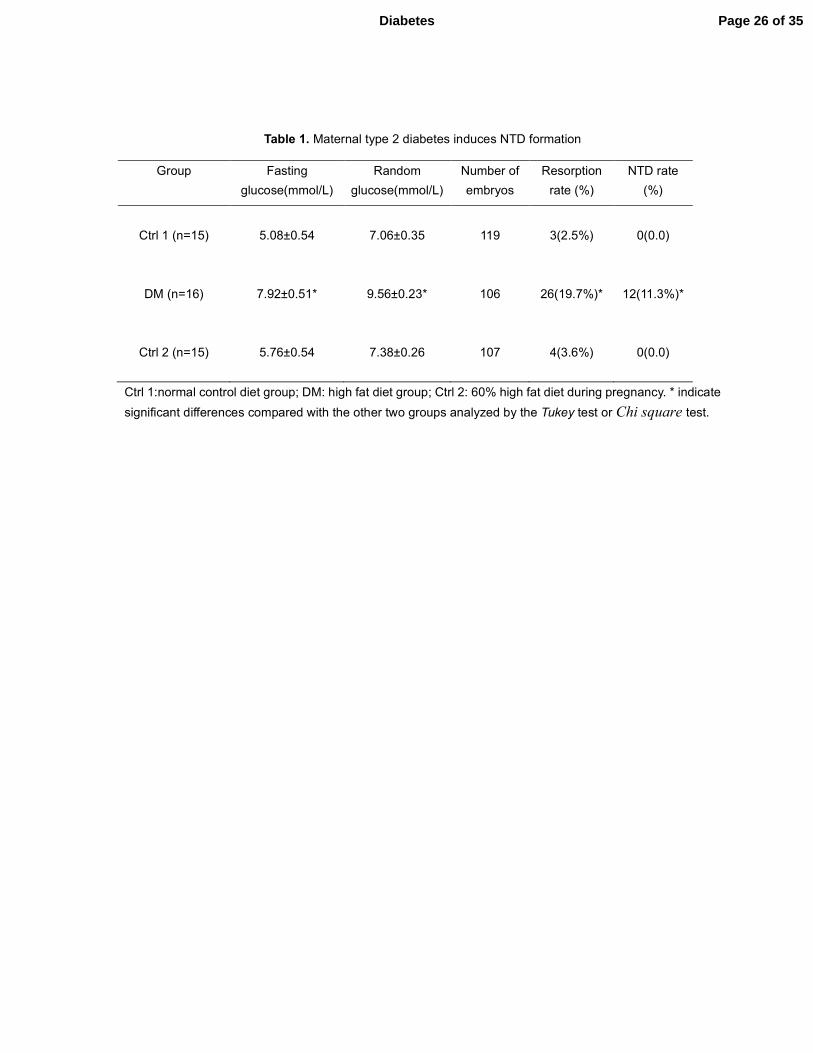
Table 1. Maternal type 2 diabetes induces NTD formation
Ctrl 1:normal control diet group; DM: high fat diet group; Ctrl 2: 60% high fat diet during pregnancy. * indicate
significant differences compared with the other two groups analyzed by the Tukey test or Chi square test.
Group Fasting
glucose(mmol/L)
Random
glucose(mmol/L)
Number of
embryos
Resorption
rate (%)
NTD rate
(%)
Ctrl 1 (n=15)
5.08±0.54
7.06±0.35
119
3(2.5%)
0(0.0)
DM (n=16)
7.92±0.51*
9.56±0.23*
106
26(19.7%)*
12(11.3%)*
Ctrl 2 (n=15)
5.76±0.54
7.38±0.26
107
4(3.6%)
0(0.0)
Page 26 of 35Diabetes
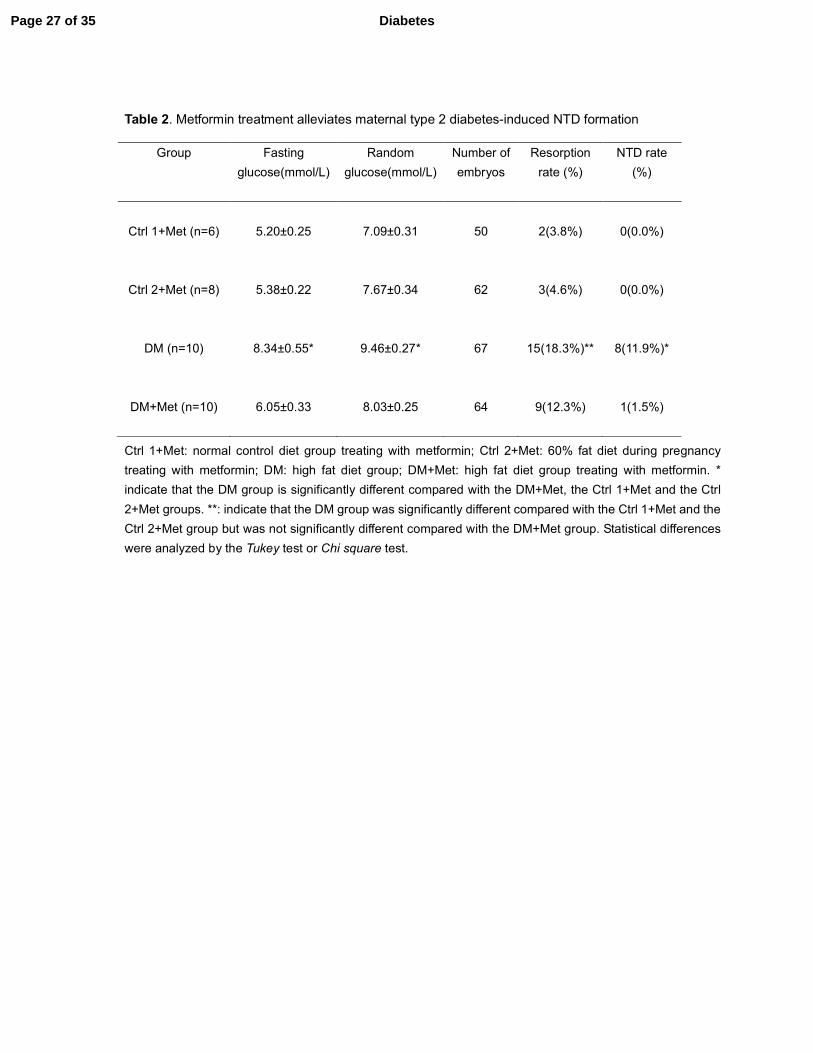
Table 2. Metformin treatment alleviates maternal type 2 diabetes-induced NTD formation
Ctrl 1+Met: normal control diet group treating with metformin; Ctrl 2+Met: 60% fat diet during pregnancy
treating with metformin; DM: high fat diet group; DM+Met: high fat diet group treating with metformin. *
indicate that the DM group is significantly different compared with the DM+Met, the Ctrl 1+Met and the Ctrl
2+Met groups. **: indicate that the DM group was significantly different compared with the Ctrl 1+Met and the
Ctrl 2+Met group but was not significantly different compared with the DM+Met group. Statistical differences
were analyzed by the Tukey test or Chi square test.
Group Fasting
glucose(mmol/L)
Random
glucose(mmol/L)
Number of
embryos
Resorption
rate (%)
NTD rate
(%)
Ctrl 1+Met (n=6)
5.20±0.25
7.09±0.31
50
2(3.8%)
0(0.0%)
Ctrl 2+Met (n=8)
5.38±0.22
7.67±0.34
62
3(4.6%)
0(0.0%)
DM (n=10)
8.34±0.55*
9.46±0.27*
67
15(18.3%)**
8(11.9%)*
DM+Met (n=10)
6.05±0.33
8.03±0.25
64
9(12.3%)
1(1.5%)
Page 27 of 35 Diabetes
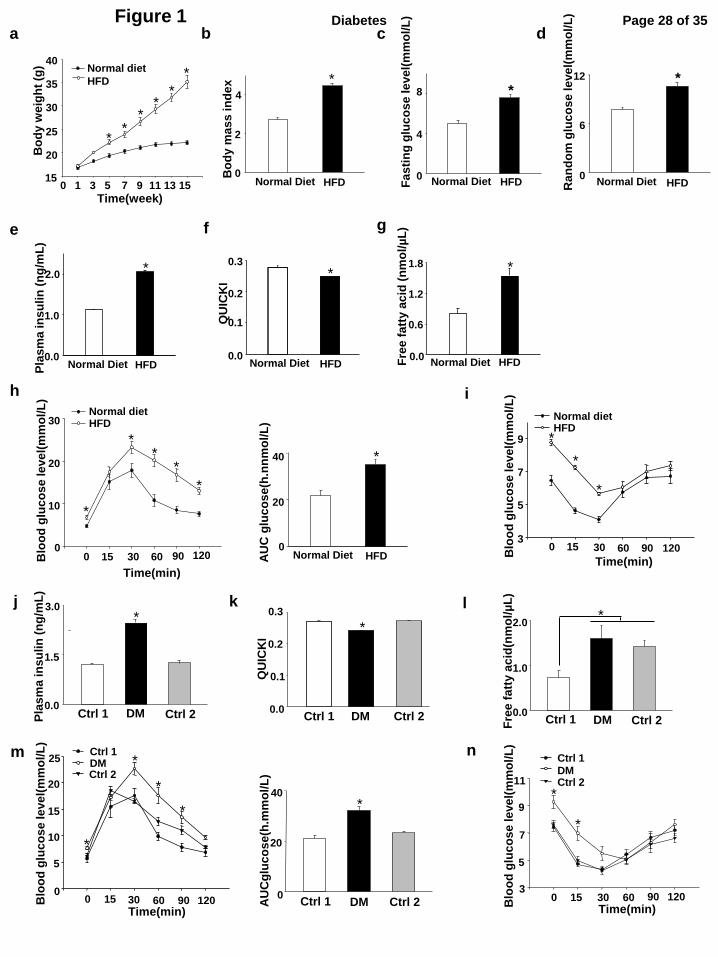
Figure 1 a c
Time(week) 0 1 3 5 7 9 11 13 15
Bo
dy w
eig
ht
(g)
15
20
25
30
35
40 Normal diet
HFD
*
* *
*
*
*
b d
Bo
dy m
as
s in
de
x
0
2
4
Normal Diet
*
HFD
*
Fa
sti
ng
glu
co
se
le
ve
l(m
mo
l/L
)
0
4
8
Normal Diet HFD
*
Ra
nd
om
glu
co
se
le
ve
l(m
mo
l/L
)
0
6
12
Normal Diet HFD
f
*
Pla
sm
a in
su
lin
(n
g/m
L)
0.0
1.0
2.0
Normal Diet HFD
QU
ICK
I
0.0
0.1
0.2
0.3
*
HFD Normal Diet
*
Fre
e f
att
y a
cid
(n
mo
l/µ
L)
0.0
0.6
1.2
1.8
Normal Diet HFD
h
Time(min)
0 15 30 60 90 120
Blo
od
glu
co
se
le
ve
l(m
mo
l/L
)
3
5
7
9
Normal diet HFD
*
*
*
g
j k
Fre
e f
att
y a
cid
(nm
ol/
µL
)
0.0
1.0
2.0
Ctrl 1 DM Ctrl 2
* *
Pla
sm
a in
su
lin
(n
g/m
L)
0.0
1.5
3.0
Ctrl 1 DM Ctrl 2
QU
ICK
I
0.0
0.1
0.2
0.3
Ctrl 2 DM Ctrl 1
*
m
*
AU
Cg
luc
os
e(h
.mm
ol/
L)
0
20
40
Ctrl 1 DM Ctrl 2
n
Time(min) 0 15 30 60 90 120
Blo
od
glu
co
se
le
ve
l(m
mo
l/L
)
3
5
7
9
11
*
*
Ctrl 1 DM Ctrl 2
e
i
AU
C g
luc
os
e(h
.nn
mo
l/L
)
0
20
40
Normal Diet HFD
*
l
30
Time(min)
0 15 60 90 120 Blo
od
glu
co
se
le
ve
l(m
mo
l/L
)
0
10
20
30 Normal diet HFD
*
* *
*
*
Time(min) 0 15 30 60 90 120 B
loo
d g
luc
os
e le
ve
l(m
mo
l/L
)
0
5
10
15
20
25 Ctrl 1 DM Ctrl 2
*
*
*
*
Page 28 of 35Diabetes
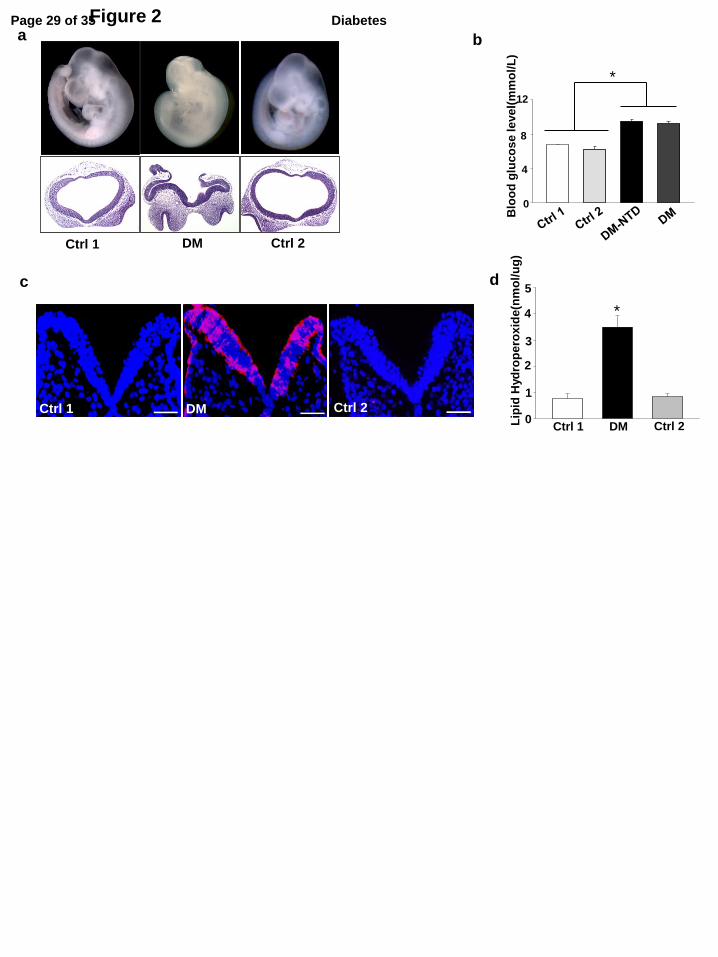
Figure 2 a
c
b
Ctrl 1 DM Ctrl 2
Ctrl 1 Ctrl 2 DM
Blo
od
glu
co
se
le
ve
l(m
mo
l/L
)
4
8
12
0
*
d
Lip
id H
yd
rop
ero
xid
e(n
mo
l/u
g)
0
2
4
Ctrl 1 DM Ctrl 2
1
3
5
*
Page 29 of 35 Diabetes
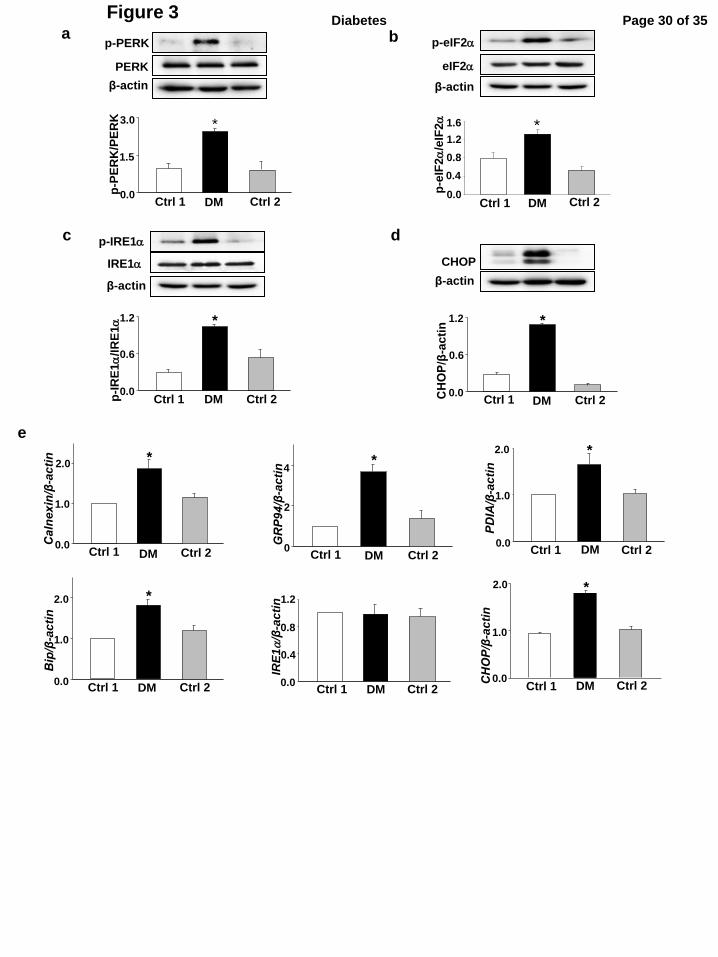
Figure 3 a b p-eIF2a
eIF2a
β-actin
PERK
p-PERK
β-actin
0.0
1.5
3.0
Ctrl 1 DM Ctrl 2
p-P
ER
K/P
ER
K
*
d c p-IRE1a
β-actin
IRE1a
*
0.0
0.6
1.2
Ctrl 1 DM Ctrl 2 p-I
RE
1a
/IR
E1
a
CHOP
β-actin
*
0.0
0.6
1.2
Ctrl 1 DM Ctrl 2 CHOP/β
-ac
tin
e
Ctrl 1 DM Ctrl 2 0.0
1.0
2.0
Calnexin/β
-ac
tin
*
0
2
4
GRP94/β
-ac
tin
*
Ctrl 1 DM Ctrl 2
PDIA/β
-ac
tin
0.0
1.0
2.0 *
Ctrl 1 DM Ctrl 2
0.0
1.0
2.0
Bip/β
-ac
tin
*
Ctrl 1 DM Ctrl 2 0.0
0.4
0.8
1.2
IRE
1a/β
-ac
tin
Ctrl 1 DM Ctrl 2 0.0
1.0
2.0
CHOP/β
-ac
tin
*
Ctrl 1 DM Ctrl 2
0.0
0.4
1.2
Ctrl 1 DM Ctrl 2
p-e
IF2
a/e
IF2
a
0.8
1.6 *
Page 30 of 35Diabetes
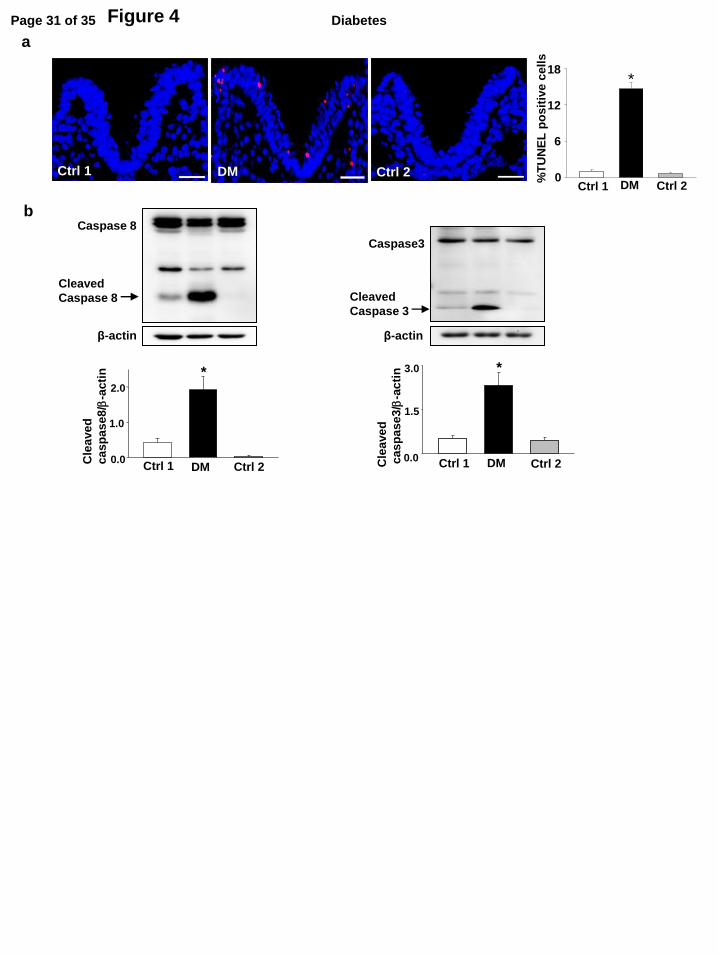
Figure 4
a
DM Ctrl 1 Ctrl 2
b
β-actin
Caspase 8
Cleaved
Caspase 8
*
Cle
ave
d
ca
sp
as
e8
/b-a
cti
n
0.0
1.0
2.0
Ctrl 1 DM Ctrl 2
Caspase3
β-actin
Cleaved
Caspase 3
*
0.0
1.5
3.0
Cle
ave
d
ca
sp
as
e3
/b-a
cti
n
Ctrl 1 DM Ctrl 2
%T
UN
EL
po
sit
ive
ce
lls
0
6
12
18
Ctrl 1 DM Ctrl 2
*
Page 31 of 35 Diabetes
a b
Figure 5
c
Time(min)
0 15 30 60 90 120
Blo
od
glu
co
se
le
ve
l(m
mo
l/L
)
0
10
20
30
**
#
#
#
Ctrl 1+Met
DM+Met
Ctrl 2+Met DM
Time(min) 0 15 30 60 90 120
Blo
od
glu
co
se
le
ve
l(m
mo
l/L
)
2
4
6
8
10
12 *
*
Ctrl 1+Met
DM+Met
Ctrl 2+Met DM
d
0.0
0.1
0.2
0.3
QU
ICK
I
*
#
AU
Cg
luc
os
e(h
.mm
ol/
L)
0
20
40
Pla
sm
a in
su
lin
le
ve
l(n
g/m
L)
1.0
2.0
0.0
0.5
1.5
2.5
*
Page 32 of 35Diabetes
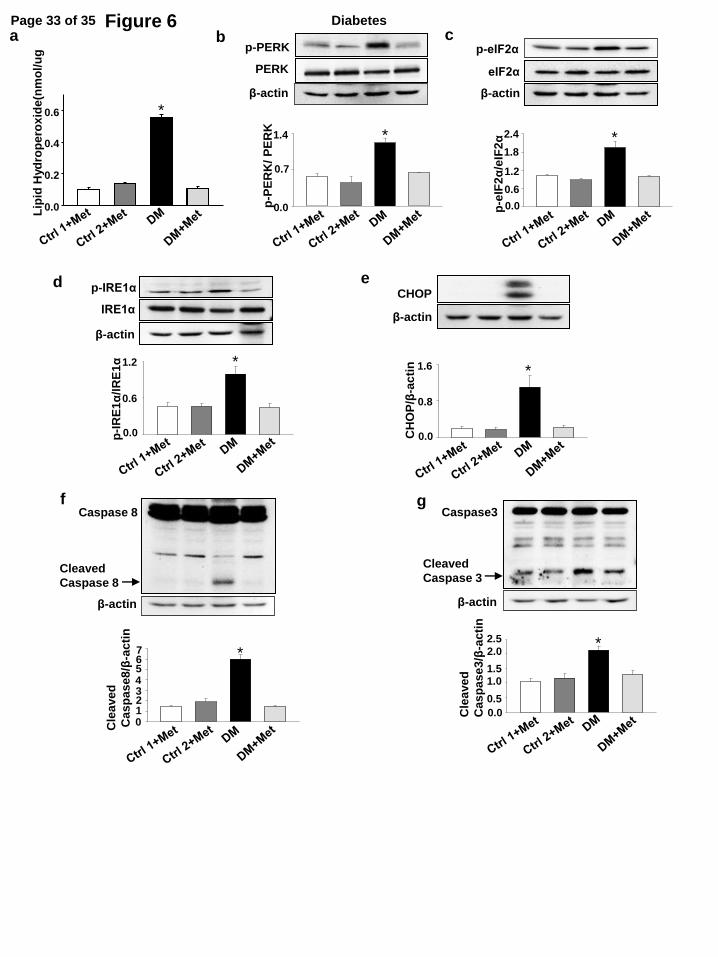
Figure 6 L
ipid
Hyd
rop
ero
xid
e(n
mo
l/u
g
0.0
0.2
0.4
0.6 *
a b
e CHOP
β-actin
CH
OP
/β-a
cti
n
0.0
0.8
1.6
*
c p-eIF2α
eIF2α
β-actin
p-e
IF2α
/eIF
2α
*
0.0
0.6
1.2
1.8
2.4
f
Cleaved
Caspase 8
Caspase 8
β-actin
Cle
ave
d
Cas
pa
se
8/β
-ac
tin
0
2
4
6
1
3
5
7 *
d p-IRE1α
IRE1α
β-actin *
p-I
RE
1α
/IR
E1α
0.0
0.6
1.2 *
g
Cle
ave
d
Cas
pa
se
3/β
-ac
tin
0.0
1.0
2.0 *
0.5
1.5
2.5
Caspase3
Cleaved
Caspase 3
β-actin
p-PERK
PERK
β-actin
p-P
ER
K/
PE
RK
0.0
0.7
1.4 *
Page 33 of 35 Diabetes
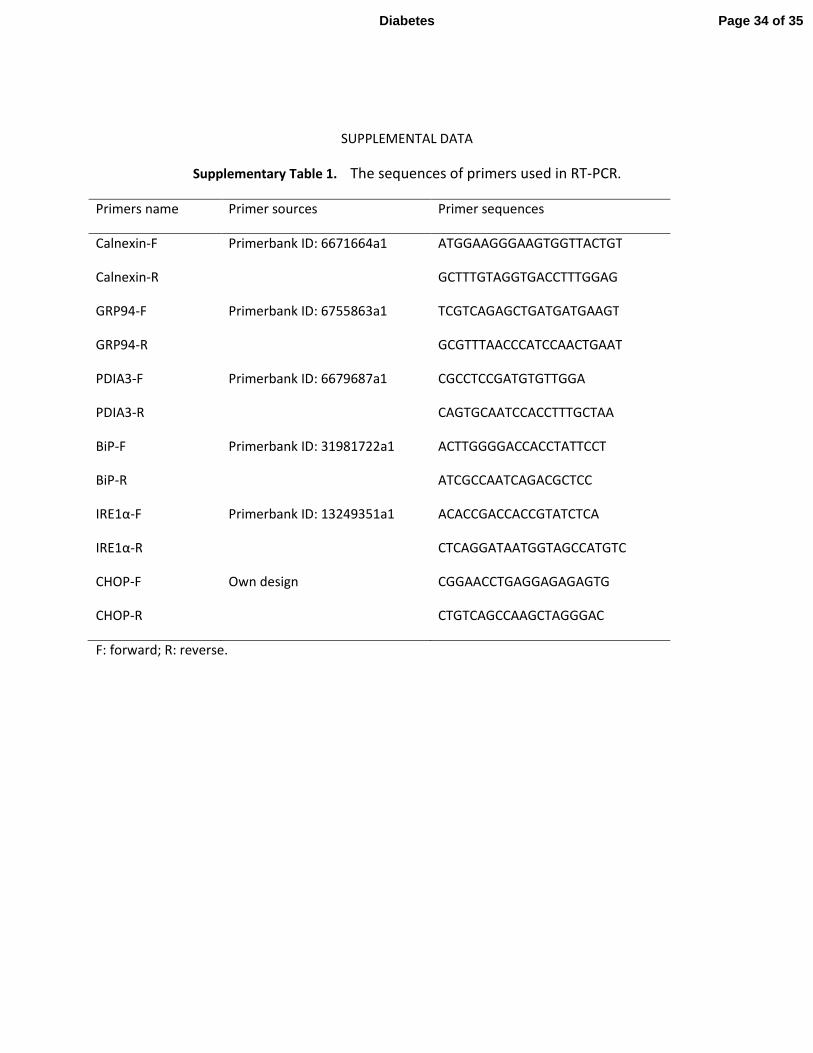
SUPPLEMENTAL DATA
Supplementary Table 1. The sequences of primers used in RT-PCR.
Primers name Primer sources Primer sequences
Calnexin-F Primerbank ID: 6671664a1 ATGGAAGGGAAGTGGTTACTGT
Calnexin-R GCTTTGTAGGTGACCTTTGGAG
GRP94-F Primerbank ID: 6755863a1 TCGTCAGAGCTGATGATGAAGT
GRP94-R GCGTTTAACCCATCCAACTGAAT
PDIA3-F Primerbank ID: 6679687a1 CGCCTCCGATGTGTTGGA
PDIA3-R CAGTGCAATCCACCTTTGCTAA
BiP-F Primerbank ID: 31981722a1 ACTTGGGGACCACCTATTCCT
BiP-R ATCGCCAATCAGACGCTCC
IRE1α-F Primerbank ID: 13249351a1 ACACCGACCACCGTATCTCA
IRE1α-R CTCAGGATAATGGTAGCCATGTC
CHOP-F Own design CGGAACCTGAGGAGAGAGTG
CHOP-R CTGTCAGCCAAGCTAGGGAC
F: forward; R: reverse.
Page 34 of 35Diabetes
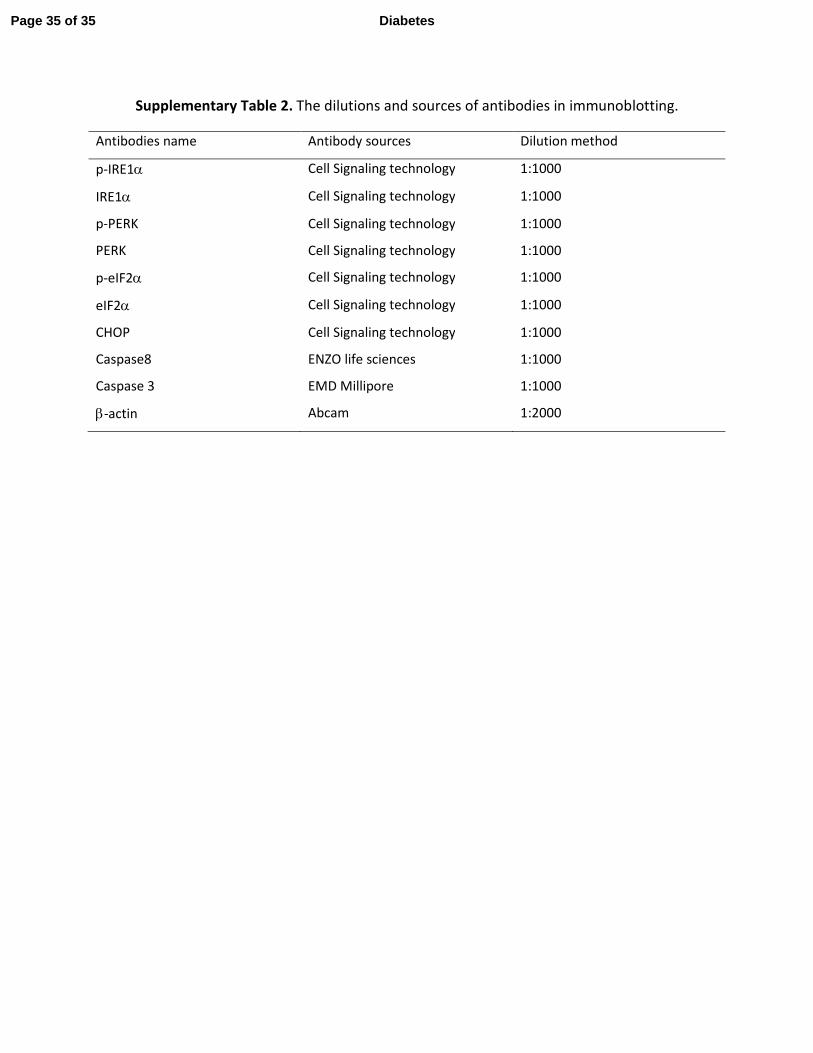
Supplementary Table 2. The dilutions and sources of antibodies in immunoblotting.
Antibodies name Antibody sources Dilution method
p-IRE1α Cell Signaling technology 1:1000
IRE1α Cell Signaling technology 1:1000
p-PERK Cell Signaling technology 1:1000
PERK Cell Signaling technology 1:1000
p-eIF2α Cell Signaling technology 1:1000
eIF2α Cell Signaling technology 1:1000
CHOP Cell Signaling technology 1:1000
Caspase8 ENZO life sciences 1:1000
Caspase 3 EMD Millipore 1:1000
β-actin Abcam 1:2000
Page 35 of 35 Diabetes