Cell Mechanics Studied by a Reconstituted Model Tissue
16
Cell Mechanics Studied by a Reconstituted Model Tissue Tetsuro Wakatsuki,* Michael S. Kolodney, George I. Zahalak, ‡ and Elliot L. Elson* *Department of Biochemistry and Molecular Biophysics, Washington University School of Medicine, St. Louis, Missouri 63110; Division of Dermatology, Department of Medicine, 1519 MacDonald Research Laboratory, UCLA School of Medicine, Los Angeles, California 90095; and ‡ Departments of Biomedical and Mechanical Engineering, School of Engineering, Washington University, St. Louis, Missouri 63130 USA ABSTRACT Tissue models reconstituted from cells and extracellular matrix (ECM) simulate natural tissues. Cytoskeletal and matrix proteins govern the force exerted by a tissue and its stiffness. Cells regulate cytoskeletal structure and remodel ECM to produce mechanical changes during tissue development and wound healing. Characterization and control of mechanical properties of reconstituted tissues are essential for tissue engineering applications. We have quantitatively characterized mechanical properties of connective tissue models, fibroblast-populated matrices (FPMs), via uniaxial stretch measurements. FPMs resemble natural tissues in their exponential dependence of stress on strain and linear dependence of stiffness on force at a given strain. Activating cellular contractile forces by calf serum and disrupting F-actin by cytochalasin D yield “active” and “passive” components, which respectively emphasize cellular and matrix mechanical contributions. The strain-dependent stress and elastic modulus of the active component were independent of cell density above a threshold density. The same quantities for the passive component increased with cell number due to compression and reorganization of the matrix by the cells. INTRODUCTION Tissue models reconstituted from specified cells and extra- cellular matrix (ECM) components provide simplified bio- logical systems in which to study cell-matrix interactions in wound healing and tissue development (Bell et al., 1979, Grinnell, 1994). Quantitative measurements of the force exerted by these models provide a powerful and flexible approach to study mechanisms of force regulation in non- muscle cells (Goeckeler and Wysolmerski, 1995; Kolodney and Elson, 1993, 1995; Kolodney and Wysolmerski, 1992). Measurements of tissue stiffness introduce an additional dimension, revealing mechanical functions of matrix com- ponents and cellular structural systems such as the cytoskel- eton. Stiffness measurements can also probe mechanical interactions between cells and ECM, and mechanisms of tissue remodeling in development and wound healing. Moreover, characterization and control of the mechanical properties and functions of reconstituted tissue equivalents are essential tasks for practical applications of tissue engineering. We have developed methods for quantitative measure- ment of the forces produced by reconstituted tissue models both of nonmuscle cells and cardiomyocytes (Eschenhagen et al., 1997; Kolodney and Elson, 1993). This paper de- scribes an extension of this method to measurements of tissue stiffness and a characterization of the mechanical properties of reconstituted tissue models assembled with chick embryo fibroblasts. One of our long-range goals is to use reconstituted tissue models to study the mechanical functions of cytoskeletal proteins. Because the cells, the matrix, and their interactions determine the mechanical properties of model tissues, we have sought conditions in which cytoskeletal contributions to the mechanics can be measured specifically. A major conclusion from this work is that under specified conditions, the mechanical contributions of the cells to the fibroblast-populated matrix (FPM) can be distinguished from those of the matrix. The stiffness of the model tissues is the sum of two components, termed “Active” and “Pas- sive.” The latter represents the mechanical properties of FPMs from which cytoskeletal and some matrix contribu- tions have been eliminated by disrupting actin filaments. The ECM dominates the Passive component. The Active and Passive components have significantly different me- chanical properties. The dynamic stiffness increases much more rapidly at high strain for the passive than for the active component. The force that resists stretching the matrix is an exponential function of the strain. At high strain, at which the matrix dominates the mechanical properties of the FPM, the dynamic stiffness of the tissue is therefore a linear function of the force that the tissue exerts or which is exerted on the tissue. Furthermore, the dynamic stiffness of the tissue model increases linearly with the logarithm of the oscillation frequency at which it is stretched. Both these properties are seen in natural biological tissues (Fung, 1993). They present a challenge for structural interpretation. MATERIALS AND METHODS Cell and tissue culture Chicken embryo fibroblasts (CEFs) isolated from 11-day chicken embryos (Spafas Inc., Preston, CT) were maintained in Dulbecco’s modified Eagle’s medium (DMEM) supplemented with 10% fetal calf serum (FCS), peni- Received for publication 28 February 2000 and in final form 31 July 2000. Address reprint requests to Dr. Elliot L. Elson, Dept. of Biochemistry/ Molecular Biophysics, Washington University School of Medicine, 600 S. Euclid Ave., Box 8231, St. Louis, MO 63110-1093. Tel.: 314-362-3346; Fax: 314-362-7183; E-mail: [email protected]. © 2000 by the Biophysical Society 0006-3495/00/11/2353/16 $2.00 2353 Biophysical Journal Volume 79 November 2000 2353–2368
Transcript of Cell Mechanics Studied by a Reconstituted Model Tissue

Cell Mechanics Studied by a Reconstituted Model Tissue
Tetsuro Wakatsuki,* Michael S. Kolodney,† George I. Zahalak,‡ and Elliot L. Elson**Department of Biochemistry and Molecular Biophysics, Washington University School of Medicine, St. Louis, Missouri 63110;†Division of Dermatology, Department of Medicine, 1519 MacDonald Research Laboratory, UCLA School of Medicine,Los Angeles, California 90095; and ‡Departments of Biomedical and Mechanical Engineering, School of Engineering,Washington University, St. Louis, Missouri 63130 USA
ABSTRACT Tissue models reconstituted from cells and extracellular matrix (ECM) simulate natural tissues. Cytoskeletal andmatrix proteins govern the force exerted by a tissue and its stiffness. Cells regulate cytoskeletal structure and remodel ECMto produce mechanical changes during tissue development and wound healing. Characterization and control of mechanicalproperties of reconstituted tissues are essential for tissue engineering applications. We have quantitatively characterizedmechanical properties of connective tissue models, fibroblast-populated matrices (FPMs), via uniaxial stretch measurements.FPMs resemble natural tissues in their exponential dependence of stress on strain and linear dependence of stiffness on forceat a given strain. Activating cellular contractile forces by calf serum and disrupting F-actin by cytochalasin D yield “active” and“passive” components, which respectively emphasize cellular and matrix mechanical contributions. The strain-dependentstress and elastic modulus of the active component were independent of cell density above a threshold density. The samequantities for the passive component increased with cell number due to compression and reorganization of the matrix by thecells.
INTRODUCTION
Tissue models reconstituted from specified cells and extra-cellular matrix (ECM) components provide simplified bio-logical systems in which to study cell-matrix interactions inwound healing and tissue development (Bell et al., 1979,Grinnell, 1994). Quantitative measurements of the forceexerted by these models provide a powerful and flexibleapproach to study mechanisms of force regulation in non-muscle cells (Goeckeler and Wysolmerski, 1995; Kolodneyand Elson, 1993, 1995; Kolodney and Wysolmerski, 1992).Measurements of tissue stiffness introduce an additionaldimension, revealing mechanical functions of matrix com-ponents and cellular structural systems such as the cytoskel-eton. Stiffness measurements can also probe mechanicalinteractions between cells and ECM, and mechanisms oftissue remodeling in development and wound healing.Moreover, characterization and control of the mechanicalproperties and functions of reconstituted tissue equivalentsare essential tasks for practical applications of tissueengineering.
We have developed methods for quantitative measure-ment of the forces produced by reconstituted tissue modelsboth of nonmuscle cells and cardiomyocytes (Eschenhagenet al., 1997; Kolodney and Elson, 1993). This paper de-scribes an extension of this method to measurements oftissue stiffness and a characterization of the mechanicalproperties of reconstituted tissue models assembled withchick embryo fibroblasts. One of our long-range goals is to
use reconstituted tissue models to study the mechanicalfunctions of cytoskeletal proteins. Because the cells, thematrix, and their interactions determine the mechanicalproperties of model tissues, we have sought conditions inwhich cytoskeletal contributions to the mechanics can bemeasured specifically.
A major conclusion from this work is that under specifiedconditions, the mechanical contributions of the cells to thefibroblast-populated matrix (FPM) can be distinguishedfrom those of the matrix. The stiffness of the model tissuesis the sum of two components, termed “Active” and “Pas-sive.” The latter represents the mechanical properties ofFPMs from which cytoskeletal and some matrix contribu-tions have been eliminated by disrupting actin filaments.The ECM dominates the Passive component. The Activeand Passive components have significantly different me-chanical properties. The dynamic stiffness increases muchmore rapidly at high strain for the passive than for the activecomponent. The force that resists stretching the matrix is anexponential function of the strain. At high strain, at whichthe matrix dominates the mechanical properties of the FPM,the dynamic stiffness of the tissue is therefore a linearfunction of the force that the tissue exerts or which isexerted on the tissue. Furthermore, the dynamic stiffness ofthe tissue model increases linearly with the logarithm of theoscillation frequency at which it is stretched. Both theseproperties are seen in natural biological tissues (Fung,1993). They present a challenge for structural interpretation.
MATERIALS AND METHODS
Cell and tissue culture
Chicken embryo fibroblasts (CEFs) isolated from 11-day chicken embryos(Spafas Inc., Preston, CT) were maintained in Dulbecco’s modified Eagle’smedium (DMEM) supplemented with 10% fetal calf serum (FCS), peni-
Received for publication 28 February 2000 and in final form 31 July 2000.
Address reprint requests to Dr. Elliot L. Elson, Dept. of Biochemistry/Molecular Biophysics, Washington University School of Medicine, 600 S.Euclid Ave., Box 8231, St. Louis, MO 63110-1093. Tel.: 314-362-3346;Fax: 314-362-7183; E-mail: [email protected].
© 2000 by the Biophysical Society
0006-3495/00/11/2353/16 $2.00
2353Biophysical Journal Volume 79 November 2000 2353–2368

cillin at 50 units/ml, and streptomycin at 50 mg/ml. The CEFs used to makeFPMs were passaged once or twice from primary cultures. Monomericcollagen solubilized in 0.02 M acetic acid (Upstate Biotechnology Inc.,Lake Placid, NY) was neutralized at 4°C with 0.1 N NaOH and mixed withconcentrated DMEM stock to yield a final normal DMEM concentration.The fibroblasts suspended by trypsin (Fig. 1a) were mixed with thecollagen solution (Fig. 1b), the cell suspension was poured into Tefloncasting wells (Fig. 1c), and wells were incubated at 37°C with 5% CO2
(Fig. 1 d). The collagen polymerized within 15–30 min and fibroblastswere captured within the hydrated collagen gel. The collagen gel formed aring (3 mm thick, 3 cm diameter) between the inner wall of the cylindricalwell and the central mandrel. While in culture the cells compressed thisring, reducing its volume;10-fold (thickness 200–300mm). The ringcould then be removed from the mandrel (Fig. 1,e andf) and mounted onthe measuring instrument (Fig. 1g) as described below.
Mechanical measurements
After 2 days of incubation (serum starvation for the final 12–16 h), themandrel was removed from the well and the FPM-ring was removed gently
from the mandrel. The FPM-ring was looped over the triangular hookconnected to an isometric force transducer (model 52-9545, Harvard Ap-paratus, South Natick, MA) by a gold chain. The ring was also looped overa horizontal bar connected to a sliding element moved linearly by a steppermotor (P/N 1-19-3400 24V DC 1.8° step size, Haward Industry, St. Louis,MO) controlled by a microstepping driver (IM483 Intelligent MotionSystems, Inc., Marlborough CT) (Fig. 1g). The apparatus changes thetissue length with prescribed time and amplitude to measure stress anddynamic modulus of the sample. The microstepping driver controlled by apersonal computer with custom software (developed by Bill McCon-naughey) enabled the stepper motor to achieve smooth motion. An analog-to-digital signal converter (CIO-DAS1602/16, Computer Boards, Inc.,Mansfield, MA) attached to the computer translated the voltage signal fromthe isometric force transducer to a digital signal for recording. The samplewas submerged in 50 ml Hepes-buffered DMEM (pH 7.4) in a thermo-regulated organ bath (Harvard Apparatus, South Natick, MA) maintainedat 37°C. The two horizontal bars over which the ring was looped wereinitially set to hold the ring at its original contour length (corresponding to[1⁄2] of the circumference of the mandrel). The amplitude of the forceresponse divided by the driving amplitude corresponded to the dynamicstiffness of the sample subjected to a sinusoidal length change (20mmamplitude;,0.5% stain, 0.5 Hz frequency). The dynamic stiffness andtension of the FPM were measured at various strain levels by elongatingand shortening the sample at a constant rate (10mm/min) up to 20% strain.
Measurement of tissue cross-sectional area
After a 2-day incubation the FPM forms a tight ring around the mandrel.The mandrel with the FPM was placed vertically on an inverted micro-scope (IM-35, Carl Zeiss Inc., Thornwood, NY). An image of the ringviewed along its axis was captured by video camera and the thickness wasdetermined by image analysis. The width of the FPM was measured usinga caliper.
Estimation of cross-sectional areas
The cells in the FPMs were stained with the cytoplasmic fluorescent dyeCell Tracker (Molecular Probes, Eugene, OR) using the recommendedconcentration in serum-free DMEM and incubating for 15 min at 37°C.The samples were washed twice with PBS to remove excess dye and fixedwith 3.7% formaldehyde in PBS for 30 min at room temperature. Thecircumferential direction of the FPM was aligned to they axis of theconfocal scanning axis so that they axis of the image was always parallelto the direction of stretch. A total of 36 images were taken at focal planesseparated by 2mm along thez axis of the FPM (perpendicular to its planarsurface). The smallest confocal aperture (0.7 mm) was used to maximizeresolution along thezaxis, and the parameters were carefully chosen to usethe whole intensity range and to avoid saturation. A stack of 36 images wasresliced in the plane perpendicular to the axis of the stretch by ScionImagesoftware (Scion Corporation, Frederick, MD). The total cross-sectionalarea of cells was computed by summing all the pixels with intensity higherthan a threshold. The threshold was determined once using one of theimages following a published procedure (Satoh et al., 1996). The samethreshold was used for all the samples because the images were obtainedusing the same confocal parameters. The accuracy and reproducibility ofthe reslicing was confirmed by repeating the procedure for sphericalfluorescent beads (6mm diameter) embedded in a collagen matrix.
RESULTS
A remodeling of the matrix by the cells strongly influencesthe mechanical characteristics of an FPM. After gelation ofthe collagen, the cells adhere to the collagen fibers, elon-
FIGURE 1 Schematic of methods for preparing and measuring FPMs.The CEFs and monomeric collagen (a) are mixed in DMEM at pH 7 (b).This solution is poured into casting wells (c) and polymerized at 37°C (d).The wells are incubated (d) for few days, during which the cells compressand remodel the collagen matrix. After the incubation the mandrel isremoved from the well (e) and the FPM-ring is removed gently from themandrel (f). The FPM-ring is connected to the force-measuring apparatus(an isometric force transducer) and a stepper motor that controls the tissuestrain (g).
2354 Wakatsuki et al.
Biophysical Journal 79(5) 2353–2368

gate, and compress and stiffen the collagen matrix, reducingits volume by;10-fold and increasing its stiffness fromnear zero to;1 dyn/mm. The cells near the edge of thetissue orient parallel to the edge (Kolodney and Elson,1993). The elongated shapes of the cells labeled with afluorescent cytoplasmic dye and their distribution within thematrix are readily displayed using scanning confocal fluo-rescence microscopy (Fig. 2). The mechanical properties oftissues depend on the distribution of the cells and theirorientations. To a reasonable first approximation we mayconsider the positions and orientations of the cells to berandom (except near the edges of the tissue). See Zahalak etal. (2000) (accompanying paper) for a more detailed dis-cussion of orientation effects.
Our major purpose in this work is to characterize therelative contributions of the cells and the matrix to themechanical properties of the reconstituted model tissues. Toaccomplish this goal we measured the stiffness of the FPMsat various strains and strain rates. We have developed aninstrument to measure the forces either generated by anFPM or applied to it by a computer-controlled microstep-ping motor (Fig. 1). Using this instrument we can measurestiffness of a model tissue by determining the force required
to stretch it to a defined level of strain. As described above,we have typically used a triangular ramp stretch on which issuperimposed a small sinusoidal strain (n 5 0.5 Hz). Thedynamic stiffness was measured as the peak-to-peak changein force per change in strain.
Dependence of force and stiffness on slow strain
Typically, the model tissue is subjected to a sequence ofstretch cycles. In each cycle it is slowly stretched from 0 to20% over 30 min and is then returned at the same rate to itsoriginal length. The increase in force during the first stretchis substantially larger than in subsequent stretches (Fig. 3).This change in mechanical properties during the first cycleis not affected by disrupting the organization of cellularactin filaments with cytochalasin D (CD), and so is mostlikely due to a change in the properties of the matrix duringthe first stretch (Asnes and Wakatsuki, unpublished obser-vations). For each stretch after the first there is a furthersmall decrease in maximum force. We have chosen to useonly the first loading cycle for “preconditioning” becausethe major irreversible change in tissue mechanical proper-
FIGURE 2 Scanning confocal micro-graphs of FPMs with different concentra-tions of cells. The fibroblasts were labeledwith a fluorescent cytoplasmic dye (CellTracker). The cells are elongated and ran-domly oriented. The concentrations of fi-broblasts before gel compression were1,000,000 (a), 700,000 (b), 400,000 (c), and100,000 (d) cells per initial unit volume (1ml) of the cell-collagen solution.
Reconstituted Tissue Mechanics 2355
Biophysical Journal 79(5) 2353–2368
ties occurs during this stretch. Moreover, the small changesthat occur between the subsequent stretch cycles (normally6–7% decrease), while detectable, are not large enough toinfluence our conclusions. In addition, unlike tissue samplesfrom an adult animal, FPMs are still slowly remodeling onthe second day after their formation. Repetitive stretchcycles could modulate the remodeling process and so intro-duce an additional variable into the experiment that could bedifficult to control. Effects of stretching on the tissue re-modeling process will be the subject of future investigation.Prestretching also reduces the variability of force versusstretch properties from one FPM to another. In the followingwe use the second and third stretch cycles for our experi-mental measurements. Similar behavior is seen for biolog-ical tissues, although many rather than only one precondi-tioning stretches are used to reach a state in which forceversus strain curves are repeatable (Fung, 1993). Further-more, the variation of force with strain is quite similar whenthe strain rate is doubled. Although the loading and unload-ing curves differ, each is repeatable and relatively insensi-tive to strain rate over this narrow range of slow strains(Fung, 1993).
Uniformity of strain
During first (preconditioning) stretch local strain is inho-mogeneous, and in some regions irreversible. During laterstretches the strain appears homogeneous and reversible
throughout the tissue. The local strain was measured byfollowing the displacement of small markers embeddedthroughout the FPM. Time-lapse images of the sample weretaken every 2 min of each stretch cycle in the same appa-ratus described above (Fig. 1) using a video camera with amagnifying lens focused on the sample through the trans-parent organ bath. The displacements of markers made fromsmall pieces of sterilized silk surgical suture (,0.5 mm inlength) were traced using Scion-image software (PC versionof NIH-image). During the first stretch the local strain in theportions of the tissue closest to the horizontal bars aroundwhich the FPM was looped were larger than the in themiddle of the tissue. Moreover, the markers in the regionsclosest to the bars did not return to their original positionsafter the first stretch. In the second and subsequent stretchesthe local strain measured by the markers appeared uniformand reversible in all parts of the FPM.
Structural components that resist strain
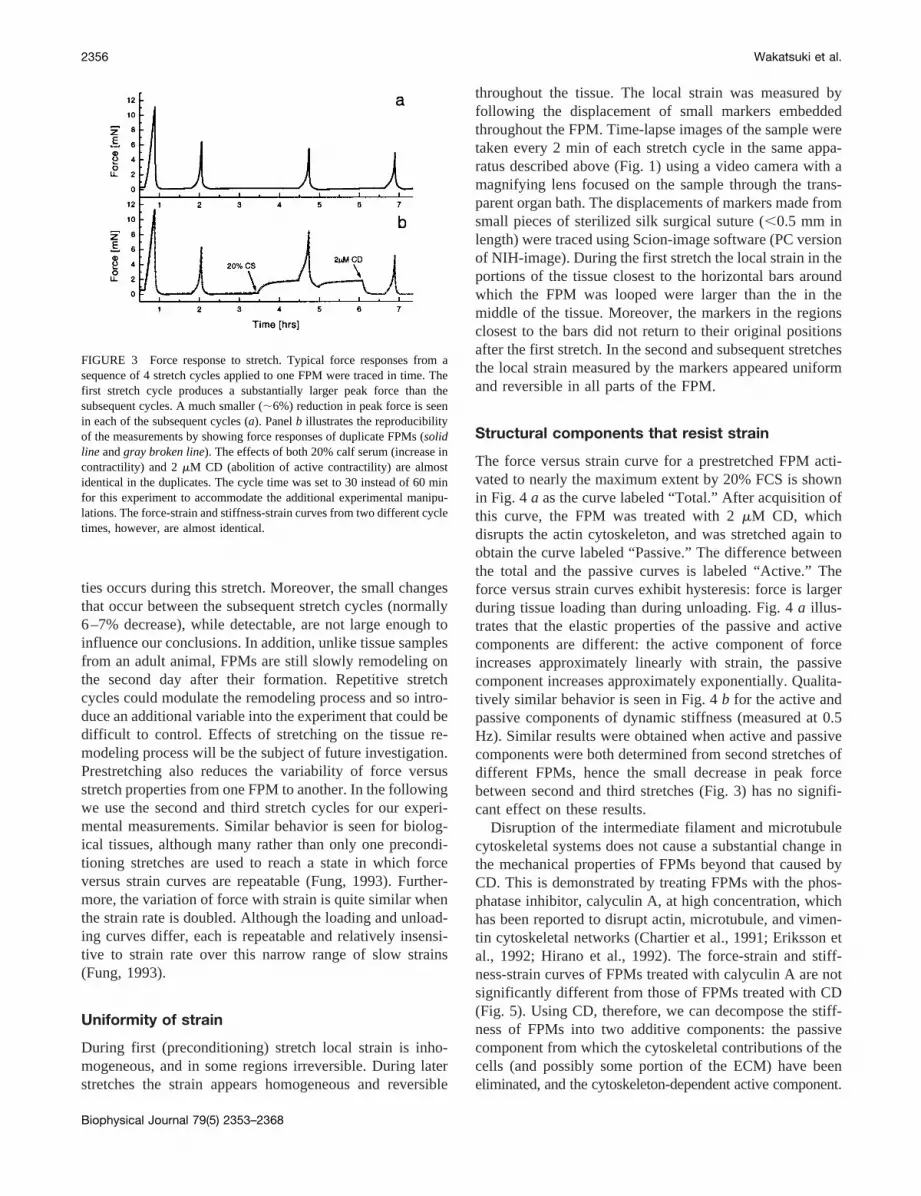
The force versus strain curve for a prestretched FPM acti-vated to nearly the maximum extent by 20% FCS is shownin Fig. 4a as the curve labeled “Total.” After acquisition ofthis curve, the FPM was treated with 2mM CD, whichdisrupts the actin cytoskeleton, and was stretched again toobtain the curve labeled “Passive.” The difference betweenthe total and the passive curves is labeled “Active.” Theforce versus strain curves exhibit hysteresis: force is largerduring tissue loading than during unloading. Fig. 4a illus-trates that the elastic properties of the passive and activecomponents are different: the active component of forceincreases approximately linearly with strain, the passivecomponent increases approximately exponentially. Qualita-tively similar behavior is seen in Fig. 4b for the active andpassive components of dynamic stiffness (measured at 0.5Hz). Similar results were obtained when active and passivecomponents were both determined from second stretches ofdifferent FPMs, hence the small decrease in peak forcebetween second and third stretches (Fig. 3) has no signifi-cant effect on these results.
Disruption of the intermediate filament and microtubulecytoskeletal systems does not cause a substantial change inthe mechanical properties of FPMs beyond that caused byCD. This is demonstrated by treating FPMs with the phos-phatase inhibitor, calyculin A, at high concentration, whichhas been reported to disrupt actin, microtubule, and vimen-tin cytoskeletal networks (Chartier et al., 1991; Eriksson etal., 1992; Hirano et al., 1992). The force-strain and stiff-ness-strain curves of FPMs treated with calyculin A are notsignificantly different from those of FPMs treated with CD(Fig. 5). Using CD, therefore, we can decompose the stiff-ness of FPMs into two additive components: the passivecomponent from which the cytoskeletal contributions of thecells (and possibly some portion of the ECM) have beeneliminated, and the cytoskeleton-dependent active component.
FIGURE 3 Force response to stretch. Typical force responses from asequence of 4 stretch cycles applied to one FPM were traced in time. Thefirst stretch cycle produces a substantially larger peak force than thesubsequent cycles. A much smaller (;6%) reduction in peak force is seenin each of the subsequent cycles (a). Panelb illustrates the reproducibilityof the measurements by showing force responses of duplicate FPMs (solidline andgray broken line). The effects of both 20% calf serum (increase incontractility) and 2mM CD (abolition of active contractility) are almostidentical in the duplicates. The cycle time was set to 30 instead of 60 minfor this experiment to accommodate the additional experimental manipu-lations. The force-strain and stiffness-strain curves from two different cycletimes, however, are almost identical.
2356 Wakatsuki et al.
Biophysical Journal 79(5) 2353–2368

The magnitude of the active force increasing linearly withstrain remains greater up to;20% strain than that of thepassive component that increases exponentially. It is alsonoteworthy that the active force level diminishes with in-creasing strain at strains.;17% (Fig. 4a). In muscle, thisbehavior is thought to result from a decrease in the overlapbetween actin and myosin filaments (Murphy, 1980). Todetermine whether a similar mechanism is involved inFPMs would require correlation of force with a parameteranalogous to sarcomere spacing in a skeletal or cardiacmuscle. This would be difficult to accomplish in the fibro-blasts in an FPM.
Analogous results are obtained in measurements onFPMs, which have not been activated by FCS (data notshown). In contrast to relaxed muscle, nonactivated FPMsexert a basal level of contractile force, which persists evenafter the first conditioning stretch. Hence, under the condi-tions of these experiments, the nonactivated FPM retainssome actin-myosin interaction. Measurements of the phos-phorylation of the regulatory light chain of nonmuscle my-
FIGURE 4 Force and stiffness versus strain for activated and CD-treatedFPMs. The force versus strain (a) and dynamic stiffness versus strain (b)for a prestretched FPM activated by 20% CS is shown by solid lineslabeled “Total.” The force and stiffness curves obtained after treatment by2 mM CD are shown by broken lines labeled “Passive.” The differencebetween the Total and the Passive curves, labeled “Active,” is shown bydotted lines. All the curves exhibit hysteresis. The Active curves increasesapproximately linearly with strain; the Passive curves increases approxi-mately exponentially. The dynamic stiffness was measured at 0.5 Hz (b).
FIGURE 5 Effects of calyculin A and CD on FPMs. Two duplicateFPMs were subjected to a preconditioning stretch, treated with 20% CS,and then stretched a second time to characterize the activated FPMs. OneFPM was then treated with the phosphatase inhibitor calyculin A (10 nM),known to disrupt actin, microtubule, and vimentin cytoskeletal networks(broken lines). The other sample was treated with 2mM cytochalasin D(solid lines). The force-strain (a) and stiffness-strain (b) curves of the FPMtreated with calyculin A are not significantly different from those of theFPM treated with CD. This indicates that no significant contribution to themechanical properties measured in the dynamic range used in this work(strain rate of 1.6mm/s up to 20% strain plus 40mm amplitude sinusoidaloscillation at 0.5 Hz) are detected from the cytoskeletal filament systemsother than the actin system. (Note that mechanical effects of intermediatefilaments and microtubules that required an intact actin cytoskeleton wouldnot be detected by this measurement.)
Reconstituted Tissue Mechanics 2357
Biophysical Journal 79(5) 2353–2368

osin demonstrate that myosin is partly activated under theseconditions (cf. Kolodney and Elson, 1993).
Although the active cellular contribution to the “total”force versus strain curve is largely eliminated by CD, theeffect of the matrix compression and remodeling by thecells is large and persists after CD treatment. Fig. 6 illus-trates that even after treatment by 2mM CD, the FPM ismuch stiffer than a collagen matrix gelled without cells.This difference in mechanical properties results from theremodeling of the matrix by the cells during the period inwhich the matrix is compressed. A residual cross-linkingof matrix filaments by the cells could persist after CDtreatment.
The active curve was obtained by subtracting data ob-tained during a third stretch from data obtained in a second
stretch. To assess the influence of the small reduction inmaximum force between second and third stretches, anactive curve was obtained from two second stretches ondifferent FPMs, one treated with CS, the other with both CSand CD. The active curve obtained in this way from dupli-cate samples had;6% smaller maximum force than thecurve obtained using second and third stretches on the sameFPM. The shapes of the curves obtained using the twodifferent methods were qualitatively indistinguishable,hence active and passive mechanical parameters measuredusing sequential stretches might be overestimated and un-derestimated, respectively, by;6%.
Dependence of dynamic stiffness on theoscillation frequency of force and strain
A plot of the dynamic stiffness of an activated FPM mea-sured at 0.5 Hz over the range of strains from 0 to 20% isshown in Fig. 4b. Unlike a linear elastic spring withstiffness independent of strain, the dynamic stiffness of theFPM increases with increasing strain. The plots of stiffnessversus strain for the total, active, and passive componentsare qualitatively similar to the plots of force versus strain forthe same components. Replotting these data reveals a strik-ing linear dependence of stiffness on stretching force (Fig.7). Similarly, stiffness also shows a linear variation withcontractile force generated by the cells in the FPM. Fig. 8shows that stiffness increases in parallel with force afteractivation by serum and decreases in parallel with forceafter treatment by CD. The proportionality constant for thedependence on stretching force,;0.008mm21, is similar tothat for the cell-generated force, 0.005mm21, even though
FIGURE 6 The effect of cells on the mechanical properties of the matrix.The force-strain (a) and stiffness-strain (b) relationships for a collagenmatrix remodeled by fibroblasts for 2 days after casting and then treatedwith CD to eliminate cytoskeletal contributions to the mechanical proper-ties (solid curves) and for a collagen matrix prepared similarly but withoutcells (broken curves).
FIGURE 7 Stiffness versus imposed force. Replotting the force-strainand stiffness-strain relationships in terms of stiffness versus force revealsa striking linear dependence of stiffness on the stretching force. These datawere obtained from the loading (stretching) curves for serum-activated(filled circles) and CD-treated (open squares) FPMs.
2358 Wakatsuki et al.
Biophysical Journal 79(5) 2353–2368

the measurements were performed on FPMs prepared ondifferent occasions.
As expected for a viscoelastic system, the dynamic stiff-ness varies also with the rate of stretch (oscillation frequen-cy). Fig. 9 a demonstrates that the dynamic stiffness in-creases almost linearly with log(n) from 0.008 to 0.4 Hz foractivated, inactivated, and CD-treated FPMs. We have ob-tained data up to 10 Hz, which showed a similar trend, butdue to limitations of the measurement system, these data areless reliable than the measurements up ton ; 2 Hz. Asbefore, higher stiffness values are associated with highervalues of force. Also, the rate at which stiffness increaseswith log(n) is greater the larger the stiffness. These mea-surements were carried out on prestretched FPMs that hadbeen returned to zero initial strain to emphasize the cellularcontribution to the dynamic stiffness. Under these condi-tions the stiffness of the CD-treated FPM is low and in-creases little with increasingn (Fig. 9 a). The dynamicstiffness results mainly from the active component, whichdominates mechanical properties of the FPM at low strain.
The storage and loss moduli,G9(n) and G0(n), respec-tively, indicate the portions of the energy required to deformthe FPM that are either stored or dissipated as heat. In asinusoidal deformation occurring at frequencyn, G9(n) isthe force in phase with the strain andG0(n), the force 90°out of phase with the strain, both divided by the strain(Ferry, 1980).G9 and G0 are plotted for non-activated,
activated, and CD-treated FPMs in Fig. 9,c andd. Both G9andG0 markedly increase after activation by CS, but for allconditionsG9 is substantially greater thanG0. Hence, forthese FPMs the elastic resistance to stretching substantiallyexceeds viscous resistance. TheG0 of the activated FPMsshowed a maximum at;0.4 Hz, and the maximum disap-peared by CD treatment. It suggests the actin-myosin inter-action contributes largely to viscosity of the FPMs. Theexperimental results are compared to a simple linear stan-dard solid model (Fig. 9,e andf). For appropriate values ofthe springs,k1 andk2, and the dashpot viscosity,h, we seethat the increase ofG9 over the frequency range of themeasurements and the maximum observed forG0 are bothqualitatively reproduced. Nevertheless, it is clear that for theFPMs the frequency range over whichG9 increases and the
FIGURE 8 Stiffness versus cell-generated force. Stiffness versus forcerelationships for FPMs for which the force changes resulted from activa-tion by serum (a) and from treatment by CD (b) under isometric conditions.The stiffness is a remarkably linear function of the isometric force inducedby these treatments (c). FIGURE 9 Dynamic stiffness, phase delay, storage, and loss modulus as
functions of frequency. For activated (filled circles), unactivated (opensquares), and CD-treated (filled triangles) FPMs the dynamic stiffnessincreases almost linearly with log(n) (a) and the phase angle decreases withincreasing frequency from 0.008 to 0.4 Hz (b). The values of both the phasedelay and the dynamic stiffness are largest and depend most sensitively onfrequency for the activated FPMs. Storage and loss moduli,G9 and G0,respectively, were calculated from the dynamic stiffness and phase angle.TheG9 increases with log(n) similarly to the dynamic stiffness (c). TheG0showed a maximum at around 0.04 Hz, especially for the activated FPMs(d). The G9 and G0 are simulated using the standard linear solid modelshown in panele. Using appropriate constants fork1, k2, and h, the G9increases with log(n) (e) and theG0 shows a maximum at a similarfrequency to the experiment (f). The points are averages of 4 samples andthe bars represent standard deviations.
Reconstituted Tissue Mechanics 2359
Biophysical Journal 79(5) 2353–2368

breadth of the maximum ofG0 are significantly greater thanobserved for the simple model, which is characterized by asingle relaxation process. This suggests that for the tissuemodels a spectrum of relaxation times contributes to themechanics, as has been observed for natural biologicaltissues (Fung, 1993).
Another indicator of the dependence of the mechanicalproperties on rate of stretch is the phase delay,d, betweenthe sinusoidal driving function and the force response. Thisphase delay depends on the viscosity of the material and isrelated to the storage and loss moduli asG0/G9 5 tand. Theviscous damping energy is calculated as follows. The time-dependent applied strain,e(t), is defined ase(t) 5 e0 sin nt.The stress,s(t), i.e., the force per unit cross-sectional area,A, of the sample, is defined as,s(t) 5 F(t)/A 5 s0 sin(nt 1d). The energy loss per cycle of the oscillation per unitvolume of tissue,DW, is the integral of the work done in onecycle, T, which is
DW5 E0
T
s~t!de~t!
dtdt 5 ps0e0sin d.
The fractional damping energy is calculated by normalizingDW by the maximum energy,W, that the system could storeelastically for a given strain amplitude. The quantityW isobtained by integrating the work done in a quarter cyclewithout phase delay, which is
W5 E0
T/4
s~t!de~t!
dtdt 5
s0e0
2.
Therefore, the normalized damping energy,DW/W, isequal to 2p sin d, which is independent of the strain andstress amplitude and depends only on the phase angle (Find-ley et al., 1976). Hence, we have usedd as an indicator ofthe viscosity of the FPMs. The values ofd for FPMs beforeand after activation and after treatment with CD are shownin Fig. 9 b. The value of d decreases with increasingfrequency and more rapidly, the higher the stiffness. If wefurther decreased the oscillation frequency, the value of tand might start to decrease, as is seen in the standard linearsolid viscoelastic model. There should be a lower limit tothe frequency dependence of the mechanical response that isdue to the material properties of the FPM. The slow activeresponses of the living cells within the matrix can, however,also modulate the properties of the FPM at low frequencies.
Dependence of mechanical properties oncell concentration
The active force and stiffness of an FPM depends on thenumber of cells it contains. This is demonstrated by com-paring the mechanical properties of FPMs assembled withinitial cell concentrations of 1.0, 0.7, 0.4, and 0.13 106
cells/ml (Fig. 2). As illustrated in Fig. 10, the active forceand stiffness vary roughly in proportion to the initial num-ber of cells in the range 0.4–1.03 106 cells/ml. In contrast,the force and stiffness for the passive component is inde-pendent of input cell number over this range. The FPMinitiated with 0.13 106 cells/ml has disproportionately lowforce and stiffness in comparison to the model tissues withhigher numbers of cells (see below).
Stress and elastic modulus
The mechanical characteristics of the model tissues aremore readily interpreted when expressed in terms of stress(force/unit cross-sectional area of tissue) and elastic modu-lus (stiffness3 length/unit cross-sectional area of tissue).These material properties should be independent of theshape and size of the model tissues and so can be morereadily compared from one tissue to another. In this com-parison we assume that differences in stress and stiffness aredue to differences in material properties rather than todifferences in tissue microarchitecture; we effectively as-sume that our test specimens are homogeneous and isotro-pic. If there are systematic variations in the density andorientations of the cells, this must be taken into accountusing a more detailed analytical approach. The first step inthe development of a theoretical model that accounts forFPM mechanics in terms of the organization and properties
FIGURE 10 Dependence of force and stiffness on cell number. Theforce-strain (a, b) and stiffness-strain (c, d) curves for the active andpassive components of FPMs assembled with initial cell concentrations of1.0, 0.7, 0.4, and 0.13 106 cells/ml are shown by black solid, gray solid,light gray solid, and dotted lines, respectively. The active force (a) andstiffness (c) vary roughly in proportion to the initial number of cells. Incontrast, the force (b) and stiffness (d) for the passive component areindependent of input cell number. The FPM initiated with 0.13 106
cells/ml has a disproportionately low force and stiffness.
2360 Wakatsuki et al.
Biophysical Journal 79(5) 2353–2368

of the constituent cells and matrix is presented by Zahalaket al. (2000). The cross-sectional areas of the FPMs weremeasured as described under Methods. As shown in Fig. 11,the thickness of the FPMs decreases with increasing num-bers of cells, although the extent of compression appears tobe approaching a limit at the highest cell concentration.Stress and elastic modulus at zero strain were computed bydividing the force and stiffness by the cross-sectional areaof the unstrained FPMs. Then stress and modulus werecalculated at higher strains by assuming incompressibilityof the tissue to calculate the variation of cross-sectional areawith strain (Fig. 12). As do the force and stiffness, the stressand elastic modulus of the active component increase as theinitial concentration of the cells increases. In contrast to theforce and stiffness, however, the stress and elastic modulusof the passive component also increased with increasinginitial concentration of cells. Normalization of the force andstiffness with respect to the total cross-sectional area of thetissue yields intensive mechanical properties. It is still moreinformative, however, to normalize the active force withrespect to the cross-sectional area of the cells and thepassive component with respect to the cross-sectional areaof the matrix.
The fraction of the cross-sectional area of an FPM occu-pied by cells is determined from confocal images of FPMsin which the cells were loaded with a cytoplasmic fluoro-phore, as explained above. The stack of confocal images,acquired with the image planes parallel to the long axis ofthe tissue, were computationally resliced to provide a se-quence of optical sections perpendicular to the long axis ofthe tissue (Satoh et al., 1996). Using a threshold as de-scribed under Methods, the fluorescent cytoplasmic volumewas discriminated from the ECM and integrated within the
image planes to provide the ratio of cytoplasmic to totalFPM area. The ratios of the cross-sectional area of the cellsdivided by that of the FPM are plotted versus distance alongthe tissue axis for different initial cell concentrations in Fig.13 a. The averaged ratio is linearly related to the number ofcells initially incorporated into the model tissues (Fig. 13b).Fibroblasts embedded in collagen gels have been shown toslow their proliferation significantly (Schor, 1980). Inas-much as our samples were cultured only for 2 days beforethe experiment, including 16 h of serum starvation, theincrease in cell number is expected to be minimal. It isnoteworthy that only in the samples with an initial cellconcentration of 0.13 106 cells/ml does the average celldensity in the images approach zero at various locationsalong the axis of the tissue.
The mean value of the cross-sectional area of the FPMwas used to compute the active stress,sA, elastic modulus,EA, passive stress,sP, and elastic modulus,EP. The activestresses were computed by normalizing the active and pas-sive forces,FA and FP, by the cross-sectional area of theFPM,A. ThensA 5 FA/A andsp 5 FP/A. To compare withmeasurements on single cells (Tables 2 and 3) it is alsoinformative to compute the active stress and modulus,sa
and Ea, and the passive stress and modulus,sp, and Ep,normalized by the total cross-sectional areas of the cells andmatrix, AA and AP, respectively. The total cross-sectionalarea of the FPM isA 5 AA 1 AP (Fig. 13). Thensa 5
FIGURE 11 Dependence of FPM thickness on cell number. Thicknessand width were measured on FPMs that had been compressed by the cellsduring two days of matrix remodeling after gelation of the collagen. Thethickness and width of the FPMs decrease with increasing numbers of cells,although the extent of compression appears to be approaching a limit at thehighest cell concentration.
FIGURE 12 Stress and modulus relative to entire cross-sectional areasof FPMs. Stress and elastic modulus (Cauchy stress and modulus, see textfor details) obtained by dividing the force and stiffness by the entirecross-sectional area of the FPMs assembled with initial cell concentrationsof 1.0, 0.7, 0.4, and 0.13 106 cells/ml are shown by black solid, gray solid,light gray solid, and dotted lines, respectively. The stress and elasticmodulus of both the active component (a, c) and of the passive component(b, d) increase as the initial concentration of the cells increases.
Reconstituted Tissue Mechanics 2361
Biophysical Journal 79(5) 2353–2368

FA/AA 5 sA/Rc andsp 5 FP/Ap 5 sP/(1 2 Rc), whereRc 5AA/A. (Note thatsA 1 sp 5 sT, the modulus for the entiretissue model. In contrast,sT Þ sa 1 sp.). The elasticmoduli were computed by using the same principles.
The curves representing active mechanical properties(stress and elastic modulus) became very similar to eachother when expressed in terms of the cross-sectional area ofthe cells, except for the tissue with the lowest cell number(Fig. 14). Hence, for the FPMs with the three higher cellconcentrations, the force exerted per cell estimated using thenormalization method was the same in each tissue indepen-dent of initial cell concentration. This result strongly sup-ports the concept that the “active” component represents aspecific contribution of the cells to the mechanical charac-teristics of the tissue. In contrast, the passive componentnormalized with respect to the area of the ECM showed astronger dependence of mechanical parameters on the cellconcentrations: the higher the cell concentration, the higherthe stress and elastic modulus. This suggests that the extentof stiffening by collagen remodeling increases with the cellconcentration (cf. Figs. 12 and 14).
The active mechanical properties estimated from the dataobtained at the lowest cell concentration are significantlydifferent from those at the other concentrations. This indi-cates a failure of the assumption of similarity of the distri-butions of the cells in the FPMs. As seen in Fig. 13, theFPM with the lowest concentration of cells shows somecross-sections that contain no cells. For FPMs with higherinitial cell concentrations all cross-sections contained cells.Hence, at the lowest cell concentrations, fluctuations in cell
number along the axis of the FPM were relatively large.This correlates with the exceptional values of stress andmodulus for the FPM with the lowest cell concentration incontrast to the similar stress and modulus seen in FPMs withhigher concentrations and more homogeneous distributionsof cells (Fig. 14). Perhaps more important is the possibilitythat the cells at the higher concentrations could approach theformation of a separate continuous phase embedded withinthe ECM. In contrast, at the lowest concentration, the sec-tions in which no cells were present represent discontinui-ties in the cellular phase (Fig. 13).
The magnitudes of the stress and modulus of the cells aremuch higher than those of the ECM (Fig. 14). We expectthat at longer incubation times the ECM and the tissueoverall would become much stiffer due to further compres-sion of the matrix, de novo ECM synthesis, or the enzymaticcross-linking of ECM filaments (Huang et al., 1993).
DISCUSSION
Mechanical measurements on FPMs
We describe a simple, flexible approach for measuring themechanical characteristics of reconstituted model tissues(Fig. 1). In the FPMs studied in this work the cells havecompressed the matrix to;10% of its original volume
FIGURE 13 Fraction of FPM cross-sectional areas occupied by cells.The fraction of the cross-sectional area of a FPM occupied by cells wasdetermined from confocal images of FPMs. The fractional cell area ofFPMs assembled with initial cell concentrations of 1.0, 0.7, 0.4, and 0.13106 cells/ml are plotted against the position along the tissue axis (east andwest direction on the image plane) by open squares, light gray filledsquares, filled triangles, and filled gray down-triangles, respectively (a). Itis noteworthy that only in the samples with an initial cell concentration of0.1 3 106 cells/ml does the average cell density in the images reach zeroat various locations along the axis of the tissue. The averaged fractional cellareas increase almost proportionally to the initial cell concentration (b).
FIGURE 14 Specific stress and modulus relative to cross-sectional areasof cells and matrix. Active stress and elastic modulus were obtained bydividing the active force and stiffness by the total cross-sectional area ofthe cells. Passive stress and elastic modulus were obtained by dividing thepassive force and stiffness by the total cross-sectional area of the FPMminus the area of the cells. Black solid, gray solid, light gray solid, anddotted lines represent data computed from FPMs assembled with initial cellconcentrations of 1.0, 0.7, 0.4, and 0.13 106 cells/ml, respectively. Theactive stress and elastic modulus are very similar for each FPM except theone with the lowest cell number (a, c). In contrast, the passive componentshows a stronger dependence on cell concentrations (b, d):
2362 Wakatsuki et al.
Biophysical Journal 79(5) 2353–2368

while also stiffening the tissue and establishing a “basal”contractile force. This remodeling is probably similar toprocesses that occur in normal tissue development andwound healing. Its mechanism has been studied but is notyet fully understood (Grinnell, 1994; Stopak and Harris,1982). The FPMs that we have studied have undergone aphase of compression, stiffening, and force developmentover 1–2 days in culture, but further slower mechanicalchanges continue over extended time periods due to cellularreorientation and additional matrix cross-linking (Huang etal., 1993). The matrix components of the FPMs are initiallyin a mechanically metastable state. They are reduced by asingle preconditioning stretch cycle to a state with some-what lower stiffness in which repeatable force and stiffnessversus strain curves can be obtained. FPMs developed underdifferent culture conditions, e.g., with different amounts ofserum present, or assembled with cells other than CEF,differ with respect to the extent and time course of matrixcompression, stiffening, and basal force. Characterization ofthe mechanics of FPMs at both earlier and later stages ofdevelopment than those studied for this work will be de-ferred to a later time. Some aspects of the early stages ofdevelopment of fibroblast-containing model tissues havepreviously been studied (Barocas et al., 1995; Eastwood etal., 1996).
Distinguishable contributions ofcytoskeleton and matrix
As a preconditioned FPM (activated with 20% calf serum)is slowly stretched, the force increases nonlinearly with thestrain. As the strain is reduced, the force drops rapidly sothat there is a substantial hysteresis between the loading andunloading curves (Fig. 4a). These curves are repeatable andrelatively independent of small changes in rate of strain. Asdiscussed below, however, the dynamic stiffness does in-crease significantly with strain rate at higher strain rates,indicating significant time-dependent mechanical behavior.
When the FPM is treated with CD to disrupt the actincytoskeletons, the force over the entire range of strains from0 to 20% is reduced (Fig. 4a). For strains between 0 and2.5% these forces, measured in both loading and unloading,are negligible compared to the values measured for theuntreated FPM. A simple, provisional phenomenologicalmodel (Fig. 15) provides a structural vantage from which tointerpret the results. We suppose that the cellular contribu-tions are dominated by the actin cytoskeleton. This includesa contractile component (CC) dependent on actin-myosininteractions and a series cellular (SC) component, whichincludes the substantial portion of the actin cytoskeletonthat does not directly interact with myosin. Cells connect tothe extracellular matrix via structures that bind to the cor-tical actin filaments (Luna and Hitt, 1992). Therefore, wehave also included a series matrix (SM) component, whichdepends on the integrity of the actin cytoskeleton. Ex hy-
pothesis, CD completely eliminates the CC and SC (and,therefore, the SM) components. We have also included aparallel cellular (non-actin) component, PC, to account forpossible residual cellular contributions to the mechanics ofCD-treated FPMs. The contributions of the matrix parallelto the cells is represented by PM, which we assume is notdirectly affected by CD. The passive component is repre-sented by PC1 PM, the active component by SC, CC, andSM. In this model we assume that the variation of force withstrain for PM and PC is independent of that for SC1 CC1SM and that the contributions of the three parallel branchesin Fig. 15 can be simply added to yield the behavior of theintact tissue. For purposes of illustration, suppose that eachof the elements in the model behaves as a simple elasticspring. Then it is straightforward to show that the springconstant for the tissue overall isk 5 kpm 1 kpc 1 (1/ksm 11/ksc 1 1/kcc)
21, wherekpm, kpc, ksm, ksc, and kcc are thespring constants for the parallel matrix, parallel cell, seriesmatrix, series cell, and contractile elements. The effectivespring constant or stiffness for the passive component iskpm 1 kpc; that for the active component is (1/ksm 1 1/ksc 11/kcc)
21. If SM is very stiff (ksm3 `), then the stiffness ofthe active component (1/ksc 1 1/kcc)
21 is determined onlyby cellular constituents. In general, however, the relativemagnitudes ofksm, ksc, andkcc are unknown, and so we mustregard the stiffness of the active component as including acontribution from that portion of the extracellular matrixthat is connected to the actin cytoskeleton. Similarly, ifkpm .. kpc, then the stiffness of the passive componentdepends only on the state of the ECM. In general, however,we must acknowledge that there could be cellular contribu-tions to the behavior of the matrix, especially in cross-linking matrix filaments via cellular structures. An impor-tant task for the future is to estimate the relative magnitudesof the various spring constants in this model to provide anassessment of the mechanical contributions of the structuralelements in the model.
FIGURE 15 Schematic model of FPM mechanics. In this schematicmodel the contractile (CC), the series cytoskeletal (SC), and the seriesmatrix components (SM), all in series, are mechanically connected inparallel with the parallel cellular component (PC) and the parallel matrixcomponent (PM). CD treatment eliminates CC and SC (and therefore SM),from the total tissue mechanics.
Reconstituted Tissue Mechanics 2363
Biophysical Journal 79(5) 2353–2368

There could be noncytoskeletal cellular contributions tothe passive component. Treatment of nonactivated FPMswith the nonionic detergent Triton X-100 (0.2% in 150 mMNaCl) caused up to a 30% reduction of force below the levelobserved with CD treatment (result not shown). Under thesehigh salt conditions detergent extraction disrupts not onlycellular membranes, but also the cytoskeleton. Hence, thisexperiment suggests the extent to which nonmembranous,noncytoskeletal cellular structures might contribute to thepassive mechanical properties of FPMs. These effects mightarise from cellular cross-linking of matrix strands or fromthe space-occupying properties of the nucleus. Interpreta-tion of these experiments is complicated, however, by un-certainty about the effect of the detergent on the structure ofthe matrix independent of its effects on cell membranes.
We have tested the proposition that active forces gener-ated by the cells are approximately independent of matrixforces caused by stretching by determining the increment offorce resulting from serum stimulation when the FPM hasbeen strained to different extents. As seen in Fig. 16, theforce increment is roughly independent of the strain leveleven though the stresses sustained by PC1 PM are differ-ent at different strains. If we suppose that the same contrac-tile force is generated by the cells in response to serum ateach level of strain, this experiment indicates that the forcesexerted or sustained by the cellular compartment of thetissue are measured independently of the stresses sustainedby the matrix component.
A similar conclusion is suggested by the observation thatat a specified strain, the average stress on the cellularcompartment of the tissue model is independent of initialcell concentration, even though the stress sustained by the
PC1 PM at each strain varies with cell concentration (Fig.14). Hence, variations in the mechanical contributions ofPC1 PM do not strongly influence measurements of forceexerted by the active component.
Even after the disruption of the actin cytoskeleton, vi-mentin intermediate filaments, microtubules, or other cel-lular structures might provide a cellular contribution to theparallel cellular component (PC) that remains after CDtreatment. We have assessed this possibility by using thephosphatase inhibitor calyculin A. Treatment of cells with ahigh concentration of calyculin A disrupts intermediatefilaments and microtubules as well as actin filaments(Hirano et al., 1992). We have verified this effect on inter-mediate filaments and microtubules in FPMs (data notshown). Fig. 5 demonstrates that force and stiffness duringa slow stretch experiment, measured in FPMs in whichintermediate filaments and microtubules are disrupted, arenot significantly different from the corresponding measure-ments in which the actin cytoskeleton has been disrupted byCD. This suggests that the cytoskeletal contribution to PC isnegligible, although it is still possible that microtubules andintermediate filaments exert some effect on mechanics viathe actin cytoskeleton. These effects could not be observedin CD-treated cells. Preliminary observations of FPMs con-taining cells lacking functional vimentin intermediate fila-ments, however, indicate that these filaments contributelittle to the mechanical properties of FPMs with intact actincytoskeletons at the strain levels used in these experiments(Wakatsuki, Elson, and Wysolmerski, unpublished results).Because the mechanical properties of a cell are dominatedby its cytoskeleton (Petersen et al., 1982), it seems unlikelythat PC exerts a significant effect on FPM mechanics ex-cept, possibly, via cellular cross-linking of matrix filaments.Even this effect, however, is expected to be small. The cellis linked to the ECM through matrix attachment sites pro-vided by integrins or the dystrophin system via actin fila-ments (Luna and Hitt, 1992), and so should be vulnerable todisruption by CD. There could also be some influence of thespace-occupying properties of the nucleus on the FPMmechanics.
In sum, we haveoperationally defined additive activeand passive contributions to the mechanics of FPMs. CDeliminates the active contributions; the passive contribu-tions remain after CD treatment. The active cellular com-ponent is dominated by cytoskeletal structures (CC and SC)but there can also be an active matrix component arisingfrom ECM structures that interact directly in series with theactin cytoskeleton (SM). For example, microfilament bun-dles are linked to the ECM through focal adhesions. Hence,disruption of actin filaments by CD could influence themechanical properties of the matrix. The passive componentis dominated by the ECM (PM) but is also potentiallyinfluenced by passive cellular structures that survive CD-treatment (PC). We expect that a cytoskeletal perturbationwould largely appear as an effect on the active component,
FIGURE 16 Dependence of active force on strain. Identically preparedFPMs were subjected to strains of 0.00, 0,03, 0.10, and 0.17 (shown assolid, broken, dotted, andbroken dot lines, respectively). After the forcereached a steady level at each strain, 20% CS was added and the increasein force due to myosin activation was recorded. The force increments areroughly independent of the initial strain level.
2364 Wakatsuki et al.
Biophysical Journal 79(5) 2353–2368

while a change in ECM structure would mainly influencethe passive component.
The active component
Fig. 14 demonstrates that the dependence on strain of theforce and stiffness of the active component changes appar-ently discontinuously when the density of the cells is re-duced below a critical level. This suggests that the cellsform a structurally coherent substructure within the FPMwhen the initial cell density is equal to or greater than400,000 cells/ml. When the initial density is reduced to100,000, however, the cells are apparently too sparse toform this network. This hypothesis is supported by theobservation that there are cells present in all cross-sectionsobserved for tissue models with initial cell densities of400,000 and above, but that sections devoid of cells are seenfor tissue models with initial densities of 100,000 cells (Fig.13). This structural coherence of the cellular compartmentcould arise either if there were sufficiently strong directmechanical connections among the cells or if the ECMelements linking the cells (the SM component in Fig. 15)were sufficiently stiff.
That calyculin A causes no additional reduction of forceor stiffness relative to CD indicates that contributions of thecells are dominated by the actin cytoskeleton at the strainsused in these experiments (Fig. 5). This result is consistentwith results from cell indentation measurements (Petersen etal., 1982) and also with expectations from rheological mea-surements of the purified actin microfilaments, microtu-bules, and vimentin intermediate filaments (Janmey et al.,1991). (As pointed out above, however, it is still possiblethat microtubules and intermediate filaments could make asubstantial mechanical contribution if that contribution weredependent on the integrity of, i.e., were mechanically inseries with, the actin filament system.)
It is difficult to directly test the specific cellular contri-butions to the FPMs because the mechanical characteristicsof the cellular components cannot be measured in the ab-sence of the ECM. The matrix is essential to the integrity ofthe FPM, and so the state of the matrix could influence themechanical properties of the active component. Unlike thepassive component, which can be measured in the absenceof the active component, we can measure the active com-ponent only in the presence of the passive component. If weprovisionally suppose thatksm is large andkpc is small, thenthe passive component mainly represents the mechanicalcontributions of the matrix, and the active componentmainly represents the mechanical contributions of the cells.Hence, a perturbation of the FPM, which mainly influencesthe active component, would be supposed to have mainlyaffected cytoskeletal structure. Conversely, a perturbationthat mainly influenced the passive component would beexpected to have mainly influenced the ECM. If a structuralchange affects both active and passive components, then the
effects specific to the cytoskeletons and to the ECM can beextracted only with the aid of a valid quantitative model thatrelates the structure of an FPM to its mechanics (Zahalak etal., 2000).
The passive component
The mechanical properties of the matrix are profoundlyinfluenced by the remodeling process, which occurs afterformation of the collagen gel. During this process the cellscompress and stiffen the matrix. The effect of the remodel-ing process persists even after the cells are largely elimi-nated from the tissue mechanical system (Fig. 6). As dem-onstrated in Fig. 10, both the force and stiffness of thematrix as a function of strain are independent of the initialdensity of cells for densities equal to or greater than400,000/ml. This is in contrast to the stress and modulus,both of which increase with increasing cell density at cor-responding strains (Fig. 14). The change in stiffness is likelyto depend not only on the increased density of the collagenfilaments in the compressed gel, but also on noncovalentcross-links introduced by the cells (Tranquillo, 1999). Overa period of days to weeks in culture covalent cross-links areformed, which further stiffen the tissue model (Huang et al.,1993). The extent of compression depends on the initialdensity of cells in the gel (Fig. 11).
Dynamic stiffness
Both the passive and active stiffnesses were observed toincrease linearly with the force, at an approximate rate of0.008mm21. For an elastic material such a linear relationimplies an exponential dependence of force on strain. Sev-eral natural biological tissues have this behavior (Fung,1993). The actual value of the passive dynamic stiffness wasobserved to be higher than the static stiffness, defined as theslope of the passive force-length curve measured in slowramp stretch. However, the stretch rates used to measure thedynamic stiffness were relatively high, with a frequencyapproximately equal to the inverse characteristic relaxationtime of the matrix (Zahalak et al., 2000), and this may be thereason for the increase in stiffness.
The active component, however, does not behave like anelastic material, because both the stiffness and the forcevary linearly with strain. Such behavior is reminiscent ofmuscle fibers, where a linear variation of force with strainimplies a linear variation of stiffness with strain, becauseboth are proportional to the number of myosin molecules(cross-bridges) bonded to actin (Ford et al., 1981). How-ever, the slope of the static force-length curve depends onthe rate of increase of bonded cross-bridges with length.Thus, for such actin-myosin contractile systems there is nosimple relation between the static and dynamic stiffnesses,as there is for an elastic material, although there is a simple
Reconstituted Tissue Mechanics 2365
Biophysical Journal 79(5) 2353–2368

relation between force and dynamic stiffness. The stiff-nesses of the passive tendon (Rack and Westbury, 1984) andthe active contractile tissue (Joyce and Rack, 1969) havebeen measured with dynamic length perturbations, for ex-ample, for the cat soleus muscle in situ. Both of thesestiffnesses increase approximately linearly with force.Scaled to the dimensions of our FPM test specimens, therate of change of stiffness with force is 0.008mm21 fortendon and 0.005mm21 for active contractile tissue. Thesenumbers are close to our experimental values and suggestthat contractile interactions may have an important influ-ence on the mechanics of the active component, while quitedifferent dynamics of polymer networks may account forthe passive component’s behavior. For comparison, thestiffness of passive rabbit papillary muscle also increaseslinearly with force, but at a rate of only 0.0008mm21 (Fung,1993) when scaled to the dimensions of our FPMs.
The dynamic stiffness varies approximately linearly withlog(n). This behavior is also seen in biological tissues andhas been discussed in terms of a phenomenological modelbased on a continuous spectrum of relaxation times for thetissue (Fung, 1993). An important problem for the future isto interpret this behavior in terms of defined cell structuresand their dynamic mechanical properties.
Comparison of mechanical properties of FPMswith natural tissues
The mechanical parameters obtained from this work arecompared to published values in Tables 1–3, except in thiswork the elastic modulus was obtained from the derivativeof the stress-strain relationship. The dependence on strainrate was not characterized. As discussed above, the dynamicstiffness measured at 0.5 Hz was higher than the stiffness
obtained for the slope of the stress-strain curves measured atslow stretching speeds. The dynamic elastic modulus of theFPM was around 0.8 MPa at maximum strain. This value is;5-fold lower than that of the larger arteries but is in therange seen in small arteries. This gap can be minimized bystrengthening the ECM and increasing the cell volumeoccupying the tissue. The FPMs studied here were incu-bated for only 2 days and cells occupied at most;12% ofthe tissue, whereas smooth muscle cells occupied 69% inthe small arteries (Intengan et al., 1999).
Supposing that the active component measures cellularelastic properties, the dynamic elastic modulus of the CEFat the maximum strain used in this work (;2.5 MPa) isclose to that of single smooth muscle cells, but is threeorders of magnitude greater than measured by shearingsingle CEF between microplates (Thoumine and Ott, 1997).Differences in measurement techniques could be responsi-ble for this discrepancy, but a change of the CEF to amyofibroblast phenotype expressing smooth muscle actin asseen in granulation tissue might also contribute (Grinnell,1994). Since the single cell measurement is done within afew hours of the attachment of the cell to the microplate, aless organized actin cytoskeleton and focal adhesion com-plexes might influence stress development (Chrzanowska-Wodnicka and Burridge, 1996). The estimated force pro-duction by a single CEF (assuming the average cross-sectional area of the cell is;50 mm2) is ;1000 nN, which,apart from the values of Kolodney et al., also measured in
TABLE 1 Modulus of tissue
Type of tissue Elastic Modulus (MPa) Reference
Tendo achillis 375 Lewis and Shaw (1997)Human knee menisci 73–151 (circumferential) Tissakht and Ahmed (1995)Human knee menisci 30–60 (radial) Tissakht and Ahmed (1995)Human brachial artery 4 Bank and Kaiser (1998)Human small artery 0.1–2 Intengan et al. (1999)FPM* 0.08–0.24 Chapuis and Agache (1992)Collagen sponge 0.017–0.028 Jain et al. (1990)FPM 0.8 This work
*0.65 mg/ml collagen, 57,000 cells/ml.
TABLE 2 Modulus of cell
CellElastic Modulus
(MPa) Reference
Single smooth muscle 6.8 Harris and Warshaw (1991)Single smooth muscle 1.2 Glerum et al. (1990)Single CEF 0.001 Thoumine and Ott (1997)CEF 2.5 This work
TABLE 3 Force produced by a single cell
Cell Force (nN/cell) Reference
Smooth muscle*† 1500 Harris and Warshaw (1991)Keratocytes*‡ 48 Oliver et al. (1995)Fibroblasts*§ 52 Roy et al. (1999)Fibroblasts*¶ 40 Thoumine and Ott (1997)Fibroblasts*\ 1–3 (nN/mm2) Galbraith and Sheetz (1997)Fibroblasts** 500 Kolodney and Wysolmerski (1992)Fibroblasts** 0.1 Eastwood et al. (1996)Fibroblasts 1000 This work
*Force is measured by a single cell manipulation.Force is measured by†force transducer,‡silicon substratum,§collagensubstratum,¶microplates,\nano-fabricated substratum.**Force is estimated from the contractile force produced by FPMs.
2366 Wakatsuki et al.
Biophysical Journal 79(5) 2353–2368
FPMs, is much higher than the values listed for fibroblastsin Table 3. This force level is, however, comparable to thatmeasured for smooth muscle cells. Apart from differencesdependent on measurement technique, the higher force val-ues measured in FPMs could be due to an enhancement offibroblast contractility by interactions with ECM proteins,including fibronectin and collagen, which could activatecell contraction via a positive feedback loop as proposed bySchoenwaelder and Burridge (1999).
SUMMARY AND CONCLUSIONS
We have shown that the mechanical properties of reconsti-tuted model connective tissues can be conveniently andsimply characterized using the approaches described. Likenatural biological tissues, the models show an exponentialdependence of force on strain and a linear dependence ofdynamics stiffness on log(n). The active and passive me-chanical components, obtained by using CD to eliminate thecytoskeletal contributions, were related to the cytoskeletaland ECM structures in the tissue. The intensive mechanicalparameters of the active and passive components were cal-culated separately by measuring the ratio of cell area to thetotal cross-sectional area of the tissue using confocal mi-croscopy and image reconstruction. FPMs have the advan-tageous quality of maintaining cells within a relativelynatural three-dimensional matrix environment similar to anatural tissue. This approach can be used to assess themechanical function of cytoskeletal and matrix proteins. Forexample, the functions of cytoskeletal proteins, which havebeen eliminated from cells via molecular genetic methods,can be investigated in model tissues assembled from themutant cells (Eschenhagen et al., 1997; Zutter et al., 1999).Furthermore, this approach can be used to assess and opti-mize the mechanical properties of reconstituted tissue, animportant objective in tissue engineering.
This work was partially supported by National Institutes of Health GrantGM38838.
REFERENCES
Bank, A. J., and D. R. Kaiser. 1998. Smooth muscle relaxation: effects onarterial compliance, distensibility, elastic modulus, and pulse wave ve-locity. Hypertension.32:356–359.
Barocas, V. H., A. G. Moon, and R. T. Tranquillo. 1995. The fibroblast-populated collagen microsphere assay of cell traction force—Part 2.Measurement of the cell traction parameter.J. Biomech. Eng.117:161–170.
Bell, E., B. Ivarsson, and C. Merrill. 1979. Production of a tissue-likestructure by contraction of collagen lattices by human fibroblasts ofdifferent proliferative potential in vitro.Proc. Natl. Acad. Sci. U.S.A.76:1274–1278.
Chapuis, J. F., and P. Agache. 1992. A new technique to study themechanical properties of collagen lattices.J. Biomech.25:115–120.
Chartier, L., L. L. Rankin, R. E. Allen, Y. Kato, N. Fusetani, H. Karaki, S.Watabe, and D. J. Hartshorne. 1991. Calyculin-A increases the level of
protein phosphorylation and changes the shape of 3T3 fibroblasts.CellMotil. Cytoskeleton.18:26–40.
Chrzanowska-Wodnicka, M., and K. Burridge. 1996. Rho-stimulated con-tractility drives the formation of stress fibers and focal adhesions.J. CellBiol. 133:1403–1415.
Eastwood, M., R. Porter, U. Khan, G. McGrouther, and R. Brown. 1996.Quantitative analysis of collagen gel contractile forces generated bydermal fibroblasts and the relationship to cell morphology.J. CellPhysiol.166:33–42.
Eriksson, J. E., D. L. Brautigan, R. Vallee, J. Olmsted, H. Fujiki, and R. D.Goldman. 1992. Cytoskeletal integrity in interphase cells requires pro-tein phosphatase activity.Proc. Natl. Acad. Sci. U.S.A.89:11093–11097.
Eschenhagen, T., C. Fink, U. Remmers, H. Scholz, J. Wattchow, J. Weil,W. Zimmermann, H. H. Dohmen, H. Schafer, N. Bishopric, T. Wakat-suki, and E. L. Elson. 1997. Three-dimensional reconstitution of embry-onic cardiomyocytes in a collagen matrix: a new heart muscle modelsystem [In Process Citation].Faseb J.11:683–694.
Ferry, J. D. 1980. Viscoelastic Properties of Polymers. John Wiley, NewYork.
Findley, W. N., J. S. Lai, and K. Onaran. 1976. Creep and Relaxation ofNonlinear Viscoelastic Materials. Dover Publications, Inc., New York.
Ford, L. E., A. F. Huxley, and R. M. Simmons. 1981. The relation betweenstiffness and filament overlap in striated frog muscle fibers.J. Physiol.311:219–249.
Fung, Y. C. 1993. Biomechanics. Mechanical Properties of Living Tissues.Springer-Verlag, New York.
Galbraith, C. G., and M. P. Sheetz. 1997:A micromachined device providesa new bend on fibroblast traction forces.Proc. Natl. Acad. Sci. U.S.A.94: 9114–9118.
Glerum, J. J., R. Van Mastrigt, and A. J. Van Koeveringe. 1990. Mechan-ical properties of mammalian single smooth muscle cells. III. Passiveproperties of pig detrusor and human a terme uterus cells.J. Muscle Res.Cell Motil. 11:453–462.
Goeckeler, Z. M., and R. B. Wysolmerski. 1995. Myosin light chainkinase-regulated endothelial cell contraction: the relationship betweenisometric tension, actin polymerization, and myosin phosphorylation.J. Cell Biol. 130:613–627.
Grinnell, F. 1994. Fibroblasts, myofibroblasts, and wound contraction.J. Cell Biol. 124:401–404.
Harris, D. E., and D. M. Warshaw. 1991. Length versus active forcerelationship in single isolated smooth muscle cells.Am J. Physiol. CellPhysiol. 260:C1104–C1112.
Hirano, K., L. Chartier, R. G. Taylor, R. E. Allen, N. Fusetani, H. Karaki,and D. J. Hartshorne. 1992. Changes in the cytoskeleton of 3T3 fibro-blasts induced by the phosphatase inhibitor, calyculin-A.J. Muscle Res.Cell Motil. 13:341–353.
Huang, D., T. R. Chang, A. Aggarwal, R. C. Lee, and H. P. Ehrlich. 1993.Mechanisms and dynamics of mechanical strengthening in ligament-equivalent fibroblast-populated collagen matrices.Ann. Biomed. Eng.21:289–305.
Intengan, H. D., L. Y. Deng, J. S. Li, and E. L. Schiffrin. 1999. Mechanicsand composition of human subcutaneous resistance arteries in essentialhypertension.Hypertension.33:569–574.
Jain, M. K., R. A. Berg, and G. P. Tandon. 1990. Mechanical stress andcellular metabolism in living soft tissue composites.Biomaterials.11:465–472.
Janmey, P. A., U. Euteneuer, P. Traub, and M. Schliwa. 1991. Viscoelasticproperties of vimentin compared with other filamentous biopolymernetworks.J. Cell Biol. 113:155–160.
Joyce, G. C., and P. M. H. Rack. 1969. Isotonic shortening and lengtheningmovements of cat soleus muscle.J. Physiol.204:475–491.
Kolodney, M. S., and E. L. Elson. 1993. Correlation of myosin light chainphosphorylation with isometric contraction of fibroblasts.J. Biol. Chem.268:23850–23855.
Kolodney, M. S., and E. L. Elson. 1995. Contraction due to microtubuledisruption is associated with increased phosphorylation of myosin reg-ulatory light chain.Proc. Natl. Acad. Sci. U.S.A.92:10252–10256.
Reconstituted Tissue Mechanics 2367
Biophysical Journal 79(5) 2353–2368

Kolodney, M. S., and R. B. Wysolmerski. 1992. Isometric contraction byfibroblasts and endothelial cells in tissue culture: a quantitative study.J. Cell Biol. 117:73–82.
Lewis, G., and K. M. Shaw. 1997. Tensile properties of human tendoAchillis: effect of donor age and strain rate.J. Foot Ankle Surg.36:435–445.
Luna, E. J., and A. L. Hitt. 1992. Cytoskeleton-plasma membrane interac-tions.Science.258:955–964.
Murphy, R. A. 1980. Mechanics of vascular smooth muscle.In Handbookof Physiology, Section 2: The Cardiovascular System. D. F. Bohr, A. P.Somlyo, and H. V. Sparks, editors. American Physiological Society,Bethesda, MD. 325–351.
Oliver, T., M. Dembo, and K. Jacobson. 1995. Traction forces in locomot-ing cells.Cell Motil. Cytoskeleton.31:225–240.
Petersen, N. O., W. B. McConnaughey, and E. L. Elson. 1982. Dependenceof locally measured cellular deformability on position on the cell,temperature, and cytochalasin B.Proc. Natl. Acad. Sci. U.S.A.79:5327–5331.
Rack, P. M. H., and D. R. Westbury. 1984. Elastic properties of the catsoleus tendon and their functional importance.J. Physiol.. 347:479–495.
Roy, P., W. M. Petroll, H. D. Cavanagh, and J. V. Jester. 1999. Exertionof tractional force requires the coordinated up-regulation of cell con-tractility and adhesion.Cell Motil. Cytoskeleton.43:23–34.
Satoh, H., L. M. Delbridge, L. A. Blatter, and D. M. Bers. 1996. Surface-volume relationship in cardiac myocytes studied with confocal micros-copy and membrane capacitance measurements: species-dependence anddevelopmental effects.Biophys. J.70:1494–1504.
Schoenwaelder, S. M., and K. Burridge. 1999. Bidirectional signalingbetween the cytoskeleton and integrins.Curr. Opin. Cell Biol. 11:274–286.
Schor, S. L. 1980. Cell proliferation and migration on collagen substrata invitro. J. Cell Sci.41:159–175.
Stopak, D., and A. K. Harris. 1982. Connective tissue morphogenesis byfibroblast traction. I. Tissue culture observations.Dev. Biol.90:383–398.
Thoumine, O., and A. Ott. 1997. Time scale dependent viscoelastic andcontractile regimes in fibroblasts probed by microplate manipulation.J. Cell Sci.110:2109–2116.
Tissakht, M., and A. M. Ahmed. 1995. Tensile stress-strain characteristicsof the human meniscal material.J. Biomech.28:411–422.
Tranquillo, R. T. 1999. Self-organization of tissue-equivalents: the natureand role of contact guidance.Biochem. Soc. Symp.65:27–42.
Zahalak, G. I., J. E. Wagenseil, T. Wakatsuki, and E. L. Elson. 2000. Acell-based constitutive relation for bio-artificial tissues.Biophys. J.79:2369–2381.
Zutter, M. M., S. A. Santoro, J. E. Wu, T. Wakatsuki, S. K. Dickeson, andE. L. Elson. 1999. Collagen receptor control of epithelial morphogenesisand cell cycle progression.Am. J. Pathol.155:927–940.
2368 Wakatsuki et al.
Biophysical Journal 79(5) 2353–2368