CE EMC Test Report - Vecow
78
Report No.: CEBDBO-WTW-P20120314 Page No. 1 / 78 Report Format Version: 6.1.3 CE EMC Test Report Report No.: CEBDBO-WTW-P20120314 Test Model: ECX-2000 Series Model: ECX-2000 Series, ECX-2XXXXXXXXXXXXXXXXXXXXXXXXXXXXXX (“X” can be 0-9, A-Z or blank for marketing purposes) Received Date: Dec. 14, 2020 Test Date: Dec. 14 to 31, 2020 Issued Date: Jan. 5, 2021 Applicant: Vecow Co., Ltd. Address: 3F., No.10, Jiankang Rd., Zhonghe Dist., New Taipei City 23586, Taiwan Issued By: Bureau Veritas Consumer Products Services (H.K.) Ltd., Taoyuan Branch Lin Kou Laboratories Lab Address: No. 47-2, 14th Ling, Chia Pau Vil., Lin Kou Dist., New Taipei City, Taiwan This report is for your exclusive use. Any copying or replication of this report to or for any other person or entity, or use of our name or trademark, is permitted only with our prior written permission. This report sets forth our findings solely with respect to the test samples identified herein. The results set forth in this report are not indicative or representative of the quality or characteristics of the lot from which a test sample was taken or any similar or identical product unless specifically and expressly noted. Our report includes all of the tests requested by you and the results thereof based upon th e information that you provided to us. You have 60 days from date of issuance of this report to notify us of any material error or omission caused by our neglig ence, provided, however, that such notice shall be in writing and shall specifically address the issue you wish to raise. A failure to raise such issue within the prescribed time shall constitute your unqualified acceptance of the completeness of this report, the tests conducted and the correctness of the report contents. Un less specific mention, the uncertainty of measurement has been explicitly taken into account to declare the compliance or non-compliance to the specification.
-
Upload
khangminh22 -
Category
Documents
-
view
6 -
download
0
Transcript of CE EMC Test Report - Vecow

Report No.: CEBDBO-WTW-P20120314 Page No. 1 / 78 Report Format Version: 6.1.3
CE EMC Test Report
Report No.: CEBDBO-WTW-P20120314
Test Model: ECX-2000
Series Model: ECX-2000 Series, ECX-2XXXXXXXXXXXXXXXXXXXXXXXXXXXXXX
(“X” can be 0-9, A-Z or blank for marketing purposes)
Received Date: Dec. 14, 2020
Test Date: Dec. 14 to 31, 2020
Issued Date: Jan. 5, 2021
Applicant: Vecow Co., Ltd.
Address: 3F., No.10, Jiankang Rd., Zhonghe Dist., New Taipei City 23586, Taiwan
Issued By: Bureau Veritas Consumer Products Services (H.K.) Ltd., Taoyuan Branch Lin Kou Laboratories
Lab Address: No. 47-2, 14th Ling, Chia Pau Vil., Lin Kou Dist., New Taipei City, Taiwan
This report is for your exclusive use. Any copying or replication of this report to or for any other person or entity, or use of our name or trademark, is permitted only with our prior written permission. This report sets forth our findings solely with respect to the test samples identified herein. The results set forth in this report are not indicative or representative of the quality or characteristics of the lot from which a test sample was taken or any similar or identical product unless specifically and expressly noted. Our report includes all of the tests requested by you and the results thereof based upon th e information that you provided to us. You have 60 days from date of issuance of this report to notify us of any material error or omission caused by our negligence, provided, however, that such notice shall be in writing and shall specifically address the issue you wish to raise. A failure to raise such issue within the prescribed time shall constitute your unqualified acceptance of the completeness of this report, the tests conducted and the correctness of the report contents. Un less specific mention, the uncertainty of measurement has been explicitly taken into account to declare the compliance or non-compliance to the specification.

Report No.: CEBDBO-WTW-P20120314 Page No. 2 / 78 Report Format Version: 6.1.3
Table of Contents
Release Control Record ........................................................................................................................ 4
1 Certificate of Conformity................................................................................................................ 5
2 Summary of Test Results ............................................................................................................... 6
2.1 Measurement Uncertainty ......................................................................................................... 7 2.2 Modification Record .................................................................................................................. 7
3 General Information ....................................................................................................................... 8
3.1 Description of EUT.................................................................................................................... 8 3.2 Features of EUT ....................................................................................................................... 8 3.3 Operating Modes of EUT and Determination of Worst Case Operating Mode ................................ 9 3.4 Test Program Used and Operation Descriptions ........................................................................ 10 3.5 Primary Clock Frequencies of Internal Source .......................................................................... 10
4 Configuration and Connections with EUT.................................................................................... 11
4.1 Connection Diagram of EUT and Peripheral Devices..................................................................11 4.2 Configuration of Peripheral Devices and Cable Connections...................................................... 13
5 Conducted Emission from the AC Mains Power Port ................................................................... 15
5.1 Limits ..................................................................................................................................... 15 5.2 Test Instruments ..................................................................................................................... 15 5.3 Test Arrangement ................................................................................................................... 16 5.4 Test Results ........................................................................................................................... 17
6 Asymmetric Mode Conducted Emission at Telecommunication Ports......................................... 21
6.1 Limits ..................................................................................................................................... 21 6.2 Test Instruments ..................................................................................................................... 22 6.3 Test Arrangement ................................................................................................................... 23 6.4 Test Results ........................................................................................................................... 24
7 Radiated Emission at Frequencies up to 1GHz ............................................................................ 26
7.1 Limits ..................................................................................................................................... 26 7.2 Test Instruments ..................................................................................................................... 26 7.3 Test Arrangement ................................................................................................................... 27 7.4 Test Results ........................................................................................................................... 28
8 Radiated Emission at Frequencies above 1GHz .......................................................................... 30
8.1 Limits ..................................................................................................................................... 30 8.2 Test Instruments ..................................................................................................................... 31 8.3 Test Arrangement ................................................................................................................... 32 8.4 Test Results ........................................................................................................................... 33
9 Harmonics Current Measurement ................................................................................................ 35
9.1 Limits ..................................................................................................................................... 35 9.2 Classification of Equipment ..................................................................................................... 35 9.3 Test Instruments ..................................................................................................................... 35 9.4 Test Arrangement ................................................................................................................... 36 9.5 Test Results ........................................................................................................................... 37
10 Voltage Fluctuations and Flicker Measurement ........................................................................... 38
10.1 Limits ..................................................................................................................................... 38 10.2 Test Instruments ..................................................................................................................... 38 10.3 Test Arrangement ................................................................................................................... 38 10.4 Test Results ........................................................................................................................... 39
11 General Immunity Requirements ................................................................................................. 40

Report No.: CEBDBO-WTW-P20120314 Page No. 3 / 78 Report Format Version: 6.1.3
11.1 Performance Criteria ............................................................................................................... 41
12 Electrostatic Discharge Immunity Test (ESD) .............................................................................. 42
12.1 Test Specification .................................................................................................................... 42 12.2 Test Instruments ..................................................................................................................... 42 12.3 Test Arrangement ................................................................................................................... 42 12.4 Test Results ........................................................................................................................... 44
13 Radiated, Radio-frequency, Electromagnetic Field Immunity Test (RS) ....................................... 48
13.1 Test Specification .................................................................................................................... 48 13.2 Test Instruments ..................................................................................................................... 48 13.3 Test Arrangement ................................................................................................................... 49 13.4 Test Results ........................................................................................................................... 50
14 Electrical Fast Transient/Burst Immunity Test (EFT) .................................................................... 51
14.1 Test Specification .................................................................................................................... 51 14.2 Test Instruments ..................................................................................................................... 51 14.3 Test Arrangement ................................................................................................................... 52 14.4 Test Results ........................................................................................................................... 53
15 Surge Immunity Test .................................................................................................................... 54
15.1 Test Specification .................................................................................................................... 54 15.2 Test Instruments ..................................................................................................................... 54 15.3 Test Arrangement ................................................................................................................... 55 15.4 Test Results ........................................................................................................................... 56
16 Immunity to Conducted Disturbances Induced by RF Fields (CS) ............................................... 57
16.1 Test Specification .................................................................................................................... 57 16.2 Test Instruments ..................................................................................................................... 58 16.3 Test Arrangement ................................................................................................................... 59 16.4 Test Results ........................................................................................................................... 60
17 Power Frequency Magnetic Field Immunity Test ......................................................................... 61
17.1 Test Specification .................................................................................................................... 61 17.2 Test Instruments ..................................................................................................................... 61 17.3 Test Arrangement ................................................................................................................... 61 17.4 Test Results ........................................................................................................................... 62
18 Voltage Dips and Interruptions..................................................................................................... 63
18.1 Test Specification .................................................................................................................... 63 18.2 Test Instruments ..................................................................................................................... 63 18.3 Test Arrangement ................................................................................................................... 63 18.4 Test Results ........................................................................................................................... 64
19 Pictures of Test Arrangements..................................................................................................... 65
19.1 Conducted Emission from the AC Mains Power Port ................................................................. 65 19.2 Asymmetric Mode Conducted Emission at Telecommunication Ports .......................................... 66 19.3 Radiated Emission at Frequencies up to 1GHz ......................................................................... 68 19.4 Radiated Emission at Frequencies above 1GHz ....................................................................... 69 19.5 Harmonics Current, Voltage Fluctuations and Flicker Measurement ........................................... 70 19.6 Electrostatic Discharge Immunity Test (ESD) ............................................................................ 70 19.7 Radio-frequency, Electromagnetic Field Immunity Test (RS) ...................................................... 71 19.8 Electrical Fast Transient/Burst Immunity Test (EFT) .................................................................. 72 19.9 Surge Immunity Test ............................................................................................................... 74 19.10 Conducted Disturbances Induced by RF Fields (CS) ................................................................. 75 19.11 Power Frequency Magnetic Field Immunity Test (PFMF) ........................................................... 77 19.12 Voltage Dips and Interruptions ................................................................................................. 77
Appendix – Information of the Testing Laboratories ........................................................................... 78

Report No.: CEBDBO-WTW-P20120314 Page No. 4 / 78 Report Format Version: 6.1.3
Release Control Record
Issue No. Description Date Issued
CEBDBO-WTW-P20120314 Original release. Jan. 5, 2021

Report No.: CEBDBO-WTW-P20120314 Page No. 5 / 78 Report Format Version: 6.1.3
1 Certificate of Conformity
Product: Fanless Embedded System
Brand: Vecow
Test Model: ECX-2000
Series Model: ECX-2000 Series, ECX-2XXXXXXXXXXXXXXXXXXXXXXXXXXXXXX
(“X” can be 0-9, A-Z or blank for marketing purposes)
Sample Status: Engineering sample
Applicant: Vecow Co., Ltd.
Test Date: Dec. 14 to 31, 2020
Standards: EN 55032:2015 +A11:2020, Class A
CISPR 32:2015+Cor1:2016, Class A
AS/NZS CISPR 32:2015, Class A
EN 61000-3-2:2014, Class A
EN 61000-3-3:2013
EN 55024:2010 / EN55024:2010 +A1:2015
EN 61000-4-2:2009 / IEC 61000-4-2:2008 ED. 2.0
EN 61000-4-3:2006 +A1:2008 +A2:2010 / IEC 61000-4-3:2010 ED. 3.2
EN 61000-4-4:2012 / IEC 61000-4-4:2012 ED. 3.0
EN 61000-4-5:2014 +A1:2017 / IEC 61000-4-5:2014 +A1:2017 ED. 3.0
EN 61000-4-6:2014 +AC:2015 / IEC 61000-4-6:2013 ED. 4.0
EN 61000-4-8:2010 / IEC 61000-4-8:2009 ED. 2.0
EN 61000-4-11:2004 +A1:2017 / IEC 61000-4-11:2004 +A1:2017 ED. 2.0
The above equipment has been tested by Bureau Veritas Consumer Products Services (H.K.) Ltd.,
Taoyuan Branch, and found compliance with the requirement of the above standards. The test record, data
evaluation & Equipment Under Test (EUT) configurations represented herein are true and accurate accounts
of the measurements of the sample’s EMC characteristics under the conditions specified in this report.
Prepared by : , Date: Jan. 5, 2021
Jessica Cheng / Senior Specialist
Approved by
:
, Date: Jan. 5, 2021
Jim Hsiang / Associate Technical Manager

Report No.: CEBDBO-WTW-P20120314 Page No. 6 / 78 Report Format Version: 6.1.3
2 Summary of Test Results
Emission
Standard Test Item Result/Remarks Verdict
EN 55032:2015 +A11:2020 CISPR 32:2015+Cor1:2016
AS/NZS CISPR 32:2015
Conducted emission from the AC mains power port
Minimum passing Class A margin is -18.16 dB at 3.58969 MHz
Pass
Asymmetric mode conducted emission at telecommunication ports
Minimum passing Class A margin is -2.26 dB at 3.59360 MHz
Pass
Radiated emission 30-1000 MHz
Minimum passing Class A margin is -1.04 dB at 154.01 MHz
Pass
Radiated emission above 1GHz
Minimum passing Class A margin is -8.88 dB at 3080.00 MHz
Pass
EN 61000-3-2:2014 Harmonic current emissions Class A. Pass
EN 61000-3-3:2013 Voltage fluctuations and flicker
Pst ≦ 1.0 dmax ≦ 4%
Plt ≦ 0.65 dc ≦ 3.3%
Tmax ≦ 500ms
Pass
Immunity
EN 55024 Clause
Basic standard Test Item Result/Remarks Verdict
4.2.1 EN 61000-4-2:2009 / IEC 61000-4-2:2008 ED. 2.0
Electrostatic discharge (ESD)
Performance Criterion B Pass
4.2.3.2
EN 61000-4-3:2006
+A1:2008 +A2:2010 / IEC 61000-4-3:2010 ED. 3.2
Continuous radiated disturbances (RS)
Performance Criterion A Pass
4.2.2 EN 61000-4-4:2012 / IEC 61000-4-4:2012 ED. 3.0
Electrical fast
transients (EFT) Performance Criterion A Pass
4.2.5
EN 61000-4-5:2014 +A1:2017 /
IEC 61000-4-5:2014 +A1:2017 ED. 3.0
Surges Performance Criterion A Pass
4.2.3.3
EN 61000-4-6:2014 +AC:2015 / IEC 61000-4-6:2013 ED. 4.0
Continuous conducted
disturbances (CS) Performance Criterion A Pass
4.2.4 EN 61000-4-8:2010 / IEC 61000-4-8:2009
ED. 2.0
Power-frequency magnetic fields
(PFMF) Performance Criterion A Pass
4.2.6
EN 61000-4-11:2004 +A1:2017 /
IEC 61000-4-11:2004 +A1:2017 ED. 2.0
Voltage dips and
interruptions
Voltage Dips:
>95% reduction – 0.5 period,
Performance Criterion A
30% reduction – 25 periods,
Performance Criterion A
Voltage Interruptions:
>95% reduction – 250 periods,
Performance Criterion C
Pass
Note:
1. The above EN/IEC basic standards are applied with latest version if customer has no special requirement. 2. There is no deviation to the applied test methods and requirements covered by the scope of this report. 3. Determining compliance based on the results of the compliance measurement, not taking into account
measurement instrumentation uncertainty.

Report No.: CEBDBO-WTW-P20120314 Page No. 7 / 78 Report Format Version: 6.1.3
3. N/A: Not Applicable
2.1 Measurement Uncertainty
Where relevant, the following measurement uncertainty levels have been estimated for tests performed on the EUT as specified in CISPR 16-4-2:
Measurement Expanded Uncertainty
(k=2) (±) Maximum allowable
uncertainty (±)
Conducted emission from AC mains power port using AMN, 150kHz ~ 30MHz
2.94 dB 3.4 dB (Ucispr)
Asymmetric mode conducted emission using AAN, 150kHz ~ 30MHz
3.88 dB 5.0 dB (Ucispr)
Radiated emission, 30MHz ~ 1GHz 4.30 dB 6.3 dB (Ucispr)
Radiated emission, 1GHz ~ 6GHz 4.48 dB 5.2 dB (Ucispr)
2.2 Modification Record
There were no modifications required for compliance.

Report No.: CEBDBO-WTW-P20120314 Page No. 8 / 78 Report Format Version: 6.1.3
3 General Information
3.1 Description of EUT
Product Fanless Embedded System
Brand Vecow
Test Model ECX-2000
Series Model ECX-2000 Series, ECX-2XXXXXXXXXXXXXXXXXXXXXXXXXXXXXX
(“X” can be 0-9, A-Z or blank for marketing purposes)
Model Difference Marketing Differentiation
Sample Status Engineering sample
Operating Software Windows 10
Power Supply Rating DC from Adapter
Accessory Device N/A
Data Cable Supplied N/A
Note:
1. The EUT uses following adapter.
Brand FSP
Model FSP180-AABN3
Input Power 100-240Vac, 2.3A, 50-60Hz
Output Power 24Vdc, 7.5A, 180.0W
Power Line AC 3Pin
Non-shielded DC (1.5m) with one ferrite core.
3.2 Features of EUT
1. The tests reported herein were performed according to the method specified by Vecow Co., Ltd., for
detailed feature description, please refer to the manufacturer's specifications or user's manual.
2. The EUT was configured with the following key components:
Components Brand Model Specification
CPU Intel I7-10700TE 2.0GHz
RAM Vecow VMD4NIS-08G00C 8GB DDR4 3200 W/T SODIMM
RAM Vecow VMD4NIS-16G00C 16GB DDR4 3200 W/T SODIMM
SSD - - 2.5” SATA SSD 3ME4 128GB

Report No.: CEBDBO-WTW-P20120314 Page No. 9 / 78 Report Format Version: 6.1.3
3.3 Operating Modes of EUT and Determination of Worst Case Operating Mode
1. The EUT was pre-tested under operating and standby condition and the worst emission level was found
under operating condition.
2. The EUT consumed power from AC adapter, which designed with AC power supply of 100-240Vac,
50-60Hz.
For radiated emission evaluation, 230Vac/50Hz & 110Vac/60Hz had been covered during the pre-test.
The worst radiated emission data was founded at 110Vac/60Hz and recorded in the applied test report.
3. Test modes are presented in the report as below.
Mode Test Condition Input Power
Conducted emission test
1 Full system
(DVI: 1920*1080, 60Hz + DP: 3840*2160, 60Hz)
110Vac/ 60Hz&
230Vac/ 50Hz
Asymmetric mode conducted emission at telecommunication ports test
1
Full system
(DVI: 1920*1080, 60Hz + DP: 3840*2160, 60Hz)
LAN 1 port: Speed (1Gbps)
230Vac/ 50Hz
2
Full system
(DVI: 1920*1080, 60Hz + DP: 3840*2160, 60Hz)
PoE LAN 6 port: Speed (100Mbps)
230Vac/ 50Hz
The idle mode of conducted emission test at telecom port was pre-tested based on the worst case of link
mode. Due to emissions of idle mode being very low compared to link mode, only the link mode data were
presented in the test report.
Radiated emission test
1 Full system
(DVI: 1920*1080, 60Hz + DP: 3840*2160, 60Hz) 110Vac/ 60Hz
Harmonics & Flicker and Immunity tests
1 Full system
(DVI: 1920*1080, 60Hz + DP: 3840*2160, 60Hz) 230Vac/ 50Hz

Report No.: CEBDBO-WTW-P20120314 Page No. 10 / 78 Report Format Version: 6.1.3
3.4 Test Program Used and Operation Descriptions
Emission tests (Harmonics & Flicker excluded):
a. Turned on the power of all equipment.
b. EUT ran a test program to enable all functions.
c. EUT read and wrote messages from/to SSD and ext. HDDs.
d. EUT sent and received messages to/from Notebook PCs (kept in a remote area) via two UTP
LAN cables.
e. EUT sent “color bars with moving element” messages to ext. LCD Monitors. Then they
displayed “color bars with moving element” messages on their screens simultaneously.
f. EUT sent 1kHz audio signal to earphone.
g. EUT sent messages to printer and printer printed them out.
h. Cameras captured video image to LCD Monitors via EUT.
i. Steps c-h were repeated.
Harmonics & Flicker, Immunity tests:
a. Turned on the power of all equipment.
b. EUT ran a test program to enable all functions.
c. EUT read and wrote messages from/to SSD and ext. USB flashs, HDDs.
d. EUT sent and received messages to/from Notebook PCs (kept in a remote area) via two UTP
LAN cables.
e. EUT sent and received messages to/from Notebook PCs (kept in a remote area) via two STP
LAN cables. (For CS test only)
f. EUT sent "H" messages to ext. LCD Monitors. Then they displayed "H" patterns on their
screens simultaneously.
g. EUT sent audio signal to speaker.
h. Cameras captured video image to LCD Monitors via EUT.
i. Steps c-h were repeated.
3.5 Primary Clock Frequencies of Internal Source
The highest frequency generated or used within the EUT or on which the EUT operates or tunes is 2.0GHz,
provided by Vecow Co., Ltd., for detailed internal source, please refer to the manufacturer's specifications.

Report No.: CEBDBO-WTW-P20120314 Page No. 11 / 78 Report Format Version: 6.1.3
4 Configuration and Connections with EUT
4.1 Connection Diagram of EUT and Peripheral Devices
Emission tests (Harmonics & Flicker excluded):
230Vac /110Vac
7
EUT
Remote site
10
Notebook PC*2 (K)
LAN 1, 2
14
COM*4 COM Load*4 (G)
Earphone (H)
11
12
PoE LAN 3~ 6 Camera*4 (J)
Isolated DIO
USB 3.0*3 USB 3.0 HDD *3 (E) 5
USB 3.0
USB 3.0
USB 3.0
Display
USB Printer (F) 6
USB Mouse (D) 4
USB Keyboard (C) 3
1
DC input
Audio Out
Audio In 9
Microphone (I)
DVI *2 LCD Monitor*2 (B)
LCD Monitor (A)
2
8 13
AC Adapter (EUT)

Report No.: CEBDBO-WTW-P20120314 Page No. 12 / 78 Report Format Version: 6.1.3
Harmonics & Flicker & Immunity tests:
230Vac
7
EUT
Remote site
10
Notebook PC*2 (K)
LAN 1, 2
11
COM*4 COM Load*4 (G)
Speaker (H)
6
12
PoE LAN 3~ 6 Camera*4 (J)
Isolated DIO
USB 3.0*2 USB 3.1 HDD *2 (F) 5
USB 3.0*2
USB 3.0
USB 3.0
Display
USB Flash*2 (E)
USB Mouse (D) 4
USB Keyboard (C) 3
1
DC input
Audio Out
Audio In 9
Microphone (I)
DVI *2 LCD Monitor*2 (B)
LCD Monitor (A)
2
8 13
AC Adapter (EUT)

Report No.: CEBDBO-WTW-P20120314 Page No. 13 / 78 Report Format Version: 6.1.3
4.2 Configuration of Peripheral Devices and Cable Connections
Emission tests (Harmonics & Flicker excluded):
ID Product Brand Model No. Serial No. FCC ID Remarks
A. LCD Monitor ASUS MG28U H1LMTF041254 FCC DoC Approved Provided by Lab
B. 24" LCD MONITOR DELL U2410 CN082WXD728720CC0UHL FCC DoC Approved Provided by Lab
24" LCD MONITOR DELL U2410 CN082WXD728720CC0LGL FCC DoC Approved Provided by Lab
C. USB KEYBOARD Dell KB216t CN-0W33XP-LO300-7CL-19
09 FCC DoC Approved Provided by Lab
D. USB Mouse Microsoft 1113 9170528318308 FCC DoC Approved Provided by Lab
E.
USB 3.0 Hard Disk WD WDBUZG0010BBK-
PESN WXM1E1532Z4Z FCC DoC Approved Provided by Lab
USB 3.0 Hard Disk WD WDBUZG0010BBK-
PESN WX61A45JRXLF FCC DoC Approved Provided by Lab
USB 3.0 Hard Disk WD WDBUZG0010BBK-
PESN WX61A45JR2YK FCC DoC Approved Provided by Lab
F. Printer HP Officejet pro 251dw N/A B94SDGOB1191 Provided by Lab
G. COM Load*4 N/A N/A N/A N/A Supplied by client
H. EARPHONE KWORLD G13 N/A N/A Provided by Lab
I. MICROPHONE N/A N/A N/A N/A Provided by Lab
J. PoE Camera*4 N/A MBL030A-ORZ0310 N/A N/A Supplied by client
K. Notebook PC SONY SVS151A12P 275548477001024 FCC DoC Approved Provided by Lab
Notebook PC LENOVO T480 PF1EZSAW FCC DoC Approved Provided by Lab
Note:
1. All power cords of the above support units are non-shielded (1.8m).
2. Item K acted as communication partners to transfer data.
ID Cable Descriptions Qty. Length (m) Shielding (Yes/No) Cores (Qty.) Remarks
1. Display cable 1 2.0 Y 0 Provided by Lab
2. DVI cable 2 1.8 Y 2 Provided by Lab
3. USB cable 1 1.8 Y 0 Provided by Lab
4. USB cable 1 1.8 Y 1 Provided by Lab
5. USB cable 3 1.0 Y 0 Provided by Lab
6. USB cable 1 1.5 Y 0 Provided by Lab
7. Audio cable 1 2.0 N 0 Provided by Lab
8. Signal cable 1 1.5 N 0 Provided by Lab
9. Audio cable 1 2.0 N 0 Provided by Lab
10. LAN cable 4 3.0 N 0 Provided by Lab
(RJ45, Cat.5e)
11. DC power 1 1.5 N 1 Supplied by client
12. AC power cord 1 1.8 N 0 Provided by Lab
13. GND cable 1 1.8 N 0 Provided by Lab
14. LAN cable 2 10 N 0 Provided by Lab
(RJ45, Cat.5e)
Note: The core(s) is(are) originally attached to the cable(s).

Report No.: CEBDBO-WTW-P20120314 Page No. 14 / 78 Report Format Version: 6.1.3
Harmonics, Flicker, Immunity tests:
ID Product Brand Model No. Serial No. FCC ID Remarks
A. 24 LCD MONITOR DELL P2415Qb CN-OGTTPW-74261-66
2-OAGL NA Provided by Lab
B.
24 LCD MONITOR DELL U2412M CN-07N2FG-TV100-975
-095U NA Provided by Lab
24 LCD MONITOR DELL U2412M CN-07N2FG-TV100-975
-090U NA Provided by Lab
C. USB Keyboard HP KUS0133 NA NA Provided by Lab
D. USB Mouse HP M-UAE96 NA NA Provided by Lab
E. USB Flash * 2 HP 16GB NA NA Provided by Lab
F. USB 3.1 Hard Disk WD WDBKVX5120PSL 1922MD400404 FCC DoC Approved Provided by Lab
USB 3.1 Hard Disk WD WDBKVX5120PSL 1922JG400125 FCC DoC Approved Provided by Lab
G. COM Load*4 N/A N/A N/A N/A Provided by Lab
H. Speaker N/A NA N/A NA Supplied by client
I. MICROPHONE N/A NA N/A NA Provided by Lab
J. PoE Camera*4 N/A MBL030A-ORZ0310 N/A N/A Supplied by client
K. Notebook PC SONY SVS151A12P 275548477001024 NA Provided by Lab
Notebook PC LENOVO T480 PF1EZSAW NA Provided by Lab
Note:
1. All power cords of the above support units are non-shielded (1.8m).
2. Items K acted as communication partners to transfer data.
ID Cable Descriptions Qty. Length (m) Shielding (Yes/No) Cores (Qty.) Remarks
1. Display cable 1 2.0 Y 0 Provided by Lab
2. DVI cable 2 1.8 Y 2 Provided by Lab
3. USB cable 1 1.8 Y 0 Provided by Lab
4. USB cable 1 1.8 Y 0 Provided by Lab
5. USB cable 2 0.5 Y 0 Provided by Lab
6. DC cable 1 1.5 N 1 Supplied by client
7. Audio cable 1 2.0 N 0 Provided by Lab
8. Signal cable 1 1.5 N 0 Provided by Lab
9. Audio cable 1 2.0 N 0 Provided by Lab
10. LAN cable 4 3.0 N 0 Provided by Lab
(RJ45, Cat.5e)
11.
LAN cable 2 10 N 0 Provided by Lab
(RJ45, Cat.5e)
LAN cable 2 10 Y 0
Provided by Lab
(RJ45, Cat.5e)
For CS test only
12. AC power cord 1 1.8 N 0 Provided by Lab
13. GND cable 1 2.0 N 0 Provided by Lab
Note: The core(s) is(are) originally attached to the cable(s).

Report No.: CEBDBO-WTW-P20120314 Page No. 15 / 78 Report Format Version: 6.1.3
5 Conducted Emission from the AC Mains Power Port
5.1 Limits
Class A
Frequency range
(MHz) Coupling device
Detector type /
bandwidth
Limits
(dBuV)
0.15 - 0.5
AMN
Quasi-peak / 9kHz 79
0.5 - 30.0 73
0.15 - 0.5 Average / 9kHz
66
0.5 - 30.0 60
Class B
Frequency range
(MHz) Coupling device
Detector type /
bandwidth
Limits
(dBuV)
0.15 - 0.5
AMN
Quasi-peak / 9kHz
66 - 56
0.5 - 5 56
5 - 30.0 60
0.15 - 0.5
Average / 9kHz
56 - 46
0.5 - 5 46
5 - 30.0 50
Notes: 1. The lower limit shall apply at the transition frequencies.
2. The limit decreases linearly with the logarithm of the frequency in the range of 0.15 to 0.50 MHz.
5.2 Test Instruments
Description & Manufacturer Model No. Serial No. Cal. Date Cal. Due
ROHDE & SCHWARZ
Test Receiver ESR3 102414 Jan. 13, 2020 Jan. 12, 2021
ROHDE & SCHWARZ
Artificial Mains Network (for EUT) ENV216 101197 Jun. 10, 2020 Jun. 9, 2021
LISN With Adapter (for EUT) 101197 NA Jun. 10, 2020 Jun. 9, 2021
ROHDE & SCHWARZ
Artificial Mains Network
(for peripherals)
ESH3-Z5 100218 Dec. 2, 2020 Dec. 1, 2021
SCHWARZBECK
Artificial Mains Network (For EUT) NNLK8129 8129229 May 14, 2020 May 13, 2021
SCHWARZBECK
Artificial Mains Network
(for EUT)
NNLK 8121 8121-808 Apr. 10, 2020 Apr. 9, 2021
Software Cond_V7.3.7.4 NA NA NA
RF cable (JYEBAO)
With 10dB PAD 5D-FB Cable-C10.01 Feb. 12, 2020 Feb. 11, 2021
LYNICS Terminator
(For ROHDE & SCHWARZ LISN) 0900510 E1-011484 May 26, 2020 May 25, 2021
Note: 1. The calibration interval of the above test instruments is 12 months and the calibrations are
traceable to NML/ROC and NIST/USA.
2. The test was performed in Shielded Room No. 10. (Conduction 10)
3. The VCCI Site Registration No. C-11852.
4. Tested Date: Dec. 14, 2020

Report No.: CEBDBO-WTW-P20120314 Page No. 16 / 78 Report Format Version: 6.1.3
5.3 Test Arrangement
a. The EUT was placed 0.4 meters from the conducting wall of the shielded room with EUT being connected
to the power mains through an Artificial Mains Network (AMN). Other support units were connected to the
power mains through another AMN. The two AMNs provide 50 Ohm/ 50uH of coupling impedance for the
measuring instrument.
b. Both lines of the power mains connected to the EUT were checked for maximum conducted interference.
c. The test results of conducted emissions at mains ports are recorded of six worst margins for quasi-peak
(mandatory) [and average (if necessary)] values against the limits at frequencies of interest unless the
margin is 20 dB or greater.
Note: The resolution bandwidth and video bandwidth of test receiver is 9kHz for quasi-peak detection (QP)
and average detection (AV) at frequency 0.15MHz-30MHz.
Note: 1. Support units were connected to second AMN.
2. The distance specified between EUT/AE and other metallic
objects is ≥ 0.8 m in the measurement arrangement for
table-top EUT.
3. Cable on the RGP must to be insulated.
40cm
80cm
Test Receiver
Horizontal Ground
Reference Plane
EUT
AMN
Vertical Ground
Reference Plane
For the actual test configuration, please refer to the related item – Photographs of the Test Configuration.

Report No.: CEBDBO-WTW-P20120314 Page No. 17 / 78 Report Format Version: 6.1.3
5.4 Test Results
Frequency Range 150kHz ~ 30MHz Detector Function &
Resolution Bandwidth
Quasi-Peak (QP) / Average
(AV), 9kHz
Input Power 110Vac, 60Hz Environmental Conditions 21℃, 76%RH, 1013mbar
Tested by John Liao Test Date 2020/12/14
Test Mode Mode 1
Phase Of Power : Line (L)
No
Frequency
Correction
Factor
Reading Value
(dBuV)
Emission Level
(dBuV)
Limit
(dBuV)
Margin
(dB)
(MHz) (dB) Q.P. AV. Q.P. AV. Q.P. AV. Q.P. AV.
1 0.16845 9.71 35.62 29.63 45.33 39.34 79.00 66.00 -33.67 -26.66
2 0.66781 9.73 31.20 21.88 40.93 31.61 73.00 60.00 -32.07 -28.39
3 3.58969 9.82 36.99 32.02 46.81 41.84 73.00 60.00 -26.19 -18.16
4 7.18234 9.87 34.78 24.76 44.65 34.63 73.00 60.00 -28.35 -25.37
5 23.90968 10.11 31.52 22.36 41.63 32.47 73.00 60.00 -31.37 -27.53
6 29.96782 10.22 30.12 24.30 40.34 34.52 73.00 60.00 -32.66 -25.48
Remarks:
1. Q.P. and AV. are abbreviations of quasi-peak and average individually.
2. The emission levels of other frequencies were very low against the limit.
3. Margin value = Emission level – Limit value
4. Correction factor = Insertion loss + Cable loss
5. Emission Level = Correction Factor + Reading Value

Report No.: CEBDBO-WTW-P20120314 Page No. 18 / 78 Report Format Version: 6.1.3
Frequency Range 150kHz ~ 30MHz Detector Function &
Resolution Bandwidth
Quasi-Peak (QP) / Average
(AV), 9kHz
Input Power 110Vac, 60Hz Environmental Conditions 21℃, 76%RH, 1013mbar
Tested by John Liao Test Date 2020/12/14
Test Mode Mode 1
Phase Of Power : Neutral (N)
No
Frequency
Correction
Factor
Reading Value
(dBuV)
Emission Level
(dBuV)
Limit
(dBuV)
Margin
(dB)
(MHz) (dB) Q.P. AV. Q.P. AV. Q.P. AV. Q.P. AV.
1 0.17738 9.71 43.23 38.11 52.94 47.82 79.00 66.00 -26.06 -18.18
2 0.21258 9.71 38.32 26.98 48.03 36.69 79.00 66.00 -30.97 -29.31
3 0.39896 9.71 38.23 32.20 47.94 41.91 79.00 66.00 -31.06 -24.09
4 0.66426 9.73 35.32 26.91 45.05 36.64 73.00 60.00 -27.95 -23.36
5 7.18625 9.87 36.35 28.20 46.22 38.07 73.00 60.00 -26.78 -21.93
6 28.73586 10.13 30.26 24.99 40.39 35.12 73.00 60.00 -32.61 -24.88
Remarks:
1. Q.P. and AV. are abbreviations of quasi-peak and average individually.
2. The emission levels of other frequencies were very low against the limit.
3. Margin value = Emission level – Limit value
4. Correction factor = Insertion loss + Cable loss
5. Emission Level = Correction Factor + Reading Value

Report No.: CEBDBO-WTW-P20120314 Page No. 19 / 78 Report Format Version: 6.1.3
Frequency Range 150kHz ~ 30MHz Detector Function &
Resolution Bandwidth
Quasi-Peak (QP) / Average
(AV), 9kHz
Input Power 230Vac, 50Hz Environmental Conditions 21℃, 76%RH, 1013mbar
Tested by John Liao Test Date 2020/12/14
Test Mode Mode 1
Phase Of Power : Line (L)
No
Frequency
Correction
Factor
Reading Value
(dBuV)
Emission Level
(dBuV)
Limit
(dBuV)
Margin
(dB)
(MHz) (dB) Q.P. AV. Q.P. AV. Q.P. AV. Q.P. AV.
1 0.16564 9.71 35.32 26.32 45.03 36.03 79.00 66.00 -33.97 -29.97
2 0.22431 9.71 33.20 30.11 42.91 39.82 79.00 66.00 -36.09 -26.18
3 0.91457 9.74 30.20 19.89 39.94 29.63 73.00 60.00 -33.06 -30.37
4 1.71241 9.77 32.69 21.85 42.46 31.62 73.00 60.00 -30.54 -28.38
5 3.59360 9.82 37.23 28.63 47.05 38.45 73.00 60.00 -25.95 -21.55
6 8.35173 9.88 32.02 25.65 41.90 35.53 73.00 60.00 -31.10 -24.47
Remarks:
1. Q.P. and AV. are abbreviations of quasi-peak and average individually.
2. The emission levels of other frequencies were very low against the limit.
3. Margin value = Emission level – Limit value
4. Correction factor = Insertion loss + Cable loss
5. Emission Level = Correction Factor + Reading Value

Report No.: CEBDBO-WTW-P20120314 Page No. 20 / 78 Report Format Version: 6.1.3
Frequency Range 150kHz ~ 30MHz Detector Function &
Resolution Bandwidth
Quasi-Peak (QP) / Average
(AV), 9kHz
Input Power 230Vac, 50Hz Environmental Conditions 21℃, 76%RH, 1013mbar
Tested by John Liao Test Date 2020/12/14
Test Mode Mode 1
Phase Of Power : Neutral (N)
No
Frequency
Correction
Factor
Reading Value
(dBuV)
Emission Level
(dBuV)
Limit
(dBuV)
Margin
(dB)
(MHz) (dB) Q.P. AV. Q.P. AV. Q.P. AV. Q.P. AV.
1 0.16526 9.71 37.20 25.30 46.91 35.01 79.00 66.00 -32.09 -30.99
2 0.39635 9.71 38.63 32.99 48.34 42.70 79.00 66.00 -30.66 -23.30
3 0.65253 9.73 36.32 30.02 46.05 39.75 73.00 60.00 -26.95 -20.25
4 3.58969 9.82 37.32 29.63 47.14 39.45 73.00 60.00 -25.86 -20.55
5 11.21849 9.93 34.20 31.02 44.13 40.95 73.00 60.00 -28.87 -19.05
6 29.97173 10.14 30.12 22.97 40.26 33.11 73.00 60.00 -32.74 -26.89
Remarks:
1. Q.P. and AV. are abbreviations of quasi-peak and average individually.
2. The emission levels of other frequencies were very low against the limit.
3. Margin value = Emission level – Limit value
4. Correction factor = Insertion loss + Cable loss
5. Emission Level = Correction Factor + Reading Value

Report No.: CEBDBO-WTW-P20120314 Page No. 21 / 78 Report Format Version: 6.1.3
6 Asymmetric Mode Conducted Emission at Telecommunication Ports
6.1 Limits
Class A
Frequency range
(MHz) Coupling device
Detector type /
bandwidth
Voltage limits
(dBuV)
Current limits
(dBuA)
0.15 - 0.5 AAN Quasi-peak / 9kHz
97 – 87
N/A 0.5 - 30.0 87
0.15 - 0.5 AAN Average / 9kHz
84-74
0.5 - 30.0 74
0.15 - 0.5 CVP
and current probe Quasi-peak / 9kHz
97 – 87 53 – 43
0.5 - 30.0 87 43
0.15 - 0.5 CVP
and current probe Average / 9kHz
84-74 40 – 30
0.5 - 30.0 74 30
0.15 - 0.5 Current Probe Quasi-peak / 9kHz
N/A
53 – 43
0.5 - 30.0 43
0.15 - 0.5 Current Probe Average / 9kHz
40 – 30
0.5 - 30.0 30
Class B
Frequency range
(MHz) Coupling device
Detector type /
bandwidth
Voltage limits
(dBuV)
Current limits
(dBuA)
0.15 - 0.5 AAN Quasi-peak / 9kHz
84 – 74
N/A 0.5 - 30.0 74
0.15 - 0.5 AAN Average / 9kHz
74-64
0.5 - 30.0 64
0.15 - 0.5 CVP
and current probe Quasi-peak / 9kHz
84 – 74 40 – 30
0.5 - 30.0 74 30
0.15 - 0.5 CVP
and current probe Average / 9kHz
74-64 30 – 20
0.5 - 30.0 64 20
0.15 - 0.5 Current Probe Quasi-peak / 9kHz
N/A
40 – 30
0.5 - 30.0 30
0.15 - 0.5 Current Probe Average / 9kHz
30 – 20
0.5 - 30.0 20
Notes: 1. The lower limit shall apply at the transition frequencies.
2. The limit decreases linearly with the logarithm of the frequency in the range of 0.15 to 0.50 MHz.

Report No.: CEBDBO-WTW-P20120314 Page No. 22 / 78 Report Format Version: 6.1.3
6.2 Test Instruments
Description & Manufacturer Model No. Serial No. Cal. Date Cal. Due
ROHDE & SCHWARZ
Test Receiver ESR3 102414 Jan. 13, 2020 Jan. 12, 2021
ROHDE & SCHWARZ
Artificial Mains Network (for EUT) ENV216 101197 Jun. 10, 2020 Jun. 9, 2021
LISN With Adapter (for EUT) 101197 NA Jun. 10, 2020 Jun. 9, 2021
ROHDE & SCHWARZ
Artificial Mains Network
(for peripherals)
ESH3-Z5 100218 Dec. 2, 2020 Dec. 1, 2021
SCHWARZBECK
Artificial Mains Network (For EUT) NNLK8129 8129229 May 14, 2020 May 13, 2021
SCHWARZBECK
Artificial Mains Network
(for EUT)
NNLK 8121 8121-808 Apr. 10, 2020 Apr. 9, 2021
Software Cond_V7.3.7.4 NA NA NA
Software ISN_V7.3.7.4 NA NA NA
RF cable (JYEBAO)
With 10dB PAD 5D-FB Cable-C10.01 Feb. 12, 2020 Feb. 11, 2021
LYNICS Terminator
(For ROHDE & SCHWARZ LISN) 0900510 E1-011484 May 26, 2020 May 25, 2021
FCC ISN F-071115-1057-1 20652 Jan. 20, 2020 Jan. 19, 2021
Note: 1. The calibration interval of the above test instruments is 12 months and the calibrations are
traceable to NML/ROC and NIST/USA.
2. The test was performed in Shielded Room No. 10. (ISN 10)
3. The VCCI Site Registration No. T-11611.
4. Tested Date: Dec. 14, 2020

Report No.: CEBDBO-WTW-P20120314 Page No. 23 / 78 Report Format Version: 6.1.3
6.3 Test Arrangement
Method of Using AANs:
a. The EUT is placed 0.4 meters from the conducting wall of the shielded room and connected to AAN
directly to reference ground plane.
b. If voltage measurement is used, measure voltage at the measurement port of the AAN, correct the
reading by adding the AAN voltage division factor, and compare to the voltage limit.
c. It is not necessary to apply the voltage and the current limit if a AAN is used.
d. The test results of disturbance at telecommunication ports are recorded of six worst margins for
quasi-peak (mandatory) [and average (if necessary)] values against the limits at frequencies of interest
unless the margin is 20 dB or greater.
Note: The resolution bandwidth and video bandwidth of test receiver is 9kHz for quasi-peak detection (QP)
and average detection (AV) at frequency 0.15MHz-30MHz.
For the actual test configuration, please refer to the related item – Photographs of the Test Configuration.

Report No.: CEBDBO-WTW-P20120314 Page No. 24 / 78 Report Format Version: 6.1.3
6.4 Test Results
Frequency Range 150kHz ~ 30MHz Detector Function &
Resolution Bandwidth
Quasi-Peak (QP) / Average
(AV), 9kHz
Input Power 230Vac, 50Hz Environmental Conditions 21℃, 72%RH, 1013mbar
Tested by John Liao Test Date 2020/12/14
Test Mode Mode 1
LAN PORT 1 (1Gbps, TFGEN+PING)
No
Frequency
Correction
Factor
Reading Value
(dBuV)
Emission Level
(dBuV)
Limit
(dBuV)
Margin
(dB)
(MHz) (dB) Q.P. AV. Q.P. AV. Q.P. AV. Q.P. AV.
1 0.39806 9.45 42.90 36.27 52.35 45.72 88.89 75.89 -36.54 -30.17
2 0.66429 9.34 41.46 31.79 50.80 41.13 87.00 74.00 -36.20 -32.87
3 1.18297 9.25 41.32 26.33 50.57 35.58 87.00 74.00 -36.43 -38.42
4 3.59362 9.17 48.19 47.11 57.36 56.28 87.00 74.00 -29.64 -17.72
5 14.36684 9.52 40.32 36.32 49.84 45.84 87.00 74.00 -37.16 -28.16
6 26.15069 10.22 36.69 30.87 46.91 41.09 87.00 74.00 -40.09 -32.91
Remarks:
1. Q.P. and AV. are abbreviations of quasi-peak and average individually.
2. The emission levels of other frequencies were very low against the limit.
3. Margin value = Emission level – Limit value
4. Correction factor = Insertion loss + Cable loss
5. Emission Level = Correction Factor + Reading Value

Report No.: CEBDBO-WTW-P20120314 Page No. 25 / 78 Report Format Version: 6.1.3
Frequency Range 150kHz ~ 30MHz Detector Function &
Resolution Bandwidth
Quasi-Peak (QP) / Average
(AV), 9kHz
Input Power 230Vac, 50Hz Environmental Conditions 21℃, 72%RH, 1013mbar
Tested by John Liao Test Date 2020/12/14
Test Mode Mode 2
POE LAN PORT 6 (100Mbps, TFGEN+PING)
No
Frequency
Correction
Factor
Reading Value
(dBuV)
Emission Level
(dBuV)
Limit
(dBuV)
Margin
(dB)
(MHz) (dB) Q.P. AV. Q.P. AV. Q.P. AV. Q.P. AV.
1 0.50110 9.39 56.85 53.99 66.24 63.38 87.00 74.00 -20.76 -10.62
2 0.98105 9.27 56.12 55.92 65.39 65.19 87.00 74.00 -21.61 -8.81
3 1.79454 9.20 60.12 58.99 69.32 68.19 87.00 74.00 -17.68 -5.81
4 2.39292 9.17 61.23 60.12 70.40 69.29 87.00 74.00 -16.60 -4.71
5 2.98740 9.16 62.24 60.23 71.40 69.39 87.00 74.00 -15.60 -4.61
6 3.59360 9.17 65.01 62.57 74.18 71.74 87.00 74.00 -12.82 -2.26
7 21.66086 9.94 50.59 47.89 60.53 57.83 87.00 74.00 -26.47 -16.17
Remarks:
1. Q.P. and AV. are abbreviations of quasi-peak and average individually.
2. The emission levels of other frequencies were very low against the limit.
3. Margin value = Emission level – Limit value
4. Correction factor = Insertion loss + Cable loss
5. Emission Level = Correction Factor + Reading Value

Report No.: CEBDBO-WTW-P20120314 Page No. 26 / 78 Report Format Version: 6.1.3
7 Radiated Emission at Frequencies up to 1GHz
7.1 Limits
Class A
Frequency range
(MHz)
Distance
(m)
Limits
(dBuV/m)
30 - 230 10
40
230 - 1000 47
30 - 230 3
50
230 - 1000 57
Class B
Frequency range
(MHz)
Distance
(m)
Limits
(dBuV/m)
30 - 230 10
30
230 - 1000 37
30 - 230 3
40
230 - 1000 47
Note: The lower limit shall apply at the transition frequencies.
7.2 Test Instruments
Description & Manufacturer Model No. Serial No. Cal. Date Cal. Due
ROHDE & SCHWARZ
TEST RECEIVER ESCS 30 100027 May 19, 2020 May 18, 2021
Schwarzbeck
Bilog Antenna VULB9168 9168-303 Nov. 5, 2020 Nov. 4, 2021
Agilent Preamplifier 8447D 2944A08119 Feb. 19, 2020 Feb. 18, 2021
ADT. Turn Table TT100 0205 NA NA
ADT. Tower AT100 0205 NA NA
Software Radiated_V7.6.15.9.5 NA NA NA
ADT RF Switches BOX EMH-011 1001 Oct. 23, 2020 Oct. 22, 2021
Pacific RF cable
With 5dB PAD 8D CABLE-ST2-01 Oct. 23, 2020 Oct. 22, 2021
Note: 1. The calibration interval of the above test instruments is 12 months and the calibrations are traceable
to NML/ROC and NIST/USA.
2. The test was performed in Open Site No. 2.
3. The VCCI Site Registration No. R-10237.
4. Tested Date: Dec. 18, 2020

Report No.: CEBDBO-WTW-P20120314 Page No. 27 / 78 Report Format Version: 6.1.3
7.3 Test Arrangement
a. The EUT was placed on the top of a rotating table 0.8 meters above the ground at an accredited test facility.
The table was rotated 360 degrees to determine the position of the highest radiation.
b. The EUT was set 10 meters away from the interference-receiving antenna, which was mounted on the top
of a variable-height antenna tower.
c. The antenna is a broadband antenna, and its height is varied from one meter to four meters above the
ground to determine the maximum value of the field strength. Both horizontal and vertical polarizations of
the antenna are set to make the measurement.
d. For each suspected emission, the EUT was arranged to its worst case and then the antenna was tuned to
heights from 1 meter to 4 meters and the rotatable table was turned from 0 degrees to 360 degrees to find
the maximum reading.
e. The test-receiver system was set to quasi-peak detect function and specified bandwidth with maximum
hold mode when the test frequency is up to 1 GHz.
Note:
1. The resolution bandwidth and video bandwidth of test receiver/spectrum analyzer is 120kHz for
quasi-peak detection (QP) at frequency up to 1GHz.
2. The measurement distance is the shortest horizontal distance between an imaginary circular periphery
just encompassing this arrangement and the calibration point of the antenna.
3m or 10m
Ant. Tower 1- 4m Variable
Test Table
EUT& Support Units
Ground Plane
Test Receiver
80cm
Note: Cable on the RGP must to be insulated.
For the actual test configuration, please refer to the related item – Photographs of the Test Configuration.

Report No.: CEBDBO-WTW-P20120314 Page No. 28 / 78 Report Format Version: 6.1.3
7.4 Test Results
Frequency Range 30MHz ~ 1GHz Detector Function &
Resolution Bandwidth Quasi-Peak (QP), 120kHz
Tested By ED. Lin Environmental
Conditions
20.0℃, 83.0%RH,
1012mbar
Test Mode Mode 1 Test Date 2020/12/18
Antenna Polarity & Test Distance : Horizontal at 10 m
No Frequency
(MHz)
Emission
Level
(dBuV/m)
Limit
(dBuV/m)
Margin
(dB)
Antenna
Height
(m)
Table
Angle
(Degree)
Raw
Value
(dBuV)
Correction
Factor
(dB/m)
1 66.87 36.21 QP 40.00 -3.79 3.98 H 187 47.52 -11.31
2 154.01 38.96 QP 40.00 -1.04 4.00 H 250 47.83 -8.87
3 222.62 38.75 QP 40.00 -1.25 4.00 H 168 50.29 -11.54
4 239.75 43.14 QP 47.00 -3.86 3.20 H 151 53.14 -10.00
5 324.31 41.12 QP 47.00 -5.88 2.11 H 182 47.85 -6.73
6 462.21 42.45 QP 47.00 -4.55 2.05 H 252 46.44 -3.99
7 475.01 38.74 QP 47.00 -8.26 1.88 H 221 42.53 -3.79
8 616.01 42.21 QP 47.00 -4.79 1.74 H 221 42.83 -0.62
9 742.71 39.12 QP 47.00 -7.88 1.06 H 19 37.13 1.99
10 924.21 40.32 QP 47.00 -6.68 1.43 H 281 34.63 5.69
Remarks:
1. Emission Level(dBuV/m) = Raw Value(dBuV) + Correction Factor(dB/m)
2. Correction Factor(dB/m) = Antenna Factor (dB/m) + Cable Factor (dB)
– Pre-Amplifier Factor (dB)
3. The other emission levels were very low against the limit.
4. Margin value = Emission level – Limit value

Report No.: CEBDBO-WTW-P20120314 Page No. 29 / 78 Report Format Version: 6.1.3
Frequency Range 30MHz ~ 1GHz Detector Function &
Resolution Bandwidth Quasi-Peak (QP), 120kHz
Tested By ED. Lin Environmental
Conditions
20.0℃, 83.0%RH,
1012mbar
Test Mode Mode 1 Test Date 2020/12/18
Antenna Polarity & Test Distance : Vertical at 10 m
No Frequency
(MHz)
Emission
Level
(dBuV/m)
Limit
(dBuV/m)
Margin
(dB)
Antenna
Height
(m)
Table
Angle
(Degree)
Raw
Value
(dBuV)
Correction
Factor
(dB/m)
1 68.43 36.12 QP 40.00 -3.88 1.31 V 14 47.98 -11.86
2 154.01 37.74 QP 40.00 -2.26 1.00 V 104 46.61 -8.87
3 208.31 35.24 QP 40.00 -4.76 1.00 V 268 47.25 -12.01
4 222.41 38.87 QP 40.00 -1.13 1.00 V 286 50.40 -11.53
5 308.00 41.74 QP 47.00 -5.26 1.00 V 152 49.06 -7.32
6 335.41 39.72 QP 47.00 -7.28 1.00 V 221 46.30 -6.58
7 462.61 38.21 QP 47.00 -8.79 2.29 V 223 42.19 -3.98
8 616.25 37.21 QP 47.00 -9.79 2.54 V 209 37.83 -0.62
9 856.01 40.11 QP 47.00 -6.89 1.71 V 259 35.78 4.33
Remarks:
1. Emission Level(dBuV/m) = Raw Value(dBuV) + Correction Factor(dB/m)
2. Correction Factor(dB/m) = Antenna Factor (dB/m) + Cable Factor (dB)
– Pre-Amplifier Factor (dB)
3. The other emission levels were very low against the limit.
4. Margin value = Emission level – Limit value
Report No.: CEBDBO-WTW-P20120314 Page No. 30 / 78 Report Format Version: 6.1.3
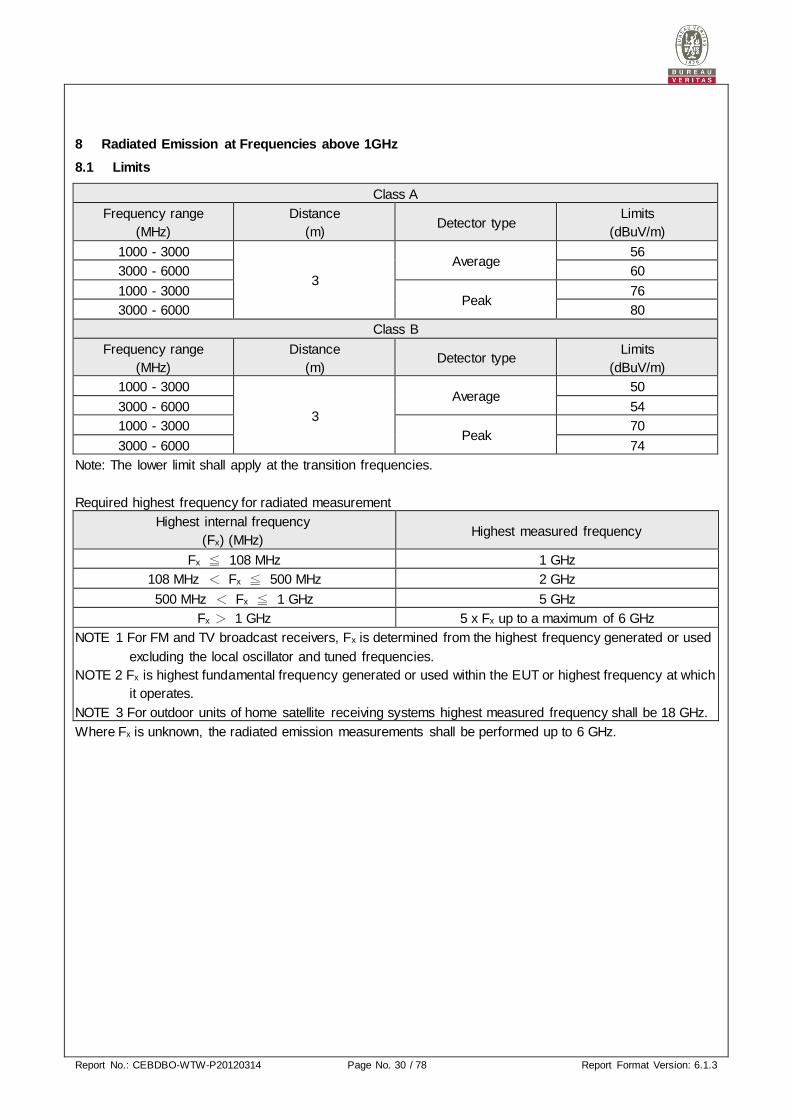
8 Radiated Emission at Frequencies above 1GHz
8.1 Limits
Class A
Frequency range
(MHz)
Distance
(m) Detector type
Limits
(dBuV/m)
1000 - 3000
3
Average 56
3000 - 6000 60
1000 - 3000 Peak
76
3000 - 6000 80
Class B
Frequency range
(MHz)
Distance
(m) Detector type
Limits
(dBuV/m)
1000 - 3000
3
Average 50
3000 - 6000 54
1000 - 3000 Peak
70
3000 - 6000 74
Note: The lower limit shall apply at the transition frequencies.
Required highest frequency for radiated measurement
Highest internal frequency
(Fx) (MHz) Highest measured frequency
Fx ≦ 108 MHz 1 GHz
108 MHz < Fx ≦ 500 MHz 2 GHz
500 MHz < Fx ≦ 1 GHz 5 GHz
Fx > 1 GHz 5 x Fx up to a maximum of 6 GHz
NOTE 1 For FM and TV broadcast receivers, Fx is determined from the highest frequency generated or used
excluding the local oscillator and tuned frequencies.
NOTE 2 Fx is highest fundamental frequency generated or used within the EUT or highest frequency at which
it operates.
NOTE 3 For outdoor units of home satellite receiving systems highest measured frequency shall be 18 GHz.
Where Fx is unknown, the radiated emission measurements shall be performed up to 6 GHz.

Report No.: CEBDBO-WTW-P20120314 Page No. 31 / 78 Report Format Version: 6.1.3
8.2 Test Instruments
Description & Manufacturer Model No. Serial No. Cal. Date Cal. Due
Agilent Spectrum E4446A MY51100009 Jun. 23, 2020 Jun. 22, 2021
Agilent Preamplifier 8449B 3008A01292 Feb. 20, 2020 Feb. 19, 2021
MITEQ Preamplifier AMF-6F-260400-33-8P 892164 Feb. 20, 2020 Feb. 19, 2021
EMCI Preamplifier EMC184045B 980235 Feb. 20, 2020 Feb. 19, 2021
ETS Preamplifier 3117-PA 00215857 Nov. 23, 2020 Nov. 22, 2021
Schwarzbeck Horn Antenna BBHA-9170 212 Nov. 22, 2020 Nov. 21, 2021
EMCO Horn Antenna 3115 6714 Nov. 22, 2020 Nov. 21, 2021
Max Full. Turn Table MF7802 MF780208216 NA NA
Software Radiated_V8.7.08 NA NA NA
KIK + WOKEN RF cable
With 3/4dB PAD
K1K50-UP0279-K1K50
-3000+WC01
Cable-CH10(3m)
-04
+Cable-CH10-03
Jul. 9, 2020 Jul. 8, 2021
MICRO-TRONICS
Notch filter BRC50703-01 010 May 29, 2020 May 28, 2021
MICRO-TRONICS
Band Pass Filter BRM17690 005 May 29, 2020 May 28, 2021
Note: 1. The calibration interval of the above test instruments is 12 months and the calibrations are traceable
to NML/ROC and NIST/USA.
2. The 3dB beamwidth of the horn antenna is minimum 41degree (or w = 2.24m at 3m distance)
for 1~6 GHz.
3. The test was performed in Chamber No. 10.
4. The VCCI Site Registration No. G-10427
5. Tested Date: Dec. 20, 2020

Report No.: CEBDBO-WTW-P20120314 Page No. 32 / 78 Report Format Version: 6.1.3
8.3 Test Arrangement
a. The EUT was placed on the top of a rotating table 0.8 meters above the ground at an accredited chamber
room. The table was rotated 360 degrees to determine the position of the highest radiation.
b. The EUT was set 3 meters away from the interference-receiving antenna, which was mounted on the top
of a variable-height antenna tower.
c. The height of antenna can be varied from one meter to four meters, the height of adjustment depends on
the EUT height and the antenna 3dB beamwidth both, to detect the maximum value of the field strength.
Both horizontal and vertical polarizations of the antenna are set to make the measurement.
d. For each suspected emission, the EUT was arranged to its worst case and then the antenna was tuned to
heights and the rotatable table was turned from 0 degrees to 360 degrees to find the maximum reading.
e. The spectrum analyzer system was set to peak and average detect function and specified bandwidth with
maximum hold mode when the test frequency is above 1 GHz.
Note:
1. The resolution bandwidth of test receiver/spectrum analyzer is 1MHz and video bandwidth is 3MHz for
Peak detection (PK) at frequency above 1GHz. The resolution bandwidth of test receiver/spectrum
analyzer is 1 MHz for Average detection (AV) at frequency above 1GHz.
2. The measurement distance is the shortest horizontal distance between an imaginary circular periphery
just encompassing this arrangement and the calibration point of the antenna.
* :depends on the EUT height and the antenna 3dB beamwidth both.
For the actual test configuration, please refer to the related item – Photographs of the Test Configuration.
3m
Ant. Tower 1-4m*
Variable
Test Table
EUT&
Support Units
Ground Plane
Spectrum analyzer
80cm
Absorber
Note: Cable on the RGP must to be insulated.

Report No.: CEBDBO-WTW-P20120314 Page No. 33 / 78 Report Format Version: 6.1.3
8.4 Test Results
Frequency Range 1GHz ~ 6GHz Detector Function &
Resolution Bandwidth
Peak (PK) / Average (AV),
1MHz
Tested By Kobe Lu Environmental
Conditions
23.0℃, 66.0%RH,
1015mbar
Test Mode Mode 1 Test Date 2020/12/20
Antenna Polarity & Test Distance : Horizontal at 3 m
No Frequency
(MHz)
Emission
Level
(dBuV/m)
Limit
(dBuV/m)
Margin
(dB)
Antenna
Height
(m)
Table
Angle
(Degree)
Raw
Value
(dBuV)
Correction
Factor
(dB/m)
1 1465.87 50.81 PK 76.00 -25.19 1.56 H 67 55.25 -4.44
2 1465.87 35.30 AV 56.00 -20.70 1.56 H 67 39.74 -4.44
3 1650.00 56.25 PK 76.00 -19.75 1.42 H 243 59.81 -3.56
4 1650.00 40.64 AV 56.00 -15.36 1.42 H 243 44.20 -3.56
5 2001.87 53.20 PK 76.00 -22.80 1.00 H 182 55.80 -2.60
6 2001.87 46.56 AV 56.00 -9.44 1.00 H 182 49.16 -2.60
7 2310.00 55.17 PK 76.00 -20.83 1.65 H 197 56.87 -1.70
8 2310.00 40.18 AV 56.00 -15.82 1.65 H 197 41.88 -1.70
9 2944.37 53.48 PK 76.00 -22.52 1.41 H 232 53.41 0.07
10 2944.37 36.72 AV 56.00 -19.28 1.41 H 232 36.65 0.07
11 4997.37 56.10 PK 80.00 -23.90 1.00 H 12 52.11 3.99
12 4997.37 37.90 AV 60.00 -22.10 1.00 H 12 33.91 3.99
Remarks:
1. Emission Level(dBuV/m) = Raw Value(dBuV) + Correction Factor(dB/m)
2. Correction Factor(dB/m) = Antenna Factor (dB/m) + Cable Factor (dB)
– Pre-Amplifier Factor (dB)
3. The other emission levels were very low against the limit.
4. Margin value = Emission level – Limit value

Report No.: CEBDBO-WTW-P20120314 Page No. 34 / 78 Report Format Version: 6.1.3
Frequency Range 1GHz ~ 6GHz Detector Function &
Resolution Bandwidth
Peak (PK) / Average (AV),
1MHz
Tested By Kobe Lu Environmental
Conditions
23.0℃, 66.0%RH,
1015mbar
Test Mode Mode 1 Test Date 2020/12/20
Antenna Polarity & Test Distance : Vertical at 3 m
No Frequency
(MHz)
Emission
Level
(dBuV/m)
Limit
(dBuV/m)
Margin
(dB)
Antenna
Height
(m)
Table
Angle
(Degree)
Raw
Value
(dBuV)
Correction
Factor
(dB/m)
1 1464.25 56.77 PK 76.00 -19.23 1.00 V 138 61.21 -4.44
2 1464.25 40.62 AV 56.00 -15.38 1.00 V 138 45.06 -4.44
3 1639.62 62.12 PK 76.00 -13.88 1.25 V 234 65.75 -3.63
4 1639.62 40.07 AV 56.00 -15.93 1.25 V 234 43.70 -3.63
5 2310.00 55.96 PK 76.00 -20.04 2.06 V 249 57.66 -1.70
6 2310.00 44.31 AV 56.00 -11.69 2.06 V 249 46.01 -1.70
7 3080.00 60.32 PK 80.00 -19.68 1.00 V 94 59.64 0.68
8 3080.00 51.12 AV 60.00 -8.88 1.00 V 94 50.44 0.68
9 3850.00 60.86 PK 80.00 -19.14 1.77 V 12 57.80 3.06
10 3850.00 48.20 AV 60.00 -11.80 1.77 V 12 45.14 3.06
11 4988.12 57.90 PK 80.00 -22.10 1.50 V 346 53.92 3.98
12 4988.12 39.87 AV 60.00 -20.13 1.50 V 346 35.89 3.98
Remarks:
1. Emission Level(dBuV/m) = Raw Value(dBuV) + Correction Factor(dB/m)
2. Correction Factor(dB/m) = Antenna Factor (dB/m) + Cable Factor (dB)
– Pre-Amplifier Factor (dB)
3. The other emission levels were very low against the limit.
4. Margin value = Emission level – Limit value

Report No.: CEBDBO-WTW-P20120314 Page No. 35 / 78 Report Format Version: 6.1.3
9 Harmonics Current Measurement
9.1 Limits
Limits for Class A equipment Limits for Class D equipment
Harmonic Order
n
Max. permissible harmonics current
A
Harmonic Order
n
Max. permissible harmonics current per
watt mA/W
Max. permissible harmonics current
A
Odd harmonics Odd Harmonics only
3 2.30 3 3.4 2.30
5 1.14 5 1.9 1.14
7 0.77 7 1.0 0.77
9 0.40 9 0.5 0.40
11 0.33 11 0.35 0.33
13 0.21 13 0.30 0.21
15≦n≦39 0.15 x 15/n 15≦n≦39 3.85/n 0.15 x 15/n
Even harmonics
2 1.08
4 0.43
6 0.30
8≦n≦40 0.23 x 8/n
Notes: 1. Class A and Class D are classified according to section 5 of EN 61000-3-2. 2. According to section 7 of EN 61000-3-2, the above limits for all equipment except for lighting
equipment having an active input power > 75 W and no limits apply for equipment with an active input power up to and including 75 W.
9.2 Classification of Equipment
Class A Class B Class C Class D Balanced three-phase equipment;
Household appliances excluding
equipment as Class D;
Tools excluding portable tools;
Dimmers for incandescent lamps;
Audio equipment;
Equipment not specified in one of the
three other classes.
Portable tools;
Arc welding
equipment which is
not professional
equipment.
Lighting
equipment. Equipment having a specified
power less than or equal to 600
W of the following types:
Personal computers and
personal computer monitors;
Television receivers;
Refrigerators and freezers
having one or more
variable-speed drives to control
compressor motor(s).
9.3 Test Instruments
Description & Manufacturer Model No. Serial No. Cal. Date Cal. Due
Teseq Harmonics - Flicker
Test System Profline 2105
32A00983 &
1639A01863 Sep. 16, 2020 Sep. 15, 2021
Software CTS 4 NA NA NA
Note: 1. The calibration interval of the above test instruments is 12 months and the calibrations are
traceable to NML/ROC and NIST/USA.
2. The test was performed in EMS Room No. 1.
3. According to IEC 61000-4-7: 2002, the time window shall be synchronized with each group of 10 or
12 cycles (200 ms)for power frequency of 50 or 60Hz.
4. Tested Date: Dec. 22, 2020

Report No.: CEBDBO-WTW-P20120314 Page No. 36 / 78 Report Format Version: 6.1.3
9.4 Test Arrangement
a. The EUT was placed on the top of a wooden table 0.8 meters above the ground and operated to produce the maximum harmonic components under normal operating conditions for each successive harmonic component in turn.
b. The correspondent test program of test instrument to measure the current harmonics emanated from
EUT is chosen. The measure time shall be not less than the time necessary for the EUT to be exercised.
EUT
For the actual test configuration, please refer to the related item – Photographs of the Test Configuration.

Report No.: CEBDBO-WTW-P20120314 Page No. 37 / 78 Report Format Version: 6.1.3
9.5 Test Results
Fundamental
Voltage/Ampere
230.54Vrms/
0.442Arms Power Frequency 50.00Hz
Power Consumption 82.4W Power Factor 0.847
Enviromental Conditions 20°C, 79% RH Tested by Kent Wang
Test Mode Mode 1 Test Date 2020/12/22
Harm# Harms (avg)
(A)
100% Limit
(A)
Harms (max)
(A)
150% Limit
(A) Test Result
2 0.002 1.080 0.003 1.620 Pass
3 0.121 2.300 0.122 3.450 Pass
4 0.002 0.430 0.002 0.645 Pass
5 0.028 1.140 0.029 1.710 Pass
6 0.002 0.300 0.002 0.450 Pass
7 0.010 0.770 0.012 1.155 Pass
8 0.001 0.230 0.002 0.345 Pass
9 0.012 0.400 0.012 0.600 Pass
10 0.002 0.184 0.002 0.276 Pass
11 0.008 0.330 0.009 0.495 Pass
12 0.001 0.153 0.002 0.230 Pass
13 0.011 0.210 0.011 0.315 Pass
14 0.002 0.131 0.002 0.197 Pass
15 0.009 0.150 0.010 0.225 Pass
16 0.002 0.115 0.002 0.173 Pass
17 0.012 0.132 0.013 0.198 Pass
18 0.002 0.102 0.002 0.153 Pass
19 0.003 0.118 0.004 0.178 Pass
20 0.001 0.092 0.002 0.138 Pass
21 0.005 0.107 0.006 0.161 Pass
22 0.002 0.084 0.002 0.125 Pass
23 0.005 0.098 0.005 0.147 Pass
24 0.001 0.077 0.002 0.115 Pass
25 0.005 0.090 0.005 0.135 Pass
26 0.002 0.071 0.003 0.107 Pass
27 0.002 0.083 0.003 0.125 Pass
28 0.002 0.066 0.002 0.099 Pass
29 0.006 0.078 0.006 0.116 Pass
30 0.004 0.061 0.004 0.092 Pass
31 0.004 0.073 0.005 0.109 Pass
32 0.002 0.058 0.002 0.086 Pass
33 0.005 0.068 0.006 0.102 Pass
34 0.003 0.054 0.003 0.081 Pass
35 0.002 0.064 0.002 0.096 Pass
36 0.001 0.051 0.002 0.077 Pass
37 0.004 0.061 0.004 0.091 Pass
38 0.002 0.048 0.002 0.073 Pass
39 0.004 0.058 0.004 0.087 Pass
40 0.001 0.046 0.002 0.069 Pass
Note: Dynamic limits were applied for this test. The highest harmonics values in the above table may not
occur at the same window as the maximum harmonics/limit ratio.

Report No.: CEBDBO-WTW-P20120314 Page No. 38 / 78 Report Format Version: 6.1.3
10 Voltage Fluctuations and Flicker Measurement
10.1 Limits
Test item Limit Note
Pst 1.0 Pst: short-term flicker severity.
Plt 0.65 Plt: long-term flicker severity.
Tmax (ms) 500 Tmax: maximum time duration during the observation period
that the voltage deviation d(t) exceeds the limit for dc .
dmax (%) 4 dmax: maximum absolute voltage change during an
observation period.
dc (%) 3.3 dc: maximum steady state voltage change during an
observation period.
10.2 Test Instruments
Description & Manufacturer Model No. Serial No. Cal. Date Cal. Due
Teseq Harmonics - Flicker
Test System Profline 2105
32A00983 &
1639A01863 Sep. 16, 2020 Sep. 15, 2021
Software CTS 4 NA NA NA
Note: 1. The calibration interval of the above test instruments is 12 months and the calibrations are
traceable to NML/ROC and NIST/USA.
2. The test was performed in EMS Room No. 1.
3. Tested Date: Dec. 22, 2020
10.3 Test Arrangement
a. The EUT was placed on the top of a wooden table 0.8 meters above the ground and operated to produce the most unfavorable sequence of voltage changes under normal operating conditions.
b. During the flick measurement, the measure time shall include that part of whole operation cycle in which the EUT produce the most unfavorable sequence of voltage changes. The observation period for short-term flicker indicator is 10 minutes and the observation period for long-term flicker indicator is 2 hours.
EUT
For the actual test configuration, please refer to the related item – Photographs of the Test Configuration.
Report No.: CEBDBO-WTW-P20120314 Page No. 39 / 78 Report Format Version: 6.1.3
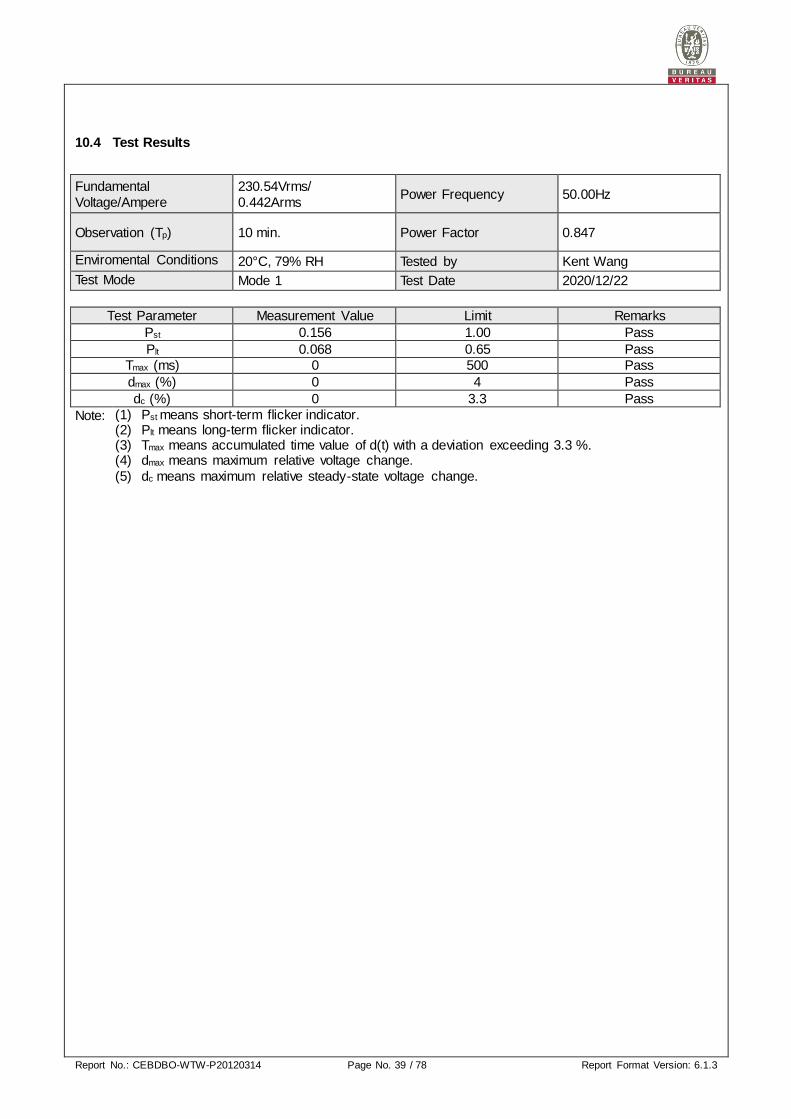
10.4 Test Results
Fundamental
Voltage/Ampere
230.54Vrms/
0.442Arms Power Frequency 50.00Hz
Observation (Tp) 10 min. Power Factor 0.847
Enviromental Conditions 20°C, 79% RH Tested by Kent Wang
Test Mode Mode 1 Test Date 2020/12/22
Test Parameter Measurement Value Limit Remarks
Pst 0.156 1.00 Pass
Plt 0.068 0.65 Pass
Tmax (ms) 0 500 Pass
dmax (%) 0 4 Pass
dc (%) 0 3.3 Pass
Note: (1) Pst means short-term flicker indicator. (2) Plt means long-term flicker indicator. (3) Tmax means accumulated time value of d(t) with a deviation exceeding 3.3 %. (4) dmax means maximum relative voltage change.
(5) dc means maximum relative steady-state voltage change.

Report No.: CEBDBO-WTW-P20120314 Page No. 40 / 78 Report Format Version: 6.1.3
11 General Immunity Requirements
EN 55024:2010/ EN55024:2010 +A1:2015, Immunity requirements
Clause Reference
standard Table Test specification
Performance Criterion
4.2.1 EN/IEC 61000-4-2
ESD 1.3
Enclosure port:
±8kV Air discharge, ±4kV Contact discharge B
4.2.3.2 EN/IEC 61000-4-3
RS 1.2
Enclosure port:
80-1000 MHz, 3V/m, 80% AM (1kHz) A
4.2.2 EN/IEC 61000-4-4
EFT
2.3
Signal ports and telecommunication ports:
xDSL equipment: ±0.5kV, 5/50 (Tr/Th) ns, 100kHz
others: ±0.5kV, 5/50 (Tr/Th) ns, 5kHz B
3.3 Input DC power port: ±0.5kV, 5/50 (Tr/Th) ns, 5kHz
4.5 Input AC Power ports: ±1kV, 5/50 (Tr/Th) ns, 5kHz
4.2.5 EN/IEC 61000-4-5
Surge
2.2
Signal and telecommunication ports (direct to outdoor
cables): 10/700 (5/320) (Tr/Th) μs
w/o primary protectors: ±1kV, or
with primary protectors fitted: ±4kV
C
3.2
Input DC power port (direct to outdoor cables):
1.2/50 (8/20) (Tr/Th) μs
Line to earth: ±0.5kV B
4.4
Input AC Power ports: 1.2/50 (8/20) (Tr/Th) μs,
Line to line: ±1kV
Line to earth: ±2kV
4.2.3.3 EN/IEC 61000-4-6
CS
2.1 Signal and telecommunication ports(cable length >
3m): 0.15-80 MHz, 3V, 80% AM (1kHz)
A 3.1 Input DC power port: 0.15-80 MHz, 3V, 80% AM (1kHz)
4.1 Input AC Power ports: 0.15-80 MHz, 3V, 80% AM
(1kHz)
4.2.4 EN/IEC 61000-4-8
PFMF 1.1
Enclosure port:
50 or 60 Hz, 1A/m A
4.2.6
EN/IEC 61000-4-11
Dips &
Interruptions
4.2
Input AC Power ports:
Voltage Dips:
>95% reduction – 0.5 period
30% reduction – 25 periods
B
C
4.3
Input AC Power ports:
Voltage Interruptions:
>95% reduction – 250 periods
C

Report No.: CEBDBO-WTW-P20120314 Page No. 41 / 78 Report Format Version: 6.1.3
11.1 Performance Criteria
General Performance Criteria
Performance criterion A
The equipment shall continue to operate as intended without operator intervention. No degradation of
performance or loss of function is allowed below a performance level specified by the manufacturer when the
equipment is used as intended. The performance level may be replaced by a permissible loss of performance.
If the minimum performance level or the permissible performance loss is not specified by the manufacturer,
then either of these may be derived from the product description and documentation, and by what the user
may reasonably expect from the equipment if used as intended.
Performance criterion B
After the test, the equipment shall continue to operate as intended without operator intervention. No
degradation of performance or loss of function is allowed, after the application of the phenomena below a
performance level specified by the manufacturer, when the equipment is used as intended. The performance
level may be replaced by a permissible loss of performance. During the test, degradation of performance is
allowed. However, no change of operating state or stored data is allowed to persist after the test. If the
minimum performance level (or the permissible performance loss) is not specified by the manufacturer, then
either of these may be derived from the product description and documentation, and by what the user may
reasonably expect from the equipment if used as intended.
Performance criterion C
Loss of function is allowed, provided the function is self-recoverable, or can be restored by the operation of the
controls by the user in accordance with the manufacturer's instructions. Functions, and/or information stored
in non-volatile memory, or protected by a battery backup, shall not be lost.
Particular performance criteria
The particular performance criteria which are specified in the normative annexes of EN 55024 take
precedence over the corresponding parts of the general performance criteria. Where particular performance
criteria for specific functions are not given, then the general performance criteria shall apply.

Report No.: CEBDBO-WTW-P20120314 Page No. 42 / 78 Report Format Version: 6.1.3
12 Electrostatic Discharge Immunity Test (ESD)
12.1 Test Specification
Basic Standard: EN/IEC 61000-4-2
Discharge Impedance: 330 ohm / 150 pF
Discharge Voltage: Air Discharge: ±2, ±4, ±8kV (Direct)
Contact Discharge: ±2, ±4kV (Indirect & Direct )
Number of Discharge: Air – Direct: 10 discharges per location (each polarity)
Contact – Direct & Indirect: 25 discharges per location (each polarity) and
min. 200 times in total
Discharge Mode: Single Discharge
Discharge Period: 1-second minimum
12.2 Test Instruments
Description & Manufacturer Model No. Serial No. Cal. Date Cal. Due
KeyTek, ESD Simulator MZ-15/EC 0504259 Nov. 6, 2020 Nov. 5, 2021
Note: 1. The calibration interval of the above test instruments is 12 months and the calibrations are
traceable to NML/ROC and NIST/USA.
2. The test was performed in ESD Room No. 1.
3. Tested Date: Dec. 23, 2020
12.3 Test Arrangement
The discharges shall be applied in two ways:
a. Contact discharges to the conductive surfaces and coupling planes:
The EUT shall be exposed to at least 200 discharges, 100 each at negative and positive polarity, at a
minimum of four test points. One of the test points shall be subjected to at least 50 indirect discharges
to the center of the front edge of the horizontal coupling plane. The remaining three test points shall
each receive at least 50 direct contact discharges. If no direct contact test points are available, then at
least 200 indirect discharges shall be applied in the indirect mode. Test shall be performed at a
maximum repetition rate of one discharge per second.
b. Air discharges at slots and apertures and insulating surfaces:
On those parts of the EUT where it is not possible to perform contact discharge testing, the equipment
should be investigated to identify user accessible points where breakdown may occur. Such points are
tested using the air discharge method. This investigation should be restricted to those area normally
handled by the user. A minimum of 10 single air discharges shall be applied to the selected test point
for each such area.

Report No.: CEBDBO-WTW-P20120314 Page No. 43 / 78 Report Format Version: 6.1.3
The basic test procedure was in accordance with EN/IEC 61000-4-2:
a. Electrostatic discharges were applied only to those points and surfaces of the EUT that are accessible
to users during normal operation.
b. The test was performed with at least ten single discharges on the pre-selected points in the most
sensitive polarity.
c. The time interval between two successive single discharges was at least 1 second.
d. The ESD generator was held perpendicularly to the surface to which the discharge was applied and
the return cable was at least 0.2 meters from the EUT.
e. Contact discharges were applied to the non-insulating coating, with the pointed tip of the generator
penetrating the coating and contacting the conducting substrate.
f. Air discharges were applied with the round discharge tip of the discharge electrode approaching the
EUT as fast as possible (without causing mechanical damage) to touch the EUT. After each discharge,
the ESD generator was removed from the EUT and re-triggered for a new single discharge. The test
was repeated until all discharges were complete.
g. At least ten single discharges (in the most sensitive polarity) were applied to the Horizontal Coupling
Plane at points on each side of the EUT. The ESD generator was positioned at a distance of 0.1
meters from the EUT with the discharge electrode touching the HCP.
h. At least ten single discharges (in the most sensitive polarity) were applied to the center of one vertical
edge of the Vertical Coupling Plane in sufficiently different positions that the four faces of the EUT
were completely illuminated. The VCP (dimensions 0.5m x 0.5m) was placed vertically to and 0.1
meters from the EUT.
PS
EUT
Vertical coupling plane
0.5mm Isolation Support
Ground Reference Plane
>1m
470k
x4
0.1m
80cm
ESD Generator
Horizontal coupling plane
Nearest Wall
TABLE-TOP EQUIPMENT
The configuration consisted of a wooden table 0.8 meters high standing on the Ground Reference Plane. The
GRP consisted of a sheet of aluminum at least 0.25mm thick, and 2.5 meters square connected to the
protective grounding system. A Horizontal Coupling Plane (1.6m x 0.8m) was placed on the table and
attached to the GRP by means of a cable with 940k total impedance. The equipment under test, was
installed in a representative system as described in section 7 of
EN/IEC 61000-4-2, and its cables were placed on the HCP and isolated by an insulating support of 0.5mm
thickness. A distance of 1-meter minimum was provided between the EUT and the walls of the laboratory and
any other metallic structure.
For the actual test configuration, please refer to the related item – Photographs of the Test Configuration.
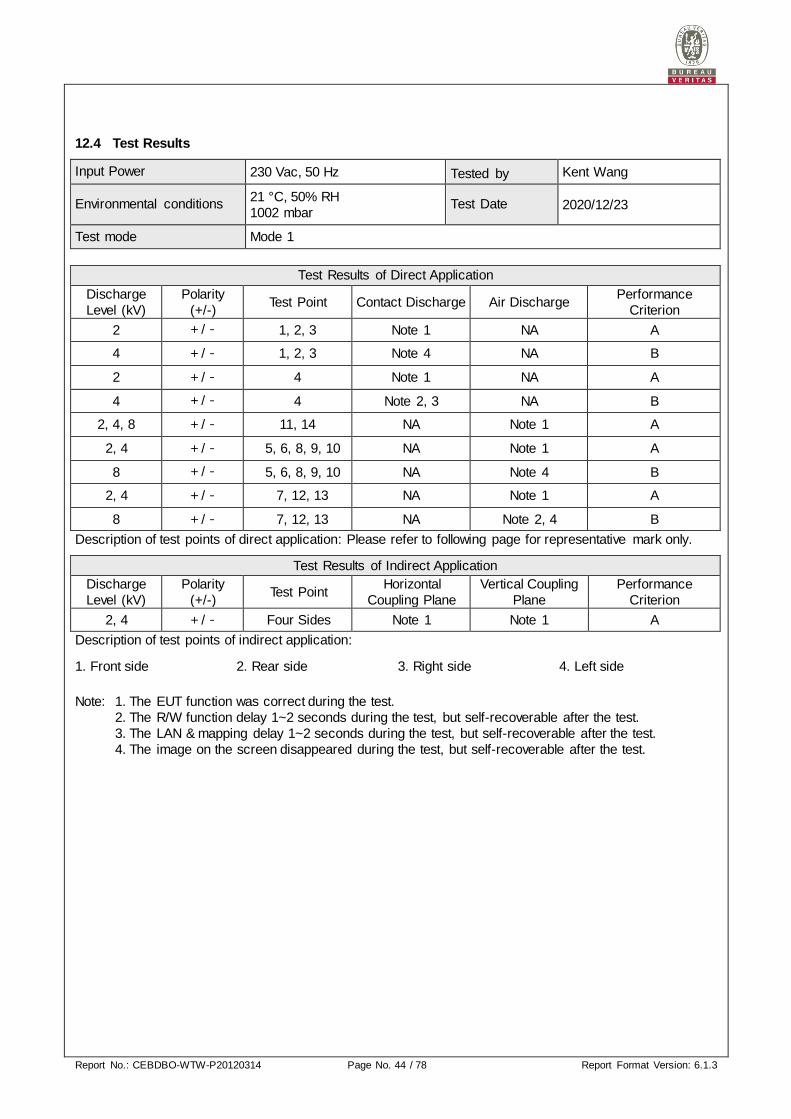
Report No.: CEBDBO-WTW-P20120314 Page No. 44 / 78 Report Format Version: 6.1.3
12.4 Test Results
Input Power 230 Vac, 50 Hz Tested by Kent Wang
Environmental conditions 21 °C, 50% RH
1002 mbar Test Date 2020/12/23
Test mode Mode 1
Test Results of Direct Application
Discharge
Level (kV)
Polarity
(+/-) Test Point Contact Discharge Air Discharge
Performance
Criterion
2 +/- 1, 2, 3 Note 1 NA A
4 +/- 1, 2, 3 Note 4 NA B
2 +/- 4 Note 1 NA A
4 +/- 4 Note 2, 3 NA B
2, 4, 8 +/- 11, 14 NA Note 1 A
2, 4 +/- 5, 6, 8, 9, 10 NA Note 1 A
8 +/- 5, 6, 8, 9, 10 NA Note 4 B
2, 4 +/- 7, 12, 13 NA Note 1 A
8 +/- 7, 12, 13 NA Note 2, 4 B
Description of test points of direct application: Please refer to following page for representative mark only.
Test Results of Indirect Application
Discharge
Level (kV)
Polarity
(+/-) Test Point
Horizontal
Coupling Plane
Vertical Coupling
Plane
Performance
Criterion
2, 4 +/- Four Sides Note 1 Note 1 A
Description of test points of indirect application:
1. Front side 2. Rear side 3. Right side 4. Left side
Note: 1. The EUT function was correct during the test.
2. The R/W function delay 1~2 seconds during the test, but self-recoverable after the test.
3. The LAN & mapping delay 1~2 seconds during the test, but self-recoverable after the test.
4. The image on the screen disappeared during the test, but self-recoverable after the test.
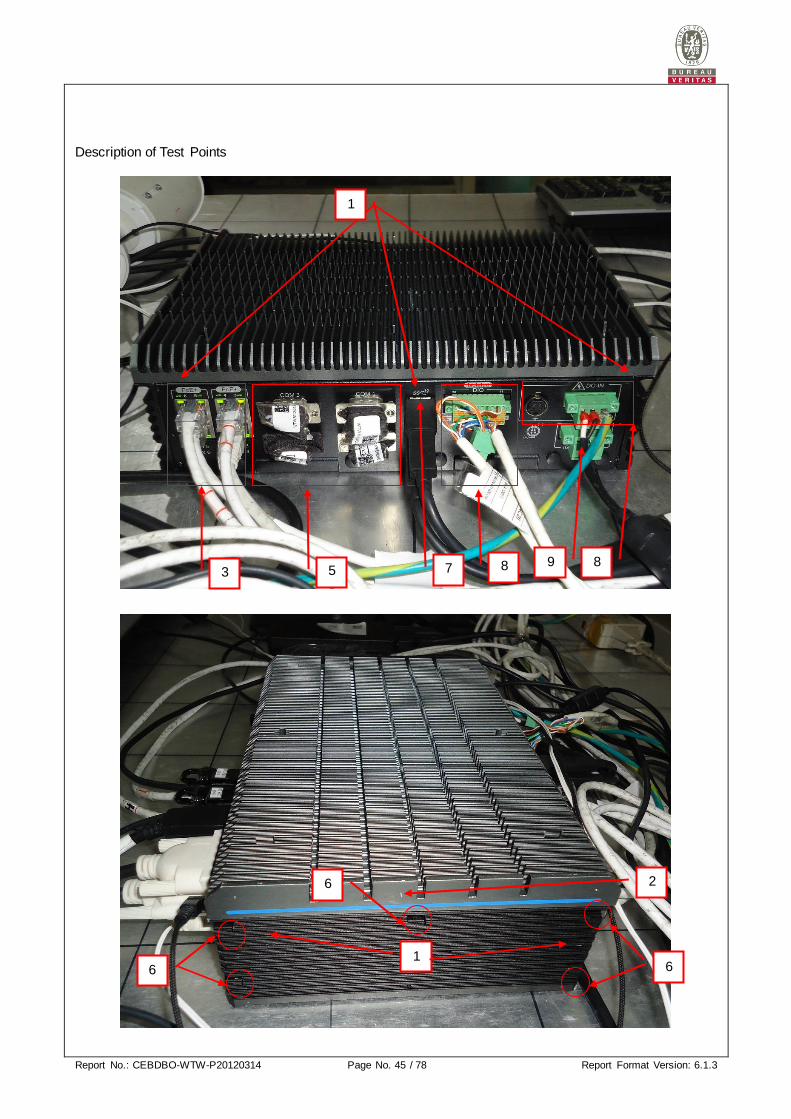
Report No.: CEBDBO-WTW-P20120314 Page No. 45 / 78 Report Format Version: 6.1.3
Description of Test Points
8
2
9 8 7 5 3
1
1 6
6
6

Report No.: CEBDBO-WTW-P20120314 Page No. 46 / 78 Report Format Version: 6.1.3
6
13 12 3 11 4
1
10
1
1
6

Report No.: CEBDBO-WTW-P20120314 Page No. 47 / 78 Report Format Version: 6.1.3
1
14
6
6

Report No.: CEBDBO-WTW-P20120314 Page No. 48 / 78 Report Format Version: 6.1.3
13 Radiated, Radio-frequency, Electromagnetic Field Immunity Test (RS)
13.1 Test Specification
Basic Standard: EN/IEC 61000-4-3
Frequency Range: 80 MHz - 1000 MHz
Field Strength: 3 V/m,
Modulation: 1kHz Sine Wave, 80%, AM Modulation
Frequency Step: 1 % of preceding frequency value
Polarity of Antenna: Horizontal and Vertical
Antenna Height: 1.5m
Dwell Time: 3 seconds
13.2 Test Instruments
Description & Manufacturer Model No. Serial No. Cal. Date Cal. Due
AgilentSignal Generator E8257D MY48050465 Jun. 8, 2020 Jun. 7, 2021
BONN
RF Amplifier BSA 0125-800 1912556 NA NA
TESTQAmplifier CBA 1G-275 T44344 NA NA
AR RF Amplifier 35S4G8AM4 0326094 NA NA
AR RF Amplifier 100S1G4M3 0329249 NA NA
AR Controller SC1000M3 305910 NA NA
ARLog-Periodic Antenna AT6080 0329465 NA NA
BOONTON
RF Voltage Meter 4232A 10180 May 29, 2020 May 28, 2021
BOONTON Power Sensor 51011-EMC 34152 May 29, 2020 May 28, 2021
BOONTON Power Sensor 51011-EMC 34153 May 29, 2020 May 28, 2021
EMCO BiconiLog Antenna 3141 1001 NA NA
ARHigh Gain Antenna AT4010 0329800 NA NA
SchwarzbeckLOG ANTENNA Stlp 9149 9149-260 NA NA
CHANCE MOST
Full Anechoic
Chamber (9x5x3m)
Chance Most RS-002 Feb. 5, 2020 Feb. 4, 2021
Software RS_V7.6 NA NA NA
Note: 1. The calibration interval of the above test instruments is 12 months and the calibrations are
traceable to NML/ROC and NIST/USA.
2. The test was performed in RS Room No.2.
3. The transmit antenna was located at a distance of 3 meters from the EUT.
4. Tested Date: Dec. 22., 2020

Report No.: CEBDBO-WTW-P20120314 Page No. 49 / 78 Report Format Version: 6.1.3
13.3 Test Arrangement
The test procedure was in accordance with EN/IEC 61000-4-3.
a. The testing was performed in a fully anechoic chamber.
b. The frequency range is swept from 80 MHz to 1000 MHz, with the signal 80% amplitude modulated with
a 1kHz sine wave.
c. The field strength level was 3 V/m.
d. The test was performed with the EUT exposed to both vertically and horizontally polarized fields on each
of the four sides.
Table-top Equipment
The EUT installed in a representative system as described in section 7 of EN/IEC 61000-4-3 was placed on a
non-conductive table 0.8 meters in height. The system under test was connected to the power and signal wire
according to relevant installation instructions.
For the actual test configuration, please refer to the related item – Photographs of the Test Configuration.
EUT
RF Amplifier
RF Generator and control system
Monitoring system

Report No.: CEBDBO-WTW-P20120314 Page No. 50 / 78 Report Format Version: 6.1.3
13.4 Test Results
Input Power 230 Vac, 50 Hz Tested by Thomas Cheng
Environmental conditions 18 °C, 66% RH Test Date 2020/12/22
Test mode Mode 1
Frequency (MHz) Polarity Azimuth(°) Applied Field Strength
Observation Performance
Criterion (V/m) Modulation
80 -1000 V&H 0 3 80% AM (1kHz) Note A
80 -1000 V&H 90 3 80% AM (1kHz) Note A
80 -1000 V&H 180 3 80% AM (1kHz) Note A
80 -1000 V&H 270 3 80% AM (1kHz) Note A
Note: The EUT function was correct during the test.

Report No.: CEBDBO-WTW-P20120314 Page No. 51 / 78 Report Format Version: 6.1.3
14 Electrical Fast Transient/Burst Immunity Test (EFT)
14.1 Test Specification
Basic Standard: EN/IEC 61000-4-4
Test Voltage: Signal / telecommunication port: ±0.5kV
Input DC power port:N/A
Input AC power port: ±1kV
Impulse Repetition Frequency: xDSL telecommunication port: 100kHz
others: 5kHz
Impulse Wave Shape: 5/50 ns
Burst Duration: 0.75 ms for 100kHz Repetition Frequency
15 ms for 5kHz Repetition Frequency
Burst Period: 300 ms
Test Duration: 1 min.
14.2 Test Instruments
Description & Manufacturer Model No. Serial No. Cal. Date Cal. Due
TESEQ, EFT Simulator NSG 3060 1572 May 12, 2020 May 11, 2021
TESEQ, CDN CDN 3083-B100 303 May 12, 2020 May 11, 2021
Haefely,Capacitive Clamp IP4A 155173 Apr. 20, 2020 Apr. 19, 2021
Note: 1. The calibration interval of the above test instruments is 12 months and the calibrations are
traceable to NML/ROC and NIST/USA.
2. The test was performed in EMS Room No. 2.
3. Tested Date: Dec. 25, 2020

Report No.: CEBDBO-WTW-P20120314 Page No. 52 / 78 Report Format Version: 6.1.3
14.3 Test Arrangement
a. Both positive and negative polarity discharges were applied.
b. The distance between any coupling devices and the EUT should be 0.5 m for table-top equipment testing,
and 1.0 m for floor standing equipment.
c. The duration time of each test sequential was 1 minute.
d. The transient/burst waveform was in accordance with EN/IEC 61000-4-4, 5/50 ns.
NOTE:
(A) location for supply line coupling
(B) location for signal lines coupling
For the actual test configuration, please refer to the related item – Photographs of the Test Configuration.

Report No.: CEBDBO-WTW-P20120314 Page No. 53 / 78 Report Format Version: 6.1.3
14.4 Test Results
Input Power 230 Vac, 50 Hz Tested by Thomas Cheng
Environmental conditions 18 °C, 62% RH Test Date 2020/12/25
Test mode Mode 1
Input AC power port
Voltage (kV) Test Point Polarity (+/-) Observation Performance Criterion
1 L1 +/- Note A
1 L2 +/- Note A
1 PE +/- Note A
1 L1-L2-PE +/- Note A
Signal / telecommunication port
Voltage (kV) Test Point Polarity (+/-) Observation Performance Criterion
0.5 LAN 1 +/- Note A
0.5 LAN 2 +/- Note A
0.5 POE LAN 5 +/- Note A
Note: The EUT function was correct during the test.
2. USB link preview image stop during the test, but could self-recover after the test.
The R/W function was delayed 1-3 seconds during the test, but could self-recover after the test.

Report No.: CEBDBO-WTW-P20120314 Page No. 54 / 78 Report Format Version: 6.1.3
15 Surge Immunity Test
15.1 Test Specification
Basic Standard: EN/IEC 61000-4-5
Wave-Shape: Signal / telecommunication port (direct to outdoor cables*): 10/700 μs Open Circuit Voltage 5/320 μs Short Circuit Current
Input DC power port (direct to outdoor cables*): 1.2/50 μs Open Circuit Voltage 8/20 μs Short Circuit Current
Input AC power port: 1.2/50 μs Open Circuit Voltage 8/20 μs Short Circuit Current
Test Voltage: Signal and telecommunication ports**: w/o primary protectors: N/A with primary protectors fitted: N/A
Input DC power port: Line to earth or ground: N/A
Input AC power ports: Line to line: ±0.5kV, ±1kV, Line to earth or ground: ±0.5kV, ±1kV, ±2kV
AC Phase Angle (degree): 0, 90, 180, 270
Pulse Repetition Rate: 1 time / 20 sec.
Number of Tests: 5 positive and 5 negative at selected points
* This test is only applicable only to ports, which according to the manufacturer's specification, may connect directly to outdoor cables.
** For ports where primary protection is intended, surges are applied at voltages up to 4 kV with the primary
protectors fitted. Otherwise the 1 kV test level is applied without primary protection in place.
15.2 Test Instruments
Description & Manufacturer Model No. Serial No. Cal. Date Cal. Due
TESEQ, Surge Simulator NSG 3060 1572 May 12, 2020 May 11, 2021
Coupling Decoupling Network CDN-UTP8 045 Aug. 18, 2020 Aug. 17, 2021
TESEQ Coupling Decoupling Network CDN HSS-2 41009 May 12, 2020 May 11, 2021
TESEQ Coupling Decoupling Network CDN 118-T8 40386 Sep. 8, 2020 Sep. 7, 2021
TESEQ CDN for Unshielded Unsymmetrical
Signal & Data Lines CDN117 40144 Sep. 8, 2020 Sep. 7, 2021
Note: 1. The calibration interval of the above test instruments is 12 months and the calibrations are
traceable to NML/ROC and NIST/USA.
2. The test was performed in EMS Room No. 2.
3. Tested Date: Dec. 25, 2020

Report No.: CEBDBO-WTW-P20120314 Page No. 55 / 78 Report Format Version: 6.1.3
15.3 Test Arrangement
a. Input AC/DC Power ports:
The surge shall be applied to the EUT power supply terminals via the capacitive coupling network.
Decoupling networks are required in order to avoid possible adverse effects on equipment not under test
that may be powered by the same lines and to provide sufficient decoupling impedance to the surge
wave. The power cord between the EUT and the coupling network shall not exceed 2 meters in length.
For double-insulated products without PE or external earth connections, the test shall be done in a
similar way as for grounded products but without adding any additional external grounded connections. If
there are no other possible connections to earth, line-to-ground tests may be omitted.
b. Signal and telecommunication ports,
Unshielded unsymmetrical interconnection lines:
The coupling / decoupling networks shall not influence the specified functional conditions of the EUT. The
interconnection line between the EUT and the coupling network shall not exceed 2 meters in length.
Unshielded symmetrical interconnection lines:
For symmetrical interconnection lines and high-speed interconnection lines, the CDN shall be selected to
match the number of lines/pairs existing in the cable. If coupling arrestors are use, test levels below the
ignition point of the coupling arrestor cannot be specified.
The interconnection line between the EUT and the coupling/decoupling networks shall not exceed 2
meters in length.
In order to avoid the coupling and decoupling capacitors having a filtering effect on the data transfer, a
balanced high frequency design associating the coupling capacitors with coupling chokes is required.
Where normal functioning of high speed communications lines cannot be achieved because of the
impact of the CDN on the EUT, product committees should specify appropriate operation or that no surge
immunity test is required.
Shielded lines:
The EUT is isolated from ground and the surge is applied to its metallic enclosure; the termination (or
auxiliary equipment) at the port(s) under test is grounded. This test applies to equipment with one or
more shielded cables.
The length of the cable between the port(s) under test and the device attached to the other end of the
cable shall be:
– 20 m (preferred length) or,
– the shortest length over 10 m, where the manufacturer provides pre-assembled cables used in actual
installations.
No test shall be required for cables which according to the manufacturer’s specification are ≤ 10 m.
Rules for application of the surge to shielded lines:
a) Shields grounded at both ends: – the test shall be carried out.
The test level is applied on shields with a 2 Ω generator source impedance and with the 18 μF capacitor.
b) Shields grounded at one end: – the test shall be carried out according to unshielded unsymmetrical interconnection lines or
unshielded symmetrical interconnection lines because the shield does not provide any protection
against surges induced by magnetic fields.
For EUTs which do not have metallic enclosures, the surge is applied directly to the shielded cable at the
EUT side.

Report No.: CEBDBO-WTW-P20120314 Page No. 56 / 78 Report Format Version: 6.1.3
For the actual test configuration, please refer to the related item – Photographs of the Test Configuration.
15.4 Test Results
Input Power 230 Vac, 50 Hz Tested by Thomas Cheng
Environmental conditions 18 °C, 62% RH Test Date 2020/12/25
Test mode Mode 1
Input AC power port
Voltage (kV) Test Point Polarity (+/-) Observation Performance Criterion
0.5, 1 L1-L2 +/- Note A
0.5, 1, 2 L1-PE +/- Note A
0.5, 1, 2 L2-PE +/- Note A
Note: The EUT function was correct during the test.
EUT
Combination
Wave Generator
Coupling &
Decoupong
Network L ≦ 2m

Report No.: CEBDBO-WTW-P20120314 Page No. 57 / 78 Report Format Version: 6.1.3
16 Immunity to Conducted Disturbances Induced by RF Fields (CS)
16.1 Test Specification
Basic Standard: EN/IEC 61000-4-6
Frequency Range: 0.15 MHz - 80 MHz
Voltage Level: 3 V
Modulation: 1kHz Sine Wave, 80%, AM Modulation
Frequency Step: 1 % of preceding frequency value
Dwell Time 3 seconds

Report No.: CEBDBO-WTW-P20120314 Page No. 58 / 78 Report Format Version: 6.1.3
16.2 Test Instruments
Description & Manufacturer Model No. Serial No. Cal. Date Cal. Due
ROHDE & SCHWARZ
Signal Generator SML03 101801 Jan. 17, 2020 Jan. 16, 2021
Digital Sweep Function Generator 8120 984801 NA NA
AR Power Amplifier 75A250AM1 306331 NA NA
FCC Coupling Decoupling Network FCC-801-M2-16A 01047 Jun. 18, 2020 Jun. 17, 2021
FISCHER CUSTOM
COMMUNICATIONS
EM Injection Clamp
F-203I-23mm 455 NA NA
FISCHER CUSTOM
COMMUNICATIONS
Current Injection Clamp
F-120-9A 361 Jul. 30, 2020 Jul. 29, 2021
B&K Ear Simulator 4185 2553594 NA NA
EM TEST Coupling
Decoupling Network CDN M1/32A 306508 Jun. 18, 2020 Jun. 17, 2021
TESEQ Coupling Decoupling Network CDN T800 34428 Jun. 18, 2020 Jun. 17, 2021
TESEQ Coupling Decoupling Network CDN T800 29459 Jun. 18, 2020 Jun. 17, 2021
TESEQ Coupling Decoupling Network CDN T8-230 56641 Feb. 26, 2020 Feb. 25, 2021
TESEQ Coupling Decoupling Network CDN T8-230 56642 Feb. 26, 2020 Feb. 25, 2021
R&S Power Sensor NRV-Z5 837878/039 Nov. 10, 2020 Nov. 9, 2021
R&S Power Meter NRVD 837794/040 Nov. 10, 2020 Nov. 9, 2021
TESEQ Coupling Decoupling Network CDN M232 37702 Jun. 18, 2020 Jun. 17, 2021
TESEQ Coupling Decoupling Network CDN M332 41258 Jun. 18, 2020 Jun. 17, 2021
TESEQ Coupling Decoupling Network CDN M332 41256 Jun. 18, 2020 Jun. 17, 2021
TESEQ Coupling Decoupling Network CDN T8-10 40376 Jun. 18, 2020 Jun. 17, 2021
TESEQ Coupling Decoupling Network CDN T8-230 56643 Feb. 26, 2020 Feb. 25, 2021
TESEQ Coupling Decoupling Network CDN S200 53490 May 27, 2020 May 26, 2021
TESEQ Coupling Decoupling Network CDN S400 52115 Jun. 18, 2020 Jun. 17, 2021
TESEQ Coupling Decoupling Network CDN T400A 49918 Feb. 26, 2020 Feb. 25, 2021
FCC Coupling Decoupling Network FCC-801-M5-50A 100018 Jan. 20, 2020 Jan. 19, 2021
TESEQ Coupling Decoupling Network CDN T2A-10 54942 Feb. 26, 2020 Feb. 25, 2021
TESEQ Coupling Decoupling Network CDN S751A 56435 Feb. 26, 2020 Feb. 25, 2021
TESEQ Coupling Decoupling Network CDN ST08A 56527 Feb. 26, 2020 Feb. 25, 2021
TESEQ Coupling Decoupling Network CDN ST08A 56525 Feb. 26, 2020 Feb. 25, 2021
TESEQ Coupling Decoupling Network CDN M432S 56519 Feb. 26, 2020 Feb. 25, 2021
TESEQ Coupling Decoupling Network CDN S751A 56436 Apr. 13, 2020 Apr. 12, 2021
Software CS_V7.4.2 NA NA NA
Note: 1. The calibration interval of the above test instruments is 12 months and the calibrations are
traceable to NML/ROC and NIST/USA.
2. The test was performed in CS Room No. 1.
3. Tested Date: Dec. 23, 2020

Report No.: CEBDBO-WTW-P20120314 Page No. 59 / 78 Report Format Version: 6.1.3
16.3 Test Arrangement
a. The EUT shall be tested within its intended operating and climatic conditions.
b. An artificial hand was placed on the hand-held accessory and connected to the ground reference plane.
c. One of the CDNs not used for injection was terminated with 50 ohm, providing only one return path. All
other CDNs were coupled as decoupling networks.
d. The frequency range is swept from 150 kHz to 80 MHz, using the signal level established during the
setting process and with a disturbance signal of 80 % amplitude. The signal is modulated with a 1 kHz
sine wave, pausing to adjust the RF signal level or the switch coupling devices as necessary. Where the
frequency is swept incrementally, the step size shall not exceed 1 % of the preceding frequency value.
e. Attempts should be made to fully exercise the EUT during testing, and to fully interrogate all exercise
modes selected for susceptibility.
Note: 1.The EUT clearance from any metallic obstacles shall be at least 0,5 m.
2. Interconnecting cables (≦1 m) belonging to the EUT shall remain on the insulating support.
3. The equipment to be tested is placed on an insulating support of 0.1 meters height above a ground
reference plane. All relevant cables shall be provided with the appropriate coupling and decoupling
devices at a distance between 0.1 meters and 0.3 meters from the projected geometry of the EUT on
the ground reference plane.
For the actual test configuration, please refer to the related item – Photographs of the Test Configuration.

Report No.: CEBDBO-WTW-P20120314 Page No. 60 / 78 Report Format Version: 6.1.3
16.4 Test Results
Input Power 230 Vac, 50 Hz Tested by Thomas Cheng
Environmental conditions 19 °C, 62% RH Test Date 2020/12/23
Test mode Mode 1
Frequency
(MHz)
Level
(Vrms) Tested Line
Injection
Method Return Path Observation
Performance
Criterion
0.15 – 80 3 AC Power CDN-M3 CDN-M1 Note A
0.15 – 80 3 LAN 1 CDN-ST08A CDN-M1 Note A
0.15 – 80 3 LAN 2 CDN-ST08A CDN-M1 Note A
0.15 – 80 3 POE LAN 5 CDN-T8-10 CDN-M1 Note A
Note: The EUT function was correct during the test.

Report No.: CEBDBO-WTW-P20120314 Page No. 61 / 78 Report Format Version: 6.1.3
17 Power Frequency Magnetic Field Immunity Test
17.1 Test Specification
Basic Standard: EN/IEC 61000-4-8
Frequency Range: 50Hz
Field Strength: 1 A/m
Observation Time: 1 minute
Inductance Coil: Rectangular type, 1 m x 1 m
17.2 Test Instruments
Description & Manufacturer Model No. Serial No. Cal. Date Cal. Due
HAEFELY Magnetic Field Tester MAG 100 083794-06 NA NA
COMBINOVA Magnetic Field Meter MFM10 224 May 7, 2020 May 6, 2021
Note: 1. The calibration interval of the above test instruments is 12 months and the calibrations are
traceable to NML/ROC and NIST/USA.
2. The test was performed in EMS Room No. 1
3. Tested Date: Dec. 31, 2020
17.3 Test Arrangement
a. The equipment is configured and connected to satisfy its functional requirements.
b. The power supply, input and output circuits shall be connected to the sources of power supply, control and signal.
c. The cables supplied or recommended by the equipment manufacturer shall be used. 1 meter of all cables used shall be exposed to the magnetic field.
TABLETOP EQUIPMENT
The equipment shall be subjected to the test magnetic field by using the induction coil of standard dimension
(1 m x 1 m). The induction coil shall then be rotated by 90 degrees in order to expose the EUT to the test field
with different orientations.
For the actual test configuration, please refer to the related item – Photographs of the Test Configuration.

Report No.: CEBDBO-WTW-P20120314 Page No. 62 / 78 Report Format Version: 6.1.3
17.4 Test Results
Input Power 230 Vac, 50 Hz Tested by Kent Wang
Environmental conditions 17 °C, 66% RH Test Date 2020/12/31
Test mode Mode 1
Application Frequency (Hz) Field Strength (A/m) Observation Performance Criterion
X - Axis 50 1 Note A
Y - Axis 50 1 Note A
Z - Axis 50 1 Note A
Note: The EUT function was correct during the test.

Report No.: CEBDBO-WTW-P20120314 Page No. 63 / 78 Report Format Version: 6.1.3
18 Voltage Dips and Interruptions
18.1 Test Specification
Basic Standard: EN/IEC 61000-4-11
Test levels: Voltage Dips:
>95% reduction – 0.5 period
30% reduction – 25 periods
Voltage Interruptions:
>95% reduction – 250 periods
Interval between Event: Minimum ten seconds
Sync Angle (degrees): 0° / 180°
Test Cycle: 3 times
18.2 Test Instruments
Description & Manufacturer Model No. Serial No. Cal. Date Cal. Due
Teseq Immunity Test System Profline 2105 1632A00983 &
1639A01863 Jun. 9, 2020 Jun. 8, 2021
Software WIN2120 NA NA NA
Note: 1. The calibration interval of the above test instruments is 12 months and the calibrations are
traceable to NML/ROC and NIST/USA.
2. The test was performed in EMS Room No. 1.
3. Tested Date: Dec. 31, 2020.
18.3 Test Arrangement
The EUT shall be tested for each selected combination of test levels and duration with a sequence of 3
dips/interruptions with intervals of 10 s minimum (between each test event). Each representative mode of
operation shall be tested. Abrupt changes in supply voltage shall occur at 0 degree crossover point of the
voltage waveform.
EUTVoltage Dips Generator AC Power Line
For the actual test configuration, please refer to the related item – Photographs of the Test Configuration.

Report No.: CEBDBO-WTW-P20120314 Page No. 64 / 78 Report Format Version: 6.1.3
18.4 Test Results
Input Power
230 Vac, 50 Hz
240 Vac, 50 Hz
100 Vac, 50 Hz
Tested by Kent Wang
Environmental Conditions 17°C, 66% RH Test Date 2020/12/31
Test mode Mode 1
Input Power for testing: 230 Vac, 50 Hz (Nominal input Voltage)
Voltage Reduction
(%)
Duration
(period) Interval (sec) Times Observation
Performance
Criterion
>95 0.5 10 3 Note 1 A
30 25 10 3 Note 1 A
>95 250 10 3 Note 2 C
Input Power for testing: 240 Vac, 50 Hz (Maximum rated input voltage)
Voltage Reduction
(%)
Duration
(period) Interval (sec) Times Observation
Performance
Criterion
>95 0.5 10 3 Note 1 A
30 25 10 3 Note 1 A
>95 250 10 3 Note 2 C
Input Power for testing: 100 Vac, 50 Hz (Minimum rated input voltage)
Voltage Reduction
(%)
Duration
(period) Interval (sec) Times Observation
Performance
Criterion
>95 0.5 10 3 Note 1 A
30 25 10 3 Note 1 A
>95 250 10 3 Note 2 C
Note: 1. The EUT function was correct during the test.
2. The EUT shutdown during the test, and must be recovered manually.

Report No.: CEBDBO-WTW-P20120314 Page No. 65 / 78 Report Format Version: 6.1.3
19 Pictures of Test Arrangements
19.1 Conducted Emission from the AC Mains Power Port

Report No.: CEBDBO-WTW-P20120314 Page No. 66 / 78 Report Format Version: 6.1.3
19.2 Asymmetric Mode Conducted Emission at Telecommunication Ports
LAN Port

Report No.: CEBDBO-WTW-P20120314 Page No. 67 / 78 Report Format Version: 6.1.3
PoE LAN Port
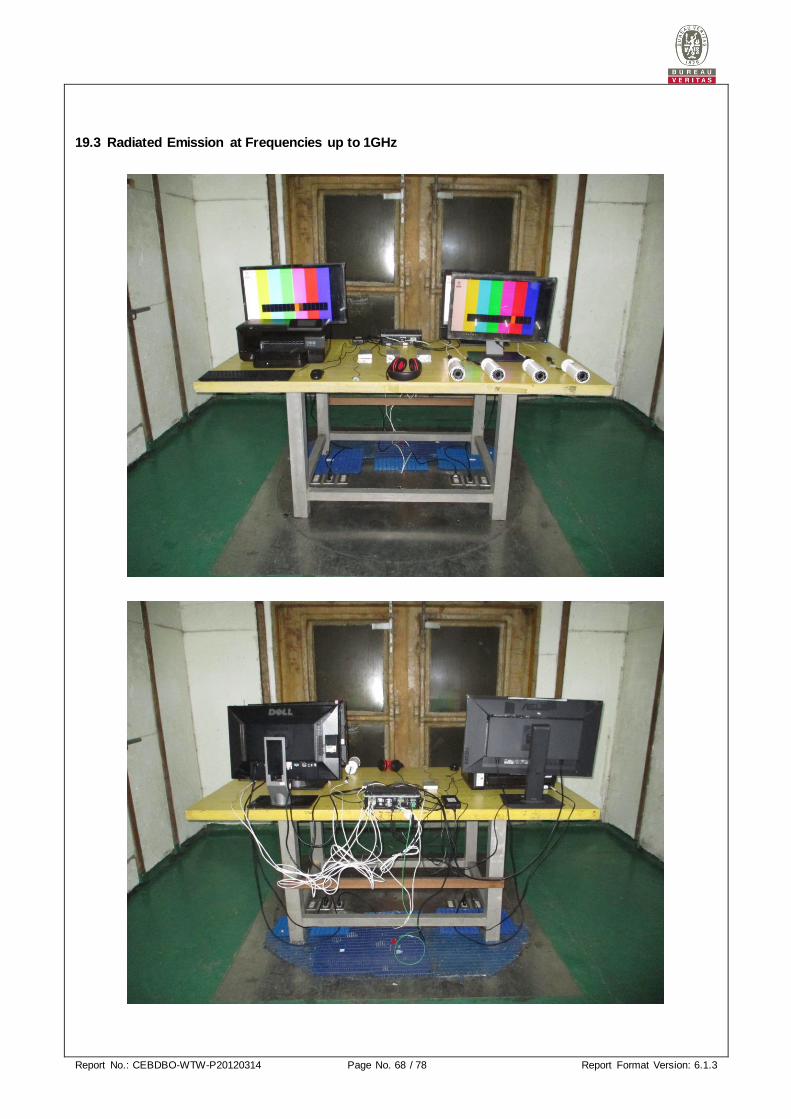
Report No.: CEBDBO-WTW-P20120314 Page No. 68 / 78 Report Format Version: 6.1.3
19.3 Radiated Emission at Frequencies up to 1GHz
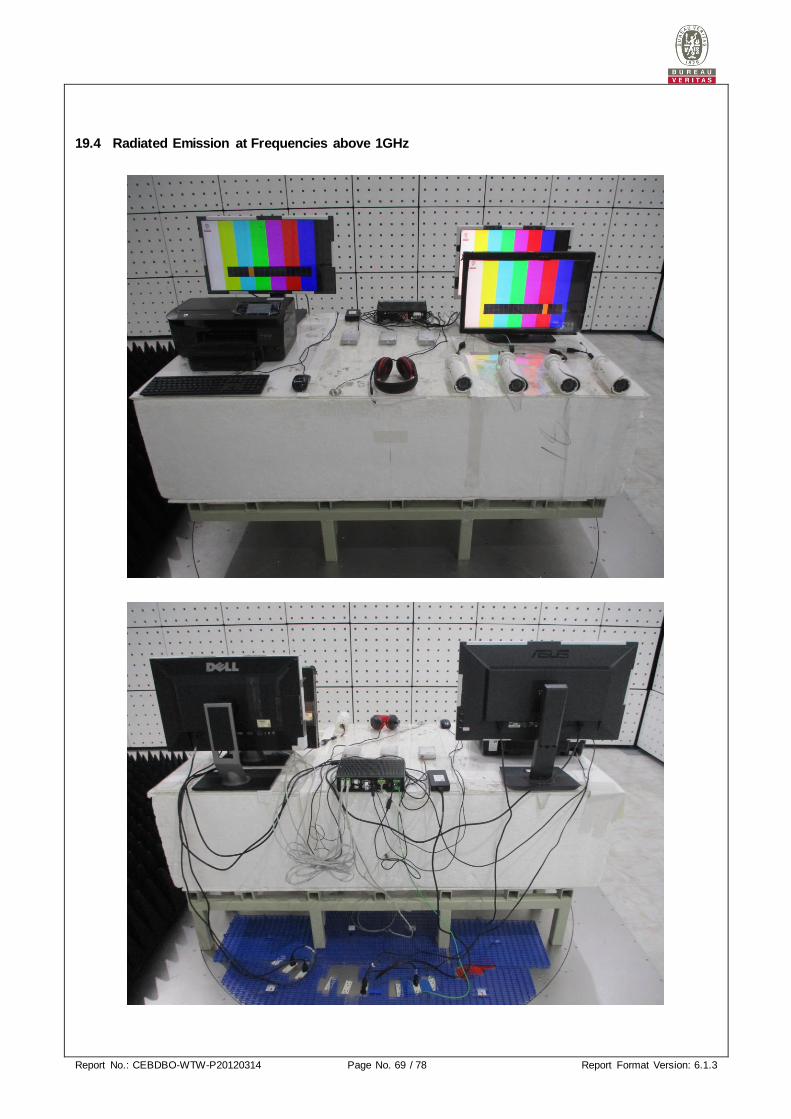
Report No.: CEBDBO-WTW-P20120314 Page No. 69 / 78 Report Format Version: 6.1.3
19.4 Radiated Emission at Frequencies above 1GHz
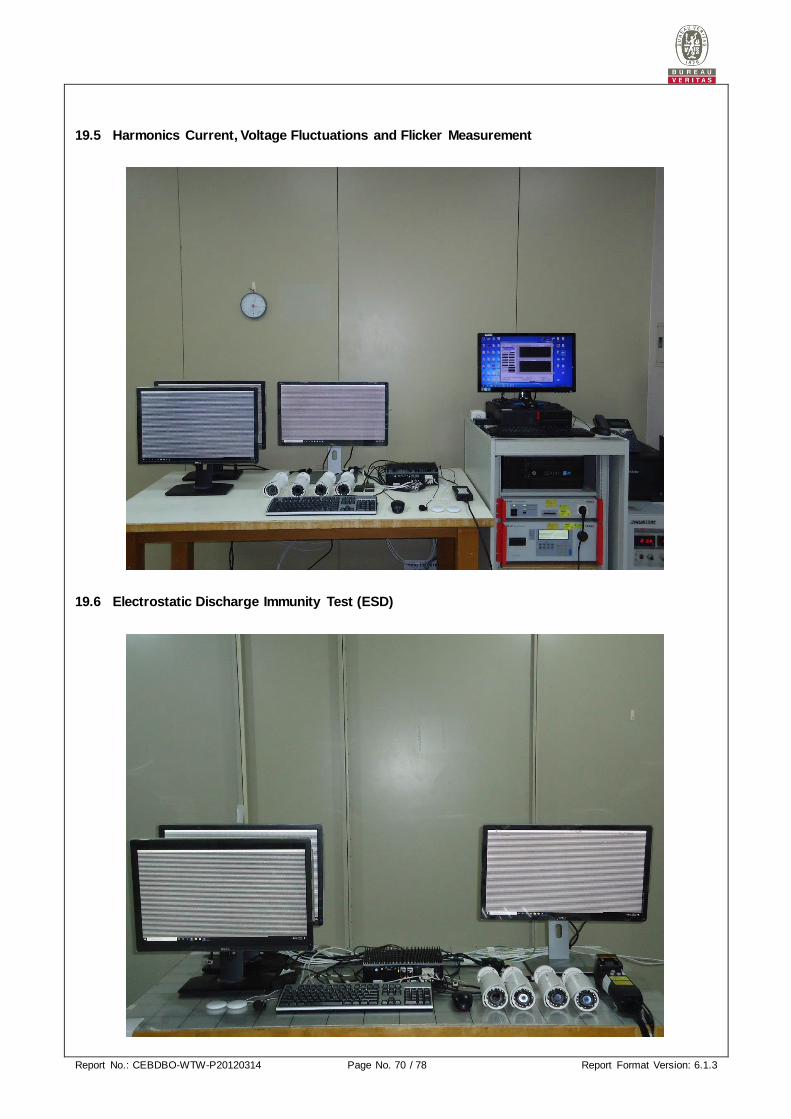
Report No.: CEBDBO-WTW-P20120314 Page No. 70 / 78 Report Format Version: 6.1.3
19.5 Harmonics Current, Voltage Fluctuations and Flicker Measurement
19.6 Electrostatic Discharge Immunity Test (ESD)

Report No.: CEBDBO-WTW-P20120314 Page No. 71 / 78 Report Format Version: 6.1.3
19.7 Radio-frequency, Electromagnetic Field Immunity Test (RS)

Report No.: CEBDBO-WTW-P20120314 Page No. 72 / 78 Report Format Version: 6.1.3
19.8 Electrical Fast Transient/Burst Immunity Test (EFT)
Mains port
Signal ports – LAN 1, 2

Report No.: CEBDBO-WTW-P20120314 Page No. 73 / 78 Report Format Version: 6.1.3
Signal ports – PoE LAN

Report No.: CEBDBO-WTW-P20120314 Page No. 74 / 78 Report Format Version: 6.1.3
19.9 Surge Immunity Test
Mains port
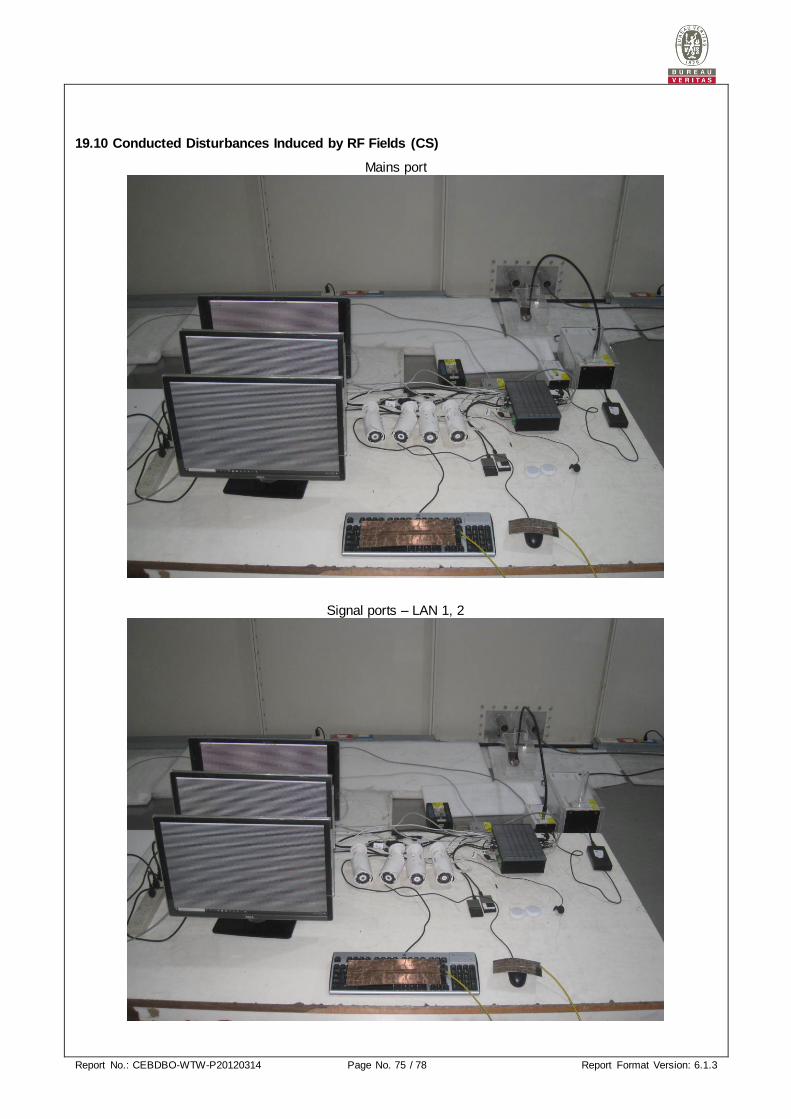
Report No.: CEBDBO-WTW-P20120314 Page No. 75 / 78 Report Format Version: 6.1.3
19.10 Conducted Disturbances Induced by RF Fields (CS)
Mains port
Signal ports – LAN 1, 2

Report No.: CEBDBO-WTW-P20120314 Page No. 76 / 78 Report Format Version: 6.1.3
Signal ports – PoE LAN

Report No.: CEBDBO-WTW-P20120314 Page No. 77 / 78 Report Format Version: 6.1.3
19.11 Power Frequency Magnetic Field Immunity Test (PFMF)
19.12 Voltage Dips and Interruptions
Report No.: CEBDBO-WTW-P20120314 Page No. 78 / 78 Report Format Version: 6.1.3
Appendix – Information of the Testing Laboratories
We, Bureau Veritas Consumer Products Services (H.K.) Ltd., Taoyuan Branch, were founded in 1988 to
provide our best service in EMC, Radio, Telecom and Safety consultation. Our laboratories are accredited and
approved according to ISO/IEC 17025.
If you have any comments, please feel free to contact us at the following:
Lin Kou EMC/RF Lab
Tel: 886-2-26052180
Fax: 886-2-26051924
Hsin Chu EMC/RF/Telecom Lab
Tel: 886-3-6668565
Fax: 886-3-6668323
Hwa Ya EMC/RF/Safety Lab
Tel: 886-3-3183232
Fax: 886-3-3270892
Email: [email protected]
Web Site: www.bureauVeritas-adt.com
The address and road map of all our labs can be found in our web site also.
--- END ---